
Annual Report 2017 Financial Results - uniper.energy · Employee turnover rate % 5.0 4.0 1.0 TRIF...
248
3 Financial Results Annual Report 2017
Transcript of Annual Report 2017 Financial Results - uniper.energy · Employee turnover rate % 5.0 4.0 1.0 TRIF...
3
Financial Results
Annual Report 2017

Uniper
Annual Report 2017
Adjusted EBIT
European Generation Global Commodities International Power Generation Administration/Consolidation
30%
€337 million
55%
€616 million
-16%
-€180 million
31%
€341 million
External Sales Revenues
European Generation Global Commodities International Power Generation Administration/Consolidation
10%
€7,107 million
2%
€1,170 million
-10%
-€7,073 million
98%
€71,034 million
Performance Indicators at a Glance
Selected Financial Performance Indicators by Segment
1Adjusted for non-operating effects (see Glossary of Financial Terms). 2Basis: of outstanding shares as of reporting date. 3For the respective fiscal
year; proposal for 2017 4Figure provided for information purposes, not a principal indicator in 2016. 5Excluding Russia.
Financial and Non-financial Indicators for the Uniper Group
Unit 2017 2016 +/-%
Power procurement and owned generation Billion kWh 728.2 693.8 5.0
Electricity sales Billion kWh 725.9 691.3 5.0
Gas sales Billion kWh 1,944.8 1,725.7 12.7
Sales € in millions 72,238 67,285 7.4
Adjusted EBIT 1 € in millions 1,114 1,362 -18.2
For information purposes: Adjusted EBITDA 1 € in millions 1,741 2,122 -18.0
Net income/loss € in millions -538 -3,234 83.4
Earnings per share 2, 3 € -1.79 -8.79 79.6
Dividend proposal / Dividend per share 2 € 0.74 0.55 34.5
Cash provided by operating activities € in millions 1,385 2,184 -36.6
Adjusted FFO 1 € in millions 753 (479) 4 57.2
Investments € in millions 843 781 7.9
Growth € in millions 451 381 18.4
Maintenance and replacement € in millions 392 400 -2.0
Economic Net Debt 1 € in millions -2,445 -4,167 -41.3
Employees 12,180 12,635 -3.6
Proportion of female employees % 23.9 24.1 -0.2
Average age Years 44 44 –
Employee turnover rate % 5.0 4.0 1.0
TRIF (Uniper employees) 1.41 1.24 13.7
For information purposes: TRIF (combined) 5 1.98 2.13 -7.0

Main Events in the 2017 Fiscal Year
JanuaryUniper received the requisite permit for the Datteln 4 power plant pursuant to immission-control laws
and continues to make progress on the road to commissioning.
FebruaryUniper showcased itself for the first time as a listed company and with its own stand at the energy trade
fair “E-World” in Essen.
MarchUniper published its first consolidated financial statements, which showed that 2016, its first fiscal year
as an independent company, was a positive year overall.
AprilUniper and four other European energy companies – ENGIE, OMV, Shell and Wintershall – signed financing
agreements with Nord Stream 2 AG.
The Uniper subsidiary LIQVIS and the food logistics service provider Meyer Logistik opened the first
publicly accessible liquefied natural gas (LNG) filling station.
MayIn its Q1 2017 communication, Uniper announced that it had gotten off to a stable start to the 2017
fiscal year.
JuneUniper was the first major energy company to be given a rating by Scope Ratings AG; the rating given
was BBB+ with a stable outlook.
Uniper also invited its shareholders to the first Annual Shareholders Meeting in June.
JulyThe Finnish utility company Fortum approached the Uniper Management Board with a first takeover bid.
AugustRepresentatives of Uniper met for the first time with the most important non-governmental organiza-
tions to discuss human rights violations in the coal supply chain in Colombia in a personal dialog.
SeptemberWith an increase in share price and market capitalization of more than 100%, Uniper had a successful
first year on the stock exchange following its IPO.
Fortum Oyj and Fortum Deutschland SE had communicated the preparation of a voluntary public take-
over bid and published the decision to submit the offer in accordance with Section 10 of the German
Securities Acquisition and Takeover Act (Wertpapiererwerbs- und Übernahmegesetz; WpÜG).
OctoberTogether with BP, Uniper announced its intention to use “green hydrogen” for the production of fuels.
NovemberUniper successfully completed the sale of its stake in the Yuzhno-Russkoye gas field in Russia to the
Austrian OMV Group, which was announced in March 2017. The Uniper stake of around 25% was sold
for €1,749 million plus the liquid funds.
DecemberUniper presented the update of its strategy and gave an early earnings and dividend outlook for the
fiscal year 2018. In line with the revised strategy, Uniper plans to increase the dividend by an average
of 25% per year through 2020 compared to the base year 2016.

Only the German version of this Annual Report is legally binding.
This Annual Report, and especially the Forecast Report section, contains certain forward-looking statements that are based
on current assumptions and forecasts made by Uniper SE management and on other information currently available to
Uniper SE management. Various known and unknown risks, uncertainties and other factors could cause the actual results,
financial condition, development or performance of the Company to differ materially from that anticipated in the estimates
given here. Risks and chances of this nature include, but are not limited to, the risks and chances specifically described in the
Risk and Chances Report. Uniper SE does not intend, and specifically disclaims any obligation, to update such forward-looking
statements or to revise them in line with future events or developments.
Contents
Letter to Shareholders 2
Report of the Supervisory Board 4
Uniper Stock 10
Strategy and Objectives 14
Combined Management Report 16
Corporate Profile 16
Business Report 21
Macroeconomic and Industry Environment 21
Business Performance 30
Earnings 36
Financial Condition 42
Assets 46
Earnings, Financial Condition and Net Assets of Uniper SE 47
Non-Financial Performance Indicators 49
Risk and Chances Report 52
Forecast Report 64
Internal Control System for the Accounting Process 68
Additional Disclosures Regarding Takeovers 70
Corporate Governance Report 74
Corporate Governance Declaration 74
Compensation Report 84
Combined Separate Non-Financial Report 96
Independent Auditor’s Report 110
Consolidated Financial Statements 118
Consolidated Statements of Income 118
Consolidated Statements of Recognized Income and Expenses 119
Consolidated Balance Sheets 120
Consolidated Statements of Cash Flows 121
Statement of Changes in Equity 122
Notes 124
Declaration of the Management Board 227
List of Shareholdings 228
Members of the Supervisory Board 232
Members of the Management Board 233
Independent Practitioner’s Report on Non-financial Reporting 234
Further Financial Information 237
Glossary of Financial Terms 237
Financial Calendar 243

2Uniper
Annual Report 2017
In less than two years on the stock exchange, Uniper has already experienced a very exciting
and successful history. Within a very short period of time, a company has emerged that once
again has a solid financial basis, has established a new strategic and structural orientation
and is, at the same time, a fundamental part of society—after all, it ensures the supply of
electricity and gas in Europe and Russia on a daily basis. The untiring commitment and out-
standing skills of the Company’s some 12,000 employees allow Uniper to compete success-
fully in the market. Our products are in demand and our opinion is valued. The share price
and market capitalization have more than doubled since the IPO.
Although the starting conditions were not easy for Uniper, since the first day of our indepen-
dence we have consistently implemented what we have announced to the capital market.
As a result, our debt has decreased significantly—as have our costs. By the end of 2018, we
will have achieved our target of reducing our controllable costs by €400 million annually.
From the very beginning, we have also limited our capital investments to the essentials. We
optimized our portfolio and achieved our debt reduction target early in the 2017 fiscal year
by selling our stake in the Russian gas field Yuzhno-Russkoye. As of December 31, 2017,
economic net debt stood at €2.4 billion—more than €1.7 billion less than at the end of the
2016 fiscal year. This has created the conditions for a solid investment-grade rating.
Uniper generates solid operating results. This was the case again in the 2017 fiscal year:
Operating income (adjusted EBIT) reached €1.1 billion, fully in line with our forecast. The
consolidated net loss of €538 million is due to a balance sheet effect: Upon completion of
the sale of our Yuzhno-Russkoye gas field investment, exchange rate losses previously recog-
nized in equity had to be reclassified, which had a corresponding impact on net income.
By contrast, there was a significant increase in adjusted funds from operations—a key figure
that Uniper uses, among other things, to measure the potential distribution available to
shareholders. In order to enable our shareholders to participate appropriately in the positive
development of our business, we will propose to the Annual Shareholders Meeting on June 6
that a total dividend payment of around €271 million be made for the 2017 fiscal year. In
addition, we have already announced our intention to increase the dividend by an average of
25% until 2020. Accordingly, around €310 million are to be distributed to Uniper shareholders
for the 2018 fiscal year.
Despite Uniper’s success so far, it could not be assumed that you, our shareholders, would
remain loyal to us. Until February 2, 2018, you could have taken advantage of the opportunity
to sell your Uniper shares to Fortum, the Finnish energy company. An offer to this effect was
made to all Uniper shareholders after it became known that Fortum intended to acquire
around 47% of Uniper shares from our previous major shareholder E.ON. Fortum has an-
nounced its intention to complete the takeover by mid-2018. Fortum will then—subject to
pending approvals—be our largest shareholder. The Management Board and Supervisory
Board of Uniper had recommended to all other shareholders that they not accept the Fortum
offer. We had come to the conclusion, without a dissenting vote, that the offer of €21.31 per
share did not reflect the actual value of Uniper. Furthermore, there was no significant contri-
bution to improving Uniper’s prospects for its further development. And the stock market
price of the Uniper share during the acceptance period confirmed our assessment—it rose
significantly above the offer price and did so even after the acceptance period had expired.
On February 7, 2018, Fortum then announced that only a further 0.47% of the shares were
tendered to them in addition to E.ON’s block of shares. Overall, this makes the acceptance
rate for the Fortum offer 47.12%. The overwhelming majority of our shareholders therefore
followed our vote and did not accept the takeover bid. On behalf of the entire Uniper Manage-
ment Board, I would like to express my sincere thanks to you for this trust. It strengthens us
and shows us that the capital market continues to believe in our strategy and our long-term
competitiveness as an independent company.
Letter to Shareholders

3
Irrespective of the possible changes in our shareholder structure, we at Uniper worked hard in
2017 to further develop our successful strategy and align it consistently with the requirements
of the future energy world. Having significantly strengthened our financial base in the past
two fiscal years, it is now time to focus on the future of our business and individual growth
areas. Various external developments play into our hands. Firstly, despite the sharp increase
in the share of renewable energy sources and a decline in European gas production, people
expect a secure and affordable supply of electricity and gas at all times. Wind and sun are not
available around the clock and in all weather conditions, which means that the energy supply
can fluctuate considerably. Uniper has exactly the right portfolio and the right contracts to
ensure the necessary balance and security. With our flexible coal and gas-fired power plants,
CO2-free hydroelectric power, nuclear energy in Sweden and our gas storage facilities, we
are in a position to guarantee energy supply at all times.
Inevitably, there will be even greater demand for the product supply security in the coming
years. With the decommissioning of older power plants and the phasing out of nuclear energy
in Germany, there are signs of a significant shortage on the electricity markets in Western
and Northern Europe. Especially for the period from 2020, we expect that this will lead to a
further recovery in electricity prices and a reassessment of supply security. This also results
in opportunities for our portfolio—and for our investors. In many countries, including France,
the United Kingdom and Russia, we already offer supply security in competitively organized
markets and receive compensation for this. We are convinced that these models will play a
decisive role in our business in the future. We see direct marketing of our power plants as
another attractive growth area. Selling our electricity and other energy sources such as
process steam from certain plants directly to our customers and partners makes us less
dependent on income from fluctuating energy prices. By 2020, the share of our operating in-
come that is not affected by fluctuations in the price of electricity will increase significantly.
Another trend from which Uniper can benefit is the fact that markets worldwide are converg-
ing. As one of the largest energy traders in Europe, we can be actively involved in this develop-
ment. With our sales, gas infrastructure and long-term gas supply contracts, we are already
well positioned in our trading business. We intend to use this strong foundation in the future
and focus our trading activities more strongly on North America and Asia, where demand for
coal and gas is increasing. LNG is also playing an increasingly important role in Asia, the U.S.
and Europe. Our energy trading is thus becoming even more global and versatile. A third factor
that Uniper can benefit from is that the demand for energy is growing worldwide. In particular,
natural gas will play an indispensable role in meeting the world’s energy needs in the coming
decades. In these new markets, we also want to offer customers attractive energy products
and services.
Dear Shareholders, Uniper is a global energy company with a unique portfolio, strong techni-
cal and commercial expertise and a great workforce that is well positioned for the energy
world of tomorrow. We offer a secure energy supply and tailor-made energy solutions in an
increasingly complex energy world. We have a solid financial basis, reliably generate freely
available funds and create sustainable value for our shareholders. At Uniper, we have a lot of
energy— energy that we would like to use in the best interests of our shareholders, employees
and customers. I would be pleased if you would continue to accompany Uniper on its excit-
ing journey.
With best wishes,
Klaus Schäfer

4Uniper
Annual Report 2017
The market environment remained challenging last year. Nevertheless, the energy markets in
Germany and Europe recovered in the second half of the year, with fuel and energy prices
rising on the national and international markets, although the overall generation margins
remained at a low level.
Operationally, the key topics for Uniper in 2017 were the progress on major projects in the
power plant sector, the commitment to projects to secure the energy supply and measures
to further reduce debt. The focus was also on the further restructuring of the Company and
the adjustment of cost structures to the ongoing challenging market environment.
Another main topic in the second half of the year was the discussion of the takeover bid by
Fortum. This was also a major focus of the Supervisory Board’s work in 2017.
In the 2017 fiscal year, the Supervisory Board of Uniper SE carefully performed all its duties
and obligations under law, the Company’s Articles of Association and its own rules of pro-
cedure. It thoroughly examined the Company’s situation and discussed in depth the conse-
quences of the continually changing energy-policy and economic environment.
We advised the Management Board regularly about the Company’s management and contin-
ually monitored the Management Board’s activities, assuring ourselves that the Company’s
management was legal, purposeful and orderly. We were closely involved in all business
transactions of key importance to the Company and discussed these transactions thoroughly
based on the Management Board’s reports.
The Management Board regularly provided us with timely and comprehensive information in
both written and oral form. At the meetings of the full Supervisory Board and its committees,
we had sufficient opportunity to actively discuss the Management Board’s reports, motions
and proposed resolutions. We voted on such matters when it was required by law, the Com-
pany’s Articles of Association or the Supervisory Board’s rules of procedure. The Supervisory
Board decided on the resolutions proposed by the Management Board after thoroughly
examining and discussing them. Accordingly, the Supervisory Board was regularly informed
about the current operating performance of the major Group companies, significant business
transactions, the development of key financial figures and relevant decisions under consid-
eration.
Furthermore, there was a regular exchange of information between the Chairman of the
Supervisory Board and the Chairman of the Management Board throughout the entire fiscal
year. In the case of particularly important issues, the Chairman of the Supervisory Board
was kept informed at all times. The Chairman of the Supervisory Board likewise maintained
contact with the members of the Supervisory Board outside of board meetings.
As the Supervisory Board, we addressed the issues relevant to the Company in five regular
and five extraordinary meetings, which are described below. A list of the meetings and the
participation of individuals in the meetings can be found on page 82 of the annual report.
Report of the
Supervisory Board

5
Key Topics of the Supervisory Board’s Discussions
With respect to the Group’s operations, we discussed in detail the price movements in the
national and international energy markets and the business situation of the Group companies,
about which we were continually informed by the Management Board. More specifically, we
discussed Uniper SE’s and the Uniper Group’s assets, liabilities, financial condition and earn-
ings, as well as workforce developments and earnings chances and risks. At regular intervals,
we also discussed the development of foreign currencies relevant for Uniper.
The Supervisory Board was provided information on a regular basis about the Company’s
health, (occupational) safety and environmental performance (in particular the development
of key accident indicators). A further focus was placed on activities to increase diversity
within the Company and to ensure the sustainability of Uniper’s business, especially in the
coal value chain.
Other overarching topics of our discussions included developments in European and German
energy policy, the latest regulatory developments and the macroeconomic and economic-
policy situation in the countries in which Uniper is active, especially as regards their impact on
each of Uniper’s various business areas.
The strategy of the Company and its further development were discussed extensively and
adopted. Approaches to innovation and digitization were also discussed. The divestments
planned by the Company were also part of the strategy. This included, in particular, the sale
of the stake in the Yuzhno-Russkoye gas field, which the Supervisory Board dealt with in
detail. This transaction was successfully concluded at the end of November 2017.
We thoroughly discussed current developments in our business activities. With respect to
generation activities, the Management Board provided us with detailed information on the
progress on the commissioning of the Provence 4 power plant in France. In addition, the
Supervisory Board was kept continuously informed of the status of the new Datteln 4 project
in Germany. We also regularly discussed with the Management Board the progress of the
reconstruction of the Russian Berezovskaya 3 power plant and approved the necessary budget.
With regard to the global trading business, we were informed in detail about new procurement
and supply contracts. The involvement of Uniper in the Nord Stream 2 pipeline project was
also reported on an ongoing basis and, following a detailed discussion, the financing funds
agreed upon were approved. In the liquefied natural gas (LNG) business, we focused on
activities to build up business in the United Arab Emirates and on transactions relating to
our long-term regasification capacity in Europe.
New business approaches we were informed about included a coal joint venture in the U.S.,
the cooperation agreement with SOCAR (the State Oil Company of the Azerbaijan Republic)
in Azerbaijan and the development of our energy services in India and South Africa.
Furthermore, the Management Board discussed with us in detail the Uniper Group’s financing
requirements, and at the beginning of the year was given the corresponding approvals for
issue of a commercial paper program. In addition, we were kept constantly informed about
the development of the Uniper share on the market, the shareholder structure and analyst
ratings. We also dealt regularly with the views of the relevant analysts on the Company’s rating.
In addition, we discussed in detail with the Management Board the Uniper Group’s medi-
um-term planning for the years 2018 to 2020 on the basis of updated assumptions on the
long-term development of energy and commodity prices, capacity market premiums and
seasonal price differences and approved the budget for 2018.

6Uniper
Annual Report 2017
The Management Board also informed us in detail about the restructuring program estab-
lished for making the necessary adjustments to cost and organizational structures in order
to adapt to the difficult market environment. In this context, we also discussed the negotia-
tions and agreements on collective and individual bargaining.
With respect to legal issues, the Management Board reported in detail on significant ongoing
proceedings and negotiations, including on long-term supply contracts.
In the second half of the reporting year, the activities of the Supervisory Board were domi-
nated by Fortum’s takeover bid to the shareholders of Uniper SE. The Supervisory Board dealt
with this matter intensively in several ordinary and extraordinary meetings and advised the
Management Board closely. The Supervisory Board formed a special committee, which dealt
with the legal, strategic, regulatory and financial implications of the takeover bid. An essential
part of the discussion in the special committee and Supervisory Board was the preparation
of the statement on Fortum’s voluntary public takeover bid, which was submitted jointly with
the Management Board on November 21, 2017, in accordance with section 27 of the German
Securities Acquisition and Takeover Act (Wertpapiererwerbs- und Übernahmegesetz, WpÜG).
The Supervisory Board also dealt with the Combined Separate Non-financial Report as of
December 31, 2017, prepared by the Management Board. An audit firm conducted a limited
assurance audit and issued an unqualified opinion. The Management Board explained the
documents in detail at the meetings; the auditor’s representatives reported on the main find-
ings of their audit and answered additional questions from the Supervisory Board members.
Following its examination, the Supervisory Board had no objections.
Finally, we also discussed the activity reports of the Supervisory Board’s committees.
Corporate Governance
The Supervisory Board and the Management Board jointly issued the annual declaration of
compliance with the German Corporate Governance Code (the “Code”) for Uniper SE in Febru-
ary of 2018, which is now publicly available on the Uniper SE website. In the past, all recom-
mendations of the Code have been complied with since the last declaration in February 2017,
and these will continue to be complied with in the future. With few exceptions, the suggestions
were followed. The Management Board states its views on this in the Corporate Governance
Report.
Additional corporate governance matters are also reported on in the Corporate Governance
Report by the Management Board.
Report of the
Supervisory Board
7
Committee Work
To fulfill its duties carefully and efficiently, the Supervisory Board has created the committees
described in detail below. Information about the committees’ composition and responsibilities
can also be found on pages 81 and 82 of the Corporate Governance Report. Within the scope
permissible by law, the Supervisory Board has transferred to the committees the authority
to adopt resolutions on certain matters. Committee chairs reported the agenda and results
of their respective committee’s meetings to the full Supervisory Board on a regular basis,
typically at the Supervisory Board meeting subsequent to their committee meeting.
• The Supervisory Board’s Executive Committee met a total of four times. In particular,
this committee prepared the meetings of the full Supervisory Board. The Nord Stream 2
project was also discussed and the sale of the stake in the Yuzhno-Russkoye gas field was
intensively prepared in order to enable the Supervisory Board to issue a subsequent
disposal mandate. In addition, the Executive Committee prepared the Supervisory Board’s
resolutions to determine that the Management Board met its targets for 2016/2017 and
to set the targets for 2018. Furthermore, it discussed Management Board compensation
and did comprehensive preparatory work for the Supervisory Board’s resolutions on these
matters.
• The Audit and Risk Committee met four times in the 2017 fiscal year. In an in-depth exam-
ination—taking into account the auditor’s reports and in discussion with the auditor—the
committee dealt in particular with the annual financial statements and consolidated
financial statements prepared in accordance with the International Financial Reporting
Standards (IFRS) for the 2016 fiscal year and the interim reports of Uniper SE in 2017.
The committee discussed the proposal for the appointment of the auditor and gave
instructions for its audit services, defined the focal points and costs of the audit and
reviewed its qualification and independence in accordance with the requirements of the
German Corporate Governance Code. In addition, the committee discussed in detail the
Combined Management Report and the proposal for the appropriation of profits, prepared
the corresponding recommendations to the Supervisory Board and reported to the Super-
visory Board. The Audit and Risk Committee intensively addressed market conditions,
especially market changes, as well as regulatory and political developments and the
resulting impairment consequences for Uniper’s activities.
Extensive discussions were also held on issues relating to accounting, the internal control
system and the audit of risk management, the Company’s risk-bearing capacity and
quality assurance of the risk management system. This examination was based on consul-
tations with the independent auditor and, among other things, reports from the Company’s
Risk Committee.
The committee also addressed in detail the work performed by internal audit, including
the audits conducted in 2017, and dealt with audit planning and the determination of
audit priorities. Furthermore, the committee discussed the internal control system (ICS),
the compliance reports and other issues related to auditing. The Management Board
also reported to the committee on ongoing proceedings and on legal and regulatory risks
for the Uniper Group’s business.
• The Nomination Committee met once in 2017 to submit proposals to the Supervisory
Board for the election of suitable candidates to the Supervisory Board by the Annual
Shareholders Meeting, based on the objectives of the Supervisory Board for its compo-
sition. The proposed members were then elected at the Annual Shareholders Meeting
in June 2017.
• The Special Committee on Takeover Matters was established in July 2017, after Fortum
informed Uniper of the proposed takeover. This committee met six times in 2017 and
focused on the legal, strategic, regulatory and financial implications of Fortum’s proposed
acquisition.

8Uniper
Annual Report 2017
Examination and Approval of the Annual Financial Statements, Approval of the Consolidated Financial Statements, Proposal for Profit Appropriation for the Year Ended December 31, 2017
PricewaterhouseCoopers GmbH, Wirtschaftsprüfungsgesellschaft, Düsseldorf, the indepen-
dent auditor chosen by the Annual Shareholders Meeting and appointed by the Supervisory
Board, audited and submitted an unqualified opinion on the Annual Financial Statements and
Management Report of Uniper SE, as well as on the Consolidated Financial Statements and
the Combined Management Report, for the year ended December 31, 2017.
Furthermore, the auditor examined Uniper SE’s early-warning system regarding risks. This
examination revealed that the Management Board has taken appropriate measures to meet
the requirements of risk monitoring and that the early-warning system regarding risks is
fulfilling its tasks.
At the Supervisory Board’s meeting on March 7, 2018, we thoroughly discussed—in the pres-
ence of the independent auditor and with knowledge of, and reference to, the Independent
Auditor’s Report and the results of the preliminary review by the Audit and Risk Committee—
Uniper SE’s Annual Financial Statements, Consolidated Financial Statements, Combined
Management Report, and the Management Board’s proposal for profit appropriation. The inde-
pendent auditor was available for supplementary questions and answers. After concluding
its own examination, the Supervisory Board determined that there are no objections to the
findings. We therefore acknowledged and approved the Independent Auditor’s Report.
We approved the Annual Financial Statements of Uniper SE prepared by the Management
Board and the Consolidated Financial Statements. The Annual Financial Statements are thus
adopted. We agree with the Combined Management Report and, in particular, with its state-
ments concerning the Company’s future development.
We examined the Management Board’s proposal for profit appropriation, which includes a
cash dividend of €0.74 per ordinary share, also taking into consideration the Company’s liquidity
and the financing and investment planning. The proposal is in the Company’s interest
with due consideration for the shareholders’ interests. After examining and weighing all
arguments, we agree with the Management Board’s proposal for profit appropriation.
Report of the
Supervisory Board

9
Personnel Changes on the Management Board
Mr. Andreas Scheidt resigned from the Supervisory Board at his own request with effect
from the end of the Annual Shareholders Meeting on June 8, 2017. Mr. Immo Schlepper was
appointed by the employees as his successor.
On the shareholder representatives’ side, the Supervisory Board mandate of Dr. Johannes
Teyssen, who did not run for re-election at his own request, also ended with effect from the
end of the Annual Shareholders Meeting on June 8, 2017. The Annual Shareholders Meeting
on June 8, 2017 elected Mr. David Davies to the Supervisory Board as his successor.
Further changes in the Supervisory Board’s committees are explained in detail in the Corpo-
rate Governance Report on page 81.
The Supervisory Board sincerely thanks the members of the Management Board and of the
Works Councils, as well as all the employees of the Uniper Group, for their dedication and
hard work in the 2017 fiscal year.
Düsseldorf, March 7, 2018
The Supervisory Board
Sincerely,
Dr. Bernhard Reutersberg
Chairman
Dr. Bernhard Reu
Chairman

10Uniper
Annual Report 2017
Uniper Stock
Uniper share price reaches new highs
Dividend proposal of €0.74 per share (previous year €0.55)
2017: Solid Stock Market Year for the Energy Utility Sector
The upward trend on the stock markets seen in recent years continued in 2017. The “equities” asset
class remained very attractive for investors. On the other hand, bonds did not offer a viable alternative
due to their continued historically low interest rates. In the second half of 2017 in particular, equity
markets were supported by the more robust performance of the global economy. All the member states
of the European Union recorded an expansion of economic activity. The U.S. maintained the same growth
rate as in the previous year. Important economic nations, in particular Russia and China, recorded more
stable performances than expected. At the beginning of 2018, optimism remained that the global econ-
omy would continue to grow robustly in 2018.
The shares of European energy utilities contributed to the positive price performance of the European
stock market in 2017. However, following an above-average performance in the first three quarters, the
sector lacked further drivers in the fourth quarter. Overall, the energy utilities sector slightly under-
performed the overall European equity market as a whole. Within the sector, the individual companies
turned in extremely varied performances. A number of companies are benefiting from their portfolio
and cost optimization measures. Optimism within the sector was fueled by rising commodity and energy
prices and increasingly positive signals from policymakers regarding ensuring supply security in the
future. In many cases, this resulted in a more proactive dividend policy for companies in the energy utili-
ties sector compared with the previous year.
Uniper SE: Stock Performance in 2017
Uniper STOXX Europe Utilities MDAX
Jan Feb Mar Apr May Jun Jul Aug Sep Oct Nov Dec
%1)
220
200
180
160
140
120
100
1Total return of the Uniper share and the MDAX and STOXX Europe Utilities; indexed, 100 = 2016 year-end prices
Source: Bloomberg
11
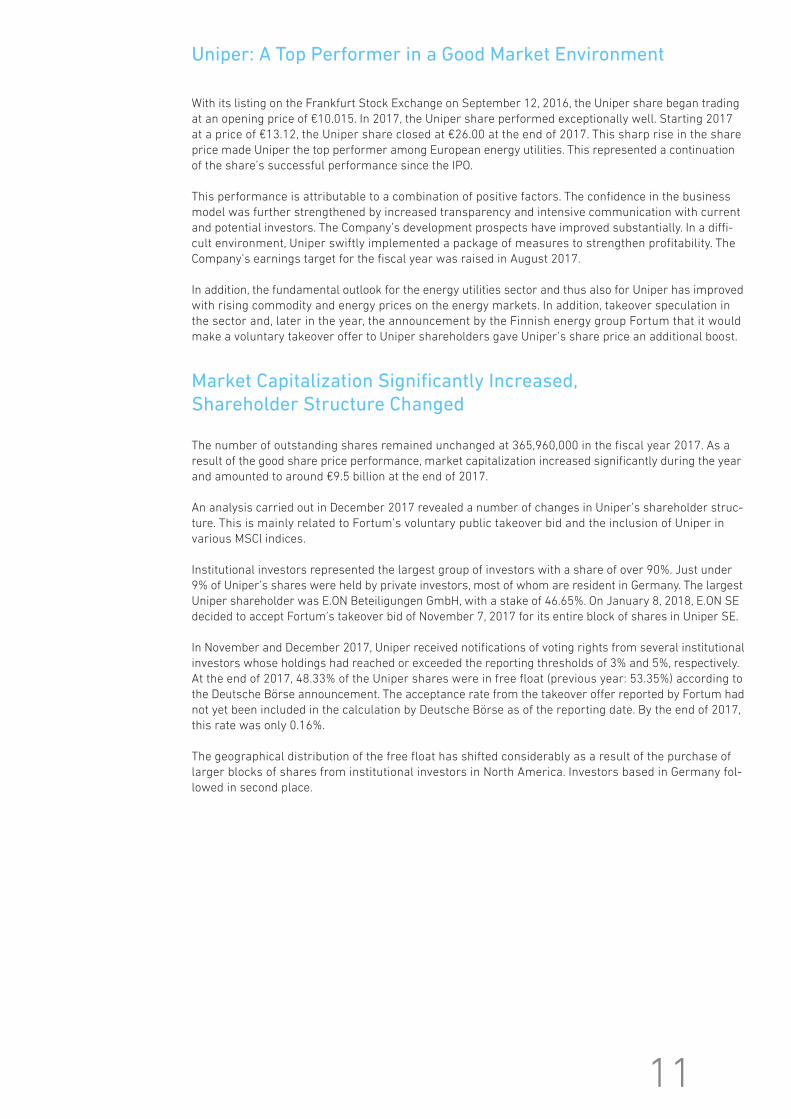
Uniper: A Top Performer in a Good Market Environment
With its listing on the Frankfurt Stock Exchange on September 12, 2016, the Uniper share began trading
at an opening price of €10.015. In 2017, the Uniper share performed exceptionally well. Starting 2017
at a price of €13.12, the Uniper share closed at €26.00 at the end of 2017. This sharp rise in the share
price made Uniper the top performer among European energy utilities. This represented a continuation
of the share’s successful performance since the IPO.
This performance is attributable to a combination of positive factors. The confidence in the business
model was further strengthened by increased transparency and intensive communication with current
and potential investors. The Company’s development prospects have improved substantially. In a diffi-
cult environment, Uniper swiftly implemented a package of measures to strengthen profitability. The
Company’s earnings target for the fiscal year was raised in August 2017.
In addition, the fundamental outlook for the energy utilities sector and thus also for Uniper has improved
with rising commodity and energy prices on the energy markets. In addition, takeover speculation in
the sector and, later in the year, the announcement by the Finnish energy group Fortum that it would
make a voluntary takeover offer to Uniper shareholders gave Uniper’s share price an additional boost.
Market Capitalization Significantly Increased, Shareholder Structure Changed
The number of outstanding shares remained unchanged at 365,960,000 in the fiscal year 2017. As a
result of the good share price performance, market capitalization increased significantly during the year
and amounted to around €9.5 billion at the end of 2017.
An analysis carried out in December 2017 revealed a number of changes in Uniper’s shareholder struc-
ture. This is mainly related to Fortum’s voluntary public takeover bid and the inclusion of Uniper in
various MSCI indices.
Institutional investors represented the largest group of investors with a share of over 90%. Just under
9% of Uniper’s shares were held by private investors, most of whom are resident in Germany. The largest
Uniper shareholder was E.ON Beteiligungen GmbH, with a stake of 46.65%. On January 8, 2018, E. ON SE
decided to accept Fortum’s takeover bid of November 7, 2017 for its entire block of shares in Uniper SE.
In November and December 2017, Uniper received notifications of voting rights from several institutional
investors whose holdings had reached or exceeded the reporting thresholds of 3% and 5%, respectively.
At the end of 2017, 48.33% of the Uniper shares were in free float (previous year: 53.35%) according to
the Deutsche Börse announcement. The acceptance rate from the takeover offer reported by Fortum had
not yet been included in the calculation by Deutsche Börse as of the reporting date. By the end of 2017,
this rate was only 0.16%.
The geographical distribution of the free float has shifted considerably as a result of the purchase of
larger blocks of shares from institutional investors in North America. Investors based in Germany fol-
lowed in second place.

12Uniper
Annual Report 2017
Uniper in the Focus of the Finnish Energy Group Fortum
The first half of 2017 was influenced by substantial takeover speculation in the energy utilities sector,
including speculation relating to Uniper. On September 20, 2017, E.ON SE and Fortum Oyj, Finland,
announced that they had entered into advanced negotiations for an agreement to sell E.ON’s 46.65%
stake in Uniper SE. On September 26, 2017, Fortum Deutschland SE announced its decision to make an
offer to the shareholders of Uniper SE to acquire all registered no-par value shares of Uniper SE as
part of a voluntary public takeover offer. This was preceded on September 26, 2017 by the ad hoc
announcement published by E.ON SE of an agreement with Fortum under which E.ON could tender its
remaining stake in Uniper as part of a public takeover bid by Fortum at the beginning of 2018.
On November 7, 2017, Fortum Deutschland SE published the offer document for the voluntary public
takeover bid (cash offer) of Fortum Deutschland SE to the shareholders of Uniper SE for the acquisition
of its registered no-par value shares. The offer was addressed to all Uniper shareholders and provided
for a cash payment of €21.31 per Uniper share. In addition, Uniper shareholders would be able to partic-
ipate in the dividend for the fiscal year ended December 31, 2017. If the 2018 Annual Shareholders
Meeting does not approve a dividend or approves a dividend of less than €0.69 per Uniper share and
provided that the offer is completed, the bidder will make up for the difference to €0.69 to those Uniper
shareholders who have accepted the offer. A minimum acceptance threshold was not included in the
offer.
On November 21, 2017, Uniper’s Management Board and Supervisory Board published a joint statement
on the voluntary public takeover bid by Fortum. Both boards believe that Fortum’s public offer is not in
the interest of Uniper, its shareholders, employees and other stakeholders. The Management Board and
Supervisory Board therefore recommended that Uniper shareholders not accept Fortum’s offer. The
Group Works Council fully supported the joint statement of the Management Board and Supervisory
Board and therefore did not issue a separate statement.
On January 8, 2018, E. ON exercised the right to tender its 46.65% stake in Uniper as part of Fortum’s
public takeover offer of November 7, 2017.
After the extended acceptance period expired, Fortum announced on February 7, 2018, that the offer
had been accepted for a total of 172,439,375 Uniper shares. This corresponds to around 47.12% of the
share capital and voting rights of Uniper SE. Completion of the offer is subject to approval by various
jurisdictions.
Shareholder Structure of Uniper SE by Investor Group
E.ON Beteiligungen 47%
Institutional investors 41%
Retail investors 9%
Unidentifi ed 3%
Sources: Ipreo, Share register, Voting rights notifications as of December 29, 2017

13
Uniper With a Clear Dividend Policy
The Company pursues a clear dividend policy. It is an integral part of the financing policy. Uniper’s ambi-
tion is to achieve a healthy balance between attractive cash flows and balance sheet stability. On the one
hand, the Company is geared toward a solid financial structure with a comfortable investment-grade
rating, which leaves the Management Board with sufficient economic freedom for the strategic develop-
ment of the Company and, on the other hand, it allows shareholders to participate to a large extent in
the Company’s business success.
The distribution is a dividend linked to the success of the business activities and calculated from the
free cash flow from operating activities (“FCfO”). The aim is to achieve a dividend payout ratio of at least
75% to 100% of this cash flow from operating activities.
For the 2017 fiscal year, a total dividend payment of €271 million (2016: €201 million) is expected. The
Management Board and Supervisory Board intend to propose to the Annual Shareholders Meeting on
June 6, 2018 that the net income available for distribution be distributed to pay a dividend of €0.74 per
share (2016: €0.55) on the dividend-paying capital stock. In December 2017, Uniper announced a medi-
um-term dividend growth target in line with the revised strategy. Based on the dividend distribution
for the 2016 fiscal year, the dividend is expected to increase by an average of 25% per year until the
2020 fiscal year.
Investor Relations Work for Greater Transparency
Investor relations work focuses on providing transparent information for shareholders and capital
market participants. The primary objective is to increase awareness of Uniper’s business model and
value drivers among capital market participants.
Uniper’s Management Board commented on the development of business as part of its regular presen-
tations of results. In order to create even more transparency, the Uniper Management Board explained
in detail the business and prospects of the European Generation segment and the gas midstream division
in separate telephone conferences. Finally, in December 2017, an update on the Company’s strategic
direction was announced. In addition, the Investor Relations department provided support for a large
number of roadshow appointments and further meetings between the Management Board and analysts
and investors.
You can find essential information about the stock as well as Uniper’s strategy on the Investor Relations
website at: https://ir.uniper.energy/.

14Uniper
Annual Report 2017
Strategy and Objectives
Foundations Successfully Laid
Just over a year after its IPO, Uniper has successfully laid the foundations for the Company’s long-term
direction. There has been an increase in operational efficiency, the organizational structure has been
streamlined, the controllable cost base has been significantly decreased and debt has been reduced
through disposals, in particular the sale of the stake in the Yuzhno-Russkoye gas field in Russia.
This gives Uniper the financial flexibility to undertake initial growth initiatives on a small scale in the
coming fiscal years within the framework of its existing dividend policy. One option being considered to
implement the strategy, in addition to the existing financial flexibility, is the selective sale of individual,
strategically insignificant portfolio components.
Future-Oriented in a Changing Energy Market
The global energy market, and therefore Uniper, too, is subject to a multitude of medium- and long-
term trends. These include market changes and technological, regulatory and social developments.
However, there are regional differences.
In Europe, the focus is on decarbonization with the continued strong growth in the expansion of renew-
ables, stricter climate protection regulations (e.g., the planned and in some cases already approved
phase-out of coal in numerous European core countries) and the increasing influence of carbon pricing
on the generation mix. In the medium term, conventional power plants will increasingly be used to en-
sure supply security and appropriate remuneration structures are increasingly being adopted. As the
most environmentally friendly fossil fuel, gas will benefit from the shift in the generation mix and poten-
tially from increased use in the transport sector—both on land and at sea. Due to declining domestic
production, import demand in Europe is rising. This demand is being met by LNG as well as by increasing
quantities of pipeline gas from established and new suppliers. At the same time, the security of the gas
supply is expected to gain in importance.
Globally, in addition to the growth of renewable energies, Uniper also expects to see the expansion of
conventional power plant technology, especially based on natural gas. Outside Europe, particularly in
Asia, South America and the Middle East, the construction of new coal-fired power plants will also play
a role. Overall, Uniper believes that this will lead to an increase in global trade flows for coal and, in
particular, LNG.
Technological trends and innovations, for example, in the areas of digitization, energy storage, carbon
capture and utilization, will become increasingly important, but will still have a relatively minor impact
in the coming years.
Strategy for Uniper—Offering Custom-Tailored Energy Solutions. Mastering Complexity.
Uniper’s strategy remains on its successful path towards initial growth momentum within the strict finan-
cial framework that has been established. The plan is to make optimal use of the existing, very well
positioned portfolio and to selectively expand it. Geographically, Uniper is, and will continue to be, active
in markets that rely on a secure and competitive energy supply. In addition to Europe (including Russia),
the focus will be expanded to include the U.S. and Asia. In terms of growth investments, Uniper will use
the best technology in each case, with a focus on the gas business, both in power plants and in the
trading portfolio. The proportion of the business that is not directly exposed to fluctuations in energy
prices is to be steadily expanded, while keeping a focus on risk.

15
Focus on Supply Security and Industrial Customer Solutions
Uniper has an efficient power plant portfolio in Europe and Russia. With this power plant portfolio, Uniper
will continue to make a contribution to ensuring system stability and supply security in the European
and Russian electricity markets. Due to the distribution between different countries and regions and the
use of different technologies and energy sources, Uniper’s power plant portfolio is in a position to meet
the demand for flexible and controllable conventional power generation and to take advantage of oppor-
tunities that arise in existing and potential capacity markets or through the expected increase in the
relevant commodity prices and, in particular, volatilities.
In addition to revenues from contributions to supply security from existing and possibly also new plants,
a greater emphasis is being placed on customer-specific and custom-tailored generation solutions from
a single source, for example by offering combined products from electricity and steam, heat or by-prod-
ucts. In this context, Uniper is focusing, in particular, on the expansion of existing business relationships
with industrial customers.
In order to ensure the long-term stability of the European gas market, Uniper is positioning itself as one
of the leading players in Central Europe with its extensive portfolio of long-term contracts, gas storage
facilities, pipeline capacities, LNG regasification capacity and customer activities.
Diversification and Expansion of Uniper’s Global Presence
Uniper has a flexible physical portfolio of short and long-term gas procurement, coal positions and LNG,
which not only enables the Company to meet its own needs but allows it to offer individual solutions
to partners. Uniper plans to expand its globally networked portfolios of energy and commodity positions
as well as its global energy trading activities by concluding additional procurement and delivery posi-
tions. At the same time, the Company will enter into partnerships in the area of commodity procurement
and marketing in order to further diversify the portfolio.
Uniper’s European gas portfolio of existing long-term contracts is to be supplemented by further con-
tracts and transport routes. In addition, the European gas business is to be linked more closely with other
regions, particularly the U.S. and Asia, through global trading in LNG.
Looking at the global coal market, Uniper’s existing procurement positions for supplying its own power
plant fleet give it established market access. In this area, the intention is to enter into partnerships with
other coal-fired power plant operators, particularly outside Europe, in order to expand the procurement
position and, at the same time, to take over global marketing for existing coal suppliers.
Participation in the Growth of the Electricity Markets Worldwide
Using its available expertise, Uniper intends to further advance and expand the provision of energy
services for third parties, for example in the areas of development, planning, operation, maintenance,
fuel supply and the marketing of power plants.
This integrated approach will also be applied to the development of any new construction projects in
which Uniper may participate.

16Uniper
Annual Report 2017 Combined Management Report
Combined Management Report
Adjusted EBIT of €1.1 billion in line with forecast; year-over-year decline due to absence of elevated non-recurring effects
Adjusted FFO of €753 million significantly above prior-year figure
Economic net debt reduced by more than €1.7 billion
Dividend proposal of €271 million (€0.74 per share)
Outlook for 2018: Adjusted EBIT expected to be between €0.8 and €1.1 billion
Corporate Profile
Business Model
Uniper is a parent-owned international energy company with operations in more than 40 countries and
some 12,000 employees. Its business is the secure provision of energy and related services. The ultimate
lead company of the Group is Uniper SE; the corporate headquarters are in Düsseldorf, Germany.
The shares of Uniper SE are traded on the Frankfurt Stock Exchange’s regulated market in its subseg-
ment with additional post-admission obligations (the “Prime Standard”), and are included in the MDAX
and various MSCI Stock Indices.
The Uniper Group is composed of three operating business segments: European Generation, Global
Commodities and International Power Generation. Combined separately under Administration/Consoli-
dation are administrative functions that are performed centrally across segments, as well as the con-
solidations required to be carried out at Group level.
European GenerationThe European Generation segment comprises the various power and heat generation facilities that the
Uniper Group operates in Europe. In addition to fossil-fuel power plants (coal, gas, oil and combined gas-
and-steam power plants) and hydroelectric power plants, these generation facilities also include nuclear
power plants in Sweden, a biomass plant in France and a small number of photovoltaic and wind
power facilities. The majority of the energy generated is sold to the Global Commodities segment, which
is responsible for the marketing and sale of the energy to major customers via the trading markets and
its own sales organization. A further portion of the energy generated is marketed by means of long-
term electricity and heat supply contracts. In addition to the power plant business, this segment is also
engaged in the marketing of energy services ranging from fuel procurement and engineering to opera-
tional and maintenance services to trading services (under the “Energy Services” brand).

17
Global CommoditiesThe Global Commodities segment bundles the energy trading activities and forms the commercial inter-
face between the Uniper Group and the global wholesale markets for energy as well as the major
customers. Within this segment, the fuels required for power generation (mainly coal and gas) are pro-
cured, emission allowances are traded, the electricity produced is marketed and the portfolio is opti-
mized by managing the use of the power plants. The gas business is engaged in the supply of gas to
industrial and municipal-utility customers and in the importation of gas from various sources. In addition,
this segment includes infrastructure investments and the gas storage operations, as well as all the
activities of the Uniper Group relating to the equity investment in the Russian gas field Yuzhno-Russkoye,
which was sold at the end of November 2017.
International Power GenerationThe International Power Generation segment brings together the operating power generation business
of the Uniper Group in Russia and Brazil. PAO Unipro, an indirect subsidiary of Uniper SE listed in Russia,
is responsible for conducting all business in connection with power generation and associated activities
in Russia. These include the procurement of the fuels needed for the power plants, the operation and
management of the plants and the trading and sale of the energy produced. The Uniper Group’s business
in Brazil primarily comprises a 6.10% financial investment in the energy utility ENEVA S.A. held by the
Uniper Group and a 50% shareholding in Pecém II Participações S.A., which operates a coal power plant.
Technology and Innovation
Uniper will continue to be confronted with a rapidly changing energy landscape: decarbonization, decen-
tralization and digitization are three trends that will have a major impact on the energy world. Despite
the current challenging business environment, Uniper is working on shaping these trends and making
them commercially viable. Innovation plays a key role in this approach. Uniper’s main focus is on the
development of new, scalable business models that contribute to the further development of the existing
business.
The long-term goal of extensively decarbonizing global economies was established as part of the 2015
Paris Agreement on Climate Change. A central means to achieve the climate targets defined there is the
increased use of renewables in power and heat generation. In order to ensure a sustainable and secure
supply of energy, additional flexible and efficient power plants are needed to safeguard fluctuating gen-
eration from renewable energy sources, as are innovative storage solutions and flexibility options for
energy users.
The operation of the test facility for large-scale batteries is one of the first steps towards the innovative
storage of generated power. The project “M5BAT” makes it possible to conduct technical and commercial
testing of different types of batteries; this project is being carried out by Uniper together with RWTH
Aachen University and other partners. The battery storage system uses five different battery technolo-
gies with a total capacity of 5 megawatts (MW); these battery technologies are being tested under real
market conditions. One of Uniper’s roles in the project consortium is to integrate the battery storage
system into the energy market, where it is successfully being used mainly to compensate for fluctua-
tions in the energy grid.
Uniper is also working on the further development of power-to-gas technology for the conversion and
storage of power from renewables. Uniper has already gained practical experience in this area in two
pilot plants in Germany, located in Falkenhagen and Hamburg-Reitbrook. In 2017, the test operation of
the “WindGas Falkenhagen” pilot plant was suspended because the plant is currently being expanded to
include a methanization facility. In this new part of the plant, energy is first converted to hydrogen and
then converted into a synthetic natural gas with the help of CO2.
18Uniper
Annual Report 2017 Combined Management Report
Uniper is also active in alternative fuels such as LNG in heavy goods vehicles. Environmentally friendly
LNG is likely to play a key role in the transport sector in the future, since this area has great potential for
reducing emissions (for example, CO2, NOX and particulate matter). LIQVIS GmbH, a Uniper subsidiary,
is already successfully operating two LNG filling stations in Germany and one in France. For the further
development of LNG filling stations, Uniper has received a total of €9.6 million in funding from the EU’s
Connecting Europe Facility for Transport (“CEF Transport”) funding program through the end of 2020.
Another area in which Uniper is active is the commercial use of CO2 as a commodity (carbon capture
and usage). For example, Uniper joined with 42 partners from industry and research to found the new
European association CO2 Value Europe in 2017. This organization is dedicated to developing sustainable
technologies and improving their market conditions to enable, for example, the production of building
materials, chemicals and fuels using CO2 on an industrial scale.
In addition, Uniper is continuously working on making conventional power plants more flexible in order
to further increase their efficiency in the area of system services.
The energy revolution is taking place not only at energy companies, but also increasingly in private
households and industrial companies, due to the growing decentralization of the energy supply. Power,
heat and mobility are converging, a trend also known as sector coupling. As part of this trend, there is an
increasing demand for innovative solutions, for example for the conversion of power from renewables,
in the form of gas (power to gas) or heat (power to heat), and for products and services in the area of
electromobility. Uniper’s Shamrock power plant site, for example, offers innovative power-to-heat solu-
tions. This plant uses power from renewable sources to generate heat and feed it into the local heat-
ing network. Further examples of sector coupling are the power-to-gas plants in Falkenhagen and
Hamburg-Reitbrook, which are described above.
Uniper also analyzes the impact of the general progress in digitization on its business segments and
work processes and evaluates the extent to which this trend may represent new business opportunities.
For example, Uniper is actively working on digitizing customer interfaces to make interaction with
business customers even easier. In addition, Uniper uses digitization specifically to streamline and auto-
mate internal processes, such as in the power plant fleet, energy trading, security and in the mainte-
nance of plants.

19
Management System
Beginning in 2017, the principal indicators for managing the operating business and assessing the Uniper
Group’s financial condition are adjusted EBIT (with adjusted EBITDA also still used in 2016), as well as
adjusted funds from operations (“adjusted FFO”).
Alongside those most important management indicators, Uniper also presents financial and non-financial
performance indicators in the Combined Management Report to highlight developments in the operating
business and in the context of responsibility to all stakeholders—its employees, customers, shareholders
and creditors, as well as the Uniper companies. Examples of other financial performance indicators
include operating cash flow before interest and taxes, economic net debt, net financial position and cash-
effective investments. Measures of non-financial performance indicators include the female proportion
of leadership positions within the Uniper Group and Total Recordable Incidents Frequency (“TRIF”), which
measures the number of work-related accidents and illnesses. The chapter non-financial performance
indicators contain explanatory information about these performance indicators.
The principal financial indicators for managing the operating business are:
Adjusted EBITFrom January 1, 2017, adjusted EBIT, a measure of earnings before interest and taxes adjusted for non-
operating effects, is the key measure in the Uniper Group for purposes of internal management control
and as the most important indicator of the profitability of its operations.
Unadjusted earnings before interest and taxes (“EBIT”) represents the Uniper Group’s income/loss
before financial results and income taxes in accordance with IFRS, taking into account the net income/
expense from equity investments. Unadjusted EBIT is adjusted for certain non-operating effects in order
to increase its meaningfulness as an indicator of the operating performance of Uniper’s business.
The non-operating effects on earnings for which EBIT is adjusted include, in particular, income and
expenses from the fair value measurement of derivative financial instruments used in hedges and,
where material, book gains/losses, expenses for restructuring / cost-management programs initiated
prior to the spin-off and impairment charges/reversals on non-current assets, on companies accounted
for under the equity method and other long-term financial assets and on goodwill in the context of im-
pairment tests, as well as other contributions to non-operating earnings.
Net book gains are equal to the sum of book gains and losses from disposals, which are included in
other operating income and other operating expenses. Effects from the fair value measurement of the
aforementioned derivatives are also included in other operating expenses and income. Expenses for
restructuring / cost management programs initiated prior to the spin-off represent additional expenses
that are not directly attributable to the operating business. Other non-operating earnings encompass
other non-operating income and expenses that are unique or rare in nature. Depending on the particular
case, such income and expenses may affect different line items in the income statement.
20Uniper
Annual Report 2017 Combined Management Report
Adjusted FFOBeginning in 2017, adjusted funds from operations (“adjusted FFO”) is a key performance indicator used
by the Uniper Group for determining, among other things, the residual cash flow available for distribution
to shareholders and the variable compensation of the Management Board.
The basis of the funds from operations measure is cash provided by operating activities (i.e., operating
cash flow). In a first step, this cash flow is adjusted for changes in operating and tax assets and liabil-
ities during the reporting period, which eliminates timing differences caused by unforeseeable inflows
and outflows of cash. Reported as changes in operating assets and liabilities are, among other things,
changes from the fair value measurement of derivatives entered into for hedging purposes. These changes
are also eliminated because they do not affect cash flows. Finally, for the same reason, income from
foreign-currency translation of operating receivables and payables, as well as an adjustment for cash
flows arising from subsequent purchase price adjustments from acquisitions and disposals, are also
eliminated, because the latter originate from investing activities.
To determine Adjusted FFO, current employer service cost and past service cost affecting future cash
flows are subtracted from FFO. Furthermore, net payments to, and reimbursements from, the Swedish
Nuclear Waste Fund (net presentation) are subtracted from FFO even though they are reported as cash
flow from investing activities because they result directly from operations. Dividends declared and dis-
tributed to minority shareholders of subsidiaries are also not available to shareholders of the Company,
and are eliminated accordingly.

21
Business Report
Macroeconomic and Industry Environment
Macroeconomic EnvironmentGlobal economic growth accelerated in 2017. The Organisation for Economic Cooperation and Develop-
ment (“OECD”) has estimated that global gross domestic product (“GDP”), at around 3.6%, will be at its
highest level since 2010. Economic growth has improved in both the industrialized countries and the
emerging markets. Important sentiment indicators for consumer confidence and the business climate
are at a high level and employment is recording strong growth. Global trade and investment activity,
however, only recorded modest growth. Nevertheless, both inflation and wage growth remained remark-
ably low compared to previous upturns.
Economic growth in the euro area as a whole also improved slightly. This was mainly due to rising
domestic demand, driven by a robust labor market and an improved investment climate. In October 2017,
the European Central Bank announced the gradual reduction of its monthly bond purchases. Unlike in
the U.S., however, key interest rate hikes are not yet in sight, but the announced reduction of monetary
policy expansion alone has led to a significant recovery of the euro. The euro also benefited from a
general decline in political uncertainty following the French presidential elections.
In Germany, the economic upturn continued unabated. Rising real estate prices combined with low inter-
est rates and increasing incomes supported the construction industry. Private consumption benefited
from the continued upturn on the labor market, while exports profited from the upswing in the economy
in key partner countries. In France, growth also accelerated as a result of the labor market upturn, and
the Netherlands continued to record strong growth rates.
The United States (U.S.) economy continued to improve throughout the year. This was mainly due to
consumer demand, which benefited from a sharp rise in asset prices and high income growth. The U.S.
Federal Reserve Bank raised key interest rates several times during the course of the year and an-
nounced the reduction of its balance sheet. Nevertheless, long-term interest rate expectations declined
slightly due to persistently low inflation and modest wage growth, which caused the U.S. dollar to de-
preciate steadily until September 2017. In addition, the pace of tax and health care reforms as well as
the announced infrastructure program probably had a significant negative impact on expectations.
From September onwards, the U.S. dollar fluctuated significantly, due mainly to the announcement of
on U.S. tax reform and the gradual release of details on these reforms.
In contrast to this global trend, economic performance in the United Kingdom (U.K.) deteriorated consid-
erably in 2017. After growth remained remarkably robust in 2016 following the referendum on with-
drawal from the EU (“Brexit”), the depreciation of the British pound resulted in a sharp rise in inflation.
The associated loss of purchasing power weighed on private consumption, and the political uncertainty,
which intensified again after the parliamentary elections, had a negative impact on the investment climate.
In Sweden, however, growth remained robust. In particular, investment spending grew strongly, boosted
by an expansionary monetary and fiscal policy. In Russia, growth was positive again after years of the
recession, driven by the rise in oil prices and growth in purchasing power due to exceptionally low in-
flation for Russia.

22Uniper
Annual Report 2017 Combined Management Report
Energy Policy and Regulatory Environment
European UnionUniper is closely involved in the European energy markets, from power generation, storage and trading
to the distribution of power, gas and heat. Uniper’s products make a significant contribution to supply
security in Europe. In this respect, the energy policy discussions in the European Union (EU) in 2017 were
highly relevant to Uniper’s business in terms of strengthening gas supply security, the further develop-
ment of climate policy and ongoing discussions on the European Commission’s winter package of 2016.
The new regulation to strengthen gas supply security entered into force on November 1, 2017. For the
first time, it contains guidelines for crisis prevention and defense in Europe’s gas supply. A key measure
in this respect is the creation of several groups of regionally linked member states. Measures are also
planned to provide solidarity assistance to neighboring member states in the event that it is no longer
possible to guarantee the supply of residential customers. These measures also provide for obligations
for gas utilities to disclose certain content of significant long-term gas procurement contracts to relevant
national authorities and the European Commission.
In the EU, the debate was also dominated by the negotiations on the withdrawal of the United Kingdom,
while the reform of the EU Emissions Trading System (“EU ETS”) was decided upon in November 2017
after more than two years of discussion. This reform includes, for example, the doubling of the allocation
of certificates to the market stability reserve from 2019 onwards and the cancellation of excess emis-
sion allowances from the reserve from 2023. As a result, the supply of emission allowances on the
market will become even more scarce from 2019 onwards. The market for these emission allowances
has already reacted with a price increase.
Furthermore, the EU Commission’s proposals from the winter package of November 30, 2016, under
the name of “Clean Energy for all Europeans”, with eight legislative proposals and numerous non-legis-
lative documents, were further discussed in the European Parliament and in the European Council
without any final decisions being made in 2017. These include, among other things, rules according to
which the European electricity market will function in the future and how the market for renewable
energies is to be structured.
2017 GDP Growth in Real Terms
Annual change in percent
0.0 1.0 2.0 3.0 4.0
Germany
Euro area
France
United Kingdom
Netherlands
Russia
Sweden
USA
Source: OECD (November 2017)

23
GermanyThe key political events in 2017 were numerous state elections and, above all, the federal elections in
September. Against this background, there were only a few new energy policy initiatives to implement
the energy transition. In June 2017, the Grid Charges Modernization Act was passed to harmonize the
grid charges of German transmission grid operators. The new law also regulates the payments for grid-
relieving feed-ins, termed avoided grid charges, which also affect Uniper, as it has several power plants.
The law sets the amount of avoided grid charges for all existing power plants except photovoltaic and
wind power plants on the basis of the prices of 2016.
In addition, the regulations for special network resources were revised: It is now up to the transmission
grid operators to decide to tender for and contract out up to 1,200 megawatts of new generation plants
or interruptible loads. In view of the existing legal separation of generation from the grid, these facilities
should not be operated by grid operators. Since the final conditions for this will not be determined until
2018, it is not yet possible to make a clear statement about the impact on Uniper.
In August 2017, the new grid access regulation for gas came into force, which, among other things,
provides for a single market area for gas in Germany by 2022 at the latest. This makes higher liquidity
and transparency in the market likely, which could benefit Uniper.
Since a government has not yet been formed following the Bundestag elections on September 24, 2017,
no further legislative proposals have been discussed apart from the submission of an amendment to
the Ordinance on Access to Electricity Supply Networks.
NetherlandsIn the Netherlands, the new government was formed by four parties on October 26, 2017, following long
negotiations after the elections on March 15, 2017. In the energy and climate sector, the aim is to phase
out coal-fired power generation by 2030 at the latest, in consultation with the operators of coal-fired
power plants. Furthermore, the CO2 price is expected to rise to €43 per metric ton by 2030 due to an
additional national levy on the European CO2 price. This minimum price is expected to be €18 per ton
from 2019. From 2024 onwards, there will no longer be any new subsidies for the use of biomass in
power plants. So far, these proposals are only agreements that are part of the coalition agreement and
will still have to be implemented in laws.
FranceThe French capacity market was launched on January 1, 2017, following the approval by the European
Commission under state-aid rules. Since then, several auctions have taken place for the delivery years
2017 to 2019. With its power plants, Uniper participated in almost all auctions in France in 2017 and
due to the high availability of its plants it was able to achieve nearly maximum potential capacity in the
capacity market.
Considerations on the introduction of a national carbon tax for coal-fired power plants were initially
abandoned during the year. In July 2017, the French government announced that coal-fired power
generation would be phased out by 2022. In September 2017, it also proposed the introduction of a
Franco-German carbon tax, which would later be levied in other European countries, as this measure
is an effective way of decarbonizing the power sector. No details on the transposition of these plans in
national laws have been provided so far.

24Uniper
Annual Report 2017 Combined Management Report
United KingdomThe agreement of December 8, 2017, between the British Government elected in June 2017 and the Euro-
pean Commission contains commitments by the United Kingdom to allow the start of the second phase
of the Brexit negotiations. These ongoing negotiations will establish transitional arrangements and reg-
ulate future trade relations between the EU and the UK. It can be assumed that this also includes the
domestic energy market. The pending concrete contractual implementation of these projects will have
an impact on the European carbon price and thus also on electricity prices and Uniper’s ability to benefit
from the common market. In February 2017, the British government launched a public consultation on
coal-based power generation, the outcome of which confirmed, among other things, the termination
of coal-fired power generation in 2025. The autumn budget of the government’s draft budget proposed
extending the current minimum carbon price of 18 British pounds per ton to March 2020 and raising
this figure to 18.52 British pounds per ton from April 2020 to March 2021. The government also announced
that no new carbon taxes would be introduced before 2025. This increases planning reliability for Uniper
power plants in the United Kingdom. There were regular auctions for power plant capacities in Febru-
ary 2018 for winter 2018/2019 and for the year 2021/22. The majority of the Uniper power plants
registered for the auctions were successfully included in them and were able to secure a temporary
capacity agreement.
RussiaIn Russia, formulas for calculating capacity prices were updated in February 2017 for capacities com-
missioned since 2010 under capacity supply contracts. Adjustments related to the recalculation of deduc-
tions for electricity market revenues and a final determination of the compensation of investment
repayments originally planned for years eleven to fifteen after commissioning for years seven to ten.
Price caps for capacity auctions were lifted in September 2017. As a result, capacity prices for 2014
rose significantly. In 2017, the regulator drew up a basic approach for a modernization program for
existing power plant units. These regulations may have a positive effect on the profitable operation and
modernization of Uniper power plants in Russia. The mechanisms for investment in modernization
projects are to be completed by May 2018.
SwedenIn 2017, Sweden introduced tax relief for nuclear and hydroelectric power plants. This improved the
economic situation of the Uniper plants in Sweden. The next important step towards the final implemen-
tation of the Swedish Energy Agreement is the introduction of the modernized environmental legal
framework for hydropower as part of the national implementation of the EU Water Framework Directive.
Legal implementation is expected in 2018. It will contain requirements for the operation of hydroelectric
power plants in Sweden. However, its significance cannot be sufficiently determined until after the
legislative proposals have been adopted.

25
Energy IndustryDespite increasing energy efficiency, energy consumption in Germany rose in 2017. According to prelimi-
nary figures from AGEB, an energy-industry working group, Germany consumed 462 million metric tons
of coal equivalent (“MTCE”), 1% more than in 2016. In addition to the positive economic performance,
the reason for this development was the cooler weather at the beginning of the year compared to the
previous year.
In 2017, petroleum consumption rose by 3% year over year to about 160 million MTCE. Developments in
the consumption of natural gas, hard coal and lignite are influenced by the electricity generation sector.
For example, nuclear power generation fell by 10% as a result of changes in planned outages at power
plants and the resulting downtimes of these plants. At the same time, the contribution of renewables
increased by 6%. Natural gas consumption rose by 5% to 109 million MTCE in 2017. Consumption of hard
coal declined by 10% to 51 MTCE. The consumption of lignite fell to 52 million MTCE, 1% below the level
of the previous year.
Power generation from renewables increased by 6%. There was a significant increase of 34% in onshore
and offshore wind generation. Generation from biomass remained constant at the previous year’s level,
while the feed-in of solar energy (photovoltaics and solar thermal) increased by 5%. Hydroelectric power
generation (excluding pumped storage) fell by 4% due to weather conditions.
Electricity consumption in Northern Europe stagnated last year at 380 billion kWh. Electricity consump-
tion in the United Kingdom was 217 billion kWh in the first three quarters, 2.5% lower than in the prior-
year period. Electricity demand in France remained stable at 428 billion kWh in the first eleven months
of the year, while electricity demand in Hungary reached 27.8 billion kWh in the first eight months of the
year. Electricity consumption in Italy rose by 1.2% to 155 billion kWh in the first six months of the year.
In Russia, electricity demand in the European price zone rose by 2% last year.
Similar to the situation in Germany, gas sales rose in France, Italy and Hungary. Based on initial estimates
by natural gas pipeline companies, gas consumption in the United Kingdom fell by 2.9% to 56.2 billion m³
in the first ten months of last year compared with the same period last year. In France and Italy,
gas demand rose slightly in the first ten months of the year by 0.7% to 32.8 billion m³ and by 7.4% to
54.3 billion m³, respectively. In Hungary, gas demand rose by 11.8% to 7.4 billion m³ in the first ten
months of the year versus the prior-year period because of increased heating demand. These figures
are based on the most recent statistics available, but do not include a full twelve-month period as de-
scribed above in individual cases.
Primary Energy Consumption in Germany
Percentages 2017 2016
Petroleum 34.6 34.0
Natural gas 23.7 22.7
Hard coal 11.0 12.2
Lignite 11.2 11.4
Nuclear 6.1 6.9
Renewables 13.1 12.6
Other (including net power imports/exports) 0.3 0.2
Total 100.0 100.0
Source: AG Energiebilanzen
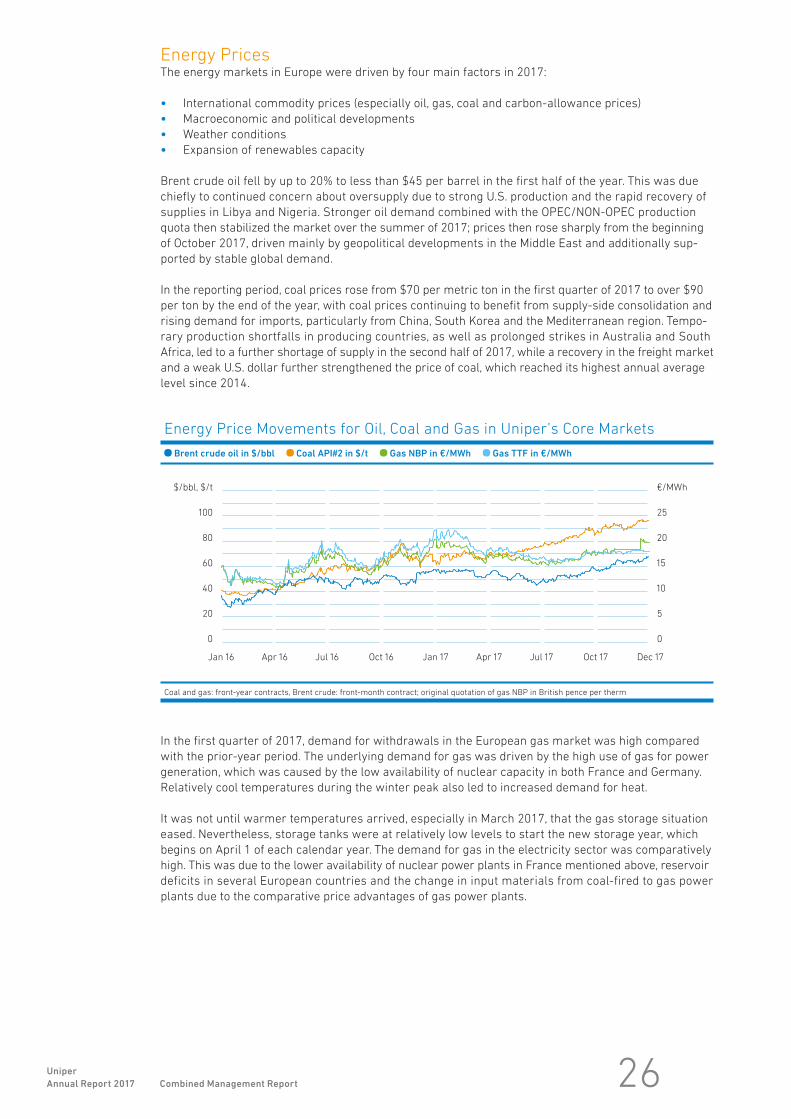
26Uniper
Annual Report 2017 Combined Management Report
Energy PricesThe energy markets in Europe were driven by four main factors in 2017:
• International commodity prices (especially oil, gas, coal and carbon-allowance prices)
• Macroeconomic and political developments
• Weather conditions
• Expansion of renewables capacity
Brent crude oil fell by up to 20% to less than $45 per barrel in the first half of the year. This was due
chiefly to continued concern about oversupply due to strong U.S. production and the rapid recovery of
supplies in Libya and Nigeria. Stronger oil demand combined with the OPEC/NON-OPEC production
quota then stabilized the market over the summer of 2017; prices then rose sharply from the beginning
of October 2017, driven mainly by geopolitical developments in the Middle East and additionally sup-
ported by stable global demand.
In the reporting period, coal prices rose from $70 per metric ton in the first quarter of 2017 to over $90
per ton by the end of the year, with coal prices continuing to benefit from supply-side consolidation and
rising demand for imports, particularly from China, South Korea and the Mediterranean region. Tempo-
rary production shortfalls in producing countries, as well as prolonged strikes in Australia and South
Africa, led to a further shortage of supply in the second half of 2017, while a recovery in the freight market
and a weak U.S. dollar further strengthened the price of coal, which reached its highest annual average
level since 2014.
In the first quarter of 2017, demand for withdrawals in the European gas market was high compared
with the prior-year period. The underlying demand for gas was driven by the high use of gas for power
generation, which was caused by the low availability of nuclear capacity in both France and Germany.
Relatively cool temperatures during the winter peak also led to increased demand for heat.
It was not until warmer temperatures arrived, especially in March 2017, that the gas storage situation
eased. Nevertheless, storage tanks were at relatively low levels to start the new storage year, which
begins on April 1 of each calendar year. The demand for gas in the electricity sector was comparatively
high. This was due to the lower availability of nuclear power plants in France mentioned above, reservoir
deficits in several European countries and the change in input materials from coal-fired to gas power
plants due to the comparative price advantages of gas power plants.
Energy Price Movements for Oil, Coal and Gas in Uniper’s Core Markets
Brent crude oil in $/bbl Coal API#2 in $/t Gas NBP in €/MWh Gas TTF in €/MWh
Jan 16 Apr 16 Jul 16 Oct 16 Jan 17 Apr 17 Jul 17 Oct 17 Dec 17
$/bbl, $/t
100
80
60
40
20
0
€/MWh
25
20
15
10
5
0
Coal and gas: front-year contracts, Brent crude: front-month contract; original quotation of gas NBP in British pence per therm

27
Despite the high level of Norwegian and Russian deliveries, the impact of the reduction in own production
volumes in recent years and of relatively low LNG deliveries in Northwestern Europe, due to the exposure
to global competition, was noticeable in the gas markets. At the end of the 2017 gas year, which ends
on October 1 of each calendar year, the gas storage facilities in Europe were filled by around 5% below
the levels of the previous year. However, this deficit was reduced to around 1.5% by the end of 2017.
In European emissions trading, after a weak first half of 2017, a strong recovery in allowance prices
began in the second half of 2017. In addition to an increase in demand for allowances—especially from
the energy sector—the main drivers were political signals pointing toward a future supply shortage:
At the beginning of November 2017, the negotiators of the member states and the European Parliament
agreed on the rules for the next trading period of emissions trading from 2021 onwards and on changes
to the market stability reserve. The changes agreed upon will significantly reduce the number of new
allowances beginning in 2019. The agreement was adopted by the Permanent Representatives of the
Member States and by the European Parliament’s Environment Committee at the end of November 2017.
At the same time, measures were adopted whose aim is to prevent the placement of emissions allow-
ances in the market that would no longer be offset by an obligation to cover emissions, if the UK (or
another member state) were to withdraw from emissions trading.
European Union Allowance Price Movements
Carbon EUA
€/t
10
8
6
4
2
0
Jan 16 Apr 16 Jul 16 Oct 16 Jan 17 Apr 17 Jul 17 Oct 17 Dec 17
Price in €/t for front-year contracts
Movement of Clean Dark Spreads and Clean Spark Spreads in the UK
CDS winter 17 CSS winter 117 CDS summer 18 CSS summer 18
Jan 17 Apr 17 Jul 17 Oct 17 Dec 17
£/MWh
15
10
5
0
-5
Electricity and gas: winter/summer contracts, coal: quarterly contracts, carbon: annual contracts incl. UK Carbon Price Support
CDS: Clean Dark Spread (efficiency 36.5%, emission factor: 0.33 t/MWhth)
CSS: Clean Spark Spread (efficiency 49.13%, emissions factor: 0.195 t/MWhth)
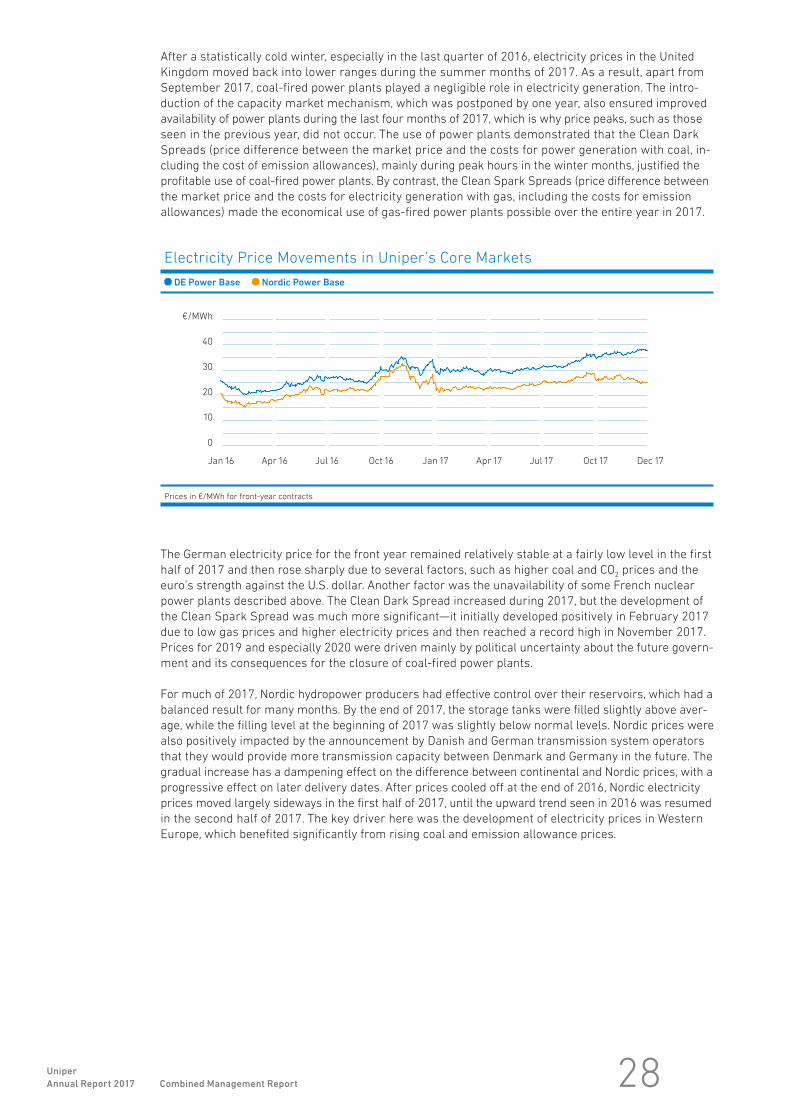
28Uniper
Annual Report 2017 Combined Management Report
After a statistically cold winter, especially in the last quarter of 2016, electricity prices in the United
Kingdom moved back into lower ranges during the summer months of 2017. As a result, apart from
September 2017, coal-fired power plants played a negligible role in electricity generation. The intro-
duction of the capacity market mechanism, which was postponed by one year, also ensured improved
availability of power plants during the last four months of 2017, which is why price peaks, such as those
seen in the previous year, did not occur. The use of power plants demonstrated that the Clean Dark
Spreads (price difference between the market price and the costs for power generation with coal, in-
cluding the cost of emission allowances), mainly during peak hours in the winter months, justified the
profitable use of coal-fired power plants. By contrast, the Clean Spark Spreads (price difference between
the market price and the costs for electricity generation with gas, including the costs for emission
allowances) made the economical use of gas-fired power plants possible over the entire year in 2017.
The German electricity price for the front year remained relatively stable at a fairly low level in the first
half of 2017 and then rose sharply due to several factors, such as higher coal and CO2 prices and the
euro’s strength against the U.S. dollar. Another factor was the unavailability of some French nuclear
power plants described above. The Clean Dark Spread increased during 2017, but the development of
the Clean Spark Spread was much more significant—it initially developed positively in February 2017
due to low gas prices and higher electricity prices and then reached a record high in November 2017.
Prices for 2019 and especially 2020 were driven mainly by political uncertainty about the future govern-
ment and its consequences for the closure of coal-fired power plants.
For much of 2017, Nordic hydropower producers had effective control over their reservoirs, which had a
balanced result for many months. By the end of 2017, the storage tanks were filled slightly above aver-
age, while the filling level at the beginning of 2017 was slightly below normal levels. Nordic prices were
also positively impacted by the announcement by Danish and German transmission system operators
that they would provide more transmission capacity between Denmark and Germany in the future. The
gradual increase has a dampening effect on the difference between continental and Nordic prices, with a
progressive effect on later delivery dates. After prices cooled off at the end of 2016, Nordic electricity
prices moved largely sideways in the first half of 2017, until the upward trend seen in 2016 was resumed
in the second half of 2017. The key driver here was the development of electricity prices in Western
Europe, which benefited significantly from rising coal and emission allowance prices.
Electricity Price Movements in Uniper’s Core Markets
DE Power Base Nordic Power Base
€/MWh
40
30
20
10
0
Jan 16 Apr 16 Jul 16 Oct 16 Jan 17 Apr 17 Jul 17 Oct 17 Dec 17
Prices in €/MWh for front-year contracts

29
Although the price trend on the Russian electricity market was subject to seasonal fluctuations, current
prices (spot prices for the European and Siberian price zones) are back at the level of the beginning
of 2017. Demand in the industrial sector in the European zone shows growth of 2.0% (+17.5 TWh) com-
pared to 2016. This growth is offset by increased production from nuclear power of 4.1% (+7.3 TWh)
and hydroelectric power plants of 10.2% (+6.1 TWh). Total demand in the Siberian price zone is down
slightly by 0.7% (-1.9 TWh), due to mild temperatures in the winter months of January and February as
well as in the autumn months of October and November. This effect was offset by relatively dry weather
conditions with correspondingly lower generation from hydroelectric power plants in Siberia (a drop of
5.6% or 5.1 TWh), with the result that prices were at the previous year’s level on an annual average.
Price Movements in the Russian Power Market
Europe (30d mov. avg.) Siberia (30d mov. avg.)
Jan 16 Apr 16 Jul 16 Oct 16 Jan 17 Apr 17 Jul 17 Oct 17 Dec 17
RUB/MWh
1,500
1,000
500
0
Daily spot prices (30-day average)
Product Price Movements in Uniper’s Core Markets
Product Unit Dec. 29, 2017 Jan. 2, 2017 Change 2017 high 2017 low
DE Power Base (Cal-18) €/MWh 37.7 30.1 25% 38.2 28.0
Nordic Power Base (Cal-18) €/MWh 25.4 25.5 0% 29.5 21.6
Brent Oil (Front Month) $/bbl 66.9 56.8 18% 67.0 44.8
Coal API #2 (Cal-18) $/metric ton 95.6 64.4 49% 96.7 60.8
Gas NBP (Cal-18) €/MWh 17.3 19.8 -13% 19.8 16.0
Gas TTF (Cal-18) €/MWh 18.3 18.6 -2% 18.7 15.7
Carbon E U A (Dec-18) €/metric ton 8.2 6.2 32% 8.2 4.4
British CDS Base (Sum-18) £/MWh 7.2 6.2 15% 8.5 5.3
British CSS Peak (Sum-18) £/MWh -0.3 5.6 -106% 5.6 -1.3
CDS: Clean Dark Spread (efficiency 36.5%, emission factor: 0.33 t/MWhth)
CSS: Clean Spark Spread (efficiency 49.13%, emission factor: 0.195 t/MWhth)

30Uniper
Annual Report 2017 Combined Management Report
Business Performance
Generation CapacityThe Uniper Group’s attributable generation capacity (the capacity that reflects Uniper’s ownership interest
in the power plants) fell to 35,318 MW or 4.3% (1,575 MW) below that of the previous year (36,893 MW).
Changes in the Group’s conventional generation assets primarily reflect the disposal of the Vilvoorde
plant in Belgium and the decommissioning of the Maasvlakte 1 and 2 power plant units in the Nether-
lands. In Swedish nuclear generation, the operation of Oskarshamn 1 was discontinued in 2017. This
was counteracted by increases in output at the Irsching power plant in Germany and the Cottam power
plant in the United Kingdom.
Uniper Group: Legally Attributable Generation Capacity1
in MW
European Generation 2017 International Power Generation 2017
European Generation 2016 International Power Generation 2016
95
0 5,000 10,000 15,000 20,000 25,000 35,000 40,00030,000
Hydro
Nuclear (SE)
Fossil Generation
Other 94
3,696
3.721
29,273
30,565
2,255
2,513
1Any rounding differences between individual volumes and totals are accepted.

31
Fully consolidated generation capacity also fell from 38,198 MW by 4.6% (1,760 MW) to 36,438 MW.
The reasons outlined above also apply here.
Power Procurement and Owned GenerationIn 2017 the amount of electricity generated by our own power plants stood at 120.8 billion kWh, down
17.9 billion kWh, or 12.9%, from the previous year. Purchased electricity, on the other hand, increased
by 50.4 billion kWh, or 9.3%, to 595.0 billion kWh.
The European Generation segment’s owned generation amounted to 72.4 billion kWh, 11.6 billion kWh
(13.8%) below the previous year’s level of 84.0 billion kWh. This was mainly due to deteriorating market
conditions for gas- and coal-fired power plants in the United Kingdom and Germany. There were also
effects from the decommissioning of the Oskars hamn 1 nuclear power plant unit in Sweden and of the
Maasvlakte 1 and 2 power plant units in the Netherlands. The prolonged shutdown of the Oskars hamn 3
nuclear power plant unit was slightly more than compensated for by higher hydroelectric power gener-
ation in Sweden due to higher water inflows. Furthermore, capacity constraints in the French electricity
market led to higher generation by fossil-fuel power plants.
Uniper Group: Fully Consolidated Generation Capacity
in MW
European Generation 2017 International Power Generation 2017
European Generation 2016 International Power Generation 2016
94
94
0 5,000 10,000 15,000 20,000 25,000 35,000 40,00030,000
Hydro
Nuclear (SE)
Fossil Generation
Other
3,568
3,563
1,400
1,873
31,376
32,668
Power Procurement and Owned Generation
Billion kWh
Total
Power procurement and
owned generation
Jointly owned
power plants
Wholesale market/
Global Commodities
2017
728.2
120.8
12.4
595.0
2016
693.8
138.7
10.5
544.6

32Uniper
Annual Report 2017 Combined Management Report
In the International Power Generation segment (Russia), owned generation declined by 6.3 billion kWh,
or 11.5%, from 54.7 billion kWh to 48.4 billion kWh. This was mainly due to the higher downtimes of
the Surgutskaya power plant, whose capacities were placed in cold reserve more frequently than in the
previous year, and to general overhauls of the Shaturskaya and Surgutskaya power plants (Unit 8).
Electricity SalesIn 2017, electricity sales of the Uniper Group stood at 725.9 billion kWh, 5.0% above the previous year’s
sales of 691.3 billion kWh.
The shifts in electricity sales volumes mainly result from electricity trading and portfolio optimization
in the Global Commodities segment.
Alongside electricity trading on the energy markets, a portion of Uniper Group’s electricity sales to major
customers such as municipal utilities and industrial customers in Germany and in Europe is transacted
through an internal sales unit, Uniper Energy Sales GmbH (“UES”). In addition to sales, UES also handles
marketing for the Uniper Group. It also offers its customers services in consulting, service and the
electricity sector. Electricity sales by UES in fiscal 2017 came to 46.0 billion kWh, slightly below the
previous year (49.8 billion kWh). The decrease is mainly due to expiring contracts with customers: in an
intensely competitive environment, UES faces aggressive pricing policies on the part of its competitors.
Electricity Sales1, 2
Billion kWh
Total
Business customers
and resellers
Wholesale market /
Global Commodities
725.9
76.8
649.1
2017
691.3
77.1
614.1
2016
1Difference from power procurement is caused by internal use and network losses.2Any rounding differences between individual volumes and totals are accepted.

33
Gas ProcurementIn 2017, the Global Commodities segment procured roughly 1,977.2 billion kWh of gas from domestic
and foreign producers and at gas trading points. Gas procurement increased in comparison to the
previous year’s figure (1,760.1 billion kWh).
Long-Term Gas Supply ContractsThe procurement of gas takes place to a significant extent on the basis of various long-term contracts
with gas producers. The gas required by the Uniper Group is supplied mainly by providers in Germany,
the Netherlands, Norway and Russia. In 2017, 406 billion kWh of gas were purchased via long-term
contracts (2016: 407 billion kWh).
Gas SalesThe Uniper Group’s gas sales increased to 1,944.8 billion kWh in 2017, significantly higher than the
previous year’s sales (1,725.7 billion kWh).
The shifts in gas sales relate to the Global Commodities segment. The increase is driven mainly by
significantly higher activities at gas trading points. In addition, there was a decline in sales to business
customers and resellers due to the intense competitive environment.
Alongside gas trading in energy markets, a portion of the Uniper Group’s gas sales is transacted through
the internal sales unit UES by means of long-term contracts with major customers such as municipal
utilities, regional gas suppliers, industrial customers and power plants in Germany and abroad. The
volume of gas sold by the UES in fiscal 2017 came to 213.2 billion kWh, which is significantly below the
previous year (259.0 billion kWh). The decrease is mainly due to lower contracted volumes.
Gas Storage CapacityUniper Energy Storage GmbH is responsible for the operation of gas storage for Uniper Group. Its activi-
ties include technical and commercial development, the construction and operation of underground
storage facilities for natural gas, the marketing of capacities, services and products on the European
storage market and the development of new storage technologies. Uniper Energy Storage GmbH man-
ages natural gas storage facilities in Germany, Austria and through a subsidiary in the UK. In 2017, gas
storage capacity stood at 8.2 billion m³, slightly below the level of the previous year (8.5 billion m³), due
primarily to the sale of gas storage facilities.
Gas Sales
Billion kWh
Total
Business customers
and resellers
Wholesale market /
Global Commodities
1,944.8
215.9
1,728.9
2017
1,725.7
268.6
1,457.1
2016

34Uniper
Annual Report 2017 Combined Management Report
Business Development and Key Events in 2017During the past fiscal year, Uniper achieved an adjusted EBIT of €1.1 billion. The result was therefore
exactly at the midpoint of the published forecast of between €1.0 billion and €1.2 billion.
Cash-flow investment in fiscal 2017 amounted to €843 million and was therefore likewise within the
expected range of €750 to €850 million previously communicated.
Compared with the end of 2016, the economic net debt of €4.2 billion decreased by more than €1.7 bil-
lion to €2.4 billion. This is mainly attributable to the high operating cash flow and proceeds from divest-
ments, mainly due to the sale of the stake in the Russian Yuzhno-Russkoye gas field.
The following events had a significant impact on business in 2017:
At the beginning of the year, the transfer of Uniper-related services and assets of E.ON’s integrated
service provider, E.ON Business Services (“EBS”), into the Uniper Group was initiated. Related employees
in IT Services, HR Services and Financial Services were successfully integrated into different Uniper
units. Before the transfer, the corresponding services and tasks had been purchased from EBS on the
basis of service level agreements.
In January 2017, Uniper received the requisite permit for the Datteln 4 power plant pursuant to immis-
sion-control laws and continues to make progress on the road to commissioning. During the trial run,
cracks occurred in the heating surfaces of the steam generator, which are currently being investigated
by the manufacturer. For this reason, Uniper does not expect to be able to bring the plant into service
before the fourth quarter of 2018.
Uniper Exploration & Production GmbH successfully completed the sale of its Russian gas field invest-
ment Yuzhno-Russkoye to the Austrian oil and gas company OMV Exploration & Production GmbH (OMV),
which was announced on March 5, 2017. The Russian authorities and the co-partners have issued all
approvals necessary for the sale. The sale price for Uniper’s stake of around 25% is €1,749 million plus
the liquid funds carried over based on the Company’s balance sheet as of December 31, 2016. The
transaction will be retroactively effective as of January 1, 2017. Taking into account the dividends collect-
ed earlier in 2017, Uniper received €1,719 million upon the completion of the transaction at the end of
November 2017.
Given the lack of viable market prospects, Uniper and its co-owners of the Irsching 5 gas-fired power
plant, and Uniper as the sole owner of the Irsching 4 gas-fired power plant, have once again announced
the preliminary closure of the two units to the German Federal Network Agency and the network oper-
ator TenneT on March 29, 2017. TenneT has since designated both of the power plant units as system-
relevant, which means that they will remain in reserve operation until April 30, 2019.
In April and June 2017, Uniper and four other European energy companies signed a financing agreement
with Nord Stream 2 AG, the company responsible for the planning, construction and future operation
of the Nord Stream 2 gas pipeline. As part of the agreement, Uniper has pledged financing of up to
€950 million (corresponding to 10% of the currently expected total cost of the project). Uniper has pro-
vided a long-term funding facility of €285 million for about 30% of its financing commitment, which was
almost completely drawn down by Nord Stream 2 AG as of December 31, 2017. The remaining financing
commitments are intended as security for the planned additional funding of the project through banks
in the context of project financing of Nord Stream 2 AG. At the end of July 2017, the U.S. administration,
through the Department of State, released public guidance on the implementation of the sanctions legis-
lation relating to Russian energy export pipelines to exclude financing contracts for such services signed
before August 2, 2017, from the scope of the law.

35
Levels and flows of water in the rivers feeding the German hydroelectric power plants were below those
recorded in the previous year; this was offset by significantly higher water volumes in Sweden com-
pared with the previous year. At the Swedish nuclear power plants, the recommissioning of the Ringhals 2
plant in December 2016 made a positive impact that was mainly diminished by the closure of the
Oskarshamn 1 power plant and the unavailability of the Ringhals 1 plant. Reduced taxation of nuclear
power plants and the reduced property tax on hydroelectric power plants in Sweden contributed posi-
tively to earnings.
In addition, 2017 saw the electricity market in Northwestern Europe undergo a difficult phase, brought
about primarily by capacity constraints that arose from the unavailability of nuclear facilities in France.
Through increased utilization, the Uniper power plants contributed to the security of supply in France
during this period.
With its gas-storage and gas-optimization portfolio, Uniper made a contribution to the security of supply
in continental Europe in 2017 and generated additional short-term optimization income in the process.
In 2017, Uniper’s Russian majority shareholding Unipro received the expected remaining insurance pay-
ment of €310 million (RUB 20.4 billion) for damage caused by a boiler fire in the Berezovskaya 3 power
plant unit. The progress of the restoration project is in line with the cost and time expectations announced
in August 2017, with a scheduled resumption of operations in the third quarter of 2019. As of the end
of 2017, a further investment of around RUB 21 billion was required.
The movement of the Russian ruble’s exchange rate had an additional positive effect on business in 2017.
Changes in RatingsOn January 18, 2018, the rating agency S&P Global Ratings confirmed Uniper’s BBB- rating with a posi-
tive outlook from April 2017. The positive outlook reflects the possibility of a rating improvement to BBB,
provided that the change in shareholder structure does not have a negative impact on the sustained im-
provement of the financial figures after the sale of the stake in the Russian gas field Yuzhno-Russkoye,
due to a change in Uniper’s independence, strategy and financial policy.
Uniper is also rated by Scope Ratings AG, which gave Uniper a rating of BBB+ with a stable outlook in
June 2017. The agency particularly emphasizes the further reduction of net debt following the success-
ful completion of the sale of the stake in the Russian gas field Yuzhno-Russkoye.

36Uniper
Annual Report 2017 Combined Management Report
Earnings
Transfer Pricing SystemAll energy-related contracts with Uniper Group companies are accounted for at market prices or market-
price-based transfer prices. The transfer prices are derived from current forward prices for a specified
time (from one month to three years) prior to delivery.
The existing energy-related contracts with the power plant companies were terminated by Uniper Global
Commodities SE (UGC) at the end of 2017 and replaced with new contracts. As of 2018, a new transfer
pricing system will be introduced in which UGC hedges the expected electricity production of the power
plant companies by entering into hedging transactions at current market prices as part of a portfolio
management contract. These changes have no substantial effect on the future asset situation, financial
condition and earnings of UGC and the Uniper Group.
Sales PerformanceSales revenues rose from €67,285 million in the previous year by 7%, to €72,238 million in the 2017
fiscal year. The increase in sales is primarily attributable to higher sales and higher volumes in the gas
business of the Global Commodities segment due to increased prices. In addition to the increase in
sales revenues in the gas business, sales revenues in the electricity business also increased due to
higher volumes.
Sales
€ in millions 2017 2016
Changes
(percentages)
European Generation 7,107 6,835 4.0
Global Commodities 71,034 66,465 6.9
International Power Generation 1,170 1,063 10.1
Administration/Consolidation -7,073 -7,078 0.1
Total 72,238 67,285 7.4
European GenerationSales revenues in the European Generation segment rose compared with the previous year, from
€6,835 million by €272 million to €7,107 million in 2017.
The increase in sales is primarily attributable to higher generation by fossil-fuel power plants in
France, which benefited from capacity constraints in the French electricity market.
Global CommoditiesSales revenues in the Global Commodities segment rose from €66,465 million in 2016 by €4,569 million
to €71,034 million in 2017.
The increase in sales is primarily attributable to increased trading activities in the electricity business.
Sales additionally increased in the gas business due to higher prices and increased sales at gas trading
points.
International Power GenerationSales revenues in the International Power Generation segment rose by €107 million in comparison to
the previous year, from €1,063 million in 2016 to €1,170 million in the 2017 fiscal year.
The higher sales were attributable, in particular, to positive currency translation effects, which more
than compensated for the absence of capacity payments for Unit 3 of the Berezovskaya power plant,
which had been shut down in February 2016.

37
Administration/ConsolidationThis reconciliation item consists primarily of consolidation entries, which decreased by €5million
from -€7,078 million in 2016 to -€7,073 million in the 2017 fiscal year.
Sales revenues by product break down as follows:
Sales
€ in millions 2017 2016
Changes
(percentages)
Electricity 28,777 27,623 4.2
Gas 38,560 37,146 3.8
Other 4,901 2,516 94.8
Total 72,238 67,285 7.4
Significant Earnings TrendsThe net loss of the Group improved to €538 million (previous year: -€3,234 million). Income before
financial results and taxes increased to -€88 million (previous year: -€3,973 million).
The principal factors driving this earnings trend are presented below:
In 2017, the cost of materials increased to €69,479 million (2016: €63,535 million). The increase in the
cost of materials is primarily attributable to higher volumes in electricity procurement and to higher
volumes and prices in gas procurement. Accordingly, the trend in the cost of materials was almost
identical to the trend in sales. The cost of materials was further increased by the non-recurrence of
expense reductions achieved in the previous year from the reversal of a provision (€383 million) that
had resulted from an adjustment of price terms in long-term gas delivery contracts to reflect current
market conditions.
Personnel costs declined year over year by €188 million to €991 million (2016: €1,179 million). Aside
from cost-cutting, this reduction is attributable to lower restructuring expenses than in the previous
year. The decline was also due to lower expenses for wages and salaries and lower social security con-
tributions, mainly as a result of the measures taken under the restructuring programs and the associ-
ated reduction in the workforce. The integration of the service functions of EBS, which in the previous
year were reported as purchased services under other operating expenses, and an increase in expenses
for company pension plans had a slightly offsetting effect.
Impairments on property, plant and equipment recognized in the 2017 fiscal year totaled €344 million
(2016: €3,279 million). The decrease was mainly attributable to significantly lower impairments in the
European Generation and Global Commodities segments. Amortization of property, plant and equipment
and intangible assets in the 2017 fiscal year fell to €631 million (2016: €743 million). This is due in
particular to lower depreciation volumes resulting from impairment charges on property, plant and equip-
ment in the previous year. In addition, goodwill impairment charges of €224 million (2016: €0 million)
were recorded in connection with the sale of the stake in the Yuzhno-Russkoye gas field in Russia.
Other operating income increased in the 2017 fiscal year to €9,999 million (2016: €7,477 million).
This increase resulted especially from higher gains on derivative financial instruments, which rose to
€8,128 million (2016: €4,714 million), caused primarily by the marking to market of commodity deriva-
tives. Other operating income was increased further by the award of insurance payments as a conse-
quence of the damage sustained in the previous year by the Berezovskaya 3 power plant unit in Russia.
This was offset by the non-recurrence of €528 million in gains recognized in the previous year on the
disposal of the shares in PEG Infrastruktur AG (“PEGI”), including its equity interest in Nord Stream AG.
In addition, income from exchange rate differences fell to €874 million (2016: €1,163 million).

38Uniper
Annual Report 2017 Combined Management Report
Other operating expenses increased in fiscal 2017 to €10,810 million (2016: €10,004 million). This
increase is primarily attributable to higher losses on derivative financial instruments, which rose to
€7,982 million (2016: €6,404 million), mainly due to the marking to market of commodity derivatives.
In addition to this, the increase in other operating expenses results from the recognition of amounts
previously recognized in other comprehensive income from currency translation (€890 million) as an
expense in connection with the sale of the investment in the Russian Yuzhno-Russkoye gas field. This
was offset by the non-recurrence of expenses for the formation of a provision for contingency reserves
in the Global Commodities segment (€1,068 million) included in the prior year and a provision for Ger-
man real estate transfer tax incurred in the context of the spin-off (€236 million). The loss on disposal
of property, plant and equipment (€176 million) in the prior year, which resulted from a fire in unit 3 of
the Berezovskaya power plant in Russia, was also eliminated.
Reconciliation of Income/Loss before Financial Results and TaxesUnadjusted earnings before interest and taxes (“EBIT”) represents the Uniper Group’s income/loss
before financial results and taxes in accordance with IFRS, taking into account the net income/loss
from equity investments.
Unadjusted EBIT is adjusted for certain non-operating effects in order to increase its meaningfulness as
an indicator of the operating performance of Uniper’s business.
The non-operating effects on earnings for which EBIT is adjusted include, in particular, income and
expenses from the fair value measurement of derivative financial instruments used in hedges and, where
material, book gains/losses, expenses for restructuring / cost-management programs initiated prior to
the spin-off and impairment charges/reversals on non-current assets, on companies accounted for
under the equity method and other long-term financial assets and on goodwill in the context of impair-
ment tests, as well as other contributions to non-operating earnings.
Owing to the adjustments made, the earnings items shown here may differ from the figures determined
in accordance with IFRS.
1Expenses for restructuring/cost-management in the Global Commodities segment included depreciation and amortization of €14 million in 2017
(2016: €16 million).2Expenses for restructuring/cost-management do not include expenses incurred for the current restructuring program and its related subprojects.3Non-operating impairment charges/reversals consist of non-operating impairment charges and reversals triggered by regular impairment tests.
The total of the non-operating impairment charges/reversals and economic depreciation and amortization/reversals differs from depreciation,
amortization and impairment charges reported in the statement of income since the two items also include impairment charges on companies ac-
counted for under the equity method and other financial assets; in addition, a small portion is included in restructuring / cost-management expenses
and in miscellaneous other non-operating earnings.
Reconciliation of Income/Loss before Financial Results and Taxes
€ in millions 2017 2016
Income/Loss before financial results and taxes -88 -3,973
Net income/loss from equity investments -24 10
EBIT -112 -3,963
Non-operating adjustments 1,226 5,325
Net book gains/losses 890 -522
Marking to market of derivative financial instruments -88 1,636
Restructuring / Cost-management expenses 1, 2 18 344
Non-operating impairment charges (+)/reversals (-) 3 400 2,921
Miscellaneous other non-operating earnings 6 946
Adjusted EBIT 1,114 1,362

39
Net Book Gains/LossesIn the reporting period, the sale of the interest in the Russian Yuzhno-Russkoye gas field to the Austrian
oil and gas company OMV was completed. The disposal at the end of November 2017 resulted in a loss
of €890 million due to the reclassification to the income statement of losses from currency translation
previously recognized directly in equity as accumulated other comprehensive income.
The net book gains in 2016 amounting to €522 million had resulted primarily from the disposal of PEGI,
including its equity interest in Nord Stream AG, and the disposal of part of Uniper’s stake in AS Latvijas
Gāze.
Fair Value Measurement of Derivative Financial InstrumentsThe fair value measurement of derivatives used to hedge the operating business against price fluctua-
tions generated income of €88 million as of the December 31, 2017 reporting date (2016: -€1,636 million).
Restructuring / Cost ManagementIn 2017, restructuring and cost-management expenses decreased by €326 million year over year. They
amounted to €18 million in 2017 (2016: €344 million). The reduction resulted primarily from a one-time
expense of €236 million for real-estate transfer taxes that arose in the context of the spin-off in 2016.
Non-operating ImpairmentsNon-operating impairments reduced by reversals in the net amount of -€400 million were recorded in
the reporting period (2016: -€2,921 million).
The decrease relative to the previous year resulted primarily from the fact that impairment charges were
recognized in the prior-year period at a level that was not required in 2017. In addition, a non-operating
impairment of the goodwill allocated to Yuzhno-Russkoye was carried out.
Miscellaneous Other Non-operating EarningsMiscellaneous other non-operating earnings amounted to -€6 million in the 2017 fiscal year (2016:
-€946 million). The improvement was mainly due to the fact that a provision for onerous contracts, which
was recognized in the income in 2016, did not have to be recognized in 2017.

40Uniper
Annual Report 2017 Combined Management Report
Adjusted EBIT
SegmentsThe following table shows adjusted EBIT for fiscal 2017 and 2016 broken down by segment.
European GenerationAdjusted EBIT in the European Generation segment increased from €126 million in the previous year by
€211 million to €337 million in 2017.
This positive development is primarily attributable to the impairments recognized on fossil-fuel power
plants in 2016, and the resulting reduction of depreciation expense, as well as to negative one-off effects
from 2016 such as the formation of provisions for nuclear waste management obligations in Sweden
and the formation of provisions for the Voyager restructuring program. In addition, cost savings, the re-
commissioning of the Ringhals 2 nuclear power plant in Sweden at the end of 2016, and higher revenues
from system services led to an increase in earnings in 2017; the reduction in taxes on hydroelectric and
nuclear power plants in Sweden also boosted earnings.
These effects were partially offset by negative price developments in the European wholesale electricity
markets.
Global CommoditiesAdjusted EBIT in the Global Commodities segment fell from €1,327 million in the previous year by
€986 million to €341 million in 2017.
Adjusted EBIT was substantially affected by the non-recurrence of the positive prior-year effect on
income from the reversal of provisions for past delivery periods following the successful conclusion
of price negotiations for long-term gas procurement contracts. The agreement reached related to the
adjustment of price terms to reflect current market conditions. Additionally reflected was the non-recur-
rence of exceptionally positive results from optimization activities in the prior-year period, especially
in the gas business.
Adjusted EBIT
€ in millions 2017 2016
Changes
(percentages)
European Generation 337 126 167.5
Global Commodities 341 1,327 -74.3
International Power Generation 616 106 481.1
Administration/Consolidation -180 -197 8.6
Total 1,114 1,362 -18.2

41
International Power GenerationAdjusted EBIT in the International Power Generation segment rose by €510 million from €106 million in
2016 to €616 million in 2017.
The full remittance of the insurance payment and the elimination of the partial derecognition of property,
plant and equipment for a damaged boiler, caused by the temporary shutdown of the 800 MW unit of
the Berezovskaya power plant in February 2016 as the result of an accident, made a positive impact on
adjusted EBIT. Further positive effects stemmed from higher tariff payments for new capacity and the
movement of the Russian ruble.
Administration/ConsolidationThe adjusted EBIT attributable to the reconciliation item Administration/Consolidation improved from
-€197 million in 2016 by €17 million to -€180 million in fiscal 2017.
Adjusted Funds from OperationsAdjusted FFO for the 2017 fiscal year amounted to €753 million, a year-over-year increase of €274 million
(2016: €479 million). The payment of the insurance benefit for damages in the Berezovskaya 3 power
plant unit caused by a boiler fire and the elimination of the use of provisions due to the conclusion of price
negotiations for long-term gas procurement contracts in 2016 had a positive effect compared with the
previous year; this was partly offset by the absence of extraordinary income from gas optimization activi-
ties from the previous year.
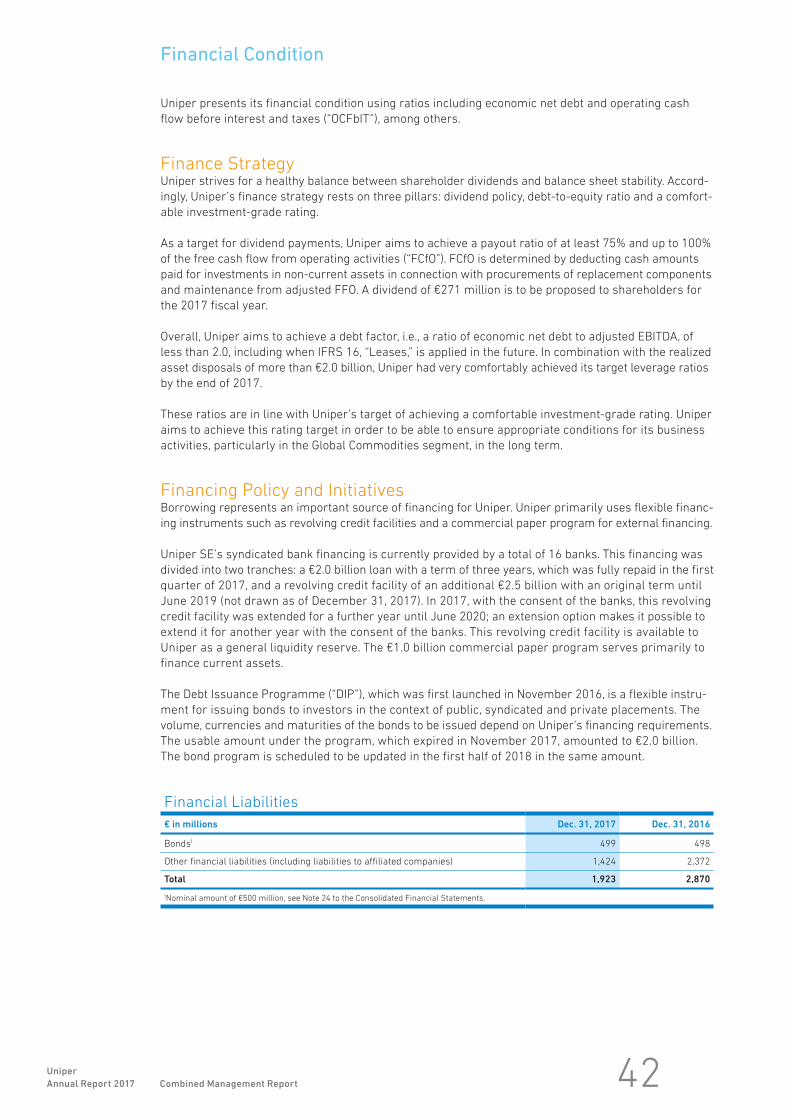
42Uniper
Annual Report 2017 Combined Management Report
Financial Condition
Uniper presents its financial condition using ratios including economic net debt and operating cash
flow before interest and taxes (“OCFbIT”), among others.
Finance StrategyUniper strives for a healthy balance between shareholder dividends and balance sheet stability. Accord-
ingly, Uniper’s finance strategy rests on three pillars: dividend policy, debt-to-equity ratio and a comfort-
able investment-grade rating.
As a target for dividend payments, Uniper aims to achieve a payout ratio of at least 75% and up to 100%
of the free cash flow from operating activities (“FCfO”). FCfO is determined by deducting cash amounts
paid for investments in non-current assets in connection with procurements of replacement components
and maintenance from adjusted FFO. A dividend of €271 million is to be proposed to shareholders for
the 2017 fiscal year.
Overall, Uniper aims to achieve a debt factor, i.e., a ratio of economic net debt to adjusted EBITDA, of
less than 2.0, including when IFRS 16, “Leases,” is applied in the future. In combination with the realized
asset disposals of more than €2.0 billion, Uniper had very comfortably achieved its target leverage ratios
by the end of 2017.
These ratios are in line with Uniper’s target of achieving a comfortable investment-grade rating. Uniper
aims to achieve this rating target in order to be able to ensure appropriate conditions for its business
activities, particularly in the Global Commodities segment, in the long term.
Financing Policy and InitiativesBorrowing represents an important source of financing for Uniper. Uniper primarily uses flexible financ-
ing instruments such as revolving credit facilities and a commercial paper program for external financing.
Uniper SE’s syndicated bank financing is currently provided by a total of 16 banks. This financing was
divided into two tranches: a €2.0 billion loan with a term of three years, which was fully repaid in the first
quarter of 2017, and a revolving credit facility of an additional €2.5 billion with an original term until
June 2019 (not drawn as of December 31, 2017). In 2017, with the consent of the banks, this revolving
credit facility was extended for a further year until June 2020; an extension option makes it possible to
extend it for another year with the consent of the banks. This revolving credit facility is available to
Uniper as a general liquidity reserve. The €1.0 billion commercial paper program serves primarily to
finance current assets.
The Debt Issuance Programme (“DIP”), which was first launched in November 2016, is a flexible instru-
ment for issuing bonds to investors in the context of public, syndicated and private placements. The
volume, currencies and maturities of the bonds to be issued depend on Uniper’s financing requirements.
The usable amount under the program, which expired in November 2017, amounted to €2.0 billion.
The bond program is scheduled to be updated in the first half of 2018 in the same amount.
Financial Liabilities
€ in millions Dec. 31, 2017 Dec. 31, 2016
Bonds 1 499 498
Other financial liabilities (including liabilities to affiliated companies) 1,424 2,372
Total 1,923 2,870
1Nominal amount of €500 million, see Note 24 to the Consolidated Financial Statements.

43
Uniper additionally has arranged various guarantee credit lines with banks to cover guarantee require-
ments in its operations. Note 24 to the Consolidated Financial Statements contains more information
about outstanding Uniper bonds and financial liabilities.
DebtCompared with December 31, 2016, Uniper’s economic net debt fell by €1,722 million to -€2,445 million
as of December 31, 2017, (2016: -€4,167 million). The divestment of Uniper’s stake in the Russian gas
field Yuzhno-Russkoye in the amount of around €1.75 billion plus liquid assets had a major impact on
this development. The operating cash flow primarily covered investments and the dividend payment,
so that there was no significant change in the net financial position. A slight decline in provisions for
pensions and disposal management increased the positive change in economic net debt.
Financial liabilities decreased by €947 million in 2017. In the first quarter of 2017, Uniper SE repaid in
full a loan in the amount of €800 million as of December 31, 2016, which was part of the syndicated
bank financing agreement. In addition, neither the revolving credit line nor the commercial paper pro-
gram were used as of December 31, 2017.
Economic Net Debt
€ in millions Dec. 31, 2017 Dec. 31, 2016
Liquid funds 1,027 341
Non-current securities 104 160
Financial liabilities -1,923 -2,870
Net financial position -792 -2,369
Provisions for pensions and similar obligations -676 -785
Provisions for asset retirement obligations 1 -977 -1,013
Economic net debt -2,445 -4,167
1Reduced by receivables from the Swedish Nuclear Waste Fund.

44Uniper
Annual Report 2017 Combined Management Report
Investments
Investments of the Uniper Group as a whole were above prior-year level.
The development in the European Generation segment is attributable primarily to higher growth invest-
ments for the Datteln 4 site, which were partially offset by the lower investment required in Maasvlaakte
in 2017 due to the completion of the third power plant unit in 2016. This was offset by lower maintenance
investments, mainly in coal and gas-fired power plants as well as in German and Swedish hydroelectric
power plants.
The reduction in the Global Commodities segment resulted from lower spending on growth investments
relative to the prior-year. In the previous year, investments were mainly made in two companies based
in the United Arab Emirates.
Investments in the International Power Generation segment totaled €222 million, €35 million more
than the €187 million reported for the prior-year period. This increase is due mainly to the investment
in the repair of Unit 3 of the Berezovskaya power plant.
The increase in the Administration/Consolidation reconciliation item relative to the year 2016 was mainly
due to the transfer of assets in connection with the integration of service functions of EBS into the
Uniper Group.
Cash Flow
Investments
€ in millions 2017 2016
Investments
European Generation 518 494
Global Commodities 49 99
International Power Generation 222 187
Administration/Consolidation 54 1
Total 843 781
Growth 451 381
Maintenance and Replacement 392 400
Cash Flow
€ in millions 2017 2016
Cash provided by (used for) operating activities (operating cash flow) 1,385 2,184
Cash provided by (used for) investing activities 517 -328
Cash provided by (used for) financing activities -1,129 -2,000

45
Cash Flow from Operating Activities (Operating Cash Flow), Operating Cash Flow before Interest and Taxes
Cash provided by operating activities (operating cash flow) declined by €799 million to €1,385 million in
2017 (2016: €2,184 million). The principal driver of this reduction in operating cash flow was a compara-
tively low outflow for gas procurement under long-term supply contracts in the prior year due, in partic-
ular, to changes in the timing of payments. Operating cash flow had additionally been augmented in the
prior-year period by extraordinary income from gas optimization activities and by a one-time payment
made by the Finnish energy utility Fortum in relation to its pro-rata assumption of costs for the partial
decommissioning of the Oskarshamn nuclear power plant in Sweden.
There were positive effects from the insurance payment for the damage caused by a boiler fire in the
Berezovskaya 3 power plant unit and, compared with the prior-year period, from the elimination of the
use of provisions due to the conclusion of the price negotiations for long-term gas procurement con-
tracts in 2016.
The following table presents the reconciliation of cash flow from operating activities to operating cash
flow before interest and taxes:
Cash Flow from Investing ActivitiesCash flow from investing activities increased by €845 million from -€328 million in 2016 to €517 million
in the 2017 fiscal year. The €1,796 million increase in proceeds from divestments (2016: €1,235 million),
which resulted mainly from the sale of the Russian Yuzhno-Russkoye gas field investment, had a positive
impact. This was offset by the non-recurrence of the sale of the stake in PEGI, including its holding in
Nord Stream AG to E.ON Beteiligungen GmbH.
In addition, lower payments to the Swedish nuclear fund in the European Generation segment, as well
as lower payments for loans to majority shareholders of nuclear power plants in Sweden, resulted in a
higher cash flow from investing activities.
Cash Flow from Financing ActivitiesIn 2017, cash used for financing activities amounted to -€1,129 million (2016: -€2,000 million). The in-
crease compared with the previous year is attributable to special effects in 2016. This is mainly due to
the fact that financial liabilities to the E.ON Group were repaid in the first quarter of 2016 and therefore
did not have a negative effect on cash flow from financing activities in the 2017 fiscal year. This was
offset in 2017 by the repayment of the €800 million syndicated bank financing agreement and the first
dividend payment to Uniper shareholders in the amount of €201 million.
Operating Cash Flow before Interest and Taxes
€ in millions 2017 2016 Difference
Operating cash flow 1,385 2,184 -799
Interest payments 1 186 -185
Tax payments 332 -6 338
Operating cash flow before interest and taxes 1,718 2,364 -646

46Uniper
Annual Report 2017 Combined Management Report
Assets
Consolidated Assets, Liabilities and Equity
€ in millions Dec. 31, 2017 Dec. 31, 2016
Non-current assets 22,877 27,199
Current assets 20,284 21,672
Total assets 43,161 48,871
Equity 12,789 12,803
Non-current liabilities 11,713 15,272
Current liabilities 18,659 20,796
Total equity and liabilities 43,161 48,871
Non-current assets as of December 31, 2017, declined relative to the previous year, from €27,199 million
to €22,877 million. The principal reason for this was the sale of the assets associated with the company
AO Gazprom YRGM Development and of the stake in the company OAO Severneftegazprom, in the amount
of approximately €1,848 million. In addition, there was a reduction of €1,315 million in deferred tax
assets resulting primarily in relation to provisions and liabilities. There was a valuation-related decrease
of €630 million in receivables from derivative financial instruments.
Current assets fell from €21,672 million as of December 31, 2016, to €20,284 million. The primary causes
of the decline were the valuation-related reduction in receivables from derivative financial instruments
from €10,139 million by €1,898 million to €8,241 million, and the decrease in trade receivables from
€7,353 million by €227 million to €7,126 million. These were offset by the increase in liquid funds to
€686 million.
Equity as of December 31, 2017 remained almost unchanged at €12,789 million compared with
€12,803 million in the previous year. The net loss of the Group made a negative contribution of €538 mil-
lion to equity. The dividend distributed to Uniper shareholders in the second quarter of 2017 in the
amount of €201 million offset some of this increase. The increase in cumulative other comprehensive
income of €640 million partly offset the negative effects, in particular, of changes in assets and liabili-
ties of €486 million due to changes in exchange rates and the remeasurement of defined benefit plans.
In connection with the disposal of the Yuzhno-Russkoye gas field in Russia, accumulated other compre-
hensive income of -€890 million was reclassified with a corresponding negative impact on net income,
but with no effect on total equity. The equity ratio as of December 31, 2017, at 30%, was higher than
the 26% reported as of December 31, 2016.
Non-current liabilities decreased from €15,272 million at the end of the previous year to €11,713 million
as of December 31, 2017. The decrease resulted primarily from the reduction of loans and financial
liabilities in the amount of €905 million and the reclassification of current and non-current financial lia-
bilities. In addition, deferred tax liabilities were reduced by €1,211 million, primarily in relation to receiv-
ables and liabilities. There was a valuation-related decrease in liabilities from derivative financial instru-
ments from €3,315 million by €275 million to €3,040 million. Non-current other provisions also decreased
by €449 million. The main reason for this was the reclassification of non-current to current other provi-
sions. Provisions for pensions and similar obligations decreased by €109 million from €785 million to
€676 million.
Current liabilities fell significantly from €20,796 million at the end of the previous year to €18,659 million.
This development is primarily attributable to the valuation-related decrease in liabilities from derivative
financial instruments from €10,532 million by €2,499 million to €8,033 million. Current provisions fell by
€404 million. The increase in other operating liabilities by €505 million and the reclassification of cur-
rent and non-current financial liabilities mentioned above had an offsetting effect.

47
Earnings, Financial Condition and Net Assets of Uniper SE
The annual separate financial statements and the management report have been prepared in accor-
dance with the provisions of the German Commercial Code (“HGB”), as amended by the German law
implementing the EU Accounting Directive (“BilRUG”) and the EU Regulation on the Statute for a Euro-
pean company (SE), in conjunction with the German Stock Corporation Act (“AktG”), and the German
Electricity and Gas Supply Act (Energy Industry Act, “EnWG”).
Balance Sheet of Uniper SE (HGB)
€ in millions
December 31
2017 2016
Financial assets 11,463.0 11,463.0
Fixed assets 11,463.0 11,463.0
Receivables and other assets 11,016.9 10,576.2
Securities – 150.0
Bank balances 797.3 51.9
Current assets 11,814.2 10,778.1
Accrued expenses 4.7 6.0
Excess of plan assets over pension liability 0.2 0.3
Total assets 23,282.1 22,247.4
Capital stock 622.1 622.1
Additional paid-in capital 10,824.9 10,824.9
Retained earnings 33.0 24.5
Net income available for distribution 270.8 201.3
Equity 11,750.8 11,672.8
Provisions for pensions and similar obligations 2.8 29.6
Provisions for taxes 132.2 219.3
Miscellaneous provisions 89.9 62.0
Provisions 224.9 310.9
Bonds 500.0 500.0
Bank loans/Liabilities to banks 7.0 800.3
Liabilities to affiliated companies 10,745.7 8,852.8
Miscellaneous liabilities 45.2 97.9
Liabilities 11,297.9 10,251.0
Deferred income 8.5 12.7
Total equity and liabilities 23,282.1 22,247.4
Because it is the parent company of the Uniper Group, the net assets of Uniper SE are characterized to
a considerable degree by the function of management of equity investments and by the financing func-
tion of the Group’s activities. This is reflected both in the amount of financial assets and in receivables
from, and liabilities to, affiliated companies.
Fixed assets, which essentially consist of shares in affiliated companies, make up 49% of total assets.
The proportion of receivables from affiliated companies is 47% of total assets.
Bank balances rose by €745.4 million in the reporting year to €797.3 million. At the same time, Uniper SE
reduced its liabilities to banks by a further €800.0 million.
With regard to treasury shares, please refer to the Company’s notes.
Provisions for pensions and similar expenses fell by €26.8 million in the reporting year due to payments
into the pension plan assets. 96% of the pension obligations are covered by these pension plan assets.

48Uniper
Annual Report 2017 Combined Management Report
The earnings of Uniper SE as the Group’s parent company are significantly influenced by its income
from equity investments. The positive income from equity investments in the amount of €341.2 million
was the result of earnings contributed by the equity investments in Uniper Holding GmbH, Uniper Russia
Holding GmbH and Uniper Beteiligungs GmbH.
Other operating expenses and income resulted primarily from currency effects related to Group-wide
currency hedging.
Earnings before taxes were €258.4 million. After subtraction of taxes, Uniper SE generated net income
for the year of €279.3 million (previous year: €210.0 million). After a transfer of €8.5 million to retained
earnings, the net income available for distribution amounted to €270.8 million.
The Management Board and the Supervisory Board will propose to the Annual Shareholders Meeting
to be held on June 6, 2018, that the net income available for distribution be used to distribute a dividend
of €0.74 per share (365,960,000 shares) of the dividend-paying capital stock of €622.1 million.
Income Statement of Uniper SE (HGB)
€ in millions 2017 2016
Other operating income 937.7 1,100.7
Personnel costs -76.2 -60.3
Other operating expenses -1,054.9 -1,293.4
Income from equity investments 137.1 741.8
Other interest and similar income 96.8 53.0
Other interest and similar expenses 13.8 -23.2
Income from transfers of profits 204.1 192.3
Expense from assumptions of losses – -337.5
Income taxes 20.9 -163.4
Net income/loss 279.3 210.0
Addition to retained earnings -8.5 -8.7
Net income/loss available for distribution / carried forward 270.8 201.3

49
Non-Financial Performance Indicators
With the amendment of the German Commercial Code (HGB) resulting from the CSR Directive Implemen-
tation Act (CSR-RUG) adopted on April 19, 2017, the legislature has transposed the requirements of
Directive 2014/95/EU (CSR Directive) of October 22, 2014 into national law. Large (capital market-orient-
ed) companies with more than 500 employees must provide, at the least, information on environmental,
labor, social, human rights and anti-corruption issues as part of their management report or in a sepa-
rate non-financial report.
Uniper has decided to publish a separate combined non-financial report outside the management report
as a separate chapter of the annual report (see page 96), in which all the requirements of non-financial
Group reporting are taken into account in detail. Uniper’s annual report has been made permanently
available to the public on the Investor Relations website at: https://ir.uniper.energy/.
For this reason, this chapter of the Combined Management Report discusses the Uniper Group’s most
important non-financial performance indicators—the proportion of female executives in the Uniper Group
and the Total Recordable Incidents Frequency (TRIF).
Proportion of Women in Leadership Positions within the Uniper GroupIn accordance with the German “Law on Equal Participation of Women and Men in Leadership Positions
in the Private and Public Sector,” the Management Board set an initial target of 20% for the proportion
of women in the first management level below the Management Board, and one of 22.5% for the pro-
portion of women in the second management level below the Management Board to be achieved by
June 30, 2017. At the end of June 2017, these two targets had been achieved.
For the period from July 1, 2017, through June 30, 2022, for the two management levels below the
Management Board, targets of 25% for the first management level and of 25% for the second manage-
ment level were set for the proportion of women; these targets are to be achieved by June 30, 2022.
More information on the implementation of Germany’s Law for the Equal Participation of Women and Men
in Leadership Positions in the Private Sector and the Public Sector can be found in Corporate Gover-
nance Declaration.
Occupational Health and SafetyOccupational health and safety and responsible business conduct are of the highest priority at Uniper SE.
Uniper is committed to demonstrating leadership in this area, and endeavors to ensure a culture of
continuous improvement.
One of the key performance indicators for occupational health and safety is Total Recordable Incidents
Frequency (TRIF) for employees, which measures the number of fatalities, lost-time injuries, restricted-
work injuries, and medical-treatment injuries that occur on the job and on business travel per million
hours of work. TRIF takes account of all relevant reports, including those from Uniper companies that
are not fully consolidated but in which Uniper SE has operational control. In addition, the combined
TRIF, which also takes into account the results for employees of contractual partners of the Group, is
made available for internal information purposes.
In 2017, TRIF for the Group’s own employees was 1.41 (2016: 1.24). The TRIF increase from 2016 to 2017
is due to the increased number of incidents at Uniper’s Anlagenservice GmbH, in its hydropower activities,
and in administration. The largest increase occurred in Uniper’s Anlagenservice GmbH, part of the engi-
neering business unit, which was primarily due to organizational changes and the subsequent failure in
a few instances to adequately assess risks in good time. A program has now been initiated to improve
last-minute risk assessments in the business unit and general safety awareness among employees.
Other non-financial performance indicators, such as number of employees and workforce composition,
which are not used for management purposes, are also discussed below.
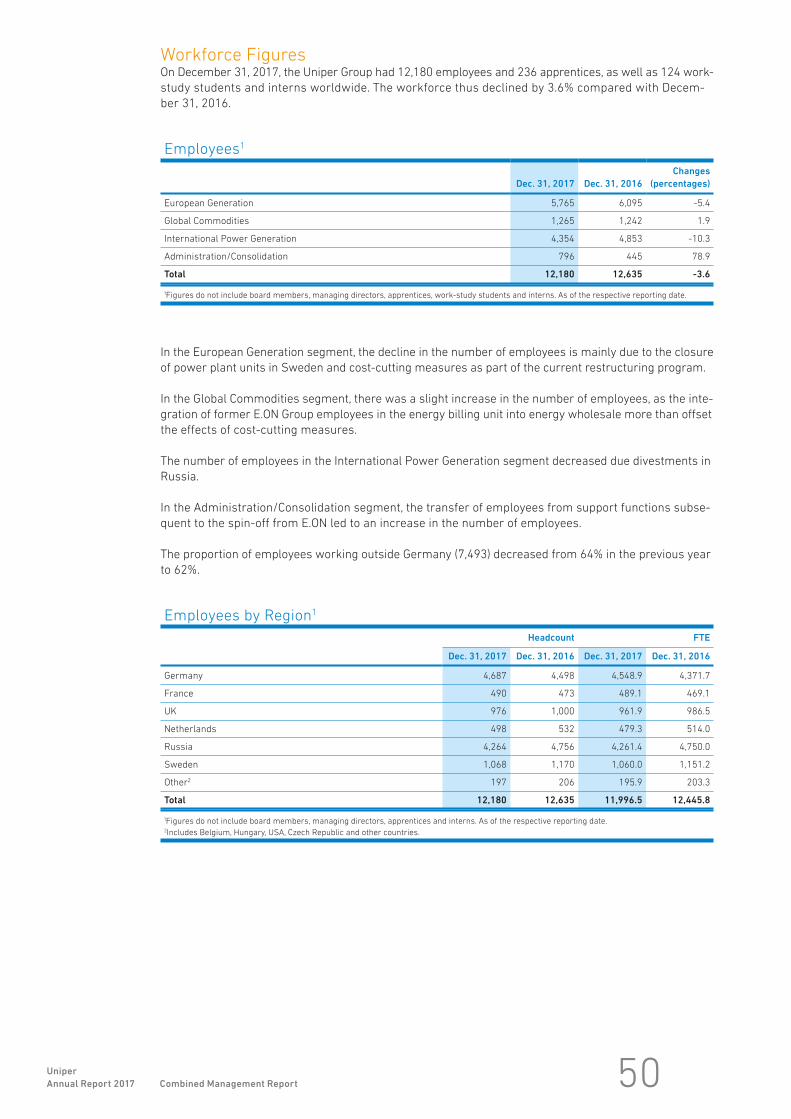
50Uniper
Annual Report 2017 Combined Management Report
Workforce FiguresOn December 31, 2017, the Uniper Group had 12,180 employees and 236 apprentices, as well as 124 work-
study students and interns worldwide. The workforce thus declined by 3.6% compared with Decem-
ber 31, 2016.
Employees 1
Dec. 31, 2017 Dec. 31, 2016
Changes
(percentages)
European Generation 5,765 6,095 -5.4
Global Commodities 1,265 1,242 1.9
International Power Generation 4,354 4,853 -10.3
Administration/Consolidation 796 445 78.9
Total 12,180 12,635 -3.6
1Figures do not include board members, managing directors, apprentices, work-study students and interns. As of the respective reporting date.
In the European Generation segment, the decline in the number of employees is mainly due to the closure
of power plant units in Sweden and cost-cutting measures as part of the current restructuring program.
In the Global Commodities segment, there was a slight increase in the number of employees, as the inte-
gration of former E.ON Group employees in the energy billing unit into energy wholesale more than offset
the effects of cost-cutting measures.
The number of employees in the International Power Generation segment decreased due divestments in
Russia.
In the Administration/Consolidation segment, the transfer of employees from support functions subse-
quent to the spin-off from E.ON led to an increase in the number of employees.
The proportion of employees working outside Germany (7,493) decreased from 64% in the previous year
to 62%.
Employees by Region 1
Headcount FTE
Dec. 31, 2017 Dec. 31, 2016 Dec. 31, 2017 Dec. 31, 2016
Germany 4,687 4,498 4,548.9 4,371.7
France 490 473 489.1 469.1
UK 976 1,000 961.9 986.5
Netherlands 498 532 479.3 514.0
Russia 4,264 4,756 4,261.4 4,750.0
Sweden 1,068 1,170 1,060.0 1,151.2
Other 2 197 206 195.9 203.3
Total 12,180 12,635 11,996.5 12,445.8
1Figures do not include board members, managing directors, apprentices and interns. As of the respective reporting date.2Includes Belgium, Hungary, USA, Czech Republic and other countries.

51
Gender and Age Profile, Part-Time StaffThe proportion of women in the workforce as of December 31, 2017, was 23.9%, slightly down from the
prior-year figure of 24.1%.
Proportion of Female Employees
Percentages Dec. 31, 2017 Dec. 31, 2016
European Generation 16.6 16.6
Global Commodities 33.6 30.4
International Power Generation 27.6 29.5
Administration/Consolidation 41.6 48.8
Uniper Group 23.9 24.1
Employees by Age
Percentages Dec. 31, 2017 Dec. 31, 2016
30 and younger 11.5 12.8
31 to 50 55.2 54.9
51 and older 33.3 32.3
Part-Time Rates
Percentages Dec. 31, 2017 Dec. 31, 2016
European Generation 7.4 10.5
Global Commodities 10.7 8.6
International Power Generation 0.3 0.4
Administration/Consolidation 13.2 14.6
Uniper Group 5.6 6.6
Employee Turnover Rates
Percentages 2017 2016
European Generation 5.0 4.0
Global Commodities 4.7 3.7
International Power Generation 5.0 4.1
Administration/Consolidation 4.8 3.5
Uniper Group 5.0 4.0
The average age of the Uniper Group workforce was about 44, and the average length of service was
about 14 years.
A total of 683 employees, or 5.6% of the Uniper Group’s workforce, worked on a part-time schedule at
year-end. Of these, 463 (68%), were women.
Employee turnover averaged 5.0% across the Group, higher than in the previous year.

52Uniper
Annual Report 2017 Combined Management Report
Operational Risks/
Chances*
Credit Risks/
Chances
Financial Risks/
Chances
Market Risks/
Chances
Risk and Chances Report
For the first time, the Uniper Group has produced a combined risk and chances report to provide infor-
mation on risks and chances. This reflects the scope of the group-wide risk management system,
which takes into account both risks and chances. The combined consideration of risks and chances re-
quired a different approach to assess risks/chances than in 2016. This is explained in detail below.
Risk Management System
The Uniper Group manages its risks and chances through an enterprise risk management system
that takes into account all risk and chance categories.
The aims of this system are:
• to fulfill legal and regulatory requirements (e.g., the Act for Control and Transparency in the Corporate
Sector, “KonTraG”),
• to ensure the continued existence of Uniper Group by keeping total risk proportionate to available
financial resources,
• to protect and increase the company’s value through integrated active management of all risks and
chances which may impact the commercial targets of the Uniper Group, and
• to generate additional value by appropriately taking into consideration not only returns but also
risks which relate to important decisions and processes, including investments, risk capital allo-
cation and corporate planning.
Monthly Update
Enterprise Risk Management acts as an umbrella across all specialised risk management
activities focussing on all material risks and chances above a certain materiality threshold
Uniper Risk Committee
Uniper Management Board
Uniper Supervisory Board (Audit und Risk Committee)
Management, Monitoring and Reporting of risks and chances across Uniper group
through specialised Functions
Group wide Internal Control System across Uniper Functions mitigating process,
compliance and reporting risks
Quarterly Enterprise Risk Reporting
Internal Audit
Audits
Audit
report
*incl. Legal, Political and Regulatory Risks/Chances

53
Ultimate legal responsibility for establishing and monitoring the effectiveness of the group-wide enter-
prise risk management system at Uniper Group lies with the Uniper SE Management Board. Operational-
ly, the Management Board has delegated its risk-related tasks to the Risk Committee at the level of the
Uniper Group. The Management Board establishes the Uniper Group Risk Committee, sets the risk appe-
tite for the Group as well as overall risk limits for individual risk (sub-)categories, which the Risk Com-
mittee then monitors.
The Uniper Group Risk Committee deals with all significant business risks relevant to the economic and
financial governance of the Uniper Group. It is composed of the Chief Financial Officer (CFO/chairman),
the Chief Risk Officer (CRO/deputy chairman), the Chief Commercial Officer (CCO), the Chief Operating Of-
ficer (COO) and the Executive Vice President Group Finance and Investor Relations as well as the General
Counsel/Chief Compliance Officer. The core responsibility of the Risk Committee is to establish a gover-
nance structure and infrastructure for risk management with which to manage business risks at all or-
ganizational levels.
The key components of the risk management system at the Uniper Group are the risk policies, the risk
management organization and the risk management process.
Risk PoliciesThe Group Enterprise Risk Policy defines the principles and minimum requirements for group-wide
management of all types of risks and chances. This includes the definition of the central risk manage-
ment process and the establishment of associated responsibilities. The defined process ensures that
risks/chances throughout the Group are fully and promptly identified and are assessed and reported in
a transparent manner that allows for comparison. Responsibilities are assigned to risk/chance manag-
ers who are responsible for actively managing and monitoring risks/chances. Below the group level of
enterprise risk policy, there are risk policies that define the principles and minimum requirements for
group-wide management of individual risk (sub-)categories. In addition to the risk policies, the Uniper
Group documents its risk strategy, specifying the groupwide principles, objectives and measures that
Uniper uses to manage risks resulting from the pursuit of its business strategy.
Risk Management OrganizationOrganizationally, the risk management system at the Uniper Group is based on the functional organiza-
tional structure of the group. Risk Management has the responsibility for the Group’s central risk man-
agement system. This function is headed up by the CRO, who reports directly to the CFO. Risk Manage-
ment is responsible for the development, implementation, coordination and ongoing development of the
central risk management process.
There is at least one risk representative for each function outside of Risk Management. This representa-
tive is responsible for the implementation of the Group Enterprise Risk Policy. The representative’s task
is to identify, assess, manage and report all risks/chances associated with their function across all cor-
porate legal entities. Risk and chance management (i.e., acceptance, mitigation, transfer of risks) is car-
ried out on the instructions of the head of the function, who is also the risk/chances manager, as far as
is consistent with the risk appetite of the group. The responsibility for risk/chances is assigned to the
functional area that is best suited to manage it. There are dedicated teams for certain risk (sub-)catego-
ries (e.g., commodity price risks, credit risks, asset operation risks, etc.) that develop policies for group-
wide management of each risk (sub-)category and ensure global compliance with these policies.
54Uniper
Annual Report 2017 Combined Management Report
Risk Management ProcessEach quarter the risk officers of each function review the risks/chances they have identified with re-
spect to completeness and current evaluation. Changes to the risk/chances situation are reported to
risk management via a centralized IT tool, where they are evaluated for plausibility and subjected to
quality control in co-operation with Accounting and Controlling. To manage risk, risk managers take
measures to reduce the likelihood and/or extent of the loss. For example, hedging transactions are
concluded using financial instruments or insurance policies are taken out. Similarly, the managers re-
sponsible for chances take measures to increase their probability of occurrence and the advantages
that can be gained from chances. Costs and benefits as well as the risk appetite of the group are taken
into account when choosing management instruments.
Based on this quarterly process, the Risk Committee, the Management Board and the Audit Committee
of the Supervisory Board of Uniper Group are informed of the current risk/chance situation. Significant
changes in risks are identified and addressed at any time, even during the quarter. The effectiveness of
the risk management system is regularly reviewed by Internal and External Audit in accordance with
legal requirements.
Risk and Chances Management by Category
In the course of conducting its commercial activities, the Uniper Group is exposed to uncertainties that
are inextricably linked to its business activities. These uncertainties are reflected in risks and chances.
Uncertain events with a possible negative effect on the currently planned adjusted EBIT and/or Net In-
come are referred to as risks, and events with a possible positive effect are referred to as chances.
Due to the large number of individual risks/chances, they are grouped into categories and subcatego-
ries in order to improve the clarity and management of concentrations by the Group Risk Committee.
The following section describes the risk/chance categories to which the Uniper Group is exposed and
the approaches used to manage them.
Financial Risks and ChancesThe Uniper Group is exposed to financial risks, for example, in connection with possible effects on cur-
rent or deferred taxes arising from current or future tax audits, changes in legislation and the decisions
by the various tax courts. In addition to changes in the law, these include the further development of
national and international law through enactments and decrees of the respective tax authorities and
legal decisions, as well as other financial management measures. Conversely, changes in legislation or
the decisions by the various tax courts may have a positive effect on the current or deferred tax liabili-
ty.
There are also financial risks and chances arising from unforeseeable non periodic results and possi-
ble write-downs of financial investments. In order to reduce risks in this area, Uniper closely monitors
the development of tax legislation and legal decisions and carries out regular impairment tests on its
investments.
Credit Risks and ChancesThe Uniper Group is exposed to credit risks associated with business operations and the use of finan-
cial instruments. Credit risks arise from the non-settlement or partial settlement of outstanding receiv-
ables by counterparties and from replacement risks for open transactions.
Uniper applies appropriate measures to actively manage credit risks, including setting limits for indi-
vidual counterparties and counterparty groups, securing collateral, structuring contracts, transferring
credit risk to third parties (such as insurers) and diversifying the credit portfolio. Existing credit risks
are continuously measured and monitored to ensure that the measures taken are appropriate.
55
As part of centralized credit risk management, the credit rating of business partners is systematically
assessed and monitored on the basis of group-wide minimum standards. If creditworthiness is inade-
quate, collateral is demanded (e.g., guarantees from the parent company, letters of awareness, etc.).
To reduce the credit risk from derivative financial instruments, these instruments are concluded
through exchanges or bilaterally, generally on the basis of standard contracts, where an offset (netting)
of all current transactions can be agreed. In addition, bilateral margining agreements are concluded
with selected business partners.
Liquid funds are invested with counterparties with an investment-grade rating.
Market Risks and Chances
Commodity Price Risks and ChancesThe Uniper Group’s operating activity, in particular the physical assets, long-term procurement con-
tracts and sales agreements with key customers, is exposed to considerable risks and chances due to
the fluctuations in the price of commodities. For Uniper, market price risks arise in the following com-
modity areas: electricity, gas, coal, freight, oil, liquefied natural gas and emission allowances.
The Uniper Group manages the majority of its commodity price risks/chances through a central trading
function. The aim of the trading function is to optimize the value of the Uniper Group’s commodity port-
folio while limiting and securing against associated potential losses. This involves the use of derivative
financial instruments. Derivatives are also entered into for proprietary trading purposes. This takes
place exclusively in compliance with tight internal and regulatory restrictions.
Risk management for commodity trading activities is based on general standards in the industry for
trading transactions and also involves the segregation of duties as well as daily income and risk calcu-
lation and reporting. Commodity price risks are kept within limits set by the Management Board and
Supervisory Board.
For purposes of risk management, commodity positions are aggregated into portfolios based on inter-
nal organizational responsibilities and trading strategies that are subject to risk limitations. Based on
internal guidelines, value-at-risk limits are allocated and supplemented by stop-loss and vol-
ume-based indicators. Where necessary, additional portfolio-specific restrictions are set.
Foreign Exchange (FX)/Interest Rate (IR) Risks and ChancesThe Uniper Group is exposed to currency translation risks/chances due to its participation in business
activities outside the euro area. In addition, foreign exchange transactions also involve operational and
financial transaction risks/chances. Operational foreign exchange risks/chances arise from the physi-
cal and financial trading of commodities and investment projects in foreign currencies. Financial for-
eign exchange risks/chances arise from receivables and liabilities in foreign currency relating to ex-
ternal financing, and from shareholder loans within the Uniper Group in foreign currency.
Hedging against translation risks is managed partly by financing activities in the local currency equiv-
alent. Uniper companies are responsible for managing operational currency risks/chances. Uniper SE
assumes responsibility for overall coordination of hedging measures by the companies, hedging
against translation risks and financial transaction risks and makes use of external derivative financial
instruments as necessary. Derivative financial instruments (forward transactions) are used in the for-
eign exchange area exclusively to hedge existing foreign exchange risks, but not for proprietary trad-
ing.
Foreign currency risks are analyzed and monitored daily by a team of specialists. Responsible man-
agement is informed daily of profits and losses associated with foreign exchange activities and of ex-
isting risks and limit utilization.

56Uniper
Annual Report 2017 Combined Management Report
The Uniper Group is exposed to risks associated with fluctuating interest rates as a result of variable-
rate borrowings and/or investments, pension liabilities and other liabilities on the balance sheet. Fluc-
tuations in interest rates may negatively affect net (interest) income/expense and the valuation of as-
sets and liabilities on the balance sheet. These risks are monitored and managed by the Uniper Group
risk management system, and are partly hedged using derivative and non-derivative financial instru-
ments.
Market Environment Risks and ChancesIn addition to commodity price risks, the Uniper Group is exposed to the risks/chances of a general de-
terioration/improvement of the market environment. These include macroeconomic developments af-
fecting the supply and demand of energy, changes in the competitive situation and radical changes in
global energy markets (e.g., the decline in conventional production in favor of renewable generation to
reduce CO2 emissions). Such developments could result in the Uniper Group’s operating activities, such
as the portfolio of physical investments, losing their market. Significant risks/chances in connection
with the market environment are addressed in the strategy process.
Operational Risks and Chances
Asset Operation Risks and ChancesTechnologically complex production, generation, storage, distribution and handling facilities are used in
the generation of energy. In principle, there is the possibility that human error, technical malfunctions
or other events resulting in losses (e.g., natural disasters, sabotage, terrorist attacks, strikes, etc.) may
negatively affect the availability of facilities. In addition, the aforementioned events could necessitate
major repairs and result in personal injury and damage to property and the environment. Moreover, as
regards electricity generation, the Uniper Group is exposed to a production volume risk from meteoro-
logical and hydrological fluctuations.
To limit these risks, facilities are regularly inspected and maintained using a risk-based approach. In
addition, production processes and technologies are constantly being upgraded and optimized and
staff trained accordingly. For losses that nevertheless occur, appropriate crisis-prevention measures
have been set up and emergency plans created that also take into account environmental risks, and in-
surance coverage has been provided to an extent that is economically appropriate.
Asset Project RisksPart of the Uniper Group’s business activities involve the construction, expansion, renovation, conver-
sion or decommissioning of power plants or other power supply facilities. This involves the risk that
actual construction costs exceed planned costs, that construction delays may occur e.g. as the result
of the regulatory approval process or that construction could even be stopped.
Risks relating to asset projects are addressed through a professional project management system
that recognizes that the identification of project-related risks is an integral part of project manage-
ment whose purpose is to quickly identify and minimize such risks.
People and Process RisksPeople risks include health and safety risks, risks due to the loss of special skills and risks due to er-
rors on the part of employees who have not been sufficiently trained or who are not sufficiently quali-
fied. In order to reduce people risks, the Uniper Group takes measures to ensure high health and safety
standards and invests in the development and distribution of skills and succession planning. In addi-
tion, the existing compensation system for employees is regularly reviewed and adjusted. Furthermore,
there is a risk that members of executive bodies or employees may conclude unauthorized or illegal
transactions that could lead to legal proceedings being initiated against the Uniper Group or its em-
ployees, resulting in fines, loss of licenses or similar. The Uniper Group counters this risk with a com-
prehensive network of controls and a compliance risk management system.
57
Process risks include risks due to inadequate, inefficient or broken business processes. Such process
risks and human error risks are reduced by a comprehensive, Group-wide internal control system
which is regularly audited. There is effective business continuity management in cases where people
or process risks arise.
Information Technology (IT) RisksOperational and strategic management at Uniper Group is highly dependent on complex information
and communication technology. Specifically, the Uniper Group operates process information technolo-
gy in connection with the production of electricity and the storage of natural gas, as well as commer-
cial IT, which extends to a variety of other areas such as office applications or trading systems. Techni-
cal malfunctions, improper operation by employees, virus attacks, data loss or outages of IT systems
can have significant negative impacts on ongoing operations of individual segments of the group or
the Uniper Group as a whole and result in considerable costs, which increase with the duration of the
malfunction. Other risks are related to the electronic storage and use of business-relevant data. Unau-
thorized access from outside, misuse or inadvertent dissemination of confidential information by an
employee could lead to the disclosure of commercial secrets or violate data privacy policy.
To limit these risks, security measures are put in place that take into account the importance of these
systems. Due to constant changes in the area of cyber threats, the Uniper Group is implementing a
comprehensive information security management system based on the ISO/IEC 27001 standard to
protect its business processes and systems.
Legal Risks and ChancesUniper’s operations in a variety of jurisdictions expose the Group to various legal risks and chances.
These mainly comprise risks/chances arising from threatened or pending legal proceedings with regard
to contract and price adjustments in connection with long-term supply or sales contracts, energy law and
regulatory issues, licensing matters as well as supplier disputes.
In order to minimize legal risks for Uniper, significant developments in the relevant jurisdictions are con-
tinuously monitored and actively communicated to the functions of the Uniper organization concerned. In
addition, the legal department is involved at an early stage in contract negotiations and threatened legal
proceedings in order to minimize risks and take advantage of chances by providing appropriate proce-
dural support and assisting in the drafting of contracts in advance.
Political and Regulatory Risks and ChancesRegulatory interventions present the Uniper Group’s operations with various risks/chances. These in-
clude, for example, the introduction and modification of capacity markets, the phasing out of coal-fired
power generation, which is being discussed in various countries, and the reform of the European emis-
sions trading system. Other risks arise from the implementation and amendment of financial market
regulations that affect the Uniper Group, such as EMIR (European Market Infrastructure Regulation),
REMIT (Regulation on Energy Market Integrity and Transparency), MiFiD II (Markets in Financial Instru-
ments Directive). Potential changes to existing financial market regulation could significantly increase
administrative burdens and result in the need for additional liquidity. The Uniper Group monitors regula-
tory developments continuously in order to ensure compliance with relevant requirements.
To limit regulatory risk, the Uniper Group maintains intensive dialogue with external stakeholders, such
as government agencies, political parties, regulators and associations, in order to identify in a timely
manner any potential adverse effects on the Uniper Group arising from changes in the political, regula-
tory and legislative environment and to reduce this risk through involvement in shaping the proposed
measures.

58Uniper
Annual Report 2017 Combined Management Report
Risk and Chances Profile of the Uniper Group
Assessment Approach for Risks and ChancesIn the Uniper Group, individual risks and chances are quantified wherever possible. A qualitative as-
sessment is made only in the few exceptional cases for which quantification is not possible. Individual
risks are considered on a net basis, i.e. including implemented and effective risk reduction measures.
In principle, the quantification is carried out by statistical modelling of probability of occurrence and
impact. The impact is primarily modelled as potential impact on earnings, i.e. impact on the currently
planned adjusted EBIT and/or Net Income.
To assess the risk and chances profile, the Uniper Group uses a multi-stage process, some of which
has changed compared to 2016. In a first step, all quantified individual risks and chances with a poten-
tial impact on planned adjusted EBIT and/or Net Income are allocated to the categories and subcatego-
ries described above. The materiality threshold for taking individual risks and chances into account
was reduced from €50 million to €20 million in 2017. This takes into account all quantified risks which,
in the worst-case scenario (99% confidence interval), could cause losses of more than €20 million after
risk mitigation measures in one year. Similarly, all quantified chances are taken into account which, in
the best-case scenario (1% confidence interval), will have a positive impact of at least €20 million in
one year. Extreme risks and chances with a likelihood of occurrence <1% but a potentially very high im-
pact, are not taken into account.
In a second step, the risks/chances are aggregated in each category/subcategory. For this purpose, the
Uniper Group no longer used the cumulative expected value in 2017. Instead, a Monte Carlo simulation
is applied to all the risks/chances assigned to a category/subcategory, which produces an aggregated
distribution function per year. From this aggregated distribution function per year, the 1% and 99% con-
fidence intervals are gathered for each year and an average over the relevant three-year time horizon
is calculated. On the basis of this average value, each category/subcategory is assigned an assessment
class for the best and worst case in accordance with the following table.
For example, if a category/subcategory is rated as “moderate”, this means that no loss is expected
from this category/subcategory in the worst case (99%) that is higher than the average of €20.1 to 100
million per year (in the best case (1%) no positive effect is expected that is higher than the average of
€20.1 to 100 million per year).
Assessment Classes
Assessment Class Potential average impact on earnings per year (Best Case/Worst Case)
insignificant ≤ € 5 million
low € 5,1 million - € 20 million
moderate € 20,1 million - € 100 million
significant € 100,1 million - € 300 million
major > € 300 million

59
Assessment of the Chances and Risk Profile (Worst-Case Scenario) and Major Individual Risks in the Worst Case
The following table provides an overview of the chances and risk profile in the worst-case scenario for
the Uniper Group as of December 31, 2017:
Potential average impact on earnings (worst case)
Category Subcategory
Potential average impact
on earnings in a
worst case (99%)
Financial Risks/Chances significant
Credit Risks/Chances significant
Market Risks/Chances
Commodity Price Risks/Chances significant
Foreign Currency and Interest Rates Risks/Chances moderate
Market Environment Risks/Chances significant
Operational Risks/Chances
Asset Operation Risks/Chances significant
Asset Project Risks major
People and Processes Risks significant
Information Technology (IT) Risks moderate
Legal Risks/Chances major
Political and Regulatory Risks/Chances moderate
Major individual risks from the chances and risk profile described above are explained in more de-
tail in the following sections of this chapter. Major individual risks are quantified individual risks
with a worst case potential loss of earnings (99%) of over €300 million in one year. In addition, indi-
vidual risks that have not been included in the above chances and risk profile are also described.
These include pure liquidity risks, which can have an impact of more than €300 million on the oper-
ating cash flow of a year, as well as qualitatively assessed individual risks, if their level of loss may
also exceed €300 million in a year.
Provisioning Risk Regasification Capacities A deterioration in the economic situation or upheavals in the market for LNG could lead to a lower
than planned utilization of the long-term capacity booked in the regasification plants in the LNG
business and make it necessary to set up provisions for onerous contracts over the entire remaining
booking period. The Uniper Group strives to further increase the utilization of this booked capacity
and thus improve the revenue situation.
Project Failure Risk Nord Stream 2 ProjectThe Uniper Group is involved in financing the Nord Stream 2 project. As part of this financing, there is a
default risk for receivables from Nord Stream 2 AG, particularly in the event the project is terminated.
Due to the contractual rights of Uniper’s financing subsidiary, this default risk is considered to be lower
than for comparable financial assets.
The risk that the project would result in the application of the U.S. Sanction Act on Russian energy ex-
port pipelines to the Uniper Group is currently considered low based on the guidance of the U.S. admin-
istration, but is being closely monitored on an ongoing basis.

60Uniper
Annual Report 2017 Combined Management Report
Rating Downgrade RiskThe Uniper Group’s main liquidity risk consists of a downgrade of its long-term investment grade rat-
ing from the current BBB-. This could result in counterparties being prepared to enter into trading and
hedging transactions with the Company only against increased collateral requirements, particularly in
the trading sector. Such collateral requirements would have to be covered by the provision of liquid or
similar funds (e.g., guarantees). In order to limit this risk, Uniper strives for a solid investment grade
rating of BBB.
Risk of a Takeover by FortumFortum’s takeover bid entails risks for Uniper, which are described in the joint Substantiated Statement
by the Management Board and Supervisory Board in November 2017. These include a possible failure
of the Uniper Group to achieve its planned strategic objectives due to differences in the strategic orien-
tation of the two companies, a possible downgrading of Uniper’s credit rating and possible negative ef-
fects on Uniper’s financial structure in the event of a change in ownership and control. The proposed
takeover also leads to an increased risk for employee turnover in terms of employee attrition and a loss
of core competencies. Uniper’s Management Board is monitoring the situation closely and tightly man-
aging it.
Risk of Renegotiation of Long-Term Gas Supply ContractsLong-term gas supply contracts generally include the possibility for the customer and the supplier to
adapt contractual terms to changed market conditions. This entails the risk for Uniper that suppliers
will impose conditions that are detrimental to the Uniper Group. In order to limit this risk, intensive ne-
gotiations are conducted by the most experienced employees who have access to the entire expertise
of the Uniper Group and, if necessary, even beyond.
Information about the risk situation of strategically important asset projects is given below.
Information on the Risk Situation of Strategically Important Asset Projects
Datteln 4
The Uniper Group is currently building a coal-fired power plant in Datteln with a net electrical output of
approximately 1,055 MW and has already invested significantly more than €1 billion in this project. Af-
ter the city of Datteln’s development plan was declared invalid, a new planning procedure was suc-
cessfully completed to restore the planning basis for the Datteln 4 power plant. On January 19, 2017,
the municipal government of Münster granted permission under immission-control law to complete
the construction of the power plant and put it into operation. Further capital expenditures are planned
to complete the plant. The currently planned commercial operation date is not before the fourth quar-
ter 2018. Given pending lawsuits further delays cannot be ruled out. If, as a result of pending legal pro-
ceedings, the new development plan is declared invalid or the approval under immission control law is
revoked, there is a risk that all investments made and planned to date will have to be written off. This is
a major individual risk for the Uniper Group. Uniper still assumes that the power plant will be commis-
sioned.
Construction of the power plant has been completed, with the exception of a small amount of remain-
ing work. The project is in the commissioning and optimization phase. The commissioning process was
interrupted at the end of 2017 due to indications of cracking on T24 heating surfaces of the steam gen-
erator. The extent of the damage is currently being comprehensively investigated by the manufacturer.
Cracks have appeared in numerous boiler components. After completion of the damage investigation, a
repair plan is being developed. It is not yet available. The repair as well as other problems occurring
during commissioning may lead to a delay in commissioning and may result in revenues being gener-
ated later than planned.

61
To cover the investment costs of Datteln 4, long-term contracts were concluded with major customers
for the marketing of power plant capacity. These contracts allow customers to request power output
from the Datteln 4 unit at contract prices based on the costs of the Datteln 4 unit. Due to the delay in
the commissioning of Datteln 4 and the change in wholesale prices for electricity in recent years, the
contracting parties to these long-term electricity supply contracts have requested adjustments. In the
meantime, one of the customers has terminated its purchase contracts due to alleged breaches of con-
tract by the affected companies of the Uniper Group as well as due to delayed commissioning and the
supposedly changed market conditions. Uniper is taking legal action against this termination. While
these legal proceedings are on-going, the customer does assert a claim for a price reduction. If the ter-
mination should nevertheless prove to be effective, or if the long-term contracts described should ac-
tually be adjusted, the Uniper Group is exposed to the risk that the electricity volumes generated in
Datteln 4 in the future can only be sold at prices lower than those originally agreed in these contracts.
This could have a significant adverse effect on the economic viability of Datteln 4.
Berezovskaja 3
On February 1, 2016, a fire broke out in the boiler house at the GRES TG 3 unit of the Berezovskaya power
plant in Russia, damaging essential components of the 800 MW boiler that must now be replaced. The
power plant unit is out of operation while repairs are underway as planned. The repairs that have been
started may turn out to be more expensive than planned and delays in recommissioning may result in
lower revenues being generated than originally planned.
In addition, major customers are attempting to demand the return of capacity payments made after the
fire for the non-operational unit, in accordance with valid market regulations. Anti-trust proceedings initi-
ated against PAO Unipro and the Russian transmission system operator could also result in fines for PAO
Unipro. In the worst case, the aim of these efforts could be to unilaterally terminate the unit’s entire ca-
pacity supply contract. Such a case would have a material adverse effect on the profitability of the
Berezovskaya 3 power plant unit.
Provence 4
Based on an approval in 2012, unit 4 of “Provence”, Uniper’s coal-fired power plant in France, was con-
verted from coal to biomass firing. Several lawsuits were filed between 2013 and 2015 against the en-
vironmental permit granted in 2012. Opponents of the project fear, among other things, environmental
impacts associated with the supply of wood from local forests. In June 2017, the proceedings led to the
withdrawal of the permit granted in 2012 and the granting of a temporary environmental permit until
March 2018, and Uniper, as well as the regional government of the Provence region, appealed against
the ruling, while preparing a new environmental permit application which must be filed in March 2018.
There is a risk that the permanent environmental permit will only be granted under certain conditions
or not at all. In the first case, the Uniper Group could incur additional costs due to further investments
and business interruptions; in the second case, all investments made so far would have to be written
off.
Commissioning continued under the temporary approval. On February 1, 2018, the plant was success-
fully started up and the electricity supply contract with a French counterparty begun. Tests required by
the grid operator will be carried out and commissioning completed by mid-March. During the term of
the electricity supply contract, there is a risk of having to pay penalties to the French counterparty if a
certain number of full load hours are not reached within a contract year.

62Uniper
Annual Report 2017 Combined Management Report
Assessment of the Chances and Risks Profile (Best-Case Scenario) and Major Individual Chances in the Best Case
The following table provides an overview of the Uniper Group’s chances and risks profile in the best-
case scenario as of December 31, 2017.
Major individual chances from the abovementioned chances and risk profile are explained in more de-
tail in the following sections of this chapter. Major individual chances are quantified with a potential
best case (1%) positive impact on earnings of more than €300 million in one year.
Qualitative chances that are important for an understanding of the Uniper Group’s chances profile are
also described, even if they are not major individual chances.
Chance of Reclaiming Property Taxes Already Paid on Swedish Hydro-electric Power Plants
In the years 2011-2017, Sweden levied a property tax of 2.8% on hydroelectric power plants, but only
0.5% on other power plants. One market participant sees this as a subsidy incompatible with European
competition law and has brought legal action against this policy in a test case. The lawsuit has already
been allowed in the lower court and is now being tried in higher courts. If the lawsuit is successful,
Uniper has the chance to reclaim some of the tax paid based on this precedent.
Chances from Beneficial Market DevelopmentsWith regard to operating activities, chances could arise from the positive development of Uniper’s market
prices for electricity, gas, coal, oil and CO2 on the wholesale markets as well as the resulting development
of the spreads (clean dark and clean spark spreads or seasonal summer/winter spreads). Increasing vola-
tility on the trading markets may lead to increased optimization and earnings potential. Due to cold weath-
er periods, demand for electricity and gas can lead to increased sales volumes at Uniper. As Uniper is ac-
tive worldwide, foreign exchange developments can have a positive effect on the net assets and results of
operations.
Potential average impact on earnings (Best Case)
Category Subcategory
Potential average impact
on earnings in a
best case (1%)
Financial Risks/Chances low
Credit Risks/Chances low
Market Risks/Chances
Commodity Price Risks/Chances significant
Foreign Currency and Interest Rates Risks/Chances moderate
Market Environment Risks/Chances moderate
Operational Risks/Chances
Asset Operation Risks/Chances low
Asset Project Risks -
People and Processes Risks -
Information Technology (IT) Risks -
Legal Risks/Chances significant
Political and Regulatory Risks/Chances insignificant

63
Chances from Portfolio OptimizationWith good project management, the downtimes of power plants can be shortened (e.g., due to outages) and
the availability of power plants as well as the technical availability of gas storage facilities can be im-
proved. Additional earnings can be generated by continuously optimizing the transport and storage capaci-
ties booked as well as existing gas supply contracts. With regard to long-term gas supply contracts, Uniper
is constantly involved in (both regular and extraordinary) renegotiations to adjust the terms of delivery. A
positive result in these negotiations can have a significant impact on the earnings situation.
Chances from Political and Regulatory DevelopmentsDevelopments in the political and regulatory environment in the countries in which Uniper is active can
have a positive impact on the earnings, financial and asset situation. For example, the introduction of addi-
tional capacity markets could mean that the supply of flexible power plants to compensate for the fluctuat-
ing generation of renewable energies is possible under better conditions than previously planned. In addi-
tion, new technologies such as the conversion of electricity from renewable energies into gas (Power to
Gas) or heat (Power to Heat) or products and services in the area of electromobility could open up addition-
al sources of revenue.
Chances from DigitizationDigitization will also have a decisive impact on the world of energy. The Uniper Group is working to help
shape this development and make it commercially viable. Innovations play a key role here. Uniper sees
digitization as an opportunity to make internal processes more efficient and enable new business mod-
els. Uniper is already making use of digitization in its efforts to streamline and automate internal pro-
cesses, for example in digital distribution and in the power plant fleet, in the area of safety and in the
maintenance and repair of plants. In addition, a wide variety of trends are constantly analyzed and
evaluated to determine how they affect the business and whether Uniper has an opportunity to become
active here. An innovation team has been set up specifically for this purpose.
Assessment of the Overall Risk Situation
In 2017, the Uniper Group is applying a more advanced approach to analyze the overall risk situation
than in 2016. In 2017, the Uniper Group developed an improved risk-bearing capacity concept that de-
fines the enterprise value in the form of the market value of equity as the given risk-bearing capacity.
Based on the risk/chances profile described above, a final step is taken to determine the average over-
all potential impact (99%) at Group level over the relevant three-year horizon by taking into account
correlations between the categories of risk/chances.
This average potential overall impact (99%) at Group level is compared with the available risk-bearing
capacity.
Based on this analysis, the overall risk situation of Uniper SE is not considered to be a threat to the
company’s continued existence. The overall risk situation is also considered appropriate in view of the
financial targets set.

64Uniper
Annual Report 2017 Combined Management Report
Forecast Report
Business Environment
Macroeconomic SituationThe OECD expects global growth to accelerate slightly in 2018, although the pace will be modest com-
pared to previous upturns. The main drivers of the economy are the positive employment trend and fa-
vorable financing conditions, coupled with continued expansionary monetary and fiscal policies.
In Germany, France and the Netherlands, the economy is expected to remain robust. The growth will be
driven by investment, sustained favorable financing conditions and the continued upturn in employ-
ment. Exports should also continue to benefit from the global economic upturn. The same holds true
for the euro area as a whole, although unemployment levels remain high in many European countries,
with the result that wage growth and inflation are likely to remain low. Despite visible progress, unre-
solved debt problems in the banking sector and in national budgets, particularly in Italy and other
southern European countries, continue to represent significant risk potential.
In the U.S., the economic expansion is likely to accelerate slightly again in 2018. Growth drivers will
continue to be private consumption and investment, which should benefit from the agreed tax reforms.
Even though the U.S. Federal Reserve will further reduce the degree of monetary policy expansion, the
upturn in employment is still likely to result in higher wage growth and thus higher purchasing power.
By contrast, a further slowdown in growth is to be expected for the United Kingdom, as consumer
spending, in particular, is likely to be hurt by the loss of purchasing power caused by inflation. Invest-
ment activity is also likely to remain subdued as a result of the imminent Brexit and the associated un-
knowns. In Sweden, the OECD is also expecting a slight economic slowdown, as the job market is show-
ing signs of an increasing labor shortage, which is likely to slow down the investments, especially in
the construction industry. In Russia, the upswing is likely to continue, given stable oil prices and im-
proved financing conditions, but the growth is likely to remain modest overall.
Energy MarketsOverall, the energy markets are likely to experience increased volatility in 2018 because they are still
significantly influenced by macroeconomic developments and policy decisions.
The aim of the agreement between OPEC members and Russia, in particular, to extend the cuts in
crude oil production until the end of 2018 is to keep crude oil prices relatively stable. The question is to
what extent the oil-producing countries will be disciplined in their adherence to the quotas or how the
supply in countries not covered by the OPEC/NON-OPEC agreement will react. For example, it is con-
ceivable that unconventional oil production in the U.S. could be ramped up at a relatively high crude oil
price, thus compensating at least in part for the supply shortage. In contrast, geopolitical problems will
continue to drive up prices, especially in oil-producing regions such as the Middle East. Overall, global
demand for crude oil is expected to rise again in 2018.
65
A stabilization of the coal supply situation should have a dampening effect on the development of coal
prices, with the recovery on the crude oil and freight markets likely to support coal prices in the medium
term. Due to declining demand in the Northwestern European market, the price of coal will increasingly
be influenced by developments in the Pacific region. In the medium term, the growing importance of the
Pacific region could lead to rising price volatility in the Atlantic market. The coal market will continue to
respond to adjustments on the production side as demand in the Atlantic market is experiencing a steady
decline. This will continue to hold down Atlantic coal prices as well. A recovery in the crude-oil markets,
however, serves to support coal prices.
The influencing factors for the gas market will probably be similar in 2018 to those seen in the gas
market in 2017, with demand for storage likely to be high in the following summer—assuming season-
ally normal winter weather conditions. Northwestern Europe will continue to compete globally for LNG
supplies. The reductions in coal capacity will probably continue to stimulate demand for gas in the
electricity sector and domestic production of the gas market in the EU will continue to decline.
In 2018, the price of emission allowances will again be subject to strong pressure from a very high
auction supply before the market stability reserve begins to reduce auction volumes in 2019. At the
same time, however, an increasing number of market participants are expected to increase their hold-
ings in anticipation of the supply shortage in the following year, which will act to stabilize the price. In
addition, there are many uncertain aspects regarding Brexit, as it is still completely open whether and
when the United Kingdom will also withdraw from emissions trading. The decision to leave the market
at an early stage could encourage British market participants to sell their allowances and thus exert
additional pressure on prices.
German electricity prices in 2018 will continue to be largely determined by the prices of hard coal and
emission allowances. There will continue to be political uncertainties until a government is formed and,
subsequently, a decision is made on power plant closures. Despite this, the announced and already
completed decommissioning of coal-fired power plants and the gradual entry into force of a capacity
reserve for lignite plants, as well as the phase-out of nuclear power plants in the coming years, will
have a positive effect on the level of electricity prices in Germany and will further increase volatility. On
the other hand, the further expansion of photovoltaic and, especially, wind capacity should dampen the
rise in prices.
Similar to 2017, electricity prices in the United Kingdom will depend on various factors in the future. In
the summer, developments in the gas market will be the main factor for the British electricity market,
while in the winter, the adequate availability of possible power plants during load peaks will determine
the price level. The influence of conventional power plants will decrease due to the capacity market
mechanism and the continuous expansion of wind turbines. In general, the use of power plants is ex-
pected to be similar to 2017, although the share of conventional power generation will continue to
come under pressure from renewable energies.
Price developments in Western Europe will continue to be a key anchor for the development of Nordic
electricity prices, especially against the backdrop of numerous interconnector projects. Developments
in the markets for fuels and emission allowances thus also indirectly determine the price development
of the low-emission Nordic electricity system. In addition, weather factors such as temperature, precip-
itation and the resulting level of the reservoirs in Norway and Sweden also play an important role as
they have an impact on prices, especially in the short term, and affect the spread to Western European
price levels.

66Uniper
Annual Report 2017 Combined Management Report
Adjusted EBIT
€ in billions 2017 Forecast
European Generation 0,3 noticeably above prior year
Global Commodities 0,3 significantly above prior year
International Power Generation 0,6 significantly below prior year
Human Resources
The cost-cutting and reorganization program may result in the continued decline in the number of em-
ployees, among other things.
Forecasting Methods
Uniper continuously reviews its outlook for its medium-term earnings and financial situation. The Com-
pany publishes a forecast of the expected development of the main controlling factors, including an
outlook for adjusted EBIT and adjusted FFO. In addition, an outlook for the expected dividend payout is
given. The latest forecasts regarding the development of commodity prices, controllable costs, depreci-
ation and amortization, as well as relevant special effects, are taken into account.
Anticipated Earnings and Financial Condition, General Statement on Expected Future Development
The forecast for the 2018 fiscal year remains adversely affected by the difficult conditions in the ener-
gy industry and the associated lower prices in all of Europe’s electricity markets. In addition, the
non-recurrence of the insurance payment for the damage to the Berezovskaya 3 power plant unit, as
well as the loss of earnings contributions from the stake in the Russian gas field Yuzhno-Russkoye
after its sale, will have a negative impact on earnings in 2018. These effects may be mitigated by pos-
itive earnings effects from sources such as the reduced taxation of nuclear power plants and hydro-
electric installations in Sweden and additional earnings contributions from capacity markets, as well
as by cost-cutting and higher income from the early termination in 2017 of forward contracts to opti-
mize credit risk. Uniper expects adjusted EBIT for 2018 to be noticeably lower than in the previous
year, within a range from €0.8 billion to €1.1 billion.
For each of the operating segments, this means:

67
For the European Generation segment, adjusted EBIT for 2018 is expected to be noticeably higher than
in the previous year, due in large part to the reduced taxation of Swedish nuclear power plants ans sim-
ilarly reduced taxation of hydroelectric installations in Sweden, as well as higher capacity premiums in
the United Kingdom and the planned commissioning of the Provence 4 biomass power plant. These ef-
fects will be partly offset by lower prices in all European electricity markets.
For the Global Commodities segment, Uniper expects adjusted EBIT for 2018 to be significantly higher
than it was in 2017. The electricity business is expected to deliver higher earnings contributions from op-
timization, while the early termination in 2017 of forward contracts to optimize credit risk is expected to
provide an additional positive effect. The LNG, coal and freight businesses are expected to experience a
significant improvement in earnings. The finalization of the sale of the stake in the Russian gas field Yu-
zhno-Russkoye at the end of 2017 will have a negative impact on 2018 adjusted EBIT due to the absence
of its earnings contribution.
In the International Power Generation segment, Uniper expects adjusted EBIT for 2018 to be signifi-
cantly below the prior-year figure, but this is attributable to the non-recurrence of insurance payments
received in 2017 for the fire damage sustained by the Berezovskaya 3 power plant unit.
Adjusted FFO is expected to range between €0.5 billion and €0.8 billion, which is largely in line with the
development of adjusted EBIT.
Uniper is exposed to growing pressure on margins in the energy markets and, to position itself more ef-
ficiently, has set itself the goal of reducing the Group’s controllable costs by approximately €0.4 billion
compared with the 2015 base year (€2.3 billion). This goal is to be achieved in 2018. On the basis of de-
velopments in 2017, Uniper believes it is well on track toward achieving this objective.
The disclaimer statement on the inside cover page of this Annual Report applies, in particular, to the
forward-looking statements made here.
Planned Financing InitiativesThe Group expects to be able to finance the investment spending planned for 2018 and the dividend
payout for the 2017 fiscal year from the operating cash flow it expects to generate in 2018. The revolv-
ing credit facility and the Commercial Paper Programme are available to cover any peaks in the
Group’s financing needs during the year. A decision on refinancing the €500 million bond maturing on
December 8, 2018, will be made during 2018 after due consideration of other financing requirements
and market conditions.

68Uniper
Annual Report 2017 Combined Management Report
Internal Control System for the Accounting Process (Disclosures Pursuant to Section 289 (4) and Section 315 (4), of the German Commercial Code on the Internal Control System for the Accounting Process)
General Principles
Uniper’s Consolidated Financial Statements are prepared in accordance with Section 315e (1) of the
German Commercial Code (“HGB”) and with those International Financial Reporting Standards (“IFRS”)
and IFRS Interpretations Committee interpretations (“IFRIC”) that were adopted by the European Com-
mission for use in the EU as of the end of the reporting period, and whose application was mandatory as
of the balance sheet date (see Note 1 in the Notes to the Financial Statements). The Group’s IFRS re-
portable segments are European Generation, Global Commodities and International Power Generation.
The annual financial statements of Uniper SE are prepared in accordance with the provisions of the
German Commercial Code, the SE Regulation in conjunction with the German Stock Corporation Act
(“AktG”), and the German Energy Industry Act (“EnWG”).
Uniper prepares a Combined Management Report that applies to both the Uniper Group and Uniper SE.
Accounting Process
All companies included in the Consolidated Financial Statements must comply with uniform accounting
and reporting guidelines for consolidated annual and interim financial statements. The guidelines de-
scribe the applicable principles of accounting and measurement consistent with IFRS, and they addition-
ally explain accounting rules for topics such as regulatory obligations that are particular to Uniper.
Changes to laws, new or amended accounting standards and other pronouncements are analyzed reg-
ularly in terms of their relevance to and impact on the Consolidated Financial Statements and, if neces-
sary, reflected in updates to policies and to systems.
The Group companies are responsible for preparing their financial statements in a proper and timely
manner. They receive substantial support from Uniper Financial Services GmbH (UFS) in Regensburg,
Germany, and from an external service provider, both of which kept accounts and performed work on
the annual financial statements. The financial statements of subsidiaries within the scope of consolida-
tion are audited by the subsidiaries’ respective independent auditor. Uniper SE then combines these
statements into its Consolidated Financial Statements using uniform SAP consolidation software.
The specialist department for consolidation is responsible for performing consolidation activities and
for monitoring adherence to guidelines for scheduling, processes and content. Monitoring of sys-
tem-based automated controls is supplemented by manual checks.
Additional qualitative and quantitative information relevant to accounting and financial reporting is
compiled within the year-end closing processes. Furthermore, dedicated quality-control processes are
in place for all departments involved to discuss and ensure the completeness of relevant information
on a regular basis.
Uniper SE’s separate annual financial statements are also prepared with SAP software. The accounting
and preparation processes are divided into discrete functional steps. Processes relating to certain sub-
sidiary ledgers and certain bank activities were transferred to an external service provider; those re-
lating to the general ledgers were transferred to UFS. Automated or manual controls are integrated into
each step. Defined procedures ensure that all transactions and the preparation of the annual financial
statements are recorded, processed, assigned on an accrual basis and documented in a complete, time-
ly and accurate manner. Relevant data from Uniper SE’s separate financial statements are, where
necessary, adjusted to conform with IFRS and then transferred to the consolidation software system
using SAP-supported transfer technology.

69
Internal Control and Risk Management System
The following explanations concerning the internal control system (“ICS”) and general IT controls apply
equally to the Consolidated Financial Statements and Uniper SE’s separate financial statements.
Internal controls are an integral part of Uniper’s accounting processes. Uniform accounting requirements
and procedures are defined for the entire Uniper Group in a standardized set of guidelines. These guide-
lines encompass general and specific requirements for a system of internal controls, as well as standards
for establishing, documenting and evaluating internal controls and the final sign-off process. These rules
are designed to prevent the occurrence of material misstatements in the Consolidated Financial State-
ments, the Combined Management Report and the interim reports due to errors and to fraud.
The internal control system is based on the globally recognized COSO framework (COSO: The Commit-
tee of Sponsoring Organizations of the Treadway Commission). The specific ICS requirements are de-
fined in a centralized risk catalog (ICS model), which encompasses company- and industry-specific as-
pects, defines possible risks for the accounting processes and thus serves as a checklist and provides
guidance for the establishment and documentation of internal controls within the different functions.
Controls covering the risks defined in the risk catalog are documented in a central IT application.
The general ICS requirements form another key component of the internal control system: they define
the overarching ICS principles that are fundamental to every function within the Uniper Group. The inter-
nal sign-off process is based, among other things, on an annual assessment by functional owners of the
processes and controls for which they are responsible, and comprises a statement concerning the effec-
tiveness of the internal control system that is in place. All functions within the Uniper Group are involved
in this process before the full Management Board signs off on effectiveness for the Uniper Group as a
whole.
Internal Audit regularly informs the Uniper SE Supervisory Board’s Audit and Risk Committee about the
internal control system and any significant issue areas it identifies in the Uniper Group’s various pro-
cesses.
External service providers provide IT services for most of the Uniper Group’s entities. The effective-
ness of the automated controls in the standard accounting software systems and in key additional ap-
plications depends to a considerable degree on the proper functioning of IT systems. These IT controls
primarily involve ensuring the proper functioning of access-control mechanisms of systems and appli-
cations, of daily IT operations (such as emergency measures) of the program change process and of the
management of external IT service providers.

70Uniper
Annual Report 2017 Combined Management Report
Additional Disclosures Regarding Takeovers in Accordance with Sections 289a and 315a (1) of the German Commercial Code
Composition of Capital Stock
The capital stock amounts to €622,132,000 and consists of 365,960,000 no-par-value shares (shares
without nominal amount). The shares are registered shares. Each share of stock has the same rights
and one vote at a Shareholders Meeting.
Restrictions on Voting Rights or the Transfer of Shares
In the cases provided for by Section 136 of the German Stock Corporation Act (“AktG”), voting rights
pertaining to the affected shares are excluded by law. Accordingly, if Uniper SE acquires and holds
treasury shares, Section 71b AktG prohibits the exercise of rights pertaining to such shares. There are
no other known restrictions on voting rights or the transfer of shares.
E.ON SE and E.ON Beteiligungen GmbH have made a joint undertaking to Uniper SE by contract executed
on December 15, 2016, and effective December 31, 2016, that they will not exercise the voting rights of
E.ON Beteiligungen GmbH with respect to the election of two (2) of the six (6) shareholder representatives
to the Supervisory Board of Uniper SE at the Annual Shareholders Meeting and, in the event of a pre-
mature reelection of the aforementioned Supervisory Board members, that they will not vote on their
replacements or on a decision to remove them. The agreement ends as soon as E.ON SE’s (in)direct
shareholding in Uniper SE falls below 20% of the shares.
There are no other known restrictions on voting rights or the transfer of shares.
Direct or Indirect Shareholdings Exceeding 10% of Voting Rights
46.65% of the shares of Uniper SE, and the voting rights corresponding to these shares, are held directly by
E.ON Beteiligungen GmbH, whose registered office is in Essen, Germany, and whose business address is
Brüsseler Platz 1, 45131 Essen, Germany, and indirectly (via E.ON Beteiligungen GmbH) by E.ON SE, whose
registered office is in Essen, Germany, and whose business address is Brüsseler Platz 1, 45131 Essen,
Germany.
In accordance with the public statements of E.ON SE and Fortum Oyj, on January 8, 2018, E.ON accept-
ed in full the public takeover offer of Fortum Deutschland SE for the stake it holds, the completion of
which is conditional at the time this report was prepared and is still outstanding.
Statutory Requirements and Provisions in the Company’s Articles of Association Regarding the Appointment and Removal of Management Board Members and Amendments to the Articles of Association
Pursuant to the Company’s Articles of Association, the Company’s Management Board consists of at
least two members. The Supervisory Board determines the number of members and decides on their
appointment and removal.
The Supervisory Board appoints members to the Management Board for a term not exceeding five
years. Reappointments are permissible. The Supervisory Board can appoint one of the members of the
Management Board as its Chairman. In the absence of a required Management Board member, the
courts make the necessary appointment in urgent cases. The Supervisory Board can revoke the appoint-
ment of a member of the Management Board and the appointment as Chairman of the Management
Board for serious cause.

71
Resolutions of the Shareholders Meeting are adopted with the majority of valid votes cast, unless other-
wise stipulated by mandatory law or the Articles of Association. Unless another type of majority is
stipulated by mandatory legal provisions, amendments to the Articles of Association require a majority
of two-thirds of the votes cast or, if at least one-half of the capital stock is represented, a simple major-
ity of votes cast. This does not apply for changing the purpose of the Company, for a resolution accord-
ing to Article 8 (6) of the SE Regulation and for other cases requiring a higher majority of capital.
The Supervisory Board is authorized to decide by resolution on amendments to the Articles of Association
that affect only their wording and, in particular, is authorized to revise the wording of the Articles of
Association upon utilization of authorized or contingent capital.
Authority of the Management Board to Issue or Buy Back Shares
Authorized CapitalThe Management Board is authorized, subject to the Supervisory Board’s consent, to increase the Com-
pany’s capital stock until June 30, 2021, by up to €145,112,289 through the issue on one or more occasions
of up to 85,360,170 new no-par-value registered shares against cash and/or non-cash contributions.
The Management Board may, subject to the Supervisory Board’s consent, exclude the subscription right
that must, in principle, be granted to shareholders. Such exclusion of subscription rights is possible
when shares are issued against cash contributions in the amount of up to 10% of the capital stock then
existing or—should this value be lower—the capital stock existing when the authorization is exercised.
Subscription rights may also be excluded when shares are issued against non-cash contributions, but
only to the extent that the shares issued under such authorization against non-cash contributions do
not represent in the aggregate more than 20% of the capital stock then existing or—should this value be
lower—the capital stock existing when the authorization is exercised. Furthermore, shareholder sub-
scription rights may also be excluded with regard to fractional amounts and when shares are issued to
persons employed by the Company or one of its affiliates.
Convertible Bonds and Warrant-Linked BondsThe Management Board is authorized, subject to the Supervisory Board’s consent, to issue debt instru-
ments during the period up to June 30, 2021, having a total nominal value of up to €1,000,000,000 that,
respectively, grant rights or impose obligations of conversion or purchase, in accordance with the rel-
evant terms and conditions of the bonds and warrants, with respect to up to 85,360,170 no-par-value
registered shares of the Company, representing a pro-rata interest in its capital stock of up to
€145,112,289 in total, to or on the holders or creditors of the bonds or warrants.
The bonds may also be issued by an affiliate of the Company against cash and/or non-cash contributions.
Here, too, the Management Board may, with the Supervisory Board’s consent, exclude the subscription
right to which shareholders are entitled in principle. In connection with these convertible bonds and
warrant-linked bonds, conditional capital was created by shareholder resolution. Pursuant thereto, the
capital stock is conditionally increased by up to €145,112,289 through the issue of up to 85,360,170
no-par-value registered shares for the purpose of granting shares upon exercise of rights and obligations
of conversion or purchase.

72Uniper
Annual Report 2017 Combined Management Report
Purchase of Treasury SharesPursuant to a resolution of August 30, 2016, the Company is authorized until June 30, 2021 to acquire
treasury shares up to a total of 10% of the capital stock existing at the time the resolution was adopted.
At the Management Board’s discretion, such purchase may take place on the stock exchange, by way of
a purchase offer addressed to all shareholders, a public offering or a public solicitation of offers for the
exchange of liquid exchange shares for Company shares (so-called “exchange offer”), or through the
use of derivatives (put or call options or a combination of both). The Management Board is also autho-
rized, subject to the Supervisory Board’s consent and excluding shareholder subscription rights, to use
shares of the Company in a specified manner. The Management Board is further authorized to cancel
treasury shares without requiring a separate shareholder resolution to that effect.
Offsetting ClauseAs a result of offsetting clauses to that effect, the aforementioned authorizations to exclude subscription
rights with respect to the authorized capital, the convertible bonds and warrant-linked bonds and the
use of treasury shares are offset during period of their validity in such a way that any new shares thus
issued or sold, and any shares that are to be issued based on rights that enable or require the sub-
scription of Company shares, notionally do not account for more than 20% of the capital stock then exist-
ing or—should this value be lower—the capital stock existing when the authorizations are exercised.
Significant Agreements to Which the Company Is a Party That Take Effect on a Change of Control of the Company Following a Takeover Bid
Some principal agreements on the financing of the Company provide for a right of termination enforce-
able on the Company in the event of a change of control. The possibility of termination is partly subject
to further conditions. In some cases, creditors have already waived the right of termination in the event
of a change of control to Fortum. Additional information on financial liabilities can be found under “Fi-
nancial Condition” in the Combined Management Report and in Note 24 to the Consolidated Financial
Statements.

73
Settlement Agreement between the Company and Management Board Members or Employees in the Case of a Change-of-Control Event
In the event of a premature loss of a Management Board position due to a change-of-control event, the
members of the Management Board are entitled to receive a settlement. Management Board members
are entitled to a settlement payment if, within twelve months of the change of control, their service
agreement is terminated by mutual consent, expires or is terminated by them (in the latter case, how-
ever, only if their position on the Management Board is materially affected by the change in control).
The settlement payment to Management Board members of the members of the Management Board
consists of their base salary and target bonus (100%) plus fringe benefits for a period of two years from
the premature termination of the service contract. In accordance with the German Corporate Gover-
nance Code, these settlement payments for Management Board members shall not exceed 150% of a
general settlement cap.
A change of control would further trigger a premature settlement of the current long-term multi-year
bonus tied to the performance of Uniper stock and of the Uniper Performance Cash Plan.
Remaining Items of Sections 289a and 315a (1) of the German Commercial Code
The remaining items of Sections 289a and 315a (1) of the German Commercial Code not discussed
here concern issues not present within Uniper SE.

74Uniper
Annual Report 2017 Combined Management Report
Corporate Governance Report
Declaration in Accordance with Section 289f and Section 315d of the German Commercial Code
Declaration on the Corporate Governance Code Made in Accordance with Section 161 of the German Stock Corporation Act by the Management Board and the Supervisory Board of Uniper SEPursuant to Section 161 para. 1 sentence 1 of the German Stock Corporation Act (“AktG”), the Manage-
ment Board and the Supervisory Board of Uniper SE have to issue annually a declaration that Uniper SE
has been, and is, in compliance with the recommendations of the “Government Commission on the Ger-
man Corporate Governance Code” (hereinafter the “Code”) as published by the German Federal Ministry
of Justice in the official section of the Federal Gazette (Bundesanzeiger), or to advise of any recom-
mendations that have not been, or are not being, applied and the reasons for this.
Pursuant to Section 161 AktG, the Management Board and the Supervisory Board of Uniper SE hereby
declare as follows:
1. Uniper SE complies with and will continue to comply with all recommendations of the Code as
amended on February 7, 2017.
2. Since the last declaration of compliance was issued in February 2017, Uniper SE has complied with
all the recommendations of the Code as amended on May 5, 2015 and, since its entry into force, with
the recommendations of the Code as amended on February 7, 2017.
Düsseldorf, February 2018
For the Management Board
Klaus Schäfer Christopher Delbrück
For the Supervisory Board
Dr. Bernhard Reutersberg
This Declaration is continuously available to the public on the Company’s Internet site at
https://ir.uniper.energy/websites/uniper/English/7500/corporate-governance-policy.html.
75
Relevant Information about Management PracticesCorporate Governance
Uniper SE is a European Company (Societas Europaea, “SE”). The governing bodies of the Company are
the Management Board (Vorstand), the Supervisory Board (Aufsichtsrat) and the Annual Shareholders
Meeting (Hauptversammlung). The Company has a two-tier corporate governance structure. The Man-
agement Board and the Supervisory Board work independently of one another. A member of the
Company’s Supervisory Board may not, in principle, be a member of the Company’s Management Board
at the same time. Prior to the conversion into a European Company through a change in legal form,
Uniper SE was constituted as a German stock corporation, Uniper AG.
Good corporate governance is of the highest priority at Uniper SE. It is ensured through close and efficient
collaboration between the Management Board and the Supervisory Board for the good of the Company,
it guides all decision-making and ensures that the Company’s success is earned responsibly and sustain-
ably. Management Board members and members of the Supervisory Board shall serve the interests of
the Company. No member of the Management Board or of the Supervisory Board may pursue personal
interests when making decisions.
The Company’s Management Board and Supervisory Board subscribe to the goals of the German Corpo-
rate Governance Code, which seeks to promote responsible, transparent corporate governance and
controls aimed at enhancing enterprise value in the long term. In that respect, Uniper SE is also near-
ly fully in compliance with the suggestions of the Code, which are only voluntary.
In accordance with the suggestion under Section 4.1.3 of the German Corporate Governance Code, a
protected whistleblowing system has also been made available to third parties since November 2017.
The compensation plan provides for the early payment of multi-year variable compensation compo-
nents in accordance with Section 4.2.3 of the German Corporate Governance Code only in cases where
a continuation up to the planned date does not correspond to the regulatory purpose (e.g., “change-of-
control” situation, death).
The suggestion in Section 3.7 of the German Corporate Governance Code that an extraordinary general
meeting should be convened in the event of a takeover bid was not complied with. In the Company’s
view, in the specific instance of Fortum’s public offer the costs involved in holding a corresponding ex-
traordinary general meeting were not in line with the benefits for shareholders.
At the time this report was prepared, the current members of the Management Board and the Supervi-
sory Board of Uniper SE together hold 102,539 shares of the Company. This corresponds to a share of
0.28% relative to the total of 365,960,000 shares issued. According to publicly available information, the
shares held by Dr. Marc Spieker have been tendered in Fortum’s public offering. Considering the effect
of rounding, a completion of this transaction would have no impact on the percentage currently held.
Integrity
Uniper’s business activities are grounded in integrity and respect for the law. They are based on the
Uniper Code of Conduct, as amended in October 2017, approved by resolution of the Management
Board. The Code requires that all employees in all of the Group companies comply with all laws and
regulations and with Company policies. The Management Board and line managers serve as role models
and must act accordingly. The Code sets out principles for dealings with business partners, third parties
and government institutions, particularly with regard to laws on combating corruption, money laun-
dering and the financing of terrorism, on compliance with international sanctions and with antitrust
law, the granting and accepting of benefits, the involvement of intermediaries, and the selection of
suppliers and service providers. Other rules address issues including the avoidance of conflicts of inter-
est (such as non-compete obligations, secondary employment, material financial investments) and
the handling of Company information, property and resources. The policies and procedures of the com-
pliance organization ensure the investigation, evaluation, cessation and punishment of reported viola-
tions by the appropriate Compliance Officers and the Uniper Group’s Chief Compliance Officer. Violations
of the Code of Conduct can also be reported anonymously (for example, by means of a whistleblower
report). The Code of Conduct and further information on the Company’s Compliance Management Sys-
tem can be viewed online at
https://www.uniper.energy/en/we-are-uniper/our-corporate-responsibility/compliance.html.

76Uniper
Annual Report 2017 Combined Management Report
Diversity Concept
The Management Board of Uniper gave its full commitment to developing diversity and inclusion at
Uniper after Uniper’s CEO Klaus Schäfer signed the Diversity Charter at the end of 2016. The Diversity
Charter has been signed by over 2,700 companies in Germany who respect and are committed to pro-
moting diversity in the six dimensions of gender, nationality or ethnic background, religion or world-
view, disability, age/generations, sexual orientation and identity. A diverse workforce reflects modern
society, is influenced by globalization trends and demographic changes and according to much current
research also makes very good business sense. Teams made up of diverse employees and their vari-
ous capabilities are more innovative and creative than a workforce of homogeneous teams.
Thus, at Uniper, diversity is an essential and integral part of “The Uniper Way”. It is recognized as a
long-term goal that can and will be achieved by commitment at both the executive and employee lev-
els. In 2017, the Management Board agreed to focus on measures in all six diversity dimensions and
implement measures to foster a more innovative and creative culture. An employee survey was carried
out using diversity questions to create greater awareness among all employees. Managers have been
discussing the results with their teams and are working on measures to manage and promote diverse
teamwork. A working group of senior managers and diversity ambassadors from various areas of the
Company was also established in 2017 and given a platform to work on a Diversity Improvement Plan
for 2018–2020 that will apply to the entire company, including at the management levels.
Description of the Functioning of the Management Board and Supervisory Board and of the Composition and Functioning of Their Committees
Management Board
The Management Board consists of
• Klaus Schäfer, the Chairman of the Management Board and Chief Executive Officer (“CEO”);
• Christopher Delbrück, the Chief Financial Officer (“CFO”);
• Keith Martin, the Chief Commercial Officer (“CCO”) responsible for commercial activities; and
• Eckhardt Rümmler, the Chief Operating Officer (“COO”) responsible for operations.
The Management Board of Uniper SE manages the Company on its own authority in accordance with the
law, the provisions of corporate by-laws and the rules of procedure for the Management Board and
the Supervisory Board, giving due consideration to the resolutions adopted at meetings of shareholders.
The Management Board determines and updates the Group’s business objectives, fundamental strategic
orientation, corporate policy and organizational structure. This includes, in particular, management of
the Group and its financial resources, the development of the human resources strategy, appointments
to management positions within the Group and leadership development, as well as representation of the
Group to capital markets and the general public.
In addition, it is responsible for the coordination and monitoring of operations in accordance with the
established Group strategy.
The Management Board represents the Company in transactions with third parties. It manages the Com-
pany’s businesses, with all its members bearing joint responsibility for its decisions. The principle of
joint management notwithstanding, the individual Management Board members act independently and
on their own authority within their particular areas of responsibility, although they must place the
general interests of the Company above those of their respective areas of responsibility. Individual Man-
agement Board members must inform the other members of the Management Board about important
measures, decisions, material business transactions, risks and losses within their area of business
responsibility. The decisions reserved for the full Management Board (by law, by rules of procedure or
by corresponding resolution) are normally voted on in Board meetings convened by the Chairman. Per-
sons who are not members of the Management Board may directly participate in such meetings for
consultation on individual matters. The Management Board can generally adopt resolutions by simple
majority vote. In the event of a tied vote, the Chairman shall have the casting vote.

77
The Management Board is appointed by and reports to the Supervisory Board.
Accordingly, the Management Board, under the leadership of its Chairman, informs the Supervisory
Board regularly, promptly and comprehensively on all issues of planning, business development, compli-
ance, the risk situation and risk management that are relevant to the Company. It addresses instances
where the course of business has deviated from the approved plans and objectives, and specifies the
reasons for them. The Management Board shall generally submit to the Supervisory Board a quarterly
report on the items specified in Section 90 of the German Stock Corporation Act, as well as reports
about the Group. The Management Board shall additionally submit its planning for the Group’s invest-
ments, finances and human resources, as well as the medium-term plan, to the Supervisory Board.
The Chairman of the Management Board promptly informs the Chairman of the Supervisory Board of
important events that are of fundamental significance in assessing the Company’s situation and devel-
opment and to its management, and also of any defects that have arisen in the monitoring systems that
Management Board is required to set up. Transactions and measures requiring the Supervisory Board’s
consent are also submitted to the Supervisory Board in a timely manner. If a Management Board mem-
ber holds a conflict of interest, such member shall disclose that conflict to the Supervisory Board and
inform the other members of the Management Board thereof.
Supervisory Board
Shareholders are represented on the Supervisory Board by Dr. Bernhard Reutersberg (Chairman),
Jean-Francois Cirelli, David Charles Davies (since June 8, 2017), Dr. Marion Helmes, Rebecca Ranich
and Dr. Marc Spieker (Deputy Chairman), who were appointed or reappointed by the Annual Share-
holders Meeting on June 8, 2017. Dr. Johannes Teyssen retired on June 8, 2017 after the end of his
term of office without being subsequently reappointed. The employees are represented on the Super-
visory Board by Ingrid Asander, Oliver Biniek, Barbara Jagodzinski, Andre Muilwijk, Immo Schlepper
(since June 8, 2017) and Harald Seegatz (Deputy Chairman). Andreas Scheidt resigned from office
with effect from June 8, 2017.
In the opinion of the Supervisory Board, all members of the Supervisory Board are, with one exception,
independent members of the Supervisory Board within the meaning of the German Corporate Gover-
nance Code. Due to the current interests of Uniper SE, on the one hand, and E.ON SE, on the other hand,
Dr. Marc Spieker no longer qualifies as an independent member of the Supervisory Board within the
meaning of the German Corporate Governance Code as a result of the planned public takeover by For-
tum.
The Supervisory Board of Uniper SE appoints, oversees and advises the Management Board and is di-
rectly involved in decisions that are of fundamental importance to the Company. The Supervisory Board
Chairman coordinates the work of the Supervisory Board.
The Supervisory Board consists of twelve members. Six members are elected by the Annual Sharehold-
ers Meeting, and six members are elected by the employees in accordance with the election procedures
established in the agreement on employee participation in Uniper SE. Former Management Board
members are generally prohibited from serving on the Supervisory Board for a qualifying period of
two years after leaving the Management Board. This is designed to avoid conflicts of interest. However,
an exception is made to this provision if the election to the Supervisory Board comes at the suggestion
of shareholders who have more than 25% of the voting rights in the Company.
The Supervisory Board’s composition should ensure that, on balance, its members have the necessary
expertise, skills, and professional experience to discharge their duties properly. In view of Section 289f
(2) no. 6 of the German Commercial Code and Item 5.4.1 of the German Corporate Governance Code, as
amended on February 7, 2017, the Supervisory Board has defined targets for its composition and de-
veloped a competency profile that reads as follows:

78Uniper
Annual Report 2017 Combined Management Report
Definition of Targets
Basis
“The Supervisory Board’s composition should ensure that, on balance, its members have the neces-
sary expertise, skills, and professional experience to discharge their duties properly. Each Superviso-
ry Board member should have or acquire the minimum expertise and skills needed to be able to un-
derstand and assess on his or her own all the business events and transactions that generally
occur.
Independence and Conflicts of Interests
“The Supervisory Board should include a sufficient number of independent candidates; members
are deemed independent if they do not have any personal or business relationship with the Com-
pany, its Management Board, a shareholder with a controlling interest in the Company, or with a
company affiliated with such a shareholder, and such a relationship could constitute a material, and
not merely temporary, conflict of interest. The Supervisory Board has a sufficient number of inde-
pendent members if ten of its twelve members are independent. Employee representatives are, as a
rule, deemed independent.
“The Supervisory Board should not include more than two former members of the Management
Board, and members must not sit on the boards of, or act as consultants for, any of the Compa-
ny’s major competitors.
Availability
“Each Supervisory Board member must have sufficient time available to perform his or her board
duties. Persons who are members of the management board of a listed company should therefore
only be or remain members of Uniper’s Supervisory Board if they do not sit on more than three
supervisory boards of listed non-Group companies or in comparable supervisory bodies of non-
Group companies.
Age Limit
“As a general rule, members should not be older than 70 at the time of their election and should
not be members for more than three full terms (15 years).
Diversity
“The Supervisory Board intends to consider other criteria in its nomination of candidates in order
to increase the Supervisory Board’s diversity, if and to the extent the qualifications of several can-
didates for the Supervisory Board meet, to an equal degree, the general and Company-related re-
quirements.
Gender Diversity
“As required by law, the Supervisory Board consists of at least 30% women and at least 30% men.
This will be considered for new appointments to the Supervisory Board of Uniper SE.

79
Detailed Profile of Skills and Expertise
Specific Leadership Experience
“The key role of the Supervisory Board is to oversee and advise the Management Board. Conse-
quently, a majority of the shareholder representatives on the Supervisory Board should have expe-
rience as members of the management board of a stock corporation or of a comparable company
or association in order to discharge their duties in a qualified manner.
“Connected thereto, at least some of the members should have specific experience, in addition to
general responsibility for management and results as well as personnel and leadership, as regards
corporate strategy and future strategic development, as regards accounting and auditing, as re-
gards controlling as well as regards a holistic perspective of risk, compliance and corporate gover-
nance.
Specific Energy Industry Expertise
“In addition, the Supervisory Board as a whole should have particular expertise in the energy indus-
try and Uniper’s business operations.
“For this purpose, at least some members should have specific experience which allows them to
deeply understand the business models and the major business areas (markets and competition,
products and customers) along the value chain and to assess them, particularly from a strategic and
risk perspective.
“Preferably, at least some members should have specific experience from related or other indus-
tries to provide for an external view on the matters of the Company.
“Specific expertise in the energy industry and business operations also includes in particular knowl-
edge about the key markets in which Uniper operates. Here at least some of the members should
have specific experience which allows them also to understand the development of such markets.
“Due to the international orientation of the Uniper Group having its focuses in Western Europe and
Russia at least some members should have specific experience in these regions.
General Professional Expertise
“Each member of the Supervisory Board should have general knowledge about the industry, the dif-
ferent business models, the accounting and the key factors for the Company’s results, the legal
framework and compliance requirements, except for reasonable exceptions. In case of a reasonable
exception, the member should be in a position to gain such general knowledge in the near term.
“Moreover, each member of the Supervisory Board should have the ability to make a general plausi-
bility check of the financial statements of the Company and in individual cases with the support of
the auditor to conduct an appropriate deeper review thereof. Each member should be in the position
to review the reporting by the Management Board at least for its general soundness, to scrutinize
and discuss it. Furthermore, each member should be able to assess the correctness, the profitability
and the lawfulness of the business decisions to be passed, to review them at least for their general
soundness, to scrutinize and discuss them, as and where required to be supported by expert advice.
“In view of Uniper’s international orientation, the Supervisory Board should include a sufficient num-
ber of members who have spent a significant part of their professional career abroad.

80Uniper
Annual Report 2017 Combined Management Report
General Personal Expertise
“Each member of the Supervisory Board should have a level of personal independence and integrity
that permits them to fulfill the tasks of supervising and reviewing. To advise and supervise the Man-
agement Board in its management responsibilities each member of the Supervisory Board should
have sufficient experience from leadership functions or should have gained the required expertise
otherwise. Each member of the Supervisory Board should be particularly professional, discreet,
open to discussion, solution-oriented and have the ability to work cooperatively.
“In addition, each member should be prepared to devote sufficient attention to the tasks arising from
the Supervisory Board’s activities, including work in the committees, and to pursue the relevant top-
ics outside of the specific Supervisory Board’s activities. Each member should have the flexibility to
be available at short notice in the event they are urgently needed and to appropriately prioritize the
requirements of the Uniper Supervisory Board.
Chairman of the Supervisory Board
“The Chairman of the Supervisory Board should directly fulfill key elements of the special competencies
which are required of the Supervisory Board as a whole and thus only of some members. In particular,
the Chairman of the Supervisory Board should have special relevant management experience and
should, in principle, have relevant management experience of his or her own in order to be able to fully
carry out his or her advisory and supervisory tasks.
“If the Chairman of the Supervisory Board does not possess specific expertise in the energy industry,
the Chairman should have specific experience from related or other industries. The Chairman of the Su-
pervisory Board should, without exception and to a particular extent, meet the general professional and
personal requirements.”
In its current composition, the Supervisory Board meets the targets of this competency profile.
Each Supervisory Board member is required to disclose to the Supervisory Board any conflicts of inter-
est, particularly if a conflict arises from their advising, or exercising a board function with, customers,
suppliers, creditors or other third parties. In its report to the Shareholders Meeting, the Supervisory
Board informs shareholders about conflicts of interest and their disposition. Material conflicts of interest
that are not merely temporary shall result in the termination of a member’s appointment to the Super-
visory Board. The Supervisory Board regularly reviews the efficiency of its activities, generally every two
years.
The Supervisory Board regularly adopts its resolutions in Board meetings. The Management Board reg-
ularly participates in these meetings unless the Supervisory Board decides to exclude the Management
Board from a meeting on a case-by-case basis. Third parties may also participate in Supervisory Board
meetings for consultation on individual matters. The Supervisory Board can generally adopt resolutions
by simple majority vote. In the event of a tied vote, the Chairman shall have the casting vote.
The Supervisory Board may form committees from among its ranks and transfer decision-making au-
thority to these committees to the extent permitted by law. The Supervisory Board stipulates the com-
mittees’ responsibilities, powers and procedures. The Supervisory Board has established the following
committees, which are tasked with the responsibilities described below:

81
Executive Committee
The Executive Committee (Präsidialausschuss) coordinates the work of the Supervisory Board, prepares
the Supervisory Board meetings and is also responsible for personnel matters relating to the Manage-
ment Board. It is also charged with preparing resolutions on the appointment of Management Board
members and negotiating the terms and conditions of their employment agreements, including com-
pensation. The Executive Committee submits proposals to the full Supervisory Board on setting the to-
tal compensation to be granted to the individual members of the Management Board. The Executive
Committee’s tasks also include, among others: (i) granting consent to requests by Management Board
members to take on other positions or other material secondary employment or exempting them from
non-compete obligations; (ii) granting loans to members of the Management Board and of the Supervi-
sory Board and their dependents; and (iii) granting consent to transactions between the Company and
its affiliates on the one hand, and any Management Board member or a related party on the other.
The Executive Committee consists of six members: Dr. Bernhard Reutersberg (Chairman), Harald See-
gatz (Deputy Chairman), Jean-Francois Cirelli, Barbara Jagodzinski, Immo Schlepper and Dr. Marc
Spieker. Jean-Francois Cirelli joined the committee on January 26, 2017. Until June 8, 2017, Dr. Jo-
hannes Teyssen was a member of this committee instead of Dr. Marc Spieker, and Andreas Scheidt was
a member instead of Immo Schlepper. Until his departure, Andreas Scheidt held the chairmanship of
the committee instead of Harald Seegatz.
Audit and Risk Committee
The Audit and Risk Committee (Prüfungs- und Risikoausschuss) assists the Supervisory Board with its
responsibilities in monitoring accounting processes and financial reporting. These include preparing
the review of the correctness and completeness of the Company’s annual and consolidated financial
statements and related disclosures, as well as monitoring the Company’s internal control, risk man-
agement and internal audit systems. The Committee also monitors the performance, qualifications
and independence of the external auditor and discusses the semi-annual and the quarterly reports with
the Management Board.
The Audit and Risk Committee consists of four members: David Charles Davies (Committee Chairman),
Andre Muilwijk (Deputy Chairman), Oliver Biniek and Dr. Marion Helmes. Dr. Marion Helmes joined the
committee on January 26, 2017. Until June 8, 2017, Dr. Marc Spieker was a member and chairman of
this committee instead of David Charles Davies, and Harald Seegatz was a member instead of Oliver
Biniek. Until his departure, Harald Seegatz was Deputy Chairman of the committee instead of Andre
Muilwijk.
Nomination Committee
The Nomination Committee (Nominierungsausschuss) is responsible for preparing the decisions of the
Supervisory Board regarding proposals to the Shareholders Meeting on the appointment of sharehold-
er representatives to the Supervisory Board.
The Nomination Committee consists of three members: Dr. Bernhard Reutersberg (Committee Chair-
man), Jean-Francois Cirelli and Dr. Marc Spieker. Dr. Marc Spieker joined the committee on February
22, 2017. Until June 8, 2017, Dr. Johannes Teyssen was a member of this committee instead of
Jean-Francois Cirelli.
Special Committee
The Special Committee (Sonderausschuss) is a committee of the Supervisory Board responsible for
takeover matters.
The Special Committee consists of six members: Dr. Bernhard Reutersberg (Committee Chairman),
Jean-Francois Cirelli, Dr. Marion Helmes, Barbara Jagodzinski, Andre Muilwijk and Harald Seegatz.
The following overview shows the individual participation of the members of the Supervisory Board in
the meetings of the Supervisory Board and its committees; in each case as the participation of that
member in the meetings of the Supervisory Board during the term of office or committee activity of the
respective member:

82Uniper
Annual Report 2017 Combined Management Report
Shareholders, Annual Shareholders MeetingThe Annual Shareholders Meeting is the meeting at which shareholders of Uniper SE exercise their
rights. The Shareholders Meeting is held at the site of the Company’s registered office or in another
German city with at least 100,000 inhabitants. The SE Regulation provides that the Shareholders Meet-
ing must be held at least once every calendar year within the first six months after the close of a giv-
en fiscal year. It is normally convened by the Management Board. Each share has one vote at a Share-
holders Meeting. Only those shareholders are entitled to participate in the Shareholders Meeting and
to exercise their voting rights who have registered in due time and are recorded in the shareholder reg-
ister for the shares being registered. Voting rights can be exercised through proxies.
The Shareholders Meeting resolves on the following, in particular: appointment of shareholder represen-
tatives to the Supervisory Board; appropriation of net retained profits; ratification of the actions of the
Management Board and Supervisory Board members; appointment of the independent auditor; amend-
ments to the Articles of Association; corporate actions involving capital increases or reductions (in the
absence of authorization such as that conferred by authorized or conditional capital); and dissolution of
the Company.
Statutory AuditorPricewaterhouseCoopers GmbH Wirtschaftsprüfungsgesellschaft, Düsseldorf, was elected as auditor of
Uniper SE by the Annual Shareholders Meeting on June 8, 2017. The audit mandate will run until the
next Annual Shareholders Meeting in June 2018. PricewaterhouseCoopers GmbH Wirtschaftsprüfungs-
gesellschaft, Düsseldorf, has been active as auditor of the financial statements of Uniper SE without in-
terruption since the company fulfilled its requirements as a public interest entity within the meaning of
Section 319a (1) sentence 1 of the German Commercial Code (HGB) for the first time in the 2016 fiscal
year. The auditor responsible for the audit since then has been Markus Dittmann.
Overview of the Attendance of Supervisory Board Members at Meetings of the Supervisory
Board and Its Committees
Supervisory Board member
Supervisory Board
Meetings
Executive
Committee
Audit and Risk
Committee
Special committee
on takeover activi-
ties
Nomination
Committee
Dr. Bernhard Reutersberg 10/10 4/4 - 6/6 1/1
Harald Seegatz 10/10 4/4 2/2 (until June 8) 6/6 -
Dr. Marc Spieker 7/10 1/1 (since June 8) 2/2 (until June 8) - 1/1 (since Feb. 22)
Andreas Scheidt 4/4 (until June 8) 3/3 (until June 8) - - -
Dr. Johannes Teyssen 4/4 (until June 8) 3/3 (bis 8. Juni) - - 1/1 (until June 8)
Ingrid Asander 9/10 - - - -
Oliver Biniek 10/10 - 1/2 (since June 8) - -
Jean-Francois Cirelli 8/10 3/4 (since Jan. 26) - 5/6 -
David Davies 6/6 (since June 8) - 2/2 (since June 8) - -
Dr. Marion Helmes 9/10 - 3/4 6/6 -
Immo Schlepper 6/6 (since June 8) 1/1 (since June 8) - - -
Barbara Jagodzinski 10/10 4/4 - 6/6 -
Andre Muilwijk 9/10 - 4/4 6/6 -
Rebecca Ranich 9/10 - - - -
83
Targets for Promoting the Participation of Women and Men in Leadership Positions pursuant to Section 76 (4) and Section 111 (5) of the German Stock Corporation ActThe Law for the Equal Participation of Women and Men in Leadership Positions in the Private Sector and
the Public Sector also imposes upon Uniper SE (the ultimate lead company of the Uniper Group) the
obligation to set targets for the proportion of women on its Supervisory Board and its Management Board,
as well as in the two levels of management below the Management Board.
It was determined that the Supervisory Board, in accordance with statutory requirements, must consist
of at least 30% women and at least 30% men. The date for achieving both targets is June 30, 2017. This
requirement has been reached for June 30, 2017. For the period from July 1, 2017 to June 30, 2022, the
Supervisory Board has set a target figure of 30% for the proportion of women.
For the Management Board it was determined, taking into account the spin-off process, that a short-term
target of zero percent for the proportion of women on the Management Board of Uniper SE, reflecting
the status quo, should apply through June 30, 2017. For the Management Board, the Supervisory
Board has adopted a target figure of 20% for the proportion of women for the period from July 1, 2017
to June 30, 2022.
For the two management levels below the Management Board, targets of 30% for the first management
level and of 26.5% for the second management level were set for the proportion of women. An inter-
nal implementation was not adopted; the statutory deadline (June 30, 2017) therefore applies. As of
June 30, 2017, both targets had been exceeded. For the two management levels of Uniper SE below
the Management Board, a target of 30% for the proportion of women in the first management level
and 30% for the second management level has been set for the period from July 1, 2017 to June 30,
2022.

84Uniper
Annual Report 2017 Combined Management Report
Compensation Report pursuant to Section 289a (2) and Section 315a (2) of the German Commercial Code
The compensation report describes the basic features of the compensation plans for members of the
Management Board and of the Supervisory Board of Uniper SE and provides information about the com-
pensation granted and paid in the 2017 fiscal year. It applies the provisions of accounting standards for
capital-market- oriented companies (the German Commercial Code (“HGB”), German Accounting Stan-
dards, and International Financial Reporting Standards (“IFRS”)) and the recommendations and sugges-
tions of the German Corporate Governance Code dated February 7, 2017.
Basic Features of the Management Board Compensation PlanThe purpose of Uniper SE’s Management Board compensation plan is to create an incentive for perfor-
mance-related and sustainable corporate governance. The compensation of Management Board mem-
bers consists, in principle, of a fixed base salary, a performance-based annual bonus, and long-term per-
formance-based variable compensation.
The system is designed to be competitive and to meet regulatory requirements.
At the same time, the compensation plan serves to align management and shareholder interests and ob-
jectives by tying long-term variable compensation to the so-called Total Shareholder Return, a measure
of the market performance of Uniper’s share price plus dividends paid.
The Supervisory Board approves the Management Board compensation structure. It reviews the struc-
ture and appropriateness of the Management Board’s total compensation and its individual components
on a regular basis and, if necessary, makes adjustments. It considers the provisions of the German Stock
Corporation Act (“AktG”) and follows the German Corporate Governance Code’s recommendations and
suggestions.
Fixed CompensationThe members of the Management Board receive a fixed base salary, which is paid as a monthly salary.
Additionally granted are compensation in kind and fringe benefits customary in the market, such as
the continued payment of compensation in the event of short-term disability, the provision of a compa-
ny car (for the Chief Executive Officer, including driver), the payment of costs associated with medical
screening and accident insurance, and property damage liability insurance with a deductible.
Compensation Structure of the Management Board Members
(Based on 100% Target Attainment)
Base salary Annual bonus Long-term variable compensation
Chief Executive Offi cer Average for ordinary
Management Board members
35%
25%
40%
35%
25%
40%

85
Pursuant to the German Stock Corporation Act and the recommendation in the German Corporate
Governance Code, the property damage liability insurance policy includes a deductible of 10% of the
respective damage claim for Management Board members. The deductible has a maximum cumula-
tive annual cap of 150% of a member’s annual fixed base salary.
Performance-Based CompensationWithin the framework of the compensation plan for the Management Board of Uniper SE, about 60% of
the long-term variable compensation depends on the achievement of long-term targets, ensuring that
the variable compensation is sustainable under the criteria of Section 87 AktG. Performance-based
compensation consists of the annual bonus and long-term variable compensation.
Annual BonusThe annual bonus is dependent on the business performance of the Company in the respective fiscal
year. The Supervisory Board further assesses the individual performance of each Management Board
member (applying a factor of 0.7 to 1.3). To determine the Company’s business performance, the Su-
pervisory Board establishes performance measures and appropriate targets at the beginning of each
fiscal year. Beginning in the 2017 reporting year, performance is measured based on adjusted funds
from operations (“adjusted FFO”).
Adjusted FFO is derived from adjusted cash flow and considered to a material indicator for managing
the operating business and for assessing the Uniper Group’s financial condition, which makes it an ap-
propriate measure of business performance. The target for a particular fiscal year is the budget figure
approved by the Supervisory Board. If the actual adjusted FFO is equal to the adjusted FFO target, this
constitutes 100% attainment. If it is 50% or more below the target, this constitutes 0% attainment. If it
is 50% or more above the target, this constitutes 200% attainment, which is the maximum achievable
target attainment. Linear interpolation is used to translate intermediate figures.
In assigning Management Board members their individual performance factors, the Supervisory Board
applies concrete criteria to evaluate the individual contribution of the members of the Management
Board to the achievement of collective goals, as well as the attainment of their individual targets. Col-
lective goals and individual targets are agreed upon in advance and set down in a target agreement
between the Management Board and the Supervisory Board. For the 2017 fiscal year, these goals and
targets included strategic development and success in the capital markets, as well as sustainability,
long-term positioning and human-resources development. The agreed goals and targets for the 2018
fiscal year again include the development and implementation of strategy, as well as sustainability,
long-term positioning and human-resources development.
Target attainment in terms of the individual performance factor is determined by the Supervisory
Board after the close of the fiscal year on the basis of the degree to which each of the previously de-
fined individual targets and collective goals has been achieved. In making this determination, the Su-
pervisory Board pays particular attention to the criteria of Section 87 AktG and of the German Corpo-
rate Governance Code.
According to the Management Board contracts, the Supervisory Board may, in the event of extraordi-
nary developments, consider other aspects when determining the bonus. This can lead to a corre-
spondingly higher or lower performance bonus. In line with the German Corporate Governance Code’s
recommendation, the above-described goals, targets and comparative parameters may not be
changed retroactively. In addition, the Supervisory Board may grant Management Board members
special compensation for outstanding achievements as part of the bonus. No additional aspects were
considered for the 2017 reporting year, nor was any special compensation granted to Management
Board members.
The bonus, including any special compensation, is limited to a maximum of 200% of the target amount
(payout cap). Subject to any taxes, the bonus is paid out in April of the following year.

86Uniper
Annual Report 2017 Combined Management Report
Long-Term Variable CompensationMembers of the Management Board are granted long term incentive (“LTI”) payments. Uniper’s LTI pro-
gram is the Performance Cash Plan. The plan is set up to pay annual tranches, with a performance pe-
riod of four years for each tranche. The amounts paid out under the Performance Cash Plan are based
on an LTI target amount, which is granted at the start of the performance period as a future entitle-
ment, as well as on the respective performance factor. The performance factor is determined at the
end of the performance period by comparing the absolute Total Shareholder Return (“TSR”) achieved
with the target values specified by the Supervisory Board. At the end of the four-year performance pe-
riod, the performance factor reached is multiplied by the respective LTI target amount to determine the
amount to be paid out under a granted tranche of the Performance Cash Plan. The payout amount is
capped at 400% of the target amount (payout cap). Long-term compensation is generally paid out after
the end of the performance period.
The absolute TSR refers to the total return on Uniper’s stock, and takes into account the performance
of the share price and dividend payments during the four-year performance period. The TSR reflects
the Company’s capital-market performance and thus serves to align the interests and objectives of
both management and shareholders. The initial price is the equal-weighted average closing price
(arithmetic mean) of the last 60 trading days prior to the beginning of the performance period. The final
price is determined by analogy as the arithmetic mean of the closing prices of the last 60 trading days
prior to the end of the performance period. This mitigates the effects of incidental, short-lived price
changes.
The LTI payout is subject to firm predefined parameters for the absolute TSR and takes place only upon
reaching a calibrated threshold. If an absolute TSR of 15% is achieved, the members of the Manage-
ment Board receive a payout equivalent to 50% of the target amount. If the TSR threshold of 15% is not
achieved, no LTI payment takes place. An absolute TSR of 25% constitutes 100% target attainment and
therefore results in a payout of the full LTI target amount. The maximum payout of 400% of the target
amount is obtained only upon reaching an absolute TSR of 80%. Additional increases in the absolute
TSR will not result in additional payouts. Linear interpolation is used to translate intermediate figures
between the specified parameters.
Share Ownership GuidelinesIn the context of the special incentive bonus paid in 2016 when Uniper was spun off from E.ON SE, the
Management Board members agreed to form personal stock portfolios of Uniper shares. 25% of the
one-time special incentive bonus awarded for 2016 vests following the close of each full year from the
effective date of the spin-off. It is therefore presented pro rata for the 2017 fiscal year. Members of the
Management Board are obliged to accumulate holdings of Uniper shares worth 100% of their annual
fixed base salary, and to hold the acquired shares during their tenure. The period for forming the rele-
vant stock portfolio is a maximum of four years from the date of registration of the spin-off in the com-
mercial register of E.ON SE. All Management Board members consented to the share ownership guide-
lines before payment of the special incentive bonus. By Supervisory Board resolution dated September
8, 2017, further accumulation of shares was suspended for the time being in light of the takeover offer
by Fortum for Uniper SE.

87
Pension EntitlementsUniper SE has agreed on a defined contribution pension plan with the members of the Management
Board pursuant to the Uniper Management Board Contribution Plan.
Uniper SE makes contributions to Management Board members’ pension accounts equivalent to a maxi-
mum of 18% of their eligible compensation (base salary and target bonus). The amount of the annual
contributions is made up of a fixed base percentage (14%) and a matching contribution (4%). The
matching contribution will only be granted if the Management Board member makes a minimum con-
tribution in the same amount by deferring compensation. The matching contribution funded by the
Company will be suspended if the dividend distribution corridor set by the Supervisory Board is not
met for three consecutive years. The credits are converted in accordance with actuarial principles into
units of capital (based on the age of 62) and accrue to the pension accounts of the Management Board
members. The units of capital earn interest each year at the yield of long-term government bonds of
the Federal Republic of Germany observed in that year. The Management Board members (upon
reaching the age of 62), or their surviving dependents, may opt to have the accrued balance on their
pension account paid out in the form of a pension, in installments or in one lump sum.
In line with the German Corporate Governance Code’s recommendation, the Supervisory Board will
regularly review the Management Board member benefits levels, and the resulting annual and long-
term expense, and adjust the payments as needed.
Settlement Payments for Termination of Management Board DutiesIn line with the recommendation of the German Corporate Governance Code, the service agreements of
Management Board members include a settlement cap.
In the event of the early termination of an appointment to the Management Board and the service con-
tract without cause, any settlement payable shall be limited to two times the total annual compensation,
and at most to the compensation of the remaining term. The calculation of this cap is made in accor-
dance with the provisions of section 4.2.3. of the German Corporate Governance Code. If there is cause
within the meaning of Section 626 of the German Civil Code (“BGB”), no settlement shall be paid. In the
event of a change of control, the following special rules shall apply:
In the event of a premature loss of a Management Board position due to a change-of-control event,
Management Board members are entitled to settlement payments.
The change-of-control clause stipulates that a change of control can take three forms: (i) a third party
directly or indirectly acquires at least 30% of the Company’s voting rights, and thus reaches the con-
trol threshold under the German Securities Acquisition and Corporate Takeover Act (“WpÜG”); (ii) Uni-
per SE, as a dependent entity, signs a corporate agreement; or (iii) Uniper SE is merged with another
company pursuant to Sections 2 et seq. of the German Transformation Act (“UmwG”), unless the enter-
prise value of the other legal entity at the time of the decision by the transferring company amounts to
less than 20% of the enterprise value of Uniper SE. Management Board members are entitled to a set-
tlement payment if, within twelve months of the change of control, their service agreement is terminat-
ed by mutual consent, expires, or is terminated by the member (in the latter case only if their position
on the Management Board is materially affected by the change of control). The settlement payment for
Management Board members consists of their base salary and target bonus (100%) plus fringe benefits
for a period of two years after early termination of the service agreement. In accordance with the Ger-
man Corporate Governance Code, the settlement payments for Management Board members shall not
exceed 150% of the settlement cap described above.
The service agreements of Management Board members include a non-compete clause pursuant to
Section 88 AktG. For a period of six months after the termination of their service agreements, Man-
agement Board members are contractually prohibited from working directly or indirectly for a direct or
indirect competitor of Uniper SE or its affiliates. The prorated payment is based on 100% of their con-
tractually stipulated annual target compensation (without long-term variable compensation) but is, at
a minimum, 60% of their most recently received contractual compensation.

88Uniper
Annual Report 2017 Combined Management Report
Management Board Compensation for the 2017 Fiscal YearThe Supervisory Board reviewed the Management Board’s compensation plan and the components of
individual members’ compensation. The Supervisory Board found the Management Board’s compensation
appropriate from both a horizontal and vertical perspective and adopted a resolution authorizing the
performance-based compensation described below. The Supervisory Board found the horizontal per-
spective to be customary after comparing the compensation with that paid by companies of a similar size.
The appropriateness review included a vertical comparison of the Management Board’s compensation
with that of Uniper SE’s top management and the rest of its workforce. In the Supervisory Board’s view,
there was no reason to adjust the Management Board’s compensation in 2017.
Outlook for 2018In the course of the current restructuring program, the compensation of the members of the Manage-
ment Board was reduced for their respective terms of office, at their suggestion and with the consent
of the Supervisory Board, by about 7% (i.e., 7%, respectively, of the base salary, annual bonus, long-
term variable compensation and pension plan contributions).
Performance-Based Compensation for the 2017 Fiscal YearThe Supervisory Board fixed the annual bonuses of the Management Board members for the 2017 fis-
cal year as follows: €1,201,250 for Mr. Schäfer and €674,250 each for Mr. Delbrück, Mr. Rümmler and
Mr. Martin. Accordingly, the total amount of the annual bonus was €3,224,000. The financial perfor-
mance target attainment in the 2017 fiscal year was 155% of adjusted FFO. When it determined the in-
dividual target attainment of the Management Board members, the Supervisory Board evaluated each
member’s personal performance and acknowledged, in particular, that all material targets agreed with
the Management Board for the 2017 fiscal year were achieved.
The Supervisory Board launched the second tranche (planned performance period: 2017–2020) as part
of the Uniper Performance Cash Plan for the 2017 fiscal year and made allocations to the members of
the Management Board under this plan. The performance of this tranche will be determined in large
part by the performance of Uniper’ share price and dividend payments in the next four years. The actu-
al payments made to Management Board members in 2021 may thus deviate—under certain circum-
stances considerably—from the calculated figures disclosed here. Because a conversion into actual
numbers of shares is not provided for under the terms of the Uniper Performance Cash Plan, no such
numbers can be determined or disclosed.
The contractually promised LTI target (100%) corresponds to 88% of the base salary amount, and for
the full 2017 fiscal year amounts to €1,085,000 for Mr. Schäfer, and €615,000 each for Mr. Delbrück, Mr.
Rümmler and Mr. Martin.
The following expenses have been incurred under the Performance Cash Plan of the Management
Board members for the 2017 fiscal year:
The expense for the multi-year bonus granted to Mr. Schäfer for the last time in 2016 amounted to
€0.6 million in the 2017 fiscal year (2016: €0.3 million).
Total Share-based Payment Expense
€
Expense recognized in 2017
(Tranche 2, 2017–2020)
Expense recognized in 2017
(Tranche 1, 2016–2019)
Expense recognized in 2017
(Total)
Expense recognized in 2016
(Total)
Klaus Schäfer 1,085,000 2,170,000 3,255,000 0
Christopher Delbrück 615,000 1,230,000 1,845,000 0
Keith Martin (since Mar. 1, 2016) 615,000 1,025,000 1,640,000 0
Eckhardt Rümmler 615,000 1,230,000 1,845,000 0
Total 2,930,000 5,655,000 8,585,000 0

89
Management Board Pensions for the 2017 Fiscal YearThe following table provides an overview of current pension entitlements of Management Board
members, as well as the expenses and the present value of the pension obligations. The present value of
the pension obligations is calculated in compliance with IFRS and the provisions of the German Com-
mercial Code. An actuarial interest rate of 2.6% (IFRS) and 3.68% (HGB) was used for discounting.
Total Compensation for the 2017 Fiscal YearThe total compensation of the Management Board members pursuant to HGB for the 2017 fiscal year
amounted to €13.0 million (2016: €14.6 million). The special incentive bonus paid in the amount of
€4.1 million in total to the members of the Management Board in December 2016 must be recognized
as a non-interest-bearing advance payment pursuant to the German Commercial Code because of the
contractually agreed repayment provisions. 25% of the special incentive bonus vests following the
close of each full year from the effective date of the spin-off of Uniper SE from E.ON SE. It is therefore
presented pro rata for the 2017 fiscal year.
Uniper SE has promised Mr. Martin to pay relocation and broker’s fee costs and the rental costs for
maintaining a second home for a maximum of two years.
Pensions of the Members of the Management Board—IFRS
€
Expense in fiscal year Present value of the defined
benefit obligation (DBO)
as of Dec. 31Total Interest cost
2017 2016 2017 2016 2017 2016
Klaus Schäfer 324,117 279,481 105,363 101,255 4,378,937 4,390,123
Christopher Delbrück 227,713 220,657 60,749 62,140 2,612,380 2,531,224
Keith Martin (since March 1, 2016) 258,037 235,800 5,659 0 422,615 235,800
Eckhardt Rümmler 247,555 224,643 73,413 92,130 3,169,923 3,058,881
Pensions of the Members of the Management Board—HGB
€
Expense in fiscal year Settlement amount
of the pension obligation
as of Dec. 31Total Interest cost
2017 2016 2017 2016 2017 2016
Klaus Schäfer 298,860 595,230 303,468 114,587 3,779,978 3,481,118
Christopher Delbrück 248,222 390,960 178,757 64,111 2,252,635 2,004,413
Keith Martin (since March 1, 2016) 175,971 196,814 22,214 0 370,018 194,047
Eckhardt Rümmler 251,337 104,025 179,550 100,622 2,914,825 2,663,488

90Uniper
Annual Report 2017 Combined Management Report
Total Compensation of the Management Board
€
Base salary Annual bonus One-time special incentive bonus 1
2017 2016 2017 2016 2017 2016
Klaus Schäfer 1,240,000 1,240,000 1,201,250 775,000 403,000 0
Christopher Delbrück 700,000 700,000 674,250 435,000 227,500 0
Keith Martin (since March 1, 2016) 700,000 583,333 674,250 362,500 192,500 0
Eckhardt Rümmler 700,000 700,000 674,250 435,000 192,500 0
Total 3,340,000 3,223,333 3,224,000 2,007,500 1,015,500 0
1The special incentive bonus was paid to the members of the Management Board in December 2016. However, owing to the terms providing for prorated repayment of the bonus
(repayment provisions), no component of the bonus had yet vested for the 2016 fiscal year. Accordingly, the special incentive bonus was not yet included in the total compensation
reported for 2016. For 2017, 25% of each special incentive bonus has vested and is therefore presented pro rata.2For Mr. Schäfer, the value of share-based payment granted in 2016 also includes the multi-year bonus of €636,000 million paid by Uniper for the 2015 base year as part of the transfer
of entitlements from E.ON to Uniper.3Reported under “Other compensation” for Mr. Martin are all compensation payments for bonus commitments and long-term incentives forfeited with his former employer as a
result of his transfer to Uniper.
Compensation Granted
€
Klaus Schäfer (Chief Executive Officer) Christopher Delbrück (Chief Financial Officer)
2017
target value
2017
minimum
2017
maximum
2016
target value
2017
target value
2017
minimum
2017
maximum
2016
target value
Fixed compensation 1,240,000 1,240,000 1,240,000 1,240,000 700,000 700,000 700,000 700,000
Fringe benefits 22,942 22,942 22,942 24,093 22,394 22,394 22,394 22,336
Total 1,262,942 1,262,942 1,262,942 1,264,093 722,394 722,394 722,394 722,336
One-year variable compensation 775,000 0 1,550,000 2,015,000 435,000 0 870,000 1,135,000
Bonus 775,000 0 1,550,000 775,000 435,000 0 870,000 435,000
One-time special incentive bonus - - - 1,240,000 - - - 700,000
Multi-year variable compensation 1,974,391 0 4,340,000 1,721,000 1,119,125 0 2,460,000 615,000
Performance Cash Plan
(Tranche 1, 2016–2019) - - - 1,085,000 - - - 615,000
Performance Cash Plan
(Tranche 2, 2017–2020) 1,974,391 0 4,340,000 - 1,119,125 0 2,460,000 -
Multi-year bonus - - - 636,000 1 - - - -
Total 4,012,333 1,262,942 7,152,942 5,000,093 2,276,519 722,394 4,052,394 2,472,336
Service cost 218,754 218,754 218,754 178,226 166,964 166,964 166,964 158,517
Total compensation 4,231,087 1,481,696 7,371,696 5,178,319 2,443,483 889,358 4,219,358 2,630,853
1Mr. Schäfer was granted the multi-year bonus of €636,000 million paid by Uniper for the 2015 base year as part of the transfer of entitlements from E.ON to Uniper.
Compensation Allocated
€
Klaus Schäfer (Chief Executive Officer) Christopher Delbrück (Chief Financial Officer)
Compensation
allocated in 2017
Compensation
allocated in 2016
Compensation
allocated in 2017
Compensation
allocated in 2016
Fixed compensation 1,240,000 1,240,000 700,000 700,000
Fringe benefits 22,942 24,093 22,394 22,336
Total 1,262,942 1,264,093 722,394 722,336
One-year variable compensation 1,201,250 2,387,000 674,250 1,345,000
Bonus 1,201,250 775,000 674,250 435,000
One-time special incentive bonus - 1,612,000 - 910,000
Total 2,464,192 3,651,093 1,396,644 2,067,336
Service cost 218,754 178,226 166,964 158,517
Total compensation 2,682,946 3,829,319 1,563,608 2,225,853
1This amount for Mr. Martin contained an installment amounting to an equivalent value of approximately €1.7 million that would only be paid out in 2017, but which the German
Corporate Governance Code requires to be disclosed as allocated compensation for 2016.
Individual members of the Management Board received the following compensation according to the
German Commercial Code:
The following table shows the compensation granted and allocated to members of the Management
Board as recommended by the German Corporate Governance Code:
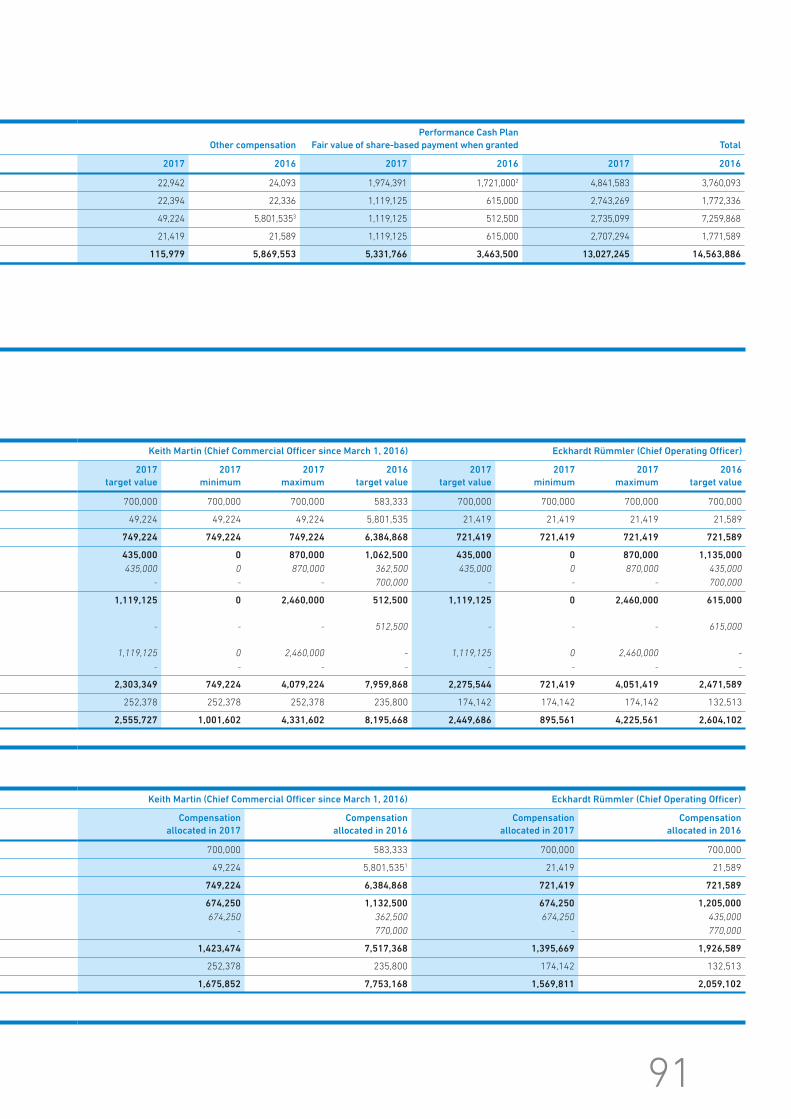
91
Other compensation
Performance Cash Plan
Fair value of share-based payment when granted Total
2017 2016 2017 2016 2017 2016
22,942 24,093 1,974,391 1,721,000 2 4,841,583 3,760,093
22,394 22,336 1,119,125 615,000 2,743,269 1,772,336
49,224 5,801,535 3 1,119,125 512,500 2,735,099 7,259,868
21,419 21,589 1,119,125 615,000 2,707,294 1,771,589
115,979 5,869,553 5,331,766 3,463,500 13,027,245 14,563,886
Keith Martin (Chief Commercial Officer since March 1, 2016) Eckhardt Rümmler (Chief Operating Officer)
2017
target value
2017
minimum
2017
maximum
2016
target value
2017
target value
2017
minimum
2017
maximum
2016
target value
700,000 700,000 700,000 583,333 700,000 700,000 700,000 700,000
49,224 49,224 49,224 5,801,535 21,419 21,419 21,419 21,589
749,224 749,224 749,224 6,384,868 721,419 721,419 721,419 721,589
435,000 0 870,000 1,062,500 435,000 0 870,000 1,135,000
435,000 0 870,000 362,500 435,000 0 870,000 435,000
- - - 700,000 - - - 700,000
1,119,125 0 2,460,000 512,500 1,119,125 0 2,460,000 615,000
- - - 512,500 - - - 615,000
1,119,125 0 2,460,000 - 1,119,125 0 2,460,000 -
- - - - - - - -
2,303,349 749,224 4,079,224 7,959,868 2,275,544 721,419 4,051,419 2,471,589
252,378 252,378 252,378 235,800 174,142 174,142 174,142 132,513
2,555,727 1,001,602 4,331,602 8,195,668 2,449,686 895,561 4,225,561 2,604,102
Keith Martin (Chief Commercial Officer since March 1, 2016) Eckhardt Rümmler (Chief Operating Officer)
Compensation
allocated in 2017
Compensation
allocated in 2016
Compensation
allocated in 2017
Compensation
allocated in 2016
700,000 583,333 700,000 700,000
49,224 5,801,535 1 21,419 21,589
749,224 6,384,868 721,419 721,589
674,250 1,132,500 674,250 1,205,000
674,250 362,500 674,250 435,000
- 770,000 - 770,000
1,423,474 7,517,368 1,395,669 1,926,589
252,378 235,800 174,142 132,513
1,675,852 7,753,168 1,569,811 2,059,102

92Uniper
Annual Report 2017 Combined Management Report
Uniper SE and its subsidiaries granted no loans to and did not enter into any contingencies benefiting
Management Board members in the 2017 fiscal year. Additional information about the members of the
Management Board is provided on page 233.
Payments Made to Former Members of the Management BoardAs of December 31, 2017, Uniper SE, as a result of the corporate conversion, did not have any current
or prospective pension recipients who had previously served as members of the Management Board or
as managing directors. The total compensation of former Management Board members and their
beneficiaries, as well as the pension obligations to former Management Board members and their
beneficiaries, was thus €0. The same applies to the preceding 2016 fiscal year.
Compensation Plan for the Supervisory BoardThe compensation for members of the Supervisory Board determined by the Annual Shareholders
Meeting is governed by Section 15 of the Articles of Association of Uniper SE. The objective of the
compensation plan is to strengthen the independence of the Supervisory Board as a governing body.
That is why—in addition to having their expenses reimbursed—the members of the Supervisory Board
also receive fixed compensation, as well as additional compensation for committee duties. Further-
more, in order to have the Supervisory Board participate in the long-term success of Uniper SE, a
component of 20% of the aforementioned compensation is converted into virtual shares of Uniper SE.
The Chairman of the Supervisory Board receives €210,000 in compensation, and the Chairman’s dep-
uties receive compensation of €140,000. Other Supervisory Board members receive €70,000 in com-
pensation. The Chairman of the Audit and Risk Committee receives an additional €70,000; members
of the Audit and Risk Committee receive an additional €35,000. Other committee chairs receive an ad-
ditional €35,000; other committee members receive an additional €15,000. Members serving on more
than one committee receive only the highest applicable committee compensation. The Chairman and
the Deputy Chairmen of the Supervisory Board receive no additional compensation for their commit-
tee duties. Supervisory Board members departing from the Supervisory Board during a fiscal year re-
ceive prorated compensation.
Supervisory Board members receive a component of 20% of the compensation described above in the
form of variable compensation. That compensation is granted as a future right to payment in the form
of virtual shares, with the aforementioned component being the target. The virtual shares are used
purely for calculation purposes and do not confer on the beneficiary any entitlements or shareholder
rights—particularly voting rights or dividend rights. To determine the number of virtual shares, the
variable compensation from the previous year is divided in January of each calendar year by the 60-
day average share price of Uniper SE from the last 60 trading days prior to January 1 of the current
year. The reference price for the variable compensation attributable to the 2016 fiscal year was the
price set at the opening auction on the first day of public trading. After four calendar years, the virtual
shares are multiplied by the trading-volume-weighted average share price of Uniper SE from the last
60 trading days prior to January 1 of the fourth calendar year and increased by the amount of divi-
dends paid to shareholders on each share of Uniper SE over the previous four years. The variable
compensation is paid within the first month after the end of the four-year period and is limited to
200% of the compensation described above (payout cap).

93
Deviating from the compensation plan as described above, 100% of the prorated compensation pay-
able for the year of departure is paid as fixed compensation. In the event of a departure, the payout
amount of as yet unpaid variable compensation for previous years is determined based on the plan as
described above. The last day of the month of departure is used to determine the applicable 60-day
average share price.
Mr. Scheidt and Dr. Teyssen departed from the Supervisory Board of Uniper SE effective June 8, 2017.
For the variable compensation for the 2016 fiscal year converted into virtual shares in January 2017,
an early payment is made.
A total of approximately €65,000 (2016: €13,000) was reimbursed to the Supervisory Board for
outlays.
Mr. Biniek and Mr. Seegatz also received further compensation for their Supervisory Board duties in
Uniper Group subsidiaries in the 2017 fiscal year. Mr. Biniek received approximately €2,000 (previous
year: €2,000) and Mr. Seegatz received approximately €6,000 (previous year: €4,000).
Supervisory Board compensation granted for the 2017 fiscal year totaled approximately €1.4 million.
Section 113 (2) AktG provides that only the Annual Shareholders Meeting can authorize compensation
for the members of the Company’s first Supervisory Board after its conversion into an SE on April 14,
2016. The resolution can only be adopted by the Annual Shareholders Meeting deciding on the dis-
charge of the members of the first Supervisory Board. For that reason, the Supervisory Board com-
pensation for 2016 was prorated for a period of approximately nine months and granted only in the
2017 fiscal year, in the amount of approximately €1.1 million. The difference from the total compensa-
tion of €1.0 million estimated and disclosed for the previous year on the basis of the compensation
policy thus amounts to €0.1 million.
Where in place, existing D&O insurance policies covering board member liabilities for their activities
as board members also cover the members of the Supervisory Board. In line with the German Corpo-
rate Governance Code’s recommendation, the policy includes a deductible of 10% of the respective
damage claim for Management Board and Supervisory Board members. The deductible has a maxi-
mum cumulative annual cap of 150% of a member’s annual fixed compensation.
No loans or advances were granted by Uniper SE to Supervisory Board members in the 2017 fiscal
year. In addition, no contingencies have been entered into for the benefit of Supervisory Board mem-
bers.

94Uniper
Annual Report 2017 Combined Management Report
Individual members of the Supervisory Board received the following compensation for the 2016 and
2017 fiscal years:
Supervisory Board Compensation for 2017 (€)
Members of the Supervisory Board
Annual compensation
Committee
compensationIncome
from subsidiaries Total for 2017Fixed Variable Fixed Variable
Dr. Bernhard Reutersberg 168,000 50,415 0 0 0 218,415
Harald Seegatz (Deputy Chairman since June 8, 2017) 87,759 26,336 12,121 3,637 5,980 135,833
Dr. Marc Spieker (Deputy Chairman since June 8, 2017) 87,759 26,336 24,241 7,275 0 145,611
Andreas Scheidt (until June 8, 2017) 60,986 1 0 0 0 0 60,986
Dr. Johannes Teyssen (until June 8, 2017) 60,986 1 0 0 0 0 60,986
Ingrid Åsander 56,000 16,805 0 0 0 72,805
Oliver Biniek 56,000 16,805 15,879 4,765 2,450 95,899
Jean-Francois Cirelli (since January 1, 2017) 56,000 16,805 11,145 3,345 0 87,295
David Charles Davies (since June 8, 2017) 31,759 9,531 31,759 9,531 0 82,580
Dr. Marion Helmes (since January 1, 2017) 56,000 16,805 26,005 7,804 0 106,614
Immo Schlepper (since June 8, 2017) 31,759 9,531 6,805 2,042 0 50,137
Barbara Jagodzinski 56,000 16,805 12,000 3,601 0 88,406
Andre Muilwijk 56,000 16,805 28,000 8,403 0 109,208
Rebecca Ranich (since January 1, 2017) 56,000 16,805 0 0 0 72,805
Total 921,008 239,784 167,955 50,403 8,430 1,387,580
1Because Mr. Scheidt and Dr. Teyssen departed from the Supervisory Board effective June 8, 2017, their compensation for the period from January 1, 2017, through June 8, 2017, is fully
paid out as fixed compensation. There is no conversion into virtual shares.
Supervisory Board Compensation for 2016 (€)
Members of the Supervisory Board
Annual compensation
Committee
compensationIncome
from subsidiaries Total for 2016Fixed Variable Fixed Variable
Dr. Bernhard Reutersberg 120,262 52,258 0 0 0 172,520
Harald Seegatz (Deputy Chairman since June 8, 2017) 40,087 17,419 18,590 8,078 4,257 88,431
Dr. Marc Spieker (Deputy Chairman since June 8, 2017) 40,087 17,419 37,180 16,156 0 110,842
Andreas Scheidt (until June 8, 2017) 80,175 34,839 0 0 0 115,014
Dr. Johannes Teyssen (until June 8, 2017) 80,175 34,839 0 0 0 115,014
Ingrid Åsander 40,087 17,419 0 0 0 57,506
Oliver Biniek 40,087 17,419 0 0 2,011 59,517
Karl-Heinz Feldmann (until December 31, 2016) 50,109 1 0 0 0 0 50,109
Barbara Jagodzinski 40,087 17,419 7,967 3,462 0 68,935
Andre Muilwijk 40,087 17,419 18,590 8,078 0 84,174
Michael Sen (until December 31, 2016) 50,109 1 0 9,959 1 0 0 60,068
Dr. Verena Volpert (until December 31, 2016) 50,109 1 0 23,238 1 0 0 73,347
Total 671,461 226,450 115,524 35,774 6,268 1,055,477
1Because Mr. Feldmann, Mr. Sen and Dr. Volpert had departed from the Supervisory Board effective December 31, 2016, their compensation for the period from April 14, 2016, through
December 31, 2016, was fully paid out as fixed compensation. There was no conversion into virtual shares.

95
The component of 20% of the Supervisory Board compensation determined for the 2017 fiscal year
was converted into virtual shares on the basis of a share price of €24.362 (60-day average of Uniper’s
share price from the last 60 trading days prior to January 1, 2018). For the 2016 fiscal year, the vari-
able component had been converted into virtual shares at a share price of €10.015.
The following table shows the number of virtual shares of the members of the Supervisory Board for
the compensation granted in the 2016 and 2017 fiscal years:
Number of Virtual Shares
Members of the Supervisory Board
Converted in January 2018 as
part of compensation for 2017
Converted in January 2017 as
part of compensation for 2016 Total
Paid out through
January 2018
Dr. Bernhard Reutersberg 1,724 3,002 4,726 0
Harald Seegatz (Deputy Chairman since June 8, 2017) 1,025 1,465 2,490 0
Dr. Marc Spieker (Deputy Chairman since June 8, 2017) 1,149 1,929 3,078 0
Andreas Scheidt (until June 8, 2017) - 2,001 2,001 2,001
Dr. Johannes Teyssen (until June 8, 2017) - 2,001 2,001 2,001
Ingrid Åsander 575 1,001 1,576 0
Oliver Biniek 738 1,001 1,739 0
Jean-Francois Cirelli (since January 1, 2017) 689 - 689 0
David Charles Davies (since June 8, 2017) 652 - 652 0
Karl-Heinz Feldmann (until December 31, 2016) - - 0 0
Dr. Marion Helmes (since January 1, 2017) 842 - 842 0
Immo Schlepper (since June 8, 2017) 396 - 396 0
Barbara Jagodzinski 698 1,200 1,898 0
Andre Muilwijk 862 1,465 2,327 0
Rebecca Ranich (since January 1, 2017) 575 - 575 0
Michael Sen (until December 31, 2016) - - 0 0
Dr. Verena Volpert (until December 31, 2016) - - 0 0
Total 9,925 15,065 24,990 4,002

96Uniper
Annual Report 2017 Combined Separate Non-Financial Report
Combined Separate Non-Financial Report
Introduction
This Combined Separate Non-Financial Report (CNFR) complies with the reporting requirements of the
German CSR Directive Implementation Act and the German Commercial Code (§§ 289b section 3 and
315b section 3). The disclosures made in this CNFR apply equally to Uniper SE as a group and parent
company, unless stated otherwise in the report.
The framework of the Global Reporting Initiative (GRI) was used to prepare the CNFR. This CNFR refer-
ences the GRI Standard 103: Management Approach related to recommendations and guidance set for
the Standards 103-1 and 103-2.
Further information is contained in other chapters of the Combined Management Report. To avoid re-
dundancies, the CNFR refers the reader to these chapters and, where necessary, provides additional
information. Key non-financial performance indicators that are relevant for management purposes are
disclosed in the respective chapter of the Combined Management Report. They are supplemented in
this CNFR by further relevant non-financial performance indicators for the aspects and issues that
were identified as material. Uniper’s business model is described in detail in the Corporate Profile
chapter of the Combined Management Report.
This CNFR is specifically intended for analysts, investors and regulators. After the release of the CNFR,
additional information will be made available on Uniper’s sustainability website, including figures
based on Global Reporting Initiative standards and details on the Group’s sustainability strategy. Any
link to information on the sustainability website is not considered to be part of the CNFR.
Material Topics and Risks
By law, aspects of Uniper’s business model are material for the CNFR if they potentially have a signifi-
cant impact on Uniper and third parties and if they are relevant for understanding the Group’s current
and future development. Consequently, the CNFR includes information on the five mandatory aspects
defined in the §§ 289c and 315c of the German Commercial Code:
• environmental matters
• employee matters
• social matters
• human rights and
• anti-corruption and anti-bribery.
The Group defined Uniper-specific aspects from its 2017 materiality assessment and aligned them
with the German Commercial Code’s five mandatory reporting matters. Uniper’s materiality assess-
ment is based on the significance of the Group’s economic, environmental and social impacts as well
as their substantive influence on stakeholders’ assessments and decisions, i.e. if they are relevant for
understanding the Group’s current and future development.
Uniper considers a combination of internal and external factors to assess whether a topic is material
from the perspective of employees, senior managers, customers, non-governmental organizations, in-
dustry partners, as well as current and potential institutional investors.
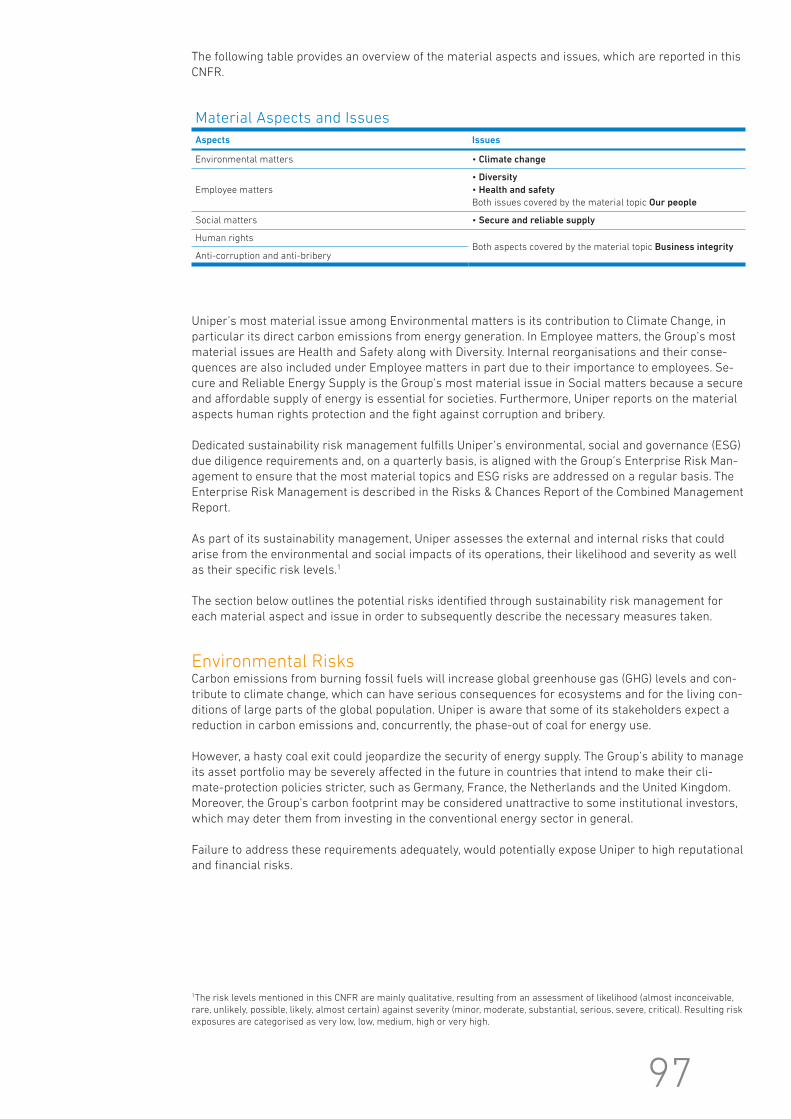
97
The following table provides an overview of the material aspects and issues, which are reported in this
CNFR.
Uniper’s most material issue among Environmental matters is its contribution to Climate Change, in
particular its direct carbon emissions from energy generation. In Employee matters, the Group’s most
material issues are Health and Safety along with Diversity. Internal reorganisations and their conse-
quences are also included under Employee matters in part due to their importance to employees. Se-
cure and Reliable Energy Supply is the Group’s most material issue in Social matters because a secure
and affordable supply of energy is essential for societies. Furthermore, Uniper reports on the material
aspects human rights protection and the fight against corruption and bribery.
Dedicated sustainability risk management fulfills Uniper’s environmental, social and governance (ESG)
due diligence requirements and, on a quarterly basis, is aligned with the Group’s Enterprise Risk Man-
agement to ensure that the most material topics and ESG risks are addressed on a regular basis. The
Enterprise Risk Management is described in the Risks & Chances Report of the Combined Management
Report.
As part of its sustainability management, Uniper assesses the external and internal risks that could
arise from the environmental and social impacts of its operations, their likelihood and severity as well
as their specific risk levels.1
The section below outlines the potential risks identified through sustainability risk management for
each material aspect and issue in order to subsequently describe the necessary measures taken.
Environmental RisksCarbon emissions from burning fossil fuels will increase global greenhouse gas (GHG) levels and con-
tribute to climate change, which can have serious consequences for ecosystems and for the living con-
ditions of large parts of the global population. Uniper is aware that some of its stakeholders expect a
reduction in carbon emissions and, concurrently, the phase-out of coal for energy use.
However, a hasty coal exit could jeopardize the security of energy supply. The Group’s ability to manage
its asset portfolio may be severely affected in the future in countries that intend to make their cli-
mate-protection policies stricter, such as Germany, France, the Netherlands and the United Kingdom.
Moreover, the Group’s carbon footprint may be considered unattractive to some institutional investors,
which may deter them from investing in the conventional energy sector in general.
Failure to address these requirements adequately, would potentially expose Uniper to high reputational
and financial risks.
Material Aspects and Issues
Aspects Issues
Environmental matters • Climate change
Employee matters
• Diversity
• Health and safety
Both issues covered by the material topic Our people
Social matters • Secure and reliable supply
Human rightsBoth aspects covered by the material topic Business integrity
Anti-corruption and anti-bribery
1The risk levels mentioned in this CNFR are mainly qualitative, resulting from an assessment of likelihood (almost inconceivable,
rare, unlikely, possible, likely, almost certain) against severity (minor, moderate, substantial, serious, severe, critical). Resulting risk
exposures are categorised as very low, low, medium, high or very high.

98Uniper
Annual Report 2017 Combined Separate Non-Financial Report
Employee-related RisksNecessary restructuring and cost-reduction measures were introduced in Uniper in 2016 and 2017 in
response to increasing challenges. This particularly affected the workforce based in Germany, Sweden,
the United Kingdom, the Netherlands and Russia, resulting in the loss of some experienced human
capital and an increased sense of uncertainty for many employees. Employee figures as at 31 Decem-
ber 2017 are disclosed in the Non-Financial Performance Indicators of the Combined Management Re-
port on page 49.
Planned plant decommissioning and the entry into force of national coal phase-out policies may affect
employment in Uniper. Furthermore, Uniper could face a potential long-term risk if it fails to meet the
challenges of an aging workforce and does not offset this by fostering diversity. A diverse workforce
can make a company more resilient, as it promotes an innovative and creative corporate culture, which
is particularly important during transition periods.
Stressful situations and unsafe work habits in complex environments such as power plants and gas
storage facilities could lead to injuries, serious accidents and fatalities. Accidents could involve the
public near Uniper facilities as well. Group-wide programs and policies that are adapted to differences
in the safety practices of countries where Uniper operates, are in place. They are designed to provide a
safe and healthy workplace, both for employees and contractors, particularly those involved in high-
risk activities of plant decommissioning and demolition underway in Germany, Sweden, the Nether-
lands and the United Kingdom.
Social RisksA secure and reliable supply of energy is essential for the functioning of society. Unplanned asset un-
availability and supply bottlenecks can threaten grid stability and severely disrupt supply security in
several regions of Europe and Russia resulting in high potential risks. A history of significant or fre-
quent interruptions of these essential services could reduce the Group’s competitiveness, jeopardize
the functioning of crucial infrastructure, and cause economic and social damage.
Uniper’s long-term gas procurement contracts, natural gas storage facilities, global gas trading activi-
ties and capacities for the regasification of liquefied natural gas (LNG) play an important role in ensur-
ing supply security, especially when demand fluctuates. Furthermore, Uniper’s flexible generation facil-
ities can respond quickly to fluctuations in renewables output, which is important for grid stability and
supply security in several regions of Germany and elsewhere.
More than one billion people worldwide currently do not have electricity. Many communities in emerg-
ing countries still lack sufficient access to basic energy services. This represents an opportunity for en-
ergy providers such as Uniper to help ensure an affordable and secure supply of energy and fuel to the
people in these communities.
Human-Rights-related RisksGenerally, cases of modern slavery, unlawful forced displacements, forced and child labor still exist in
countries with a history of insufficient standards for the protection of human rights. Furthermore, in-
stances of violence, inhumane and degrading treatment can occur in high-risk areas and in more sta-
ble countries that have authoritarian governments. From Uniper’s perspective, the occurrence of such
situations, which are an unwanted indirect consequence of business activities in such countries, may
adversely affect the safety and security of employees and contractors, particularly during travel. Al-
though rare, these medium-level risks may negatively affect the quality of operations and reduce confi-
dence towards Uniper and its business partners. It may also increase the chance of lawsuits, cause
project delays, incite social unrest, and, ultimately, harm the Group’s reputation.

99
Due to its sourcing and trading of coal and gas, Uniper’s business activities may have an indirect im-
pact on human-rights-related issues resulting in a medium risk exposure. Uniper also faces medium
level risks when providing engineering and energy services in areas such as the Middle East, Central
and South East Asia and North Africa. Failure to take adequate measures to prevent, monitor and miti-
gate these risks would significantly increase the risk potential.
Corruption and Bribery Risks Corruption and bribery promote crime and social inequality. Non-compliance with laws and company
policies aimed at combating corruption may lead to criminal and civil liability, not only of the persons
involved but also of the respective Group company, its directors and officers, and may potentially dam-
age Uniper’s reputation.
Uniper has business dealings with counterparties around the world, including those located in coun-
tries that rank low on Transparency International’s Corruption Perception Index (CPI). Failure to fulfill
the legal and regulatory requirements necessary to comply with the key anti-corruption rules would
likely lead to serious reputational, legal and financial impacts on the Group.
Governance and ESG Management
Uniper has put in place measures to control, minimize, and mitigate the risks mentioned in the previ-
ous section. Management actions taken and planned are also incorporated in Uniper’s governance
structure, responsibilities and relevant policies.
The Uniper SE Management Board bears overall responsibility for the identification and implementa-
tion of Group-wide measures. One of its members is appointed as Chief Sustainability Officer (CSO) and
periodically reports to the Supervisory Board on strategic sustainability activities. As Uniper’s highest
governance board, the Supervisory Board oversees the Group’s achievement of its sustainability obli-
gations and goals.
The Management Board assigns to the Health, Safety, Security and Environment (HSSE) & Sustainabili-
ty function the responsibility for defining ESG targets and key performance indicators and for design-
ing Group-wide measures for the material aspects. On a regular basis, the HSSE & Sustainability func-
tion identifies ESG risks and emerging issues that could affect Uniper. Based on the annual materiality
analysis, it undertakes sustainability-related tasks, such as analysing the Group’s carbon footprint,
raising awareness of human rights due diligence and carrying out ESG impact assessments.
Uniper’s functional units and subsidiaries have a responsibility to implement annual HSSE & Sustain-
ability Improvement Plans to help meet the Group’s overall objectives in areas of HSSE & Sustainability.
Employee involvement is essential for achieving a robust sustainability culture, HSSE & Sustainability
involves all levels of leadership on at least a quarterly basis and engages regularly with the Group
Works Council through the Consultative Council, a cross-functional committee.
Uniper functions that are responsible for addressing key material aspects – such as Legal & Compli-
ance for anti-corruption and anti-bribery, Human Resources for Diversity, and Asset Operations for se-
cure and reliable energy supply – communicate with HSSE & Sustainability on a more frequent basis.
In November 2017, the HSSE & Sustainability Policy Statement defining Uniper’s ambitions and priori-
ties for HSSE and sustainability was signed by all members of the Board of Management. This state-
ment provides the framework for developing Group-wide Sustainability Strategic Plans (SSPs), which
are approved by the Management Board, and to evaluate their effectiveness.

100Uniper
Annual Report 2017 Combined Separate Non-Financial Report
The SSPs describe how sustainability supports the Group’s long-term business strategy and propose
improvement targets for its ESG performance. The material ESG issues provide the framework for me-
dium-term target-setting, annual progress reviews, and specific action plans in alignment with select-
ed UN Sustainable Development Goals (SDGs), which are shown in the table below.
Uniper aims to build on its potential for business growth and resilience, characterised by strong stake-
holder support and active management to minimise the main negative environmental and social im-
pacts caused by its operations and business models. The first SSP, which will be published by end of
the second quarter of 2018, will be built around a set of long-term commitments that reflect core ele-
ments of Uniper’s corporate culture and business strategy.
Uniper’s business strategy aims for the Group to be highly skilled at managing complexity and tailoring
energy solutions for customers in a responsible, environmentally and socially aware way. It is commit-
ted to deploying its services and products where they are most needed, operating in a transparent way
for its customers, employees and the communities it impacts, directly and indirectly.
Uniper Sustainability Commitments
Aspects pursuant to Section
289c and 315c of the German
Commercial Code Uniper-specific issues Relevant SDGs Uniper commitments
Environmental matters • Climate change
• Promote lower carbon fuels like gas and LNG
worldwide
• Develop CO2 utilization business models to
reduce overall CO2 emissions
• Promote less carbon intensive power gener-
ation technology
• Monitor and optimise CO2 intensity of Europe-
an Generation portfolio
• Promote waste reduction, soil-pollution pre-
vention and responsible mining
Employee matters
• Diversity
• Health and safety
Both issues covered by the
material topic Our people
• Have zero tolerance of discrimination on the
basis of gender, ethnic background or any oth-
er diversity-related factors.
• Foster and deliver equal opportunity, enhanc-
ing diversity promotion in leadership positions
• Protect labour rights and ensure safe and se-
cure work environments for all employees
and contractors; promote the same standards
in our partnerships and business ventures
Social matters • Secure and reliable supply
• Enter markets in developing and emerging
countries responsibly.
• Foster established and new flexible genera-
tion solutions to enable a safe transition to-
ward renewables worldwide
Human rights
Both aspects covered by the
material topic Business integrity
• Have zero tolerance of forced labour, child
labour, modern slavery, human trafficking
Anti-corruption and
anti-bribery
• Continue to strengthen the Group’s compli-
ance culture and protect the business from
corruption risks
• Foster the development of effective, account-
able and transparent institutions at all levels

101
PoliciesUniper has in place policies related to its material ESG topics, which are implemented throughout the
Group and monitored regularly. Furthermore, the Code of Conduct addresses a wide range of issues,
including compliance issues such as combating corruption and bribery as well as human rights issues.
The policies and the Code of Conduct are readily available to all employees. The policies stipulate how
the Group addresses its material sustainability issues and how it coordinates the cascade effects
across the organization.
The Sustainability Management Policy delineates the responsibilities for sustainability management
that are assigned to the Management Board, the Supervisory Board, senior management and various
functions. It also outlines how Uniper will manage its ESG risks and SSP.
The Code of Conduct is binding for all employees and defines the basic principles of conduct that ev-
eryone at Uniper must follow. It is founded on a commitment to one another, to the business and com-
munities. Although third parties are not subject to the Code of Conduct, the Group strives to work,
whenever possible, with third parties that have comparable principles to Uniper. The Group also re-
quires its suppliers to observe all principles of the Uniper Supplier Code of Conduct.
Uniper plans to introduce a new Know-Your-Counterparty Business Policy in February 2018 to enhance
its existing processes for the identification and reporting of the main compliance risks potentially
caused by new counterparties. The purpose of the policy is to uncover counterparty-related risks (such
as corruption, money laundering, and terrorism financing) before entering into a binding business rela-
tionship. In 2017 the process mainly focused on counterparties of Uniper Global Commodities, resulting
in 304 newly approved counterparties and one rejected.
In parallel, the HSSE & Sustainability Know-Your-Counterparty Business Directive will establish a
Group-wide sub-process for identifying and reporting the main ESG risks of all new potential counter-
parties, intermediaries and business partners. Its purpose is to uncover potential problems (such as
human rights, environmental, and social risks) before any business deals are finalised. In 2017 specific
sustainability-related assessments were undertaken for proposed projects in Spain and Pakistan.
Environmental Matters
Uniper’s awareness of its environmental impacts is strategically important as the environmental per-
formance of its assets significantly affects the Group’s operating efficiency, market position, and local
perception. Uniper ensures that it complies with all applicable laws to prevent uncontrolled emissions
to the air, water, and soil to retain its license to operate. Efforts that go beyond compliance are evaluat-
ed on a cost-benefit basis and coordinated centrally with the aim of having a generally low exposure to
operational and legal risks.
To mitigate environmental risks, the HSSE & Sustainability function at Uniper Group Management de-
fines and implements dedicated management systems. The majority of Uniper’s facilities have environ-
mental management systems (EMS) certified to ISO 14001, the internationally recognised standard for
environmental management. In 2017 many of these facilities were certified to the most recent and
more stringent version of this standard (ISO 14001: 2015), which has made the Group’s EMS more ro-
bust.
At year-end 2017, 88% of Uniper’s fully consolidated industrial facilities were certified to ISO 14001, an
increase from 83% at year-end 2016. In 2017, additional power plants in Germany located in Wilhelm-
shaven/Huntorf, Irsching (units 3, 4, and 5) and Kirchmöser, as well as the support functions at the
head office in Düsseldorf, were certified to ISO 14001:2015. The Group plans to obtain ISO14001 certifi-
cation for its remaining plants in Germany in 2018. All Uniper’s fully consolidated industrial facilities in
other countries (France, the Netherlands, Hungary, Russia, Sweden, and the United Kingdom) are certi-
fied to ISO 14001. In addition, the energy management systems of all Uniper fossil-fuelled plants in
Germany were recertified to ISO 50001 in 2017.

102Uniper
Annual Report 2017 Combined Separate Non-Financial Report
Through ISO14001 certified EMS, Uniper aims to prevent incidents that could have an adverse impact
on the environment. Uniper investigates all significant environmental near-hits and all incidents, learns
from them, and takes steps to prevent them from recurring. It also systematically shares knowledge
about previous incidents – at Uniper and across the industry – so that they are not repeated. In 2017,
Uniper had no severe environmental incidents, which are defined as ‘the release of a substance to the
soil, water, or air that would result in a long-term or irreversible change in the biological or physical
environment or an extensive loss of habitats or species’.
Uniper monitors legislative processes that could result in changes to the environmental compliance re-
quirements where it operates. In 2017 the European Union adopted the updated Best Available Tech-
niques Reference (BREF) document, a new set of emission standards that conventional power plants
must meet by 2021 unless they obtain a formal derogation. To comply with BREF, the Group may need
to invest in more advanced emissions-monitoring systems for some plants. However, an impact as-
sessment Uniper carried out in the third quarter of 2017 indicated that the majority of its conventional
power plants will meet BREF emission thresholds. As country-specific rules may significantly affect
the final assessments, Uniper launched a cross-departmental project to manage the implementation of
BREF across its generation business in Europe.
Climate ChangeUniper considers that the transition to a low-carbon energy system needs to move forward in a respon-
sible manner. Uniper’s ongoing dialogue with analysts, policymakers and the media, on its role in the
energy transition, helps to reduce its reputational risk by emphasising the contribution that convention-
al power plants continue to make towards a secure and reliable power supply and grid stability.
Upstream, the Group sold its stake in Yuzhno-Russkoye, a gas field in Russia, in 2017 and has no plans
to own directly any stakes in gas exploration and production or to invest directly in coal-mining opera-
tions.
In 2017 the Group specifically communicated that it has no intention to invest in any new coal-fired
power plants of its own after the commissioning of its 1.1 GW coal-fired power plant in Datteln, Germa-
ny. Datteln power plant is not operational yet and commissioning is not planned before the fourth quar-
ter of 2018. For the years ahead, the Group has prioritised gas and gas-based solutions and is planning
to expand its global gas and LNG third-party trading. The current physical coal sourcing and trading ca-
pabilities will also be enhanced through partnerships to provide market access and logistic support for
thermal and metallurgical coal producers worldwide. Such business developments will gradually shift
Uniper from direct to indirect carbon-footprint accountability. From an operational point of view, strict
standards in Uniper’s natural gas transport and storage business represent an opportunity to minimise
fugitive GHG emissions and thus maintain a low exposure to risks of uncontrolled methane emissions.
Uniper closely monitors developments at the Task Force on Climate-related Financial Disclosures
(TCFD), which plans to design a framework for voluntary, consistent climate-related financial risk dis-
closures that companies can use to provide information to their investors and stakeholders. Uniper will
continue to assess whether the framework can add value to the future development of climate-related
risk disclosures and financial reporting.

103
In 2017 Uniper’s direct carbon emissions from the combustion of fossil fuels for power and heat gener-
ation declined to 63.3 million metric tonnes (2016: 73.6 million metric tonnes), mainly because of re-
duced generation in Russia and Germany, the closure of units 1 and 2 at Maasvlakte power station in
the Netherlands and the increased use of gas rather than coal in the United Kingdom. Indirect Scope 2
and Scope 3 emissions will be published on Uniper’s sustainability website.
As part of the Group’s contribution to help ensure security of supply for Europe’s transition to a
low-carbon future, Uniper recognises the importance of low carbon power production from nuclear and
hydro assets, as well as the need to monitor and optimise the carbon intensity of its own generation
portfolio in the future. Uniper commits to developing and publishing measurable targets for the CO2 in-
tensity of its own European Generation which also consider regulatory and economic developments as
far as possible.
Uniper invests in pilot projects to become a more flexible business and to foster the research, develop-
ment, and deployment of technologies that support the transition to a low-carbon future as described
in the Technology and Innovation chapter on pages 17 and 18 of the Combined Management Report.
In June 2017, the development of the Rotterdam Opslag en Afvang Demonstratieproject (ROAD) Carbon
Capture, Transport and Storage (CCS) pilot project – deployed since 2010 on coal-fired power plants in
the Rotterdam port and industrial area – was terminated. Together with the other main partners, Uni-
per concluded that the uncertainty surrounding the Netherlands’ potential phase-out of coal-fired gen-
eration renders the project currently unviable. Moreover, it has been recognised that carbon dioxide
capture, storage and utilisation (CCSU) is a more sustainable way to design such complex projects, in-
cluding from a financial point of view. As part of this, Uniper began its presidency of CO2 Value Europe
in December 2017. This is a new European platform that brings stakeholders together along the car-
bon value chain and is dedicated to collaborating on responsible industrial deployment of CO2 utilisa-
tion on a broad scale to jointly develop the right business and policy framework for business solutions.
Direct CO2-Emissions from Fuel Combustion by Country
Million metric tons 2017 2016
France 5.1 4.3
Germany 16.9 19.6 1
Hungary 0.8 0.6
Netherlands 7.9 10.9
Russia 26.4 29.4
Sweden <0.01 0.2
United Kingdom 6.2 8.6
Total 63.3 73.6
Operational control approach taken. The data for all countries, except Russia was determined according to the EU Emissions Trading Scheme rules.1Figures for Germany include Kiel coal-fired power plant operated but not fully consolidated, which was not disclosed in the 2016 Sustainability
Report but figures are amended here to ensure comparable data.

104Uniper
Annual Report 2017 Combined Separate Non-Financial Report
Employee Matters
A significant employee matter in 2017 was the continuation of a comprehensive restructuring and
cost-saving program that led to numerous consultations and negotiations with employee representa-
tives (unions and works councils) to implement the programme in a socially responsible way. Agree-
ments for this purpose were concluded in the summer and autumn of 2017.
In parallel, to support Uniper’s business strategy of becoming more streamlined and competitive, the
Group’s long-term human resource (HR) activities focused mainly on capability management. In 2017
Uniper identified the critical capabilities needed to meet its future strategic objectives and anticipate
changes in its competitive environment. It will maintain and nurture these capabilities through a capa-
bility-based approach to hiring and developing people.
Uniper has placed a significant emphasis on building a stronger corporate culture, which it calls the
Uniper Way. It has three core elements and three corresponding guiding statements: leadership (grow
and empower people), teamwork (become one and simplify), and individual contribution (act as it was
your own company). The Uniper Way is brought to life by embedding it in leadership and business tools
that emphasise it in day-to-day interactions, fostering an agile and flexible organization combined with
leaner and cost efficient processes, supported by digitalisation. Several employee opinion surveys con-
ducted in 2017 confirm that the changes have been noticed by many employees.
Competitive compensation and fringe benefits are essential to today’s work environment. Employee
compensation includes variable components that give due regard to the Group’s performance, includ-
ing occupational health and safety, and reward individual employee performance. Uniper provides its
employees with other valuable contributions such as disability insurance and family coverage. Compa-
ny-funded benefits are supplemented by attractive retirement planning in some countries. This helps
employees to lay the foundation for their future financial security and that of their dependents, while at
the same time fostering employee retention.
By providing young people with vocational training for a wide variety of commercial and technical occu-
pations, with internships offering preparation for formal apprenticeships as well as through its gradu-
ate programme, Uniper is meeting the challenges of demographic change and a shortage of qualified
personnel. The standard of quality for vocational training remains high. Uniper had 236 apprentices
and 124 work-study students and interns in Germany as of 31 December, 2017, which represented
4.7% of its total workforce there. In addition, Uniper is committed to integrating persons with disabilities.

105
DiversityAs stated on page 76 in the chapter Diversity Concept of the Combined Management Report, in 2017
the Uniper Management Board decided to strengthen the topic of “diversity” within its internal compa-
ny culture by fostering diversity in all six areas (gender, nationality, ethnic background, religion or worl-
dview, disability, age, and sexual preference and identity) of the Corporate Charter of Diversity in Ger-
many, which Uniper signed in 2016.
In addition, Uniper raised its targets for women in leadership positions from 20% on the first level of
management below the Board of Management and from 22.5% on the second level to 25% for both the
first and second levels. Uniper intends to reach this target by June 2022 at the latest, primarily through
more diverse selection and recruitment procedures, mentoring, and flexible work arrangements for all
employees.
More information on Uniper’s compliance with Germany’s Law for the Equal Participation of Women
and Men in Leadership Positions in the Private Sector and the Public Sector can be found in the Corpo-
rate Governance Declaration on pages 74 to 76 of this report.
Health and SafetyMaintaining high health and safety (H&S) standards is essential for Uniper because it cares for its peo-
ple. Safety is also important to operate its facilities and enables it to avoid the additional cost of work
stoppages and lost time that result from accidents.
Uniper’s main safety metric for management purposes is Total Recordable Incidents Frequency (TRIF),
which measures the number of incidents per million hours of work. TRIF employee figures are reported
in section Health and Safety on page 49 of the Combined Management Report. Uniper had no fatal acci-
dents in 2017.
Combined TRIF, which includes the safety performance of contractors that work for Uniper, is reported
on Uniper’s sustainability website.
To achieve safety targets, Uniper expects each one of its managers, employees, and contractors to
comply with its high H&S standards. Uniper has processes in place to ensure that all incidents are re-
ported and investigated to a high standard and shared across the business to ensure cross fleet learn-
ing. Uniper also implements appropriate control measures where required. Onboarding agreements
with contractors include clauses obliging them to meet these standards. Uniper’s commitment to H&S
also extends to people who live near its facilities and to visitors.
The H&S management systems of all Uniper’s operating entities are certified to OHSAS 18001, the in-
ternationally recognised standard for H&S management. The HSSE & Sustainability function supports
the organisation and employees in integrating H&S standards into their strategic and operational plan-
ning, business decisions, and daily activities. It issues guidelines and policies, conducts workshops, and
coordinates the sharing of best practices. Based on the central Group-wide HSSE & Sustainability Im-
provement Plan, the operating entities design their own annual improvement plans, which include H&S
targets and improvement measures. Progress toward the targets is monitored regularly. These plans
help Uniper live up to its commitment to continually improve its H&S performance. To promote continu-
al improvement in employee health management, in 2017 Uniper engaged leaders in health workshops
and initiated local health action plans. In 2018 it plans to conduct a campaign to raise awareness of
mental health.

106Uniper
Annual Report 2017 Combined Separate Non-Financial Report
Social Matters
Uniper’s core business represents its main contribution to society. Uniper’s conventional generating
capacity, natural gas transport operations as well as the technical expertise and flexible energy ser-
vices the Group markets worldwide are essential for meeting people’s basic needs.
Uniper is a new company striving for the public’s trust and support. As such, it faces the challenge of
convincing people of its contribution to society. Uniper addresses this challenge by promoting fact-
based dialogue with relevant stakeholder groups.
The Corporate Communications & Governmental Relations function oversees Uniper’s stakeholder
management across the Group. Stakeholder engagement varies, ranging from dialogue with EU and
national policymakers and regulatory agencies to public forums for residents who live near Uniper
power plants. The purpose of these forums is to discuss and enable Uniper to learn more about local
stakeholder views and concerns.
Secure and Reliable Energy SupplyUniper maintains its commitment to providing a secure, affordable and reliable supply of power, gas,
and steam to its industrial and commercial customers in Europe and Russia. To manage the operating
risks of its generation assets, Uniper has an integrated Asset and HSSE management system that con-
forms with industry practices and has been in place since 2016.
Uniper’s key performance indicator for supply reliability is average asset availability. Uniper’s conven-
tional fleets in Europe and Russia had an average asset availability of 82.2% in 2017, slightly lower
than in 2016. The reduction is due to increased planned unavailability to conduct maintenance that will
help reduce unplanned unavailability in the future. Uniper reduced its unplanned unavailability from
9.2% in 2016 to 7.9% in 2017. A necessary maintenance outage was the main reason for lower avail-
ability in Hungary.
Uniper has employees with decades of experience in integrated, reliable, and tailor-made utility man-
agement. It now markets this experience in emerging and developing countries, providing operation
and maintenance (O&M) services for power plant operators as well as support for new energy infra-
structure projects. In 2017 Uniper concluded contracts to provide long-term O&M and related services
(training, procedures, processes, and engineering) in several emerging countries. These services will
enable customers’ power plants to meet high international standards for operational excellence, in-
cluding their HSSE performance.
Average Asset Availability by Country
Percentages 2017 2016
France 86.8 82.7
Germany 85.9 86.5
Hungary 85.4 95.7
Netherlands 78.3 81.8
Russia 78.5 77.0
Sweden 88.6 89.5
United Kingdom 81.8 86.3
Total 82.2 82.8
The figures shown for 2016 and 2017 are calculated using 100% - (breakdown unavailability + opportunity maintenance + planned outages). The 2016
Sustainability Report recorded figures using a different calculation, but they have been adjusted here to facilitate year-on-year comparison. Uniper
Group figures represent a volume-based weighted average.

107
Uniper expects that natural gas will become a more important fuel that could help Europe transition
toward a more diversified and low-carbon energy mix. Gas plays a key role in the security of the power
and heat supply. For example, Uniper’s technologically advanced gas-fired power plants can respond to
fluctuations in renewables output fast and flexibly. This enables them to ensure grid stability and a reli-
able energy supply when challenges arise.
Uniper procures natural gas from a variety of producers in several countries, mainly Russia, the Neth-
erlands and Germany. To provide European customers with more diversified gas supplies, additional
volumes from Azerbaijan’s gas fields are expected in the years ahead.
As stated in the chapter Long-Term Gas Supply Contracts on page 33 of the Combined Management
Report, in 2017 Uniper procured 406 TWh of gas via long-term contracts in 2017. In addition, Uniper
buys and sells gas on a forward and a spot basis at Europe’s trading venues. Uniper sold a total of
1,944.8 TWh of gas in 2017.
In addition to procuring pipeline gas, Uniper purchases LNG from Qatar and Algeria and, going forward,
North America. Uniper has long-term capacity bookings as well as participations in several LNG termi-
nals in Europe and in gas transmission pipelines. These include an LNG floating regasification terminal
in Italy, the OPAL natural gas pipeline in Germany and the Nord Stream projects in the Baltic Sea.
To further optimise its portfolio in a rapidly expanding downstream LNG market, Uniper chartered LNG
tankers in 2017. This enhances Uniper’s ability to operate in Asian markets, where flexible and afford-
able energy is in great demand and contributes to Uniper’s strategy of ‘diversification and global
growth’ in the commodities area.
Human Rights Protection
Uniper does business around the world, including countries where fragile institutions are not always
fully able to protect basic human rights. Because Uniper considers human rights violations unaccept-
able for any entity operating ethically and correctly, respect for human rights is embedded into its busi-
ness policies and procedures, ensuring that the Group does not benefit from breaches of human rights.
Uniper respects and supports human rights, including the prohibition against child and forced labour,
across its business activities, in accordance with the Universal Declaration of Human Rights.
The Uniper Code of Conduct states that the Group expects its business partners and suppliers to do the
same. Respecting human rights is part of the Group’s social responsibility. Consequently, Uniper is
committed to identifying, preventing, and monitoring any human-rights-related risks in its business op-
erations and within its sphere of influence.
At least on an annual basis, Uniper performs a world-wide assessment based on a combination of eco-
nomic and social indexes to map the potential country-specific issues (e.g. working conditions, violation
of political rights and civil liberties, as well as security threats) which may directly affect Uniper if new
business chances are pursued. The results of this assessment leads to different due diligence require-
ments and mitigation measures, particularly when negotiating with new counterparties operating in
medium or high risk countries.

108Uniper
Annual Report 2017 Combined Separate Non-Financial Report
For coal procurement, Uniper seeks to mitigate these risks by participating in Bettercoal, a not-for-
profit initiative established by a group of major European utilities committed to a more responsible coal
supply chain. In March 2017 Uniper joined a Bettercoal delegation for a stakeholder engagement cam-
paign in Bogota and in the Cesar mining region in Colombia. The purpose was to have all the major
coal-mining companies in the region participate in the Bettercoal Assessment Program. Thanks to this
campaign, it is expected that by the beginning of the second quarter of 2018, the vast majority of Co-
lombian thermal coal will come from Bettercoal Suppliers, enhancing Bettercoal’s role in supporting
the national peace-building and social development efforts.
From 2017, Uniper has held periodic discussions with several non-governmental organisations focused
on ESG topics, particularly on human rights issues, along the coal supply chain. This Group-wide cam-
paign to meet and talk with relevant international NGOs and local groups active in Europe started in
August 2017 with meetings with NGOs focused on addressing human rights violations in the Colombian
coal industry.
To promote an inclusive discussion, in December 2017 Uniper Benelux hosted in Rotterdam the annual
Dutch Dialogue on Coal, an event promoted by the Ministry of Foreign Affairs, the main utilities operat-
ing in Netherlands and the Port Authority. Colombia’s Deputy Ambassador to the Netherlands ended
the plenary session with an update on the peace process in Colombia and an outlook on the post-coal
era in the mining regions, calling for a collective effort to build peace in the country. Together with oth-
er concerned Bettercoal members, Uniper is working to encourage the reconciliation efforts in these
regions.
In 2018 Uniper is developing a new ESG Due Diligence procedure containing more rigorous checks on
potential significant adverse human rights and environmental impacts related to its suppliers and busi-
ness partners. This process will be developed in accordance with the UN Guiding Principles on Busi-
ness and Human Rights (2011) and the latest version of the OECD Due Diligence Guidance for Respon-
sible Supply Chains of Minerals from Conflict-Affected and High-Risk Areas (2016).

109
Anti-Corruption and Anti-Bribery
Engaging in any type of corruption, whether with public officials or in the private sector, is a breach of
the Uniper Code of Conduct. Employees are prohibited from offering, promising, or giving anything of
value (such as money, gifts, offers of employment, or other benefits) to gain business or to influence
any action or for any other advantage, especially to a public official. They are likewise prohibited from
doing so indirectly through a spouse, partner, relative, or friend.
Business relations with intermediaries (agents, brokers, advisors, representatives, and so forth) pose a
higher risk of corruption and bribery. Consequently, Uniper carries out all such relations in accordance
with Business Policy Intermediary Agreements to avoid the intermediary’s fee or commission being
used to make illegal payments on Uniper’s behalf.
If employees become aware of suspicious activities, they can report them directly to the Compliance
function or use an (anonymous) whistle-blower system. In the first quarter of the year 2017, Uniper in-
troduced quarterly compliance reporting. Its purpose is to monitor the performance of the Compliance
Monitoring System.
Three new cases of alleged corruption were reported internally at Uniper in 2017. Two of these were
closed and one is still pending. Because two cases reported in 2016 were still open, a total of three
cases of alleged corruption were pending at year-end 2017. All the cases were or are being investigat-
ed. As of October 2016, Uniper had conducted a Group-wide Compliance Risk Assessment (CRA) of all
business functions. Corruption was one risk area of the CRA. In 2017, the results were communicated
internally to the business functions, and appropriate reactive measures were taken.
The CRA’s findings were taken into consideration in the drafting of the new Code of Conduct that took
effect in October 2017. The new Code of Conduct explains corruption risks and provides hands-on guid-
ance for addressing them. It also introduces new rules for gifts and hospitality that reflect international
legal standards and take into consideration a variety of business situations. Additional materials en-
able employees to ensure that they understand the rules and to apply them on business situations. As
in previous years, continued Group-wide training which covers the Code of Conduct’s main principles
and how to apply them, was provided to employees again in December 2017. In addition, employees
who work in business functions exposed to a high risk of corruption received further training tailored
to their function’s particular type of exposure.

110Uniper
Annual Report 2017 Independent Auditor’s Report
INDEPENDENT AUDITOR'S REPORT
To Uniper SE, Düsseldorf
REPORT ON THE AUDIT OF THE CONSOLIDATED FINANCIAL STATEMENTS AND OF THE GROUP MANAGEMENT REPORT
Audit OpinionsWe have audited the consolidated financial statements of Uniper SE, Düsseldorf, and its subsidiaries
(the Group), which comprise the balance sheet as at 31 December 2017, the income statement, statement
of recognized income and expenses as part of equity, statement of cash flows and consolidated state-
ment of changes in equity for the financial year from 1 January to 31 December 2017, and notes to the
consolidated financial statements, including a summary of significant accounting policies. In addition,
we have audited the group management report of Uniper SE, which is combined with the Company’s
management report, for the financial year from 1 January to 31 December 2017. We have not audited
the content of those parts of the group management report listed in the “Other Information” section of
our auditor’s report in accordance with the German legal requirements.
In our opinion, on the basis of the knowledge obtained in the audit,
• the accompanying consolidated financial statements comply, in all material respects, with the IFRSs
as adopted by the EU, and the additional requirements of German commercial law pursuant to
§ [Article] 315e Abs. [paragraph] 1 HGB [Handelsgesetzbuch: German Commercial Code] and, in
compliance with these requirements, give a true and fair view of the assets, liabilities, and financial
position of the Group as at 31 December 2017, and of its financial performance for the financial
year from 1 January to 31 December 2017, and
• the accompanying group management report as a whole provides an appropriate view of the Group’s
position. In all material respects, this group management report is consistent with the consolidated
financial statements, complies with German legal requirements and appropriately presents the
opportunities and risks of future development. Our audit opinion on the group management report
does not cover the content of those parts of the group management report listed in the “Other In-
formation” section of our auditor’s report.
Pursuant to § 322 Abs. 3 Satz [sentence] 1 HGB, we declare that our audit has not led to any reserva-
tions relating to the legal compliance of the consolidated financial statements and of the group manage-
ment report.
Basis for the Audit OpinionsWe conducted our audit of the consolidated financial statements and of the group management report
in accordance with § 317 HGB and the EU Audit Regulation (No. 537/2014, referred to subsequently as
“EU Audit Regulation”) and in compliance with German Generally Accepted Standards for Financial
Statement Audits promulgated by the Institut der Wirtschaftsprüfer [Institute of Public Auditors in
Germany] (IDW). Our responsibilities under those requirements and principles are further described in
the “Auditor’s Responsibilities for the Audit of the Consolidated Financial Statements and of the Group
Management Report” section of our auditor’s report. We are independent of the group entities in accor-
dance with the requirements of European law and German commercial and professional law, and we
have fulfilled our other German professional responsibilities in accordance with these requirements.
In addition, in accordance with Article 10 (2) point (f) of the EU Audit Regulation, we declare that we
have not provided non-audit services prohibited under Article 5 (1) of the EU Audit Regulation. We be-
lieve that the audit evidence we have obtained is sufficient and appropriate to provide a basis for our
audit opinions on the consolidated financial statements and on the group management report.

111Uniper
Annual Report 2017 Independent Auditor’s Report
Key Audit Matters in the Audit of the Consolidated Financial StatementsKey audit matters are those matters that, in our professional judgment, were of most significance in our
audit of the consolidated financial statements for the financial year from 1 January to 31 December 2017.
These matters were addressed in the context of our audit of the consolidated financial statements as
a whole, and in forming our audit opinion thereon; we do not provide a separate audit opinion on these
matters.
In our view, the matters of most significance in our audit were as follows:
1 Energy trading
2 Recoverability of goodwill
3 Recoverability of power plants and gas storages
Our presentation of these key audit matters has been structured in each case as follows:
a Matter and issue
b Audit approach and findings
c Reference to further information
Hereinafter we present the key audit matters:
1 Energy trading
a Within the Uniper Group, a large number of physically settled and financially settled financial in-
struments are entered into by the subsidiary Uniper Global Commodities SE ("UGC") for the Group
companies, for the purpose of optimizing the power and gas portfolio on a centralized basis as well
as in order to safeguard the gas storage and transport infrastructure and to manage commodity
price risks efficiently. UGC trades on the spot and futures market for electricity, gas, coal, freight,
oil, LNG and emission rights on a number of stock exchanges and, additionally, on the over-the-
counter market for these purposes. These contracts represent derivative financial instruments in
accordance with IAS 39 that - irrespective of their accounting treatment - are measured on the
basis of prices quoted on futures markets or using valuation models. The derivative financial in-
struments are generally accounted for either at fair value through profit or loss (classified as held-
for-trading financial instruments) or as pending transactions if the underlying for the derivative
financial instrument will be received or delivered at a future date as part of the Company's own
expected purchase, sale or usage requirements ("own use exemption").
Financial instruments that are not recognized at market value due to the own use exemption are
combined into portfolios in keeping with the Group's risk management system and reviewed for
anticipated losses in accordance with IAS 37.
The accounting treatment for physically settled derivative financial instruments is determined with
the aid of UGC’s risk management system, which allocates these derivative financial instruments
to their corresponding purpose and therefore to the appropriate accounting treatment from a Group
perspective. Accordingly, physically settled derivative financial instruments that do not form part
of the Group's own expected purchase, sale or usage requirements and all financially settled deriva-
tive financial instruments are measured at fair value through profit or loss. The energy trading op-
erations are supported by energy trading systems. These systems handle the process chain from
the recording of trading transactions to the calculation and measurement of positions and the con-
firmation of trading transactions, as well as risk management. A booking structure in the individual
trading systems ensures that the transactions are classified correctly (own use vs. at fair value
through profit or loss). Compliance with the booking structure is monitored regularly.
In view of the high volume of trading and the complexity of accounting for derivatives in accordance
with IAS 39 and IFRS 13, respectively, and the accounting requirements for provisions for anticipated
losses in accordance with IAS 37, as well as its significant effects on the assets, liabilities, financial
position, and financial performance, this business area is of particular significance for the consoli-
dated financial statements and the conduct of our audit.

112Uniper
Annual Report 2017 Independent Auditor’s Report
b For the purposes of our audit, we first of all, in collaboration with our internal specialists from the
Corporate Treasury Solutions department, obtained an understanding of the trading strategies
within the Group and the related product streams, and evaluated the risk management strategy
implemented by the Group.
During our audit, among other things, we also assessed the appropriateness of the internal control
system established for the purpose of entering into and settling energy trading transactions, includ-
ing the trading systems used for this purpose. As part of our audit of the internal control system,
we also evaluated the effectiveness of the controls established by the Company on a sample basis.
Furthermore, we assessed the internal guidelines and requirements of the risk management
system, together with the responsibilities and procedures laid down for the purpose of monitoring
them and for ensuring that the trading data is up-to-date. We analyzed the methodology for deter-
mining the fair values of the derivative instruments with respect to compliance with IFRS 13 and
assessed the appropriateness of the market-based input factors and the underlying valuation mod-
els.
We verified the logic and integrity of the valuation models employed as well as the consideration
of contractual terms and conditions and assumptions. We reconciled observable input data with
externally available information. With respect to the accounting treatment of the derivatives in
accordance with IAS 39, we reproduced the application of the own use exemption for physically
settled derivative financial instruments using the process implemented within the Group and
assessed whether the own use exemption was applied correctly. In addition, we assessed the out-
come of the review of financial instruments that are not recognized at fair value due to the “own
use exemption” and assessed the need to recognize provisions for contingent losses in accordance
with IAS 37.
In our view, the accounting and measurement policies applied by the executive directors and the
methodology for accounting for energy trading transactions are appropriate overall.
c The Company's disclosures relating to energy trading and its effects on the consolidated financial
statements are contained in the notes to the consolidated financial statements in particular in
sections 28 and 29, as well as sections 2, 5, 7 and 8.
2 Recoverability of goodwill
a In the Company's consolidated financial statements, goodwill amounting in total to € 1.9 billion
(representing 4 % of total assets and 15 % of equity) is reported under the "Intangible assets" bal-
ance sheet item. Goodwill is tested for impairment by the Company once a year or when there are
indications of impairment to determine any possible need for write-downs. Impairment testing is
carried out at the level of the groups of cash-generating units to which the relevant goodwill has
been allocated. The carrying amount of the relevant cash-generating units, including goodwill, is
compared with the corresponding recoverable amount in the context of the impairment test. The
recoverable amount is generally calculated on the basis of value in use. The present value of the
future cash flows from the respective group of cash-generating units normally serves as the basis
of valuation. The present values are calculated using discounted cash flow models. For this pur-
pose, the adopted Group medium-term business plan forms the starting point, which is extrapolated
based on assumptions about long-term rates of growth. Expectations relating to future market
developments and assumptions about the development of macroeconomic factors are also taken
into account. The discount rate used is the weighted average cost of capital for the relevant group
of cash-generating units. The impairment test determined that no write-downs were necessary.
The outcome of this valuation exercise is dependent to a large extent on the estimates made by the
executive directors with respect to the future cash inflows from the respective group of cash-gener-
ating units, the discount rate used, the rate of growth and other assumptions, and is therefore
subject to considerable uncertainty. Against this background and due to the complex nature of the
valuation, this matter was of particular significance in the context of our audit.
113
b As part of our audit, we assessed the methodology employed for the purposes of performing the
impairment test, among other things. After matching the future cash inflows used for the calcula-
tion against the adopted Group medium-term business plan, we assessed the appropriateness of
the calculation, in particular by reconciling it with general and sector-specific market expectations.
We also assessed whether the basis for including the costs of Group functions was appropriate. In
the knowledge that even relatively small changes in the discount rate applied and the growth rate
used can have a material impact on the value of the entity calculated using this method, we focused
our testing in particular on the parameters used to determine the discount rate applied, and eval-
uated the measurement model. In order to reflect the uncertainty inherent in the projections, we
assessed the sensitivity analyses performed by the Company and carried out our own sensitivity
analyses with respect to those groups of cash-generating units with low headroom (recoverable
amount compared with the carrying amount). Taking into account the information available, we de-
termined that the carrying amounts of the respective cash-generating units, including the allocated
goodwill, were adequately covered by the discounted future net cash inflows.
Overall, the measurement inputs and assumptions used by the executive directors are in line with
our expectations and are also within the ranges considered by us to be reasonable.
c The Company's disclosures on goodwill are contained in note 14 of the notes to the consolidated
financial statements.
3 Recoverability of power plants and gas storages
a In the Company's consolidated financial statements, property, plant, and equipment amounting in
total to EUR 11.5 billion (representing 27 % of total assets and 90 % of equity) is reported. Most of
the carrying amount of the property, plant, and equipment relates to power stations and gas storage
facilities. The power stations and gas storage facilities are tested for impairment by the Company
whenever there are indications of impairment to determine any possible need for write-downs. In
the current financial year, especially the impairment test was carried out in light of the difference
between reported net assets and the market capitalization. The impairment test is performed at the
level of the cash-generating unit in accordance with IAS 36. The carrying amount of the relevant
cash-generating unit is compared with the corresponding recoverable amount for the purposes of
the impairment test. The recoverable amount is generally calculated on the basis of fair value less
costs of disposal. The present value of the future cash flows from the respective cash-generating
unit normally serves as the basis of measurement. The present values are calculated using dis-
counted cash flow models. The starting point is the adopted Group medium-term business plan.
Expectations relating to future market developments and assumptions about the development of
macroeconomic factors are also taken into account. The discount rate used is the weighted aver-
age cost of capital for the relevant cash-generating unit.
As a result of the impairment test impairment losses of € 342 million and reversals of write downs
totaling € 156 million were recognized mainly on power plants in Germany, France, the UK and the
Netherlands. Impairment losses at the gas storage facilities also totaled € 116 million.
The outcome of this valuation exercise is dependent to a large extent on the estimates made by
the executive directors with respect to the future cash inflows from the respective cash-generating
unit, the discount rate used, and other assumptions, and is therefore subject to considerable uncer-
tainty. Against this background and due to the complex nature of the valuation, this matter was of
particular significance in the context of our audit.
Uniper
Annual Report 2017 Independent Auditor’s Report

114Uniper
Annual Report 2017 Independent Auditor’s Report
b As part of our audit, we assessed the methodology employed for the purposes of performing the
impairment test, among other things. After matching the future cash inflows used for the calculation
against the adopted Group medium-term business plan, we assessed the appropriateness of the
calculation, in particular by reconciling it with general and sector-specific market expectations. In
the knowledge that even relatively small changes in the discount rate applied can have a material
impact on the respective recoverable amount calculated using this method, we focused our testing
in particular on the parameters used to determine the discount rate applied, and evaluated the
measurement model. We assessed the sensitivity analyses performed by the Company, in order to
reflect the uncertainty inherent in the projections.
Overall, the measurement inputs and assumptions used by the executive directors are in line with
our expectations and are also within the ranges considered by us to be reasonable.
c The Company's disclosures on property, plant, and equipment and on impairment testing are con-
tained in note 14 of the notes to the consolidated financial statements.
Other Information The executive directors are responsible for the other information. The other information comprises the
following non-audited parts of the group management report:
• the statement on corporate governance pursuant to § 289f HGB and § 315d HGB included in section
“Corporate Governance Report” of the group management report
• the separate non-financial report pursuant to § 289b Abs. 3 HGB and § 315b Abs. 3 HGB
The other information comprises further the remaining parts of the annual report – excluding cross-ref-
erences to external information – with the exception of the audited consolidated financial statements,
the audited group management report and our auditor’s report.
Our audit opinions on the consolidated financial statements and on the group management report do
not cover the other information, and consequently we do not express an audit opinion or any other form
of assurance conclusion thereon.
In connection with our audit, our responsibility is to read the other information and, in so doing, to con-
sider whether the other information
• is materially inconsistent with the consolidated financial statements, with the group management
report or our knowledge obtained in the audit, or
• otherwise appears to be materially misstated.
115
Responsibilities of the Executive Directors and the Supervisory Board for the Consolidated Financial Statements and the Group Management ReportThe executive directors are responsible for the preparation of the consolidated financial statements
that comply, in all material respects, with IFRSs as adopted by the EU and the additional requirements
of German commercial law pursuant to § 315e Abs. 1 HGB and that the consolidated financial state-
ments, in compliance with these requirements, give a true and fair view of the assets, liabilities, financial
position, and financial performance of the Group. In addition the executive directors are responsible
for such internal control as they have determined necessary to enable the preparation of consolidated
financial statements that are free from material misstatement, whether due to fraud or error.
In preparing the consolidated financial statements, the executive directors are responsible for assess-
ing the Group’s ability to continue as a going concern. They also have the responsibility for disclosing,
as applicable, matters related to going concern. In addition, they are responsible for financial reporting
based on the going concern basis of accounting unless there is an intention to liquidate the Group or to
cease operations, or there is no realistic alternative but to do so.
Furthermore, the executive directors are responsible for the preparation of the group management re-
port that, as a whole, provides an appropriate view of the Group’s position and is, in all material respects,
consistent with the consolidated financial statements, complies with German legal requirements, and
appropriately presents the opportunities and risks of future development. In addition, the executive direc-
tors are responsible for such arrangements and measures (systems) as they have considered necessary
to enable the preparation of a group management report that is in accordance with the applicable
German legal requirements, and to be able to provide sufficient appropriate evidence for the assertions
in the group management report.
The supervisory board is responsible for overseeing the Group’s financial reporting process for the
preparation of the consolidated financial statements and of the group management report.
Auditor’s Responsibilities for the Audit of the Consolidated Financial Statements and of the Group Management Report
Our objectives are to obtain reasonable assurance about whether the consolidated financial statements
as a whole are free from material misstatement, whether due to fraud or error, and whether the group
management report as a whole provides an appropriate view of the Group’s position and, in all material
respects, is consistent with the consolidated financial statements and the knowledge obtained in the
audit, complies with the German legal requirements and appropriately presents the opportunities and
risks of future development, as well as to issue an auditor’s report that includes our audit opinions on
the consolidated financial statements and on the group management report.
Reasonable assurance is a high level of assurance, but is not a guarantee that an audit conducted in
accordance with § 317 HGB and the EU Audit Regulation and in compliance with German Generally
Accepted Standards for Financial Statement Audits promulgated by the Institut der Wirtschaftsprüfer
(IDW) will always detect a material misstatement. Misstatements can arise from fraud or error and are
considered material if, individually or in the aggregate, they could reasonably be expected to influence
the economic decisions of users taken on the basis of these consolidated financial statements and this
group management report.
Uniper
Annual Report 2017 Independent Auditor’s Report
116Uniper
Annual Report 2017 Independent Auditor’s Report
We exercise professional judgment and maintain professional skepticism throughout the audit. We also:
• Identify and assess the risks of material misstatement of the consolidated financial statements and
of the group management report, whether due to fraud or error, design and perform audit proce-
dures responsive to those risks, and obtain audit evidence that is sufficient and appropriate to
provide a basis for our audit opinions. The risk of not detecting a material misstatement resulting
from fraud is higher than for one resulting from error, as fraud may involve collusion, forgery, inten-
tional omissions, misrepresentations, or the override of internal control.
• Obtain an understanding of internal control relevant to the audit of the consolidated financial state-
ments and of arrangements and measures (systems) relevant to the audit of the group management
report in order to design audit procedures that are appropriate in the circumstances, but not for
the purpose of expressing an audit opinion on the effectiveness of these systems.
• Evaluate the appropriateness of accounting policies used by the executive directors and the reason-
ableness of estimates made by the executive directors and related disclosures.
• Conclude on the appropriateness of the executive directors’ use of the going concern basis of ac-
counting and, based on the audit evidence obtained, whether a material uncertainty exists related
to events or conditions that may cast significant doubt on the Group’s ability to continue as a going
concern. If we conclude that a material uncertainty exists, we are required to draw attention in the
auditor’s report to the related disclosures in the consolidated financial statements and in the group
management report or, if such disclosures are inadequate, to modify our respective audit opinions.
Our conclusions are based on the audit evidence obtained up to the date of our auditor’s report.
However, future events or conditions may cause the Group to cease to be able to continue as a going
concern.
• Evaluate the overall presentation, structure and content of the consolidated financial statements,
including the disclosures, and whether the consolidated financial statements present the underlying
transactions and events in a manner that the consolidated financial statements give a true and fair
view of the assets, liabilities, financial position and financial performance of the Group in compliance
with IFRSs as adopted by the EU and the additional requirements of German commercial law pursu-
ant to § 315e Abs. 1 HGB.
• Obtain sufficient appropriate audit evidence regarding the financial information of the entities or
business activities within the Group to express audit opinions on the consolidated financial state-
ments and on the group management report. We are responsible for the direction, supervision and
performance of the group audit. We remain solely responsible for our audit opinions.
• Evaluate the consistency of the group management report with the consolidated financial state-
ments, its conformity with German law, and the view of the Group’s position it provides.
• Perform audit procedures on the prospective information presented by the executive directors in
the group management report. On the basis of sufficient appropriate audit evidence we evaluate,
in particular, the significant assumptions used by the executive directors as a basis for the prospec-
tive information, and evaluate the proper derivation of the prospective information from these
assumptions. We do not express a separate audit opinion on the prospective information and on the
assumptions used as a basis. There is a substantial unavoidable risk that future events will differ
materially from the prospective information.

117
We communicate with those charged with governance regarding, among other matters, the planned
scope and timing of the audit and significant audit findings, including any significant deficiencies in
internal control that we identify during our audit.
We also provide those charged with governance with a statement that we have complied with the rele-
vant independence requirements, and communicate with them all relationships and other matters that
may reasonably be thought to bear on our independence, and where applicable, the related safeguards.
From the matters communicated with those charged with governance, we determine those matters
that were of most significance in the audit of the consolidated financial statements of the current period
and are therefore the key audit matters. We describe these matters in our auditor’s report unless law
or regulation precludes public disclosure about the matter.
OTHER LEGAL AND REGULATORY REQUIREMENTS
Further Information pursuant to Article 10 of the EU Audit RegulationWe were elected as group auditor by the annual general meeting on 8 June 2017. We were engaged by
the supervisory board on 4 July 2017. We have been the group auditor of Uniper SE, Düsseldorf, without
interruption since the Company first met the requirements as a public-interest entity within the mean-
ing of § 319a Abs. 1 Satz 1 HGB in the financial year 2016.
We declare that the audit opinions expressed in this auditor’s report are consistent with the additional
report to the audit committee pursuant to Article 11 of the EU Audit Regulation (long-form audit report).
GERMAN PUBLIC AUDITOR RESPONSIBLE FOR THE ENGAGEMENT
The German Public Auditor responsible for the engagement is Markus Dittmann.
Düsseldorf, 27 February 2018
PricewaterhouseCoopers GmbH
Wirtschaftsprüfungsgesellschaft
(sgd. Markus Dittmann) (sgd. Michael Servos)
Wirtschaftsprüfer Wirtschaftsprüfer
(German Public Auditor) (German Public Auditor)
Uniper
Annual Report 2017 Independent Auditor’s Report

118Uniper
Annual Report 2017 Consolidated Financial Statements
Sales including electricity and energy taxes 72,745 67,788
Electricity and energy taxes -507 -503
Sales (5) 72,238 67,285
Changes in inventories (finished goods and work in progress) -6 -43
Own work capitalized (6) 145 60
Other operating income (7) 9,999 7,477
Cost of materials (8) -69,479 -63,535
Personnel costs (11) -991 -1,179
Depreciation, amortization and impairment charges (14) -1,198 -4,135
Other operating expenses (7) -10,810 -10,004
Income from companies accounted for under the equity method 14 101
Income/loss before financial results and taxes -88 -3,973
Financial results (9) -42 -285
Net income/loss from equity investments -24 10
Income from other securities, interest and similar income 172 170
Interest and similar expenses -190 -465
Income taxes (10) -408 1,024
Net income/loss -538 -3,234
Attributable to shareholders of Uniper SE -656 -3,217
Attributable to non-controlling interests 118 -17
in €
Earnings per share (attributable to shareholders of Uniper SE)—basic and diluted (13)
from continuing operations -1.79 -8.79
from net loss/income -1.79 -8.79
Uniper SE and Subsidiaries Consolidated Statements of Income
€ in millions Note 2017 2016

119
Net income/loss -538 -3,234
Remeasurements of defined benefit plans 149 -240
Remeasurements of defined benefit plans of companies accounted for under the equity
method -1 –
Income taxes -47 109
Items that will not be reclassified subsequently to the income statement 101 -131
Cash flow hedges -11 -22
Unrealized changes -1 -10
Reclassification adjustments recognized in income -10 -12
Available-for-sale securities 159 240
Unrealized changes 171 240
Reclassification adjustments recognized in income -12 –
Currency translation adjustments 528 545
Unrealized changes -379 545
Reclassification adjustments recognized in income 907 –
Companies accounted for under the equity method -33 156
Unrealized changes -33 63
Reclassification adjustments recognized in income – 93
Income taxes -4 16
Items that might be reclassified subsequently to the income statement 639 935
Total income and expenses recognized directly in equity 740 804
Total recognized income and expenses (total comprehensive income) 202 -2,430
Attributable to shareholders of Uniper SE 127 -2,272
Attributable to non-controlling interests 75 -158
Uniper SE and Subsidiaries Consolidated Statements
of Recognized Income and Expenses
€ in millions 2017 2016

120Uniper
Annual Report 2017 Consolidated Financial Statements
Equity and Liabilities
Capital stock (19) 622 622
Additional paid-in capital (19) 10,825 10,825
Retained earnings (19) 3,399 4,156
Accumulated other comprehensive income (20) -2,699 -3,382
Equity attributable to shareholders of Uniper SE 12,147 12,221
Attributable to non-controlling interests (21) 642 582
Equity 12,789 12,803
Financial liabilities (24) 961 2,376
Operating liabilities (24) 3,618 3,993
Provisions for pensions and similar obligations (22) 676 785
Miscellaneous provisions (23) 6,068 6,517
Deferred tax liabilities (10) 390 1,601
Non-current liabilities 11,713 15,272
Financial liabilities (24) 962 494
Trade payables and other operating liabilities (24) 16,277 18,348
Income taxes (10) 55 188
Miscellaneous provisions (23) 1,362 1,766
Liabilities associated with assets held for sale 3 –
Current liabilities 18,659 20,796
Total equity and liabilities 43,161 48,871
Goodwill (14) 1,890 2,701
Intangible assets (14) 819 2,121
Property, plant and equipment 11,496 11,700
Companies accounted for under the equity method (15) 448 827
Other financial assets (15) 814 728
Equity investments 710 568
Non-current securities 104 160
Financial receivables and other financial assets (17) 3,308 3,054
Operating receivables and other operating assets (17) 3,206 3,857
Income tax assets (10) 6 6
Deferred tax assets (10) 890 2,205
Non-current assets 22,877 27,199
Inventories (16) 1,659 1,746
Financial receivables and other financial assets (17) 1,195 1,268
Trade receivables and other operating assets (17) 16,163 18,250
Income tax assets (10) 170 64
Liquid funds (18) 1,027 341
Securities and fixed-term deposits 64 162
Restricted cash and cash equivalents 112 10
Cash and cash equivalents 851 169
Assets held for sale 70 3
Current assets 20,284 21,672
Total assets 43,161 48,871
Uniper SE and Subsidiaries Consolidated Balance Sheets
€ in millions Note
December 31
2017 2016
Assets

121
1Additional information on the Statements of Cash Flows is provided in Note 27.2No material netting has taken place in either of the years presented here.3The transactions with the E.ON Group in 2016 mostly relate to payments arising from dividends and from profit-and-loss-pooling agreements and to
financing with the E.ON Group.4Cash and cash equivalents at the beginning of 2017 also include an amount of €21 million that had been attributable to the divested participation to
the russian gas field Yuzhno-Russkoye.
Uniper SE and Subsidiaries Consolidated Statements of Cash Flows 1
€ in millions 2017 2016
Net income/loss -538 -3,234
Depreciation, amortization and impairment of intangible assets and of property, plant and equipment 1,198 4,135
Changes in provisions -608 11
Changes in deferred taxes 309 -1,184
Other non-cash income and expenses -96 -298
Gain/loss on disposal of intangible assets and property, plant and equipment,
equity investments and securities (> 3 months) 865 -404
Intangible assets and property, plant and equipment -16 154
Equity investments 898 -558
Securities (> 3 months) -17 –
Changes in operating assets and liabilities and in income taxes 255 3,158
Inventories and Emissionsrights 184 191
Trade receivables 152 1,349
Other operating receivables and income tax assets 2,204 3,747
Trade payables -345 -420
Other operating liabilities and income taxes -1,940 -1,709
Cash provided by operating activities (operating cash flow) 1,385 2,184
Proceeds from disposal of 1,796 1,235
Intangible assets and property, plant and equipment 40 9
Equity investments 1,756 1,226
Purchases of investments in -843 -781
Intangible assets and property, plant and equipment -825 -713
Equity investments -18 -68
Cash payments in connection with disposals -66 –
Proceeds from disposal of securities (> 3 months) and of financial receivables and fixed-term deposits 951 790
Purchases of securities (> 3 months) and of financial receivables and fixed-term deposits -1,215 -1,561
Changes in restricted cash and cash equivalents -106 -11
Cash provided by investing activities 517 -328
Payments received/made from changes in capital 2 15 127
Transactions with the E.ON Group 3 – -2,738
Cash dividends paid to shareholders of Uniper SE -201 –
Cash dividends paid to other shareholders -35 -44
Proceeds from financial liabilities 23 1,662
Repayments of financial liabilities -931 -1,007
Cash used for financing activities -1,129 -2,000
Net increase in cash and cash equivalents 773 -144
Effect of foreign exchange rates on cash and cash equivalents -12 14
Cash and cash equivalents at the beginning of the year 4 169 299
Cash and cash equivalents of deconsolidated companies -79 –
Cash and cash equivalents of continuing operations at the end of the year 851 169
Supplementary Information on Cash Flows from Operating Activities
Income taxes paid (less refunds) -332 6
Interest paid -66 -262
Interest received 65 76
Dividends received 66 88

122Uniper
Annual Report 2017 Consolidated Financial Statements
Statement of Changes in Equity
€ in millions Capital stock
Additional
paid-in capital
Retained
earnings
Accumulated other comprehensive income
Currency trans-
lation adjust-
ments
Available-for-
sale securities
Cash flow hedg-
es
Balance as of January 1, 2016 0 0 18,684 -4,251 87 -59
Allocation of retained earnings in accor-
dance with legal structure 283 4,068 -4,351
Presentation of non-controlling interests
in accordance with legal structure -9,968 2,268 -46 31
Capital increase 7 120
Capital decrease
Dividends
Equity addition/reduction -3
Total comprehensive income -2,956 417 235 32
Net income/loss -3,217
Other comprehensive income 261 417 235 32
Remeasurements of defined benefit
plans 261
Changes in accumulated
other comprehensive income 417 235 32
Contribution of non-controlling interests
and corresponding capital increase 332 6,637 2,750 -2,152 48 8
Balance as of December 31, 2016 622 10,825 4,156 -3,718 324 12
Balance as of January 1, 2017 622 10,825 4,156 -3,718 324 12
Change in scope of consolidation
Capital increase
Capital decrease
Dividends -201
Total comprehensive income -556 527 164 -8
Net income/loss -656
Other comprehensive income 100 527 164 -8
Remeasurements of defined benefit
plans 100
Changes in accumulated
other comprehensive income 527 164 -8
Balance as of December 31, 2017 622 10,825 3,399 -3,191 488 4

123
Shares
attributable
to shareholders
of Uniper SE Non-controlling interests
Presentation of the non-con-
trolling interests attributable
to Uniper Beteiligungs GmbH
Total non-controlling inter-
ests Total
14,461 540 0 540 15,001
0 0 0
-7,715 7,715 7,715 0
127 11 145 156 283
0 0 0
0 -44 -44 -44
-3 -4 -4 -7
-2,272 75 -233 -158 -2,430
-3,217 -17 -17 -3,234
945 92 -233 -141 804
261 -1 -391 -392 -131
684 93 158 251 935
7,623 -7,623 -7,623 0
12,221 582 0 582 12,803
12,221 582 0 582 12,803
0 -1 -1 -1
0 22 22 22
0 -1 -1 -1
-201 -35 -35 -236
127 75 75 202
-656 118 118 -538
783 -43 -43 740
100 1 1 101
683 -44 -44 639
12,147 642 0 642 12,789

124Uniper
Annual Report 2017 Consolidated Financial Statements
(1) Basis of Presentation
The Consolidated Financial Statements of Uniper SE (“Uniper” or “the Group”) have been prepared in
accordance with Section 315e (1) of the German Commercial Code (“HGB”) and with those International
Financial Reporting Standards (“IFRS”) and IFRS Interpretations Committee interpretations (“IFRS IC”)
that were adopted by the European Commission for use in the EU as of the end of the fiscal year, and
whose application was mandatory as of December 31, 2017. Any changes in accounting policies that
may have arisen compared with the previous year are presented in Note 3, “Newly Adopted Standards
and Interpretations.” The fiscal year of the Group is identical to the calendar year.
The parent company of the Uniper Group is Uniper SE (“the Company”), Düsseldorf. The registered office
of the Company is in Düsseldorf. The Company’s address is: Uniper SE, E.ON-Platz 1, 40479 Düsseldorf,
Germany. The Company is entered in the Düsseldorf Commercial Register, Section B, under the num-
ber 77425. Uniper’s operating activities are aimed at the supply of energy and related services.
The Management Board and the Supervisory Board of Uniper SE made the requisite declaration of com-
pliance pursuant to Section 161 of the German Stock Corporation Act (“AktG”) in February 2018. The
declaration has been made permanently and publicly accessible to shareholders on the Company’s
Web site (www.uniper.energy).
The Consolidated Financial Statements were prepared in euro. Unless otherwise indicated, all amounts
are presented in millions of euro (€ million). Uniper applies commercial rounding. Any rounding differ-
ences existing between individual amounts and totals are accepted.
The Management Board of Uniper SE approved the release of the Consolidated Financial Statements
to the Supervisory Board on February 26, 2018.

125
Spin-off and Initial Public Offering in 2016
At the end of November 2014, E.ON SE, Düsseldorf, announced its plan to create a new group of compa-
nies for the activities of today’s Uniper, and to prepare a placement on the stock exchange by means of a
spin-off through absorption into another company (“Abspaltung zur Aufnahme”) with the issue of new
Uniper shares to the shareholders of E.ON SE.
The spin-off took effect on September 9, 2016.
Effective December 31, 2016, E.ON SE and E.ON Beteiligungen GmbH made a joint undertaking to
Uniper that they would not exercise their voting rights with respect to the election of two of the six
shareholder representatives on the Uniper Supervisory Board at the Annual Shareholders Meeting of
Uniper SE. The purpose of this agreement was to end E.ON SE’s control of Uniper SE, even though
E. ON SE will initially continue to hold a minority interest in the Company of 46.65%, which is likely to
constitute a majority of the share capital represented at any shareholders’ meeting of Uniper SE.
A detailed presentation of the spin-off and of the associated transactions and events is provided in
Uniper’s 2016 Consolidated Financial Statements.

126Uniper
Annual Report 2017 Consolidated Financial Statements
(2) Summary of Significant Accounting Policies
The Consolidated Financial Statements of the Uniper Group are generally prepared based on historical
cost, with the exception of available-for-sale financial assets that are measured at fair value and of finan-
cial assets and liabilities (including derivative financial instruments) that are recognized in income
and measured at fair value.
Scope of Consolidation
The Consolidated Financial Statements incorporate the financial statements of Uniper SE and entities
controlled by Uniper (“subsidiaries”). Control exists when Uniper, as the investor, has the current ability
to direct the relevant activities of the investee entity. Relevant activities are those activities that most
significantly affect the performance of a business. In addition, Uniper must participate in this business
performance in the form of variable returns and be able to influence those returns to its benefit through
existing opportunities and rights. Control is normally deemed established if Uniper directly or indirectly
holds a majority of the voting rights in the investee. In structured entities, control can be established by
means of contractual arrangements. The results of the subsidiaries acquired or disposed of during the
year are included in the Consolidated Statements of Income from the date of acquisition or until the
date of their disposal, respectively. Where necessary, adjustments are made to the subsidiaries’ financial
statements to bring their accounting policies into line with those of the Group. Intragroup receivables,
liabilities and results between Group companies are eliminated in the consolidation process.
Associated Companies
An associate is an entity over whose relevant activities Uniper has significant influence, but which is
neither a subsidiary nor an interest in a joint venture. Significant influence exists when Uniper has the
power to participate in the financial and operating policy decisions of the investee but does not control
or jointly control these decisions. Significant influence is generally presumed if Uniper directly or indi-
rectly holds at least 20%, but not more than 50%, of an entity’s voting rights. Included in this consider-
ation are potentially existing practical majorities that in certain cases could also lead to a controlling
majority in the associate.
Interests in associated companies are generally accounted for using the equity method. This also applies
to majority-owned companies in which Uniper does not exercise control due to restrictions concerning
the control of assets or management. Interests in associated companies accounted for using the equity
method are reported on the balance sheet at cost, adjusted for changes in Uniper’s share of the net as-
sets after the date of acquisition and for any impairment charges. Losses that might potentially exceed
the Group’s interest in an associated company when attributable long-term loans are taken into con-
sideration are generally not recognized. Any difference between the cost of the investment and the remea-
sured value of its net assets is recognized in the consolidated financial statements as part of the carry-
ing amount.
Unrealized gains and losses arising from transactions with associated companies accounted for using
the equity method are eliminated within the consolidation process on a pro-rata basis if and insofar as
these are material.
Companies accounted for using the equity method are tested for impairment by comparing the carry-
ing amount with its recoverable amount. If the carrying amount exceeds the recoverable amount, the
carrying amount is adjusted in the amount of this difference. If the reasons for previously recognized
impairment losses no longer exist, such impairment losses are reversed. The financial statements of
investments accounted for under the equity method are generally prepared using accounting that is
uniform within the Group.
127
Joint Arrangements
Joint ventures are also accounted for using the equity method. Unrealized gains and losses arising from
transactions with joint-venture companies are eliminated within the consolidation process on a pro-rata
basis if and to the extent these are material. A joint operation exists when Uniper and the other parties
to a joint arrangement have direct rights to the assets, and obligations for the liabilities, attributable
to the operation. In a joint operation, assets and liabilities, as well as revenues and expenses, are recog-
nized pro rata according to the rights and obligations attributable to Uniper.
Business Combinations
Business combinations are accounted for by applying the purchase method, whereby the purchase price
is offset against the proportional share in the acquired company’s net assets. In doing so, the values
at the acquisition date that corresponds to the date at which control of the acquired company was at-
tained are used as a basis. The acquiree’s identifiable assets, liabilities and contingent liabilities are
generally recognized at their fair values irrespective of the extent attributable to non-controlling inter-
ests. The fair values of individual assets are determined in different ways, which in the case of market-
able securities involve using published exchange or market prices at the time of acquisition, for example,
and in the case of land, buildings and major technical equipment, generally using independent expert
reports that have been prepared by third parties. If exchange or market prices are unavailable for con-
sideration, fair values are determined using the most reliable information available that is based on
market prices for comparable assets or on suitable valuation techniques. In such cases, Uniper deter-
mines fair value using the discounted cash flow method by discounting estimated future cash flows by
a weighted-average cost of capital. The discount rate reflects the specific risks inherent in the acquired
activities. Non-controlling interests can be measured either at cost (partial goodwill method) or at fair
value (full goodwill method). The choice of method can be made on a case-by-case basis. The partial
goodwill method is generally used within the Uniper Group.
Transactions with non-controlling shareholders are treated in the same way as transactions with inves-
tors. Should the acquisition of additional shares in a subsidiary result in a difference between the cost
of purchasing the shares and the carrying amounts of the non-controlling interests acquired, that differ-
ence must be fully recognized in equity. Gains and losses from disposals of shares to subsidiaries are
also recognized in equity, provided that such disposals do not coincide with a loss of control. Intangible
assets must be recognized separately from goodwill if they are clearly separable or if their recognition
arises from a contractual or other legal right. Provisions for restructuring measures may not be re-
corded in a purchase price allocation. If the purchase price paid exceeds the proportional share in the
net assets at the time of acquisition, the positive difference is recognized as goodwill. No goodwill is
recognized for positive differences attributable to non-controlling interests. A negative difference is
immediately recognized in income.
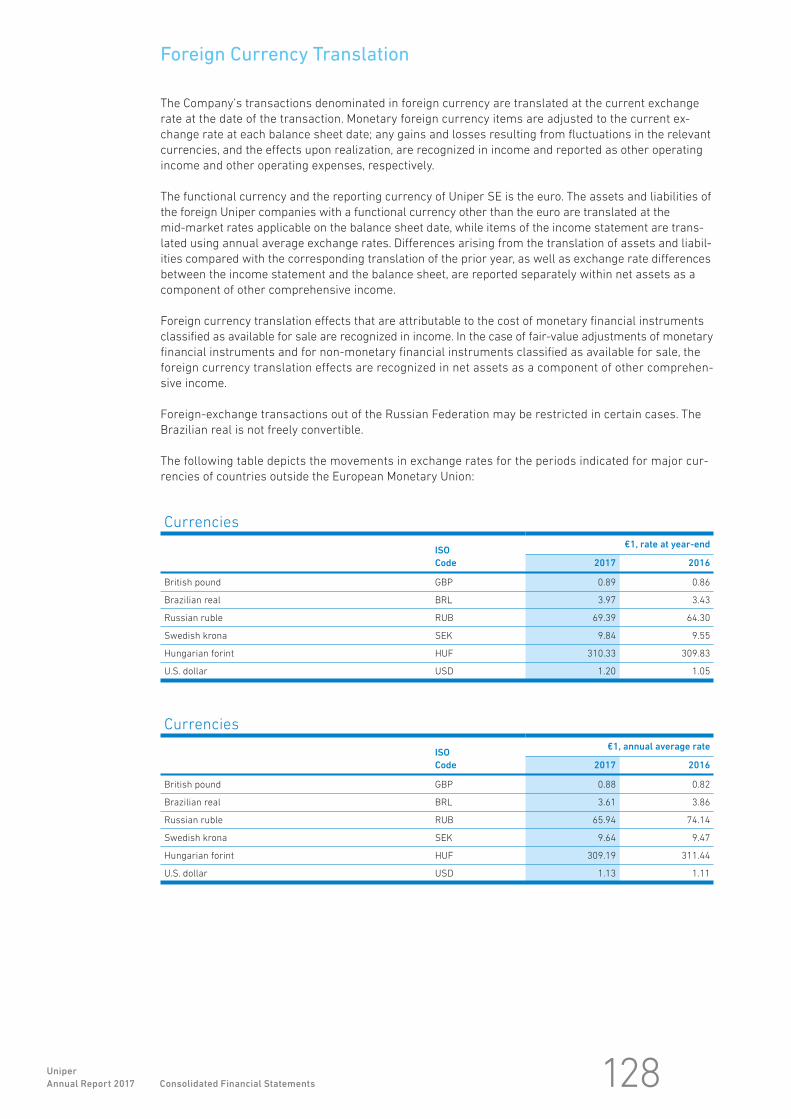
128Uniper
Annual Report 2017 Consolidated Financial Statements
Foreign Currency Translation
The Company’s transactions denominated in foreign currency are translated at the current exchange
rate at the date of the transaction. Monetary foreign currency items are adjusted to the current ex-
change rate at each balance sheet date; any gains and losses resulting from fluctuations in the relevant
currencies, and the effects upon realization, are recognized in income and reported as other operating
income and other operating expenses, respectively.
The functional currency and the reporting currency of Uniper SE is the euro. The assets and liabilities of
the foreign Uniper companies with a functional currency other than the euro are translated at the
mid-market rates applicable on the balance sheet date, while items of the income statement are trans-
lated using annual average exchange rates. Differences arising from the translation of assets and liabil-
ities compared with the corresponding translation of the prior year, as well as exchange rate differences
between the income statement and the balance sheet, are reported separately within net assets as a
component of other comprehensive income.
Foreign currency translation effects that are attributable to the cost of monetary financial instruments
classified as available for sale are recognized in income. In the case of fair-value adjustments of monetary
financial instruments and for non-monetary financial instruments classified as available for sale, the
foreign currency translation effects are recognized in net assets as a component of other comprehen-
sive income.
Foreign-exchange transactions out of the Russian Federation may be restricted in certain cases. The
Brazilian real is not freely convertible.
The following table depicts the movements in exchange rates for the periods indicated for major cur-
rencies of countries outside the European Monetary Union:
Currencies
ISO
Code
€1, rate at year-end
2017 2016
British pound GBP 0.89 0.86
Brazilian real BRL 3.97 3.43
Russian ruble RUB 69.39 64.30
Swedish krona SEK 9.84 9.55
Hungarian forint HUF 310.33 309.83
U.S. dollar USD 1.20 1.05
Currencies
ISO
Code
€1, annual average rate
2017 2016
British pound GBP 0.88 0.82
Brazilian real BRL 3.61 3.86
Russian ruble RUB 65.94 74.14
Swedish krona SEK 9.64 9.47
Hungarian forint HUF 309.19 311.44
U.S. dollar USD 1.13 1.11

129
Recognition of Income
a) RevenuesThe Company generally recognizes revenue upon delivery of goods to customers or purchasers, or upon
completion of services rendered. Delivery is deemed complete when the risks and rewards associated
with ownership have been transferred to the buyer as contractually agreed, compensation has been
contractually established and collection of the resulting receivable is probable. Revenues from the sale
of goods and services are measured at the fair value of the consideration received or receivable. They
reflect the value of the volume supplied, including an estimated value of the volume supplied to custom-
ers between the date of the last invoice and the end of the period.
Revenues include the surcharge mandated by the German Renewable Energy Sources Act and other
applicable statutory charges, and are presented net of sales taxes, returns, rebates and discounts, and
after elimination of sales within the Uniper Group.
Revenues are generated predominantly from the sale of electricity and gas to industrial and com-
mercial customers and in wholesale markets, including related physical and financial hedges. Also
shown in this line item are revenues earned from the transportation of gas and from deliveries of
steam, heat and water.
b) Interest IncomeInterest income is recognized pro rata using the effective interest method.
c) Dividend IncomeDividend income is recognized when the right to receive the distribution payment arises.
Electricity and Energy Taxes
The electricity tax is levied, in particular, on electricity delivered to retail customers and is calculated
on the basis of a fixed tax rate per megawatt-hour (“MWh”) that varies between different classes of cus-
tomers. Electricity and energy taxes paid are deducted from sales revenues on the face of the income
statement.
Goodwill and Intangible Assets
GoodwillIn accordance with IFRS 3, goodwill is not amortized, but rather tested for impairment at level of the
cash-generating unit (“CGU”) on at least an annual basis. Impairment tests must also be performed be-
tween these annual tests if events or changes in circumstances indicate that the carrying amount of
the respective cash-generating unit might not be recoverable.
Newly created goodwill is allocated to those CGUs expected to benefit from the respective business com-
bination. The CGUs to which goodwill is allocated are generally equivalent to the operating segments,
since goodwill is reported, and considered in performance metrics for controlling, only at that level.
Goodwill impairment testing is performed in the functional currency of the respective CGU. The underly-
ing goodwill is also carried in the functional currency.

130Uniper
Annual Report 2017 Consolidated Financial Statements
In a goodwill impairment test, the recoverable amount of a CGU is compared with its carrying amount,
including goodwill. The recoverable amount is the higher of the CGU’s fair value less costs to sell and its
value in use. To determine the recoverable amount of the cash-generating units that carry goodwill, the
Uniper Group first establishes the value in use. The valuation of the Global Commodities CGU is based
on the medium-term planning for the cash-generating unit, which covers three years and is followed
by long-term planning. For the International Power Generation CGU, where the recoverable amount is
determined to a great extent by the Russian generation activities, the value in use is determined in lo-
cal currency and is established in line with the regulatory framework over a detailed planning period
of 15 years. If needed, a calculation of fair value (less costs to sell) is also performed.
Unlike fair value, which has a market perspective, the value in use is calculated from the viewpoint of
management. In accordance with IAS 36, it is further ensured that restructuring expenses in particular,
as well as initial and subsequent capital investments (where those have not yet commenced), are not
included in the valuation. Expenses at the Group’s corporate departments are included in the determi-
nation of the recoverable amount.
If the carrying amount exceeds the recoverable amount of a CGU, the goodwill allocated to that unit is
adjusted in the amount of this difference.
If the impairment thus identified exceeds the goodwill allocated to the affected CGU, the remaining as-
sets of the unit must be written down in proportion to their carrying amounts. Individual assets may be
written down only if their respective carrying amounts do not fall below the highest of the following
values as a result:
• Fair value less costs to sell
• Value in use
• Zero
The Uniper Group has elected to perform the annual testing of goodwill for impairment at the CGU level
in the fourth quarter of each fiscal year.
Impairment charges on the goodwill of a CGU and reported in the income statement under “Deprecia-
tion, amortization and impairment charges” may not be reversed in subsequent reporting periods.
Intangible AssetsIAS 38, “Intangible Assets,” (“IAS 38”) requires that intangible assets be amortized over their expected
useful lives unless their lives are considered to be indefinite. Factors such as typical product life cycles
and legal or similar limits on use are taken into account in the classification.
Acquired intangible assets subject to amortization are classified as marketing-related, customer-related,
contract-based, and technology-based. Internally generated intangible assets subject to amortization
are related to software. Intangible assets subject to amortization are measured at cost and amortized
on a straight-line basis over their useful lives. The useful lives of marketing-related, customer-related
and contract-based intangible assets generally range between 5 and 25 years. Technology-based intan-
gible assets are generally amortized over a useful life of between 3 and 5 years. This category includes
software in particular. Contract-based intangible assets are amortized in accordance with the provisions
specified in the contracts. Useful lives and amortization methods are subject to annual verification.
Intangible assets subject to amortization are tested for impairment whenever events or changes in cir-
cumstances indicate that such assets may be impaired.

131
Intangible assets not subject to amortization are measured at cost and tested for impairment annually
or more frequently if events indicate that such assets may be impaired. Moreover, such assets are
reviewed annually to determine whether an assessment of indefinite useful life remains applicable.
In accordance with IAS 36, the carrying amount of an intangible asset, whether subject to amortization
or not, is tested for impairment by comparing the carrying amount with the asset’s recoverable amount,
which is the higher of its value in use and its fair value less costs to sell. Should the carrying amount
exceed the corresponding recoverable amount, an impairment charge equal to the difference between
the carrying amount and the recoverable amount is recognized and reported in income under “Deprecia-
tion, amortization and impairment charges.”
If the reasons for previously recognized impairment losses no longer exist, such impairment losses are
reversed. A reversal shall not cause the carrying amount of an intangible asset subject to amortization
to exceed the carrying amount that would have been determined, net of amortization, during the period
had no impairment losses been recognized in earlier periods.
If a recoverable amount cannot be determined for an individual intangible asset, the recoverable
amount for the smallest identifiable group of assets that the intangible asset may be assigned to is
determined. See Note 14 for additional information about goodwill and intangible assets.
Research and Development Costs
Under IFRS, expenses for internally generated intangible assets must be separated and allocated to a
research phase and a development phase. While expenditure on research is expensed as incurred, de-
velopment costs must be capitalized as an intangible asset if all of the general criteria for recognition
specified in IAS 38, as well as certain other specific prerequisites, have been fulfilled. In the 2017 and
2016 fiscal years, these criteria were not fulfilled, except in the case of internally generated software.
Property, Plant and Equipment
Property, plant and equipment are measured at acquisition or production cost, including decommissioning
or restoration costs that must be capitalized, and are depreciated over the expected useful lives of the
components, generally using the straight-line method, unless a different method of depreciation reflects
the depletion of the asset more accurately in certain exceptional cases. The useful lives of the major
components of property, plant and equipment are presented below:
Useful Lives of Property, Plant and Equipment
Buildings 10 to 50 years
Technical equipment, plant and machinery 10 to 65 years
Other equipment, fixtures, furniture and office equipment 3 to 25 years
Property, plant and equipment are tested for impairment whenever events or changes in circumstances
indicate that an asset may be impaired. In such a case, property, plant and equipment are tested for
impairment according to the principles prescribed for intangible assets in IAS 36. If an impairment loss
is determined, the remaining useful life of the asset might also be subject to adjustment, where applica-
ble. If the reasons for previously recognized impairment losses no longer exist, such impairment loss-
es are reversed and recognized in income. Such reversal shall not cause the carrying amount to exceed
the amount that would have resulted had no impairment been recognized in earlier periods.

132Uniper
Annual Report 2017 Consolidated Financial Statements
Investment subsidies do not reduce the acquisition and production costs of the respective assets; they
are instead reported on the balance sheet as deferred income.
Subsequent costs arising, for example, from additional or replacement capital expenditure are only
recognized as part of the acquisition or production cost of the asset, or else - if relevant - recognized
as a separate asset if it is probable that the Uniper Group will receive a future economic benefit as a
result and the cost of the asset can be determined reliably.
Repair and maintenance costs that do not constitute significant replacement capital expenditure are
expensed as incurred.
Borrowing Costs
Borrowing costs that arise in connection with the acquisition, construction or production of a qualifying
asset from the time of acquisition or from the beginning of construction or production until its entry into
service are capitalized and subsequently amortized alongside the related asset. In the case of a specific
financing arrangement, the respective borrowing costs incurred for that particular arrangement during
the period are used. For non-specific financing arrangements, a uniform Company-specific financing
rate of 4.16% was applied within the Uniper Group for the 2017 fiscal year (2016: 2.60%). This rate cov-
ers the interest rates of all financial liabilities, including those for finance leases. Other borrowing costs
are expensed.
Government Grants
Government investment subsidies do not reduce the acquisition and production costs of the respective
assets; they are instead reported on the balance sheet as deferred income. They are recognized in income
on a straight-line basis over the associated asset’s expected useful life.
Government grants are recognized at fair value if it is highly probable that the grant will be issued and
if the Uniper Group satisfies the necessary conditions for receipt of the grant.
Government grants for costs are posted as income over the period in which the costs to be compensated
through the respective grants are incurred.
133
Leasing
Leasing transactions are classified according to the lease agreements and to the underlying risks and
rewards specified therein in line with IAS 17, “Leases” (“IAS 17”). In addition, IFRIC 4, “Determining Wheth-
er an Arrangement Contains a Lease,” (“IFRIC 4”) further defines the criteria as to whether an agreement
that conveys a right to use an asset meets the definition of a lease. Certain purchase and supply con-
tracts in the electricity and gas business as well as certain rights of use may also be classified as leases
if the criteria are met. The Uniper Group is party to some agreements in which it is the lessor and to
others in which it is the lessee.
Leasing transactions in which the Uniper Group is the lessee are classified either as finance leases or
operating leases. If the Company bears substantially all of the risks and rewards incident to ownership
of the leased property, the lease is classified as a finance lease. Accordingly, the Company recognizes
on its balance sheet the leased asset and the associated liability in equal amounts.
Recognition takes place at the beginning of the lease term at the lower of the fair value of the leased
property or the present value of the minimum lease payments.
The leased property is depreciated over its useful economic life or, if it is shorter, the term of the lease.
The liability is subsequently measured using the effective interest method.
All other transactions in which the Uniper Group is the lessee are classified as operating leases. Payments
made under operating leases are generally expensed over the term of the lease on a straight-line basis.
Leasing transactions in which the Uniper Group is the lessor and substantially all the risks and rewards
arising from the use of the leased property are transferred to the lessee are classified as finance leases.
In this type of lease, the present value of the minimum lease payments is recorded as a receivable.
Payments by the lessee are apportioned between a reduction of the lease receivable and interest in-
come. The income from such arrangements is recognized over the term of the lease using the effective
interest method.
All other transactions in which the Uniper Group is the lessor are classified as operating leases; the
leased asset continues to be recognized by the Uniper Group and the lease payments are generally
recorded as income over the term of the lease on a straight-line basis.
Financial Instruments
Non-Derivative Financial InstrumentsNon-derivative financial instruments are recognized at fair value, including transaction costs, on the
settlement date when acquired. IFRS 13, “Fair Value Measurement,” (“IFRS 13”) defines fair value as the
price that would be received to sell an asset or paid to transfer a liability in an orderly transaction
between market participants on the measurement date (exit price). The valuation techniques used are
classified according to the fair value hierarchy provided for by IFRS 13.
Unconsolidated equity investments and securities are measured in accordance with IAS 39, “Financial
Instruments: Recognition and Measurement” (“IAS 39”). Uniper categorizes financial assets as held for
trading, available-for-sale securities, or as loans and receivables. Management determines the catego-
rization of the financial assets at initial recognition.
Available-for-sale securities are non-derivative financial instruments that have either been allocated
to this category or have not been allocated to one of the other categories. They are reported under non-
current assets if management does not intend to sell them within twelve months following the balance
sheet date and the asset does not fall due within that period. Securities classified as available for sale
are measured at fair value on an ongoing basis. Any resulting unrealized gains and losses are reported
as a component of equity (other comprehensive income), net of deferred taxes, until they are realized.

134Uniper
Annual Report 2017 Consolidated Financial Statements
Realized gains and losses are determined by analyzing each transaction individually. If there is objective
evidence of impairment, any losses previously recognized in other comprehensive income are instead
recognized in financial results. When estimating a possible impairment loss, the Uniper Group takes
into consideration all available information, such as market conditions and the length and extent of the
impairment. If the value on the balance sheet date of the equity instruments classified as available for
sale and of similar long-term investments is 20% or more below their cost, or if the value has been on
average significantly below their cost for a period of more than twelve months, this constitutes objec-
tive evidence of impairment. For debt instruments, objective evidence of impairment is generally
deemed present if the rating awarded by one of the three leading rating agencies has deteriorated from
investment-grade to non-investment-grade. Reversals of impairment losses relating to equity instru-
ments are recognized exclusively in equity, while reversals relating to debt instruments are recognized
entirely in income.
Loans and receivables (including trade receivables) are non-derivative financial assets with fixed or
determinable payments that are not traded in an active market. Loans and receivables are reported on
the balance sheet under “Receivables and other assets.” They are subsequently measured at amortized
cost. Valuation allowances are provided for identifiable individual risks.
Non-derivative financial liabilities (including trade payables) within the scope of IAS 39 are measured at
amortized cost, using the effective interest method. Initial measurement takes place at fair value, with
transaction costs included in the measurement. In subsequent periods, the net book value is adjusted for
amortization and accretion of any premium or discount remaining until maturity. The premium or dis-
count is included in financial results.
Derivative Financial Instruments and HedgingDerivative financial instruments and separated embedded derivatives are measured at fair value as of
the trade date at initial recognition and in subsequent periods. IAS 39 requires that they be categorized
as held for trading as long as they are not a component of a hedge accounting relationship. Gains and
losses from changes in fair value are immediately recognized in income.
The instruments primarily used are foreign-exchange forwards and swaps. In commodities, the instru-
ments used include physically and financially settled options and forwards related to electricity, gas,
coal, oil and emission rights.
As part of fair value measurement in accordance with IFRS 13, the counterparty risk is also taken into
account for derivative financial instruments. The Uniper Group determines this risk based on a portfolio
valuation in a bilateral approach for both own credit risk (“debt value adjustment”) and the credit risk
of the corresponding counterparty (“credit value adjustment”). The counterparty risks thus determined
are allocated to the individual financial instruments by applying the relative fair value method on a net
basis.
IAS 39 sets requirements for the designation and documentation of hedging relationships, the hedging
strategy, as well as ongoing retrospective and prospective measurement of effectiveness in order to
qualify for hedge accounting. The Company does not exclude any component of derivative gains and loss-
es from the measurement of hedge effectiveness. Hedge accounting is considered to be appropriate
if the assessment of hedge effectiveness indicates that the change in fair value of the hedging instru-
ment is 80% to 125% effective at offsetting the change in fair value of the hedged item.

135
Changes in fair value of derivative instruments that must be recognized in income are presented as
other operating income or expenses. Gains and losses from derivative financial instruments are shown
net as either revenues or cost of materials, provided they meet the corresponding conditions for such
accounting. Certain realized amounts are, if related to the sale of products or services, also included in
sales or cost of materials.
Unrealized gains and losses resulting from the initial measurement of derivative financial instruments
at the inception of the contract are not recognized in income. They are instead deferred and recognized
in income systematically over the term of the derivative. An exception to the accrual principle applies
if unrealized gains and losses from the initial measurement are verified by quoted market prices, observ-
able prices of other current market transactions or other observable data supporting the valuation
technique. In this case the gains and losses are recognized in income.
Contracts that are entered into for purposes of receiving or delivering non-financial items in accordance
with the Uniper Group’s anticipated procurement, sale or use requirements, and held as such, can be
classified as own-use contracts. They are not accounted for as derivative financial instruments at fair
value in accordance with IAS 39, but as open transactions subject to the rules of IAS 37.
IFRS 7, “Financial Instruments: Disclosures,” (“IFRS 7”) and IFRS 13 both require comprehensive quanti-
tative and qualitative disclosures about the extent of risks arising from financial instruments. Additional
information on financial instruments is provided in Notes 28 and 29.
Primary and derivative financial instruments are netted on the balance sheet if the Uniper Group has
both an unconditional right - even in the event of the counterparty’s insolvency - and the intention to
settle offsetting positions simultaneously or on a net basis.
Inventories
The Company measures inventories at the lower of acquisition or production cost and net realizable
value. The cost of raw materials, finished products and goods purchased for resale is determined
based on the average cost method. In addition to production materials and wages, production costs
include material and production overheads based on normal capacity. The costs of general administra-
tion are not capitalized. Inventory risks resulting from excess and obsolescence are provided for using
appropriate valuation allowances, whereby inventories are written down to net realizable value.

136Uniper
Annual Report 2017 Consolidated Financial Statements
Receivables and Other Assets
Receivables and other assets are initially measured at fair value, which generally approximates nominal
value. They are subsequently measured at amortized cost, using the effective interest method. Valuation
allowances, included in the reported net carrying amount, are provided for identifiable individual risks.
If the loss of a certain part of the receivables is probable, valuation allowances are provided to cover the
expected loss.
Emission Rights
Emission rights held under national and international emission-rights systems for the settlement of obli-
gations are reported under other operating assets. These rights are capitalized at cost at the time of ac-
quisition.
A provision is recognized for emissions produced. The provision is measured at the carrying amount of
the emission rights held or, in the case of a shortfall, at the current fair value of the emission rights need-
ed. The expenses incurred for the recognition of the provision are reported under cost of materials.
Liquid Funds
Liquid funds include cash on hand and bank balances, as well as current available-for-sale securities.
Bank balances and available-for-sale securities with an original maturity of more than three months
are recognized under securities and fixed-term deposits. Liquid funds with an original maturity of less
than three months are considered to be cash and cash equivalents, unless they are restricted.
Restricted cash with a remaining maturity in excess of twelve months is classified as financial receiv-
ables and other financial assets.
Assets Held for Sale and Liabilities Associated with Assets Held for Sale
Individual non-current assets or groups of assets held for sale and any directly attributable liabilities
(disposal groups) are reported in these line items if they can be disposed of in their current condition
and if there is sufficient probability of their disposal actually taking place. For a group of assets and
associated liabilities to be classified as a disposal group, the assets and liabilities in it must be held for
sale in a single transaction or as part of a comprehensive plan.
Non-current assets that are held for sale either individually or collectively as part of a disposal group
are no longer depreciated. They are instead accounted for at the lower of the carrying amount and the
fair value less any remaining costs to sell. If the fair value is less than the carrying amount, an impair-
ment loss is recognized.

137
Equity Instruments
IFRS defines equity, as distinct from debt, as the residual interest in the Uniper Group’s assets after
deducting all liabilities. Therefore, equity is the net amount of all recognized assets and liabilities.
If shareholders of entities own statutory, non-excludable rights of termination (as in the case of Ger-
man partnerships, for example), IAS 32, “Financial Instruments: Presentation,” provides that such termi-
nation rights require the reclassification of non-controlling interests in such entities held within the
Group from equity into liabilities. The liability is reported at the present value of the expected settlement
amount in the event of termination. The amount is recognized irrespective of the probability of termina-
tion. Changes in the value of the liability are reported within other operating income. Accretion of the lia-
bility and the non-controlling shareholders’ share in net income are shown as interest expense.
Where Uniper has entered into purchase commitments to holders of non-controlling interests in sub-
sidiaries, those non-controlling shareholders have the right to require Uniper to purchase their shares
under previously specified conditions. In such a case, IAS 32 requires that a liability be recognized at the
present value of the probable future exercise price. This amount is reclassified from a separate compo-
nent within non-controlling interests and reported separately as a liability. The reclassification occurs
irrespective of the probability of exercise. The subsequent measurement of the liability is recognized in
financial results. If a purchase commitment expires unexercised, the liability reverts to non-controlling
interests. Any difference between liabilities and non-controlling interests is recognized directly in re-
tained earnings.
Share-based Payment
In the 2017 reporting year, members of the Uniper Management Board and selected executives were
granted allocations under the Uniper Performance Cash Plan. The Uniper Performance Cash Plan rep-
resents cash-settled share-based payment, which is measured at fair value as of each balance sheet
date. In the Performance Cash Plan, the fair value is determined based on firmly defined performance
targets on the respective balance sheet dates. The expenses of the Performance Cash Plan are recog-
nized in the income statement over the period through the end of the respective plan term. Additional
information on the Uniper Performance Cash Plan can be found in the Compensation Report, which is
part of the Combined Management Report of the Uniper Group.
In the 2017 reporting year, members of the Supervisory Board received a component of 20% of their
compensation as variable compensation. That compensation is granted as a future right to payment in
the form of virtual shares. The virtual shares are used purely for calculation purposes and do not grant
to the beneficiary any entitlements or shareholder rights, particularly voting rights or dividend rights.
The variable compensation is paid in cash within the first month after the end of the four-year period
and is limited to 200% of the allocation amount. Accordingly, this compensation represents cash-settled
share-based payment. The value of the virtual shares is measured based on the fair value on the re-
spective balance sheet dates. The expenses for the Supervisory Board’s virtual shares are recognized in
the income statement over the period through the end of the respective measurement period. Additional
information on the virtual shares awarded to the Supervisory Board can be found in the Compensation
Report, which is part of the Combined Management Report of the Uniper Group.

138Uniper
Annual Report 2017 Consolidated Financial Statements
Provisions for Pensions and Similar Obligations
Measurement of defined benefit obligations in accordance with IAS 19 (revised 2011), “Employee Benefits,”
is based on the projected unit credit method, with actuarial valuations performed as of the end of each
fiscal year. The valuation encompasses both pension obligations and pension entitlements that are known
on the reporting date and economic trend assumptions such as assumptions on wage and salary
growth rates and pension increase rates, among others, that are made in order to reflect realistic expec-
tations, as well as variables specific to reporting dates, such as discount rates, for example.
Included in gains and losses from the remeasurements of the net defined benefit liability or asset are
actuarial gains and losses that may arise especially from differences between estimated and actual
variations in underlying assumptions about demographic and financial variables and, additionally, from
developments in these assumptions as of each reporting date. Also included is the difference between
the actual return on plan assets and the interest income on plan assets contained in the net interest re-
sult. Remeasurement effects are recognized in full in the period in which they occur and are not report-
ed within the income statement, but are instead recorded in the Uniper Group’s Statement of Recog-
nized Income and Expenses (other comprehensive income).
The employer service cost representing the additional benefits that employees earned under the benefit
plan during the fiscal year is reported under personnel costs; the net interest on the net liability or asset
from defined benefit pension plans determined based on the discount rate applicable at the start of
the fiscal year is reported under financial results.
Past service cost, as well as gains and losses from settlements, are fully recognized in the income
statement in the period in which the underlying plan amendment, curtailment or settlement takes place.
They are reported under personnel costs.
The amount reported on the balance sheet represents the present value of the defined benefit obligations
reduced by the fair value of plan assets. If a net asset position arises from this calculation, the amount
is limited to the present value of available refunds and the reduction in future contributions and to the
benefit from prepayments of minimum funding requirements. Such an asset position is recognized in
the “Operating receivables and other operating assets” line item.
Payments for defined contribution pension plans are expensed as incurred and reported under personnel
costs. Contributions to state pension plans are treated like payments for defined contribution pension
plans to the extent that the obligations under these pension plans generally correspond to those under
defined contribution pension plans.
139
Provisions for Asset Retirement Obligations and Miscellaneous Provisions
In accordance with IAS 37, “Provisions, Contingent Liabilities and Contingent Assets” (“IAS 37”), provisions
are recognized when there are legal or constructive present obligations toward third parties resulting
from events that occurred in the past, it is probable that a future outflow of resources will be required
to settle these obligations, and the amounts of the obligations can be measured with sufficient reliability.
The provision is recognized at the expected settlement amount. Long-term obligations are reported as li-
abilities at the present value of their expected settlement amounts if the interest rate effect (the differ-
ence between present value and repayment amount) resulting from discounting is material; future cost
increases that are foreseeable and likely to occur on the balance sheet date must also be included in
the measurement. Long-term obligations are generally discounted at the market interest rate applica-
ble as of the respective balance sheet date. The accretion amounts and the effects of changes in inter-
est rates are generally presented as part of financial results. A reimbursement related to the provision
that is virtually certain to be collected is capitalized as a separate asset. No offsetting within provi-
sions is permitted.
Obligations arising from the decommissioning or dismantling of property, plant and equipment are recog-
nized during the period of their occurrence at their discounted settlement amounts, provided that the
obligation can be reliably estimated. The carrying amounts of the respective property, plant and equip-
ment are increased by the same amounts. In subsequent periods, capitalized asset retirement costs
are amortized over the expected remaining useful lives of the related assets, and the provision is accret-
ed to its present value on an annual basis.
Changes in estimates arise in particular from deviations from original cost estimates, from changes to
the maturity or the scope of the relevant obligation, and also as a result of the regular adjustment of the
discount rate to current market interest rates. The adjustment of provisions for the decommissioning
and restoration of property, plant and equipment for changes to estimates is generally recognized by way
of a corresponding adjustment to these assets, with no effect on income. If the property, plant and equip-
ment to be decommissioned have already been fully depreciated, changes to estimates are recognized
within the income statement.
Under Swedish law, the Uniper Group’s Swedish nuclear operations are required to pay fees to the
Swedish Nuclear Waste Fund (“Kärnavfallsfonden”). The Swedish Radiation Safety Authority proposes the
fees for the disposal of high-level radioactive waste and nuclear power plant decommissioning for the
particular nuclear power plant on the basis of the amount of electricity produced or on a time basis,
taking into account nuclear-specific inflation rates and risk premiums. The proposed fees are then sub-
mitted to government offices for approval and the corresponding payments are made by the respective
owner of the power plants. In accordance with IFRIC 5, “Rights to Interests Arising from Decommission-
ing, Restoration and Environmental Rehabilitation Funds” (“IFRIC 5”), a right of reimbursement for as-
set retirement expenditure is recognized as an asset under “Other financial assets” for payments into
the Swedish Nuclear Waste Fund. In accordance with customary procedure in Sweden, the provisions
are discounted at a real interest rate.
A material element in the estimates are the real interest rates applied (the applied discount rate, less
the general rate of inflation, less the nuclear-specific cost increase rate). A change of 0.1 percentage
points in the applied real interest rate leads to a change in the provision of approximately €24 million
(2016: €26 million). The impact on adjusted EBIT depends on the level of the corresponding adjustment
posted to property, plant and equipment.

140Uniper
Annual Report 2017 Consolidated Financial Statements
No provisions are established for contingent asset retirement obligations where the type, scope, timing
and associated probabilities can not be determined reliably.
If onerous contracts exist in which the unavoidable costs of meeting a contractual obligation exceed the
economic benefits expected to be received under the contract, provisions are established for losses from
open transactions. Such provisions are recognized at the lower of the excess obligation upon perfor-
mance under the contract and any potential penalties or compensation arising in the event of non-per-
formance. Obligations under an open contractual relationship are determined from a customer perspec-
tive.
Contingent liabilities are possible obligations toward third parties arising from past events that are not
wholly within the control of the entity, or else present obligations toward third parties arising from past
events in which an outflow of resources embodying economic benefits is not probable or where the
amount of the obligation cannot be measured with sufficient reliability. Contingent liabilities are generally
not recognized on the balance sheet.
Where necessary, provisions for restructuring costs are recognized at the present value of the future
outflows of resources. Provisions are recognized once a detailed restructuring plan has been decided
on by management and publicly announced or communicated to the employees or their representatives.
Only those expenses that are directly attributable to the restructuring measures are used in measuring
the amount of the provision. Expenses associated with future operations are not taken into consideration.
Income Tax
Under IAS 12, “Income Taxes” (“IAS 12”), deferred taxes are recognized on temporary differences arising
between the carrying amounts of assets and liabilities on the balance sheet and their tax bases (balance
sheet liability method). Deferred tax assets and liabilities are recognized for temporary differences that
will result in taxable or deductible amounts when taxable income is calculated for future periods, unless
those differences are the result of the initial recognition of an asset or liability in a transaction other
than a business combination that, at the time of the transaction, affects neither accounting nor taxable
profit/loss (initial differences). Uncertain tax positions are recognized at their most likely value. IAS 12
further requires that deferred tax assets be recognized for unused tax loss carryforwards and unused
tax credits. Deferred tax assets are recognized to the extent that it is probable that taxable profit will
be available against which the deductible temporary differences and unused tax losses can be utilized.
Each of the corporate entities is assessed individually with regard to the probability of a positive tax
result in future years. Any existing history of losses is incorporated in this assessment. Deferred tax-
es are not taken into consideration for the portion of the deferred tax assets to which these assump-
tions do not apply.
Deferred tax liabilities caused by temporary differences associated with investments in subsidiaries and
associated companies are recognized unless the timing of the reversal of such temporary differences
can be controlled within the Uniper Group and it is probable that, owing to this control, the differences
will in fact not be reversed in the foreseeable future.
Deferred tax assets and liabilities are measured using the tax rates expected to be applicable in the
years in which the temporary differences are expected to be recovered or settled. The effect on deferred
tax assets and liabilities of changes in tax rates and tax law is generally recognized in income. Equity
is adjusted for deferred taxes that had previously been recognized directly in equity. The adjustment is
generally recorded in the period in which the legislative process is substantially completed.
Deferred taxes for domestic companies are calculated using an overall tax rate of 31% (2016: 31%). This
tax rate includes, in addition to the 15% (2016: 15%) corporate income tax, the solidarity surcharge of
5.5% on the corporate income tax (2016: 5.5%), and the average trade tax rate of 15% (2016: 15%) ap-
plicable to the Uniper Group. Foreign subsidiaries use applicable national tax rates.

141
Cash Flow Statement
In accordance with IAS 7, “Cash Flow Statements” (“IAS 7”), cash flows are classified by operating, in-
vesting and financing activities. Interest received and paid, income taxes paid and refunded, as well as
dividends received are classified as operating cash flows, whereas dividends paid are classified as fi-
nancing cash flows. The purchase and sale prices respectively paid (received) in acquisitions and dis-
posals of shares in companies are reported net of any cash and cash equivalents acquired (disposed of)
under investing activities if the respective acquisition or disposal results in a gain or loss of control. In
the case of acquisitions and disposals that do not, respectively, result in a gain or loss of control, the
corresponding cash flows are reported under financing activities. The impact on cash and cash equiva-
lents of valuation changes due to exchange rate fluctuations is disclosed separately.
Segment Information
In accordance with the so-called management approach required by IFRS 8, “Operating Segments”
(“IFRS 8”), the Company’s internal reporting structure is used to identify its reportable segments. The
chief operating decision maker as defined in this standard is the Management Board of Uniper SE.
The internal performance measure used as the segment result is earnings before interest and taxes
adjusted to exclude non-operating effects (“adjusted EBIT,” see Note 31). Because it had still been in-
cluded in the E.ON Group for part of the 2016 fiscal year, a measure of earnings before interest, taxes,
depreciation and amortization adjusted for non-operating effects (“adjusted EBITDA”) was additionally
taken into account in the internal reporting organization.
Structure of the Consolidated Balance Sheets and Statements of Income
In accordance with IAS 1, “Presentation of Financial Statements” (“IAS 1”), the Consolidated Balance
Sheets have been prepared using a classified balance sheet structure. Assets that will be realized
within twelve months of the reporting date, as well as liabilities that are due to be settled within one
year of the reporting date, are generally classified as current.
The Consolidated Statements of Income are classified using the nature-of-expense method, which is
also applied for internal purposes.
Capital Structure Management
To manage capital structure, Uniper uses the ratio of current economic net debt to adjusted earnings
before interest, taxes, depreciation and amortization (adjusted EBITDA). Uniper’s overall goal is to
achieve a debt factor (ratio of economic net debt to adjusted EBITDA) of less than 2.0. Based on adjust-
ed EBITDA in 2017 of €1,741 million (2016: €2,122 million) and economic net debt of €2,445 million as
of the balance sheet date (2016: €4,167 million), the ratio of economic net debt to adjusted EBITDA is
1.4 (2016: 2.0).

142Uniper
Annual Report 2017 Consolidated Financial Statements
Critical Accounting Estimates and Assumptions; Critical Judgments in the Application of Accounting Policies
The preparation of the Consolidated Financial Statements requires management to make estimates and
assumptions that may influence the application of accounting policies within the Uniper Group and af-
fect the measurement and presentation of reported figures. Estimates are based on past experience
and on additional knowledge obtained on transactions to be reported. Actual amounts may differ from
these estimates.
The estimates and underlying assumptions are reviewed on an ongoing basis. Adjustments to account-
ing estimates are recognized in the period in which the estimate is revised if the change affects only
that period, or in the period of the revision and subsequent periods if both current and future periods
are affected.
Estimates are particularly necessary for the recognition and measurement of deferred tax assets, the
accounting treatment of provisions for pensions and miscellaneous provisions, for impairment testing
in accordance with IAS 36, as well as for the determination of the fair value of certain financial instru-
ments.
The underlying principles used for estimates in each of the relevant topics are outlined in the respective
sections.
(3) Newly Adopted Standards and Interpretations
Where new or amended standards and interpretations were adopted, respectively, by the International
Accounting Standards Board (“IASB”) and the IFRS Interpretations Committee (“IFRS IC”) but are not
mentioned in this Note, Uniper believes that such omitted pronouncements are not relevant to its Con-
solidated Financial Statements because Uniper’s business model is not covered by their scope.
Standards and Interpretations Applicable in 2017
The International Accounting Standards Board and the IFRS Interpretations Committee have issued
the following standards and interpretations that have been adopted by the EU into European law and
whose application is mandatory in the reporting period from January 1, 2017, through December 31,
2017:
Amendments to IAS 7—Disclosure InitiativeIn January 2016, the IASB published “Disclosure Initiative (Amendments to IAS 7).” The amendments
require disclosures that will enable users of financial statements to assess changes in liabilities arising
from financing activities, including changes arising from cash flows and non-cash changes. The amend-
ments shall be applied for the first time in the first reporting period of a fiscal year that begins on or
after January 1, 2017. Earlier application is permitted. The amendments have been adopted by the
EU into European law. Uniper SE has included the required disclosures in its Consolidated Financial
Statements.
Other IFRS PronouncementsThe following IFRS pronouncements were also applied for the first time in 2017, but they had no impact
on the Consolidated Financial Statements:
• Amendments to IAS 12—Recognition of Deferred Tax Assets for Unrealized Losses
• Amendments to IFRS 12 as part of the Omnibus Standard to Amend Multiple International
Financial Reporting Standards (2014–2016 Cycle)

143
Standards and Interpretations Not Yet Applicable in 2017
The IASB and the IFRS IC have issued the following additional standards and interpretations. These stan-
dards and interpretations are not being applied by Uniper in the 2017 fiscal year because endorsement
by the EU remains outstanding at this time for some of them, or because their application is not yet
mandatory.
IFRS 9, “Financial Instruments”In July 2014, the IASB published the final version of IFRS 9, “Financial Instruments.” The standard in-
cludes, among other things, new requirements for the classification and measurement of financial as-
sets, and it introduces new impairment rules for financial instruments, the so-called “expected credit
loss model.” In the case of financial liabilities for which the fair value option is used, changes in value
based on changes in own credit risk must be recognized in other comprehensive income unless the lia-
bilities relate to financial guarantee contracts and loan commitments or such recognition then creates
accounting mismatches. Comprehensive revisions have also been made with respect to hedge ac-
counting. The EU has adopted IFRS 9 into European law.
Uniper will apply IFRS 9 beginning on January 1, 2018. The transition from IAS 39 to IFRS 9 will be ret-
rospective. Uniper will elect, as provided for in IFRS 9.7.2.15, not to restate prior-year figures when
making the disclosures required under paragraphs 42L–42O of IFRS 7.
Other operating equity investments over which Uniper has no significant influence will be carried at
fair value through other comprehensive income (“FVOCI”). Significant other equity investments have to
date been assigned to the available-for-sale IAS 39 category. Non-significant other equity investments
for which there were no quoted prices in active markets have to date been carried at cost, taking into
account any impairment losses. The difference of roughly €4 million, including deferred tax assets, be-
tween the previous measurement and fair value will be recognized in retained earnings, in accordance
with IFRS 9.7.2.12.
Shares in other financial assets such as investment funds, equity funds or bond funds that previously
were classified as available for sale will, in the future, be accounted for at fair value and recognized in
income (fair value through profit or loss, or “FVTPL”). Past fluctuations in value previously reported in
cumulative total comprehensive income, before deferred tax assets of roughly €5 million, will be re-
classified to retained earnings on the initial application date.
The transition to IFRS 9 will have no impact on the presentation of commodity futures and currency
forwards. Likewise, no changes to the accounting treatment of financial liabilities have been identified.
The fair value option for financial liabilities is currently not in use.
For trade receivables and contract assets, the simplified valuation allowance model of IFRS 9.5.5.15(a)
will be applied, even for those trade receivables and contract assets that contain a significant financ-
ing component. Uniper will not resort to the simplified model for lease receivables (IFRS 9.5.5.15(b)).
Expected credit losses pursuant to IFRS 9.5.5 will be calculated by Uniper using the probability-of-de-
fault method (as illustrated in IFRS 9.IE49 et seq). Probabilities of default are determined for signifi-
cant financial assets within credit risk management and are applied both for expected credit losses
pursuant to IFRS 13 and for the purposes of IFRS 9. Whenever possible, probabilities of default are de-
rived from available market data (liquid credit default swaps or liquid debt instruments). If there are
no publicly available market data, an internal credit rating is applied. This ensures that forward-look-
ing information is sufficiently considered within the meaning of IFRS 9.5.5.4.
The financial assets carried at amortized cost that are within the scope of the IFRS 9 valuation allow-
ance model consist to a significant extent of trade receivables. The remaining financial assets undergo
a quarterly assessment to determine whether the credit risk has increased significantly since initial
recognition. If the credit risk is low, it is assumed, pursuant to IFRS 9.5.5.10, not to have increased sig-

144Uniper
Annual Report 2017 Consolidated Financial Statements
nificantly. According to IFRS 9.B5.5.23, a financial instrument with an investment-grade rating is as-
sumed to have low credit risk. On the other hand, if a financial instrument loses its investment-grade
rating after initial recognition, it is assumed that the credit risk has increased significantly.
For the date of initial application, a transition effect including deferred tax assets from the introduction
of the IFRS 9 valuation allowance model was calculated in the amount of roughly €7 million. This addi-
tional expected credit loss will be recognized in retained earnings as of the initial application date.
Uniper will apply the new hedge accounting requirements of IFRS 9 and not make use of the option
provided in IFRS 9.7.2.21. This will not result in any significant effects on the initial application date.
Contracts that were entered into, and continue to be held, for the purpose of receiving or delivering
non-financial items in accordance with expected purchase, sale or usage requirements continue to
qualify for the so-called own-use exemption and are not measured at fair value.
Uniper expects no material impact on, or higher volatility in, its net income as a consequence of the
initial application of IFRS 9, because several transactions are being recognized under the FVTPL mea-
surement category.
Amendments to IFRS 9—Prepayment Features with Negative Compensation
In October 2017, the IASB published amendments to IFRS 9. IFRS 9 currently provides that the cash
flow requirement is not met if lenders are effectively required to pay compensation in the event of ter-
mination by a borrower. Applying the amendments, existing provisions in IFRS 9 relating to termination
rights are modified to allow for measurement at amortized cost or at fair value through other compre-
hensive income even in cases of negative compensation. The IASB further clarifies that, for modified
financial liabilities where the modification does not result in the derecognition of the liability, the carry-
ing amount must be adjusted and such adjustment must be recognized in income. The amendments
shall be applied for the first time for fiscal years beginning on or after January 1, 2019. Voluntary earli-
er application is permitted. The amendments have not yet been adopted by the EU into European law.
Uniper SE is currently evaluating the impact on its Consolidated Financial Statements.
IFRS 15, “Revenue from Contracts with Customers”In May 2014, the IASB published the new standard IFRS 15, “Revenue from Contracts with Customers”
(“IFRS 15”). The objective of IFRS 15 is to establish a uniform set of accounting rules that can be applied
across sectors for revenues and other cash flows arising from a contract with a customer, and thereby
replace with one common standard the many standards and interpretations currently relevant to this
issue. Under IFRS 15, the recognition amount and the timing or period of revenue recognition will, in
the future, follow the so-called 5-step model (identification of a contract with a customer, identifica-
tion of separate performance obligations, determination of the transaction price, possible allocation to
separate performance obligations, determination of revenues collected at a point in time or over time). In
addition, IFRS 15 contains numerous detailed provisions and requirements for extended disclosures.
IFRS 15 shall be applied for the first time for fiscal years beginning on or after January 1, 2018. First-
time adopters have the option of using a fully retrospective or a modified retrospective application method.
The EU adopted the standard into European law in October 2016.
Uniper has decided against early application of the new standard. It will instead be applied in the Uniper
Group for the first time, using the modified retrospective method, effective January 1, 2018.
When it applies IFRS 15 for the first time, Uniper expects, in consideration of an otherwise unchanged en-
vironment and of the fact that, due to the spin-off, Uniper has been a separate legal entity only since
the 2016 fiscal year, that revenues will decline by roughly €10 billion to €11 billion. This is because, pur-
suant to the provisions of IFRS 15 in conjunction with IFRS 9, portions of the existing revenues from Uni-

145
per’s trading operations are no longer considered to be revenues generated from customers. Instead,
they must be reported in future as other operating income, which will increase accordingly as a result.
This will not have any impact on the Group’s net income.
Uniper’s contracts with customers generally contain a performance obligation for which the entire trans-
action price is recognized as revenue when the obligation is satisfied. Progress is usually measured in
the form of units of energy supplied. Uniper therefore applies the simplification provision of IFRS 15.B16,
allowing it to recognize revenue in the amount to which it has a right to invoice. But there are also some
contracts where, in addition to the consumption-based component, the transaction price also includes a
monthly fixed component. This fixed component of the transaction price is currently recognized as reve-
nue on a straight-line basis; pursuant to IFRS 15, it will, in the future, together with the consump-
tion-based transaction-price component, be adjusted to match the customer’s actual consumption pro-
file. The change in the timing of revenue recognition takes place only during fiscal years for contracts
having a seasonal delivery profile, meaning that there will be no impact on the revenue from such con-
tracts for any fiscal year as a whole.
Amendments to IFRS 15, “Revenue from Contracts with Customers”In April 2016, the IASB published amendments to its new standard IFRS 15, “Revenue from Contracts with
Customers.” The amendments relate to the identification of performance obligations, principal-ver-
sus-agent considerations and licenses, and provide additional transitional relief for modified con-
tracts and completed contracts. The IASB concluded that it was not necessary to amend IFRS 15 with
clarifications on collectability and the measurement of non-cash consideration. The amendments shall
be applied for the first time in the first reporting period of a fiscal year that begins on or after January 1,
2018. Earlier application is permitted. The EU has adopted the amendments into European law without
specifying an alternative mandatory effective date.
IFRS 16, “Leases”In May 2016, the IASB published the new standard IFRS 16, “Leases” (“IFRS 16”). IFRS 16 replaces the
existing guidance on leases, which includes IAS 17, “Leases” (“IAS 17”), IFRIC 4, “Determining whether an
Arrangement contains a Lease” (“IFRIC 4”), SIC-15, “Operating leases—incentives” (“SIC-15”), and SIC-27,
“Evaluating the Substance of Transactions Involving the Legal Form of a Lease” (“SIC-27”). IFRS 16 in-
troduces a uniform lessee accounting model. Applying that model, a lessee is required to recognize a
right-of-use asset representing the lessee’s right to use the underlying asset and a financial liability
representing the lessee’s obligation to make future lease payments. There are exemptions for short-
term leases and leases of low-value assets. Lessor accounting remains comparable to that provided by
the existing Leases standard—lessors continue to classify their leases as operating leases or finance
leases. The standard shall be applied for the first time in the first reporting period of a fiscal year that
begins on or after January 1, 2019. Early application is permitted for entities that also apply IFRS 15,
“Revenue from Contracts with Customers,” on or before the date of initial application of IFRS 16. The
standard has been adopted by the EU into European law. Uniper will apply IFRS 16 beginning on Janu-
ary 1, 2018.
The previous determination pursuant to IAS 17 and IFRIC 4 of whether a contract is a lease is main-
tained for existing contracts, in accordance with IFRS 16.C3–C4. The transition to the new lease account-
ing from the existing rules will be accomplished using the modified retrospective method according to
IFRS 16.C5(b); when the 2018 consolidated financial statements are prepared, the comparative informa-
tion for the 2017 fiscal year will not be restated. In principle, right-of-use assets are initially recognized
at the value of the corresponding liabilities. In some cases, the value of right-of-use assets may differ
from the value of the liabilities due to offsetting against existing provisions or as a result of valuation al-
lowances.
Uniper will make use of the option not to apply the new recognition requirements to short-term leases
and to leases of low-value assets (IFRS 16.5) as soon as it applies the new standard.
In the context of the initial application of IFRS 16, Uniper expects an increase in property, plant and
equipment of roughly €245 million (net of valuation allowances of roughly €64 million) and an increase
in financial liabilities of roughly €324 million. Provisions previously recognized for onerous operating

146Uniper
Annual Report 2017 Consolidated Financial Statements
leases in the amount of roughly €3 million, as well as accrued operating liabilities of roughly €2 million,
will be derecognized, and the value of the corresponding right-of-use assets will be reduced by that
same amount. An increase in receivables from finance leases of roughly €10 million is expected in con-
nection with subleases. Deferred tax assets have been recognized in the amount of roughly €11 million.
Retained earnings are expected to diminish by roughly €52 million in total.
Uniper expects no material impact on net income as a consequence of the initial application of IFRS 16.
Expected additional depreciation charges and added interest expense from leases will be offset in the
income statement by the foreseeable relief resulting from the elimination of currently existing lease ex-
penses. In the Consolidated Statement of Cash Flows, the application of IFRS 16 will have a positive im-
pact on cash flow from operating activities and a negative one on cash flow from financing activities,
because a portion of lease payments will in future be presented as repayments of financial liabilities,
and only the interest portion will continue to be classified as operating cash flow. On balance, the de-
scribed impact on the Consolidated Statement of Cash Flows is not material.
Amendments to IFRS 2—Classification and Measurement of Share-based Payment Transactions
In June 2016, the IASB published “Classification and Measurement of Share-based Payment Transactions
(Amendments to IFRS 2)”. IFRS 2, “Share-based Payment,” provides that an entity shall disclose share-
based payment transactions (guaranteed shares, share options or guaranteed share appreciation) in its
financial statements. These include transactions with employees and other parties that are to be settled
in cash, other assets, or equity instruments of the entity. The standard contains specific accounting rules
for cash-settled and equity-settled share-based payment transactions, as well as for transactions in
which the entity or the employee has a choice of settlement. The amendments to IFRS 2 contain clari-
fications and changes relating to the above issues for the accounting treatment of cash-settled share-
based payments that contain a performance condition, the classification of share-based payment
transactions with a net settlement feature for withholding tax obligations and the accounting for modi-
fications of share-based payment transactions from “cash-settled” to “equity-settled.” The amend-
ments shall be applied for the first time in the first reporting period of a fiscal year that begins on or
after January 1, 2018. Earlier application is permitted. The amendments have not yet been adopted by
the EU into European law. Uniper SE expects no material impact on future consolidated financial state-
ments.
Amendments to IAS 28—Long-term Interests in Associates and Joint Ventures
In October 2017, the IASB published amendments to IAS 28. The amendments clarify that IFRS 9 shall
be applied to long-term interests in an associate or a joint venture that form part of the net investment
in that associate or joint venture but are not accounted for under the equity method. The amendments
shall be applied for fiscal years beginning on or after January 1, 2019. Voluntary earlier application is
permitted. The amendments have not yet been adopted by the EU into European law. Uniper is current-
ly evaluating the impact on its consolidated financial statements.
Omnibus Standard to Amend Multiple International Financial Reporting Standards (2014–2016 Cycle)
In the context of its Annual Improvements Process, the IASB revises existing standards. In December 2016,
the IASB published a corresponding omnibus standard. It contains changes to IFRS and their associated
Bases for Conclusions. The revisions affect the standards IFRS 1, IFRS 12 and IAS 28. The amendments
to IFRS 12 shall be applied for fiscal years beginning on or after January 1, 2017; those to IFRS 1 and
IAS 28 for fiscal years beginning on or after January 1, 2018. Earlier application is permitted. The EU
adopted the amendments into European law in February 2018 without specifying alternative mandatory
effective dates. Uniper SE expects no impact on future consolidated financial statements.

147
Omnibus Standard to Amend Multiple International Financial Report-ing Standards (2015–2017 Cycle)
In the context of its Annual Improvements Process, the IASB revises existing standards. In December
2017, the IASB published a corresponding omnibus standard. It contains changes to IFRS and their as-
sociated Bases for Conclusions. The revisions affect the standards IFRS 3, IFRS 11, IAS 12 and IAS 23.
The amendments shall be applied on or after January 1, 2019. Earlier application is permitted. The
amendments have not yet been adopted by the EU into European law. Uniper SE is currently evaluating
the impact on future consolidated financial statements.
IFRIC 22, “Foreign Currency Transactions and Advance Consideration”In December 2016, the IASB published IFRIC 22, “Foreign Currency Transactions and Advance Consider-
ation”. This interpretation addresses an application issue of IAS 21, “The Effects of Changes in Foreign
Exchange Rates.” It clarifies how to determine the date of a transaction that involves advance consider-
ation paid or received in a foreign currency for the purpose of determining the exchange rate. It con-
cludes that the exchange rate to be used for the underlying asset, income or expense shall be deter-
mined based on the date at which the asset or liability arising from the advance consideration is initially
recognized. The interpretation shall be applied on or after January 1, 2018. Earlier application is per-
mitted. The interpretation has not yet been adopted by the EU into European law. Uniper SE expects no
material impact on future consolidated financial statements.
IFRIC 23, “Uncertainty over Income Tax Treatments”In June 2017, the IASB published Interpretation 23 of the IFRS Interpretations Committee. The interpre-
tation governs the accounting treatment to apply to tax liabilities and assets when the income tax
treatment is uncertain. It is assumed in these cases that the tax authorities will conduct a review of the
facts and circumstances, and have full knowledge of all pertinent information when doing so. The inter-
pretation shall be applied for fiscal years beginning on or after January 1, 2019. Voluntary earlier appli-
cation is permitted. The interpretation has not yet been adopted by the EU into European law. Uniper
expects no material impact on future consolidated financial statements.
OtherIn addition to the standards and interpretations already presented above, the IASB issued IFRS 17, “In-
surance Contracts,” in May 2017. IFRS 17 addresses the accounting for insurance contracts and shall
be applied for fiscal years beginning on or after January 1, 2021. Earlier application of IFRS 17 is per-
mitted as long as IFRS 15 and IFRS 9 are also being applied. The standard has not yet been adopted by
the EU into European law. Uniper will evaluate any potential impact on its consolidated financial state-
ments arising from the insurance companies it owns, as well as any interactions with IFRS 15.
(4) Scope of Consolidation, Equity Investments and Disposals
A complete list of all the companies included in the scope of consolidation, as well as the disclosures
on shareholdings required pursuant to Section 313 (2) of the German Commercial Code, which are an
integral part of these Notes to the Financial Statements, are provided in Note 33. The list of sharehold-
ings also contains the information relating to company names, registered offices and equity interests
required pursuant to IFRS 12, as well as the way in which each company is included in the Consolidat-
ed Financial Statements.

148Uniper
Annual Report 2017 Consolidated Financial Statements
Scope of Consolidation
Domestic Foreign Total
Consolidated companies as of January 1, 2017 26 39 65
Additions 1 2 3
Disposals/Mergers – 4 4
Consolidated companies as of December 31, 2017 27 37 64
In the 2017 fiscal year a total of 3 domestic and 12 foreign associated companies were accounted for
under the equity method (2016: 3 domestic and 12 foreign).
Significant Disposals in 2017
Yuzhno-RusskoyeIn March 2017, Uniper Exploration & Production GmbH, Düsseldorf, Germany, entered into an agree-
ment with the Austrian oil and gas company OMV Exploration & Production GmbH (“OMV”), Vienna,
Austria, on the sale of its interest in the Russian gas field Yuzhno-Russkoye. Uniper owned a share of
approximately 25% in Yuzhno-Russkoye through equity investments in OAO Severneftegazprom and AO
Gazprom YRGM Development. OMV is acquiring all of Uniper’s shares in both companies. The economic
effective date of the transaction was January 1, 2017. The value of the transaction is USD 1,850 million
(approximately €1,749 million based on an agreed exchange rate of €1 = USD 1.0575), plus transferred
liquid funds, based on the company’s balance sheet as of December 31, 2016. The transaction had a
negative effect on income of approximately €1.1 billion when it closed at the end of November 2017. It
is composed primarily of the reclassification to the income statement of currency translation differenc-
es of €0.9 billion that had been recognized in other comprehensive income in preceding periods and of
an impairment charge on goodwill of roughly €0.2 billion from the final allocation of goodwill from the
Global Commodities CGU to the disposal group (roughly €0.75 billion in total).
Held as a disposal group in the Global Commodities segment, the major asset and liability items of
these activities as of the disposal date were goodwill (€0.5 billion), other non-current assets (€1.3 bil-
lion) and current assets (€0.1 billion), as well as liabilities (€0.3 billion).
Significant Disposals in 2016
PEG Infrastruktur AG / Nord Stream AGAs of the January 1, 2016, economic effective date, 100% of the shares in PEG Infrastruktur AG (“PEGI”),
Zug, Switzerland, including its equity interest in Nord Stream AG, Zug, Switzerland, were sold to E.ON
Beteiligungen GmbH, Düsseldorf, Germany. The transaction closed in March 2016. The sale resulted in
the deconsolidation of the equity investment shareholding in PEGI, which had been fully consolidated in
the Global Commodities segment, and of the interest in Nord Stream AG accounted for under the equity
method, in the first quarter of 2016. The sale price amounted to approximately €1.0 billion and was re-
ceived in the first quarter of 2016. The transaction generated a gain on disposal of €0.5 billion.
AS Latvijas GāzeOn December 22, 2015, Uniper entered into an agreement to sell 28.974% of the shares in its associate
AS Latvijas Gāze, Riga, Latvia, to the Luxembourg company Marguerite Gas I S.à r.l. The carrying
amount of the investment, which had been reported in the Global Commodities segment, had amount-
ed to around €0.1 billion as of December 31, 2015. The transaction, which closed in January 2016 at a
sale price of around €0.1 billion, resulted in a marginal gain on disposal.
The number of consolidated companies changed as follows:

149
(5) Revenues
At €72,238 million, sales revenues in the 2017 fiscal year were 7% higher than in the previous year
(2016: €67,285 million). The overall increase in sales was primarily attributable to a volume- and
price-related sales increase in the gas business of the Global Commodities segment. In addition to the
increase in gas sales, electricity sales also rose due to higher volumes.
The classification of revenues by segment is presented in Note 31.
(6) Own Work Capitalized
Own work capitalized amounted to €145 million in the 2017 fiscal year (2016: €60 million) and was
generated from engineering and IT services, among other items.
(7) Other Operating Income and Expenses
The table below provides details of other operating income for the periods indicated:
Other Operating Income
€ in millions 2017 2016
Income from exchange rate differences 874 1,163
Gain on derivative financial instruments 8,128 4,714
Gain on disposal of equity investments and securities 31 568
Write-ups of non-current assets 273 460
Gain on disposal of property, plant and equipment 24 29
Miscellaneous 669 543
Total 9,999 7,477
The Uniper Group generally employs derivatives to hedge commodity and currency risks. Gains and
losses on derivative financial instruments relate to the fair value measurement of derivatives under IAS 39.
The principal effects for this item resulted from changes in commodity derivatives measured at market
values.
Income from exchange rate differences consisted primarily of realized gains from currency derivatives
in the amount of €400 million (2016: €548 million) and from the translation of foreign currency assets
and liabilities in the amount of €425 million (2016: €567 million). There also were unrealized currency
effects from translation at the closing rate on the balance sheet date in the amount of €49 million (2016:
€48 million).
Gains on disposals of equity investments and securities did not involve material transactions in the
2017 fiscal year. Gains on disposals of equity investments and securities in the previous year had con-
sisted primarily of the gain on the sale of the shareholding in PEGI, including its equity interest in Nord
Stream AG, to E.ON Beteiligungen GmbH (2016: €528 million).
Write-ups of non-current assets are described in more detail in Note 14.
Miscellaneous other operating income includes €310 million in insurance payments awarded in the re-
porting year for the damage sustained in the previous year by the Berezovskaya 3 power plant unit in
Russia (2016: €76 million). In addition, as in previous years, income from goods and services recharged
was reported under this item in the amount of €99 million (2016: €138 million). Gains on the reversal of
provisions, which are also reported as other operating income, amounted to €32 million (2016: €13 mil-
lion). Gains on the reversal of impairments on loans and receivables amounted to €24 million (2016:
20 million).

150Uniper
Annual Report 2017 Consolidated Financial Statements
The following table provides details of other operating expenses for the periods indicated:
For the reasons for the changes in losses from derivative financial instruments, please refer to the
information on other operating income.
Expenses from exchange rate differences consisted primarily of realized losses from currency derivatives
in the amount of €365 million (2016: €429 million) and from the translation of foreign currency assets
and liabilities in the amount of €516 million (2016: €538 million). There also were unrealized currency
effects from translation at the closing rate on the balance sheet date in the amount of €34 million
(2016: €40 million).
Other taxes in the previous year had included, in particular, the expense recognized for the recognition
of a provision for German real-estate transfer tax in the amount of €236 million, which had arisen in
the context of the spin-off.
The losses on the disposal of equity investments and securities in the reporting year resulted predomi-
nantly from the sale of the stake in the Russian gas field Yuzhno-Russkoye, in the amount of €890 mil-
lion. The loss on disposal includes the realized loss of €890 million from foreign exchange translation
differences that had previously been presented in other comprehensive income.
Miscellaneous other operating expenses in 2017 included third-party services of €155 million (2016:
€182 million) and IT expenditure of €205 million (2016: €215 million).
The line item additionally includes a large number of other transactions and expenses including, for
example, rentals and leases, insurance premiums, and fees.
In the previous year, miscellaneous other operating expenses had included especially an expense of
€1,068 million for the recognition of a provision for onerous contracts in the Global Commodities seg-
ment. Also included in the previous year was the loss of €176 million recognized on the disposal of
property, plant and equipment, which had arisen as a consequence of a fire in Unit 3 of the
Berezovskaya power plant in Russia.
Other Operating Expenses
€ in millions 2017 2016
Loss from exchange rate differences 917 1,019
Loss on derivative financial instruments 7,982 6,404
Taxes other than income taxes 164 439
Loss on disposal of equity investments and securities 911 10
Miscellaneous 836 2,132
Total 10,810 10,004

151
(8) Cost of Materials
The following table provides details of the cost of materials for the periods indicated:
The cost of materials rose to €69,479 million in the 2017 fiscal year (2016: €63,535 million). The increase
in the cost of materials is primarily attributable to higher volumes in electricity procurement and to high-
er volumes and prices in gas procurement. Accordingly, the trend in the cost of materials was almost
identical to the trend in sales.
Expenses for raw materials and supplies and for purchased goods consisted especially of purchases of
gas and electricity in the amount of €61 billion (2016: €58 billion). Network usage charges of
€1,156 million (2016 €1,005 million) are also included in this line item.
Expenses for purchased services mainly comprised maintenance costs totaling €224 million (2016:
€235 million) and other purchased services totaling €505 million (2016: €400 million).
(9) Financial Results
The following table provides details of financial results for the periods indicated:
Cost of Materials
€ in millions 2017 2016
Expenses for raw materials and supplies and for purchased goods 68,628 62,675
Expenses for purchased services 851 860
Total 69,479 63,535
1The measurement categories are described in detail in Note 2.
Financial Results
€ in millions 2017 2016
Income from companies in which equity investments are held 3 12
Impairment charges on other financial assets -27 -2
Income from equity investments -24 10
Income from securities, interest
and similar income 1 172 170
Available for sale 3 3
Loans and receivables 66 61
Other interest income 103 106
Interest and similar expenses 1 -190 -465
Amortized cost -4 -198
Other interest expenses -186 -267
Net interest income -18 -295
Financial results -42 -285
The improvement in financial results for the 2017 fiscal year relative to 2016 was primarily attributable
to the positive change in net interest income, caused by the elimination on non-recurring effects from
the early repayment of a loan in 2016.
Additional positive impacts came from lower interest payments on financial liabilities of €3 million
(2016: €60 million) and from changes in interest rates applied to the discounting of non-current provi-
sions amounting to €12 million (2016: -€36 million). Interest and similar expenses were reduced by
higher capitalized borrowing costs, at €68 million, compared with the previous year (2016: €35 million).

152Uniper
Annual Report 2017 Consolidated Financial Statements
(10) Income Taxes
The following table provides details of income taxes, including deferred taxes, for the periods indicated:
The tax expense in the fiscal year amounted to €408 million, compared with tax income of €1,024 mil-
lion in the previous year. The income before taxes produced a tax expense in 2017 with an associated
tax rate of -314% (2016: 24%), which primarily reflects the level of expenses that are not deductible
for tax purposes. The tax income reported for 2016 had been mainly due to tax-reducing effects on
temporary differences. Of the amount reported as current taxes in the 2017 fiscal year, -€69 million relat-
ed to prior periods (2016: -€9 million).
Of the €309 million in deferred taxes reported in total, an amount of €340 million (2016: -€1,083 mil-
lion) resulted from changes in temporary differences, and an amount of -€31 million (2016: -€101 mil-
lion) from changes in loss carryforwards.
Deferred tax liabilities were not recognized as of the reporting date in respect of differences between the
net assets and the tax bases of subsidiaries and associates (“outside basis differences”) to the extent that
Uniper can control the reversal effect and it is probable that temporary differences will not be reversed
in the foreseeable future. Accordingly, no deferred taxes were recognized on these outside basis differ-
ences totaling €65 million (2016: €544 million).
Income Taxes
€ in millions 2017 2016
Domestic income taxes -27 177
Foreign income taxes 126 -17
Current taxes 99 160
Domestic 305 -1,048
Foreign 4 -136
Deferred taxes 309 -1,184
Total income taxes 408 -1,024
A lower valuation result from the Swedish Nuclear Waste Fund in the amount of -€44 million (2016:
-€21 million) produced a negative effect. Interest and similar expenses further included, aside from pe-
riodic interest accrued on provisions for asset retirement obligations amounting to €85 million (2016:
€67 million), the net interest cost arising from pension provisions in the amount of €19 million (2016:
€17 million). In addition, income from equity investments deteriorated by €34 million to -€24 million be-
cause of higher impairments.

153
Reconciliation to Effective Income Taxes/Tax Rate
2017 2016
€ in millions % € in millions %
Income/Loss before taxes -130 100 -4,258 100
Expected income taxes -40 31 -1,320 31
Foreign tax rate differentials -53 40 106 -2
Changes in tax rate / tax law 1 15 -11 -2 –
Tax effects on tax-free income -84 65 -45 1
Tax effects of non-deductible outlays and permanent differences 206 -158 250 -6
Tax effects on income from companies accounted for under the equity method -1 1 -30 1
Tax effects of goodwill impairment and deconsolidation 2 347 -267 -164 4
Tax effects of changes in value and non-recognition of deferred taxes 16 -12 125 -3
Tax effects of other taxes on income 36 -28 38 -1
Tax effects of income taxes related to other periods -23 17 19 -1
Other -11 8 -1 –
Effective income taxes/tax rate 408 -314 -1,024 24
1Primarily reflects the lower tax rates from the U.S. tax reform.2The figure for 2017 primarily reflects the disposals of AO Gazprom YRGM Development and OAO Severneftegazprom (€68 million from goodwill im-
pairment, €279 million from deconsolidation).
The income tax rate of 31% applicable in Germany is made up of corporate income tax (15%), trade tax
(15%) and the solidarity surcharge (1%). The differences between this rate and the effective rate of tax
are reconciled as follows:
Deferred Tax Assets and Liabilities
€ in millions
December 31, 2017 December 31, 2016
Tax assets Tax liabilities Tax assets Tax liabilities
Intangible assets 86 214 109 459
Property, plant and equipment 150 673 343 689
Financial assets 8 15 11 21
Inventories 30 48 41 12
Receivables 63 4,143 45 4,701
Provisions 1,645 104 2,812 454
Liabilities 3,761 152 4,239 581
Loss carryforwards 220 – 286 –
Other 162 182 194 195
Subtotal 6,125 5,531 8,080 7,112
Changes in value -94 – -364 –
Deferred taxes (gross) 6,031 5,531 7,716 7,112
Offsetting -5,141 -5,141 -5,511 -5,511
Deferred taxes (net) 890 390 2,205 1,601
Current 48 24 897 448
Deferred tax assets and liabilities break down as shown in the following table:
Of the deferred taxes reported, a total of €73 million was recognized directly in equity (2016: 113 million).

154Uniper
Annual Report 2017 Consolidated Financial Statements
The declared tax loss carryforwards as of the dates indicated are as follows:
Income taxes recognized in other comprehensive income during the reporting year break down as fol-
lows:
Tax Loss Carryforwards
€ in millions
December 31
2017 2016
Domestic tax loss carryforwards 261 160
Foreign tax loss carryforwards 1,896 1,697
Total 2,157 1,857
Income Taxes on Components of Other Comprehensive Income
€ in millions
2017 2016
Before
income
taxes
Income
taxes
After
income
taxes
Before
income
taxes
Income
taxes
After
income
taxes
Cash flow hedges -11 2 -9 -22 14 -8
Available-for-sale securities 159 4 163 240 -2 238
Currency translation adjustments 528 -10 518 545 4 549
Remeasurements of defined benefit plans 148 -47 101 -240 109 -131
Companies accounted for under the equity method -33 – -33 156 – 156
Total 791 -51 740 679 125 804
Domestic tax loss carryforwards can only be offset against a maximum of €1 million plus 60% of the to-
tal amount of taxable income over €1 million reported for the respective assessment period (“minimum
taxation” rule); any remaining loss carryforwards can be carried forward without limitation in terms of
time. This rule relating to minimum taxation for corporate income tax purposes also applies to trade
tax loss carryforwards. The domestic tax loss carryforwards result from adding corporate income tax
loss carryforwards amounting to €128 million (2016: €93 million) and trade tax loss carryforwards
amounting to €133 million (2016: €67 million).
Foreign tax loss carryforwards consist primarily of corporate income tax loss carryforwards. A significant
portion of the foreign tax loss carryforwards relates to previous years.
Deferred taxes were not recognized, or were no longer recognized, as of the December 31, 2017, re-
porting date on a total of €942 million (2016: €1,194 million) in foreign loss carryforwards that, for the
most part, do not expire.
No deferred tax assets were recognized in respect of temporary differences amounting to €2,322 mil-
lion (2016: €1,157 million).
As of December 31, 2017, Uniper reported deferred tax assets for companies that incurred losses in the
reporting period or in the prior-year period that exceed the reported deferred tax liabilities by
€842 million. As of December 31, 2016, the excess amount had been €267 million. The basis for rec-
ognizing deferred tax assets is an estimate by management of the extent to which it is probable that
the respective companies will achieve taxable earnings in the future against which the as yet unused
tax losses, tax credits and deductible temporary differences can be offset.

155
(11) Personnel-Related Information
Personnel Costs
The following table provides details of personnel costs for the periods indicated:
Personnel Costs
€ in millions 2017 2016
Wages and salaries 734 932
Social security contributions 127 135
Occupational Pension costs and other employee
benefits 130 112
Occupational Pension costs 129 111
Total 991 1.179
The personnel costs of the Uniper Group fell by €188 million in the 2017 fiscal year to €991 million (2016:
€1,179 million). The decline relative to the previous year is mainly attributable to lower restructuring
expenses. In addition, expenses for wages and salaries and social security contributions were also
lower, mainly as a result of the measures taken under restructuring programs and the associated re-
duction in the workforce. These effects were slightly offset by the integration of service functions of
E. ON Business Services, which in the previous year had been reportable under other operating
expenses as services received, and by an increase in expenses for occupational retirement benefits.
Employees
During the reporting year, Uniper employed an average of 12,575 persons (2016: 12,890). This figure
does not include an average of 221 apprentices (2016: 238), nor does it include interns, board members
and managing directors.
The average headcount by segment broke down as shown in the table below:
Employees
2017 2016
European Generation 5.822 6.248
Global Commodities 1.290 1.263
International Power Generation 4.734 4.953
Administration/Consolidation 729 426
Total 12.575 12.890
Domestic 4.689 4.555
Foreign 7.886 8.335

156Uniper
Annual Report 2017 Consolidated Financial Statements
Share-based Payment
In the 2017 and 2016 fiscal years, employees of the Uniper Group participated in the share-based payment
programs of the Uniper Group and in those of the E.ON Group. In addition, Uniper Group Supervisory
Board members receive a component of their compensation in the form of virtual shares.
Share-based payment plans (employee stock purchase programs in Germany and the UK, as well as the
multi-year bonus, the Uniper Performance Cash Plan and the virtual shares for the Supervisory Board)
generated expenses in 2017 amounting to €25.6 million (2016: €10.5 million).
Employee Stock Purchase Program
Employees of the Uniper Group were promised a one-time special payment after the successful comple-
tion of the spin-off. Employees in Germany will receive this special payment in the form of a package of
Uniper stock with an equivalent value of around €600. The intention is to distribute the stock package
to employees in Germany in two annual tranches with an equivalent value of around €300 each in 2017
and 2018. Employees in the other European countries, except those in Russia, will receive a correspond-
ing gross cash payment. The issue of the first tranche of Uniper shares, as well as the corresponding
payments of around €300, took place in the first half of 2017. No personnel costs were incurred for this
special payment in the 2017 fiscal year (2016: €5 million), since the expense had already been recog-
nized in 2016 through recognition of a corresponding provision at the time the obligation to make the
payment was assumed.
Since the stock exchange listing of Uniper SE in September 2016, Uniper employees in the United
Kingdom have the opportunity to purchase Uniper shares as part of an employee stock purchase pro-
gram and to acquire bonus shares in addition. The expense for the Uniper companies resulting from the
issue of these shares amounted to €0.4 million in 2017 (2016: €0.1 million) and is recorded under “Wag-
es and salaries” as personnel costs.
Prior to the stock exchange listing of Uniper SE in September 2016, Uniper employees in the United
Kingdom had the opportunity to purchase E.ON shares through an employee stock purchase program
and to acquire bonus shares in addition. The expense for the Uniper companies resulting from the is-
sue of these shares had amounted to €0.3 million in 2016 and was also recorded under “Wages and sal-
aries” as personnel costs.
Long-Term Variable Compensation
Members of the Management Board of Uniper SE and selected executives of the Uniper Group receive
share-based payment as a voluntary component of their long-term variable compensation. The purpose
of such compensation is to reward the contribution made to increasing enterprise value and to further
the long-term success of the Company. This variable compensation component, comprising a long-term
incentive effect along with a certain element of risk, provides for a sensible linking of the interests of
shareholders and management.
The following discussion includes reports on the multi-year bonus introduced in 2015 and on the Uni-
per Performance Cash Plan introduced for members of the Management Board of Uniper SE in 2016
and expanded to include selected executives of the Uniper Group in 2017. The Supervisory Board addi-
tionally receives long-term variable compensation in the form of virtual shares.

157
Multi-Year Bonus
In 2015 and 2016, selected executives were granted a multi-year bonus extending over a term of four
years. One Management Board member also received an allocation under the multi-year bonus for
2015. Beneficiaries were informed individually of the target value of the multi-year bonus.
The amount paid out corresponds to the target value if the Uniper share price at the end of the term is
equal to the price after the spin-off. If the share price at the end of the term is higher or lower than the
share price after the spin-off, the amount paid out will increase or decrease relative to the target value
in proportion to the deviation of the share price from the target value. Dividend payments that took place
during the term are included when determining the amount for the multi-year bonus that was prom-
ised in the 2016 fiscal year. However, the maximum allowed payout is twice the target value.
A payout will generally not take place before the end of the four-year term. This is true even if the benefi-
ciary retires beforehand, or if the beneficiary’s contract is terminated on operational grounds or expires
during the term. A payout before the end of the term will take place in the event of a change of control
or on the death of the beneficiary. However, the spin-off of Uniper SE from E.ON SE is not treated as a
change of control. If the service or employment relationship ends before the end of the term for reasons
within the control of the beneficiary, there is no entitlement to a multi-year bonus payout.
Sixty-day average prices are used to determine both the share price after the spin-off and the final
price in order to mitigate the effects of incidental, short-lived price movements.
The plan contains adjustment mechanisms to eliminate the effect of events such as interim corporate
actions.
For accounting purposes, a notional payout determined as of each balance sheet date that is based on
the 60-day average price and prorated according to the respective period elapsed is generally used as
the basis.
The provision for the multi-year bonus as of December 31, 2017, is €14.3 million (2016: €5.0 million).
The expense amounted to €10.8 million in the 2017 fiscal year (2016: €3.5 million).
Uniper Performance Cash Plan
The members of the Management Board and selected executives of Uniper SE received allocations un-
der the Uniper Performance Cash Plan in 2017. The amounts paid out under the Performance Cash
Plan are based on a Long-Term Incentive (“LTI”) target amount, which is granted at the start of the perfor-
mance period as a future entitlement. The plan has a performance period of four years. The perfor-
mance factor on which the payout is based is determined at the end of the performance period using
the absolute Total Shareholder Return (“TSR”). The payout amount is capped at 400% of the target amount
(payout cap). Long-term compensation is generally paid out in cash after the end of the performance peri-
od.
The absolute TSR refers to the total return on Uniper’s stock, and takes into account the performance of
the share price and dividend payments during the four-year performance period. The TSR reflects the
Company’s capital-market performance and thus serves to align the interests and objectives of both man-
agement and shareholders. The initial price is the equal-weighted average closing price (arithmetic mean)
of the last 60 trading days prior to the beginning of the performance period. The final price is determined
by analogy as the arithmetic mean of the closing prices of the last 60 trading days prior to the end of the
performance period. This mitigates the effects of incidental, short-lived price changes.

158Uniper
Annual Report 2017 Consolidated Financial Statements
The LTI payout is subject to firm predefined parameters for the absolute TSR and takes place only upon
reaching a calibrated threshold. If an absolute TSR of 15% is achieved, a payout equivalent to 50% of the
target amount takes place. If the TSR threshold of 15% is not achieved, no LTI payment takes place. An ab-
solute TSR of 25% constitutes 100% target attainment and therefore results in a payout of the full LTI tar-
get amount. The maximum payout of 400% of the target amount is obtained only upon reaching an abso-
lute TSR of 80%. Additional increases in the absolute TSR will not result in additional payouts. Linear
interpolation is used to translate intermediate figures between the specified parameters.
The provision for the Uniper Performance Cash Plan as of December 31, 2017, is €14.2 million (2016:
€0 million). The expense also amounted to €14.2 million in the 2017 fiscal year (2016: €0 million).
Virtual Shares for the Supervisory Board
Supervisory Board members receive a component of 20% of their compensation in the form of variable
compensation. That compensation is granted as a future right to payment in the form of virtual shares.
The virtual shares are used purely for calculation purposes and do not confer on the beneficiary any enti-
tlements or shareholder rights—particularly voting rights or dividend rights. To determine the number of
virtual shares, the variable compensation from the previous year is divided in January of each calendar
year by the 60-day average share price of the Company from the last 60 trading days prior to January 1 of
the current year. After four calendar years, the virtual shares are multiplied by the trading-volume-weight-
ed average share price of the Company from the last 60 trading days prior to January 1 of the fourth cal-
endar year and increased by the amount of dividends paid to shareholders on each share of the Company
over the previous four years. The variable compensation is paid within the first month after the end of the
four-year period and is limited to 200% of the allocation amount.
The provision for the Supervisory Board’s virtual shares as of December 31, 2017, is €0.2 million (2016:
€0 million). The expense also amounted to €0.2 million in the 2017 fiscal year (2016: €0 million).
159
(12) Other Information
Compensation of Supervisory Board and Management Board
Supervisory BoardTotal compensation paid to the Supervisory Board for the 2017 fiscal year amounted to roughly
€1.4 million (2016: €1.0 million). Supervisory Board compensation for 2016 was paid out only after the
first Annual Shareholders Meeting of Uniper SE held on June 8, 2017. A total of €65 thousand (2016:
€13 thousand) was reimbursed for outlays.
In 2017, members of the Supervisory Board were granted a total of 9,925 virtual shares having a fair
value of €0.3 million when they were granted.
There were no outstanding loans or advances to members of the Supervisory Board in the 2017 fiscal
year, nor have any contingencies been entered into in favor of the Supervisory Board.
The Supervisory Board’s compensation plan is presented on pages 84 through 95 in the Compensation
Report.
Additional information about the members of the Supervisory Board is provided on page 232.
Management BoardTotal compensation paid to members of the Management Board amounted to €13.0 million (2016:
€14.6 million). They receive a fixed base salary and other compensation elements (fringe benefits) unre-
lated to performance, as well as performance-based compensation components including the bonus
and share-based payments (as a long-term incentive).
The members of the Management Board were granted allocations under the Uniper Performance Cash
Plan having a fair value of €5.3 million when they were granted.
The one-time special incentive bonus was paid to the members of the Management Board in Decem-
ber 2016. As of the 2016 balance sheet date, however, owing to the terms providing for prorated repay-
ment of the bonus (repayment provisions), no component of the bonus had yet vested. Accordingly, the
special incentive bonus of €4.1 million in total had not yet been included in the total compensation to
be reported for the 2016 fiscal year. A total of 25% of the special incentive bonus vests following the
close of each full year after the registration of the spin-off of Uniper SE from E.ON SE. The vested portion of
the special incentive bonus for the members of the Management Board thus amounted to approxi-
mately €1.0 million in total in the 2017 fiscal year.
Uniper SE has no former Management Board members or managing directors. Accordingly, no pay-
ments to former Management Board members were made either in the reporting year or in the previous
year. Likewise, there are no reportable pension obligations to this group of persons.
Uniper SE and its subsidiaries granted no loans to, and did not enter into any contingencies benefiting,
Management Board members in the 2017 fiscal year.
The compensation plan for the Management Board and the amounts paid to each member of the
Management Board are presented on pages 84 through 95 in the Compensation Report.
Additional information about the members of the Management Board is provided on page 233.

160Uniper
Annual Report 2017 Consolidated Financial Statements
Fees and Services of the Independent Auditor
During the 2017 fiscal year, the following fees for services provided by the independent auditor of the
Consolidated Financial Statements, Pricewaterhouse Coopers (“PwC”) GmbH Wirtschafts prüfungs-
gesellschaft (domestic), and by companies in the international PwC network, were recorded as
expenses:
Independent Auditor Fees
€ in millions 2017 2016
Financial statement audits 10,9 12,6
Domestic 8,4 10,0
Other attestation services 0,4 0,2
Domestic 0,4 0,2
Tax advisory services 0,3 0,1
Domestic 0,3 0,1
Other services 0,2 0,6
Domestic 0,2 0,6
Total 11,8 13,5
Domestic 9,3 10,9
The fees for financial statement audits concern the audit of the Consolidated Financial Statements and
the financial statements of Uniper SE and its affiliates, as well as the review of the interim financial
statements. Additionally included within this category are the examinations of internal control systems
at service providers and project-related reviews performed in the context of the introduction of IT and
internal control systems.
Fees for other attestation services concern, in particular, fees charged for other mandatory and vol untary
audits.
Fees for tax advisory services primarily include analyses of income tax issues and ongoing consulting
related to the prepa ration of tax returns.
Fees for other services consist primarily of specialist support in regulatory issues, as well as advice on
accounting issues for planned transactions.

161
(13) Earnings per Share
The computation of basic and diluted earnings per share for the periods indicated is shown below:
Income/Loss from continuing operations -538 -3,234
Less: Non-controlling interests -118 17
Loss from continuing operations (attributable to shareholders of Uniper SE) -656 -3,217
Net income/loss attributable to shareholders of Uniper SE -656 -3,217
in €
Earnings per share (attributable to shareholders of Uniper SE)
from continuing operations -1.79 -8.79
from net income/loss -1.79 -8.79
Weighted-average number of shares outstanding (in millions) 366 366
Earnings per Share
€ in millions 2017 2016
The computation of diluted earnings per share is identical to that of basic earnings per share because
Uniper SE has issued no potentially dilutive ordinary shares.
Regarding the change in the number of shares outstanding, see also Note 19.

162Uniper
Annual Report 2017 Consolidated Financial Statements
Goodwill, Intangible Assets and Property, Plant and Equipment
€ in millions
Acquisition and production costs
January 1,
2017
Exchange
rate
differences
Changes in
scope of con-
solidation Additions Disposals Transfers
December 31,
2017
Goodwill 5,864 -156 -758 0 0 0 4,950
Customer-related intangible assets 74 – – – – – 74
Contract-based intangible assets 3,191 -126 -1,600 – -1 – 1,464
Technology-based intangible assets 178 -1 4 25 -6 6 206
Internally generated intangible assets 127 – – 16 – 12 155
Intangible assets subject to amortization 3,570 -127 -1,596 41 -7 18 1,899
Intangible assets not subject to amortization 188 -1 – 151 -281 -2 55
Advance payments on intangible assets 42 – – 47 -18 -15 56
Intangible assets 3,800 -129 -1,596 240 -306 2 2,011
Real estate and leasehold rights 1,915 -44 -43 2 -3 1 1,828
Buildings 3,505 -103 -64 28 -14 31 3,383
Technical equipment, plant and machinery 29,291 -504 -407 265 -117 97 28,625
Other equipment, fixtures, furniture and
office equipment 363 -5 -2 13 -61 6 314
Advance payments and construction in progress 2,578 -39 10 571 -7 -138 2,975
Property, plant and equipment 37,652 -695 -504 878 -202 -2 37,127
Changes in Goodwill and in Other Reversals and Impairment Charges by Segment
from January 1, 2017
€ in millions
European Genera-
tion
Global Commodi-
ties
International Power
Generation 2 Uniper Group
Net carrying amount of good-
will as of January 1, 2017 0 2,077 624 2,701
Changes resulting from acquisitions and disposals – -534 – -534
Impairment charges – -224 – -224
Exchange rate differences – -8 -45 -53
Net carrying amount of good-
will as of December 31, 2017 0 1,311 579 1,890
Growth rate (in %) – 1.0 4.0 –
Cost of capital (in %) – 5.1 10.6 –
Other non-current assets 1
Impairment 339 5 5 349
Reversals 157 135 – 292
1Other non-current assets consist of intangible assets and of property, plant and equipment.2Growth rate and cost of capital in local currency.
(14) Goodwill, Intangible Assets and Property, Plant and Equipment
The changes in goodwill and intangible assets, and in property, plant and equipment, are presented
in the tables on the following pages:

163
Accumulated depreciation
Net carrying
amounts
January 1,
2017
Exchange
rate
differences
Changes in
scope of con-
solidation Additions Disposals Transfers Impairment Reversals
December 31,
2017
December 31,
2017
-3,163 103 224 0 0 0 -224 0 -3,060 1,890
-55 – – -9 – – – – -64 9
-1,394 44 506 -34 1 – -1 – -878 587
-137 1 – -26 6 – -1 – -157 49
-70 – – -21 – – – – -91 65
-1,656 45 506 -90 7 – -2 – -1,190 710
-21 – – – 5 – -4 19 -1 54
-2 – – – 1 – – – -1 55
-1,679 46 505 -90 13 – -5 19 -1,191 819
-328 2 8 -8 – – -7 3 -330 1,499
-2,194 42 21 -60 12 – -1 26 -2,154 1,230
-22,418 317 400 -451 74 – -125 244 -21,959 6,667
-279 4 2 -19 41 – – – -251 61
-733 5 – – 5 – -212 – -935 2,040
-25,952 371 431 -539 132 0 -344 273 -25,628 11,496

164Uniper
Annual Report 2017 Consolidated Financial Statements
Goodwill, Intangible Assets and Property, Plant and Equipment
€ in millions
Acquisition and production costs
January 1,
2016
Exchange
rate
differences
Changes in
scope of con-
solidation Additions Disposals Transfers
December 31,
2016
Goodwill 6,013 -149 0 0 0 0 5,864
Customer-related intangible assets 60 – – 14 – – 74
Contract-based intangible assets 2,859 330 1 1 – – 3,191
Technology-based intangible assets 163 1 – 14 -3 3 178
Internally generated intangible assets 104 – 1 22 – – 127
Intangible assets subject to amortization 3,186 331 2 51 -3 3 3,570
Intangible assets not subject to amortization 307 -2 – 205 -321 -1 188
Advance payments on intangible assets 32 – – 20 -9 -1 42
Intangible assets 3,525 329 2 276 -333 1 3,800
Real estate and leasehold rights 1,988 -57 1 – -19 2 1,915
Buildings 3,289 171 – 58 -53 40 3,505
Technical equipment, plant and machinery 29,820 -552 60 298 -504 169 29,291
Other equipment, fixtures, furniture and
office equipment 357 – – 17 -26 15 363
Advance payments and construction in progress 2,326 18 -13 483 -9 -227 2,578
Property, plant and equipment 37,780 -420 48 856 -611 -1 37,652
Changes in Goodwill and in Other Reversals and Impairment Charges by Segment
from January 1, 2016
€ in millions
European Genera-
tion
Global Commodi-
ties
International Power
Generation 2 Uniper Group
Net carrying amount of good-
will as of January 1, 2016 0 2,057 498 2,555
Changes resulting from acquisitions and disposals – – – –
Impairment charges – – – –
Exchange rate differences – 20 126 146
Net carrying amount of good-
will as of December 31, 2016 0 2,077 624 2,701
Growth rate (in %) – 1.5 4.0 –
Cost of capital (in %) – 5.1 and 9.5 10.8 –
Other non-current assets 1
Impairment -2,145 -1,184 -68 -3,397
Reversals 367 93 – 460
1Other non-current assets consist of intangible assets and of property, plant and equipment.2Growth rate and cost of capital in local currency.

165
Accumulated depreciation
Net carrying
amounts
January 1,
2016
Exchange
rate
differences
Changes in
scope of con-
solidation Additions Disposals Transfers Impairment Reversals
December 31,
2016
December 31,
2016
-3,458 295 0 0 0 0 0 0 -3,163 2,701
-46 – – -9 – – – – -55 19
-1,129 -87 – -66 – – -112 – -1,394 1,797
-119 – 1 -20 2 – -1 – -137 41
-56 – – -14 – – – – -70 57
-1,350 -87 1 -109 2 – -113 – -1,656 1,914
-14 – – – – – -7 – -21 167
-2 – – – – – – – -2 40
-1,366 -87 1 -109 2 – -120 – -1,679 2,121
-321 -3 -1 -4 15 – -14 – -328 1,587
-2,012 -34 – -56 9 -1 -115 15 -2,194 1,311
-20,271 601 5 -553 359 1 -2,967 407 -22,418 6,873
-275 3 – -23 17 – -1 – -279 84
-604 7 – – 6 – -180 38 -733 1,845
-23,483 574 4 -636 406 0 -3,277 460 -25,952 11,700

166Uniper
Annual Report 2017 Consolidated Financial Statements
Goodwill and Non-Current Assets
ImpairmentsIFRS 3 prohibits the amortization of goodwill. Instead, goodwill is tested for impairment at least annually
at the level of the cash-generating units. Goodwill must also be tested for impairment at the level of
individual CGUs between these annual tests if events or changes in circumstances indicate that the re-
coverable amount of a particular CGU might be impaired. Intangible assets subject to amortization
and property, plant and equipment must generally be tested for impairment whenever there are partic-
ular events or external circumstances indicating the possibility of impairment. Uniper performs its an-
nual goodwill impairment test in the fourth quarter of the fiscal year. To determine the recoverable
amounts used to test goodwill for impairment in the Global Commodities and International Power Gener-
ation CGUs, Uniper applies the “value in use” concept. The European Generation CGU carries no good-
will.
The impairment testing of goodwill is generally derived from the respective individual measurements
of the particular sub-units (“sum of the parts” measurement). Within the Global Commodities CGU, valu-
ations are based on the medium-term corporate planning authorized by the Management Board. The
calculations are generally based on the three planning years of the medium-term plan plus a period of
long-term planning. Subsequent to the long-term planning calculations, a terminal value is assessed.
Long-term planning was based on a period ending in 2035, particularly against the backdrop of long-
term contractual relationships in trading and in the gas-storage business.
The value in use for the International Power Generation CGU is determined to a great extent by the
Russian generation activities and is deemed to be the value in use in local currency, established in line
with the regulatory framework over a detailed planning period of 15 years. The after-tax cost of capital
at the International Power Generation CGU was 10.6% in local currency (2016: 10.8%); at the Global
Commodities CGU, it was 5.1% (2016: 5.1% and 9.5% respectively).
The cash flow assumptions extending beyond the detailed planning period are determined using seg-
ment-specific growth rates that are based on historical analysis and prospective forecasting. The growth
rates used are generally derived from the inflation rates in the respective countries where the CGUs
operate. The growth rate used for the Global Commodities CGU was 1.0% (2016: 1.5%), and the growth
rate used for the International Power Generation CGU was 4.0% (2016: 4.0%).
The principal assumptions underlying the determination by management of the recoverable amount
are the respective forecasts for commodity market prices, future electricity and gas prices in the
wholesale and retail markets, the seasonal price difference in gas markets (known as the “sum-
mer-winter spread”) in the gas-storage business, Uniper’s investment activity, changes in the regula-
tory framework, as well as for rates of growth and the cost of capital. These assumptions are based on
publicly available market data, on external market analyses and on internal estimates based on past
experience.
The growth rates and costs of capital given in the preceding tables headed “Changes in Goodwill and in
Other Reversals and Impairment Charges by Segment” relate only to those units making a significant
value contribution to the respective CGU.
Goodwill impairment testing performed in the fourth quarter of the 2017 fiscal year necessitated no rec-
ognition of impairment charges (2016: €0 million). The recoverable amounts of both the Global Com-
modities and the International Power Generation CGUs significantly exceed their respective carrying
amounts with the result that, based on the current assessment of the economic situation, only a signifi-
cant change in the material valuation parameters would necessitate the recognition of impairment
charges on goodwill.
In the course of the sale of the stake in the Russian gas field Yuzhno-Russkoye, an impairment charge
on the goodwill attributable to the disposal group was recognized in the amount of €0.2 billion (for de-
tails on the disposal, see Note 4).

167
The above discussion for goodwill applies accordingly to the testing for impairment of intangible assets
and of property, plant and equipment, and of groups of these assets. In the European Generation seg-
ment, for example, the tests are based on the respective remaining useful life and on other plant-specif-
ic valuation parameters. Uniper makes the general assumption that the electricity market in Europe will
not return to equilibrium without regulatory involvement. Appropriate compensation elements are taken
into account. Uncertainties relating to the deteriorated regulatory environment have been taken into
account by means of scenario evaluations. The recoverable amounts were generally calculated as fair
values using Level 3 inputs pursuant to IFRS 13.
Because impairments were recognized on a large number of assets in previous years, especially relating
to property, plant and equipment in the European Generation segment, the assets involved are particu-
larly sensitive in subsequent years to future changes in the principal assumptions used to determine their
recoverable amounts. Accordingly, the medium-term corporate planning authorized by the Management
Board in the fourth quarter, combined with the regular updates of the cost of capital and of the fore-
casts for commodity market prices and for future electricity and gas prices in the wholesale and retail
markets, led to a large number of adjustments. The most substantial individual impairments in terms
of amount related to two power plants within and outside Germany held in the European Generation
segment and amounted to approximately €0.1 billion each. The impairments had in each case been
necessitated by amended estimates relative to the previous year concerning their future operation.
The after-tax interest rates used for discounting cash flows were determined using market data for
each CGU and ranged between 5.2% and 5.8% as of the valuation date. The remaining impairments and
reversals recognized in the reporting year were not material.
During the previous year, in the second quarter of 2016, Uniper had determined impairments on property,
plant and equipment totaling €2.8 billion, of which €1.8 billion had been attributable to the European
Generation segment and €1.0 billion to the Global Commodities segment, as well as an additional impair-
ment of €0.1 billion on intangible assets in the Global Commodities segment. The most substantial indi-
vidual items in terms of amount had related to two conventional power plants outside Germany, at
€0.8 billion and €0.7 billion (recoverable amounts: €0.7 billion and €0.3 billion), respectively, and to stor-
age infrastructure outside Germany, at €0.5 billion (recoverable amount: €0 billion). Reasons for these
impairments had included, in particular, amended estimates of the regulatory conditions and the change
in the market environment, which had led to a deterioration in forecast earnings for the affected as-
sets. The after-tax interest rates used for discounting cash flows had been determined using market
data for each CGU and had ranged between 5.4% and 6.1% as of the valuation date.
A large number of individual impairments (totaling approximately €0.5 billion) and reversals (totaling
approximately €0.5 billion) had also been recognized on property, plant and equipment in the fourth
quarter of the 2016 fiscal year. Of the impairments, approximately €0.4 billion was attributable to the
European Generation segment and approximately €0.1 billion each to the Global Commodities and In-
ternational Power Generation segments. In European Generation, the most substantial individual items
in terms of amount related to two conventional power plants in Germany (€0.1 billion each) and a fur-
ther charge relating to the two conventional power plants outside Germany that had already been
written down in the second quarter (€0.1 billion each). The recoverable amounts of the two conven-
tional power plants outside Germany as of December 31, 2016, were €0.7 billion and €0.2 billion, re-
spectively. Of the reversals, approximately €0.3 billion was attributable to the European Generation
segment and €0.1 billion to the Global Commodities segment. The after-tax interest rates used for
discounting cash flows had ranged between 5.2% and 5.9% as of the valuation date, and the rate used
for the impairment tests on conventional power plants in Russia had been 10.8% in local currency after
taxes.
A total of €0.3 billion (2016: €3.3 billion) in impairments was charged to property, plant and equipment
in the 2017 fiscal year.
Impairments on intangible assets totaled €5 million in the 2017 fiscal year (2016: €120 million).
Reversals of impairments recognized in previous years totaled roughly €0.3 billion in the 2017 fiscal
year (2016: €0.4 billion).

168Uniper
Annual Report 2017 Consolidated Financial Statements
Some of the leases contain price-adjustment clauses, as well as extension and purchase options.
The corresponding payment obligations under finance leases are due as shown below:
Intangible Assets
Amortization of intangible assets amounted to €90 million in 2017 (2016: €109 million). Impairment
charges on intangible assets amounted to €5 million in the reporting year (2016: €120 million).
Reversals of impairments on intangible assets totaled €19 million in 2017 (2016: €0 million).
€2 million in research and development costs as defined by IAS 38 were expensed in the reporting year
(2016: €5 million).
Intangible assets decreased by €1,093 million in 2017 in connection with the disposal of the stake in
the Russian gas field Yuzhno-Russkoye.
Property, Plant and Equipment
Borrowing costs in the amount of €68 million were capitalized in the reporting year (2016: €35 million)
as part of the historical cost of property, plant and equipment.
The depreciation expense for property, plant and equipment amounted to €539 million in 2017 (2016:
€636 million). Impairment charges were recognized on property, plant and equipment in the amount of
€344 million (2016: €3,277 million). A total of €273 million in reversals of impairments on property,
plant and equipment was recognized in the reporting year (2016: €460 million).
Especially gas storage facilities and IT infrastructure are utilized under finance leases and capitalized
in the Consolidated Financial Statements because the economic ownership of the assets leased is at-
tributable to Uniper.
The property, plant and equipment thus capitalized had the following net carrying amounts as of Decem-
ber 31, 2017:
The present value of the minimum lease obligations is reported under liabilities from leases.
Uniper as Lessee—Carrying Amounts of Capitalized Lease Assets
€ in millions
December 31
2017 2016
Technical equipment, plant and machinery 394 388
Other equipment, fixtures, furniture and office equipment 1 23
Net carrying amount of capitalized lease assets 395 411
Uniper as Lessee—Payment Obligations under Finance Leases
€ in millions
Minimum lease payments Covered interest share Present values
2017 2016 2017 2016 2017 2016
Due within 1 year 47 74 37 45 10 29
Due in 1 to 5 years 183 180 143 139 40 41
Due in more than 5 years 968 1,014 566 601 402 413
Total 1,198 1,268 746 785 452 483

169
Regarding future obligations under operating leases where economic ownership is not transferred to
Uniper, see Note 25.
The Uniper Group also functions in the capacity of lessor. Future lease installments receivable under
operating leases are due as shown below:
Uniper as Lessor—Operating Leases
€ in millions 2017 2016
Due within 1 year 4 5
Due in 1 to 5 years 6 12
Due in more than 5 years 4 6
Total 14 23
See Note 17 for information on receivables from finance leases.
(15) Companies Accounted for under the Equity Method and Other Financial Assets
The following table shows the structure of the companies accounted for under the equity method and
the other financial assets as of the dates indicated:
Companies Accounted for under the Equity Method and Other Financial Assets
€ in millions
December 31, 2017 December 31, 2016
Uniper Group Associates 1Joint
ventures 1 Uniper Group Associates 1Joint
ventures 1
Companies accounted for under the
equity method 448 422 26 827 707 120
Equity investments 710 22 13 568 22 26
Non-current securities 104 – – 160 – –
Total 1,262 444 39 1,555 729 146
1The associates and Joint ventures presented as equity investments are associated companies and Joint ventures accounted for at cost on materiality grounds.
The amount shown for non-current securities relates primarily to fixed-income securities.
In the 2017 fiscal year, impairment charges on companies accounted for under the equity method
amounted to €88 million (2016: €12 million) and related to a Brazilian investment in the International
Power Generation segment in the amount of €59 million and an Italian investment in the Global Com-
modities segment in the amount of €29 million. The impairment charges in the 2016 fiscal year related
mainly to an Italian investment in the Global Commodities segment in the amount of €12 million.
Impairments on other financial assets amounted to €27 million (2016: €2 million). The carrying amount
of impaired other financial assets was €13 million as of December 31, 2016 (2016: €0 million).

170Uniper
Annual Report 2017 Consolidated Financial Statements
Shares in Companies Accounted for under the Equity Method
OAO Severneftegazprom had been presented as a material associate in 2016. It was sold in 2017. As a
result, disclosures according to IFRS 12 are no longer required for this company. The proportional
share of net income attributable to the Company in the reporting year was €42 million (2016: €59 mil-
lion), and the corresponding proportional share of other comprehensive income was -€18 million
(2016: €46 million). For the 2017 fiscal year, no other companies are considered to be material associ-
ates.
The carrying amounts of the immaterial associates accounted for under the equity method amounted
to €422 million (2016: €470 million), and those of the joint ventures amounted to €26 million (2016:
€120 million).
Investment income received by Uniper from companies accounted for under the equity method amount-
ed to €109 million in the reporting year (2016: €99 million).
The following table summarizes significant line items of the aggregated statements of comprehensive
income of the individually immaterial associates and joint ventures that are accounted for under the eq-
uity method:
The carrying amounts of companies accounted for under the equity method whose shares are market-
able totaled €22 million (2016: €71 million). The fair values of those shares amounted to €72 million
(2016: €61 million).
As of the balance sheet date, no investments in associates were restricted as collateral for financing
(2016: €237 million).
There are no further material restrictions apart from those contained in standard legal and contractual
provisions.
Summarized Financial Information for Individually Immaterial Associates and
Joint Ventures Accounted for under the Equity Method
€ in millions
Associates Joint ventures Total
2017 2016 2017 2016 2017 2016
Proportional share of net income 52 46 -80 -23 -28 23
Proportional share of other comprehensive income -4 2 -11 20 -15 22
Proportional share of total comprehensive income 48 48 -91 -3 -43 45

171
Inventories
€ in millions
December 31
2017 2016
Raw materials and supplies 592 707
Goods purchased for resale 1,031 997
Work in progress and finished products 36 42
Total 1,659 1,746
Receivables and Other Assets
€ in millions
December 31, 2017 December 31, 2016
Current Non-current Current Non-current
Receivables from finance leases 16 194 15 209
Other financial receivables and financial assets 1,179 3,114 1,253 2,845
Financial receivables and other financial assets 1,195 3,308 1,268 3,054
Trade receivables 7,126 – 7,353 –
Receivables from derivative financial instruments 8,241 3,008 10,139 3,638
Other operating assets 796 198 758 219
Trade receivables and other operating assets 16,163 3,206 18,250 3,857
Total 17,358 6,514 19,518 6,911
(16) Inventories
The following table provides a breakdown of inventories as of the dates indicated:
Raw materials, goods purchased for resale and finished products are generally valued at average cost.
Valuation allowances in 2017 amounted to €37 million (2016: €130 million) and related primarily to
uranium and nuclear fuel rods and to raw materials and supplies. No material reversals were recog-
nized in 2017 (2016: €22 million).
No inventories have been pledged as collateral.
(17) Receivables and Other Assets
The following table lists receivables and other assets by remaining time to maturity as of the dates
indicated:

172Uniper
Annual Report 2017 Consolidated Financial Statements
Based on the provisions of IFRIC 5, other financial assets include a claim for a refund from the Swedish
Nuclear Waste Fund in the amount of €2,331 million (2016: €2,388 million) in connection with the de-
commissioning and dismantling of nuclear power plants and nuclear waste disposal. Of this total,
€138 million (2016: €117 million) is reported under current financial assets, and €2,193 million (2016:
€2,271 million) under non-current financial assets. Since this asset is designated for a particular pur-
pose, the Uniper Group’s access to it is restricted.
In addition, current financial receivables include margin account deposits for stock exchange futures
transactions amounting to €432 million (2016: €449 million), and non-current financial receivables
include shareholder loans amounting to €525 million (2016: €558 million).
Other financial receivables include restricted cash of €65 million (2016: €55 million) deposited in the
context of OTC transactions.
The aging schedule for trade receivables is as follows:
Aging Schedule of Trade Receivables
€ in millions
December 31
2017 2016
Not impaired and not past-due 6,907 6,988
Not impaired and past-due by 149 239
up to 60 days 138 222
61 to 90 days – 3
91 to 180 days 7 4
181 to 360 days 3 –
more than 360 days 1 10
Net value of impaired receivables 70 126
Total trade receivables 7,126 7,353
Valuation Allowances for Trade Receivables
€ in millions 2017 2016
Balance as of January 1 -128 -120
Change in scope of consolidation -1 2
Write-downs -4 -23
Reversals of write-downs 24 20
Disposals 32 5
Other 1 5 -12
Balance as of December 31 -72 -128
1“Other” includes also currency translation adjustments.
The individual impaired receivables are due from customers from whom it is unlikely that full repayment
will ever be received. Receivables are monitored within the individual companies.

173
Receivables from finance leases are primarily the result of certain electricity delivery contracts that
must be treated as leases according to IFRIC 4. The nominal and present values of the outstanding lease
payments have the following due dates:
In the reporting year, there was €112 million in restricted cash (2016: €10 million) with a maturity of
less than three months.
Cash and cash equivalents include €831 million (2016: €138 million) in cash on hand and balances in
Bundesbank accounts and at other financial institutions with an original maturity of less than three
months, to the extent that they are not restricted.
Uniper as Lessor—Finance Leases
€ in millions
Gross investment in finance
lease arrangements Unrealized interest income
Present value of minimum
lease payments
2017 2016 2017 2016 2017 2016
Due within 1 year 28 32 16 17 12 15
Due in 1 to 5 years 109 115 58 63 51 52
Due in more than 5
years 217 242 70 85 147 157
Total 354 389 144 165 210 224
Liquid Funds
€ in millions
December 31
2017 2016
Current securities with an original maturity greater than 3 months 64 162
Restricted cash and cash equivalents 112 10
Cash and cash equivalents 851 169
Total 1,027 341
The present value of the outstanding lease payments is reported under receivables from finance leases.
(18) Liquid Funds
The following table provides a breakdown of liquid funds by original maturity as of the dates indicated:
174Uniper
Annual Report 2017 Consolidated Financial Statements
(19) Equity
Upon completion of the reorganization under corporate law at the start of the 2016 fiscal year, the Uni-
per Group came into existence within the meaning of IFRS, with Uniper SE as the parent company. Since
January 1, 2016, Uniper SE has thus been the sole parent company of the Uniper Group.
On January 19, 2016, the Annual Shareholders Meeting of Uniper AG (today’s Uniper SE), in preparation
for the spin-off, resolved to increase the capital stock of €283,445,000 by €6,779,578 to €290,224,578
and to divide it into 170,720,340 no-par-value registered shares, each representing a notional interest
in the capital stock of €1.70.
The conversion of Uniper AG into a European Company (“SE”), which was resolved by the Annual Share-
holders Meeting of Uniper AG on March 23, 2016, and took effect on April 14, 2016, when it was entered
in the relevant commercial register, did not change the capital stock of €290,224,578 or the division
thereof into 170,720,340 no-par value registered shares, each representing a notional interest in the
capital stock of €1.70. There are no restrictions on the transferability of the Company’s shares.
The no-par-value shares are fully paid in. Each no-par-value share represents a notional interest in the
capital stock of €1.70 and carries full dividend rights from January 1, 2016. On March 30, 2016, E.ON
Beteiligungen GmbH paid an amount of €120 million into the free capital reserves of Uniper SE.
Also on March 30, 2016, Uniper Beteiligungs GmbH paid an amount of €145 million into the free capital
reserves of Uniper Holding GmbH.
The Annual Shareholders Meeting of Uniper SE approved the spin-off on May 24, 2016; the Annual Share-
holders Meeting of E.ON SE gave its approval on June 8, 2016. After the spin-off was recorded in the
commercial register file for Uniper SE, and then in the corresponding file for E.ON SE, all of the shares
in Uniper Beteiligungs GmbH were spun off from E.ON SE to Uniper SE on September 9, 2016. Share-
holders of E.ON SE were allotted new shares of Uniper SE as consideration for this spin-off, as a result
of which shareholders of E.ON SE have acquired 53.35% of the shares of Uniper SE and the ownership
interest of the E.ON Group—held indirectly via E.ON Beteiligungen GmbH—has been diluted to 46.65%.
In this context, the capital stock of Uniper SE was increased by €331,907,422, and the additional paid-in
capital by €6,637 million. A total of €7,623 million was reclassified from non-controlling interests to equity
attributable to shareholders of Uniper SE; accordingly, retained earnings of €2,750 million and other
comprehensive income (“OCI”) of -€2,096 million were recognized. With the spin-off of Uniper Beteili-
gungs GmbH, the number of shares increased to 365,960,000.
The shares of Uniper SE were admitted to the Frankfurt Stock Exchange’s regulated market for trading in
its subsegment with additional post-admission obligations (the “Prime Standard”) on September 9, 2016,
and official trading commenced on September 12, 2016.
At the Annual Shareholders Meeting on June 6, 2018, shareholders will vote on a proposal that the net
income available for distribution of €270,810,400 be used to distribute a dividend of €0.74 per share
(365,960,000 shares) of the dividend-paying capital stock of €622.1 million.
Retained Earnings
As of December 31, 2017, retained earnings amounted to €3,399 million (2016: €4,156 million). Of this
amount, €21.6 million is subject to the distribution restriction pursuant to Section 268 (8), sentence 3,
in conjunction with sentence 1, of the German Commercial Code (“HGB”) and in accordance with Sec-
tion 253 (6), sentence 2, HGB.
The individual components of equity and their development are presented in the Statement of Changes
in Equity of the Uniper Group.

175
Information on Stockholders of Uniper SE
The following ownership interests pursuant to Section 160 (1), no. 8, of the German Stock Corporation
Act existing as of the reporting date have been communicated to the Company:
Authorized Capital
The Management Board was authorized, subject to the Supervisory Board’s consent, to increase the
Company’s capital stock until June 30, 2021, by up to €145,112,289 through the issue on one or more
occasions of up to 85,360,170 new no-par-value registered shares against cash and/or non-cash con-
tributions. The Management Board may, subject to the Supervisory Board’s consent, exclude the sub-
scription right that must, in principle, be granted to shareholders. Such exclusion of subscription rights
is possible when shares are issued against cash contributions in the amount of up to 10% of the capital
stock then existing or—should this value be lower—the capital stock existing when the authorization is
exercised. Subscription rights may also be excluded when shares are issued against non-cash contri-
butions, but only to the extent that the shares issued under such authorization against non-cash contribu-
tions do not represent in the aggregate more than 20% of the capital stock then existing or—should this
value be lower—the capital stock existing when the authorization is exercised. Furthermore, shareholder
subscription rights may also be excluded with regard to fractional amounts and when shares are issued
to persons employed by the Company or one of its affiliates.
Contingent Capital
The Management Board is authorized, subject to the Supervisory Board’s consent, to issue debt instru-
ments during the period up to June 30, 2021, having a total nominal value of up to €1,000,000,000 that,
respectively, grant rights or impose obligations of conversion or purchase, in accordance with the relevant
terms and conditions of the bonds and warrants, with respect to up to 85,360,170 no-par-value regis-
tered shares of the Company, representing a pro-rata interest in its capital stock of up to €145,112,289
in total, to or on the holders or creditors of the bonds or warrants. The bonds may also be issued by an
affiliate of the Company against cash and/or non-cash contributions. Here, too, the Management Board
may, with the Supervisory Board’s consent, exclude the subscription right to which shareholders are
entitled in principle. In connection with these convertible bonds and warrant-linked bonds, conditional
capital was created by shareholder resolution. Pursuant thereto, the capital stock is conditionally in-
creased by up to €145,112,289 through the issue of up to 85,360,170 no-par-value registered shares
for the purpose of granting shares upon exercise of rights and obligations of conversion or purchase.
Information on Stockholders of Uniper SE
Stockholder
Date of
notice
Threshold
exceeded
Gained voting
rights on Allocation
Voting rights
Percent-
ages Absolute
E.ON Beteiligungen GmbH, Düsseldorf Sep. 13, 2016 50% Sep. 9, 2016 direct 46,65% 170.720.340
Republic of Finland, Helsinki, Finland Sep. 27, 2017 30% Sep. 26, 2017 indirect 46,65% 1 170.720.340
BlackRock Inc. Wilmington, U.S. Dec. 6, 2017 3% Nov. 30, 2017 indirect 4,19% 15.326.768
Paul E. Singer Dec. 19, 2017 5% Dec. 12, 2017 indirect 7,38% 26.996.906
Eric Knight Dec. 22, 2017 5% Dec. 21, 2017 indirect 5,02% 18.374.165
1Instrument pursuant to Section 25, WpHG

176Uniper
Annual Report 2017 Consolidated Financial Statements
Treasury Shares
By resolution dated August 30, 2016, the Company is authorized to purchase own shares representing
up to a total of 10% of the capital stock existing when the resolution was adopted until June 30, 2021. At
the Management Board’s discretion, such purchase may take place on the stock exchange, by way of a
purchase offer addressed to all shareholders, a public offering or a public solicitation of offers for the
exchange of liquid exchange shares for Company shares (a so-called “exchange offer”), or through the
use of derivatives (put or call options or a combination of both). The Management Board is also autho-
rized, subject to the Supervisory Board’s consent and excluding shareholder subscription rights, to use
shares of the Company in a specified manner. The Management Board is further authorized to cancel
treasury shares without requiring a separate shareholder resolution to that effect.
(20) Accumulated Other Comprehensive Income
Cumulative currency translation differences represent the principal component of accumulated OCI. Cu-
mulative translation losses of €890 million were reclassified to the income statement in connection with
the disposal of the stake in the Russian gas field Yuzhno-Russkoye.
The share of accumulated OCI attributable to companies accounted for under the equity method is il-
lustrated in the table below:
(21) Non-Controlling Interests
Non-controlling interests by segment as of the dates indicated are shown in the following table:
Non-controlling interests
€ in millions
December 31
2017 2016
European Generation 381 342
Global Commodities – 1
International Power Generation 261 239
Administration/Consolidation – –
Total 642 582
Share of OCI Attributable to Companies Accounted for under the Equity Method
€ in millions 2017 2016
Balance as of December 31 (before taxes) -183 -150
Taxes 3 3
Balance as of December 31 (after taxes) -180 -147
The increase of €60 million in non-controlling interests in 2017 resulted primarily from current earn-
ings in the International Power Generation and European Generation segments. In the 2016 compara-
tive period, the increase of €42 million in non-controlling interests had resulted mainly from currency
effects in the International Power Generation segment.
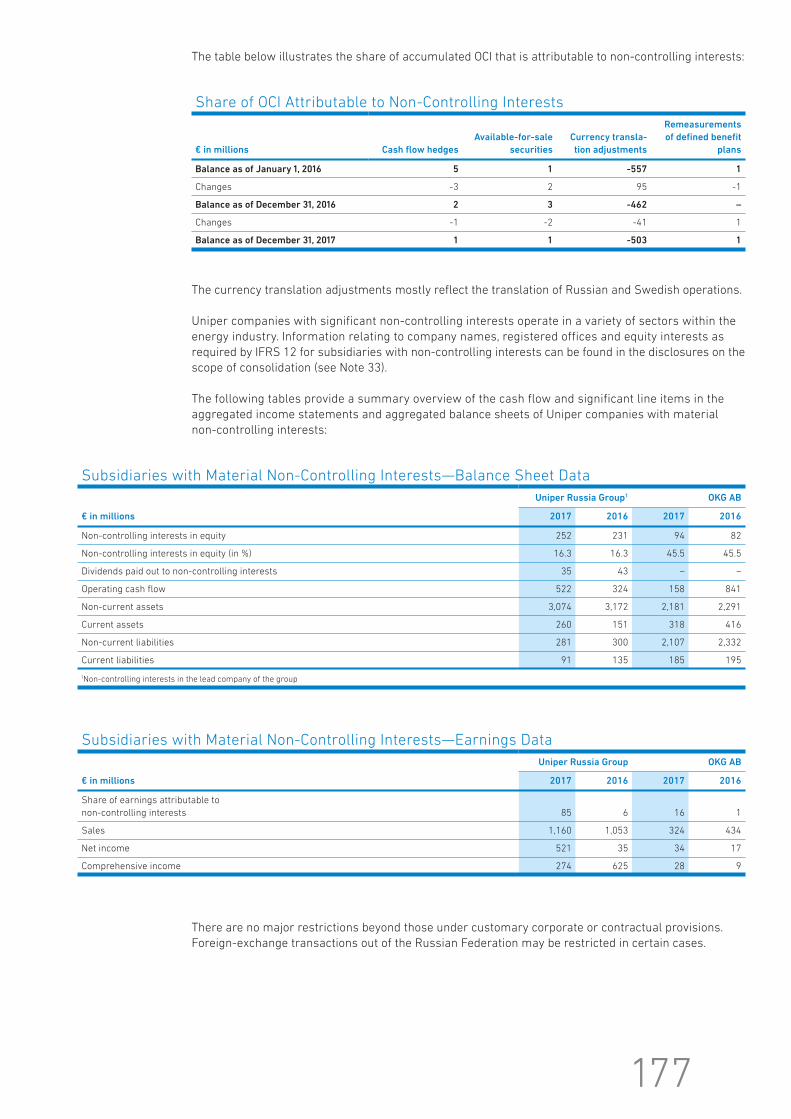
177
The table below illustrates the share of accumulated OCI that is attributable to non-controlling interests:
There are no major restrictions beyond those under customary corporate or contractual provisions.
Foreign-exchange transactions out of the Russian Federation may be restricted in certain cases.
Share of OCI Attributable to Non-Controlling Interests
€ in millions Cash flow hedges
Available-for-sale
securities
Currency transla-
tion adjustments
Remeasurements
of defined benefit
plans
Balance as of January 1, 2016 5 1 -557 1
Changes -3 2 95 -1
Balance as of December 31, 2016 2 3 -462 –
Changes -1 -2 -41 1
Balance as of December 31, 2017 1 1 -503 1
Subsidiaries with Material Non-Controlling Interests—Balance Sheet Data
€ in millions
Uniper Russia Group 1 OKG AB
2017 2016 2017 2016
Non-controlling interests in equity 252 231 94 82
Non-controlling interests in equity (in %) 16.3 16.3 45.5 45.5
Dividends paid out to non-controlling interests 35 43 – –
Operating cash flow 522 324 158 841
Non-current assets 3,074 3,172 2,181 2,291
Current assets 260 151 318 416
Non-current liabilities 281 300 2,107 2,332
Current liabilities 91 135 185 195
1Non-controlling interests in the lead company of the group
Subsidiaries with Material Non-Controlling Interests—Earnings Data
€ in millions
Uniper Russia Group OKG AB
2017 2016 2017 2016
Share of earnings attributable to
non-controlling interests 85 6 16 1
Sales 1,160 1,053 324 434
Net income 521 35 34 17
Comprehensive income 274 625 28 9
The currency translation adjustments mostly reflect the translation of Russian and Swedish operations.
Uniper companies with significant non-controlling interests operate in a variety of sectors within the
energy industry. Information relating to company names, registered offices and equity interests as
required by IFRS 12 for subsidiaries with non-controlling interests can be found in the disclosures on the
scope of consolidation (see Note 33).
The following tables provide a summary overview of the cash flow and significant line items in the
aggregated income statements and aggregated balance sheets of Uniper companies with material
non-controlling interests:
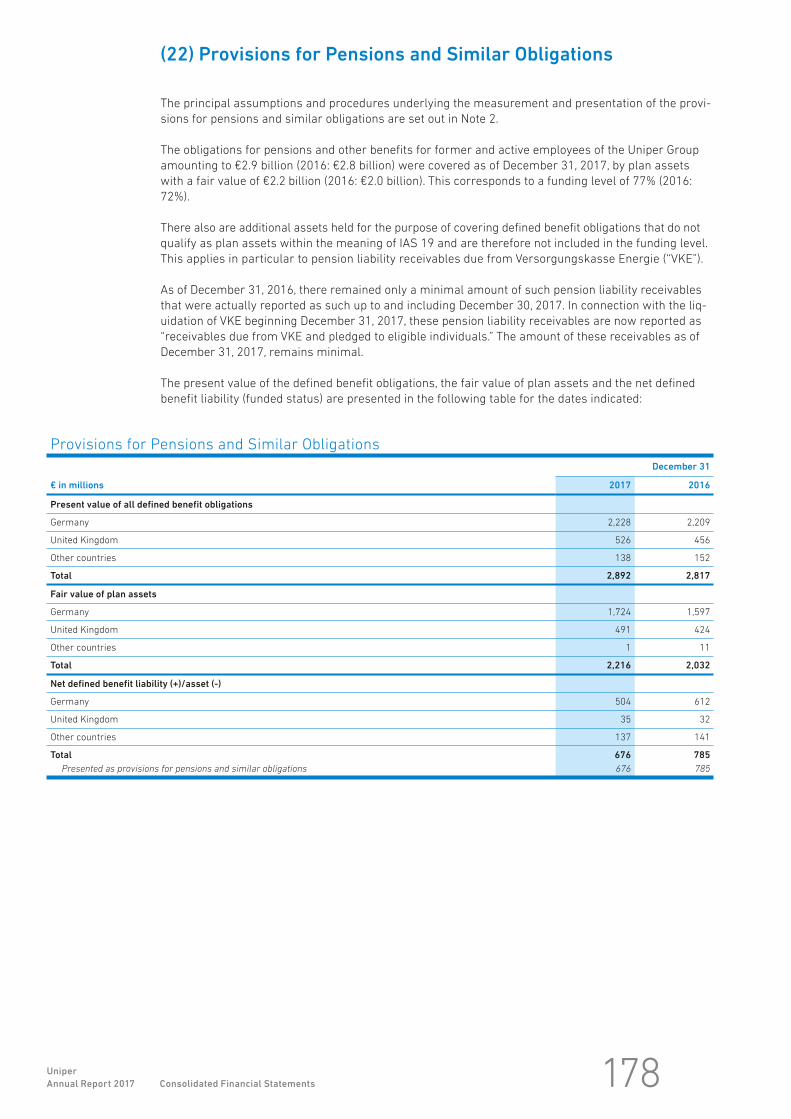
178Uniper
Annual Report 2017 Consolidated Financial Statements
(22) Provisions for Pensions and Similar Obligations
The principal assumptions and procedures underlying the measurement and presentation of the provi-
sions for pensions and similar obligations are set out in Note 2.
The obligations for pensions and other benefits for former and active employees of the Uniper Group
amounting to €2.9 billion (2016: €2.8 billion) were covered as of December 31, 2017, by plan assets
with a fair value of €2.2 billion (2016: €2.0 billion). This corresponds to a funding level of 77% (2016:
72%).
There also are additional assets held for the purpose of covering defined benefit obligations that do not
qualify as plan assets within the meaning of IAS 19 and are therefore not included in the funding level.
This applies in particular to pension liability receivables due from Versorgungskasse Energie (“VKE”).
As of December 31, 2016, there remained only a minimal amount of such pension liability receivables
that were actually reported as such up to and including December 30, 2017. In connection with the liq-
uidation of VKE beginning December 31, 2017, these pension liability receivables are now reported as
“receivables due from VKE and pledged to eligible individuals.” The amount of these receivables as of
December 31, 2017, remains minimal.
The present value of the defined benefit obligations, the fair value of plan assets and the net defined
benefit liability (funded status) are presented in the following table for the dates indicated:
Provisions for Pensions and Similar Obligations
€ in millions
December 31
2017 2016
Present value of all defined benefit obligations
Germany 2,228 2,209
United Kingdom 526 456
Other countries 138 152
Total 2,892 2,817
Fair value of plan assets
Germany 1,724 1,597
United Kingdom 491 424
Other countries 1 11
Total 2,216 2,032
Net defined benefit liability (+)/asset (-)
Germany 504 612
United Kingdom 35 32
Other countries 137 141
Total 676 785
Presented as provisions for pensions and similar obligations 676 785

179
Description of the Benefit Plans
In addition to their entitlements under government retirement systems and the income from private
retirement planning, most active and former Uniper Group employees are also covered by occupational
benefit plans. Both defined benefit plans and defined contribution plans are in place at Uniper. Benefits
under defined benefit plans are generally paid upon reaching retirement age, or in the event of disability
or death.
The pension plans within the Uniper Group are regularly reviewed with respect to their financial risks.
Typical risk factors for defined benefit plans are longevity and changes in nominal interest rates, as
well as increases in inflation and rising wages and salaries. In order to avoid exposure to future risks
from occupational benefit plans, newly designed pension plans were introduced at the major German
and foreign Uniper Group companies beginning in 1998. Virtually all employees hired at Uniper Group
companies after 1998 are now covered by benefit plans for which the risk factors can be better calcu-
lated and controlled as presented below.
The existing entitlements under defined benefit plans as of the balance sheet date cover about 10,500
active employees (2016: 10,700), about 4,900 retirees and surviving dependents (2016: 4,600) and about
2,900 former employees with vested entitlements (2016: 2,600). The corresponding present value of the
defined benefit obligations is attributable to active employees in the amount of roughly €1.5 billion
(2016: €1.5 billion), to retirees and surviving dependents in the amount of roughly €0.7 billion (2016:
€0.6 billion) and to former employees with vested entitlements in the amount of roughly €0.7 billion
(2016: €0.7 billion).
The features and risks of defined benefit plans are regularly shaped by the general legal, tax and regula-
tory conditions prevailing in the respective country. Described below are the configurations of the ma-
jor defined benefit and defined contribution pension plans within the Uniper Group.
GermanyActive employees at German Uniper companies are predominantly covered by defined contribution
benefit plans. In addition, some final-pay arrangements, and a small number of fixed-amount arrange-
ments, still exist under individual contracts.
The majority of the reported benefit obligation toward active employees is centered on the “BAS Plan,”
a pension unit system launched in 2001, and on the “Zukunftssicherung” plan, a variant of the "BAS
Plan" that emerged from the harmonization in 2004 of numerous benefit plans granted in the past. In
the “Zukunftssicherung” benefit plan, vested final-pay entitlements are considered in addition to the de-
fined contribution pension units when determining the benefit. These plans are closed to new hires.
The plans described in the preceding paragraph generally provide for ongoing pension benefits that
generally are payable upon reaching the age threshold, or in the event of disability or death.
The only plan open for new hires is a defined contribution plan. This plan is a “units of capital” system
that provides for the alternative payout options of a prorated single payment and payments of install-
ments in addition to the payment of a regular pension.
The benefit expense for all the defined contribution plans mentioned above is dependent on compensa-
tion and is determined at different percentage rates based on the ratio between compensation and the
contribution limit in the statutory retirement pension system in Germany. Employees can additionally
choose to defer compensation. The defined contribution plans contain different interest rate assumptions
for the pension units and the units of capital, respectively. Whereas fixed interest rate assumptions
apply for both the “BAS Plan” and the “Zukunfts sicherung” plan, the units of capital for the open de-
fined contribution plan earn interest at the average yield of long-term government bonds of the Federal
Republic of Germany observed in the fiscal year. Future pension increases at a rate of 1% p.a. are guaran-
teed for a portion of the eligible individuals including, in particular, a large number of active employees.
For the remaining eligible individuals, pensions are adjusted mostly in line with the rate of inflation,
usually in a three-year cycle.

180Uniper
Annual Report 2017 Consolidated Financial Statements
Pension plans at the German Uniper companies are funded through designated pension vehicles that
are legally distinct from the Company.
In addition to plan assets administered by smaller German pension vehicles (“Pensionskassen”), plan
assets in the form of a Contractual Trust Arrangement (“CTA”) were established to fund domestic pen-
sion plans for most of the German Uniper companies. The plan assets of the CTA are administered by
Uniper Pension Trust e. V. as trustee on the basis of the investment principles specified for it.
With regard to the funding of pension commitments that to date had been covered by VKE, the method
of occupational retirement provision was changed to a pension fund commitment in the first quarter of
2016. As part of the transition, corresponding pension liability receivables of €0.2 billion were settled by
VKE by way of direct payments to the newly established Group-wide pension fund, which is qualified un-
der IAS 19 as plan assets, to repay the Uniper companies’ one-off contribution obligations owed to the
pension fund. The assets contributed to the pension fund thus provide the funding for the obligations
transferred to the pension fund that had previously been covered through VKE.
In the first quarter of 2018, owing to the liquidation of VKE beginning December 31, 2017, the method of
occupational retirement provision for those pension commitments that were still almost entirely cov-
ered by VKE up to and including December 30, 2017, will be changed to a pension fund commitment, as
had previously been done in the first quarter of 2016. In this context, the “receivables due from VKE and
pledged to eligible individuals” that were reported up to and including December 30, 2017, as pension
liability receivables due from VKE and accounted for as of December 31, 2017, in the “Operating receiv-
ables and other operating assets” line item, will be transferred to the Group-wide pension fund by way
of a direct payment by VKE.
Only the Pensionskassen vehicles and the pension fund are subject to regulatory provisions in relation to
the investment of capital and funding requirements.
United KingdomIn the United Kingdom, there are various pension plans. During the reporting period, Uniper employees
in the United Kingdom participated in pension plans set up by Uniper UK Limited, which have now re-
placed the corresponding formerly applicable pension plans of E.ON UK plc.
The structure of the pension plans of Uniper UK Limited is as follows: Until 2008, employees were cov-
ered by defined benefit plans, which for the most part were final salary plans and made up the majority
of the pension obligations then reported for Uniper’s employees in the United Kingdom. These plans
were closed to employees hired subsequently. Since December 2008, new hires have been offered a pure
defined contribution plan. Aside from the payment of employer and employee contributions, this plan
entails no additional risks for the employer.
Plan assets in the United Kingdom covering the benefit obligations under the final salary and retirement
balance plans (excluding those of the defined contribution plan, which is established by contract) are ad-
ministered by Uniper UK Trustees Limited in its capacity as trustee of the Uniper Group of the Electricity
Supply Pensions Scheme (“Uniper Group of the ESPS”). The trustees are respectively chosen by the
members of the Uniper Group of the ESPS or appointed by the company Uniper UK Limited. In that ca-
pacity, the trustees are wholly responsible for the investment of the plan assets and to that end they
have appointed a fiduciary manager.

181
Employees who had transferred from E.ON companies in the United Kingdom to Uniper companies in the
United Kingdom during 2017 had the choice of leaving their entitlements earned prior to the transfer with
the E.ON companies in the United Kingdom or having them transferred to the Uniper Group of the ESPS.
Based on the employees’ decision, the plan assets actually transferred to the Uniper Group of the ESPS
were ultimately determined by the trustees of E.ON UK Pension Trust as the transferring trustee, in coor-
dination with the trustees of the Uniper Group of the ESPS.
Benefit payments to the beneficiaries of the existing defined benefit pension plans are adjusted for infla-
tion as measured by the UK Retail Price Index (“RPI”).
The Pensions Regulator in the United Kingdom requires that a valuation of the funding of pension plans
in the United Kingdom be performed at least once every three years. The actuarial assumptions un-
derlying the valuation are agreed between the trustees of Uniper UK Pension Trustees Limited and
Uniper UK Limited. They include presumed life expectancy, wage and salary growth rates, investment
returns, inflationary assumptions and interest rate levels. The effective date for the initial valuation of
the Uniper Group of the ESPS was March 31, 2016. The valuation resulted in a technical funding deficit of
£43 million. The agreed deficit repair plan provides for a one-off repair payment of £10 million in 2017
and further annual payments of £3.2 million to the Uniper Group of the ESPS from 2020 through 2025.
The results from the valuation were communicated to members in September 2017.
Other CountriesThe remaining pension obligations are spread across various international activities of the Uniper Group.
However, the defined benefit and defined contribution plans in Belgium, France, the Netherlands, Russia,
Sweden, Hungary, the Czech Republic and the USA are largely of minor significance from the perspec-
tive of the Uniper Group.

182Uniper
Annual Report 2017 Consolidated Financial Statements
Description of the Benefit Obligation
The following table shows the changes in the present value of the defined benefit obligations for the
periods indicated:
The benefit obligations in the other countries as of the December 31, 2017, reporting date relate most-
ly to the Uniper companies in France, in the amount of €126 million (2016: €129 million).
Changes in the Defined Benefit Obligation
€ in millions
2017 2016
Total Germany
United
Kingdom
Other
countries Total Germany
United
Kingdom
Other
countries
Defined benefit obligation as of January 1 2,817 2,209 456 152 2,366 1,850 378 138
Employer service cost 80 56 21 3 71 49 19 3
Past service cost 13 7 7 -1 2 1 2 -1
Gains (-) and losses (+) on settlements 7 5 2 – 10 10 – –
Interest cost on the present value of the defined benefit ob-
ligations 71 53 14 4 75 57 14 4
Remeasurements -83 -104 29 -8 350 236 105 9
Actuarial gains (-)/losses (+) arising from changes in de-
mographic assumptions -4 – -3 -1 – – – –
Actuarial gains (-)/losses (+) arising from changes in finan-
cial assumptions -24 -86 61 1 371 240 113 18
Actuarial gains (-)/losses (+) arising from experience ad-
justments -55 -18 -29 -8 -21 -4 -8 -9
Benefit payments -48 -40 -6 -2 -41 -36 -2 -3
Exchange rate differences -17 – -17 – -58 – -60 2
Other 52 42 20 -10 42 42 – –
Defined benefit obligation as of December 31 2,892 2,228 526 138 2,817 2,209 456 152
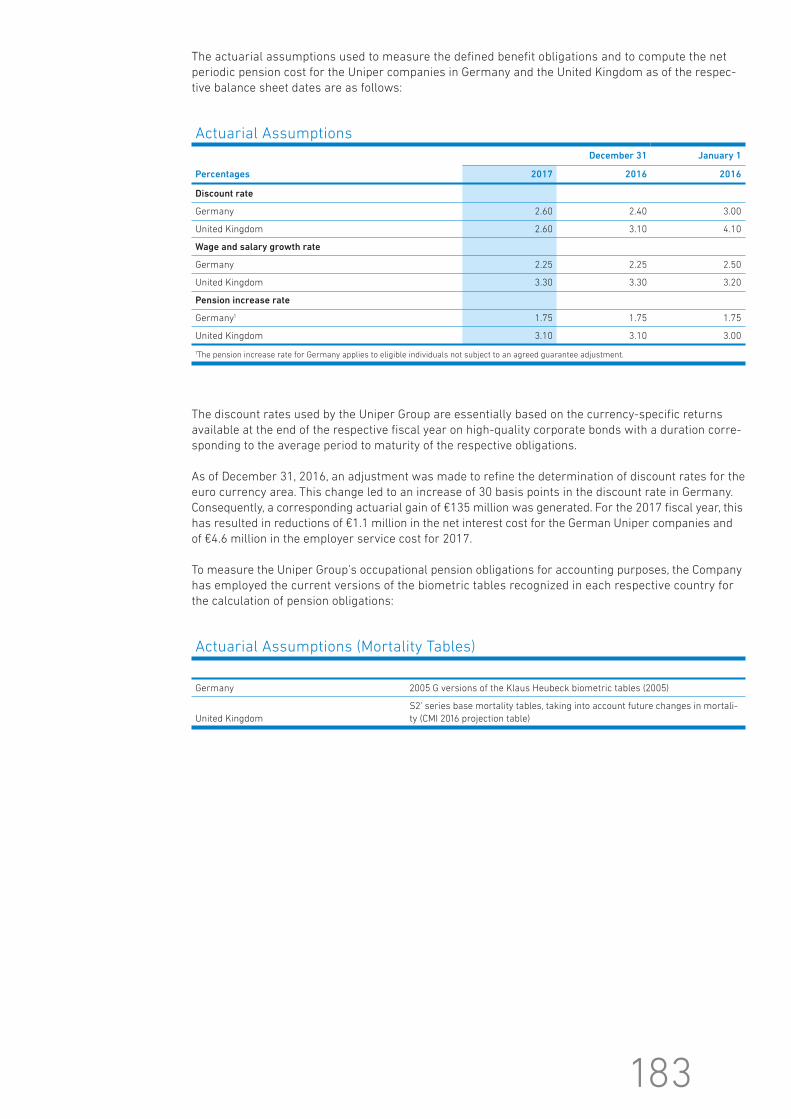
183
The actuarial assumptions used to measure the defined benefit obligations and to compute the net
periodic pension cost for the Uniper companies in Germany and the United Kingdom as of the respec-
tive balance sheet dates are as follows:
The discount rates used by the Uniper Group are essentially based on the currency-specific returns
available at the end of the respective fiscal year on high-quality corporate bonds with a duration corre-
sponding to the average period to maturity of the respective obligations.
As of December 31, 2016, an adjustment was made to refine the determination of discount rates for the
euro currency area. This change led to an increase of 30 basis points in the discount rate in Germany.
Consequently, a corresponding actuarial gain of €135 million was generated. For the 2017 fiscal year, this
has resulted in reductions of €1.1 million in the net interest cost for the German Uniper companies and
of €4.6 million in the employer service cost for 2017.
To measure the Uniper Group’s occupational pension obligations for accounting purposes, the Company
has employed the current versions of the biometric tables recognized in each respective country for
the calculation of pension obligations:
Actuarial Assumptions
Percentages
December 31 January 1
2017 2016 2016
Discount rate
Germany 2.60 2.40 3.00
United Kingdom 2.60 3.10 4.10
Wage and salary growth rate
Germany 2.25 2.25 2.50
United Kingdom 3.30 3.30 3.20
Pension increase rate
Germany 1 1.75 1.75 1.75
United Kingdom 3.10 3.10 3.00
1The pension increase rate for Germany applies to eligible individuals not subject to an agreed guarantee adjustment.
Actuarial Assumptions (Mortality Tables)
Germany 2005 G versions of the Klaus Heubeck biometric tables (2005)
United Kingdom
S2’ series base mortality tables, taking into account future changes in mortali-
ty (CMI 2016 projection table)
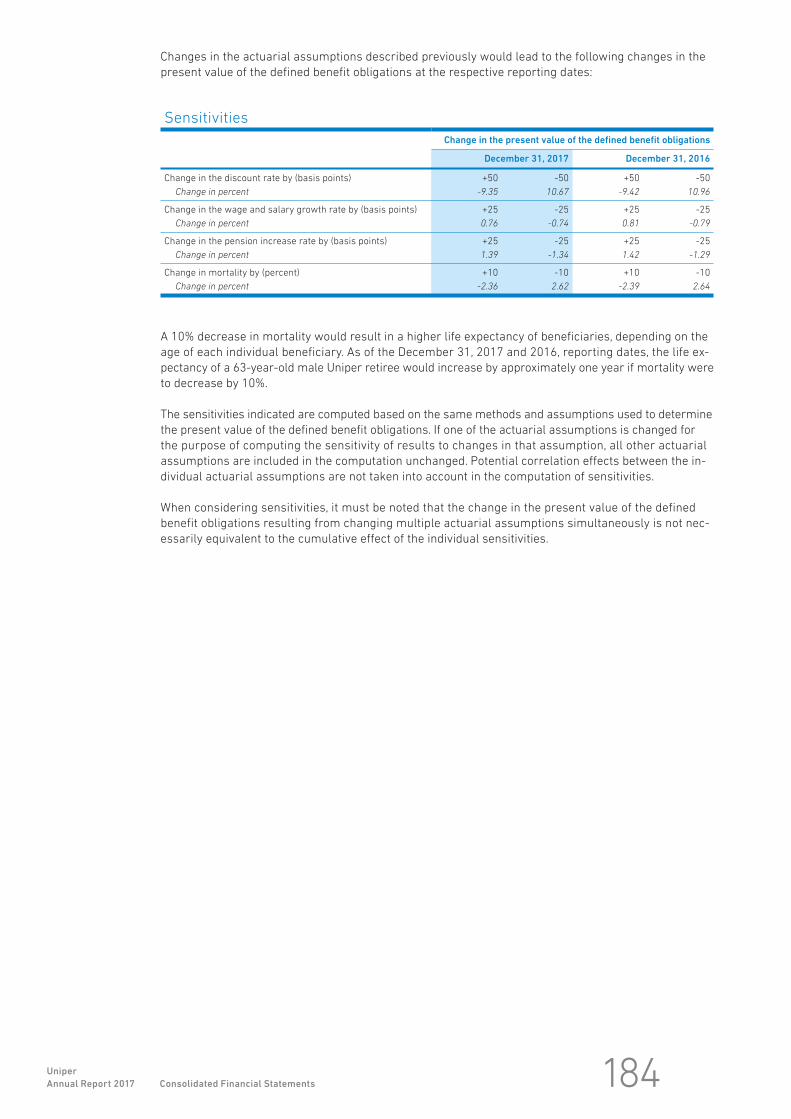
184Uniper
Annual Report 2017 Consolidated Financial Statements
Changes in the actuarial assumptions described previously would lead to the following changes in the
present value of the defined benefit obligations at the respective reporting dates:
A 10% decrease in mortality would result in a higher life expectancy of beneficiaries, depending on the
age of each individual beneficiary. As of the December 31, 2017 and 2016, reporting dates, the life ex-
pectancy of a 63-year-old male Uniper retiree would increase by approximately one year if mortality were
to decrease by 10%.
The sensitivities indicated are computed based on the same methods and assumptions used to determine
the present value of the defined benefit obligations. If one of the actuarial assumptions is changed for
the purpose of computing the sensitivity of results to changes in that assumption, all other actuarial
assumptions are included in the computation unchanged. Potential correlation effects between the in-
dividual actuarial assumptions are not taken into account in the computation of sensitivities.
When considering sensitivities, it must be noted that the change in the present value of the defined
benefit obligations resulting from changing multiple actuarial assumptions simultaneously is not nec-
essarily equivalent to the cumulative effect of the individual sensitivities.
Sensitivities
Change in the present value of the defined benefit obligations
December 31, 2017 December 31, 2016
Change in the discount rate by (basis points) +50 -50 +50 -50
Change in percent -9.35 10.67 -9.42 10.96
Change in the wage and salary growth rate by (basis points) +25 -25 +25 -25
Change in percent 0.76 -0.74 0.81 -0.79
Change in the pension increase rate by (basis points) +25 -25 +25 -25
Change in percent 1.39 -1.34 1.42 -1.29
Change in mortality by (percent) +10 -10 +10 -10
Change in percent -2.36 2.62 -2.39 2.64

185
Changes in the Fair Value of Plan Assets
€ in millions
2017 2016
Total Germany
United
Kingdom
Other
countries Total Germany
United
Kingdom
Other
countries
Fair value of plan assets as of January 1 2,032 1,597 424 11 1,572 1,181 380 11
Interest income on plan assets 52 39 13 – 58 44 14 –
Remeasurements 66 49 17 – 110 47 63 –
Return on plan assets recognized in equity, not including
amounts contained in the interest income on plan assets 66 49 17 – 110 47 63 –
Employer contributions 118 78 39 1 360 332 27 1
Benefit payments -46 -39 -6 -1 -37 -34 -2 -1
Exchange rate differences -16 – -16 – -58 – -58 –
Other 10 – 20 -10 27 27 – –
Fair value of plan assets as of December 31 2,216 1,724 491 1 2,032 1,597 424 11
Description of Plan Assets and the Investment Policy
The defined benefit plans are funded by plan assets held in designated pension vehicles that are legal-
ly distinct from the Company. The fair value of these plan assets changed as follows:
The increase in plan assets in the 2017 fiscal year is principally attributable to the addition of further
employer contributions and the return generated.
In 2016, the increase in plan assets had primarily resulted from the implementation of the Group-
wide pension fund and its funding in the amount of the former liability receivables of Uniper companies
due from VKE, as well as from the addition of further employer contributions and the return generated.
The actual return on plan assets in 2017 was a gain of €118 million (2016: €168 million).
Plan assets during the reporting period included virtually no owner-occupied real estate, and virtually
no equity or debt instruments, of Uniper companies.

186Uniper
Annual Report 2017 Consolidated Financial Statements
Each of the individual plan asset components has been allocated to an asset class based on its sub-
stance. The plan assets thus classified break down as shown in the following table:
The primary investment objective for the plan assets is to provide full coverage of benefit obligations at
all times for the payments due under the corresponding benefit plans. To that end, the target portfolio
structure is reviewed periodically in the context of asset-liability management (“ALM”) studies on the
basis of existing investment principles, the structure of the benefit obligations and the condition of the
capital markets, and is adjusted as necessary. The long-term investment strategy thus derived seeks to
ensure that any changes in the defined benefit obligation, especially those caused by fluctuating inflation
and interest rates are, to a certain degree, offset by simultaneous corresponding changes in the fair val-
ue of plan assets. The investment strategy may also involve the use of derivatives (for example, inter-
est rate swaps and inflation swaps, as well as currency hedging instruments) to facilitate the control
of specific risk factors of pension liabilities. In the table above, derivatives have been allocated, based
on their substance, to the respective asset classes in which they are used. In order to improve the fund-
ed status and the funding level at the Uniper Group over the long term, a portion of the plan assets is
also invested in a diversified portfolio of asset classes that are expected to provide for long-term re-
turns in excess of those of fixed-income investments and thus in excess of the discount rate. Asset man-
agers are tasked with implementing the target portfolio structure and monitored for target attainment
on a regular basis.
Since the spring of 2017, portfolio management for the CTA has been based on the first ever ALM study
performed by Uniper, which has replaced the E.ON study previously used as the basis.
This investment policy stems from the corresponding governance guidelines of the Uniper Group,
which have replaced the guidelines of the E.ON Group that had applied prior to the spin-off. In these
guidelines, a deterioration of the funding level and the funded status, as well as the cumulative loss of
value of the plan assets, are identified as a risk for the CTA and controlled accordingly by specifying risk
budgets. Changes in these indicators are also regularly reviewed in order to monitor this risk.
1Since 2016, asset management in the United Kingdom has been performed by an appointed fiduciary manager. Plan assets are invested in investment funds (“pooled funds”) that
are not listed in an active market. The “Other” category of assets consists primarily of “liability hedging” assets and hedge funds.
Classification of Plan Assets
Percentages
December 31, 2017 December 31, 2016
Total Germany
United
Kingdom 1Other
countries Total Germany
United
Kingdom 1Other
countries
Plan assets listed in an active market
Equity securities (stocks) 27 34 – 24 24 30 – 2
Debt securities 42 54 – 40 46 59 – 97
Government bonds 25 33 – – 29 37 – –
Corporate bonds 17 21 – 40 17 22 – 97
Other investment funds – – – 8 – – – –
Total listed plan assets 69 88 0 72 70 89 0 99
Plan assets not listed in an active market
Equity securities not traded on an exchange 6 – 28 – 7 – 33 –
Debt securities 2 – 8 15 2 – 8 1
Real estate 9 10 5 – 9 10 5 –
Cash and cash equivalents 3 2 9 13 2 1 7 –
Other 1 11 – 50 – 10 – 47 –
Total unlisted plan assets 31 12 100 28 30 11 100 1
Total 100 100 100 100 100 100 100 100

187
In the United Kingdom, Uniper’s plan assets are invested by a fiduciary manager appointed by the trustee
of the Uniper Group of the ESPS. Within the confines of previously defined general terms, the fiducia-
ry manager invests the plan assets in a liability hedging component and a growth component. The lia-
bility hedging component aims to match a percentage of the fixed interest- and inflation-linked pension
obligations through the use of “leveraged gilt funds” and cash. The growth component invests in a di-
verse range of asset classes and investment funds, with the target of achieving asset growth in excess of
the growth of the liabilities over the long term. The appointment of the fiduciary manager notwith-
standing, the trustee retains overall responsibility for the plan assets and, accordingly, for their in-
vestment. The trustee further controls how much plan assets should be invested in each component,
as well as the percentage of the liabilities to be hedged.
Description of the Pension Cost
The net periodic pension cost for defined benefit plans included in the “Provisions for pensions and
similar obligations” balance sheet item is shown in the table below:
Net Periodic Pension Cost
€ in millions
2017 2016
Total Germany
United
Kingdom
Other
countries Total Germany
United
Kingdom
Other
countries
Employer service cost 80 56 21 3 71 49 19 3
Past service cost 13 7 7 -1 2 1 2 -1
Gains (-) and losses (+) on settlements 7 5 2 – 10 10 – –
Net interest on the net
defined benefit liability/asset 19 14 1 4 17 13 – 4
Total 119 82 31 6 100 73 21 6

188Uniper
Annual Report 2017 Consolidated Financial Statements
The past service cost for 2017 and 2016 consists mostly of expenses incurred in the context of restruc-
turing measures.
In addition to the total net periodic pension cost for defined benefit plans, an amount of €26 million in
fixed contributions to external insurers or similar institutions was paid in 2017 (2016: €26 million) for
pure defined contribution plans.
Contributions to state plans totaled €0.1 billion (2016: €0.1 billion).
Description of Contributions and Benefit Payments
In 2017, Uniper made employer contributions to plan assets totaling €118 million (2016: €360 million)
to fund existing defined benefit obligations.
For the 2018 fiscal year, it is expected that employer contributions to plan assets for the Uniper Group
will amount to a total of €86 million and primarily involve the funding of new and existing benefit obli-
gations, with an amount of €22 million attributable to foreign companies.
Benefit payments to cover defined benefit obligations totaled €48 million in 2017 (2016: €41 million);
of this amount, €2 million (2016: €4 million) was not paid out of plan assets.
Prospective benefit payments under the defined benefit plans existing as of December 31, 2017, for the
next ten years are shown in the following table:
As of December 31, 2017, the duration of the defined benefit obligations measured within the Uniper
Group was 23.5 years (2016: 23.8 years).
Prospective Benefit Payments
€ in millions Total Germany United Kingdom Other countries
2018 57 47 3 7
2019 63 55 3 5
2020 65 56 3 6
2021 71 62 4 5
2022 80 69 6 5
2023–2027 488 421 43 24
Total 824 710 62 52

189
Description of the Net Defined Benefit Liability
The recognized net liability from the Uniper Group’s defined benefit plans results from the difference
between the present value of the defined benefit obligations and the fair value of plan assets:
Changes in the Net Defined Benefit Liability
€ in millions
2017 2016
Total Germany
United
Kingdom
Other
countries Total Germany
United
Kingdom
Other
countries
Net liability as of January 1 785 612 32 141 794 669 -2 127
Net periodic pension cost 119 82 31 6 100 73 21 6
Changes from remeasurements -149 -153 12 -8 240 189 42 9
Employer contributions to plan assets -118 -78 -39 -1 -360 -332 -27 -1
Net benefit payments -2 -1 – -1 -4 -2 – -2
Exchange rate differences -1 – -1 – – – -2 2
Other 42 42 – – 15 15 – –
Net liability as of December 31 676 504 35 137 785 612 32 141
Miscellaneous Provisions
€ in millions
December 31, 2017 December 31, 2016
Current
Non-
current Current
Non-
current
Nuclear waste management obligations 142 2,256 117 2,343
Personnel obligations 110 353 214 402
Other asset retirement obligations 52 859 33 909
Supplier-related obligations 105 999 197 1,133
Generation-related obligations 228 576 215 582
Distribution-related obligations 125 362 165 528
Customer-related obligations 136 16 190 11
Environmental remediation and similar obligations 19 350 52 304
Other 445 297 583 305
Total 1,362 6,068 1,766 6,517
(23) Miscellaneous Provisions
The following table lists the miscellaneous provisions as of the dates indicated:
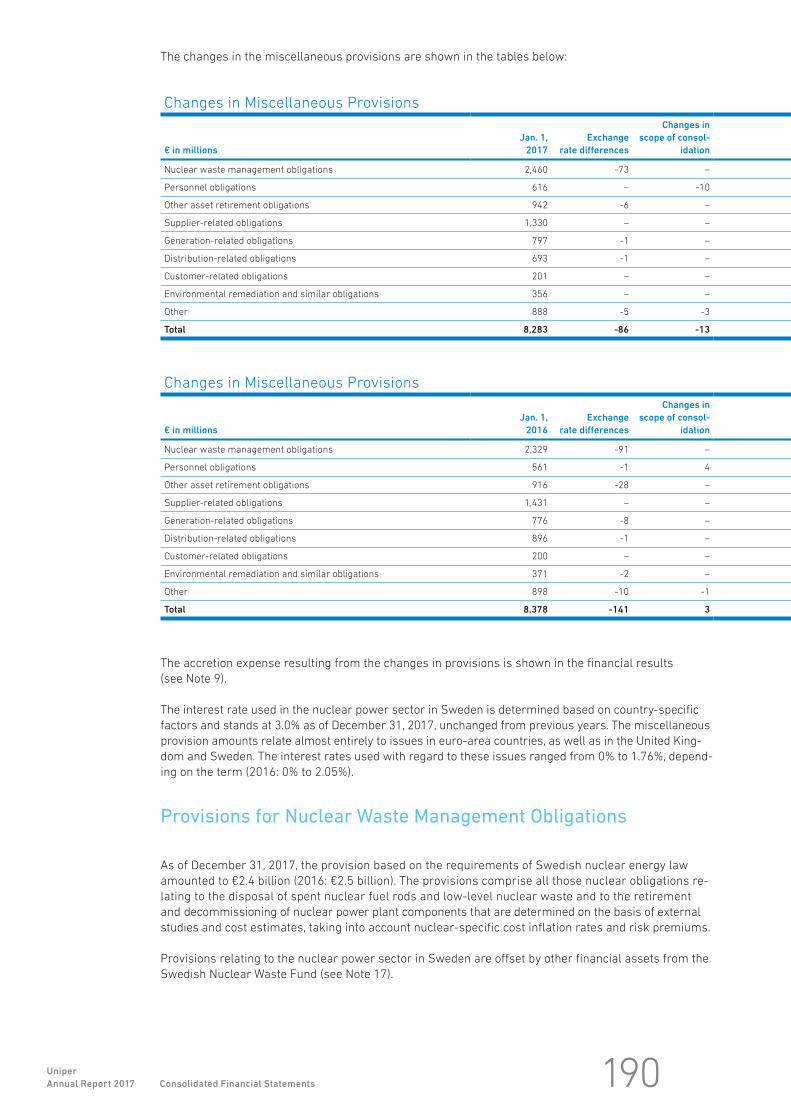
190Uniper
Annual Report 2017 Consolidated Financial Statements
The changes in the miscellaneous provisions are shown in the tables below:
The accretion expense resulting from the changes in provisions is shown in the financial results
(see Note 9).
The interest rate used in the nuclear power sector in Sweden is determined based on country-specific
factors and stands at 3.0% as of December 31, 2017, unchanged from previous years. The miscellaneous
provision amounts relate almost entirely to issues in euro-area countries, as well as in the United King-
dom and Sweden. The interest rates used with regard to these issues ranged from 0% to 1.76%, depend-
ing on the term (2016: 0% to 2.05%).
Provisions for Nuclear Waste Management Obligations
As of December 31, 2017, the provision based on the requirements of Swedish nuclear energy law
amounted to €2.4 billion (2016: €2.5 billion). The provisions comprise all those nuclear obligations re-
lating to the disposal of spent nuclear fuel rods and low-level nuclear waste and to the retirement
and decommissioning of nuclear power plant components that are determined on the basis of external
studies and cost estimates, taking into account nuclear-specific cost inflation rates and risk premiums.
Provisions relating to the nuclear power sector in Sweden are offset by other financial assets from the
Swedish Nuclear Waste Fund (see Note 17).
Changes in Miscellaneous Provisions
€ in millions
Jan. 1,
2017
Exchange
rate differences
Changes in
scope of consol-
idation
Nuclear waste management obligations 2,460 -73 –
Personnel obligations 616 – -10
Other asset retirement obligations 942 -6 –
Supplier-related obligations 1,330 – –
Generation-related obligations 797 -1 –
Distribution-related obligations 693 -1 –
Customer-related obligations 201 – –
Environmental remediation and similar obligations 356 – –
Other 888 -5 -3
Total 8,283 -86 -13
Changes in Miscellaneous Provisions
€ in millions
Jan. 1,
2016
Exchange
rate differences
Changes in
scope of consol-
idation
Nuclear waste management obligations 2,329 -91 –
Personnel obligations 561 -1 4
Other asset retirement obligations 916 -28 –
Supplier-related obligations 1,431 – –
Generation-related obligations 776 -8 –
Distribution-related obligations 896 -1 –
Customer-related obligations 200 – –
Environmental remediation and similar obligations 371 -2 –
Other 898 -10 -1
Total 8,378 -141 3

191
Accretion Additions Utilization Reclassifications Reversals
Changes
in estimates
Dec. 31,
2017
73 11 -103 – – 30 2,398
2 139 -166 -5 -113 – 463
12 2 -16 – – -23 911
-16 22 -87 27 -172 – 1,104
2 254 -219 – -29 – 804
-1 21 -160 – -65 – 487
– 67 -14 – -102 – 152
– 22 -6 – -3 – 369
– 101 -185 -3 -51 – 742
72 639 -956 19 -535 7 7,430
Accretion Additions Utilization Reclassifications Reversals
Changes
in estimates
Dec. 31,
2016
68 11 -70 – – 213 2,460
10 242 -165 -3 -35 3 616
-1 17 -16 – – 54 942
-31 1,146 -615 -153 -448 – 1,330
3 309 -270 – -13 – 797
7 54 -158 – -105 – 693
– 96 -19 – -76 – 201
– 3 -14 – -2 – 356
4 332 -172 2 -165 – 888
60 2,210 -1,499 -154 -844 270 8,283
Provisions for Nuclear Waste Management Obligations
€ in millions
December 31,
2017 2016
Decommissioning 838 859
Disposal of nuclear fuel rods and operational waste 1,560 1,601
Total 2,398 2,460
The provisions are classified primarily as non-current provisions and measured at their settlement
amounts, discounted to the balance sheet date.
The asset retirement obligations recognized for nuclear obligations include the anticipated costs of
post-operation and service operation of the facility, dismantling costs, and the cost of removal and dis-
posal of the nuclear components of the nuclear power plant.
Changes in estimates affecting provisions for the Swedish operations were recognized in the amount of
€30 million (2016: €213 million). Provisions were utilized in the amount of €103 million (2016: €70 mil-
lion), of which €32 million (2016: €30 million) is attributable to the Barsebäck nuclear power plant, which
is in post-operation.
The following table lists the provisions by technical specification as of the dates indicated:

192Uniper
Annual Report 2017 Consolidated Financial Statements
Personnel-Related Obligations
Provisions for personnel costs primarily cover provisions for early retirement benefits, performance-
based compensation components, in-kind obligations, restructuring and other deferred personnel
costs. Other than those for early retirement that continue to be reportable, the provisions recognized in
2016 in the context of the Uniper restructuring program have been utilized virtually in full, or have been
reversed.
Provisions for Other Asset Retirement Obligations
The provisions for other asset retirement obligations consist of obligations for conventional and renew-
able-energy power plants, including the conventional plant components in the nuclear power segment,
which are based on legally binding civil agreements and public regulations. Also reported here are
provisions for environmental improvements at gas storage facilities and for the dismantling of in-
stalled infrastructure.
Supplier-Related Obligations
Provisions for supplier-related obligations include, among other things, provisions for potential losses on
open purchase contracts and for onerous contracts in the amount of €1.0 billion (2016: €1.1 billion).
These provisions relate to infrastructure used by Uniper in the gas-storage business on the basis of
long-term contracts. Where reclassifications are reported, they relate to matters that have become
more concrete and are therefore required to be recognized as liabilities. Reversals of provisions have
primarily resulted from the adjustment of price terms for long-term gas delivery contracts to reflect
current market conditions.
Generation-Related Obligations
Generation-related obligations consist primarily of provisions from the hydroelectric power business
segment and of provisions for emission rights.
Distribution-Related Obligations
Distribution-related obligations consist primarily of provisions for gas transportation and for regasifi-
cation.
Customer-Related Obligations
Provisions for customer-related obligations consist primarily of potential losses on rebates and on
open sales contracts.
Environmental Remediation and Similar Obligations
Provisions for environmental remediation refer primarily to redevelopment and water protection
measures, the rehabilitation of contaminated sites, and other environmental improvement measures.
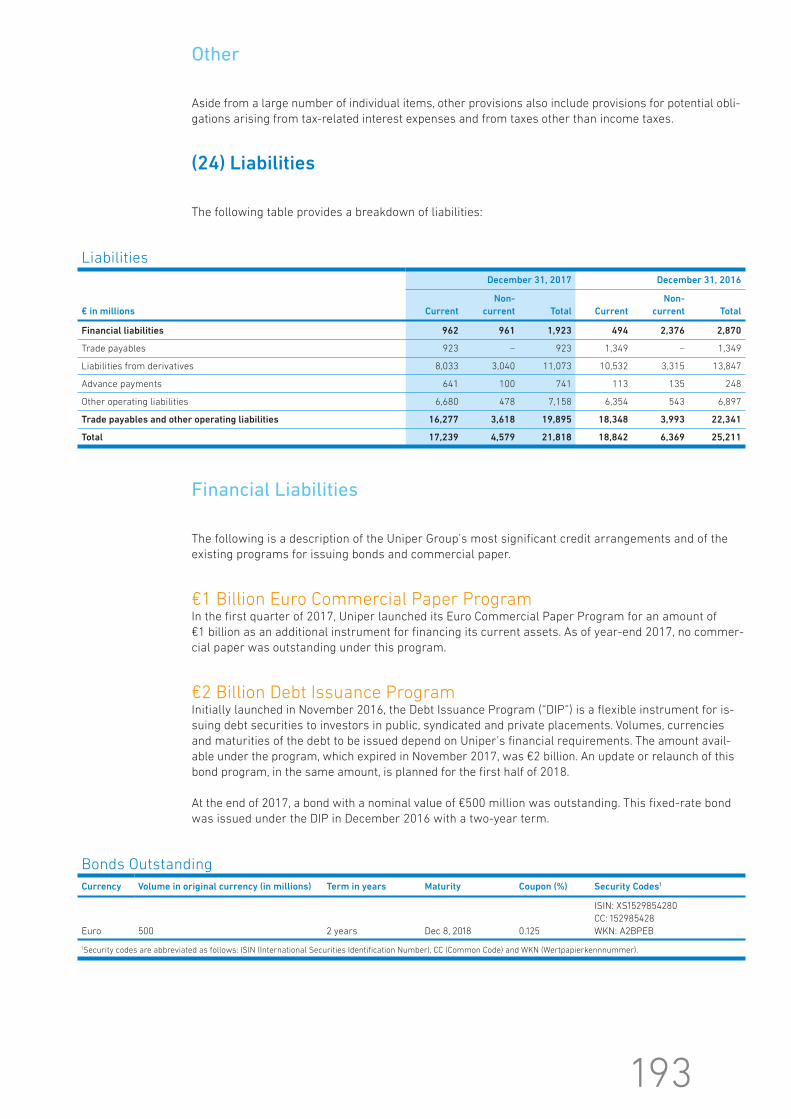
193
Liabilities
€ in millions
December 31, 2017 December 31, 2016
Current
Non-
current Total Current
Non-
current Total
Financial liabilities 962 961 1,923 494 2,376 2,870
Trade payables 923 – 923 1,349 – 1,349
Liabilities from derivatives 8,033 3,040 11,073 10,532 3,315 13,847
Advance payments 641 100 741 113 135 248
Other operating liabilities 6,680 478 7,158 6,354 543 6,897
Trade payables and other operating liabilities 16,277 3,618 19,895 18,348 3,993 22,341
Total 17,239 4,579 21,818 18,842 6,369 25,211
(24) Liabilities
The following table provides a breakdown of liabilities:
Financial Liabilities
The following is a description of the Uniper Group’s most significant credit arrangements and of the
existing programs for issuing bonds and commercial paper.
€1 Billion Euro Commercial Paper ProgramIn the first quarter of 2017, Uniper launched its Euro Commercial Paper Program for an amount of
€1 billion as an additional instrument for financing its current assets. As of year-end 2017, no commer-
cial paper was outstanding under this program.
€2 Billion Debt Issuance ProgramInitially launched in November 2016, the Debt Issuance Program (“DIP”) is a flexible instrument for is-
suing debt securities to investors in public, syndicated and private placements. Volumes, currencies
and maturities of the debt to be issued depend on Uniper’s financial requirements. The amount avail-
able under the program, which expired in November 2017, was €2 billion. An update or relaunch of this
bond program, in the same amount, is planned for the first half of 2018.
At the end of 2017, a bond with a nominal value of €500 million was outstanding. This fixed-rate bond
was issued under the DIP in December 2016 with a two-year term.
Bonds Outstanding
Currency Volume in original currency (in millions) Term in years Maturity Coupon (%) Security Codes 1
Euro 500 2 years Dec 8, 2018 0.125
ISIN: XS1529854280
CC: 152985428
WKN: A2BPEB
1Security codes are abbreviated as follows: ISIN (International Securities Identification Number), CC (Common Code) and WKN (Wertpapierkennnummer).
Other
Aside from a large number of individual items, other provisions also include provisions for potential obli-
gations arising from tax-related interest expenses and from taxes other than income taxes.
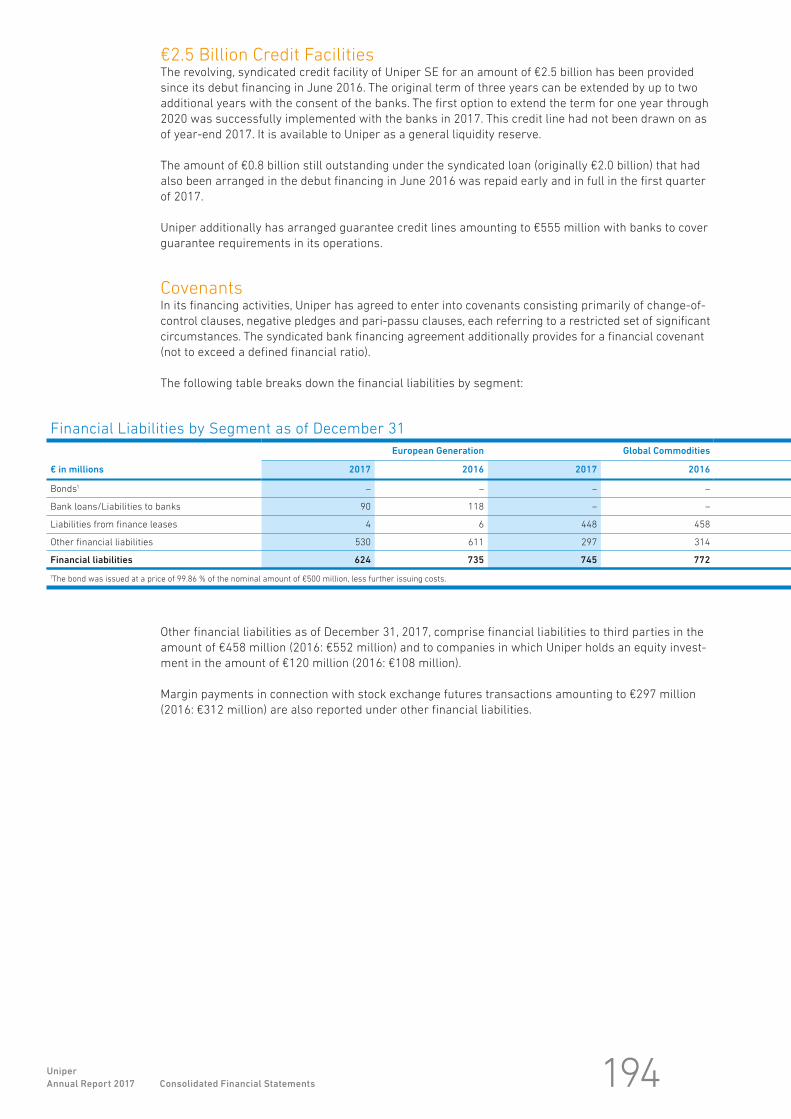
194Uniper
Annual Report 2017 Consolidated Financial Statements
€2.5 Billion Credit FacilitiesThe revolving, syndicated credit facility of Uniper SE for an amount of €2.5 billion has been provided
since its debut financing in June 2016. The original term of three years can be extended by up to two
additional years with the consent of the banks. The first option to extend the term for one year through
2020 was successfully implemented with the banks in 2017. This credit line had not been drawn on as
of year-end 2017. It is available to Uniper as a general liquidity reserve.
The amount of €0.8 billion still outstanding under the syndicated loan (originally €2.0 billion) that had
also been arranged in the debut financing in June 2016 was repaid early and in full in the first quarter
of 2017.
Uniper additionally has arranged guarantee credit lines amounting to €555 million with banks to cover
guarantee requirements in its operations.
CovenantsIn its financing activities, Uniper has agreed to enter into covenants consisting primarily of change-of-
control clauses, negative pledges and pari-passu clauses, each referring to a restricted set of significant
circumstances. The syndicated bank financing agreement additionally provides for a financial covenant
(not to exceed a defined financial ratio).
The following table breaks down the financial liabilities by segment:
Other financial liabilities as of December 31, 2017, comprise financial liabilities to third parties in the
amount of €458 million (2016: €552 million) and to companies in which Uniper holds an equity invest-
ment in the amount of €120 million (2016: €108 million).
Margin payments in connection with stock exchange futures transactions amounting to €297 million
(2016: €312 million) are also reported under other financial liabilities.
Financial Liabilities by Segment as of December 31
€ in millions
European Generation Global Commodities
2017 2016 2017 2016
Bonds 1 – – – –
Bank loans/Liabilities to banks 90 118 – –
Liabilities from finance leases 4 6 448 458
Other financial liabilities 530 611 297 314
Financial liabilities 624 735 745 772
1The bond was issued at a price of 99.86 % of the nominal amount of €500 million, less further issuing costs.

195
International Power Generation Administration/Consolidation Uniper Group
2017 2016 2017 2016 2017 2016
– – 499 498 499 498
– – 7 800 97 918
– – – 19 452 483
– – 48 46 875 971
0 0 554 1,363 1,923 2,870
Trade Payables and Other Operating Liabilities
Trade payables amounted to €923 million as of December 31, 2016 (2016: €1,349 million).
The other operating liabilities principally comprised accruals of €5,898 million (2016: €5,556 million)
and liabilities for taxes in the amount of €293 million (2016: €297 million). Also included in other oper-
ating liabilities are non-controlling interests in fully consolidated partnerships with legal structures that
give their investors a statutory right of withdrawal combined with a compensation claim amounting to
€97 million (2016: €98 million).
196Uniper
Annual Report 2017 Consolidated Financial Statements
(25) Contingencies and Other Financial Obligations
As part of its business activities, the Uniper Group is subject to contingencies and other financial obli-
gations involving a variety of underlying matters. These primarily include guarantees, obligations from
litigation and claims for damages (as discussed in more detail in Note 26), short- and long-term contrac-
tual, legal and other obligations and commitments.
Contingencies
The settlement amount of the Uniper Group’s contingent liabilities arising from existing contingencies
was €9 million as of December 31, 2017 (2016: €10 million). The Uniper Group does not currently have
any significant reimbursement rights relating to these contingent liabilities.
The Uniper Group has issued direct and indirect guarantees to third parties and to parties outside of
the Uniper Group, which require Uniper to make contingent payments based on the occurrence of cer-
tain events. These consist primarily of financial guarantees and warranties.
In addition, the Uniper Group has also entered into indemnification agreements. Along with other guaran-
tees, these indemnification agreements are incorporated in agreements entered into by Uniper companies
concerning the disposal of shareholdings and, above all, cover the customary representations and
warranties, as well as environmental damage and tax contingencies. In some cases, obligations are cov-
ered in the first instance by provisions of the companies sold before Uniper itself is required to make any
payments. Guarantees issued by companies that were later sold by E.ON SE (or VEBA AG and VIAG AG
before their merger) are usually included in the respective final sales contracts in the form of indem-
nities.
Moreover, the Uniper Group has commitments under which it assumes joint and several liability arising
from its interests in civil-law companies (“GbR”), non-corporate commercial partnerships and consortia
in which it participates.
With respect to the activities of the Swedish nuclear plants, the companies of the Swedish generation
units and E.ON Sverige AB have issued guarantees to governmental authorities in accordance with
Swedish law. The guarantees were issued to cover possible additional costs related to the disposal of
high-level radioactive waste and to the asset retirement and decommissioning of nuclear power plants.
These costs could arise if actual costs exceed accumulated funds. In addition, the companies of the
Swedish generation unit are responsible for all costs related to the disposal of low-level radioactive waste.
E.ON Sverige AB is not part of the Uniper Group. The transfer of these guarantees from E.ON to Uniper
requires the approval of the Swedish National Debt Office (“Riksgälden”), the competent authority for
such matters, which had not been granted as of December 31, 2017. Until approval is received, the
Uniper Group has released E.ON from any obligations arising from the guarantees referred to above by
means of an indemnification agreement.
In Sweden, owners of nuclear facilities are liable for damages resulting from accidents occurring in
those nuclear facilities and for accidents involving any radioactive substances connected to the operation
of those facilities. The liability per incident as of December 31, 2017, was limited to SEK 3,517 million,
or €357 million (2016: SEK 3,669 million, or €384 million). This amount must be insured according to
the Law Concerning Nuclear Liability. The necessary insurance for the affected nuclear power plants
has been purchased. On July 1, 2010, the Swedish Parliament passed a law that requires the operator
of a nuclear power plant in operation to have liability insurance or other financial cover in an amount
equivalent to €1.2 billion per facility. As of December 31, 2017, the conditions enabling this law to take
effect were not yet in place.
The European Generation segment operates nuclear power plants exclusively in Sweden. Accordingly,
there are no additional contingencies comparable to those mentioned above.

197
Other Financial Obligations
In addition to provisions and liabilities carried on the balance sheet and to reported contingent liabilities,
there also are other mostly long-term financial obligations arising mainly from contracts entered into
with third parties, or on the basis of legal requirements.
As of December 31, 2017, purchase commitments for investments in intangible assets and in property,
plant and equipment amounted to €0.5 billion (2016: €0.5 billion). This item mainly includes financial
obligations totaling €0.4 billion (2016: €0.3 billion) for as yet outstanding investments in connection with
new power plant construction projects and the expansion and modernization of existing generation
assets, as well as with gas infrastructure projects, particularly in the European Generation segment. Of
the total purchase commitments mentioned above, an amount of €0.3 billion (2016: €0.3 billion) is due
within one year.
Additional financial obligations arose from rental and tenancy agreements and from operating leases.
The corresponding minimum lease payments are due as broken down in the table below:
The expenses reported in the income statement for such contracts amounted to €115 million (2016:
€83 million).
Uniper as Lessee—Operating Leases
€ in millions
Minimum lease payments
2017 2016
Due within 1 year 122 115
Due in 1 to 5 years 153 189
Due in more than 5 years 181 173
Total 456 477

198Uniper
Annual Report 2017 Consolidated Financial Statements
Additional long-term contractual obligations in place at the Uniper Group as of the balance sheet date
related primarily to the purchase of fossil fuels such as natural gas, lignite and hard coal. The finan-
cial obligations under these purchase contracts amounted to approximately €143.3 billion on Decem-
ber 31, 2017 (due within one year: €6.6 billion) and to €171.9 billion on December 31, 2016 (due within
one year: €7.1 billion).
Gas is usually procured on the basis of long-term purchase contracts with large international producers
of natural gas. Such contracts are generally of a “take-or-pay” nature. The prices paid for natural gas
are tied to the prices of competing energy sources or market reference prices, as dictated by market
conditions. The conditions of these long-term contracts are reviewed at certain specific intervals (usually
every three years) as part of contract negotiations and may thus change accordingly. In the absence of
agreement on a pricing review, a neutral board of arbitration makes a final binding decision. Financial
obligations arising from these contracts are calculated based on the same principles that govern internal
budgeting. Furthermore, the take-or-pay conditions in the individual contracts are also considered in
the calculations.
The contractual obligations for purchases of fossil fuels registered a decline in the 2017 fiscal year
compared with the previous year. The decrease in contractual obligations for the purchase of fossil fuels,
and gas procurement in particular, is primarily attributable to a reduction in the minimum purchase
requirement and to an increase in contracts measured at fair value. The latter have already been ac-
counted for at their market values.
Contractual obligations for the purchase of electricity amounted to approximately €0.5 billion as of
December 31, 2017 (due within one year: €0.3 billion) and to approximately €0.6 billion as of Decem-
ber 31, 2016 (due within one year: €0.3 billion), and relate in part to purchases from jointly operated
power plants in the generation units. The purchase price of electricity from jointly operated power
plants is normally based on the supplier’s production cost plus a profit margin that is generally calcu-
lated on the basis of an agreed return on capital.
Further purchase obligations amounted to approximately €4.4 billion as of December 31, 2017 (due
within one year: €0.4 billion) and to approximately €3.9 billion as of December 31, 2016 (due within one
year: €0.3 billion). In addition to purchase obligations mainly for heat and alternative fuels, the European
Generation segment has long-term contractual obligations for services relating to the interim and
permanent storage of fuel rods in connection with the Uniper Group’s Swedish nuclear power plants.
There were additional financial obligations of approximately €1.0 billion as of December 31, 2017 (due
within one year: €0.3 billion) and approximately €1.0 billion as of December 31, 2016 (due within one
year: €0.3 billion). Among other items, they include financial obligations for future purchases of services.

199
(26) Litigation
A number of different court actions, arbitration proceedings and regulatory investigations and proceed-
ings are currently pending against the Uniper Group, and further actions or proceedings may be instituted
or asserted in the future. In addition to disputes under public law, this in particular includes legal actions
and proceedings on contract amendments and price adjustments initiated in response to market up-
heavals and the changed economic situation in the gas and electricity sectors (also as a consequence
of the energy transition) concerning price increases and anticompetitive practices.
These aforementioned proceedings include several court or arbitration proceedings with major cus-
tomers and major suppliers, also initiated in some instances by the Uniper Group, on contract amend-
ments and price adjustments in long-term supply contracts and procurement options for electricity
and gas, and in certain cases for other commodities, as well as long-term bookings of line capacity and
long-term contracts for storage capacity in response to the altered situation brought about by market
upheavals, and also reimbursements of costs. In some of these cases, the validity of the price-adjustment
clauses and of the contracts in their entirety is being challenged; in others, the effectiveness of contract
terminations is in dispute. Long-term gas-procurement contracts generally include the option for pro-
ducers and importers to adjust the terms in line with constantly changing market conditions. On this
basis, Uniper continuously conducts extensive negotiations with producers. The possibility of further legal
disputes cannot be excluded.
Applying the provisions of IAS 37.92, Uniper is making no additional disclosures on the proceedings
presented or on the associated risks or measures taken, in particular because such disclosure could
prejudice their outcome.
The Uniper Group is also engaged in proceedings with suppliers in connection with construction and
other work on power-plant projects. In addition, proceedings are pending concerning the obligation to
pay statutory energy-sector levies and the clarification of regulatory requirements.
Applying the provisions of IAS 37.92, Uniper is making no additional disclosures on the proceedings
presented or on the associated risks or measures taken, in particular because such disclosure could
prejudice their outcome.
Public-law disputes are pending in particular in connection with the operating license of the hard coal
power station in Datteln and for the biomass power plant Provence 4 in France, as well as with the
coal tax in the Netherlands and with a capacity agreement in Russia.
Applying the provisions of IAS 37.92, Uniper is making no additional disclosures on the proceedings
presented or on the associated risks or measures taken, in particular because such disclosure could
prejudice their outcome.

200Uniper
Annual Report 2017 Consolidated Financial Statements
(27) Supplemental Cash Flow Disclosures
Supplemental Cash Flow Disclosures
€ in millions 2017 2016
Non-cash investing and financing activities
Funding of external fund assets for pension obligations through transfer of fixed-term deposits
and securities 118 360
Cash provided by operating activities (operating cash flow) fell by €799 million in 2017 to €1,385 million
(prior-year period: €2,184 million). The principal driver of this reduction in operating cash flow was a
comparatively low outflow for gas procurement under long-term supply contracts in the prior-year period
due, in particular, to changes in the timing of payments. Operating cash flow had additionally been aug-
mented in the prior-year period by extraordinary cash proceeds from gas optimization activities and
by a one-time payment from the Finnish energy utility Fortum in relation to its pro-rata assumption of
costs for the partial decommissioning of the Oskarshamn nuclear power plant in Sweden.
There were positive effects from the insurance payment for the damage caused by a boiler fire in the
Berezovskaya 3 power plant unit and, compared with the previous year, from the elimination of the use
of provisions due to the conclusion of the price negotiations for long-term gas procurement contracts
in 2016.
Cash provided by (used for) investing activities rose from -€328 million in the previous year by €845 mil-
lion to €517 million in the 2017 fiscal year. The €1,796 million increase in proceeds from divestments
(2016: €1,235 million), which resulted mainly from the sale of the investment in the Russian Yuzhno-
Russkoye gas field, had a positive impact. This was offset by the non-recurrence of the disposal of the
stake in PEGI, including its equity interest in Nord Stream AG, to E.ON. In addition, lower payments to
the Swedish Nuclear Waste Fund in the European Generation segment, as well as lower payments for
investment loans extended to power plant operating companies in Sweden in which Uniper is a minority
shareholder, resulted in higher cash flow from investing activities.

201
Cash used for financing activities amounted to -€1,129 million in 2017 (2016: -€2,000 million). The net in-
crease compared with the previous year is primarily attributable to the non-recurrence of special effects
in 2016. This is mainly due to the fact that financial liabilities to the E.ON Group were repaid in the first
quarter of 2016 and therefore did not have a negative effect on cash flow from financing activities in the
2017 fiscal year. This positive effect was offset in 2017 by the repayment of the €800 million syndicated
bank loan and by the first dividend distribution to Uniper shareholders in the amount of €201 million.
The disposal of its stake in the Russian gas field Yuzhno-Russkoye provided a cash consideration to Uniper
of €1,719 million in the reporting year when the transaction closed. Cash and cash equivalents divested
in connection with the disposal amounted to €79 million. The closing of the transaction led to disposals of
goodwill in the amount of €0.5 billion, other non-current assets in the amount of €1.3 billion and current
assets in the amount of €0.1 billion, and of liabilities in the amount of €0.3 billion. In the 2016 fiscal year,
Uniper had received a cash consideration of €1,024 million from the disposal of PEGI, including its equity
interest in Nord Stream AG. The sale had reduced non-current assets by €0.4 billion. The other asset and
liability items were not material.
The following table presents the reconciliation of financial liabilities:
Reconciliation of Financial Liabilities
€ in millions 2017 2016
Balance as of January 1 2,870 12,847
Cash proceeds from financial liabilities 23 1,662
Cash repayments of financial liabilities -931 -1,007
Change in scope of consolidation – -131
Foreign currency translation 83 -130
Other -122 -10,371
Balance as of December 31 1,923 2,870
The reconciliation of financial liabilities for 2016 contains a non-cash change in other financial liabili-
ties of €9,901 million. This change resulted from the repayment of liabilities due to E.ON SE under the
cash-pooling arrangement and is shown under “Other.” The actual repayment of the liabilities due to
E.ON SE took place after netting with the receivables from cash pooling.

202Uniper
Annual Report 2017 Consolidated Financial Statements
(28) Hedging Transactions
Strategy and Objectives
Hedge accounting in accordance with IAS 39 is employed primarily to hedge long-term receivables and
debts denominated in foreign currency, as well as planned capital investments.
In commodities, potentially volatile future cash flows resulting primarily from planned purchases and
sales of electricity within and outside of the Group, as well as from anticipated fuel purchases and pur-
chases and sales of gas, are hedged.
Cash Flow Hedges
Cash flow hedges are used to protect against the risk arising from variable cash flows. Cross-currency
interest rate swaps are the principal instruments used to limit currency risks. The purpose of these
swaps is to maintain the level of payments arising from long-term interest-bearing receivables and
liabilities and from capital investments denominated in foreign currency and euro by using cash flow
hedge accounting in the functional currency of the respective Uniper company.
As of December 31, 2017, hedged transactions outstanding included foreign currency cash flow hedges
with maturities of up to 6 years (2016: up to 7 years).
There were no ineffective portions of the cash flow hedges in 2017 or 2016.
Pursuant to the information available as of the balance sheet date, the following effects will accompany
the reclassifications from accumulated other comprehensive income to the income statement in sub-
sequent periods:
Timing of Reclassifications from OCI 1 to the Income Statement—2017
€ in millions
Carrying
amount
Expected gains/losses
2018 2019 2020–2022 >2022
OCI—Currency cash flow hedges 6 -1 -1 -2 -2
1 = Other comprehensive income; Figures are pre-tax
Timing of Reclassifications from OCI 1 to the Income Statement—2016
€ in millions
Carrying
amount
Expected gains/losses
2017 2018 2019–2021 >2021
OCI—Currency cash flow hedges 15 -8 -1 -1 -5
1 = Other comprehensive income; Figures are pre-tax

203
Other comprehensive income includes effects from cash flow hedges that are recognized proportionally
under the equity method of accounting.
Gains and losses from reclassification are generally reported in that line item of the income statement
which also includes the respective hedged transaction. Gains and losses from the ineffective portions of
cash flow hedges are classified as other operating income or other operating expenses. The fair values
of the designated derivatives in cash flow hedges totaled €39 million (2016: €48 million)
A gain of €1 million (2016: €10 million loss) was posted to other comprehensive income in 2017. In the
same period, a gain amounting to €10 million (2016: €12 million gain) was reclassified to the income
statement.
Measurement of Derivative Instruments
The fair value of derivative financial instruments is sensitive to movements in the underlying market
variables. The Company assesses and monitors the fair value of derivative instruments at regular inter-
vals. The fair value to be determined for each derivative instrument is the price that would be received
to sell an asset or paid to transfer a liability in an orderly transaction between market participants on the
measurement date (exit price). Uniper also takes into account the counterparty credit risk when deter-
mining fair value (credit value adjustment). The fair values of derivative instruments are calculated using
common market valuation methods with reference to available market data on the measurement date.
The following is a summary of the methods and assumptions for the valuation of utilized derivative
financial instruments:
• Currency, electricity, gas, oil and coal forward contracts and swaps, and emissions-related derivatives,
are valued separately at their forward rates and prices as of the balance sheet date. Whenever
possible, forward rates and prices are based on market quotations, with any applicable forward
premiums and discounts taken into consideration.
• Market prices for electricity and gas options are valued using standard pricing models commonly
used in the market. The fair values of caps, floors and collars are determined using quoted market
prices or on the basis of option pricing models.
• Equity forwards are valued on the basis of the stock prices of the underlying equities, taking account
of time components.
• Exchange-traded futures and option contracts are valued individually at daily settlement prices
determined on the futures markets that are published by their respective clearing houses. Initial
margins paid are disclosed under other assets. Variation margins received or paid during the term
of such contracts are reported under other liabilities or other assets, respectively.
• Certain long-term energy contracts are valued with the aid of valuation models that use internal data
if market prices are not available. A hypothetical 10% increase or decrease in these internal valua-
tion parameters as of the balance sheet date would lead to a theoretical decrease in market values
of €120 million (2016: €55 million) or an increase of €120 million (2016: €54 million), respectively.
At the beginning of 2017, a gain of €219 million (2016: €30 million loss) from the initial measurement
of derivatives was deferred. The realization of gains and losses during 2017 generated an additional
loss of €37 million and an additional gain of €20 million (2016: €16 million loss and €22 million gain).
This resulted in a net deferred gain of €202 million at year-end (2016: €219 million gain), which will be
realized as the contract terms end.

204Uniper
Annual Report 2017 Consolidated Financial Statements
(29) Additional Disclosures on Financial Instruments
The carrying amounts of the financial instruments, their grouping into IAS 39 measurement categories,
their fair values and their measurement sources by class are presented in the following table:
The carrying amounts of cash and cash equivalents and of trade receivables are considered reasonable
estimates of their fair values because of their short maturity.
Where the value of a financial instrument can be derived from an active market without the need for
an adjustment, that value is used as the fair value. This is the case, for example, for equities held.
1AfS: Available for sale; LaR: Loans and receivables; HfT: Held for trading; AmC: Amortized cost. The measurement categories are described in detail in Note 2. The amounts deter-
mined using valuation techniques with unobservable inputs (Level 3 of the fair value hierarchy) correspond to the difference between the total fair value and the fair values of the
two hierarchy levels listed.2Liabilities from put options include counterparty obligations and non-controlling interests in fully consolidated partnerships (see Note 24).
Carrying Amounts, Fair Values and Measurement Categories by Class
within the Scope of IFRS 7 as of December 31, 2017
€ in millions
Carrying
amounts
Total carrying
amounts within
the scope
of IFRS 7
IAS 39
measure-
ment
category 1 Fair value
Determined
using market
prices
Derived
from
active
market
prices
Equity investments 710 710 AfS 710 80 104
Financial receivables and other financial assets 4,503 4,503 4,570 – –
Receivables from finance leases 210 210 n/a 210 – –
Financial reimbursement rights relating to asset retirement ob-
ligations 2,331 2,331 n/a 2,331 – –
Other financial receivables and financial assets 1,962 1,962 LaR 2,029 – –
Trade receivables and other operating assets 19,369 18,729 18,729 3,906 6,890
Trade receivables 7,126 7,126 LaR 7,126 – –
Derivatives with no hedging relationships 11,249 11,249 HfT 11,249 3,906 6,890
Other operating assets 994 354 LaR 354 – –
Securities and fixed-term deposits 168 168 AfS 168 114 54
Cash and cash equivalents 851 851 LaR 851 831 20
Restricted cash 112 112 LaR 112 112 –
Total assets 25,713 25,073 25,140 5,043 7,068
Financial liabilities 1,923 1,923 2,150 512 919
Bonds 499 499 AmC 501 501 –
Commercial paper – – AmC – – –
Bank loans/Liabilities to banks 97 97 AmC 97 – 97
Liabilities from finance leases 452 452 n/a 719 – –
Other financial liabilities 875 875 AmC 833 11 822
Trade payables and other operating liabilities 19,895 18,095 18,095 3,970 6,973
Trade payables 923 923 AmC 923 – –
Derivatives with no hedging relationships 11,073 11,073 HfT 11,073 3,970 6,973
Put option liabilities under IAS 32 2 97 97 AmC 97 – –
Other operating liabilities 7,802 6,002 AmC 6,002 – –
Total liabilities 21,818 20,018 20,245 4,482 7,892

205
The fair value of shareholdings in unlisted companies and of financial receivables and financial liabili-
ties that are not actively traded is determined by discounting future cash flows. Any necessary dis-
counting takes place using current market interest rates over the remaining terms of the financial in-
struments. Shareholdings for which fair value measurement was not applied as the cash flows could
not be reliably determined are not material in comparison with the overall position of the Uniper
Group.
The carrying amount of borrowings under short-term credit facilities and of trade payables is used as
the fair value due to the short maturities of these items. The determination of the fair value of derivative
financial instruments is discussed in Note 28.
1AfS: Available for sale; LaR: Loans and receivables; HfT: Held for trading; AmC: Amortized cost. The measurement categories are described in detail in Note 2. The amounts deter-
mined using valuation techniques with unobservable inputs (Level 3 of the fair value hierarchy) correspond to the difference between the total fair value and the fair values of the
two hierarchy levels listed.2Liabilities from put options include counterparty obligations and non-controlling interests in fully consolidated partnerships (see Note 24).
Carrying Amounts, Fair Values and Measurement Categories by Class
within the Scope of IFRS 7 as of December 31, 2016
€ in millions
Carrying
amounts
Total carrying
amounts within
the scope
of IFRS 7
IAS 39
measure-
ment
category 1 Fair value
Determined
using market
prices
Derived
from
active
market
prices
Equity investments 568 568 AfS 568 98 107
Financial receivables and other financial assets 4,322 4,322 4,322 – –
Receivables from finance leases 224 224 n/a 224 – –
Financial reimbursement rights relating to asset retirement ob-
ligations 2,388 2,388 n/a 2,388 – –
Other financial receivables and financial assets 1,710 1,710 LaR 1,710 – –
Trade receivables and other operating assets 22,107 21,544 21,544 4,844 8,384
Trade receivables 7,353 7,353 LaR 7,353 – –
Derivatives with no hedging relationships 13,777 13,777 HfT 13,777 4,844 8,384
Derivatives with hedging relationships – – n/a – – –
Other operating assets 977 414 LaR 414 – –
Securities and fixed-term deposits 322 322 AfS 322 172 150
Cash and cash equivalents 169 169 LaR 169 138 31
Restricted cash 10 10 LaR 10 10 –
Assets held for sale 3 – AfS – – –
Total assets 27,501 26,935 26,935 5,262 8,672
Financial liabilities 2,870 2,870 3,128 797 1,544
Bonds 498 498 AmC 501 501 –
Commercial paper – – AmC – – –
Bank loans/Liabilities to banks 918 918 AmC 918 – 918
Liabilities from finance leases 483 483 n/a 787 – –
Other financial liabilities 971 971 AmC 922 296 626
Trade payables and other operating liabilities 22,341 21,118 21,118 5,185 8,452
Trade payables 1,349 1,349 AmC 1,349 – –
Derivatives with no hedging relationships 13,839 13,839 HfT 13,839 5,185 8,444
Derivatives with hedging relationships 8 8 n/a 8 – 8
Put option liabilities under IAS 32 2 98 98 AmC 98 – –
Other operating liabilities 7,047 5,824 AmC 5,824 – –
Total liabilities 25,211 23,988 24,246 5,982 9,996

206Uniper
Annual Report 2017 Consolidated Financial Statements
In the 2017 fiscal year, there were no material reclassifications between Levels 1 and 2 of the fair value
hierarchy. At the end of each reporting period, Uniper assesses whether there might be grounds for
reclassification between hierarchy levels.
The input parameters of Level 3 of the fair value hierarchy for equity investments are specified taking
into account economic developments and available industry and corporate data (see also Note 2). In
2017, equity investments were reclassified into Level 3 of the fair value hierarchy in the amount of
€9 million, and none were reclassified out of Level 3 into Level 2. The fair values determined using val-
uation techniques for financial instruments carried at fair value are reconciled as shown in the follow-
ing table:
Fair Value Hierarchy Level 3 Reconciliation (Values Determined Using Valuation Techniques)
€ in millions Jan. 1, 2017
Purchases
(including
additions)
Sales
(including
disposals) Settlements
Gains/
Losses in
income
statement
Transfers
Gains/
Losses in
OCI
Dec. 31,
2017
into
Level 3
out of
Level 3
Equity investments 363 9 – – -10 – – 164 526
Derivative financial instruments 339 11 – – -27 – – – 323
Total 702 20 0 0 -37 0 0 164 849
Netting Agreements for Financial Assets and Liabilities as of December 31, 2017
€ in millions Gross amount
Conditional
netting
amount
(netting
agreements)
Financial
collateral
received/
pledged Net value
Financial assets
Trade receivables 7,126 3,748 – 3,378
Interest-rate and currency derivatives 83 – – 83
Commodity derivatives 11,166 5,355 310 5,501
Total 18,375 9,103 310 8,962
Financial liabilities
Interest-rate and currency derivatives 211 – – 211
Commodity derivatives 10,862 5,355 472 5,035
Trade payables and other operating liabilities 8,725 3,748 – 4,977
Total 19,798 9,103 472 10,223
The extent to which the offsetting of financial assets is covered by netting agreements is presented in
the following table:
Transactions and business relationships resulting in the derivative financial receivables and liabilities
presented are generally concluded on the basis of standard contracts that permit the netting of open
transactions in the event that a counterparty becomes insolvent.

207
Netting Agreements for Financial Assets and Liabilities as of December 31, 2016
€ in millions Gross amount
Conditional
netting
amount
(netting
agreements)
Financial
collateral
received/
pledged Net value
Financial assets
Trade receivables 7,353 3,381 – 3,972
Interest-rate and currency derivatives 151 – – 151
Commodity derivatives 13,626 6,456 310 6,860
Total 21,130 9,837 310 10,983
Financial liabilities
Interest-rate and currency derivatives 148 – – 148
Commodity derivatives 13,699 6,456 539 6,704
Trade payables and other operating liabilities 8,396 3,381 – 5,015
Total 22,243 9,837 539 11,867
The netting agreements are derived from netting clauses contained in master agreements including
those of the International Swaps and Derivatives Association (ISDA) and the European Federation of
Energy Traders (EFET), as well as the German Master Agreement for Financial Derivatives Transactions
(“DRV”) and the Financial Energy Master Agreement (“FEMA”). For commodity derivatives, the netting
option is not presented in the accounting because the legal enforceability of netting agreements varies
by country. As of December 31, 2017, other financial assets amounting to €472 million (2016: €539 mil-
lion) had been deposited as collateral.

208Uniper
Annual Report 2017 Consolidated Financial Statements
The following tables illustrate the contractually agreed (undiscounted) cash outflows arising from the
liabilities included in the scope of IFRS 7:
Cash Flow Analysis as of December 31, 2017
€ in millions
Cash
outflows
2018
Cash
outflows
2019
Cash
outflows
2020–2022
Cash
outflows
from 2023
Bonds 500 – – –
Bank loans/Liabilities to banks 24 30 42 –
Liabilities from finance leases 47 48 135 969
Other financial liabilities 429 22 15 443
Cash outflows for financial liabilities 1,000 100 192 1,412
Trade payables 923 – – –
Derivatives (with/without hedging relationships) 3,842 1,274 595 289
Put option liabilities under IAS 32 13 – – 84
Other operating liabilities 6,002 – – –
Cash outflows for trade payables and other operating liabilities 10,780 1,274 595 373
Cash outflows for liabilities within the scope of IFRS 7 11,780 1,374 787 1,785
Cash Flow Analysis as of December 31, 2016
€ in millions
Cash
outflows
2017
Cash
outflows
2018
Cash
outflows
2019–2021
Cash
outflows
from 2022
Bonds – 500 – –
Bank loans/Liabilities to banks 828 17 67 6
Liabilities from finance leases 74 48 132 1,014
Other financial liabilities 555 145 20 500
Cash outflows for financial liabilities 1,457 710 219 1,520
Trade payables 1,349 – – –
Derivatives (with/without hedging relationships) 8,752 2,262 442 20
Put option liabilities under IAS 32 11 – – 87
Other operating liabilities 5,800 1 38 –
Cash outflows for trade payables and other operating liabilities 15,912 2,263 480 107
Cash outflows for liabilities within the scope of IFRS 7 17,369 2,973 699 1,627

209
In addition to interest income and valuation allowances from financial receivables, the net gains and
losses in the loans and receivables category consist primarily of valuation allowances on trade receiv-
ables and loans.
Gains and losses on the disposal of available-for-sale securities and equity investments are reported
under other operating income and other operating expenses, respectively.
The net gains and losses in the amortized cost category are due primarily to interest and potential
prepayment penalties on financial liabilities, reduced by capitalized construction-period interest.
The net gains and losses in the held-for-trading category encompass both the changes in fair value of
the derivative financial instruments and the gains and losses on realization. The fair value measure-
ment of commodity derivatives and of realized gains and losses on currency derivatives is the most
important factor in the net result for this category.
Risk Management
PrinciplesThe risk management system at the Uniper Group is based on centrally developed, globally applicable
principles.
The organizational structure, specialist expertise, systems, processes and policies are material compo-
nents of the Group’s risk management system and ensure that risks are appropriately identified, analyzed,
quantified, aggregated and managed.
The risk from financial instruments is primarily bundled within the trading unit and managed centrally.
The risk management system for financial instruments is based on the fundamental prin ciple that risks
are accepted and authorized according to existing policies and mandates, and that they are kept within
permissible limits and continuously analyzed, monitored and managed. Key to the risk management
system for financial instruments are the principles of managing market- price and credit risks, as well
as financing activities and associated liquidity risks.
Net Gains and Losses by Category 1
€ in millions 2017 2016
Loans and receivables 81 35
Available for sale 1 -352
Held for trading -54 -1,833
Amortized cost -4 -198
Total 24 -2,348
1The categories are described in detail in Note 2.
As in the previous year, no financial guarantees were issued in the 2017 fiscal year.
For financial liabilities that bear floating interest rates, the rates that were fixed on the balance sheet
date are used to calculate future interest payments for subsequent periods as well. Financial liabilities
that can be terminated at any time are assigned to the earliest maturity band in the same way as put
options that are exercisable at any time.
In gross-settled derivatives (usually currency derivatives and commodity derivatives), outflows are
accompanied by related inflows of funds or commodities.
The net gains and losses from financial instruments by IAS 39 category are shown in the following table:

210Uniper
Annual Report 2017 Consolidated Financial Statements
The management and control of the aforementioned risks is organized along three “lines of defense,” each
of which operates separately from the other two. The first line consists of the Group’s trading operations,
which decide on the assumption of risk and, as risk owners, actively manage those risks. The second
line consists of risk and control units that are responsible for the processing of trades and for risk analy-
sis and monitoring. The third line of defense is the realm of internal audit, which reviews and supervises
the activities of the first and second lines.
One of the central responsibilities of Uniper SE’s Management Board is to ensure that an effective risk
management system is put in place. Functions and tasks to support and aid the operational implementa-
tion of the central risk management principles are delegated appropriately within the Uniper organiza-
tion, with due consideration given to functional responsibilities.
The Risk Committee of the Uniper Group is the supreme body in charge of monitoring the risks associated
with the Uniper Group’s business activities. Headed by the Group’s Chief Financial Officer, it is further
composed of the Chief Risk Officer, the Chief Commercial Officer, the Chief Operating Officer and the Exec-
utive Vice President for Group Finance. This committee discusses material risks exposures and decides
on their disposition. Risk monitoring and the management of countermeasures include the determi-
nation of necessary risk capital, the allocation of risk limits and the development of effective risk manage-
ment policies and risk control methods.
1. Liquidity ManagementThe primary objectives of liquidity management consist of ensuring ability to pay at all times, the timely
satisfaction of contractual payment obligations and the optimization of costs within the Uniper Group.
The key component of liquidity management is central cash pooling and the centralization of external
financing at Uniper SE. All liquid funds are provided to the other Group companies as needed on the
basis of an “in-house banking” solution.
The financing requirements of the Uniper Group companies are determined on the basis of short- and
medium-term liquidity planning. The financing of the Uniper Group is controlled and implemented cen-
trally on a forward-looking basis in accordance with the planned liquidity requirement or surplus. Rele-
vant planning factors taken into consideration include operating cash flow, capital expenditures, divest-
ments, margin payments and the maturities of financial liabilities.
2. Market RisksThe Uniper Group is exposed to the risk of changes in prices in foreign currencies, interest rates and
commodities as part of its ordinary business activities. Uniper SE has developed-risk reduction strate-
gies to limit the resulting fluctuations in earnings, equity, indebtedness and cash flows that are applicable
across the entire Uniper Group. Financial derivatives are used for the purpose of reducing risk and
optimizing earnings.
Foreign Exchange Risk ManagementUniper SE is responsible for controlling the currency risks to which the Uniper Group is exposed.
Because it holds interests in businesses outside of the euro area, currency translation risks arise within
the Uniper Group. Fluctuations in exchange rates produce accounting effects attributable to the trans-
lation of items in the balance sheets and income statements of the consolidated foreign Uniper compa-
nies included in the Consolidated Financial Statements. Translation risks are hedged through borrow-
ing in the corresponding local currency, which may also include shareholder loans in foreign currency.
In addition, derivative and primary financial instruments are employed as needed. The Uniper Group’s
translation risks are reviewed at regular intervals and the level of hedging is adjusted whenever neces-
sary. The respective debt factor and the enterprise value denominated in the foreign currency are the
principal criteria governing the level of hedging.

211
The Uniper Group is also exposed to operating and financial transaction risks attributable to foreign
currency transactions. These risks arise for the Uniper Group companies primarily from physical and
financial trading in commodities, from business relations within the Uniper Group and from capital
spending projects in foreign currencies. The Uniper companies are responsible for controlling their op-
erating currency risks. Uniper SE is responsible for the overall coordination of the companies’ hedging
activities and makes use of external derivatives as needed.
Financial transaction risks result from payments originating from financial receivables and payables.
They are generated both by external financing in a variety of foreign currencies, and also by shareholder
loans within the Uniper Group denominated in foreign currency.
As of December 31, 2017, the one-day value-at-risk (99% confidence) from the translation of deposits
and borrowings denominated in foreign currency, plus foreign-exchange derivatives, was €22.8 million
(2016: €24.6 million) and resulted primarily from the positions in U.S. dollars, Swedish kronor, British
pounds and Russian rubles.
Interest Risk ManagementThe Uniper companies are generally financed using the Uniper Group’s cash pooling system. Cash pool-
ing balances bear interest at market rates specific to maturities and currencies. Individual Uniper
companies that are not included in the cash pool due to legal restrictions arrange financing inde-
pendently or deposit their excess liquidity with leading local banks.
Uniper SE funds itself primarily on the basis of fixed interest rates. At this time, floating-rate financial li-
abilities are temporary and exist only on very a short-term basis, so there is no resulting material inter-
est risk for Uniper. Accordingly, a disclosure about interest rate risk is not made.
Commodity Price Risk ManagementThe Uniper portfolio of physical assets, long-term contracts and wholesale customer contracts is ex-
posed to substantial risks from fluctuations in commodity prices. The commodity price risks to which
Uniper is exposed relate to electricity, gas, coal, freight charters, petroleum products, liquefied natural
gas and emission allowances.
The Uniper Group manages the majority of its commodity risks through a central trading function. Risk
management for commodity trading activities is based on general standards in the industry for trading
operations and also involves the segregation of tasks, as well as daily income and risk calculation and
reporting. The objective of commodity risk management is to optimize the value of the Uniper Group’s
commodity portfolio while limiting associated potential losses.
The key elements of commodity risk management are governed by the market price risk policy. These
key elements include the new-product process, which supports the identification of new risks, a series
of key indicators to aid the quantification of the commodity risk, and a system of risk controls and
limits. Commodity price risks are measured based on a value-at-risk approach with a 95% confidence
interval and take into account the amount of the open position, as well as the prices, their volatility and
the liquidity on the respective markets. The value-at-risk figures are supplemented by stop-loss and
volume- based indicators. Where necessary, additional portfolio-specific restrictions are set.
212Uniper
Annual Report 2017 Consolidated Financial Statements
Commodity positions are aggregated into portfolios based on internal organizational responsibilities and
trading strategies. In the calculations of commodity risk, market correlations and portfolio diversification
are taken into account together with adopted risk policies. The methods for quantifying and analyzing
commodity risk are reviewed and enhanced on a regular basis to ensure that they appropriately reflect
the risk positions and the resulting exposure. Commodity price risks are incurred within the caps ap-
proved by the Management Board and the Supervisory Board.
Two complementary approaches are followed to manage commodity risks at Uniper. Viewed firstly from
an economic perspective, risks are limited over the entire tradable time horizon, with market liquidity
taken into account. At the same time, these risks are also limited in line with accounting policies over a
three-year planning horizon. The second approach supports the limitation of potential negative deviations
from target adjusted EBIT.
The specification and approval of commodity risk caps is embedded in the higher-level Group-wide risk-
assessment procedure, in which all known obligations and quantifiable risks are incorporated.
Commodity price risks are analyzed and monitored daily by a dedicated team of specialists. Responsible
management is informed daily about gains and losses associated with commodity-trading activities
and about existing risks.
Based on the current Uniper portfolio, as of December 31, 2017, the calendar-year-based, weighted val-
ue-at-risk, which takes market liquidities into account and ignores correlations between the years,
was €326 million for financial and physical commodity positions covering a planning horizon of three
years (2016: €681 million). The reduction of the risk can be attributed in part to methodology, as Uniper
now takes diversification between the business areas into account. But it is also due to a very great ex-
tent to reduced price volatility in the electricity market.
Commodity risk management as presented above reflects the Uniper Group’s internal management
reporting and also covers the financial instruments within the scope of IFRS 7.
3. Credit RisksUniper is exposed to credit risk in its operating activities and through the use of financial instruments.
Credit risk is the risk that the Uniper Group might incur a financial loss as a consequence of the non-
settlement or partial settlement of outstanding receivables by counterparties and from replacement
risks for open transactions.
213
Credit Risk ManagementAs part of centralized credit risk management, the credit rating of business partners is systematically
assessed and monitored on the basis of Group-wide minimum standards, which in certain business
operations where most of the risks are incurred are supplemented by specific internal control processes.
Uniper applies appropriate measures to manage credit risks. They include setting limits for individual
counterparties, counterparty groups and at portfolio level, as well as securing collateral, structuring
contracts and/or transferring credit risk to third parties (such as insurers). Credit risks are continuously
measured and monitored to ensure that the measures taken are in fact appropriate. The Risk Committee
is kept informed about material credit risks on a regular basis. An additional foundation for the manage-
ment of risk is a conservative investment strategy and a broadly diversified portfolio.
Guarantees issued by the respective parent companies or evidence of profit-and-loss-pooling agree-
ments in combination with letters of awareness are accepted as collateral for credit risks. The Company
also requires bank guarantees and deposits of cash and securities as collateral to reduce credit risk.
Collateral amounting to €3,372 million (2016: €4,226 million) has been accepted in the context of risk
management.
The amounts and backgrounds of financial assets received as collateral are described in more detail
in Note 17.
To reduce credit risk, bilateral margining agreements are entered into with selected counterparties.
Margining involves paying cash into a margin account to cover unfavorable price movements in con-
tracts entered into on a margin basis. The inherent margining and liquidity risk is linked directly to
actual or potential market price movements. The resulting margining risk is measured, monitored and
managed using an overall limit for the entire Uniper Group.
To further reduce credit risk, derivative transactions are generally executed on the basis of standard
agreements under which the netting of all open transactions can in principle be agreed with individual
counterparties.
Liquid funds are generally invested with counterparties with good credit ratings. Uniper companies that
are not included in the Uniper Group cash pool due to legal restrictions deposit money with leading local
banks. Standardized credit assessment and limit-setting is complemented by daily monitoring of CDS
levels, stock prices and other market-relevant information at the banks and at other significant counter-
parties.

214Uniper
Annual Report 2017 Consolidated Financial Statements
(30) Transactions with Related Parties
Uniper exchanges goods and services with a large number of companies as part of its continuing opera-
tions. Some of these companies are related parties of both the E.ON Group and the Uniper Group.
The deconsolidation agreement entered into by E.ON SE, E.ON Beteiligungen GmbH and Uniper SE took
effect at the end of the day on December 31, 2016 (see also Note 1). The signing of the deconsolidation
agreement led to E.ON SE losing control of the Uniper Group.
For that reason, for the purposes of the disclosure of transactions with related parties, the relationships
with E.ON SE and its subsidiaries and joint ventures have been presented as transactions involving
entities with significant influence over Uniper. Transactions with associated companies of the Uniper
Group and their subsidiaries, as well as with joint ventures of the Uniper Group, are presented sepa-
rately. Transactions with subsidiaries of the Uniper Group that are not fully consolidated are presented
as transactions with other related parties.
The share of transactions with other related parties is not material in terms of the extent of the trans-
actions mentioned in the following section.
The following were the principal transactions with related parties in the 2017 and 2016 fiscal years.
Related-Party Transactions—Income Statement
€ in millions 2017 2016
Income 7,462 10,955
Entities with significant influence over Uniper 7,034 10,356
Associated companies 371 341
Joint ventures 26 21
Other related parties 31 237
Expenses 3,601 7,008
Entities with significant influence over Uniper 3,108 6,500
Associated companies 357 259
Joint ventures 47 45
Other related parties 89 204
Related-Party Transactions—Balance Sheet
€ in millions Dec. 31, 2017 Dec. 31, 2016
Receivables 2,262 2,245
Entities with significant influence over Uniper 1,235 1,253
Associated companies 531 482
Joint ventures 454 446
Other related parties 42 64
Liabilities 1,500 2,012
Entities with significant influence over Uniper 1,166 1,835
Associated companies 144 3
Joint ventures 48 42
Other related parties 142 132

215
Transactions for Goods and Services
Business relationships with related parties primarily consist of the Group-wide procurement and sales
activities of Uniper Global Commodities SE, mainly in connection with electricity and gas in the com-
modity markets, for the E.ON Group. These relationships are responsible for the extensive mutual obli-
gations and trade relations.
Income generated from transactions with E.ON SE and E.ON Group companies included, in particular,
revenues from deliveries of electricity and gas in the amount of €5,922 million (2016: €8,073 million).
Expenses from transactions with E.ON SE and E.ON Group companies principally related to material costs
associated with electricity and gas procurement in the amount of €2,524 million (2016: €3,118 million).
Both revenues and cost of materials result from spot and forward transactions concluded at market
terms that were conducted by Uniper Global Commodities SE as part of the provision of market access
for the E.ON Group’s companies.
Accordingly, receivables from and liabilities to related parties consist primarily of trade receivables
relating to electricity and gas transactions amounting to €589 million (2016: €822 million) and trade
payables relating to electricity and gas transactions amounting to €245 million (2016: €337 million).

216Uniper
Annual Report 2017 Consolidated Financial Statements
Hedging Transactions and Derivative Financial Instruments
With the organizational restructuring of the Uniper Finance department subsequent to the completion
of the spin-off from the E. ON Group, hedging transactions to protect against exchange rate movements
are conducted by Uniper SE. The derivative receivables and liabilities from currency hedging transactions
with E. ON SE that had still existed in 2016 already had a carrying amount of zero as of year-end 2016.
No new hedging transactions have been entered into with related parties in the 2017 fiscal year.
Accordingly, there was no corresponding income or expense from currency hedging transactions with
E. ON SE in 2017. In the 2016 fiscal year, income from these hedging transactions had amounted to
€429 million, while expenses from these hedging transactions had amounted to €442 million.
In the 2017 fiscal year, gains from the marking to market of commodity futures transactions with E.ON
companies amounted to €1,002 million (2016: €957 million); corresponding losses amounted to
€460 million (2016: €2,230 million). Derivative receivables relating to the marking to market of com-
modity futures transactions were recognized in the amount of €581 million (2016: €382 million); corre-
sponding derivative liabilities relating to the marking to market of commodity futures transactions
were recognized in the amount of €880 million (2016: €1,250 million).
Collateral, Global Letters of Awareness, Guarantees
The E.ON Group has provided collateral in favor of the Uniper Group. The guarantees issued by the E.ON
Group had a value of €2,488 million as of December 31, 2017 (2016: €3,855 million). The reduction in 2017
resulted primarily from the expiration of guarantees. An additional factor in the decline is that Uniper
has now itself issued guarantees that E.ON SE had previously given in favor of Uniper companies prior
to the spin-off.
The guarantees from E.ON for the Uniper Group referred to above include guarantees in connection with
the Swedish nuclear power activities. Those guarantees had been issued to cover possible additional
costs related to the disposal of high-level radioactive waste and to the decommissioning of nuclear
power plants. The transfer of these guarantees and obligations from E.ON to Uniper requires the approval
of the Swedish National Debt Office (“Riksgälden”), the competent authority for such matters, which had
not been granted as of December 31, 2017. Until approval is received, the Uniper Group has released
E.ON from any obligations arising from the aforementioned guarantees by means of an indemnification
agreement.
Other
In the 2016 comparative period, a gain of €528 million had been recognized on the sale of PEGI, including
its equity interest in Nord Stream AG, to E. ON.

217
Related Parties
Under IAS 24, compensation paid to key management personnel (members of the Management Board
and of the Supervisory Board) must be disclosed.
The expense for the 2017 fiscal year for members of the Uniper Management Board amounted to
€6.7 million (2016: €15.2 million) in short-term benefits, €0.0 million (2016: €0.0 million) in termination
benefits and €1.1 million (2016: €1.0 million) in post-employment benefits. The expense determined in
accordance with IFRS 2 for the share-based payment tranches in existence in 2017 was €9.2 million
(2016: €0.3 million).
Accordingly, the total expense recognized was €17.0 million (2016: €16.5 million). Other provisions have
been recognized in the amount of €12.4 million (2016: €4.1 million).
Additionally taken into account in 2017 were actuarial gains totaling €0.7 million (2016: losses of
€0.7 million). The cost of post-employment benefits is equal to the service and interest cost of the
provisions for pensions.
A provision for variable compensation of €0.2 million (2016: €0.0 million) was recognized to cover
Uniper SE Supervisory Board compensation for 2017. Reimbursements paid by Uniper SE to Super-
visory Board members for outlays, as well as Supervisory Board compen sation paid to Supervisory
Board members by subsidiaries of Uniper SE, totaled roughly €73 thousand for the 2017 fiscal year
(2016: €19 thousand).
The expense for short-term compensation of members of the Supervisory Board amounted to €1.1 mil-
lion for the 2017 fiscal year, and the expense for variable compensation determined pursuant to the
requirements of IFRS 2 amounted to €0.2 million (2016: €1.0 million). Employee representatives on the
Supervisory Board were awarded compensation under the existing employment contracts with subsid-
iaries of Uniper SE totaling €0.5 million (2016: €0.4 million).
For further details on the compensation of key management personnel, see also the Compensation Report
beginning on page 84.

218Uniper
Annual Report 2017 Consolidated Financial Statements
(31) Segment Information
The following information is provided on the basis of the Uniper Group’s internal reporting system in
order to enable an assessment to be made of the nature and financial consequences of the business
activities conducted by the Uniper Group and of the economic environment in which the Group operates.
Operating Segments
The following operating segments are reported separately, in accordance with IFRS 8, in line with the
management of the Group by the Management Board of Uniper SE in its capacity as the Group’s chief
operating decision maker.
European GenerationThe European Generation segment comprises the various power and heat generation facilities that the
Uniper Group operates in Europe. In addition to fossil-fuel power plants (coal, gas, oil and combined
gas-and-steam power plants) and hydroelectric power plants, these generation facilities also include
nuclear power plants in Sweden, a biomass plant in France, and a small number of photovoltaic and
wind power facilities. The majority of the energy generated is sold to the Global Commodities segment,
which is responsible for the marketing and sale of the energy to major customers via the trading markets
and its own sales organization. A further portion of the energy generated is marketed by means of
long-term electricity and heat supply contracts. In addition to the power plant business, this segment is
also engaged in the marketing of energy services ranging from fuel procurement and engineering to
operational and maintenance services to trading services (under the “Energy Services” brand).
Global CommoditiesThe Global Commodities segment bundles the energy trading activities and forms the commercial inter-
face between the Uniper Group and the global wholesale markets for energy as well as the major cus-
tomers. Within this segment, the fuels required for power generation (mainly coal and gas) are procured,
emission allowances are traded, the electricity produced is marketed and the portfolio is optimized by
managing the use of the power plants. The gas business is engaged in the supply of gas to industrial and
municipal-utility customers and in the importation of gas from various sources. In addition, this seg-
ment includes infrastructure investments and the gas storage operations, as well as all the activities of
the Uniper Group relating to the equity investment in the Russian gas field Yuzhno-Russkoye, which
was sold at the end of November 2017.

219
International Power GenerationThe International Power Generation segment brings together the operating power generation business
of the Uniper Group in Russia and Brazil. PAO Unipro, an indirect subsidiary of Uniper SE listed in Russia,
is responsible for conducting all business in connection with power generation and associated activi-
ties in Russia. These include the procurement of the fuels needed for the power plants, the operation and
management of the plants and the trading and sale of the energy produced. The Uniper Group’s busi-
ness in Brazil primarily comprises a 6.1% financial investment in the energy utility ENEVA S.A held by the
Uniper Group and a 50% shareholding in Pecém II Participações S.A., which operates a coal-fired power
plant.
In addition, the Group-wide non-operating functions carried out centrally for all segments of the Uniper
Group are brought together under Administration/Consolidation. The consolidations required to be car-
ried out at Group level are also made here.
Management System
Adjusted EBIT, earnings before interest and taxes adjusted for non-operating effects, is the key measure
at Uniper for purposes of internal management control and as the most important indicator of a busi-
ness’s operating performance. Because it was still included in the E.ON Group for part of the 2016 fiscal
year, a measure of earnings before interest, taxes, depreciation and amortization adjusted for non-op-
erating effects (“adjusted EBITDA”) was additionally taken into account in the internal reporting organi-
zation.
Unadjusted earnings before interest and taxes (“EBIT”) represents the Uniper Group’s income/loss before
financial results and taxes in accordance with IFRS, taking into account the net income/loss from equity
investments. Unadjusted EBIT is adjusted for certain non-operating effects in order to increase its mean-
ingfulness as an indicator of the operating performance of Uniper’s business. Operating income also in-
cludes income from investment subsidies for which liabilities are recognized.
The non-operating effects on earnings for which EBIT is adjusted include, in particular, income and ex-
penses from the fair value measurement of derivative financial instruments used in hedges and, where
material, book gains/losses, expenses for restructuring / cost-management programs initiated prior to
the spin-off and impairment charges/reversals on non-current assets, on companies accounted for
under the equity method and other long-term financial assets and on goodwill in the context of impair-
ment tests, as well as other contributions to non-operating earnings.
Net book gains are equal to the sum of book gains and losses from disposals, which are included in other
operating income and other operating expenses. Effects from the fair value measurement of derivatives
are also included in other operating expenses and income. Expenses for restructuring/cost manage-
ment programs initiated prior to the spin-off represent additional expenses that are not directly attribut-
able to the operating business. Other non-operating earnings encompass other non-operating income
and expenses that are unique or rare in nature. Depending on the particular case, such income and ex-
penses may affect different line items in the income statement.
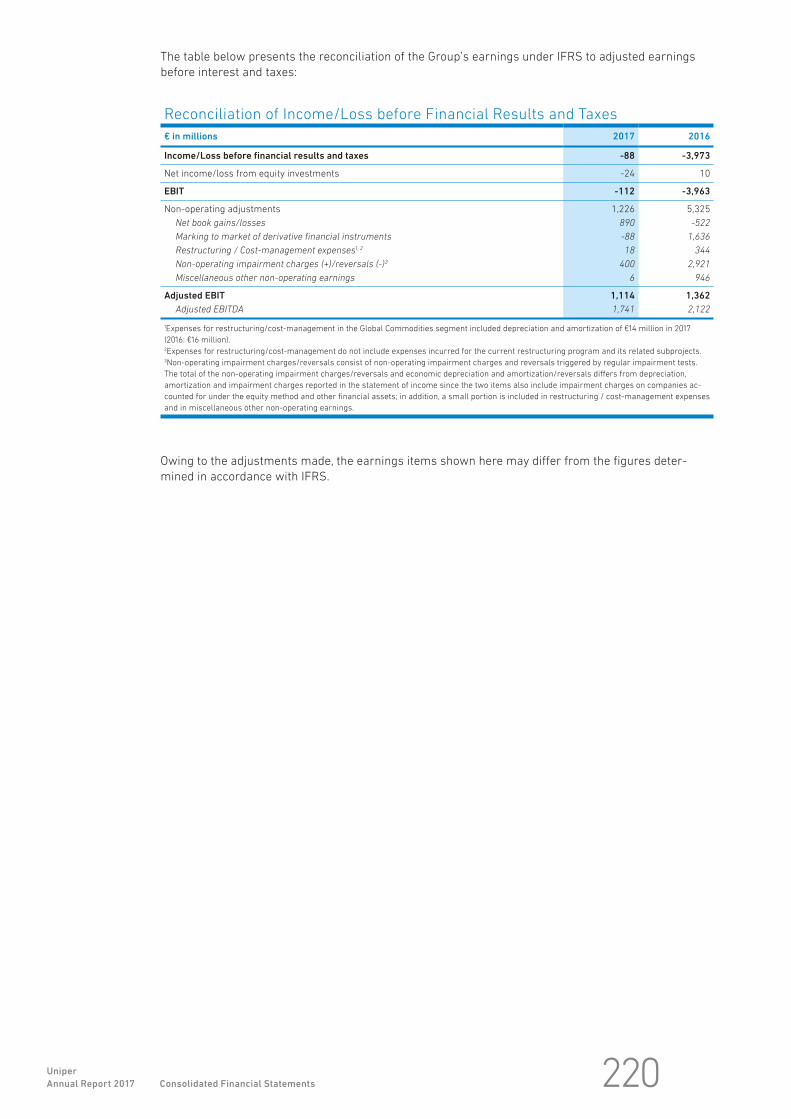
220Uniper
Annual Report 2017 Consolidated Financial Statements
The table below presents the reconciliation of the Group’s earnings under IFRS to adjusted earnings
before interest and taxes:
Owing to the adjustments made, the earnings items shown here may differ from the figures deter-
mined in accordance with IFRS.
1Expenses for restructuring/cost-management in the Global Commodities segment included depreciation and amortization of €14 million in 2017
(2016: €16 million).2Expenses for restructuring/cost-management do not include expenses incurred for the current restructuring program and its related subprojects.3Non-operating impairment charges/reversals consist of non-operating impairment charges and reversals triggered by regular impairment tests.
The total of the non-operating impairment charges/reversals and economic depreciation and amortization/reversals differs from depreciation,
amortization and impairment charges reported in the statement of income since the two items also include impairment charges on companies ac-
counted for under the equity method and other financial assets; in addition, a small portion is included in restructuring / cost-management expenses
and in miscellaneous other non-operating earnings.
Reconciliation of Income/Loss before Financial Results and Taxes
€ in millions 2017 2016
Income/Loss before financial results and taxes -88 -3,973
Net income/loss from equity investments -24 10
EBIT -112 -3,963
Non-operating adjustments 1,226 5,325
Net book gains/losses 890 -522
Marking to market of derivative financial instruments -88 1,636
Restructuring / Cost-management expenses 1, 2 18 344
Non-operating impairment charges (+)/reversals (-) 3 400 2,921
Miscellaneous other non-operating earnings 6 946
Adjusted EBIT 1,114 1,362
Adjusted EBITDA 1,741 2,122

221
Net Book Gains/Losses
In the reporting period, the sale of the shareholding in the Russian gas field Yuzhno-Russkoye to the
Austrian oil and gas company OMV was finalized. The disposal at the end of November 2017 resulted
in a net loss of €890 million due to the reclassification to the income statement of currency translation
losses previously recognized in equity as accumulated other comprehensive income.
The net book gains of €522 million in 2016 had resulted primarily from the disposal of PEGI, including
its equity interest in Nord Stream AG, and from the partial disposal of Uniper’s stake in AS Latvijas Gāze.
Fair Value Measurement of Derivative Financial Instruments
The fair value measurement of derivatives used to hedge the operating business against price fluctua-
tions generated income of €88 million as of the December 31, 2017, reporting date (2016: €1,636 million
expense).
Restructuring / Cost Management
In the 2017 fiscal year, restructuring and cost-management expenses decreased by €326 million year
over year. They amounted to €18 million in 2017 (2016: €344 million). The reduction resulted primarily
from a one-time expense of €236 million for real-estate transfer taxes that arose in the context of the
spin-off in 2016.
Non-operating Impairments/Reversals
In the reporting period, non-operating impairments were recognized, net of reversals, in the amount of
-€400 million (2016: -€2,921 million).
The decrease relative to the previous year resulted primarily from the fact that impairment charges
were recognized in the previous year at a level that was not required in the 2017 fiscal year. In addition,
a non-operating impairment loss was recognized on the goodwill allocated to Yuzhno-Russkoye.
Miscellaneous Other Non-operating Earnings
Miscellaneous other non-operating earnings amounted to -€6 million in the 2017 fiscal year (2016:
-€946 million). The improvement resulted primarily from the fact that a provision recognized for onerous
contracts in the comparative period no longer had to be recognized in 2017.

222Uniper
Annual Report 2017 Consolidated Financial Statements
The investments presented in the financial information by business segment tables are the purchases
of investments reported in the Consolidated Statements of Cash Flows.
Transactions within the Uniper Group are generally executed at market prices.
The following table shows the reconciliation of operating cash flow to operating cash flow before interest
and taxes:
Financial Information by Business Segment
€ in millions
European Generation Global Commodities
2017 2016 2017 2016
External sales 3,199 2,988 67,862 63,233
Intersegment sales 3,908 3,847 3,172 3,232
Sales 7,107 6,835 71,034 66,465
Adjusted EBIT (segment result) 337 126 341 1,327
Equity-method earnings 1 – – 105 121
Operating cash flow before interest and taxes 545 942 800 1,096
Investments 518 494 49 99
1The income/loss from companies accounted for under the equity method presented here is generally adjusted for non-operating effects and therefore differs from the income/loss from companies accou
Operating Cash Flow before Interest and Taxes
€ in millions 2017 2016 Difference
Operating cash flow 1,385 2,184 -799
Interest payments 1 186 -185
Tax payments 332 -6 338
Operating cash flow before interest and taxes 1,718 2,364 -646

223
International Power Generation Administration/Consolidation Uniper Group
2017 2016 2017 2016 2017 2016
1,170 1,063 7 1 72,238 67,285
– – -7,080 -7,079 – –
1,170 1,063 -7,073 -7,078 72,238 67,285
616 106 -180 -197 1,114 1,362
-5 -9 2 – 102 112
671 340 -298 -14 1,718 2,364
222 187 54 1 843 781
unted for under the equity method as presented in the income statement in accordance with IFRS.

224Uniper
Annual Report 2017 Consolidated Financial Statements
Additional Entity-Level Disclosures
External sales by product break down as follows:
The “Other” item consists, in particular, of revenues generated from services and from other trading
activities.
The following table breaks down external sales (by customer and company location), intangible assets
and property, plant and equipment, as well as the carrying amounts of companies accounted for under
the equity method, by geographic area:
The Group’s customer structure did not result in any major concentration in any given geographical
region or business area, with the exception of the business relationships with the E.ON Group described
in Note 30. Due to the Company’s large number of customers and the variety of its business activities,
there are no customers whose business volume is material in relation to the total business volume of
the Group.
Segment Information by Product
€ in millions 2017 2016
Electricity 28,777 27,623
Gas 38,560 37,146
Other 4,901 2,516
Total 72,238 67,285
Geographic Segment Information
€ in millions
Germany United Kingdom
2017 2016 2017 2016
External sales by location of customer 23,393 21,036 16,881 17,395
External sales by location of seller 66,425 63,572 100 97
Intangible assets 720 800 2 1
Property, plant and
equipment 3,935 3,768 1,090 1,204
Companies accounted for under the equity method 312 697 37 27

225
Sweden Netherlands Europe (other) Other Total
2017 2016 2017 2016 2017 2016 2017 2016 2017 2016
1,049 1,529 17,299 15,407 10,111 10,808 3,505 1,110 72,238 67,285
182 236 733 699 2,869 2,565 1,929 116 72,238 67,285
60 63 14 22 21 1,232 2 3 819 2,121
2,775 2,885 759 797 2,884 2,979 53 67 11,496 11,700
51 53 39 40 – – 9 10 448 827

226Uniper
Annual Report 2017 Consolidated Financial Statements
(32) Other Significant Issues after the Balance Sheet Date
An investigation initiated by the Federal Antimonopoly Service of Russia (“FAS”) in July 2017 led to the
decision in January 2018 to accuse Uniper and the system operator of having illegally received, through
abuse of a dominant position in the electricity and capacity market, capacity payments for the third
power plant unit at the Berezovskaya site following its shutdown due to an accident. On the basis of the
available data, Unipro does not have a dominant market position with its share of installed power plant
capacity and received the capacity payments in accordance with the market regulations in force at the
time. Accordingly, Unipro intends to appeal against the FAS decision.
On February 7, 2018, following the expiration of the extended acceptance period for its takeover offer to
Uniper shareholders, the Finnish energy group Fortum announced that, aside from the block of shares
controlled by E.ON, an additional 0.47% of the shares had been tendered. This corresponds to an overall
acceptance rate of 47.12%. Were the takeover offer to be finalized, a total of 172,439,375 shares would
change owners. This event has no impact on the 2017 annual financial statements.
In February 2018, Gazprom initiated arbitration proceedings against a company of the Uniper Group
regarding price adjustments for existing gas supply contracts. This event has no impact on the 2017
annual financial statements. Any potential impact on the current fiscal year also cannot be adequately
determined at this time.

227
Declaration of the Management Board
To the best of our knowledge, we declare that, in accordance with applicable financial reporting princi-
ples, the Consolidated Financial Statements give a true and fair view of the assets, liabilities, financial
position and profit or loss of the Group, and that the Group Management Report, which is combined with
the management report of Uniper SE, provides a fair review of the development and performance of the
business and the position of the Uniper Group, together with a description of the principal opportunities
and risks associated with the expected development of the Group.
Düsseldorf, February 26, 2018
The Management Board
Klaus Schäfer Christopher Delbrück
Keith Martin Eckhardt Rümmler

228Uniper
Annual Report 2017 Consolidated Financial Statements
Disclosures Pursuant to Section 313 (2) HGB of Companies in which Equity
Investments Are Held (as of December 31, 2017)
Legal name, Registered Office Percentages
(33) List of Shareholdings Pursuant to Section 313 (2) HGB
AB Svafo, SE, Stockholm 5 22.00
Aerodis, S.A., FR, Colombes 1 100.00
B.V. NEA, NL, Dodewaard 5 25.00
Barsebäck Kraft AB, SE, Löddeköpinge 2 100.00
BauMineral GmbH, DE, Herten 1, 7 100.00
BBL Company V.O.F., NL, Groningen 4 20.00
Bergeforsens Kraftaktiebolag, SE, Bispgården 4 40.00
BIOPLYN Třeboň spol. s r.o., CZ, Třeboň 5 24.67
Blackjewel Marketing and Sales Holdings LLC, US, Wilmington 4 30.00
Blåsjön Kraft AB, SE, Arbrå 4 50.00
Deutsche Flüssigerdgas Terminal beschränkt haftende oHG, DE, Düsseldorf 2 90.00
DFTG-Deutsche Flüssigerdgas Terminal Gesellschaft mit beschränkter Haftung, DE, Wilhelmshaven 2 90.00
Donau-Wasserkraft Aktiengesellschaft, DE, München 1 100.00
E.ON Belgium N.V., BE, Vilvoorde 1 100.00
E.ON Benelux Geothermie B.V. (in liquidation), NL, Rotterdam 2 100.00
E.ON Benelux Levering B.V., NL, Eindhoven 1 100.00
E.ON Perspekt GmbH, DE, Essen 5 30.00
E.ON Ruhrgas Austria GmbH in Liqu., AT, Wien 2 100.00
E.ON Ruhrgas Nigeria Limited, NG, Abuja 2 100.00
EASYCHARGE.me GmbH, DE, Düsseldorf 2 100.00
EGC UAE SUPPLY & PROCESSING LTD FZE, AE, Fujairah free zone 2 100.00
Energie-Pensions-Management GmbH, DE, Hannover 5 30.00
Ergon Holdings Ltd, MT, St. Julians 1 100.00
Ergon Insurance Ltd, MT, St. Julians 1 100.00
Etzel Gas-Lager GmbH & Co. KG, DE, Friedeburg-Etzel 4 75.22
Etzel Gas-Lager Management GmbH, DE, Friedeburg-Etzel 5 75.20
Exporting Commodities International LLC, US, Marlton 4 49.00
Freya Bunde-Etzel GmbH & Co. KG, DE, Essen 3 59.98
Gas-Union GmbH, DE, Frankfurt am Main 4 23.58
Gemeinschaftskraftwerk Irsching GmbH, DE, Vohburg 1 50.20
Gemeinschaftskraftwerk Kiel Gesellschaft mit beschränkter Haftung, DE, Kiel 5 50.00
Gemeinschaftskraftwerk Veltheim Gesellschaft mit beschränkter Haftung, DE, Porta Westfalica 1 66.67
Greanex LLC, US, Wilmington 2 51.00
Hamburger Hof Versicherungs-Aktiengesellschaft, DE, Düsseldorf 2 100.00
Holford Gas Storage Limited, GB, Edinburgh 1 100.00
Hydropower Evolutions GmbH, DE, Düsseldorf 2 100.00
India Uniper Power Services Private Limited, IN, Kolkata 5 50.00
Induboden GmbH & Co. Industriewerte OHG, DE, Düsseldorf 2 100.00
Javelin Global Commodities Holdings LLP, GB, London 4 28.00
Kärnkraftsäkerhet & Utbildning AB, SE, Nyköping 5 33.00
Klåvbens AB, SE, Olofström 5 50.00
Kokereigasnetz Ruhr GmbH, DE, Essen 1, 7 100.00
Kolbäckens Kraft KB, SE, Sundsvall 1 100.00
1Consolidated affiliated company2Non-consolidated affiliated company (accounted for at cost for reasons of immateriality)3Joint venture pursuant to IFRS 114Associated company (accounted for under the equity method)5Joint venture or associated company (accounted for at cost for reasons of immateriality).6Other company in which share investments is held7This company exercised its exemption option under either Section 264 (3) or Section 264b of the German Commercial Code8IFRS figures as of December 31, 2016, in EUR9Local-GAAP figures as of December 31, 2016, in EUR10Change of legal form into ‘‘GmbH’’ in 2018

229
Disclosures Pursuant to Section 313 (2) HGB of Companies in which Equity
Investments Are Held (as of December 31, 2017)
Legal name, Registered Office Percentages
Kraftwerk Buer GbR, DE, Gelsenkirchen 5 50.00
Kraftwerk Schkopau Betriebsgesellschaft mbH, DE, Schkopau 1 55.60
Kraftwerk Schkopau GbR, DE, Schkopau 1 58.10
Liqvis GmbH, DE, Düsseldorf 2 100.00
Lubmin-Brandov Gastransport GmbH, DE, Essen 1 100.00
Maasvlakte CCS Project B.V., NL, Rotterdam 5 50.00
Mainkraftwerk Schweinfurt Gesellschaft mit beschränkter Haftung, DE, München 2 75.00
METHA-Methanhandel GmbH, DE, Essen 1 100.00
Mittlere Donau Kraftwerke Aktiengesellschaft, DE, München 2 60.00
Obere Donau Kraftwerke Aktiengesellschaft, DE, München 2 60.00
OKG AB, SE, Oskarshamn 1 54.50
OLT Offshore LNG Toscana S.p.A., IT, Milano 3 48.24
OOO Agro-industrial Park «Siberia», RU, Sharypovskiy 2 100.00
OOO E.ON Connecting Energies, RU, Moskau 5 50.00
OOO Unipro Engineering, RU, Moskau 2 100.00
PAO Unipro, RU, Surgut 1 83.73
Pecém II Participações S.A., BR, Rio de Janeiro 3 50.00
RAG-Beteiligungs-Aktiengesellschaft, AT, Maria Enzersdorf 4 29.98
RGE Holding GmbH, DE, Essen 1, 7 100.00
Rhein-Main-Donau Aktiengesellschaft, DE, München 1, 10 77.49
Ringhals AB, SE, Varberg 4 29.56
RMD Wasserstraßen GmbH, DE, München 2 100.00
RMD-Consult GmbH Wasserbau und Energie, DE, München 2 100.00
RuhrEnergie GmbH, EVR, DE, Gelsenkirchen 1 100.00
SOCAR-UNIPER LLC, AZ, Sumgait 5 49.00
Société des Eaux de l'Est S.A., FR, Saint-Avold (Creutzwald) 5 25.00
Solar Energy s.r.o., CZ, Znojmo 5 24.99
SQC Swedish Qualification Centre AB, SE, Stockholm 5 33.30
Stensjön Kraft AB, SE, Stockholm 4 50.00
store-x Storage Capacity Exchange GmbH i.L., DE, Leipzig 5 32.00
Surschiste, S.A., FR, Mazingarbe 2 100.00
Svensk Kärnbränslehantering AB, SE, Stockholm 5 34.00
Sydkraft AB, SE, Malmö 1 100.00
Sydkraft Försäkring AB, SE, Malmö 1 100.00
Sydkraft Hydropower AB, SE, Sundsvall 1 100.00
Sydkraft Nuclear Power AB, SE, Malmö 1 100.00
Sydkraft Thermal Power AB, SE, Malmö 1 100.00
Teplárna Tábor, a.s., CZ, Tábor 1 51.95
Uniper Anlagenservice GmbH, DE, Gelsenkirchen 1 100.00
Uniper Benelux CCS Project B.V., NL, Rotterdam 2 100.00
Uniper Benelux Holding B.V., NL, Rotterdam 1 100.00
Uniper Benelux N.V., NL, Rotterdam 1 100.00
Uniper Beteiligungs GmbH, DE, Düsseldorf 1, 7 100.00
Uniper Brasil Energia Ltda., BR, City of São Paulo 2 100.00
Uniper Climate & Renewables France Solar S.A.S., FR, Colombes 1 100.00
1Consolidated affiliated company2Non-consolidated affiliated company (accounted for at cost for reasons of immateriality)3Joint venture pursuant to IFRS 114Associated company (accounted for under the equity method)5Joint venture or associated company (accounted for at cost for reasons of immateriality).6Other company in which share investments is held7This company exercised its exemption option under either Section 264 (3) or Section 264b of the German Commercial Code8IFRS figures as of December 31, 2016, in EUR9Local-GAAP figures as of December 31, 2016, in EUR10Change of legal form into ‘‘GmbH’’ in 2018

230Uniper
Annual Report 2017 Consolidated Financial Statements
Disclosures Pursuant to Section 313 (2) HGB of Companies in which Equity
Investments Are Held (as of December 31, 2017)
Legal name, Registered Office Percentages
Uniper Energies Renouvelables S.A.S., FR, Colombes 1 100.00
Uniper Energy DMCC, AE, Dubai 1 100.00
Uniper Energy Limited, GB, Birmingham 2 100.00
Uniper Energy Sales GmbH, DE, Düsseldorf 1 100.00
Uniper Energy Sales Polska Sp. z o.o. w likwidacji, PL, Warschau 2 100.00
Uniper Energy Southern Africa (Pty) Ltd., ZA, Johannesburg (Sandton) 2 100.00
Uniper Energy Storage GmbH, DE, Essen 1 100.00
Uniper Energy Storage Limited (in Liquidation), GB, Birmingham 2 100.00
Uniper Energy Trading NL Staff Company 2 B.V., NL, Rotterdam 2 100.00
Uniper Energy Trading NL Staff Company B.V., NL, Rotterdam 2 100.00
Uniper Energy Trading Srbija d.o.o., RS, Belgrad 2 100.00
Uniper Energy Trading UK Staff Company Limited, GB, Birmingham 1 100.00
Uniper Exploration & Production GmbH, DE, Düsseldorf 1, 7 100.00
Uniper Financial Services GmbH, DE, Regensburg 2 100.00
Uniper France Energy Solutions S.A.S., FR, Colombes 1 100.00
Uniper France Power S.A.S., FR, Colombes 1 100.00
Uniper France S.A.S., FR, Colombes 1 100.00
Uniper Gas Transportation and Finance B.V., NL, Rotterdam 1 100.00
Uniper Global Commodities Canada Inc., CA, Toronto 2 100.00
Uniper Global Commodities London Ltd., GB, Birmingham 2 100.00
Uniper Global Commodities North America LLC, US, Wilmington 1 100.00
Uniper Global Commodities SE, DE, Düsseldorf 1 100.00
Uniper Global Commodities UK Limited, GB, Birmingham 1 100.00
Uniper Holding GmbH, DE, Düsseldorf 1, 7 100.00
Uniper Holdings Limited, GB, Birmingham 2 100.00
Uniper HR Services Berlin GmbH, DE, Berlin 2 100.00
Uniper HR Services Hannover GmbH, DE, Hannover 2 100.00
Uniper Hungary Energetikai Kft., HU, Budapest 1 100.00
Uniper Infrastructure Asset Management B.V., NL, Rotterdam 1 100.00
Uniper IT GmbH, DE, Düsseldorf 1, 7 100.00
Uniper Kraftwerke GmbH, DE, Düsseldorf 1 100.00
Uniper Market Solutions GmbH, DE, Düsseldorf 2 100.00
Uniper NefteGaz LLC, RU, Moskau 2 100.00
Uniper Risk Consulting GmbH, DE, Düsseldorf 1, 7 100.00
Uniper Ruhrgas BBL B.V., NL, Rotterdam 1 100.00
Uniper Ruhrgas International GmbH, DE, Essen 1, 7 100.00
Uniper Russia Beteiligungs GmbH, DE, Düsseldorf 2 100.00
Uniper Russia Holding GmbH, DE, Düsseldorf 1, 7 100.00
Uniper Technologies B.V., NL, Rotterdam 2 100.00
Uniper Technologies GmbH, DE, Gelsenkirchen 1 100.00
Uniper Technologies Limited, GB, Birmingham 1 100.00
Uniper Trading Canada Ltd., CA, Toronto 2 100.00
Uniper Trend s.r.o., CZ, České Budějovice 1 100.00
Uniper UK Corby Limited, GB, Birmingham 1 100.00
Uniper UK Cottam Limited, GB, Birmingham 2 100.00
1Consolidated affiliated company2Non-consolidated affiliated company (accounted for at cost for reasons of immateriality)3Joint venture pursuant to IFRS 114Associated company (accounted for under the equity method)5Joint venture or associated company (accounted for at cost for reasons of immateriality).6Other company in which share investments is held7This company exercised its exemption option under either Section 264 (3) or Section 264b of the German Commercial Code8IFRS figures as of December 31, 2016, in EUR9Local-GAAP figures as of December 31, 2016, in EUR10Change of legal form into ‘‘GmbH’’ in 2018

231
Other companies in which share investments are held
Gesellschaft, Sitz %
Equity as at
reporting date 2016
Net income as at
reporting date 2016
Other companies in which share investments are held
AS Latvijas Gaze, LV, Riga 4, 9 18,26 599.366.000,00 37.506.000,00
ENEVA S.A., BR, Rio de Janeiro 6, 8 6,10 1.131.082,58 -30.825,45
Forsmarks Kraftgrupp AB, SE, Östhammar 6, 9 8,50 699.372.600,01 62.479,96
Mellansvensk Kraftgrupp AB, SE, Stockholm 6, 9 5,35 8.141.063,41 207,57
1Consolidated affiliated company2Non-consolidated affiliated company (accounted for at cost for reasons of immateriality)3Joint venture pursuant to IFRS 114Associated company (accounted for under the equity method)5Joint venture or associated company (accounted for at cost for reasons of immateriality).6Other company in which share investments is held7This company exercised its exemption option under either Section 264 (3) or Section 264b of the German Commercial Code8IFRS figures as of December 31, 2016, in EUR9Local-GAAP figures as of December 31, 2016, in EUR10Change of legal form into ‘‘GmbH’’ in 2018
Disclosures Pursuant to Section 313 (2) HGB of Companies in which Equity
Investments Are Held (as of December 31, 2017)
Legal name, Registered Office Percentages
Uniper UK Gas Limited, GB, Birmingham 1 100.00
Uniper UK Ironbridge Limited, GB, Birmingham 1 100.00
Uniper UK Limited, GB, Birmingham 1 100.00
Uniper UK Trustees Limited, GB, Birmingham 2 100.00
Uniper Wärme GmbH, DE, Gelsenkirchen 1 100.00
Untere Iller AG, DE, Landshut 2 60.00
Utilities Center Maasvlakte Leftbank b.v., NL, Rotterdam 1 100.00
Volkswagen AG Preussen Elektra AG Offene Handelsgesellschaft, DE, Wolfsburg 5 95.00
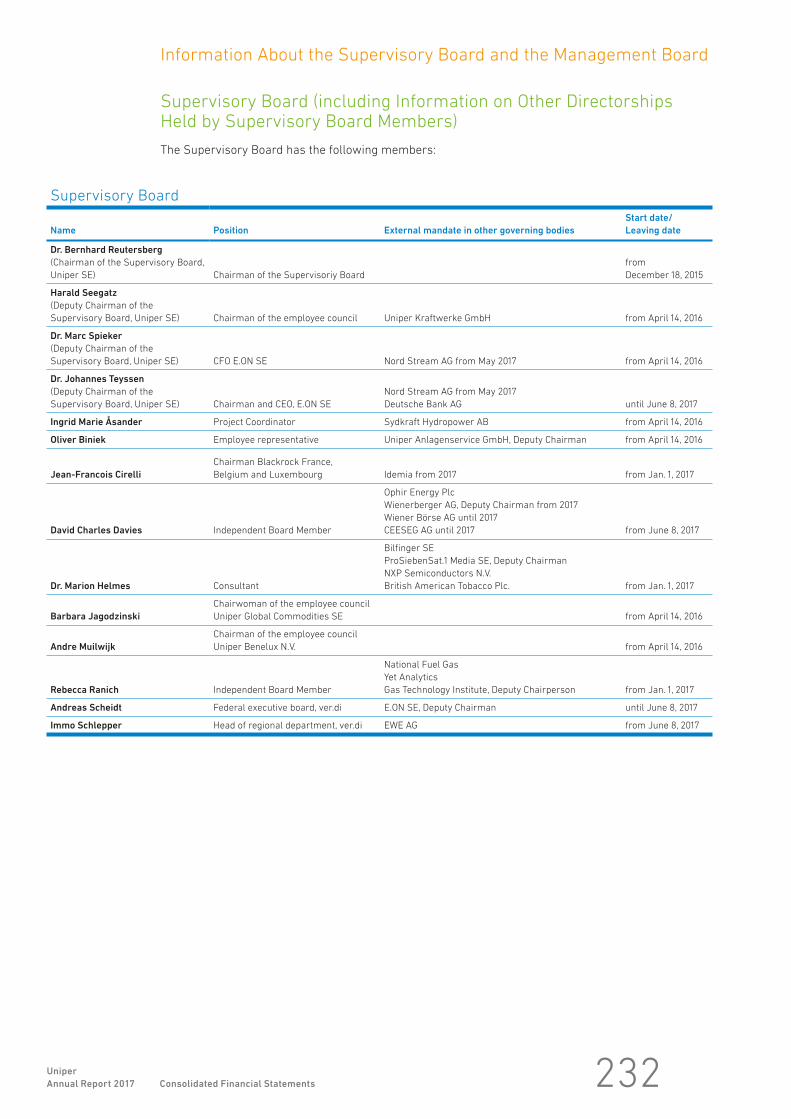
232Uniper
Annual Report 2017 Consolidated Financial Statements
Information About the Supervisory Board and the Management Board
Supervisory Board (including Information on Other Directorships Held by Supervisory Board Members)
The Supervisory Board has the following members:
Supervisory Board
Name Position External mandate in other governing bodies
Start date/
Leaving date
Dr. Bernhard Reutersberg
(Chairman of the Supervisory Board,
Uniper SE) Chairman of the Supervisoriy Board
from
December 18, 2015
Harald Seegatz
(Deputy Chairman of the
Supervisory Board, Uniper SE) Chairman of the employee council Uniper Kraftwerke GmbH from April 14, 2016
Dr. Marc Spieker
(Deputy Chairman of the
Supervisory Board, Uniper SE) CFO E.ON SE Nord Stream AG from May 2017 from April 14, 2016
Dr. Johannes Teyssen
(Deputy Chairman of the
Supervisory Board, Uniper SE) Chairman and CEO, E.ON SE
Nord Stream AG from May 2017
Deutsche Bank AG until June 8, 2017
Ingrid Marie Åsander Project Coordinator Sydkraft Hydropower AB from April 14, 2016
Oliver Biniek Employee representative Uniper Anlagenservice GmbH, Deputy Chairman from April 14, 2016
Jean-Francois Cirelli
Chairman Blackrock France,
Belgium and Luxembourg Idemia from 2017 from Jan. 1, 2017
David Charles Davies Independent Board Member
Ophir Energy Plc
Wienerberger AG, Deputy Chairman from 2017
Wiener Börse AG until 2017
CEESEG AG until 2017 from June 8, 2017
Dr. Marion Helmes Consultant
Bilfinger SE
ProSiebenSat.1 Media SE, Deputy Chairman
NXP Semiconductors N.V.
British American Tobacco Plc. from Jan. 1, 2017
Barbara Jagodzinski
Chairwoman of the employee council
Uniper Global Commodities SE from April 14, 2016
Andre Muilwijk
Chairman of the employee council
Uniper Benelux N.V. from April 14, 2016
Rebecca Ranich Independent Board Member
National Fuel Gas
Yet Analytics
Gas Technology Institute, Deputy Chairperson from Jan. 1, 2017
Andreas Scheidt Federal executive board, ver.di E.ON SE, Deputy Chairman until June 8, 2017
Immo Schlepper Head of regional department, ver.di EWE AG from June 8, 2017

233
Management Board (including Information on Other Directorships Held by the Management Board Members)
The Management Board has the following members:
Management Board
Name Profession Other directorships Entry date:
Klaus Schäfer Chairman of the Management Board (CEO)
Nord Stream AG, until May 2017
Uniper Global Commodities SE, Chairman
Uniper Kraftwerke GmbH, Chairman
PAO Unipro, Chairman Dec. 30, 2015
Christopher Delbrück Member of the Management Board (CFO)
Nord Stream AG, until May 2017
PAO Unipro Dec. 30, 2015
Keith Martin Member of the Management Board (CCO) March 1, 2016
Eckhardt Rümmler Member of the Management Board (COO)
Uniper Technologies GmbH, Chairman
PAO Unipro Dec. 30, 2015

234Uniper
Annual Report 2017 Independent Practitioner’s Report on Non-financial Reporting
Independent Practitioner’s Report on a Limited Assurance Engagement on Non-financial Reporting1
To Uniper SE, Düsseldorf
We have performed a limited assurance engagement on the combined separate non-financial report
pursuant to §§ (Articles) 289b Abs. (paragraph) 3 and 315b Abs. 3 HGB (“Handelsgesetzbuch”: “German
Commercial Code”) of Uniper SE, Düsseldorf, (hereinafter the “Company”) for the period from 01 January
to 31 December 2017 (hereinafter the “Non-financial Report”).
Responsibilities of the Executive Directors
The executive directors of the Company are responsible for the preparation of the Non-financial Report
in accordance with §§ 315b and 315c in conjunction with 289c to 289e HGB.
This responsibility of Company’s executive directors includes the selection and application of appropri-
ate methods of non-financial reporting as well as making assumptions and estimates related to individ-
ual non-financial disclosures which are reasonable in the circumstances. Furthermore, the executive
directors are responsible for such internal control as they have considered necessary to enable the
preparation of a Non-financial Report that is free from material misstatement whether due to fraud or
error.
Independence and Quality Control of the Audit Firm
We have complied with the German professional provisions regarding independence as well as other
ethical requirements.
Our audit firm applies the national legal requirements and professional standards – in particular the
Professional Code for German Public Auditors and German Chartered Auditors (“Berufssatzung für
Wirtschaftsprüfer und vereidigte Buchprüfer“: “BS WP/vBP”) as well as the Standard on Quality Control 1
published by the Institut der Wirtschaftsprüfer (Institute of Public Auditors in Germany; IDW): Require-
ments to quality control for audit firms (IDW Qualitätssicherungsstandard 1: Anforderungen an die Quali-
tätssicherung in der Wirtschaftsprüferpraxis - IDW QS 1) – and accordingly maintains a comprehensive
system of quality control including documented policies and procedures regarding compliance with
ethical requirements, professional standards and applicable legal and regulatory requirements.
1PricewaterhouseCoopers GmbH has performed a limited assurance engagement on the German version of the separate combined
non-financial report and issued an independent assurance report in German language, which is authoritative. The following text is
a translation of the independent assurance report.

235Uniper
Annual Report 2017 Independent Practitioner’s Report on Non-financial Reporting
Practitioner’s Responsibility
Our responsibility is to express a limited assurance conclusion on the Non-financial Report based on
the assurance engagement we have performed.
Within the scope of our engagement we did not perform an audit on external sources of information or
expert opinions, referred to in the Non-financial Report.
We conducted our assurance engagement in accordance with the International Standard on Assurance
Engagements (ISAE) 3000 (Revised): Assurance Engagements other than Audits or Reviews of Historical
Financial Information, issued by the IAASB. This Standard requires that we plan and perform the assur-
ance engagement to allow us to conclude with limited assurance that nothing has come to our attention
that causes us to believe that the Company’s Non-financial Report for the period from 1 January to
31 December 2017 has not been prepared, in all material aspects, in accordance with §§ 315b and 315c
in conjunction with 289c to 289e HGB.
In a limited assurance engagement the assurance procedures are less in extent than for a reasonable
assurance engagement, and therefore a substantially lower level of assurance is obtained. The assur-
ance procedures selected depend on the practitioner’s judgment.
Within the scope of our assurance engagement, we performed amongst others the following assurance
procedures and further activities:
• Obtaining an understanding of the structure of the sustainability organization and of the stakeholder
engagement
• Inquiries of personnel involved in the preparation of the Non-financial Report regarding the prepa-
ration process, the internal control system relating to this process and selected disclosures in the
Non-financial Report
• Identification of the likely risks of material misstatement of the Non-financial Report
• Analytical evaluation of selected disclosures in the Non-financial Report
• Evaluation of the presentation of the non-financial information

236
Assurance Conclusion
Based on the assurance procedures performed and assurance evidence obtained, nothing has come
to our attention that causes us to believe that the Company’s Non-financial Report for the period from
01 January to 31 December 2017 has not been prepared, in all material aspects, in accordance with
§§ 315b and 315c in conjunction with 289c to 289e HGB.
Intended Use of the Assurance Report
We issue this report on the basis of the engagement agreed with the Company. The assurance engage-
ment has been performed for purposes of the Company and the report is solely intended to inform the
Company about the results of the limited assurance engagement. The report is not intended for any
third parties to base any (financial) decision thereon. Our responsibility lies only with the Company.
We do not assume any responsibility towards third parties.
Düsseldorf, 27 February 2018
PricewaterhouseCoopers GmbH
Wirtschaftsprüfungsgesellschaft
Markus Dittmann Hendrik Fink
Wirtschaftsprüfer Wirtschaftsprüfer
[German public auditor] [German public auditor]
Uniper
Annual Report 2017 Independent Practitioner’s Report on Non-financial Reporting

237
238Uniper
Annual Report 2017
Further Financial Information
Glossary of Financial Terms
Actuarial gains and lossesThe actuarial calculation of provisions for pensions is based on projections of variables (such as trends
in wages and pensions). Actuarial gains and losses are recognized when the actual numbers turn out to
be different from the projections.
Adjusted EBITAdjusted EBIT as applied by Uniper is a measure of earnings before interest and taxes adjusted for
non-operating effects (see page 18 of this Annual Report for a detailed definition).
Adjusted EBITDAAdjusted EBITDA is a measure of earnings before interest, taxes, depreciation, and amortization and re-
versals adjusted for non-operating effects.
Adjusted funds from operations (“adjusted FFO”)Cash flow measure used by Uniper. Adjusted funds from operations (“adjusted FFO”), is an adjusted
cash flow from operating activities (see page 18 of this Annual Report for a detailed definition).
BondDebt security in which the right to repayment of the bond’s nominal value plus interest is securitized.
Issuers include government entities, banks and businesses. They are a form of medium- and long-term
debt financing for the issuer.
Capital stockThe share capital of a stock corporation as specified in its articles of association and recorded in the
commercial register. It is shown on the liabilities side of the balance sheet.
Cash flow statementThe cash flow statement assists in the determination and presentation of the cash a company has gener-
ated or consumed during a reporting period as a result of its operating, investing and financing activities.
Commercial paper (“CP”)Short-term, unsecured debt instruments issued by entities such as businesses and banks as part of a
CP program.
ConsolidationIn the Consolidated Financial Statements, all Group companies are presented together as if they formed
a single legal entity. All intragroup expenses and income, all intragroup trade payables and receivables
and all other transactions between Group companies are offset against each other and eliminated. Equity
investments in Group companies are offset against their capital stock (consolidation of investments) and
all intragroup receivables and liabilities are eliminated, since such rights and obligations do not exist with-
in a single legal entity. The adding together and consolidation of the remaining items of the annual finan-
cial statements produces the Consolidated Balance Sheet and the Consolidated Statement of Income.
Contractual Trust Arrangement (“CTA”)A model for funding pension obligations using a trust. In a CTA, a company with pension obligations
transfers assets to a separate, legally independent trustee, which uses the assets to satisfy the company’s
pension obligations.

239
Controllable costsControllable costs are an indicator for the management of costs, and include those expenses over which
operations management can exercise independent influence.
Cost of capitalThe cost of capital employed is calculated as the weighted average of the costs of debt and equity financ-
ing (weighted-average cost of capital, “WACC”). The cost of equity is the return expected by an investor in
a given stock. The cost of debt is geared to market terms for loans and bonds. The interest on corporate
debt is tax-deductible (referred to as the tax shield on corporate debt).
Credit default swap (“CDS”)The buyer of a CDS buys protection against risks involving a debtor’s failure to make required payments
on loans, bonds or other forms of financing, and these risks are assumed by the seller of the CDS in
exchange for a premium.
Credit facilityLines of credit and other financing usually extended contractually by banks to businesses to cover their
financing needs.
Debt factorRatio of economic net debt to adjusted EBITDA. The debt factor serves as a target value for the capital
structure.
Debt Issuance Programme (“DIP”)Uniper’s program for issuing bonds domestically and abroad.
Discontinued operationsIdentifiable business units that are intended for sale or have been sold. They are subject to special
disclosure rules.
Economic net debtMeasure that shows total economic debt by taking into account the net financial position and provi-
sions for pensions and similar obligations and provisions for asset retirement obligations. Any assets
allocated to these obligations (e.g., receivables from the Swedish Nuclear Waste Fund) are netted.
Equity-method accountingMethod of accounting for shareholdings in associated companies that is not included in the Consolidated
Financial Statements on the basis of full consolidation with all assets and liabilities. The book value
(carrying amount) recognized for such shareholdings is adjusted for the change in the owned portion of
the shareholding’s equity. This change is shown in the owning company’s income statement.
Fair valueThe amount for which assets, liabilities and derivative financial instruments could be exchanged or settled
between knowledgeable, willing and independent parties (arm’s-length transaction).
Financial leverageRatio of the financial position to adjusted EBITDA. The financial net debt ratio serves as a target for the
capital structure.

240Uniper
Annual Report 2017
Free cash flowThe free cash flow target describes Uniper’s aspiration to achieve neutral to positive free cash from
operations after paying out the dividend while simultaneously optimizing the operating, financing and
investing components of cash flow.
Free cash flow from operations (“FCFO”)Free cash from operations (“FCFO”) is used by Uniper as the basis for calculating dividend payments.
FCFO is adjusted FFO less investment spending for maintenance and replacement.
German Corporate Governance Code The German Corporate Governance Code embodies material statutory provisions for the management
and supervision of German listed companies. Its recommendations and suggestions contain internation-
ally and nationally recognized standards of good and responsible corporate governance.
GoodwillThe value of a subsidiary as disclosed in the Consolidated Financial Statements resulting from the
consolidation of investments (after elimination of hidden reserves and charges), calculated by offsetting
the carrying amount of the parent company’s investment in the subsidiary against the parent company’s
portion of the subsidiary’s equity.
Impairment testPeriodic comparison of an asset’s carrying amount (book value) with its recoverable amount (fair value).
If it is determined that an asset’s recoverable amount has fallen below its carrying amount, an impair-
ment charge must be recognized on the asset.
International Financial Reporting Standards (“IFRS”)International accounting standards which must, pursuant to the relevant regulation of the European
Parliament and of the European Council, be applied by publicly traded companies in the EU.
InvestmentsCash-effective investments as reported in the cash flow statement. These investments are divided into
growth investments and investments in fixed assets in connection with replacement of existing equip-
ment and maintenance.
Net financial positionBalance of liquid funds and non-current securities net of financial liabilities (including financial liabilities
to affiliated companies).
Net income/lossEarnings figure that includes interest, income taxes and income from non-controlling interests, and
which has not been adjusted for any extraordinary effects.
Operating cash flow before interest and taxes (“OCFbIT”)Operating cash flow before interest and taxes (“OCFbIT”) is a measure of cash flow from operating
activities (operating cash flow) net of cash provided by or used for interest and taxes (less refunds).

241
Purchase price allocationAllocation to individual assets and liabilities of the purchase price paid for an acquired entity in a business
combination.
RatingClassification by a rating agency of short- and long-term debt issues or of issuers into grades of credit
quality or into rating categories. The main function of a rating is to create transparency and thus com-
parability for investors and creditors with regard to the risk of default of an issuer or a debt instru-
ment.
Spin-offRefers to the term from German law governing the reorganization of corporate entities (“Abspaltung”).
A spin-off is a separation process in which one or more parts of an entity’s assets are transferred to
existing or newly established entities, while the original entity remains intact. As consideration for the
assets thus separated, the owners of the transferring entity receive shares in the entity that receives
the separated assets.
Spot marketA spot market (or cash market) is the economic venue where offers and bids for spot or cash transactions
come together. Items traded in the spot market include, in particular, currencies, securities and com-
modities that are traded under standardized contracts.
Value at risk (“VaR”)Statistical risk measure that indicates the potential loss that a portfolio of investments will not exceed
with a certain degree of probability (for example, 99%) over a certain period of time (for example, one
day). Holding periods can be specified with market liquidities taken into account. Due to correlations
between markets, the risk to a portfolio determined in VaR can be less than the sum of the individual
underlying risks within the portfolio.

242Uniper
Annual Report 2017
This Annual Report was printed on paper produced from fiber that comes
from a responsibly managed forest certified by the Forest Stewardship
Council.

243
May 8, 2018Quarterly Statement: January–March 2018
June 6, 20182018 Annual Shareholders Meeting (Grugahalle, Essen)
August 7, 2018Half-Year Interim Report: January–June 2018
November 13, 2018Quarterly Statement: January–September 2018
March 12, 2019Annual Report: 2018
May 7, 2019Quarterly Statement: January–March 2019
May 22, 20192019 Annual Shareholders Meeting (Düsseldorf, Congress Center)
August 8, 2019Half-Year Interim Report: January–June 2019
November 12, 2019Quarterly Statement: January–September 2019
Financial Calendar
Further information
Media [email protected]
Investor [email protected]
Creditor [email protected]

Uniper SE
E.ON-Platz 1
40479 Düsseldorf
Germany
www.uniper.energy


![Controllable Sliding Bearings and Controllable Lubrication ... · Review Controllable Sliding Bearings and Controllable ... or evolutionary [5], but it does not change the fact that](https://static.fdocuments.in/doc/165x107/5fc50df11ca4e1756528a85b/controllable-sliding-bearings-and-controllable-lubrication-review-controllable.jpg)


