Annual Report 2017 - Chiba Bank Founded the Chiba Bank Chiba Godo Bank, Omigawa Agricultural and...
72
Annual Report 2017 Year ended March 31, 2017
Transcript of Annual Report 2017 - Chiba Bank Founded the Chiba Bank Chiba Godo Bank, Omigawa Agricultural and...
Annual Report 2017Year ended March 31, 2017
Overview of Japanese Regional Banks
billion¥
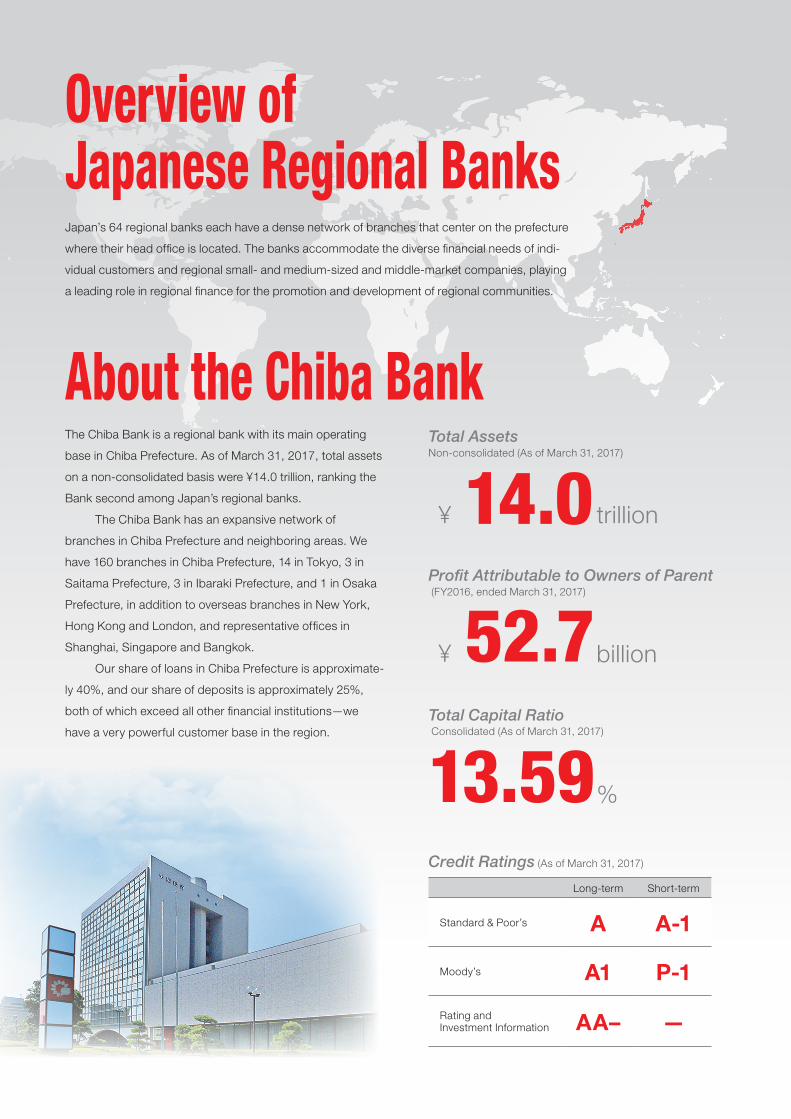
Profit Attributable to Owners of Parent
trillion¥ 14.0Total Assets
13.59Total Capital Ratio
Credit Ratings (As of March 31, 2017)
%
Long-term Short-term
Standard & Poor’s A A-1
Moody’s A1 P-1
Rating and Investment Information AA– —
Non-consolidated (As of March 31, 2017)
(FY2016, ended March 31, 2017)
Consolidated (As of March 31, 2017)
About the Chiba BankThe Chiba Bank is a regional bank with its main operating
base in Chiba Prefecture. As of March 31, 2017, total assets
on a non-consolidated basis were ¥14.0 trillion, ranking the
Bank second among Japan’s regional banks.
The Chiba Bank has an expansive network of
branches in Chiba Prefecture and neighboring areas. We
have 160 branches in Chiba Prefecture, 14 in Tokyo, 3 in
Saitama Prefecture, 3 in Ibaraki Prefecture, and 1 in Osaka
Prefecture, in addition to overseas branches in New York,
Hong Kong and London, and representative offices in
Shanghai, Singapore and Bangkok.
Our share of loans in Chiba Prefecture is approximate-
ly 40%, and our share of deposits is approximately 25%,
both of which exceed all other financial institutions—we
have a very powerful customer base in the region.
Japan’s 64 regional banks each have a dense network of branches that center on the prefecture
where their head office is located. The banks accommodate the diverse financial needs of indi-
vidual customers and regional small- and medium-sized and middle-market companies, playing
a leading role in regional finance for the promotion and development of regional communities.
52.7
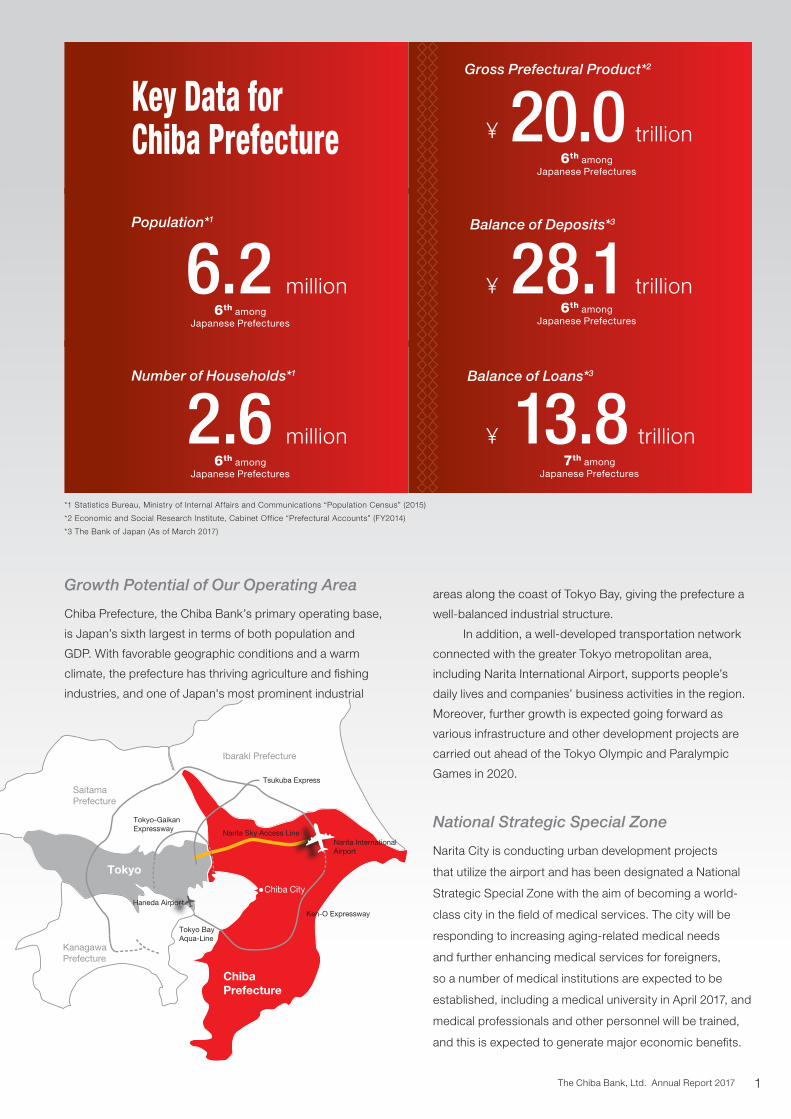
Gross Prefectural Product*2
¥ 20.0 trillion6th among
Japanese Prefectures
6.2Population*1
million6th among
Japanese Prefectures
6th amongJapanese Prefectures
million
Number of Households*1
2.6
6th amongJapanese Prefectures
Balance of Deposits*3
trillion28.1
6
Haneda Airport
Narita International Airport
Saitama Prefecture
Ibaraki Prefecture
Chiba City
Chiba Prefecture
Tsukuba Express
Tokyo-GaikanExpressway
Tokyo BayAqua-Line
Narita Sky Access Line
Ken-O Expressway
Kanagawa Prefecture
Tokyo
Key Data for Chiba Prefecture
Narita City is conducting urban development projects
that utilize the airport and has been designated a National
Strategic Special Zone with the aim of becoming a world-
class city in the field of medical services. The city will be
responding to increasing aging-related medical needs
and further enhancing medical services for foreigners,
so a number of medical institutions are expected to be
established, including a medical university in April 2017, and
medical professionals and other personnel will be trained,
and this is expected to generate major economic benefits.
National Strategic Special Zone
Chiba Prefecture, the Chiba Bank’s primary operating base,
is Japan’s sixth largest in terms of both population and
GDP. With favorable geographic conditions and a warm
climate, the prefecture has thriving agriculture and fishing
industries, and one of Japan's most prominent industrial
Growth Potential of Our Operating Area
¥
trillion
Balance of Loans*3
7th amongJapanese Prefectures
13.8¥
*1 Statistics Bureau, Ministry of Internal Affairs and Communications “Population Census” (2015)
*2 Economic and Social Research Institute, Cabinet Office “Prefectural Accounts” (FY2014)
*3 The Bank of Japan (As of March 2017)
areas along the coast of Tokyo Bay, giving the prefecture a
well-balanced industrial structure.
In addition, a well-developed transportation network
connected with the greater Tokyo metropolitan area,
including Narita International Airport, supports people’s
daily lives and companies’ business activities in the region.
Moreover, further growth is expected going forward as
various infrastructure and other development projects are
carried out ahead of the Tokyo Olympic and Paralympic
Games in 2020.
The Chiba Bank, Ltd. Annual Report 2017 1
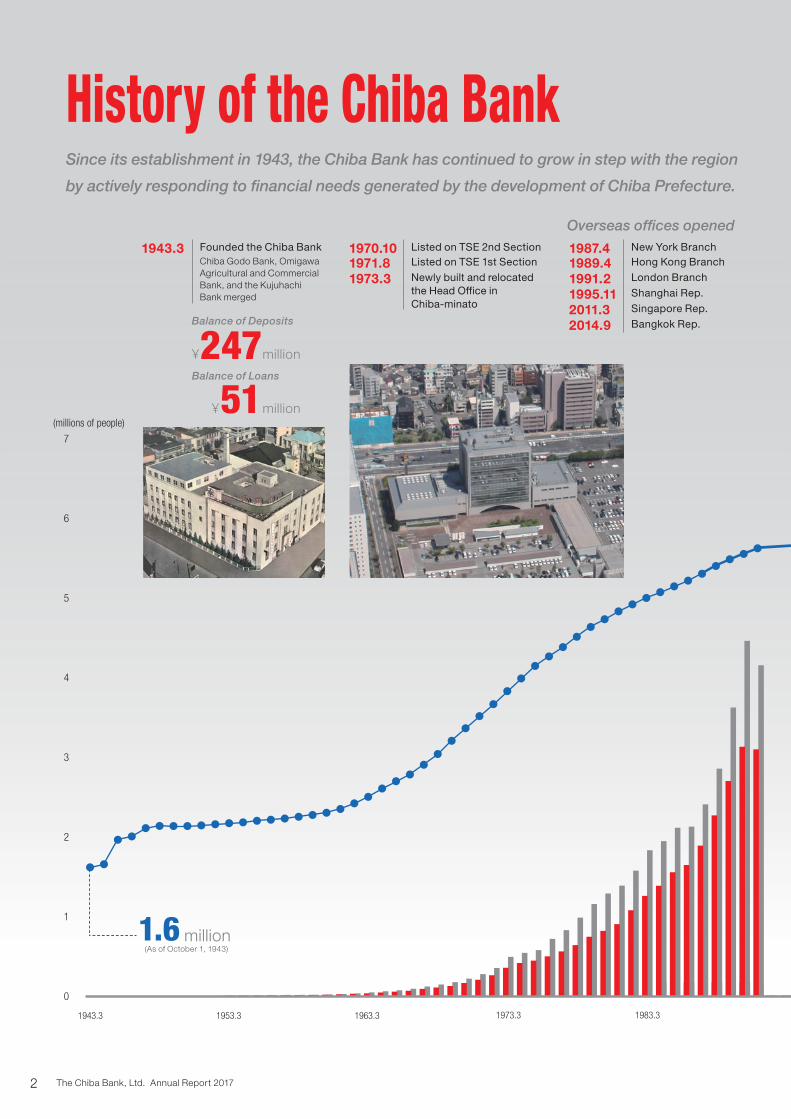
History of the Chiba Bank
1943.3 1953.3 1963.3 1973.3 1983.3 1993.3 2003.3 2013.3 2017.3
0
2
1
3
4
5
6
7
(millions of people)
0
2
4
6
8
10
12
(¥ trillion)
Since its establishment in 1943, the Chiba Bank has continued to grow in step with the region
by actively responding to financial needs generated by the development of Chiba Prefecture.
Overseas offices opened
1943.3 Founded the Chiba BankChiba Godo Bank, Omigawa Agricultural and Commercial Bank, and the Kujuhachi Bank merged
1970.10 Listed on TSE 2nd Section
1971.8 Listed on TSE 1st Section
1973.3 Newly built and relocated the Head Office in Chiba-minato
1987.4 New York Branch
1989.4 Hong Kong Branch
1991.2 London Branch
1995.11 Shanghai Rep.
2011.3 Singapore Rep.
2014.9 Bangkok Rep.
million51¥
Balance of Loans
million¥
Balance of Deposits
247
1.6(As of October 1, 1943)
million
The Chiba Bank, Ltd. Annual Report 20172
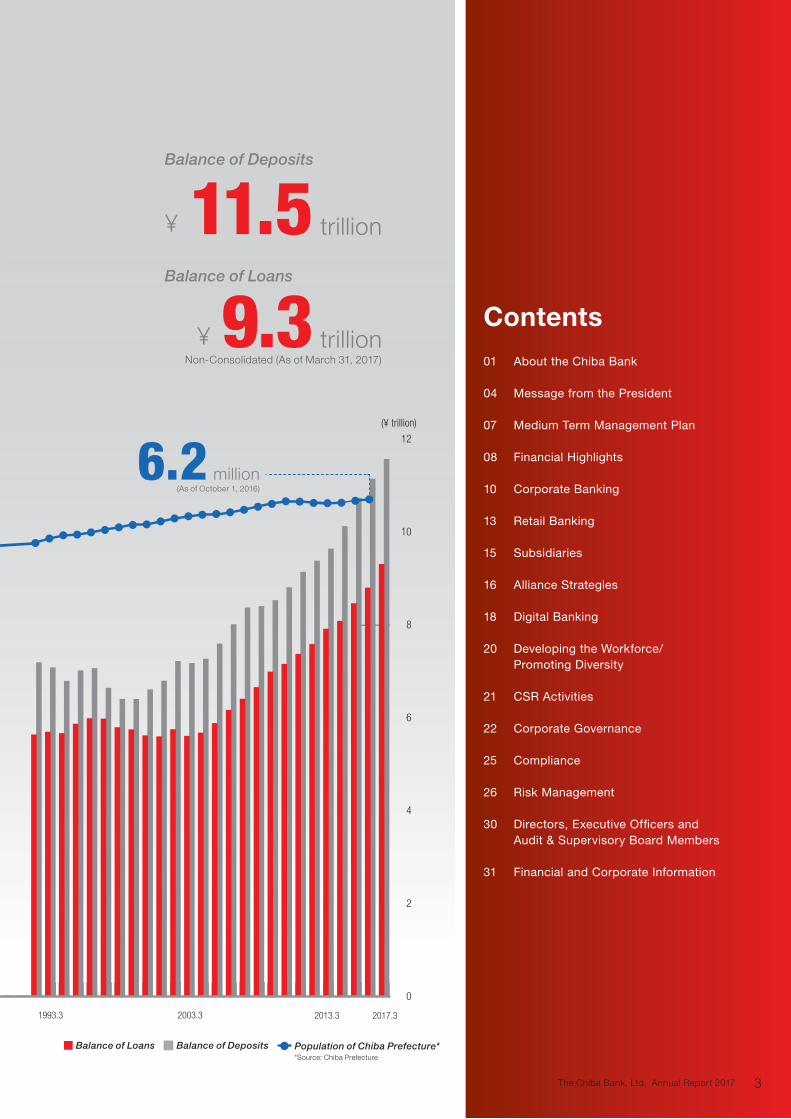
Contents01 About the Chiba Bank
04 Message from the President
07 Medium Term Management Plan
08 Financial Highlights
10 Corporate Banking
13 Retail Banking
15 Subsidiaries
16 Alliance Strategies
18 Digital Banking
20 Developing the Workforce/ Promoting Diversity
21 CSR Activities
22 Corporate Governance
25 Compliance
26 Risk Management
30 Directors, Executive Officers and Audit & Supervisory Board Members
31 Financial and Corporate Information
1943.3 1953.3 1963.3 1973.3 1983.3 1993.3 2003.3 2013.3 2017.3
0
2
1
3
4
5
6
7
(millions of people)
0
2
4
6
8
10
12
(¥ trillion)
Balance of Loans Population of Chiba Prefecture*Balance of Deposits
Overseas offices opened
9.3
trillion¥
Balance of Deposits
trillion¥
Balance of Loans
11.5
Non-Consolidated (As of March 31, 2017)
*Source: Chiba Prefecture
6.2(As of October 1, 2016)
million
The Chiba Bank, Ltd. Annual Report 2017 3
Financial Results for the Fiscal Year Ended March 31, 2017Consolidated ordinary profit decreased by ¥7.9 billion
year on year to ¥77.6 billion, and we reported ¥52.7 bil-
lion in profit attributable to owners of parent, a decline
of ¥2.7 billion, in the fiscal year ended March 31, 2017.
We posted our third-highest level of profits, despite the
negative interest rate policy of the Bank of Japan and
other factors. In addition, we maintained a very high
degree of financial soundness with a consolidated total
capital ratio of 13.59%.
As of March 31, 2017, our balance of loans
increased by ¥507.9 billion from the end of the previous
fiscal year to ¥9,305.3 billion, breaking above the ¥9
trillion level as a result of aggressive efforts to address
customer needs, such as by extending loans to SMEs
and housing loans. The balance of deposits increased
by ¥425.5 billion compared with the previous fiscal
year-end to ¥11,565.7 billion, due mainly to an increase
in deposits from individual customers.
Market Environment The Japanese economy stayed on a moderate recovery
trend amid continued improvement in employment con-
ditions and household income. There are still concerns
that must be addressed by continuous initiatives, how-
ever, such as the declining population in the medium
Review of the Fiscal Year Ended March 31, 2017The previous fiscal year was the final year of our
previous medium-term management plan. I believe we
were able to demonstrate a resolute, assertive stance
on various fronts and make considerable progress. We
proactively contributed to regional revitalization while
offering proposals with high added value for solving
issues faced by our customers. At the same time, we
made substantial progress forging alliances with other
banks and sharing systems and increasing productivity
by streamlining and specializing work processes, all the
while accurately reading the latest trends.
Meanwhile, we have laid a solid foundation for
future growth. As digital technology spreads rapidly
throughout society, digital banking is becoming more
prevalent within the context of services, work process-
es and bank employees. In July 2016, we established
a joint venture to assess and research FinTech. In
September, we launched a prototype next-generation
branch model at an actual bank branch. In October, a
department to promote work style reform was created
to advance work style reforms and conduct a sweeping
review of IT-driven work methods. We are taking on
the challenge of constructively transforming ourselves,
guided by new ideas that break from traditional
approaches and stereotypes.
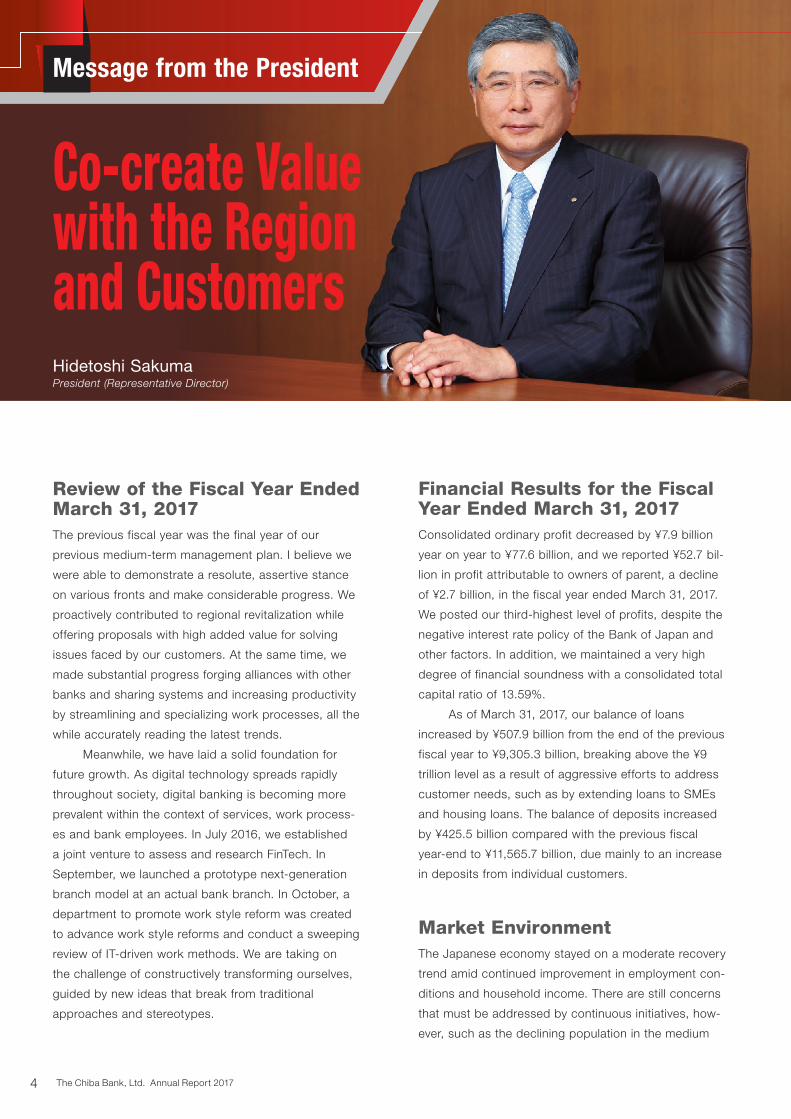
Message from the President
Co-create Value with the Region and CustomersHidetoshi SakumaPresident (Representative Director)
The Chiba Bank, Ltd. Annual Report 20174

to long term and widening regional disparity between
urban and rural areas.
Situated in the Tokyo metropolitan area, Chiba
Prefecture, the main operating area of the Chiba Bank,
is projected to continue growing strongly, thanks to
upgrades in transportation infrastructure including the
Ken-O Expressway and the Tokyo-Gaikan Expressway,
progress on regional revitalization projects, and eco-
nomic boosts from the Tokyo Olympic and Paralympic
Games. In the near future, however, major changes are
likely to arise in the business environment, as current
forecasts predict the population in Chiba Prefecture will
start shrinking around 2020, amid the rapid spread of
digital technology, competitors coming from different
sectors, and the increasing use of artificial intelligence.
New Medium Term Management PlanWith an eye on this changing landscape, the Bank
initiated its 13th Medium Term Management Plan “Best
Bank 2020 Final Stage—3 years of value co-creation”
for the period beginning in April 2017 and ending in
March 2020. This plan is the final three-year (“Final
Stage”) for reaching our goal of becoming the “best
retail” banking group by 2020, continued from our pre-
vious management plan. The phrase “value co-creation”
underscores our focus on solving customer issues and
advancing regional revitalization, which promotes our
growth as a bank with sound finances.
Our Vision Our aim is to be the “best retail” banking group, provid-
ing top-class satisfaction through advanced services,
and to be highly regarded by our regional customers,
both individuals and SMEs. By co-creating value with
stakeholders, including customers, shareholders,
employees and regional communities, we aim for
sustainable growth with the region through heightened
levels of productivity and unwavering trust.
In line with our goal of becoming the “best retail”
banking group, the new medium term plan identifies
three main issues to be addressed: “co-creating
customer value,” “realizing work style reform for
all employees,” and “strengthening a sustainable
management structure.” The management plan has six
numerical targets for the final fiscal year, ending March
31, 2020, including profit attributable to owners of
parent of ¥60 billion, a loan balance of ¥10,500 billion,
and a deposit balance of ¥12,500 billion.
Co-creating Customer ValueThe Chiba Bank is stepping up efforts to support
regional revitalization and customers’ main businesses
based on evaluation of their potential. From Chiba
Prefecture, our primary operating base, we aim to
expand our share in the Tokyo metropolitan area by
opening new branches in the strategic operating area of
Tokyo’s 23 wards and deepening the Chiba-Musashino
Alliance. Moreover, we are enhancing our client-oriented
fiduciary duties. Latching onto digital trends throughout
society, the Bank is developing advanced services with
high added value that utilize FinTech.
Realizing Work Style Reform for All EmployeesThe Chiba Bank is nurturing professional staff able to
produce strong results produced by their customer-first
attitude, their high level of expertise, and their broad
business skills. Positioning diversity as a management
strategy, we seek out diverse human resources in order
to enhance our ability to flexibly and rapidly adapt
to changes in the business environment. In addition,
we are reassessing the way each employee works,
encouraging them to focus on doing work with even
higher added value in a bid to exceed the expectations
of our customers.
Strengthening a Sustainable Management StructureThe Chiba Bank aims to strengthen sales growth
and reduce costs by deepening alliances with other
banks, including the Chiba-Musashino Alliance and the
TSUBASA Alliance for Enhancing Financial Systems
The Chiba Bank, Ltd. Annual Report 2017 5

In Conclusion Our mission as a regional financial institution is to meet
customer needs and contribute to developments in the
region by providing financial services. In fulfilling this
mission, we will make every effort to provide valuable
products and services to customers as a unified group
of companies, and work toward solving the various
issues faced by regional communities.
At the same time, the Bank aims to improve
its capital efficiency and shareholder returns while
maintaining the financial soundness necessary for
reliably supplying funds to the region. We will steadily
implement the measures in the management plan by
effectively using capital and investing in strategic fields,
in order to build a solid business foundation resilient to
changes in the operating environment and ultimately
increase corporate value over the medium and long
terms.
All Group directors and employees are ready
to make every effort to meet the expectations of our
stakeholders. We ask for your continued support and
patronage.
(TSUBASA Alliance). We also aim to realize low-cost
operations by undertaking a sweeping review of
business processes, while enhancing corporate gover-
nance and striving to resolve issues affecting regional
communities. In these and other ways, the Chiba Bank
is proactively and assertively acting on environmental,
social and governance (ESG) issues.
Strategic AlliancesThe Chiba-Musashino Alliance between the Chiba
Bank and The Musashino Bank, Ltd., which is based in
Saitama Prefecture, has already exceeded our expec-
tations in terms of the measures undertaken thus far.
This achievement reflects the high level of collaboration
between the two banks in each business field and their
initiative to focus on objectives that can be quickly
attained. In order to organizationally and sustainably
advance these undertakings, both banks established
Chiba-Musashino Alliance Co., Ltd. through equal
investments in April 2017 with the responsibility of ad-
vising the banks on medium- and long-term strategies
and cross-organizational measures for the alliance.
Also, we are deepening partnerships across
regions through the TSUBASA Alliance, an alliance
between the six regional banks of the Chiba Bank,
Daishi Bank, Chugoku Bank, Iyo Bank, Toho Bank, and
North Pacific Bank. In May 2017, we started a project
to develop a shared application programming interface
(API) platform with our joint venture T&I Innovation
Center Co., Ltd. and IBM Japan, Ltd. In addition, we
collaborated on the joint formation of syndicated loans,
and the Chiba Bank, Daishi Bank and Toho Bank
started cooperation in inheritance-related business.
In April 2017, we established the Alliance
Management Office at our Head Office dedicated to
deepening these alliances.
Message from the President
0 0
10
5
15
20 60
50
40
30
20
10
(¥ billion) (%)
2012.3
Dividend Shareholder Return Ratio*Acquisition of Treasury Shares
2014.3
around 50%
2016.3 2018.3(Plan)
2020.3(Target)
Aggressive Shareholder Return
* Shareholder return ratio = Total shareholder return ÷ Non-consolidated profit
The Chiba Bank, Ltd. Annual Report 20176

The 13th Medium Term Management Plan
2017.4.1 – 2020.3.31
Best Bank 2020 Final Stage — 3 years of value co-creation
Our vision “best retail” banking group
Target Indicators
2020/3 (Target)2017/3 (Actual)(¥ billion)
Profit Attributable to Owners of Parent 52.7 60Consolidated ROE* 6.86% 7% range
Consolidated Common Equity Tier I Capital Ratio 12.65% 12% range
Balance of Loans 9,305.3 10,500Balance of Deposits 11,565.7 12,500Group Total Balance of Financial Products 2,010.0 2,500
Co-creating customer value
• Conducting comprehensive evaluation of a customer’s business and contributing to regional revitalization• Strengthening fiduciary duties• Providing integrated personal financial services matching the diverse needs of customers• Creating new services responding to digitalization• Upgrading the retail base in the metropolitan area• Strengthening international business responding to customers’ globalization• Advancing activities for customer satisfaction
Realizing work style reform for all employees
• Developing a highly professional workforce• Accelerating diversity• Promoting work style reform
Strengthening a sustainable management structure
• Further promoting strategic alliances (Chiba-Musashino Alliance, TSUBASA Alliance)• Strengthening the Group management structure• Promoting business efficiency• Strengthening investment capabilities and profitability• Strengthening the risk management structure• Ensuring thorough compliance and protection of customers• Positive and active action on ESG issues
3
12
CS Customer SatisfactionRespond speedily to customers’ needs
ES Employee Satisfaction Make a work environment where all employees can realize their potential
SS Social SatisfactionDrive regional development,
concentrating our Group’s capabilities
— We will aim to be the “best retail” banking group, providing top-class satisfaction through advanced services, and to be highly regarded by our regional customers, both individuals and SMEs. —
* Consolidated ROE = Profit attributable to owners of parent ÷ Total shareholders’ equity (Capital stock + Capital surplus + Retained earnings − Treasury shares)
The Chiba Bank, Ltd. Annual Report 2017 7
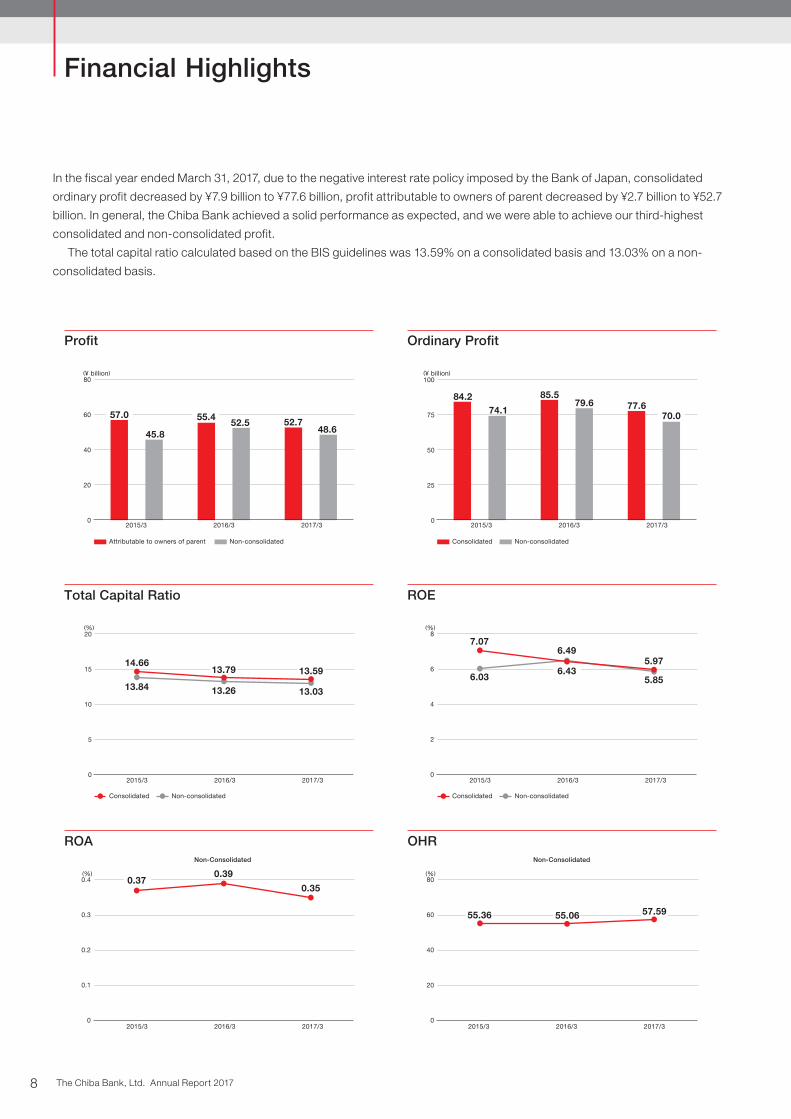
Financial Highlights
In the fiscal year ended March 31, 2017, due to the negative interest rate policy imposed by the Bank of Japan, consolidated
ordinary profit decreased by ¥7.9 billion to ¥77.6 billion, profit attributable to owners of parent decreased by ¥2.7 billion to ¥52.7
billion. In general, the Chiba Bank achieved a solid performance as expected, and we were able to achieve our third-highest
consolidated and non-consolidated profit.
The total capital ratio calculated based on the BIS guidelines was 13.59% on a consolidated basis and 13.03% on a non-
consolidated basis.
(¥ billion)
45.8
Pro�t
57.052.5
55.448.6
52.7
Attributable to owners of parent Non-consolidated
0
20
40
60
80
2015/3 2016/3 2017/3
(%)
Total Capital Ratio
Consolidated Non-consolidated
0
5
10
15
20
2015/3 2016/3 2017/3
14.66
13.84 13.26 13.03
13.79 13.59
(%)
ROA
0.370.39
0.35
0
0.1
0.2
0.3
0.4
2015/3 2016/3 2017/3
Non-Consolidated
0
25
50
75
100(¥ billion)
74.1
Ordinary Pro�t
84.279.6
85.577.6
Consolidated Non-consolidated
2015/3 2016/3 2017/3
70.0
(%)
ROE
0
2
4
6
8
2015/3 2016/3 2017/3
7.076.49
6.036.43
5.97
5.85
Consolidated Non-consolidated
(%)
OHR
0
20
40
60
80
2015/3 2016/3 2017/3
55.36 55.06 57.59
Non-Consolidated
The Chiba Bank, Ltd. Annual Report 20178

The balance of loans increased by ¥507.9 billion from the previous fiscal year-end to ¥9,305.3 billion. Among these,
outstanding SME loans increased by ¥355.0 billion and outstanding housing loans increased by ¥141.2 billion from the previous
fiscal year-end. Disclosed claims under the Financial Reconstruction Law decreased by ¥12.7 billion from the previous fiscal
year-end to ¥139.0 billion, and the non-performing loan ratio was maintained at a low level of 1.47%.
The balance of deposits, including negotiable certificates of deposit (NCDs), increased by ¥505.5 billion compared with the
previous fiscal year-end to ¥12,044.7 billion.
The balance of securities decreased by ¥74.2 billion compared with the previous fiscal year-end to ¥2,373.6 billion.
(¥ billion)
Balance of Loans
8,461.1
8,797.4
9,305.3
Non-Consolidated
8,000
8,500
9,000
9,500
10,000
2015/3 2016/3 2017/3
(¥ billion)
Balance of Deposits including NCD
11,267.4
11,539.2
12,044.7
Non-Consolidated
10,500
11,000
11,500
12,000
12,500
2015/3 2016/3 2017/3
(¥ billion)
2015/3 2016/3 2017/30
1,000
2,000
3,000
4,000
2,355.7 2,447.8 2,373.6
Balance of Securities
Non-Consolidated
Non-Consolidated(¥ billion)
3,016.3
SME Loans / Housing Loans
3,583.93,140.5
3,786.6
3,281.7
4,141.6
SME Loans Housing Loans
0
1,250
2,500
3,750
5,000
2015/3 2016/3 2017/3
Non-Consolidated(¥ billion)
Investment-type Financial Products
113.2
181.958.2
102.4
0
100
200
300
400
2015/3 2016/3 2017/3
273.2
Sale of Investment Trusts Personal Annuities Insurance Premiums
114.5
(¥ billion)
Disclosed Claims under the Financial Reconstruction Law / Non-performing Loan Ratio
Disclosed Claims under the Financial Reconstruction Law
0
50
100
150
200(%)
0
0.5
1.0
1.5
2.0
2015/3 2016/3 2017/3
151.7160.0
1.701.86
1.47139.0
Non-Consolidated
Non-performing Loan Ratio
The Chiba Bank, Ltd. Annual Report 2017 9
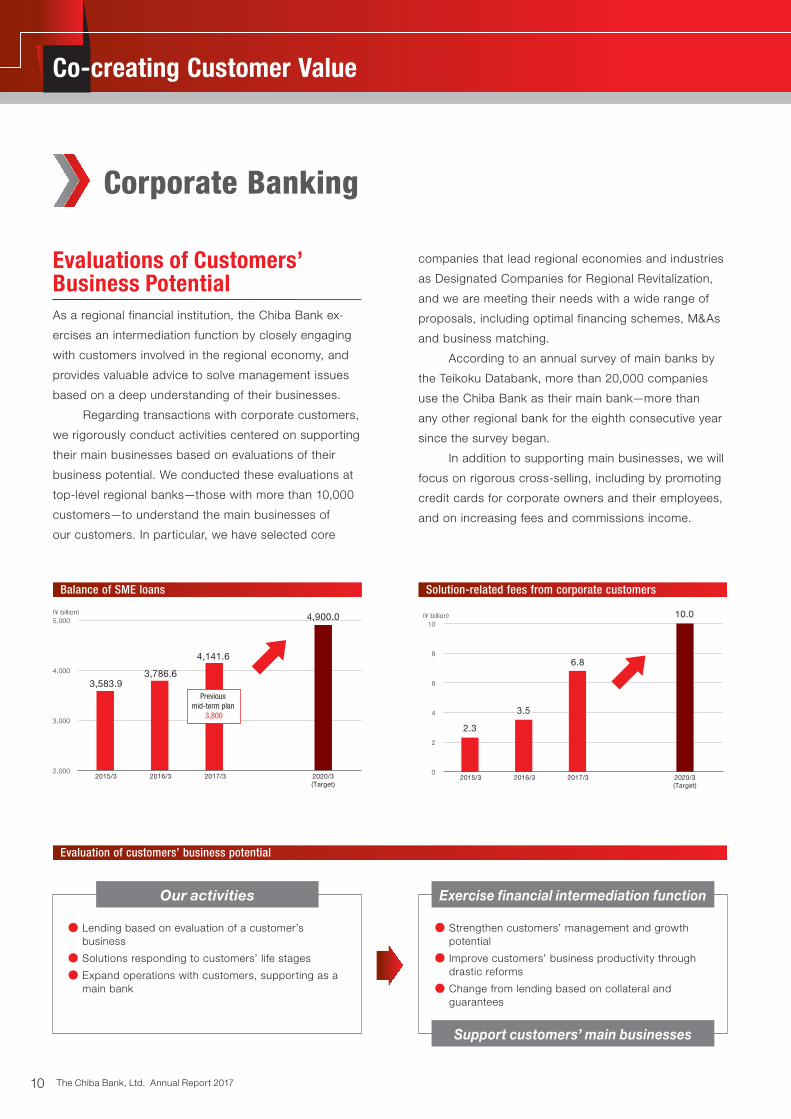
Evaluations of Customers’ Business PotentialAs a regional financial institution, the Chiba Bank ex-
ercises an intermediation function by closely engaging
with customers involved in the regional economy, and
provides valuable advice to solve management issues
based on a deep understanding of their businesses.
Regarding transactions with corporate customers,
we rigorously conduct activities centered on supporting
their main businesses based on evaluations of their
business potential. We conducted these evaluations at
top-level regional banks—those with more than 10,000
customers—to understand the main businesses of
our customers. In particular, we have selected core
Co-creating Customer Value
Evaluation of customers’ business potential
Solution-related fees from corporate customersBalance of SME loans
4,900.0
4,141.6
3,786.63,583.9
(¥ billion)
2015/3 2016/3 2017/3 2020/3(Target)
2,000
3,000
4,000
5,000
Previous mid-term plan
3,800
10.0(¥ billion)
2015/3 2016/3 2020/3(Target)
2017/30
6
4
2
8
10
2.3
6.8
3.5
● Lending based on evaluation of a customer’s business
● Solutions responding to customers’ life stages
● Expand operations with customers, supporting as a main bank
● Strengthen customers’ management and growth potential
● Improve customers’ business productivity through drastic reforms
● Change from lending based on collateral and guarantees
Our activities Exercise financial intermediation function
Support customers’ main businesses
Corporate Banking
companies that lead regional economies and industries
as Designated Companies for Regional Revitalization,
and we are meeting their needs with a wide range of
proposals, including optimal financing schemes, M&As
and business matching.
According to an annual survey of main banks by
the Teikoku Databank, more than 20,000 companies
use the Chiba Bank as their main bank—more than
any other regional bank for the eighth consecutive year
since the survey began.
In addition to supporting main businesses, we will
focus on rigorous cross-selling, including by promoting
credit cards for corporate owners and their employees,
and on increasing fees and commissions income.
The Chiba Bank, Ltd. Annual Report 201710
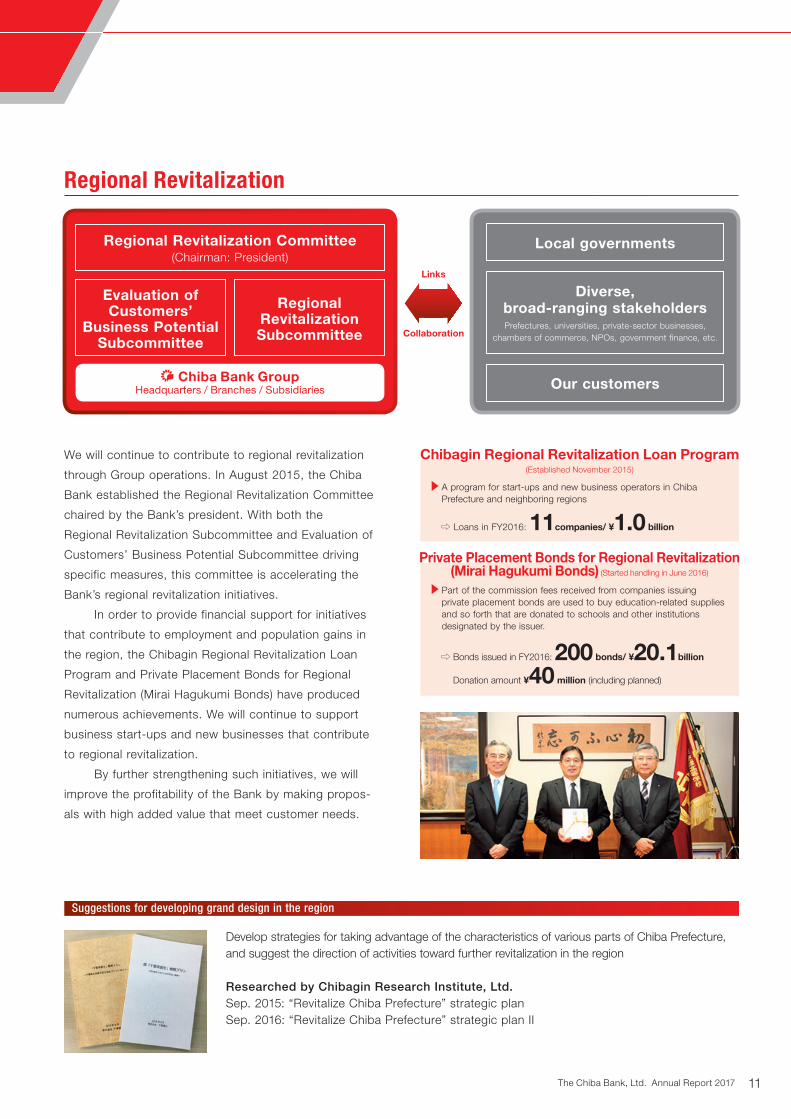
We will continue to contribute to regional revitalization
through Group operations. In August 2015, the Chiba
Bank established the Regional Revitalization Committee
chaired by the Bank’s president. With both the
Regional Revitalization Subcommittee and Evaluation of
Customers’ Business Potential Subcommittee driving
specific measures, this committee is accelerating the
Bank’s regional revitalization initiatives.
In order to provide financial support for initiatives
that contribute to employment and population gains in
the region, the Chibagin Regional Revitalization Loan
Program and Private Placement Bonds for Regional
Revitalization (Mirai Hagukumi Bonds) have produced
numerous achievements. We will continue to support
business start-ups and new businesses that contribute
to regional revitalization.
By further strengthening such initiatives, we will
improve the profitability of the Bank by making propos-
als with high added value that meet customer needs.
Regional Revitalization
Chibagin Regional Revitalization Loan Program (Established November 2015)
A program for start-ups and new business operators in Chiba Prefecture and neighboring regions
⇨ Loans in FY2016: 11companies/ ¥1.0 billion
Suggestions for developing grand design in the region
Develop strategies for taking advantage of the characteristics of various parts of Chiba Prefecture, and suggest the direction of activities toward further revitalization in the region
Researched by Chibagin Research Institute, Ltd. Sep. 2015: “Revitalize Chiba Prefecture” strategic planSep. 2016: “Revitalize Chiba Prefecture” strategic plan II
Local governments
Our customers
Diverse, broad-ranging stakeholdersPrefectures, universities, private-sector businesses,
chambers of commerce, NPOs, government finance, etc.
Regional Revitalization Committee (Chairman: President)
Evaluation of Customers’
Business Potential Subcommittee
Regional Revitalization Subcommittee
Private Placement Bonds for Regional Revitalization(Mirai Hagukumi Bonds) (Started handling in June 2016)
Part of the commission fees received from companies issuing private placement bonds are used to buy education-related supplies and so forth that are donated to schools and other institutions designated by the issuer.
⇨ Bonds issued in FY2016: 200 bonds/ ¥20.1billion
Donation amount ¥40 million (including planned)
Links
Collaboration
Headquarters / Branches / SubsidiariesChiba Bank Group
The Chiba Bank, Ltd. Annual Report 2017 11

Ibaraki
Saitama
Chiba
Kanagawa(Yokohama/Kawasaki)
Tokyo
Ibaraki¥7.7trillion
Saitama¥20.2trillion
Tokyo¥208.3
trillionChiba¥15.8trillion
Chiba Bank
Musashino Bank
Regional banks, 2nd-tier regional banks (ex. Chiba Bank)
City banks
¥0.1 trillion
1.7%
¥6.2 trillion
39.7%
¥2.0 trillion
1.0%
Other
¥0.1 trillion
0.7%
Chiba Bank¥2.8 trillion
14.0%
Musashino Bank
(As of March 31, 2016, by KINYU JOURNAL)
Overseas branch network
Domestic branch network
Accepted trainees at our overseas offices One from the Musashino Bank in Singapore
Four from the TSUBASA Alliance banks in NY and HK
Bangkok Rep.
Shanghai Rep.Hong Kong Branch
Singapore Rep.
Co-creating Customer Value
Our Operating Base in the Tokyo Metropolitan Area While maintaining Chiba Prefecture as our core foundation,
we will further strengthen the Chiba-Musashino Alliance in
order to bolster loans and expand our operating base in
the Tokyo metropolitan area, especially in Tokyo, Saitama,
and Ibaraki where market potential is high.
The number of branches inside the 23 wards
of Tokyo, which have been positioned as a Strategic
Operating Area, has increased to 14 branches. By
conducting problem-solving sales activities based on
our business evaluations developed in Chiba Prefecture,
we are expanding our customer base while keeping
appropriate interest rate levels.
Going forward, we will firmly respond to robust
financial needs, while properly conducting project ap-
praisal and risk management, and continue to approach
good small- and medium-sized enterprises (SMEs)
and wealthy customers, thereby expanding our retail
transactions.
Furthermore, in addition to continuing to open its
own branches in the Tokyo metropolitan area, the Chiba
Bank is also examining sales development and other
activities in cooperation with The Musashino Bank, Ltd.,
and aims to further expand its trading share.
International OperationsThe Chiba Bank has overseas branches in New York,
London and Hong Kong, and representative offices in
Shanghai, Singapore and Bangkok.
In addition to this overseas branch network of one
of the largest regional banks, we are further enhancing
our alliances with local financial institutions. We support
the overseas business expansion of our customers,
including by supporting trade transactions, providing
the latest overseas information and holding business
consultations aimed at developing sales channels.
At overseas branches, we accept trainees from the
Musashino Bank and the TSUBASA Alliance banks, and
we will work to expand our earnings opportunities by
proactively responding to the finance needs of the client
companies of alliance banks.
London BranchNew York Branch
181160
143
in Chiba
in Tokyo
in Saitama
branches (As of March 31, 2017)
Of which,
Targeting co-rep. office with the Musashino Bank
31
in Ibaraki
in Osaka
Loan shares and market sizes in the metropolitan area
(As of March 31, 2017)
The Chiba Bank, Ltd. Annual Report 201712

Retail Banking
Fiduciary DutiesUnder its customer first policy, the Chiba Bank is
endeavoring to further enhance customer service im-
provement activities and rigorously conduct its fiduciary
duties by having its Customer Service Division function
as a supervisory department.
In June 2017, we announced our policy regarding
customer-oriented business operations (fiduciary duties).
Through a committee established at the same time, a
management team will accurately understand and assist
the initiatives of each subsidiary, thereby enhancing the
effectiveness of efforts based on this policy.
Going forward, we will work to thoroughly
understand the increasingly diversifying needs of our
customers, reflecting the changes in Japan’s social
structure, and we will provide the products and services
that optimally suit them.
Asset Management ConsultingIn the field of asset management, the Chiba Bank Group
will closely respond to customers’ needs, resulting in an
increase in investment-type financial products. We will
also respond appropriately to insurance needs.
In addition to further utilizing specialized staff,
the Head Office, branches, and subsidiaries will
work together to conduct various activities, including
strengthening the banking and securities cooperation,
and expanding the fund originated by Chibagin Asset
Management Co., Ltd. to other banks.
Moreover, the Chiba Bank will support customers
by stably accumulating assets and providing advanced
services, such as enhancing marketing that uses big
data analysis and having a robot financial advisor
propose advanced portfolios to customers.
Improve all employees’ awareness
Reflect customers’ opinions
Set up an environ-ment which can be used securely and safely by everyone
Establish “fiduciary duties”
Carry out sales thoroughly to meet customers’ needs and provide benefits
Strengthen the conflict of interest management system
Provide important information, in-cluding fees, in an understandable way
Enhance financial education
“Customer first policy”
Customer Service Division(as a supervisory department,
appointed senior deputy general manager in charge)
Customersatisfaction
Head Office Branches Subsidiaries
Fiduciary duties
Chiba Bank Group
Changes in social structure
Prepare
Save, Increase
Use conveniently
Borrow
The Chiba Bank, Ltd. Annual Report 2017 13

Co-creating Customer Value
Consumer LoansRegarding consumer loans that are customized for different
life stages and events, the balance of housing loans and
unsecured consumer loans has been steadily increasing.
Based on the opinions of its customers, the Chiba
Bank has revised the marketability of its education and
auto loans, including by expanding eligibility for and
increasing the maximums of loans. We are also introducing
new products such as loans to support elderly people. In
addition to developing direct channels such as our Internet
Branch and call center, we aim to further expand our
customer base by developing effective sales promotions.
Inheritance-related ServicesThe Chiba Bank expects that asset transfers across re-
gions and generations will proceed, and customer needs
related to inheritance and succession of assets and
businesses will continue to increase in the future. We will
further expand the inheritance-related services through
alliances and collaborations with other banks, such as the
Musashino Bank and the TSUBASA Alliance banks, with
the aim of increasing fees and commissions income.
In the fiscal year ended March 31, 2017, we
handled 878 inheritance-related transactions and fees
and commissions income reached a record high of ¥478
million. One of the Chiba Bank’s strengths is its ability
to respond to the diverse needs of wealthy individuals,
mainly landowners and company owners, by providing
one-stop services through its main banking business, and
this has earned high praise from our customers.
Moreover, we work to understand the details of
our customers’ assets, and this leads to the conclusion
of many transactions with customers, including in asset
investment and management.
In addition, we are also responding to Japan’s aging
society by beginning to offer new solutions that utilize
trusts tailored to financial needs associated with receiving
an inheritance or succeeding real estate and businesses.
Other regional banks are also strongly interested in
these initiatives concerned with our inheritance-related
services. By utilizing the expertise and systems that we
have cultivated to date, we can offer similar services
to customers at each bank. We have already started
collaborating with the Daishi Bank, Chugoku Bank,
Musashino Bank, and Toho Bank, and we will continue to
proactively respond to a wide range of customer needs in
the future.
Balance of housing loans
Balance of unsecured customer loans
Number of contracts and income for inheritance-related services
(¥ billion)
2015/3 2016/3 2017/32,000
2,500
3,000
3,500
4,000
3,600.0
2020/3(Target)
Previous mid-term plan
3,200
3,281.73,140.5
3,016.3
(¥ billion)
2015/3 2016/3 2017/30
50
100
150
200
Other unsecured loans
Card loans
170.0
2020/3(Target)
126.3
74.9
51.3
107.8
62.8
45.0
89.5
49.3
40.2
(¥ million)
2014/3 2015/3 2016/3
478
2017/3
253
172145
878 cases
764 cases
350 cases
0
200
100
300
400
500
Support service*1, Testamentary trust*2 and Inheritance rearranging*3
298 cases
*1 Support service: Consulting for asset and business successions
*2 Testamentary trust: Discussing and drawing up wills while customers are alive and safekeeping and executing wills and other notarized documents
*3 Inheritance rearranging: Representing inheritance procedures, including other banks’, entrusted by successors
The Chiba Bank, Ltd. Annual Report 201714
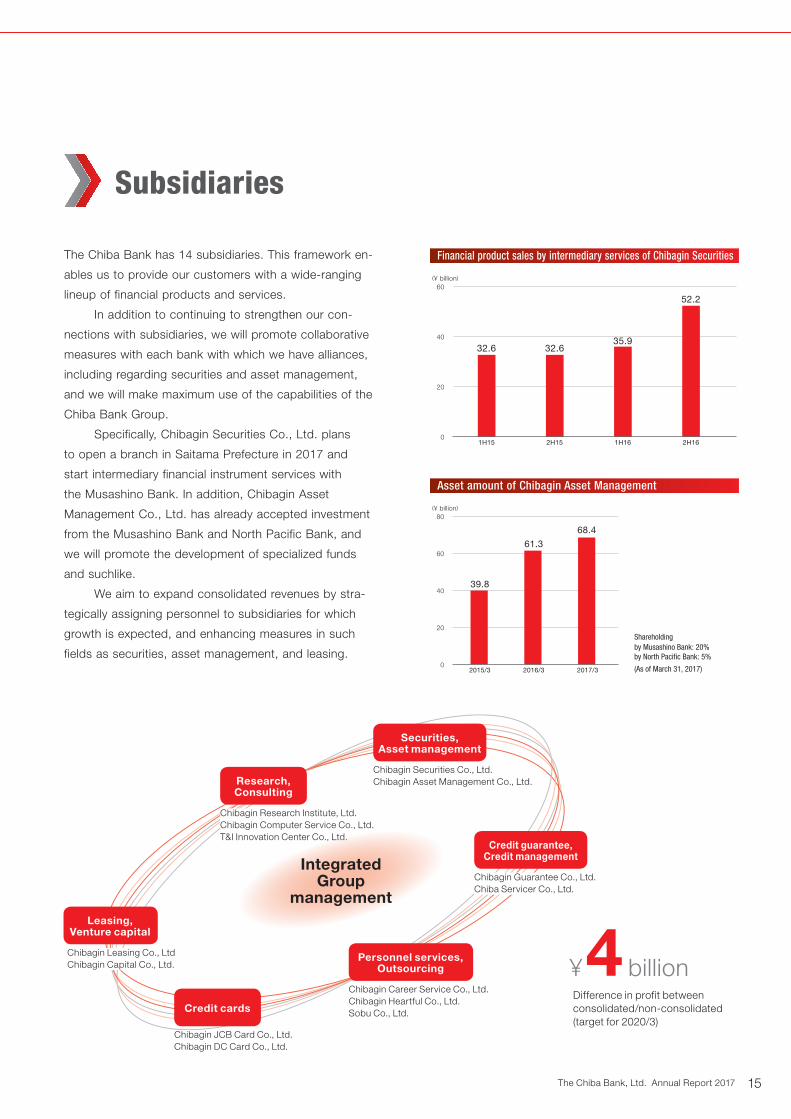
Financial product sales by intermediary services of Chibagin Securities
(¥ billion)
0
20
40
60
1H15 2H15 1H16
52.2
2H16
35.932.632.6
Asset amount of Chibagin Asset Management
(¥ billion)
2015/3 2016/3 2017/30
20
40
60
80
68.4
61.3
39.8
Shareholdingby Musashino Bank: 20% by North Paci�c Bank: 5%
(As of March 31, 2017)
Subsidiaries
The Chiba Bank has 14 subsidiaries. This framework en-
ables us to provide our customers with a wide-ranging
lineup of financial products and services.
In addition to continuing to strengthen our con-
nections with subsidiaries, we will promote collaborative
measures with each bank with which we have alliances,
including regarding securities and asset management,
and we will make maximum use of the capabilities of the
Chiba Bank Group.
Specifically, Chibagin Securities Co., Ltd. plans
to open a branch in Saitama Prefecture in 2017 and
start intermediary financial instrument services with
the Musashino Bank. In addition, Chibagin Asset
Management Co., Ltd. has already accepted investment
from the Musashino Bank and North Pacific Bank, and
we will promote the development of specialized funds
and suchlike.
We aim to expand consolidated revenues by stra-
tegically assigning personnel to subsidiaries for which
growth is expected, and enhancing measures in such
fields as securities, asset management, and leasing.
Difference in profit between consolidated/non-consolidated (target for 2020/3)
Credit cards
Personnel services,Outsourcing
Leasing,Venture capital
4 billion¥
Research,Consulting
Securities,Asset management
Credit guarantee, Credit management
Chibagin Securities Co., Ltd.Chibagin Asset Management Co., Ltd.
Chibagin Guarantee Co., Ltd.Chiba Servicer Co., Ltd.
Chibagin Career Service Co., Ltd.Chibagin Heartful Co., Ltd.Sobu Co., Ltd.
Chibagin Leasing Co., LtdChibagin Capital Co., Ltd.
Chibagin JCB Card Co., Ltd.Chibagin DC Card Co., Ltd.
Chibagin Research Institute, Ltd.Chibagin Computer Service Co., Ltd.T&I Innovation Center Co., Ltd.
Integrated Group
management
The Chiba Bank, Ltd. Annual Report 2017 15
Strategic AlliancesThe Chiba Bank is leveraging various alliance frame-
works in its pursuit to provide customers in the region
with a range of benefits.
Such alliances shall have economic paybacks—in
terms of improving our earnings and thereby increasing
our corporate value—that are far greater than consoli-
dating another bank in a merger.
Regional financial institutions believe these collab-
orations, such as the Chiba-Musashino Alliance and the
TSUBASA Alliance, are optimal for enabling cooperative
operations while remaining rooted in the region.
From the viewpoint of enhancing these alliances,
we established the Alliance Management Office in the
Corporate Planning Division in April this year. By further
promoting these alliances, we will evolve our “Alliance”
concept, a new form of regional bank collaboration.
Strengthening the Foundation for Sustainable Growth
Alliance Strategies
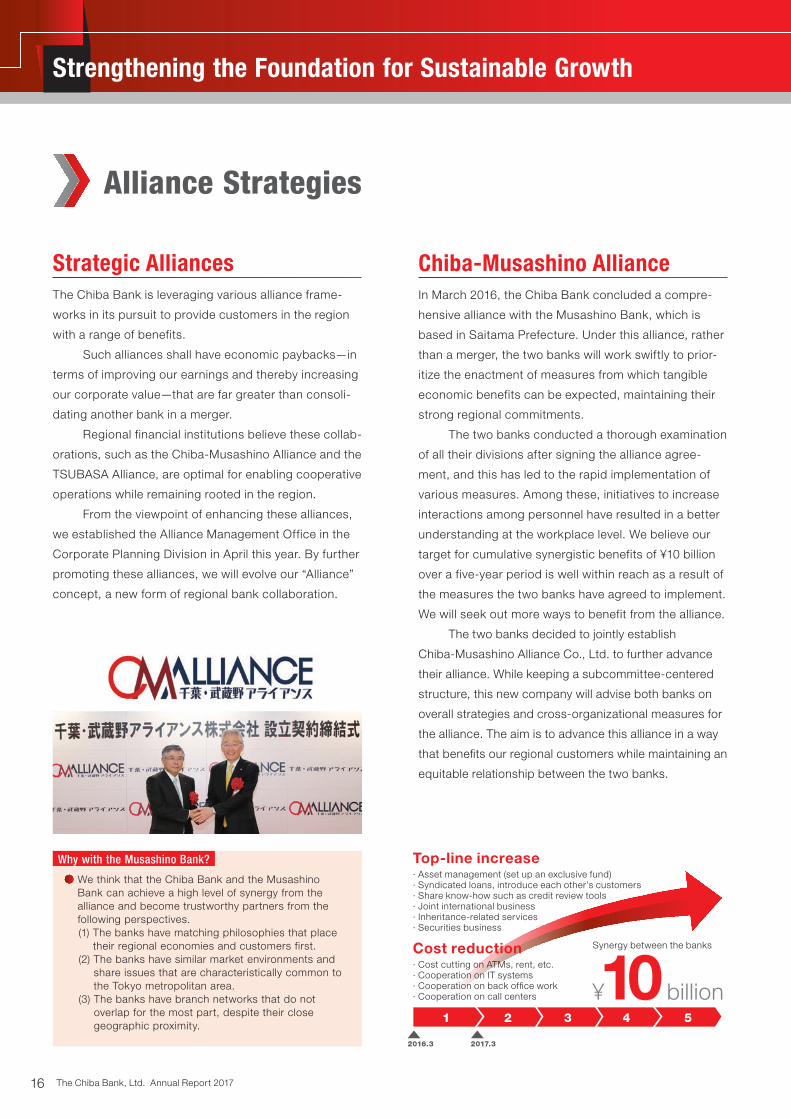
Why with the Musashino Bank?
We think that the Chiba Bank and the Musashino Bank can achieve a high level of synergy from the alliance and become trustworthy partners from the following perspectives.(1) The banks have matching philosophies that place
their regional economies and customers first.(2) The banks have similar market environments and
share issues that are characteristically common to the Tokyo metropolitan area.
(3) The banks have branch networks that do not overlap for the most part, despite their close geographic proximity.
Chiba-Musashino AllianceIn March 2016, the Chiba Bank concluded a compre-
hensive alliance with the Musashino Bank, which is
based in Saitama Prefecture. Under this alliance, rather
than a merger, the two banks will work swiftly to prior-
itize the enactment of measures from which tangible
economic benefits can be expected, maintaining their
strong regional commitments.
The two banks conducted a thorough examination
of all their divisions after signing the alliance agree-
ment, and this has led to the rapid implementation of
various measures. Among these, initiatives to increase
interactions among personnel have resulted in a better
understanding at the workplace level. We believe our
target for cumulative synergistic benefits of ¥10 billion
over a five-year period is well within reach as a result of
the measures the two banks have agreed to implement.
We will seek out more ways to benefit from the alliance.
The two banks decided to jointly establish
Chiba-Musashino Alliance Co., Ltd. to further advance
their alliance. While keeping a subcommittee-centered
structure, this new company will advise both banks on
overall strategies and cross-organizational measures for
the alliance. The aim is to advance this alliance in a way
that benefits our regional customers while maintaining an
equitable relationship between the two banks.
54321
10 billion¥
2016.3 2017.3
Top-line increase· Asset management (set up an exclusive fund)· Syndicated loans, introduce each other’s customers· Share know-how such as credit review tools · Joint international business · Inheritance-related services· Securities business
Cost reduction· Cost cutting on ATMs, rent, etc. · Cooperation on IT systems· Cooperation on back office work· Cooperation on call centers
Synergy between the banks
The Chiba Bank, Ltd. Annual Report 201716
Strengthening the Foundation for Sustainable Growth
Wider Area
Metropolitan Area
Chiba Prefecture
Through the TSUBASA Alliance, we will deepen our partnerships that transcend regional boundaries in fields beyond IT and FinTech.
We aim to increase and enhance top-line income while reducing costs through the comprehensive Chiba-Musashino Alliance with the Musashino Bank.
We are reducing costs by pooling clerical operations with other local banks.
Cooperation on the main frame system
FinTech subsidiary
New alliance model for regional banks
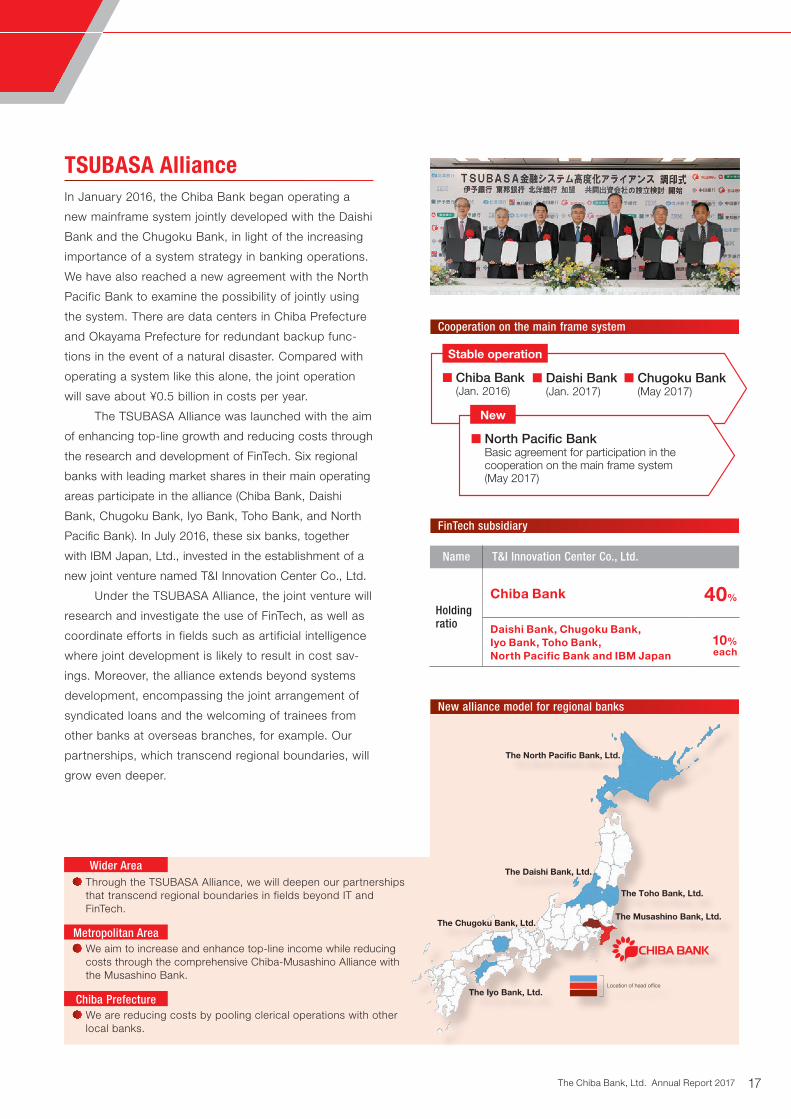
TSUBASA AllianceIn January 2016, the Chiba Bank began operating a
new mainframe system jointly developed with the Daishi
Bank and the Chugoku Bank, in light of the increasing
importance of a system strategy in banking operations.
We have also reached a new agreement with the North
Pacific Bank to examine the possibility of jointly using
the system. There are data centers in Chiba Prefecture
and Okayama Prefecture for redundant backup func-
tions in the event of a natural disaster. Compared with
operating a system like this alone, the joint operation
will save about ¥0.5 billion in costs per year.
The TSUBASA Alliance was launched with the aim
of enhancing top-line growth and reducing costs through
the research and development of FinTech. Six regional
banks with leading market shares in their main operating
areas participate in the alliance (Chiba Bank, Daishi
Bank, Chugoku Bank, Iyo Bank, Toho Bank, and North
Pacific Bank). In July 2016, these six banks, together
with IBM Japan, Ltd., invested in the establishment of a
new joint venture named T&I Innovation Center Co., Ltd.
Under the TSUBASA Alliance, the joint venture will
research and investigate the use of FinTech, as well as
coordinate efforts in fields such as artificial intelligence
where joint development is likely to result in cost sav-
ings. Moreover, the alliance extends beyond systems
development, encompassing the joint arrangement of
syndicated loans and the welcoming of trainees from
other banks at overseas branches, for example. Our
partnerships, which transcend regional boundaries, will
grow even deeper.
Stable operation
New
Location of head of�ce
The North Paci�c Bank, Ltd.
The Toho Bank, Ltd.
The Daishi Bank, Ltd.
The Iyo Bank, Ltd.
The Chugoku Bank, Ltd.The Musashino Bank, Ltd.
Name T&I Innovation Center Co., Ltd.
Holding ratio
Chiba Bank 40%
Daishi Bank, Chugoku Bank, Iyo Bank, Toho Bank, North Pacific Bank and IBM Japan
10%each
■ Chiba Bank (Jan. 2016)
■ North Pacific Bank Basic agreement for participation in the cooperation on the main frame system (May 2017)
■ Daishi Bank (Jan. 2017)
■ Chugoku Bank (May 2017)
The Chiba Bank, Ltd. Annual Report 2017 17
Strengthening the Foundation for Sustainable Growth
•Search our branches
•Push notifications
•Account inquiry service
Chibagin app for smartphones
API platform development project
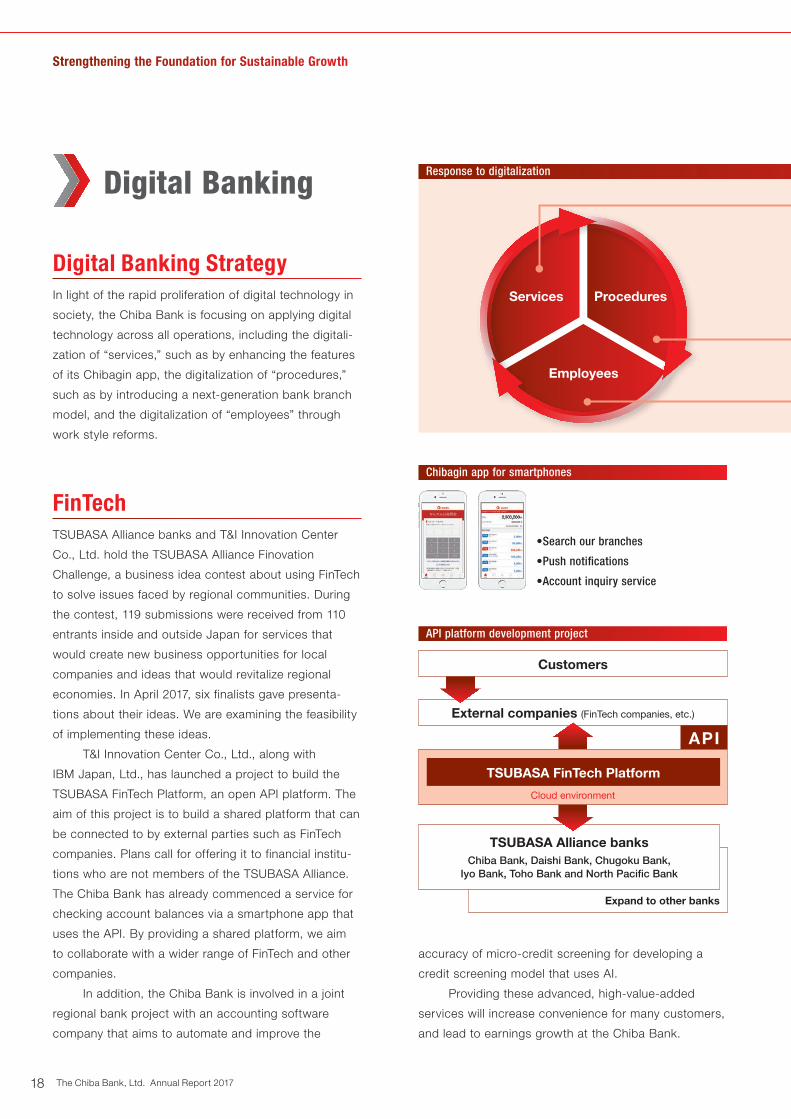
Digital Banking StrategyIn light of the rapid proliferation of digital technology in
society, the Chiba Bank is focusing on applying digital
technology across all operations, including the digitali-
zation of “services,” such as by enhancing the features
of its Chibagin app, the digitalization of “procedures,”
such as by introducing a next-generation bank branch
model, and the digitalization of “employees” through
work style reforms.
FinTechTSUBASA Alliance banks and T&I Innovation Center
Co., Ltd. hold the TSUBASA Alliance Finovation
Challenge, a business idea contest about using FinTech
to solve issues faced by regional communities. During
the contest, 119 submissions were received from 110
entrants inside and outside Japan for services that
would create new business opportunities for local
companies and ideas that would revitalize regional
economies. In April 2017, six finalists gave presenta-
tions about their ideas. We are examining the feasibility
of implementing these ideas.
T&I Innovation Center Co., Ltd., along with
IBM Japan, Ltd., has launched a project to build the
TSUBASA FinTech Platform, an open API platform. The
aim of this project is to build a shared platform that can
be connected to by external parties such as FinTech
companies. Plans call for offering it to financial institu-
tions who are not members of the TSUBASA Alliance.
The Chiba Bank has already commenced a service for
checking account balances via a smartphone app that
uses the API. By providing a shared platform, we aim
to collaborate with a wider range of FinTech and other
companies.
In addition, the Chiba Bank is involved in a joint
regional bank project with an accounting software
company that aims to automate and improve the
Digital Banking
accuracy of micro-credit screening for developing a
credit screening model that uses AI.
Providing these advanced, high-value-added
services will increase convenience for many customers,
and lead to earnings growth at the Chiba Bank.
Response to digitalization
ProceduresServices
Employees
Customers
External companies (FinTech companies, etc.)
Expand to other banks
Cloud environment
TSUBASA FinTech Platform
API
TSUBASA Alliance banksChiba Bank, Daishi Bank, Chugoku Bank,
Iyo Bank, Toho Bank and North Pacific Bank
The Chiba Bank, Ltd. Annual Report 201718
Improve Business EfficiencyWithout increasing the total number of employees, we
plan to reallocate to growth fields the personnel who have
been freed up by improvements in business efficiency.
Work reforms at the counters of bank branches
are already being promoted through our next-generation
branch model. Based on the outcome of these model
experiments, we intend to roll out work reforms to other
branches as quickly as possible. For example, custom-
ers enter their transaction details on tablets, reducing
the amount of time spent filling out slips of paper and
waiting in line. Moreover, we expect this innovation to
reduce the volume of administrative work at the counter
and in the back office. We are also reviewing loan
operations in parallel with branch reforms. We aim to
improve customer convenience and increase business
efficiency by undertaking sweeping reforms of business
processes and systems.
Work Style ReformsIn Japan, employees’ scope of duties is expanding, and
the content of their work is progressively becoming more
sophisticated. At the same time, a serious shortage of
labor is expected in the future due to the decreasing
working-age population, and there are strong demands
for companies to institute work style reforms that will
curb long working hours and improve productivity.
The Chiba Bank’s initiatives to institute work
style reforms have been officially recognized, including
by the Bank being certified as one of the Excellent
Enterprises of Health and Productivity Management
(White 500) by the Ministry of Economy, Trade and
Industry and the Nippon Kenko Kaigi, and being
honored by a Commendation Award in the Ministry of
Health, Labour and Welfare’s Awards for Enterprises
and Workplaces with Pleasant Working Environments
and High Productivity. We will continue to proactively
push forward with work style reforms, centering on
the actions of the Workplace Revolution Development
Division.
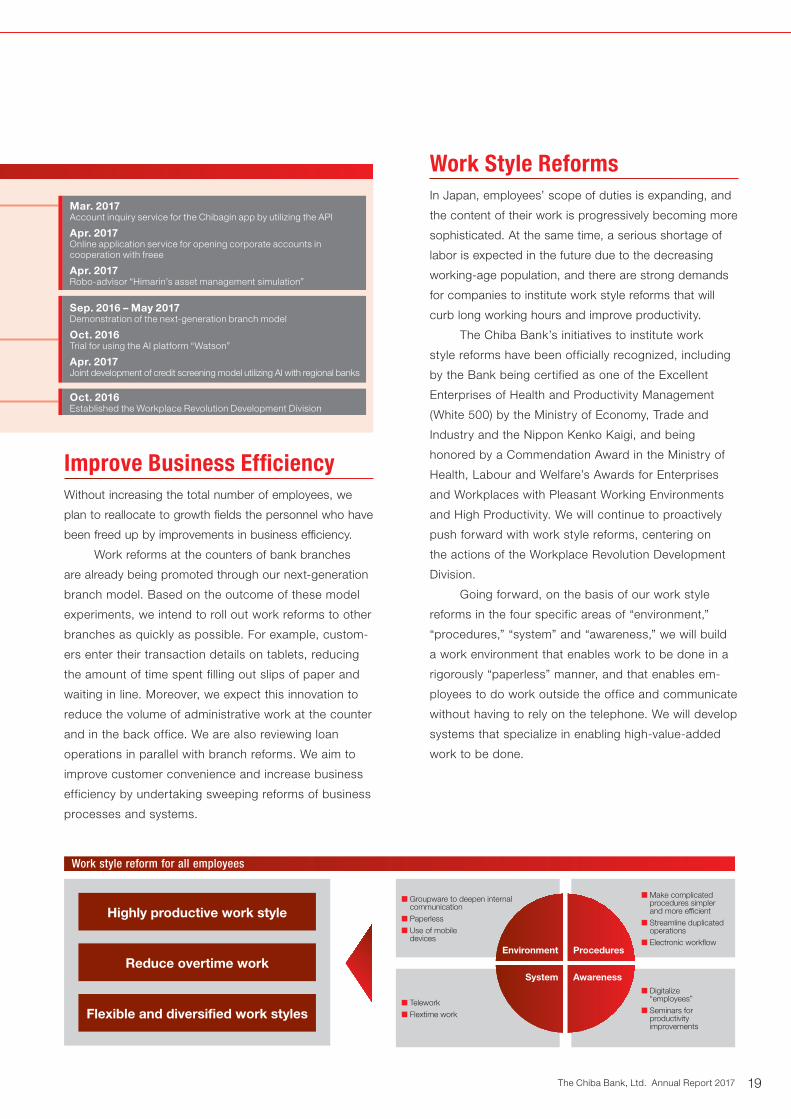
Going forward, on the basis of our work style
reforms in the four specific areas of “environment,”
“procedures,” “system” and “awareness,” we will build
a work environment that enables work to be done in a
rigorously “paperless” manner, and that enables em-
ployees to do work outside the office and communicate
without having to rely on the telephone. We will develop
systems that specialize in enabling high-value-added
work to be done.
Work style reform for all employees
Response to digitalization
■ Groupware to deepen internal communication
■ Paperless■ Use of mobile
devices
■ Make complicated procedures simpler and more efficient
■ Streamline duplicated operations
■ Electronic workflow
■ Telework■ Flextime work
■ Digitalize “employees”
■ Seminars for productivity improvements
Highly productive work style
Reduce overtime work
Flexible and diversified work styles
Procedures
Awareness
Environment
System
Mar. 2017 Account inquiry service for the Chibagin app by utilizing the API
Apr. 2017 Online application service for opening corporate accounts in cooperation with freee
Apr. 2017 Robo-advisor “Himarin’s asset management simulation”
Sep. 2016 – May 2017 Demonstration of the next-generation branch model
Oct. 2016 Trial for using the AI platform “Watson”
Apr. 2017 Joint development of credit screening model utilizing AI with regional banks
Oct. 2016 Established the Workplace Revolution Development Division
The Chiba Bank, Ltd. Annual Report 2017 19
Developing the Workforce/ Promoting Diversity
Enhance management skills• Active use of internal and external seminars
Positively adopt external talent• Set up evaluation system and career path with
specialization
• Strategic staffing in subsidiaries to expand earning power
Nurture the young into a skilled workforce earlier• Visualize skills and behavioral characteristics
Strengthening the Foundation for Sustainable Growth
Developing the WorkforceIn addition to instilling business knowledge, the Chiba
Bank will develop a professional workforce that combines
business skills, such as IT and logical thinking capabilities,
with leadership and management skills.
We will speed up the training of young employees,
train personnel with high levels of expertise in every
field, including corporate banking/retail banking and
administrative sections such as planning and promotion
in our headquarters, and proactively continue mid-career
recruitment.
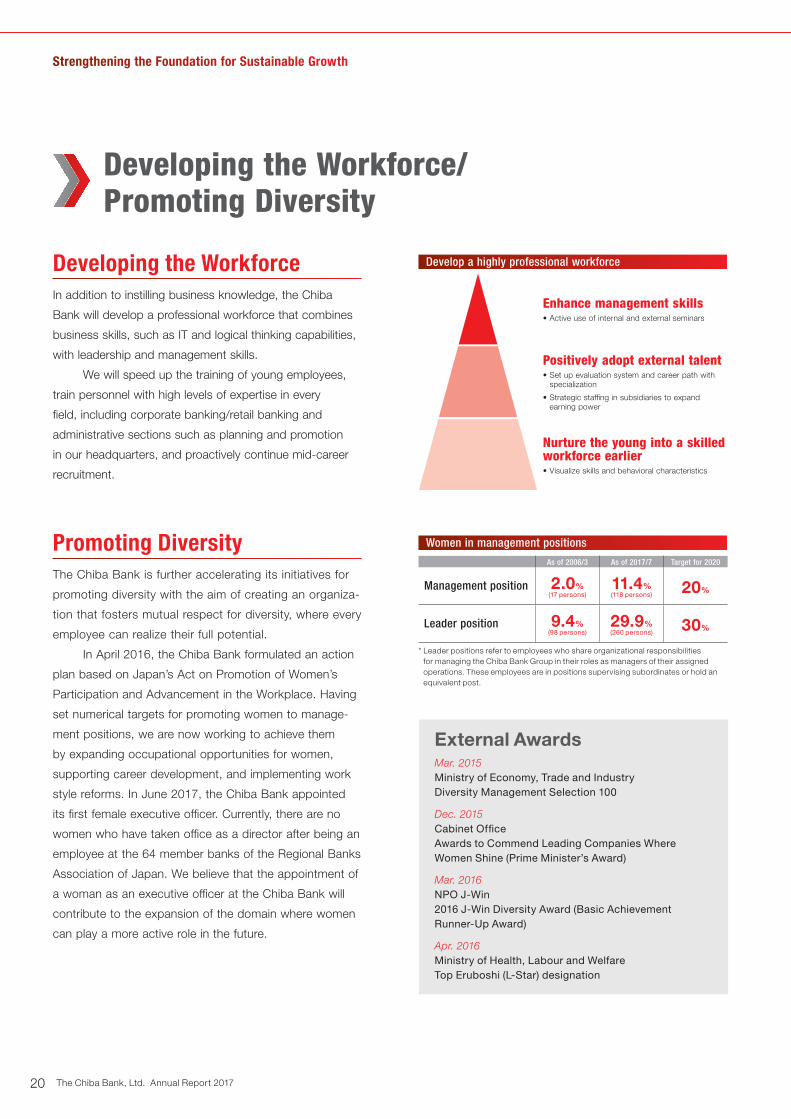
Promoting DiversityThe Chiba Bank is further accelerating its initiatives for
promoting diversity with the aim of creating an organiza-
tion that fosters mutual respect for diversity, where every
employee can realize their full potential.
In April 2016, the Chiba Bank formulated an action
plan based on Japan’s Act on Promotion of Women’s
Participation and Advancement in the Workplace. Having
set numerical targets for promoting women to manage-
ment positions, we are now working to achieve them
by expanding occupational opportunities for women,
supporting career development, and implementing work
style reforms. In June 2017, the Chiba Bank appointed
its first female executive officer. Currently, there are no
women who have taken office as a director after being an
employee at the 64 member banks of the Regional Banks
Association of Japan. We believe that the appointment of
a woman as an executive officer at the Chiba Bank will
contribute to the expansion of the domain where women
can play a more active role in the future.
As of 2006/3 As of 2017/7 Target for 2020
Management position 2.0%(17 persons)
11.4%(118 persons)
20%
Leader position 9.4%(98 persons)
29.9%(260 persons)
30%
External AwardsMar. 2015Ministry of Economy, Trade and IndustryDiversity Management Selection 100
Dec. 2015Cabinet OfficeAwards to Commend Leading Companies Where Women Shine (Prime Minister’s Award)
Mar. 2016NPO J-Win2016 J-Win Diversity Award (Basic Achievement Runner-Up Award)
Apr. 2016Ministry of Health, Labour and WelfareTop Eruboshi (L-Star) designation
Develop a highly professional workforce
Women in management positions
* Leader positions refer to employees who share organizational responsibilities for managing the Chiba Bank Group in their roles as managers of their assigned operations. These employees are in positions supervising subordinates or hold an equivalent post.
The Chiba Bank, Ltd. Annual Report 201720

CSR Activities
Environmentally Friendly BranchesNewly established and relocated branches have been intro-
ducing solar power generation systems, rooftop greenery,
and other facilities to help reduce CO2 emissions. As of
June 2017, 12 branches have installed solar power gener-
ation systems and three have installed rooftop greenery.
The Bank has also introduced fuel-cell vehicles
and hybrid cars for its sales fleet as a measure to
counter global warming.
Financial Education ActivitiesTo help people of all ages to grasp the importance
of money, the workings of finance, and a correct
understanding as a consumer, the Bank works to
provide financial education. We receive visits to our
locations from school children of all ages, teaching
staff, local government organizations, and companies
from other industries. We also provide visiting
lessons. Other initiatives include cohosting of the
Chiba contest within the national high school finance
and economics quiz championship called “Economics
Koshien” each year. At the Chibagin Archive on
Finance, established to mark our 70th anniversary,
we provide educational exhibits on the history of
finance and Chiba Prefecture.
Forest Management ActivitiesWe conduct “Chibagin Forest” forest management ac-
tivities in various locations throughout Chiba Prefecture.
The activities aim to regenerate coastal barrier forests
that have been lost to insect damage and tsunami. The
Bank’s directors, employees and former employees
volunteer regularly in forest nurturing activities such as
cutting the underbrush.
Social Welfare ActivitiesWe established the Chibagin Heartful Welfare Fund to
support social welfare corporations in Chiba Prefecture
by providing them with financial assistance to help
realize a vibrant and warm local community. As of
September 2016, the fund had donated ¥49 million in
assistance to 87 organizations.
Furthermore, Chibagin Heartful Co., Ltd. celebrat-
ed its 10th anniversary of operation in April 2017. The
company was founded to further promote employment
of people with disabilities and currently employs
28 people with disabilities, helping to support their
independence.
The Chiba Bank, Ltd. Annual Report 2017 21
Corporate Governance
Directors and Board of DirectorsThe Board of Directors consists of 12 directors, including three
outside directors. The Board of Directors makes decisions about
management policies and other important matters and supervises
the execution of business by the directors and executive officers.
The Chiba Bank also employs an executive officer system. This
system provides for the clear separation of the role of the directors,
who reach decisions on important matters, supervise the execution
of business operations, and perform other tasks, and the role of the
executive officers, who conduct business operations.
Audit & Supervisory Board and Its MembersThe Chiba Bank has adopted a company with audit & supervisory
board system with five Audit & Supervisory Board members,
including a majority of three outside Audit & Supervisory Board
members. In particular, three of the Audit & Supervisory Board
members, including two of the outside Audit & Supervisory Board
members, are standing Audit & Supervisory Board members.
They regularly attend meetings of the Board of Directors and other
important meetings, check important documents, and perform
other tasks to conduct objective and reasonable audits of the status
of business execution. The Chiba Bank believes that this system
provides an adequate management supervisory function.
CommitteesThe Corporate Advisory Committee discusses important
management issues, and the Appointment Advisory Committee
and the Remuneration Advisory Committee, the majority of
members of which are outside directors, debate the nomination and
remuneration of director candidates.
Internal AuditThe Audit and Inspection Division, which reports directly to the
Board of Directors and is independent of the units subject to
auditing, conducts internal audits of headquarters, branches and
subsidiaries in accordance with the Internal Audit Regulations and
the Internal Audit Plan, which is established each year by the Board
of Directors. The division reports the results and findings of internal
audits on a monthly basis to the Board of Directors, in addition
to an Internal Audit Committee, which meets once a month as a
rule. Problem areas from the perspective of compliance and risk
management and improvement measures are examined during this
process.
Group Management SystemsThe Chiba Bank maintains a system under which subsidiaries
decide their own regulations, in line with the Bank’s Compliance
Regulations and various risk management regulations, and the
Bank’s administrative departments control subsidiary compliance
and risk management. The Chiba Bank’s internal audit units
conduct internal audits of subsidiaries and assure proper operations
throughout the Chiba Bank Group.
Internal Control SystemThe Chiba Bank introduced a basic policy for the establishment
of systems to ensure the appropriateness of operations (Internal
Control Systems) through the Board of Directors. In accordance
with this policy, the Chiba Bank is working to establish a high-quality
management structure.
Corporate governance system Audit & supervisory board system
Number of directors 12
Of which, outside directors 3
Number of Audit & Supervisory Board members 5
Of which, outside Audit & Supervisory Board members 3
Number of independent directors and Audit & Supervisory Board members 6 (3 outside directors, 3 outside Audit & Supervisory Board members)
Corporate Governance StructureThe Chiba Bank bases all of its corporate activities on the Chiba Bank Code of Ethics, which includes earning unwav-
ering trust, thorough compliance with laws, rules and other fundamental principles, opposition to antisocial forces,
and transparent management. Under the medium-term management plan “Best Bank 2020 Final Stage—3 years of
value co-creation” (FY2017–FY2019), we have raised “positive and active action on ESG issues” as an initiative to be
undertaken, and we are working to advance the level of corporate governance.
To create a more robust and sound organizational structure, the Bank has adopted the supervisory systems below
and created an efficient business execution structure.
The Chiba Bank, Ltd. Annual Report 201722

Directors and Audit & Supervisory Board MembersDirectors who possess the knowledge and experience needed to precisely, fairly and efficiently execute bank management duties have been
appointed.
Name (Appointment) Reason for Appointment as a Director
Hidetoshi Sakuma (June 2003)
President since March 2009, after serving previously as General Manager, Corporate Planning Division and General Manager, Head Office
Osamu Kimura (June 2012)
Previously served as General Manager, Keisei-ekimae Branch, General Manager, Inage Branch, General Manager, Matsudo Branch, and General Manager, Branch Support Division
Kenichi Sawai (June 2014)
Previously served as General Manager, Yagiri Branch, General Manager, Anesaki Branch, General Manager, Abiko Branch, and General Manager, Business Promotion Headquarters
Daizo Iijima (June 2015)
Previously served as General Manager, Kencho Branch, General Manager, Head Office and General Manager, Human Resources Division
Tomoyuki Ikeda (June 2015)
Previously served as General Manager, Inage-higashiguchi Branch, General Manager, Treasury Division, General Manager, Corporate Planning Division, General Manager, Mobara Branch, and President, Chibagin Asset Management Co., Ltd. from June 2014 to June 2015
Joji Sugo (June 2016)
Previously served as General Manager, Makuhari Shintoshin Branch, General Manager, Treasury Division, and General Manager, Credit Division
Norio Takatsu (June 2016)
Previously served as General Manager, EDP System Division
Yukihito Inamura (June 2016)
Previously served as General Manager, New York Branch, General Manager, Public Relations and CSR Division, and General Secretariat, Human Resources Division
Tsutomu Yonemoto (June 2017)
Previously served as General Manager, Hong Kong Branch, General Manager, Akihabara Branch, General Manager, Corporate Planning Division, and General Manager, Business Promotion Division
Audit & Supervisory Board members who possess the knowledge and experience to audit the directors’ execution of business accurately,
fairly, and efficiently have been appointed.
Name (Appointment) Reason for Appointment as an Audit & Supervisory Board Member
Toshikazu Okubo (June 2016)
Previously served as General Manager, Yachiyo Branch and General Manager, Corporate Planning Division. Served as a director from June 2011 to June 2016
Kazuyoshi Fukushima (June 2016)
Previously served as General Manager, Risk Management Division and General Manager, Audit and Inspection Division
Outside Directors and Outside Audit & Supervisory Board MembersOutside directors have been appointed for their ability to help improve the Bank’s corporate value over the medium and long term as they apply
their knowledge and experience to the management of the Bank toward the strengthening of the decision-making functions and supervisory
functions of the Board of Directors.
Name (Appointment) Reason for Appointment as an Outside Director
Tomoyuki Yokota (June 2017)
Has a high level of expertise as a judge and attorney, with experience as a Supreme Court Justice and advisor at Nagashima Ohno & Tsunematsu Law Office
Yuko Tashima (June 2015)
Has a high level of expertise as an attorney, with experience as an outside director at other operating companies, and public service as an official of the Financial Services Agency
Yasuko Takayama (June 2015)
Has experience as a manager of customer service and CSR divisions and as a standing Audit & Supervisory Board member of Shiseido Company Limited, as well as experience as an outside director at other companies
The Chiba Bank, Ltd. Annual Report 2017 23
Corporate Governance
(Relationship with the Chiba Bank)The Chiba Bank has three outside directors and three outside Audit
& Supervisory Board members. None of them have any personal
relationships with other directors or Audit & Supervisory Board
members at the Chiba Bank, nor does the Chiba Bank have any
particular beneficial relationships with them.
(Functions and roles in corporate governance)The Chiba Bank has appointed three outside directors to further
strengthen the management decision-making and supervisory
functions of business operations. The outside Audit & Supervisory
Board members serve a management supervisory function for the
Chiba Bank, using their impartial viewpoints from outside of the
Bank to audit business operations objectively and reasonably.
They work to implement efficient and effective auditing,
cooperating with the representative directors, internal audit units,
independent auditor and internal control departments through
periodical information exchange and holding interviews as
necessary.
(Standards regarding independence)The Chiba Bank has established standards regarding the
independence of outside directors and outside Audit & Supervisory
Board members in electing members that can satisfy independence
while appropriately performing their duties. All the Chiba Bank’s
outside directors and outside Audit & Supervisory Board members
satisfy these standards regarding independence. We have
submitted notification to the Tokyo Stock Exchange that the three
outside directors and three outside Audit & Supervisory Board
members are independent and secure from any risk of conflicts of
interest with general shareholders.
(Overview of liability limitation agreements)Based on Article 427, Section 1 of the Companies Act, the Chiba
Bank has entered into liability limitation agreements with the outside
directors and outside Audit & Supervisory Board members to limit
their liability for damages pursuant to Article 423, Section 1 of the
Companies Act to the minimum liability amount set forth in Article
425, Section 1 of the Companies Act when they have acted in good
faith and have not been grossly negligent in performing their duties.
Remuneration of Directors and Audit & Supervisory Board MembersRemuneration of the Chiba Bank’s directors is based on
remuneration regulations established by the Board of Directors,
and is determined by the Board of Directors following deliberations
by the Corporate Advisory Committee, whose members include
a majority of outside directors, to ensure that the remuneration
is transparent, fair and rational. To function as a sound incentive
for the directors to strive for sustainable growth and enhance
corporate value over the medium to long term, equity-based
remuneration in the form of stock options, linked to the Chiba
Bank’s medium- to long-term earnings performance, is provided as
a component of the remuneration packages. From the standpoint
of emphasizing soundness as a financial institution, the Chiba Bank
has not introduced remuneration linked to short-term earnings
performance.
Remuneration Policies
• Director remuneration consists of a fixed portion comprising fixed
remuneration based on rank, and a variable portion comprising
fluctuating remuneration linked to stock price performance.
However, outside directors only receive fixed remuneration.
• Fixed remuneration based on rank is paid to match the weight of
responsibility for each position.
• The ratio of fixed remuneration based on rank to variable
remuneration (equity-based remuneration in the form of stock
options) is 80:20.
Remuneration Determination Procedure
• Remuneration of a director shall be determined by resolution of the
Board of Directors within the scope of the total remuneration for
directors established by resolution of the Annual General Meeting
of Shareholders.
Regarding remuneration for Audit & Supervisory Board members,
a full fixed remuneration shall be determined through discussions
with them in order to ensure their independence.
Outside Audit & Supervisory Board members who can enhance auditing functions by applying their knowledge and experience to the
management of the Bank have been appointed.
Name (Appointment) Reason for Appointment as an Outside Audit & Supervisory Board Member
Tomohiko Sakamoto (June 2017)
Has a high level of expertise gained through experience as a branch manager, Director-General, Administration Department, and other positions at the Bank of Japan as well as extensive knowledge in finance overall
Kazuhiko Ishihara (June 2017)
Has a high level of expertise and extensive knowledge of overall administration gained through experience as Deputy Director-General of the Minister’s Secretariat, Ministry of Finance, Director-General, Okinawa Development and Promotion Bureau, Cabinet Office, and other positions
Akio Shirato (June 2011)
Has broad and deep knowledge of administration and related matters gained from experience as Vice Governor of Chiba Prefecture
The Chiba Bank, Ltd. Annual Report 201724

Compliance
Compliance StructureThe Chiba Bank is constantly working on making compliance
activities even more effective. We are determined to conduct all of
our business activities fairly and in good faith, by complying with all
laws and regulations relating to banking transactions, by observing
all internal rules and regulatory requirements pertaining to our role in
society and by avoiding actions that would fall short of normal social
expectations.
Specific action plans and measures to ensure compliance are
formulated at regular meetings of the Compliance Committee. This
committee is chaired by the president and consists of directors,
executive officers, and divisional general managers.
The Compliance Division is responsible for various compliance-
related tasks, including the administration of compliance regulations
and manuals, the preparation and monitoring of training programs
and periodic checks on the compliance situation. They also monitor
branch-level compliance and provide advice.
Consistent Implementation of Basic PoliciesWe have a clearly defined code of conduct for employees in the
form of the Chiba Bank Code of Ethics. To ensure that these rules
are understood and observed, all employees receive a copy of our
Compliance Manual, which contains specific guidelines.
Compliance ProgramEvery year, the Board of Directors establishes a compliance
program to provide a specific action plan for achieving further
improvements in compliance activities. The execution of this
program is checked on a regular basis by the Board of Directors and
Compliance Committee.
Protecting Customers and Personal InformationTo protect customers and offer them greater convenience,
employees of the Chiba Bank receive guidance and training
designed to ensure that everyone conducts business with sincerity
and fairness. We pay particular attention to complex financial
products with risks that include the possible loss of principal and
to derivative transactions. In these cases, we comply with the
Financial Instruments and Exchange Law and always perform
proper solicitation and sales activities in line with the Chiba Bank
Solicitation Policy. Furthermore, we plan to upgrade follow-up
activities for customers who use these types of financial products.
Prevention of Money Laundering and Financial CrimesThe Chiba Bank has established the Management Policy to Prevent
Money Laundering and Terrorism Financing Activities and follows
this policy in making thorough efforts aimed at preventing these
problems. In addition, we are reinforcing measures to protect
customers from a variety of financial crimes.
Opposition to Antisocial ForcesThe Chiba Bank maintains links with police authorities, lawyers, and
other external organizations as a structure to provide appropriate
countermeasures against unreasonable demands, interference, or
other inappropriate approaches from antisocial forces.
Moreover, the Bank has added organized crime disclaimers to all
transaction documentation, particularly deposit account regulations,
bank transaction agreements, and loan agreements, and is actively
adding more measures to counteract antisocial forces.
The Chiba Bank Code of Ethics
Earning Unwavering Trust
Remaining constantly aware of the social responsibility and
public mission of a bank, the Chiba Bank will strive to earn
the unwavering trust of society through sound, appropriate
business operations based on the principle of accountability.
Thorough Compliance with Laws,
Rules and Other Fundamental Principles
Complying strictly with all laws and rules and never deviating
from social standards, the Chiba Bank will conduct fair and
honest business activities.
Opposition to Antisocial Forces
The Chiba Bank will firmly oppose antisocial forces and
groups that threaten the order and safety of society and that
undermine healthy economic and social development.
Transparent Management
The Chiba Bank will provide active and fair disclosure of
management information and manage its operations in a
transparent manner.
Management Policy to Prevent MoneyLaundering and Terrorism Financing ActivitiesThe Chiba Bank recognizes the importance of preventing money laundering and terrorism financing activities (“money laundering, etc.,” hereinafter) and has established appropriate internal systems for the prevention of money laundering, etc.
Unified ControlThe roles and responsibilities of managers and others who are responsible for preventing money laundering, etc., are clearly defined and control is centralized based on the suitable cooperation of all related departments.
Appropriate Administrative ProceduresThe Chiba Bank has established and upgraded administrative procedures that are needed for the prevention of money laundering, etc., such as verification of customer identification, confirmation of frozen assets and other measures, and reports about suspicious transactions.
Employee Training ProgramsThere are continuous employee training programs on the prevention of money laundering, etc., to ensure that all employees are aware of the related laws and regulations and administrative procedures.
Verification of EffectivenessThe Chiba Bank monitors its internal management system regarding the prevention of money laundering, etc., verifies the effectiveness of these systems, and takes additional steps to upgrade these systems based on the outcomes of monitoring.
The Chiba Bank, Ltd. Annual Report 2017 25
Integrated Risk Management SystemThe principal forms of risk to which banking operations are subject
include credit risk, market risk, and operational risk. In order to
improve profitability and ensure sound business operations, the
Chiba Bank considers it necessary to not only individually manage
each of these forms of risk, but also to centrally monitor those risks
to control within acceptable overall limits.
Accordingly, in addition to assigning divisions to manage overall
risk in the Group for each form of risk, the Chiba Bank has an
integrated risk management system in which the Risk Management
Division centrally monitors these risks. The division engages in
detailed management and discussions of risks at meetings of
the ALM Committee, Credit Risk Management Committee, and
Operational Risk Management Committee and reports to the Board
of Directors on risk-related matters. In addition, the division is
developing an integrated risk management system for considering
and implementing risk countermeasures.
To ensure an effective risk management system, the Audit
and Inspection Division periodically conducts audits to determine
whether risk management is appropriately implemented and reports
the audit results to the Board of Directors.
Integrated Risk ManagementThe basis of risk management at the Chiba Bank is the integrated
management of various risks using uniform measures to the extent
possible. The term “integrated risk” refers to the sum of credit risk,
market risk, and operational risk measurement, forms of risk that
can be managed by means of risk quantification.
The Risk Management Department in the Risk Management
Division, the section responsible for integrated risk management,
conducts a comparison of quantified integrated risk and capital,
verifies the adequacy of capital with respect to risk, and reports
the results quarterly to the Board of Directors. The division also
conducts stress tests, a means of verification of capital adequacy
in times of stress that involves the assumption of certain stress
scenarios, such as deterioration of the corporate environment in a
period of recession, or a decrease in land prices, and forecasting
the increase in the amount of risk based on the scenarios.
The Chiba Bank has introduced a risk appetite framework, which
it uses to control the occurrence of losses. The framework monitors
the current status of risk capital use and risk-return performance in
each business sector. It also performs scenario analysis predicated
on future environmental changes.
Credit Risk ManagementCredit risk is the risk of incurring a loss because of a decline in, or
total loss of, the value of owned assets as a result of deterioration in
the financial soundness of debtors. Credit risk accounts for a major
portion of risk in banking operations.
The Chiba Bank has developed a rigorous credit risk
management system centered on an internal credit rating system
and engages in individual credit management and credit portfolio
management. In the self-assessment of assets, the Chiba Bank
implements appropriate write-offs and provisions and has
introduced a rating and self-assessment system linked to internal
credit ratings to upgrade credit risk management.
Also the Chiba Bank has long ensured the independence of the
sections involved in credit risk. Specifically, the credit screening
and administrative sections manage credit risk for individual
business transactions in the credit executing section (banking
offices and sales promotion divisions). The Credit Risk Management
Department in the Risk Management Division, whose organization
and operation are independent from the credit screening and
administrative sections and the credit executing sections, is a credit
risk management section that engages in unified management of
overall credit risk. The Risk Management Department in the Risk
Management Division is a unified risk management section that
engages in the integrated management of all forms of risk, including
credit risk. The Audit and Inspection Division audits operations in
the business units involved in credit risk management.
The Credit Risk Management Committee meets regularly and
considers credit risk management policy, monitors the operation of
the internal credit rating system and the credit portfolio, and works
to ensure the quality of loan assets.
Internal Credit Rating SystemThe Chiba Bank uses an internal credit rating system to place
borrowers into 15 credit rating categories on the basis of financial
data such as financial condition and cash flow. We strive to enhance
the identification and examination of the financial circumstances at
companies, the starting point of credit risk management, by means
of periodic annual reviews and reviews at other times in accordance
with the status of individual debtors. The internal credit rating
system is the core of credit risk management and is extensively
used in actual management, such as credit pricing standards and
approval authorization.
Individual Asset Credit ManagementThe banking branches or offices and the Credit and Supervisory
Department in the Credit Division take the lead with regard to
examining individual applications for credit, engaging in rigorous
investigations in accordance with screening criteria on the basis of
the basic principles of credit (safety, profitability, liquidity, growth
potential and public good). The Business Support Department in
the Business Support Division provides support for the financial
soundness of borrowers who need to improve their operations,
and the Credit Administration Department in the Business Support
Division engages in resolution and collection activities with regard
to Bankrupt Debtors and other borrowers. The Chiba Bank strives
to accumulate high-quality loan assets and minimize future losses
through this practice of advanced screening and supervision after
credit has been extended.
Risk Management
The Chiba Bank, Ltd. Annual Report 201726

Credit Portfolio ManagementCredit portfolio management is the management of the risk
of incurring a major loss due to the concentration of individual
loans in specific countries or specific industries. The Credit Risk
Management Department in the Risk Management Division
monitors the state of credit risk from various perspectives, such as
by country, by industry, and by customer credit rating.
In credit portfolio management, the Chiba Bank engages in the
quantification of credit risk. The quantification of credit risk is the
forecasting by statistical methods of the amount of future losses
(the amount of risk) forecasted to occur due to circumstances such
as borrower bankruptcy or worsening business performance. We
measure value at risk (VaR: the assumed maximum loss) as the
amount of risk and strive to increase the soundness of the credit
portfolio by accumulating and organizing default data and loan
recovery data from defaulted borrowers.
By importing the quantitative results into various systems,
we utilize them in loan pricing that reflects credit risk and other
processes. In this way, we aim to ensure more appropriate
interest rate levels than were previously possible and refine risk
management.
Self-Assessment of AssetsSelf-assessment of assets is the practice whereby financial
institutions review and analyze their own assets individually and
classify them on the basis of asset value impairment and the risk
of default. Self-assessment of assets is obligatory for financial
institutions under the system of prompt corrective action under the
Banking Law. The system of prompt corrective action is a system
by which administrative measures are triggered in accordance with
the state of the capital ratio of financial institutions. A prerequisite to
the accurate calculation of capital is implementation of appropriate
write-offs and provisions and the preparation of financial
statements that, to the extent possible, objectively reflect the actual
state of asset quality.
At the Chiba Bank, branches and offices conduct self-
assessments of assets on the basis of Asset Self-Assessment
Regulations, and the credit screening and administrative sections
check details of self-assessments. Next, the Audit and Credit
Assessment Department in the Audit and Inspection Division
conducts an audit to verify the accuracy of the self-assessment
results and process. According to the results of these assessments,
the Credit Risk Management Department in the Risk Management
Division calculates the amounts of provisions, and the Credit
Administration Department in the Business Support Division
implements write-offs. Finally, the Audit and Credit Assessment
Department in the Audit and Inspection Division conducts an audit.
Through this process, the Chiba Bank rigorously maintains the
soundness of its assets.
Market Risk ManagementMarket risk is the risk of incurring a loss due to a change in the value
of owned assets as a result of fluctuations in interest rates, prices of
securities or other financial instruments, or exchange rates.
The Chiba Bank has introduced an ALM management system
with respect to market risk. The ALM Committee meets periodically
Risk Management System
Audit & Supervisory Board Board of Directors
ALM Committee
Risk Management Division
Credit RiskManagement Committee
Operational RiskManagement Committee
Operational Risk
Risk Operation Section
Audit Section
Operation Planning DivisionEDP System Division
Human Resources DivisionCorporate Administration
Division
Primary Control
Risk Management Section
Integrated Management
Various Risks
Secondary Control
Branches, Headquarters, Subsidiaries
Audit and Inspection Division
Market RiskIntegrated Risk Credit RiskLiquidity Risk
The Chiba Bank, Ltd. Annual Report 2017 27

to discuss and decide detailed measures to counter interest rate
risk, foreign exchange risk and price fluctuation risk, and manage
overall market risk.
Specifically, as part of the Risk Capital Allocation System, within
the scope of the risk capital allocated to the business sectors,
the Chiba Bank sets and manages risk limits for the amount of
market risk (value at risk or VaR: the assumed maximum loss) for
each product, such as securities investments and other market
transactions or loans and deposits. In this way, we strive to ensure
management soundness. In addition to VaR management of
market transactions, the Chiba Bank sets upper limits for market
investments according to the balance and alarm point of valuation
differences and implements risk-control by reviewing investment
policy each quarter.
With regard to market risk for market transactions for trading
purposes (trading with the aim of earning profit by means of short
term fluctuations in interest rates or prices), VaR is calculated
on a daily basis, periodic stress tests (the estimation and testing
of losses in worst-case scenarios that assume sudden market
fluctuations) are conducted, and risk is limited and the occurrence
of major losses avoided through the setting of maximum trading
limits and the rigorous application of stop loss rules.
The allotment of market operations among the front office (the
Treasury Division and overseas branches), back office (the Treasury
Operation Division), and middle office (the Market Risk Management
Department in the Risk Management Division) results in the mutual
control of each section.
Liquidity Risk ManagementLiquidity risk consists of cash flow risk and market liquidity risk.
Cash flow risk is the risk of incurring a loss due to failure to maintain
cash flow as a result of the inability to secure necessary funds or
the necessity of procuring funds at significantly higher interest
rates than usual due to the worsening of the financial institution’s
financial position or other circumstances. Market liquidity risk is the
risk of incurring a loss due to the inability to trade on markets or the
necessity of trading at prices significantly less favorable than usual
due to market turmoil or other circumstances.
At the Chiba Bank, the Treasury Division is the section
that manages cash flow. The division ascertains the market
environment and analyzes the state of investment and procurement
of funds. With respect to cash flow risk, the division engages in
appropriate day-to-day cash flow management through such
means as the establishment of upper limits to ensure that the
amount of funds procured on the market is not excessive and the
maintenance of a certain minimum level of assets as a liquidity
reserve that can be converted to cash in a short time. The Chiba
Bank manages market liquidity risk by setting limits on daily
positions taken in market trading.
As the section that manages risk, the Market Risk Management
Department in the Risk Management Division strives to avoid
increases in liquidity risk by identifying and assessing various
factors that affect liquidity risk and monitoring the observance of
limits. The ALM Committee meets to discuss and decide matters
related to liquidity risk, as it does with market risk. The Chiba Bank
also maintains a crisis management plan that provides for a rapid,
network-wide response in the event of unforeseen circumstances
that could affect the Chiba Bank’s cash flow.
Operational Risk ManagementOperational risk is the risk of incurring losses due to the
inappropriateness of business processes, employee activities, or
systems or external events. The Chiba Bank classifies operational
risk into clerical risk (described below), system risk (described
below), human risk, tangible asset risk, and reputational risk.
Human risk is the risk of a loss occurring due to workplace
safety, discrimination, or the like. Tangible asset risk is the risk
of a loss occurring due to damage to buildings or facilities or the
like. Reputational risk is the risk of a loss occurring due to loss of
public confidence resulting from deterioration of the Chiba Bank’s
reputation.
In its risk management structure, the Chiba Bank decides the
corporate divisions having jurisdiction over the various forms of
operational risk (the Operation Planning Division for clerical risk,
the EDP System Division for system risk, the Human Resources
Division for human risk, and the Corporate Administration
Division for tangible asset risk), and the divisions collaborate
in risk management under the overall management of the Risk
Management Department in the Risk Management Division, which
is responsible for central oversight of risk. The Risk Management
Department in the Risk Management Division directly manages
reputational risk and, the Compliance Division jointly manages
legal risk and compliance-related risk included in the various risk
categories with the corporate divisions that have jurisdiction.
The Chiba Bank has an Operational Risk Management
Committee. On the basis of direct involvement in management,
the committee receives reports concerning the state of operational
risk losses and develops a management structure for improving
and correcting problem areas by means of a PDCA cycle involving
the preparation of a risk management plan, development of
management regulations, and evaluation and improvement. To
ensure the effectiveness of management by means of this PDCA
cycle, the Chiba Bank has introduced Control Self-Assessment
(CSA), by which it formulates and implements measures to identify,
assess, monitor, and manage the details of risk, as well as to
reduce risk. Management by means of CSA entails responding to
operational risk loss events that have occurred at the Chiba Bank
as well as preventing problems from occurring by evaluating the
adequacy of the Chiba Bank’s management system. This is based
on scenarios prepared using loss events that have occurred at
other banks or in other industries and devising countermeasures as
necessary.
Clerical Risk ManagementClerical risk is the risk of incurring a loss due to the failure to perform
accurate clerical work, clerical accidents or fraud, or the failure to
Risk Management
The Chiba Bank, Ltd. Annual Report 201728
perform official obligations or provide explanations to customers.
The Chiba Bank considers accurate clerical work to be essential
to obtain the trust of customers, and the Operation Planning
Division plays a central role in the performance of exact clerical work
in accordance with basic procedures and in the effort to prevent
clerical accidents.
Specifically, the division prepares clerical standards that
indicate detailed clerical procedures for each operation; ensures
the correct handling of cash, promissory notes, passbooks, and
other important items; provides guidance on clerical management
systems at branches, offices, and headquarters; and conducts
training to raise the standard of clerical work.
The branches and offices periodically conduct self-
assessments and strive to ensure clerical accuracy and raise the
level of clerical work through monitoring and verification by the
Operation Planning Division.
With regard to the auditing system, the Audit and Inspection
Division visits all branches, offices, and headquarters at least
once a year and conducts rigorous audits of all clerical work in
accordance with auditing standards. The division promptly notifies
the branches, offices, and headquarters of the audit results,
periodically reports to the Board of Directors, and implements a
framework for reflecting audit results in clerical improvements.
System Risk ManagementSystem risk is the risk of incurring a loss resulting from a leak
or falsification of information owned by the Chiba Bank or the
unauthorized use, failure, or incorrect operation of computer
systems.
The Chiba Bank possesses customer transaction data and
various other types of information and has developed systems to
process that information. To ensure the provision of various services
to customers, the role of computer systems in banking operations is
increasing year by year, and a system risk event would result in great
inconvenience to customers. For this reason, we regard system risk
management as increasingly important.
The EDP System Division plays a central role in devising
measures to ensure the stable operation of computer systems.
Specifically, the Chiba Bank duplicates hardware and circuits
for account systems, information systems, and other backbone
systems and maintains a framework for rapidly switching to
the backup system so that business can continue in the event
of a failure. In addition, for all computer systems, including
those used individually at departments, the Chiba Bank has
implemented a rigorous data management system, measures to
prevent unauthorized access or the introduction of viruses, and
the preparation of a contingency plan to provide for unforeseen
circumstances such as large-scale disasters.
Moreover, in terms of cyber-security, the Bank continues to take
measures to ensure customer safety and security.
As part of audit procedures, the Audit and Inspection Division
conducts audits of computer systems throughout the organization.
Business Continuity SystemIn addition to the risk management system described above,
the Chiba Bank maintains a business continuity system to allow
essential operations to continue for the preservation of the financial
system during an unexpected disaster such as an earthquake or
pandemic influenza. Centered in the Risk Management Department
in the Risk Management Division, this system focuses on the rapid
restoration of operations that the Chiba Bank would be forced to
suspend during an emergency.
Since the Great East Japan Earthquake, the Chiba Bank
has installed emergency in-house power generators at more
branches, upgraded countermeasures against tsunami risk,
expanded measures for persons unable to return home due to a
disaster, and taken other steps to continue business operations
following a disaster.
Basel III ComplianceThe Basel III capital adequacy regulation was first applied in the
fiscal year ended March 31, 2013. Changes to the new regulation
compared with the earlier Basel II regulation include tighter rules
for items included in capital and an increase in the number of
items excluded with the aim of improving the quality of capital.
Other changes include additional provision for risks relating
to transactions with large financial institutions and derivative
transactions. Banks will also be required to meet minimum capital
adequacy standards based on four capital ratios: total capital
ratio, Tier 1 capital ratio, common equity Tier 1 capital ratio, and
capital buffer ratio (applicable from the fiscal year ended March
31, 2016). Basel III consists of three pillars. Pillar 1 is a minimum
capital ratio, which is the level of capital required to cover a bank’s
risk. Pillar 2 is the development of capital strategies by banks and
verification by regulatory authorities. Pillar 3 is the assurance of
market discipline through the increased disclosure of information.
Under the regulation, each bank selects a method of calculating
minimum required capital according to its risk profile and risk
management method.
The basic policy of the Chiba Bank is to expand its business by
upgrading internal management, and it is proactively complying
with the regulation as part of its policy of building an integrated risk
management system. With regard to the calculation of minimum
required capital, we have adopted the foundation internal ratings-
based (FIRB) approach for credit risk and standardized approach
for operational risk (both approaches require the approval of
regulatory authorities) and more thoroughly reflect risk in capital
ratios.
Furthermore, for Pillar 3, disclosure of the leverage ratio was
started as an indicator to complement the capital ratios.
Going forward, a number of new requirements will be
introduced, including the net stable funding ratio. The Chiba Bank
is currently developing and strengthening management systems to
comply with these regulations.
The Chiba Bank, Ltd. Annual Report 2017 29
Executive Officers
Managing Executive Officer
Kazuhiko MizushimaGeneral Manager, Head Office
Managing Executive Officer
Shigenobu SadachiGeneral Manager, Tokyo Head Office
Executive Officer
Shigeo MiyauchiGeneral Manager, Funabashi Branch
Executive Officer
Shunichi IshiiGeneral Manager, Workplace Revolution Development Division
Executive Officer
Junya WakabayashiGeneral Manager, Risk Management Division
Executive Officer
Satoru MakiGeneral Manager, Audit and Inspection Division
Executive Officer
Takayuki HosokaiGeneral Manager, Public Relations and CSR Division
Executive Officer
Hirofumi KadohataIn change of Business Promotion Division, Customer Service Division, Corporate Business Division, Regional Revitalization Division, Trust Business Division, Consumer Loan Business Division, Retail Business Division and Asset Management Support Division
Executive Officer
Tadayoshi ShinozakiGeneral Manager, Corporate Planning Division
Executive Officer
Chigusa SaitoGeneral Manager, Human Resources Division
Executive Officer
Arihiko TotsukaGeneral Manager, Credit Division
Audit & Supervisory Board Members
Standing Audit & Supervisory Board Member
Toshikazu Okubo
Standing Audit & Supervisory Board Member
(Outside Audit & Supervisory Board Member)
Tomohiko Sakamoto
Standing Audit & Supervisory Board Member
(Outside Audit & Supervisory Board Member)
Kazuhiko Ishihara
Non-Standing Audit & Supervisory Board Member
Kazuyoshi Fukushima
Non-Standing Audit & Supervisory Board Member
(Outside Audit & Supervisory Board Member)
Akio Shirato
Directors
President (Representative Director)
Hidetoshi Sakuma
Deputy President (Representative Director)
Osamu Kimura
Director and Senior Executive Officer
Kenichi SawaiGeneral Manager of Business Promotion Headquarters Executive Officer in charge of Business Promotion Division, Customer Service Division, Corporate Business Division, Regional Revitalization Division, Trust Business Division, Consumer Loan Business Division, Retail Business Division and Asset Management Support Division
Director and Senior Executive Officer
Daizo IijimaGeneral Manager of Corporate Planning and Administration Headquarters Executive Officer in charge of Corporate Planning Division and Public Relations and CSR Division
Director and Managing Executive Officer
Tomoyuki IkedaExecutive Officer in charge of Risk Management Division and Compliance Division
Director and Managing Executive Officer
Joji SugoExecutive Officer in charge of Credit Division and Business Support Division
Director and Managing Executive Officer
Norio TakatsuExecutive Officer in charge of Operation Planning Division, EDP System Division, Business Operation Division and Operation Division
Director and Managing Executive Officer
Yukihito InamuraExecutive Officer in charge of Workplace Revolution Development Division, Corporate Administration Division, Human Resources Division and Diversity Management Division
Director and Managing Executive Officer
Tsutomu YonemotoExecutive Officer in charge of Treasury Division and Treasury Operation Division
Non-Standing Director (Outside Director)
Tomoyuki Yokota
Non-Standing Director (Outside Director)
Yuko Tashima
Non-Standing Director (Outside Director)
Yasuko Takayama
The Chiba Bank, Ltd. As of June 28, 2017
Directors, Executive Officers and Audit & Supervisory Board Members
The Chiba Bank, Ltd. Annual Report 201730
The Chiba Bank, Ltd. Annual Report 2017 31
Financial andCorporate Information32 Five-Year Summary (Consolidated)
33 Management’s Discussion and Analysis
34 Asset Quality
36 Consolidated Balance Sheet
37 Consolidated Statement of Income
37 Consolidated Statement of Comprehensive Income
38 Consolidated Statement of Changes in Net Assets
39 Consolidated Statement of Cash Flows
40 Notes to Consolidated Financial Statements
61 Independent Auditor’s Report
62 Non-Consolidated Balance Sheet (Unaudited)
63 Non-Consolidated Statement of Income (Unaudited)
64 Supplementary Information (Unaudited)
67 Organization
68 Subsidiaries
69 Corporate Data
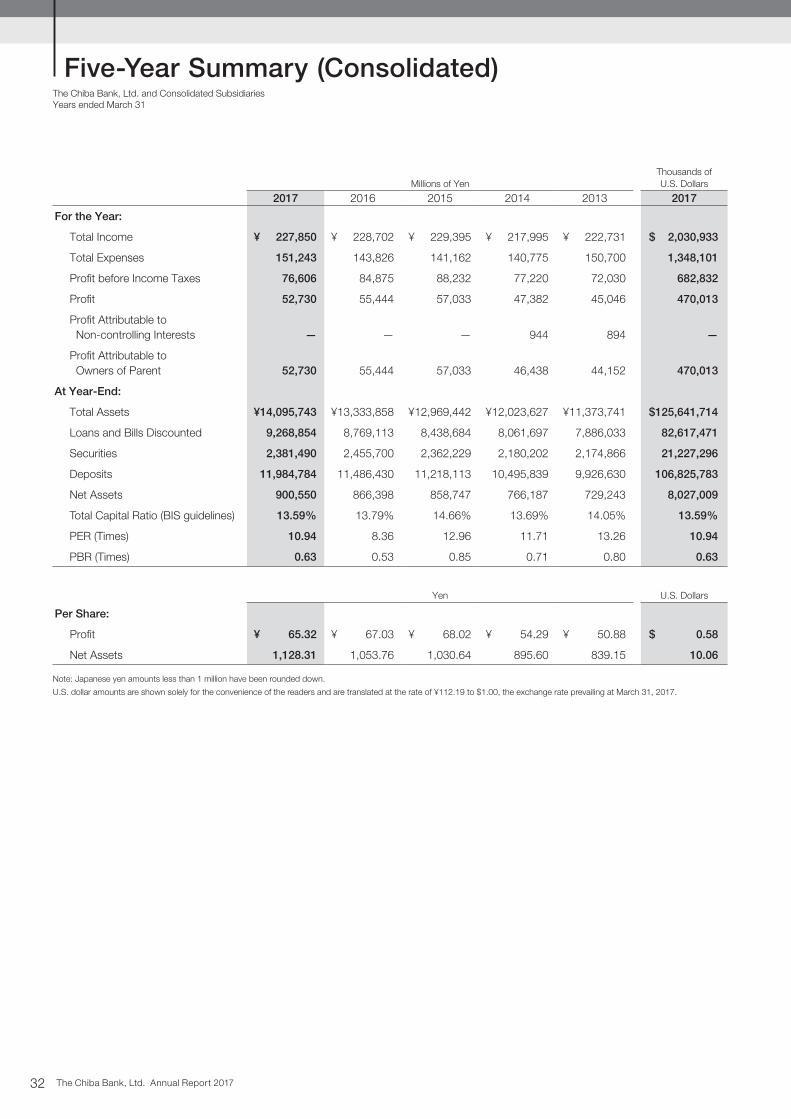
The Chiba Bank, Ltd. Annual Report 201732
Millions of YenThousands ofU.S. Dollars
2017 2016 2015 2014 2013 2017
For the Year:
Total Income ¥ 227,850 ¥ 228,702 ¥ 229,395 ¥ 217,995 ¥ 222,731 $ 2,030,933
Total Expenses 151,243 143,826 141,162 140,775 150,700 1,348,101
Profit before Income Taxes 76,606 84,875 88,232 77,220 72,030 682,832
Profit 52,730 55,444 57,033 47,382 45,046 470,013
Profit Attributable to Non-controlling Interests — — — 944 894 —
Profit Attributable to Owners of Parent 52,730 55,444 57,033 46,438 44,152 470,013
At Year-End:
Total Assets ¥14,095,743 ¥13,333,858 ¥12,969,442 ¥12,023,627 ¥11,373,741 $125,641,714
Loans and Bills Discounted 9,268,854 8,769,113 8,438,684 8,061,697 7,886,033 82,617,471
Securities 2,381,490 2,455,700 2,362,229 2,180,202 2,174,866 21,227,296
Deposits 11,984,784 11,486,430 11,218,113 10,495,839 9,926,630 106,825,783
Net Assets 900,550 866,398 858,747 766,187 729,243 8,027,009
Total Capital Ratio (BIS guidelines) 13.59% 13.79% 14.66% 13.69% 14.05% 13.59%
PER (Times) 10.94 8.36 12.96 11.71 13.26 10.94
PBR (Times) 0.63 0.53 0.85 0.71 0.80 0.63
Yen U.S. Dollars
Per Share:
Profit ¥ 65.32 ¥ 67.03 ¥ 68.02 ¥ 54.29 ¥ 50.88 $ 0.58
Net Assets 1,128.31 1,053.76 1,030.64 895.60 839.15 10.06
Note: Japanese yen amounts less than 1 million have been rounded down.
U.S. dollar amounts are shown solely for the convenience of the readers and are translated at the rate of ¥112.19 to $1.00, the exchange rate prevailing at March 31, 2017.
The Chiba Bank, Ltd. and Consolidated SubsidiariesYears ended March 31
Five-Year Summary (Consolidated)
The Chiba Bank, Ltd. Annual Report 2017 33
Financial and Economic EnvironmentIn the fiscal year ended March 31, 2017, the Japanese economy continued to stage a gradual recovery, as personal consumption trended firmly as a result of improved employment and income levels and other factors. Corporate earnings also trended at a high level overall, mainly supported by the progression of the yen’s depreciation following the U.S. presidential election. Economic conditions in Chiba Prefecture saw personal consumption trend firmly amid a continuing population inflow, primarily to major urban areas. Chiba Prefecture’s economy performed steadily overall, mainly underpinned by progress on the development of transportation infrastructure and various development projects, in addition to an upturn in corporate business performance led by export companies. Turning to financial market conditions, the unsecured overnight call rate stood at around minus 0.05% throughout the fiscal year. Secondary market yields on long-term government bonds declined as far as around minus 0.2% due to the impact of the negative interest rate policy of the Bank of Japan, but rose to around positive 0.1% mainly due to the impact of the U.S. presidential election. The Nikkei Stock Average had been trending at around ¥16,000, but had rallied to the ¥19,000 level by the second half of the fiscal year.
Review of FY2016In this financial and economic environment, the Chiba Bank pushed ahead with “Best Bank 2020—3 years of value creation,” a three-year medium-term management plan running from April 2014 to March 2017. Under this plan, we have vigorously implemented various measures to become the “best retail” banking group, providing the highest satisfaction and being highly regarded by our regional customers, including individuals and small- and medium-sized enterprises. We made a Group-wide effort to focus on regional revitalization. To support the growth of the small- and medium-sized enterprises responsible for regional industries, we proactively implemented measures such as providing loans and support for core businesses based on evaluations of customers’ business potential. Moreover, we commenced demonstration trials of the next-generation branch model as part of our efforts to enhance customer service and streamline operations at branches. Efforts were also made to upgrade and expand the branch network in the 23 wards of Tokyo, which have been positioned as a strategic operating area. In addition, we stepped up collaborations with other banks. Measures included strengthening the Chiba-Musashino Alliance, a comprehensive alliance with The Musashino Bank, Ltd., and the TSUBASA Alliance for Enhancing Financial Systems, an alliance that transcends regional boundaries.
Operating ResultsTotal income decreased by ¥0.8 billion from the previous fiscal year to ¥227.8 billion, mainly due to a decrease in interest income, including interest on loans and discounts. Total expenses increased by ¥7.4 billion from the previous fiscal year to ¥151.2 billion, mainly because there was an increase in general and administrative expenses, primarily reflecting increases in retirement benefit costs in response to a reduction in the discount rate due to the impact of
a negative interest rate policy. As a result, profit before income taxes decreased by ¥8.2 billion from the previous fiscal year to ¥76.6 billion. Profit attributable to owners of parent decreased by ¥2.7 billion to ¥52.7 billion.
Cash FlowsNet cash provided by operating activities was ¥361.3 billion, mainly due to an increase in deposits. Net cash provided by investing activities was ¥72.5 billion, mainly due to sales of securities. Net cash used in financing activities was ¥16.8 billion, mainly due to the purchase of treasury shares. As a result, cash and cash equivalents was ¥1,614.2 billion as of March 31, 2017, an increase of ¥417.0 billion compared with the previous fiscal year-end.
Financial ConditionThe balance of deposits including NCD as of March 31, 2017 was ¥11,984.7 billion, an increase of ¥498.3 billion from the previous fiscal year-end. This increase reflected our efforts to provide a variety of financial products and services, as well as a campaign to encourage customers to make the Chiba Bank their main banking institution for salary and pension payments and other household needs. The balance of loans and bills discounted increased by ¥499.7 billion from the previous fiscal year-end to ¥9,268.8 billion as of March 31, 2017, reflecting our efforts to actively respond to the borrowing needs of both corporate and individual customers. The balance of securities decreased by ¥74.2 billion from the previous fiscal year-end to ¥2,381.4 billion as of March 31, 2017. On this basis, the balance of total assets reached ¥14,095.7 billion as of March 31, 2017, an increase of ¥761.8 billion from a year earlier. The balance of net assets amounted to ¥900.5 billion as of the fiscal year-end, an increase of ¥34.1 billion from a year earlier.
Dividends PolicyIn light of the vital public role of the banking sector, the Bank’s basic policy is to actively return profits to shareholders through stable dividends and share buybacks while maintaining sound financial health, in conjunction with effectively deploying capital to drive growth. Moreover, our basic dividend policy is to pay out dividends twice a year via an interim dividend and a year-end dividend, with record dates of September 30 and March 31 every year, respectively. The interim dividend is approved by resolution of the Board of Directors, while the year-end dividend is approved by resolution at the Annual General Meeting of Shareholders. In terms of the dividends for the fiscal year ended March 31, 2017, a year-end dividend of ¥7.5 per share was approved at the Annual General Meeting of Shareholders. As a result, the total annual dividend, including the interim dividend of ¥7.5 per share, was ¥15 per share.
Outlook for FY2017For the fiscal year ending March 31, 2018, our earnings forecasts are ordinary profit of ¥78.0 billion and profit attributable to owners of parent of ¥53.0 billion. Our annual dividend forecast is ¥15 per share, including a projected interim dividend of ¥7.5 per share.
Management’s Discussion and Analysis
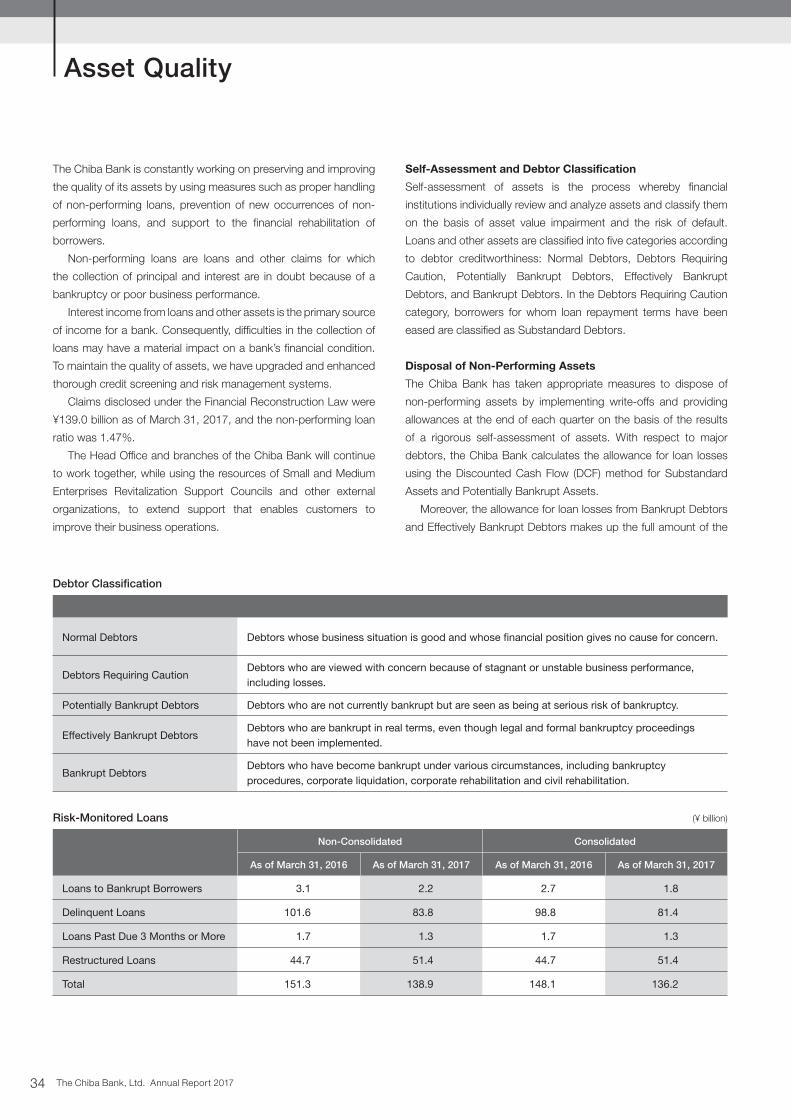
The Chiba Bank, Ltd. Annual Report 201734
The Chiba Bank is constantly working on preserving and improving
the quality of its assets by using measures such as proper handling
of non-performing loans, prevention of new occurrences of non-
performing loans, and support to the financial rehabilitation of
borrowers.
Non-performing loans are loans and other claims for which
the collection of principal and interest are in doubt because of a
bankruptcy or poor business performance.
Interest income from loans and other assets is the primary source
of income for a bank. Consequently, difficulties in the collection of
loans may have a material impact on a bank’s financial condition.
To maintain the quality of assets, we have upgraded and enhanced
thorough credit screening and risk management systems.
Claims disclosed under the Financial Reconstruction Law were
¥139.0 billion as of March 31, 2017, and the non-performing loan
ratio was 1.47%.
The Head Office and branches of the Chiba Bank will continue
to work together, while using the resources of Small and Medium
Enterprises Revitalization Support Councils and other external
organizations, to extend support that enables customers to
improve their business operations.
Self-Assessment and Debtor Classification
Self-assessment of assets is the process whereby financial
institutions individually review and analyze assets and classify them
on the basis of asset value impairment and the risk of default.
Loans and other assets are classified into five categories according
to debtor creditworthiness: Normal Debtors, Debtors Requiring
Caution, Potentially Bankrupt Debtors, Effectively Bankrupt
Debtors, and Bankrupt Debtors. In the Debtors Requiring Caution
category, borrowers for whom loan repayment terms have been
eased are classified as Substandard Debtors.
Disposal of Non-Performing Assets
The Chiba Bank has taken appropriate measures to dispose of
non-performing assets by implementing write-offs and providing
allowances at the end of each quarter on the basis of the results
of a rigorous self-assessment of assets. With respect to major
debtors, the Chiba Bank calculates the allowance for loan losses
using the Discounted Cash Flow (DCF) method for Substandard
Assets and Potentially Bankrupt Assets.
Moreover, the allowance for loan losses from Bankrupt Debtors
and Effectively Bankrupt Debtors makes up the full amount of the
Debtor Classification
Normal Debtors Debtors whose business situation is good and whose financial position gives no cause for concern.
Debtors Requiring CautionDebtors who are viewed with concern because of stagnant or unstable business performance, including losses.
Potentially Bankrupt Debtors Debtors who are not currently bankrupt but are seen as being at serious risk of bankruptcy.
Effectively Bankrupt DebtorsDebtors who are bankrupt in real terms, even though legal and formal bankruptcy proceedings have not been implemented.
Bankrupt DebtorsDebtors who have become bankrupt under various circumstances, including bankruptcy procedures, corporate liquidation, corporate rehabilitation and civil rehabilitation.
Risk-Monitored Loans (¥ billion)
Non-Consolidated Consolidated
As of March 31, 2016 As of March 31, 2017 As of March 31, 2016 As of March 31, 2017
Loans to Bankrupt Borrowers 3.1 2.2 2.7 1.8
Delinquent Loans 101.6 83.8 98.8 81.4
Loans Past Due 3 Months or More 1.7 1.3 1.7 1.3
Restructured Loans 44.7 51.4 44.7 51.4
Total 151.3 138.9 148.1 136.2
Asset Quality
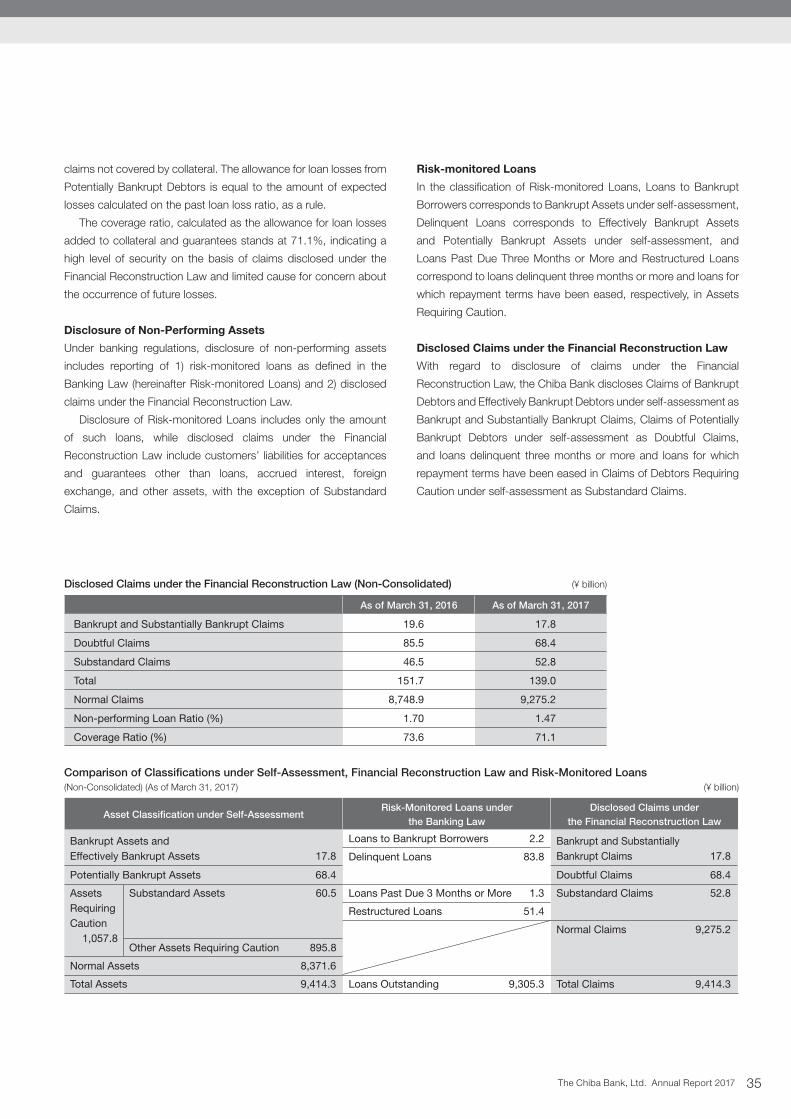
The Chiba Bank, Ltd. Annual Report 2017 35
claims not covered by collateral. The allowance for loan losses from
Potentially Bankrupt Debtors is equal to the amount of expected
losses calculated on the past loan loss ratio, as a rule.
The coverage ratio, calculated as the allowance for loan losses
added to collateral and guarantees stands at 71.1%, indicating a
high level of security on the basis of claims disclosed under the
Financial Reconstruction Law and limited cause for concern about
the occurrence of future losses.
Disclosure of Non-Performing Assets
Under banking regulations, disclosure of non-performing assets
includes reporting of 1) risk-monitored loans as defined in the
Banking Law (hereinafter Risk-monitored Loans) and 2) disclosed
claims under the Financial Reconstruction Law.
Disclosure of Risk-monitored Loans includes only the amount
of such loans, while disclosed claims under the Financial
Reconstruction Law include customers’ liabilities for acceptances
and guarantees other than loans, accrued interest, foreign
exchange, and other assets, with the exception of Substandard
Claims.
Risk-monitored Loans
In the classification of Risk-monitored Loans, Loans to Bankrupt
Borrowers corresponds to Bankrupt Assets under self-assessment,
Delinquent Loans corresponds to Effectively Bankrupt Assets
and Potentially Bankrupt Assets under self-assessment, and
Loans Past Due Three Months or More and Restructured Loans
correspond to loans delinquent three months or more and loans for
which repayment terms have been eased, respectively, in Assets
Requiring Caution.
Disclosed Claims under the Financial Reconstruction Law
With regard to disclosure of claims under the Financial
Reconstruction Law, the Chiba Bank discloses Claims of Bankrupt
Debtors and Effectively Bankrupt Debtors under self-assessment as
Bankrupt and Substantially Bankrupt Claims, Claims of Potentially
Bankrupt Debtors under self-assessment as Doubtful Claims,
and loans delinquent three months or more and loans for which
repayment terms have been eased in Claims of Debtors Requiring
Caution under self-assessment as Substandard Claims.
Disclosed Claims under the Financial Reconstruction Law (Non-Consolidated) (¥ billion)
As of March 31, 2016 As of March 31, 2017
Bankrupt and Substantially Bankrupt Claims 19.6 17.8
Doubtful Claims 85.5 68.4
Substandard Claims 46.5 52.8
Total 151.7 139.0
Normal Claims 8,748.9 9,275.2
Non-performing Loan Ratio (%) 1.70 1.47
Coverage Ratio (%) 73.6 71.1
Comparison of Classifications under Self-Assessment, Financial Reconstruction Law and Risk-Monitored Loans(Non-Consolidated) (As of March 31, 2017) (¥ billion)
Asset Classification under Self-AssessmentRisk-Monitored Loans under
the Banking LawDisclosed Claims under
the Financial Reconstruction Law
Bankrupt Assets andEffectively Bankrupt Assets 17.8
Loans to Bankrupt Borrowers 2.2 Bankrupt and SubstantiallyBankrupt Claims 17.8Delinquent Loans 83.8
Potentially Bankrupt Assets 68.4 Doubtful Claims 68.4
Assets RequiringCaution
1,057.8
Substandard Assets 60.5 Loans Past Due 3 Months or More 1.3 Substandard Claims 52.8
Restructured Loans 51.4
Normal Claims 9,275.2
Other Assets Requiring Caution 895.8
Normal Assets 8,371.6
Total Assets 9,414.3 Loans Outstanding 9,305.3 Total Claims 9,414.3

The Chiba Bank, Ltd. Annual Report 201736
Millions of Yen (Note 1)Thousands of
U.S. Dollars (Note 1)
2017 2016 2017
AssetsCash and Due from Banks (Note 27) ¥ 1,806,514 ¥ 1,397,413 $ 16,102,274 Call Loans and Bills Bought 154,078 198,378 1,373,374 Receivables under Resale Agreements 14,999 4,999 133,701 Monetary Claims Bought 21,626 22,051 192,769 Trading Assets (Notes 6 and 33) 129,820 182,592 1,157,148 Money Held in Trust (Note 35) 28,140 36,893 250,829 Securities (Notes 7, 12, 33 and 34) 2,381,490 2,455,700 21,227,296 Loans and Bills Discounted (Notes 8, 12 and 33) 9,268,854 8,769,113 82,617,471 Foreign Exchanges (Note 9) 4,563 2,596 40,679 Other Assets (Notes 10 and 12) 144,579 109,881 1,288,703 Tangible Fixed Assets (Notes 11 and 20) 101,185 101,971 901,908 Intangible Fixed Assets 10,942 10,934 97,533 Deferred Tax Assets (Note 30) 5,326 5,928 47,480 Customers’ Liabilities for Acceptances and Guarantees 56,172 76,214 500,690 Allowance for Loan Losses (32,551) (40,811) (290,142)
Total Assets ¥14,095,743 ¥13,333,858 $125,641,714
LiabilitiesDeposits (Notes 12, 13 and 33) ¥11,984,784 ¥11,486,430 $106,825,783 Call Money and Bills Sold (Note 12) 250,000 134,500 2,228,363 Payables under Securities Lending Transactions (Note 12) 318,992 191,699 2,843,326 Trading Liabilities (Notes 14 and 33) 16,474 22,905 146,841 Borrowed Money (Notes 12 and 15) 279,442 268,485 2,490,799 Foreign Exchanges (Note 16) 692 640 6,174 Bonds Payable (Note 17) 117,267 107,545 1,045,257 Borrowed Money from Trust Account 62 — 558Other Liabilities (Note 18) 108,149 121,252 963,989 Net Defined Benefit Liability (Note 19) 22,838 24,483 203,573 Provision for Directors’ Retirement Benefits 169 166 1,513 Provision for Reimbursement of Deposits 2,920 2,275 26,034 Provision for Point Loyalty Programs 506 414 4,516 Reserve under Special Laws 22 27 201 Deferred Tax Liabilities (Note 30) 25,765 19,349 229,658 Deferred Tax Liabilities for Land Revaluation (Note 20) 10,930 11,069 97,431 Acceptances and Guarantees 56,172 76,214 500,690
Total Liabilities ¥13,195,193 ¥12,467,459 $117,614,705
Net AssetsCapital Stock (Note 21) ¥ 145,069 ¥ 145,069 $ 1,293,066 Capital Surplus 122,134 122,134 1,088,636 Retained Earnings 566,050 524,817 5,045,463 Treasury Shares (52,219) (37,480) (465,459)
Total Shareholders’ Equity 781,033 754,540 6,961,707 Valuation Difference on Available-for-sale Securities (Note 36) 109,427 103,921 975,375 Deferred Gains or Losses on Hedges 1,510 231 13,461 Revaluation Reserve for Land (Note 20) 10,733 11,050 95,673 Remeasurements of Defined Benefit Plans (2,577) (3,861) (22,978)
Total Accumulated Other Comprehensive Income 119,093 111,342 1,061,531 Subscription Rights to Shares 423 516 3,771
Total Net Assets ¥ 900,550 ¥ 866,398 $ 8,027,009 Total Liabilities and Net Assets ¥14,095,743 ¥13,333,858 $125,641,714
See notes to consolidated financial statements.
The Chiba Bank, Ltd. and Consolidated SubsidiariesAs of March 31, 2017
Consolidated Balance Sheet
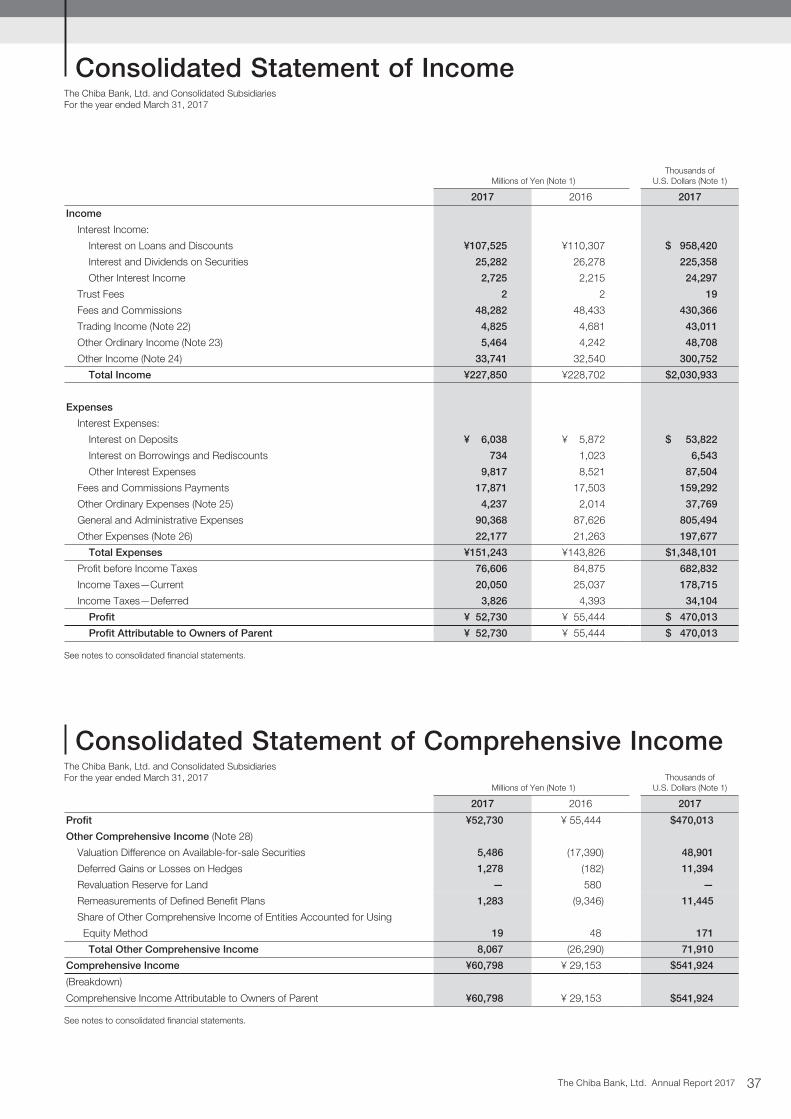
The Chiba Bank, Ltd. Annual Report 2017 37
Millions of Yen (Note 1)Thousands of
U.S. Dollars (Note 1)
2017 2016 2017
Income
Interest Income:
Interest on Loans and Discounts ¥107,525 ¥110,307 $ 958,420
Interest and Dividends on Securities 25,282 26,278 225,358
Other Interest Income 2,725 2,215 24,297
Trust Fees 2 2 19
Fees and Commissions 48,282 48,433 430,366
Trading Income (Note 22) 4,825 4,681 43,011
Other Ordinary Income (Note 23) 5,464 4,242 48,708
Other Income (Note 24) 33,741 32,540 300,752
Total Income ¥227,850 ¥228,702 $2,030,933
Expenses
Interest Expenses:
Interest on Deposits ¥ 6,038 ¥ 5,872 $ 53,822
Interest on Borrowings and Rediscounts 734 1,023 6,543
Other Interest Expenses 9,817 8,521 87,504
Fees and Commissions Payments 17,871 17,503 159,292
Other Ordinary Expenses (Note 25) 4,237 2,014 37,769
General and Administrative Expenses 90,368 87,626 805,494
Other Expenses (Note 26) 22,177 21,263 197,677
Total Expenses ¥151,243 ¥143,826 $1,348,101
Profit before Income Taxes 76,606 84,875 682,832
Income Taxes—Current 20,050 25,037 178,715
Income Taxes—Deferred 3,826 4,393 34,104
Profit ¥ 52,730 ¥ 55,444 $ 470,013
Profit Attributable to Owners of Parent ¥ 52,730 ¥ 55,444 $ 470,013
See notes to consolidated financial statements.
The Chiba Bank, Ltd. and Consolidated SubsidiariesFor the year ended March 31, 2017
Consolidated Statement of Comprehensive IncomeThe Chiba Bank, Ltd. and Consolidated SubsidiariesFor the year ended March 31, 2017
Millions of Yen (Note 1)Thousands of
U.S. Dollars (Note 1)
2017 2016 2017
Profit ¥52,730 ¥ 55,444 $470,013
Other Comprehensive Income (Note 28)
Valuation Difference on Available-for-sale Securities 5,486 (17,390) 48,901
Deferred Gains or Losses on Hedges 1,278 (182) 11,394
Revaluation Reserve for Land — 580 —
Remeasurements of Defined Benefit Plans 1,283 (9,346) 11,445
Share of Other Comprehensive Income of Entities Accounted for Using
Equity Method 19 48 171
Total Other Comprehensive Income 8,067 (26,290) 71,910
Comprehensive Income ¥60,798 ¥ 29,153 $541,924
(Breakdown)
Comprehensive Income Attributable to Owners of Parent ¥60,798 ¥ 29,153 $541,924
See notes to consolidated financial statements.
Consolidated Statement of Income

The Chiba Bank, Ltd. Annual Report 201738
Millions of Yen (Note 1)
Shareholders’ Equity Accumulated Other Comprehensive Income
Capital Stock
Capital Surplus
Retained Earnings Treasury Shares
Total Shareholders’
Equity
Valuation Difference on Available-for-
sale Securities
Deferred Gains or
Losses on Hedges
Revaluation Reserve for Land
Remeasure-ments of
Defined Benefit Plans
Total Accumulated
Other Comprehensive
Income
Subscription Rights
to SharesTotal Net Assets
Balance at March 31, 2015 ¥145,069 ¥122,134 ¥480,803 ¥(27,532) ¥720,474 ¥121,264 ¥ 414 ¥10,663 ¥ 5,484 ¥137,826 ¥446 ¥858,747
Cash Dividends — — (11,610) — (11,610) — — — — — — (11,610)
Profit — — 55,444 — 55,444 — — — — — — 55,444
Purchase of Treasury Shares — — — (10,065) (10,065) — — — — — — (10,065)
Disposal of Treasury Shares — — (12) 116 103 — — — — — — 103
Reversal of Revaluation Reserve for Land — — 193 — 193 — — — — — — 193
Net Changes of Items other than Shareholders’ Equity — — — — — (17,342) (182) 386 (9,346) (26,484) 69 (26,414)
Total of Items during FY2015 — — 44,014 (9,948) 34,065 (17,342) (182) 386 (9,346) (26,484) 69 7,651
Balance at March 31, 2016 ¥145,069 ¥122,134 ¥524,817 ¥(37,480) ¥754,540 ¥103,921 ¥ 231 ¥11,050 ¥(3,861) ¥111,342 ¥516 ¥866,398
Cash Dividends — — (11,783) — (11,783) — — — — — — (11,783)
Profit — — 52,730 — 52,730 — — — — — — 52,730
Purchase of Treasury Shares — — — (15,027) (15,027) — — — — — — (15,027)
Disposal of Treasury Shares — — (31) 288 256 — — — — — — 256
Reversal of Revaluation Reserve for Land — — 316 — 316 — — — — — — 316
Net Changes of Items other than Shareholders’ Equity — — — — — 5,505 1,278 (316) 1,283 7,750 (92) 7,657
Total of Items during FY2016 — — 41,232 (14,738) 26,493 5,505 1,278 (316) 1,283 7,750 (92) 34,151
Balance at March 31, 2017 ¥145,069 ¥122,134 ¥566,050 ¥(52,219) ¥781,033 ¥109,427 ¥1,510 ¥10,733 ¥(2,577) ¥119,093 ¥423 ¥900,550
Thousands of U.S. Dollars (Note 1)
Shareholders’ Equity Accumulated Other Comprehensive Income
Capital Stock
Capital Surplus
Retained Earnings Treasury Shares
Total Shareholders’
Equity
Valuation Difference on Available-for-
sale Securities
Deferred Gains or
Losses on Hedges
Revaluation Reserve for Land
Remeasure-ments of
Defined Benefit Plans
Total Accumulated
Other Comprehensive
Income
Subscription Rights
to SharesTotal Net Assets
Balance at March 31, 2016 $1,293,066 $1,088,636 $4,677,937 $(334,084) $6,725,556 $926,303 $ 2,067 $98,497 $(34,423) $ 992,444 $4,600 $7,722,600
Cash Dividends — — (105,029) — (105,029) — — — — — — (105,029)
Profit — — 470,013 — 470,013 — — — — — — 470,013
Purchase of Treasury Shares — — — (133,946) (133,946) — — — — — — (133,946)
Disposal of Treasury Shares — — (283) 2,572 2,289 — — — — — — 2,289
Reversal of Revaluation Reserve for Land — — 2,824 — 2,824 — — — — — — 2,824
Net Changes of Items other than Shareholders’ Equity — — — — — 49,072 11,394 (2,824) 11,445 69,086 (829) 68,258
Total of Items during FY2016 — — 367,526 (131,375) 236,151 49,072 11,394 (2,824) 11,445 69,086 (829) 304,409
Balance at March 31, 2017 $1,293,066 $1,088,636 $5,045,463 $(465,459) $6,961,707 $975,375 $13,461 $95,673 $(22,978) $1,061,531 $3,771 $8,027,009
See notes to consolidated financial statements.
The Chiba Bank, Ltd. and Consolidated SubsidiariesFor the year ended March 31, 2017
Consolidated Statement of Changes in Net Assets

The Chiba Bank, Ltd. Annual Report 2017 39
Millions of Yen (Note 1)Thousands of
U.S. Dollars (Note 1)
2017 2016 2017
Cash Flows from Operating Activities: Profit before Income Taxes ¥ 76,606 ¥ 84,875 $ 682,832 Depreciation and Amortization 8,020 8,169 71,486 Impairment Loss 270 233 2,415 Equity in (Earnings) Losses of Affiliates (270) (184) (2,408)Increase (Decrease) in Allowance for Loan Losses (8,260) (4,148) (73,633)Decrease (Increase) in Net Defined Benefit Asset — (1,102) —Increase (Decrease) in Net Defined Benefit Liability (1,644) (577) (14,656)Increase (Decrease) in Provision for Directors’ Retirement Benefits 3 (19) 32 Increase (Decrease) in Provision for Reimbursement of Deposits 644 182 5,747 Increase (Decrease) in Provision for Point Loyalty Programs 92 (28) 825 Interest Income (135,533) (138,801) (1,208,075)Financing Expenses 16,589 15,417 147,868 Loss (Gain) Related to Securities (384) (5,010) (3,423)Loss (Gain) on Money Held in Trust 262 (409) 2,338 Foreign Exchange Losses (Gains) 43 100 390 Loss (Gain) on Disposal of Fixed Assets 726 447 6,479 Net Decrease (Increase) in Trading Assets 52,771 89,182 470,377 Net Increase (Decrease) in Trading Liabilities (6,431) 2,117 (57,329)Net Decrease (Increase) in Loans and Bills Discounted (499,740) (330,428) (4,454,410)Net Increase (Decrease) in Deposits (excluding Negotiable Certificates of Deposit) 423,184 404,788 3,772,032 Net Increase (Decrease) in Negotiable Certificates of Deposit 75,170 (136,471) 670,025 Net Increase (Decrease) in Borrowed Money (excluding Subordinated Borrowings) 10,957 (40,227) 97,670 Net Decrease (Increase) in Due from Banks (excluding Due from BOJ) 7,960 14,220 70,954 Net Decrease (Increase) in Call Loans and Bills Bought and Others 34,723 129,115 309,508 Net Decrease (Increase) in Receivables under Securities Borrowing Transactions — 2,091 —Net Increase (Decrease) in Call Money and Bills Sold 115,500 94,621 1,029,504 Net Increase (Decrease) in Payables under Securities Lending Transactions 127,293 37,330 1,134,626 Net Decrease (Increase) in Foreign Exchanges—Assets (1,966) 5,483 (17,531)Net Increase (Decrease) in Foreign Exchanges—Liabilities 52 (126) 466 Increase (Decrease) in Issuance and Redemption of Straight Bonds — 37,130 —Increase (Decrease) in Borrowed Money from Trust Account 62 — 558 Interest and Dividends Received 134,100 135,636 1,195,299 Interest Paid (16,377) (15,426) (145,980)Other, Net (28,875) (10,741) (257,384)
Subtotal ¥ 385,552 ¥ 377,440 $ 3,436,599 Income Taxes Paid (24,231) (26,531) (215,986)
Net Cash Provided by (Used in) Operating Activities ¥ 361,320 ¥ 350,909 $ 3,220,613 Cash Flows from Investing Activities:
Purchase of Securities ¥(1,133,369) ¥(1,544,164) $(10,102,234)Proceeds from Sales of Securities 976,889 1,095,274 8,707,459 Proceeds from Redemption of Securities 227,708 306,558 2,029,672 Increase in Money Held in Trust (5,900) (6,300) (52,589)Decrease in Money Held in Trust 14,253 10,959 127,052 Purchase of Tangible Fixed Assets (3,133) (3,783) (27,928)Purchase of Intangible Fixed Assets (3,810) (3,237) (33,965)Payments for Retirement of Tangible Fixed Assets (47) (71) (427)
Net Cash Provided by (Used in) Investing Activities ¥ 72,591 ¥ (144,763) $ 647,039 Cash Flows from Financing Activities:
Issuance of Subordinated Bonds ¥ 20,000 ¥ — $ 178,269 Redemption of Subordinated Bonds (10,000) — (89,135)Cash Dividends Paid (11,783) (11,610) (105,029)Purchase of Treasury Shares (15,027) (10,065) (133,946)Proceeds from Sales of Treasury Shares 3 9 35
Net Cash Provided by (Used in) Financing Activities ¥ (16,806) ¥ (21,667) $ (149,806)Effect of Exchange Rate Change on Cash and Cash Equivalents ¥ (43) ¥ (100) $ (390)Net Increase (Decrease) in Cash and Cash Equivalents ¥ 417,061 ¥ 184,377 $ 3,717,456 Cash and Cash Equivalents at Beginning of Period ¥ 1,197,238 ¥ 1,012,861 $ 10,671,524 Cash and Cash Equivalents at End of Period (Note 27) ¥ 1,614,299 ¥ 1,197,238 $ 14,388,980
See notes to consolidated financial statements.
The Chiba Bank, Ltd. and Consolidated SubsidiariesFor the year ended March 31, 2017
Consolidated Statement of Cash Flows
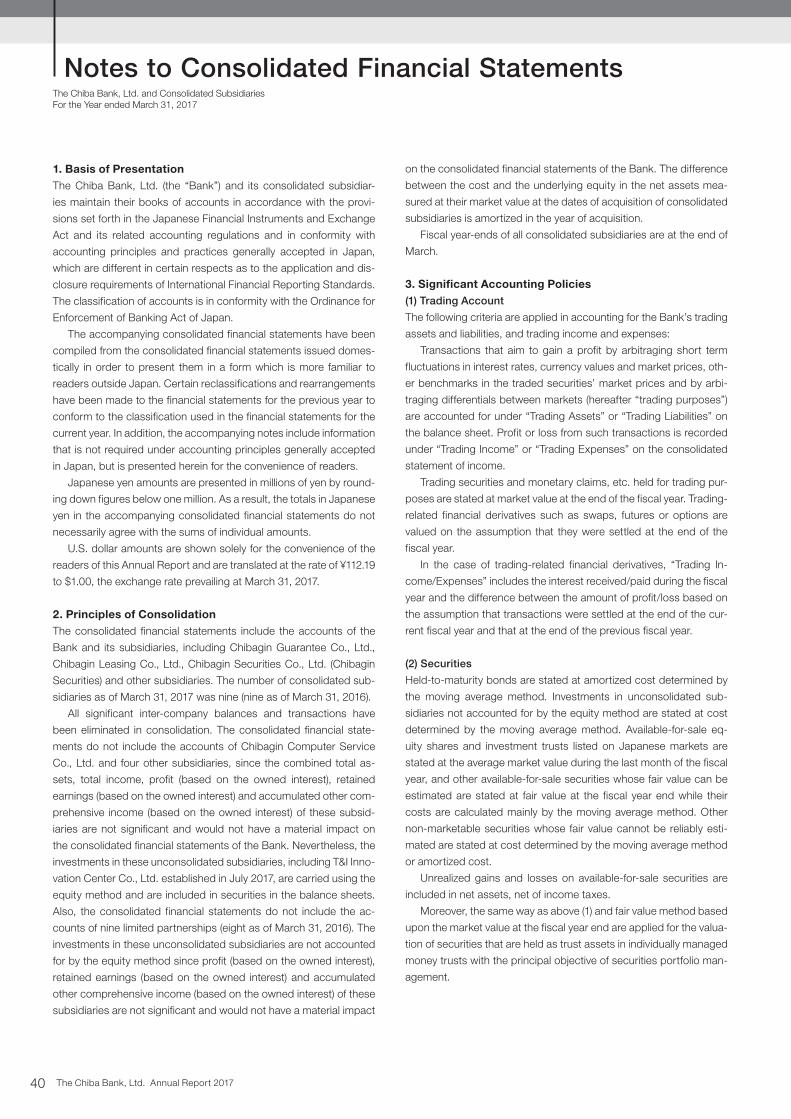
The Chiba Bank, Ltd. Annual Report 201740
1. Basis of PresentationThe Chiba Bank, Ltd. (the “Bank”) and its consolidated subsidiar-
ies maintain their books of accounts in accordance with the provi-
sions set forth in the Japanese Financial Instruments and Exchange
Act and its related accounting regulations and in conformity with
accounting principles and practices generally accepted in Japan,
which are different in certain respects as to the application and dis-
closure requirements of International Financial Reporting Standards.
The classification of accounts is in conformity with the Ordinance for
Enforcement of Banking Act of Japan.
The accompanying consolidated financial statements have been
compiled from the consolidated financial statements issued domes-
tically in order to present them in a form which is more familiar to
readers outside Japan. Certain reclassifications and rearrangements
have been made to the financial statements for the previous year to
conform to the classification used in the financial statements for the
current year. In addition, the accompanying notes include information
that is not required under accounting principles generally accepted
in Japan, but is presented herein for the convenience of readers.
Japanese yen amounts are presented in millions of yen by round-
ing down figures below one million. As a result, the totals in Japanese
yen in the accompanying consolidated financial statements do not
necessarily agree with the sums of individual amounts.
U.S. dollar amounts are shown solely for the convenience of the
readers of this Annual Report and are translated at the rate of ¥112.19
to $1.00, the exchange rate prevailing at March 31, 2017.
2. Principles of ConsolidationThe consolidated financial statements include the accounts of the
Bank and its subsidiaries, including Chibagin Guarantee Co., Ltd.,
Chibagin Leasing Co., Ltd., Chibagin Securities Co., Ltd. (Chibagin
Securities) and other subsidiaries. The number of consolidated sub-
sidiaries as of March 31, 2017 was nine (nine as of March 31, 2016).
All significant inter-company balances and transactions have
been eliminated in consolidation. The consolidated financial state-
ments do not include the accounts of Chibagin Computer Service
Co., Ltd. and four other subsidiaries, since the combined total as-
sets, total income, profit (based on the owned interest), retained
earnings (based on the owned interest) and accumulated other com-
prehensive income (based on the owned interest) of these subsid-
iaries are not significant and would not have a material impact on
the consolidated financial statements of the Bank. Nevertheless, the
investments in these unconsolidated subsidiaries, including T&I Inno-
vation Center Co., Ltd. established in July 2017, are carried using the
equity method and are included in securities in the balance sheets.
Also, the consolidated financial statements do not include the ac-
counts of nine limited partnerships (eight as of March 31, 2016). The
investments in these unconsolidated subsidiaries are not accounted
for by the equity method since profit (based on the owned interest),
retained earnings (based on the owned interest) and accumulated
other comprehensive income (based on the owned interest) of these
subsidiaries are not significant and would not have a material impact
on the consolidated financial statements of the Bank. The difference
between the cost and the underlying equity in the net assets mea-
sured at their market value at the dates of acquisition of consolidated
subsidiaries is amortized in the year of acquisition.
Fiscal year-ends of all consolidated subsidiaries are at the end of
March.
3. Significant Accounting Policies(1) Trading Account
The following criteria are applied in accounting for the Bank’s trading
assets and liabilities, and trading income and expenses:
Transactions that aim to gain a profit by arbitraging short term
fluctuations in interest rates, currency values and market prices, oth-
er benchmarks in the traded securities’ market prices and by arbi-
traging differentials between markets (hereafter “trading purposes”)
are accounted for under “Trading Assets” or “Trading Liabilities” on
the balance sheet. Profit or loss from such transactions is recorded
under “Trading Income” or “Trading Expenses” on the consolidated
statement of income.
Trading securities and monetary claims, etc. held for trading pur-
poses are stated at market value at the end of the fiscal year. Trading-
related financial derivatives such as swaps, futures or options are
valued on the assumption that they were settled at the end of the
fiscal year.
In the case of trading-related financial derivatives, “Trading In-
come/Expenses” includes the interest received/paid during the fiscal
year and the difference between the amount of profit/loss based on
the assumption that transactions were settled at the end of the cur-
rent fiscal year and that at the end of the previous fiscal year.
(2) Securities
Held-to-maturity bonds are stated at amortized cost determined by
the moving average method. Investments in unconsolidated sub-
sidiaries not accounted for by the equity method are stated at cost
determined by the moving average method. Available-for-sale eq-
uity shares and investment trusts listed on Japanese markets are
stated at the average market value during the last month of the fiscal
year, and other available-for-sale securities whose fair value can be
estimated are stated at fair value at the fiscal year end while their
costs are calculated mainly by the moving average method. Other
non-marketable securities whose fair value cannot be reliably esti-
mated are stated at cost determined by the moving average method
or amortized cost.
Unrealized gains and losses on available-for-sale securities are
included in net assets, net of income taxes.
Moreover, the same way as above (1) and fair value method based
upon the market value at the fiscal year end are applied for the valua-
tion of securities that are held as trust assets in individually managed
money trusts with the principal objective of securities portfolio man-
agement.
The Chiba Bank, Ltd. and Consolidated SubsidiariesFor the Year ended March 31, 2017
Notes to Consolidated Financial Statements

The Chiba Bank, Ltd. Annual Report 2017 41
(3) Derivatives
Derivatives for purposes other than trading are stated at fair value.
(4) Tangible Fixed Assets
Depreciation of tangible fixed assets of the Bank is computed using
the declining-balance method. Principal useful lives are as follows:
Buildings ......................... 6 years to 50 years
Others ............................. 2 years to 20 years
Tangible fixed assets of the consolidated subsidiaries are depre-
ciated principally by the declining-balance method over the estimat-
ed useful lives.
(5) Intangible Fixed Assets
Depreciation of intangible fixed assets is computed using the straight-
line method. Depreciation for capitalized software for internal use is
computed using the straight-line method based on useful lives deter-
mined by the Bank and its consolidated subsidiaries (5 years).
(6) Allowance for Loan Losses
Allowance for Loan Losses made by the Bank is provided in accor-
dance with the internally established standards for write-offs and
provisions.
For claims on borrowers that have entered into bankruptcy, spe-
cial liquidation proceedings or similar legal proceedings (“Bankrupt
Borrowers”), or borrowers that are not legally or formally insolvent but
are regarded as substantially in the same situation (“Effectively Bank-
rupt Borrowers”), an allowance is provided based on the amount of
claims, after the write-off stated below, net of the expected amount
of recoveries from collateral and guarantees.
For claims on borrowers that are not currently bankrupt but likely
to become bankrupt in the future (“Potentially Bankrupt Borrowers”),
an allowance is provided in the amount deemed necessary based
on an overall solvency assessment of the claims, net of the expected
amount of recoveries from collateral and guarantees.
For claims on Potentially Bankrupt Borrowers and on borrowers
whose loans are classified as “Loans past due 3 months or more” or
“Restructured Loans” over a certain amount, if future cash flows from
the collection of principal and interest are reasonably estimated, the
allowances for loan losses are calculated by “Discounted Cash Flow
Method,” by which the allowances for loan losses are calculated as
the difference between the booked amounts of the loans and the
cash flows discounted by the original contractual interest rates.
For other claims, an allowance is provided based on the historical
loan-loss ratio.
The operating divisions assess all claims in accordance with the
Bank’s policy and guidelines for the self-assessment of asset quality,
and the Internal Audit and Inspection Unit, which is independent from
the operating divisions, audits these assessments. The allowance for
loan losses is provided based on the results of these assessments.
For collateralized or guaranteed claims on Bankrupt Borrowers
and Effectively Bankrupt Borrowers, the amount exceeding the es-
timated value of collateral and guarantees is deemed to be uncol-
lectible and written off against the total outstanding amount of the
claims. The amount of write-off as of March 31, 2017 was ¥24,004
million (¥29,621 million as of March 31, 2016). Allowance made
by consolidated subsidiaries for general claims is provided in the
amount deemed necessary based on the historical loan-loss ratio,
and for specific claims in the amount deemed uncollectible based on
the respective assessments.
(7) Provision for Directors’ Retirement Benefits
Provision for directors’ retirement benefits is provided for payment
of retirement benefits to directors and corporate auditors of consoli-
dated subsidiaries, in the amount deemed accrued until the fiscal
year-end.
(8) Provision for Reimbursement of Deposits
Provision for reimbursement of deposits, which were derecognized
from liabilities, is based on the possible losses on the future claims of
withdrawal to prepare for depositor’s needs of withdrawal.
(9) Provision for Point Loyalty Programs
Provision for point loyalty programs which is provided for accumula-
tion of points granted to customers using the credit card of the Bank
or the consolidated subsidiaries is based on the estimated amounts
equivalent to expected future usage of the points.
(10) Reserve under Special Laws
Reserve under special laws is a Reserve for Financial Products
Transaction Liabilities provided by Chibagin Securities. This reserve
is provided for losses from securities transactions pursuant to Para-
graph 46-5-1 of the Financial Instruments and Exchange Act and
Paragraph 175 of the Cabinet Office Ordinance on Financial Instru-
ment Business Operators, etc.
(11) Retirement Benefits
In retirement benefit obligation calculations, the method of allocat-
ing the estimated value of retirement benefits to the current fiscal
year is based on the benefit formula method. The net actuarial gain
(loss) is amortized using the straight-line method over 10 years from
following fiscal year. Consolidated subsidiaries calculate the net de-
fined benefit liability and retirement benefit cost using the simplified
method which assumes the retirement benefit obligation to be equal
to the necessary payments assuming the voluntary retirement of all
employees at the fiscal year-end.
(12) Translation of Foreign Currencies
The Bank’s assets and liabilities denominated in foreign currencies
and overseas branches’ accounts are translated into Japanese yen
primarily at the exchange rate at the balance sheet date. Consolidat-
ed subsidiaries’ assets and liabilities denominated in foreign curren-
cies are translated into Japanese yen at the exchange rate prevailing
at the fiscal year-end of each company.
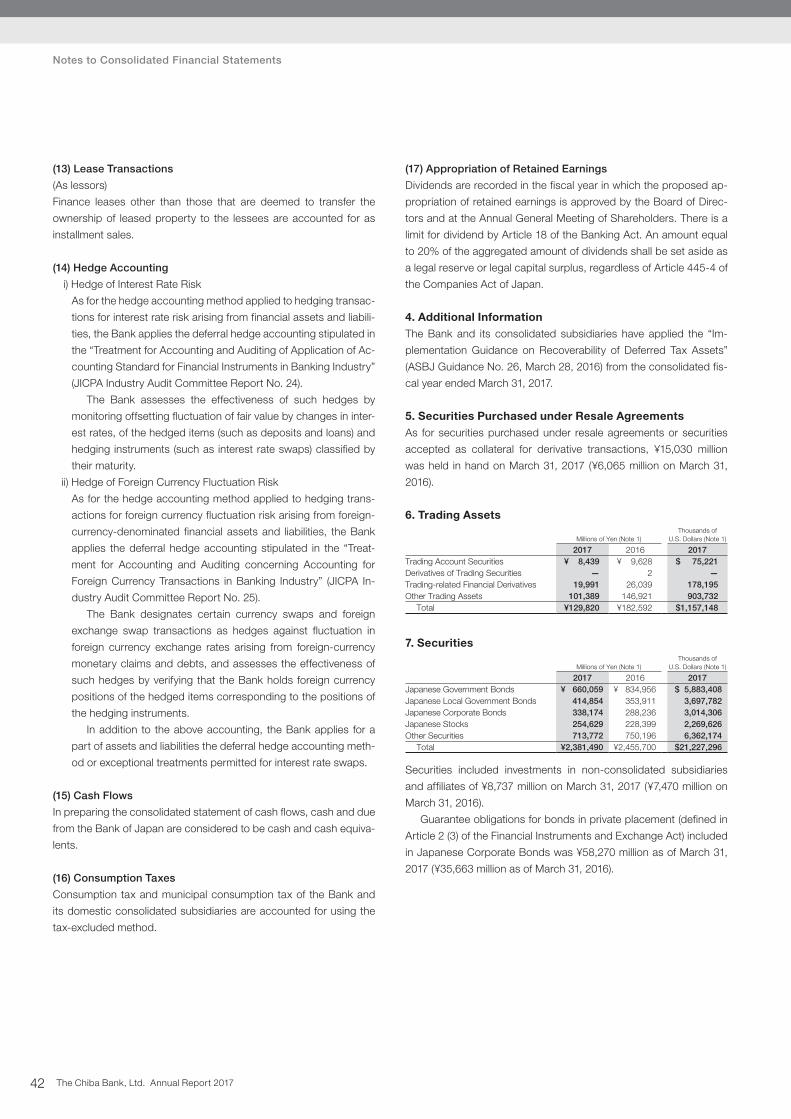
The Chiba Bank, Ltd. Annual Report 201742
Notes to Consolidated Financial Statements
(13) Lease Transactions
(As lessors)
Finance leases other than those that are deemed to transfer the
ownership of leased property to the lessees are accounted for as
installment sales.
(14) Hedge Accounting
i) Hedge of Interest Rate Risk
As for the hedge accounting method applied to hedging transac-
tions for interest rate risk arising from financial assets and liabili-
ties, the Bank applies the deferral hedge accounting stipulated in
the “Treatment for Accounting and Auditing of Application of Ac-
counting Standard for Financial Instruments in Banking Industry”
(JICPA Industry Audit Committee Report No. 24).
The Bank assesses the effectiveness of such hedges by
monitoring offsetting fluctuation of fair value by changes in inter-
est rates, of the hedged items (such as deposits and loans) and
hedging instruments (such as interest rate swaps) classified by
their maturity.
ii) Hedge of Foreign Currency Fluctuation Risk
As for the hedge accounting method applied to hedging trans-
actions for foreign currency fluctuation risk arising from foreign-
currency-denominated financial assets and liabilities, the Bank
applies the deferral hedge accounting stipulated in the “Treat-
ment for Accounting and Auditing concerning Accounting for
Foreign Currency Transactions in Banking Industry” (JICPA In-
dustry Audit Committee Report No. 25).
The Bank designates certain currency swaps and foreign
exchange swap transactions as hedges against fluctuation in
foreign currency exchange rates arising from foreign-currency
monetary claims and debts, and assesses the effectiveness of
such hedges by verifying that the Bank holds foreign currency
positions of the hedged items corresponding to the positions of
the hedging instruments.
In addition to the above accounting, the Bank applies for a
part of assets and liabilities the deferral hedge accounting meth-
od or exceptional treatments permitted for interest rate swaps.
(15) Cash Flows
In preparing the consolidated statement of cash flows, cash and due
from the Bank of Japan are considered to be cash and cash equiva-
lents.
(16) Consumption Taxes
Consumption tax and municipal consumption tax of the Bank and
its domestic consolidated subsidiaries are accounted for using the
tax-excluded method.
(17) Appropriation of Retained Earnings
Dividends are recorded in the fiscal year in which the proposed ap-
propriation of retained earnings is approved by the Board of Direc-
tors and at the Annual General Meeting of Shareholders. There is a
limit for dividend by Article 18 of the Banking Act. An amount equal
to 20% of the aggregated amount of dividends shall be set aside as
a legal reserve or legal capital surplus, regardless of Article 445-4 of
the Companies Act of Japan.
4. Additional InformationThe Bank and its consolidated subsidiaries have applied the “Im-
plementation Guidance on Recoverability of Deferred Tax Assets”
(ASBJ Guidance No. 26, March 28, 2016) from the consolidated fis-
cal year ended March 31, 2017.
5. Securities Purchased under Resale AgreementsAs for securities purchased under resale agreements or securities
accepted as collateral for derivative transactions, ¥15,030 million
was held in hand on March 31, 2017 (¥6,065 million on March 31,
2016).
6. Trading Assets
Millions of Yen (Note 1)Thousands of
U.S. Dollars (Note 1)
2017 2016 2017Trading Account Securities ¥ 8,439 ¥ 9,628 $ 75,221 Derivatives of Trading Securities — 2 —Trading-related Financial Derivatives 19,991 26,039 178,195 Other Trading Assets 101,389 146,921 903,732
Total ¥129,820 ¥182,592 $1,157,148
7. Securities
Millions of Yen (Note 1)Thousands of
U.S. Dollars (Note 1)
2017 2016 2017Japanese Government Bonds ¥ 660,059 ¥ 834,956 $ 5,883,408 Japanese Local Government Bonds 414,854 353,911 3,697,782 Japanese Corporate Bonds 338,174 288,236 3,014,306 Japanese Stocks 254,629 228,399 2,269,626 Other Securities 713,772 750,196 6,362,174
Total ¥2,381,490 ¥2,455,700 $21,227,296
Securities included investments in non-consolidated subsidiaries
and affiliates of ¥8,737 million on March 31, 2017 (¥7,470 million on
March 31, 2016).
Guarantee obligations for bonds in private placement (defined in
Article 2 (3) of the Financial Instruments and Exchange Act) included
in Japanese Corporate Bonds was ¥58,270 million as of March 31,
2017 (¥35,663 million as of March 31, 2016).

The Chiba Bank, Ltd. Annual Report 2017 43
8. Loans and Bills Discounted(1) Loans and Bills Discounted
Millions of Yen (Note 1)Thousands of
U.S. Dollars (Note 1)
2017 2016 2017Bills Discounted ¥ 14,254 ¥ 16,003 $ 127,058 Loans on Bills 141,466 119,332 1,260,955 Loans on Deeds 8,499,318 8,019,586 75,758,250 Overdrafts 613,814 614,191 5,471,208
Total ¥9,268,854 ¥8,769,113 $82,617,471
Bills discounted are accounted for as financial transactions in ac-
cordance with JICPA Industry Audit Committee Report No. 24. The
Bank has rights to sell or pledge bank acceptance bought, com-
mercial bills discounted, documentary bills and foreign exchanges
bought without restrictions. Their total face value as of March 31,
2017 was ¥14,445 million (¥16,309 million as of March 31,2016).
Contracts of overdraft facilities and loan commitment limits are
the contracts that the Bank lends to customers up to the prescribed
limits in response to customers’ application of loan as long as there
is no violation of any condition in the contracts. The unused amount
within the limits was ¥2,179,845 million relating to these contracts, in-
cluding ¥2,025,470 million of which the term of contracts is less than
one year or revocable at any time, as of March 31, 2017 (respective
amounts were ¥2,072,563 million and ¥1,934,336 million as of March
31, 2016).
Since many of these commitments expire without being utilized,
the unused amount does not necessarily represent a future cash
requirement. Most of these contracts have conditions that the Bank
can refuse customers’ application of loan or decrease the contract
limits with proper reasons (e.g., changes in financial situation, de-
terioration in customers’ creditworthiness). At the inception of con-
tracts, the Bank obtains real estate, securities, etc. as collateral if
considered to be necessary. Subsequently, the Bank performs peri-
odic review of the customers’ business results based on initial rules,
and takes necessary measures to reconsider conditions in contracts
and/or require additional collateral and guarantees.
Additionally, the unused amount within the limits of overdraft fa-
cilities on General Accounts as of March 31, 2017 was ¥902,880
million (¥936,904 million as of March 31, 2016). General Accounts
are the Ordinary Deposit Accounts that its depositors can overdraw
up to the amounts calculated by multiplying incidental Time Deposits
and so on by certain weight.
(2) Risk-monitored Loans
Millions of Yen (Note 1)Thousands of
U.S. Dollars (Note 1)
2017 2016 2017Loans to Bankrupt Borrowers ¥ 1,881 ¥ 2,784 $ 16,770 Delinquent Loans 81,499 98,878 726,438 Loans Past Due 3 Months or More 1,362 1,790 12,146 Restructured Loans 51,468 44,728 458,761
Total ¥136,211 ¥148,182 $1,214,114
Loans to bankrupt borrowers represent non-accrual loans to bor-
rowers who are legally bankrupt as defined in Article 96 (1) (iii) and
(iv) of the Corporation Tax Act Enforcement Ordinance (Article 97 of
1965 Cabinet Order).
Delinquent loans represent non-accrual loans other than (i) loans
to bankrupt borrowers and (ii) loans of which payments of interest are
deferred in order to assist or facilitate the restructuring of borrowers
in financial difficulties.
Loans past due 3 months or more represent loans on which the
payment of principal and/or interest has not been received for 3
months or more from the due date, and which are not included in
Loans to bankrupt borrowers or Delinquent loans.
Restructured loans are loans which have been restructured to
support the rehabilitation of certain borrowers who are encounter-
ing financial difficulties, with the intention of ensuring recovery of the
loans by providing easier repayment terms for the borrowers (such
as by reducing the rate of interest or by providing a grace period for
the payment of principal/interest, etc.) and are not classified in any of
the above categories.
9. Foreign Exchange Assets
Millions of Yen (Note 1)Thousands of
U.S. Dollars (Note 1)
2017 2016 2017Due from Foreign Banks (Our Accounts) ¥3,654 ¥1,692 $32,571 Foreign Bills Bought 190 307 1,699 Foreign Bills Receivable 719 596 6,409
Total ¥4,563 ¥2,596 $40,679
10. Other Assets
Millions of Yen (Note 1)Thousands of
U.S. Dollars (Note 1)
2017 2016 2017Accrued Income ¥ 13,099 ¥ 13,687 $ 116,760 Prepaid Expenses 861 710 7,683 Derivatives 5,734 14,461 51,114 Lease Investment Assets 44,178 40,236 393,782 Other 80,705 40,786 719,363
Total ¥144,579 ¥109,881 $1,288,703

The Chiba Bank, Ltd. Annual Report 201744
Notes to Consolidated Financial Statements
11. Tangible Fixed Assets Depreciation was computed using the declining-balance method.
Tangible fixed assets were shown at net of the following accumu-
lated depreciation:
Millions of Yen (Note 1)Thousands of
U.S. Dollars (Note 1)
2017 2016 2017¥95,467 ¥94,584 $850,949
Deferred gain on real estate deductible for tax purposes amounted
to ¥11,576 million as of March 31, 2017 (¥11,368 million as of March
31, 2016).
12. Assets Pledged
Millions of Yen (Note 1)Thousands of
U.S. Dollars (Note 1)
2017 2016 2017Securities ¥886,594 ¥947,978 $7,902,614 Loans and Bills Discounted 299,966 — 2,673,737
Liabilities related to the above pledged assets were as follows:
Millions of Yen (Note 1)Thousands of
U.S. Dollars (Note 1)
2017 2016 2017Deposits ¥ 49,158 ¥ 71,204 $ 438,168 Call Money and Bills Sold — 24,500 —Payables under Securities Lending Transactions 318,992 191,699 2,843,326 Borrowed Money 275,841 265,427 2,458,704
In addition, the following was pledged as collateral for settlements of
exchange or margins for futures transactions.
Millions of Yen (Note 1)Thousands of
U.S. Dollars (Note 1)
2017 2016 2017Securities ¥60,621 ¥74,620 $540,347
Initial margins of futures markets of ¥1,212 million, cash collateral
paid for financial instruments of ¥26,778 million and guarantee de-
posits of ¥6,360 million were included in Other Assets as of March
31, 2017 (The respective amounts were ¥489 million, ¥8,098 million
and ¥6,432 million as of March 31, 2016).
13. Deposits
Millions of Yen (Note 1)Thousands of
U.S. Dollars (Note 1)
2017 2016 2017Current Deposits ¥ 248,972 ¥ 228,099 $ 2,219,207 Ordinary Deposits 7,180,337 6,681,666 64,001,586 Savings Deposits 247,038 243,218 2,201,967 Deposits at Notice 5,452 5,842 48,600 Time Deposits 3,583,043 3,665,701 31,937,279 Other Deposits 285,747 302,878 2,546,993
Subtotal ¥11,550,592 ¥11,127,408 $102,955,632 Negotiable Certificates of Deposit 434,192 359,022 3,870,152
Total ¥11,984,784 ¥11,486,430 $106,825,783
14. Trading Liabilities
Millions of Yen (Note 1)Thousands of
U.S. Dollars (Note 1)
2017 2016 2017Derivatives of Trading Securities ¥ 6 ¥ 18 $ 54 Trading-related Financial Derivatives 16,467 22,886 146,786
Total ¥16,474 ¥22,905 $146,841
15. Borrowed Money
Millions of Yen (Note 1)Thousands of
U.S. Dollars (Note 1)
2017 2016 2017Borrowings from the Bank of Japan and Other Financial Institutions ¥279,442 ¥268,485 $2,490,799
16. Foreign Exchange Liabilities
Millions of Yen (Note 1)Thousands of
U.S. Dollars (Note 1)
2017 2016 2017Foreign Bills Sold ¥340 ¥483 $3,035 Foreign Bills Payable 352 157 3,139
Total ¥692 ¥640 $6,174
17. Bonds Payable
Millions of Yen (Note 1)Thousands of
U.S. Dollars (Note 1)
2017 2016 2017Subordinated Bonds ¥ 50,000 ¥ 40,000 $ 445,673 Straight Bond 67,267 67,545 599,585
Total ¥117,267 ¥107,545 $1,045,257
18. Other Liabilities
Millions of Yen (Note 1)Thousands of
U.S. Dollars (Note 1)
2017 2016 2017Domestic Exchange Settlement Account, Credit ¥ 59 ¥ 13 $ 533 Accrued Expenses 10,181 9,806 90,753 Unearned Revenue 30,443 28,445 271,355 Income Taxes Payable 7,491 11,672 66,772 Derivatives 11,582 4,101 103,238 Other 48,391 67,212 431,339
Total ¥108,149 ¥121,252 $963,989
19. Retirement Benefit PlansThe Bank and its consolidated subsidiaries have defined benefit
plans, i.e., lump-sum payment plans, welfare pension fund plans and
tax-qualified pension plans, as well as corporate-type defined con-
tribution plans.
Net retirement benefit liability and retirement benefit cost of the
consolidated subsidiaries’ lump-sum payment plans are calculated
by the simplified method.
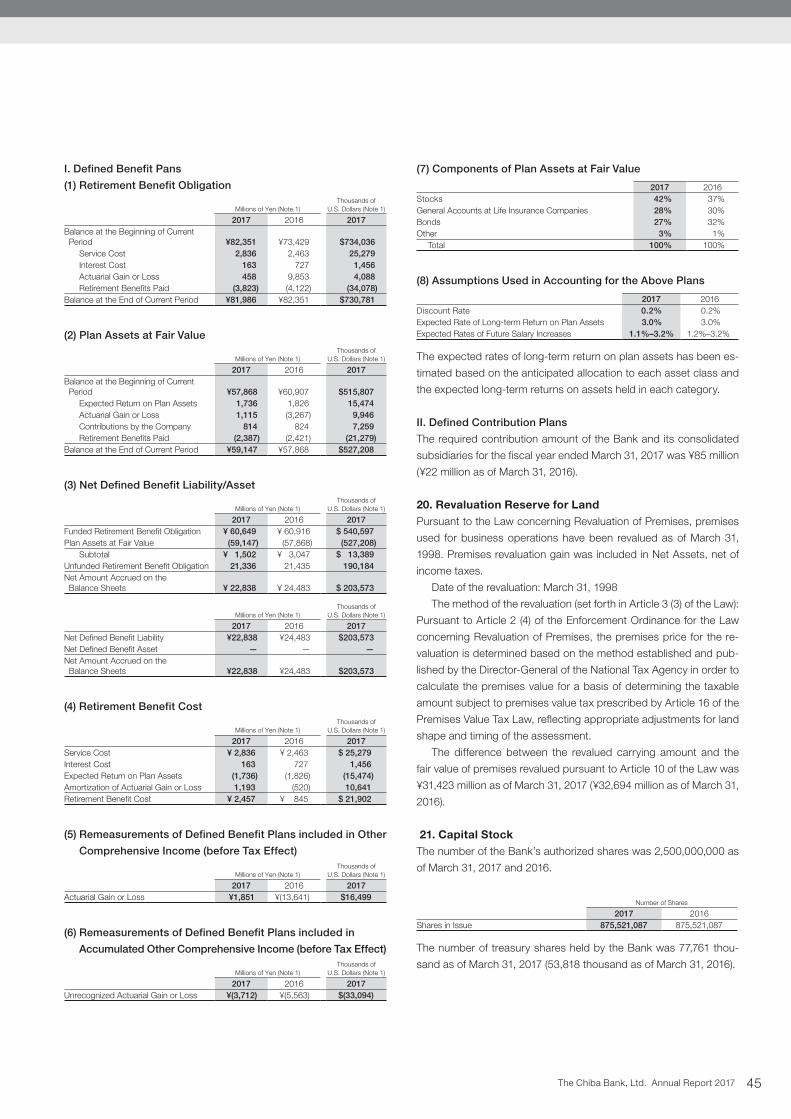
The Chiba Bank, Ltd. Annual Report 2017 45
I. Defined Benefit Pans
(1) Retirement Benefit Obligation
Millions of Yen (Note 1)Thousands of
U.S. Dollars (Note 1)
2017 2016 2017Balance at the Beginning of Current Period ¥82,351 ¥73,429 $734,036
Service Cost 2,836 2,463 25,279 Interest Cost 163 727 1,456 Actuarial Gain or Loss 458 9,853 4,088 Retirement Benefits Paid (3,823) (4,122) (34,078)
Balance at the End of Current Period ¥81,986 ¥82,351 $730,781
(2) Plan Assets at Fair Value
Millions of Yen (Note 1)Thousands of
U.S. Dollars (Note 1)
2017 2016 2017Balance at the Beginning of Current Period ¥57,868 ¥60,907 $515,807
Expected Return on Plan Assets 1,736 1,826 15,474 Actuarial Gain or Loss 1,115 (3,267) 9,946 Contributions by the Company 814 824 7,259 Retirement Benefits Paid (2,387) (2,421) (21,279)
Balance at the End of Current Period ¥59,147 ¥57,868 $527,208
(3) Net Defined Benefit Liability/Asset
Millions of Yen (Note 1)Thousands of
U.S. Dollars (Note 1)
2017 2016 2017Funded Retirement Benefit Obligation ¥ 60,649 ¥ 60,916 $ 540,597Plan Assets at Fair Value (59,147) (57,868) (527,208)
Subtotal ¥ 1,502 ¥ 3,047 $ 13,389Unfunded Retirement Benefit Obligation 21,336 21,435 190,184Net Amount Accrued on the Balance Sheets ¥ 22,838 ¥ 24,483 $ 203,573
Millions of Yen (Note 1)Thousands of
U.S. Dollars (Note 1)
2017 2016 2017Net Defined Benefit Liability ¥22,838 ¥24,483 $203,573 Net Defined Benefit Asset — — —Net Amount Accrued on the Balance Sheets ¥22,838 ¥24,483 $203,573
(4) Retirement Benefit Cost
Millions of Yen (Note 1)Thousands of
U.S. Dollars (Note 1)
2017 2016 2017Service Cost ¥ 2,836 ¥ 2,463 $ 25,279 Interest Cost 163 727 1,456 Expected Return on Plan Assets (1,736) (1,826) (15,474)Amortization of Actuarial Gain or Loss 1,193 (520) 10,641 Retirement Benefit Cost ¥ 2,457 ¥ 845 $ 21,902
(5) Remeasurements of Defined Benefit Plans included in Other
Comprehensive Income (before Tax Effect)
Millions of Yen (Note 1)Thousands of
U.S. Dollars (Note 1)
2017 2016 2017Actuarial Gain or Loss ¥1,851 ¥(13,641) $16,499
(6) Remeasurements of Defined Benefit Plans included in
Accumulated Other Comprehensive Income (before Tax Effect)
Millions of Yen (Note 1)Thousands of
U.S. Dollars (Note 1)
2017 2016 2017Unrecognized Actuarial Gain or Loss ¥(3,712) ¥(5,563) $(33,094)
(7) Components of Plan Assets at Fair Value
2017 2016Stocks 42% 37%General Accounts at Life Insurance Companies 28% 30%Bonds 27% 32%Other 3% 1%
Total 100% 100%
(8) Assumptions Used in Accounting for the Above Plans
2017 2016Discount Rate 0.2% 0.2%Expected Rate of Long-term Return on Plan Assets 3.0% 3.0%Expected Rates of Future Salary Increases 1.1%–3.2% 1.2%–3.2%
The expected rates of long-term return on plan assets has been es-
timated based on the anticipated allocation to each asset class and
the expected long-term returns on assets held in each category.
II. Defined Contribution Plans
The required contribution amount of the Bank and its consolidated
subsidiaries for the fiscal year ended March 31, 2017 was ¥85 million
(¥22 million as of March 31, 2016).
20. Revaluation Reserve for LandPursuant to the Law concerning Revaluation of Premises, premises
used for business operations have been revalued as of March 31,
1998. Premises revaluation gain was included in Net Assets, net of
income taxes.
Date of the revaluation: March 31, 1998
The method of the revaluation (set forth in Article 3 (3) of the Law):
Pursuant to Article 2 (4) of the Enforcement Ordinance for the Law
concerning Revaluation of Premises, the premises price for the re-
valuation is determined based on the method established and pub-
lished by the Director-General of the National Tax Agency in order to
calculate the premises value for a basis of determining the taxable
amount subject to premises value tax prescribed by Article 16 of the
Premises Value Tax Law, reflecting appropriate adjustments for land
shape and timing of the assessment.
The difference between the revalued carrying amount and the
fair value of premises revalued pursuant to Article 10 of the Law was
¥31,423 million as of March 31, 2017 (¥32,694 million as of March 31,
2016).
21. Capital StockThe number of the Bank’s authorized shares was 2,500,000,000 as
of March 31, 2017 and 2016.
Number of Shares
2017 2016Shares in Issue 875,521,087 875,521,087
The number of treasury shares held by the Bank was 77,761 thou-
sand as of March 31, 2017 (53,818 thousand as of March 31, 2016).
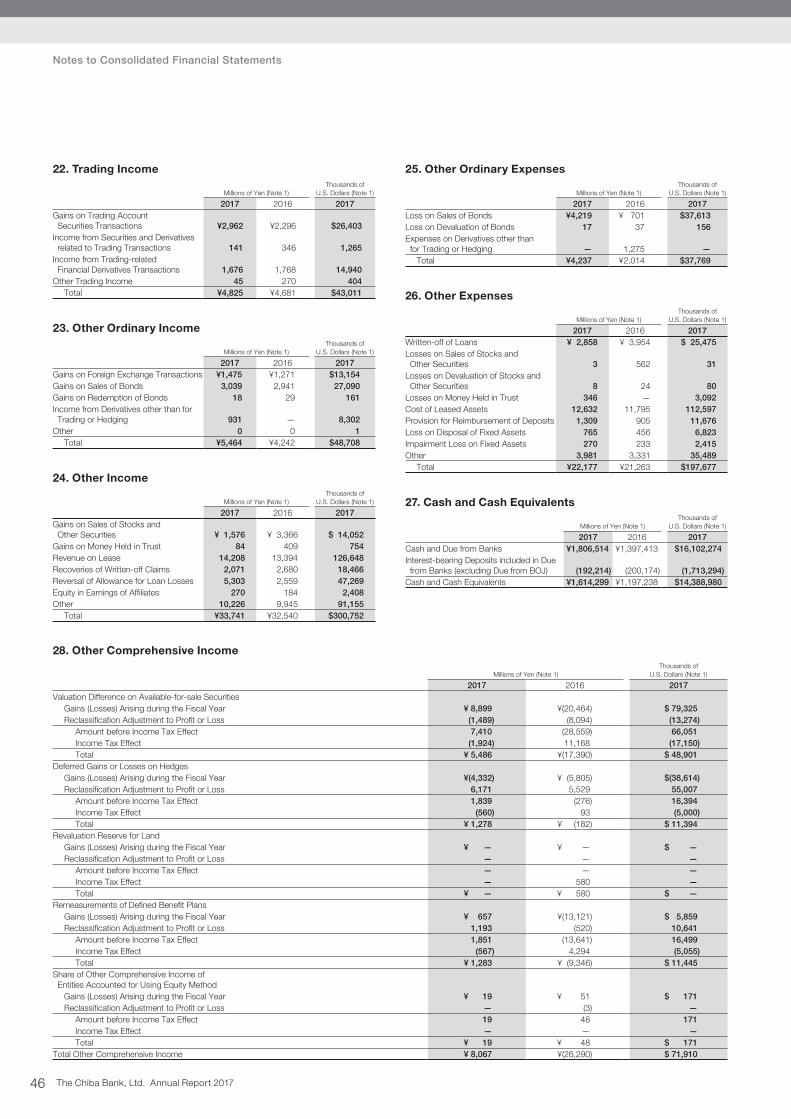
The Chiba Bank, Ltd. Annual Report 201746
Notes to Consolidated Financial Statements
28. Other Comprehensive Income
Millions of Yen (Note 1)Thousands of
U.S. Dollars (Note 1)
2017 2016 2017Valuation Difference on Available-for-sale Securities
Gains (Losses) Arising during the Fiscal Year ¥ 8,899 ¥(20,464) $ 79,325 Reclassification Adjustment to Profit or Loss (1,489) (8,094) (13,274)
Amount before Income Tax Effect 7,410 (28,559) 66,051 Income Tax Effect (1,924) 11,168 (17,150)Total ¥ 5,486 ¥(17,390) $ 48,901
Deferred Gains or Losses on HedgesGains (Losses) Arising during the Fiscal Year ¥(4,332) ¥ (5,805) $(38,614)Reclassification Adjustment to Profit or Loss 6,171 5,529 55,007
Amount before Income Tax Effect 1,839 (276) 16,394 Income Tax Effect (560) 93 (5,000)Total ¥ 1,278 ¥ (182) $ 11,394
Revaluation Reserve for LandGains (Losses) Arising during the Fiscal Year ¥ — ¥ — $ — Reclassification Adjustment to Profit or Loss — — —
Amount before Income Tax Effect — — — Income Tax Effect — 580 — Total ¥ — ¥ 580 $ —
Remeasurements of Defined Benefit PlansGains (Losses) Arising during the Fiscal Year ¥ 657 ¥(13,121) $ 5,859 Reclassification Adjustment to Profit or Loss 1,193 (520) 10,641
Amount before Income Tax Effect 1,851 (13,641) 16,499 Income Tax Effect (567) 4,294 (5,055)Total ¥ 1,283 ¥ (9,346) $ 11,445
Share of Other Comprehensive Income of Entities Accounted for Using Equity Method
Gains (Losses) Arising during the Fiscal Year ¥ 19 ¥ 51 $ 171 Reclassification Adjustment to Profit or Loss — (3) —
Amount before Income Tax Effect 19 48 171 Income Tax Effect — — —Total ¥ 19 ¥ 48 $ 171
Total Other Comprehensive Income ¥ 8,067 ¥(26,290) $ 71,910
22. Trading Income
Millions of Yen (Note 1)Thousands of
U.S. Dollars (Note 1)
2017 2016 2017Gains on Trading Account Securities Transactions ¥2,962 ¥2,296 $26,403 Income from Securities and Derivatives related to Trading Transactions 141 346 1,265 Income from Trading-related Financial Derivatives Transactions 1,676 1,768 14,940 Other Trading Income 45 270 404
Total ¥4,825 ¥4,681 $43,011
23. Other Ordinary Income
Millions of Yen (Note 1)Thousands of
U.S. Dollars (Note 1)
2017 2016 2017Gains on Foreign Exchange Transactions ¥1,475 ¥1,271 $13,154 Gains on Sales of Bonds 3,039 2,941 27,090 Gains on Redemption of Bonds 18 29 161 Income from Derivatives other than for Trading or Hedging 931 — 8,302 Other 0 0 1
Total ¥5,464 ¥4,242 $48,708
24. Other Income
Millions of Yen (Note 1)Thousands of
U.S. Dollars (Note 1)
2017 2016 2017Gains on Sales of Stocks and Other Securities ¥ 1,576 ¥ 3,366 $ 14,052 Gains on Money Held in Trust 84 409 754 Revenue on Lease 14,208 13,394 126,648 Recoveries of Written-off Claims 2,071 2,680 18,466 Reversal of Allowance for Loan Losses 5,303 2,559 47,269 Equity in Earnings of Affiliates 270 184 2,408 Other 10,226 9,945 91,155
Total ¥33,741 ¥32,540 $300,752
25. Other Ordinary Expenses
Millions of Yen (Note 1)Thousands of
U.S. Dollars (Note 1)
2017 2016 2017Loss on Sales of Bonds ¥4,219 ¥ 701 $37,613 Loss on Devaluation of Bonds 17 37 156 Expenses on Derivatives other than for Trading or Hedging — 1,275 —
Total ¥4,237 ¥2,014 $37,769
26. Other Expenses
Millions of Yen (Note 1)Thousands of
U.S. Dollars (Note 1)
2017 2016 2017Written-off of Loans ¥ 2,858 ¥ 3,954 $ 25,475 Losses on Sales of Stocks and Other Securities 3 562 31 Losses on Devaluation of Stocks and Other Securities 8 24 80 Losses on Money Held in Trust 346 — 3,092 Cost of Leased Assets 12,632 11,795 112,597 Provision for Reimbursement of Deposits 1,309 905 11,676 Loss on Disposal of Fixed Assets 765 456 6,823 Impairment Loss on Fixed Assets 270 233 2,415 Other 3,981 3,331 35,489
Total ¥22,177 ¥21,263 $197,677
27. Cash and Cash Equivalents
Millions of Yen (Note 1)Thousands of
U.S. Dollars (Note 1)
2017 2016 2017Cash and Due from Banks ¥1,806,514 ¥1,397,413 $16,102,274 Interest-bearing Deposits included in Due from Banks (excluding Due from BOJ) (192,214) (200,174) (1,713,294)Cash and Cash Equivalents ¥1,614,299 ¥1,197,238 $14,388,980

The Chiba Bank, Ltd. Annual Report 2017 47
29. Lease TransactionsOperating Lease Transactions
Millions of Yen (Note 1)Thousands of
U.S. Dollars (Note 1)
2017 2016 2017Lessee Side (Lease Payables related to Non-cancelable Operating Lease Transactions)
Amount Corresponding to Lease Payables (within 1 year) ¥143 ¥166 $1,278 Amount Corresponding to Lease Payables (over 1 year) 549 679 4,894
Total ¥692 ¥845 $6,171
30. Tax Effect
Millions of Yen (Note 1)Thousands of
U.S. Dollars (Note 1)
2017 2016 2017Deferred Tax Assets:
Allowance for Loan Losses ¥ 15,556 ¥ 18,998 $ 138,662 Net Defined Benefit Liability 6,060 6,106 54,017 Write-offs of Securities 1,081 1,072 9,637 Remeasurements of Defined Benefit Plans 1,134 1,701 10,116 Other 7,109 7,480 63,368
Subtotal ¥ 30,942 ¥ 35,359 $ 275,801 Valuation Allowance (1,816) (1,659) (16,191)
Total Deferred Tax Assets ¥ 29,125 ¥ 33,699 $ 259,610 Deferred Tax Liabilities:
Valuation Difference on Available-for-sale Securities ¥(47,621) ¥(45,697) $(424,469)Net Defined Benefit Asset (200) (308) (1,787)Other (1,742) (1,114) (15,532)
Total Deferred Tax Liabilities ¥(49,564) ¥(47,120) $(441,788)Net Deferred Tax Assets (Liabilities) ¥(20,438) ¥(13,421) $(182,178)
2017 2016Effective Statutory Tax Rate — 32.8%(Adjustments)
Decrease in Deferred Tax Assets at Year-end due to the Tax Rate Change — 1.5%Other — 0.3%
Effective Income Tax Rate — 34.6%
For the fiscal year ended March 31, 2017, as the difference between
the statutory tax rate and the effective income tax rate was less than
5 percent of the statutory tax rate, the reconciliation of the effective
income tax rate is not disclosed.
31. Material Subsequent EventsNone.
32. Segment InformationI. Segment Information of the Current Fiscal Year (from April 1,
2016 to March 31, 2017) and the Previous Fiscal Year (from
April 1, 2015 to March 31, 2016)
Since the Bank and its consolidated subsidiaries (the “Group”) operate
solely within the banking segment, segment information is omitted.
II. Related Information
(1) Information by Service Type
Since the Ordinary income of banking business from external custom-
ers of the Group exceeds 90% of Ordinary income in the consolidated
statement of income, segment information is omitted.
(2) Information by Geographic Areas
i) Ordinary Income
Since the Ordinary income from domestic external customers of
the Group exceeds 90% of Ordinary income in the consolidated
statement of income, segment information is omitted.
ii) Tangible Fixed Assets
Since the balance of the Group’s tangible fixed assets located in
Japan exceeds 90% of the balance of those in the consolidated
balance sheets, segment information is omitted.
(3) Information by Major Customers
Since there is no single customer with which the Group earns ordinary
income exceeding 10% of Ordinary income in the consolidated state-
ment of income, segment information by major customers is omitted.
III. Information about Impairment Loss of Fixed Assets by
Reporting Segments
Since the Group operates solely within the banking segment, segment
information is omitted.
IV. Information about Amortization Expense and Unamortized
Balance of Goodwill by Reporting Segments
Not applicable.
V. Information about Gains from Negative Goodwill by
Reporting Segment
Not applicable.

The Chiba Bank, Ltd. Annual Report 201748
Notes to Consolidated Financial Statements
33. Financial InstrumentsI. Disclosure on Financial Instruments
(1) Policy on Financial Instruments
The Group conducts market businesses such as deposit-taking, lend-
ing and securities investments as a regional bank which is mainly
based in Chiba Prefecture.
The Group takes deposits, which are its main financing source,
and invests those deposits in corporate loans, personal housing loans
and securities. In order to manage these assets and liabilities and also
to make management plan in response to changes in market envi-
ronment, we have established ALM management system led by ALM
Committee.
(2) Types of and Risks Associated with Financial Instruments
Because of corporate and housing loans being our main financial as-
sets, we are exposed to credit risk which is the risk of losses on re-
ceivable such as those arising from nonperformance of borrowers.
We hold securities primarily comprising bonds, stocks and invest-
ment trusts for investment and operating purposes. These securities
have credit risk of the issuers and market risk arising from changes in
interest rates, prices and exchange rates.
The Group’s financial liabilities are mainly deposits from our indi-
vidual customers in Chiba Prefecture which consist of liquid deposits
and time deposits. These deposits have liquidity risk arising from un-
expected outflows of fund in certain situations.
The Group has interest rate risk caused by a mismatch in terms
of interest rates or time period between the assets (e.g., loans) and
liabilities (e.g., deposits). We in part hedge the risk using interest rate
swaps.
We also have foreign exchange risk arising from a position mis-
match between the foreign currency denominated assets and liabili-
ties, which we in part hedge using currency swaps.
We utilize derivatives for purposes of: addressing customer’s vari-
ous needs for investments and financing, managing risks from the
assets and liabilities, and trading (i.e., for a gain from sales in a short
term). We enter into derivatives transactions to hedge interest rate and
exchange rate risks from the assets and liabilities as follows:
Hedged Item Hedging InstrumentInterest rate risk hedge Loans and bills discounted Interest rate swapsForeign exchange risk hedge Receivables and payables
denominated in foreign currencies
Currency swapsForward foreign exchange
We apply hedge accounting to these transactions. Derivatives bear
market risk and credit risk like other transactions in markets.
Some of our subsidiaries have leasing credit and installment receiv-
ables which are subject to interest rate risk and credit risk.
(3) Risk Management Relating to Financial Instruments
i) Credit Risk Management
We have established the system of self-assessment of assets to
provide appropriate allowance and write-offs. We also perform
rigid credit risk management through individual credit manage-
ment and credit portfolio management based on internal rating
system. The Risk Management Division, which is responsible for
credit risk management, has been placed as a division indepen-
dent of the Credit Unit (including the Credit Division) for a check-
and-balance effect. Further, the Credit Risk Management Com-
mittee discusses plans and actions on credit portfolios based on
consideration of credit risk situations.
The details of credit risk management are as follows:
(Individual Credit Management)
Branches and the Credit Division take the lead in credit review
in accordance with credit review standards under the basic prin-
ciples of credit (safety, profitability, liquidity, growth potential and
public good). The Business Support Division provides support for
customers who need to improve business operations and en-
gages in resolution and collection activities with regard to Bank-
rupt Borrowers and others. The Bank strives to accumulate high-
performing loan assets and minimize future losses through these
in-advance review and after-the-fact administration.
(Credit Portfolio Management)
Credit portfolio management is to control risk of incurring a major
loss at a time due to concentration of individual loans in specific
countries or specific industries. The Risk Management Division
monitors the state of credit risk from various perspectives, such as
by country, by industry, and by customer credit rating. They also
establish policies and take actions such as setting credit limits to
control an increase in credit risk.
ii) Market Risk Management
We have established strict market risk management system in-
cluding risk limit monitoring. The Risk Management Division, which
is responsible for market risk management, has been placed as
a division independent of the Treasury Division and overseas
branches in business operation unit and the Treasury Operation
Division in business management unit, for a check-and-balance
effect. The ALM Committee chaired by the president discusses
plans and actions on overall management of the assets and liabili-
ties based on market risk situations. The following is how we set
and monitor the upper guideline limits:
(Risk Limit Monitoring)
We set and monitor upper guideline limits to control market risk
of financial assets such as securities, loans and deposits. In or-
der to control an increase in market risk, we also set upper limits
on investment balances, average duration, 10BPV and unrealized
gains (losses) according to risk characteristics of transactions and
products, and utilize such limits as additional management indica-
tors. For trading, we set and monitor upper guideline limits on
positions and losses.
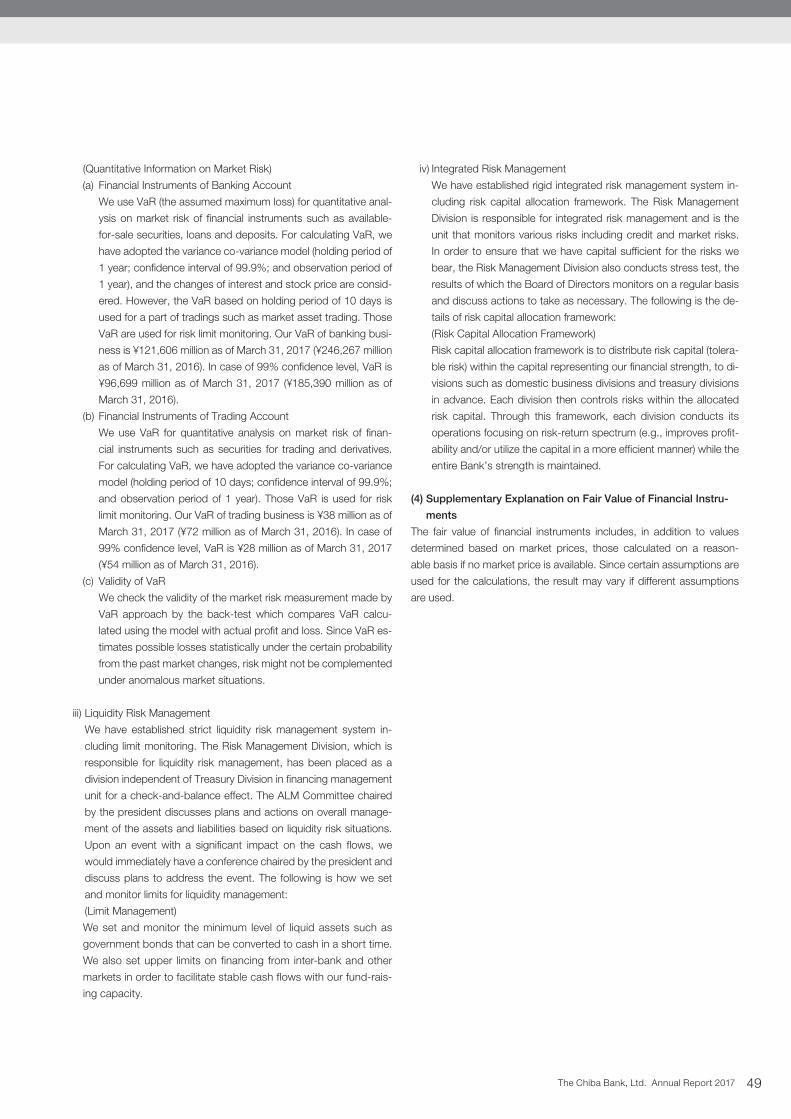
The Chiba Bank, Ltd. Annual Report 2017 49
(Quantitative Information on Market Risk)
(a) Financial Instruments of Banking Account
We use VaR (the assumed maximum loss) for quantitative anal-
ysis on market risk of financial instruments such as available-
for-sale securities, loans and deposits. For calculating VaR, we
have adopted the variance co-variance model (holding period of
1 year; confidence interval of 99.9%; and observation period of
1 year), and the changes of interest and stock price are consid-
ered. However, the VaR based on holding period of 10 days is
used for a part of tradings such as market asset trading. Those
VaR are used for risk limit monitoring. Our VaR of banking busi-
ness is ¥121,606 million as of March 31, 2017 (¥246,267 million
as of March 31, 2016). In case of 99% confidence level, VaR is
¥96,699 million as of March 31, 2017 (¥185,390 million as of
March 31, 2016).
(b) Financial Instruments of Trading Account
We use VaR for quantitative analysis on market risk of finan-
cial instruments such as securities for trading and derivatives.
For calculating VaR, we have adopted the variance co-variance
model (holding period of 10 days; confidence interval of 99.9%;
and observation period of 1 year). Those VaR is used for risk
limit monitoring. Our VaR of trading business is ¥38 million as of
March 31, 2017 (¥72 million as of March 31, 2016). In case of
99% confidence level, VaR is ¥28 million as of March 31, 2017
(¥54 million as of March 31, 2016).
(c) Validity of VaR
We check the validity of the market risk measurement made by
VaR approach by the back-test which compares VaR calcu-
lated using the model with actual profit and loss. Since VaR es-
timates possible losses statistically under the certain probability
from the past market changes, risk might not be complemented
under anomalous market situations.
iii) Liquidity Risk Management
We have established strict liquidity risk management system in-
cluding limit monitoring. The Risk Management Division, which is
responsible for liquidity risk management, has been placed as a
division independent of Treasury Division in financing management
unit for a check-and-balance effect. The ALM Committee chaired
by the president discusses plans and actions on overall manage-
ment of the assets and liabilities based on liquidity risk situations.
Upon an event with a significant impact on the cash flows, we
would immediately have a conference chaired by the president and
discuss plans to address the event. The following is how we set
and monitor limits for liquidity management:
(Limit Management)
We set and monitor the minimum level of liquid assets such as
government bonds that can be converted to cash in a short time.
We also set upper limits on financing from inter-bank and other
markets in order to facilitate stable cash flows with our fund-rais-
ing capacity.
iv) Integrated Risk Management
We have established rigid integrated risk management system in-
cluding risk capital allocation framework. The Risk Management
Division is responsible for integrated risk management and is the
unit that monitors various risks including credit and market risks.
In order to ensure that we have capital sufficient for the risks we
bear, the Risk Management Division also conducts stress test, the
results of which the Board of Directors monitors on a regular basis
and discuss actions to take as necessary. The following is the de-
tails of risk capital allocation framework:
(Risk Capital Allocation Framework)
Risk capital allocation framework is to distribute risk capital (tolera-
ble risk) within the capital representing our financial strength, to di-
visions such as domestic business divisions and treasury divisions
in advance. Each division then controls risks within the allocated
risk capital. Through this framework, each division conducts its
operations focusing on risk-return spectrum (e.g., improves profit-
ability and/or utilize the capital in a more efficient manner) while the
entire Bank’s strength is maintained.
(4) Supplementary Explanation on Fair Value of Financial Instru-
ments
The fair value of financial instruments includes, in addition to values
determined based on market prices, those calculated on a reason-
able basis if no market price is available. Since certain assumptions are
used for the calculations, the result may vary if different assumptions
are used.
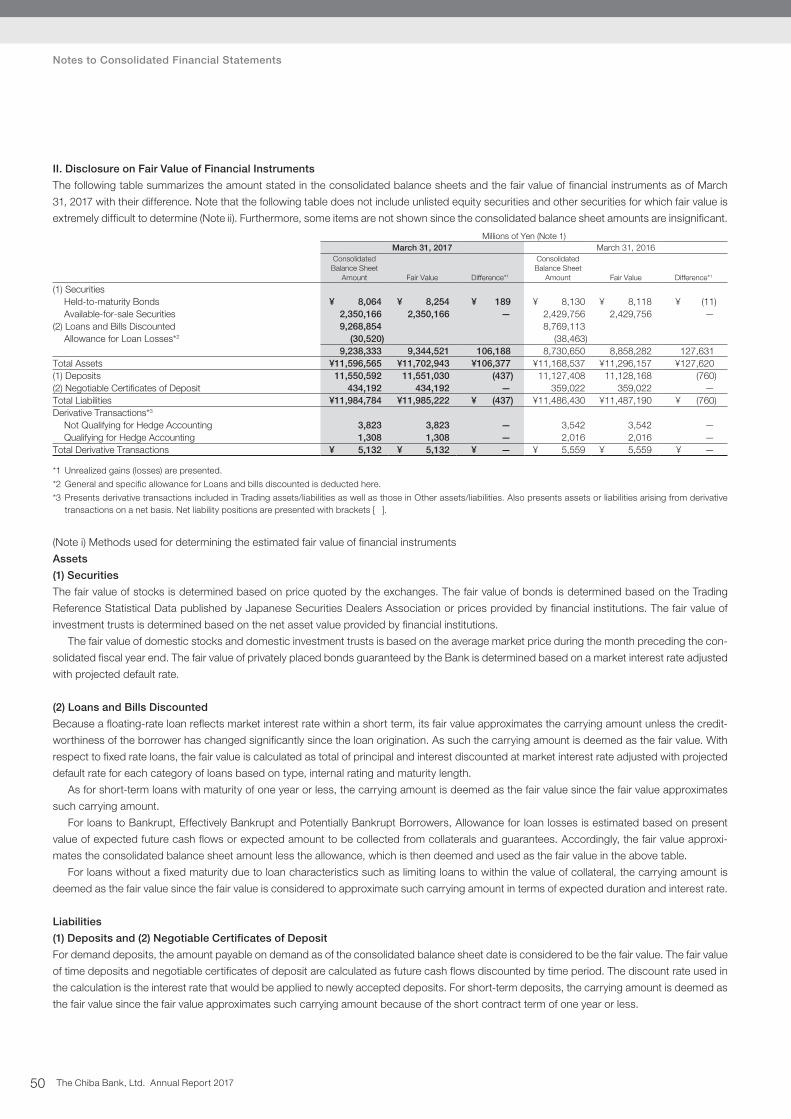
The Chiba Bank, Ltd. Annual Report 201750
Notes to Consolidated Financial Statements
II. Disclosure on Fair Value of Financial Instruments
The following table summarizes the amount stated in the consolidated balance sheets and the fair value of financial instruments as of March
31, 2017 with their difference. Note that the following table does not include unlisted equity securities and other securities for which fair value is
extremely difficult to determine (Note ii). Furthermore, some items are not shown since the consolidated balance sheet amounts are insignificant.
Millions of Yen (Note 1)March 31, 2017 March 31, 2016
Consolidated Balance Sheet
Amount Fair Value Difference*1
Consolidated Balance Sheet
Amount Fair Value Difference*1
(1) SecuritiesHeld-to-maturity Bonds ¥ 8,064 ¥ 8,254 ¥ 189 ¥ 8,130 ¥ 8,118 ¥ (11)Available-for-sale Securities 2,350,166 2,350,166 — 2,429,756 2,429,756 —
(2) Loans and Bills Discounted 9,268,854 8,769,113 Allowance for Loan Losses*2 (30,520) (38,463) 9,238,333 9,344,521 106,188 8,730,650 8,858,282 127,631
Total Assets ¥11,596,565 ¥11,702,943 ¥106,377 ¥11,168,537 ¥11,296,157 ¥127,620 (1) Deposits 11,550,592 11,551,030 (437) 11,127,408 11,128,168 (760)(2) Negotiable Certificates of Deposit 434,192 434,192 — 359,022 359,022 —Total Liabilities ¥11,984,784 ¥11,985,222 ¥ (437) ¥11,486,430 ¥11,487,190 ¥ (760)Derivative Transactions*3
Not Qualifying for Hedge Accounting 3,823 3,823 — 3,542 3,542 —Qualifying for Hedge Accounting 1,308 1,308 — 2,016 2,016 —
Total Derivative Transactions ¥ 5,132 ¥ 5,132 ¥ — ¥ 5,559 ¥ 5,559 ¥ —
*1 Unrealized gains (losses) are presented.
*2 General and specific allowance for Loans and bills discounted is deducted here.
*3 Presents derivative transactions included in Trading assets/liabilities as well as those in Other assets/liabilities. Also presents assets or liabilities arising from derivative transactions on a net basis. Net liability positions are presented with brackets [ ].
(Note i) Methods used for determining the estimated fair value of financial instruments
Assets
(1) Securities
The fair value of stocks is determined based on price quoted by the exchanges. The fair value of bonds is determined based on the Trading
Reference Statistical Data published by Japanese Securities Dealers Association or prices provided by financial institutions. The fair value of
investment trusts is determined based on the net asset value provided by financial institutions.
The fair value of domestic stocks and domestic investment trusts is based on the average market price during the month preceding the con-
solidated fiscal year end. The fair value of privately placed bonds guaranteed by the Bank is determined based on a market interest rate adjusted
with projected default rate.
(2) Loans and Bills Discounted
Because a floating-rate loan reflects market interest rate within a short term, its fair value approximates the carrying amount unless the credit-
worthiness of the borrower has changed significantly since the loan origination. As such the carrying amount is deemed as the fair value. With
respect to fixed rate loans, the fair value is calculated as total of principal and interest discounted at market interest rate adjusted with projected
default rate for each category of loans based on type, internal rating and maturity length.
As for short-term loans with maturity of one year or less, the carrying amount is deemed as the fair value since the fair value approximates
such carrying amount.
For loans to Bankrupt, Effectively Bankrupt and Potentially Bankrupt Borrowers, Allowance for loan losses is estimated based on present
value of expected future cash flows or expected amount to be collected from collaterals and guarantees. Accordingly, the fair value approxi-
mates the consolidated balance sheet amount less the allowance, which is then deemed and used as the fair value in the above table.
For loans without a fixed maturity due to loan characteristics such as limiting loans to within the value of collateral, the carrying amount is
deemed as the fair value since the fair value is considered to approximate such carrying amount in terms of expected duration and interest rate.
Liabilities
(1) Deposits and (2) Negotiable Certificates of Deposit
For demand deposits, the amount payable on demand as of the consolidated balance sheet date is considered to be the fair value. The fair value
of time deposits and negotiable certificates of deposit are calculated as future cash flows discounted by time period. The discount rate used in
the calculation is the interest rate that would be applied to newly accepted deposits. For short-term deposits, the carrying amount is deemed as
the fair value since the fair value approximates such carrying amount because of the short contract term of one year or less.

The Chiba Bank, Ltd. Annual Report 2017 51
Derivative Transactions
See “37. Derivative Transactions.”
(Note ii) The following table summarizes financial instruments whose fair value is extremely difficult to be estimated. These securities are not
included in the amount presented under “Assets, (1) Available-for-sale Securities” in the above table.
Millions of Yen (Note 1)March 31, 2017 March 31, 2016
Consolidated BalanceSheet Amount
Consolidated BalanceSheet Amount
(1) Unlisted Stocks*1, *2 ¥ 5,359 ¥ 5,393 (2) Investments in Limited Partnerships, etc.*3 9,161 4,949 Total ¥14,521 ¥10,342
*1 Unlisted stocks do not carry quoted market prices. Since it is extremely difficult to estimate the fair value of these securities, the fair value is not disclosed.
*2 An impairment loss of ¥8 million (¥24 million for the previous fiscal year) was recorded on these unlisted stocks in the current fiscal year.
*3 Fair value of investments in limited partnerships, etc., is not disclosed since such partnerships invest in assets, such as unlisted stocks, of which fair value is extremely difficult to be estimated.
(Note iii) Redemption schedule of monetary claims and securities with maturities:
Millions of Yen (Note 1)
March 31, 2017
Within 1 Year 1–3 Years 3–5 Years 5–7 Years 7–10 Years Over 10 Years
Securities ¥ 334,484 ¥ 600,613 ¥ 482,188 ¥138,387 ¥ 329,774 ¥ 93,902 Held-to-maturity Bonds — — — 5,609 2,243 —Available-for-sale Securities with Maturities 334,484 600,613 482,188 132,777 327,531 93,902
Government Bonds 172,500 247,500 112,000 22,500 83,500 7,700Local Government Bonds 63,906 72,647 69,612 44,264 157,402 679Short-term Corporate Bonds — — — — — —Corporate Bonds 28,607 80,075 143,586 59,582 6,450 16,227
Loans* 1,187,867 1,568,392 1,147,274 813,808 925,233 2,930,110Total ¥1,522,352 ¥2,169,006 ¥1,629,462 ¥952,195 ¥1,255,008 ¥3,024,012
* These amounts do not include loans to Bankrupt, Effectively Bankrupt or Potentially Bankrupt Borrowers and other loans of which redemption amount cannot be projected and those which do not have specific maturities, amounting to ¥696,166 million in total.
Millions of Yen (Note 1)
March 31, 2016
Within 1 Year 1–3 Years 3–5 Years 5–7 Years 7–10 Years Over 10 Years
Securities ¥ 273,157 ¥ 683,617 ¥ 526,562 ¥220,933 ¥ 259,411 ¥ 108,182 Held-to-maturity Bonds — — — — 7,887 —Available-for-sale Securities with Maturities 273,157 683,617 526,562 220,933 251,524 108,182
Government Bonds 143,500 317,000 135,000 108,000 100,500 8,000Local Government Bonds 60,827 95,469 83,856 18,827 88,668 —Short-term Corporate Bonds — — — — — —Corporate Bonds 21,655 63,362 115,574 73,273 2,800 7,442
Loans* 1,222,451 1,498,885 1,084,091 729,653 865,993 2,654,701Total ¥1,495,608 ¥2,182,502 ¥1,610,654 ¥950,587 ¥1,125,404 ¥2,762,884
* These amounts do not include loans to Bankrupt, Effectively Bankrupt or Potentially Bankrupt Borrowers and other loans of which redemption amount cannot be projected and those which do not have specific maturities, amounting to ¥713,336 million in total.
(Note iv) Repayment schedule of interest-bearing liabilities:
Millions of Yen (Note 1)
March 31, 2017
Within 1 Year 1–3 Years 3–5 Years 5–7 Years 7–10 Years Over 10 Years
Deposits* ¥10,815,306 ¥667,794 ¥50,349 ¥6,496 ¥10,645 ¥— Negotiable Certificates of Deposit 434,192 — — — — — Total ¥11,249,498 ¥667,794 ¥50,349 ¥6,496 ¥10,645 ¥—
* Demand deposits are included in “Within 1 year.”
Millions of Yen (Note 1)
March 31, 2016
Within 1 Year 1–3 Years 3–5 Years 5–7 Years 7–10 Years Over 10 Years
Deposits* ¥10,350,546 ¥705,037 ¥52,473 ¥6,669 ¥12,681 ¥— Negotiable Certificates of Deposit 359,022 — — — — — Total ¥10,709,568 ¥705,037 ¥52,473 ¥6,669 ¥12,681 ¥—
* Demand deposits are included in “Within 1 year.”
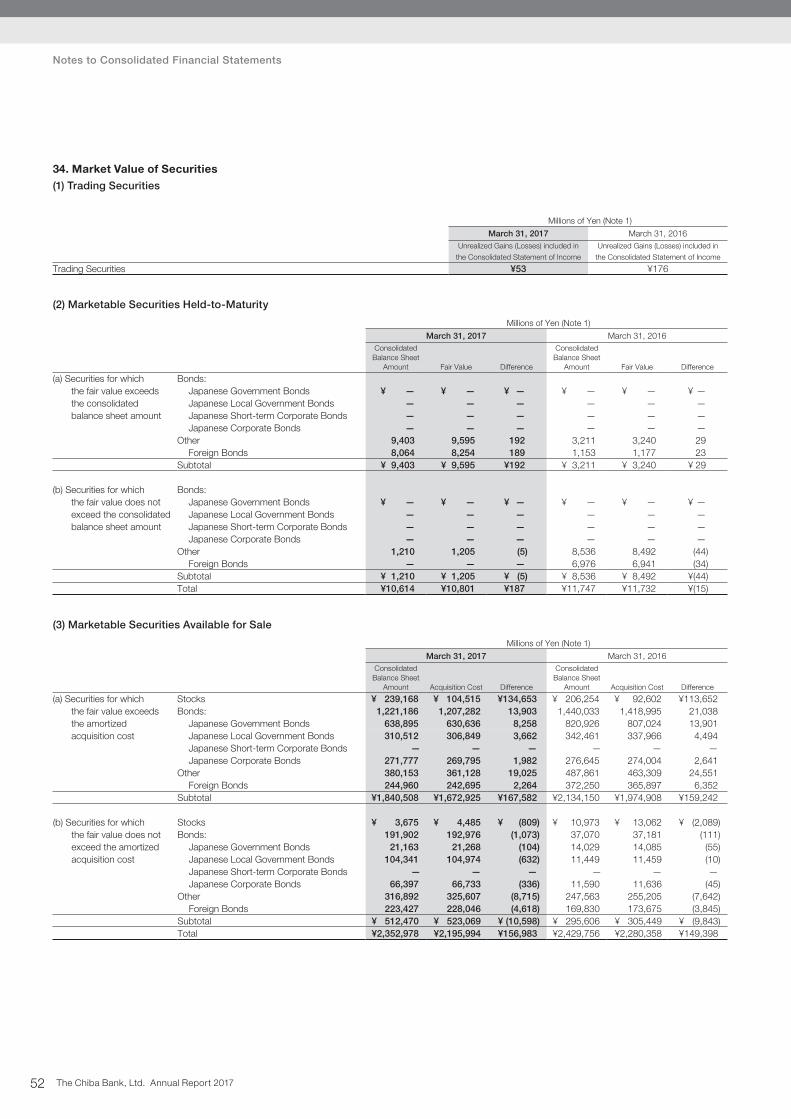
The Chiba Bank, Ltd. Annual Report 201752
Notes to Consolidated Financial Statements
34. Market Value of Securities(1) Trading Securities
Millions of Yen (Note 1)
March 31, 2017 March 31, 2016Unrealized Gains (Losses) included in
the Consolidated Statement of Income
Unrealized Gains (Losses) included in
the Consolidated Statement of Income
Trading Securities ¥53 ¥176
(2) Marketable Securities Held-to-Maturity
Millions of Yen (Note 1)
March 31, 2017 March 31, 2016Consolidated
Balance Sheet Amount Fair Value Difference
ConsolidatedBalance Sheet
Amount Fair Value Difference
(a) Securities for which Bonds: the fair value exceeds Japanese Government Bonds ¥ — ¥ — ¥ — ¥ — ¥ — ¥ — the consolidated Japanese Local Government Bonds — — — — — — balance sheet amount Japanese Short-term Corporate Bonds — — — — — —
Japanese Corporate Bonds — — — — — —Other 9,403 9,595 192 3,211 3,240 29
Foreign Bonds 8,064 8,254 189 1,153 1,177 23Subtotal ¥ 9,403 ¥ 9,595 ¥192 ¥ 3,211 ¥ 3,240 ¥ 29
(b) Securities for which Bonds: the fair value does not Japanese Government Bonds ¥ — ¥ — ¥ — ¥ — ¥ — ¥ — exceed the consolidated Japanese Local Government Bonds — — — — — — balance sheet amount Japanese Short-term Corporate Bonds — — — — — —
Japanese Corporate Bonds — — — — — —Other 1,210 1,205 (5) 8,536 8,492 (44)
Foreign Bonds — — — 6,976 6,941 (34)Subtotal ¥ 1,210 ¥ 1,205 ¥ (5) ¥ 8,536 ¥ 8,492 ¥(44)Total ¥10,614 ¥10,801 ¥187 ¥11,747 ¥11,732 ¥(15)
(3) Marketable Securities Available for Sale
Millions of Yen (Note 1)
March 31, 2017 March 31, 2016Consolidated
Balance Sheet Amount Acquisition Cost Difference
ConsolidatedBalance Sheet
Amount Acquisition Cost Difference
(a) Securities for which Stocks ¥ 239,168 ¥ 104,515 ¥134,653 ¥ 206,254 ¥ 92,602 ¥113,652 the fair value exceeds Bonds: 1,221,186 1,207,282 13,903 1,440,033 1,418,995 21,038 the amortized Japanese Government Bonds 638,895 630,636 8,258 820,926 807,024 13,901 acquisition cost Japanese Local Government Bonds 310,512 306,849 3,662 342,461 337,966 4,494
Japanese Short-term Corporate Bonds — — — — — —Japanese Corporate Bonds 271,777 269,795 1,982 276,645 274,004 2,641
Other 380,153 361,128 19,025 487,861 463,309 24,551 Foreign Bonds 244,960 242,695 2,264 372,250 365,897 6,352
Subtotal ¥1,840,508 ¥1,672,925 ¥167,582 ¥2,134,150 ¥1,974,908 ¥159,242
(b) Securities for which Stocks ¥ 3,675 ¥ 4,485 ¥ (809) ¥ 10,973 ¥ 13,062 ¥ (2,089) the fair value does not Bonds: 191,902 192,976 (1,073) 37,070 37,181 (111) exceed the amortized Japanese Government Bonds 21,163 21,268 (104) 14,029 14,085 (55) acquisition cost Japanese Local Government Bonds 104,341 104,974 (632) 11,449 11,459 (10)
Japanese Short-term Corporate Bonds — — — — — —Japanese Corporate Bonds 66,397 66,733 (336) 11,590 11,636 (45)
Other 316,892 325,607 (8,715) 247,563 255,205 (7,642)Foreign Bonds 223,427 228,046 (4,618) 169,830 173,675 (3,845)
Subtotal ¥ 512,470 ¥ 523,069 ¥ (10,598) ¥ 295,606 ¥ 305,449 ¥ (9,843)Total ¥2,352,978 ¥2,195,994 ¥156,983 ¥2,429,756 ¥2,280,358 ¥149,398

The Chiba Bank, Ltd. Annual Report 2017 53
(4) Securities Held-to-Maturity Sold during the Fiscal Year
None.
(5) Securities Available for Sale Sold during the Fiscal YearMillions of Yen (Note 1)
March 31, 2017 March 31, 2016Proceeds from
Sales Gain LossProceeds from
Sales Gain Loss
Stocks ¥ 4,060 ¥1,562 ¥ 1 ¥ 6,569 ¥3,075 ¥ 75 Bonds: 772,076 756 1,627 981,640 2,187 377
Japanese Government Bonds 770,472 754 1,606 978,387 2,173 377 Japanese Local Government Bonds 1,336 — 21 — — —Japanese Short-term Corporate Bonds — — — — — —Japanese Corporate Bonds 267 2 — 3,253 13 —
Other 166,320 2,297 2,593 107,031 1,044 811 Foreign Bonds 158,578 921 2,206 93,226 583 324
Total ¥942,457 ¥4,615 ¥4,223 ¥1,095,241 ¥6,307 ¥1,264
(6) Securities for which the Holding Purpose has been Altered
None.
(7) Impairment Losses on Securities
Marketable securities available for sale are subject to write-downs when the market value or reasonably estimated value of these securities
(collectively, “fair value”) has declined considerably and it is not probable that the value will recover to the acquisition cost. In such case, any
differences between fair value and acquisition cost are recognized as losses for the period. For the current fiscal year, impairment losses was
¥26 million (Corporate bonds: ¥17 million, Stocks: ¥8 million) (¥62 million (Stocks: ¥24 million, Corporate bonds, etc.: ¥37 million) for the previous
fiscal year).
“Considerable decline in fair value” is determined based on the classification of issuers in accordance with the internal standards for self-
assessment of assets as follows:
Bankrupt, effectively bankrupt and potentially bankrupt
Fair value is lower than acquisition cost.
Requiring caution
Fair value has declined by 30% or more from acquisition cost.
Normal
Fair value has declined by 50% or more from acquisition cost, or fair value has declined by more than 30% but less than 50% from acquisition
cost and stayed below a certain level.
Bankrupt issuer means one who has entered into bankruptcy, special liquidation proceedings, corporate rehabilitation, civil rehabilitation or simi-
lar legal proceedings or whose notes have been dishonored and suspended from processing through clearing houses.
Effectively bankrupt issuer means one who is not legally or formally bankrupt but regarded as substantially in a similar condition.
Potentially bankrupt issuer means one who is not legally bankrupt but deemed to have high possibility of becoming bankrupt.
Requiring caution issuer means one who is financially weak and under close monitoring conducted by the Bank.
Normal issuer means one who does not belong to the other categories.
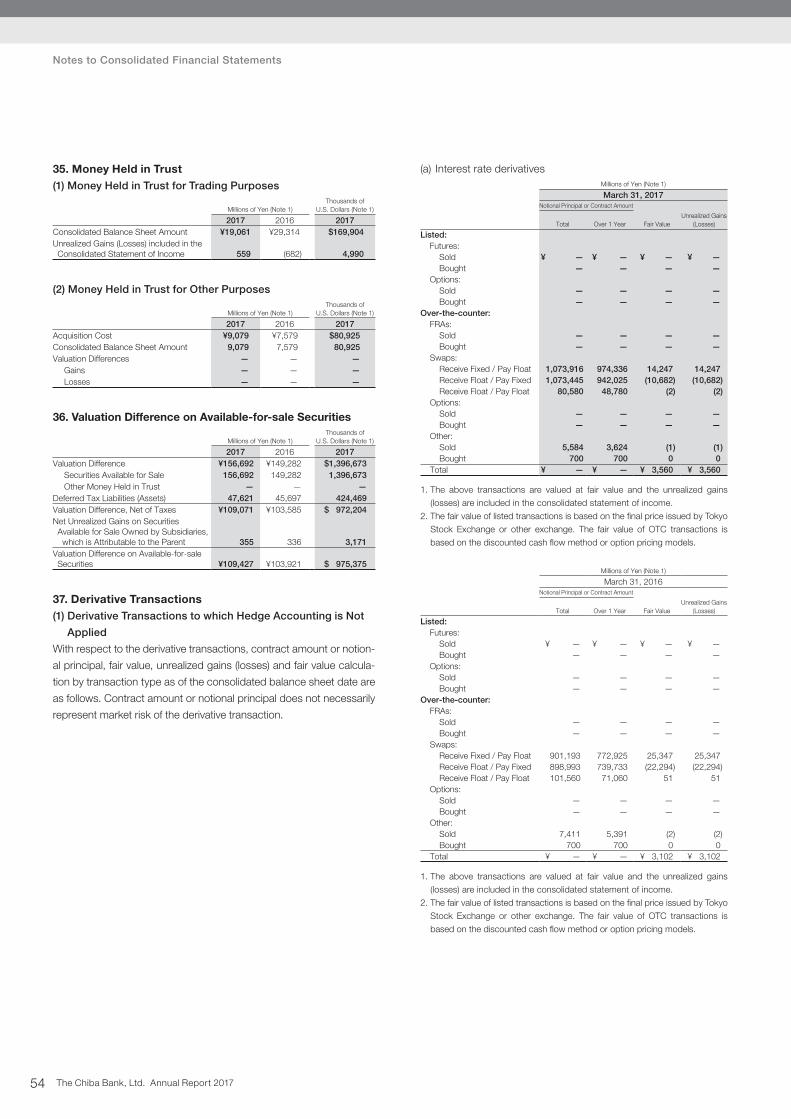
The Chiba Bank, Ltd. Annual Report 201754
Notes to Consolidated Financial Statements
35. Money Held in Trust(1) Money Held in Trust for Trading Purposes
Millions of Yen (Note 1)Thousands of
U.S. Dollars (Note 1)
2017 2016 2017Consolidated Balance Sheet Amount ¥19,061 ¥29,314 $169,904 Unrealized Gains (Losses) included in the Consolidated Statement of Income 559 (682) 4,990
(2) Money Held in Trust for Other Purposes
Millions of Yen (Note 1)Thousands of
U.S. Dollars (Note 1)
2017 2016 2017Acquisition Cost ¥9,079 ¥7,579 $80,925 Consolidated Balance Sheet Amount 9,079 7,579 80,925 Valuation Differences — — —
Gains — — — Losses — — —
36. Valuation Difference on Available-for-sale Securities
Millions of Yen (Note 1)Thousands of
U.S. Dollars (Note 1)
2017 2016 2017Valuation Difference ¥156,692 ¥149,282 $1,396,673
Securities Available for Sale 156,692 149,282 1,396,673 Other Money Held in Trust — — —
Deferred Tax Liabilities (Assets) 47,621 45,697 424,469 Valuation Difference, Net of Taxes ¥109,071 ¥103,585 $ 972,204 Net Unrealized Gains on Securities Available for Sale Owned by Subsidiaries,
which is Attributable to the Parent 355 336 3,171 Valuation Difference on Available-for-sale Securities ¥109,427 ¥103,921 $ 975,375
37. Derivative Transactions(1) Derivative Transactions to which Hedge Accounting is Not
Applied
With respect to the derivative transactions, contract amount or notion-
al principal, fair value, unrealized gains (losses) and fair value calcula-
tion by transaction type as of the consolidated balance sheet date are
as follows. Contract amount or notional principal does not necessarily
represent market risk of the derivative transaction.
(a) Interest rate derivatives Millions of Yen (Note 1)
March 31, 2017Notional Principal or Contract Amount
Total Over 1 Year Fair ValueUnrealized Gains
(Losses)
Listed: Futures: Sold ¥ — ¥ — ¥ — ¥ — Bought — — — — Options: Sold — — — — Bought — — — —Over-the-counter: FRAs: Sold — — — — Bought — — — — Swaps: Receive Fixed / Pay Float 1,073,916 974,336 14,247 14,247 Receive Float / Pay Fixed 1,073,445 942,025 (10,682) (10,682) Receive Float / Pay Float 80,580 48,780 (2) (2) Options: Sold — — — — Bought — — — — Other: Sold 5,584 3,624 (1) (1) Bought 700 700 0 0 Total ¥ — ¥ — ¥ 3,560 ¥ 3,560
1. The above transactions are valued at fair value and the unrealized gains (losses) are included in the consolidated statement of income.
2. The fair value of listed transactions is based on the final price issued by Tokyo Stock Exchange or other exchange. The fair value of OTC transactions is based on the discounted cash flow method or option pricing models.
Millions of Yen (Note 1)
March 31, 2016Notional Principal or Contract Amount
Total Over 1 Year Fair ValueUnrealized Gains
(Losses)
Listed: Futures: Sold ¥ — ¥ — ¥ — ¥ — Bought — — — — Options: Sold — — — — Bought — — — —Over-the-counter: FRAs: Sold — — — — Bought — — — — Swaps: Receive Fixed / Pay Float 901,193 772,925 25,347 25,347 Receive Float / Pay Fixed 898,993 739,733 (22,294) (22,294) Receive Float / Pay Float 101,560 71,060 51 51 Options: Sold — — — — Bought — — — — Other: Sold 7,411 5,391 (2) (2) Bought 700 700 0 0 Total ¥ — ¥ — ¥ 3,102 ¥ 3,102
1. The above transactions are valued at fair value and the unrealized gains (losses) are included in the consolidated statement of income.
2. The fair value of listed transactions is based on the final price issued by Tokyo Stock Exchange or other exchange. The fair value of OTC transactions is based on the discounted cash flow method or option pricing models.
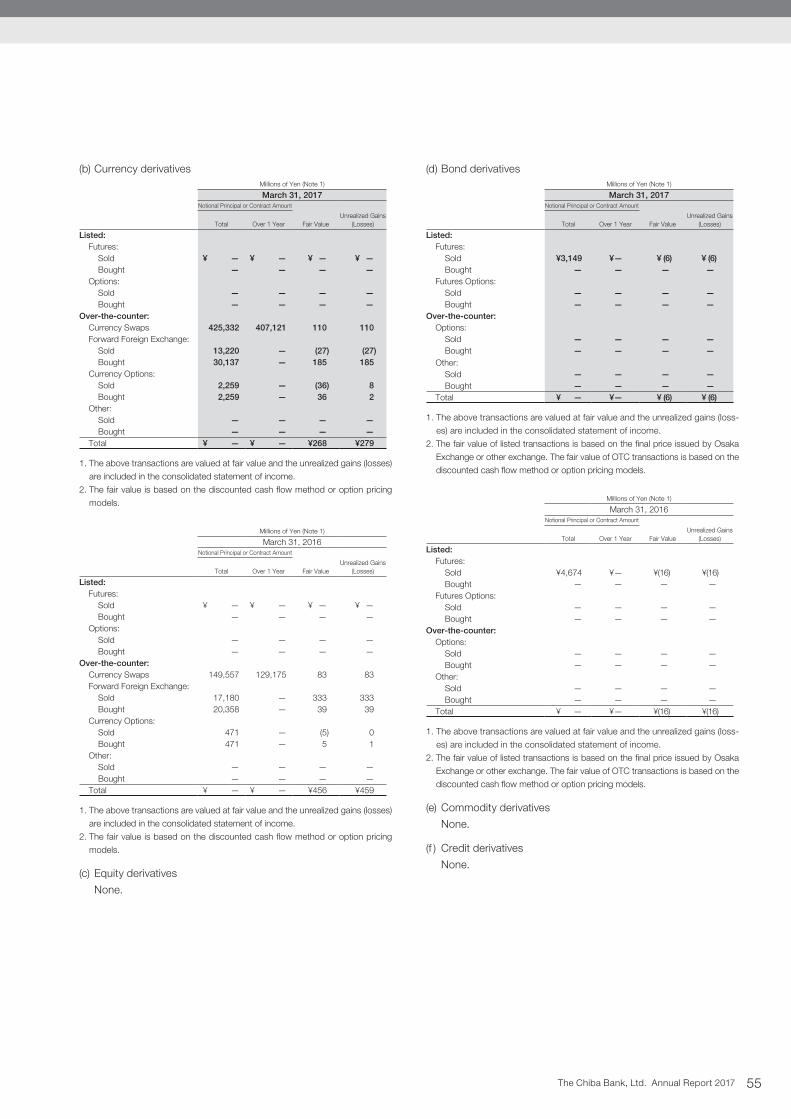
The Chiba Bank, Ltd. Annual Report 2017 55
(b) Currency derivativesMillions of Yen (Note 1)
March 31, 2017Notional Principal or Contract Amount
Total Over 1 Year Fair ValueUnrealized Gains
(Losses)
Listed: Futures: Sold ¥ — ¥ — ¥ — ¥ — Bought — — — — Options: Sold — — — — Bought — — — —Over-the-counter: Currency Swaps 425,332 407,121 110 110 Forward Foreign Exchange: Sold 13,220 — (27) (27) Bought 30,137 — 185 185 Currency Options: Sold 2,259 — (36) 8 Bought 2,259 — 36 2 Other: Sold — — — — Bought — — — — Total ¥ — ¥ — ¥268 ¥279
1. The above transactions are valued at fair value and the unrealized gains (losses) are included in the consolidated statement of income.
2. The fair value is based on the discounted cash flow method or option pricing models.
Millions of Yen (Note 1)
March 31, 2016Notional Principal or Contract Amount
Total Over 1 Year Fair ValueUnrealized Gains
(Losses)
Listed: Futures: Sold ¥ — ¥ — ¥ — ¥ — Bought — — — — Options: Sold — — — — Bought — — — —Over-the-counter: Currency Swaps 149,557 129,175 83 83 Forward Foreign Exchange: Sold 17,180 — 333 333 Bought 20,358 — 39 39 Currency Options: Sold 471 — (5) 0 Bought 471 — 5 1 Other: Sold — — — — Bought — — — — Total ¥ — ¥ — ¥456 ¥459
1. The above transactions are valued at fair value and the unrealized gains (losses) are included in the consolidated statement of income.
2. The fair value is based on the discounted cash flow method or option pricing models.
(c) Equity derivatives
None.
(d) Bond derivativesMillions of Yen (Note 1)
March 31, 2017Notional Principal or Contract Amount
Total Over 1 Year Fair ValueUnrealized Gains
(Losses)
Listed: Futures: Sold ¥3,149 ¥— ¥ (6) ¥ (6) Bought — — — — Futures Options: Sold — — — — Bought — — — —Over-the-counter: Options: Sold — — — — Bought — — — — Other: Sold — — — — Bought — — — — Total ¥ — ¥— ¥ (6) ¥ (6)
1. The above transactions are valued at fair value and the unrealized gains (loss-es) are included in the consolidated statement of income.
2. The fair value of listed transactions is based on the final price issued by Osaka Exchange or other exchange. The fair value of OTC transactions is based on the discounted cash flow method or option pricing models.
Millions of Yen (Note 1)
March 31, 2016Notional Principal or Contract Amount
Total Over 1 Year Fair ValueUnrealized Gains
(Losses)
Listed: Futures: Sold ¥4,674 ¥— ¥(16) ¥(16) Bought — — — — Futures Options: Sold — — — — Bought — — — —Over-the-counter: Options: Sold — — — — Bought — — — — Other: Sold — — — — Bought — — — — Total ¥ — ¥— ¥(16) ¥(16)
1. The above transactions are valued at fair value and the unrealized gains (loss-es) are included in the consolidated statement of income.
2. The fair value of listed transactions is based on the final price issued by Osaka Exchange or other exchange. The fair value of OTC transactions is based on the discounted cash flow method or option pricing models.
(e) Commodity derivatives
None.
(f ) Credit derivatives
None.
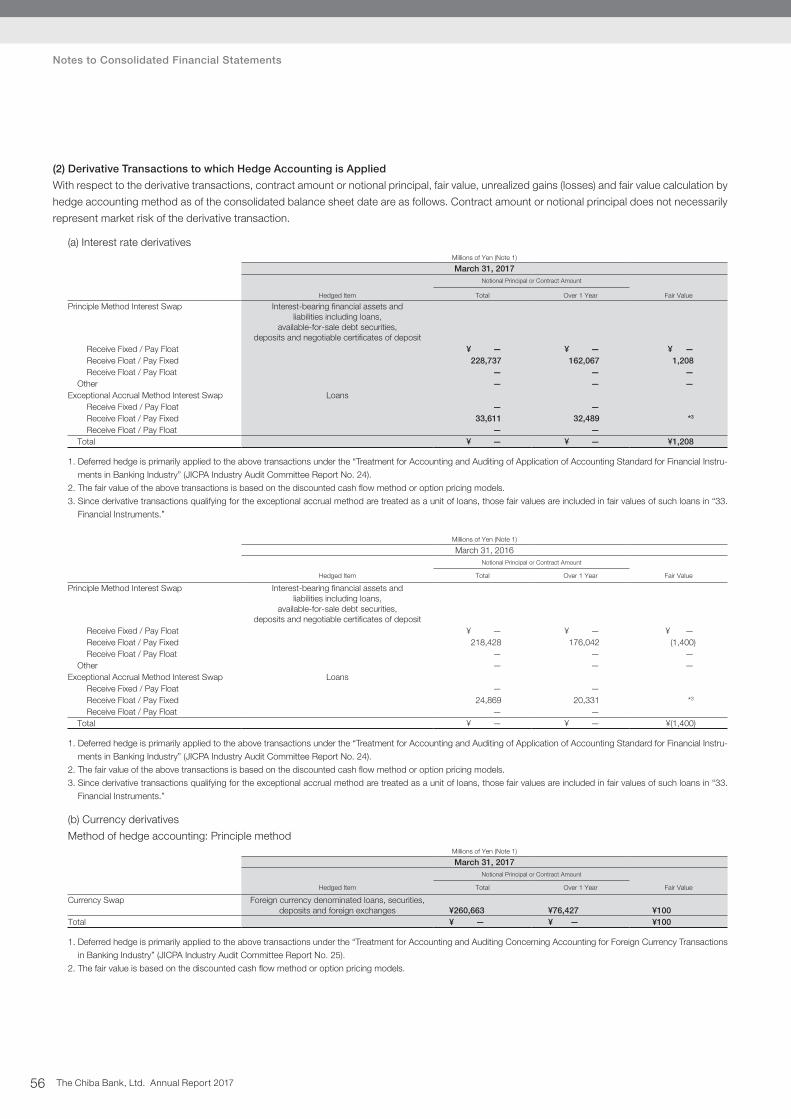
The Chiba Bank, Ltd. Annual Report 201756
Notes to Consolidated Financial Statements
(2) Derivative Transactions to which Hedge Accounting is Applied
With respect to the derivative transactions, contract amount or notional principal, fair value, unrealized gains (losses) and fair value calculation by
hedge accounting method as of the consolidated balance sheet date are as follows. Contract amount or notional principal does not necessarily
represent market risk of the derivative transaction.
(a) Interest rate derivatives Millions of Yen (Note 1)
March 31, 2017Notional Principal or Contract Amount
Hedged Item Total Over 1 Year Fair Value
Principle Method Interest Swap Interest-bearing financial assets and liabilities including loans,
available-for-sale debt securities, deposits and negotiable certificates of deposit
Receive Fixed / Pay Float ¥ — ¥ — ¥ — Receive Float / Pay Fixed 228,737 162,067 1,208 Receive Float / Pay Float — — — Other — — —Exceptional Accrual Method Interest Swap Loans Receive Fixed / Pay Float — — Receive Float / Pay Fixed 33,611 32,489 *3
Receive Float / Pay Float — — Total ¥ — ¥ — ¥1,208
1. Deferred hedge is primarily applied to the above transactions under the “Treatment for Accounting and Auditing of Application of Accounting Standard for Financial Instru-ments in Banking Industry” (JICPA Industry Audit Committee Report No. 24).
2. The fair value of the above transactions is based on the discounted cash flow method or option pricing models.3. Since derivative transactions qualifying for the exceptional accrual method are treated as a unit of loans, those fair values are included in fair values of such loans in “33.
Financial Instruments.”
Millions of Yen (Note 1)
March 31, 2016Notional Principal or Contract Amount
Hedged Item Total Over 1 Year Fair Value
Principle Method Interest Swap Interest-bearing financial assets and liabilities including loans,
available-for-sale debt securities, deposits and negotiable certificates of deposit
Receive Fixed / Pay Float ¥ — ¥ — ¥ — Receive Float / Pay Fixed 218,428 176,042 (1,400) Receive Float / Pay Float — — — Other — — —Exceptional Accrual Method Interest Swap Loans Receive Fixed / Pay Float — — Receive Float / Pay Fixed 24,869 20,331 *3
Receive Float / Pay Float — — Total ¥ — ¥ — ¥(1,400)
1. Deferred hedge is primarily applied to the above transactions under the “Treatment for Accounting and Auditing of Application of Accounting Standard for Financial Instru-ments in Banking Industry” (JICPA Industry Audit Committee Report No. 24).
2. The fair value of the above transactions is based on the discounted cash flow method or option pricing models.3. Since derivative transactions qualifying for the exceptional accrual method are treated as a unit of loans, those fair values are included in fair values of such loans in “33.
Financial Instruments.”
(b) Currency derivatives
Method of hedge accounting: Principle methodMillions of Yen (Note 1)
March 31, 2017Notional Principal or Contract Amount
Hedged Item Total Over 1 Year Fair Value
Currency Swap Foreign currency denominated loans, securities, deposits and foreign exchanges ¥260,663 ¥76,427 ¥100
Total ¥ — ¥ — ¥100
1. Deferred hedge is primarily applied to the above transactions under the “Treatment for Accounting and Auditing Concerning Accounting for Foreign Currency Transactions in Banking Industry” (JICPA Industry Audit Committee Report No. 25).
2. The fair value is based on the discounted cash flow method or option pricing models.
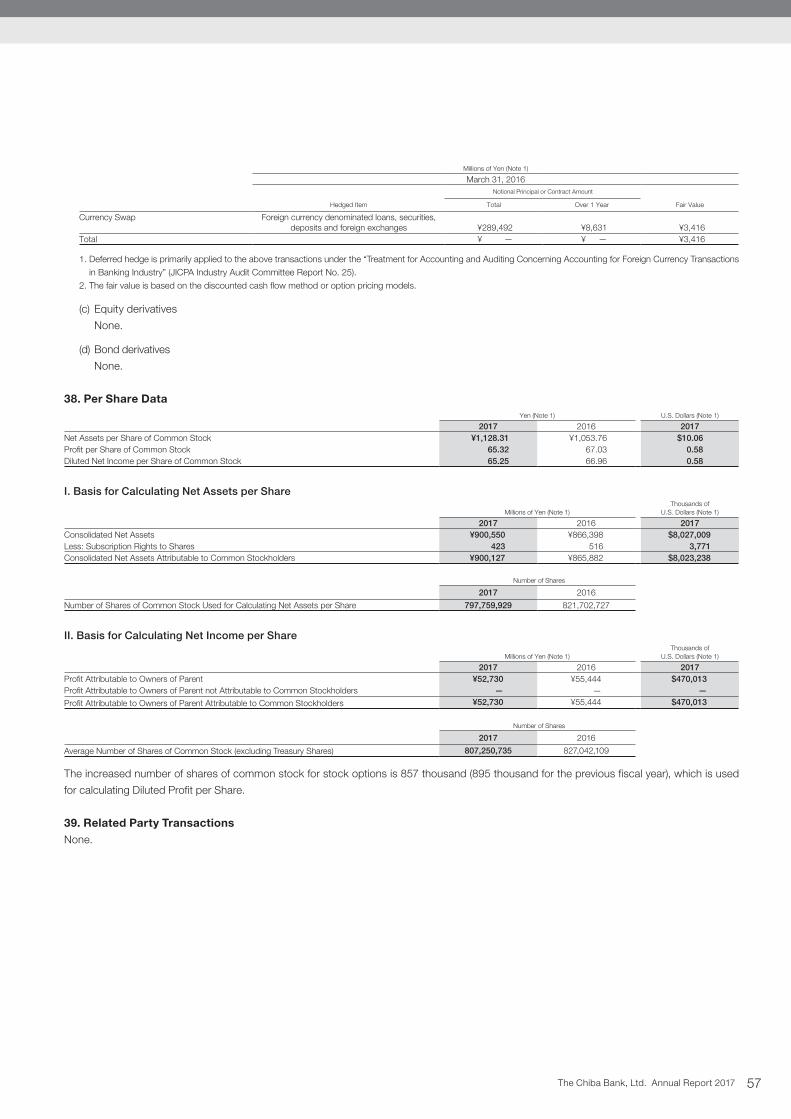
The Chiba Bank, Ltd. Annual Report 2017 57
Millions of Yen (Note 1)
March 31, 2016Notional Principal or Contract Amount
Hedged Item Total Over 1 Year Fair Value
Currency Swap Foreign currency denominated loans, securities, deposits and foreign exchanges ¥289,492 ¥8,631 ¥3,416
Total ¥ — ¥ — ¥3,416
1. Deferred hedge is primarily applied to the above transactions under the “Treatment for Accounting and Auditing Concerning Accounting for Foreign Currency Transactions in Banking Industry” (JICPA Industry Audit Committee Report No. 25).
2. The fair value is based on the discounted cash flow method or option pricing models.
(c) Equity derivatives
None.
(d) Bond derivatives
None.
38. Per Share DataYen (Note 1) U.S. Dollars (Note 1)
2017 2016 2017Net Assets per Share of Common Stock ¥1,128.31 ¥1,053.76 $10.06 Profit per Share of Common Stock 65.32 67.03 0.58 Diluted Net Income per Share of Common Stock 65.25 66.96 0.58
I. Basis for Calculating Net Assets per Share
Millions of Yen (Note 1)Thousands of
U.S. Dollars (Note 1)
2017 2016 2017Consolidated Net Assets ¥900,550 ¥866,398 $8,027,009 Less: Subscription Rights to Shares 423 516 3,771 Consolidated Net Assets Attributable to Common Stockholders ¥900,127 ¥865,882 $8,023,238
Number of Shares
2017 2016
Number of Shares of Common Stock Used for Calculating Net Assets per Share 797,759,929 821,702,727
II. Basis for Calculating Net Income per Share
Millions of Yen (Note 1)Thousands of
U.S. Dollars (Note 1)
2017 2016 2017Profit Attributable to Owners of Parent ¥52,730 ¥55,444 $470,013 Profit Attributable to Owners of Parent not Attributable to Common Stockholders — — —
Profit Attributable to Owners of Parent Attributable to Common Stockholders ¥52,730 ¥55,444 $470,013
Number of Shares
2017 2016
Average Number of Shares of Common Stock (excluding Treasury Shares) 807,250,735 827,042,109
The increased number of shares of common stock for stock options is 857 thousand (895 thousand for the previous fiscal year), which is used
for calculating Diluted Profit per Share.
39. Related Party TransactionsNone.
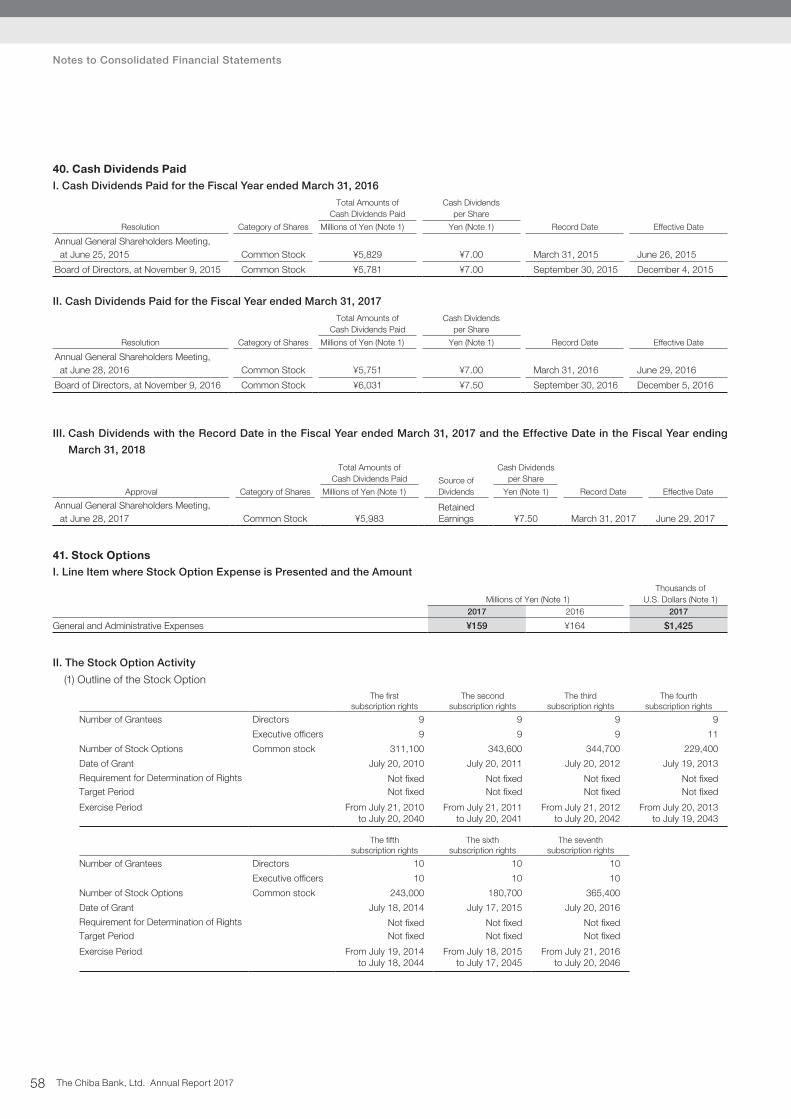
The Chiba Bank, Ltd. Annual Report 201758
Notes to Consolidated Financial Statements
40. Cash Dividends PaidI. Cash Dividends Paid for the Fiscal Year ended March 31, 2016
Resolution Category of Shares
Total Amounts of Cash Dividends Paid
Cash Dividends per Share
Record Date Effective DateMillions of Yen (Note 1) Yen (Note 1)
Annual General Shareholders Meeting, at June 25, 2015 Common Stock ¥5,829 ¥7.00 March 31, 2015 June 26, 2015
Board of Directors, at November 9, 2015 Common Stock ¥5,781 ¥7.00 September 30, 2015 December 4, 2015
II. Cash Dividends Paid for the Fiscal Year ended March 31, 2017
Resolution Category of Shares
Total Amounts of Cash Dividends Paid
Cash Dividends per Share
Record Date Effective DateMillions of Yen (Note 1) Yen (Note 1)
Annual General Shareholders Meeting, at June 28, 2016 Common Stock ¥5,751 ¥7.00 March 31, 2016 June 29, 2016
Board of Directors, at November 9, 2016 Common Stock ¥6,031 ¥7.50 September 30, 2016 December 5, 2016
III. Cash Dividends with the Record Date in the Fiscal Year ended March 31, 2017 and the Effective Date in the Fiscal Year ending
March 31, 2018
Approval Category of Shares
Total Amounts of Cash Dividends Paid Source of
Dividends
Cash Dividends per Share
Record Date Effective DateMillions of Yen (Note 1) Yen (Note 1)
Annual General Shareholders Meeting, at June 28, 2017 Common Stock ¥5,983
Retained Earnings ¥7.50 March 31, 2017 June 29, 2017
41. Stock OptionsI. Line Item where Stock Option Expense is Presented and the Amount
Millions of Yen (Note 1)Thousands of
U.S. Dollars (Note 1)2017 2016 2017
General and Administrative Expenses ¥159 ¥164 $1,425
II. The Stock Option Activity
(1) Outline of the Stock OptionThe first
subscription rightsThe second
subscription rightsThe third
subscription rightsThe fourth
subscription rights
Number of Grantees Directors 9 9 9 9
Executive officers 9 9 9 11
Number of Stock Options Common stock 311,100 343,600 344,700 229,400
Date of Grant July 20, 2010 July 20, 2011 July 20, 2012 July 19, 2013
Requirement for Determination of Rights Not fixed Not fixed Not fixed Not fixedTarget Period Not fixed Not fixed Not fixed Not fixed
Exercise Period From July 21, 2010 to July 20, 2040
From July 21, 2011 to July 20, 2041
From July 21, 2012 to July 20, 2042
From July 20, 2013 to July 19, 2043
The fifth subscription rights
The sixth subscription rights
The seventh subscription rights
Number of Grantees Directors 10 10 10
Executive officers 10 10 10
Number of Stock Options Common stock 243,000 180,700 365,400
Date of Grant July 18, 2014 July 17, 2015 July 20, 2016
Requirement for Determination of Rights Not fixed Not fixed Not fixedTarget Period Not fixed Not fixed Not fixed
Exercise Period From July 19, 2014 to July 18, 2044
From July 18, 2015 to July 17, 2045
From July 21, 2016 to July 20, 2046

The Chiba Bank, Ltd. Annual Report 2017 59
(2) Size and Situation of the Stock Option
(a) The number of the stock optionNumber of Shares
The first subscription rights
The second subscription rights
The third subscription rights
The fourth subscription rights
Non-vested
As of March 31, 2016 — — — —
Granted — — — —
Forfeited — — — —
Vested — — — —
Outstanding — — — —
Vested
As of March 31, 2016 98,100 128,800 159,700 145,500
Vested — — — —
Exercised 44,100 70,800 78,400 78,700
Forfeited — — — —
Outstanding 54,000 58,000 81,300 66,800
The fifth subscription rights
The sixth subscription rights
The seventh subscription rights
Non-vested
As of March 31, 2016 — — —
Granted — — 365,400
Forfeited — — —
Vested — — 365,400
Outstanding — — —
Vested
As of March 31, 2016 185,600 180,700 —
Vested — — 365,400
Exercised 82,900 65,000 —
Forfeited — — —
Outstanding 102,700 115,700 365,400
(b) Price informationYen (Note 1)
The first subscription rights
The second subscription rights
The third subscription rights
The fourth subscription rights
Exercise Price 1 1 1 1Average Price at Exercise 485 485 485 485Fair Value at Grant Date 467 446 403 686
The fifth subscription rights
The sixth subscription rights
The seventh subscription rights
Exercise Price 1 1 1Average Price at Exercise 485 485 —Fair Value at Grant Date 673 913 433
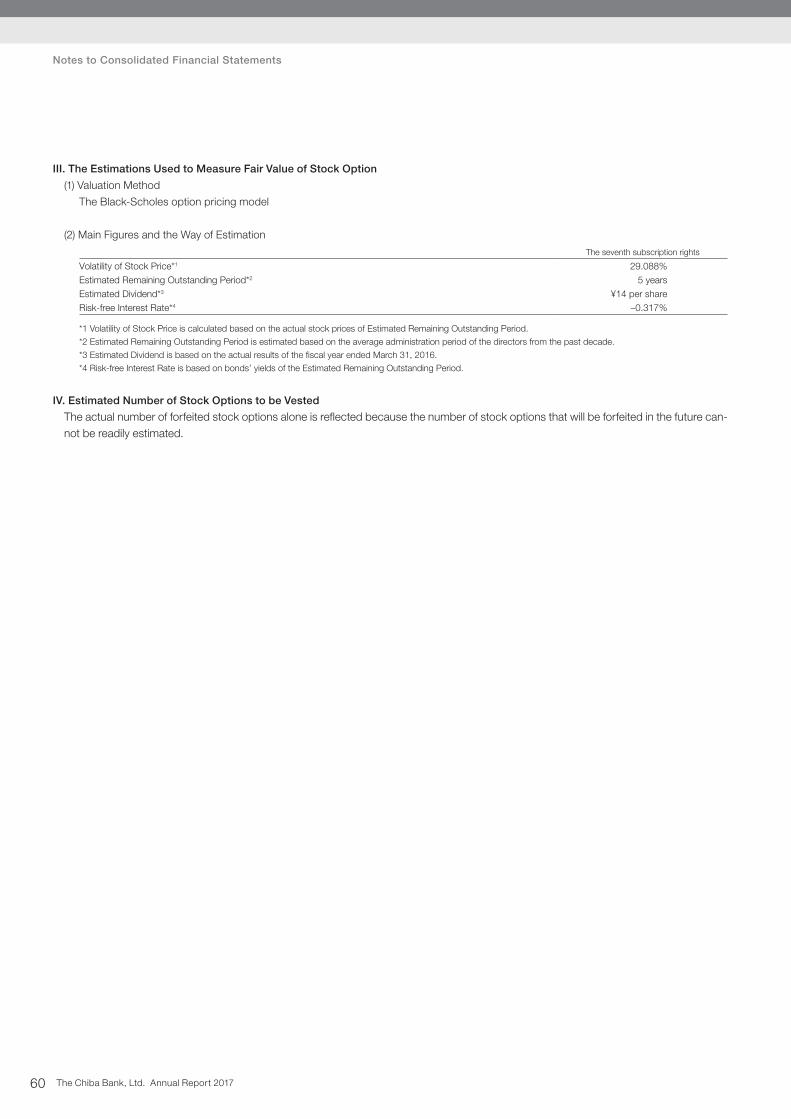
The Chiba Bank, Ltd. Annual Report 201760
Notes to Consolidated Financial Statements
III. The Estimations Used to Measure Fair Value of Stock Option
(1) Valuation Method
The Black-Scholes option pricing model
(2) Main Figures and the Way of Estimation
The seventh subscription rights
Volatility of Stock Price*1 29.088%Estimated Remaining Outstanding Period*2 5 yearsEstimated Dividend*3 ¥14 per shareRisk-free Interest Rate*4 –0.317%
*1 Volatility of Stock Price is calculated based on the actual stock prices of Estimated Remaining Outstanding Period.*2 Estimated Remaining Outstanding Period is estimated based on the average administration period of the directors from the past decade.*3 Estimated Dividend is based on the actual results of the fiscal year ended March 31, 2016.*4 Risk-free Interest Rate is based on bonds’ yields of the Estimated Remaining Outstanding Period.
IV. Estimated Number of Stock Options to be Vested
The actual number of forfeited stock options alone is reflected because the number of stock options that will be forfeited in the future can-not be readily estimated.
The Chiba Bank, Ltd. Annual Report 2017 61
Independent Auditor’s Report
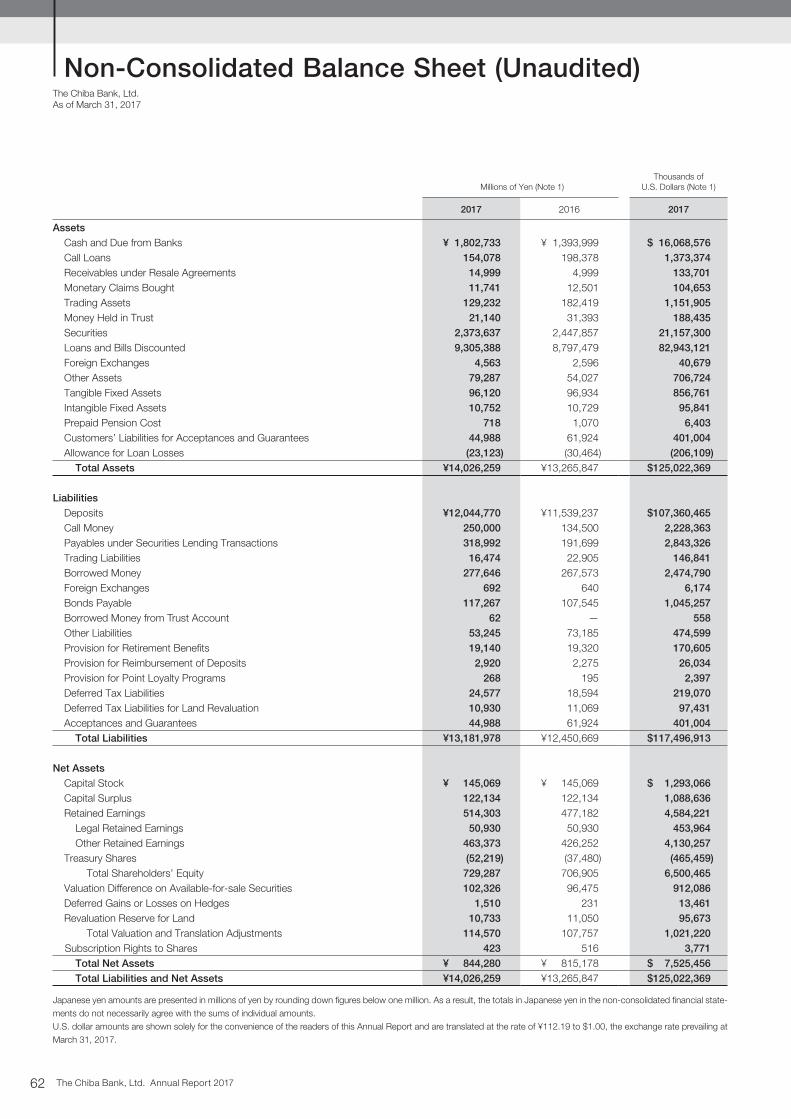
The Chiba Bank, Ltd. Annual Report 201762
Millions of Yen (Note 1)Thousands of
U.S. Dollars (Note 1)
2017 2016 2017
AssetsCash and Due from Banks ¥ 1,802,733 ¥ 1,393,999 $ 16,068,576 Call Loans 154,078 198,378 1,373,374 Receivables under Resale Agreements 14,999 4,999 133,701 Monetary Claims Bought 11,741 12,501 104,653 Trading Assets 129,232 182,419 1,151,905 Money Held in Trust 21,140 31,393 188,435 Securities 2,373,637 2,447,857 21,157,300 Loans and Bills Discounted 9,305,388 8,797,479 82,943,121 Foreign Exchanges 4,563 2,596 40,679 Other Assets 79,287 54,027 706,724 Tangible Fixed Assets 96,120 96,934 856,761 Intangible Fixed Assets 10,752 10,729 95,841 Prepaid Pension Cost 718 1,070 6,403 Customers’ Liabilities for Acceptances and Guarantees 44,988 61,924 401,004 Allowance for Loan Losses (23,123) (30,464) (206,109)
Total Assets ¥14,026,259 ¥13,265,847 $125,022,369
LiabilitiesDeposits ¥12,044,770 ¥11,539,237 $107,360,465 Call Money 250,000 134,500 2,228,363 Payables under Securities Lending Transactions 318,992 191,699 2,843,326 Trading Liabilities 16,474 22,905 146,841 Borrowed Money 277,646 267,573 2,474,790 Foreign Exchanges 692 640 6,174 Bonds Payable 117,267 107,545 1,045,257 Borrowed Money from Trust Account 62 — 558 Other Liabilities 53,245 73,185 474,599 Provision for Retirement Benefits 19,140 19,320 170,605 Provision for Reimbursement of Deposits 2,920 2,275 26,034 Provision for Point Loyalty Programs 268 195 2,397 Deferred Tax Liabilities 24,577 18,594 219,070 Deferred Tax Liabilities for Land Revaluation 10,930 11,069 97,431 Acceptances and Guarantees 44,988 61,924 401,004
Total Liabilities ¥13,181,978 ¥12,450,669 $117,496,913
Net AssetsCapital Stock ¥ 145,069 ¥ 145,069 $ 1,293,066 Capital Surplus 122,134 122,134 1,088,636 Retained Earnings 514,303 477,182 4,584,221
Legal Retained Earnings 50,930 50,930 453,964 Other Retained Earnings 463,373 426,252 4,130,257
Treasury Shares (52,219) (37,480) (465,459)Total Shareholders’ Equity 729,287 706,905 6,500,465
Valuation Difference on Available-for-sale Securities 102,326 96,475 912,086 Deferred Gains or Losses on Hedges 1,510 231 13,461 Revaluation Reserve for Land 10,733 11,050 95,673
Total Valuation and Translation Adjustments 114,570 107,757 1,021,220 Subscription Rights to Shares 423 516 3,771
Total Net Assets ¥ 844,280 ¥ 815,178 $ 7,525,456 Total Liabilities and Net Assets ¥14,026,259 ¥13,265,847 $125,022,369
Japanese yen amounts are presented in millions of yen by rounding down figures below one million. As a result, the totals in Japanese yen in the non-consolidated financial state-ments do not necessarily agree with the sums of individual amounts.U.S. dollar amounts are shown solely for the convenience of the readers of this Annual Report and are translated at the rate of ¥112.19 to $1.00, the exchange rate prevailing at March 31, 2017.
The Chiba Bank, Ltd.As of March 31, 2017
Non-Consolidated Balance Sheet (Unaudited)
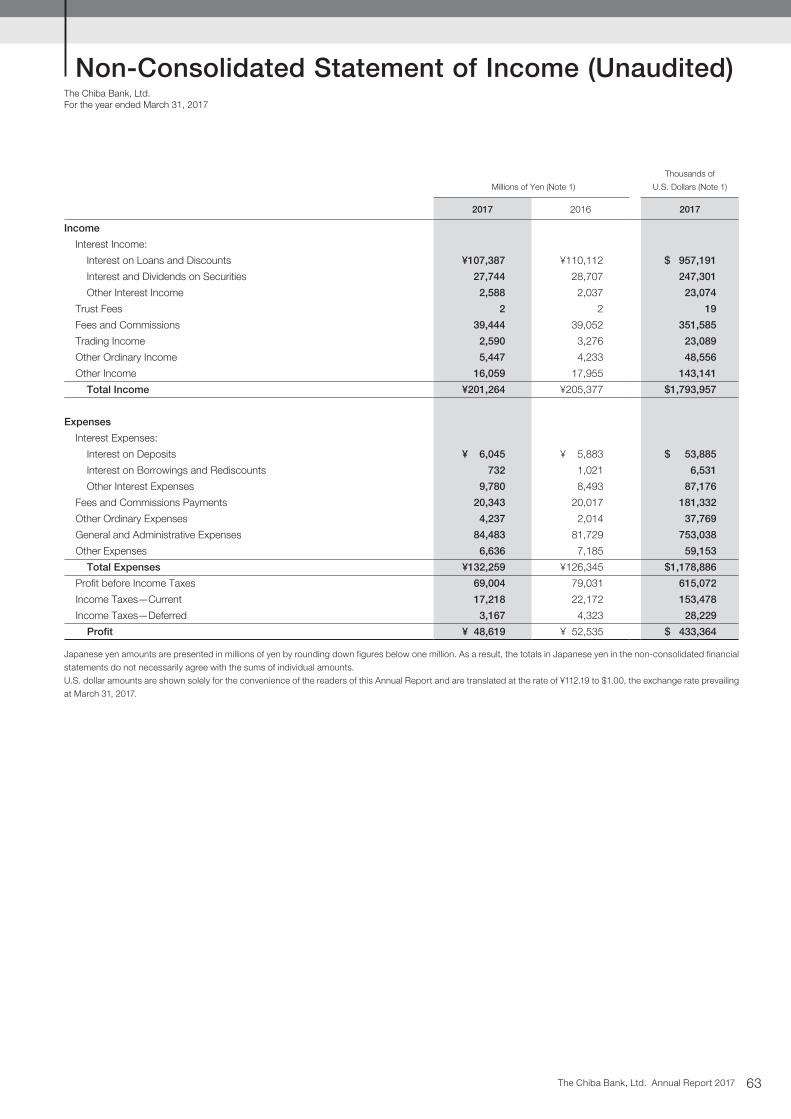
The Chiba Bank, Ltd. Annual Report 2017 63
The Chiba Bank, Ltd.For the year ended March 31, 2017
Millions of Yen (Note 1)
Thousands of
U.S. Dollars (Note 1)
2017 2016 2017
Income
Interest Income:
Interest on Loans and Discounts ¥107,387 ¥110,112 $ 957,191
Interest and Dividends on Securities 27,744 28,707 247,301
Other Interest Income 2,588 2,037 23,074
Trust Fees 2 2 19
Fees and Commissions 39,444 39,052 351,585
Trading Income 2,590 3,276 23,089
Other Ordinary Income 5,447 4,233 48,556
Other Income 16,059 17,955 143,141
Total Income ¥201,264 ¥205,377 $1,793,957
Expenses
Interest Expenses:
Interest on Deposits ¥ 6,045 ¥ 5,883 $ 53,885
Interest on Borrowings and Rediscounts 732 1,021 6,531
Other Interest Expenses 9,780 8,493 87,176
Fees and Commissions Payments 20,343 20,017 181,332
Other Ordinary Expenses 4,237 2,014 37,769
General and Administrative Expenses 84,483 81,729 753,038
Other Expenses 6,636 7,185 59,153
Total Expenses ¥132,259 ¥126,345 $1,178,886
Profit before Income Taxes 69,004 79,031 615,072
Income Taxes—Current 17,218 22,172 153,478
Income Taxes—Deferred 3,167 4,323 28,229
Profit ¥ 48,619 ¥ 52,535 $ 433,364
Japanese yen amounts are presented in millions of yen by rounding down figures below one million. As a result, the totals in Japanese yen in the non-consolidated financial statements do not necessarily agree with the sums of individual amounts.U.S. dollar amounts are shown solely for the convenience of the readers of this Annual Report and are translated at the rate of ¥112.19 to $1.00, the exchange rate prevailing at March 31, 2017.
Non-Consolidated Statement of Income (Unaudited)
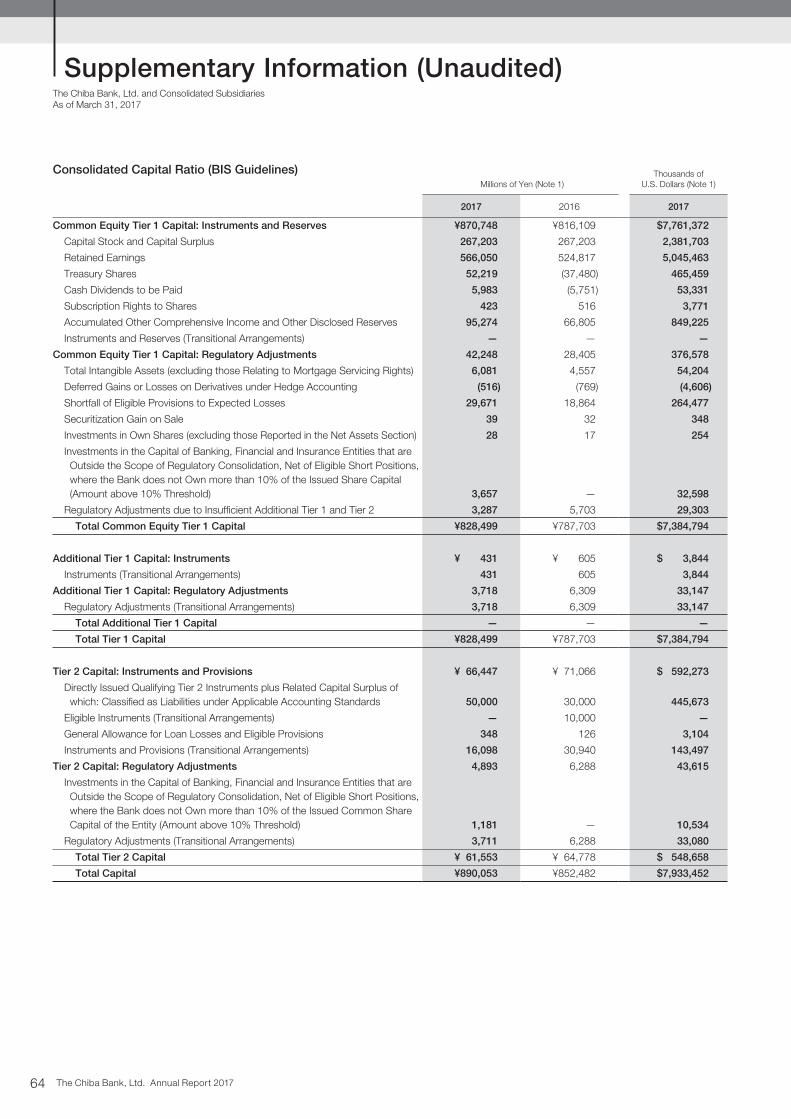
The Chiba Bank, Ltd. Annual Report 201764
The Chiba Bank, Ltd. and Consolidated SubsidiariesAs of March 31, 2017
Consolidated Capital Ratio (BIS Guidelines) Millions of Yen (Note 1)
Thousands ofU.S. Dollars (Note 1)
2017 2016 2017
Common Equity Tier 1 Capital: Instruments and Reserves ¥870,748 ¥816,109 $7,761,372
Capital Stock and Capital Surplus 267,203 267,203 2,381,703
Retained Earnings 566,050 524,817 5,045,463
Treasury Shares 52,219 (37,480) 465,459
Cash Dividends to be Paid 5,983 (5,751) 53,331
Subscription Rights to Shares 423 516 3,771
Accumulated Other Comprehensive Income and Other Disclosed Reserves 95,274 66,805 849,225
Instruments and Reserves (Transitional Arrangements) — — —
Common Equity Tier 1 Capital: Regulatory Adjustments 42,248 28,405 376,578
Total Intangible Assets (excluding those Relating to Mortgage Servicing Rights) 6,081 4,557 54,204
Deferred Gains or Losses on Derivatives under Hedge Accounting (516) (769) (4,606)
Shortfall of Eligible Provisions to Expected Losses 29,671 18,864 264,477
Securitization Gain on Sale 39 32 348
Investments in Own Shares (excluding those Reported in the Net Assets Section) 28 17 254
Investments in the Capital of Banking, Financial and Insurance Entities that are Outside the Scope of Regulatory Consolidation, Net of Eligible Short Positions, where the Bank does not Own more than 10% of the Issued Share Capital (Amount above 10% Threshold) 3,657 — 32,598
Regulatory Adjustments due to Insufficient Additional Tier 1 and Tier 2 3,287 5,703 29,303
Total Common Equity Tier 1 Capital ¥828,499 ¥787,703 $7,384,794
Additional Tier 1 Capital: Instruments ¥ 431 ¥ 605 $ 3,844
Instruments (Transitional Arrangements) 431 605 3,844
Additional Tier 1 Capital: Regulatory Adjustments 3,718 6,309 33,147
Regulatory Adjustments (Transitional Arrangements) 3,718 6,309 33,147
Total Additional Tier 1 Capital — — —
Total Tier 1 Capital ¥828,499 ¥787,703 $7,384,794
Tier 2 Capital: Instruments and Provisions ¥ 66,447 ¥ 71,066 $ 592,273
Directly Issued Qualifying Tier 2 Instruments plus Related Capital Surplus of which: Classified as Liabilities under Applicable Accounting Standards 50,000 30,000 445,673
Eligible Instruments (Transitional Arrangements) — 10,000 —
General Allowance for Loan Losses and Eligible Provisions 348 126 3,104
Instruments and Provisions (Transitional Arrangements) 16,098 30,940 143,497
Tier 2 Capital: Regulatory Adjustments 4,893 6,288 43,615
Investments in the Capital of Banking, Financial and Insurance Entities that are Outside the Scope of Regulatory Consolidation, Net of Eligible Short Positions, where the Bank does not Own more than 10% of the Issued Common Share Capital of the Entity (Amount above 10% Threshold) 1,181 — 10,534
Regulatory Adjustments (Transitional Arrangements) 3,711 6,288 33,080
Total Tier 2 Capital ¥ 61,553 ¥ 64,778 $ 548,658
Total Capital ¥890,053 ¥852,482 $7,933,452
Supplementary Information (Unaudited)
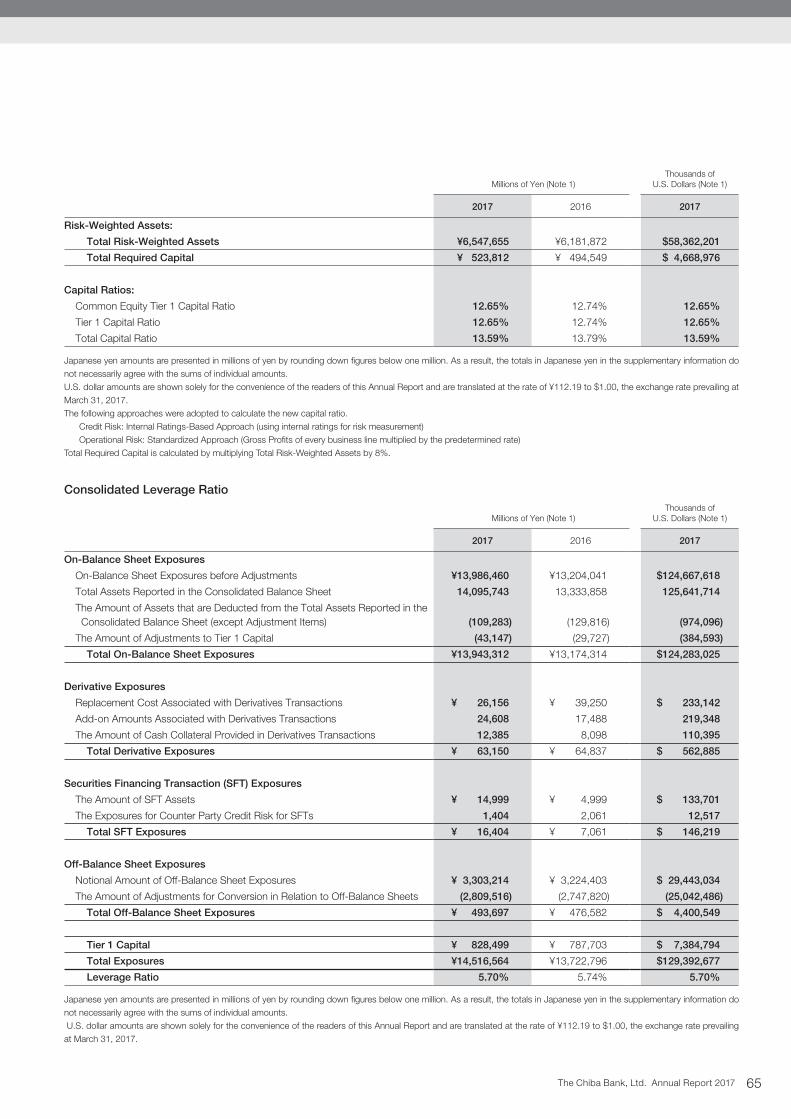
The Chiba Bank, Ltd. Annual Report 2017 65
Millions of Yen (Note 1)Thousands of
U.S. Dollars (Note 1)
2017 2016 2017
Risk-Weighted Assets:
Total Risk-Weighted Assets ¥6,547,655 ¥6,181,872 $58,362,201
Total Required Capital ¥ 523,812 ¥ 494,549 $ 4,668,976
Capital Ratios:
Common Equity Tier 1 Capital Ratio 12.65% 12.74% 12.65%
Tier 1 Capital Ratio 12.65% 12.74% 12.65%
Total Capital Ratio 13.59% 13.79% 13.59%
Japanese yen amounts are presented in millions of yen by rounding down figures below one million. As a result, the totals in Japanese yen in the supplementary information do not necessarily agree with the sums of individual amounts.U.S. dollar amounts are shown solely for the convenience of the readers of this Annual Report and are translated at the rate of ¥112.19 to $1.00, the exchange rate prevailing at March 31, 2017.The following approaches were adopted to calculate the new capital ratio. Credit Risk: Internal Ratings-Based Approach (using internal ratings for risk measurement) Operational Risk: Standardized Approach (Gross Profits of every business line multiplied by the predetermined rate)Total Required Capital is calculated by multiplying Total Risk-Weighted Assets by 8%.
Consolidated Leverage Ratio
Millions of Yen (Note 1)Thousands of
U.S. Dollars (Note 1)
2017 2016 2017
On-Balance Sheet Exposures
On-Balance Sheet Exposures before Adjustments ¥13,986,460 ¥13,204,041 $124,667,618
Total Assets Reported in the Consolidated Balance Sheet 14,095,743 13,333,858 125,641,714
The Amount of Assets that are Deducted from the Total Assets Reported in the Consolidated Balance Sheet (except Adjustment Items) (109,283) (129,816) (974,096)
The Amount of Adjustments to Tier 1 Capital (43,147) (29,727) (384,593)
Total On-Balance Sheet Exposures ¥13,943,312 ¥13,174,314 $124,283,025
Derivative Exposures
Replacement Cost Associated with Derivatives Transactions ¥ 26,156 ¥ 39,250 $ 233,142
Add-on Amounts Associated with Derivatives Transactions 24,608 17,488 219,348
The Amount of Cash Collateral Provided in Derivatives Transactions 12,385 8,098 110,395
Total Derivative Exposures ¥ 63,150 ¥ 64,837 $ 562,885
Securities Financing Transaction (SFT) Exposures
The Amount of SFT Assets ¥ 14,999 ¥ 4,999 $ 133,701
The Exposures for Counter Party Credit Risk for SFTs 1,404 2,061 12,517
Total SFT Exposures ¥ 16,404 ¥ 7,061 $ 146,219
Off-Balance Sheet Exposures
Notional Amount of Off-Balance Sheet Exposures ¥ 3,303,214 ¥ 3,224,403 $ 29,443,034
The Amount of Adjustments for Conversion in Relation to Off-Balance Sheets (2,809,516) (2,747,820) (25,042,486)
Total Off-Balance Sheet Exposures ¥ 493,697 ¥ 476,582 $ 4,400,549
Tier 1 Capital ¥ 828,499 ¥ 787,703 $ 7,384,794
Total Exposures ¥14,516,564 ¥13,722,796 $129,392,677
Leverage Ratio 5.70% 5.74% 5.70%
Japanese yen amounts are presented in millions of yen by rounding down figures below one million. As a result, the totals in Japanese yen in the supplementary information do not necessarily agree with the sums of individual amounts. U.S. dollar amounts are shown solely for the convenience of the readers of this Annual Report and are translated at the rate of ¥112.19 to $1.00, the exchange rate prevailing at March 31, 2017.
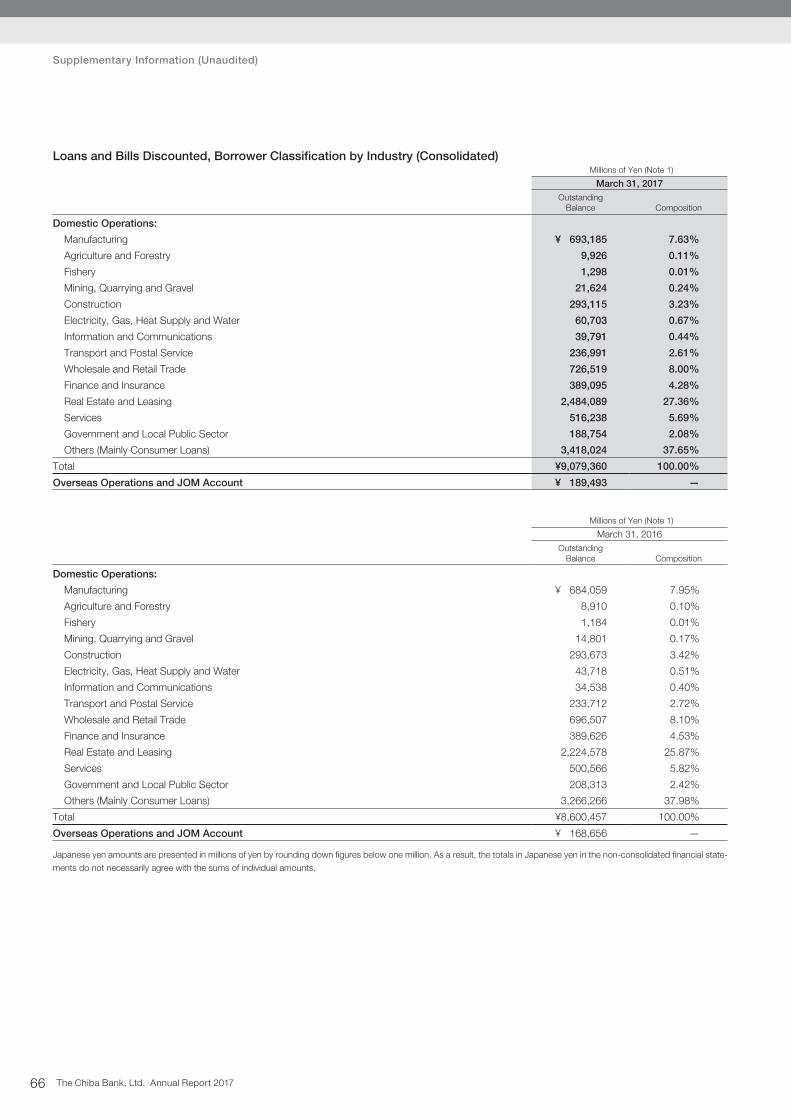
The Chiba Bank, Ltd. Annual Report 201766
Supplementary Information (Unaudited)
Millions of Yen (Note 1)
March 31, 2017Outstanding
Balance
Composition
Domestic Operations:
Manufacturing ¥ 693,185 7.63%
Agriculture and Forestry 9,926 0.11%
Fishery 1,298 0.01%
Mining, Quarrying and Gravel 21,624 0.24%
Construction 293,115 3.23%
Electricity, Gas, Heat Supply and Water 60,703 0.67%
Information and Communications 39,791 0.44%
Transport and Postal Service 236,991 2.61%
Wholesale and Retail Trade 726,519 8.00%
Finance and Insurance 389,095 4.28%
Real Estate and Leasing 2,484,089 27.36%
Services 516,238 5.69%
Government and Local Public Sector 188,754 2.08%
Others (Mainly Consumer Loans) 3,418,024 37.65%
Total ¥9,079,360 100.00%
Overseas Operations and JOM Account ¥ 189,493 —
Millions of Yen (Note 1)
March 31, 2016Outstanding
Balance
Composition
Domestic Operations:
Manufacturing ¥ 684,059 7.95%
Agriculture and Forestry 8,910 0.10%
Fishery 1,184 0.01%
Mining, Quarrying and Gravel 14,801 0.17%
Construction 293,673 3.42%
Electricity, Gas, Heat Supply and Water 43,718 0.51%
Information and Communications 34,538 0.40%
Transport and Postal Service 233,712 2.72%
Wholesale and Retail Trade 696,507 8.10%
Finance and Insurance 389,626 4.53%
Real Estate and Leasing 2,224,578 25.87%
Services 500,566 5.82%
Government and Local Public Sector 208,313 2.42%
Others (Mainly Consumer Loans) 3,266,266 37.98%
Total ¥8,600,457 100.00%
Overseas Operations and JOM Account ¥ 168,656 —
Japanese yen amounts are presented in millions of yen by rounding down figures below one million. As a result, the totals in Japanese yen in the non-consolidated financial state-ments do not necessarily agree with the sums of individual amounts.
Loans and Bills Discounted, Borrower Classification by Industry (Consolidated)
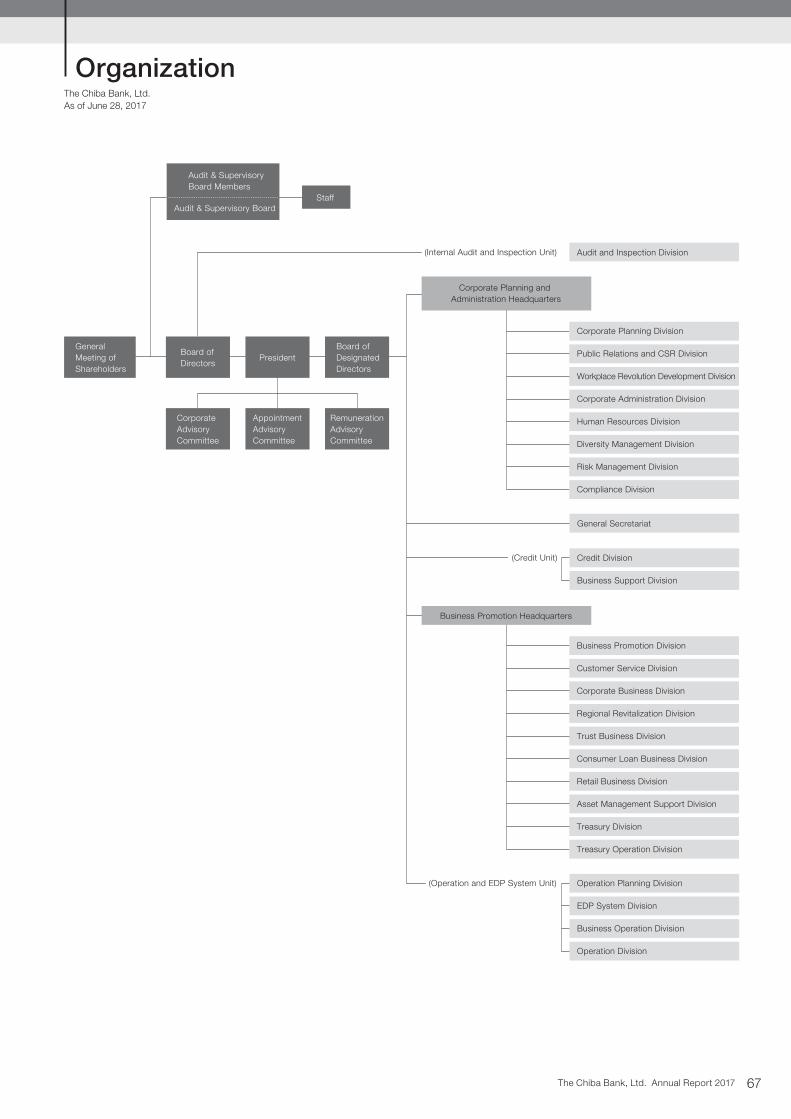
The Chiba Bank, Ltd. Annual Report 2017 67
(Credit Unit)
Business Promotion Headquarters
Corporate Planning and Administration Headquarters
(Internal Audit and Inspection Unit)
(Operation and EDP System Unit)
GeneralMeeting ofShareholders
Board ofDesignatedDirectors
RemunerationAdvisoryCommittee
Credit Division
Business Support Division
Staff
Audit & SupervisoryBoard Members
Audit & Supervisory Board
Audit and Inspection Division
President
AppointmentAdvisoryCommittee
Board ofDirectors
CorporateAdvisoryCommittee
Business Promotion Division
Customer Service Division
Corporate Business Division
Regional Revitalization Division
Trust Business Division
Consumer Loan Business Division
Retail Business Division
Asset Management Support Division
Treasury Division
Treasury Operation Division
Operation Planning Division
EDP System Division
Business Operation Division
Operation Division
Corporate Planning Division
Public Relations and CSR Division
Workplace Revolution Development Division
Corporate Administration Division
Human Resources Division
Diversity Management Division
Risk Management Division
Compliance Division
General Secretariat
The Chiba Bank, Ltd. As of June 28, 2017
Organization
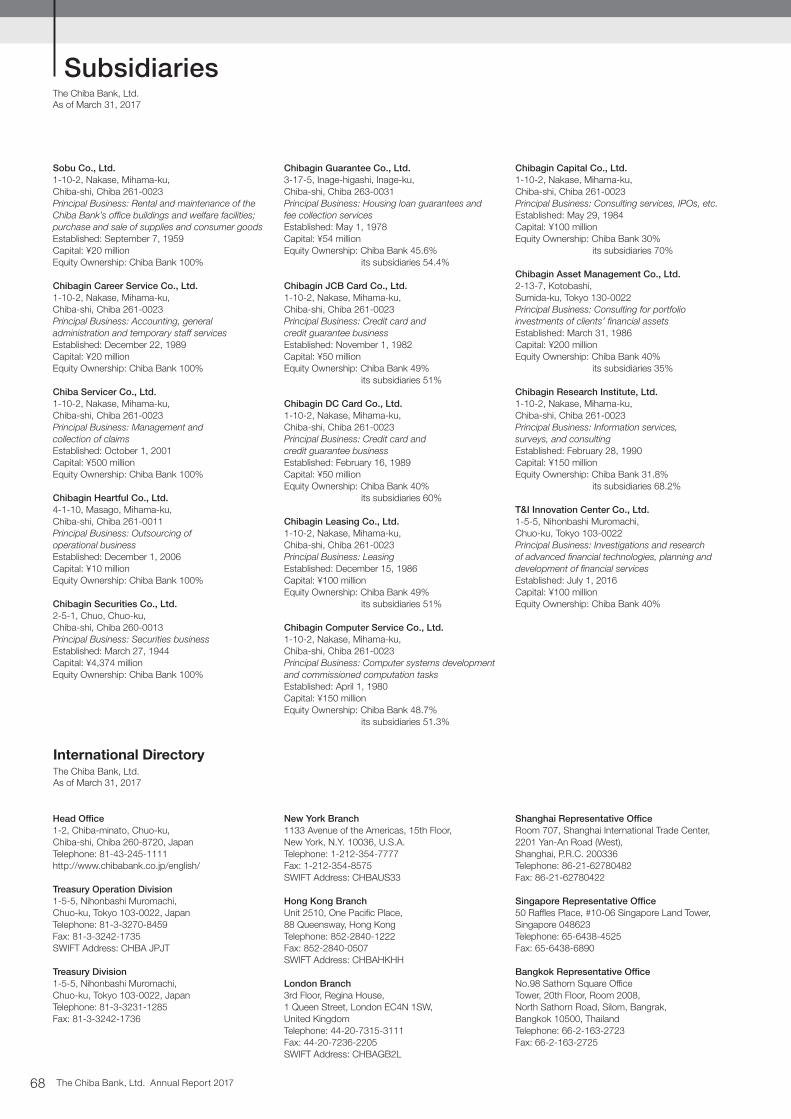
The Chiba Bank, Ltd. Annual Report 201768
The Chiba Bank, Ltd.As of March 31, 2017
Sobu Co., Ltd.1-10-2, Nakase, Mihama-ku, Chiba-shi, Chiba 261-0023Principal Business: Rental and maintenance of the Chiba Bank’s office buildings and welfare facilities; purchase and sale of supplies and consumer goodsEstablished: September 7, 1959Capital: ¥20 millionEquity Ownership: Chiba Bank 100%
Chibagin Career Service Co., Ltd.1-10-2, Nakase, Mihama-ku, Chiba-shi, Chiba 261-0023Principal Business: Accounting, general administration and temporary staff services Established: December 22, 1989Capital: ¥20 millionEquity Ownership: Chiba Bank 100%
Chiba Servicer Co., Ltd.1-10-2, Nakase, Mihama-ku, Chiba-shi, Chiba 261-0023Principal Business: Management and collection of claimsEstablished: October 1, 2001Capital: ¥500 millionEquity Ownership: Chiba Bank 100%
Chibagin Heartful Co., Ltd.4-1-10, Masago, Mihama-ku, Chiba-shi, Chiba 261-0011Principal Business: Outsourcing of operational businessEstablished: December 1, 2006Capital: ¥10 millionEquity Ownership: Chiba Bank 100%
Chibagin Securities Co., Ltd.2-5-1, Chuo, Chuo-ku,Chiba-shi, Chiba 260-0013Principal Business: Securities businessEstablished: March 27, 1944Capital: ¥4,374 millionEquity Ownership: Chiba Bank 100%
Chibagin Guarantee Co., Ltd.3-17-5, Inage-higashi, Inage-ku, Chiba-shi, Chiba 263-0031Principal Business: Housing loan guarantees and fee collection servicesEstablished: May 1, 1978Capital: ¥54 millionEquity Ownership: Chiba Bank 45.6% its subsidiaries 54.4%
Chibagin JCB Card Co., Ltd.1-10-2, Nakase, Mihama-ku, Chiba-shi, Chiba 261-0023Principal Business: Credit card and credit guarantee businessEstablished: November 1, 1982Capital: ¥50 millionEquity Ownership: Chiba Bank 49% its subsidiaries 51%
Chibagin DC Card Co., Ltd.1-10-2, Nakase, Mihama-ku, Chiba-shi, Chiba 261-0023Principal Business: Credit card and credit guarantee businessEstablished: February 16, 1989Capital: ¥50 millionEquity Ownership: Chiba Bank 40% its subsidiaries 60%
Chibagin Leasing Co., Ltd.1-10-2, Nakase, Mihama-ku, Chiba-shi, Chiba 261-0023Principal Business: LeasingEstablished: December 15, 1986Capital: ¥100 millionEquity Ownership: Chiba Bank 49% its subsidiaries 51%
Chibagin Computer Service Co., Ltd.1-10-2, Nakase, Mihama-ku, Chiba-shi, Chiba 261-0023Principal Business: Computer systems development and commissioned computation tasksEstablished: April 1, 1980Capital: ¥150 millionEquity Ownership: Chiba Bank 48.7% its subsidiaries 51.3%
Chibagin Capital Co., Ltd.1-10-2, Nakase, Mihama-ku,Chiba-shi, Chiba 261-0023Principal Business: Consulting services, IPOs, etc.Established: May 29, 1984Capital: ¥100 millionEquity Ownership: Chiba Bank 30% its subsidiaries 70%
Chibagin Asset Management Co., Ltd.2-13-7, Kotobashi, Sumida-ku, Tokyo 130-0022Principal Business: Consulting for portfolio investments of clients’ financial assetsEstablished: March 31, 1986Capital: ¥200 millionEquity Ownership: Chiba Bank 40% its subsidiaries 35%
Chibagin Research Institute, Ltd.1-10-2, Nakase, Mihama-ku, Chiba-shi, Chiba 261-0023Principal Business: Information services, surveys, and consultingEstablished: February 28, 1990Capital: ¥150 millionEquity Ownership: Chiba Bank 31.8% its subsidiaries 68.2%
T&I Innovation Center Co., Ltd.1-5-5, Nihonbashi Muromachi, Chuo-ku, Tokyo 103-0022Principal Business: Investigations and research of advanced financial technologies, planning and development of financial servicesEstablished: July 1, 2016Capital: ¥100 millionEquity Ownership: Chiba Bank 40%
International DirectoryThe Chiba Bank, Ltd.As of March 31, 2017
Head Office1-2, Chiba-minato, Chuo-ku,Chiba-shi, Chiba 260-8720, JapanTelephone: 81-43-245-1111http://www.chibabank.co.jp/english/
Treasury Operation Division1-5-5, Nihonbashi Muromachi, Chuo-ku, Tokyo 103-0022, JapanTelephone: 81-3-3270-8459 Fax: 81-3-3242-1735 SWIFT Address: CHBA JPJT
Treasury Division1-5-5, Nihonbashi Muromachi, Chuo-ku, Tokyo 103-0022, Japan Telephone: 81-3-3231-1285 Fax: 81-3-3242-1736
New York Branch1133 Avenue of the Americas, 15th Floor, New York, N.Y. 10036, U.S.A. Telephone: 1-212-354-7777 Fax: 1-212-354-8575 SWIFT Address: CHBAUS33
Hong Kong BranchUnit 2510, One Pacific Place, 88 Queensway, Hong Kong Telephone: 852-2840-1222 Fax: 852-2840-0507 SWIFT Address: CHBAHKHH
London Branch3rd Floor, Regina House, 1 Queen Street, London EC4N 1SW, United KingdomTelephone: 44-20-7315-3111Fax: 44-20-7236-2205SWIFT Address: CHBAGB2L
Shanghai Representative OfficeRoom 707, Shanghai International Trade Center,2201 Yan-An Road (West), Shanghai, P.R.C. 200336Telephone: 86-21-62780482Fax: 86-21-62780422
Singapore Representative Office50 Raffles Place, #10-06 Singapore Land Tower, Singapore 048623Telephone: 65-6438-4525Fax: 65-6438-6890
Bangkok Representative OfficeNo.98 Sathorn Square Office Tower, 20th Floor, Room 2008, North Sathorn Road, Silom, Bangrak, Bangkok 10500, ThailandTelephone: 66-2-163-2723Fax: 66-2-163-2725
Subsidiaries
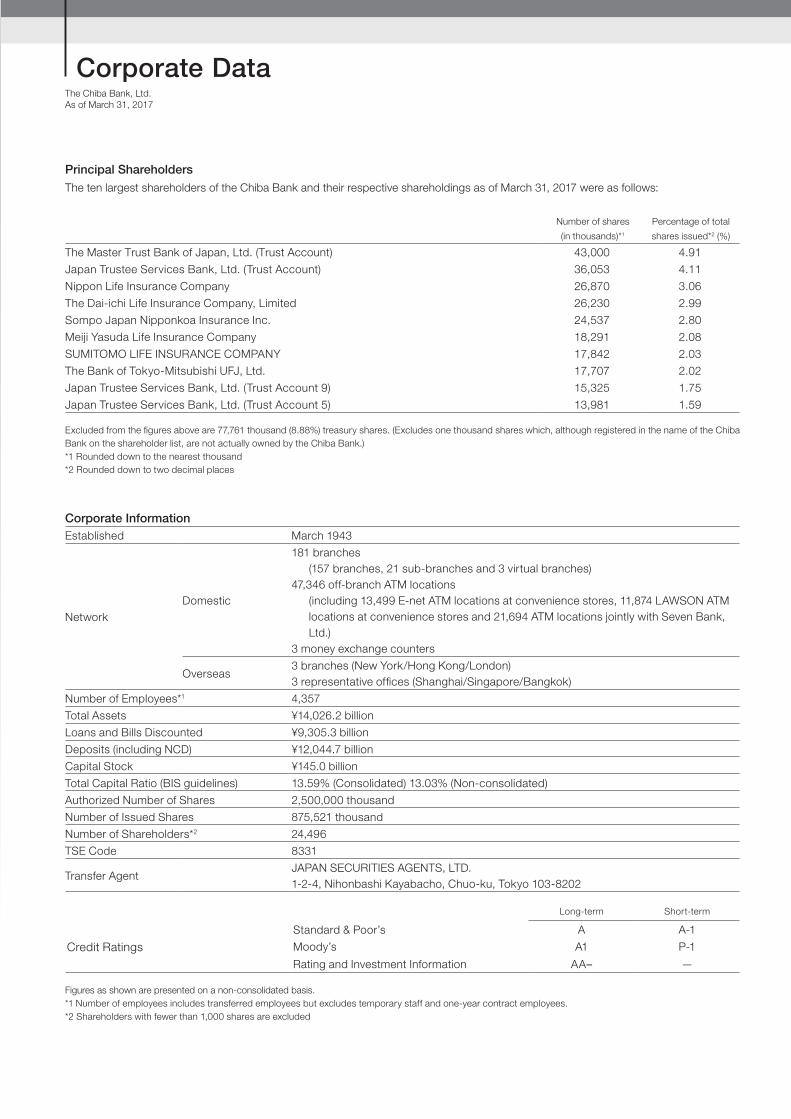
The Chiba Bank, Ltd.As of March 31, 2017
Corporate InformationEstablished March 1943
Network Domestic
181 branches (157 branches, 21 sub-branches and 3 virtual branches) 47,346 off-branch ATM locations (including 13,499 E-net ATM locations at convenience stores, 11,874 LAWSON ATM
locations at convenience stores and 21,694 ATM locations jointly with Seven Bank, Ltd.)
3 money exchange counters
Overseas 3 branches (New York/Hong Kong/London) 3 representative offices (Shanghai/Singapore/Bangkok)
Number of Employees*1 4,357
Total Assets ¥14,026.2 billion
Loans and Bills Discounted ¥9,305.3 billion
Deposits (including NCD) ¥12,044.7 billion
Capital Stock ¥145.0 billion
Total Capital Ratio (BIS guidelines) 13.59% (Consolidated) 13.03% (Non-consolidated)
Authorized Number of Shares 2,500,000 thousand
Number of Issued Shares 875,521 thousand
Number of Shareholders*2 24,496
TSE Code 8331
Transfer AgentJAPAN SECURITIES AGENTS, LTD.1-2-4, Nihonbashi Kayabacho, Chuo-ku, Tokyo 103-8202
Long-term Short-term
Standard & Poor’s A A-1
Credit Ratings Moody’s A1 P-1
Rating and Investment Information AA– —
Figures as shown are presented on a non-consolidated basis.*1 Number of employees includes transferred employees but excludes temporary staff and one-year contract employees.*2 Shareholders with fewer than 1,000 shares are excluded
Principal ShareholdersThe ten largest shareholders of the Chiba Bank and their respective shareholdings as of March 31, 2017 were as follows:
Number of shares
(in thousands)*1
Percentage of total
shares issued*2 (%)
The Master Trust Bank of Japan, Ltd. (Trust Account) 43,000 4.91
Japan Trustee Services Bank, Ltd. (Trust Account) 36,053 4.11
Nippon Life Insurance Company 26,870 3.06
The Dai-ichi Life Insurance Company, Limited 26,230 2.99
Sompo Japan Nipponkoa Insurance Inc. 24,537 2.80
Meiji Yasuda Life Insurance Company 18,291 2.08
SUMITOMO LIFE INSURANCE COMPANY 17,842 2.03
The Bank of Tokyo-Mitsubishi UFJ, Ltd. 17,707 2.02
Japan Trustee Services Bank, Ltd. (Trust Account 9) 15,325 1.75
Japan Trustee Services Bank, Ltd. (Trust Account 5) 13,981 1.59
Excluded from the figures above are 77,761 thousand (8.88%) treasury shares. (Excludes one thousand shares which, although registered in the name of the Chiba Bank on the shareholder list, are not actually owned by the Chiba Bank.)*1 Rounded down to the nearest thousand*2 Rounded down to two decimal places
Corporate Data