ANNUAL REPORT 2016 - Tatua Dairy Company as sharp as that which occurred in 2014, but this was the...
52
ANNUAL REPORT 2016
-
Upload
truongdien -
Category
Documents
-
view
216 -
download
0
Transcript of ANNUAL REPORT 2016 - Tatua Dairy Company as sharp as that which occurred in 2014, but this was the...

ANNUAL REPORT 2016

2

The Tatua Co-operative Dairy Company Limited Annual Report 20163
WELCOME TO TATUA
4-9 Report from the Chairman &
Chief Executive Officer
10 Key Financial Performance Summary
11-13 Statutory Information
FINANCIAL STATEMENTS 14 Balance Sheet
15 Statement of Comprehensive Income
16 Statement of Changes in Equity
17 Statement of Cash Flows
18-47 Notes to the Financial Statements
48 Audit Report
49 Statistics & Progress Table
50 Directory
4
Stephen Allen Chairman
Paul McGilvary Chief Executive Officer
The 2015/16 year was challenging, with global milk supply rising ahead of demand. Despite this, Tatua’s caseinate, whey protein concentrate and anhydrous milk fat remained the preferred product mix. Our specialised added-value business continued to grow, which also helped underpin our competitive financial result.
2016 The Year in Review
REPORT FROM THE CHAIRMAN & CHIEF EXECUTIVE OFFICER
The Tatua Co-operative Dairy Company Limited Annual Report 20165
FINANCIAL SUMMARYTatua generated Group revenue of NZ$289.3 million for the 2015/16
financial year. Earnings before payout, taxation and retentions was
$99.8 million, which equated to $6.41 per kilogram of milksolids.
The Board decided on a final cash payout of $6.30 per kilogram of
milksolids. A pre-tax retention of 11 cents per kilogram of milksolids
was made from earnings. Tatua enjoyed strong cash flows throughout
2015/16 and incurred no doubtful or bad debts during the year.
Our average New Zealand dollar foreign exchange conversion rate
was 0.7135 to the USD.
Our gearing ratio, or debt divided by debt plus equity, was 35.7%
at year end.
INTERNATIONAL DAIRY MARKET OVERVIEWThe 2015/16 year started well enough. August and September saw
market prices stage a short rally which buoyed hopes of a sustained
recovery. However, this was not to be; with dairy product pricing
trending lower for the remaining ten months of the year. The fall was
not as sharp as that which occurred in 2014, but this was the third
year in a row of softer dairy prices.
The softer dairy pricing was driven mainly by oversupply of milk from
the northern hemisphere. For many years European milk quotas
had constrained milk growth, so, when they were removed in early
2015, the opportunity for expansion of milk supply was seized upon
by European Union farmers. This was especially true for farmers
in more export-focused dairying nations like Ireland, the Netherlands
and Denmark.
Total European Union milk production grew by more than 2% in 2015
and this growth continued for most of 2016. With dairy production
in Europe over eight times that of New Zealand, the growth meant
that there was a large volume of extra product on the international
market. Even with global prices declining, many European farmers
resolutely increased their milk production. This growth was supported
by strong domestic dairy prices, especially for milkfat - with skim
milk powder and protein surpluses being exported into the
international market.
More positively, global dairy demand across the year was steady;
with dairy commodity import statistics for many markets regaining a
more positive tone. China’s dairy imports have been weak in recent
years, which has disrupted the market, but now we are seeing import
volumes increase. This is in spite of growth in Chinese domestic
milk production.
Demand for dairy has been somewhat subdued in oil producing
nations, due to low oil prices. But, for the most part, global
consumption has been stronger, based on recognition by consumers
of dairy’s nutritional advantages.
STRATEGIC PROGRESS2015/16 could best be described as a year of building the base
for the next stage of growth.
In 2015/16 we did much to make our business more sustainable.
Our first project was to design and build a new Enterprise Resource
Planning (ERP) system for the business. Strong progress was made
on this, and at year end we had completed the detailed design phase
and had started on building the system. The “go-live” date for this
new system is set for 31 March 2017.
It is essential that Tatua has modern information technology systems,
which connects our business end-to-end to deliver superior customer
service and maximise operating efficiency into the future.
Secondly, we developed and had approved a proposal to further
improve the quality of the water flowing from the plant. Construction
has started on a Dissolved Air Flotation (DAF) plant to remove
residual milksolids from our waste-water and allow a much cleaner
stream of water to be irrigated on surrounding farms. The DAF plant
is scheduled to be operational for the start of the 2017/18 milk
season. Associated with this project was renewal of all local authority
consents to discharge water for another 15 years.
Thirdly, we fully resourced and bedded down the operations of our two
new offshore subsidiaries, Tatua Dairy Products (Shanghai) Co., Ltd
and Tatua USA Ltd. These two companies, along with
Tatua Japan Co Ltd, represent our physical presence in our most
important markets. These companies and their 17 staff enable us to
provide technical support for our products on the ground in market,
better control our supply chain all the way to the final customer, and
gain better market intelligence. This structure provides us with a
stronger business platform for future growth.
6
Other key projects to improve Tatua’s future sustainability included:
1) Expansion of our milk reception capacity to improve milk
handling at the peak of the season;
2) Investment in a new site security system to ensure our supply
chain and production processes are secure from outside
interference;
3) Upgrading of our lactoferrin plant to meet higher customer
requirements;
4) Review of our systems for managing milk supply growth;
No changes were made, but our knowledge base has been
extended for the future;
5) Submissions to the Ministry for Primary Industries on the
shape of the regulations supporting competition within the
New Zealand dairy industry; and
6) Strengthened governance structures for both Health and
Safety, and Food Safety.
The other key focus in 2015/16 was people. At Tatua we believe in
the power of people. We have a strategic theme to recruit, retain and
develop great people.
Several key appointments were made during the year, including a new
advisor for the Tatua Shanghai board, and a new manager of product
development. In addition, the company maintained a very high level
of investment in both vocational training and the development of key
leadership talent.
We believe the quality of our people is a key differentiator for Tatua.
DIRECTORSMark Dewdney and Bruce Wilton retired by rotation during the year.
Both offered themselves for re-election and were both re-elected
for a further three year term. Appointed directors Peter Schuyt and
Ross Townshend reached the end of their three year term and were
also reappointed.
OUTLOOK 2016/17In announcing a strong result for 2015/16, we are mindful that the
2016/17 year will remain challenging. Global demand is stronger,
but the strength of demand is mixed across markets.
Prices for milkpowder are responding positively to lower New Zealand
milk production, but there is some doubt that these can be sustained.
The high global stocks of animal feed at historically low prices means
milk supply can respond quickly to any lift in prices.
The European Union (EU) has just announced another extensive
range of support measures under the title “500m Euro Solidarity
Package for Farmers”. This includes extensions to Skim Milk Powder
intervention and private storage aid beyond 30 September 2016.
These extensions, plus the requirement for the EU to start releasing
older stocks to the market soon, does not bode well for further
milkpowder or caseinate price recovery in the short term.
With the investment we have made in our offshore subsidiaries we
are now better placed to continue selling, especially specialised
added value products, into our key markets.
Our expected earnings for 2016/17 is $5.50 - $6.00 per kilogram of
milksolids and our opening advance milk price is $4.00 per kilogram
of milksolids. These will both be reviewed when we undertake our
first reforecast for the year in November 2016.
Tatua continues to focus on all aspects of sustainability;
environmental, financial and social. Our Company is made up of 113
supplying farms, comprising 86 farming families and 370 employees
and their respective families. Long-term confidence and stability for
our farming families, staff and customers is paramount to allow Tatua
to continue its strategy of adding value to our Shareholders milk.
The Tatua Co-operative Dairy Company Limited Annual Report 20167
COMMUNITY INITIATIVESWe hosted many students at Tatua during the year. These visits
comprise a presentation of the Company, introduction to staff
from different areas in the business, a product tasting, and a site
tour. Our intention is to provide students with an insight into the
career opportunities which exist in a business such as Tatua.
As a multi-dimensional food and nutritionals company, the students
get a sense of the opportunities that exist in science, technology,
commerce, international trade, and environmental sustainability.
We also talk about our vision and values, and the importance of
leadership and developing people.
During the year we hosted visits from:
• St Peter’s School
• Lincoln University
• Springdale School
• Rabobank Agri Development – The University of Waikato
• Ngāti Hauā Students• Agri Business students from The University of Waikato
• Morrinsville Intermediate School
• Morrinsville College Science Academy Mentor Students
• Morrinsville College
• St Peter’s Economics Group
This is a strong signal regarding Tatua’s growing engagement
with the wider community.
Katrina Chun, the first recipient of the Tatua Graduate Scholarship,
received her Masters Degree in Engineering from The University of
Auckland in May 2016 and is now working with Tatua’s Commercial
and Technology Manager, Tim Winter, as a Technology Analyst.
FAREWELLSTwo key people have advised their intention to leave the company
this year. Hon. John Luxton (Director) and Mr Paul McGilvary, our
current Chief Executive Officer.
Both John and Paul feature in the next section of the Annual Report. Paul McGilvary Chief Executive Officer
Stephen Allen Chairman
ACKNOWLEDGEMENTSPeople are fundamental to Tatua. Other assets can be replicated
but people are the unique differentiator for our company.
We want to acknowledge all those people who contribute so much
to the performance of Tatua.
Firstly, to our customers. No customers, no business, it’s that simple.
We sincerely thank you for trusting us with your critical supplies
and we assure you that we have a deep commitment to meet your
requirements on a long term basis.
To our suppliers of goods and services. Our quality depends on
your quality. The support you give us is fantastic.
To our shareholders. Your loyalty and commitment to Tatua is
unquestioned. Once again you have supplied milk to us of the
highest quality, but more than that, you have willingly committed
resources to allow us to continue to build Tatua as an iconic
New Zealand company. A co-operative is only as strong as its
members and you demonstrate every day the strength which allows
Tatua to flourish.
Finally, to our staff. Day in and day out you add value to our farmers’
milk. Our staff survey tells us you are a highly motivated and capable
team. We are proud of you and feel privileged to work with you.
Our thanks to you all, without you Tatua would not be the iconic
company that it is.
8
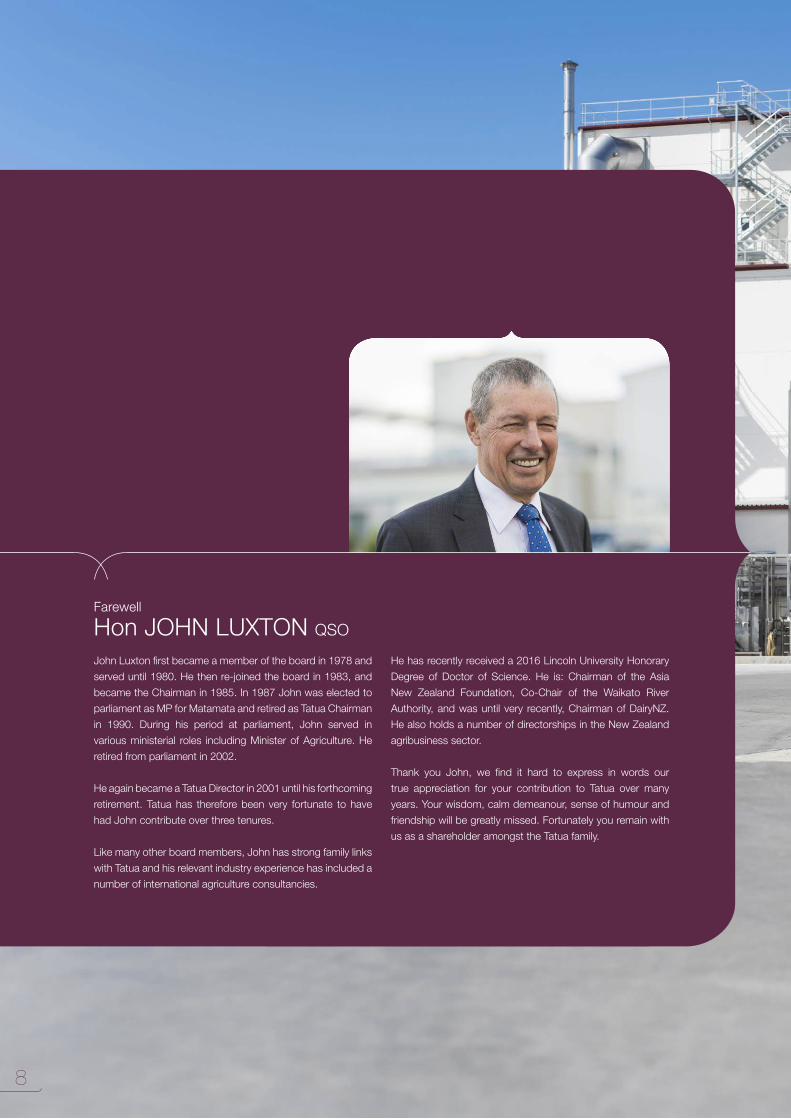
John Luxton first became a member of the board in 1978 and
served until 1980. He then re-joined the board in 1983, and
became the Chairman in 1985. In 1987 John was elected to
parliament as MP for Matamata and retired as Tatua Chairman
in 1990. During his period at parliament, John served in
various ministerial roles including Minister of Agriculture. He
retired from parliament in 2002.
He again became a Tatua Director in 2001 until his forthcoming
retirement. Tatua has therefore been very fortunate to have
had John contribute over three tenures.
Like many other board members, John has strong family links
with Tatua and his relevant industry experience has included a
number of international agriculture consultancies.
He has recently received a 2016 Lincoln University Honorary
Degree of Doctor of Science. He is: Chairman of the Asia
New Zealand Foundation, Co-Chair of the Waikato River
Authority, and was until very recently, Chairman of DairyNZ.
He also holds a number of directorships in the New Zealand
agribusiness sector.
Thank you John, we find it hard to express in words our
true appreciation for your contribution to Tatua over many
years. Your wisdom, calm demeanour, sense of humour and
friendship will be greatly missed. Fortunately you remain with
us as a shareholder amongst the Tatua family.
Farewell
Hon JOHN LUXTON QSO

The Tatua Co-operative Dairy Company Limited Annual Report 20169
Paul McGilvary began as Chief Executive Officer at Tatua on
1 June 2008.
During Paul’s time at Tatua we have seen the company
grow in terms of staff numbers, physical assets and returns
to shareholders.
Paul’s emphasis on people has created a culture where
people are highly engaged at Tatua.
For the past eight and a half years Paul has led Tatua into a
leading position in the New Zealand dairy industry with record
payout differentials.
Under Paul’s leadership, production facilities have been
brought up to a world class standard and our industry
relationships have been greatly strengthened. In addition,
our three offshore subsidiaries are in place in our key markets
to further drive growth and de-risk our supply chain.
Paul leaves Tatua with all the infrastructure and systems in place
for the company to undertake another major growth step.
The relationship between the Chief Executive Officer and
the Board, particularly the Chairman, is unique and special.
The nature of the relationship can be best described as friendly,
but above all professional. It is our most important relationship.
Thank you so much Paul, you have been fantastic for Tatua.
We are sure that you will continue to make a significant
contribution to New Zealand, through a range of non-executive
roles. You will always be a part of the Tatua family. Go well Paul!
Farewell
Mr PAUL McGILVARY

0
200
400
600
800
1000
2011/12 2012/13 2013/14 2014/15 2015/16
Group Surplus Before Payout And Tax
cent
s /
kg m
ilkso
lids
827
857
1032
773
641
0
40%
2011/12 2012/13 2013/14 2014/15 2015/16
Gearing (%Debt To Debt Plus Members Funds)
5%
10%
20%
30%
15%
25%
35%
33.7
%
27.8
%
25.2
%
36.6
%
35.7
%
0
900
2011/12 2012/13 2013/14 2014/15 2015/16
Payout – Income Equivalent
cent
s /
kg m
ilkso
lids
200
300
500
700
100
400
600
800
750
740
900
710
630
0
140
2011/12 2012/13 2013/14 2014/15 2015/16
Members Funds
$ m
illion
s
20
60
100
40
80
120
$77m
$87m
$106
m
$100
m
$117
m
10
KEY FINANCIAL PERFORMANCE SUMMARY2015/16 IN REVIEW
Summary 2015/16 2014/15
Milk Received from Suppliers litres 173,184,398 173,353,171Milksolids Received from Suppliers kgs 15,568,586 15,663,949Group Revenue $ $289,337,045 $285,767,169 Group Surplus Before Payout & Tax cts/kg m'solids 640.7 773.2Group Depreciation cts/kg m'solids 70.6 50.0Cash Payout to Suppliers cts/kg m'solids 630.0 710.0Capital Expenditure $ $8,163,723 $58,824,623 Group Assets $ $238,810,564 $241,418,570 Gearing: Debt to Debt + Equity % 35.7% 36.6%
The Tatua Co-operative Dairy Company Limited Annual Report 201611
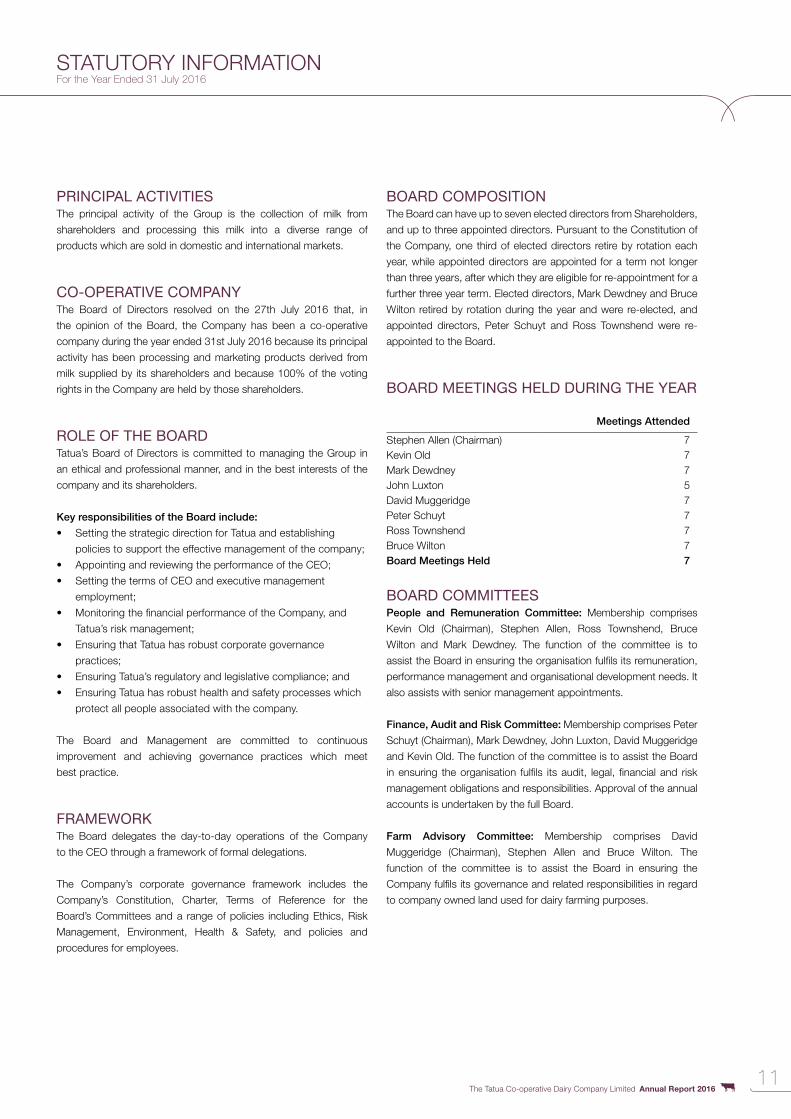
STATUTORY INFORMATIONFor the Year Ended 31 July 2016
PRINCIPAL ACTIVITIESThe principal activity of the Group is the collection of milk from
shareholders and processing this milk into a diverse range of
products which are sold in domestic and international markets.
CO-OPERATIVE COMPANYThe Board of Directors resolved on the 27th July 2016 that, in
the opinion of the Board, the Company has been a co-operative
company during the year ended 31st July 2016 because its principal
activity has been processing and marketing products derived from
milk supplied by its shareholders and because 100% of the voting
rights in the Company are held by those shareholders.
ROLE OF THE BOARDTatua’s Board of Directors is committed to managing the Group in
an ethical and professional manner, and in the best interests of the
company and its shareholders.
Key responsibilities of the Board include:
• Setting the strategic direction for Tatua and establishing
policies to support the effective management of the company;
• Appointing and reviewing the performance of the CEO;
• Setting the terms of CEO and executive management
employment;
• Monitoring the financial performance of the Company, and
Tatua’s risk management;
• Ensuring that Tatua has robust corporate governance
practices;
• Ensuring Tatua’s regulatory and legislative compliance; and
• Ensuring Tatua has robust health and safety processes which
protect all people associated with the company.
The Board and Management are committed to continuous
improvement and achieving governance practices which meet
best practice.
FRAMEWORKThe Board delegates the day-to-day operations of the Company
to the CEO through a framework of formal delegations.
The Company’s corporate governance framework includes the
Company’s Constitution, Charter, Terms of Reference for the
Board’s Committees and a range of policies including Ethics, Risk
Management, Environment, Health & Safety, and policies and
procedures for employees.
BOARD COMPOSITIONThe Board can have up to seven elected directors from Shareholders,
and up to three appointed directors. Pursuant to the Constitution of
the Company, one third of elected directors retire by rotation each
year, while appointed directors are appointed for a term not longer
than three years, after which they are eligible for re-appointment for a
further three year term. Elected directors, Mark Dewdney and Bruce
Wilton retired by rotation during the year and were re-elected, and
appointed directors, Peter Schuyt and Ross Townshend were re-
appointed to the Board.
BOARD MEETINGS HELD DURING THE YEAR
Meetings Attended
Stephen Allen (Chairman) 7Kevin Old 7Mark Dewdney 7John Luxton 5David Muggeridge 7Peter Schuyt 7Ross Townshend 7Bruce Wilton 7Board Meetings Held 7
BOARD COMMITTEESPeople and Remuneration Committee: Membership comprises
Kevin Old (Chairman), Stephen Allen, Ross Townshend, Bruce
Wilton and Mark Dewdney. The function of the committee is to
assist the Board in ensuring the organisation fulfils its remuneration,
performance management and organisational development needs. It
also assists with senior management appointments.
Finance, Audit and Risk Committee: Membership comprises Peter
Schuyt (Chairman), Mark Dewdney, John Luxton, David Muggeridge
and Kevin Old. The function of the committee is to assist the Board
in ensuring the organisation fulfils its audit, legal, financial and risk
management obligations and responsibilities. Approval of the annual
accounts is undertaken by the full Board.
Farm Advisory Committee: Membership comprises David
Muggeridge (Chairman), Stephen Allen and Bruce Wilton. The
function of the committee is to assist the Board in ensuring the
Company fulfils its governance and related responsibilities in regard
to company owned land used for dairy farming purposes.

12
DIRECTORS REMUNERATIONDirectors’ remuneration is approved by shareholder resolution at the
Annual General Meeting based upon a recommendation from the
Directors’ Remuneration Committee, which is comprised of non-
Director shareholders. The following persons held office as Director
during the year and received the following remuneration:
Stephen Allen $110,000 Mark Dewdney $44,000 John Luxton $44,000 David Muggeridge $59,000 Kevin Old $59,000 Peter Schuyt $59,000 Ross Townshend $44,000 Bruce Wilton $44,000
$463,000
DIRECTORS’ SHAREHOLDINGSAt 31 July 2016 Directors held the following shares in the Company:
Beneficially Held
Non-Beneficially
Held
Held By Associated
Persons
Stephen Allen 2,252,110 – 854,960 John Luxton 4,759,410 – 2,743,970 David Muggeridge 1,036,500 – – Kevin Old 1,252,380 – 2,703,410 Mark Dewdney 1,368,040 – – Bruce Wilton 1,299,010 – –
DIRECTORS’ INSURANCEThe Company paid insurance premiums during the year for Directors
and Officers Liability Insurance as permitted by the Constitution and
the Companies Act 1993. This insurance provides cover against
costs and expenses involved in defending legal actions and any
resulting payments arising from a liability to persons (other than the
Company or related body corporate) incurred in their capacity as
Director or executive employee unless the conduct involves a wilful
breach of duty or an improper use of inside information or position
to gain advantage.
DISCLOSURE OF INTERESTSDirectors have declared that they are to be regarded as having an
interest in any contract that may be made with entities below by
virtue of their directorship or membership of those entities.
All elected Directors, in their capacity as Supplying Shareholders,
conduct business with the Company. Directors who hold shares in the
Company do so on the basis that they are Supplying Shareholders.
Director Position Company
Stephen Allen Director Claybrook Farms LtdDirector Claybrook No 7 LtdDirector Claybrook South LtdDirector RDGP LtdDirector RDL Dairies LtdDirector Mowata GP LtdDirector Cheadle Farms LtdDirector Bendigo Terrace Farming LtdDirector Allen Children LtdTrustee Sarah Ethne Allen TrustTrustee SB & BL Allen Family Trust Trustee Cheadle TrustTrustee David Johnstone
Charitable TrustTrustee JES Allen Estate
David Muggeridge Director Muggeridge Farms LtdKevin Old Director Kold Holdings Ltd
Director VGO LtdTrustee VGO TrustTrustee/Beneficiary
CR & AL Old Trust
Ross Townshend Chairman Robert Monk Transport LtdDirector Ranworth Farm LtdDirector Townshend Aviation LtdExecutive Chairman
RML Engineering Ltd (and subsidiaries)
Chairman BAR Automation Ltd (India)Director Townshend Holdings
(2015) LtdDirector Townshend
Developments LtdAppointed Director
Veterinary Enterprises Group
STATUTORY INFORMATIONFor the Year Ended 31 July 2016

The Tatua Co-operative Dairy Company Limited Annual Report 201613
John Luxton Chairman Pouarua FLPChairman Asia NZ FoundationCo-Chairman Waikato River AuthorityDirector Wallace Corporation LtdDirector JD & RD Wallace LtdDirector Luxton & Co LtdDirector Marire Holdings LtdDirector JoRoBros LtdDirector Luxlink Farms LtdDirector Brojo Farms LtdDirector Level 8 LtdTrustee Luxton Family TrustTrustee RJ Douglas Trust
Peter Schuyt Director TSB Bank LtdDirector Dairy Investments Fund LtdDirector Pumpkin Patch Ltd (In
Receivership)Director Tax Management NZ LtdDirector Foodstuffs North Island LtdDirector DairyNZ Ltd
Mark Dewdney Director/Shareholder
Civram Ltd
Director Yanakie Farm Management Pty Ltd
Director PGG Wrightson Limited Group subsidiaries
Director Northern Districts Cricket Association
Trustee/Beneficiary
Dewdney Family Trust
Trustee Marvic Family TrustTrustee Mark Dewdney Family TrustTrustee Namaste Farming Pty LtdTrustee Namaste Land Pty Ltd
Bruce Wilton Director Brandmar LtdDirector Fernwater Investments 2013
Ltd
EMPLOYEES’ REMUNERATIONDuring the year to 31 July 2016 the following number of employees
of the Group received total remuneration of at least $100,000:
Total remuneration includes salaries, bonus payments, and other
benefits received in the capacity as an employee during the year, e.g.
company vehicles, insurance and superannuation. Bonus payments
may relate to multiple years, but paid in one lump sum.
Number of Employees
Group Parent$100,000 – $109,999 33 32 $110,000 – $119,999 33 33 $120,000 – $129,999 16 15 $130,000 – $139,999 12 12 $140,000 – $149,999 7 7 $150,000 – $159,999 8 7 $160,000 – $169,999 3 2 $170,000 – $179,999 3 3 $180,000 – $189,000 5 4 $190,000 – $199,999 2 2 $200,000 – $209,999 2 2 $210,000 – $219,999 3 3 $220,000 – $229,999 - -$230,000 – $239,999 - -$240,000 – $249,999 1 1 $250,000 – $259,999 1 1 $280,000 – $289,999 1 -$290,000 – $299,999 1 1 $300,000 – $309,999 1 -$340,000 – $349,999 2 1 $440,000 – $449,999 1 1 $470,000 – $479,999 1 1 $1,230,000 – $1,239,999 1 1
137 129
DONATIONS & GRANTSDonations and grants for the year ended 31 July 2016 were $44,836
(2015: $25,202).
14
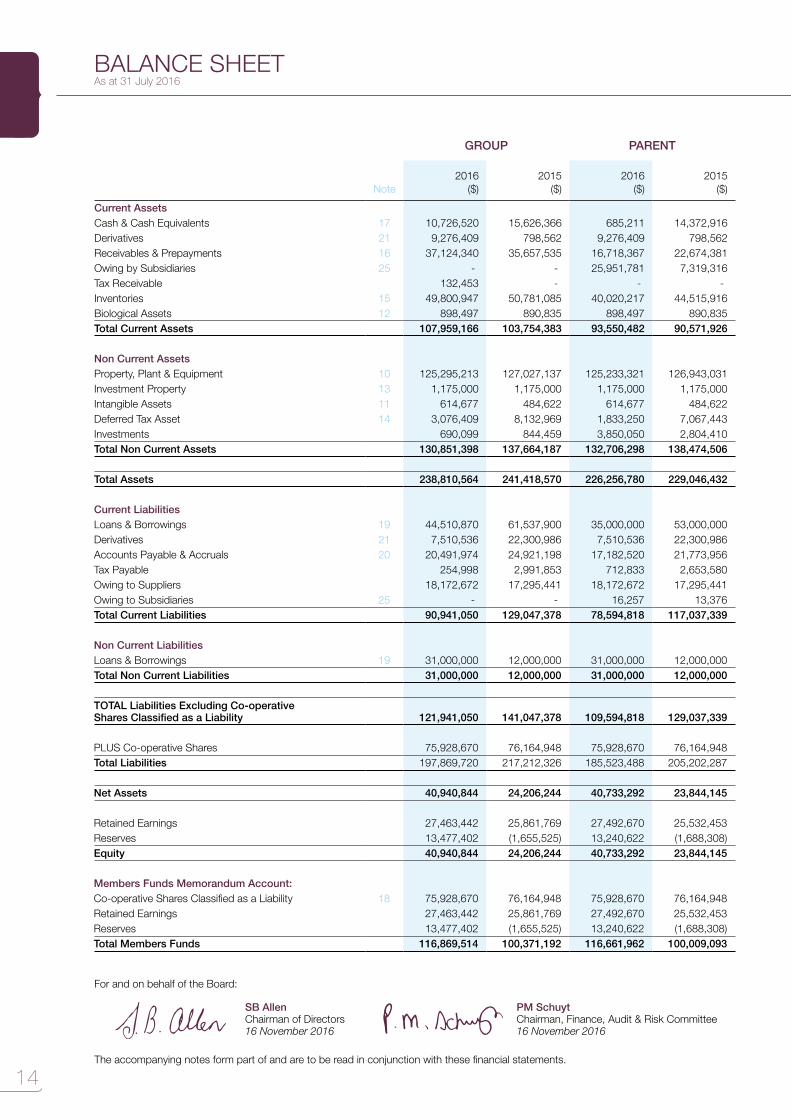
For and on behalf of the Board:
SB Allen Chairman of Directors16 November 2016
PM Schuyt Chairman, Finance, Audit & Risk Committee16 November 2016
The accompanying notes form part of and are to be read in conjunction with these financial statements.
GROUP PARENT
Note2016
($)2015
($)2016
($)2015
($)
Current AssetsCash & Cash Equivalents 17 10,726,520 15,626,366 685,211 14,372,916 Derivatives 21 9,276,409 798,562 9,276,409 798,562 Receivables & Prepayments 16 37,124,340 35,657,535 16,718,367 22,674,381 Owing by Subsidiaries 25 - - 25,951,781 7,319,316 Tax Receivable 132,453 - - -Inventories 15 49,800,947 50,781,085 40,020,217 44,515,916 Biological Assets 12 898,497 890,835 898,497 890,835 Total Current Assets 107,959,166 103,754,383 93,550,482 90,571,926
Non Current AssetsProperty, Plant & Equipment 10 125,295,213 127,027,137 125,233,321 126,943,031 Investment Property 13 1,175,000 1,175,000 1,175,000 1,175,000 Intangible Assets 11 614,677 484,622 614,677 484,622 Deferred Tax Asset 14 3,076,409 8,132,969 1,833,250 7,067,443 Investments 690,099 844,459 3,850,050 2,804,410 Total Non Current Assets 130,851,398 137,664,187 132,706,298 138,474,506
Total Assets 238,810,564 241,418,570 226,256,780 229,046,432
Current LiabilitiesLoans & Borrowings 19 44,510,870 61,537,900 35,000,000 53,000,000 Derivatives 21 7,510,536 22,300,986 7,510,536 22,300,986 Accounts Payable & Accruals 20 20,491,974 24,921,198 17,182,520 21,773,956 Tax Payable 254,998 2,991,853 712,833 2,653,580 Owing to Suppliers 18,172,672 17,295,441 18,172,672 17,295,441 Owing to Subsidiaries 25 - - 16,257 13,376 Total Current Liabilities 90,941,050 129,047,378 78,594,818 117,037,339
Non Current LiabilitiesLoans & Borrowings 19 31,000,000 12,000,000 31,000,000 12,000,000 Total Non Current Liabilities 31,000,000 12,000,000 31,000,000 12,000,000
TOTAL Liabilities Excluding Co-operative Shares Classified as a Liability 121,941,050 141,047,378 109,594,818 129,037,339
PLUS Co-operative Shares 75,928,670 76,164,948 75,928,670 76,164,948 Total Liabilities 197,869,720 217,212,326 185,523,488 205,202,287
Net Assets 40,940,844 24,206,244 40,733,292 23,844,145
Retained Earnings 27,463,442 25,861,769 27,492,670 25,532,453 Reserves 13,477,402 (1,655,525) 13,240,622 (1,688,308)Equity 40,940,844 24,206,244 40,733,292 23,844,145 Members Funds Memorandum Account:Co-operative Shares Classified as a Liability 18 75,928,670 76,164,948 75,928,670 76,164,948 Retained Earnings 27,463,442 25,861,769 27,492,670 25,532,453 Reserves 13,477,402 (1,655,525) 13,240,622 (1,688,308)Total Members Funds 116,869,514 100,371,192 116,661,962 100,009,093
BALANCE SHEETAs at 31 July 2016

The Tatua Co-operative Dairy Company Limited Annual Report 201615
The accompanying notes form part of and are to be read in conjunction with these financial statements.
GROUP PARENT
Note
Year Ended 31 July
2016($)
Year Ended 31 July
2015($)
Year Ended 31 July
2016($)
Year Ended 31 July
2015($)
Profit or Loss ItemsTotal Operating Revenue 289,337,045 285,767,169 277,187,504 278,531,169less Payments for Milk Supplied (97,679,820) (110,603,176) (97,679,820) (110,603,176)less Other Cost of Sales (147,482,221) (136,867,018) (140,394,926) (128,804,048)Gross Profit 44,175,004 38,296,975 39,112,758 39,123,945
plus Other Income 5 1,984,558 2,952,801 1,952,483 2,429,712less Sales & Marketing Expenses (20,010,048) (16,840,063) (14,774,320) (14,491,670)less Administration Expenses 6 (10,273,228) (11,427,835) (10,273,228) (11,427,835)Surplus from Operating Activities 15,876,286 12,981,878 16,017,693 15,634,152
Finance Income 8 4,383,272 5,032,446 4,374,985 5,042,341less Finance Expenses 8 (18,188,583) (7,497,821) (17,989,520) (7,327,768)Net Finance Income (13,805,311) (2,465,375) (13,614,535) (2,285,427)
Surplus before Income Tax 2,070,975 10,516,503 2,403,158 13,348,725
less Income Tax (Expense) 9 (469,302) (3,496,083) (442,941) (4,044,053)
Net Surplus 1,601,673 7,020,420 1,960,217 9,304,672
Other Comprehensive IncomeMovement in Land Revaluation Reserve 1,292,500 90,471 1,292,500 90,471Change in Fair Value of Cash Flow Hedges Transferred to Income Statement 23,268,298 (18,923,731) 23,268,298 (18,923,731)
Effective Portion of Changes in the Fair Value of Cashflow Hedges (4,328,812) (4,702,843) (4,328,812) (4,702,843)
Movement in Foreign Exchange Reserve 203,997 340,451 - -Income Tax on Other Comprehensive Income (5,303,056) 6,615,440 (5,303,056) 6,615,440
Other Comprehensive Income for the Year 15,132,927 (16,580,212) 14,928,930 (16,920,663)
Total Comprehensive Income 16,734,600 (9,559,792) 16,889,147 (7,615,991)
STATEMENT OF COMPREHENSIVE INCOMEFor the Year Ended 31 July 2016
16
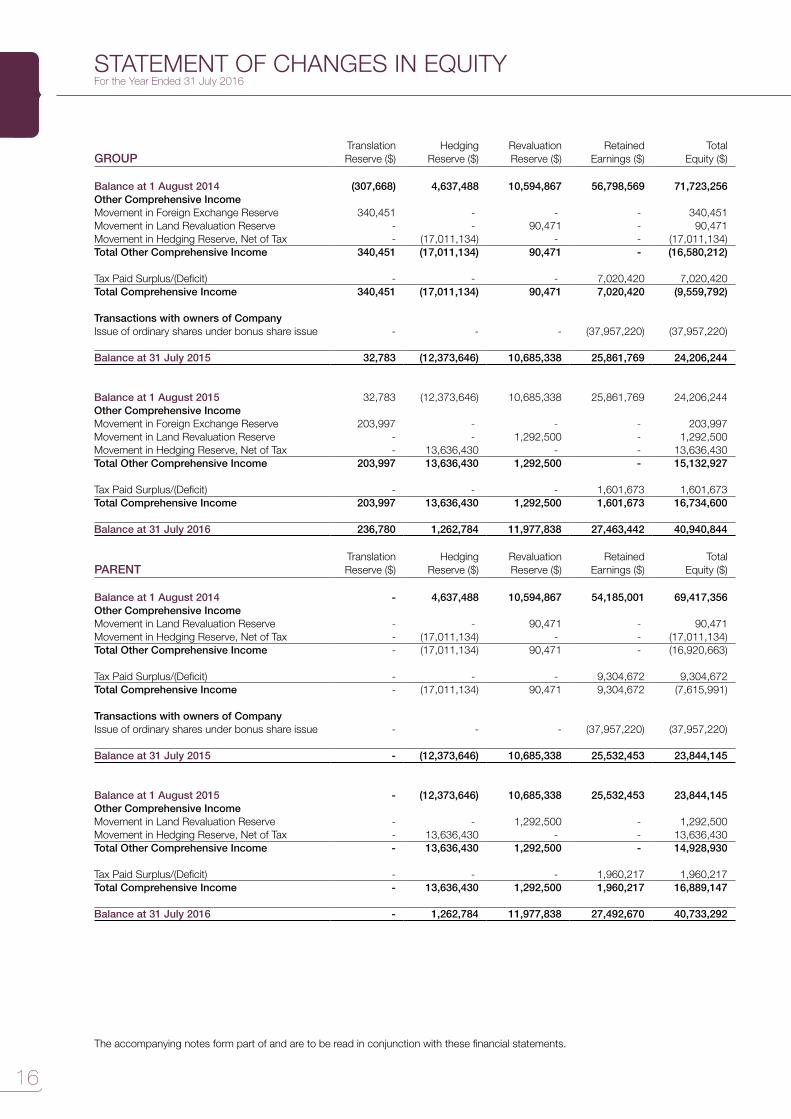
The accompanying notes form part of and are to be read in conjunction with these financial statements.
GROUPTranslation Reserve ($)
Hedging Reserve ($)
Revaluation Reserve ($)
Retained Earnings ($)
Total Equity ($)
Balance at 1 August 2014 (307,668) 4,637,488 10,594,867 56,798,569 71,723,256Other Comprehensive IncomeMovement in Foreign Exchange Reserve 340,451 - - - 340,451 Movement in Land Revaluation Reserve - - 90,471 - 90,471 Movement in Hedging Reserve, Net of Tax - (17,011,134) - - (17,011,134)Total Other Comprehensive Income 340,451 (17,011,134) 90,471 - (16,580,212)
Tax Paid Surplus/(Deficit) - - - 7,020,420 7,020,420 Total Comprehensive Income 340,451 (17,011,134) 90,471 7,020,420 (9,559,792)
Transactions with owners of CompanyIssue of ordinary shares under bonus share issue - - - (37,957,220) (37,957,220)
Balance at 31 July 2015 32,783 (12,373,646) 10,685,338 25,861,769 24,206,244
Balance at 1 August 2015 32,783 (12,373,646) 10,685,338 25,861,769 24,206,244 Other Comprehensive IncomeMovement in Foreign Exchange Reserve 203,997 - - - 203,997 Movement in Land Revaluation Reserve - - 1,292,500 - 1,292,500 Movement in Hedging Reserve, Net of Tax - 13,636,430 - - 13,636,430 Total Other Comprehensive Income 203,997 13,636,430 1,292,500 - 15,132,927
Tax Paid Surplus/(Deficit) - - - 1,601,673 1,601,673 Total Comprehensive Income 203,997 13,636,430 1,292,500 1,601,673 16,734,600
Balance at 31 July 2016 236,780 1,262,784 11,977,838 27,463,442 40,940,844
PARENTTranslation Reserve ($)
Hedging Reserve ($)
Revaluation Reserve ($)
Retained Earnings ($)
Total Equity ($)
Balance at 1 August 2014 - 4,637,488 10,594,867 54,185,001 69,417,356 Other Comprehensive IncomeMovement in Land Revaluation Reserve - - 90,471 - 90,471 Movement in Hedging Reserve, Net of Tax - (17,011,134) - - (17,011,134)Total Other Comprehensive Income - (17,011,134) 90,471 - (16,920,663)
Tax Paid Surplus/(Deficit) - - - 9,304,672 9,304,672 Total Comprehensive Income - (17,011,134) 90,471 9,304,672 (7,615,991)
Transactions with owners of CompanyIssue of ordinary shares under bonus share issue - - - (37,957,220) (37,957,220)
Balance at 31 July 2015 - (12,373,646) 10,685,338 25,532,453 23,844,145
Balance at 1 August 2015 - (12,373,646) 10,685,338 25,532,453 23,844,145 Other Comprehensive IncomeMovement in Land Revaluation Reserve - - 1,292,500 - 1,292,500 Movement in Hedging Reserve, Net of Tax - 13,636,430 - - 13,636,430 Total Other Comprehensive Income - 13,636,430 1,292,500 - 14,928,930
Tax Paid Surplus/(Deficit) - - - 1,960,217 1,960,217 Total Comprehensive Income - 13,636,430 1,292,500 1,960,217 16,889,147
Balance at 31 July 2016 - 1,262,784 11,977,838 27,492,670 40,733,292
STATEMENT OF CHANGES IN EQUITYFor the Year Ended 31 July 2016
The Tatua Co-operative Dairy Company Limited Annual Report 201617
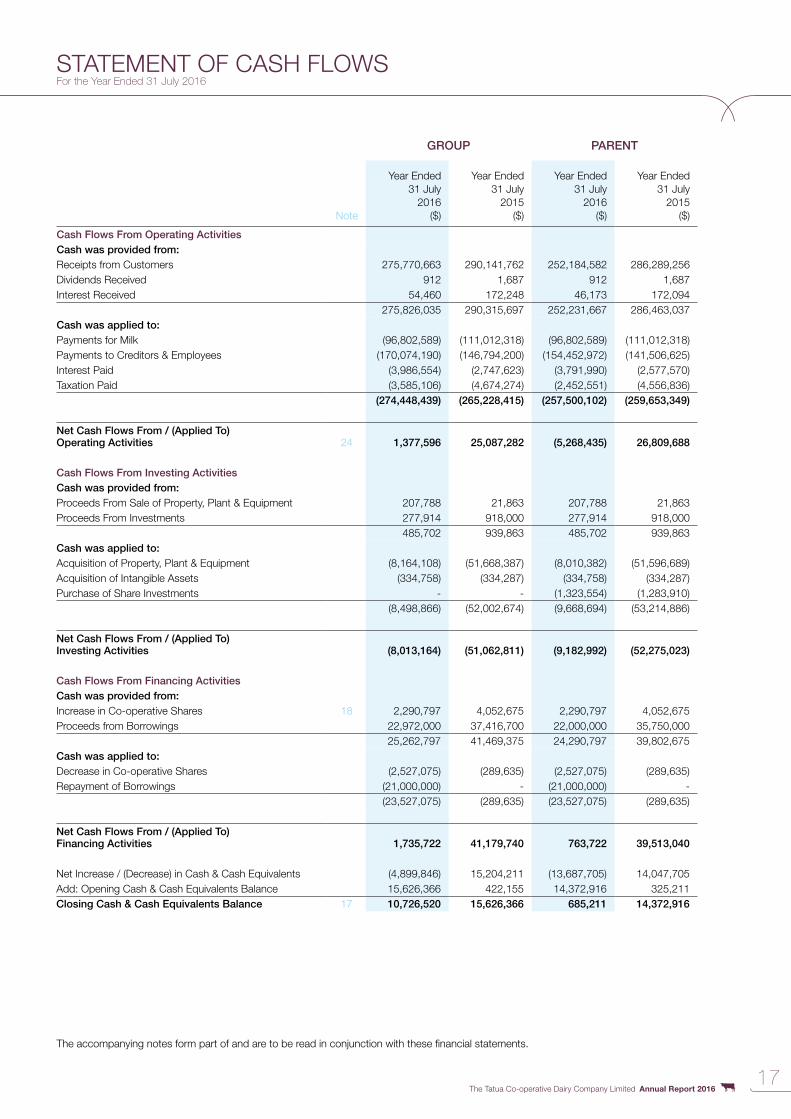
The accompanying notes form part of and are to be read in conjunction with these financial statements.
STATEMENT OF CASH FLOWSFor the Year Ended 31 July 2016
GROUP PARENT
Note
Year Ended 31 July
2016($)
Year Ended 31 July
2015($)
Year Ended 31 July
2016($)
Year Ended 31 July
2015($)
Cash Flows From Operating ActivitiesCash was provided from:Receipts from Customers 275,770,663 290,141,762 252,184,582 286,289,256Dividends Received 912 1,687 912 1,687Interest Received 54,460 172,248 46,173 172,094
275,826,035 290,315,697 252,231,667 286,463,037Cash was applied to:Payments for Milk (96,802,589) (111,012,318) (96,802,589) (111,012,318)Payments to Creditors & Employees (170,074,190) (146,794,200) (154,452,972) (141,506,625)Interest Paid (3,986,554) (2,747,623) (3,791,990) (2,577,570)Taxation Paid (3,585,106) (4,674,274) (2,452,551) (4,556,836)
(274,448,439) (265,228,415) (257,500,102) (259,653,349)
Net Cash Flows From / (Applied To) Operating Activities 24 1,377,596 25,087,282 (5,268,435) 26,809,688
Cash Flows From Investing ActivitiesCash was provided from:Proceeds From Sale of Property, Plant & Equipment 207,788 21,863 207,788 21,863Proceeds From Investments 277,914 918,000 277,914 918,000
485,702 939,863 485,702 939,863Cash was applied to:Acquisition of Property, Plant & Equipment (8,164,108) (51,668,387) (8,010,382) (51,596,689)Acquisition of Intangible Assets (334,758) (334,287) (334,758) (334,287)Purchase of Share Investments - - (1,323,554) (1,283,910)
(8,498,866) (52,002,674) (9,668,694) (53,214,886)
Net Cash Flows From / (Applied To) Investing Activities (8,013,164) (51,062,811) (9,182,992) (52,275,023)
Cash Flows From Financing ActivitiesCash was provided from:Increase in Co-operative Shares 18 2,290,797 4,052,675 2,290,797 4,052,675Proceeds from Borrowings 22,972,000 37,416,700 22,000,000 35,750,000
25,262,797 41,469,375 24,290,797 39,802,675Cash was applied to:Decrease in Co-operative Shares (2,527,075) (289,635) (2,527,075) (289,635)Repayment of Borrowings (21,000,000) - (21,000,000) -
(23,527,075) (289,635) (23,527,075) (289,635)
Net Cash Flows From / (Applied To) Financing Activities 1,735,722 41,179,740 763,722 39,513,040
Net Increase / (Decrease) in Cash & Cash Equivalents (4,899,846) 15,204,211 (13,687,705) 14,047,705Add: Opening Cash & Cash Equivalents Balance 15,626,366 422,155 14,372,916 325,211Closing Cash & Cash Equivalents Balance 17 10,726,520 15,626,366 685,211 14,372,916
18
NOTES TO THE FINANCIAL STATEMENTS
19 1. Reporting Entity
19 2. Basis of Preparation
20 3. Significant Accounting Policies
25 4. Determination of Fair Values
26 5. Other Income
27 6. Administration Expenses
27 7. Personnel Expenses
27 8. Finance Income and Expense
28 9. Income Tax Expense
29 10. Property, Plant & Equipment
32 11. Intangible Assets
33 12. Biological Assets
33 13. Investment Property
34 14. Deferred Tax Assets and Liabilities
35 15. Inventories
35 16. Receivables & Prepayments
36 17. Cash & Cash Equivalents
36 18. Members Funds
37 19. Loans & Borrowings
37 20. Accounts Payable & Accruals
38 21. Financial Instruments
45 22. Leases
45 23. Capital Commitments
45 24. Reconciliation of Cash Flows from Operating Activities
46 25. Related Party Transactions
47 26. Group Entities
47 27. Subsequent Events
The Tatua Co-operative Dairy Company Limited Annual Report 201619
1. REPORTING ENTITYThe Tatua Co-operative Dairy Company Limited (the parent company) is a co-operative company domiciled and incorporated in New Zealand, and registered under the Co-operative Companies Act 1996 and the Companies Act 1993. At 31 July 2016 the Group consists of The Tatua Co-operative Dairy Company Ltd and its subsidiaries Tatua Japan Co. Ltd, Tatua Dairy Products (Shanghai) Co., Ltd and Tatua USA Ltd.
The Group is a producer and marketer of dairy products with sales to both domestic and export markets.
These financial statements are for the year ended 31 July 2016.
These financial statements were approved by the Board of Directors on 16 November 2016 and have been prepared in accordance with the New Zealand Companies Act 1993 and the Financial Reporting Act 1993.
2. BASIS OF PREPARATION
(a) Statement of Compliance and Basis of PreparationThe financial statements have been prepared in accordance with Generally Accepted Accounting Practice in New Zealand (NZ GAAP). They comply with New Zealand equivalents to International Financial Reporting Standards (NZ IFRS) and other applicable Financial Reporting Standards, as appropriate for profit oriented entities. These financial statements also comply with International Financial Reporting Standards (IFRS).
These accounting policies have been applied consistently to all periods presented in these financial statements.
(b) Basis of MeasurementThe financial statements are prepared on the historical cost basis except for the following:
• Biological assets are measured at fair value less point-of-sale costs• Investment property is measured at fair value• Derivative financial instruments are measured at fair value• Land and improvements are valued at fair value
The methods used to measure fair values are discussed further in Note 4.
The financial statements have been prepared on a going concern basis.
(c) Functional and Presentation CurrencyThe financial statements are presented in New Zealand dollars (NZD), which is the Company’s functional currency, and rounded to the nearest dollar.
(d) Use of Estimates and JudgementThe preparation of financial statements requires management to make judgements, estimates and assumptions that affect the application of accounting policies and the reported amounts of assets, liabilities, income, and expenses. Actual results may differ from these estimates.
Estimates and underlying assumptions are reviewed on an ongoing basis. Revisions to accounting estimates are recognised in the period in which the estimate is revised and in any future periods affected. In particular, information about significant areas of estimation, uncertainty and critical judgements in applying accounting policies that have the most significant effect on the amount recognised in the financial statements are described in the following notes:
Note 4. Determination Of Fair Values – (C) Investment Property & (D) DerivativesNote 10. Property, Plant & Equipment – Revaluation of Land & ImprovementsNote 14. Deferred Tax Assets And Liabilities – Recognition of Deferred Tax AssetNote 21. Financial Instruments – Valuation of Derivative Financial Instruments
20
NOTES TO THE FINANCIAL STATEMENTS
3. SIGNIFICANT ACCOUNTING POLICIESThe accounting policies set out below have been applied consistently to all periods presented in these financial statements.
(a) Basis of Consolidation(i) Subsidiaries
Subsidiaries are entities controlled by the Group. Control exists when the Group has the power over the entity, exposure or rights to variable returns from its involvement with the entity, and the ability to use its power over the entity to affect the amount of the entity’s return. In assessing control, potential voting rights are only considered if the rights are substantive. The financial statements of subsidiaries are included in the consolidated financial statements from the date that control commences until the date that control ceases.
(ii) Equity Accounted Investees (Joint Ventures)Joint ventures are those arrangements in which the Group has contractually agreed to share control and where the Group has rights to the net assets rather than rights to the assets and obligations for the liabilities. Joint ventures are initially recognised at cost (including any goodwill identified on acquisition). Subsequent to initial recognition they are accounted for using the equity method in the consolidated financial statements.
The consolidated financial statements include the Group’s share of the profit or loss after tax of joint ventures after adjustments to align the accounting policies of the Group, from the date that significant influence or joint control commences until the date that significant influence or joint control ceases.
(iii) Transactions Eliminated on ConsolidationIntra-group balances, and any unrealised income and expenses arising from intra-group transactions, are eliminated in preparing the consolidated financial statements.
(b) Foreign Currency(i) Foreign Currency Transactions
Transactions in foreign currencies are translated to NZD at exchange rates at the dates of the transactions. Monetary assets and liabilities denominated in foreign currencies at the reporting dates are retranslated to the functional currency at the exchange rate at that date. The foreign currency gain or loss on monetary items is the difference between amortised cost in the functional currency at the beginning of the period, adjusted for effective interest and payments during the period, and the amortised cost in foreign currency translated at the exchange rate at the end of the period. Foreign currency differences arising on retranslation are recognised in profit or loss.
(ii) Foreign OperationsThe assets and liabilities of foreign operations, including goodwill and fair value adjustments arising on acquisition, are translated to New Zealand dollars at exchange rates at the reporting date. The income and expenses of foreign operations are translated to New Zealand dollars at exchange rates at the dates of the transactions.
Foreign currency differences are recognised in the foreign currency translation reserve (FCTR). When a foreign operation is disposed of, in part or in full, the relevant amount in the FCTR is transferred to profit or loss as part of the gain or loss on disposal.
(c) Financial Instruments(i) Non-derivative Financial Instruments
Non-derivative financial instruments comprise receivables, cash and cash equivalents, owing by subsidiaries, loans and borrowings, owing to suppliers, owing to subsidiaries and accounts payable & accruals. Non-derivative financial instruments are recognised initially at fair value plus, for instruments not at fair value through profit or loss, any directly attributable transaction costs. Subsequent to initial recognition non-derivative financial instruments are measured as described below.
A financial instrument is recognised if the Group becomes a party to the contractual provisions of the instrument. Financial assets are derecognised if the Group’s contractual rights to the cash flows from the financial assets expire or if the Group transfers the financial asset to another party without retaining control or substantially all risks and rewards of the asset. Regular purchases and sales of financial assets are accounted for at trade date, i.e. the date that the Group commits itself to purchase or sell the asset. Financial liabilities are derecognised if the Group’s obligations specified in the contract expire or are discharged or cancelled.
ReceivablesReceivables are stated at their cost less impairment losses and are classified as loans and receivables.
Cash and Cash Equivalents Cash and cash equivalents comprise cash balances. Bank overdrafts that are repayable on demand and form an integral part of the Group’s cash management are included as a component of cash and cash equivalents for the purpose of the statement of cash flows. Accounting for finance income and expense is discussed in note 3(p).
Cash and cash equivalents are classified as loans and receivables or other non-derivative financial liabilities.
The Tatua Co-operative Dairy Company Limited Annual Report 201621
3. SIGNIFICANT ACCOUNTING POLICIES (CONTINUED)
Loans and BorrowingsInterest-bearing borrowings are classified as other non-derivative financial liabilities and are measured at amortised cost using the effective interest rate.
Accounts Payable & AccrualsTrade and other payables are stated at cost and are classified as other non-derivative financial liabilities.
(ii) Derivative Financial InstrumentsThe Group uses derivative financial instruments to hedge its exposure to foreign exchange and interest rate risks arising from operational, financing and investment activities. In accordance with its treasury policy, the Group does not hold or issue derivative financial instruments for trading purposes. Derivatives that do not qualify for hedge accounting are accounted for as trading instruments. Derivative financial instruments are recognised initially at fair value and transaction costs are expensed immediately. Subsequent to initial recognition, derivative financial instruments are stated at fair value. The gain or loss on remeasurement to fair value is recognised immediately in profit or loss. However, where derivatives qualify for hedge accounting, recognition of any resultant gain or loss depends on the nature of the hedging relationship (see below).
Cash Flow HedgesChanges in the fair value of the derivative hedging instrument designated as a cash flow hedge are recognised in other comprehensive income and held in equity to the extent that the hedge is effective. To the extent that the hedge is ineffective, changes in fair value are recognised in profit or loss as part of finance expense/income.
If the hedging instrument no longer meets the criteria for hedge accounting, expires or is sold, terminated or exercised, then hedge accounting is discontinued prospectively. The cumulative gain or loss previously recognised in equity remains there until the forecast transaction occurs. When the hedged item is a non-financial asset, the amount recognised in equity is transferred to the carrying amount of the asset when it is recognised. In other cases the amount recognised in equity is transferred to profit or loss in the same period that the hedged item affects profit or loss.
Economic HedgesHedge accounting is not applied to derivative instruments that economically hedge monetary assets and liabilities denominated in foreign currencies. Changes in the fair value of such derivatives are recognised in profit or loss as part of foreign currency gains and losses and separately disclosed.
(d) Property, Plant and Equipment(i) Recognition and Measurement
Items of property, plant and equipment (except land and improvements) are measured at cost less accumulated depreciation and impairment losses. Land is stated at fair value. Cost includes expenditures that are directly attributable to the acquisition of the asset. The cost of self-constructed assets includes the cost of materials and direct labour, any other costs directly attributable to bringing the asset to a working condition for its intended use, and the costs of dismantling and removing the items and restoring the site on which they are located. Purchased software that is integral to the functionality of the related equipment is capitalised as part of that equipment. Any gain on remeasurement is recognised in other comprehensive income and held in equity, any loss is recognised in profit and loss, unless there is a credit balance existing in the revaluation surplus.
Borrowing costs that are directly attributable to the acquisition, construction or production of a qualifying asset are capitalised as part of the cost of the asset.
When parts of an item of property, plant and equipment have different useful lives, they are accounted for as separate items (major components) of property, plant and equipment.
(ii) Reclassification to Investment PropertyWhen the use of a property changes from owner-occupied to investment property, the property is remeasured to fair value and reclassified as investment property.
(iii) Subsequent CostsThe cost of replacing part of an item of property, plant and equipment is recognised in the carrying amount of the item if it is probable that the future economic benefits embodied within the part will flow to the Group and its cost can be measured reliably. The carrying amount of the replaced component is derecognised. The costs of the day-to-day servicing of property, plant and equipment are recognised in profit or loss as incurred.
22
NOTES TO THE FINANCIAL STATEMENTS
3. SIGNIFICANT ACCOUNTING POLICIES (CONTINUED)
(iv) DepreciationDepreciation is recognised in profit and loss on a straight line basis over the estimated useful lives of the items of plant, property and equipment. Land is not depreciated. The Group has established the following useful lives:
• Land improvements – 20 years• Buildings – 5 to 40 years• Plant and equipment – 3 to 20 years• Vehicles – 5 years
Depreciation methods, useful lives and residual values are reassessed at the reporting date.
(e) Intangible Assets(i) Recognition and Measurement
Intangible assets that are acquired by the Group which have finite useful lives are measured at cost less accumulated amortisation and accumulated impairment losses.
(ii) Subsequent ExpenditureSubsequent expenditure is capitalised only when it increases the future economic benefits embodied in the specific asset to which it relates. All other expenditure, including expenditure on internally generated goodwill and brands, is recognised in profit or loss when incurred.
(iii) AmortisationAmortisation is recognised in profit or loss on a straight-line basis over the estimated useful lives of intangible assets from the date that they are available for use. The estimated useful lives for the current and comparative periods are as follows:
• Software – 3 years• Resource Consent – 15 years
(f) Biological AssetsBiological assets are measured at fair value less point-of-sale costs, with any change therein recognised in profit or loss. Point-of-sale costs include all costs that would be necessary to sell the assets. An independent valuation is used to obtain the fair value of these assets.
(g) Investment PropertyInvestment property is property held either to earn rental income or for capital appreciation or for both. Investment property is measured at fair value with any change therein recognised in profit or loss. Fair value is determined in accordance with the policy in Note 4(c).
(h) Leased AssetsLeases that the Group assumes substantially all the risks and rewards of ownership are classified as finance leases. Upon initial recognition the leased asset is measured at an amount equal to the lower of its fair value and the present value of the minimum lease payments. Subsequent to initial recognition, the asset is accounted for in accordance with the accounting policy applicable to that asset.
Other leases are operating leases and, except for investment property, the leased assets are not recognised on the Group’s balance sheet.
(i) InventoriesInventories are measured at the lower of cost or net realisable value. The cost of inventories is based on weighted average cost, and includes expenditure incurred in acquiring the inventories and bringing them to their existing location and condition. In the case of manufactured inventories and work in progress, cost includes an appropriate share of production overheads based on normal operating capacity. Net realisable value is the estimated selling price in the ordinary course of business, less the estimated costs of completion and selling expenses. Shareholder supplied milk included within inventories is valued at the price determined under the Dairy Industry Restructuring Act 2001 (DIRA) .
The Tatua Co-operative Dairy Company Limited Annual Report 201623
3. SIGNIFICANT ACCOUNTING POLICIES (CONTINUED)
(j) ImpairmentThe carrying amounts of the Group’s assets are reviewed at each balance sheet date to determine whether there is any objective evidence of impairment. An impairment loss is recognised whenever the carrying amount of an asset exceeds its recoverable amount. Impairment losses directly reduce the carrying amount of assets and are recognised in profit or loss.
(i) Impairment of ReceivablesThe recoverable amount of the Group’s receivables carried at amortised cost is calculated as the present value of estimated future cash flows. Since all of the receivables are current they are not discounted.
(ii) Impairment of Non-financial AssetsThe carrying amounts of the Group’s non-financial assets, other than inventories, biological assets, investment property and deferred tax assets, are reviewed at each reporting date to determine whether there is any indication of impairment. If any such indication exists then the asset’s recoverable amount is estimated.
An impairment loss is recognised if the carrying amount of an asset or its cash-generating unit exceeds its recoverable amount. A cash-generating unit is the smallest identifiable asset group that generates cash flows that are largely independent from other assets and groups. Impairment losses are recognised in profit and loss. Impairment losses recognised in respect of cash-generating units are allocated to reduce the carrying amount of the assets in the unit (group of units) on a pro rata basis.
The recoverable amount of an asset or cash-generating unit is the greater of its value in use and its fair value less costs to sell. In assessing value in use, the estimated future cash flows are discounted to their present value using a pre-tax discount rate that reflects current market assessments of the time value of money and the risks specific to the asset.
Impairment losses recognised in prior periods are assessed at each reporting date for any indications that the loss has decreased or no longer exists. An impairment loss is reversed if there has been a change in the estimates used to determine the recoverable amount (other than goodwill). An impairment loss is reversed only to the extent that the assets carrying amount does not exceed the carrying amount that would have been determined, net of depreciation or amortisation, if no impairment loss had been recognised.
(k) Employee Benefits(i) Defined Contribution Plans
Obligations for contributions to defined contribution pension plans are recognised as an expense in profit or loss when they are due.
(ii) Termination BenefitsTermination benefits are recognised as an expense when the Group is demonstrably committed, without realistic possibility of withdrawal, to a formal detailed plan to terminate employment before the normal retirement date. Termination benefits for voluntary redundancies are recognised if the Group has made an offer encouraging voluntary redundancy, it is probable that the offer will be accepted, and the number of acceptances can be estimated reliably.
(iii) Short-term BenefitsShort-term employee benefit obligations are measured on an undiscounted basis and are expensed as the related service is provided. A liability is recognised for the amount expected to be paid if the Group has a present legal or constructive obligation to pay this amount as a result of past service provided by the employee and the obligation can be estimated reliably.
(l) ProvisionsA provision is recognised if, as a result of a past event, the Group has a present legal or constructive obligation that can be estimated reliably, and it is probable that an outflow of economic benefits will be required to settle the obligation. Provisions are determined by discounting the expected future cash flows at a pre-tax rate that reflects current market assessments of the time value of money and the risks specific to the liability.
(m) Revenue(i) Goods Sold
Revenue from the sale of goods is measured at the fair value of the consideration received or receivable, net of returns and allowances, trade discounts and volume rebates. Revenue is recognised when the significant risks and rewards of ownership have been transferred to the buyer, recovery of the consideration is probable, the associated costs and possible return of goods can be estimated reliably, and there is no continuing management involvement with the goods. Transfers of risks and rewards vary depending on the individual terms of the contract of sale.
24
NOTES TO THE FINANCIAL STATEMENTS
3. SIGNIFICANT ACCOUNTING POLICIES (CONTINUED)
(n) Other IncomeRental income from investment property is recognised in profit or loss on a straight-line basis over the term of the lease. Lease incentives granted are recognised as an integral part of the total rental income, over the term of the lease.
(o) Lease PaymentsPayments made under operating leases are recognised in profit or loss on a straight-line basis over the term of the lease. Lease incentives received are recognised as an integral part of the total lease expense, over the term of the lease.
Minimum lease payments made under finance leases are apportioned between the finance expense and the reduction of the outstanding liability. The finance expense is allocated to each period during the lease term so as to produce a constant periodic rate of interest on the remaining balance of the liability. Contingent lease payments are accounted for by revising the minimum lease payments over the remaining term of the lease when the lease adjustment is confirmed.
(p) Finance Income and ExpensesFinance income comprises interest income on funds invested, changes in fair value of financial assets at fair value through profit or loss and foreign currency gains that are recognised in profit or loss. Interest income is recognised as it accrues, using the effective interest method.
Finance expenses comprise interest expense on borrowings, foreign currency losses, impairment losses recognised on financial assets (except for trade receivables) and losses on hedging instruments that are recognised in profit or loss. All borrowing costs are recognised in profit or loss using the effective interest method, except for those that are directly attributable to the acquisition, construction or production of a qualifying asset, in which case they are capitalised as part of the cost of that asset.
(q) Income Tax ExpenseIncome tax expense comprises current and deferred tax. Income tax expense is recognised in profit or loss except to the extent that it relates to items recognised directly in equity or in other comprehensive income, in which case it is recognised in equity or in other comprehensive income.
Current tax is the expected tax payable on the taxable income for the year, using tax rates enacted or substantially enacted at the reporting date, and any adjustment to tax payable in respect of previous years.
Deferred tax is recognised in respect of temporary differences between the carrying amounts of assets and liabilities for financial reporting purposes and the amounts used for taxation purposes. Deferred tax is not recognised for the following temporary differences: initial recognition of assets or liabilities in a transaction that is not a business combination and that affects neither accounting nor taxable profit, and differences relating to investments in subsidiaries to the extent that they probably will not reverse in the foreseeable future. Deferred tax is measured at the tax rates that are expected to be applied to the temporary differences when they reverse, based on the laws that have been enacted or substantively enacted by the reporting date.
A deferred tax asset is recognised to the extent that it is probable that future taxable profits will be available against which temporary differences can be utilised. Deferred tax assets are reviewed at each reporting date and are reduced to the extent that it is no longer probable that the related tax benefit will be realised.
(r) Goods and Services TaxThe financial statements have been prepared on a GST exclusive basis, except for Accounts Receivable and Accounts Payable which are stated inclusive of GST.
(s) Co-operative SharesShares in the co-operative are held in proportion to the current or expected milk supply. The share standard is ten 50 cent shares for every kilogram of milksolids. Shares are issued or redeemed annually to ensure compliance with the share standard. Due to their redemption nature, shares are classified as a liability in the balance sheet. When the group performs a bonus share issue, with new shares issued at the same rate as existing shares, retained earnings is decreased to match the increase in co-operative shares.

The Tatua Co-operative Dairy Company Limited Annual Report 201625
3. SIGNIFICANT ACCOUNTING POLICIES (CONTINUED)
(t) New Standards and Interpretations(i) New and amended standards adopted by the Group
No new or amended standards were adopted that had a material impact on the Group’s financial statements.
(ii) New and amended standards issued but not yet effective– Disclosure initiative (amendments to NZ IAS 1). Effective for periods beginning 1 January 2016. The amendments do not require any significant change to current practice, but should facilitate improved reporting, including an emphasis on only including material disclosures, clarity on the aggregation and disaggregation of line items, the presentation of subtotals, the ordering of notes and the identification of significant accounting policies.
– NZ IFRS 9 – Financial Instruments: Classification and Measurement. Effective for periods beginning from 1 January 2018. The new standard includes revised guidance on the classification and measurement of financial assets, including a new expected credit loss model for calculating impairment, and supplements the new general hedge accounting requirements previously published.
– NZ IFRS 15 – Revenue from Contracts with Customers. Effective for periods beginning from 1 January 2018. The standard contains a single model that applies to contracts with customers and two approaches to recognising revenue: at a point in time or over time. The model features a contract-based five-step analysis of transactions to determine whether, how much and when revenue is recognised.
– NZ IFRS 16 – Leases. Effective for periods beginning from 1 January 2019. NZ IFRS 16 removes the classification of leases as either operating or finance leases – for the lessee – effectively treating all leases as finance leases. Lessor accounting remains similar to current practice – i.e. lessors continue to classify leases as finance and operating leases.
The impact of these amendments on the Group’s financial statements has not yet been fully determined, although Management believe there will not be a material impact arising from these standards.
From 1 April 2014, the new Financial Reporting Act 2013 (“FRA 2013”) has come into force replacing the Financial Reporting Act 1993. The FRA 2013 is effective for companies with financial periods beginning on or after 1 April 2014 unless they meet the definition of a FMC reporting entity under the Financial Markets Conduct Act (“FMC Act”) and meet the transitional provision requirements of the FMC Act that require them to apply the Financial Reporting Act 1993. As the Group meets the requirements of an entity operating under the transitional provisions of the FMC Act, the Group will be required to report under the FRA 2013 at the earlier of making an issue of securities under the FMC Act, opting into the FMC Act, becoming a recipient of funds from a conduit issuer, or at the Group’s next balance date after 1 December 2016 (i.e. 31 July 2017).
The change in legislation has no material impact on the entity’s obligation to prepare general-purpose financial statements. Neither the FRA 2013 nor the FMC Act require the preparation of parent financial statements where group financial statements are prepared. Accordingly on adoption of the FMC Act and the FRA 2013 the Group will no longer be required to prepare separate financial statements for the Company.
There are a number of other standards and interpretations which are not yet effective and management consider they will have no impact on the Group.
4. DETERMINATION OF FAIR VALUESA number of the Group’s accounting policies and disclosures require the determination of fair value, for both financial and non-financial assets and liabilities. Fair values have been determined for measurement and/or disclosure purposes based on the following methods. Where applicable, further information about the assumptions made in determining fair values is disclosed in the notes specific to that asset or liability.
(a) Property Plant and EquipmentThe fair value of land within property, plant and equipment is based on market values determined by an independent valuer. The market value of land is the estimated amount for which land could be exchanged on the date of valuation between a willing buyer and a willing seller in an arm’s length transaction after proper marketing wherein the parties had each acted knowledgeably, prudently and without compulsion.
(b) Biological AssetsThe fair value of livestock is based on the market price of livestock of similar age, breed and genetic make-up, and is determined by Allied Farmers Ltd.

26
NOTES TO THE FINANCIAL STATEMENTS
4. DETERMINATION OF FAIR VALUES (CONTINUED)
(c) Investment PropertyAn external, independent valuation company, having appropriate recognised professional qualifications and recent experience in the location and category of property being valued, values the Group’s investment property. The fair values are based on market values, being the estimated amount for which a property could be exchanged on the date of the valuation between a willing buyer and a willing seller in an arm’s length transaction after proper marketing wherein the parties had each acted knowledgeably, prudently and without compulsion.
In the absence of current prices in an active market, the valuations are prepared by considering the aggregate of the estimated cash flows expected to be received from renting out the property. A yield that reflects the specific risks inherent in the net cash flows then is applied to the net annual cash flows to arrive at the property valuation.
Valuations reflect, where appropriate: the type of tenants actually in occupation or responsible for meeting lease commitments or likely to be in occupation after letting vacant accommodation, and the market’s general perception of their creditworthiness; the allocation of maintenance and insurance responsibilities between the Group and the lessee; and the remaining economic life of the property. When rent reviews or lease renewals are pending with anticipated reversionary increases, it is assumed that all notices and where appropriate counter-notices have been served validly and within the appropriate time.
(d) DerivativesThe fair value of forward exchange contracts and options is based on their listed market price, if available. If a listed market price is not available, then fair value is estimated by discounting the difference between the contractual forward price and the current forward price for the residual maturity of the contract using a risk-free interest rate (based on government bonds).
The fair value of interest rate swaps is based on independent valuations provided by the bank. The valuation is tested for reasonableness by discounting estimated future cash flows based on the terms and maturity of each contract and using market interest rates for a similar instrument at the measurement date.
(e) Non derivative Financial LiabilitiesFair value, which is determined for disclosure purposes, is calculated based on the present value of future principal and interest cash flows, discounted at the market rate of interest at the reporting date.
5. OTHER INCOMEGROUP PARENT
2016($)
2015($)
2016($)
2015($)
Sundry Asset Sales/Gain on Disposal of Property, Plant & Equipment 31,649 32,158 31,649 32,158 Rental Income from Investment Property 108,000 108,000 108,000 108,000 Rental Income from Farm Houses 38,148 43,095 38,148 43,095 Insurance Claim Proceeds 84,769 20,309 84,769 20,309 MilkTest NZ Ltd Income 280,491 722,369 280,491 722,369 Sundry Income 1,441,501 2,026,870 1,409,426 1,503,781
1,984,558 2,952,801 1,952,483 2,429,712
The Tatua Co-operative Dairy Company Limited Annual Report 201627
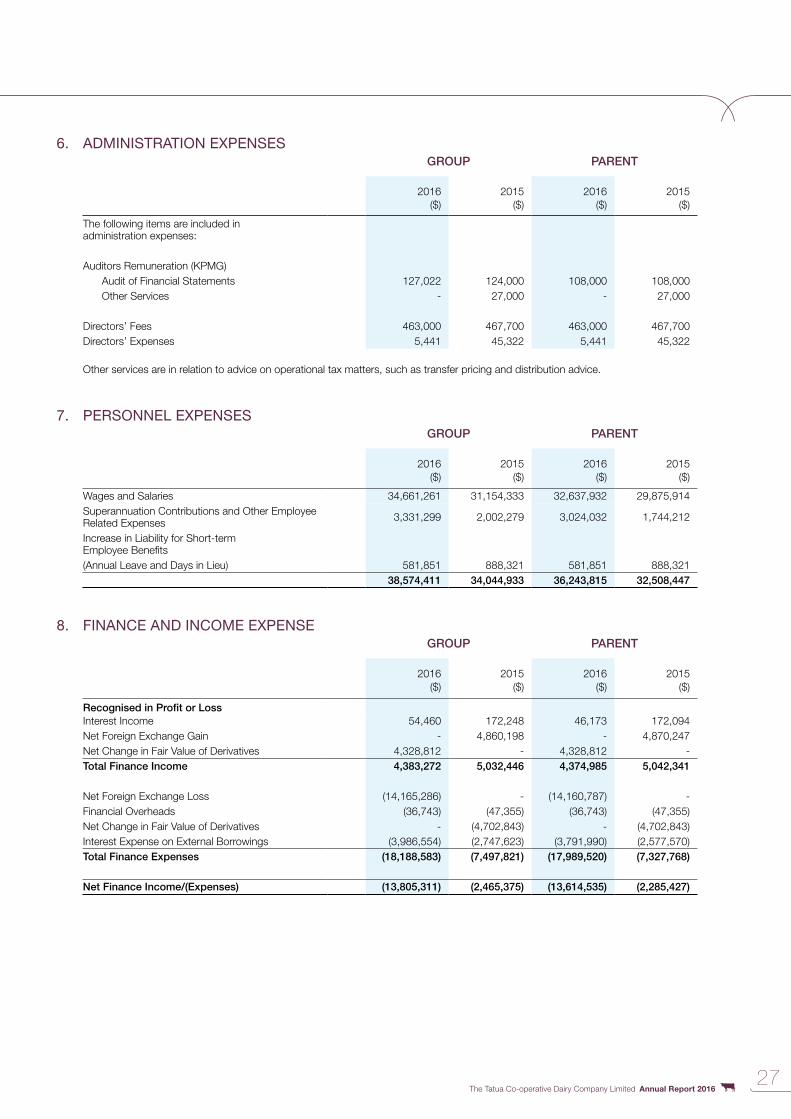
6. ADMINISTRATION EXPENSESGROUP PARENT
2016($)
2015($)
2016($)
2015($)
The following items are included in administration expenses:
Auditors Remuneration (KPMG)Audit of Financial Statements 127,022 124,000 108,000 108,000 Other Services - 27,000 - 27,000
Directors’ Fees 463,000 467,700 463,000 467,700 Directors’ Expenses 5,441 45,322 5,441 45,322
Other services are in relation to advice on operational tax matters, such as transfer pricing and distribution advice.
7. PERSONNEL EXPENSESGROUP PARENT
2016($)
2015($)
2016($)
2015($)
Wages and Salaries 34,661,261 31,154,333 32,637,932 29,875,914 Superannuation Contributions and Other Employee Related Expenses 3,331,299 2,002,279 3,024,032 1,744,212
Increase in Liability for Short-term Employee Benefits(Annual Leave and Days in Lieu) 581,851 888,321 581,851 888,321
38,574,411 34,044,933 36,243,815 32,508,447
8. FINANCE AND INCOME EXPENSE GROUP PARENT
2016($)
2015($)
2016($)
2015($)
Recognised in Profit or LossInterest Income 54,460 172,248 46,173 172,094 Net Foreign Exchange Gain - 4,860,198 - 4,870,247 Net Change in Fair Value of Derivatives 4,328,812 - 4,328,812 -Total Finance Income 4,383,272 5,032,446 4,374,985 5,042,341
Net Foreign Exchange Loss (14,165,286) - (14,160,787) -Financial Overheads (36,743) (47,355) (36,743) (47,355)Net Change in Fair Value of Derivatives - (4,702,843) - (4,702,843)Interest Expense on External Borrowings (3,986,554) (2,747,623) (3,791,990) (2,577,570)Total Finance Expenses (18,188,583) (7,497,821) (17,989,520) (7,327,768)
Net Finance Income/(Expenses) (13,805,311) (2,465,375) (13,614,535) (2,285,427)
28
NOTES TO THE FINANCIAL STATEMENTS
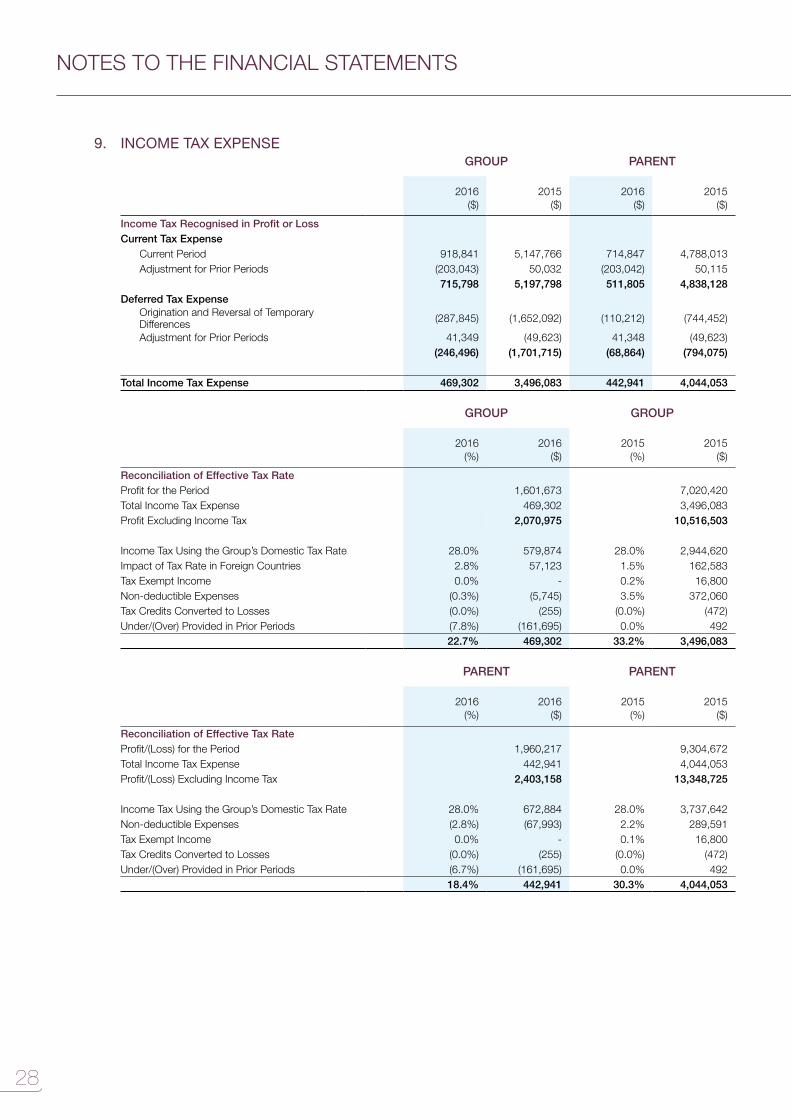
9. INCOME TAX EXPENSE GROUP PARENT
2016($)
2015($)
2016($)
2015($)
Income Tax Recognised in Profit or LossCurrent Tax Expense
Current Period 918,841 5,147,766 714,847 4,788,013 Adjustment for Prior Periods (203,043) 50,032 (203,042) 50,115
715,798 5,197,798 511,805 4,838,128 Deferred Tax Expense
Origination and Reversal of Temporary Differences (287,845) (1,652,092) (110,212) (744,452)
Adjustment for Prior Periods 41,349 (49,623) 41,348 (49,623)(246,496) (1,701,715) (68,864) (794,075)
Total Income Tax Expense 469,302 3,496,083 442,941 4,044,053
GROUP GROUP
2016(%)
2016($)
2015(%)
2015($)
Reconciliation of Effective Tax RateProfit for the Period 1,601,673 7,020,420 Total Income Tax Expense 469,302 3,496,083 Profit Excluding Income Tax 2,070,975 10,516,503
Income Tax Using the Group’s Domestic Tax Rate 28.0% 579,874 28.0% 2,944,620 Impact of Tax Rate in Foreign Countries 2.8% 57,123 1.5% 162,583 Tax Exempt Income 0.0% - 0.2% 16,800 Non-deductible Expenses (0.3%) (5,745) 3.5% 372,060 Tax Credits Converted to Losses (0.0%) (255) (0.0%) (472)Under/(Over) Provided in Prior Periods (7.8%) (161,695) 0.0% 492
22.7% 469,302 33.2% 3,496,083
PARENT PARENT
2016(%)
2016($)
2015(%)
2015($)
Reconciliation of Effective Tax RateProfit/(Loss) for the Period 1,960,217 9,304,672 Total Income Tax Expense 442,941 4,044,053 Profit/(Loss) Excluding Income Tax 2,403,158 13,348,725
Income Tax Using the Group’s Domestic Tax Rate 28.0% 672,884 28.0% 3,737,642 Non-deductible Expenses (2.8%) (67,993) 2.2% 289,591 Tax Exempt Income 0.0% - 0.1% 16,800 Tax Credits Converted to Losses (0.0%) (255) (0.0%) (472)Under/(Over) Provided in Prior Periods (6.7%) (161,695) 0.0% 492
18.4% 442,941 30.3% 4,044,053
The Tatua Co-operative Dairy Company Limited Annual Report 201629
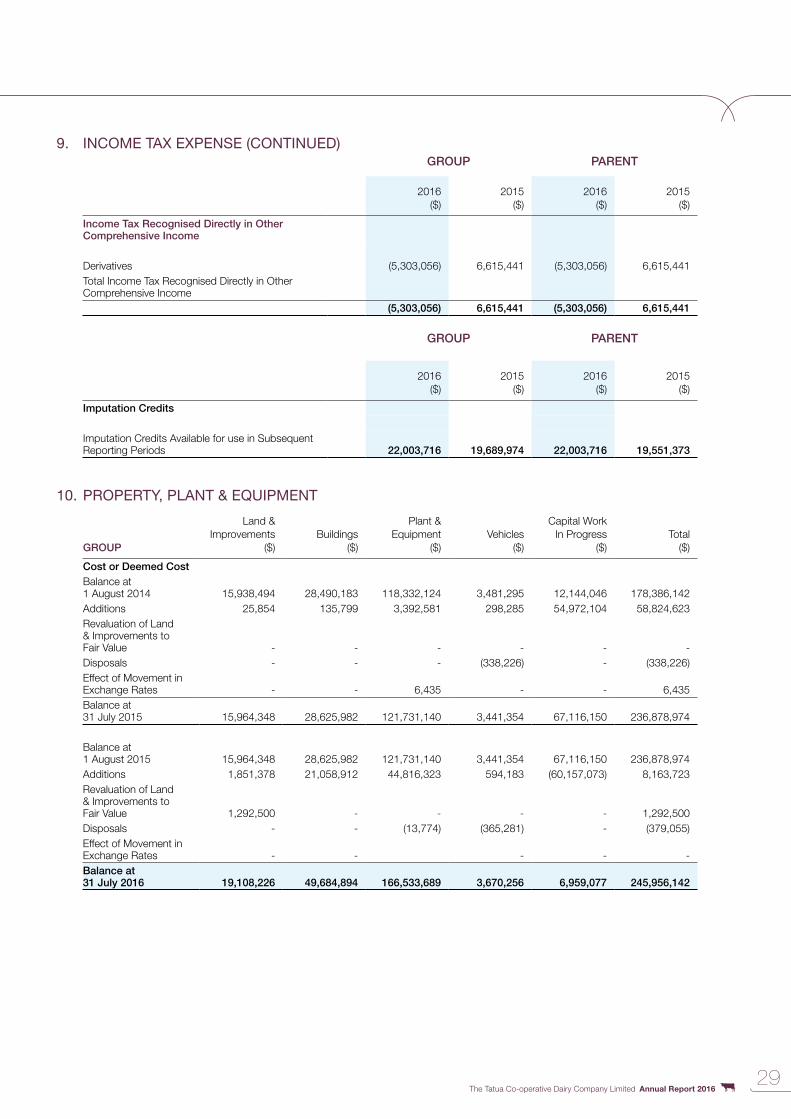
9. INCOME TAX EXPENSE (CONTINUED)GROUP PARENT
2016($)
2015($)
2016($)
2015($)
Income Tax Recognised Directly in Other Comprehensive Income
Derivatives (5,303,056) 6,615,441 (5,303,056) 6,615,441 Total Income Tax Recognised Directly in Other Comprehensive Income
(5,303,056) 6,615,441 (5,303,056) 6,615,441
GROUP PARENT
2016($)
2015($)
2016($)
2015($)
Imputation Credits
Imputation Credits Available for use in Subsequent Reporting Periods 22,003,716 19,689,974 22,003,716 19,551,373
10. PROPERTY, PLANT & EQUIPMENT
GROUP
Land & Improvements
($)Buildings
($)
Plant & Equipment
($) Vehicles
($)
Capital Work In Progress
($) Total
($)
Cost or Deemed CostBalance at 1 August 2014 15,938,494 28,490,183 118,332,124 3,481,295 12,144,046 178,386,142Additions 25,854 135,799 3,392,581 298,285 54,972,104 58,824,623Revaluation of Land & Improvements to Fair Value - - - - - -Disposals - - - (338,226) - (338,226)Effect of Movement in Exchange Rates - - 6,435 - - 6,435 Balance at 31 July 2015 15,964,348 28,625,982 121,731,140 3,441,354 67,116,150 236,878,974
Balance at 1 August 2015 15,964,348 28,625,982 121,731,140 3,441,354 67,116,150 236,878,974Additions 1,851,378 21,058,912 44,816,323 594,183 (60,157,073) 8,163,723 Revaluation of Land & Improvements to Fair Value 1,292,500 - - - - 1,292,500 Disposals - - (13,774) (365,281) - (379,055)Effect of Movement in Exchange Rates - - - - -Balance at 31 July 2016 19,108,226 49,684,894 166,533,689 3,670,256 6,959,077 245,956,142
30
NOTES TO THE FINANCIAL STATEMENTS
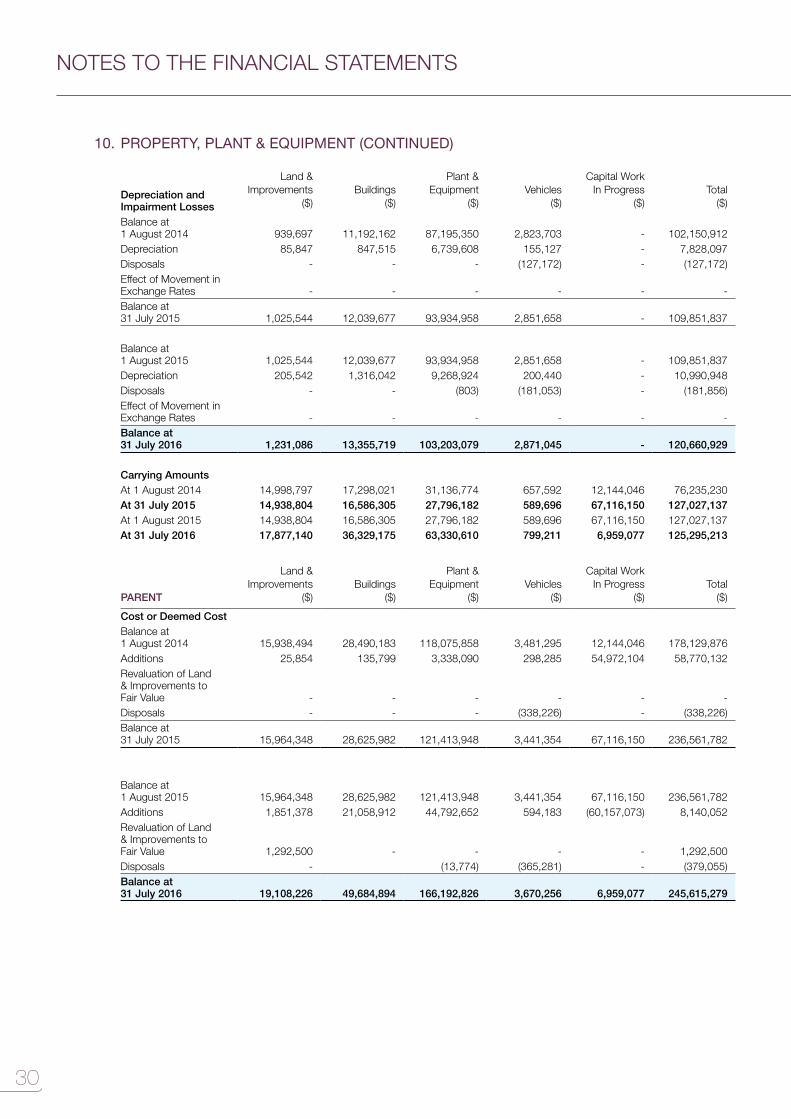
10. PROPERTY, PLANT & EQUIPMENT (CONTINUED)
Depreciation and Impairment Losses
Land & Improvements
($)Buildings
($)
Plant & Equipment
($) Vehicles
($)
Capital Work In Progress
($) Total
($)
Balance at 1 August 2014 939,697 11,192,162 87,195,350 2,823,703 - 102,150,912Depreciation 85,847 847,515 6,739,608 155,127 - 7,828,097 Disposals - - - (127,172) - (127,172)Effect of Movement in Exchange Rates - - - - - -Balance at 31 July 2015 1,025,544 12,039,677 93,934,958 2,851,658 - 109,851,837
Balance at 1 August 2015 1,025,544 12,039,677 93,934,958 2,851,658 - 109,851,837 Depreciation 205,542 1,316,042 9,268,924 200,440 - 10,990,948 Disposals - - (803) (181,053) - (181,856)Effect of Movement in Exchange Rates - - - - - -Balance at 31 July 2016 1,231,086 13,355,719 103,203,079 2,871,045 - 120,660,929
Carrying AmountsAt 1 August 2014 14,998,797 17,298,021 31,136,774 657,592 12,144,046 76,235,230At 31 July 2015 14,938,804 16,586,305 27,796,182 589,696 67,116,150 127,027,137At 1 August 2015 14,938,804 16,586,305 27,796,182 589,696 67,116,150 127,027,137At 31 July 2016 17,877,140 36,329,175 63,330,610 799,211 6,959,077 125,295,213
PARENT
Land & Improvements
($)Buildings
($)
Plant & Equipment
($) Vehicles
($)
Capital Work In Progress
($) Total
($)
Cost or Deemed CostBalance at 1 August 2014 15,938,494 28,490,183 118,075,858 3,481,295 12,144,046 178,129,876 Additions 25,854 135,799 3,338,090 298,285 54,972,104 58,770,132 Revaluation of Land & Improvements to Fair Value - - - - - -Disposals - - - (338,226) - (338,226)Balance at 31 July 2015 15,964,348 28,625,982 121,413,948 3,441,354 67,116,150 236,561,782
Balance at 1 August 2015 15,964,348 28,625,982 121,413,948 3,441,354 67,116,150 236,561,782 Additions 1,851,378 21,058,912 44,792,652 594,183 (60,157,073) 8,140,052 Revaluation of Land & Improvements to Fair Value 1,292,500 - - - - 1,292,500 Disposals - (13,774) (365,281) - (379,055)Balance at 31 July 2016 19,108,226 49,684,894 166,192,826 3,670,256 6,959,077 245,615,279

The Tatua Co-operative Dairy Company Limited Annual Report 201631
10. PROPERTY, PLANT & EQUIPMENT (CONTINUED)
Depreciation and Impairment Losses
Land & Improvements
($)Buildings
($)
Plant & Equipment
($) Vehicles
($)
Capital Work In Progress
($) Total
($)
Balance at 1 August 2014 939,697 11,192,162 86,995,897 2,823,703 - 101,951,459 Depreciation 85,847 847,515 6,705,975 155,127 - 7,794,464 Disposals - - - (127,172) - (127,172)Balance at 31 July 2015 1,025,544 12,039,677 93,701,872 2,851,658 - 109,618,751
Balance at 1 August 2015 1,025,544 12,039,677 93,701,872 2,851,658 - 109,618,751 Depreciation 205,542 1,316,042 9,223,039 200,440 - 10,945,063 Disposals - (803) (181,053) - (181,856)Balance at 31 July 2016 1,231,086 13,355,719 102,924,108 2,871,045 - 120,381,958
Carrying AmountsAt 1 August 2014 14,998,797 17,298,021 31,079,961 657,592 12,144,046 76,178,417At 31 July 2015 14,938,804 16,586,305 27,712,076 589,696 67,116,150 126,943,031At 1 August 2015 14,938,804 16,586,305 27,712,076 589,696 67,116,150 126,943,031At 31 July 2016 17,877,140 36,329,175 63,268,718 799,211 6,959,077 125,233,321
Revaluation of Land & ImprovementsLand and improvements are stated at their fair value. The revaluation was undertaken as at 31 July 2016 by Fergusson Lockwood and Associates Ltd, independent registered valuers. The land and improvements were valued at $15.374m, an increase of $1.292m from the previous year. The valuation established a market value and was undertaken in accordance with the Property Institute of New Zealand (PINZ) International Valuation Standards. Market value is the estimated amount for which a property should exchange on the date of valuation between a willing buyer and a willing seller in an arms length transaction.
The value of the land and improvements at cost is $5,282,686 (2015: $5,282,686).
DepreciationDepreciation is recognised as part of other cost of sales in the Profit or Loss.
Capital Work in ProgressDuring the year ending 31 July 2016, the Group undertook numerous capital projects to maintain and improve the Groups infrastructure. The cost incurred of all capital works in progress up to the reporting date totalled $6,959,077 (2015: $67,116,150).
During the year ending 31 July 2016, $67,116,150 (2015: $12,144,046) of the previous year's capital work in progress was reclassified to various fixed asset categories.
Borrowing costs capitalised during the year were nil (2015:$1,007,885).

32
NOTES TO THE FINANCIAL STATEMENTS
11. INTANGIBLE ASSETSGROUP/PARENT
Software($)
Total($)
CostBalance at 1 August 2014 2,190,441 2,190,441 Additions 334,287 334,287 Disposals - -Balance at 31 July 2015 2,524,728 2,524,728
Balance at 1 August 2015 2,524,728 2,524,728 Additions 334,758 334,758 Disposals - -Balance at 31 July 2016 2,859,486 2,859,486
Amortisation and Impairment LossesBalance at 1 August 2014 1,716,591 1,716,591 Amortisation for the Year 323,515 323,515 Disposals - -Balance at 31 July 2015 2,040,106 2,040,106
Balance at 1 August 2015 2,040,106 2,040,106 Amortisation for the Year 204,703 204,703 Disposals - -Balance at 31 July 2016 2,244,809 2,244,809
Carrying AmountsAt 1 August 2014 473,850 473,850At 31 July 2015 484,622 484,622
At 1 August 2015 484,622 484,622At 31 July 2016 614,677 614,677
AmortisationThe amortisation is recognised as part of administration expenses in the Profit or Loss.
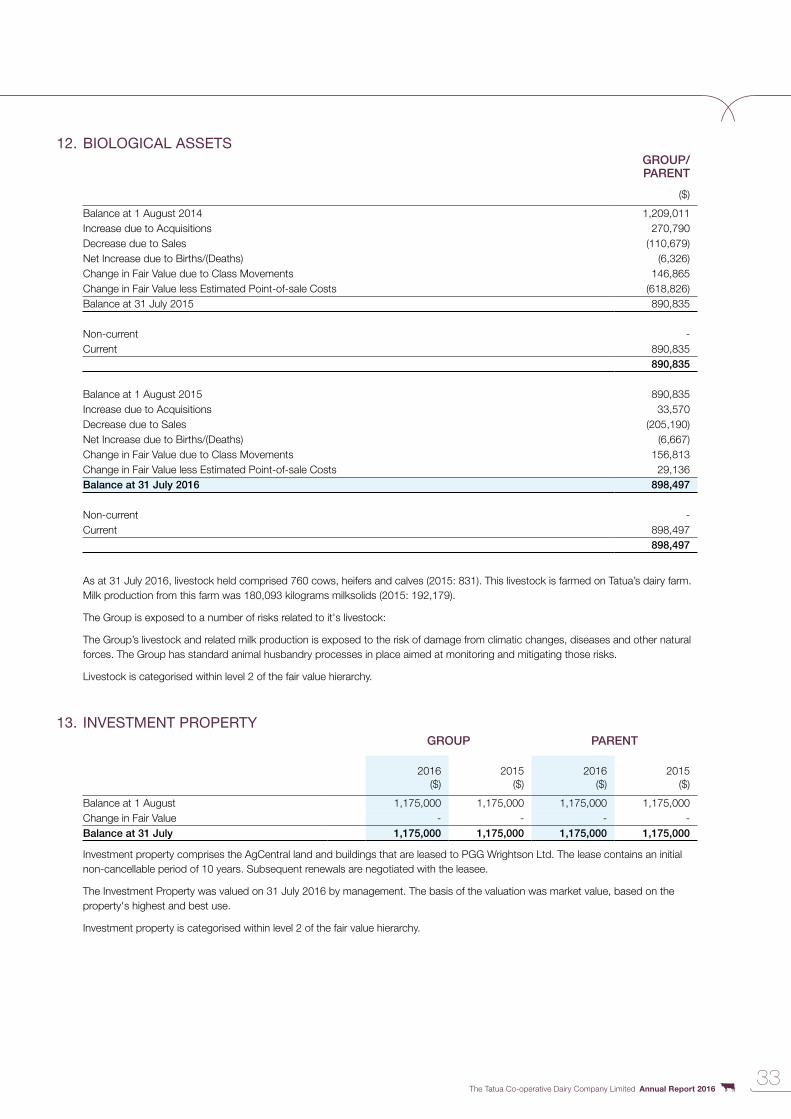
The Tatua Co-operative Dairy Company Limited Annual Report 201633
12. BIOLOGICAL ASSETSGROUP/ PARENT
($)
Balance at 1 August 2014 1,209,011 Increase due to Acquisitions 270,790 Decrease due to Sales (110,679)Net Increase due to Births/(Deaths) (6,326)Change in Fair Value due to Class Movements 146,865 Change in Fair Value less Estimated Point-of-sale Costs (618,826)Balance at 31 July 2015 890,835
Non-current -Current 890,835
890,835
Balance at 1 August 2015 890,835 Increase due to Acquisitions 33,570 Decrease due to Sales (205,190)Net Increase due to Births/(Deaths) (6,667)Change in Fair Value due to Class Movements 156,813 Change in Fair Value less Estimated Point-of-sale Costs 29,136 Balance at 31 July 2016 898,497
Non-current -Current 898,497
898,497
As at 31 July 2016, livestock held comprised 760 cows, heifers and calves (2015: 831). This livestock is farmed on Tatua’s dairy farm. Milk production from this farm was 180,093 kilograms milksolids (2015: 192,179).
The Group is exposed to a number of risks related to it's livestock:
The Group’s livestock and related milk production is exposed to the risk of damage from climatic changes, diseases and other natural forces. The Group has standard animal husbandry processes in place aimed at monitoring and mitigating those risks.
Livestock is categorised within level 2 of the fair value hierarchy.
13. INVESTMENT PROPERTYGROUP PARENT
2016($)
2015($)
2016($)
2015($)
Balance at 1 August 1,175,000 1,175,000 1,175,000 1,175,000 Change in Fair Value - - - -Balance at 31 July 1,175,000 1,175,000 1,175,000 1,175,000
Investment property comprises the AgCentral land and buildings that are leased to PGG Wrightson Ltd. The lease contains an initial non-cancellable period of 10 years. Subsequent renewals are negotiated with the leasee.
The Investment Property was valued on 31 July 2016 by management. The basis of the valuation was market value, based on the property's highest and best use.
Investment property is categorised within level 2 of the fair value hierarchy.

34
NOTES TO THE FINANCIAL STATEMENTS
14. DEFERRED TAX ASSETS AND LIABILITIES
Recognised Deferred Tax Assets and Liabilities – GROUP
Assets Liabilities Net
2016 ($)
2015 ($)
2016 ($)
2015 ($)
2016 ($)
2015 ($)
Deferred tax assets and liabilities are attributable to the following:Property, Plant and Equipment 885,688 822,951 - - 885,688 822,951 Investment Property - - (81,014) (81,014) (81,014) (81,014)Derivatives - 4,811,973 (491,083) - (491,083) 4,811,973 Biological Assets - - - - - -Inventory 1,243,159 1,065,526 - - 1,243,159 1,065,526 Provisions & Accruals 1,514,925 1,516,010 - - 1,514,925 1,516,010 Tax Loss Carry-forwards 4,734 - - (2,477) 4,734 (2,477)Tax Assets /(Liabilities) 3,648,506 8,216,460 (572,097) (83,491) 3,076,409 8,132,969
Movement in Temporary Differences During The Year
Balance 1 August
2014($)
Recognised in Profit or
Loss($)
Recognised in Other
Comprehensive Income
($)
Balance 31 July
2015 ($)
Recognised in Profit or
Loss($)
Recognised in Other
Comprehensive Income
($)
Balance 31 July
2016 ($)
Deferred tax assets and liabilities are attributable to the following:Property, Plant and Equipment 580,671 242,280 - 822,951 62,737 - 885,688 Investment Property (81,014) - - (81,014) - - (81,014)Derivatives (1,803,468) - 6,615,441 4,811,973 - (5,303,056) (491,083)Biological Assets - - - - - - -Inventory 157,886 907,640 - 1,065,526 177,633 - 1,243,159 Provisions & Accruals 961,658 554,352 - 1,516,010 (1,085) - 1,514,925 Other Items - (2,477) - (2,477) 7,211 - 4,734 Tax Loss Carry-forwards - - - - - - -Tax Assets /(Liabilities) (184,267) 1,701,795 6,615,441 8,132,969 246,496 (5,303,056) 3,076,409
Recognised Deferred Tax Assets and Liabilities – PARENT
Assets Liabilities Net
2016 ($)
2015 ($)
2016 ($)
2015 ($)
2016 ($)
2015 ($)
Deferred tax assets and liabilities are attributable to the following:Property, Plant and Equipment 885,688 822,950 - - 885,688 822,950 Investment Property - - (81,014) (81,014) (81,014) (81,014)Derivatives - 4,811,974 (491,083) - (491,083) 4,811,974 Provisions & Accruals 1,514,925 1,516,010 - - 1,514,925 1,516,010 Tax Loss Carry-forwards 4,734 - - (2,477) 4,734 (2,477)Tax Assets /(Liabilities) 2,405,347 7,150,934 (572,097) (83,491) 1,833,250 7,067,443

The Tatua Co-operative Dairy Company Limited Annual Report 201635
14. DEFERRED TAX ASSETS AND LIABILITIES (CONTINUED)
Movement in Temporary Differences During The Year
Balance 1 August
2014($)
Recognised in Profit or
Loss($)
Recognised in Other
Comprehensive Income
($)
Balance 31 July
2015 ($)
Recognised in Profit or
Loss($)
Recognised in Other
Comprehensive Income
($)
Balance 31 July
2016 ($)
Deferred tax assets and liabilities are attributable to the following:Property, Plant and Equipment 580,671 242,280 - 822,950 62,738 - 885,688 Investment Property (81,014) - - (81,014) - - (81,014)Derivatives (1,803,467) - 6,615,441 4,811,974 (1) (5,303,056) (491,083)Biological Assets - - - - - - -Provisions & Accruals 961,741 554,269 - 1,516,010 (1,085) - 1,514,925 Other Items - (2,477) - (2,477) 7,211 - 4,734 Tax Assets /(Liabilities) (342,070) 794,072 6,615,441 7,067,443 68,863 (5,303,056) 1,833,250
The utilisation of the deferred tax asset is dependent on future taxable profits arising from the reversal of existing taxable temporary differences. Recognition of the deferred tax asset is based on the ability of the company to record taxable profits through retentions or through the reclassification of payout.
15. INVENTORIES
GROUP PARENT
2016($)
2015($)
2016($)
2015($)
Finished Goods 38,190,705 39,191,277 28,409,975 32,926,108 Raw Materials 11,610,242 11,589,808 11,610,242 11,589,808
49,800,947 50,781,085 40,020,217 44,515,916
Inventory valued at net realisable value included in finished goods above:
- - - -
16. RECEIVABLES & PREPAYMENTSGROUP PARENT
2016($)
2015($)
2016($)
2015($)
Trade Receivables 34,890,721 32,606,128 14,547,861 19,698,237 Prepayments and Sundries 2,233,619 3,051,407 2,170,506 2,976,144
37,124,340 35,657,535 16,718,367 22,674,381
GROUPUSD
($)AUD
($) JPY
($) EUR
($) CNY
($)
Trade Receivables Denominated in Foreign Currencies2016 7,554,540 2,345,935 1,012,885,408 40,000 21,318,928 2015 11,517,969 1,881,186 972,342,618 56,500 -
PARENTUSD
($)AUD
($) JPY
($) EUR
($) CNY
($)
Trade Receivables Denominated in Foreign Currencies2016 6,021,879 2,345,935 - 40,000 -2015 11,517,969 1,881,186 - 56,500 -

36
NOTES TO THE FINANCIAL STATEMENTS
17. CASH & CASH EQUIVALENTSGROUP PARENT
2016($)
2015($)
2016($)
2015($)
JPY Bank Deposits 1,897,297 208,085 - -USD Bank Deposits 639,143 529,617 - -CNY Bank Deposits 7,504,869 515,748 - -NZD Bank Deposits 685,211 14,372,916 685,211 14,372,916Bank Deposits 10,726,520 15,626,366 685,211 14,372,916
Cash & Cash Equivalents in the Statement of Cash Flows 10,726,520 15,626,366 685,211 14,372,916
18. MEMBERS FUNDS
As at 31 July 2016 151,837,340 (2015: 152,309,895) fully paid shares were on issue to shareholders.
Voting Rights – Under the Company Constitution, voting may take place by show of hands, voice or poll. On a poll, one vote may be cast for every whole 1,000kg of qualifying milksolids held. No shareholder shall cast votes exceeding 5% of the total votes which could be cast if all shareholders were present and voting.
Redemption Features – Shares are redeemed at nominal value of 50 cents, or paid up value if lower.
Treasury Stock – As at 31 July 2016 472,556 shares were held as treasury stock. (2015: Nil)
Movements in the Company's Issued Shares were as follows:
2016 2015
Shares ($) Shares ($)
Shares at the beginning of the Year 152,309,895 76,164,948 68,889,375 34,444,688 Bonus Share Issue - - 75,894,440 37,957,220 Shares Issued 4,581,594 2,290,797 8,105,350 4,052,675 Shares Repurchased (5,054,150) (2,527,075) (579,270) (289,635)Shares at the end of the Year 151,837,340 75,928,670 152,309,895 76,164,948
Reserves
Translation ReserveThe translation reserve comprises all foreign currency differences arising from the translation of the financial statements of foreign operations.
Hedging ReserveThe hedging reserve comprises the effective portion of the cumulative net change in the fair value of cash flow hedging instruments related to hedged transactions that have not yet occurred.
Revaluation ReserveThe revaluation reserve relates to the revaluation of land and improvements.
Retained EarningsAll retained earnings are attributable to equity holders of the Company.

The Tatua Co-operative Dairy Company Limited Annual Report 201637
19. LOANS & BORROWINGSGROUP PARENT
2016($)
2015($)
2016($)
2015($)
CurrentJPY Bank Loans 9,510,870 8,537,900 - -NZD Bank Loans 35,000,000 53,000,000 35,000,000 53,000,000
44,510,870 61,537,900 35,000,000 53,000,000 Non CurrentNZD Bank Loans 31,000,000 12,000,000 31,000,000 12,000,000
31,000,000 12,000,000 31,000,000 12,000,000
Total 75,510,870 73,537,900 66,000,000 65,000,000
2016 CurrencyNominal
Interest RateYear of
Maturity Face Value
Carrying Amount
(NZD) Current Bank Loans JPY 1.00% 2017 ¥700,000,000 $9,510,870
NZD 3.12% 2017 $35,000,000 $35,000,000
Non Current Bank Loans NZD 4.33% 2019 $31,000,000 $31,000,000
2015 CurrencyNominal
Interest Rate
Year of
Maturity Face Value
Carrying Amount
(NZD) Current Bank Loans JPY 1.05% 2016 ¥700,000,000 $8,537,900
NZD 4.29% 2016 $53,000,000 $53,000,000
Non Current Bank Loans NZD 4.33% 2017 $12,000,000 $12,000,000
The Group’s bank loans are secured by registered first mortgages, preferred security interest in all present and after acquired property, and an interlocking guarantee from companies within the Group. The Group’s borrowings are subject to various covenants such as minimum equity, interest cover ratio and gearing ratio and the Group was in compliance with the various covenants.
The Group has committed (but undrawn) facilities with expiry dates through to 2019 of $46.442m. The Group’s funding facility is currently being renegotiated and is expected to be extended.
20. ACCOUNTS PAYABLE & ACCRUALSGROUP PARENT
2016($)
2015($)
2016($)
2015($)
Trade Payables 5,495,816 5,527,503 5,956,180 4,986,785 Employee Entitlements 5,913,446 5,331,595 5,913,446 5,331,595 Income in Advance 381,016 895,892 - -Accruals 8,701,696 13,166,208 5,312,894 11,455,576
20,491,974 24,921,198 17,182,520 21,773,956

38
NOTES TO THE FINANCIAL STATEMENTS
21. FINANCIAL INSTRUMENTS
Exposure to credit, liquidity, foreign currency and interest rate risks arises in the normal course of the Group’s business.
Credit RiskThe Group’s exposure to credit risk is mainly influenced by its customer base. There is no risk concentration either geographically or by sector.
Tatua has a credit policy under which each customer is assessed for credit worthiness and assigned a credit limit. Where available the Group reviews external credit reports for both country and customer risk. Credit limits are reviewed on a regular basis. The Group’s credit policy requires certain risk mitigations such as insurance, letters of credit or prepayment depending on the country and/or customer.
The Group does not require collateral for trade and other receivables. However, where practicable, purchase money security interests over New Zealand-based customers are registered on the Personal Property and Securities Register.
Liquidity RiskLiquidity risk represents the Group’s ability to meet its contractual obligations. The Group evaluates its liquidity requirements on an ongoing basis. In general, the Group generates sufficient cash flows from its operating activities to meet its obligations arising from financial liabilities and has credit lines in place to cover any timing differences.
Foreign Currency RiskThe Group is exposed to foreign currency risk predominantly on sales that are denominated in a currency other than the Group’s functional currency. The New Zealand dollar ($) is the presentation currency of the Group. The currencies in which transactions are primarily denominated are United States dollars, Japanese Yen and Australian dollars.
The Group has a policy of maintaining a level of foreign currency hedging that allows for a degree of certainty in its future cash flows and to help protect it against sudden increases in the value of the New Zealand dollar against the United States dollar, Japanese yen and Australian dollar.
The Group uses forward exchange contracts and currency options to hedge its foreign currency exposure. All of the forward exchange contracts and options have maturities of less than two years at balance date.
Forecast TransactionsThe Group classifies its forward exchange and option contracts, which are hedging forecast transactions, as cash flow hedges.
Interest Rate RiskInterest rate risk is the risk that the value of the Group’s assets and liabilities will fluctuate due to changes in market interest rates. The Group is exposed to interest rate risk primarily through its cash balances and advances, bank overdraft and borrowings. Interest rate swaps have been entered into to achieve an appropriate mix of fixed and floating rate exposure within the Group’s policy.
Other Market Price RiskThe entity is not exposed to substantial other market price risk arising from financial instruments.
Capital ManagementThe Group’s members funds includes co-operative shares, reserves and retained earnings. The Group’s policy is to maintain a strong members funds base so as to maintain shareholder, creditor and market confidence and to sustain future development of the business.
The Group’s objective is to provide returns for shareholders and to maintain an optimal capital structure to reduce the cost of capital. The Group distributes its surplus by way of payout. However, in order to retain or modify the capital structure, the Group may decide to retain profits within the business.
The Board primarily monitors capital on the basis of the gearing ratio. For the period ending 31 July 2016 the gearing ratio was 34.3% (2015: 36.6%). The ratio is calculated as net interest bearing debt divided by total capital. Net interest bearing debt is calculated as total borrowings less cash and cash equivalents. Total capital is calculated as members funds plus net interest bearing debt. Tatua is a co-operative company, and as such members funds change in proportion to milk supplied. (Refer to Note 18). The Group is required to meet certain ratios under its bank convenants, which have been met, including a requirement that Group members funds be not less than $70,000,000 (2015: $60,000,000), but otherwise the Group is not subject to any externally imposed capital requirements.
There have been no material changes in the Group’s management of capital during the period.
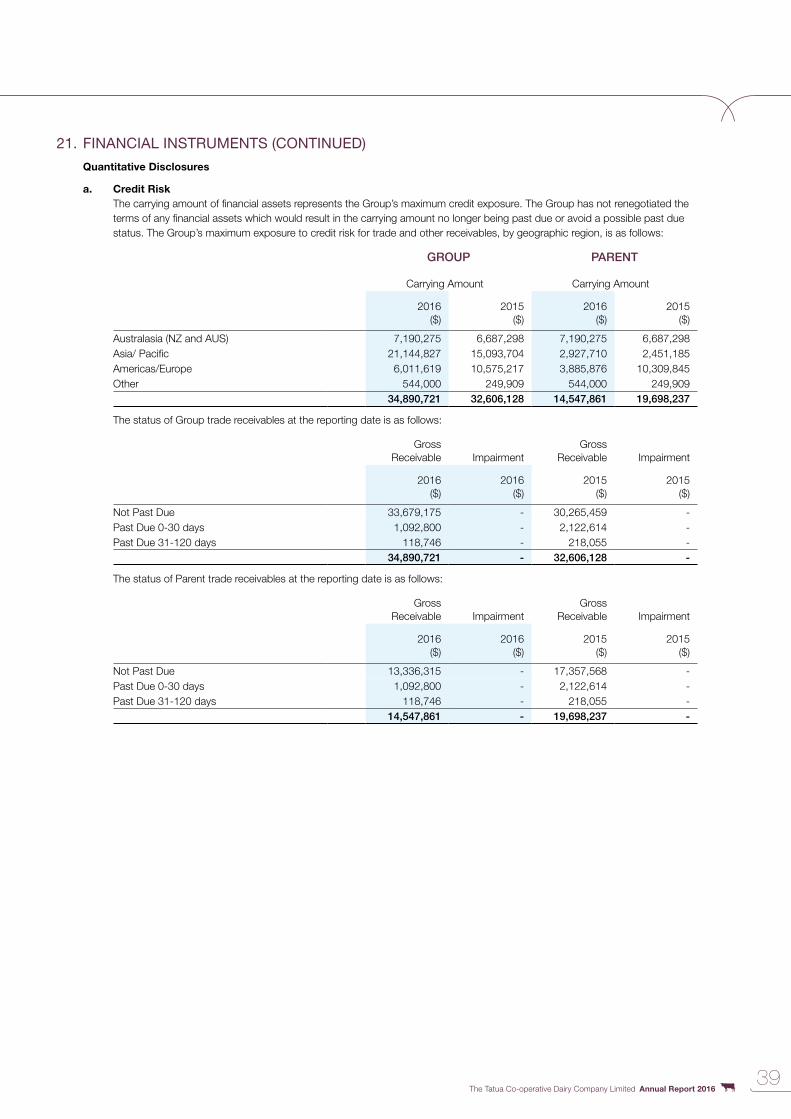
The Tatua Co-operative Dairy Company Limited Annual Report 201639
21. FINANCIAL INSTRUMENTS (CONTINUED)
Quantitative Disclosures
a. Credit RiskThe carrying amount of financial assets represents the Group’s maximum credit exposure. The Group has not renegotiated the terms of any financial assets which would result in the carrying amount no longer being past due or avoid a possible past due status. The Group’s maximum exposure to credit risk for trade and other receivables, by geographic region, is as follows:
GROUP PARENT
Carrying Amount Carrying Amount
2016 ($)
2015 ($)
2016 ($)
2015 ($)
Australasia (NZ and AUS) 7,190,275 6,687,298 7,190,275 6,687,298Asia/ Pacific 21,144,827 15,093,704 2,927,710 2,451,185Americas/Europe 6,011,619 10,575,217 3,885,876 10,309,845 Other 544,000 249,909 544,000 249,909
34,890,721 32,606,128 14,547,861 19,698,237
The status of Group trade receivables at the reporting date is as follows:
Gross Receivable Impairment
Gross Receivable Impairment
2016 ($)
2016 ($)
2015 ($)
2015 ($)
Not Past Due 33,679,175 - 30,265,459 -Past Due 0-30 days 1,092,800 - 2,122,614 -Past Due 31-120 days 118,746 - 218,055 -
34,890,721 - 32,606,128 -
The status of Parent trade receivables at the reporting date is as follows:
Gross Receivable Impairment
Gross Receivable Impairment
2016 ($)
2016 ($)
2015 ($)
2015 ($)
Not Past Due 13,336,315 - 17,357,568 -Past Due 0-30 days 1,092,800 - 2,122,614 -Past Due 31-120 days 118,746 - 218,055 -
14,547,861 - 19,698,237 -
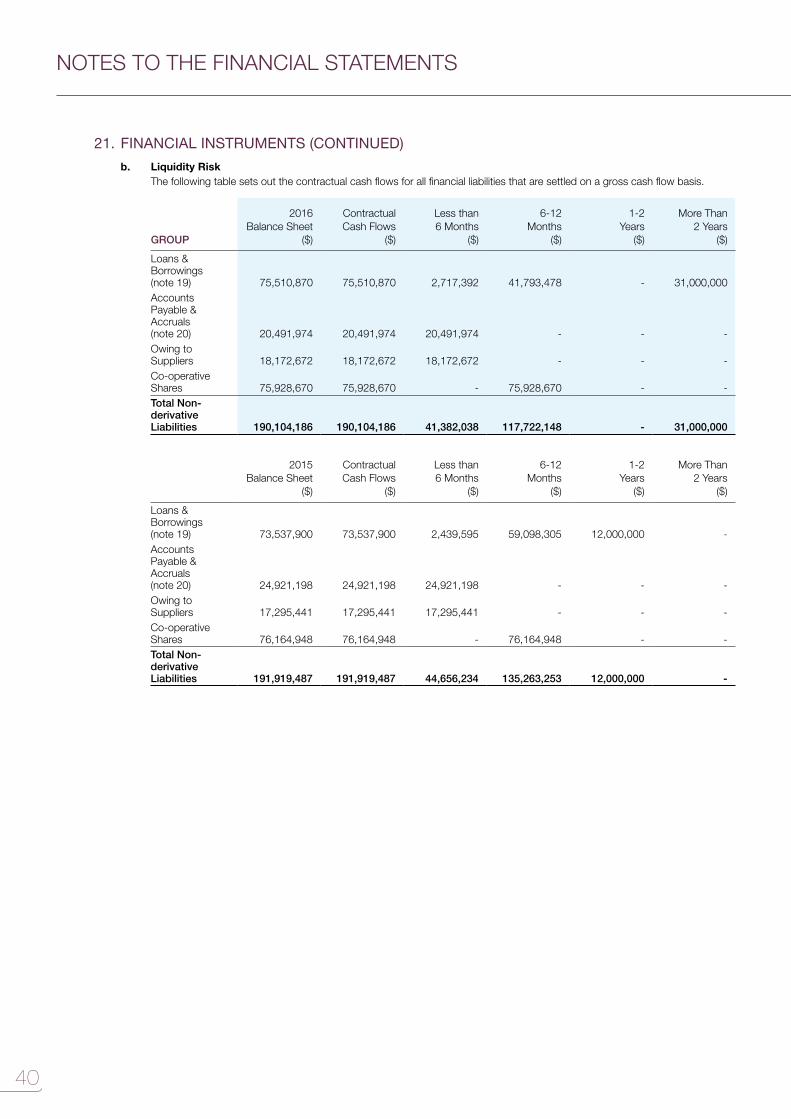
40
NOTES TO THE FINANCIAL STATEMENTS
21. FINANCIAL INSTRUMENTS (CONTINUED)
b. Liquidity RiskThe following table sets out the contractual cash flows for all financial liabilities that are settled on a gross cash flow basis.
GROUP
2016 Balance Sheet
($)
Contractual Cash Flows
($)
Less than 6 Months
($)
6-12 Months
($)
1-2 Years
($)
More Than 2 Years
($)
Loans & Borrowings (note 19) 75,510,870 75,510,870 2,717,392 41,793,478 - 31,000,000 Accounts Payable & Accruals (note 20) 20,491,974 20,491,974 20,491,974 - - -Owing to Suppliers 18,172,672 18,172,672 18,172,672 - - -Co-operative Shares 75,928,670 75,928,670 - 75,928,670 - -Total Non-derivative Liabilities 190,104,186 190,104,186 41,382,038 117,722,148 - 31,000,000
2015 Balance Sheet
($)
Contractual Cash Flows
($)
Less than 6 Months
($)
6-12 Months
($)
1-2 Years
($)
More Than 2 Years
($)
Loans & Borrowings (note 19) 73,537,900 73,537,900 2,439,595 59,098,305 12,000,000 -Accounts Payable & Accruals (note 20) 24,921,198 24,921,198 24,921,198 - - -Owing to Suppliers 17,295,441 17,295,441 17,295,441 - - -Co-operative Shares 76,164,948 76,164,948 - 76,164,948 - -Total Non-derivative Liabilities 191,919,487 191,919,487 44,656,234 135,263,253 12,000,000 -
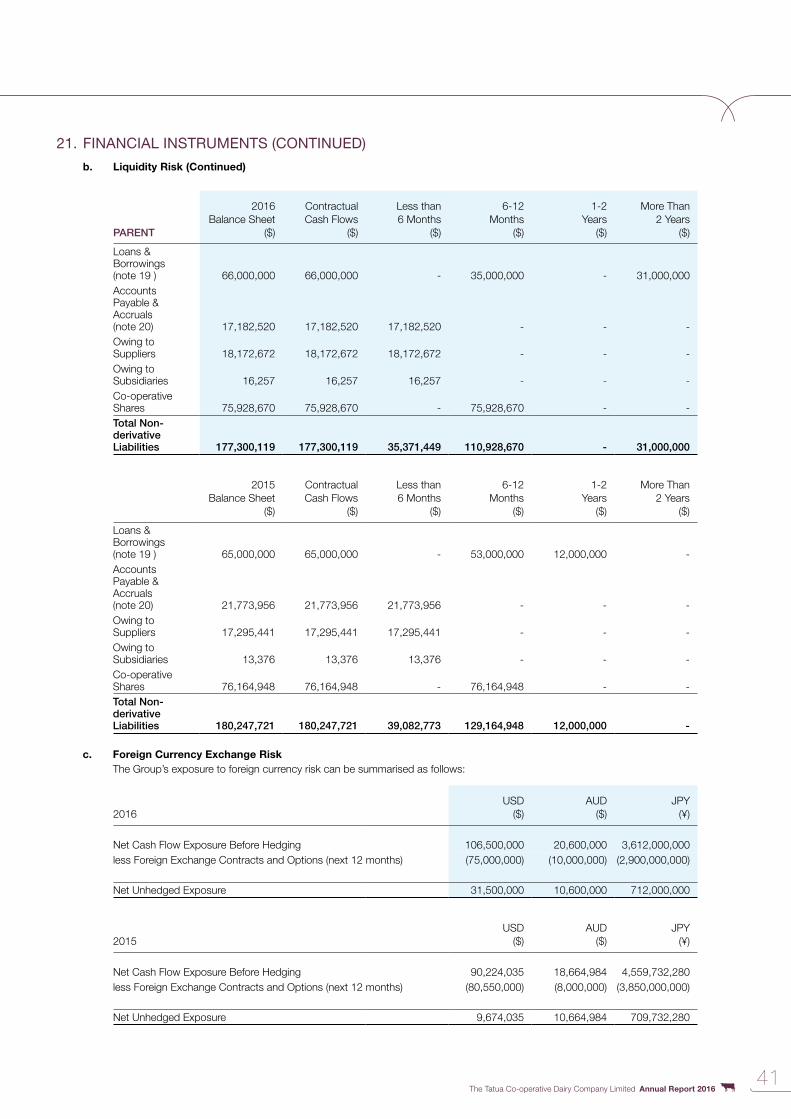
The Tatua Co-operative Dairy Company Limited Annual Report 201641
21. FINANCIAL INSTRUMENTS (CONTINUED)
b. Liquidity Risk (Continued)
PARENT
2016 Balance Sheet
($)
Contractual Cash Flows
($)
Less than 6 Months
($)
6-12 Months
($)
1-2 Years
($)
More Than 2 Years
($)
Loans & Borrowings (note 19 ) 66,000,000 66,000,000 - 35,000,000 - 31,000,000 Accounts Payable & Accruals (note 20) 17,182,520 17,182,520 17,182,520 - - -Owing to Suppliers 18,172,672 18,172,672 18,172,672 - - -Owing to Subsidiaries 16,257 16,257 16,257 - - -Co-operative Shares 75,928,670 75,928,670 - 75,928,670 - -Total Non-derivative Liabilities 177,300,119 177,300,119 35,371,449 110,928,670 - 31,000,000
2015 Balance Sheet
($)
Contractual Cash Flows
($)
Less than 6 Months
($)
6-12 Months
($)
1-2 Years
($)
More Than 2 Years
($)
Loans & Borrowings (note 19 ) 65,000,000 65,000,000 - 53,000,000 12,000,000 -Accounts Payable & Accruals (note 20) 21,773,956 21,773,956 21,773,956 - - -Owing to Suppliers 17,295,441 17,295,441 17,295,441 - - -Owing to Subsidiaries 13,376 13,376 13,376 - - -Co-operative Shares 76,164,948 76,164,948 - 76,164,948 - -Total Non-derivative Liabilities 180,247,721 180,247,721 39,082,773 129,164,948 12,000,000 -
c. Foreign Currency Exchange RiskThe Group’s exposure to foreign currency risk can be summarised as follows:
2016 USD
($) AUD
($) JPY
(¥)
Net Cash Flow Exposure Before Hedging 106,500,000 20,600,000 3,612,000,000 less Foreign Exchange Contracts and Options (next 12 months) (75,000,000) (10,000,000) (2,900,000,000)
Net Unhedged Exposure 31,500,000 10,600,000 712,000,000
2015 USD
($) AUD
($) JPY
(¥)
Net Cash Flow Exposure Before Hedging 90,224,035 18,664,984 4,559,732,280 less Foreign Exchange Contracts and Options (next 12 months) (80,550,000) (8,000,000) (3,850,000,000)
Net Unhedged Exposure 9,674,035 10,664,984 709,732,280

42
NOTES TO THE FINANCIAL STATEMENTS
21. FINANCIAL INSTRUMENTS (CONTINUED)
d. Interest Rate Risk – Repricing AnalysisVariable Rate Instruments (also refer to note 19)
GROUP
2016 Total
($)
6 Months or Less
($)
6-12 Months
($)
1-2 Years
($)
More Than 2 Years
($)
Cash and Cash Equivalents 10,726,520 10,726,520 - - -NZD Bank Loans (66,000,000) - (35,000,000) - (31,000,000)JPY Bank Loans (9,510,870) (2,717,392) (6,793,478) - -Total (64,784,350) 8,009,128 (41,793,478) - (31,000,000)
2015Total
($)
6 Months or Less
($)
6-12 Months
($)
1-2 Years
($)
More Than 2 Years
($)
Cash and Cash Equivalents 15,626,366 15,626,366 - - -NZD Bank Loans (65,000,000) - (53,000,000) (12,000,000) -JPY Bank Loans (8,537,900) (2,439,595) (6,098,305) - -Total (57,911,534) 13,186,771 (59,098,305) (12,000,000) -
PARENT
2016 Total
($)
6 Months or Less
($)
6-12 Months
($)
1-2 Years
($)
More Than 2 Years
($)
Cash and Cash Equivalents 685,211 685,211 - - -NZD Bank Loans (66,000,000) - (35,000,000) - (31,000,000)Total (65,314,789) 685,211 (35,000,000) - (31,000,000)
2015Total
($)
6 Months or Less
($)
6-12 Months
($)
1-2 Years
($)
More Than 2 Years
($)
Cash and Cash Equivalents 14,372,916 14,372,916 - - -NZD Bank Loans (65,000,000) - (53,000,000) (12,000,000) -Total (50,627,084) 14,372,916 (53,000,000) (12,000,000) -
e. Sensitivity AnalysisIn managing interest rate and currency risks the Group aims to reduce the impact of short-term fluctuations on the Group’s earnings. Over the longer-term, however, permanent changes in foreign exchange and interest rates will have an impact on profit.
Interest Rates:At 31 July it is estimated that a general increase of one percentage point in NZ interest rates would decrease the Parent’s profit before income tax by approximately $547,880 (2015: $324,579). Interest rate swaps have been included in this calculation.
Foreign Exchange Rates:The Group has a foreign exchange policy to mitigate the risk associated with the fluctuations in the value of the New Zealand Dollar. At 31 July it is estimated that a general increase of one cent in the NZD/USD exchange rate would decrease the Group’s profit by $694,672 (2015: $640,854). Foreign exchange hedging has been included in this calculation.
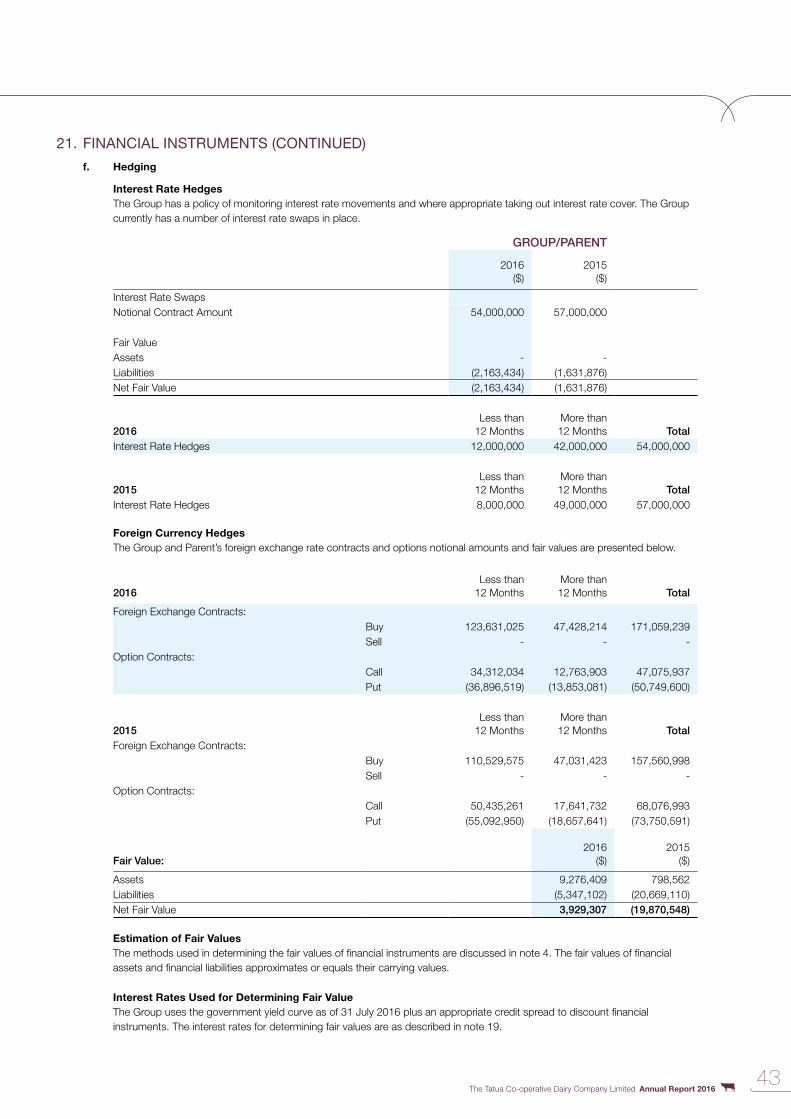
The Tatua Co-operative Dairy Company Limited Annual Report 201643
21. FINANCIAL INSTRUMENTS (CONTINUED)
f. Hedging
Interest Rate HedgesThe Group has a policy of monitoring interest rate movements and where appropriate taking out interest rate cover. The Group currently has a number of interest rate swaps in place.
GROUP/PARENT
2016($)
2015($)
Interest Rate SwapsNotional Contract Amount 54,000,000 57,000,000
Fair ValueAssets - -Liabilities (2,163,434) (1,631,876)Net Fair Value (2,163,434) (1,631,876)
2016 Less than 12 Months
More than 12 Months Total
Interest Rate Hedges 12,000,000 42,000,000 54,000,000
2015 Less than 12 Months
More than 12 Months Total
Interest Rate Hedges 8,000,000 49,000,000 57,000,000
Foreign Currency HedgesThe Group and Parent’s foreign exchange rate contracts and options notional amounts and fair values are presented below.
2016 Less than 12 Months
More than 12 Months Total
Foreign Exchange Contracts:Buy 123,631,025 47,428,214 171,059,239 Sell - - -
Option Contracts:Call 34,312,034 12,763,903 47,075,937 Put (36,896,519) (13,853,081) (50,749,600)
2015 Less than 12 Months
More than 12 Months Total
Foreign Exchange Contracts:Buy 110,529,575 47,031,423 157,560,998 Sell - - -
Option Contracts:Call 50,435,261 17,641,732 68,076,993 Put (55,092,950) (18,657,641) (73,750,591)
Fair Value:2016
($)2015
($)
Assets 9,276,409 798,562 Liabilities (5,347,102) (20,669,110)Net Fair Value 3,929,307 (19,870,548)
Estimation of Fair ValuesThe methods used in determining the fair values of financial instruments are discussed in note 4. The fair values of financial assets and financial liabilities approximates or equals their carrying values.
Interest Rates Used for Determining Fair ValueThe Group uses the government yield curve as of 31 July 2016 plus an appropriate credit spread to discount financial instruments. The interest rates for determining fair values are as described in note 19.
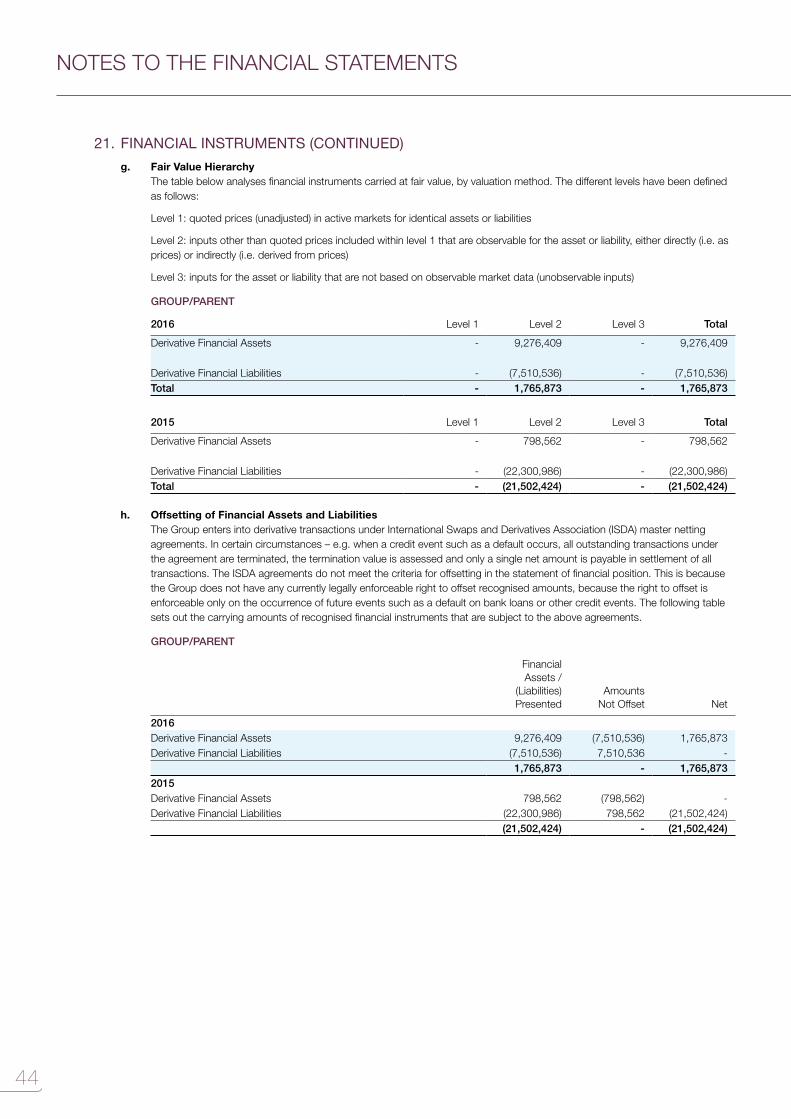
44
NOTES TO THE FINANCIAL STATEMENTS
21. FINANCIAL INSTRUMENTS (CONTINUED)
g. Fair Value HierarchyThe table below analyses financial instruments carried at fair value, by valuation method. The different levels have been defined as follows:
Level 1: quoted prices (unadjusted) in active markets for identical assets or liabilities
Level 2: inputs other than quoted prices included within level 1 that are observable for the asset or liability, either directly (i.e. as prices) or indirectly (i.e. derived from prices)
Level 3: inputs for the asset or liability that are not based on observable market data (unobservable inputs)
GROUP/PARENT
2016 Level 1 Level 2 Level 3 Total
Derivative Financial Assets - 9,276,409 - 9,276,409
Derivative Financial Liabilities - (7,510,536) - (7,510,536)Total - 1,765,873 - 1,765,873
2015 Level 1 Level 2 Level 3 Total
Derivative Financial Assets - 798,562 - 798,562
Derivative Financial Liabilities - (22,300,986) - (22,300,986)Total - (21,502,424) - (21,502,424)
h. Offsetting of Financial Assets and LiabilitiesThe Group enters into derivative transactions under International Swaps and Derivatives Association (ISDA) master netting agreements. In certain circumstances – e.g. when a credit event such as a default occurs, all outstanding transactions under the agreement are terminated, the termination value is assessed and only a single net amount is payable in settlement of all transactions. The ISDA agreements do not meet the criteria for offsetting in the statement of financial position. This is because the Group does not have any currently legally enforceable right to offset recognised amounts, because the right to offset is enforceable only on the occurrence of future events such as a default on bank loans or other credit events. The following table sets out the carrying amounts of recognised financial instruments that are subject to the above agreements.
GROUP/PARENT
Financial Assets /
(Liabilities) Presented
Amounts Not Offset Net
2016Derivative Financial Assets 9,276,409 (7,510,536) 1,765,873 Derivative Financial Liabilities (7,510,536) 7,510,536 -
1,765,873 - 1,765,873 2015Derivative Financial Assets 798,562 (798,562) -Derivative Financial Liabilities (22,300,986) 798,562 (21,502,424)
(21,502,424) - (21,502,424)
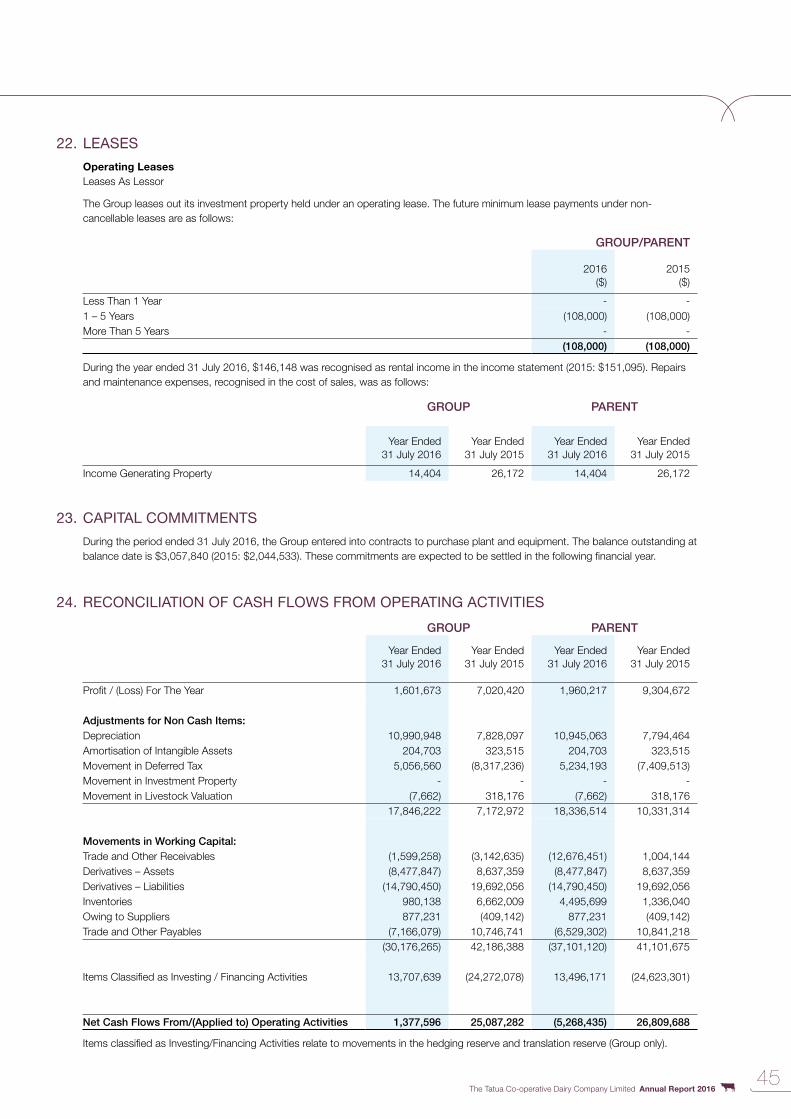
The Tatua Co-operative Dairy Company Limited Annual Report 201645
22. LEASES
Operating LeasesLeases As Lessor
The Group leases out its investment property held under an operating lease. The future minimum lease payments under non-cancellable leases are as follows:
GROUP/PARENT
2016($)
2015($)
Less Than 1 Year - -1 – 5 Years (108,000) (108,000)More Than 5 Years - -
(108,000) (108,000)
During the year ended 31 July 2016, $146,148 was recognised as rental income in the income statement (2015: $151,095). Repairs and maintenance expenses, recognised in the cost of sales, was as follows:
GROUP PARENT
Year Ended 31 July 2016
Year Ended 31 July 2015
Year Ended 31 July 2016
Year Ended 31 July 2015
Income Generating Property 14,404 26,172 14,404 26,172
23. CAPITAL COMMITMENTS
During the period ended 31 July 2016, the Group entered into contracts to purchase plant and equipment. The balance outstanding at balance date is $3,057,840 (2015: $2,044,533). These commitments are expected to be settled in the following financial year.
24. RECONCILIATION OF CASH FLOWS FROM OPERATING ACTIVITIES
GROUP PARENT
Year Ended31 July 2016
Year Ended31 July 2015
Year Ended31 July 2016
Year Ended31 July 2015
Profit / (Loss) For The Year 1,601,673 7,020,420 1,960,217 9,304,672
Adjustments for Non Cash Items:Depreciation 10,990,948 7,828,097 10,945,063 7,794,464 Amortisation of Intangible Assets 204,703 323,515 204,703 323,515 Movement in Deferred Tax 5,056,560 (8,317,236) 5,234,193 (7,409,513)Movement in Investment Property - - - -Movement in Livestock Valuation (7,662) 318,176 (7,662) 318,176
17,846,222 7,172,972 18,336,514 10,331,314
Movements in Working Capital:Trade and Other Receivables (1,599,258) (3,142,635) (12,676,451) 1,004,144 Derivatives – Assets (8,477,847) 8,637,359 (8,477,847) 8,637,359 Derivatives – Liabilities (14,790,450) 19,692,056 (14,790,450) 19,692,056 Inventories 980,138 6,662,009 4,495,699 1,336,040 Owing to Suppliers 877,231 (409,142) 877,231 (409,142)Trade and Other Payables (7,166,079) 10,746,741 (6,529,302) 10,841,218
(30,176,265) 42,186,388 (37,101,120) 41,101,675
Items Classified as Investing / Financing Activities 13,707,639 (24,272,078) 13,496,171 (24,623,301)
Net Cash Flows From/(Applied to) Operating Activities 1,377,596 25,087,282 (5,268,435) 26,809,688
Items classified as Investing/Financing Activities relate to movements in the hedging reserve and translation reserve (Group only).

46
NOTES TO THE FINANCIAL STATEMENTS
25. RELATED PARTY TRANSACTIONS
Directors and ShareholdersDirectors and Shareholders may conduct business with the Group in the normal course of their business.
Key Management PersonnelKey management personnel compensation
GROUP PARENT
Year Ended 31 July 2016
Year Ended 31 July 2015
Year Ended 31 July 2016
Year Ended 31 July 2015
Short Term Employee Benefits 1,923,639 1,502,925 938,459 843,187 Long Term Employee Benefits - 150,000 - 150,000
Transactions and Balances with Key Management PersonnelKey management personnel may conduct business with the Group.
The aggregate value of transactions and outstanding balances relating to key management personnel and entities over which they have control or significant influence were as follows: Nil (2015: Nil).
Transactions and Balances with Other Related PartiesElected directors conduct business with the Group in the normal course of their business activities.
The Group has paid director fees of $463,000 (2015: $468,000), which is separately disclosed within the directors report.
The Group has not used the services of any other related parties (2015:$Nil).
Directors Farm Supply (included in Owing to Suppliers)
Value of Transactions
15/16
Balance Outstanding
31 July 2016
Value of Transactions
14/15
Balance Outstanding
31 July 2015
Directors’ Farm Supply (including Owing to Suppliers) 6,911,808 1,205,667 7,972,553 1,157,927
Transactions and Balances with SubsidiariesTatua and it's subsidiaries, Tatua Japan, Tatua USA and Tatua Shanghai, conduct business with the Group in the normal course of their business activities. All of these transactions are conducted on normal commercial terms and conditions.
PARENT
Value of Transactions
15/16
Balance Outstanding
31 July 2016
Value of Transactions
14/15
Balance Outstanding
31 July 2015
Sales by Tatua to Tatua Japan 54,606,207 - 55,351,366 -Sales by Tatua to Tatua USA 20,349,729 - 2,000,821 -Sales by Tatua to Tatua Dairy Products (Shanghai) 20,969,755 - - -Sales by Tatua Japan to Tatua 776,516 - 361,824 -Money Owing by Tatua Japan to Tatua - 6,491,142 - 5,529,061 Money Owing by Tatua USA to Tatua - 14,286,820 - 1,790,255 Money Owing by Tatua Dairy Products (Shanghai) to Tatua - 5,173,819 - -Money Owing by Tatua to Tatua Japan - (16,257) - (13,376)
96,702,207 25,935,524 57,714,011 7,305,940

The Tatua Co-operative Dairy Company Limited Annual Report 201647
26. GROUP ENTITIESSubsidiaries Ownership Interest
Country Of Incorporation
2016 2015
Tatua Japan Limited Japan 100% 100%Tatua USA Limited USA 100% 100%Tatua Dairy Products (Shanghai) Co., Ltd China 100% 100%
Equity Accounted InvesteeMilktest New Zealand Limited New Zealand 10% 10%
27. SUBSEQUENT EVENTSThere were no material events subsequent to 31 July 2016 that would impact these financial statements.

48
TO THE SHAREHOLDERS OF THE TATUA CO-OPERATIVE DAIRY COMPANY LIMITED
Report on the company and group financial statements
We have audited the accompanying financial statements of The Tatua Co-Operative Dairy Company Limited (‘’the company’’) and the group,
comprising the company and its subsidiaries, on pages 14 to 47. The financial statements comprise the statements of financial position as
at 31 July 2016, the statements of comprehensive income, changes in equity and cash flows for the year then ended, and a summary of
significant accounting policies and other explanatory information, for both the company and the group.
This report is made solely to the shareholders as a body. Our audit work has been undertaken so that we might state to the company’s
shareholders those matters we are required to state to them in the auditor’s report and for no other purpose. To the fullest extent permitted
by law, we do not accept or assume responsibility to anyone other than the company’s shareholders as a body, for our audit work, this
report or any of the opinions we have formed.
Directors’ responsibility for the company and group financial statements
The directors are responsible on behalf of the company for the preparation of company and group financial statements in accordance with
generally accepted accounting practice in New Zealand and International Financial Reporting Standards that give a true and fair view of the
matters to which they relate, and for such internal control as the directors determine is necessary to enable the preparation of company and
group financial statements that are free from material misstatement whether due to fraud or error.
Auditor’s responsibility
Our responsibility is to express an opinion on these company and group financial statements based on our audit. We conducted our audit
in accordance with International Standards on Auditing (New Zealand). Those standards require that we comply with ethical requirements
and plan and perform the audit to obtain reasonable assurance about whether the company and group financial statements are free from
material misstatement.
An audit involves performing procedures to obtain audit evidence about the amounts and disclosures in the company and group financial
statements. The procedures selected depend on the auditor’s judgement, including the assessment of the risks of material misstatement
of the financial statements, whether due to fraud or error. In making those risk assessments, the auditor considers internal control relevant
to the company and group’s preparation of the financial statements that give a true and fair view of the matters to which they relate in order
to design audit procedures that are appropriate in the circumstances, but not for the purpose of expressing an opinion on the effectiveness
of the company and group’s internal control. An audit also includes evaluating the appropriateness of accounting policies used and the
reasonableness of accounting estimates, as well as evaluating the presentation of the financial statements.
We believe that the audit evidence we have obtained is sufficient and appropriate to provide a basis for our audit opinion.
Subject to certain restrictions, partners and employees of our firm may deal with the company and group on normal terms within the
ordinary course of trading activities of the business of the company and group. These matters have not impaired our independence as
auditor of the company and group. The firm has no other relationship with, or interest in, the company and group.
Opinion
In our opinion the financial statements on pages 14 to 47:
• comply with generally accepted accounting practice in New Zealand;
• comply with International Financial Reporting Standards;
• give a true and fair view of the financial position of the company and the group as at 31 July 2016 and of the financial performance
and cash flows of the company and the group for the year then ended.
Report on other legal and regulatory requirements
In accordance with the requirements of sections 16(1)(d) and 16(1)(e) of the Financial Reporting Act 1993, we report that:
• we have obtained all the information and explanations that we have required; and
• in our opinion, proper accounting records have been kept by The Tatua Co-Operative Dairy Company Limited as far as appears from
our examination of those records.
16 November 2016
Hamilton
AUDITORS REPORT2016

The Tatua Co-operative Dairy Company Limited Annual Report 201649
2015/16 2014/15 2013/14 2012/13 2011/12
Milk Received from SuppliersLitres 173,184,398 173,353,171 147,647,758 140,723,652 147,155,635Milksolids 15,568,586 15,663,949 13,223,427 12,523,609 13,186,565
Income Equivalent Payout (cents/kg ms)Made up of:Cash Payout 630.0 710.0 900.0 740.0 750.0 Imputation Credits - - - - -
Total Income Equivalent Payout 630.0 710.0 900.0 740.0 750.0
Summary of Milk Payment Rates 2015/16 2014/15Cents / kg
FatCents / kg
ProteinCents / kg
FatCents / kg
Protein
Advance Rate 20 July 260.0 635.0 261.0 705.0 Retrospective Increase 20 March 9.0 22.0 26.0 69.0 Retrospective Increase 20 April 7.0 16.0 - -Retrospective Increase 20 May 6.0 16.0 - -Retrospective Increase 20 June 19.0 45.0 24.0 67.0 Retrospective Increase 20 July 19.0 45.0 38.0 103.0 Retrospective Increase 20 August 18.0 46.0 21.0 56.0 Retrospective Increase 20 September 19.0 45.0 20.0 55.0 Final Payment 20 October 30.5925 75.3475 18.9350 50.2298
Total Payout Averaged Over All Grades 387.593 945.348 408.935 1,105.230
YearNo. of
Suppliers
MilksolidsFrom own
Supply(Kg)
PayoutCents/kg ms
(IncomeEquivalent)
Total Shareholders
Funds $
Commodity Products (tonnes)
Proteins Powders Cheese AMF
2015/16 113 15,568,586 630.0 116,869,514 9,645 10,1942014/15 118 15,663,949 710.0 100,371,192 9,654 9,7912013/14 109 13,223,427 900.0 106,167,944 7,408 9,5352012/13 108 12,523,609 740.0 87,044,650 7,168 8,0692011/12 109 13,186,565 750.0 76,825,363 8,037 9,4692010/11 111 12,041,622 810.0 75,438,331 6,715 7,2882005/06 121 12,237,952 459.1 50,988,615 6,718 8,3642000/01 136 8,908,866 552.3 25,376,429 8,0001995/96 146 7,989,118 418.7 15,082,806 7,8631990/91 130 6,382,505 261.7 11,604,650 2,7051985/86 104 5,013,554 241.4 5,611,760 1,7531980/81 87 3,618,763 155.2 1,738,208 971 7611975/76 74 2,938,277 81.3 752,270 1,144 1,2751970/71 70 2,182,343 48.9 275,015 1,005 6091965/66 70 1,926,323 47.0 232,534 9261960/61 62 1,314,518 40.6 157,920 4741955/56 56 1,038,843 42.5 111,051 3471950/51 49 916,178 36.1 84,624 3181945/46 43 613,418 24.2 40,832 8851940/41 45 752,929 19.4 37,342 1,1121935/36 46 763,155 14.3 32,113 1,1101930/31 49 697,178 12.4 29,788 1,0241925/26 51 324,125 20.3 23,213 846Note: For the seasons to 1985/86 milkfat has been converted to “milksolids” using a factor of 1 kg milkfat = 1.74 kg milksolids
STATISTICS
PROGRESS

50
DIRECTORY
Registered Office 3434 State Highway 26
Tatuanui, Morinsville 3374
NEW ZEALAND
Postal Address Private Bag 800
Morrinsville 3340
NEW ZEALAND
Telephone +64 7 889 3999
Website Address www.tatua.com
Chairman SB Allen, B.Com., Dip.P.E.
Directors KM Old, B.M.S., M.B.A., Ph.D (Waikato)
MJF Luxton, Q.S.O., B.Agr.Sc., M.Man.
DP Muggeridge
PM Schuyt, B.Com., C.F.Inst.D.
MBN Dewdney, B.M.S.
RE Townshend, B.Tech (Massey), AMP (Harvard)
BR Wilton, B.Agr.Sc.
Chief Executive Officer PD McGilvary, BCA(Hons)
General Manager Marketing & Sales JT Powell, B.Sc., Dip. Dairy Sci. & Tech.
General Manager Operations BA Greaney, B.M.S.
General Manager Finance & Corporate Administration CJ Foster, B.M.S., C.A., Grad.Dip. Treas. & Fin. Mgmt.
Company Secretary JI Houghting
Auditors KPMG (Hamilton)
Solicitors Harkness Henry & Co
Bankers Bank of New Zealand Ltd
Insurance Brokers Willis Towers Watson Ltd

tatua.com


![[Important] Softer Approach to Preventing Violent Extremism](https://static.fdocuments.in/doc/165x107/55cf97ea550346d0339469de/important-softer-approach-to-preventing-violent-extremism.jpg)