
Annual Report 2016 - Rejlers Report 2016 Five-year summary ... Interest-bearing liabilities 309.1...
58
Contents Annual Report 2016 Five-year summary ........................................ 1 Alternative performance measures .............. 2 The Share ....................................................... 7 Board and management ................................ 9 Administration Report ................................. 11 Corporate Governance Report ..................... 15 Consolidated accounts ................................ 19 Notes - Group ............................................. 23 Parent Company accounts .......................... 43 Notes - Parent Company ............................. 47
Transcript of Annual Report 2016 - Rejlers Report 2016 Five-year summary ... Interest-bearing liabilities 309.1...

Contents
Annual Report2016
Five-year summary ........................................ 1
Alternative performance measures .............. 2
The Share ....................................................... 7
Board and management ................................ 9
Administration Report ................................. 11
Corporate Governance Report ..................... 15
Consolidated accounts ................................ 19
Notes - Group ............................................. 23
Parent Company accounts .......................... 43
Notes - Parent Company ............................. 47
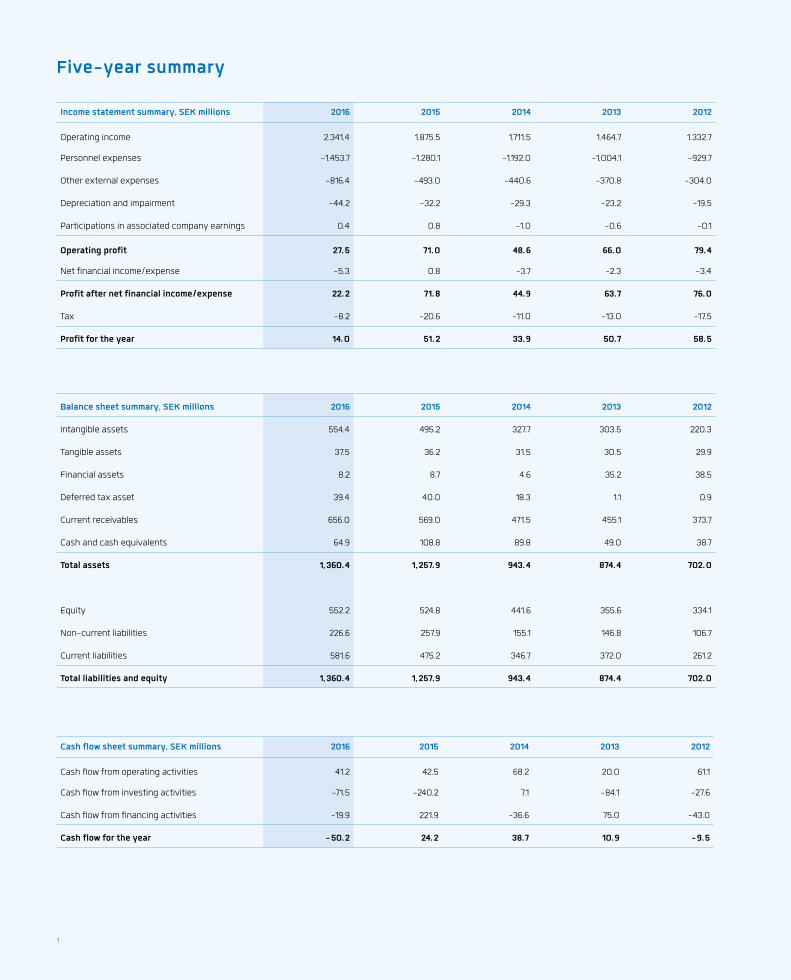
Five-year summary
Income statement summary, SEK millions 2016 2015 2014 2013 2012
Operating income 2,341.4 1,875.5 1,711.5 1,464.7 1,332.7
Personnel expenses -1,453.7 -1,280.1 -1,192.0 -1,004.1 -929.7
Other external expenses -816.4 -493.0 -440.6 -370.8 -304.0
Depreciation and impairment -44.2 -32.2 -29.3 -23.2 -19.5
Participations in associated company earnings 0.4 0.8 -1.0 -0.6 -0.1
Operating profit 27.5 71.0 48.6 66.0 79.4
Net financial income/expense -5.3 0.8 -3.7 -2.3 -3.4
Profit after net financial income/expense 22.2 71.8 44.9 63.7 76.0
Tax -8.2 -20.6 -11.0 -13.0 -17.5
Profit for the year 14.0 51.2 33.9 50.7 58.5
Balance sheet summary, SEK millions 2016 2015 2014 2013 2012
Intangible assets 554.4 495.2 327.7 303.5 220.3
Tangible assets 37.5 36.2 31.5 30.5 29.9
Financial assets 8.2 8.7 4.6 35.2 38.5
Deferred tax asset 39.4 40.0 18.3 1.1 0.9
Current receivables 656.0 569.0 471.5 455.1 373.7
Cash and cash equivalents 64.9 108.8 89.8 49.0 38.7
Total assets 1,360.4 1,257.9 943.4 874.4 702.0
Equity 552.2 524.8 441.6 355.6 334.1
Non-current liabilities 226.6 257.9 155.1 146.8 106.7
Current liabilities 581.6 475.2 346.7 372.0 261.2
Total liabilities and equity 1,360.4 1,257.9 943.4 874.4 702.0
Cash flow sheet summary, SEK millions 2016 2015 2014 2013 2012
Cash flow from operating activities 41.2 42.5 68.2 20.0 61.1
Cash flow from investing activities -71.5 -240.2 7.1 -84.1 -27.6
Cash flow from financing activities -19.9 221.9 -36.6 75.0 -43.0
Cash flow for the year -50.2 24.2 38.7 10.9 -9.5
1

Alternative performance measures
Operating margin
Definition: Operating profit divided by net sales Motivation: Relevant to assess Rejlers efficiency and value creation.
2016 2015 2014 2013 2012
Operating profit 27.5 71.0 48.6 66.0 79.4
Net sales 2,339.3 1,872.4 1,708.6 1,463.2 1,328.4
Operating margin, % 1.2 3.8 2.8 4.5 6.0
Operating profit per full-time employee
Definition: Operating profit divided by the number of
full-time employees.
Motivation: A measure to show efficiency per full-time employee.
2016 2015 2014 2013 2012
Operating profit 27.5 71.0 48.6 66.0 79.4
Number of full-time employees 1,939 1,793 1,690 1,537 1,429
Operating income per full-time employee, SEK thousand
14 40 29 43 56
Equity/assets ratio
Definition: Total equity attributable to the Parent
Company shareholders divided by total assets.
Motivation: Relevant for assessing Rejlers possibilities of meeting its
financial commitments.
2016 2015 2014 2013 2012
Total equity attributable to Parent Company shareholders
536.2 516.5 441.4 355.6 334.0
Total assets 1,360.4 1,257.9 943.4 874.6 702.1
Equity/assets ratio, % 40.6 41.7 46.8 40.7 47.6
Equity per share
Definition: Total equity attributable to Parent Company
shareholders divided by the number of shares at the
end of the period.
Motivation: A measure for describing the size of the equity that belongs
to the shareholders in the Parent Company.
2016 2015 2014 2013 2012
Total equity attributable to Parent Company shareholders
536.2 516.5 441.4 355.6 334.0
Number of shares at end of period 12,921,721 12,921,721 12,321,721 11,421,721 11,321,721
Equity per share at the end of the period 41.50 39.97 35.83 31.13 29.50
2

Net indebtedness
Definition: Current and non-current interest-bearing
liabilities (i.e. bank loans and finance leases) and
pension provisions less cash and cash equivalents.
Motivation: A measure to show Rejlers’ total indebtedness.
2016 2015 2014 2013 2012
Non-current liabilities to credit institutions 155.0 177.5 67.5 103.9 64.9
Current liabilities to credit institutions 133.4 103.2 39.4 99.8 31.7
Pension provisions 20.7 25.0 43.6 0.0 0.0
Cash and cash equivalents -64.9 -108.8 -89.8 -49.0 -38.7
Net indebtedness 244.2 196.9 60.7 154.7 57.9
Net debt/EBITDA rolling 12 month basis
Definition: Net debt divided by EBITDA for the past
12-month period
Motivation: Relevant for showing financial risk and for the follow-up of
the level of Rejlers’ indebtedness.
2016 2015 2014 2013 2012
Operating profit 27.5 71.0 48.6 66.0 79.4
Depreciations and impairments of property, plant and equipment and intangible assets
44.2 32.2 29.3 23.2 19.5
EBITDA 71.7 103.2 77.9 89.2 98.9
Net debt/EBITDA 3.4 1.9 0.8 1.7 0.6
Profit margin
Definition: Profit before tax divided by net sales Motivation: Relevant to assess Rejlers efficiency and value creation.
2016 2015 2014 2013 2012
Profit before tax 22.2 71.8 44.9 63.6 75.9
Net sales 2,339.3 1,872.4 1,708.6 1,463.2 1,328.4
Profit margin, % 0.9 3.8 2.6 4.4 5.7
Return on equity
Definition: Profit before tax divided by average equity
attributable to Parent Company shareholders
Motivation: Relevant to assessing how Rejlers uses its assets to generate
profits in the company.
2016 2015 2014 2013 2012
Profit before tax 22.2 71.8 44.9 63.6 75.9
Equity attributable to Parent Company shareholders
536.2 516.5 441.4 355.6 334.0
Average equity attributable to Parent Company shareholders
526.4 479.0 398.5 344.8 324.1
Return on equity, % 4.2 15.0 11.3 18.5 23.5
3

Return on capital employed
Definition: Operating profit plus financial income
divided by average capital employed
Capital employed: Equity plus interest-bearing
liabilities
Motivation: Relevant to assess Rejlers efficiency and value creation.
2016 2015 2014 2013 2012
Operating profit 27.5 71.0 48.6 66.0 79.4
Financial income 7.1 8.1 3.5 4.8 2.2
Operating profit plus financial income 34.6 79.1 52.1 70.8 81.6
Total equity 552.2 524.8 441.6 355.7 334.1
Non-current liabilities to credit institutions 155.0 177.5 67.5 103.9 64.9
Current liabilities to credit institutions 133.4 103.2 39.4 99.8 31.7
Pension provisions 20.7 25.0 43.6 0.0 0.0
Capital employed 861.3 830.5 592.1 559.4 430.7
Average capital employed 845.9 712.0 577.0 495.8 425.2
Return on capital employed, % 4.1 11.1 9.0 14.3 19.2
Quick ratio
Definition: Total current assets divided by total current
assets (excluding unutilised credit)
Motivation: Indicates Rejlers’ short-term payment capacity.
2016 2015 2014 2013 2012
Total current assets 720.9 677.8 561.3 504.2 412.5
Total current liabilities 581.7 475.2 346.8 372.1 261.4
Quick ratio (excluding unused credit), % 124 143 162 136 158
Debt/equity ratio
Definition: Interest-bearing liabilities divided by equity
attributable to Parent Company shareholders
Motivation: Relevant to describing Rejlers’ financial risk.
2016 2015 2014 2013 2012
Non-current liabilities to credit institutions 155.0 177.5 67.5 103.9 64.9
Current liabilities to credit institutions 133.4 103.2 39.4 99.8 31.7
Pension provisions 20.7 25.0 43.6 0.0 0.0
Interest-bearing liabilities 309.1 305.7 150.5 203.7 96.6
Equity attributable to Parent Company shareholders
536.2 516.5 441.4 355.6 334.0
Debt/equity ratio, times 0.6 0.6 0.3 0.6 0.3
4
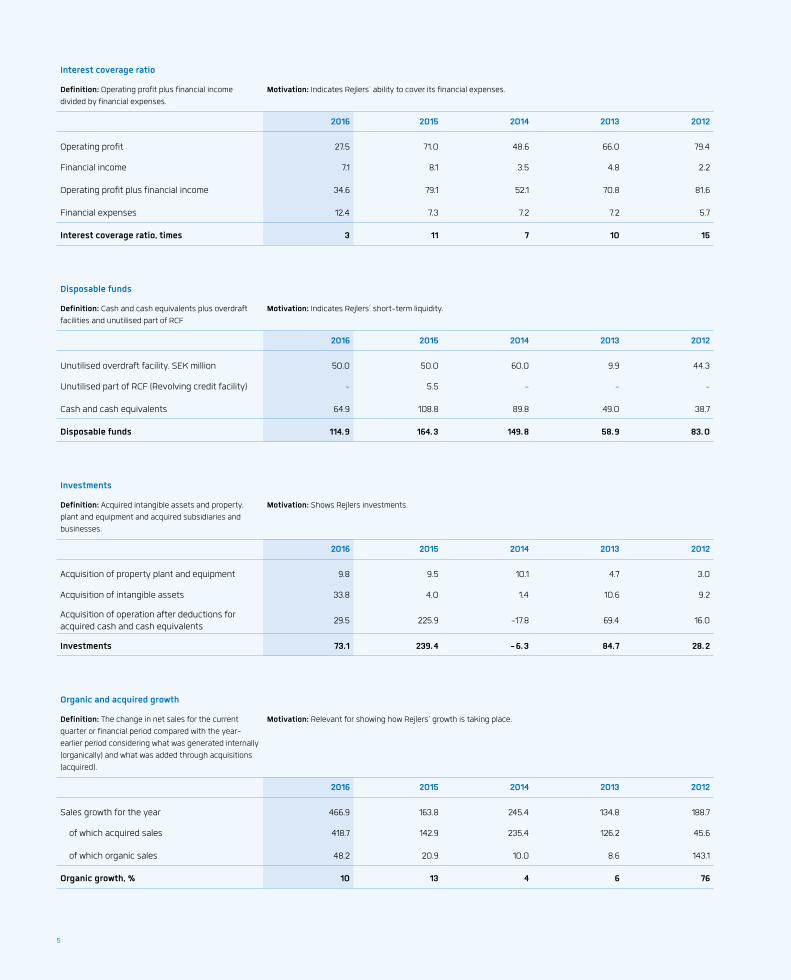
Interest coverage ratio
Definition: Operating profit plus financial income
divided by financial expenses.
Motivation: Indicates Rejlers’ ability to cover its financial expenses.
2016 2015 2014 2013 2012
Operating profit 27.5 71.0 48.6 66.0 79.4
Financial income 7.1 8.1 3.5 4.8 2.2
Operating profit plus financial income 34.6 79.1 52.1 70.8 81.6
Financial expenses 12.4 7.3 7.2 7.2 5.7
Interest coverage ratio, times 3 11 7 10 15
Disposable funds
Definition: Cash and cash equivalents plus overdraft
facilities and unutilised part of RCF
Motivation: Indicates Rejlers’ short-term liquidity.
2016 2015 2014 2013 2012
Unutilised overdraft facility, SEK million 50.0 50.0 60.0 9.9 44.3
Unutilised part of RCF (Revolving credit facility) - 5.5 - - -
Cash and cash equivalents 64.9 108.8 89.8 49.0 38.7
Disposable funds 114.9 164.3 149.8 58.9 83.0
Investments
Definition: Acquired intangible assets and property,
plant and equipment and acquired subsidiaries and
businesses.
Motivation: Shows Rejlers investments.
2016 2015 2014 2013 2012
Acquisition of property plant and equipment 9.8 9.5 10.1 4.7 3.0
Acquisition of intangible assets 33.8 4.0 1.4 10.6 9.2
Acquisition of operation after deductions for acquired cash and cash equivalents
29.5 225.9 -17.8 69.4 16.0
Investments 73.1 239.4 -6.3 84.7 28.2
Organic and acquired growth
Definition: The change in net sales for the current
quarter or financial period compared with the year-
earlier period considering what was generated internally
(organically) and what was added through acquisitions
(acquired).
Motivation: Relevant for showing how Rejlers’ growth is taking place.
2016 2015 2014 2013 2012
Sales growth for the year 466.9 163.8 245.4 134.8 188.7
of which acquired sales 418.7 142.9 235.4 126.2 45.6
of which organic sales 48.2 20.9 10.0 8.6 143.1
Organic growth, % 10 13 4 6 76
5

Growth adjusted for exchange rate effects
Definition: Change in net sales for the current quarter
or financial period compared with the year-earlier period
in the respective country’s currency.
Motivation: A measure that shows underlying growth in local currency.
2016 2015 2014 2013 2012
Sales growth for the year excluding exchange rate effects
446.6 171.4 251.1 141.8 199.2
of which acquired sales 418.7 142.9 235.4 126.2 45.6
of which organic sales 27.9 28.5 15.7 15.6 153.7
Organic growth excluding exchange rate effects %
6 17 6 11 77
IFRS key performance indicators 2016 2015 2014 2013 2012
Earnings per share before and after turnoverDefinition: Profit after tax divided by average number
of shares
1.03 4.15 2.78 4.45 5.17
Average number of sharesDefinition: Parent Company’s weighted average
number of shares for the financial year
12,921,721 12,346,379 12,200,899 11,381,173 11,321,721
Number of shares at end of periodDefinition: Parent Company’s number of shares
at end of the financial year
12,921,721 12,921,721 12,321,721 11,421,721 11,321,721
Operational key performance indicators 2016 2015 2014 2013 2012
Billable hours ratioDefinition: Debited time divided by time in attendance
73.0 75.0 75.3 74.7 76.4
Sales per full-time employeeDefinition: Net sales per full-time employee
1,208 1,046 1,022 953 933
Number of working daysDefinition: Number of working days in the Parent
Company
251 249 248 249 248
Number of full-time employeesDefinition: Total time divided by standard time
1,939 1,793 1,690 1,537 1,429
Number of employees at end of periodDefinition: Number of employees at end of the
financial year
2,027 2,082 1,742 1,664 1,532
Other 2016 2015 2014 2013 2012
Dividend per share (2016, proposed dividend) 0.00 2.00 2.00 2.00 3.00
6

The Share
Rejlers’ total number of outstanding shares amounts to 12,921,721 shares,
of which 1,251,250 shares of Class A and 11,670,471 shares of Class B. Total
number of votes amounts to 24,182,971 divided by 12,512,500 for shares
of Class A and 11,670,471 for shares of Class B. The share capital amounts
to SEK 25,843,442.
Dividend policy
Rejlers’ long-term policy is for around 50 per cent of the company’s
earnings to be paid out as dividends. The dividend policy remains fast,
but in view of the fact that the company is conducting a rights issue,
the Board is proposing to the Annual General Meeting that no dividend
be paid for the 2016 financial year. Last year, a dividend of SEK 2.00 per
share was paid for the 2015 financial year with a total dividend amount of
SEK 25.8 million.
Listing and trading
The company’s Class B shares have been listed on Nasdaq Stockholm
since 18 December 2006 after having been listed on the Nordic Growth
Market (NGM) since 8 May 2003. During 2016, shares to a total value of
SEK 101.4 million were traded on Nasdaq OMX. The final share price for
Rejlers Class B shares was SEK 81.75 (110.00) per share at year-end, a
decrease of 26 per cent compared to 30 December 2015. The highest
and lowest share prices during the year were SEK 111.00 and SEK 77.00
respectively.
Development Rejlers’ share Jan 2012 – Dec 2016
Kurs(kronor)
Volym(tusental aktier)
20162012 2013 2014 2015
100
80
60
40
20
200
180
160
140
120
0 0
100
200
300
400
500
600
700
800
900
1 000
1 100
1 200
1 300
1 400
1 500
Rejlers B-aktie (kurs, ultimo) OMX Nordic 40 OMX Stockholm Small Cap PIRejlers B-aktie (volym, tusental)
Ownership
At the end of 2016, the number of shareholders was 2,110 (2,134). Institu-
tions and funds owned 38 per cent (37) of the votes and 72 per cent (69)
of equity. Foreign owners accounted for 13 per cent (13) of the votes and
21 per cent (21) of equity. The Rejler family owned 57 per cent (57) of the
votes and 24 per cent (24) of the equity, of which CEO Peter Rejler holds
38 per cent (38) of the votes and 7 per cent (7) of the equity. In addition to
the family, major owners are Lannebo fonder, Nordea Investment Funds
and Didner & Gerge Fonder. The 10 biggest owners are presented in the
table on the following page.
New share issue
At an Extraordinary General Meeting on 13 March 2017, it was resolved
to conduct a new share issue with preferential rights for existing
shareholders. With a subscription price of SEK 39 per share, regardless
of share class, Rejlers will upon full subscription of the rights issue will
raise an amount of approximately SEK 202 million before issue expenses
and the company’s share capital will increase from SEK 25,843,442 to
SEK 36,180,818. The number of shares in Rejlers can increase from a total
of 12,921,721, of which 1,251,250 shares of Class A and 11,670,471 shares
of Class B, to a maximum of 18,090,409 shares, of which 1,751,750 shares
of Class A and 16,338,659 shares of Class B. The total number of shares
issued in the rights issue is 5,168,688 shares, of which 500,500 shares of
Class A and 4,668,188 shares of Class B.
Shareholder contacts
Rejlers is proactive in providing information to facilitate the valuation of
the Rejlers share. In addition to the Group president and Group CFO, the
respective IR managers act as contacts.
7

Rejlers 10 biggest shareholders
The table shows the situation as of 30/12/2016
Name A shares B shares Holding(%) Votes (%)
Peter Rejler 911,250 2,500 7.1 37.7
Jan Rejler, directly and through company
262,500 382,450 5.0 12.4
Lannebo Fonder - 1,902,205 14.7 7.9
Nordea Investment Funds - 1,267,751 9.8 5.3
Didner & Gerge Fonder Aktiebolag
- 1,201,291 9.3 5.0
Lauri Valkonen 50,000 425,000 3.7 3.8
Lisa Rejler 9,375 777,000 6.1 3.6
Swedbank Robur fonder - 859,906 6.7 3.6
Martina Rejler 9,375 696,250 5.5 3.3
Fondita fonder - 620,000 4.8 2.6
Total, 10 biggest shareholders
1,242,250 8,134,353 72.6 85.0
Total, other shareholders 8,750 3,536,118 27.4 15.0
Total 1,251,250 11,670,471 100.0 100.0
Share capital development
Year Event Increase of share capi-
tal, SEK
Total share capital,
SEK
Increase in the number
of shares
Total number of
shares
2003 New share issue 1,090,000 18,140,000 109,000 1,814,000
2005 New share issue 3,219,510 21,359,510 321,951 2,135,951
2006 Split 5:1 - 21,359,510 8,543,804 10,679,755
2006 New share issue 142,040 21,501,550 71,020 10,750,775
2007 New share issue 66452 21,568,002 33,226 10,784,001
2008 New share issue 75440 21,643,442 37,720 10,821,721
2010 New share issue 1,000,000 22,643,442 500,000 11,321,721
2013 New share issue 200,000 22,843,442 100,000 11,421,721
2014 New share issue 1,800,000 24,643,442 900,000 12,321,721
2015 New share issue 1,200,000 25,843,442 600,000 12,921,721
Per-share data
2016 2015 2014 2013 2012
Earnings per share after dilution, SEK
1.03 4.15 2.78 4.45 5.17
Equity per share, SEK 41.50 39.97 35.83 31.13 29.50
Dividend per share, SEK 1) 0.00 2.00 2.00 2.00 3.00
1) Proposed 2016 dividend.
Distribution of shareholdings
Number of shares Number of owners
Number of shares
Proportion of capital (%)
Proportion of votes (%)
1 - 500 1,539 244,839 1.9% 1.0%
501 - 1000 233 196,421 1.5% 0.8%
1001 - 5000 238 566,683 4.4% 2.3%
5001 - 10000 34 253,485 2.0% 1.1%
10001 - 15000 13 172,573 1.3% 0.7%
15001 - 20000 10 185,401 1.4% 0.8%
20001- 43 11,302,319 87.5% 93.2%
Total 2,110 12,921,721 100.0% 100.0%
8

Board of Directors
STEN PETTERSSON
Born: 1970.
Employee representative.
Elected: 2009. Undergraduate
qualification in engineering.
Project manager at Rejlers
Sverige AB.
Rejlers shareholding:
700 B shares.
JAN SAMUELSSON
Born: 1950.
Elected: 2010. Graduate in eco-
nomics.
Former CEO of Lunds Energikon-
cernen AB.
Other important assignments:
Chairman of the Board at Energi-
forsk AB and Värmeforskkoncer-
nen. Chairman of the Board at Ste-
na Renewable AB, The Brittedals
Group and Drhorace AB.
Rejlers shareholding:
1,400 B shares.
THORD WILKNE
Born: 1943.
Elected: 2007. Economist. Founder
of WM-data.
Other important assignments:
Member of the Board of Addnode
Group AB.
Rejlers shareholding:
200,000 B shares.
IVAR VERNER
Born: 1947.
Chairman/Vice Chairman since: 2010.
Elected: 2010. Graduate in eco-
nomics. Former authorized public
accountant; Chairman in Grant
Thornton Sweden AB.
Other important assignments:
Chairman of the Boards of Erland-
sons Brygga AB, Centrumfastigheter
i Norrtälje AB and Welcome Hotel
and member of the Boards of Con-
strera AB, Bioarctic Neuroscience AB
and Svenska Vårdfastigheter.
Rejlers shareholding: 5,000 B shares.
PETER REJLER
Born: 1966.
Elected: 2010. Master of Science
in Engineering President and
CEO of Rejlers AB, 1999–2012 and
2014–.
Rejlers shareholding:
911,250 A shares and 2,500 B
shares.
HELENA NORDMAN-KNUTSON
Born: 1964.
Elected: 2014. Graduate in
economics and political science.
Senior Director Hallvarsson &
Halvarson.
Other important assignments:
Member of the Board of CLX
Networks.
Rejlers shareholding: —
BJÖRN LAUBER
Born: 1965.
Employee representative.
Elected: 1998. Graduate in
economics. Economist at Rejlers
Sverige AB.
Rejlers shareholding: —
ANNIKA STEIBER
Born: 1968.
Elected: 2016. PhD from Chalmers
University of Technology.
Rejlers AB shareholding: —
9

Management
SEPPO SORRI
CEO, Rejlers Finland Oy
Born: 1966.
Employed since: 2005.
Rejlers shareholding: —
MORTEN THORKILDSEN
President of Rejlers Norge AS
Born: 1961.
Employed since: 2013.
Rejlers shareholding: —
MATS ÅSTRÖM
CFO of Rejlers AB
Born: 1965.
Employed since: 2014.
Rejlers shareholding:
500 B shares.
PETER REJLER
President and CEO of Rejlers AB
Born: 1966.
Employed since: 1998.
Rejlers shareholding: 911,250 A
shares and 2,500 B shares
JONAS THIMBERG
CEO, Rejlers Sverige AB
Born: 1967.
Employed since: 2000.
Rejlers shareholding:
946 B shares
MIKAEL SCHMIDT
Head of HR of Rejlers AB
Born: 1958.
Employed since: 2007.
Rejlers shareholding: —
MATS REHNQVIST
Head of IT, Rejlers Sverige
AB
Born: 1965.
Employed since: 2015.
Rejlers shareholding: —
THOMAS PETTERSEN
CEO Rejlers Embriq AS
Born: 1975.
Employed since: 2015.
Rejlers shareholding: —
THOMAS REBERMARK
Marketing and Communi-
cation Director of Rejlers
AB
Born: 1964.
Employed since: 2016.
Rejlers shareholding:
111 B shares
Shareholding as of 1 April 2017.
10

Rejlers AB (publ)
Company registration number 556349-8426
The Board and Chief Executive Officer of Rejlers AB (publ) submit
herewith the annual accounts for the financial year 1 January 2016–31
December 2016.
2016 2015 2014 2013 2012
Sales, SEK million 2,341.4 1,875.5 1,711.5 1,464.7 1,332.7
Operating profit, SEK million 27.5 71.0 48.6 66.0 79.4
Operating margin, % 1.2 3.8 2.8 4.5 6.0
Operations
Rejlers was founded in 1942 and offers services to customers within the
areas of Building and property, Energy, Industry and Infrastructure. At
year-end, Rejlers had a total of 2,027 employees (2,082) located at 80
places in Sweden, Finland and Norway. The head office is located in
Stockholm. Rejlers’ operations are divided into four segments: Rejlers
Sweden, Rejlers Finland, Rejlers Norway and Rejlers Embriq. As of 1 Janu-
ary 2017, the IT Solutions segment changed names to Rejlers Embriq.
Consolidated sales and profit
Sales totalled SEK 2,341.4 million (1,875.5), which corresponds to an
increase of 25 per cent compared to the same period last year. Organic
sales growth, adjusted for currency effects, amounted to 0 per cent, as
an effect of the year’s restructuring.
Operating profit for the year was SEK 27.5 million (71.0), equivalent
to an operating margin of 1.2 per cent (3.8). The restructuring costs in
Sweden amounted to SEK 21.5 million (-) during the year and can be
attributed to cut-backs in unprofitable parts of the industrial busi-
ness in Rejlers Sweden. Adjusted for restructuring costs, operating profit
amounted to SEK 49.0 million (71.0), corresponding to an adjusted
operating margin of 2.1 per cent (3.8). Large start-up costs of projects in
Norway negatively impacted operating profit on a scale of SEK 12.0 mil-
lion. However, the calendar effect has had a positive impact on operating
profit (two days).
The billing ratio amounted to 73.0 per cent (75.0).
Cash flow and financial position
Cash flow from operating activities totalled SEK 41.2 million (42.5) for the
year. Consolidated cash and cash equivalents at the end of the year
amounted to SEK 64.9 million compared to SEK 108.8 million on 31 Decem-
ber 2015. The change in cash and cash equivalents during the year was
affected by a dividend of SEK 26.3 million (24.6), investments in non-cur-
rent assets, subsidiaries and businesses for SEK 73.1 million (240.4) and
a new loan of SEK 55.5 million (249.5) and repayments of SEK 49.1 million
(62.1).
Interest-bearing liabilities increased by SEK 7.7 million since 31
December 2015 and was SEK 288.4 million at the end of the period.
Net debt amounted to SEK 244.2 million, compared with SEK 196.9 million
as at 31 December 2015. The equity/assets ratio at the end of the period
amounted to 40.6 per cent compared to 41.7 per cent as of 31 December
2015. Equity per share was SEK 41.50 at the end of the period compared to
SEK 39.97 as of 31 December 2015. The Group’s overdraft facilities of SEK
50 million (50) remained fully unutilised as in the previous year.
During the first quarter of 2017, Rejlers conducted a new share issue of
approximately SEK 202 million (see Note 31).
Investments
Investments in property, plant and equipment over the year totalled SEK
9.8 million (9.5) and investments in intangible non-current assets totalled
SEK 3.8 million (4.0). Investments in subsidiaries and businesses amounted to
SEK 29.5 million (225.9). Further information about investments in subsidi-
aries and operations is available under note 28. Depreciation, amortisation
and impairment losses amounted to SEK 44.2 million (32.2).
Employees
The number of employees at year end was 2,027 (2,082), a decrease of 3
per cent. There were 1,939 full-year employees (1,793). At the end of the
year, 21 (13) employees in Finland and 5 (-) in Norway had been laid off as
of the end of the period.
Sales, operating profit and operating margin per segment
Sales, SEK million
Operating profit, SEK million
Operating margin, %
Jan-Dec 2016
Jan-Dec 2015
Jan-Dec 2016
Jan-Dec 2015
Jan-Dec 2016
Jan-Dec 2015
Rejlers Sweden 1,226.2 1,099.0 28.0 51.4 2.3 4.7
Rejlers Finland 389.4 336.4 15.0 18.9 3.9 5.6
Rejlers Norway 335.6 298.5 -13.3 3.5 -4.0 1.2
Rejlers Embriq 417.1 151.3 15.6 9.3 3.7 6.1
Group wide 22.7 27.1 -17.8 -12.1 - -
Eliminations -49.6 -36.8 - - - -
Consolidated total 2,341.4 1,875.5 27.5 71.0 1.2 3.8
Rejlers Sweden
In 2016, net sales amounted to SEK 1,226.2 million, compared with SEK
1,099.0 million in the preceding year. Of the growth of SEK 127.2 million
(corresponding to 12 per cent), SEK 131.7 million or a growth of 11.7 per
cent was related to acquisitions, which means that the organic growth
amounted to SEK -4.5 million (corresponding to -0.4 per cent).
Operating profit declined from SEK 51.4 million to SEK 28.0 million,
which means an earnings growth of -45 per cent and an operating margin
for the year of 2.3 per cent (4.7).
The year was affected by low demand in some parts of the industry
and is attributable to the rapid slowing of the nuclear power industry,
savings programmes in the mining industry and tough price pressure in
manufacturing industries. This negatively impacted Rejlers Sweden and
as a result, Rejlers initiated a programme of measures at the beginning of
the year and a transition of the industrial operations. Unprofitable parts,
mainly in mechanical engineering and processes, have been wound up
or cut back. The coverage rate increased in the second half of the year,
which is an effect of steps taken.
Administration Report
11

Key performance indicators – Rejlers Norway
Jan-Dec 2016 Jan-Dec 2015
Sales, SEK million 1,226.2 1,099.0
Operating profit, SEK million 28.0 51.4
Operating margin, % 2.3 4.7
Number of employees 1,090 1,173
Rejlers Finland
In 2016, net sales amounted to SEK 389.4 million, compared with SEK
336.4 million in the preceding year. Of the growth of SEK 53.0 million
(corresponding to 16 per cent), SEK 38.6 million or a growth of 11.5 per
cent was related to acquisitions, which means that the organic growth
amounted to SEK 14.4 million (corresponding to 4.3 per cent).
Operating profit declined from SEK 18.9 million to SEK 15.0 million,
which means an earnings growth of -21.0 per cent and an operating
margin for the year of 3.9 per cent (5.6).
Sales and the earnings trend were negatively impacted, mainly as a
result of weak coverage in the industry sector and delays of large build-
ing projects. An adaptation to prevailing market conditions was done in
the form of temporary lay-offs, a more efficient organisation and a better
customer structure. At the same time, Rejlers notes an increased demand
for services in energy production and energy management.
Key performance indicators – Rejlers Finland
Jan-Dec 2016 Jan-Dec 2015
Sales, SEK million 389.4 336.4
Operating profit, SEK million 15.0 18.9
Operating margin, % 3.9 5.6
Number of employees 526 482
Rejlers Norway
In 2016, net sales amounted to SEK 335.6 million, compared with SEK
298.5 million in the preceding year. Of the growth of SEK 37.1 million (cor-
responding to 12.0 per cent), SEK 0.0 million or a growth of 0 per cent was
related to acquisitions, which means that the organic growth amounted
to SEK 37.1 million (corresponding to 12.0 per cent).
Operating profit declined from SEK 3.5 million to a loss of SEK 13.3 mil-
lion, which means an earnings growth of -480 per cent and an operating
margin for the year of -4.0 per cent (1.2).
Rejlers Norway reports a clearly worse development than expected, due
to a low coverage rate and efficiency problems with high start-up costs in
the ICT and railway area. Measures in the form of efficiency improvements
to the organisation and cost savings were carried out during the year and
Rejlers renegotiated an important ICT agreement at the beginning of 2017,
which will have a significant effect on earnings in the future.
Key performance indicators – Rejlers Norway
Jan-Dec 2016 Jan-Dec 2015
Sales, SEK million 335.6 298.5
Operating profit, SEK million -13.3 3.5
Operating margin, % -4.0 1.2
Number of employees 244 239
Rejlers Embriq
In 2016, net sales amounted to SEK 417.1 million, compared with SEK 151.3 mil-
lion in the preceding year. Of the growth of SEK 265.8 million (correspond-
ing to 175.7 per cent), SEK 248.4 million or a growth of 164.2 per cent was
related to acquisitions, which means that the organic growth amounted
to SEK 17.4 million (corresponding to 11.5 per cent).
Operating profit increased from SEK 9.3 million to SEK 15.6 million,
which means an earnings growth of 68.0 per cent and an operating mar-
gin for the year of 3.7 per cent (6.1).
Sales and earnings showed a strong growth and were in line with plan,
while the operating margin declined somewhat. The lower margin is
mainly attributable to the installation of hardware, which initially has a
negative impact.
Key performance indicators – Rejlers Embriq
Jan-Dec 2016 Jan-Dec 2015
Sales, SEK million 417.1 151.3
Operating profit, SEK million 15.6 9.3
Operating margin, % 3.7 6.1
Number of employees 156 179
Acquisitions
During the year, Rejlers acquired three businesses: 100 per cent of the
assets in Inspacon Oy, and 100 per cent of the shares in JS-Verkot Oy
and CMN Services Oy. During the year, acquisitions contributed SEK 17.2
million to sales and SEK 2.8 million to operating profit. See also note 28.
Sensitivity
Rejlers’ earnings are sensitive to changes in the billable hours ratio,
hourly prices and wage cost trends.
Every change of one percentage point in its parameters has the
following effect on Rejlers’ operating result in SEK millions:
Billable hours ratio 32 (24)
Hourly price 23 (19)
Pay expense increase 14 (12)
Personnel expenses amount to 62 per cent (68) of revenues while other
operating expenses including depreciation constitute 37 per cent (28) of
revenues.
Parent Company
Net sales in the Parent Company during the year amounted to SEK 22.7
million (25.1) and earnings after tax totalled SEK 3.1 million (22.8).
Duties of the Board and corporate governance
We refer to the corporate governance report in this annual report for
information regarding the duties of the Board and corporate governance.
See pages 15–18.
Guidelines for remunerations and other terms of employment for
senior executives
The 2016 AGM resolved the following guidelines for remunerations to the
CEO and other senior executives. Other senior executives refers to the
members of the Group’s management group.
12
The main principle for these guidelines is that senior executive at
Rejlers must be offered remunerations on market terms to enable the
company to attract, develop and retain key individuals. In general, Rejlers
does not offer benefits beyond that which constitutes local practice.
Remunerations to the CEO and other senior executives must be on
market terms and consist of basic salary, variable remuneration, pension
and in certain cases other benefits. The variable remuneration is limited
to a maximum 60 per cent of basic salary.
The variable remuneration is based chiefly on the Group’s financial per-
formance and individual performance in relation to set quantitative and
qualitative goals.
The pension is premium based and there are no pension obli-
gations in addition to pension premiums paid. In the case of other
senior executives, the National Pension Insurance Fund applies, either
via the ITP plan or through individual occupational pension policies within
the ITP framework.
The company and the CEO are subject to a mutual 12-month period of
notice. The company and other senior executives are subject to a mutual
6-12-month period of notice.
The Board proposes that it be authorized to deviate from the above
proposed guidelines where there are special reasons for this in individual
cases.
The Board’s proposals for guidelines for 2017 remain in principle un-
changed compared to 2016.
Risks and risk management
All business activities are subject to a certain degree of risk-taking.
Rejlers regularly carries out surveys of the Group’s risks with the aim of
continually developing and strengthening the procedures for day-to-day
risk monitoring. The Group’s Board and senior management is responsi-
ble for risk management.
Strategic and operational risks
Market
Rejlers operates in Sweden, Finland and Norway and is thus depend-
ent upon short-term economic circumstances in these markets. The
company is also exposed to competition from both major international
competitors and a number of smaller local competitors in each individual
market. Political decisions may also have a decisive influence on the will-
ingness of customers to invest. Rejlers manages market risks by having
a broad customer base with an even distribution of private and public
clients and a broad range of services to minimize sensitivity to weaken-
ing in individual sectors.
Assignments
Assignment risks include those linked to individual assignments. Rejlers
works with different forms of contract. A fixed-price assignment may entail
an increased risk if the time required to complete the assignment is miscal-
culated. Rejlers has a limited proportion of fixed-price assignments. They
are managed according to a special decision-making process and require
careful supervision. The major proportion of the company’s assignments
are charged at an hourly rate, and therefore the risk they present is limited.
The quality of assignments is assured in the group-wide busi-
ness management system, which is certified to ISO 9001:2008 and
ISO 14001:2004 standards in Sweden, Finland and parts of Norway.
Employees
Employees constitute a core resource in a consultancy. There is always a
risk that skilled employees leave Rejlers to join competitors, customers or
start their own operations.
Being able to retain existing employees is important for company
growth, as is the ability to recruit new employees. In connection with
acquisitions, it is important that the new employees be integrated
into the operation well. Rejlers endeavours to be a good employer and
always pays great attention to employee job satisfaction. The size of the
company makes it possible to offer varied assignments in terms of both
geography and skills. Being able to offer a stimulating workplace for
employees and provide good opportunities for training and development
contributes to company growth.
Acquisitions
The acquisition of a consultancy always entails a risk that personnel will
leave the company acquired. A major acquisition puts the organization
under strain and directs attention to internal issues, which may hinder
marketing efforts.
In every acquisition, Rejlers always seeks to integrate new employees
and operations to create additional value for both the acquiring and the
acquired company. By gaining local support within the organization in re-
spect of potential acquisitions, we also avoid the risk of bad investments.
Media exposure and brands
With the increasing renown and exposure of Rejlers and the Rejlers
brand also comes the risk of e.g. media scrutiny and negative publici-
ty. Rejlers has a structured method for monitoring and following what
is written and reported about the company and the major projects we
are involved in, in both conventional media and social media. There are
established guidelines for how the company’s employees should act in
relation to various media.
Financial risks
Liquidity risks, currency risks and interest rate risks
Changes in interest rates and foreign exchange rates have an effect on
cash flow, earnings and the balance sheet. The Group’s expenses and
revenues are chiefly in local currencies, i.e. SEK, NOK and EUR. Even in
the event of major foreign exchange rate changes we consider the con-
solidated balance sheet only to be exposed to a minor extent.
The liquidity risk is limited through good liquidity planning. Seasonal
reductions in liquidity are countered by changes in the limit of overdraft
facilities. The Group endeavours to have guaranteed overdrafts and cash
and cash equivalents equivalent to the sum of all loans falling due in the
next six months.
Because the Group makes acquisitions on an ongoing basis, it’s indebt-
edness and financial risk also change. The Group also has net borrowing,
which means increased attention must be paid to liquidity risks and interest
rate risks. The Group’s equity/assets ratio continues to be good.
Credit risk
Credit risk entails risks linked to the ability of customers to pay. Rejlers
has a major exposure to customers in the public sector where the credit
risk is low. Because customers are invoiced on an ongoing basis, the
accrued credit risk is relatively limited even in major assignments.
13
The Rejlers share
The final share price for Rejlers Class B shares was SEK 81,75 per share at
year-end, an increase of 26 per cent compared to 31 December 2015. The
Rejlers share is listed on Nasdaq Stockholm.
In all, there is a total of 12,921,721 shares distributed among
1,251,250 Class A shares (ten votes per share) and 11,670,471 Class B
shares (one vote per share). Rejlers’ total share capital amounts to
SEK 25,843,442 and the total number of votes is 24,182,971.
Shareholders with more than 10 per cent of the votes in the company
are Peter Rejler and Jan Rejler through a company.
Dividends
Rejlers long-term policy is for around 50 per cent of the company’s earn-
ings to be paid out as dividends. The dividend policy remains fast, but in
view of the fact that the company is conducting a rights issue, the Board
is proposing to the Annual General Meeting that no dividend be paid for
the 2016 financial year. The Board considered the proposal to be rea-
sonable considering the demands the nature of the operation places on
equity financing, the ability in both the short and long terms of fulfilling
the Group’s obligations and the estimation of the Group’s future growth.
Proposed allocation of profit
Non-restricted equity in the Parent Company amounts to SEK 171,013,754
The Board of Directors and CEO propose that a dividend
be paid to the shareholders in the amount of SEK 0
To be carried forward SEK 171,013,754
14

Corporate Governance Report
Rejlers is a Swedish public limited company and is regulated by Swedish
legislation, mainly through the Swedish Companies Act. The company’s
Class B shares are listed for trade on Nasdaq Stockholm, which is why
the company also applies Nasdaq Stockholm’s rules. Lastly, the company
also applies the Swedish Corporate Governance Code. The Swedish Cor-
porate Governance Code should be applied by companies whose shares
are listed for trade on a regulated market.
General
Rejlers corporate governance is based on the Swedish Companies Act,
the articles of association as approved by the shareholders and obliga-
tions the company has undertaken through contracts such as the listing
contract with Nasdaq OMX. As a result of the listing contract, the com-
pany has applied the Swedish Corporate Governance Code since 1 July
2008. In addition to this, the company is required to comply with applica-
ble Swedish and foreign laws and regulations.
Shareholders
The company’s Class B shares have been noted on the NASDAQ OMX
Nordic list, the regulated market for share trading, since 18 December
2006. Before then, the share had been listed on the Nordic Growth Mar-
ket, NGM, since 8 May 2003.
In total during the year, no change took place in the number of
shares, but 12,321,721 are distributed between 1,251,250 Class A shares and
11,670,471 Class B shares. The number of vote is the same as the year be-
fore and amount to 24,182,971 votes. The share capital is SEK 25,843,442.
Upon request from the shareholder, Class A shares may be trans-
formed into Class B shares. There is no limit to how many votes a share-
holder may cast at the AGM. Class A shares confer 10 votes per share
while Class B shares confer 1 vote per share. Shareholders with more
than 10 per cent of the votes are Peter Rejler and Jan Rejler through a
company.
Annual General Meeting and shareholders’ meeting
The Annual General Meeting (AGM) is the company’s highest deci-
sion-making body in which all shareholders have the right to participate
in the decisions. If an individual shareholder wishes to have a matter for
resolution taken up at the AGM, it must be submitted in writing to the
Board no later than seven weeks before the AGM. In accordance with
the articles of association, notice to attend must promulgated in the
Official Swedish Gazette (Post- och Inrikes Tidningar) and posted on the
company’s website. Information regarding the promulgation of a notice to
attend must be provided in an advertisement in Dagens Nyheter.
The company’s AGM in respect of the 2015 financial year took place
on 9 May 2016 in Stockholm. The AGM was attended by 31 shareholders
who represented 76.0 per cent of the company’s votes and 59.2 per cent
of equity. The company auditor and all of the Board members elected by
the AGM were present at the meeting. The AGM was chaired by Chairman
of the Board, Ivar Verner. The minutes from the Annual General Meeting
are available on the company’s website www.rejlers.com/se.
The AGM resolved, inter alia: ρ To pay a dividend of SEK 2.00 per share as proposed by the Board. ρ To discharge the members of the Board and CEO from liability as pro-
posed by the auditor.
ρ To change the Articles of Association regarding the election of auditors.
The election of auditors shall apply until the end of the General Meeting
that is held the fourth financial year after the election of auditors. The
previous wording was that the appointment of the auditor would take
place every third financial year after the appointment of the auditor. ρ To re-elect Ivar Verner as Chairman of the Board as proposed by the
Nomination Committee. In addition to this, the AGM resolved to re-elect
Peter Rejler, Jan Samuelsson, Helena Nordman-Knutson and Thord
Wilkne as Board members and to elect Annika Steiber. ρ The adoption of principles for Nomination Committee assignments and
appointments and the guidelines for remuneration of senior executives. ρ To authorize the Board to pass a resolution for the issue of a maxi-
mum of 600,000 Class B shares without preferential rights for existing
shareholders.
All of the AGM resolutions were passed unanimously. The company did
not hold any other shareholders meetings in addition to the AGM during
2016. The 2017 AGM in respect of the 2016 financial year will be held
on 24 April 2017 in Stockholm.
Nomination Committee
The Nomination Committee nominates members to Rejlers’ Board who
are then proposed to the AGM. The Nomination Committee’s work begins
with an evaluation of the incumbent Board. When making nominations to
the future Board, the Nomination Committee takes into consideration the
potential members’ strategic skills, education and any other Board work.
The Nomination Committee also solicits points of view from the princi-
pal owners. The Nomination Committee submits proposals regarding
remuneration of members of the Board at the AGM. The Nomination
Committee also submits proposals regarding the election of auditors.
The Nomination Committee is appointed by the AGM. The Nomination
Committee charged with preparing agenda items prior to the 2016 AGM
consists of Kent Hägglund representing Peter Rejler, Martina Rejler rep-
resenting Jan Rejler and Johan Lannebo representing Lannebo Fonder.
The Nomination Committee must draft proposals regarding: the AGM
chair, the number of Board members, fees to Board members, Board
members and Chairman of the Board, the number of auditors, how the
Nomination Committee should be appointed before the 2017 AGM and the
Nomination Committee’s assignment.
As the basis for the Nomination Committee’s work, the chairman of
the Board and the CEO submitted a report on the work of the Board dur-
ing the year. Furthermore, an annual evaluation of the Board was carried
out on behalf of the Nomination Committee.
Board of Directors
Rejlers Board and the Chairman of the Board are appointed by the AGM.
The Board approves Rejlers strategy and objectives, ensures effective
evaluation of operations and monitors the company’s development and
financial situation. During the 2016 financial year, the Board consist-
ed of six members, who are presented in greater detail on page 9. The
Board held 11 minuted meetings during the 2016 financial year. Average
attendance was 97 per cent, and on average Board meetings lasted
around three hours. Representatives from Group management and other
management personnel regularly participated in Board meetings during
the year to discuss issues in their respective areas. In addition to the
15
Board meetings mentioned above, the Board holds minuted teleconfer-
ences for updates on current issues. No Board decisions are made during
teleconferences.
The Board is also responsible for acquisitions and divestments of
operations, major investments, appointments and remuneration of Group
management. The Board also approves business plans and the annual
accounts and monitors the work of the CEO.
The union organizations appointed Björn Lauber and Sten Pettersson
as Board members and Thore Gregorsson as a deputy member.
Ivar Verner was elected by the Annual General Meeting as the Chair-
man of the Board. At the Board’s statutory meeting, it was decided to es-
tablish an Audit Committee consisting of Jan Samuelsson (chair.),Helena
Nordman Knutsson and Ivar Verna and that the Board in its entirety will
serve as the remuneration committee. It was also resolved to establish a
Projects/Investment Committee comprising Peter Rejler and Ivar Verner.
In addition to CEO Peter Rejler (Board member), other salaried employ-
ees from the organization take part in the work of the Board to report on
specific matters.
The Board’s rules of procedure
The Board has not allocated any specific areas of responsibility internally
between its members. In addition to the allocation of responsibility that
applies generally under the Swedish Companies Act, the Articles Of
Association and the Swedish Code of Corporate Governance, the Board’s
work is governed by its rules of procedure, which stipulate inter alia that
the Board must: ρ In addition to the statutory meeting, hold five ordinary meetings ρ Establish the overarching objectives for the company’s operations and
decide on company’s strategy ρ Approve the budget and corresponding long-term plans including the
investment budget ρ Address and approve matters regarding tenders and projects with
amounts in excess of SEK 30 million. ρ Decide on the purchase and sale of real estate, shares or the acquisi-
tion of another company’s operations in excess of SEK 15 million ρ Appoint an Audit Committee ρ Appoint a Projects/Investment Committee ρ Approve the annual accounts, administration report and interim reports ρ Raising of loans ρ Initiate major processes and the settlement of disputes of material
significance ρ Other issues of material financial or other significance
The following items must be taken up at every ordinary Board meeting: ρ A report on the company’s activities including its financial management ρ A report on exceptional measures taken or events occurring between
Board meetings ρ The development of major projects in progress and anticipated busi-
ness events ρ A report on existing or potential disputes that may have a significant
impact on the company’s operations
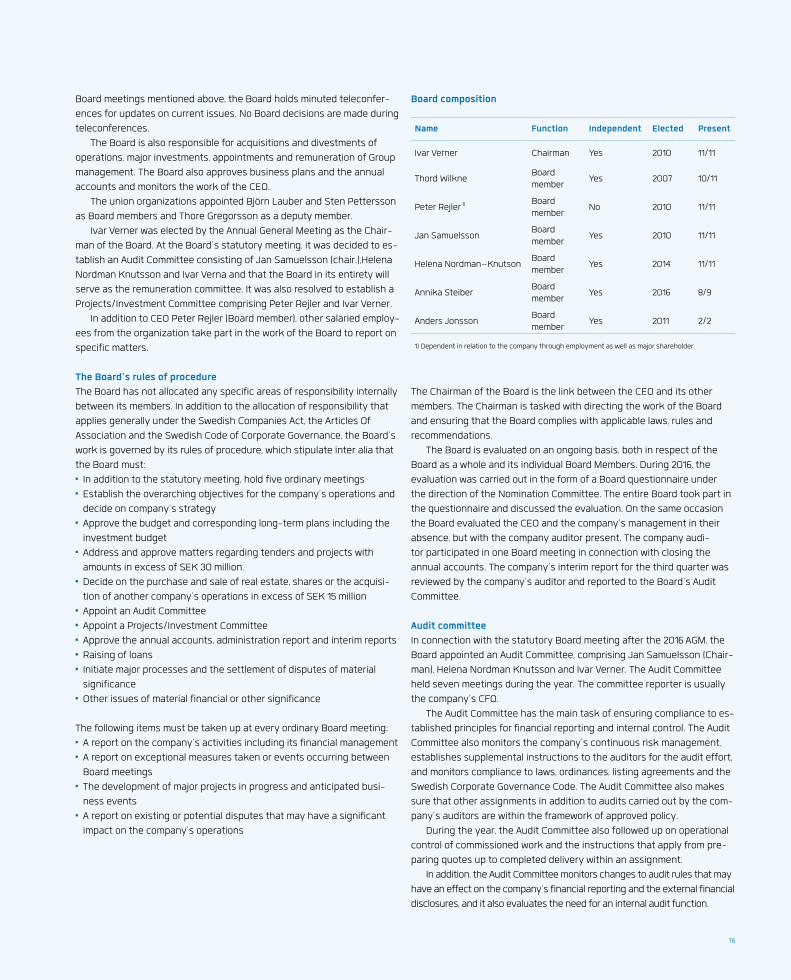
Board composition
Name Function Independent Elected Present
Ivar Verner Chairman Yes 2010 11/11
Thord WilkneBoard member
Yes 2007 10/11
Peter Rejler 1) Board member
No 2010 11/11
Jan SamuelssonBoard member
Yes 2010 11/11
Helena Nordman–KnutsonBoard member
Yes 2014 11/11
Annika SteiberBoard member
Yes 2016 8/9
Anders JonssonBoard member
Yes 2011 2/2
1) Dependent in relation to the company through employment as well as major shareholder.
The Chairman of the Board is the link between the CEO and its other
members. The Chairman is tasked with directing the work of the Board
and ensuring that the Board complies with applicable laws, rules and
recommendations.
The Board is evaluated on an ongoing basis, both in respect of the
Board as a whole and its individual Board Members. During 2016, the
evaluation was carried out in the form of a Board questionnaire under
the direction of the Nomination Committee. The entire Board took part in
the questionnaire and discussed the evaluation. On the same occasion
the Board evaluated the CEO and the company’s management in their
absence, but with the company auditor present. The company audi-
tor participated in one Board meeting in connection with closing the
annual accounts. The company’s interim report for the third quarter was
reviewed by the company’s auditor and reported to the Board’s Audit
Committee.
Audit committee
In connection with the statutory Board meeting after the 2016 AGM, the
Board appointed an Audit Committee, comprising Jan Samuelsson (Chair-
man), Helena Nordman Knutsson and Ivar Verner. The Audit Committee
held seven meetings during the year. The committee reporter is usually
the company’s CFO.
The Audit Committee has the main task of ensuring compliance to es-
tablished principles for financial reporting and internal control. The Audit
Committee also monitors the company’s continuous risk management,
establishes supplemental instructions to the auditors for the audit effort,
and monitors compliance to laws, ordinances, listing agreements and the
Swedish Corporate Governance Code. The Audit Committee also makes
sure that other assignments in addition to audits carried out by the com-
pany’s auditors are within the framework of approved policy.
During the year, the Audit Committee also followed up on operational
control of commissioned work and the instructions that apply from pre-
paring quotes up to completed delivery within an assignment.
In addition, the Audit Committee monitors changes to audit rules that may
have an effect on the company’s financial reporting and the external financial
disclosures, and it also evaluates the need for an internal audit function.
16
Internal control
At present, it is the Board’s assessment that the company’s size and
complexity do not motivate a special internal audit unit, but rather that
the accounting function will take care of the continuous controls and
conduct improvement projects in financial management and control.
Internally, audits are done of the commissioned work, follow-up of out-
comes and potential needs for changed procedures. A new assessment
will be made during the year.
Project/Investment Committee
At its statutory meeting following the 2016 AGM, the Board appointed a
Projects/Investment Committee comprising Ivar Verner (chairman), Anni-
ka Stebier in certain investment issues and Peter Rejler. The Investment
Committee held two meetings during the year where those present
were Ivar Verner and Peter Rejler. The committee reporter is usually the
company’s CFO.
The principal task of the Investment Committee is to discuss matters
relating to investments that require a Board decision.
Remuneration committee
The Board has decided not to appoint a special remuneration committee.
Instead, the Board in its entirety will constitute a remuneration com-
mittee and will address remuneration and employment issues regard-
ing the CEO and the other senior executives based on the guidelines
adopted by the AGM. The remuneration committee is represented by the
Chairman of the Board in negotiations with the CEO.
Remuneration
Resolutions were made during the 2016 AGM regarding guidelines for
remuneration of the CEO and senior executives. These were mainly
the same as in previous years. The main principle for these guidelines
is that senior executives at Rejlers must be offered remuneration on
market terms to enable the company to attract, develop and retain key
individuals. The remuneration structure may be made up of a basic salary,
variable remuneration and in certain cases other benefits. The variable
remuneration for senior executives is limited to a maximum 60 per cent
of basic salary. The full guidelines are available appended to the AGM
minutes and on the company website. The term senior executives refers
to the members of the Group’s management group.
The AGM approved remuneration of the Board in the amount of
SEK 370,000 to the Chairman of the Board and SEK 200,000 each
to the other members who are not Rejlers employees. An additional
SEK 225,000 was set aside for committee work.
See Note 7 to the annual accounts for remuneration of the Board.
CEO and Group management
The CEO is appointed by the Board and is tasked with the day-to-day
administration of the company in accordance with the guidelines and
instructions contained in law, the articles of association and the internal
work instructions.
Day-to-day management includes all measures that, in consideration
of the scope and nature of the company’s operations, are of an unusual
character or of great significance or are expressly defined as falling with-
in the responsibility of the Board.
Peter Rejler has been President and CEO for Rejlers since 1 April 2014. He
was born in 1966 and has worked within Rejlers since 1998.
In 1999, he became the CEO for Rejlers’ operations until 2012. During
the period 2012-2014, he was the executive Chairman of the Board but
returned to his role as CEO as of 1 April 2014. As of August 2014, Peter also
had the role as the President of Rejlers’ Swedish operations.
Peter holds a Bachelor of Science in Electronics and a Master of
Science in Mechanical Engineering.
The CEO directs the work of Group management and makes decisions
in consultation with other members of the management team. Group
management holds regular meetings under the direction of the CEO.
Between these meetings, regular checks are made regarding the status
of each operation. Group management prepares an annual business plan
which is followed up through monthly reports that focus on profitability,
cost control and cash flow. Group management comprised the CEO, the
CFO, the Heads of operations for Sweden, Norway and Finland, the Head
of IT Solutions, the CIO and the Head of HR, in all six members.
Information about the CEO and the members of the group manage-
ment team, their ages, education and shareholdings, is available in the
Group Management section on page 10.
Audits
The AGM’s tasks include selecting an auditor. The 2016 AGM elected Deloitte
as auditors, with authorized public accountant Birgitta Lööf as audi-
tor-in-charge. Deloitte audits all active Rejlers companies in Sweden, Finland
and Norway which were wholly owned by Rejlers during 2016 except for
Embriq. The auditor works from an audit plan and reports her observations to
the Audit Committee on an ongoing basis throughout the year. Reporting to
the Board takes place in conjunction with the annual closing of accounts.
A review of internal procedures and control systems is also carried
out in conjunction with the audit review.
In addition to the audit review, Deloitte was also engaged for other
assignments. Among other things, the work included tax and acquisitions
issues along with various audit issues (see also Note 8 to the annual
accounts). All of the assignments fall within the framework of policy laid
down by the Audit Committee.
Remuneration of the company auditors for 2016 and 2015 are pre-
sented in the Annual Report.
Financial reporting and information
Rejlers provides the market with regular information on the progress and
financial position of the company. Information is provided regularly in the
form of: ρ Interim reports ρ Rejlers’ annual report ρ Press releases about news and events that may materially affect the
valuation and future prospects of the company. Rejlers’ policy is to
publish orders that are of strategic value ρ Presentations for financial analysts, investors and media ρ Rejlers’ website – www.rejlers.com – where the information described
above is available
17
The Board’s description of the internal control system
and risk management
Control environment
The control environment constitutes the basis of internal control. The
control environment creates the culture upon which Rejlers operates
and defines standards and guidelines for the operation’s actions. In prac-
tical terms, the control environment consists of documented guidelines,
manuals and instructions disseminated throughout the organization. The
quality management system is supplemented by a series of document-
ed directives, which include a financial manual containing policies for
accounting and financial management together with the information
policy. Rejlers maintains a quality management system that includes
procedures, instructions and templates for relevant processes. Rejlers
is always busy developing and improving quality and processes in order
to meet the standards customers, suppliers and employees demand of
a consultancy. The organizational structure is transparent, with defined
roles and responsibilities that are communicated through document-
ed work instructions for the Board, Board committees, the CEO and
managers in the Group. There are rules of procedure for the Board and
instructions for the CEO of each company in the Group, based on the
same principles as those for Rejlers AB.
Each company has a board tasked with continuously ensuring
compliance with the overall guidelines and policies and making regular
assessments of the company’s financial situation.
The boards each have at their disposal a president, who in the larger
subsidiaries also has a management group. In each of the countries con-
cerned, the Rejlers organization allows local units great independence.
Managers at all levels have clearly assigned responsibilities and powers
to develop their operations based on local conditions and their custom-
ers’ needs. Regular evaluations are conducted in the organization at both
function and departmental level in order to ensure relevant knowledge of
financial reporting in the organization. The aim is the ability to guarantee
with reasonable certainty that Rejlers’ short-term and long-term targets
are achieved. The aim of risk management and internal controls in con-
nection with financial reporting is the ability to guarantee with reasona-
ble certainty that the external financial reporting is reliable with regard
to interim reporting, annual reporting and the annual accounts, and to
ensure that the external financial reporting is prepared in accordance
with laws, applicable financial reporting standards and other require-
ments that must be met by listed companies.
Information and communication
The most important steering documents regarding the financial state-
ments are continuously updated and communicated to relevant employ-
ees over the company’s intranet, information letters, regular meetings,
etc. Information channels are established to communicate to concerned
employees in the organization as effectively as possible. Rejlers also has
an information policy in regard to both internal and external communi-
cation.
Control activities
The control structure is designed to manage the risks the Board and
the senior management consider significant for operational activities,
compliance with laws and regulations and financial reporting. Defined de-
cision-making procedures, including an authorization manual, are estab-
lished e.g. for investments and signing of contracts. Where appropriate,
automatic controls specifically related to financial reporting have been
established. Most control activities are integrated into the company’s
key processes, such as order booking, revenue recognition, investments,
supplier contracts and purchases. To ensure risks in customer projects
are noted, managed and correctly reflected in financial reporting, a
separate function has been set up – the project building – to carry out
regular checks to ensure customer projects are run in compliance with
Rejlers’ quality management system in regard to both implementation
and financial follow-up. The IT structure is designed to manage potential
IT-related risks with checks in the IT systems related to the processes
that have an impact on financial reporting.
Monitoring
Each unit head is responsible for ensuring adequate internal control
in the unit concerned and for ensuring that the units comply with the
Group’s directives for financial reporting. In addition, the internal control
structure of separate, decentralized functions is reviewed by a special
function. Because the Board considers Rejlers’ significant areas of risk to
be covered by the reviews carried out, it sees no current need to set up a
separate function for internal audit at present.
Stockholm, 20 March 2017
Board of Directors Rejlers AB
18

Consolidated income statement
Consolidated statement of comprehensive income
Amount SEK million Note 2016 2015
Operating revenues
Net sales 5 2,339.3 1,872.4
Other operating revenues 6 2.1 3.1
Total operating revenue 2,341.4 1,875.5
Operating expenses
Other external expenses 8 -816.4 -493.0
Personnel expenses 7 -1,453.7 -1,280.1
Depreciation of property, plant and equipment and amortization of intangible assets 9-13 -44.2 -32.2
Participations in associated company earnings 14 0.4 0.8
Operating profit 27.5 71.0
Financial income 15 7.1 8.1
Financial expenses 16 -12.4 -7.3
Total net financial income/expense 5.3 0.8
Profit before tax 22.2 71.8
Tax 17 -8.2 -20.6
PROFIT FOR THE YEAR 14.0 51.2
Attributable to the Parent Company’s shareholders 13.3 51.2
Attributable to shareholders without a controlling influence 0.7 -0.1
Earnings per share for profits attributable to the Parent Company’s shareholders before dilution, SEK
18 1.03 4.15
Earnings per share for profits attributable to the Parent Company’s shareholders after dilution, SEK
18 1.03 4.15
Amount SEK million 2016 2015
Profit for the period 14.0 51.2
Items that may be reclassified to the income statement
Translation differences of foreign operations, net after-tax 28.5 -22.4
Items that will not be reclassified to the income statement
Revaluation of net pension provisions 4.3 12.1
46.8 40.9
Attributable to:
Parent Company’s shareholders 45.5 41.0
Shareholders without a controlling influence 1.3 -0.1
19

Consolidated balance sheet
Amount SEK million Note 2016 2015
ASSETS
N O N - CU R R E N T A S S E T S
Intangible assets
Capitalized expenditures for program development
9 37.5 16.5
Software 10 4.9 4.2
Customer values 11 79.4 79.1
Goodwill 12 432.6 395.4
Total intangible assets 554.4 495.2
Property, plant and equipment
Inventories, tools and installations 13 37.5 36.2
Total property, plant and equipment 37.5 36.2
Financial assets
Participations in associated companies 14 0.6 0.2
Non-current securities held as non-current assets
19 3.8 3.2
Other non-current receivables 20 3.8 5.3
Total financial assets 8.2 8.7
Deferred tax asset 17 39.4 40.0
Total non-current assets 639.5 580.1
CU R R E N T A S S E T S
Current receivables
Inventories 6.3 6.4
Trade receivables 21 390.2 344.5
Current tax assets 17.2 21.4
Other receivables 11.9 16.8
Prepaid expenses and accrued income 22 230.4 179.9
Total current receivables 656.0 569.0
Cash and cash equivalents 64.9 108.8
Total current assets 720.9 677.8
TOTAL ASSETS 1,360.4 1,257.9
Amount SEK million Note 2016 2015
EQUITY AND LIABILITIES
Equity
Share capital 25.8 25.8
Other capital contributed 209.6 209.6
Reserves -0.3 -28.3
Accumulated profit including profit for the year
301.1 309.4
Total equity attributable to Parent Company shareholders
536.2 516.5
Equity attributable to shareholders without a controlling influence
16.0 8.3
Total equity 552.2 524.8
Non-current liabilities
Liabilities to credit institutions 24 155.0 177.5
Deferred tax liability 17 45.7 48.9
Pension provisions 25 20.7 25.0
Other liabilities 5.1 6.5
Total non-current liabilities 226.5 257.9
Current liabilities
Liabilities to credit institutions 24 133.4 103.2
Accounts payable 134.0 75.9
Advance payments from customers 0.2 0.1
Current tax liabilities 0.4 11.6
Other liabilities 125.5 113.6
Accrued expenses and deferred income 26 188.2 170.9
Total current liabilities 581.7 475.2
TOTAL EQUITY AND LIABILITIES 1,360.4 1,257.9
20
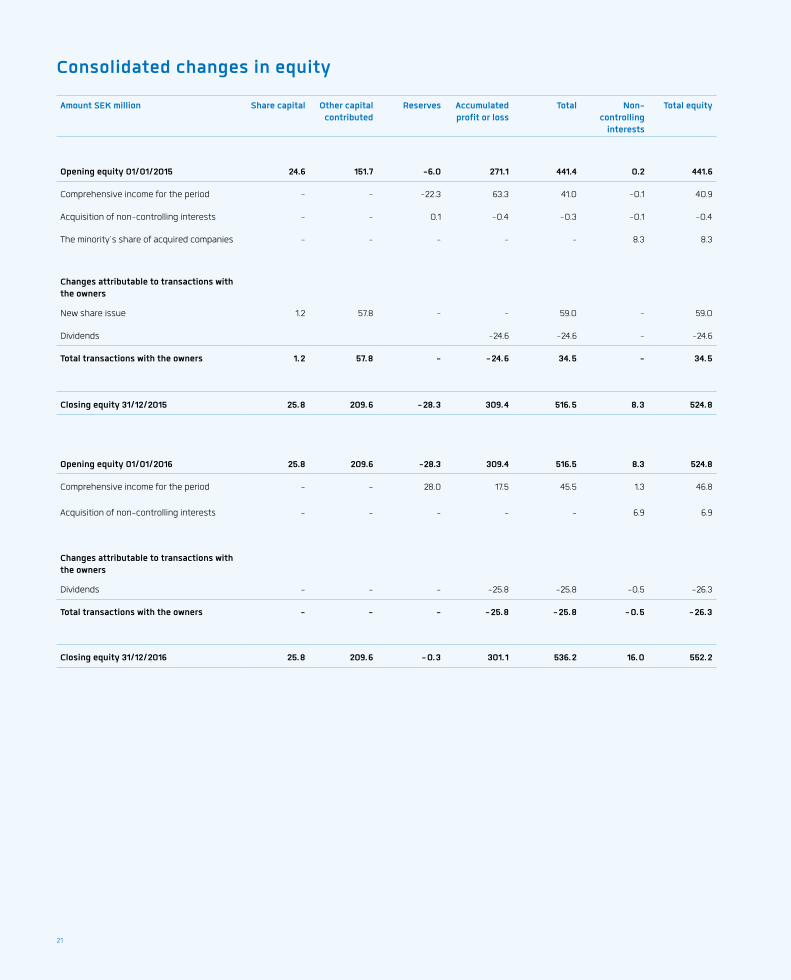
Consolidated changes in equity
Amount SEK million Share capital Other capital contributed
Reserves Accumulated profit or loss
Total Non-controlling
interests
Total equity
Opening equity 01/01/2015 24.6 151.7 -6.0 271.1 441.4 0.2 441.6
Comprehensive income for the period - - -22.3 63.3 41.0 -0.1 40.9
Acquisition of non-controlling interests - - 0.1 -0.4 -0.3 -0.1 -0.4
The minority’s share of acquired companies - - - - - 8.3 8.3
Changes attributable to transactions with the owners
New share issue 1.2 57.8 - - 59.0 - 59.0
Dividends -24.6 -24.6 - -24.6
Total transactions with the owners 1.2 57.8 - -24.6 34.5 - 34.5
Closing equity 31/12/2015 25.8 209.6 -28.3 309.4 516.5 8.3 524.8
Opening equity 01/01/2016 25.8 209.6 -28.3 309.4 516.5 8.3 524.8
Comprehensive income for the period - - 28.0 17.5 45.5 1.3 46.8
Acquisition of non-controlling interests - - - - - 6.9 6.9
Changes attributable to transactions with the owners
Dividends - - - -25.8 -25.8 -0.5 -26.3
Total transactions with the owners - - - -25.8 -25.8 -0.5 -26.3
Closing equity 31/12/2016 25.8 209.6 -0.3 301.1 536.2 16.0 552.2
21
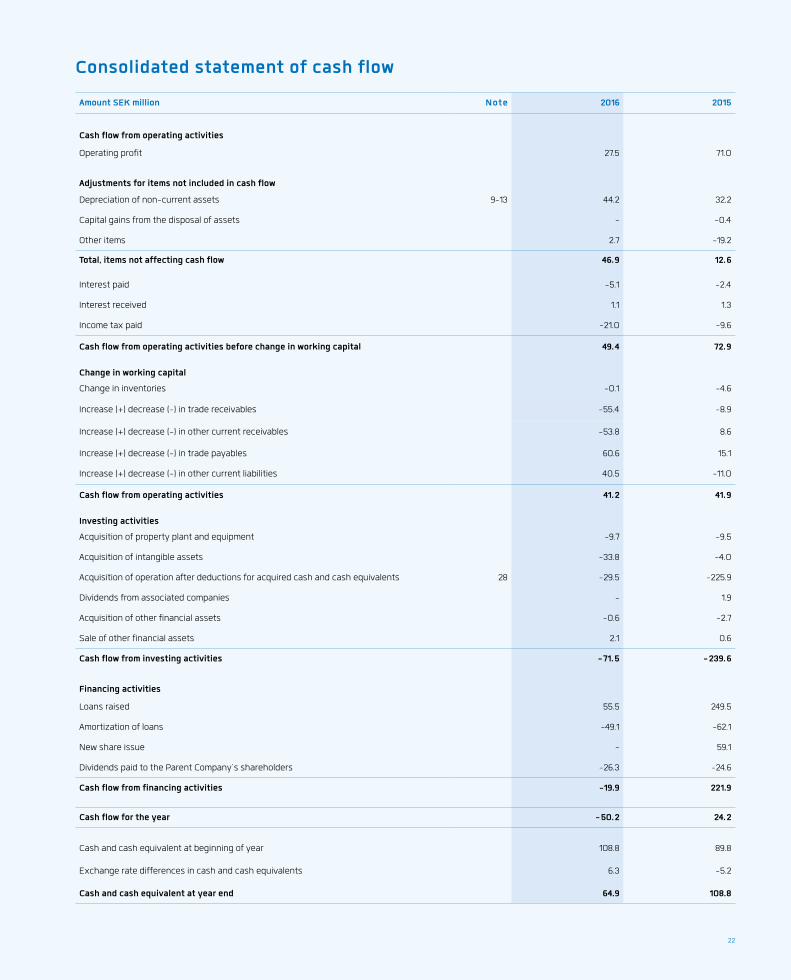
Consolidated statement of cash flow
Amount SEK million Note 2016 2015
Cash flow from operating activities
Operating profit 27.5 71.0
Adjustments for items not included in cash flow
Depreciation of non-current assets 9-13 44.2 32.2
Capital gains from the disposal of assets - -0.4
Other items 2.7 -19.2
Total, items not affecting cash flow 46.9 12.6
Interest paid -5.1 -2.4
Interest received 1.1 1.3
Income tax paid -21.0 -9.6
Cash flow from operating activities before change in working capital 49.4 72.9
Change in working capital
Change in inventories -0.1 -4.6
Increase (+) decrease (-) in trade receivables -55.4 -8.9
Increase (+) decrease (-) in other current receivables -53.8 8.6
Increase (+) decrease (-) in trade payables 60.6 15.1
Increase (+) decrease (-) in other current liabilities 40.5 -11.0
Cash flow from operating activities 41.2 41.9
Investing activities
Acquisition of property plant and equipment -9.7 -9.5
Acquisition of intangible assets -33.8 -4.0
Acquisition of operation after deductions for acquired cash and cash equivalents 28 -29.5 -225.9
Dividends from associated companies - 1.9
Acquisition of other financial assets -0.6 -2.7
Sale of other financial assets 2.1 0.6
Cash flow from investing activities -71.5 -239.6
Financing activities
Loans raised 55.5 249.5
Amortization of loans -49.1 -62.1
New share issue - 59.1
Dividends paid to the Parent Company’s shareholders -26.3 -24.6
Cash flow from financing activities -19.9 221.9
Cash flow for the year -50.2 24.2
Cash and cash equivalent at beginning of year 108.8 89.8
Exchange rate differences in cash and cash equivalents 6.3 -5.2
Cash and cash equivalent at year end 64.9 108.8
22

Notes to the consolidated financial statements
Amounts in SEK million unless otherwise indicated.
NOTE 1. GENERAL INFORMATION
Rejlers AB (publ) (556349-8426) (the Parent Company) and its subsidiaries
(jointly called the Group) is a Nordic business group that offers services
to customers in the areas of buildings and properties, energy, industry
and infrastructure.
The Parent Company is a Swedish public limited company with its reg-
istered office in Stockholm. The address of the head office is Box 30233,
Lindhagensgatan 126, SE 104 25 Stockholm, SWEDEN. The company’s B
shares are listed on Nasdaq Stockholm.
The annual report and consolidated financial statements were
approved for publication by the Board 20 March 2017. The consolidated
income statement and balance sheet and the Parent Company’s income
statement and balance sheet are proposed as items for adoption by the
AGM on 24 April 2017.
NOTE 2. SUMMARY OF IMPORTANT ACCOUNTING POLICIES
Basis for the preparation of the reports
Rejlers Prepares its consolidated financial statements in accordance with
International Financial Reporting Standards (IFRS) as published by the
International Accounting Standards Board (IASB) and interpretations from
the IFRS Interpretations Committee (IFRS IC) as adopted by the EU. The
Swedish Annual Accounts Act is also applied as are the recommendations
published by the Swedish Financial Reporting Board, RFR1, Supplementa-
ry rules for consolidated financial statements.
The Parent Company applies the same accounting policies as the Group
except as stated under Parent Company accounting policies in Note A.
Changed disclosure requirements
ESMA has published guidelines for disclosures on alternative perfor-
mance measures that should be followed in financial reports that are
published after 3 July 2016. The guidelines mean that disclosures have
been expanded with regard to financial measures that are not defined
in IFRS. In accordance with the requirements in the guidelines, there
are definitions and checks of alternative performance measures in the
Five-year summary section on pages 1-5. Otherwise, the accounting
principles, classifications and calculation methods applied by the Group
during the financial year essentially agree with the principles applied in
the 2015 annual report.
New or amended IFRS
The new standards and amendments to and revisions of standards that
entered into effect 1 January 2016 have not had any effect on the con-
solidated financial statements for the 2016 financial year.
Upcoming regulatory changes
IFRS 9 Financial Instruments, which will replace IAS 39 Financial Instru-
ments: Recognition and Measurement, has been adopted for application
by the EU. The standard will be applied as of the 2018 financial year.
The standard comprises three areas: classification and measurement,
impairment of financial instruments and general hedge accounting.
According to the new rules for classification and measurement, financial
assets shall be classified according to fair value through profit or loss,
amortized cost or fair value through other comprehensive income. The
starting point for the classification of debt instruments is the company’s
business model for handling the financial asset and whether or not the
instrument’s contractual cash flows only contain payments of interest
and principal. Equity instruments shall be classified at fair value through
profit or loss unless the company at initial recognition chose to present
such instruments at fair value through other comprehensive income.
Such a choice means that only dividends from these holdings are rec-
ognized in profit or loss. Other gains and losses as a result of changes in
fair value may not be reclassified from other comprehensive income to
profit or loss. The rules for classification of financial liabilities are largely
unchanged compared with IAS 39. The largest change is that fair value
changes as a result of changes in own credit risk for financial liabilities
chosen to be value through profit or loss are recognized in other com-
prehensive income instead of profit or loss. Rejlers current preliminary
assessment is that the classification and valuation rules will not have any
significant impact on the financial reports.
In addition, IFRS 15 Revenue from Contracts with Customers was
approved for application by the EU. The standard will be applied as
of the 2018 financial year, but may be applied early. Rejlers does not
intend to apply the standard early. IFRS 15 introduces a five-step model
to determine how and when revenue recognition shall take place. The
standard contains expanded disclosure requirements regarding revenue.
The current preliminary assessment is that the new standard will not
have any significant impact on Rejlers’ financial reports.
IFRS16 Leases has also been published by IASB. On condition that
IFRS 16 is adopted by the EU and the effective date that IASB proposed
does not change, the standard will be applied as of the 2019 financial
year. The largest change that the standard entails is that all leases (ex-
cept for short-term leases and leases where underlying assets amount
to a low value) shall be recognized as an asset (right of use) and as a
liability in the lessee’s balance sheet. Rejlers’ assessment is that the new
standard will have some impact on Rejlers’ financial reports.
None of the other changes in the recognition regulations that are
issued for application are deemed to have any material impact on Rejlers’
financial reports.
Segment reporting
Segment information is presented based on the company management’s
perspective and the operating segment is identified based on the inter-
nal reporting to the company’s highest executive decision maker.
Rejlers has identified the CEO as being its highest executive decision
maker and the internal reporting used by him to follow up operations and
make decisions regarding the allocation of resources form the basis for
the segment information presented here.
The accounting policies used in reportable segments correspond to
the principles applied by the Group as a whole. Because Rejlers operates
a technical consultancy and provides IT services, four different operating
segments are reported – consulting operations in Sweden, Finland and
Norway, and IT services in IT Solutions.
23
Classifications
Non-current assets and non-current liabilities refer to assets and liabil-
ities that are expected to be recovered i.e. through use or consumption
or paid more than 12 months from the closing date. Current assets and
liabilities refer to amounts that are expected to be recovered or paid
within 12 months of the closing date.
Consolidation principles
Subsidiaries
The consolidated income statement and balance sheet covers all of the
companies in which Rejlers AB holds, directly or indirectly, more than half
of the shares’ voting rights as well as companies in which the Group in
some other way has a controlling influence. Subsidiaries are included
in the consolidated financial statements as of the day when controlling
influence was transferred to the Group. Subsidiaries are excluded from
the consolidated financial statements as of the day when controlling
influence ceases.
The acquisition method is used for reporting the Group’s business
combinations. The purchase some for the acquisition of a subsidiary
constitutes the fair value of transferred assets and liabilities and the
value of the equity instruments submitted as payment. The purchase
sum also includes the fair value of all assets or liabilities resulting from
an agreement regarding a contingent consideration. Expenses related to
acquisitions are expensed as they arise. Identifiable acquired assets and
assumed liabilities in a business combination are measured initially at fair
value on the acquisition date. For each acquisition, the Group decides
whether the holding without a controlling influence in the acquired com-
pany will be reported at fair value or as the holding’s proportional share
of the acquired company’s net assets.
The amount by which the purchase sum, any holding without a
controlling influence and the fair value on the acquisition date of the
earlier shareholding, exceeds the fair value of the Group’s share of the
identifiable acquired net assets is reported as goodwill. If the difference
is negative, it is reported as gains from a bargain purchase directly in the
income statement following review of the difference.
Transactions with shareholders without a controlling influence that do
not lead to a loss of controlling influence, are reported as equity trans-
actions – i.e. transactions with the owners in their role as owners. When
making acquisitions from shareholders without a controlling influence,
the difference between the fair value of the purchase sum paid and the
actual acquired share of the carrying amount of the subsidiary’s net as-
sets is reported in equity. Gains and losses from disposals to sharehold-
ers without a controlling influence are also reported in equity.
If the business combination is carried out in several stages, the pre-
vious equity participations in the acquired company are re-measured to
their fair value at the time of acquisition. Any gains or losses arising from
the revaluation are reported in the income statement.
Each contingent consideration that will be transferred by the Group
is reported at fair value at the time of acquisition. Subsequent changes
to the fair value of a contingent consideration classified as an asset
or liability is reported in accordance with IAS 39 either in the income
statement or other comprehensive income. Contingent considerations
classified as equity are not re-measured and subsequent regulation is
reported in equity.
Intra-group transactions, balance sheet items and unrealized gains
between group companies are eliminated. Unrealized losses are also
eliminated, but any losses are considered to indicate a need to recognize
impairment for the transferred asset. The accounting policies in acquired
subsidiaries have been changed where applicable to guarantee consis-
tent application of the Group’s principles.
Associated companies
Associated companies refers to all of the companies in which the Group
has a significant but not controlling interest, which generally applies to
all shareholdings that comprise between 20 and 50 per cent of the votes.
Holdings in associated companies are reported according to the equity
method and measured initially at cost. The Group’s carrying amount for
associated company holdings includes goodwill identified at acquisition,
net after any impairment charges.
The Group’s share of profit or loss after tax arising in the associated
company after acquisition is reported in the income statement under ‘Par-
ticipations in associated company earnings’ and as part of operating profit/
loss. The Group’s proportion of changes in reserves after acquisition are
reported in the item Reserves. Accumulated changes after the acquisition
are reported as changes in the carrying amount of the holding. When the
Group’s share of an associated company’s losses amounts to or exceeds
its holding in the associated company, including any unsecured claims, the
Group does not report further losses unless the Group has assumed liabili-
ties or made payments on behalf of the associated company.
Unrealized gains from transactions between the Group and its associ-
ated companies are eliminated in proportion to the Group’s shareholding
in the associated company. Unrealized losses are also eliminated, unless
the transaction constitutes proof of a need to recognize impairment for
the transferred asset. The accounting policies in acquired associated
companies have been changed where applicable to guarantee consistent
application of the Group’s principles.
Translation of foreign currencies
Foreign subsidiaries report in their functional currency, which corre-
sponds to the currency in the principal financial environment in which
each subsidiary operates.
Transactions in foreign currency are translated to the functional
currency according to the foreign exchange rate applicable on the trans-
action date or the date when the items were re-measured. Exchange
rate gains and losses that arise upon payment of such transactions and
when converting monetary assets and liabilities in foreign currency at
the closing date exchange rate are reported in the income statement.
In the consolidated financial statements, subsidiary company ac-
counts have been translated to Swedish kronor, which is the Group’s
reporting currency. The translation of foreign subsidiaries’ income state-
ments and balance sheets to Swedish currency is carried out as follows:
a) assets and liabilities are translated at the closing day rate,
b) income and expenses are translated to the average exchange rate
(unless this average is not a reasonable approximation of the accu-
mulated effects of the exchange rates that applied on the transac-
tion date, in which case income and expenses are converted at the
transaction date’s exchange rate), and
c) all exchange rate differences that arise are reported as a separate
part of other comprehensive income.
24

On consolidation, exchange-rate differences that arise as a result of the
translation of net investments in foreign operations, are reported in other
comprehensive income. When a foreign operation is disposed of wholly or
in part, the exchange rate differences reported in equity are transferred
to the income statement and reported as part of capital gains or losses.
Goodwill and adjustments to fair value that arise in connection with
the acquisition of a foreign operation are treated as assets and liabilities
at said operation and translated at the closing day rate.
Property, plant and equipment
Property, plant and equipment are recognized at cost less depreciation.
Cost includes expenses directly attributable to the acquisition of the
asset.
Additional expenditures are added to the asset’s carrying amount or
reported as a separate asset as appropriate only if it is probable that the
future economic benefits associated with the asset will accrue to the
Group and that the asset’s cost can be measured in a reliable manner.
The carrying amount for the replaced part is removed from the balance
sheet. All other forms of repair and maintenance are expensed in the
income statement during the period in which they arise.
No depreciations are made for land. Depreciation of the costs or
re-measured amounts of other assets down to the calculated residual
value over their estimated period of use is done on a straight-line basis
as follows:
ρ Vehicles, 5 years ρ Fixtures and fittings, 3-5 years
The residual values and useful lives of assets are tested every closing
day and adjusted as necessary.
The reported residual value of an asset is immediately written down
to its recoverable value if the asset’s carrying amount exceeds its recov-
erable value.
Intangible assets
Goodwill
The amount by which the purchase sum, any holding without a con-
trolling influence and the fair value on the acquisition date of the earlier
holding, exceeds the fair value of the identifiable acquired net assets
is reported as goodwill. Goodwill from the acquisition of subsidiaries is
reported as intangible assets. Goodwill from the acquisition of an asso-
ciated company is included in the value of the holding in the associated
company and is tested for the need to recognize any impairment as a
proportion of the value of the total holding. Goodwill is tested annually to
identify any need for impairment and is reported at cost less accumulat-
ed impairments. Goodwill impairments are not reversed. Gains or losses
from the disposal of a unit include the remaining carrying amount of
the goodwill in respect of the unit disposed of. Goodwill is allocated to
cash-generating units during tests for any need for impairment. Alloca-
tion is made to cash-generating units or groups of cash-generating units
that are expected to benefit from the business combination that gave
rise to the goodwill item.
Customer values
Acquired customer values refers to customer relationships, customer
agreements etc. They have a limited useful life and are reported at cost
less accumulated depreciations. Depreciations are made on a straight-
line basis to distribute the expense of customer values over the estimat-
ed useful life (ten years).
Software
Software licenses are capitalized on the basis of the expenses that arose
when the software in question was acquired and put into operation.
These capitalized expenses are depreciated during the estimated useful
life (three to five years).
Capitalized expenditures for program development
Expenditures for the development and maintenance of software are
expensed as they arise. Expenditures directly associated with the
development of identifiable, unique software products under the control
of the Group that have probable financial advantages for more than one
year and which exceed the expenses, are reported as intangible assets.
The expense includes employee expenses that arose during the devel-
opment of software and a reasonable proportion of indirect expenses.
Interest rate expenditures in connection with development projects are
capitalized. Software development expenses are depreciated during the
estimated useful life (three to five years).
Impairment tests for non-financial assets
Assets with an indefinable useful life such as goodwill are not depreci-
ated but tested annually for any need for impairment. Assets that are
depreciated are assessed in regard to their reduction in value whenever
events or changes in circumstances indicate that the carrying amount
might not be recoverable. An impairment loss is made in the amount by
which the asset’s carrying amount exceeds its recovery value. The re-
covery value is the higher of the asset’s fair value less selling expenses
and its value in use. When assessing the need to recognize impairment,
assets are grouped at the lowest levels where there are separate identi-
fiable cash flows (cash-generating units). Previously depreciated assets,
other than financial assets and goodwill, are tested at every closing date
for the need for reversal.
Financial assets and liabilities
Financial instruments are measured and reported in the consolidated
financial statements in accordance with the rules in IAS 39. Financial
instruments reported in the balance sheet include financial assets
measured at fair value via the income statement, loan receivables, trade
receivables, other non-current receivables, other receivables and other
current investments. Liabilities include trade payables, loan liabilities
and other liabilities. Cash and cash equivalents comprise cash and bank
balances. Financial instruments (which in the subsequent report are not
reported at fair value) are initially reported at cost corresponding to the
instrument’s fair value with additions for transaction expenses for all fi-
nancial instruments. Reporting then takes place depending on how they
are classified according to the below.
A financial asset or liability is shown in the balance sheet when the
company becomes party to the instrument’s contractual conditions.
Trade receivables are entered in the balance sheet as invoices are sent.
25

Payables are recognized when the counterparty has performed and a
contractual obligation to pay exists, even if an invoice has not yet been
received. Trade payables are entered as invoices are received. A finan-
cial asset is removed from the balance sheet when the obligations of the
agreement are fulfilled, lapse or the company loses control of them. The
same applies to parts of a financial asset. A financial liability is removed
from the balance sheet when the obligation in the agreement is fulfilled or
is otherwise terminated. The same applies to parts of a financial liability.
The acquisition and disposal of financial assets is entered on the
transaction day which is the day upon which the company undertakes to
acquire or dispose of the asset.
The fair value of listed financial assets corresponds to the asset’s
listed purchase price on the closing date. The fair value of unlisted finan-
cial assets is determined through the use of measurement techniques
e.g. transactions recently carried out, the price of similar instruments and
discounted cash flows. At each reporting date, the company evaluates
if there are objective indications of a financial asset’s being in need of
impairment.
IAS 39 classifies financial instruments into categories. Classification
depends on the intent behind the acquisition of the financial instrument.
Classification is determined on acquisition date but is tested at every
reporting date. The categories are as follows:
Loans and trade receivables
Loans and trade receivables are financial assets that are not derivatives,
have determined or determinable payments and which are not listed on
an active market. They are included in current assets with the exception
of items with a maturity later than 12 months after
the closing date, which are classified as non-current assets. The Group’s
loan receivables and trade receivables are made up of trade receivables
and other receivables and cash and cash equivalents on the balance
sheet. Impairments of trade receivables and other receivables are report-
ed under other external operating expenses and impairments of loan
receivables under financial expenses. They are recognized at cost, when
they are current and discounting would not have any significant effect.
Financial assets measured at fair value through profit and loss
Financial instruments in this category are measured on an ongoing basis
at fair value with changes in value recognized in profit or loss.
Other financial liabilities
Financial liabilities that are not held for trade are measured at accrued
cost. Amortized cost is determined based on the effective rate of interest
calculated at the time the liability was entered. This means surplus val-
ues and deficit values as well as direct emission expenses are distrib-
uted over the duration of the liability. The consolidated items comprise
borrowing, trade payables and other liabilities.
Inventories
Inventories are reported at cost or net realizable value, whichever is the
lower. Cost is determined by using the first-in, first-out method.
Taxes
Tax expenses or tax income comprise current tax and deferred tax.
Current tax is the tax that must be paid or received in respect of the
current year by applying the tax rates adopted as of the closing date.
Deferred tax is calculated in accordance with the balance sheet method.
In the balance sheet method, calculations are based on the application of
closing date tax rates to the differences between an asset’s or liability’s
book value or tax -related value and loss carry forward. These loss
carry-forwards may be used to reduce future taxable income. In cases
where such loss carry forwards are considered possible, a deferred tax
asset is entered for said loss carry forwards.
Tax is reported in the income statement except where it refers to
items that are reported in other comprehensive income or directly in
equity. In such cases the tax is also reported in other comprehensive
income or equity respectively.
The current tax asset is offset against the current tax liability in different
units in cases where offset is possible between tax-related profits/
losses between corresponding units and the Group intends to make
use of such offset opportunities. The corresponding principle applies to
deferred tax assets and liabilities.
Remuneration of employees
Pension obligations
The pension arrangements within the Group are classified as de-
fined-contribution and defined-benefit pension plans. Premiums for
defined-contribution pension arrangements are expensed during the
period they concern. In the case of defined-benefits pension plans, the
pension benefit expense is determined based on actuarial calculations
according to the Projected Unit Credit Method. Remeasurements, includ-
ing actuarial gains and losses, the effects of changes to the asset ceiling
and rates of return on plan assets (excluding the interest rate compo-
nent which is reported in the income statement), are reported directly in
the balance sheet as an income or expense corresponding to the change
for the period in the statement of comprehensive income in the period
in which they arise. Remeasurements reported in other comprehensive
income effect accumulated profit or loss and are not reclassified to
the income statement. Past service costs are expensed in the income
statement in the period during which the plan was changed. Net interest
is calculated by applying the discount rate at the beginning of the period
to the defined-benefits net liability or asset.
The defined-benefits expenses are divided into the following categories: ρ service costs (including service costs for the current period, service
costs for earlier periods and gains and losses in respect of reductions
and/or settlements) ρ net interest expense on net interest income ρ remeasurements
The first two categories are reported in the income statement as per-
sonnel expenses (service cost) and net financial income/expense (net in-
terest expense). Gains and losses related to reductions and settlements
are reported as service costs from earlier periods. Remeasurements are
reported in other comprehensive income.
According to a statement from the Swedish Financial Reporting Board,
UFR 10 Accounting for pension plan ITP 2 financed through insurance
with Alecta, UFR 10 must be applied until Alecta is able to present basic
data for the calculation of defined-benefits pension commitments.
UFR 10 means pension arrangements with Alecta are classified as de-
fined-contribution plans until further notice.
26
Termination benefits
Termination benefits are paid when an employee is terminated by the
Group before normal pensionable age or when an employee accepts
voluntary retirement in exchange for such benefits. The Group reports
severance pay when it is demonstrably obliged either to terminate the
employee according to a detailed, formal, irrevocable plan or to pay com-
pensation upon termination as a result of an offer made to encourage
voluntary retirement. Benefits that fall due more than 12 months from the
closing date are discounted to present value.
Profit-sharing and bonus plans
The Group reports a liability and an expense for bonuses and profit
sharing based on a formula that takes into account the profit that is
attributable to the Parent Company’s shareholders following certain ad-
justments. The Group reports a provision when there is a legal or informal
obligation as a result of earlier practice.
Provisions
Provisions are recognized when the Group has an existing legal or
informal obligation as a result of prior events where it is probable that an
outflow of resources will be required to settle the commitment and the
amount was calculated in a reliable manner.
Provisions for restructuring include costs for the termination of leases
and severance pay. No provisions are made for future operating losses. If
there are a number of similar commitments, the probability of there being
an outflow of resources for the settlement of all of the commitments in
this group is considered. The provisions are measured at the present
value of the amount anticipated as necessary to settle the commitment.
In this regard, a discount rate before tax is used, which reflects a current
market assessment of the time value of money and the risks associated
with the provision.
The increase in the provision due to the passage of time, is reported
as an interest expense.
Revenue recognition
Revenue includes the fair value of what was received or will be received.
The company’s income consists mainly of revenues from consultancy,
operating and administrative services, licence income from proprietary
products and maintenance rights and rights of use.
Consultancy income on current account is recognized as revenue
when the work is carried out. Work in progress but not yet invoiced on
current account is carried in the balance sheet at the invoicing value of
work carried out.
For consultancy income at fixed prices, the percentage-of-comple-
tion method is applied, i.e. revenue is recognized in relation to the degree
of completion of the project concerned as of balance sheet date. Degree
of completion is calculated on the basis of accrued expense in relation
to the total cost of the project. If the total expenses for a project are esti-
mated to exceed the total income, the anticipated loss is recognized im-
mediately in its entirety. If the final outcome cannot be reliably estimated,
income is recognized at a value equivalent to expense. Non-invoiced
fixed-price projects in progress are recognized less any loss risks and
advance payments, in the balance sheet as accrued income.
Income from operation and administrative services as well as mainte-
nance rights and rights of use are recognized as income on a straight-
line basis over the contract period.
Licence income is taken up as income on delivery of software if
no material obligations remain after delivery. If significant adaptations
remain after delivery, the income is accrued over the contract period with
consideration of remaining obligations.
Interest income is reported on an ongoing basis as it is earned at the
effective interest rate applicable to each asset. Dividends from invest-
ments are reported when entitlement to receive payment is established.
Leasing
Leasing is classified in the consolidated financial statements as either
financial or operational leasing. Financial leasing is when the econom-
ic risks and benefits associated with ownership are transferred in all
material respects to Rejlers; where this is not the case, it is a question of
operational leasing.
Leasing contracts mainly concern vehicles, computers and photo-
copiers. Leasing of assets (vehicles) that constitutes financial leasing
is reported as non-current assets and financial liabilities. Depreciation
takes place according to the same principles as for other assets of the
same type. Operational leasing (computers, photocopiers) is expensed on
a straight-line basis over the leasing period.
Dividends
Dividends to the Parent Company’s shareholders are reported as a liabili-
ty in the consolidated financial statements in the period during which the
dividend was approved by the Parent Company’s shareholders.
Borrowing costs
Borrowing costs directly attributable to the acquisition, design or pro-
duction of assets that take a substantial period of time to prepare for
the intended use or sale, are capitalized as part of the cost of the asset
where it is probable that the asset will lead to future economic benefits
for the Group and the expenditures can be measured reliably. Other
borrowing costs are expensed in the period in which they arise and are
classified in their entirety as financial expenses in the income statement.
Borrowing is classified as current liabilities, unless the Group is entitled
to defer payment of the liability for at least 12 months after the balance
sheet date.
State subsidies
State subsidies are reported in their entirety in the income statement at
fair value as soon as there is a reasonable certainty that the subsidy will
be received and that the Group will fulfil the terms associated with the
subsidy. Subsidies that concern expenses are accrued and reported in
the same periods as the expenses the subsidies are intended to cover.
Rejlers in some cases receives grants for payroll expenses. Where
applicable, they have reduced the company’s employee expenses.
Statement of cash flows
The statement of cash flows is prepared according to the indirect meth-
od. Cash and cash equivalents in the statement of cash flows consist of
cash and bank balances as well as current investments with a maturity
from the acquisition date of less than three months, which are only ex-
posed to an insignificant risk of changes in value.
27

Parent Company Accounting Policies
The Parent Company has prepared its financial statements and annual
report in accordance with the Swedish Annual Accounts Act and Swedish
Financial Accounting Standards Council recommendation RFR 2 Account-
ing for Legal Entities. See Note A, Accounting policies.
NOTE 3. FINANCIAL RISK FACTORS AND OTHER RISKS
The overall objective of Rejlers’ financial operations is to support oper-
ating activities by securing financing and loan commitments, as well as
efficient cash flow management both locally and centrally, and to deal
with the financial risks to which the Group is exposed. Management of
Rejlers’ financial risk exposure is centralized in the company’s finance
department. The company has a financial policy set by the Board, which
describes the objectives for the financial functions and the distribution of
responsibilities within them. This financial policy aims to control and limit
the financial risk to which the Group is exposed through the establish-
ment of targets, guidelines and rules for the management of financial risk
exposure and cash flow. The following financial risks are considered to
be present in Rejlers’ operations.
Currency risk, the risk of changes in the value of a currency in relation to
other currencies poses a currency risk. Exchange rate risks are limited,
since the majority of payments are made in the local currencies of the
respective companies. When subsidiaries’ balance sheets in local cur-
rency are translated to SEK, a difference arises as the translation for the
current year is at a different exchange rate than the previous year, and
because income statements are translated at a different exchange rate
than the balance sheets.
Rejlers’ policy is not to hedge translation differences. The Group’s
policy is to limit currency risk where applicable, if the risk might affect
the cash flow within the Group to an appreciable extent. A risk assess-
ment must be carried out in such cases.
Impact on earnings after tax 1) 2016 2015
Exchange rate change EUR/SEK
+ 10% 0.9 1.4
- 10% -0.9 -1.4
Exchange rate change NOK/SEK
+ 10% 0.2 0.3
- 10% -0.2 -0.3
1) As the Group does not recognize any value changes in other comprehensive income or equity, a corresponding effect arises in equity.
Liquidity risk, i.e. the risk of failing to meet payment obligations. This risk
must be limited through good liquidity planning, by which means Rejlers
can secure e.g. timely loan commitments. Seasonal reductions in liquidity
are offset against changes in the overdraft limit. The Group endeavours
to have guaranteed overdrafts and cash and cash equivalents equivalent
to the sum of all loans falling due in the next six months.
Interest rate risk refers to changes in the value of an interest-bearing
item as a consequence of changes in market interest rates.
The investment time horizon of assets is governed by financial policy
and the Group’s acquisition plans. In the case of acquisitions, the repay-
ment time for loans with fixed interest rates must reflect the calculat-
ed depreciation time for the acquisition. Short-term loans are usually
arranged at variable interest rates so that the Group will be able to pay
them off without expense in the event of surplus liquidity.
Impact on earnings after tax 1) 2016 2015
Interest rate change
+ 1% -2.0 -1,3
- 1% 2.0 1.3
Credit risk refers to counterparty risk, the risk of a counterparty failing
to meet its obligations. This risk is limited in major business deals by
checking, before anything else, the counterparty’s ability to pay. Rejlers
has considerable customer exposure to government and other public
authorities where the credit risk is very low or insignificant. In the case of
private-sector clients, an individual assessment of each client’s ability to
pay is carried out as required. Usually, customers are invoiced monthly,
which means exposure an individual customer basis is relatively small.
Any funds invested must be in government, municipal, bank or certain
selected commercial papers.
The Group’s maximum exposure to credit risk is assessed to be matched
by carrying amounts on all financial assets, which amount to SEK 491.7
million (500.0).
The table below analyses the Group’s financial liabilities, classified by
the time remaining until the contractual due date, as of balance sheet
date. The amounts also include estimated interest rates.
2016 less than 1 year
between 1 and 2 years
between 2 and 5 years
More than 5 years
Liabilities to credit institutions 128.3 28.3 120.0 -
Trade payables and other liabilities 134.0 - - -
2015 less than 1 year
between 1 and 2 years
between 2 and 5 years
More than 5 years
Liabilities to credit institutions 103.2 34.6 142.9 -
Trade payables and other liabilities 189.8 - - -
Managing capital risk
The Group’s objective regarding capital structure is to safeguard its
ability to continue operations in order to go on generating a return for
shareholders and benefits for other stakeholders as well as maintaining
an optimum capital structure to keep capital costs down.
To maintain or adjust the capital structure, the Group may change the
dividend paid to shareholders, repay capital to shareholders, issue new
28
shares or sell assets to reduce liabilities. In the same way as other com-
panies in the industry, the Group assesses capital based on the equity/
assets ratio and debt/equity ratio. The debt/equity ratio is calculated as
net liabilities divided by equity. Net liabilities are calculated as the total
borrowing (including the items “Short-term liabilities to credit institutes”
and “Non-current liabilities to credit institutes” in the Group’s balance
sheet) and pension provisions less cash and cash equivalents.
During 2016, the Group’s strategy, which remains unchanged com-
pared to 2015, was to maintain a strong balance sheet with a minimum
debt/equity ratio of 30 per cent and a low debt/equity ratio. The equity/
assets ratio at year-end 2016 was 41 per cent (42). The debt/equity
ratios as of 31 December 2016 and 2015 were as follows:
2016 2015
Interest-bearing liabilities 309.1 280.7
Total equity 552.2 524.8
Debt/equity ratio, times 0.6 0.5
Certain special conditions, known as covenants, usually apply to the
Group’s borrowing. On 22 December 2016, Rejlers’ bank SEB and Rejlers
entered a supplemental agreement regarding the conditions in the
credit agreement. According to the supplemental agreement, the credit
agreement was changed, in part such that the size of the interest rate
margin shall be dependent on net debt relative to the EBITDA, and in part
such that Rejlers committed to take steps to implement a rights issue of
at least SEK 100 million. The equity/assets ratio for the Group at the end
of 2016 was 41 per cent (42) and the net debt/ equity ratio in relation to
EBITDA was 3.4 (1.9).
At year-end, the group had SEK 64.9 million (108.8) in cash and cash
equivalents.
NOTE 4. IMPORTANT ASSUMPTIONS AND ESTIMATIONS
The Group makes assumptions and estimations about the future. The
estimations for accounting purposes that arise will, by definition, rarely
match the actual outcome. The assumptions and estimations which
involve, should they change, a significant risk for substantial adjustments
in carrying amount for assets and liabilities during the next financial year
are specified below.
Testing for goodwill impairment
Every year, or more frequently, the Group analyses whether there is any
need for goodwill impairment. The recoverable value of cash generating
units is determined by calculating their value-in-use. When calculating
value-in-use, several assumptions are made regarding future conditions.
It is possible that changes to these conditions could have an effect on
the carrying amount for goodwill. Note 12 contains a sensitivity analy-
sis, showing the sensitivity of value-in-use to changes in sales and the
operating margin.
To assess the future cash flow, Group Management has compiled a
forecast based on next year’s budget and an assessment of the sub-
sequent four years. An average growth of 3 per cent (3) is used in the
calculations. Forecast cash flows were then calculated at present value,
with a discount rate of 12 per cent (12) after tax, equivalent to 16 per cent
(15) before tax.
If the estimated discount rate before tax applied for discounted cash
flows had been one percentage point lower, the value-in-use for the
Group would have grown by approximately SEK 334 million (414).
Revenue recognition
The valuation of projects in progress is done according to the percent-
age of completion method. Fees for work performed but not invoiced
are recorded in the balance sheet as current account assignments as
are fixed-price assignments valued at the invoicing price after deduc-
tion of any discrepancies between production and the level of comple-
tion. Assignments in progress are usually invoiced monthly. The level
of completion in fixed price assignments is assessed by allowing the
assignment manager to compile an assessment of work completed and
work remaining. Revenue is not recognized if there is any uncertainty
regarding the value.
Income taxes
The Group is obliged to pay tax in several different countries. Com-
prehensive assessments are necessary to determine the income tax
provision in these countries. There are many transactions and calcula-
tions where the final tax is uncertain. In cases where the final tax differs
from the amounts first recognized, the differences will have an impact on
current and deferred tax assets and liabilities during the period in which
such determinations are made.
NOTE 3 CONTINUED
29

NOTE 5. SEGMENT INFORMATION
Income statement in summary per segment
Sweden Finland Norway Embriq Group wide Eliminations Group
2016 2015 2016 2015 2016 2015 2016 2015 2016 2015 2016 2015 2016 2015
External sales 1,210.2 1,094.2 386.6 334.7 334.0 297.2 408.4 144.3 0.1 2.0 - - 2,339.3 1,872.4
Sales between segments
15.4 2.5 1.3 0.4 1.6 0.9 8.7 7.0 22.6 25.1 -49.6 -35.9 - -
Other income 0.6 2.3 1.5 1.3 0.0 0.4 0.0 0.0 0.0 0.0 - -0.9 2.1 3.1
Total income 1,226.2 1,099.0 389.4 336.4 335.6 298.5 417.1 151.3 22.7 27.1 -49.6 -36.8 2,341.4 1,875.5
Depreciation -10.9 -8.9 -9.3 -7.4 -6.3 -7.5 -12.4 -3.7 -5.3 -4.7 - - -44.2 -32.2
Other operating expenses
-1,187.3 -1,038.7 -365.1 -310.1 -342.6 -287.5 -389.1 -138.3 -35.2 -34.5 49.6 36.8 -2,269.7 -1,772.3
Operating profit 28.0 51.4 15.0 18.9 -13.3 3.5 15.6 9.3 -17.8 -12.1 - - 27.5 71.0
Investments 6.0 142.5 32.8 13.5 2.9 1.9 31.3 84.6 0.0 0.3 - - 73.0 242.8
Rejlers’ operations are divided into four segments. As of 31 December
2016, the IT Solutions segment changed names to Rejlers Embriq.
The Sweden segment comprises mainly technical consultancy
services provided by Rejlers Sverige AB and Rejlers Energiprojekt AB.
The Finland segment comprises mainly technical consultancy
services provided by Rejlers Oy, Matti Leppä Oy and CMN Services Oy.
The Norway segment comprises mainly technical consultancy
services provided by Rejlers Norge AS and Rejlers Elsikkerhet AS.
The Embriq segment consists of the companies Rejlers Embriq AS,
Embriq AB, Rejlers Energitjänster AB and ComIT Rejlers AB.
Group-wide refers to Parent Company revenue, costs, assets and
liabilities.
Eliminations refers to transactions between the segments.
All sales between the segments take place on market terms.
The Group’s segments are monitored based on operating profit, operating
margin and billable hours ratio. The same accounting policies apply to
operating segments as to the Group as a whole.
Information by country
Sales Non-current assets
2016 2015 2016 2015
Sweden 1,287.9 1,145.4 207.8 209.3
Finland 389.4 354.1 141.4 100.6
Norway 691.0 372.9 74.9 70.4
External income recognized under the countries above represents in-
come invoiced in the country concerned. No customer accounts for more
than 10 per cent of the total revenues.
30
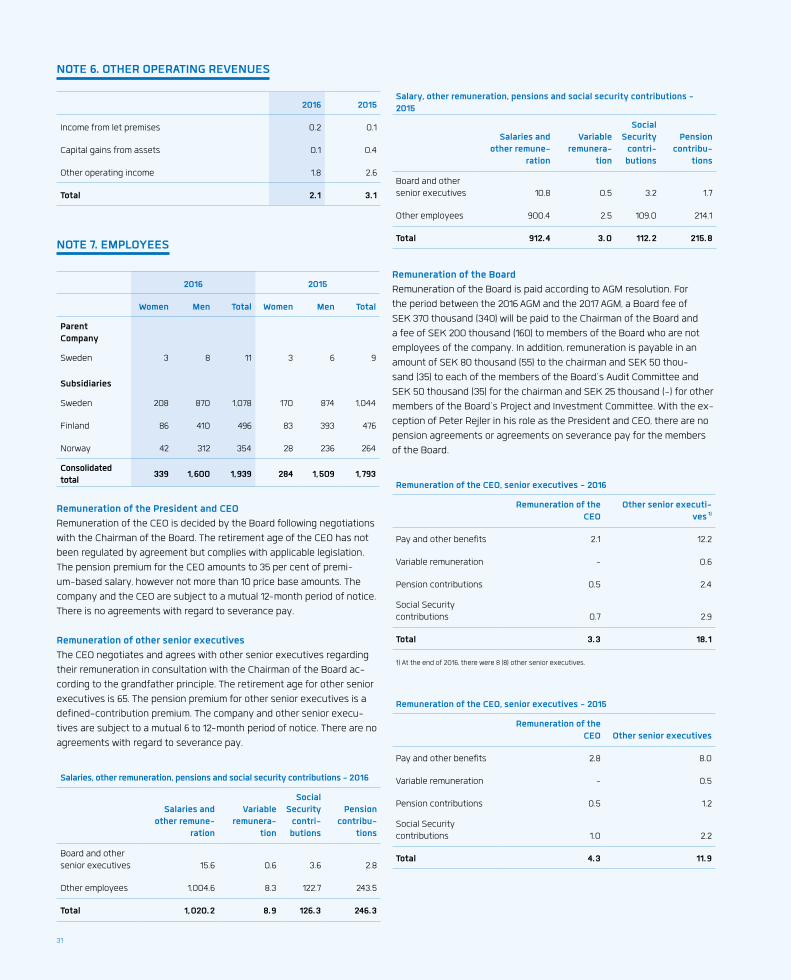
NOTE 6. OTHER OPERATING REVENUES
2016 2015
Income from let premises 0.2 0.1
Capital gains from assets 0.1 0.4
Other operating income 1.8 2.6
Total 2.1 3.1
NOTE 7. EMPLOYEES
2016 2015
Women Men Total Women Men Total
Parent Company
Sweden 3 8 11 3 6 9
Subsidiaries
Sweden 208 870 1,078 170 874 1,044
Finland 86 410 496 83 393 476
Norway 42 312 354 28 236 264
Consolidated total
339 1,600 1,939 284 1,509 1,793
Remuneration of the President and CEO
Remuneration of the CEO is decided by the Board following negotiations
with the Chairman of the Board. The retirement age of the CEO has not
been regulated by agreement but complies with applicable legislation.
The pension premium for the CEO amounts to 35 per cent of premi-
um-based salary, however not more than 10 price base amounts. The
company and the CEO are subject to a mutual 12-month period of notice.
There is no agreements with regard to severance pay.
Remuneration of other senior executives
The CEO negotiates and agrees with other senior executives regarding
their remuneration in consultation with the Chairman of the Board ac-
cording to the grandfather principle. The retirement age for other senior
executives is 65. The pension premium for other senior executives is a
defined-contribution premium. The company and other senior execu-
tives are subject to a mutual 6 to 12-month period of notice. There are no
agreements with regard to severance pay.
Salaries, other remuneration, pensions and social security contributions - 2016
Salaries and other remune-
ration
Variable remunera-
tion
Social Security
contri-butions
Pension contribu-
tions
Board and other senior executives 15.6 0.6 3.6 2.8
Other employees 1,004.6 8.3 122.7 243.5
Total 1,020.2 8.9 126.3 246.3
Salary, other remuneration, pensions and social security contributions - 2015
Salaries and other remune-
ration
Variable remunera-
tion
Social Security
contri-butions
Pension contribu-
tions
Board and other senior executives 10.8 0.5 3.2 1.7
Other employees 900.4 2.5 109.0 214.1
Total 912.4 3.0 112.2 215.8
Remuneration of the Board
Remuneration of the Board is paid according to AGM resolution. For
the period between the 2016 AGM and the 2017 AGM, a Board fee of
SEK 370 thousand (340) will be paid to the Chairman of the Board and
a fee of SEK 200 thousand (160) to members of the Board who are not
employees of the company. In addition, remuneration is payable in an
amount of SEK 80 thousand (55) to the chairman and SEK 50 thou-
sand (35) to each of the members of the Board’s Audit Committee and
SEK 50 thousand (35) for the chairman and SEK 25 thousand (-) for other
members of the Board’s Project and Investment Committee. With the ex-
ception of Peter Rejler in his role as the President and CEO, there are no
pension agreements or agreements on severance pay for the members
of the Board.
Remuneration of the CEO, senior executives - 2016
Remuneration of the CEO
Other senior executi-ves 1)
Pay and other benefits 2.1 12.2
Variable remuneration - 0.6
Pension contributions 0.5 2.4
Social Security contributions 0.7 2.9
Total 3.3 18.1
1) At the end of 2016, there were 8 (8) other senior executives.
Remuneration of the CEO, senior executives - 2015
Remuneration of the CEO Other senior executives
Pay and other benefits 2.8 8.0
Variable remuneration - 0.5
Pension contributions 0.5 1.2
Social Security contributions 1.0 2.2
Total 4.3 11.9
31

Remuneration of the Board - 2016
Board fees, SEK thousand 1) Fee Committee
Ivar Verner, chairman 355 85
Peter Rejler, member - -
Thord Wilkne, member 180 -
Jan Samuelsson, member 180 68
Annika Steiber, member 100 13
Helena Nordman–Knutson, member 180 42
Anders Jonsson, member 80 -
Total 1,075 208
1) The table shows remuneration expensed during the year.
Remuneration of the Board - 2015
Board fees, SEK thousand 1) Fee Committee
Ivar Verner, chairman 340 70
Peter Rejler, member - -
Thord Wilkne, member 160 -
Lauri Valkonen, member 53 -
Jan Samuelsson, member 160 55
Åsa Söderström Jerring, member 53 -
Helena Nordman–Knutson, member 160 -
Anders Jonsson, member 160 55
Total 1,086 180
1) The table shows remuneration expensed during the year.
NOTE 8. AUDITORS FEES
2016 2015
Deloitte
Remuneration for audit assignment 2.0 2.1
Remuneration for auditing activities in addition to the audit assignment
0.7 0.3
Remuneration for tax consultancy services - -
Remuneration for other assignments 0.1 1.0
Other auditors
Remuneration for audit assignment 0.5 0.4
Remuneration for other assignments 0.0 -
Remuneration for auditing activities in addition to the audit assignment
-
Remuneration for tax consultancy services 0.0 -
Total 3.3 3.8
Audit assignments refer to the review of the annual accounts, the ac-
counting records and the administration by the Board and CEO as well as
other tasks the company’s auditors are required to perform or advise on,
or any other assistance resulting from findings made during the review or
while carrying out these other assignments. Deloitte has been principal
auditor since its election in the 2013 Annual General Meeting.
NOTE 9. CAPITALIZED EXPENDITURES FOR PROGRAM
DEVELOPMENT
2016 2015
Opening cost 23.8 5.7
Translation difference 9.6 -1.5
Internally developed software for the year 30.1 2.9
Increase via business acquisitions - 16.7
Sales/retirements -1,3 -
Closing accumulated cost 62.2 23.8
Opening depreciations -7.3 -4.4
Translation difference -7.3 0.0
Depreciations for the year -11.4 -2.9
Sales/retirements 1.3 -
Closing accumulated depreciations -24.7 -7.3
Closing residual value 37.5 16.5
NOTE 7 CONTINUED
32
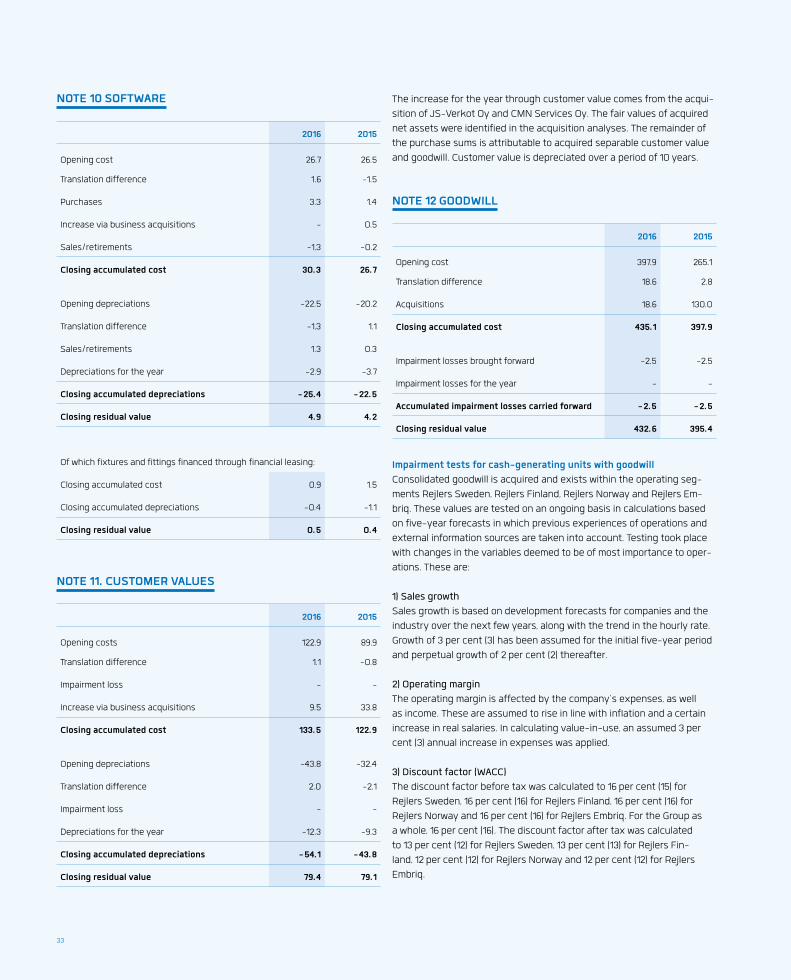
NOTE 10 SOFTWARE
2016 2015
Opening cost 26.7 26.5
Translation difference 1.6 -1.5
Purchases 3.3 1.4
Increase via business acquisitions - 0.5
Sales/retirements -1,3 -0.2
Closing accumulated cost 30.3 26.7
Opening depreciations -22.5 -20.2
Translation difference -1,3 1.1
Sales/retirements 1.3 0.3
Depreciations for the year -2.9 -3.7
Closing accumulated depreciations -25.4 -22.5
Closing residual value 4.9 4.2
Of which fixtures and fittings financed through financial leasing:
Closing accumulated cost 0.9 1.5
Closing accumulated depreciations -0.4 -1.1
Closing residual value 0.5 0.4
NOTE 11. CUSTOMER VALUES
2016 2015
Opening costs 122.9 89.9
Translation difference 1.1 -0.8
Impairment loss - -
Increase via business acquisitions 9.5 33.8
Closing accumulated cost 133.5 122.9
Opening depreciations -43.8 -32.4
Translation difference 2.0 -2.1
Impairment loss - -
Depreciations for the year -12.3 -9.3
Closing accumulated depreciations -54.1 -43.8
Closing residual value 79.4 79.1
The increase for the year through customer value comes from the acqui-
sition of JS-Verkot Oy and CMN Services Oy. The fair values of acquired
net assets were identified in the acquisition analyses. The remainder of
the purchase sums is attributable to acquired separable customer value
and goodwill. Customer value is depreciated over a period of 10 years.
NOTE 12 GOODWILL
2016 2015
Opening cost 397.9 265.1
Translation difference 18.6 2.8
Acquisitions 18.6 130.0
Closing accumulated cost 435.1 397.9
Impairment losses brought forward -2.5 -2.5
Impairment losses for the year - -
Accumulated impairment losses carried forward -2.5 -2.5
Closing residual value 432.6 395.4
Impairment tests for cash-generating units with goodwill
Consolidated goodwill is acquired and exists within the operating seg-
ments Rejlers Sweden, Rejlers Finland, Rejlers Norway and Rejlers Em-
briq. These values are tested on an ongoing basis in calculations based
on five-year forecasts in which previous experiences of operations and
external information sources are taken into account. Testing took place
with changes in the variables deemed to be of most importance to oper-
ations. These are:
1) Sales growth
Sales growth is based on development forecasts for companies and the
industry over the next few years, along with the trend in the hourly rate.
Growth of 3 per cent (3) has been assumed for the initial five-year period
and perpetual growth of 2 per cent (2) thereafter.
2) Operating margin
The operating margin is affected by the company’s expenses, as well
as income. These are assumed to rise in line with inflation and a certain
increase in real salaries. In calculating value-in-use, an assumed 3 per
cent (3) annual increase in expenses was applied.
3) Discount factor (WACC)
The discount factor before tax was calculated to 16 per cent (15) for
Rejlers Sweden, 16 per cent (16) for Rejlers Finland, 16 per cent (16) for
Rejlers Norway and 16 per cent (16) for Rejlers Embriq. For the Group as
a whole, 16 per cent (16). The discount factor after tax was calculated
to 13 per cent (12) for Rejlers Sweden, 13 per cent (13) for Rejlers Fin-
land, 12 per cent (12) for Rejlers Norway and 12 per cent (12) for Rejlers
Embriq.
33
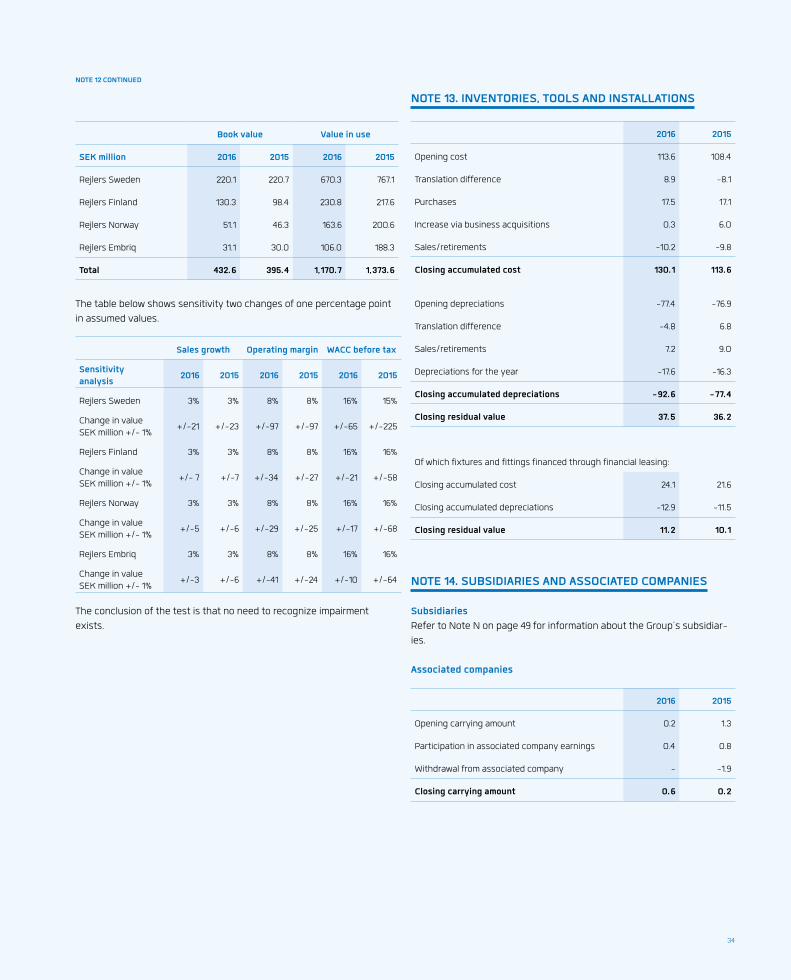
Book value Value in use
SEK million 2016 2015 2016 2015
Rejlers Sweden 220.1 220.7 670.3 767.1
Rejlers Finland 130.3 98.4 230.8 217.6
Rejlers Norway 51.1 46.3 163.6 200.6
Rejlers Embriq 31.1 30.0 106.0 188.3
Total 432.6 395.4 1,170.7 1,373.6
The table below shows sensitivity two changes of one percentage point
in assumed values.
Sales growth Operating margin WACC before tax
Sensitivity analysis
2016 2015 2016 2015 2016 2015
Rejlers Sweden 3% 3% 8% 8% 16% 15%
Change in value SEK million +/- 1%
+/-21 +/-23 +/-97 +/-97 +/-65 +/-225
Rejlers Finland 3% 3% 8% 8% 16% 16%
Change in value SEK million +/- 1%
+/- 7 +/-7 +/-34 +/-27 +/-21 +/-58
Rejlers Norway 3% 3% 8% 8% 16% 16%
Change in value SEK million +/- 1%
+/-5 +/-6 +/-29 +/-25 +/-17 +/-68
Rejlers Embriq 3% 3% 8% 8% 16% 16%
Change in value SEK million +/- 1%
+/-3 +/-6 +/-41 +/-24 +/-10 +/-64
The conclusion of the test is that no need to recognize impairment
exists.
NOTE 13. INVENTORIES, TOOLS AND INSTALLATIONS
2016 2015
Opening cost 113.6 108.4
Translation difference 8.9 -8.1
Purchases 17.5 17.1
Increase via business acquisitions 0.3 6.0
Sales/retirements -10.2 -9.8
Closing accumulated cost 130.1 113.6
Opening depreciations -77.4 -76.9
Translation difference -4.8 6.8
Sales/retirements 7.2 9.0
Depreciations for the year -17.6 -16.3
Closing accumulated depreciations -92.6 -77.4
Closing residual value 37.5 36.2
Of which fixtures and fittings financed through financial leasing:
Closing accumulated cost 24.1 21.6
Closing accumulated depreciations -12.9 -11.5
Closing residual value 11.2 10.1
NOTE 14. SUBSIDIARIES AND ASSOCIATED COMPANIES
Subsidiaries
Refer to Note N on page 49 for information about the Group’s subsidiar-
ies.
Associated companies
2016 2015
Opening carrying amount 0.2 1.3
Participation in associated company earnings 0.4 0.8
Withdrawal from associated company - -1.9
Closing carrying amount 0.6 0.2
NOTE 12 CONTINUED
34

Share of equity Group’s share of profits for the year
Co. Reg. No.Registered office
Operations 2016 2015 2016 2015
Mirakelbolaget AB 556835-4350 Stockholm Program development 50% 50% 0.4 0.3
Summary of financial information from associated companies
Income Profit for the year Assets Liabilities
2016 2015 2016 2015 2016 2015 2016 2015
Mirakelbolaget AB 9.0 8.1 0.8 0.6 4.1 6.2 2.9 2.1
NOTE 15. FINANCIAL INCOME
2016 2015
Interest income 1.0 0.9
Exchange-rate gains 6.1 6.9
Other income from financial items 0.0 0.3
Total 7.1 8.1
NOTE 16. FINANCIAL EXPENSES
2016 2015
Interest expenses -4.3 -2.2
Exchange-rate losses -7.4 -4.9
Other financial expenses -0.7 -0.2
Total -12.4 -7.3
NOTE 17. TAX ON PROFIT FOR THE YEAR
2016 2015
The following items are included in tax expense:
Tax on profit for the year 13.8 16.2
Deferred tax -5.2 4.4
Adjustment, previous years -0.4 0.0
Total 8.2 20.6
Profit before tax 22.2 71.8
Tax according to applicable rate 22% (22) 4.8 15.8
Effect of foreign tax rates -0.7 -0.6
Effect of non-deductible expenses 6.7 4.9
Effect of tax-exempt income -3.9 -0.8
Effect of changed tax rates -0.3 1.5
Other 1.5 -0.2
Reported tax 8.2 20.6
In the Group, there are tax loss carry-forwards where deferred tax is not
booked. The tax loss carry-forwards amount to SEK 36.3 million (36.3) and
are estimated to be used in the Swedish operations as soon as the Group
contribution limit has been passed in 2021. The tax loss carry-forwards have
no expiration date.
The gross change in regard to deferred taxes is as follows:
2016 2015
Opening balance -8.9 -23.3
Translation difference 2.8 -0.8
Through business combination -1.9 23.4
Recognized in the income statement 5.2 -4.4
Recognized in other comprehensive income -3.5 -3.8
Deferred taxes, net -6.3 -8.9
NOTE 14 CONTINUED
35

The change in deferred tax liabilities and receivables is shown below:
Deferred tax liabilities Untaxed reserves Customer values Other Total
As of 01/01/2016 26.1 17.4 5.4 48.9
Reported in the income statement -3.7 -3.0 0.6 -6.1
Increase through business combination - 1.9 - 1.9
Translation difference - 1.2 -0.2 1.0
As of 31/12/2016 22.4 17.5 5.8 45.7
Deferred tax liabilities Untaxed reserves Customer values Other Total
As of 01/01/2015 23.4 13.6 4.6 41.6
Reported in the income statement 2.7 -2.5 0.5 0.7
Increase through business combination 0.0 7.2 0.0 7.2
Translation difference 0.0 -0.9 0.3 -0.6
As of 31/12/2015 26.1 17.4 5.4 48.9
Deferred tax assets Tax losses ProvisionsDefined benefits
pension liabilitiesTotal
As of 01/01/2016 30.6 8.6 0.8 40.0
Reported in the income statement -0.9 - - -0.9
Increase through business acquisition - - - -
Recognized in other comprehensive income - - -3.5 -3.5
Translation difference 4.0 - -0.2 -3.8
As of 31/12/2016 33.7 8.6 -2.9 39.4
Deferred tax assets Tax losses ProvisionsDefined benefits
pension liabilitiesTotal
As of 01/01/2015 0.5 12.7 5.1 18.3
Reported in the income statement -0.5 -3.1 0.0 -3.6
Increase through business acquisition 30.6 0.0 0.0 30.6
Recognized in other comprehensive income 0.0 0.0 -3.8 -3.8
Translation difference 0.0 -1.0 -0.5 -1.5
As of 31/12/2015 30.6 8.6 0.8 40.0
NOTE 17 CONTINUED
36
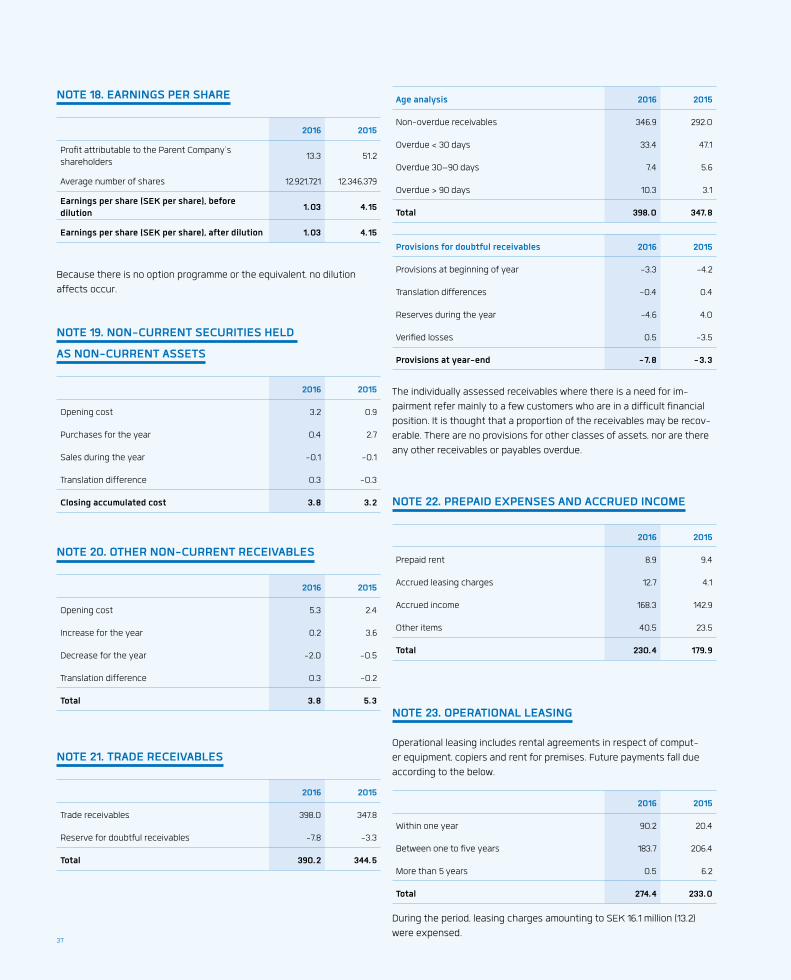
NOTE 18. EARNINGS PER SHARE
2016 2015
Profit attributable to the Parent Company’s shareholders
13.3 51.2
Average number of shares 12,921,721 12,346,379
Earnings per share (SEK per share), before dilution
1.03 4.15
Earnings per share (SEK per share), after dilution 1.03 4.15
Because there is no option programme or the equivalent, no dilution
affects occur.
NOTE 19. NON-CURRENT SECURITIES HELD
AS NON-CURRENT ASSETS
2016 2015
Opening cost 3.2 0.9
Purchases for the year 0.4 2.7
Sales during the year -0.1 -0.1
Translation difference 0.3 -0.3
Closing accumulated cost 3.8 3.2
NOTE 20. OTHER NON-CURRENT RECEIVABLES
2016 2015
Opening cost 5.3 2.4
Increase for the year 0.2 3.6
Decrease for the year -2.0 -0.5
Translation difference 0.3 -0.2
Total 3.8 5.3
NOTE 21. TRADE RECEIVABLES
2016 2015
Trade receivables 398.0 347.8
Reserve for doubtful receivables -7.8 -3.3
Total 390.2 344.5
Age analysis 2016 2015
Non-overdue receivables 346.9 292.0
Overdue < 30 days 33.4 47.1
Overdue 30–90 days 7.4 5.6
Overdue > 90 days 10.3 3.1
Total 398.0 347.8
Provisions for doubtful receivables 2016 2015
Provisions at beginning of year -3.3 -4.2
Translation differences -0.4 0.4
Reserves during the year -4.6 4.0
Verified losses 0.5 -3.5
Provisions at year-end -7.8 -3.3
The individually assessed receivables where there is a need for im-
pairment refer mainly to a few customers who are in a difficult financial
position. It is thought that a proportion of the receivables may be recov-
erable. There are no provisions for other classes of assets, nor are there
any other receivables or payables overdue.
NOTE 22. PREPAID EXPENSES AND ACCRUED INCOME
2016 2015
Prepaid rent 8.9 9.4
Accrued leasing charges 12.7 4.1
Accrued income 168.3 142.9
Other items 40.5 23.5
Total 230.4 179.9
NOTE 23. OPERATIONAL LEASING
Operational leasing includes rental agreements in respect of comput-
er equipment, copiers and rent for premises. Future payments fall due
according to the below.
2016 2015
Within one year 90.2 20.4
Between one to five years 183.7 206.4
More than 5 years 0.5 6.2
Total 274.4 233.0
During the period, leasing charges amounting to SEK 16.1 million (13.2)
were expensed.37

NOTE 24. LIABILITIES TO CREDIT INSTITUTIONS
Non-current 2016 2015
Bank loans 148.4 171.2
Financial leasing 6.6 6.3
Total 155.0 177.5
Current 2016 2015
Bank loans 128.3 99.1
Financial leasing 5.1 4.1
Total 133.4 103.2
The Group has an overdraft facility with a limit of SEK 50 million (50). The
overdraft is entirely unutilized. The company has no liabilities that fall
due for payment later than five years.
Financial leasing liabilities include mainly vehicles leased for three
years. The company has no liabilities falling due for payment in more than
five years.
Maturity analysis, liabilities to credit institutions 2016 2015
Within one year 133.4 103.2
1-2 years 155.0 31.9
2–3 years - 145.6
3-4 years - -
4-5 years - -
Conditions and repayment plans
Loan amount in currency
Reported amount
(SEK million)
Inte-rest
rate, %
Final payment
year
Fixed- interest
term
Bank loans SEK
50.0 50.0 2.5 2017 30 days
Bank loans SEK
50.0 50.0 2.5 2017 30 days
Bank loans SEK
56.7 56.7 1.6 2018 30 days
RCF 120.0 120.0 1.6 2018 90 days
NOTE 25. PENSION OBLIGATIONS
Defined-benefits pension plans
Sweden
For salaried employees in Sweden, the ITP 2 defined-benefit pension
commitments for retirement and family pension (alternatively survivor
pension) are secured through an insurance policy with Alecta. According
to a statement by the Swedish Financial Reporting Board, UFR 10 Rec-
ognition of the ITP 2 pension scheme financed via insurance from Alecta,
this is a defined benefit plan that comprises several employers. For
the 2016 financial year, the company has not had access to information
enabling it to account for its proportionate share of the plan’s commit-
ments, plan assets and costs, with the result that it has not been possible
to recognize the plan as a defined-benefit plan. The ITP 2 pension plan
secured through an insurance policy with Alecta is therefore recog-
nized as a defined-contribution plan. Premiums for the defined-benefit
retirement and family pension are individually calculated and depend,
inter alia, on salary, previously earned pension and expected remaining
length of service. Anticipated premiums for the next reporting period for
ITP 2 pensions with Alecta amount to SEK 25.4 million (35,4). The Group’s
share of total contributions to the plan and the Group’s share of the total
number of active members in the plan are 0.1912 per cent (0.00064) and
0.15663 per cent (0.00080) respectively. The collective level of consoli-
dation consists of the market value of Alecta’s assets as a percentage
of the insurance commitments calculated according to Alecta’s actuarial
methods and assumptions, which are not in agreement with IAS 19.
The collective level of consolidation should usually be allowed to vary
between 125 and 155 per cent. If Alecta’s collective level of consolidation
is lower than 125 per cent or higher than 155 per cent, measures must be
taken aimed at creating the necessary conditions for the level of con-
solidation to return to the normal range. In the case of low consolidation,
measures could include raising the agreed price of new subscriptions
and expanding existing benefits. In the case of high consolidation one
measure could be the introduction of premium reductions. At year-end
2016, Alecta’s surplus in the form of the collective consolidation level
was 149 per cent (158).
Norway
There are defined benefit pension plans for employees hired be-
fore 2007 in Rejlers Norge AS, Rejlers Elsikkerhet AS and Embriq
AS; 38 (38) gainfully employed and 27 (28) retired individuals are covered
by the plan. The pension plan provides a defined future pension based on
number of years of service and salary level at the time of retirement. Plan
assets are managed by an external asset manager.
Finland
There are no defined-benefits pension plans in Finland.
38

Defined-benefits pension plans in the balance sheet
2016 2015
Present value of defined-benefits liabilities -164.3 -144.8
Fair value of plan assets 143.5 119.8
Total -20.8 -25.0
Pension provisions 20.8 25.0
Reported in the balance sheet 20.8 25.0
Change in defined-benefits pension obligation
Opening balance -144.8 -153.8
Acquired pension obligations - -15.0
Service cost for current year -4.3 -4.9
Interest expenses -4.0 -3.5
Actuarial gains and losses 0.6 16.0
Changes in plans 2.1 -
Compensations paid 2.3 2.0
Payroll tax on pension funds paid -0.1 0.4
Translation difference -16.1 14.0
Total defined-benefits obligations -164.3 -144.8
Change in the fair value of plan assets
Opening balance 119.8 110.2
Acquired plan assets - 12.2
Charges from the employer 4.0 6.4
Yield from plan assets, excluding interest 3.4 2.6
Actuarial gains and losses 5.0 1.2
Compensations paid -2.3 -2.0
Employer’s contributions on pensions paid -0.2 -0.7
Translation difference 13.8 -10.1
Total plan assets 143.5 119.8
Allocation of plan assets 2016 2015
Cash and cash equivalents 9% 8%
Shares 20% 20%
Interest-bearing securities 59% 60%
Properties 12% 12%
Total 100% 100%
Actuarial assumptions2016 2015
Discount rate, % 2.5 2.5
Expected future annual pay increase, % 2.5 2.5
Sensitivity analysis 2016 2015
Discount rate +1%/-1% 18.4/-18.4 27.5/-27.5
Future annual pay increase +1%/-1% 1.4/-1.4 2.4/-2.4
The sensitivity analysis is based on changes of an assumption while all other assumptions are kept constant.
At year-end, the average maturity of the pension plan was 6.9 years (6.9).
Pension plan contributions are estimated at SEK 4.4 million (8.2) for the
coming year. The defined-benefit pension plans expose the Group to a
number of actuarial risks such as investment risk, interest-rate risk, risk
relating to life expectancy and risk of pay increases. However, in view of
the size of the defined-benefit pension plan, the company deems these
risks to be limited. The current value of the defined-benefit pension
provision is calculated using a discount rate established on the basis of
the rate of interest for corporate bonds in Norway. If the yield on plant
assets is lower than this interest rate, there will be a deficit in the plan. At
present, the plan has a relatively balanced spread of investments divided
into shares and interest-bearing securities. A rise in corporate bond rates
would lead to a decrease in the pension obligation. A rise in assumptions
on life expectancy would also lead to an increase in pension provisions.
As the calculation of pension provisions takes account of future pay in-
creases, an increase in employee salaries leads to an increase in pension
provisions.
NOTE 26. ACCRUED EXPENSES AND DEFERRED INCOME
2016 2015
Accrued pay 109.2 95.1
Accrued Social Security contributions 21.7 22.1
Deferred income 17.5 11.3
Other 39.8 42.4
Total 188.2 170.9
NOTE 25 CONTINUED
39

NOTE 27. PLEDGED ASSETS AND CONTINGENT LIABILITIES
2016 2015
Overdraft facilities
Floating charges 64.0 64.0
Liabilities to credit institutions
Fixtures and fittings with financial leasing 59.9 55.4
Pledged shares - 72.3
Other bank guarantees 17.6 -
Contingent liabilities
Rental responsibility 28.1 19.6
Total 169.6 211.3
NOTE 28. BUSINESS COMBINATIONS
Acquisitions 2016 Transaction DatePart, trans Part after
Purcha-se sum
Insplacon Oy Shares 01/01/2016 100.0% 100.0% 0.4
JS-Verkot Oy Shares 01/05/2016 100.0% 100.0% 2.9
CMN Services Oy Shares 03/10/2016 51,0% 51,0% 41.5
Total 44.8
Acquisition 2015 Transaction DatePart, trans
Part after
Pur-chase
sum
Energy Business Sweden AB
Shares 10/03/2015 100.0% 100.0% 3.2
Carunas (Project Monitoring unit)
Assets+ liabilities
12/05/2015 - - 11.2
Automationscenter & Bråvalla Elteknik (consultancy operation)
Assets+ liabilities
22/06/2015 - - 1.9
Embriq AS Shares 22/10/2015 90.5% 90.5% 81.6
Orbion Consulting AB
Shares 16/11/2015 100.0% 100.0% 130.9
Sassicon Oy Shares 31/12/2015 100.0% 100.0% 0.1
Elmil Oy Shares 31/12/2015 34.0% 100.0% 0.4
Total 229.3
The acquired businesses’ contributions to sales and earnings
2016 2015
Contribution to sales in accounts for the year 17.2 103.8
Contributions to sales where the business was owned for the full year
49.4 332.9
Contribution to operating profit in accounts for the year 2.8 1.7
Contributions to operating profit where the business was owned for the full year
6.5 0.8
Total net assets of the acquired businesses at the time of acquisition
2016 2015
Non-current assets 0.4 22.0
Current assets 6.9 142.0
Cash and cash equivalents
15.3 2.4
Other current liabilities -5.7 -10.6
Non-current liabilities - -96.0
Net identifiable assets and liabilities
16.9 59.8
Goodwill 20.3 143.1
Customer values 9.5 33.9
Deferred tax on intangible assets
-1.9 -7.5
Total purchase sum 44.8 229.3
Less:
Cash and cash equivalents in acquired companies
-15.3 -2.4
Non--settled purchase sum
- -1.0
Decrease in cash and cash equivalents (+), increase (-)
29.5 225.9
Surplus values are identified on acquisition. Surplus values are divided into
customer value and goodwill. During 2016, surplus values were divided into a
customer value of SEK 9.5 million (33.9) and goodwill of SEK 20.3 million (143.1).
The goodwill value, which is not tax deductible in business acquisitions
(but is tax deductible in net asset acquisitions), includes the technical
skills of staff, acquired customer relationships that are not separable and
synergies. Otherwise, the fair value of the assets and liabilities at the time of
acquisition corresponds to the carrying amount in the acquired companies.
There are no uncertain receivables among the acquired assets. Acquisi-
tion-related costs were expensed as other external expenses when they
were incurred. In all, these amounts total SEK 0.0 million (2.1).
40

NOTE 29. FINANCIAL INSTRUMENTS PER CATEGORY
Fair value and carrying value are reported in the balance sheet below:
2016Financial assets measured at fair value
via the income statementLoan and trade
receivablesOther financial
liabilitiesTotal carrying
amountTotal fair
value
Financial investments 3.8 - - 3.8 3.8
Non-current receivables - 3.8 - 3.8 3.8
Trade receivables - 390.2 - 390.2 390.2
Other current receivables - 29.0 - 29.0 29.0
Cash and cash equivalents - 64.9 - 64.9 64.9
Total 3.8 487.9 - 491.7 491.7
Non-current interest-bearing liabilities - - 155.0 155.0 155.0
Current interest-bearing liabilities - - 133.4 133.4 133.4
Other current liabilities - - 126.1 126.1 126.1
Trade payables - - 134.0 134.0 134.0
Total - - 548.5 548.5 548.5
2015Financial assets measured at fair value
via the income statementLoan and trade
receivablesOther financial
liabilitiesTotal carrying
amountTotal fair
value
Financial investments 3.2 - - 3.2 3.2
Non-current receivables - 5.3 - 5.3 5.3
Trade receivables - 344.5 - 344.5 344.5
Other current receivables - 38.2 - 38.2 38.2
Cash and cash equivalents - 108.8 - 108.8 108.8
Total 3.2 496.8 - 500.0 500.0
Non-current interest-bearing liabilities - - 177.5 177.5 177.5
Current interest-bearing liabilities - - 103.2 103.2 103.2
Other current liabilities - - 125.2 125.2 125.2
Trade payables - - 75.9 75.9 75.9
Total - - 481.8 481.8 481.8
Financial investments measured at fair value via the income statement
are measured at fair value according to level one (fair value determined
on the basis of prices quoted on an active market for the same instru-
ment). A calculation of fair value based on discounted future cash flows,
where a discount rate reflecting the counterparty’s credit risk consti-
tutes the most material input data, is not deemed to cause a material
difference in comparison with the carrying amount of financial assets
and financial liabilities included in level two. The carrying amount for
all financial assets and liabilities is therefore considered to be a good
approximation of the fair value.
41

NOTE 30. RELATED PARTY TRANSACTIONS
Rejlers has identified the Rejler family with 57 per cent of the votes and
associated companies as related parties. Purchases and sales between
group companies and related parties take place on market terms.
Summary of related party transactions
Sales to related partiesReceivables from
related parties
2016 2015 2016 2015
Associated companies
0.1 0.1 0.2 0.4
Rejler family - - - -
Remuneration of the CEO
Peter Rejler is the CEO. The level of remuneration of the CEO follows
guidelines regarding remuneration on market terms of senior executives.
Decisions regarding the level of remuneration are taken by the Board
excluding Peter Rejler. Also see Note 7.
NOTE 31. EVENTS AFTER THE END OF THE YEAR
On 1 January, we carried out an operational consolidation of the compa-
nies that are a part of Rejlers IT Solutions, which in continuation will be
gathered under Rejlers Embriq.
With the aim of accelerating the on-going transformation work and
strengthen Rejlers’ financial position and operating flexibility, Re-
jlers’Board of Directors decided on 8 February 2017, on condition of the
General Meeting’s subsequent approval, to increase the company’s share
capital through a new share issue with preferential rights for existing
shareholders. The Board’s decision was approved at an Extraordinary
General Meeting on 13 March 2017. The subscription price has been set
at SEK 39 per share, regardless of share class, which means that the
rights issue, upon full subscription, will infuse Rejlers with a total of ap-
proximately SEK 202 million before issue expenses. More information is
available on Rejlers’ website www.rejlers.se/com.
NOTE 32. CORRECTION OF ERRORS
The annual report for 2015 incorrectly stated a figure for earnings per
share after dilution that deviated from earnings per share before dilution.
Rejlers had no dilution effects during these periods, which means that
there should be no difference between earnings per share before and
after dilution. Corrections made are presented below.
2015Previously
reported Recalculation Recalculated
Earnings per share after dilution 3.96 0.19 4.15
NOT 33. PROPOSED ALLOCATION OF PROFIT
Non-restricted equity in the Parent Company amounts to SEK 171,013,754
The Board of Directors and CEO propose that a dividend be paid to the
shareholders in the amount of SEK 0
To be carried forward SEK 171,013,754
42

Income Statement - Parent Company
Statement of comprehensive income - Parent Company
Amount SEK million Note 2016 2015
Operating revenues
Net sales B,C 22.7 25.1
Total operating revenue 22.7 25.1
Operating expenses
Other external expenses C,D -23.6 -19.9
Personnel expenses E -15.0 -15.5
Depreciation, amortization and impairment of property, plant and equipment and intangible assets
K,L -0.7 -1.1
Operating profit -16.6 -11.4
Profit/loss from financial items
Profit-sharing, Group companies F 13.1 37.7
Other interest income and similar profit/loss items G 3.0 8.0
Interest expenses and similar profit/loss items H -5.4 -6.0
Profit after financial items -5.9 28.3
Appropriations I 8.8 0.1
Tax on profit for the year J 0.2 -5.6
PROFIT FOR THE YEAR 3.1 22.8
Amount SEK million 2016 2015
Profit for the year 3.1 22.8
Comprehensive income for the year 3.1 22.8
43

Balance Sheet - Parent Company
Amount SEK million Note 2016 2015
ASSETS
N O N - CU R R E N T A S S E T S
Intangible assets
Capitalized expenditures for program development
K 0.0 0.4
Total intangible assets 0.0 0.4
Property, plant and equipment
Inventories, tools and installations L 0.4 0.6
Total property, plant and equipment 0.4 0.6
Financial assets
Participations in associated companies M 0.0 0.0
Participations in Group companies N 387.4 385.2
Receivables from Group companies 13.4 9.2
Other non-current receivables 1.6 1.6
Total financial assets 402.4 396.0
Total non-current assets 402.8 397.0
CU R R E N T A S S E T S
Current receivables
Receivables from Group companies 131.4 191.6
Other receivables 0.7 4.7
Current tax assets 9.8 -
Prepaid expenses and accrued income O 0.8 1.0
Total current receivables 142.7 197.3
Cash and cash equivalents 50.2 36.5
Total current assets 192.9 233.8
TOTAL ASSETS 595.7 630.8
Amount SEK million Note 2016 2015
EQUITY
Restricted equity
Share capital 25.8 25.8
Statutory reserve 29.6 29.6
Total restricted equity 55.4 55.4
Non-restricted equity
Accumulated profit or loss -14.1 -11.1
Share premium account 182.0 182.0
Profit for the year 3.1 22.8
Total non-restricted equity 171.0 193.7
Total equity 226.4 249.1
Untaxed reserves P 22.0 30.8
LIABILITIES
Non-current liabilities
Liabilities to credit institutions 148.4 171.2
Other non-current liabilities 3.7 1.6
Total non-current liabilities 152.1 172.8
Current liabilities
Trade payables 1.5 2.2
Liabilities with Group companies 61.5 70.1
Liabilities to credit institutions 128.3 99.1
Other liabilities 0.0 0.2
Current tax liabilities 0.0 3.7
Accrued expenses and deferred income Q 3.9 2.8
Total current liabilities 195.2 178.1
TOTAL EQUITY AND LIABILITIES 595.7 630.8
44

Changes in equity - Parent Company
Restricted equity Non-restricted equity
Share capital Statutory reserve
Share premium account
Accumulated profit or loss
Total equity
Opening balance 01/01/2015 24.6 29.6 124.2 13.5 191.9
Profit for the year - - - 22.8 22.8
Transactions with shareholders
Dividend in respect of 2014 - - - -24.6 -24.6
New share issue 1.2 - 57.8 - 59.0
Closing balance 31/12/2015 25.8 29.6 182.0 11.7 249.1
Opening balance 01/01/2016 25.8 29.6 182.0 11.7 249.1
Profit for the year - - - 3.1 3.1
Transactions with shareholders
Dividend in respect of 2015 - - - -25.8 -25.8
New share issue - - - - 0.0
Closing balance 31/12/2016 25.8 29.6 182.0 -11.0 226.4
45

Cash flow - Parent Company
Amount SEK million Note 2016 2015
Cash flow from operating activities
Operating profit -16.6 -11.4
Adjustment for items not included in cash flow
Depreciation of non-current assets 0.8 1.1
Total, items not affecting cash flow 0.8 1.1
Dividends from Group companies 4.3 4.1
Interest received 1.5 0.9
Interest paid -3.5 -1.9
Income tax paid -11.2 -6.0
Cash flow from operating activities before change in working capital -24.7 -13.2
Change in working capital
Increase/decrease in current receivables 60.1 -133.0
Increase/decrease in accounts payable -0.8 -0.6
Increase/decrease in other current liabilities -8.1 17.2
Cash flow from operating activities 26.5 -164.0
Investing activities
Acquisition of subsidiary -2.2 -83.5
Withdrawal from associated company - 0.6
Acquisition of tangible assets 0.0 -0.3
Cash flow from investing activities -2.2 -83.2
Financing activities
New share issue - 59.1
Loans raised 55.5 249.5
Amortizations -49.1 -49.2
Group contributions paid -1.3 -
Group contributions received 10.0 35.0
Dividend paid -25.8 -24.6
Cash flow from financing activities -10.7 269.8
Cash flow for the year 13.6 22.6
Cash and cash equivalent at beginning of year 36.5 13.9
Exchange rate differences in cash and cash equivalents 0.1 0.0
Cash and cash equivalent at year and 50.2 36.5
46
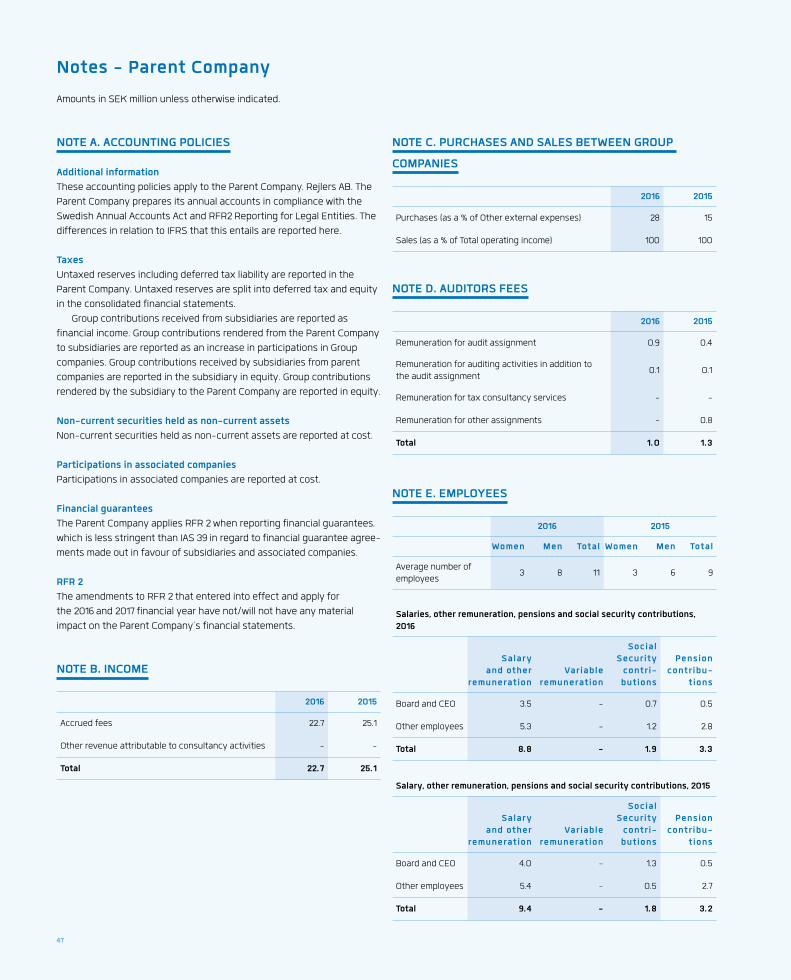
Notes - Parent Company
Amounts in SEK million unless otherwise indicated.
NOTE A. ACCOUNTING POLICIES
Additional information
These accounting policies apply to the Parent Company, Rejlers AB. The
Parent Company prepares its annual accounts in compliance with the
Swedish Annual Accounts Act and RFR2 Reporting for Legal Entities. The
differences in relation to IFRS that this entails are reported here.
Taxes
Untaxed reserves including deferred tax liability are reported in the
Parent Company. Untaxed reserves are split into deferred tax and equity
in the consolidated financial statements.
Group contributions received from subsidiaries are reported as
financial income. Group contributions rendered from the Parent Company
to subsidiaries are reported as an increase in participations in Group
companies. Group contributions received by subsidiaries from parent
companies are reported in the subsidiary in equity. Group contributions
rendered by the subsidiary to the Parent Company are reported in equity.
Non-current securities held as non-current assets
Non-current securities held as non-current assets are reported at cost.
Participations in associated companies
Participations in associated companies are reported at cost.
Financial guarantees
The Parent Company applies RFR 2 when reporting financial guarantees,
which is less stringent than IAS 39 in regard to financial guarantee agree-
ments made out in favour of subsidiaries and associated companies.
RFR 2
The amendments to RFR 2 that entered into effect and apply for
the 2016 and 2017 financial year have not/will not have any material
impact on the Parent Company’s financial statements.
NOTE B. INCOME
2016 2015
Accrued fees 22.7 25.1
Other revenue attributable to consultancy activities - -
Total 22.7 25.1
NOTE C. PURCHASES AND SALES BETWEEN GROUP
COMPANIES
2016 2015
Purchases (as a % of Other external expenses) 28 15
Sales (as a % of Total operating income) 100 100
NOTE D. AUDITORS FEES
2016 2015
Remuneration for audit assignment 0.9 0.4
Remuneration for auditing activities in addition to the audit assignment
0.1 0.1
Remuneration for tax consultancy services - -
Remuneration for other assignments - 0.8
Total 1.0 1.3
NOTE E. EMPLOYEES
2016 2015
Women Men Total Women Men Total
Average number of employees
3 8 11 3 6 9
Salaries, other remuneration, pensions and social security contributions, 2016
Salary and other
remuneration
Variable
remuneration
Social Security
contri-
butions
Pension contribu-
tions
Board and CEO 3.5 - 0.7 0.5
Other employees 5.3 - 1.2 2.8
Total 8.8 - 1.9 3.3
Salary, other remuneration, pensions and social security contributions, 2015
Salary and other
remunerationVariable
remuneration
Social Security
contri- butions
Pension contribu-
tions
Board and CEO 4.0 - 1.3 0.5
Other employees 5.4 - 0.5 2.7
Total 9.4 - 1.8 3.2
47

NOTE F. PROFIT-SHARING, GROUP COMPANIES
2016 2015
Dividend from subsidiaries 4.4 2.7
Group contributions 8.7 35.0
Total 13.1 37.7
NOTE G. OTHER INTEREST INCOME AND SIMILAR PROFIT/
LOSS ITEMS
2016 2015
Exchange-rate gains 1.5 5.8
Dividends from associated companies - 1.3
Interest income, external 0.3 0.4
Interest income, internal 1.2 0.5
Total 3.0 8.0
NOTE H. INTEREST EXPENSES AND SIMILAR PROFIT/LOSS
ITEMS
2016 2015
Exchange-rate losses -1.9 -4.1
Interest expense, external -3.4 -1.5
Interest expense, internal -0.1 -0.4
Total -5.4 -6.0
NOTE I. APPROPRIATIONS
2016 2015
Tax allocation reserve for the year -0.3 -6.0
Tax allocation reserve reversal for the year 8.7 6.2
Change to accelerated depreciation for the year 0.4 -0.1
Total 8.8 0.1
NOTE J. TAX ON PROFIT FOR THE YEAR
2016 2015
The following items are included in tax expense:
Tax on profit for the year 0.2 -5.6
Total 0.2 -5.6
Profit before tax 2.9 28.3
Tax according to applicable rate 22% (22) -0.6 -6.2
Tax effect of:
Expenses, non-deductible -0.1 -0.2
Income not liable to tax 0.9 0.8
Reported tax 0.2 -5.6
NOTE K. CAPITALIZED EXPENDITURES FOR PROGRAM
DEVELOPMENT
2016 2015
Opening cost 3.9 3.9
Closing accumulated cost 3.9 3.9
Opening amortization -3.5 -2.7
Amortization for the year -0.4 -0.8
Closing accumulated amortization -3.9 -3.5
Closing residual value 0.0 0.4
48

NOTE L. INVENTORIES, TOOLS AND INSTALLATIONS
2016 2015
Opening cost 1.2 0.9
Purchases 0.1 0.3
Closing accumulated cost 1.3 1.2
Opening depreciation -0.6 -0.3
Depreciation for the year -0.3 -0.3
Closing accumulated depreciation -0.9 -0.6
Closing residual value 0.4 0.6
NOTE M. PARTICIPATIONS IN ASSOCIATED COMPANIES
Share of equity Book value
Co. Reg. No. Registered office
Operations 2016 2015 2016 2015
Mirakelbolaget AB 556835-4350 Stockholm Program development 50% 50% 0.0 0.0
NOTE N. PARTICIPATIONS IN GROUP COMPANIES
Book value
2016 2015
Sweden (registered office Stockholm)
Rejlers Sverige AB 100.7 100.7
Rejlers Energitjänster AB 0.1 -
ComIT Rejlers AB 2.1 -
Råbe Industrikonsult i Örnsköldsvik AB 0.4 0.4
Råbe Industrikonsult i Göteborg AB 0.3 0.3
Finland
Rejlers Finland Oy 44.4 44.4
Norway
Rejlers Norge AS 155.8 88.7
Rejlers Consulting AS - 67.1
Embriq AS 83.6 83.6
Total 387.4 385.2
All of the companies in the table above are wholly owned by Rejlers AB. Rejlers Consulting AS merged with Rejlers Norge AS.Rejlers Energitjänster AB and ComIT Rejlers AB were internally acquired by Rejlers Sverige AB.
49
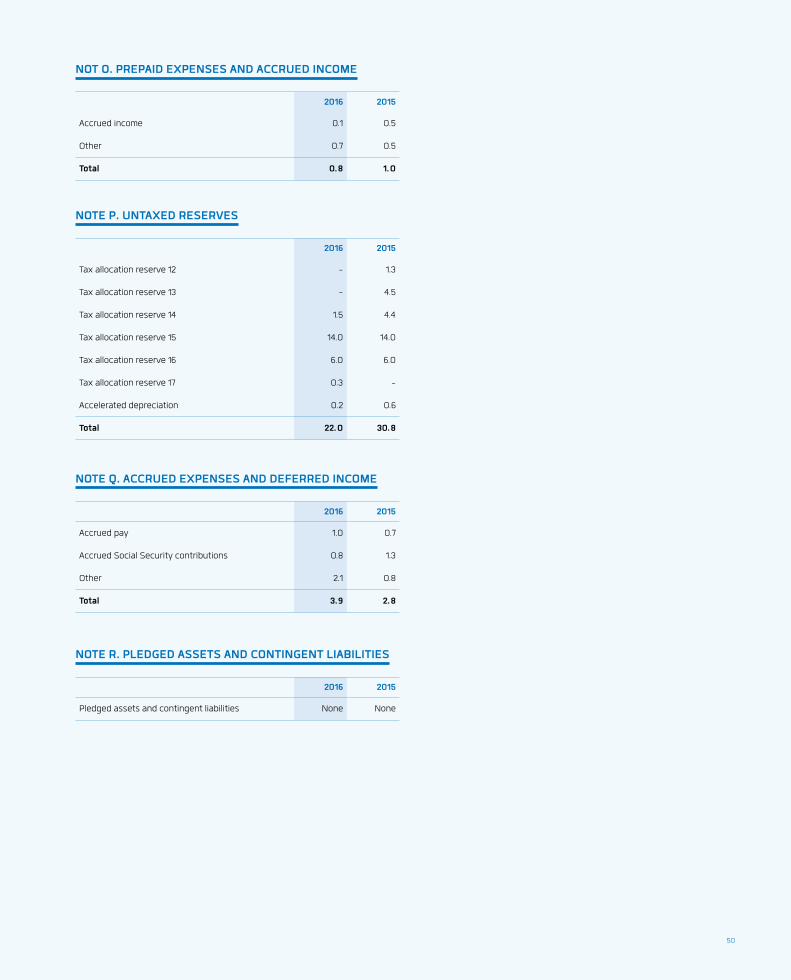
NOT O. PREPAID EXPENSES AND ACCRUED INCOME
2016 2015
Accrued income 0.1 0.5
Other 0.7 0.5
Total 0.8 1.0
NOTE P. UNTAXED RESERVES
2016 2015
Tax allocation reserve 12 - 1.3
Tax allocation reserve 13 - 4.5
Tax allocation reserve 14 1.5 4.4
Tax allocation reserve 15 14.0 14.0
Tax allocation reserve 16 6.0 6.0
Tax allocation reserve 17 0.3 -
Accelerated depreciation 0.2 0.6
Total 22.0 30.8
NOTE Q. ACCRUED EXPENSES AND DEFERRED INCOME
2016 2015
Accrued pay 1.0 0.7
Accrued Social Security contributions 0.8 1.3
Other 2.1 0.8
Total 3.9 2.8
NOTE R. PLEDGED ASSETS AND CONTINGENT LIABILITIES
2016 2015
Pledged assets and contingent liabilities None None
50

The Board of Directors and Chief Executive Officer certify that the consolidated financial statements have been prepared in accordance
with International Financial Reporting Standards (IFRS) as adopted by the EU and fairly represent the Group’s position and performance.
The annual accounts have been prepared in accordance with good accounting practice and fairly present the Parent Company’s position
and performance.
The administration reports for the Group and Parent Company provide a fair view of the Group’s and the Parent Company’s opera-
tions, position and performance and describes the significant risks and uncertainties to which the Parent Company and Group compa-
nies are exposed.
Assurance
Stockholm, 20 March 2017 Rejlers AB (publ)
Our audit report was submitted on 31 March 2017
Deloitte AB
Ivar Verner
Chairman
Birgitta Lööf
Authorised Public Accountant
Annika Steiber
Board member
Thord Wilkne
Board member
Peter Rejler
CEO, Group President and Board
member
Helena Nordman–Knutson
Board member
Björn Lauber
Employee representative
Jan Samuelsson
Board member
Sten Pettersson
Employee representative
51

Auditor’s reportTo the General Meeting of Shareholders of Rejlers AB (publ) corp. ID no. 556349-8426
Report on the annual accounts and consolidated financial statements
Opinions
We have conducted an audit of the annual accounts and consolidated
financial statements of Rejlers AB (publ) for 2016. The company’s annual
report and consolidated financial statements are included on pages 11-51
in this document.
In our opinion, the annual accounts have been prepared in accord-
ance with the Swedish Annual Accounts Act and in all material respects
fairly present the Parent Company’s financial position as of 31 Decem-
ber 2016 and its financial performance and cash flows for the year in
accordance with the Swedish Annual Accounts Act. The consolidat-
ed financial statements have been prepared in accordance with the
Swedish Annual Accounts Act and in all material respects fairly present
the Group’s financial position as of 31 December 2016 and its financial
performance and cash flows for the year in accordance with Internation-
al Financial Reporting Standards (IFRS) as adopted by the EU and the
Swedish Annual Accounts Act. The administration report is consistent
with the other sections of the annual accounts and the consolidated
accounts.
We therefore recommend that the AGM adopt the income statement
and balance sheet for the Parent Company and the Group.
Basis for the opinions
We have conducted the audit in accordance with International Stand-
ards on Auditing (ISA) and generally accepted auditing standards in Swe-
den. Our responsibility according to these standards is described in more
detail in the section on Auditor’s responsibility. We are independent in
relation to the Parent Company and Group in accordance with generally
accepted auditing standards in Sweden and have otherwise fulfilled our
professional ethics responsibility according to these requirements.
We believe that the audit evidence we have obtained is sufficient and
appropriate as a basis for our opinions.
Particularly significant areas
Areas of particular significance to the audit are those that in our pro-
fessional opinion were the most significant to the audit of the annual ac-
counts and consolidated financial statements for the period in question.
These areas are addressed within the scope of the audit of, and in our
opinion on, the annual accounts and consolidated financial statements as
a whole, but we make no separate statements regarding these areas.
Revenue recognition
Assessment of risk
As at 31 December 2016, net sales amount to SEK 2,339.3 million and
are generated from the Group’s assignments that are conducted either
on account or as fixed price assignments. On-going projects are valued
according to percentage of completion, which corresponds to the invoice
price less any deviations between the work-up rate and the degree of
completion.
Revenue recognition and measurement of on-going projects are as-
sociated with risks linked to each individual assignment. The recognition
builds on assessments and assumptions in the projects regarding the
degree of completion and outstanding risks in implementation, which
may have a significant impact on the Group’s net sales and profit. These
assessments and risks are primarily uniform in the countries in which the
Group is active.
For further information, please refer to the section on revenue recogni-
tion on page 27, the Group’s accounting principles in Note 2 and risks and
risk management on pages 28-29, Note 3 and Note 4 in the annual report.
Our auditing procedures
Our auditing procedures comprised, but were not limited to: ρ evaluation of the company’s principles for revenue recognition and
compliance with them for the various kinds of projects ρ evaluation of significant key controls in the revenue process, mainly
with regard to confirmation and follow-up of assignments ρ reviewed internal and external documentation that forms the basis
of the management’s assessment of outstanding assignment risks in
on-going projects ρ review of the completeness of the revenues through, for example, use
of data analysis tools and selection of significant agreements.
Financing and compliance with loan terms
As at 31 December 2016, total liabilities to credit institutions amount to
SEK 288.4 million. When raising loans, Rejlers has a number of commit-
ments to the lenders in the form of loan conditions. Violating these loan
conditions may mean that the interest rate margin becomes higher or
that financing ends. In 2017, Rejlers will refinance SEK 128 million of its
interest-bearing liabilities.
Recognition and classification of Rejlers’ external credits is associated
with the company fulfilling the commitment of a new share issue in 2017.
For further information, please refer to the section on risk manage-
ment on pages 28-29, Note 3 Financial risk factors and other risks and
Note 24 Liabilities to credit institutions
Our auditing procedures
Our audit comprised the following auditing procedures, but was not
limited to: ρ review and assessment of Rejlers’ procedures regarding financing and
follow-up of key figures and loan conditions ρ review of the Group’s compliance with loan conditions and finance
policies ρ review of the conditions in Rejlers’ issue prospectus, which was ap-
proved by the Extraordinary General Meeting on 13 March 2017 with
the aim of ensuring that the company fulfils the commitment of a new
share issue ρ review of relevant supplemental disclosures in the financial statements
Information other than the annual accounts and consolidated financial
statements
This document also contains information other than the annual report
and consolidated financial statements and can be found on pages 1-10. It
is the Board and the CEO who have the responsibility for this information.
Our opinion regarding the annual report and consolidated financial
statements does not comprise this information and we make no state-
ment confirming this information.
52

In connection with our audit of the annual report and consolidated
financial statements, it is our responsibility to read the information iden-
tified above and consider if the information to a material extent is incon-
sistent with the annual report and consolidated financial statements. In
this review, we also take into account the information we collected oth-
erwise during the audit and assess if the information otherwise appears
to contain material misstatements.
If we draw the conclusion based on the work we have done regarding
this information that the information contains a material misstatement,
we are obliged to report it. We have nothing to report in this respect.
Responsibilities of the Board of Directors and the Chief Executive
Officer
It is the Board of Directors and the CEO that are responsible for the
preparation of the annual accounts and consolidated financial state-
ments and that they provide a true and fair view according to the Annual
Accounts Act and, with regard to the consolidated financial statements,
according to IFRS as adopted by the EU. The Board and CEO are also re-
sponsible for the internal control that they deem to be necessary to pre-
pare annual report and the consolidated financial statements that do not
contain any material misstatement, whether due to error or impropriety.
In preparing the annual report and consolidated financial statements,
the Board and CEO are responsible for the assessment of the company’s
ability to continue the operations. They provide information, when ap-
propriate, concerning conditions that may affect the ability to continue
operations and to use the going concern assumption. The going concern
assumption is not, however, applied if the Board and CEO intend to
liquidate the company, cease operations or have no realistic alternative
than to do so.
The Board’s audit committee shall, without it affecting the Board’s
responsibility and duties otherwise, monitor the company’s financial
reporting, among other things.
Auditor’s responsibility
Our responsibility is to achieve a reasonable degree of certainty whether
or not the annual report and consolidated financial statements as a
whole contain any material misstatements, whether due to error or
impropriety, and to provide an audit report that contains our opinions.
Reasonable certainty is a high degree of certainty, but is no guarantee
that an audit done according to ISA and generally accepted auditing
standards in Sweden will always discover a material misstatement if
such exists. Misstatements can arise due to impropriety or error and are
considered to be material if they individually or together can reasonably
be expected to affect financial decisions that users make based on the
annual report and consolidated financial statements.
As a part of an audit according to ISA, we use professional judgement
and have a professionally sceptical approach in the entire audit. More-
over: ρ we identify and assess the risks of material misstatements in the
annual accounts and consolidated financial statements, whether
they are due to impropriety or error, formulate and carry out auditing
procedures based in part on these risks and gather audit evidence
that is adequate and suitable to form a basis for our opinions. The risk
of not discovering a material misstatement due to impropriety is higher
than for a material misstatement due to error because improprieties
can include acting in collusion, falsifying, intentional omission, incorrect
information or disregarding internal controls. ρ we obtain an understanding of the part of the company’s internal con-
trol that is of significance to our audit to carry out auditing procedures
that are suitable considering the circumstances, but not to make a
statement on the effectiveness of internal controls. ρ we evaluate the suitability of the accounting principles used and the
reasonability of the Board’s and CEO’s estimates in the accounting and
associated disclosures. ρ we draw a conclusion on the suitability of the Board and CEO using
the going concern assumption in preparing the annual accounts and
consolidated financial statements. We also draw a conclusion based on
the audit evidence collected whether or not there are any material un-
certainty factors pertaining to such events or conditions that may lead
to significant doubt about the company’s ability to continue business.
If we draw the conclusion that there is a material uncertainty factor, we
must in our audit report call attention to the disclosures in the annual
report regarding the material uncertainty factor or, if such disclosures
are inadequate, modify the opinion regarding the annual accounts and
consolidated financial statements. Our conclusions are based on the
audit evidence gathered up to the date of the audit report. However,
future events or circumstances may mean that the company can no
longer continue business. ρ we evaluate the overall presentation, structure and content of the
annual accounts and consolidated financial statements, including the
disclosures, and if the annual accounts and consolidated financial
statements portray the underlying transactions and events in a manner
that provides a true and fair view. ρ we gather adequate and suitable audit evidence regarding the financial
information for the units or business activities within the Group to ex-
press an opinion concerning the consolidated financial statements. We
are responsible for the management, supervision and implementation
of the Group audit. We are solely responsible for our opinions.
We must inform the Board of the audit’s planned scope and emphasis
as well as it’s timing. We must also inform about significant observations
during the audit, including the significant deficiencies in the internal
control we identified.
We must also provide the Board with a statement that we have
complied with relevant requirements of professional ethics regarding
independence, and take up all relationships and other circumstances
that may reasonably affect our independence, and where applicable
associated countermeasures.
Of the areas communicated with the Board, we determine which of
them have been most significant to the audit of the annual accounts
and consolidated financial statements, including the most important
assessed risks of material misstatements, and which therefore constitute
the areas of particular importance to the audit. We describe these areas
in the audit report insofar as laws or other statutes do not prevent dis-
closure of the matter or when, in very rare cases, we assess that an issue
shall not be communicated in the audit report because the negative
consequences of doing so could reasonably be expected to outweigh the
general interest of this communication.
53
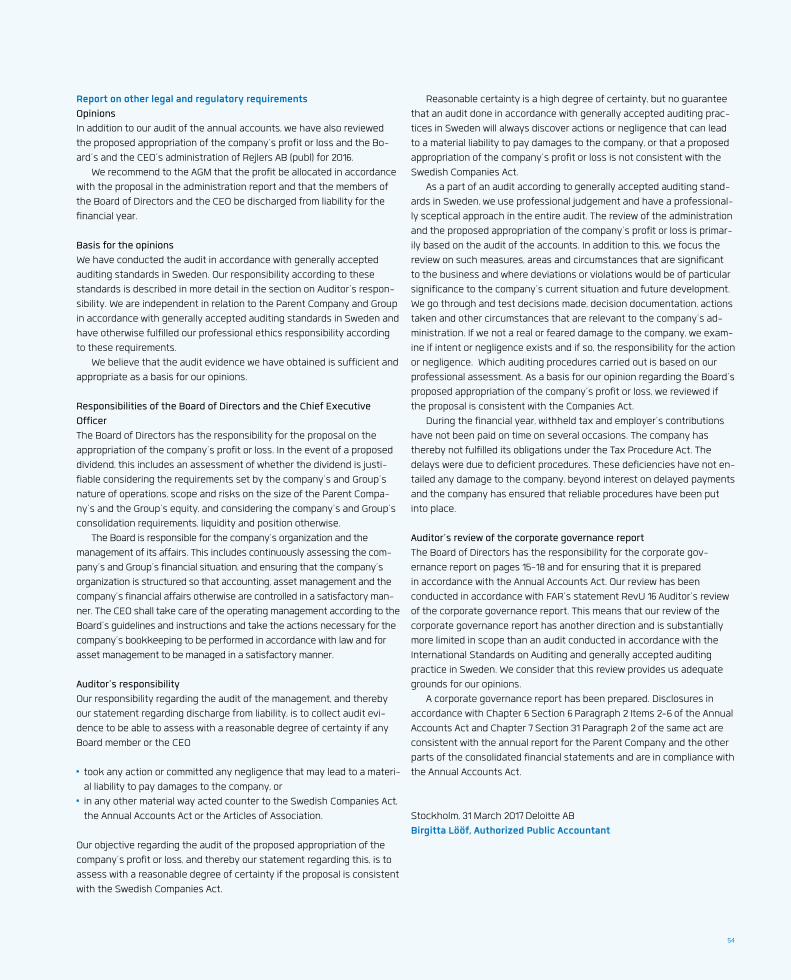
Report on other legal and regulatory requirements
Opinions
In addition to our audit of the annual accounts, we have also reviewed
the proposed appropriation of the company’s profit or loss and the Bo-
ard’s and the CEO’s administration of Rejlers AB (publ) for 2016.
We recommend to the AGM that the profit be allocated in accordance
with the proposal in the administration report and that the members of
the Board of Directors and the CEO be discharged from liability for the
financial year.
Basis for the opinions
We have conducted the audit in accordance with generally accepted
auditing standards in Sweden. Our responsibility according to these
standards is described in more detail in the section on Auditor’s respon-
sibility. We are independent in relation to the Parent Company and Group
in accordance with generally accepted auditing standards in Sweden and
have otherwise fulfilled our professional ethics responsibility according
to these requirements.
We believe that the audit evidence we have obtained is sufficient and
appropriate as a basis for our opinions.
Responsibilities of the Board of Directors and the Chief Executive
Officer
The Board of Directors has the responsibility for the proposal on the
appropriation of the company’s profit or loss. In the event of a proposed
dividend, this includes an assessment of whether the dividend is justi-
fiable considering the requirements set by the company’s and Group’s
nature of operations, scope and risks on the size of the Parent Compa-
ny’s and the Group’s equity, and considering the company’s and Group’s
consolidation requirements, liquidity and position otherwise.
The Board is responsible for the company’s organization and the
management of its affairs. This includes continuously assessing the com-
pany’s and Group’s financial situation, and ensuring that the company’s
organization is structured so that accounting, asset management and the
company’s financial affairs otherwise are controlled in a satisfactory man-
ner. The CEO shall take care of the operating management according to the
Board’s guidelines and instructions and take the actions necessary for the
company’s bookkeeping to be performed in accordance with law and for
asset management to be managed in a satisfactory manner.
Auditor’s responsibility
Our responsibility regarding the audit of the management, and thereby
our statement regarding discharge from liability, is to collect audit evi-
dence to be able to assess with a reasonable degree of certainty if any
Board member or the CEO
ρ took any action or committed any negligence that may lead to a materi-
al liability to pay damages to the company, or ρ in any other material way acted counter to the Swedish Companies Act,
the Annual Accounts Act or the Articles of Association.
Our objective regarding the audit of the proposed appropriation of the
company’s profit or loss, and thereby our statement regarding this, is to
assess with a reasonable degree of certainty if the proposal is consistent
with the Swedish Companies Act.
Reasonable certainty is a high degree of certainty, but no guarantee
that an audit done in accordance with generally accepted auditing prac-
tices in Sweden will always discover actions or negligence that can lead
to a material liability to pay damages to the company, or that a proposed
appropriation of the company’s profit or loss is not consistent with the
Swedish Companies Act.
As a part of an audit according to generally accepted auditing stand-
ards in Sweden, we use professional judgement and have a professional-
ly sceptical approach in the entire audit. The review of the administration
and the proposed appropriation of the company’s profit or loss is primar-
ily based on the audit of the accounts. In addition to this, we focus the
review on such measures, areas and circumstances that are significant
to the business and where deviations or violations would be of particular
significance to the company’s current situation and future development.
We go through and test decisions made, decision documentation, actions
taken and other circumstances that are relevant to the company’s ad-
ministration. If we not a real or feared damage to the company, we exam-
ine if intent or negligence exists and if so, the responsibility for the action
or negligence. Which auditing procedures carried out is based on our
professional assessment. As a basis for our opinion regarding the Board’s
proposed appropriation of the company’s profit or loss, we reviewed if
the proposal is consistent with the Companies Act.
During the financial year, withheld tax and employer’s contributions
have not been paid on time on several occasions. The company has
thereby not fulfilled its obligations under the Tax Procedure Act. The
delays were due to deficient procedures. These deficiencies have not en-
tailed any damage to the company, beyond interest on delayed payments
and the company has ensured that reliable procedures have been put
into place.
Auditor’s review of the corporate governance report
The Board of Directors has the responsibility for the corporate gov-
ernance report on pages 15-18 and for ensuring that it is prepared
in accordance with the Annual Accounts Act. Our review has been
conducted in accordance with FAR’s statement RevU 16 Auditor’s review
of the corporate governance report. This means that our review of the
corporate governance report has another direction and is substantially
more limited in scope than an audit conducted in accordance with the
International Standards on Auditing and generally accepted auditing
practice in Sweden. We consider that this review provides us adequate
grounds for our opinions.
A corporate governance report has been prepared. Disclosures in
accordance with Chapter 6 Section 6 Paragraph 2 Items 2-6 of the Annual
Accounts Act and Chapter 7 Section 31 Paragraph 2 of the same act are
consistent with the annual report for the Parent Company and the other
parts of the consolidated financial statements and are in compliance with
the Annual Accounts Act.
Stockholm, 31 March 2017 Deloitte AB
Birgitta Lööf, Authorized Public Accountant
54
AGM Information
The Annual General Meeting of Rejlers AB (publ) will be held on Monday, 24 April 2017 at 5:00 p.m. at the Lindhagen Conference Centre, Lindhagensgatan 126 in Stockholm.
Registration
Shareholders registered in the shareholders’ ledger administered by Euroclear Sweden AB on
Tuesday, 18 April 2017 have the right to participate. Those intending to participate in the AGM must
register no later than Tuesday, 18 April 2017, either by phone: + 46 73-440 41 63, or by email to
[email protected] or in writing addressed to:
Annual General Meeting
Rejlers AB (publ)
Box 30233
SE 104 25 Stockholm, SWEDEN
Upon registration, shareholders must provide their name, personal ID number/company registra-
tion number, address and telephone number along with the number of shares represented.
Notice to attend the AGM is posted on the Rejlers website at www.rejlers.com/se and published
in newspapers in the manner prescribed by the articles of association.
Shares registered with nominees
Shareholders with shares registered to nominees (“on behalf of the owner”) must register the
shares temporarily in their own name before 24 April 2017 to gain the right to participate in the
AGM. Shareholders must inform nominees of this in good time before 24 April 2017.
Proxies for agents
Shareholders represented by agents must complete proxies for their agents. Proxies should be
sent to the company at the above address in good time before the AGM. If a proxy is issued by a
legal entity, a certified copy of the registration certificate for the legal entity must be attached.
Agenda
The AGM must address matters as prescribed by law and the company’s articles of association as
well as additional matters described in the notice to attend.
Dividends
The Board of Directors proposes that no dividends be paid for the 2016 financial year.
Photo cover: Shutterstock.
Photo: Board and management: Klas Wiréhn.
Form and production: Narva. Print: Elanders, Mölnlycke, 2017.
55

Rejlers is turning 75! Because we are aiming to be industry leaders with
value-generating innovations for at least another 75 years, we want to celebrate this under the motto Beyond 75.
Since the beginning in 1942, Rejlers has developed into one of the Nordic region’s major technical consultants. This growth took place through committed, creative
efforts. Rejlers is now stepping into the future with new conditions and a new value-generating development.

REJLERS AB (publ)
Co. Reg. No. 556349-8426, Box 30233, SE 104 25 Stockholm
Tel +46 771-78 00 00, Fax +46 8-654 33 39
Email [email protected], www.rejlers.com/se


