(Gloria) (Gloria) IVE/HKDI : 2897 ... · (Gloria) (Gloria) IVE/HKDI : 2897 6111 (Seth) (Seth) Seth

ANNUALREPORT2016
CONTENTS
Registered Offi ce andPrincipal Administrative Offi ceIVE Group Limited
Building B, 350 Parramatta Road
Homebush NSW 2140
Telephone: +61 2 8020 4400
ACN 606 252 644
The 2016 Annual General Meeting
of shareholders of the company
will be held at 10am on
21 November 2016 at The Mint,
10 Macquarie Street, Sydney
NSW 2000.
About IVE 1
Performance Summary 2
Executive Chairman’s Report 4
Managing Director’s Report 6
Case Studies 10
IVE’s Divisions 12
Operating and Financial Review 29
Directors’ Report 36
Auditor’s Independence Declaration 51
Consolidated Financial Statements 53
Notes to the ConsolidatedFinancial Statements 57
Directors’ Declaration 88
Independent Auditor’s Report 89
Additional Shareholder Information 90
Corporate Governance Statement 92
Corporate Directory 92
1Annual Report 2016
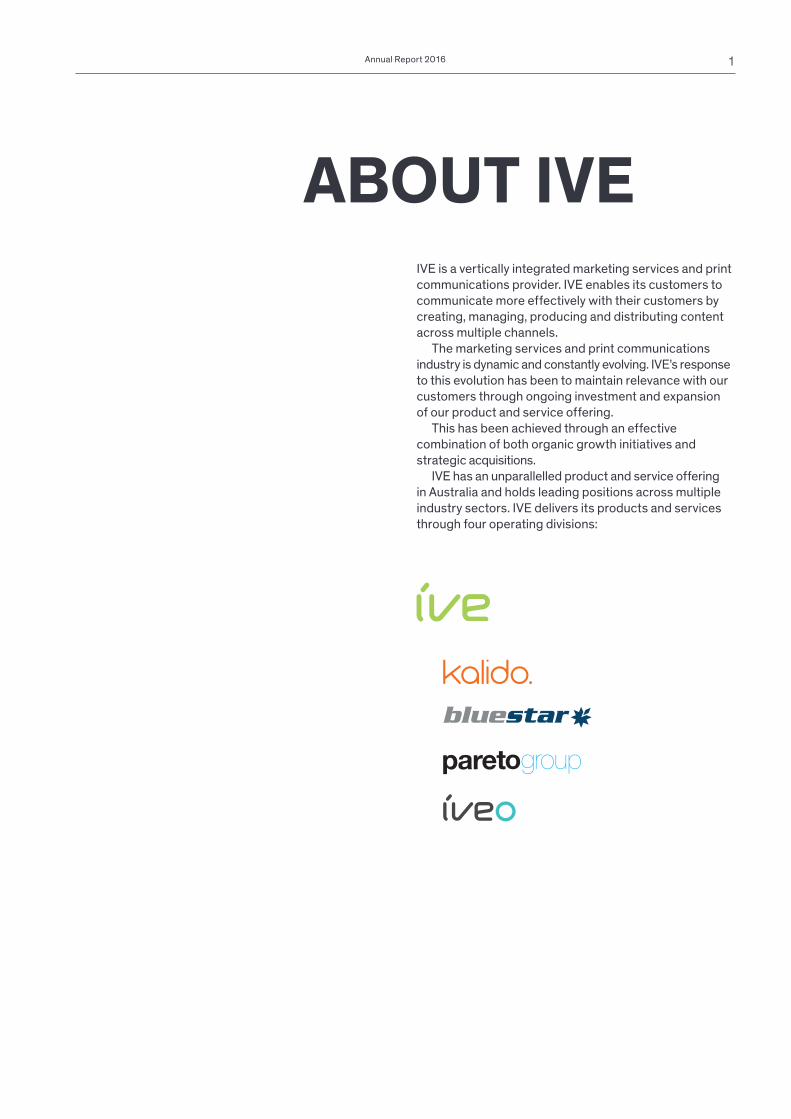
ABOUT IVEIVE is a vertically integrated marketing services and print
communications provider. IVE enables its customers to
communicate more effectively with their customers by
creating, managing, producing and distributing content
across multiple channels.
The marketing services and print communications
industry is dynamic and constantly evolving. IVE’s response
to this evolution has been to maintain relevance with our
customers through ongoing investment and expansion
of our product and service offering.
This has been achieved through an effective
combination of both organic growth initiatives and
strategic acquisitions.
IVE has an unparallelled product and service offering
in Australia and holds leading positions across multiple
industry sectors. IVE delivers its products and services
through four operating divisions:
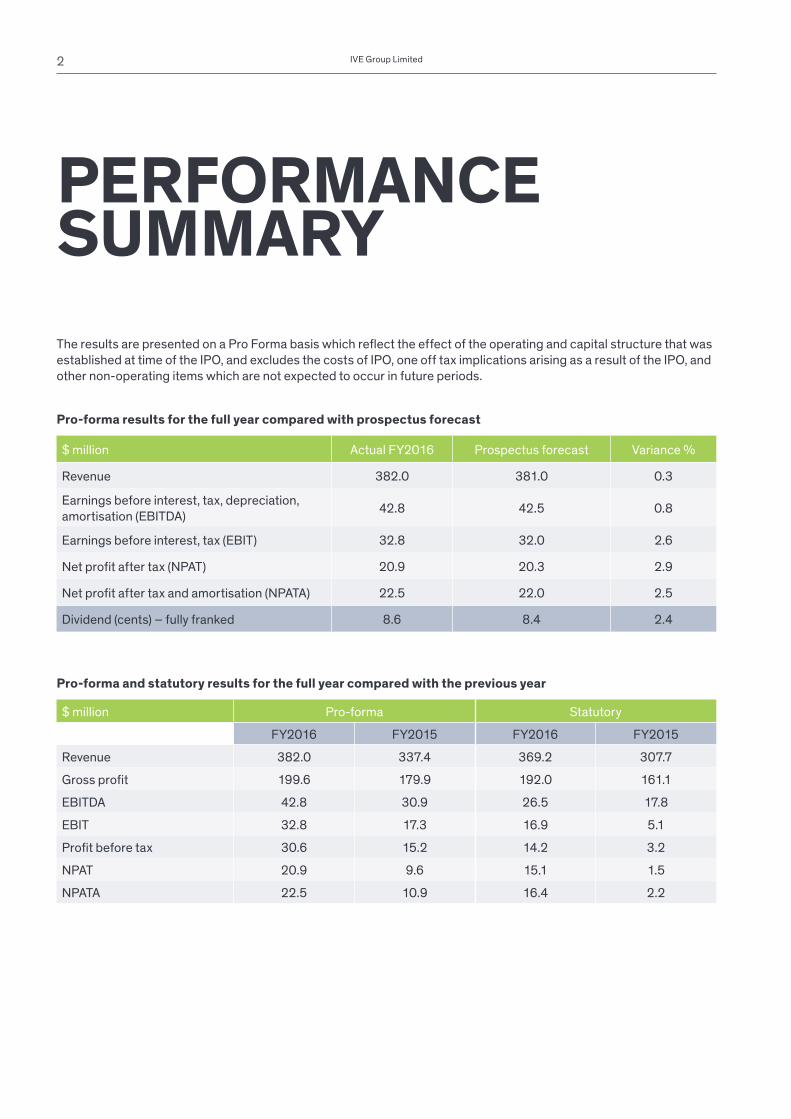
PERFORMANCESUMMARYThe results are presented on a Pro Forma basis which refl ect the effect of the operating and capital structure that was
established at time of the IPO, and excludes the costs of IPO, one off tax implications arising as a result of the IPO, and
other non-operating items which are not expected to occur in future periods.
Pro-forma results for the full year compared with prospectus forecast
Pro-forma and statutory results for the full year compared with the previous year
IVE Group Limited
$ million Actual FY2016 Prospectus forecast Variance %
Revenue 382.0 381.0 0.3
Earnings before interest, tax, depreciation,
amortisation (EBITDA)42.8 42.5 0.8
Earnings before interest, tax (EBIT) 32.8 32.0 2.6
Net profi t after tax (NPAT) 20.9 20.3 2.9
Net profi t after tax and amortisation (NPATA) 22.5 22.0 2.5
Dividend (cents) – fully franked 8.6 8.4 2.4
$ million Pro-forma Statutory
FY2016 FY2015 FY2016 FY2015
Revenue 382.0 337.4 369.2 307.7
Gross profi t 199.6 179.9 192.0 161.1
EBITDA 42.8 30.9 26.5 17.8
EBIT 32.8 17.3 16.9 5.1
Profi t before tax 30.6 15.2 14.2 3.2
NPAT 20.9 9.6 15.1 1.5
NPATA 22.5 10.9 16.4 2.2
2
Annual Report 2016
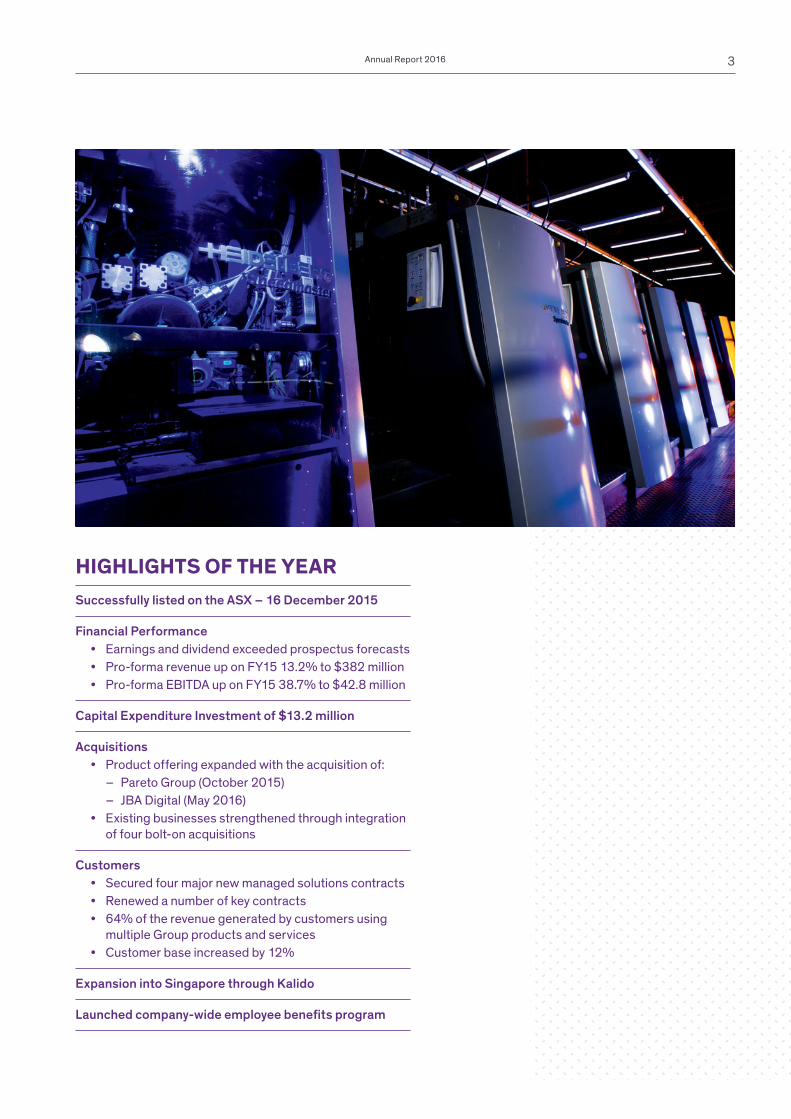
HIGHLIGHTS OF THE YEARSuccessfully listed on the ASX – 16 December 2015
Financial Performance
• Earnings and dividend exceeded prospectus forecasts
• Pro-forma revenue up on FY15 13.2% to $382 million
• Pro-forma EBITDA up on FY15 38.7% to $42.8 million
Capital Expenditure Investment of $13.2 million
Acquisitions
• Product offering expanded with the acquisition of:
– Pareto Group (October 2015)
– JBA Digital (May 2016)
• Existing businesses strengthened through integration
of four bolt-on acquisitions
Customers
• Secured four major new managed solutions contracts
• Renewed a number of key contracts
• 64% of the revenue generated by customers using
multiple Group products and services
• Customer base increased by 12%
Expansion into Singapore through Kalido
Launched company-wide employee benefi ts program
3
EXECUTIVECHAIRMAN’SREPORT
FY2016 was a signifi cant year for IVE Group Limited,
with the company successfully listing on the Australian
Securities Exchange on 16 December 2015.
We’ve come a long way since our family founded
a suburban newspaper printing business in 1921.
Today, the underlying strengths and performance of the
business are testament to the commitment and talent of
our people, the effectiveness of our strategy to place our
customers at the centre of our thinking, and the drive to
have an offering that remains relevant to our customers’
evolving communication and marketing needs.
These solid foundations, combined with access to
capital as a public company, place us in a unique position
from which to continue the execution of our ongoing
diversifi cation strategy and growth initiatives over the
years ahead.
Results for the yearI am pleased to report that our prospectus forecasts
were exceeded for the year to 30 June 2016. Pro-forma
after-tax profi t, at $20.9 million, was 2.9% above forecast.
Compared with the previous year, pro-forma revenue
was up 13.2% to $382 million as a result of continued
organic growth, higher revenue from existing customers
through an expanded service offering, and further
contributions from acquisitions. Pro-forma EBITDA of
$42.8 million was an increase of 38.7% over the previous
year, and was achieved through revenue growth, a stable
gross profi t margin, continued capital expenditure to
improve effi ciency, and rigorous management of the
cost base.
Cash generation was strong with net debt at 30 June
2016 of $36.6 million, representing 0.9 times pro-forma
EBITDA. The board declared a fully franked fi nal dividend
of 8.6 cents per share, compared with the prospectus
forecast of 8.4 cents.
Operational performanceIVE’s solutions-based strategy has led to deep, long-term
relationships with our customers, providing a wonderful
opportunity to expand further the extent to which they
engage with us. Our customer profi le and metrics refl ect
the effectiveness of this strategy, with approximately
64% of revenue coming from customers using multiple
products and services, an average tenure of our largest
20 customers of eight years, and 77% of our entire revenue
either contracted or based on long-term relationships.
Our customer profi le is particularly strong, with broad
industry spread and the largest customer accounting for
only 4% of group revenue.
We continued throughout the year with our disciplined
acquisition program, with a number of bolt-on acquisitions,
including two strategic acquisitions that further expanded
our value proposition: Pareto Group, an agency that works
closely with the not-for-profi t sector to develop strategy,
execute and measure data-driven direct fundraising
programs; and JBA Digital, which has capabilities in
customer analytics, marketing automation and website
optimisation. I am pleased to report all acquisitions are
performing in line with expectations.
Our board and shareholdersFollowing our listing on the ASX last December,
we enhanced further the diversity and skill set of the
board with the appointment of three highly experienced
independent non-executive directors – Andrew Harrison,
Gavin Bell and Sandra Hook.
I would like to recognise and thank Angus Stuart, who
retired from the board in June of this year, for his meaningful
contribution over the last three and a half years.
We are very pleased with the quality of both our private
and institutional investor base, and look forward to
building further on the relationships we have developed
since the listing.
IVE Group Limited4
Dear Shareholders,
OutlookThe marketing communications landscape continues
to remain complex and ever-changing. IVE has a proven
track record of anticipating and responding to changed
market conditions through evolving our offering to ensure
we maintain our relevance with customers. We are
therefore very well positioned to expand our share of the
marketing services and print communications market over
the year ahead, resulting in increases in both revenue
and earnings.
We will continue to pursue our strategy of diversifi cation
and growth, a disciplined acquisition program to take
advantage of sector consolidation opportunities, and
targeted capital expenditure to drive effi ciency and to
enhance our offer further.
Thank youIt has been a seminal year for the business as we
successfully transitioned from private to public ownership,
delivering a fi nancial result with all performance metrics
above our prospectus forecasts and well up over the
previous year.
I am particularly proud of the product and service
offering IVE takes to market and the reputation we have
for operating a values-based business. We are most
fortunate to have very supportive customers and supply
partners that we have worked with over many years.
On behalf of the board I convey my thanks to our Managing
Director Warwick Hay and the entire leadership team for
their outstanding commitment over the last year. Finally,
to our wonderful staff, thank you for your continued
efforts to ensure the ongoing sustainability and success
of the business.
Geoff SeligExecutive Chairman
19.09.2016
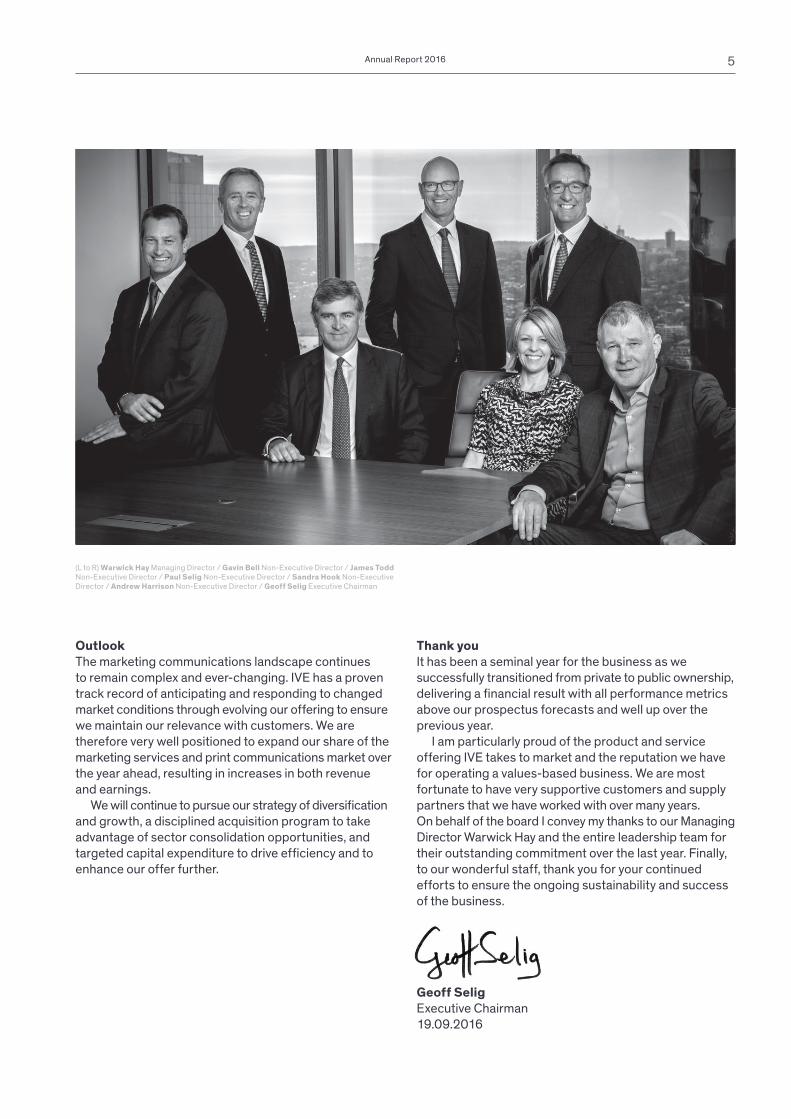
(L to R) Warwick Hay Managing Director / Gavin Bell Non-Executive Director / James Todd Non-Executive Director / Paul Selig Non-Executive Director / Sandra Hook Non-Executive Director / Andrew Harrison Non-Executive Director / Geoff Selig Executive Chairman
Annual Report 2016 5
MANAGINGDIRECTOR’SREPORT
FY2016 was an enjoyable and rewarding year for
IVE Group. As Geoff Selig has outlined, we delivered
strong growth across all fi nancial metrics compared
to the previous year.
The marketing services and print communications
sectors, across which IVE operates, continue to evolve
with technology advancements that provide organisations
with more communication channels than ever before.
Increasingly, companies look to outsource marketing
services to a single supply partner which has an in-depth
understanding of its communication objectives and needs.
These developments create opportunities for IVE to
identify and provide solutions to more customers in all
industry sectors. As an industry leader, we understand
this ever-changing and diverse communication landscape
and are well positioned to create, design, produce and
manage tailored communications across multiple channels.
In turn, this helps our customers connect with their
customers in the most effi cient and effective manner.
Our investment strategy therefore is focused on
complementary communication-related technology as we
continually enhance and expand our product and service
offering to give our customers a real point of difference.
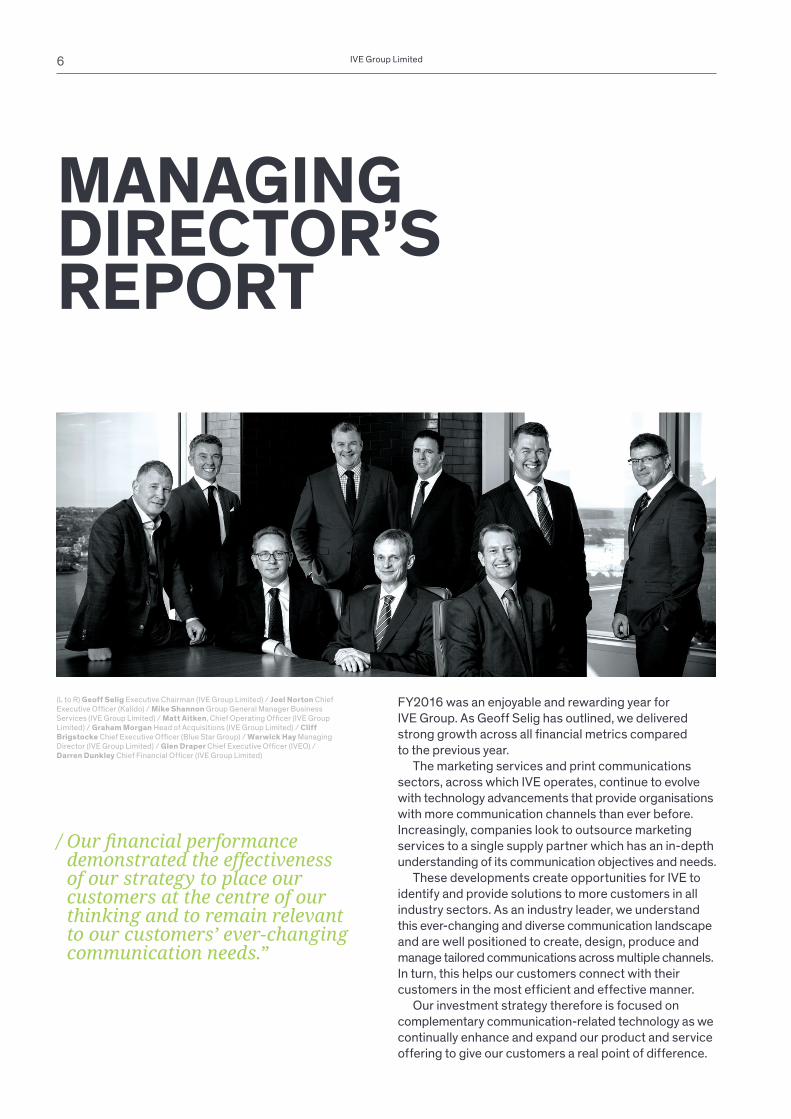
(L to R) Geoff Selig Executive Chairman (IVE Group Limited) / Joel Norton Chief Executive Offi cer (Kalido) / Mike Shannon Group General Manager Business Services (IVE Group Limited) / Matt Aitken, Chief Operating Offi cer (IVE Group Limited) / Graham Morgan Head of Acquisitions (IVE Group Limited) / Cliff Brigstocke Chief Executive Offi cer (Blue Star Group) / Warwick Hay Managing Director (IVE Group Limited) / Glen Draper Chief Executive Offi cer (IVEO) / Darren Dunkley Chief Financial Offi cer (IVE Group Limited)
IVE Group Limited
/ Our fi nancial performancedemonstrated the effectivenessof our strategy to place ourcustomers at the centre of our thinking and to remain relevantto our customers’ ever-changing communication needs.”
6
Strong year-on-year performanceRevenue
IVE strives to deliver year-on-year growth and it’s pleasing
to see the Group’s 13.2% pro-forma revenue increase on
FY2015 to $382 million. This was helped by successful
cross-selling of services and securing a number of new
customers.
New business development across a broad cross-
section of customers was strong during the year, and we
also renewed a number of major key contracts. Overall,
we worked with over 2,260 customers, an increase of
12% over FY2015, demonstrating our business model’s
stability and scalability as a reliable partner in the
marketing services and print communications sector.
The Group’s revenue also benefi ted from the successful
integration of acquisitions made in the second half of both
FY2015 and FY2016.
Earnings
IVE’s ability to grow revenue and leverage its existing
cost base resulted in an increase in EBITDA margin
from 9.2% in FY2015 to 11.2%, and a 38.7% increase
in EBITDA over the previous year to $42.8 million on a
pro-forma basis. This was achieved through revenue
growth, a technology-focused capital expenditure
program, and several major initiatives across the Group
to drive continuous improvements in performance.
Annual Report 2016 7
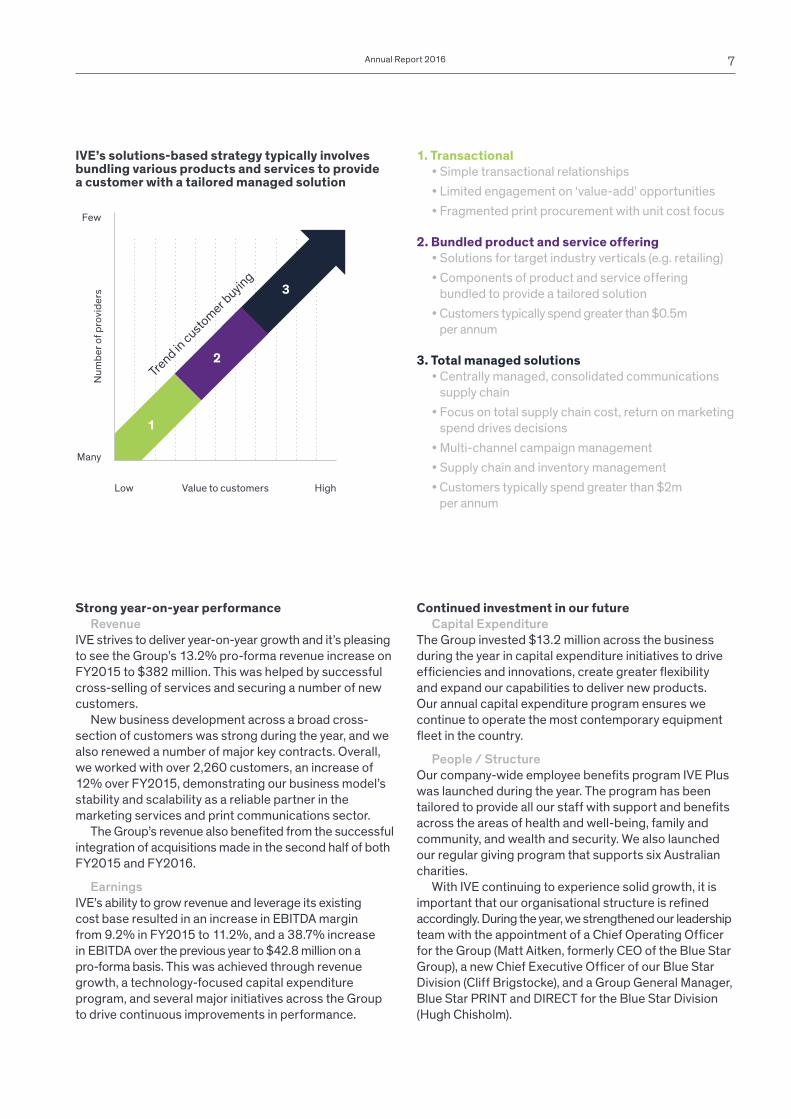
1. Transactional• Simple transactional relationships
• Limited engagement on ‘value-add’ opportunities
• Fragmented print procurement with unit cost focus
2. Bundled product and service offering• Solutions for target industry verticals (e.g. retailing)
• Components of product and service offering
bundled to provide a tailored solution
• Customers typically spend greater than $0.5m
per annum
3. Total managed solutions• Centrally managed, consolidated communications
supply chain
• Focus on total supply chain cost, return on marketing
spend drives decisions
• Multi-channel campaign management
• Supply chain and inventory management
• Customers typically spend greater than $2m
per annum
IVE’s solutions-based strategy typically involves bundling various products and services to providea customer with a tailored managed solution
Trend in
custo
mer b
uying
Nu
mb
er
of
pro
vid
ers
Few
Many
Low
1
2
3
Value to customers High
Continued investment in our future Capital Expenditure
The Group invested $13.2 million across the business
during the year in capital expenditure initiatives to drive
effi ciencies and innovations, create greater fl exibility
and expand our capabilities to deliver new products.
Our annual capital expenditure program ensures we
continue to operate the most contemporary equipment
fl eet in the country.
People / Structure
Our company-wide employee benefi ts program IVE Plus
was launched during the year. The program has been
tailored to provide all our staff with support and benefi ts
across the areas of health and well-being, family and
community, and wealth and security. We also launched
our regular giving program that supports six Australian
charities.
With IVE continuing to experience solid growth, it is
important that our organisational structure is refi ned
accordingly. During the year, we strengthened our leadership
team with the appointment of a Chief Operating Offi cer
for the Group (Matt Aitken, formerly CEO of the Blue Star
Group), a new Chief Executive Offi cer of our Blue Star
Division (Cliff Brigstocke), and a Group General Manager,
Blue Star PRINT and DIRECT for the Blue Star Division
(Hugh Chisholm).

MANAGING DIRECTOR’SREPORT (CONT’D)
IVE Group Limited8
Disciplined acquisition strategyWe continued throughout the year with our disciplined
acquisition strategy, expanding our product and service
offering with the addition of two businesses:
JBA Digital, a customer analytics and marketing
automation business at the forefront of helping brands
to deliver exceptional customer experience based on
data insights. It also has a strong website analytics and
optimisation offering. JBA builds on the digital capability
of Kalido, IVE’s creative and digital services division.
The acquisition was completed in May 2016.
Pareto Group, a leader in developing and executing
direct fundraising programs for the not-for-profi t sector.
Pareto Fundraising is Australia’s and New Zealand’s
largest fundraising strategy and data-driven solutions
company for the sector. Pareto Phone is our outbound
call centre that uses the latest technology to enable
charities to communicate effectively with their supporters.
The acquisition was completed in October 2015.
We also made four bolt-on acquisitions which have
been integrated successfully with our existing operations:
Oxygen, a medium-size sheet fed printer with capability
in offset and digital print along with sourcing of offshore
printed material. The business has been integrated into
our Blue Star PRINT operation in Sydney. The acquisition
was completed in August 2015.
Laser Computer Services (LCS), a specialist in
data-driven business-to-customer communications,
offering a complete range of personalised mail and
digital communication solutions. The business has been
integrated into our Blue Star DIRECT Victorian business.
The acquisition was completed in February 2016.
Fineline, which has a suite of services including
design, commercial printing, wide format printing, print
management and warehousing. The business has been
integrated into our Blue Star PRINT Victorian business.
The acquisition was completed in April 2016.
Frost Promotions, one of Melbourne’s premier
promotional agencies with a reputation for quality and
operational excellence. The business has been integrated
into our Blue Star PROMOTE business. The acquisition
was completed in May 2016.
Percentage of revenue generated by customers using multiple products and services
36% 1 Product / Service
9% 2 Product / Services
5% 3 Product / Services
29% 4 Product / Services
21% 5 or more Product / Services
Our ongoing commitmentOver the past 12 months, IVE has continued to execute
successfully our strategy to evolve our value proposition
through an expanded product and service offering to our
customers. Tailored communication options supporting
multi-channel strategies have helped to create a
competitive edge for our customers.
This approach continues to be the backbone for the
Group’s future growth and will ensure that we remain
relevant to our customers in an ever-changing
communications landscape.
Annual Report 2016
Looking forwardIVE is well-positioned to build on its business
momentum and on the strong culture that now defi nes
the company, a culture that continues to excel in leading
the market across many areas. We are confi dent we will
leverage our market position to continue to deliver year-
on-year growth.
We could not have achieved these results without
the support of our dedicated and skilled staff and supply
partners to whom I would like to offer my sincere thanks.
Importantly, we recognise and thank our customers
for the opportunities and trust they place in us to provide
solutions to their changing communication needs.
We are committed to continuing to increase value to
our customers over the years ahead.
Warwick HayManaging Director
19.09.2016
9
IVE Group Limited10
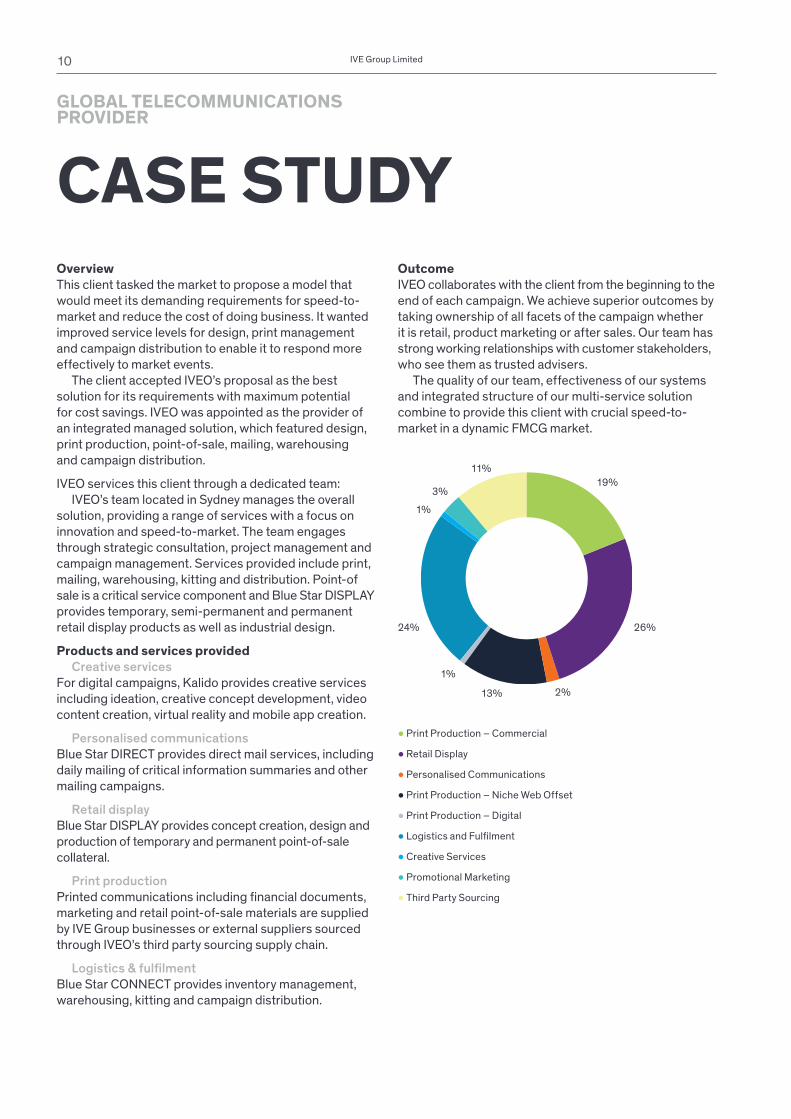
OverviewThis client tasked the market to propose a model that
would meet its demanding requirements for speed-to-
market and reduce the cost of doing business. It wanted
improved service levels for design, print management
and campaign distribution to enable it to respond more
effectively to market events.
The client accepted IVEO’s proposal as the best
solution for its requirements with maximum potential
for cost savings. IVEO was appointed as the provider of
an integrated managed solution, which featured design,
print production, point-of-sale, mailing, warehousing
and campaign distribution.
IVEO services this client through a dedicated team:
IVEO’s team located in Sydney manages the overall
solution, providing a range of services with a focus on
innovation and speed-to-market. The team engages
through strategic consultation, project management and
campaign management. Services provided include print,
mailing, warehousing, kitting and distribution. Point-of
sale is a critical service component and Blue Star DISPLAY
provides temporary, semi-permanent and permanent
retail display products as well as industrial design.
Products and services providedCreative services
For digital campaigns, Kalido provides creative services
including ideation, creative concept development, video
content creation, virtual reality and mobile app creation.
Personalised communications
Blue Star DIRECT provides direct mail services, including
daily mailing of critical information summaries and other
mailing campaigns.
Retail display
Blue Star DISPLAY provides concept creation, design and
production of temporary and permanent point-of-sale
collateral.
Print production
Printed communications including fi nancial documents,
marketing and retail point-of-sale materials are supplied
by IVE Group businesses or external suppliers sourced
through IVEO’s third party sourcing supply chain.
Logistics & fulfi lment
Blue Star CONNECT provides inventory management,
warehousing, kitting and campaign distribution.
OutcomeIVEO collaborates with the client from the beginning to the
end of each campaign. We achieve superior outcomes by
taking ownership of all facets of the campaign whether
it is retail, product marketing or after sales. Our team has
strong working relationships with customer stakeholders,
who see them as trusted advisers.
The quality of our team, effectiveness of our systems
and integrated structure of our multi-service solution
combine to provide this client with crucial speed-to-
market in a dynamic FMCG market.
CASE STUDY
19%
26%24%
13% 2%
1%
1%
3%
11%
● Print Production – Commercial
● Retail Display
● Personalised Communications
● Print Production – Niche Web Offset
● Print Production – Digital
● Logistics and Fulfi lment
● Creative Services
● Promotional Marketing
● Third Party Sourcing
GLOBAL TELECOMMUNICATIONSPROVIDER
Annual Report 2016 11
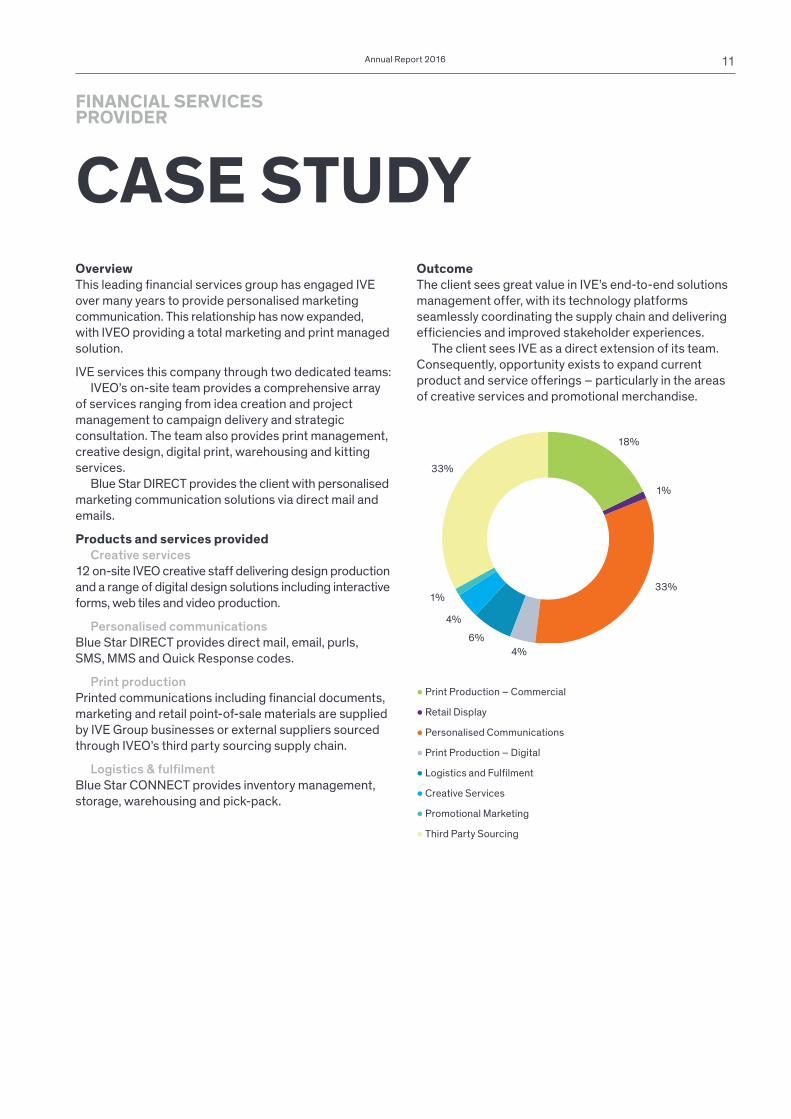
OverviewThis leading fi nancial services group has engaged IVE
over many years to provide personalised marketing
communication. This relationship has now expanded,
with IVEO providing a total marketing and print managed
solution.
IVE services this company through two dedicated teams:
IVEO’s on-site team provides a comprehensive array
of services ranging from idea creation and project
management to campaign delivery and strategic
consultation. The team also provides print management,
creative design, digital print, warehousing and kitting
services.
Blue Star DIRECT provides the client with personalised
marketing communication solutions via direct mail and
emails.
Products and services providedCreative services
12 on-site IVEO creative staff delivering design production
and a range of digital design solutions including interactive
forms, web tiles and video production.
Personalised communications
Blue Star DIRECT provides direct mail, email, purls,
SMS, MMS and Quick Response codes.
Print production
Printed communications including fi nancial documents,
marketing and retail point-of-sale materials are supplied
by IVE Group businesses or external suppliers sourced
through IVEO’s third party sourcing supply chain.
Logistics & fulfi lment
Blue Star CONNECT provides inventory management,
storage, warehousing and pick-pack.
OutcomeThe client sees great value in IVE’s end-to-end solutions
management offer, with its technology platforms
seamlessly coordinating the supply chain and delivering
effi ciencies and improved stakeholder experiences.
The client sees IVE as a direct extension of its team.
Consequently, opportunity exists to expand current
product and service offerings – particularly in the areas
of creative services and promotional merchandise.
CASE STUDY
● Print Production – Digital
● Logistics and Fulfi lment
● Creative Services
● Promotional Marketing
● Third Party Sourcing
18%
33%
33%
4%
6%
4%
1%
1%
● Print Production – Commercial
● Retail Display
● Personalised Communications
FINANCIAL SERVICESPROVIDER
WE THRIVEON CREATIVITY Just as a kaleidoscope reveals unexpected patterns
and shifts your perspective, we help create new visions
for our clients.
Business models are being disrupted leading to
trepidation about the path ahead. In this era of constant
and rapid change, our focus is the combination of art
+ science, leveraging technology and craft, to create
something beautiful.
And that’s why we exist, to create beautiful futures.
For the clients we have, the people they serve, and for
ourselves.
12 IVE Group Limited
WE CREATEBEAUTIFUL FUTURES
13Annual Report 2016
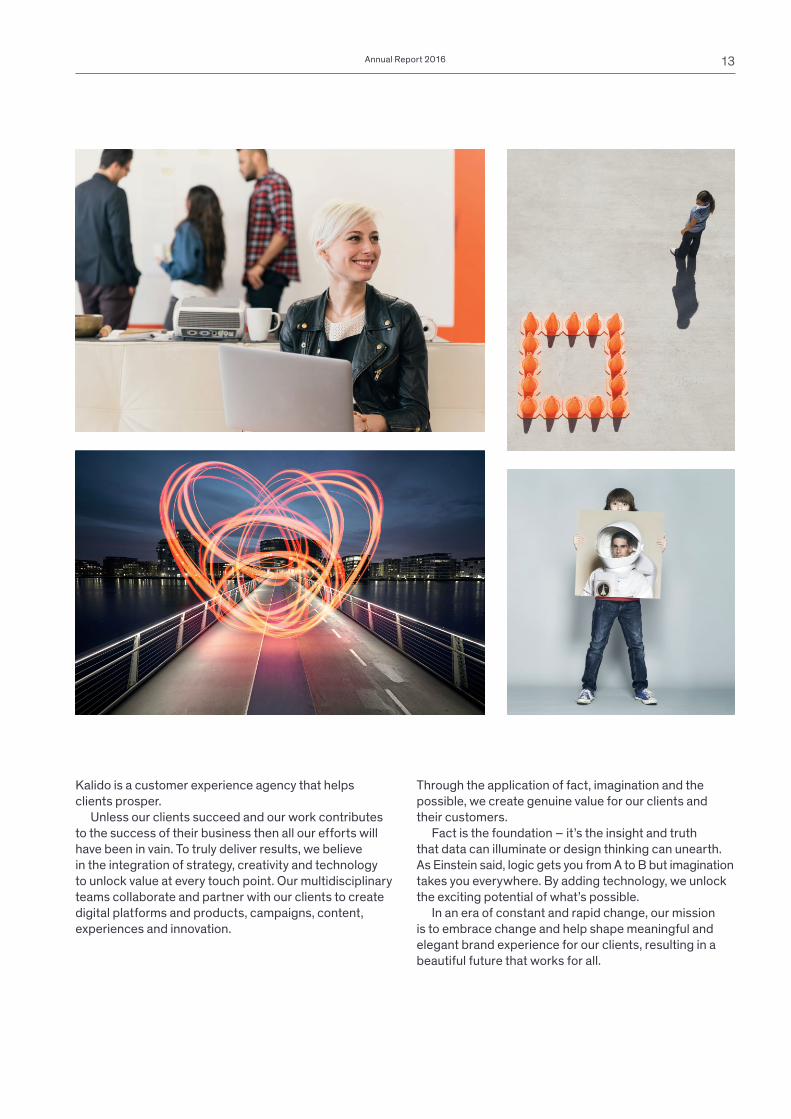
Kalido is a customer experience agency that helps
clients prosper.
Unless our clients succeed and our work contributes
to the success of their business then all our efforts will
have been in vain. To truly deliver results, we believe
in the integration of strategy, creativity and technology
to unlock value at every touch point. Our multidisciplinary
teams collaborate and partner with our clients to create
digital platforms and products, campaigns, content,
experiences and innovation.
Through the application of fact, imagination and the
possible, we create genuine value for our clients and
their customers.
Fact is the foundation – it’s the insight and truth
that data can illuminate or design thinking can unearth.
As Einstein said, logic gets you from A to B but imagination
takes you everywhere. By adding technology, we unlock
the exciting potential of what’s possible.
In an era of constant and rapid change, our mission
is to embrace change and help shape meaningful and
elegant brand experience for our clients, resulting in a
beautiful future that works for all.
WE ARRIVEAT SOLUTIONS
Blue Star Group is Australia’s leading provider of
integrated print, display, personalised communications,
promotional products, warehouse and logistics services.
Operating across six specialist businesses, the Blue Star
Division is Australia’s most diversifi ed business of its kind.
Continual focus on technology, innovation and effi ciency,
coupled with our highly experienced and passionate team,
creates a nimble and fl exible environment dedicated to
delivering a responsive service to the market.
14 IVE Group Limited
15Annual Report 2016
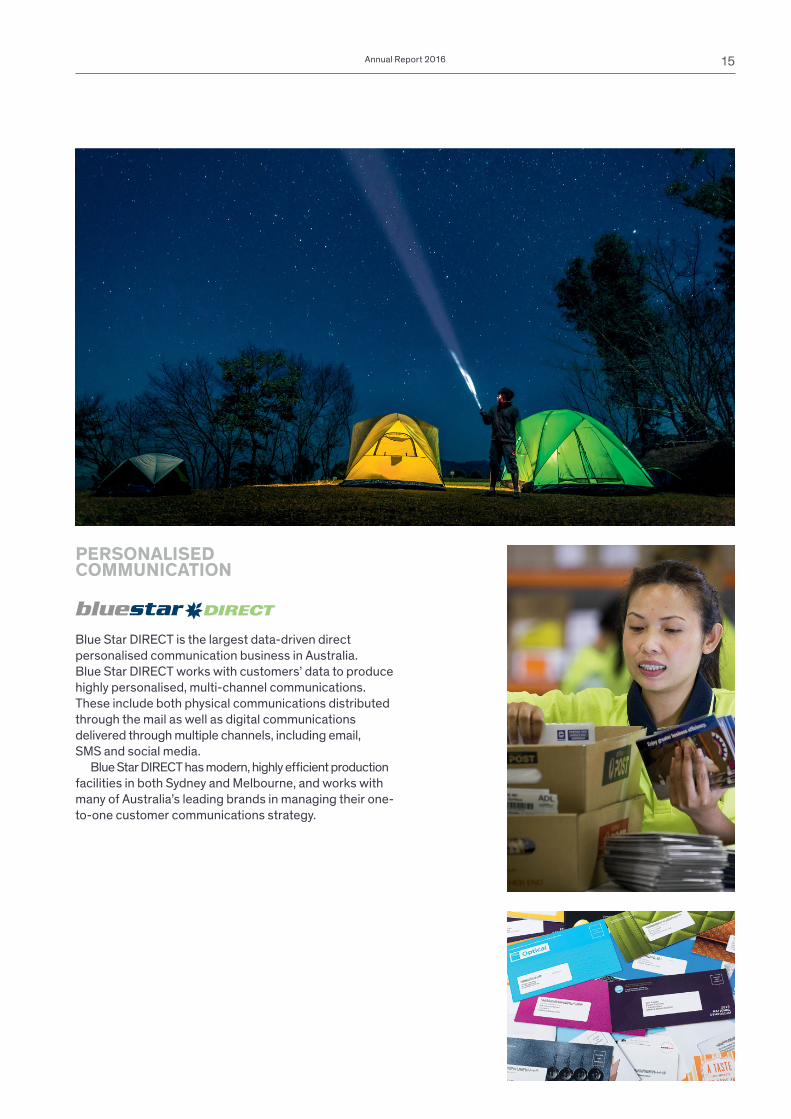
Blue Star DIRECT is the largest data-driven direct
personalised communication business in Australia.
Blue Star DIRECT works with customers’ data to produce
highly personalised, multi-channel communications.
These include both physical communications distributed
through the mail as well as digital communications
delivered through multiple channels, including email,
SMS and social media.
Blue Star DIRECT has modern, highly effi cient production
facilities in both Sydney and Melbourne, and works with
many of Australia’s leading brands in managing their one-
to-one customer communications strategy.
PERSONALISEDCOMMUNICATION
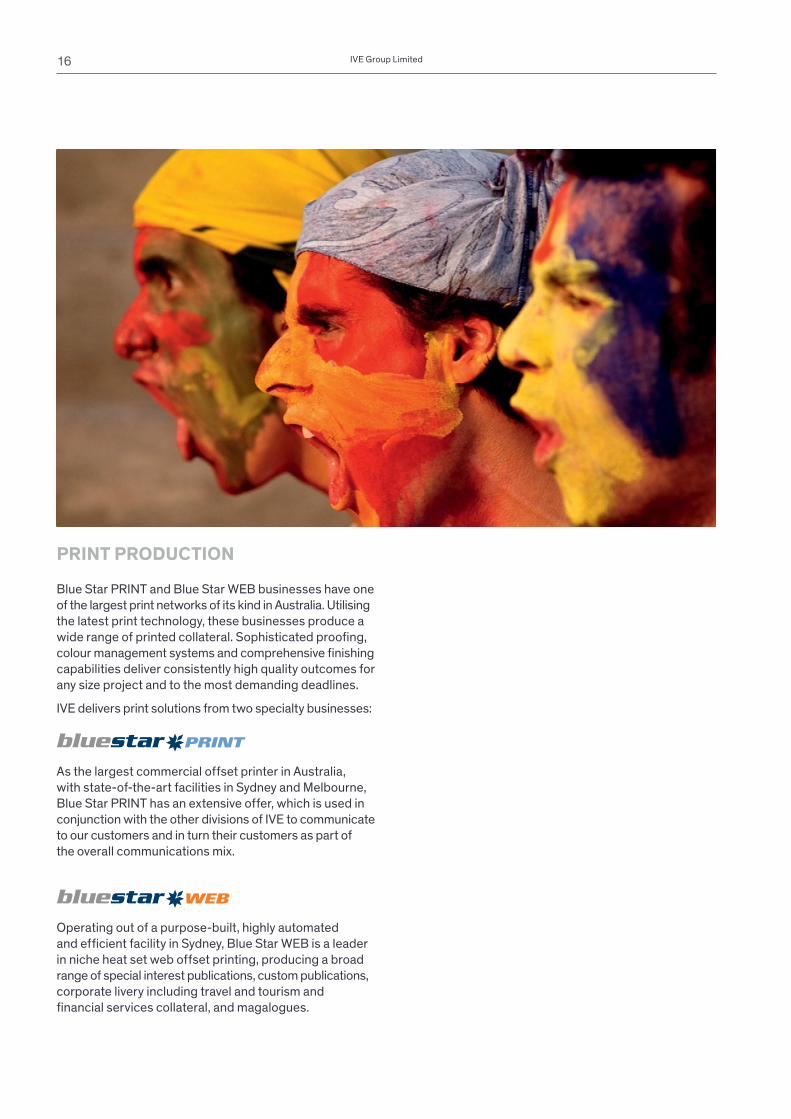
As the largest commercial offset printer in Australia,
with state-of-the-art facilities in Sydney and Melbourne,
Blue Star PRINT has an extensive offer, which is used in
conjunction with the other divisions of IVE to communicate
to our customers and in turn their customers as part of
the overall communications mix.
Operating out of a purpose-built, highly automated
and effi cient facility in Sydney, Blue Star WEB is a leader
in niche heat set web offset printing, producing a broad
range of special interest publications, custom publications,
corporate livery including travel and tourism and
fi nancial services collateral, and magalogues.
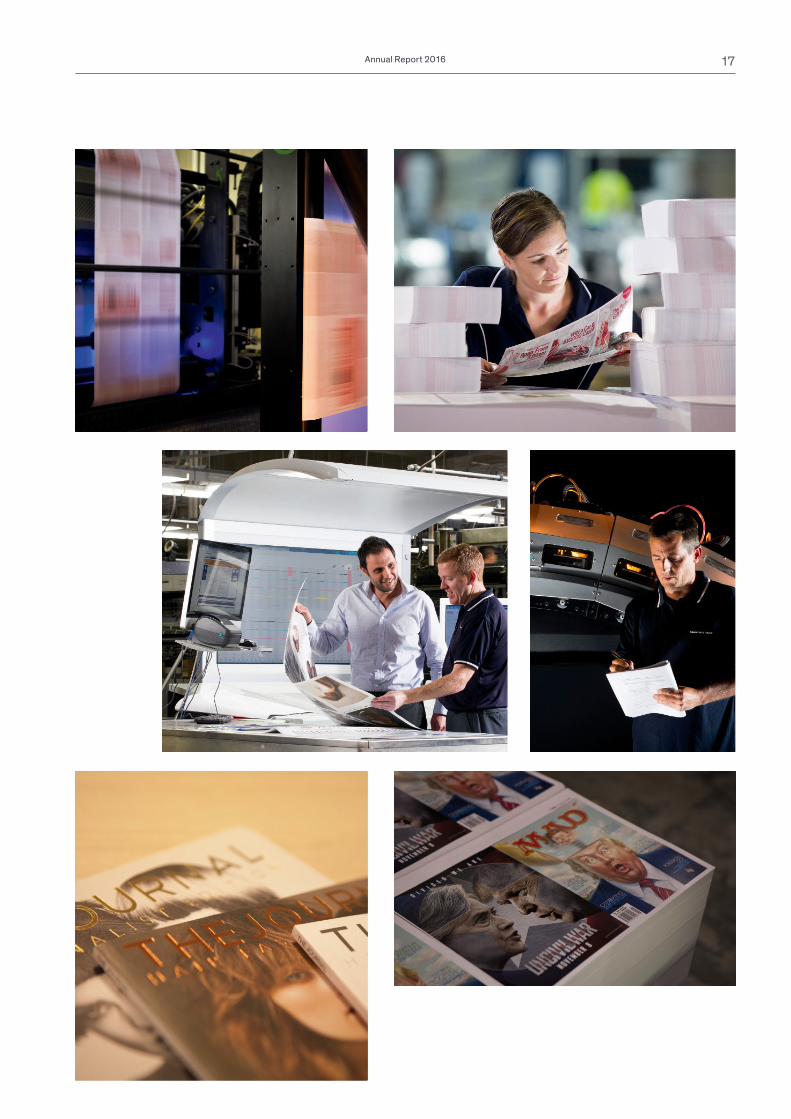
Blue Star PRINT and Blue Star WEB businesses have one
of the largest print networks of its kind in Australia. Utilising
the latest print technology, these businesses produce a
wide range of printed collateral. Sophisticated proofi ng,
colour management systems and comprehensive fi nishing
capabilities deliver consistently high quality outcomes for
any size project and to the most demanding deadlines.
IVE delivers print solutions from two specialty businesses:
PRINT PRODUCTION
16 IVE Group Limited
17Annual Report 2016
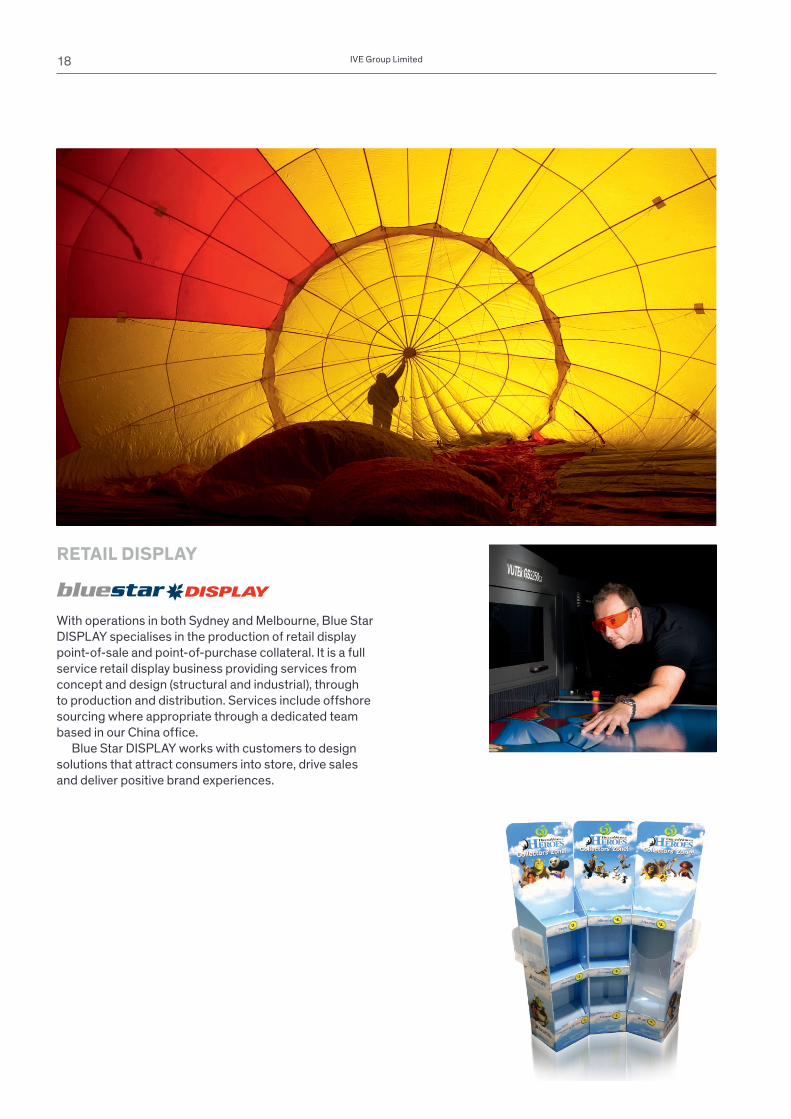
With operations in both Sydney and Melbourne, Blue Star
DISPLAY specialises in the production of retail display
point-of-sale and point-of-purchase collateral. It is a full
service retail display business providing services from
concept and design (structural and industrial), through
to production and distribution. Services include offshore
sourcing where appropriate through a dedicated team
based in our China offi ce.
Blue Star DISPLAY works with customers to design
solutions that attract consumers into store, drive sales
and deliver positive brand experiences.
RETAIL DISPLAY
18 IVE Group Limited
19Annual Report 2016
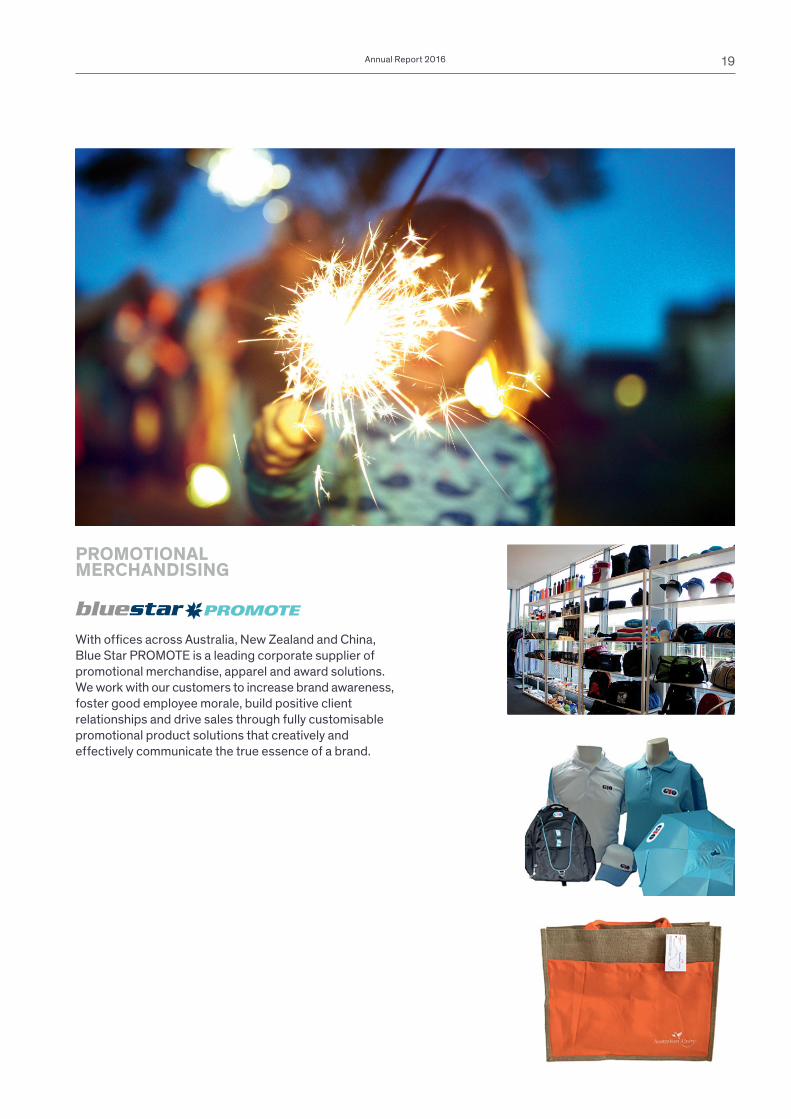
With offi ces across Australia, New Zealand and China,
Blue Star PROMOTE is a leading corporate supplier of
promotional merchandise, apparel and award solutions.
We work with our customers to increase brand awareness,
foster good employee morale, build positive client
relationships and drive sales through fully customisable
promotional product solutions that creatively and
effectively communicate the true essence of a brand.
PROMOTIONALMERCHANDISING
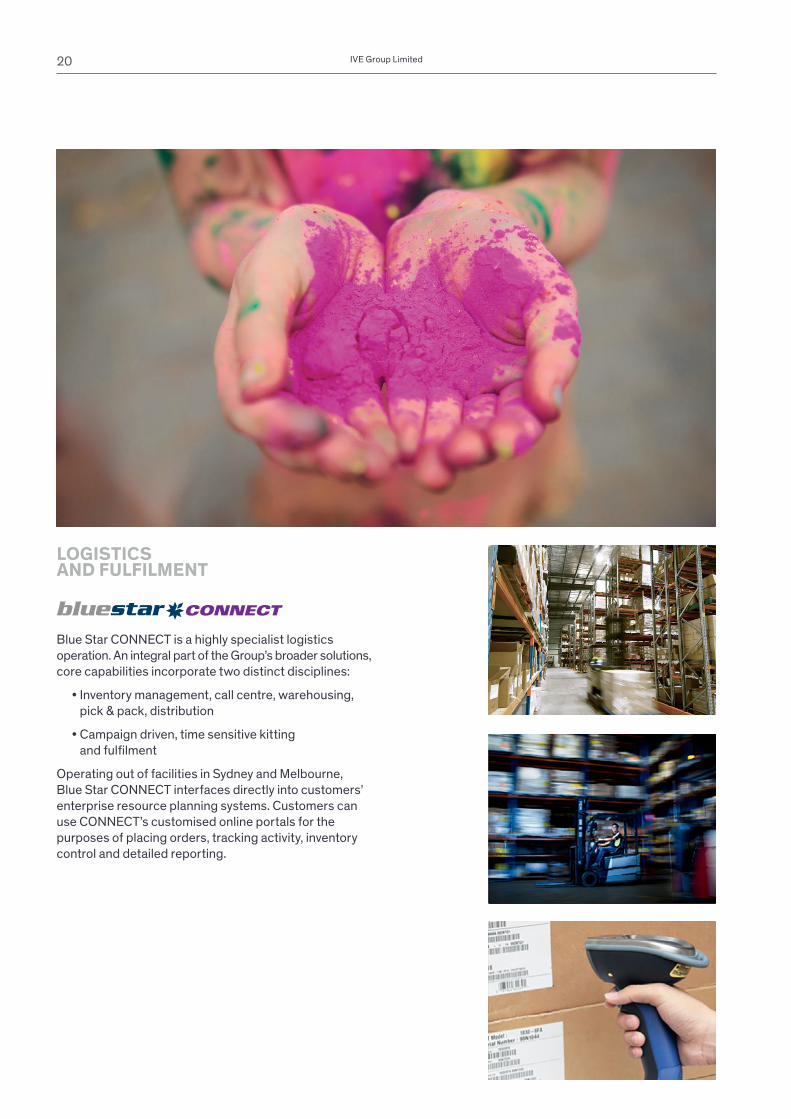
Blue Star CONNECT is a highly specialist logistics
operation. An integral part of the Group’s broader solutions,
core capabilities incorporate two distinct disciplines:
• Inventory management, call centre, warehousing,
pick & pack, distribution
• Campaign driven, time sensitive kitting
and fulfi lment
Operating out of facilities in Sydney and Melbourne,
Blue Star CONNECT interfaces directly into customers’
enterprise resource planning systems. Customers can
use CONNECT’s customised online portals for the
purposes of placing orders, tracking activity, inventory
control and detailed reporting.
LOGISTICSAND FULFILMENT
20 IVE Group Limited

WE DRIVE YOUR BUSINESS FURTHER
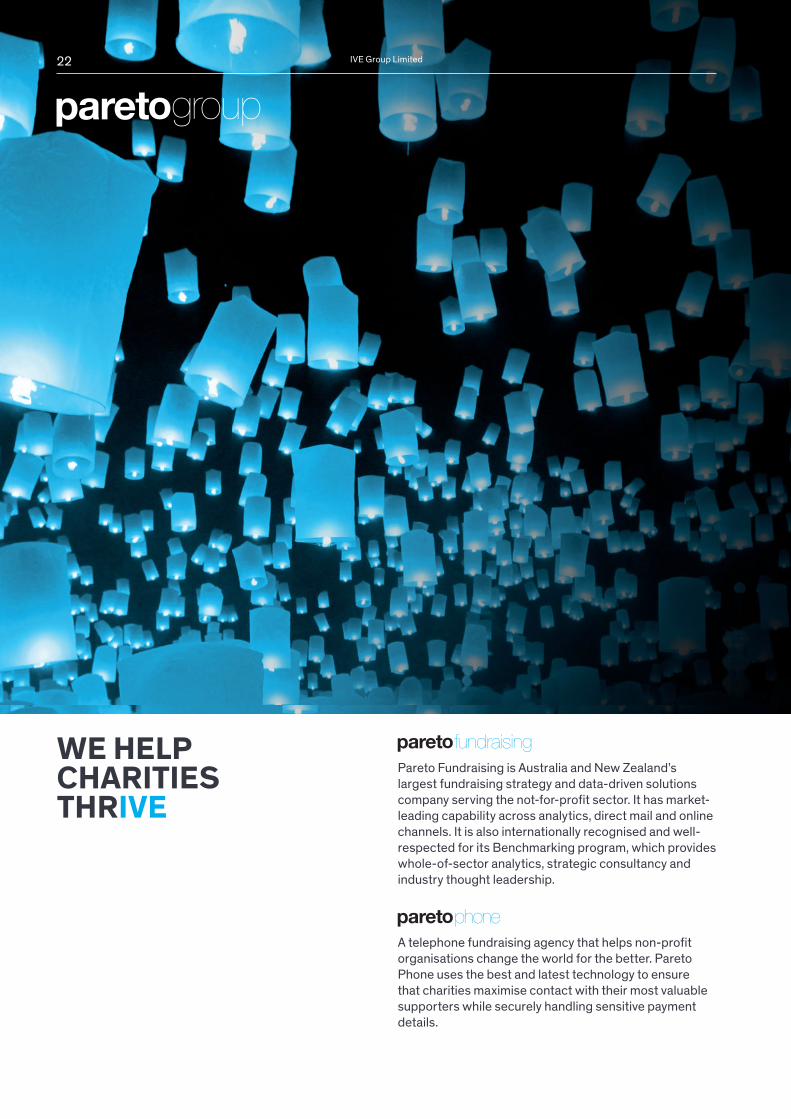
WE HELPCHARITIESTHRIVE
Pareto Fundraising is Australia and New Zealand’s
largest fundraising strategy and data-driven solutions
company serving the not-for-profi t sector. It has market-
leading capability across analytics, direct mail and online
channels. It is also internationally recognised and well-
respected for its Benchmarking program, which provides
whole-of-sector analytics, strategic consultancy and
industry thought leadership.
A telephone fundraising agency that helps non-profi t
organisations change the world for the better. Pareto
Phone uses the best and latest technology to ensure
that charities maximise contact with their most valuable
supporters while securely handling sensitive payment
details.
22 IVE Group Limited

23Annual Report 2016
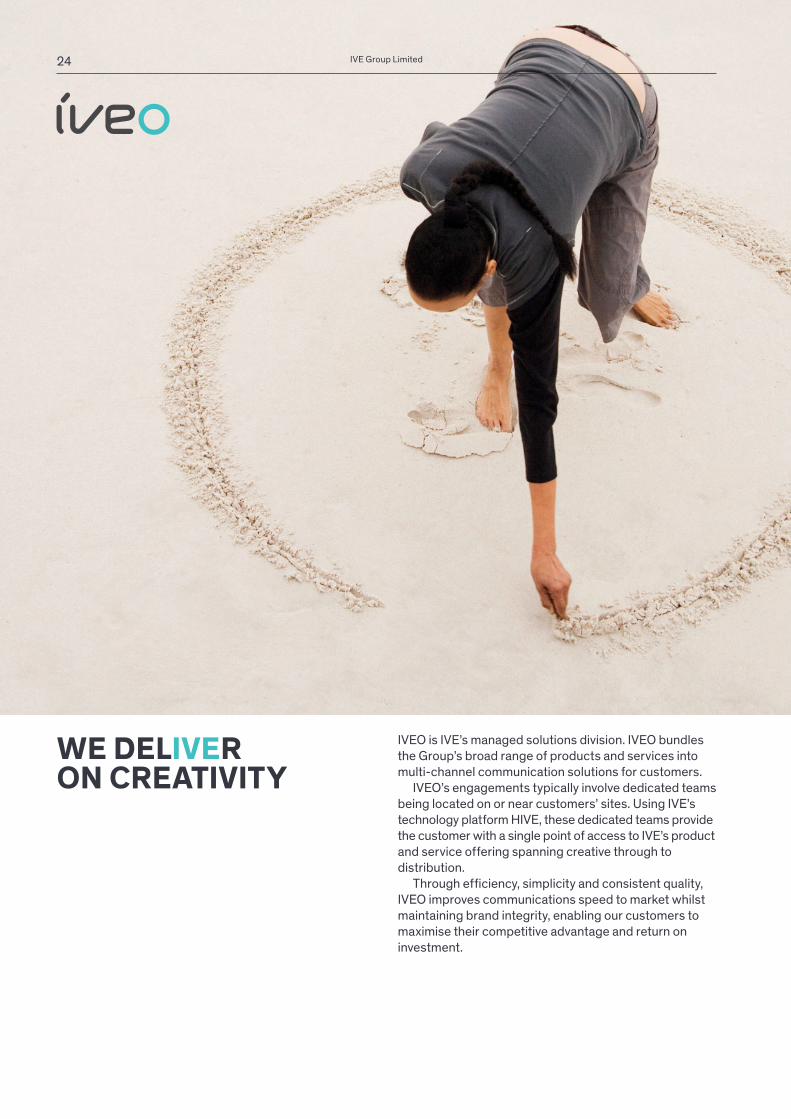
WE DELIVERON CREATIVITY
IVEO is IVE’s managed solutions division. IVEO bundles
the Group’s broad range of products and services into
multi-channel communication solutions for customers.
IVEO’s engagements typically involve dedicated teams
being located on or near customers’ sites. Using IVE’s
technology platform HIVE, these dedicated teams provide
the customer with a single point of access to IVE’s product
and service offering spanning creative through to
distribution.
Through effi ciency, simplicity and consistent quality,
IVEO improves communications speed to market whilst
maintaining brand integrity, enabling our customers to
maximise their competitive advantage and return on
investment.
24 IVE Group Limited

25Annual Report 2016

26 IVE Group Limited
27Annual Report 2016

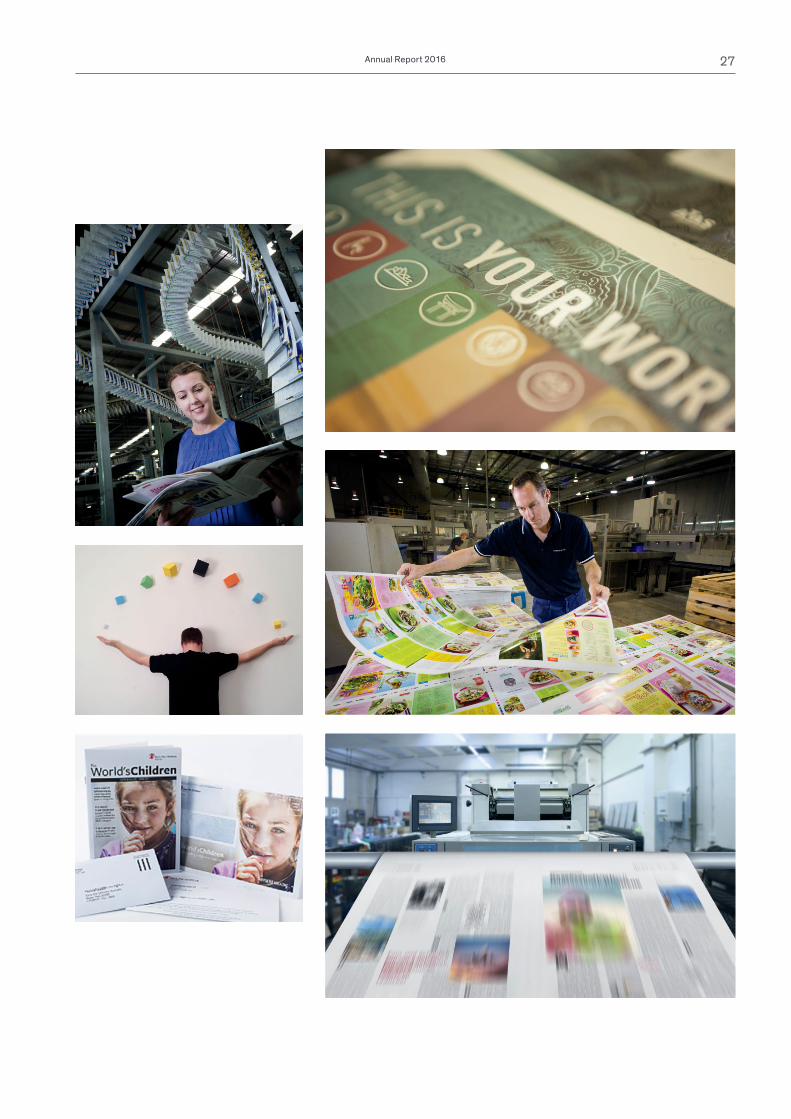
WE STRIVE FOR PERFECTION
29Annual Report 2016
IVE GROUP LIMITED FINANCIAL REPORTYEAR ENDED 30 JUNE 2016
OPERATING AND FINANCIAL REVIEW
1. INTRODUCTIONThe Directors are pleased to present the full year Operating and Financial Review (OFR)
for IVE Group Limited (IVE) for the year ended 30 June 2016 (FY2016).
The OFR is provided to assist shareholders’ understanding of IVE’s business
performance and factors underlying its results and financial position.
2. SUMMARYIVE achieved strong revenue growth for FY2016 of 13.2% compared to the prior
corresponding period (‘PCP’) on a Pro Forma basis, and 20.0% revenue growth on a
Statutory basis (Pro Forma and Statutory basis are defined in Section 5 of the OFR).
The revenue increase, which was in line with the Pro Forma revenue growth disclosed in
the Prospectus dated 4 December 2015 of 12.9%, reflects continued organic growth
through a combination of new business from the existing customer base and expanded
service offering (share of wallet), as well as business acquisitions throughout the year.
IVE also achieved continued EBITDA growth with Pro Forma EBITDA growth of 38.7%
over the PCP (37.6% per Prospectus) through a combination of revenue growth (outlined
above), as well as continued productivity gains and cost base refinement through capital
expenditure investment, continued focus on cost management, and the benefits arising
from acquisition synergies. Statutory EBITDA is 48.6% higher than the PCP due mainly
to similar factors outlined above, and is in line with the Prospectus Statutory forecast.
Pro Forma NPAT achieved 117.5% to PCP, which was in line with Prospectus forecast
and Statutory NPAT growth on PCP of 930.6% and was impacted by a one-off tax benefit.
During FY2016 IVE completed the successful integration of H2 FY2015 acquisitions,
and continued its acquisition program acquiring 100% of share capital in Pareto Phone
Pty Ltd and Pareto Fundraising Pty Ltd (October 15) as well as acquiring the assets
of Oxygen8 Pty Ltd (July 15), Laser Computer Services Pty Ltd (February 16), Fineline
Pty Ltd (April 16), Frost Promotions (May 16) and in mid May 2016 acquiring 100% of
the share capital in James Bennett & Associates Pty Ltd.
3. LISTINGIVE Group Limited listed on the Australian Securities Exchange via an Initial Public
Offering on 16 December 2015.
30 IVE Group Limited
OPERATING AND FINANCIAL REVIEW (CONT.)
4. STRATEGY AND OPERATING OVERVIEWIVE is a vertically integrated marketing and print communications provider. IVE enables
its customers to communicate more effectively with their customer by creating,
managing, producing and distributing content across multiple channels. IVE has an
unparalleled product and service offering in Australia and holds leading positions across
multiple industry sectors.
IVE’s growth strategy is focused on the following key initiatives:
• New customer origination driven by a highly customer centric culture;
• Growing share of wallet with existing customers;
• Execution of a disciplined acquisition program;
• Expansion of the value proposition through the addition of complementary products
and services;
• Continued strengthening and leveraging of the existing business through targeted
operational efficiency programs.
Further information on IVE’s strategy, operations and market is set out in the Prospectus.
Other than the effect of acquisitions during FY2016, there have been no significant
changes to IVE’s strategy, operations and market from the Prospectus.
5. OVERVIEW OF RESULTS FOR FY2016IVE’s Financial Report for FY2016 is presented on a statutory basis in accordance with
Australian Accounting Standards which comply with International Financial Reporting
Standards (IFRS).
In this OFR, certain non-IFRS financial information has also been included to
allow investors to understand the underlying performance of IVE, and relate to the
performance outlined in the Prospectus prepared on a Pro Forma basis.
The Directors believe that the Pro Forma presentation of the results better reflects the
underlying performance, is consistent with Prospectus, and differs from the Statutory
presentation. The Pro Forma results reflect the effect of the operating and capital
structure that was established at time of the IPO, and excludes the costs of IPO, one-off
tax implications arising as a result of the IPO, and other non-operating items which are
not expected to occur in future periods.
The non-IFRS Pro Forma financial information has not been audited or reviewed.
Data in this OFR is expressed in millions and has been rounded to one decimal place.
This differs from the Financial Report where numbers are expressed in thousands. As a
result, some minor rounding discrepancies occur.

31Annual Report 2016
5.1 PRO FORMA RESULTSPro Forma results are provided for FY2016 to allow investors to make a comparison
to the Prospectus forecast, and to make an assessment of IVE’s performance on an
ongoing basis as a listed company.
The FY2016 Pro Forma results set out in table 1 show that IVE exceeded its full year
Pro Forma forecast per the Prospectus at revenue, EBITDA, EBIT, NPAT and NPATA level.
Table 1: Pro Forma and Statutory results
Pro Forma
ActualFY2016
ProspectusForecast
Jun-16
ActualJun-15
Variance$’M
Variance%
Revenue 382.0 381.0 337.4 44.6 13.2%
Gross Profi t 199.6 199.2 179.9 19.7 10.9%
% of Revenue 52.2% 52.3% 53.3% –1.1% –2.0%
EBITDA 42.8 42.5 30.9 11.9 38.7%
EBIT 32.8 32.0 17.3 15.6 90.1%
Profi t before tax 30.6 29.7 15.2 15.4 101.5%
NPAT 20.9 20.3 9.6 11.3 117.5%
NPATA 22.5 22.0 10.9 11.6 106.7%
5.2 STATUTORY RESULTS PER THE FINANCIAL REPORTTable 2 outlines the statutory results for FY2016 and FY2015 on a comparable
basis. The Statutory FY2016 forecast per the Prospectus has also been included for
comparative purposes.
Table 2: Statutory results
ActualFY2016
ProspectusForecast
Jun-16
ActualJun-15
Variance$’M
Variance%
Revenue 369.2 368.2 307.7 61.5 20.0%
Gross Profi t 192.0 193.6 161.1 30.9 19.2%
% of Revenue 52.0% 52.6% 52.4% –0.4% –0.7%
EBITDA 26.5 27.9 17.8 8.7 48.6%
EBIT 16.9 17.8 5.1 11.8 232.4%
Profi t before tax 14.2 15.1 3.2 11.0 343.4%
NPAT 15.1 8.3 1.5 13.6 930.6%
NPATA 16.4 9.6 2.2 14.2 658.6%
32 IVE Group Limited
OPERATING AND FINANCIAL REVIEW (CONT.)
5.2 STATUTORY RESULTS PER THE FINANCIAL REPORT (CONT.)The key variances on a Statutory basis between FY2016 and FY2015 are as follows:
• RevenueRevenue increase of $61.5M or 20.0% over PCP reflects the impacts of continued
organic growth, increased revenue from the existing customer base through expanded
service offering, and the contribution from acquisitions undertaken in H2 FY2015
and in FY2016. The revenue increase has been achieved through realising the
successful execution of IVE’s growth strategy initiatives. This has led to a number a
of new customers partnering the Group throughout the year, the continued success
of cross selling to existing and acquired customers, and the ability to achieve several
key contract extensions.
• Gross profitGross profit increase of $30.9M over PCP largely driven by increased revenue. Achieved
gross profit of 52.0% to revenue compared with 52.4% in PCP largely reflects the sales
mix including the contribution from acquisitions. Gross profit has remained stable as a
result of managing inputs, continued leveraging of supply chain and reducing outsource
spend wherever possible by producing internally.
• EBITDA (Earnings before interest, tax, depreciation and amortisation)EBITDA of $26.5M represents an increase of $8.7M or 48.6% over PCP achieved
through organic and acquisition revenue growth, as well as efficiency gains expanding
the EBITDA margin.
Production expenses (excluding depreciation and amortisation) of $84.7M are 22.9%
to revenue compared $78.3M and 25.4% to revenue in PCP. Production costs further
refined through capital expenditure efficiencies.
Administration expenses (excluding depreciation and amortisation) of $74.7M are 20.2%
to revenue compared to $54.1M and 17.6% to revenue in PCP, again increased due to
revenue growth as well as being impacted by one-off costs associated with the close out
of the Management Equity Plan on listing of $6.2M.
• NPAT (Net profit after tax)Increase in NPAT from PCP of $13.6M is attributable to the results from trading outlined
above. PCP was also impacted by a one-off impairment charge reflected in depreciation
expense of $2.9M.
A non-recurring deferred tax benefit of $7.1M was recognised in FY2016 as a result of
IVE entering into a tax consolidation in connection with the IPO and the consequential
uplift of tax carrying values.
33Annual Report 2016
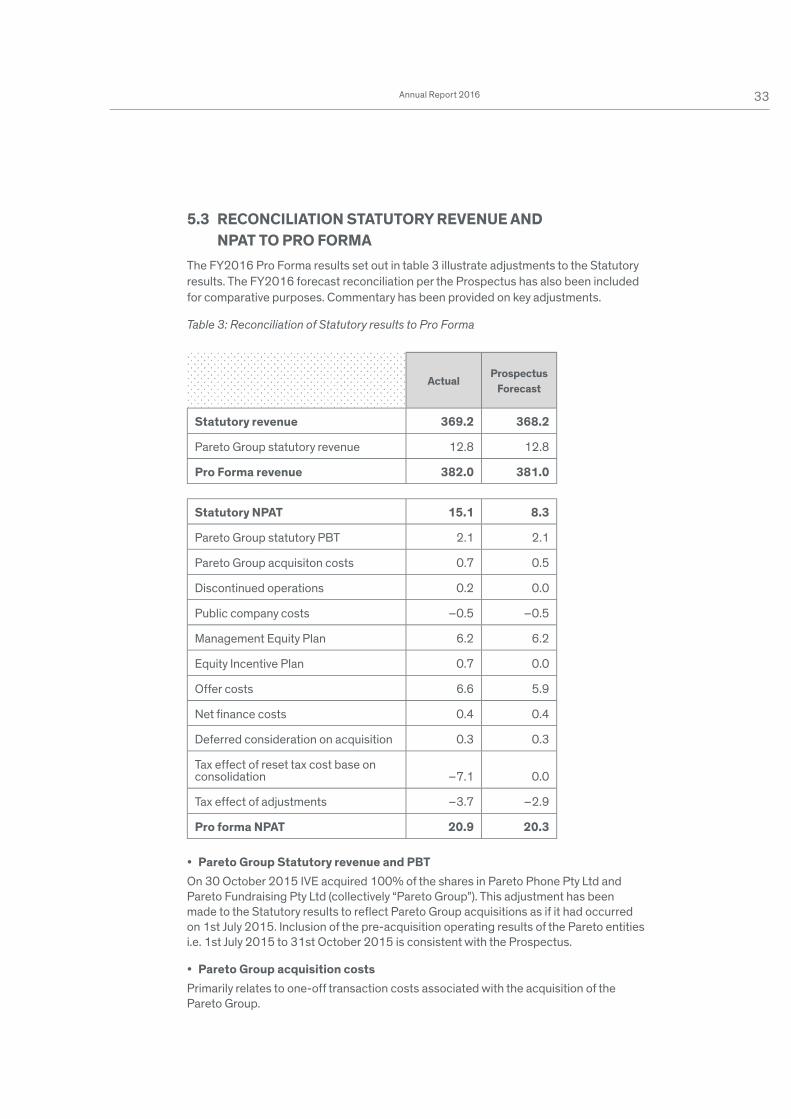
5.3 RECONCILIATION STATUTORY REVENUE ANDNPAT TO PRO FORMA
The FY2016 Pro Forma results set out in table 3 illustrate adjustments to the Statutory
results. The FY2016 forecast reconciliation per the Prospectus has also been included
for comparative purposes. Commentary has been provided on key adjustments.
Table 3: Reconciliation of Statutory results to Pro Forma
ActualProspectus
Forecast
Statutory revenue 369.2 368.2
Pareto Group statutory revenue 12.8 12.8
Pro Forma revenue 382.0 381.0
Statutory NPAT 15.1 8.3
Pareto Group statutory PBT 2.1 2.1
Pareto Group acquisiton costs 0.7 0.5
Discontinued operations 0.2 0.0
Public company costs –0.5 –0.5
Management Equity Plan 6.2 6.2
Equity Incentive Plan 0.7 0.0
Offer costs 6.6 5.9
Net fi nance costs 0.4 0.4
Deferred consideration on acquisition 0.3 0.3
Tax effect of reset tax cost base on consolidation –7.1 0.0
Tax effect of adjustments –3.7 –2.9
Pro forma NPAT 20.9 20.3
• Pareto Group Statutory revenue and PBTOn 30 October 2015 IVE acquired 100% of the shares in Pareto Phone Pty Ltd and
Pareto Fundraising Pty Ltd (collectively “Pareto Group”). This adjustment has been
made to the Statutory results to reflect Pareto Group acquisitions as if it had occurred
on 1st July 2015. Inclusion of the pre-acquisition operating results of the Pareto entities
i.e. 1st July 2015 to 31st October 2015 is consistent with the Prospectus.
• Pareto Group acquisition costsPrimarily relates to one-off transaction costs associated with the acquisition of the
Pareto Group.
34 IVE Group Limited
OPERATING AND FINANCIAL REVIEW (CONT.)
5.3 RECONCILIATION STATUTORY REVENUE ANDNPAT TO PRO FORMA (CONT.)
• Discontinued operationsIn FY2013 IVE discontinued its operations in ACT. This reconciliation reflects a small
adjustment to an onerous lease recognised in FY2015.
• Listed company expensesAn adjustment has been made to include IVE’s estimate of the incremental annual costs
that it will incur as a listed company.
• Management Equity PlanThe Management Equity Plan that existed prior to listing has been closed out as a result
of the IPO. An adjustment has been made to eliminate the one-off cost associated with
the closure.
• Equity Incentive Plan (EIP)As outlined in Prospectus, certain employees were issued with performance rights under
the EIP. This was not reflected in the Prospectus forecast, and is consequently being
adjusted as a reconciling difference.
• Offer costsReflects costs associated with the IPO which are expensed in the Statutory results and
excluded from Pro Forma on the basis that they relate to the IPO and are non-recurring.
• Net finance costsNet finance costs included in the Statutory results have been adjusted to reflect the net
debt level and leverage ratio in the post IPO capital structure.
• Deferred consideration on acquisitionReflects an immaterial non-recurring component of deferred consideration paid as a
payroll expense.
• Tax effect of reset cost base on consolidationAs part of the IPO, IVE formed a consolidated group for taxation purposes. Part of this
process involved reassessing carrying values for IVE’s tax asset base and resulted in a
one-off uplift in tax carrying values. The impact is a non-recurring credit to tax expense in
FY2016 and an increase to deferred tax assets representing future deductions available.
• Tax effect of adjustmentsThe tax effect on the above adjustments has been estimated based on a statutory tax
rate of 30% excluding items which are identified as non-deductible.
35Annual Report 2016
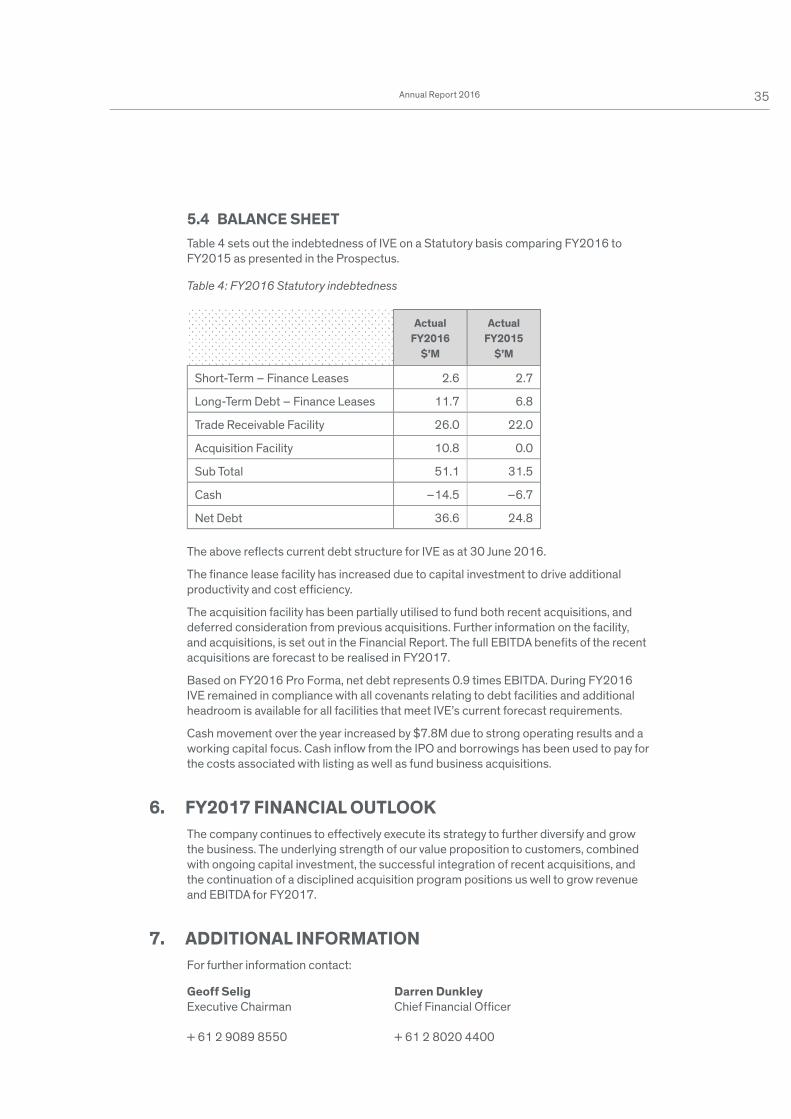
5.4 BALANCE SHEETTable 4 sets out the indebtedness of IVE on a Statutory basis comparing FY2016 to
FY2015 as presented in the Prospectus.
Table 4: FY2016 Statutory indebtedness
Actual FY2016
$’M
Actual FY2015
$’M
Short-Term – Finance Leases 2.6 2.7
Long-Term Debt – Finance Leases 11.7 6.8
Trade Receivable Facility 26.0 22.0
Acquisition Facility 10.8 0.0
Sub Total 51.1 31.5
Cash –14.5 –6.7
Net Debt 36.6 24.8
The above reflects current debt structure for IVE as at 30 June 2016.
The finance lease facility has increased due to capital investment to drive additional
productivity and cost efficiency.
The acquisition facility has been partially utilised to fund both recent acquisitions, and
deferred consideration from previous acquisitions. Further information on the facility,
and acquisitions, is set out in the Financial Report. The full EBITDA benefits of the recent
acquisitions are forecast to be realised in FY2017.
Based on FY2016 Pro Forma, net debt represents 0.9 times EBITDA. During FY2016
IVE remained in compliance with all covenants relating to debt facilities and additional
headroom is available for all facilities that meet IVE’s current forecast requirements.
Cash movement over the year increased by $7.8M due to strong operating results and a
working capital focus. Cash inflow from the IPO and borrowings has been used to pay for
the costs associated with listing as well as fund business acquisitions.
6. FY2017 FINANCIAL OUTLOOKThe company continues to effectively execute its strategy to further diversify and grow
the business. The underlying strength of our value proposition to customers, combined
with ongoing capital investment, the successful integration of recent acquisitions, and
the continuation of a disciplined acquisition program positions us well to grow revenue
and EBITDA for FY2017.
7. ADDITIONAL INFORMATIONFor further information contact:
Geoff Selig Darren DunkleyExecutive Chairman Chief Financial Officer
+ 61 2 9089 8550 + 61 2 8020 4400

36 IVE Group Limited
DIRECTORS’ REPORTFor the year ended 30 June 2016
The directors present their report together with the consolidated financial statements of the Group comprising of
IVE Group Limited (the Company), and its subsidiaries (the Group) for the financial year ended 30 June 2016 and the
auditor’s report thereon.
Principal activitiesThe principal activities of the Group during the course of the financial year were:
• Conceptual and creative design across print, mobile and interactive media;
• Printing of magazines, catalogues, marketing and corporate communications materials and stationery;
• Printing of point of sale display material and large format banners for retail applications;
• Personalised communications including marketing mail, publication mail, eCommunications and multi-channel
solutions; and
• Outsourced communications solutions for large organisations including development of customised multi-channel
management models covering creative and digital services, supply chain optimisation, inventory management,
warehousing and logistics.
The Group services all major industry sectors in Australia including financial services, publishing, retail, communications,
property, clubs and associations, not-for-profit, utilities, manufacturing, education and government.
There were no significant changes in the nature of the activities of the Group during the year.
Operating and financial reviewThe profit after tax of the Group for the year ended 30 June 2016 was $15,051 thousand (2015: $1,460 thousand).
A review of operations and results of the Group for the year ended 30 June 2016 are set out in the Operating and Financial
Review, which forms part of the Annual Financial Report.
DividendsThe directors have declared a final dividend of 8.6 Australian cents per share, fully franked, to be paid on 20 October 2016
to shareholders on the register at 14 September 2016. Total dividends of $7,647 thousand were declared by the Company
to members in respect of the year ended 30 June 2016 (2015: $8,000 thousand).
Significant changes in the state of affairsInitial Public Offering – ListingIVE Group Limited was incorporated on 10 June 2015, but did not undertake any trading activities until its listing
on the Australian Stock Exchange (ASX) on 16 December 2015 where from the majority of the listing proceeds it
contemporaneously acquired Caxton Print Group Holdings Pty Ltd (CPGH). The consolidated financial statements of the
new IVE Group have been presented as a continuation of the pre existing accounting values of assets and liabilities in
CPGH’s financial statements. Further details are provided in note 1 of the Financial Report.
During the year, the Group acquired a number of businesses, the details of which are included in note 22 of the Financial
Report.
In the opinion of the directors there were no other significant changes in the state of affairs of the Group that occurred
during the financial year under review.
37Annual Report 2016
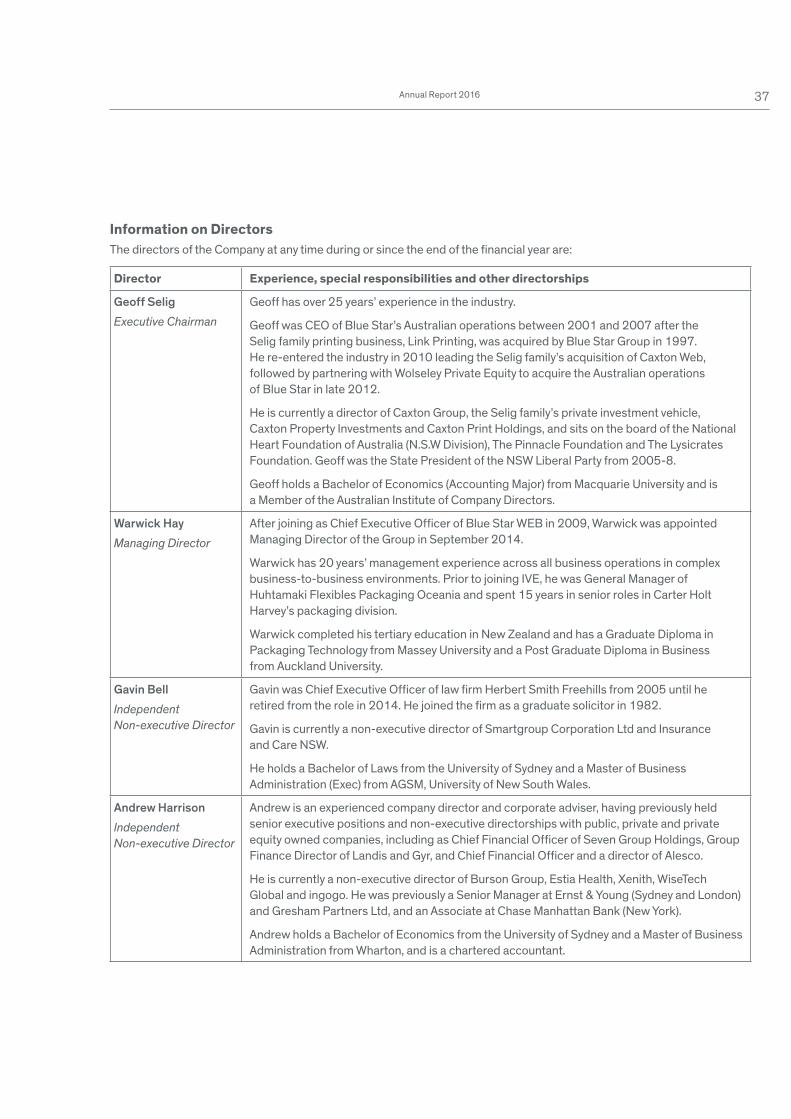
Information on DirectorsThe directors of the Company at any time during or since the end of the financial year are:
Director Experience, special responsibilities and other directorships
Geoff Selig
Executive Chairman
Geoff has over 25 years’ experience in the industry.
Geoff was CEO of Blue Star’s Australian operations between 2001 and 2007 after the
Selig family printing business, Link Printing, was acquired by Blue Star Group in 1997.
He re-entered the industry in 2010 leading the Selig family’s acquisition of Caxton Web,
followed by partnering with Wolseley Private Equity to acquire the Australian operations
of Blue Star in late 2012.
He is currently a director of Caxton Group, the Selig family’s private investment vehicle,
Caxton Property Investments and Caxton Print Holdings, and sits on the board of the National
Heart Foundation of Australia (N.S.W Division), The Pinnacle Foundation and The Lysicrates
Foundation. Geoff was the State President of the NSW Liberal Party from 2005-8.
Geoff holds a Bachelor of Economics (Accounting Major) from Macquarie University and is
a Member of the Australian Institute of Company Directors.
Warwick Hay
Managing Director
After joining as Chief Executive Officer of Blue Star WEB in 2009, Warwick was appointed
Managing Director of the Group in September 2014.
Warwick has 20 years’ management experience across all business operations in complex
business-to-business environments. Prior to joining IVE, he was General Manager of
Huhtamaki Flexibles Packaging Oceania and spent 15 years in senior roles in Carter Holt
Harvey’s packaging division.
Warwick completed his tertiary education in New Zealand and has a Graduate Diploma in
Packaging Technology from Massey University and a Post Graduate Diploma in Business
from Auckland University.
Gavin Bell
Independent
Non-executive Director
Gavin was Chief Executive Officer of law firm Herbert Smith Freehills from 2005 until he
retired from the role in 2014. He joined the firm as a graduate solicitor in 1982.
Gavin is currently a non-executive director of Smartgroup Corporation Ltd and Insurance
and Care NSW.
He holds a Bachelor of Laws from the University of Sydney and a Master of Business
Administration (Exec) from AGSM, University of New South Wales.
Andrew Harrison
Independent
Non-executive Director
Andrew is an experienced company director and corporate adviser, having previously held
senior executive positions and non-executive directorships with public, private and private
equity owned companies, including as Chief Financial Officer of Seven Group Holdings, Group
Finance Director of Landis and Gyr, and Chief Financial Officer and a director of Alesco.
He is currently a non-executive director of Burson Group, Estia Health, Xenith, WiseTech
Global and ingogo. He was previously a Senior Manager at Ernst & Young (Sydney and London)
and Gresham Partners Ltd, and an Associate at Chase Manhattan Bank (New York).
Andrew holds a Bachelor of Economics from the University of Sydney and a Master of Business
Administration from Wharton, and is a chartered accountant.

38 IVE Group Limited
DIRECTORS’ REPORT (CONT.)For the year ended 30 June 2016
Director Experience, special responsibilities and other directorships
Paul Selig
Non-executive Director
Paul has over 25 years’ experience in the industry and is currently Managing Director of
Caxton Group, the Selig family’s private investment vehicle.
In 2010, he was appointed a director of Caxton Web following its acquisition by Caxton Group.
He became a director of IVE following the purchase of Blue Star’s Australian operations, of
which he was Chief Executive Officer from 1997 until 2001, in partnership with Wolseley
Private Equity.
Paul is currently a director of Caxton Group, Caxton Property Investments, Caxton Print
Holdings and Thornleigh Golf Centre.
He holds a Bachelor of Economics (Hons) from Macquarie University.
James Todd
Non-executive Director
James was appointed non-executive chairman of Caxton Print Group Holdings (IVE’s
predecessor company) in November 2012 and became a non-executive director in
September 2014 when Geoff Selig was appointed Executive Chairman.
James is an experienced company director, corporate adviser and investor. He is Managing
Director of Wolseley Private Equity, an independent private equity firm which he co-founded in
1999. He commenced his career in investment banking with Hambros Bank, both in Sydney
and London, and has taken active roles with, and invested in, a range of public and private
companies.
James also served as a Council Member of the Australian Private Equity and Venture
Capital Association (AVCAL), where he was chair of the AVCAL Growth Funds Committee.
He is currently a non-executive director of AGS World Transport.
James holds a Bachelor of Commerce and Bachelor of Laws from the University of New South
Wales, and a Graduate Diploma from the Financial Services Institute of Australia (FINSIA),
where he is a Fellow. He is also a Member of the Australian Institute of Company Directors.
Sandra Hook
Independent
Non-executive Director
Sandra has extensive operational, financial management and strategic experience built over
25 years in senior executive roles as a CEO, COO, Marketing Director, and General Manager of
some of Australia’s largest media companies including Foxtel, Federal Publishing Company,
Murdoch Magazines, Fairfax, ACP and News Limited. She has a track record in driving
transformation and transitioning traditional businesses in rapidly evolving environments.
She currently holds a number of directorships including Chair of WYZA Limited, non- executive
director of RXP Services Limited, MedAdvisor Limited, Sydney Fish Markets, and is a Trustee of
the Royal Botanic Gardens and Sydney Harbour Federation Trust.
39Annual Report 2016
Company SecretaryEmma LawlerEmma was appointed as Company Secretary on 11 December 2015. Emma has two decades of experience as a company
secretary and governance professional. Emma holds a Bachelor of Business and a Graduate Diploma in Applied Corporate
Governance and is a Fellow of the Governance Institute of Australia.
Darren DunkleyDarren has been the Chief Financial Officer (CFO) of the Group since 2012, and has been with IVE for over 15 years. He has
over 25 years of experience with a range of blue chip companies including Sharp Corporation, ANZ Banking Group Ltd and
Nashua Australia. Darren has a Bachelor of Commerce majoring in Accounting and is a CPA.
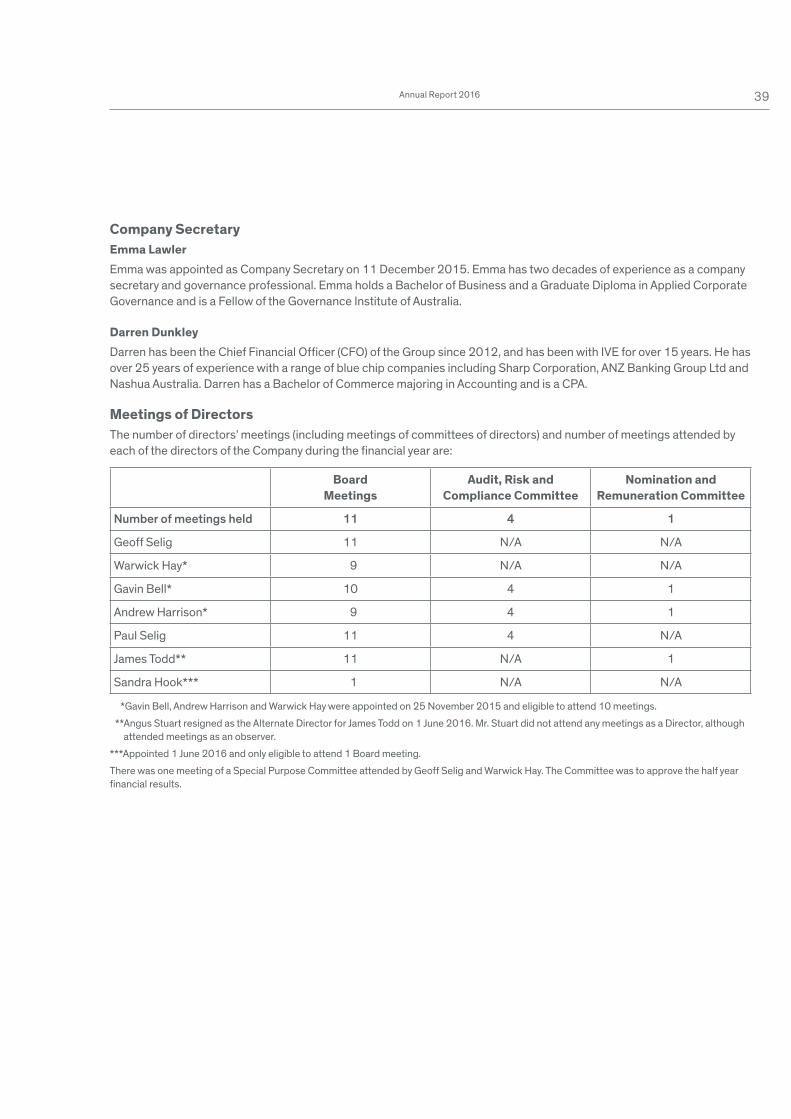
Meetings of DirectorsThe number of directors’ meetings (including meetings of committees of directors) and number of meetings attended by
each of the directors of the Company during the financial year are:
BoardMeetings
Audit, Risk and Compliance Committee
Nomination and Remuneration Committee
Number of meetings held 11 4 1
Geoff Selig 11 N/A N/A
Warwick Hay* 9 N/A N/A
Gavin Bell* 10 4 1
Andrew Harrison* 9 4 1
Paul Selig 11 4 N/A
James Todd** 11 N/A 1
Sandra Hook*** 1 N/A N/A
* Gavin Bell, Andrew Harrison and Warwick Hay were appointed on 25 November 2015 and eligible to attend 10 meetings.
** Angus Stuart resigned as the Alternate Director for James Todd on 1 June 2016. Mr. Stuart did not attend any meetings as a Director, although
attended meetings as an observer.
*** Appointed 1 June 2016 and only eligible to attend 1 Board meeting.
There was one meeting of a Special Purpose Committee attended by Geoff Selig and Warwick Hay. The Committee was to approve the half year
financial results.
40 IVE Group Limited
Directors’ interest and benefits The relevant interests of each director in the shares of the Company as at the date of this report are disclosed in the
Remuneration Report (on page 41).
Environmental regulationThe Group’s operation is not subject to any significant environmental regulations under either Commonwealth or State
legislation. However, the Board believes that the Group has adequate systems in place for the management of its
environmental requirements and is not aware of any breach of those environmental requirements as they may apply to the
Group during the period covered by this report.
Events subsequent to reporting dateThere has not arisen in the interval between the end of the financial year and the date of this report any item, transaction
or event of a material and unusual nature likely, in the opinion of the directors of the Company, to affect significantly the
operations of the Group, the results of those operations, or the state of affairs of the Group, in future financial years.
Likely developmentsInformation about likely developments in the operations of the Group and the expected results of those operations in
future financial years has not been included in this report because disclosure of the information would be likely to result in
unreasonable prejudice to the Group.
Indemnification and insurance of officers and auditorsIndemnificationThe Company has not indemnified or made a relevant agreement for indemnifying against a liability any person who is or
has been an officer or auditor of the Company.
Insurance premiumsDuring the financial year the Company has paid premiums in respect of directors’ and officers’ liability insurance contracts
for the year ended 30 June 2016. In addition, since the financial year, the Company paid or agreed to pay premiums in
respect of such insurance contracts for the year ending 30 June 2017. Such insurance contracts insure against certain
liability (subject to specific exclusions) for persons who are or have been directors or executive officers of the Company.
The directors have not included details of the nature of the liabilities covered or the amount of the premiums paid in respect
of the directors’ and officers’ liability insurance contracts, as such disclosure is prohibited under the terms of the contract.
Non-audit servicesDuring the year, KPMG, the Group’s auditor has performed certain other services in addition to its statutory duties. The
Board has considered the non-audit services provided during the year by the auditor, and, in accordance with the advice
received from the Audit Committee, is satisfied that the provision of those non-audit services during the year by the auditor
is compatible with, and did not compromise, the auditor independence requirement of the Corporations Act 2001 (Cth) for
the following reasons:
• All non-audit services are subject to corporate governance procedures adopted by the Group and have been reviewed
by those charged with governance throughout the year to ensure they do not impact the integrity and objectivity of the
auditor; and
• The non-audit services provided do not undermine the general principles relating to audit independence as set out in
the APES 110 Code of Ethics for Professional Accountants, as they did not involve reviewing or auditing the auditor’s
own work, acting in a management or decision making capacity for the Group, acting as an advocate to the Group or
jointly sharing the risks and rewards.
Details of the amounts paid to the auditor of the Group, KPMG, for audit and non-audit services provided during the year
are set out in note 31 of the Financial Report.
DIRECTORS’ REPORT (CONT.)For the year ended 30 June 2016
41Annual Report 2016
Remuneration Report (Audited)This Remuneration Report (Report), which has been audited, describes the Key Management Personnel (KMP)
remuneration arrangements for the period ended 30 June 2016 for IVE Group, in accordance with the Corporations Act
2001 and its regulations.
The remuneration report contains the following sections:
• Who this report covers
• Overview of the remuneration framework for executive KMP
• Linking reward and performance
• Share based remuneration
• Non-Executive Director remuneration framework
• Contractual arrangements with executive KMPs
• Details of remuneration for KMPs
• Directors and executive KMP shareholdings in IVE Group Limited
• Other statutory disclosures
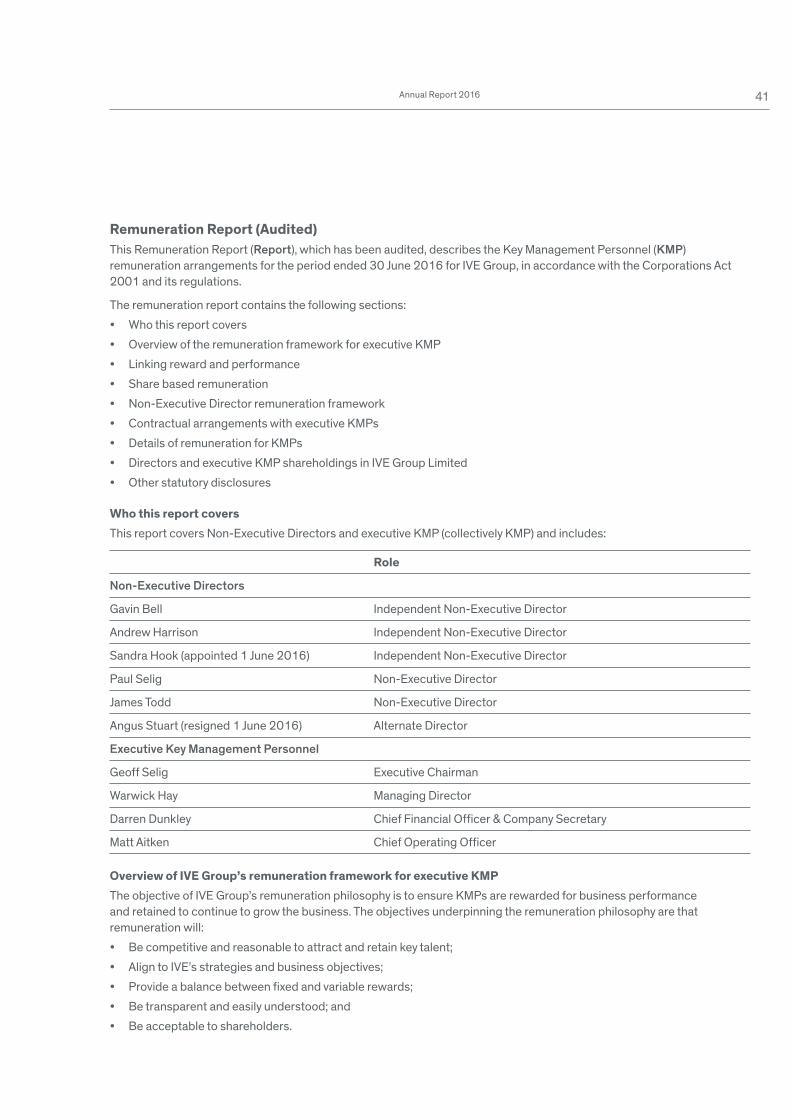
Who this report coversThis report covers Non-Executive Directors and executive KMP (collectively KMP) and includes:
Role
Non-Executive Directors
Gavin Bell Independent Non-Executive Director
Andrew Harrison Independent Non-Executive Director
Sandra Hook (appointed 1 June 2016) Independent Non-Executive Director
Paul Selig Non-Executive Director
James Todd Non-Executive Director
Angus Stuart (resigned 1 June 2016) Alternate Director
Executive Key Management Personnel
Geoff Selig Executive Chairman
Warwick Hay Managing Director
Darren Dunkley Chief Financial Officer & Company Secretary
Matt Aitken Chief Operating Officer
Overview of IVE Group’s remuneration framework for executive KMPThe objective of IVE Group’s remuneration philosophy is to ensure KMPs are rewarded for business performance
and retained to continue to grow the business. The objectives underpinning the remuneration philosophy are that
remuneration will:
• Be competitive and reasonable to attract and retain key talent;
• Align to IVE’s strategies and business objectives;
• Provide a balance between fixed and variable rewards;
• Be transparent and easily understood; and
• Be acceptable to shareholders.
42 IVE Group Limited
A key factor in IVE Group’s business success will be being able to attract and retain key talent and the remuneration
framework has been designed to enable this.
Governance
When IVE Group listed on the ASX, it established a Nomination and Remuneration Committee (NRC) whose role is to assist
the Board with its remuneration responsibilities, including reviewing and recommending arrangements for executives,
Executive Directors and Non-Executive Directors. The NRC has three members, two of whom are independent, including
an independent Chair. The members of the NRC have appropriate qualifications and experience to enable the NRC to fulfil
its role.
External remuneration consultants
The Terms of Reference for the NRC requires that any remuneration consultants engaged be appointed by the NRC. During
2016 IVE did not engage the services of any external remuneration consultants.
Any advice that may be received from remuneration consultants in future will be carefully considered by the NRC to ensure
it is given free of undue influence by IVE Group executives.
Structure of Remuneration
The remuneration framework for KMP includes both fixed and performance-based pay.
Fixed remuneration
Fixed remuneration is set using a combination of historical levels and sector comparisons. Fixed remuneration includes
base pay, statutory contributions for superannuation and non-monetary benefits.
The NRC reviews the fixed remuneration of executive KMP on an annual basis.
Short term incentive (STI)
In 2016, executive KMP were eligible to receive an STI payment up to 30% of fixed remuneration. The STI is a cash
incentive payment and is conditional on achievement of certain performance-based criteria, including:
• Financial and non-financial performance; and
• IVE Group’s profit performance.
The performance measures for each KMP’s STI are assessed and their relative weightings tailored to each KMP role
by the NRC each year.
Due in part to the listing of IVE Group during the year, the Board has determined that no STI payments will be made to
executive KMP for 2016.
STI will be offered in 2017, to be paid as a cash incentive, up to a total target as specified in the table on page 48 for
achievement of EBITDA targets at a Group level.
Long term incentive (LTI)
The Board has established a LTI Plan as disclosed in the Prospectus and outlined in the section in this Report entitled
“Share based remuneration”. No offers were made to KMP in FY2016 under the LTI Plan, although offers will be made
as part of the FY2017 remuneration framework.
The LTI Plan will offer Performance Share Rights (Rights) and the Rights will vest and convert to ordinary shares on a
one-for-one basis after a 3 year performance period, subject to meeting specific performance conditions as outlined in
the section in this Report entitled “Share based remuneration”. The LTI Plan has been designed commensurate with IVE
Group’s long-term strategic objectives so that the Senior Leadership Team will be rewarded when there is a demonstrable
increase in shareholder value.
DIRECTORS’ REPORT (CONT.)For the year ended 30 June 2016
43Annual Report 2016
The grant of Rights to the Executive Chairman and Managing Director are subject to shareholder approval at the
2016 Annual General Meeting. The proportion of total remuneration to be granted as part of the LTI Plan is shown in
the table below.
The Board has the discretion to amend the vesting terms and performance hurdles for each award of Rights to ensure
that they are aligned to market practice and ensure the best outcome for IVE Group. The Board also has the discretion
to change the LTI Plan and to determine whether LTI grants will be made in future years. Note there is no-retesting of
performance hurdles.
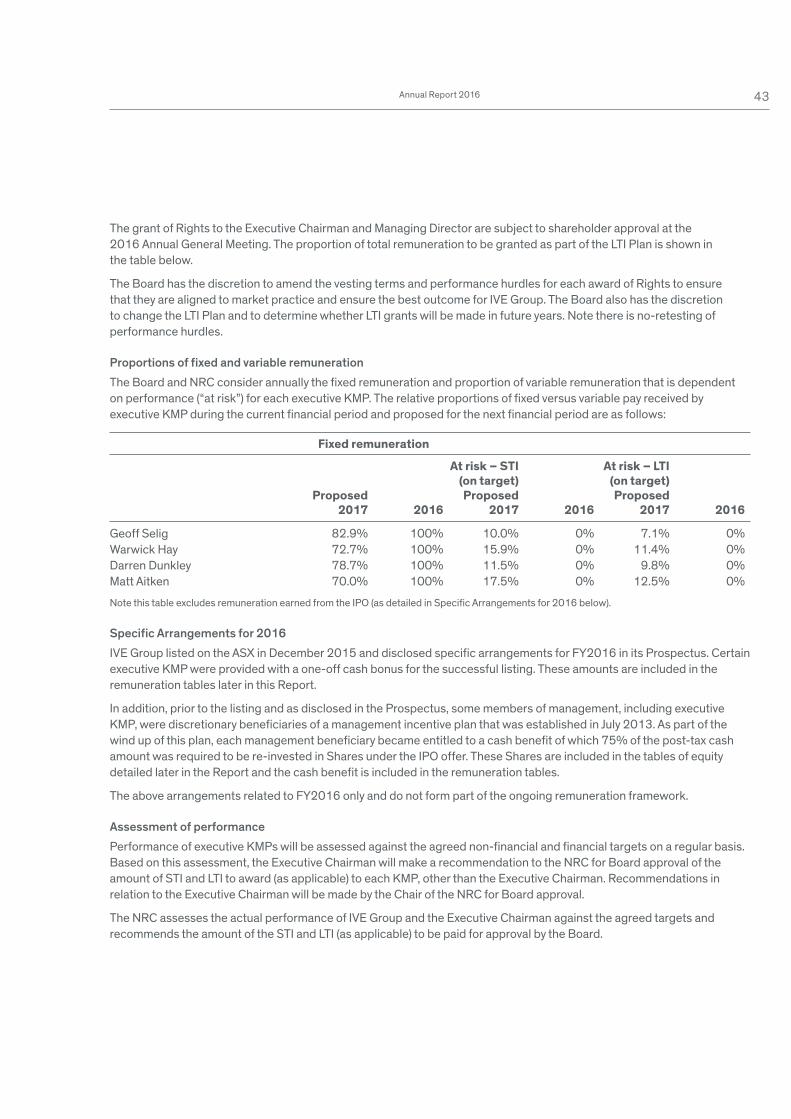
Proportions of fixed and variable remuneration
The Board and NRC consider annually the fixed remuneration and proportion of variable remuneration that is dependent
on performance (“at risk”) for each executive KMP. The relative proportions of fixed versus variable pay received by
executive KMP during the current financial period and proposed for the next financial period are as follows:
Fixed remuneration
At risk – STI At risk – LTI (on target) (on target) Proposed Proposed Proposed 2017 2016 2017 2016 2017 2016
Geoff Selig 82.9% 100% 10.0% 0% 7.1% 0%
Warwick Hay 72.7% 100% 15.9% 0% 11.4% 0%
Darren Dunkley 78.7% 100% 11.5% 0% 9.8% 0%
Matt Aitken 70.0% 100% 17.5% 0% 12.5% 0%
Note this table excludes remuneration earned from the IPO (as detailed in Specific Arrangements for 2016 below).
Specific Arrangements for 2016
IVE Group listed on the ASX in December 2015 and disclosed specific arrangements for FY2016 in its Prospectus. Certain
executive KMP were provided with a one-off cash bonus for the successful listing. These amounts are included in the
remuneration tables later in this Report.
In addition, prior to the listing and as disclosed in the Prospectus, some members of management, including executive
KMP, were discretionary beneficiaries of a management incentive plan that was established in July 2013. As part of the
wind up of this plan, each management beneficiary became entitled to a cash benefit of which 75% of the post-tax cash
amount was required to be re-invested in Shares under the IPO offer. These Shares are included in the tables of equity
detailed later in the Report and the cash benefit is included in the remuneration tables.
The above arrangements related to FY2016 only and do not form part of the ongoing remuneration framework.
Assessment of performance
Performance of executive KMPs will be assessed against the agreed non-financial and financial targets on a regular basis.
Based on this assessment, the Executive Chairman will make a recommendation to the NRC for Board approval of the
amount of STI and LTI to award (as applicable) to each KMP, other than the Executive Chairman. Recommendations in
relation to the Executive Chairman will be made by the Chair of the NRC for Board approval.
The NRC assesses the actual performance of IVE Group and the Executive Chairman against the agreed targets and
recommends the amount of the STI and LTI (as applicable) to be paid for approval by the Board.

44 IVE Group Limited
How reward is linked to performancePerformance indicators
IVE Group’s financial performance has been strong and Prospectus forecasts have been achieved.
As IVE Group has recently listed, statutory disclosures relating to dividend payments, dividend payout ratio, and increase/
(decrease) in share price are not applicable. Key financial metrics over the last four years are shown below:
Net profi t Revenue EBITDA after tax $’M $’M $’M
2013 276.5 20.3 5.1
2014 303.5 22.9 6.4
2015 337.4 30.9 9.7
2016 382.0 42.8 20.9
The above results are prepared on a pro forma basis.
Performance and impact on remuneration
However, it should be noted that there is no direct link between remuneration and performance in FY2016. As stated
above and due in part to the listing of IVE Group during the year, the Board has determined not to award STI and LTI
payments for FY2016 for the senior management team. The Board will report on the link between pay and performance in
future reports.
Share based remunerationIVE Group operates an LTI plan for eligible senior executives (the IVE Group Equity Incentive Plan). The vesting of
Performance Share Rights (Rights) is subject to the achievement of performance conditions as set out in the LTI
description in the “Overview of IVE Group’s remuneration framework” section of this report. Rights carry no dividend or
voting rights. No Rights were granted to KMP during the year. Rights which were granted to certain senior managers
(no KMP) as a one-off equity grant for commitment to the business and significant contributions in the lead up to the listing
on the ASX vested converted to Shares during the year (325,000 shares) and are disclosed in this Report.
There were no unvested Performance Share Rights or options as at 30 June 2016.
The terms of the Equity Incentive Plan which provide the framework under which the LTI grants will be made in 2017 are as
follows:
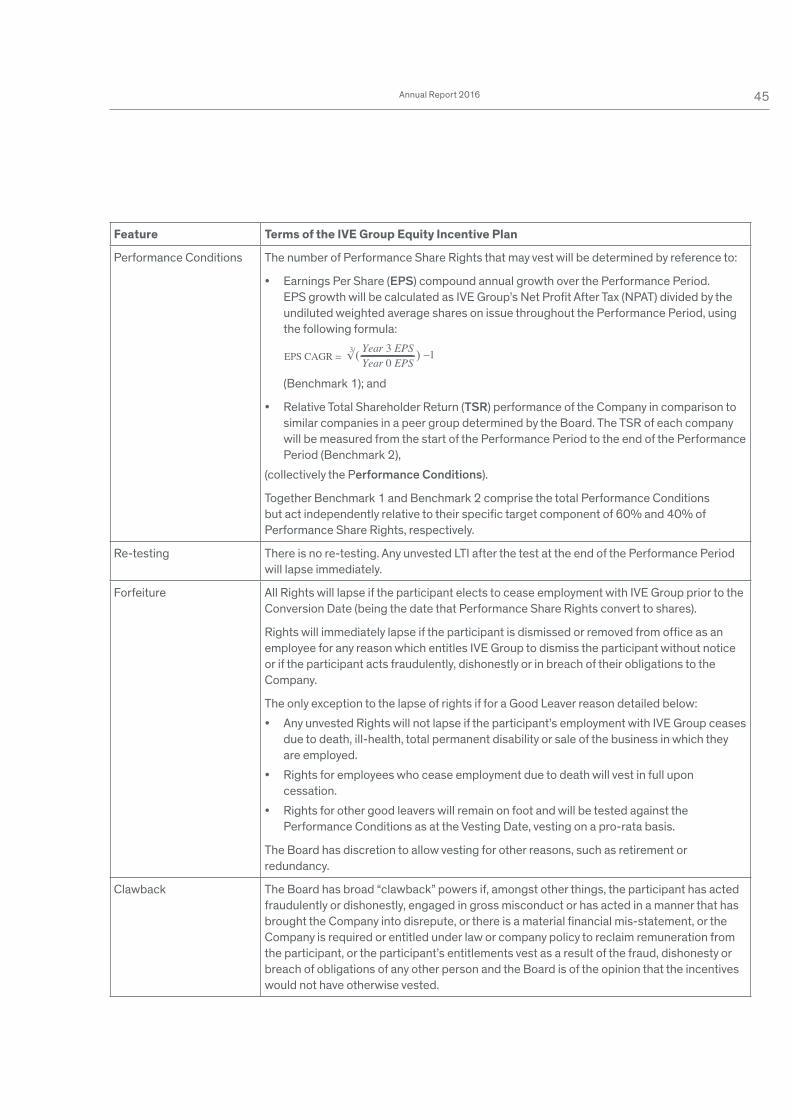
Feature Terms of the IVE Group Equity Incentive Plan
Type of security Performance Share Rights which are an entitlement to receive fully paid ordinary IVE Group
Limited shares (as traded on the ASX) on a one-for-one basis.
Valuation The number of Performance Share Rights for each KMP is calculated by dividing the
allocated value of the LTI award for that KMP by the fair value of a Performance Share Right
calculated using a Black Scholes financial model.
For the Executive Chairman and Managing Director, the value of the potential LTI award, as
recommended by the Board, will be submitted for approval by shareholders at the relevant
Annual General Meeting, as required by the ASX Listing Rules.
Performance Period The Performance Period is the three year period 1 July to 30 June inclusive.
DIRECTORS’ REPORT (CONT.)For the year ended 30 June 2016
45Annual Report 2016
Feature Terms of the IVE Group Equity Incentive Plan
Performance Conditions The number of Performance Share Rights that may vest will be determined by reference to:
• Earnings Per Share (EPS) compound annual growth over the Performance Period.
EPS growth will be calculated as IVE Group’s Net Profit After Tax (NPAT) divided by the
undiluted weighted average shares on issue throughout the Performance Period, using
the following formula:
(Benchmark 1); and
• Relative Total Shareholder Return (TSR) performance of the Company in comparison to
similar companies in a peer group determined by the Board. The TSR of each company
will be measured from the start of the Performance Period to the end of the Performance
Period (Benchmark 2),
(collectively the Performance Conditions).
Together Benchmark 1 and Benchmark 2 comprise the total Performance Conditions
but act independently relative to their specific target component of 60% and 40% of
Performance Share Rights, respectively.
Re-testing There is no re-testing. Any unvested LTI after the test at the end of the Performance Period
will lapse immediately.
Forfeiture All Rights will lapse if the participant elects to cease employment with IVE Group prior to the
Conversion Date (being the date that Performance Share Rights convert to shares).
Rights will immediately lapse if the participant is dismissed or removed from office as an
employee for any reason which entitles IVE Group to dismiss the participant without notice
or if the participant acts fraudulently, dishonestly or in breach of their obligations to the
Company.
The only exception to the lapse of rights if for a Good Leaver reason detailed below:
• Any unvested Rights will not lapse if the participant’s employment with IVE Group ceases
due to death, ill-health, total permanent disability or sale of the business in which they
are employed.
• Rights for employees who cease employment due to death will vest in full upon
cessation.
• Rights for other good leavers will remain on foot and will be tested against the
Performance Conditions as at the Vesting Date, vesting on a pro-rata basis.
The Board has discretion to allow vesting for other reasons, such as retirement or
redundancy.
Clawback The Board has broad “clawback” powers if, amongst other things, the participant has acted
fraudulently or dishonestly, engaged in gross misconduct or has acted in a manner that has
brought the Company into disrepute, or there is a material financial mis-statement, or the
Company is required or entitled under law or company policy to reclaim remuneration from
the participant, or the participant’s entitlements vest as a result of the fraud, dishonesty or
breach of obligations of any other person and the Board is of the opinion that the incentives
would not have otherwise vested.
EPS CAGR = √3 Year 3 EPSYear 0 EPS –1)(
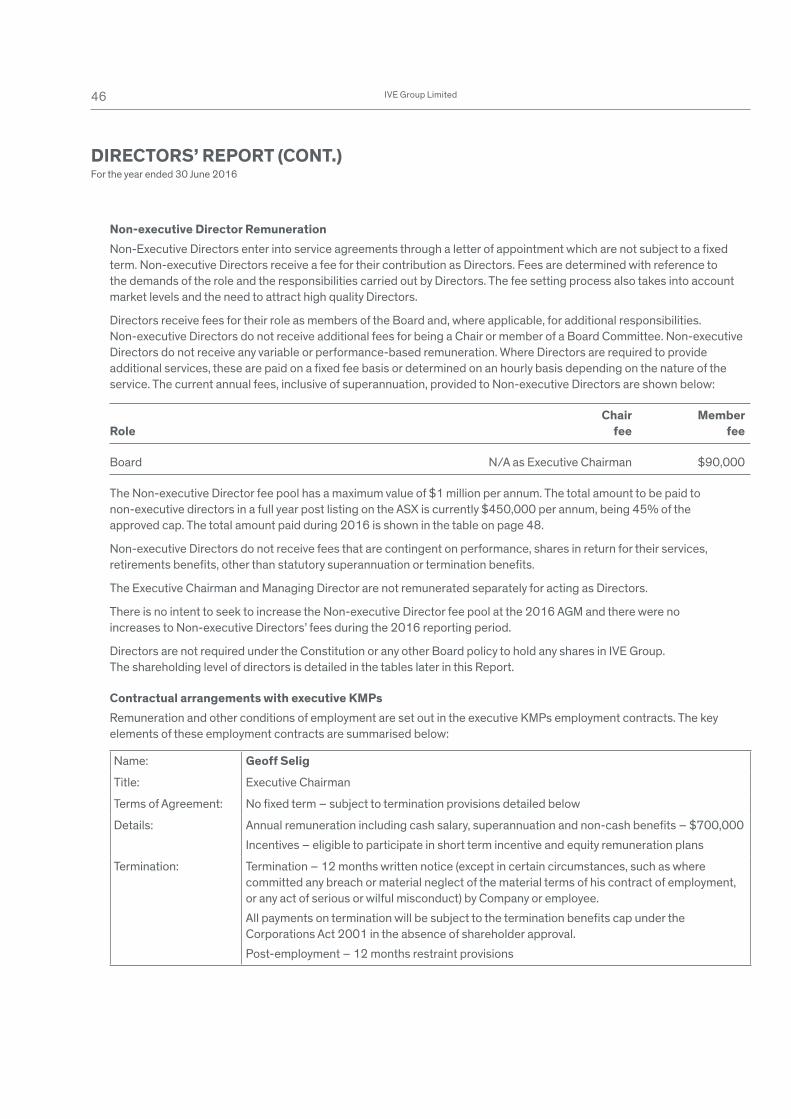
46 IVE Group Limited
Non-executive Director Remuneration Non-Executive Directors enter into service agreements through a letter of appointment which are not subject to a fixed
term. Non-executive Directors receive a fee for their contribution as Directors. Fees are determined with reference to
the demands of the role and the responsibilities carried out by Directors. The fee setting process also takes into account
market levels and the need to attract high quality Directors.
Directors receive fees for their role as members of the Board and, where applicable, for additional responsibilities.
Non-executive Directors do not receive additional fees for being a Chair or member of a Board Committee. Non-executive
Directors do not receive any variable or performance-based remuneration. Where Directors are required to provide
additional services, these are paid on a fixed fee basis or determined on an hourly basis depending on the nature of the
service. The current annual fees, inclusive of superannuation, provided to Non-executive Directors are shown below:
Chair MemberRole fee fee
Board N/A as Executive Chairman $90,000
The Non-executive Director fee pool has a maximum value of $1 million per annum. The total amount to be paid to
non-executive directors in a full year post listing on the ASX is currently $450,000 per annum, being 45% of the
approved cap. The total amount paid during 2016 is shown in the table on page 48.
Non-executive Directors do not receive fees that are contingent on performance, shares in return for their services,
retirements benefits, other than statutory superannuation or termination benefits.
The Executive Chairman and Managing Director are not remunerated separately for acting as Directors.
There is no intent to seek to increase the Non-executive Director fee pool at the 2016 AGM and there were no
increases to Non-executive Directors’ fees during the 2016 reporting period.
Directors are not required under the Constitution or any other Board policy to hold any shares in IVE Group.
The shareholding level of directors is detailed in the tables later in this Report.
Contractual arrangements with executive KMPsRemuneration and other conditions of employment are set out in the executive KMPs employment contracts. The key
elements of these employment contracts are summarised below:
Name: Geoff Selig
Title: Executive Chairman
Terms of Agreement: No fixed term – subject to termination provisions detailed below
Details: Annual remuneration including cash salary, superannuation and non-cash benefits – $700,000
Incentives – eligible to participate in short term incentive and equity remuneration plans
Termination: Termination – 12 months written notice (except in certain circumstances, such as where
committed any breach or material neglect of the material terms of his contract of employment,
or any act of serious or wilful misconduct) by Company or employee.
All payments on termination will be subject to the termination benefits cap under the
Corporations Act 2001 in the absence of shareholder approval.
Post-employment – 12 months restraint provisions
DIRECTORS’ REPORT (CONT.)For the year ended 30 June 2016
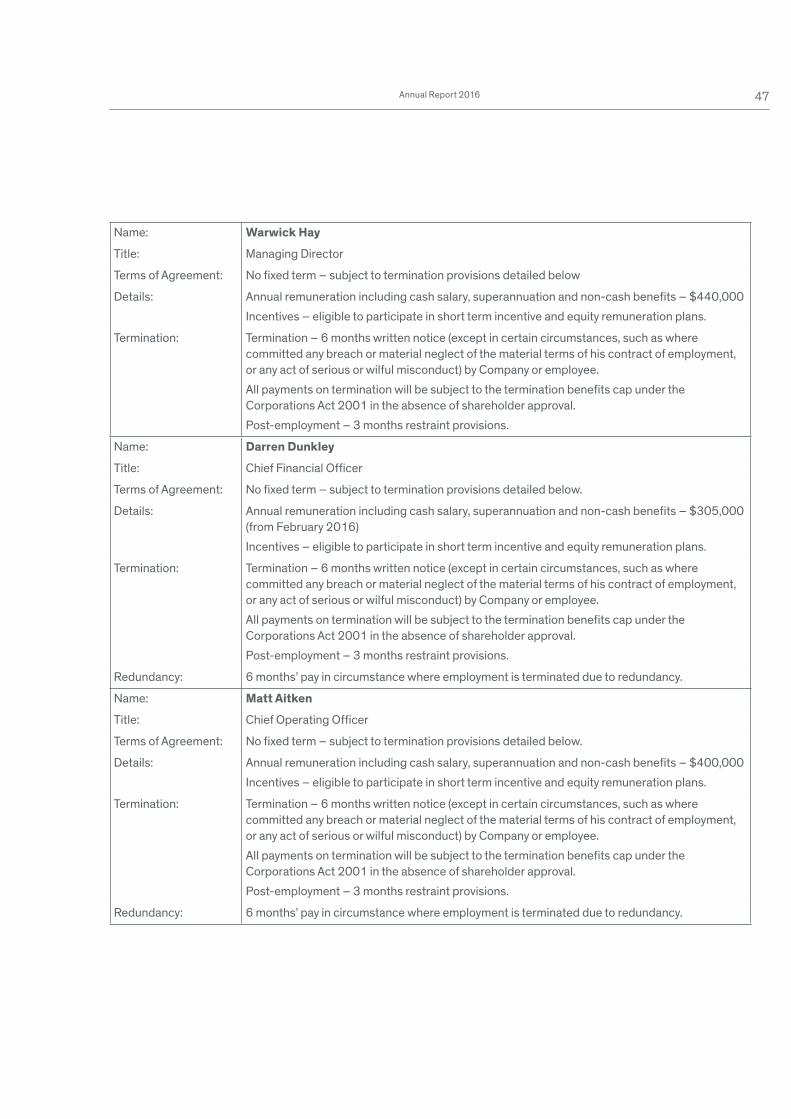
47Annual Report 2016
Name: Warwick Hay
Title: Managing Director
Terms of Agreement: No fixed term – subject to termination provisions detailed below
Details: Annual remuneration including cash salary, superannuation and non-cash benefits – $440,000
Incentives – eligible to participate in short term incentive and equity remuneration plans.
Termination: Termination – 6 months written notice (except in certain circumstances, such as where
committed any breach or material neglect of the material terms of his contract of employment,
or any act of serious or wilful misconduct) by Company or employee.
All payments on termination will be subject to the termination benefits cap under the
Corporations Act 2001 in the absence of shareholder approval.
Post-employment – 3 months restraint provisions.
Name: Darren Dunkley
Title: Chief Financial Officer
Terms of Agreement: No fixed term – subject to termination provisions detailed below.
Details: Annual remuneration including cash salary, superannuation and non-cash benefits – $305,000
(from February 2016)
Incentives – eligible to participate in short term incentive and equity remuneration plans.
Termination: Termination – 6 months written notice (except in certain circumstances, such as where
committed any breach or material neglect of the material terms of his contract of employment,
or any act of serious or wilful misconduct) by Company or employee.
All payments on termination will be subject to the termination benefits cap under the
Corporations Act 2001 in the absence of shareholder approval.
Post-employment – 3 months restraint provisions.
Redundancy: 6 months’ pay in circumstance where employment is terminated due to redundancy.
Name: Matt Aitken
Title: Chief Operating Officer
Terms of Agreement: No fixed term – subject to termination provisions detailed below.
Details: Annual remuneration including cash salary, superannuation and non-cash benefits – $400,000
Incentives – eligible to participate in short term incentive and equity remuneration plans.
Termination: Termination – 6 months written notice (except in certain circumstances, such as where
committed any breach or material neglect of the material terms of his contract of employment,
or any act of serious or wilful misconduct) by Company or employee.
All payments on termination will be subject to the termination benefits cap under the
Corporations Act 2001 in the absence of shareholder approval.
Post-employment – 3 months restraint provisions.
Redundancy: 6 months’ pay in circumstance where employment is terminated due to redundancy.
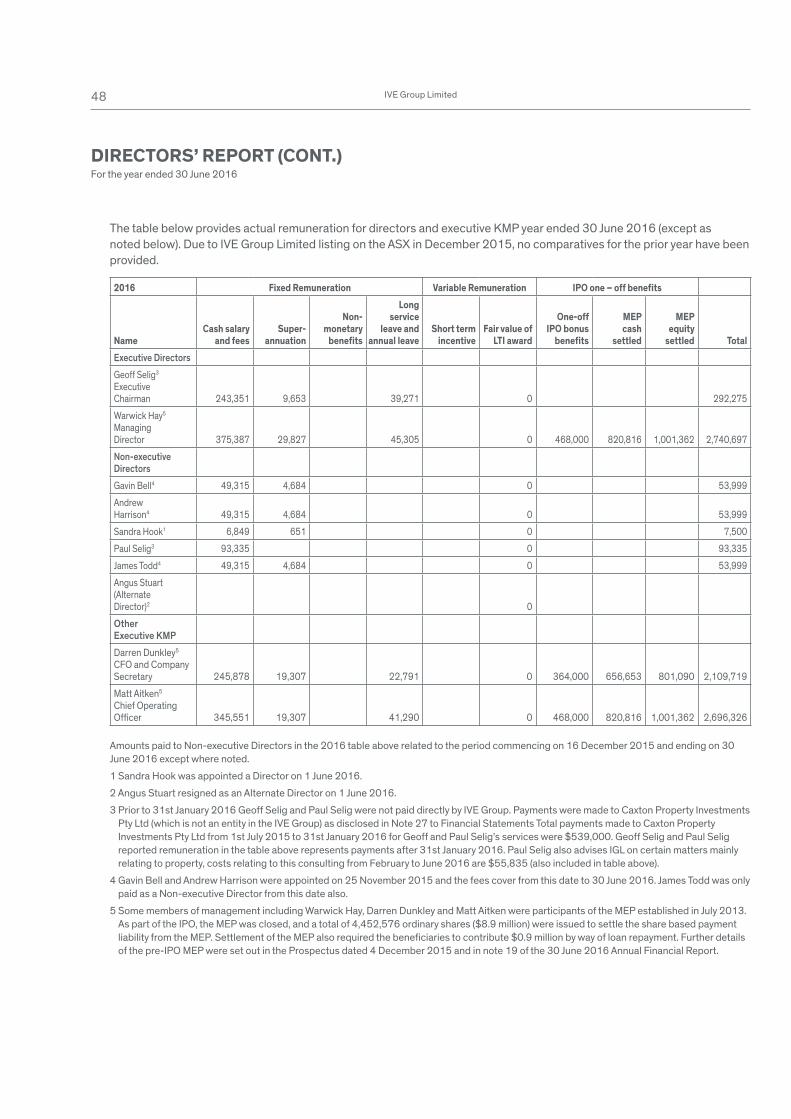
48 IVE Group Limited
The table below provides actual remuneration for directors and executive KMP year ended 30 June 2016 (except as
noted below). Due to IVE Group Limited listing on the ASX in December 2015, no comparatives for the prior year have been
provided.
2016 Fixed Remuneration Variable Remuneration IPO one – off benefits
NameCash salary
and feesSuper-
annuation
Non-monetary
benefits
Long service
leave and annual leave
Short term incentive
Fair value of LTI award
One-off IPO bonus
benefits
MEPcash
settled
MEPequity
settled TotalExecutive Directors
Geoff Selig3
ExecutiveChairman 243,351 9,653 39,271 0 292,275
Warwick Hay5
ManagingDirector 375,387 29,827 45,305 0 468,000 820,816 1,001,362 2,740,697
Non-executiveDirectors
Gavin Bell4 49,315 4,684 0 53,999
AndrewHarrison4 49,315 4,684 0 53,999
Sandra Hook1 6,849 651 0 7,500
Paul Selig3 93,335 0 93,335
James Todd4 49,315 4,684 0 53,999
Angus Stuart(AlternateDirector)2 0
OtherExecutive KMP
Darren Dunkley5
CFO and Company Secretary 245,878 19,307 22,791 0 364,000 656,653 801,090 2,109,719
Matt Aitken5
Chief Operating Officer 345,551 19,307 41,290 0 468,000 820,816 1,001,362 2,696,326
Amounts paid to Non-executive Directors in the 2016 table above related to the period commencing on 16 December 2015 and ending on 30
June 2016 except where noted.
1 Sandra Hook was appointed a Director on 1 June 2016.
2 Angus Stuart resigned as an Alternate Director on 1 June 2016.
3 Prior to 31st January 2016 Geoff Selig and Paul Selig were not paid directly by IVE Group. Payments were made to Caxton Property Investments
Pty Ltd (which is not an entity in the IVE Group) as disclosed in Note 27 to Financial Statements Total payments made to Caxton Property
Investments Pty Ltd from 1st July 2015 to 31st January 2016 for Geoff and Paul Selig’s services were $539,000. Geoff Selig and Paul Selig
reported remuneration in the table above represents payments after 31st January 2016. Paul Selig also advises IGL on certain matters mainly
relating to property, costs relating to this consulting from February to June 2016 are $55,835 (also included in table above).
4 Gavin Bell and Andrew Harrison were appointed on 25 November 2015 and the fees cover from this date to 30 June 2016. James Todd was only
paid as a Non-executive Director from this date also.
5 Some members of management including Warwick Hay, Darren Dunkley and Matt Aitken were participants of the MEP established in July 2013.
As part of the IPO, the MEP was closed, and a total of 4,452,576 ordinary shares ($8.9 million) were issued to settle the share based payment
liability from the MEP. Settlement of the MEP also required the beneficiaries to contribute $0.9 million by way of loan repayment. Further details
of the pre-IPO MEP were set out in the Prospectus dated 4 December 2015 and in note 19 of the 30 June 2016 Annual Financial Report.
DIRECTORS’ REPORT (CONT.)For the year ended 30 June 2016

49Annual Report 2016
Director and Executive KMP ShareholdingThe table below provides the number of shares in IVE Group Limited held by each Director and executive KMP during the
period, including their related parties:
Shares received during Balance the period on at Listing exercise of Additional Balance at Date or Performance shares the end of Appointment Share Rights issued the period
Executive Directors
Geoff Selig, Executive Chairman1 13,316,329 - - 13,316,329
Warwick Hay, Managing Director5 500,681 - - 500,681
Non-executive Directors
Gavin Bell 75,002 - - 75,002
Andrew Harrison 30,000 - - 30,000
Sandra Hook4 0 - - 0
Paul Selig1 13,316,329 - - 13,316,329
James Todd2 50,000 - - 50,000
Angus Stuart
(Alternate Director) 2, 3 25,000 - - N/A
Executive KMP
Darren Dunkley,
CFO and Company Secretary5 400,545 – – 400,545
Matt Aitken,
Chief Operating Offi cer5 500,681 - - 500,681
1 Geoff Selig and Paul Selig do not hold a direct interest in shares in IVE Group Limited. However each of Paul Selig and Geoff Selig are
beneficiaries of the Selig Family Trust No. 5, the trustee of which holds 13,316,329 shares.
2 James Todd is the Managing Director of Wolseley Private Equity, and Angus Stuart was a director of Wolseley Private Equity, which holds an
ultimate beneficial interest of 33.8 million shares.
3 Angus Stuart resigned as an Alternate Director on 1 June 2016.
4 Sandra Hook was appointed as a Director on 1 June 2016.
5 Issued as part of pre-IPO MEP close out.
This concludes the remuneration report, which has been audited.
Loans to directors and executivesNo loans were made to directors and executives of IVE Group Limited including their close family and entities related to
them during the year.
Shares under optionThere were no unissued ordinary shares of IVE Group Limited under option outstanding at the date of this report.
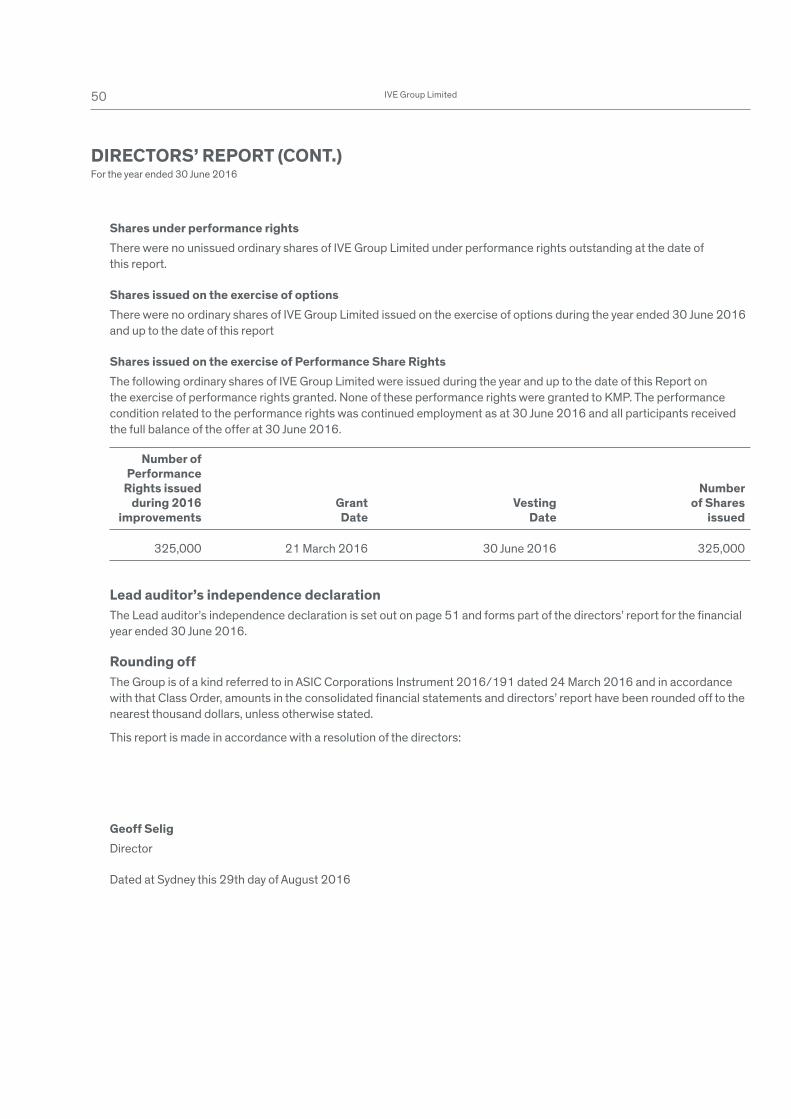
50 IVE Group Limited
Shares under performance rightsThere were no unissued ordinary shares of IVE Group Limited under performance rights outstanding at the date of
this report.
Shares issued on the exercise of optionsThere were no ordinary shares of IVE Group Limited issued on the exercise of options during the year ended 30 June 2016
and up to the date of this report
Shares issued on the exercise of Performance Share RightsThe following ordinary shares of IVE Group Limited were issued during the year and up to the date of this Report on
the exercise of performance rights granted. None of these performance rights were granted to KMP. The performance
condition related to the performance rights was continued employment as at 30 June 2016 and all participants received
the full balance of the offer at 30 June 2016.
Number of Performance Rights issued Number during 2016 Grant Vesting of Shares improvements Date Date issued
325,000 21 March 2016 30 June 2016 325,000
Lead auditor’s independence declarationThe Lead auditor’s independence declaration is set out on page 51 and forms part of the directors’ report for the financial
year ended 30 June 2016.
Rounding offThe Group is of a kind referred to in ASIC Corporations Instrument 2016/191 dated 24 March 2016 and in accordance
with that Class Order, amounts in the consolidated financial statements and directors’ report have been rounded off to the
nearest thousand dollars, unless otherwise stated.
This report is made in accordance with a resolution of the directors:
Geoff SeligDirector
Dated at Sydney this 29th day of August 2016
DIRECTORS’ REPORT (CONT.)For the year ended 30 June 2016
51Annual Report 2016
To: the directors of IVE Group Limited
I declare that, to the best of my knowledge and belief, in relation to the audit for the financial year ended 30 June 2016,
there have been:
(i) no contraventions of the auditor independence requirements as set out in the Corporations Act 2001 in relation to
the audit; and
(ii) no contraventions of any applicable code of professional conduct in relation to the audit.
KPMG
Chris HollisPartner
Sydney
29 August 2016
LEAD AUDITOR’S INDEPENDENCE DECLARATION UNDER SECTION 307C OF THE CORPORATIONS ACT 2001
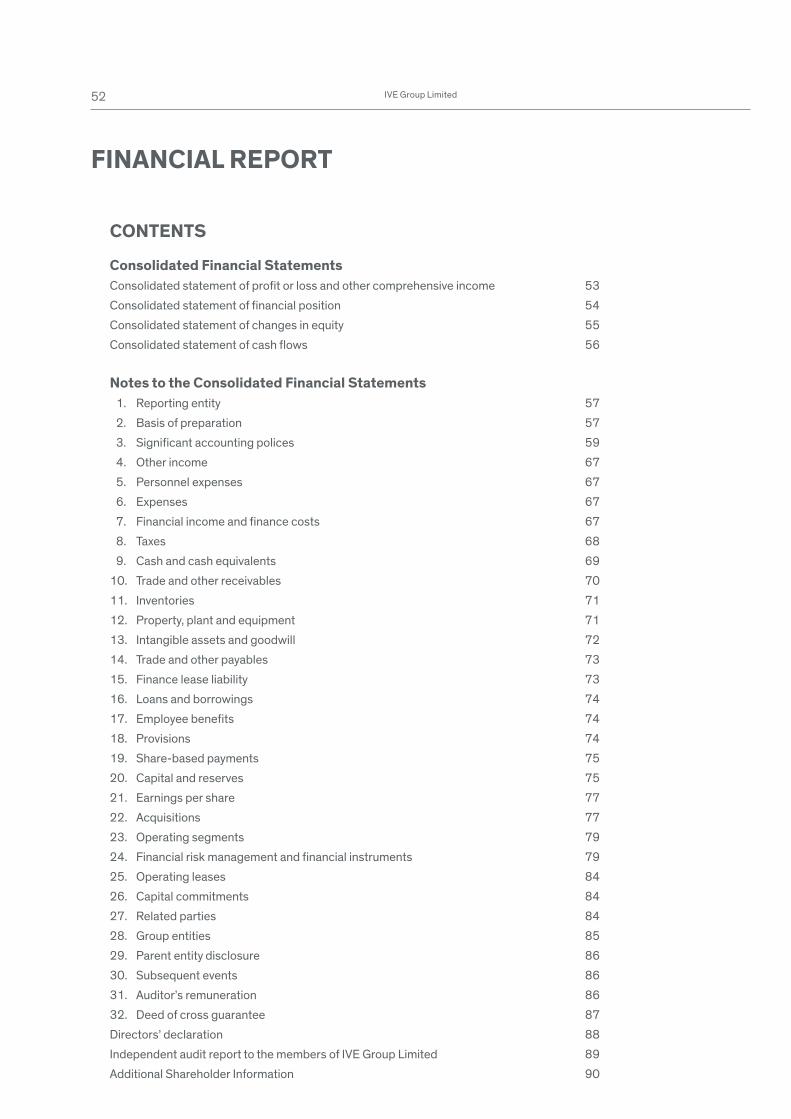
52 IVE Group Limited
FINANCIAL REPORT
CONTENTS
Consolidated Financial StatementsConsolidated statement of profit or loss and other comprehensive income 53
Consolidated statement of financial position 54
Consolidated statement of changes in equity 55
Consolidated statement of cash flows 56
Notes to the Consolidated Financial Statements 1. Reporting entity 57
2. Basis of preparation 57
3. Significant accounting polices 59
4. Other income 67
5. Personnel expenses 67
6. Expenses 67
7. Financial income and finance costs 67
8. Taxes 68
9. Cash and cash equivalents 69
10. Trade and other receivables 70
11. Inventories 71
12. Property, plant and equipment 71
13. Intangible assets and goodwill 72
14. Trade and other payables 73
15. Finance lease liability 73
16. Loans and borrowings 74
17. Employee benefits 74
18. Provisions 74
19. Share-based payments 75
20. Capital and reserves 75
21. Earnings per share 77
22. Acquisitions 77
23. Operating segments 79
24. Financial risk management and financial instruments 79
25. Operating leases 84
26. Capital commitments 84
27. Related parties 84
28. Group entities 85
29. Parent entity disclosure 86
30. Subsequent events 86
31. Auditor’s remuneration 86
32. Deed of cross guarantee 87
Directors’ declaration 88
Independent audit report to the members of IVE Group Limited 89
Additional Shareholder Information 90
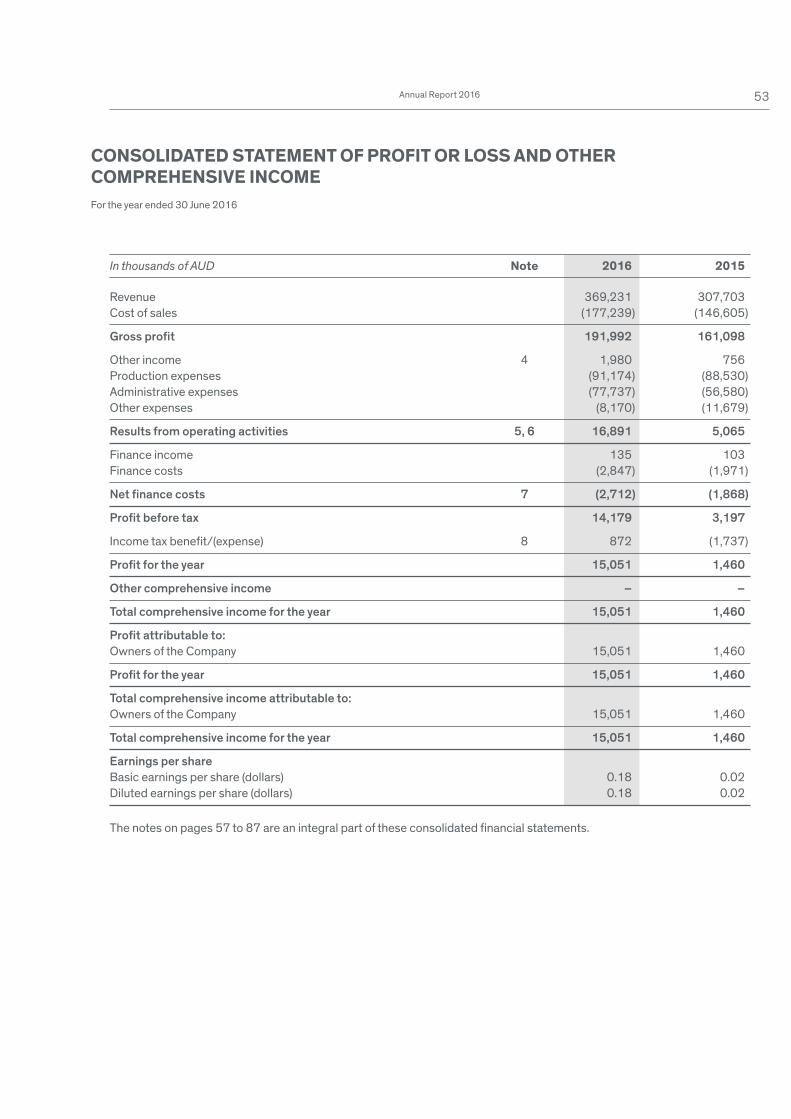
53Annual Report 2016
In thousands of AUD Note 2016 2015
Revenue 369,231 307,703
Cost of sales (177,239) (146,605)
Gross profi t 191,992 161,098
Other income 4 1,980 756
Production expenses (91,174) (88,530)
Administrative expenses (77,737) (56,580)
Other expenses (8,170) (11,679)
Results from operating activities 5, 6 16,891 5,065
Finance income 135 103
Finance costs (2,847) (1,971)
Net fi nance costs 7 (2,712) (1,868)
Profi t before tax 14,179 3,197
Income tax benefi t/(expense) 8 872 (1,737)
Profi t for the year 15,051 1,460
Other comprehensive income – –
Total comprehensive income for the year 15,051 1,460
Profi t attributable to:
Owners of the Company 15,051 1,460
Profi t for the year 15,051 1,460
Total comprehensive income attributable to:
Owners of the Company 15,051 1,460
Total comprehensive income for the year 15,051 1,460
Earnings per share
Basic earnings per share (dollars) 0.18 0.02
Diluted earnings per share (dollars) 0.18 0.02
The notes on pages 57 to 87 are an integral part of these consolidated financial statements.
CONSOLIDATED STATEMENT OF PROFIT OR LOSS AND OTHER COMPREHENSIVE INCOMEFor the year ended 30 June 2016
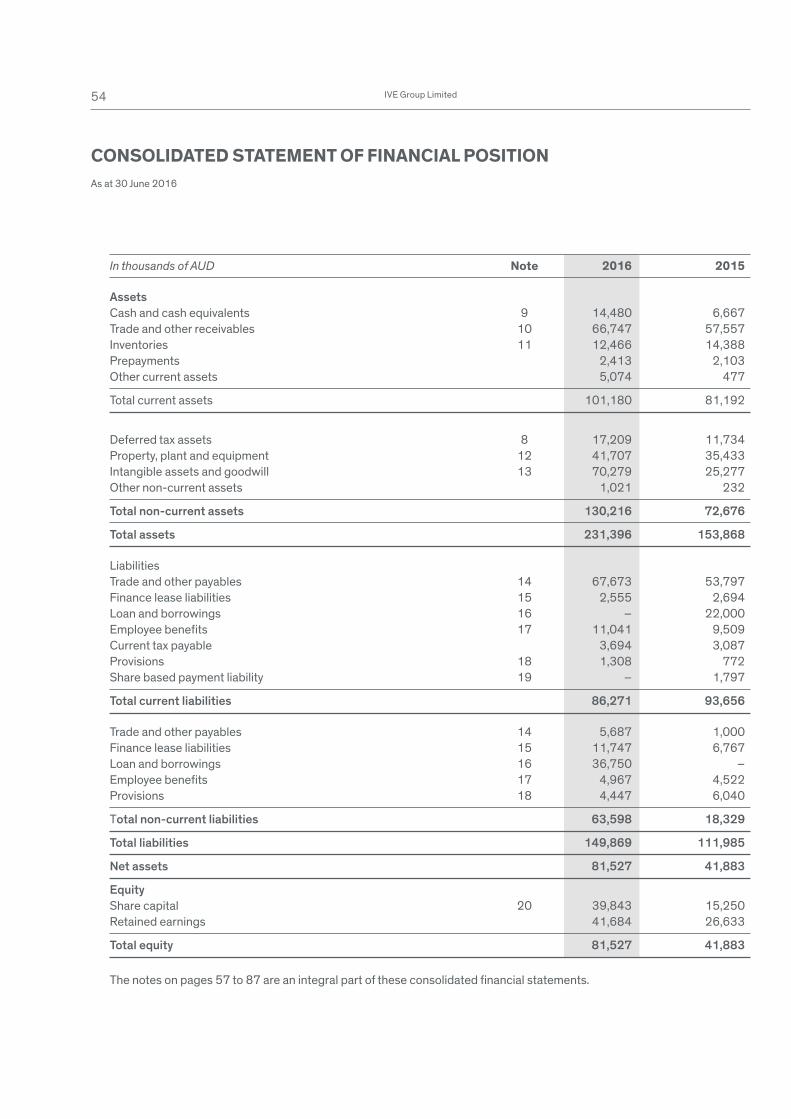
54 IVE Group Limited
In thousands of AUD Note 2016 2015
Assets
Cash and cash equivalents 9 14,480 6,667
Trade and other receivables 10 66,747 57,557
Inventories 11 12,466 14,388
Prepayments 2,413 2,103
Other current assets 5,074 477
Total current assets 101,180 81,192
Deferred tax assets 8 17,209 11,734
Property, plant and equipment 12 41,707 35,433
Intangible assets and goodwill 13 70,279 25,277
Other non-current assets 1,021 232
Total non-current assets 130,216 72,676
Total assets 231,396 153,868
Liabilities
Trade and other payables 14 67,673 53,797
Finance lease liabilities 15 2,555 2,694
Loan and borrowings 16 – 22,000
Employee benefi ts 17 11,041 9,509
Current tax payable 3,694 3,087
Provisions 18 1,308 772
Share based payment liability 19 – 1,797
Total current liabilities 86,271 93,656
Trade and other payables 14 5,687 1,000
Finance lease liabilities 15 11,747 6,767
Loan and borrowings 16 36,750 –
Employee benefi ts 17 4,967 4,522
Provisions 18 4,447 6,040
Total non-current liabilities 63,598 18,329
Total liabilities 149,869 111,985
Net assets 81,527 41,883
Equity
Share capital 20 39,843 15,250
Retained earnings 41,684 26,633
Total equity 81,527 41,883
The notes on pages 57 to 87 are an integral part of these consolidated fi nancial statements.
CONSOLIDATED STATEMENT OF FINANCIAL POSITIONAs at 30 June 2016
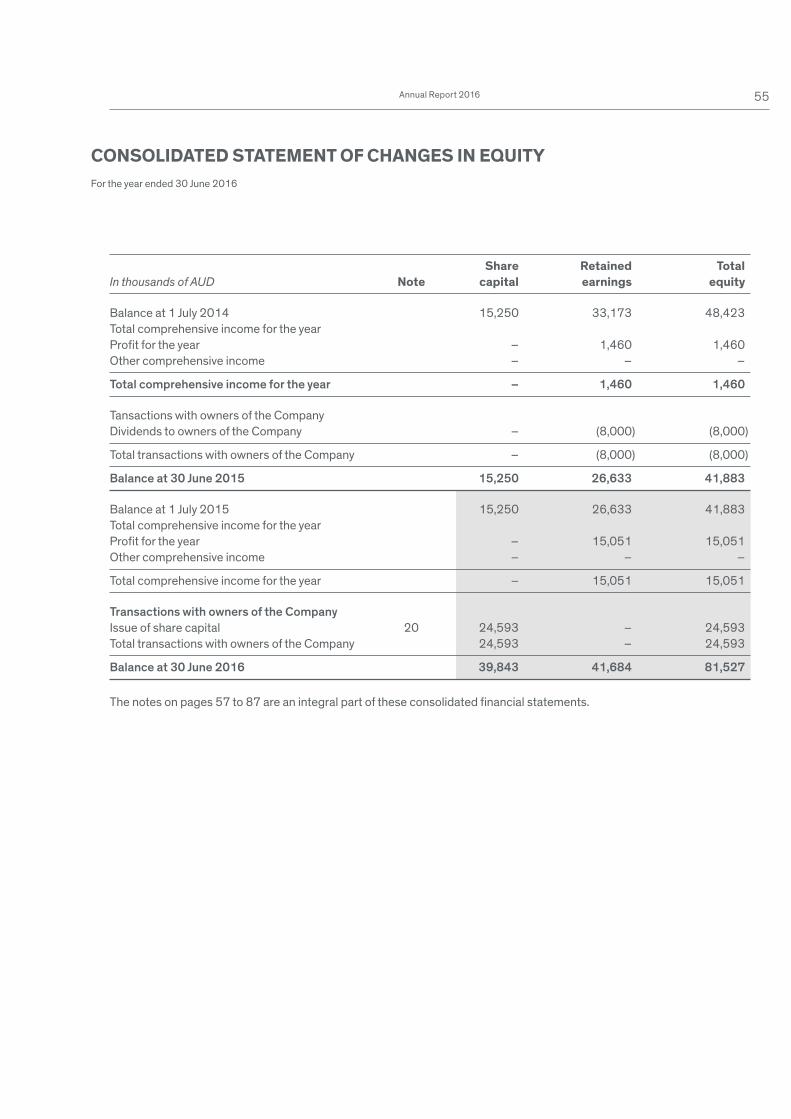
55Annual Report 2016
Share Retained TotalIn thousands of AUD Note capital earnings equity
Balance at 1 July 2014 15,250 33,173 48,423
Total comprehensive income for the year
Profi t for the year – 1,460 1,460
Other comprehensive income – – –
Total comprehensive income for the year – 1,460 1,460
Tansactions with owners of the Company
Dividends to owners of the Company – (8,000) (8,000)
Total transactions with owners of the Company – (8,000) (8,000)
Balance at 30 June 2015 15,250 26,633 41,883
Balance at 1 July 2015 15,250 26,633 41,883
Total comprehensive income for the year
Profi t for the year – 15,051 15,051
Other comprehensive income – – –
Total comprehensive income for the year – 15,051 15,051
Transactions with owners of the Company
Issue of share capital 20 24,593 – 24,593
Total transactions with owners of the Company 24,593 – 24,593
Balance at 30 June 2016 39,843 41,684 81,527
The notes on pages 57 to 87 are an integral part of these consolidated fi nancial statements.
CONSOLIDATED STATEMENT OF CHANGES IN EQUITYFor the year ended 30 June 2016
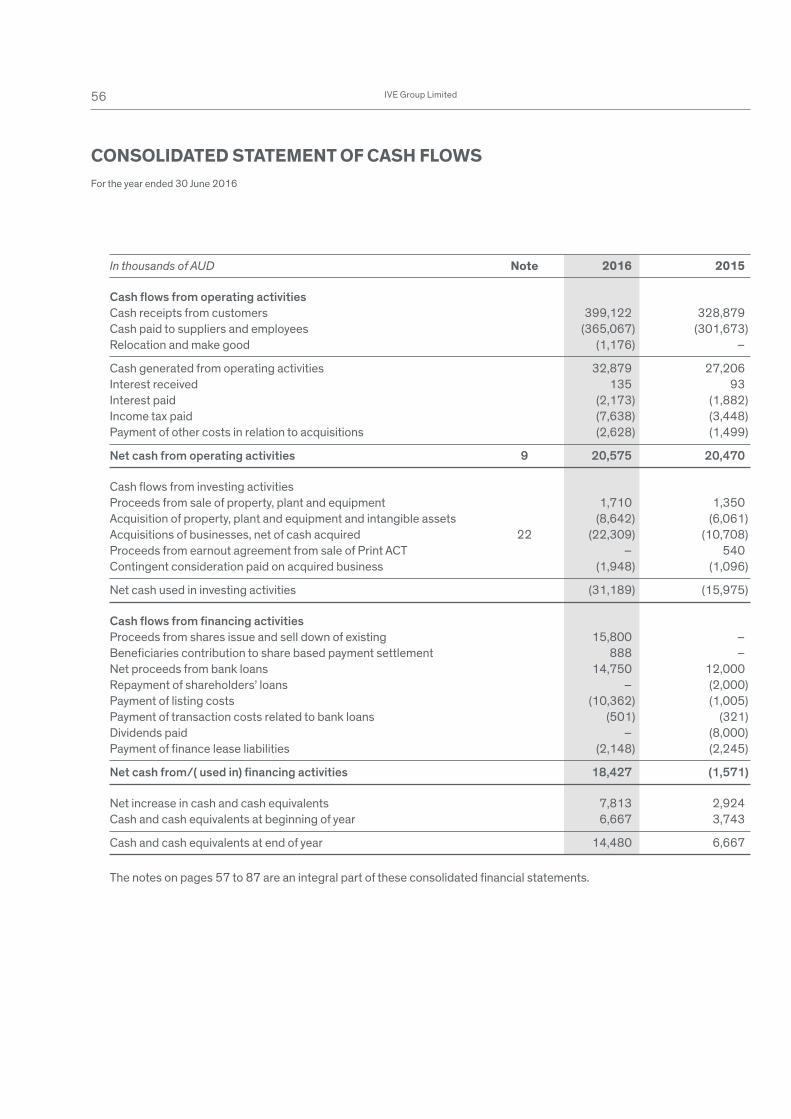
56 IVE Group Limited
In thousands of AUD Note 2016 2015
Cash fl ows from operating activities
Cash receipts from customers 399,122 328,879
Cash paid to suppliers and employees (365,067) (301,673)
Relocation and make good (1,176) –
Cash generated from operating activities 32,879 27,206
Interest received 135 93
Interest paid (2,173) (1,882)
Income tax paid (7,638) (3,448)
Payment of other costs in relation to acquisitions (2,628) (1,499)
Net cash from operating activities 9 20,575 20,470
Cash fl ows from investing activities
Proceeds from sale of property, plant and equipment 1,710 1,350
Acquisition of property, plant and equipment and intangible assets (8,642) (6,061)
Acquisitions of businesses, net of cash acquired 22 (22,309) (10,708)
Proceeds from earnout agreement from sale of Print ACT – 540
Contingent consideration paid on acquired business (1,948) (1,096)
Net cash used in investing activities (31,189) (15,975)
Cash fl ows from fi nancing activities
Proceeds from shares issue and sell down of existing 15,800 –
Benefi ciaries contribution to share based payment settlement 888 –
Net proceeds from bank loans 14,750 12,000
Repayment of shareholders’ loans – (2,000)
Payment of listing costs (10,362) (1,005)
Payment of transaction costs related to bank loans (501) (321)
Dividends paid – (8,000)
Payment of fi nance lease liabilities (2,148) (2,245)
Net cash from/( used in) fi nancing activities 18,427 (1,571)
Net increase in cash and cash equivalents 7,813 2,924
Cash and cash equivalents at beginning of year 6,667 3,743
Cash and cash equivalents at end of year 14,480 6,667
The notes on pages 57 to 87 are an integral part of these consolidated fi nancial statements.
CONSOLIDATED STATEMENT OF CASH FLOWSFor the year ended 30 June 2016
57Annual Report 2016
1. Reporting entityIVE Group Limited (the ultimate parent entity or the Company) is a company domiciled in Australia. It’s registered address is
350 Parramatta Road, Homebush NSW 2140.
This consolidated financial reporting as at and for the year ended 30 June 2016 comprises the Company and its
subsidiaries (IVE or Group).
IVE Group Limited was incorporated on 10 June 2015, but did not undertake any trading activities until its listing (IPO)
on the Australian Stock Exchange (ASX) on 16 December 2015 where it also contemporaneously acquired Caxton Print
Group Holdings Pty Ltd (CPGH). There are no historical consolidated financial statements for the newly incorporated IVE
Group Limited, which became the holding company of CPGH immediately prior to listing.
An internal restructure took place resulting in IVE Group Limited becoming the holding company of CPGH. The Directors
elected to account for the restructure as a capital re-organisation rather than a business combination. In the Directors’
judgement, the continuation of the existing accounting values is consistent with the accounting that would have occurred
if the assets and liabilities had already been in a structure suitable to IPO and most appropriately reflects the substance
of the internal restructure. As such, the consolidated financial statements of the new IVE Group have been presented as a
continuation of the pre existing accounting values of assets and liabilities in CPGH’s financial statements.
For the year ended 30 June 2016 the consolidated statement of profit or loss and other comprehensive income,
consolidated statement of changes in equity, consolidated statement of cash flows and accompanying explanatory notes
include the results of IVE Group Limited and all of its controlled entities for the full twelve month period. The comparative
information for the year ended 30 June 2015 is from the audited statutory consolidated historical financial statements of
CPGH as at 30 June 2015.
In adopting this approach the Directors note that there is an alternative view that such a restructure conditional on the IPO
completing could be accounted for as a business combination that follows the legal structure of the Company being the
acquirer. If this view had been taken, the net assets of the Group would have been uplifted to fair value by $123.1 million,
based on a market capitalisation at IPO of $177.7 million, which consequently impacts on the profit and loss and
statement of financial position.
An IASB project on accounting for common control transactions is likely to address such restructures in the future.
However, the precise nature of any new requirements and the timing of these are uncertain. In any event, history indicates
that any potential changes are unlikely to require retrospective amendments to the financial statements.
The Group is a for-profit entity. The Group is primary involved in:
• Conceptual and creative design across print, mobile and interactive media;
• Printing of magazines, catalogues, marketing and corporate communications materials and stationery;
• Printing of point of sale display material and large format banners for retail applications;
• Personalised communications including marketing mail, publication mail, eCommunications and multi-channel
solutions; and
• Outsourced communications solutions for large organisations including development of customised multi-channel
management models covering creative and digital services, supply chain optimisation, inventory management,
warehousing and logistics.
The Group services all major industry sectors in Australia including financial services, publishing, retail, communications,
property, clubs and associations, not-for-profit, utilities, manufacturing, education and government.
2. Basis of preparation(a) Statement of complianceThe consolidated financial statements are general purpose financial statements which have been prepared in accordance
with Australian Accounting Standards (AASBs) adopted by the Australian Accounting Standards Board (AASB) and the
Corporations Act 2001. The consolidated financial statements comply with International Financial Reporting Standards
(IFRSs) adopted by the International Accounting Standards Board (IASB).
The consolidated financial statements were authorised for issue by the Board of Directors on 29 August 2016. Details of
the Group’s accounting policies is included in Note 3.
NOTES TO THE CONSOLIDATED FINANCIAL STATEMENTSFor the year ended 30 June 2016
58 IVE Group Limited
2. Basis of preparation (cont.)(b) Basis of measurementThe consolidated financial statements have been prepared on the historical cost basis except for contingent consideration,
which is measured at fair value.
(c) Functional and presentation currencyThese consolidated financial statements are presented in Australian dollars, which is the Company’s functional currency.
The Company is of a kind referred to in ASIC Corporations Instrument 2016/191 dated 24 March 2016 and in accordance
with that Class Order, all financial information presented in Australian dollars has been rounded to the nearest thousand
unless otherwise stated.
(d) Use of estimates and judgementsIn preparing these consolidated financial statements, management has made judgements, estimates and assumptions
that affect the application of accounting policies and the reported amounts of assets, liabilities, income and expenses.
Actual results may differ from these estimates.
The significant judgements made by management in applying the Group’s accounting policies and the key sources of
estimation uncertainty were the same as those that applied to the consolidated financial statements of CPGH as at and
for the year ended 30 June 2015 other than in relation to the accounting treatment applied to IPO costs. Significant
judgements in relation to the accounting for IPO costs included identification of incremental qualifying costs that are
attributable to the share issue.
Estimates and underlying assumptions are reviewed on an ongoing basis. Revisions to accounting estimates are
recognised prospectively.
(i) Judgements
Information about judgements made in applying the Group’s accounting policies that have the most significant effects on
the amounts recognised in the consolidated financial statements is included in the following notes:
• Note 3(d) & (e) – estimation of useful lives of assets;
• Note 3(j) – provisions; and
• Note 24 – Level 3 fair value of contingent consideration.
(ii) Assumptions and estimation uncertainties
Information about assumptions and estimation uncertainties that have a significant risk of resulting in a material
adjustment in the year ending 30 June 2016 is included in the following notes:
• Note 3(h)(ii) & 13 – impairment testing for cash generating units containing goodwill; and
• Note 22 – acquisitions: fair value measured on a provisional basis.
Measurement of fair values
When measuring the fair value of an asset or a liability, the group uses market observable data as possible. Fair values are
categorised into different levels in a fair value hierarchy based on the inputs used in the valuation techniques as follows:
• Level 1: quoted prices (unadjusted) in active markets for identical assets or liabilities.
• Level 2: inputs other than quoted prices included within Level 1 that are observable for the asset or liability, either
directly (i.e., as prices) or indirectly (i.e., derived from prices).
• Level 3: inputs for the asset or liability that are not based on observable market data (unobservable inputs).
NOTES TO THE CONSOLIDATED FINANCIAL STATEMENTS (CONT.)For the year ended 30 June 2016
59Annual Report 2016
3. Significant accounting policiesThe accounting policies set out below have been applied consistently during the period presented in these consolidated
financial statements, and have been applied consistently by all entities in the Group.
(a) Basis of consolidation(i) Business combinations
The Group accounts for business combinations using the acquisition method when control is transferred to the Group.
The consideration transferred in the acquisition is generally measured at fair value, as are the identifiable net assets
acquired. Any goodwill that arises is tested annually for impairment. Any gain on a bargain purchase is recognised in
profit or loss immediately. Transaction costs are expensed as incurred, except those related to the issue of debt or
equity securities.
The consideration transferred does not include amounts related to the settlement of pre-exiting relationships. Such
amounts are generally recognised in profit or loss.
Any contingent consideration is measured at fair value at the date of acquisition, with subsequent changes in the fair value
of the contingent consideration recognised in profit or loss.
(ii) Subsidiaries
Subsidiaries are entities controlled by the Group. The Group controls an entity when it is exposed to, or has rights to,
variable returns from its involvement with the entity and has the ability to affect those returns through its power over the
entity. The financial statements of subsidiaries are included in the consolidated financial statements from the date on
which control commences until the date on which control ceases.
(iii) Transactions eliminated on consolidation
Intra-group balances and transactions, and any unrealised income and expenses arising from intra-group transactions, are
eliminated in preparing the consolidated financial statements.
(b) Foreign currencyForeign currency transactions
Transactions in foreign currencies are translated to the functional currency of the Group (Australian dollars) at exchange
rates at the dates of the transactions. Monetary assets and liabilities denominated in foreign currencies are translated to
the functional currency at the exchange rate at the reporting date.
Foreign currency differences arising on retranslation are recognised in profit or loss.
(c) Financial instruments(i) Non-derivative financial assets
The Group initially recognises receivables on the date that they are originated. All other financial assets are recognised
initially on the date at which the Group becomes a party to the contractual provisions of the instrument.
The Group derecognises a financial asset when the contractual rights to the cash flows from the asset expire, or it transfers
the rights to receive the contractual cash flows on the financial asset in a transaction in which substantially all the risks and
rewards of ownership of the financial asset are transferred. Any interest in transferred financial assets that is created or
retained by the Group is recognised as a separate asset or liability.
The Group has the following categories of non-derivative financial assets: cash and cash equivalents, and trade and other
receivables.
Cash and cash equivalents
Cash and cash equivalents comprise cash balances and call deposits with original maturities of three months or less from
the acquisition date that are subject to an insignificant risk of changes in their fair value, and are used by the Group in the
management of its short-term commitments.
60 IVE Group Limited
3. Significant accounting policies (cont.)(c) Financial instruments (cont.)(i) Non-derivative financial assets (cont.)
Trade and other receivables
Trade and other receivables are financial assets with fixed or determinable payments that are not quoted in an active
market. Such assets are recognised initially at fair value plus any directly attributable transaction costs. Subsequent to
initial recognition trade and other receivables are measured at amortised cost using the effective interest method, less any
impairment losses.
(ii) Non-derivative financial liabilities
Financial liabilities are recognised initially on the date at which the Group becomes a party to the contractual provisions of
the instrument.
The Group derecognises a financial liability when its contractual obligations are discharged, cancelled or expire.
The Group classifies non-derivative financial liabilities into the other financial liabilities category. Such financial liabilities
are recognised initially at fair value plus any directly attributable transaction costs. Subsequent to initial recognition, these
financial liabilities are measured at amortised cost using the effective interest method.
Other financial liabilities comprise finance lease liabilities, bank loan, and trade and other payables.
(iii) Share capital
Ordinary shares
Ordinary shares are classified as equity. Incremental costs directly attributable to the issue of ordinary shares are
recognised as a deduction from equity, net of any tax effects.
(iv) Derivative financial instruments and hedge accounting
The Group holds derivative financial instruments to hedge its foreign currency risk exposures. Embedded derivatives are
separated from the host contract and accounted for separately if certain criteria are met.
Derivatives are recognised initially at fair value; any directly attributable transaction costs are recognised in profit or loss
as they are incurred. Subsequent to initial recognition, derivatives are measured at fair value, and changes therein are
generally recognised in profit or loss.
Cash flow hedges
When a derivative is designated as a cash flow hedging instrument, the effective portion of changes in the fair value of the
derivative is recognised in OCI and accumulated in the hedging reserve. Any ineffective portion of changes in the fair value
of the derivative is recognised immediately in profit or loss.
The amount accumulated in equity is retained in OCI and reclassified to profit or loss in the same period or periods during
which the hedged item affects profit or loss.
If the hedging instrument no longer meets the criteria for hedge accounting, expires or is sold, terminated or exercised, or
the designation is revoked, then hedge accounting is discontinued prospectively. If the forecast transaction is no longer
expected to occur, then the amount accumulated in equity is reclassified to profit or loss.
(d) Property, plant and equipment(i) Recognition and measurement
Items of property, plant and equipment are measured at cost less accumulated depreciation and accumulated impairment
losses.
Cost includes expenditure that is directly attributable to the acquisition of the asset. Purchased software that is integral to
the functionality of the related equipment is capitalised as part of that equipment.
NOTES TO THE CONSOLIDATED FINANCIAL STATEMENTS (CONT.)For the year ended 30 June 2016
61Annual Report 2016
3. Significant accounting policies (cont.)(d) Property, plant and equipment (cont.)(i) Recognition and measurement (cont.)
When parts of an item of property, plant and equipment have different useful lives, they are accounted for as separate
items of property, plant and equipment.
Any gains and losses on disposal of an item of property, plant and equipment (calculated as the difference between the net
proceeds from disposal and the carrying amount of the item) are recognised in profit or loss.
(ii) Subsequent costs
Subsequent expenditure is capitalised only when it is probable that the future economic benefits associated with the
expenditure will flow to the Group. Ongoing repairs and maintenance are expensed as incurred.
(iii) Depreciation
Items of property, plant and equipment are depreciated from the date that they are installed and are ready for use, or in
respect of internally constructed assets, from the date that the asset is completed and ready for use.
Depreciation is calculated to write off the cost of property, plant and equipment less their estimated residual values using
the straight-line basis over their estimated useful lives. Depreciation is generally recognised in profit or loss, unless the
amount is included in the carrying amount of another asset. Leased assets are depreciated over the shorter of the lease
term and their useful lives unless it is reasonably certain that the Group will obtain ownership by the end of the lease term.
The estimated useful lives for the current year of significant items of property, plant and equipment are as follows:
• Leasehold improvements shorter of lease term and life of asset 3-12 years
• plant and equipment 5-10 years
• fixtures and fittings
Depreciation methods, useful lives and residual values are reviewed at each reporting date and adjusted if appropriate.
(e) Intangible assets and goodwill(i) Goodwill
Goodwill arising on the acquisition of subsidiaries is measured at cost less accumulated impairment losses.
(ii) Other intangible assets
Intangible assets that are acquired by the Group and have finite useful lives are measured at cost less accumulated
amortisation and accumulated impairment losses.
(iii) Subsequent expenditure
Subsequent expenditure is capitalised only when it increases the future economic benefits embodied in the specific asset
to which it relates. All other expenditure, including expenditure on internally generated goodwill and brands, is recognised
in profit or loss as incurred.
(iv) Amortisation
Amortisation is calculated to write off the cost of intangible assets less their estimated residual values using the straight-
line method over their estimated useful lives, and is generally recognised in profit or loss. Goodwill is not amortised.
The estimated useful lives are as follows:
• computer software 3 years
• customer relationships 5-7 years
Amortisation methods, useful lives and residual values are reviewed at each reporting date and adjusted if appropriate.
62 IVE Group Limited
3. Significant accounting policies (cont.)(f) Leased assets
Leases in terms of which the Group assumes substantially all the risks and rewards of ownership are classified as finance
leases. Upon initial recognition of finance leases the leased asset is measured at an amount equal to the lower of its fair
value and the present value of the minimum lease payments. Subsequent to initial recognition, the asset is accounted for
in accordance with the accounting policy applicable to that asset.
Other leases are classified as operating leases and are not recognised in the Group’s consolidated statement of financial
position.
(g) InventoriesInventories are measured at the lower of cost and net realisable value. The cost of inventories is based on the first-in,
first-out principle. In the case of manufactured inventories and work in progress, cost includes an appropriate share of
production overheads based on normal operating capacity.
(h) Impairment(i) Non-derivative financial assets
Financial assets not classified as at fair value through profit or loss are assessed at each reporting date to determine
whether there is objective evidence of impairment.
Objective evidence that financial assets are impaired can include default or delinquency by a debtor, restructuring of an
amount due to the Group on terms that the Group would not consider otherwise, indications that a debtor or issuer will
enter bankruptcy, adverse changes in the payment status of borrowers or issuers in the Group or economic conditions that
correlate with defaults.
Financial assets measured at amortised cost
The Group considers evidence of impairment for financial assets measured at amortised cost at both a specific asset and
collective level. All individually significant assets are assessed for specific impairment. Those found not to be specifically
impaired are then collectively assessed for any impairment that has been incurred but not yet identified. Assets that
are not individually significant are collectively assessed for impairment by grouping together assets with similar risk
characteristics.
In assessing collective impairment the Group uses historical trends of the probability of default, timing of recoveries and
the amount of loss incurred, adjusted for management’s judgement as to whether current economic and credit conditions
are such that the actual losses are likely to be greater or less than suggested by historical trends.
An impairment loss in respect of a financial asset measured at amortised cost is calculated as the difference between
its carrying amount and the present value of the estimated future cash flows discounted at the asset’s original effective
interest rate. Losses are recognised in profit or loss and reflected in an allowance account against receivables. Interest on
the impaired asset continues to be recognised through the unwinding of the discount.
When an event occurring after the impairment was recognised causes the amount of impairment loss to decrease, the
decrease in impairment loss is reversed through profit or loss.
(ii) Non-financial assets
The carrying amounts of the Group’s non-financial assets, other than inventories and deferred tax assets, are reviewed
at each reporting date to determine whether there is any indication of impairment. If any such indication exists, then the
asset’s recoverable amount is estimated. Goodwill is tested annually for impairment.
For impairment testing, assets are grouped together into the smallest group of assets that generates cash inflows from
continuing use that are largely independent of the cash inflows of other assets or cash-generating unit (CGU). Goodwill
arising from a business combination is allocated to CGUs or groups of CGUs that are expected to benefit from the
synergies of the combination.
NOTES TO THE CONSOLIDATED FINANCIAL STATEMENTS (CONT.)For the year ended 30 June 2016
63Annual Report 2016
3. Significant accounting policies (cont.)(h) Impairment (cont.)(ii) Non-financial assets (cont.)
The recoverable amount of an asset or CGU is the greater of its value in use and its fair value less costs to sell. In assessing
value in use, the estimated future cash flows are discounted to their present value using a pre-tax discount rate that
reflects current market assessments of the time value of money and the risks specific to the asset.
An impairment loss is recognised if the carrying amount of an asset or CGU exceeds its estimated recoverable amount.
Impairment losses are recognised in profit or loss. Impairment losses recognised in respect of CGUs are allocated first to
reduce the carrying amount of any goodwill allocated to the CGU (group of CGUs), and then to reduce the carrying amounts
of the other assets in the CGU (group of CGUs) on a pro rata basis.
An impairment loss in respect of goodwill is not reversed. For other assets, an impairment loss is reversed only to the
extent that the asset’s carrying amount does not exceed the carrying amount that would have been determined, net of
depreciation or amortisation, if no impairment loss had been recognised.
(i) Employee benefits(i) Defined contribution plans
A defined contribution plan is a post-employment benefit plan under which an entity pays fixed contributions into a
separate entity and will have no legal or constructive obligation to pay further amounts. Obligations for contributions to
defined contribution pension plans are recognised as an employee benefit expense in profit or loss in the periods during
which services are rendered by employees.
(ii) Other long-term employee benefits
The Group’s net obligation in respect of long-term employee benefits is the amount of future benefit that employees have
earned in return for their service in the current and prior periods. That benefit is discounted to determine its present value.
Remeasurements are recognised in profit or loss in the period in which they arise.
(iii) Short-term employee benefits
Short-term employee benefits are expensed as the related service is provided. A liability is recognised for the amount
expected to be paid if the Group has a present legal or constructive obligation to pay this amount as a result of past service
provided by the employee and the obligation can be estimated reliably.
(iv) Share-based payment transactions
The grant-date fair value of equity-settled share-based payment awards granted to employees is generally recognised as
an expense, with a corresponding increase in equity, over the vesting period of the awards. The amount recognised as an
expense is adjusted to reflect the number of awards for which the related service and non-market performance conditions
are expected to be met, such that the amount ultimately recognised is based on the number of awards that meet the
related service and non-market performance conditions at the vesting date. For share-based payment awards with non-
vesting conditions, the grant-date fair value of the share-based payment is measured to reflect such conditions and there
is no true-up for differences between expected and actual outcomes.
The fair value of the amount payable to employees in respect of share appreciation rights (SARs), which are settled in
cash, is recognised as an expense with a corresponding increase in liabilities, over the period during which the employees
become unconditionally entitled to payment. The liability is remeasured at each reporting date and at settlement date
based on the fair value of the SARs. Any changes in the liability are recognised in profit or loss.
64 IVE Group Limited
NOTES TO THE CONSOLIDATED FINANCIAL STATEMENTS (CONT.)For the year ended 30 June 2016
3. Significant accounting policies (cont.)(j) ProvisionsA provision is recognised if, as a result of a past event, the Group has a present legal or constructive obligation that can
be estimated reliably, and it is probable that an outflow of economic benefits will be required to settle the obligation.
Provisions are determined by discounting the expected future cash flows at a pre-tax rate that reflects current market
assessments of the time value of money and the risks specific to the liability. The unwinding of the discount is recognised
as finance cost.
(i) Restructuring
A provision for restructuring is recognised when the Group has approved a detailed and formal restructuring plan, and the
restructuring either has commenced or has been announced publicly. Future operating losses are not provided for.
(ii) Make good provision
A make good provision is recognised when the Group enters into a lease contract that requires the property to be returned
to the lessor in its original condition. The provision is based on the expected future cost of the refurbishment discounted to
reflect current market assessments.
(k) Revenue(i) Sales
Revenue from the sale of goods is measured at the fair value of the consideration received or receivable, net of returns,
trade discounts and volume rebates. Revenue is recognised when the significant risks and rewards of ownership have
been transferred to the customer, recovery of the consideration is probable, the associated costs and possible return
of goods can be estimated reliably, there is no continuing management involvement with the goods, and the amount of
revenue can be measured reliably.
(ii) Rendering of services
The Group is involved in a range of services relating to print, communications, creative and digital services, supply chain
optimisation, inventory management, warehousing and logistics. If the services under a single arrangement are rendered in
different reporting periods, then the consideration is allocated on a relative fair value basis between the different services.
The Group recognises revenue from rendering of services in proportion to the stage of completion of the transaction at the
reporting date. The stage of completion is assessed based on surveys of work performed.
(l) Lease paymentsPayments made under operating leases are recognised in profit or loss on a straight-line basis over the term of the lease.
Lease incentives received are recognised as an integral part of the total lease expense, over the term of the lease.
Minimum lease payments made under finance leases are apportioned between the finance expense and the reduction of
the outstanding liability. The finance expense is allocated to each period during the lease term so as to produce a constant
periodic rate of interest on the remaining balance of the liability.
Contingent lease payments are accounted for by revising the minimum lease payments over the remaining term of the
lease when the lease adjustment is confirmed.
(m) Finance income and finance costsFinance income comprises interest income on funds invested and foreign exchange gains. Interest income is recognised
as it accrues in profit or loss, using the effective interest method.
Finance costs comprise interest expense on borrowings. Borrowing costs that are not directly attributable to the
acquisition, construction or production of a qualifying asset are recognised in profit or loss using the effective interest
method.
65Annual Report 2016
3. Significant accounting policies (cont.)(m) Finance income and finance costs (cont.)Foreign currency gains and losses are reported on a net basis as either finance income or finance cost depending on
whether foreign currency movements are in a net gain or net loss position.
(n) Income taxIncome Tax expense comprises current and deferred tax. Current and deferred tax are recognised in profit or loss except to
the extent that it relates to items recognised directly in equity or in other comprehensive income.
(i) Current tax
Current tax is the expected tax payable or receivable on the taxable income or loss for the year, using tax rates enacted or
substantively enacted at the reporting date, and any adjustment to tax payable in respect of previous years.
(ii) Deferred tax
Deferred tax is recognised in respect of temporary differences between the carrying amounts of assets and liabilities for
financial reporting purposes and the amounts used for taxation purposes. Deferred tax is not recognised for:
• temporary differences on the initial recognition of assets or liabilities in a transaction that is not a business combination
and that affects neither accounting nor taxable profit or loss; or
• temporary differences related to investments in associates to the extent that the Company is able to control the timing
of the reversal of the temporary differences and it is probable that they will not reverse in the foreseeable future, and
• taxable temporary differences arising on the initial recognition of goodwill.
The measurement of deferred tax reflects the tax consequences that would follow the manner in which the Group expects,
at the end of the reporting period, to recover or settle the carrying amount of its assets and liabilities.
Deferred tax is measured at the tax rates that are expected to be applied to temporary differences when they reverse, using
tax rates enacted or substantively enacted at the reporting date.
Deferred tax assets and liabilities are offset if there is a legally enforceable right to offset current tax liabilities and
assets, and they relate to taxes levied by the same tax authority on the same taxable entity, or on different tax entities,
but they intend to settle current tax liabilities and assets on a net basis or their tax assets and liabilities will be realised
simultaneously.
A deferred tax asset is recognised for unused tax losses, tax credits and deductible temporary differences, to the extent
that it is probable that future taxable profits will be available against which they can be utilised. Deferred tax assets are
reviewed at each reporting date and are reduced to the extent that it is no longer probable that the related tax benefit
will be realised.
(iii) Tax exposures
In determining the amount of current and deferred tax the Group takes into account the impact of uncertain tax positions
and whether additional taxes and interest may be due. This assessment relies on estimates and assumptions and may
involve a series of judgements about future events. New information may become available that causes the Group to
change its judgement regarding the adequacy of existing tax liabilities; such changes to tax liabilities will impact tax
expense in the period that such a determination is made.
(iv) Tax consolidation
IVE Group Limited and it’s wholly owned Australian controlled entities formed a tax consolidated group on 16 December
2015. As a consequence, these entities are taxed as a single entity and the deferred tax asset and liabilities of these
entities are offset in the consolidated financial statements.
The entities have also entered into a Tax Sharing and Tax Funding Agreement. The Tax Sharing Agreement provides for
the allocation of income tax liability between the entities should the head entity default on it’s obligation. The Tax Funding
Agreement provides for the allocation of current tax assets and liabilities between the entities.
66 IVE Group Limited
3. Significant accounting policies (cont.)(o) Good and services tax (GST)Revenue, expenses and assets are recognized net of the amount of GST, except where the amount of GST incurred is not
recoverable from the taxation authority. In these circumstances, the GST is recognised as part of the cost of acquisition of
the asset or as part of an item of expense. Receivables and payables are shown inclusive of GST.
The net amount of GST recoverable from, or payable to, the taxation authority is included as part of receivables or payables
in the statement of financial position.
Cash flows are presented on a gross basis. The GST components of cash flows arising from investing or financing
activities, which is recoverable from, or payable to, the taxation authority is classified as operating cash flows.
(p) Earnings per shareThe Group presents basic and diluted earnings per share data for its ordinary shares. Basic earnings per share is
calculated by dividing the profit or loss attributable to ordinary shareholders of the Company by the weighted average
number of ordinary shares outstanding during the year, adjusted for own shares held. Diluted earnings per share is
determined by adjusting the profit or loss attributable to ordinary shareholders and the weighted average number of
ordinary shares outstanding, adjusted for own shares held, for the effects of all dilutive potential ordinary shares, which
comprise convertible notes and share options granted to employees.
(q) Segment reportingOperating segments are reported in a manner consistent with the internal reporting provided to the chief operating
decision maker. It has been determined the Board of Directors is the chief operating decision maker, as they are ultimately
responsible for allocating resources and assessing performance.
(r) New standards and interpretations not yet adoptedA number of new standards, amendments to standards and interpretations are effective for annual periods beginning after
1 July 2016, and have not been applied in preparing these financial statements. Those which may be relevant to the Group
are set out below. The Group does not plan to adopt these standards early, and is currently assessing the impact of these
standards on it’s accounting policies and consolidated financial statements.
AASB 9 Financial Instruments (2014)
AASB 9, approved in December 2014, replaces the existing guidance in AASB 139 Financial Instruments: Recognition and
Measurement. AASB 9 includes revised guidance on the classification and measurement of financial instruments, including
a new expected credit loss model for calculating impairment on financial assets, and the new general hedge accounting
requirements. It also carries forward the guidance on recognition and derecognition of financial instruments from AASB
139. AASB 9 is effective for annual reporting periods beginning on or after 1 January 2018.
AASB 15 Revenue from Contracts with Customers
AASB 15 establishes a comprehensive framework for determining whether, how much and when revenue is recognised.
It replaces existing revenue recognition guidance, including AASB 118 Revenue, AASB 111 Construction Contracts
and IFRIC 13 Customer Loyalty Programmes. AASB 15 is effective for annual reporting periods beginning on or after
1 January 2018.
AASB 16 Leases
Under this Standard, there will no longer be a distinction between operating and finance leases. Instead, there will be
one treatment and a requirement to recognise an asset and a lease liability for all leases. The effective date is for annual
reporting periods beginning on or after 1 January 2019.
NOTES TO THE CONSOLIDATED FINANCIAL STATEMENTS (CONT.)For the year ended 30 June 2016
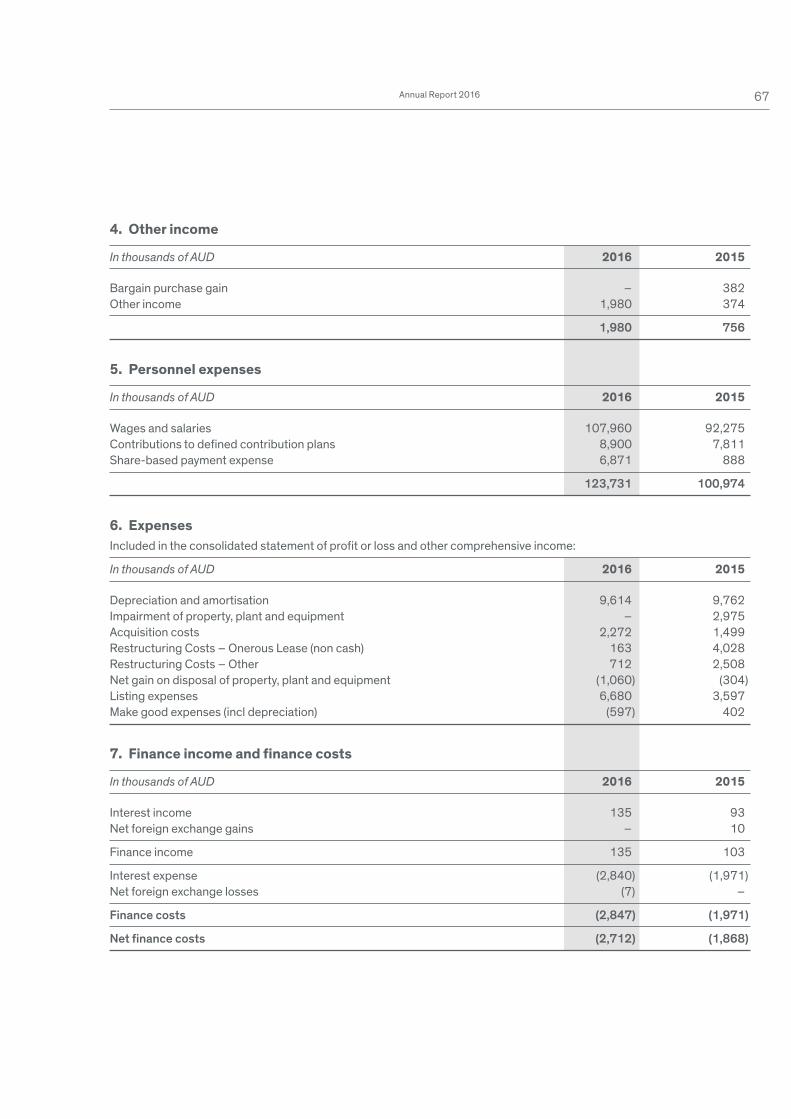
67Annual Report 2016
4. Other income
In thousands of AUD 2016 2015
Bargain purchase gain – 382
Other income 1,980 374
1,980 756
5. Personnel expenses
In thousands of AUD 2016 2015
Wages and salaries 107,960 92,275
Contributions to defined contribution plans 8,900 7,811
Share-based payment expense 6,871 888
123,731 100,974
6. ExpensesIncluded in the consolidated statement of profit or loss and other comprehensive income:
In thousands of AUD 2016 2015
Depreciation and amortisation 9,614 9,762
Impairment of property, plant and equipment – 2,975
Acquisition costs 2,272 1,499
Restructuring Costs – Onerous Lease (non cash) 163 4,028
Restructuring Costs – Other 712 2,508
Net gain on disposal of property, plant and equipment (1,060) (304)
Listing expenses 6,680 3,597
Make good expenses (incl depreciation) (597) 402
7. Finance income and finance costs
In thousands of AUD 2016 2015
Interest income 135 93
Net foreign exchange gains – 10
Finance income 135 103
Interest expense (2,840) (1,971)
Net foreign exchange losses (7) –
Finance costs (2,847) (1,971)
Net fi nance costs (2,712) (1,868)
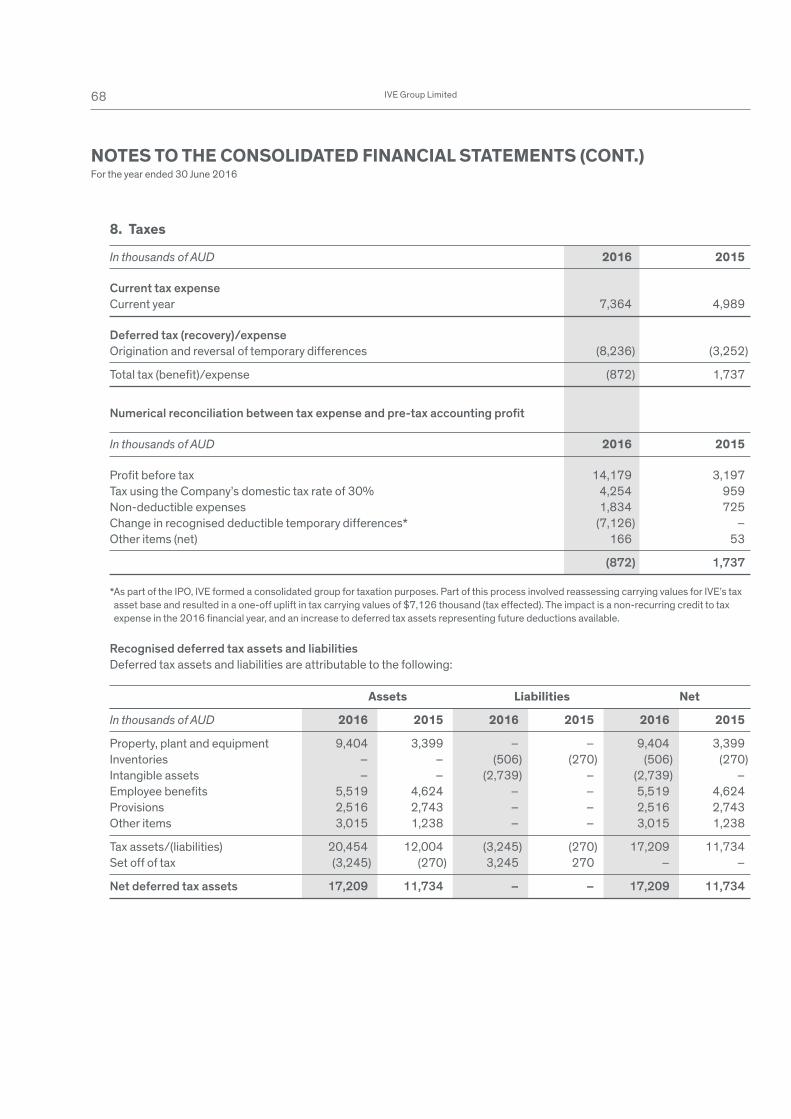
68 IVE Group Limited
8. Taxes
In thousands of AUD 2016 2015
Current tax expense
Current year 7,364 4,989
Deferred tax (recovery)/expense
Origination and reversal of temporary differences (8,236) (3,252)
Total tax (benefi t)/expense (872) 1,737
Numerical reconciliation between tax expense and pre-tax accounting profi t
In thousands of AUD 2016 2015
Profi t before tax 14,179 3,197
Tax using the Company’s domestic tax rate of 30% 4,254 959
Non-deductible expenses 1,834 725
Change in recognised deductible temporary differences* (7,126) –
Other items (net) 166 53
(872) 1,737
* As part of the IPO, IVE formed a consolidated group for taxation purposes. Part of this process involved reassessing carrying values for IVE’s tax
asset base and resulted in a one-off uplift in tax carrying values of $7,126 thousand (tax effected). The impact is a non-recurring credit to tax
expense in the 2016 financial year, and an increase to deferred tax assets representing future deductions available.
Recognised deferred tax assets and liabilities
Deferred tax assets and liabilities are attributable to the following:
Assets Liabilities Net
In thousands of AUD 2016 2015 2016 2015 2016 2015
Property, plant and equipment 9,404 3,399 – – 9,404 3,399
Inventories – – (506) (270) (506) (270)
Intangible assets – – (2,739) – (2,739) –
Employee benefi ts 5,519 4,624 – – 5,519 4,624
Provisions 2,516 2,743 – – 2,516 2,743
Other items 3,015 1,238 – – 3,015 1,238
Tax assets/(liabilities) 20,454 12,004 (3,245) (270) 17,209 11,734
Set off of tax (3,245) (270) 3,245 270 – –
Net deferred tax assets 17,209 11,734 – – 17,209 11,734
NOTES TO THE CONSOLIDATED FINANCIAL STATEMENTS (CONT.)For the year ended 30 June 2016
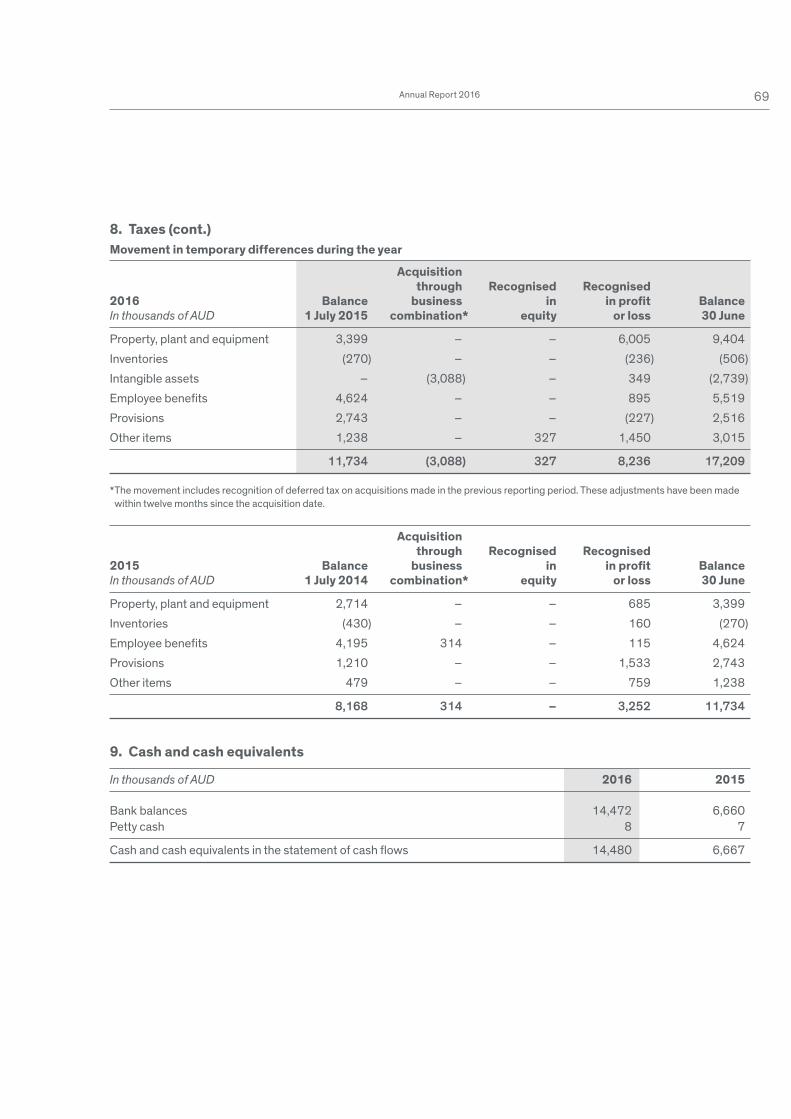
69Annual Report 2016
8. Taxes (cont.)Movement in temporary differences during the year
Acquisition through Recognised Recognised2016 Balance business in in profi t BalanceIn thousands of AUD 1 July 2015 combination* equity or loss 30 June
Property, plant and equipment 3,399 – – 6,005 9,404
Inventories (270) – – (236) (506)
Intangible assets – (3,088) – 349 (2,739)
Employee benefi ts 4,624 – – 895 5,519
Provisions 2,743 – – (227) 2,516
Other items 1,238 – 327 1,450 3,015
11,734 (3,088) 327 8,236 17,209
* The movement includes recognition of deferred tax on acquisitions made in the previous reporting period. These adjustments have been made
within twelve months since the acquisition date.
Acquisition through Recognised Recognised2015 Balance business in in profi t BalanceIn thousands of AUD 1 July 2014 combination* equity or loss 30 June
Property, plant and equipment 2,714 – – 685 3,399
Inventories (430) – – 160 (270)
Employee benefi ts 4,195 314 – 115 4,624
Provisions 1,210 – – 1,533 2,743
Other items 479 – – 759 1,238
8,168 314 – 3,252 11,734
9. Cash and cash equivalents
In thousands of AUD 2016 2015
Bank balances 14,472 6,660
Petty cash 8 7
Cash and cash equivalents in the statement of cash fl ows 14,480 6,667
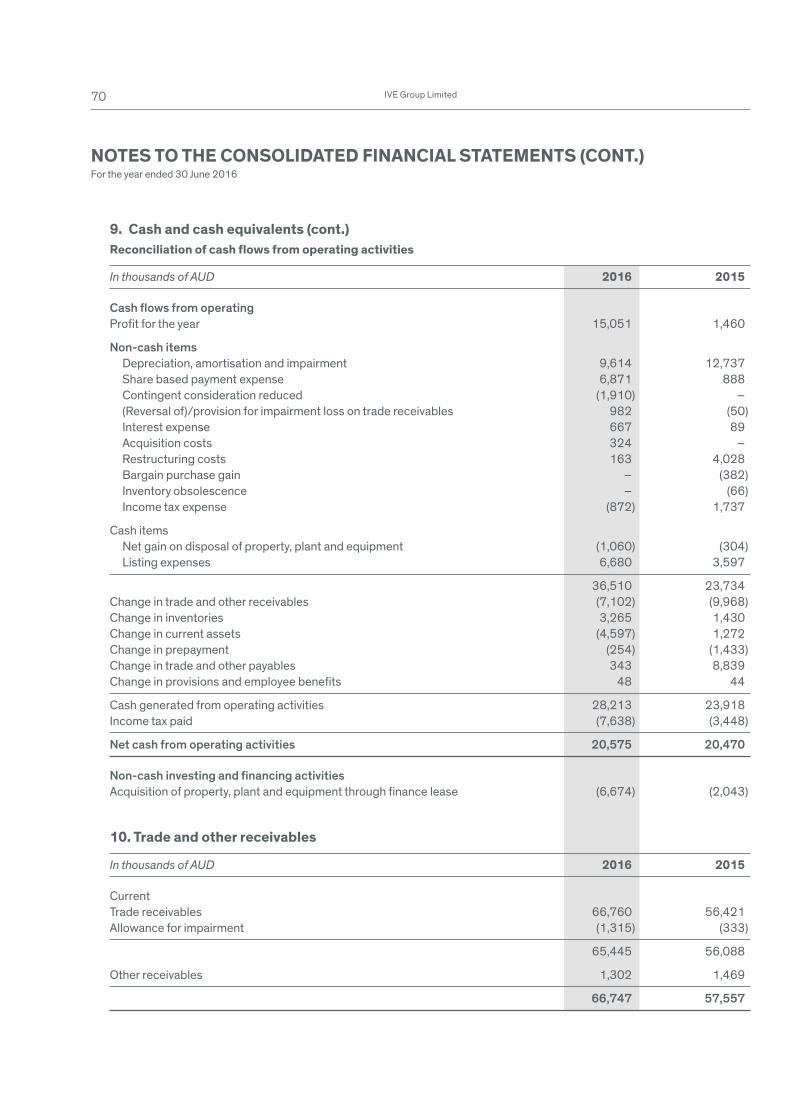
70 IVE Group Limited
9. Cash and cash equivalents (cont.)Reconciliation of cash flows from operating activities
In thousands of AUD 2016 2015
Cash fl ows from operating
Profi t for the year 15,051 1,460
Non-cash items
�Depreciation, amortisation and impairment 9,614 12,737
�Share based payment expense 6,871 888
�Contingent consideration reduced (1,910) –
�(Reversal of)/provision for impairment loss on trade receivables 982 (50)
�Interest expense 667 89
�Acquisition costs 324 –
�Restructuring costs 163 4,028
�Bargain purchase gain – (382)
�Inventory obsolescence – (66)
�Income tax expense (872) 1,737
Cash items
�Net gain on disposal of property, plant and equipment (1,060) (304)
�Listing expenses 6,680 3,597
36,510 23,734
Change in trade and other receivables (7,102) (9,968)
Change in inventories 3,265 1,430
Change in current assets (4,597) 1,272
Change in prepayment (254) (1,433)
Change in trade and other payables 343 8,839
Change in provisions and employee benefi ts 48 44
Cash generated from operating activities 28,213 23,918
Income tax paid (7,638) (3,448)
Net cash from operating activities 20,575 20,470
Non-cash investing and fi nancing activities
Acquisition of property, plant and equipment through fi nance lease (6,674) (2,043)
10. Trade and other receivables
In thousands of AUD 2016 2015
Current
Trade receivables 66,760 56,421
Allowance for impairment (1,315) (333)
65,445 56,088
Other receivables 1,302 1,469
66,747 57,557
NOTES TO THE CONSOLIDATED FINANCIAL STATEMENTS (CONT.)For the year ended 30 June 2016
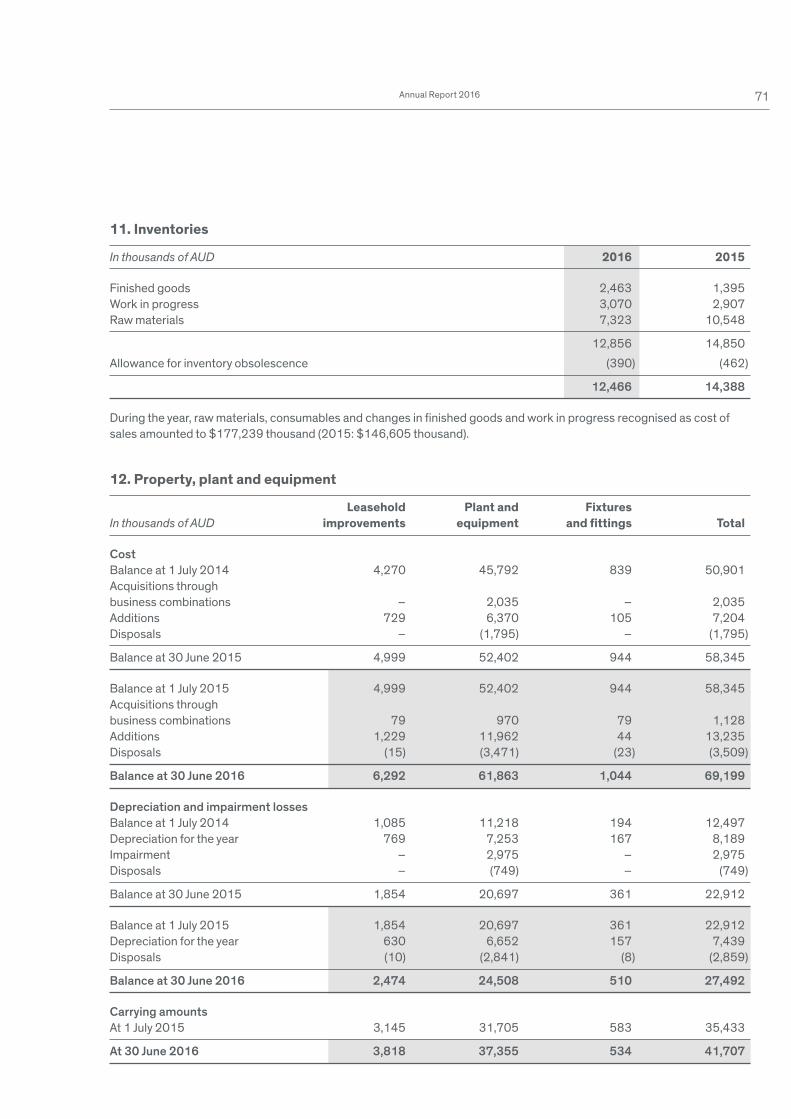
71Annual Report 2016
11. Inventories
In thousands of AUD 2016 2015
Finished goods 2,463 1,395
Work in progress 3,070 2,907
Raw materials 7,323 10,548
12,856 14,850
Allowance for inventory obsolescence (390) (462)
12,466 14,388
During the year, raw materials, consumables and changes in fi nished goods and work in progress recognised as cost of
sales amounted to $177,239 thousand (2015: $146,605 thousand).
12. Property, plant and equipment
Leasehold Plant and FixturesIn thousands of AUD improvements equipment and fi ttings Total
Cost
Balance at 1 July 2014 4,270 45,792 839 50,901
Acquisitions through
business combinations – 2,035 – 2,035
Additions 729 6,370 105 7,204
Disposals – (1,795) – (1,795)
Balance at 30 June 2015 4,999 52,402 944 58,345
Balance at 1 July 2015 4,999 52,402 944 58,345
Acquisitions through
business combinations 79 970 79 1,128
Additions 1,229 11,962 44 13,235
Disposals (15) (3,471) (23) (3,509)
Balance at 30 June 2016 6,292 61,863 1,044 69,199
Depreciation and impairment losses
Balance at 1 July 2014 1,085 11,218 194 12,497
Depreciation for the year 769 7,253 167 8,189
Impairment – 2,975 – 2,975
Disposals – (749) – (749)
Balance at 30 June 2015 1,854 20,697 361 22,912
Balance at 1 July 2015 1,854 20,697 361 22,912
Depreciation for the year 630 6,652 157 7,439
Disposals (10) (2,841) (8) (2,859)
Balance at 30 June 2016 2,474 24,508 510 27,492
Carrying amounts
At 1 July 2015 3,145 31,705 583 35,433
At 30 June 2016 3,818 37,355 534 41,707

72 IVE Group Limited
12. Property, plant and equipment (cont.)Leased plant and machineryThe Group leases production equipment under a number of finance lease agreements. Some leases provide the Group
with the option to purchase the equipment at a beneficial price. At 30 June 2016 the net carrying amount of leased
assets was $18,465 thousand (2015: $11,637 thousand).
SecurityAt 30 June 2016 the carrying amount of total assets less the written down value of finance leased assets were held as
security for bank facilities.
13. Intangible assets and goodwill
Computer CustomerIn thousands of AUD Note Goodwill software relationships Total
Cost
Balance at 1 July 2014 8,772 3,311 896 12,979
Acquisition through
business combinations 11,300 – 2,050 13,350
Other additions – 900 – 900
Other adjustments 1,511 – – 1,511
Balance at 30 June 2015 21,583 4,211 2,946 28,740
Balance at 1 July 2015 21,583 4,211 2,946 28,740
Acquisition through
business combinations 22 36,512 97 8,430 45,039
Other additions – 1,456 – 1,456
Other adjustments 682 – – 682
Balance at 30 June 2016 58,777 5,764 11,376 75,917
Amortisation and impairment losses
Balance at 1 July 2014 – 1,729 161 1,890
Amortisation for the year – 892 681 1,573
Balance at 30 June 2015 – 2,621 842 3,463
Balance at 1 July 2015 – 2,621 842 3,463
Amortisation for the year – 856 1,319 2,175
Balance at 30 June 2016 – 3,477 2,161 5,638
Carrying amounts
At 1 July 2015 21,583 1,590 2,104 25,277
At 30 June 2016 58,777 2,287 9,215 70,279
No impairment losses in relation to goodwill have been recognised in the year ended 30 June 2016 (2015 nil).
NOTES TO THE CONSOLIDATED FINANCIAL STATEMENTS (CONT.)For the year ended 30 June 2016
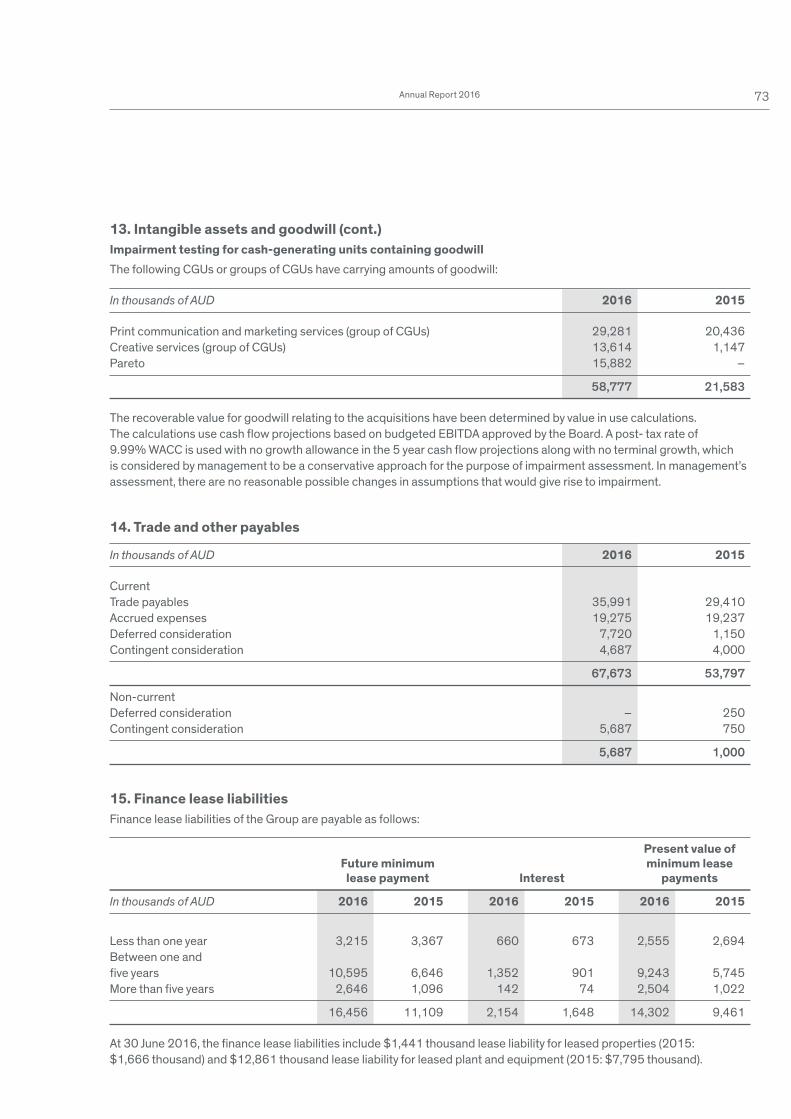
73Annual Report 2016
13. Intangible assets and goodwill (cont.)Impairment testing for cash-generating units containing goodwillThe following CGUs or groups of CGUs have carrying amounts of goodwill:
In thousands of AUD 2016 2015
Print communication and marketing services (group of CGUs) 29,281 20,436
Creative services (group of CGUs) 13,614 1,147
Pareto 15,882 –
58,777 21,583
The recoverable value for goodwill relating to the acquisitions have been determined by value in use calculations.
The calculations use cash flow projections based on budgeted EBITDA approved by the Board. A post- tax rate of
9.99% WACC is used with no growth allowance in the 5 year cash flow projections along with no terminal growth, which
is considered by management to be a conservative approach for the purpose of impairment assessment. In management’s
assessment, there are no reasonable possible changes in assumptions that would give rise to impairment.
14. Trade and other payables
In thousands of AUD 2016 2015
Current
Trade payables 35,991 29,410
Accrued expenses 19,275 19,237
Deferred consideration 7,720 1,150
Contingent consideration 4,687 4,000
67,673 53,797
Non-current
Deferred consideration – 250
Contingent consideration 5,687 750
5,687 1,000
15. Finance lease liabilitiesFinance lease liabilities of the Group are payable as follows:
Present value of Future minimum minimum lease lease payment Interest payments
In thousands of AUD 2016 2015 2016 2015 2016 2015
Less than one year 3,215 3,367 660 673 2,555 2,694
Between one and
fi ve years 10,595 6,646 1,352 901 9,243 5,745
More than fi ve years 2,646 1,096 142 74 2,504 1,022
16,456 11,109 2,154 1,648 14,302 9,461
At 30 June 2016, the fi nance lease liabilities include $1,441 thousand lease liability for leased properties (2015:
$1,666 thousand) and $12,861 thousand lease liability for leased plant and equipment (2015: $7,795 thousand).

74 IVE Group Limited
16. Loans and borrowings
In thousands of AUD 2016 2015
Current
Bank loans – 22,000
Non-current
Bank loans 36,750 –
Bank loan covenantsThe Group had a bank loan with a carrying amount and face value of $36,750 thousand at 30 June 2016 (2015: $22,000
thousand). This loan is a trade receivable and acquisition facility with a 3 year term, interest of 0.9% plus BBSY Bid rate,
and matures on 16 December 2018. The Company was in compliance with all loan covenants as at 30 June 2016.
17. Employee benefits
In thousands of AUD 2016 2015
Current
Liability for long service leave 4,134 3,569
Liability for annual leave 6,907 5,940
11,041 9,590
Non-current
Liability for long service leave 4,967 4,522
4,967 4,522
18. Provisions
In thousands of AUD Restructuring Make good Total
Balance at 1 July 2015 4,028 2,784 6,812
Provisions made during the year 163 – 163
Provisions reversed during the year (773) (447) (1,220)
Balance at 30 June 2016 3,418 2,337 5,755
Current 915 393 1,308
Non-current 2,503 1,944 4,447
3,418 2,337 5,755
Note 3(j) provides a description on the nature of the provisions.
NOTES TO THE CONSOLIDATED FINANCIAL STATEMENTS (CONT.)For the year ended 30 June 2016
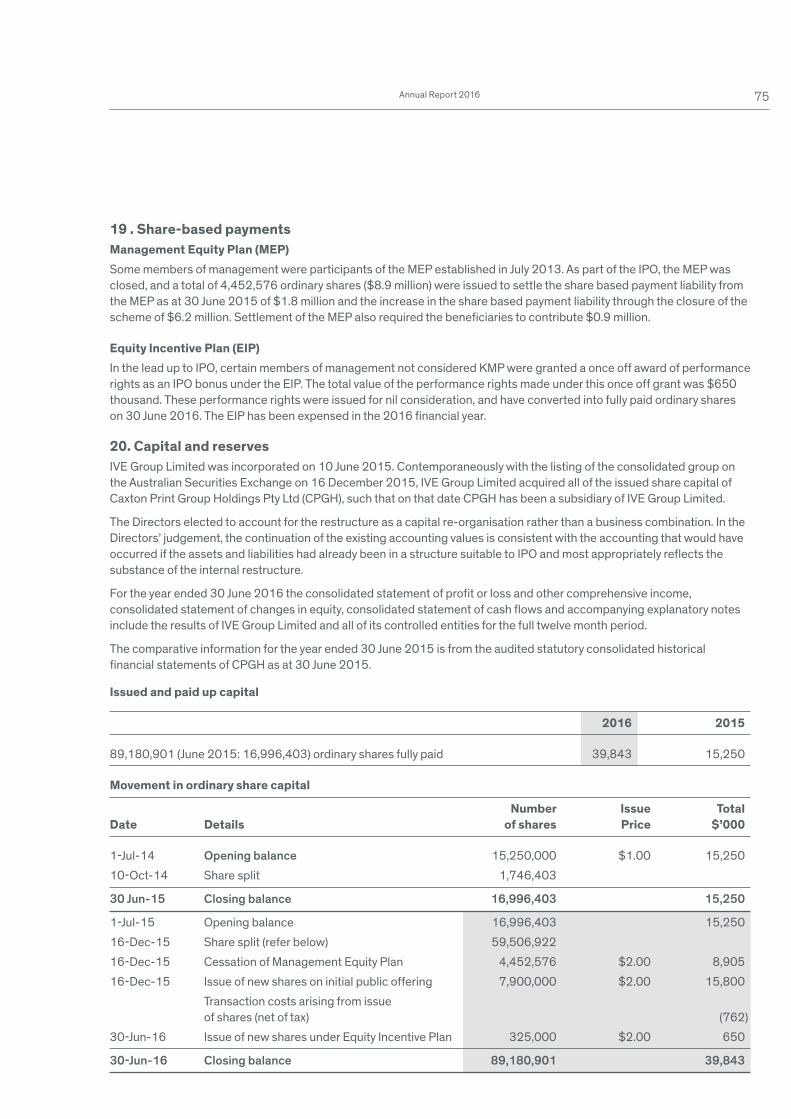
75Annual Report 2016
19 . Share-based paymentsManagement Equity Plan (MEP)Some members of management were participants of the MEP established in July 2013. As part of the IPO, the MEP was
closed, and a total of 4,452,576 ordinary shares ($8.9 million) were issued to settle the share based payment liability from
the MEP as at 30 June 2015 of $1.8 million and the increase in the share based payment liability through the closure of the
scheme of $6.2 million. Settlement of the MEP also required the beneficiaries to contribute $0.9 million.
Equity Incentive Plan (EIP)In the lead up to IPO, certain members of management not considered KMP were granted a once off award of performance
rights as an IPO bonus under the EIP. The total value of the performance rights made under this once off grant was $650
thousand. These performance rights were issued for nil consideration, and have converted into fully paid ordinary shares
on 30 June 2016. The EIP has been expensed in the 2016 financial year.
20. Capital and reservesIVE Group Limited was incorporated on 10 June 2015. Contemporaneously with the listing of the consolidated group on
the Australian Securities Exchange on 16 December 2015, IVE Group Limited acquired all of the issued share capital of
Caxton Print Group Holdings Pty Ltd (CPGH), such that on that date CPGH has been a subsidiary of IVE Group Limited.
The Directors elected to account for the restructure as a capital re-organisation rather than a business combination. In the
Directors’ judgement, the continuation of the existing accounting values is consistent with the accounting that would have
occurred if the assets and liabilities had already been in a structure suitable to IPO and most appropriately reflects the
substance of the internal restructure.
For the year ended 30 June 2016 the consolidated statement of profit or loss and other comprehensive income,
consolidated statement of changes in equity, consolidated statement of cash flows and accompanying explanatory notes
include the results of IVE Group Limited and all of its controlled entities for the full twelve month period.
The comparative information for the year ended 30 June 2015 is from the audited statutory consolidated historical
financial statements of CPGH as at 30 June 2015.
Issued and paid up capital
2016 2015
89,180,901 (June 2015: 16,996,403) ordinary shares fully paid 39,843 15,250
Movement in ordinary share capital
Number Issue TotalDate Details of shares Price $’000
1-Jul-14 Opening balance 15,250,000 $1.00 15,250
10-Oct-14 Share split 1,746,403
30 Jun-15 Closing balance 16,996,403 15,250
1-Jul-15 Opening balance 16,996,403 15,250
16-Dec-15 Share split (refer below) 59,506,922
16-Dec-15 Cessation of Management Equity Plan 4,452,576 $2.00 8,905
16-Dec-15 Issue of new shares on initial public offering 7,900,000 $2.00 15,800
Transaction costs arising from issue
of shares (net of tax) (762)
30-Jun-16 Issue of new shares under Equity Incentive Plan 325,000 $2.00 650
30-Jun-16 Closing balance 89,180,901 39,843
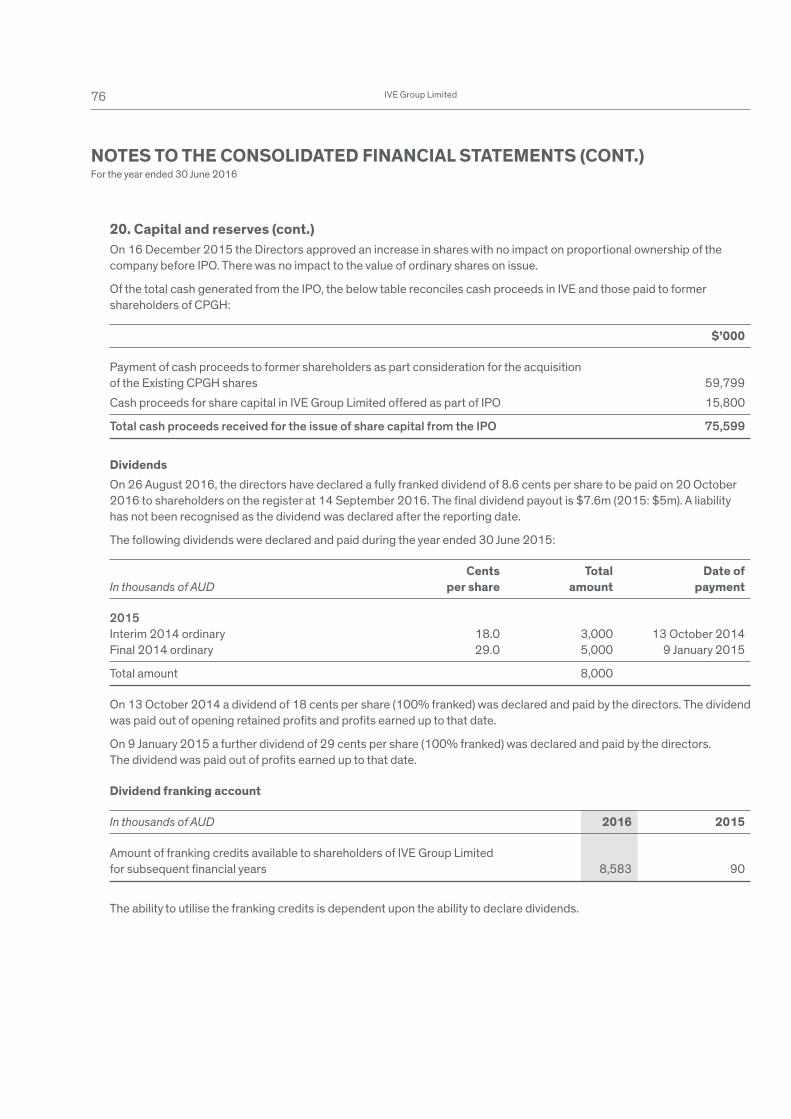
76 IVE Group Limited
20. Capital and reserves (cont.)On 16 December 2015 the Directors approved an increase in shares with no impact on proportional ownership of the
company before IPO. There was no impact to the value of ordinary shares on issue.
Of the total cash generated from the IPO, the below table reconciles cash proceeds in IVE and those paid to former
shareholders of CPGH:
$’000
Payment of cash proceeds to former shareholders as part consideration for the acquisition
of the Existing CPGH shares 59,799
Cash proceeds for share capital in IVE Group Limited offered as part of IPO 15,800
Total cash proceeds received for the issue of share capital from the IPO 75,599
DividendsOn 26 August 2016, the directors have declared a fully franked dividend of 8.6 cents per share to be paid on 20 October
2016 to shareholders on the register at 14 September 2016. The final dividend payout is $7.6m (2015: $5m). A liability
has not been recognised as the dividend was declared after the reporting date.
The following dividends were declared and paid during the year ended 30 June 2015:
Cents Total Date ofIn thousands of AUD per share amount payment
2015
Interim 2014 ordinary 18.0 3,000 13 October 2014
Final 2014 ordinary 29.0 5,000 9 January 2015
Total amount 8,000
On 13 October 2014 a dividend of 18 cents per share (100% franked) was declared and paid by the directors. The dividend
was paid out of opening retained profits and profits earned up to that date.
On 9 January 2015 a further dividend of 29 cents per share (100% franked) was declared and paid by the directors.
The dividend was paid out of profits earned up to that date.
Dividend franking account
In thousands of AUD 2016 2015
Amount of franking credits available to shareholders of IVE Group Limited
for subsequent fi nancial years 8,583 90
The ability to utilise the franking credits is dependent upon the ability to declare dividends.
NOTES TO THE CONSOLIDATED FINANCIAL STATEMENTS (CONT.)For the year ended 30 June 2016
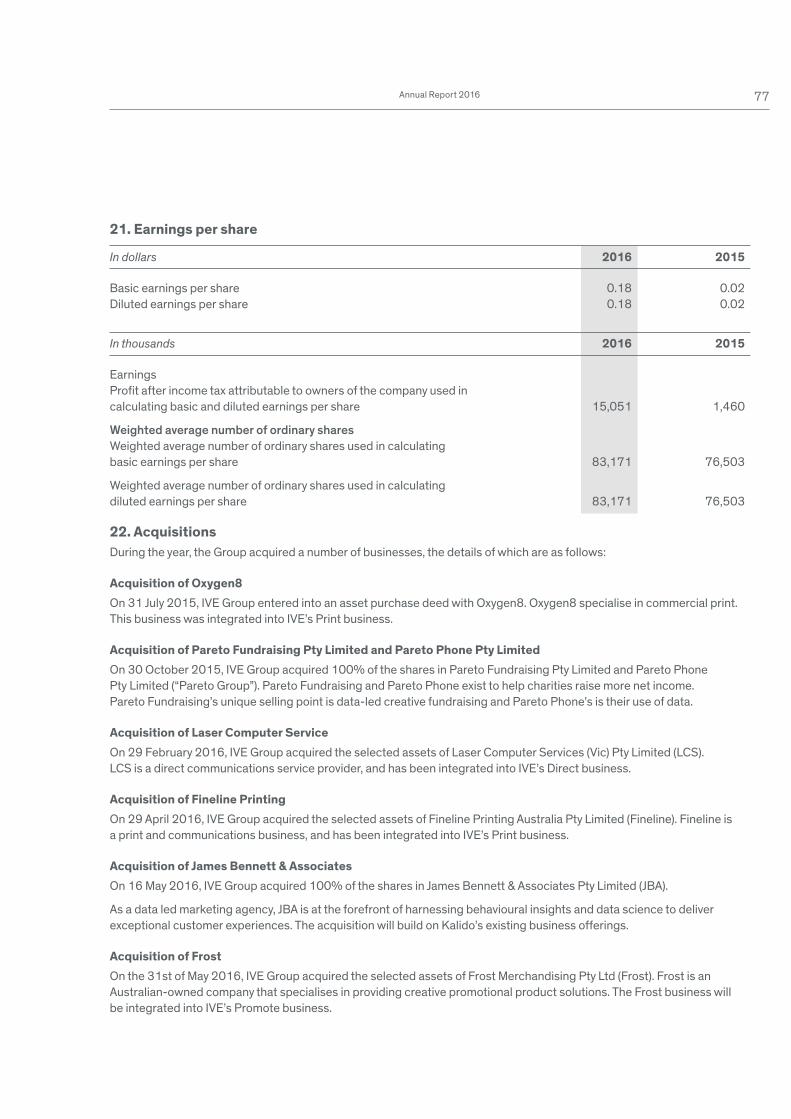
77Annual Report 2016
21. Earnings per share
In dollars 2016 2015
Basic earnings per share 0.18 0.02
Diluted earnings per share 0.18 0.02
In thousands 2016 2015
Earnings
Profi t after income tax attributable to owners of the company used in
calculating basic and diluted earnings per share 15,051 1,460
Weighted average number of ordinary shares
Weighted average number of ordinary shares used in calculating
basic earnings per share 83,171 76,503
Weighted average number of ordinary shares used in calculating
diluted earnings per share 83,171 76,503
22. AcquisitionsDuring the year, the Group acquired a number of businesses, the details of which are as follows:
Acquisition of Oxygen8On 31 July 2015, IVE Group entered into an asset purchase deed with Oxygen8. Oxygen8 specialise in commercial print.
This business was integrated into IVE’s Print business.
Acquisition of Pareto Fundraising Pty Limited and Pareto Phone Pty LimitedOn 30 October 2015, IVE Group acquired 100% of the shares in Pareto Fundraising Pty Limited and Pareto Phone
Pty Limited (“Pareto Group”). Pareto Fundraising and Pareto Phone exist to help charities raise more net income.
Pareto Fundraising’s unique selling point is data-led creative fundraising and Pareto Phone’s is their use of data.
Acquisition of Laser Computer Service On 29 February 2016, IVE Group acquired the selected assets of Laser Computer Services (Vic) Pty Limited (LCS).
LCS is a direct communications service provider, and has been integrated into IVE’s Direct business.
Acquisition of Fineline PrintingOn 29 April 2016, IVE Group acquired the selected assets of Fineline Printing Australia Pty Limited (Fineline). Fineline is
a print and communications business, and has been integrated into IVE’s Print business.
Acquisition of James Bennett & AssociatesOn 16 May 2016, IVE Group acquired 100% of the shares in James Bennett & Associates Pty Limited (JBA).
As a data led marketing agency, JBA is at the forefront of harnessing behavioural insights and data science to deliver
exceptional customer experiences. The acquisition will build on Kalido’s existing business offerings.
Acquisition of FrostOn the 31st of May 2016, IVE Group acquired the selected assets of Frost Merchandising Pty Ltd (Frost). Frost is an
Australian-owned company that specialises in providing creative promotional product solutions. The Frost business will
be integrated into IVE’s Promote business.
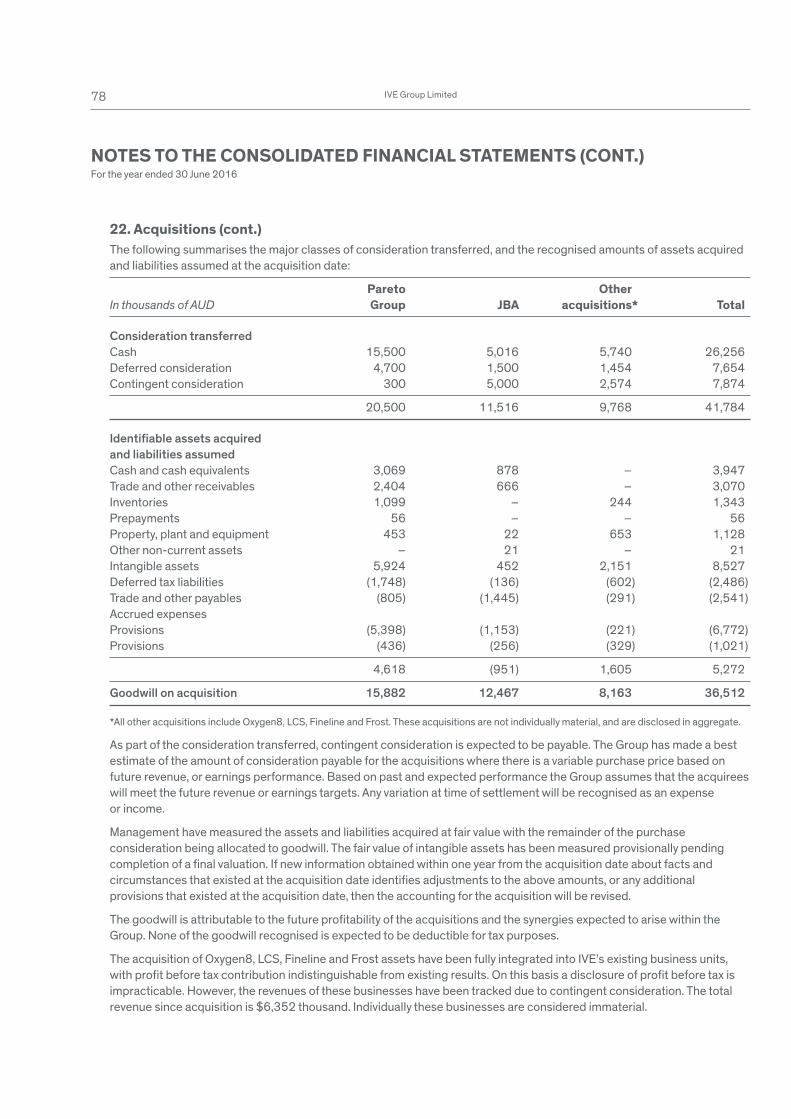
78 IVE Group Limited
22. Acquisitions (cont.)The following summarises the major classes of consideration transferred, and the recognised amounts of assets acquired
and liabilities assumed at the acquisition date:
Pareto OtherIn thousands of AUD Group JBA acquisitions* Total
Consideration transferred
Cash 15,500 5,016 5,740 26,256
Deferred consideration 4,700 1,500 1,454 7,654
Contingent consideration 300 5,000 2,574 7,874
20,500 11,516 9,768 41,784
Identifi able assets acquired
and liabilities assumed
Cash and cash equivalents 3,069 878 – 3,947
Trade and other receivables 2,404 666 – 3,070
Inventories 1,099 – 244 1,343
Prepayments 56 – – 56
Property, plant and equipment 453 22 653 1,128
Other non-current assets – 21 – 21
Intangible assets 5,924 452 2,151 8,527
Deferred tax liabilities (1,748) (136) (602) (2,486)
Trade and other payables (805) (1,445) (291) (2,541)
Accrued expenses
Provisions (5,398) (1,153) (221) (6,772)
Provisions (436) (256) (329) (1,021)
4,618 (951) 1,605 5,272
Goodwill on acquisition 15,882 12,467 8,163 36,512
* All other acquisitions include Oxygen8, LCS, Fineline and Frost. These acquisitions are not individually material, and are disclosed in aggregate.
As part of the consideration transferred, contingent consideration is expected to be payable. The Group has made a best
estimate of the amount of consideration payable for the acquisitions where there is a variable purchase price based on
future revenue, or earnings performance. Based on past and expected performance the Group assumes that the acquirees
will meet the future revenue or earnings targets. Any variation at time of settlement will be recognised as an expense
or income.
Management have measured the assets and liabilities acquired at fair value with the remainder of the purchase
consideration being allocated to goodwill. The fair value of intangible assets has been measured provisionally pending
completion of a final valuation. If new information obtained within one year from the acquisition date about facts and
circumstances that existed at the acquisition date identifies adjustments to the above amounts, or any additional
provisions that existed at the acquisition date, then the accounting for the acquisition will be revised.
The goodwill is attributable to the future profitability of the acquisitions and the synergies expected to arise within the
Group. None of the goodwill recognised is expected to be deductible for tax purposes.
The acquisition of Oxygen8, LCS, Fineline and Frost assets have been fully integrated into IVE’s existing business units,
with profit before tax contribution indistinguishable from existing results. On this basis a disclosure of profit before tax is
impracticable. However, the revenues of these businesses have been tracked due to contingent consideration. The total
revenue since acquisition is $6,352 thousand. Individually these businesses are considered immaterial.
NOTES TO THE CONSOLIDATED FINANCIAL STATEMENTS (CONT.)For the year ended 30 June 2016
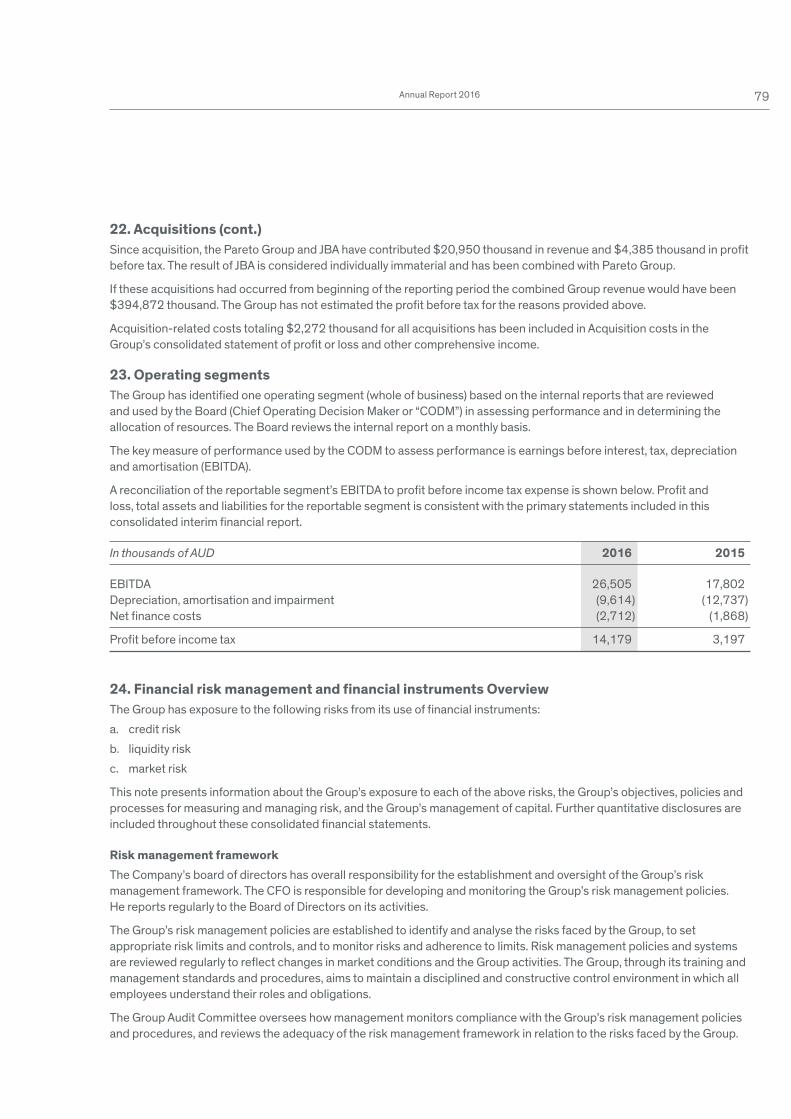
79Annual Report 2016
22. Acquisitions (cont.)Since acquisition, the Pareto Group and JBA have contributed $20,950 thousand in revenue and $4,385 thousand in profit
before tax. The result of JBA is considered individually immaterial and has been combined with Pareto Group.
If these acquisitions had occurred from beginning of the reporting period the combined Group revenue would have been
$394,872 thousand. The Group has not estimated the profit before tax for the reasons provided above.
Acquisition-related costs totaling $2,272 thousand for all acquisitions has been included in Acquisition costs in the
Group’s consolidated statement of profit or loss and other comprehensive income.
23. Operating segmentsThe Group has identified one operating segment (whole of business) based on the internal reports that are reviewed
and used by the Board (Chief Operating Decision Maker or “CODM”) in assessing performance and in determining the
allocation of resources. The Board reviews the internal report on a monthly basis.
The key measure of performance used by the CODM to assess performance is earnings before interest, tax, depreciation
and amortisation (EBITDA).
A reconciliation of the reportable segment’s EBITDA to profit before income tax expense is shown below. Profit and
loss, total assets and liabilities for the reportable segment is consistent with the primary statements included in this
consolidated interim financial report.
In thousands of AUD 2016 2015
EBITDA 26,505 17,802
Depreciation, amortisation and impairment (9,614) (12,737)
Net fi nance costs (2,712) (1,868)
Profi t before income tax 14,179 3,197
24. Financial risk management and financial instruments OverviewThe Group has exposure to the following risks from its use of financial instruments:
a. credit risk
b. liquidity risk
c. market risk
This note presents information about the Group’s exposure to each of the above risks, the Group’s objectives, policies and
processes for measuring and managing risk, and the Group’s management of capital. Further quantitative disclosures are
included throughout these consolidated financial statements.
Risk management frameworkThe Company’s board of directors has overall responsibility for the establishment and oversight of the Group’s risk
management framework. The CFO is responsible for developing and monitoring the Group’s risk management policies.
He reports regularly to the Board of Directors on its activities.
The Group’s risk management policies are established to identify and analyse the risks faced by the Group, to set
appropriate risk limits and controls, and to monitor risks and adherence to limits. Risk management policies and systems
are reviewed regularly to reflect changes in market conditions and the Group activities. The Group, through its training and
management standards and procedures, aims to maintain a disciplined and constructive control environment in which all
employees understand their roles and obligations.
The Group Audit Committee oversees how management monitors compliance with the Group’s risk management policies
and procedures, and reviews the adequacy of the risk management framework in relation to the risks faced by the Group.
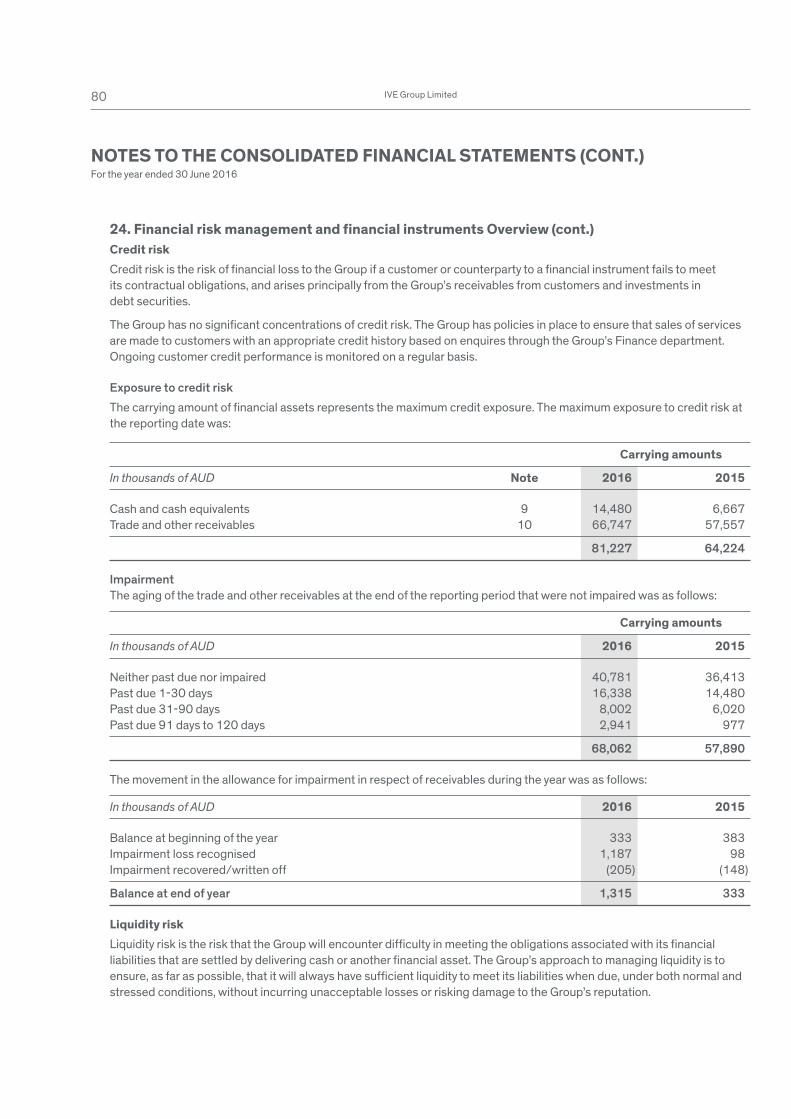
80 IVE Group Limited
24. Financial risk management and financial instruments Overview (cont.)Credit riskCredit risk is the risk of financial loss to the Group if a customer or counterparty to a financial instrument fails to meet
its contractual obligations, and arises principally from the Group’s receivables from customers and investments in
debt securities.
The Group has no significant concentrations of credit risk. The Group has policies in place to ensure that sales of services
are made to customers with an appropriate credit history based on enquires through the Group’s Finance department.
Ongoing customer credit performance is monitored on a regular basis.
Exposure to credit risk
The carrying amount of fi nancial assets represents the maximum credit exposure. The maximum exposure to credit risk at
the reporting date was:
Carrying amounts
In thousands of AUD Note 2016 2015
Cash and cash equivalents 9 14,480 6,667
Trade and other receivables 10 66,747 57,557
81,227 64,224
Impairment
The aging of the trade and other receivables at the end of the reporting period that were not impaired was as follows:
Carrying amounts
In thousands of AUD 2016 2015
Neither past due nor impaired 40,781 36,413
Past due 1-30 days 16,338 14,480
Past due 31-90 days 8,002 6,020
Past due 91 days to 120 days 2,941 977
68,062 57,890
The movement in the allowance for impairment in respect of receivables during the year was as follows:
In thousands of AUD 2016 2015
Balance at beginning of the year 333 383
Impairment loss recognised 1,187 98
Impairment recovered/written off (205) (148)
Balance at end of year 1,315 333
Liquidity riskLiquidity risk is the risk that the Group will encounter difficulty in meeting the obligations associated with its financial
liabilities that are settled by delivering cash or another financial asset. The Group’s approach to managing liquidity is to
ensure, as far as possible, that it will always have sufficient liquidity to meet its liabilities when due, under both normal and
stressed conditions, without incurring unacceptable losses or risking damage to the Group’s reputation.
NOTES TO THE CONSOLIDATED FINANCIAL STATEMENTS (CONT.)For the year ended 30 June 2016
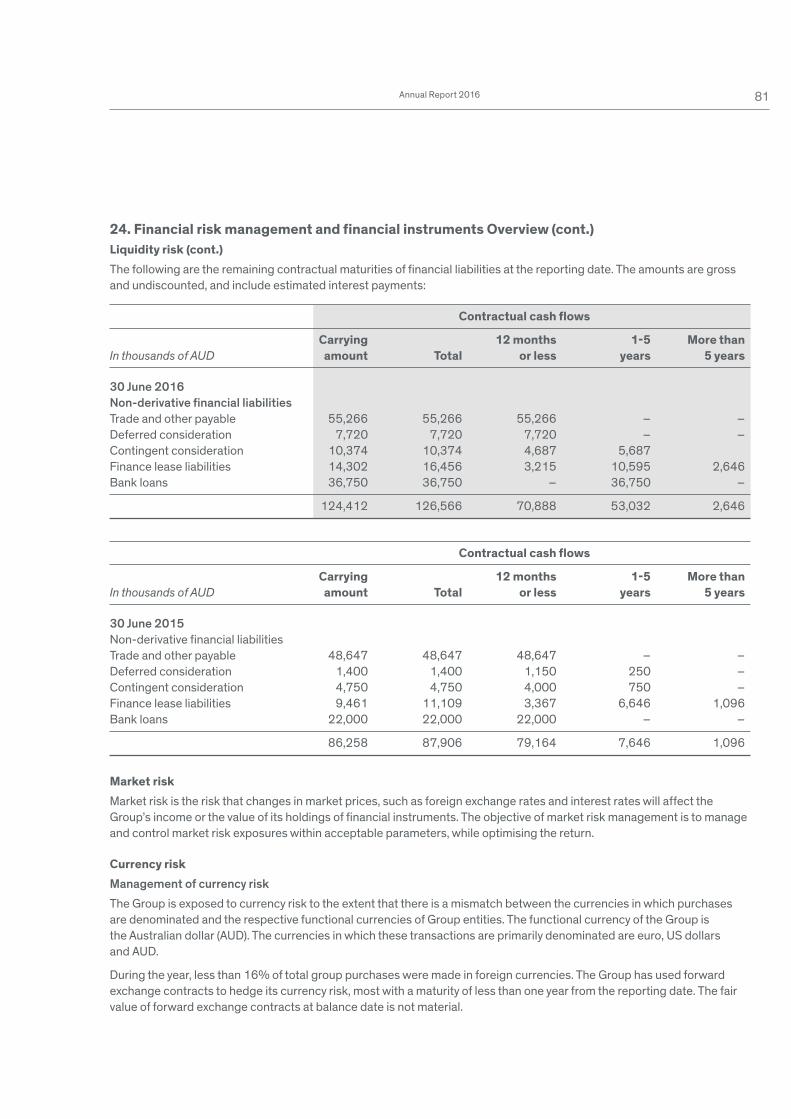
81Annual Report 2016
24. Financial risk management and financial instruments Overview (cont.)Liquidity risk (cont.)The following are the remaining contractual maturities of fi nancial liabilities at the reporting date. The amounts are gross
and undiscounted, and include estimated interest payments:
Contractual cash fl ows
Carrying 12 months 1-5 More thanIn thousands of AUD amount Total or less years 5 years
30 June 2016
Non-derivative fi nancial liabilities
Trade and other payable 55,266 55,266 55,266 – –
Deferred consideration 7,720 7,720 7,720 – –
Contingent consideration 10,374 10,374 4,687 5,687
Finance lease liabilities 14,302 16,456 3,215 10,595 2,646
Bank loans 36,750 36,750 – 36,750 –
124,412 126,566 70,888 53,032 2,646
Contractual cash fl ows
Carrying 12 months 1-5 More thanIn thousands of AUD amount Total or less years 5 years
30 June 2015
Non-derivative fi nancial liabilities
Trade and other payable 48,647 48,647 48,647 – –
Deferred consideration 1,400 1,400 1,150 250 –
Contingent consideration 4,750 4,750 4,000 750 –
Finance lease liabilities 9,461 11,109 3,367 6,646 1,096
Bank loans 22,000 22,000 22,000 – –
86,258 87,906 79,164 7,646 1,096
Market riskMarket risk is the risk that changes in market prices, such as foreign exchange rates and interest rates will affect the
Group’s income or the value of its holdings of financial instruments. The objective of market risk management is to manage
and control market risk exposures within acceptable parameters, while optimising the return.
Currency riskManagement of currency risk
The Group is exposed to currency risk to the extent that there is a mismatch between the currencies in which purchases
are denominated and the respective functional currencies of Group entities. The functional currency of the Group is
the Australian dollar (AUD). The currencies in which these transactions are primarily denominated are euro, US dollars
and AUD.
During the year, less than 16% of total group purchases were made in foreign currencies. The Group has used forward
exchange contracts to hedge its currency risk, most with a maturity of less than one year from the reporting date. The fair
value of forward exchange contracts at balance date is not material.
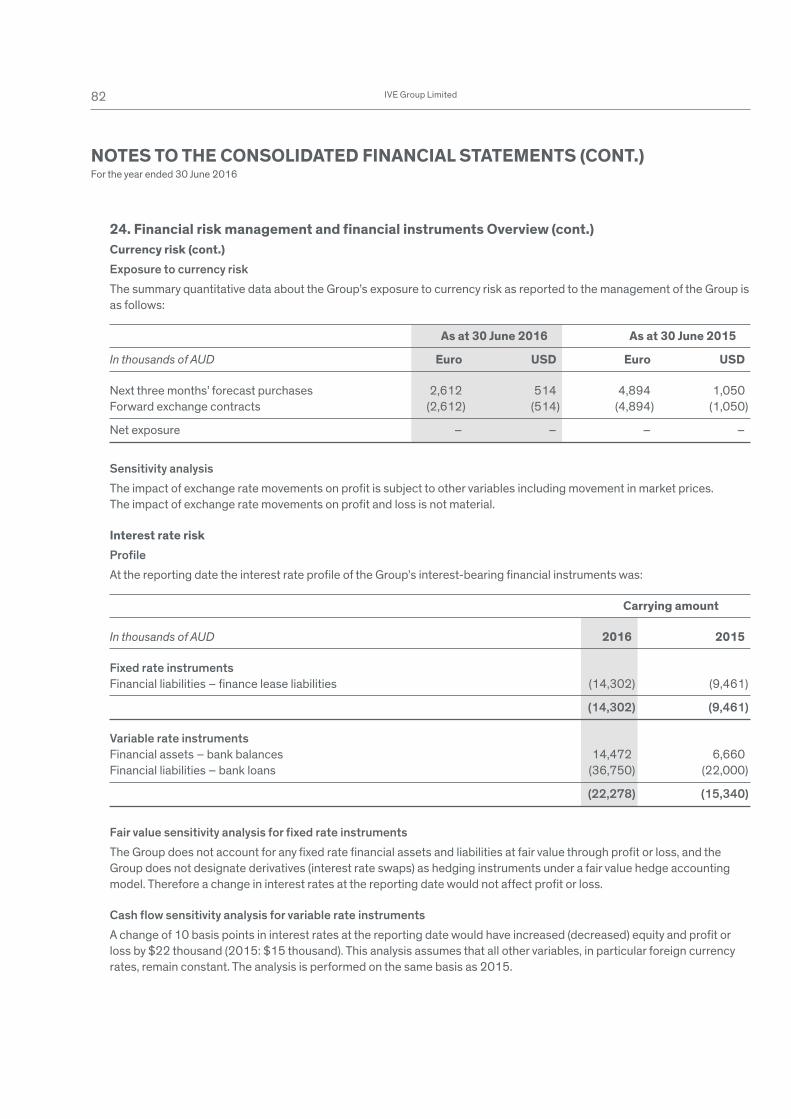
82 IVE Group Limited
NOTES TO THE CONSOLIDATED FINANCIAL STATEMENTS (CONT.)For the year ended 30 June 2016
24. Financial risk management and financial instruments Overview (cont.)Currency risk (cont.)Exposure to currency risk
The summary quantitative data about the Group’s exposure to currency risk as reported to the management of the Group is
as follows:
As at 30 June 2016 As at 30 June 2015
In thousands of AUD Euro USD Euro USD
Next three months’ forecast purchases 2,612 514 4,894 1,050
Forward exchange contracts (2,612) (514) (4,894) (1,050)
Net exposure – – – –
Sensitivity analysis
The impact of exchange rate movements on profit is subject to other variables including movement in market prices.
The impact of exchange rate movements on profit and loss is not material.
Interest rate riskProfile
At the reporting date the interest rate profile of the Group’s interest-bearing financial instruments was:
Carrying amount
In thousands of AUD 2016 2015
Fixed rate instruments
Financial liabilities – fi nance lease liabilities (14,302) (9,461)
(14,302) (9,461)
Variable rate instruments
Financial assets – bank balances 14,472 6,660
Financial liabilities – bank loans (36,750) (22,000)
(22,278) (15,340)
Fair value sensitivity analysis for fixed rate instruments
The Group does not account for any fixed rate financial assets and liabilities at fair value through profit or loss, and the
Group does not designate derivatives (interest rate swaps) as hedging instruments under a fair value hedge accounting
model. Therefore a change in interest rates at the reporting date would not affect profit or loss.
Cash flow sensitivity analysis for variable rate instruments
A change of 10 basis points in interest rates at the reporting date would have increased (decreased) equity and profi t or
loss by $22 thousand (2015: $15 thousand). This analysis assumes that all other variables, in particular foreign currency
rates, remain constant. The analysis is performed on the same basis as 2015.
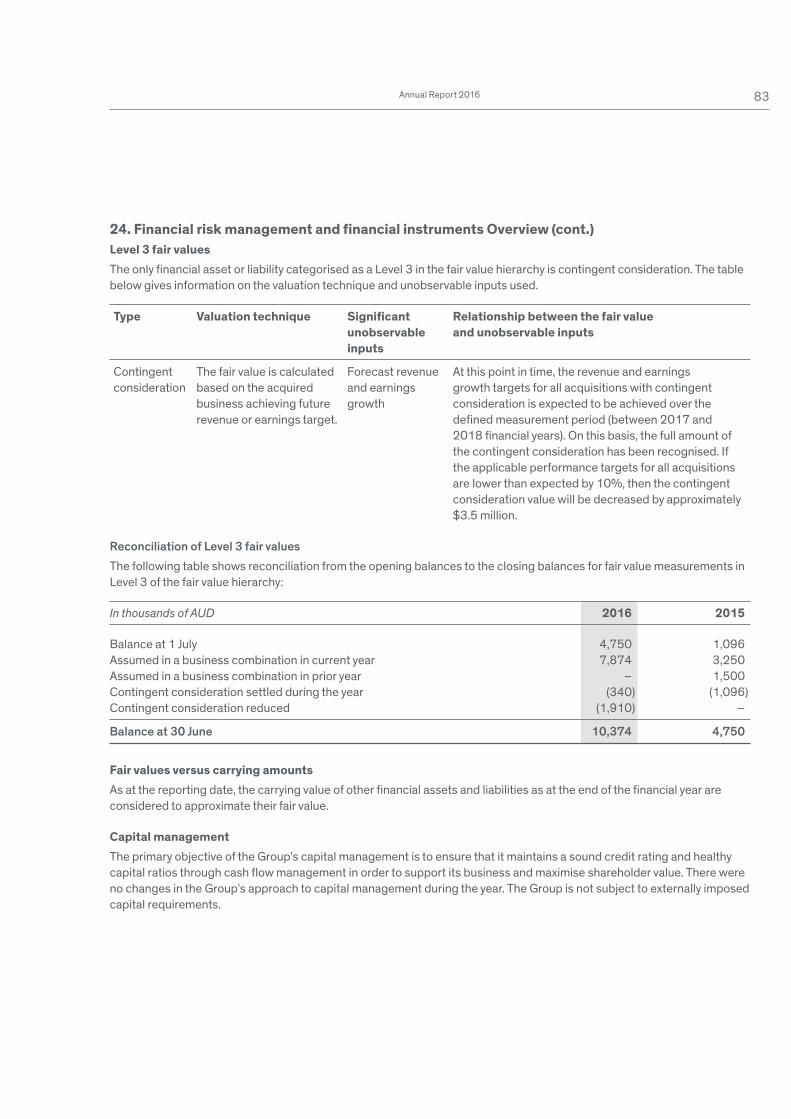
83Annual Report 2016
24. Financial risk management and financial instruments Overview (cont.)Level 3 fair valuesThe only financial asset or liability categorised as a Level 3 in the fair value hierarchy is contingent consideration. The table
below gives information on the valuation technique and unobservable inputs used.
Type Valuation technique Signifi cantunobservableinputs
Relationship between the fair valueand unobservable inputs
Contingent
consideration
The fair value is calculated
based on the acquired
business achieving future
revenue or earnings target.
Forecast revenue
and earnings
growth
At this point in time, the revenue and earnings
growth targets for all acquisitions with contingent
consideration is expected to be achieved over the
defined measurement period (between 2017 and
2018 financial years). On this basis, the full amount of
the contingent consideration has been recognised. If
the applicable performance targets for all acquisitions
are lower than expected by 10%, then the contingent
consideration value will be decreased by approximately
$3.5 million.
Reconciliation of Level 3 fair values
The following table shows reconciliation from the opening balances to the closing balances for fair value measurements in
Level 3 of the fair value hierarchy:
In thousands of AUD 2016 2015
Balance at 1 July 4,750 1,096
Assumed in a business combination in current year 7,874 3,250
Assumed in a business combination in prior year – 1,500
Contingent consideration settled during the year (340) (1,096)
Contingent consideration reduced (1,910) –
Balance at 30 June 10,374 4,750
Fair values versus carrying amountsAs at the reporting date, the carrying value of other financial assets and liabilities as at the end of the financial year are
considered to approximate their fair value.
Capital managementThe primary objective of the Group’s capital management is to ensure that it maintains a sound credit rating and healthy
capital ratios through cash flow management in order to support its business and maximise shareholder value. There were
no changes in the Group’s approach to capital management during the year. The Group is not subject to externally imposed
capital requirements.
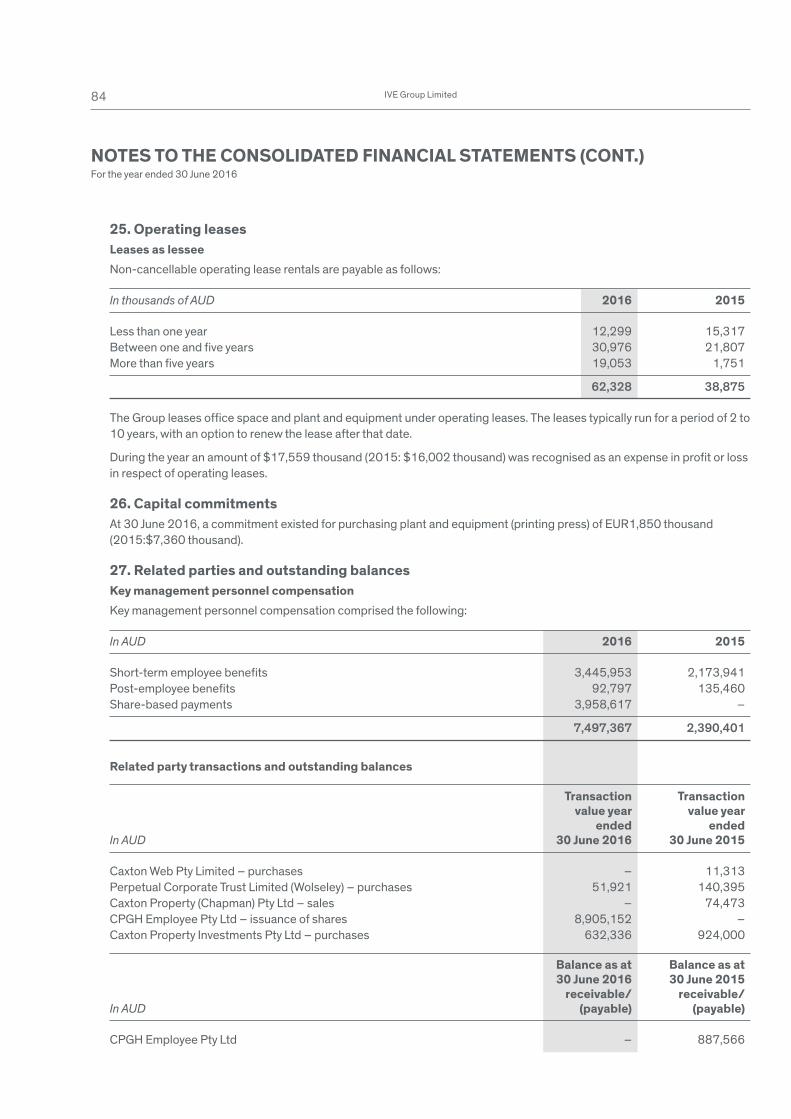
84 IVE Group Limited
NOTES TO THE CONSOLIDATED FINANCIAL STATEMENTS (CONT.)For the year ended 30 June 2016
25. Operating leasesLeases as lessee Non-cancellable operating lease rentals are payable as follows:
In thousands of AUD 2016 2015
Less than one year 12,299 15,317
Between one and fi ve years 30,976 21,807
More than fi ve years 19,053 1,751
62,328 38,875
The Group leases office space and plant and equipment under operating leases. The leases typically run for a period of 2 to
10 years, with an option to renew the lease after that date.
During the year an amount of $17,559 thousand (2015: $16,002 thousand) was recognised as an expense in profit or loss
in respect of operating leases.
26. Capital commitmentsAt 30 June 2016, a commitment existed for purchasing plant and equipment (printing press) of EUR1,850 thousand
(2015:$7,360 thousand).
27. Related parties and outstanding balancesKey management personnel compensationKey management personnel compensation comprised the following:
In AUD 2016 2015
Short-term employee benefi ts 3,445,953 2,173,941
Post-employee benefi ts 92,797 135,460
Share-based payments 3,958,617 –
7,497,367 2,390,401
Related party transactions and outstanding balances
Transaction Transaction value year value year ended endedIn AUD 30 June 2016 30 June 2015
Caxton Web Pty Limited – purchases – 11,313
Perpetual Corporate Trust Limited (Wolseley) – purchases 51,921 140,395
Caxton Property (Chapman) Pty Ltd – sales – 74,473
CPGH Employee Pty Ltd – issuance of shares 8,905,152 –
Caxton Property Investments Pty Ltd – purchases 632,336 924,000
Balance as at Balance as at 30 June 2016 30 June 2015 receivable/ receivable/In AUD (payable) (payable)
CPGH Employee Pty Ltd – 887,566
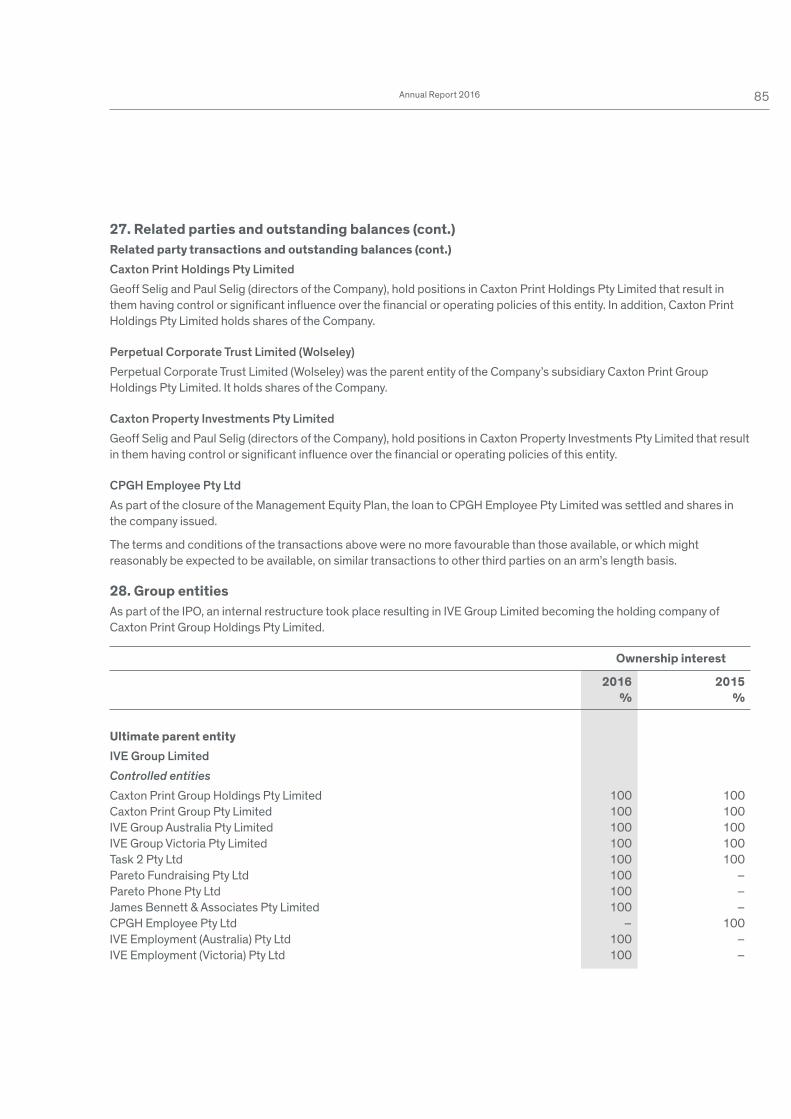
85Annual Report 2016
27. Related parties and outstanding balances (cont.)Related party transactions and outstanding balances (cont.)Caxton Print Holdings Pty Limited
Geoff Selig and Paul Selig (directors of the Company), hold positions in Caxton Print Holdings Pty Limited that result in
them having control or significant influence over the financial or operating policies of this entity. In addition, Caxton Print
Holdings Pty Limited holds shares of the Company.
Perpetual Corporate Trust Limited (Wolseley)
Perpetual Corporate Trust Limited (Wolseley) was the parent entity of the Company’s subsidiary Caxton Print Group
Holdings Pty Limited. It holds shares of the Company.
Caxton Property Investments Pty Limited
Geoff Selig and Paul Selig (directors of the Company), hold positions in Caxton Property Investments Pty Limited that result
in them having control or significant influence over the financial or operating policies of this entity.
CPGH Employee Pty Ltd
As part of the closure of the Management Equity Plan, the loan to CPGH Employee Pty Limited was settled and shares in
the company issued.
The terms and conditions of the transactions above were no more favourable than those available, or which might
reasonably be expected to be available, on similar transactions to other third parties on an arm’s length basis.
28. Group entitiesAs part of the IPO, an internal restructure took place resulting in IVE Group Limited becoming the holding company of
Caxton Print Group Holdings Pty Limited.
Ownership interest
2016 2015 % %
Ultimate parent entityIVE Group Limited
Controlled entities
Caxton Print Group Holdings Pty Limited 100 100
Caxton Print Group Pty Limited 100 100
IVE Group Australia Pty Limited 100 100
IVE Group Victoria Pty Limited 100 100
Task 2 Pty Ltd 100 100
Pareto Fundraising Pty Ltd 100 –
Pareto Phone Pty Ltd 100 –
James Bennett & Associates Pty Limited 100 –
CPGH Employee Pty Ltd – 100
IVE Employment (Australia) Pty Ltd 100 –
IVE Employment (Victoria) Pty Ltd 100 –
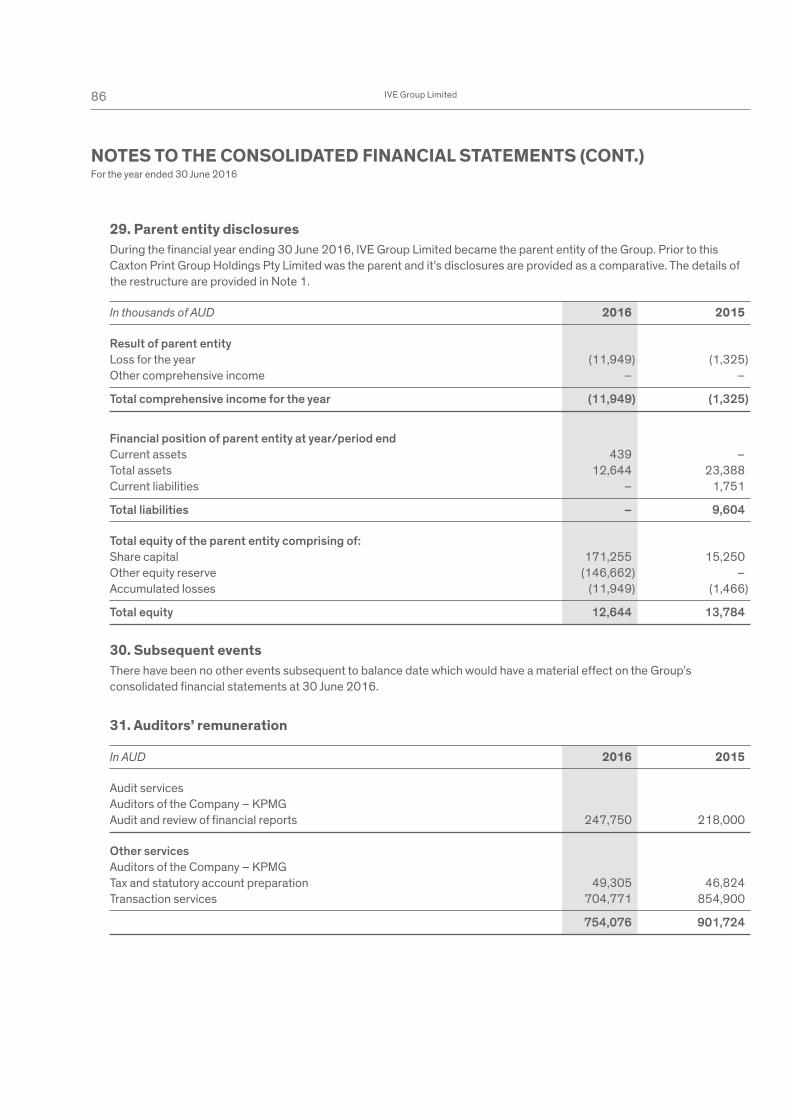
86 IVE Group Limited
NOTES TO THE CONSOLIDATED FINANCIAL STATEMENTS (CONT.)For the year ended 30 June 2016
29. Parent entity disclosuresDuring the financial year ending 30 June 2016, IVE Group Limited became the parent entity of the Group. Prior to this
Caxton Print Group Holdings Pty Limited was the parent and it’s disclosures are provided as a comparative. The details of
the restructure are provided in Note 1.
In thousands of AUD 2016 2015
Result of parent entity
Loss for the year (11,949) (1,325)
Other comprehensive income – –
Total comprehensive income for the year (11,949) (1,325)
Financial position of parent entity at year/period end
Current assets 439 –
Total assets 12,644 23,388
Current liabilities – 1,751
Total liabilities – 9,604
Total equity of the parent entity comprising of:
Share capital 171,255 15,250
Other equity reserve (146,662) –
Accumulated losses (11,949) (1,466)
Total equity 12,644 13,784
30. Subsequent eventsThere have been no other events subsequent to balance date which would have a material effect on the Group’s
consolidated fi nancial statements at 30 June 2016.
31. Auditors’ remuneration
In AUD 2016 2015
Audit services
Auditors of the Company – KPMG
Audit and review of fi nancial reports 247,750 218,000
Other services
Auditors of the Company – KPMG
Tax and statutory account preparation 49,305 46,824
Transaction services 704,771 854,900
754,076 901,724
87Annual Report 2016
32. Deed of cross guaranteePursuant to ASIC Class Order 98/1418 (as amended) dated 13 August 1998, the wholly-owned subsidiaries listed below
are relieved from the Corporations Act 2001 requirements for preparation, audit and lodgement of financial reports, and
directors’ reports.
It is a condition of the Class Order that the Company and each of the subsidiaries enter into a Deed of Cross Guarantee.
The effect of the Deed is that the Company guarantees to each creditor payment in full of any debt in the event of winding
up of any of the subsidiaries under certain provisions of the Corporations Act 2001. If a winding up occurs under other
provisions of the Act, the Company will only be liable in the event that after six months any creditor has not been paid in full.
The subsidiaries have also given similar guarantees in the event that the Company is wound up.
The Company and its subsidiaries entered into a Deed of Cross Guarantee on 27 February 2014. The subsidiaries subject
to the Deed are:
a. Caxton Print Group Holdings Pty Limited
b. IVE Group Australia Pty Limited
c. IVE Group Victoria Pty Limited
d. Caxton Print Group Pty Limited
e. Task 2 Pty Ltd
f. Pareto Fundraising Pty Ltd
g. Pareto Phone Pty Ltd
h. James Bennett & Associates Pty Limited
i. IVE Employment (Australia) Pty Limited
j. IVE Employment (Victoria) Pty Limited
A consolidated statement of profit or loss and other comprehensive income and consolidated statement of financial
position, comprising the Company and controlled entities which are a party to the Deed, after eliminating all transactions
between parties to the Deed of Cross Guarantee, for the year ended 30 June 2016 is set out on pages 53 and 54 of this
financial report.

88 IVE Group Limited
DIRECTORS’ DECLARATION
1. In the opinion of the directors of IVE Group Limited (the Company):
(a) the consolidated financial statements and notes, set out on pages 53 to 87, are in accordance with the
Corporations Act 2001, including:
(i) giving a true and fair view of the Group’s financial position as at 30 June 2016 and of its performance for the
financial year ended on that date; and
(ii) complying with Australian Accounting Standards and the Corporations Regulations 2001; and
(b) there are reasonable grounds to believe that the Company will be able to pay its debts as and when they become
due and payable.
2. There are reasonable grounds to believe that the Company and the group entities identified in Note 27 will be able to
meet any obligations or liabilities to which they are or may become subject to by virtue of the Deed of Cross Guarantee
between the Company and those group entities pursuant to ASIC Class Order 98/1418.
3. The directors draw attention to Note 2 to the consolidated financial statements, which includes a statement of
compliance with International Financial Reporting Standards.
Signed in accordance with a resolution of directors.
Geoff SeligDirector
Dated at Sydney this 29th day of August 2016
89Annual Report 2016
INDEPENDENT AUDIT REPORT TO THE MEMBERS OF IVE GROUP LIMITED
We have audited the accompanying financial report of IVE Group Limited (the Company), which comprises the
consolidated statement of financial position as at 30 June 2016, and consolidated statement of profit or loss and other
comprehensive income, consolidated statement of changes in equity and consolidated statement of cash flows for the
year ended on that date, notes 1 to 32 comprising a summary of significant accounting policies and other explanatory
information and the directors’ declaration of the Group comprising the Company and the entities it controlled at the year’s
end or from time to time during the financial year.
Directors’ responsibility for the financial reportThe directors of the Company are responsible for the preparation of the financial report that gives a true and fair view in
accordance with Australian Accounting Standards and the Corporations Act 2001 and for such internal control as the
directors determine is necessary to enable the preparation of the financial report that is free from material misstatement
whether due to fraud or error.
Auditor’s responsibilityOur responsibility is to express an opinion on the financial report based on our audit. We conducted our audit in accordance
with Australian Auditing Standards. These Auditing Standards require that we comply with relevant ethical requirements
relating to audit engagements and plan and perform the audit to obtain reasonable assurance whether the financial report
is free from material misstatement.
An audit involves performing procedures to obtain audit evidence about the amounts and disclosures in the financial
report. The procedures selected depend on the auditor’s judgement, including the assessment of the risks of material
misstatement of the financial report, whether due to fraud or error. In making those risk assessments, the auditor considers
internal control relevant to the entity’s preparation of the financial report that gives a true and fair view in order to design
audit procedures that are appropriate in the circumstances, but not for the purpose of expressing an opinion on the
effectiveness of the entity’s internal control . An audit also includes evaluating the appropriateness of accounting policies
used and the reasonableness of accounting estimates made by the directors, as well as evaluating the overall presentation
of the financial report.
We performed the procedures to assess whether in all material respects the financial report presents fairly, in accordance
with the Corporations Act 2001 and Australian Accounting Standards, a true and fair view which is consistent with our
understanding of the Group’s financial position and of its performance.
We believe that the audit evidence we have obtained is sufficient and appropriate to provide a basis for our audit opinion.
IndependenceIn conducting our audit, we have complied with the independence requirements of the Corporations Act 2001.
Auditor’s opinionIn our opinion the financial report of the Group is in accordance with the Corporations Act 2001, including:
(i) giving a true and fair view of the Group’s financial position as at 30 June 2014 and of its performance for the period
ended on that date; and
(ii) complying with Australian Accounting Standards and the Corporations Regulations 2001.
KPMG
Chris HollisPartner
Sydney
29 August 2016
90 IVE Group Limited
ADDITIONAL SHAREHOLDER INFORMATION
Additional information required by the Australian Securities Exchange (ASX) and not shown elsewhere in this report is as
follows. The information is current at 22 August 2016.
Substantial Shareholders
Name Number Current Date became a of Shares Interest Substantial Shareholder
Caxton Print Holdings Pty Ltd
as trustee for the Selig Family Trust 13,316,329 14.93% 18/12/2015
Wolseley Partners Pty Ltd
and Wolseley Partners Fund II LP 33,758,608 37.85% 18/12/2015
IVE Group Limited and its subsidiaries 51,056,583 57.46% 16/12/2015
Distribution of ShareholdersThere are 649 holders of 89,180,901 ordinary shares. There are no other classes of equity securities on issue.
Ordinary Shares
Ordinary Shares
Number of Holders Number of Shares
1 – 1,000 37 19,793
1,001 – 5,000 134 488,878
5,001 – 10,000 168 1,432,593
10,001 – 100,000 274 7,790,702
100,001 and over 36 79,448,935
Total 649 89,180,901
There were 10 holders of ordinary shares holding less than a marketable parcel.
Top Twenty Shareholders
Number ofName Ordinary Shares held %
Perpetual Corporate Trust Limited 33,758,608 37.85
Caxton Print Holdings Pty Ltd 13,316,329 14.93
Citicorp Nominees Pty Limited 6,275,184 7.04
National Nominees Limited 6,183,812 6.93
HSBC Custody Nominees (Australia) Limited 3,856,102 4.32
J P Morgan Nominees Australia Limited 2,820,719 3.16
HSBC Custody Nominees (Australia) Limited – A/C 3 2,244,715 2.52
Shansley Pty Ltd 1,862,899 2.09
BNP Paribas Noms Pty Ltd 1,330,000 1.49
BNP Paribas Nominees Pty Ltd 1,254,243 1.41
RBC Investor Services Australia Nominees Pty Limited 645,757 0.72
MVEL Aitken Pty Ltd 500,681 0.56
WLHALH Holdings Pty Ltd 500,681 0.56
UBS Nominees Pty Ltd 470,000 0.53
DNSMD Pty Ltd 400,545 0.45
91Annual Report 2016
Top Twenty Shareholders (cont.)
Name Number of Ordinary Shares held %
R.E.D Investment Holdings Pty Ltd 400,545 0.45
Pershing Australia Nominees Pty Ltd 347,984 0.39
Citicorp Nominees Pty Limited 328,967 0.37
Pacific Custodians Pty Limited 325,000 0.36
Boost Marketing Solutions Pty Ltd 316,295 0.35
Escor Investments Pty Ltd 200,000 0.22
Mr Raymond Charles King & Mrs Dawn King 176,000 0.20
Total Top 20 77,515,066 86.92
On-Market Buy BackThere is no current on-market buy back.
Voting RightsThe voting rights attached to ordinary shares are set out below:
On a show of hands every member present at a meeting in person or by proxy shall have one vote and upon a poll each
share shall have one vote.
There are no other classes of equity securities.
OptionsIVE Group has no options on issue.
Securities subject to Voluntary Escrow
Period escrow ends Number of securities subject to escrow
The first day after the day on which IVE Group’s audited results for
the period ending 30 June 2016 are released to ASX 42,407,592
The first day after the day on which IVE Group’s audited results for
the period ending 30 June 2017 are released to ASX 8,648,991
Total of Escrowed Shares 51,056,583
Use of Cash and AssetsIVE Group has used the cash and assets in a form readily convertible to cash at the time of admission to the ASX in a way
consistent with its business objectives as stated in its Prospectus.
Stock Exchange ListingIVE Group securities are only listed on the ASX.
92 IVE Group Limited
CORPORATE GOVERNANCE STATEMENTThe Board is responsible for the overall corporate governance of IVE Group Limited, including adopting appropriate
policies and procedures designed to ensure that the IVE Group is properly managed to protect and enhance Shareholder
interests.
The Board monitors the operational and financial position and performance of IVE and oversees its business strategy,
including approving the strategic goals of IVE. The Board is committed to maximising performance, generating appropriate
levels of Shareholder value and financial return, and sustaining the growth and success of IVE.
In conducting business with these objectives, the Board is committed to ensuring that IVE is properly managed to
protect and enhance Shareholder interests, and that IVE, its Directors, officers and employees operate in an appropriate
environment of corporate governance. Accordingly, the Board has created a framework for managing IVE, including
adopting relevant internal controls, risk management processes and corporate governance policies and practices, which
it believes are appropriate for IVE’s business and that are designed to promote the responsible management and conduct
of IVE.
Details of IVE’s key governance policies and the charters for the Board and each of its committees are available on IVE’s
website at www.ivegroup.com.au.
The Corporate Governance Statement reports against the 3rd edition of the ASX Corporate Governance Council’s
Principles and Recommendations (ASX Principles) and the practices detailed in the Corporate Governance Statement
are current as at 26 August 2016. It has been approved by the Board and is available on the IVE website under Investors
at http://investors.ivegroup.com.au/homevvv/.
IVE GROUP LIMITED CORPORATE DIRECTORYBoard of DirectorsGeoff Selig – Executive Chairman
Warwick Hay – Managing Director
Gavin Bell – Non-executive Director
Andrew Harrison – Non-executive Director
Sandra Hook – Non-executive Director
Paul Selig – Non-executive Director
James Todd – Non-executive Director
SecretariesDarren Dunkley
Emma Lawler
Registered Office andPrincipal Administrative OfficeBuilding B, 350 Parramatta Road
Homebush NSW 2140
Telephone: +61 2 8020 4400
Share RegistryLink Market Services Limited
Level 12, 680 George Street, Sydney South NSW 2000
Telephone: +61 1300 554 474
AuditorsKPMG
Level 38, Tower 3, 300 Barangaroo Avenue
Sydney NSW 2000 Australia
BankersWestpac Banking Corporation
Level 3, Westpac Place,
275 Kent Street, Sydney, NSW 2000


ivegroup.com.au
IVE338571/1016