carta hiroki final · Title: carta hiroki final.cdr Author: SUSO Created Date: 4/23/2019 3:56:06 PM

2016Annual Report
Hong Kong
HAITONG BANK, S.A.
1
INDEX
MANAGEMENT REPORT
MESSAGE FROM THE CHAIRMAN ----------------------------------------------------------------------------------------- 4
1. GOVERNANCE --------------------------------------------------------------------------------------------------------------- 6
Corporate Bodies-------------------------------------------------------------------------------------------------------------- 6
Executive Committee -------------------------------------------------------------------------------------------------------- 7
Branches, Subsidiaries and Representative Offices------------------------------------------------------------------ 8
Senior Management Responsibilities ---------------------------------------------------------------------------------- 10
Corporate Values------------------------------------------------------------------------------------------------------------ 14
Organisational Charts ------------------------------------------------------------------------------------------------------ 15
2. EARNINGS DISTRIBUTION PROPOSAL ---------------------------------------------------------------------------- 17
3. DECLARATION OF CONFORMITY ----------------------------------------------------------------------------------- 18
4. GLOBAL STRATEGY AND MAIN DEVELOPMENTS ------------------------------------------------------------ 20
Global Strategy -------------------------------------------------------------------------------------------------------------- 20
Corporate Events------------------------------------------------------------------------------------------------------------ 21
Macroeconomic Environment -------------------------------------------------------------------------------------------- 23
Financial Highlights --------------------------------------------------------------------------------------------------------- 27
Financial Overview --------------------------------------------------------------------------------------------------------- 28
Rating -------------------------------------------------------------------------------------------------------------------------- 30
5. BUSINESS ACTIVITY ----------------------------------------------------------------------------------------------------- 31
Business Model -------------------------------------------------------------------------------------------------------------- 31
5.1. INVESTMENT BANKING ------------------------------------------------------------------------------------------ 32
Mergers & Acquisitions ---------------------------------------------------------------------------------------------- 32
Capital Markets ------------------------------------------------------------------------------------------------------- 35
Project Finance -------------------------------------------------------------------------------------------------------- 41
Acquisition Finance --------------------------------------------------------------------------------------------------- 42
Other Credits ---------------------------------------------------------------------------------------------------------- 44

2016 Annual Report 2
5.2. MARKETS -------------------------------------------------------------------------------------------------------------- 45
Equities ------------------------------------------------------------------------------------------------------------------ 45
Research ---------------------------------------------------------------------------------------------------------------- 47
Emerging Markets Fixed Income ---------------------------------------------------------------------------------- 48
Fixed Income, Currencies and Commodities ------------------------------------------------------------------- 48
5.3. WEALTH AND FUND MANAGEMENT ------------------------------------------------------------------------- 50
Asset Management -------------------------------------------------------------------------------------------------- 50
Wealth Management ------------------------------------------------------------------------------------------------ 51
Private Equity ---------------------------------------------------------------------------------------------------------- 52
6. TREASURY ----------------------------------------------------------------------------------------------------------------- 54
7. HUMAN RESOURCES --------------------------------------------------------------------------------------------------- 56
8. RISK MANAGEMENT ----------------------------------------------------------------------------------------------------- 58
CONSOLIDATED FINANCIAL STATEMENTS AND NOTES
Consolidated Financial Statements ----------------------------------------------------------------------------------------- 80
Notes to the Consolidated Financial Statements ------------------------------------------------------------------------ 85
• Report and Opinion of the Supervisory Board --------------------------------------------------------------- 183• Statutory Audit Certification and Audit Report--------------------------------------------------------------- 187
INDIVIDUAL FINANCIAL STATEMENTS AND NOTES
Individual Financial Statements -------------------------------------------------------------------------------------------- 196
Notes to the Individual Financial Statements -------------------------------------------------------------------------- 201
• Report and Opinion of the Supervisory Board ------------------------------------------------------------- 277• Statutory Audit Certification and Audit Report ------------------------------------------------------------- 281
ANNEXES
I - Shares and Bonds held by the Members of the Board of Directors and the Supervisory Bodies --- 290
II - Shareholders ----------------------------------------------------------------------------------------------------------- 291
III - Corporate Governance Structures and Practices --------------------------------------------------------------- 292
IV - Bank of Portugal Reference Indicators---------------------------------------------------------------------------- 294
V - Remuneration of the Board of Directors and Supervisory Board Members and Relevant Staff (Senior Managing Directors and Control Functions Staff) --------------------------------------------------- 296

HAITONG BANK, S.A.
3
MANAGEMENT REPORT
2016 Annual Report 4
MESSAGE FROM THE EXECUTIVE CHAIRMAN
2016 has seen the full integration of Haitong Bank into Haitong Securities Group. During the year, some key cooperation initiatives have taken place:
● The sale of Haitong Securities India Private Limited to Haitong International Securities (Hong Kong),leveraging on the Group’s Pan-Asian business integration;
● The creation of China desks and the establishment of joint working teams at a Group level, allowingHaitong Bank to participate in cross-border DCM and M&A transactions originated together withHaitong Securities and Haitong International.
Nevertheless, during 2016, the Bank has faced significant headwinds. The difficult global investment banking environment was worsened by the deterioration of the macroeconomic conditions and increased political uncertainty in some of our key regions, namely Brazil and the UK, while in Iberia the economic recovery was slower, namely in the first half of the year. In addition, the Bank had to manage a full transition process into a new financial group.
As a consequence, 2016 was a very challenging year for the Bank with a EUR 96 million net loss. The negative operational result was due to the change in the business model which has affected revenue generation and also the existing disproportionate cost structure. This cost structure was related to the former strategy as well as to the need to set up a new banking infrastructure after severing ties with Novo Banco. Finally, on top of this negative operating situation, there was a need to recognise further credit impairments. These were related to the legacy credit portfolio in Project Finance and Acquisition Finance. After several years of portfolio clean-up, we expect to have finally reached the last part of this stage of restructuring.
In this context, Haitong Securities decided, at the end of 2016, to implement a management reshuffle with the aim of relaunching the business. This will be executed under a new strategy underpinned by a recapitalization to support growth. The new strategic positioning, called “Haitong Bank 2025”, is based on two strategic pillars, China Angle and Emerging Markets, and three main areas of activity - Investment Banking, Markets (centred on Fixed Income), and Alternative Products. This new business model will be rolled out in the core domestic markets - Iberia, Poland and Brazil, and the distribution hubs - NY and London. This business repositioning will be accompanied, in 2017, by a structural cost reduction.
The new strategy is being implemented under a new set of values: (i) Teamwork; (ii) Transparency; (iii) Accountability; (iv) Communication; (v) Pro-Business Activity; and (vi) Effective Budget Management.
We are preparing Haitong Bank to play a central role at the Group level: the Bank has a strong origination franchise in local markets such as Iberia, Brazil and Poland that can be leveraged on by the distribution capability in the London and New York hubs and going forward into Shanghai and Hong Kong. Our objective is to develop this franchise, adjusting the size and cost of our platform to ensure a sustainable profitable business, whilst supporting the ambition to strengthen Haitong Securities Group’s international franchise.
The full integration into Haitong Securities Group and the implementation of “Haitong Bank 2025” are the basis for this new project, paving the way for the Bank’s return to profitability. The revised cost structure, as well as the conclusion of the legacy asset restructuring will also contribute for the Bank’s performance improvement.
From the outset, our parent company Haitong Securities has been conscious of the effort to reorganise and reposition this business, providing both operational and financial support to this turnaround. As part of its
HAITONG BANK, S.A.
5
commitment to Haitong Bank's development plan, Haitong Securities Company Limited is considering taking some initiatives to further strengthen the Bank’s capital position in 2017:
● The conversion of EUR 80 million Subordinated additional Tier 1 instruments into Common Equity Tier1 capital;
● A further EUR 139 million capital increase in Haitong Bank, S.A. through the conversion of the Shareholder loan into capital;
● An additional EUR 200 million capital injection.
This reinforced capital position, to be approved by the Shareholder, will allow Haitong Bank to meet regulatory capital requirements, both in terms of Tier 1 ratio and total capital ratio, whilst giving it further leverage for the business to grow.
Our first words of recognition therefore go to our ultimate controlling shareholder Haitong Securities for its long term strategic commitment.
To our Clients, we reiterate our dedication to continue to provide a service of excellence. Today, we are the only Chinese owned investment bank offering a differentiated and innovative service in EMEA and the Americas.
To our Employees, our Supervisory Board and our Auditors we thank them for their commitment and professionalism. To the Bank of Portugal, the Portuguese Securities Market Commission and the Supervision Authorities in the countries where we are present, we thank them for their cooperation and trust.
Hiroki Miyazato
Chairman of the Board of Directors and of the Executive Committee

2016 Annual Report
6
1. GOVERNANCE
CORPORATE BODIES
GENERAL MEETING BOARD
Chairman1
Secretary José Miguel Alecrim Duarte
BOARD OF DIRECTORS
Chairman Hiroki Miyazato
Members Christian Georges Jacques Minzolini Mo Yiu Poon Paulo José Lameiras Martins Alan do Amaral Fernandes Pan Guangtao Lin Yong David Charles Denholm Hobley Vincent Marie Camerlynck
SUPERVISORY BOARD
Permanent Members José Manuel Macedo Pereira (Chairman) Tito Manuel das Neves Magalhães Basto Mário Paulo Bettencourt de Oliveira
Deputy Member Paulo Ribeiro da Silva
1 Vacant due to the resignation of the former holder
HAITONG BANK, S.A.
7
EXECUTIVE COMMITTEE
Chairman Hiroki Miyazato
Members Christian Georges Jacques Minzolini Mo Yiu Poon Paulo José Lameiras Martins Alan do Amaral Fernandes
Senior Managing Directors with a Seat on the Enlarged Executive Committee Bartlomiej Dmitruk José Pinto Basto Krzysztof Rosa Nuno Cardoso Paulo Araújo Pedro Costa Pedro Toscano Rico Pedro Ventaneira
Executive Committee Secretary José Miguel Alecrim Duarte
STATUTORY AUDITORS
Deloitte & Associados, SROC S.A. represented by João Carlos Henriques Gomes Ferreira
2016 Annual Report
8
BRANCHES, SUBSIDIARIES AND REPRESENTATIVE OFFICES
BRANCHES
HAITONG BANK, S.A. – SPAIN BRANCH Ricardo Domenech José Miguel Rego2
HAITONG BANK, S.A. – LONDON BRANCH Aníbal Paçó Paulo Araújo3
HAITONG BANK, S.A. – WARSAW BRANCH Krzysztof Rosa Bartlomiej Dmitruk
HAITONG BANCO DE INVESTIMENTO DO BRASIL, S.A. - CAYMAN BRANCH Frederico Alegria
SUBSIDIARIES
HAITONG BANCO DE INVESTIMENTO DO BRASIL, S.A. (BRAZIL) Alan Fernandes
HAITONG SECURITIES DO BRASIL CORRETORA DE CÂMBIO E VALORES MOBILIÁRIOS, S.A. (BRAZIL) Alan Fernandes
HAITONG DO BRASIL DTVM, S.A. (BRAZIL) Alan Fernandes
HAITONG CAPITAL - SOCIEDADE DE CAPITAL DE RISCO, S.A. (PORTUGAL) José Pinto Basto Luís Valença Pinto
HAITONG INVESTMENT IRELAND P.L.C. (IRELAND) Mo Yiu Poon
HAITONG (UK) LIMITED (UNITED KINGDOM) Keith Jones Paulo Araújo
2 In process of registration 3 In process of registration

HAITONG BANK, S.A.
9
HAITONG SECURITIES (UK) LIMITED (UNITED KINGDOM) Keith Jones Paulo Araújo
HAITONG SECURITIES USA LLC (UNITED STATES OF AMERICA) Nuno Cardoso
LUSITANIA CAPITAL, S.A.P.I. DE C.V., SOFOM, E.N.R. (MEXICO) Nuno Cardoso Hugo Villalobos
REPRESENTATIVE OFFICES
NEW YORK Nuno Cardoso
MEXICO CITY Hugo Villalobos
GERMANY Mário Vieira de Carvalho
2016 Annual Report
10
SENIOR MANAGEMENT RESPONSIBILITIES
In its meeting held on 16 December 2016, the Board of Directors has resolved to change the composition of the Executive Committee and the distribution of functions as follows:
Hiroki Miyazato
Chairman of the Board of Directors and of the Executive Committee
Corporate Strategy Human Resources and Organisation
Christian Minzolini
Chief Operating Officer Human Resources and Organisation Legal Operations Corporate Communication Information Technology Information and Documentation Capital Structure Advisory
Mo Yiu Poon
Chief Financial Officer Accounting & Management Information Treasury Banking and Financial Institutions Relationships Asset Management Wealth Management Global Markets Haitong Investment Ireland plc
HAITONG BANK, S.A.
11
SENIOR MANAGEMENT RESPONSIBILITIES
CEO of Haitong Banco de Investimento do Brasil, S.A. Haitong Banco de Investimento do Brasil, S.A. and subsidiaries
Alan Fernandes
Global Head of Markets
FICC EMFI Equities Research Lusitânia Capital, SAPI, SOFOM
Nuno Cardoso
Global Head of Investment Banking Mergers & Acquisitions Capital Markets Client Coverage Acquisition Finance and Other Loans Project Finance & Securitization
Paulo Martins
2016 Annual Report
12
SENIOR MANAGEMENT RESPONSIBILITIES
José Pinto Basto
Haitong Capital – SCR, S.A.
Pedro Toscano Rico
Global Credit Committee
Pedro Ventaneira
Risk Management Department (Chief Risk Officer)

HAITONG BANK, S.A.
13
SENIOR MANAGEMENT RESPONSIBILITIES
Haitong Bank, S.A. – Warsaw Branch
Krzysztof Rosa
Haitong Securities (UK) Limited
Paulo Araújo
Corporate Strategy Department
Pedro Costa
Haitong Bank, S.A. – Warsaw Branch
Bartlomiej Dmitruk

2016 Annual Report
14
CORPORATE VALUES
New Management Culture – “One Haitong Bank”
The new corporate culture reflects a more cohesive management approach under the “One Haitong Bank” principle, which means:
This new management approach should filter down through the organisation, increasing team spirit, accountability and more integration.
The new set of Corporate Values are as follows:
One set of core values
One organisation across different businesses and regions
One Management style
One true alignement with the Shareholder
One Strategy

HAITONG BANK, S.A.
15
ORGANISATIONAL CHARTS

2016 Annual Report
16
ORGANISATIONAL CHARTS

HAITONG BANK, S.A.
17
2. EARNINGS DISTRIBUTION PROPOSAL
Considering that the individual income statement for the year ended on 31 December 2016 showed a net loss of EUR 151,280,504.05 the Board of Directors submits to the Annual General Meeting the following proposal for the distribution of the year’s results:
● TO OTHER RESERVES AND RETAINED EARNINGS: EUR -151,280,504.05 euros (net loss of one hundred fifty one million, two hundred eighty thousand five hundred and four euros and five cents)
● TOTAL: EUR -151,280,504.05 euros (net loss of one hundred fifty one million, two hundred eighty thousand five hundred and four euros and five cents)

2016 Annual Report
18
3. DECLARATION OF CONFORMITY
In accordance with Article 245, number 1, paragraph c, of the Portuguese Securities Code, the Members of the Board of Directors of Haitong Bank, S.A. hereby declare that, to the best of their knowledge:
a) The individual financial statements of Haitong Bank, S.A. for the year ended on 31 December 2016 were prepared in accordance with the legally applicable accounting standards and the Portuguese legislation, as set forth in Article 245, number 3, of the Portuguese Securities Code;
b) The consolidated financial statements of Haitong Bank, S.A. for the year ended on 31 December 2016 were prepared in accordance with the legally applicable accounting standards and with Regulation (EC) no. 1606/2002 of the European Parliament and of the Council, of July 19th, as set forth in Article 245, number 3, of the Portuguese Securities Code;
c) The financial statements referred to in paragraphs a) and b) above give a true and fair view of Haitong Bank, S.A. and consolidated companies’ assets, liabilities, equity and earnings;
d) The Management Report describes faithfully Haitong Bank, S.A. and consolidated companies’ business evolution, performance and financial position for the year ended on 31 December 2016, and includes a description of the main risks and uncertainties that could affect the business.
Lisbon, 20 March 2017 Hiroki Miyazato (Chairman of the Board of Directors and of the Executive Committee)
Christian Georges Jacques Minzolini (Executive Board Member)
Mo Yiu Poon (Executive Board Member)

HAITONG BANK, S.A.
19
Paulo José Lameiras Martins (Executive Board Member)
Alan do Amaral Fernandes (Executive Board Member)
Pan Guangtao (Non-Executive Board Member)
Lin Yong (Non-Executive Board Member)
David Charles Denholm Hobley (Non-Executive Board Member)
Vincent Marie Camerlynck (Non-Executive Board Member)

2016 Annual Report
20
4. GLOBAL STRATEGY AND MAIN DEVELOPMENTS
GLOBAL STRATEGY
Haitong Bank is currently repositioning its strategy from an asset based business to a Client focused, fee generative model.
Going forward, Haitong Bank aims at being a self-sustained Investment Bank in its core local geographies covering the Americas and Europe with a China Angle, becoming a reference player in the Emerging Markets space in areas such as Debt Capital Markets. The repositioning of the business will be underpinned by the following components:
● Values: Teamwork; Transparency; Accountability; Communication; Pro-Business Activity; Effective Budget Management.
● Differentiators: The unique China Angle. Haitong is the only Chinese Investment Bank covering markets outside Asia.
● Shareholder: The business will be aligned with the strategic goals of the Shareholder to create an international franchise for Haitong Group.
● Clients: The business will be Client focused. We aim at increasing the proportion of Client’s business and decrease the weight of pure balance sheet related activities.
● Management: A new culture. A more integrated business. One Haitong Bank.
● Geographies: Presence in key local markets (Iberia, Brazil and Poland) and main Western financial hubs (London and New York).
● Expertise: Haitong Bank’s recognised expertise in Emerging Markets and core regions.
HAITONG BANK, S.A.
21
CORPORATE EVENTS
● In January 2016 Haitong Bank, S.A. fully subscribed and paid up Haitong Securities USA LLC initial share capital of USD 300 thousand.
● In February 2016 Haitong Bank, S.A. agreed to purchase all of the 1,477,491 shares held by the minority shareholder of Haitong Securities India Private Limited, for INR 245,795 thousand. This acquisition was completed in May 2016.
● In March 2016 Haitong Bank, S.A. fully subscribed the capital increase of Haitong Securities USA LLC, an investment of USD 10,000 thousand.
● In March 2016 Haitong Bank, S.A. fully subscribed the capital increase of Haitong Securities India Private Limited, an investment of INR 344,748 thousand. Haitong Bank, S.A. subscribed 13,725,289 new shares increasing the number of shares held in this company to 19,635,252.
● In March 2016 Haitong Bank, S.A. concluded the winding up of its New York Branch and returned the respective licence to the New York Department of Financial Services. Since then Haitong Bank remained present in this market through a Representative Office, whose licence had been granted by the same Supervision Authority in January 2016. In October 2016, Haitong Bank, S.A. started its activities as a broker dealer through its subsidiary Haitong Securities USA LLC.
● In March 2016 Mr. Tiago Vaz Pinto Cyrne de Castro handed in his resignation to his position as member of the Board of Directors of Haitong Bank, S.A..
● In April 2016 Messrs Luis Miguel Pina Alves Luna Vaz and Miguel António Igrejas Horta e Costa resigned their positions as Member and Vice-Chairman, respectively, of the Board of Directors of Haitong Bank, S.A..
● In April 2016 the Bank of Portugal authorised Mr. Lin Yong to take office as member of Haitong Bank, S.A.'s Board of Directors. Mr. Lin Yong will remain in office until the end of the current mandate (2013-2016).
● In May 2016 Haitong Bank, S.A. issued Fixed Rate Perpetual Deeply Subordinated Additional Tier 1 Resettable Instruments for a global amount of EUR 80,000 thousand.
● In June 2016 Haitong Bank concluded the refinancing of the Novo Banco EUR 750,000 thousand facility via a syndicate of Asian banks and with the guarantee of Haitong Securities.
● In June 2016 Haitong Bank received a EUR 138,500 thousand 5-year intercompany loan from Haitong International Holdings Limited.
● In July 2016 the Bank of Portugal authorised Mr. David Charles Denholm Hobley to take office as member of Haitong Bank, S.A.'s Board of Directors. Mr. David Hobley will remain in office until the end of the current mandate (2013-2016).
● In July 2016 Haitong Bank, S.A. concluded the winding up of Haitong & Company (UK) Limited.
● In October 2016 Haitong Bank, S.A. fully subscribed and paid up Haitong Securities USA LLC share capital increase, an investment of USD 3,438 thousand.
● In October 2016 the corporate name of Espírito Santo Investimentos, S.A. was changed to Haitong Negócios, S.A..

2016 Annual Report
22
● In November 2016 the Bank of Portugal authorised Mr. Vincent Marie Camerlynck to take office as member of Haitong Bank, S.A.'s Board of Directors.
● In December 2016, Haitong Bank, S.A. concluded the sale of its subsidiary Haitong Securities India Private Limited (19,635,252 shares) for the amount of USD 11,365 thousand.
● In December, Haitong Capital – SCR, S.A. concluded the sale of 20% of Coporgest – Companhia Portuguesa de Gestão e Desenvolvimento Imobiliário, S.A. for the amount of EUR 1,993 thousand.
● In December 2016 Mr. José Maria Ricciardi resigned his positions as Member of the Board of Directors and Chief Executive Officer of the Executive Committee of Haitong Bank, S.A..
● In December 2016 Messrs Rafael Caldeira de Castel-Branco Valverde, Félix Aguirre Cabanyes and Frederico dos Reis de Arrochela Alegria resigned their positions as Members of the Board of Directors and Members of the Executive Committee of Haitong Bank, S.A..

HAITONG BANK, S.A.
23
MACROECONOMIC ENVIRONMENT
The beginning of 2016 was marked by instability and risk aversion in the financial markets, mainly associated with a sharp decline in oil prices (from USD 37 to a low of USD 26/barrel early in January, in the case of Brent crude), but also with concerns with a potential deceleration of China’s economy, fuelling an increase in capital outflows and a devaluation of the renminbi. The movements in the oil price and in the renminbi supported fears of global deflationary pressures, with potential negative impacts on global economic growth. The fall in oil prices also resulted in a rise in corporate defaults in the mining sector (particularly in the US), reflected in the widening of high yield corporate spreads, which supported fears of contagion to the financial sector.
These concerns abated in the course of the first semester, with a recovery in oil prices and with gradual signs of stabilisation in China’s economic growth. The increase in commodity prices was also visible in other sectors, with the Commodity Research Bureau Index of metal prices rising close to 45% in 2016. After rising 27% until the beginning of September, the price of gold fell in the final months of the year, penalized by a rapid appreciation in the USD. In 2016 as a whole, gold still gained 10%.
Oil Price
20
40
60
80
100
120
140
160
2007 2008 2009 2010 2011 2012 2013 2014 2015 2016
Brent
WTI
USD / barrel
Source: Reuters EcoWin Pro.
Financial market instability and risk aversion increased again at the end of the first semester, with Britain’s vote to leave the EU. After a strong risk-off reaction, financial markets stabilised but global expectations of “lower for longer” rates were reinforced, supported by the affirmation of an easing bias by the Bank of England, the ECB and the Bank of Japan. In the US, the Federal Reserve signalled a postponement in the expected rate hikes. Market interest rates extended the declines observed in the first half of the year and yield curves flattened. Between January and June, the 10-year US Treasury yield fell from 2.27% to 1.47% and the 10-year Bund yield declined from 0.629% to -0.13%. In turn, the 3-month Euribor fell from -0.131% to -0.286%. In the Euro Area, the ECB had already contributed to this environment of low rates by announcing, in March – among other measures – a 5 bps cut in the main refinancing rate, to 0%; a 10 bps cut in the deposit facility rate, to -0.4%; a EUR 20 billion expansion in monthly asset purchases, to EUR 80 billion; and the launch of four new Targeted Longer-Term Refinancing Operations. The environment of very low interest rates posed significant challenges to investors, which then favoured a selective demand for assets with higher risk and longer maturities, as well as investments in alternative assets, such as real estate and, in the stock market, defensive sectors and companies with stable and solid dividends.

2016 Annual Report
24
The second half of the year saw a change in the global economic and financial environment. Expansionary fiscal and monetary policies gradually gave way to a recovery in demand in the US, in Europe and in China. The rise in oil prices allowed for a recovery in industrial activity, particularly in the US mining sector, and improved the terms of trade and prospects for economic activity in commodity exporting economies, including emerging markets. With the recovery in demand and in labour markets (particularly in the US), and with the rise in oil prices, deflationary pressures first subsided and, then, gave way to a moderately reflationary environment. The expectation of global reflation was further supported by the surprise victory of Donald Trump in the US Presidential election, in November. The main policy proposals of the new President-Elect included aggressive fiscal policy stimuli (in the form of tax cuts and infrastructure spending), as well as strong deregulation of economic activity and a number of protectionist measures. In the US, the scenario of an aggressively expansionary fiscal policy in an economy already close to its potential supported expectations of higher growth, higher inflation and higher interest rates which, in turn, resulted in the appreciation of the USD. The 10-year Treasury yield rose from 1.47% to 2.45% in the second half of the year, while the 10-year Bund yield rose from -0.13% to 0.21%. After falling 3.2% against the EUR between January and September, to EUR/USD 1.123, the USD appreciated 6.5% in Q4, to EUR/USD 1.054 (3% in the whole of 2016).
10-year Treasuries and Bunds yields (%)
-0.5
0.0
0.5
1.0
1.5
2.0
2.5
3.0
3.5
4.0
4.5
5.0
2007 2008 2009 2010 2011 2012 2013 2014 2015 2016
USA
Germany
Source: Bloomberg.
In this reflationary environment, investors increased their focus on cyclical sectors in the final months of the year. In the US and in Europe, the main stock indices posted annual gains in 2016, benefiting from a combination of expansionary monetary policies, on one side, and a recovery in economic activity and in earnings, on the other. In China, capital outflows contributed to a 12.3% decline in the Shanghai Composite.
In spite of this volatile environment, marked by periods of financial instability and political uncertainty, global GDP growth remained relatively stable in 2016, declining only marginally, from 3.2% to 3.1%. Developed economies decelerated as a group, with GDP growth falling from 2.1% to 1.6%, while emerging markets expanded 4.1%, maintaining the pace of growth observed in 2015. In the US, GDP increased 1.6% in real terms, after 2.6% growth in 2015. After a subdued start of the year, economic activity gradually strengthened, mainly on the back of stronger private consumption and net exports. Fixed investment, mainly in infrastructure, also improved its contribution to growth in H2. In this environment, labour market conditions improved in 2016, with the unemployment rate falling from a high of 5% in April to 4.7% in December, as a percentage of the labour force. This improvement was reflected in average hourly earnings which, over the year, rose by 2.9%,
HAITONG BANK, S.A.
25
the biggest gain since 2009. With headline inflation rising from a low of 0.8% in July to 2.1% in December, the Federal Reserve raised the target Fed Funds rate by 25 bps in December, to 0.5%-0.75% and kept a tightening bias. Inflation was mainly supported by the YoY rise in energy prices, but stronger domestic demand and higher wage growth also supported the core inflation rate, which hovered around 2.2%-2.3% in 2016.
In 2016, the Chinese economy expanded 6.7% in real terms, down from 6.9% in 2015, but in line with the authorities’ medium term target of 6.5% to 7% growth. In spite of this stabilisation in activity, capital outflows continued throughout the year, leading to a gradual devaluation of the renminbi. After strengthening to USD/CNY 6.44 between mid-January and April, the Chinese currency gradually retreated, reaching USD/CNY 6.94 by the end of the year. For the whole of the 2016, the CNY fell 6.6% against the USD. Efforts by the authorities to stabilise the currency – including restrictions to capital outflows – resulted in a revaluation of the renminbi in early 2017, to around USD/CNY 6.85. The same efforts – through interventions in the exchange rate market – also resulted in a decline in foreign exchange reserves in the second half of 2016, to USD 3.01 trillion, from USD 3.33 trillion one year earlier. Periods of scarce CNY liquidity led to a rise in interbank rates in 2016 (and in the beginning of 2017).
In Brazil, GDP contracted 3.5% in 2016 (-3.8% in 2015). However, economic activity showed signs of stabilisation, with YoY GDP growth going from -5.8% in Q1 to -2.9% in Q3 and with a return to a (mild) annual expansion of the economy expected for 2017. This stabilisation was underpinned by a recovery in business and consumer confidence, resulting from lower political uncertainty and from lower inflation. Sentiment in the first months of 2016 had been impacted by uncertainty surrounding the impeachment of President Dilma Rousseff (in May), which eventually led to her replacement by President Temer (in August). The ensuing political stabilisation and the adoption of more market friendly economic policies by the new Government also improved investors’ perceptions of Brazil. In the context of a generally favourable market environment for emerging economies, the Bovespa index jumped 38.9% in the year, and the BRL appreciated 21.7% against the USD (to USD/BRL 3.26) and 25.5% against the EUR (to EUR/BRL 3.43). Inflation fell from 10.7% to 6.3% in 2016, allowing the Central Bank to start lowering the SELIC interest rate in October, from 14.25% to 14%. The benchmark rate was again lowered in November, by 25 bps to 13.75%, and in January 2017, by 75 bps to 13%.
In the UK, annual GDP growth retreated from 2.2% to 1.8%, in spite of concerns with Brexit. As the year progressed, economic activity was supported by manufacturing and utilities, while services and construction advanced at a slower pace. With the economy’s current account deficit expected to reach close to 6% of GDP in 2016, the decision to leave the EU resulted in a sharp depreciation of the GBP. In spite of a recovery in the final months of the year, the British currency lost around 13% against the EUR and the USD in 2016. This depreciation and, above all, the rise in energy prices, contributed to a rise in inflation, from 0.3% to 1.6% YoY. In the Euro Area, annual GDP growth stood at 1.7%, down from 2% in 2015, but above initial expectations. Domestic demand was supported by the lagged impact of lower energy prices on real income and on consumers’ purchasing power, as well as by expansionary fiscal and monetary policies. Financing conditions improved and supported a recovery in credit growth, despite ongoing concerns with the banking sector in some regions. Nevertheless, economic growth was still insufficient to generate significant inflationary pressures. Favourable base effects related to energy prices pushed the annual headline inflation up from a low of -0.2% in April to 1.1% in December, while core inflation rose from 0.7% to 0.9% in the same period. In December, the ECB announced an extension of the asset purchase program, from March 2017 to (at least) December 2017, although lowering the monthly purchases from EUR 80 to 60 billion. The 3-month Euribor extended its declining trend in the second half of the year and reached -0.319% in December.
In spite of the political impasse preventing the new Government from taking office until October, Spain continued to be an outlier in the Euro Area, with GDP expanding 3.2% in 2016, repeating 2015’s reading. Domestic demand decelerated, but continued to grow at a relatively strong pace and was, again, the main driver of GDP growth. Fixed investment is expected to have decelerated from 6% to 3.6% growth, while private consumption growth was seen rising from 2.9% to 3.1%. Household spending was initially supported by the lagged effects of lower energy prices, but also, throughout the year, by an improvement in financing conditions,

2016 Annual Report 26
with the ECB’s expansionary policies leading to lower interest rates. Overall, domestic demand also benefitted from an expansionary fiscal policy; from steps forward in deleveraging; and from higher job growth, with the unemployment rate declining from 20.9% to 18.6% of the labour force. The housing market continued its recovery, with house prices rising 4% YoY in Q3 2016. Net exports also increased their contribution to GDP growth, from -0.1 to 0.4 p.p., with the slowdown in investment contributing to a deceleration in imports. Energy effects led to a rise in average annual inflation rate, from -0.5% to -0.2%. Political uncertainty did not prevent a decline in public debt yields, with Spain benefiting from an improvement in investors’ confidence in the economy, as well as from the impact of the ECB’s asset purchasing program. The 10-year yield spread versus the German Bunds rose marginally from 114 to 117 bps, but the 10-year bond yield fell from 1.77% to 1.38% (although with a rising trend from a year low of 0.92% in August, which continued in the beginning of 2017).
In Portugal, real GDP increased 1.4% in 2016, down from 1.6% in 2015 but slightly above expectations. Domestic demand lowered its contribution to growth, with a deceleration in private consumption, from 2.6% to 2.1%, and a decline in investment (expected to fall close to 1.5%). The unemployment rate declined from 12.4% to 11% of the labour force. In spite of a strong momentum in tourism services, overall exports growth declined from 5.2% in 2015 to around 3.7% in 2016. House prices continued to show a rising trend, growing 7.6% YoY in Q3. Economic activity also benefited from an improvement in financing conditions, mainly resulting from the expansionary stance of the ECB’s monetary policy. However, constraints related to high indebtedness levels and to ongoing adjustments in the banking sector still weighed on credit and activity growth. The public deficit was expected to have declined from 4.4% (or 3% excluding one-offs) to 2.1% of GDP, while public debt remained stable, rising only slightly from 129% to 130.2% of GDP. In a context of political uncertainty, of rising global inflation and of speculation around a future tapering of the ECB’s quantitative easing policy, 10-year Portuguese Government bond yields rose from 2.5% to 3.8% in 2016, extending this trend in January 2017, to above 4%. The spread versus the German Bund widened from 190 to 356 bps in 2016 (and to 364 bps in January 2017).
10-years Portuguese Government bond yields
-1
1
3
5
7
9
11
13
15
17
19
21
2009 2010 2011 2012 2013 2014 2015 2016
10 Years
2 Years
3.76
0.04
%
Source: Haitong Bank.
Looking ahead, global economic activity is expected to accelerate moderately in 2017, from 3.1% to around 3.4% growth, with stronger growth both in developed and emerging markets. Inflation is expected to increase in the major developed economies, first as a result of higher energy prices, but also reflecting improvements in labour markets and in wage growth. Although inflation should still remain relatively contained by historical standards, interest rates are expected to rise in 2017, particularly in the US, as central banks moderate the expansionary stance of monetary policy. Last but not least, the global economy should remain subject to high political uncertainty and risks.
HAITONG BANK, S.A.
27
FINANCIAL HIGHLIGHTS
(thousands of euro)
Consolidated Income Statement 2016 2015
Change Published Restated
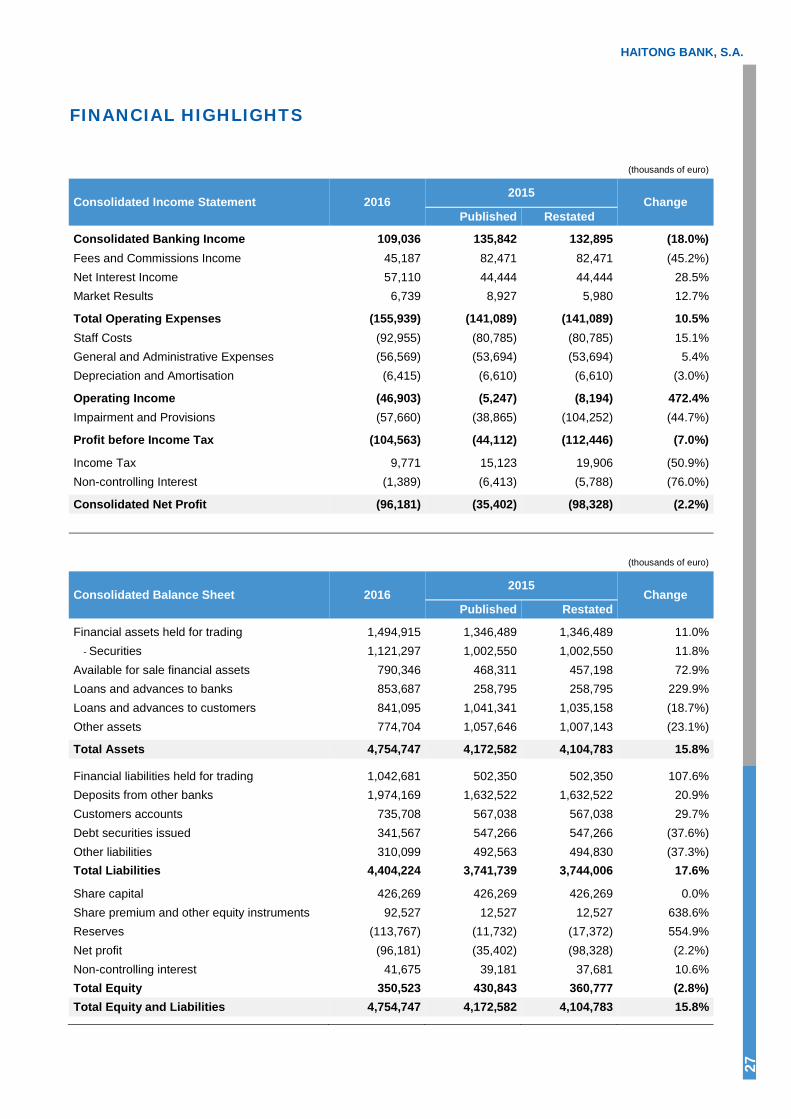
Consolidated Banking Income 109,036 135,842 132,895 (18.0%) Fees and Commissions Income 45,187 82,471 82,471 (45.2%) Net Interest Income 57,110 44,444 44,444 28.5% Market Results 6,739 8,927 5,980 12.7%
Total Operating Expenses (155,939) (141,089) (141,089) 10.5% Staff Costs (92,955) (80,785) (80,785) 15.1% General and Administrative Expenses (56,569) (53,694) (53,694) 5.4% Depreciation and Amortisation (6,415) (6,610) (6,610) (3.0%) Operating Income (46,903) (5,247) (8,194) 472.4% Impairment and Provisions (57,660) (38,865) (104,252) (44.7%) Profit before Income Tax (104,563) (44,112) (112,446) (7.0%) Income Tax 9,771 15,123 19,906 (50.9%) Non-controlling Interest (1,389) (6,413) (5,788) (76.0%) Consolidated Net Profit (96,181) (35,402) (98,328) (2.2%)
(thousands of euro)
Consolidated Balance Sheet 2016 2015
Change Published Restated
Financial assets held for trading 1,494,915 1,346,489 1,346,489 11.0% - Securities 1,121,297 1,002,550 1,002,550 11.8% Available for sale financial assets 790,346 468,311 457,198 72.9% Loans and advances to banks 853,687 258,795 258,795 229.9% Loans and advances to customers 841,095 1,041,341 1,035,158 (18.7%) Other assets 774,704 1,057,646 1,007,143 (23.1%) Total Assets 4,754,747 4,172,582 4,104,783 15.8% Financial liabilities held for trading 1,042,681 502,350 502,350 107.6% Deposits from other banks 1,974,169 1,632,522 1,632,522 20.9% Customers accounts 735,708 567,038 567,038 29.7% Debt securities issued 341,567 547,266 547,266 (37.6%) Other liabilities 310,099 492,563 494,830 (37.3%) Total Liabilities 4,404,224 3,741,739 3,744,006 17.6% Share capital 426,269 426,269 426,269 0.0% Share premium and other equity instruments 92,527 12,527 12,527 638.6% Reserves (113,767) (11,732) (17,372) 554.9% Net profit (96,181) (35,402) (98,328) (2.2%) Non-controlling interest 41,675 39,181 37,681 10.6% Total Equity 350,523 430,843 360,777 (2.8%) Total Equity and Liabilities 4,754,747 4,172,582 4,104,783 15.8%
2016 Annual Report
28
FINANCIAL OVERVIEW
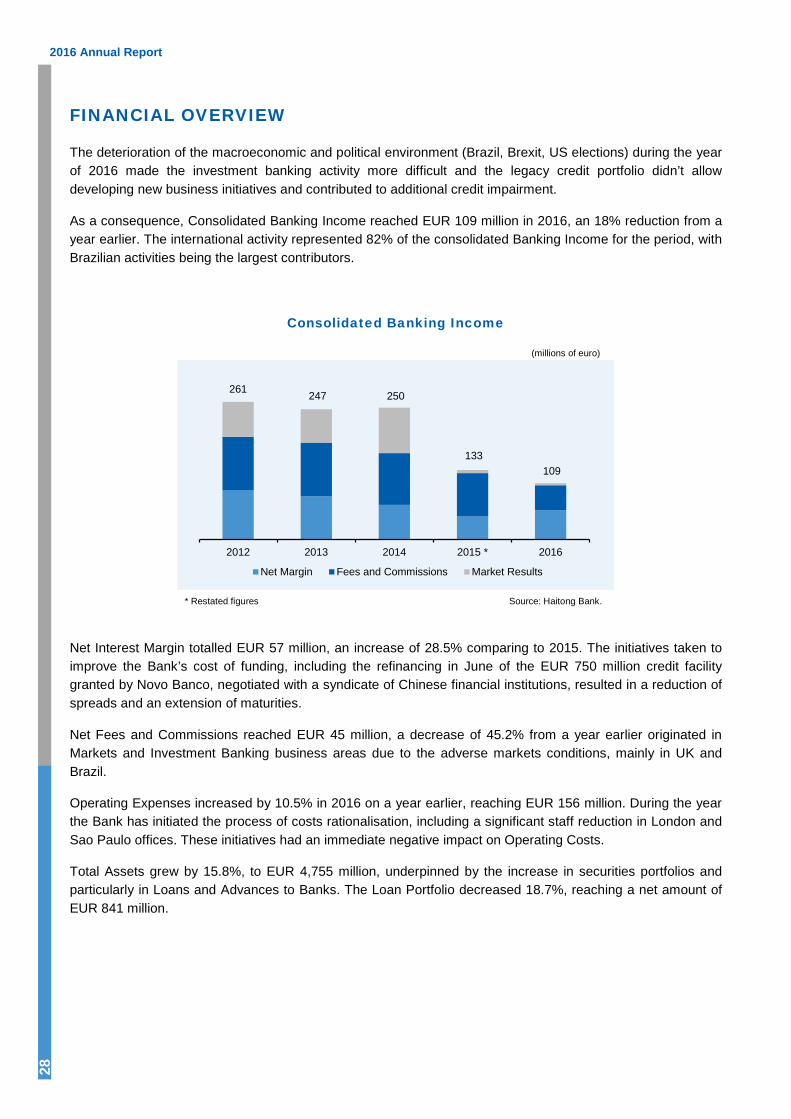
The deterioration of the macroeconomic and political environment (Brazil, Brexit, US elections) during the year of 2016 made the investment banking activity more difficult and the legacy credit portfolio didn’t allow developing new business initiatives and contributed to additional credit impairment.
As a consequence, Consolidated Banking Income reached EUR 109 million in 2016, an 18% reduction from a year earlier. The international activity represented 82% of the consolidated Banking Income for the period, with Brazilian activities being the largest contributors.
Consolidated Banking Income
(millions of euro)
* Restated figures Source: Haitong Bank.
Net Interest Margin totalled EUR 57 million, an increase of 28.5% comparing to 2015. The initiatives taken to improve the Bank’s cost of funding, including the refinancing in June of the EUR 750 million credit facility granted by Novo Banco, negotiated with a syndicate of Chinese financial institutions, resulted in a reduction of spreads and an extension of maturities.
Net Fees and Commissions reached EUR 45 million, a decrease of 45.2% from a year earlier originated in Markets and Investment Banking business areas due to the adverse markets conditions, mainly in UK and Brazil.
Operating Expenses increased by 10.5% in 2016 on a year earlier, reaching EUR 156 million. During the year the Bank has initiated the process of costs rationalisation, including a significant staff reduction in London and Sao Paulo offices. These initiatives had an immediate negative impact on Operating Costs.
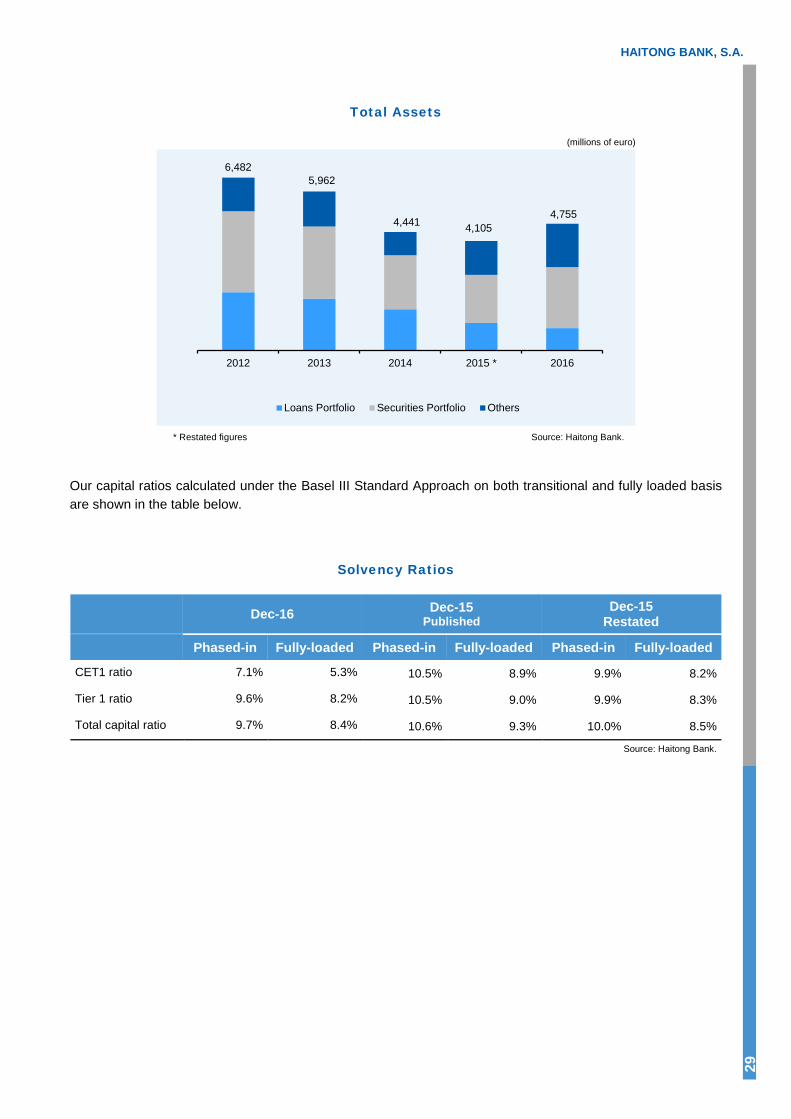
Total Assets grew by 15.8%, to EUR 4,755 million, underpinned by the increase in securities portfolios and particularly in Loans and Advances to Banks. The Loan Portfolio decreased 18.7%, reaching a net amount of EUR 841 million.
261 247 250
133 109
2012 2013 2014 2015 * 2016
Net Margin Fees and Commissions Market Results
HAITONG BANK, S.A.
29
Total Assets
(millions of euro)
* Restated figures Source: Haitong Bank.
Our capital ratios calculated under the Basel III Standard Approach on both transitional and fully loaded basis are shown in the table below.
Solvency Ratios
Dec-16 Dec-15 Published
Dec-15 Restated
Phased-in Fully-loaded Phased-in Fully-loaded Phased-in Fully-loaded
CET1 ratio 7.1% 5.3% 10.5% 8.9% 9.9% 8.2%
Tier 1 ratio 9.6% 8.2% 10.5% 9.0% 9.9% 8.3%
Total capital ratio 9.7% 8.4% 10.6% 9.3% 10.0% 8.5%
Source: Haitong Bank.
6,482 5,962
4,105 4,441 4,755
2012 2013 2014 2015 * 2016
Loans Portfolio Securities Portfolio Others
2016 Annual Report
30
RATING
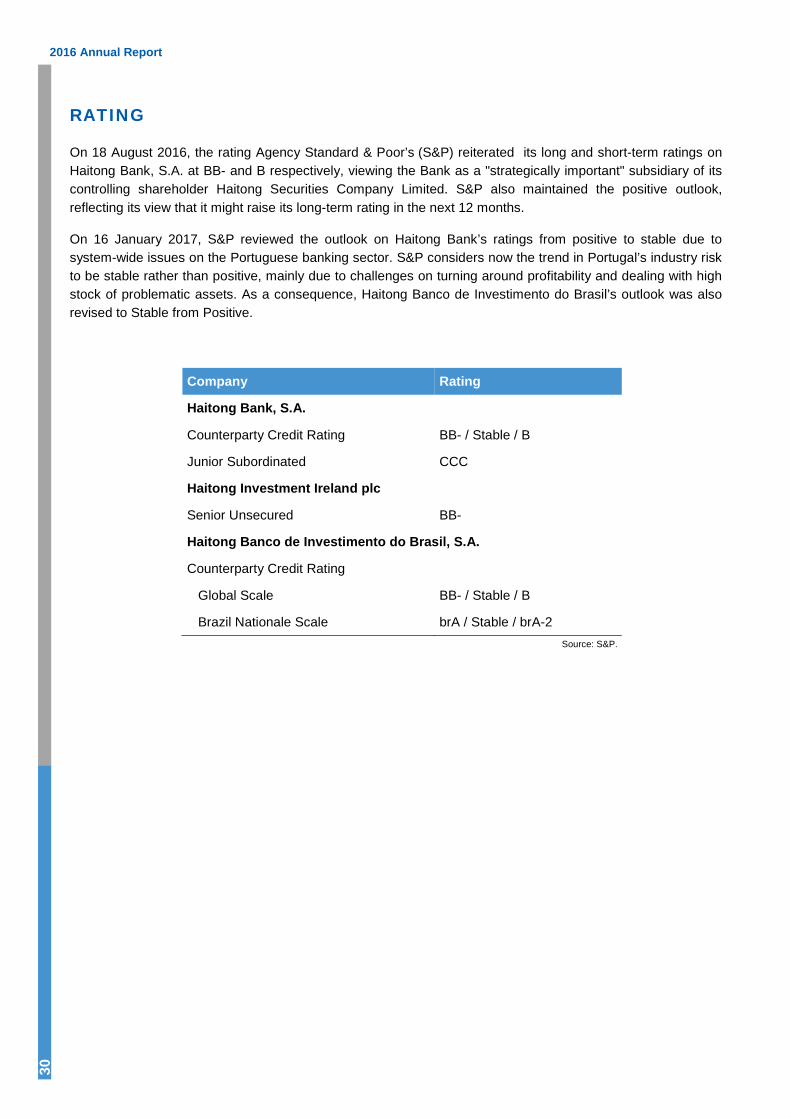
On 18 August 2016, the rating Agency Standard & Poor’s (S&P) reiterated its long and short-term ratings on Haitong Bank, S.A. at BB- and B respectively, viewing the Bank as a "strategically important" subsidiary of its controlling shareholder Haitong Securities Company Limited. S&P also maintained the positive outlook, reflecting its view that it might raise its long-term rating in the next 12 months.
On 16 January 2017, S&P reviewed the outlook on Haitong Bank’s ratings from positive to stable due to system-wide issues on the Portuguese banking sector. S&P considers now the trend in Portugal’s industry risk to be stable rather than positive, mainly due to challenges on turning around profitability and dealing with high stock of problematic assets. As a consequence, Haitong Banco de Investimento do Brasil’s outlook was also revised to Stable from Positive.
Company Rating
Haitong Bank, S.A.
Counterparty Credit Rating BB- / Stable / B
Junior Subordinated CCC
Haitong Investment Ireland plc
Senior Unsecured BB-
Haitong Banco de Investimento do Brasil, S.A.
Counterparty Credit Rating Global Scale BB- / Stable / B
Brazil Nationale Scale brA / Stable / brA-2 Source: S&P.

HAITONG BANK, S.A.
31
5. BUSINESS ACTIVITY
BUSINESS MODEL
Haitong Bank’s main objective is to provide a wide range of financial services to large and medium-sized Corporate Clients, Institutional Clients, and in some specific segments, Private Clients.
Haitong Bank is uniquely positioned to foster investment and capture cross-border flows between Asia, Europe, Latin America and Africa. Its cross-border platform leverages on the Bank’s geographical coverage and the connectivity into China, firmly supporting the Shareholder’s international strategy.
The Bank maintains its focus on growing client focused fee-generating activities with a light balance sheet, leveraging on its distribution capacity in the London and New York hubs.
At the end of 2016, Haitong Bank’s business model was based on three main areas: Investment Banking (including the lending activities under Project Finance and Acquisition Finance & Other Credits), Markets and Wealth and Fund Management.
The Bank continues to deeply analyse its business structure, aiming to find the best organisation model to support its core strategy: (i) Capturing the growing cross-border M&A flows from Chinese Companies and (ii) originate Emerging Markets, including Chinese Capital Markets Deals to Distribute in Europe and the Americas.
2016 Annual Report
32
5.1. INVESTMENT BANKING
MERGERS & ACQUISITIONS
MARKET BACKGROUND
2016 was a very challenging year for the Bank, which was highly impacted by different sources of turbulence affecting the financial markets such as the outcome of the Brexit and the US presidential elections as well as concerns regarding global economic growth, which have impacted certain corporate transactions.
In Portugal, where Haitong Bank’s has it head office, the performance of the economy was no exception. After 2015, when the economic recovery was marked by the exit from the bailout programme, the economy showed some signs of growth driven by private consumption supported by decreasing unemployment and increasing disposable income. The banking sector weakened, resulting in an increasing downward pressure on credit creation and risks for public finances.
The M&A activity of the Bank in Spain, UK, Brazil and the US was also marked by local and global political unrest. On the other hand, regions like the CEE, where the Bank is present, registered an outstanding year in the M&A market, counting with several big ticket transactions.
HAITONG BANK ACTIVITY
In this context, Haitong Bank was able to advise 20 M&A transactions with an approximate total value of EUR 2 billion, mostly in Portugal where the Banks maintained its leading position in the Portuguese M&A market (according to MergerMarket and Bloomberg).
The acquisition of BESI by Haitong Securities was awarded in the category of M&A Deal of the Year by the leading financial publication, World Finance. This deal is considered a landmark for a number of reasons, chiefly for marking the first ever acquisition by a Chinese security broker of a European investment bank and providing strong exposure of Chinese services to overseas institutional Clients.
In 2016, Haitong Bank was named by Euromoney as the “Best Bank in M&A Advisory in Portugal”, in the Euromoney Real Estate Awards. Also this year, Haitong Bank was considered the “Most Innovative Investment Bank in Asia-Pacific” by Global Finance.

HAITONG BANK, S.A.
33
During 2016, Haitong Bank worked in some of the most emblematic and complex deals, where M&A advisory was successfully provided to:
● Novo Banco S.A., in the sale together with Mota-Engil SGPS S.A. of Tertir-Terminais de Portugal SA, a port management company, to Yildirim Group, a Turkey-based company engaged in mining, energy, port management, fertilizers, shipping, ship building, construction and private equity business, for a total consideration of EUR 300 million;
● Ascendi Group, the operator of toll road networks and a subsidiary of Mota-Engil SGPS S.A., in the partnership established with Ardian, the France-based private equity firm, to jointly own and operate five Ascendi branded road concessions in Portugal. Ardian invested EUR 300 million in the partnership in exchange for a 50% ownership of a newly incorporated company (Ascendi PT II) which held the equity stakes in the five road concessions;
● The Management of getBack in the PLN 825 million (circa EUR 200 million) management buyout of getBack, a leading debt management and advisory company in Poland and Romania from Idea Bank – Warsaw Stock Exchange listed bank majority-owned by a Polish investor. The transaction was sponsored by Emest Investments, a consortium of private equity funds, being one of the biggest MBO in the region in 2016;
● EDP Renewables North America, in the sale of an additional 24% stake in EDPR Wind Farm portfolio (Vento III) to a consortium led by Fiera Axium, John Hancock and Swiss Life.
Also in 2016, Haitong Bank was engaged in emblematic cross-border M&A transactions involving Chinese entities, by providing financial advisory to:

2016 Annual Report
34
● Hunan Dakang Pasture Farming Co Ltd, a China-based company engaged in animal husbandry and agriculture and a subsidiary of the Chinese conglomerate Shanghai Pengxin Group Co, in the acquisition of 57.57% of Fiagril Ltda., one of the leading Brazilian grains company, for a total consideration of USD 200 million (circa EUR 188 million). The deal also involved the provision of credit facilities to the target by the parent company, Shanghai Pengxin Group;
● Novo Banco S.A., a Portuguese-based bank, in the sale of Novo Banco Asia, S.A., a Macau-based bank, to Well Link Group Holdings Limited, a Hong Kong-based company with interests in insurance, securities and futures brokerage, and financial services. The deal is currently pending the regulatory approvals for formal completion;
● Tandem Bank, a UK Digital Challenger Bank, on the private placement of shares to investors led by the Sanpower Group, the leading Chinese conglomerate focused on technology, financial services, retail, information services, medical & health care, and real estate, owner of House of Fraser, a leading UK department store group. The deal is currently pending the regulatory approval for formal completion.
OUTLOOK
The uncertainty surrounding Brexit in the UK and the President Donald Trump in the US are likely to weigh in 2017, with changing interest-rate cycle and elections in France and Germany also contributing to the year’s unpredictability. The increased capital outflow regulations imposed by the Chinese government represent another major challenge given the impact they will have on cross-border transactions involving Chinese parties, a strategic milestone of the Bank’s M&A activity.
Regardless of the upcoming challenges for the M&A activity during 2017, the outlook of Haitong Bank remains optimistic in regard to Europe and the Americas, where it operates. The 2017 outlook for the Portuguese M&A industry, the Bank’s core geography, remains robust and in line with the strong deal execution that allowed to consolidate its position as the leading investment bank advisor in the market over the years. The increasing interest from international investors in Portugal coupled with a strong pipeline, allow the Bank to consolidate expectations for a favourable performance again in 2017. Also in Spain, there are favourable prospects for the M&A industry complemented by the increase of cross-border activity with China. These positive expectations are supported by the country’s current economic and political stability, the improvement of business confidence and the current context of liquidity, with several private equities having recently raised new funds, all combined with the lack of companies at attractive prices in other countries. The M&A activity in the UK is expected to remain robust, driven by the cross-border Chinese related transactions in fintech, autotech, FIG, TMT and
HAITONG BANK, S.A.
35
consumer/retail in European large economic regions covered by the Bank, such as Germany and Central Europe. The positive M&A trend in Poland during 2016 is expected to keep up in 2017, with private equity players recently concluding the successful launch of new funds dedicated to CEE, as well as funds associated with Chinese One Belt One Road initiative. The “repolonisation” of the FIG sector, new opportunities derived from global trends towards low emissions in the Utilities sector and the political impact on Consumer Retail and Real Estate industries translated into attractive valuations and market consolidation, are some of the key M&A drivers to be taken into account in Poland for 2017.
Also the M&A outlook in the Americas looks promising for 2017. Despite the existing uncertainty involving the recent President Donald Trump election, expected new regulatory and tax reforms can create a positive dealmaking environment. The Bank has built a strong pipeline for the Americas with several live opportunities involving Chinese Clients seeking to invest in the US and LatAm with a special focus on Energy and Infra-structure. Moreover, Haitong Bank will continue to source investors for M&A activity in other jurisdictions, e.g. Western Europe and India. Regarding the Brazilian M&A market, the Bank expects to improve its penetration in Chinese companies, especially in Energy and Infrastructure, with interest to invest in the country, to become a reference advisor in cross-border deals involving both geographies. The Brazilian M&A operation will also keep focused in maintaining the flow of medium size domestic deals, based on the track record with local groups.
CAPITAL MARKETS
MARKET BACKGROUND
Equity Capital Markets (ECM) activity saw a decrease in 2016, with a global volume of USD 724.2 billion (5,288 deals), 21% below 2015’s, the lowest annual total since 2012, according to Dealogic. Global follow-on volume totalled USD 508.4 billion in 2016, down by 19% year-on-year, though reaching 70% of global ECM volume, up from 61% in 2015. IPO volume (USD 135.6 billion) followed the same trend, falling 30% year-on-year, also the lowest level since 2012.
For the first time on record, Asia Pacific led global ECM volume for two consecutive years with USD 313.5 billion (43% of total) via 2,868 deals, down 12% from 2015 (USD 355.2 billion). China accounted for 69% of Asia Pacific volume with USD 215.7 billion, its largest market share on record and up 14% year-on-year. The biggest ECM deal globally in 2016 was the USD 7.4 billion IPO of Postal Saving Bank of China, the largest since Alibaba (USD 25.0 billion) in 2014.
Overall global Debt Capital Markets (DCM) activity reached an all-time record totalling USD 7.0 trillion (over 21,000 deals) during 2016, a 16% increase compared to 2015 and the strongest annual volume since records began in 1980, according to Thomson Reuters.
Global high grade corporate debt offerings totalled a record USD 3.4 trillion in 2016, up 11% from 2015. US-dollar issuance hit a record USD 1.3 trillion, the eighth consecutive year-to-date increase for US investment grade debt. Total investment grade euro issuance in 2016 was EUR 876 billion, compared to EUR 840.1 billion in 2015, making 2016 the second busiest year on record after the EUR 1.07 trillion peak seen in 2009.
The volume of global high yield corporate debt reached USD 305.8 billion during 2016, a 13% decrease compared to 2015 and the slowest annual period since 2011.
DCM activity from government & agency issuers totalled USD 1.9 trillion during 2016, registering an industry-leading increase of 48% compared to 2015 levels. Corporate debt from emerging markets issuers totalled USD

2016 Annual Report
36
267 billion during 2016, up 34% from the previous year. Corporate debt issuers from India, Mexico, Brazil and Russia accounted for 50% of 2016 activity.
Asian G3 (USD, Euro, Yen) bond offerings in 2016 reached USD 217.3 billion from 402 issues, up 18.9% from 2015, representing the highest annual proceeds on record.
HAITONG BANK ACTIVITY
In 2016, Haitong Bank was involved in over 20 capital markets transactions, in excess of EUR 7.5 billion across the Bank’s main geographies.
2016 was a pivotal year for Haitong Bank, as it brought a series of debut Chinese borrowers into the international capital markets. In the first full year of operation following its acquisition, the Bank was involved in a number of China related landmark deals including the following:
● The Republic of Poland’s debut Panda Bond issue, the first for a European sovereign, in the amount of
CNY 3.0 billion with a 3-year maturity and a yearly coupon of 3.4% (Co-Manager), under the issuer’s CNY 6 billion 2016 Renminbi Bond Issuance Programme;
● Chinese conglomerate Fujian Zhanglong Group Co., Ltd. debut Eurobond senior unsecured USD 150 million Reg S Notes (Joint Bookrunner & Joint Lead Manager);
● USD 250 million private placement of senior unsecured Reg S Notes for Chinese engineering and construction services provider Zunyi Tourism Industry Development (Group) Co. Ltd (Joint Placing Agent);
● Private placement drawdowns (USD 40 million 3% 3-year Series 4, and USD 24 million 2.9% 3-year Series 5) for Unican Limited under USD 1 billion MTN programme guaranteed by Haitong UT Capital Group Co., Limited with the benefit of a Keepwell Deed provided by Haitong Securities Co., Ltd. (Manager);
● EUR-denominated private placement senior unsecured Reg S Notes for Haitong Securities Co., Ltd.: initial issue of EUR 100 million 1.6% 5-year, as well as a re-opening for an additional EUR 120 million, bringing total issue size to EUR 220 million (Joint Placing Agent).
HAITONG BANK, S.A.
37
In investment grade Debt Capital Markets we highlight Haitong Bank’s participation in several bond issues in Portugal, in which it played a leading role as Joint Lead Manager and Joint Bookrunner, among which:
● Utility EDP – Energias de Portugal, S.A.’s Senior Unsecured 7-year bond issue (EUR 600 million);
● Motorway concessionaire Brisa Concessão Rodoviária, S.A.’s Senior Secured 7-year bond issue (EUR 300 million);
● Utility REN - Redes Energéticas Nacionais, SGPS, S.A.’s Senior Unsecured bond issue in the amount of EUR 200 million, a tap of its existing EUR 300 million bond due February 2025, increasing the total amount of the bond to EUR 500 million.
In the high yield and non-rated debt market, Haitong Bank had a leading role in several different types of transactions, including:
● The Republic of Venezuela’s landmark transaction in 2016, a bond issue of USD 5 billion with a 6.5% yearly coupon, its largest issue since 1990 and the first in the international capital markets since 2011. This transaction also marks the first time Haitong Bank has participated in a sovereign issue from Latin America (Exclusive Dealer Manager);
● Bond exchange offer and issuance of a new bond in the amount of EUR 65 million by Portuguese pulp producer Celulose Beira Industrial (Celbi), S.A. (Sole Dealer Manager and Bookrunner);

2016 Annual Report
38
● Public bond issue of EUR 50 million by Portuguese football club Benfica SAD, maturing in 2019 and with a yearly coupon of 4.25% (Joint Global Coordinator);
● New Commercial Paper Programmes for Portuguese corporates for which Haitong Bank acts as Sole Dealer Manager: NOS, SGPS, S.A. (EUR 100 million), Electricidade dos Açores, S.A. (EUR 20 million), and Colep Portugal, S.A. (EUR 15 million).
● Bond issues by several Polish corporates: (i) PLN 51 million issued by rehabilitation and orthotic equipment producer and distributor Medort S.A.’s (Sole Arranger); (ii) pulp and paper producer Arctic Paper S.A.’s PLN 100 million issue (Sole Arranger), the latter as part of a complex refinancing transaction for the total amount of PLN 350 million, which Haitong Bank helped to finalise; (iii) HB Reavis Finance PL 2 Sp. z o.o.’s PLN 100 million issue (Co-Arranger and Joint Bookrunner).
HAITONG BANK, S.A.
39
● Brazilian local project bond, Fernão Dias' BRL 65 million infrastructure debenture due 2026 (Bookrunner);
● Brazilian vehicle and equipment rental operator Ouro Verde's BRL 30 million commercial paper due 2017 (Lead Manager);
● Brazilian vehicle rental operator Unidas' BRL170 million debenture due 2019 (Bookrunner).
In Equity Capital Markets, Haitong Bank successfully closed the following transactions in 2016:
● IPO of PBKM SA on Warsaw Stock Exchange (PLN 56.4 million), a leading European cord blood bank, in which Haitong Bank acted as Joint Global Coordinator, Joint Bookrunner and Joint Offering Agent, representing the Sponsor of the transaction, Enterprise Investors, a leading CEE Private Equity fund;
● Public tender offer, squeeze out and delisting of Polish company GRAAL SA (PLN 143.8 million), in which Haitong Bank acted as Global Coordinator, as part of a Public-to-Private transaction executed on behalf of Abris Capital Partners, a leading CEE Private Equity fund;
● Accelerated bookbuilding offer of 30% of the share capital of Skarbiec Holding SA (PLN 56.7 million), a Polish WSE listed mutual funds manager. Haitong Bank acted as Global Coordinator and Joint Bookrunner on behalf of Enterprise Investors, a leading CEE Private Equity fund;
2016 Annual Report
40
● The first China related equity-linked issue in which Haitong Bank participated as Joint Bookrunner, a zero coupon convertible bond of HKD 3.88 billion issued by Haitong International Securities Group Ltd..
OUTLOOK
Given the growing interest demonstrated by issuers in diversifying their funding sources into Asia, we expect to see an increasing number of transactions where the China angle plays a key differentiating factor.
The attraction of the international capital markets for Chinese borrowers was not affected by geo-political events in 2016 as we continued to see significant fund raising activity from Asia in all currencies. In 2017, Haitong Bank expects to build on the foundations laid in 2016 with a healthy pipeline of Chinese borrowers seeking to access international capital markets as well as European issuers (in fixed income and equity) seeking Chinese investors.
In Latam, the resurgence of Argentina and Brazil promises abundant supply of international issuance. On the local Brazilian capital markets angle we also expect a very active 2017, with issuance volumes higher than in 2016 on the back of falling interest rates. Overall, with interest rates still at historically low levels despite the recent increase in treasury yields, and abundant liquidity, there will be plenty of opportunities for issuers from all geographies in Latam to successfully complete international DCM transactions.
In Eastern Europe, Haitong Bank intends to continue pursuing debt transaction opportunities and to increase volume in equity capital markets, focusing specially on the long-standing relationship with our Clients and companies which we historically listed on Warsaw Stock Exchange.
In Western Europe, after a shift in strategy following its acquisition, Haitong Bank expects to continue strengthening its position in its core market, targeting the increased appetite for debt capital markets funding by mid and large corporates, on both the domestic and the international front. Overall improved outlook for equities and Europe in particular should also foster equity markets deals in the region.

HAITONG BANK, S.A.
41
PROJECT FINANCE
In 2016, the Project Finance activity was affected by the low dynamics in our European core markets - where the Governmental budgetary constraints in Portugal kept preventing new infrastructure projects to be launched – and by increasing competition from large commercial banks driven by the abundant liquidity and low funding costs as a result of the “quantitative easing” monetary policy.
In line with the recent trend, the renewable energy sector has been the most active one in Portugal along with some occasional opportunities in the infrastructure and real estate sectors, mostly resulting from some M&A deals and corporate reorganization processes.
Although still conditioned by the transition process to the new shareholding structure, which is currently ongoing, Project Finance business has maintained a positive performance and outlook.
In Portugal, the Bank has completed the renegotiation and restructuring of an infrastructure project concession and acted as Mandated Lead Arranger for two refinancing deals, while in Spain two restructuring deals were successfully closed in the renewable energy sector.
In Latin America, the Project Finance team continued to expand its presence in Spanish Speaking countries focusing on project financing advisory and structuring with its Clients in the region. While the Mexican market continues to be the most important for the team, boosted by its energy reform that created an important opportunity for its arranging and advisory services, great progress was made in expanding the Bank’s activity to the Andean region, primarily in Peru and Colombia as both countries have put forth ambitious investment plans in the infrastructure sector. Finally, as part of the Haitong network, the Bank is actively working with the Head Office to develop relationships with Chinese companies with presence in Latam to assist them in their financing needs for projects in the region.
In Brazil, the Bank continued to act as Adviser for ongoing infrastructure projects in different sectors, including energy (generation and transmission) and public health, in addition to actively trying to position itself for the next round of infrastructure auctions announced by the Government in 4Q2016. Additionally, the team focused on the search of new advisory transactions in the infrastructure sectors that have gone largely unaffected by the crisis and still present great opportunities for companies and investors, such as Public Lighting, Water & Sewage, Renewable Energy and Transmission. Finally, the Bank also has sought to position itself as a financial adviser to potential investors, particularly Asian and European groups, interested in participating in future concessions and privatizations announced by the new Government, led by interim President Michel Temer.

2016 Annual Report
42
OUTLOOK
Under a new strategic positioning, based on an asset light balance sheet driven business model, essentially focusing in structuring and arranging roles with potential for distribution and cross-selling with the Debt Capital Markets and M&A businesses, the outlook for Haitong’s Project Finance activity remains positive. Portuguese Government has recently announced a new plan of infrastructure projects with particular emphasis on railways and ports that together with the existing pipeline represent good prospects for the near future.
The sound expertise and track record on infrastructure and energy, now based on a new and strong shareholding structure, combined with the great potential to access Chinese and Asian Clients and Investors, namely targeting the universe of infrastructure projects under the “One Belt One Road” initiative are key elements paving the way for Haitong’s Project Finance business.
ACQUISITION FINANCE
MARKET BACKGROUND
In 2016 the global syndicated loans volume decreased 5% to USD 4.3 trillion (lowest level since 2012), whereas global corporate loans volume decreased 3% to USD 3.4 trillion. Nonetheless, the global syndicated loan revenue went up 4%, reversing the trend of the two previous years. The Americas led the global corporate loan volume with a 64% share and the technology sector was the most important contributor with a market share of 12%.
In Europe the syndicated loan volume fell 30% YoY to USD 834.2 billion, the lowest total since 2012 (USD 717.2 billion) and represented just 85% of all EMEA loan volume, the lowest share on record.
A total of USD 2.6 trillion in loans from EMEA borrowers is currently outstanding, Spain being the largest contributor in 2016 with USD 69.7 billion, followed closely by the United Kingdom and France with USD 63.6 billion and USD 46.9 billion respectively.
Loan Volume in Europe
(USD billion)
Source: Dealogic.
717
959
1,233 1,192
834
0
500
1,000
1,500
2,000
2,500
0
200
400
600
800
1,000
1,200
1,400
2012 2013 2014 2015 2016
Deals Loan Volume
Loan Volume Deals

HAITONG BANK, S.A.
43
HAITONG BANK ACTIVITY
During 2016, Haitong Bank was involved in several transactions originated in Europe and Asia, namely acting as:
● Mandated Lead Arranger on the EUR 66 million refinancing of LeYa, S.A., a Portuguese publishing company;
● Mandated Lead Arranger on the RMB 120 million Corporate Loan to Haitong Unitrust Financial Leasing Corporation;
● Mandated Lead Arranger on the RMB 153.6 million Corporate Loan to Haitong Unistrust International Leasing Corporation;
● Mandated Lead Arranger on the EUR 7.2 million Bridge Loan & Advisory to Reditus Gestão, S.A..
In Poland, the Bank continued to develop its business line related to the issuance of bank guarantees and it has also provided settlement services to its Clients, of which we highlight the transaction related to the acquisition of GetBack’s shares, in the total amount of PLN 515 million.

2016 Annual Report
44
OUTLOOK
Looking ahead to 2017, Haitong Bank will continue to leverage its position as a Chinese financial institution with more than 30 years’ worth of experience and contacts in international markets, making it the perfect link for Asian clients trying to expand abroad. Haitong Bank is also working closely with its Shareholder to identify potential synergies in the Acquisition Finance activity.
OTHER CREDITS
HAITONG BANK ACTIVITY
Regarding Other Credits activities in Brazil, the year was marked by the reduction of the loan portfolio by around 25% due to the maturity of the credit transactions plus the lack of new disbursements, which follows the new strategic vision for the use of credit exclusively to leverage other investment banking transactions.
It is also worth noting that the team has been working with other areas in order to leverage the relationship it has with its customers, especially those in the infrastructure sector, to seek cross-selling for other services and bank products, such as M&A, Capital Markets and Derivatives. The effort has paid off so far, since four transactions of M&A and two transactions of Capital Markets in the Water & Sewage and Energy sectors were signed. Moreover, the Bank originated treasury deals in the form of hedge products to Chinese companies.
OUTLOOK
For 2017, the Bank will focus on attracting Asian investors, capturing opportunities in the Brazil-China trade flow, actively seeking opportunities for financial advisory services and financial structuring of projects, as well as the origination and resumption of Trade Finance deals and Leasing opportunities with Unitrust.
HAITONG BANK, S.A.
45
5.2. MARKETS
EQUITIES
MARKET BACKGROUND
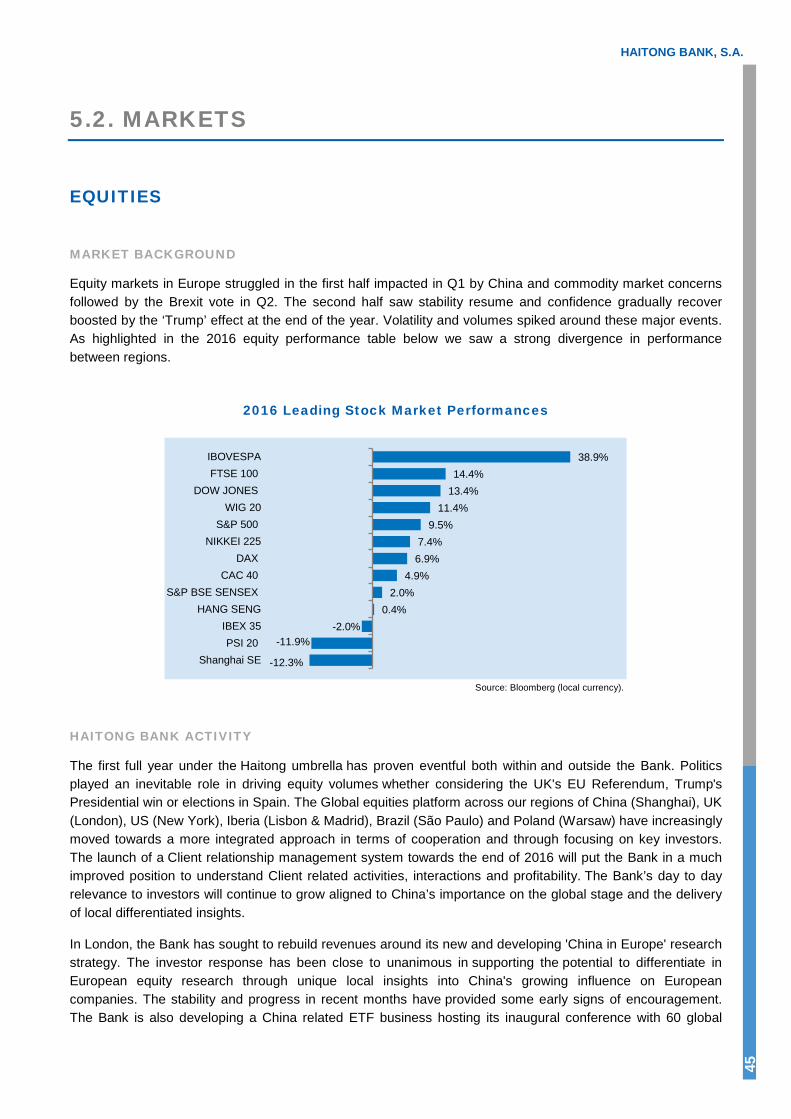
Equity markets in Europe struggled in the first half impacted in Q1 by China and commodity market concerns followed by the Brexit vote in Q2. The second half saw stability resume and confidence gradually recover boosted by the ‘Trump’ effect at the end of the year. Volatility and volumes spiked around these major events. As highlighted in the 2016 equity performance table below we saw a strong divergence in performance between regions.
2016 Leading Stock Market Performances
Source: Bloomberg (local currency).
HAITONG BANK ACTIVITY
The first full year under the Haitong umbrella has proven eventful both within and outside the Bank. Politics played an inevitable role in driving equity volumes whether considering the UK's EU Referendum, Trump's Presidential win or elections in Spain. The Global equities platform across our regions of China (Shanghai), UK (London), US (New York), Iberia (Lisbon & Madrid), Brazil (São Paulo) and Poland (Warsaw) have increasingly moved towards a more integrated approach in terms of cooperation and through focusing on key investors. The launch of a Client relationship management system towards the end of 2016 will put the Bank in a much improved position to understand Client related activities, interactions and profitability. The Bank’s day to day relevance to investors will continue to grow aligned to China’s importance on the global stage and the delivery of local differentiated insights.
In London, the Bank has sought to rebuild revenues around its new and developing 'China in Europe' research strategy. The investor response has been close to unanimous in supporting the potential to differentiate in European equity research through unique local insights into China's growing influence on European companies. The stability and progress in recent months have provided some early signs of encouragement. The Bank is also developing a China related ETF business hosting its inaugural conference with 60 global
-12.3%
-11.9% -2.0%
0.4% 2.0%
4.9% 6.9% 7.4%
9.5% 11.4%
13.4% 14.4%
38.9%
Shanghai SEPSI 20
IBEX 35HANG SENG
S&P BSE SENSEXCAC 40
DAXNIKKEI 225
S&P 500WIG 20
DOW JONESFTSE 100
IBOVESPA
2016 Annual Report
46
issuers, index providers, stock exchanges and asset managers attending supported by a presentation from the Global Head of Equity Research at MSCI discussing China’s index inclusion.
A very important step was achieved in the US development with the approval of a licence allowing the Bank to distribute and market its equity research to US based investors. This will provide a valuable extension of its revenue opportunity in the future and we have seen similar investor support for the China related strategy.
In Iberia, volumes in Spain were heavily impacted by a change in the structure of equity settlements and the uncertain political climate despite the economy performing well in 2016 leaving the years value traded down -32%. In Portugal meanwhile the stock markets has continued to be challenged by a difficult banking sector.
After a significant restructuring of the business in Brazil and moving from full broker dealer to a new platform, the sales and distribution teams have been refocusing efforts on accounts that are eligible to deal with Haitong under the new framework. The teams have been working closely to create synergies through closer cooperation with all regions, business lines and distributing China related product domestically. The local office has also provided the support and management of several non-deal roadshows for European investors which proved a valuable source for generating revenues.
In Poland the Bank has continued the strategy of selling CEE equities research product to both local and international funds. The Research team was ranked #5 in Parkiet’s (local newspaper) latest review of best research brokers in January 2017. Investor activity in 2016 was visibly lower with market volumes down by 10% despite a strong economic backdrop. Risks of regulation for the banking sector and specific to state controlled companies created headwinds. The local pension fund industry faced considerable uncertainty in the early part of the year but the prospect of nationalization was significantly reduced after the draft of pensions system reform was released during the second half. Taking advantage of its international research product the Bank benefitted from the international diversification trend of Polish investment and pension funds. During the year the Bank also hosted local conferences across ‘Real Estate’, ‘Media & Entertainment’ and ‘Retail & Consumer’ with a total of 26 companies attending.
In terms of corporate access events the highlight of 2016 was hosting the inaugural Auto Tech Conference entitled ‘Mobility 2.0’ in September in London with 30 companies from China, Europe, US and Israel and 160 investors. Tesla sponsored two cars for the exhibition – the models S & X - while Baofeng sponsored their latest Virtual Reality goggle. The conference provided a unique and insightful event for investors, companies, and investment banking enhancing all participants’ knowledge of the rapidly changing world of automotive and the related technological developments. The Bank also hosted its 5th Iberian Conference in London with 31 companies and 100 investors. The concerns raised about Portuguese political change and budgetary consolidation, and Spanish political gridlock proved insightful.

HAITONG BANK, S.A.
47
RESEARCH
In 2016, Haitong Bank continued to evolve its Research offering to be better integrated with Haitong Securities' leading Chinese Research Institute, where more than 200 analysts cover more than 1000 Chinese equities. Haitong Bank Research supports the Bank's core equity and fixed income businesses, as well as its Wealth Management and Asset Management divisions.
Haitong Bank Research provides insightful fundamental equity research, as well as idea driven global cross asset research. Haitong Bank's 30 research analysts are based in 6 countries, providing local analysis for global investors on more than 175 equities. In Equity Research, Haitong provides Pan European research through three products:
● Coverage of Portuguese and Spanish stocks through a team of analysts based in Lisbon and Madrid;
● Coverage of UK consumer stocks through a team based in London;
● Coverage of selected Pan European sectors through a unique China Insight approach, focusing onhow China provides both a business opportunity, as well as a competitive threat, for key Europeancorporates.
The latter is produced in London, while also being supported by a Shanghai based analyst providing on the ground insight, and a link to Haitong Securities equity analysts. Haitong Bank produces a daily 'Shanghai Expresso' report, recapping noteworthy Chinese newsflow and identifying the China Impact on Pan-European equities. Haitong's China Insight product is also supported by Haitong Bank's London based China Strategist, including a regular 'East Meets West' product where Chinese economic data and government policy is analysed and implications for global assets are identified.
Haitong Bank also provides equity research in key emerging markets, including coverage of CE3 (Poland, Czech and Hungary) stocks through a team based in Warsaw, and Brazilian stocks through a team based in São Paulo. Haitong Bank also provides Global Cross Asset Strategy research through its 'Week Ahead' product where the Bank's Economics Research team analyse key upcoming data points and identify potential trades to benefit from its non-consensus views. The Bank also provides Global Cross Asset Technical Research, with tailored products and actionable trade ideas in Fixed Income, Forex, Commodities as well as Equities. Haitong Bank also distributes Haitong Securities' Chinese Macro and Fixed Income Research, produced by Haitong's top ranked Shanghai based Economics team, to Haitong Bank's Clients in Europe and the Americas.
Finally, all of Haitong Bank's analysts contribute to the Haitong 5-year Plan research product where analysts identify key long-term trends and themes in sectors and asset classes , as well as how China will likely impact these sectors and asset classes’ overtime.

2016 Annual Report 48
EMERGING MARKETS FIXED INCOME
Haitong Bank has launched a global Emerging Markets Fixed Income (EMFI) strategic initiative in 2016, a Client centric business focused on Fixed Income trading in Emerging Markets with Global, Local and Emerging Markets institutional investors.
The team trades sovereign and corporate credits at a global level and has connected with institutional Clients throughout Europe, Asia and the Americas. New York and London are the primary trading centres for the EMFI business but the team is also trading in Warsaw and São Paulo.
All traders and sales people have at least 10 years of experience in emerging markets and bring strong relationships globally.
This business is expected to increase the bank’s critical mass in Emerging Markets, paving the way to develop a China related distribution capability. This business line brings the necessary distribution capability for distributing new DCM issues in Emerging Markets and China related issuers.
FIXED INCOME, CURRENCIES AND COMMODITIES
In 2016, the Bank started to turn around the FICC business into a much more Client facing business with a focus on flow trading with Clients and fee generating opportunities.
The Credit and Rates business generated more than half of FICC revenues in 2016. The Bank re-allocated some resources to the Credit and Rates trading for Southern Europe to be able to become a larger flow player and generate higher profitability from intermediating trading flows with international Clients. Haitong Bank was able to increase its Client franchise and broaden its distribution with international investors and substantially increased the number of bonds quoted, both in the credit and sovereign sectors. Amid a volatile year, the risk in the trading books was properly managed and we finished the year with a modest positive result. As the Bank continues to increase its Client coverage this activity is expected to become more profitable in 2017.
The Credit and Rates business includes Corporate Derivatives Solutions activity in Europe and Brazil. 2016 was an untypical year for our corporate clients in Europe as they left a higher percentage of their balance sheets floating, to benefit from low interest rates, betting on a slow recovery of the economy in the Eurozone. Therefore a larger share of revenues in Europe this year was generated by providing hedge solutions for FX and commodities than interest rates. Furthermore, both in Europe and Brazil this activity was adjusted to the new business model adopted by Haitong Bank by reducing exposure to longer maturities and reducing counterparty risk through increased use of CSA’s and a more selective process to determine suitable counterparties. Nevertheless Derivatives contributed around 80% of revenues for Credit and Rates business.
The Structured Products business generated approximately one third of FICC revenues, mostly through secondary trading and buybacks. The issuance of new notes in 2016 was extremely limited due to several factors such as the current BB- rating but also due to a need to re-align the sales efforts from historically investors in Portugal to a new, much more international, investor base. Therefore in 2016 the team focused on expanding the investor base for Structured Notes issued by Haitong Bank through the implementation of a full FCA compliant Structured Notes framework in the UK that will allow us to offer the Notes to a much wider group of investors. The Bank also started focusing on expanding its sales into Switzerland which, in addition to the sales expansion into Asia and Latin America, will be a big focus in 2017. The team also started a Fund Placements business in 2016 which is essentially a new product for Haitong Bank that generated no revenues yet but Haitong Bank on-boarded several large Chinese asset managers to be their European distribution
HAITONG BANK, S.A.
49
partner. Furthermore, it was signed an agreement with a major international investment bank to act as a Smart Beta product distribution partner in China. On the Private Placements side the Bank successfully raised funding for Tandem from House of Frasers, backed by a strategic Chinese investor, SanPower Group.
The Syndicate business generated approximately 10% of FICC Revenues. Haitong Bank acted as Joint-Bookrunner on its first public transaction out of China for Fujian Zhanglong and acted as Sole Bookrunner on the USD 5 billion bond issue by the Republic of Venezuela. The Syndicate team also carried out the first successful auction since 2013 selling approximately EUR 60 million of the loan portfolio at a profit for the Bank.
OUTLOOK
The Markets business started a significant transformation during the second half of 2016. A greater business focus was given to Fixed Income and Structured Products, and in particular into Emerging Markets Fixed Income. Markets business also spearheaded a major upgrade of all market related systems and procedures executed by several support functions. This resulted in substantial increased automation, providing the ability to trade a much larger number of products. This process is continuing in 2017.

2016 Annual Report
50
5.3. WEALTH AND FUND MANAGEMENT
ASSET MANAGEMENT
MARKET BACKGROUND
Overall, 2016 closed with mixed returns on the equity indices as their performances mask a year of great instability, heavy initial losses and enormous swings in the performance of different sectors. Particularly noteworthy was the better behaviour of the US market (S&P 500:+9.5%) and emerging markets (MSCI Emerging Markets:+8.6%) compared to Europe (STOXX 600:-1.2%).
Looking back to the start of the year, along with a very sharp fall in oil prices (in excess of 30% until mid-February), the key talking point was deflation, with the world apparently on the brink of another recession. The strong change in growth expectations at a global level drove asset prices upwards in the second half of the year. For example, one witnessed a recovery of almost 50% in the European financial sector after the pro-Brexit vote, and crude oil ended up as one of the assets with the largest gains in 2016, as it rose by over 100% from its low and 46.7% over the year. We should also recall that, after the crash that lasted until mid-February, the year was marked by the vote for United Kingdom’s exit from the European Union, followed by Donald Trump’s unexpected US election victory, or the referendum on constitutional issues in Italy, the lengthy formation of a new Government in Spain, the refugee crisis, terrorist attacks, the instability of Italian banks, among various other elements contributing to instability. A final note for the sectors, with a special comment for the better performance of cyclical stocks (i.e. materials or oil) with a higher beta and benefitting from the increase in inflation, while the worst performers were those sectors theoretically considered the most defensive, more sensitive to the upturn in yields and that had risen the most in recent years (i.e. telecoms or healthcare).
HAITONG BANK ACTIVITY
Although the final results were only marginally positive over the year (+0.9% and +1.6% in Haitong’s Flexible and Aggressive portfolios, respectively), these performances left the team satisfied insofar as both portfolios posted a substantial recovery from the minimums seen this year (February 11th) and managed to close practically at the highest value of the year and in positive territory. We cannot forget that all this was achieved in one of the most challenging and certainly most difficult years for asset management in recent decades. Hence, the team was forced to take an even more active strategy doing continuous adjustments in our positioning, in line with our mandate to protect portfolios in times of disturbance.
In a less positive angle, Assets under Management registered an overall decrease of 31.9% in 2016, to EUR 173.4 million. Beside the context mentioned above, several other specific issues influenced the Clients negatively; within them we highlight the uncertainty surrounding Novo Banco’s future which impacted the distribution of our portfolios in Novo Banco’s bank network.
OUTLOOK
In 2017 the Bank will continue to look forward to repay the confidence of its Clients by continuing to add value to their asset portfolios either by increasing their worth or, when necessary, by ensuring their protection. The main objective is to overcome the negative trend with regard to the recent AUM outflows throughout several initiatives. For the first time the Bank will try to capture institutional Clients both in Portugal and Spain while it
HAITONG BANK, S.A.
51
will fight to recover some Clients with a permanent and consistent proximity campaign. Alongside those objectives, the Bank’s objective entails obtaining share of wallet within those Clients, increasing its product scope mainly with less riskier products. At last, beyond its progressively deeper relation with China, the Bank will continue to look for new products or structures allowing to increase the scope of distribution of Asset Management services.
WEALTH MANAGEMENT
HAITONG BANK ACTIVITY
The Wealth Management activity took the first steps in the second half of 2016, where the commercial flow started to materialize some significant deals.
In fact, despite some IT developments still under construction, which limit the product offer, and commercial restrictions related with the Carve Out agreements with Novo Banco, the Team was able to promote the Bank services within a substantial number of Clients.
In order to highlight some achievements, we would refer to:
● Several important new Institutional Clients allowing new funding;
● The start of some cross-border deals with individual Clients;
● The first contacts with Chinese Clients to promote local investments;
● The creation of a partnership with a mutual funds distributor to enhance our product offer;
● The creation of a partnership with a credit card company to allow debit/credit operations;
● Protocol with an insurance company to leverage insurance products;
● The creation of a pipeline of deals and Clients to support an increasing commercial flow.

2016 Annual Report
52
Assets under Management in 2016
By Client By Product
Institutional Clients
69%
Individual Clients31%
Cash & Deposits
1%
Term Deposits
79%
Asset Management
7%
Execution13%
Source: Haitong Bank.
OUTLOOK
For 2017 the team’s strategy includes the consolidation of this new business line through the setting up of new product lines like Unit Linked products, Advisory or tailor made structured products for retail and an increasing the level of service through Client targeted reports and Client use of the IT platform.
In addition, it will focus on a continuous commercial approach to serve Haitong Bank Clients in other geographies, thus creating a competitive advantage.
PRIVATE EQUITY
In 2016, private equity activities were carried out normally through its management company. Haitong Capital manages three private equity funds devoted to the infrastructure and buyout/capital development market segments within Europe, that altogether, including own portfolio, represent an amount under management of circa EUR 166 million. During the past year the company also launched structuring works towards the setup of new investment vehicles consistent with its market positioning as expert within both the east-west trade and the infrastructure sector.
During the year, 22 investment opportunities were analysed, mainly in the development capital segment in Portugal. As a result of that sourcing effort, an amount exceeding EUR 3.4 million was invested in transactions involving SMEs.
On the opposite sense, Haitong Capital concluded exit transactions for a global amount of ca. EUR 31 million. Within the portfolio of companies sold, we include the stakes held by ES Iberia in its subsidiaries Sicame and Protéines, the securities held in both Sierra Sesnández and Cova da Serpe II, held by the HIF and Coporgest (partial sale). Regarding the Cova da Serpe II transaction, the portion of the transaction consideration over EUR 21 million will only be received in March 2017.

HAITONG BANK, S.A.
53
Throughout the year, distributions of funds of the portfolio under management were obtained for an aggregate amount of EUR 10.8 million. These distributions made by means of dividends, reimbursement of shareholder loans or interest paid, were mostly received by Windpart, Cova da Serpe II, Sierra Sésnandez, Globalwatt, GLT and Epedal.
INVESTMENT PORTFOLIO AND FINANCIAL HIGHLIGHTS (INDIVIDUAL BASE)
The management company tried to maintain a hands-on management approach focused on the value creation of the portfolio of companies under management.
This portfolio is valued twice a year (June and December), according to the methodologies defined by the regulator.
In December, the fair market valuation of the investment portfolio reached an amount of EUR 114 million. This compares with an amount of EUR 125 million calculated in December 2015, on a like-for-like basis. However, should we include shareholder cash inflows resulting from the very same group of securities, the amount would have been similar to the one posted in the previous year.
The private equity posted a net profit for the year of EUR 658 thousand, which includes realised capital gains of circa EUR 2.2 million and a non-recurring cost of approximately EUR 0.9 million. In December, total equity amounted to EUR 45.6 million.
OUTLOOK
The company expects to maintain the regular portfolio management activities for 2017, and to fulfil the investment mandates taken by the company. It also expects to develop and implement the dedicated workstreams trending to the launch of new funds targeting the infrastructure and the east-west trade worlds.

2016 Annual Report
54
6. TREASURY
MARKET BACKGROUND
European Central Bank’s loose monetary policy was one of the pivotal facts of the year. The additional 10 basis points cut in the deposit facility, to -0.40%, contributed to a general decrease in interbank funding costs and discouraged financial institutions within the Euro Area from holding cash in an extremely low interest rate environment.
The rate cut combined with the increased size and extent of the ECB’s bond buying programme pressured the yields of Euro Zone sovereign debt, especially of core countries, to record lows throughout the third quarter of the year. During this period, the German 10-year yield traded in negative territory. Access to the international debt markets remained however closed for the Portuguese banking sector.
It is also worth mentioning the ECB reinstatement of the waiver affecting the eligibility of Greek bonds used as collateral in Eurosystem monetary policy operations. This should have a positive contribution to the financing conditions of the Greek banking system, despite the high haircuts applied to these assets.
Brazil’s political and economic risks have improved since Ms. Dilma Rousseff was replaced by Michel Temer in the wake of the Lava-Jato probe. Following a very volatile start of the year, BRL and domestic interest rates have recovered considerably and business confidence has improved. The Government was able to approve important fiscal measures that helped curb inflation and paved the way for the Central Bank of Brazil to start cutting rates in 2017.
HAITONG BANK ACTIVITY
In May 2016, Haitong Bank strengthened its regulatory capital ratios by issuing perpetual instruments, eligible as additional tier 1, in the amount of EUR 80 million. In June, the EUR 750 million Novo Banco credit facility was refinanced with better financial conditions, through a Chinese financial institutions syndicated loan.
The Bank has also received from Haitong International Holdings Limited a 5-year maturity intercompany loan, in the amount of EUR 138.5 million. In September, Haitong Bank started a partnership with an online platform to attract term German retail Clients deposits and we expect that this funding source will become relevant to the Bank’s funding profile in the medium-term.
Outstanding debt issued under the Medium-Term Note Program (MTNs) totalled EUR 358 million as of 31 December 2016, which compares with EUR 593 million by the end of 2015.
In Brazil, the Bank focused its efforts on three main objectives: (i) maintenance of prudent liquidity levels (ii) diversification of funding sources, and (iii) generation of recurrent revenues through structured deals.
Considerable progress was achieved towards improving the risk perception of the Haitong name with a series of initiatives that aimed to disclose the Bank’s strategy to investors. This culminated in the opening of a number of relevant institutional accounts that contributed to better funding conditions and a more balanced liabilities structure.

HAITONG BANK, S.A.
55
EMTN Programme / Total Outstanding Amount
(millions of euro)
Note: Issue value outstanding deducted from buybacks Source: Haitong Bank.
OUTLOOK
In 2017, Treasury’s main goal is to seek additional funding sources and strengthen those already in place, so as to ensure a stable and diversified funding structure, adjusted to the balance sheet and business model.
In Europe, given its flexibility, the EMTN will remain an important pillar of this strategy, while the Bank maintains its focus on serving the investors, adapting the offer to the Client’s needs.
In Brazil, 2017 goals include the continuous improvement of the funding framework and the structuring of deals focusing on the enhancement of the ALM efficiency and profitability.
933
1,102
775
593
358
2012 2013 2014 2015 2016

2016 Annual Report
56
7. HUMAN RESOURCES
Headcount Dec-16 Dec-15 Change % Change
Total Group 663 720 -57 -7.9%
PORTUGAL 274 254 +20 +7.9% Haitong Bank, S.A. 264 245 +19
Haitong Capital - SCR, S.A. 10 9 +1
SPAIN 88 91 -3 -3.3% Haitong Bank, S.A. - Spain Branch 88 91 -3
UNITED KINGDOM 85 110 -25 -22.7% Haitong Bank, S.A. - London Branch 1 2 -1
Haitong UK Limited 84 108 -24
POLAND 53 58 -5 -8.6% Haitong Bank, S.A - Warsaw Branch 53 58 -5
IRELAND 3 3 0 0.0% Haitong Investment Ireland Plc 3 3 0
BRAZIL 119 156 -37 -23.7% Haitong Banco de Investimento do Brasil S.A. 108 120 -12
Haitong Securities do Brasil S.A. 11 35 -24 Haitong Brasil DTVM S.A. 0 1 -1
USA 37 17 +20 +117.7% Haitong Securities USA LLC 37 17 +20
MEXICO 4 4 0 0.0% Representative Office in Mexico City 4 4 0
INDIA 0 27 -27 -100.0% Haitong Securities India Private Limited 0 27 -27
Note: Does not include temporary staff and trainees. Source: Haitong Bank.
HEADCOUNT
Haitong Bank Headcount decreased by 7.9% in 2016 in global terms. However, there were significant staff reductions in Brazil (-24%) and in the UK (-23%) due to the process of reorganization of their activities for better alignment with the new Shareholder’s strategy. The Indian unit was sold to Haitong International Holdings Limited.
In the US, the Bank has been granted a broker dealer license allowing the development of its business in the region. As a consequence, team building has started and the headcount more than doubled. In Portugal, the headcount increased 7.9% due to the consolidation of some support and control areas.

HAITONG BANK, S.A.
57
TRAINING
Haitong Bank still supports the Training Policy by offering to their employees several courses (MBA’s, Post Graduations, Master, etc.).
All employees had the opportunity to attend Mandarin classes in the Bank. This action was highly requested with a good level of results.
TALENT MANAGEMENT
2016 was the first full year of Haitong Group as a Shareholder, with Haitong Bank being intended as a benchmark in Global Investment Banking.
Haitong Bank intends to develop a Human Resources programme that focuses on the Selection and Retention of High Potential Staff through the development of protocols with the best universities in Portugal and abroad.
Mobility programmes will also be created to allow the rotation of recent graduates and technical staff between the various geographies of the Bank, including Shanghai and Hong Kong units.
SOCIAL RESPONSIBILITY INITIATIVES
Haitong Bank provided financial support to the following institutions:
● Instituto de Apoio à Criança (IAC, a children support institution) - Acquisition of works of art from the IAC's collection;
● Clube Inter Cultural Europeu (NGO) - Donation of IT equipment to develop training initiatives targeting young people with limited resources.
As part of its social responsibility initiatives, the Bank also invited its Employees to take part in the following initiatives:
● “Terra dos Sonhos” - Possibility to use the premises of Casa dos Sonhos to hold private events, thus helping this institution;
● ECO information - Haitong Bank disclosed its contribution to reduce the environmental footprint through the safe and confidential destruction of more than 12.5 tonnes of documents by the company Reisswolf.

2016 Annual Report
58
8. RISK MANAGEMENT As a result of the acquisition of 100% of its share capital by Haitong Securities, Co., Ltd. in September 2015, Haitong Bank management and governance model is being redefined to align with the new Shareholder’s objectives and practices
Acting with independence of business lines and units whose risks it controls, the Risk Management is a Bank’s central organizational feature, enabling to make informed decision and assuring that the risk management processes approved by the Board of Directors are duly implemented and followed.
GOVERNANCE
The Board of Directors is responsible for establishing the risk appetite policy and control systems framework that assure the Bank has the necessary skills and resources to meet its objectives.
The risk management function is independent from the business units, supervising all material risks to which Haitong Bank various units are exposed to and consistently incorporates risk, capital and liquidity concepts into the Group's strategy and business decisions.
The current structure of the relevant Committees for the Bank’s Risk Management is summarized below.
RISK COMMITTEE
The Risk Committee is missioned to continuously monitor the development and implementation of the risk strategy and the risk appetite of the institution and verify whether these are compatible with a sustainable strategy in the medium and long-term and with the action programme and budget approved, advising the Board of Directors in these areas.
Global Credit Committee
Impairment Committee
Capital, Assets and Liabilities Management
Committee
Board of Directors
Executive Committee
Risk Management Department
Risk Committee
HAITONG BANK, S.A.
59
The Risk Committee is responsible for, in particular:
● Advising the Board of Directors on the Bank’s present and future general risk appetite and risk strategy, taking into account all categories of risk, ensuring its alignment with the business strategy, objectives, corporate culture and values;
● Assisting the Board of Directors in supervising the execution of the Bank’s risk strategy and in the fulfilment of their respective limits;
● Reviewing periodically the risk profile and risk policies and strategies of the institution;
● Assessing the consistency between the business model, strategy, the recovery plan, the remuneration policies and the budget, as well as the efficiency and effectiveness of the structure, procedures and instruments associated with the implementation and execution of the strategies of risk;
● Issuing recommendations on adjustments to the strategy of risk resulting from changes in the business model, market developments or business context where the Bank operates;
● Analysing and evaluating the methodology and its results to support the process of identification, evaluation and measurement of risks;
● Examining scenarios including stress tests in order to determine their impact on the risk profile of the Bank and assessing the resilience of the institution to changes caused by idiosyncratic, systemic or mixed factors;
● Analysing if the conditions of the products and services offered to clients take into consideration the Bank’s business model and risk strategy, and presenting a correction plan to the Board of Directors whenever appropriate;
● Establishing if the incentives set in the Bank’s remuneration policy take into consideration the risk, the capital, the liquidity and the expectations in respect of results, including revenues’ data;
● Setting the risk reporting framework to be presented at Board of Directors meetings;
● Ensuring the existence of effective procedures for monitoring risk and monitoring internal control deficiencies related to the risk management framework;
● Specifying and reviewing the conditions of authority and independence to support the exercise of responsibilities for risk management, including the adoption of the work plan of the risk management function;
● Reviewing and monitoring periodically the scope and nature of the activities developed by Haitong Group Bank related to risk management; and
● Ensuring that the risk management function has adequate resources for the performance of its duties.
2016 Annual Report
60
RISK MANAGEMENT DEPARTMENT
As an independent control function that holds the sufficient authority, stature and resources, the Risk Management Department aims to enable the Bank to make informed decision and to assure that the ‘risk rules’ approved by the management body are duly implemented and followed.
Being actively involved in all material decisions and aligned with parent guideline and practices, the Risk Management Department is responsible for:
● Advising the Risk Committee on the overall business strategy and risk strategy including risk appetite and its tolerance levels;
● Ensuring the institution has effective risk management processes in place to identify, measure and control all material risks as stipulated by the Risk Committee;
● Implementing an adequate identification, measurement, and control of all material risks, in accordance with the Risk Committee guidelines and instructions;
● Providing comprehensive and understandable information and reporting on risks, enabling the management body to understand the institution’s overall risk profile and oversee the implementation of the institution’s risk appetite;
● Advising the Risk Committee on the amounts, types and distribution of both internal capital and regulatory capital to cover adequately the risks of the institution.
CAPITAL, ASSETS AND LIABILITIES MANAGEMENT COMMITTEE
The Capital, Assets and Liabilities Management Committee is responsible, as per delegation of the Executive Committee, for:
● Submitting to the appraisal of the Executive Committee the policy and/or strategy, it has defined to be included in the Risk Appetite Policy of the Bank and the Group;
● Preparing the Funding and Capital Plan, as well as the Liquidity Contingency Plan, taking into account the policy and/or capital, funding and liquidity management strategy approved by the Executive Committee;
● Ensuring the fully effectiveness of the funding and liquidity management strategy of the Bank and the Group;
● Defining any mitigation measures to comply with the goals laid down in the liquidity management policy of the Bank and the Group;
● Collaborating closely with the Global Credit Committee and the Risk Committee in order to ensure a strategic alignment concerning the liquidity management policy;
● Reporting to the Executive Committee on a regular basis any decisions and initiatives within the scope of the duties described hereinabove.
HAITONG BANK, S.A.
61
GLOBAL CREDIT COMMITTEE
The Global Credit Committee shall assess and decide on the approval of:
● Operations proposed by each one of Europe’s geographies (Portugal, Spain, United Kingdom and Poland);
● Limits of the delegation of powers of approval for Brazil Credit Committee;
● Operations where respective amounts or specific characteristics exceed the pre-established limits of the delegation of powers of approval for Brazil Credit Committee;
● New products and services of all geographies of the Bank;
● Individual, regional and global limits of exposure and risk tolerance, taking into account the risk appetite and risk policies approved by the Board of Directors.
IMPAIRMENT COMMITTEE
The Impairment Committee shall:
● Monitor and control the evolution of the loan portfolio, both individually and on an overall basis;
● Analyse and decide on impairment amounts to be assigned to credit clients;
● Decide on which credit must be followed by the Capital Structure Advisory Department;
● Review and confirm all clients identified with impairment triggers, default situations or restructured loans due to financial problems and inform the Executive Committee and the Heads of the areas concerned via the Risk Weekly Report.
RISK APPETITE
Haitong Bank aims to become a world leading China-focused investment bank, backed by its solid expertise and the Haitong Securities market position in Asia. As a full-service investment bank, we shaped our organization in three business streams: Investment Banking, Markets and Wealth and Fund Management.
Haitong Bank acknowledges that its risk management model is a key factor for achieving the Group’s strategic objectives and provides additional line of defence in protecting enterprise value. Taking in consideration our current risk profile and the appropriate balance between enterprise value creation initiatives and control mechanisms intended to protect enterprise value, Haitong Bank is currently willing to accept a moderate risk tolerance to pursue sustainable growth and recognition.
Haitong Banks’ overall risk vision assessment is set around the following three guiding principles:
● Capital: Haitong Bank aims to maintain prudent capital buffers on top of both internal and regulatory capital requirements;
● Liquidity and Funding: Haitong Bank as a whole and all its subsidiaries individually, aims to maintain a solid short-term position and a sustainable medium long-term funding profile;
● Earnings: The Group has the goal of generating recurrent earnings to guarantee its sustainability and a reasonable level of profitability for the Shareholder.

2016 Annual Report
62
8.1. CREDIT RISK
Credit risk is the potential financial loss arising from the failure of an obligor or counterparty to honour its contractual obligation. As the major risk to which the Bank is exposed, credit risk management and control are supported by a robust system that permits to identify, assess, quantify and report risk.
MANAGEMENT PRACTICES
Credit portfolio management is carried out as an ongoing process that requires the full coordination between the various teams/functions responsible for the management of risk during the different stages of the credit process.
LIMITS SETTING
All transactions involving credit or market risk, as well as the risk limits framework for each Haitong Bank business unit (in Portugal, Spain, Poland, the United States of America, Mexico, Brazil, the United Kingdom and Ireland) are approved by the Global Credit Committee.
This ensures that the maximum exposure limits approved per counterparty, rating and sector are attributed taking into account the specific features of markets, products, currencies and maturities.
The approval of limits is preceded by an in-depth analysis of the markets, particularly regarding their liquidity to ensure that the Bank’s strategic objectives can be reached at both individual and consolidated level. The use of internal and external ratings for purposes of establishing portfolio ceilings that limit credit approvals by both product and rating levels, inhibit credit approvals for the worse risk ratings.
INTERNAL RATINGS
Haitong Bank internal rating function is constituted by an experienced team of analysts powered by a rating tool (scorecards and guidelines) sponsored by Standard and Poor’s.
A new system was developed internally enabling the effective management and monitoring of internal and external ratings, namely auditing of the rating process, mitigation of operational risk through checks and several alerts on credit risk changes.
The internal ratings measure the probability of default in a one-year period and they are assigned to all Clients and counterparties of Haitong Bank. They are mandatory for credit decisions and used as impairment trigger and warning signal. Annual update and maintenance of the internal rating framework is ensured by contracted services with Standard and Poor’s.
MONITORING
The credit risk monitoring and control activities aim to quantify and control the evolution of credit risk and to allow early definition and implementation of measures to deal with specific situations where there is a deterioration of risk – with a view to mitigating potential losses -, as well as to outline global strategies for credit portfolio management.
HAITONG BANK, S.A.
63
In this context, and with the central goal of complying with risk management standards, the credit risk monitoring function and its implementation are objectively considered as one of the top priorities of the risk management and control system.
This function comprises the following main processes:
● Daily and weekly portfolio monitoring
Haitong Bank teams in each business unit work closely with the risk management team in Portugal to ensure risk monitoring and control routines are properly implemented. This involves the following processes:
- Daily collection, preparation, control and reporting to the different business areas of information on loans, securities portfolios, derivatives and other products’ positions and use level of approved limits;
- Weekly risk reporting on each category of risk, namely the risk appetite of the Bank’s loan portfolio by type of instrument, the total exposure by instrument, country, rating, industry sector, maturity, margin, capital requirements, new/recent approvals by the Global Credit Committee, limits exceeded, impairment signs, among others;
- Preparation of support material for external and internal reporting on credit and counterparty risk.
● Monitoring of Clients with impairment triggers
To strengthen monitoring and control of the loan portfolio the Impairment Committee has the specific purpose of assessing the Bank’s loan portfolio provisions, especially for impaired exposures.
The Committee uses credit risk model information in conjunction with the analysis, among others, of:
- The Client’s overall exposure and the existence of overdue loans;
- The economic and financial viability of the Client’s business and its capacity to generate sufficient resources to service its debt in the future;
- The existence of privileged creditors;
- The existence, nature and estimated value of collaterals;
- The Client’s exposure in the financial sector;
- The amount and timing of expected recoveries.
An exposure is considered to be impaired, when: (i) there is objective evidence of impairment resulting from one or more events occurring after its initial recognition; (ii) the event or events have an impact on the recoverable value of the future cash flows of the loan or loan portfolio, as far as this can be reasonably estimated.
● Global risk analysis of credit portfolios.
Credit portfolio management is an ongoing process that requires interaction among the various teams responsible for the management of risk during the different stages of the credit process. The risk of credit portfolios, specifically in what concerns the evolution of credit exposure and the monitoring of credit losses, is reported to the Executive Committee.
The portfolio limits/ceilings are used to monitor the evolution of the risk appetite of the various credit portfolios. Compliance with the established ceilings is monitored on a regular basis. The resulting information is distributed to the business areas and to the Global Credit Committee.

2016 Annual Report
64
In what concerns concentration risk – the risks that arises from the possibility of an exposure or group of exposures that share common or interrelated risk factors producing sufficiently large losses to undermine an institution’s solvency - Haitong Bank has established limits for the largest individual exposures and for exposures by sector. The regular monitoring of these limits, together with that of regulatory limits, namely for Large Exposures, reinforces the Bank’s monitoring and follow-up framework for credit risk concentration. The impact of concentration risk is incorporated in the economic capital model for credit risk.
CREDIT RECOVERY PROCESS
To support credit recovery and restructuring, Haitong Bank’s Capital Structure Advisory Division advises on and implements corporate liabilities' management solutions. The division also works on loan restructurings aiming to maximize the credit recovery rate.
ASSET QUALITY
LOAN PORTFOLIO
Portfolio breakdown As of December 2016 the gross loan portfolio totalled EUR 1,097 million, which represents a contraction of EUR 273 million during 2016, mainly observed on the Project Finance (EUR -170 million) and on the international Acquisition Finance portfolios.
Loan Portfolio Product Lines and Geographic Breakdown
(thousands of euro)
Dec-16 Dec-15
Domestic International Total Domestic International Total
Loan Portfolio1 481,996 615,048 1,097,044 582,896 787,111 1,370,008
Project Finance 279,851 372,868 652,719 399,625 423,941 823,566
Acquisition Finance 199,153 222,397 421,550 180,379 363,138 543,517
Other Credits 2,992 19,783 22,775 2,892 33 2,925
1 Gross of provisions
Source: Haitong Bank.
The breakdown of the loan portfolio by industry sector reflects the Bank’s lending strategy developed over the last few years in the various regions where it operates, with special emphasis on project finance in the transportation and energy infrastructure sectors. In 2016, there was an increase on the financial sector, due to new loans from Acquisition Finance business line.

HAITONG BANK, S.A.
65
Loan Portfolio Product Lines by Sector
Dec-16 Dec-15
Project Finance
Acquisition Finance
Other Credits
Total Project
Finance Acquisition
Finance Other
Credits Total
TOTAL 59% 38% 2% 100% 60% 40% 0% 100%
Financials 0.0% 16% 2% 17% 0.3% 11% 0% 11%
Construction and Public Works 9% 3% 0% 12% 13% 2% 0% 14%
Energy 22% 1% 0% 23% 19% 1% 0% 20%
Transport Infrastructure 15% 0.0% 0.0% 15% 14% 0.0% 0.0% 14%
Transports and Communications 1% 3% 0% 4% 1% 3% 0% 4%
Other Manufacturing Sectors 1% 5% 0% 6% 1% 6% 0% 7%
Real Estate and Rental Activity 0.0% 1% 0.0% 1% 0.0% 6% 0.0% 6%
Services 2% 7% 0% 8% 5% 5% 0% 10%
Wholesale and Retail 6% 0% 0% 6% 5% 1% 0% 6%
Other sectors 3% 4% 0% 7% 2% 6% 0% 8%
Source: Haitong Bank.
Internal Rating Profile Haitong Bank uses internal rating models to support credit decisions and credit risk monitoring. In 2016, the loan portfolio is distributed by internal ratings as shown in the table below.
Loan Portfolio Rating Profile
Dec-16 Dec-15
[aaa; a-] 0% 1%
[bbb+; bbb-] 5% 10%
[bb+; bb-] 50% 37%
[b+; b-] 31% 44%
[ccc+; lccc] 15% 8%
In percentage of non-default rated portfolio Source: Haitong Bank.

2016 Annual Report
66
Risk Indicators In 2016, Haitong Bank continued to pursue a conservative approach regarding loan portfolio impairments, by accomplishing a significant provisioning coverage.
Loan Portfolio Risk Indicators
(thousands of euro)
Dec-16 Dec-15
Loan Portfolio 1,097,044 1,370,008
Overdue > 90 days 203,504 189,407
Overdue > 90 days / Loan portfolio 18.6% 13.8%
Credit at Risk1 483,574 502,048
Credit at Risk / Loan portfolio 44% 37%
Credit Provisions 255,949 334,849
Credit Provisions / Overdue Loans > 90 days 126% 177%
Credit Provisions /Credit at Risk 53% 67%
Credit Provisions / Loan portfolio 23% 24%
Additional Credit Provisions 49,269 66,414
Additional Credit Provisions / Gross Loans 4.5% 4.9%
Source: Haitong Bank. 1 According to Instruction 23/2011 of Bank of Portugal, credit at risk includes: a) total value of credit with capital or interest past due by 90 days or more; b) other restructured credit, where the principal or interest payments were past due by more than 90 days and have been capitalized or refinanced without full coverage by collaterals or the interest fallen due have not yet been fully paid by the debtor; and c) credits of an insolvent or bankrupt debtor.
FIXED INCOME ASSETS
Portfolio breakdown The fixed income portfolio ended 2016 with a net total of EUR 1,877 million, a year-on-year increase of EUR 436 million, as a result of Haitong Banco de Investimento do Brasil’s activity, essentially made up of Brazilian Treasury Notes and Brazilian Central Bank Notes (issued and funded in local currency).

HAITONG BANK, S.A.
67
Fixed Income Portfolio by Sector
(thousands of euro)
Dec-16 Dec-15
Total 1,868,554 1,430,093
Sovereign 1,625,843 1,231,291
Financials 135,112 67,042
Construction and Public Works 4,899 3,224
Energy 5,279 3,749
Transport Infrastructure 0 621
Transports and Communications 6,307 12,226
Other Manufacturing Sectors 49,476 18,646
Real Estate and Rental Activity 4,013 8,384
Services 26,769 29,499
Wholesale and Retail 1,611 0
Other sectors 9,245 55,411
Source: Haitong Bank.
Internal Rating Profile In 2016 the risk profile of the Bank’s fixed income portfolio reflected the Brazilian sovereign debt downgrade.
Fixed Income Portfolio Rating Profile
Dec-16 Dec-15
[aaa; a-] 0.6% 0.1%
[bbb+; bbb-] 1.3% 75.0%
[bb+; bb-] 86.7% 19.7%
[b+; b-] 11.1% 2.5%
[ccc+; lccc] 0.3% 2.8%
In percentage of non-default rated portfolio Source: Haitong Bank.
DERIVATIVES PORTFOLIO
Portfolio Breakdown The counterparty risk exposure in the Bank’s portfolio of interest rate, exchange rate, and equity derivatives amounted EUR 274 million at the end of 2016.
In terms of the breakdown by counterparty risk sector, 28% of the global exposure is related to Transport Infrastructure interest rate deals and 26% to Financial sector counterparties.
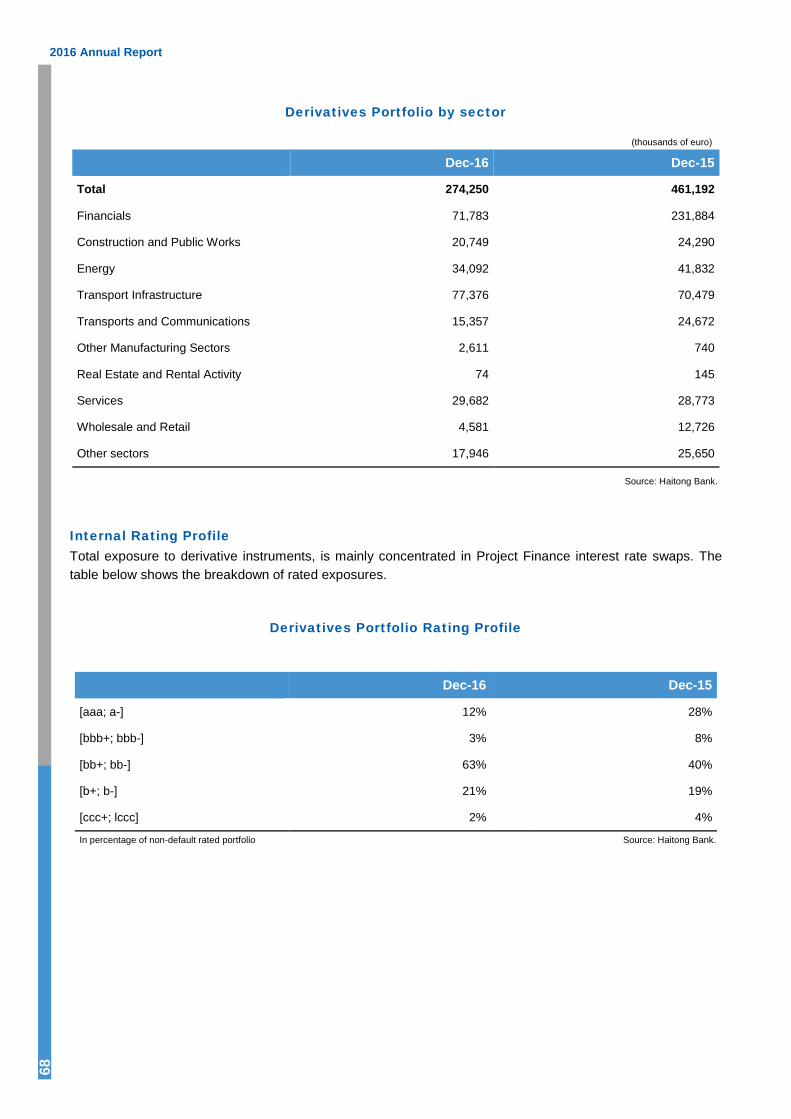
2016 Annual Report
68
Derivatives Portfolio by sector
(thousands of euro)
Dec-16 Dec-15
Total 274,250 461,192
Financials 71,783 231,884
Construction and Public Works 20,749 24,290
Energy 34,092 41,832
Transport Infrastructure 77,376 70,479
Transports and Communications 15,357 24,672
Other Manufacturing Sectors 2,611 740
Real Estate and Rental Activity 74 145
Services 29,682 28,773
Wholesale and Retail 4,581 12,726
Other sectors 17,946 25,650
Source: Haitong Bank.
Internal Rating Profile Total exposure to derivative instruments, is mainly concentrated in Project Finance interest rate swaps. The table below shows the breakdown of rated exposures.
Derivatives Portfolio Rating Profile
Dec-16 Dec-15
[aaa; a-] 12% 28%
[bbb+; bbb-] 3% 8%
[bb+; bb-] 63% 40%
[b+; b-] 21% 19%
[ccc+; lccc] 2% 4%
In percentage of non-default rated portfolio Source: Haitong Bank.
HAITONG BANK, S.A.
69
8.2. MARKET RISK
Market risk is the possible loss resulting from an adverse change in the value of a financial instrument due to fluctuations in interest rates, foreign exchange rates, share/indexes prices, commodity prices, real estate prices, volatility and credit spreads.
Market Risk is monitored on a short-term perspective (10 days) for the trading book and on a medium-term perspective (1 year) for the banking book.
TRADING BOOK RISK
MANAGEMENT PRACTICES
The main measure of market risk is the estimation of potential losses under adverse market conditions, for which Value at Risk (VaR) methodology is used. VaR is calculated using the Historical simulation, with a 99% confidence level and an investment period of 10 business days. Volatilities and correlations are historical, based on an observation period of one year.
The identification, valuation, monitoring and control of market risk are the responsibility of a specific unit, the Market Risk Control unit, which works in full independence from the Bank’s business areas.
In organisational terms, Market Risk Control functions are spread geographically among the Bank’s different business units, which have the appropriate skills and resources to evaluate the specific activities and risks incurred by each company of the Group.
The Market Risk Control unit is responsible for analysing the relevant factors for each type of risk using statistical techniques, measuring market volatility, analysing depth and liquidity indicators, and simulating the transactions value under different market conditions to establish adequate limits for each business area. In addition to the technical analysis for setting appropriate limits, the Market Risk Control unit also takes into account the track record and experience of the business area concerned and its strategic objectives to ensure that the limits reflect the Bank’s guidelines for each category of risk.
The proposed limits are submitted for approval to local Credit Committee in Brazil, and to the Global Credit Committee in Lisbon. The limits are reviewed at least annually or whenever required by strategic reasons or market conditions.
To obtain a clear picture of the risks incurred and to provide the whole organisation with clear messages regarding the desired risk appetite, a wide range of risk assessment measures are used, complemented by position, stop loss, and concentration limits.
Risk assessment measures used include VaR (Value at Risk), the BPV (Basis Point Value) sensitivity measure, and Greeks (Delta, Vega and Rho). VaR quality and accuracy is gauged by back testing analysis.
The way in which the risk assessment and control methodologies, described above, are implemented is adapted to factor in the specific features of the market in which each business entity operates.
Value at risk (VaR) on 31 December 2016, relating to trading positions in equities, interest rate instruments, volatility, credit spreads, commodities, as well as FX positions (except the FX position in equities in the

2016 Annual Report
70
available for sale portfolio and in the portfolio of assets at fair value) totalled EUR 4.69 million, which compares with EUR 4.45 million on 31 December 2015.
VaR - 99% at 10 Days
(millions of euro)
Dec-16 Dec-15
Exchange Risk 2.54 1.78
Interest Risk 1.85 1.16
Shares and Commodities 0.73 0.10
Credit Spread 2.16 2.12
Covariance -2.59 -0.71
Total 4.69 4.45 Source: Haitong Bank.
The main risk factor to which the Bank was exposed at the end of 2016 was the EUR/USD exchange rate and Portugal sovereign credit spread.
BANKING BOOK RISKS
Other risks in the banking book arise from adverse movements in interest rates, credit spreads, and in the market value of equity securities and real estate in non-trading exposures in the balance sheet.
INTEREST RATE RISK
Interest Rate Risk may be understood in two different but complementary ways, namely as the effect on the net interest margin, or as the impact on capital, resulting from interest rate movements that affect a bank’s banking book.
Fluctuations in market interest rates can affect a bank’s net interest margin by altering the amount of income and costs associated to interest rate sensitive products, as well as by impacting the value of the underlying assets, liabilities and off-balance sheet instruments.
The banking book exposure to interest rate risk is calculated in compliance with the Bank for International Settlements (BIS) methodology, classifying all interest rate sensitive assets, liabilities and off balance sheet items, excluding those from trading, using repricing tenors.
The model used is similar to the duration model, using a stress testing scenario corresponding to a parallel shift of 200 basis points in the yield curve for all interest rate levels (Bank of Portugal Instruction 19/2005).
Interest rate risk measurement basically consists in determining the effect of changes in interest rates on equity and net interest income. On 31 December 2016 interest rate risk had a EUR 37,917 thousand positive impact on the Bank’s shareholders’ equity, which compares with a EUR 14,829 thousand positive impact at the end of 2015.
HAITONG BANK, S.A.
71
CREDIT SPREAD RISK
The credit spread, which reflects the ability of an issuer to meet its obligations when they fall due, is one of the factors considered in the assets’ valuation. It shows the difference between the interest rate of a risky asset and the interest rate of a risk-free asset in the same currency and with the same maturity.
The credit spread risk of an asset derives from the respective issuer’s credit spread volatility. This risk is measured based on a VaR at 99% with a holding period of one year.
RISK OF EQUITY INSTRUMENTS AND OTHER VARIABLE INCOME SECURITIES
The Bank is also subject to other types of risk in the banking book, namely the risk of Equity Holdings and the risk of Mutual Funds. These risks may broadly be described as the probability of a loss resulting from an adverse change in the market value of these financial instruments.
The risk of equity holdings and mutual funds, which arises from the respective market prices and equity indexes, is measured based on a VaR at 99%, considering a holding period of one year. This includes the FX risk in equities in the available for sale portfolio.
REAL ESTATE RISK
Real estate risk arises from adverse changes in the market value of real estate assets where the Bank has exposure to, in the balance sheet, through investment funds.
PENSION FUND RISK
The pension fund risk stems from the possibility of the value of the fund’s liabilities (the obligations of the fund) exceeding the value of its assets (the fund’s investments). When that occurs, the Bank must cover the difference and incur in the respective loss (contributions to the fund).
The Bank’s pension fund risk is measured based on the estimated value of assets and liabilities with a time frame of one year.
The Fund’s estimated return corresponds to the maximum losses which the Fund may incur in a period of one year. This return is determined by calculating, for a confidence interval of 99%, the 1-year VaR of the Pension Fund’s assets portfolio at the reference date.
The responsibilities are updated based on the projected current cost within one year.
To quantify the pension fund risk the Bank uses the same models and methodologies used to determine the material risks incurred by its assets.

2016 Annual Report
72
8.3. OPERATIONAL RISK
Operational risk may be defined as the probability of occurrence of events with a negative impact on earnings or capital resulting from inadequate or negligent application of internal procedures, inadequacy or failure of information systems, staff behaviour, or external events. Legal and Reputational risks are also included in this definition. Operational risk is therefore considered as the sum of the operational, information systems, compliance and reputational risks.
MANAGEMENT PRACTICES
Operational risk is managed through a set of procedures that standardise, systematise and regulate the frequency of actions aimed at the identification, monitoring, control and mitigation of this risk. The priority in operational risk management is to identify and mitigate or eliminate risk sources, even if these have not resulted in financial losses.
In 2016, the Operational risk function was integrated within the Risk Management Department.
The management methodologies in place are supported by the principles and approaches to operational risk management issued by the Basel Committee and those underlying the Risk Assessment Model implemented by the Bank of Portugal, recognised as reflecting the best practices in this area.
The operational risk management model is supported by a structure within the organisation exclusively dedicated to its design, monitoring and maintenance. This structure works in close coordination with the elements indicated below, whose active participation is crucial:
● The departments, branches and subsidiaries integrated within the scope of operational risk management, who are responsible for the day-to-day management of operational risk, guaranteeing that the established procedures are implemented;
● The Compliance Department, which plays an important role in guaranteeing that the processes are well documented and in compliance with relevant laws and regulations;
● The Internal Audit Department which tests the effectiveness of risk management and controls, identifies required steps for improvement and assesses their implementation;
● The Information Technology Department for its role on business continuity.
The operational risk management includes the following:
● Identification and reporting of operational risk events. This database not only considers loss-events but also events with positive impacts and others with no accounting impacts;
● Implementation of procedures to monitor the registration of events in order to verify the effectiveness of the identification/mitigation processes implemented in each subsidiary and branch and at the same time ensure the collection and consistency of the information on events with financial impacts;
● Regularly carrying out self-assessment analyses to identify the larger risks and corresponding mitigation actions;
● Calculation of capital requirements in accordance with the Standardised Approach (this is performed by the Management Information Department).

HAITONG BANK, S.A.
73
OPERATIONAL RISK ANALYSIS
In 2016, less than 2% of reported events carried losses above EUR 5,000, representing more than 80% of total operational risk events losses.
Source: Haitong Bank.
The operational risk events are duly reported so as to permit their full and systematic categorization and the monitoring of follow-up mitigation actions. Every event is classified in accordance with the risk categories defined in the Bank of Portugal’s Risk Assessment Model, by business lines and Basel Risk types.
In 2016 the vast majority of events occurred on ‘Execution, Delivery and Process Management’, while losses present a scattered pattern also comprising “Clients, Products & Business Practices” and ‘Employment practices and workplace safety’.
Source: Haitong Bank
17.8%
16.4%
21.8%
44.0%
98.8%
1.0%
0.1%
0.1%
<= 5.000,00 €
]5.000,00 €; 20.000,00 €]
]20.000,00 €; 100.000,00 €]
> 100.000,00 €
Frequency
Severity
21.8%
46.5%
0.0%
0.0%
31.7%
0.1%
0.3%
0.1%
3.7%
95.8%
Employment Practices & WorkplaceSafety
Clients, Products & Business Practices
Damage to Physical Assets
Business or system failures
Execution, Delivery & ProcessManagement
Frequency
Severity
2016 Annual Report
74
8.4. LIQUIDITY RISK
Liquidity risk arises from an institution’s present or future inability to meet all payment obligations when they come due or secure such resources only at excessive cost.
Liquidity risk may be divided into two types:
● Market liquidity risk – the impossibility of selling an asset due to lack of liquidity in the market, leading to the widening of the bid/offer spread or the application of a haircut to its market value;
● Funding liquidity risk – the impossibility to obtain market funding to finance assets and/o refinance debt coming to maturity, in the desired currency. This can lead to a sharp increase in the cost of funding or to the requirement of collaterals in exchange for funding. Difficulties in (re)financing may lead to the sale of assets incurring significant losses.
MANAGEMENT PRACTICES Liquidity and funding management is a key element in Haitong Bank business strategy and a fundamental pillar, together with capital, in supporting its strength and resilience.
Haitong Bank takes the primary responsibility for its own liquidity risk management. Liquidity management and Haitong's funding strategy is the responsibility of the Capital, Assets and Liabilities Management Committee which assures the managing of the Bank’s liquidity in an integrated way, with the Executive Committee and the treasuries of all Haitong’s entities.
To provide protection against unexpected fluctuations and based on a solid organizational and governance model, Haitong Bank liquidity risk management envisages delivering appropriate term and structure of funding consistent with the following principles:
● Ensure the ability to meet obligations as they come due in a timely manner and at a reasonable cost;
● Compliance with regulatory standards on liquidity in each geography the Bank operates;
● Full alignment with liquidity risk appetite;
● Availability of sufficient immediate liquidity buffer to ensure ability to react to any event of stress that could restrict the capability to market access under both normal and stressed conditions;
● Development of a diversified investors’ base and maintaining access to a variety of alternative funding sources, while minimising the cost of funding.
● Promote the adequacy between the funding structure and the necessary funds to finance the Bank’s activity, namely in terms of maturities, counterparties and funding instruments diversification; and
● Continuous development an appropriate internal framework for the identification, measurement, limitation, monitoring and mitigation of liquidity risk.

HAITONG BANK, S.A.
75
LIQUIDITY POSITION
LIQUIDITY COVERAGE RATIO (30 DAYS)
The Liquidity Coverage Ratio (LCR) is established by the CRD IV (Directive 2013/36/EU) and it is designed to promote short-term resilience of a bank’s liquidity risk profile by measuring how adequate is the stock of high-quality liquid assets (HQLA) that can be easily converted in cash to meet liquidity needs for a 30 calendar day liquidity stress scenario.
In October 2014, the European Commission published the Delegated Act (EU) 2015/61 for the LCR under the European CRD IV regime, which went into force on October 2016. Since 1st of October 2016, the Delegated Act requires phased compliance with the LCR standard from a minimum of 70% increasing to 100% by January 2018, as shown in the table below.
Minimum Liquidity Coverage Ratio
Oct-16 Jan-17 Jan-18
Liquidity Coverage Ratio (LCR) 70% 80% 100%
As of 31 December 2016, Haitong Bank reached an LCR of 328%, which represents a surplus regarding both the December 2016 and the 2018 regulatory minimums, and demonstrates Bank’s resilience to short-term liquidity stress scenarios.
Liquidity Coverage Ratio
(thousands of euro)
Dec-16
High-Quality Liquid Assets 279,874
30 days Net Outflow 85,216
Liquidity Coverage Ratio (LCR) 328%
2016 Annual Report
76
8.5. CAPITAL MANAGEMENT
Capital management seeks to guarantee Haitong Bank’s sound solvency and profitability under the strategic objectives and the risk appetite set by the Executive Committee and therefore is of critical importance to Haitong’s approach to financial stability and sustainability management.
MANAGEMENT PRACTICES
The capital management practices and guidelines are shaped to accomplish the business strategic aims and the risk appetite set by the Board of Directors. Accordingly, with the objective of maintaining capital that is adequate in quantity and quality, Haitong Bank has in place a capital management framework assisted by the following streams:
● Constant monitoring of regulatory capital requirements;
● Annual revision of the risk appetite;
● Business objectives adequately measured on capital planning.
Complementing the regulatory focus, Haitong Bank executes on an annual basis an internal risk-based capital self-assessment (ICAAP) that consists in a forward-looking measurement of all material risks incurred by Haitong Bank (including the ones not covered on Pillar 1 regulatory capital).
As part of our capital management policy, Haitong Bank maintains a recovery capital plan, which provides the escalation path for crisis management governance and identifies the list of actions and strategies designed to respond to a capital stress event.
REGULATORY CAPITAL AND LEVERAGE RATIOS
SOLVENCY
Regulatory capital requirements are determined by the Bank of Portugal under the CRR (Regulation EU nº 575/2013) and CRD IV (Directive 2013/36/EU). Under these regulatory frameworks, capital requirements are set in consideration of the level of risk that the Bank is exposed to, which is measured through both risk-weighted assets (RWAs) and leverage.
The regulation provides for a transitional period to exclude some elements previously included (phase-out) and include/deduct new elements (phase-in) in which institutions may accommodate the new requirements. The transitional period for the majority of the elements will last until the end of 2017, with the exception of the deferred tax assets generated prior to 1 January 2014 and both the subordinated debt and all the hybrid instruments not eligible as own funds under the new regulations, which have a longer period (until the end of 2021).
Under this regulatory framework, the minimum CET1 ratio is 4.5%, the minimum Tier1 ratio is 6% and the minimum Total capital ratio is 8%.

HAITONG BANK, S.A.
77
In addition, these minimum ratios are supplemented by the capital conservation buffer. CRD IV requirements permit to phase in the impact of this buffer, beginning on January 1, 2016, in increments of 0.625% per year until it reaches 2.5% of RWAs on January 1, 2019.
Still under the CRD IV capital buffers context, Bank of Portugal decided in November 2016 to impose a capital surcharge to six Portuguese banking groups classified as O-SIIs (Other Systemically Important Institutions) in the scope of its annual revision of the identification of the imposition of capital buffers, pursuant to Article 138-R (2) of the Legal Framework of Credit Institutions and Financial Companies (RGICSF). The O-SII buffer will be effective from January 1, 2018. According to Bank of Portugal’s decision, Haitong Bank was, at this point in time, excluded from the scope of application of this macro-prudential buffer.
The regulation also provides a counter-cyclical capital buffer of up to 2.5%, to be imposed in the event that national supervisors deem it necessary in order to counteract excessive credit growth in Portugal. As of January 1, 2017, Bank of Portugal decided not to impose any additional counter-cyclical capital buffer, by setting a 0% of total risk exposure amount). This decision applies to the first quarter of 2017 and will be subject to revision on a quarterly basis.
Our estimated capital ratios calculated under the Basel III Standard Approach on both transitional and fully loaded basis are shown in the table below.
Solvency Ratios
Dec-16 Dec-15 Published
Dec-15 Restated
Phased-in Fully-loaded Phased-in Fully-loaded Phased-in Fully-loaded
CET1 ratio 7.1% 5.3% 10.5% 8.9% 9.9% 8.2%
Tier 1 ratio 9.6% 8.2% 10.5% 9.0% 9.9% 8.3%
Total capital ratio 9.7% 8.4% 10.6% 9.3% 10.0% 8.5%
Source: Haitong Bank.
LEVERAGE
Supplementary the CRR/CRD framework introduced a non-risk based leverage ratio. The leverage ratio compares Tier 1 capital to a measure of leverage exposure, aiming to constrain the build-up of excessive leverage in the banking sector and to backstop the existing risk-weighted capital requirements with a simple, non-risk-weighted measure. Leverage ratio minimum requirement was set at 3% and it is expected to be introduced as a binding measure as of 2018.
As of December 2017, Haitong Bank estimated leverage ratio was 6.1%. This estimate is based on our current understanding of the regulatory framework and may evolve as we discuss its interpretation and application with our Regulator.

2016 Annual Report
78
This Page Intentionally Left Blank

HAITONG BANK, S.A.
79
CONSOLIDATED FINANCIAL STATEMENTS AND NOTES TO THE CONSOLIDATED FINANCIAL STATEMENTS
These consolidated financial statements are a free translation into English of the original
Portuguese version. In case of doubt or misinterpretation the Portuguese version will prevail.

2016 Annual Report 80
1. CONSOLIDATED FINANCIAL STATEMENTS
Consolidated Income Statement for the financial years ended on the 31st December 2016 and 2015
(thousand euros)
Notes 31.12.2016 31.12.2015
Restatement
Interest and similar income 5 271 135 251 514Interest and similar expense 5 214 025 207 070
Financial margin 57 110 44 444
Fees and commissions income 6 52 684 94 274Fees and commissions expenses 6 ( 7 497) ( 11 803)Net gains/(losses) from assets and liabilities at fair value through profit or loss 7 ( 27 581) 74 940Net gains/(losses) from available-for-sale financial assets 8 995 3 080Net gains/(losses) from foreign exchange revaluation 9 26 365 ( 61 930)Net gains/(losses) arising from the disposal of other assets 10 10 752 95Other operating results 11 ( 3 958) ( 9 062)
Operating Income 108 870 134 038
Employee costs 12 92 955 80 785Administrative costs 14 56 569 53 694Depreciation and amortisation 24 e 25 6 415 6 610Provisions net of reversals 32 2 380 ( 22 020)Loan impairment net of reversals and recoveries 21 49 269 66 414Impairment on other financial assets net of reversal and recoveries 19 e 20 4 780 6 081Impairment on other assets net of reversals and recoveries 25, 26 e 27 1 231 53 777
Operating expenses 213 599 245 341
Share of profit in associates 26 166 ( 1 143)-
Profit / (Loss) before Income Tax ( 104 563) ( 112 446)Income tax
Current tax 33 ( 7 109) 26 606
Deferred tax 33 ( 2 662) ( 46 512)-( 9 771) ( 19 906)
Net Profit / (Loss) for the year ( 94 792) ( 92 540)
Attributable to shareholders of the parent company ( 96 181) ( 98 328)Attributable to non-controlling interests 37 1 389 5 788
( 94 792) ( 92 540)
Basic Income per Share (in euros) 15 -1.13 -1.49Diluted Income per Share (in euros) 15 -1.13 -1.49
The following notes form an integral part of these consolidated financial statements
Chief Accountant The Board of Directors
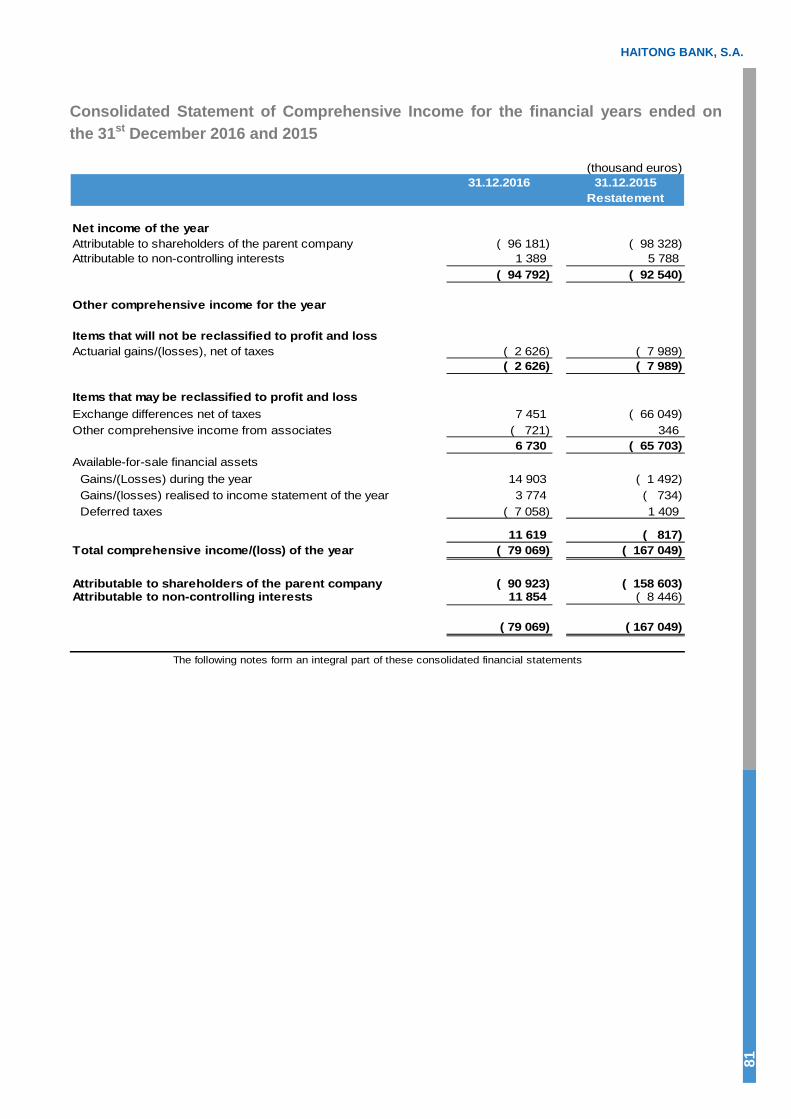
HAITONG BANK, S.A.
81
Consolidated Statement of Comprehensive Income for the financial years ended on the 31st December 2016 and 2015
(thousand euros)31.12.2016 31.12.2015
Restatement
Net income of the yearAttributable to shareholders of the parent company ( 96 181) ( 98 328)Attributable to non-controlling interests 1 389 5 788
( 94 792) ( 92 540)
Other comprehensive income for the year
Items that will not be reclassified to profit and lossActuarial gains/(losses), net of taxes ( 2 626) ( 7 989)
( 2 626) ( 7 989)
Items that may be reclassified to profit and lossExchange differences net of taxes 7 451 ( 66 049)Other comprehensive income from associates ( 721) 346
6 730 ( 65 703)Available-for-sale financial assets
Gains/(Losses) during the year 14 903 ( 1 492)Gains/(losses) realised to income statement of the year 3 774 ( 734)Deferred taxes ( 7 058) 1 409
11 619 ( 817)Total comprehensive income/(loss) of the year ( 79 069) ( 167 049)
Attributable to shareholders of the parent company ( 90 923) ( 158 603)Attributable to non-controlling interests 11 854 ( 8 446)
( 79 069) ( 167 049)
The following notes form an integral part of these consolidated financial statements

2016 Annual Report 82
Consolidated Statement of Financial Position as at the 31st December 2016 and 2015(thousand euros)
Notes 31.12.2016 31.12.2015 01.01.2015
Restatement Restatement
AssetsCash and deposits at central banks 16 37 550 117 684 1 524Deposits at other credit institutions 17 104 254 38 960 49 067Financial assets held-for-trading 18 1 494 915 1 346 489 1 468 473Available-for-sale financial assets 19 790 346 457 198 543 923Loans and advances to banks 20 853 687 258 795 34 308Loans and advances to customers 21 841 095 1 035 158 1 549 218Risk management derivatives 22 18 273 15 236 25 754Non-current assets held-for-sale 23 3 600 3 600 3 600Other tangible assets 24 11 853 12 164 15 493Intangible assets 25 26 013 26 279 77 396Investments in associated companies 26 6 591 10 343 26 878Current income tax assets 33 11 286 10 029 5 173Deferred income tax assets 33 145 618 145 933 100 230Other assets 27 409 666 626 915 532 442
Total Assets 4 754 747 4 104 783 4 433 479
LiabilitiesResources of central banks 28 60 000 61 139 61 108Financial liabilities held-for-trading 18 1 042 681 502 350 621 548Resources of other credit institutions 29 1 974 169 1 632 522 1 397 284Resources of customers 30 735 708 567 038 448 912Debt securities issued 31 341 567 547 266 1 072 210Risk management derivatives 22 32 907 116 397 33 939Provisions 32 8 815 10 810 47 075Current income tax liabilities 33 4 111 4 370 17 728Deferred income tax liabilities 33 1 628 194 717Subordinated liabilities 34 - 215 37 096Other liabilities 35 202 638 301 705 266 849
Total Liabilities 4 404 224 3 744 006 4 004 466
Equity Share capital 36 426 269 426 269 326 269Share premium 36 8 796 8 796 8 796Other equity instruments 36 83 731 3 731 3 731Fair-value reserves 37 ( 2 312) ( 11 919) ( 11 639)Other reserves and retained income 37 ( 111 455) ( 5 453) 200 725Net profit/(loss) of the year attributable shareholders of the parent company ( 96 181) ( 98 328) ( 145 958)
Total equity attributable to the shareholders of the parent company 308 848 323 096 381 924
Non-controlling interests 37 41 675 37 681 47 089
Total Equity 350 523 360 777 429 013
Total Equity and Liabilities 4 754 747 4 104 783 4 433 479
The following notes form an integral part of these consolidated financial statements
The Director of the Accounting Department The Board of Directors
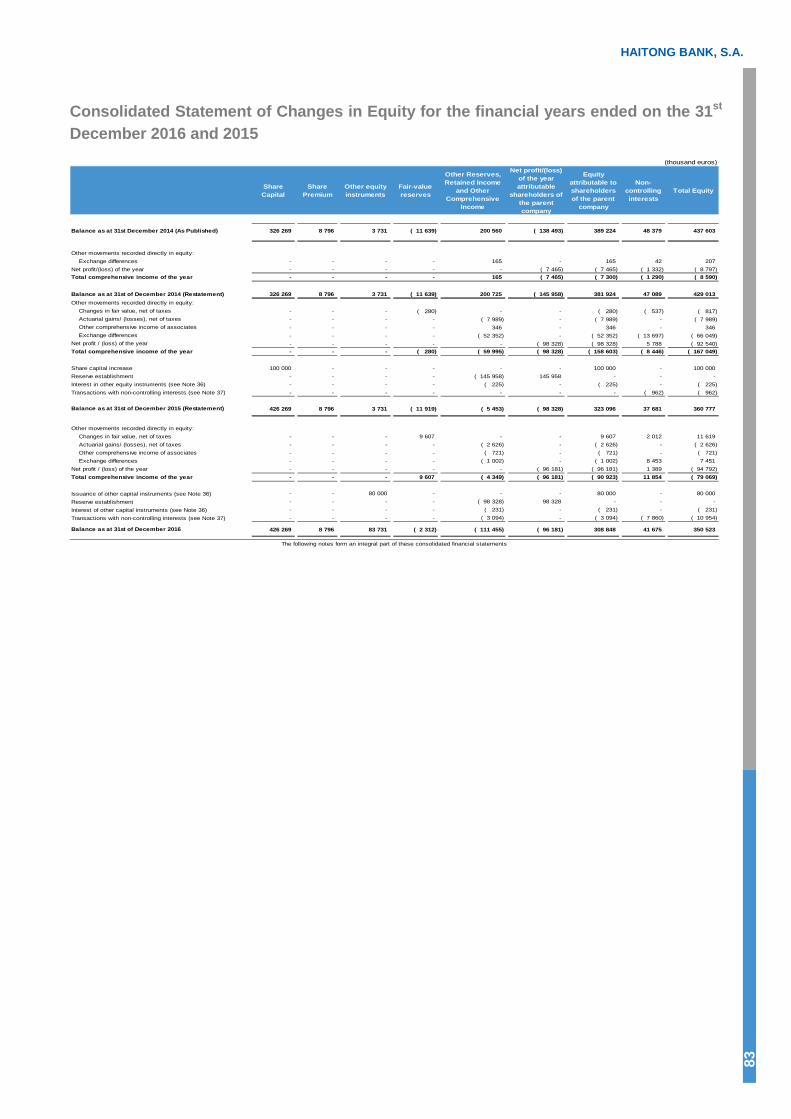
HAITONG BANK, S.A.
83
Consolidated Statement of Changes in Equity for the financial years ended on the 31st December 2016 and 2015
(thousand euros)
Share Capital
Share Premium
Other equity instruments
Fair-value reserves
Other Reserves, Retained Income
and Other Comprehensive
Income
Net profit/(loss) of the year attributable
shareholders of the parent company
Equity attributable to shareholders of the parent
company
Non-controlling interests
Total Equity
Balance as at 31st December 2014 (As Published) 326 269 8 796 3 731 ( 11 639) 200 560 ( 138 493) 389 224 48 379 437 603
Other movements recorded directly in equity: Exchange differences - - - - 165 - 165 42 207 Net profit/(loss) of the year - - - - - ( 7 465) ( 7 465) ( 1 332) ( 8 797)Total comprehensive income of the year - - - - 165 ( 7 465) ( 7 300) ( 1 290) ( 8 590)
Balance as at 31st of December 2014 (Restatement) 326 269 8 796 3 731 ( 11 639) 200 725 ( 145 958) 381 924 47 089 429 013 Other movements recorded directly in equity: Changes in fair value, net of taxes - - - ( 280) - - ( 280) ( 537) ( 817) Actuarial gains/ (losses), net of taxes - - - - ( 7 989) - ( 7 989) - ( 7 989) Other comprehensive income of associates - - - - 346 - 346 - 346 Exchange differences - - - - ( 52 352) - ( 52 352) ( 13 697) ( 66 049)Net profit / (loss) of the year - - - - - ( 98 328) ( 98 328) 5 788 ( 92 540)Total comprehensive income of the year - - - ( 280) ( 59 995) ( 98 328) ( 158 603) ( 8 446) ( 167 049)
Share capital increase 100 000 - - - - - 100 000 - 100 000 Reserve establishment - - - - ( 145 958) 145 958 - - - Interest in other equity instruments (see Note 36) - - - - ( 225) - ( 225) - ( 225)Transactions with non-controlling interests (see Note 37) - - - - - - - ( 962) ( 962)
Balance as at 31st of December 2015 (Restatement) 426 269 8 796 3 731 ( 11 919) ( 5 453) ( 98 328) 323 096 37 681 360 777
Other movements recorded directly in equity: Changes in fair value, net of taxes - - - 9 607 - - 9 607 2 012 11 619 Actuarial gains/ (losses), net of taxes - - - - ( 2 626) - ( 2 626) - ( 2 626) Other comprehensive income of associates - - - - ( 721) - ( 721) - ( 721) Exchange differences - - - - ( 1 002) - ( 1 002) 8 453 7 451 Net profit / (loss) of the year - - - - - ( 96 181) ( 96 181) 1 389 ( 94 792)Total comprehensive income of the year - - - 9 607 ( 4 349) ( 96 181) ( 90 923) 11 854 ( 79 069)
Issuance of other capital instruments (see Note 36) - - 80 000 - - - 80 000 - 80 000 Reserve establishment - - - - ( 98 328) 98 328 - - - Interest of other capital instruments (see Note 36) - - - - ( 231) - ( 231) - ( 231)Transactions with non-controlling interests (see Note 37) - - - - ( 3 094) - ( 3 094) ( 7 860) ( 10 954)
Balance as at 31st of December 2016 426 269 8 796 83 731 ( 2 312) ( 111 455) ( 96 181) 308 848 41 675 350 523
The following notes form an integral part of these consolidated financial statements
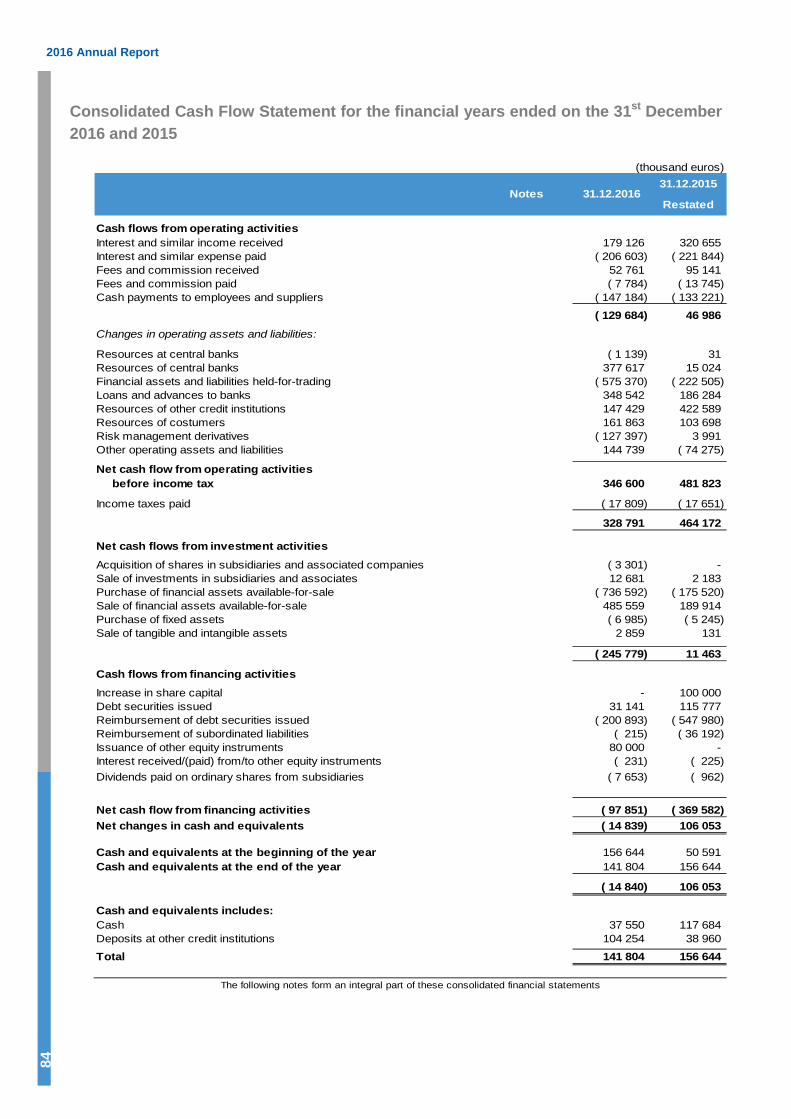
2016 Annual Report 84
Consolidated Cash Flow Statement for the financial years ended on the 31st December 2016 and 2015
(thousand euros)31.12.2015
Restated
Cash flows from operating activities Interest and similar income received 179 126 320 655 Interest and similar expense paid ( 206 603) ( 221 844)Fees and commission received 52 761 95 141 Fees and commission paid ( 7 784) ( 13 745)Cash payments to employees and suppliers ( 147 184) ( 133 221)
( 129 684) 46 986 Changes in operating assets and liabilities:
Resources at central banks ( 1 139) 31 Resources of central banks 377 617 15 024 Financial assets and liabilities held-for-trading ( 575 370) ( 222 505)Loans and advances to banks 348 542 186 284 Resources of other credit institutions 147 429 422 589 Resources of costumers 161 863 103 698 Risk management derivatives ( 127 397) 3 991 Other operating assets and liabilities 144 739 ( 74 275)
Net cash flow from operating activities before income tax 346 600 481 823
Income taxes paid ( 17 809) ( 17 651)
328 791 464 172
Net cash flows from investment activitiesAcquisition of shares in subsidiaries and associated companies ( 3 301) - Sale of investments in subsidiaries and associates 12 681 2 183 Purchase of financial assets available-for-sale ( 736 592) ( 175 520)Sale of financial assets available-for-sale 485 559 189 914 Purchase of fixed assets ( 6 985) ( 5 245)Sale of tangible and intangible assets 2 859 131
( 245 779) 11 463
Cash flows from financing activities Increase in share capital - 100 000Debt securities issued 31 141 115 777Reimbursement of debt securities issued ( 200 893) ( 547 980)Reimbursement of subordinated liabilities ( 215) ( 36 192)Issuance of other equity instruments 80 000 - Interest received/(paid) from/to other equity instruments ( 231) ( 225)Dividends paid on ordinary shares from subsidiaries ( 7 653) ( 962)
Net cash flow from financing activities ( 97 851) ( 369 582)Net changes in cash and equivalents ( 14 839) 106 053
Cash and equivalents at the beginning of the year 156 644 50 591 Cash and equivalents at the end of the year 141 804 156 644
( 14 840) 106 053
Cash and equivalents includes:Cash 37 550 117 684 Deposits at other credit institutions 104 254 38 960
Total 141 804 156 644
The following notes form an integral part of these consolidated financial statements
Notes 31.12.2016
HAITONG BANK, S.A.
85
2. EXPLANATORY NOTES TO THE CONSOLIDATED FINANCIAL STATEMENTS
Haitong Bank, S.A.
NOTE 1 – ACTIVITY AND GROUP STRUCTURE
Haitong Bank, S.A. (Bank or Haitong Bank) is an investment bank based in Portugal, Lisbon, at Rua Alexandre Herculano, n.º 38. The Bank is duly authorised by the Portuguese authorities, central banks and regulators in order to carry out its business in Portugal and in the countries where it operates through international financial branches.
The Institution was established in February 1983 as an Investment Company, as a foreign investment in Portugal under the company name FINC – Sociedade Portuguesa Promotora de Investimentos, S.A.R.L.. In the 1986 financial year, the Company became part of the Grupo Espírito Santo, under the name Espírito Santo – Sociedade de Investimentos, S.A..
In order to widen the scope of its business, the Institution has obtained a license from the Portuguese official bodies for its conversion into an Investment Bank, by means of Ordinance no. 366/92 of November 23rd, published in the Portuguese Official Gazette – Series II – no. 279, of December 3rd. Its business as an Investment Bank started on the 1st of April, 1993, under the company name Banco ESSI, S.A..
In the 2000 financial year, Banco Espírito Santo, S.A acquired the whole of BES Investimento’s share capital in order to reflect all existing synergies between both institutions in its consolidated accounts.
On the 3rd of August, 2014, following the implementation of a resolution measure by the Bank of Portugal, applied to Banco Espirito Santo, S.A., the Bank became held by Novo Banco, S.A..
Haitong Internacional Holdings Limited acquired the whole of BES Investimento’s share capital on September 2015, and the Bank’s company name was thereby changed into Haitong Bank, S.A..
Haitong Bank currently operates through its headquarters in Lisbon, as well as through branches in London, Warsaw and Madrid, and subsidiaries in Brazil, Ireland, United Kingdom, Mexico and United States of America.
Haitong Bank’s financial statements are consolidated by Haitong Internacional Holdings Limited, based in Li Po Chun Chambers, n.º 189, Des Voeux Road Central, in Hong Kong.

2016 Annual Report
86
Group companies where the Bank has a direct or indirect holding greater or equal to 20%, on over which the Bank exercises control or has significant influence, and that were included in the consolidated financial statements, is as follows:
Haitong Bank SA 1983 - Portugal Bank 100% Full Consolidation
Haitong Investment Ireland PLC 1996 1996 Ireland Non-bank finance company 100% Full Consolidation
Lusitania Capital, S.A.P.I. de C.V., SOFOM, E.N.R. 2013 2013 Mexico Non-bank finance company 100% Full Consolidation
MCO2 - Soc. Gestora de Fundos de Investimento Mobiliário, S.A. 2008 2008 Portugal Asset management - investment funds 25% Equity method
Haitong Capital - SCR, S.A. 1988 1996 Portugal Venture capital 100% Full Consolidation
Salgar Investments 2007 2007 Spain Real estate / Non-Bank finance company 25% Equity method
SES Iberia 2004 2004 Spain Asset management - investment funds 50% Full Consolidation
Fundo Espírito Santo IBERIA I 2004 2004 Portugal Venture capital fund 46% Equity method
WindPart, Lda 2013 2013 Portugal Holding company 20% Full Consolidation a)
Haitong (UK) Limited 2010 2010 United Kingdom Holding company 100% Full Consolidation
Haitong Securities (UK) Limited 2000 2010 United Kingdom Brokerage house a) 100% Full Consolidation
Noble Advisory India Private Ltd 2008 2010 India Research services provider 100% Full Consolidation
Clear Info-Analytic Private Ltd 2004 2010 India Research services provider 100% Full Consolidation
Haitong Banco de Investimento do Brasil S.A. 2000 2000 Brazil Investment bank 80% Full Consolidation
FI Multimercado Treasury 2005 2005 Brazil Investment fund 80% Full Consolidation
Haitong do Brasil Participações Ltda 2004 2004 Brazil Asset management 80% Full Consolidation
Haitong Negocios, SA 1996 1999 Brazil Holding company 80% Full Consolidation
Haitong do Brasil DTVM, SA 2009 2010 Brazil Asset management 80% Full Consolidation
Haitong Securities do Brasil S.A. 2000 2000 Brazil Brokerage house 80% Full Consolidation
Haitong Securities USA 2015 2015 U.S.A. Brokerage house 100% Full Consolidation
a) These companies were included in the consolidated balance-sheet by Full Consolidation since the Group is in control of their activities.
Consolidation method
Incorporation date
Acquisition date Headquarters Activity % Economic
interest
In 2013, Haitong Bank started a simplification plan for its group. Several measures were taken within the scope of such process, including the disposal and merger of several holdings, with no significant impact on the accounts. The simplification process continued throughout 2016, and the main changes made to the group’s structure are set forth below.
Subsidiaries
• Although it has been incorporated on the 30th of September, 2015, in January 2016, Haitong Securities USA LLC has been added to the consolidation perimeter of consolidated companies in Haitong Bank, S.A. Haitong Bank, S.A., which fully subscribed the initial paying-up capital of that company, amounting to 300,000 dollars.
• In March 2016, Haitong Bank, S.A. fully subscribed the capital increase of Haitong Securities USA LLC, corresponding to an investment of 10,000 thousand dollars.
• In March 2016, Haitong Bank, S.A. fully subscribed the capital increase of Haitong Securities India Private Limited, corresponding to an investment of 344,748 thousand Indian rupees. Haitong Bank, S.A. subscribed 13,725,289 shares, thereby holding 19,635,252 shares of the company.
• In March 2016, Haitong Bank, S.A. has completed the winding up of its New York branch, having returned the corresponding license to the New York Department of Financial Services, and having started its business through the representative office.
• In May 2016, Haitong Bank, S.A. completed the acquisition of 1,477,491 shares held by the minority shareholder of Haitong Securities India Private Limited, for the aggregate amount of INR 245,795,160.
• In July 2016, Haitong & Company (UK) Limited was dissolved.

HAITONG BANK, S.A.
87
• In September 2016, Haitong Bank, S.A. has been granted authorisation to engage in brokerage activities through its subsidiary, Haitong Securities USA LLC, having thereby closed its representative office in New York.
• In October 2016, Haitong Bank, S.A. fully subscribed the capital increase of Haitong Securities USA LLC, corresponding to an investment of 3,438 thousand dollars.
• In October 2016, the company name of Espirito Santo Investimentos, S.A. was changed to Haitong Negócios, S.A..
• In December 2016, Haitong Bank, S.A. sold the holding in Haitong Securities India Private Limited, of 19,635,252 shares, having received 11,365 thousand dollars.
Associates (see note 26)
• In March 2016, a distribution of capital of Fundo Espírito Santo IBERIA I was carried out, and 1,573 thousand euros have been attributed to Haitong Capital – SCR, S.A..
• In July 2016, a distribution of capital of Fundo Espírito Santo IBERIA I was carried out, and 173 thousand euros have been attributed to Haitong Capital – SCR, S.A..
• In December 2016, Haitong Capital – SCR, S.A. sold 20% of the holding in Coportgest – Companhia Portuguesa de Gestão e Desenvolvimento Imobiliário, S.A., for 1,993 thousand euros.
(thousand euros)
31.12.2016
Acquisition cost
Other Investments (a) Total Sale amount (a)
Other Reimbursements
(b)Total Gains/ (losses)
in sales/disposals
Subsidiaries Haitong Securities USA 275 11 925 12 200 - - - - Haitong Securities India Private Limited 3 301 4 570 7 871 10 853 - 10 853 7 706 WindPart, Lda - - - - 813 813 -
3 576 16 495 20 071 - 10 853 813 11 666 7 706 Associates Coporgest, SA - - - 1 993 - 1 993 933 Fundo Espírito Santo IBERIA I - - - - 1 746 1 746 -
- - - 1 993 1 746 3 739 933 Total 3 576 16 495 20 071 12 846 2 559 15 405 8 639
(a) Share capital increases, supplementary capital and loans to companies.(b) Share capital decreases, supplementary capital and loans to companies.
DisposalsAcquisitions
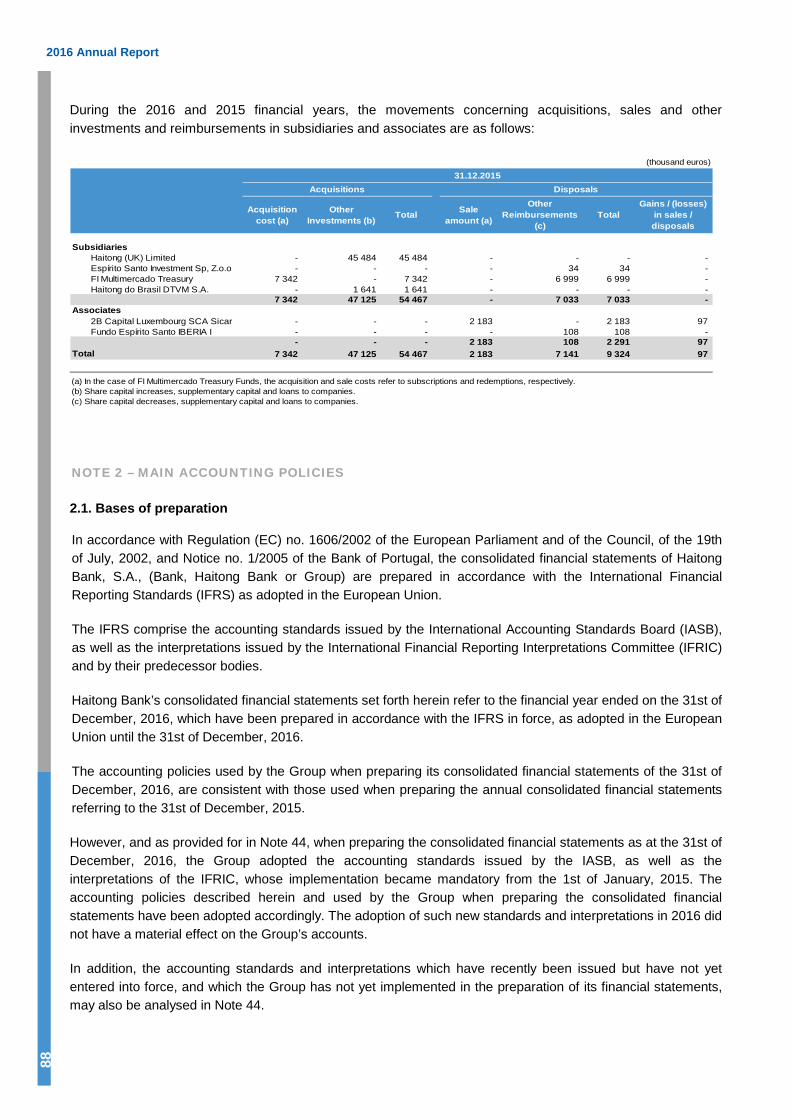
2016 Annual Report
88
During the 2016 and 2015 financial years, the movements concerning acquisitions, sales and other investments and reimbursements in subsidiaries and associates are as follows:
(thousand euros)
31.12.2015
Acquisition cost (a)
Other Investments (b) Total Sale
amount (a)
Other Reimbursements
(c)Total
Gains / (losses)in sales / disposals
Subsidiaries Haitong (UK) Limited - 45 484 45 484 - - - - Espírito Santo Investment Sp, Z.o.o - - - - 34 34 - FI Multimercado Treasury 7 342 - 7 342 - 6 999 6 999 - Haitong do Brasil DTVM S.A. - 1 641 1 641 - - - -
7 342 47 125 54 467 - 7 033 7 033 - Associates 2B Capital Luxembourg SCA Sicar - - - 2 183 - 2 183 97 Fundo Espírito Santo IBERIA I - - - - 108 108 -
- - - 2 183 108 2 291 97 Total 7 342 47 125 54 467 2 183 7 141 9 324 97
(a) In the case of FI Multimercado Treasury Funds, the acquisition and sale costs refer to subscriptions and redemptions, respectively.(b) Share capital increases, supplementary capital and loans to companies.(c) Share capital decreases, supplementary capital and loans to companies.
DisposalsAcquisitions
NOTE 2 – MAIN ACCOUNTING POLICIES
2.1. Bases of preparation
In accordance with Regulation (EC) no. 1606/2002 of the European Parliament and of the Council, of the 19th of July, 2002, and Notice no. 1/2005 of the Bank of Portugal, the consolidated financial statements of Haitong Bank, S.A., (Bank, Haitong Bank or Group) are prepared in accordance with the International Financial Reporting Standards (IFRS) as adopted in the European Union.
The IFRS comprise the accounting standards issued by the International Accounting Standards Board (IASB), as well as the interpretations issued by the International Financial Reporting Interpretations Committee (IFRIC) and by their predecessor bodies.
Haitong Bank’s consolidated financial statements set forth herein refer to the financial year ended on the 31st of December, 2016, which have been prepared in accordance with the IFRS in force, as adopted in the European Union until the 31st of December, 2016.
The accounting policies used by the Group when preparing its consolidated financial statements of the 31st of December, 2016, are consistent with those used when preparing the annual consolidated financial statements referring to the 31st of December, 2015.
However, and as provided for in Note 44, when preparing the consolidated financial statements as at the 31st of December, 2016, the Group adopted the accounting standards issued by the IASB, as well as the interpretations of the IFRIC, whose implementation became mandatory from the 1st of January, 2015. The accounting policies described herein and used by the Group when preparing the consolidated financial statements have been adopted accordingly. The adoption of such new standards and interpretations in 2016 did not have a material effect on the Group’s accounts.
In addition, the accounting standards and interpretations which have recently been issued but have not yet entered into force, and which the Group has not yet implemented in the preparation of its financial statements, may also be analysed in Note 44.
HAITONG BANK, S.A.
89
The consolidated financial statements are denominated in thousands of euros, rounded to the nearest thousand, and have been prepared in accordance with the historical cost principle, with the exception of the assets and liabilities accounted for at fair value, such as financial derivatives, financial assets and liabilities at fair value through profit and loss and available-for-sale financial assets.
The preparation of financial statements in accordance with the IFRS requires the Group to make judgements and estimates, as well as to use assumptions affecting the implementation of the accounting policies and the amounts corresponding to income, expenses, assets and liabilities. Any changes to such assumptions, or any difference thereof comparing to reality may have an impact on the current estimates and judgements. The areas involving a higher degree of judgement or complexity, or in which significant assumptions and estimates are used when preparing the consolidated financial statements, are analysed in Note 3.
The consolidated financial statements herein have been approved in the Board of Directors meeting held on the 20th of March 2017.
2.2 Basis of consolidation
The consolidated financial statements set forth herein reflect the assets, liabilities, income and expenses of Haitong Bank and its subsidiaries (Group or Haitong Bank Group), and the profit or loss attributable to the Group concerning the financial holdings in associates.
The accounting policies have been consistently implemented by all the Group companies in the periods covered by these consolidated financial statements.
Subsidiaries
Subsidiaries are entities (including investment funds) controlled by the Group. The Group controls an entity when exposed or entitled to the variability in the returns resulting from its involvement with such entity, and may get hold of such returns through its power over the relevant business of such entity (de facto control). The subsidiaries’ financial statements are comprised in the consolidated financial statements from the date in which the Group acquires control, until the date when such control ceases to exist.
The accumulated losses of a subsidiary are attributed to non-controlling interests in the proportions held, which could imply the recognition of negative non-controlling interests.
In a step acquisition transaction resulting in the acquisition of control, any previous minority holding is reassessed at fair value against income statement when calculating goodwill. Upon a partial sale resulting in the loss of control over a subsidiary, any remaining minority holding is reassessed at fair value on the date of the sale, and the profit or loss resulting from such reassessment is accounted for in the income statement.
Associates
Associates are all companies over which the Group holds the right to exercise significant influence, namely over its financial and operating policies, but which the Group does not control. It is normally assumed that the Group has significant influence when it holds the power of exercising over 20% of the voting rights of the associate. However, even when the Group’s voting rights are below 20%, it may exercise significant influence by participating in the management of the associate or in the composition of the Administration bodies with executive powers.
Investments in associates are accounted for in the consolidated financial statements of the Bank through the equity method, from the moment when the Group acquires significant influence until the moment it ceases to exist. The statement of financial positions value of investments in associates comprises the amount of the

2016 Annual Report
90
corresponding goodwill as determined in the acquisitions, and is shown net of possible impairment losses.
In a step acquisition transaction resulting in the acquisition of significant influence, any previously held stake in that entity is reassessed at fair value through the income statement upon the first implementation of the equity method.
When the amount of the accumulated losses incurred by an associate and attributable to the Group is equal to or exceeds the book value of the holding and of any other medium and long term interests in such associate, the equity method is interrupted, except if the Group is legally or constructively obliged to recognise such losses, or if the Group has made payments on behalf of the associate.
The gains or losses incurred in the sale of share capital in associates are accounted for against income statement, even if such sale does not result in the loss of significant influence.
Goodwill
The goodwill resulting from the acquisitions carried out until the 1st of January, 2004, is deducted from the shareholders’ equity, as per the option granted by IFRS 1, adopted by the Group on the date of transition to the IFRS.
Business combinations occurred from the 1st of January, 2004, to the 31st of December, 2009 have been accounted for by the Group using the purchase method. The acquisition cost includes the fair values – determined as at the date of purchase – of the assets and equity instruments transferred, and of the liabilities assumed or incurred, plus costs directly attributable to the acquisition.
The goodwill represented the difference between the so determined cost of acquisition of the holding and the fair value attributable to the assets, liabilities and acquired contingent liabilities.
From the 1st of January, 2010, and as per IFRS 3 – Business Combinations, the Group calculates goodwill as the difference between the fair value of the cost of acquisition of the holding, including the fair value of any previous minority holding, and the fair value attributable to the acquired assets and assumed liabilities. Fair values are determined on the date of acquisition. Costs directly attributable to the acquisition are recognised upon the acquisition in costs of the financial year.
On the date of acquisition, the Group recognises as non-controlling interests the amounts corresponding to the proportion of fair value of the acquired assets and assumed liabilities without the respective goodwill portion. Therefore, the goodwill recognised in the consolidated financial statements herein corresponds solely to the portion attributable to the Bank’s shareholders.
In accordance with IFRS 3 – Business Combinations, the positive goodwill is accounted for as an asset at its cost and is not amortised. In the case of investments in associates, goodwill is comprised in the corresponding statement of financial positions value, determined based on the equity method. Negative goodwill is directly recognised in income statement on the period of the acquisition.
The recoverable amount of the goodwill accounted for as an asset is reviewed on an annual basis, regardless of whether there is evidence of impairment. Any losses determined by impairment are recognised in the income statement. The recoverable amount is the larger amount out of the value in use and the market value deducted from selling costs. The value in use is determined by discounting future estimated cash flows, based on a rate reflecting market conditions, time value and risks associated with the business.
Transactions with non-controlling interests
The acquisition of non-controlling interests which do not result in a change in control over a subsidiary is
HAITONG BANK, S.A.
91
accounted for as a transaction with shareholders and, therefore, no additional goodwill resulting arising from such transaction shall be recognised. The difference between the acquisition cost and the statement of financial positions value of the acquired non-controlling interests is directly recognised in reserves. Similarly, gains or losses arising from disposals of non-controlling interests which do not result in the loss of control over a subsidiary are always recognised against reserves.
The gains or losses arising from the dilution or sale of part of a financial holding in a subsidiary, with the loss of control, are recognised by the Group in the income statement.
Translation of financial statements in foreign currency
The financial statements of each of the Group’s subsidiaries and associates are prepared using their functional currency, which is defined as the currency of the economy in which such subsidiaries and associates operate. The Group’s consolidated financial statements are prepared in euros, which is Haitong Bank's functional currency.
The Group’s financial statements whose functional currency is other than euro are translated into euros, in accordance with the following criteria:
• Assets and liabilities are converted at the exchange rate as at the date of the statement of financial positions;
• Income and expenses are converted based on the application of exchange rates approximated to the real rates as at the date of each transaction;
• Exchange rate differences determined between the conversion amount in euros of the financial position at the beginning of the year and its amount converted at the exchange rate in force as at the date of statement of financial position to which the consolidated accounts relate are accounted for against reserves. Similarly, regarding the subsidiaries’ and associated companies’ results, the exchange differences arising from the translation of income and expenses at the rates ruling at the dates of the transactions and that determined at the statement of financial position date are recorded in reserves. As at the date of the company’s divestiture, such differences are recognised in income statement as an integral part of the gain or loss arising from the divestiture.
Balances and transactions eliminated on consolidation
The balances and transactions between companies of the Group, including any unrealised gains or losses arising from intra-group transactions, are eliminated on the consolidation process, except for the cases where the unrealised losses reveal an impairment which should be recognised in the consolidated accounts.
Unrealised gains arising from transactions with associates are eliminated proportionally to the Group’s holding in such associates. Unrealised losses are also eliminated, but only in the cases where they do not reveal an impairment.
2.3. Foreign currency transactions
Foreign currency transactions are converted at the exchange rate in force as at the date of the transaction. The monetary assets and liabilities denominated in foreign currency are converted into Euros at the exchange rate in force at the date of the statement of financial position. The exchange rate differences arising from such conversion are recognised in income statement.
Non-monetary assets and liabilities accounted for at historical cost, denominated in foreign currency, are converted at the exchange rate as at the transaction date. Non-monetary assets and liabilities denominated in
2016 Annual Report
92
foreign currency accounted for at fair value are converted at the exchange rate in force as at the date of determination of the fair value. The exchange rate differences resulting thereof are recognised in profit and loss, except for the differences concerning shares classified as available-for-sale financial assets, which shall be accounted for in other comprehensive income.
2.4. Financial derivatives
Classification
The Group classifies as derivatives for risk management the derivatives acquired with the purpose of economically hedge certain assets and liabilities designated at fair value through profit or loss, but which have not been classified as hedging derivatives. All remaining derivatives are classified as derivatives held for trading.
Recognition and measurement
The financial derivatives are recognised on their trade date, at their fair value. Subsequently, the fair value of the financial derivatives is reassessed on a regular basis, and the gains or losses resulting from such reassessment are directly accounted for in income statement of the financial year, except for hedging derivatives.
The fair value of the financial derivatives corresponds to their quoted market price, when available, or is determined based on valuation techniques, including discounted cash flows models and options pricing models, as appropriate.
Derivatives traded in organised markets, such as futures and a few options contracts, are accounted for as being held-for-trading derivatives, which are reassessed against income statement. Considering the fact that the variations in fair value of such derivatives are settled through margin accounts held by the Group, such derivatives evidence a null statement of financial position value. The margin accounts are accounted for in Other assets (see Note 27) and include the minimum required collateral regarding open interests.
Embedded derivatives
The derivatives embedded in other financial instruments are treated separately when their economic features and their risks are not linked to the main instrument, and the main instrument is not accounted for at fair value through profit and loss.
Such embedded derivatives are measured at fair value with the changes in fair value being recognised in the income statement.
2.5. Loans and advances to customers
Loans and advances to customers include loans originated by the Group, whose purpose is not to be sold in the short term, being recognised on the date the cash is advanced to customers.
Loans and advances to customers are unrecognised from the statement of financial position when (i) the Group’s contractual rights concerning their corresponding cash flows have terminated, (ii) the Group has substantially transferred all risks and benefits linked to the holding thereof, or (iii) the control over the assets is transferred, notwithstanding the Group having partly, but not wholly, retained the risks and benefits linked to the holding thereof.
Loans and advances to customers are initially recognised at their fair value plus transaction costs, and are subsequently measured at amortised cost based on the effective interest rate method, thereby being deducted
HAITONG BANK, S.A.
93
from impairment losses.
Impairment
The Group regularly assesses whether there is objective evidence of impairment within its loan portfolio. The identified impairment losses are accounted for in the income statement, and are subsequently reversed trough income statement, if in a later period the impairment amount decreases.
A loan granted to customers, or a granted loan portfolio, which is defined as a set of loans with similar risk characteristics, is impaired when: (i) there is objective evidence of impairment arising out of one or more events occurring after its initial recognition and (ii) once such event (or events) has an impact on the recoverable amount of the future cash flows of such loan, or loan portfolio, that can be reliably estimated.
Firstly, the Group assesses whether there is objective evidence of impairment for each loan individually. In order to carry out such assessment, and when identifying impaired loans on an individual basis, the Group amongst others, the following factors:
● the aggregate exposure to the customer and the existence of non-performing loans;
● the economic and financial feasibility of the customer’s business and its ability to create the means in order to meet future debt services;
● the existence of privileged creditors;
● the existence, nature and estimated value of collaterals;
● the customer’s indebtedness towards the financial sector;
● the amount and timing of expected recoveries.
If there is no objective evidence of impairment of a certain loan in individual terms, such loan shall be included in a group of loans with similar risk characteristics (loan portfolio), which is assessed collectively – impairment analysis on a collective basis. Loans assessed individually and for which an impairment loss is determined are not included in the collective assessment.
If an impairment loss is determined on individual terms, the amount of the loss to be recognised shall correspond to the difference between the loan’s carrying amount and the net present value of future estimated cash flows (considering the recovery period), discounted at the effective interest rate of the contract. The carrying amount of loans and advances to costumers is presented net of impairment in the statement of financial position. For a variable interest rate loan, the discount rate to be used for determining the corresponding impairment loss is the current effective interest rate, which is established based on the rules of each contract.
The calculation of the present value of future estimated cash flows of a collateralised loan reflects the cash flows which may arise out of the recovery and sale of collateral, less costs inherent to its recovery and sale.
When the Group considers that a certain loan is unrecoverable, and a 100% impairment loss has been recognised, such loan is written off from assets.
2.6. Other financial assets
Classification
The Group classifies its other financial assets upon their acquisition by taking into consideration their corresponding purpose, according to the following categories:
2016 Annual Report
94
● Financial assets at fair value through profit or loss
This category includes: (i) financial assets held-for-trading, which are assets acquired with the main purpose of being traded in the short term or which are held as an integral part of an assets portfolio, usually of securities, concerning which there is evidence of recent transactions leading to short term gains, and (ii) financial assets designated upon their initial recognition at fair value with variations recognised in income statement.
The Group designates certain financial assets – in their initial recognition – at fair value through profit or loss when:
● such financial assets are internally generated, assessed and analysed based on their fair value;
● derivatives transactions are contractually agreed with the purpose of economically hedge such assets, thereby assuring consistency in the valuation of assets and derivatives (accounting mismatch); or
● such financial assets contain embedded derivatives.
Structured products acquired by the Group, which are financial instruments containing one or more embedded derivatives, follow the valuation method of the financial assets at fair value through profit or loss, due to the fact that such structured products always fall within one out of the three aforementioned conditions.
● Available-for-sale financial assets
Available-for-sale financial assets are non-derivative financial assets which: (i) the Group intends to keep indefinitely, (ii) are designated as available-for-sale at the time of their initial recognition, or (iii) do not fall within the aforementioned categories.
Initial recognition and measurement, and derecognition
Acquisitions and disposals of: (i) financial assets at fair value through profit or loss, (ii) held-to-maturity investments and (iii) available-for-sale financial assets, are recognised on their trade date, i.e., on the date when the group undertakes to acquire or dispose of the asset.
Financial assets are initially recognised at their fair value plus transaction costs, except for financial assets at fair value though profit or loss, in which case such transaction costs are directly recognised in income statement.
Such assets are derecognised when (i) the Group’s contractual rights to receive their corresponding cash flows have terminated, (ii) the Group has substantially transferred all risks and benefits of ownership, or (iii) the control over the assets is transferred, notwithstanding the Group having partly, but not wholly, retained the risks and benefits linked to the ownership.
Subsequent measurement
Following their initial recognition, the financial assets at fair value through profit and loss are measured at fair value, and the changes thereof are recognised in income statement.
Available-for-sale financial assets are also accounted for at fair value, however, their corresponding changes are recognised in other comprehensive income, until the assets are derecognised, or an impairment loss is identified, in which case the accumulated amount of the potential gains and losses accounted for in other comprehensive income is transferred to income statement. The exchange rate movements linked to such assets are also recognised in other comprehensive income, in the case of shares and other equity instruments, and in income statement, in the case of debt instruments. Interest – calculated at the effective interest rate –
HAITONG BANK, S.A.
95
and dividends are recognised in the income statement.
The fair value of quoted financial assets is their bid-price. In the absence of a quotation, the Group calculates fair value by using (i) valuation techniques, such as the use of transaction prices which are recent, similar and executed in market conditions, discounted cash flows techniques and customised options pricing models in order to reflect the features and circumstances of the instrument, and (ii) valuation assumptions based on market information.
Impairment
The Group regularly assesses whether there is objective evidence that a financial asset, or group thereof, shows indications of impairment. For the financial assets presenting impairment indicators, the respective recoverable amount is determined and the impairment losses are accounted for against income statement.
A financial asset, or group thereof, is impaired when there is objective evidence of impairment arising out of one or more events occurring after its initial recognition, such as: (i) in the case of shares and other equity instruments, a significant or prolonged decline in their market value, below the acquisition cost, (ii) in the case of debt securities, when such event (or events) has an impact on the estimated amount of the future cash flows of the financial asset, or group thereof, which may reasonably be estimated, and (iii) devaluation of 30% or consecutive devaluation during one year.
When there is evidence of impairment in the available-for-sale financial assets, the potential loss accumulated in other comprehensive income corresponds to the difference between the acquisition cost and the fair value, less any impairment loss in the financial asset previously recognised in income statement, is transferred to income statement. If the amount of the impairment loss decreases in a subsequent period, the previously recognised impairment loss is reversed against income statement of the financial year until recovery of the acquisition cost if the increase is objectively linked to an event occurring after the recognition of the impairment loss, except for shares or other equity instruments in which the subsequent gains are recognised in other comprehensive income.
2.7. Assets sold with repurchase agreement and securities lending
Securities sold subject to repurchase agreement (repos) at a fixed price or at a price equal to that of the sale plus interest inherent to the maturity of the transaction are not derecognised from the statement of financial position. The corresponding liability is accounted for in amounts due to banks or to customers, as appropriate, as appropriate. The difference between the sale value and the repurchase value is treated as interest and is deferred while the agreement is in force, using the effective interest rate method.
Securities bought with a resale agreement (reverse repos) at a fixed price or at a price equal to that of the sale plus interest inherent to the maturity of the transaction are not recognised in the statement of financial position, and the purchase value is accounted for as loans and advances to banks or customers, as appropriate, as appropriate. The difference between the purchase value and the resale value is treated as interest and is deferred while the agreement is in force, using the effective interest rate method.
Securities assigned through loan agreements are not derecognised from the statement of financial positions, being classified and measured in accordance with the accounting policy referred to in Note 2.6. Securities received through loan agreements are not recognised in the statement of financial positions.
2.8. Financial liabilities
An instrument is classified as a financial liability when there is a contractual obligation for its settlement to be made in cash or through any other financial asset, regardless of its legal form.
2016 Annual Report
96
Non-derivative financial liabilities include resources of credit institutions and customers, loans, debt securities, other subordinated liabilities and short selling.
Such financial liabilities are recognised (i) initially at their fair value less incurred transaction costs and (ii) subsequently at amortised cost, based on the effective interest rate method, except for short selling and financial liabilities designated at fair value through profit and loss, which are accounted for at fair value.
The Group designates certain financial liabilities – in their initial recognition – at fair value through profit or loss when:
• derivatives transactions are contractually agreed with the purpose of economically hedge such liabilities, thereby assuring consistency in the valuation of liabilities and derivatives (accounting mismatch); or
• such financial liabilities contain embedded derivatives.
Structured products issued by the Group follow are measured at fair value through profit or loss, due to the fact that such structured products always fall within one out of the aforementioned conditions.
The fair value of quoted financial liabilities is their quoted value. In the absence of a quotation, the Group calculates fair value by using valuation techniques considering assumptions based on market information, including in determining the issuer´s own credit risk.
If the Group repurchases an issued debt, it shall be derecognised from the consolidated statement of financial positions, and the difference between the liability’s carry amount and the purchase value is accounted for in income statement.
2.9. Financial guarantees
Financial guarantees are contracts which require its issuing entity to make payments to reimburse the holder for incurred losses resulting from breaches of the contractual terms set forth in debt instruments, namely the payment of the corresponding capital and/or interest.
Issued financial guarantees are initially recognised at their fair value. Subsequently, such guarantees are measured at the higher of (i) the initially recognised fair value and (ii) the amount of any financial obligation arising as a result of guarantee contracts, measured at the statement of financial positions date. Any change in the amount of the liability relating to guarantees is taken to the income statement
Financial guarantees issued by the Group usually have a set maturity and a periodic fee charged in advance, which varies in accordance with the counterparty risk, amount and maturity date of the contract. On that basis, the guarantees’ fair value as at the date of initial recognition thereof is approximately zero, by considering that the agreed conditions are market conditions. Therefore, the amount recognised at the contract date is equal to the amount of the initial received fee, which is recognised in income statement for the period thereof. Subsequent fees are recognised in income statement for the period to which they relate.
2.10. Equity instruments
An instrument is classified as an equity instrument when there is no contractual obligation providing for its settlement to be made in cash or by the delivery of another financial asset, regardless of its legal form, showing a residual interest in the assets of an entity following deduction of all its liabilities.
Costs directly attributable to the issuing of equity instruments are accounted for under equity, as a deduction to the issuing amount. Amounts paid and received by the purchase and sale of equity instruments are accounted for under equity, net of transaction costs.
HAITONG BANK, S.A.
97
When declared, distributions to holders of an equity instrument are deducted directly from equity as dividends.
2.11. Offsetting financial instruments
Financial assets and liabilities are presented in statement of financial position at net value when there is a legal possibility of offsetting the recognised amounts and there is an intent of settlement thereof by their net value, or to simultaneously realise the asset and settle the liability.
2.12. Non-current assets held-for-sale
Non-current assets or disposal groups (group of assets to be disposed together in a single transaction, and directly associated liabilities which include at least one non-current asset) are classified as held-for-sale when their statement of financial positions value is recovered mainly through a sale transaction (including those acquired exclusively with the purpose to sell), the assets or disposal groups are available for immediate sale and the sale is highly likely to occur.
Immediately prior to the initial classification of the asset (or disposal group) as held-for-sale, the measurement of non-current assets (or of all the Group’s assets and liabilities) is carried out in accordance with the relevant IFRS in force. Subsequently, such assets or disposal groups are re-measured at the lower of their carrying value and fair value less costs to sell.
2.13. Other tangible assets
The Group's other tangible assets are measured at cost, less their corresponding accumulated amortisations and impairment losses. The cost includes expenses directly attributable to the acquisition of the assets.
The subsequent costs with other tangible assets are only recognised when it is probable that future economic benefits associated with them will flow to the Group. All repair and maintenance costs are charged to the income statement during the period in which they are incurred, on the accrual basis.
Land is not amortised. The amortisations of other tangible assets are calculated based on the straight-line method, at the following amortisation rates reflecting the expected useful life of the goods.
Number of YearsOwned Real Estate 35 to 50Improvements in leasehold property 5 to 10Computer Equipment 3 to 8Indoor Installations 5 to 12Furniture and supplies 3 to 10Safety Equipment 4 to 10Tools and Machines 4 to 10Transportation Material 4 to 5Other Equipment 5
As defined in IAS 36, when there is evidence that an asset may be impaired, its recoverable amount is required to be estimated, and an impairment loss shall be recognised whenever the net value of an asset exceeds its recoverable amount. Any impairment losses are recognised in the income statement.
The recoverable amount is determined as the highest amount between its net selling price and its value in use, the latter being calculated based on the net present value of the estimated future cash flows expected to be obtained from the continued use of the asset and of its disposal at the end of its useful life.

2016 Annual Report
98
2.14. Intangible assets
Costs incurred with the purchase, production and development of software are capitalised, as well as additional expenses required for its deployment, which are borne by the Group. Such costs are amortised on a linear basis throughout the expected useful life of such assets, which usually ranges from 3 to 8 years.
Costs directly related to the development of software applications are recognised and accounted for as intangible assets if they are expected to create future economic benefits beyond one financial year. Such costs include employee expenses, such employees being from the companies of the Group which are specialised in Information Technology, while they are directly associated with the concerned projects.
All remaining charges associated with Information Technology services are recognised as costs when incurred.
2.15. Leases
The Group classifies the leasing transactions as financial or operating leases, depending on their substance rather than its legal form, in compliance with the criteria set forth in IAS 17 — Leases. The transactions classified as financial leases are those where the risks and benefits inherent to the ownership of an asset are transferred to the lessee. All remaining leasing transactions are classified as operating leases.
Operating leases
Payments made by the Group under operating lease agreements are accounted for in costs of the relevant periods.
Financial leases
The financial lease agreements are accounted for at the date such agreements take effect, in assets and in liabilities, at the acquisition cost of the leased property, which is equivalent to the net present value of the payable lease rents.
Rents are comprised of (i) the financial expense recognised in income statement and (ii) the financial amortisation of capital, deducted from the liability. Financial expenses are recognised as expenses throughout the lease period, in order to produce a constant periodic interest rate on the remaining balance of the liability in each period.
● As a lessor
Financial lease agreements are accounted for in the statement of financial position as loans granted at an amount equivalent to the net investment carried out in the leased goods.
Interest included in instalments charged to customers are accounted for as income, whereas capital amortisations – which are also included in rents – are deducted at the value of the loans granted. The recognition of interest reflects a periodic and constant rate of return over the remaining net investment of the lessor.
2.16. Employee benefits
Pensions
As a result of the signing of the Collective Labour Agreement (CLA), the Bank and remaining companies of the Group have established pension funds and other mechanisms in order to ensure coverage of the responsibilities taken on towards old-age retirement pensions, disability pensions, survivor’s pensions and healthcare benefits.
HAITONG BANK, S.A.
99
From the 1st of January, 2011, bank employees have been included in the Social Security’s General Scheme, which is now able to ensure protection of employees in the events of maternity, paternity, adoption and old-age, and the banks shall continue to take responsibility for protection in sickness, disability, survival and death (Decree-Law no. 1-A/2011, of the 3rd of January).
The contribution rate is 26.6%, out of which 23.6% is to be borne by the employer and 3% by the employees, thereby replacing the Caixa de Abono de Família dos Empregados Bancários (CAFEB) [Family Allowance Fund of Bank Employees], which was dissolved under the aforementioned Decree-Law. As a result of such change, the entitlement of active employees to the pension is now covered under the conditions laid down in the Social Security’s General Scheme, by taking into account the period of service provided from the 1st of January, 2011, until the retirement age, and now the banks shall bear the necessary differential for the pension, guaranteed under the Collective Labour Agreement.
Following the Government’s approval of Decree-Law no. 127/2011, published on the 31st of December, a Tripartite Agreement was entered into between the Government, the Portuguese Banking Association and Unions of the bank employees on the transfer to Social Security of the responsibilities relating to pensions in payment of retired persons and pensioners, as at the 31st of December, 2011.
Such decree established that the responsibilities to be transferred were the pensions in payment as at the 31st of December, 2011, at constant values (0% discount rate), in the component provided for in the Instrumento de Regulação Colectiva de Trabalho (‘IRCT’) [Collective Labour Regulation Instrument] for retired persons and pensioners. The responsibilities regarding pension updates, supplementary benefits, contributions to SAMS [Social and Medical Assistance Services] on retirement and survivor’s pensions, death allowance and survivor's pension remained assigned to the Institutions.
Coverage of responsibilities is ensured by means of pension funds managed by GNB – Sociedade Gestora de Fundos de Pensões, S.A..
Existing pension plans in the Group are defined benefit plans, since they define the criteria for determining the amount of the pension which an employee will be granted during retirement, which usually depend on one or more factors such as age, years of service and reward.
In 2012, the Group retrospectively changed its accounting policy of actuarial gains and losses recognition, by adjusting the opening statement of financial positions and comparative values, having begun to account for such values as provided for in paragraph 93A of IAS 19 ‘Employee benefits’, with a deduction to equity in the ‘other comprehensive income’ heading.
The Group’s responsibilities regarding retirement pensions are calculated on an annual basis, on the 31st of December of each year, for each plan individually, using the Projected Unit Credit Method. Such responsibilities are subject to annual review by independent actuaries.
The discount rate used in this calculation is determined based on the market rates associated with the issuing of high-quality companies bonds, denominated in the currency in which the benefits shall be paid and with a maturity corresponding to the end date of the plan’s obligations.
The interest income/costs with the pensions plan is calculated by the Group by multiplying the asset/responsibility with retirement pensions (responsibilities less fair value of the fund’s assets) by the discount rate used for determining the aforementioned responsibilities with retirement pensions. On that basis, the net interest income/costs includes interest cost associated with the responsibilities with retirement pensions and the expected return of the fund’s assets, both measured based on the discount rate used in the calculation of responsibilities.

2016 Annual Report
100
Actuarial gains and losses determined on an annual basis, arising out of (i) the differences between the actuarial and financial assumptions used and the effectively determined values (gains and losses from experience) and (îi) of the changes in actuarial assumptions, are recognised against equity in the 'other comprehensive income' heading.
For each period, and in the income statement, the Group recognises as cost a net aggregate amount, which includes (i) the current service cost, (ii) the interest cost, (iii) the expected return of the fund’s assets, (iv) the effect of early retirements, and (v) the effects of any settlement or curtailment occurred during the period. Charges in respect of early retirements correspond to the increase in responsibility due to the fact that such retirement occurs before the employee reaches 65 years of age.
The Group makes payments to the funds in order to ensure their solvency, whose minimum levels are laid down by the Bank of Portugal as follows: (i) full financing at the end of each financial year of the actuarial responsibilities for pensions in payment and (ii) 95% minimum financing of the actuarial value of responsibilities for past services provided by active personnel.
For each plan, and on an annual basis, the Group assesses the recoverability of the possible excess of the fund in relation to the responsibilities with retirement pensions, on the basis of the expectation of a reduction in future required contributions.
Health-care benefits
The Group ensures medical assistance to bank employees by means of a Social and Medical Assistance Service. The Social and Medical Assistance Service – SAMS is an autonomous entity managed by its corresponding Union.
The recipients of SAMS are provided with services and/or allowances for expenses within the scope of medical assistance, auxiliary diagnostic means, drugs, hospital admissions and surgeries, according to its available funds and internal regulation.
The Group is required to pay contributions to SAMS amounting to 6.50% of the total effective remuneration of active employees, including, but not limited to, the holiday subsidy and Christmas subsidy.
The calculation and accounting of the Group’s obligations with healthcare benefits attributable to employees in retirement age are performed in a manner similar to that of responsibilities with pensions. Such benefits are covered by the Pensions Fund, which now comprises all responsibilities with pensions and healthcare benefits.
Long-term service bonuses
Under the Collective Labour Agreement of the Banking Sector, the Haitong Bank Group has undertaken to pay to their employees – when they reach 15, 25 and 30 years of service to the Group – long-term service bonuses respectively amounting to one, two or three times the monthly salary received as at the payment date of such bonuses.
At the date of early retirement due to disability or presumed disability, employees have the right to a long-term service bonus proportional to that which they would receive if they were to remain in service until meeting the next bonus level.
Long-term service bonuses are accounted for by the Group in accordance with IAS 19, as other long-term employee benefits.
The amount of the Group’s responsibilities with such long-term service bonuses is calculated on an annual basis by the Group, by taking into account the Projected Unit Credit Method. The used actuarial assumptions
HAITONG BANK, S.A.
101
are based on prospects of future salary increases and mortality tables. The discount rate used in this calculation was determined based on the same methodology used for retirement pensions.
In each period, the increase in responsibility with long-term service bonuses, including actuarial gains and losses and past services costs, is recognised in income statement.
New Collective Labour Agreement
Until June 2016, pursuant to the Collective Labour Agreement – CLA of the banking sector, entered into by the various financial institutions, the payment of a long-term service bonus was due on the month the Employees (of the domestic activity) reached 15, 25 and 30 years of good and effective service in the banking sector, respectively amounting to one, two or three months of their effective monthly remuneration (on the year the bonus was granted).
On the 14th of June, 2016, a new CLA was entered into with the unions of the aforementioned sector. It was published in the Boletim do Trabalho e do Emprego [Bulletin of Labour and Employment] on the 8th of August, 2016, having taken effect on the following day.
With the entry into force of the new CLA, the long-term service bonus has been eliminated. However, the new CLA provides for the payment of the proportion of the long-term service bonus for the ongoing anniversary regarding 15, 25 or 30 years of bank seniority and corresponding to the years of good and effective service in the banking sector as at the date of the new CLA’s entry into force. The new CLA provides for the payment of an end-of-career bonus which is 1.5 times the amount of the effective monthly remuneration of the Employee upon termination of the employment contract due to retirement.
The new CLA shall not amend the pension’s scheme and the supplementary health scheme (SAMS) applicable to employees and retired employees of the banking sector, although it has set forth new financing rules of SAMS, to be borne by the credit institutions. With such amendments, the value of charges relating to SAMS concerning retired employees and pensioners will shift, from a percentage of the pension amount to a fixed amount per capita, by type of recipient (retired person or survivor’s pensioner).
With the new CLA, mandatory promotions due to long-term service have been eliminated, therefore only remaining the following promotion for the employees who have been promoted up to the 31st of December, 2014.
Variable remuneration paid to employees
In accordance with IAS 19 - Employee benefits, variable remuneration (profit sharing, bonuses and others) granted to employees and, possibly, to executive members of administration bodies, is accounted for in profit or loss of its respective financial year.
2.17. Income taxes
Income taxes comprise current and deferred taxes. Income taxes are recognised in income statement, unless when relating to items not directly recognised in equity, in which case they are also accounted for against equity. Taxes recognised in equity, as a result of the reassessment of available-for-sale assets and cash flow hedging derivatives, are subsequently recognised in income statement when the gains and losses which were in their origin are recognised in income statement.
Current taxes are those expected to be paid based on the taxable income which is calculated in accordance with the existing tax rules and by using the tax rate enacted or substantially enacted in each jurisdiction.
Deferred taxes are calculated in accordance with the liability method based on the statement of financial
2016 Annual Report
102
positions, on the temporary differences between the carry amount of assets and liabilities and their tax base, by using the tax rates which have been enacted or substantially enacted on the date of the statement of financial position in each jurisdiction and which are expected to be applied once the temporary differences are reversed.
Deferred tax liabilities are recognised for all taxable temporary differences, except for goodwill not deductible for tax purposes, of the differences arising out of the initial recognition of assets and liabilities which affect neither accounting profit nor taxable profit, and of differences relating to investments in subsidiaries insofar as it is not likely that they reverse in the future. Deferred tax assets are only recognised insofar as it is expected that there will be taxable profit in the future which will absorb the tax losses carried forward and the deductible temporary differences.
The Group offsets assets and liabilities by deferred taxes for each subsidiary, every time (i) the income tax of each subsidiary to be paid to the Tax Authorities is determined on a net basis, i.e., offsetting current asset and liability taxes, and (ii) taxes are collected by the same Tax Authority over the same tax entity. This offset is, therefore, performed at the level of each subsidiary, with the deferred tax asset presented in the consolidated statement of financial position corresponding to the sum of the subsidiaries’ amounts which present net deferred tax assets and the deferred tax liability presented in the consolidated statement of financial position corresponding to the sum of the subsidiaries’ amounts which present net deferred tax liabilities.
2.18. Provisions
Provisions are recognised when (i) the Group has a current, legal or constructive obligation, (ii) it is likely that its payment will be required and (iii) when the amount of such obligation may be estimated in a reliable manner.
When the effect of the passage of time (discounting) is material, the provision corresponds to the net present value of the expected future payments, discounted at an appropriate rate considering the risk associated with the obligation. In these cases, the increase in the provision due to the passage of time is recognised in financial expenses.
If it is not possible for payment to be required, it is a contingent liability. Contingent liabilities are only subject to disclosure, unless the likelihood of their realization is remote. Provisions for restructuring are recognised once the Group approves a formal and detailed restructuring plan, and such restructuring has been commenced or publically announced on the reference date of the financial statements.
A provision for onerous contracts is recognised when the expected benefits of a formal contract are lower than the costs that the Group will inevitably incur in order to meet the obligations arising therefrom. This provision is measured based on the current lowest value between the contract termination costs or the net estimated costs of continuing the contract.
2.19. Recognition of interest income and expense
Interest income and expense is recognised in the income statement under interest and similar income and interest expense and similar charges for all financial instruments measured at amortised cost and for all available-for-sale financial assets, using the effective interest rate method. Interest arising on financial assets and liabilities at fair value through profit or loss is also included under interest and similar income or interest expense and similar charges, as appropriate.
The effective interest rate is the rate which exactly discounts estimated future payments or receipts throughout the expected life of the financial instrument or, where appropriate, during a shorter period, for the net carrying amount of the financial asset or liability. The effective interest rate is calculated at the inception of the financial assets and liabilities and is not subsequently reviewed.

HAITONG BANK, S.A.
103
For the purpose of calculating the effective interest rate, future cash flows are estimated by considering all contractual terms concerning the financial instrument (i.e. early payment options), although not considering possible future credit losses. The calculation comprises fees which are an integral part of the effective interest rate, transaction costs and all premiums and discounts directly associated with the transaction. In the case of financial assets or groups of similar financial assets for which impairment losses have been recognised, interest accounted for in ‘interest and similar income’ are determined based on the interest rate used when measuring the impairment loss.
Concerning financial derivatives, with the exception of those classified as derivatives for risk management (see Note 2.4), the interest component inherent to the fair value variation is not separate, and is classified in the ‘income from assets and liabilities measured at fair value through profit or loss’ heading. The interest component inherent to the fair value variation of financial derivatives for risk management is recognised in the ‘interest and similar income’ or ‘interest and similar expenses' heading.
2.20. Recognition of fee and commission income
Income from services and commissions are recognised as follows:
● Income from services and commissions obtained from the performance of a significant act, such as commissions in the syndication of loans, are recognised in income once the significant act has been completed;
● Income from services and commissions obtained as the services are being provided are recognised in income for the relevant period;
Income from services and commissions which are an integral part of the effective interest rate of a financial instrument are accounted for in income statement by the effective interest rate method.
2.21. Recognition of dividend income
Income from equity instruments (dividends) are recognised once the right to receive its payment is established.
2.22. Segment reporting
The Group adopted IFRS 8 – Operating Segments for the disclosure of financial information by operating segments (see Note 4).
An operating segment is a component of the Group: (i) which engages in business activities from which it may earn revenues and incur expenses; (ii) whose operating results are regularly reviewed by the Group’s chief operating decision makers to make decisions on the allocation of resources to the segment and assess its performance; and (iii) for which discrete financial information is available.
2.23. Earnings per share
Basic earnings per share are calculated by dividing the net profit attributable to shareholders of the parent company by the weighted average number of ordinary shares outstanding, with the exclusion of the average number of own shares held by the Group.
For the calculation of diluted earnings per share, the weighted average number of ordinary shares outstanding is adjusted to reflect the effect of all dilutive potential ordinary shares, such as those arising out of convertible debt and of options granted to employees over own shares. The effect of the dilution is a decrease in earnings per share, resulting from the assumption that the convertible instruments are converted or that the granted options are exercised.

2016 Annual Report
104
2.24. Cash and cash equivalents
For the purposes of the cash flow statement, cash and its equivalents encompass the amounts accounted for in the statement of financial position whose maturity is less than three months from the date of acquisition/contract, which include cash, deposits in Central Banks and in other credit institutions. Cash and cash equivalents exclude mandatory deposits held with Central Banks.
NOTE 3 – MAIN ESTIMATES AND JUDGEMENTS USED IN THE PREPARATION OF FINANCIAL STATEMENTS
The IFRS set forth a range of accounting treatments and require the Board of Directors to make the necessary judgements and estimates to decide on the most appropriate accounting treatment. The Group’s main accounting estimates and judgements used thereby when applying the accounting principles are laid down in this Note with the purpose of improving the understanding on how the implementation thereof affects the Group’s reported results and their disclosure.
A broader description of the main accounting policies used by the Group is shown in Note 2 to the consolidated financial statements.
Whereas in many situations there are alternatives to the accounting treatment adopted by the Board of Directors, the results reported by the Group could have differed if it adopted a different treatment. The Board of Directors believes that it made the appropriate choices, and that the financial statements give an adequate description of the Group’s financial position and of the result of its operations in all material respects.
3.1 Impairment and valorization of available-for-sale financial assets
The Group considers that their available-for-sale assets are impaired when there is a significant or prolonged decline in their fair value or when it foresees an impact on the assets’ future cash flows. The latter consideration requires judgement, in which the Group collects and assesses all relevant information for the formulation of the decision, such as the normal volatility of financial instruments’ prices. For the purpose and as a result of the high volatility in markets, the following parameters were considered as triggers of impairment:
(i) Equity instruments: significant or prolonged decline in their market value, below the acquisition cost;
(ii) Debt securities: when there is objective evidence of events that impact on the recoverable amount of future cash flows of these assets;
(iii) Devaluation of 30% or consecutive devaluation during one year.
Additionally, assessments are obtained through market to market or market to model, which require the implementation of certain assumptions or judgements when estimating fair value.
The use of alternative methodologies and of different assumptions and estimates may result in a different level of recognised impairment losses, along with its corresponding impact in the Group’s income statement.
3.2 Fair value of financial derivatives and assets and liabilities at fair value through profit or loss
Fair values are based on listed market prices when available; otherwise fair value is determined with reference to similar recent arm’s length transaction prices, or in accordance with valuation methodologies based on discounted future cash flows techniques, by taking into account the market conditions, temporal value, yield curve and volatility factors. Such methodologies further incorporate own credit risk as well as the counterparty’s credit risk. Such methodologies may require the use of assumptions or judgements when

HAITONG BANK, S.A.
105
estimating fair value.
Hence, the use of different methodologies or of different assumptions or judgements when applying a certain model could result in financial results that are different from the results reported.
3.3 Impairment losses on loans and advances to costumers
From time to time, the Group reviews its loan portfolio to assess impairment, as laid down in Note 2.5.
The evaluation process in determining whether an impairment loss should be recorded in the income statement is subject to numerous estimates and judgments, including the existence of impairment triggers, recovery estimates and collaterals valuation. The use of alternative methodologies and of different assumptions and estimates may result in a different level of recognised impairment losses, along with its corresponding impact in the Group’s income statement.
3.4 Goodwill Impairment
The recoverable amount of the goodwill accounted for as an asset of the Group is reviewed on an annual basis, regardless of whether there is evidence of impairment.
For such purpose, the statement of financial positions value of the units of the Group for which their respective goodwill is recognised as an asset, is compared to their fair value. An impairment loss associated with goodwill is recognised when the fair value of the unit to be tested is below its statement of financial positions value.
If no market value is available, it shall be calculated based on discounted cash flows techniques by using a discount rate taking accounting for the risk associated with the unit to be tested. Judgement is involved when determining future cash flows to be discounted, as well as the discount rate to be used.
Variations in expected cash flows and in discount rates to be used could result in conclusions that are different to those which were the basis for preparing the financial statements herein.
3.5 Income taxes
The Group is subject to the payment of income taxes in various jurisdictions. Determining the aggregate amount of income taxes requires certain interpretations and estimates. There are several transactions and calculations for which determining the final amount of tax to be paid is uncertain throughout the normal course of business.
Other interpretations and estimates could result in a different level of income taxes recognised in the period, whether current or deferred.
On the other hand, the Bank accounts for deferred taxes in accordance with the policy set forth in Note 2.17, whereby deferred tax assets are accounted for only insofar as it is expected that there will be taxable profit in the future, which are able to absorb tax losses carried forward and deductible temporary differences.
The assessment of the recoverability of deferred tax assets (including the rate at which they shall be realised) was carried out by the Group based on projections of its future taxable profit, such projections being specified from a business plan.
The estimate of future taxable profit involves a significant level of judgement regarding the future development of the Group’s activity and the timing of execution of temporary differences. For such purpose, several assumptions were adopted, including the measures described in Note 43, the taxation scheme applicable in future years and the execution of operations which are currently expected by the Bank, being deemed as the
2016 Annual Report
106
most appropriate by the Bank’s Board of 28
Directors in relation to the information available as at the date of approval of the financial statements. However, the use of different assumptions concerning the level of the aforesaid variables could result in different conclusions from those which were the basis when preparing the financial statements herein.
Tax Authorities are required to review the calculation of the basis of assessment, made by the Bank and its subsidiaries based in Portugal, for a period of four or six years, if there are reportable tax losses. Hence, there is a possibility that the basis of assessment will be corrected, mainly due to differences in interpretation of the tax legislation. However, the Bank’s Boards of Directors and its subsidiaries believe that there will be no significant corrections to the Income taxes accounted for in the financial statements.
3.6 Pensions and other employee benefits
Determining responsibilities for retirement pensions requires the use of assumptions and estimates, including actuarial projections, estimated profitability of investments and other factors which could impact on expenses and responsibilities of the pensions plan.
Any changes to such assumptions could have a significant impact on the determined amounts.
NOTE 4 – SEGMENT REPORTING
4.1 Description of operating segments
Each of the operating segments comprise the following activities, products, customers and structures of the Group:
Project Finance and Securitisation
The Project Finance and Securitisation Directorate is designed to create, execute and engage in transactions concerning the structuring of and raising financing for project finance investment projects, as well as to monitor, follow-up and manage the transactions portfolio in which the Bank is engaged.
This Directorate is also responsible for providing financial consulting to customers for the carrying out of project finance transactions and projects.
Acquisition Finance and Other Loans
The Acquisition Finance and Other Financing Directorate is designed to provide services associated with the structuring, underwriting and syndication of the financing of transactions involving the acquisition of medium and large companies, or of their main assets. Such transactions may be executed for corporate clients or for financial investors.
Transactions for corporate clients are also structured, in addition to acquisition transactions, provided the former are significantly large for placement on the market and have certain complexity.
Moreover, this Directorate is also designed to develop the trade finance business, in particular by issuing bank guarantees.
Corporate Finance
The Mergers and Acquisitions Directorate is designed to provide financial consulting to customers in corporate
HAITONG BANK, S.A.
107
purchases, sales or mergers, thereby generating business and value for the Bank, as a result thereof.
Moreover, such Directorate is also designed to execute specific projects, such as assessments, restructurings and feasibility studies in order to strengthen the relationship with its customers, thereby enabling the business continuity.
Capital Markets
The Capital Market Directorate is designed to secure mandates for the placement of debt instruments and equity on the market, as well as to organise, monitor and structure the corresponding transactions.
Moreover, such Directorate promotes potential synergies with the remaining business areas and geographies of the Bank, especially concerning the opportunities arising from cross-border deals.
Fixed Income
The Fixed Income Directorate is designed to provide a professional and differentiated service of order execution, with focus on offering fixed income market securities, as well as products on foreign exchange and goods, from issuers based in China and in emerging markets, denominated in USD, EUR and RMB, intended for international investors and always complying with the legislation in force.
Such Directorate further offers a platform for supporting the Group’s Investment Banking through the distribution of new issues, thereby providing access for its international investors to the Chinese debt markets and Dim Sum.
Global Markets
This Directorate is responsible for optimising the risk / reward ratio of the own portfolio of interest rate, foreign exchange rate, shares and other financial instruments of the Bank.
Brokerage
The Brokerage Directorate is designed to provide a service of order execution, with focus on offering shares and equity instruments from European and American issuers, as well as from emerging markets, intended for European investors.
Such Directorate further offers a platform for supporting the Group’s Investment Banking through the distribution of new issues of capital.
Treasury
The Treasury Directorate is designed to ensure the appropriate financing level in order to meet the Bank’s and the Group’s funding needs, as well as the appropriate liquidity level to satisfy financial liabilities.
Additionally, the Treasury Directorate is also designed to efficiently and effectively manage the Bank’s own treasury portfolio.
Private Equity
This segment undertakes to provide support to the private corporate initiative, by promoting productive investment which is mostly financed by equity.
2016 Annual Report
108
Capital structure advisory
Capital structure advisory Directorate has the purpose to perform the follow and manage the loans with impairment triggers, aiming the maximization of the recoverable amount of such situations, as well as take part in capital structure advisory services in which the Group is not the lender.
Corporate centre
This business area is not exactly an operating segment. It is a combination of corporate transversal structures ensuring basic functions of global management for the Group, such as those associated with the Administration and Supervisory bodies, Compliance, Strategic Planning, Accounting, Risk Control, Customers, among others.
Other
Includes all remaining segments of the Group’s Management Information model, which, in accordance with the provisions laid down in IFRS 8, is not subject to mandatory individualisation (Financial Consulting to Medium Companies, Asset Management, Private Customers, Wealth Management, Credit Syndication and other revenue centres).
4.2 Criteria for the attribution of the business and of the results to the segments
The financial information set forth for each segment has been prepared by reference to the criteria used for the preparation of internal information, on the basis of which the Group’s decisions are made, as provided by the IFRS 8.
The accounting policies used when preparing the information concerning the operating segments are those used when preparing the financial statements herein, as referred to in Note 2.
Measurement of profits or losses from the segments
The Group uses the profit/loss before tax as a measurement tool for the performance assessment of each operating segment.
Haitong Bank’s Structures dedicated to the Segment
Haitong Bank’s business encompasses all operating segments, therefore being subject to disaggregation accordingly.
For the purpose of allocating financial information, the following principles are used: (i) origination of transactions, i.e., the business originated by the commercial structures dedicated to the segment is allocated to each segment, even if the Group makes a subsequent strategic decision to securitize some of these assets originating therefrom; (ii) allocation of direct costs from commercial and central structures dedicated to the segment; (iii) allocation of indirect costs (central support and IT services) determined in accordance with 7 specific parameters and with the internal Information Management model; (iv) allocation of credit risk determined in accordance with the impairment model.
Transactions between legally autonomous units of the Group are carried out at market prices; the price of provisions between the structures of each unit, such as the prices set for the provision or internal assignment of funds, is determined by the margins process referred to above (which vary according to the strategic relevance of the instrument and the balance of the structures between the fundraising and the credit assignment roles); the remaining transactions are allocated to the segments in accordance with the Management Information internal model.

HAITONG BANK, S.A.
109
The services rendered by the various units of the Corporate Centre are governed by SLAs (Service Level Agreements).
Interest income and expenses
Since the Group’s activities are exclusively related to the financial sector, a substantial amount of generated revenue results from the difference between interest received from its assets and interest borne by the raised financial resources. This situation and the fact that the segments’ activity is assessed by management through negotiated or predetermined margins for each instrument, leads to the profits of the brokerage activity being presented, as permitted by IFRS 8, paragraph 23, by the net value of interest, under the designation of Financial Income.
Investments consolidated under the equity method
Investments in associates which are consolidated under the equity method are comprised in the segment designated ‘Other', for Haitong Bank’s associates. For investments in associates of other entities of the Group, such entities are allocated to the segments they relate to.
Non-current assets
The Corporate Centre segment comprises non-current assets, which, as foreseen in IFRS 8, comprise Other tangible assets, Intangible assets and real estate received as payment in kind not yet falling into the classification of Non-current assets held-for-sale.
Deferred tax assets
The Income tax component is an element for the generating of the Group’s income statement which does not have an effect on the assessment of the Operating Segments. Deferred tax assets are allocated to the Corporate Centre segment.
Domestic and International Areas
In the presentation of the financial information by geographical areas, the operating units making up the International Area are the Branches in London, Spain, Poland and New York, as well as the subsidiaries in the consolidation perimeter, with the allocation being made by the Headquarters’ country (see Note 1).
The statement of financial position and economical items concerning the international area are those shown in the financial statements of such units, along with their corresponding consolidation eliminations and adjustments.
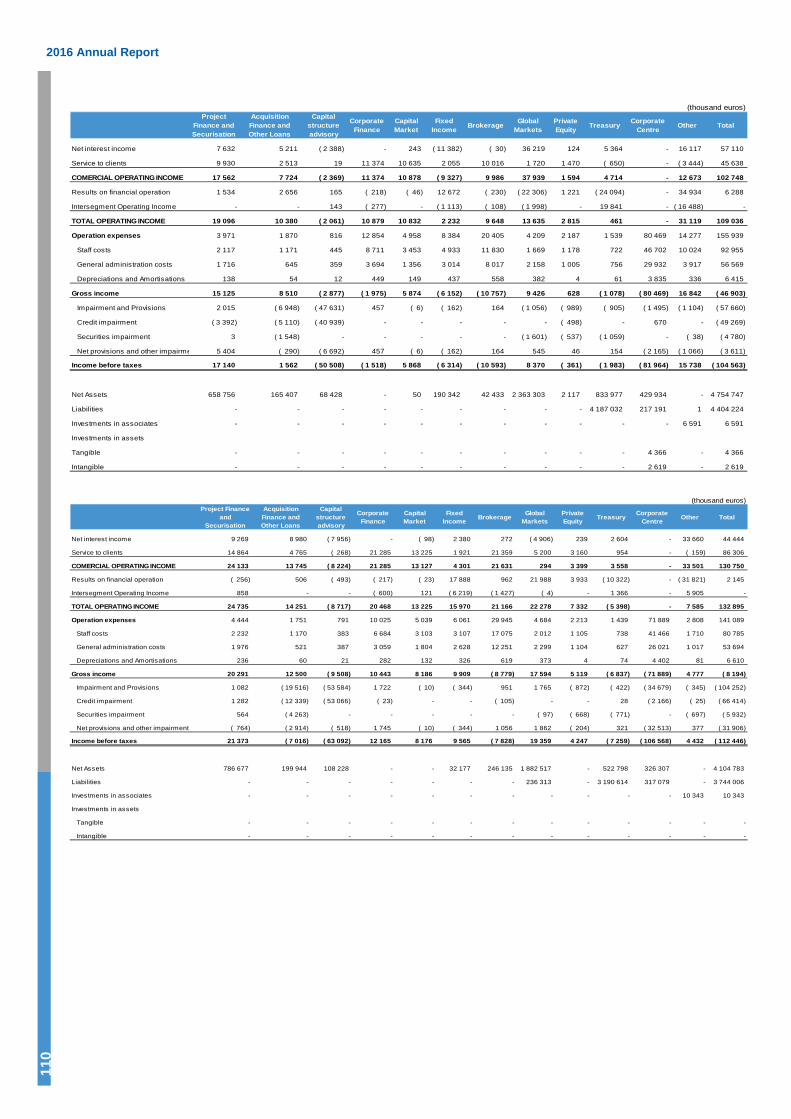
2016 Annual Report
110
(thousand euros)Project
Finance and Securisation
Acquisition Finance and Other Loans
Capital structure advisory
Corporate Finance
Capital Market
Fixed Income Brokerage Global
MarketsPrivate Equity Treasury Corporate
Centre Other Total
Net interest income 7 632 5 211 ( 2 388) - 243 ( 11 382) ( 30) 36 219 124 5 364 - 16 117 57 110
Service to clients 9 930 2 513 19 11 374 10 635 2 055 10 016 1 720 1 470 ( 650) - ( 3 444) 45 638
COMERCIAL OPERATING INCOME 17 562 7 724 ( 2 369) 11 374 10 878 ( 9 327) 9 986 37 939 1 594 4 714 - 12 673 102 748
Results on financial operation 1 534 2 656 165 ( 218) ( 46) 12 672 ( 230) ( 22 306) 1 221 ( 24 094) - 34 934 6 288
Intersegment Operating Income - - 143 ( 277) - ( 1 113) ( 108) ( 1 998) - 19 841 - ( 16 488) -
TOTAL OPERATING INCOME 19 096 10 380 ( 2 061) 10 879 10 832 2 232 9 648 13 635 2 815 461 - 31 119 109 036
Operation expenses 3 971 1 870 816 12 854 4 958 8 384 20 405 4 209 2 187 1 539 80 469 14 277 155 939
Staff costs 2 117 1 171 445 8 711 3 453 4 933 11 830 1 669 1 178 722 46 702 10 024 92 955
General administration costs 1 716 645 359 3 694 1 356 3 014 8 017 2 158 1 005 756 29 932 3 917 56 569
Depreciations and Amortisations 138 54 12 449 149 437 558 382 4 61 3 835 336 6 415
Gross income 15 125 8 510 ( 2 877) ( 1 975) 5 874 ( 6 152) ( 10 757) 9 426 628 ( 1 078) ( 80 469) 16 842 ( 46 903)
Impairment and Provisions 2 015 ( 6 948) ( 47 631) 457 ( 6) ( 162) 164 ( 1 056) ( 989) ( 905) ( 1 495) ( 1 104) ( 57 660)
Credit impairment ( 3 392) ( 5 110) ( 40 939) - - - - - ( 498) - 670 - ( 49 269)
Securities impairment 3 ( 1 548) - - - - - ( 1 601) ( 537) ( 1 059) - ( 38) ( 4 780)
Net provisions and other impairme 5 404 ( 290) ( 6 692) 457 ( 6) ( 162) 164 545 46 154 ( 2 165) ( 1 066) ( 3 611)
Income before taxes 17 140 1 562 ( 50 508) ( 1 518) 5 868 ( 6 314) ( 10 593) 8 370 ( 361) ( 1 983) ( 81 964) 15 738 ( 104 563)
Net Assets 658 756 165 407 68 428 - 50 190 342 42 433 2 363 303 2 117 833 977 429 934 - 4 754 747
Liabilities - - - - - - - - - 4 187 032 217 191 1 4 404 224
Investments in associates - - - - - - - - - - - 6 591 6 591
Investments in assets
Tangible - - - - - - - - - - 4 366 - 4 366
Intangible - - - - - - - - - - 2 619 - 2 619
(thousand euros)Project Finance
and Securisation
Acquisition Finance and Other Loans
Capital structure advisory
Corporate Finance
Capital Market
Fixed Income Brokerage Global
MarketsPrivate Equity Treasury Corporate
Centre Other Total
Net interest income 9 269 8 980 ( 7 956) - ( 98) 2 380 272 ( 4 906) 239 2 604 - 33 660 44 444
Service to clients 14 864 4 765 ( 268) 21 285 13 225 1 921 21 359 5 200 3 160 954 - ( 159) 86 306
COMERCIAL OPERATING INCOME 24 133 13 745 ( 8 224) 21 285 13 127 4 301 21 631 294 3 399 3 558 - 33 501 130 750
Results on financial operation ( 256) 506 ( 493) ( 217) ( 23) 17 888 962 21 988 3 933 ( 10 322) - ( 31 821) 2 145
Intersegment Operating Income 858 - - ( 600) 121 ( 6 219) ( 1 427) ( 4) - 1 366 - 5 905 -
TOTAL OPERATING INCOME 24 735 14 251 ( 8 717) 20 468 13 225 15 970 21 166 22 278 7 332 ( 5 398) - 7 585 132 895
Operation expenses 4 444 1 751 791 10 025 5 039 6 061 29 945 4 684 2 213 1 439 71 889 2 808 141 089
Staff costs 2 232 1 170 383 6 684 3 103 3 107 17 075 2 012 1 105 738 41 466 1 710 80 785
General administration costs 1 976 521 387 3 059 1 804 2 628 12 251 2 299 1 104 627 26 021 1 017 53 694
Depreciations and Amortisations 236 60 21 282 132 326 619 373 4 74 4 402 81 6 610
Gross income 20 291 12 500 ( 9 508) 10 443 8 186 9 909 ( 8 779) 17 594 5 119 ( 6 837) ( 71 889) 4 777 ( 8 194)
Impairment and Provisions 1 082 ( 19 516) ( 53 584) 1 722 ( 10) ( 344) 951 1 765 ( 872) ( 422) ( 34 679) ( 345) ( 104 252)
Credit impairment 1 282 ( 12 339) ( 53 066) ( 23) - - ( 105) - - 28 ( 2 166) ( 25) ( 66 414)
Securities impairment 564 ( 4 263) - - - - - ( 97) ( 668) ( 771) - ( 697) ( 5 932)
Net provisions and other impairment ( 764) ( 2 914) ( 518) 1 745 ( 10) ( 344) 1 056 1 862 ( 204) 321 ( 32 513) 377 ( 31 906)
Income before taxes 21 373 ( 7 016) ( 63 092) 12 165 8 176 9 565 ( 7 828) 19 359 4 247 ( 7 259) ( 106 568) 4 432 ( 112 446)
Net Assets 786 677 199 944 108 228 - - 32 177 246 135 1 882 517 - 522 798 326 307 - 4 104 783
Liabilities - - - - - - - 236 313 - 3 190 614 317 079 - 3 744 006
Investments in associates - - - - - - - - - - - 10 343 10 343
Investments in assets
Tangible - - - - - - - - - - - - -
Intangible - - - - - - - - - - - - -
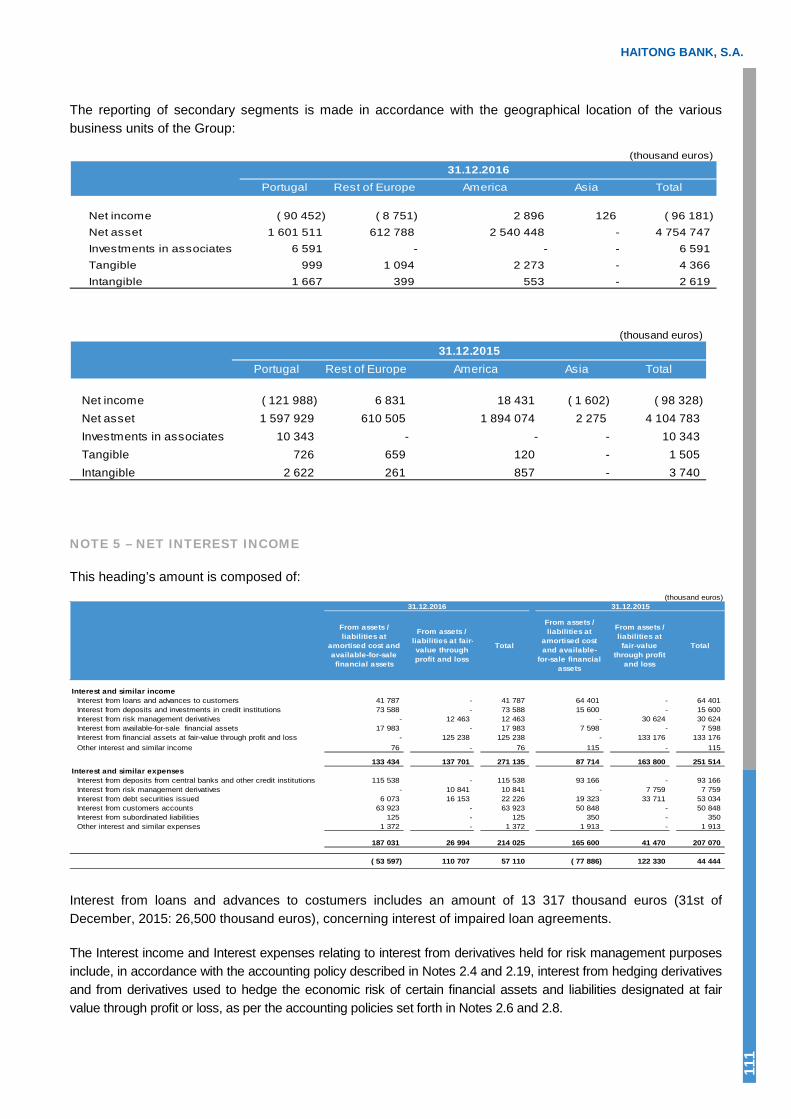
HAITONG BANK, S.A.
111
The reporting of secondary segments is made in accordance with the geographical location of the various business units of the Group:
(thousand euros)
Portugal Rest of Europe America Asia Total
Net income ( 90 452) ( 8 751) 2 896 126 ( 96 181)Net asset 1 601 511 612 788 2 540 448 - 4 754 747 Investments in associates 6 591 - - - 6 591 Tangible 999 1 094 2 273 - 4 366 Intangible 1 667 399 553 - 2 619
31.12.2016
(thousand euros)
Portugal Rest of Europe America Asia Total
Net income ( 121 988) 6 831 18 431 ( 1 602) ( 98 328)Net asset 1 597 929 610 505 1 894 074 2 275 4 104 783 Investments in associates 10 343 - - - 10 343 Tangible 726 659 120 - 1 505 Intangible 2 622 261 857 - 3 740
31.12.2015
NOTE 5 – NET INTEREST INCOME
This heading’s amount is composed of: (thousand euros)
31.12.2016 31.12.2015
From assets / liabilities at
amortised cost and available-for-sale financial assets
From assets / liabilities at fair-value through profit and loss
Total
From assets / liabilities at
amortised cost and available-
for-sale financial assets
From assets / liabilities at fair-value
through profit and loss
Total
Interest and similar incomeInterest from loans and advances to customers 41 787 - 41 787 64 401 - 64 401 Interest from deposits and investments in credit institutions 73 588 - 73 588 15 600 - 15 600 Interest from risk management derivatives - 12 463 12 463 - 30 624 30 624 Interest from available-for-sale financial assets 17 983 - 17 983 7 598 - 7 598 Interest from financial assets at fair-value through profit and loss - 125 238 125 238 - 133 176 133 176 Other interest and similar income 76 - 76 115 - 115
133 434 137 701 271 135 87 714 163 800 251 514 Interest and similar expenses
Interest from deposits from central banks and other credit institutions 115 538 - 115 538 93 166 - 93 166 Interest from risk management derivatives - 10 841 10 841 - 7 759 7 759 Interest from debt securities issued 6 073 16 153 22 226 19 323 33 711 53 034 Interest from customers accounts 63 923 - 63 923 50 848 - 50 848 Interest from subordinated liabilities 125 - 125 350 - 350 Other interest and similar expenses 1 372 - 1 372 1 913 - 1 913
187 031 26 994 214 025 165 600 41 470 207 070
( 53 597) 110 707 57 110 ( 77 886) 122 330 44 444
Interest from loans and advances to costumers includes an amount of 13 317 thousand euros (31st of December, 2015: 26,500 thousand euros), concerning interest of impaired loan agreements.
The Interest income and Interest expenses relating to interest from derivatives held for risk management purposes include, in accordance with the accounting policy described in Notes 2.4 and 2.19, interest from hedging derivatives and from derivatives used to hedge the economic risk of certain financial assets and liabilities designated at fair value through profit or loss, as per the accounting policies set forth in Notes 2.6 and 2.8.

2016 Annual Report
112
NOTE 6 – NET FEES AND COMMISSIONS INCOME
This heading’s amount is composed of:
(thousand euros)
31.12.2016 31.12.2015
Fees and commissions incomeFrom banking services 23 585 53 521 From guarantees provided 3 213 5 525 From transactions with securities 25 886 35 228
52 684 94 274
Fees and commissions expensesFrom banking services rendered by third parties 2 138 2 431 From transactions with securities 3 512 8 912 From guarantees received 675 389 Other fee and comission expenses 1 172 71
7 497 11 803
45 187 82 471
NOTE 7 – NET GAINS/(LOSSES) FROM ASSETS AND LIABILITIES AT FAIR VALUE THROUGH PROFIT OR LOSS
This heading’s amount is composed of:
(thousand euros)31.12.2016 31.12.2015
Income Expenses Total Income Expenses Total
Securities held-for-tradingBonds and other fixed-income securities
Issued by public entities 218 614 318 146 ( 99 532) 278 690 346 712 ( 68 022)Of other entities 9 598 6 284 3 314 13 476 8 156 5 320
Shares 5 965 4 020 1 945 15 243 15 550 ( 307)
234 177 328 450 ( 94 273) 307 409 370 418 ( 63 009)
Financial derivatives held-for-trading Foreign-exchange contracts 2 052 291 2 160 507 ( 108 216) 2 812 026 2 674 225 137 801 Interest rates contracts 853 076 667 008 186 068 1 848 116 1 851 479 ( 3 363)Equity/indexes contracts 27 610 31 925 ( 4 315) 207 305 205 364 1 941 Credit default contracts - 1 561 ( 1 561) 2 151 5 821 ( 3 670)Other 4 039 - 4 039 4 951 - 4 951
2 937 016 2 861 001 76 015 4 874 549 4 736 889 137 660
Financial derivatives for risk managementForeign-exchange contracts - 8 934 ( 8 934) 1 388 - 1 388 Interest rates contracts 1 372 - 1 372 11 286 14 121 ( 2 835)Equity/indexes contracts 8 220 - 8 220 - 7 338 ( 7 338)Credit default contracts 1 074 42 602 ( 41 528) - 80 200 ( 80 200)
10 666 51 536 ( 40 870) 12 674 101 659 ( 88 985)
3 181 859 3 240 987 ( 59 128) 5 194 632 5 208 966 ( 14 334)
Financial liabilities at fair-value throughprofit and loss
Debt securities issued 39 172 7 625 31 547 90 491 1 217 89 274 39 172 7 625 31 547 90 491 1 217 89 274
3 221 031 3 248 612 ( 27 581) 5 285 123 5 210 183 74 940
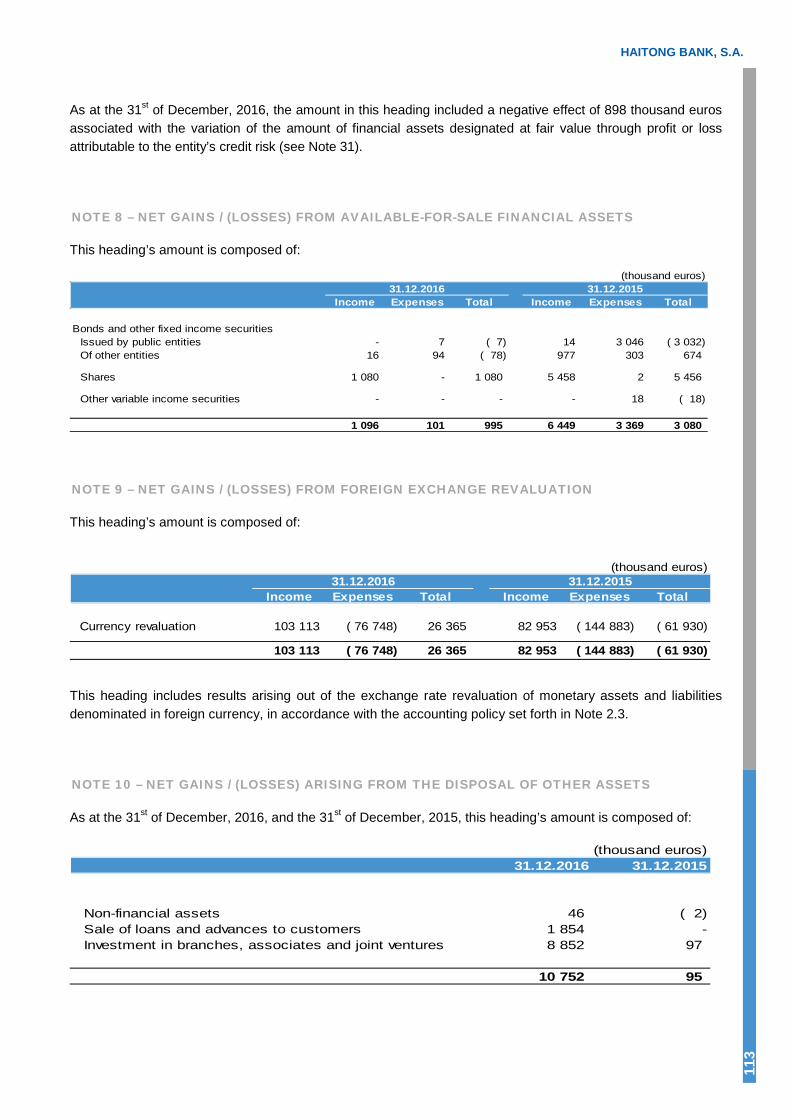
HAITONG BANK, S.A.
113
As at the 31st of December, 2016, the amount in this heading included a negative effect of 898 thousand euros associated with the variation of the amount of financial assets designated at fair value through profit or loss attributable to the entity’s credit risk (see Note 31).
NOTE 8 – NET GAINS / (LOSSES) FROM AVAILABLE-FOR-SALE FINANCIAL ASSETS
This heading’s amount is composed of:
(thousand euros)31.12.2016 31.12.2015
Income Expenses Total Income Expenses Total
Bonds and other fixed income securitiesIssued by public entities - 7 ( 7) 14 3 046 ( 3 032)Of other entities 16 94 ( 78) 977 303 674
Shares 1 080 - 1 080 5 458 2 5 456
Other variable income securities - - - - 18 ( 18)
1 096 101 995 6 449 3 369 3 080
NOTE 9 – NET GAINS / (LOSSES) FROM FOREIGN EXCHANGE REVALUATION
This heading’s amount is composed of:
(thousand euros)31.12.2016 31.12.2015
Income Expenses Total Income Expenses Total
Currency revaluation 103 113 ( 76 748) 26 365 82 953 ( 144 883) ( 61 930)
103 113 ( 76 748) 26 365 82 953 ( 144 883) ( 61 930)
This heading includes results arising out of the exchange rate revaluation of monetary assets and liabilities denominated in foreign currency, in accordance with the accounting policy set forth in Note 2.3.
NOTE 10 – NET GAINS / (LOSSES) ARISING FROM THE DISPOSAL OF OTHER ASSETS
As at the 31st of December, 2016, and the 31st of December, 2015, this heading’s amount is composed of:
(thousand euros)31.12.2016 31.12.2015
Non-financial assets 46 ( 2)Sale of loans and advances to customers 1 854 -Investment in branches, associates and joint ventures 8 852 97
10 752 95

2016 Annual Report
114
NOTE 11 – OTHER OPERATING RESULTS
This heading’s amount is composed of:
(thousand euros)
31.12.2016 31.12.2015
Other customer services 450 3 839 Direct and Indirect taxes ( 5 824) ( 5 639)Other operating results 1 416 ( 7 262)
( 3 958) ( 9 062)
Direct and indirect taxes include 1,593 thousand euros concerning the cost associated with the Bank Levy (31st of December, 2015: 1,611 thousand euros), established pursuant to Law no. 55-A/2010, of the 31st of December (see Note 33).
As at the 31st of December, 2016, the balance Other operating income and expenses includes expenses in the amount of 2 263 thousand euros related to Deposit Guarantee Funds’ Contributions (2 727 thousand euros as at the 31st of December, 2015) and an amount of 1 293 thousand euros associated with the Contributions for the Resolution Fund (1 441 thousand euros as at the 31st of December, 2015).
NOTE 12 – EMPLOYEE COSTS
This heading’s amount is composed of: (thousand euros)
31.12.2016 31.12.2015
Wages and salariesRemuneration 68 863 61 847 Long-term service benefits (see Note 13) ( 891) 207 Career benefits (see Note 13) 583 -Changes in SAMS regulation (see Note 13) ( 1 454) -
Expenses with retirement pensions (see Note 13) 1 724 1 243 Other mandatory social charges 13 003 11 241 Other expenses 11 127 6 247
92 955 80 785
Expenses with remunerations and other benefits granted to the key management personnel of the Haitong Bank Group are as follows:
(thousand euros)
Board of Directors
Other key management
staffTotal
2016Remunerations and other short-term benefits 3 020 29 022 32 042 Long-term service benefits 161 776 937 Variable remunerations 456 8 376 8 832 Total 3 637 38 174 41 811
2015Remunerations and other short-term benefits 3 223 21 706 24 929 Long-term service benefits 69 90 159 Variable remunerations 15 6 471 6 486 Total 3 307 28 267 31 574
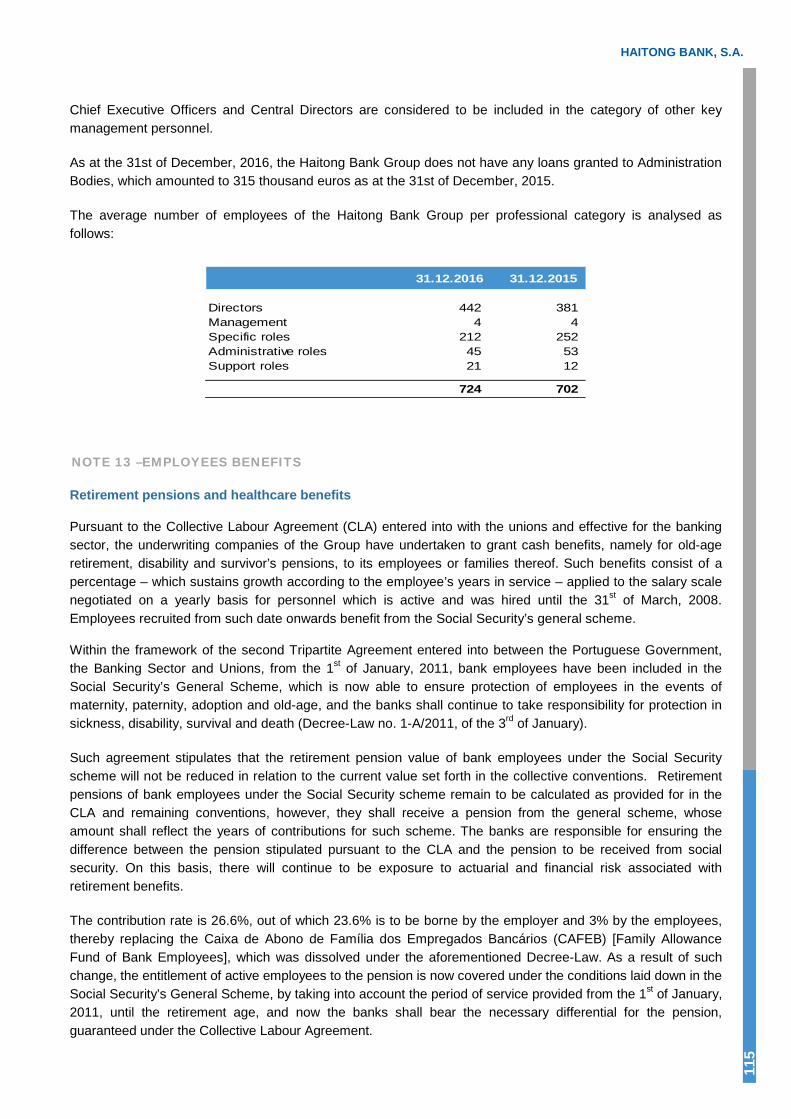
HAITONG BANK, S.A.
115
Chief Executive Officers and Central Directors are considered to be included in the category of other key management personnel.
As at the 31st of December, 2016, the Haitong Bank Group does not have any loans granted to Administration Bodies, which amounted to 315 thousand euros as at the 31st of December, 2015.
The average number of employees of the Haitong Bank Group per professional category is analysed as follows:
31.12.2016 31.12.2015
Directors 442 381 Management 4 4 Specific roles 212 252 Administrative roles 45 53 Support roles 21 12
724 702
NOTE 13 –EMPLOYEES BENEFITS
Retirement pensions and healthcare benefits
Pursuant to the Collective Labour Agreement (CLA) entered into with the unions and effective for the banking sector, the underwriting companies of the Group have undertaken to grant cash benefits, namely for old-age retirement, disability and survivor’s pensions, to its employees or families thereof. Such benefits consist of a percentage – which sustains growth according to the employee’s years in service – applied to the salary scale negotiated on a yearly basis for personnel which is active and was hired until the 31st of March, 2008. Employees recruited from such date onwards benefit from the Social Security’s general scheme.
Within the framework of the second Tripartite Agreement entered into between the Portuguese Government, the Banking Sector and Unions, from the 1st of January, 2011, bank employees have been included in the Social Security’s General Scheme, which is now able to ensure protection of employees in the events of maternity, paternity, adoption and old-age, and the banks shall continue to take responsibility for protection in sickness, disability, survival and death (Decree-Law no. 1-A/2011, of the 3rd of January).
Such agreement stipulates that the retirement pension value of bank employees under the Social Security scheme will not be reduced in relation to the current value set forth in the collective conventions. Retirement pensions of bank employees under the Social Security scheme remain to be calculated as provided for in the CLA and remaining conventions, however, they shall receive a pension from the general scheme, whose amount shall reflect the years of contributions for such scheme. The banks are responsible for ensuring the difference between the pension stipulated pursuant to the CLA and the pension to be received from social security. On this basis, there will continue to be exposure to actuarial and financial risk associated with retirement benefits.
The contribution rate is 26.6%, out of which 23.6% is to be borne by the employer and 3% by the employees, thereby replacing the Caixa de Abono de Família dos Empregados Bancários (CAFEB) [Family Allowance Fund of Bank Employees], which was dissolved under the aforementioned Decree-Law. As a result of such change, the entitlement of active employees to the pension is now covered under the conditions laid down in the Social Security’s General Scheme, by taking into account the period of service provided from the 1st of January, 2011, until the retirement age, and now the banks shall bear the necessary differential for the pension, guaranteed under the Collective Labour Agreement.

2016 Annual Report
116
Integration leads to an effective decrease in the current value of the total benefits reported on the normal retirement age to be borne by the Pensions fund. However, since there was no reduction in benefits for the recipient, responsibilities for past services remained unchanged.
By the end of the 2011 financial year, following the 3rd tripartite agreement, a decision was made on the transfer to Social Security of the responsibilities relating to pensions in payment of retired persons and pensioners, as at the 31st of December, 2011.
Under such tripartite agreement, Social Security became responsible for the pensions in payment as at the 31st of December, 2012, at constant values (0% discount rate), in the component provided for in the Instrumento de Regulação Colectiva de Trabalho (‘IRCT’) [Collective Labour Regulation Instrument] for bank employees, including the cases of death, disability and survival. The responsibilities regarding pension updates, supplementary benefits, contributions to SAMS [Social and Medical Assistance Services], death allowance and deferred survivor’s pensions, remained assigned to the financial institutions, whose financing was ensured by means of the corresponding pension funds.
The agreement further stipulated that the assets of the pension funds of the corresponding financial institutions were to be transferred to the Portuguese State, in order to fulfil the aforementioned pensions responsibilities.
Insofar as such transfer consists of a definitive and irreversible transfer of responsibilities concerning pensions in payment (even if they only concern part of the benefit), the underlying conditions of the concept of liquidation – as provided for in IAS 19 ‘Benefits to employees’ – are met, due to the fact that the obligation became extinguished on the transfer date concerning the payment of the benefits covered.
The pension funds in Portugal are managed by GNB – Sociedade Gestora de Fundos de Pensões, S.A. (50%) and Mercer Portugal (50%), which investment policy is being defined by Mercer Portugal.
In accordance with the policy set forth in Note 2.16 – Benefits to employees, the Group shall calculate the responsibilities with retirement pensions, as well as actuarial gains and losses, on a yearly basis.
New Collective Labour Agreement
Until June 2016, pursuant to the Collective Labour Agreement – CLA of the banking sector, entered into by the various financial institutions, the payment of a long-term service bonus was due on the month the Employees (of the domestic activity) reached 15, 25 and 30 years of good and effective service in the banking sector, respectively amounting to one, two or three months of their effective monthly remuneration (on the year the bonus was granted).
On the 14th of June, 2016, a new CLA was entered into with the unions of the aforementioned sector. It was published in the Boletim do Trabalho e do Emprego [Bulletin of Labour and Employment] on the 8th of August, 2016, having taken effect on the following day.
With the entry into force of the new CLA, the long-term service bonus has been eliminated. However, the new CLA provides for the payment of the proportion of the long-term service bonus for the ongoing anniversary regarding 15, 25 or 30 years of bank seniority and corresponding to the years of good and effective service in the banking sector as at the date of the new CLA’s entry into force. The new CLA provides for the payment of an end-of-career bonus which is 1.5 times the amount of the effective monthly remuneration of the Employee upon termination of the employment contract due to retirement.
The new CLA shall not amend the pension’s scheme and the supplementary health scheme (SAMS) applicable to employees and retired employees of the banking sector, although it has set forth new financing rules of SAMS, to be borne by the credit institutions. With such amendments, the value of charges relating to
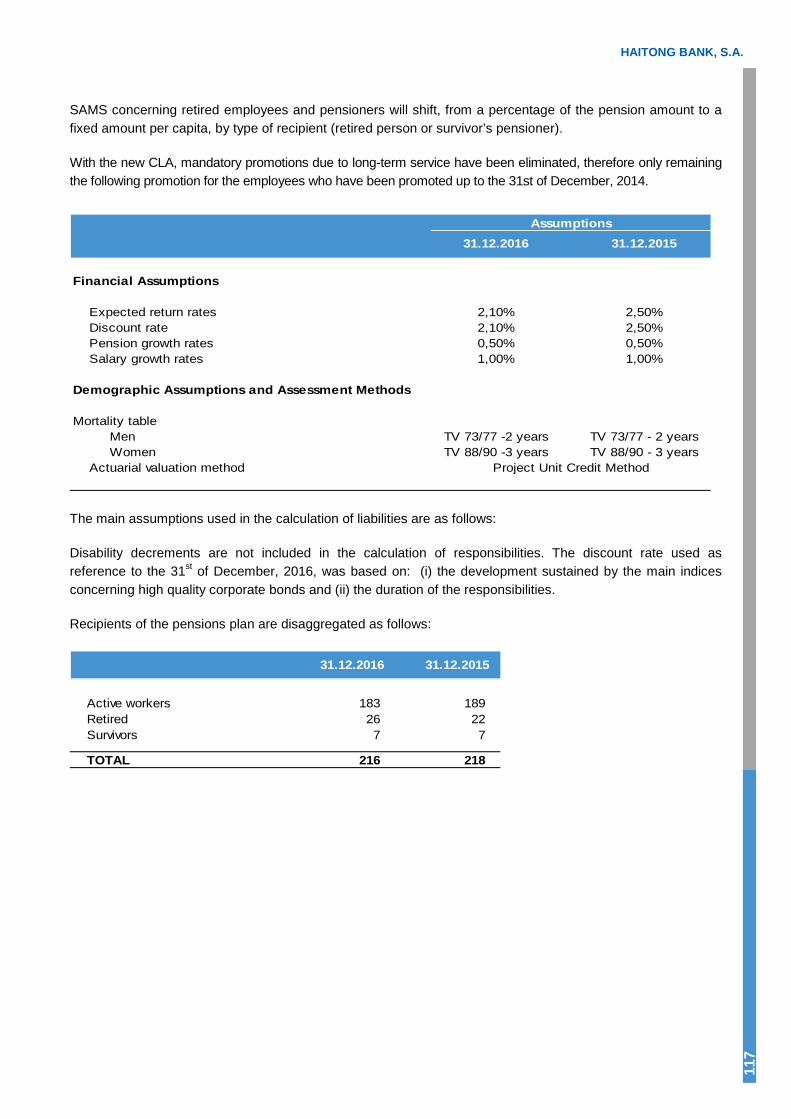
HAITONG BANK, S.A.
117
SAMS concerning retired employees and pensioners will shift, from a percentage of the pension amount to a fixed amount per capita, by type of recipient (retired person or survivor’s pensioner).
With the new CLA, mandatory promotions due to long-term service have been eliminated, therefore only remaining the following promotion for the employees who have been promoted up to the 31st of December, 2014.
31.12.2016 31.12.2015
Financial Assumptions
Expected return rates 2,10% 2,50% Discount rate 2,10% 2,50% Pension growth rates 0,50% 0,50% Salary growth rates 1,00% 1,00%
Demographic Assumptions and Assessment Methods
Mortality tableMen TV 73/77 -2 years TV 73/77 - 2 yearsWomen TV 88/90 -3 years TV 88/90 - 3 years
Actuarial valuation method
Assumptions
Project Unit Credit Method
The main assumptions used in the calculation of liabilities are as follows:
Disability decrements are not included in the calculation of responsibilities. The discount rate used as reference to the 31st of December, 2016, was based on: (i) the development sustained by the main indices concerning high quality corporate bonds and (ii) the duration of the responsibilities.
Recipients of the pensions plan are disaggregated as follows:
31.12.2016 31.12.2015
Active workers 183 189 Retired 26 22 Survivors 7 7
TOTAL 216 218

2016 Annual Report
118
The IAS 19 application implies the following liabilities and coverage levels, which shall be reported on the 31st of December 2016 and 2015:
(thousand euros)
31.12.2016 31.12.2015
Net Assets / (Liabilities) recognised in the statement of financial position
Liabilities as at 31st of December Pensioners 7 460 7 101 Active workers 63 275 63 643
70 735 70 744
Balance of funds as at 31st of December 67 349 70 744
Excess of coverage / Contributions to the fund ( 3 386) -
Assets / (Liabilities) in the statement of financial position (see Note 35) ( 3 386) -
Acummulated actuarial gains / losses recognised in other comprehensive income 31 641 27 346
The evolution of liabilities regarding retirement pensions and healthcare benefits is analysed as follows:
(thousand euros)
31.12.2016 31.12.2015
Liabilities at the beginning of the period 70 744 63 867
Current service cost 1 724 1 243
Interest expenses 1 763 1 590
Participants contributions 129 127
Actuarial (gains)/losses ( 1 718) 8 827
- Changes in assumptions 5 937 4 008
- Experience (Gains)/losses ( 7 655) 4 819
Pensions paid by the fund ( 453) ( 268)
Changes in SAMS regulation (see Note 12) ( 1 454) -
Transfers from liabilities - ( 4 642)
Liabilities at the end of the period 70 735 70 744
Considering the situation on the 31st of December 2016, the analysis to the sensibility and alterations of the actuarial assumptions revealed the following impacts:
● An increase in the discount rate of 40 basis points would have represented a reduction in liabilities of approximately 6,097 thousand euros; a decrease of equal range would have represented an increase in liabilities of approximately 6,716 thousand euros;
● An increase of 25 basis points in the growth of salaries and pensions would have represented an increase in liabilities of approximately 4,369 thousand euros; a decrease of equal range would have represented a decrease in liabilities of approximately 4,117 thousand euros;
The evolution of value regarding the pension funds on the financial years ending on the 31st of December 2016 and 2015, may be analysed as follows:

HAITONG BANK, S.A.
119
(thousand euros)
31.12.2016 31.12.2015
Pension Funds at the beginning of the period 70 744 63 002
Real income of the fund ( 4 250) ( 779)
Group contributions 1 179 13 304
Participants contributions 129 127
Benefits paid ( 453) ( 268)
Transfers from liabilities - ( 4 642)
Pension Funds at the end of the period 67 349 70 744
In early 2017, the Bank made an extraordinary contribution for the fund in the amount of 3,324 thousand euros, therefore, the fund is now in the amount of 70,673 thousand euros, thereby representing a liability financing level of 99,9%.
The assets of the pension funds may be analysed in the following manner:
2016 2015
Bonds 15.00% 55.30%
Shares 5.80% 26.70%
Alternative investment 0.00% 2.60%
Mixed Fund 0.00% 0.00%
Real estate 0.90% 1.90%
Liquidity 78.30% 13.50%
Total 100.00% 100.00%
% Portfolio
On the 31st of December 2016 and 2015 the funds did not contain securities issued by entities of the Group.
The evolution of accumulated actuarial deviations reflected in other comprehensive income may be analysed as follows:
(thousand euros)
31.12.2016 31.12.2015
Deferred actuarial gains / (losses) as at 1st January 27 346 16 454
- Actuarial assumptions changes 5 937 4 008 - (Gains)/losses in experience ( 1 642) 6 884
Deferred actuarial deviations as at 31st of December 31 641 27 346
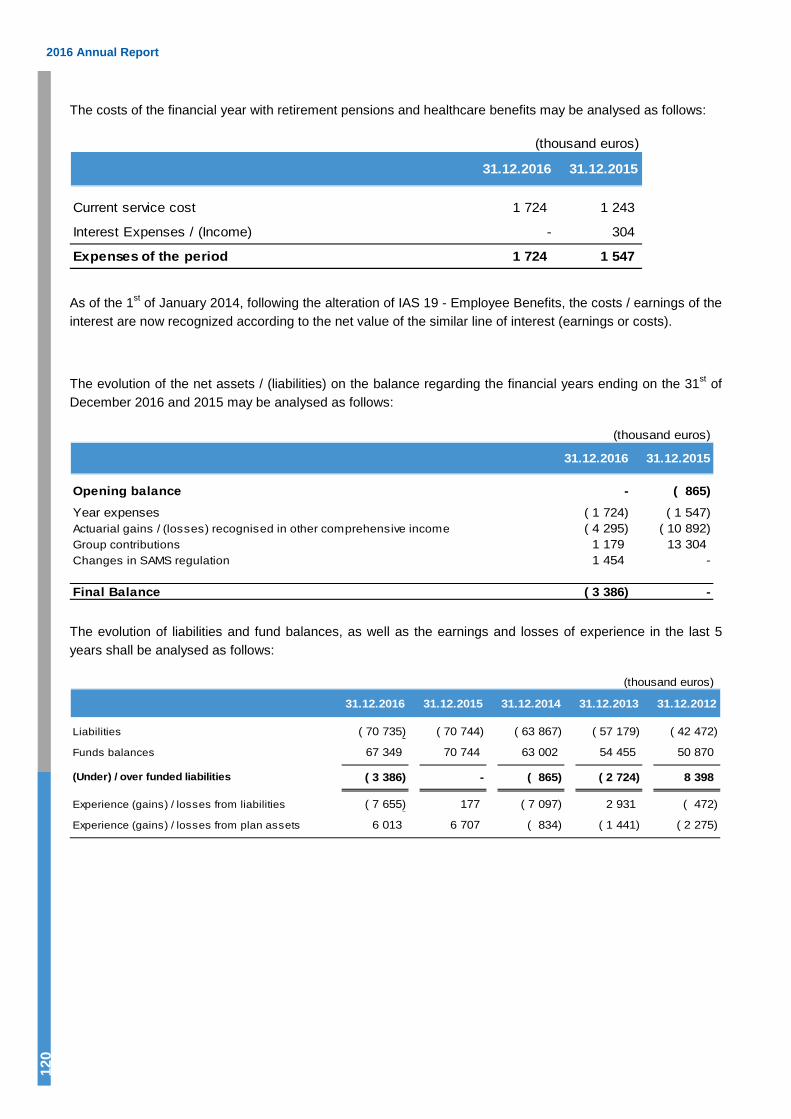
2016 Annual Report
120
The costs of the financial year with retirement pensions and healthcare benefits may be analysed as follows:
(thousand euros)
31.12.2016 31.12.2015
Current service cost 1 724 1 243
Interest Expenses / (Income) - 304
Expenses of the period 1 724 1 547
As of the 1st of January 2014, following the alteration of IAS 19 - Employee Benefits, the costs / earnings of the interest are now recognized according to the net value of the similar line of interest (earnings or costs).
The evolution of the net assets / (liabilities) on the balance regarding the financial years ending on the 31st of December 2016 and 2015 may be analysed as follows:
(thousand euros)
31.12.2016 31.12.2015
Opening balance - ( 865) - -Year expenses ( 1 724) ( 1 547)Actuarial gains / (losses) recognised in other comprehensive income ( 4 295) ( 10 892)Group contributions 1 179 13 304 Changes in SAMS regulation 1 454 -
Final Balance ( 3 386) -
The evolution of liabilities and fund balances, as well as the earnings and losses of experience in the last 5 years shall be analysed as follows:
(thousand euros)
31.12.2016 31.12.2015 31.12.2014 31.12.2013 31.12.2012
Liabilities ( 70 735) ( 70 744) ( 63 867) ( 57 179) ( 42 472) -Funds balances 67 349 70 744 63 002 54 455 50 870
(Under) / over funded liabilities ( 3 386) - ( 865) ( 2 724) 8 398
Experience (gains) / losses from liabilities ( 7 655) 177 ( 7 097) 2 931 ( 472) -Experience (gains) / losses from plan assets 6 013 6 707 ( 834) ( 1 441) ( 2 275)
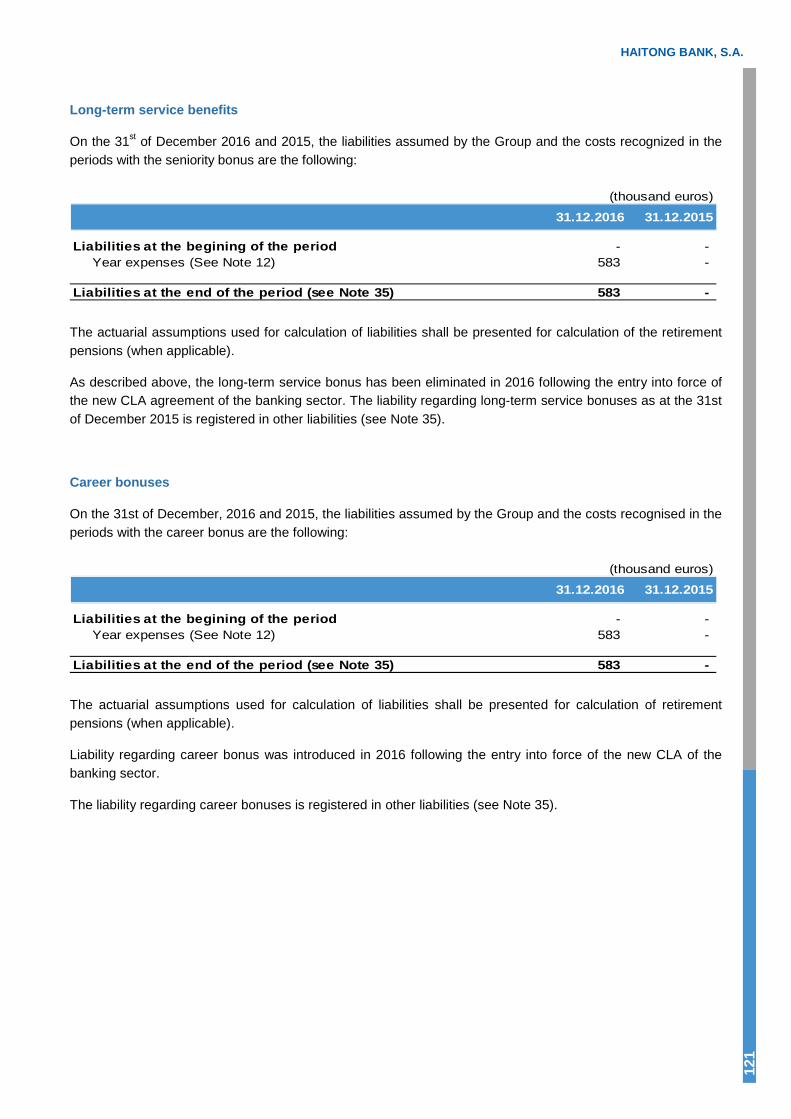
HAITONG BANK, S.A.
121
Long-term service benefits
On the 31st of December 2016 and 2015, the liabilities assumed by the Group and the costs recognized in the periods with the seniority bonus are the following:
(thousand euros)
31.12.2016 31.12.2015
Liabilities at the begining of the period - - Year expenses (See Note 12) 583 -
Liabilities at the end of the period (see Note 35) 583 -
The actuarial assumptions used for calculation of liabilities shall be presented for calculation of the retirement pensions (when applicable).
As described above, the long-term service bonus has been eliminated in 2016 following the entry into force of the new CLA agreement of the banking sector. The liability regarding long-term service bonuses as at the 31st of December 2015 is registered in other liabilities (see Note 35).
Career bonuses
On the 31st of December, 2016 and 2015, the liabilities assumed by the Group and the costs recognised in the periods with the career bonus are the following:
(thousand euros)
31.12.2016 31.12.2015
Liabilities at the begining of the period - - Year expenses (See Note 12) 583 -
Liabilities at the end of the period (see Note 35) 583 -
The actuarial assumptions used for calculation of liabilities shall be presented for calculation of retirement pensions (when applicable).
Liability regarding career bonus was introduced in 2016 following the entry into force of the new CLA of the banking sector.
The liability regarding career bonuses is registered in other liabilities (see Note 35).

2016 Annual Report
122
NOTE 14 – ADMINISTRATIVE COSTS
The amounts of this item are as follows:
(thousand euros)
31.12.2016 31.12.2015
Lease and rental 9 756 9 614 Marketing and advertisement 1 158 743 Press releases and expedition 11 921 12 557 Travelling and representation 6 401 5 970 Maintenance and related services 1 574 1 610 Insurances 729 334 Legal and litigation 790 464 Specialised services IT services 6 048 5 506 Temporary labour 327 327 Independent work 3 174 2 743 Other specialised services 10 245 9 031 Other expenses 4 446 4 795
56 569 53 694
The ‘Other Specialised Services’ heading includes, among others, the costs with external consultants and auditors. The item Other Costs includes, among others, the costs with security and surveillance, information, training costs and costs with external suppliers.
The earnings from outstanding rents regarding non-cancellable operating lease contracts, shall be as follows:
(thousand euros)
31.12.2016 31.12.2015
Up to one year 730 1 106 One to five years 1 960 1 968
2 690 3 074

HAITONG BANK, S.A.
123
Services agreed during the financial years of 2016 and 2015 with the Company of Statutory Auditors and by the auditors, according to the provisions of article 508-F of the Commercial Companies Code, are as follows:
(thousand euros)
31.12.2016 31.12.2015
Statutory audit of annual accounts (Haitong Bank) 218 104 Statutory audit of annual accounts (subsidiaries) 360 519 Other reliability assurance services 280 311 Tax advisory - 39 Other non-statutory audit services 40 213
Total value of agreed services 898 1 186
NOTE 15 – EARNINGS PER SHARE
Basic earnings per share
The basic earnings per share are calculated by the division of the result to be attributed to the shareholders of the Bank by the average number of ordinary shares issued during the year, excluding the average number of shares bought and held in portfolio as own shares.
(thousand euros)
31.12.2016 31.12.2015
Consolidated net income attributable to shareholders of the parent company(1) ( 96 412) ( 98 328)
Weighted average number of ordinary shares outstanding (thousand) 85 254 66 023
Basic earnings per share attributable to shareholders of the parent company (euros) -1.13 -1.49(1) Net profit/ (loss) for the period attributable to the equity holders of the Bank adjusted by the interest paid from perpetual subordinated bonds atributtable to the period (that are recorded as a change in reserves).
Diluted earnings per share
The diluted earnings per share are calculated by adjusting the effect of all the potential ordinary diluting shares to the considered average number of existing ordinary shares and to the net result attributed to the bank shareholders.
On the 31st of December 2016 and 2015, the Bank holds instruments issued without diluting effect, and therefore the result according to a diluted share equals the result according to a basic share.
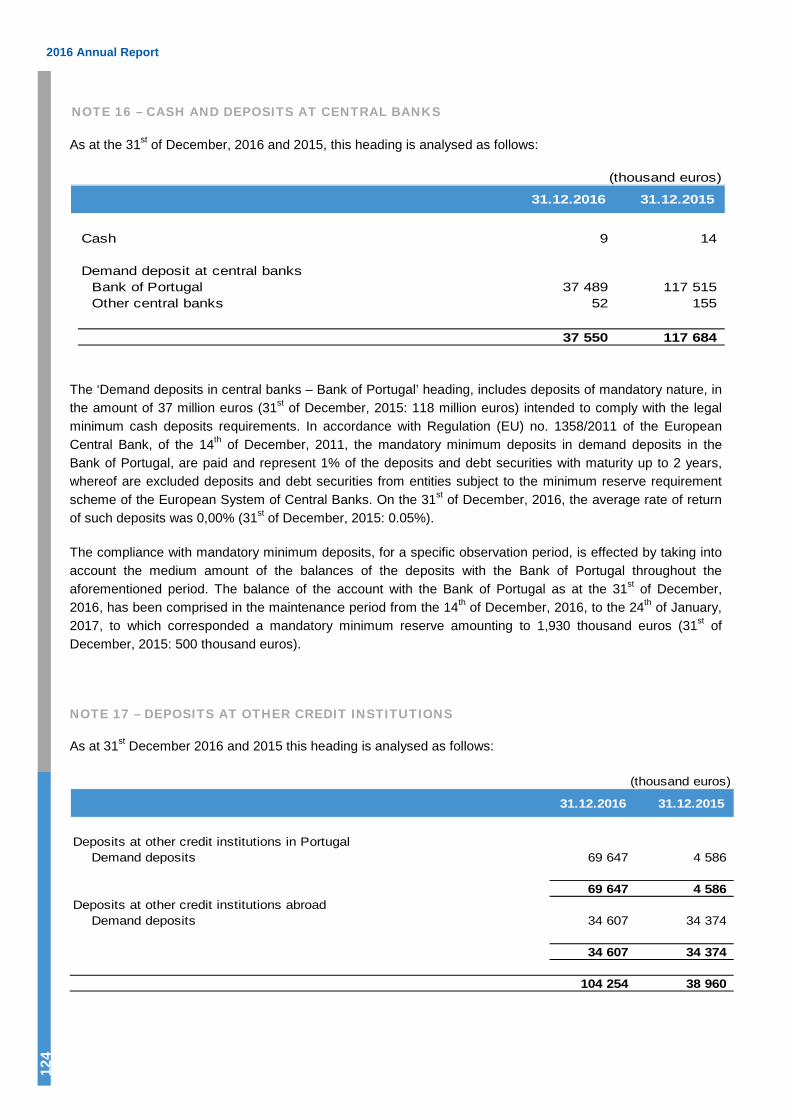
2016 Annual Report
124
NOTE 16 – CASH AND DEPOSITS AT CENTRAL BANKS
As at the 31st of December, 2016 and 2015, this heading is analysed as follows:
(thousand euros)
31.12.2016 31.12.2015
Cash 9 14
Demand deposit at central banks Bank of Portugal 37 489 117 515 Other central banks 52 155
37 550 117 684
The ‘Demand deposits in central banks – Bank of Portugal’ heading, includes deposits of mandatory nature, in the amount of 37 million euros (31st of December, 2015: 118 million euros) intended to comply with the legal minimum cash deposits requirements. In accordance with Regulation (EU) no. 1358/2011 of the European Central Bank, of the 14th of December, 2011, the mandatory minimum deposits in demand deposits in the Bank of Portugal, are paid and represent 1% of the deposits and debt securities with maturity up to 2 years, whereof are excluded deposits and debt securities from entities subject to the minimum reserve requirement scheme of the European System of Central Banks. On the 31st of December, 2016, the average rate of return of such deposits was 0,00% (31st of December, 2015: 0.05%).
The compliance with mandatory minimum deposits, for a specific observation period, is effected by taking into account the medium amount of the balances of the deposits with the Bank of Portugal throughout the aforementioned period. The balance of the account with the Bank of Portugal as at the 31st of December, 2016, has been comprised in the maintenance period from the 14th of December, 2016, to the 24th of January, 2017, to which corresponded a mandatory minimum reserve amounting to 1,930 thousand euros (31st of December, 2015: 500 thousand euros).
NOTE 17 – DEPOSITS AT OTHER CREDIT INSTITUTIONS
As at 31st December 2016 and 2015 this heading is analysed as follows:
(thousand euros)
31.12.2016 31.12.2015
Deposits at other credit institutions in Portugal Demand deposits 69 647 4 586
69 647 4 586 Deposits at other credit institutions abroad
Demand deposits 34 607 34 374
34 607 34 374
104 254 38 960
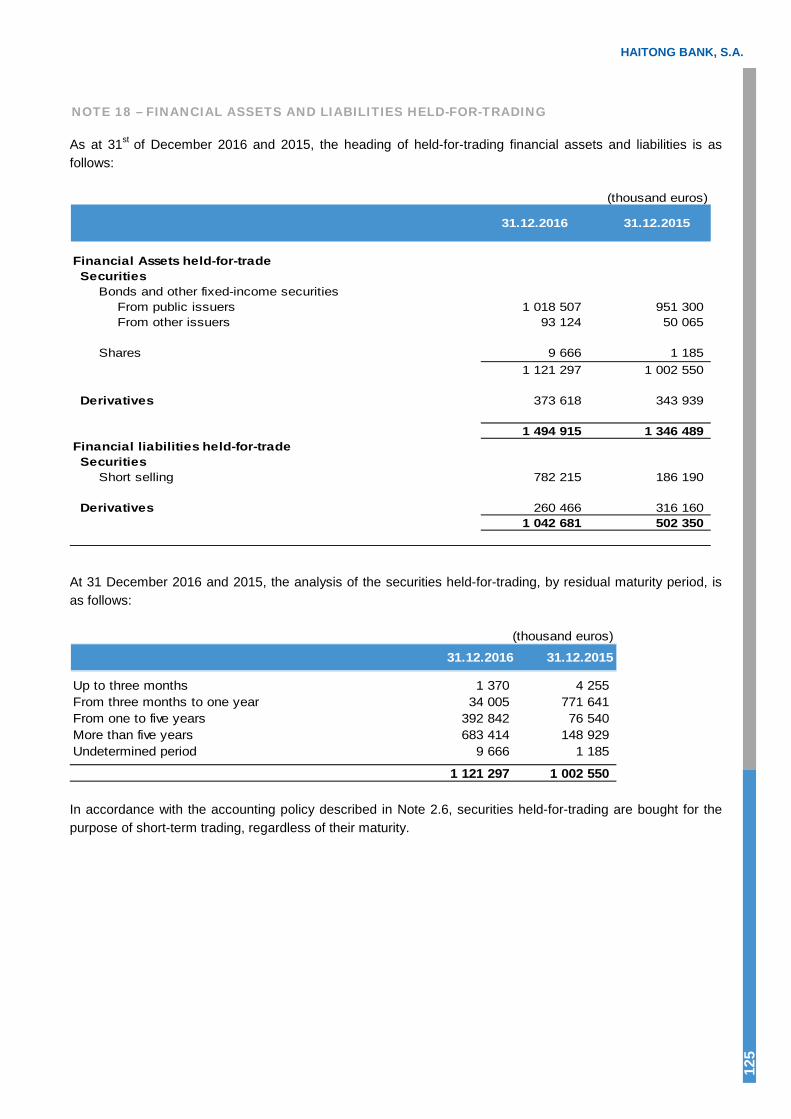
HAITONG BANK, S.A.
125
NOTE 18 – FINANCIAL ASSETS AND LIABILITIES HELD-FOR-TRADING
As at 31st of December 2016 and 2015, the heading of held-for-trading financial assets and liabilities is as follows:
(thousand euros)
Financial Assets held-for-tradeSecurities
Bonds and other fixed-income securitiesFrom public issuers 1 018 507 951 300 From other issuers 93 124 50 065
Shares 9 666 1 185 1 121 297 1 002 550
Derivatives 373 618 343 939
1 494 915 1 346 489 Financial liabilities held-for-tradeSecurities
Short selling 782 215 186 190
Derivatives 260 466 316 160 1 042 681 502 350
31.12.2016 31.12.2015
At 31 December 2016 and 2015, the analysis of the securities held-for-trading, by residual maturity period, is as follows:
(thousand euros)
31.12.2016 31.12.2015
Up to three months 1 370 4 255 From three months to one year 34 005 771 641 From one to five years 392 842 76 540 More than five years 683 414 148 929 Undetermined period 9 666 1 185
1 121 297 1 002 550
In accordance with the accounting policy described in Note 2.6, securities held-for-trading are bought for the purpose of short-term trading, regardless of their maturity.
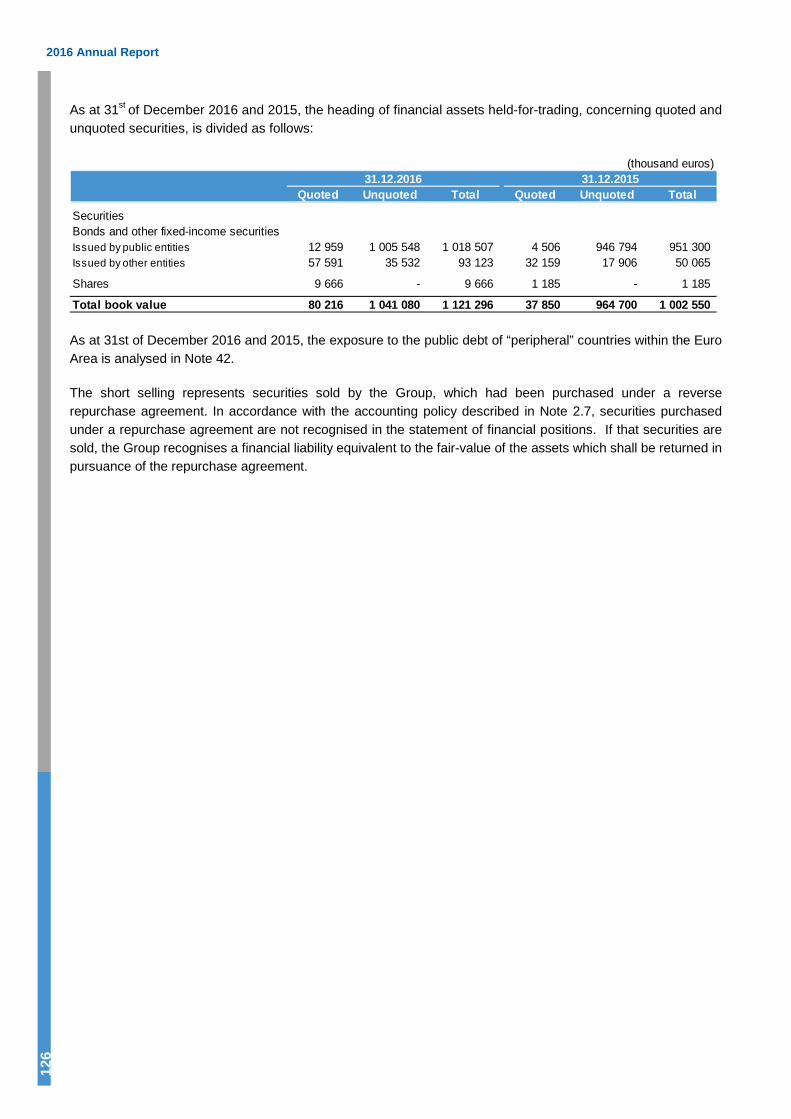
2016 Annual Report
126
As at 31st of December 2016 and 2015, the heading of financial assets held-for-trading, concerning quoted and unquoted securities, is divided as follows:
(thousand euros)31.12.2016 31.12.2015
Quoted Unquoted Total Quoted Unquoted Total
SecuritiesBonds and other fixed-income securitiesIssued by public entities 12 959 1 005 548 1 018 507 4 506 946 794 951 300 Issued by other entities 57 591 35 532 93 123 32 159 17 906 50 065
Shares 9 666 - 9 666 1 185 - 1 185
Total book value 80 216 1 041 080 1 121 296 37 850 964 700 1 002 550
As at 31st of December 2016 and 2015, the exposure to the public debt of “peripheral” countries within the Euro Area is analysed in Note 42.
The short selling represents securities sold by the Group, which had been purchased under a reverse repurchase agreement. In accordance with the accounting policy described in Note 2.7, securities purchased under a repurchase agreement are not recognised in the statement of financial positions. If that securities are sold, the Group recognises a financial liability equivalent to the fair-value of the assets which shall be returned in pursuance of the repurchase agreement.

HAITONG BANK, S.A.
127
As at 31st of December 2016 and 2015, the financial derivatives heading is analysed as follows:
(thousand euros)31.12.2016 31.12.2015
Positive Negative Positive Negative
Foreign-exchange contractsForward 1 090 15 137 19 791 606 - buy 466 614 443 003 - sell 471 113 441 690 Currency Swaps 1 731 62 597 2 263 - buy 189 013 232 044 - sell 187 066 233 254 Currency Futures - - - - - buy 1 167 325 721 544 - sell 1 043 862 763 825 Currency Interest Rate Swaps 1 555 1 555 - - - buy 38 194 - - sell 38 194 - Currency Options 697 698 2 501 2 258 - buy 59 952 248 468 - sell 66 442 227 512
3 727 775 5 073 17 452 3 311 340 22 889 5 127 Interest-rate contracts
Forward Rate Agreements - - 715 625 - buy - 552 238 - sell - 552 238 Interest Rate Swaps 346 822 224 823 299 671 293 672 - buy 5 023 952 6 340 627 - sell 5 023 952 6 340 627 Interest Rate Caps & Floors 9 793 9 819 11 701 11 690 - buy 449 525 891 264 - sell 459 525 901 264 Interest Rate Futures - - - - - buy 1 950 667 1 692 356 - sell 1 637 584 3 195 939 Interest Rate Options 2 679 2 679 - - - buy 2 292 523 - - sell 2 291 503 -
19 129 231 359 294 237 321 20 466 553 312 087 305 987
Contracts on shares/indexesEquity / Index Swaps 2 754 2 702 955 1 160 - buy 7 364 1 814 - sell 7 364 1 814 Equity / Index Options 2 918 2 838 6 536 3 595 - buy 19 634 24 123 - sell 15 470 24 123 Equity / Index Futures - - - - - buy 12 988 - - sell 20 567 -
83 387 5 672 5 540 51 874 7 491 4 755
Credit agreementsCredit Default Swaps 3 579 153 1 472 291 - buy 89 407 72 221 - sell 23 000 42 833
112 407 3 579 153 115 054 1 472 291
Total 23 052 800 373 618 260 466 23 944 821 343 939 316 160
Notional Fair value Notional Fair value
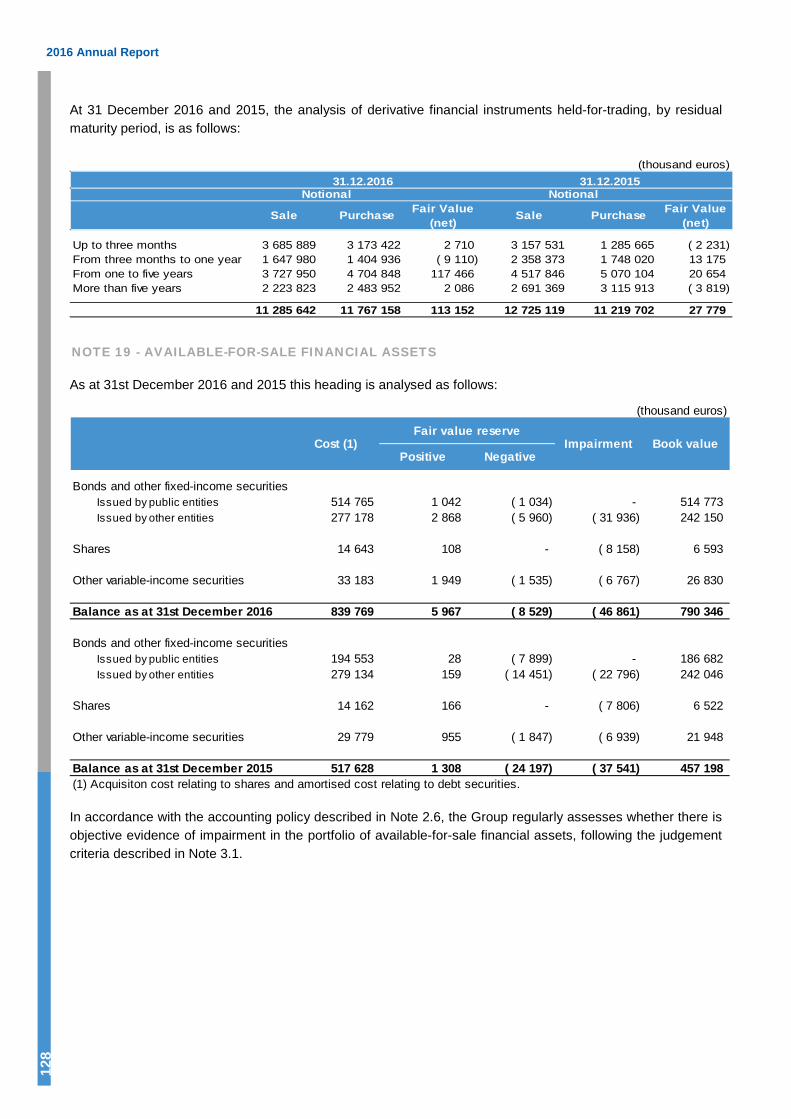
2016 Annual Report
128
At 31 December 2016 and 2015, the analysis of derivative financial instruments held-for-trading, by residual maturity period, is as follows:
(thousand euros)
Notional Notional
Sale Purchase Fair Value (net) Sale Purchase Fair Value
(net)
Up to three months 3 685 889 3 173 422 2 710 3 157 531 1 285 665 ( 2 231)From three months to one year 1 647 980 1 404 936 ( 9 110) 2 358 373 1 748 020 13 175 From one to five years 3 727 950 4 704 848 117 466 4 517 846 5 070 104 20 654 More than five years 2 223 823 2 483 952 2 086 2 691 369 3 115 913 ( 3 819)
11 285 642 11 767 158 113 152 12 725 119 11 219 702 27 779
31.12.2016 31.12.2015
NOTE 19 - AVAILABLE-FOR-SALE FINANCIAL ASSETS
As at 31st December 2016 and 2015 this heading is analysed as follows:
(thousand euros)
Positive Negative
Bonds and other fixed-income securitiesIssued by public entities 514 765 1 042 ( 1 034) - 514 773 Issued by other entities 277 178 2 868 ( 5 960) ( 31 936) 242 150
Shares 14 643 108 - ( 8 158) 6 593
Other variable-income securities 33 183 1 949 ( 1 535) ( 6 767) 26 830
Balance as at 31st December 2016 839 769 5 967 ( 8 529) ( 46 861) 790 346
Bonds and other fixed-income securitiesIssued by public entities 194 553 28 ( 7 899) - 186 682 Issued by other entities 279 134 159 ( 14 451) ( 22 796) 242 046
Shares 14 162 166 - ( 7 806) 6 522
Other variable-income securities 29 779 955 ( 1 847) ( 6 939) 21 948
Balance as at 31st December 2015 517 628 1 308 ( 24 197) ( 37 541) 457 198 (1) Acquisiton cost relating to shares and amortised cost relating to debt securities.
Cost (1)Fair value reserve
Impairment Book value
In accordance with the accounting policy described in Note 2.6, the Group regularly assesses whether there is objective evidence of impairment in the portfolio of available-for-sale financial assets, following the judgement criteria described in Note 3.1.

HAITONG BANK, S.A.
129
The movements associated with impairment losses of financial assets available-for-sale are presented as follows:
(thousand euros)
31.12.2016 31.12.2015
Opening balance 37 541 41 525 Allocation for the period 4 769 6 429 Utilisation during the period ( 385) ( 5 674)Write-back for the period - ( 497)Exchange differences and others 4 936 ( 4 242)
Closing balance 46 861 37 541
The heading of financial assets available-for-sale includes 335,964 thousand euros in securities pledged as collateral by the Group (100,224 thousand euros as at 31st of December 2015), see note 38.
As at 31 December 2016 and 2015, the analysis of available-for-sale financial assets by maturity period, is presented as follows:
(thousand euros)
31.12.2016 31.12.2015
Up to three months 539 921 150 608 From three months to one year 522 5 375 From one to five years 154 784 214 804 More than five years 61 695 57 941 Undetermined period 33 424 28 470
790 346 457 198
As at 31st of December 2016 and 2015, the heading of financial assets held-for-trading, concerning quoted and unquoted securities, is divided as follows:
(thousand euros)31.12.2016 31.12.2015
Quoted Unquoted Total Quoted Unquoted Total
SecuritiesBonds and other fixed-income securities
Issued by public entities 289 742 225 031 514 773 20 231 166 451 186 682 Issued by other entities 50 394 191 756 242 150 62 323 179 723 242 046 -
Shares 59 6 534 6 593 516 6 006 6 522 - Other variable-income securities 2 547 24 283 26 830 1 128 20 820 21 948
Total statement of financial position value 342 742 447 604 790 346 84 198 373 000 457 198
As at 31st of December 2016 and 2015, the exposure to the public debt of “peripheral” countries within the Euro Area is presented in Note 42.
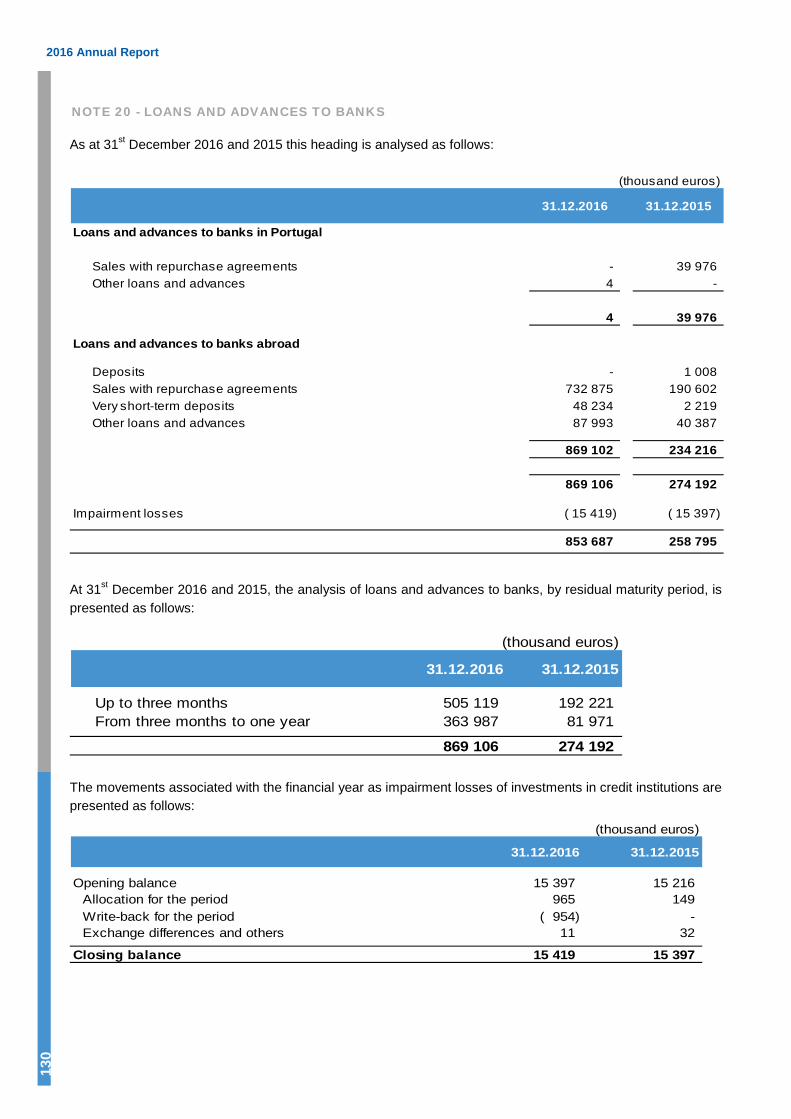
2016 Annual Report
130
NOTE 20 - LOANS AND ADVANCES TO BANKS
As at 31st December 2016 and 2015 this heading is analysed as follows:
(thousand euros)
31.12.2016 31.12.2015
Loans and advances to banks in Portugal
Sales with repurchase agreements - 39 976 Other loans and advances 4 -
4 39 976
Loans and advances to banks abroad
Deposits - 1 008 Sales with repurchase agreements 732 875 190 602 Very short-term deposits 48 234 2 219 Other loans and advances 87 993 40 387
869 102 234 216
869 106 274 192
Impairment losses ( 15 419) ( 15 397)
853 687 258 795
At 31st December 2016 and 2015, the analysis of loans and advances to banks, by residual maturity period, is presented as follows:
(thousand euros)
31.12.2016 31.12.2015
Up to three months 505 119 192 221 From three months to one year 363 987 81 971
869 106 274 192
The movements associated with the financial year as impairment losses of investments in credit institutions are presented as follows:
(thousand euros)
31.12.2016 31.12.2015
Opening balance 15 397 15 216 Allocation for the period 965 149 Write-back for the period ( 954) - Exchange differences and others 11 32
Closing balance 15 419 15 397
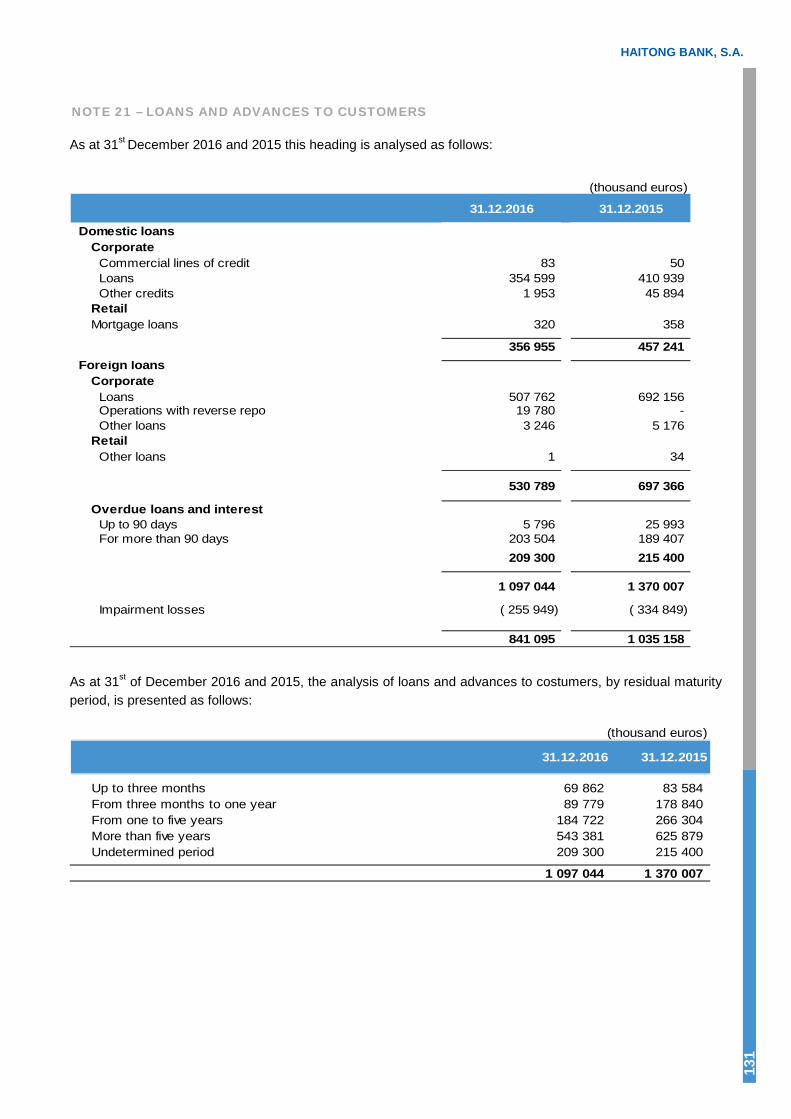
HAITONG BANK, S.A.
131
NOTE 21 – LOANS AND ADVANCES TO CUSTOMERS
As at 31st December 2016 and 2015 this heading is analysed as follows:
(thousand euros)
31.12.2016 31.12.2015
Domestic loansCorporate
Commercial lines of credit 83 50 Loans 354 599 410 939 Other credits 1 953 45 894
RetailMortgage loans 320 358
356 955 457 241 Foreign loans
CorporateLoans 507 762 692 156 Operations with reverse repo 19 780 - Other loans 3 246 5 176
RetailOther loans 1 34
530 789 697 366
Overdue loans and interestUp to 90 days 5 796 25 993 For more than 90 days 203 504 189 407
209 300 215 400
1 097 044 1 370 007
Impairment losses ( 255 949) ( 334 849)
841 095 1 035 158
As at 31st of December 2016 and 2015, the analysis of loans and advances to costumers, by residual maturity period, is presented as follows:
(thousand euros)
31.12.2016 31.12.2015
Up to three months 69 862 83 584 From three months to one year 89 779 178 840 From one to five years 184 722 266 304 More than five years 543 381 625 879 Undetermined period 209 300 215 400
1 097 044 1 370 007

2016 Annual Report
132
The movements in impairment losses in loans and advances to customers are as follows:
(thousand euros)
31.12.2016 31.12.2015
Opening balance 334 849 283 780 Allocation for the period 116 687 132 125 Utilisation during the period ( 135 623) ( 14 787)Write-back for the period ( 67 418) ( 65 711)Transfers 3 226 1 116 Exchange differences and others 4 228 ( 1 674)
Closing balance 255 949 334 849
As at 31st of December 2016 and 2015, impairment information is as follows:
(thousands euros)31.12.2016
Impairment calculated on an individual basis
Impairment calculated on a portfolio basis Total
Loan value Impairment Loan value Impairment Loan value Impairment Loans ( Net of impairment)
Corporate loans 510 554 246 410 586 123 9 534 1 096 677 255 944 840 733 Mortgage loans - - 320 5 320 5 315 Consumers loans - other - - 47 - 47 - 47
Total 510 554 246 410 586 490 9 539 1 097 044 255 949 841 095
(thousand euros)31.12.2015
Impairment calculated on an individual basis
Impairment calculated on a portfolio basis Total
Loan value Impairment Loan value Impairment Loan value Impairment Loans ( Net of impairment)
Corporate loans 565 608 324 341 804 007 10 503 1 369 615 334 844 1 034 771 Mortgage loans - - 358 5 358 5 353 Consumers loans - other - - 34 - 34 - 34
Total 565 608 324 341 804 399 10 508 1 370 007 334 849 1 035 158
The Group undertakes a renegotiation of a loan in order to maximise its recovery. A loan is renegotiated in accordance with selective criteria, based on the analysis of the overdue circumstances, or whether there is a high risk of the loan becoming overdue, in verifying that the customer has gone through reasonable effort in order to comply with the conditions agreed to upon contract and is also expected to meet the new terms. The renegotiation often includes the extension of maturity, alteration of the established payment term and/or amendments of the contracts’ covenants. If possible, the renegotiation is followed by the obtainment of new collaterals. The renegotiated loans are also subject of an impairment analysis resulting from the revaluation of the new cash flow expectation associated with the new contract conditions. These are updated with reference to the original effective interest rate, also taking the new presented collaterals into account.
As at 31st of December 2016, the gross loan includes an amount of 605,479 thousand euros of renegotiated loan (759,536 thousand euros as at 31st of December 2015).

HAITONG BANK, S.A.
133
As at 31st of December 2016, the impairment losses recognised in relation to the renegotiated loan in the balance-sheet amount to 245,982 thousand euros (324,914 thousand euros as at 31st December 2015). The interest recognised in the income statement amounts to 21,532 thousand euros (23,309 thousand euros as at 31st of December 2015).
Loan operations are collateralised in order to mitigate credit risk, namely mortgages or pledges. The fair-value of these collaterals is determined when lending credits, and is regularly revaluated.
The loan value and associated collaterals are as follows:
(thousand euros)31.12.2016 31.12.2015
Credit value
Fair value of the
collateral
Credit value
Fair value of the
collateralMortgage loans
Mortgages 320 1 219 358 1 219 320 1 219 358 1 219
Consumer loansUncollateralised 47 - 33 -
47 - 33 - Corporate loans
Mortgages 106 809 54 772 118 573 57 666 Pledge 11 428 9 830 13 318 8 325 Uncollateralised 978 440 - 1 237 725 -
1 096 677 64 602 1 369 616 65 991
Total 1 097 044 65 821 1 370 007 67 210
Loans and advances to customers by interest rate type are as follows:
(thousand euros)
31.12.2016 31.12.2015
Fixed rate 274 281 483 591 Variable rate 822 763 886 416
1 097 044 1 370 007
As at 31st of December 2016 and 2015, the exposure and established impairment detail is as follows:
(thousand euros)
SegmentTotal
exposurePerforming
creditOf which
curedOf which
restructuredNon-performing
creditOf which
restructured Total
ImpairmentPerforming
creditNon-performing
credit
Project Finance 652 719 517 613 - 122 683 135 106 135 106 ( 22 888) ( 4 747) ( 18 141)
Aquisition Finance 421 550 276 311 - 202 450 145 239 145 240 ( 232 452) ( 114 132) ( 118 320)
Others 22 775 22 775 - - - - ( 609) ( 609) -
Total 1 097 044 816 699 - 325 133 280 345 280 346 ( 255 949) ( 119 488) ( 136 461)
Exposure as at 31.12.2016 Impairment as at 31.12.2016
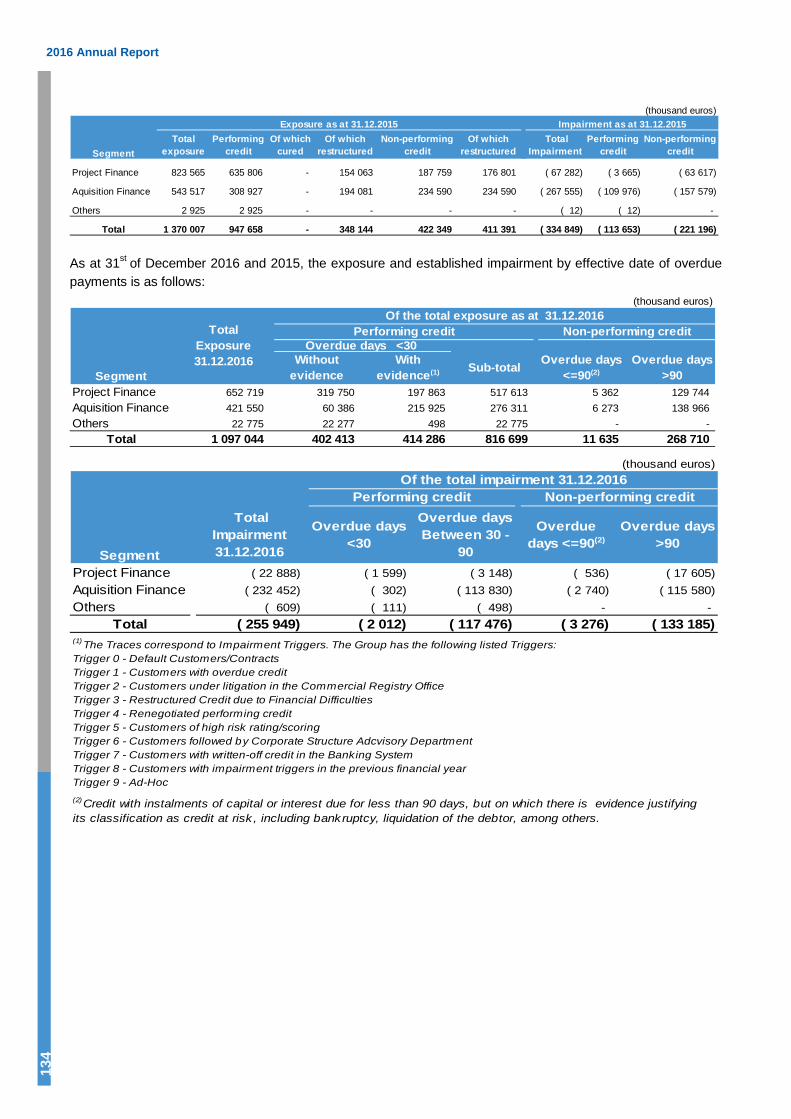
2016 Annual Report
134
(thousand euros)
SegmentTotal
exposurePerforming
creditOf which
curedOf which
restructuredNon-performing
creditOf which
restructured Total
ImpairmentPerforming
creditNon-performing
credit
Project Finance 823 565 635 806 - 154 063 187 759 176 801 ( 67 282) ( 3 665) ( 63 617)
Aquisition Finance 543 517 308 927 - 194 081 234 590 234 590 ( 267 555) ( 109 976) ( 157 579)
Others 2 925 2 925 - - - - ( 12) ( 12) -
Total 1 370 007 947 658 - 348 144 422 349 411 391 ( 334 849) ( 113 653) ( 221 196)
Exposure as at 31.12.2015 Impairment as at 31.12.2015
As at 31st of December 2016 and 2015, the exposure and established impairment by effective date of overdue payments is as follows:
(thousand euros)
SegmentWithout
evidenceWith
evidence(1) Sub-total Overdue days <=90(2)
Overdue days >90
Project Finance 652 719 319 750 197 863 517 613 5 362 129 744 Aquisition Finance 421 550 60 386 215 925 276 311 6 273 138 966 Others 22 775 22 277 498 22 775 - -
Total 1 097 044 402 413 414 286 816 699 11 635 268 710
Overdue days <30
Of the total exposure as at 31.12.2016Performing credit Non-performing creditTotal
Exposure 31.12.2016
(thousand euros)
Segment
Total Impairment 31.12.2016
Overdue days <30
Overdue days Between 30 -
90
Overdue days <=90(2)
Overdue days >90
Project Finance ( 22 888) ( 1 599) ( 3 148) ( 536) ( 17 605)Aquisition Finance ( 232 452) ( 302) ( 113 830) ( 2 740) ( 115 580)Others ( 609) ( 111) ( 498) - -
Total ( 255 949) ( 2 012) ( 117 476) ( 3 276) ( 133 185)
Of the total impairment 31.12.2016Performing credit Non-performing credit
(2)Credit with instalments of capital or interest due for less than 90 days, but on which there is evidence justifying its classification as credit at risk , including bankruptcy, liquidation of the debtor, among others.
(1)The Traces correspond to Impairment Triggers. The Group has the following listed Triggers:Trigger 0 - Default Customers/ContractsTrigger 1 - Customers with overdue creditTrigger 2 - Customers under litigation in the Commercial Registry OfficeTrigger 3 - Restructured Credit due to Financial DifficultiesTrigger 4 - Renegotiated performing creditTrigger 5 - Customers of high risk rating/scoringTrigger 6 - Customers followed by Corporate Structure Adcvisory DepartmentTrigger 7 - Customers with written-off credit in the Banking SystemTrigger 8 - Customers with impairment triggers in the previous financial year Trigger 9 - Ad-Hoc
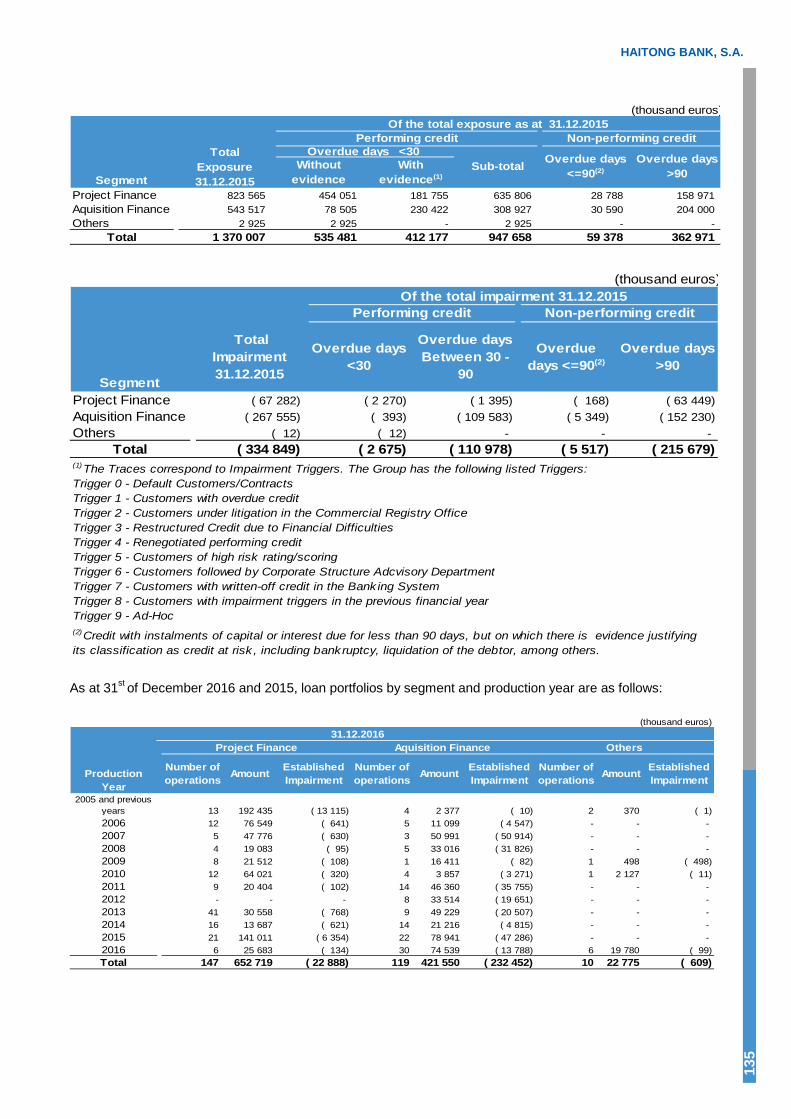
HAITONG BANK, S.A.
135
(thousand euros)Of the total exposure as at 31.12.2015
SegmentWithout
evidenceWith
evidence(1)
Project Finance 823 565 454 051 181 755 635 806 28 788 158 971 Aquisition Finance 543 517 78 505 230 422 308 927 30 590 204 000 Others 2 925 2 925 - 2 925 - -
Total 1 370 007 535 481 412 177 947 658 59 378 362 971
Performing credit Non-performing creditOverdue days <30
Sub-total Overdue days >90
Overdue days <=90(2)
Total Exposure 31.12.2015
(thousand euros)Of the total impairment 31.12.2015
Segment
Total Impairment 31.12.2015
Overdue days <30
Overdue days Between 30 -
90
Overdue days <=90(2)
Overdue days >90
Project Finance ( 67 282) ( 2 270) ( 1 395) ( 168) ( 63 449)Aquisition Finance ( 267 555) ( 393) ( 109 583) ( 5 349) ( 152 230)Others ( 12) ( 12) - - -
Total ( 334 849) ( 2 675) ( 110 978) ( 5 517) ( 215 679)(1)The Traces correspond to Impairment Triggers. The Group has the following listed Triggers:Trigger 0 - Default Customers/ContractsTrigger 1 - Customers with overdue creditTrigger 2 - Customers under litigation in the Commercial Registry OfficeTrigger 3 - Restructured Credit due to Financial DifficultiesTrigger 4 - Renegotiated performing creditTrigger 5 - Customers of high risk rating/scoringTrigger 6 - Customers followed by Corporate Structure Adcvisory DepartmentTrigger 7 - Customers with written-off credit in the Bank ing SystemTrigger 8 - Customers with impairment triggers in the previous financial year Trigger 9 - Ad-Hoc(2)Credit with instalments of capital or interest due for less than 90 days, but on which there is evidence justifying its classification as credit at risk , including bankruptcy, liquidation of the debtor, among others.
Performing credit Non-performing credit
As at 31st of December 2016 and 2015, loan portfolios by segment and production year are as follows:
(thousand euros)31.12.2016
Production Year
Number of operations Amount Established
ImpairmentNumber of operations Amount Established
ImpairmentNumber of operations Amount Established
Impairment
2005 and previous years 13 192 435 ( 13 115) 4 2 377 ( 10) 2 370 ( 1)2006 12 76 549 ( 641) 5 11 099 ( 4 547) - - - 2007 5 47 776 ( 630) 3 50 991 ( 50 914) - - - 2008 4 19 083 ( 95) 5 33 016 ( 31 826) - - - 2009 8 21 512 ( 108) 1 16 411 ( 82) 1 498 ( 498)2010 12 64 021 ( 320) 4 3 857 ( 3 271) 1 2 127 ( 11)2011 9 20 404 ( 102) 14 46 360 ( 35 755) - - - 2012 - - - 8 33 514 ( 19 651) - - - 2013 41 30 558 ( 768) 9 49 229 ( 20 507) - - - 2014 16 13 687 ( 621) 14 21 216 ( 4 815) - - - 2015 21 141 011 ( 6 354) 22 78 941 ( 47 286) - - - 2016 6 25 683 ( 134) 30 74 539 ( 13 788) 6 19 780 ( 99)Total 147 652 719 ( 22 888) 119 421 550 ( 232 452) 10 22 775 ( 609)
Project Finance Aquisition Finance Others

2016 Annual Report
136
(thousand euros)31.12.2015
Production Year
Number of operations Amount Established
ImpairmentNumber of operations Amount Established
ImpairmentNumber of operations Amount Established
Impairment2004 e anteriores 10 157 833 ( 789) 4 3 651 ( 19) 7 2 925 ( 12)
2005 3 10 430 ( 4 669) - - - - - - 2006 21 232 862 ( 59 087) 4 14 934 ( 534) - - - 2007 9 73 321 ( 795) 7 62 636 ( 57 529) - - - 2008 4 45 857 ( 229) 3 22 079 ( 9 466) - - - 2009 8 19 739 ( 99) 5 26 971 ( 8 766) - - - 2010 13 64 420 ( 322) 5 4 958 ( 3 299) - - - 2011 10 19 367 ( 97) 24 115 946 ( 87 020) - - - 2012 1 283 ( 116) 24 85 297 ( 47 745) - - - 2013 46 33 494 ( 173) 25 63 263 ( 17 044) - - - 2014 16 11 586 ( 110) 35 82 503 ( 17 242) - - - 2015 22 154 373 ( 796) 30 61 279 ( 18 891) - - - Total 163 823 565 ( 67 282) 166 543 517 ( 267 555) 7 2 925 ( 12)
Project Finance Aquisition Finance Others
As at 31st December 2016 and 2015, the gross credit exposure and impairment by segment, sector and geography are as follows:
a) By segment (thousand euros)
Exposure Impairment Exposure Impairment Exposure Impairment Exposure Impairment
AssessmentIndividual 181 862 ( 20 534) 334 559 ( 232 017) 498 ( 498) 516 919 ( 253 049)Collective 470 857 ( 2 354) 86 991 ( 435) 22 277 ( 111) 580 125 ( 2 900)
Total 652 719 ( 22 888) 421 550 ( 232 452) 22 775 ( 609) 1 097 044 ( 255 949)
31.12.2016Project Finance Aquisition Finance Others Total
(thousand euros)
Exposure Impairment Exposure Impairment Exposure Impairment Exposure Impairment
AssessmentIndividual 185 054 ( 64 089) 407 459 ( 266 875) 518 - 593 031 ( 330 964)Collective 638 511 ( 3 193) 136 058 ( 680) 2 407 ( 12) 776 976 ( 3 885)
Total 823 565 ( 67 282) 543 517 ( 267 555) 2 925 ( 12) 1 370 007 ( 334 849)
Project Finance Aquisition Finance Others Total31.12.2015
b) By sector
(thousand euros)
Business Sector Exposure Impairment Exposure Impairment Exposure Impairment Exposure ImpairmentFinancial activities 114 767 ( 107 936) 75 965 ( 380) 121 380 ( 98 273) 27 705 ( 139)Construction and Public Works 102 952 ( 24 615) 25 686 ( 128) 57 189 ( 19 229) 139 721 ( 699)Energy 75 333 ( 12 958) 174 850 ( 874) 25 914 ( 11 390) 241 906 ( 1 210)Transport Infrastructures 13 785 ( 6 570) 155 775 ( 779) 23 765 ( 4 788) 173 106 ( 866)Transport and Communications 30 486 ( 8 552) 11 817 ( 59) 25 088 ( 1 088) 28 609 ( 143)Other Industrial Sectors 47 192 ( 24 536) 23 619 ( 118) 55 392 ( 13 653) 34 176 ( 169)Real Estate Development 9 366 ( 3 607) 588 ( 3) 63 176 ( 55 466) 12 784 ( 64)Services 82 922 ( 47 628) 8 874 ( 44) 126 438 ( 74 670) 13 832 ( 69)Commerce - - 69 910 ( 350) 50 490 ( 18 829) 33 024 ( 165)Other Sectors 40 116 ( 16 647) 33 041 ( 165) 44 199 ( 33 578) 72 113 ( 361)
Total 516 919 ( 253 049) 580 125 ( 2 900) 593 031 ( 330 964) 776 976 ( 3 885)
31.12.2016 31.12.2015Assessment Assessment
Individual Collective Individual Collective

HAITONG BANK, S.A.
137
c) By geography
(thousand euros)
Geography Exposure Impairment Exposure Impairment Exposure Impairment Exposure ImpairmentPortugal 154 138 ( 95 957) 327 858 ( 1 639) 245 454 ( 108 456) 337 938 ( 1 690)Spain 188 667 ( 139 584) 153 234 ( 766) 296 049 ( 210 258) 144 642 ( 723)Brazil 110 883 ( 7 375) 30 924 ( 155) 45 974 ( 8 245) 138 862 ( 694)Mexico - - - - - - 54 681 ( 273)USA 56 866 ( 4 829) 42 305 ( 211) - - 65 104 ( 326)United Kingdom - - - - 33 - 28 233 ( 141)Poland 6 365 ( 5 304) 25 804 ( 129) 5 521 ( 4 005) 7 516 ( 38)
Total 516 919 ( 253 049) 580 125 ( 2 900) 593 031 ( 330 964) 776 976 ( 3 885)
31.12.2016 31.12.2015Assessment Assessment
Individual Collective Individual Collective
As at 31st of December 2016 and 2015, the inflows and outflows of the restructured loan portfolio was as follows:
(thousand euros)
31.12.2016 31.12.2015
Opening balance of the portfolio of the restructured (impairment gross) 759 535 774 323 Restructured Credits in the period 49 563 135 527 Accrued interest of the restructured portfolio 3 368 ( 3 250)Restructured credit liquidation (partial or total) ( 151 502) ( 150 298)Credit sales ( 75 650) ( 36 137)Others 20 165 39 370 Final balance of the restructured portfolio (gross of impairment) 605 479 759 535
Haitong Bank uses internal rating systems in order to assist the monitoring of the credit risk. The average credit risk profile remained similar to the previous year.
December 2016 December 2015
[aaa; a-] 0% 1%
[bbb+; bbb-] 5% 10%
[bb+; bb-] 50% 37%
[b+; b-] 31% 44%
[ccc+; lccc] 15% 8%
Note: as a percentage of the portfolio not default with credit ratings.

2016 Annual Report
138
NOTE 22 – RISK MANAGEMENT DERIVATIVES
As at 31st of December 2016 and 2015, the hedging derivatives in the statement of financial position are analysed as follows:
(thousand euros)
31.12.2016 31.12.2015
Derivatives for risk management purposes (assets)Interest-rate contracts 13 329 8 624 Equity / Index contracts 384 847 Other contracts 4 560 5 765
18 273 15 236 Derivatives for risk management purposes (liabilities)
Interest-rate contracts 12 760 10 471 Equity / Index contracts 14 122 22 803 Other contracts 6 025 83 123
32 907 116 397 ( 14 634) ( 101 161)
Risk Management Derivatives heading comprises the derivatives acquired for economic hedge of specific financial assets and liabilities designated at fair-value through profit and loss (and which were not designated as hedging derivatives).
a) Other risk management derivatives
Other risk management derivatives include risk management instruments associated with specific financial assets and liabilities designated at fair-value through profit and loss in accordance with the accounting policy described in Notes 2.4, 2.6 and 2.8 and that the Group did not assign to hedge accounting.
As at 31st of December 2016 and 2015, the hedging operations can be analysed as follows:
(thousand euros)
Derivative Associated liability
Sell Buy
Debt securities issued Credit Default Swap 206 071 - ( 1 605) ( 41 528) ( 18 775) 38 245 214 574 201 942 Debt securities issued Equity Swap 97 808 97 808 ( 13 738) 8 977 9 868 ( 6 753) 79 825 96 605 Debt securities issued Interest Rate Swap 171 576 172 693 569 ( 7 744) ( 661) ( 1 657) 18 343 19 521 Debt securities issued Equity Option - 1 433 140 ( 757) ( 166) 966 1 473 1 452
475 455 271 934 ( 14 634) ( 41 052) ( 9 734) 30 801 314 215 319 520
Financial liabilities economically hedged
Derivative Instrument
31.12.2016
Notional Fair Value
Fair value changes in the period
Fair Value
Fair value changes in the period
Book valueReimbursement amount at the
maturity
(thousand euros)
Notional Fair value
Fair value changes in the period
Fair value
Fair value changes in the period
Book value
Reimbursement amount at the
maturity
Debt securities issued Credit Default Swap 391 482 ( 78 437) ( 78 990) 61 176 81 246 311 694 372 868 Debt securities issued Equity Swap 135 872 ( 21 956) ( 21 912) 17 697 7 434 111 734 129 431 Debt securities issued Interest Rate Swap 190 418 ( 1 848) 942 ( 1 640) ( 103) 31 444 29 804 Debt securities issued Fx Option 1 800 - ( 81) 20 ( 47) 1 719 1 739 Debt securities issued Equity Option 11 460 1 080 ( 18) ( 819) ( 662) 10 369 9 550
731 032 ( 101 161) ( 100 059) 76 434 87 868 466 960 543 392
Associated liabilityDerivative
Hedged item Derivative Instrument
31.12.2015

HAITONG BANK, S.A.
139
The fair-value component of financial liabilities recognised at fair-value through profit and loss referable to the Group´s own credit risk is positive and the corresponding accumulated value as at 31st of December 2016 amounts to 2 110 thousand euros (31st of December 2015: positive in 365 thousand euros).
The operations with risk management derivatives as at 31st of December 2016 and 2015 can be analysed by maturity as follows:
(thousand euros)31.12.2016
Other derivatives
Sell Buy
Up to three months 21 807 21 807 ( 774)From three months to one year 22 498 23 931 ( 3 600)From one to five years 427 725 222 771 ( 11 317)More than five years 3 425 3 425 1 057
475 455 271 934 ( 14 634)
Fair ValueNotional
(thousand euros)31.12.2016
Other derivatives
Sell Buy
Up to three months 17 770 21 791 629 From three months to one year 70 844 36 370 ( 10 411)From one to five years 569 897 255 058 ( 90 514)More than five years 61 061 27 166 ( 865)
719 572 340 385 ( 101 161)
Fair ValueNotional
NOTE 23 - NON-CURRENT ASSETS HELD-FOR-SALE
As at 31st December 2016 and 2015 this heading is analysed as follows:
(thousand euros)
31.12.2016 31.12.2015
Subsidiaries acquired exclusively for resale purposes 3 600 3 600 3 600 3 600
Non-current assets held-for-sale include the assets of subsidiaries acquired for resale concerning to companies controlled by the Group but acquired exclusively for the purpose of resale in the short-term.
The Group has introduced a plan for immediate sale of subsidiaries held-for-sale. However, due to current market conditions it has been impossible to carry out the disposals within the previously estimated deadline. The Group continues all its efforts in order to achieve the established disposal plan.
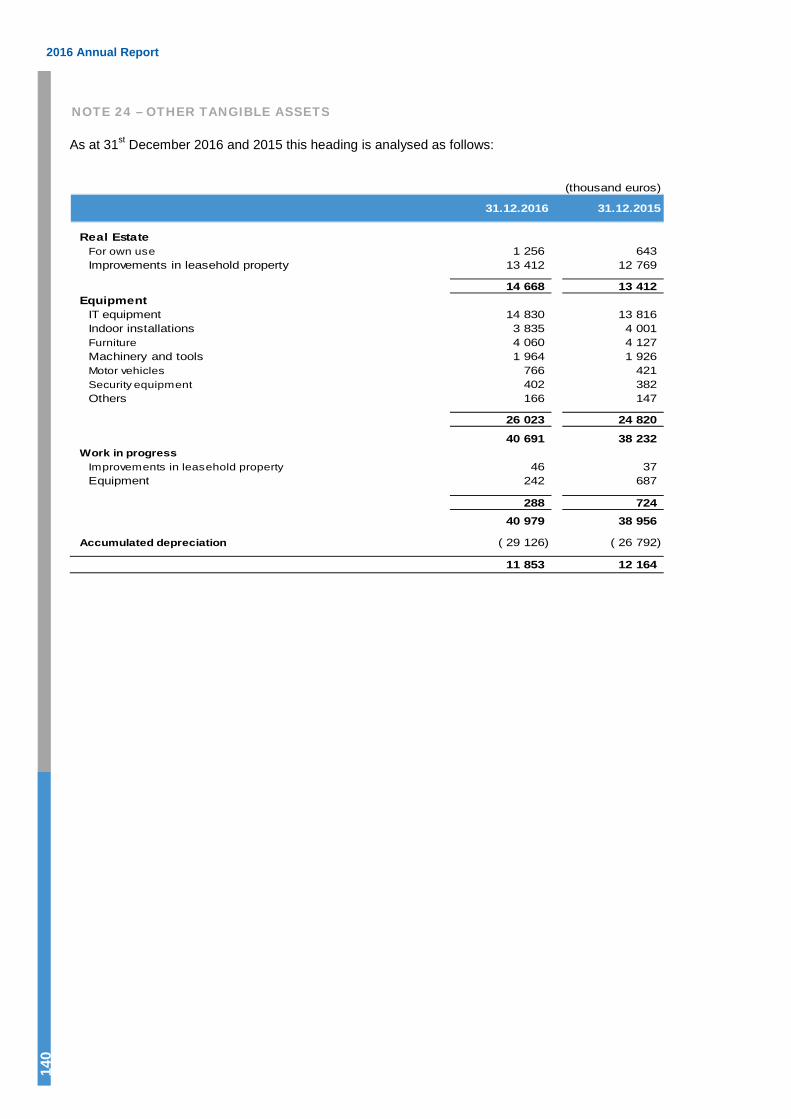
2016 Annual Report
140
NOTE 24 – OTHER TANGIBLE ASSETS
As at 31st December 2016 and 2015 this heading is analysed as follows:
(thousand euros)
31.12.2016 31.12.2015
Real EstateFor own use 1 256 643 Improvements in leasehold property 13 412 12 769
14 668 13 412 Equipment
IT equipment 14 830 13 816 Indoor installations 3 835 4 001 Furniture 4 060 4 127 Machinery and tools 1 964 1 926 Motor vehicles 766 421 Security equipment 402 382 Others 166 147
26 023 24 820
40 691 38 232 Work in progress
Improvements in leasehold property 46 37 Equipment 242 687
288 724 40 979 38 956
Accumulated depreciation ( 29 126) ( 26 792)
11 853 12 164

HAITONG BANK, S.A.
141
The movement in this heading was as follows:
(thousand euros)
Real estate Equipment Fixed asset in progress Total
Acquisition cost
Balance as at 31st December 2014 13 938 25 392 362 39 692 Acquisitions 242 576 687 1 505 Write-offs / sales ( 18) ( 465) - ( 483)Transfers - 22 - 22 Exchange variation and other movements ( 750) ( 705) ( 325) ( 1 780)
Balance as at 31st December 2015 13 412 24 820 724 38 956 Acquisitions 1 408 2 230 728 4 366 Write-offs / sales ( 642) ( 1 309) ( 177) ( 2 128)Transfers 64 452 ( 486) 30 Exchange variation and other movements 426 ( 170) ( 501) ( 245)
Balance as at 31st December 2016 14 668 26 023 288 40 979
Depreciations
Balance as at 31st December 2014 6 702 17 497 - 24 199 Depreciations of the financial year 1 117 3 035 - 4 152 Write-offs / sales ( 18) ( 403) - ( 421)Exchange variation and other movements ( 701) ( 437) - ( 1 138)
Balance as at 31st December 2015 7 100 19 692 - 26 792 Depreciations of the financial year 1 087 2 443 - 3 530 Write-offs / sales ( 264) ( 1 002) - ( 1 266)Exchange variation and other movements 75 ( 5) - 70
Balance as at 31st December 2016 7 998 21 128 - 29 126
Net book value as at 31st December 2016 6 670 4 895 288 11 853
Net book value as at 31st December 2015 6 312 5 128 724 12 164
NOTE 25 – INTANGIBLE ASSETS
As at 31st December 2016 and 2015 this heading is analysed as follows:
(thousand euros)
31.12.2016 31.12.2015
Goodwill 9 859 11 063
Purchased from third partiesSoftware 35 950 30 286 Others 916 916
36 866 31 202
Work in progress 1 343 4 458
48 068 46 723
Accumulated amortisation (22 055) (19 722)Impairment losses - ( 722)
(22 055) (20 444)
26 013 26 279

2016 Annual Report
142
Goodwill is registered in accordance with the accounting policy described in Note 2.2, and analysed as follows:
(thousand euros)
31.12.2016 31.12.2015
Subsidiaries
Haitong Capital - Sociedade de Capital de Risco, S.A. 9 859 9 858 Other - 1 205
9 859 11 063
Impairment losses - ( 722)
9 859 10 341
Annually, the Bank analyses the goodwill impairment in accordance with IAS 36 - Impairment of Assets.
The recoverable amount of Haitong Capital – Sociedade de Capital de Risco, S.A. was determined based on the discounted cash-flows method based on (i) the business plan of the company for the next 6 years and (ii) a discount rate of 13.7%. Based on these assumptions, the Board of Directors determined that the recognition of impairment regarding the Goodwill of this company as at 31st of December 2016 shall not be included.
Nonetheless, the undertaken analysis based on the described assumptions, the recoverable amount of the investment in Haitong (UK) Limited, depends on the company and the Group's ability to carry out measures deemed necessary in order to achieve the business plan. The Bank carried out an analysis in order to determine the level of implementation of the business plan that would imply that the estimated recoverable amount of Haitong Capital would be equivalent to the corresponding balance-sheet value. It was concluded that this shall be the case if the business plan is only achieved by 80%.

HAITONG BANK, S.A.
143
The movement in this heading was as follows:
(thousand euros)
Goodwill Software Other fixed assets
Fixed assets in progress Total
Acquisition cost
Balance as at 31st December 2014 64 032 26 309 916 6 033 97 290 Acquisitions:
Purchased from third parties - 1 167 - 2 573 3 740 Write-offs / sales - ( 229) - - ( 229)Charge off (55 752) - - - (55 752)Transfers - 3 098 - (3 120) ( 22)Exchange rate variation and other movements 2 783 ( 59) - (1 028) 1 696
Balance as at 31st December 2015 11 063 30 286 916 4 458 46 723 Acquisitions:
Purchased from third parties - 1 360 - 1 259 2 619 Write-offs / sales - ( 64) - ( 96) ( 160)Transfers - 4 750 - (4 780) ( 30)Exchange rate variation and other movements 310 ( 382) - 502 430
Balance as at 31st December 2016 9 859 35 950 916 1 343 48 068
Deprciations
Balance as at 31st December 2014 - 16 660 916 - 17 576
Deprciations of the financial year - 2 458 - - 2 458 Write-offs / sales - ( 255) - - ( 255)Exchange rate variation and other movements - ( 57) - - ( 57)
Balance as at 31st December 2015 - 18 806 916 - 19 722
Deprciations of the financial year - 2 885 - - 2 885 Write-offs / sales - ( 64) - - ( 64)Exchange rate variation and other movements - ( 488) - - ( 488)
Balance as at 31st December 2016 - 21 139 916 - 22 055
Balance as at 31st December 2014 2 318 - - - 2 318
Impairment losses 54 282 - - - 54 282 Charge off (55 752) - - - (55 752)Exchange rate variation and other movements ( 126) - - - ( 126)
Balance as at 31st December 2015 722 - - - 722
Impairment losses 539 - - - 539 Charge off (1 514) - - - (1 514)Exchange rate variation and other movements 253 - - - 253
Balance as at 31st December 2016 - - - - -
Net balance as at 31st December 2016 9 859 14 811 - 1 343 26 013
Net balance as at 31st December 2015 10 341 11 480 - 4 458 26 279
NOTE 26 – INVESTMENTS IN ASSOCIATED COMPANIES
Financial information regarding associated companies is presented in the following table:
(thousand euros)
Liabilities Equity Income Net income
31.12.2016 31.12.2015 31.12.2016 31.12.2015 31.12.2016 31.12.2015 31.12.2016 31.12.2015 31.12.2016 31.12.2015
Fundo Espírito Santo IBERIA I 7 703 12 606 116 134 7 587 12 472 1 719 592 487 ( 1 702)
Salgar Investments 45 971 43 509 13 322 11 951 32 649 31 558 28 415 31 482 1 644 410
Assets

2016 Annual Report
144
(thousand euros)
% held
31.12.2016 31.12.2015 31.12.2016 31.12.2015 31.12.2016 31.12.2015 31.12.2016 31.12.2015
Fundo Espírito Santo IBERIA I 5 098 6 845 46% 46% 3 824 6 068 224 ( 782)Salgar Investments 8 173 8 173 25% 25% 8 173 8 173 - - Other 738 1 238 - - 524 1 906 ( 58) ( 361)
14 009 16 256 12 521 16 147 166 ( 1 143)
Impairment ( 5 930) ( 5 804)
6 591 10 343
Aquisition cost Book ValueNet income from the
associated companies attributable to the Group
The movement of this heading is as follows: (thousand euros)
31.12.2016 31.12.2015
Opening balance 10 343 26 878 Disposals and other reimbursements ( 2 806) ( 15 738)Net Income from associated companies 166 ( 1 143)Other comprehensive income from associates ( 721) 346 Impairment of the financial year ( 126) - Change of the consolidation perimeter ( 265) -
Closing balance 6 591 10 343
NOTE 27 – OTHER ASSETS
As at 31st of December 2016 and 2015 the Other Assets heading is analysed as follows:
(thousand euros)
31.12.2016 31.12.2015
Debtors and other assets Collateral deposited under collateral agreements 173 537 286 541 Supplies, supplementary capital instalments and subordinated assets 226 205 Public sector 44 331 28 491 Deposits placed under margin accounts (futures contracts) 11 844 17 051 Other sundry debtors 23 677 39 789
253 615 372 077 Impairment losses for debtors and other investments ( 13 808) ( 13 107)
239 807 358 970 Other assetsGold, other precious metals, numismatic, medalsand other liquid assets 23 690 6 963 Other assets 14 744 5 880
38 434 12 843
Income receivable - 298
Prepayments and deferred costs 6 293 6 006
Other sundry assetsExchange transactions pending settlement 2 531 6 354 Market securities transactions pending settlement 47 357 225 328 Other transactions pending settlement 75 244 17 116
125 132 248 798
409 666 626 915

HAITONG BANK, S.A.
145
Stock exchange transactions pending settlement refer to transactions with securities recorded at the trade date pending settlement, in accordance with the accounting policy described in Note 2.6.
At 31 December 2016, the balance of other operations to be settled includes the amount of 30,372 thousand euros related to receivables from sales of credit operations.
The movements associated with impairment losses in Other Assets are presented as follows:
(thousand euros)
31.12.2016 31.12.2015
Opening balance 13 107 15 701 Charge for the period 6 750 11 053 Charge off ( 1 127) ( 746)Reversals ( 6 184) ( 11 558)Transfers 971 ( 1 116)Exchange differences and others 291 ( 227)
Closing balance 13 808 13 107
NOTE 28 – RESOURCES OF CENTRAL BANKS
This heading includes a transaction of Interbank Money Market with the Bank of Portugal in the amount of 60,000 thousand euros (31st of December 2015: 61,100 thousand euros) and without accrued interest to date (31st of December 2015: 39 thousand euros), with maturity in September 2018.
NOTE 29 – RESOURCES OF OTHER CREDIT INSTITUTIONS
The deposits from other credit institutions heading is presented as follows:
(thousand euros)
31.12.2016 31.12.2015
DomesticInterbank money market 51 497 - Very-short term resources 12 809 - Deposits 1 884 337 Repurchase agreements 13 757 15 215 Other resources 7 -
79 954 15 552 Abroad
Deposits - 30 Loans 948 500 750 000 Repurchase agreements 874 296 805 057 Other resources 71 419 61 883
1 894 215 1 616 970
1 974 169 1 632 522

2016 Annual Report
146
As at 31st December 2016 and 2015, the analysis of deposits from other credit institutions by residual maturity period is as follows:
(thousand euros)
31.12.2016 31.12.2015
Up to three months 1 055 579 807 178 From three months to one year 39 - From one to five years 861 317 770 970 More than five years 57 234 54 374
1 974 169 1 632 522
NOTE 30 – RESOURCES OF CUSTOMERS
The balance of the resources of customers heading is composed, with regard to its nature, as follows:
(thousand euros)
31.12.2016 31.12.2015
Repayable on demand Demand deposits 19 469 9 349
Time deposits Fixed-term deposits 682 366 426 845
Other resources Repurchase agreements 32 285 129 053 Loans - 486 Other Deposits 1 580 1 291 Other 8 14
33 873 130 844
735 708 567 038
As at 31st December 2016 and 2015, the analysis of due to customers by residual maturity period is as follows:
(thousand euros)
31.12.2016 31.12.2015
Demand deposits 19 477 9 548 Fixed-term depositsUp to 3 months 215 607 228 236 3 to 12 months 346 326 218 649 1 to 5 years 151 280 110 605 More than 5 years 3 018 -
716 231 557 490
735 708 567 038

HAITONG BANK, S.A.
147
NOTE 31 – DEBT SECURITIES ISSUED
The debt securities issued heading can be divided as follows:
(thousand euros)
31.12.2016 31.12.2015
Euro Medium Term Notes 316 369 483 238 Other Bonds 25 198 64 028
341 567 547 266
The fair-value of the portfolio regarding debt securities issued is presented in Note 40.
This heading includes 314,215 thousand euros (31st of December 2015: 466,960 thousand euros) of liabilities accounted for in the statement of financial position at fair-value through profit and loss (see Note 22).
During the 2016 financial year, the Haitong Bank Group issued securities amounting to 31,141 thousand euros (31st of December 2015: 115,777 thousand euros), where 200,893 thousand euros were reimbursed (31st of December 2015: 547,980 thousand euros). Additionally, the profit produced by the revaluation of liabilities amounted to 31,547 thousand euros (see Note 7). As at 31st of December 2016 and 2015, the residual duration of the debt securities issued is as follows:
(thousand euros)
31.12.2016 31.12.2015
Up to three months 20 731 32 548 From three months to one year 23 907 109 010 From one to five years 295 872 339 706 More than five years 1 057 66 002
341 567 547 266

2016 Annual Report
148
The main characteristics of the outstanding debt securities issued are as follows:
(thousand euros)
Issuer Designation Currency Issue Date Book Value Maturity Interest Rate
HT_BR LF LETRA FINANCEIRA IPCA LF IPCA BRINTLLFI138 BRL 2013 2 312 2018 IPCA 100% + 6,00%HT_BR LF LETRA FINANCEIRA BES INVESTIMENTO BRINTLLFI195 BRL 2013 89 2017 CDI 118%HT_BR LF LETRA FINANCEIRA BES INVESTIMENTO BRINTLLFI1A6 BRL 2014 399 2018 CDI 118%HT_BR LF LETRA FINANCEIRA BES INVESTIMENTO BRINTLLFI1B4 BRL 2014 690 2018 IPCA 100% + 8,25%HT_BR LF LETRA FINANCEIRA BES INVESTIMENTO BRINTLLFI1C2 BRL 2014 111 2018 CDI 118%HT_BR LF LETRA FINANCEIRA BES INVESTIMENTO BRINTLLFI1D0 BRL 2014 177 2018 CDI 118%HT_BR LF LETRA FINANCEIRA BES INVESTIMENTO BRINTLLFI1E8 BRL 2014 305 2017 CDI 117%HT_BR LF LETRA FINANCEIRA BES INVESTIMENTO BRINTLLFI1G3 BRL 2014 431 2017 CDI 117,5%HT_BR LF LETRA FINANCEIRA BES INVESTIMENTO BRINTLLFI1I9 BRL 2014 213 2017 CDI 117%HT_BR LF LETRA FINANCEIRA BES INVESTIMENTO BRINTLLFI1L3 BRL 2015 138 2018 CDI 111,5%HT_BR LF LETRA FINANCEIRA BES INVESTIMENTO BRINTLLFI1M1 BRL 2015 320 2017 CDI 114%HT_BR LF LETRA FINANCEIRA BES INVESTIMENTO BRINTLLFI1N9 BRL 2015 3 496 2017 CDI 100% + 2,10%HT_BR LF LETRA FINANCEIRA HAITONG BRINTLLFI1O7 BRL 2016 322 2018 CDI 114%HT_BR LF LETRA FINANCEIRA HAITONG BRINTLLFI1P4 BRL 2016 115 2018 CDI 114%HT_BR LF LETRA FINANCEIRA BES INVESTIMENTO BRINTLLFI1Q2 BRL 2016 632 2018 CDI 113%HT_BR LF LETRA FINANCEIRA BES INVESTIMENTO BRINTLLFI1R0 BRL 2016 786 2018 CDI 113%HT_BR LF LETRA FINANCEIRA BES INVESTIMENTO BRINTLLFI1S8 BRL 2016 3 080 2018 CDI 113%HT_BR LF LETRA FINANCEIRA HAITONG BRINTLLFI1T6 BRL 2016 61 2018 CDI 113%HT_BR LF LETRA FINANCEIRA HAITONG BRINTLLFI1U4 BRL 2016 307 2018 CDI 113%HT_BR LF LETRA FINANCEIRA BES INVESTIMENTO BRINTLLFI1V2 BRL 2016 1 344 2018 CDI 113%HT_BR LF LETRA FINANCEIRA BES INVESTIMENTO BRINTLLFI1W0 BRL 2016 209 2018 CDI 112%HT_BR LF LETRA FINANCEIRA HAITONG BRINTLLFI1X8 BRL 2016 88 2018 CDI 112%HT_BR LF LETRA FINANCEIRA BES INVESTIMENTO BRINTLLFI1Y6 BRL 2016 585 2018 CDI 112%HT_BR LF LETRA FINANCEIRA HAITONG BRINTLLFI1Z3 BRL 2016 4 386 2018 CDI 112,5%HT_BR LF LETRA FINANCEIRA BES INVESTIMENTO BRINTLLFI203 BRL 2016 1 169 2018 CDI 112%HT_BR COE BRINTLOE0031 BRL 2016 227 2017 PRÉ 14,80%HT_BR COE BRINTLOE0064 BRL 2016 413 2017 PRÉ 14,57%HT_BR COE BRINTLOE0072 BRL 2016 651 2017 PRÉ 14,26%HT_BR COE BRINTLOE0080 BRL 2016 711 2017 PRÉ 14,86%HT_BR COE BRINTLOE00A9 BRL 2016 171 2017 PRÉ 14,71%HT_BR COE BRINTLOE00B7 BRL 2016 101 2017 PRÉ 14,71%HT_BR COE BRINTLOE00C5 BRL 2016 491 2017 PRÉ 13,43%HT_BR COE BRINTLOE00D3 BRL 2016 81 2017 PRÉ 13,69%HT_BR COE BRINTLOE00E1 BRL 2016 587 2017 PRÉ 13,20%HTIIP PLC ESIP CALL RANGE ACCRUAL NOV2017 EUR 2005 2 152 2017 Range accrual HTIIP PLC ESIP JAN2017 INDEX BASKET LKD a) EUR 2007 7 181 2017 b)HTIIP PLC ESIP FIXED AMOUNT + AMORT NOV22 a) EUR 2009 1 057 2022 Fixed AmountsHTIIP PLC ESIP UTILIT FINANCIALS SHS DEC18 a) EUR 2011 1 758 2018 c)HTIIP PLC ESIP UTILITIES SHS DEC2018 a) EUR 2011 445 2018 d)HTIIP PLC ESIP PORTUGUESE REP CLN DEC2021 a) EUR 2011 34 902 2021 6% + Republica Portuguesa CLNHTIIP PLC ESIP EMPRES CHINESAS FEB2017 EQL a) EUR 2012 960 2017 e)HTIIP PLC ESIP APR2019 RECOV BASKET LINKED a) EUR 2012 71 2019 f)HTIIP PLC ESIP APR2020 BES PROTECCAO LKD a) EUR 2012 656 2020 Inflation LinkedHTIIP PLC ESIP EUR BRL SEP2017 a) EUR 2012 2 428 2017 EUR/BRL LinkedHTIIP PLC ESIP BRAZILIAN NOTES IV OCT2017 a) EUR 2012 1 211 2017 EUR/BRL LinkedHTIIP PLC ESIP BASKET OCT2019 EQL2 a) EUR 2012 1 550 2019 REP e BSCH LinkedHTIIP PLC ESIP AUTOCALL JAN20 EQL a) EUR 2013 494 2020 g)HTIIP PLC ESIP 4Y AUTOCALL FEB2017 EQL a) EUR 2013 8 140 2017 h)HTIIP PLC ESIP TURKISH LIRA FXL MAR2018 a) EUR 2013 1 213 2018 EUR/TRY LinkedHTIIP PLC ESIP CLN GALP MAR2018 a) EUR 2013 4 212 2018 EUR GALP CLN LinkedHTIIP PLC ESIP USD CLN GALP MAR2018 a) USD 2013 5 747 2018 USD GALP CLN LinkedHTIIP PLC ESIP MAY18 BULLISH ES AFRICA LKD a) EUR 2013 1 243 2018 Espirito Santo Africa LinkedHTIIP PLC ESIP 4Y LEVERAGE EURIBOR AUG2017 a) EUR 2013 2 200 2017 j)HTIIP PLC ESIP USD TARN USDTRY JUL2018 a) USD 2013 252 2018 k)HTIIP PLC ESIP CLN TELECOM ITALIA SEP2018 a) EUR 2013 12 862 2018 5.90% + Telecom Italia CLNHTIIP PLC ESIP CLN THYSSENKRUPP SEP2018 a) EUR 2013 10 638 2018 5.50% + THYSSENKRUPP CLNHTIIP PLC ESIP CLN THYSSENKRUPP DEC18 a) EUR 2013 4 633 2018 5.5% + Thyssenkrupp CLNHTIIP PLC ESIP CLN BRITISH AIRWAYS DEC18 a) EUR 2013 7 391 2018 6% + British Airw ays CLNHTIIP PLC ESIP CLN COMPORTA OCT2020 a) EUR 2013 0 2020 m)HTIIP PLC ESIP 4Y BULLISH EUROSTOX NOV2017 a) EUR 2013 1 473 2017 Indexado ao indice SX5EHTIIP PLC ESIP EUR 6Y CLN EDP DEC19 a) EUR 2013 704 2019 6.25% + EDP CLNHTIIP PLC ESIP CLN BRITISH AIR DEC18 a) EUR 2013 1 753 2018 5.35% + British Airw ays CLNHTIIP PLC ESIP EUR 6Y CLN BKT 0 REC DEC19 a) EUR 2013 647 2019 7.15% + n)HTIIP PLC ESIP 5Y AIR FRANCE CLN MAR2019 a) EUR 2014 1 062 2019 6.25% + Air France CLNHTIIP PLC ESIP 3Y AC WO SANT. TELEF. JAN17 a) EUR 2014 1 052 2017 l)HTIIP PLC ESIP EUR 6Y CLN BKT 0 RECO DEC19 a) EUR 2014 782 2019 6.1% + r)HTIIP PLC ESIP 3Y AUTOCALL FEB2017 EQL a) EUR 2014 1 854 2017 p)HTIIP PLC ESIP 5Y FTD EUROPE MAR2019 a) EUR 2014 9 024 2019 6% + q)HTIIP PLC ESIP 3Y AC WO BANKS JAN2017 a) EUR 2014 967 2017 o)HTIIP PLC ESIP 5Y CLN BRISA MAR2019 a) EUR 2014 7 838 2019 5.65% + Brisa CLNHTIIP PLC ESIP 6Y CLN BASKET 0 REC MAR20 a) EUR 2014 309 2020 5.5% + q)HTIIP PLC ESIP APR2019 PT EDP GALP LINKED a) EUR 2014 4 176 2019 v)HTIIP PLC ESIP PT EDP GALP LINKED APR17 a) EUR 2014 1 933 2017 u)HTIIP PLC ESIP PT EDP GALP LINKED APR17 5 a) USD 2014 532 2017 u)HTIIP PLC ESIP 7Y SAN GDF SANOFI LKD APR21 a) EUR 2014 403 2021 ab)
31.12.2016

HAITONG BANK, S.A.
149
(thousand euros)
Issuer Designation Currency Issue Date Book Value Maturity Interest Rate
HTIIP PLC ESIP 7Y SAN GDF LINKED APR21 2 a) EUR 2014 355 2021 5.5% + t)HTIIP PLC ESIP 5Y CLN BASKET JUN2019 4 a) EUR 2014 2 940 2019 6% + y)HTIIP PLC ESIP 5Y CLN PETROBRAS JUN2019 7 a) EUR 2014 6 330 2019 4.75% + Petrobras CLNHTIIP PLC ESIP APR2019 PT EDP GALP LINKED6 a) EUR 2014 4 521 2019 v)HTIIP PLC ESIP APR2019 PT EDP GALP LINKED7 a) EUR 2014 3 775 2019 v)HTIIP PLC ESIP 3Y IBEX PSI20 LINKED APR17 a) EUR 2014 1 057 2017 i)HTIIP PLC ESIP MAY2019 PT EDP GALP LINKED a) EUR 2014 4 091 2019 u)HTIIP PLC ESIP 5Y CLN BASKET JUN2020 5 a) EUR 2014 99 2020 6.75% + z)HTIIP PLC ESIP MAY19 BASKET LKD a) EUR 2014 4 506 2019 ac)HTIIP PLC ESIP MAY19 PSI IBEX FTSEMIB LKD a) EUR 2014 4 631 2019 ad)HTIIP PLC ESIP 5Y CLN PETROBRAS USD JUN19 a) USD 2014 915 2019 5.15% + Petrobras CLNHTIIP PLC ESIP MAY19 BASKET LKD 5 a) EUR 2014 2 768 2019 ac)HTIIP PLC ESIP MAY19 BASKET LKD 4 a) EUR 2014 1 387 2019 ac)HTIIP PLC ESIP 5Y CLN THYSSEN EUR JUN19 10 a) EUR 2014 4 730 2019 4.35% + ThyssenKrupp AG CLNHTIIP PLC ESIP 5Y CLN BASKET EUR JUN19 11 a) EUR 2014 4 360 2019 5.9% + t)HTIIP PLC ESIP 6Y CLN AIR.MIT.THY.PG JUN20 a) EUR 2014 1 531 2020 5.5% + aa)HTIIP PLC ESIP 5Y CLN BASKET EUR JUN19 13 a) EUR 2014 3 210 2019 6% + x)HTIIP PLC ESIP 4Y SAN & TEF MAY2018 a) EUR 2014 4 881 2018 l)HTIIP PLC ESIP 5Y CLN BASKET EUR JUN19 12 a) EUR 2014 263 2019 6.5% + w )HTIIP PLC ESIP 3Y AUTOC REP+GALP MAY2017 a) EUR 2014 1 105 2017 s)HTIIP PLC ESIP 5Y CLN PEUGEOT JUN19 15 a) EUR 2014 1 885 2019 4.15% + Peugeot CLNHTIIP PLC ESIP DUAL SONAE EQL JAN2017 a) EUR 2014 200 2017 Indexado a acção da SonaeHTIIP PLC ESIP 5Y CLN BASKET JUN19 16 a) EUR 2014 1 782 2019 5% + ae)HTIIP PLC ESIP BASKET CLN SEP2020 a) EUR 2014 887 2020 5.6% + af)HTIIP PLC ESIP 5Y CLN GALP JUN20 a) EUR 2015 3 050 2020 4.15% + GALP CLNHTIIP PLC ESIP 5Y CLN ARC MIIT JUN20 a) EUR 2015 15 767 2020 4.4% + ARCELORMITTAL CLNHTIIP PLC ESIP 3Y CLN ALTICE JUN2018 a) EUR 2015 2 121 2018 4% + ALTICE CLNHTIIP PLC ESIP 5Y CLN ARCELORMITT 4 JUN20 a) EUR 2015 8 245 2020 4.4% + ARCELORMITTAL CLNHTIIP PLC ESIP 5Y CLN ALTICE JUN20 a) EUR 2015 8 139 2020 5.35% + ALTICE CLNHTIIP PLC ESIP 3Y SX5E JUN2018 a) EUR 2015 933 2018 SX5E LinkedHTIIP PLC ESIP JUL2018 FIX TO FLOAT a) EUR 2015 4 033 2018 2.5% e Euribor6m + 1%HTIIP PLC ESIP BASKET CLN JUL2020 a) EUR 2015 7 929 2020 3% e ag)HTIIP PLC ESIP BASKET CLN SEP2020 USD II a) USD 2015 457 2020 5.6% + aj)HTIIP PLC ESIP BASKET CLN SEP2020 EUR IV a) EUR 2015 3 499 2020 3% e 4.65% ai)HTIIP PLC ESIP BASKET CLN SEP2020 EUR III a) EUR 2015 960 2020 5.25% + ah)HTIIP PLC ESIP DUAL EQL AUG2017 a) EUR 2015 812 2017 6% e ak)HTIIP PLC HIIP DUAL CLN BASKET SEP2020 EUR III a) EUR 2015 4 258 2020 3% e 5.4% ai)HTIIP PLC HIIP BASKET CLN SEP2020 EUR a) EUR 2015 8 709 2020 5.8% + al)HTIIP PLC HIIP CLN FIAT DEC2020 (MTN-S-884) a) EUR 2015 1 408 2020 4.55% + Fiat CLNHTIIP PLC HIIP CLN BASKET DEC2020 (MTN-S-885) a) EUR 2015 4 228 2020 5% + am)HTIIP PLC HIIP CLN BASKET DEC2020 (MTN-S-886) a) EUR 2015 3 994 2020 5% + an)HTIIP PLC HIIP EQL BASKET NOV2017 (MTN-S-887) a) EUR 2015 1 093 2017 4% e aq)HTIIP PLC HIIP CLN BASKET DEC2020 (MTN-S-888) a) EUR 2015 5 669 2020 4.5% + an)HTIIP PLC HIIP ENERGY METALS DEC18 (MTN-S-889) a) EUR 2015 974 2018 ap)HTIIP PLC HIIP CLN BASKET DEC2020 (MTN-S-890) a) EUR 2015 5 353 2020 4.5% + ao)HTIIP PLC HIIP CLN BRASIL DEC2018 (MTN-S-891) a) EUR 2016 5 196 2018 4.5% + CLN Republic BrazilHTIIP PLC HIIP CRUDE OIL FEB2019 (MTN-S-893) a) EUR 2016 4 347 2019 Crude OilHTIIP PLC HIIP CLN MITTAL DEC2020 (MTN-S-895) a) EUR 2016 729 2020 9.70% + CLN ArcelorMittalHTIIP PLC HIIP CRUDE OIL USD MAR2019 (MTN-S-896) a) USD 2016 966 2019 Crude OilHTIIP PLC HIIP CRUDE OIL MAR2019 (MTN-S-894) a) EUR 2016 1 544 2019 Crude OilHTIIP PLC HIIP CLN BASKET JUN2019 (MTN-S-897) a) USD 2016 1 841 2019 4.8% + eg)
341 567
31.12.2016
a) liabilities designated at fair value through profit or loss or with embedded derivativeb) Indexed to Basket composed of the indexes Dow Jones Eurostoxx 50, S&P 500 and Nikkei 225c) Indexed to Basket of Shares Telefonica, Santander, Deutsche Bank and Deutsche Telecomd) Indexed to Basket of Shares Telefonica, Iberdrola, ENI spa and Deutsche Telecom.e) Indexed to Basket of Shares China Life Insurance Co, Petrochina Co and China Mobile LTDf) Indexed to Basket of Shares Telefonica, BNP Paribas, Vodafone Group PLC and E.ONg) Indexed to Basket of Shares Repsol, BSCH, Nestle.h) Indexed to Basket of Shares EDP, Portugal Telecom and GALP.i) Indexed to Basket of Indexes PSI20 and IBEX.j) Indexed to euribor at 3 months.k) 8.5% + USD/TRY FX Linkedl) Indexed to Basket of Shares Santander and Telefonica.m) 7% + Indexed to bond of Comportan) Indexed to Credit on Telecom Italia, PT, Peugeot, EDP and ThyssenKrupp.o) Indexed to Basket of Shares Barclays, BBVA and UBS.p) Indexed to Basket of Shares Amadarko Petroleum Corp, Halliburion Co and Ebay Inc.q) Indexed to Credit on EDP, Telefonica, ThyssenKrupp, British Airways and Peugeot.r) Indexed to Credit on EDP, PT, Telecom Italia, Fiat Spa and British Airways.s) Indexed to Basket of Shares REPSOL and GALPt) Indexed to Credit on ThyssenKruppAG, Peugeot, Arcelor and AirFranceu) Indexed to Basket of EDP and GALPv) Indexed to Basket of Shares PT, EDP, GALPw) Indexed to Credit on WindAcquisition, Peugeot, PetroleoBrasileiro and Arcelor x) Indexed to Credit on Peugeot, Arcelor, Brisa and PetroleoBrasileiroy) Indexaed to Credit on AirFrance, Brisa, TelecomItalia and Arcelorz) Indexed to Credit on AirFrance, Brisa, Arcelor, TelecomItalia and ThyssenKruppAGaa) Indexed to Credit on PT, Arcelor, Peugeot and ThyssenKruppAGab) Indexed to Basket of Shares Santander, GDF Suez and Sanofiac) Indexed to Basket of Shares ProcterGamble, Vodafone, McDonald's, Pfizerad) Indexed to Basket of Indexes IBEX, PSI20 and FTSEMIBae) Indexed to Credit on Melia Hotels International, Peugeot and ArcelorMittalaf) Indexed to Credit on Petrobras, Arcelor Mittal, ThyssenKrupp, Renault and Peugeotag) 5.25% indexed to Credit on Bombardier, Peugeot, Galp, ArcelorMittalah) Indexed to Credit on ArcelorMittal, Stena, Galp, Peugeotai) Indexed to Credit on Stena, Peugeot, Galp, ArcelorMittalaj) Indexed to Credit on ArcelorMittal, Open Joint Stock Company, Newmont Mining Corporation, Royal Caribbean Cruisesak) Indexed to Basket of Shares Roche HLD, BMW, Cie Financiere Richemont, Nikeal) Indexed to Credit on Stena, Jaguar Land Rover, Rallye, ArcelorMittalam) Indexed to Credit on Fiat Chrysler, Jaguar Land Rover, Peugeot, ThyssenKruppan) Indexed to Credit on Dell, Tesco, Virgin Media Finance, Galpao) Indexed to Credit on Dell, Tesco, Virgin Media Finance, ThyssenKruppap) Indexed to Basket composed of the indexes S&P GSCI Industrial Metals, S&P GSCI Energyaq) Indexed to Basket composed of the indexes EuroStoxx50, Standard and Poors 500, Nikkei225
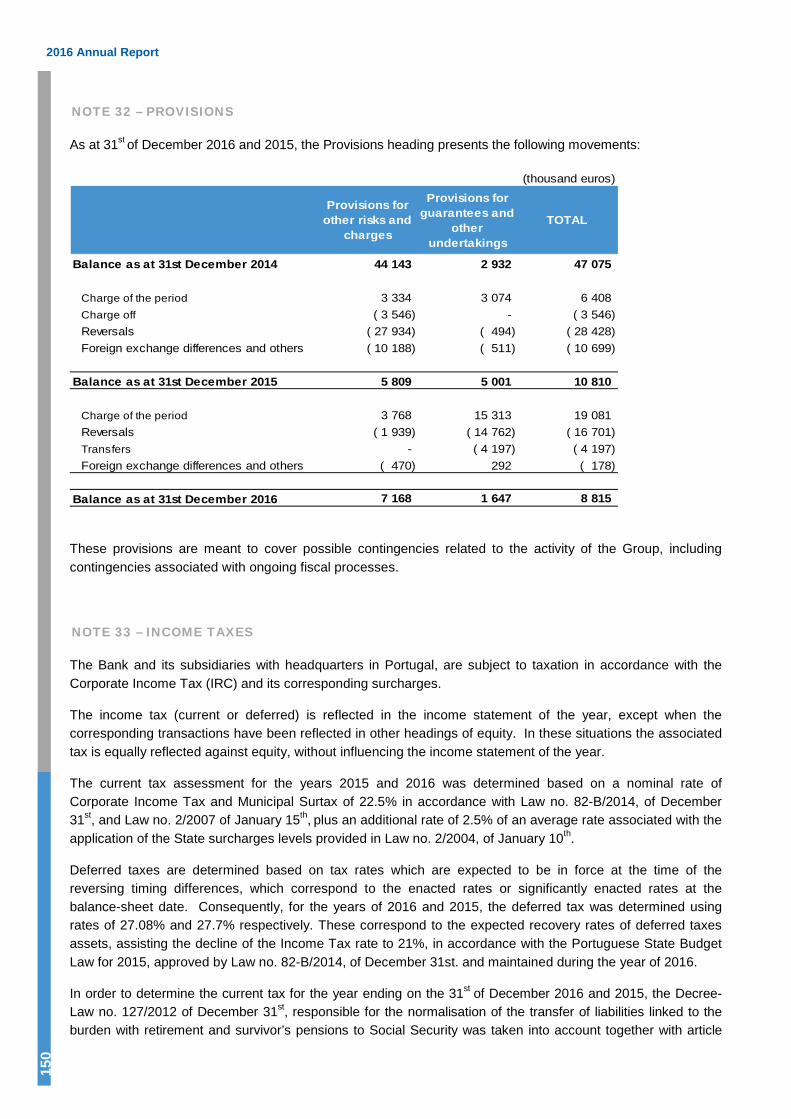
2016 Annual Report
150
NOTE 32 – PROVISIONS
As at 31st of December 2016 and 2015, the Provisions heading presents the following movements:
(thousand euros)
Provisions for other risks and
charges
Provisions for guarantees and
other undertakings
TOTAL
Balance as at 31st December 2014 44 143 2 932 47 075
Charge of the period 3 334 3 074 6 408 Charge off ( 3 546) - ( 3 546)Reversals ( 27 934) ( 494) ( 28 428)Foreign exchange differences and others ( 10 188) ( 511) ( 10 699)
Balance as at 31st December 2015 5 809 5 001 10 810
Charge of the period 3 768 15 313 19 081 Reversals ( 1 939) ( 14 762) ( 16 701)Transfers - ( 4 197) ( 4 197)Foreign exchange differences and others ( 470) 292 ( 178)
Balance as at 31st December 2016 7 168 1 647 8 815
These provisions are meant to cover possible contingencies related to the activity of the Group, including contingencies associated with ongoing fiscal processes.
NOTE 33 – INCOME TAXES
The Bank and its subsidiaries with headquarters in Portugal, are subject to taxation in accordance with the Corporate Income Tax (IRC) and its corresponding surcharges.
The income tax (current or deferred) is reflected in the income statement of the year, except when the corresponding transactions have been reflected in other headings of equity. In these situations the associated tax is equally reflected against equity, without influencing the income statement of the year.
The current tax assessment for the years 2015 and 2016 was determined based on a nominal rate of Corporate Income Tax and Municipal Surtax of 22.5% in accordance with Law no. 82-B/2014, of December 31st, and Law no. 2/2007 of January 15th, plus an additional rate of 2.5% of an average rate associated with the application of the State surcharges levels provided in Law no. 2/2004, of January 10th.
Deferred taxes are determined based on tax rates which are expected to be in force at the time of the reversing timing differences, which correspond to the enacted rates or significantly enacted rates at the balance-sheet date. Consequently, for the years of 2016 and 2015, the deferred tax was determined using rates of 27.08% and 27.7% respectively. These correspond to the expected recovery rates of deferred taxes assets, assisting the decline of the Income Tax rate to 21%, in accordance with the Portuguese State Budget Law for 2015, approved by Law no. 82-B/2014, of December 31st. and maintained during the year of 2016.
In order to determine the current tax for the year ending on the 31st of December 2016 and 2015, the Decree-Law no. 127/2012 of December 31st, responsible for the normalisation of the transfer of liabilities linked to the burden with retirement and survivor’s pensions to Social Security was taken into account together with article
HAITONG BANK, S.A.
151
183 of Law no. 64-B/2011 of December 30th (State Budget Law for 2012), establishing a special scheme for tax deduction of expenses and other asset variations from that transfer:
● The impact of negative asset variations associated with the amendments of the accounting policy regarding the recognition of actuarial gains and losses previously deferred will be fully deductible in equal parts for 10 years, from the year starting on the 1st of January 2012 onwards;
● The impact of the settlement (determined by the difference between the liability measured in accordance with the criteria established by IAS 19 and by the criteria established by the agreement) will be fully deductible in order to determine taxable profit, in equal parts, according to the average life expectancy of pensioners whose liabilities were transferred (17 years), from the year starting on the 1st of January 2012 onwards.
Deferred tax assets of the transfer of liabilities and amendment of the accounting policy regarding the recognition of actuarial discrepancies can be recovered for periods between 10 and 17 years.
If there are any tax losses, the reverse-charge statement, of the Bank and subsidiaries with headquarters in Portugal referring to 2016 and previous years, these will be subject to inspection and possible adjustment by the Tax Authorities for a period of four or six years. Thus, additional charges regarding taxes may take place mainly due to different interpretations of the tax law. However, the Management of the Bank and its subsidiaries with headquarters in Portugal believe there will be no additional charges of any significant amount concerning the consolidated financial statements.
Special Scheme Applicable to Deferred Tax Assets
In 2014, Haitong Bank joined the special scheme applicable to deferred tax assets (REAID) related to impairment losses in credits and post-employment or long-term employee benefits, established by Law no. 61/2014, of August 26th. For the purpose of this scheme, the conversion of the mentioned assets in tax credits is expected in the following situations:
● Determining net losses;
● Voluntary winding-up, court insolvency or, when applicable, with the withdrawal of the corresponding authorisation by the competent supervising authority.
As at 31st of December 2015, Haitong Bank determined a tax credit of 5,869 thousand euros, which corresponds to a special reserve of 6,456 thousand euros recorded during the year of 2016.
As at 31st of December 2016, Haitong Bank determined a net loss within its individual financial statements, for which it shall, and upon approval of the statements, convert the deferred taxes covered by this scheme into tax credits proportionally, between net profit and loss and equity, as well as establish a special reserve and conversion of debt into equity rights in 2017, attributable to the Portuguese Government.
In pursuance of the abovementioned scheme, such conversion rights correspond to securities that grant the Government the right to request Haitong Bank to issue and deliver ordinary shares at no charge, following the increase in share capital through the inclusion of the reserve value. However, Haitong Bank´s shareholders are granted the right to acquire those conversion rights in accordance with Ordinance no. 293-A/2016 of November the 18th.
The amount of assets by deferred taxes converted into tax credit, the establishment of the special reserve and the issuing and granting of conversion rights to the Government shall be certified by the certified public accountant.

2016 Annual Report
152
It is important to note that, in accordance with Law no. 23/2016 of August the 19th, the special scheme applicable to deferred tax assets (REAID) stopped being applicable to expenses and other negative asset variations accounted for in previous tax periods starting on or after the 1st of January 2016.
The activity developed by branches of the Bank in foreign countries is comprised in the statements of the headquarters in order to determine the basis of assessment subject to Income Tax. Furthermore, the profit and loss of said branches is also subject to local taxes of the countries where they are located. Local taxes are deductible from the Income Tax of the headquarters, in accordance with article 91 of the Corporate Income Tax Code, when applicable. The profit and loss from branches are subject to local taxation of nominal rates indicated below:
Branch Nominal income tax rate
London 20%Madrid 30%Warsaw 19%
The subsidiaries in foreign countries, specifically the ones in Brazil, Ireland and United States of America, are subject to tax on their profits in accordance with the tax regulations in force within those countries. In Ireland, the profit is subject to a nominal rate of 12.5%, and the profit of the companies in Brazil is subject to nominal rates between 34% and 45%. In United States of America, profit is subject to a nominal tax rate of 48.95%.
Current tax assets and liabilities recognized in the statement of financial position in 2016 and 2015 may be analyzed as follows:
(thousand euros)
31.12.2016 31.12.2015 31.12.2016 31.12.2015
Corporate income tax 5 417 10 029 ( 4 111) ( 4 370)
Tax Credit (Special Scheme for Deferred Taxes) 5 869 - - -
Current tax asset / (liability) 11 286 10 029 ( 4 111) ( 4 370)
Asset Liabiity
Deferred tax assets and liabilities recognised in the statement of financial position of 2016 and 2015 can be analysed as follows:
(thousand euros)
Asset Liability Net
31.12.2016 31.12.2015 31.12.2016 31.12.2015 31.12.2016 31.12.2015
Derivative f inancial instruments 448 10 891 ( 5 804) - ( 5 356) 10 891
Available-for-sale financial assets 5 906 14 235 ( 1 513) ( 160) 4 393 14 075
Loans and advances to customers 86 746 92 695 - - 86 746 92 695
Provisions 7 998 2 274 - - 7 998 2 274
Pension Fund 9 227 8 544 ( 3) ( 3) 9 224 8 541
Other 508 414 ( 1 676) ( 565) ( 1 168) ( 151)
Tax credits resulting from double taxation - 412 - 1 487 - 1 899
Tax losses carried forward 42 153 18 489 - - 42 153 18 489
Deferred tax asset/(liability) 152 986 147 954 ( 8 996) 759 143 990 148 713
Assets / liabilities compensation for deferred taxes ( 7 368) ( 2 021) 7 368 ( 953) - ( 2 974)
Net deferred tax asset / (liability) 145 618 145 933 ( 1 628) ( 194) 143 990 145 739

HAITONG BANK, S.A.
153
The Group assessed the recoverability of its deferred taxes in the statement of financial position based on the estimated future taxable profits (see Note 3.5).
The Group does not recognise deferred tax assets regarding tax losses carried forward by certain subsidiaries since recovery cannot be expected within a near future.
Movements within the deferred tax in the statement of financial position heading obtained the following compensation:
(thousand euros)
31.12.2016 31.12.2015
Opening balance 145 739 99 512 Recognised in profit or loss 2 662 46 512 Recognised in fair value reserves ( 7 058) 1 409 Recognised in other reserves 121 2 903 Foreign exchange variation and others 2 526 ( 4 597)
Closing balance (Asset / (Liability)) 143 990 145 739
Tax recognised in the income statement and reserves during the 2015 and 2016 financial years had the following sources:
(thousand euros)
31.12.2016 31.12.2015
Recognised in profit or loss
Recognised in reserves
Recognised in profit or loss
Recognised in reserves
Deferred TaxesDerivative f inancial instruments 16 247 - ( 26 347) - Available-for-sale financial assets 975 7 058 ( 2 082) ( 1 409)Loans and advances to customers 4 573 - ( 13 371) - Provisions ( 4 101) - 9 933 - Pension Fund ( 533) ( 121) ( 6 324) ( 2 121)Other 3 641 - ( 1 670) - Tax credits resulting from double taxation 412 - - - Tax losses carried forward ( 23 876) - ( 6 651) ( 782)
( 2 662) 6 937 ( 46 512) ( 4 312)
Current Taxes ( 7 109) ( 1 153) 26 606 ( 27 169)
Total recognised tax ( 9 771) 5 784 ( 19 906) ( 31 481)
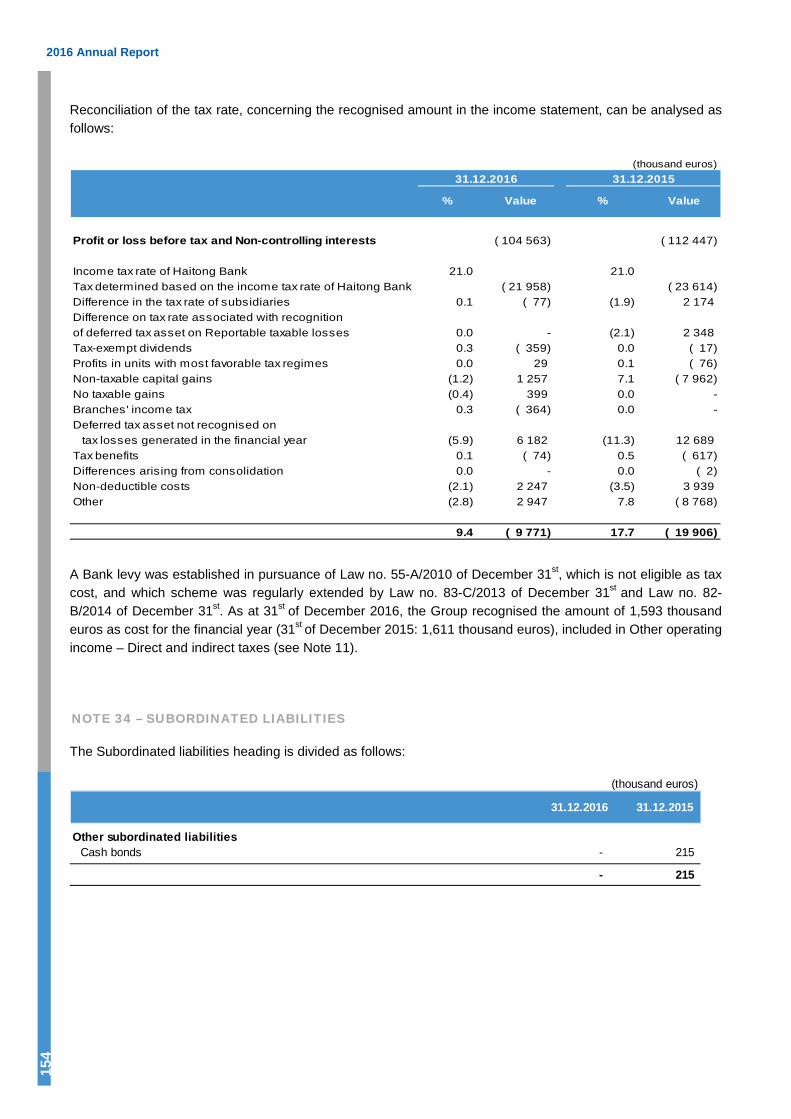
2016 Annual Report
154
Reconciliation of the tax rate, concerning the recognised amount in the income statement, can be analysed as follows:
(thousand euros)31.12.2016 31.12.2015
Profit or loss before tax and Non-controlling interests ( 104 563) ( 112 447)
Income tax rate of Haitong Bank 21.0 21.0Tax determined based on the income tax rate of Haitong Bank ( 21 958) ( 23 614)Difference in the tax rate of subsidiaries 0.1 ( 77) (1.9) 2 174
of deferred tax asset on Reportable taxable losses 0.0 - (2.1) 2 348 Tax-exempt dividends 0.3 ( 359) 0.0 ( 17)Profits in units with most favorable tax regimes 0.0 29 0.1 ( 76)Non-taxable capital gains (1.2) 1 257 7.1 ( 7 962)No taxable gains (0.4) 399 0.0 -Branches' income tax 0.3 ( 364) 0.0 -Deferred tax asset not recognised on tax losses generated in the financial year (5.9) 6 182 (11.3) 12 689 Tax benefits 0.1 ( 74) 0.5 ( 617)Differences arising from consolidation 0.0 - 0.0 ( 2)Non-deductible costs (2.1) 2 247 (3.5) 3 939 Other (2.8) 2 947 7.8 ( 8 768)
9.4 ( 9 771) 17.7 ( 19 906)
% Value % Value
Difference on tax rate associated with recognition
A Bank levy was established in pursuance of Law no. 55-A/2010 of December 31st, which is not eligible as tax cost, and which scheme was regularly extended by Law no. 83-C/2013 of December 31st and Law no. 82-B/2014 of December 31st. As at 31st of December 2016, the Group recognised the amount of 1,593 thousand euros as cost for the financial year (31st of December 2015: 1,611 thousand euros), included in Other operating income – Direct and indirect taxes (see Note 11).
NOTE 34 – SUBORDINATED LIABILITIES
The Subordinated liabilities heading is divided as follows:
(thousand euros)
31.12.2016 31.12.2015
Other subordinated liabilitiesCash bonds - 215
- 215
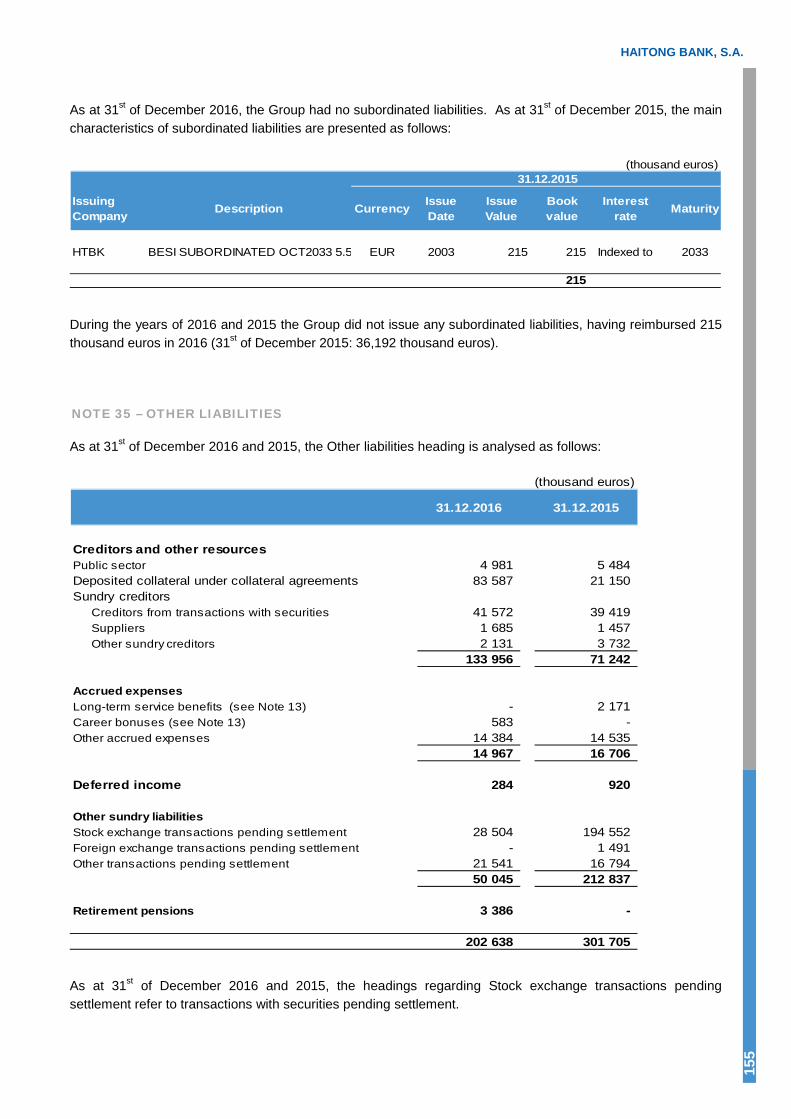
HAITONG BANK, S.A.
155
As at 31st of December 2016, the Group had no subordinated liabilities. As at 31st of December 2015, the main characteristics of subordinated liabilities are presented as follows:
(thousand euros)31.12.2015
Issuing Company Description Currency Issue
DateIssue Value
Book value
Interest rate Maturity
HTBK BESI SUBORDINATED OCT2033 5.5 EUR 2003 215 215 Indexed to 2033
215
During the years of 2016 and 2015 the Group did not issue any subordinated liabilities, having reimbursed 215 thousand euros in 2016 (31st of December 2015: 36,192 thousand euros).
NOTE 35 – OTHER LIABILITIES
As at 31st of December 2016 and 2015, the Other liabilities heading is analysed as follows:
(thousand euros)
31.12.2016 31.12.2015
Creditors and other resourcesPublic sector 4 981 5 484 Deposited collateral under collateral agreements 83 587 21 150 Sundry creditors
Creditors from transactions with securities 41 572 39 419 Suppliers 1 685 1 457 Other sundry creditors 2 131 3 732
133 956 71 242
Accrued expensesLong-term service benefits (see Note 13) - 2 171 Career bonuses (see Note 13) 583 - Other accrued expenses 14 384 14 535
14 967 16 706
Deferred income 284 920
Other sundry liabilitiesStock exchange transactions pending settlement 28 504 194 552 Foreign exchange transactions pending settlement - 1 491 Other transactions pending settlement 21 541 16 794
50 045 212 837
Retirement pensions 3 386 -
202 638 301 705
As at 31st of December 2016 and 2015, the headings regarding Stock exchange transactions pending settlement refer to transactions with securities pending settlement.
2016 Annual Report
156
NOTE 36 – CAPITAL, SHARE PREMIUM AND OTHER CAPITAL INSTRUMENTS
Ordinary shares
Until August 3rd 2014 the Bank was part of Grupo Banco Espírito Santo, S.A.
On the 3rd of August 2014, the Bank of Portugal applied a resolution action to Banco Espírito Santo, S.A., shareholder of 100% of the capital of the Bank, and established Novo Banco, S.A., with the share capital of 4.9 billion euros, which incorporated assets of Banco Espírito Santo, S.A. selected by the Bank of Portugal. In this regard, the Bank, its branches and subsidiaries were transferred to Novo Banco, S.A.
On the 7th of September 2015, the capital of the Bank was fully purchased by Haitong International Holdings Limited.
On the 17th of December 2015, the Bank increased its capital in 100,000 thousand euros, through the issuance of 20,000,000 shares with the nominal value of 5 euros each, fully subscribed and paid-up by Haitong International Holdings Limited.
As at 31st of December 2016, the share capital of Haitong Bank amounts to 426,269 thousand euros and is represented by 85,253,800 shares with the nominal value of 5 euros each, fully held by Haitong International Holdings Limited.
Share premiums
As at 31st of December 2016 and 2015, share premiums are represented by 8,796 thousand euros, corresponding to the amount paid by shareholders in the increase of capital of previous years.
Other equity instruments
During October 2010 the Group issued perpetual subordinated bonds with conditioned interest in the overall amount of 50 million euros. These bonds have a noncumulative conditioned interest, payable only if and when declared by the Board of Directors.
This conditioned interest, corresponding to the applicable annual rate of 8.5% on nominal value, is paid biannually. These securities may be fully, but not partially, reimbursed after the 15th of September 2015, relying solely on the choice of Haitong Bank, upon approval of the Bank of Portugal. These bonds are considered a capital instrument in accordance with the accounting policy described in Note 2.10 due to their characteristics.
During the year of 2011, 46,269 thousand euros in other capital instruments were cancelled due to a transaction regarding owned instruments.
These bonds are subordinated in relation to any liability of Haitong Bank and pari passu regarding any identical subordinated bonds that may be issued by the Bank.
As at 31st of December 2016, 3,731 thousand euros regarding these bonds are in circulation. In the year of 2016 the Group paid interest in the amount of 231 thousand euros, recorded as a deduction in reserves (as at 31st of December 2015: 225 thousand euros).
In May 2016, the Bank issued perpetual instruments eligible as additional own funds of level 1 (Additional Tier 1), in the overall amount of 80,000 thousand euros identified as “Fixed Rate Perpetual Deeply Subordinated Additional Tier 1 Resettable Instruments”. Such bonds have a non-cumulative conditional interest which is payable only if and when reported by the Board of Directors. Due to their features, such bonds are deemed to be capital instruments, in accordance with the accounting policy laid down in Note 2.10.
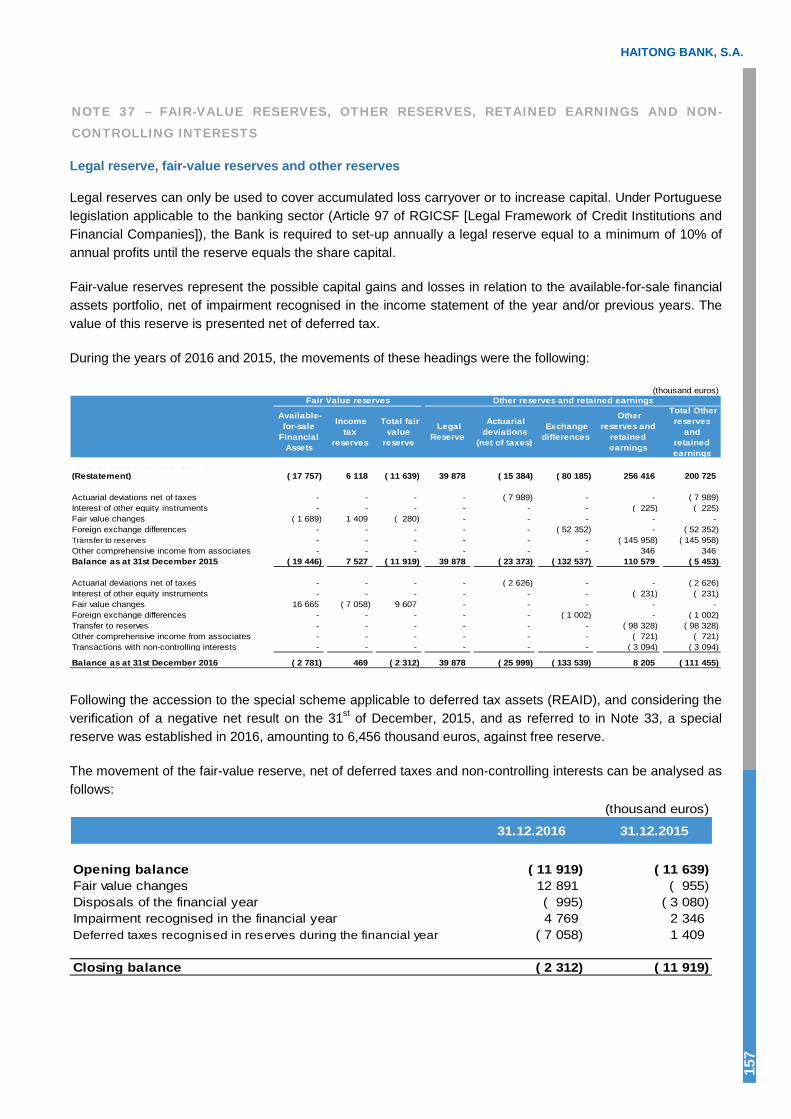
HAITONG BANK, S.A.
157
NOTE 37 – FAIR-VALUE RESERVES, OTHER RESERVES, RETAINED EARNINGS AND NON-CONTROLLING INTERESTS
Legal reserve, fair-value reserves and other reserves
Legal reserves can only be used to cover accumulated loss carryover or to increase capital. Under Portuguese legislation applicable to the banking sector (Article 97 of RGICSF [Legal Framework of Credit Institutions and Financial Companies]), the Bank is required to set-up annually a legal reserve equal to a minimum of 10% of annual profits until the reserve equals the share capital.
Fair-value reserves represent the possible capital gains and losses in relation to the available-for-sale financial assets portfolio, net of impairment recognised in the income statement of the year and/or previous years. The value of this reserve is presented net of deferred tax.
During the years of 2016 and 2015, the movements of these headings were the following:
(thousand euros)
a a ce as at 3 st ece be 0 (Restatement) ( 17 757) 6 118 ( 11 639) 39 878 ( 15 384) ( 80 185) 256 416 200 725
Actuarial deviations net of taxes - - - - ( 7 989) - - ( 7 989)Interest of other equity instruments - - - - - - ( 225) ( 225)Fair value changes ( 1 689) 1 409 ( 280) - - - - - Foreign exchange differences - - - - - ( 52 352) - ( 52 352)Transfer to reserves - - - - - - ( 145 958) ( 145 958)Other comprehensive income from associates - - - - - - 346 346 Balance as at 31st December 2015 ( 19 446) 7 527 ( 11 919) 39 878 ( 23 373) ( 132 537) 110 579 ( 5 453)
Actuarial deviations net of taxes - - - - ( 2 626) - - ( 2 626)Interest of other equity instruments - - - - - - ( 231) ( 231)Fair value changes 16 665 ( 7 058) 9 607 - - - - - Foreign exchange differences - - - - - ( 1 002) - ( 1 002)Transfer to reserves - - - - - - ( 98 328) ( 98 328)Other comprehensive income from associates - - - - - - ( 721) ( 721)Transactions with non-controlling interests - - - - - - ( 3 094) ( 3 094)
Balance as at 31st December 2016 ( 2 781) 469 ( 2 312) 39 878 ( 25 999) ( 133 539) 8 205 ( 111 455)
Other reserves and
retained earnings
Total Other reserves
and retained earnings
Fair Value reserves Other reserves and retained earnings
Available-for-sale
Financial Assets
Income tax
reserves
Total fair value
reserve
Legal Reserve
Actuarial deviations
(net of taxes)
Exchange differences
Following the accession to the special scheme applicable to deferred tax assets (REAID), and considering the verification of a negative net result on the 31st of December, 2015, and as referred to in Note 33, a special reserve was established in 2016, amounting to 6,456 thousand euros, against free reserve.
The movement of the fair-value reserve, net of deferred taxes and non-controlling interests can be analysed as follows:
(thousand euros)
31.12.2016 31.12.2015
Opening balance ( 11 919) ( 11 639)Fair value changes 12 891 ( 955)Disposals of the financial year ( 995) ( 3 080)Impairment recognised in the financial year 4 769 2 346 Deferred taxes recognised in reserves during the financial year ( 7 058) 1 409
Closing balance ( 2 312) ( 11 919)

2016 Annual Report
158
Non-controlling interests
The Non-controlling interests´ heading information per subsidiary is as follows:
(thousand euros)
Statement of Financial Position
Income statement
Statement of Financial Position
Income statement
Haitong Banco de Investimento do Brasil S.A. 27 225 188 20 016 2 163 Haitong Securities do Brasil S.A. 5 320 ( 231) 4 440 ( 4)FI Multimercado Treasury 4 456 1 617 - - WindPart, Lda 1 ( 4) 6 859 3 018 Outras 4 673 ( 181) 6 366 611
41 675 1 389 37 681 5 788
31.12.2016 31.12.2015
The movement of Non-controlling interests of the years ended on the 31st of December 2016 and 2015 can be analysed as follows:
(thousand euros)
Non-controlling interests as at 1st January 37 681 47 088 Changes in the consolidation perimeter ( 207) - Dividends paid ( 7 653) ( 962)Changes in fair value reserve 2 012 ( 537)Exchange difference and other 8 453 ( 13 696)Net income for the period 1 389 5 788
Non-controlling interests as at 31st December 41 675 37 681
31.12.201531.12.2016
NOTE 38 – OFF-BALANCE SHEET ITEMS
As at 31st of December 2016 and 2015, off-balance elements are as follows:
(thousand euros)
31.12.2016 31.12.2015
Contingent liabilities Guarantees and stand by letters of credit 220 021 269 354 Assets pledged as collateral 321 940 85 767
541 961 355 121
Commitments Irrevocable commitments 15 880 48 211
15 880 48 211
The rendered guarantees and sureties are banking transactions that do not necessarily represent any outflow for the Group.
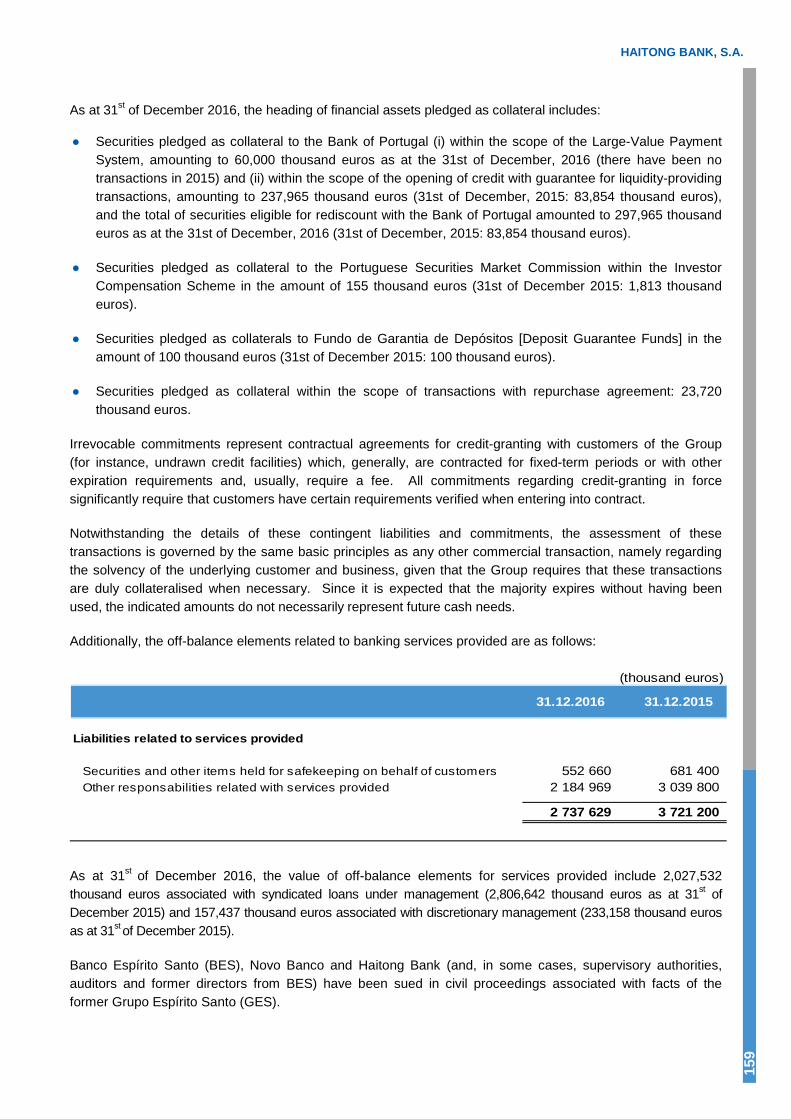
HAITONG BANK, S.A.
159
As at 31st of December 2016, the heading of financial assets pledged as collateral includes:
● Securities pledged as collateral to the Bank of Portugal (i) within the scope of the Large-Value Payment System, amounting to 60,000 thousand euros as at the 31st of December, 2016 (there have been no transactions in 2015) and (ii) within the scope of the opening of credit with guarantee for liquidity-providing transactions, amounting to 237,965 thousand euros (31st of December, 2015: 83,854 thousand euros), and the total of securities eligible for rediscount with the Bank of Portugal amounted to 297,965 thousand euros as at the 31st of December, 2016 (31st of December, 2015: 83,854 thousand euros).
● Securities pledged as collateral to the Portuguese Securities Market Commission within the Investor Compensation Scheme in the amount of 155 thousand euros (31st of December 2015: 1,813 thousand euros).
● Securities pledged as collaterals to Fundo de Garantia de Depósitos [Deposit Guarantee Funds] in the amount of 100 thousand euros (31st of December 2015: 100 thousand euros).
● Securities pledged as collateral within the scope of transactions with repurchase agreement: 23,720 thousand euros.
Irrevocable commitments represent contractual agreements for credit-granting with customers of the Group (for instance, undrawn credit facilities) which, generally, are contracted for fixed-term periods or with other expiration requirements and, usually, require a fee. All commitments regarding credit-granting in force significantly require that customers have certain requirements verified when entering into contract.
Notwithstanding the details of these contingent liabilities and commitments, the assessment of these transactions is governed by the same basic principles as any other commercial transaction, namely regarding the solvency of the underlying customer and business, given that the Group requires that these transactions are duly collateralised when necessary. Since it is expected that the majority expires without having been used, the indicated amounts do not necessarily represent future cash needs.
Additionally, the off-balance elements related to banking services provided are as follows:
(thousand euros)
31.12.2016 31.12.2015
Liabilities related to services provided
Securities and other items held for safekeeping on behalf of customers 552 660 681 400 Other responsabilities related with services provided 2 184 969 3 039 800
2 737 629 3 721 200
As at 31st of December 2016, the value of off-balance elements for services provided include 2,027,532 thousand euros associated with syndicated loans under management (2,806,642 thousand euros as at 31st of December 2015) and 157,437 thousand euros associated with discretionary management (233,158 thousand euros as at 31st of December 2015).
Banco Espírito Santo (BES), Novo Banco and Haitong Bank (and, in some cases, supervisory authorities, auditors and former directors from BES) have been sued in civil proceedings associated with facts of the former Grupo Espírito Santo (GES).

2016 Annual Report
160
Within this framework, Haitong Bank is a defendant in a proceeding associated with the capital increase of BES, which took place in June 2014. In fact, there were 2 proceedings associated with the capital increase of BES, however, the Court has ruled not to prosecute due to “abandonment” in one of the aforesaid proceedings. Such decision has already been confirmed by the Lisbon Court of Appeal [Tribunal da Relação de Lisboa].
Haitong Bank is also a defendant in 78 proceedings, nearly all of which are associated with issues of commercial paper of GES’s entities (Rioforte and ESI – Espirito Santo International) (2 of which concern issues of notes by Haitong Bank’s subsidiary based in Ireland (HIIP) whose underlying asset were bonds issued by Espírito Santo Financial Portugal (ESFP)), and which were brought before the courts in 2015 and 2016.
In note 38, in what concerns the 2015 accounts, it is stated that, in the opinion of Haitong Bank’s Legal Department and of the external lawyers to whom the proceedings have been entrusted, such proceedings do not have legal sustainability, wherefore it is considered unlikely that any judgment will be made against Haitong Bank in relation thereto. Such opinion is hereby reasserted, based on the following grounds.
Concerning the shares associated with issues of commercial paper of GES, it is true that Haitong Bank (then BESI – Banco Espírito Santo de Investimento) acted as administrative agent in several issuances, having dealt with their integration in the Central Securities Depository, and as paying agent, being responsible for paying interest and principal to the holders of such securities (evidently, in the assumption of having received the necessary funds from the issuer for such purpose). However, such issues were subject to private offering, and BESI did not take part in their listing, nor did it liaise with investors. Their corresponding information notes are unambiguous, by stating that their respective issuers are exclusively responsible for information contained therein. Concerning the 2 aforementioned proceedings associated with issues from HIIP, such issues are credit linked notes, whose remuneration and reimbursement depended on facts (such as insolvency) related to the issuer of the underlying asset – in this case ESFP –, which, as we know, has been declared insolvent, in which case the investors should receive their own underlying asset or the profits from their sale. The conditions of such issues are clearly set forth in their information documents, and BESI has also not listed such issues with investors.
Such opinion has since been supported by several judicial decisions.
Therefore, in 4 of the proceedings concerning GES’s commercial paper, the Courts have ruled to discharge Haitong Bank on every account, without the need of trial, based on grounds fundamentally similar to those referred to above. Such decisions may be subject to appeal. However, their grounds reinforces the understanding that Haitong Bank shall be discharged on every account.
In Brazil, there is a judicial discussion around the constitutionality of the law applicable to the contributions of PIS (“Programa de Integração Social”) and COFINS (“Financiamento da Seguridade Social) taxes which falls over other income that is not originated from sale of goods or from services rendered. Based on a court decision, all Brazilian group entities are monthly depositing to the court the amount under discussion and only are assessing to Tax Authorities the amount of tax related to services rendered, which are not under such discussion. The amounts subject to judicial deposit are recorded on Balance Sheet, in other assets, and are reported to Brazilian Tax Authorities in the corresponding returns. It’s the understanding of the Group, based on external legal opinions, that is not probable that the court decision should be unfavorable, which supports the Group decision to not record any provision for this contingency. At 31 December 2016, the accumulated amount of the mentioned non-assessed contributions, but judicially deposited by the group was 39,452 million euros.
Following the above stated, Haitong Bank did not establish any provision related to such legal proceedings.
HAITONG BANK, S.A.
161
Resolution Fund
In accordance with Decree-Law no. 24/2013 that determines the operation of the Resolution Fund ('RF'), the Bank has provided mandatory contributions since 2013 pursuant to the aforementioned Decree. Thus, since its establishment, the Bank has provided initial contribution to the RF in accordance with article 3 of the Decree-Law and periodical contributions in 2013 and 2014, in accordance with article 4 of the Decree-Law.
On the 3rd of November 2015, the Bank of Portugal issued a Circular-Letter according to which the periodical contribution for the Resolution Fund must be recognised as cost at the time of the event that originates mandatory contribution payments, which is in the last day of April of each year, pursuant to article no. 9 of Decree-Law no. 24/2013 of February the 19th, ensuring that the Bank recognises the contribution as an expense in the year it is due.
On the 15th of November 2015, the Resolution Fund issued a press release stating: “it is further explained that it is unlikely that the Resolution Fund shall propose the establishment of a special contribution for the financing of the resolution measure applied to BES. Therefore, the chance of a possible charge of a special contribution is far-flung.”
Subsequently, after the issuance of the mentioned press release from RF, and in view of the resolution process of Banco Espírito Santo, S.A., the Bank of Portugal resolved, as announced on the 29th of December 2015, the transfer of responsibility to RF of “…possible negative outcomes of future decisions, arising from the resolution process [of Banco Espírito Santo, S.A.], with responsibilities or contingencies as a result.". In accordance with the available public information, the volume of litigations associated with this proceeding is significant, although the amount that the RF may have to lose for such litigations or possible losses by divestiture of Novo Banco is not properly clarified.
Additionally, the Bank of Portugal established a resolution measure over BANIF – Banco Internacional do Funchal, S.A. on the 19th and 20th of December 2015. (‘BANIF’), the amount of which, regarding losses the RF may have to comply with pursuant to this proceeding, is again not properly clarified.
Accordingly, as at 31st of December 2016, there are no expectations regarding the value of possible losses connected to the divesture process of Novo Banco, of the mentioned litigations associated with the resolution process of Banco Espírito Santo or of the potential losses of the RF following the resolution of BANIF and how they may affect the RF. Nevertheless, considering the measures announced in September 2016, it is the Bank's expectation that no special contributions or any other extraordinary contribution will be required to finance the resolution measures applied to BES and BANIF.
In 2015 and with respect to the establishment of the European Resolution Fund, the Bank had to pay an initial contribution in the amount of 1,006 thousand euros. The European Resolution Fund does not cover the existing situations, as at 31st of December 2015, with the Portuguese Resolution Fund.
On 28th of September 2016 the Resolution Fund issued a statement in which it is stated that the maturity of the loan that matured on 31st of December 2017 would be adjusted to ensure the Fund's ability to fully meet its obligations based on its regular revenues, and regardless of the contingencies to which it is exposed, no need of extraordinary contributions.
In February 2017, the loan agreement was added.

2016 Annual Report
162
NOTE 39 – RELATED PARTIES TRANSACTIONS
(thousand euros)31.12.2016 31.12.2015
Assets Liabilities Guarantees Income Expense Assets Liabilities Guarantees Income Expense
Associates
COPORGEST 7 606 1 7 551 134 - 6 961 1 161 169 - FUNDO ESPIRITO SANTO IBERIA - - - - - - - - 2 433 - MCO2 S G FUNDOS INVEST MOB SA - - - - - 550 - - - -
TOTAL 7 606 1 7 551 134 - 7 511 1 161 2 602 -
The value of transactions of the Group partially related to the years ending on 31st of December 2016 and 2015, as well as their corresponding income and expenses recognised within the year, can be summarised as follows:
Assets in the statement of financial position regarding associated companies included in the previous table are essentially related to loans and advances and shareholder loans granted. Liabilities are essentially related to bank deposits.
As at 31st of December 2016 and 2015, the aggregate amount of assets and liabilities of the Haitong Bank Group regarding operations carried out with entities related to the Haitong Group can be summarised as follows:
(thousand euros)
31.12.2016Assets
Loans Securities Other Total
ShareholdersHAITONG SECURITIES - - 996 996 - 2 317 -
Subsidiaries and associatesHAITONG INTERNATIONAL STRATEGIC INVESTMENT - 12 278 949 13 227 - 1 810 - HAITONG INTERNATIONAL HOLDINGS LIMITED - - - - 140 622 - 1 434 HAITONG UNITRUST FINANCIAL & LEASING 16 834 - - 16 834 - 436 - HAITONG INTERNATIONAL INVESTMENT (SINGAPORE) PTE, LTD - - - - - 7 706 - HAITONG UNITRUST INTERNATIONAL LEASING C 21 010 - - 21 010 - 27 -
TOTAL 37 844 12 278 1 945 52 067 140 622 12 296 1 434
Liabilities Income Expenses
(thousand euros)31.12.2015
Assets
Loans Securities Other Total
ShareholdersHAITONG SECURITIES - - - - - 1 763 -
Subsidiaries and associatesHAITONG INTERNATIONAL STRATEGIC INVESTMENT - - - - - 9 440 -
Novo Banco Group Companies - - - - - 46 485 10 831
OtherBoard of Directors 315 - - 315 - - -
TOTAL 315 - - 315 - 57 688 10 831
Liabilities Income Expenses
The balance shown regarding the related entity, Haitong International Investment (Singapore) PTE, Ltd, is associated with the sale of the subsidiary Haitong Securities India Private Limited, as provided for in Note 1.

HAITONG BANK, S.A.
163
NOTE 40 – FAIR-VALUE OF FINANCIAL ASSETS AND LIABILITIES
Fair-value of financial assets and liabilities
The fair-value of financial assets and liabilities for the Group is analysed as follows:
(thousand euros)Valued at Fair Value
Amortised cost
Quoted Market Price
(Level 1)
Valuation models based on observable market information (Level 2)
Valuation models based on non-onbservable
market information (Level 3)
Total book value Fair Value
Balance as at 31st December 2016
Cash and deposits at central banks 37 550 - - - 37 550 37 550 Deposits at other credit institutions 104 254 - - - 104 254 104 254 Financial assets held-for-trade - 83 230 1 382 966 28 719 1 494 915 1 494 915 Available-for-sale financial assets 2 922 342 742 353 597 91 085 790 346 790 346 Loans and advances to banks 853 687 - - - 853 687 853 687 Loans and advances to customers 841 095 - - - 841 095 801 420 Risk management derivatives - - 18 273 - 18 273 18 273
Financial Assets 1 839 508 425 972 1 754 836 119 804 4 140 120 4 100 445
Deposits from central banks 60 000 - - - 60 000 60 000 Financial liabilities held-for-trading - 32 443 1 010 238 - 1 042 681 1 042 681 Deposits from other credit institutions 1 974 169 - - - 1 974 169 1 974 169 Customer accounts 735 708 - - - 735 708 735 708 Debt securities issued 27 352 - 314 215 - 341 567 341 709 Risk management derivatives - - 32 907 - 32 907 32 907
Financial Liabilities 2 797 229 32 443 1 357 360 - 4 187 032 4 187 174
Balance as at 31st December 2015
Cash and deposits at central banks 117 684 - - - 117 684 117 684 Deposits at other credit institutions 38 960 - - - 38 960 38 960 Financial assets held-for-trade - 37 850 1 297 976 10 663 1 346 489 1 346 489 Available-for-sale financial assets 2 253 84 198 262 429 119 431 468 311 468 311 Loans and advances to banks 258 795 - - - 258 795 258 795 Loans and advances to customers 1 041 341 - - - 1 041 341 1 004 697 Risk management derivatives - - 15 236 - 15 236 15 236
Financial Assets 1 459 033 122 048 1 575 641 130 094 3 286 816 3 250 172
Deposits from central banks 61 139 - - - 61 139 61 139 Financial liabilities held-for-trading - - 502 350 - 502 350 502 350 Deposits from other credit institutions 1 632 522 - - - 1 632 522 1 632 522 Customer accounts 567 038 - - - 567 038 567 038 Debt securities issued 80 306 - 466 960 - 547 266 547 925 Risk management derivatives - - 116 397 - 116 397 116 397 Subordinated liabilities - - 215 - 215 215
Financial Liabilities 2 341 005 - 1 085 922 - 3 426 927 3 427 586
Assets and Liabilities at fair-value of the Haitong Bank Group are valued according to the following hierarchy:
Quoted market value – This category includes financial instruments with market prices quoted on official markets.
Valuation models based on observable market information – this category includes financial instruments: (i) quotations released by entities who usually provide prices for this type of assets and (ii) the valuation of which is based on the usage of internal valuation models, namely discounted cash flow and option pricing models, involving the use of estimates and requiring evaluation that varies in accordance with the complexity of the products being subject to valuation. Nonetheless, the Group uses variables provided by the market as inputs in its models, such as yield curves, credit spreads, volatility and price indexes.
Valuation models based on non-observable market information – this aggregate includes valuations determined through the use of internal valuation or pricing models provided by third parties but with non-observable market parameters.

2016 Annual Report
164
The movement of financial assets valued through methods with non-observable market parameters during 2016 can be analysed as follows:
(thousand euros)
31.12.2016 31.12.2015
Opening balance 130 094 170 804 Acquisitions 27 497 29 862 Disposals ( 35 981) ( 51 982)Transfers ( 11 201) 4 021 Changes in value 9 395 ( 22 611)Closing balance 119 804 130 094
The main parameters used during 2016 in what concerns valuation models were the following:
Yield curves
The short-term rates set out below reflect indicative values of deposit interest rates and/or futures. Swap rates are used for the long-term:
(%)
31.12.2016 31.12.2015EUR USD GBP EUR USD GBP
Overnight -0.41 0.70 0.22 -0.35 0.27 0.451 month -0.42 0.77 0.25 -0.23 0.43 0.50
3 months -0.36 1.00 0.36 -0.17 0.51 0.596 months -0.38 0.97 0.53 -0.10 0.61 0.75
1 year -0.28 1.14 0.55 -0.06 0.87 0.853 years -0.10 1.66 0.69 0.06 1.40 1.305 years 0.08 1.97 0.87 0.33 1.72 1.597 years 0.33 2.16 1.04 0.62 1.95 1.80
10 years 0.67 2.35 1.24 1.00 2.19 1.9915 years 1.06 2.52 1.43 1.40 2.42 2.1620 years 1.21 2.59 1.48 1.57 2.53 2.2025 years 1.25 2.61 1.46 1.60 2.59 2.1830 years 1.27 2.61 1.44 1.61 2.62 2.16

HAITONG BANK, S.A.
165
Credit Spreads
Credit spreads used by the Group when assessing credit derivatives are captured on a daily basis by Markit at the end of the day, and the values of the reference entities are used for such purpose. The development of the main credit indexes is set out below, representing the behaviour of credit spreads in the market throughout the year:
(basis points)
Index Series 1 year 3 years 5 years 7 years 10 years
Year 2015CDX USD Main 25 - 60.46 88.32 110.25 126.93iTraxx Eur Main 24 - 51.50 77.28 96.30 113.75iTraxx Eur Senior Financial 24 - - 76.86 - 106.81
Year 2016CDX USD Main 27 - 34.23 67.47 95.14 113.58iTraxx Eur Main 26 - 43.70 72.32 94.63 111.62iTraxx Eur Senior Financial 26 - - 93.44 - -
Interest rate volatility
The following figures are concerned with implied volatility (at-the-money), that work as foundation for the assessment of interest rate options:
(%)
31.12.2016 31.12.2015EUR USD GBP EUR USD GBP
1 year -- 24.82 80.81 -- 42.65 39.663 years -- 37.27 -- -- 45.92 53.365 years 164.92 40.83 97.10 148.15 46.21 54.117 years 94.34 40.85 90.36 82.95 43.92 51.7210 years 71.96 38.35 -- 55.66 40.48 47.7015 years 62.39 35.58 -- 41.68 35.58 42.18
Foreign exchange rate and volatilities
Presented below, are the foreign exchange rates (European Central Bank) at the statement of financial position date and the implicit volatilities (at the money) for the main currencies used in the derivatives’ valuation:
Exchange 31.12.2016 31.12.2015 1 month 3 months 6 months 9 months 1 year
EUR/USD 1.05410 1.08870 10.31 10.53 10.84 10.63 10.52EUR/GBP 0.85618 0.73395 9.83 10.27 10.85 10.81 10.79EUR/CHF 1.07390 1.08350 5.34 6.13 7.12 7.36 7.48EUR/PLN 4.41030 4.26390 6.66 7.08 7.55 7.72 7.84EUR/CNY 7.32020 7.06080 - - - - -USD/BRL a) 3.25444 3.96041 15.99 16.22 16.32 16.40 16.43a) Determined based on EUR/USD and EUR/BRL
Volatiliy (%)
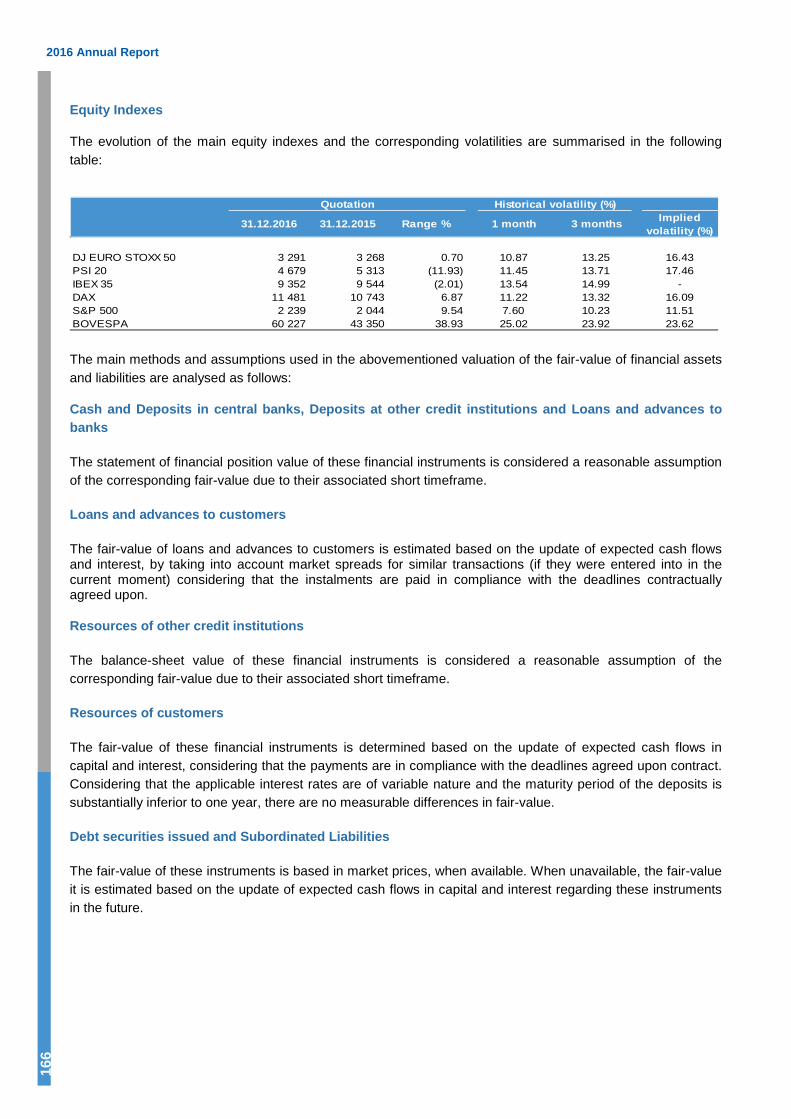
2016 Annual Report
166
Equity Indexes
The evolution of the main equity indexes and the corresponding volatilities are summarised in the following table:
Quotation Historical volatility (%)
31.12.2016 31.12.2015 Range % 1 month 3 months Implied volatility (%)
DJ EURO STOXX 50 3 291 3 268 0.70 10.87 13.25 16.43PSI 20 4 679 5 313 (11.93) 11.45 13.71 17.46IBEX 35 9 352 9 544 (2.01) 13.54 14.99 -DAX 11 481 10 743 6.87 11.22 13.32 16.09S&P 500 2 239 2 044 9.54 7.60 10.23 11.51BOVESPA 60 227 43 350 38.93 25.02 23.92 23.62
The main methods and assumptions used in the abovementioned valuation of the fair-value of financial assets and liabilities are analysed as follows:
Cash and Deposits in central banks, Deposits at other credit institutions and Loans and advances to banks
The statement of financial position value of these financial instruments is considered a reasonable assumption of the corresponding fair-value due to their associated short timeframe.
Loans and advances to customers
The fair-value of loans and advances to customers is estimated based on the update of expected cash flows and interest, by taking into account market spreads for similar transactions (if they were entered into in the current moment) considering that the instalments are paid in compliance with the deadlines contractually agreed upon.
Resources of other credit institutions
The balance-sheet value of these financial instruments is considered a reasonable assumption of the corresponding fair-value due to their associated short timeframe.
Resources of customers
The fair-value of these financial instruments is determined based on the update of expected cash flows in capital and interest, considering that the payments are in compliance with the deadlines agreed upon contract. Considering that the applicable interest rates are of variable nature and the maturity period of the deposits is substantially inferior to one year, there are no measurable differences in fair-value.
Debt securities issued and Subordinated Liabilities
The fair-value of these instruments is based in market prices, when available. When unavailable, the fair-value it is estimated based on the update of expected cash flows in capital and interest regarding these instruments in the future.

HAITONG BANK, S.A.
167
NOTE 41 – RESTATEMENT OF CONSOLIDATED FINANCIAL STATEMENTS
The statement of changes in equity and the balance as at the 1st of January, 2015, as well as the consolidated income, comprehensive income, changes in equity and cash flow statements of the financial year ended on the 31st of December, 2015, showed herein for comparison purposes, have been restated in compliance with the IFRS.
The effects of the correction of errors, in the statement of changes in equity as at the 1st of January, 2015, and the 31st of December, 2015, may be presented as follows:
(thousand euros)
Published Financial Statements 427 064 ( 35 402) 391 662 39 181 430 843 389 224 48 379 437 603
Restatement by error :Impairment for goodwill on Haitong UK - ( 54 001) ( 54 001) - ( 54 001) - - -Credit impairment need - ( 5 175) ( 5 175) - ( 5 175) - - -Debt securities impairment need ( 3 686) ( 1 204) ( 4 890) ( 1 222) ( 6 112) ( 5 162) ( 1 290) ( 6 452)Other corrections ( 1 954) ( 2 546) ( 4 500) ( 278) ( 4 778) ( 2 138) - ( 2 138)
Total of adjustments ( 5 640) ( 62 926) ( 68 566) ( 1 500) ( 70 066) ( 7 300) ( 1 290) ( 8 590)
Restated financial statements 421 424 ( 98 328) 323 096 37 681 360 777 381 924 47 089 429 013
Description(net amounts of the tax effect, where
applicable)
31.12.2015 01.01.2015Equity (without
Net profit/ (loss))
Net profit/(loss)of the year
Sub-TotalNon-
controlling interests
TotalEquity (without Non-controlling
interests)
Non-controlling
interestsTotal
Hence, the main differences arising from errors which had an impact in the Group’s financial statements are the following:
• Impairment for goodwill on Haitong UK: Total impairment of Goodwill recognised with the subsidiary Haitong UK, resulting from the fact that, when Haitong Securities acquired Haitong Bank (formerly BESI), it resulted in a change of the business model, which was underlying to the calculation of the initial Goodwill.
• Credit impairment need: Insufficiency in Group´s exposure, whose events underlying to the need of impairment recognition have occurred in 2015.
• Debt securities impairment need: Following the analysis of securities impairment in the 2016 financial year, an insufficiency was found, whose events underlying to the need of impairment recognition have occurred in 2014.
• Other corrections: Result from identified situations related with previous exercises.
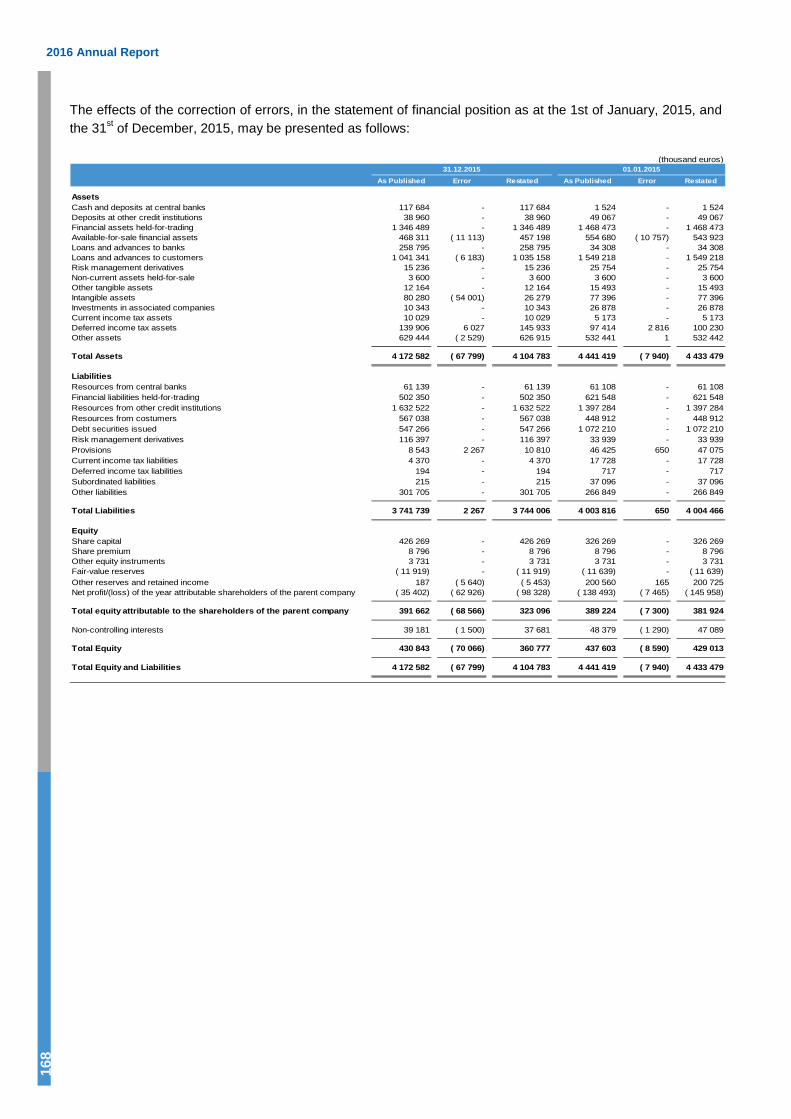
2016 Annual Report
168
The effects of the correction of errors, in the statement of financial position as at the 1st of January, 2015, and the 31st of December, 2015, may be presented as follows:
(thousand euros)
As Published Error Restated As Published Error Restated
AssetsCash and deposits at central banks 117 684 - 117 684 1 524 - 1 524Deposits at other credit institutions 38 960 - 38 960 49 067 - 49 067Financial assets held-for-trading 1 346 489 - 1 346 489 1 468 473 - 1 468 473Available-for-sale financial assets 468 311 ( 11 113) 457 198 554 680 ( 10 757) 543 923Loans and advances to banks 258 795 - 258 795 34 308 - 34 308Loans and advances to customers 1 041 341 ( 6 183) 1 035 158 1 549 218 - 1 549 218Risk management derivatives 15 236 - 15 236 25 754 - 25 754Non-current assets held-for-sale 3 600 - 3 600 3 600 - 3 600Other tangible assets 12 164 - 12 164 15 493 - 15 493Intangible assets 80 280 ( 54 001) 26 279 77 396 - 77 396Investments in associated companies 10 343 - 10 343 26 878 - 26 878Current income tax assets 10 029 - 10 029 5 173 - 5 173Deferred income tax assets 139 906 6 027 145 933 97 414 2 816 100 230Other assets 629 444 ( 2 529) 626 915 532 441 1 532 442
Total Assets 4 172 582 ( 67 799) 4 104 783 4 441 419 ( 7 940) 4 433 479
LiabilitiesResources from central banks 61 139 - 61 139 61 108 - 61 108Financial liabilities held-for-trading 502 350 - 502 350 621 548 - 621 548Resources from other credit institutions 1 632 522 - 1 632 522 1 397 284 - 1 397 284Resources from costumers 567 038 - 567 038 448 912 - 448 912Debt securities issued 547 266 - 547 266 1 072 210 - 1 072 210Risk management derivatives 116 397 - 116 397 33 939 - 33 939Provisions 8 543 2 267 10 810 46 425 650 47 075Current income tax liabilities 4 370 - 4 370 17 728 - 17 728Deferred income tax liabilities 194 - 194 717 - 717Subordinated liabilities 215 - 215 37 096 - 37 096Other liabilities 301 705 - 301 705 266 849 - 266 849
Total Liabilities 3 741 739 2 267 3 744 006 4 003 816 650 4 004 466
Equity Share capital 426 269 - 426 269 326 269 - 326 269Share premium 8 796 - 8 796 8 796 - 8 796Other equity instruments 3 731 - 3 731 3 731 - 3 731Fair-value reserves ( 11 919) - ( 11 919) ( 11 639) - ( 11 639)Other reserves and retained income 187 ( 5 640) ( 5 453) 200 560 165 200 725Net profit/(loss) of the year attributable shareholders of the parent company ( 35 402) ( 62 926) ( 98 328) ( 138 493) ( 7 465) ( 145 958)
391 662 ( 68 566) 323 096 389 224 ( 7 300) 381 924
Non-controlling interests 39 181 ( 1 500) 37 681 48 379 ( 1 290) 47 089
Total Equity 430 843 ( 70 066) 360 777 437 603 ( 8 590) 429 013
Total Equity and Liabilities 4 172 582 ( 67 799) 4 104 783 4 441 419 ( 7 940) 4 433 479
31.12.2015 01.01.2015
Total equity attributable to the shareholders of the parent company

HAITONG BANK, S.A.
169
The effects of the correction of errors, in the consolidated income statement as at the 31st of December, 2015, may be presented as follows:
(thousand euros)
As Published Error Restated
Interest and similar income 251 514 - 251 514Interest and similar expense 207 070 - 207 070
Financial margin 44 444 - 44 444
Fees and commissions income 94 274 - 94 274Fees and commissions expenses ( 11 803) - ( 11 803)Net gains/(losses) from assets and liabilities at fair value through profit or loss 77 887 ( 2 947) 74 940Net gains/(losses) from available-for-sale financial assets 3 080 - 3 080Net gains/(losses) from foreign exchange revaluation ( 61 930) - ( 61 930)Net gains/(losses) arising from the disposal of other assets 95 - 95Other operating results ( 9 062) - ( 9 062)
Operating Income 136 985 ( 2 947) 134 038
Employee costs 80 785 - 80 785Administrative costs 53 694 - 53 694Depreciation and amortisation 6 610 - 6 610Provisions net of reversals ( 23 637) 1 617 ( 22 020)Loan impairment net of reversals and recoveries 60 231 6 183 66 414Impairment on other financial assets net of reversal and recoveries 2 495 3 586 6 081Impairment on other assets net of reversals and recoveries ( 224) 54 001 53 777
Operating expenses 179 954 65 387 245 341
Share of profit in associates ( 1 143) - ( 1 143)
Profit/ (Loss) before Income Tax ( 44 112) ( 68 334) ( 112 446)
Income taxCurrent tax 26 606 - 26 606Deferred tax ( 41 729) ( 4 783) ( 46 512)
( 15 123) ( 4 783) ( 19 906)
Net Profit/(Loss) for the year ( 28 989) ( 63 551) ( 92 540)
Attributable to shareholders of the parent company ( 35 402) ( 62 926) ( 98 328)Attributable to non-controlling interests 6 413 ( 625) 5 788
( 28 989) ( 63 551) ( 92 540)
31.12.2015

2016 Annual Report
170
The effects of the correction of errors, in the consolidated comprehensive income statement as at the 31st of December, 2015, may be presented as follows:
(thousand euros)
As Published Error Restated
Net income of the yearAttributable to shareholders of the parent company ( 35 402) ( 62 926) ( 98 328)Attributable to non-controlling interests 6 413 ( 625) 5 788
( 28 989) ( 63 551) ( 92 540)
Other comprehensive income for the year
Items that will not be reclassified to profit and lossActuarial gains/(losses), net of taxes ( 7 989) - ( 7 989)
( 7 989) - ( 7 989)
Items that may be reclassified to profit and lossExchange differences net of taxes ( 68 124) 2 075 ( 66 049)Other comprehensive income from associates 346 - 346
( 67 778) 2 075 ( 65 703)Available-for-sale financial assets
Gains/(Losses) during the year ( 1 492) - ( 1 492) Gains/(losses) realised to income statement of the year ( 734) - ( 734)Deferred taxes 1 409 - 1 409
( 817) - ( 817)Total comprehensive income/(loss) of the year ( 105 573) ( 61 476) ( 167 049) Attributable to shareholders of the parent company ( 97 337) ( 61 266) ( 158 603)Attributable to non-controlling interests ( 8 236) ( 210) ( 8 446)
( 105 573) ( 61 476) ( 167 049)
31.12.2015
NOTE 42 – RISK MANAGEMENT
Resources of customers
Credit Risk is based on possible financial losses due to failure by the customer or counterpart in relation to the obligations established with the Group upon contract within their credit activity. Credit risk is essentially present in traditional banking products – loans, guarantees and other contingent liabilities - and in negotiation products – swaps, forwards and options (counterpart risk).
Permanent management of loan portfolio is undertaken, which favours the interaction between several teams engaged in risk management throughout the continuous stages of the credit process. This approach is complemented by the implementation of continuous upgrades to the methodologies and tools of risk evaluation and control.
There are regular follow-ups of the Group's credit risk profile, namely in what concerns the evolution of credit exposures and monitoring of credit losses. Also subject to analysis is the compliance with the approved credit limits and the correct operation of mechanisms associated with the approval of credit lines within the business area’s ongoing activity.

HAITONG BANK, S.A.
171
Information regarding the exposure of Haitong Bank Group to credit risk is presented as follows:
(thousand euros)
31.12.2016 31.12.2015
Deposits with banks 995 482 415 425 Financial assets held for trading 1 485 249 1 345 304 Available-for-sale financial assets 756 923 439 841 Loans and advances to customers 841 095 1 041 341 Derivatives for risk management purposes 18 273 15 236 Other assets 236 129 342 903 Guarantees granted 220 021 269 354 Irrevocable commitments 15 880 48 211 Credit risk associated to the credit derivatives reference entities - 1 Total 4 569 052 3 917 616
Concentration risk
The distribution of loan and advances to customers and securities by sectors for the years ending on the 31st of December 2016 and 2015 is presented as follows:
(thousand euros)
Outstanding loans
Overdue loans
Outstanding loans
Overdue loans
Agriculture 12 267 - 90 - 906 3 3 Mining - - - - 3 686 - - Food, beverage and tobaco 9 828 - 408 - 2 329 - - Shoes - 197 - 98 - - - Paper industry - - - - 14 186 - - Refining and oil - - - - 2 168 - - Chemicals and rubber 9 155 16 907 5 809 16 062 422 4 045 - Non-metallic minerals 9 571 - 77 - 691 - - Metallic products 10 341 118 52 - 1 065 18 884 103 Production of machinery, equipment and electric devices 14 781 - 120 - 8 927 - - Production of transport material - - - - 521 - - Electricity, gas and water 243 531 6 652 7 374 6 458 34 423 4 019 - Collection, purification / distribution of water, sanitation, waste management and cleaning 21 790 5 362 1 420 536 1 356 - - Construction 41 314 87 324 4 143 20 600 20 863 3 938 - Real estate activities 2 846 - 1 584 - 68 - - Wholesale and retail; repair of motor vehicles and motorcycles 67 937 1 974 350 - 5 807 - - Transports and storage 180 804 26 983 8 572 7 368 88 371 5 980 - Printing and publishing 9 741 - 2 435 - - 150 - Communication activities 4 077 - 20 - 3 843 826 499 IT Consulting - - - - - 22 370 22 370 Monetary intermediation - - - - 176 644 96 068 - Holding companies 68 553 47 098 59 805 47 095 20 492 93 190 9 493 Other financial and insurance activities 74 288 793 623 793 40 864 45 701 13 718 Real estate activities 7 108 - 2 026 - 4 013 477 - Services provided to companies 7 841 56 798 56 26 628 25 303 600 Administrative activities and suporting services 5 905 - 4 010 - - - - Travelling activities - 15 520 - 15 520 - - - Renting activities 38 488 - 25 790 - 4 975 1 327 - Public services - - - - 1 018 641 514 773 - Local public services 4 044 - 20 - 57 ( 1) - Human health activities and social support 19 764 - 99 - 12 969 - - Arts, entretainment, sports and recreation activities 18 809 316 15 576 138 - 154 75 Other service activities 4 591 - 24 - - - - Mortgage loans 370 - - - - - - TOTAL 887 744 209 300 141 225 114 724 1 494 915 837 207 46 861
31.12.2016
Loans and advances to customers Financial assets
held-for-trading
Available-for-sale financial assets
Gross amount Impairment Gross amount Impairment
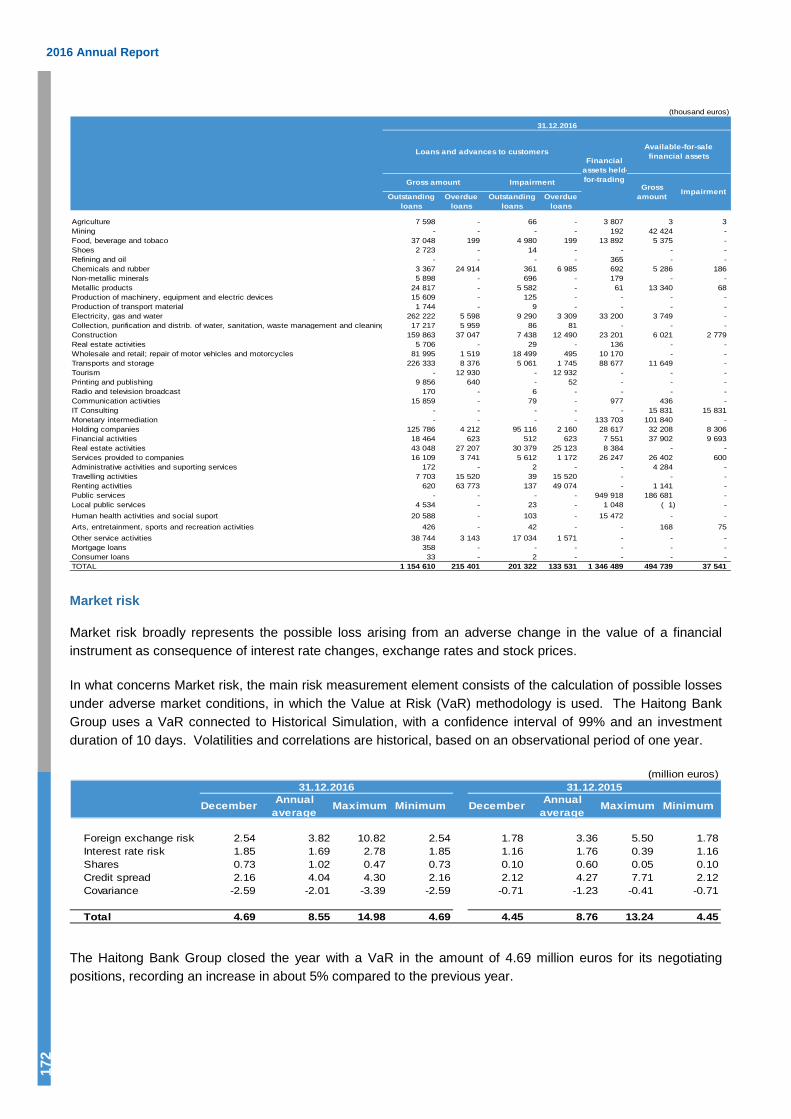
2016 Annual Report
172
(thousand euros)
Outstanding loans
Overdue loans
Outstanding loans
Overdue loans
Agriculture 7 598 - 66 - 3 807 3 3 Mining - - - - 192 42 424 - Food, beverage and tobaco 37 048 199 4 980 199 13 892 5 375 - Shoes 2 723 - 14 - - - - Refining and oil - - - - 365 - - Chemicals and rubber 3 367 24 914 361 6 985 692 5 286 186 Non-metallic minerals 5 898 - 696 - 179 - - Metallic products 24 817 - 5 582 - 61 13 340 68 Production of machinery, equipment and electric devices 15 609 - 125 - - - - Production of transport material 1 744 - 9 - - - - Electricity, gas and water 262 222 5 598 9 290 3 309 33 200 3 749 - Collection, purification and distrib. of water, sanitation, waste management and cleaning 17 217 5 959 86 81 - - - Construction 159 863 37 047 7 438 12 490 23 201 6 021 2 779 Real estate activities 5 706 - 29 - 136 - - Wholesale and retail; repair of motor vehicles and motorcycles 81 995 1 519 18 499 495 10 170 - - Transports and storage 226 333 8 376 5 061 1 745 88 677 11 649 - Tourism - 12 930 - 12 932 - - - Printing and publishing 9 856 640 - 52 - - - Radio and television broadcast 170 - 6 - - - - Communication activities 15 859 - 79 - 977 436 - IT Consulting - - - - - 15 831 15 831 Monetary intermediation - - - - 133 703 101 840 - Holding companies 125 786 4 212 95 116 2 160 28 617 32 208 8 306 Financial activities 18 464 623 512 623 7 551 37 902 9 693 Real estate activities 43 048 27 207 30 379 25 123 8 384 - - Services provided to companies 16 109 3 741 5 612 1 172 26 247 26 402 600 Administrative activities and suporting services 172 - 2 - - 4 284 - Travelling activities 7 703 15 520 39 15 520 - - - Renting activities 620 63 773 137 49 074 - 1 141 - Public services - - - - 949 918 186 681 - Local public services 4 534 - 23 - 1 048 ( 1) - Human health activities and social suport 20 588 - 103 - 15 472 - - Arts, entretainment, sports and recreation activities 426 - 42 - - 168 75 Other service activities 38 744 3 143 17 034 1 571 - - - Mortgage loans 358 - - - - - - Consumer loans 33 - 2 - - - - TOTAL 1 154 610 215 401 201 322 133 531 1 346 489 494 739 37 541
31.12.2016
Loans and advances to customersFinancial
assets held-for-trading
Available-for-sale financial assets
Gross amount Impairment Gross amount Impairment
Market risk
Market risk broadly represents the possible loss arising from an adverse change in the value of a financial instrument as consequence of interest rate changes, exchange rates and stock prices.
In what concerns Market risk, the main risk measurement element consists of the calculation of possible losses under adverse market conditions, in which the Value at Risk (VaR) methodology is used. The Haitong Bank Group uses a VaR connected to Historical Simulation, with a confidence interval of 99% and an investment duration of 10 days. Volatilities and correlations are historical, based on an observational period of one year.
(million euros)
December Annual average Maximum Minimum December Annual
average Maximum Minimum
Foreign exchange risk 2.54 3.82 10.82 2.54 1.78 3.36 5.50 1.78Interest rate risk 1.85 1.69 2.78 1.85 1.16 1.76 0.39 1.16Shares 0.73 1.02 0.47 0.73 0.10 0.60 0.05 0.10Credit spread 2.16 4.04 4.30 2.16 2.12 4.27 7.71 2.12Covariance -2.59 -2.01 -3.39 -2.59 -0.71 -1.23 -0.41 -0.71
Total 4.69 8.55 14.98 4.69 4.45 8.76 13.24 4.45
31.12.2016 31.12.2015
The Haitong Bank Group closed the year with a VaR in the amount of 4.69 million euros for its negotiating positions, recording an increase in about 5% compared to the previous year.
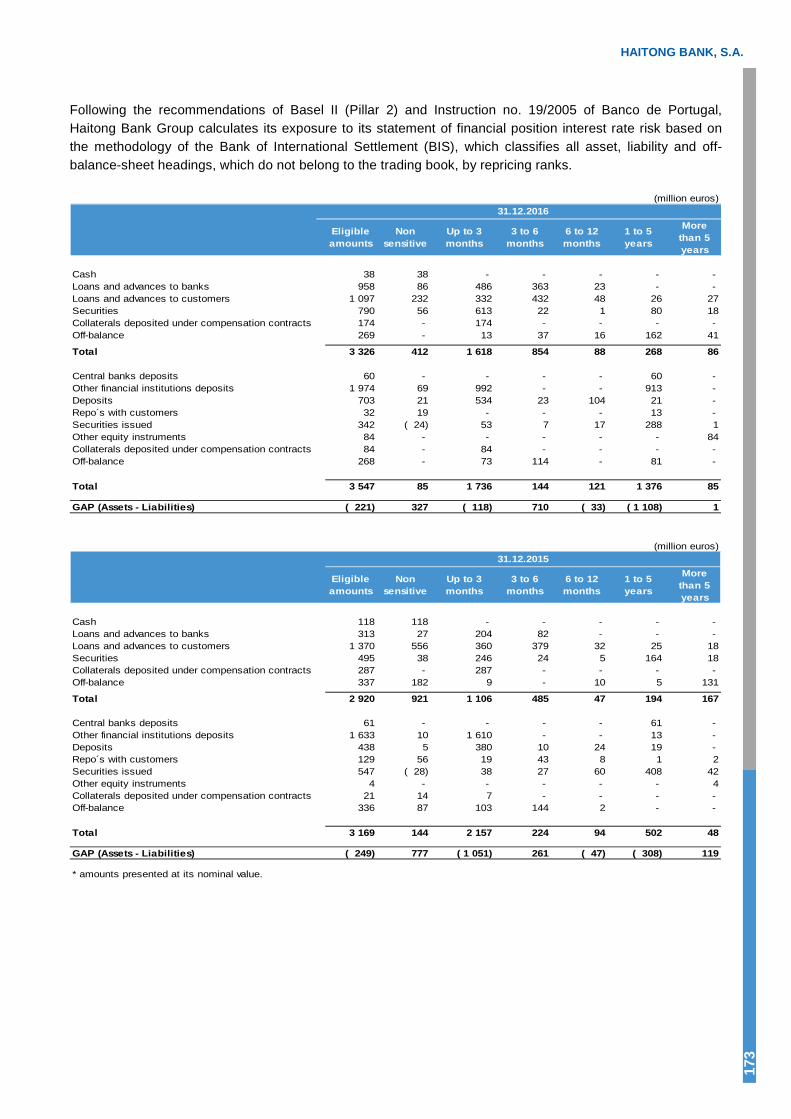
HAITONG BANK, S.A.
173
Following the recommendations of Basel II (Pillar 2) and Instruction no. 19/2005 of Banco de Portugal, Haitong Bank Group calculates its exposure to its statement of financial position interest rate risk based on the methodology of the Bank of International Settlement (BIS), which classifies all asset, liability and off-balance-sheet headings, which do not belong to the trading book, by repricing ranks.
(million euros)
Eligible amounts
Non sensitive
Up to 3 months
3 to 6 months
6 to 12 months
1 to 5 years
More than 5 years
Cash 38 38 - - - - - Loans and advances to banks 958 86 486 363 23 - - Loans and advances to customers 1 097 232 332 432 48 26 27Securities 790 56 613 22 1 80 18Collaterals deposited under compensation contracts 174 - 174 - - - - Off-balance 269 - 13 37 16 162 41
Total 3 326 412 1 618 854 88 268 86
Central banks deposits 60 - - - - 60 - Other financial institutions deposits 1 974 69 992 - - 913 - Deposits 703 21 534 23 104 21 - Repo´s with customers 32 19 - - - 13 - Securities issued 342 ( 24) 53 7 17 288 1Other equity instruments 84 - - - - - 84Collaterals deposited under compensation contracts 84 - 84 - - - - Off-balance 268 - 73 114 - 81 -
Total 3 547 85 1 736 144 121 1 376 85
GAP (Assets - Liabilities) ( 221) 327 ( 118) 710 ( 33) ( 1 108) 1
31.12.2016
(million euros)
Eligible amounts
Non sensitive
Up to 3 months
3 to 6 months
6 to 12 months
1 to 5 years
More than 5 years
Cash 118 118 - - - - - Loans and advances to banks 313 27 204 82 - - - Loans and advances to customers 1 370 556 360 379 32 25 18Securities 495 38 246 24 5 164 18Collaterals deposited under compensation contracts 287 - 287 - - - - Off-balance 337 182 9 - 10 5 131
Total 2 920 921 1 106 485 47 194 167
Central banks deposits 61 - - - - 61 - Other financial institutions deposits 1 633 10 1 610 - - 13 - Deposits 438 5 380 10 24 19 - Repo´s with customers 129 56 19 43 8 1 2Securities issued 547 ( 28) 38 27 60 408 42Other equity instruments 4 - - - - - 4Collaterals deposited under compensation contracts 21 14 7 - - - - Off-balance 336 87 103 144 2 - -
Total 3 169 144 2 157 224 94 502 48
GAP (Assets - Liabilities) ( 249) 777 ( 1 051) 261 ( 47) ( 308) 119
* amounts presented at its nominal value.
31.12.2015
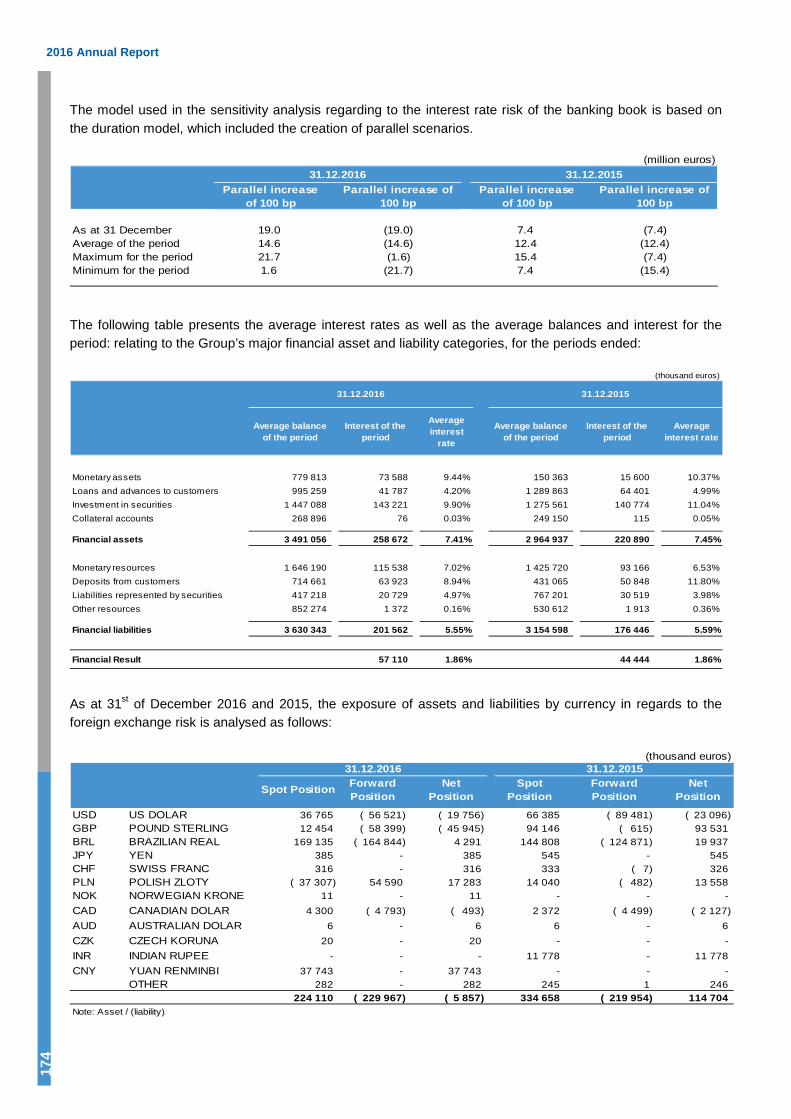
2016 Annual Report
174
The model used in the sensitivity analysis regarding to the interest rate risk of the banking book is based on the duration model, which included the creation of parallel scenarios.
(million euros)31.12.2016 31.12.2015
Parallel increase of 100 bp
Parallel increase of 100 bp
Parallel increase of 100 bp
Parallel increase of 100 bp
As at 31 December 19.0 (19.0) 7.4 (7.4)Average of the period 14.6 (14.6) 12.4 (12.4)Maximum for the period 21.7 (1.6) 15.4 (7.4)Minimum for the period 1.6 (21.7) 7.4 (15.4)
The following table presents the average interest rates as well as the average balances and interest for the period: relating to the Group’s major financial asset and liability categories, for the periods ended:
(thousand euros)
Average balance of the period
Interest of the period
Average interest
rate
Average balance of the period
Interest of the period
Average interest rate
Monetary assets 779 813 73 588 9.44% 150 363 15 600 10.37%Loans and advances to customers 995 259 41 787 4.20% 1 289 863 64 401 4.99%Investment in securities 1 447 088 143 221 9.90% 1 275 561 140 774 11.04%Collateral accounts 268 896 76 0.03% 249 150 115 0.05%
Financial assets 3 491 056 258 672 7.41% 2 964 937 220 890 7.45%
Monetary resources 1 646 190 115 538 7.02% 1 425 720 93 166 6.53%Deposits from customers 714 661 63 923 8.94% 431 065 50 848 11.80%Liabilities represented by securities 417 218 20 729 4.97% 767 201 30 519 3.98%Other resources 852 274 1 372 0.16% 530 612 1 913 0.36%
Financial liabilities 3 630 343 201 562 5.55% 3 154 598 176 446 5.59%
Financial Result 57 110 1.86% 44 444 1.86%
31.12.2016 31.12.2015
As at 31st of December 2016 and 2015, the exposure of assets and liabilities by currency in regards to the foreign exchange risk is analysed as follows:
(thousand euros)
Spot Position Forward Position
Net Position
Spot Position
Forward Position
Net Position
USD US DOLAR 36 765 ( 56 521) ( 19 756) 66 385 ( 89 481) ( 23 096)GBP POUND STERLING 12 454 ( 58 399) ( 45 945) 94 146 ( 615) 93 531 BRL BRAZILIAN REAL 169 135 ( 164 844) 4 291 144 808 ( 124 871) 19 937 JPY YEN 385 - 385 545 - 545 CHF SWISS FRANC 316 - 316 333 ( 7) 326 PLN POLISH ZLOTY ( 37 307) 54 590 17 283 14 040 ( 482) 13 558 NOK NORWEGIAN KRONE 11 - 11 - - - CAD CANADIAN DOLAR 4 300 ( 4 793) ( 493) 2 372 ( 4 499) ( 2 127)AUD AUSTRALIAN DOLAR 6 - 6 6 - 6 CZK CZECH KORUNA 20 - 20 - - - INR INDIAN RUPEE - - - 11 778 - 11 778 CNY YUAN RENMINBI 37 743 - 37 743 - - -
OTHER 282 - 282 245 1 246 224 110 ( 229 967) ( 5 857) 334 658 ( 219 954) 114 704
Note: Asset / (liability)
31.12.2016 31.12.2015
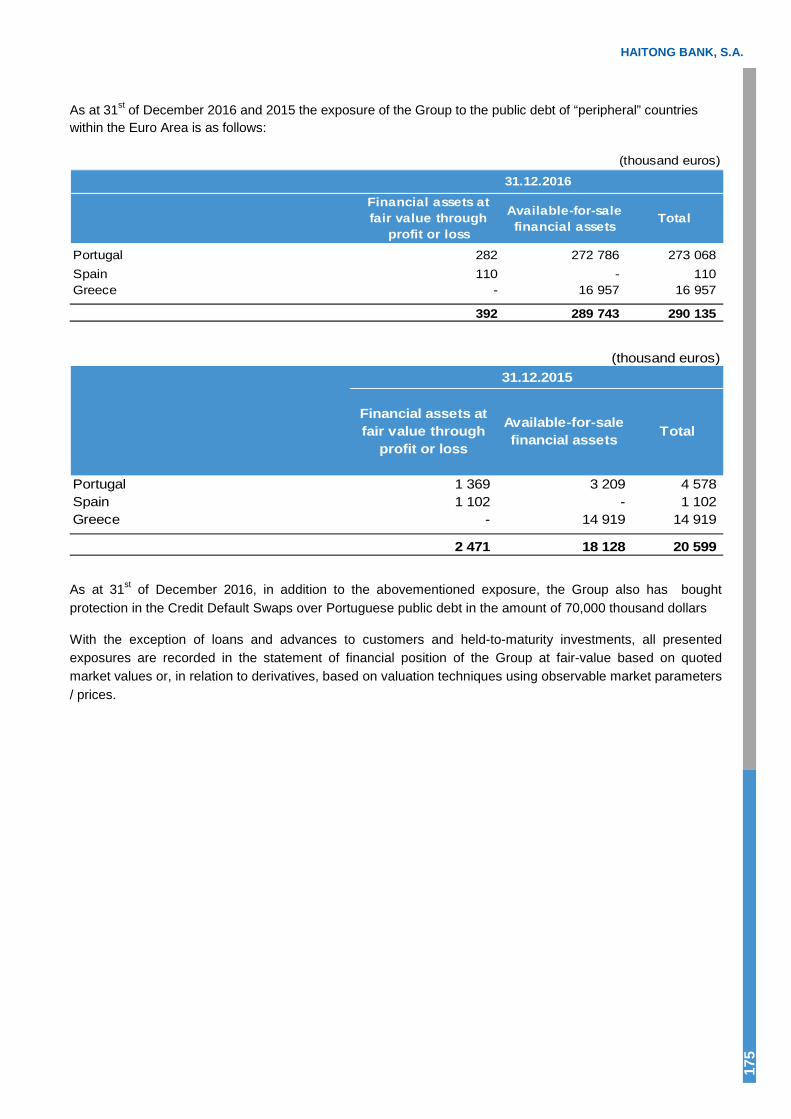
HAITONG BANK, S.A.
175
As at 31st of December 2016 and 2015 the exposure of the Group to the public debt of “peripheral” countries within the Euro Area is as follows:
(thousand euros)
Portugal 282 272 786 273 068 Spain 110 - 110 Greece - 16 957 16 957
392 289 743 290 135
31.12.2016Financial assets at fair value through
profit or loss
Available-for-sale financial assets Total
(thousand euros)
Portugal 1 369 3 209 4 578 Spain 1 102 - 1 102 Greece - 14 919 14 919
2 471 18 128 20 599
31.12.2015
Financial assets at fair value through
profit or loss
Available-for-sale financial assets Total
As at 31st of December 2016, in addition to the abovementioned exposure, the Group also has bought protection in the Credit Default Swaps over Portuguese public debt in the amount of 70,000 thousand dollars
With the exception of loans and advances to customers and held-to-maturity investments, all presented exposures are recorded in the statement of financial position of the Group at fair-value based on quoted market values or, in relation to derivatives, based on valuation techniques using observable market parameters / prices.
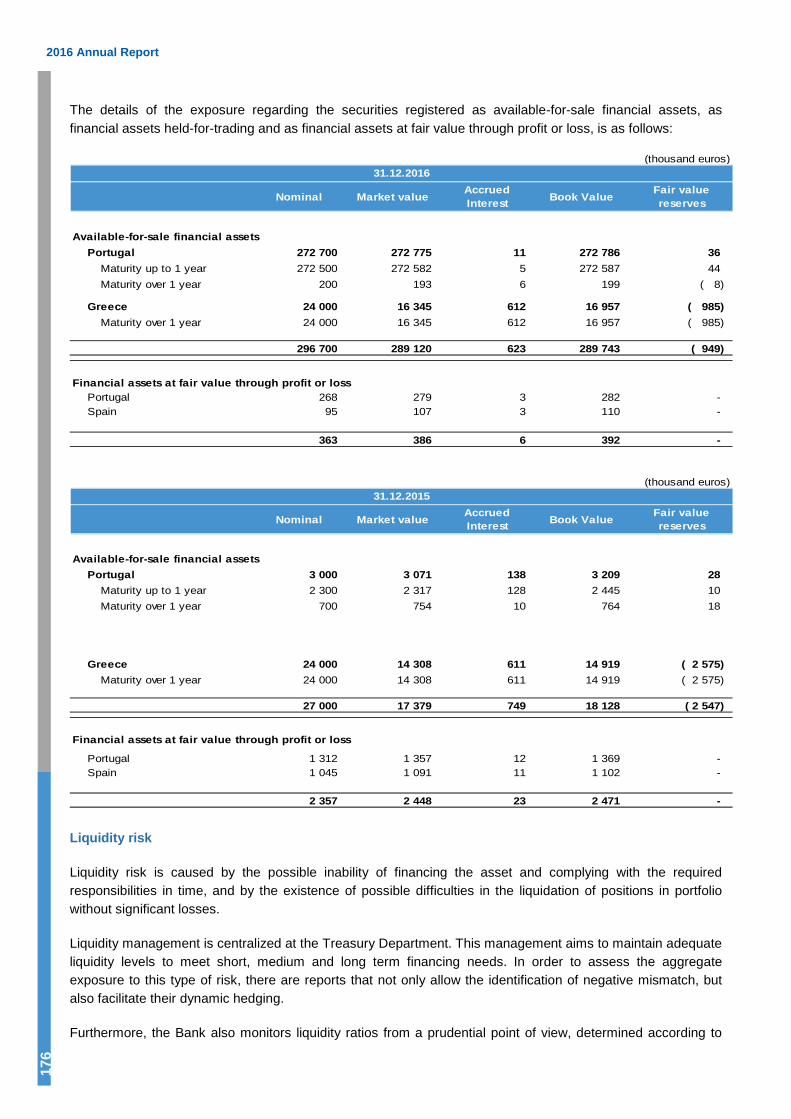
2016 Annual Report
176
The details of the exposure regarding the securities registered as available-for-sale financial assets, as financial assets held-for-trading and as financial assets at fair value through profit or loss, is as follows:
(thousand euros)
Nominal Market value Accrued Interest Book Value Fair value
reserves
Available-for-sale financial assetsPortugal 272 700 272 775 11 272 786 36
Maturity up to 1 year 272 500 272 582 5 272 587 44 Maturity over 1 year 200 193 6 199 ( 8)
Greece 24 000 16 345 612 16 957 ( 985)Maturity over 1 year 24 000 16 345 612 16 957 ( 985)
296 700 289 120 623 289 743 ( 949)
Financial assets at fair value through profit or lossPortugal 268 279 3 282 - Spain 95 107 3 110 -
363 386 6 392 -
31.12.2016
(thousand euros)
Nominal Market value Accrued Interest Book Value Fair value
reserves
Available-for-sale financial assetsPortugal 3 000 3 071 138 3 209 28
Maturity up to 1 year 2 300 2 317 128 2 445 10 Maturity over 1 year 700 754 10 764 18
Greece 24 000 14 308 611 14 919 ( 2 575)Maturity over 1 year 24 000 14 308 611 14 919 ( 2 575)
27 000 17 379 749 18 128 ( 2 547)
Financial assets at fair value through profit or loss
Portugal 1 312 1 357 12 1 369 - Spain 1 045 1 091 11 1 102 -
2 357 2 448 23 2 471 -
31.12.2015
Liquidity risk
Liquidity risk is caused by the possible inability of financing the asset and complying with the required responsibilities in time, and by the existence of possible difficulties in the liquidation of positions in portfolio without significant losses.
Liquidity management is centralized at the Treasury Department. This management aims to maintain adequate liquidity levels to meet short, medium and long term financing needs. In order to assess the aggregate exposure to this type of risk, there are reports that not only allow the identification of negative mismatch, but also facilitate their dynamic hedging.
Furthermore, the Bank also monitors liquidity ratios from a prudential point of view, determined according to

HAITONG BANK, S.A.
177
the rules established by the Bank of Portugal and provided in the CRD IV (Directive 2013/36/UE).
As at 31 December 2016, contractual undiscounted cash flows of financial assets and liabilities present the following structure:
(thousand euros)
On demand Up to 3 months
3 months to 1 year
1 to 5 years
More than 5 years Undetermined Total
AssetsCash and deposits at central banks 37 541 - - - - - 37 541Deposits at other credit institutions 105 496 - - - - - 105 496Financial assets held-for-trading (Securities) 1 019 154 2 215 28 195 68 929 30 112 - 1 148 605Available-for-sale financial assets 365 115 365 947 4 159 39 488 51 088 - 825 797Loans and advances to banks 162 235 447 683 209 152 9 952 796 - 829 818Loans and advances to customers 20 164 32 279 26 159 121 419 447 267 193 808 841 095Derivatives Instruments 394 291 362 216 290 526 885 299 123 669 - 2 056 002
2 103 996 1 210 340 558 191 1 125 088 652 931 193 808 5 844 353LiabilitiesResources of central banks - - - 60 000 - - 60 000Resources of other credit institutions 771 535 203 402 39 940 163 57 234 - 1 972 373Resources of customers 110 760 115 597 315 877 141 259 2 915 - 686 408Debt securities issued 25 433 24 303 37 595 314 039 3 770 - 405 140Financial liabilities held-for-trading (Securities) 782 215 - - - - - 782 215Derivatives Instruments 303 401 358 787 288 887 770 763 118 354 - 1 840 192Provisions 4 937 - - - - - 4 937
1 998 282 702 090 642 399 2 226 224 182 272 - 5 751 266
31.12.2016
As at 31 December 2015, contractual undiscounted cash flows of financial assets and liabilities present the following structure:
(thousand euros)
On demand Up to 3 months
3 months to 1 year
1 to 5 years
More than 5 years Undetermined Total
AssetsCash and deposits at central banks 117 657 - - - 13 - 117 670Deposits at other credit institutions 35 645 - - - 1 247 - 36 893Financial assets held-for-trading (Securities) 4 135 1 706 773 405 84 231 148 183 - 1 011 661Available-for-sale financial assets 74 831 105 407 27 756 239 489 75 883 - 523 366Loans and advances to banks 69 368 103 664 81 174 - 921 - 255 126Loans and advances to customers 16 876 48 769 181 612 173 293 492 054 128 737 1 041 341Derivatives Instruments 470 218 706 681 263 611 802 450 151 151 - 2 394 111
788 730 966 227 1 327 558 1 299 464 869 452 128 737 5 380 167LiabilitiesResources of central banks - - - 61 100 - - 61 100Resources of other credit institutions 655 571 94 513 8 326 812 849 56 444 - 1 627 702Resources of customers 72 936 169 608 181 959 101 067 - - 525 570Debt securities issued 63 373 28 585 94 926 477 908 61 047 - 725 839Financial liabilities held-for-trading (Securities) 186 190 - - - - - 186 190Derivatives Instruments 201 832 705 361 230 369 747 110 163 377 - 2 048 049Provisions 3 908 - - - - - 3 908
1 183 810 998 067 515 580 2 200 034 280 867 - 5 178 358
31.12.2015
Consolidated Liquidity Indicators
As at 31st of December 2016, the Haitong Bank achieved a liquidity coverage ratio of 329 %, being above the legal minimum rate for both December 2016 and December 2018.
Operational risk
Operating Risk corresponds to possible losses produced by failures in the fulfilment of internal proceedings, either by the behaviour of the people, computing systems or external events.
A management system was developed and implemented, seeking to ensure the standardisation, systematisation and repetition of activities regarding identification, monitoring, control and mitigation of operating risk.
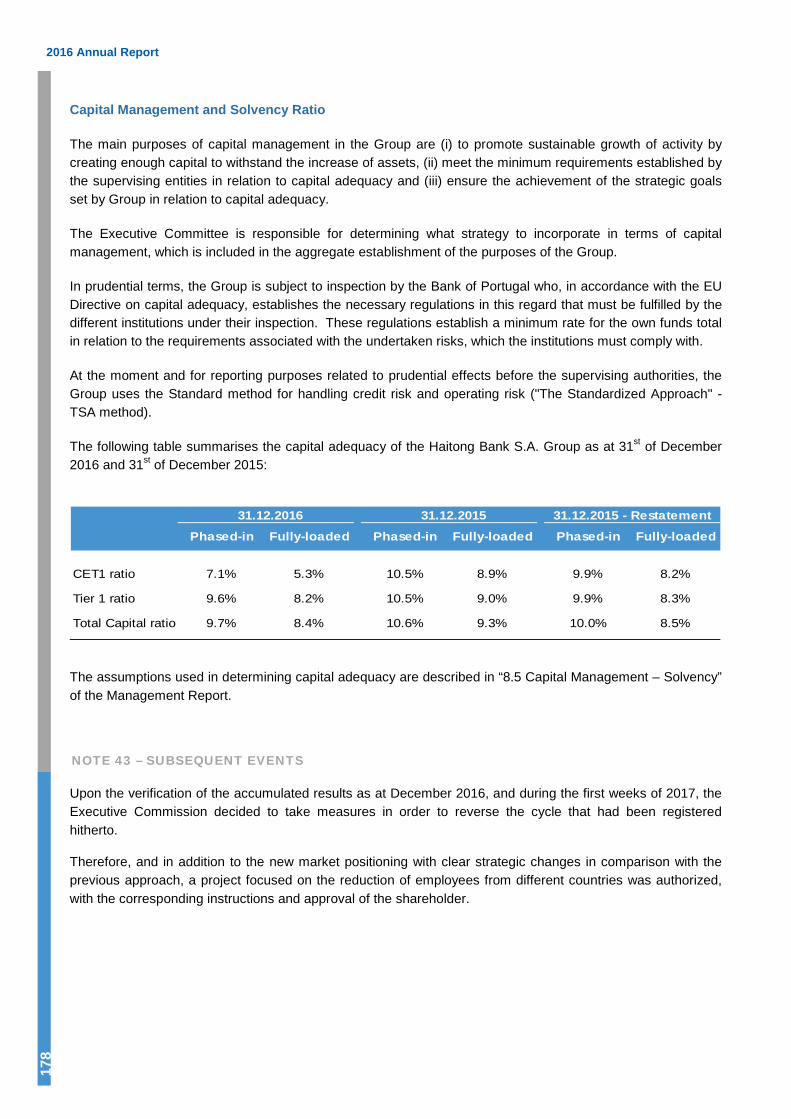
2016 Annual Report
178
Capital Management and Solvency Ratio
The main purposes of capital management in the Group are (i) to promote sustainable growth of activity by creating enough capital to withstand the increase of assets, (ii) meet the minimum requirements established by the supervising entities in relation to capital adequacy and (iii) ensure the achievement of the strategic goals set by Group in relation to capital adequacy.
The Executive Committee is responsible for determining what strategy to incorporate in terms of capital management, which is included in the aggregate establishment of the purposes of the Group.
In prudential terms, the Group is subject to inspection by the Bank of Portugal who, in accordance with the EU Directive on capital adequacy, establishes the necessary regulations in this regard that must be fulfilled by the different institutions under their inspection. These regulations establish a minimum rate for the own funds total in relation to the requirements associated with the undertaken risks, which the institutions must comply with.
At the moment and for reporting purposes related to prudential effects before the supervising authorities, the Group uses the Standard method for handling credit risk and operating risk ("The Standardized Approach" - TSA method).
The following table summarises the capital adequacy of the Haitong Bank S.A. Group as at 31st of December 2016 and 31st of December 2015:
31.12.2016 31.12.2015 31.12.2015 - Restatement
Phased-in Fully-loaded Phased-in Fully-loaded Phased-in Fully-loaded
CET1 ratio 7.1% 5.3% 10.5% 8.9% 9.9% 8.2%
Tier 1 ratio 9.6% 8.2% 10.5% 9.0% 9.9% 8.3%
Total Capital ratio 9.7% 8.4% 10.6% 9.3% 10.0% 8.5%
The assumptions used in determining capital adequacy are described in “8.5 Capital Management – Solvency” of the Management Report.
NOTE 43 – SUBSEQUENT EVENTS
Upon the verification of the accumulated results as at December 2016, and during the first weeks of 2017, the Executive Commission decided to take measures in order to reverse the cycle that had been registered hitherto.
Therefore, and in addition to the new market positioning with clear strategic changes in comparison with the previous approach, a project focused on the reduction of employees from different countries was authorized, with the corresponding instructions and approval of the shareholder.
HAITONG BANK, S.A.
179
NOTE 44 – ACCOUNTING STANDARDS AND RECENT INTERPRETATIONS ADOPTED BY THE GROUP
The following were the standards and interpretations (either new or revised) applicable to the activity of the
Haitong Bank Group, reflected in the financial statements as at the 31st of December:
● Amendment to IAS 19 – Employee benefits – Employee contributions: Applicable in the EU in the financial years beginning on or after the 1st of February, 2015. Such amendment specified in which circumstances employee contributions for post-employment benefit plans represent a decrease in the costs with short-term benefits.
● Improvements to the International Financial Reporting Standards – 2010-2012 Cycle – Applicable in the EU in the financial years beginning on or after the 1st of February, 2015. Such improvements involved the clarification of certain aspects relating to (i) IFRS 2 – Share-based Payment: defining vesting condition; (ii) IFRS 3 – Business combinations: accounting for contingent payments; (iii) IFRS 8 – Operating segments: disclosures related to the judgement applied concerning the aggregation of segments and clarification on the need of reconciling the total assets by segment with the value of assets in the financial statements; (iv) IAS 16 – Fixed tangible assets; and (v) IAS 38 – Intangible assets: need for proportional reassessment of accumulated amortisations in the event of revaluation of fixed assets; and (vi) IAS 24 – Related party disclosures: defines that an entity which provides management services to the Company or its parent company is considered a related party; and (vii) IFRS 13 – Fair value: clarifications concerning the measurement of short-term accounts receivable or payable.
● Improvements to the international standards – 2012-2014 Cycle – Applicable in the EU in the financial years beginning on or after the 1st of January, 2016. Such improvements involved the clarification of certain aspects relating to: (i) IFRS 5 – Non-current assets held for sale and discontinued operations: introduces guidelines on how to act in the event of changes as to the expected method of realisation (sale or distribution to shareholders); (ii) IFRS 7 – Financial instruments: disclosures: clarifies the impacts of asset tracking contracts within the scope of disclosures associated with ongoing involvement of derecognised assets and exempts interim financial statements from the disclosures required in respect of offsetting financial assets and liabilities; (iii) IAS 19 – Employee benefits: determines that the rate to be used for the purpose of discounting defined benefits shall be determined with reference to high-quality bonds of companies issued in the currency in which the benefits shall be settled; and (iv) IAS 34 – Interim financial reporting: clarification on the procedures to be adopted when the information is available in other documents issued together with the interim financial statements.
● Amendment to IFRS 11 – Joint arrangements: Accounting for acquisitions of interests in joint arrangements – Applicable in the EU in the financial years beginning on or after the 1st of January, 2016. Such amendment has determined the mandatory application of IFRS 3 when the acquired joint operation is a business activity in accordance with IFRS 3. When the joint operation in question is not a business activity, the transaction shall be recorded as an asset acquisition. Such amendment is of prospective application for new acquisitions of interests.
● Amendment to the IAS 1 standard – Presentation of financial statements: “Disclosure Initiative” – Applicable in the EU in the financial years beginning on or after the 1st of January, 2016. Such amendment clarifies certain aspects related to the disclosures initiative, in particular: (i) the entity shall not hinder the readability of financial statements through the aggregation of tangible items with intangible items or through the aggregation of tangible items of different natures; (ii) disclosures specifically required by the IFRS only have to be provided if the information in question is material; (iii) the lines of the financial statements specified by IAS 1 may be aggregated or disaggregated, as more relevant to the objectives of the financial reporting; (iv) the part of the other comprehensive income resulting from the application of the equity method in associates and joint arrangements shall be presented separately from the remaining
2016 Annual Report
180
elements of other comprehensive income, thereby also segregating items that may be reclassified to results which will not be reclassified; (v) the structure of the notes must be flexible, and they shall observe the following order:
− a statement of compliance with the IFRS in the first section of the notes;
− a description of the relevant accounting policies in the second section;
− supporting information on the items on the face of the financial statements in the third section; and
− other information in the fourth section
● Amendment to IAS 16 – Fixed tangible assets and IAS 38 – Intangible assets: Acceptable methods of depreciation – Applicable in the EU in the financial years beginning on or after the 1st of January, 2016. Such amendment establishes the assumption (which may be refuted) that revenue is not a suitable basis to amortise intangible assets and prohibits the use of revenue as the basis for the amortisation of fixed tangible assets. The presumption established for the amortisation of intangible assets may only be refuted when the intangible asset is expressed in terms of generated revenue or when the use of the economic benefits is highly correlated with the generated revenue.
● Amendment to IAS 27 – Application of the equity method in separate financial statements – Applicable in the EU in the financial years beginning on or after the 1st of January, 2016. Such amendment introduces the possibility of measuring the interests in subsidiaries, joint arrangements and associates in separate financial statements under the equity method, in addition to the current measurement methods. This amendment applies retrospectively.
● Amendments to IFRS 10 – Consolidated financial statements, IFRS 12 - Disclosure of interests in other entities and IAS 28 – Investments in associates and joint ventures – Applicable in the EU in the financial years beginning on or after the 1st of January, 2016. Such amendments involve the clarification of several aspects related to the application of the exception of consolidation by investment entities.
The adoption of the abovementioned standards, interpretations, amendments and revisions has not produced significant effects in the financial statements of the Haitong Bank Group in the financial year ended as at the 31st of December, 2016.
Standards, amendments and interpretations issued but not yet effective for the Group
The following standards, interpretations, amendments and revisions, of mandatory application in future financial years, have been endorsed by the European Union up to the date of approval of the financial statements herein:
● IFRS 9 – Financial instruments (2009) and subsequent amendments – Applicable in the EU in the financial years beginning on or after the 1st of January, 2018. Such standard is part of the project of revision of IAS 39 and lays down the new requirements regarding the classification and measurement of financial assets and liabilities, the impairment calculation methodology and the application of hedge accounting rules.
● IFRS 15 – Revenue from contracts with customers – Applicable in the EU in the financial years beginning on or after the 1st of January, 2018. This standard introduces a structure for revenue recognition based on principles and on a model to be applied to all contracts entered into with customers, thereby replacing standards IAS 18 - Revenue, IAS 11 - Construction contracts; IFRIC 13 – Customer loyalty programmes; IFRIC 15 – Agreements for the construction of real estate; IFRIC 18 – Transfers of Assets from Customers and SIC 31 – Revenue – Barter transactions involving advertising services.

HAITONG BANK, S.A.
181
The Group started a process of assessment of the potential effects of the aforesaid standards. However, given the nature of the Group’s activities, it is expected that such standard has significant impacts on the financial statements.
Standards, interpretations, amendments and revisions not yet endorsed by the European Union
The following standards, interpretations, amendments and revisions, of mandatory application in future financial years, have not been endorsed by the European Union up to the date of approval of the financial statements herein:
● IFRS 14 – Regulatory assets: This standard determines the reporting requirements by entities which adopt the IFRS applicable to regulatory assets for the first time.
● IFRS 16 – Leases: This standard introduces the principles of recognition and measurement of leases, thereby replacing IAS 17 – Leases. Such standard defines a single model of accounting for lease contracts which results in the recognition by the lessee of assets and liabilities for all lease contracts, except for leases of a duration of less than 12 months or for leases involving low value assets. Lessors shall continue to classify leases as operating or financial, wherefore IFRS 16 will not imply substantial changes for such entities in respect of the stipulations of IAS 17.
● Amendments to IFRS 10: Consolidated financial statements and IAS 28 – Investments in associates and joint ventures: Such amendments eliminate a conflict between the referred to standards, concerning the sale or the contribution of assets between the investor and the associate or between the investor and the joint venture.
● Amendments to IAS 12 – Income taxes: Such amendments clarify the conditions for the recognition and measurement of tax assets resulting from unrealised losses.
● Amendments to IAS 7 – Statement of cash flows: Such amendments introduce additional disclosures associated with cash flows from financing activities.
● Amendments to IFRS 15 – Revenue from contracts with customers: Such amendments introduce several clarifications in the standard in order to remove the possibility of different interpretations of various subjects arising.
● Amendments to IFRS 2 – Share-based payment: Such amendments introduce several clarifications in the standard concerning: (i) the recording of cash-settled share-based payment transactions; (ii) the recording of changes in share-based payment transactions (from cash-settled to equity-settled); (iii) the classification of transactions having characteristics of an offset settlement.
● Amendments to IFRS 4 – Insurance contracts: Such amendments provide guidelines on the implementation of IFRS 4 together with IFRS 9.
● Improvements to the international financial reporting standards – 2014-2016 Cycle – Such improvements involve the clarification of certain aspects related to: (i) IFRS 1 – First-time adoption of international financial reporting standards: eliminates certain short-term exemptions; (ii) IFRS 12 – Disclosure of interests in other entities: clarifies the standard’s scope concerning the application thereof to interests classified as held for sale or held for distribution under IFRS 5; (iii) IAS 28 – Investments in associates and joint ventures: introduces clarifications on the fair value measurement by investment results, such investments having been made in associates or joint ventures, held by venture capital companies or investment funds.
2016 Annual Report
182
● IFRIC 22: Foreign currency transactions and advance consideration. Such interpretations sets out the date of the initial recognition of the advance consideration or of the deferred income as the transaction date for the purpose of determining the exchange rate of the revenue recognition.
The above standards have not yet been endorsed by the European Union and, as such, have not been implemented by the Haitong Bank Group in the financial year ended as at the 31st of December, 2016.
The Group does not expect that the implementation of such amendment will have significant impact on its financial statements.

HAITONG BANK, S.A.
183
Report and Opinion of the Supervisory Board
Haitong Bank, S.A.
for financial year 2016
To the Shareholder of Haitong Bank, S.A.,
In accordance with the applicable legislation, we hereby present our report on the audit performed by the
Supervisory Board to the Management Report, the individual and the consolidated financial statements and the
proposal for the distribution of the year’s results presented by the Board of Directors of Haitong Bank
(hereinafter Haitong) for the year ended 31 December 2016.
During the financial year of 2016 Haitong’s Supervisory Board, as part of its designated functions, monitored,
in accordance with the law and the company’s articles of association, the development of Haitong’s
management and business activities, namely:
(i) assessed the adequacy and effectiveness of the risk management, internal control and internal audit
systems;
(ii) attended Board of Directors meetings whenever invited;
(iii) reviewed management information documents submitted to the Supervisory Board by the Board of
Directors;
(iv) monitored the verification of the accounting records and underlying support documents;
(v) assessed the accounting policies and valuation criteria adopted by Haitong; and
(vi) held meetings with the Statutory Auditor, whenever necessary, on the assessment of the accounting
policies and valuation criteria adopted by Haitong, which always provided the information required.
Within this, at an institutional level, Haitong’s Supervisory Board spoke with both entities, Amável
Calhau, Ribeiro da Cunha & Associados – Sociedade de Revisores Oficiais de Contas and Deloitte &
Associados, SROC, S.A..

2016 Annual Report 184
In accordance with the applicable legislation, the Supervisory Board also assessed the Auditor’s Report
prepared by the Statutory Auditor (Deloitte & Associados, SROC, S.A.) on the individual and consolidated
financial statements and was made aware of the individual and consolidated Statutory Audit Certification
(“Certificação Legal de Contas”) on the referred financial statements for financial year 2016, with which the
Supervisory Board agrees.
The Supervisory Board also analysed the Management Report submitted by the Board of Directors and
considers that the report complies with the applicable legal and statutory requirements and elucidates the main
aspects of Haitong’s activities in 2016, both in individual and in consolidated terms.
The Supervisory Board highlight’s the following:
• Haitong’s Individual and Consolidated Financial Statements have been restated for the year of 2015,
which have been disclosed on note 41 of the corresponding annual reports. This restatement
includes the adjustment of the value of the goodwill associated to the subsidiary Haitong (UK)
Limited;
• The qualified opinion of the Statutory Auditor, as an emphasis, noting the need to increase Haitong’s
solvency in order to ensure that the going concern is not at stake. This increase is dependent of a
capital increase, which was already supported by the Shareholder, by the amount of EUR 418.5
million, as disclosed in the Management Report. The Board expectation is that such capital increase
will occur during the first half of 2017; and
• The description of the relevant audit issues and other subjects for both individual and consolidated
which are reported in the Statutory Audit Certification and Audit Report;
HAITONG BANK, S.A.
185
In light of the above, it is the opinion of the Supervisory Board that the following should be approved:
• The Management Report and remaining individual and consolidated reporting documents relative
to the financial year ended on 31 December 2016;
• The proposal submitted by the Board of Directors on the allocation of the net loss for the year
2016, in the amount of EUR 151,280,504.05.
Lisbon, 26 April 2017
THE SUPERVISORY BOARD
José Manuel Macedo Pereira
(Chairman)
Tito Manuel das Neves Magalhães Basto
Mário Paulo Bettencourt de Oliveira

2016 Annual Report 186
Declaration of Conformity with the Financial Information Reported
The present declaration is submitted under the terms of Article 245 (1-c)) of the Portuguese Securities Code.
The Supervisory Board hereby declares that, to the best of its knowledge:
• The information referred to in Article 245 (1-a)) of the Portuguese Securities Code as at 31
December 2016 was prepared in accordance with the applicable accounting standards, providing a
true and fair view of the assets and liabilities, the financial situation and the results of Haitong and
the companies included within its consolidated scope; and
• The management report faithfully details the evolution of the business and the performance and
position of Haitong and the companies included within its consolidation scope, and contains a
description of the main risks and uncertainties faced within the framework of ongoing activities.
Lisbon, 26 April 2017
THE SUPERVISORY BOARD
José Manuel Macedo Pereira
(Chairman)
Tito Manuel das Neves Magalhães Basto
Mário Paulo Bettencourt de Oliveira

HAITONG BANK, S.A.
187
STATUTORY AUDIT CERTIFICATION AND AUDIT REPORT
(Amounts expressed in thousands of euros – t.euros)
(Translation of a report originally issued in Portuguese – in the case of discrepancies, the original version in Portuguese prevails)
REPORT ON THE AUDIT OF THE CONSOLIDATED FINANCIAL STATEMENTS
Opinion
We have audited the accompanying consolidated financial statements of Haitong Bank, S.A. (“the Bank”) and of its subsidiaries (“the Group”), which comprise the consolidated balance sheet as at 31 December 2016 (that presents a total of 4,754,747 t.euros and total equity of 350,523 t.euros, including a net loss
attributable to the shareholders of the Bank of 96,181 t.euros), the consolidated income statement, the consolidated statement of comprehensive income, the consolidated statement of changes in equity and the consolidated statement of cash flows for the year then ended, and the accompanying notes to the consolidated financial statements, which include a summary of the significant accounting policies.
In our opinion, the accompanying consolidated financial statements present true and fairly, in all material respects, the consolidated financial position of Haitong Bank, S.A. as at 31 December 2016 and its consolidated financial performance and cash flows for the year then ended in accordance with the International Financial Reporting Standards as endorsed by the European Union (IFRS).
Basis for opinion
We conducted our audit in accordance with International Standards on Auditing (ISAs) and further standards, technical and ethical directives of the Portuguese Institute of Statutory Auditors (“Ordem dos Revisores Oficiais de Contas”). Our responsibilities under those standards are described in the “Auditor’s responsibilities for the audit of the consolidated financial statements” section below. We are independent from the entities that constitute the Group in the terms of the law and we have fulfilled the other ethical requirements under the ethical code of the Portuguese Institute of Statutory Auditors (“Ordem dos Revisores Oficiais de Contas”).
We believe that the audit evidence we have obtained is sufficient and appropriate to provide a basis for our opinion.
Emphasis of Matter
As disclosed in the Management Report, at the date of approval of the Bank's financial statements, it was the Board of Directors’ expectation that the shareholder would approve a capital increase, thus strengthening the Bank's solvency and promoting the growth of its activity. On 30 March 2017, Haitong Securities Company Limited, the indirect holder of the Bank's total capital, publicly announced the approval of the subscription of a capital increase of the Bank of 418.5 million euros, of which 80 million euros through the conversion into share capital of subordinated financial instruments already recorded as equity instruments (Note 36). This capital increase shall be preceded by the required regulatory approvals, being the Bank's Board of Directors’ expectation that the transaction will be completed by the end of the first semester of 2017.
Our opinion is not qualified in respect of this matter.

2016 Annual Report 188
Page 2 of 7
Key audit matters
Key audit matters are those matters that, in our professional judgment, were of most significance in our audit of the consolidated financial statements of the current period. Those matters were addressed in the
context of our audit of the consolidated financial statements as a whole, and in forming our opinion thereon, but we do not provide a separate opinion on those matters.
Description of the most significant risks of material misstatement identified
Summary of the auditor’s response to the most significant assessed risks of material misstatement
Impairment for Goodwill (Notes 2.2, 3.4 and 25)
As of 31 December 2016 the Group has recorded in the caption “Intangible assets” Goodwill in the amount of 9,859 t.euros related to the acquisition of the subsidiary Haitong Capital – Sociedade de Capital de Risco, S.A..
As disclosed in Note 41 to the consolidated financial statements, in 2016 an impairment loss of 54,001 t.euros was recorded for Goodwill arising on the acquisition of the subsidiary Haitong (UK) Limited, within the scope of the restatement described in that note.
Goodwill is subject to annual impairment assessment, based on projections of future results of the units to which it is allocated. The estimation of future results and the determination of the rate at which they should be discounted imply a high degree of judgment by Management. For this reason, this was considered a key audit matter.
We analysed the relevant control activities implemented by the Bank in the process of determination of impairment losses for Goodwill.
We analysed the reasonableness of the Goodwill impairment tests prepared by the Bank, namely through a critical analysis of profit forecasts and of the main assumptions made by Management and sensitivity analyses of the most critical variables. In our work we involved internal valuation experts.
We reviewed the disclosures relating to Goodwill
impairment, considering the applicable accounting framework.
Description of the most significant risks of material misstatement identified
Summary of the auditor’s response to the most significant assessed risks of material misstatement
Impairment for loans to customers (Notes 2.5, 3.3, 21 and 42)
As of December 31, 2016, the balance of "Loans and advances to customers" amounts to 841,095 t.euros, net of impairment of 255,949 t.euros.
The Group determines the impairment losses for loans granted in accordance with the methodologies described in Note 2.5. to the consolidated financial statements. Given the characteristics of the Group's loan portfolio, a very significant portion of the clients are subject to individual impairment analysis.
Since the determination of impairment through individual analysis involves the realization by the Group of estimates that incorporate a significant level of judgment, namely in the identification of impairment triggers and in estimating the
recoverable amount, this was considered a key audit matter.
We analysed the relevant control activities implemented by the Bank in the process of determining impairment losses for its loan portfolio through individual analysis.
For a sample of clients, we analysed the reasonableness of the estimated impairment losses recorded in the financial statements based on the review of the Bank's judgments on the economic and financial situation of clients, perspectives on the evolution of their activity and valuation of existing collaterals.
We reviewed the disclosures related to impairment for loans to customers, considering the applicable accounting framework.
HAITONG BANK, S.A.
189
Page 3 of 7
Description of the most significant risks of material misstatement identified
Summary of the auditor’s response to the most significant assessed risks of material
misstatement
Recoverability of deferred tax assets (Notes 2.17, 3.5 and 33)
As of 31 December 2016, the Group has recorded deferred tax assets in the amount of 145,618 t.euros, essentially related to: (i) temporary differences arising from impairment
for loans to customers (86,746 t.euros) andemployee benefits (9,227 t.euros);
(ii) tax losses carried forward (42,153 t.euros), ofwhich 31,432 t.euros arising from the nonconsolidated activity of the Bank, essentiallyoriginated in 2015 and 2016, that can be usedwithin a period of 12 years, not exceeding 70%of the taxable profit in each of those years.
In accordance with IAS 12 - Income Taxes, deferred tax assets can only be recorded up to the extent that it is probable that future taxable profit will be available against which they can be utilised.
The Bank prepared a forecast of its taxable profit to assess the recoverability of deferred tax assets. This estimate is judgmental by nature and depends on the assumptions made by the Management to estimate the evolution of pre-tax profit and its interpretation of the tax legislation.
To this extent, the recoverability of deferred tax assets is dependent on the Bank's ability to generate the estimated results.
Any changes in the assumptions used in the estimation of future results or in the interpretation of the tax legislation may have a material impact on deferred tax assets.
Given the materiality of deferred tax assets in the Bank's consolidated financial statements and the need to use estimates to determine their recoverability, this area was considered a key audit matter.
We analysed the relevant control activities implemented by the Bank in the process of assessing the recoverability of deferred tax assets.
We analysed the main assumptions considered by the Bank to estimate the evolution of pre-tax
profits in the period covered by its analysis.
We reviewed the reasonableness of the interpretation of the relevant tax legislation considered by the Bank in the estimation of future taxable profits. For this aspect, we involved our internal specialists in this area.
We analysed the reasonableness of the evaluation of the recoverability of deferred tax assets prepared by the Bank, taking into account the understanding of the assumptions and the review
of the interpretation of the tax legislation described above.
We reviewed the disclosures related to deferred tax assets, considering the applicable accounting framework.
2016 Annual Report 190
Page 4 of 7
Description of the most significant risks of material misstatement identified
Summary of the auditor’s response to the most significant assessed risks of material
misstatement
Provision for legal contingencies (Notes 2.18 and 38)
As disclosed in Note 38 to the consolidated financial statements, as of 31 December 2016, there are several lawsuits against the Bank, including some related to commercial paper issued by entities of the Espírito Santo Group and bonds issued by Banco Espírito Santo, S.A.
Taking into account the relevance of the amounts involved, this was considered a key audit matter.
We analysed the relevant internal control procedures implemented by the Bank in the process of quantifying provisions for legal contingencies.
We obtained information from external lawyers
accompanying the proceedings, including the description of disputes and the quantification of liabilities.
We discussed with the Bank's Legal Department the current state of lawsuits and expectations regarding their outcome.
We reviewed the disclosures related to legal contingencies.
Resolution Fund (Note 38)
Following the resolution measures applied to Banco Espírito Santo, S.A. (BES) and Banif - Banco Internacional do Funchal, S.A. (Banif), the Resolution Fund became holder of the entire share capital of Novo Banco, S.A. and Oitante, S.A.. In this context it obtained a loan from the Portuguese State and from a banking syndicate (in which the Bank does not participate) and assumed other responsibilities and contingent liabilities.
In order to reimburse these loans and to meet other responsibilities it may assume, the proceeds of the Resolution Fund are essentially the periodic contributions from participating institutions (including the Bank) and contributions over the banking sector. The member of the Portuguese Government responsible for the finance area may also determine by ministerial order that the participating institutions make special contributions in the situations provided for in the applicable
legislation, particularly in the event that the Resolution Fund does not have sufficient own resources for the fulfilment of its obligations.
As of 31 December 2016, the Portuguese State’s loan to the Resolution Fund of 3,900,000 t.euros and the banking syndicate’s loan, after a first amendment to the initial contracts, were to mature on 31 December 2017, although it was public since September 2016 that all contracts were being renegotiated, including the extension of its maturity.
We analysed the public communications from the Resolution Fund and from the Office of the Portuguese Minister of Finance of 28 September 2016 and the public communication from the Resolution Fund of 21 March 2017, regarding the new conditions of the loans to the Resolution Fund and the corresponding impact on its sustainability and financial soundness.
We read the last Report and Accounts of the Resolution Fund that refers to the year 2015.
We reviewed the accounting framework of the contributions to the Resolution Fund, considering the available information as of the date of approval of the financial statements.
We reviewed the disclosures included in the financial statements related to this matter, presented in Note 38.

HAITONG BANK, S.A.
191
Page 5 of 7
Description of the most significant risks of material misstatement identified
Summary of the auditor’s response to the most significant assessed risks of material
misstatement
Resolution Fund (Note 55)
According to a public notice from the Resolution Fund dated 21 March 2017, the conditions of the loans that the Resolution Fund obtained to finance the resolution measures applied to BES and Banif were de facto renegotiated in the first quarter of 2017, including the extension of the maturity date
to 31 December 2046, including the possibility of adjusting that date, with the purpose of guaranteeing the capacity of the Resolution Fund to fully meet its obligations based on regular revenues and without the need to resort to special contributions or any other type of extraordinary contributions from the banking sector.
The financial statements as of 31 December 2016 reflect the Bank’s expectation that no special contributions or any other extraordinary contributions will be required to finance the
resolution measures applied to BES and Banif.
Other matters
As mentioned in section "Report on other legal and regulatory requirements - About the additional elements included in article 10 of Regulation (UE) 537/2014" below, we were appointed Statutory Auditors of the Bank for the first time at the Shareholders General meeting held on 16 November 2016 to conclude the ongoing mandate until the end of 2016. The comparative consolidated financial statements for the year ended December 31, 2015 are presented by the Bank in order to comply with requirements for the presentation of accounts. These consolidated financial statements, without considering the effects resulting from the
restatement described in Note 41 to the consolidated financial statements, were audited by other Statutory Auditor and the Statutory Audit Certification and Audit Report thereon, dated 29 March 2016, included four emphases of matter.
Responsibilities of Management and Supervisory Body for the consolidated financial statements
Management is responsible for:
- the preparation of consolidated financial statements that present true and fairly the financial position,the financial performance and the cash flows of the Group in accordance with the International FinancialReporting Standards as endorsed by the European Union (IFRS);
- the preparation of the management report, including the corporate governance report, under theapplicable legal and regulatory terms;
- the implementation and maintenance of an appropriate internal control system that allows thepreparation of financial statements that are free from material misstatements due to fraud or error;
- the adoption of accounting principles and criteria appropriate in the circumstances; and
- the evaluation of the Group’s ability to continue as a going concern, disclosing, whenever applicable, thematters that may cast significant doubt on the continuity of its operations.
The Supervisory Body is responsible for overseeing the Group’s consolidated financial closing and reporting process.
2016 Annual Report 192
Page 6 of 7
Auditor’s responsibilities for the audit of the consolidated financial statements
Our responsibility consists in obtaining a reasonable assurance on whether the consolidated financial statements as a whole are free from material misstatements, whether due to fraud or error, and to issue an
auditor’s report that includes our opinion. Reasonable assurance is a high level of assurance, but is not a guarantee that an audit conducted in accordance with ISAs will always detect a material misstatement when it exists. Misstatements can arise from fraud or error and are considered material if, individually or in the aggregate, they could reasonably be expected to influence the economic decisions of users taken on the basis of those consolidated financial statements.
As part of an audit in accordance with ISAs, we exercise professional judgment and maintain professional scepticism throughout the audit. We also:
- identify and assess the risks of material misstatement of the consolidated financial statements, whetherdue to fraud or error, design and perform audit procedures responsive to those risks, and obtain auditevidence that is sufficient and appropriate to provide a basis for our opinion. The risk of not detecting a
material misstatement resulting from fraud is higher than not detecting one resulting from error, asfraud may involve collusion, forgery, intentional omissions, misrepresentations, or override of internalcontrol;
- obtain an understanding of internal control relevant to the audit in order to design audit procedures thatare appropriate in the circumstances, but not for the purpose of expressing an opinion on theeffectiveness of the Group’s internal control;
- evaluate the appropriateness of accounting policies used and the reasonableness of accountingestimates and related disclosures made by Management;
- conclude on the appropriateness of Management’s use of the going concern basis of accounting and,
based on the audit evidence obtained, whether any material uncertainty exists related to events orconditions that may cast significant doubt on the Group’s ability to continue as a going concern. If weconclude that a material uncertainty exist, we should draw attention in our auditor’s report to therelated disclosures in the consolidated financial statements or, if such disclosures are inadequate,modify our opinion. Our conclusions are based on the audit evidence obtained up to the date of ourreport. However, future events or conditions may cause the Group to cease to continue as a goingconcern;
- evaluate the overall presentation, structure and content of the consolidated financial statements,including the disclosures, and whether those consolidated financial statements represent the underlyingtransactions and events in a manner that achieves fair presentation;
- obtain sufficient appropriate audit evidence regarding the financial information of the entities orbusiness activities within the Group to express an opinion on the consolidated financial statements. Weare responsible for the direction, supervision and performance of the Group audit and we are theultimate responsables for our audit opinion;
- we communicate with those charged with governance, including the Supervisory Body, regarding,among other matters, the planned scope and timing of the audit and significant audit findings, includingany significant deficiency in internal control identified during the audit;
- from the matters we communicate with those charged with governance, including the Supervisory Body,we determine those matters that were of most significance in the audit of the consolidated financial
statements of the current period and are therefore the key audit matters. We describe these matters inour report unless law or regulation precludes public disclosure about the matter;
- we declare to the Supervisory Body that we have complied with relevant ethical requirements regardingindependence, and we communicate with them all relationships and other matters that may reasonablybe perceived to threat our independence, and where applicable, related safeguards.
Our responsibility includes also the verification of the agreement of the information included in the Management report with the consolidated financial statements and the verifications included in article 451, numbers 4 and 5, of the Portuguese Commercial Code (“Código das Sociedades Comerciais”).
HAITONG BANK, S.A.
193
Page 7 of 7
REPORT ON OTHER LEGAL AND REGULATORY REQUIREMENTS
About the Management report
In compliance with article 451, number 3.e) of the Portuguese Commercial Code (“Código das Sociedades Comerciais”), we conclude that the Management report was prepared in accordance with the current applicable law and regulations and the information included therein is in agreement with the audited consolidated financial statements, and considering our knowledge of the Group, we did not identify material misstatements.
About the Corporate governance report
In compliance with article 451, number 4, of the Portuguese Commercial Code (“Código das Sociedades Comerciais”), we conclude that the corporate governance report includes the elements required to the Group under the terms of article 245-A of the Portuguese Securities Code (“Código dos Valores Mobiliários”), and we have not identified any material mistakes in the information disclosed in such report to comply with the
requirements of items c), d), f), h), i) and m) of the referred article.
About the additional elements included in article 10 of Regulation (UE) 537/2014
In compliance with article 10 of Regulation (UE) 537/2014 of the European Parliament and of the Council of 16 April 2014, and beyond the key audit matters mentioned above, we further report the following:
- We have been appointed auditors of the Bank for the first time in the shareholders’ general meetingheld on 16 November 2016, to conclude the ongoing mandate until the end of 2016.
- Management confirmed to us that they are unaware of the occurrence of any fraud or suspected fraudwith a material effect in the consolidated financial statements. As part of the planning and execution of
our audit in accordance with ISAs, we kept professional scepticism and designed audit procedures torespond to the risk of material misstatements in the consolidated financial statements due to fraud. As aresult of our work, we have not identified any material misstatement in the consolidated financialstatements due to fraud.
- We confirm that the audit opinion issued is consistent with the additional report that we prepared anddelivered to the Group’s Supervisory Body as at 26 April 2017.
- We declare that we have not provided any prohibited services under the terms of article 77, number 8,of the Legal Regime of the Portuguese Statutory Auditors (“Estatuto da Ordem dos Revisores Oficiais deContas”) and that we kept our independence from the Group during the execution of the audit.
Lisbon, 26 April 2017
________________________________________ Deloitte & Associados, SROC S.A. Represented by João Carlos Henriques Gomes Ferreira
EXPLANATION ADDED FOR TRANSLATION
(This report is a translation of a report originally issued in Portuguese. Therefore according to Deloitte & Associados, SROC S.A. internal procedures, the report is not to be signed. In the event of discrepancies, the Portuguese language version prevails.)

2016 Annual Report 194
This Page Intentionally Left Blank

HAITONG BANK, S.A.
195
INDIVIDUAL FINANCIAL STATEMENTS AND NOTES TO THE INDIVIDUAL FINANCIAL STATEMENTS
These individual financial statements are a free translation to English from the original Portuguese version. In case of doubt or misinterpretation, the Portuguese version will prevail.

2016 Annual Report
196
1. INDIVIDUAL FINANCIAL STATEMENTS
Individual Income Statement for the financial years ended on the 31st December 2016 and 2015
(thousand euros)
31.12.2015
Restatement
Interest and similar income 4 20 539 28 948Interest and similar expense 4 31 226 33 831
Financial margin ( 10 687) ( 4 883)
Dividend income 5 3 537 3 849Fees and commissions income 6 34 566 65 473Fees and commissions expenses 6 ( 3 961) ( 6 210)Net gains/(losses) from assets and liabilities at fair value through profit or loss 7 ( 15 180) 16 374Net gains/(losses) from available-for-sale financial assets 8 1 079 ( 2 431)Net gains/(losses) from foreign exchange revaluation 9 ( 21 915) ( 26 487)Net gains/(losses) arising from the disposal of other assets 10 ( 5 836) ( 8)Other operating results 11 2 001 ( 4 044)
Operating Income ( 16 396) 41 633
Employee costs 12 44 567 38 985Administrative costs 14 32 623 30 576Depreciation and amortisation 24 and 25 4 775 4 692Provisions net of reversals 32 9 310 7 796Loan impairment net of reversals and recoveries 21 32 779 40 073Impairment on other financial assets net of reversal and recoveries 19 and 20 38 1 016Impairment on other assets net of reversals and recoveries 26 and 27 32 434 130 681
Operating expenses 156 526 253 819
Profit / (Loss) before Income Tax ( 172 922) ( 212 186)
Income taxCurrent tax 33 ( 3 615) ( 3 896)Deferred tax 33 ( 18 026) ( 27 685)
( 21 641) ( 31 581)
Net Profit / (Loss) for the year ( 151 281) ( 180 605)- -
Basic Income per Share (in euros) 15 -1,78 -2,74Diluted Income per Share (in euros) 15 -1,78 -2,74
The following notes form an integral part of these financial statements
Notes 31.12.2016
Chief Accountant The Board of Directors
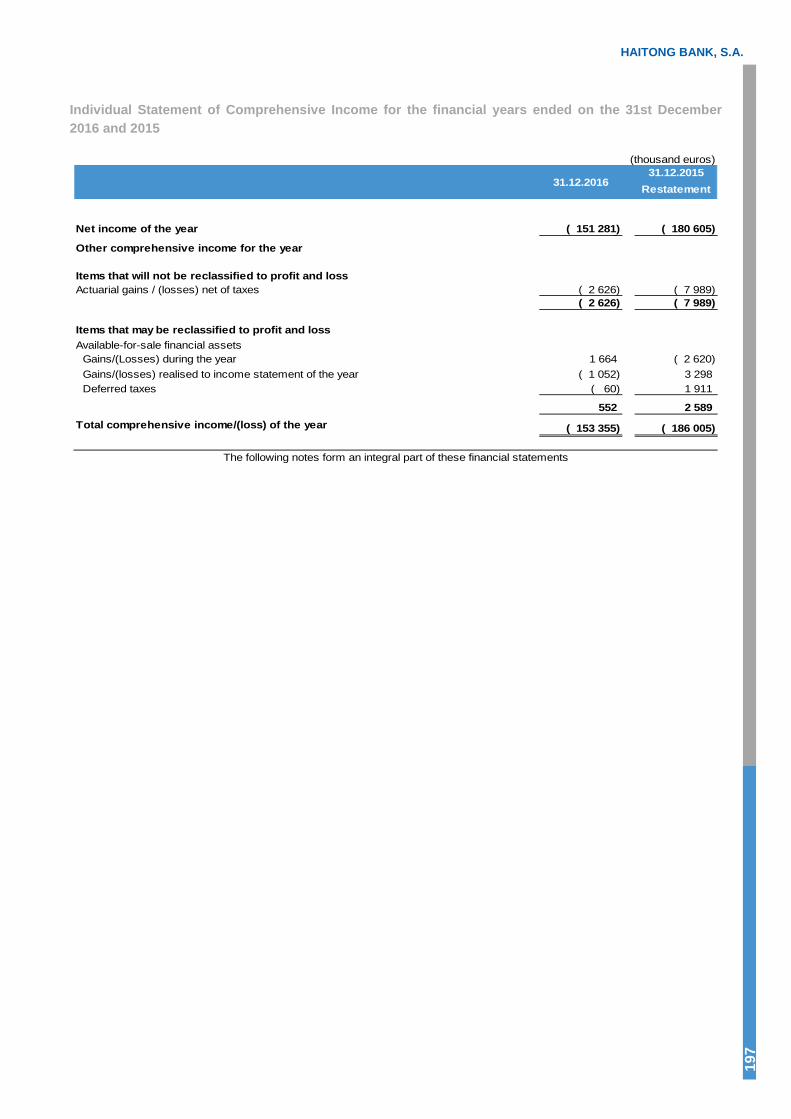
HAITONG BANK, S.A.
197
Individual Statement of Comprehensive Income for the financial years ended on the 31st December 2016 and 2015
(thousand euros)31.12.2015
Restatement
Net income of the year ( 151 281) ( 180 605)- - Other comprehensive income for the year
Items that will not be reclassified to profit and lossActuarial gains / (losses) net of taxes ( 2 626) ( 7 989)
( 2 626) ( 7 989)
Items that may be reclassified to profit and lossAvailable-for-sale financial assets
Gains/(Losses) during the year 1 664 ( 2 620)Gains/(losses) realised to income statement of the year ( 1 052) 3 298 Deferred taxes ( 60) 1 911
552 2 589 Total comprehensive income/(loss) of the year ( 153 355) ( 186 005)
The following notes form an integral part of these financial statements
31.12.2016
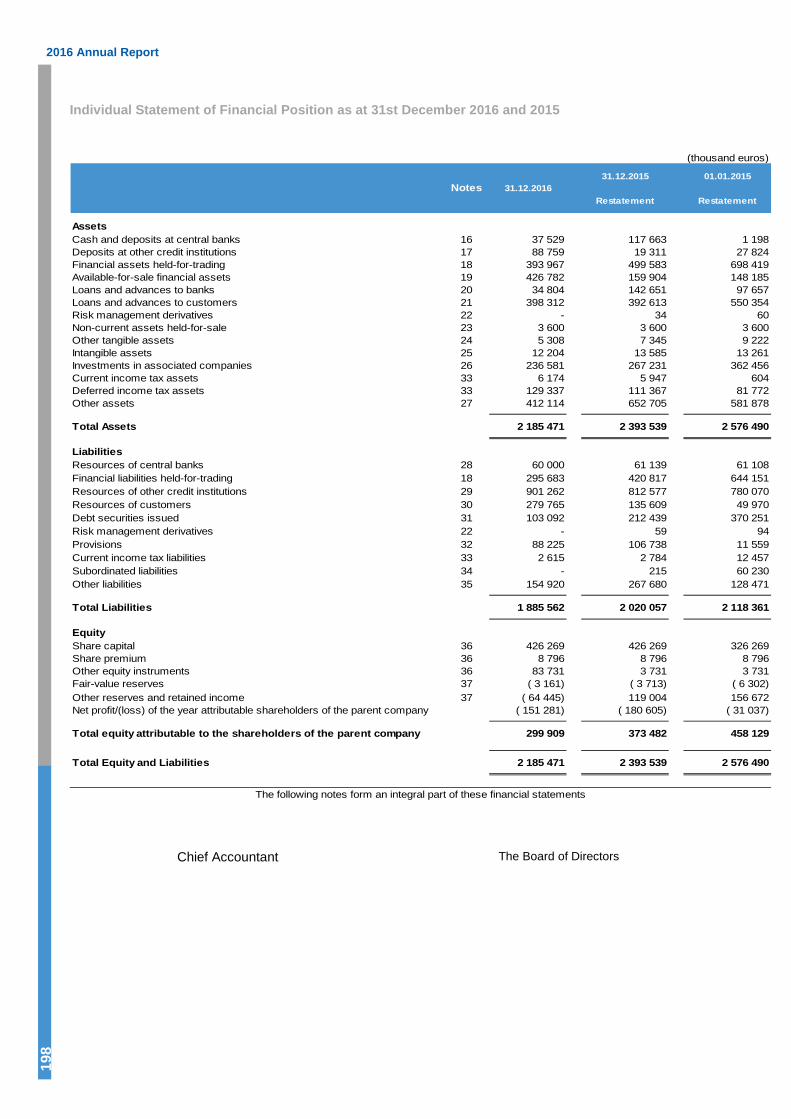
2016 Annual Report 19
8
Individual Statement of Financial Position as at 31st December 2016 and 2015
(thousand euros)
31.12.2015 01.01.2015
Restatement Restatement
AssetsCash and deposits at central banks 16 37 529 117 663 1 198Deposits at other credit institutions 17 88 759 19 311 27 824Financial assets held-for-trading 18 393 967 499 583 698 419Available-for-sale financial assets 19 426 782 159 904 148 185Loans and advances to banks 20 34 804 142 651 97 657Loans and advances to customers 21 398 312 392 613 550 354Risk management derivatives 22 - 34 60Non-current assets held-for-sale 23 3 600 3 600 3 600Other tangible assets 24 5 308 7 345 9 222Intangible assets 25 12 204 13 585 13 261Investments in associated companies 26 236 581 267 231 362 456Current income tax assets 33 6 174 5 947 604Deferred income tax assets 33 129 337 111 367 81 772Other assets 27 412 114 652 705 581 878
Total Assets 2 185 471 2 393 539 2 576 490
LiabilitiesResources of central banks 28 60 000 61 139 61 108Financial liabilities held-for-trading 18 295 683 420 817 644 151Resources of other credit institutions 29 901 262 812 577 780 070Resources of customers 30 279 765 135 609 49 970Debt securities issued 31 103 092 212 439 370 251Risk management derivatives 22 - 59 94Provisions 32 88 225 106 738 11 559Current income tax liabilities 33 2 615 2 784 12 457Subordinated liabilities 34 - 215 60 230Other liabilities 35 154 920 267 680 128 471
Total Liabilities 1 885 562 2 020 057 2 118 361
EquityShare capital 36 426 269 426 269 326 269Share premium 36 8 796 8 796 8 796Other equity instruments 36 83 731 3 731 3 731Fair-value reserves 37 ( 3 161) ( 3 713) ( 6 302)Other reserves and retained income 37 ( 64 445) 119 004 156 672Net profit/(loss) of the year attributable shareholders of the parent company ( 151 281) ( 180 605) ( 31 037)
Total equity attributable to the shareholders of the parent company 299 909 373 482 458 129
Total Equity and Liabilities 2 185 471 2 393 539 2 576 490
The following notes form an integral part of these financial statements
Notes 31.12.2016
Chief Accountant The Board of Directors
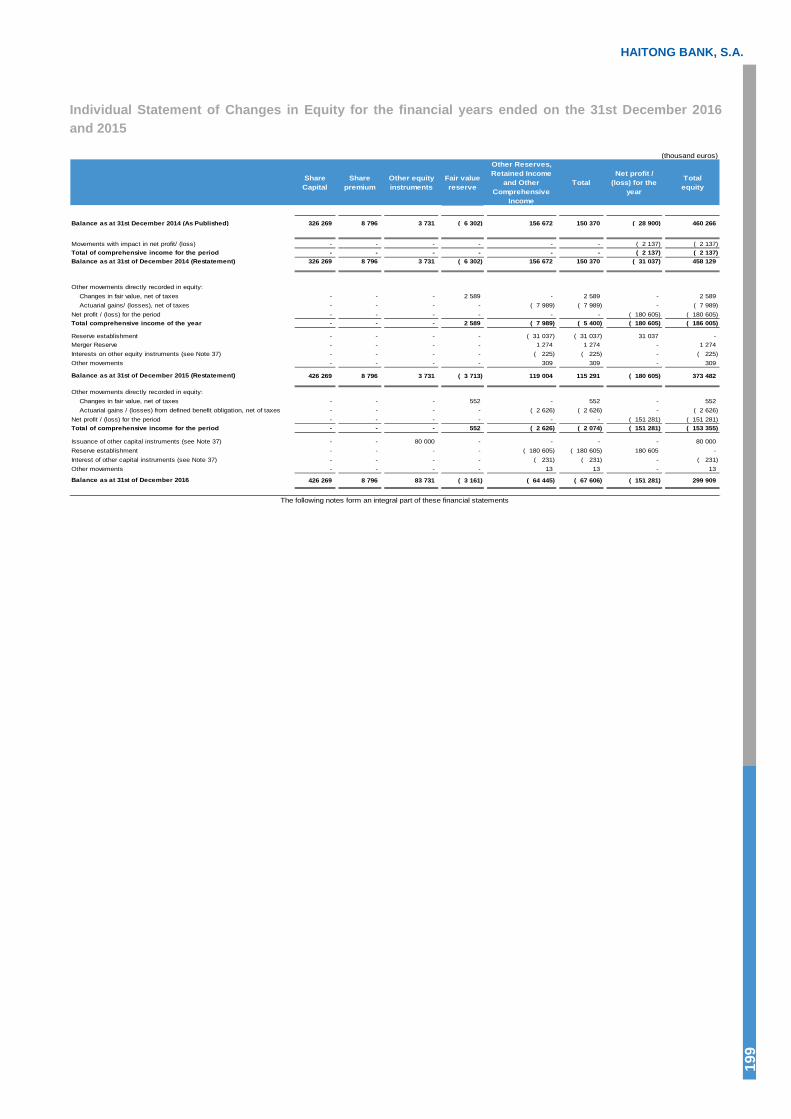
HAITONG BANK, S.A.
199
Individual Statement of Changes in Equity for the financial years ended on the 31st December 2016 and 2015
(thousand euros)
Share Capital
Share premium
Other equity instruments
Fair value reserve
Other Reserves, Retained Income
and Other Comprehensive
Income
TotalNet profit /
(loss) for the year
Totalequity
Balance as at 31st December 2014 (As Published) 326 269 8 796 3 731 ( 6 302) 156 672 150 370 ( 28 900) 460 266
Movements with impact in net profit/ (loss) - - - - - - ( 2 137) ( 2 137)Total of comprehensive income for the period - - - - - - ( 2 137) ( 2 137)Balance as at 31st of December 2014 (Restatement) 326 269 8 796 3 731 ( 6 302) 156 672 150 370 ( 31 037) 458 129
Other movements directly recorded in equity: Changes in fair value, net of taxes - - - 2 589 - 2 589 - 2 589 Actuarial gains/ (losses), net of taxes - - - - ( 7 989) ( 7 989) - ( 7 989)Net profit / (loss) for the period - - - - - - ( 180 605) ( 180 605)Total comprehensive income of the year - - - 2 589 ( 7 989) ( 5 400) ( 180 605) ( 186 005)
Reserve establishment - - - - ( 31 037) ( 31 037) 31 037 - Merger Reserve - - - - 1 274 1 274 - 1 274 Interests on other equity instruments (see Note 37) - - - - ( 225) ( 225) - ( 225)Other movements - - - - 309 309 - 309
Balance as at 31st of December 2015 (Restatement) 426 269 8 796 3 731 ( 3 713) 119 004 115 291 ( 180 605) 373 482
Other movements directly recorded in equity: Changes in fair value, net of taxes - - - 552 - 552 - 552 Actuarial gains / (losses) from defined benefit obligation, net of taxes - - - - ( 2 626) ( 2 626) - ( 2 626)Net profit / (loss) for the period - - - - - - ( 151 281) ( 151 281)Total of comprehensive income for the period - - - 552 ( 2 626) ( 2 074) ( 151 281) ( 153 355)
Issuance of other capital instruments (see Note 37) - - 80 000 - - - - 80 000 Reserve establishment - - - - ( 180 605) ( 180 605) 180 605 - Interest of other capital instruments (see Note 37) - - - - ( 231) ( 231) - ( 231)Other movements - - - - 13 13 - 13
Balance as at 31st of December 2016 426 269 8 796 83 731 ( 3 161) ( 64 445) ( 67 606) ( 151 281) 299 909
The following notes form an integral part of these financial statements

2016 Annual Report 20
0
Individual Cash Flow Statement for the financial years ended on the 31st December 2016 and 2015
(thousand euros)
31.12.2015
Restatement
Cash flows from operating activities Interest and similar income received ( 77 883) 35 192 Interest and similar expense paid ( 33 046) ( 33 512)Fees and commission received 35 912 64 189 Fees and commission paid ( 4 701) ( 7 082)Cash payments to employees and suppliers ( 73 056) ( 84 212)
( 152 774) ( 25 425)
Changes in operating assets and liabilities:
Resources of central banks ( 38 038) ( 16 843)Financial assets and liabilities held-for-trading 104 570 ( 46 539)Loans and advances to banks ( 1 139) 31 Resources of other credit institutions 87 773 23 476 Loans and advances to customers 17 499 198 739 Resources of costumers 140 229 84 303 Risk management derivatives 1 ( 18)Other operating assets and liabilities 36 089 76 514
Net cash flow from operating activities before income tax 194 210 294 238
Income taxes paid 3 219 ( 3 197)
197 429 291 041
Net cash flows from investment activities
Acquisition of shares in subsidiaries and associated companies ( 3 301) ( 44 348)Sale of investments in subsidiaries and associates 10 853 - Dividends received 3 537 3 849 Purchase of financial assets available-for-sale ( 316 612) ( 95 952)Sale of financial assets available-for-sale 145 215 77 507 Purchase of fixed assets ( 4 073) ( 4 010)Sale of tangible and intangible assets 2 163 ( 28)
( 162 218) ( 62 982)
Cash flows from financing activities
Increase in share capital - 100 000Subsidiaries share capital increase ( 16 770) - Issuance of other equity instruments 80 000 - Debt securities issued 103 092 210 165 Reimbursement of debt securities issued ( 211 773) ( 370 047)Reimbursement of subordinated liabilities ( 215) ( 60 000)Interest received/(paid) from/to other equity instruments ( 231) ( 225)
Net cash flow from financing activities ( 45 897) ( 120 107)
Net changes in cash and equivalents ( 10 686) 107 952
Cash and equivalents at the beginning of the year 136 974 29 022 Cash and equivalents at the end of the year 126 288 136 974
( 10 686) 107 952
Cash and equivalents includes:Cash 15 to 16 37 529 117 663 Deposits at other credit institutions 16 to 17 88 759 19 311
Total 126 288 136 974
The following notes form an integral part of these financial statements
Notas 31.12.2016

HAITONG BANK, S.A.
201
2. NOTES TO THE INDIVIDUAL FINANCIAL STATEMENTS
Haitong Bank, S.A.
NOTE 1 - ACTIVITY
Haitong Bank, S.A. (the Bank or Haitong Bank) is an investment bank headquartered in Portugal, Rua Alexandre Herculano, no. 38, in Lisbon. The Bank is authorized by the Portuguese authorities, central banks and other regulatory authorities to operate in Portugal and in the countries where its international branches are located.
The company was established in February 1983 as a foreign investment in Portugal under the name FINC - Sociedade Portuguesa Promotora de Investimentos, S.A.R.L.. During 1986, the company was integrated into the Espírito Santo Group under the designation Espírito Santo – Sociedade de Investimentos, S.A..
In order to enlarge the scope of its business, the company obtained permission from the Portuguese authorities to operate as an investment bank. This involved the publication of Order-in-Council no. 366/92, of 23 November, published in the Diário da República – Series II – no. 279, of 3 December. The activity as an investment bank started under the name Banco ESSI, S.A., on 1 April 1993.
During 2000, Banco Espírito Santo, S.A. (BES) acquired all of the share capital of BES Investimento in order to reflect in its consolidated financial statements all the existing synergies between both institutions.
On the 3rd of August, 2014, following the implementation of a resolution measure by the Bank of Portugal, applied to Banco Espirito Santo, S.A., the Bank became held by Novo Banco, S.A.
In September 2015, Haitong International Holdings Limited acquired the entire share capital of BES Investimento. The bank’s corporate name was changed to Haitong Bank, S.A..
Haitong Bank currently operates through its headquarters in Lisbon, branches in London, Warsaw and Madrid, as well as through its subsidiaries in Brazil, Ireland, United Kingdom, USA and Mexico.
Haitong Bank’s financial statements are consolidated by Haitong International Holdings Limited, headquartered at Li Po Chun Chambers, no. 189, Des Voeux Road Central, in Hong Kong.
NOTE 2 – MAIN ACCOUNTING POLICIES
2.1. Basis of preparation
In accordance with Regulation (EC) no. 1606/2002 of 19 July 2002 from the European Council and Parliament, and its adoption into Portuguese Law through Decree-Law no. 35/2005, of 17 February 2005, and Regulation no. 5/2015 of 7 December 2015, from the Bank of Portugal, Haitong Bank, S.A. is required to prepare its financial statements in accordance with the International Financial Reporting Standards (IFRS), as established by the Bank of Portugal.
Until 2015 the financial statements have been prepared in accordance with the NCA and the impacts of this change is identified in Note 41.
IFRS comprise accounting standards issued by the International Accounting Standards Board (IASB) and its predecessor body, as well as interpretations issued by the International Financial Reporting Interpretations Committee (IFRIC) and its predecessor body.

2016 Annual Report 20
2
Haitong Bank’s individual financial statements set forth herein refer to the financial year ended on the 31st of December, 2016, which have been prepared in accordance with the IFRS in force, as adopted in the European Union until the 31st of December, 2016.
The accounting policies applied by the Bank in the preparation of these financial statements as at 31st December 2016 are consistent with the ones used in the preparation of the financial statements as at 31st December 2015.
These individual financial statements are expressed in thousands of euro, rounded to the nearest thousand, and have been prepared under the historical cost convention, except for the liabilities accounted for at fair value, namely, derivative contracts, financial assets and financial liabilities at fair value through profit or loss and available-for-sale financial assets.
The preparation of financial statements in conformity with IFRS requires the application of judgment and the use of estimates and assumptions by management that affects the process of applying the Bank’s accounting policies and the reported amounts of income, expenses, assets and liabilities. Actual results in the future may differ from those reported. The areas involving a higher degree of judgement or complexity or areas where assumptions and estimates are significant to the financial statements are disclosed in Note 3.
The individual financial statements herein have been approved in the Board of Directors meeting held on the March 20th 2017.
2.2. Foreign currency transactions
Foreign currency transactions are translated into the functional currency using the exchange rates in force at the dates of the transactions. Monetary assets and liabilities denominated in foreign currencies are translated to euro at the foreign exchange rates in force at the balance sheet date. Foreign exchange differences arising on translation are recognised in the income statement.
Non-monetary assets and liabilities in a foreign currency that are measured at historical cost are translated using the exchange rate at the date of the transaction. Non-monetary assets and liabilities denominated in foreign currencies that are stated at fair value are translated to euro at the foreign exchange rates ruling at the dates the fair value was determined. The resulting exchange differences are accounted for in the income statement, except if related to equity instruments classified as available-for-sale, which are accounted for in equity, within the fair value reserve.
2.3. Derivative financial instruments
Classification
Derivatives for risk management purposes includes derivatives used to manage the risk of certain financial assets and financial liabilities designated at fair value through profit or loss that were not classified as hedging derivatives.
All other derivatives are classified as trading derivatives.
Recognition and measurement
Derivatives are initially recognised at fair value on the date on which a derivative contract is entered into (trade date). Subsequent to initial recognition, the fair value of derivative financial instruments is re-measured on a regular basis and the resulting gains or losses on re-measurement are recognised directly in the income statement.
Fair values are obtained from quoted market prices in active markets, if available, or are determined using valuation techniques, including discounted cash flow models and option pricing models, as appropriate.

HAITONG BANK, S.A.
203
Derivatives traded in organised markets, namely futures and some options, are recognised as trading derivatives, being marked to market on a daily basis while the resulting gains or losses are recognised directly in the income statement. Since the fair value changes on these derivatives are settled daily through the margin accounts held by the Group, these derivatives do not present any fair value on the balance sheet. The margin accounts are included under the caption Other assets (see Note 27) and comprise the minimum collateral mandatory for open positions.
Embedded derivatives
Derivatives that are embedded in other financial instruments are treated as separate derivatives when their economic characteristics and risks are not closely related to those of the host contract and the host contract is not carried at fair value through profit or loss.
These embedded derivatives are measured at fair value with changes in fair value recognised in the income statement.
2.4. Loans and advances to customers
Loans and advances to customers include loans and advances originated by the Bank, which are not intended to be sold in the short term. Loans and advances to customers are recognised when cash is advanced to borrowers.
Loans and advances to customers are derecognised from the balance sheet when (i) the contractual rights to receive their cash flows have expired, (ii) the Bank has substantially transferred all risks and rewards of ownership or (iii) although retaining some but not substantially all of the risks and rewards of ownership, the Bank has transferred the control over the assets.
Loans and advances to customers are initially recorded at fair value plus transaction costs and are subsequently measured at amortised cost, using the effective interest rate method, less impairment losses.
Impairment
The Bank assesses, on a regular basis, whether there is objective evidence of impairment within its loan portfolio. Impairment losses identified are recognised in the income statement, and are subsequently reversed through the income statement if, in a subsequent period, the amount of the impairment losses decreases.
A loan or a loan portfolio, defined as a group of loans with similar credit risk characteristics, is impaired when: (i) there is objective evidence of impairment as a result of one or more events that occurred after its initialrecognition and (ii) that event (or events) has an impact on the estimated future cash flows of the loan or of theloan portfolio, which can be reliably estimated.
The Bank first assesses whether objective evidence of impairment exists individually for each loan. In this assessment the Bank takes into consideration from others, the following factors:
● the aggregate exposure to the customer and the existence of non-performing loans;
● the viability of the customer’s business model and its capability to successfully trade and generatesufficient cash flow to service their debt obligations;
● the extent of other creditors’ commitments ranking ahead of the Bank;
● the existence, nature and estimated realisable value of collaterals;
● the exposure of the customer within the financial sector;
● the amount and timing of expected recoveries.

2016 Annual Report 20
4
When loans have been individually assessed and no evidence of loss has been identified, these loans are grouped together on the basis of similar credit risk characteristics for the purpose of evaluating the impairment on a portfolio basis (collective assessment). Loans that are assessed individually and found to be impaired are not included in a collective assessment for impairment.
If an impairment loss is identified on an individual basis, the amount of the impairment loss to be recognised is calculated as the difference between the book value of the loan and the present value of the expected future cash flows (considering the recovery period), discounted at the original effective interest rate. The carrying amount of impaired loans is reduced through the use of an allowance account. If a loan has a variable interest rate, the discount rate for measuring the impairment loss is the current effective interest rate determined under the contract rules.
The calculation of the present value of future estimated cash flows of a collateralised loan reflects the cash flows which may arise out of the recovery and sale of collateral, less costs inherent to its recovery and sale.
When a loan is considered by the Bank as uncollectible and an impairment loss of 100% was recognised, it is written off against the related allowance for loan impairment.
2.5. Other financial assets
Classification
The Bank classifies other financial assets at initial recognition in the following categories:
● Financial assets at fair value through profit or loss
This category includes: (i) financial assets held-for-trading, which are those acquired principally for the purpose of selling in the short term or that are owned as part of a portfolio of identified financial instruments that are managed together and for which there is evidence of a recent actual pattern of short-term profit taking and (ii) financial assets that are designated at fair value through profit or loss at inception.
The Bank classifies, at inception, certain financial assets at fair value through profit or loss when:
● Such financial assets are managed, measured and their performance evaluated on a fair value basis;
● Such financial assets are being hedged (on an economical basis), in order to eliminate an accountingmismatch; or
● Such financial assets contain an embedded derivative.
The structured products acquired by the Bank that correspond to financial instruments containing one or more embedded derivatives meet the abovementioned conditions, and, in accordance, are classified under the fair value through profit or loss category.
● Available-for-sale financial assets
Available-for-sale financial assets are non-derivative financial assets (i) intended to be held for an indefinite period of time, (ii) designated as available-for-sale at initial recognition or (iii) that are not classified in any of the above categories.
Initial recognition, initial measurement and derecognition
Purchases and sales of: (i) financial assets at fair value through profit or loss, (ii) held to maturity investments and (iii) available-for-sale financial assets, are recognised on trade-date – the date on which the Bank commits to the purchase or sale of the asset.

HAITONG BANK, S.A.
205
Financial assets are initially recognised at fair value plus transaction costs except for financial assets at fair value through profit or loss, in which case these transaction costs are directly recognised in the income statement.
Financial assets are derecognised when (i) the contractual rights to receive their cash flows expire, (ii) the Bank has substantially transferred all risks and rewards of ownership or, (iii) although retaining some but not substantially all of the risks and rewards of ownership, the Bank has transferred control over the assets.
Subsequent measurement
Financial assets at fair value through profit or loss are subsequently carried at fair value and gains and losses arising from changes in their fair value are included in the income statement in the period in which they arise.
Available-for-sale financial assets are also subsequently carried at fair value. However, gains and losses arising from changes in their fair value are recognised directly in equity, until the financial assets are derecognised or impaired, at which time the cumulative gain or loss previously recognised in equity is recognised in the income statement. Foreign exchange differences arising from equity investments classified as available-for-sale are also recognised in equity, while foreign exchange differences arising from debt investments are recognised in the income statement. Interest, calculated using the effective interest rate method and dividends are recognised in the income statement.
The fair values of quoted investments in active markets are based on current bid prices. For unlisted securities the Bank establishes fair value by using (i) valuation techniques, including the use of recent arm’s length transactions, discounted cash flow analysis and option pricing models and (ii) valuation assumptions based on market information.
Impairment
In accordance with IFRS, the Bank periodically assesses whether there is objective evidence that a financial asset or group of financial assets is impaired. If there is objective evidence of impairment, the recoverable amount of the asset is determined and impairment losses are recognised through the income statement.
A financial asset or a group of financial assets is impaired if there is objective evidence of impairment as a result of one or more events that occurred after their initial recognition, such as: (i) for equity securities, a significant or prolonged decline in the fair value of the security below its cost, (ii) for debt securities, when that event (or events) has an impact on the estimated future cash flows of the financial asset or group of financial assets, that can be reliably estimated, and (iii) devaluation of 30% or consecutive devaluation during one year.
If there is objective evidence that an impairment loss on available-for-sale financial assets has been incurred, the cumulative loss recognised in equity – measured as the difference between the acquisition cost and the current fair value, less any impairment loss on that financial asset previously recognised in the income statement – is taken to the income statement. If, in a subsequent period, the amount of the impairment loss decreases, the previously recognised impairment loss is reversed through the income statement up to the acquisition cost if the increase is objectively related to an event occurring after the impairment loss was recognised, except in relation to equity instruments, in which case the reversal is recognised in equity.
2.6. Sale and repurchase agreements
Securities sold subject to repurchase agreements (repos) at a fixed price or at the sales price plus a lender’s return are not derecognized. The corresponding liability is included in amounts due to banks or to customers, as appropriate. The difference between sale and repurchase price is treated as interest and accrued over the life of the agreements using the effective interest rate method.

2016 Annual Report 20
6
Securities purchased under agreements to resell (reverse repos) at a fixed price or at the purchase price plus a lender’s return are not recognised, while the purchase price paid is recorded as loans and advances to banks or customers, as appropriate. The difference between purchase and resale price is treated as interest and accrued over the life of the agreements using the effective interest rate method.
Securities lent under lending agreements are not derecognised being classified and measured in accordance with the accounting policy described in Note 2.5. Securities borrowed under borrowing agreements are not recognised in the balance sheet.
2.7. Financial liabilities
An instrument is classified as a financial liability when it contains a contractual obligation to transfer cash or another financial asset, independently from its legal form.
Non-derivatives financial liabilities include deposits from banks and due to customers, loans, debt securities, subordinated debt and short sales.
The financial liabilities are recognised (i) initially at fair value less transaction costs and (ii) subsequently at amortised cost, using the effective interest rate method, except for short sales and financial liabilities designated at fair value through profit or loss, which are measured at fair value.
The Bank designates, at inception, certain financial liabilities as at fair value through profit or loss when:
● Such financial liabilities are being hedged (on an economical basis), in order to eliminate an accountingmismatch; or
● Such financial liabilities contain embedded derivatives.
The structured products issued by the Bank meet the above mentioned conditions and, in accordance, are classified under the fair value through profit or loss category.
The fair value of quoted financial liabilities is based on the current price. In the absence of a quoted price, the Bank establishes the fair value by using valuation techniques based on market information, including in determining the own credit risk of the issuer.
If the Bank repurchases debt issued, it is derecognised from the balance sheet and the difference between the carrying amount of the liability and its acquisition cost is recognised in the income statement.
2.8. Financial Guarantees
Financial guarantee contracts are contracts that require the issuer to make specified payments to reimburse the holder for a loss it incurs because a specified debtor fails to make payments when due in accordance with the terms of a debt instrument, namely the payment of principal and/or interests.
Financial guarantees are initially recognised in the financial statements at fair value on the date that the guarantee is issued. Subsequently financial guarantees are measured at the higher of (i) the fair value recognised on initial recognition or (ii) any financial obligation arising as a result of the guarantees at the balance sheet date. Any increase in the liability relating to guarantees is taken to the income statement.
The financial guarantee contracts issued by the Bank normally have a stated maturity date and a periodic fee. This fee varies depending on the counterparty risk, the amount and the time period of the contract. Therefore, the fair value of the financial guarantee contracts issued by the Bank, at the inception date, equal the initial fee received, which is recognised in the income statement over the period to which it relates. The subsequent periodic fees are recognised in the income statement in period to which they relate.
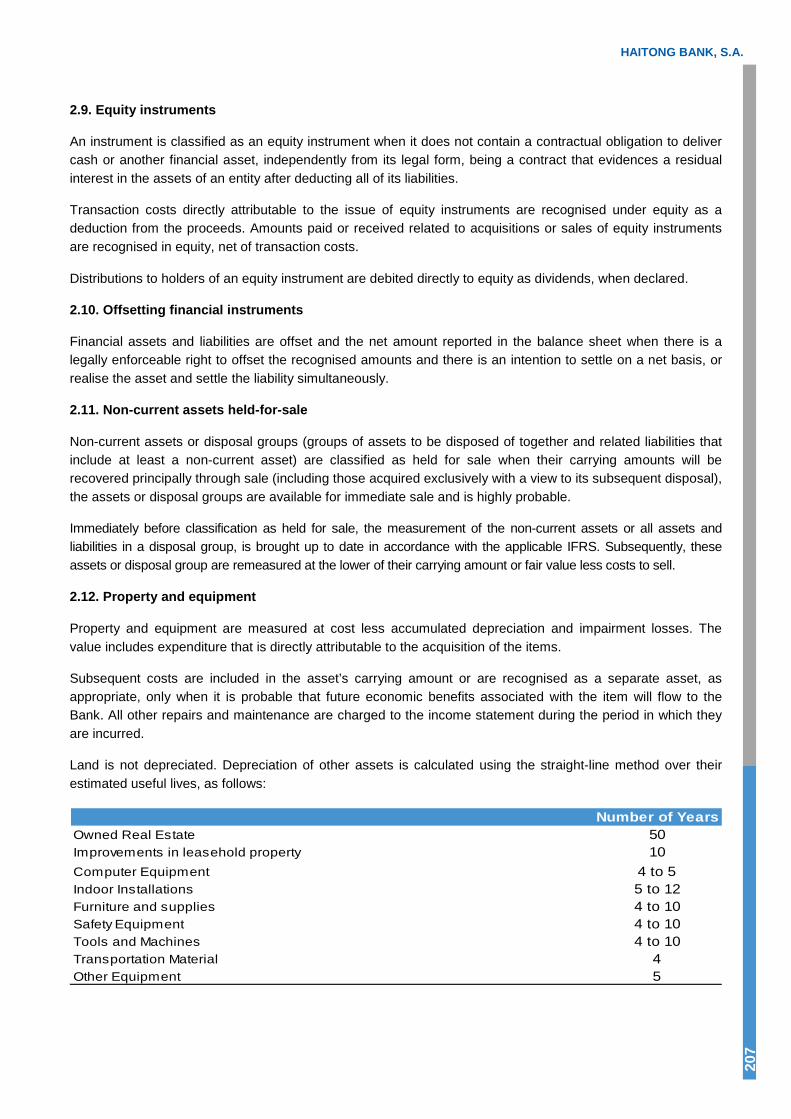
HAITONG BANK, S.A.
207
2.9. Equity instruments
An instrument is classified as an equity instrument when it does not contain a contractual obligation to deliver cash or another financial asset, independently from its legal form, being a contract that evidences a residual interest in the assets of an entity after deducting all of its liabilities.
Transaction costs directly attributable to the issue of equity instruments are recognised under equity as a deduction from the proceeds. Amounts paid or received related to acquisitions or sales of equity instruments are recognised in equity, net of transaction costs.
Distributions to holders of an equity instrument are debited directly to equity as dividends, when declared.
2.10. Offsetting financial instruments
Financial assets and liabilities are offset and the net amount reported in the balance sheet when there is a legally enforceable right to offset the recognised amounts and there is an intention to settle on a net basis, or realise the asset and settle the liability simultaneously.
2.11. Non-current assets held-for-sale
Non-current assets or disposal groups (groups of assets to be disposed of together and related liabilities that include at least a non-current asset) are classified as held for sale when their carrying amounts will be recovered principally through sale (including those acquired exclusively with a view to its subsequent disposal), the assets or disposal groups are available for immediate sale and is highly probable.
Immediately before classification as held for sale, the measurement of the non-current assets or all assets and liabilities in a disposal group, is brought up to date in accordance with the applicable IFRS. Subsequently, these assets or disposal group are remeasured at the lower of their carrying amount or fair value less costs to sell.
2.12. Property and equipment
Property and equipment are measured at cost less accumulated depreciation and impairment losses. The value includes expenditure that is directly attributable to the acquisition of the items.
Subsequent costs are included in the asset’s carrying amount or are recognised as a separate asset, as appropriate, only when it is probable that future economic benefits associated with the item will flow to the Bank. All other repairs and maintenance are charged to the income statement during the period in which they are incurred.
Land is not depreciated. Depreciation of other assets is calculated using the straight-line method over their estimated useful lives, as follows:
Number of YearsOwned Real Estate 50Improvements in leasehold property 10Computer Equipment 4 to 5Indoor Installations 5 to 12Furniture and supplies 4 to 10Safety Equipment 4 to 10Tools and Machines 4 to 10Transportation Material 4Other Equipment 5

2016 Annual Report
208
When there is an indication that an asset may be impaired, IAS 36 requires that its recoverable amount be estimated and an impairment loss recognised when the net book value of the asset exceeds its recoverable amount. Impairment losses are recognised in the income statement.
The recoverable amount is determined as the greater of its net selling price and value in use which is based on the net present value of future cash flows arising from the continuing use and ultimate disposal of the asset.
2.13. Intangible assets
The costs incurred with the acquisition, production and development of software are capitalised, as well as the costs incurred to acquire and bring to use the specific software. These costs are amortised on a straight line basis during their expected useful lives, which is usually between three to eight years.
Costs that are directly associated with the development of identifiable specific software applications and that will probably generate economic benefits beyond one year, are recognised as intangible assets. These costs include employee costs from the Bank companies specialised in IT directly associated with the development of the referred software.
All remaining costs associated with IT services are recognised as an expense as incurred.
2.14. Leases
The Bank classifies its lease agreements as operating leases taking into consideration the substance of the transaction rather than its legal form, in accordance with IAS 17 – Leases.
Operating leases
Payments made under operating leases are charged to the income statement in the period to which they relate.
2.15. Employee benefits
Pensions
After signing the Collective labour agreement (“Acordo Colectivo de Trabalho” - ACT), the Bank set up pension funds and other mechanisms to cover the liabilities with pensions on retirement and disability, widows’ pension and health-care benefits.
Since 1 January 2011, the Bank’s employees were included in the Social Security System, which ensures their protection in motherhood, fatherhood, adoption and old age, while the banks remain responsible for insurance related to illness, disability, survival and death (Decree-Law no. 1-A/2011, of 3 January).
The contribution rate is 26.6%, of which 23.6% belongs to the employer and 3% to employees, replacing the “CAFEB - Caixa de Abono de Família dos Empregados Bancários”, extinguished by the same Decree-Law. As a result, the pension rights of active employees started to be covered by the terms defined by the Social Security System, considering the period of service rendered since 1 January 2011 until the retirement age. The difference to the minimum pension guaranteed is supported by the banks, in accordance with the terms defined in the Collective labour agreement (“Acordo Colectivo de Trabalho” - ACT).
Following the Government’s approval of the Decree-Law no. 127/2011, which was published in 31 December, a Three Party Agreement between the Government, the Portuguese Bank Association and the Union of Bank employees was established, regarding the transfer to the Social Security domain of the liabilities with pensions under payment to retired employees and pensioners, as at 31 December 2011.
HAITONG BANK, S.A.
209
This decree-law established that the liabilities to be transferred were the liabilities with pensions under payment at 31 December 2011 to retired employees and pensioners, at permanent values (discount rate 0%) in the terms set forth in Collective Labour Regulation Instrument (IRCT). The liabilities regarding the update of pensions, benefit plans, contributions to Social-Medical Assistance Services over retirement and survival pensions, death subsidy and deferred survival pension are still under the responsibility of the Institutions.
The hedging of these responsibilities is ensured through pension funds managed by GNB – Sociedade Gestora de Fundos de Pensões, S.A..
The pension plans of the Bank are classified as defined benefit plans, since the criteria to determine the pension benefit to be received by employees on retirement are predefined and usually depend on factors such as age, years of service and level of salary.
In 2011, the Bank retrospectively changed the accounting policy related to actuarial gains and losses recognition, adjusting the opening balance sheet and comparative values, starting to recognise, as allowed under paragraph 93A of IAS 19 “Employee Benefits”, the actuarial deviations under other comprehensive income.
The liability with pensions is calculated annually by the Bank, as at 31 December each year for each plan individually, using the projected unit credit method, and is reviewed annually by qualified independent actuaries.
The discount rate used in this calculation was determined with reference to market rates associated with high-quality corporate bonds issues, denominated in the currency in which benefits will be paid and with a maturity similar to the expiry date of the plan obligations.
The interest gain/(loss) with the pension plan is calculated by the Bank, through the multiplication of the net asset/liability with retirement pensions (liabilities deducted from the fair value of the fund assets) by the discount rate used to estimate the liabilities with the retirement pensions referred above. The net interest gain/(loss) includes the related costs with the interest associated to the liabilities with retirement pensions and the expected income from the funds assets, both measured based in the discount rate used in the liabilities calculations.
Actuarial gains and losses determined annually and resulting from (i) the differences between financial and actuarial assumptions used and real values obtained and (ii) the changes in actuarial assumptions, are recognised under equity in the balance other comprehensive income.
At each period, the Bank recognises as a cost in the income statement a net total amount that comprises (i) the service cost, (ii) the interest cost, (iii) the expected return on plan assets, (iv) effect of early retirement, and (v) effect of settlement or curtailment occurred during the period. Early retirement costs correspond to anincrease on the liabilities due to the fact the employee retires before reaching 65 years of age.
The Bank makes payments to the funds in order to maintain its solvency and to comply with the following minimum levels establish by the national central bank: (i) the liability with pensioners shall be totally funded at the end of each year, and (ii) the liability related to past services cost with employees in service shall be funded at a minimum level of 95%.
Annually, the Bank assesses for each plan separately, the recoverability of any recognised asset in relation to the defined benefit pension plans, based on the expectation of reductions in future contributions to the funds.
2016 Annual Report 21
0
Health care benefits
The Bank provides to its banking employees health care benefits through a specific Social-Medical Assistance Service. This Social-Medical Assistance Service (SAMS) is an autonomous entity which is managed by the respective Union.
SAMS provides to its beneficiaries services and/or contributions on medical assistance expenses, diagnostics, medicines, hospital confinement and surgical operations, in accordance with its financing availability and internal regulations.
The annual contribution of the Bank to SAMS amounts to 6.5% of the total annual remuneration of employees, including, among others, the holiday and Christmas subsidy.
The measurement and recognition of the Bank’s liability with post-retirement healthcare benefits is similar to the measurement and recognition of the pension liability described above. These benefits are covered by the Pension Fund which at present covers all responsibilities with pensions and health care benefits.
Long-term service benefits
In accordance with the Collective labour agreement for the banking sector, the Bank has assumed the commitment to pay to current employees that achieve 15, 25 and 30 years of service within the Bank, long-term service premiums corresponding, respectively, to 1, 2 and 3 months of their effective monthly remuneration earned at the date the premiums are paid.
At the date of early retirement or disability, employees have the right to a premium proportional to what they would earn if they remained in service until the next payment date.
These long-term service benefits are accounted for by the Bank in accordance with IAS 19 as other long-term employee benefits.
The liability with long-term service benefits is calculated annually, at the balance sheet date, by the Bank using the projected unit credit method. The actuarial assumptions used are based on the expectations about future salary increases and mortality tables. The discount rate used in this calculation was determined based on the same methodology described for pensions.
In each period the increase in the liability for long-term service premiums, including actuarial gains and losses and past service costs is charged to the income statement.
New Collective Labour Agreement
Until June 2016, pursuant to the Collective Labour Agreement – CLA of the banking sector, entered into by the various financial institutions, the payment of a long-term service bonus was due on the month the Employees (of the domestic activity) reached 15, 25 and 30 years of good and effective service in the banking sector, respectively amounting to one, two or three months of their effective monthly remuneration (on the year the bonus was granted).
On the 14th of June, 2016, a new CLA was entered into with the unions of the aforementioned sector. It was published in the Boletim do Trabalho e do Emprego [Bulletin of Labour and Employment] on the 8th of August, 2016, having taken effect on the following day.
With the entry into force of the new CLA, the long-term service bonus has been eliminated. However, the new CLA provides for the payment of the proportion of the long-term service bonus for the ongoing anniversary regarding 15, 25 or 30 years of bank seniority and corresponding to the years of good and effective service in the banking sector as at the date of the new CLA’s entry into force. The new CLA provides for the payment of

HAITONG BANK, S.A.
211
an end-of-career bonus which is 1.5 times the amount of the effective monthly remuneration of the Employee upon termination of the employment contract due to retirement.
The new CLA shall not amend the pension’s scheme and the supplementary health scheme (SAMS) applicable to employees and retired employees of the banking sector, although it has set forth new financing rules of SAMS, to be borne by the credit institutions. With such amendments, the value of charges relating to SAMS concerning retired employees and pensioners will shift, from a percentage of the pension amount to a fixed amount per capita, by type of recipient (retired person or survivor’s pensioner).
With the new CLA, mandatory promotions due to long-term service have been eliminated, therefore only remaining the following promotion for the employees who have been promoted up to the 31st of December, 2014.
Bonus to employees and to the Board of Directors
In accordance with IAS 19 Employee benefits, the bonus payment to employees and to the Board of Directors is recognised in the income statement in the period to which they relate.
2.16. Income tax
Income tax for the period comprises current tax and deferred tax. Income tax is recognised in the income statement except to the extent that it relates to items recognised directly in equity, in which case it is recognised in equity. Income tax recognised directly in equity relating to fair value re-measurement of available-for-sale financial assets and cash flow hedges is subsequently recognised in the income statement when gains or losses giving rise to the income tax are also recognised in the income statement.
Current tax is the tax expected to be paid on the taxable profit for the period, calculated using tax rates enacted or substantively enacted at the balance sheet date at each jurisdiction.
Deferred tax is provided using the balance sheet liability method, providing for temporary differences between the carrying amounts of assets and liabilities for financial reporting purposes and their respective tax basis, and is calculated using the tax rates enacted or substantively enacted at the balance sheet date in any jurisdiction and that are expected to apply when the related deferred income tax asset is realised or the deferred income tax liability is settled.
Deferred tax liabilities are recognised for all taxable temporary differences, differences arising on initial recognition of assets and liabilities that affect neither accounting nor taxable profit and differences relating to investments in subsidiaries to the extent that probably they will not reverse in the foreseeable future. Deferred tax assets are recognised to the extent it is probable that future taxable profits will absorb the the tax loss carried forward and the deductible temporary differences.
2.17. Provisions
Provisions are recognised when: (i) the Bank has present legal or constructive obligation, (ii) it is probable that settlement will be required in the future and (iii) a reliable estimate of the obligation can be made.
When the effect of the passage of time (discount) is material, the provision corresponds to the net present value of the expected future payments, discounted at an appropriate rate considering the risk associated to the obligation.
If it is not possible for payment to be required, it is a contingent liability. Contingent liabilities are only subject to disclosure, unless the likelihood of their realization is remote. Provisions for restructuring are recognised once the Group approves a formal and detailed restructuring plan, and such restructuring has been commenced or publically announced on the reference date of the financial statements.
2016 Annual Report
212
A provision for onerous contracts is recognised when the expected benefits to be derived by the Bank from a contract are lower than the unavoidable costs of meeting its obligation under the contract. The provision is measured at the present value of the lower of the expected cost of terminating the contract and the expected net costs of continuing with the contract.
2.18. Interest income and expenses
Interest income and expense are recognised in the income statement under interest and similar income and interest expense and similar charges for all non-derivative financial instruments measured at amortised cost and for the available-for-sale financial assets, using the effective interest rate method. Interest income arising from non-derivative financial assets and liabilities at fair value through profit or loss is also included under interest and similar income or interest expense and similar charges, respectively.
The effective interest rate is the rate that exactly discounts estimated future cash payments or receipts through the expected life of the financial instrument or, when appropriate, a shorter period to the net carrying amount of the financial asset or financial liability. The effective interest rate is calculated at inception and it is not subsequently revised.
When calculating the effective interest rate, the Bank estimates cash flows considering all contractual terms of the financial instrument (for example, prepayment options) but does not consider future credit losses. The calculation includes all fees and commissions paid or received that are an integral part of the effective interest rate, transaction costs and all other premiums or discounts. In the case of financial assets or groups of similar financial assets for which an impairment loss was recognised, interest income is calculated using the interest rate used to measure the impairment loss.
For derivative financial instruments, except for derivatives for risk management purposes (see Note 2.3), the interest component of the changes in their fair value is not separated out and is classified under net gains/(losses) from financial assets and financial liabilities at fair value through profit or loss. The interest component of the changes in the fair value of derivatives for risk management purposes is recognised under interest and similar income or interest expense and similar charges.
2.19. Recognition of fees and commission income
Fees and commissions are recognised as follows:
● Fees and commissions that are earned on the execution of a significant act, as loan syndication fees, are recognised as income when the significant act has been completed;
● Fees and commissions earned over the period in which the services are provided are recognised as income in the period the services are provided;
● Fees and commissions that are an integral part of the effective interest rate of a financial instrument are recognised as income using the effective interest rate method.
2.20. Recognition of dividend income
Dividend income is recognised when the right to receive payment is established.
2.21. Segmental reporting
According to paragraph 4 of IFRS 8 – Operating Segments, the Bank is exempt from submitting a report on an individual basis by segment, since the individual financial statements are presented together with the consolidated financial statements.
HAITONG BANK, S.A.
213
2.22. Earnings per share
Basic earnings per share is calculated by dividing net income available to ordinary shareholders by the weighted average number of ordinary shares outstanding during the year, excluding the average number of ordinary shares purchased by the Bank and held as treasury stock.
For the diluted earnings per share, the weighted average number of ordinary shares outstanding is adjusted to assume conversion of all dilutive potential ordinary shares, such as convertible debt and share options granted to employees. Potential or contingent share issuances are treated as dilutive when their conversion to shares would decrease net earnings per share.
2.23. Cash and cash equivalents
For the purposes of the cash flow statement, cash and cash equivalents comprise balances with less than three months’ maturity from the inception date, including cash, deposits with banks and deposits at central banks.
Cash and cash equivalents exclude restricted balances with Central Banks.
2.24. Investments in subsidiaries and associated companies
These assets are recorded at acquisition cost, being subject to periodic analyses of impairment.
Dividends are recorded as an income in the year in which its distribution is decided by the subsidiaries and associated companies.
NOTE 3 – CRITICAL ACCOUNTING ESTIMATES AND JUDGMENTS IN APPLYING ACCOUNTING POLICIES
IFRS set forth a range of accounting treatments and require management to apply judgment and make estimates in deciding which treatment is most appropriate. The most significant of these accounting policies are discussed in this section in order to improve understanding of how their application affects the Bank’s reported results and related disclosure. A broader description of the accounting policies employed by the Bank is shown in Note 2 to the Financial Statements.
Because in many cases there are other alternatives to the accounting treatment chosen by management, the Bank’s reported results would differ if a different treatment were chosen. Management believes that the choices made by it are appropriate and that the financial statements present the Bank’s financial position and results fairly in all material respects.
3.1. Impairment and valorization of available-for-sale financial assets
The Bank determines that available-for-sale financial assets are impaired when there has been a significant or prolonged decline in the fair value below its cost or when it has identified an event with impact on the estimated future cash flows of the assets. This determination requires judgement based on all available relevant information, including the normal volatility of the financial instruments prices. Considering the high volatility of the markets, the Bank has considered the following parameters when assessing the existence of impairment losses:
(i) Equity securities: significant decline in market value in relation to the acquisition cost or marketvalue below the acquisition cost for a prolonged period;
(ii) Debt securities: objective evidence of events that have an impact on the estimated future cash
2016 Annual Report 21
4
flows of these assets;
(iii) Devaluation of 30% or consecutive devaluation during one year.
In addition, valuations are generally obtained through market quotation (mark to market) or valuation models (mark to model) that may require assumptions or judgement in making estimates of fair value.
Alternative methodologies and the use of different assumptions and estimates could result in a higher level of impairment losses recognised with a consequent impact in the income statement of the Bank.
3.2. Fair value of financial derivatives and assets and liabilities at fair value through profit or loss
Fair values are based on listed market prices when available; otherwise fair value is determined with reference to similar recent arm’s length transaction prices, or in accordance with valuation methodologies based on discounted future cash flows techniques, by taking into account the market conditions, temporal value, yield curve and volatility factors. Such methodologies further incorporate own credit risk as well as the counterparty’s credit risk. Such methodologies may require the use of assumptions or judgements when estimating fair value.
Consequently, the use of a different model or different assumptions or judgements in applying a particular model may have produced different financial results from the ones reported.
3.3. Impairment losses on loans and advances
The Bank reviews its loan portfolios to assess impairment on a regular basis, as described in Note 2.4.
The evaluation process in determining whether an impairment loss should be recorded in the income statement is subject to numerous estimates and judgments, including the existence of impairment triggers, recovery estimates and collaterals valuation.
Alternative methodologies and the use of different assumptions and estimates could result in a different level of impairment losses with a consequent impact in the income statement of the Bank.
3.4. Income Taxes
The Bank is subject to income taxes in numerous jurisdictions. Significant interpretations and estimates are required in determining the worldwide amount for income taxes. There are many transactions and calculations for which the ultimate tax determination is uncertain during the ordinary course of business.
Different interpretations and estimates would result in a different level of income taxes, current and deferred, recognised in the period.
On the other hand, the Bank accounts for deferred taxes in accordance with the policy set forth in Note 2.16, whereby deferred tax assets are accounted for only insofar as it is expected that there will be taxable profit in the future, which are able to absorb tax losses carried forward and deductible temporary differences.
The assessment of the recoverability of deferred tax assets (including the rate at which they shall be realised) was carried out by the Group based on projections of its future taxable profit, such projections being specified from a business plan.
The estimate of future taxable profit involves a significant level of judgement regarding the future development of the Group’s activity and the timing of execution of temporary differences. For such purpose, several assumptions were adopted, including the measures described in Note 43, the taxation scheme applicable in future years and the execution of operations which are currently expected by the Bank, being deemed as the

HAITONG BANK, S.A.
215
most appropriate by the Bank’s Board of Directors in relation to the information available as at the date of approval of the financial statements. However, the use of different assumptions concerning the level of the aforesaid variables could result in different conclusions from those which were the basis when preparing the financial statements herein.
The Tax Authorities are entitled to review the Bank’ determination of annual taxable earnings, for a period of four years or six years in case tax losses are brought forward. Hence, it is possible that some additional taxes may be assessed, mainly as a result of differences in interpretation of the tax law. However, the Bank’s Board of Directors is confident that there will be no material tax assessments within the context of the financial statements.
3.5. Pensions and other employee benefits
Determining pension liabilities requires the use of assumptions and estimates, including the use of actuarial projections, estimated returns on investment, and other factors that could impact the cost and liability of the pension plan.
Changes in these assumptions could materially affect these values.
3.6 Impairment losses in subsidiaries and associated companies
Investments in subsidiaries and associated companies are analysed periodically for the purpose of identifying signs of impairment. If any, the impairment is determined in accordance with the rules set forth in IAS 36. In the absence of an available market value, the recoverable amount is normally determined based on discounted value techniques using a discount rate that considers the risk associated with unit to be tested. The determination of the future cash flows to be discounted and the discount rate to be used involves judgment. Changes in expected cash flows and in the discount rates to be used could lead to different conclusions from those that formed the basis of the preparation of these financial statements.
NOTE 4 – NET INTEREST INCOME
This heading’s amount is composed of:
(thousand euros)31.12.2016 31.12.2015
Assets/Liabilities at Amortised Cost and Available-for-Sale Financial Assets
Assets/Liabilities at Fair Value
Through Profit or Loss
Total
Assets/Liabilities at Amortised Cost and Available-for-
Sale Financial Assets
Assets/Liabilities at Fair Value
Through Profit or Loss
Total
Interest and similar incomeInterest from loans and advances to customers 12 550 - 12 550 17 471 - 17 471 Interest from deposits and investments in credit institutions - 3 301 3 301 - 2 600 2 600 Interest from risk management derivatives 948 - 948 1 305 - 1 305 Interest from available-for-sale financial assets 3 622 - 3 622 7 259 - 7 259 Interest from financial assets at fair-value through profit and loss - 42 42 - 199 199 Other interest and similar income 76 - 76 114 - 114
17 196 3 343 20 539 26 149 2 799 28 948 Interest and similar expenses
Interest from deposits from central banks and other credit institu 8 511 - 8 511 16 168 - 16 168 Interest from risk management derivatives 2 085 - 2 085 523 - 523 Interest from debt securities issued 19 191 - 19 191 14 978 - 14 978 Interest from customers accounts - 33 33 - 173 173 Interest from subordinated liabilities 125 - 125 430 - 430 Other interest and similar expenses 1 281 - 1 281 1 559 - 1 559
31 193 33 31 226 33 658 173 33 831
( 13 997) 3 310 ( 10 687) ( 7 509) 2 626 ( 4 883)
Interest from derivatives for risk management purposes includes, in accordance with the accounting policy described in Notes 2.3 and 2.18, interests from derivatives used to manage the risk of certain financial assets and financial liabilities designated at fair value through profit or loss in accordance with the accounting policies described in Notes 2.5 and 2.7.
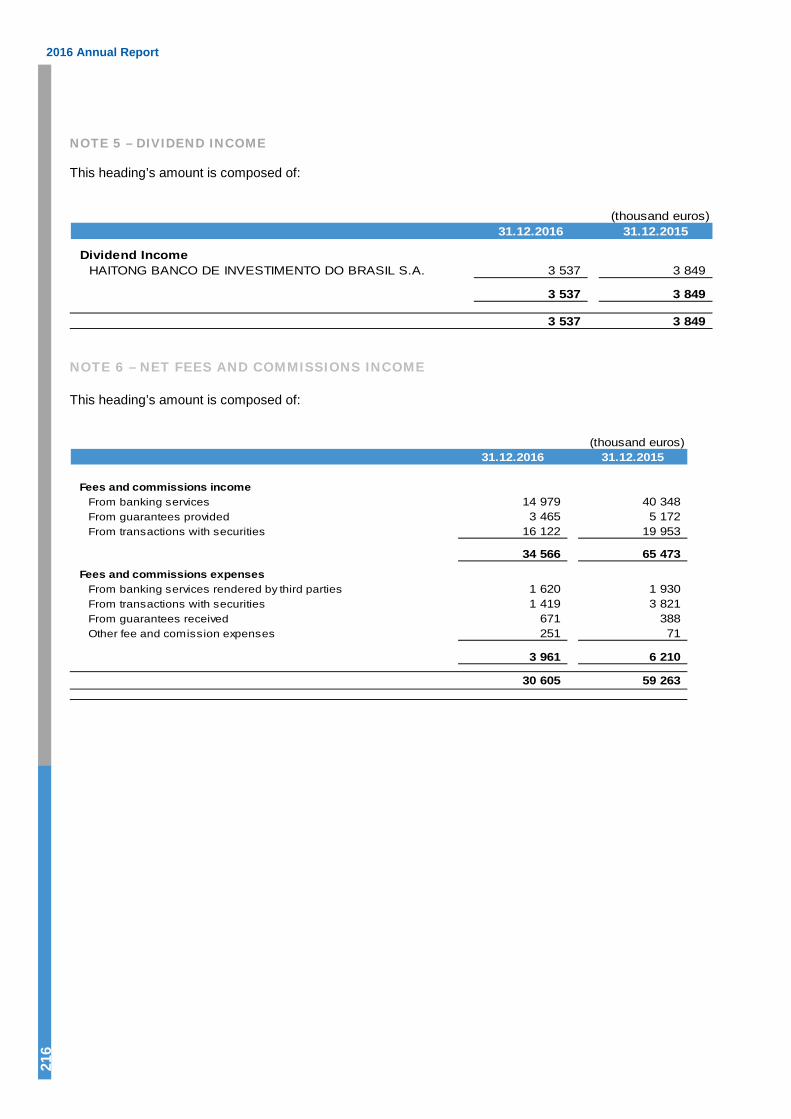
2016 Annual Report
216
NOTE 5 – DIVIDEND INCOME
This heading’s amount is composed of:
(thousand euros)31.12.2016 31.12.2015
Dividend IncomeHAITONG BANCO DE INVESTIMENTO DO BRASIL S.A. 3 537 3 849
3 537 3 849
3 537 3 849
NOTE 6 – NET FEES AND COMMISSIONS INCOME
This heading’s amount is composed of:
(thousand euros)31.12.2016 31.12.2015
Fees and commissions incomeFrom banking services 14 979 40 348 From guarantees provided 3 465 5 172 From transactions with securities 16 122 19 953
34 566 65 473
Fees and commissions expensesFrom banking services rendered by third parties 1 620 1 930 From transactions with securities 1 419 3 821 From guarantees received 671 388 Other fee and comission expenses 251 71
3 961 6 210
30 605 59 263

HAITONG BANK, S.A.
217
NOTE 7 – NET GAINS/ (LOSSES) FROM FINANCIAL ASSETS AND FINANCIAL LIABILITIES AT FAIR VALUE THROUGH PROFIT OR LOSS
This heading’s amount is composed of: (thousand euros)
31.12.2016 31.12.2015Gains Losses Total Gains Losses Total
Securities held for trading
Bonds and other fixed income securitiesIssued by public entities 4 850 4 207 643 14 097 13 170 927 Of other entities 5 198 2 511 2 687 4 377 1 903 2 474- - - - - -
Shares 4 185 3 926 259 5 238 4 366 872
14 233 10 644 3 589 23 712 19 439 4 273 Derivative financial instruments
Foreign-exchange contracts 5 013 15 021 ( 10 008) 10 828 5 655 5 173 Interest rates contracts 39 715 40 966 ( 1 251) 632 047 642 310 ( 10 263)Equity/indexes contracts 25 591 29 684 ( 4 093) 202 789 217 028 ( 14 239)Credit default contracts 43 676 47 110 ( 3 434) 73 444 86 094 ( 12 650)Other - - - 44 022 - 44 022
113 995 132 781 ( 18 786) 963 130 951 087 12 043
Financial liabilities at fair-value throughprofit and loss (1)
Debt securities issued 128 111 17 67 9 58 128 111 17 67 9 58
128 356 143 536 ( 15 180) 986 909 970 535 16 374
(1) It includes the change in fair value or at fair value option of liabilities hedged
NOTE 8 – NET GAINS/ (LOSSES) FROM AVAILABLE-FOR-SALE FINANCIAL ASSETS
This heading’s amount is composed of:
(thousand euros)31.12.2016 31.12.2015
Gains Losses Total Gains Losses Total
Bonds and other fixed income securitiesIssued by public entities - 7 ( 7) 14 3 046 ( 3 032)Of other entities 6 - 6 626 6 620 Shares 1 080 - 1 080 - 2 ( 2)Other variable income securities - - - - 17 ( 17)
1 086 7 1 079 640 3 071 ( 2 431)

2016 Annual Report 21
8
NOTE 9 – NET GAINS/ (LOSSES) FROM FOREIGN EXCHANGE REVALUATION
This heading’s amount is composed of:
(thousand euros)31.12.2016 31.12.2015
Gains Losses Total Gains Losses Total
Currency revaluation 89 949 111 864 ( 21 915) 66 183 92 670 ( 26 487)
89 949 111 864 ( 21 915) 66 183 92 670 ( 26 487)
This balance includes the exchange differences arising on translating monetary assets and liabilities at the exchange rates ruling at the balance sheet date in accordance with the accounting policy described in Note 2.2..
NOTE 10 – NET GAINS / (LOSSES) ARISING FROM THE DISPOSAL OF OTHER ASSETS
As at the 31st of December, 2016, and the 31st of December, 2015, this heading’s amount is composed of:
(thousand euros)31.12.2016 31.12.2015
Net gains / (losses) from the sale of other assetsNon-financial assets 41 ( 42)Investments in subsidiaries, associates and jointly ventures (Note 26) ( 5 877) 34
( 5 836) ( 8)
( 5 836) ( 8)
NOTE 11 – OTHER OPERATING RESULTS
This heading’s amount is composed of:
(thousand euros)31.12.2016 31.12.2015
Other customer services 128 972 Direct and Indirect taxes ( 4 223) ( 3 440)Other operating results 6 096 ( 1 576)
2 001 ( 4 044)
Direct and indirect taxes include 1,593 thousand euros concerning the cost associated with the Bank Levy (31st of December, 2015: 1,611 thousand euros), established pursuant to Law no. 55-A/2010, of the 31st of December (see Note 33).
As at the 31st of December, 2016, there were no costs relating to Deposit Guarantee Funds’ Contributions (4 thousand euros as at the 31st of December, 2015) in the ‘Other operating results’ heading, with costs amounting to 1,293 thousand euros having been recognised (1,441 thousand euros as at the 31st of December, 2015), associated with the Contributions for the Resolution Fund.
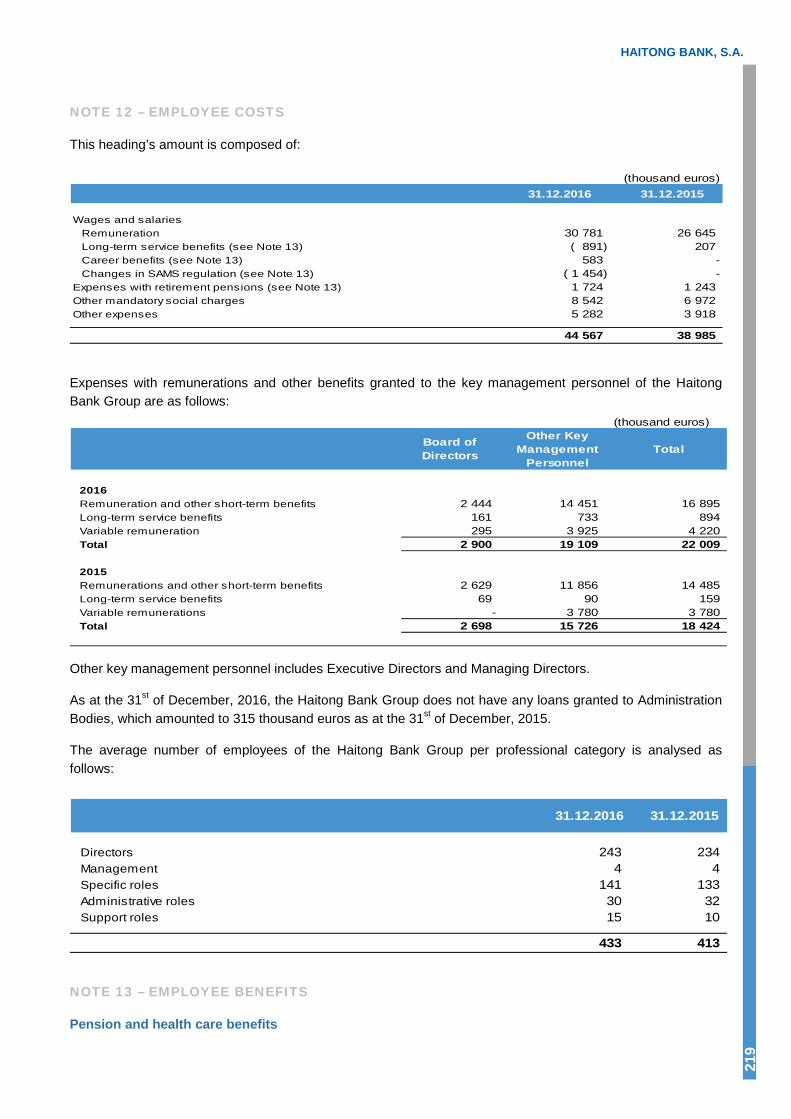
HAITONG BANK, S.A.
219
NOTE 12 – EMPLOYEE COSTS
This heading’s amount is composed of:
(thousand euros)31.12.2016 31.12.2015
Wages and salariesRemuneration 30 781 26 645 Long-term service benefits (see Note 13) ( 891) 207 Career benefits (see Note 13) 583 -Changes in SAMS regulation (see Note 13) ( 1 454) -
Expenses with retirement pensions (see Note 13) 1 724 1 243 Other mandatory social charges 8 542 6 972 Other expenses 5 282 3 918
44 567 38 985
Expenses with remunerations and other benefits granted to the key management personnel of the Haitong Bank Group are as follows:
(thousand euros)
Board of Directors
Other Key Management
PersonnelTotal
2016Remuneration and other short-term benefits 2 444 14 451 16 895 Long-term service benefits 161 733 894 Variable remuneration 295 3 925 4 220 Total 2 900 19 109 22 009
2015Remunerations and other short-term benefits 2 629 11 856 14 485 Long-term service benefits 69 90 159 Variable remunerations - 3 780 3 780 Total 2 698 15 726 18 424
Other key management personnel includes Executive Directors and Managing Directors.
As at the 31st of December, 2016, the Haitong Bank Group does not have any loans granted to Administration Bodies, which amounted to 315 thousand euros as at the 31st of December, 2015.
The average number of employees of the Haitong Bank Group per professional category is analysed as follows:
31.12.2016 31.12.2015
Directors 243 234 Management 4 4 Specific roles 141 133 Administrative roles 30 32 Support roles 15 10
433 413
NOTE 13 – EMPLOYEE BENEFITS
Pension and health care benefits
2016 Annual Report 22
0
In compliance with the Collective labour agreement (CLA) for the banking sector established with the unions, the Bank undertook the commitment to grant its employees, or their families, pension on retirement and disability, and widows’ pension. Pension payments consist of a rising percentage based on years of service, applicable to each year’s negotiated salary table for the active work force. Only employees hired before 31 March 2008 are covered by this benefit. Employees hired after that date are covered by the Portuguese Social Security Scheme.
In accordance with the second Three-Party Agreement celebrated between the Government, the Portuguese Bank Associations and Union of Bank employees, after 1 January 2011 the bank employees were integrated in the Social Security Regime, which assumed the protection of banking sector employees in the contingencies of maternity, paternity and adoption and even old age, remaining under the responsibility of the banks the protection in sickness, disability, survivor and death (Decree-Law n.1-A / 2011 of 3 January).
This agreement establishes that the retirement pension value of bank employees under Social Security scheme will not be reduced when compared to the value set forth in the collective conventions. Retirement pensions of bank employees integrated in the Social Security scheme continue to be calculated in accordance with the provisions of ACT and other conventions. However, bank employees are entitled to receive a pension under the general regime, which amount takes into account the number of years of discounts for that scheme. Banks are responsible for the difference between the pension determined in accordance with the provisions of ACT and the one that the bank employees are entitled to receive from Social Security. In this basis, the exposure to the actuarial and financial risk associated to retirement benefits is the same.
The contribution rate to the Social Security Regime is 26.6%, 23.6% paid by the employer and 3% paid by the employees, instead of Caixa de Abono de Família dos Empregados Bancários (CAFEB), abolished by the same law. In consequence of this change, the pension rights of active employers is to be covered under the terms defined by the General Social Security Regime, taking into account the length of service from 1 January 2011 until retirement. The differential required to support the guaranteed pension in terms of the ACT is paid by the Banks.
Notwithstanding, the integration leads to an effective decrease in the present value of total benefits reported to the normal retirement age (VABT) to be borne by the pension fund. Since there was no reduction in benefits from the perspective of the beneficiary on the date of integration into the second Three Party agreement, the past service liability remained unchanged.
At the end of 2011 following the third three party agreement, it was decided to transfer to the Social Security Regime the banks liabilities with pension in payment as at 31 December 2011.
The three party agreement established, provides for the transfer to the Social Security sphere of the liabilities with pensions in payment as of 31 December 2012 at constant values (0% discount rate) in the terms set forth in Collective Labour Regulation Instrument (IRCT). The responsibilities relating to updates of pensions value, other pension benefits in addition to those to be borne by the Social Security, health-care benefits, death allowance and deferred survivor pensions, will remain in the sphere of responsibility of the banks with the correspondent funding being provided through the respective pension funds.
The bank’s pension funds assets, specifically allocated to the cover of the transferred liabilities, were also transferred to the Government.
As the transfer of the liabilities with pensions in payment (even if only on a portion of the benefit) is a definitive and irreversible transfer, the conditions set out in IAS 19 ‘Employee benefits’ underlying the concept of settlement are met, since the obligation with pensions in payment was extinguished at the transfer date.
The pension funds in Portugal are managed by GNB – Sociedade Gestora de Fundos de Pensões, S.A. (50%) and Mercer Portugal (50%), which investment policy is being defined by Mercer Portugal.

HAITONG BANK, S.A.
221
In accordance with the policy defined in Note 2.15. Employee Benefits, the Group calculates the liabilities related with pensions and actuarial gains and losses on an annual basis.
Employee Benefits – New Collective Labour Agreement
Until June 2016, pursuant to the Collective Labour Agreement – CLA of the banking sector, entered into by the various financial institutions, the payment of a long-term service bonus was due on the month the Employees (of the domestic activity) reached 15, 25 and 30 years of good and effective service in the banking sector, respectively amounting to one, two or three months of their effective monthly remuneration (on the year the bonus was granted).
On the 14th of June, 2016, a new CLA was entered into with the unions of the aforementioned sector. It was published in the Boletim do Trabalho e do Emprego [Bulletin of Labour and Employment] on the 8th of August, 2016, having taken effect on the following day.
With the entry into force of the new CLA, the long-term service bonus has been eliminated. However, the new CLA provides for the payment of the proportion of the long-term service bonus for the ongoing anniversary regarding 15, 25 or 30 years of bank seniority and corresponding to the years of good and effective service in the banking sector as at the date of the new CLA’s entry into force. The new CLA provides for the payment of an end-of-career bonus which is 1.5 times the amount of the effective monthly remuneration of the Employee upon termination of the employment contract due to retirement.
The new CLA shall not amend the pension’s scheme and the supplementary health scheme (SAMS) applicable to employees and retired employees of the banking sector, although it has set forth new financing rules of SAMS, to be borne by the credit institutions. With such amendments, the value of charges relating to SAMS concerning retired employees and pensioners will shift, from a percentage of the pension amount to a fixed amount per capita, by type of recipient (retired person or survivor’s pensioner).
With the new CLA, mandatory promotions due to long-term service have been eliminated, therefore only remaining the following promotion for the employees who have been promoted up to the 31st of December, 2014.
The main actuarial assumptions used to calculate pension liabilities are as follows:
31.12.2016 31.12.2015
Financial Assumptions
Expected return rates 2,10% 2,50% Discount rate 2,10% 2,50% Pension growth rates 0,50% 0,50% Salary growth rates 1,00% 1,00%
Demographic Assumptions and Assessment Methods
Mortality tableMen TV 73/77 - 2 years TV 73/77 - 2 yearsWomen TV 88/90 - 3 years TV 88/90 - 3 years
Actuarial valuation method
Assumptions
Project Unit Credit Method
Disability decrements are not included in the calculation of responsibilities. The discount rate used as reference to the 31st of December, 2016, was based on: (i) the development sustained by the main indices concerning high quality corporate bonds and (ii) the duration of the responsibilities.

2016 Annual Report
222
The participants in the pension plan are categorized as follows:
31.12.2016 31.12.2015
Active workers 183 189 Retired 26 22 Survivors 7 7
TOTAL 216 218
The IAS 19 application implies the following liabilities and coverage levels, which shall be reported on the 31st of December 2016 and 2015:
(thousand euros)
31.12.2016 31.12.2015
Net Assets / (Liabilities) recognised in the statement of financial position
Liabilities as at 31st of December Pensioners 7 460 7 101 Active workers 63 275 63 643
70 735 70 744
Balance of the Funds at 31 December 67 349 70 744
Excess of coverage / Contributions to the fund ( 3 386) -
Assets / (Liabilities) in the statement of financial position (see Note 35) ( 3 386) -
Acummulated actuarial gains / losses recognised in other comprehensive income 31 641 27 346
The evolution of liabilities regarding retirement pensions and healthcare benefits is analysed as follows:
(thousand euros)
31.12.2016 31.12.2015
Liabilities at the beginning of the period 70 744 63 867
Current service cost 1 724 1 243 Interest expenses 1 763 1 590 Participants contributions 129 127 Actuarial (gains)/losses ( 1 718) 8 827
-Changes in assumptions 5 937 4 008 - Experience (Gains)/losses ( 7 655) 4 819
Pensions paid by the fund ( 453) ( 268)Changes in SAMS regulation (see Note 12) ( 1 454) -Transfers from liabilities - ( 4 642)Liabilities at the end of the period 70 735 70 744
Considering the situation on the 31st of December 2016, the analysis to the sensibility and alterations of the actuarial assumptions revealed the following impacts:
● An increase in the discount rate of 40 base points would have represented a reduction in liabilities of approximately 6,097 thousand euros; a decrease of equal range would have represented an increase in liabilities of approximately 6,716 thousand euros;
● An increase of 25 base points in the growth of salaries and pensions would have represented an increase in liabilities of approximately 4,369 thousand euros; a decrease of equal range would have represented a decrease in liabilities of approximately 4,117 thousand euros.
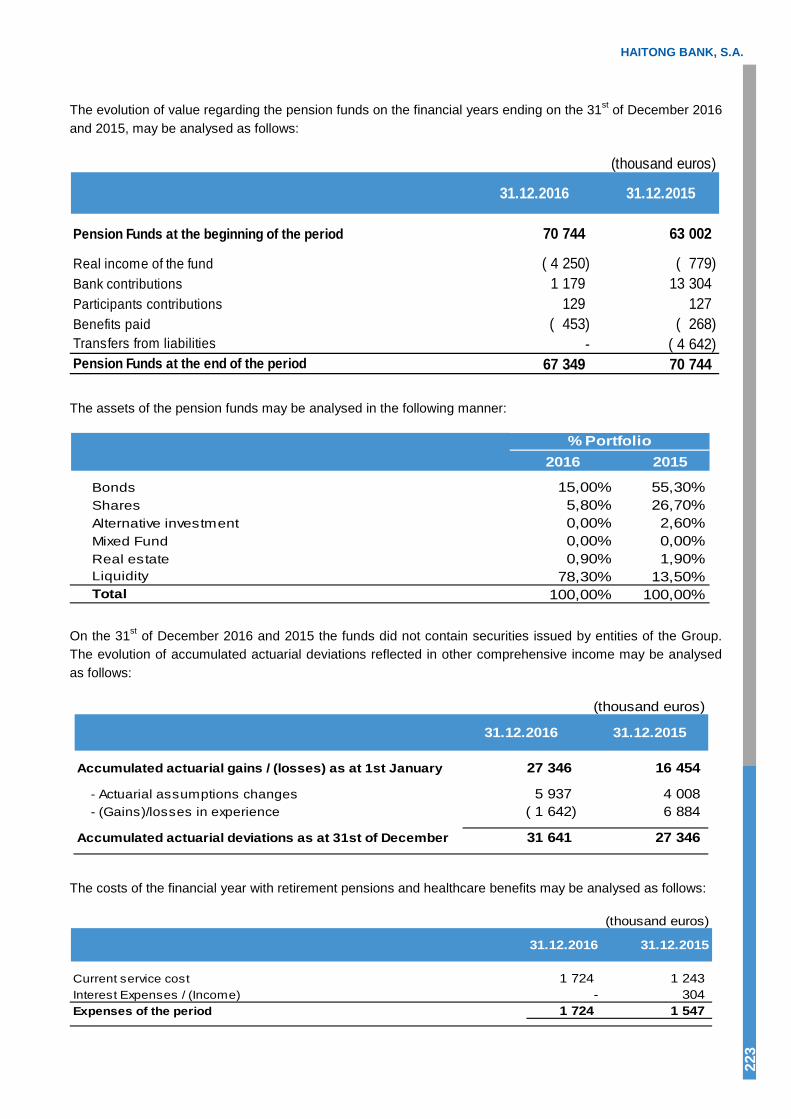
HAITONG BANK, S.A.
223
The evolution of value regarding the pension funds on the financial years ending on the 31st of December 2016 and 2015, may be analysed as follows:
(thousand euros)
31.12.2016 31.12.2015
Pension Funds at the beginning of the period 70 744 63 002
Real income of the fund ( 4 250) ( 779)Bank contributions 1 179 13 304 Participants contributions 129 127 Benefits paid ( 453) ( 268)Transfers from liabilities - ( 4 642)Pension Funds at the end of the period 67 349 70 744
The assets of the pension funds may be analysed in the following manner:
2016 2015
Bonds 15,00% 55,30%Shares 5,80% 26,70%Alternative investment 0,00% 2,60%Mixed Fund 0,00% 0,00%Real estate 0,90% 1,90%Liquidity 78,30% 13,50%Total 100,00% 100,00%
% Portfolio
On the 31st of December 2016 and 2015 the funds did not contain securities issued by entities of the Group. The evolution of accumulated actuarial deviations reflected in other comprehensive income may be analysed as follows:
(thousand euros)
31.12.2016 31.12.2015
Accumulated actuarial gains / (losses) as at 1st January 27 346 16 454
- Actuarial assumptions changes 5 937 4 008 - (Gains)/losses in experience ( 1 642) 6 884
Accumulated actuarial deviations as at 31st of December 31 641 27 346
The costs of the financial year with retirement pensions and healthcare benefits may be analysed as follows:
(thousand euros)
31.12.2016 31.12.2015
Current service cost 1 724 1 243 Interest Expenses / (Income) - 304 Expenses of the period 1 724 1 547
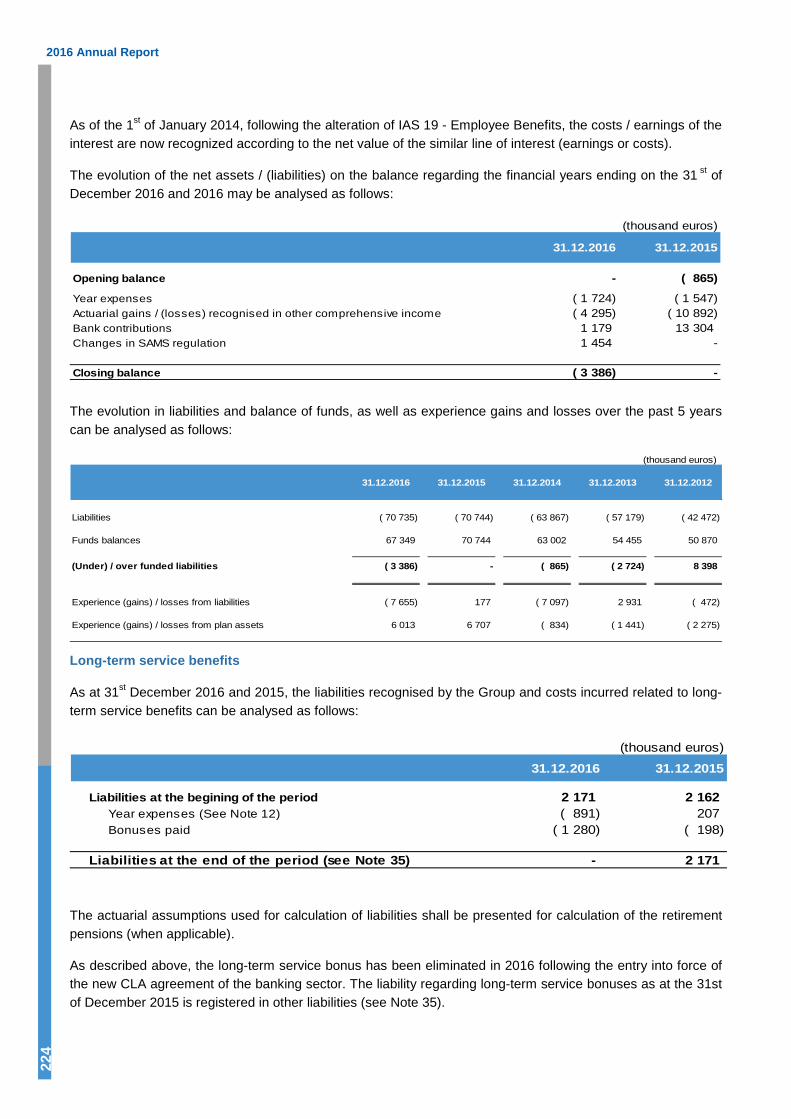
2016 Annual Report
224
As of the 1st of January 2014, following the alteration of IAS 19 - Employee Benefits, the costs / earnings of the interest are now recognized according to the net value of the similar line of interest (earnings or costs).
The evolution of the net assets / (liabilities) on the balance regarding the financial years ending on the 31 st of December 2016 and 2016 may be analysed as follows:
(thousand euros)
31.12.2016 31.12.2015
Opening balance - ( 865)
Year expenses ( 1 724) ( 1 547)Actuarial gains / (losses) recognised in other comprehensive income ( 4 295) ( 10 892)Bank contributions 1 179 13 304 Changes in SAMS regulation 1 454 -
Closing balance ( 3 386) -
The evolution in liabilities and balance of funds, as well as experience gains and losses over the past 5 years can be analysed as follows:
(thousand euros)
31.12.2016 31.12.2015 31.12.2014 31.12.2013 31.12.2012
Liabilities ( 70 735) ( 70 744) ( 63 867) ( 57 179) ( 42 472)
Funds balances 67 349 70 744 63 002 54 455 50 870
(Under) / over funded liabilities ( 3 386) - ( 865) ( 2 724) 8 398
Experience (gains) / losses from liabilities ( 7 655) 177 ( 7 097) 2 931 ( 472)
Experience (gains) / losses from plan assets 6 013 6 707 ( 834) ( 1 441) ( 2 275)
Long-term service benefits
As at 31st December 2016 and 2015, the liabilities recognised by the Group and costs incurred related to long-term service benefits can be analysed as follows:
(thousand euros)
31.12.2016 31.12.2015
Liabilities at the begining of the period 2 171 2 162 Year expenses (See Note 12) ( 891) 207 Bonuses paid ( 1 280) ( 198)
Liabilities at the end of the period (see Note 35) - 2 171
The actuarial assumptions used for calculation of liabilities shall be presented for calculation of the retirement pensions (when applicable).
As described above, the long-term service bonus has been eliminated in 2016 following the entry into force of the new CLA agreement of the banking sector. The liability regarding long-term service bonuses as at the 31st of December 2015 is registered in other liabilities (see Note 35).

HAITONG BANK, S.A.
225
Career bonuses On the 31st of December, 2016 and 2015, the liabilities assumed by the Group and the costs recognised in the periods with the career bonus are the following:
(thousand euros)
31.12.2016 31.12.2015
Liabilities at the begining of the period - - Year expenses (See Note 12) 583 -
Liabilities at the end of the period (see Note 35) 583 -
The actuarial assumptions used for calculation of liabilities shall be presented for calculation of retirement pensions (when applicable).
Liability regarding career bonus was introduced in 2016 following the entry into force of the new CLA of the banking sector.
The liability regarding career bonuses is registered in other liabilities (see Note 35).
NOTE 14 – ADMINISTRATIVE COSTS
The amounts of this item are as follows:
(thousand euros)
31.12.2016 31.12.2015
Lease and rental 6 127 6 292 Marketing and advertisement 701 314 Press releases and expedition 5 782 5 658 Travelling and representation 3 840 4 102 Maintenance and related services 1 202 1 288 Insurances 635 238 Legal and litigation 187 59 Specialised services IT services 3 849 3 882 Temporary labour 135 226 Independent work 2 856 2 582 Other specialised services 5 259 3 692 Other expenses 2 050 2 243
32 623 30 576
The ‘Other Specialised Services’ heading includes, among others, costs with external auditors and tax consultants.
The item Other Costs includes, among others, staff training and external charges for services.
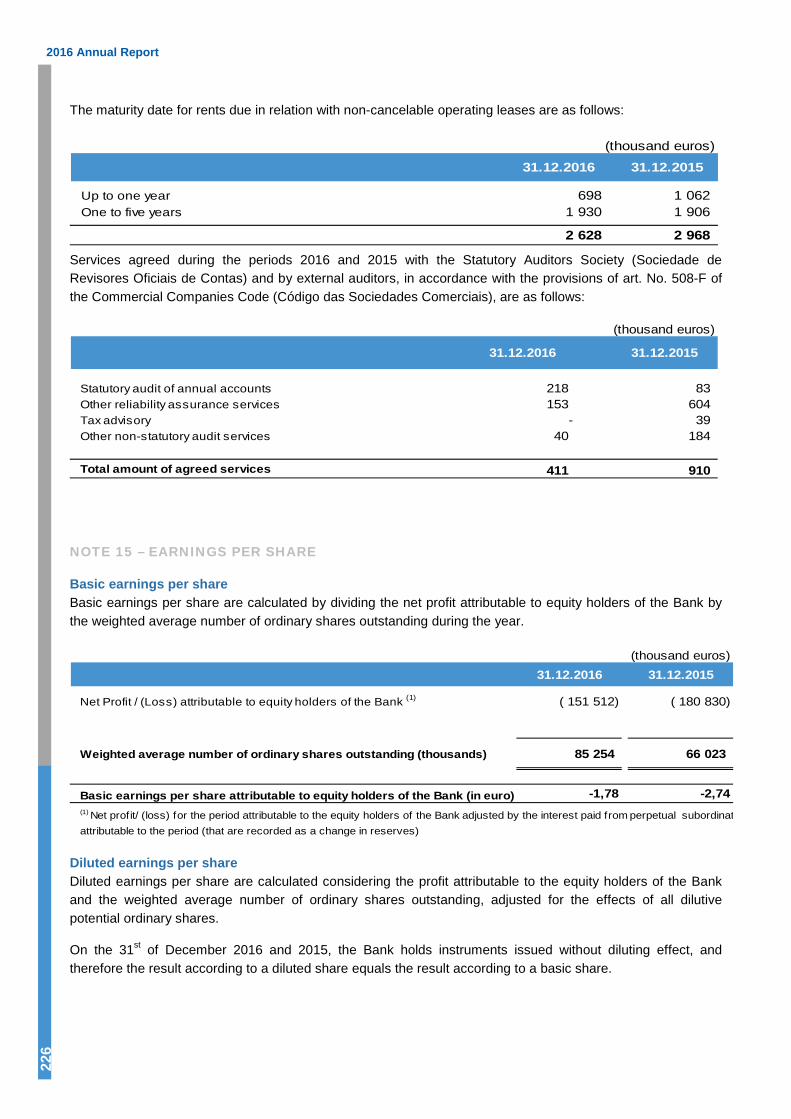
2016 Annual Report
226
The maturity date for rents due in relation with non-cancelable operating leases are as follows:
(thousand euros)
31.12.2016 31.12.2015
Up to one year 698 1 062 One to five years 1 930 1 906
2 628 2 968
Services agreed during the periods 2016 and 2015 with the Statutory Auditors Society (Sociedade de Revisores Oficiais de Contas) and by external auditors, in accordance with the provisions of art. No. 508-F of the Commercial Companies Code (Código das Sociedades Comerciais), are as follows:
(thousand euros)
31.12.2016 31.12.2015
Statutory audit of annual accounts 218 83 Other reliability assurance services 153 604 Tax advisory - 39 Other non-statutory audit services 40 184
Total amount of agreed services 411 910
NOTE 15 – EARNINGS PER SHARE
Basic earnings per share Basic earnings per share are calculated by dividing the net profit attributable to equity holders of the Bank by the weighted average number of ordinary shares outstanding during the year.
(thousand euros)31.12.2016 31.12.2015
Net Profit / (Loss) attributable to equity holders of the Bank (1) ( 151 512) ( 180 830)
Weighted average number of ordinary shares outstanding (thousands) 85 254 66 023
Basic earnings per share attributable to equity holders of the Bank (in euro) -1,78 -2,74(1) Net profit/ (loss) for the period attributable to the equity holders of the Bank adjusted by the interest paid from perpetual subordinat attributable to the period (that are recorded as a change in reserves)
Diluted earnings per share Diluted earnings per share are calculated considering the profit attributable to the equity holders of the Bank and the weighted average number of ordinary shares outstanding, adjusted for the effects of all dilutive potential ordinary shares.
On the 31st of December 2016 and 2015, the Bank holds instruments issued without diluting effect, and therefore the result according to a diluted share equals the result according to a basic share.
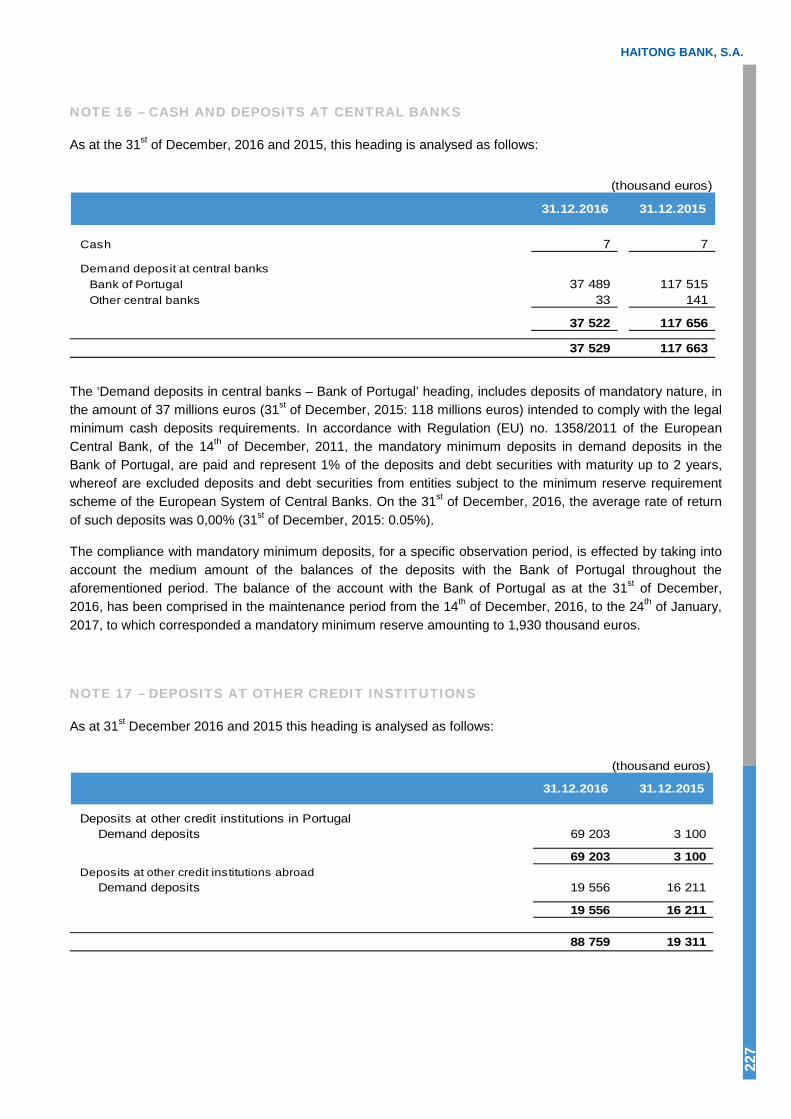
HAITONG BANK, S.A.
227
NOTE 16 – CASH AND DEPOSITS AT CENTRAL BANKS
As at the 31st of December, 2016 and 2015, this heading is analysed as follows:
(thousand euros)
31.12.2016 31.12.2015
Cash 7 7
Demand deposit at central banks Bank of Portugal 37 489 117 515 Other central banks 33 141
37 522 117 656
37 529 117 663
The ‘Demand deposits in central banks – Bank of Portugal’ heading, includes deposits of mandatory nature, in the amount of 37 millions euros (31st of December, 2015: 118 millions euros) intended to comply with the legal minimum cash deposits requirements. In accordance with Regulation (EU) no. 1358/2011 of the European Central Bank, of the 14th of December, 2011, the mandatory minimum deposits in demand deposits in the Bank of Portugal, are paid and represent 1% of the deposits and debt securities with maturity up to 2 years, whereof are excluded deposits and debt securities from entities subject to the minimum reserve requirement scheme of the European System of Central Banks. On the 31st of December, 2016, the average rate of return of such deposits was 0,00% (31st of December, 2015: 0.05%).
The compliance with mandatory minimum deposits, for a specific observation period, is effected by taking into account the medium amount of the balances of the deposits with the Bank of Portugal throughout the aforementioned period. The balance of the account with the Bank of Portugal as at the 31st of December, 2016, has been comprised in the maintenance period from the 14th of December, 2016, to the 24th of January, 2017, to which corresponded a mandatory minimum reserve amounting to 1,930 thousand euros.
NOTE 17 – DEPOSITS AT OTHER CREDIT INSTITUTIONS
As at 31st December 2016 and 2015 this heading is analysed as follows:
(thousand euros)
31.12.2016 31.12.2015
Deposits at other credit institutions in Portugal Demand deposits 69 203 3 100
69 203 3 100 Deposits at other credit institutions abroad
Demand deposits 19 556 16 211
19 556 16 211
88 759 19 311
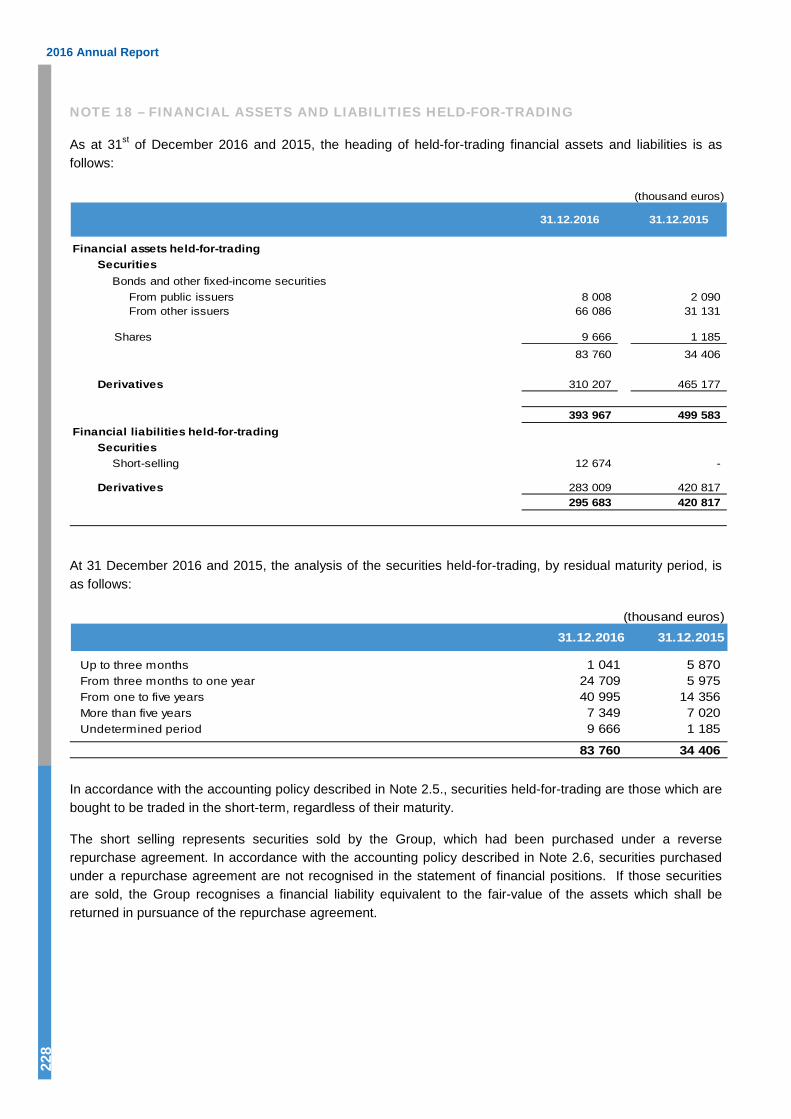
2016 Annual Report
228
NOTE 18 – FINANCIAL ASSETS AND LIABILITIES HELD-FOR-TRADING
As at 31st of December 2016 and 2015, the heading of held-for-trading financial assets and liabilities is as follows:
(thousand euros)
Financial assets held-for-trading Securities
Bonds and other fixed-income securitiesFrom public issuers 8 008 2 090 From other issuers 66 086 31 131
Shares 9 666 1 185 83 760 34 406
Derivatives 310 207 465 177
393 967 499 583 Financial liabilities held-for-trading Securities
Short-selling 12 674 -
Derivatives 283 009 420 817 295 683 420 817
31.12.2016 31.12.2015
At 31 December 2016 and 2015, the analysis of the securities held-for-trading, by residual maturity period, is as follows:
(thousand euros)
31.12.2016 31.12.2015
Up to three months 1 041 5 870 From three months to one year 24 709 5 975 From one to five years 40 995 14 356 More than five years 7 349 7 020 Undetermined period 9 666 1 185
83 760 34 406
In accordance with the accounting policy described in Note 2.5., securities held-for-trading are those which are bought to be traded in the short-term, regardless of their maturity.
The short selling represents securities sold by the Group, which had been purchased under a reverse repurchase agreement. In accordance with the accounting policy described in Note 2.6, securities purchased under a repurchase agreement are not recognised in the statement of financial positions. If those securities are sold, the Group recognises a financial liability equivalent to the fair-value of the assets which shall be returned in pursuance of the repurchase agreement.
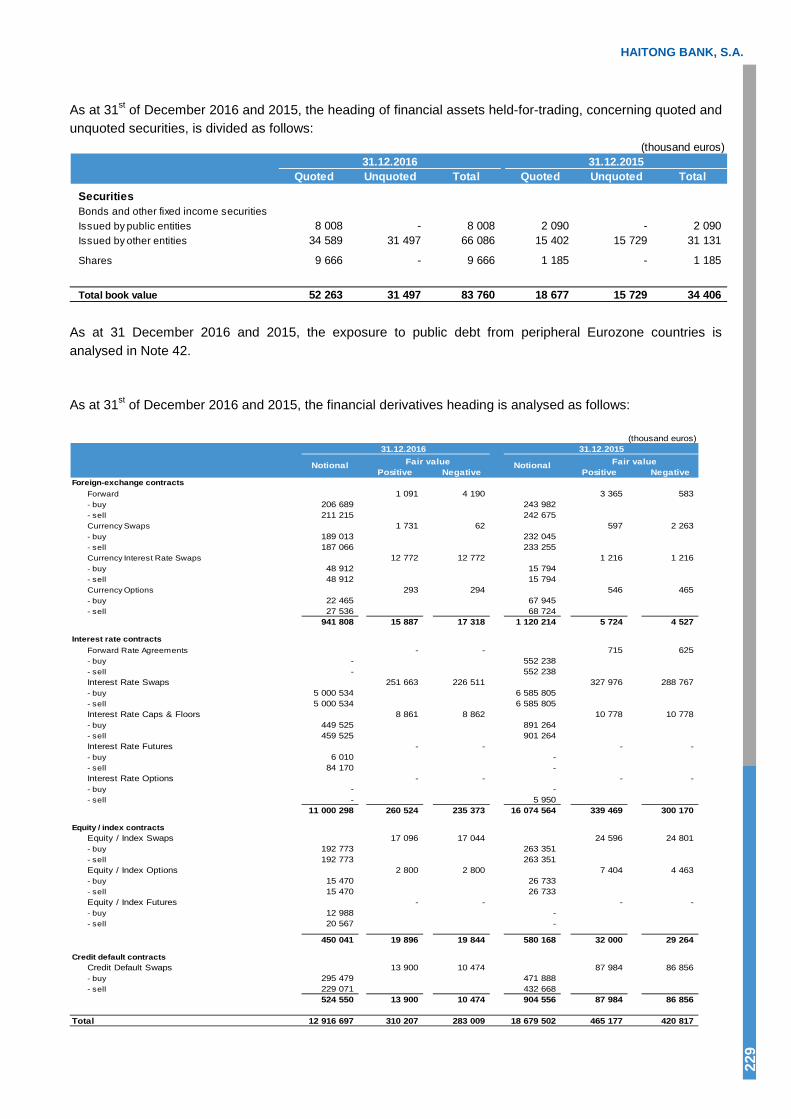
HAITONG BANK, S.A.
229
As at 31st of December 2016 and 2015, the heading of financial assets held-for-trading, concerning quoted and unquoted securities, is divided as follows:
(thousand euros)31.12.2016 31.12.2015
Quoted Unquoted Total Quoted Unquoted Total
SecuritiesBonds and other fixed income securitiesIssued by public entities 8 008 - 8 008 2 090 - 2 090 Issued by other entities 34 589 31 497 66 086 15 402 15 729 31 131 - - - - - - Shares 9 666 - 9 666 1 185 - 1 185
Total book value 52 263 31 497 83 760 18 677 15 729 34 406
As at 31 December 2016 and 2015, the exposure to public debt from peripheral Eurozone countries is analysed in Note 42.
As at 31st of December 2016 and 2015, the financial derivatives heading is analysed as follows:
(thousand euros)31.12.2016 31.12.2015
Positive Negative Positive NegativeForeign-exchange contracts
Forward 1 091 4 190 3 365 583 - buy 206 689 243 982 - sell 211 215 242 675 Currency Swaps 1 731 62 597 2 263 - buy 189 013 232 045 - sell 187 066 233 255 Currency Interest Rate Swaps 12 772 12 772 1 216 1 216 - buy 48 912 15 794 - sell 48 912 15 794 Currency Options 293 294 546 465 - buy 22 465 67 945 - sell 27 536 68 724
941 808 15 887 17 318 1 120 214 5 724 4 527
Interest rate contractsForward Rate Agreements - - 715 625 - buy - 552 238 - sell - 552 238 Interest Rate Swaps 251 663 226 511 327 976 288 767 - buy 5 000 534 6 585 805 - sell 5 000 534 6 585 805 Interest Rate Caps & Floors 8 861 8 862 10 778 10 778 - buy 449 525 891 264 - sell 459 525 901 264 Interest Rate Futures - - - - - buy 6 010 - - sell 84 170 - Interest Rate Options - - - - - buy - - - sell - 5 950
11 000 298 260 524 235 373 16 074 564 339 469 300 170
Equity / index contractsEquity / Index Swaps 17 096 17 044 24 596 24 801 - buy 192 773 263 351 - sell 192 773 263 351 Equity / Index Options 2 800 2 800 7 404 4 463 - buy 15 470 26 733 - sell 15 470 26 733 Equity / Index Futures - - - - - buy 12 988 - - sell 20 567 -
450 041 19 896 19 844 580 168 32 000 29 264
Credit default contractsCredit Default Swaps 13 900 10 474 87 984 86 856 - buy 295 479 471 888 - sell 229 071 432 668
524 550 13 900 10 474 904 556 87 984 86 856
Total 12 916 697 310 207 283 009 18 679 502 465 177 420 817
Notional Fair value Notional Fair value

2016 Annual Report
230
At 31 December 2016 and 2015, the analysis of derivative financial instruments held-for-trading, by residual maturity period, is as follows:
(thousand euros)
Sale Purchase Sale Purchase
Up to three months 610 599 522 246 ( 1 341) 727 604 723 452 2 742 From three months to one year 572 613 562 630 ( 365) 1 012 875 1 012 876 354 From one to five years 3 289 165 3 350 519 25 461 4 911 581 4 938 321 32 616 More than five years 2 004 462 2 004 463 3 443 2 676 397 2 676 396 8 648
6 476 839 6 439 858 27 198 9 328 457 9 351 045 44 360
31.12.2016 31.12.2015Notional Fair Value
(net)Notional Fair Value
(net)
NOTE 19 – AVAILABLE-FOR-SALE FINANCIAL ASSETS
As at 31st December 2016 and 2015 this heading is analysed as follows:
(thousand euros)
Positive Negative
Bonds and other fixed-income securitiesIssued by public entities 290 692 44 ( 993) - 289 743 Issued by other entities 137 650 - ( 3 437) - 134 213
Shares 1 870 8 - ( 1 768) 110
Other variable-income securities 6 883 5 - ( 4 172) 2 716
Balance as at 31st December 2016 437 095 57 ( 4 430) ( 5 940) 426 782
Bonds and other fixed-income securitiesIssued by public entities 21 932 28 ( 2 576) - 19 384 Issued by other entities 139 399 71 ( 2 706) - 136 764
Shares 2 482 48 - ( 1 953) 577
Other variable-income securities 7 524 - - ( 4 345) 3 179
Balance as at 31st December 2015 171 337 147 ( 5 282) ( 6 298) 159 904 (1) Acquisiton cost relating to shares and amortised cost relating to debt securities.
Cost (1)Fair value reserve
Impairment Book value
In accordance with the accounting policy described in Note 2.5., the Bank periodically assesses whether there is objective evidence of impairment on the available-for-sale financial assets, following the judgment criteria described in Note 3.1..
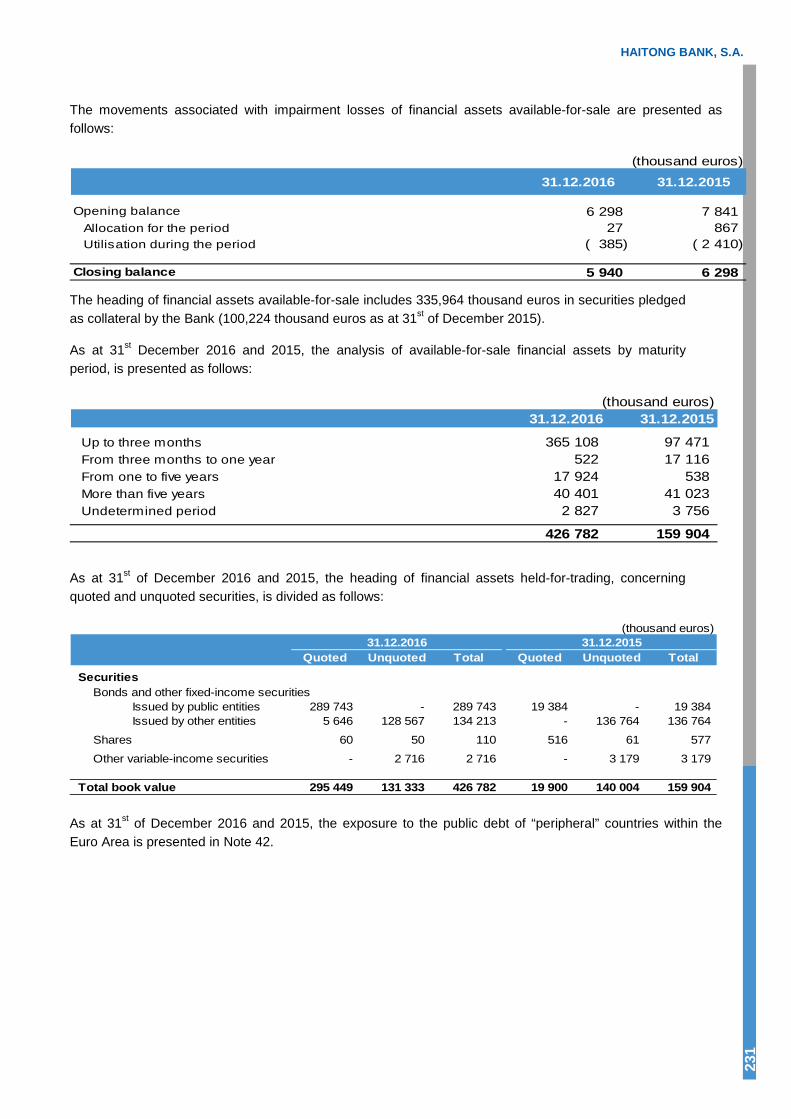
HAITONG BANK, S.A.
231
The movements associated with impairment losses of financial assets available-for-sale are presented as follows:
(thousand euros)
31.12.2016 31.12.2015
Opening balance 6 298 7 841 Allocation for the period 27 867 Utilisation during the period ( 385) ( 2 410)
Closing balance 5 940 6 298
The heading of financial assets available-for-sale includes 335,964 thousand euros in securities pledged as collateral by the Bank (100,224 thousand euros as at 31st of December 2015).
As at 31st December 2016 and 2015, the analysis of available-for-sale financial assets by maturity period, is presented as follows:
(thousand euros)31.12.2016 31.12.2015
Up to three months 365 108 97 471 From three months to one year 522 17 116 From one to five years 17 924 538 More than five years 40 401 41 023 Undetermined period 2 827 3 756
426 782 159 904
As at 31st of December 2016 and 2015, the heading of financial assets held-for-trading, concerning quoted and unquoted securities, is divided as follows:
(thousand euros)31.12.2016 31.12.2015
Quoted Unquoted Total Quoted Unquoted TotalSecurities
Bonds and other fixed-income securitiesIssued by public entities 289 743 - 289 743 19 384 - 19 384Issued by other entities 5 646 128 567 134 213 - 136 764 136 764
Shares 60 50 110 516 61 577
Other variable-income securities - 2 716 2 716 - 3 179 3 179
Total book value 295 449 131 333 426 782 19 900 140 004 159 904
As at 31st of December 2016 and 2015, the exposure to the public debt of “peripheral” countries within the Euro Area is presented in Note 42.

2016 Annual Report
232
NOTE 20 – LOANS AND ADVANCES TO BANKS
As at 31st December 2016 and 2015 this heading is analysed as follows:
(thousand euros)
31.12.2016 31.12.2015
Loans and advances to banks in Portugal
Other loans and advances 6 718 - Sales with repurchase agreements - 39 976
6 718 39 976
Loans and advances to banks abroad
Very short-term deposits 24 182 102 075 Other loans and advances 19 323 15 997
43 505 118 072
50 223 158 048
Impairment losses ( 15 419) ( 15 397)
34 804 142 651
At 31st December 2016 and 2015, the analysis of loans and advances to banks, by residual maturity period, is presented as follows:
(thousand euros)
31.12.2016 31.12.2015
Up to three months 42 720 157 128 From three months to one year 796 - More than five years 6 707 920
50 223 158 048
The movements associated with the financial year as impairment losses of investments in credit institutions are presented as follows:
(thousand euros)
31.12.2016 31.12.2015
Opening balance 15 397 15 216 Allocation for the period 965 149 Write-back for the period ( 954) - Exchange differences and others 11 32
Closing balance 15 419 15 397
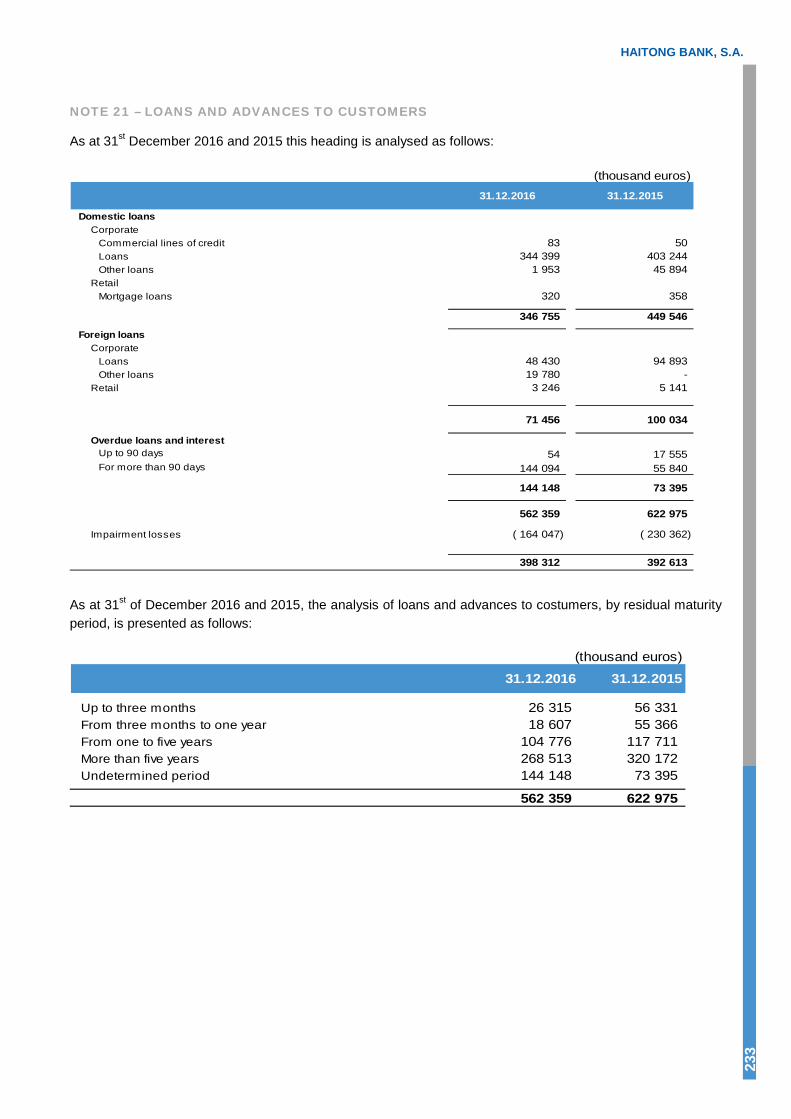
HAITONG BANK, S.A.
233
NOTE 21 – LOANS AND ADVANCES TO CUSTOMERS
As at 31st December 2016 and 2015 this heading is analysed as follows:
(thousand euros)
31.12.2016 31.12.2015
Domestic loansCorporate
Commercial lines of credit 83 50 Loans 344 399 403 244 Other loans 1 953 45 894
Retail Mortgage loans 320 358
346 755 449 546
Foreign loansCorporate
Loans 48 430 94 893 Other loans 19 780 -
Retail 3 246 5 141
71 456 100 034
Overdue loans and interestUp to 90 days 54 17 555 For more than 90 days 144 094 55 840
144 148 73 395
562 359 # 622 975
Impairment losses ( 164 047) ( 230 362)
398 312 392 613
As at 31st of December 2016 and 2015, the analysis of loans and advances to costumers, by residual maturity period, is presented as follows:
(thousand euros)
31.12.2016 31.12.2015
Up to three months 26 315 56 331 From three months to one year 18 607 55 366 From one to five years 104 776 117 711 More than five years 268 513 320 172 Undetermined period 144 148 73 395
562 359 622 975

2016 Annual Report
234
The movements in impairment losses of loans and advances to customers are as follows:
(thousand euros)
31.12.2016 31.12.2015
Opening balance 230 362 277 372 Allocation for the period 81 622 59 543 Utilisation during the period ( 41 318) ( 674)Write-back for the period ( 48 843) ( 19 470)Transfers ( 59 240) ( 86 484)Exchange differences and others 1 464 75
Closing balance 164 047 230 362
The Bank undertakes a renegotiation of a loan in order to maximize its recovery. A loan is renegotiated in accordance with selective criteria, based on the analysis of the overdue circumstances, or whether there is a high risk of the loan becoming overdue, in verifying that the customer has gone through reasonable effort in order to comply with the conditions agreed to upon contract and is also expected to meet the new terms. The renegotiation often includes the extension of maturity, alteration of the established payment term and/or amendments of the contracts’ covenants. If possible, the renegotiation is followed by the obtainment of new collaterals. The renegotiated loans are also subject of an impairment analysis resulting from the revaluation of the new cash flow expectation associated with the new contract conditions. These are updated with reference to the original effective interest rate, also taking the new presented collaterals into account.
As at 31st December 2016, gross loans and advances (loans and advances to customers excluding overdue loans and interest) include an amount of 123,871 thousand euros of restructured loans (31 December 2015: 222,250 thousand euros). As at 31st December 2016, recognised impairment losses referring to restructured loans amounted to 159,818 thousand euros (31 December 2015: 157,067 thousand euros). The interest recognised in the income statement amounts to 7,697 thousand euros (31 December 2015: 6,688 thousand euros).
Loans and advances to customers by interest rate type are as follows:
(thousand euros)
31.12.2016 31.12.2015
Fixed rate 141 364 137 537 Variable rate 420 995 485 438
562 359 622 975

HAITONG BANK, S.A.
235
NOTE 22 – RISK MANAGEMENT DERIVATIVES
As at 31st of December 2016 and 2015, the hedging derivatives in the statement of financial position are analysed as follows:
(thousand euros)
31.12.2016 31.12.2015
Derivatives for risk management purposes (assets)Interest-rate contracts - 10 Other contracts - 24
- 34 Derivatives for risk management purposes (liabilities)
Interest-rate contracts - 10 Other contracts - 49
- 59
- ( 25)
The balance Derivatives for risk management purposes includes hedging derivatives and derivatives contracted with the purpose of managing the risk of certain financial assets and liabilities designated at fair value through profit or loss (and that were not classified as hedging derivatives).
For the period 2016 there were no hedging derivatives operations. Hedging operations carried out during the period 2015 reached maturity before 31 December 2015.
a) Other risk management derivatives.
Other risk management derivatives include risk management instruments associated with specific financial assets and liabilities designated at fair-value through profit and loss in accordance with the accounting policy described in Notes 2.3, 2.5 and 2.7 and that the Group did not assign to hedge accounting.
As at 31st of December 2015, the hedging operations that were assigned as such in accounting terms can be analysed as follows:
(thousand euros)
Derivatives Associated liability
Buy Sell
Debt securities issued Credit Default Swap 1 647 3 293 ( 25) ( 24) ( 1) 26 - - Debt securities issued Interest Swap 3 294 3 294 - ( 1) - 32 - -
4 941 6 587 ( 25) ( 25) ( 1) 58 - -
31.12.2015
Financial liabilities economically hedged
Derivative Instrument
Notional Fair Value
Fair value changes in the period
Book Value
Reimbursement amount at the
maturity
Fair Value
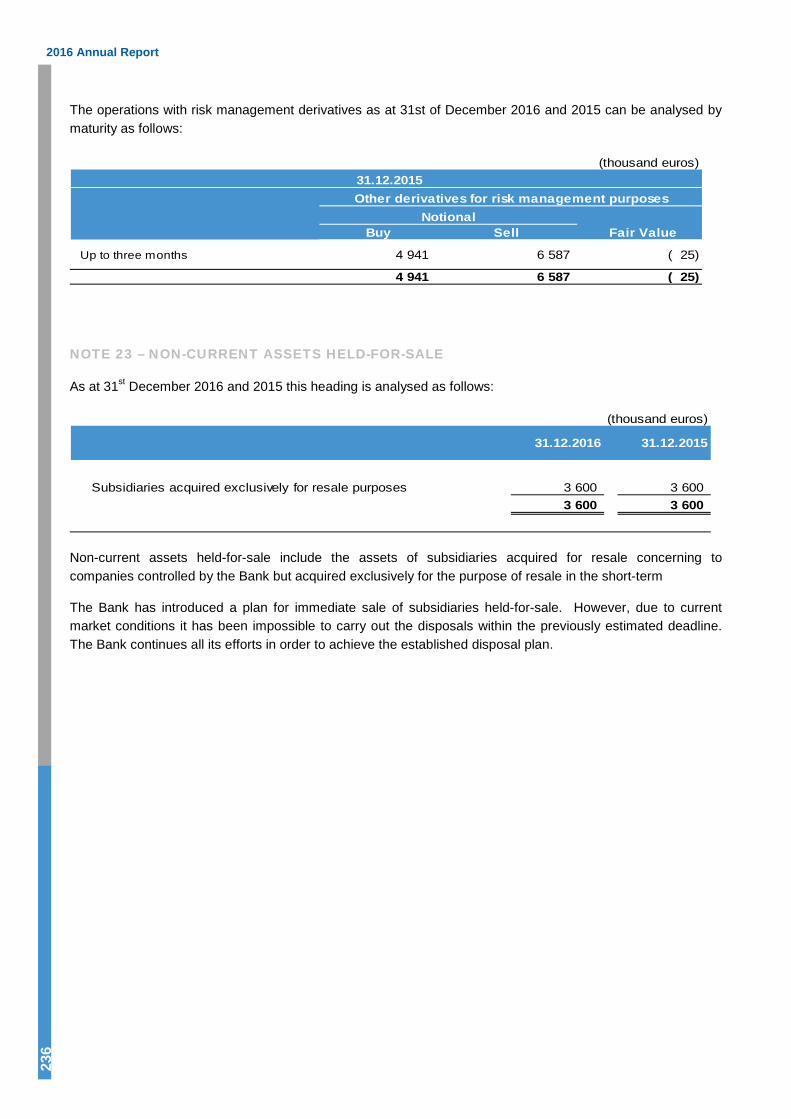
2016 Annual Report
236
The operations with risk management derivatives as at 31st of December 2016 and 2015 can be analysed by maturity as follows:
(thousand euros)31.12.2015Other derivatives for risk management purposes
Buy Sell
Up to three months 4 941 6 587 ( 25)
4 941 6 587 ( 25)
NotionalFair Value
NOTE 23 – NON-CURRENT ASSETS HELD-FOR-SALE
As at 31st December 2016 and 2015 this heading is analysed as follows:
(thousand euros)
31.12.2016 31.12.2015
Subsidiaries acquired exclusively for resale purposes 3 600 3 600 3 600 3 600
Non-current assets held-for-sale include the assets of subsidiaries acquired for resale concerning to companies controlled by the Bank but acquired exclusively for the purpose of resale in the short-term
The Bank has introduced a plan for immediate sale of subsidiaries held-for-sale. However, due to current market conditions it has been impossible to carry out the disposals within the previously estimated deadline. The Bank continues all its efforts in order to achieve the established disposal plan.

HAITONG BANK, S.A.
237
NOTE 24 – OTHER TANGIBLE ASSETS
As at 31st December 2016 and 2015 this heading is analysed as follows:
(thousand euros)
31.12.2016 31.12.2015
Real EstateFor own use - 642Improvements in leasehold property 6 141 7 618
6 141 8 260 Equipment
IT equipment 12 050 11 069 Indoor installations 3 361 3 949 Furniture 3 064 3 411 Machinery and tools 1 020 1 077 Motor vehicles 68 115 Security equipment 286 373 Others 167 146
20 016 20 140 26 157 28 400
Work in progressImprovements in leasehold property - 37 Equipment 242 687
242 724
26 399 29 124
Accumulated depreciation ( 21 091) ( 21 779) 5 308 7 345
The movement in this heading was as follows: (thousand euros)
Property Equipment Work in progress Total
Acquisiton cost
Balance as at 31st December 2014 8 133 19 897 363 28 393 Acquisitions 127 303 687 1 117 Write-offs / sales - ( 60) - ( 60)Exchange differences and other movements - - ( 326) ( 326)
Balance as at 31st December 2015 8 260 20 140 724 29 124 Acquisitions 58 1 219 728 2 005 Write-offs / sales ( 2 177) ( 1 829) ( 213) ( 4 219)Transfers - 486 ( 486) - Exchange variation and other movements - - ( 511) ( 511)
Balance as at 31st December 2016 6 141 20 016 242 26 399
Depreciation
Balance as at 31st December 2014 4 663 14 508 - 19 171Depreciations of the financial year 558 2 113 - 2 671Write-offs / sales - ( 63) - ( 63)
Balance as at 31st December 2015 5 221 16 558 - 21 779Depreciations of the financial year 515 1 674 - 2 189Write-offs / sales ( 1 316) ( 1 561) - ( 2 877)
Balance as at 31st December 2016 4 420 16 671 - 21 091
Net book value as at 31st December 2016 1 721 3 345 242 5 308
Net book value as at 31st December 2015 3 039 3 582 724 7 345
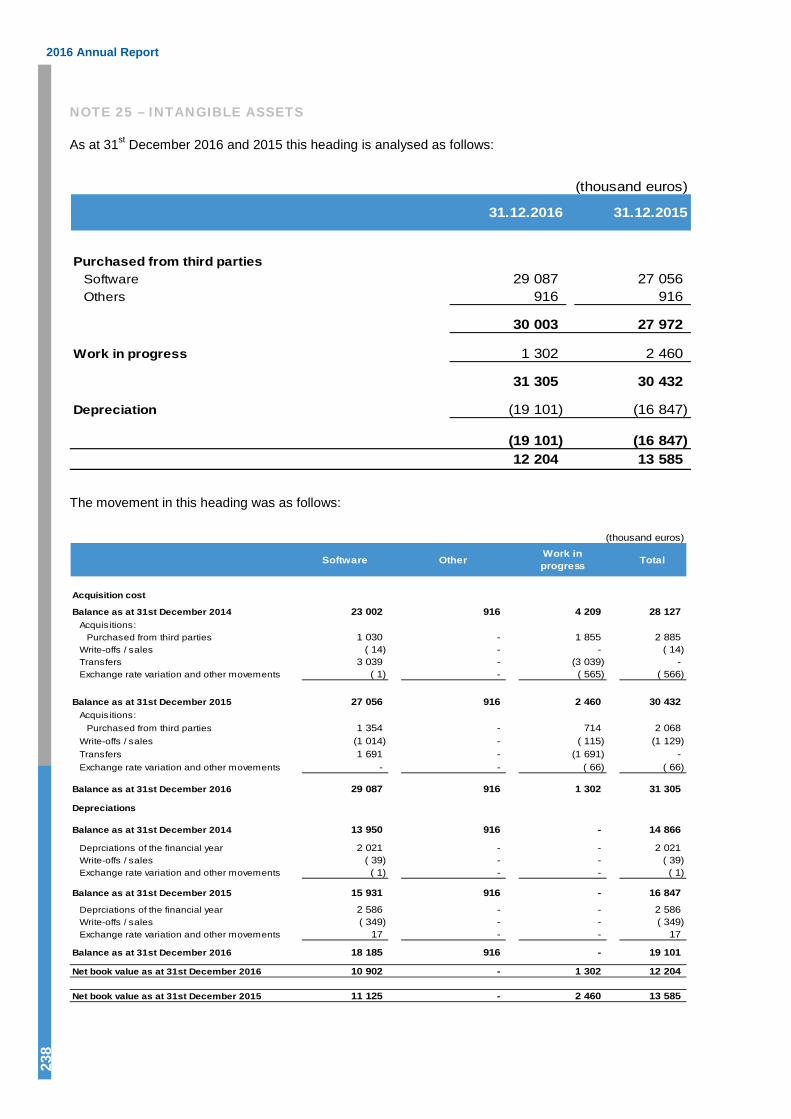
2016 Annual Report
238
NOTE 25 – INTANGIBLE ASSETS
As at 31st December 2016 and 2015 this heading is analysed as follows:
(thousand euros)
31.12.2016 31.12.2015
Purchased from third partiesSoftware 29 087 27 056 Others 916 916
30 003 27 972
Work in progress 1 302 2 460
31 305 30 432
Depreciation (19 101) (16 847)
(19 101) (16 847)12 204 13 585
The movement in this heading was as follows:
(thousand euros)
Software Other Work in progress Total
Acquisition cost
Balance as at 31st December 2014 23 002 916 4 209 28 127 Acquisitions:
Purchased from third parties 1 030 - 1 855 2 885 Write-offs / sales ( 14) - - ( 14)Transfers 3 039 - (3 039) - Exchange rate variation and other movements ( 1) - ( 565) ( 566)
Balance as at 31st December 2015 27 056 916 2 460 30 432 Acquisitions:
Purchased from third parties 1 354 - 714 2 068 Write-offs / sales (1 014) - ( 115) (1 129)Transfers 1 691 - (1 691) - Exchange rate variation and other movements - - ( 66) ( 66)
Balance as at 31st December 2016 29 087 916 1 302 31 305
Depreciations
Balance as at 31st December 2014 13 950 916 - 14 866
Deprciations of the financial year 2 021 - - 2 021 Write-offs / sales ( 39) - - ( 39)Exchange rate variation and other movements ( 1) - - ( 1)
Balance as at 31st December 2015 15 931 916 - 16 847
Deprciations of the financial year 2 586 - - 2 586 Write-offs / sales ( 349) - - ( 349)Exchange rate variation and other movements 17 - - 17
Balance as at 31st December 2016 18 185 916 - 19 101
Net book value as at 31st December 2016 10 902 - 1 302 12 204
Net book value as at 31st December 2015 11 125 - 2 460 13 585

HAITONG BANK, S.A.
239
NOTE 26 – INVESTMENTS IN ASSOCIATED COMPANIES
The financial information regarding subsidiaries and associates is presented in the following table:
(thousand euros)31.12.2016
% held % heldNumber of by the Par Value Acquisition Number of by the Par Value Acquisition
shares bank (Euro) Cost shares bank (Euro) Cost
AssociatesMCO2 - SOCIEDADE GESTORA DE FUNDOS DE INV MOBILIARIO, S.A. 7 375 25,00% 100,00 738 7 375 25,0% 100,00 738
SubsidiariesHAITONG (UK) LIMITED 164 031 379 100,00% 1,17 171 520 164 031 379 100,0% 1,36 171 520HAITONG BANCO DE INVESTIMENTO DO BRASIL S.A. 101 870 930 80,00% 0,58 174 496 101 870 930 80,0% 0,46 174 496HAITONG SECURITIES INDIA PRIVATE LIMITED - - - - 4 432 472 75,0% 0,01 8 859HAITONG CAPITAL - SCR, S.A. 5 000 000 100,00% 5,00 42 660 5 000 000 100,0% 5,00 42 660HAITONG INVESTMENT IRELAND PUBLIC LIMITED COMPANY 164 994 100,00% 5,00 825 164 994 100,0% 5,00 825LUSITANIA CAPITAL SAPI DE CV SOFOM ENR 1 000 000 100,00% 0,05 59 1 000 000 100,0% 0,05 59HAITONG SECURITIES USA 1 000 000 100,00% 948,68 12 200
402 498 399 157
Impairment losses ( 165 917) ( 131 926)
236 581 267 231
31.12.2015
As at 31st December 2016 include the amount of 165,383 thousand euros related to Haitong (UK) Limited.
During the period 2016, the balance Investments in subsidiaries and associates presented the following changes:
Subsidiaries:
● Although it has been incorporated on the 30th of September, 2015, in January 2016, Haitong SecuritiesUSA LLC has been added to the consolidation perimeter of consolidated companies in Haitong Bank, S.A.Haitong Bank, S.A., which fully subscribed the initial paying-up capital of that company, amounting to300,000 dollars.
● In March 2016, Haitong Bank, S.A. fully subscribed the capital increase of Haitong Securities USA LLC,corresponding to an investment of 10,000 thousand dollars.
● In March 2016, Haitong Bank, S.A. fully subscribed the capital increase of Haitong Securities India PrivateLimited, corresponding to an investment of 344,748 thousand Indian rupees. Haitong Bank, S.A.subscribed 13,725,289 shares, thereby holding 19,635,252 shares of the company.
● In March 2016, Haitong Bank, S.A. has completed the winding up of its New York branch, having returnedthe corresponding license to the New York Department of Financial Services, and having started itsbusiness through the representative office.
● In May 2016, Haitong Bank, S.A. completed the acquisition of 1,477,491 shares held by the minorityshareholder of Haitong Securities India Private Limited, for the aggregate amount of INR 245,795,160.
● In July 2016, Haitong & Company (UK) Limited was dissolved.
● In September 2016, Haitong Bank, S.A. has been granted authorisation to engage in brokerage activitiesthrough its subsidiary, Haitong Securities USA LLC, having thereby closed its representative office in NewYork.
● In October 2016, Haitong Bank, S.A. fully subscribed the capital increase of Haitong Securities USA LLC,corresponding to an investment of 3,438 thousand dollars.
● In October 2016, the company name of Espirito Santo Investimentos, S.A. was changed to HaitongNegócios, S.A..
● In December 2016, Haitong Bank, S.A. sold the holding in Haitong Securities India Private Limited, of19,635,252 shares, having received 11,365 thousand dollars.

2016 Annual Report
240
The evolution of impairment losses of Investments in subsidiaries and associates is presented as follows:
(thousand euros)
31.12.2016 31.12.2015
Opening balance 131 926 3 995
Charge for the period 33 991 131 392 Charge off - ( 3 461)
Closing balance 165 917 131 926
Annually, the Bank analyses the investment impairment following the disposals on IAS 36 – Assets Impairment.
The recoverable amount of investment held in Haitong Capital - Sociedade de Capital de Risco, S.A was determined using cash flow/dividends predictions based on (i) the financial budget approved by management covering a 5.5 years period and (ii) a discount rate of 13.7%. Based on these assumptions, Haitong Bank Management made the assessment that the recoverable amount of the investment in Haitong Capital exceeds its carrying amount.
A sensitive analysis was also performed using (i) changing in 65% de revenues of the Business Plan for the following 5.5 years and (ii) keeping all the assumptions unchanged. Based on this sensitive analysis, no impairment losses were identified in this investment.
Notwithstanding the analysis performed based on the described assumptions, the recoverable amount of the investment in Haitong Capital is dependent on the ability of the Group of putting in place the necessary measures to allow the accomplishment of the business plan.
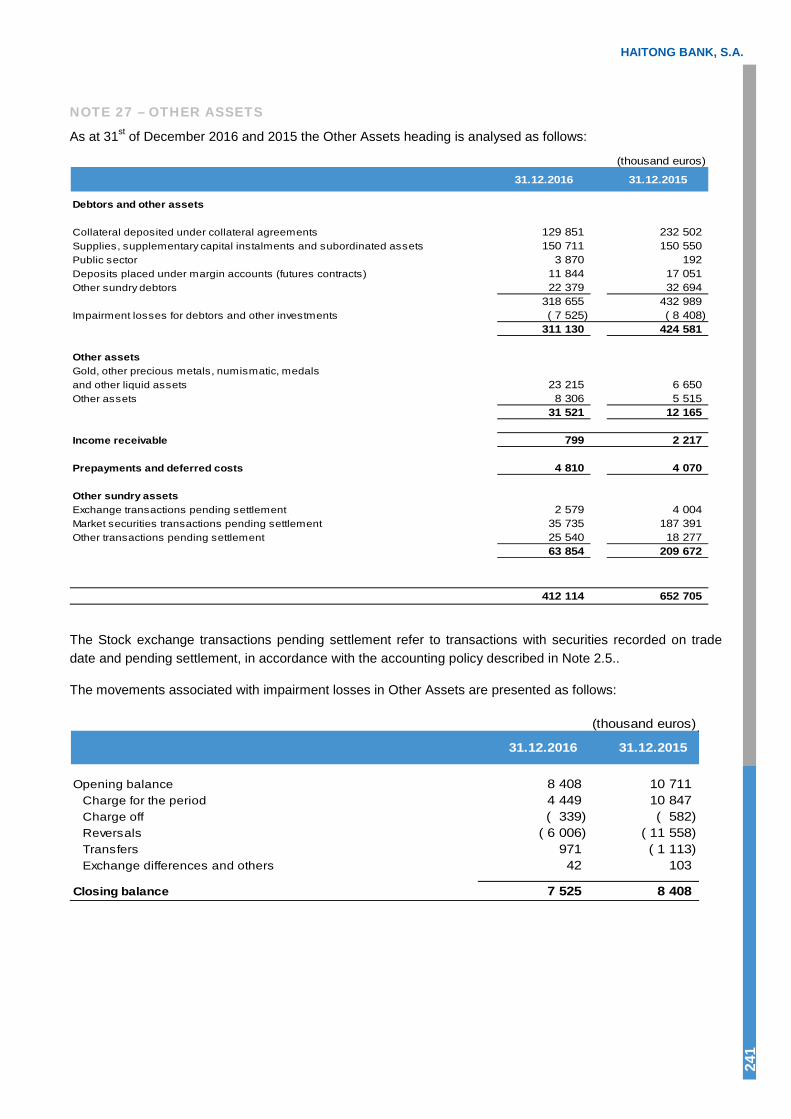
HAITONG BANK, S.A.
241
NOTE 27 – OTHER ASSETS
As at 31st of December 2016 and 2015 the Other Assets heading is analysed as follows:
(thousand euros)
31.12.2016 31.12.2015
Debtors and other assets
Collateral deposited under collateral agreements 129 851 232 502 Supplies, supplementary capital instalments and subordinated assets 150 711 150 550 Public sector 3 870 192 Deposits placed under margin accounts (futures contracts) 11 844 17 051 Other sundry debtors 22 379 32 694
318 655 432 989 Impairment losses for debtors and other investments ( 7 525) ( 8 408)
311 130 424 581
Other assetsGold, other precious metals, numismatic, medalsand other liquid assets 23 215 6 650 Other assets 8 306 5 515
31 521 12 165
Income receivable 799 2 217
Prepayments and deferred costs 4 810 4 070
Other sundry assetsExchange transactions pending settlement 2 579 4 004 Market securities transactions pending settlement 35 735 187 391 Other transactions pending settlement 25 540 18 277
63 854 209 672
412 114 652 705
The Stock exchange transactions pending settlement refer to transactions with securities recorded on trade date and pending settlement, in accordance with the accounting policy described in Note 2.5..
The movements associated with impairment losses in Other Assets are presented as follows:
(thousand euros)
31.12.2016 31.12.2015
Opening balance 8 408 10 711 Charge for the period 4 449 10 847 Charge off ( 339) ( 582)Reversals ( 6 006) ( 11 558)Transfers 971 ( 1 113)Exchange differences and others 42 103
Closing balance 7 525 8 408
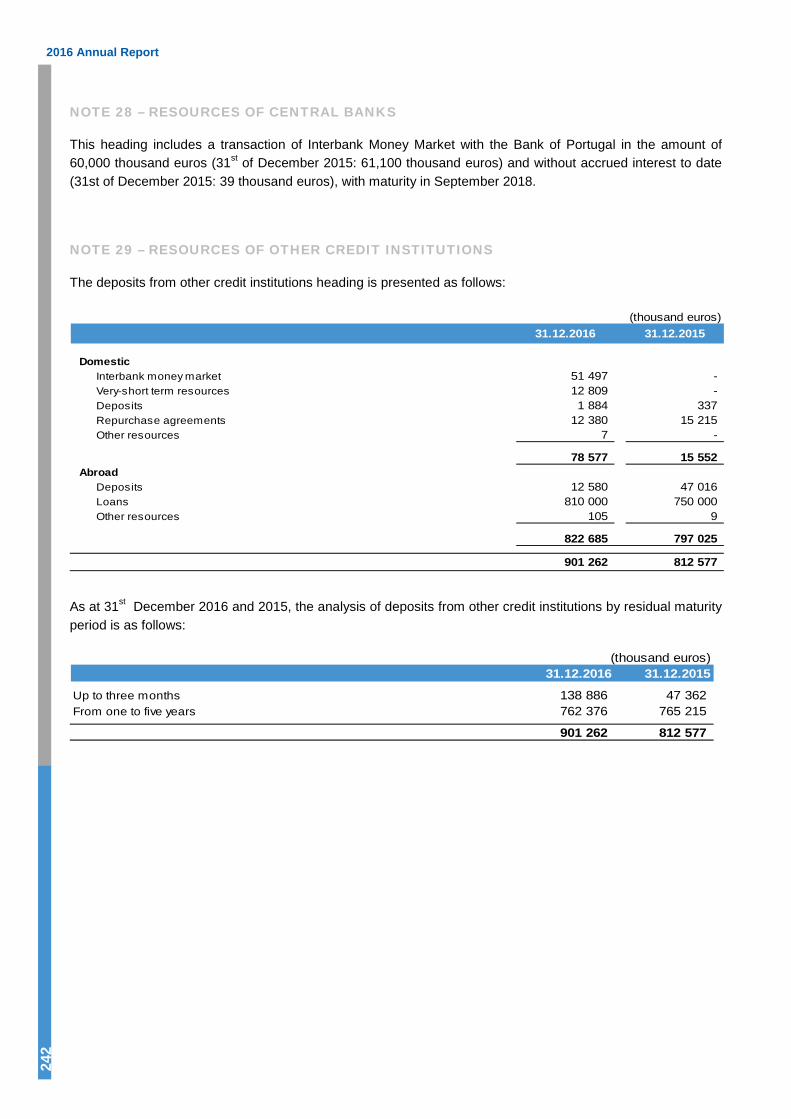
2016 Annual Report
242
NOTE 28 – RESOURCES OF CENTRAL BANKS
This heading includes a transaction of Interbank Money Market with the Bank of Portugal in the amount of 60,000 thousand euros (31st of December 2015: 61,100 thousand euros) and without accrued interest to date (31st of December 2015: 39 thousand euros), with maturity in September 2018.
NOTE 29 – RESOURCES OF OTHER CREDIT INSTITUTIONS
The deposits from other credit institutions heading is presented as follows:
(thousand euros)31.12.2016 31.12.2015
DomesticInterbank money market 51 497 - Very-short term resources 12 809 - Deposits 1 884 337 Repurchase agreements 12 380 15 215 Other resources 7 -
78 577 15 552 Abroad
Deposits 12 580 47 016 Loans 810 000 750 000 Other resources 105 9
822 685 797 025
901 262 812 577
As at 31st December 2016 and 2015, the analysis of deposits from other credit institutions by residual maturity period is as follows:
(thousand euros)31.12.2016 31.12.2015
Up to three months 138 886 47 362 From one to five years 762 376 765 215
901 262 812 577

HAITONG BANK, S.A.
243
NOTE 30 – RESOURCES OF CUSTOMERS
The balance of the resources of customers heading is composed, with regard to its nature, as follows:
(thousand euros)31.12.2016 31.12.2015
Repayable on demand Demand deposits 20 649 9 850
Time deposits Fixed-term deposits 243 717 105 049
Other resources Repurchase agreements 13 810 19 367 Other Deposits 1 580 1 291 Other 9 52
15 399 20 710
279 765 135 609
As at 31st December 2016 and 2015, the analysis of due to customers by residual maturity period is as follows:
(thousand euros)31.12.2016 31.12.2015
Demand deposits 20 658 9 902 Fixed-term deposits
Up to 3 months 152 893 51 160 3 to 12 months 104 269 74 347 1 to 5 years 1 945 200
259 107 125 707
279 765 135 609
NOTE 31 – DEBT SECURITIES ISSUED
The Debt securities issued heading can be divided as follows:
(thousand euros)
31.12.2016 31.12.2015
Debt securities issuedEuro Medium Term Notes 103 092 211 787 Cash bonds - 652
103 092 212 439
The fair value of the portfolio of Debt securities issued is presented on Note 40.
This heading includes 1 622 thousand euros (31st of December 2015: 0 thousand euros) of liabilities accounted for in the statement of financial position at fair-value through profit and loss (see Note 22).
During the 2015 financial year, the Bank issued securities amounting to 210,165 thousand euros (there weren’t securities issued on 2016 financial year), where 370 thousand euros were reimbursed (31st of December 2016: 108,695 thousand euros).

2016 Annual Report
244
As at 31st of December 2016 and 2015, the residual duration of the debt securities issued is as follows:
(thousand euros)31.12.2016 31.12.2015
Up to three months - 2 274 From one to five years 103 092 210 165
103 092 212 439
The main characteristics of these Debt securities issued are as follows:
(thousand euros)
Issuer Designation Currency Issue Date Book Value Maturity Interest Rate
HT BANK HTB FLOATING RATE DEC18 (HTB-S-89 EUR 2015 103 092 2018 Euribor3m + 3.95%
103 092
31.12.2016
(thousand euros)
Issuer Designation Currency Issue Date Book Value Maturity Interest Rate
HT BANK BESI OBCX R.ACCRUAL TARN MAR201 EUR 2006 652 2016 Taxa Fixa 6% + Range Accrual
HT BANK BESI MAR2016 FTD CRD LKD USD a) USD 2013 1 622 2016Taxa Fixa 6% + Indexada ao evento de
créditoHT BANK HTB FLOATING RATE DEC18 (HTB-S-89 EUR 2015 210 165 2018 Euribor3m + 3.95%
212 439
a) Liabilities at fair value through profit or loss or with embedded derivatives.
31.12.2015
NOTE 32 – PROVISIONS
As at 31st of December 2016 and 2015, the Provisions heading presents the following movements:
(thousand euros)
Provisions for other risks
and charges
Provisions for guarantees and
other undertakings
TOTAL
Balance as at 31st December 2014 11 559 - 11 559
Charge of the period 1 250 15 254 16 504 Charge off ( 8 214) ( 494) ( 8 708)Transfers ( 76) 87 972 87 896 Foreign exchange differences and others ( 64) ( 449) ( 513)
Balance as at 31st December 2015 4 455 102 283 106 738
Charge of the period 2 512 21 560 24 072 Charge off - ( 14 762) ( 14 762)Reversals - ( 86 730) ( 86 730)Transfers - 58 269 58 269 Foreign exchange differences and others 126 512 638
Balance as at 31st December 2016 7 093 81 132 88 225
HAITONG BANK, S.A.
245
These provisions are meant to cover possible contingencies related to the Bank’s activities, including contingencies related to ongoing fiscal processes.
NOTE 33 – INCOME TAXES
The Bank is subject to taxation in accordance with the corporate income tax code (IRC) and surcharges.
The income tax (current or deferred) is reflected in the income statement of the year, except when the corresponding transactions have been reflected in other headings of equity. In these situations the associated tax is equally reflected against equity, without influencing the income statement of the year.
The current tax assessment for the years 2015 and 2016 was determined based on a nominal rate of Corporate Income Tax and Municipal Surtax of 22.5% in accordance with Law no. 82-B/2014, of December 31st, and Law no. 2/2007 of January 15th, plus an additional rate of 2.5% of an average rate associated with the application of the State surcharges levels provided in Law no. 2/2004, of January 10th.
Deferred taxes are determined based on tax rates which are expected to be in force at the time of the reversing timing differences, which correspond to the enacted rates or significantly enacted rates at the balance-sheet date. Consequently, for the years of 2016 and 2015, the deferred tax was determined using rates of 27.08% and 27.7% respectively. These correspond to the expected recovery rates of deferred taxes assets, assisting the decline of the Income Tax rate to 21%, in accordance with the Portuguese State Budget Law for 2015, approved by Law no. 82-B/2014, of December 31st and maintained during the year of 2016, as well considering the preliminary amendment of the tax regime related to provisions and impairment.
In order to determine the current tax for the year ending on the 31st of December 2016 and 2015, the Decree-Law no. 127/2012 of December 31st, responsible for the normalisation of the transfer of liabilities linked to the burden with retirement and survivor’s pensions to Social Security was taken into account together with article 183 of Law no. 64-B/2011 of December 30th (State Budget Law for 2012), establishing a special scheme for tax deduction of expenses and other asset variations from that transfer:
● The impact of negative asset variations associated with the amendments of the accounting policyregarding the recognition of actuarial gains and losses previously deferred will be fully deductible in equalparts for 10 years, from the year starting on the 1st of January 2012 onwards;
● The impact of the settlement (determined by the difference between the liability measured in accordancewith the criteria established by IAS 19 and by the criteria established by the agreement) will be fullydeductible in order to determine taxable profit, in equal parts, according to the average life expectancy ofpensioners whose liabilities were transferred (17 years), from the year starting on the 1st of January 2012onwards.
Deferred tax assets of the transfer of liabilities and amendment of the accounting policy regarding the recognition of actuarial discrepancies can be recovered for periods between 10 and 17 years.
If there are any tax losses, the reverse-charge statement, of the Bank referring to 2016 and previous years, these will be subject to inspection and possible adjustment by the Tax Authorities for a period of four or six years. Thus, additional charges regarding taxes may take place mainly due to different interpretations of the tax law. However, the Management of the Bank believe there will be no additional charges of any significant amount concerning the individual financial statements.

2016 Annual Report
246
Special regime applicable to Deferred Tax Assets
In 2014, Haitong Bank joined the special scheme applicable to deferred tax assets (REAID) related to impairment losses in credits and post-employment or long-term employee benefits, established by Law no. 61/2014, of August 26th. For the purpose of this scheme, the conversion of the mentioned assets in tax credits is expected in the following situations:
● Determining net losses;
● Voluntary winding-up, court insolvency or, when applicable, with the withdrawal of the corresponding authorisation by the competent supervising authority.
As at 31st of December 2015, Haitong Bank determined a tax credit of 5,869 thousand euros, which corresponds to a special reserve of 6,456 thousand euros recorded during the year of 2016.
As at 31st of December 2016, Haitong Bank determined a net loss within its individual financial statements, for which it shall, and upon approval of the statements, convert the deferred taxes covered by this scheme into tax credits proportionally, between net profit and loss and equity, as well as establish a special reserve and conversion of debt into equity rights in 2017, attributable to the Portuguese Government.
In pursuance of the abovementioned scheme, such conversion rights correspond to securities that grant the Government the right to request Haitong Bank to issue and deliver ordinary shares at no charge, following the increase in share capital through the inclusion of the reserve value. However, Haitong Bank´s shareholders are granted the right to acquire those conversion rights in accordance with Ordinance no. 293-A/2016 of November the 18th.
The amount of assets by deferred taxes converted into tax credit, the establishment of the special reserve and the issuing and granting of conversion rights to the Government shall be certified by the certified public accountant.
It is important to note that, in accordance with Law no. 23/2016 of August the 19th, the special scheme applicable to deferred tax assets (REAID) stopped being applicable to expenses and other negative asset variations accounted for in previous tax periods starting on or after the 1st of January 2016.
The activity developed by branches of the Bank in foreign countries is comprised in the statements of the headquarters in order to determine the basis of assessment subject to Income Tax. Furthermore, the profit and loss of said branches is also subject to local taxes of the countries where they are located. Local taxes are deductible from the Income Tax of the headquarters, in accordance with article 91 of the Corporate Income Tax Code, when applicable. The profit and loss from branches are subject to local taxation of nominal rates indicated below:
Branch Nominal income tax rate
London 20%
Madrid 30%
Warsaw 19%
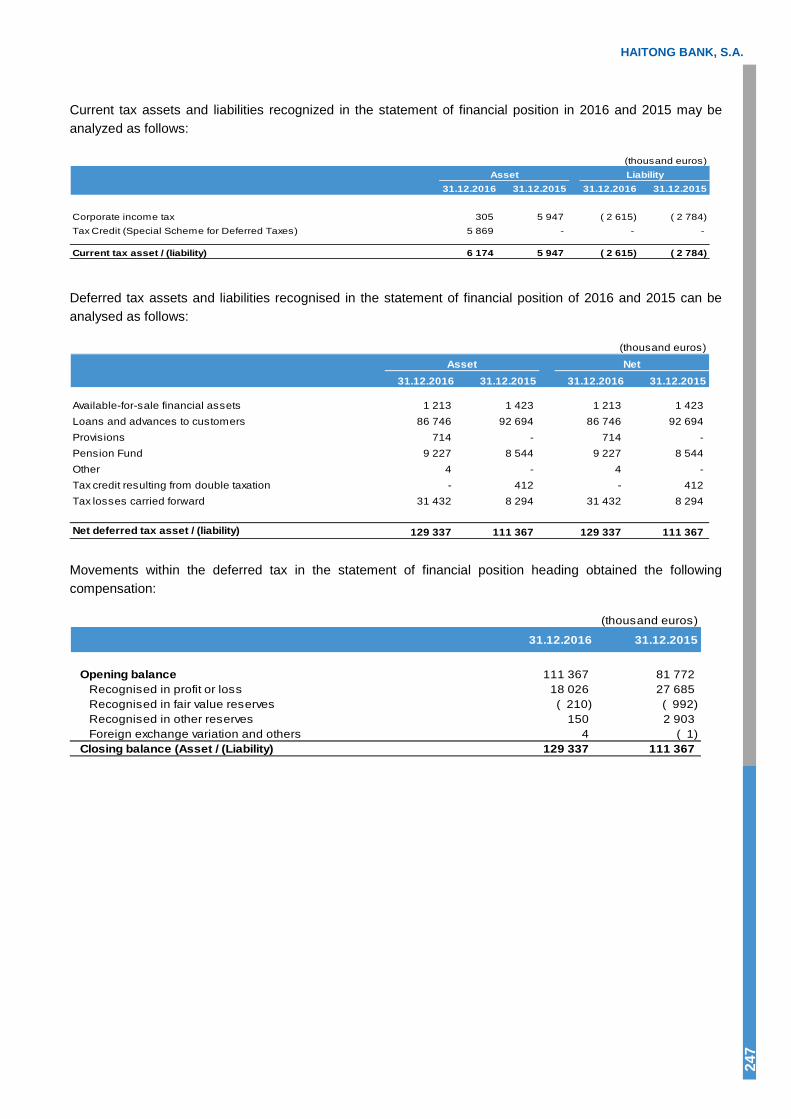
HAITONG BANK, S.A.
247
Current tax assets and liabilities recognized in the statement of financial position in 2016 and 2015 may be analyzed as follows:
(thousand euros)
31.12.2016 31.12.2015 31.12.2016 31.12.2015
Corporate income tax 305 5 947 ( 2 615) ( 2 784)Tax Credit (Special Scheme for Deferred Taxes) 5 869 - - -
Current tax asset / (liability) 6 174 5 947 ( 2 615) ( 2 784)
Asset Liability
Deferred tax assets and liabilities recognised in the statement of financial position of 2016 and 2015 can be analysed as follows:
(thousand euros)
Asset Net31.12.2016 31.12.2015 31.12.2016 31.12.2015
Available-for-sale financial assets 1 213 1 423 1 213 1 423 Loans and advances to customers 86 746 92 694 86 746 92 694 Provisions 714 - 714 - Pension Fund 9 227 8 544 9 227 8 544 Other 4 - 4 - Tax credit resulting from double taxation - 412 - 412Tax losses carried forward 31 432 8 294 31 432 8 294
Net deferred tax asset / (liability) 129 337 111 367 129 337 111 367
Movements within the deferred tax in the statement of financial position heading obtained the following compensation:
(thousand euros)
31.12.2016 31.12.2015
Opening balance 111 367 81 772 Recognised in profit or loss 18 026 27 685 Recognised in fair value reserves ( 210) ( 992)Recognised in other reserves 150 2 903 Foreign exchange variation and others 4 ( 1)
Closing balance (Asset / (Liability) 129 337 111 367
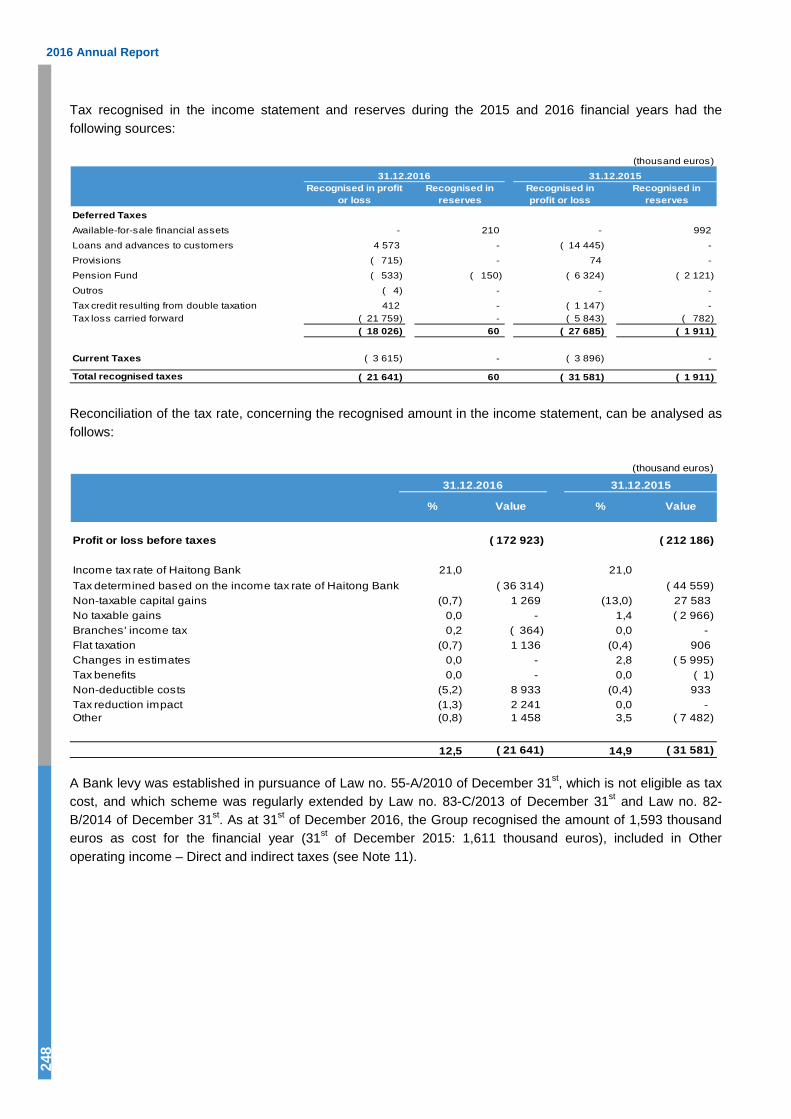
2016 Annual Report
248
Tax recognised in the income statement and reserves during the 2015 and 2016 financial years had the following sources:
(thousand euros)
31.12.2016 31.12.2015Recognised in profit
or lossRecognised in
reservesRecognised in profit or loss
Recognised in reserves
Deferred TaxesAvailable-for-sale financial assets - 210 - 992
Loans and advances to customers 4 573 - ( 14 445) -
Provisions ( 715) - 74 -
Pension Fund ( 533) ( 150) ( 6 324) ( 2 121)
Outros ( 4) - - -
Tax credit resulting from double taxation 412 - ( 1 147) - Tax loss carried forward ( 21 759) - ( 5 843) ( 782)
( 18 026) 60 ( 27 685) ( 1 911)
Current Taxes ( 3 615) - ( 3 896) -
Total recognised taxes ( 21 641) 60 ( 31 581) ( 1 911)
Reconciliation of the tax rate, concerning the recognised amount in the income statement, can be analysed as follows:
(thousand euros)
31.12.2016 31.12.2015
Profit or loss before taxes ( 172 923) ( 212 186)
Income tax rate of Haitong Bank 21,0 21,0Tax determined based on the income tax rate of Haitong Bank ( 36 314) ( 44 559)Non-taxable capital gains (0,7) 1 269 (13,0) 27 583 No taxable gains 0,0 - 1,4 ( 2 966)Branches' income tax 0,2 ( 364) 0,0 - Flat taxation (0,7) 1 136 (0,4) 906 Changes in estimates 0,0 - 2,8 ( 5 995)Tax benefits 0,0 - 0,0 ( 1)Non-deductible costs (5,2) 8 933 (0,4) 933 Tax reduction impact (1,3) 2 241 0,0 - Other (0,8) 1 458 3,5 ( 7 482)
12,5 ( 21 641) 14,9 ( 31 581)
% Value % Value
A Bank levy was established in pursuance of Law no. 55-A/2010 of December 31st, which is not eligible as tax cost, and which scheme was regularly extended by Law no. 83-C/2013 of December 31st and Law no. 82-B/2014 of December 31st. As at 31st of December 2016, the Group recognised the amount of 1,593 thousand euros as cost for the financial year (31st of December 2015: 1,611 thousand euros), included in Other operating income – Direct and indirect taxes (see Note 11).
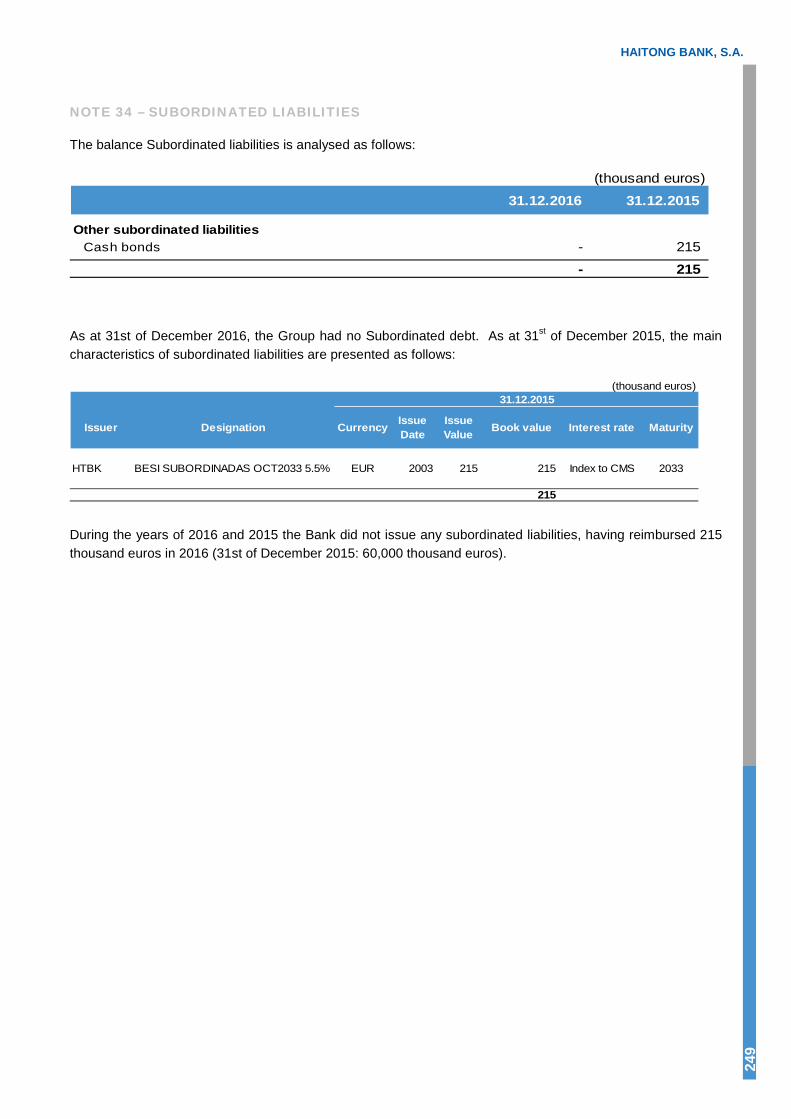
HAITONG BANK, S.A.
249
NOTE 34 – SUBORDINATED LIABILITIES
The balance Subordinated liabilities is analysed as follows:
(thousand euros)
31.12.2016 31.12.2015
Other subordinated liabilitiesCash bonds - 215
- 215
As at 31st of December 2016, the Group had no Subordinated debt. As at 31st of December 2015, the main characteristics of subordinated liabilities are presented as follows:
(thousand euros)31.12.2015
Issuer Designation Currency IssueDate
IssueValue Book value Interest rate Maturity
HTBK BESI SUBORDINADAS OCT2033 5.5% EUR 2003 215 215 Index to CMS 2033
215
During the years of 2016 and 2015 the Bank did not issue any subordinated liabilities, having reimbursed 215 thousand euros in 2016 (31st of December 2015: 60,000 thousand euros).

2016 Annual Report
250
NOTE 35 – OTHER LIABILITIES
As at 31st of December 2016 and 2015, the Other liabilities heading is analysed as follows:
(thousand euros)
31.12.2016 31.12.2015
Creditors and other resourcesPublic sector 3 256 3 574 Deposited collateral under collateral agreements 3 100 7 297 Sundry creditors
Creditors from transactions with securities 39 932 39 419 Suppliers 1 568 1 445 Other sundry creditors 6 388 297
54 244 52 032
Accrued expensesLong-term service benefits (see Note 13) - 2 171 Career bonuses (see Note 13) 583 - Other accrued expenses 8 261 9 192
8 844 11 363
Deferred income 82 659
Other sundry liabilitiesStock exchange transactions pending settlement 21 355 185 217 Foreign exchange transactions pending settlement 383 97 Other transactions pending settlement 66 626 18 312
88 364 203 626
Retirement pensions (see Note 13) 3 386 -
154 920 267 680
As at 31st of December 2016 and 2015, the headings regarding Stock exchange transactions pending settlement refer to transactions with securities pending settlement.
The headings regarding Other transactions pending settlement include amounts to be settled resulting from the exercise of guarantees provided to the subsidiary in Ireland (see Note 39).
NOTE 36 – CAPITAL, SHARE PREMIUM AND OTHER CAPITAL INSTRUMENTS
Ordinary shares Until 3 August 2014, the Bank was part of Grupo Banco Espírito Santo, S.A..
On 3 August 2014, the Bank of Portugal decided to apply a resolution measure to Banco Espírito Santo, S.A., holder of 100% of the Bank’s share capital, resulting in the establishment of Novo Banco, S.A., with a share capital of euro 4.9 thousand million, into which some assets of Banco Espírito Santo, S.A. were incorporated, as selected by the Bank of Portugal. In this context, the Bank and its branches and subsidiaries were transferred to Novo Banco, S.A..
On 7 September 2015, the Bank’s share capital was fully acquired by Haitong International Holdings Limited.

HAITONG BANK, S.A.
251
On 17 December 2015, the Bank performed a capital increase of euro 100 000 thousand, through the issuance of 20,000,000 shares at the nominal value of 5 euros each, which was fully subscribed by Haitong International Holdings Limited.
On 31 December 2016, Haitong Bank’s share capital amounts to euro 462,269 thousand and is represented by 85,253,800 shares at the nominal value of 5 euros each. Haitong Holdings Limited holds 100% of the Bank’s share capital.
Share Premium As at 31 December 2016 and 2015, the share premium in the amount of euro 8,796 thousand refers to the capital increase that took place in previous years.
Other equity instruments During October 2010, the Bank issued perpetual subordinated bonds with conditioned interest in the total amount of 50 million euros. These bonds have a conditioned, non-cumulative interest, payable only when and if the Board of Directors decides to do so.
This conditioned interest corresponds to the application of an annual rate of 8.5% over the nominal value, payable semi-annually. The reimbursement of these securities may be made in full, but not partially, after 15 September 2015, depending only on Haitong Bank’s option and the prior approval of the Bank of Portugal. Given their characteristics, these obligations are considered equity instruments in accordance with the accounting policy described in Note 2.9.
During the period 2011, a reimbursement of Other equity instruments in the amount of 46 269 thousand euros took place through the purchase of the Bank’s own share capital.
These bonds are subordinated in respect of any of Haitong Bank’s liabilities and pari passu in respect of any subordinated bonds with identical characteristics that may be issued by the Bank.
As at 31st of December 2016, 3,731 thousand euros regarding these bonds are in circulation. In the year of 2016 the Group paid interest in the amount of 231 thousand euros, recorded as a deduction in reserves (as at 31st of December 2015: 225 thousand euros).
In May 2016, the Bank issued perpetual instruments eligible as additional own funds of level 1 (Additional Tier 1), in the overall amount of 80,000 thousand euros identified as “Fixed Rate Perpetual Deeply Subordinated Additional Tier 1 Resettable Instruments”. Such bonds have a non-cumulative conditional interest which is payable only if and when reported by the Board of Directors. Due to their features, such bonds are deemed to be capital instruments, in accordance with the accounting policy laid down in Note 2.9.
NOTE 37 – FAIR-VALUE RESERVES, OTHER RESERVES, RETAINED EARNINGS AND NON-CONTROLLING INTERESTS
Legal reserve, fair value reserve and other reserves
The legal reserve can only be used to absorb accumulated losses or to increase the amount of the share capital. Portuguese legislation applicable to the banking sector (Article 97 of RGICSF) requires that 10% of the profit for the year must be transferred to the legal reserve until it is equal to the share capital.
The fair value reserve represents the amount of the unrealised gains and losses arising from securities classified as available-for-sale, net of impairment losses recognised in the income statement in the year/previous years. The amount of this reserve is presented as net of deferred taxes.
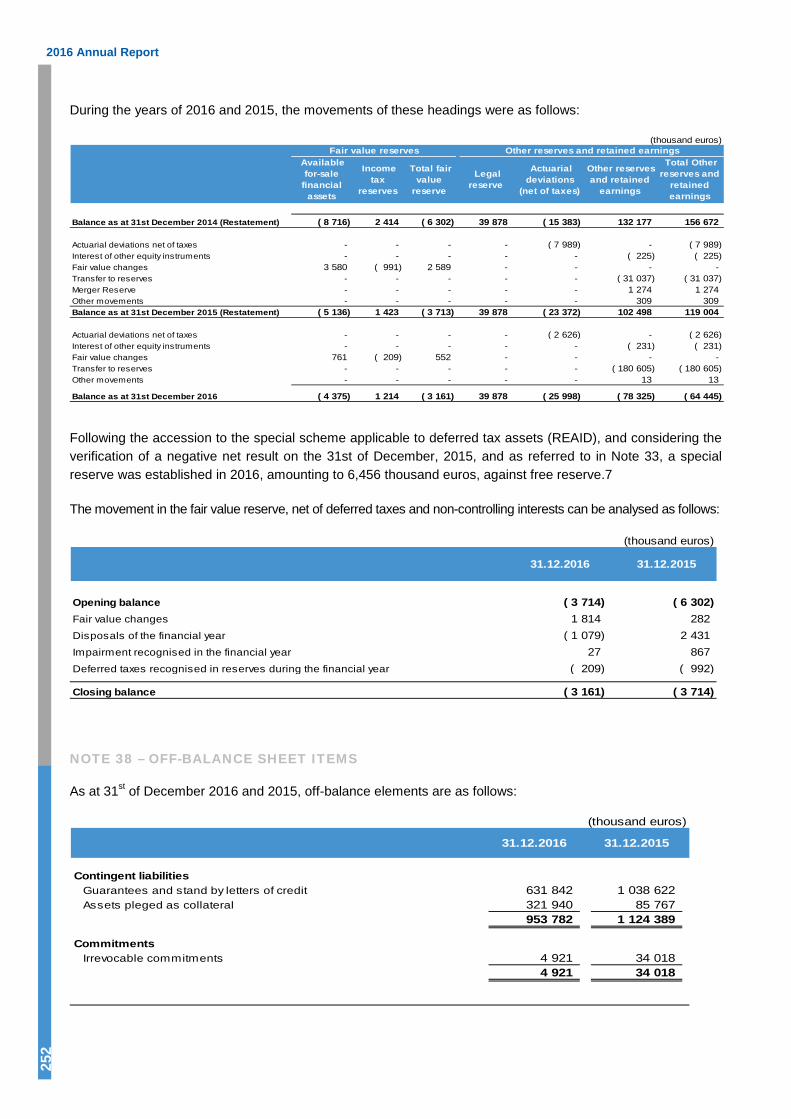
2016 Annual Report
252
During the years of 2016 and 2015, the movements of these headings were as follows:
(thousand euros)
Balance as at 31st December 2014 (Restatement) ( 8 716) 2 414 ( 6 302) 39 878 ( 15 383) 132 177 156 672
Actuarial deviations net of taxes - - - - ( 7 989) - ( 7 989)Interest of other equity instruments - - - - - ( 225) ( 225)Fair value changes 3 580 ( 991) 2 589 - - - - Transfer to reserves - - - - - ( 31 037) ( 31 037)Merger Reserve - - - - - 1 274 1 274 Other movements - - - - - 309 309 Balance as at 31st December 2015 (Restatement) ( 5 136) 1 423 ( 3 713) 39 878 ( 23 372) 102 498 119 004
Actuarial deviations net of taxes - - - - ( 2 626) - ( 2 626)Interest of other equity instruments - - - - - ( 231) ( 231)Fair value changes 761 ( 209) 552 - - - - Transfer to reserves - - - - - ( 180 605) ( 180 605)Other movements - - - - - 13 13
Balance as at 31st December 2016 ( 4 375) 1 214 ( 3 161) 39 878 ( 25 998) ( 78 325) ( 64 445)
Other reserves and retained
earnings
Total Other reserves and
retained earnings
Fair value reserves Other reserves and retained earnings Available
for-sale financial
assets
Income tax
reserves
Total fair value
reserve
Legal reserve
Actuarial deviations
(net of taxes)
Following the accession to the special scheme applicable to deferred tax assets (REAID), and considering the verification of a negative net result on the 31st of December, 2015, and as referred to in Note 33, a special reserve was established in 2016, amounting to 6,456 thousand euros, against free reserve.7
The movement in the fair value reserve, net of deferred taxes and non-controlling interests can be analysed as follows:
(thousand euros)
31.12.2016 31.12.2015
Opening balance ( 3 714) ( 6 302)Fair value changes 1 814 282 Disposals of the financial year ( 1 079) 2 431 Impairment recognised in the financial year 27 867 Deferred taxes recognised in reserves during the financial year ( 209) ( 992)
Closing balance ( 3 161) ( 3 714)
NOTE 38 – OFF-BALANCE SHEET ITEMS
As at 31st of December 2016 and 2015, off-balance elements are as follows:
(thousand euros)
31.12.2016 31.12.2015
Contingent liabilities Guarantees and stand by letters of credit 631 842 1 038 622 Assets pleged as collateral 321 940 85 767
953 782 1 124 389
Commitments Irrevocable commitments 4 921 34 018
4 921 34 018

HAITONG BANK, S.A.
253
Guarantees and standby letters of credits are banking operations that do not imply any out-flow by the Bank.
As at 31 December 2016, the balance Assets pledged as collateral includes:
● Securities pledged as collateral to the Bank of Portugal (i) within the scope of the Large-Value PaymentSystem, amounting to 60,000 thousand euros as at the 31st of December, 2016 (there have been notransactions in 2015) and (ii) within the scope of the opening of credit with guarantee for liquidity-providingtransactions, amounting to 237,965 thousand euros (31st of December, 2015: 83,854 thousand euros),and the total of securities eligible for rediscount with the Bank of Portugal amounted to 297,965 thousandeuros as at the 31st of December, 2016 (31st of December, 2015: 83,854 thousand euros).
● Securities pledged as collateral to the Portuguese Securities Market Commission within the InvestorCompensation Scheme in the amount of 155 thousand euros (31st of December 2015: 1,813 thousandeuros).
● Securities pledged as collaterals to Fundo de Garantia de Depósitos [Deposit Guarantee Funds] in theamount of 100 thousand euros (31st of December 2015: 100 thousand euros).
● Securities pledged as collateral within the scope of transactions with repurchase agreement: 23,720thousand euros.
Irrevocable commitments represent contractual agreements to extend credit to the Bank’s customers (e.g. unused credit lines). These agreements are generally contracted for fixed periods of time or with other expiration requisites, and usually require the payment of a commission. Substantially, all credit commitments require that clients maintain certain conditions verified at the time when the credit was granted.
Notwithstanding the particular characteristics of these contingent liabilities and commitments, the analysis of these operations follows the same basic principles of any one another commercial operation, namely the solvency of the underlying client and business, and the Bank requires these operations to be adequately covered by collaterals when needed. It is expected that the majority of these contingent liabilities and commitments will expire without having been used, and so the indicated amounts do not necessarily represent future cash-flows needs.
Additionally, the liabilities accounted for in the off-balance sheet and related to banking services provided are as follows:
(thousand euros)
31.12.2016 31.12.2015
Liabilities related to services provided
Securities and other items held for safekeeping on behalf of customers 552 660 681 400 Other responsabilities related with services provided 1 608 690 2 190 649
2 161 350 2 872 049
As at 31st of December 2016, the value of off-balance elements for services provided include 1,451,252 thousand euros associated with syndicated loans under management (1,957,750 thousand euros as at 31st of December 2015) and 157,437 thousand euros associated with discretionary management (232,899 thousand euros as at 31st of December 2015).
Banco Espírito Santo (BES), Novo Banco and Haitong Bank (and, in some cases, supervisory authorities, auditors and former directors from BES) have been sued in civil proceedings associated with facts of the former Grupo Espírito Santo (GES).
2016 Annual Report
254
Within this framework, Haitong Bank is a defendant in a proceeding associated with the capital increase of BES, which took place in June 2014. In fact, there were 2 proceedings associated with the capital increase of BES, however, the Court has ruled not to prosecute due to “abandonment” in one of the aforesaid proceedings. Such decision has already been confirmed by the Lisbon Court of Appeal [Tribunal da Relação de Lisboa].
Haitong Bank is also a defendant in 78 proceedings, nearly all of which are associated with issues of commercial paper of GES’s entities (Rioforte and ESI – Espirito Santo International) (2 of which concern issues of notes by Haitong Bank’s subsidiary based in Ireland (HIIP) whose underlying asset were bonds issued by Espírito Santo Financial Portugal (ESFP)), and which were brought before the courts in 2015 and 2016.
In note 38, in what concerns the 2015 accounts, it is stated that, in the opinion of Haitong Bank’s Legal Department and of the external lawyers to whom the proceedings have been entrusted, such proceedings do not have legal sustainability, wherefore it is considered unlikely that any judgment will be made against Haitong Bank in relation thereto. Such opinion is hereby reasserted, based on the following grounds.
Concerning the shares associated with issues of commercial paper of GES, it is true that Haitong Bank (then BESI – Banco Espírito Santo de Investimento) acted as administrative agent in several issuances, having dealt with their integration in the Central Securities Depository, and as paying agent, being responsible for paying interest and principal to the holders of such securities (evidently, in the assumption of having received the necessary funds from the issuer for such purpose). However, such issues were subject to private offering, and BESI did not take part in their listing, nor did it liaise with investors. Their corresponding information notes are unambiguous, by stating that their respective issuers are exclusively responsible for information contained therein. Concerning the 2 aforementioned proceedings associated with issues from HIIP, such issues are credit linked notes, whose remuneration and reimbursement depended on facts (such as insolvency) related to the issuer of the underlying asset – in this case ESFP –, which, as we know, has been declared insolvent, in which case the investors should receive their own underlying asset or the profits from their sale. The conditions of such issues are clearly set forth in their information documents, and BESI has also not listed such issues with investors.
Such opinion has since been supported by several judicial decisions.
Therefore, in 4 of the proceedings concerning GES’s commercial paper, the Courts have ruled to discharge Haitong Bank on every account, without the need of trial, based on grounds fundamentally similar to those referred to above. Such decisions may be subject to appeal. However, their grounds reinforces the understanding that Haitong Bank shall be discharged on every account.
Following the above stated, Haitong Bank did not establish any provision related to such legal proceedings.
Resolution Fund In accordance with Decree-Law No. 24/2013 which establishes the modus operando of the Resolution Fund ('RF'), the Bank has since 2013, made the mandatory contributions, as provided for in that law. Thus, since the inception of the RF, the Bank made the initial contribution, pursuant to Article 3 of Decree-Law and the periodical contributions in 2013 and 2014, under Article 4 of Decree-Law.
On 3 November 2015, the Bank of Portugal issued a Circular Letter under which it was clarified that the periodic contribution to the RF should be recognized as an expense at the time of the occurrence of the event which creates the obligation to pay the contribution, ie on the last day of April of each year, as stipulated in Article 9 of Decree-Law No. 24/2013, of 19 February. The Bank is recognizing as an expense the contribution to the RF in the year in which it becomes due.

HAITONG BANK, S.A.
255
The Resolution Fund issued, on 15th of November 2015, a public statement declaring: "it is further clarified that it is not expected that the Resolution Fund will propose the setting up of a special contribution to finance the resolution measure applied to BES. The eventual collection of a special contribution appears, therefore, remote. "
Subsequently, after issuance by the RF of such statement, in the scope of the resolution process of Banco Espírito Santo, S.A., the Bank of Portugal decided, as announced on 29 December 2016, to transfer to the RF the responsibilities arising from the " ... possible negative effects of future decisions, resulting from the resolution process [of Banco Espírito Santo, SA], which result in liabilities or contingencies". According to publicly available information, the volume of litigation associated with this process is high, not being duly clarified which amount of losses the RF my incur with these litigations or with the sale of Novo Banco, S.A..
Additionally, the Bank of Portugal decided on 19 and 20 December 2015, to apply a resolution measure to Banif - Banco Internacional do Funchal, SA ('BANIF'), not being clear which amount of losses the RF may incur with this process.
Accordingly, as at 31st of December 2016, there are no expectations regarding the value of possible losses connected to the divesture process of Novo Banco, of the mentioned litigations associated with the resolution process of Banco Espírito Santo or of the potential losses of the RF following the resolution of BANIF and how they may affect the RF. Nevertheless, considering the measures announced in September 2016, it is the Bank's expectation that no special contributions or any other extraordinary contribution will be required to finance the resolution measures applied to BES and BANIF.
In 2015, following the establishment of the European Resolution Fund, the Bank had to make an initial contribution in the amount of 1,006 thousand euros. The European Resolution Fund does not cover under going situations as at 31st of December 2015, with the Portuguese Resolution Fund.
On 28th of September 2016 the Resolution Fund issued a statement in which it is stated that the maturity of the loan that matured on 31st of December 2017 would be adjusted to ensure the Fund's ability to fully meet its obligations based on its regular revenues, and regardless of the contingencies to which it is exposed, no need of extraordinary contributions.
In February 2017, the loan agreement was added.
NOTE 39 – RELATED PARTIES TRANSACTIONS
As at 31st of December 2016 and 2015, the total amount of assets, liabilities, income and expenses with related parties are presented as follows:
(thousand euros)31.12.2016 31.12.2015
Assets Liabilities Guarantees Income Expenses Assets Liabilities Guarantees Income Expenses
Associates
MCO2 S G FUNDOS INVEST MOB S - - - - - 550 - - - -
TOTAL - - - - - 550 - - - -
Assets recognised with associated companies relate mainly to loans. The liabilities relate mainly to bank deposits taken.
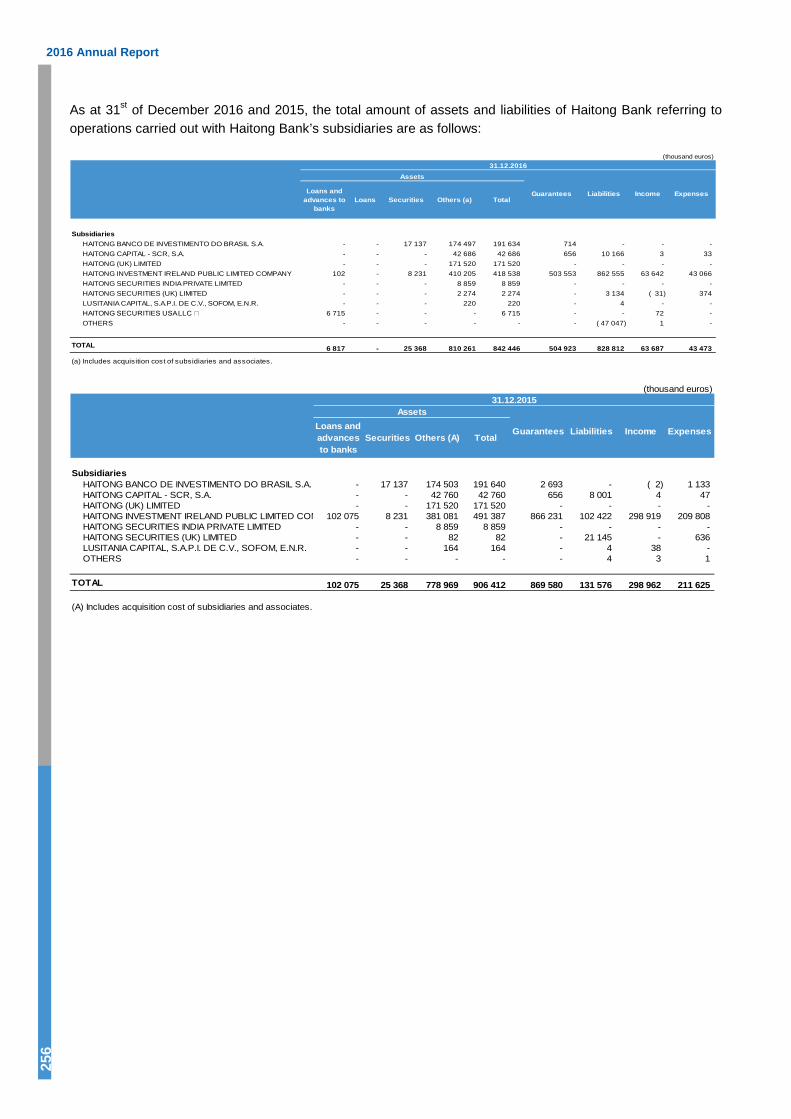
2016 Annual Report
256
As at 31st of December 2016 and 2015, the total amount of assets and liabilities of Haitong Bank referring to operations carried out with Haitong Bank’s subsidiaries are as follows:
(thousand euros)31.12.2016
Assets
Loans and advances to
banksLoans Securities Others (a) Total
SubsidiariesHAITONG BANCO DE INVESTIMENTO DO BRASIL S.A. - - 17 137 174 497 191 634 714 - - - HAITONG CAPITAL - SCR, S.A. - - - 42 686 42 686 656 10 166 3 33 HAITONG (UK) LIMITED - - - 171 520 171 520 - - - - HAITONG INVESTMENT IRELAND PUBLIC LIMITED COMPANY 102 - 8 231 410 205 418 538 503 553 862 555 63 642 43 066 HAITONG SECURITIES INDIA PRIVATE LIMITED - - - 8 859 8 859 - - - - HAITONG SECURITIES (UK) LIMITED - - - 2 274 2 274 - 3 134 ( 31) 374 LUSITANIA CAPITAL, S.A.P.I. DE C.V., SOFOM, E.N.R. - - - 220 220 - 4 - - HAITONG SECURITIES USA LLC �� 6 715 - - - 6 715 - - 72 - OTHERS - - - - - - ( 47 047) 1 -
TOTAL 6 817 - 25 368 810 261 842 446 504 923 828 812 63 687 43 473
(a) Includes acquisition cost of subsidiaries and associates.
Guarantees Liabilities Income Expenses
(thousand euros)31.12.2015
AssetsLoans and advances to banks
Securities Others (A) Total
SubsidiariesHAITONG BANCO DE INVESTIMENTO DO BRASIL S.A. - 17 137 174 503 191 640 2 693 - ( 2) 1 133 HAITONG CAPITAL - SCR, S.A. - - 42 760 42 760 656 8 001 4 47 HAITONG (UK) LIMITED - - 171 520 171 520 - - - - HAITONG INVESTMENT IRELAND PUBLIC LIMITED COM 102 075 8 231 381 081 491 387 866 231 102 422 298 919 209 808 HAITONG SECURITIES INDIA PRIVATE LIMITED - - 8 859 8 859 - - - - HAITONG SECURITIES (UK) LIMITED - - 82 82 - 21 145 - 636 LUSITANIA CAPITAL, S.A.P.I. DE C.V., SOFOM, E.N.R. - - 164 164 - 4 38 - OTHERS - - - - - 4 3 1
TOTAL 102 075 25 368 778 969 906 412 869 580 131 576 298 962 211 625
(A) Includes acquisition cost of subsidiaries and associates.
Income ExpensesGuarantees Liabilities
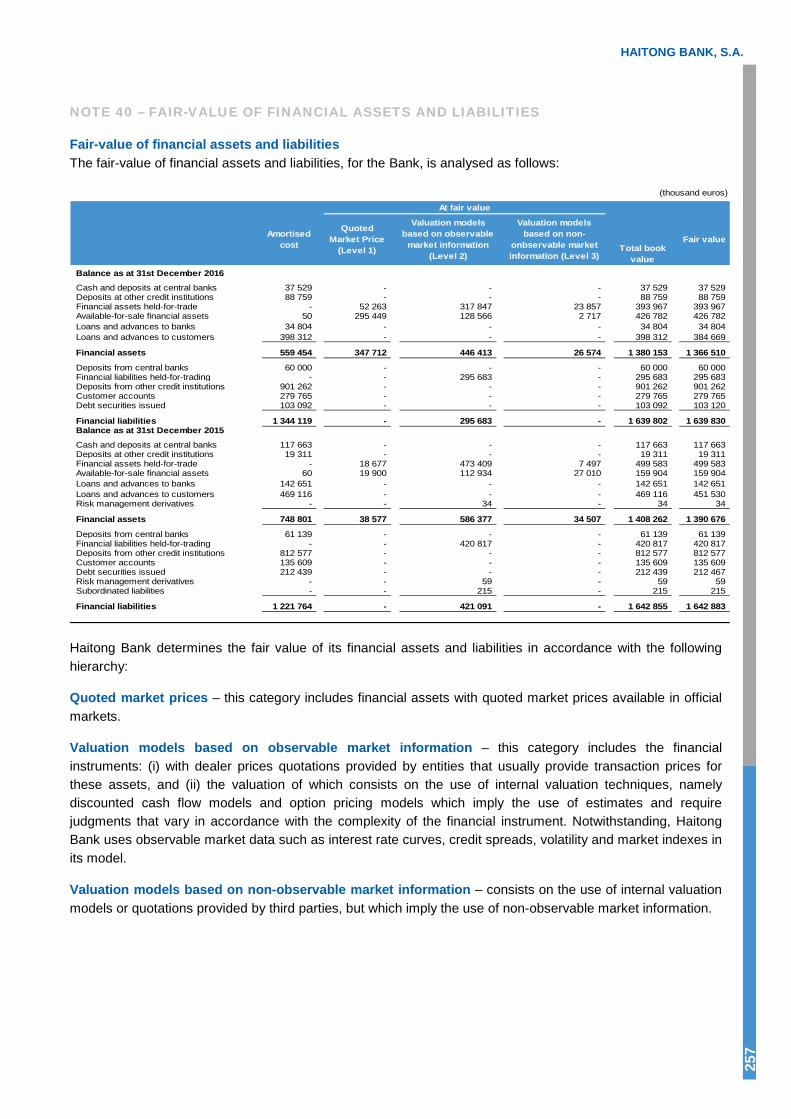
HAITONG BANK, S.A.
257
NOTE 40 – FAIR-VALUE OF FINANCIAL ASSETS AND LIABILITIES
Fair-value of financial assets and liabilities The fair-value of financial assets and liabilities, for the Bank, is analysed as follows:
(thousand euros)
At fair value
Amortised cost
Quoted Market Price
(Level 1)
Valuation models based on observable
market information (Level 2)
Valuation models based on non-
onbservable market information (Level 3)
Total book value
Fair value
Balance as at 31st December 2016Cash and deposits at central banks 37 529 - - - 37 529 37 529 Deposits at other credit institutions 88 759 - - - 88 759 88 759 Financial assets held-for-trade - 52 263 317 847 23 857 393 967 393 967 Available-for-sale financial assets 50 295 449 128 566 2 717 426 782 426 782 Loans and advances to banks 34 804 - - - 34 804 34 804 Loans and advances to customers 398 312 - - - 398 312 384 669
Financial assets 559 454 347 712 446 413 26 574 1 380 153 1 366 510
Deposits from central banks 60 000 - - - 60 000 60 000 Financial liabilities held-for-trading - - 295 683 - 295 683 295 683 Deposits from other credit institutions 901 262 - - - 901 262 901 262 Customer accounts 279 765 - - - 279 765 279 765 Debt securities issued 103 092 - - - 103 092 103 120
Financial liabilities 1 344 119 - 295 683 - 1 639 802 1 639 830 Balance as at 31st December 2015Cash and deposits at central banks 117 663 - - - 117 663 117 663 Deposits at other credit institutions 19 311 - - - 19 311 19 311 Financial assets held-for-trade - 18 677 473 409 7 497 499 583 499 583 Available-for-sale financial assets 60 19 900 112 934 27 010 159 904 159 904 Loans and advances to banks 142 651 - - - 142 651 142 651 Loans and advances to customers 469 116 - - - 469 116 451 530 Risk management derivatives - - 34 - 34 34
Financial assets 748 801 38 577 586 377 34 507 1 408 262 1 390 676
Deposits from central banks 61 139 - - - 61 139 61 139 Financial liabilities held-for-trading - - 420 817 - 420 817 420 817 Deposits from other credit institutions 812 577 - - - 812 577 812 577 Customer accounts 135 609 - - - 135 609 135 609 Debt securities issued 212 439 - - - 212 439 212 467 Risk management derivatives - - 59 - 59 59 Subordinated liabilities - - 215 - 215 215
Financial liabilities 1 221 764 - 421 091 - 1 642 855 1 642 883
Haitong Bank determines the fair value of its financial assets and liabilities in accordance with the following hierarchy:
Quoted market prices – this category includes financial assets with quoted market prices available in official markets.
Valuation models based on observable market information – this category includes the financial instruments: (i) with dealer prices quotations provided by entities that usually provide transaction prices for these assets, and (ii) the valuation of which consists on the use of internal valuation techniques, namely discounted cash flow models and option pricing models which imply the use of estimates and require judgments that vary in accordance with the complexity of the financial instrument. Notwithstanding, Haitong Bank uses observable market data such as interest rate curves, credit spreads, volatility and market indexes in its model.
Valuation models based on non-observable market information – consists on the use of internal valuation models or quotations provided by third parties, but which imply the use of non-observable market information.

2016 Annual Report
258
The movement of financial assets valued through methods with non-observable market parameters during 2016 can be analysed as follows:
(thousand euros)
31.12.2016 31.12.2015
Opening balance 34 507 28 015 Acquisitions 23 857 7 497 Disposals ( 7 497) ( 134)Transfers ( 23 830) 3 180 Changes in value ( 463) ( 4 051)Closing balance 26 574 34 507
During the period 2016, the key parameters used in the valuation models were:
Yield curves The short-term rates presented reflect benchmark values for the money market. For long-term rates, swap curves are used:
(%)
31.12.2016 31.12.2015EUR USD GBP EUR USD GBP
Overnight -0,41 0,70 0,22 -0,35 0,27 0,451 month -0,42 0,77 0,25 -0,23 0,43 0,503 months -0,36 1,00 0,36 -0,17 0,51 0,596 months -0,38 0,97 0,53 -0,10 0,61 0,75
1 year -0,28 1,14 0,55 -0,06 0,87 0,853 years -0,10 1,66 0,69 0,06 1,40 1,305 years 0,08 1,97 0,87 0,33 1,72 1,597 years 0,33 2,16 1,04 0,62 1,95 1,80
10 years 0,67 2,35 1,24 1,00 2,19 1,9915 years 1,06 2,52 1,43 1,40 2,42 2,1620 years 1,21 2,59 1,48 1,57 2,53 2,2025 years 1,25 2,61 1,46 1,60 2,59 2,1830 years 1,27 2,61 1,44 1,61 2,62 2,16

HAITONG BANK, S.A.
259
Credit spreads Credit spreads used by the Bank when assessing credit derivatives are captured on a daily basis by Markit at the end of the day, and the values of the reference entities are used for such purpose. The development of the main credit indexes is set out below, representing the behaviour of credit spreads in the market throughout the year:
(basis points)
Index Series 1 year 3 years 5 years 7 years 10 years
Year 2016CDX USD Main 25 - 34.23 67.47 95.14 113.58iTraxx Eur Main 24 - 43.70 72.32 94.63 111.62iTraxx Eur Senior Financial 24 - - 93.44 - -
CDX USD Main 25 - 60.46 88.32 110.25 126.93iTraxx Eur Main 24 - 51.50 77.28 96.30 113.75iTraxx Eur Senior Financial 24 - - 76.86 - 106.81
Year 2015
Interest rate volatility The values presented below refer to the implied volatilities (at-themoney), used for the valuation of the interest rate options:
(%)
31.12.2016 31.12.2015EUR USD GBP EUR USD GBP
1 year - 24,82 80,81 - 42,65 39,663 years - 37,27 - - 45,92 53,365 years 164,92 40,83 97,10 148,15 46,21 54,117 years 94,34 40,85 90,36 82,95 43,92 51,7210 years 71,96 38,35 - 55,66 40,48 47,7015 years 62,39 35,58 - 41,68 35,58 42,18
Foreign exchange rate and volatilities Presented below are the exchange rates (European Central bank) at the balance sheet date and the implied volatilities (at the money) for the main currency pairs used for the valuation of derivatives:
Volatility (%)
Exchange 31.12.2016 31.12.2015 1 month 3 months 6 months 9 months 1 year
EUR/USD 1.05410 1.08870 10.31 10.53 10.84 10.63 10.52EUR/GBP 0.85618 0.73395 9.83 10.27 10.85 10.81 10.79EUR/CHF 1.07390 1.08350 5.34 6.13 7.12 7.36 7.48EUR/PLN 4.41030 4.26390 6.66 7.08 7.55 7.72 7.84EUR/CNY 7.32020 7.06080 - - - - -USD/BRL a) 3.25444 3.96041 15.99 16.22 16.32 16.40 16.43a) Determined based on EUR/USD and EUR/BRL
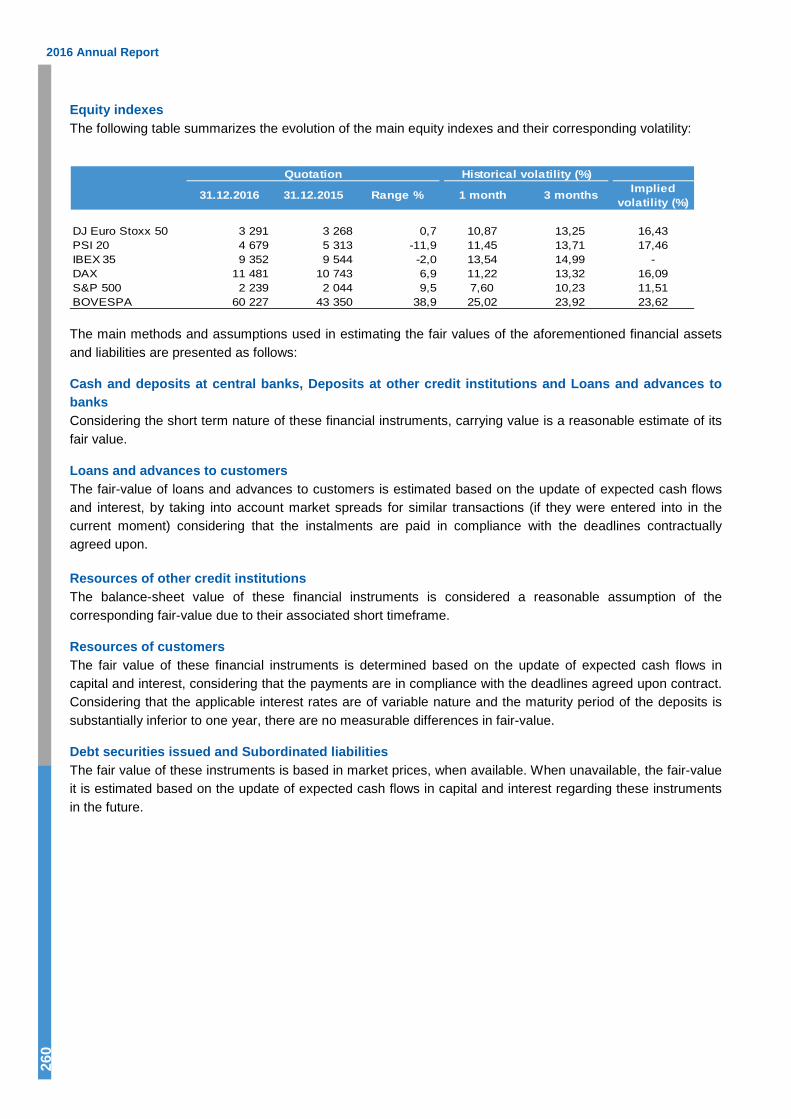
2016 Annual Report
260
Equity indexes The following table summarizes the evolution of the main equity indexes and their corresponding volatility:
Quotation Historical volatility (%)
31.12.2016 31.12.2015 Range % 1 month 3 months Implied volatility (%)
DJ Euro Stoxx 50 3 291 3 268 0,7 10,87 13,25 16,43PSI 20 4 679 5 313 -11,9 11,45 13,71 17,46IBEX 35 9 352 9 544 -2,0 13,54 14,99 -DAX 11 481 10 743 6,9 11,22 13,32 16,09S&P 500 2 239 2 044 9,5 7,60 10,23 11,51BOVESPA 60 227 43 350 38,9 25,02 23,92 23,62
The main methods and assumptions used in estimating the fair values of the aforementioned financial assets and liabilities are presented as follows:
Cash and deposits at central banks, Deposits at other credit institutions and Loans and advances to banks Considering the short term nature of these financial instruments, carrying value is a reasonable estimate of its fair value.
Loans and advances to customers The fair-value of loans and advances to customers is estimated based on the update of expected cash flows and interest, by taking into account market spreads for similar transactions (if they were entered into in the current moment) considering that the instalments are paid in compliance with the deadlines contractually agreed upon.
Resources of other credit institutions The balance-sheet value of these financial instruments is considered a reasonable assumption of the corresponding fair-value due to their associated short timeframe.
Resources of customers The fair value of these financial instruments is determined based on the update of expected cash flows in capital and interest, considering that the payments are in compliance with the deadlines agreed upon contract. Considering that the applicable interest rates are of variable nature and the maturity period of the deposits is substantially inferior to one year, there are no measurable differences in fair-value.
Debt securities issued and Subordinated liabilities The fair value of these instruments is based in market prices, when available. When unavailable, the fair-value it is estimated based on the update of expected cash flows in capital and interest regarding these instruments in the future.

HAITONG BANK, S.A.
261
NOTE 41 – RESTATEMENT OF INDIVIDUAL FINANCIAL STATEMENTS
The statement of changes in equity and the balance as at the 1st of January, 2015, as well as the consolidated income, comprehensive income, changes in equity and cash flow statements of the financial year ended on the 31st of December, 2015, showed herein for comparison purposes, have been restated in compliance with the IFRS.
The effects of the correction of errors, in the statement of changes in equity as at the 1st of January, 2015, and the 31st of December, 2015, from the adjustment of NCA to IFRS, may be presented as follows:
(thousand euros)
Published Financial Statements 556.224 (43.177) 513.047 489.166 (28.900) 460.266
Restatement by error :Impairment for investment on Haitong UK - (131.392) (131.392) - - -Credit impairment need - (4.786) (4.786) - - -Other corrections (2.137) (1.250) (3.387) - (2.137) (2.137)
Restatement by adjustments from NCA to IFRS:Reclassification fom general banking risk provisions to credit impairment - - - - - -
Total of adjustments (2.137) (137.428) (139.565) - (2.137) (2.137)
Restated financial statements 554.087 (180.605) 373.482 489.166 (31.037) 458.129
Description (net amounts of the tax effect, where applicable)
31st December 2015 1st January 2015
Equity (without net
profit/(loss) of the year)
Net profit/(loss) of
the yearTotal
Equity (without net
profit/(loss) of the year)
Net profit/(loss) of
the yearTotal
Hence, the main differences arising fom errors which had an impact in the Group’s financial statements are the following:
● Impairment for investment on Haitong UK: Total impairment recognised with the subsidiary Haitong UK,resulting from the fact that, when Haitong Securities acquired Haitong Bank (formerly BESI), it resulted in achange of the business model, which was underlying to the calculation of the initial valuation.
● Credit impairment need: Insufficiency in Bank´s exposure, whose events underlying to the need ofimpairment recognition have occurred in 2015.
● Other corrections: Result from identified situations related with previous exercises.
In addition, the Bank reclassified general banking risk provisions to credit impairment, subsequent the transition from NCA to IFRS. This reclassification had no impact in the statement of financial position.
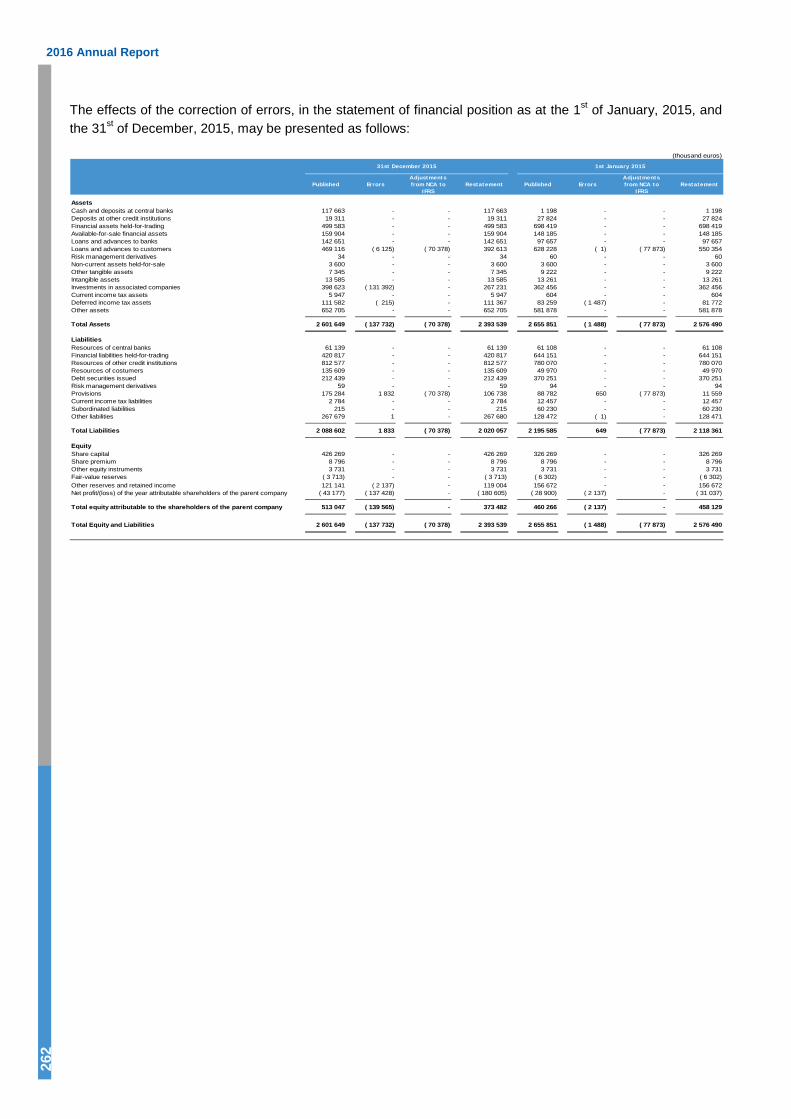
2016 Annual Report 26
2
The effects of the correction of errors, in the statement of financial position as at the 1st of January, 2015, and the 31st of December, 2015, may be presented as follows:
(thousand euros)
Published ErrorsAdjustments from NCA to
IFRSRestatement Published Errors
Adjustments from NCA to
IFRSRestatement
AssetsCash and deposits at central banks 117 663 - - 117 663 1 198 - - 1 198Deposits at other credit institutions 19 311 - - 19 311 27 824 - - 27 824Financial assets held-for-trading 499 583 - - 499 583 698 419 - - 698 419Available-for-sale financial assets 159 904 - - 159 904 148 185 - - 148 185Loans and advances to banks 142 651 - - 142 651 97 657 - - 97 657Loans and advances to customers 469 116 ( 6 125) ( 70 378) 392 613 628 228 ( 1) ( 77 873) 550 354Risk management derivatives 34 - - 34 60 - - 60Non-current assets held-for-sale 3 600 - - 3 600 3 600 - - 3 600Other tangible assets 7 345 - - 7 345 9 222 - - 9 222Intangible assets 13 585 - - 13 585 13 261 - - 13 261Investments in associated companies 398 623 ( 131 392) - 267 231 362 456 - - 362 456Current income tax assets 5 947 - - 5 947 604 - - 604Deferred income tax assets 111 582 ( 215) - 111 367 83 259 ( 1 487) - 81 772Other assets 652 705 - - 652 705 581 878 - - 581 878
Total Assets 2 601 649 ( 137 732) ( 70 378) 2 393 539 2 655 851 ( 1 488) ( 77 873) 2 576 490
LiabilitiesResources of central banks 61 139 - - 61 139 61 108 - - 61 108Financial liabilities held-for-trading 420 817 - - 420 817 644 151 - - 644 151Resources of other credit institutions 812 577 - - 812 577 780 070 - - 780 070Resources of costumers 135 609 - - 135 609 49 970 - - 49 970Debt securities issued 212 439 - - 212 439 370 251 - - 370 251Risk management derivatives 59 - - 59 94 - - 94Provisions 175 284 1 832 ( 70 378) 106 738 88 782 650 ( 77 873) 11 559Current income tax liabilities 2 784 - - 2 784 12 457 - - 12 457Subordinated liabilities 215 - - 215 60 230 - - 60 230Other liabilities 267 679 1 - 267 680 128 472 ( 1) - 128 471
Total Liabilities 2 088 602 1 833 ( 70 378) 2 020 057 2 195 585 649 ( 77 873) 2 118 361
EquityShare capital 426 269 - - 426 269 326 269 - - 326 269Share premium 8 796 - - 8 796 8 796 - - 8 796Other equity instruments 3 731 - - 3 731 3 731 - - 3 731Fair-value reserves ( 3 713) - - ( 3 713) ( 6 302) - - ( 6 302)Other reserves and retained income 121 141 ( 2 137) - 119 004 156 672 - - 156 672Net profit/(loss) of the year attributable shareholders of the parent company ( 43 177) ( 137 428) - ( 180 605) ( 28 900) ( 2 137) - ( 31 037)
Total equity attributable to the shareholders of the parent company 513 047 ( 139 565) - 373 482 460 266 ( 2 137) - 458 129
Total Equity and Liabilities 2 601 649 ( 137 732) ( 70 378) 2 393 539 2 655 851 ( 1 488) ( 77 873) 2 576 490
31st December 2015 1st January 2015
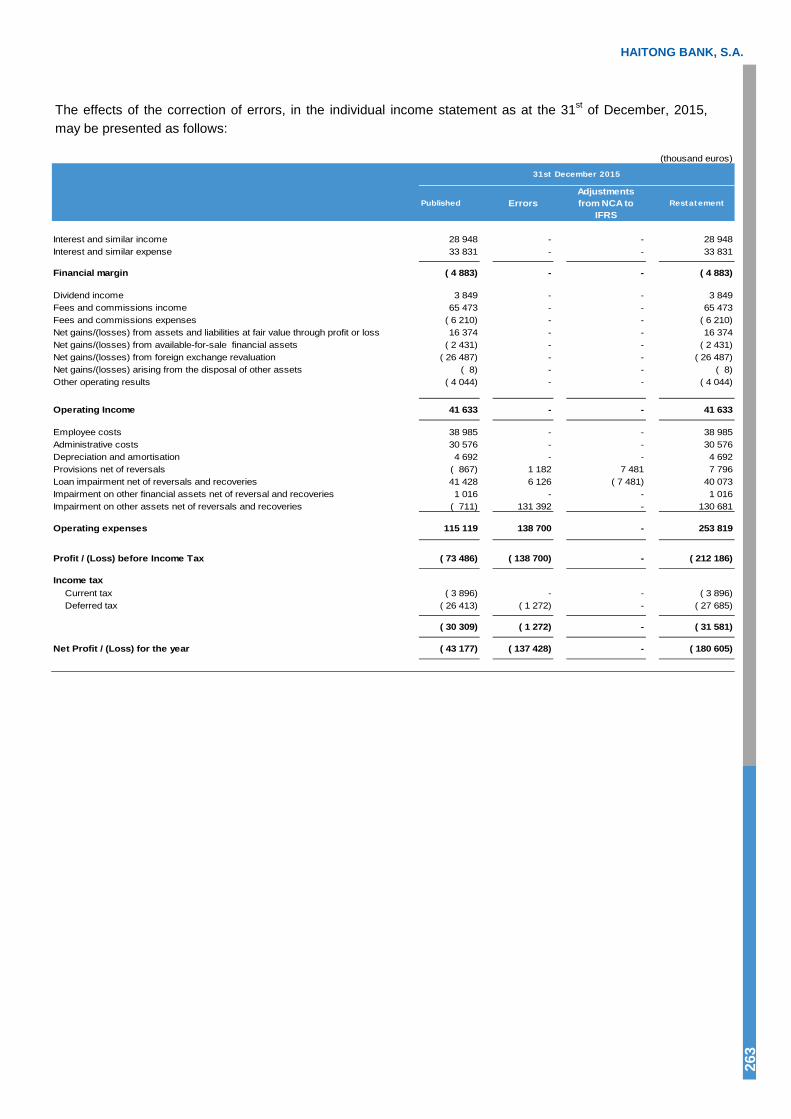
HAITONG BANK, S.A.
263
The effects of the correction of errors, in the individual income statement as at the 31st of December, 2015, may be presented as follows:
(thousand euros)
Published ErrorsAdjustments from NCA to
IFRSRestatement
Interest and similar income 28 948 - - 28 948Interest and similar expense 33 831 - - 33 831
Financial margin ( 4 883) - - ( 4 883)
Dividend income 3 849 - - 3 849Fees and commissions income 65 473 - - 65 473Fees and commissions expenses ( 6 210) - - ( 6 210)Net gains/(losses) from assets and liabilities at fair value through profit or loss 16 374 - - 16 374Net gains/(losses) from available-for-sale financial assets ( 2 431) - - ( 2 431)Net gains/(losses) from foreign exchange revaluation ( 26 487) - - ( 26 487)Net gains/(losses) arising from the disposal of other assets ( 8) - - ( 8)Other operating results ( 4 044) - - ( 4 044)
Operating Income 41 633 - - 41 633
Employee costs 38 985 - - 38 985Administrative costs 30 576 - - 30 576Depreciation and amortisation 4 692 - - 4 692Provisions net of reversals ( 867) 1 182 7 481 7 796Loan impairment net of reversals and recoveries 41 428 6 126 ( 7 481) 40 073Impairment on other financial assets net of reversal and recoveries 1 016 - - 1 016Impairment on other assets net of reversals and recoveries ( 711) 131 392 - 130 681
Operating expenses 115 119 138 700 - 253 819
Profit / (Loss) before Income Tax ( 73 486) ( 138 700) - ( 212 186)
Income taxCurrent tax ( 3 896) - - ( 3 896)Deferred tax ( 26 413) ( 1 272) - ( 27 685)
( 30 309) ( 1 272) - ( 31 581)
Net Profit / (Loss) for the year ( 43 177) ( 137 428) - ( 180 605)
31st December 2015
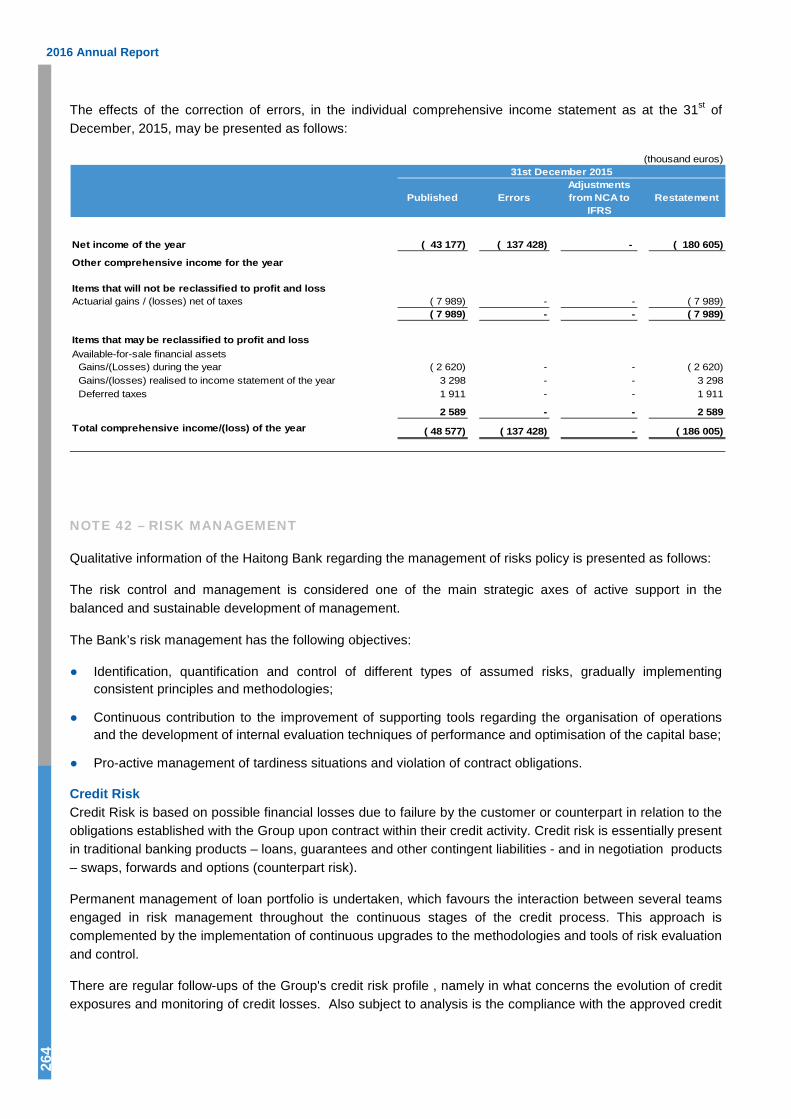
2016 Annual Report
264
The effects of the correction of errors, in the individual comprehensive income statement as at the 31st of December, 2015, may be presented as follows:
(thousand euros)
Published ErrorsAdjustments from NCA to
IFRSRestatement
Net income of the year ( 43 177) ( 137 428) - ( 180 605)
Other comprehensive income for the year
Items that will not be reclassified to profit and lossActuarial gains / (losses) net of taxes ( 7 989) - - ( 7 989)
( 7 989) - - ( 7 989)
Items that may be reclassified to profit and lossAvailable-for-sale financial assets
Gains/(Losses) during the year ( 2 620) - - ( 2 620)Gains/(losses) realised to income statement of the year 3 298 - - 3 298Deferred taxes 1 911 - - 1 911
2 589 - - 2 589Total comprehensive income/(loss) of the year ( 48 577) ( 137 428) - ( 186 005)
31st December 2015
NOTE 42 – RISK MANAGEMENT
Qualitative information of the Haitong Bank regarding the management of risks policy is presented as follows:
The risk control and management is considered one of the main strategic axes of active support in the balanced and sustainable development of management.
The Bank’s risk management has the following objectives:
● Identification, quantification and control of different types of assumed risks, gradually implementing consistent principles and methodologies;
● Continuous contribution to the improvement of supporting tools regarding the organisation of operations and the development of internal evaluation techniques of performance and optimisation of the capital base;
● Pro-active management of tardiness situations and violation of contract obligations.
Credit Risk Credit Risk is based on possible financial losses due to failure by the customer or counterpart in relation to the obligations established with the Group upon contract within their credit activity. Credit risk is essentially present in traditional banking products – loans, guarantees and other contingent liabilities - and in negotiation products – swaps, forwards and options (counterpart risk).
Permanent management of loan portfolio is undertaken, which favours the interaction between several teams engaged in risk management throughout the continuous stages of the credit process. This approach is complemented by the implementation of continuous upgrades to the methodologies and tools of risk evaluation and control.
There are regular follow-ups of the Group's credit risk profile , namely in what concerns the evolution of credit exposures and monitoring of credit losses. Also subject to analysis is the compliance with the approved credit
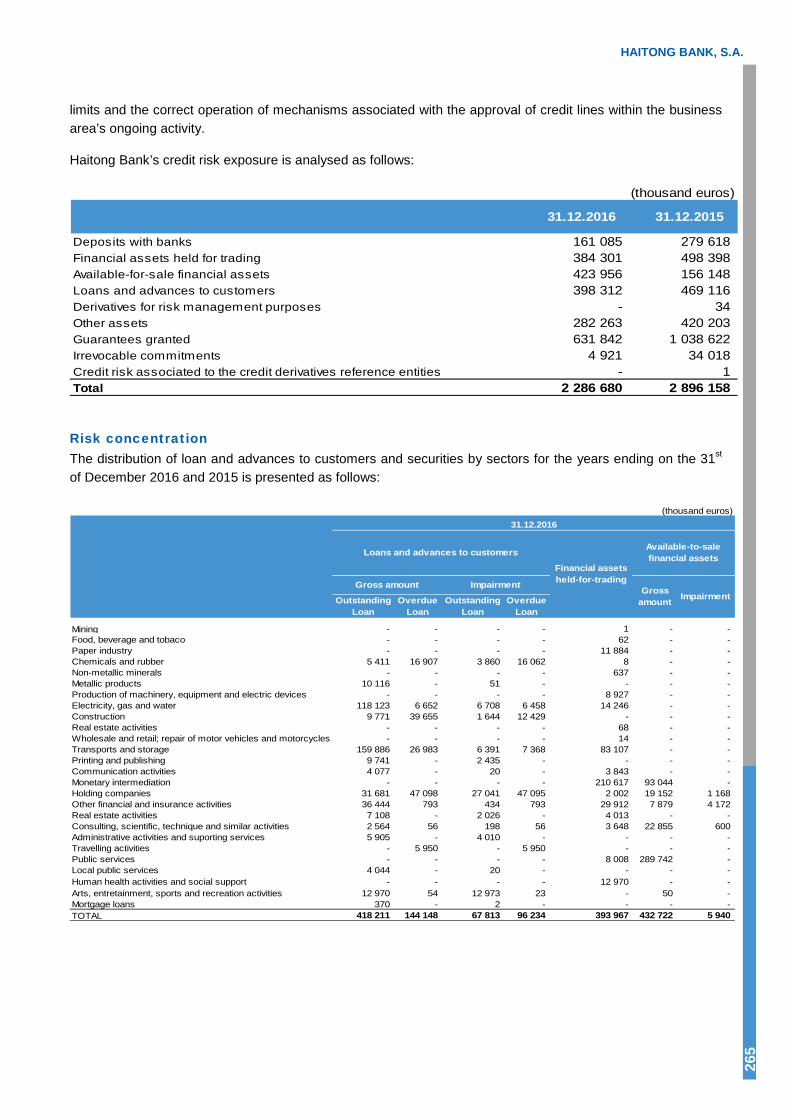
HAITONG BANK, S.A.
265
limits and the correct operation of mechanisms associated with the approval of credit lines within the business area’s ongoing activity.
Haitong Bank’s credit risk exposure is analysed as follows:
(thousand euros)
31.12.2016 31.12.2015
Deposits with banks 161 085 279 618 Financial assets held for trading 384 301 498 398 Available-for-sale financial assets 423 956 156 148 Loans and advances to customers 398 312 469 116 Derivatives for risk management purposes - 34Other assets 282 263 420 203Guarantees granted 631 842 1 038 622 Irrevocable commitments 4 921 34 018 Credit risk associated to the credit derivatives reference entities - 1 Total 2 286 680 2 896 158
Risk concentration The distribution of loan and advances to customers and securities by sectors for the years ending on the 31st of December 2016 and 2015 is presented as follows:
(thousand euros)
Outstanding Loan
Overdue Loan
Outstanding Loan
Overdue Loan
Mining - - - - 1 - - Food, beverage and tobaco - - - - 62 - - Paper industry - - - - 11 884 - - Chemicals and rubber 5 411 16 907 3 860 16 062 8 - - Non-metallic minerals - - - - 637 - - Metallic products 10 116 - 51 - - - - Production of machinery, equipment and electric devices - - - - 8 927 - - Electricity, gas and water 118 123 6 652 6 708 6 458 14 246 - - Construction 9 771 39 655 1 644 12 429 - - - Real estate activities - - - - 68 - - Wholesale and retail; repair of motor vehicles and motorcycles - - - - 14 - - Transports and storage 159 886 26 983 6 391 7 368 83 107 - - Printing and publishing 9 741 - 2 435 - - - - Communication activities 4 077 - 20 - 3 843 - - Monetary intermediation - - - - 210 617 93 044 - Holding companies 31 681 47 098 27 041 47 095 2 002 19 152 1 168 Other financial and insurance activities 36 444 793 434 793 29 912 7 879 4 172 Real estate activities 7 108 - 2 026 - 4 013 - - Consulting, scientific, technique and similar activities 2 564 56 198 56 3 648 22 855 600 Administrative activities and suporting services 5 905 - 4 010 - - - - Travelling activities - 5 950 - 5 950 - - - Public services - - - - 8 008 289 742 - Local public services 4 044 - 20 - - - - Human health activities and social support - - - - 12 970 - - Arts, entretainment, sports and recreation activities 12 970 54 12 973 23 - 50 - Mortgage loans 370 - 2 - - - - TOTAL 418 211 144 148 67 813 96 234 393 967 432 722 5 940
31.12.2016
Available-to-sale financial assets
Gross amount Impairment
Loans and advances to customers
Gross amount Impairment
Financial assets held-for-trading

2016 Annual Report
266
(thousand euros)
Outstanding Loan
Overdue Loan
Outstanding Loan
Overdue Loan
Agriculture - - - - 2 941 - - Food, beverage and tobaco - - - - 12 - - Chemicals and rubber 108 16 907 17 4 884 153 612 186 Metallic products 17 613 - 4 794 - - - - Electricity, gas and water 133 893 4 865 28 172 4 865 18 036 - - Construction 32 682 6 043 5 219 4 135 - - - Real estate activities - - - - 136 - - Transports and storage 203 920 8 376 35 972 3 130 81 412 - - Tourism - 309 - 309 - - - Printing and publishing 9 856 640 1 574 52 - - - Radio and television broadcast 170 - 32 - - - - Communication activities 5 708 - 912 - 837 - - Monetary intermediation - - - - 359 035 110 265 - Holding companies 78 740 2 466 66 298 2 038 7 019 1 268 1 168 Other financial and insurance activities 16 914 623 3 056 623 4 055 10 193 4 344 Real estate activities 37 148 27 208 30 955 25 123 8 384 - - Consulting, scientific, technique and similar activities 234 8 234 8 - 24 430 600 Travelling activities 7 703 5 950 1 230 5 950 - - - Public services - - - - 2 090 19 384 - Local public services 4 533 - 724 - - - - Human health activities and social support - - - - 15 473 - - Arts, entretainment, sports and recreation activities - - - - - 50 - Mortgage loans 358 - 56 - - - - TOTAL 549 580 73 395 179 245 51 117 499 583 166 202 6 298
31.12.2015
Loans and advances to customersFinancial
assets held for trading
Available-to-sale financial assets
Gross amount Impairment Gross amount Impairment
Market Risk Market risk broadly represents the possible loss arising from an adverse change in the value of a financial instrument as consequence of interest rate changes, exchange rates and stock prices.
In what concerns Market risk, the main risk measurement element consists of the calculation of possible losses under adverse market conditions, in which the Value at Risk (VaR) methodology is used. The Haitong Bank Group uses a VaR connected to Historical Simulation, with a confidence interval of 99% and an investment duration of 10 days. Volatilities and correlations are historical, based on an observational period of one year.
(million euros)
December Annual average Maximum Minimum December Annual average Maximum Minimum
Exchange rate 1.43 2.76 8.19 0.86 0.93 1.99 3.31 1.13Interest rate risk 0.57 0.35 0.56 0.20 0.25 0.80 1.28 0.45Shares 0.73 0.75 0.47 0.42 0.10 0.41 1.29 0.16Credit spread 1.81 1.85 1.96 2.16 0.97 0.34 0.20 0.24Covariance -0.73 -1.11 -0.98 -0.76 -0.36 -0.76 -1.77 -0.52
Total 3.81 4.59 10.22 2.88 1.89 2.78 4.31 1.46
31.12.2016 31.12.2015
The Haitong Bank Group closed the year with a VaR of 3.81 million euros for its trading positions, registering an increase of about 102% compared to the previous year.
According to the recommendations of Basel II (Pillar 2) and the Bank of Portugal’s Instruction no. 19/2005, Haitong Bank Group calculates its exposure to interest rate risk based on the methodology of the Bank of International Settlements (BIS), classifying all balance sheets relating to assets and liabilities and all off-balance sheet items, which do not belong on the trading portfolio, by repricing intervals.

HAITONG BANK, S.A.
267
(million euros)
Eligible amounts
Non sensitive
Up to 3 months
3 to 6 months
6 to 12 months
1 to 5 years
More than 5 years
Cash 38 38 - - - - - Loans and advances to banks 139 112 4 - 23 - - Loans and advances to customers 562 169 82 300 11 - - Securities 433 9 366 22 1 18 17Collaterals deposited under compensation contracts 130 - 130 - - - - Off-balance 527 1 85 151 16 233 41
Total 1 829 329 667 473 51 251 58
Central banks deposits 60 - - - - 60 - Other financial institutions deposits 901 27 124 - - 750 - Deposits 266 21 142 21 79 3 - Repo´s with customers 14 1 - - - 13 - Securities issued 103 - 103 - - - - Other equity instruments 84 - - - - - 84Collaterals deposited under compensation contracts 3 - 3 - - - - Off-balance 527 - 85 150 16 233 43
Total 1 958 49 457 171 95 1 059 127
GAP (Assets - Liabilities) ( 129) 280 210 302 ( 44) ( 808) ( 69)
31.12.2016
(million euros)
Eligible amounts
Non sensitive
Up to 3 months
3 to 6 months
6 to 12 months
1 to 5 years
More than 5 years
Cash 118 118 - - - - - Loans and advances to banks 177 35 142 - - - - Loans and advances to customers 623 217 152 236 18 - - Securities 166 9 100 41 - 1 15Collaterals deposited under compensation contracts 233 - 233 - - - - Off-balance 665 271 112 139 12 - 131
Total 1 982 650 739 416 30 1 146
Central banks deposits 61 - - - - 61 - Other financial institutions deposits 813 49 751 - - 13 - Deposits 116 11 98 - 7 - - Repo´s with customers 19 - 19 - - - - Securities issued 213 - 213 - - - - Other equity instruments 4 - - - - - 4Collaterals deposited under compensation contracts 7 - 7 - - - - Off-balance 665 271 112 139 12 - 131
Total 1 898 331 1 200 139 19 74 135
GAP (Assets - Liabilities) 84 319 ( 461) 277 11 ( 73) 11
* the amounts in risk are at nominal value
31.12.2015
The model used to monitor the sensitivity of Haitong Bank to interest rate risk is based on the duration model and considers parallel scenarios.
(million euros)31.12.2016 31.12.2015
Parallel increase of 100 bp
Parallel decrease of 100 bp
Parallel increase of 100 bp
Parallel decrease of 100 bp
As at 31 December 21.7 (21.7) 4.1 (4.1)Average of the year 19.5 (19.5) (0.2) 0.2 Maximum for the year 22.2 (13.6) 4.1 2.6 Minimum for the year 13.6 (22.2) (2.6) (4.1)
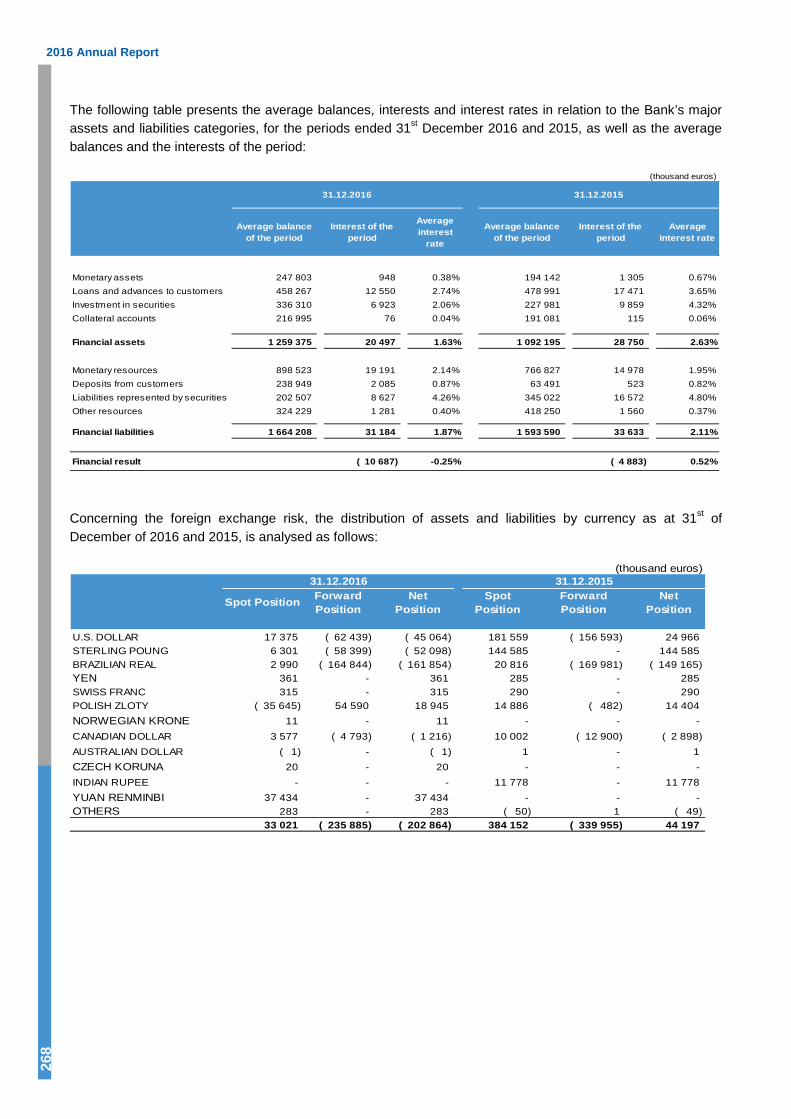
2016 Annual Report
268
The following table presents the average balances, interests and interest rates in relation to the Bank’s major assets and liabilities categories, for the periods ended 31st December 2016 and 2015, as well as the average balances and the interests of the period:
(thousand euros)
Average balance of the period
Interest of the period
Average interest
rate
Average balance of the period
Interest of the period
Average interest rate
Monetary assets 247 803 948 0.38% 194 142 1 305 0.67%Loans and advances to customers 458 267 12 550 2.74% 478 991 17 471 3.65%Investment in securities 336 310 6 923 2.06% 227 981 9 859 4.32%Collateral accounts 216 995 76 0.04% 191 081 115 0.06%
Financial assets 1 259 375 20 497 1.63% 1 092 195 28 750 2.63%
Monetary resources 898 523 19 191 2.14% 766 827 14 978 1.95%Deposits from customers 238 949 2 085 0.87% 63 491 523 0.82%Liabilities represented by securities 202 507 8 627 4.26% 345 022 16 572 4.80%Other resources 324 229 1 281 0.40% 418 250 1 560 0.37%
Financial liabilities 1 664 208 31 184 1.87% 1 593 590 33 633 2.11%
Financial result ( 10 687) -0.25% ( 4 883) 0.52%
31.12.2016 31.12.2015
Concerning the foreign exchange risk, the distribution of assets and liabilities by currency as at 31st of December of 2016 and 2015, is analysed as follows:
(thousand euros)
Spot Position Forward Position
Net Position
Spot Position
Forward Position
Net Position
U.S. DOLLAR 17 375 ( 62 439) ( 45 064) 181 559 ( 156 593) 24 966 STERLING POUNG 6 301 ( 58 399) ( 52 098) 144 585 - 144 585 BRAZILIAN REAL 2 990 ( 164 844) ( 161 854) 20 816 ( 169 981) ( 149 165)YEN 361 - 361 285 - 285 SWISS FRANC 315 - 315 290 - 290 POLISH ZLOTY ( 35 645) 54 590 18 945 14 886 ( 482) 14 404 NORWEGIAN KRONE 11 - 11 - - - CANADIAN DOLLAR 3 577 ( 4 793) ( 1 216) 10 002 ( 12 900) ( 2 898)AUSTRALIAN DOLLAR ( 1) - ( 1) 1 - 1 CZECH KORUNA 20 - 20 - - - INDIAN RUPEE - - - 11 778 - 11 778 YUAN RENMINBI 37 434 - 37 434 - - - OTHERS 283 - 283 ( 50) 1 ( 49)
33 021 ( 235 885) ( 202 864) 384 152 ( 339 955) 44 197
31.12.2016 31.12.2015

HAITONG BANK, S.A.
269
As at 31st of December 2016 and 2015 the exposure of the Group to the public debt of “peripheral” countries within the Euro Area is as follows:
(thousand euros)
Portugal - 272 786 272 786 Spain 53 - 53Greece - 16 957 16 957
53 289 743 289 796 (1) Net values: receivable/payable
31.12.2016
Financial assets at fair value through profit or loss
Available-for-sale financial assets Total
(thousand euros)
Portugal - 3 209 3 209 Spain 54 - 54Greece - 14 919 14 919
54 18 128 18 182 (1) Net values: receivable/payable
31.12.2015
Financial assets at fair value through profit or loss
Available-for-sale financial assets Total
As at 31st of December 2016, in addition to the above mentioned exposure, the Group also has bought protection in the Credit Default Swaps over Portuguese public debt in the amount of 70 000 thousand dollars.
With the exception of loans and advances to customers and held to maturity investments, all presented exposures are recorded in the statement of financial position of the Group at fair-value based on quoted market values or, in relation to derivatives, based on valuation techniques using observable market parameters / prices.
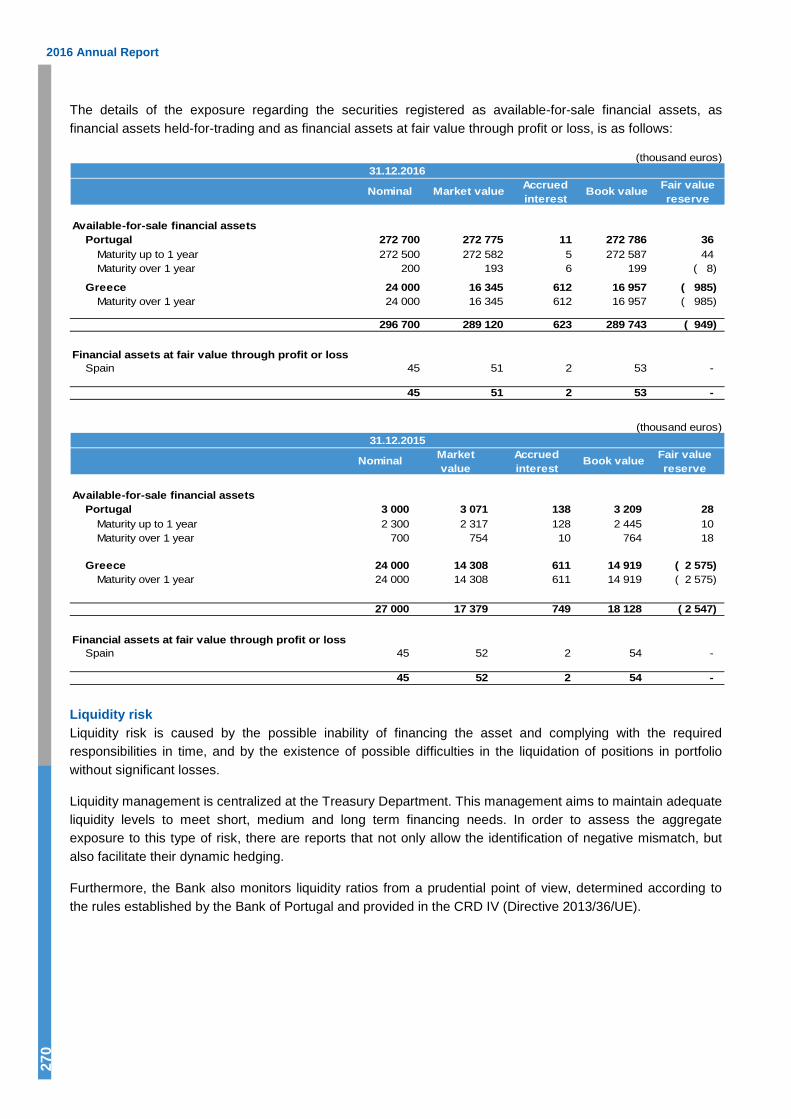
2016 Annual Report 27
0
The details of the exposure regarding the securities registered as available-for-sale financial assets, as financial assets held-for-trading and as financial assets at fair value through profit or loss, is as follows:
(thousand euros)
Nominal Market value Accrued interest
Book value Fair valuereserve
Available-for-sale financial assetsPortugal 272 700 272 775 11 272 786 36
Maturity up to 1 year 272 500 272 582 5 272 587 44 Maturity over 1 year 200 193 6 199 ( 8)
Greece 24 000 16 345 612 16 957 ( 985)Maturity over 1 year 24 000 16 345 612 16 957 ( 985)
296 700 289 120 623 289 743 ( 949)
Financial assets at fair value through profit or lossSpain 45 51 2 53 -
45 51 2 53 -
31.12.2016
(thousand euros)
Nominal Market value
Accrued interest
Book value Fair value reserve
Available-for-sale financial assetsPortugal 3 000 3 071 138 3 209 28
Maturity up to 1 year 2 300 2 317 128 2 445 10 Maturity over 1 year 700 754 10 764 18
Greece 24 000 14 308 611 14 919 ( 2 575)Maturity over 1 year 24 000 14 308 611 14 919 ( 2 575)
27 000 17 379 749 18 128 ( 2 547)
Financial assets at fair value through profit or lossSpain 45 52 2 54 -
45 52 2 54 -
31.12.2015
Liquidity risk Liquidity risk is caused by the possible inability of financing the asset and complying with the required responsibilities in time, and by the existence of possible difficulties in the liquidation of positions in portfolio without significant losses.
Liquidity management is centralized at the Treasury Department. This management aims to maintain adequate liquidity levels to meet short, medium and long term financing needs. In order to assess the aggregate exposure to this type of risk, there are reports that not only allow the identification of negative mismatch, but also facilitate their dynamic hedging.
Furthermore, the Bank also monitors liquidity ratios from a prudential point of view, determined according to the rules established by the Bank of Portugal and provided in the CRD IV (Directive 2013/36/UE).

HAITONG BANK, S.A.
271
As at 31 December 2016, contractual undiscounted cash flows of financial assets and liabilities present the following structure:
(thousand euros)31.12.2016
On demand Up to 3 months 3 months to 1 year 1 to 5 years More than 5 years Undetermined TotalAssetsCash and deposits at central banks 37 522 - - - - - 37 522Deposits at other credit institutions 90 006 - - - - - 90 006Financial assets held-for-trading (Securities) 9 743 2 012 27 415 50 895 4 138 - 94 203Available-for-sale financial assets 2 827 365 861 4 080 34 736 51 088 - 458 591Loans and advances to banks 30 889 3 421 - - 796 - 35 106Loans and advances to customers 19 776 4 555 18 816 66 428 246 641 42 095 398 312Derivatives Instruments 443 849 171 594 72 836 147 751 65 290 - 901 321
634 612 547 444 123 147 299 810 367 952 42 095 2 015 061LiabilitiesResources of central banks - - - 60 000 - - 60 000Resources of other credit institutions 27 158 111 500 0 762 756 - - 901 414Resources of customers 121 413 54 951 99 296 3 159 - - 278 819Debt securities issued - 2 469 7 543 260 132 - - 270 144Financial liabilities held-for-trading (Securities) 12 674 - - - - - 12 674Derivatives Instruments 314 523 167 613 66 761 135 176 60 093 - 744 166Provisions 3 876 - - - - - 3 876
479 644 336 532 173 601 1 221 223 60 093 - 2 271 093
As at 31 December 2015, contractual undiscounted cash flows of financial assets and liabilities present the following structure:
(thousand euros)31.12.2015
On demand Up to 3 months 3 months to 1 year 1 to 5 years More than 5 yearsUndetermined TotalAssetsCash and deposits at central banks 117 657 - - - - - 117 657Deposits at other credit institutions 19 299 - - - - - 19 299Financial assets held-for-trading (Securities) 3 489 3 868 6 962 20 529 3 664 - 38 511Available-for-sale financial assets 3 756 98 610 21 368 15 509 56 470 - 195 713Loans and advances to banks 142 048 - - - 921 - 142 969Loans and advances to customers - 22 303 47 675 93 701 280 046 44 986 488 710Derivatives Instruments 411 413 244 857 74 036 229 664 87 524 - 1 047 494
697 662 369 637 150 041 359 403 428 625 44 986 2 050 354LiabilitiesResources of central banks - - - 61 100 - - 61 100Resources of other credit institutions 47 384 - 0 763 209 - - 810 593Resources of customers 27 045 100 799 7 300 - - - 135 143Debt securities issued - 4 961 7 543 270 764 - - 283 269Financial liabilities held-for-trading (Securities) 24 213 - - - - - 24 213Derivatives Instruments 183 538 243 734 66 449 201 344 81 643 - 776 707Provisions 2 555 - - - - - 2 555
284 735 349 493 81 292 1 296 417 85 684 - 2 097 622
Individual Liquidity Indicators As at 31st of December 2016, the Haitong Bank achieved a liquidity coverage ratio of 568%, being above the legal minimum rate for both December 2016 and December 2018.
Operational Risk Operating Risk corresponds to possible losses produced by failures in the fulfilment of internal proceedings, either by the behaviour of the people, computing systems or external events.
A management system was developed and implemented, seeking to ensure the standardisation, systematisation and repetition of activities regarding identification, monitoring, control and mitigation of operating risk.
Capital management and solvency ratio The main purposes of capital management in the Group are (i) to promote sustainable growth of activity by creating enough capital to withstand the increase of assets, (ii) meet the minimum requirements established by the supervising entities in relation to capital adequacy and (iii) ensure the achievement of the strategic goals set by Group in relation to capital adequacy.
The Executive Committee is responsible for determining what strategy to incorporate in terms of capital management, which is included in the aggregate establishment of the purposes of the Group.

2016 Annual Report 27
2
In prudential terms, the Group is subject to inspection by the Bank of Portugal who, in accordance with the EU Directive on capital adequacy, establishes the necessary regulations in this regard that must be fulfilled by the different institutions under their inspection. These regulations establish a minimum rate for the own funds total in relation to the requirements associated with the undertaken risks, which the institutions must comply with.
At the moment and for reporting purposes related to prudential effects before the supervising authorities, the Group uses the Standard method for handling credit risk and operating risk ("The Standardized Approach" - TSA method).
The following table summarises the capital adequacy of the Haitong Bank S.A. as at 31st of December 2016 and 31st of December 2015:
The assumptions used in the capital adequacy calculations are described in note 8.5.Capital Management - Solvency in the Management Report.
NOTE 43 – SUBSEQUENT EVENTS
Upon the verification of the accumulated results as at December 2016, and during the first weeks of 2017, the Executive Commission decided to take measures in order to reverse the cycle that had been registered hitherto. Therefore, and in addition to the new market positioning with clear strategic changes in comparison with the previous approach, a project focused on the reduction of employees from different countries was authorized, with the corresponding instructions and approval of the shareholder.
NOTE 44 - RECENTLY ISSUED PRONOUNCEMENTS
ACCOUNTING STANDARDS AND RECENT INTERPRETATIONS ADOPTED BY THE BANK
The following were the standards and interpretations (either new or revised) applicable to the activity of Haitong Bank, reflected in the financial statements as at the 31st of December:
● Amendment to IAS 19 – Employee benefits – Employee contributions: Applicable in the EU in the financialyears beginning on or after the 1st of February, 2015. Such amendment specified in which circumstancesemployee contributions for post-employment benefit plans represent a decrease in the costs with short-term benefits.
● Improvements to the International Financial Reporting Standards – 2010-2012 Cycle – Applicable in theEU in the financial years beginning on or after the 1st of February, 2015. Such improvements involved theclarification of certain aspects relating to (i) IFRS 2 – Share-based Payment: defining vesting condition; (ii)IFRS 3 – Business combinations: accounting for contingent payments; (iii) IFRS 8 – Operating segments:disclosures related to the judgement applied concerning the aggregation of segments and clarification onthe need of reconciling the total assets by segment with the value of assets in the financial statements; (iv)IAS 16 – Fixed tangible assets and (v) IAS 38 – Intangible assets: need for proportional reassessment of
31.12.2016 31.12.2015 31.12.2015 - RestatementPhased-in Fully-loaded Phased-in Fully-loaded Phased-in Fully-loaded
CET1 ratio 7.6% 6.7% 15.7% 15.4% 11.0% 10.6%
Tier 1 ratio 10.7% 9.9% 15.7% 15.4% 11.0% 10.6%
Total Capital ratio 10.7% 9.9% 15.7% 15.4% 11.0% 10.6%
HAITONG BANK, S.A.
273
accumulated amortisations in the event of revaluation of fixed assets; and (vi) IAS 24 – Related party disclosures: defines that an entity which provides management services to the Company or its parent company is considered a related party; and (vii) IFRS 13 – Fair value: clarifications concerning the measurement of short-term accounts receivable or payable.
● Improvements to the international standards – 2012-2014 Cycle – Applicable in the EU in the financialyears beginning on or after the 1st of January, 2016. Such improvements involved the clarification ofcertain aspects relating to: (i) IFRS 5 – Non-current assets held for sale and discontinued operations:introduces guidelines on how to act in the event of changes as to the expected method of realisation (saleor distribution to shareholders); (ii) IFRS 7 – Financial instruments: disclosures: clarifies the impacts ofasset tracking contracts within the scope of disclosures associated with ongoing involvement ofderecognised assets and exempts interim financial statements from the disclosures required in respect ofoffsetting financial assets and liabilities; (iii) IAS 19 – Employee benefits: determines that the rate to beused for the purpose of discounting defined benefits shall be determined with reference to high-qualitybonds of companies issued in the currency in which the benefits shall be settled; and (iv) IAS 34 – Interimfinancial reporting: clarification on the procedures to be adopted when the information is available in otherdocuments issued together with the interim financial statements.
● Amendment to IFRS 11 – Joint arrangements: Accounting for acquisitions of interests in jointarrangements – Applicable in the EU in the financial years beginning on or after the 1st of January, 2016.Such amendment has determined the mandatory application of IFRS 3 when the acquired joint operationis a business activity in accordance with IFRS 3. When the joint operation in question is not a businessactivity, the transaction shall be recorded as an asset acquisition. Such amendment is of prospectiveapplication for new acquisitions of interests.
● Amendment to the IAS 1 standard – Presentation of financial statements: “Disclosure Initiative” –Applicable in the EU in the financial years beginning on or after the 1st of January, 2016. Such amendmentclarifies certain aspects related to the disclosures initiative, in particular: (i) the entity shall not hinder thereadability of financial statements through the aggregation of tangible items with intangible items orthrough the aggregation of tangible items of different natures; (ii) disclosures specifically required by theIFRS only have to be provided if the information in question is material; (iii) the lines of the financialstatements specified by IAS 1 may be aggregated or disaggregated, as more relevant to the objectives ofthe financial reporting; (iv) the part of the other comprehensive income resulting from the application of theequity method in associates and joint arrangements shall be presented separately from the remainingelements of other comprehensive income, thereby also segregating items that may be reclassified toresults which will not be reclassified; (v) the structure of the notes must be flexible, and they shall observethe following order:
− a statement of compliance with the IFRS in the first section of the notes;
− a description of the relevant accounting policies in the second section;
− supporting information on the items on the face of the financial statements in the third section; and
− other information in the fourth section
● Amendment to IAS 16 – Fixed tangible assets and IAS 38 – Intangible assets: Acceptable methods ofdepreciation – Applicable in the EU in the financial years beginning on or after the 1st of January, 2016.Such amendment establishes the assumption (which may be refuted) that revenue is not a suitable basisto amortise intangible assets and prohibits the use of revenue as the basis for the amortisation of fixedtangible assets. The presumption established for the amortisation of intangible assets may only be refutedwhen the intangible asset is expressed in terms of generated revenue or when the use of the economicbenefits is highly correlated with the generated revenue.
● Amendment to IAS 27 – Application of the equity method in separate financial statements – Applicable inthe EU in the financial years beginning on or after the 1st of January, 2016. Such amendment introducesthe possibility of measuring the interests in subsidiaries, joint arrangements and associates in separate

2016 Annual Report 27
4
financial statements under the equity method, in addition to the current measurement methods. This amendment applies retrospectively.
● Amendments to IFRS 10 – Consolidated financial statements, IFRS 12 - Disclosure of interests in otherentities and IAS 28 – Investments in associates and joint ventures – Applicable in the EU in the financialyears beginning on or after the 1st of January, 2016. Such amendments involve the clarification of severalaspects related to the application of the exception of consolidation by investment entities.
The adoption of the abovementioned standards, interpretations, amendments and revisions has not produced significant effects in the financial statements of Haitong Bank in the financial year ended as at the 31st of December, 2016.
STANDARDS, AMENDMENTS AND INTERPRETATIONS ISSUED BUT NOT YET EFFECTIVE FOR THE
BANK
The following standards, interpretations, amendments and revisions, of mandatory application in future financial years, have been endorsed by the European Union up to the date of approval of the financial statements herein:
● IFRS 9 – Financial instruments (2009) and subsequent amendments – Applicable in the EU in the financialyears beginning on or after the 1st of January, 2018. Such standard is part of the project of revision of IAS39 and lays down the new requirements regarding the classification and measurement of financial assetsand liabilities, the impairment calculation methodology and the application of hedge accounting rules.
● IFRS 15 – Revenue from contracts with customers – Applicable in the EU in the financial years beginningon or after the 1st of January, 2018. This standard introduces a structure for revenue recognition based onprinciples and on a model to be applied to all contracts entered into with customers, thereby replacingstandards IAS 18 - Revenue, IAS 11 - Construction contracts; IFRIC 13 – Customer loyalty programmes;IFRIC 15 – Agreements for the construction of real estate; IFRIC 18 – Transfers of Assets from Customersand SIC 31 – Revenue – Barter transactions involving advertising services.
The Bank started a process of assessment of the potential effects of the aforesaid standards. However, given the nature of the Bank’s activities, it is expected that such standard has significant impacts on the Bank’s financial statements.
STANDARDS, INTERPRETATIONS, AMENDMENTS AND REVISIONS NOT YET ENDORSED BY THE
EUROPEAN UNION
The following standards, interpretations, amendments and revisions, of mandatory application in future
financial years, have not been endorsed by the European Union up to the date of approval of the financial
statements herein:
● IFRS 14 – Regulatory assets: This standard determines the reporting requirements by entities which adoptthe IFRS applicable to regulatory assets for the first time.
● IFRS 16 – Leases: This standard introduces the principles of recognition and measurement of leases,thereby replacing IAS 17 – Leases. Such standard defines a single model of accounting for lease contractswhich results in the recognition by the lessee of assets and liabilities for all lease contracts, except forleases of a duration of less than 12 months or for leases involving low value assets. Lessors shall continueto classify leases as operating or financial, wherefore IFRS 16 will not imply substantial changes for suchentities in respect of the stipulations of IAS 17.
HAITONG BANK, S.A.
275
● Amendments to IFRS 10: Consolidated financial statements and IAS 28 – Investments in associates andjoint ventures: Such amendments eliminate a conflict between the referred to standards, concerning thesale or the contribution of assets between the investor and the associate or between the investor and thejoint venture.
● Amendments to IAS 12 – Income taxes: Such amendments clarify the conditions for the recognition andmeasurement of tax assets resulting from unrealised losses.
● Amendments to IAS 7 – Statement of cash flows: Such amendments introduce additional disclosuresassociated with cash flows from financing activities.
● Amendments to IFRS 15 – Revenue from contracts with customers: Such amendments introduce severalclarifications in the standard in order to remove the possibility of different interpretations of varioussubjects arising.
● Amendments to IFRS 2 – Share-based payment: Such amendments introduce several clarifications in thestandard concerning: (i) the recording of cash-settled share-based payment transactions; (ii) the recordingof changes in share-based payment transactions (from cash-settled to equity-settled); (iii) the classificationof transactions having characteristics of an offset settlement.
● Amendments to IFRS 4 – Insurance contracts: Such amendments provide guidelines on theimplementation of IFRS 4 together with IFRS 9.
● Improvements to the international financial reporting standards – 2014-2016 Cycle – Such improvementsinvolve the clarification of certain aspects related to: (i) IFRS 1 – First-time adoption of internationalfinancial reporting standards: eliminates certain short-term exemptions; (ii) IFRS 12 – Disclosure ofinterests in other entities: clarifies the standard’s scope concerning the application thereof to interestsclassified as held for sale or held for distribution under IFRS 5; (iii) IAS 28 – Investments in associates andjoint ventures: introduces clarifications on the fair value measurement by investment results, suchinvestments having been made in associates or joint ventures, held by venture capital companies orinvestment funds.
● IFRIC 22: Foreign currency transactions and advance consideration. Such interpretations sets out the dateof the initial recognition of the advance consideration or of the deferred income as the transaction date forthe purpose of determining the exchange rate of the revenue recognition.
The above standards have not yet been endorsed by the European Union and, as such, have not been implemented by Haitong Bank in the financial year ended as at the 31st of December, 2016.
The Bank does not expect that the implementation of such amendment will have significant impact on its financial statements.

2016 Annual Report 27
6
This Page Intentionally Left Blank
HAITONG BANK, S.A.
277
Report and Opinion of the Supervisory Board
Haitong Bank, S.A.
for financial year 2016
To the Shareholder of Haitong Bank, S.A.,
In accordance with the applicable legislation, we hereby present our report on the audit performed by the
Supervisory Board to the Management Report, the individual and the consolidated financial statements and the
proposal for the distribution of the year’s results presented by the Board of Directors of Haitong Bank
(hereinafter Haitong) for the year ended 31 December 2016.
During the financial year of 2016 Haitong’s Supervisory Board, as part of its designated functions, monitored,
in accordance with the law and the company’s articles of association, the development of Haitong’s
management and business activities, namely:
(i) assessed the adequacy and effectiveness of the risk management, internal control and internal audit
systems;
(ii) attended Board of Directors meetings whenever invited;
(iii) reviewed management information documents submitted to the Supervisory Board by the Board of
Directors;
(iv) monitored the verification of the accounting records and underlying support documents;
(v) assessed the accounting policies and valuation criteria adopted by Haitong; and
(vi) held meetings with the Statutory Auditor, whenever necessary, on the assessment of the accounting
policies and valuation criteria adopted by Haitong, which always provided the information required.
Within this, at an institutional level, Haitong’s Supervisory Board spoke with both entities, Amável
Calhau, Ribeiro da Cunha & Associados – Sociedade de Revisores Oficiais de Contas and Deloitte &
Associados, SROC, S.A..

2016 Annual Report 27
8
In accordance with the applicable legislation, the Supervisory Board also assessed the Auditor’s Report
prepared by the Statutory Auditor (Deloitte & Associados, SROC, S.A.) on the individual and consolidated
financial statements and was made aware of the individual and consolidated Statutory Audit Certification
(“Certificação Legal de Contas”) on the referred financial statements for financial year 2016, with which the
Supervisory Board agrees.
The Supervisory Board also analysed the Management Report submitted by the Board of Directors and
considers that the report complies with the applicable legal and statutory requirements and elucidates the main
aspects of Haitong’s activities in 2016, both in individual and in consolidated terms.
The Supervisory Board highlight’s the following:
• Haitong’s Individual and Consolidated Financial Statements have been restated for the year of 2015,
which have been disclosed on note 41 of the corresponding annual reports. This restatement
includes the adjustment of the value of the goodwill associated to the subsidiary Haitong (UK)
Limited;
• The qualified opinion of the Statutory Auditor, as an emphasis, noting the need to increase Haitong’s
solvency in order to ensure that the going concern is not at stake. This increase is dependent of a
capital increase, which was already supported by the Shareholder, by the amount of EUR 418.5
million, as disclosed in the Management Report. The Board expectation is that such capital increase
will occur during the first half of 2017; and
• The description of the relevant audit issues and other subjects for both individual and consolidated
which are reported in the Statutory Audit Certification and Audit Report;

HAITONG BANK, S.A.
279
In light of the above, it is the opinion of the Supervisory Board that the following should be approved:
• The Management Report and remaining individual and consolidated reporting documents relative
to the financial year ended on 31 December 2016;
• The proposal submitted by the Board of Directors on the allocation of the net loss for the year
2016, in the amount of EUR 151,280,504.05.
Lisbon, 26 April 2017
THE SUPERVISORY BOARD
José Manuel Macedo Pereira
(Chairman)
Tito Manuel das Neves Magalhães Basto
Mário Paulo Bettencourt de Oliveira
2016 Annual Report 28
0
Declaration of Conformity with the Financial Information Reported
The present declaration is submitted under the terms of Article 245 (1-c)) of the Portuguese Securities Code.
The Supervisory Board hereby declares that, to the best of its knowledge:
• The information referred to in Article 245 (1-a)) of the Portuguese Securities Code as at 31
December 2016 was prepared in accordance with the applicable accounting standards, providing a
true and fair view of the assets and liabilities, the financial situation and the results of Haitong and
the companies included within its consolidated scope; and
• The management report faithfully details the evolution of the business and the performance and
position of Haitong and the companies included within its consolidation scope, and contains a
description of the main risks and uncertainties faced within the framework of ongoing activities.
Lisbon, 26 April 2017
THE SUPERVISORY BOARD
José Manuel Macedo Pereira
(Chairman)
Tito Manuel das Neves Magalhães Basto
Mário Paulo Bettencourt de Oliveira
HAITONG BANK, S.A.
281
STATUTORY AUDIT CERTIFICATION AND AUDIT REPORT
(Amounts expressed in thousands of euros – t.euros)
(Translation of a report originally issued in Portuguese – in the case of discrepancies, the original version in Portuguese prevails)
REPORT ON THE AUDIT OF THE SEPARATE FINANCIAL STATEMENTS
Opinion
We have audited the accompanying separate financial statements of Haitong Bank, S.A. (“the Bank”), which comprise the separate balance sheet as at 31 December 2016 (that presents a total of 2,185,471 t.euros and total equity of 299,909 t.euros, including a net loss of 151,281 t.euros), the separate income statement, the
separate statement of comprehensive income, the separate statement of changes in equity and the separate statement of cash flows for the year then ended, and the accompanying notes to the separate financial statements, which include a summary of the significant accounting policies.
In our opinion, the accompanying separate financial statements present true and fairly, in all material respects, the separate financial position of Haitong Bank, S.A. as at 31 December 2016 and its separate financial performance and cash flows for the year then ended in accordance with the International Financial Reporting Standards as endorsed by the European Union (IFRS).
Basis for opinion
We conducted our audit in accordance with International Standards on Auditing (ISAs) and further standards,
technical and ethical directives of the Portuguese Institute of Statutory Auditors (“Ordem dos Revisores Oficiais de Contas”). Our responsibilities under those standards are described in the “Auditor’s responsibilities for the audit of the separate financial statements” section below. We are independent from the Bank in the terms of the law and we have fulfilled the other ethical requirements under the ethical code of the Portuguese Institute of Statutory Auditors (“Ordem dos Revisores Oficiais de Contas”).
We believe that the audit evidence we have obtained is sufficient and appropriate to provide a basis for our opinion.
Emphasis of Matter
As disclosed in the Management Report, at the date of approval of the Bank's financial statements it was the Board of Directors’ expectation that the shareholder would approve a capital increase, thus strengthening the Bank's solvency and promoting the growth of its activity. On 30 March 2017, Haitong Securities Company Limited, the indirect holder of the Bank's total capital, publicly announced the approval of the subscription of a capital increase of the Bank of 418.5 million EURO, of which 80 million EURO through the conversion into share capital of subordinated financial instruments already recorded as equity instruments (Note 36). This capital increase shall be preceded by the required regulatory approvals, being the Bank's Board of Directors’ expectation that the transaction will be completed by the end of the first semester of 2017.
Our opinion is not qualified in respect of this matter.

2016 Annual Report 282
Page 2 of 8
Key audit matters
Key audit matters are those matters that, in our professional judgment, were of most significance in our audit of the separate financial statements of the current period. Those matters were addressed in the context
of our audit of the separate financial statements as a whole, and in forming our opinion thereon, but we do not provide a separate opinion on those matters.
Description of the most significant risks of material misstatement identified
Summary of the auditor’s response to the most significant assessed risks of material misstatement
Impairment for investments in subsidiaries and associates (Notes 2.24, 3.6 and 26)
As of 31 December 2016 the caption “Investments in subsidiaries and associates” presents a balance of 236,581 t.euros net of impairment of 165,917 t.euros.
As disclosed in Note 26 to the separate financial statements, in 2016 an impairment loss of 165,383 t.euros was recorded for the investment in the subsidiary Haitong (UK) Limited (of which 131,392 t.euros within the scope of the restatement described in Note 41).
Investments in subsidiaries and associates are recorded at acquisition cost less impairment losses.
When impairment triggers are identified, these investments are subject to impairment assessment, based essentially on profit forecasts of the investees. The estimation of future results and the determination of the rate at which they should be discounted imply a high degree of judgment by Management. For this reason, this was considered a key audit matter.
We analysed the relevant control activities implemented by the Bank in the process of determination of impairment losses for the investments in subsidiaries and associates.
We analysed the reasonableness of the impairment tests prepared by the Bank for the subsidiaries and associates where it identified impairment triggers, namely through a critical analysis of profit forecasts and of the main assumptions made by Management and sensitivity analyses of the most critical variables. In our work we involved internal
valuation experts.
We reviewed the disclosures relating to investments in subsidiaries and associates, considering the applicable accounting framework.

HAITONG BANK, S.A.
283
Page 3 of 8
Description of the most significant risks of material misstatement identified
Summary of the auditor’s response to the most significant assessed risks of material
misstatement
Impairment for loans to customers (Notes 2.4, 3.3, 21 and 42)
As of December 31, 2016, the balance of "Loans and advances to customers" amounts to 398.312 t.euros, net of impairment of 164.047 t.euros, being also recorded provisions of 81,132 t.euros for guarantees and commitments assumed by the Bank (together “impairment losses for loans”).
The Bank determines the impairment losses for loans granted in accordance with the methodologies described in Note 2.4. to the separate financial statements. Given the characteristics of the Bank’s loan portfolio, a very significant portion of the clients are subject to individual impairment analysis.
Since the determination of impairment through individual analysis involves the realization by the Bank of estimates that incorporate a significant level of judgment, namely in the identification of
impairment triggers and in estimating the recoverable amount, this was considered a key audit matter.
We analysed the relevant control activities implemented by the Bank in the process of determining impairment losses for its loan portfolio through individual analysis.
For a sample of clients, we analysed the reasonableness of the estimated impairment losses
recorded in the financial statements based on the review of the Bank's judgments on the economic and financial situation of clients, perspectives on the evolution of their activity and valuation of existing collaterals.
We reviewed the disclosures related to impairment for loans to customers, considering the applicable accounting framework.
Recoverability of deferred tax assets (Notes 2.16, 3.4 and 33)
As of 31 December 2016, the Bank has recorded deferred tax assets in the amount of 129.337 t.euros, essentially related to:
(i) temporary differences arising from impairmentfor loans to customers (86,746 t.euros) andemployee benefits (9,227 t.euros);
(ii) tax losses carried forward (31,432 t.euros),essentially originated in 2015 and 2016, thatcan be used within a period of 12 years, notexceeding 70% of the taxable profit in each ofthose years.
In accordance with IAS 12 - Income Taxes, deferred tax assets can only be recorded up to the extent
that it is probable that future taxable profit will be available against which they can be utilised.
The Bank prepared a forecast of its taxable profit to assess the recoverability of deferred tax assets. This estimate is judgmental by nature and depends on the assumptions made by the Management to estimate the evolution of pre-tax profit and its interpretation of the tax legislation.
To this extent, the recoverability of deferred tax assets is dependent on the Bank's ability to
generate the estimated results.
We analysed the relevant control activities implemented by the Bank in the process of assessing the recoverability of deferred tax assets.
We analysed the main assumptions considered by the Bank to estimate the evolution of pre-tax profits in the period covered by its analysis.
We reviewed the reasonableness of the interpretation of the relevant tax legislation considered by the Bank in the estimation of future taxable profits. For this purpose, we involved our internal specialists in this area.
We analysed the reasonableness of the evaluation of the recoverability of deferred tax assets prepared by the Bank, taking into account the understanding of the assumptions and the review of the interpretation of the tax legislation described above.
We reviewed the disclosures related to deferred tax assets, considering the applicable accounting framework.
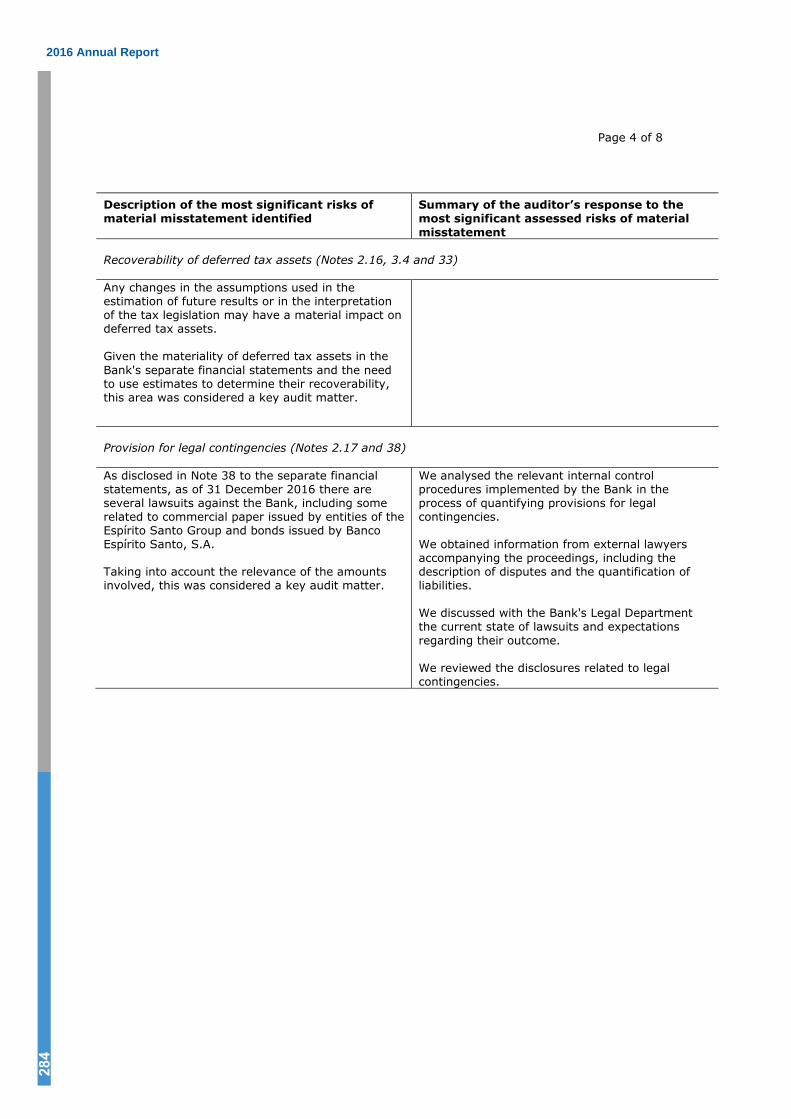
2016 Annual Report 284
Page 4 of 8
Description of the most significant risks of material misstatement identified
Summary of the auditor’s response to the most significant assessed risks of material
misstatement
Recoverability of deferred tax assets (Notes 2.16, 3.4 and 33)
Any changes in the assumptions used in the estimation of future results or in the interpretation of the tax legislation may have a material impact on deferred tax assets.
Given the materiality of deferred tax assets in the
Bank's separate financial statements and the need to use estimates to determine their recoverability, this area was considered a key audit matter.
Provision for legal contingencies (Notes 2.17 and 38)
As disclosed in Note 38 to the separate financial statements, as of 31 December 2016 there are several lawsuits against the Bank, including some related to commercial paper issued by entities of the Espírito Santo Group and bonds issued by Banco Espírito Santo, S.A.
Taking into account the relevance of the amounts involved, this was considered a key audit matter.
We analysed the relevant internal control procedures implemented by the Bank in the process of quantifying provisions for legal contingencies.
We obtained information from external lawyers accompanying the proceedings, including the description of disputes and the quantification of liabilities.
We discussed with the Bank's Legal Department the current state of lawsuits and expectations
regarding their outcome.
We reviewed the disclosures related to legal contingencies.
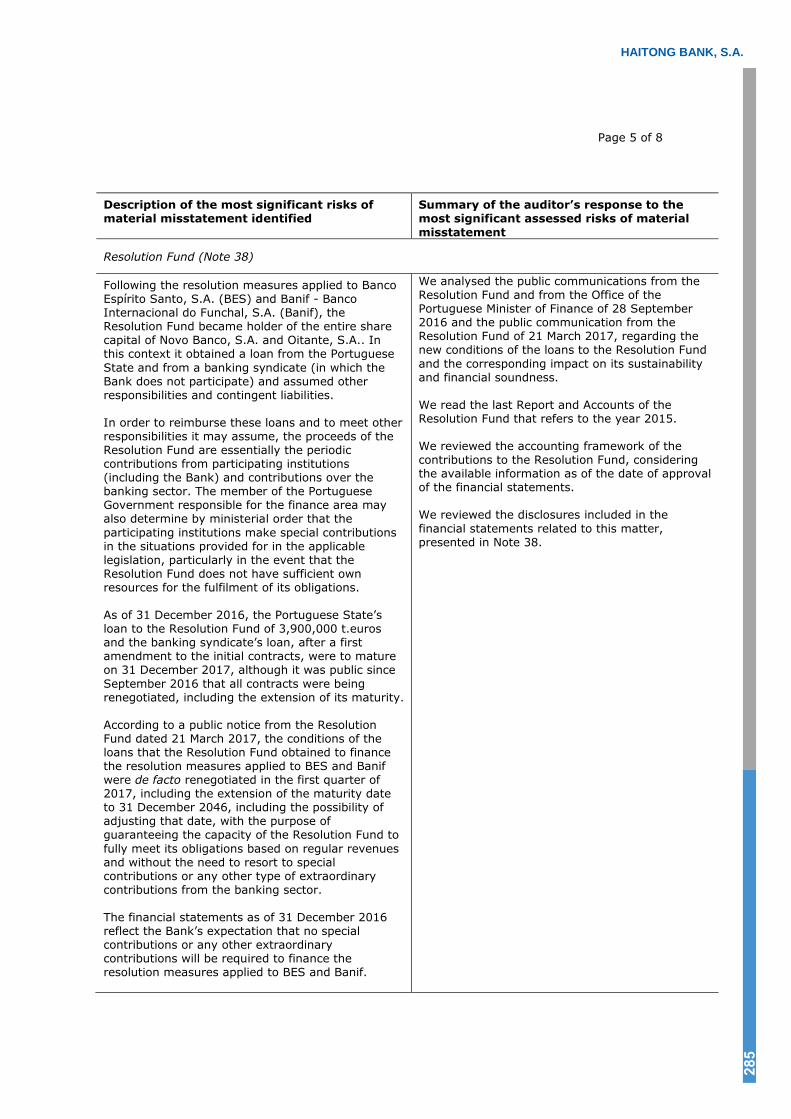
HAITONG BANK, S.A.
285
Page 5 of 8
Description of the most significant risks of material misstatement identified
Summary of the auditor’s response to the most significant assessed risks of material
misstatement
Resolution Fund (Note 38)
Following the resolution measures applied to Banco Espírito Santo, S.A. (BES) and Banif - Banco Internacional do Funchal, S.A. (Banif), the Resolution Fund became holder of the entire share capital of Novo Banco, S.A. and Oitante, S.A.. In this context it obtained a loan from the Portuguese
State and from a banking syndicate (in which the Bank does not participate) and assumed other responsibilities and contingent liabilities.
In order to reimburse these loans and to meet other responsibilities it may assume, the proceeds of the Resolution Fund are essentially the periodic contributions from participating institutions (including the Bank) and contributions over the banking sector. The member of the Portuguese Government responsible for the finance area may also determine by ministerial order that the
participating institutions make special contributions in the situations provided for in the applicable legislation, particularly in the event that the Resolution Fund does not have sufficient own resources for the fulfilment of its obligations.
As of 31 December 2016, the Portuguese State’s loan to the Resolution Fund of 3,900,000 t.euros and the banking syndicate’s loan, after a first amendment to the initial contracts, were to mature on 31 December 2017, although it was public since
September 2016 that all contracts were being renegotiated, including the extension of its maturity.
According to a public notice from the Resolution Fund dated 21 March 2017, the conditions of the loans that the Resolution Fund obtained to finance the resolution measures applied to BES and Banif were de facto renegotiated in the first quarter of 2017, including the extension of the maturity date to 31 December 2046, including the possibility of adjusting that date, with the purpose of guaranteeing the capacity of the Resolution Fund to
fully meet its obligations based on regular revenues and without the need to resort to special contributions or any other type of extraordinary contributions from the banking sector.
The financial statements as of 31 December 2016 reflect the Bank’s expectation that no special contributions or any other extraordinary contributions will be required to finance the resolution measures applied to BES and Banif.
We analysed the public communications from the Resolution Fund and from the Office of the Portuguese Minister of Finance of 28 September 2016 and the public communication from the Resolution Fund of 21 March 2017, regarding the new conditions of the loans to the Resolution Fund
and the corresponding impact on its sustainability and financial soundness.
We read the last Report and Accounts of the Resolution Fund that refers to the year 2015.
We reviewed the accounting framework of the contributions to the Resolution Fund, considering the available information as of the date of approval of the financial statements.
We reviewed the disclosures included in the
financial statements related to this matter, presented in Note 38.

2016 Annual Report 286
Page 6 of 8
Other matters
The accompanying financial statements refer to the Bank’s standalone activity and were prepared for approval and filling according to the applicable legislation. As indicated in Note 2.24 to the separate financial
statements, investments in subsidiaries and associates are recorded at cost less impairment losses. The accompanying financial statements do not include the effect of the full consolidation (nor of the application of the equity method), which will be made in consolidated financial statements to be approved and published separately. Additional information on subsidiary and associated entities is given in Note 26 to the separate financial statements.
As mentioned in section "Report on other legal and regulatory requirements - About the additional elements included in article 10 of Regulation (UE) 537/2014" below, we were appointed Statutory Auditors of the Bank for the first time at the Shareholders General meeting held on 16 November 2016 to conclude the ongoing mandate until the end of 2016. The comparative separate financial statements for the year ended December 31, 2015 are presented by the Bank in order to comply with requirements for the presentation of accounts. These separate financial statements, without considering the effects resulting from the restatement
described in Note 41 to the separate financial statements, were audited by other Statutory Auditor and the Statutory Audit Certification and Audit Report thereon, dated 29 March 2016, included four emphases of matter.
Responsibilities of Management and Supervisory Body for the separate financial statements
Management is responsible for:
- the preparation of separate financial statements that present true and fairly the financial position, thefinancial performance and the cash flows of the Bank in accordance with the International FinancialReporting Standards as endorsed by the European Union (IFRS);
- the preparation of the management report, including the corporate governance report, under theapplicable legal and regulatory terms;
- the implementation and maintenance of an appropriate internal control system that allows thepreparation of financial statements that are free from material misstatements due to fraud or error;
- the adoption of accounting principles and criteria appropriate in the circumstances; and
- the evaluation of the Bank’s ability to continue as a going concern, disclosing, whenever applicable, thematters that may cast significant doubt on the continuity of its operations.
The Supervisory Body is responsible for overseeing the Bank’s individual financial closing and reporting process.
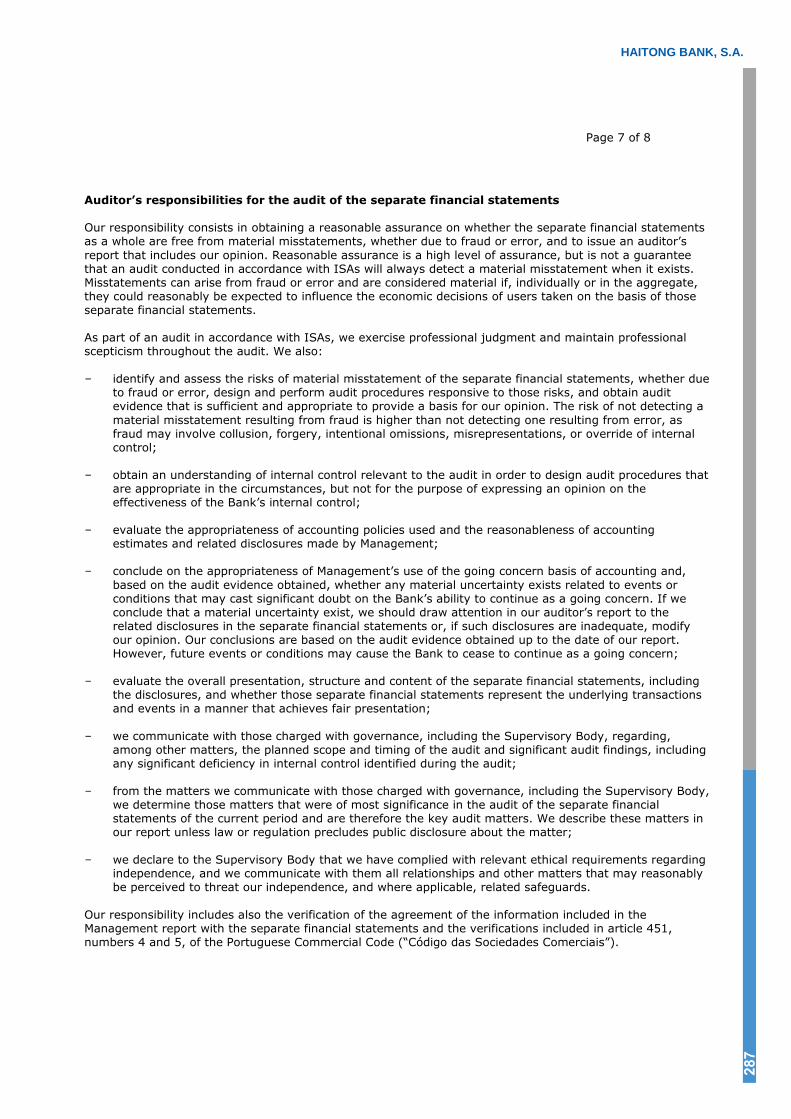
HAITONG BANK, S.A.
287
Page 7 of 8
Auditor’s responsibilities for the audit of the separate financial statements
Our responsibility consists in obtaining a reasonable assurance on whether the separate financial statements as a whole are free from material misstatements, whether due to fraud or error, and to issue an auditor’s
report that includes our opinion. Reasonable assurance is a high level of assurance, but is not a guarantee that an audit conducted in accordance with ISAs will always detect a material misstatement when it exists. Misstatements can arise from fraud or error and are considered material if, individually or in the aggregate, they could reasonably be expected to influence the economic decisions of users taken on the basis of those separate financial statements.
As part of an audit in accordance with ISAs, we exercise professional judgment and maintain professional scepticism throughout the audit. We also:
- identify and assess the risks of material misstatement of the separate financial statements, whether dueto fraud or error, design and perform audit procedures responsive to those risks, and obtain auditevidence that is sufficient and appropriate to provide a basis for our opinion. The risk of not detecting a
material misstatement resulting from fraud is higher than not detecting one resulting from error, asfraud may involve collusion, forgery, intentional omissions, misrepresentations, or override of internalcontrol;
- obtain an understanding of internal control relevant to the audit in order to design audit procedures thatare appropriate in the circumstances, but not for the purpose of expressing an opinion on theeffectiveness of the Bank’s internal control;
- evaluate the appropriateness of accounting policies used and the reasonableness of accountingestimates and related disclosures made by Management;
- conclude on the appropriateness of Management’s use of the going concern basis of accounting and,
based on the audit evidence obtained, whether any material uncertainty exists related to events orconditions that may cast significant doubt on the Bank’s ability to continue as a going concern. If weconclude that a material uncertainty exist, we should draw attention in our auditor’s report to therelated disclosures in the separate financial statements or, if such disclosures are inadequate, modifyour opinion. Our conclusions are based on the audit evidence obtained up to the date of our report.However, future events or conditions may cause the Bank to cease to continue as a going concern;
- evaluate the overall presentation, structure and content of the separate financial statements, includingthe disclosures, and whether those separate financial statements represent the underlying transactionsand events in a manner that achieves fair presentation;
- we communicate with those charged with governance, including the Supervisory Body, regarding,among other matters, the planned scope and timing of the audit and significant audit findings, includingany significant deficiency in internal control identified during the audit;
- from the matters we communicate with those charged with governance, including the Supervisory Body,we determine those matters that were of most significance in the audit of the separate financialstatements of the current period and are therefore the key audit matters. We describe these matters inour report unless law or regulation precludes public disclosure about the matter;
- we declare to the Supervisory Body that we have complied with relevant ethical requirements regardingindependence, and we communicate with them all relationships and other matters that may reasonablybe perceived to threat our independence, and where applicable, related safeguards.
Our responsibility includes also the verification of the agreement of the information included in the Management report with the separate financial statements and the verifications included in article 451, numbers 4 and 5, of the Portuguese Commercial Code (“Código das Sociedades Comerciais”).

2016 Annual Report 288
Page 8 of 8
REPORT ON OTHER LEGAL AND REGULATORY REQUIREMENTS
About the Management report
In compliance with article 451, number 3.e) of the Portuguese Commercial Code (“Código das Sociedades Comerciais”), we conclude that the Management report was prepared in accordance with the current applicable law and regulations and the information included therein is in agreement with the audited separate financial statements, and considering our knowledge of the Bank, we did not identify material misstatements.
About the Corporate governance report
In compliance with article 451, number 4, of the Portuguese Commercial Code (“Código das Sociedades Comerciais”), we conclude that the corporate governance report includes the elements required to the Bank under the terms of article 245-A of the Portuguese Securities Code (“Código dos Valores Mobiliários”), and we have not identified any material mistakes in the information disclosed in such report to comply with the
requirements of items c), d), f), h), i) and m) of the referred article.
About the additional elements included in article 10 of Regulation (UE) 537/2014
In compliance with article 10 of Regulation (UE) 537/2014 of the European Parliament and of the Council of 16 April 2014, and beyond the key audit matters mentioned above, we further report the following:
- We have been appointed auditors of the Bank for the first time in the shareholders’ general meetingheld on 16 November 2016, to conclude the ongoing mandate until the end of 2016.
- Management confirmed to us that they are unaware of the occurrence of any fraud or suspected fraudwith a material effect in the separate financial statements. As part of the planning and execution of our
audit in accordance with ISAs, we kept professional scepticism and designed audit procedures torespond to the risk of material misstatements in the separate financial statements due to fraud. As aresult of our work, we have not identified any material misstatement in the separate financialstatements due to fraud.
- We confirm that the audit opinion issued is consistent with the additional report that we prepared anddelivered to the Bank’s Supervisory Body as at 26 April 2017.
- We declare that we have not provided any prohibited services under the terms of article 77, number 8,of the Legal Regime of the Portuguese Statutory Auditors (“Estatuto da Ordem dos Revisores Oficiais deContas”) and that we kept our independence from the Bank during the execution of the audit.
Lisbon, 26 April 2017
________________________________________ Deloitte & Associados, SROC S.A. Represented by João Carlos Henriques Gomes Ferreira
EXPLANATION ADDED FOR TRANSLATION
(This report is a translation of a report originally issued in Portuguese. Therefore according to Deloitte & Associados, SROC S.A. internal procedures, the report is not to be signed. In the event of discrepancies, the Portuguese language version prevails.)

HAITONG BANK, S.A.
289
ANNEXES
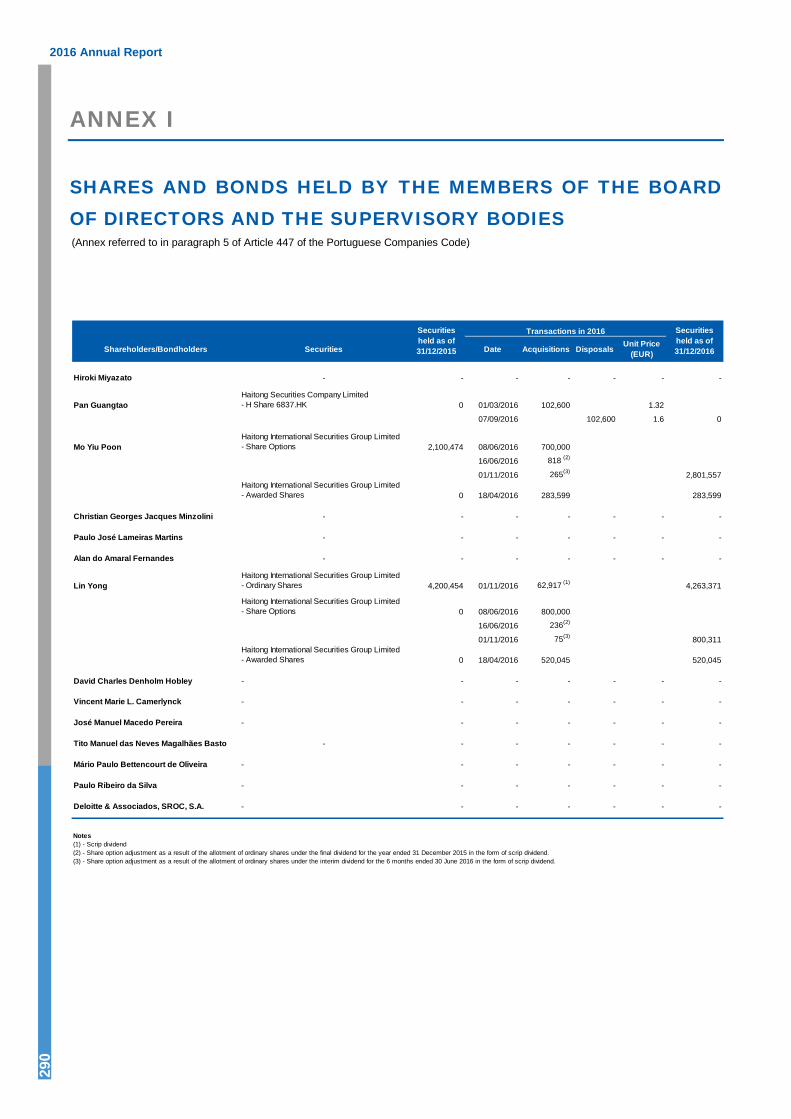
2016 Annual Report 290
ANNEX I
SHARES AND BONDS HELD BY THE MEMBERS OF THE BOARD OF DIRECTORS AND THE SUPERVISORY BODIES (Annex referred to in paragraph 5 of Article 447 of the Portuguese Companies Code)
Shareholders/Bondholders Securities Date Acquisitions Disposals Unit Price(EUR)
Hiroki Miyazato - - - - - - -
Pan GuangtaoHaitong Securities Company Limited- H Share 6837.HK 0 01/03/2016 102,600 1.32
07/09/2016 102,600 1.6 0
Mo Yiu Poon Haitong International Securities Group Limited- Share Options 2,100,474 08/06/2016 700,000
16/06/2016 818 (2)
01/11/2016 265(3) 2,801,557Haitong International Securities Group Limited- Awarded Shares 0 18/04/2016 283,599 283,599
Christian Georges Jacques Minzolini - - - - - - -
Paulo José Lameiras Martins - - - - - - -
Alan do Amaral Fernandes - - - - - - -
Lin YongHaitong International Securities Group Limited- Ordinary Shares 4,200,454 01/11/2016 62,917 (1) 4,263,371
Haitong International Securities Group Limited- Share Options 0 08/06/2016 800,000
16/06/2016 236(2)
01/11/2016 75(3) 800,311Haitong International Securities Group Limited- Awarded Shares 0 18/04/2016 520,045 520,045
David Charles Denholm Hobley - - - - - - -
Vincent Marie L. Camerlynck - - - - - - -
José Manuel Macedo Pereira - - - - - - -
Tito Manuel das Neves Magalhães Basto - - - - - - -
Mário Paulo Bettencourt de Oliveira - - - - - - -
Paulo Ribeiro da Silva - - - - - - -
Deloitte & Associados, SROC, S.A. - - - - - - -
Notes(1) - Scrip dividend
Securities held as of 31/12/2015
Securities held as of 31/12/2016
Transactions in 2016
(2) - Share option adjustment as a result of the allotment of ordinary shares under the final dividend for the year ended 31 December 2015 in the form of scrip dividend.(3) - Share option adjustment as a result of the allotment of ordinary shares under the interim dividend for the 6 months ended 30 June 2016 in the form of scrip dividend.
HAITONG BANK, S.A.
291
ANNEX II
SHAREHOLDERS (Annex referred to in paragraph 4 of Article 448 of the Portuguese Commercial Companies Code)
Shareholder % of Share Capital
Haitong International Holdings Limited 100%

2016 Annual Report 292
ANNEX III
CORPORATE GOVERNANCE STRUCTURES AND PRACTICES (Article 245 – (4) of the Portuguese Securities Code)
● Qualified holdings in the company’s share capital
Haitong International Holdings Limited, a Hong-Kong based subsidiary of Haitong Securities Co., Ltd.holds the entire share capital of the Bank with voting rights.
● Identification of the shareholders that detain special rights and a description of those rights
The Bank’s share capital is entirely represented by ordinary shares.
● Possible restrictions on voting rights, such as limitations on the voting rights dependent onholding a certain number or percentage of shares, deadlines imposed on the right to vote, or keyrights of patrimonial content.
Shareholders or groups of shareholders who hold a minimum of one hundred shares at least five daysprior to the date of the Bank’s Annual General Meeting are entitled to participate in the meeting. Each onehundred shares are entitled to one vote.
● Rules governing the appointment and replacement of members of the management body and theamendment of the articles of association
The members of the Board of Directors are elected by the Annual General Meeting. There are no specificrules concerning the replacement of Board Members. Any replacements shall be made in accordance withthe terms set out in the Companies Code.
There are no specific rules concerning changes to the Bank’s articles of association. Any such changesshall be made under the general terms foreseen in the Companies Code.
● Powers of the management body, particularly as regards resolutions on capital increase
The Board of Directors does not hold any powers to resolve on capital increases.
● Key features of the internal control and risk management systems implemented in the Company inrelation to the financial reporting process
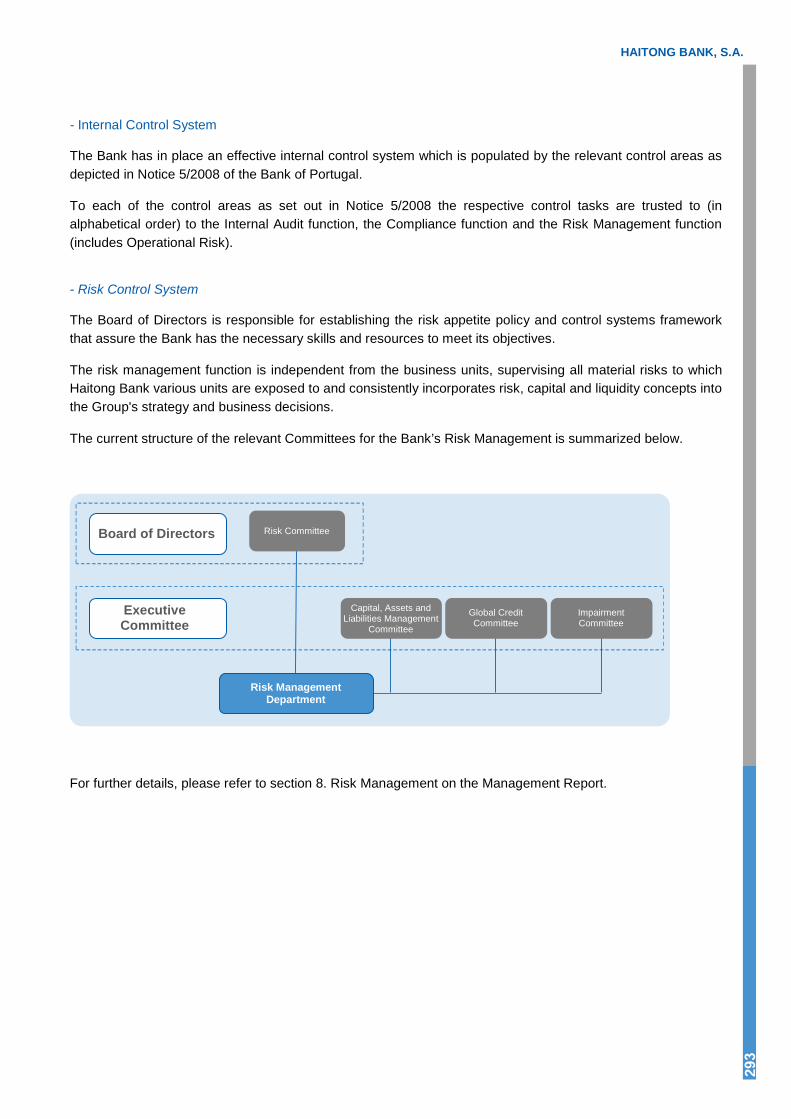
HAITONG BANK, S.A.
293
- Internal Control System
The Bank has in place an effective internal control system which is populated by the relevant control areas as depicted in Notice 5/2008 of the Bank of Portugal.
To each of the control areas as set out in Notice 5/2008 the respective control tasks are trusted to (in alphabetical order) to the Internal Audit function, the Compliance function and the Risk Management function (includes Operational Risk).
- Risk Control System
The Board of Directors is responsible for establishing the risk appetite policy and control systems framework that assure the Bank has the necessary skills and resources to meet its objectives.
The risk management function is independent from the business units, supervising all material risks to which Haitong Bank various units are exposed to and consistently incorporates risk, capital and liquidity concepts into the Group's strategy and business decisions.
The current structure of the relevant Committees for the Bank’s Risk Management is summarized below.
For further details, please refer to section 8. Risk Management on the Management Report.
Global Credit Committee
ImpairmentCommittee
Capital, Assets and Liabilities Management
Committee
Board of Directors
Executive Committee
Risk Management Department
Risk Committee
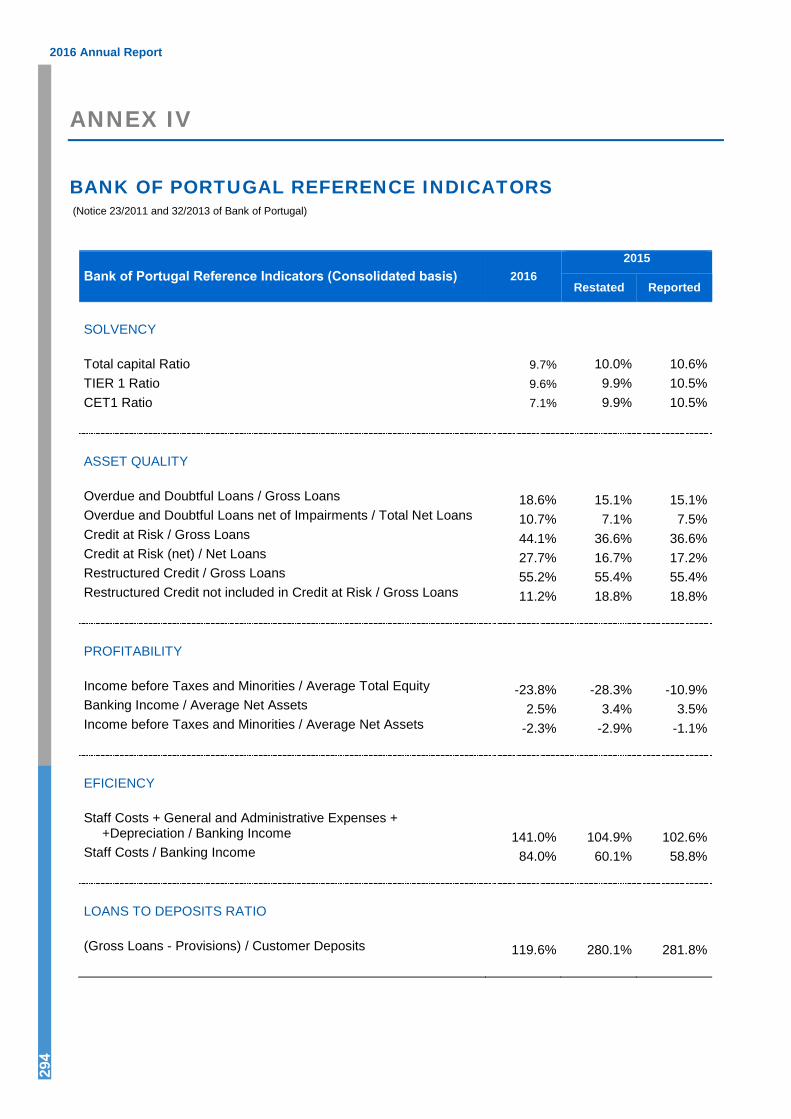
2016 Annual Report 294
ANNEX IV
BANK OF PORTUGAL REFERENCE INDICATORS (Notice 23/2011 and 32/2013 of Bank of Portugal)
Bank of Portugal Reference Indicators (Consolidated basis) 2016 2015
Restated Reported
SOLVENCY
Total capital Ratio 9.7% 10.0% 10.6% TIER 1 Ratio 9.6% 9.9% 10.5% CET1 Ratio 7.1% 9.9% 10.5%
ASSET QUALITY
Overdue and Doubtful Loans / Gross Loans 18.6% 15.1% 15.1% Overdue and Doubtful Loans net of Impairments / Total Net Loans 10.7% 7.1% 7.5% Credit at Risk / Gross Loans 44.1% 36.6% 36.6% Credit at Risk (net) / Net Loans 27.7% 16.7% 17.2% Restructured Credit / Gross Loans 55.2% 55.4% 55.4% Restructured Credit not included in Credit at Risk / Gross Loans 11.2% 18.8% 18.8%
PROFITABILITY
Income before Taxes and Minorities / Average Total Equity -23.8% -28.3% -10.9%Banking Income / Average Net Assets 2.5% 3.4% 3.5%Income before Taxes and Minorities / Average Net Assets -2.3% -2.9% -1.1%
EFICIENCY
Staff Costs + General and Administrative Expenses + +Depreciation / Banking Income 141.0% 104.9% 102.6%
Staff Costs / Banking Income 84.0% 60.1% 58.8%
LOANS TO DEPOSITS RATIO
(Gross Loans - Provisions) / Customer Deposits 119.6% 280.1% 281.8%

HAITONG BANK, S.A.
295
Bank of Portugal Reference Indicators (Individual basis) 2016 2015
Restated Reported
SOLVENCY
Total Capital Ratio 10.7% 11.0% 15.7% TIER 1 Ratio 10.7% 11.0% 15.7% CET1 Ratio 7.6% 11.0% 15.7%
ASSET QUALITY
Overdue and Doubtful Loans / Gross Loans 25.6% 11.7% 11.7% Overdue and Doubtful Loans net of Impairments / Total Net Loans 12.0% 4.7% 5.8% Credit at Risk / Gross Loans 41.6% 33.7% 33.7% Credit at Risk (net) / Net Loans 18.1% 11.1% 12.2% Restructured Credit / Gross Loans 48.4% 46.3% 46.3% Restructured Credit not included in Credit at Risk / Gross Loans 6.8% 12.6% 12.6%
PROFITABILITY
Income before Taxes and Minorities / Average Total Equity -34.3% -48.0% -16.2%Banking Income / Average Net Assets -0.6% 1.7% 1.7%Income before Taxes and Minorities / Average Net Assets -6.6% -8.4% -2.9%
EFICIENCY
Staff Costs + General and Administrative Expenses + +Depreciation / Banking Income -553.7% 171.7% 171.7% Staff Costs / Banking Income -301.1% 90.2% 90.2%
LOANS TO DEPOSITS RATIO
(Gross Loans - Provisions) / Customer Deposits 149.0% 274.0% 339.8%
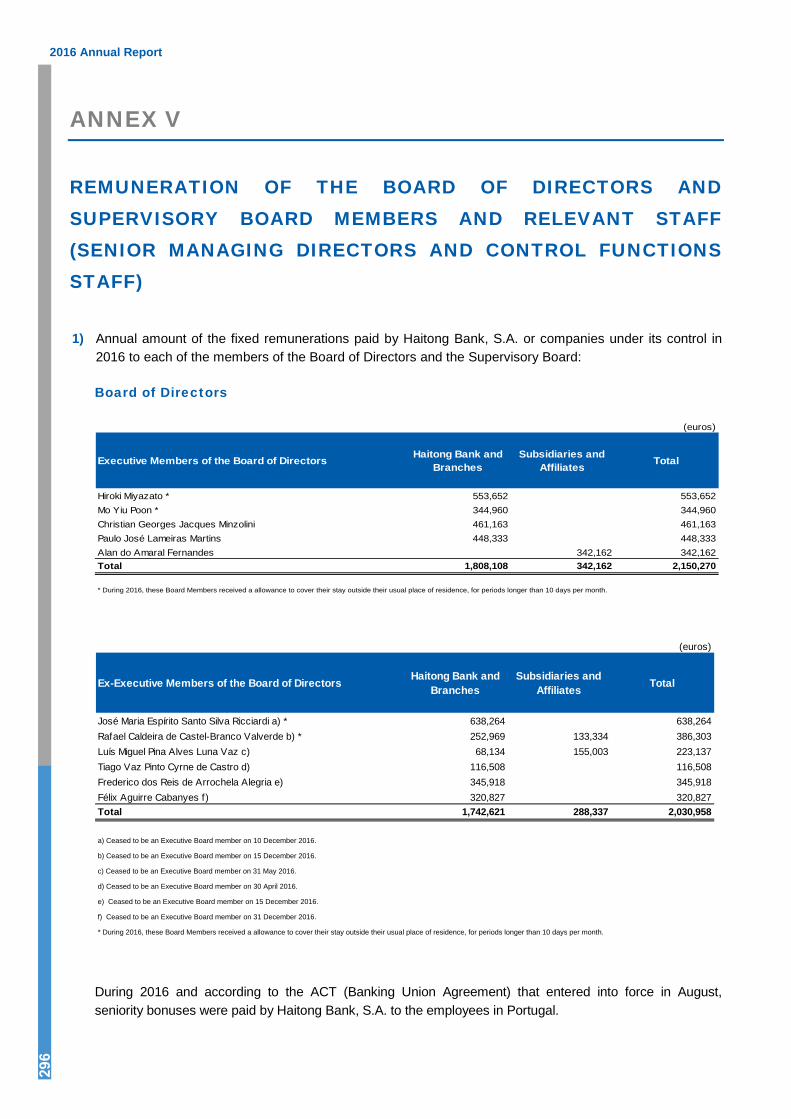
2016 Annual Report 296
ANNEX V
REMUNERATION OF THE BOARD OF DIRECTORS AND SUPERVISORY BOARD MEMBERS AND RELEVANT STAFF (SENIOR MANAGING DIRECTORS AND CONTROL FUNCTIONS STAFF)
1) Annual amount of the fixed remunerations paid by Haitong Bank, S.A. or companies under its control in2016 to each of the members of the Board of Directors and the Supervisory Board:
Board of Directors
(euros)
Executive Members of the Board of Directors Haitong Bank and Branches
Subsidiaries and Affiliates Total
Hiroki Miyazato * 553,652 553,652Mo Yiu Poon * 344,960 344,960Christian Georges Jacques Minzolini 461,163 461,163Paulo José Lameiras Martins 448,333 448,333Alan do Amaral Fernandes 342,162 342,162Total 1,808,108 342,162 2,150,270
* During 2016, these Board Members received a allowance to cover their stay outside their usual place of residence, for periods longer than 10 days per month.
(euros)
Ex-Executive Members of the Board of Directors Haitong Bank and Branches
Subsidiaries and Affiliates Total
José Maria Espírito Santo Silva Ricciardi a) * 638,264 638,264Rafael Caldeira de Castel-Branco Valverde b) * 252,969 133,334 386,303Luís Miguel Pina Alves Luna Vaz c) 68,134 155,003 223,137Tiago Vaz Pinto Cyrne de Castro d) 116,508 116,508Frederico dos Reis de Arrochela Alegria e) 345,918 345,918Félix Aguirre Cabanyes f) 320,827 320,827Total 1,742,621 288,337 2,030,958
a) Ceased to be an Executive Board member on 10 December 2016.
b) Ceased to be an Executive Board member on 15 December 2016.
c) Ceased to be an Executive Board member on 31 May 2016.
d) Ceased to be an Executive Board member on 30 April 2016.
e) Ceased to be an Executive Board member on 15 December 2016.
f) Ceased to be an Executive Board member on 31 December 2016.
* During 2016, these Board Members received a allowance to cover their stay outside their usual place of residence, for periods longer than 10 days per month.
During 2016 and according to the ACT (Banking Union Agreement) that entered into force in August, seniority bonuses were paid by Haitong Bank, S.A. to the employees in Portugal.
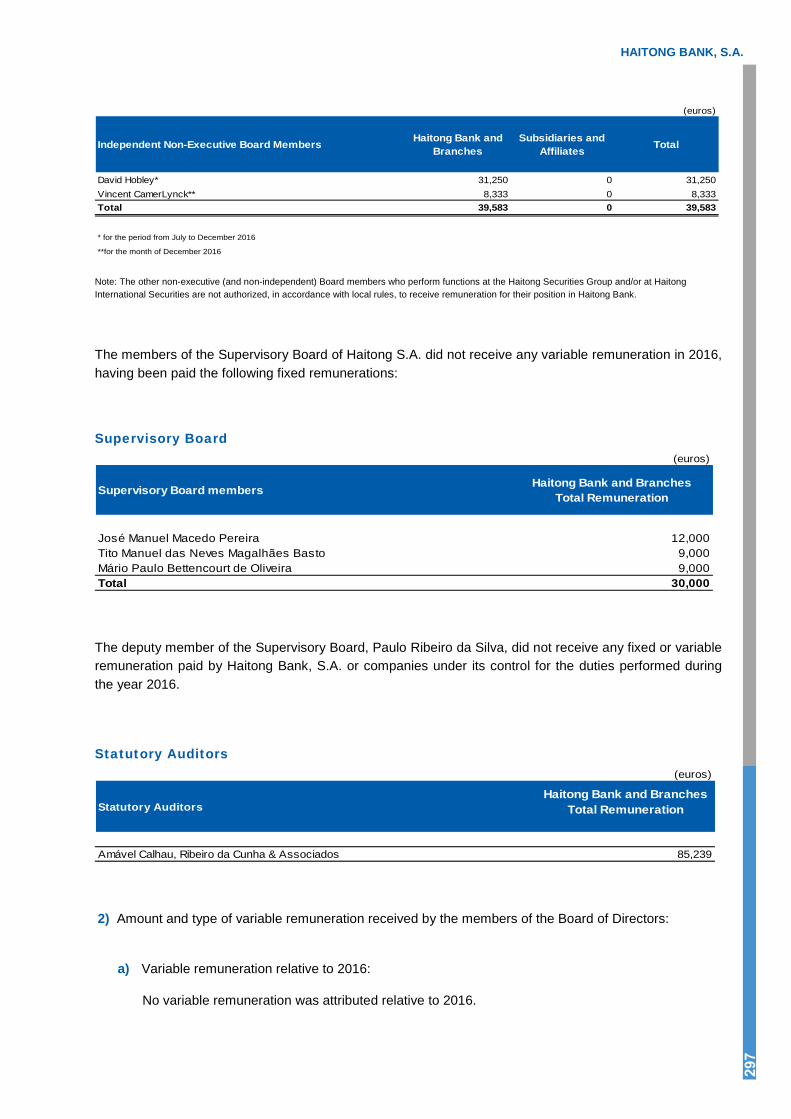
HAITONG BANK, S.A.
297
(euros)
Independent Non-Executive Board Members Haitong Bank and Branches
Subsidiaries and Affiliates Total
David Hobley* 31,250 0 31,250Vincent CamerLynck** 8,333 0 8,333Total 39,583 0 39,583
* for the period from July to December 2016
**for the month of December 2016
Note: The other non-executive (and non-independent) Board members who perform functions at the Haitong Securities Group and/or at Haitong International Securities are not authorized, in accordance with local rules, to receive remuneration for their position in Haitong Bank.
The members of the Supervisory Board of Haitong S.A. did not receive any variable remuneration in 2016, having been paid the following fixed remunerations:
Supervisory Board (euros)
Supervisory Board members Haitong Bank and BranchesTotal Remuneration
José Manuel Macedo Pereira 12,000Tito Manuel das Neves Magalhães Basto 9,000Mário Paulo Bettencourt de Oliveira 9,000Total 30,000
The deputy member of the Supervisory Board, Paulo Ribeiro da Silva, did not receive any fixed or variable remuneration paid by Haitong Bank, S.A. or companies under its control for the duties performed during the year 2016.
Statutory Auditors (euros)
Statutory AuditorsHaitong Bank and Branches
Total Remuneration
Amável Calhau, Ribeiro da Cunha & Associados 85,239
2) Amount and type of variable remuneration received by the members of the Board of Directors:
a) Variable remuneration relative to 2016:
No variable remuneration was attributed relative to 2016.
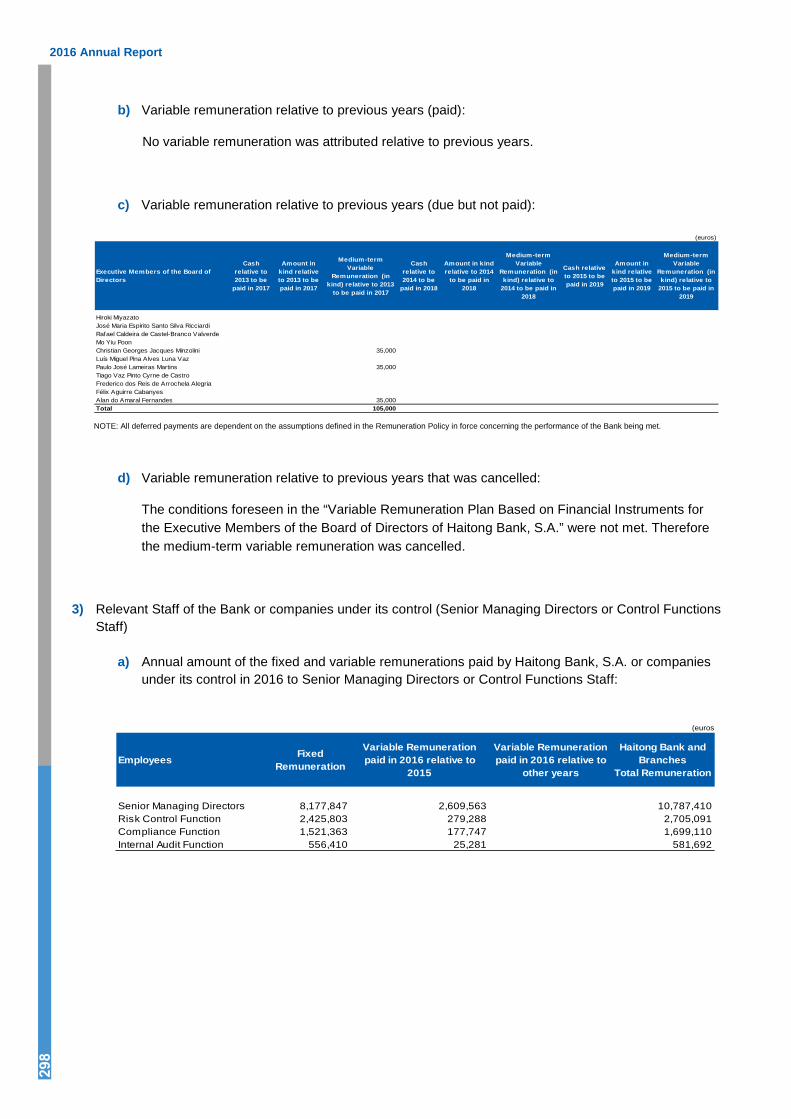
2016 Annual Report 298
b) Variable remuneration relative to previous years (paid):
No variable remuneration was attributed relative to previous years.
c) Variable remuneration relative to previous years (due but not paid):
(euros)
Executive Members of the Board of Directors
Cash relative to 2013 to be
paid in 2017
Amount in kind relative to 2013 to be paid in 2017
Medium-term Variable
Remuneration (in kind) relative to 2013
to be paid in 2017
Cash relative to 2014 to be
paid in 2018
Amount in kind relative to 2014
to be paid in 2018
Medium-term Variable
Remuneration (in kind) relative to
2014 to be paid in 2018
Cash relative to 2015 to be paid in 2019
Amount in kind relative to 2015 to be paid in 2019
Medium-term Variable
Remuneration (in kind) relative to
2015 to be paid in 2019
Hiroki MiyazatoJosé Maria Espírito Santo Silva RicciardiRafael Caldeira de Castel-Branco ValverdeMo Yiu PoonChristian Georges Jacques Minzolini 35,000Luís Miguel Pina Alves Luna VazPaulo José Lameiras Martins 35,000Tiago Vaz Pinto Cyrne de CastroFrederico dos Reis de Arrochela AlegriaFélix Aguirre CabanyesAlan do Amaral Fernandes 35,000Total 105,000
NOTE: All deferred payments are dependent on the assumptions defined in the Remuneration Policy in force concerning the performance of the Bank being met.
d) Variable remuneration relative to previous years that was cancelled:
The conditions foreseen in the “Variable Remuneration Plan Based on Financial Instruments forthe Executive Members of the Board of Directors of Haitong Bank, S.A.” were not met. Thereforethe medium-term variable remuneration was cancelled.
3) Relevant Staff of the Bank or companies under its control (Senior Managing Directors or Control FunctionsStaff)
a) Annual amount of the fixed and variable remunerations paid by Haitong Bank, S.A. or companiesunder its control in 2016 to Senior Managing Directors or Control Functions Staff:
(euros)
Employees Fixed Remuneration
Variable Remuneration paid in 2016 relative to
2015
Variable Remuneration paid in 2016 relative to
other years
Haitong Bank and Branches
Total Remuneration
Senior Managing Directors 8,177,847 2,609,563 10,787,410Risk Control Function 2,425,803 279,288 2,705,091Compliance Function 1,521,363 177,747 1,699,110Internal Audit Function 556,410 25,281 581,692
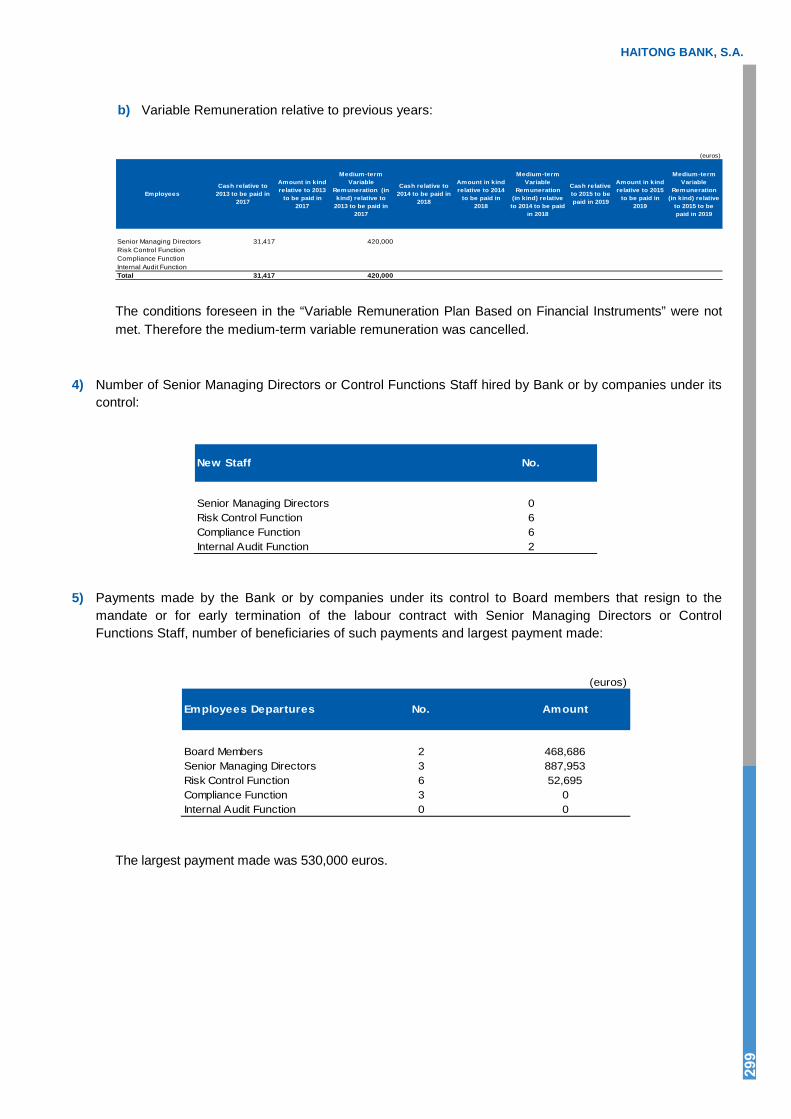
HAITONG BANK, S.A.
299
b) Variable Remuneration relative to previous years:
(euros)
EmployeesCash relative to
2013 to be paid in 2017
Amount in kind relative to 2013
to be paid in 2017
Medium-term Variable
Remuneration (in kind) relative to
2013 to be paid in 2017
Cash relative to 2014 to be paid in
2018
Amount in kind relative to 2014
to be paid in 2018
Medium-term Variable
Remuneration (in kind) relative to 2014 to be paid
in 2018
Cash relative to 2015 to be paid in 2019
Amount in kind relative to 2015
to be paid in 2019
Medium-term Variable
Remuneration (in kind) relative
to 2015 to be paid in 2019
Senior Managing Directors 31,417 420,000Risk Control FunctionCompliance FunctionInternal Audit FunctionTotal 31,417 420,000
The conditions foreseen in the “Variable Remuneration Plan Based on Financial Instruments” were not met. Therefore the medium-term variable remuneration was cancelled.
4) Number of Senior Managing Directors or Control Functions Staff hired by Bank or by companies under itscontrol:
New Staff No.
Senior Managing Directors 0Risk Control Function 6Compliance Function 6Internal Audit Function 2
5) Payments made by the Bank or by companies under its control to Board members that resign to themandate or for early termination of the labour contract with Senior Managing Directors or ControlFunctions Staff, number of beneficiaries of such payments and largest payment made:
(euros)
Employees Departures No. Amount
Board Members 2 468,686Senior Managing Directors 3 887,953Risk Control Function 6 52,695Compliance Function 3 0Internal Audit Function 0 0
The largest payment made was 530,000 euros.

HAITONG BANK, S.A.Edifício Quartzo - Rua Alexandre Herculano nr. 38 - 1269-180 Lisboa - Portugal
Registered Share Capital: 426 269 000 eurosRegistered with Lisbon Commercial Registry Office Corporate Registration and Tax Payer Number 501 385 932