Annual Report 2016 - Amazon S3
100
Annual Report 2016
Transcript of Annual Report 2016 - Amazon S3
Annual Report 2016

Delivering innovation to the
mining industry

Chairman’s Letter 3
Managing Director’s Report 4
Directors’ Report 26
Auditor’s Independence Declaration 48
Financial Statements 49
Notes to the Financial Statements 53
Directors’ Declaration 92
Independent Auditor’s Report 93
Shareholder Information 95

Delivering a decade of strongfinancial outcomes
Financial Summary ($millions) 2006(1) 2007 2008 2009 2010 2011 2012 2013 2014(2) 2015(3) 2016(4)
Earnings
Total Revenue 106 149 245 260 323 610 926 1,097 1,899 1,299 1,178
EBITDA 38 87 74 104 236 294 383 554 283 286
NPAT 10 20 47 44 97 150 177 180 243 109 110
Return on Revenue 9.7% 13.4% 19.2% 16.9% 30.0% 24.6% 19.1% 16.4% 12.8% 8.4% 9.3%
Return on Equity 23.7% 26.3% 40.5% 30.3% 20.0% 23.9% 19.3% 17.7% 21.3% 10.1% 10.9%
EPS (cents/share) 9.8 16.9 38.3 35.7 68.5 89.7 96.7 97.4 136.6 58.2 56.5
Balance Sheet
Total Assets 158 224 289 845 970 1,436 1,804 1,858 1,592 1,618
Total Liabilities 82 108 144 359 343 519 787 719 509 610
Total Equity 76 116 145 486 627 917 1,017 1,139 1,082 1,008
Net tangible assets per share (cents / share)
55.00 86.18 108.87 275.78 344.97 454.59 507.53 573.26 543.09 513.53
Cash generation
Operating cashflow 30 97 46 151 117 243 330 567 52 316
Net (Debt)/Cash position (9) 21 33 146 78 (111) (310) 81 118 188
Total Debt to equity 37% 24% 15% 6% 16% 20% 36% 11% 8% 22%
Market capitalisation
Number of shares on issue (millions) 120 120 123 124 161 169 185 186 187 188 187
Share price at 30 June ($/share) 1.14 3.41 6.50 4.25 8.10 11.50 8.95 8.25 9.59 6.60 8.31
Market capitalisation 137 410 799 528 1,306 1,945 1,654 1,534 1,789 1,238 1,553
Returns to Shareholders
Total Shareholder Return (cummulative) ($/share) 0.24 2.54 5.75 3.70 7.74 11.43 9.31 9.07 11.03 8.44 10.39
Dividends declared (cents/share) 1.20 8.30 19.40 19.40 20.00 42.00 46.00 48.00 62.00 22.50 29.50
Dividend payout rate 49.80% 50.77% 54.67% 33.20% 47.32% 48.08% 49.60% 47.71% 38.81% 50.15%
Franking 100.00% 100.00% 100.00% 100.00% 100.00% 100.00% 100.00% 100.00% 100.00% 100.00% 100.00%
Notes:
(1) 2006 NPAT is sourced from MRL’s preliminary Final Year Report for the year ended 30 June 2006.
(2) 2014 Financial Year NPAT and Earnings per Share exclude the impact of impairment of AQA shares. NPAT for the 2014 Financial Year would be $231,087,000 and EPS 124.1c/share if the impact of the impairment of AQA shares were to be included.
(3) 2015 Financial Year NPAT and Earnings Per Share exclude the impact of the reversal of Deferred Tax Asset on the abolition of the Minerals Resource Rent Tax (MRRT) and impairments. NPAT for the 2015 Financial Year would be $12,814,000 and EPS 6.85c/share if the impact of MRRT and impairments were to be included.
(4) 2016 Financial Year EBITDA, NPAT and EPS exclude the impact of impairments other than the cash profit on sale of previously impaired manganese inventory. EBITDA and NPAT for the Financial Year ended 30 June 2016 would be $278,172,000, and a loss of $24,857,000 and EPS (13.31)c/share if the impact impairments were to be included.
2 Mineral Resources Limited

Dear MRL Shareholders
On behalf of the Board, I am pleased to present the 2016 Annual Report to shareholders.
Following a period of unprecedented Chinese economic growth which underpinned record demand and prices for commodities, we are now in our third year of a very changed world. Significantly slower economic activity worldwide has driven a fundamental rebalancing of global demand for key minerals and driven significant commodity price volatility.
In the resources sector, challenging market conditions are characterised by, markedly lower commodity prices and much reduced investment in new production capacity.
Through the 2016 Financial Year, MRL continued its disciplined approach to managing operational costs and capital management. As foreshadowed in the 2015 Annual Report, MRL has focused on the things it can control by implementing highly successful operational cost reduction programs coupled with significant productivity enhancements across its activities. Significant benefits flowing from these improvements, coupled with record iron ore production and export performance, ameliorated the impact on our commodities business.
In addition, MRL’s unique and robust business model coupled with its industry position as the mining services provider of choice, counterbalanced the commodities cycle and commensurate pressure on the mine services side of the business.
The MRL Board also remains focused on developing new business initiatives which will assist growth and the generation of significant future shareholder value. The current market conditions provide investment opportunities that will establish a foundation for MRL over the next decades.
The lithium sector provides the Company with significant opportunities. Commencement of operations at Mt Marion, establishes the project as one of the world’s largest hard rock lithium operations with the opportunity to further expand the mineral resource inventory and annual production. It also provides an opportunity for MRL to monetise its 43.1% share of the underlying project whilst maintaining operatorship. In addition, purchase of the Wodgina mine assets, completed in September, provides an opportunity to establish a second hard rock lithium operation in Western Australia. Together these developments put MRL at the forefront of lithium spodumene concentrate production and also provide an opportunity to explore downstream processing activities of its own.
To ensure the Company remains at the forefront of its craft, management continues a strong culture of innovation which continues to foster the development of significant potential new revenue streams, demonstrated by its composite mining components and gas power generation businesses.
Capital allocation remains a primary consideration for the Board, considering the range of opportunities available to the Company at this point in the cycle. We are looking to make investments that will maximise long term shareholder value by applying the Company’s substantial financial strength and strategic foresight to the opportunities presenting themselves.
The Company’s strong balance sheet and free cash generation continues to provide a foundation that ensures it is well placed to pursue investment opportunities, innovation and new mining related initiatives.
Succession planning for the management and direction of the Group over the long term receives significant attention from both Board and management. Chris Ellison continues to do an extraordinary job leading the Company and he has surrounded himself with a first class management team. The business benefits from a wide range and depth of experience at all levels and significant effort is applied to maintaining this strength into the future.
Finally, I would like to take the opportunity to acknowledge the contribution of foundation director, Joe Ricciardo, who retired from the Board in April. Joe has been a cornerstone of the Company with his contribution towards the growth and development of Mineral Resources over the years. Joe brought extensive business experience to the Board and provided both the Board and management with valuable guidance and assistance. We are grateful for his contribution and wish Joe and his family the very best for the future.
I look forward to addressing shareholders at our Annual General Meeting in November and outlining further details about our plans for the future.
Peter Wade Chairman
Mineral Resources Limited
Chairman’s Letter
Annual Report 2016 3
Mining Services and Processing Division
Crushing Services International
(CSI)
CSI Crushing
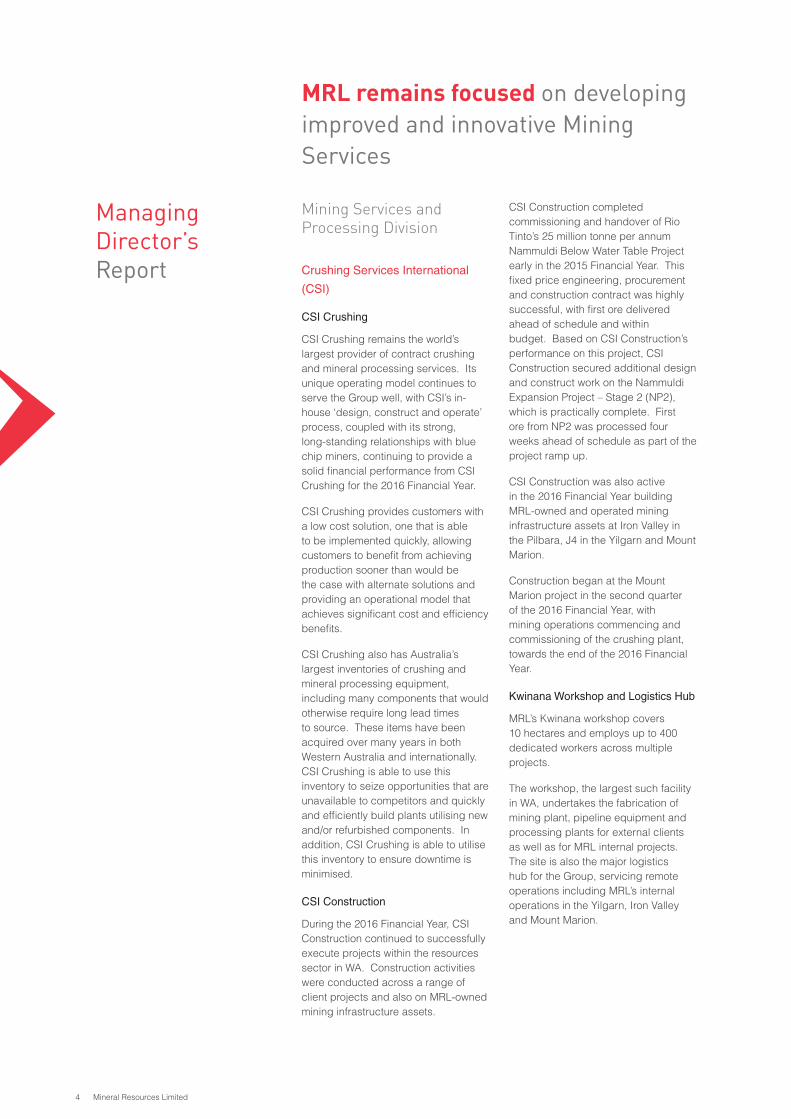
CSI Crushing remains the world’s largest provider of contract crushing and mineral processing services. Its unique operating model continues to serve the Group well, with CSI’s in-house ‘design, construct and operate’ process, coupled with its strong, long-standing relationships with blue chip miners, continuing to provide a solid financial performance from CSI Crushing for the 2016 Financial Year.
CSI Crushing provides customers with a low cost solution, one that is able to be implemented quickly, allowing customers to benefit from achieving production sooner than would be the case with alternate solutions and providing an operational model that achieves significant cost and efficiency benefits.
CSI Crushing also has Australia’s largest inventories of crushing and mineral processing equipment, including many components that would otherwise require long lead times to source. These items have been acquired over many years in both Western Australia and internationally. CSI Crushing is able to use this inventory to seize opportunities that are unavailable to competitors and quickly and efficiently build plants utilising new and/or refurbished components. In addition, CSI Crushing is able to utilise this inventory to ensure downtime is minimised.
CSI Construction
During the 2016 Financial Year, CSI Construction continued to successfully execute projects within the resources sector in WA. Construction activities were conducted across a range of client projects and also on MRL-owned mining infrastructure assets.
CSI Construction completed commissioning and handover of Rio Tinto’s 25 million tonne per annum Nammuldi Below Water Table Project early in the 2015 Financial Year. This fixed price engineering, procurement and construction contract was highly successful, with first ore delivered ahead of schedule and within budget. Based on CSI Construction’s performance on this project, CSI Construction secured additional design and construct work on the Nammuldi Expansion Project – Stage 2 (NP2), which is practically complete. First ore from NP2 was processed four weeks ahead of schedule as part of the project ramp up.
CSI Construction was also active in the 2016 Financial Year building MRL-owned and operated mining infrastructure assets at Iron Valley in the Pilbara, J4 in the Yilgarn and Mount Marion.
Construction began at the Mount Marion project in the second quarter of the 2016 Financial Year, with mining operations commencing and commissioning of the crushing plant, towards the end of the 2016 Financial Year.
Kwinana Workshop and Logistics Hub
MRL’s Kwinana workshop covers 10 hectares and employs up to 400 dedicated workers across multiple projects.
The workshop, the largest such facility in WA, undertakes the fabrication of mining plant, pipeline equipment and processing plants for external clients as well as for MRL internal projects. The site is also the major logistics hub for the Group, servicing remote operations including MRL’s internal operations in the Yilgarn, Iron Valley and Mount Marion.
MRL remains focused on developing improved and innovative Mining Services
Managing Director’s Report
4 Mineral Resources Limited
Annual Report 2016 5

6 Mineral Resources Limited

PIHA
PIHA is a leading provider of integrated project solutions for pipeline construction and mine dewatering services.
PIHA has a proven track record of successful project completions, on time and within budget. PIHA’s comprehensive suite of products, innovative construction techniques and leading edge project methodologies have enabled PIHA to deliver major benefits to a wide range of clients.
Significant projects completed during the 2016 Financial Year include:
• Rio Tinto - Design and Construct Bore Pumps Infrastructure;
• Rio Tinto - Paraburdoo Tailings Pipeline Upgrade;
• BHP Billiton - Mt Whaleback ARD Pump Station and Installation of ARD Pipeline;
• Rio Tinto - HD4 Dewatering Bores Stage 2 Project; and
• Rio Tinto - NP2 Project.
Rio Tinto’s NP2 Project is particularly worth of mention; this project, required to facilitate below water table mining, included substantial works such as the installation of 20 km of pipeline and the supply and installation of bore pumps, head works and generator trailers. Earthworks included substantial road works, creek crossings and bore field pads.
Following successful completion of this project, Rio Tinto awarded PIHA substantial further works, which included an expansion of the de-watering network by another 5 km and 13 additional bore units.
Process Minerals International
(PMI)
PMI is a multifaceted mining services provider with a suite of services that includes heavy road haulage, logistics, rail, port, camp, catering, airport and laboratory services.
PMI is also the provider of specialist mineral processing operations for Group projects.
Site Services
Site Services provides and manages high quality remote village accommodation services, both for internal MRL sites and for external clients. Site Services also provides catering services for a range of clients and for special events such as the City to Surf in Perth.
Logistics & Haulage
PMI manages mine to port logistics in the Pilbara and Yilgarn. In the Yilgarn, iron ore is hauled by road train to the rail load out where it is loaded on MRL’s heavy rail fleet.
The Group’s decision to acquire its own rail fleet continues to deliver major benefits. In-house ownership, coupled with the Group’s in-house rail wagon design which allows efficient discharge of ore while wagons remain in motion, has enabled transport costs to remain at levels significantly less than what they were when utilising external providers. The Group’s patented wagon design and a focus on rail logistics has enabled ongoing cost reductions, with further efficiencies achieved in the 2016 Financial Year in loading and unloading, train turnaround times, and fuel and labour requirements.
In addition to rail, PMI manages and operates substantial heavy haulage road transport operations overseeing the haulage of in excess of 43,000 tonnes of ore per day by Road Train. This service has been bolstered subsequent to the end of the Financial Year, with PMI acquiring full ownership in Roadtrim Civil and Mining Contractors Pty Ltd which owns a fleet of off-road Road Trains, enabling the Group to further reduce haulage costs throughout its supply chain.
This Financial Year has seen PMI successfully increase efficiencies by introducing Superquad Road Trains on the Iron Valley to Port Hedland route. These have enabled an additional 28 tonne payload per journey, reducing the overall number of truck movements on the haulage route and reducing haulage costs.
In addition to road and rail haulage, PMI operates iron ore export facilities at Utah Point in Port Hedland and the Kwinana Bulk Terminal 2 (KBT2) at Cockburn Sound.
Specialty Processing and Beneficiation Plants
PMI has significant capability in the design and construction of smaller specialty mineral processing and beneficiation plants to process specialty minerals.
A key area of focus during for PMI during the 2016 Financial Year was the design of mining and processing infrastructure at the Mount Marion Lithium Project. This operation produces high-grade lithium concentrate for delivery to our Chinese offtake partner. This site, the second largest hard-rock lithium project in the world, is expected to provide in excess of 400,000 tonnes of high value spodumene product per annum. PMI operates the mine-site infrastructure and manages the end-to-end production and logistics.
MRL utilises innovative construction techniques and leading edge project management
Annual Report 2016 7

Commodities Business
MRL’s commodity export operations set another in-house record in the 2016 Financial Year with total production of 12.148 million wet metric tonnes (WMT) of iron ore and manganese shipments during the Financial Year.
Commodity export sales volumes were as follows:
Commodity exports (‘000 WMT) 1H FY15 2H FY15 Total FY15 1H FY16 2H FY16 Total FY16
Utah Point
Iron Valley 823 2,153 2,976 3,126 3,389 6,515
Phil's Creek 1,862 173 2,035 6 - 6
Other Iron Ore 365 22 387 36 117 153
Manganese 315 - 315 - 93 93
Total Utah Point 3,365 2,348 5,713 3,168 3,599 6,767
KBT2 / Yilgarn 2,435 2,472 4,907 2,733 2,648 5,381
Total Iron Ore 5,485 4,820 10,305 5,901 6,154 12,055
Total Manganese 315 - 315 - 93 93
Total Commodity Exports 5,800 4,820 10,620 5,901 6,247 12,148
A record of 12.055 million WMT of iron ore exports was achieved, an increase of 17% (1.8 million WMT) over the previous Financial Year. In addition, 93 thousand tonnes of manganese was shipped from stockpiles.
The average achieved iron ore price for the 2016 Financial Year was CFR $64.50/WMT, a reduction of 13% when compared with the average achieved price in the previous Financial Year. This reflects the impact of significantly lower global US dollar iron ore prices, partially offset by appreciation of the US dollar.
The Group continued to focus on cost reductions and increasing operational efficiencies during the year, resulting in lower mining cash costs, which were further assisted by the impact of external factors such as foreign exchange movements and international oil price movements.
14 15 16
Mill
ions
WM
T
14,000
12,000
10,000
8,000
6,000
4,000
2,000
-
Commodity Export Volumes
14
Achieved CFR ($A/WMT)
62% Index ($A/WMT)
15 16
$A/W
MT
140
120
100
80
60
40
20
-
Realised Iron Ore Prices vs 62% Fe Index Prices
8 Mineral Resources Limited

Pilbara Iron Ore
The Iron Valley project achieved a milestone, with its 11 millionth tonne of ore mined during the final quarter of the Financial Year. A record 6.5 million tonnes of iron ore was produced and shipped (an increase of 18% over the previous corresponding period) from the Iron Valley mine during the Financial Year. Crushing performance was particularly pleasing over the Financial Year, consistently delivering above the annualised target rate of 7 million tonnes.
The current stage of mining at Iron Valley requires access to below water table ore later this calendar year and the initial required environmental approvals were gained in 2016. The preliminary 100 litres/second dewatering scheme has been achieved through the completion of large scale production bores, pumping, piping and monitoring infrastructure. Further approvals are expected in the first quarter of the 2017 Financial Year to allow the dewatering discharge rates to increase to the full level.
Yilgarn Iron Ore
The Group’s Yilgarn operations achieved a milestone this Financial Year, exporting its 20 millionth tonne of ore on 20 June 2016 through KBT2. Exports were a record 5.4 million tonnes, up from 4.9 million tonnes in the previous year (up 10% on the previous corresponding period).
In the Yilgarn, operational cost savings were achieved in the year from the continuation of in-pit dumping of waste, drill and blast improvements, and maximising direct tipping to reduce re-handling. The Yilgarn mining fleet was optimised during the year with the introduction of two new EX2600 Hitachi excavators and eight Komatsu 8HD1500 trucks. The use of larger capacity equipment delivered further operational efficiency improvements and cost reductions. The Yilgarn operations also benefited from lower global shipping costs.
Mining was completed at the Carina pit and commenced at the new J4 site in November 2015, with production from this site ramping up to reach operational capacity toward the end of the Financial Year.
Proposed J5 and Bungalbin
East Iron Ore Project
MRL proposes developing two new iron ore mines as part of its ongoing operations in the Yilgarn at J5 and Bungalbin East.
When approved, the J5 and Bungalbin East mining proposal will significantly extend the life and sustainability of MRL’s Yilgarn iron ore operations.
The J5 and Bungalbin East operations are currently the subject of a Public Environmental Review (PER), issued in September 2016 and open for public comment until 31st October.
The proposed mines will deliver significant economic and social benefits to the region and to WA including:
• The construction phase will provide around 401 Full Time Equivalent (FTE) positions comprised of 98 direct FTEs and 303 indirect FTEs (Numbers modelled by engineering firm AECOM in September 2016);
• The operational phase will allow the continuation of the permanent workforce currently occupied at J4, rail operations, port, and Kwinana Workshop of 585 FTE jobs and over 900 indirect jobs throughout the economy;
• Continued investment in exploration and site amenities;
The Group continued to focus on cost reductions and increasing operational efficiencies during the year, resulting in lower mining cash costs
• Significant port and infrastructure charges paid to the WA government including maintenance of State Royalty income;
• Continued investment in Aboriginal heritage work and traineeships; and
• A significant contribution of new scientific knowledge on biodiversity in the Yilgarn.
Exploration
MRL’s exploration focus for the 2016 Financial Year included expansion of the Mineral Resource at the Mount Marion Lithium project. Drilling comprised 59,667 metres of RC, with 1,770 metres of deeper diamond tails and 1,016 metres of diamond metallurgical drilling completed during the year. Two small RC drilling programs were completed to support resource definition at the iron ore mining operations.
Drilling of 2,006 metres was completed at Iron Valley to confirm the size of the Eastern Deposit and 2,558 metres was drilled at J4 to firm up the quality estimates of the near surface mineralisation in the West Pit.
Annual Report 2016 9

Initial annual production of 400,000 tonnes of high-value Lithium concentrate (Spodumene) is planned
Mount Marion Lithium Project
MRL’s Mount Marion Lithium Project has made substantial progress over the 2016 Financial Year, transforming from a Greenfields site to being ready to commence operations.
The beneficiation process is also nearing completion. Civil construction activities are well advanced with mining, crushing and processing plants, storage and handling facilities and associated infrastructure complete.
During the Financial Year, the Group purchased a further 13.1% of the project, lifting its equity interest to 43.1%. In addition to being a substantial equity holder, MRL is the mine operator, servicing the project with a life-of-mine, BOO contract for the entire mining, processing and supply chain activities from mine to the customer’s door in China.
The other participants in the joint operation are Neometals Limited, with a 13.8% interest and one of the world’s largest Lithium producers, Jiangxi Ganfeng Lithium Co Ltd (Ganfeng) with a 43.1% interest. Ganfeng has entered into an off-take agreement for 100% of the mine’s initial production.
In July 2016, MRL released a revised Mineral Resource Estimate, a 160% increase to 60.5 million tonnes, at 1.36% Li2O and 1.09% Fe, at a cut-off grade of 0.3% Li2O, compared to previous estimates of 23.2 million tonnes at 1.39% Li2O, at a cut-off grade of 0% Li2O.
MRL has once again deployed its OneMRL strategy at this site, with MRL’s Kwinana workshop undertaking substantial manufacture and assembly of key on-site equipment for the processing plant and other structures. The Group is installing its first gas power generation system at Mount Marion comprising five gas generators.
Shipping and storage arrangements for spodumene concentrate are advanced with Fremantle Port Authority, to provide an export pathway at KBT2 co-located with MRL’s Yilgarn iron ore stockpiles and export facilities. Annual production of an initial 400, 000 tonnes per annum is planned.
The Group will look to divest its shareholding in the project (whilst retaining its life of mine, BOO contract) in the future.
10 Mineral Resources Limited

Mount Marion Lithium Project
construction close to completion
Annual Report 2016 11

Innovation Centre
The Group encourages a culture of innovation that has led to a range of innovative products and processes that have facilitated increases in efficiency and driven costs down.
MRL is uniquely positioned to identify areas where innovation can be developed, test them in real world situations on Group sites and deploy the innovations into operations.
The successful roll out of Superquad Road Trains which are operational at Iron Valley, progressing the Bulk Ore Transportation System (BOTS), Carbon fibre manufacturing and LNG power solutions delivered by MRL Energy are examples of successful development of this strategy.
Composites Materials
The Group continues to innovate through the development and implementation of carbon fibre composite materials for applications in the mining industry.
The use of carbon fibre has the ability to revolutionise the mining industry in the same manner that this material has transformed the aviation, car racing, sailing and other industries.
MRL has established a Perth based carbon fibre manufacturing facility staffed by a specialist team of scientists, engineers and technicians. The core focus is the development and manufacture of structural components for mining and mining construction applications.
The Group has begun to manufacture structural components from carbon fibre composites using automated robotic technology.
The weight saving, wear and corrosion advantages achieved by using composites over traditional steel-based materials are significant, and these combine to result in considerable operational cost savings.
MRL has built a significant body of intellectual property having designed and patented a number of mining carrying vessels such as truck trays, rail wagons and road train tipper trailers utilising carbon fibre.
During the 2016 Financial Year, the Group completed the design and construction of manufacturing equipment to produce carbon fibre components including tubes, beams and fittings. A scaled-down prototype truck tray has successfully completed a simulated 12 month trial in a specifically designed, computer-controlled and monitored test bed.
The Group has an advanced design and completed a manufacturing facility for two 150 tonne trays for full-scale in-service testing to be trialled in real world conditions at MRL’s Yilgarn iron ore operations. Once the mining truck tray project is complete and into commercial production, the Group intends to evaluate and commercialise a range of mining products, including rail wagons, from its carbon fibre facility.
Bulk Ore Transportation System
(BOTS)
The Group is at the forefront of innovation in the bulk transportation sector.
MRL continues to develop its BOTS, a low cost, mine-to-port transport solution for bulk commodities and freight. Design work continued during the year, engineering work continued and permitting was undertaken on a possible route from Iron Valley to Port Headland.
Subsequent to the end of the Financial Year the EPA recommended approval for a 330km route for BOTS from Iron Valley to Port Hedland.
Smaller scale than heavy rail, BOTS utilises many off-the-shelf rail components but the wagons are about a third of the size.
The differentiator is that BOTS cars are fully automated and autonomous and they run on a precast concrete rail structure sitting on steel piles.
This not only minimises expensive earthworks required during construction, but also results in less disturbance to natural landscapes.
The structure is completely re-locatable once a resource is exhausted or multiple mine sites are being accessed.
BOTS is a fraction of the capital cost of traditional heavy haul rail and road haulage, but has an operating cost that is comparable to heavy rail.
12 Mineral Resources Limited

MRL Energy
The Group is at the forefront of delivering cleaner and cheaper energy through its rollout of gas solutions.
The Group continues to progress the development of its own LNG and gas power generation capabilities. The Group’s new solution will provide certainty over energy costs and energy cost savings. The Group will install and operate remote LNG and gas plants to power mine equipment and infrastructure underwritten by long term contracts.
MRL’s LNG supply chain solution is fully vertically integrated. The supply chain includes natural gas acquisition, conversion to LNG, distribution and storage at remote sites and generation of power and fuelling of mine site equipment.
The Group’s strategic investment in Empire Oil and Gas in June 2016 advanced the access to natural gas supplies for the Group’s operations.
New Cryogenic plants will convert natural gas to LNG and distribute it to clients’ remote operations where power generation and heavy plant will be progressively switched from expensive diesel to the more economical and environmentally friendly LNG. In the mining industry, energy costs for power generation and mobile equipment operation are driven by a reliance on diesel fuels and MRL is at the forefront of transitioning its mine site operations from diesel to gas.
MRL is uniquely positioned to develop innovations that can be tested in real world situations on Group sites and deployed into operations
Transforming energy: A proposed
MRL Energy Cryobox natural gas
to LNG conversion plant Annual Report 2016 13
Strategic Acquisitions
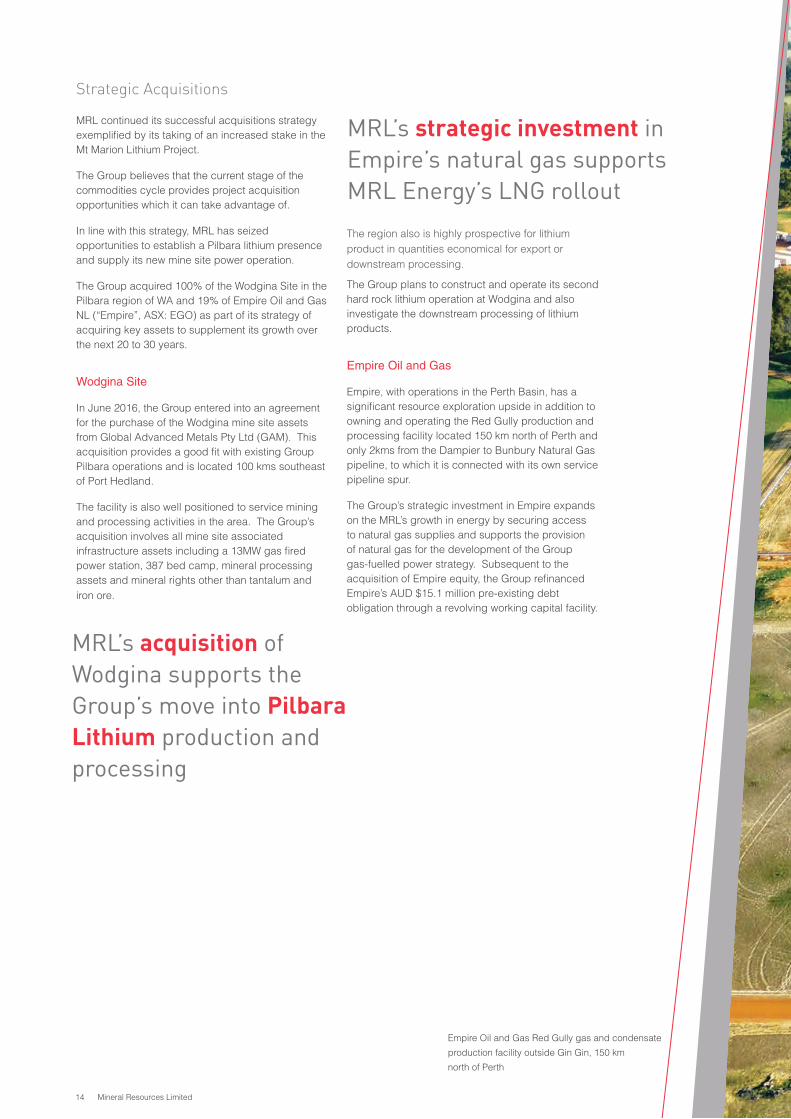
MRL continued its successful acquisitions strategy exemplified by its taking of an increased stake in the Mt Marion Lithium Project.
The Group believes that the current stage of the commodities cycle provides project acquisition opportunities which it can take advantage of.
In line with this strategy, MRL has seized opportunities to establish a Pilbara lithium presence and supply its new mine site power operation.
The Group acquired 100% of the Wodgina Site in the Pilbara region of WA and 19% of Empire Oil and Gas NL (“Empire”, ASX: EGO) as part of its strategy of acquiring key assets to supplement its growth over the next 20 to 30 years.
Wodgina Site
In June 2016, the Group entered into an agreement for the purchase of the Wodgina mine site assets from Global Advanced Metals Pty Ltd (GAM). This acquisition provides a good fit with existing Group Pilbara operations and is located 100 kms southeast of Port Hedland.
The facility is also well positioned to service mining and processing activities in the area. The Group’s acquisition involves all mine site associated infrastructure assets including a 13MW gas fired power station, 387 bed camp, mineral processing assets and mineral rights other than tantalum and iron ore.
The region also is highly prospective for lithium product in quantities economical for export or downstream processing.
The Group plans to construct and operate its second hard rock lithium operation at Wodgina and also investigate the downstream processing of lithium products.
Empire Oil and Gas
Empire, with operations in the Perth Basin, has a significant resource exploration upside in addition to owning and operating the Red Gully production and processing facility located 150 km north of Perth and only 2kms from the Dampier to Bunbury Natural Gas pipeline, to which it is connected with its own service pipeline spur.
The Group’s strategic investment in Empire expands on the MRL’s growth in energy by securing access to natural gas supplies and supports the provision of natural gas for the development of the Group gas-fuelled power strategy. Subsequent to the acquisition of Empire equity, the Group refinanced Empire’s AUD $15.1 million pre-existing debt obligation through a revolving working capital facility.
MRL’s acquisition of Wodgina supports the Group’s move into Pilbara Lithium production and processing
MRL’s strategic investment in Empire’s natural gas supports MRL Energy’s LNG rollout
Empire Oil and Gas Red Gully gas and condensate
production facility outside Gin Gin, 150 km
north of Perth
14 Mineral Resources Limited

Empire Oil and Gas Red Gully gas and condensate
production facility outside Gin Gin, 150 km
north of Perth
Annual Report 2016 15
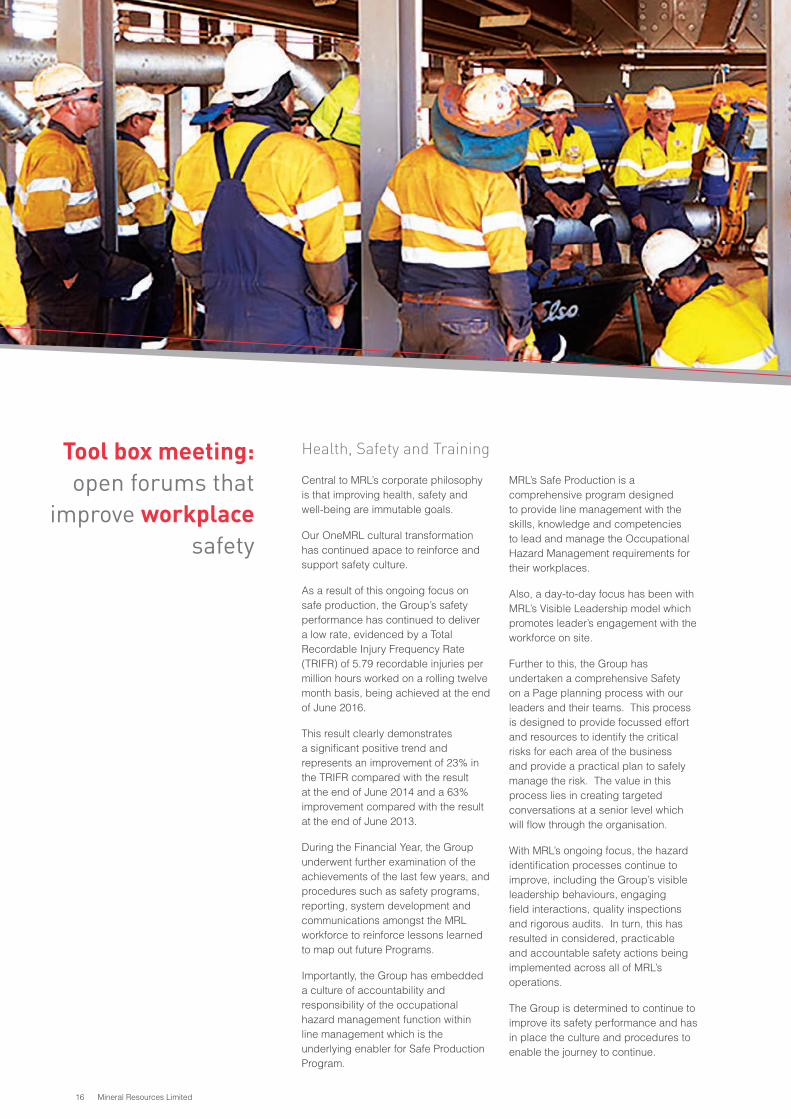
Health, Safety and Training
Central to MRL’s corporate philosophy is that improving health, safety and well-being are immutable goals.
Our OneMRL cultural transformation has continued apace to reinforce and support safety culture.
As a result of this ongoing focus on safe production, the Group’s safety performance has continued to deliver a low rate, evidenced by a Total Recordable Injury Frequency Rate (TRIFR) of 5.79 recordable injuries per million hours worked on a rolling twelve month basis, being achieved at the end of June 2016.
This result clearly demonstrates a significant positive trend and represents an improvement of 23% in the TRIFR compared with the result at the end of June 2014 and a 63% improvement compared with the result at the end of June 2013.
During the Financial Year, the Group underwent further examination of the achievements of the last few years, and procedures such as safety programs, reporting, system development and communications amongst the MRL workforce to reinforce lessons learned to map out future Programs.
Importantly, the Group has embedded a culture of accountability and responsibility of the occupational hazard management function within line management which is the underlying enabler for Safe Production Program.
MRL’s Safe Production is a comprehensive program designed to provide line management with the skills, knowledge and competencies to lead and manage the Occupational Hazard Management requirements for their workplaces.
Also, a day-to-day focus has been with MRL’s Visible Leadership model which promotes leader’s engagement with the workforce on site.
Further to this, the Group has undertaken a comprehensive Safety on a Page planning process with our leaders and their teams. This process is designed to provide focussed effort and resources to identify the critical risks for each area of the business and provide a practical plan to safely manage the risk. The value in this process lies in creating targeted conversations at a senior level which will flow through the organisation.
With MRL’s ongoing focus, the hazard identification processes continue to improve, including the Group’s visible leadership behaviours, engaging field interactions, quality inspections and rigorous audits. In turn, this has resulted in considered, practicable and accountable safety actions being implemented across all of MRL’s operations.
The Group is determined to continue to improve its safety performance and has in place the culture and procedures to enable the journey to continue.
Tool box meeting: open forums that
improve workplace safety
16 Mineral Resources Limited

Environment
Quality and prudent environmental management practices are at the heart of all MRL Group operations.
This is evidenced by MRL being awarded the 2015 Association of Mining and Exploration Companies (AMEC) Environment Award in recognition of the Group’s research investigating biodiversity in the Banded Iron Formation ranges of the southern Yilgarn region in Western Australia.
MRL understands that mining should be conducted to a high environmental standard and accepts that current and future opportunities for mining companies to utilise Australia’s resources need to place significant emphasis on environmental protection.
To this end, MRL is developing new initiatives to help position itself as an industry leader in environmental management.
The Group is a founding member of a consortium of mining companies and academic institutions implementing a $7 million Australian Research Council grant for an integrated research training program for mine rehabilitation. This program is focussed on improved mining rehabilitation outcomes and better conservation management of areas of significant biodiversity.
The Group continues to implement its Environmental Leadership program to promote the importance of effective environmental management to the Group’s sustainability. The Program is delivered to all employees across MRL’s diverse portfolio of work fronts, and it is expected that every employee will make commit to maintaining an exceptional standard in environmental performance.
In addition to the Environmental Leadership Program, the Group is progressing with review and improvement of its comprehensive
Environmental Management System (EMS) so that it aligns with the International Standard ISO14001.
The EMS has been progressively implemented across all business units with auditing of MRL sites against compliance with the standard commencing early in the next Financial Year.
Extensive environmental assessments are undertaken prior to the commencement of a project and detailed management plans are developed as required to mitigate or control potential environmental impacts.
The key project focus throughout the 2016 Financial Year has been on securing statutory approvals for the expansion of mining below water table at the Iron Valley project in the Pilbara and for the J5 and Bungalbin East iron ore proposal in the Yilgarn.
Quality environmental management is at the heart of all MRL operations
MINERAL RESOURCES WINS PRESTIGIOUS ENVIRONMENTAL AWARD
Mineral Resources is the winner of the prestigious 2015 AMEC Environment Award for its research on biodiversity modelling of Banded Ironstone Formations in the Yilgarn region, which was undertaken in partnership with Curtin University.
Annual Report 2016 17

Environmental approval for the J5 and Bungalbin East Iron Ore Proposal moved a step closer in the year with the submission of the Public Environmental Review (PER) to the EPA. This listed potential environmental impacts of the project, taking into account the Group’s strategy to mitigate these in the first instance, minimise impacts during the mining operations and rehabilitate the environment following mining.
Subsequent to the EPA making a recommendation, the Minister for Environment will determine whether the proposal will move forward.
The PER is open for public submissions until October 31, 2016.
Community consultation of the Proposal progressed during the reporting year with community workshops held at Southern Cross and Kalgoorlie.
Telephone surveys with other key stakeholder groups were undertaken in June 2016. The key focus was to update the community on the progress of the J5 and Bungalbin East approvals, and seek feedback on any aspects of the project. MRL welcomes feedback from members of the community so that it can be considered in project design and implementation.
Working closely with universities, MRL is developing new initiatives to position the Group as an industry leader in environmental management
18 Mineral Resources Limited

Landform re-contoured, top soil replaced prior to re-vegetation
Carina Iron Ore Mine Rehabilitation
The Group has an environmental commitment to rehabilitate the Carina mine prior to official closure. Progressive rehabilitation started in 2014 and is close to completion. Successful rehabilitation reduces MRL’s environmental liabilities and, once signed off by the Department of Mines and Petroleum, will result in the return to the Group of the significant mandatory payment made to the State’s Mining Rehabilitation Fund.
Rehabilitation during the Financial Year has included the re-profiling, ripping and seeding of the Carina waste rock dump as well as many access roads, exploration pads and borrow pits around site that are no longer required. Progressive rehabilitation is already underway at parts of the J4 operation despite this operation being less than 12 months old.
Annual Report 2016 19

Indigenous Engagement
MRL acknowledges and respects the contribution that Indigenous people make to our community and their deep seated connection to the land that we tread.
The Group especially recognises the traditional owners associated with lands within MRL’s project areas, and their contribution to successful project outcomes.
It is the Group’s sincere objective to build strong relationships with Indigenous communities in general and local traditional owners in particular.
Through its Indigenous engagement, MRL builds a relationship of reciprocity with the people whose land we are privileged to operate on.
MRL was proud to launch in 2015, an Indigenous Traineeship Program: Tjinanging - ‘Looking Forward’. This program provided training and work experience for Indigenous people to enhance their pathway to employment opportunities and to provide a pipeline of appropriately skilled Indigenous candidates who can be placed into full time positions across the MRL business. The program has proven successful, with a number of participants transitioning into full time roles both within the company, and across the industry.
Fundamental to the traineeship program is a supporting program of supervisor and manager training. These programs are facilitated by Indigenous leaders who have both experience working within the resources sector and are traditional land owners.
Recognition of cultural diversity is an important theme throughout MRL’s workforce and is a strong continuing theme.
During the Financial Year, the Group participated in a number of initiatives to increase Indigenous participation rates across all of its operations and continued with further education of the workforce on the value that cultural diversity brings to the organisation. Education is strongly recognised to be a key factor in successfully imbuing Indigenous culture into MRL’s procedures and operations.
The Group continues to support events which celebrate Aboriginal and Torres Strait Islander history, culture and achievements. It also provides an opportunity to recognise the contributions of Indigenous Australians.
MRL acknowledges and respects the contribution that Indigenous people make to our community and their deep seated connection to the land that we tread
20 Mineral Resources Limited

MRL builds a relationship of reciprocity with the people whose land we are privileged to operate on
Annual Report 2016 21

MRL is committed to good corporate citizenship.
The community grants MRL the opportunity to conduct business in WA and the Group recognises this social licence.
The Group makes a significant positive contribution to the community by capacity building in the not-for-profit and charitable sectors.
The key focus areas of MRL’s support involve youth, health and safety, education, environment in addition to the arts and culture.
The Group is driven by a commitment to sustainable support for reputable not-for-profit and community-based organisations that deliver long term, measurable benefits.
In order to provide a number of selected organisations with a degree of financial stability, MRL has entered into three-year partnership arrangements to provide funds to assist in the delivery of important community services and facilities.
These organisations include:
• Aspire (UWA);
• Make A Wish Foundation;
• Parkerville Children and Youth Care Centre; and
• Princess Margaret Hospital - Regional Assistance Fund;
• Salvation Army;
• Starlight Foundation;
• Youth Focus.
An example of these partnerships is MRL’s relationship with the Princess Margaret Hospital Foundation’s Regional Assistance Fund, which provides financial support to families with sick children. During the Financial Year, MRL provided significant contributions to the Fund. This changed the lives of hundreds of families from over 65 different country towns and communities.
In addition to the three-year partnership arrangements, the Group provides targeted financial support to several dozen smaller community organisations in the metropolitan area, Pilbara and Yilgarn regional centres.
As part of MRL’s Yilgarn School Sponsorship Program, funding was allocated to the Southern Cross District Junior High School, Moorine Rock Primary School and St Joseph’s all located in Southern Cross. The Group also contributed to its School Education in Low Socioeconomic Areas Program.
Furthermore, MRL substantially contributed to the Esperance Bush Fires Appeal as a demonstration of support for the Esperance community, who suffered the tragic loss of lives and damage caused by natural disaster.
MRL staff also participate in dozens of awareness days and weeks, mostly of a health nature. In August, almost 200 employees, family and friends ran and walked amongst the 30,000 people who participated in the Perth City to Surf. During the Financial Year, the Group provided significant funding for the event and had the privilege of catering for the corporate sector of the fundraising event.
MRL also actively encourages and supports a range of employee initiated fund raising and charity events throughout the year at various Group sites and operations.
PMI, through regular donations generated from wet mess sales and in-kind labour provision totalled $133,000 this Financial Year. Organisations supported included organisations such as the Royal Flying Doctor Service, and Ronald McDonald House. These donations were in addition to the financial support provided by MRL.
Another example of the many employee initiatives was the Yilgarn staff running a fundraising event at Carina and J4 for the National Breast Cancer Foundation, raising $5,000 for the cause.
Community
MRL fosters apprentices by donating tool boxes and supports health initiatives including the Breast Cancer Foundation’s national awareness week
22 Mineral Resources Limited

The Group achieved revenues of $1.2 billion for the 2016 Financial Year, which was materially in line with the previous Financial Year. A 14% increase in commodity volumes to a record 12.1 million tonnes materially offset lower construction revenue and further declines in global iron ore prices.
The Group produced normalised earnings before interest, tax, depreciation and amortisation (EBITDA) for the year of $286 million which was also in line with the previous year and was at the high end of the guidance range of $250 million to $290 million.
Despite difficult global iron ore market conditions, the Group’s EBITDA was underpinned by increased commodity exports, increased crushing and mining production, and an 18% decrease in mining cash costs. All of which were offset by lower construction activity and lower global iron ore prices.
Increased commodity production drove a 6% rise in 2016 depreciation and amortisation charges to $134 million.
Reported net loss after tax of $26 million in 2016 included $130 million of non-cash, after-tax impairment which principally related to:
• A $76 million after-tax reduction in the carrying value of the Group’s investment in manganese resources held in Mesa Minerals Limited (in administration) and Auvex Resources Pty Ltd, due to prolonged weakness in manganese prices making development of the Ant Hill and Sunday Hill projects unprofitable; and
• A $49 million after-tax reduction in the carrying value of iron ore tenements, reflecting the current iron ore market and management’s view on iron ore prices in the medium term.
After taking into account the economic conditions and the Group’s future capital expenditure and business development requirements, the directors resolved to distribute 50% of normalised after-tax earnings to shareholders as dividends and declared a fully franked dividend of 21.0 cents per share.
The final dividend, together with the interim dividend of 8.5 cents per share, makes a total fully franked dividend for the 2016 Financial Year of 29.5 cents per ordinary share.
The Group’s balance sheet is strong and has continued to benefit from significant cash generation in the year through solid operational performance of the businesses and focussed working capital management. At 30 June 2016, the Group had net cash (cash and cash equivalents less debt) of $188 million which was up $70 million in the year.
Importantly, cash generation in 2016 supported the continuation of the Group’s capital expenditure and research and development programs. Capital expenditure in 2016 totalled
Corporate/Financial
mill
ions
2,000
1,8000
1,600
1,400
1,200
1,000
800
600
400
200
-
Revenue
1413 15 16
The Group’s balance sheet benefits from solid operational performance and significant cash generation
$167 million, which was $40 million greater than in the previous year. The majority of expenditure was directed to the Mount Marion Project (both in terms of Build-Own-Operate infrastructure and increased equity ownership), the J4 iron ore operation with a larger mining fleet, the Group gas strategy and infrastructure to support LNG power generation at mine sites, and additional crushing capacity.
Annual Report 2016 23

MRL’s strong financial performance stems from cost reduction and a prudent investment strategy
mill
ions
450
400
350
300
250
200
150
100
50
0
Capital Expenditure
1413 15 16
The Group refinanced over $400 million of syndicated debt facilities for a 3-year term in the year, allowing the Group to benefit from lower interest rates.
The Group maintains a strong and conservative balance sheet that provides flexibility to facilitate growth of the business. This includes maintaining a significant cash balance to ensure that is available for strategic investments as the opportunity arises.
Mining Services and Processing revenues of $399 million were $171 million less than the previous corresponding period as a result of lower levels of construction revenue from the completion of Rio Tinto’s Nammuldi Below Water Table project in the 2015 Financial Year, together with the closure of the Spinifex Ridge mine gate operation at the end of its economic life, and a reduction in the opportunistic sale of Manganese stock holdings.
Mining Services and Processing normalised EBITDA of $187 million was $49 million lower than the previous corresponding period. The shortfall relates to lower levels of construction revenue, partially offset by volume and profitability growth in mineral crushing and processing.
The Group increased its equivalent crushing capacity by 11% in the 2016 Financial Year when compared against the previous corresponding period. This growth resulted from a continuation of the volume enhancement program undertaken for clients and increased production at the Group’s Mining operations.
The Group’s Mining segment had a strong year both operationally and financially despite the difficult commodity price environment.
Mining revenues of $778 million were $49 million (7%) greater than the previous corresponding period. The Group had another record year with total export volumes of 12.1 million wet tonnes which were up 14% from 10.6 million tonnes in the previous corresponding period. .
Mining EBITDA of $104 million was $51 million (94%) greater than the previous corresponding period, reflecting increased production and exports, cost reduction initiatives, both partially offset by further declines in iron ore prices. On a per wet tonne basis, EBITDA increased by 59% from $5.40 to $8.60.
mill
ions
300
200
100
0
-100
-200
-300
-400
Net Cash Position
1413 15 16
24 Mineral Resources Limited

Annual Report 2016 25
Financial Statements
Directors’ report 26
Auditor’s independence declaration 48
Statement of profit or loss and other
comprehensive income 49
Statement of financial position 50
Statement of changes in equity 51
Statement of cash flows 52
Notes to the financial statements 53
Directors’ declaration 92
Independent auditor’s report to the
members of Mineral Resources Limited 93
Shareholder Information 95
General information
The financial statements cover Mineral Resources Limited as a Group consisting of Mineral Resources Limited (Company) and the entities it controlled at the end of, or during, the year (Group). The financial statements are presented in Australian dollars, which is the Group’s functional and presentation currency.
Mineral Resources Limited is a listed public company limited by shares, incorporated and domiciled in Australia. Its registered office and principal place of business is:
1 Sleat Road Applecross WA 6153
A description of the nature of the Group’s operations and its principal activities are included in the notes to the financial statements.
The financial statements were authorised for issue, in accordance with a resolution of directors, on 18 August 2016. The directors do not have the power to amend and reissue the financial statements.

26 Mineral Resources Limited
Directors’ Report
The directors present their report, together with the financial statements, for the Group for the year ended 30 June 2016.
Directors
The following persons were directors of Mineral Resources Limited during the whole of the financial year and up to the date of this report, unless otherwise stated:
Peter Wade Chris Ellison Kelvin Flynn James McClements Joe Ricciardo (retired 18 April 2016)
Principal activities
During the financial year, the principal continuing activities of the Group consisted of the integrated supply of goods and services
to the resources sector.
Dividends
Dividends paid during the financial year were as follows:
Group
2016 $’000
2015 $’000
Final dividend for the year ended 30 June 2015 (2015: 30 June 2014) of 15 cents (2015: 32 cents) per ordinary share franked at a tax rate of 30% paid on 8 October 2015 (2015: 10 October 2014) 28,147 59,701
Interim dividend for the year ended 30 June 2016 (2015: 30 June 2015) of 8.5 cents (2015: 7.5 cents) per ordinary share fully franked at a tax rate of 30% paid on 4 March 2016 (2015: 23 April 2015) 15,866 14,048
44,013 73,749
Significant changes in the state of affairs
There were no significant changes in the state of affairs of the Group during the financial year.
Matters subsequent to the end of the Financial Year
On 8 July 2016 Process Minerals International Pty Ltd increased it’s holding in Roadtrim Mining and Civil Contracting Pty Ltd (Roadtrim) from 25% to 90% and on 1 August 2016 from 90% to 100%. Roadtrim provides specialist bulk haulage services to Australia’s leading mining and resource companies. The combination of both businesses will result in both increased revenue and cost savings to the Group.
On 13 July 2016 Mesa Minerals Limited (Mesa), a 59.40% subsidiary of the Group, was placed in administration. The current manganese market makes it uneconomical to develop Mesa’s manganese deposits in the short term. Mesa is unable to generate positive cash flow without the direct assistance of the Group. The Group is no longer willing to support Mesa without a significant reduction in the debts outstanding. The administrators have assumed control of Mesa’s assets and are working with the Mesa Board to maximize the outcome for all Mesa stakeholders. The impact on the financial position of the Group at 30 June 2016 is not material.
On 11 August 2016 the Group and Empire Oil and Gas NL executed final documentation in relation to a A$15.1m revolving working capital facility to refinance the ERM Power debt obligation maturing 31 August 2016. Payment was effected 12 August 2016.
On 18 August 2016 the Board approved a final fully franked dividend of 21.0c per share to be paid on 15 September 2016 – refer note 29.
No other matter or circumstance has arisen since 30 June 2016 that has significantly affected, or may significantly affect the Group’s operations, the results of those operations, or the Group’s state of affairs in future financial years.
Likely developments and expected results of operations
Information on likely developments in the operations of the Group and the expected results of operations have not been included in this report because the directors believe it would be likely to result in unreasonable prejudice to the Group.
Environmental regulation
The Group is subject to and is compliant with all aspects of environmental regulation of its exploration and mining activities. The directors are not aware of any environmental law that is not being complied with.

Annual Report 2016 27
Information on directors
Name: Peter Wade
Title: Non-Executive Chairman
Qualifications: BE (Hons), LGE
Experience and expertise: Peter has over 40 years of experience in engineering, construction, project management and mining and infrastructure services. He started his career with the NSW Public Service managing the construction of significant infrastructure projects in NSW including the Port Kembla coal loader and the grain terminals at Newcastle and Wollongong and was also the Deputy Director for the Darling Harbour Redevelopment construction project. Following his period of employment with the NSW Public Service, Peter joined the executive team of the Transfield Group. Throughout the 1980s and 1990s he was General Manager of Sabemo Pty Ltd, Transfield Construction Pty Ltd, and Transfield Power Technologies and subsequently became Transfield Chief Operations Officer (Southern). During this period Peter was responsible for significant build, own, operate projects including the Melbourne City Link, the Airport Link, the Northside Storage Tunnel and the Collinsville and Smithfield Power Plants. Peter became Managing Director of Crushing Services International Pty Ltd and PIHA Pty Ltd in 1999, and subsequently Process Minerals International Pty Ltd in 2002 (now wholly owned subsidiaries of Mineral Resources Limited). He managed the companies through a sustained period of growth and development prior to the formation and listing of Mineral Resources Limited in 2006 at which time he was appointed Managing Director of the Group. He was subsequently appointed Executive Chairman in 2008 and Non-Executive Chairman in 2012.
Other current directorships: Non-Executive Chairman of Global Construction Services Ltd
Former directorships (last 3 years): None
Special responsibilities: Chairman of Board of Directors
Interests in shares: 516,162
Interests in options: None
Name: Chris Ellison
Title: Managing Director
Experience and expertise: Chris is the founding shareholder of each of the three original subsidiary companies of Mineral Resources Limited (Crushing Services International Pty Ltd, PIHA Pty Ltd and Process Minerals International Pty Ltd) and has over 36 years of experience in the mining contracting, engineering and resource processing industries. In 1979 Chris founded Karratha Rigging and was Managing Director until its acquisition by Walter Wright Industries in 1982. Chris was subsequently appointed as the General Manager, Walter Wright Industries for the Western Australia and Northern Territory regions. In 1986 Chris founded Genco Ltd and following two years of considerable growth, Genco Ltd merged with the Monadelphous Group in 1988. In September 1988 Receivers and Managers were appointed to the Monadelphous Group. At this time, Chris was appointed the Managing Director and under his careful management, the group successfully traded out of its financial difficulties and eventually relisted on the ASX in late 1989. In 1992 Chris founded PIHA Pty Ltd, a company focused on the provision of specialised pipe lining and general infrastructure.
Other current directorships: Director of Mesa Minerals Limited
Former directorships (last 3 years): None
Special responsibilities: Managing Director
Interests in shares: 24,758,275
Interests in options: None
Name: Kelvin Flynn
Title: Independent Non-Executive Director
Qualifications B Com, CA
Experience and expertise: Kelvin has over 25 years of corporate experience in leadership positions in Australia and Asia, having held the position of Executive Director/Vice President with Goldman Sachs and Managing Director of Alvarez & Marsal in Asia. Kelvin is a qualified Chartered Accountant with significant investment banking and corporate advisory experience including private equity and special situations investments into the mining and resources sector. He has also worked in complex financial workouts, turnaround advisory and interim management. Kelvin is the founder and currently Managing Director and Head of Private Equity at Sirona Capital.
Other current directorships: Silver Lake Resources Limited (ASX,SLR)
Former directorships (last 3 years): Mutiny Gold Limited (ASX:MYG)
Special responsibilities: Member of Audit Committee and Remuneration Committee
Interests in shares: None
Interests in options: None

28 Mineral Resources Limited
Name: James McClements
Title: Independent Non-Executive Director
Qualifications B Econ (Hons)
Experience and expertise: James has 30 years of experience as a natural resources sector banker in Australia, Canada and the USA. He was raised and educated in the Pilbara region of Western Australia and began his professional career with BHP Limited before joining Standard Chartered Bank in Perth and N.M. Rothschild & Sons in Sydney then Denver. James also spent 11 years in the USA and co-founded Resource Capital Funds (RCF) during that time. James is currently the Managing Partner of RCF and has extensive board experience having served as a director of 12 RCF portfolio companies.
Other current directorships: Chairman of Global Advanced Metals Pty Ltd
Former directorships (last 3 years): None
Special responsibilities: Member of Audit Committee and Remuneration Committee and Nomination Committee
Interests in shares: None
Interests in options: None
‘Other current directorships’ quoted above are current directorships for listed entities only and excludes directorships of all other types of entities, unless otherwise stated.
‘Former directorships (in the last 3 years)’ quoted above are directorships held in the last 3 years for listed entities only and excludes directorships of all other types of entities, unless otherwise stated.
Company Secretary
Bruce Goulds (BBus, Grad Dip Management, LLB (Hons)) has over 30 years of finance and commercial experience in various listed and unlisted corporations including as Commercial Manager within Brambles Industries, Financial Controller and Company Secretary of Cockburn Corporation Limited, and Commercial Manager for the Australasian operations of international mining equipment manufacturers Svedala Industrii, Metso Minerals and Sandvik. In 2005, Bruce joined PIHA Pty Ltd, Crushing Services International Pty Ltd and Process Minerals International Pty Ltd as Group Finance Manager. In 2006, he was appointed the inaugural CFO and Company Secretary of Minerals Resources Limited on its listing on ASX. Bruce is a Fellow Certified Practicing
Accountant (CPA), a Fellow of the Institute of Chartered Secretaries and a Member of the Australian Institute of Company Directors.
Meetings of directors
The number of meetings of the Company’s Board of Directors (‘the Board’) and of each Board committee held during the year ended 30 June 2016, and the number of meetings attended by each director were:
Full Board Audit Committee Remuneration Committee Nominations Committee
Attended Held Attended Held Attended Held Attended Held
Peter Wade 10 11 n/a n/a n/a n/a n/a n/a
Chris Ellison 11 11 n/a n/a n/a n/a n/a n/a
Joe Ricciardo* 4 9 1 2 - 2 - 2
Kelvin Flynn 11 11 2 2 4 4 2 2
James McClements 9 11 2 2 4 4 2 2
Held: represents the number of meetings held during the time the director held office or was a member of the relevant committee.
*Retired on 18 April 2016
Other committee meetings are convened as required.

1. Letter from Committee Chair
Dear Shareholders
I am pleased to present the 2016 Financial Year Remuneration Report to shareholders.
The aim of this Remuneration Report is to explain to shareholders the Board’s considerations and decisions on how executive remuneration is structured to remunerate, reward and retain executives in the business.
At the 2015 Annual General Meeting, shareholders voted 84% in favour of the Remuneration Resolution. This result, albeit positive, provided the Board with useful feedback on the remuneration structure and our disclosures.
The Board is mindful of the feedback it receives from stakeholders, the broader economic conditions and the Company’s strategic direction in designing and implementing the reward systems for the Group. It strives to align executive remuneration and the generation of shareholder value by engaging with shareholders, industry experts and proxy advisors to ensure their views and expectations are taken into consideration when planning the remuneration policies and practices.
In FY16, the resources industry has continued to experience substantial volatility with significant movements in commodities prices and major fluctuations to other external economic factors. In the face of this volatility, MRL executives have remained fully focused on MRL’s business strategy and have been able to achieve a substantially positive returns for shareholders. FY16 underlying EBITDA of $286 million is at the high end of the Company’s guidance range achieved substantially through innovation, efficiency measures and cost management initiatives, countering the 18% fall in iron ore index prices. Against this backdrop, management have delivered a 13% Return on Invested Capital (ROIC) for the period, against a budgeted ROIC of 8.2%.
During 2016, the Board has taken the opportunity to refresh the structure of MRL’s remuneration system for senior managers to keep pace with changes in the business and broader market expectations. The Remuneration Committee undertook this review with input from the Board, our key shareholders and proxy advisors. In addition, we completed an independent review and critique of our remuneration disclosures with the assistance of external consultants. These reviews established the framework for changes to our remuneration system.
The key considerations in developing the new remuneration structure is to:
1. Focus management on:
a. activities that drive value creation within the business
b. achieving specific targets that are key to achieving both short and long term Group strategies
2. The uniqueness of the MRL business
3. Attract and retain executive talent
4. Be market competitive.
This new framework, explained in the detailed report below, focuses on the value drivers of the business and how the Company rewards management for creating value for shareholders. The result is a remuneration system substantially focused on key outcomes that effect the generation of shareholder wealth and provide rewards that mirror shareholder outcomes.
The Remuneration Committee and Board believe that we have the appropriate reward structure for MRL which will achieve the desired outcomes. I look forward to shareholder feedback and discussing our approach at the Annual General Meeting in November.
Yours faithfully
James McClements Lead Independent Non-Executive Director Chairman, Remuneration Committee
Annual Report 2016 29
Remuneration Report
30 Mineral Resources Limited
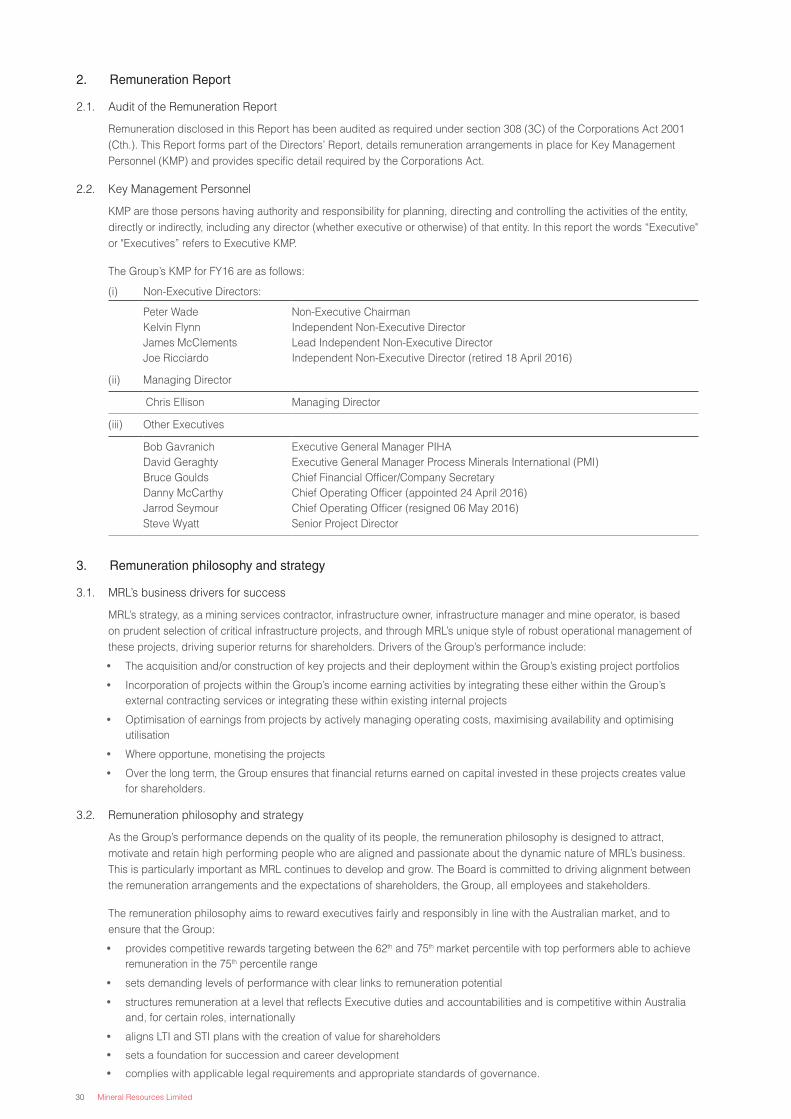
2. Remuneration Report
2.1. Audit of the Remuneration Report
Remuneration disclosed in this Report has been audited as required under section 308 (3C) of the Corporations Act 2001 (Cth.). This Report forms part of the Directors’ Report, details remuneration arrangements in place for Key Management Personnel (KMP) and provides specific detail required by the Corporations Act.
2.2. Key Management Personnel
KMP are those persons having authority and responsibility for planning, directing and controlling the activities of the entity, directly or indirectly, including any director (whether executive or otherwise) of that entity. In this report the words “Executive" or "Executives” refers to Executive KMP.
The Group’s KMP for FY16 are as follows:
(i) Non-Executive Directors:
Peter Wade Kelvin Flynn James McClements Joe Ricciardo
Non-Executive Chairman Independent Non-Executive Director Lead Independent Non-Executive Director Independent Non-Executive Director (retired 18 April 2016)
(ii) Managing Director
Chris Ellison Managing Director
(iii) Other Executives
Bob Gavranich David Geraghty Bruce Goulds Danny McCarthy Jarrod Seymour Steve Wyatt
Executive General Manager PIHA Executive General Manager Process Minerals International (PMI) Chief Financial Officer/Company Secretary Chief Operating Officer (appointed 24 April 2016) Chief Operating Officer (resigned 06 May 2016) Senior Project Director
3. Remuneration philosophy and strategy
3.1. MRL’s business drivers for success
MRL’s strategy, as a mining services contractor, infrastructure owner, infrastructure manager and mine operator, is based on prudent selection of critical infrastructure projects, and through MRL’s unique style of robust operational management of these projects, driving superior returns for shareholders. Drivers of the Group’s performance include:
• The acquisition and/or construction of key projects and their deployment within the Group’s existing project portfolios
• Incorporation of projects within the Group’s income earning activities by integrating these either within the Group’s external contracting services or integrating these within existing internal projects
• Optimisation of earnings from projects by actively managing operating costs, maximising availability and optimising utilisation
• Where opportune, monetising the projects
• Over the long term, the Group ensures that financial returns earned on capital invested in these projects creates value for shareholders.
3.2. Remuneration philosophy and strategy
As the Group’s performance depends on the quality of its people, the remuneration philosophy is designed to attract, motivate and retain high performing people who are aligned and passionate about the dynamic nature of MRL’s business. This is particularly important as MRL continues to develop and grow. The Board is committed to driving alignment between the remuneration arrangements and the expectations of shareholders, the Group, all employees and stakeholders.
The remuneration philosophy aims to reward executives fairly and responsibly in line with the Australian market, and to ensure that the Group:
• provides competitive rewards targeting between the 62th and 75th market percentile with top performers able to achieve remuneration in the 75th percentile range
• sets demanding levels of performance with clear links to remuneration potential
• structures remuneration at a level that reflects Executive duties and accountabilities and is competitive within Australia and, for certain roles, internationally
• aligns LTI and STI plans with the creation of value for shareholders
• sets a foundation for succession and career development
• complies with applicable legal requirements and appropriate standards of governance.

Annual Report 2016 31
In addition to the Fixed Annual Remuneration (FAR), Executive remuneration includes STI and LTI components. Each participant has an approved maximum percentage of base salary applied to STI and LTI with a significant proportion of the remuneration at risk.
A summary of MRL’s Executive Remuneration framework is as follows:
Attracting and retaining talented and qualified Executives
Encouraging Executives to strive for superior performance
Aligning Executive and shareholder interests
Total remuneration – comprised of FAR, STI and LTI is market related (targeting between the 62nd and 75th percentile of relevant market data and personal responsibilities and accountabilities).
A significant portion of remuneration is ‘at risk’ under STI and LTI plans. Value is derived for Executives by meeting corporate goals reflecting the generation of shareholder value, which are assessed annually. Individual Executives are also measured against personal KPI’s reflecting both corporate and personal objectives. In the case of Executives, the KPI measures are primarily corporate performance based.
STI incentives are awarded from the bonus pool only on achieving key performance targets. The maximum bonus pool allocation is not necessarily consumed in any one year.
LTI delivered through awarding MRL shares, vesting over time, on achieving and exceeding Return on Invested Capital (ROIC) hurdles.
The STI pool is based on a proportion of normalised Net Profit After Tax (NPAT).
4. Changes in detail
During FY16, the Remuneration Committee undertook a comprehensive review of the Executive remuneration and reward structures. This was considered necessary to ensure that the Executive reward system continued to achieve the desired outcomes of the Group’s reward strategy. The decision to undertake this review was based on the feedback from key stakeholders about how the MRL remuneration system was perceived and a view that the economic conditions the Group operated in had significantly changed causing the previous structures to be out of date.
To assist the Committee with establishing the framework for a new Executive remuneration system, the Committee sought input from external advisors, Proxy Advisors and key shareholders to understand their view of the strengths and weaknesses of the previous remuneration arrangements and also the Company’s disclosures.
The key findings were as follows:
• The remuneration arrangements in place were unconventional and focused on perceived short term performance
• Any future remuneration system should reflect the uniqueness of MRL’s business
• Explanation of the systems, remuneration benchmarking, incentives and hurdles could be more rigorous.
The review itself involved a wide ranging study of the current arrangements and alternative future structures to align remuneration with shareholder outcomes and expectations. This included:
1. A review of KMP Fixed Annual Remuneration (FAR) taking account of market conditions, the individual role and responsibilities of executives and increasing the proportion of overall remuneration at risk
2. Replacing the Long Term Incentive (LTI) framework with a simpler scheme focused on the underlying drivers of shareholder value within the business and incorporating some of the common features of LTI plans in ASX listed companies
3. Replacing the Short Term Incentive (STI) framework with a simple structure that rewards performance proportionately to the outcomes for shareholders.

32 Mineral Resources Limited
FAR The level of Executive FAR has been reviewed based on market conditions and comparative positions within MRL’s peer group being ASX 200 companies and a further review of duties and responsibilities.
STI The previous STI, suspended for FY15, lacked a direct correlation to shareholder value, primarily as it was based solely on individually focused performance hurdles. As a result, a new STI plan has been introduced with effect from 1 July 2015. It is considered important to implement this new system in FY16 to bring the new and robust system into operation as soon as practicable.
This new structure has a direct and overarching link to shareholder returns. It involves allocation of a proportion of Group profit for distribution as STI. The Remuneration Committee believes that providing a bonus pool from the current year profit as the basis for STI provides a direct nexus between performance, reward and shareholder returns. In this way, the senior management team is awarded a bonus based on the actual financial performance of the Group with the pool being distributed between members based on individual performance.
The Board chose to allocate a maximum STI bonus pool representing a percentage of normalised NPAT to reflect this principle. The entire allocation is not necessarily paid in STI and any surplus is not carried forward to future periods.
For FY16, this pool has been set at a maximum of 3% of normalised NPAT (this percentage may vary in future financial years depending on market conditions). This percentage is not meant to reflect a dividend like distribution but provide a relative measure for the bonus pool against shareholder returns. In other words, when profits are good, the STI pool will reflect this and equally, where a situation occurs that profits are low, it is reflected in the bonus pool.
The STI pool is available for distribution as cash bonuses for all Executives, senior managers and other employees, depending on the achievement of an individual’s personal KPIs.
No deferment of STI is included in the scheme. The Committee considers that providing the STI reward closely to achieving the performance measures emphasises the Group’s philosophy that performance be rewarded as soon as practicable to achieving the short term targets.
LTI The previous LTI, suspended for FY15, was short-term in focus (having a number of complex measures, each of which was focused on improvements over annual targets). As a result, the LTI has been revised, with revisions taking effect from 1 July 2015. It was appropriate to introduce the new structure from FY16 because the Committee considered that the new structure provided significant benefits to shareholders by simplifying and focusing executive performance.
The focus of the revised LTI is to drive a clear correlation between the Group’s achievement of its long term strategy and the LTI. Changes to the LTI address both the complexity of the previous system and its short term nature. Previously, the LTI had a number of measures and based on a comparison with previous year’s performance. These complexities have been removed.
Specific changes to the LTI are:
a. Introduction of a single financial measure on which each LTI participant’s award is based. The measure chosen is Return on Invested Capital (ROIC) with ROIC measured at the Group level. This provides a clear and unambiguous link between business performance and the generation of shareholder value. This measure has been chosen due to the fact that the key value driver in the MRL business is the financial return on investments made by management in assets such as mineral processing plants, resources and other assets related to the bulk materials sector. Value is created from the financial returns and the asset values deployed. ROIC is a long term representation of company value.
b. An increase of the vesting periods from 3 to 4 years, commencing in the first year of grant (FY16).
c. Introduction of a vesting deferral mechanism with the Board retaining the right to withhold the vesting of entitlements depending on overall Group performance and the general economic environment.
d. Introduction of a ‘reward entitlement matrix’ which delivers an LTI grant depending on the ROIC achieved, providing an uplift in the level of reward for superior performance. Details of the various levels achievable are included below.

Annual Report 2016 33
5. Remuneration structure
5.1. Fixed Annual Remuneration
Executives are provided a competitive FAR based on criticality of their role, market comparison and individual skills and experience. FAR consists of base pay, superannuation and fixed non-monetary benefits. Executives may receive their FAR in the form of cash or other benefits (for example motor vehicles) where it does not create any additional costs to the Group and provides additional value to the Executive.
FAR is reviewed annually by the Remuneration Committee, based on general economic conditions, individual and business performance, duties and responsibilities and comparable market remuneration.
5.2. Short Term Incentives
The STI is an annual scheme, settled in cash immediately following the release of the Group’s audited annual financial results to the ASX. Executive rewards are based on a combination of overall Group performance and personal KPIs.
5.2.1. STI Measurement principles
The following matrix sets out how the STI target mix has been apportioned between corporate and personal goals. The matrix has been designed to provide an appropriate mix of corporate and personal measures for each position. More senior positions have a greater emphasis on corporate targets whereas other roles have a greater focus on personal targets. Personal targets for Non-KMP positions have been clearly defined with each individual and are not covered in this Report.
Role Corporate Targets Personal Targets
C-suite
Managing Director 100% 0%
Chief Financial Officer 100% 0%
Chief Operating Officer 100% 0%
Executive GMs
EGM - PIHA 100% 0%
EGM - PMI 60% 40%
EGM - CSI Construction 60% 40%
Corporate GMs
GM - Finance 70% 30%
GM - Commercial 70% 30%
GM - Contracts 70% 30%
GM - Marketing 70% 30%
Corporate
Personal
Measures for Executives with direct business responsibility are focused on the financial and operational performance of their business and corporate managers are measured on KPIs related to their area or responsibility and specific project outcomes.
5.2.2. Measures and performance
Performance measures are a mix of Group and personal measures. For more senior positions performance is generally gauged against Group performance, whereas other Non-KMP executives are measured on a proportion of personal and Group performance.
During the period the Group’s targets of profit, capital management and other specific targets, were met. Details of strategic targets and the Group’s performance against these, are included in this Annual Report and in the presentation material that accompanies it. The Group achieved the top level of its financial guidance and budget targets. Overall STI awarded in the 2016 Financial Year was less than the maximum achievable due to broader economic influences on the Group.
Personal targets depend on the individual’s responsibilities. Executive GMs with Profit and Loss responsibility are measured against budget performance within their business area. Corporate GMs are measured against personal projects assigned for the year, linked to Group’s strategic direction. Each individual has been awarded their STI based on achievement of these goals.

34 Mineral Resources Limited
5.3. Long Term Incentives
To address the short-term characteristics of the KPIs included in the previous LTI arrangement, the LTI program has been completely revised. LTI benefits are now measured on the Group’s Return on Invested Capital (ROIC), with participants measured on achievement of the target levels annually.
Calculation of ROIC for FY16 is shown below. The various components of the calculation and rationale for including the individual parts are set out below.
1. Invested Capital
1.1. Net Assets per the published Balance Sheet is the base for the calculation.
1.2. Cash and cash equivalents are excluded from the definition. Cash is not considered a working asset of the business until it is deployed as an income earning equivalent.
1.3. Short term borrowings drawn for cash management purposes are also excluded, as this is a component of the cash and cash equivalents.
1.4. Current year, non-cash impairments are added back to invested capital to reflect the operational asset base of the business.
2. Normalised Net Profit After Tax is the profit measure for the calculation. This is chosen to reflect the underlying operational performance of the business.
The LTI system is designed to incentivise long term performance and to generate shareholder value. LTI benefits are dependent on achieving target ROIC, with LTI participants assessed on the Group’s performance against this measure. Benefits are granted annually through ‘equity performance rights’ – rights to MRL shares vesting evenly over four years. The threshold requirement for vesting of rights is dependent on ongoing permanent employment.
The Board also retains the right to delay vesting of a particular tranche in a particular year. This deferral mechanism provides a nexus between the LTI award and shareholder returns by linking the long term incentive and ongoing business performance.
The Board recognises that achievement of outstanding results has a direct impact on shareholder value and LTI participants should be motivated to strive for superior outcomes in their long term decisions. To that end, participants can achieve significantly greater rewards if thresholds outlined below are exceeded.
A summary of the LTI structure is set out below:
1. A single financial measure (ROIC) that reflects the generation of long term shareholder value is used to measure performance
2. Vesting of awards equally (i.e. 25% each year) over a period of 4 years, the first being the year of grant. The first instalment (25%) of the award vests at the time of grant. This provides recognition of the target achieved as well as the long-term retention framework for future vesting periods
3. Re-measurement / claw-back mechanisms – once an entitlement is granted, vesting will be dependent on continuing employment. The Board retains the right to withhold the vesting of individual tranches of granted rights depending on the Group performance and general economic conditions
4. Reward instruments – rights to MIN shares, with the basis for valuation being Volume Weighted Average Price (VWAP) at the time of entitlement (for FY16 this was $8.3689 per share being the VWAP for the 5 ASX trading days ending 30 June 2016). Once the entitlement to a number of shares is set, the recipient has the opportunity to benefit from share price movement between the date of grant and date of vesting
5. Participants do not have the right to hedge the value of unvested entitlements to shares
6. Benchmark ROIC of 12% for each period (i.e. each financial year)
7. ROIC base excludes cash balances, borrowings determined to be cash/cash equivalents and impairments in a particular year that reduce the net assets of the Group. Cash and cash equivalents balances are excluded as there is not an expectation that the Group holds cash with a view to achieving a return on this asset class
8. Reward entitlement matrix is dependent on ROIC achieved for the measurement period. An uplift is available for superior performance. LTI participants have an ability to exceed base entitlements based on the following matrix. The availability of an uplift in the award is in recognition of the difficulty of reaching the outstanding levels of performance (i.e. greater than 15% ROIC).
ROIC achievement Reward (% of entitlement)
18% + 150%
15 - 18% 125%
12 - <15% 100%
<12% Nil

Annual Report 2016 35
6. Remuneration Mix
The tables below show the available and actual remuneration mix for FY15, FY16 and the maximum available mix for FY17. Due to suspension of the LTI and STI in FY15 there were no ‘at risk’ awards made to Executives.
6.1. Target remuneration mix
Target remuneration opportunity mix for the Managing Director and other Executives for FY16.
The target remuneration mix has been developed to ensure that Executives have a high proportion of their overall remuneration at risk.
6.2. Actual remuneration mix
The proportion of FAR, STI and LTI paid or payable to Executives is as follows:
FAR STI – At Risk LTI – At Risk
Executive Director and Other Executives: 2016 2015 2016 2015 2016 2015
Managing Director
Chris Ellison 30% 100% 17% Nil 53% Nil
Other Executives
Bob Gavranich 71% 100% 8% Nil 21% Nil
David Geraghty 63% 100% 14% Nil 23% Nil
Bruce Goulds 44% 100% 19% Nil 37% Nil
Danny McCarthy1 18% N/A N/A Nil 82% Nil
1 FAR and LTI percentage for Danny McCarthy is effected by his period of employment for FY16.
At Risk STI
19%
17%
Base
37%
46%
50%
45%
40%
35%
30%
25%
20%
15%
10%
5%
0%
At Risk LTI
44%
37%
MD
Other KMP (weighted average)

36 Mineral Resources Limited
7. Remuneration outcomes
7.1. Return on Invested Capital (ROIC)
For FY16 the Group achieved a ROIC of 13.0% which entitles participants to be granted performance rights equal to 100% of the entitlement for FY16.
$ millions2014
Actual2015
Actual2016
Budget2016
Actual
Normalised NPAT 167.5 108.9 75.2 109.9
Invested Capital:
Net assets (per balance sheet) 1,139.3 1,082.2 1,112.5 1,008.7
Cash (206.5) (209.8) (190.9) (407.3)
Short term borrowings (cash management) 115.0
Impairments 12.7 31.2 130.0
Invested capital 945.5 903.6 921.6 846.4
ROIC % 17.7% 12.1% 8.2% 13.0%
Cash is excluded on the basis that retention of a strong cash balance and available borrowing facilities are to enable growth and investment. Retention of cash is a Board decision and Executives and Non-KMP management are not expected to earn a return on these facilities.
7.2. Total Shareholder Return
Below is Total Shareholder Return (TSR) over the last five years, and the correlation between TSR and Executive
Remuneration over the same period.
$/share 2012 2013 2014 2015 2016
Opening share price 11.50 8.95 8.25 9.59 6.60
Closing share price 8.95 8.25 9.59 6.60 8.31
Increase/(decrease) in share price (2.55) (0.70) 1.34 (2.99) 1.71
Total dividends paid 0.43 0.46 0.62 0.40 0.24
TSR (2.12) (0.24) 1.96 (2.59) 1.95
Cumulative TSR 9.31 9.07 11.03 8.44 10.39
2012 2013 2014 2015 2016
$12,000
$10,000
$8,000
$6,000
$4,000
$2,000
$0
$12.00
$10.00
$8.000
$6.00
$4.00
$2.00
$0.00
Executive Remuneration ($’000s)
Cumulative TSR ($/share)
KM
P R
emun
erat
ion
($’0
00s)
Cum
ulat
ive
TSR
($/
Sha
re)

Annual Report 2016 37
7.3. Share-based compensation
7.3.1 Issue of shares
The vested portion of the FY16 LTI has provided Executives with the following shares which will be issued on 19 August 2016:
Name RoleMIN Shares
vesting1
Chris Ellison Managing Director 53,771
Bruce Goulds Chief Financial Officer 24,495
Bob Gavranich EGM – PIHA 13,443
David Geraghty EGM – PMI 11,253
Danny McCarthy Chief Operating Officer 23,898
126,860
1 Based on VWAP for the five days to 30 June 2016 of $8.3689
7.3.2 Options
There were no options over ordinary shares granted to, or that vested in favour of, KMP as part of compensation during FY16 (FY15: nil) and no options over ordinary shares issued to KMP as part of compensation for prior financial years were outstanding as at 30 June 2016 (30 June 2015: nil).
8 Remuneration governance
8.1 Role of the Remuneration Committee
The Board is responsible for ensuring that remuneration arrangements for the Group are aligned with the overall business strategy and shareholder interests. The role of the Remuneration Committee is to advise the Board on KMP remuneration. The Committee makes recommendations to the Board on KMP remuneration arrangements, all LTI awards (which includes entitlements for the Managing Director and other Executives) and approves the STI pool (which includes entitlements for the Managing Director, other Executives, and other senior managers within the business).
The Remuneration Committee meets regularly throughout the year. Where senior management input is required, attendance is by invitation. The Directors’ Report includes a table of Remuneration Committee meetings and attendance for FY16.
The Remuneration Committee is made up of the following Non-Executive Directors:
James McClements Committee Chair Kelvin Flynn Committee Member Joe Ricciardo Committee Member (until retirement 18 April 2016).
8.2 Board discretion
8.2.1 STI clawback
The STI is subject to clawback in the event of unlawful, fraudulent, dishonest behaviour or serious breach of obligations owed to the Group. In the event of cessation of employment, rights to accrued but unpaid STI is payable at the discretion of the Board.
8.2.2 LTI clawback
The LTI is subject to clawback in the event of unlawful, fraudulent, dishonest behaviour or serious breach of obligations owed to the Group. In the event of cessation of employment, vesting of granted but unvested LTI is at the discretion of the Board. All incentive offers and final outcomes are subject to the full discretion of the Board and, through the performance period, Executives have an ongoing exposure to Group performance.
8.2.3 Change of Control / Resignation / Retirement in the event of ill health
In the event of change of control of MRL or as a result of an Executive’s resignation/retirement in the event of ill health, rights to accrued but unpaid STI and vesting of granted but not vested LTI is at the discretion of the Board.
8.3 External consultants
From time to time during FY16, the Group engaged external consultants to provide insights on remuneration trends, regulatory and governance updates and market data in relation to the remuneration of KMP.
No remuneration recommendations as defined in Section 9B of the Corporations Act 2001 were obtained during FY16.

38 Mineral Resources Limited
9 Additional disclosures relating to KMPs
9.1 KMP shareholdings
There were no options over ordinary shares granted to, or that vested in favour of, the Executive as part of compensation during FY16 (FY15: nil).
The number of MRL shares held during the Financial Year by each Director and Other Executive of the Company, including their related parties, is set out below:
Number of SharesBalance at the start of the year
Received as part of remuneration Additions Disposals/other
Balance at the end of the year
Chris Ellison 24,241,885 516,390 24,758,275
Bob Gavranich 3,272,353 (3,022,353) 250,000
Dave Geraghty 1,447,512 1,447,512
Bruce Goulds 186,498 (6,498) 180,000
Joe Ricciardo1 1,067,749 (1,067,749) -
Peter Wade 1,416,162 (900,000) 516,162
Steve Wyatt 4,652,344 (2,625,000) 2,027,344
36,284,503 - 516,390 (7,621,600) 29,179,293
1 Joe Ricciardo retired as a Director on 18 April 2016.
10 Service Agreements
Remuneration and other terms of employment for Executives are formalised in service agreements. Details of Executive FAR, STI and LTI are set out above. Key termination conditions are as follows:
Termination
notice periodRetirement Benefits
(in excess of Statutory Entitlements)
Chris Ellison Managing Director 6 months Nil
Bob Gavranich Executive General Manager – PIHA 6 months Nil
David Geraghty Executive General Manager – PMI 6 months Nil
Bruce Goulds Chief Financial Officer and Company Secretary 6 months Nil
Danny McCarthy Chief Operating Officer 6 months Nil
11 Non-Executive Director remuneration
11.1 Policy and approach to setting remuneration
The key principle underpinning Non-Executive Director remuneration is the need to attract high calibre directors to direct the current business into the future.
The Board’s policy is to periodically review its approach to Non-Executive Director remuneration and seek independent advice to ensure its Non-Executive Director remuneration remains competitive.
Non-Executive Director remuneration reflects the demands that are placed on, and the responsibilities of, the directors. No element of Non-Executive Directors remuneration is linked to the performance of the Group.
With the exception noted below, the only form of remuneration received by Non-Executive Directors is director’s fees.
To create alignment with shareholders, Non-Executive Director are encouraged to hold equity securities in the Company.
All directors are subject to the Company’s Security Trading Policy.
11.2 Non-Executive Director fees – other services
In addition to the directorship duties, the Chairman, Peter Wade, provides technical, engineering/design, and commercial services to the Group on an ad-hoc basis and is remunerated for these services on hourly rates. Mr Wade’s significant experience, as long time managing director of the Company, makes using his services appropriate for particular projects. The hourly rate is set annually and is subject to formal review and approval by the Remuneration Committee. The Chairman is not a member of the Remuneration Committee.

Annual Report 2016 39
12
KM
P r
emun
erat
ion
sche
dule
s
12.1
FY
16 re
mun
erat
ion
sche
dul
e
Sho
rt T
erm
Ben
efits
Pos
t E
mp
loym
ent
Ben
efits
Oth
er
Sta
tuto
ry
Ent
itlem
ents
Long
Ter
m
Ben
efits
LTI
Sal
ary
and
Fe
es (
FAR
) $
Oth
er
Sho
rt T
erm
E
mp
loye
e B
enefi
ts1
$
FY15
STI
pai
d
FY16
$
FY16
STI
ac
crue
d
$
Oth
er fe
es
for
serv
ices
re
nder
ed
$
Non
M
onet
ary
$
Sup
er-
annu
atio
n $
Ann
ual l
eave
p
aid
on
term
inat
ion
$
Long
ser
vice
le
ave
$Ve
sted
$
Oth
er 3
$
Gra
nted
su
bje
ct to
fu
ture
ves
ting
co
nditi
ons
$To
tal
$
Non
-Exe
cutiv
e D
irect
ors
Pet
er W
ade
199.
992
--
-97
,500
-18
,423
--
--
315,
915
Kel
vin
Flyn
n98
,100
--
--
--
--
--
98,1
00
Jam
es M
cCle
men
ts95
,540
--
--
-9,
076
--
--
104,
616
Joe
Ric
ciar
do
174
,770
--
--
-7,
103
--
--
81,8
73
Exe
cutiv
e D
irect
or
Chr
is E
lliso
n77
0,13
0-
-50
0,00
0-
74,0
3819
,308
--
450,
000
(65,
313)
1,17
0,00
02,
918,
163
Oth
er E
xecu
tives
Bob
Gav
rani
ch86
0,91
2-
-10
0,00
0-
59,0
9319
,308
--
112,
500
(48,
077)
219,
375
1,32
3,11
1
Dav
id G
erag
hty
627,
827
--
150,
000
-13
,943
19,3
08-
-94
,173
(34,
965)
183,
636
1,05
3,92
2
Bru
ce G
ould
s65
4,15
8-
-30
0,00
0-
-19
,308
--
205,
000
(35,
157)
399,
750
1,54
3,05
9
Dan
ny M
cCar
thy
124,
723
--
--
-4,
827
--
200,
000
390,
000
719.
550
Ste
ve W
yatt
666,
667
--
--
--
--
-(4
8,07
7)-
618,
590
Form
er E
xecu
tives
Jarr
od S
eym
our
287
8,80
717
3,83
8-
--
22,4
8417
,080
17,6
41-
-(3
6,91
9)-
1,07
2,93
1
5,05
1,62
617
3,83
8-
1,05
0,00
097
,500
169,
558
133,
740
17,6
41-
1,01
6,67
3(2
68,5
08)
2,36
2,76
19,
849,
829
1 Jo
e R
icci
ard
o re
tired
from
the
Boa
rd o
n 18
Ap
ril 2
016.
Rem
uner
atio
n is
for
the
per
iod
1 J
uly
2015
to 1
8 A
pril
201
6
2 Ja
rrod
Sey
mou
r re
sig
ned
as
Che
if O
per
atin
g O
ffice
r on
6 M
ay 2
016
3 O
ther
rela
tes
to fo
rgon
e 20
14 L
TI d
ue to
sus
pen
sion
of t
he L
TI in
201
5

40 Mineral Resources Limited
12.2
FY
15 re
mun
erat
ion
sche
dul
e
Sal
ary
and
Fe
es (
Fixe
d
Rem
uner
atio
n)
$
Oth
er
Sho
rt T
erm
E
mp
loye
e B
enefi
ts1
$
2014
Fin
anci
al
Year
STI
pai
d
2015
Fin
anci
al
Year
$
2015
Fin
anci
al
Year
STI
ac
crue
d
$
Oth
er fe
es
for
serv
ices
re
nder
ed
$
Non
M
onet
ary
$
Sup
er-
annu
atio
n $
Long
ser
vice
le
ave
$Ve
sted
$
Oth
er 4
$
Gra
nted
su
bje
ct to
fu
ture
ves
ting
co
nditi
ons
$To
tal
$
Non
-Exe
cutiv
e D
irect
ors
Pet
er W
ade
200,
000
--
-13
0,00
0-
25,0
00-
--
355,
000
Mar
k D
utto
n238
,076
--
--
-3,
617
--
-41
,693
Kel
vin
Flyn
n98
,100
--
--
--
--
-98
,100
Joe
Ric
ciar
do
90,0
00-
--
--
8,55
0-
--
98,5
50
Exe
cutiv
e D
irect
or
Chr
is E
lliso
n394
4,97
7-
(266
,000
)-
-56
,107
19,0
15-
-(6
5,31
3)-
688,
786
Oth
er K
MP
Bob
Gav
rani
ch86
0,91
6-
--
-18
,783
--
(48,
077)
-88
8,48
4
Dav
id G
erag
hty
651,
724
120,
734
--
-56
,862
21,0
77-
-(3
4,96
5)-
778,
960
Bru
ce G
ould
s61
5,00
016
9,94
2-
--
20,3
9035
,000
--
(35,
157)
-78
4,78
5
Jarr
od S
eym
our
783,
064
--
--
27,3
5618
,783
--
(36,
919)
-79
2,28
4
Ste
ve W
yatt
858,
382
267,
489
--
-56
,107
13,0
03-
-(4
8,07
7)-
1,14
6,90
4
5,14
0,23
955
8,16
5(2
66,0
00)
-13
0,00
021
6,82
216
2,82
8-
-(2
68,5
08)
-5,
673,
545
1 O
ther
Sho
rt T
erm
Ben
efits
rela
te to
prio
r ye
ar a
nnua
l lea
ve e
ntitl
emen
ts p
aid
out
this
fina
ncia
l yea
r
2 R
esig
ned
20
Nov
emb
er 2
014.
Rem
uner
atio
n is
for
the
per
iod
1 J
uly
2014
to 2
0 N
ovem
ber
201
4
3 C
hris
Elli
son
rep
aid
his
FY
14 S
TI d
urin
g F
Y15
4 O
ther
rela
tes
to fo
rgon
e 20
14 L
TI d
ue to
sus
pen
sion
of t
he L
TI in
201
5
Jam
es M
cCle
men
ts d
id n
ot re
ceiv
e an
y re
mun
erat
ion
dur
ing
FY
15 a
s he
join
ed th
e B
oard
on
29 M
ay 2
015

Annual Report 2016 41
13 Share-based payments
13.1 Value of shares to be issued
A total of 192,706 shares will be issued to KMP and other Non-KMP executives at an issue price of $8.37 per share (see 13.4 below for valuation details) for a value of $1,612,730 on 19 August 2016, for the value vested portion of the LTI as identified in KMP remuneration disclosures (see 12.1).
Name:
Financial year granted Amount granted ($)
Vested 2016 ($)
Chris Ellison 2016 1,800,000 450,000
Bob Gavranich 2016 450,000 112,500
Dave Geraghty 2016 376,690 94,173
Bruce Goulds 2016 820,000 205,000
Danny McCarthy 2016 800,000 200,000
4,246,690 1,061,673
Non-KMP executives 2016 2,204,230 551,057
6,450,920 1,612,730
13.2 Expenses arising from share based payment transactions
Total expenses arising from share based transactions recognised during the period as part of employee benefits were as follows:
Group
2016 $
2015 $
Value of LTI remuneration granted
Key Management Personnel 4,246,690 -
Other Senior positions 2,204,230 -
6,450,920 -
Value of LTI remuneration vested
Key Management Personnel 1,061,673 -
Other Senior positions 551,057 -
1,612,730 -
Value of LTI remuneration subject to vesting conditions
Key Management Personnel 3,185,018 406 ,388
Other Senior positions 1,653,172 50,783
4,838,190 457,171

42 Mineral Resources Limited
A summary of the LTI structure is set out below:
1. A single financial measure (ROIC) that reflects the generation of long term shareholder value is used to measure performance
2. Vesting of awards equally (i.e. 25% each year) over a period of 4 years, the first being the year of grant. Vesting in the year of the grant provides a greater incentive for Executives to ensure corporate performance aligns with shareholder returns in each year grant year
3. Re-measurement / claw-back mechanisms – once an entitlement is granted, vesting will be dependent on continuing employment. The Board retains the right to withhold the vesting of individual tranches of granted rights depending on the Group performance and general economic conditions
4. The Board also retains the right to delay vesting of a particular tranche in a particular year. This deferral mechanism provides a nexus between the LTI award and shareholder returns by linking the long term incentive and ongoing business performance
5. Reward instruments – rights to MIN shares, with the basis for valuation being Volume Weighted Average Price (VWAP) at the time of entitlement (for FY16 this was $8.3689 per share being the VWAP for the 5 ASX trading days before 30 June 2016). Once the entitlement to a number of shares is set, the recipient has the opportunity to benefit from share price movement between the date of grant and date of vesting, supporting further positive correlation between LTI’s granted and shareholder return
6. Participants do not have the right to hedge the value of unvested entitlements to shares
7. Benchmark ROIC of 12% for each period (i.e. each financial year)
8. ROIC base excludes cash balances, borrowings determined to be cash/cash equivalents and impairments in a particular year that reduce the net assets of the Group. Cash and cash equivalents balances are excluded as there is not an expectation that the Company holds cash with a view to achieving a return on this asset class
9. Reward entitlement matrix is dependent on ROIC achieved for the measurement period. An uplift is available for superior performance. LTI participants have an ability to exceed base entitlements based on the following matrix. The availability of an uplift in the award is in recognition of the difficulty of reaching the outstanding levels of performance (ie greater than 15% ROIC).
Expenses arising from share-based payment transactions 2016 2015
Key Management Personnel 3,155,926 (268,508)
Other Senior positions 1,257,752 (25,391)
4,413,678 (293,899)

Annual Report 2016 43
13.3 LTI future vesting values
The table below sets out the maximum LTI payable under each of the 2014, 2015 and 2016 LTI schemes:
Remuneration rewarded and value vested: Rights to deferred shares:
Name:Financial
Year granted
Amount Granted
($)Vested
(%)
Value vested
($)Forfeited
(%)
Financial Year end in which shares may
vest:
Maximum value yet to
vest ($)
Chris Ellison 2016 1,800,000 25.0% 450,000 0% 2016 -
2017 450,000
2018 450,000
2019 450,000
Chris Ellison 2015 - - - 100% 2015 -
2016 -
2017 -
Chris Ellison 2014 391,875 33.3% 130,625 - 2014 -
33.3% 2015 -
33.3% 2016 -
Bob Gavranich 2016 450,000 25.0% 112,500 - 2016 -
2017 112,500
2018 112,500
2019 112,500
Bob Gavranich 2015 - - - 100% 2015 -
2016 -
2017 -
Bob Gavranich 2014 288,461 33.3% 96,154 - 2014 -
33.3% 2015 -
33.3% 2016 -
David Geraghty 2016 376,690 25.0% 94,173 - 2016 -
2017 94,173
2018 94,173
2019 94,173
David Geraghty 2015 - - - 100% 2015 -
2016 -
2017 -
David Geraghty 2014 209,790 33.3% 69,930 - 2014 -
33.3% 2015 -
33.3% 2016 -

44 Mineral Resources Limited
Remuneration rewarded and value vested: Rights to deferred shares:
Name:Financial
Year granted
Amount Granted
($)Vested
(%)
Value vested
($)Forfeited
(%)
Financial Year end in which shares may
vest:
Maximum value yet to
vest ($)
Bruce Goulds 2016 820,000 25% 205,000 - 2016 -
2017 205,000
2018 205,000
2019 205,000
Bruce Goulds 2015 - - - 100% 2015 -
2016 -
2017 -
Bruce Goulds 2014 210,938 33.3% 70,313 - 2014 -
33.3% 2015 -
33.3% 2016 -
Danny McCarthy 2016 800,000 25% 200,000 - 2016 -
2017 200,000
2018 200,000
2019 200,000
Jarrod Seymour 2016 - - - - 2016 -
2017 -
2018 -
2019 -
Jarrod Seymour 2015 - - - 100% 2015 -
2016 -
2017 -
Jarrod Seymour 2014 221,514 33.3% 73,838 - 2014 -
33.3% 2015 -
33.3% 2016 -
Steve Wyatt 2016 - - - 2016 -
2017 -
2018 -
2019 -
Steve Wyatt 2015 - - - 100% 2015 -
33.3% 2016 -
33.3% 2017 -
Steve Wyatt 2014 288,461 33.3% 96,154 - 2013 -
33.3% 2015 -
33.3% 2016 -
5,857,729 1,148,685 3,185,018

Annual Report 2016 45
13.4 Share based payment – valuation:
The valuation used to determine the fair value of shares to be allotted under the FY16 LTI is the five day Volume Weighted Average price to the 30 June 2016. Details are as follows:
Thursday, 30 June 2016 Volume-Weighted Average Price Calculation - Summary
ASX Code: MIN Company Name: Mineral Resources Limited
Start Date: Friday, 24 June 2016 End Date: Thursday, 30 June 2016
Trade Volume: 8,332,316 Trade Value: $69,732,496.55
VWAP: $8.3689 % Discount: 0.0%
Date Trade Value Trade Volume Daily VWAP
24-Jun-2016 $11,594,280.36 1,355,299 $8.5548
27-Jun-2016 $11,157,141.10 1,322,033 $8.4394
28-Jun-2016 $11,459,113.86 1,398,929 $8.1913
29-Jun-2016 $12,952,644.19 1,553,822 $8.3360
30-Jun-2016 $22,569,317.04 2,702,233 $8.3521
Average of Daily VWAP N/A
Overall Average VWAP $8.3689
24/06 27/06 28/06 29/06 30/06
Trade Value
Sha
re P
rice
($A
)
Dai
ly T
rad
ed V
alue
($A
)
8.600
8.500
8.400
8.300
8.200
8.100
8.000
25,000,000
20,000,000
15,000,000
10,000,000
5,000,000
0
Share Price
Trade Values

46 Mineral Resources Limited
14 Transactions with related parties
The following transactions occurred with related parties:
Group
2016 $
2015 $
Other transactions:
Certain engineering services were provided by GR Engineering Services Limited, a company related to Joe Ricciardo (ceased being related party 18 April 2016) - (199,948)
Certain engineering services were provided to GR Engineering Services Limited, a company related to Joe Ricciardo (ceased being related party 18 April 2016) 722,480 218,786
Certain infrastructure services were provided by Global Advanced Metals Wodgina Pty Ltd, a company in which Mineral Resources has a beneficial interest and related to Kelvin Flynn and James McClements through their directorships in Global Advanced Metals Pty Ltd* (11,991) (18,938)
Properties from which the Group’s operations are performed are rented from parties related to Chris Ellison and Peter Wade (1,752,148) (1,784,914)
Receivable from and payable to related parties.
The following balances are outstanding at the reporting date in relation to transactions with related parties.
Group
2016 $
2015 $
Current receivables
Trade receivables from GR Engineering Services Ltd, a company associated with Joe Ricciardo (ceased being a related party on 18 April 2016) 89,756 237,936
Deposit receivable
Refundable deposit paid to Global Advanced Metals Pty Ltd, a company in which James McClements and Kelvin Flynn are directors 10,000,000 -
* no longer recurring
This concludes the Remuneration Report, which has been audited.
Annual Report 2016 47
Indemnity and insurance of officers
The Company has indemnified the directors and executives of the Company for costs incurred, in their capacity as a director or executive, for which they may be held personally liable, except where there is a lack of good faith.
During the financial year, the Company paid a premium in respect of a contract to insure the directors and executives of the Company against a liability to the extent permitted by the Corporations Act 2001. The contract of insurance prohibits disclosure of the nature of the liability and the amount of the premium.
Proceedings on behalf of the Company
No person has applied to the Court under section 237 of the Corporations Act 2001 for leave to bring proceedings on behalf of the Company, or to intervene in any proceedings to which the Company is a party for the purpose of taking responsibility on behalf of the Company for all or part of those proceedings.
Non-audit services
Details of the amounts paid or payable to the auditor for non-audit services provided during the financial year by the auditor are outlined in note 34 to the financial statements.
The directors are satisfied that the provision of non-audit services during the financial year, by the auditor (or by another person or firm on the auditor’s behalf), is compatible with the general standard of independence for auditors imposed by the Corporations Act 2001.
The directors are of the opinion that the services as disclosed in note 34 to the financial statements do not compromise the external auditor’s independence requirements of the Corporations Act 2001 for the following reasons:
• all non-audit services have been reviewed and approved to ensure that they do not impact the integrity and objectivity of the auditor; and
• none of the services undermine the general principles relating to auditor independence as set out in APES 110 Code of Ethics for Professional Accountants issued by the Accounting Professional and Ethical Standards Board, including reviewing or auditing the auditor’s own work, acting in a management or decision-making capacity for the Company, acting as advocate for the Company or jointly sharing economic risks and rewards.
Officers of the Company who are former partners of RSM Australia Partners
There are no officers of the Company who are former partners of RSM Australia Partners.
Rounding of amounts
The Company is of a kind referred to in ASIC Corporations (Rounding in Financial/Directors’ Report) Instrument 2016/91 and in accordance with that class order, amounts in the financial statements have been rounded off to the nearest thousand dollars, or in certain cases, the nearest dollar.
Auditor’s independence declaration
A copy of the auditor’s independence declaration as required under section 307C of the Corporations Act 2001 is set out immediately after this Directors’ Report.
Auditor
RSM Australia Partners continues in office in accordance with section 327 of the Corporations Act 2001.
This report is made in accordance with a resolution of directors, pursuant to section 298(2)(a) of the Corporations Act 2001.
On behalf of the directors
Chris Ellison Managing Director
18 August 2016 Perth

48 Mineral Resources Limited
Auditor’s Independence Declaration

Annual Report 2016 49
Group
Note2016 $’000
2015 $’000
Revenue 4 1,177,641 1,299,063
Share of profits of associates accounted for using the equity method 571 -
Other income 5 8,579 8,437
Expenses
Changes in closing stock 10,034 (18,565)
Raw materials and consumables (162,695) (136,639)
Equipment costs (24,682) (37,721)
Subcontractors (113,992) (135,235)
Employee benefits expense (185,906) (222,170)
Transport and freight (366,119) (386,177)
Depreciation and amortisation 6 (133,968) (126,904)
Other expenses (62,772) (83,992)
Finance costs 6 (7,929) (7,728)
Operating profit before impairment charges and income tax expense 138,762 152,369
Income tax on operating profit before impairment charges 7 (34,487) (43,482)
Profit after tax before non-cash impairment charges and adjustments for Minerals Resource Rent Tax (MRRT) 104,275 108,887
Impairment charges 6 (186,220) (44,544)
Income tax on impairment charges 7 55,866 13,363
(Loss)/profit before MRRT expense (26,079) 77,706
Tax expense on reversal of MRRT deferred tax assets 7 - (65,162)
(Loss)/profit after income tax expense for the year (26,079) 12,544
Included within loss after income tax expense for the year is income tax benefit/(expense) of $21,379,000 (2015: ($95,281,000))
Other comprehensive income
Items that will not be reclassified subsequently to profit or loss
Net change in asset revaluation reserve (604) 182
Reversal of asset revaluation reserve previously recognised - (4,949)
Items that may be reclassified subsequently to profit or loss
Loss on future cash flow hedge taken to equity (385) -
Other comprehensive income for the year, net of tax (989) (4,767)
Total comprehensive income for the year (27,068) 7,777
(Loss)/profit for the year is attributable to:
Non-controlling interest (1,222) (270)
Owners of Mineral Resources Limited 28 (24,857) 12,814
(26,079) 12,544
Total comprehensive income for the year is attributable to:
Non-controlling interest (1,222) (270)
Owners of Mineral Resources Limited (25,846) 8,047
(27,068) 7,777
Cents Cents
Basic and diluted profit per share after tax before impairment (2015: after tax before impairment and MRRT) (cents per share) 44 56.47 58.19
Basic and diluted profit per share (cents per share) 44 (13.31) 6.85
The above statement of profit or loss and other comprehensive income should be read in conjunction with the accompanying notes
Statement of Profit or Loss and Other Comprehensive IncomeFor the year ended 30 June 2016

50 Mineral Resources Limited
Group
Note2016 $’000
2015 $’000
Assets
Current assets
Cash and cash equivalents 8 407,293 209,814
Trade and other receivables 9 83,334 136,352
Inventories 10 80,019 73,447
Current tax assets 3,624 3,147
Other 12 12,262 5,392
Total current assets 586,532 428,152
Non-current assets
Receivables 13 11,034 11,053
Investments accounted for using the equity method 14 3,571 190
Financial assets 15 8,362 7,417
Property, plant and equipment 16 683,545 672,107
Intangibles 17 49,229 61,746
Exploration and mine development 18 242,799 372,516
Deferred tax 19 33,297 38,395
Total non-current assets 1,031,837 1,163,424
Total assets 1,618,369 1,591,576
Liabilities
Current liabilities
Trade and other payables 20 198,040 161,776
Borrowings 21 147,983 20,731
Employee benefits 22 16,897 11,750
Provisions 23 13,870 27,617
Total current liabilities 376,790 221,874
Non-current liabilities
Borrowings 24 71,445 70,892
Deferred tax 25 124,445 182,806
Provisions 26 37,035 33,851
Total non-current liabilities 232,925 287,549
Total liabilities 609,715 509,423
Net assets 1,008,654 1,082,153
Equity
Issued capital 27 502,353 504,771
Reserves 382 1,371
Retained profits 28 487,055 555,925
Equity attributable to the owners of Mineral Resources Limited 989,790 1,062,067
Non-controlling interest 18,864 20,086
Total equity 1,008,654 1,082,153
The above statement of financial position should be read in conjunction with the accompanying notes
Statement of Financial PositionAs at 30 June 2016

Annual Report 2016 51
Group
Issued capital $’000
Reserves
$’000
Retained profits $’000
Non- controlling
interest $’000
Total equity $’000
Balance at 1 July 2014 495,552 6,138 616,860 20,759 1,139,309
Profit after income tax expense for the year - - 12,814 (270) 12,544
Other comprehensive income for the year, net of tax - (4,767) - - (4,767)
Total comprehensive income for the year - (4,767) 12,814 (270) 7,777
Transactions with owners in their capacity as owners:
Transaction with non-controlling interest - - - (403) (403)
Share issued under Dividend Reinvestment Plan (note 27) 9,219 - - - 9,219
Dividends paid (note 29) - - (73,749) - (73,749)
Balance at 30 June 2015 504,771 1,371 555,925 20,086 1,082,153
Group
Issued capital $’000
Reserves
$’000
Retained profits $’000
Non- controlling
interest $’000
Total equity $’000
Balance at 1 July 2015 504,771 1,371 555,925 20,086 1,082,153
Loss after income tax expense for the year - - (24,857) (1,222) (26,079)
Other comprehensive income for the year, net of tax - (989) - - (989)
Total comprehensive income for the year - (989) (24,857) (1,222) (27,068)
Transactions with owners in their capacity as owners:
Share issued under Dividend Reinvestment Plan (note 27) 1,890 - - - 1,890
Share buy-back (note 27) (4,308) - - - (4,308)
Dividends paid (note 29) - - (44,013) - (44,013)
Balance at 30 June 2016 502,353 382 487,055 18,864 1,008,654
The above statement of changes in equity should be read in conjunction with the accompanying notes
Statement of Changes in EquityFor the year ended 30 June 2016

52 Mineral Resources Limited
Group
Note2016 $’000
2015 $’000
Cash flows from operating activities
Receipts from customers (inclusive of GST) 1,254,858 1,360,238
Payments to suppliers and employees (inclusive of GST) (900,556) (1,211,544)
354,302 148,694
Other revenue - 363
Interest received 1,342 2,689
Interest and other finance costs paid (7,696) (4,899)
Income taxes paid (31,951) (94,497)
Net cash from operating activities 43 315,997 52,350
Cash flows from investing activities
Payments for investments (9,326) (5,177)
Proceeds from disposal of investment - 178,977
Payments for property, plant and equipment (93,449) (110,084)
Payments for intangibles (5,874) (3,130)
Payments for exploration and evaluation (7,003) (7,426)
Payments for mine development expenditure (20,895) (902)
Payments for increased investment in joint operations (30,005) (499)
Proceeds from disposal of property, plant and equipment 15,126 2,281
Net cash (used in)/from investing activities (151,426) 54,040
Cash flows from financing activities
Loan advanced to third party - (4,500)
Dividends paid (42,124) (64,446)
Proceeds/(repayment) of borrowings 79,340 (34,084)
Share buy-back (4,308) -
Net cash from/(used in) financing activities 32,908 (103,030)
Net increase in cash and cash equivalents 197,479 3,360
Cash and cash equivalents at the beginning of the financial year 209,814 206,454
Cash and cash equivalents at the end of the financial year 8 407,293 209,814
The above statement of cash flows should be read in conjunction with the accompanying notes
Statement of Cash FlowsFor the year ended 30 June 2016

Annual Report 2016 53
Notes to the Financial Statements30 June 2016
Note 1. Significant accounting policies
The principal accounting policies adopted in the preparation of the financial statements are set out below. These policies have been consistently applied to all the years presented, unless otherwise stated.
New, revised or amending Accounting Standards and Interpretations adopted
The Group has adopted all of the new, revised or amending Accounting Standards and Interpretations issued by the Australian Accounting Standards Board (‘AASB’) that are mandatory for the current reporting period. The adoption of these Accounting Standards and Interpretations did not have any significant impact on the financial performance or position of the Group.
Any new, revised or amending Accounting Standards or Interpretations that are not yet mandatory have not been early adopted.
The following Accounting Standards and Interpretations are most relevant to the Group:
• AASB 9 Financial Instruments
• AASB 15 Revenue from Contracts with Customers
• AASB 16 Leases
Basis of preparation
These general purpose financial statements have been prepared in accordance with Australian Accounting Standards and Interpretations issued by the Australian Accounting Standards Board (‘AASB’) and the Corporations Act 2001, as appropriate for for-profit oriented entities. These financial statements also comply with International Financial Reporting Standards as issued by the International Accounting Standards Board (‘IASB’).
Historical cost convention
The financial statements have been prepared under the historical cost convention, except for, where applicable, the revaluation of available-for-sale financial assets, financial assets and liabilities at fair value through profit or loss, certain classes of property, plant and equipment and derivative financial instruments.
Critical accounting estimates
The preparation of the financial statements requires the use of certain critical accounting estimates. It also requires management to exercise its judgement in the process of applying the Group’s accounting policies. The areas involving a higher degree of judgement or complexity, or areas where assumptions and estimates are significant to the financial statements, are disclosed in note 2.
Parent entity information
In accordance with the Corporations Act 2001, these financial statements present the results of the Group only. Supplementary information about the parent entity is disclosed in note 38.
Principles of consolidation
The consolidated financial statements incorporate the assets and liabilities of all subsidiaries of the Company as at 30 June 2016 and the results of all subsidiaries for the year then ended.
Subsidiaries are all those entities over which the Group has control. The Group controls an entity when the Group is exposed to, or has rights to, variable returns from its involvement with the entity and has the ability to affect those returns through its power to direct the activities of the entity. Subsidiaries are fully consolidated from the date on which control is transferred to the Group. They are de-consolidated from the date that control ceases.
Intercompany transactions, balances and unrealised gains on transactions between entities in the Group are eliminated. Unrealised losses are also eliminated unless the transaction provides evidence of the impairment of the asset transferred. Accounting policies of subsidiaries have been changed where necessary to ensure consistency with the policies adopted by the Group.
The acquisition of subsidiaries is accounted for using the acquisition method of accounting. A change in ownership interest, without the loss of control, is accounted for as an equity transaction, where the difference between the consideration transferred and the book value of the share of the non-controlling interest acquired is recognised directly in equity attributable to the parent.
Non-controlling interest in the results and equity of subsidiaries are shown separately in the statement of profit or loss and other comprehensive income, statement of financial position and statement of changes in equity of the Group. Losses incurred by the Group are attributed to the non-controlling interest in full, even if that results in a deficit balance.

54 Mineral Resources Limited
Notes to the Financial Statements30 June 2016
Note 1. Significant accounting policies (continued)
Where the Group loses control over a subsidiary, it derecognises the assets including goodwill, liabilities and non-controlling interest in the subsidiary together with any cumulative translation differences recognised in equity. The Group recognises the fair value of the consideration received and the fair value of any investment retained together with any gain or loss in profit or loss.
Operating segments
Operating segments are presented using the ‘management approach’, where the information presented is on the same basis as the internal reports provided to the Chief Operating Decision Makers (‘CODM’). The CODM is responsible for the allocation of resources to operating segments and assessing their performance.
Revenue recognition
Revenue is recognised when it is probable that the economic benefit will flow to the Group and the revenue can be reliably measured. Revenue is measured at the fair value of the consideration received or receivable.
Goods sold
Revenue from the sale of goods and disposal of other assets is recognised when persuasive evidence, usually in the form of an executed sales agreement, or an arrangement exists, indicating there has been a transfer of risks and rewards to the customer, no further work or processing is required by the Group, the quantity and quality of the goods has been determined with reasonable accuracy, the price is fixed or determinable, and collectability is reasonably assured. This is generally when title passes. The majority of the Group’s sales agreements specify that title passes when the product is delivered to the destination specified by the customer, which is typically the vessel on which the product will be shipped. In practical terms, revenue is generally recognised on the bill of lading date, which is the date the commodity is delivered to the shipping agent. These sales agreements also allow for an adjustment to the sales price based on a survey of the goods by the customer (an assay for mineral content), therefore recognition of the sales revenue is based on the most recently determined estimate of product specifications.
Rendering of services
Revenue from services rendered is recognised in the statement of profit or loss and other comprehensive income in proportion to the stage of completion of the transaction at the reporting date. The stage of completion is assessed by reference to work performed.
No revenue is recognised if there are significant uncertainties regarding recovery of the consideration due or if the costs incurred or to be incurred cannot be measured reliably.
Construction contracts
Contract revenue and expenses are generally recognised on an individual contract basis using percentage of completion method when the stage or contract completion can be reliably determined, costs to date can be clearly identified, and total contract revenue and costs to complete can be reliably estimated. Two or more contracts are treated as a single contract where the contracts are negotiated as a single package, are closely interrelated and are performed concurrently or in a continuous sequence.
Profit recognition for lump sum fixed price contracts does not commence until cost to completion can be reliably measured.
Stage of contract completion is generally measured by reference to physical completion. An assessment of total labour hours and other costs incurred to date as a percentage of estimated total costs for each contract is used if it is an appropriate proxy for physical completion. Task-lists, milestones, etc. are also used to calculate or confirm the percentage of completion if appropriate.
Where the outcome of a contract cannot be reliably estimated, contract costs are expensed as incurred. Where it is probable that the costs will be recovered, revenue is recognised to the extent of costs incurred. An expected loss is recognised immediately as an expense.

Annual Report 2016 55
Notes to the Financial Statements30 June 2016
Note 1. Significant accounting policies (continued)
Income tax
The income tax expense or benefit for the period is the tax payable on that period’s taxable income based on the applicable income tax rate for each jurisdiction, adjusted by the changes in deferred tax assets and liabilities attributable to temporary differences, unused tax losses and the adjustment recognised for prior periods, where applicable.
Deferred tax assets and liabilities are recognised for temporary differences at the tax rates expected to be applied when the assets are recovered or liabilities are settled, based on those tax rates that are enacted or substantively enacted, except for:
• When the deferred income tax asset or liability arises from the initial recognition of goodwill or an asset or liability in a transaction that is not a business combination and that, at the time of the transaction, affects neither the accounting nor taxable profits; or
• When the taxable temporary difference is associated with interests in subsidiaries, associates or joint ventures, and the timing of the reversal can be controlled and it is probable that the temporary difference will not reverse in the foreseeable future.
Deferred tax assets are recognised for deductible temporary differences and unused tax losses only if it is probable that future taxable amounts will be available to utilise those temporary differences and losses.
The carrying amount of recognised and unrecognised deferred tax assets are reviewed at each reporting date. Deferred tax assets recognised are reduced to the extent that it is no longer probable that future taxable profits will be available for the carrying amount to be recovered. Previously unrecognised deferred tax assets are recognised to the extent that it is probable that there are future taxable profits available to recover the asset.
Deferred tax assets and liabilities are offset only where there is a legally enforceable right to offset current tax assets against current tax liabilities and deferred tax assets against deferred tax liabilities; and they relate to the same taxable authority on either the same taxable entity or different taxable entities which intend to settle simultaneously.
Mineral Resources Limited (the ‘head entity’) and its wholly-owned Australian subsidiaries have formed an income tax group under the tax consolidation regime. The head entity and each subsidiary in the tax group continue to account for their own current and deferred tax amounts. The tax group has applied the ‘separate taxpayer within group’ approach in determining the appropriate amount of taxes to allocate to members of the tax group.
In addition to its own current and deferred tax amounts, the head entity also recognises the current tax liabilities (or assets) and the deferred tax assets arising from unused tax losses and unused tax credits assumed from each subsidiary in the tax group.
Assets or liabilities arising under tax funding agreements with the tax group are recognised as amounts receivable from or payable to other entities in the tax group. The tax funding arrangement ensures that the intercompany charge equals the current tax liability or benefit of each tax group member, resulting in neither a contribution by the head entity to the subsidiaries nor a distribution by the subsidiaries to the head entity.
Current and non-current classification
Assets and liabilities are presented in the statement of financial position based on current and non-current classification.
An asset is current when it is expected to be realised or intended to be sold or consumed in normal operating cycle; it is held primarily for the purpose of trading; it is expected to be realised within 12 months after the reporting period; or the asset is cash or cash equivalent unless restricted from being exchanged or used to settle a liability for at least 12 months after the reporting period. All other assets are classified as non-current.
A liability is current when it is expected to be settled in normal operating cycle; it is held primarily for the purpose of trading; it is due to be settled within 12 months after the reporting period; or there is no unconditional right to defer the settlement of the liability for at least 12 months after the reporting period. All other liabilities are classified as non-current.
Deferred tax assets and liabilities are always classified as non-current.
Cash and cash equivalents
Cash and cash equivalents includes cash on hand, deposits held at call with financial institutions, other short-term, highly liquid investments with original maturities of three months or less that are readily convertible to known amounts of cash and which are subject to an insignificant risk of changes in value.

56 Mineral Resources Limited
Notes to the Financial Statements30 June 2016
Note 1. Significant accounting policies (continued)
Trade and other receivables
Trade receivables are initially recognised at fair value and subsequently measured at amortised cost using the effective interest method, less any provision for impairment. Trade receivables are generally due for settlement within 30 days.
Collectability of trade receivables is reviewed on an ongoing basis. Debts which are known to be uncollectable are written off by reducing the carrying amount directly. A provision for impairment of trade receivables is raised when there is objective evidence that the Group will not be able to collect all amounts due according to the original terms of the receivables. Significant financial difficulties of the debtor, probability that the debtor will enter bankruptcy or financial reorganisation and default or delinquency in payments are considered indicators that the trade receivable may be impaired. The amount of the impairment allowance is the difference between the asset’s carrying amount and the present value of estimated future cash flows, discounted at the original effective interest rate. Cash flows relating to short-term receivables are not discounted if the effect of discounting is immaterial.
Other receivables are recognised at amortised cost, less any provision for impairment.
Derivative financial instruments
Derivatives are initially recognised at fair value on the date a derivative contract is entered into and are subsequently remeasured to their fair value at each reporting date. The accounting for subsequent changes in fair value depends on whether the derivative is designated as a hedging instrument, and if so, the nature of the item being hedged.
Cash flow hedges
Cash flow hedges are used to cover the group’s exposure to variability in cash flows that is attributable to particular risks associated with a recognised asset or liability or a firm commitment which could affect profit or loss. The effective portion of the gain or loss on the hedging instrument is recognised in other comprehensive income through the cash flow hedges reserve in equity, whilst the ineffective portion is recognised in profit or loss. Amounts taken to equity are transferred out of equity and included in the measurement of the hedged transaction when the forecast transaction occurs.
Cash flow hedges are tested for effectiveness on a regular basis both retrospectively and prospectively to ensure that each hedge is highly effective and continues to be designated as a cash flow hedge. If the forecast transaction is no longer expected to occur, the amounts recognised in equity are transferred to profit or loss.
Inventories
Raw materials, work in progress and finished goods are stated at the lower of cost and net realisable value on a ‘first in first out’ basis. Cost comprises direct materials and delivery costs, direct labour, import duties and other taxes, an appropriate proportion of variable and fixed overhead expenditure based on normal operating capacity, and, where applicable, transfers from cash flow hedging reserves in equity. Costs of purchased inventory are determined after deducting rebates and discounts received or receivable.
Net realisable value is the estimated selling price in the ordinary course of business less the estimated costs of completion and the estimated costs necessary to make the sale.
Construction work in progress
Construction work in progress is valued at cost, plus profit recognised to date less any provision for anticipated future losses. Cost includes both variable and fixed costs relating to specific contracts, and those costs that are attributable to the contract activity in general and that can be allocated on a reasonable basis.
Construction profits are recognised on the stage of completion basis and measured using the proportion of costs incurred to date as compared to expected actual costs. Where losses are anticipated they are provided for in full.
Associates
Associates are entities over which the Group has significant influence but not control or joint control. Investments in associates are accounted for using the equity method. Under the equity method, the share of the profits or losses of the associate is recognised in profit or loss and the share of the movements in equity is recognised in other comprehensive income. Investments in associates are carried in the statement of financial position at cost plus post-acquisition changes in the Group’s share of net assets of the associate. Goodwill relating to the associate is included in the carrying amount of the investment and is neither amortised nor individually tested for impairment. Dividends received or receivable from associates reduce the carrying amount of the investment.

Annual Report 2016 57
Notes to the Financial Statements30 June 2016
Note 1. Significant accounting policies (continued)
Joint operations
A joint operation is a joint arrangement whereby the parties that have joint control of the arrangement have rights to the assets, and obligations for the liabilities, relating to the arrangement. The Group has recognised its share of jointly held assets, liabilities, revenues and expenses of joint operations. These have been incorporated in the financial statements under the appropriate classifications.
Investments and other financial assets
Investments and other financial assets are initially measured at fair value. Transaction costs are included as part of the initial measurement, except for financial assets at fair value through profit or loss. They are subsequently measured at either amortised cost or fair value depending on their classification. Classification is determined based on the purpose of the acquisition and subsequent reclassification to other categories is restricted.
Financial assets are derecognised when the rights to receive cash flows from the financial assets have expired or have been transferred and the Group has transferred substantially all the risks and rewards of ownership.
Loans and receivables
Loans and receivables are non-derivative financial assets with fixed or determinable payments that are not quoted in an active market. They are carried at amortised cost using the effective interest rate method. Gains and losses are recognised in profit or loss when the asset is derecognised or impaired.
Available-for-sale financial assets
Available-for-sale financial assets are non-derivative financial assets, principally equity securities, that are either designated as available-for-sale or not classified as any other category. After initial recognition, fair value movements are recognised in other comprehensive income through the available-for-sale reserve in equity. Cumulative gain or loss previously reported in the available-for-sale reserve is recognised in profit or loss when the asset is derecognised or impaired.
Available-for-sale financial assets are classified as non current assets when they are expected to be sold after 12 months from the end of the reporting period. All other available-for-sale financial assets are classified as current assets.
Impairment of financial assets
The Group assesses at the end of each reporting period whether there is any objective evidence that a financial asset or group of financial assets is impaired. Objective evidence includes significant financial difficulty of the issuer or obligor; a breach of contract such as default or delinquency in payments; the lender granting to a borrower concessions due to economic or legal reasons that the lender would not otherwise do; it becomes probable that the borrower will enter bankruptcy or other financial reorganisation; the disappearance of an active market for the financial asset; or observable data indicating that there is a measurable decrease in estimated future cash flows.
The amount of the impairment allowance for loans and receivables carried at amortised cost is the difference between the asset’s carrying amount and the present value of estimated future cash flows, discounted at the original effective interest rate. If there is a reversal of impairment, the reversal cannot exceed the amortised cost that would have been recognised had the impairment not been made and is reversed to profit or loss.
Available-for-sale financial assets are considered impaired when there has been a significant or prolonged decline in value below initial cost. Subsequent increments in value are recognised in other comprehensive income through the available-for-sale reserve.
Property, plant and equipment
Owned assets
Items of plant and equipment are stated at cost less accumulated depreciation and impairment losses. The cost of self-constructed assets includes the cost of materials, direct labour and an appropriate portion of production overheads. The cost of self-constructed and acquired assets includes (i) the initial estimate at the time of installation and during the period of use, when relevant, of the costs of dismantling and removing the items and restoring the site on which they are located, and (ii) changes in the measurement of existing liabilities recognised for these costs resulting from changes in the timing or outflow of resources required to settle the obligation or from changes in the discount rate.
Where parts of an item of plant and equipment have different useful lives, they are accounted for as separate items of plant and equipment.

58 Mineral Resources Limited
Notes to the Financial Statements30 June 2016
Note 1. Significant accounting policies (continued)
Leased assets
Leases in terms of which the Group assumes substantially all of the risks and rewards of ownership are classified as finance leases. Finance leases are stated at an amount equal to the lower of fair value and the present value of minimum lease payment at inception of the lease, less accumulated depreciation and impairment losses.
Depreciation is calculated on a straight-line basis to write off the net cost of each item of property, plant and equipment over their expected useful lives as follows:
Buildings 40 years
Plant and equipment financed 3 - 20 years or the term of the lease
Plant and equipment 1 - 10 years or usage basis
The residual values, useful lives and depreciation methods are reviewed, and adjusted if appropriate, at each reporting date.
Subsequent costs
The Group recognises in the carrying amount of an item of plant and equipment the cost of replacing part of such an item when that cost is incurred if it is probable that the future economic benefits embodied within the item will flow to the Group and the cost of the item can be measured reliably. All other costs are recognised in the statement of profit or loss and other comprehensive income as an expense as incurred.
Revaluation
Increases in the carrying amount arising on the revaluation of plant and equipment are credited to a revaluation reserve in equity. Decreases that offset previous increases of the same asset are charged against fair value reserves directly in equity; all other decreases are charged to the statement of profit or loss and other comprehensive income.
Leases
The determination of whether an arrangement is or contains a lease is based on the substance of the arrangement and requires an assessment of whether the fulfilment of the arrangement is dependent on the use of a specific asset or assets and the arrangement conveys a right to use the asset.
A distinction is made between finance leases, which effectively transfer from the lessor to the lessee substantially all the risks and benefits incidental to the ownership of leased assets, and operating leases, under which the lessor effectively retains substantially all such risks and benefits.
Finance leases are capitalised. A lease asset and liability are established at the fair value of the leased assets, or if lower, the present value of minimum lease payments. Lease payments are allocated between the principal component of the lease liability and the finance costs, so as to achieve a constant rate of interest on the remaining balance of the liability.
Leased assets acquired under a finance lease are depreciated over the asset’s useful life or over the shorter of the asset’s useful life and the lease term if there is no reasonable certainty that the Group will obtain ownership at the end of the lease term.
Operating lease payments, net of any incentives received from the lessor, are charged to profit or loss on a straight-line basis over the term of the lease.
Intangible assets
Intangible assets acquired as part of a business combination, other than goodwill, are initially measured at their fair value at the date of the acquisition. Intangible assets acquired separately are initially recognised at cost. Indefinite life intangible assets are not amortised and are subsequently measured at cost less any impairment. Finite life intangible assets are subsequently measured at cost less amortisation and any impairment. The gains or losses recognised in profit or loss arising from the derecognition of intangible assets are measured as the difference between net disposal proceeds and the carrying amount of the intangible asset. The method and useful lives of finite life intangible assets are reviewed annually. Changes in the expected pattern of consumption or useful life are accounted for prospectively by changing the amortisation method or period.
Goodwill
Goodwill arises on the acquisition of a business. Goodwill is not amortised. Instead, goodwill is tested annually for impairment, or more frequently if events or changes in circumstances indicate that it might be impaired, and is carried at cost less accumulated impairment losses. Impairment losses on goodwill are taken to profit or loss and are not subsequently reversed.

Annual Report 2016 59
Notes to the Financial Statements30 June 2016
Note 1. Significant accounting policies (continued)
Patents and trademarks
Significant costs associated with patents and trademarks are deferred and amortised on a straight-line basis over the period of their expected benefit.
Port access rights
Port access rights acquired as part of a business combination are recognised separately from goodwill. The rights are carried at their fair value at the date of acquisition less accumulated amortisation and impairment losses. Amortisation is calculated based on the timing of projected cash flows of the access rights over their estimated useful lives.
Exploration and evaluation assets
Exploration and evaluation expenditure in relation to separate areas of interest for which rights of tenure are current is carried forward as an asset in the statement of financial position where it is expected that the expenditure will be recovered through the successful development and exploitation of an area of interest, or by its sale; or exploration activities are continuing in an area and activities have not reached a stage which permits a reasonable estimate of the existence or otherwise of economically recoverable reserves. Where a project or an area of interest has been abandoned, the expenditure incurred thereon is written off in the year in which the decision is made.
Development expenditure
Development expenditure incurred by or on behalf of the Group is accumulated separately for each area of interest in which economically recoverable resources have been identified. Such expenditure comprises cost directly attributable to the construction of a mine and the related infrastructure.
Once a development decision has been taken, the carrying amount of the exploration and evaluation expenditure in respect of the area of interest is aggregated with the development expenditure and classified under non-current assets as development properties.
A development property is reclassified as a mining property at the end of the commissioning phase, when the mine is capable of operating in the manner intended by management.
Depreciation is charged using the units-of-production method, with separate calculations being made for each area of interest. The units-of-production basis results in a depreciation charge proportional to the depletion of proved, probable and estimated reserves. Development properties are tested for impairment in accordance with the policy on impairment of assets.
Development stripping
Development stripping costs arise from the removal of overburden and other mine waste materials removed during the development of a mine site in order to access the mineral deposit. Costs directly attributable development stripping activities costs, inclusive of an allocation of relevant overhead expenditure, are initially capitalised to Exploration and evaluation expenditure. Capitalisation of development stripping costs ceases at the time that saleable material begins to be extracted from the mine. On completion of development, all capitalised development stripping included in Exploration and evaluation is transferred to Mine development expenditures. Production stripping commences at the time that saleable materials begin to be extracted from the mine and, under normal circumstances, continue throughout the life of the mine. Costs of production stripping are charged to the profit or loss as operating costs when the ratio of waste material to ore extracted for an area of interest is expected to be constant throughout its estimated life.
When the ratio of waste to ore is not expected to be constant, production stripping costs are accounted for as follows:
(i) All costs are initially charged to profit or loss and classified as operating costs
(ii) When the current ratio of waste to ore is greater than the estimated life-of-mine ratio, a portion of the stripping costs (inclusive of an allocation of relevant overhead expenditure) is capitalised to Mine development expenditure
(iii) The amount of production stripping costs capitalised or charged in a financial year is determined so that the stripping expense for the financial year reflects the estimated life-of-mine ratio. The stripping costs are amortised against the profit or loss to the extent that, in subsequent periods, the current period ratio falls short of the life-of-mine-ratio. Changes to the estimated life-of-mine ratio are accounted for prospectively from the date of the change

60 Mineral Resources Limited
Notes to the Financial Statements30 June 2016
Note 1. Significant accounting policies (continued)
Interest in joint ventures
The Group’s share of the assets, liabilities, revenue and expenses of jointly controlled assets has been included in the appropriate line items of the consolidated financial statements. The Group’s interests in joint venture entities are brought to account using the interests in joint venture operation are brought to account using the proportionate consolidation method. Where the Group contributes assets to the joint venture, or if the Group purchases assets from the joint venture, only the portion of the gain or loss that is not attributable to the Group’s share of the joint venture shall be recognised. The Group however will recognise the full amount of any loss when the contribution results in a reduction in the net realisable value of current assets or an impairment loss.
Impairment of non-financial assets
Goodwill and other intangible assets that have an indefinite useful life are not subject to amortisation and are tested annually for impairment, or more frequently if events or changes in circumstances indicate that they might be impaired. Other non-financial assets are reviewed for impairment whenever events or changes in circumstances indicate that the carrying amount may not be recoverable. An impairment loss is recognised for the amount by which the asset’s carrying amount exceeds its recoverable amount.
Recoverable amount is the higher of an asset’s fair value less costs of disposal and value-in-use. The value-in-use is the present value of the estimated future cash flows relating to the asset using a pre-tax discount rate specific to the asset or cash-generating unit to which the asset belongs. Assets that do not have independent cash flows are grouped together to form a cash-generating unit.
Trade and other payables
These amounts represent liabilities for goods and services provided to the Group prior to the end of the financial year and which are unpaid. Due to their short-term nature they are measured at amortised cost and are not discounted. The amounts are unsecured and are usually paid within 30 days of recognition.
Borrowings
Loans and borrowings are initially recognised at the fair value of the consideration received, net of transaction costs. They are subsequently measured at amortised cost using the effective interest method.
Where there is an unconditional right to defer settlement of the liability for at least 12 months after the reporting date, the loans or borrowings are classified as non-current.
Borrowing costs
Borrowing costs directly attributable to the acquisition, construction or production of assets that necessarily take a substantial period of time to prepare for their intended use or sale are added to the cost of those assets, until such time as the assets are substantially ready for their intended use or sale.
All other borrowing costs are recognised in profit or loss in the period in which they are incurred.
Provisions
Provisions are recognised when the Group has a present (legal or constructive) obligation as a result of a past event, it is probable the Group will be required to settle the obligation, and a reliable estimate can be made of the amount of the obligation. The amount recognised as a provision is the best estimate of the consideration required to settle the present obligation at the reporting date, taking into account the risks and uncertainties surrounding the obligation. If the time value of money is material, provisions are discounted using a current pre-tax rate specific to the liability. The increase in the provision resulting from the passage of time is recognised as a finance cost.
Annual Report 2016 61
Notes to the Financial Statements30 June 2016
Note 1. Significant accounting policies (continued)
Employee benefits
Short-term employee benefits
Liabilities for wages and salaries, including non-monetary benefits, annual leave and long service leave expected to be settled wholly within 12 months of the reporting date are measured at the amounts expected to be paid when the liabilities are settled.
Other long-term employee benefits
The liability for annual leave and long service leave not expected to be settled within 12 months of the reporting date are measured as the present value of expected future payments to be made in respect of services provided by employees up to the reporting date using the projected unit credit method. Consideration is given to expected future wage and salary levels, experience of employee departures and periods of service. Expected future payments are discounted using market yields at the reporting date on national government bonds with terms to maturity and currency that match, as closely as possible, the estimated future cash outflows.
Fair value measurement
When an asset or liability, financial or non-financial, is measured at fair value for recognition or disclosure purposes, the fair value is based on the price that would be received to sell an asset or paid to transfer a liability in an orderly transaction between market participants at the measurement date; and assumes that the transaction will take place either: in the principal market; or in the absence of a principal market, in the most advantageous market.
Fair value is measured using the assumptions that market participants would use when pricing the asset or liability, assuming they act in their economic best interests. For non-financial assets, the fair value measurement is based on its highest and best use. Valuation techniques that are appropriate in the circumstances and for which sufficient data are available to measure fair value, are used, maximising the use of relevant observable inputs and minimising the use of unobservable inputs.
Assets and liabilities measured at fair value are classified, into three levels, using a fair value hierarchy that reflects the significance of the inputs used in making the measurements. Classifications are reviewed at each reporting date and transfers between levels are determined based on a reassessment of the lowest level of input that is significant to the fair value measurement.
For recurring and non-recurring fair value measurements, external valuers may be used when internal expertise is either not available or when the valuation is deemed to be significant. External valuers are selected based on market knowledge and reputation. Where there is a significant change in fair value of an asset or liability from one period to another, an analysis is undertaken, which includes a verification of the major inputs applied in the latest valuation and a comparison, where applicable, with external sources of data.
Foreign currency transactions
The financial statements are presented in Australian dollars, which is the Group’s functional and presentation currency.
Foreign currency transactions are translated into Australian dollars using the exchange rates prevailing at the dates of the transactions. Foreign exchange gains and losses resulting from the settlement of such transactions and from the translation at financial year-end exchange rates of monetary assets and liabilities denominated in foreign currencies are recognised in profit or loss.
Issued capital
Ordinary shares are classified as equity.
Incremental costs directly attributable to the issue of new shares or options are shown in equity as a deduction, net of tax, from the proceeds.
Dividends
Dividends are recognised when declared during the financial year and no longer at the discretion of the Company.

62 Mineral Resources Limited
Notes to the Financial Statements30 June 2016
Note 1. Significant accounting policies (continued)
Earnings per share
Basic earnings per share
Basic earnings per share is calculated by dividing the profit attributable to the owners of Mineral Resources Limited, excluding any costs of servicing equity other than ordinary shares, by the weighted average number of ordinary shares outstanding during the financial year, adjusted for bonus elements in ordinary shares issued during the financial year.
Diluted earnings per share
Diluted earnings per share adjusts the figures used in the determination of basic earnings per share to take into account the after income tax effect of interest and other financing costs associated with dilutive potential ordinary shares and the weighted average number of shares assumed to have been issued for no consideration in relation to dilutive potential ordinary shares.
Goods and Services Tax (‘GST’) and other similar taxes
Revenues, expenses and assets are recognised net of the amount of associated GST, unless the GST incurred is not recoverable from the tax authority. In this case it is recognised as part of the cost of the acquisition of the asset or as part of the expense.
Receivables and payables are stated inclusive of the amount of GST receivable or payable. The net amount of GST recoverable from, or payable to, the tax authority is included in other receivables or other payables in the statement of financial position.
Cash flows are presented on a gross basis. The GST components of cash flows arising from investing or financing activities which are recoverable from, or payable to the tax authority, are presented as operating cash flows.
Commitments and contingencies are disclosed net of the amount of GST recoverable from, or payable to, the tax authority.
Rounding of amounts
The Company is of a kind referred to in ASIC Corporations (Rounding in Financial/Directors’ Report) Instrument 2016/91, issued and in accordance with that class order, amounts in the financial statements have been rounded off to the nearest thousand dollars, or in certain cases, the nearest dollar.
New Accounting Standards and Interpretations not yet mandatory or early adopted
Australian Accounting Standards and Interpretations that have recently been issued or amended but are not yet mandatory, have not been early adopted by the Group for the annual reporting period ended 30 June 2016. The Group’s assessment of the impact of these new or amended Accounting Standards and Interpretations, most relevant to the Group, are set out below.
AASB 9 Financial Instruments
This standard is applicable to annual reporting periods beginning on or after 1 January 2018. The standard replaces all previous versions of AASB 9 and completes the project to replace IAS 39 ‘Financial Instruments: Recognition and Measurement’. AASB 9 introduces new classification and measurement models for financial assets. A financial asset shall be measured at amortised cost, if it is held within a business model whose objective is to hold assets in order to collect contractual cash flows, which arise on specified dates and solely principal and interest. All other financial instrument assets are to be classified and measured at fair value through profit or loss unless the entity makes an irrevocable election on initial recognition to present gains and losses on equity instruments (that are not held-for-trading) in other comprehensive income (‘OCI’). For financial liabilities, the standard requires the portion of the change in fair value that relates to the entity’s own credit risk to be presented in OCI (unless it would create an accounting mismatch). New simpler hedge accounting requirements are intended to more closely align the accounting treatment with the risk management activities of the entity. New impairment requirements will use an ‘expected credit loss’ (‘ECL’) model to recognise an allowance. Impairment will be measured under a 12-month ECL method unless the credit risk on a financial instrument has increased significantly since initial recognition in which case the lifetime ECL method is adopted. The standard introduces additional new disclosures. The Group will adopt this standard from 1 July 2018 but the impact of its adoption is yet to be assessed by the Group.

Annual Report 2016 63
Notes to the Financial Statements30 June 2016
Note 1. Significant accounting policies (continued)
AASB 15 Revenue from Contracts with Customers
This standard is applicable to annual reporting periods beginning on or after 1 January 2018. The standard provides a single standard for revenue recognition. The core principle of the standard is that an entity will recognise revenue to depict the transfer of promised goods or services to customers in an amount that reflects the consideration to which the entity expects to be entitled in exchange for those goods or services. The standard will require: contracts (either written, verbal or implied) to be identified, together with the separate performance obligations within the contract; determine the transaction price, adjusted for the time value of money excluding credit risk; allocation of the transaction price to the separate performance obligations on a basis of relative stand-alone selling price of each distinct good or service, or estimation approach if no distinct observable prices exist; and recognition of revenue when each performance obligation is satisfied. Credit risk will be presented separately as an expense rather than adjusted to revenue. For goods, the performance obligation would be satisfied when the customer obtains control of the goods. For services, the performance obligation is satisfied when the service has been provided, typically for promises to transfer services to customers. For performance obligations satisfied over time, an entity would select an appropriate measure of progress to determine how much revenue should be recognised as the performance obligation is satisfied. Contracts with customers will be presented in an entity’s statement of financial position as a contract liability, a contract asset, or a receivable, depending on the relationship between the entity’s performance and the customer’s payment. Sufficient quantitative and qualitative disclosure is required to enable users to understand the contracts with customers; the significant judgments made in applying the guidance to those contracts; and any assets recognised from the costs to obtain or fulfil a contract with a customer. The Group will adopt this standard from 1 July 2018 but the impact of its adoption is yet to be assessed by the Group.
AASB 16 Leases
This standard is applicable to annual reporting periods beginning on or after 1 January 2019. The standard replaces AASB 117 ‘Leases’ and for lessees will eliminate the classifications of operating leases and finance leases. Subject to exceptions, a ‘right-of-use’ asset will be capitalised in the statement of financial position, measured as the present value of the unavoidable future lease payments to be made over the lease term. The exceptions relate to short-term leases of 12 months or less and leases of low-value assets (such as personal computers and small office furniture) where an accounting policy choice exists whereby either a ‘right-of-use’ asset is recognised or lease payments are expensed to profit or loss as incurred. A liability corresponding to the capitalised lease will also be recognised, adjusted for lease prepayments, lease incentives received, initial direct costs incurred and an estimate of any future restoration, removal or dismantling costs. Straight-line operating lease expense recognition will be replaced with a depreciation charge for the leased asset (included in operating costs) and an interest expense on the recognised lease liability (included in finance costs). In the earlier periods of the lease, the expenses associated with the lease under AASB 16 will be higher when compared to lease expenses under AASB 117. However EBITDA (Earnings Before Interest, Tax, Depreciation and Amortisation) results will be improved as the operating expense is replaced by interest expense and depreciation in profit or loss under AASB 16. For classification within the statement of cash flows, the lease payments will be separated into both a principal (financing activities) and interest (either operating or financing activities) component. For lessor accounting, the standard does not substantially change how a lessor accounts for leases. The Group will adopt this standard from 1 July 2019 but the impact of its adoption is yet to be assessed by the Group.

64 Mineral Resources Limited
Notes to the Financial Statements30 June 2016
Note 2. Critical accounting judgements, estimates and assumptions
The preparation of the financial statements requires management to make judgements, estimates and assumptions that affect the reported amounts in the financial statements. Management continually evaluates its judgements and estimates in relation to assets, liabilities, contingent liabilities, revenue and expenses. Management bases its judgements, estimates and assumptions on historical experience and on other various factors, including expectations of future events, management believes to be reasonable under the circumstances. The resulting accounting judgements and estimates will seldom equal the related actual results. The judgements, estimates and assumptions that have a significant risk of causing a material adjustment to the carrying amounts of assets and liabilities (refer to the respective notes) within the next financial year are discussed below.
Provision for impairment of receivables
The provision for impairment of receivables assessment requires a degree of estimation and judgement. The level of provision is assessed by taking into account the recent sales experience, the ageing of receivables, historical collection rates and specific knowledge of the individual debtor’s financial position.
Estimation of useful lives of assets
The Group determines the estimated useful lives and related depreciation and amortisation charges for its property, plant and equipment and finite life intangible assets. The useful lives could change significantly as a result of technical innovations or some other event. The depreciation and amortisation charge will increase where the useful lives are less than previously estimated lives, or technically obsolete or non-strategic assets that have been abandoned or sold will be written off or written down.
Goodwill and other indefinite life intangible assets
The Group tests annually, or more frequently if events or changes in circumstances indicate impairment, whether goodwill and other indefinite life intangible assets have suffered any impairment, in accordance with the accounting policy stated in note 1. The recoverable amounts of cash-generating units have been determined based on value-in-use calculations. These calculations require the use of assumptions, including estimated discount rates based on the current cost of capital and growth rates of the estimated future cash flows.
Income tax
The Group is subject to income taxes in the jurisdictions in which it operates. Significant judgement is required in determining the provision for income tax. There are many transactions and calculations undertaken during the ordinary course of business for which the ultimate tax determination is uncertain. The Group recognises liabilities for anticipated tax audit issues based on the Group’s current understanding of the tax law. Where the final tax outcome of these matters is different from the carrying amounts, such differences will impact the current and deferred tax provisions in the period in which such determination is made.
Recovery of deferred tax assets
Deferred tax assets are recognised for deductible temporary differences only if the Group considers it is probable that future taxable amounts will be available to utilise those temporary differences and losses.
Exploration and evaluation costs
Exploration and evaluation costs have been capitalised on the basis that the Group will commence commercial production in the future, from which time the costs will be amortised in proportion to the depletion of the mineral resources. Key judgements are applied in considering costs to be capitalised which includes determining expenditures directly related to these activities and allocating overheads between those that are expensed and capitalised. In addition, costs are only capitalised if expected to be recovered either through successful development or sale of the relevant mining interest. Factors that could impact the future commercial production at the mine include the level of reserves and resources, future technology changes, which could impact the cost of mining, future legal changes and changes in commodity prices. To the extent that capitalised costs are determined not to be recoverable in the future, they will be written off in the period in which this determination is made.

Annual Report 2016 65
Notes to the Financial Statements30 June 2016
Note 2. Critical accounting judgements, estimates and assumptions (continued)
Ore reserve and resource estimates
Ore reserves are estimates of the amount of product that can be economically and legally extracted from the Group’s current mining tenements. The Group estimates its ore reserves based on information compiled by appropriately qualified persons able to interpret the geological data. The estimation of recoverable reserves is based on factors such as estimates of foreign exchange rates, commodity prices, future capital requirements, and production costs, along with geological assumptions and judgements made in estimating the size and grade of the ore body. Changes in the reserve or resource estimates may impact on the value of exploration and evaluation assets, mine properties, property plant and equipment, provision for rehabilitation and depreciation and amortisation charges.
Units of production depreciation
Estimated recoverable reserves are used in determining the depreciation and/or amortisation of mine specific assets. This results in a depreciation/amortisation charge proportional to the depletion of the anticipated remaining life of mine production. Each item’s life, which is assessed annually, has regard to both its physical life limitations and to present assessments of economically recoverable reserves of the mine property at which the asset is located. These calculations require the use of estimates and assumptions, including the amount of recoverable reserves and estimates of future capital expenditure. The Group adopts a Run of Mine (ROM) tonnes of ore produced methodology.
Construction contracts
Construction contracts require significant estimates and assumptions in relation to:
• determining the stage of completion
• estimation of total contract revenue and contract costs
• acceptance of the probability of customer approval of variations and acceptance of claims
• estimation of project completion date
• assumed levels of project execution productivity.
These uncertainties may result in future project outcomes that differ from the amounts currently expected.
Where the outcome of a contract cannot be reliably estimated, contract costs are expensed as incurred. Where it is probable that the costs will be recovered, revenue is recognised to the extent of costs incurred. An expected loss is recognised immediately as an expense.
Site rehabilitation provisions
In accordance with the Group’s legal requirements, provision is made for the anticipated costs of future restoration and rehabilitation of areas from which natural resources have been extracted. The provision includes costs associated with dismantling of assets, reclamation, plant closure, waste site closure, monitoring, demolition and decontamination. The provision is based upon current costs and has been determined on a discounted basis with reference to current legal requirements and current technology.
Each period the impact of unwinding of the discount is recognised in the statement of profit or loss and other comprehensive income as a financing cost. Any change in the restoration provision is recorded against the carrying value of the provision and the related asset, only to the extent that it is probable that future economic benefits associated with the restoration expenditure will flow to the entity, with the effect being recognised in the statement of profit or loss and other comprehensive income on a prospective basis over the remaining life of the relevant operation. The restoration provision is separated into current (estimated costs arising within 12 months) and non-current components based on the expected timing of these cash flows.
Project closure
At the completion of some projects the Group has a liability for redundancy and the cost of relocating crushing and other mobile plant. An assessment is undertaken on the probability that such expenses will be incurred in the normal business of contracting services and is provided for in the financial statements.

66 Mineral Resources Limited
Notes to the Financial Statements30 June 2016
Note 3. Operating segments
Business segment
The Group has identified its operating segments based on internal management reports that are reviewed by the Board (the Chief Operating Decision Makers) in assessing performance and in determining the allocation of resources.
The Group continues to report its business results as three operating segments being Mining Services and Processing, Mining, and Central. All are operating within the resources sector of the Australian economy.
The measurement of segment results is in line with the basis of information presented to management for internal management reporting purposes and the performance of each segment is measure based on normalised Earnings Before Interest and Tax (EBIT) contribution.
The accounting policies applied for internal reporting purposes are consistent with those applied in the preparation of the financial statements.
Operating segment information
Group – 2016
Mining Services & Processing
$’000Mining $’000
Central $’000
Total $’000
Total revenue 399,253 778,126 262 1,177,641
Other income 5,941 656 66 6,663
Other expenses (225,770) (674,592) (5,770) (906,132)
Earnings before interest, tax, depreciation and amortisation 179,424 104,190 (5,442) 278,172
Depreciation and amortisation (64,611) (68,396) (961) (133,968)
Interest income - 28 2,459 2,487
Finance costs (3,636) (978) (3,315) (7,929)
Operating profit/(loss) before impairment charges and income tax 111,177 34,844 (7,259) 138,762
Income tax on operating profit before impairment charges (34,487)
Profit after tax before impairment charges 104,275
Impairment charges, net of tax (130,354)
Loss after income tax expense (26,079)
Assets
Segment assets 625,417 494,344 498,608 1,618,369
Liabilities
Segment liabilities 274,786 185,394 149,535 609,715
Group – 2015
Total revenue 569,879 729,364 (180) 1,299,063
Other income 2,916 1,530 17 4,463
Other expenses (335,993) (677,242) (7,264) (1,020,499)
Earnings before interest, tax, depreciation and amortisation 236,802 53,652 (7,427) 283,027
Depreciation and amortisation (72,026) (52,929) (1,949) (126,904)
Interest income 58 122 3,794 3,974
Finance costs (764) (37) (6,927) (7,728)
Operating profit/(loss) before impairment charges and income tax 164,070 808 (12,509) 152,369
Income tax on operating profit before impairment charges (43,482)
Profit after tax before impairment charges 108,887
Impairment charges, net of tax (31,181)
Profit before MRRT expense 77,706
Income tax expense on reversal of MRRT deferred tax assets (65,162)
Profit after income tax expense 12,544
Assets
Segment assets 899,032 651,661 40,883 1,591,576
Liabilities
Segment liabilities 293,971 186,256 29,196 509,423

Annual Report 2016 67
Notes to the Financial Statements30 June 2016
Note 3. Operating segments (continued)
Intersegment revenue
Consolidated – 2016
Mining Services & Processing
$’000Mining $’000
Central $’000
Total $’000
Revenue
Sales to internal and external customers 501,529 779,111 262 1,280,902
Intersegment sales (102,276) (985) - (103,261)
Total revenue 399,253 778,126 262 1,177,641
Consolidated – 2015
Revenue
Sales to internal and external customers 696,415 729,512 (180) 1,425,747
Intersegment sales (126,536) (148) - (126,684)
Total revenue 569,879 729,364 (180) 1,299,063
Geographical information
Sales to external customers Geographical non-current assets
2016 $’000
2015 $’000
2016 $’000
2015 $’000
Australia 454,952 529,841 986,505 1,117,422
China 243,878 455,500 102 -
Singapore 447,011 157,791 - -
Other 31,800 155,931 - 190
1,177,641 1,299,063 986,607 1,117,612
The geographical non-current assets above are exclusive of, where applicable, financial instruments, deferred tax assets, post-employment benefits assets and rights under insurance contracts.
Revenue by customers
Revenue from services provided and mining product sold was comprised of the following clients and buyers who each on a proportionate basis equated to greater than 10% of total sales for the year.
During the year ended 30 June 2016, revenues of $289,735,000 (Mining Services and Processing Segment), being 24.6% of total external revenues and $476,159,000 (Mining Segment), being 40.43% of total external revenues were derived from the Group’s largest customers. During the year ended 30 June 2015, revenues of $286,580,000 (Mining Services and Processing Segment) being 21.1% were derived from the Group’s largest customers.
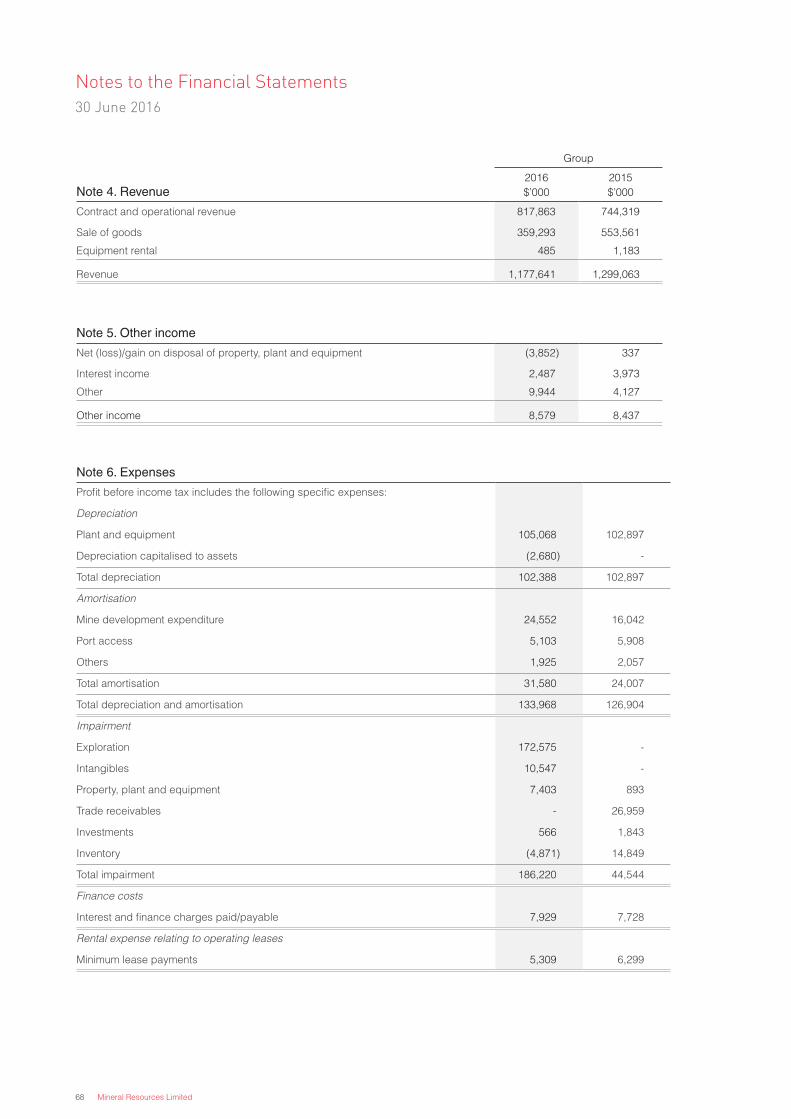
68 Mineral Resources Limited
Notes to the Financial Statements30 June 2016
Group
Note 4. Revenue2016 $’000
2015 $’000
Contract and operational revenue 817,863 744,319
Sale of goods 359,293 553,561
Equipment rental 485 1,183
Revenue 1,177,641 1,299,063
Note 5. Other income
Net (loss)/gain on disposal of property, plant and equipment (3,852) 337
Interest income 2,487 3,973
Other 9,944 4,127
Other income 8,579 8,437
Note 6. Expenses
Profit before income tax includes the following specific expenses:
Depreciation
Plant and equipment 105,068 102,897
Depreciation capitalised to assets (2,680) -
Total depreciation 102,388 102,897
Amortisation
Mine development expenditure 24,552 16,042
Port access 5,103 5,908
Others 1,925 2,057
Total amortisation 31,580 24,007
Total depreciation and amortisation 133,968 126,904
Impairment
Exploration 172,575 -
Intangibles 10,547 -
Property, plant and equipment 7,403 893
Trade receivables - 26,959
Investments 566 1,843
Inventory (4,871) 14,849
Total impairment 186,220 44,544
Finance costs
Interest and finance charges paid/payable 7,929 7,728
Rental expense relating to operating leases
Minimum lease payments 5,309 6,299

Annual Report 2016 69
Notes to the Financial Statements30 June 2016
Note 7. Income tax expense
Group
2016 $’000
2015 $’000
Income tax expense/(benefit)
Operating profit 34,487 43,483
Impairment charges (55,866) (13,363)
Reversal of MRRT Deferred Tax expense - 65,162
(21,379) 95,281
Current tax 38,386 36,078
Deferred tax - origination and reversal of temporary differences (55,392) 59,327
Adjustment recognised for prior periods (4,373) (124)
Aggregate income tax expense/(benefit) (21,379) 95,281
Deferred tax included in income tax expense/(benefit) comprises:
Decrease in deferred tax assets (note 19) 5,498 43,015
Increase/(decrease) in deferred tax liabilities (note 25) (60,890) 16,312
Deferred tax - origination and reversal of temporary differences (55,392) 59,327
Numerical reconciliation of income tax expense/(benefit) and tax at the statutory rate
Operating profit before impairment charges and income tax expense 138,762 152,369
Impairment charges (186,220) (44,544)
Profit before income tax expense (47,458) 107,825
Tax at the statutory tax rate of 30% (14,237) 32,348
Tax effect amounts which are not deductible/(taxable) in calculating taxable income:
Non allowable expenses 1,453 3,395
Research and development concessions (7,000) (5,700)
Reversal of Mineral Resource Rent Tax - 65,162
Impairment 1,722 -
(18,062) 95,205
Adjustment recognised for prior periods (4,373) (124)
Current year tax losses not recognised 1,056 200
Income tax benefit/(expense) (21,379) 95,281
Amounts credited directly to equity
Deferred tax liabilities (note 25) (121) (3,421)
Tax losses not recognised
Unused tax losses for which no deferred tax asset has been recognised 27,090 25,113
Potential tax benefit @ 30% 8,127 7,534
The above potential tax benefit for tax losses has not been recognised in the statement of financial position. These tax losses can only be utilised in the future if the continuity of ownership test is passed, or failing that, the same business test is passed.

70 Mineral Resources Limited
Notes to the Financial Statements30 June 2016
Note 8. Current assets - cash and cash equivalents
Group
2016 $’000
2015 $’000
Cash at bank and on hand 407,293 209,814
Note 9. Current assets - trade and other receivables
Trade receivables 88,735 169,983
Provision for impairment (5,401) (33,631)
83,334 136,352
Included in the trade and other receivables is amounts due from customers in relation to construction contracts of $259,000 (2015: $455,000).
The ageing of the impaired receivables provided for above are as follows:
0 to 3 months overdue - 150
Over 6 months overdue 5,401 33,481
5,401 33,631
Movements in the provision for impairment of receivables are as follows:
Opening balance 33,631 3,934
Additional provisions released/(recognised) (28,230) 29,697
Closing balance 5,401 33,631
Past due but not impaired
Customers with balances past due but without provision for impairment of receivables amount to $6,979,000 as at 30 June 2016 ($5,512,000 as at 30 June 2015).
The Group did not consider a credit risk on the aggregate balances after reviewing the credit terms of customers based on recent collection practices.
The ageing of the past due but not impaired receivables are as follows:
61-90 days overdue 6,400 4,952
Over 90 days overdue 579 560
6,979 5,512
These relate to a number of independent customers for whom there is no recent history of default.
Construction contracts
Contract costs incurred to date and profit recognised to date 161,595 555,305
Less: progress billings received and receivable (211,518) (597,686)
Net construction work in progress (49,923) (42,381)
Representing:
Amounts due from customers included in trade receivables 259 455
Amounts due to suppliers included in trade and other payables (note 20) (50,182) (42,836)
(49,923) (42,381)

Annual Report 2016 71
Notes to the Financial Statements30 June 2016
Note 10. Current assets - inventories
Group
2016 $’000
2015 $’000
Raw materials and stores 7,321 12,323
Ore inventory stockpiles 53,155 46,110
Work in progress 19,543 15,014
80,019 73,447
Note 11. Current assets - financial assets
Reconciliation - -
Reconciliation of the fair values at the beginning and end of the current and previous financial year are set out below:
Opening fair value - 178,977
Disposals - (178,977)
Closing fair value - -
Note 12. Current assets – other
Prepayments 2,262 5,392
Deposits 10,000 -
12,262 5,392
Note 13. Non-current assets - receivables
Loan receivable 10,900 10,900
Security deposits 134 153
11,034 11,053
The trade receivables are not past due nor impaired. The carrying amount is equivalent to fair value.
Note 14. Non-current assets - investments accounted for using
the equity method
Investment in Minprocess Group Inc. - 66
Investment in Iron Processing Group Inc. - 54
Investment in Process Minerals International Pty Ltd Inc. - 70
Investment in Roadtrim Mining and Civil Contracting Pty Ltd 3,571 -
3,571 190
Refer to note 40 for further information on interests in associates.
Reconciliation Reconciliation of the fair values at the beginning and end of the current and previous financial year are set out below:
Opening fair value 190 190
Transfer from financial assets (note 15) 3,571 -
Impairment of assets (190) -
3,571 190

72 Mineral Resources Limited
Notes to the Financial Statements30 June 2016
Note 15. Non-current assets - financial assets
Group
2016 $’000
2015 $’000
Shares in listed corporations - at fair value 8,362 376
Investment in unlisted company - 7,041
8,362 7,417
Reconciliation Reconciliation of the fair values at the beginning and end of the current and previous financial year are set out below:
Opening fair value 7,417 3,553
Additions 9,898 3,864
Transfer to joint operations (4,041) -
Transfer to investments accounted from using equity method (note 14) (3,571) -
Revaluation decrements (965) -
Impairment of assets (376) -
Closing fair value 8,362 7,417
Refer to note 31 for further information on fair value measurement.
Note 16. Non-current assets - property, plant and equipment
Land – cost 13,319 13,319
Buildings - cost 10,844 10,350
Less: Accumulated depreciation (1,022) (725)
9,822 9,625
Plant and equipment financed - cost 133,374 93,206
Less: Accumulated depreciation and impairment (14,336) (6,094)
119,038 87,112
Plant and equipment - cost 898,309 897,024
Less: Accumulated depreciation and impairment (356,943) (334,973)
541,366 562,051
683,545 672,107
Reconciliations
Reconciliations of the written down values at the beginning and end of the current and previous financial year are set out below:
GroupLand $’000
Building $’000
Plant and equipment financed
$’000
Plant and equipment
$’000Total $’000
Balance at 1 July 2014 13,319 9,910 13,620 624,068 660,917
Additions - - 78,512 49,087 127,599
Disposals - - (80) (3,250) (3,330)
Revaluation decrements - - - (10,182) (10,182)
Depreciation expense - (285) (4,940) (97,672) (102,897)
Balance at 30 June 2015 13,319 9,625 87,112 562,051 672,107
Additions - 494 45,252 113,448 159,194
Disposals - - (782) (18,196) (18,978)
Impairment of assets - - (814) (6,589) (7,403)
Transfers - - 783 (17,090) (16,307)
Depreciation expense - (297) (12,513) (92,258) (105,068)
Balance at 30 June 2016 13,319 9,822 119,038 541,366 683,545
Refer to note 36 for further information on property, plant and equipment secured under finance leases.

Annual Report 2016 73
Notes to the Financial Statements30 June 2016
Note 17. Non-current assets - intangibles
Group
2016 $’000
2015 $’000
Goodwill - cost 10,235 10,235
Patents - cost 1,750 17,660
Less: Accumulated amortisation - (4,525)
1,750 13,135
Port access - cost 49,679 48,518
Less: Accumulated amortisation and impairment (20,892) (15,789)
28,787 32,729
Operating lease - cost 7,038 7,038
Less: Accumulated amortisation (3,519) (2,815)
3,519 4,223
Others - cost 5,281 1,644
Less: Accumulated amortisation (343) (220)
4,938 1,424
49,229 61,746
Reconciliations
Reconciliations of the written down values at the beginning and end of the current and previous financial year are set out below:
Group
Goodwill
$’000
Patents $’000
Port access $’000
Operating lease $’000
Others $’000
Total $’000
Balance at 1 July 2014 10,235 12,615 38,677 4,926 248 66,701
Additions - 1,750 78 - 1,300 3,128
Transfers - - (118) - - (118)
Amortisation expense - (1,230) (5,908) (703) (124) (7,965)
Balance at 30 June 2015 10,235 13,135 32,729 4,223 1,424 61,746
Additions - - 1,421 - 3,637 5,058
Impairment of assets - (10,287) (260) - - (10,547)
Amortisation expense - (1,098) (5,103) (704) (123) (7,028)
Balance at 30 June 2016 10,235 1,750 28,787 3,519 4,938 49,229
Impairment testing
The following cash generating units have carrying amounts of goodwill:
Group
2016 $’000
2015 $’000
PIHA Pty Ltd 8,817 8,817
Process Minerals International Pty Ltd 1,418 1,418
10,235 10,235
Goodwill has an indefinite life.
The recoverable amount of each cash generating unit above is determined based on value-in-use calculations. Value-in-use is calculated based on the present value of cash flow projections, together with a terminal value. The cash flows are discounted using the target weighted average cost of capital for the Group.
The following assumptions were used in the value-in-use calculations:
Real pre-tax discount rate 12.9% (2015: 14.4%) Growth rate of cash flows 2.5% (2015: 2.5%).

74 Mineral Resources Limited
Notes to the Financial Statements30 June 2016
Note 18. Non-current assets - exploration and mine development
Group
2016 $’000
2015 $’000
Exploration and evaluation 152,752 315,599
Mine development expenditure 115,447 157,312
Less: Accumulated amortisation (25,400) (100,395)
90,047 56,917
242,799 372,516
Reconciliations
Reconciliations of the written down values at the beginning and end of the current and previous financial year are set out below:
Group
Exploration and evaluation
expenditure $’000
Mine development expenditure
$’000Total $’000
Balance at 1 July 2014 309,395 68,822 378,217
Additions 7,434 4,420 11,854
Write off of assets (1,230) (283) (1,513)
Amortisation expense - (16,042) (16,042)
Balance at 30 June 2015 315,599 56,917 372,516
Additions 38,862 10,760 49,622
Impairment of assets (172,575) - (172,575)
Transfers in/(out) (29,134) 46,922 17,788
Amortisation expense - (24,552) (24,552)
Balance at 30 June 2016 152,752 90,047 242,799
The recoverable amount of each cash generating unit above is determined based on value-in-use calculations. Value-in-use is calculated based on the present value of cash flow projections over a life of mine.
The following assumptions were used in the value-in-use calculations:
Future production:
The estimation of the future production is based on a detailed data analysis that reflects current life of mine and long term production plans. As each area of interest has specific economic characteristics, the cash flows applied have been calculated using appropriate models and key assumptions established by management.
Commodity prices:
Commodity prices are externally sourced, forward consensus prices, adjusted for ore properties.
Exchange rates:
Exchange rates are externally sourced forward consensus rates.
Discount rate:
A real pre-tax discount rate of 12.9% (2015: 14.4%) was applied to the pre-tax cash flows. The discount rate represents the targeted weighted average cost of capital of the Group, with appropriate adjustments made to reflect the risks specific to the cash generating unit.
Growth rate:
Growth rate of 2.5% (2015: 2.5%) was applied to the cash flows projection. Growth rates are in line with externally sourced forward consensus rates.

Annual Report 2016 75
Notes to the Financial Statements30 June 2016
Note 19. Non-current assets - deferred tax
Group
2016 $’000
2015 $’000
Deferred tax asset comprises temporary differences attributable to:
Amounts recognised in profit or loss:
Tax losses 2,581 -
Impairment of receivables 1,580 12,351
Impairment of financial assets 1,420 -
Impairment on inventory 4,738 299
Employee benefits 5,047 1,420
Provisions 15,889 23,212
Borrowings 827 946
Other 1,215 167
33,297 38,395
Movements:
Opening balance 38,395 87,784
Charged to profit or loss (note 7) (5,498) (43,015)
Under/(over) provision from prior year 400 (6,374)
Closing balance 33,297 38,395
Note 20. Current liabilities - trade and other payables
Trade payables and accruals 147,858 142,021
Amounts due to customers for contract work 50,182 19,755
198,040 161,776
Refer to note 30 for further information on financial instruments.
Note 21. Current liabilities - borrowings
Bank loans 115,000 -
Lease liability 32,983 20,731
147,983 20,731
Refer to note 24 for further information on assets pledged as security and financing arrangements.
Refer to note 30 for further information on financial instruments.
Note 22. Current liabilities - employee benefits
Employee benefits 16,897 11,750
Amounts not expected to be settled within the next 12 months
The current provision for employee benefits includes all unconditional entitlements where employees have completed the required period of service and also those where employees are entitled to pro-rata payments in certain circumstances. The entire amount is presented as current, since the Group does not have an unconditional right to defer settlement. However, based on past experience, the Group does not expect all employees to take the full amount of accrued long service leave or require payment within the next 12 months.
The following amounts reflect leave that is not expected to be taken within the next 12 months:
Employee benefits obligation expected to be settled after 12 months 5,330 3,733

76 Mineral Resources Limited
Notes to the Financial Statements30 June 2016
Note 23. Current liabilities - provisions
Group
2016 $’000
2015 $’000
Warranties (i) 480 21,480
Project closure (ii) 7,894 6,137
Site rehabilitation (iii) 5,496 -
13,870 27,617
(i) Warranties
Provision is made in respect of the Group’s estimated liability on all products are services under warranty at reporting date. The provision is measured as the present value of future cash flows estimated to be required to settle warranty obligation. The future cash flows are estimated by reference to the Group’s history of warranty claims.
(ii) Project closure
At the completion of some projects the Group has a liability for redundancy and the cost of relocating crushing and other mobile plant. The provision is measured as the present value of future cash flows estimated to be required to settle project closure obligations. An assessment is undertaken on the probability that such expenses will be incurred in the normal business of contracting services and is provided for in the financial statements.
(iii) Site rehabilitation
The provision for site rehabilitation relates to estimated costs of work required to rehabilitate a mine site and associated infrastructure to its original condition. The provision is measured as the present value of future cash flows estimated to be required to settle site rehabilitation obligations. The obligation is expected to materialise at the end of a mine’s life.
Movements in provisions
Movements in each class of provision during the current financial year, other than employee benefits, are set out below:
Group - 2016Warranties
$’000
Project Closure $’000
Site Rehabilitation
$’000Total $’000
Carrying amount at the start of the year 21,480 6,137 - 27,617
Additional provisions recognised - 2,014 5,912 7,926
Amounts transferred current/non current - (257) (375) (632)
Amounts used - - (41) (41)
Unused amounts reversed (21,000) - - (21,000)
Carrying amount at the end of the year 480 7,894 5,496 13,870

Annual Report 2016 77
Notes to the Financial Statements30 June 2016
Note 24. Non-current liabilities - borrowings
Group
2016 $’000
2015 $’000
Lease liability 71,445 70,892
Refer to note 30 for further information on financial instruments.
Total secured liabilities
The total secured liabilities (current and non-current) are as follows:
Bank loans 115,000 -
Lease liability 104,428 91,623
219,428 91,623
Assets pledged as security
The bank overdraft and loans are secured by:
(a) General Security Agreements over the whole of the assets and undertakings of Mineral Resources Ltd, Crushing Services International Pty Ltd, Process Minerals International Pty Ltd, Polaris Metals Pty Ltd, PIHA Pty Ltd, Auvex Resources Pty Ltd and Mineral Resources (Equipment) Pty Ltd;
(b) Negative pledges with respect to financial covenants; and
(c) Interlocking guarantees.
The lease liabilities are effectively secured as the rights to the leased assets, recognised in the statement of financial position, revert to the lessor in the event of default.
The interest rate for the bank loan is charged at BBSY plus a margin of 1.6%, which totals 3.49% per annum as at 30 June 2016 (2015: nil). The average interest rate for the hire purchase is 4.55% (2015: 4.80%)
Financing arrangements
Unrestricted access was available at the reporting date to the following lines of credit:
Total facilities
Bank overdraft 4,000 4,000
Bank loans 290,000 249,000
Bank guarantee 81,000 90,000
Lease liability 195,000 214,814
570,000 557,814
Used at the reporting date
Bank loans 115,000 -
Bank guarantee 36,040 60,695
Lease liability 104,429 91,623
255,469 152,318
Unused at the reporting date
Bank overdraft 4,000 4,000
Bank loans 175,000 249,000
Bank guarantee 44,960 29,305
Lease liability 90,571 123,191
314,531 405,496

78 Mineral Resources Limited
Notes to the Financial Statements30 June 2016
Note 25. Non-current liabilities - deferred tax
Group
2016 $’000
2015 $’000
Deferred tax liability comprises temporary differences attributable to:
Amounts recognised in profit or loss:
Trade and other receivables 2,678 5,418
Property, plant and equipment 83,511 57,640
Exploration and evaluation 38,256 119,748
124,445 182,806
Movements:
Opening balance 182,806 168,285
(Credited)/charged to profit or loss (note 7) (60,890) 16,312
Credited to equity (note 7) (121) (3,421)
Under-provision from prior year 2,650 1,630
Closing balance 124,445 182,806
Note 26. Non-current liabilities - provisions
Project closure (i) 2,481 2,146
Site rehabilitation (ii) 34,554 31,705
37,035 33,851
(i) Project closure
At the completion of some projects the Group has a liability for redundancy and the cost of relocating crushing and other mobile plant. An assessment is undertaken on the probability that such expenses will be incurred in the normal business of contracting services and is provided for in the financial statements.
(ii) Site rehabilitation
The provision for site rehabilitation relates to estimated costs of work required to rehabilitate a mine site and associated infrastructure to its original condition. The obligation is expected to materialise at the end of a mine’s life.
Movements in provisions
Movements in each class of provision during the current financial year, other than employee benefits, are set out below:
Group - 2016
Project Closure $’000
Site Rehabilitation
$’000Total $’000
Carrying amount at the start of the year 2,146 31,705 33,851
Additional provisions recognised 78 3,002 3,080
Addition through joint operation - 2,149 2,149
Amounts transferred 257 375 632
Amounts used - (2,677) (2,677)
Carrying amount at the end of the year 2,481 34,554 37,035
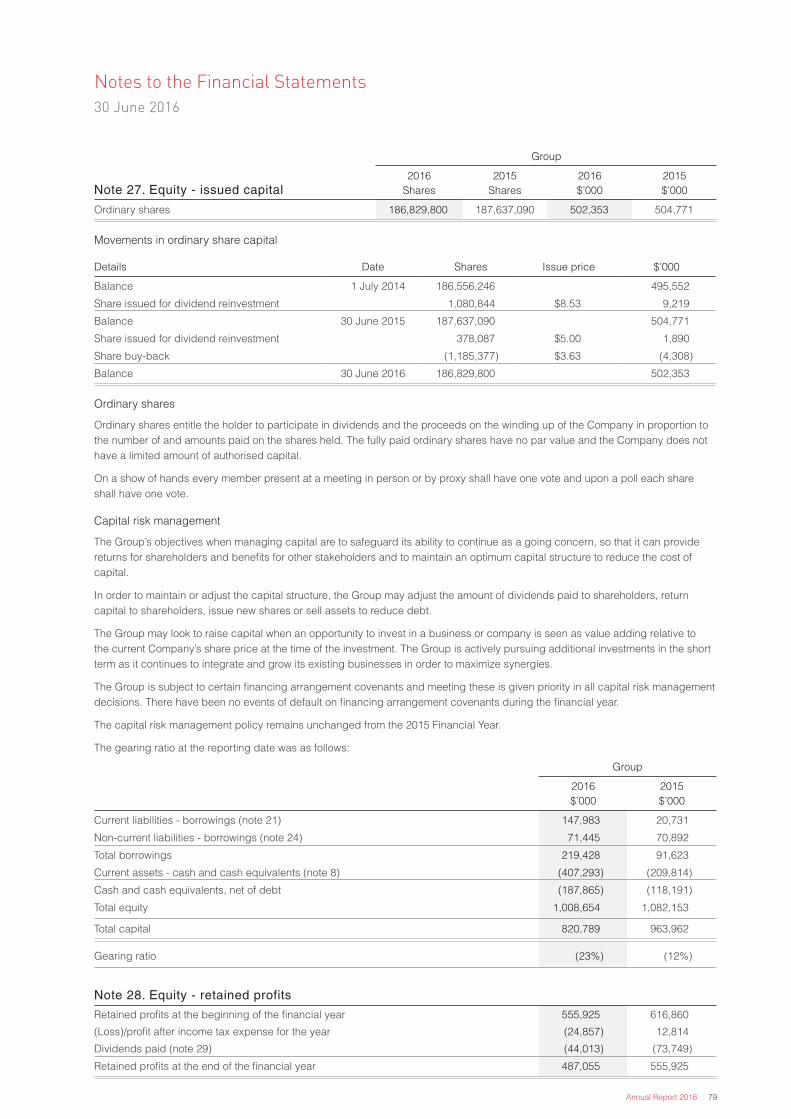
Annual Report 2016 79
Notes to the Financial Statements30 June 2016
Note 27. Equity - issued capital
Group
2016 Shares
2015 Shares
2016 $’000
2015 $’000
Ordinary shares 186,829,800 187,637,090 502,353 504,771
Movements in ordinary share capital
Details Date Shares Issue price $’000
Balance 1 July 2014 186,556,246 495,552
Share issued for dividend reinvestment 1,080,844 $8.53 9,219
Balance 30 June 2015 187,637,090 504,771
Share issued for dividend reinvestment 378,087 $5.00 1,890
Share buy-back (1,185,377) $3.63 (4,308)
Balance 30 June 2016 186,829,800 502,353
Ordinary shares
Ordinary shares entitle the holder to participate in dividends and the proceeds on the winding up of the Company in proportion to the number of and amounts paid on the shares held. The fully paid ordinary shares have no par value and the Company does not have a limited amount of authorised capital.
On a show of hands every member present at a meeting in person or by proxy shall have one vote and upon a poll each share shall have one vote.
Capital risk management
The Group’s objectives when managing capital are to safeguard its ability to continue as a going concern, so that it can provide returns for shareholders and benefits for other stakeholders and to maintain an optimum capital structure to reduce the cost of capital.
In order to maintain or adjust the capital structure, the Group may adjust the amount of dividends paid to shareholders, return capital to shareholders, issue new shares or sell assets to reduce debt.
The Group may look to raise capital when an opportunity to invest in a business or company is seen as value adding relative to the current Company’s share price at the time of the investment. The Group is actively pursuing additional investments in the short term as it continues to integrate and grow its existing businesses in order to maximize synergies.
The Group is subject to certain financing arrangement covenants and meeting these is given priority in all capital risk management decisions. There have been no events of default on financing arrangement covenants during the financial year.
The capital risk management policy remains unchanged from the 2015 Financial Year.
The gearing ratio at the reporting date was as follows:
Group
2016 $’000
2015 $’000
Current liabilities - borrowings (note 21) 147,983 20,731
Non-current liabilities - borrowings (note 24) 71,445 70,892
Total borrowings 219,428 91,623
Current assets - cash and cash equivalents (note 8) (407,293) (209,814)
Cash and cash equivalents, net of debt (187,865) (118,191)
Total equity 1,008,654 1,082,153
Total capital 820,789 963,962
Gearing ratio (23%) (12%)
Note 28. Equity - retained profits
Retained profits at the beginning of the financial year 555,925 616,860
(Loss)/profit after income tax expense for the year (24,857) 12,814
Dividends paid (note 29) (44,013) (73,749)
Retained profits at the end of the financial year 487,055 555,925

80 Mineral Resources Limited
Notes to the Financial Statements30 June 2016
Note 29. Equity - dividends
Dividends
Dividends paid during the financial year were as follows:
Group
2016 $’000
2015 $’000
Final dividend for the year ended 30 June 2015 (2015: 30 June 2014) of 15 cents (2015: 32 cents) per ordinary share franked at a tax rate of 30% paid on 8 October 2015 (2015: 10 October 2014) 28,147 59,701
Interim dividend for the year ended 30 June 2016 (2015: 30 June 2015) of 8.5 cents (2015: 7.5 cents) per ordinary share fully franked at a tax rate of 30% paid on 4 March 2016 (2015: 23 April 2015) 15,866 14,048
44,013 73,749
On 18 August 2016 the Directors declared a final dividend for the Financial Year ended 30 June 2016 of 21.0 cents per ordinary share to be paid on 15 September 2016, a total estimated distribution of $39,234,000 based on the number of ordinary shares on issue as at 18 August 2016.
Franking credits
Franking credits available for subsequent financial years based on a tax rate of 30% 81,032 77,051
The above amounts represent the balance of the franking account as at the end of the financial year, adjusted for:
• franking credits that will arise from the payment of the amount of the provision for income tax at the reporting date
• franking debits that will arise from the payment of dividends recognised as a liability at the reporting date
• franking credits that will arise from the receipt of dividends recognised as receivables at the reporting date.
Note 30. Financial instruments
Financial risk management objectives
The Group’s activities expose it to a variety of financial risks: market risk (including foreign currency risk, price risk and interest rate risk), credit risk and liquidity risk. The Group’s overall risk management program focuses on the unpredictability of financial markets and seeks to minimise potential adverse effects on the financial performance of the Group. The Group uses derivative financial instruments such as forward foreign exchange contracts to hedge certain risk exposures. Derivatives are exclusively used for hedging purposes, i.e. not as trading or other speculative instruments. The Group uses different methods to measure different types of risk to which it is exposed. These methods include sensitivity analysis in the case of interest rate, foreign exchange and other price risks, ageing analysis for credit risk and beta analysis in respect of investment portfolios to determine market risk.
Risk management is carried out by senior finance executives (‘finance’) under policies approved by the Board of Directors (‘the Board’). These policies include identification and analysis of the risk exposure of the Group and appropriate procedures, controls and risk limits. Finance identifies, evaluates and hedges financial risks within the Group’s operating units. Finance reports to the Board on a monthly basis.
Market risk
Foreign currency risk
The Group undertakes certain transactions denominated in foreign currency and is exposed to foreign currency risk through foreign exchange rate fluctuations.
Foreign exchange risk arises from future commercial transactions and recognised financial assets and financial liabilities denominated in a currency that is not the entity’s functional currency. The risk is measured using sensitivity analysis and cash flow forecasting.

Annual Report 2016 81
Notes to the Financial Statements30 June 2016
Note 30. Financial instruments (continued)
The Group enters into forward exchange contracts to buy and sell specified amounts of foreign currencies in the future at stipulated exchange rates. The objective in entering the forward exchange contracts is to protect the Group against unfavourable exchange rate movements for both the contracted and anticipated future sales undertaken in foreign currencies.
The carrying amount of the Group’s foreign currency denominated financial assets and financial liabilities at the reporting date were as follows:
Group
Assets Liabilities
2016 $’000
2015 $’000
2016 $’000
2015 $’000
US dollars 394,396 377,874 25,500 5,118
The Group had net assets denominated in foreign currencies of A$368,896,000 (assets A$394,396,000 less liabilities A$25,500,000) as at 30 June 2016. (2015: A$372,756,000 (assets A$377,874,000 less liabilities A$5,118,000). Based on this exposure, had the Australian dollar weakened by 5%/strengthened by 5% (2015: weakened by 5%/strengthened by 5%) against these foreign currencies with all other variables held constant, the Group’s profit before tax for the year would have been A$18,445,000 lower/A$18,445,000 higher (2015: A$18,638,000 lower/A$18,638,000 higher).
Price risk
The Group is exposed to commodity price risk which arises from iron ore and manganese ore held as inventory. The Group’s policy is to sell iron ore at contracted and/or spot prices. A portion of the exposure is hedged. The Group’s revenues are exposed to fluctuation in the price of iron ore. If the average selling price of iron ore $64.50 (2015: $73.50) for the financial year had increased/decreased by 10% the change in the profit before income tax for the Mining Segment would have been an increase/decrease of $77,812,000 (2015: profit before income tax of $72,936,000). As at 30 June 2016 there was no exposure to the fluctuation in the price of manganese ore.
Interest rate risk
The Group’s main interest rate risk arises from long-term borrowings. Borrowings issued at variable rates expose the Group to interest rate risk.
As at the reporting date, the Group is exposed to interest rate risk as follows:
2016 2015
Group
Weighted average
interest rate %
Balance $’000
Weighted average
interest rate %
Balance $’000
Cash and cash equivalents 0.31% 407,293 2.15% 209,814
Bank loans 3.49% (115,000) - -
Interest bearing liabilities - variable 4.55% (104,428) 4.80% (91,623)
Net exposure to cash flow interest rate risk 187,865 118,191
An analysis by remaining contractual maturities is shown in ‘liquidity and interest rate risk management’ below.
The Group has considered sensitivity relating to exposure to interest rate risk at reporting date. An official increase/decrease in interest rate of 100 (2015:100) basis points would have an adverse/favourable effect on the profit before tax of $1,878,000 (2015: $1,181,000) per annum.
Credit risk
Credit risk refers to the risk that a counterparty will default on its contractual obligations resulting in financial loss to the Group. The Group has a strict code of credit, including obtaining agency credit information, confirming references and setting appropriate credit limits. The Group obtains guarantees where appropriate to mitigate credit risk. The maximum exposure to credit risk at the reporting date to recognised financial assets is the carrying amount, net of any provisions for impairment of those assets, as disclosed in the statement of financial position and notes to the financial statements. The Group does not hold any collateral.
The Group’s exposure to financial position credit risk are as indicated by the carrying amounts of its financial assets. The Group does not have a significant exposure to any individual counterparty.

82 Mineral Resources Limited
Notes to the Financial Statements30 June 2016
Note 30. Financial instruments (continued)
Liquidity risk
Vigilant liquidity risk management requires the Group to maintain sufficient liquid assets (mainly cash and cash equivalents) and available borrowing facilities to be able to pay debts as and when they become due and payable.
The Group manages liquidity risk by maintaining adequate cash reserves and available borrowing facilities by continuously monitoring actual and forecast cash flows and matching the maturity profiles of financial assets and liabilities.
Financing arrangements
Unused borrowing facilities at the reporting date:
Group
2016 $’000
2015 $’000
Bank overdraft 4,000 4,000
Bank loans 175,000 249,000
Bank guarantee 44,960 29,305
Lease liability 90,571 125,395
314,531 407,700
The bank overdraft facilities may be drawn at any time and may be terminated by the bank without notice. Subject to the continuance of satisfactory credit ratings, the bank loan facilities may be drawn at any time and have an average maturity of 3 years (2015: 2 years).
Remaining contractual maturities
The following tables detail the Group’s remaining contractual maturity for its financial instrument liabilities. The tables have been drawn up based on the undiscounted cash flows of financial liabilities based on the earliest date on which the financial liabilities are required to be paid. The tables include both interest and principal cash flows disclosed as remaining contractual maturities and therefore these totals may differ from their carrying amount in the statement of financial position.
Group – 2016
Weighted average
interest rate %
1 year or less $’000
Between 1 and 2 years
$’000
Between 2 and 5 years
$’000Over 5 years
$’000
Remaining contractual maturities
$’000
Non-derivatives
Non-interest bearing
Trade payables - 198,040 - - - 198,040
Interest-bearing - variable
Lease liability 4.55% 32,994 33,018 27,031 11,385 104,428
Total non-derivatives 231,034 33,018 27,031 11,385 302,468
Group - 2015
Non-derivatives
Non-interest bearing
Trade payables - 161,776 - - - 161,776
Interest-bearing - variable
Lease liability 4.80% 20,731 20,518 50,374 - 91,623
Total non-derivatives 182,507 20,518 50,374 - 253,399
The cash flows in the maturity analysis above are not expected to occur significantly earlier than contractually disclosed above.
Fair value of financial instruments
Unless otherwise stated, the carrying amounts of financial instruments reflect their fair value.
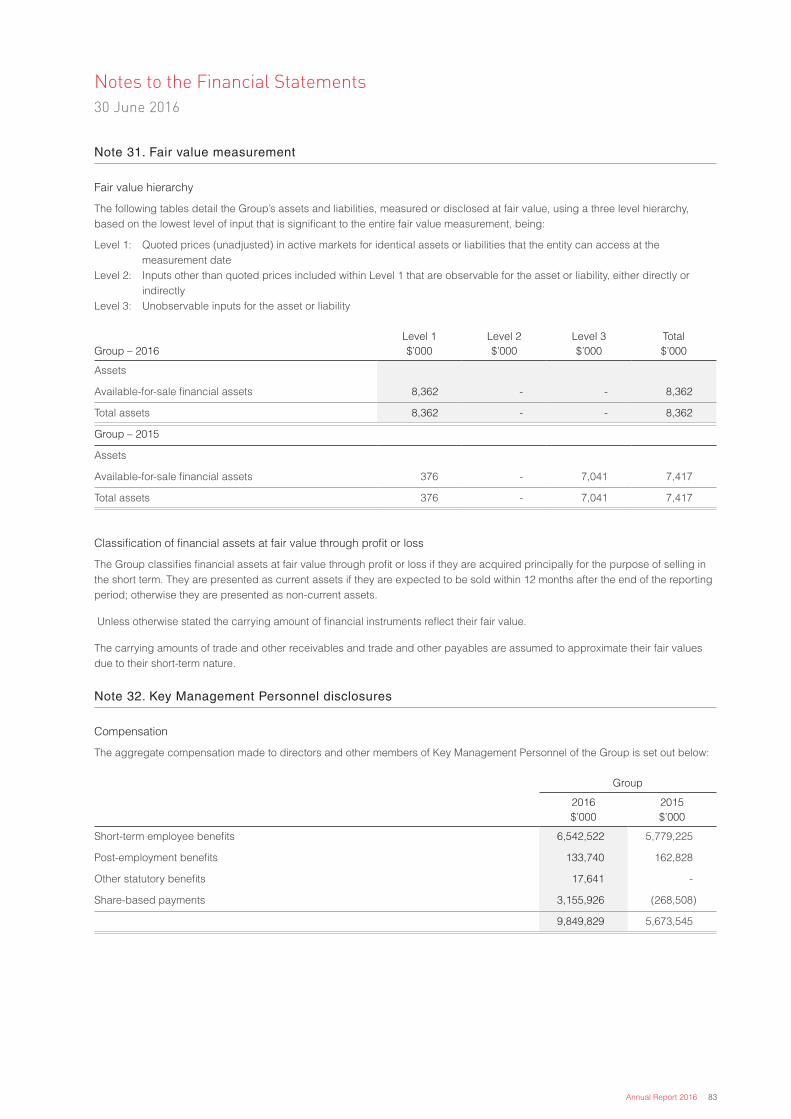
Annual Report 2016 83
Notes to the Financial Statements30 June 2016
Note 31. Fair value measurement
Fair value hierarchy
The following tables detail the Group’s assets and liabilities, measured or disclosed at fair value, using a three level hierarchy, based on the lowest level of input that is significant to the entire fair value measurement, being:
Level 1: Quoted prices (unadjusted) in active markets for identical assets or liabilities that the entity can access at the measurement date Level 2: Inputs other than quoted prices included within Level 1 that are observable for the asset or liability, either directly or indirectly Level 3: Unobservable inputs for the asset or liability
Group – 2016Level 1 $’000
Level 2 $’000
Level 3 $’000
Total $’000
Assets
Available-for-sale financial assets 8,362 - - 8,362
Total assets 8,362 - - 8,362
Group – 2015
Assets
Available-for-sale financial assets 376 - 7,041 7,417
Total assets 376 - 7,041 7,417
Classification of financial assets at fair value through profit or loss
The Group classifies financial assets at fair value through profit or loss if they are acquired principally for the purpose of selling in the short term. They are presented as current assets if they are expected to be sold within 12 months after the end of the reporting period; otherwise they are presented as non-current assets.
Unless otherwise stated the carrying amount of financial instruments reflect their fair value.
The carrying amounts of trade and other receivables and trade and other payables are assumed to approximate their fair values due to their short-term nature.
Note 32. Key Management Personnel disclosures
Compensation
The aggregate compensation made to directors and other members of Key Management Personnel of the Group is set out below:
Group
2016 $’000
2015 $’000
Short-term employee benefits 6,542,522 5,779,225
Post-employment benefits 133,740 162,828
Other statutory benefits 17,641 -
Share-based payments 3,155,926 (268,508)
9,849,829 5,673,545

84 Mineral Resources Limited
Notes to the Financial Statements30 June 2016
Note 33. Share based payments
Group
2016 $’000
2015 $’000
Value of LTI remuneration granted
Key Management Personnel 4,247 -
Other Senior positions 2,204 -
6,451 -
Value of LTI remuneration vested (i)
Key Management Personnel 1,062 -
Other Senior positions 551 -
1,613 -
Value of LTI remuneration subject to vesting conditions
Key Management Personnel 3,185 406
Other Senior positions 1,653 51
4,838 457
(i) A total of 192,706 shares will be issued to KMP and other Non-KMP executives at an issue price of $8.37 per share for a value of $1,612,730 on 19 August 2016, for the value vested portion of the LTI as identified in KMP remuneration disclosures.
A summary of the LTI structure is set out below:
1. A single financial measure (ROIC) that reflects the generation of long term shareholder value is used to measure performance
2. Vesting of awards equally (i.e. 25% each year) over a period of 4 years, the first being the year of grant. Vesting in the year of the grant provides a greater incentive for Executives to ensure corporate performance aligns with shareholder returns in each year grant year
3. Re-measurement / claw-back mechanisms – once an entitlement is granted, vesting will be dependent on continuing employment. The Board retains the right to withhold the vesting of individual tranches of granted rights depending on the Group performance and general economic conditions
4. Reward instruments – rights to MIN shares, with the basis for valuation being Volume Weighted Average Price (VWAP) at the time of entitlement (for FY16 this was $8.3689 per share being the VWAP for the 5 ASX trading days before 30 June 2016). Once the entitlement to a number of shares is set, the recipient has the opportunity to benefit from share price movement between the date of grant and date of vesting, supporting further positive correlation between LTI’s granted and shareholder return
5. Participants do not have the right to hedge the value of unvested entitlements to shares
6. Benchmark ROIC of 12% for each period (i.e. each financial year)
7. ROIC base excludes cash balances, borrowings determined to be cash/cash equivalents and impairments in a particular year that reduce the net assets of the Group. Cash and cash equivalents balances are excluded as there is not an expectation that the Company holds cash with a view to achieving a return on this asset class
8. Reward entitlement matrix is dependent on ROIC achieved for the measurement period. An uplift is available for superior performance. LTI participants have an ability to exceed base entitlements based on the following matrix. The availability of an uplift in the award is in recognition of the difficulty of reaching the outstanding levels of performance (ie greater than 15% ROIC).
Expenses arising from share-based payment transactions
Key Management Personnel 3,156 (269)
Other Senior positions 1,258 (25)
4,414 (294)

Annual Report 2016 85
Notes to the Financial Statements30 June 2016
Note 34. Remuneration of auditors
During the financial year the following fees were paid or payable for services provided by RSM Australia Partners, the auditor of the Group:
Group
2016 $’000
2015 $’000
Audit services – RSM Australia Partners
Audit or review of the financial statements 322,050 368,500
Other services - RSM Australia Partners
Taxation services 258,818 214,980
Other services 46,692 12,800
305,510 227,780
627,560 596,280
Note 35. Contingent liabilities
The Group has provided guarantee to third parties in relation to performance of contracts and against warranty obligations for a defects liability period after completion of the work. Defects liability periods are usually from 12 to 18 months duration. Bank guarantees are issued as security for these obligations.
Group
2016 $’000
2015 $’000
Bank guarantee facility 81,000 90,000
Amount utilised (36,040) (60,695)
Unused facility 44,960 29,305

86 Mineral Resources Limited
Notes to the Financial Statements30 June 2016
Note 36. Commitments
Group
2016 $’000
2015 $’000
Capital commitments
Committed at the reporting date but not recognised as liabilities, payable:
Property, plant and equipment 12,927 158,389
Lease commitments - operating
Committed at the reporting date but not recognised as liabilities, payable:
Within one year 4,482 4,383
One to five years 13,212 14,916
17,694 19,299
Lease commitments - finance
Committed at the reporting date and recognised as liabilities, payable:
Within one year 36,677 24,463
One to five years 63,706 77,048
More than five years 11,659 -
Total commitment 112,042 101,511
Less: Future finance charges (7,614) (9,888)
Net commitment recognised as liabilities 104,428 91,623
Representing:
Lease liability - current (note 21) 32,983 20,731
Lease liability - non-current (note 24) 71,445 70,892
104,428 91,623
Exploration expenditure commitments
Committed at the reporting date but not recognised as liabilities, payable:
Within one year 8,550 7,776
One to five years 39,065 36,198
47,615 43,974
Operating lease commitments includes contracted amounts for various retail outlets, warehouses, offices and plant and equipment under non-cancellable operating leases expiring within one to five years with, in some cases, options to extend. The leases have various escalation clauses. On renewal, the terms of the leases are renegotiated.
Finance lease commitments includes contracted amounts for various plant and equipment with written down value of $119,038,000 (2015: $87,112,000) secured under finance leases expiring within one to five years. Under the terms of the leases, the Group has the option to acquire the leased assets for predetermined residual values on the expiry of the leases.
Note 37. Related party transactions
Parent entity
Mineral Resources Limited is the parent entity.
Subsidiaries
Interests in subsidiaries are set out in note 39.
Associates
Interests in associates are set out in note 40.
Joint operations
Interests in joint operations are set out in note 41.
Transactions with associates and joint operations
The following transactions occurred with associates and joint operations:

Annual Report 2016 87
Notes to the Financial Statements30 June 2016
Note 37. Related party transactions (continued)
Group
2016 $’000
2015 $’000
Other transactions:
Certain services were provided by Reed Industrial Minerals Pty Ltd, a joint operation (130,500) (718,678)
Certain services were provided by Roadtrim Mining and Civil Contracting Pty Ltd, an associate (70,146,808) -
Certain services were provided to Roadtrim Mining and Civil Contracting Pty Ltd, an associate 17,977,234 -
Interest was charged to Roadtrim Mining and Civil Contracting Pty Ltd, an associate 1,152,712 -
The following transactions occurred with related parties:
Other transactions:
Certain engineering services were provided by GR Engineering Services Limited, a company related to Joe Ricciardo (ceased being related party 18 April 2016) - (199,948)
Certain engineering services were provided to GR Engineering Services Limited, a company related to Joe Ricciardo (ceased being related party 18 April 2016) 772,480 218,786
Certain crushing and engineering services were provided by Global Advanced Metals Pty Ltd, a company related to Kelvin Flynn and James McClements* (11,991) (18,938)
Properties from which the Group’s operations are performed are rented from parties related to Chris Ellison and Peter Wade (1,752,148) (1,784,914)
Receivables from and payable to related parties
The following balances are outstanding at reporting date in relation to transactions with associates and joint ventures.
Current receivables:
Trade receivables with Roadtrim Mining and Civil Contracting Pty Ltd 567,101 -
Current payables
Trade payables to Roadtrim Mining and Civil Contracting Pty Ltd 2,261,604 -
Receivables from and payables to related parties
The following balances are outstanding at reporting date in relation to transactions with related parties
Current receivables:
Trade receivables from GR Engineering Services Limited, a company associated with Joe Ricciardo (ceased being a related party 18 April 2016) 89,756 237,936
Deposit receivable
Refundable deposit paid to Global Advanced Metals Pty Ltd, a company in which James McClements and Kelvin Flynn are directors 10,000,000 -
Loans to/(from) related parties
Current receivables:
Loan to Reed Industrial Minerals Pty Ltd, a joint operation 13,973,929 -
Non-current receivables:
Loan to Roadtrim Mining and Civil Contracting Pty Ltd, an associate of the Group 10,959,726 -
Terms and conditions
All transactions were made on normal commercial terms and conditions and at market rates.
* no longer recurring

88 Mineral Resources Limited
Notes to the Financial Statements30 June 2016
Note 38. Parent entity information
Set out below is the supplementary information about the parent entity.
Statement of profit or loss and other comprehensive income
Parent
2016 $’000
2015 $’000
Profit after income tax (119,258) 271,734
Total comprehensive income (119,258) 271,734
Statement of financial position
Total current assets 746,477 172,841
Total assets 893,143 502,503
Total current liabilities 470,578 20,402
Total liabilities 649,035 92,029
Net assets 244,108 410,474
Equity
Issued capital 502,435 504,853
Reserves (676) -
Accumulated losses (257,621) (94,379)
Total equity 244,108 410,474
Guarantees entered into by the parent entity in relation to the debts of its subsidiaries
The parent entity had no guarantees in relation to the debts of its subsidiaries as at 30 June 2016 and 30 June 2015 other than as obligor under its syndicated financing facilities.
Contingent liabilities
The parent entity had no contingent liabilities as at 30 June 2016 and 30 June 2015.
Capital commitments - Property, plant and equipment
The parent entity had no capital commitments for property, plant and equipment at as 30 June 2016 and 30 June 2015.
Significant accounting policies
The accounting policies of the parent entity are consistent with those of the Group, as disclosed in note 1, except for the following:
• Investments in subsidiaries are accounted for at cost, less any impairment, in the parent entity
• Investments in associates are accounted for at cost, less any impairment, in the parent entity
• Dividends received from subsidiaries are recognised as other income by the parent entity.
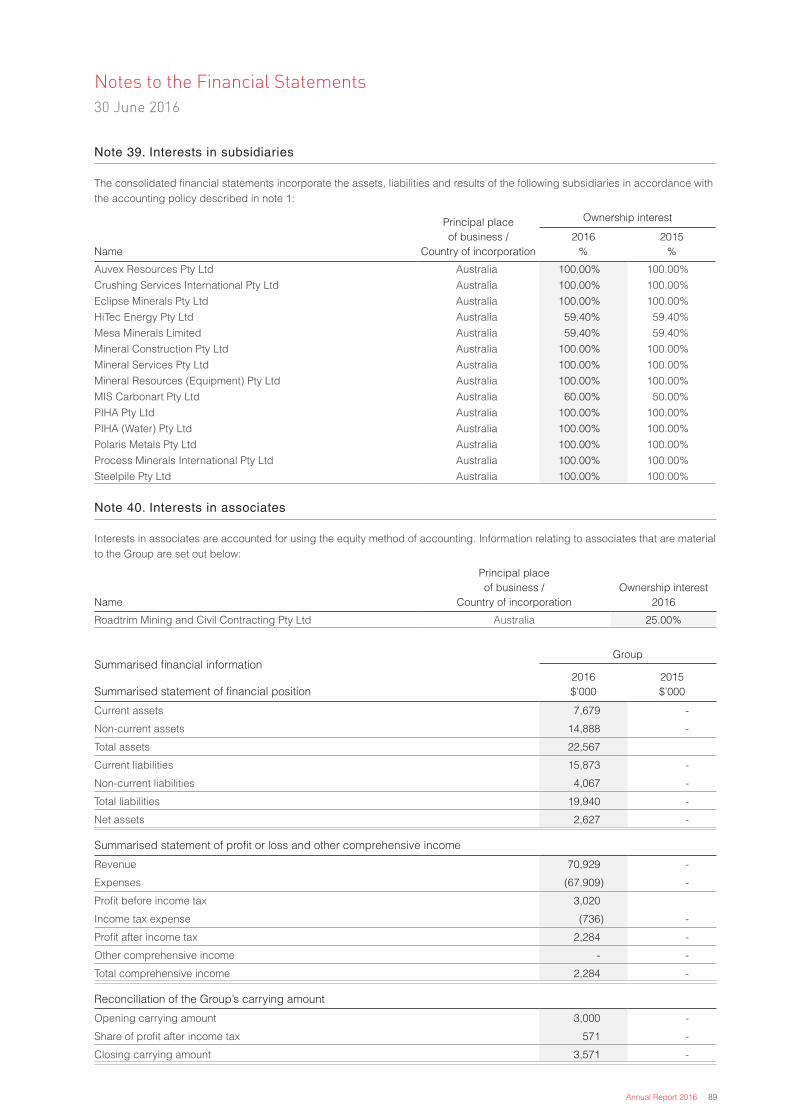
Annual Report 2016 89
Notes to the Financial Statements30 June 2016
Note 39. Interests in subsidiaries
The consolidated financial statements incorporate the assets, liabilities and results of the following subsidiaries in accordance with the accounting policy described in note 1:
Name
Principal place of business /
Country of incorporation
Ownership interest
2016 %
2015 %
Auvex Resources Pty Ltd Australia 100.00% 100.00%
Crushing Services International Pty Ltd Australia 100.00% 100.00%
Eclipse Minerals Pty Ltd Australia 100.00% 100.00%
HiTec Energy Pty Ltd Australia 59.40% 59.40%
Mesa Minerals Limited Australia 59.40% 59.40%
Mineral Construction Pty Ltd Australia 100.00% 100.00%
Mineral Services Pty Ltd Australia 100.00% 100.00%
Mineral Resources (Equipment) Pty Ltd Australia 100.00% 100.00%
MIS Carbonart Pty Ltd Australia 60.00% 50.00%
PIHA Pty Ltd Australia 100.00% 100.00%
PIHA (Water) Pty Ltd Australia 100.00% 100.00%
Polaris Metals Pty Ltd Australia 100.00% 100.00%
Process Minerals International Pty Ltd Australia 100.00% 100.00%
Steelpile Pty Ltd Australia 100.00% 100.00%
Note 40. Interests in associates
Interests in associates are accounted for using the equity method of accounting. Information relating to associates that are material to the Group are set out below:
Name
Principal place of business /
Country of incorporationOwnership interest
2016
Roadtrim Mining and Civil Contracting Pty Ltd Australia 25.00%
Summarised financial informationGroup
2016 $’000
2015 $’000Summarised statement of financial position
Current assets 7,679 -
Non-current assets 14,888 -
Total assets 22,567
Current liabilities 15,873 -
Non-current liabilities 4,067 -
Total liabilities 19,940 -
Net assets 2,627 -
Summarised statement of profit or loss and other comprehensive income
Revenue 70,929 -
Expenses (67,909) -
Profit before income tax 3,020
Income tax expense (736) -
Profit after income tax 2,284 -
Other comprehensive income - -
Total comprehensive income 2,284 -
Reconciliation of the Group’s carrying amount
Opening carrying amount 3,000 -
Share of profit after income tax 571 -
Closing carrying amount 3,571 -
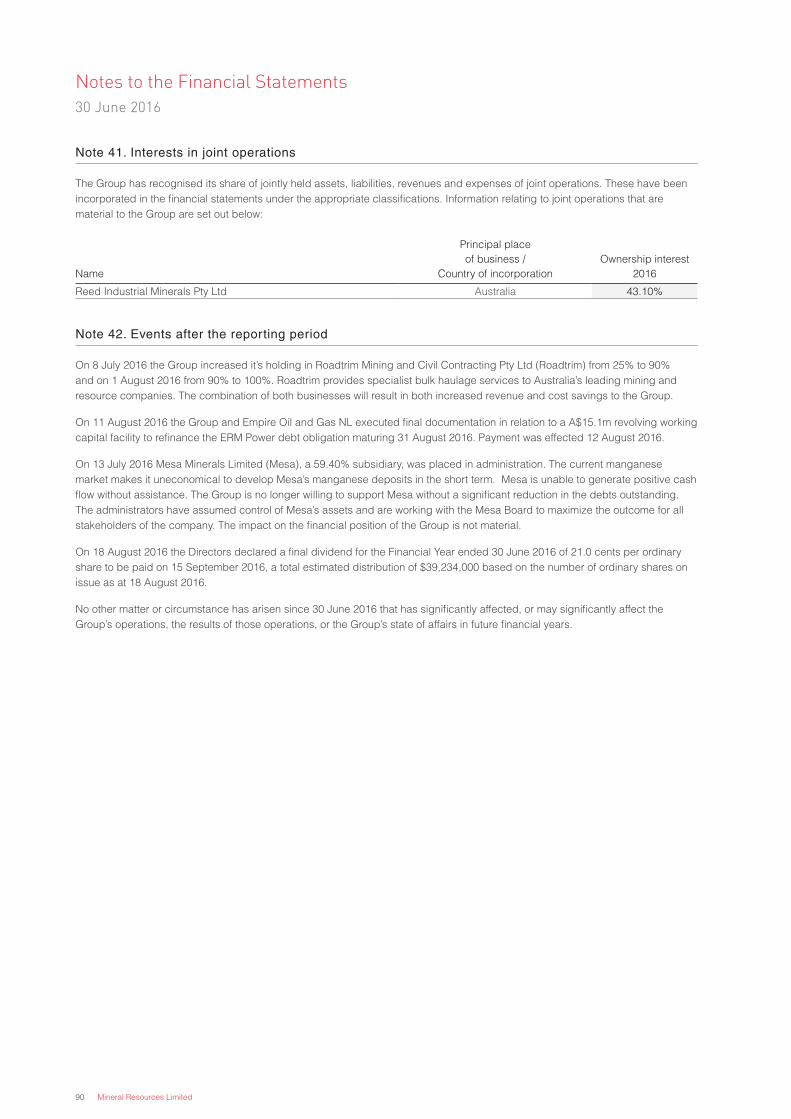
90 Mineral Resources Limited
Notes to the Financial Statements30 June 2016
Note 41. Interests in joint operations
The Group has recognised its share of jointly held assets, liabilities, revenues and expenses of joint operations. These have been incorporated in the financial statements under the appropriate classifications. Information relating to joint operations that are material to the Group are set out below:
Name
Principal place of business /
Country of incorporationOwnership interest
2016
Reed Industrial Minerals Pty Ltd Australia 43.10%
Note 42. Events after the reporting period
On 8 July 2016 the Group increased it’s holding in Roadtrim Mining and Civil Contracting Pty Ltd (Roadtrim) from 25% to 90% and on 1 August 2016 from 90% to 100%. Roadtrim provides specialist bulk haulage services to Australia’s leading mining and resource companies. The combination of both businesses will result in both increased revenue and cost savings to the Group.
On 11 August 2016 the Group and Empire Oil and Gas NL executed final documentation in relation to a A$15.1m revolving working capital facility to refinance the ERM Power debt obligation maturing 31 August 2016. Payment was effected 12 August 2016.
On 13 July 2016 Mesa Minerals Limited (Mesa), a 59.40% subsidiary, was placed in administration. The current manganese market makes it uneconomical to develop Mesa’s manganese deposits in the short term. Mesa is unable to generate positive cash flow without assistance. The Group is no longer willing to support Mesa without a significant reduction in the debts outstanding. The administrators have assumed control of Mesa’s assets and are working with the Mesa Board to maximize the outcome for all stakeholders of the company. The impact on the financial position of the Group is not material.
On 18 August 2016 the Directors declared a final dividend for the Financial Year ended 30 June 2016 of 21.0 cents per ordinary share to be paid on 15 September 2016, a total estimated distribution of $39,234,000 based on the number of ordinary shares on issue as at 18 August 2016.
No other matter or circumstance has arisen since 30 June 2016 that has significantly affected, or may significantly affect the Group’s operations, the results of those operations, or the Group’s state of affairs in future financial years.

Annual Report 2016 91
Note 43. Reconciliation of (loss)/profit after income tax to
net cash from operating activities
Group
2016 $’000
2015 $’000
(Loss)/profit after income tax for the year (26,079) 12,544
Adjustments for:
Depreciation and amortisation 133,968 126,904
Impairment loss 186,220 44,544
Net loss on disposal of property, plant, and equipment 3,852 -
Exploration expenditure written off - 1,153
Share of profit – associate (571) -
Change in operating assets and liabilities:
Decrease/(increase) in trade and other receivables 47,082 (107,753)
(Decrease)/increase in inventories (6,118) 22,744
Decrease in deferred tax assets 5,098 49,390
Decrease in other operating assets 880 11,120
Increase/(decrease) in trade and other payables 40,905 (85,955)
Decrease in provision for income tax (476) (59,930)
(Decrease)/increase in deferred tax liabilities (58,361) 14,521
(Decrease)/increase in other provisions (10,403) 23,068
Net cash from operating activities 315,997 52,350
Note 44. Earnings per share
(Loss)/profit after income tax (26,079) 12,544
Non-controlling interest 1,222 270
(Loss)/profit after income tax attributable to the owners of Mineral Resources Limited (24,857) 12,814
Number Number
Weighted average number of ordinary shares used in calculating basic earnings per share 186,819,412 187,139,075
Weighted average number of ordinary shares used in calculating diluted earnings per share 186,819,412 187,139,075
Cents Cents
Basic and diluted profit after tax before impairment (2015: after tax before impairment and MRRT) (cents per share) 56.47 58.19
Basic and diluted profit per share (cents per share) (13.31) 6.85
Notes to the Financial Statements30 June 2016

92 Mineral Resources Limited
In the directors’ opinion:
• the attached financial statements and notes comply with the Corporations Act 2001, the Accounting Standards, the Corporations Regulations 2001 and other mandatory professional reporting requirements;
• the attached financial statements and notes comply with International Financial Reporting Standards as issued by the International Accounting Standards Board as described in note 1 to the financial statements;
• the attached financial statements and notes give a true and fair view of the Group’s financial position as at 30 June 2016 and of its performance for the financial year ended on that date; and
• there are reasonable grounds to believe that the Company will be able to pay its debts as and when they become due and payable.
The directors have been given the declarations required by section 295A of the Corporations Act 2001.
Signed in accordance with a resolution of directors made pursuant to section 295(5)(a) of the Corporations Act 2001.
On behalf of the directors
Chris Ellison Managing Director 18 August 2016 Perth
Directors' Declaration30 June 2016
Annual Report 2016 93
Notes to the Financial Statements30 June 2016
Independent Auditor’s Reportto the Members of Mineral Resources Limited

94 Mineral Resources Limited
Notes to the Financial Statements30 June 2016
Independent Auditor’s Reportto the Members of Mineral Resources Limited
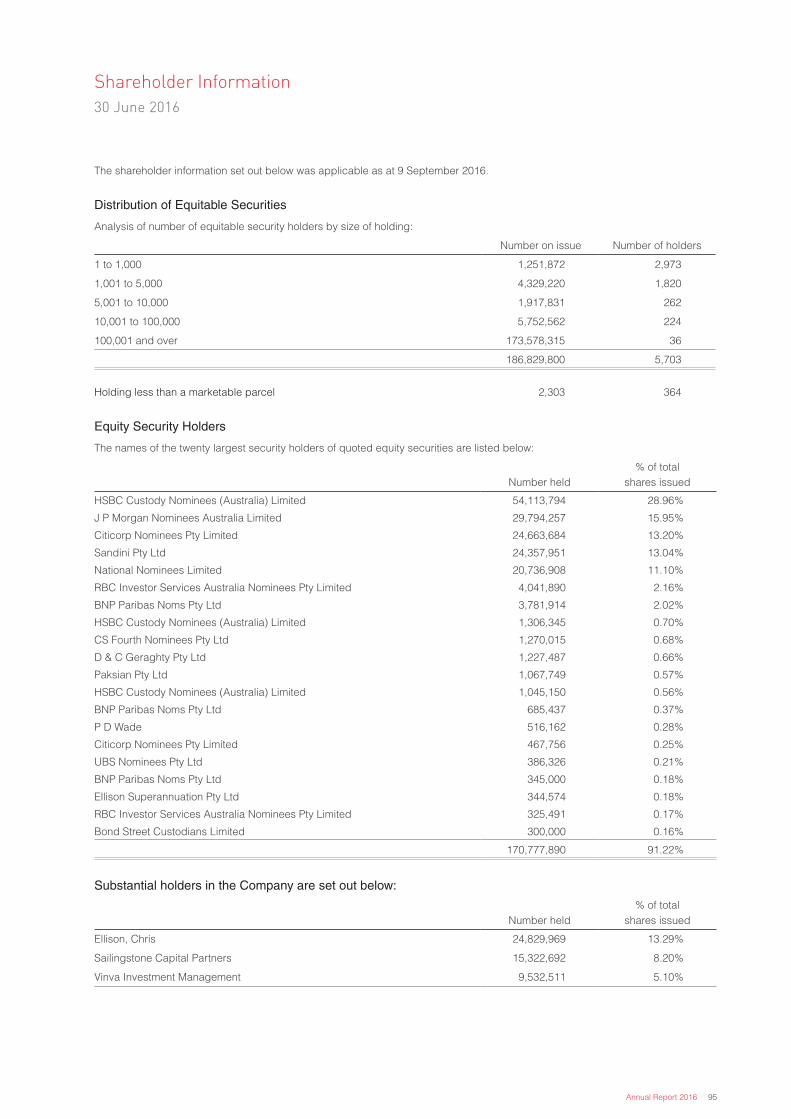
Annual Report 2016 95
Shareholder Information30 June 2016
The shareholder information set out below was applicable as at 9 September 2016.
Distribution of Equitable Securities
Analysis of number of equitable security holders by size of holding:
Number on issue Number of holders
1 to 1,000 1,251,872 2,973
1,001 to 5,000 4,329,220 1,820
5,001 to 10,000 1,917,831 262
10,001 to 100,000 5,752,562 224
100,001 and over 173,578,315 36
186,829,800 5,703
Holding less than a marketable parcel 2,303 364
Equity Security Holders
The names of the twenty largest security holders of quoted equity securities are listed below:
Number held% of total
shares issued
HSBC Custody Nominees (Australia) Limited 54,113,794 28.96%
J P Morgan Nominees Australia Limited 29,794,257 15.95%
Citicorp Nominees Pty Limited 24,663,684 13.20%
Sandini Pty Ltd 24,357,951 13.04%
National Nominees Limited 20,736,908 11.10%
RBC Investor Services Australia Nominees Pty Limited 4,041,890 2.16%
BNP Paribas Noms Pty Ltd 3,781,914 2.02%
HSBC Custody Nominees (Australia) Limited 1,306,345 0.70%
CS Fourth Nominees Pty Ltd 1,270,015 0.68%
D & C Geraghty Pty Ltd 1,227,487 0.66%
Paksian Pty Ltd 1,067,749 0.57%
HSBC Custody Nominees (Australia) Limited 1,045,150 0.56%
BNP Paribas Noms Pty Ltd 685,437 0.37%
P D Wade 516,162 0.28%
Citicorp Nominees Pty Limited 467,756 0.25%
UBS Nominees Pty Ltd 386,326 0.21%
BNP Paribas Noms Pty Ltd 345,000 0.18%
Ellison Superannuation Pty Ltd 344,574 0.18%
RBC Investor Services Australia Nominees Pty Limited 325,491 0.17%
Bond Street Custodians Limited 300,000 0.16%
170,777,890 91.22%
Substantial holders in the Company are set out below:
Number held% of total
shares issued
Ellison, Chris 24,829,969 13.29%
Sailingstone Capital Partners 15,322,692 8.20%
Vinva Investment Management 9,532,511 5.10%

96 Mineral Resources Limited

Delivering quality services and products
Corporate Directory
Directors
Peter Wade
Chris Ellison
Kelvin Flynn
James McClements
Joe Ricciardo (retired 18/04/2016)
Company Secretary
Bruce Goulds
Registered office
1 Sleat Road
Applecross WA 6153
P: + 61 8 9329 3600 F: + 61 8 9329 3601
Postal address:
Locked Bag 3, Canning Bridge, Applecross WA 6153
Principal place of business
1 Sleat Road Applecross WA 6153
Share register
Computershare Investor Services Pty Limited
Level 11 172 St Georges Terrace Perth WA 6000
www.computershare.com/au
Auditor
RSM Australia Partners
8 St Georges Terrace Perth WA 6000
www.rsmi.com.au
Bankers
National Australia Bank
100 St Georges Terrace Perth WA 6000
www.nab.com.au
Stock exchange listing
Mineral Resources Limited shares are listed on the Australian Securities Exchange (ASX code: MIN)
Website
www.mineralresources.com.au

www.mineralresources.com.au
Insight C
omm
unication & D
esign