Annual Report 2016-17 - Parliament of Western Australia · 04 Financial Report ... PTA Annual...
192
Annual Report 2016-17
Transcript of Annual Report 2016-17 - Parliament of Western Australia · 04 Financial Report ... PTA Annual...
Annual Report
2016-17

2
About this reportThis annual report covers the performance of the Public Transport Authority (PTA) and our operating areas. We fulfil our reporting obligation by identifying the relevant strategic outcomes and our contribution to them in 2016-17 through:
• operational reports that summarise the performance of our services and business activities.
• governance and compliance reports.
• audited key performance indicators.
• audited financial statements.
Performance management frameworkTo honour the Government’s vision for Western Australia, the PTA has targeted two outcomes:
• An accessible, reliable and safe public transport system.
• Protection of the long-term functionality of the rail corridor and railway infrastructure.
Indicators of success in achieving the first of these outcomes are based on patronage and service provision, accessibility, reliability, customer satisfaction, safety and cost efficiency.
For the second outcome, success results from quality management of the railway corridor and residual issues of the rail freight network, which was leased to private sector operators in 2000.
Refer to the key performance indicators.
PTA Annual Report / About this Report2
Photo: Stephen Endicott, N&I
To the Hon. Rita Saffioti MLA Minister for Transport; Planning; LandsIn accordance with section 63 of the Financial Management Act 2006 (WA), I submit for your information and presentation to Parliament, the annual report of the Public Transport Authority of Western Australia for the year ended 30 June 2017. It has been prepared in accordance with the provisions of the Financial Management Act and any other relevant written law.
Richard Sellers Chief Executive Officer

3PTA Annual Report / Contents
About this report ............................................. 2
Contents .......................................................... 3
Chief Executive Officer’s overview ............... 4
Managing Director’s overview ....................... 6
01 Corporate Snapshot .............................. 8
1.1 Organisational profile ................................... 9
1.2 Organisational structure ............................. 10
1.3 Cases in point: 2017 spotlight ................... 16
1.4 Financials at a glance ................................ 17
02 Operational Report .............................. 18
2.1 Our services .............................................. 19
2.1.1 Metro (Transperth) ............................... 19
2.1.2 Regional (Transwa) .............................. 27
2.1.3 Regional (TransRegional) ..................... 30
2.1.4 Regional (orange school buses) .......... 32
2.2 Fares and other revenue .......................... 36
2.2.1 Metro .................................................. 36
2.2.2 Regional ............................................. 39
2.3 PTA in the community ............................... 40
2.3.1 Customer satisfaction ......................... 40
2.3.2 Passenger safety and security............. 46
2.3.3 Accessible services ............................. 48
2.3.4 Communicating with our customers .... 52
2.3.5 Environment and sustainability ............ 54
2.4 Infrastructure delivery ............................. ... 55
2.4.1 Planning for the future ......................... 55
2.4.2 Major projects ..................................... 56
2.4.3 Network maintenance and upgrades .. 59
2.5 Our people ............................................... 66
03 Governance and compliance ............. 74
3.1 Bus safety ................................................. 74
3.2 Rail safety ................................................. 75
3.3 Occupational safety, health and injury management ................................... 79
3.4 Risk management .................................... 82
3.5 Corridor lease agreement compliance ....... 83
3.6 Other legal and policy requirements ......... 84
3.7 Other governance and financial disclosures ............................................... 88
3.8 Independent auditor’s report ..................... 91
3.9 Key performance indicators ...................... 95
04 Financial Report ................................ 124
4.1 Financial Statements ............................... 125
Glossary of terms ....................................... 190
Contents
4
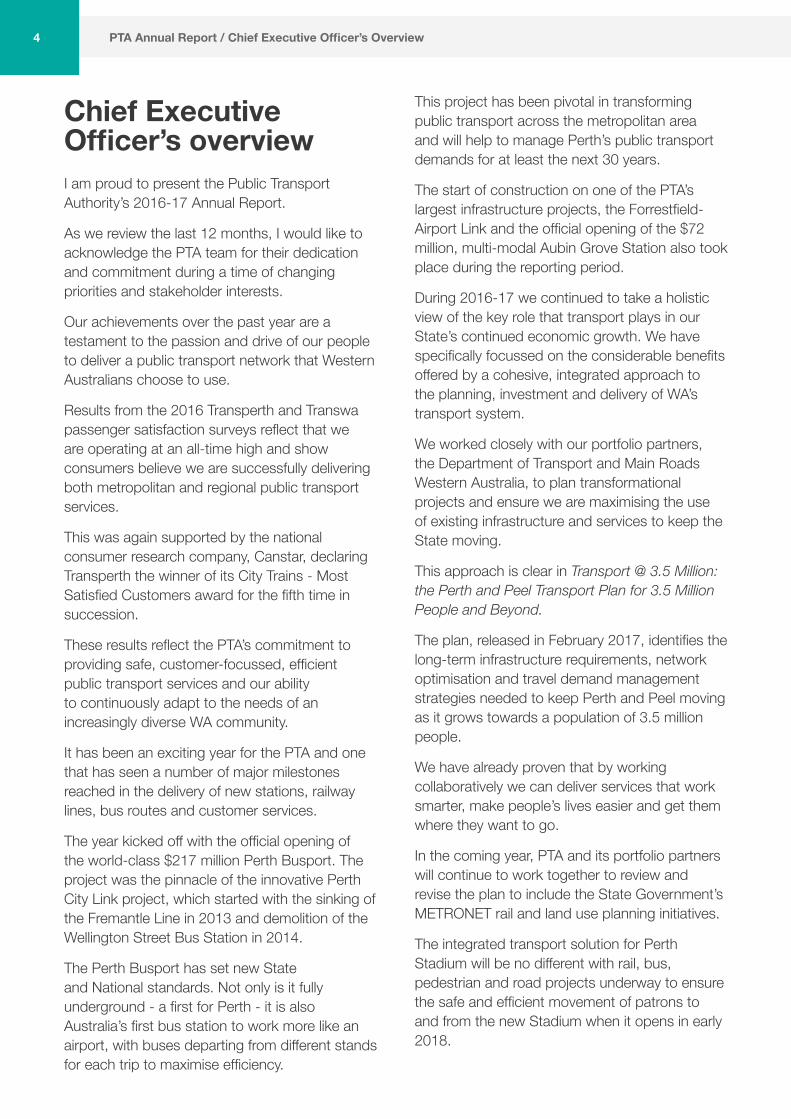
Chief Executive Officer’s overviewI am proud to present the Public Transport Authority’s 2016-17 Annual Report.
As we review the last 12 months, I would like to acknowledge the PTA team for their dedication and commitment during a time of changing priorities and stakeholder interests.
Our achievements over the past year are a testament to the passion and drive of our people to deliver a public transport network that Western Australians choose to use.
Results from the 2016 Transperth and Transwa passenger satisfaction surveys reflect that we are operating at an all-time high and show consumers believe we are successfully delivering both metropolitan and regional public transport services.
This was again supported by the national consumer research company, Canstar, declaring Transperth the winner of its City Trains - Most Satisfied Customers award for the fifth time in succession.
These results reflect the PTA’s commitment to providing safe, customer-focussed, efficient public transport services and our ability to continuously adapt to the needs of an increasingly diverse WA community.
It has been an exciting year for the PTA and one that has seen a number of major milestones reached in the delivery of new stations, railway lines, bus routes and customer services.
The year kicked off with the official opening of the world-class $217 million Perth Busport. The project was the pinnacle of the innovative Perth City Link project, which started with the sinking of the Fremantle Line in 2013 and demolition of the Wellington Street Bus Station in 2014.
The Perth Busport has set new State and National standards. Not only is it fully underground - a first for Perth - it is also Australia’s first bus station to work more like an airport, with buses departing from different stands for each trip to maximise efficiency.
This project has been pivotal in transforming public transport across the metropolitan area and will help to manage Perth’s public transport demands for at least the next 30 years.
The start of construction on one of the PTA’s largest infrastructure projects, the Forrestfield-Airport Link and the official opening of the $72 million, multi-modal Aubin Grove Station also took place during the reporting period.
During 2016-17 we continued to take a holistic view of the key role that transport plays in our State’s continued economic growth. We have specifically focussed on the considerable benefits offered by a cohesive, integrated approach to the planning, investment and delivery of WA’s transport system.
We worked closely with our portfolio partners, the Department of Transport and Main Roads Western Australia, to plan transformational projects and ensure we are maximising the use of existing infrastructure and services to keep the State moving.
This approach is clear in Transport @ 3.5 Million: the Perth and Peel Transport Plan for 3.5 Million People and Beyond.
The plan, released in February 2017, identifies the long-term infrastructure requirements, network optimisation and travel demand management strategies needed to keep Perth and Peel moving as it grows towards a population of 3.5 million people.
We have already proven that by working collaboratively we can deliver services that work smarter, make people’s lives easier and get them where they want to go.
In the coming year, PTA and its portfolio partners will continue to work together to review and revise the plan to include the State Government’s METRONET rail and land use planning initiatives.
The integrated transport solution for Perth Stadium will be no different with rail, bus, pedestrian and road projects underway to ensure the safe and efficient movement of patrons to and from the new Stadium when it opens in early 2018.
PTA Annual Report / Chief Executive Officer’s Overview

As my first year as Chief Executive Officer comes to a close, it is clear that this is an exciting time for the Agency and our portfolio partners. There are many planned projects and innovative changes that will provide significant benefits to WA communities and the State’s economy over the coming years.
It is a privilege to lead such an organisation and have the opportunity to showcase some of the Agency’s achievements over the past 12 months. I look forward to what I’m sure will be another productive year for transport in Western Australia in 2017-18.
Richard Sellers Chief Executive Officer
PTA Annual Report / Chief Executive Officer’s Overview 5
Photo: Keyvan Sheikh, N&I

6
Managing Director’s overviewThe Public Transport Authority is on the brink of one of the more exciting periods in our history.
One the one hand, that’s not saying much – our history doesn’t go back all that far. On another level, it’s a very big call – while we’ve been around for only 14 years, it’s been a pretty action-packed journey so far.
What was formerly a loose arrangement between departments was formalised in 2003 when the Public Transport Authority of WA was established. This facilitated the further integration and rationalisation of bus, train and ferry timetables, urban (Transperth) and regional (Transwa) services, ticketing and fare structures, and signalled the start of a period of remarkable expansion and innovation.
The merger enabled the 2005 staged introduction of SmartRider, the country’s first smartcard-based cashless ticketing system. SmartRider is now used by more than 85 per cent of Transperth’s regular commuters, has a 99 per cent approval rating among all users, has been extended into multiple regional areas, and provided the platform for the highly-successful SmartParker parking payment service.
The agency installed the industry’s most sophisticated CCTV security and monitoring system, introduced one of Australia’s fastest passenger trains (Transwa’s 160kmh-capability Prospector, which runs between Perth and Kalgoorlie), developed a highly-trained and well-equipped security division which is the envy of the country, extended the Joondalup Line to Clarkson, built the Thornlie spur and opened the 73km Mandurah Line – which celebrates its 10th anniversary later this year.
Further fuelled by WA’s resources-led economic boom, patronage soared to nudge 150 million total boardings in 2012-13, a remarkable 66 per cent higher than it was only a decade earlier in our inaugural year. It subsequently slipped slightly as the economic downturn reduced Transperth’s
core market – CBD commuters – but is still around 145m.
Despite the pressure generated by this explosion of passenger numbers, the quality of service remained high, and continues to do so. Transperth is among industry leaders in compliance with disability accessibility provisions and has been independently recognised as having Australia’s best rail public transport system.
Canstar Blue – a well-respected national industry pollster – has looked at public transport in Sydney, Melbourne, Brisbane, Adelaide and Perth five times in the past six years, and Transperth has been the runaway winner each time. In 2016, Canstar gave Transperth the maximum five-star rating in six (of eight) categories (including Overall Satisfaction) and four stars in the other two. There was only one other five-star rating across the entire country.
This is consistent with the findings of Transperth’s own market research. The Passenger Satisfaction Monitor (PSM), a comprehensive, independently-run tracking research program has been running for more than 25 years. The PSM puts the overall level of passenger satisfaction with Transperth in the low-mid 90s – a significant accomplishment in a city which has not only one of the world’s highest levels of car dependence, but also one of the world’s lowest levels of population density.
More recently, the network has been extended north to Butler; a significant section of the city rail system has been sunk to create new CBD spaces and connections; the 40-year-old central bus station was demolished, making way for a new underground facility with a state-of-the-art dynamic stand management system; and a new train station with park-and-ride capacity and a bus interchange has been built at Aubin Grove, about half-way down the Mandurah Line.
On top of this, there are two significant projects currently under way:
• a six-platform station and bus hub to service the $1 billion-plus stadium which is nearing completion on the Burswood peninsula, with an associated rebuild of East Perth train station
PTA Annual Report / Managing Director’s Overview

7
• and the $2 billion Forrestfield-Airport Link – an 8.5km, three-station underground extension spurring off the Midland Line at Bayswater and heading south-east through twin bored tunnels under the river and under the airport to a major new park-and-ride station and bus interchange at Forrestfield in the eastern foothills.
Along the way, the evolution of the PTA (and its predecessor organisations) reached a sweet spot in the balance between in-house and outsourced operations. With our Transperth buses operated under contract, our trains in-house (run by one division under a service agreement with another division), and part of our security cadre supplied by a contractor, we have the best of both worlds – we retain full control, but are open as to who does the operational delivery.
As a result, we have developed high levels of expertise in contract management, to the extent where we have become a benchmark for other organisations. For example, Singapore has, with our help, progressively adapted its bus operations toward the Transperth contract model.
By anyone’s measure it has been an action-packed ride so a prediction of more exciting times ahead should not be taken lightly.
METRONET, a major policy commitment of the recently-elected State Labor government, is a wide-ranging expansion and revitalisation of the urban rail system, incorporating significant elements of urban planning, land use outcomes and value-capture. The integrated project will see coordination across Government to use transport investment as a vehicle to deliver well-planned, liveable communities.
The PTA is heavily involved in METRONET. In the latter stages of the current financial year, arrangements were made for a significant part of our Infrastructure Planning team – including executive director Owen Thomas – and members of our Corporate Communications branch to be seconded to the METRONET task force.
Having our own people inside the METRONET team ensures a truly holistic approach in the planning component of infrastructure which, in due course, the PTA will be called upon
to construct and, of course, we will end up operating.
As well as completion of the Forrestfield-Airport Link, the METRONET taskforce has a long list of projects, with targets including:
• extending the Joondalup Line to Yanchep
• extending the Thornlie Line to Cockburn Central
• planning construction of a new Morley-Ellenbrook line
• extending the Armadale Line to Byford
• relocating Midland Station and extending the Midland Line
• building a new station at Karnup on the Mandurah line
• removing level crossings on the Armadale, Midland and Fremantle lines
• planning work for an inner suburb light rail system, improving bus services and circle routes and creating better synergies between cycling infrastructure and public transport.
With delivery of the first of these projects expected to start over the next couple of years, I can confidently say (again) that the PTA is on the brink of one of the more exciting periods in our history.
Mark Burgess Managing Director
PTA Annual Report / Managing Director’s Overview

8
Photo: Keyvan Sheikh, N&I
We operate public transport services in regional centres under the TransRegional brand; road coach and rail passenger services to regional areas under the Transwa brand; and administer and manage School Bus Services.
In addition to operating these transport services, we design, build and maintain public transport infrastructure and protect the long-term viability of Western Australia’s rail corridor and railway infrastructure.
We deliver public transport services seven days a week and in some cases, deliver supporting services up to 24 hours a day.
PTA Annual Report / Corporate Snapshot8
The PTA is responsible for the operation of all bus, train and ferry public transport services in the greater metropolitan area under the Transperth brand.
01 Corporate Snapshot
9PTA Annual Report / Organisational Profile
1.1 Organisational profileCorporate planVisionTo be recognised as a leader in providing world-class public transport services and solutions.
PurposeTo provide safe, customer-focussed, integrated and efficient transport services.
ValuesOur values guide our efforts to create the organisation and workforce we need to meet current and future challenges.
• Safety – We are committed to safety and protecting your future.
• Respect – We value and respect our customers, suppliers and each other.
• Recognition – We recognise each other for achievement, initiative and innovation.
• Integrity – We are honest and ethical.
• Sustainability – We consider the long-term impact of everything we do – economic, social and environmental.
Key result areasWe have five KRAs (Key Result Areas) to ensure we are focussed on realising our vision:
1. Improve system and service resilience through the strategic management of all critical assets.
2. Secure a workforce with the right capabilities and attitudes.
3. Provide public transport services that meet community demand and customer expectations.
4. Make strategic and timely decisions through the use of integrated information and knowledge management systems.
5. Apply communication strategies to improve patronage and increase customer satisfaction.
Customer service charterThe PTA is a customer service-oriented organisation, responsible for the delivery of efficient and sustainable passenger transport services to the public.
• We are committed to providing a quality passenger transport service to the public.
• Our bus, train and ferry staff and contractors are focussed on delivering safe and reliable services.
• Our staff and contractors will treat customers in a respectful and professional manner.
• Our buses, trains, ferries and facilities will be clean and well presented.
• Current information about all PTA services will be available from customer service staff, brochures, timetables, our call centres and our website.
• We will plan and review passenger transport services in consultation with the community to get the best results.
We will plan and provide transport systems that respect the environment and improve sustainability.
To help us improve our services we maintain a telephone InfoLine (13 62 13) for feedback. Our websites include www.pta.wa.gov.au, www.transperth.wa.gov.au and www.transwa.wa.gov.au
10
1.2 Organisational structureHow we operate
Service provisionWe operate four major service systems:
TransperthThe Transperth integrated public transport network is centrally-controlled, planned, marketed and coordinated by the Transperth division of the PTA. Transperth has a range of contracted service providers including Transperth Train Operations (a separate PTA division), three contracted bus companies, one contracted ferry operator and numerous ancillary contracts such as cleaning, maintenance, signage, ticketing and printing.
TranswaThe Transwa division operates four rail services (Australind, Prospector, MerredinLink and AvonLink) and a fleet of coaches to regional WA. We service more than 240 locations.
TransRegionalOur small Regional Town Bus Services (RTBS) branch manages contracted intra-town and inter-town bus services operating as TransRegional in regional centres around the State.
School Bus ServicesThe School Bus Services (SBS) branch plans school services in WA and contract-manages their delivery by contracted school bus operators. SBS manages more than 916 school bus contracts around WA.
Infrastructure deliveryWe are also responsible for designing, building and maintaining transport infrastructure in WA.
Our Network and Infrastructure (N&I) division manages and maintains the metropolitan railway infrastructure. Other N&I works include:
• Signal and crossing maintenance
• Resleepering and ballasting tracks
• Upgrading and improving accessibility of station facilities
Planning and constructing expansion of the rail network
Our Safety and Strategy division protects the long-term viability of the State’s freight rail corridor and infrastructure, with input also from N&I and our Infrastructure Planning and Land Services (IPLS) division.
IPLS provides railway engineering support, and land and environmental management. Most major new infrastructure is planned by IPLS, with the actual construction carried out through our Major Projects Unit.
Corporate servicesOur divisions – Finance and Contracts, People and Organisational Development, Safety and Strategy, and the Corporate Communications, Corporate Issues, and Investigations branches – provide a range of professional services and administrative support to facilitate the work of the PTA.
PTA Annual Report / Organisational Structure
Publ
ic T
rans
port
Auth
ority
Chi
ef E
xecu
tive
Offi
cer
Man
agin
g D
irect
or
Exec
utiv
e O
ffi ce
r to
Man
agin
g D
irect
orM
anag
erC
orpo
rate
Issu
esM
anag
erIn
vest
igat
ions
Gen
eral
Cou
nsel
Fina
nce
and
Con
tact
sTr
answ
aC
orpo
rate
Com
mun
icat
ions
Net
wor
k an
dIn
frast
ruct
ure
Maj
or
Proj
ects
Uni
tsPe
ople
and
O
rgan
isat
iona
l D
evel
opm
ent
Tran
sper
thTr
ain
Ope
ratio
ns
Safe
ty a
nd
Stra
tegi
cD
evel
opm
ent
Infra
stru
ctur
e Pl
anni
ng a
ndLa
nd S
ervi
ces
Tran
sper
th
Syst
em,
Reg
iona
l and
Sc
hool
Bus
Se
rvic
es

11PTA Annual Report / Organisational Structure
Publ
ic T
rans
port
Auth
ority
Chi
ef E
xecu
tive
Offi
cer
Man
agin
g D
irect
or
Exec
utiv
e O
ffi ce
r to
Man
agin
g D
irect
orM
anag
erC
orpo
rate
Issu
esM
anag
erIn
vest
igat
ions
Gen
eral
Cou
nsel
Fina
nce
and
Con
tact
sTr
answ
aC
orpo
rate
Com
mun
icat
ions
Net
wor
k an
dIn
frast
ruct
ure
Maj
or
Proj
ects
Uni
tsPe
ople
and
O
rgan
isat
iona
l D
evel
opm
ent
Tran
sper
thTr
ain
Ope
ratio
ns
Safe
ty a
nd
Stra
tegi
cD
evel
opm
ent
Infra
stru
ctur
e Pl
anni
ng a
ndLa
nd S
ervi
ces
Tran
sper
th
Syst
em,
Reg
iona
l and
Sc
hool
Bus
Se
rvic
es
Organisational chart

12
Our executiveRichard Sellers Chief Executive Officer
As head of the Transport Portfolio, Richard is responsible for setting the strategic direction of transport in WA, shaping
the development of a number of major integrated transport plans and leading the implementation of the State’s transformational capital projects.
Prior to his appointment in 2016, Richard held a number of senior roles in the public sector, including Director General of the Department of Mines and Petroleum.
Richard currently holds the positions of Director General of the Department of Transport, Commissioner for Main Roads WA and CEO of the PTA.
Mark Burgess Managing Director
Mark is responsible for the day-to-day operations of the PTA. Before moving to this position, he was executive director of the
Transperth system – Perth’s integrated bus, train and ferry system – for 12 years. Mark joined the PTA after six years with DoT and the Department for Planning and Infrastructure (DPI), when Transperth was managed under those agencies. He gained extensive logistics, transport and people management skills during 21 years in the army and 20 years in senior public transport management roles.
Pat Italiano General Manager, Transperth Train Operations
Pat has direct line responsibility for all customer service personnel, train controllers, train drivers,
service planners, depot staff, security personnel and rollingstock procurement and maintenance. He is responsible for promoting and managing the delivery of urban passenger rail to the highest customer service standards and is committed to ensuring the successful integration and delivery of expansions to the network.
Charlotte Hayes A/Executive Director, Transperth System, Regional and School Bus Services
Charlotte’s responsibilities include managing and marketing the Transperth
system, comprising commercial bus contractors, a commercial ferry contractor and the urban passenger rail services. She also oversees the management of Regional Town Bus Services and School Bus Services. Charlotte has over 10 years’ experience with Transperth System, Regional and School Bus Services; managing special events, marketing and passenger information delivery.
PTA Annual Report / Our Executive
13
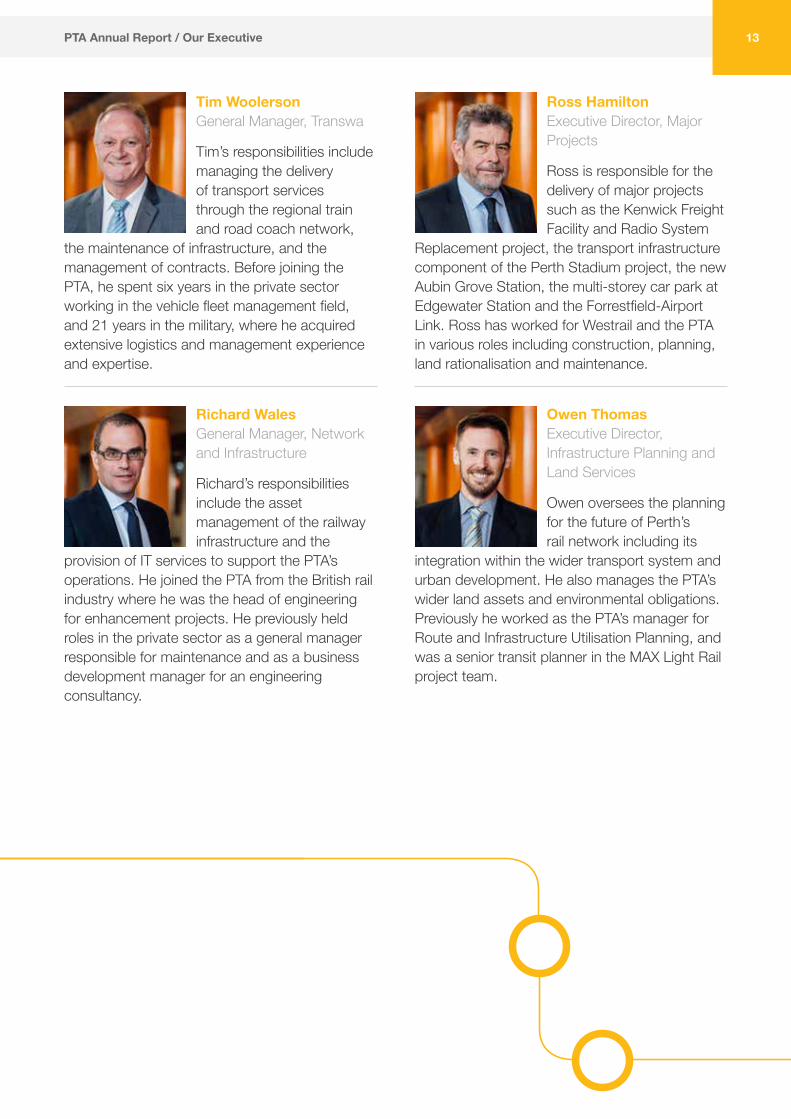
Tim Woolerson General Manager, Transwa
Tim’s responsibilities include managing the delivery of transport services through the regional train and road coach network,
the maintenance of infrastructure, and the management of contracts. Before joining the PTA, he spent six years in the private sector working in the vehicle fleet management field, and 21 years in the military, where he acquired extensive logistics and management experience and expertise.
Richard Wales General Manager, Network and Infrastructure
Richard’s responsibilities include the asset management of the railway infrastructure and the
provision of IT services to support the PTA’s operations. He joined the PTA from the British rail industry where he was the head of engineering for enhancement projects. He previously held roles in the private sector as a general manager responsible for maintenance and as a business development manager for an engineering consultancy.
Ross Hamilton Executive Director, Major Projects
Ross is responsible for the delivery of major projects such as the Kenwick Freight Facility and Radio System
Replacement project, the transport infrastructure component of the Perth Stadium project, the new Aubin Grove Station, the multi-storey car park at Edgewater Station and the Forrestfield-Airport Link. Ross has worked for Westrail and the PTA in various roles including construction, planning, land rationalisation and maintenance.
Owen Thomas Executive Director, Infrastructure Planning and Land Services
Owen oversees the planning for the future of Perth’s rail network including its
integration within the wider transport system and urban development. He also manages the PTA’s wider land assets and environmental obligations. Previously he worked as the PTA’s manager for Route and Infrastructure Utilisation Planning, and was a senior transit planner in the MAX Light Rail project team.
PTA Annual Report / Our Executive

14
David Browne Executive Director, Safety and Strategic Development
David is responsible for strategic services in safety, policy, business and information management,
workers’ compensation, risk management, disability access, environment, emergency management and strategic planning, as well as management of the freight rail network leases and the PTA’s involvement in freight rail network development initiatives. Before joining PTA predecessor WAGRC, he spent 20 years in the aviation industry including 15 years in the RAAF.
Kevin Kirk Executive Director, Finance and Contracts
As the Chief Finance Officer, Kevin is responsible for maintaining the PTA’s financial management and
procurement systems and processes. Kevin is a FCPA and a fellow of the Institute of Public Accountants. He has more than 40 years’ experience in public service and has held senior roles in MRWA and DoT.
Brian Appleby Executive Director, People and Organisational Development
Brian is responsible for strategic people management, as well as
overseeing the delivery of functional human resource services for the PTA’s people. He has more than 30 years’ experience in labour relations, human resource management, workforce services and learning and development. Brian is also vice-chair of the Logistics Training Council, and chair of the Australasian Railways Workforce Development Committee.
David Hynes Manager, Corporate Communications
David has contributed significantly to the PTA’s communications expertise and activities, specially in
media relations. He has previously worked as a media adviser to a senior Cabinet Minister; contributed to national and international publications as a freelance journalist; and run his own public relations consultancy. This followed a 20-year career at WA Newspapers, culminating in a three-year stint as Business and Finance Editor of The West Australian.
PTA Annual Report / Our Executive

15
L to R - David Hynes Ross Hamilton David Browne Brian Appleby Charlotte Hayes Richard Wales Mark Burgess Tim Woolerson Pat Italiano Kevin Kirk Owen Thomas
16
1.3 Cases in point: 2017 spotlight
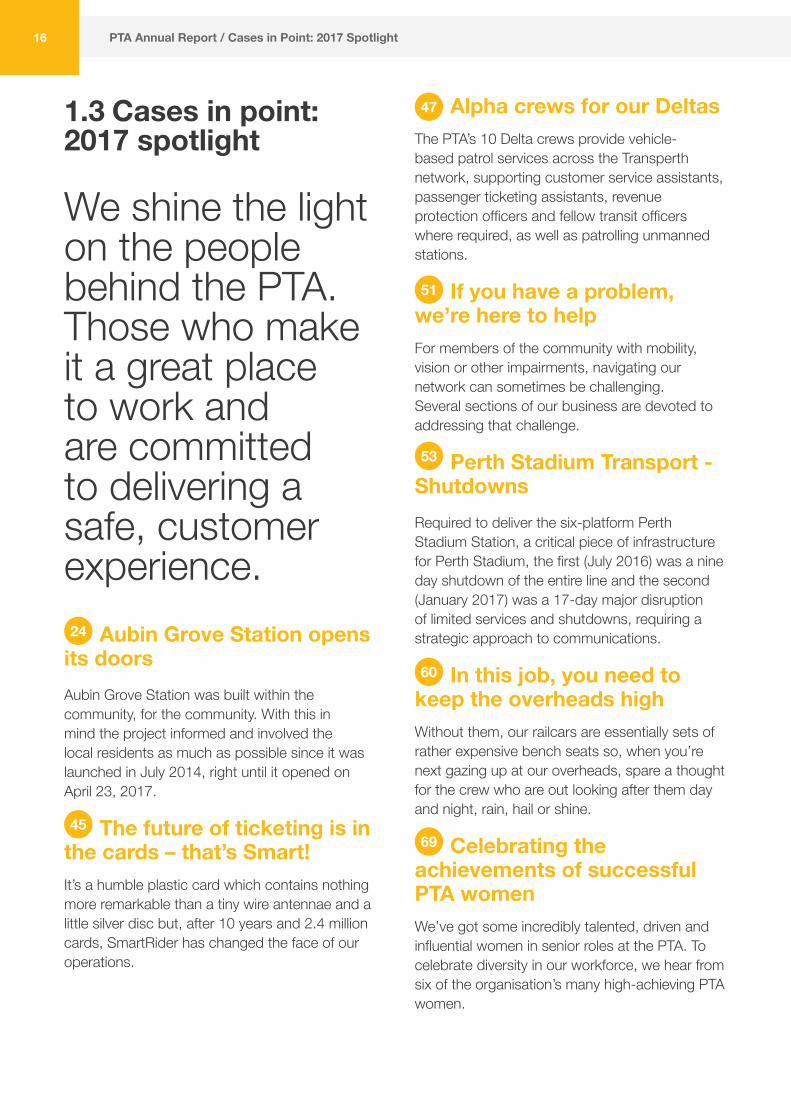
We shine the light on the people behind the PTA. Those who make it a great place to work and are committed to delivering a safe, customer experience. Aubin Grove Station opens its doorsAubin Grove Station was built within the community, for the community. With this in mind the project informed and involved the local residents as much as possible since it was launched in July 2014, right until it opened on April 23, 2017.
The future of ticketing is in the cards – that’s Smart!It’s a humble plastic card which contains nothing more remarkable than a tiny wire antennae and a little silver disc but, after 10 years and 2.4 million cards, SmartRider has changed the face of our operations.
Alpha crews for our DeltasThe PTA’s 10 Delta crews provide vehicle-based patrol services across the Transperth network, supporting customer service assistants, passenger ticketing assistants, revenue protection officers and fellow transit officers where required, as well as patrolling unmanned stations.
If you have a problem, we’re here to helpFor members of the community with mobility, vision or other impairments, navigating our network can sometimes be challenging. Several sections of our business are devoted to addressing that challenge.
Perth Stadium Transport - ShutdownsRequired to deliver the six-platform Perth Stadium Station, a critical piece of infrastructure for Perth Stadium, the first (July 2016) was a nine day shutdown of the entire line and the second (January 2017) was a 17-day major disruption of limited services and shutdowns, requiring a strategic approach to communications.
In this job, you need to keep the overheads highWithout them, our railcars are essentially sets of rather expensive bench seats so, when you’re next gazing up at our overheads, spare a thought for the crew who are out looking after them day and night, rain, hail or shine.
Celebrating the achievements of successful PTA women We’ve got some incredibly talented, driven and influential women in senior roles at the PTA. To celebrate diversity in our workforce, we hear from six of the organisation’s many high-achieving PTA women.
PTA Annual Report / Cases in Point: 2017 Spotlight
51
47
53
60
69
24
45
17
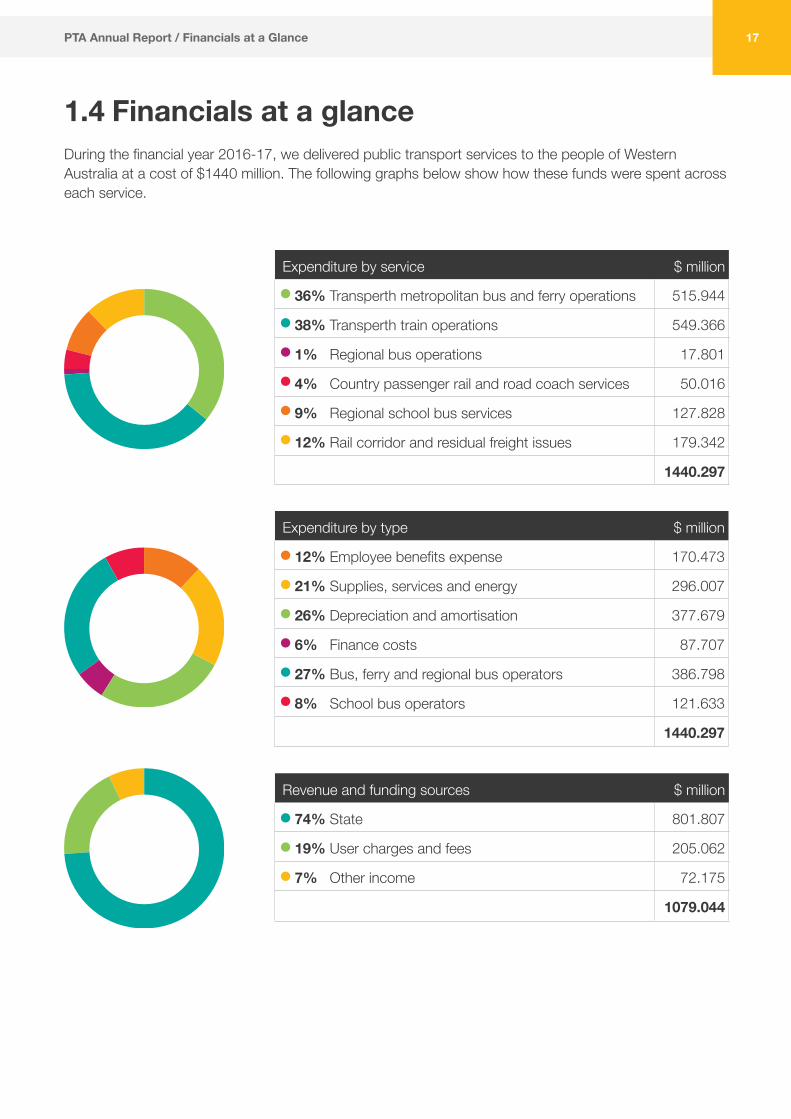
1.4 Financials at a glanceDuring the financial year 2016-17, we delivered public transport services to the people of Western Australia at a cost of $1440 million. The following graphs below show how these funds were spent across each service.
PTA Annual Report / Financials at a Glance
Expenditure by service $ million
36% Transperth metropolitan bus and ferry operations 515.944
38% Transperth train operations 549.366
1% Regional bus operations 17.801
4% Country passenger rail and road coach services 50.016
9% Regional school bus services 127.828
12% Rail corridor and residual freight issues 179.342
1440.297
Expenditure by type $ million
12% Employee benefits expense 170.473
21% Supplies, services and energy 296.007
26% Depreciation and amortisation 377.679
6% Finance costs 87.707
27% Bus, ferry and regional bus operators 386.798
8% School bus operators 121.633
1440.297
Revenue and funding sources $ million
74% State 801.807
19% User charges and fees 205.062
7% Other income 72.175
1079.044
18
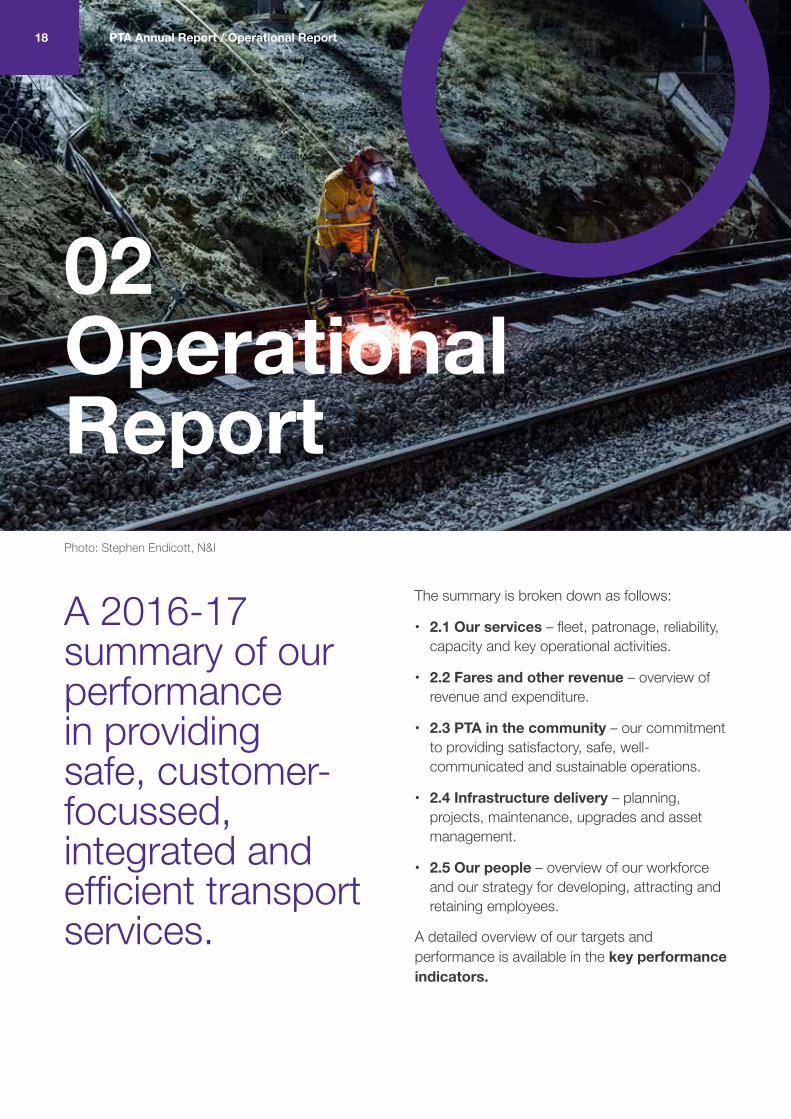
The summary is broken down as follows:
• 2.1 Our services – fleet, patronage, reliability, capacity and key operational activities.
• 2.2 Fares and other revenue – overview of revenue and expenditure.
• 2.3 PTA in the community – our commitment to providing satisfactory, safe, well-communicated and sustainable operations.
• 2.4 Infrastructure delivery – planning, projects, maintenance, upgrades and asset management.
• 2.5 Our people – overview of our workforce and our strategy for developing, attracting and retaining employees.
A detailed overview of our targets and performance is available in the key performance indicators.
PTA Annual Report / Operational Report
A 2016-17 summary of our performance in providing safe, customer-focussed, integrated and efficient transport services.
02 Operational ReportPhoto: Stephen Endicott, N&I
18

19
2.1 Our services2.1.1 Metro (Transperth)Transperth is the brand and operating name of the public transport system in the greater Perth metropolitan area.
The Transperth system consists of a bus network, a fully-electrified urban train system and a ferry service. It is managed by our Transperth branch and covers key functions such as system planning, bus service delivery, bus service security, passenger information services, ticketing and bus fleet procurement.
Transperth bus and ferry services are provided under commercial contract arrangements; train services are provided by our TTO division under an internal service-level agreement.
Passenger information comprising InfoCentre, InfoLine and customer feedback services are provided under contract by Serco.
FleetTrainsTTO operates more than 1045 services on an average weekday and 6916 services weekly. At June 30, the fleet consisted of 297 railcars (48 two-car A-Series and 67 three-car B-Series railcar sets) that can be coupled in sets of four or six-car trains.
The system covers 180.8km of track with 71 stations on five lines: Joondalup (40.9km), Fremantle (19km), Midland (16km), Armadale/Thornlie (30.5km and a 3km spur line to Thornlie), and Mandurah (71.4km).
BusesTransperth operated 1469 buses (up 2.1 per cent), consisting of 957 diesel buses (including 676 buses delivered under a Volvo contract) and 512 CNG buses. The number of diesel buses increased by 5.3 per cent; CNG bus numbers fell 3.4 per cent. The Volvo contract will deliver 887 new diesel buses over an eight-year period.
Within the fleet, 677 buses conform to Euro5 and Euro6 emission standards (46 per cent of the total), and 492 buses to Euro4 (33.5 per cent). The other 300 buses conform to Euro0 and Euro3.
Transperth buses covered 280 standard timetabled bus routes (plus 32 non-timetabled special event routes), 297 school routes and 10 CAT (Central Area Transit) routes. On a typical weekday this involved operating 15,317 standard service trips, 298 school service trips and 981 CAT service trips.
The Transperth bus network is divided into 11 geographic contract areas which are periodically subject to tender. As at June 30, three contractors operated our bus services:
• Path Transit – Kalamunda, Morley.
• Swan Transit – Canning, Claremont, Marmion, Midland (including Midland Shuttle), and Southern River.
• Transdev – Fremantle (including Fremantle CAT), Joondalup (including Joondalup CAT), Rockingham-Mandurah, and the Perth CAT contract.
FerriesTwo ferries (MV Phillip Pendal and MV Shelley Taylor-Smith) operate the Transperth ferry service between the city (Elizabeth Quay) and South Perth (Mends Street). The service is provided under contract by Captain Cook Cruises.
The ferry service operates a high frequency summer timetable and low frequency winter timetable to reflect the lower tourism and general usage during winter. The summer timetable included 122 trips a day Monday to Thursday, 134 trips on Friday, 118 trips on Saturday and 104 trips on Sunday/public holidays. The winter timetable included 60 trips a day Monday to Friday and 56 trips on weekends and public holidays.
The average trip length from Elizabeth Quay to South Perth is 1.42km.
PTA Annual Report / Our Services

20
PatronagePatronage by mode is reported in four categories:
• Fare-paying boardings – cash, paid SmartRider, and special event boardings.
• Cash and SmartRider initial boardings – fare-paying boardings plus free travel on SmartRider*.
• Total initial boardings – cash and SmartRider initial boardings plus free travel on Free Transit Zone (FTZ) services, on CAT services in Perth, Fremantle and Joondalup, and on the Midland Shuttle service.
• Total boardings – total initial boardings plus transfer boardings.
*Free travel on SmartRider refers to free travel by WA seniors, aged and disability pensioners, and carers on: weekdays before 6am, from 9am to 3.30pm, and after 7pm; and all day on weekends and public holidays. It also includes all-day free travel by veterans.
There was an overall downward trend in Transperth patronage:
Categories 2015-16 2016-17 Change
Total boardings
145.633m 140.857m -3.3%
Total initial boardings
101.731m 98.018m -3.6%
Cash and SmartRider initial boardings
85.115m 82.352m -3.2%
Fare-paying boardings
79.305m 76.556m -3.5%
Patronage decreased across all categories except free travel by seniors, aged and disability pensioners and carers which remained stable. Of the three main passenger categories, standard boardings decreased 5.6 per cent, concession decreased 1.0 per cent, and school student boardings decreased 0.4 per cent.
The decline in overall patronage resulted in the per-capita public transport usage within the Perth metropolitan area (including the City of Mandurah) falling to 48.5 initial boardings (previously 50.1).
The factors contributing to the continuing decline in fare-paying boardings include:
• The adverse impact of the higher rate of unemployment, linked to the downturn in the WA mining industry. While the majority of jobs directly related to mining are outside Transperth’s service area, the flow-on effect, particularly on professional services, has impacted CBD-based employment and is reflected partly by a near record high office vacancy rate in the Perth CBD. This has resulted in declining standard fare boardings which fell 5.6 per cent (concession fare boardings were down 1.0 per cent).
• Major improvements to most of Perth’s key arterial roads over the past few years, and low fuel prices make driving a more attractive option.
• The decline in the population rate of growth over the past few years.
• Cost-of-living pressures have impacted on discretionary travel, reflected in continuing low sales of FamilyRider and DayRider tickets.
• Significant closures and interruptions on the Armadale train line to enable construction of Stadium Station. This included a 9-day full-line closure (July 2016), 17-day part-line closure (January 2017), and numerous late night and weekend closures.
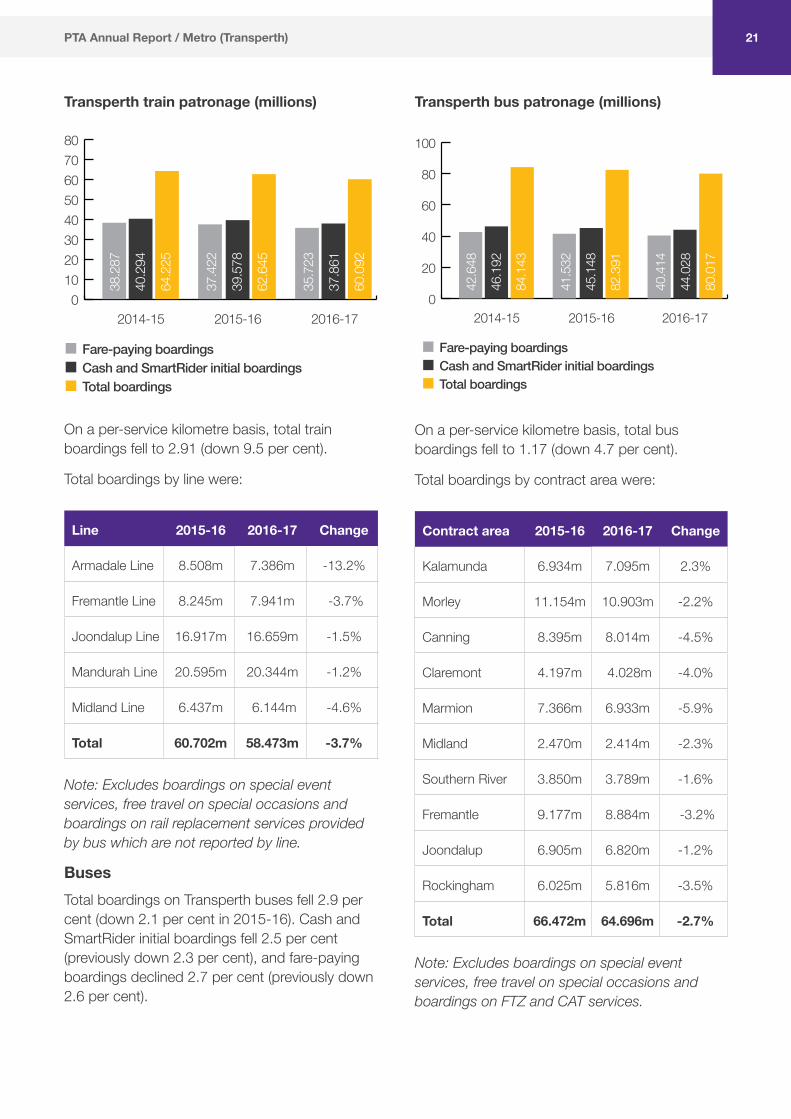
TrainsTotal boardings on trains declined by 4.1 per cent (down 2.5 per cent in 2015-16). Cash and SmartRider initial boardings fell 4.3 per cent (previously down 1.8 per cent), and fare-paying boardings recorded a significant 4.5 per cent decline (previously down 2.3 per cent).
PTA Annual Report / Metro (Transperth)
21
Transperth train patronage (millions)
01020304050607080
2014-15 2015-16 2016-17
38.2
87
40.2
94
64.2
25
37.4
22
39.5
78
62.6
45
35.7
23
37.8
61
60.0
92Fare-paying boardingsCash and SmartRider initial boardingsTotal boardings
On a per-service kilometre basis, total train boardings fell to 2.91 (down 9.5 per cent).
Total boardings by line were:
Line 2015-16 2016-17 Change
Armadale Line 8.508m 7.386m -13.2%
Fremantle Line 8.245m 7.941m -3.7%
Joondalup Line 16.917m 16.659m -1.5%
Mandurah Line 20.595m 20.344m -1.2%
Midland Line 6.437m 6.144m -4.6%
Total 60.702m 58.473m -3.7%
Note: Excludes boardings on special event services, free travel on special occasions and boardings on rail replacement services provided by bus which are not reported by line.
BusesTotal boardings on Transperth buses fell 2.9 per cent (down 2.1 per cent in 2015-16). Cash and SmartRider initial boardings fell 2.5 per cent (previously down 2.3 per cent), and fare-paying boardings declined 2.7 per cent (previously down 2.6 per cent).
Transperth bus patronage (millions)
0
20
40
60
80
100
2014-15 2015-16 2016-17
42.6
48
46.1
92
84.1
43
41.5
32
45.1
48
82.3
91
40.4
14
44.0
28
80.0
17
Fare-paying boardingsCash and SmartRider initial boardingsTotal boardings
On a per-service kilometre basis, total bus boardings fell to 1.17 (down 4.7 per cent).
Total boardings by contract area were:
Contract area 2015-16 2016-17 Change
Kalamunda 6.934m 7.095m 2.3%
Morley 11.154m 10.903m -2.2%
Canning 8.395m 8.014m -4.5%
Claremont 4.197m 4.028m -4.0%
Marmion 7.366m 6.933m -5.9%
Midland 2.470m 2.414m -2.3%
Southern River 3.850m 3.789m -1.6%
Fremantle 9.177m 8.884m -3.2%
Joondalup 6.905m 6.820m -1.2%
Rockingham 6.025m 5.816m -3.5%
Total 66.472m 64.696m -2.7%
Note: Excludes boardings on special event services, free travel on special occasions and boardings on FTZ and CAT services.
PTA Annual Report / Metro (Transperth)

22
FerriesThe ferry service represents a small proportion of Transperth system patronage (less than 0.5 per cent). Fluctuations in the tourism market have a significant impact on ferry boardings with tourists accounting for about half.
Transperth ferry patronage (millions)
0.00.10.20.30.40.50.60.70.8
2014-15 2015-16 2016-17
0.25
2
0.27
3
0.39
4
0.35
1
0.38
9
0.59
7
0.42
0
0.46
2
0.74
8
Fare-paying boardingsCash and SmartRider initial boardingsTotal boardings
With the opening of the Elizabeth Quay Jetty on January 31, 2016, patronage increased significantly to levels not seen since the formation of the PTA. With 2016-17 being the first full year of operation, full year patronage has again increased substantially.
Total boardings increased by 25.3 per cent (previously up 51.4 per cent). Cash and SmartRider initial boardings increased 18.9 per cent (previously up 42.5 per cent), and fare-paying boardings increased by 19.6 per cent (previously up 39 per cent).
Ferry total boardings per service kilometre increased 6.0 per cent to 13.996 due to the significant increase in boardings and despite the substantial increase in service kilometres.
ReliabilityTransperth reliability targets• Trains – 95 per cent of services to arrive within
4min of schedule.
• Buses – 85 per cent of services to arrive at the timing point within 4min of schedule, and never leave a terminus or travel through a mid-way timing point early.
• Ferries – 98 per cent of services to arrive within 3min of schedule.
Transperth uses technology-based monitoring methods which allow precise data-gathering to measure on-time running (OTR). On bus and ferry services, OTR is measured using the GPS information functions in SmartRider; the train control system is used to measure train OTR. Bus on-time performance is monitored through a random sample of one per cent of trips in each bus contract area. GPS information functions in SmartRider help to identify under-performing services which, after a careful review, can be re-scheduled to ensure improved performance.
Targets were exceeded on all three modes in 2016-17, with the train service recording its best OTR result in five years.
Transperth OTR performance (per cent)
0
20
40
60
80
100
2014-15 2015-16 2016-17
80.2
95.0
92.0
85.1
95.5
97.9
84.3
95.8
96.5
Bus Train Ferry
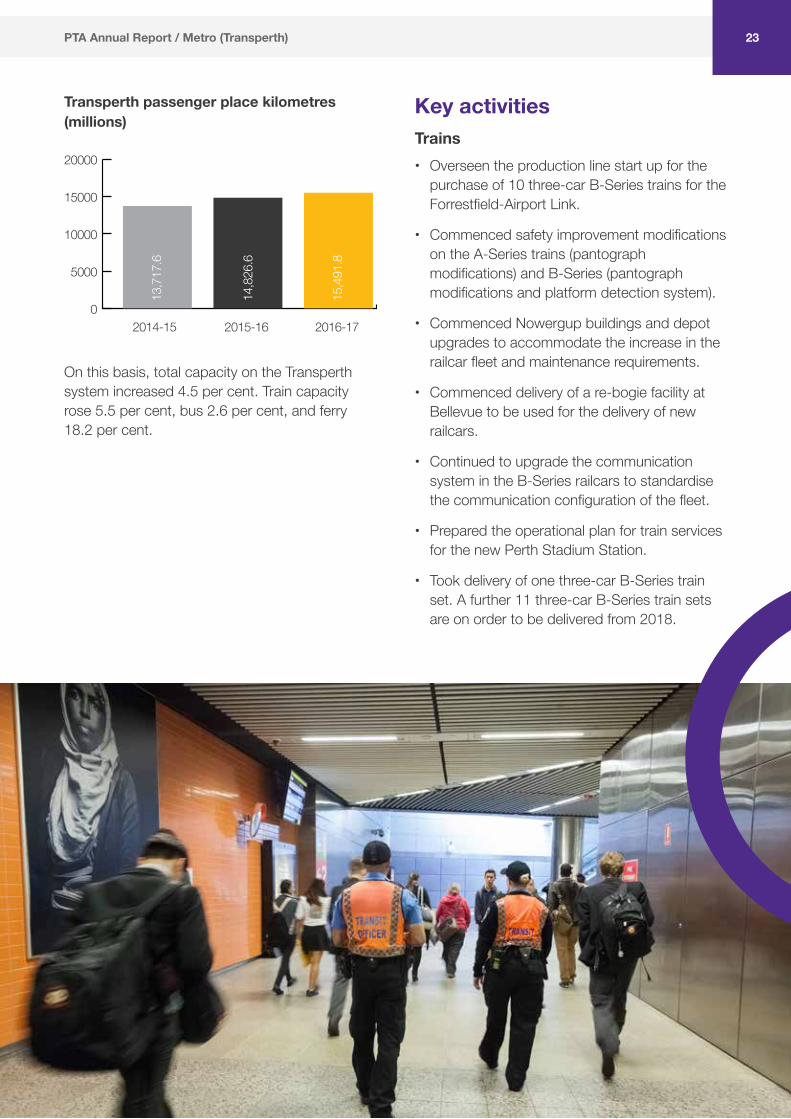
CapacityThe carrying capacity of the Transperth bus, train and ferry network is measured by a metric called passenger place kilometres. This is based on service kilometres and the average carrying capacity of the fleet, and has been increasing steadily in recent years as new buses and trains come on stream and the network expands.
PTA Annual Report / Metro (Transperth)
PTA Annual Report / Metro (Transperth)
Key activitiesTrains• Overseen the production line start up for the
purchase of 10 three-car B-Series trains for the Forrestfield-Airport Link.
• Commenced safety improvement modifications on the A-Series trains (pantograph modifications) and B-Series (pantograph modifications and platform detection system).
• Commenced Nowergup buildings and depot upgrades to accommodate the increase in the railcar fleet and maintenance requirements.
• Commenced delivery of a re-bogie facility at Bellevue to be used for the delivery of new railcars.
• Continued to upgrade the communication system in the B-Series railcars to standardise the communication configuration of the fleet.
• Prepared the operational plan for train services for the new Perth Stadium Station.
• Took delivery of one three-car B-Series train set. A further 11 three-car B-Series train sets are on order to be delivered from 2018.
Transperth passenger place kilometres (millions)
0
5000
10000
15000
20000
2014-15 2015-16 2016-17
13,7
17.6
14,8
26.6
15,4
91.8
On this basis, total capacity on the Transperth system increased 4.5 per cent. Train capacity rose 5.5 per cent, bus 2.6 per cent, and ferry 18.2 per cent.
23

CASE STUDYAubin Grove Station – built within the community, for the communityThis project philosophy informed and involved the local residents as much as possible from its launch in July 2014, right until it opened on April 23, 2017.
The excitement for a new station even extended overseas with the PTA receiving praises from Richard Lewis of Oswestry, England. Richard was visiting his sisters Christine Sambrook and Anne Morgan-Lewis, of Atwell, in April 2017. Richard was thrilled by what he felt was a fantastic and innovative project, enabling local residents to easily access public transport for work or leisure comfortably and reliably. Richard was also pleased by the prospect of reduced road congestion for his Perth family, and the positive environmental impacts of additional public transport infrastructure by reducing the vehicle emissions of local residents who will use the new station instead of driving. Richard’s views were shared by his sisters Christine and Anne who also contacted the PTA in support of their brothers’ accolades.
Following their keen interest in the project, Richard, Christine and Anne were invited to the opening of Aubin Grove Station, about which they were thrilled. Richard was unable to attend as he had returned to England; however both Anne and Christine attended and were presented a commemorative SmartRider and lanyard.
In a recent interview with the PTA, Christine further expressed her satisfaction with the new station and reiterated her gratitude for being able to attend the opening and meet some of the key people involved in the project. Christine
PTA Annual Report / Case Study
believes that the new station has eased freeway congestion with local commuters now able to use Aubin Grove Station instead of driving to other stations via an already congested freeway. Christine was also pleased with the size and design of the carpark and how easy it is to get to the platform from the carpark, Christine often discusses the new station with her brother Richard who still comments on the innovative design and great utilisation of space in the middle of a busy freeway, a design which Richard would like to see more of in England.
The PTA project team
Throughout the project, the highly engaged and growing local community played a key role, particularly with the changes to access into the western car parks. With four information sessions and six Resident Reference Group meetings throughout the project, the community were given a number of opportunities to provide feedback on final decisions and see how the project progressed.
The outcome at project conclusion was 91 per cent positive sentiments from the local community towards the project and currently an average of 1900 boardings a day at the station.
Anne Morgan-Lewis, Jess Swan from PTA and Christine Sambrook at the Aubin Grove Station opening event
24

25PTA Annual Report / Metro (Transperth)
Buses• On July 17, 2016 Transperth opened the
state-of-the-art Perth Busport that uses Dynamic Stand Management System (DSMS) to allocate buses to passengers (the official opening was June 13). Approximately 20,000 passengers and 1300 buses use the facility each day. Passengers benefit from a lounge area with 160 seats, two high-quality cafés and a Transperth Information Centre. Over 100 screens around the facility display real-time departure information, comprising the allocated bus stand and predicted departure time for all bus services departing the Perth Busport. Since opening, the number of buses operating in Perth Busport has been progressively increased from 90 buses an hour, when the facility opened, to almost 150 buses per hour in December 2016. The DSMS has been designed to cater for future growth in services and to manage up to 200 departures an hour.
• As part of the Bus Priority Program, continued to address the impact of road congestion (particularly in peak periods) on bus service reliability and patronage:
О Introduced peak-period bus priority lanes on Fitzgerald Street and Ranford Road.
О Introduced a bus-only lane on Mounts Bay Road.
О Upgraded bus interchange at Glendalough and Butler stations.
О Opened the Charles Street Bus Bridge on June 25, 2017.
• Completed Transperth’s Service Expansion Program, which began in 2011-12, adding a further 1.453 million service kilometres during the year to deliver a total of 66.983m service kilometres, up 2.2 per cent from 66.983m in 2015-16.
• Brought the SuperBus network to seven routes by introducing three new services:
О The Route 935 bus service between Kings Park and Perth Airport Terminals 3 and 4 via St Georges Terrace and Belmont Forum (replacing the Route 37 bus service).
О The Route 960 bus service from Mirrabooka Bus Station to Curtin University via Alexander Drive, Edith Cowan University, Perth Busport, Wellington Street, Albany Highway and Kent Street (replacing the Route 888 bus service between Mirrabooka and Perth).
О The Route 970 bus service between the new Perth Busport and Mirrabooka Bus Station via Flinders Street (incorporating the Route 354, 370 and 870 bus services).
• Implemented other new bus services in the year, such as:
О The Route 384 bus service from Mirrabooka to Perth via Nollamara Shopping Centre and Wanneroo Road.
О The new Aubin Grove feeder network, with the Route 525, 526, 527, 534, 535, 536 and 537 bus services.
• Improved a number of existing bus services:
О The Route 24 between Point Fraser and Claremont Station
О The Route 28 between Perth Busport and Claremont Station
О The Route 376 between Mirrabooka Bus Station and Landsdale
О The Route 388 between Perth Busport and Warwick Station
О The Route 501 between Fremantle Station and Bull Creek Station
О The Route 518 between Cockburn Central Station and Murdoch TAFE Campus
О The Route 950 between Morley Bus Station and QEII Medical Centre.
• Upgraded emergency fire systems at Elizabeth Quay Bus Station including the installation of a linear heat detection system and fire sprinkler deluge system which were commenced during the year and will be commissioned early in 2017-18.
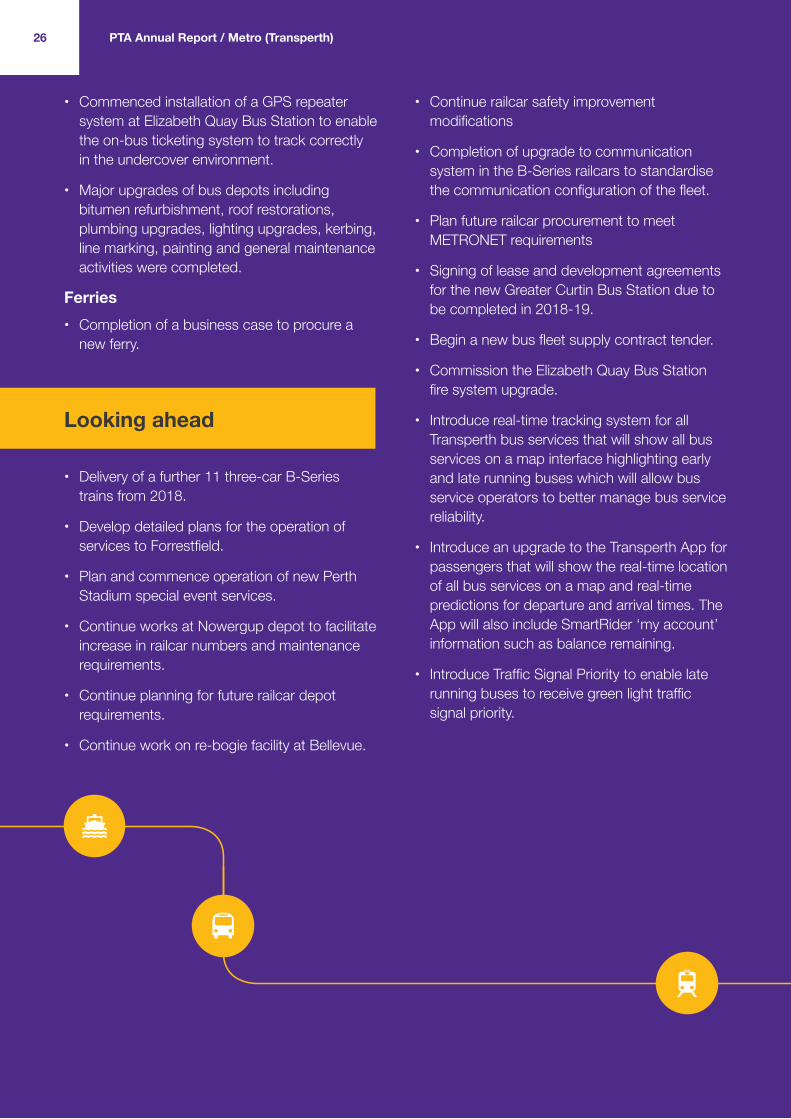
• Commenced installation of a GPS repeater system at Elizabeth Quay Bus Station to enable the on-bus ticketing system to track correctly in the undercover environment.
• Major upgrades of bus depots including bitumen refurbishment, roof restorations, plumbing upgrades, lighting upgrades, kerbing, line marking, painting and general maintenance activities were completed.
Ferries• Completion of a business case to procure a
new ferry.
Looking ahead
• Delivery of a further 11 three-car B-Series trains from 2018.
• Develop detailed plans for the operation of services to Forrestfield.
• Plan and commence operation of new Perth Stadium special event services.
• Continue works at Nowergup depot to facilitate increase in railcar numbers and maintenance requirements.
• Continue planning for future railcar depot requirements.
• Continue work on re-bogie facility at Bellevue.
• Continue railcar safety improvement modifications
• Completion of upgrade to communication system in the B-Series railcars to standardise the communication configuration of the fleet.
• Plan future railcar procurement to meet METRONET requirements
• Signing of lease and development agreements for the new Greater Curtin Bus Station due to be completed in 2018-19.
• Begin a new bus fleet supply contract tender.
• Commission the Elizabeth Quay Bus Station fire system upgrade.
• Introduce real-time tracking system for all Transperth bus services that will show all bus services on a map interface highlighting early and late running buses which will allow bus service operators to better manage bus service reliability.
• Introduce an upgrade to the Transperth App for passengers that will show the real-time location of all bus services on a map and real-time predictions for departure and arrival times. The App will also include SmartRider ‘my account’ information such as balance remaining.
• Introduce Traffic Signal Priority to enable late running buses to receive green light traffic signal priority.
26 PTA Annual Report / Metro (Transperth)

27
2.1.2 Regional (Transwa)Transwa is the brand and operating name for the road coach and rail public transport system serving regional centres.
Our Transwa network extends to Kalbarri and Meekatharra in the north, east to Kalgoorlie, and south-east to Esperance. The services link 240 regional locations to the Perth metropolitan area (and locations in between) and are used by a variety of passengers for a range of travel purposes.
FleetTrainsTranswa employs 20 railcar drivers based at East Perth and Bunbury to operate 14 railcars under four distinct services:
• The Prospector – a daily return service (with two on Mondays and Fridays) between Perth (East Perth terminal) and Kalgoorlie for a total of 18 services a week.
• The Australind – two daily return services between Bunbury and Perth for a total of 28 services a week.
• The AvonLink – three Northam-to-Midland return services on Monday, Tuesday, Thursday and Friday (except public holidays), one return service on a Wednesday and one return service on the weekend (either Saturday or Sunday), for a total of 28 services a week.
• The MerredinLink – an all-stop return service between Perth (East Perth terminal) and Merredin on a Wednesday, for a total of two services a week.
Australind onboard services are provided by Bunbury-based Transwa staff, while a contractor provides onboard services on the Prospector, AvonLink and MerredinLink trains.
Road coachesTranswa road coaches operate 130 services each week, employing 34 operators for the fleet of five-star, luxury road coaches.
The fleet consists of 23 new Volvo/Irizar road coaches, which replaced the ageing Scania fleet. Characteristics of the new road coaches include; a capacity of 56 seats, fully accessible, individual passenger entertainment systems, USB charging points in each seat, Euro 5 emission standard and an eight CCTV camera security system.
PTA Annual Report / Regional (Transwa)

28
PatronageTrainsPatronage on regional trains decreased by 5.7 per cent; largely attributed to lower numbers on the Australind and AvonLink services.
Transwa train patronage
2014-15 2015-16 2016-17
Australind 105,295 96,548 89,984
Prospector 89,107 88,628 87,257
AvonLink 19,019 23,904 19,380
MerredinLink 4,656 3,023 2,679
The fall in Australind patronage, down 6.8 per cent, was largely due to reduced occupancy availability due to mechanical issues and a number of track shut downs.
The 18.9 per cent decline in AvonLink patronage is mostly due to excessive journey delays caused by third-party track works and a reduction in demand for the frequency of services. As of July 1, 2017, the AvonLink Enhanced Train Service trial will cease, and AvonLink services will return to 10 trips per week (down from 28 per week).
Road coaches
Transwa road coach patronage slipped 1.4 per cent throughout the year.
Transwa road coach patronage
0
50000
100000
150000
200000
2014-15 2015-16 2016-17
187,
469
179,
066
176,
564
The biggest decline was recorded on routes travelling to Albany and Esperance. This was partly offset by slight increase in numbers for the East Perth to Augusta route.
Since the introduction of the new road coach fleet, patronage levels have stabilised.
ReliabilityTranswa reliability targets• Prospector – 80 per cent of services to arrive
within 15min of schedule.
• Australind – 90 per cent (10min).
• AvonLink and MerredinLink – 95 per cent respectively (10min).
• Road coaches – 95 per cent (10min).
Proportion of Transwa services meeting OTR targets (per cent)
2014-15 2015-16 2016-17
Road Coaches 97 98 97
Prospector 65 48 36
AvonLink 96 83 70
MerredinLink 84 62 57
Australind 93 94 88
The performance of the Prospector, the AvonLink and the MerredinLink were well below the reliability targets (36 per cent, 70 per cent and 57 per cent respectively). The primary reason behind the delays on the Eastern Goldfields Railway was the extensive track works by the third-party infrastructure operator around the Avon Valley section of the track.
PTA Annual Report / Regional (Transwa)
29
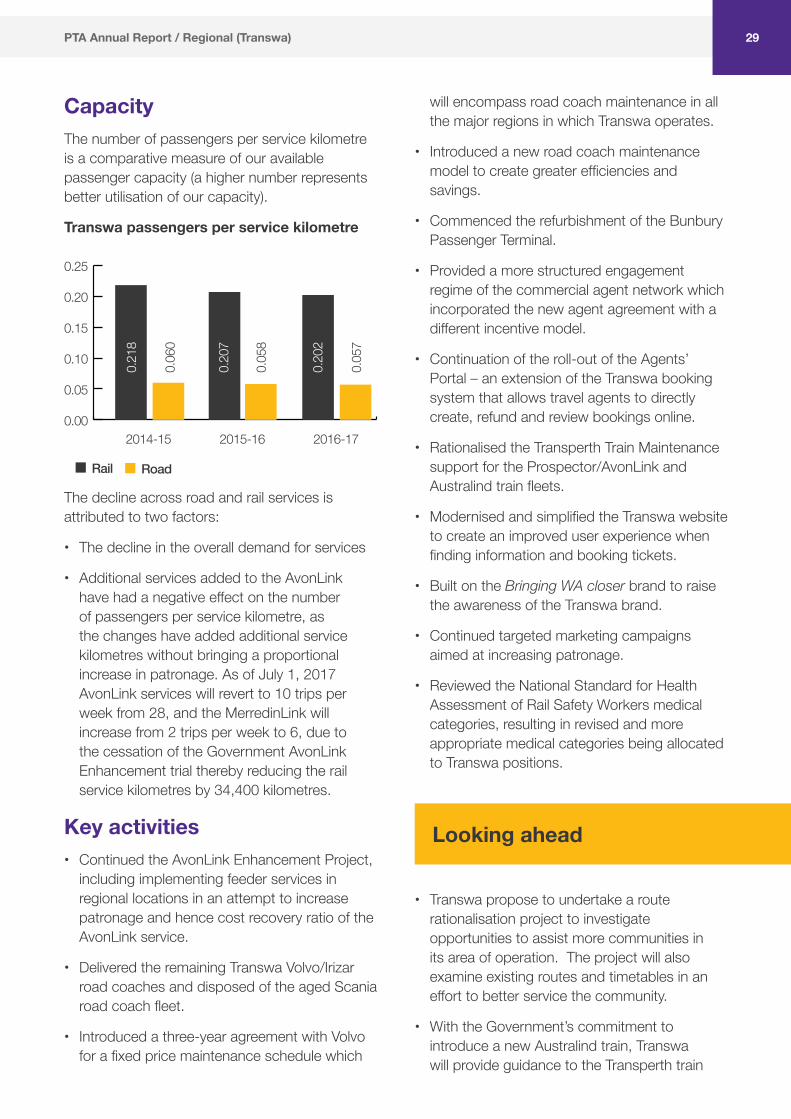
CapacityThe number of passengers per service kilometre is a comparative measure of our available passenger capacity (a higher number represents better utilisation of our capacity).
Transwa passengers per service kilometre
0.00
0.05
0.10
0.15
0.20
0.25
2014-15 2015-16 2016-17
0.21
8
0.06
0
0.20
7
0.05
8
0.20
2
0.05
7
Rail Road
The decline across road and rail services is attributed to two factors:
• The decline in the overall demand for services
• Additional services added to the AvonLink have had a negative effect on the number of passengers per service kilometre, as the changes have added additional service kilometres without bringing a proportional increase in patronage. As of July 1, 2017 AvonLink services will revert to 10 trips per week from 28, and the MerredinLink will increase from 2 trips per week to 6, due to the cessation of the Government AvonLink Enhancement trial thereby reducing the rail service kilometres by 34,400 kilometres.
Key activities• Continued the AvonLink Enhancement Project,
including implementing feeder services in regional locations in an attempt to increase patronage and hence cost recovery ratio of the AvonLink service.
• Delivered the remaining Transwa Volvo/Irizar road coaches and disposed of the aged Scania road coach fleet.
• Introduced a three-year agreement with Volvo for a fixed price maintenance schedule which
will encompass road coach maintenance in all the major regions in which Transwa operates.
• Introduced a new road coach maintenance model to create greater efficiencies and savings.
• Commenced the refurbishment of the Bunbury Passenger Terminal.
• Provided a more structured engagement regime of the commercial agent network which incorporated the new agent agreement with a different incentive model.
• Continuation of the roll-out of the Agents’ Portal – an extension of the Transwa booking system that allows travel agents to directly create, refund and review bookings online.
• Rationalised the Transperth Train Maintenance support for the Prospector/AvonLink and Australind train fleets.
• Modernised and simplified the Transwa website to create an improved user experience when finding information and booking tickets.
• Built on the Bringing WA closer brand to raise the awareness of the Transwa brand.
• Continued targeted marketing campaigns aimed at increasing patronage.
• Reviewed the National Standard for Health Assessment of Rail Safety Workers medical categories, resulting in revised and more appropriate medical categories being allocated to Transwa positions.
Looking ahead
• Transwa propose to undertake a route rationalisation project to investigate opportunities to assist more communities in its area of operation. The project will also examine existing routes and timetables in an effort to better service the community.
• With the Government’s commitment to introduce a new Australind train, Transwa will provide guidance to the Transperth train
PTA Annual Report / Regional (Transwa)
30
engineering team to improve the passenger experience.
• With the introduction of the new road coach fleet, Transwa will investigate the introduction of Bring Your Own Device (BYOD) entertainment on the road coach services which will complement the introduction of the seat mounted USB charging points.
2.1.3 Regional (TransRegional)Under the TransRegional brand, our Regional Town Bus Services (RTBS) branch manages Trans branded school and town public bus services in 14 major regional towns in rural WA, as well as seven inter-town regional bus services – four in the Pilbara and one each in the Gascoyne, Goldfields and Mid-West regions.
FleetRTBS maintained a total fleet of 152 low-floor accessible buses, all of which are PTA-owned.
PatronageTotal TransRegional boardings decreased by 2.3 per cent to 2.348 million and total fare-paying boardings decreased 0.9 per cent to 2.086m. This reflects the Transperth trend, although to a lesser extent.
Service 2015-16 2016-17 Change
Intra-town
Total boardings (millions)
2.391 2.326 -2.7%
Fare-paying boardings (millions)
2.093 2.065 -1.3%
Inter-town
Total boardings 11,994 22,103 84.3%
Fare-paying boardings
11,360 21,154 86.2%
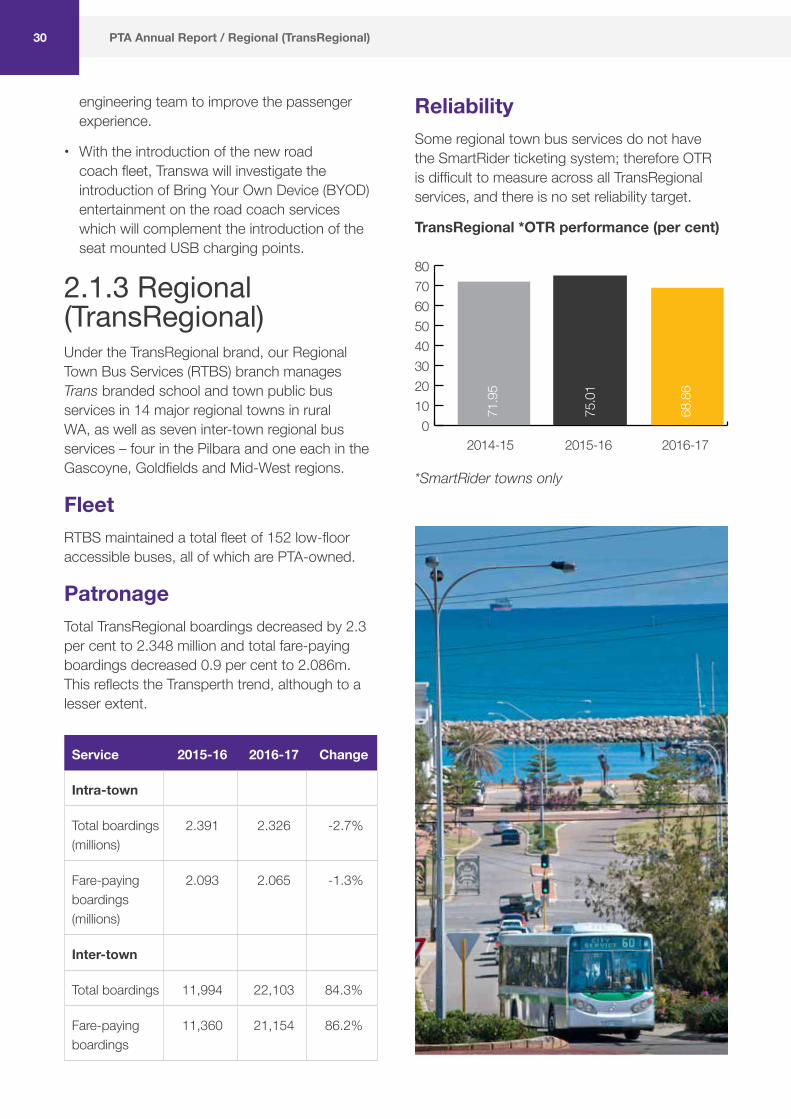
ReliabilitySome regional town bus services do not have the SmartRider ticketing system; therefore OTR is difficult to measure across all TransRegional services, and there is no set reliability target.
TransRegional *OTR performance (per cent)
01020304050607080
2014-15 2015-16 2016-17
71.9
5
75.0
1
68.8
6
*SmartRider towns only
PTA Annual Report / Regional (TransRegional)
Key activities• Introduced Trans branding to bus operations in
the State’s regional centres to lift the profile of public transport in regional WA.
• Awarded bus operation contracts for Karratha and Albany.
• Tendered the bus operation contract for Esperance.
• Implemented planned changes in the Bunbury area following a full network review. The changes involved network enhancements, significant route changes and changes to the frequency of services.
• Prepared and/or implemented TransRegional service reviews for Dunsborough, Esperance and Bridgetown.
• Completion of the RTBS bus replacement strategy ensuring the TransRegional branded bus fleet is 100 per cent PTA-owned and fully accessible.
• Purchased depots in Karratha, Esperance and Port Hedland. Each of these facilities underwent significant upgrade following their acquisition.
• Construction of new bus depot in Albany, ready for operation from July 1, 2017.
Looking ahead
• Will award bus operation contract for Esperance, commencing January 2018. This will coincide with the introduction of the SmartRider ticketing system in Esperance; consistent with other major regional towns.
• Service reviews have been scheduled for Albany and Port Hedland in 2017-18.
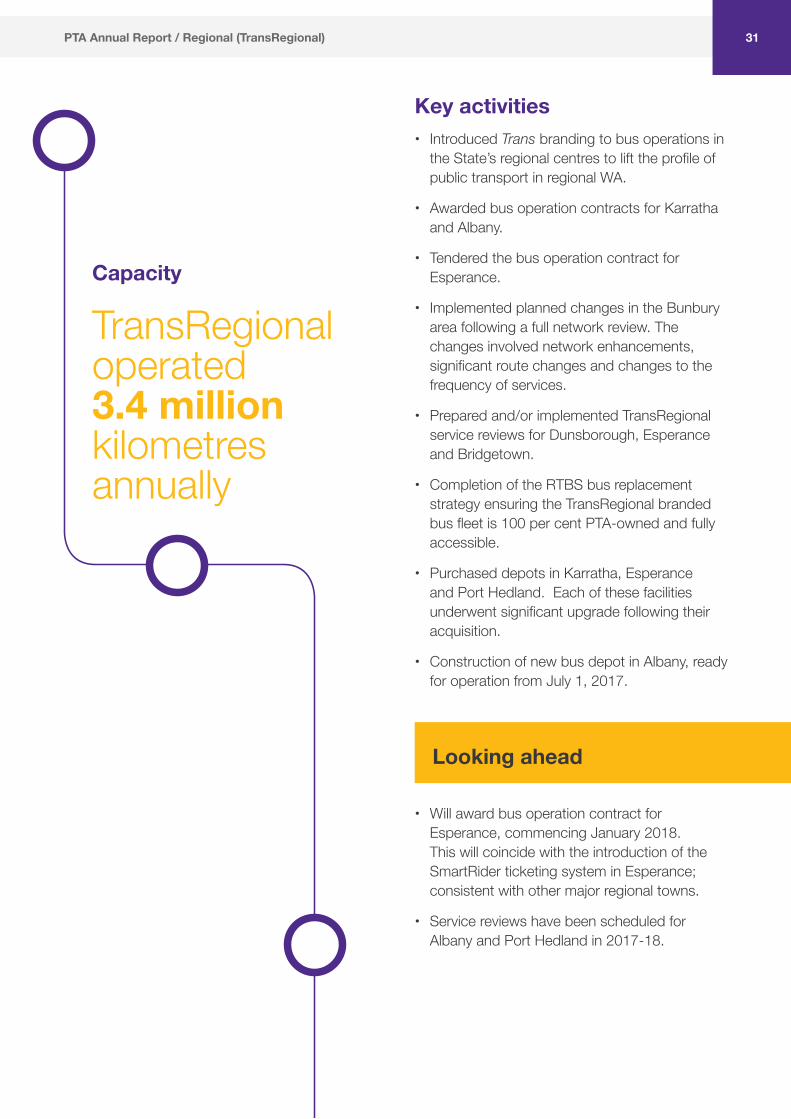
Capacity
TransRegional operated 3.4 million kilometres annually
31PTA Annual Report / Regional (TransRegional)
32
2.1.4 Regional (orange school buses)The PTA manages the policy and entitlement framework, delivers system support and oversees the contract arrangements of more than 916 orange school bus services around the State.
These buses provide access to school for students in rural areas (picking them up from the farm gate where appropriate), as well as access to schools in the metropolitan area for students attending special education facilities. Responsibility for the management of these services rests with our School Bus Services (SBS) branch.
In addition to the orange contract school buses, there are four cluster contracts made up of 53 contract school buses that are funded by the Department of Education (DoE) and administered by SBS. These services do not form part of our Student Transport Assistance Policy Framework (STAPF).
Where eligible students cannot be accommodated on a school bus, their parents/carers are paid a conveyance allowance to offset the cost of getting their children to the nearest appropriate school.
FleetThe SBS network in 2016-17 consisted of 828 contract school buses servicing mainstream schools, and 141 servicing special education facilities. All contracted school buses are operated by private contractors under the following contract arrangements:
• ECM (evergreen contract model) contracts (five-year contract term) – 690 contracts (690 services)
• CRM (composite rate model) contracts (remaining balance of 20-30-year contract term) – one contract (one service)
• Fixed-term contracts (1-15-year tendered term) – 161 contracts (161 services)
• Regional school bus cluster contracts (15-year contract term) – six contracts (64 services)
• DoE-funded cluster contracts – four contracts (53 services).
SBS initiated 13 new fixed-term contract services across the State:
Region 2016-17 contract services
Goldfields/Esperance Merredin Kellerberrin Wheelchair
Metropolitan Gladys Newton North
North East Metro LDC Ellenbrook
Durham Road Eastern Hills
Castlereagh Canning Vale
Durham Road Bayswater
Belridge ESC Banksia Grove
Riverside Halls Head
Belridge ESC Wanneroo
Riverside Coodanup ESC
Pilbara South Hedland Turner River
Paraburdoo Bellary Springs
South-West Bunbury Education Support Collie
PTA Annual Report / Regional (Orange School Buses)

33
PatronageAround the State, the services were accessed each school day by 26,691 students (1.01 per cent fewer than in 2015-16), using mainly the contracted school buses.
The decrease in the number of eligible students receiving school bus transport assistance can be explained by dividing the data of the 969 contract school bus services into two distinct groups:
• Core business – the 916 orange school bus services around the State as well as the special education services in the metro area.
• DoE-funded – the 53 services funded by Education but contract-managed by SBS outside of the STAPF, for students who qualify for assistance through the Intensive English Centres and/or other language support programs.
In previous years, patronage combined all core and DoE business in one figure. However, a review identified the need to separate the data into the two groups, to enable transparent and accurate reporting of the variances.
In the core business group, a total of 25,680 students accessed school bus transport assistance (1.6 per cent fewer than in 2015-16).
The Western Australia economy has been exposed to weaker conditions as investment activity unwinds and the labour market conditions remain subdued.
The downturn, and the diversification of the economy, appears to be having a dynamic impact on the transport needs of families residing in the regions.
Whereas the student placement programs on DoE funded services are operational matters administered by DoE. Dynamics such as the immigration intake quotas and federal funding provisions are all contributing factors to the variations in student numbers experienced to date.
A total of 1,011 students accessed these services (17.1 per cent more than in 2015-16).
The following table breaks down the 2016-17 student patronage per region and group:
Region
Core business service
patronage
DoE-funded service
patronage
Total
Gascoyne 115 - 115
Goldfields Esperance
1,113 133 1,246
Great Southern
3,307 - 3,307
Kimberley 828 - 828
Metropolitan 4,306 799 5,105
Mid-West 1,542 - 1,542
Peel 2,078 - 2,078
Pilbara 472 - 472
South-West 7,288 79 7,367
Wheatbelt 4,631 - 4,631
Total 25,680 1,011 26,691
PTA Annual Report / Regional (Orange School Buses)
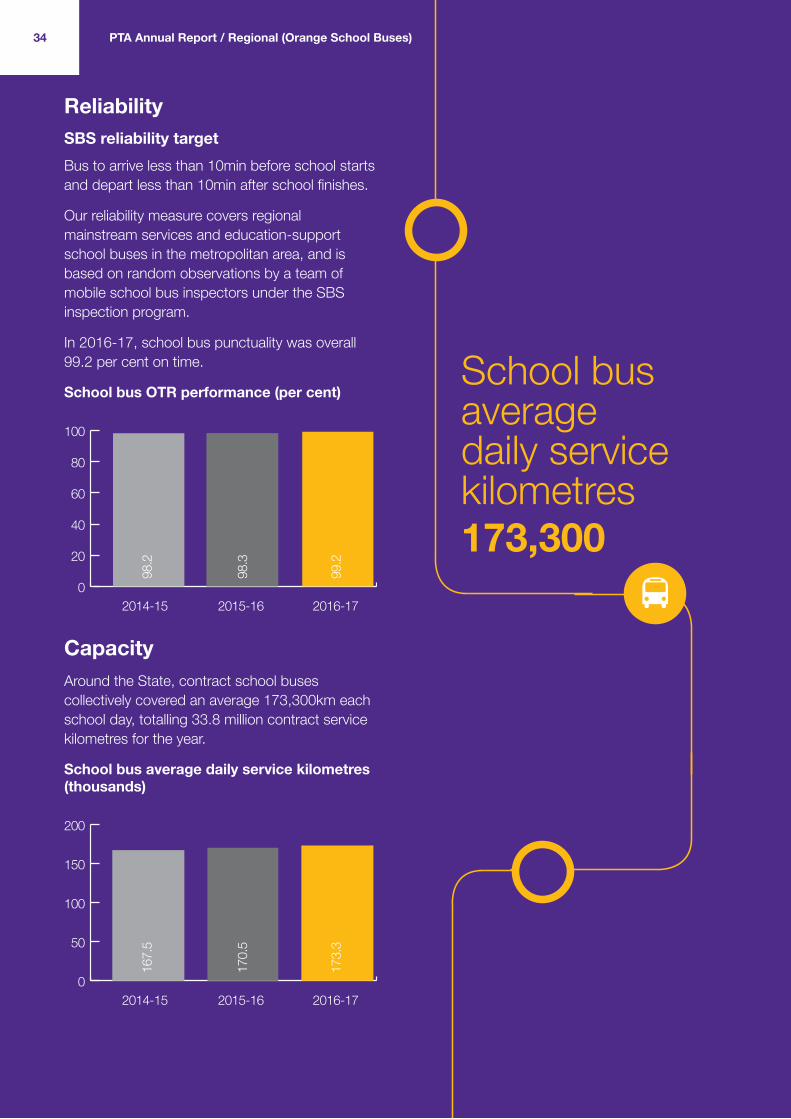
ReliabilitySBS reliability targetBus to arrive less than 10min before school starts and depart less than 10min after school finishes.
Our reliability measure covers regional mainstream services and education-support school buses in the metropolitan area, and is based on random observations by a team of mobile school bus inspectors under the SBS inspection program.
In 2016-17, school bus punctuality was overall 99.2 per cent on time.
School bus OTR performance (per cent)
0
20
40
60
80
100
2014-15 2015-16 2016-17
98.2
98.3
99.2
CapacityAround the State, contract school buses collectively covered an average 173,300km each school day, totalling 33.8 million contract service kilometres for the year.
School bus average daily service kilometres (thousands)
0
50
100
150
200
2014-15 2015-16 2016-17
167.
5
170.
5
173.
3
PTA Annual Report / Regional (Orange School Buses)34
School bus average daily service kilometres173,300
35
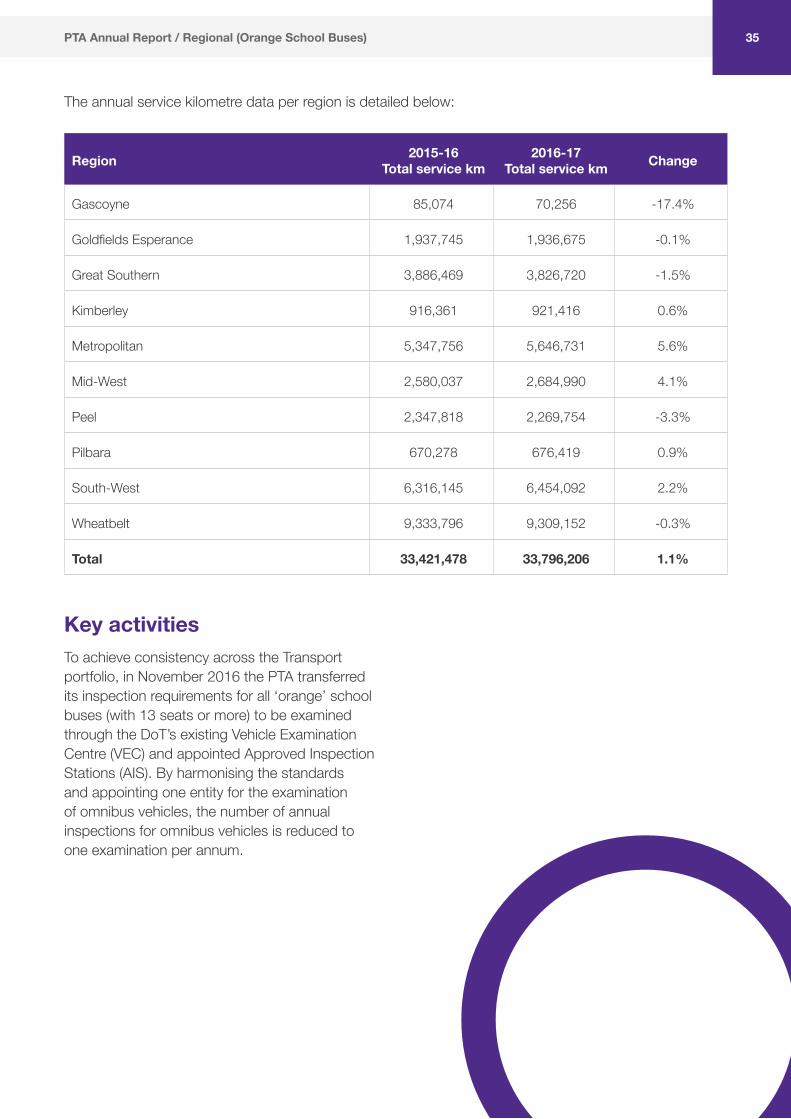
The annual service kilometre data per region is detailed below:
Region 2015-16 Total service km
2016-17 Total service km Change
Gascoyne 85,074 70,256 -17.4%
Goldfields Esperance 1,937,745 1,936,675 -0.1%
Great Southern 3,886,469 3,826,720 -1.5%
Kimberley 916,361 921,416 0.6%
Metropolitan 5,347,756 5,646,731 5.6%
Mid-West 2,580,037 2,684,990 4.1%
Peel 2,347,818 2,269,754 -3.3%
Pilbara 670,278 676,419 0.9%
South-West 6,316,145 6,454,092 2.2%
Wheatbelt 9,333,796 9,309,152 -0.3%
Total 33,421,478 33,796,206 1.1%
Key activitiesTo achieve consistency across the Transport portfolio, in November 2016 the PTA transferred its inspection requirements for all ‘orange’ school buses (with 13 seats or more) to be examined through the DoT’s existing Vehicle Examination Centre (VEC) and appointed Approved Inspection Stations (AIS). By harmonising the standards and appointing one entity for the examination of omnibus vehicles, the number of annual inspections for omnibus vehicles is reduced to one examination per annum.
PTA Annual Report / Regional (Orange School Buses)
36
2.2 Fares and other revenue2.2.1 MetroTransperthTransperth applies a common fare structure across its integrated bus, train and ferry service network.
• Fares are based on a zonal system with nine concentric bands. Zone one covers a travel distance of 8km; zones two and three each cover 9km; and zones four to nine each cover 10km.
• Fares are set for travel within a specified number of zones. A short distance fare is available for trips of up to 3.2km (two sections). School students pay a flat fare for all travel during the gazetted school year except on weekends. In addition, there are multi-trip tickets for individuals (DayRider) and groups (FamilyRider).
• Passengers are able to transfer between services and modes without extra charge within two hours on journeys of up to four zones and within three hours on journeys of five to nine zones. This free transfer facility is not available on the two-section fare.
• Ticketing facilities for passengers who choose to pay cash are electronic ticket-issuing machines (ETIMs) on all buses and ferries, and ticket-vending machines (TVMs) at all train stations and ferry jetties.
Transperth cash fares scheduleThe following fares schedule was implemented from July 1, 2016.
Category Standard Concession
2 Sections $2.10 $0.80
1 Zone $3.00 $1.20
2 Zones $4.60 $1.90
3 Zones $5.50 $2.20
4 Zones $6.50 $2.60
5 Zones $8.10 $3.20
6 Zones $9.10 $3.70
7 Zones $10.70 $4.30
8 Zones $11.60 $4.60
9 Zones $12.40 $5.00
DayRider $12.40 $5.00
FamilyRider $12.40 –
Note: The flat fare for school students ($0.60) is available only through SmartRider. It is valid for all travel on Transperth services from Monday to Friday from the first to the last gazetted school day of the year; during mid-year school term holidays; and on public holidays that fall on a weekday during the school year.
SmartRider and SmartParkerDiscounts on cash fares are provided through the SmartRider system and are based on the reload method used. A discount of 25 per cent is available to users choosing Autoload through direct debit or credit card, and a discount of 15 per cent is available to those who choose other reload methods (BPAY, add-value machines, on board bus and ferry, and at retail sales outlets and Transperth InfoCentres).
PTA Annual Report / Fares and Other Revenue

37
The SmartRider system provides a complete and accurate record of all SmartRider boardings because users are required to tag-on/tag-off at smartcard processors on buses and ferries and at train stations on each leg of their journey.
SmartRider accounted for 75.2 per cent of total fare-paying boardings compared with 74.4 per cent in 2015-16.
SmartParker, which allows patrons to pay for PTA (train station) parking with their SmartRider, accounted for 85.7 per cent of all paid parking transactions in 2016-17, up from 84.5 per cent in 2015-16.
Patronage profile• Total boardings in 2016-17 comprised 53
per cent fare-paying boardings (cash and SmartRider) (unchanged in 2015-16), 15 per cent free travel (unchanged), 30 per cent transfers (unchanged), and 1.1 per cent special event boardings (1.2 per cent).
• Excluding special event boardings, standard fare passengers accounted for 49.5 per cent of cash and paid SmartRider boardings (50.7 per cent), concession passengers 33.1 per cent (32.3 per cent) and school students 14.9 per cent (14.4 per cent). Boardings on FamilyRider tickets contributed 2.4 per cent (unchanged).
• SmartRider users accounted for 80 per cent (unchanged) of total transfers during the year.
Cost per passenger kilometreThe total cost per passenger kilometre (including annual capital charges) of providing Transperth’s bus, train and ferry services increased by 9.4 per cent.
Transperth total cost per passenger kilometre
0.00.10.20.30.40.50.60.70.8
2014-15 2015-16 2016-17
$0.6
41
$0.6
88
$0.7
53
Passenger kilometres are based on average trip length and passenger boardings. The decline in total passenger boardings with little change in the average trip length led to a 3.3 per cent decline in total passenger kilometres which contributed partly to the higher average cost.
Revenue and expenditureTotal system revenue, which includes income from fares, parking, advertising, rent, infringements, and miscellaneous items, fell 1.9 per cent.
Transperth system revenue ($ millions)
0
50
100
150
200
250
2014-15 2015-16 2016-17
$222
.736
$198
.360
$221
.053
$19
4.61
5
$216
.922
$189
.668
Total revenue Fare revenue
Fare revenue alone recorded a decline of 2.5 per cent, reflecting the decline in fare-paying boardings and despite the 2.5 per cent fare increase which came into effect on July 1.
Across the modes, fare revenue on train and bus services fell 2.4 per cent and 2.9 per cent respectively. The ferry figure rose 22.5 per cent, reflecting the significant jump in boardings.
PTA Annual Report / Metro
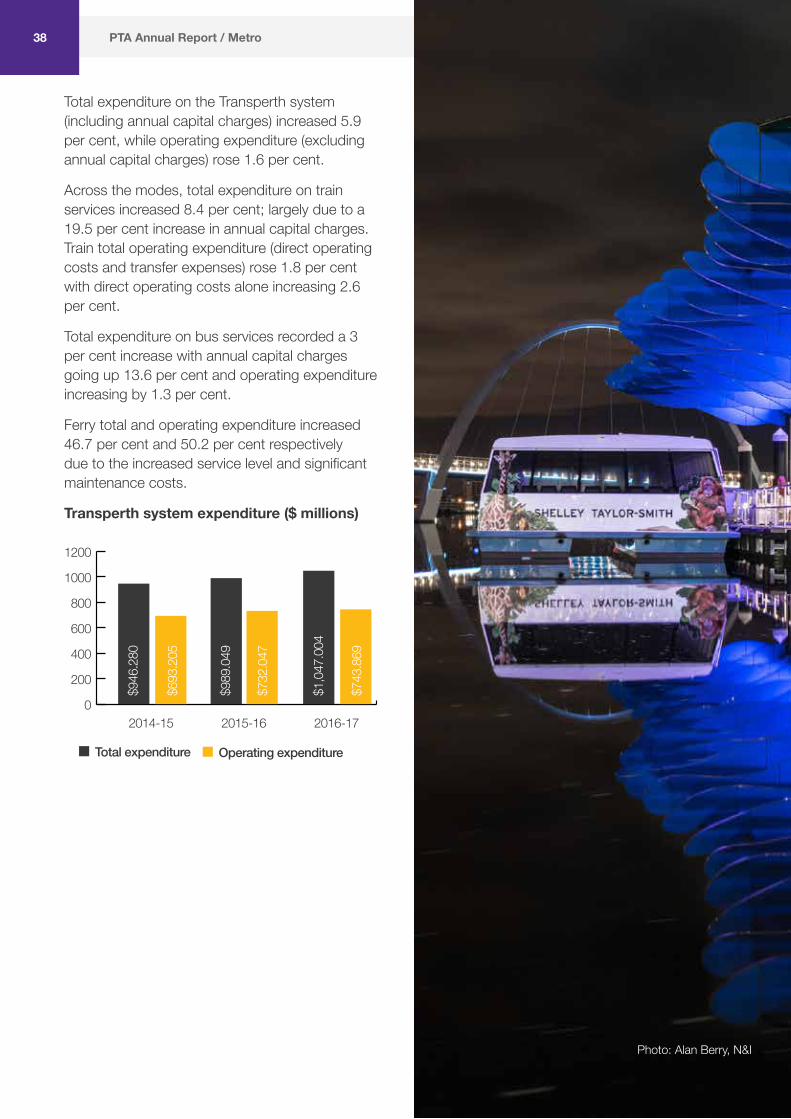
38
Total expenditure on the Transperth system (including annual capital charges) increased 5.9 per cent, while operating expenditure (excluding annual capital charges) rose 1.6 per cent.
Across the modes, total expenditure on train services increased 8.4 per cent; largely due to a 19.5 per cent increase in annual capital charges. Train total operating expenditure (direct operating costs and transfer expenses) rose 1.8 per cent with direct operating costs alone increasing 2.6 per cent.
Total expenditure on bus services recorded a 3 per cent increase with annual capital charges going up 13.6 per cent and operating expenditure increasing by 1.3 per cent.
Ferry total and operating expenditure increased 46.7 per cent and 50.2 per cent respectively due to the increased service level and significant maintenance costs.
Transperth system expenditure ($ millions)
0
200
400
600
800
1000
1200
2014-15 2015-16 2016-17
$946
.280
$693
.205
$989
.049
$732
.047
$1,0
47.0
04
$743
.869
Total expenditure Operating expenditure
PTA Annual Report / Metro
Photo: Alan Berry, N&I

2.2.2 RegionalTranswaCost per passenger kilometreThe average cost per passenger kilometre for road coaches was $0.25 (down 3.8 per cent from 2015-16). Although patronage targets were not met, the introduction of the new road coach fleet has resulted in reduced maintenance costs and lower fuel costs which are the attributors to this decrease.
The average cost per passenger kilometre for trains was $0.55, up 17.02 per cent, mainly due to lower patronage and higher operational expenditure on railcar maintenance.
Revenue and expenditureTranswa system revenue ($ millions)
0
2
4
6
8
10
2014-15 2015-16 2016-17
$10
$10
$9.7
Revenue was down by 3 per cent at $9.7 million, with a decrease in passenger numbers being the major contributor.
Photo: Alan Berry, N&I
Transwa system expenditure ($ millions)
0
10
20
30
40
50
60
2014-15 2015-16 2016-17
$46.
66
$47.
91
$47.
39
$47.
25
$50.
02
$49.
92
Actual Budget
Expenditure increased by 5.55 per cent to $50m, mainly due to higher costs on the train fleet – a reflection of higher levels of maintenance and associated labour costs.
TransRegionalCost of the serviceThe cost of operating regional town bus services in 2016-17 was $23.9 million, up 29.2 per cent from $18.5m in 2014-15.
The cost of intra-town services increased 20.1 per cent from $17.4 million to $20.9m, mainly as a result of the inclusion of full depreciation costs for PTA-owned assets (buses and depot) used in the provision of services. In the previous year, only partial depreciation costs were included.
For inter-town services, the cost increased 175.2 per cent from $1.1 million to $3.1m. The major reason for this was the inclusion of the costs associated with the subsidisation of the road coach service operating between Perth and Broome, which took effect from November 2016.
39PTA Annual Report / Regional

40
2.3 PTA in the community
We continue to ensure services are satisfactory, safe, secure, accessible, effectively communicated and sustainable.
PTA Annual Report / PTA in the Community
2.3.1 Customer satisfactionWe measure the success of Transperth and Transwa services through an annual Passenger Satisfaction Monitor (PSM) undertaken by an independent market research organisation. The survey conducts detailed face-to-face interviews with adult public transport users to assess passenger satisfaction with aspects of our services, safety and security.
The Transperth PSM has been running for 27 years. In 2017, 4100 passengers were surveyed, covering all bus contract areas, all rail lines, and the ferry service. The Transwa PSM has been running for 15 years and surveyed 1269 passengers, covering road coach operations and rail services.
PSM results are further outlined in the audited key performance indicators and can be accessed at www.transperth.wa.gov.au and www.transwa.wa.gov.au
TransperthIn 2017, overall customer satisfaction with Transperth services system-wide (calculated as the weighted average across all modes) rose 0.9 per cent.
Level of overall customer satisfaction across all Transperth services (per cent)
0
20
40
60
80
100
88.4
90.2
91.0
2015 2016 2017
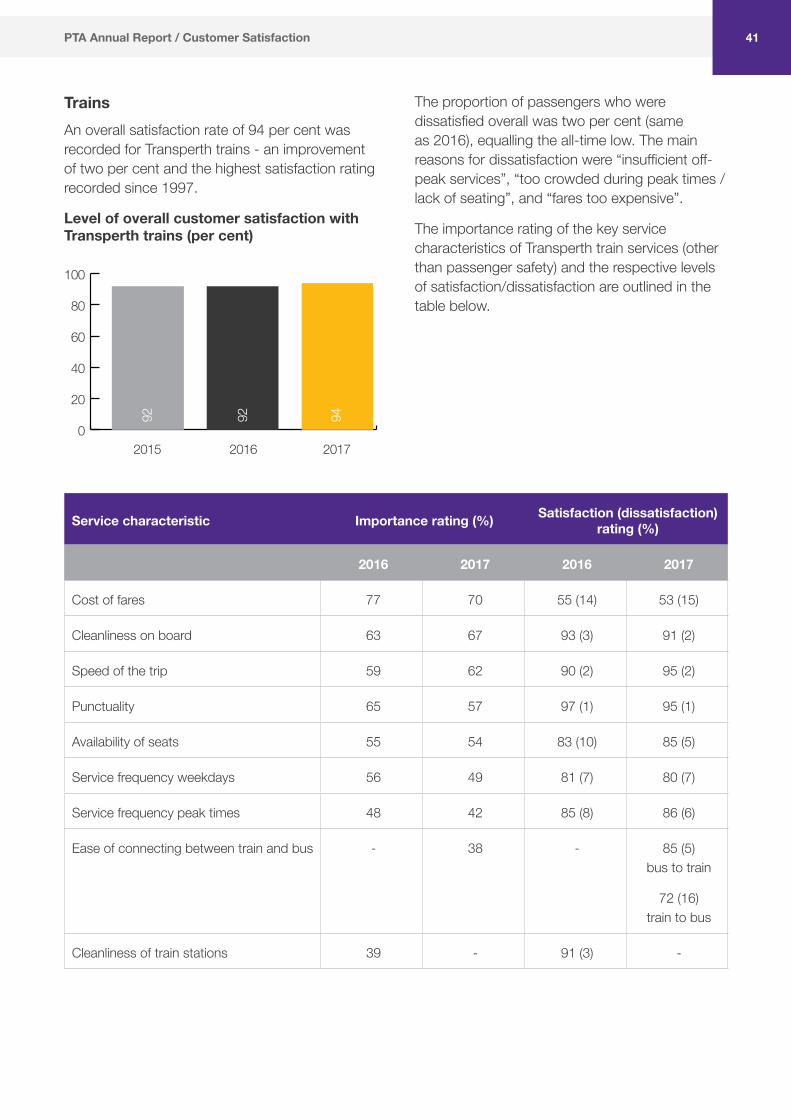
41
Service characteristic Importance rating (%) Satisfaction (dissatisfaction) rating (%)
2016 2017 2016 2017
Cost of fares 77 70 55 (14) 53 (15)
Cleanliness on board 63 67 93 (3) 91 (2)
Speed of the trip 59 62 90 (2) 95 (2)
Punctuality 65 57 97 (1) 95 (1)
Availability of seats 55 54 83 (10) 85 (5)
Service frequency weekdays 56 49 81 (7) 80 (7)
Service frequency peak times 48 42 85 (8) 86 (6)
Ease of connecting between train and bus - 38 - 85 (5) bus to train
72 (16) train to bus
Cleanliness of train stations 39 - 91 (3) -
TrainsAn overall satisfaction rate of 94 per cent was recorded for Transperth trains - an improvement of two per cent and the highest satisfaction rating recorded since 1997.
Level of overall customer satisfaction with Transperth trains (per cent)
0
20
40
60
80
100
92 92 94
2015 2016 2017
The proportion of passengers who were dissatisfied overall was two per cent (same as 2016), equalling the all-time low. The main reasons for dissatisfaction were “insufficient off-peak services”, “too crowded during peak times / lack of seating”, and “fares too expensive”.
The importance rating of the key service characteristics of Transperth train services (other than passenger safety) and the respective levels of satisfaction/dissatisfaction are outlined in the table below.
PTA Annual Report / Customer Satisfaction

42
BusesOverall satisfaction with all Transperth bus services was 89 per cent, remaining the same as 2016 and the highest satisfaction rating recorded since 1996.
Level of overall customer satisfaction with Transperth buses (per cent)
0
20
40
60
80
100
86 89 89
2015 2016 2017
The proportion of users who were dissatisfied was six per cent – remaining the lowest since 1996. The main reasons for dissatisfaction in 2017 were “services not frequent enough”, “insufficient off-peak services after 6pm on weekends”, “services unreliable”, and “bus and train do not connect well”.
The importance rating of the key service characteristics of Transperth bus services (other than passenger safety) and the respective levels of satisfaction/dissatisfaction are outlined in the table below.
Service characteristic Importance rating (%) Satisfaction (dissatisfaction) rating (%)
2016 2017 2016 2017
Punctuality 68 70 85 (9) 81 (10)
Cost of fares 68 60 57 (13) 63 (11)
Cleanliness on board 57 53 96 (1) 94 (1)
Ease of connecting between buses and trains
47 49 91 (5) bus to train
78 (13) train to bus
89 (5) bus to train
78 (12) train to bus
Shelter provided at the bus stop 52 48 82 (11) 80 (12)
Service frequency weekdays 47 46 75 (16) 75 (13)
SmartRider – 45 – 98 (11)
Speed of the trip – 44 – 93 (2)
Availability of seats 49 – 95 (2) –
PTA Annual Report / Customer Satisfaction

43
Service characteristic Importance rating (%) Satisfaction (dissatisfaction) rating (%)
2016 2017 2016 2017
Cleanliness on board 73 71 99 (0) 100 (0)
Cost of fares 74 70 87 (1) 88 (2)
Punctuality 65 70 98 (0) 98 (1)
Service frequency weekdays 58 60 91 (4) 87 (4)
Availability of seats 54 54 98 (1) 100 (0)
Shelter at the jetty 51 53 68 (25) 72 (23)
Speed of the trip 52 43 95 (3) 98 (0)
Availability of timetables – 42 – 78 (2)
ATVs working correctly 44 – 79 (21) –
Transperth ferriesIn 2017, 99 per cent of ferry users expressed overall satisfaction with Transperth ferry services - returning to a near equal all time high and recovering four per cent from 2016.
Level of overall customer satisfaction with Transperth ferries (per cent)
0
20
40
60
80
100
100
95 99
2015 2016 2017
The proportion of users who were dissatisfied was one per cent – maintaining historical trends.
The importance rating of the key service characteristics of Transperth ferry services (other than passenger safety) and the respective levels of satisfaction/dissatisfaction are outlined in the table below.
PTA Annual Report / Customer Satisfaction
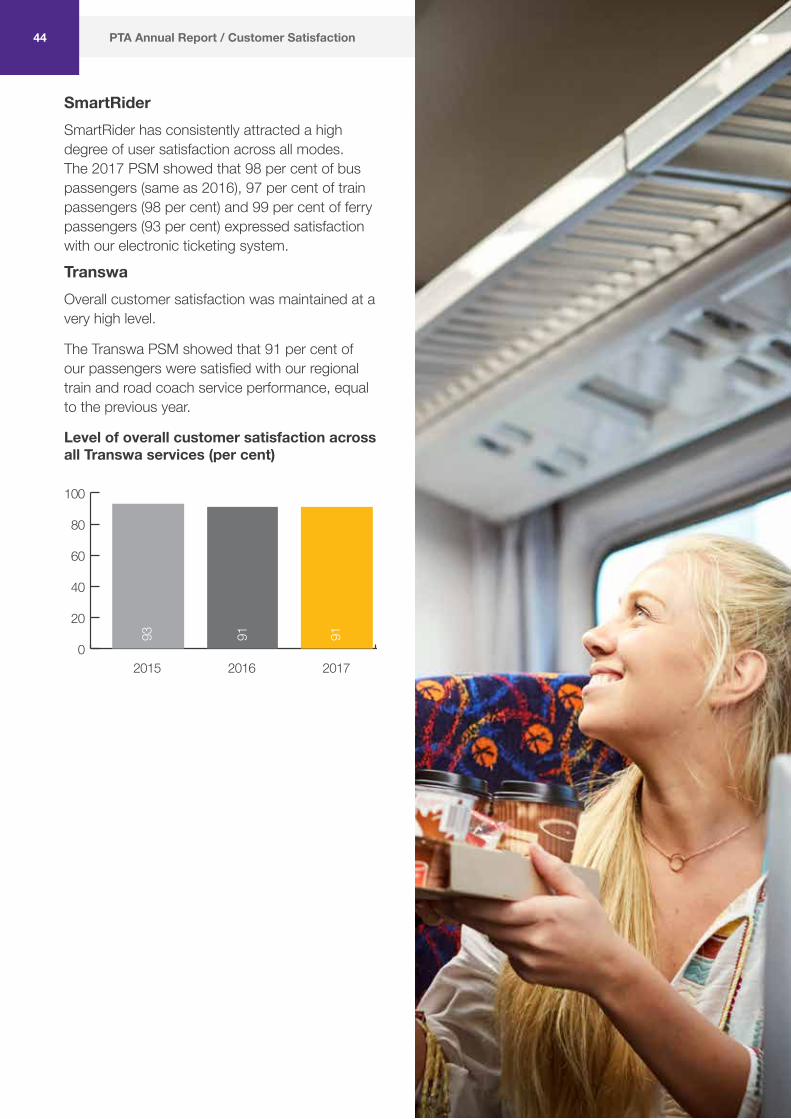
44 PTA Annual Report / Customer Satisfaction
SmartRiderSmartRider has consistently attracted a high degree of user satisfaction across all modes. The 2017 PSM showed that 98 per cent of bus passengers (same as 2016), 97 per cent of train passengers (98 per cent) and 99 per cent of ferry passengers (93 per cent) expressed satisfaction with our electronic ticketing system.
TranswaOverall customer satisfaction was maintained at a very high level.
The Transwa PSM showed that 91 per cent of our passengers were satisfied with our regional train and road coach service performance, equal to the previous year.
Level of overall customer satisfaction across all Transwa services (per cent)
0
20
40
60
80
100
2015 2016 2017
93 91 91
44

45
CASE STUDYThe future of ticketing is in the cards – that’s Smart!It’s a humble plastic card which contains nothing more remarkable than a tiny wire antennae and a little silver disc but, after 10 years and 2.4 million cards, SmartRider has changed the face of our operations.
SmartRider was launched on January 14, 2007, after about 15 months of testing with select passenger groups.
Ticketing and performance manager Wayne Veaney, who helped develop the card in his former role as SmartRider project manager, said there was a good reason SmartRider had been such a resounding success.
“We kept it simple,” he said.
“We didn’t have complicated business rules, we didn’t try to manufacture the card to go out and buy items from the local fast food store or anything like that which other States have tried to do.
“In addition we already had an integrated system with an established fare structure. A lot of the other States have different fares on buses and trains and different operators.”
As the liaison between the project team and the Britain-based developers, part of Wayne’s job was ensuring there were no glitches.
“We did think a few times if we can’t fix this particular issue we can’t launch,” he said.
“In the early days there were issues with the card-read speed. We specified 300 milliseconds and when we did our factory acceptance test in England, it was well in excess of 500 milliseconds.
“We wouldn’t accept that because it would be a slow transaction… people would be waiting at gates.”
SmartRider data has also changed things for bus planners.
“Back in the day we had guys who stood on a street corner with a piece of paper and counted how many people were on the bus that went by, as well as monitoring the bus companies for on-time running,” Wayne said.
“Now it’s all done through SmartRider data”
“Our paper-based payment systems were also easier to defraud – people would travel extra zones and not pay. We noticed the increase in revenue immediately after SmartRider was introduced.”
While there were initially concerns about how people would receive the new system, Wayne said as soon as SmartRider was embraced by seniors in the pilot project, he changed his mind.
“We had planned to phase out the old cardboard MultiRiders about three months after SmartRider launched. We phased them out a month early because SmartRider had already been so successful,” he said.
The future for SmartRider is full of possibilities.
Proposals for the second-generation of the card include upgrading card readers to allow payment by credit card (ideal for tourists or occasional users) and upgrading the back-end software so information is stored on an account rather than a card, reducing the lag between payments processing to passenger’s cards.
Crunching numbers – SmartRider$10 – the cost to buy a SmartRider card
25 – per cent, the passenger discount for an AutoLoad-enabled card
80 – per cent of Transperth passengers use SmartRider
200,000 – SmartRider users are signed up for AutoLoad
870,000 – SmartRider transactions on an average weekday
45PTA Annual Report / Case Study

46
2.3.2 Passenger safety and securityTransperthCustomer perception of safetyThe Transperth PSM assesses customer perceptions of safety during the day and at night, both while waiting for and aboard (bus/train/ferry) services.
Across the modes, virtually all passengers felt safe aboard services during the day.
Proportion of respondents who generally feel safe aboard Transperth services during the day (per cent)
0
20
40
60
80
100
2015 2016 2017
99 98 100
99 98 100
99 98 100
Bus Train Ferry
The following table shows the responses for other aspects of the safety perceptions.
2016 2017 Change
Transperth trains
On board (night)
79% 81% 2.5%
At the station/interchange (day)
99% 98% -1%
At the station/interchange (night)
76% 73% -3.9%
2016 2017 Change
Transperth buses
On board (night)
84% 83% -1.2%
At the station/interchange (day)
97% 98% 1%
At the station/interchange (night)
76% 75% -1.3%
Transperth ferries
On board (night)
100% 95% -5%
At the station/interchange (day)
99% 100% 1%
At the station/interchange (night)
97% 92% -5.2%
Commitment to safety and securityTo ensure that all passengers feel safe at all times on our services, digitised CCTV footage from all train and bus stations (including car parks and bike shelters) is monitored at the central monitoring room (CMR), a state-of-the-art facility which is manned 24 hours a day, seven days a week. During the year, the PTA added more than 200 new CCTV cameras to our network. A fleet of 28 patrol cars (nine operated by transit officers covering the rail system, and 19 operated by contracted security officers, covering the bus system) provides a fast and effective response to any incidents of anti-social behaviour. The security presence on trains was increased after 7pm across 98 per cent of all train services.
We introduced an annual bus driver training and refresher program for fire and emergency procedures, including evacuation of Transperth buses.
PTA Annual Report / Passenger Safety and Security

CASE STUDYAlpha crews for our DeltasThe PTA’s 10 Delta crews provide vehicle-based patrol services across the Transperth network, supporting customer service assistants, passenger ticketing assistants, revenue protection officers and fellow transit officers where required, as well as patrolling unmanned stations.
It’s 10.45am on a Friday, and Delta 3 crew Neil Otway and Petr Horak are signing in for their eight-hour railway patrol shift.
Neil has been a transit officer for 13 years, and Petr is a relatively new recruit, with one and a half years under his belt.
“I saw it advertised and applied at age 23, I’d worked in retail for four and a half years prior,” he said.
“My dad was a police officer for 34 years.”
“I thought I’d give this a go and see if I liked it, potentially with a view to joining the police, and then I enjoyed it so much I stayed.”
Neil said their role as one of the most public-facing parts of the PTA could be a double-edged sword, but they were well-trained to handle all kinds of scenarios.
“It’s part of our job to help with whatever the situation requires,” he said.
“While we’re not known for being the most ‘liked’ presence on the network, we do get a lot of really positive feedback, and a lot of people recognise the importance of the job we do,” he said.
“Not everyone is a troublemaker, there are lots of interesting people that you meet in this job that you would never otherwise have a chance to learn about.
“Ticketing and security is part of our core function, but I would say 95 per cent of our job is customer service – we’re just out here doing what we can to support other staff, and to look after our passengers.”
Delta 3 crew Petr Horak (left) and Neil Otway
Petr and Neil acknowledge their railcar driver colleague
47PTA Annual Report / Case Study

48
TranswaTranswa had another positive year with an overall increase in the reporting of incidents, hazards and safety issues. This assisted Transwa to deal with issues in a prompt manner and to meet set business objectives for the year.
The introduction of the new fleet of road coaches has continued to provide Transwa with a very safe service for customers through commitment to safety systems, procedures and processes. The number of passenger injuries during the year remained very low.
Several initiatives were implemented and completed throughout the year; including a review of the National Standard for Health Assessment of Rail Safety Workers medical categories; resulting in revised and more appropriate medical categories being allocated to Transwa positions. Manual handling, firefighting, first aid, safeworking, customer service and hazardous substances awareness training was provided to ensure operational staff had the knowledge and skills to deal with frontline issues.
Workplace inspections, document reviews and internal auditing continued; all demonstrating that Transwa’s safety and quality systems, procedures and activities complied with the PTA’s corporate and legislative requirements.
The Transwa Occupational Safety and Health Committee continued to provide an open and informative forum for safety representatives to raise issues, discuss solutions and provide feedback to operational work areas on safety matters for the area they are elected.
TransRegionalSecurity cages on the Port Hedland town buses were installed to ensure driver safety.
Orange school busesThe two-year safety upgrade program was completed which saw the regional orange school bus fleet retrofitted with child-check alarms. The safety device is de-activated by the driver who must walk to the rear of the bus where the device is located and so ensures that no child remains on the bus at the end of the trip.
2.3.3 Accessible servicesProximity to metropolitan servicesMore than 84 per cent of Perth homes have ready access to public transport. This metric – which has been steady for the past five years – shows the proportion of property street addresses (PSAs) in the Perth public transport area (PPTA) that are within walking distance (500m) of a Transperth stop or station providing an acceptable level of service (ASL). An ASL is defined as a 20-minute or better service in the peak-flow direction during the peak, and at least an hourly service throughout the core of the day.
Proportion of PSA in the PPTA within 500m of a Transperth stop providing an acceptable service level (per cent)
0
20
40
60
80
100
2015 2016 2017
85.0
84.7
84.7
There were 846,547 PSAs within 500m of an ASL stop/station in 2017, an increase of 9.2 per cent in the past five years. The number of ASL stops was 66.2 per cent of all stops, marginally up from 65.6 per cent in 2016.
PTA Annual Report / Accessible Services

49
Diversity and disability and access and inclusionWe provide services to WA’s diverse community in a fair and non-discriminatory manner.
Through our 2012-17 Disability Access and Inclusion Plan (DAIP), we continued to improve access to metropolitan and regional public transport for people with a disability. We also put strategies in place to appropriately communicate with culturally and linguistically diverse (CaLD) customers.
Substantive equality and community education• Transperth’s education team has a goal to
increase patronage, safety awareness and access to the network for people who have high public transport needs. This is achieved through significant face-to-face interactions, online resources, education and training on-site and at stations and major stakeholder engagements. Over the past 12 months the program has assisted over 20,350 people from high-needs groups to access the public transport network.
• Implemented a seniors’ strategy which included dedicated seniors tours in targeted regions (City of Stirling, City of Perth, City of Mandurah, City of Joondalup and City of Rockingham) across metropolitan Perth.
• Managed groups via My Alert emails as a platform to disseminate accessibility-specific updates to relevant organisations.
• Produced an accessibility information kit to assist people with disabilities travelling on the Transperth network.
• Emailed nine accessibility bulletins to 24,325 customers registered with Transperth Accessible Services to advise of system changes, upgrades and other Transperth news relating to accessibility issues.
• Received 209 calls to the Translating and Interpreting Service (TIS) for InfoCentres and Transperth Call Centre, accessing 27 languages.
• Updated staff training DVD Disability Awareness Training for Frontline Staff.
• Updated contact databases for CaLD and disability service organisations.
• Consultation conducted with key stakeholders regarding specifications for new lifts and escalators.
• Continued accepting the Companion Card to allow a companion to travel with a person with a permanent disability at no additional cost.
• Produced a new educational video which was translated into nine key languages, providing pertinent information about using Transperth services, and is available on the Transperth website and YouTube.
• Updated the Transperth website to include a Google Translate function to improve the accessibility of information.
• Developed a Transperth app called Transperth Assist for people with a disability to access information at the new Perth Busport.
• Developed a ‘Sit Stand Go’ education video, which included both closed captions and AUSLAN.
Working groups• Formed the East Perth and Perth Busport
Accessibility and Inclusion Reference Group.
• Actively participated in the Perth Stadium Accessibility and Inclusion Reference Group.
• Held two inclusion user group meetings during the design phase for Forrestfield, Belmont and Airport Central stations.
• Actively participated as a member of the Rail and Bus Standards Working Group to revise the Disability Standards for Accessible Public Transport 2002 and associated standards and guidelines.
• Actively participated as a member of the National Accessible Public Transport Advisory Committee and Accessible Public Transport Jurisdictional Committee.
PTA Annual Report / Accessible Services

50
Transport and infrastructure accessibility improvementsDuring 2016-17, Transperth:• Completed minor modifications to the B-Series
railcars to improve the position of the interior door button and safety signage.
• Reviewed and improved the priority seating in new railcars.
• Audited accessibility levels across all train stations to determine levels of compliance with the Disability Standards for Accessible Public Transport 2002.
• Undertook an upgrade of the train station audio system, which included installing new hearing loop amplifiers across the Transperth network.
• Commenced installation of bollards with lift controls to improve the usability and accessibility of lifts at train stations.
• Increased the number of new, low-floor accessible buses to 99.1 per cent of the total fleet (1457 out of 1469 buses at June 30).
• Upgraded around 700 bus stops to meet the requirements of Federal Disability Standards for Accessible Public Transport under our Bus Stop Accessibility Works Program. More than 4628 upgrades have been completed since this program started in January 2010. Upgrades typically involve the construction of a level concrete passenger boarding area at correct kerb height, installation of tactile ground surface indicators, and a short connection to the existing local footpath network.
• Continued accessible ferry services from the fully-accessible jetty at Elizabeth Quay.
During the year, RTBS:
• Early completion of the RTBS bus replacement strategy has ensured the TransRegional fleet is now 100 per cent fully accessible.
During the year, Transwa:
• Continued its work with Safety and Strategy towards advancing the third party agreement for the construction of high-level platforms at regional stations on the South West Main and the Eastern Goldfields Railway.
PTA Annual Report / Accessible Services

CASE STUDYIf you have a problem, we’re here to help!For members of the community with mobility, vision or other impairments, navigating our network can sometimes be challenging.
Several sections of our business are devoted to addressing that challenge with a number of initiatives.
The PTA’s Disability Access and Inclusion Plan, which was launched in 2002, sets out to remove existing access barriers, allowing all passengers independent travel. For sustainability coordinators Deb Gee and Jim Altham, universal access is key.
“For the past six months we’ve been auditing all our train stations for accessibility issues; answering a few hundred questions per station, down to detail like the diameter and height of the handrail,” Deb said.
“Our role also involves coordinating and liaising with a lot of the disability groups – there’s a technical side but there’s also a personal side,” Jim said.
“Building confidence to get people out is very hard, but if they go to a station and they get stuck they will never go out again, so it’s really important we get it right.”
Something as simple as the colour of platform markings can be incredibly important. For example, red markings against black asphalt, while very visible to someone with good eyesight, are low-contrast and almost invisible to many people with poor vision.
The notion that we help only people with an “official” disability is incorrect – there are people with prams or walkers, seniors who are no longer quite as nimble as they once were, right down to people who have recently had surgery.
As the Transperth system adds new stations, technologies, infrastructure and services, Louise Madden and the education team continue to identify challenges and tailor solutions so that everyone can access public transport. Prioritising
people with high public transport needs has seen demand for the program increase among people with disabilities and the ageing population.
“Learning how to use public transport is a vital means of gaining and maintaining independence,” Louise said. Chayne Chitarra, who has been a customer service assistant for the past two years, helps passengers on and off Transperth trains every day. The special assistance program has been in place for decades, with about 330 assisted trips taken by passengers every week.
“Passengers can call the special assistance number (1800 800 022) to book in, and then a customer service assistant, passenger ticketing assistant or transit officer will meet them at their station and help them on to the train,” he said.
“The staff member calls through when they depart, and someone else helps the passenger off when they get to the station.
“It’s such a good service, because it makes people feel comfortable and safe on the network.”
PTA Annual Report / Case Study
Chayne Chitarra, Jim Burke, Deb Gee and Louise Madden
51

52
2.3.4 Communicating with our customersIt is important that information about our services and projects is communicated in a timely manner. Communication strategies are applied to improve patronage and increase customer satisfaction and awareness of the benefits of public transport.
Metro activities• Successfully launched and promoted the
opening of Perth Busport, including the implementation of an iOS and Android App for people with a disability, and training regarding the Dynamic Stand Management System (DSMS).
• Continued improving signage at bus and train stations as part of a system-wide upgrade to enhance visibility of key components of infrastructure.
• Continued working with major event organisers to provide special event services and promote integrated ticketing, as well as promoting Transperth services to get to events.
• Prepared the first major shutdown of the Armadale Line to facilitate the building of the new Perth Stadium Station.
• Continued providing service disruption information to passengers across all modes of public transport.
• Continued delivering Get On Board presentations to a broad range of community groups, with the aim of encouraging more people to safely travel on Transperth services.
• Successfully launched the “Don’t Mess with Bus” campaign; aimed at encouraging safety among students around buses.
• Delivered service change information to passengers, including the opening of Claremont Station carpark and changes to Scarborough Beach Bus Station.
• Continued administering the Right Track youth education campaign to encourage safe travel and behaviour on the system.
• Successfully launched and promoted the opening of Aubin Grove Station.
• Launched an extensive campaign to encourage cycling to stations.
• Promoted the introduction of the new high-frequency bus route – the Route 960 bus service – which resulted in a significant increase in patronage.
• Developed and implement a social media strategy designed to improve passengers’ ability to receive real-time information.
PTA Annual Report / Communicating with our Customers

With more than 1.2 million impressions online, kilometres of signage and 50,000 flyers handed out, the communications was well received and supported the operational plan by encouraging passengers to plan ahead or find alternative transport.
The result was no passengers left behind in July and consistently 62% lower rail patronage compared to same period the year before in January.
The complexity, scale and effectiveness of the communications was recognised by the International Association of Business Communicators (IABC) at the World Conference in Washington DC, with a 2017 Golden Quill Excellence Award for a Government Communications Program awarded to the team.
CASE STUDYPerth Stadium Transport - Shutdowns‘I just wanted to say that as a resident in Carlisle, I thought the communications and services throughout the Shutdown were excellent. Thank you very much.’ Jody
Jody is one of the 15,000 Armadale Line passengers and thousands of residents who were impacted every day in two unprecedented rail shutdowns on the Transperth network.
Required to deliver the six-platform Perth Stadium Station, a critical piece of infrastructure for Perth Stadium, the first (July 2016) was a nine day shutdown of the entire line and the second (January 2017) was a 17-day major disruption of limited services and shutdowns.
With a strategic purpose to provide safe, customer-focussed, integrated and efficient transport services, keeping passengers moving was at the heart of the well-planned operational and communications strategy.
53

54
Regional activities• Transwa engaged with its customers and the
regional community throughout the year to improve patronage and increase the customer satisfaction experience with regional public transport services.
• With the AvonLink Train Enhancement Service trial, Transwa met extensively with the Local Governments of Northam and Toodyay and also with the Shire of Goomalling, Koorda and Mukinbudin. Extensive community consultation was also organised to ensure that community members had a voice in the conduct of the trial.
• This year Transwa took a more active approach with different tourism agencies to encourage tourism into regional areas.
• Transwa attended key regional events such as Have a Go Day to promote Transwa services.
• Continued membership with regional tourism bodies for the ongoing promotion of Transwa services.
• Developed and launched significant upgrades to the Transwa website.
• Produced a series of content videos to inform passengers about Transwa services and facilities.
• Promoted the introduction of the new Web Saver and Family fares.
2.3.5 Environment and sustainabilityWe continue to identify opportunities to maximise sustainability in the delivery of services. In 2016-17 we:
• Implemented the PTA Environmental Management Systems (EMS) manual to achieve legal compliance, control operational and capital works risks, and encourage ongoing improvement to our environmental performance.
• Installed PTA’s first renewable energy project; a 46-panel Solar System (11.96kw) on the roof of Mandurah Station, partnered with Synergy. This project has a payback period of three years and will reduce greenhouse gas emissions by 16,724kg CO2e-.
• Continued the PTA Water Efficiency Management Plan at the Public Transport Centre (PTC).
• Undertook real-time monitoring for the 73 water data loggers installed at train stations for early detection of water leaks.
• Continued using recycled water and reverse osmosis to wash railcars.
• Continued implementing energy efficiency measures identified as part of the energy assessment of the PTC. This involved installing LED lights which contributed to a three per cent energy-use reduction.
• Expanded the recycling system at the PTC.
• Carried out environmental audits at Transwa depots and PTA yards.
• Evaluated the online training of the EMS manual for staff.
• Acquired 28 additional Transperth buses which comply with Euro 6 emission standards, as well as nine Transwa road coaches which comply with Euro 5 standards.
• Developed a Sustainability Position Statement for the Forrestfield-Airport Link project.
• Adopted the Infrastructure Sustainability Council of Australia (ISCA) rating scheme for the Forrestfield-Airport Link, to evaluate and drive sustainability performance across all stages of the project.
• Integrated infrastructure for pedestrians and cyclists.
• Continued protecting and restoring air, water, soils, flora and fauna across our network.
PTA Annual Report / Environment and Sustainability

55
2.4 Infrastructure deliveryAs well as providing world-class public transport services, we strategically plan and manage our land and physical assets and deliver the infrastructure required to meet current and future transport demands.
We also invest heavily in maintenance and upgrades to improve our system’s safety, efficiency and resilience.
2.4.1 Planning for the futureThrough our IPLS division, we undertake major transport and infrastructure planning, railway engineering, and land and environmental management.
Rail engineering and infrastructure planningIPLS’ rail engineering and planning expertise provides us (and other State agencies) design solutions with sufficient detail to inform planning decisions, and underpin costing and scoping of the State’s public transport strategies.
Rail planning activities• Continued developing our Route Utilisation
Strategy (RUS), including ongoing network operational modelling, preparation of a number of station access strategies and reviewing infrastructure requirements.
• Worked with stakeholders to understand potential options for removing level crossings on the Armadale line through either grade separation or closure.
• Progressed planning investigations for a number of METRONET rail initiatives, including relocation of Midland Station, extension of the Midland line to Bellevue and a railway to Ellenbrook.
• Progressed finalisation of the Thornlie Line Extension and Yanchep Rail Extension business cases for submission to Government.
Rail engineering activities• Undertook concept and detailed design of rail
infrastructure such as depots, crossovers and sidings at key locations to support the current and future operational and maintenance requirements of the suburban rail network.
• Supplied railway engineering expertise and oversight for design and construction of railway works as part of grade separations over the freight network.
• Provided conceptual rail infrastructure designs for planned future extensions and additions to the suburban railway network.
• Supplied engineering expertise to DoT for freight initiatives and to MRWA for level crossings and grade separations on both the freight and suburban network.
Land and property managementWe manage and maintain our land assets (acquire, sell and lease), work closely with Brookfield Rail regarding the State’s rail freight corridor, and address European heritage matters.
Initiatives in 2016-17 included:
• Generated approximately $16.5 million income from land leasing.
• Acquired land at Mount Claremont from Western Power for a new Transperth Bus Depot.
• Completed land acquisition for the Kenwick rail freight facility.
• Completed land acquisition for Forrestfield-Airport Link.
• Secured $1.8 million from the sale of Lot 9600 North Coogee through railway discontinuance legislation.
• Sold the Wongan Hills Station Master’s House and Geraldton Gatekeeper’s House.
PTA Annual Report / Infrastructure Delivery

56
• Undertook mitigation of low/medium risks on disused rail lines across the South-West (50 per cent complete).
• Continued to effectively manage relationships with Brookfield Rail and third party access for works.
Environmental managementStrategic environmental planning and management activities in 2016-17 included:
• Investigated and remediated approximately 20 contaminated sites across WA.
• Obtained environmental and heritage approvals for the Kenwick rail freight facility project.
• Completed contamination investigations required to facilitate development of the Bellevue passenger railcar depot.
• Inspected asbestos across metropolitan and regional assets; and removed asbestos from nine sites as part of our strategy to reduce ongoing obligations to inspect and maintain asbestos.
• Completed rehabilitation of Chris Hill Quarry.
• Provided environmental support for the Perth Stadium project, including the Swan River Pedestrian Bridge; as well as Aubin Grove Station.
• Finalised a Bushfire Management Strategy outlining statutory responsibilities for bushfire hazard reduction for all activities and operations undertaken on PTA land.
• Prepared monthly out-of-hours Noise Management Plans for track, structures and overhead line maintenance work for submission to local councils.
Looking ahead
• Provide critical support to the new METRONET team, including undertaking business case development, rail infrastructure designs,
environmental and heritage surveys and securing key approvals to enable investment decisions and facilitate delivery of identified projects.
• Finalise the project definition plans for the Yanchep Rail Extension and Thornlie Line Extension.
• Continue rail infrastructure design works, development of station access strategies and a comprehensive review of patronage forecasts and railcar requirements to support our RUS and Government’s METRONET initiatives.
• Continue supporting the Perth Stadium and Forrestfield-Airport Link projects with land and environmental requirements, and plan support for upcoming projects including the Yanchep Rail Extension and Thornlie Line Extension.
• Continue managing and, where required, rationalising surplus land together with leasing to optimise value to the State.
2.4.2 Major projectsThe focus of our Major Projects Unit in 2016-17 was to continue managing and delivering a portfolio of major transport projects valued at more than $3 billion.
All projects are developed in consultation with the community and in line with our environmental targets. A key focus for this year was to look for opportunities to continuously improve the consistency of compliance with the following PTA procedures and protocols:
• Engineering Assurance;
• Project Management Framework;
• Contract Management and Contract Management rollout into Ellipse;
• Asset Information Management; and
• Capital Budgeting Process and financial reporting
PTA Annual Report / Major Projects
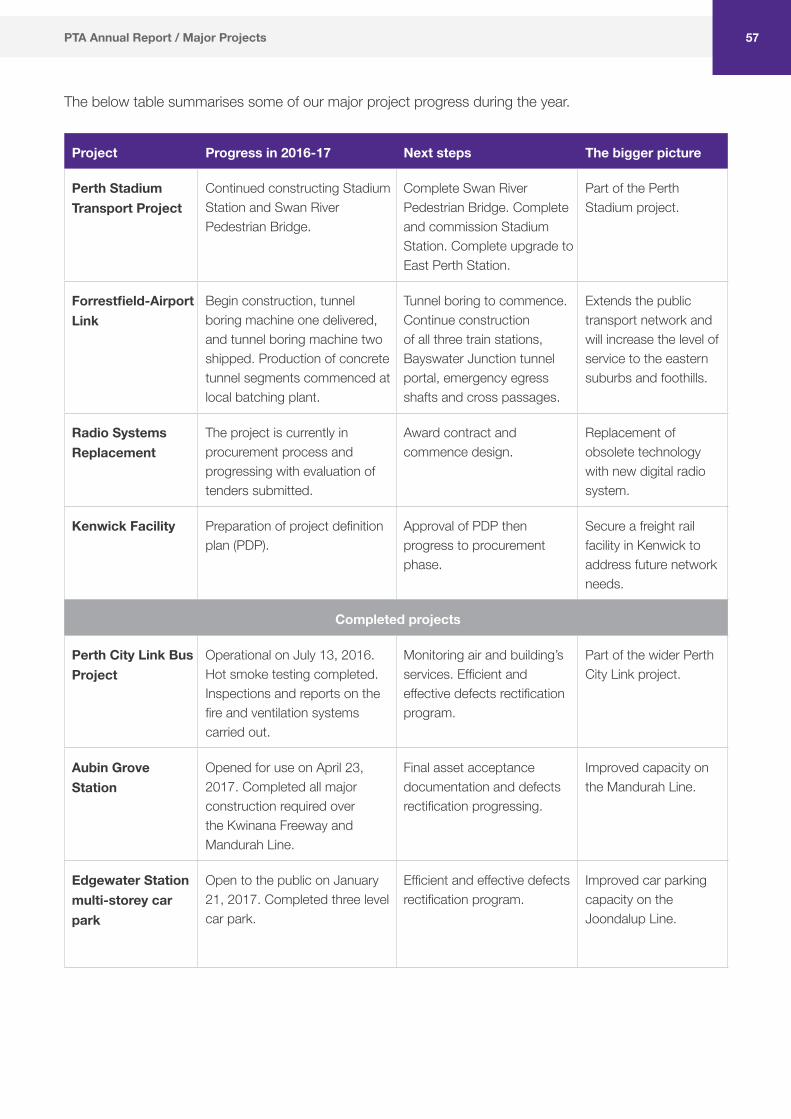
57
The below table summarises some of our major project progress during the year.
Project Progress in 2016-17 Next steps The bigger picture
Perth Stadium Transport Project
Continued constructing Stadium Station and Swan River Pedestrian Bridge.
Complete Swan River Pedestrian Bridge. Complete and commission Stadium Station. Complete upgrade to East Perth Station.
Part of the Perth Stadium project.
Forrestfield-Airport Link
Begin construction, tunnel boring machine one delivered, and tunnel boring machine two shipped. Production of concrete tunnel segments commenced at local batching plant.
Tunnel boring to commence. Continue construction of all three train stations, Bayswater Junction tunnel portal, emergency egress shafts and cross passages.
Extends the public transport network and will increase the level of service to the eastern suburbs and foothills.
Radio Systems Replacement
The project is currently in procurement process and progressing with evaluation of tenders submitted.
Award contract and commence design.
Replacement of obsolete technology with new digital radio system.
Kenwick Facility Preparation of project definition plan (PDP).
Approval of PDP then progress to procurement phase.
Secure a freight rail facility in Kenwick to address future network needs.
Completed projects
Perth City Link Bus Project
Operational on July 13, 2016. Hot smoke testing completed. Inspections and reports on the fire and ventilation systems carried out.
Monitoring air and building’s services. Efficient and effective defects rectification program.
Part of the wider Perth City Link project.
Aubin Grove Station
Opened for use on April 23, 2017. Completed all major construction required over the Kwinana Freeway and Mandurah Line.
Final asset acceptance documentation and defects rectification progressing.
Improved capacity on the Mandurah Line.
Edgewater Station multi-storey car park
Open to the public on January 21, 2017. Completed three level car park.
Efficient and effective defects rectification program.
Improved car parking capacity on the Joondalup Line.
PTA Annual Report / Major Projects

58

2.4.3 Network maintenance and upgradesOur N&I division manages our metropolitan rail infrastructure, the asset investment program, and delivery of information technology services.
Routine maintenance is carefully planned on our network so that our infrastructure is safe and reliable for employees and passengers.
Our KPI, to deliver a reliable infrastructure system, sits at 99.44 per cent (just above our target of 99.25 per cent).
Photo: Matt Beilken, TTO
59PTA Annual Report / Network Maintenance and Upgrades

CASE STUDYIn this job, you need to keep the overheads high.When you’re next gazing up at our overhead lines, spare a thought for the crew who are out looking after them day and night, rain, hail or shine.
Nick Rainey and Blake Foster are two of the PTA’s senior linesmen, charged with the power lines that run our train network.
“As linesmen we install, maintain and repair the power lines for the trains,” Nick said.
“We check out people’s work sites and ensure they aren’t in the danger zone,” Nick said.
Nick and Blake both came to PTA after their fathers – also PTA employees – encouraged them to apply.
“I came from a mining freight company where I did everything except drive trucks,” Nick said.
“My dad was one of the train control officers here at the time. He’d been trying to talk me in to working for the PTA for many years so I eventually decided to bite the bullet and find out.”
He’s now been here for eight years.
Blake, who started at the PTA when he was 18, has been here for five years.
There are four gangs of linespeople, with one gang always on call.
“Anything could happen, from a bird strike to balloons or shoes fouling the overheads,” Nick said.
“They can all cause damage to the pantograph on top of the trains which can then cause damage to the overheads, so we need to remove them,” Blake said.
“We pride ourselves on our safety culture and how we work,” said Nick. “If we don’t do our jobs properly, everyone’s in trouble … without power, there would be no trains.”
Blake says there are plenty of perks to the job.
“Being outside all the time is great, not being crammed in an office all day – getting out to see the world,” he said.
“Also, there are opportunities to get – and use – all sorts of qualifications, because we have everything from forklift tickets up to truck and crane licenses.
“And we’re not limited to one work site. It’s all of Perth—there’s about 300km of track and you could be out anywhere, any time.”
“It’s good to see the progress on big infrastructure projects as they are being done,” Nick said.
“The Stadium I’ve seen a fair bit of, it’s good to see how everything is going and what everyone else is doing.”
PTA Annual Report / Case Study60

61
Network reliability improvementsOverhead line equipmentA recovery project was completed to rapidly improve the reliability of electrical overhead line equipment (OLE) and prevent train delays on our system. The project resulted in removal of 2400 defects, introduction of a detailed planning and maintenance regime, improved work instructions, the production of a defect rectification handbook, and development of a highly-skilled maintenance workforce to continue delivering a well-maintained asset. This year the OLE has contributed to only two major train delay occurrences.
Track infrastructureTo optimise the rail/wheel interface, a new grinding profile has been implemented and should demonstrate an improved whole life cost of the rail. In readiness for the state-of-the-art MerMec Roger 800 measuring vehicle, recruitment of key resources to operate and analyse the data has begun.
Lineside infrastructureDespite higher than normal summer rainfall, the lineside vegetation has been managed effectively without incidents such as signals being obscured or contact with overhead line equipment. All vegetation has been inspected, tagged and has an optimal management plan that means vegetation management can be planned more proactively.
Signalling equipmentAn improvement program was commenced to improve reliability of the signalling system and prevent train delays. The project to date replaced 24 points machines, improving the assets reliability by 50 per cent, and replaced 117 track circuits, increasing the average rate of failure to approximately once every 10 years.
Improved resilienceInfrastructure has been altered to improve the ability to respond to incidents and allow more effective access for maintenance. The alternative train control facility is now fully operational with regular testing taking place and it was used during the year following a power failure at the PTC.
SafetyIn addition to improving competency and procedures the installation of hundreds of barriers to create new positions of safety has improved the protection for people working on the railway. Additional access points reduce the exposure to the operational railway as well as improve the efficiency of rapid response and maintenance.
Long-line public address systemThis year saw the completion of the Long-line public address upgrade project with no interference to services from either a passenger or user perspective. The new system is much more flexible than the old system and allows announcements to be produced and managed by the Customer Information Operators as well as by local station staff. The new system monitors all speaker chains and automatically notifies the maintenance team of faults which can be rectified quicker and is no longer dependant on passenger or staff reports.
PTA Annual Report / Network Maintenance and Upgrades

62
UpgradesOngoing improvement to our network is crucial to meet the demands of customers. Though most of the work remains unseen by the public, the impact on passengers is likely to be significant should the infrastructure fail. Upgrades that took place in the year are outlined below
Project Progress in 2016-17 Next steps The bigger picture
Elizabeth Quay and Perth Underground escalator replacement
Escalators and lift ordered.
Commencement of works at both Perth Underground and Elizabeth Quay station.
Commissioning of lifts at both stations by the end of November 2017.
Installation of five escalators at both stations by end of June 2018.
Realigned stairs leading from north end of Perth Underground platform by end of September 2017.
Commencement of preventative maintenance agreement for each commissioned escalator.
The replacement escalators will increase capacity to efficiently move passengers and improve reliability of the system.
Bike shelter upgrades Scope of the project agreed and designs approved.
Contract awarded at the end of the year for fabrication, supply and installation of shelters.
Works under contract to continue throughout the 2017-18 financial year, with future installation works also planned for the 2018-19 financial year.
The three-year program will significantly increase the number of bicycle parking spaces, by adding in excess of 1000 more secure spaces.
Escalator and lift upgrade
Fifteen escalators completed.
All six lifts completed.
Upgrades completed in November 2016.
The program will improve the reliability and disability access of lifts and escalators.
Greenwood Station canopy extension
Project to extend the platform canopy to be 80 per cent complete by end of financial year.
Project to be completed in August 2017.
CCTV, lighting and public audio system to be installed.
Increased weather protection and safety for passengers.
PTA Annual Report / Network Maintenance and Upgrades
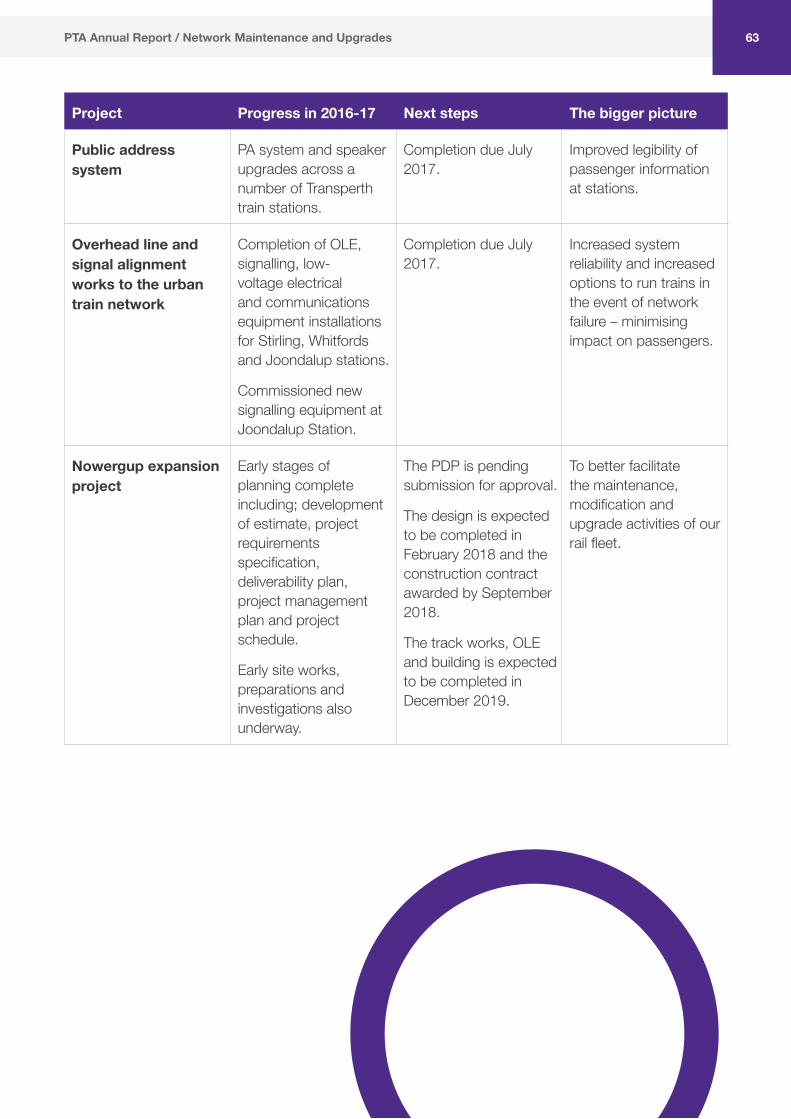
63
Project Progress in 2016-17 Next steps The bigger picture
Public address system
PA system and speaker upgrades across a number of Transperth train stations.
Completion due July 2017.
Improved legibility of passenger information at stations.
Overhead line and signal alignment works to the urban train network
Completion of OLE, signalling, low-voltage electrical and communications equipment installations for Stirling, Whitfords and Joondalup stations.
Commissioned new signalling equipment at Joondalup Station.
Completion due July 2017.
Increased system reliability and increased options to run trains in the event of network failure – minimising impact on passengers.
Nowergup expansion project
Early stages of planning complete including; development of estimate, project requirements specification, deliverability plan, project management plan and project schedule.
Early site works, preparations and investigations also underway.
The PDP is pending submission for approval.
The design is expected to be completed in February 2018 and the construction contract awarded by September 2018.
The track works, OLE and building is expected to be completed in December 2019.
To better facilitate the maintenance, modification and upgrade activities of our rail fleet.
PTA Annual Report / Network Maintenance and Upgrades

64
Project Progress in 2016-17 Next steps The bigger picture
Infrastructure diagnostics vehicle (IDV)
Currently in final phase of manufacturing.
Finalisation of commissioning plan.
Appointment of personnel to operate IDV and measuring systems.
Issuing of draft preventative maintenance agreement for measuring systems.
IDV to arrive late August 2017.
Commencement of commissioning the vehicle and measuring systems.
Training of newly-appointed personnel to operate IDV and systems.
Signing of preventative maintenance agreement for the measuring systems.
The IDV will analyse and produce rail infrastructure data (overhead and track) leading to a better understanding and management of track assets and maintenance.
Bayswater Station principal shared path (PSP) upgrade
Site possession and construction of temporary PSP ramp has taken place.
Key design issues addressed.
Demolition has commenced for limestone wall construction.
Project to be completed by August 2017.
Key deliverables include installation of a bridge over existing underpass, construction of PSP, PSP lighting and new fencing
The PSP connection will greatly improve safety and accessibility at the station by separating bicycle and pedestrian traffic from car movements.
Charles Street Bus Bridge and Northbridge Bus Layover
Charles Street Bus Bridge operational in late June 2017.
Northbridge Bus Layover to be completed in late August 2017.
Improved travel time reliability for passengers, alleviating traffic congestion in Northbridge.
PTA Annual Report / Network Maintenance and Upgrades

65

66
2.5 Our peopleOur aim is to secure a workforce with the right capabilities and attitudes. We do this by developing, attracting and retaining the right employees to meet our business needs.
Our People and Organisational Development division provides strategic and operational labour relations, HR services and systems, workforce management, payroll and training services for the PTA whilst ensuring compliance with relevant legislation.
The PTA is a Registered Training Organisation (RTO) under the Vocational Education and Training Act 1996 and trains its own train drivers, transit officers, infrastructure employees, ticketing and customer service staff. In addition, POD also manages the PTA’s graduate program and budget along with the contract management of the Employee Assistance Program and other PTA programs.
Comprising of three branches; Labour Relations; Human Resource Services; and Learning & Organisational Development, POD undertakes a range of business roles, to allow the PTA managers to focus on their primary roles and meet business outcomes.
People matrixStaff profile• 1744 total employees (1672 in 2015-16)
• 93 per cent of employees retained within the year
• 209 new starters during 2016-17
• 20 per cent 35 years and younger
• 26 per cent 55 years and older
• 62 per cent of employees have been with us for more than five years
• 9.7 years average length of service
• 6432 job applications received (151 were offered positions)
Occupational groupings• 60 per cent employed in operations which
involve looking after the day-to-day processes of delivering our public transport system.
• 25 per cent employed in infrastructure which relates to construction and maintenance of tracks, signals, stations and other facilities which allow services to operate.
• 15 per cent support service delivery in the areas of policy development and implementation, safety, contracts, communication and other corporate areas.
• Operational numbers include:
О 276 train drivers
О 290 transit officers
О 206 customer and ticketing service staff
О 69 engineers
О 34 road coach operators
О 17 signal and electrical technicians
О 28 linespersons (electrical overhead)
О 29 railway track maintainers
О 20 train controllers
О 50 contract administrators
PTA Annual Report / Our People
67
Key activitiesPOD continued to work with the wider PTA to design and implement initiatives to attract, engage, develop and manage our people.
Strategic people managementThe PTA launched its Leadership and Management (L&M) development program which emphasises the importance and impact of both effective management and good leadership. An evolution on previous strategies, the new L&M program takes a holistic approach to learning beyond the classroom to ensure learning is ongoing through on-the-job experience and application of skills and knowledge.
Additional development options are identified through the PTA’s MAP process and the Individual Development Plan (IDP) process which supports the PTA’s Succession Risk Management Program.
Leadership and Organisational DevelopmentThis year, POD merged the HR strategy branch and the Learning and Development branch to create a new branch known as Learning and Organisation Development (L&OD). A significant focus for the L&OD branch is growing our own skilled workforce.
POD continues to provide Safeworking training to the PTA’s rail safety workers and third party operators who wish to access the PTA rail network. This is a significant role to ensure the organisation meets its safety responsibilities and legislative obligations. This year the division completed a full continuous improvement review of the Safeworking training courses to ensure they align correctly with the updated Australian National Rules and Procedures.
Given the PTA’s legislative requirement to ensure the competency of its workforce, POD is working with our N&I division to develop a structured solution to maintain and assess the currency and competency of employees responsible for rail safety critical work within the division.
Labour RelationsThe Labour Relations branch has continued to provide support to operational management through the provision of industrial advice, industrial and legal advocacy support and as bargaining agents in enterprise bargaining negotiations and dispute resolution.
Key achievements for the year include:
• Finalisation and registration of two replacement Industrial Agreements covering the PTA Salaried Officers and Railway Employees (Trades).
• Assisted N&I management in development and consultation on changed rosters for overhead lines people and signal technicians.
• Represented the PTA in a number of applications and disputes before the WA Industrial Relation Commission.
• Undertook a review of the PTA rostering and payment system setup to ensure payments are compliant with relevant awards and industrial agreements for TTO and Transwa employees.
• Advised on numerous disciplinary processes including cases which led to imposition of penalties for inappropriate behaviour or performance.
PTA Annual Report / Our People

68
Diversity and equal opportunityThe PTA is committed to creating an environment where all employees and members of the public are treated with fairness, dignity and respect in accordance with equal opportunity laws and principles. The PTA endeavours to employ a workforce that reflects the community’s diversity and provides a workplace where differences are valued and respected.
Group Representation
Women 24.3%
Employees of Aboriginal or Torres Strait Islander origin
0.7%
Employees with a disability
1.1%
Employees from a culturally-diverse background
15.1%
The initiatives in the PTA’s Reconciliation Action Plan (RAP) 2016-18 assist the PTA to achieve its vision for reconciliation by delivering sustainable outcomes with the intent that our RAP actions will become an ongoing part of the way we do business. Through our initiatives, we aim to build respect within the PTA for First Australians by sharing, acknowledging, promoting and celebrating Aboriginal and Torres Strait Islander cultures and histories.
PTA Annual Report / Our People
Noongar translation of PTA’s visionTo be recognised as a leader in providing world-class public transport services and solutions.
Djinang, moorditj bridiya warniny, ni, nidja bidi bokadja kalyakool moort koorliny.
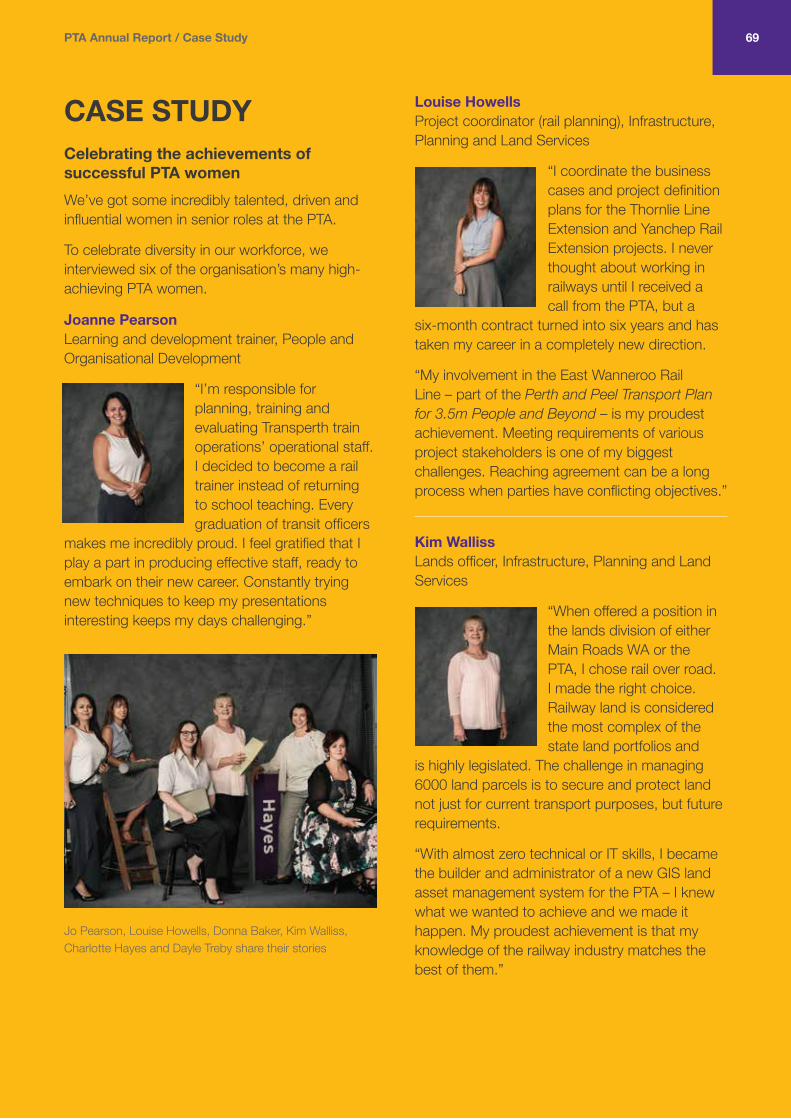
CASE STUDYCelebrating the achievements of successful PTA womenWe’ve got some incredibly talented, driven and influential women in senior roles at the PTA.
To celebrate diversity in our workforce, we interviewed six of the organisation’s many high-achieving PTA women.
Joanne Pearson Learning and development trainer, People and Organisational Development
“I’m responsible for planning, training and evaluating Transperth train operations’ operational staff. I decided to become a rail trainer instead of returning to school teaching. Every graduation of transit officers
makes me incredibly proud. I feel gratified that I play a part in producing effective staff, ready to embark on their new career. Constantly trying new techniques to keep my presentations interesting keeps my days challenging.”
Louise Howells Project coordinator (rail planning), Infrastructure, Planning and Land Services
“I coordinate the business cases and project definition plans for the Thornlie Line Extension and Yanchep Rail Extension projects. I never thought about working in railways until I received a call from the PTA, but a
six-month contract turned into six years and has taken my career in a completely new direction.
“My involvement in the East Wanneroo Rail Line – part of the Perth and Peel Transport Plan for 3.5m People and Beyond – is my proudest achievement. Meeting requirements of various project stakeholders is one of my biggest challenges. Reaching agreement can be a long process when parties have conflicting objectives.”
Kim Walliss Lands officer, Infrastructure, Planning and Land Services
“When offered a position in the lands division of either Main Roads WA or the PTA, I chose rail over road. I made the right choice. Railway land is considered the most complex of the state land portfolios and
is highly legislated. The challenge in managing 6000 land parcels is to secure and protect land not just for current transport purposes, but future requirements.
“With almost zero technical or IT skills, I became the builder and administrator of a new GIS land asset management system for the PTA – I knew what we wanted to achieve and we made it happen. My proudest achievement is that my knowledge of the railway industry matches the best of them.”
Jo Pearson, Louise Howells, Donna Baker, Kim Walliss, Charlotte Hayes and Dayle Treby share their stories
69PTA Annual Report / Case Study

Donna Baker Business manager, Network and Infrastructure
“I provide business management and improvement expertise. When I completed my MBA at 27 (the only woman among 15 mature businessmen), I realised that I could not only hold
my own in a male-dominated environment, I could excel in it. My proudest achievement was becoming the first business manager in West Yorkshire Police appointed under the age of 30.
“I knew the career path I wanted and undertook the development needed to make me the best candidate. Look for unique qualities that make you stand out from the rest of the pack and use these to your advantage. Be proud of the fact you are a woman. And don’t be afraid to express emotion, it shows you are human.”
Dayle Treby Divisional safety manager, Network and Infrastructure
“I am responsible for the safety of staff within N&I – a huge, challenging task but also the most rewarding role I’ve had. In the 80s I challenged the notion that only men could hold a safeworking qualification.
I was determined to have the same career path and opportunities as my male colleagues and the department finally agreed. This changed the path for me and for other women working in the rail environment.
“One of the biggest challenges is promoting safety in such a diverse division with a large number of employees, contractors and other stakeholders. Completing my university qualification (something I never thought I would do at my age) is my proudest achievement; it was something my Dad wanted me to accomplish. If you think you can do it, you usually can so go with your gut feeling and take the chances that are offered to you.”
Charlotte Hayes Information and events manager and A/Executive Director Transperth, Regional and School Bus Services
“My team is responsible for passenger communications, community education, special event servicing, signage, marketing, the Transperth website, App and social media, as well as research into aspects of service delivery. I didn’t know what I wanted to do when I left school. After a number of disastrous jobs I ended up at a small public relations firm, which I loved – it ignited an interest in communications, which led to me studying marketing at university and working around the world.
70 PTA Annual Report / Our People

71
Health and wellbeingThe PTA continues to promote the importance of a balanced and healthy lifestyle. The PTA offers employees information, sponsored activities, support programs (such as Peer Support) and encouragement to proactively manage their health and wellbeing. With the dedicated support of the Health and Wellbeing (H&W) advocates network, the modest H&W budget is efficiently managed by POD to achieve maximum benefit for our employees.
Service milestonesOur employees are key to our operations and we value their dedication and input in providing quality services for the public. Awards recognising 40 and 50 years of service went to the following employees:
Name Position
40-year service awards
Steven Hope Train Controller
James Wyatt Advanced Maintainer
David Van De Velde Train Services Manager
Peter Falk Administration Officer (Rosters)
Linsey Odam Railcar Driver Claisebrook
Royce Blanch Road Coach Operator East Perth
John Olding Customer Service Assistant Mandurah
Lesley Congdon Administration Officer
Gregory Moir Electrical Control Officer
Jonathan Robinson Railcar Driver Nowergup
50-year service awards
Norman Williams Customer Service Assistant Armadale
PTA Annual Report / Our People

Looking ahead
The year ahead will be particularly challenging for the PTA as it seeks to meet the commitments to design and build the new METRONET system in a pressing timeframe and in a climate of budget restraint. A key ongoing role for POD remains the provision of operational and administrative services required to manage a large workforce in a 24/7 service environment. Provision of such services in a efficient manner is critical.
Key areas of focus for the coming year will be to:
• plan for and recruit the workforce associated with the METRONET projects
• continue to develop and implement the N&I competencies project to ensure ongoing development of our staff
• manage the impacts and requirements associated with the various Machinery of Government changes
• commence negotiations on the next round of enterprise bargaining agreements for customer service staff in TTO and railway employees in N&I.
72

73

74 PTA Annual Report / Governance and Compliance
Safety audits and monitoring of Transperth bus contractors continued in line with AS 4801-OSH Management Systems.
74
03 Governance and compliance
3.1 Bus safetyEach depot was audited at least once with other documented site visits in the year. These regular audits and inspections have improved safety management systems and the safety focus of contractors. Contractor lost time injury (LTI) rates continue to be well below the industry standard.
The three contractors providing Transperth bus services have been re-certified to AS 4801:
• Swan Transit, valid to February 2018.
• Path Transit, valid to August 2018.
• Transdev, valid to January 2017.
All three contractors have also been certified as compliant with ISO 14001 Environmental Management Systems.

75
3.2 Rail safetyWe promote, administer and improve rail safety operations for our employees, contractors, stakeholders and the public.
Rail safety performance report KPIs Measures Target Results Level of
achievement Status Notes
Safety incidents per million passenger and kilometre decrease
Notifiable occurrences
Category A per million passenger boardings
0.23 0.3 29.8% above target
: Desired results not achieved – taking action
Ref #1
Notifiable occurrences
Category A per million train kilometres
0.7 0.8 14.09% above target
: Desired results not achieved – taking action
Ref #2
Notifiable occurrences
Category B per million passenger boardings
10.75 15.23 41.6% above target
: Desired results not achieved – taking action
Ref #3
Notifiable occurrences
Category B per million train kilometres
32.56 40.73 25.1% above target
: Desired results not achieved – taking action
Ref #4
Obligations under the lease are adhered to
Lease breaches 0 0 100% ~Met Target
Five-year independent audit
0 n/a n/a ~Met Target
Key ~ Met Target Close to Target : Desired results not achieved – taking action
PTA Annual Report / Rail Safety

76
Reporting of notifiable occurrencesUnder the Rail Safety National Law (WA) Act (2015), specific railway safety incidents must be reported to the Office of the National Rail Safety Regulator (ONRSR). These ‘notifiable occurrences’ are defined in the Rail Safety National Law (WA) Regulations (2015) as Category A (death, serious injury, or significant property damage) or Category B (incidents that may have the potential to cause a serious accident). They do not cover non-rail operations.
NotesRef #1Category A per million passengers boardings benchmark valueThere were 18 Category A notifiable occurrences reported to the regulator, compared with 6 in 2015-16. The increase in Category “A” reportable incidents is due to an increase in the number of suspected suicides and the changes to the legislative definitions associated with the Australian Transport Safety Bureau and the Office of the National Rail Safety Regulator which required reporting of persons attending hospital to be classified as a Category A Incident.
The target of 0.23 per million passenger boardings target was set at the beginning of the year and based on projected Transperth and Transwa train boardings totalling 60,530,216, and using historical trends in the number of notifiable incidents on the network. The train passenger total ended up at 60,291,397 passenger boardings.
Ref #2Category A per million train kilometres benchmark valueThis target was set at 0.7 based on historical trends and projected Transperth and Transwa train kilometres of 20.920 million. Train kilometres at year’s end was 22,537,732km.
Ref #3Category B per million passenger boardings benchmark valueThe number of Category B notifiable occurrences reported to the regulator totalled 918 (757 in 2015-16).
This increase was due to in the number of incidents of Trespass (328 in 2016-17 compared to 152 in 2015-16), Slip Trip or Fall Incidents increased (220 vs 197), Alleged Assault (71 vs 49) and Suspected Suicide or Attempted Suicide (15 vs 6).
There were decreases in a number of incident categories such as Level Crossing Occurrence (103 vs 110) and Alcohol or Drugs Irregularity (12 vs 14).
Ref #4Category B per million train kilometres benchmark valueThis target was set at 32.56 at the beginning of the year based on the projected estimates of Transperth and Transwa train kilometres being 20.920 million. Train kilometres at year’s end was 22,537,732km. Despite this, the ratio was still 25 per cent an increase against the target.
PTA Annual Report / Rail Safety

77
Rail safety initiativesStrategies to reduce Trespass• A review of the corporate risk register was
undertaken to ensure that the risk of “Trespass” and any appropriate control measures are captured at an organisation level as well as at a divisional level.
• Invested in a targeted campaign using social media highlighting the dangers of trespassing to the public.
• Campaign to stop photographers taking pictures of wedding parties on track.
• Utilising Transit Officers to build relationships through social activities with high risk demographics to highlight the dangers of trespassing.
• Ongoing support and engagement with the “Right Track” national program to alert of the dangers of trespassing within the rail corridor.
Strategies to reduce slip trip or fall incidents• Developed and published an educational video
about safe use of escalators on our network.
• Continued the roll out to installed new, visible and accessible emergency stop buttons on escalators.
• Continued to rotated employees throughout the day, at the bottom of the escalators at Perth Underground and Elizabeth Quay stations, to clear the cross-hatching areas.
• Attended high-risk demographic exhibitions and events to distribute brochures to promote escalator safety.
• Installed escalator safety signage on bus display boards, on trains and near escalators.
• Undertook monthly station inspections.
Strategies to reduce level crossing incidents• Requested the Office of Road Safety to
undertake a review of the penalties for breaching regulations 101-104 of the Road Traffic Code which relate to level crossings and to fund ongoing level crossing media campaigns.
• Requested WA Police participation in fine enforcement at identified high-risk level crossings.
• Commissioned and rolled out a radio campaign to highlight the dangers of vehicles entering exclusion zones at level crossings.
• Consulted with DoT to increase level crossing information in the Drive Safe and Ride Safe Handbook for WA road users.
• Developed a strategy with MRWA and DoT for short, medium and long term improvements to level crossings, including the prioritisation of crossings for grade separation.
Strategies to reduce suspected / attempted Suicides• Awareness training for Transit Officers to
identify “At-Risk” behaviours so that they are able intervene to de-escalate the incident.
• Central Monitoring Room operators undergone training to identify “At-Risk” behaviours and relay this information to the mobile or static transit officer who are able to intervene.
PTA Annual Report / Rail Safety
78
Strategies to enhance rail safety• Participated in a number of national rail
industry working groups including the SPAD (signals passed at danger) competency sub-group, National Rollingstock, Operations, Infrastructure, Train Control Systems and the Wheel Rail Interface committees which are convened by the Rail Industry Safety and Standards Board.
• Undertook a review of historical data to identify factors contributing to SPADs.
• Started trialling supplementary on-track warning beacons at signal 229, located near McIver Station, which has been identified as a common SPAD error point.
• Launched a safety cultural change program and a weekly knowledge share program within our Network & Infrastructure division.
• Continued to coordinate the Right Track program, including:
О rail safety presentations to schools and youth organisations across the metropolitan area by rail safety ambassador and double amputee Jonathan Beninca
О review of educational resources to align with the new Australian Curriculum framework.
• Transit Officers continued to visit schools in suburbs identified as being at high risk of unsafe behaviour at local level crossings and train stations.
• Engagement with at-risk youth by Transit Officers as part of the Reward Card Campaign which rewards youth how demonstrate safe behaviours around the rail network.
PTA Annual Report / Rail Safety

79
3.3 Occupational safety, health and injury managementOSH performance
KPIs Measures 2013-14 2014-15 2015-16 2016-17 Target Level of achievement
OSH
Lost-time injury/disease (LTI/D incident rate)
5.78 3.60 3.71 3.94 Zero, or 10% improvement on the previous three years
: Desired results not achieved – taking action
LTI severity rate 38.30 24.39 22.03 31.52 Zero, or 10% improvement on the previous three years
: Desired results not achieved – taking action
% of injured workers returned to work within
(i) 13 weeks and
(ii) 26 weeks
65.96%
85.11%
75.61%
89.02%
92%
93%
67.6%
82.43%
Greater than or equal to 80% return to work within 26 weeks
~Met Target
Number of fatalities (employees/contractors)
0 1 0 0 0 ~Met Target
Key ~ Met Target Close to Target : Desired results not achieved – taking action
PTA Annual Report / Occupational Safety, Health and Injury Management

80
Organisational commitment to safety and healthSafety is our core value and was a continued focus in the year. The provision of a healthy and safe workplace – under the banner Everyone Home Safe Every Day – is the prime responsibility of management across the business. A workplace where management and employees are committed to safety is integral to making our public transport safe.
Health assessment standards and management systemsAll employees who have track access continue to be monitored and reviewed in accordance with the National Standard for Health Assessment for Rail Safety Workers.
We have a robust health and wellbeing program, which is accessible to all employees and includes but is not limited to:
• onsite gymnasiums
• well established health service provider
• influenza vaccination program
• employee assistance and critical incident program
• mole check clinics
• an holistic approach is actively promoted to the PTA workforce, which encompasses the emotional, physical and mental health of our employees
HSE management systemOur Health, Safety and Environment (HSE) system is continually monitored and reviewed; and a comprehensive strategic audit program is in place to certify that it remains compliant and works effectively. The audit process provides feedback, identifies areas for improvement and ensures corrective actions are implemented, monitored and reviewed.
Our Safety and Strategy directorate has a dedicated resource that focusses on rail safety compliance using the audit program.
The system extends to contractors so that they understand PTA safety requirements, which in turn reinforces our commitment to safety.
The ONRSR also regularly inspects sections of the HSE management system throughout the year.
Reporting systemsWe have two reporting systems – STARRS and IFRS – to identify incidents trends, perform trend analysis and implement corrective actions.
STARRS enables reporting, recording and analysis of hazards, near misses, incidents, injuries and workers compensation claim data.
IFRS is the rail reporting system. It enables the reporting and storage of rail-related incidents, in particular notifiable occurrences.
There is a project nearing completion to replace the two systems with an integrated reporting, analysis and storage database.
PTA Annual Report / Occupational Safety, Health and Injury Management

81
Drug and alcohol testingWe have a zero tolerance policy to the use of alcohol and other drugs in the workplace. Drugs and alcohol are recognised occupational health and safety risks which compromise an employee’s ability to work safely.
In the year, a total of 1500 random AOD tests were undertaken of which three returned a positive result for drugs with one returning a positive result for Breath Alcohol.
All positive results are dealt in line with our Alcohol and Other Drugs Policy consequence model.
Injury managementWe are committed to reducing work-related injury and illness, and our prompt and efficient injury management promotes a safe and healthy workplace. Our program helps injured workers return to work as soon as medically appropriate and adheres to the requirements of the Workers Compensation and Injury Management Act 1981.
Supervisors, managers, divisional safety representatives and executive management actively support injured workers by ensuring suitable duties are available to meet the medical conditions whenever possible.
PTA Annual Report / Occupational Safety, Health and Injury Management
82
3.4 Risk managementWe have an ongoing commitment to maintain heightened awareness and education among employees and contractors to ensure they proactively manage and monitor risk. Our success in achieving this is closely aligned to the effectiveness of the framework in place that governs the foundations and arrangements to embed risk management across all levels of the organisation.
Risk management is crucial to achieving our purpose of providing safe, customer-focussed, integrated and efficient transport services. We do this by managing risk to a level deemed to be As Low As Reasonably Practicable (ALARP).
Effective risk management is evident when strategic, operational and project risks are proactively identified, assessed and treated, with opportunities being recognised and capitalised on. Risk management plans have been compiled across key PTA projects and initiatives; further supported by regular risk reporting that documents risk trends. The key objective of these plans and reports is to better inform the decision-making of the relevant stakeholders.
The PTA’s executive committee and senior management are committed to ensuring that risk management is well embedded in the organisation, providing best practice in decision making, business management and corporate governance, through ongoing communication, consultation and monitoring and review.
Initiatives of the PTA risk management portfolio in 2016-17 included:
• Significant review and update to the PTA’s risk management policy to incorporate the rail safety requirements and risk management practices set out by the Office National Rail Safety Regulator (ONRSR).
• Review and enhancement of risk management training programs for staff at all levels.
• Launching the Transport Portfolio (PTA, DoT and MRWA) cross-agency risk management system – GRC Manager. This is complemented by tailored, in-house training sessions and user guides.
• Ongoing structured quarterly meetings of the Divisional Risk Coordinator and Strategic Risk Management Groups.
• Quarterly risk reporting to executive management and divisions.
PTA Annual Report / Risk Management
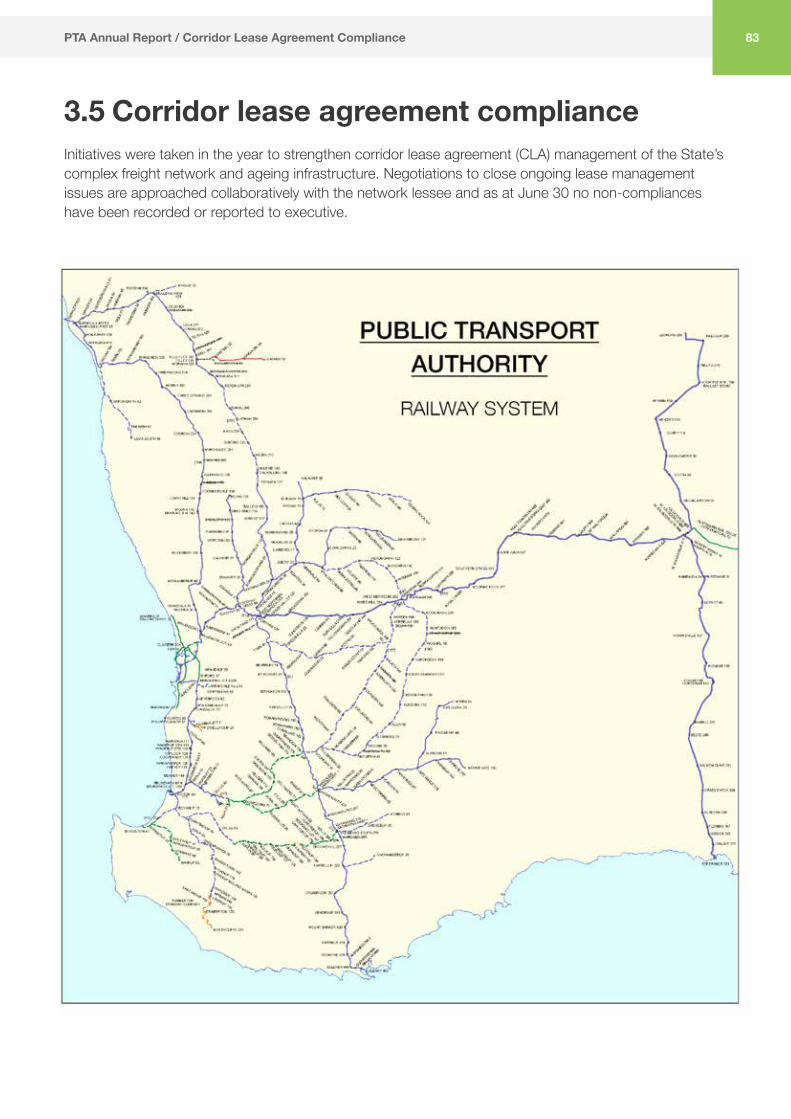
83
3.5 Corridor lease agreement complianceInitiatives were taken in the year to strengthen corridor lease agreement (CLA) management of the State’s complex freight network and ageing infrastructure. Negotiations to close ongoing lease management issues are approached collaboratively with the network lessee and as at June 30 no non-compliances have been recorded or reported to executive.
PTA Annual Report / Corridor Lease Agreement Compliance

84
3.6 Other legal and policy requirementsRecord-keeping and information managementWe are committed to best practice record-keeping processes in compliance with the State Records Act 2000. Through our Record Keeping Plan (RKP) we review our policies and procedures to ensure they meet the standards and guidelines set by the Act and the State Records Commission. In line with statutory requirements, our RKP is under review for submission in August 2017. Associated policies, procedures, and retention and disposal schedules have also been under review as per requirements under the RKP.
As part of ongoing evaluation of our electronic document and records management system (EDRMS), the PTA is embarking on an enhancement of the EDRMS to better deliver the needs of business areas and facilitate more transparent records management reporting. As part of this process, the PTA’s Business Classification Scheme has been under review to better meet both business and compliance requirements. During 2016-17, approximately 42 per cent of files requested were virtual, whereas 58 per cent were hardcopy. It is expected that these figures will reverse once all the planned changes to the EDRMS have been implemented.
The PTA’s records management training program is undergoing staged reviews to ensure its relevancy in the changing information landscape. This includes inductions to new employees and scheduled refresher training to ensure everyone at the PTA is aware of their responsibilities under the PTA’s RKP.
Milestones achieved in the EDRMS this year include:
• 9,998 files created
• 1,515 archive boxes created
• 1,355 files destroyed
• 604 file or box retrievals were processed
• 500,886 documents and 91,073 emails created
• 25,230 workflows executed
• 438,457 searches performed
Compliance with public sector standardsThe PTA’s human resource management policies and practices are subject to ongoing review and, in accordance with section 31 (1) of the Public Sector Management Act, comply fully with the public sector standards in human resource management.
PTA Annual Report / Other Legal and Policy Requirements

85
Compliance with relevant written lawEnabling legislationThe PTA is established under the Public Transport Authority Act 2003, an Act to establish a State agency responsible for providing public passenger transport services anywhere in the State and performing functions under other Acts, including the Rail Freight System Act 2000 and the Government Railways Act 1904 as well as the construction of railways under various railway enabling Acts. Currently the Minister responsible for the PTA is the Minister for Transport.
Legislation impacting on the PTA’s activitiesIn the performance of its functions, the PTA complies with all relevant written laws of Western Australia and, where required, reports on an annual basis in accordance with key legislation, including the following:
Financial Management Act 2006 (WA); Electoral Act 1907; Equal Opportunity Act 1984; State Superannuation Act 2000; Heritage of Western Australia Act 1990; Freedom of Information Act 1992; State Supply Commission Act 1991; Public Sector Management Act 1994; Disability Services Act 1993 (Cth); Rail Safety National Law (WA) Act 2015; Railways (Access) Act 1998; State Trading Concerns Act 1916; Occupational Safety and Health Act 1984; Environmental Protection Act 1986; Contaminated Sites Act 2003; Auditor General Act 2006; State Records Act 2000; Salaries and Allowances Act 1975; and Public Interest Disclosure Act 2003.
PTA Annual Report / Other Legal and Policy Requirements
Kevin Kirk Chief Finance Officer 5 September 2017
Other various Agreements/Acts and written laws impact on the PTA’s activities from time to time.
In the financial administration of the PTA, we have complied with the requirements of the Financial Management Act 2006 (WA). We have also complied with every other relevant written law and exercised controls to provide reasonable assurance that the receipt and expenditure of moneys, the acquisition and disposal of public property and the incurring of liabilities have been in accordance with legislative provisions.
At the date of signing we are not aware of any circumstances which would render the particulars included in this statement misleading or inaccurate.
Richard Sellers Accountable Authority 5 September 2017
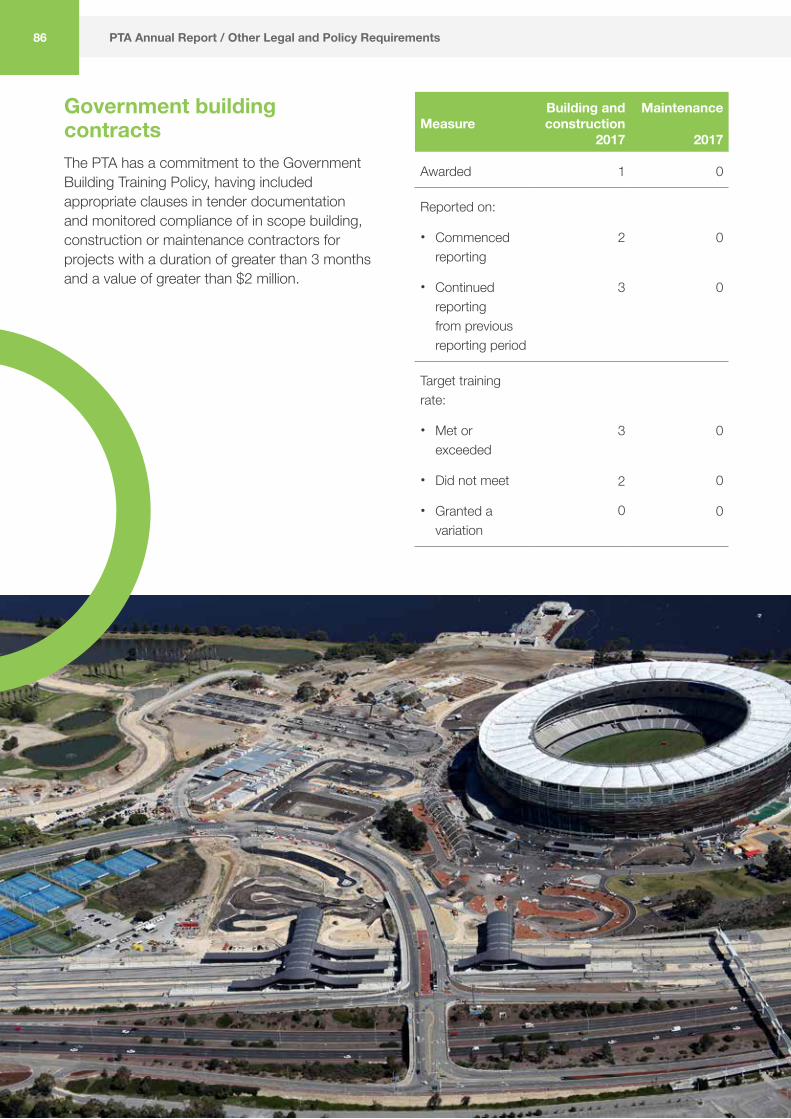
86 PTA Annual Report / Other Legal and Policy Requirements
MeasureBuilding and construction
2017
Maintenance
2017
Awarded 1 0
Reported on:
• Commenced reporting
• Continued reporting from previous reporting period
2
3
0
0
Target training rate:
• Met or exceeded
• Did not meet
• Granted a variation
3
2
0
0
0
0
Government building contractsThe PTA has a commitment to the Government Building Training Policy, having included appropriate clauses in tender documentation and monitored compliance of in scope building, construction or maintenance contractors for projects with a duration of greater than 3 months and a value of greater than $2 million.

87
Expenditure on advertising, market research, polling and direct mailIn compliance with section 175ZE of the Electoral Act 1907, the following table reports our expenditure on advertising agencies, market research organisations, polling organisations, direct mail organisations and media advertising organisations.
2016-17
$
Expenditure with Advertising Agencies:Gatecrasher Advertising Pty Ltd 423,543 Optimum Media Decision (WA) Pty Ltd
249,383
303 MullenLowe Group Pty Ltd 191,310ADCORP Australia Limited 133,722Cooch Creative Pty Ltd 83,975Definition Pty Ltd 59,255AD Capital Advertising Pty Ltd 55,220Gramercy Park Communications 17,450Southern Cross Austereo 14,263Facebook 12,895Concept Media 9,000JAC Communications 7,470Redwave Media Pty Ltd 7,400The Digital Imagineers Company 5,795Cineads Australia Pty Ltd 5,600Linkedin 5,359Google 5,152Key2Creative 4,830What’s On Publishing Pty Ltd 4,230APN Outdoor Trading 4,225Australia’s South West 3,396Regional Publishers 3,202Visual Publications 3,182Agricultural Publish 2,957Kalgoorlie Boulder Visitor Centre 2,818Vanguard Press 2,303
1,317,935
2016-17
$
Expenditure with Market Research Agencies:Painted Dog Research 404,695
404,695Expenditure with Polling Agencies:
Nil
Expenditure with Direct Mail Agencies:
Nil
Expenditure with Media Advertising Agencies:Carat Australia Media Services 153,991Western Australian Newspapers Limited
3,559
157,550 Total Expenditure 1,880,180
PTA Annual Report / Other Legal and Policy Requirements
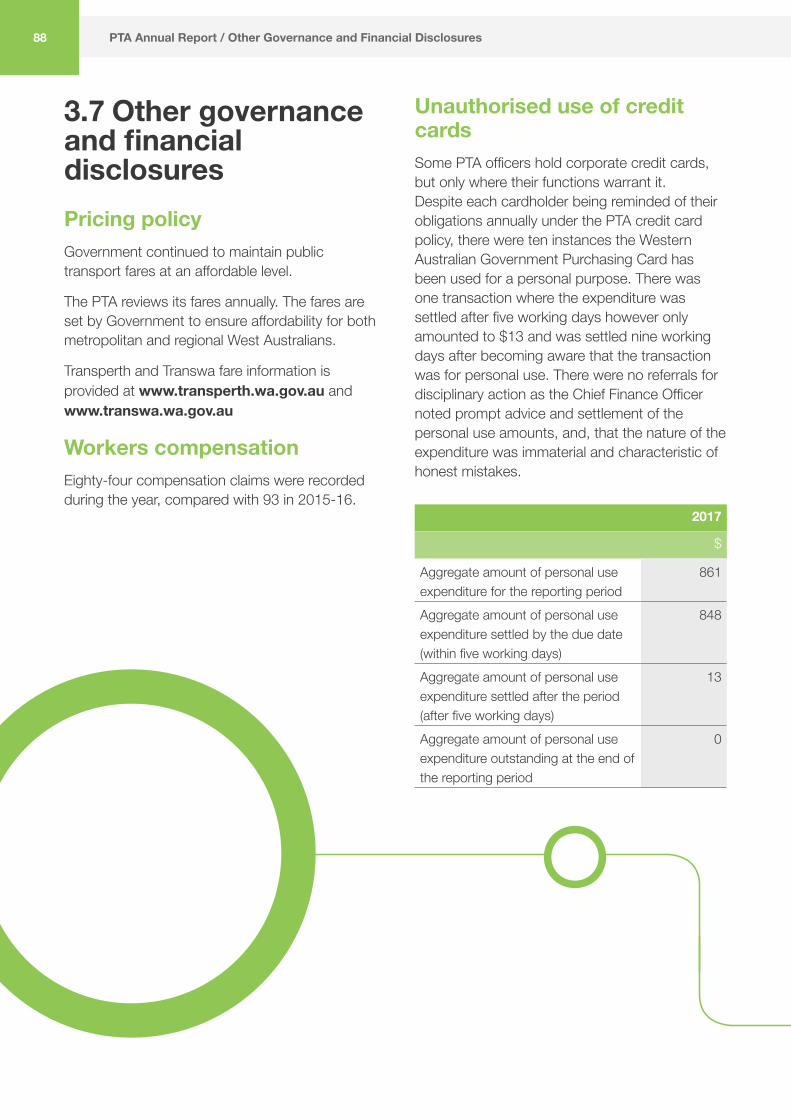
88
3.7 Other governance and financial disclosuresPricing policyGovernment continued to maintain public transport fares at an affordable level.
The PTA reviews its fares annually. The fares are set by Government to ensure affordability for both metropolitan and regional West Australians.
Transperth and Transwa fare information is provided at www.transperth.wa.gov.au and www.transwa.wa.gov.au
Workers compensationEighty-four compensation claims were recorded during the year, compared with 93 in 2015-16.
Unauthorised use of credit cards Some PTA officers hold corporate credit cards, but only where their functions warrant it. Despite each cardholder being reminded of their obligations annually under the PTA credit card policy, there were ten instances the Western Australian Government Purchasing Card has been used for a personal purpose. There was one transaction where the expenditure was settled after five working days however only amounted to $13 and was settled nine working days after becoming aware that the transaction was for personal use. There were no referrals for disciplinary action as the Chief Finance Officer noted prompt advice and settlement of the personal use amounts, and, that the nature of the expenditure was immaterial and characteristic of honest mistakes.
2017
$
Aggregate amount of personal use expenditure for the reporting period
861
Aggregate amount of personal use expenditure settled by the due date (within five working days)
848
Aggregate amount of personal use expenditure settled after the period (after five working days)
13
Aggregate amount of personal use expenditure outstanding at the end of the reporting period
0
PTA Annual Report / Other Governance and Financial Disclosures
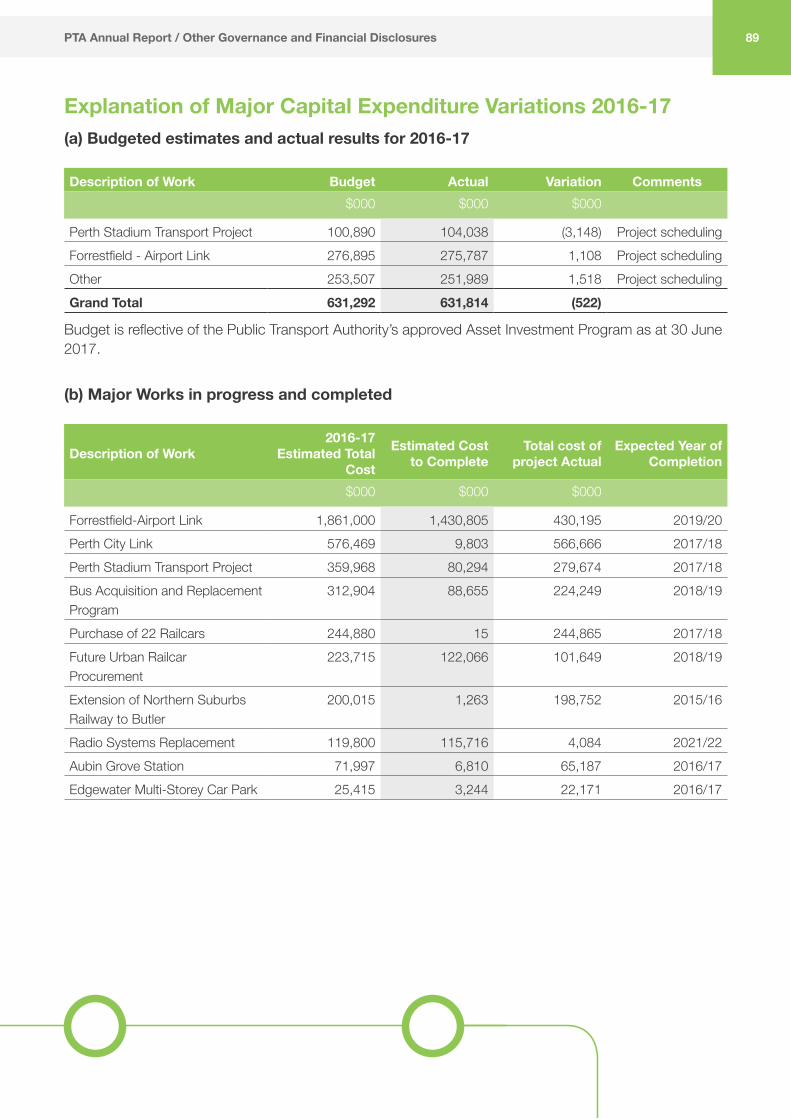
89
Explanation of Major Capital Expenditure Variations 2016-17(a) Budgeted estimates and actual results for 2016-17
Description of Work Budget Actual Variation Comments $000 $000 $000
Perth Stadium Transport Project 100,890 104,038 (3,148) Project scheduling Forrestfield - Airport Link 276,895 275,787 1,108 Project scheduling Other 253,507 251,989 1,518 Project scheduling Grand Total 631,292 631,814 (522)
Budget is reflective of the Public Transport Authority’s approved Asset Investment Program as at 30 June 2017.
(b) Major Works in progress and completed
Description of Work2016-17
Estimated Total Cost
Estimated Cost to Complete
Total cost of project Actual
Expected Year of Completion
$000 $000 $000
Forrestfield-Airport Link 1,861,000 1,430,805 430,195 2019/20 Perth City Link 576,469 9,803 566,666 2017/18Perth Stadium Transport Project 359,968 80,294 279,674 2017/18 Bus Acquisition and Replacement Program
312,904 88,655 224,249 2018/19
Purchase of 22 Railcars 244,880 15 244,865 2017/18Future Urban Railcar Procurement
223,715 122,066 101,649 2018/19
Extension of Northern Suburbs Railway to Butler
200,015 1,263 198,752 2015/16
Radio Systems Replacement 119,800 115,716 4,084 2021/22Aubin Grove Station 71,997 6,810 65,187 2016/17Edgewater Multi-Storey Car Park 25,415 3,244 22,171 2016/17
PTA Annual Report / Other Governance and Financial Disclosures

90

91
3.8 Independent auditor’s reportAuditor GeneralTo the Parliament of Western Australia
PUBLIC TRANSPORT AUTHORITY OF WESTERN AUSTRALIA Report on the Financial StatementsOpinionI have audited the financial statements of the Public Transport Authority of Western Australia which comprise the Statement of Financial Position as at 30 June 2017, the Statement of Comprehensive Income, Statement of Changes in Equity, Statement of Cash Flows for the year then ended, and Notes comprising a summary of significant accounting policies and other explanatory information.
In my opinion, the financial statements are based on proper accounts and present fairly, in all material respects, the operating results and cash flows of the Public Transport Authority of Western Australia for the year ended 30 June 2017 and the financial position at the end of that period. They are in accordance with Australian Accounting Standards, the Financial Management Act 2006 and the Treasurer’s Instructions.
Basis for OpinionI conducted my audit in accordance with the Australian Auditing Standards. My responsibilities under those standards are further described in the Auditor’s Responsibilities for the Audit of the Financial Statements section of my report. I am independent of the Authority in accordance with the Auditor General Act 2006 and the relevant ethical requirements of the Accounting Professional and Ethical Standards Board’s APES 11 0 Code of Ethics for Professional Accountants (the Code) that are relevant to my audit of the financial statements. I have also fulfilled my other ethical responsibilities in accordance with the Code. I believe that the audit evidence I have obtained is sufficient and appropriate to provide a basis for my opinion.
Responsibility of the Chief Executive Officer for the Financial StatementsThe Chief Executive Officer is responsible for keeping proper accounts, and the preparation and fair presentation of the financial statements in accordance with Australian Accounting Standards, the Financial Management Act 2006 and the Treasurer’s Instructions, and for such internal control as the Chief Executive Officer determines is necessary to enable the preparation of financial statements that are free from material misstatement, whether due to fraud or error.
In preparing the financial statements, the Chief Executive Officer is responsible for assessing the agency’s ability to continue as a going concern, disclosing, as applicable, matters related to going concern and using the going concern basis of accounting unless the Western Australian Government has made policy or funding decisions affecting the continued existence of the Authority.
Auditor’s Responsibility for the Audit of the Financial StatementsAs required by the Auditor General Act 2006, my responsibility is to express an opinion on the financial statements. The objectives of my audit are to obtain reasonable assurance about whether the financial statements as a whole are free from material misstatement, whether due to fraud or error, and to issue an auditor’s report that includes my opinion. Reasonable assurance is a high level of assurance, but is not a guarantee that an audit conducted in accordance with Australian Auditing Standards will always detect a material misstatement when it exists. Misstatements can arise from fraud or error and are considered material if, individually or in the aggregate, they could reasonably be expected to influence the economic decisions of users taken on the basis of the financial statements.
As part of an audit in accordance with Australian Auditing Standards, I exercise professional judgment and maintain professional scepticism throughout the audit. I also:
• Identify and assess the risks of material misstatement of the financial statements,
PTA Annual Report / Independent Auditor’s Report

92
whether due to fraud or error, design and perform audit procedures responsive to those risks, and obtain audit evidence that is sufficient and appropriate to provide a basis for my opinion. The risk of not detecting a material misstatement resulting from fraud is higher than for one resulting from error, as fraud may involve collusion, forgery, intentional omissions, misrepresentations, or the override of internal control.
• Obtain an understanding of internal control relevant to the audit in order to design audit procedures that are appropriate in the circumstances, but not for the purpose of expressing an opinion on the effectiveness of the agency’s internal control.
• Evaluate the appropriateness of accounting policies used and the reasonableness of accounting estimates and related disclosures made by the Chief Executive Officer.
• Conclude on the appropriateness of the Chief Executive Officer’s use of the going concern basis of accounting and, based on the audit evidence obtained, whether a material uncertainty exists related to events or conditions that may cast significant doubt on the agency’s ability to continue as a going concern. If I conclude that a material uncertainty exists, I am required to draw attention in my auditor’s report to the related disclosures in the financial statements or, if such disclosures are inadequate, to modify my opinion. My conclusions are based on the audit evidence obtained up to the date of my auditor’s report.
• Evaluate the overall presentation, structure and content of the financial statements, including the disclosures, and whether the financial statements represent the underlying transactions and events in a manner that achieves fair presentation.
I communicate with the Chief Executive Officer regarding, among other matters, the planned scope and timing of the audit and significant audit findings, including any significant deficiencies in internal control that I identify during my audit.
Report on ControlsOpinionI have undertaken a reasonable assurance engagement on the design and implementation of controls exercised by the Public Transport Authority of Western Australia. The controls exercised by the Authority are those policies and procedures established by the Chief Executive Officer to ensure that the receipt, expenditure and investment of money, the acquisition and disposal of property, and the incurring of liabilities have been in accordance with legislative provisions (the overall control objectives).
My opinion has been formed on the basis of the matters outlined in this report.
In my opinion, in all material respects, the controls exercised by the Public Transport Authority of Western Australia are sufficiently adequate to provide reasonable assurance that the receipt, expenditure and investment of money, the acquisition and disposal of property and the incurring of liabilities have been in accordance with legislative provisions during the year ended 30 June 2017.
The Chief Executive Officer’s ResponsibilitiesThe Chief Executive Officer is responsible for designing, implementing and maintaining controls to ensure that the receipt, expenditure and investment of money, the acquisition and disposal of property, and the incurring of liabilities are in accordance with the Financial Management Act 2006, the Treasurer’s Instructions and other relevant written law.
Auditor General’s ResponsibilitiesAs required by the Auditor General Act 2006, my responsibility as an assurance practitioner is to express an opinion on the suitability of the design of the controls to achieve the overall control objectives and the implementation of the controls as designed. I conducted my engagement in accordance with Standard on Assurance Engagements ASAE 3150 Assurance Engagements on Controls issued by the Australian Auditing and Assurance Standards Board. That standard requires that I comply
PTA Annual Report / Independent Auditor’s Report

93
with relevant ethical requirements and plan and perform my procedures to obtain reasonable assurance about whether, in all material respects, the controls are suitably designed to achieve the overall control objectives and the controls, necessary to achieve the overall control objectives, were implemented as designed.
An assurance engagement to report on the design and implementation of controls involves performing procedures to obtain evidence about the suitability of the design of controls to achieve the overall control objectives and the implementation of those controls. The procedures selected depend on my judgement, including the assessment of the risks that controls are not suitably designed or implemented as designed. My procedures included testing the implementation of those controls that I consider necessary to achieve the overall control objectives.
I believe that the evidence I have obtained is sufficient and appropriate to provide a basis for my opinion.
Limitations of ControlsBecause of the inherent limitations of any internal control structure it is possible that, even if the controls are suitably designed and implemented as designed, once the controls are in operation, the overall control objectives may not be achieved so that fraud, error, or noncompliance with laws and regulations may occur and not be detected. Any projection of the outcome of the evaluation of the suitability of the design of controls to future periods is subject to the risk that the controls may become unsuitable because of changes in conditions.
Report on the Key Performance Indicators OpinionI have undertaken a reasonable assurance engagement on the key performance indicators of the Public Transport Authority of Western Australia for the year ended 30 June 2017. The key performance indicators are the key effectiveness indicators and the key efficiency indicators that provide performance information about achieving outcomes and delivering services.
In my opinion, in all material respects, the key performance indicators of the Public Transport Authority of Western Australia are relevant and appropriate to assist users to assess the Authority’s performance and fairly represent indicated performance for the year ended 30 June 2017.
The Chief Executive Officer’s Responsibility for the Key Performance IndicatorsThe Chief Executive Officer is responsible for the preparation and fair presentation of the key performance indicators in accordance with the Financial Management Act 2006 and the Treasurer’s Instructions and for such internal control as the Chief Executive Officer determines necessary to enable the preparation of key performance indicators that are free from material misstatement, whether due to fraud or error.
In preparing the key performance indicators, the Chief Executive Officer is responsible for identifying key performance indicators that are relevant and appropriate having regard to their purpose in accordance with Treasurer’s Instruction 904 Key Performance Indicators.
Auditor General’s ResponsibilityAs required by the Auditor General Act 2006, my responsibility as an assurance practitioner is to express an opinion on the key performance indicators. The objectives of my engagement are to obtain reasonable assurance about whether the key performance indicators are relevant and appropriate to assist users to assess the agency’s performance and whether the key performance indicators are free from material misstatement, whether due to fraud or error, and to issue an auditor’s report that includes my opinion. I conducted my engagement in accordance with Standard on Assurance Engagements ASAE 3000 Assurance Engagements Other than Audits or Reviews of Historical Financial Information issued by the Australian Auditing and Assurance Standards Board. That standard requires that I comply with relevant ethical requirements relating to assurance engagements.
PTA Annual Report / Independent Auditor’s Report

94
An assurance engagement involves performing procedures to obtain evidence about the amounts and disclosures in the key performance indicators. It also involves evaluating the relevance and appropriateness of the key performance indicators against the criteria and guidance in Treasurer’s Instruction 904 for measuring the extent of outcome achievement and the efficiency of service delivery. The procedures selected depend on my judgement, including the assessment of the risks of material misstatement of the key performance indicators. In making these risk assessments I obtain an understanding of internal control relevant to the engagement in order to design procedures that are appropriate in the circumstances.
I believe that the evidence I have obtained is sufficient and appropriate to provide a basis for my opinion.
My Independence and Quality Control Relating to the Reports on Controls and Key Performance IndicatorsI have complied with the independence requirements of the Auditor General Act 2006 and the relevant ethical requirements relating to assurance engagements. In accordance with ASQC 1 Quality Control for Firms that Perform Audits and Reviews of Financial Reports and Other Financial Information, and Other Assurance Engagements, the Office of the Auditor General maintains a comprehensive system of quality control including documented policies and procedures regarding compliance with ethical requirements, professional standards and applicable legal and regulatory requirements.
Matters Relating to the Electronic Publication of the Audited Financial Statements and Key Performance IndicatorsThis auditor’s report relates to the financial statements and key performance indicators of the Public Transport Authority of Western Australia for the year ended 30 June 2017 included on the Authority’s website. The Authority’s management is responsible for the integrity of the Authority’s website. This audit does not provide assurance on the integrity of the Authority’s website. The auditor’s report refers only to the financial statements and key performance indicators described above. It does not provide an opinion on any other information which may have been hyperlinked to/from these financial statements or key performance indicators. If users of the financial statements and key performance indicators are concerned with the inherent risks arising from publication on a website, they are advised to refer to the hard copy of the audited financial statements and key performance indicators to confirm the information contained in this website version of the financial statements and key performance indicators.
Colin Murphy Auditor General for Western Australia 7 September 2017
PTA Annual Report / Independent Auditor’s Report

95
3.9 Key performance indicatorsRelationship to Government Strategic GoalThe following table depicts the relationship between the Government’s Goals and the outcomes and services that the PTA provides in order to achieve those goals.
Government strategic goal PTA outcomes PTA services
Results-Based Service Delivery:
Greater focus on achieving results in key service delivery areas for the benefit of all Western Australians.
Accessible, reliable and safe public transport system
1. Metropolitan and Regional Passenger Services
2. Country Passenger Rail and Road Coach Services
3. Regional School Bus Services
Protection of the long term functionality of the rail corridor and railway infrastructure
4. Rail Corridor and Residual Freight Issues Management
Note: The key performance indicators and the variances are calculated based on original source data and the results are reported with rounding to the nearest appropriate decimals.
PTA Annual Report / Key Performance Indicators

96
Financial targets: Actual compared to budget targetsThe following table provides a comparison of the financial targets and outcomes against criteria included in the Resource Agreement between the Chief Executive Officer, Minister for Transport and the Treasurer.
2016-17 Target (1)
2016-17 Actual
Variation Notes
$000 $000 $000
Total cost of services (expense limit) (sourced from Statement of Comprehensive Income)
1,442,122 1,440,297 (1,825)
Net cost of services (sourced from Statement of Comprehensive Income)
1,166,138 1,163,060 (3,078)
Total equity (sourced from Statement of Financial Position)
6,143,819 6,206,890 63,071 (2)
Approved salary expense level 167,506 156,083 (11,423)Agreed borrowing limit 2,140,240 2,140,240 0
(1) As specified in the revised Budget Statement estimates - (Revised Budget estimate 2016-17).(2) Equity increase by $63.1 million mainly due to the revaluation of buses and rollingstock.
2016-17 Agreed Limit (1)
2016-17 Actual
Variation Notes
$000 $000 $000
Agreed Working Cash Limit 62,597 51,694 (10,903) (3) (3) The variation is mainly due to the optimisation of cash management.
PTA Annual Report / Key Performance Indicators
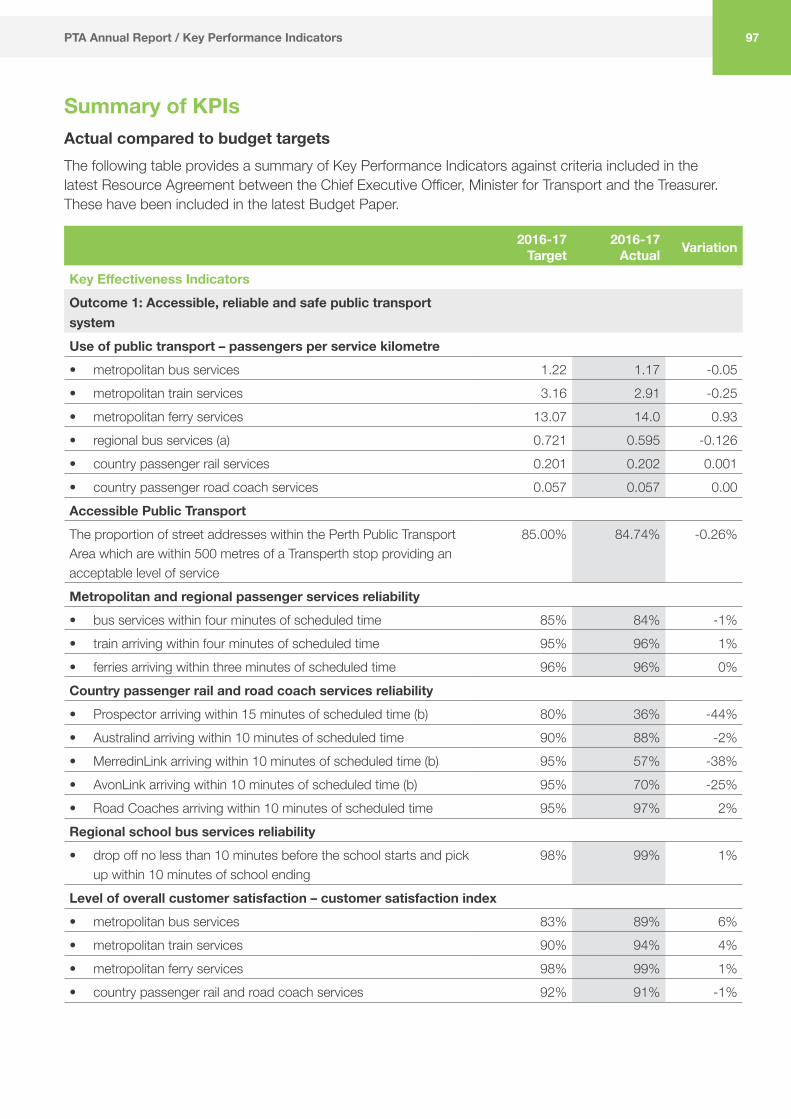
97
Summary of KPIsActual compared to budget targetsThe following table provides a summary of Key Performance Indicators against criteria included in the latest Resource Agreement between the Chief Executive Officer, Minister for Transport and the Treasurer. These have been included in the latest Budget Paper.
2016-17 Target
2016-17 Actual Variation
Key Effectiveness IndicatorsOutcome 1: Accessible, reliable and safe public transport systemUse of public transport – passengers per service kilometre• metropolitan bus services 1.22 1.17 -0.05• metropolitan train services 3.16 2.91 -0.25• metropolitan ferry services 13.07 14.0 0.93• regional bus services (a) 0.721 0.595 -0.126• country passenger rail services 0.201 0.202 0.001• country passenger road coach services 0.057 0.057 0.00Accessible Public TransportThe proportion of street addresses within the Perth Public Transport Area which are within 500 metres of a Transperth stop providing an acceptable level of service
85.00% 84.74% -0.26%
Metropolitan and regional passenger services reliability• bus services within four minutes of scheduled time 85% 84% -1%• train arriving within four minutes of scheduled time 95% 96% 1%• ferries arriving within three minutes of scheduled time 96% 96% 0%Country passenger rail and road coach services reliability• Prospector arriving within 15 minutes of scheduled time (b) 80% 36% -44%• Australind arriving within 10 minutes of scheduled time 90% 88% -2%• MerredinLink arriving within 10 minutes of scheduled time (b) 95% 57% -38%• AvonLink arriving within 10 minutes of scheduled time (b) 95% 70% -25%• Road Coaches arriving within 10 minutes of scheduled time 95% 97% 2%Regional school bus services reliability• drop off no less than 10 minutes before the school starts and pick
up within 10 minutes of school ending98% 99% 1%
Level of overall customer satisfaction – customer satisfaction index• metropolitan bus services 83% 89% 6%• metropolitan train services 90% 94% 4%• metropolitan ferry services 98% 99% 1%• country passenger rail and road coach services 92% 91% -1%
PTA Annual Report / Key Performance Indicators
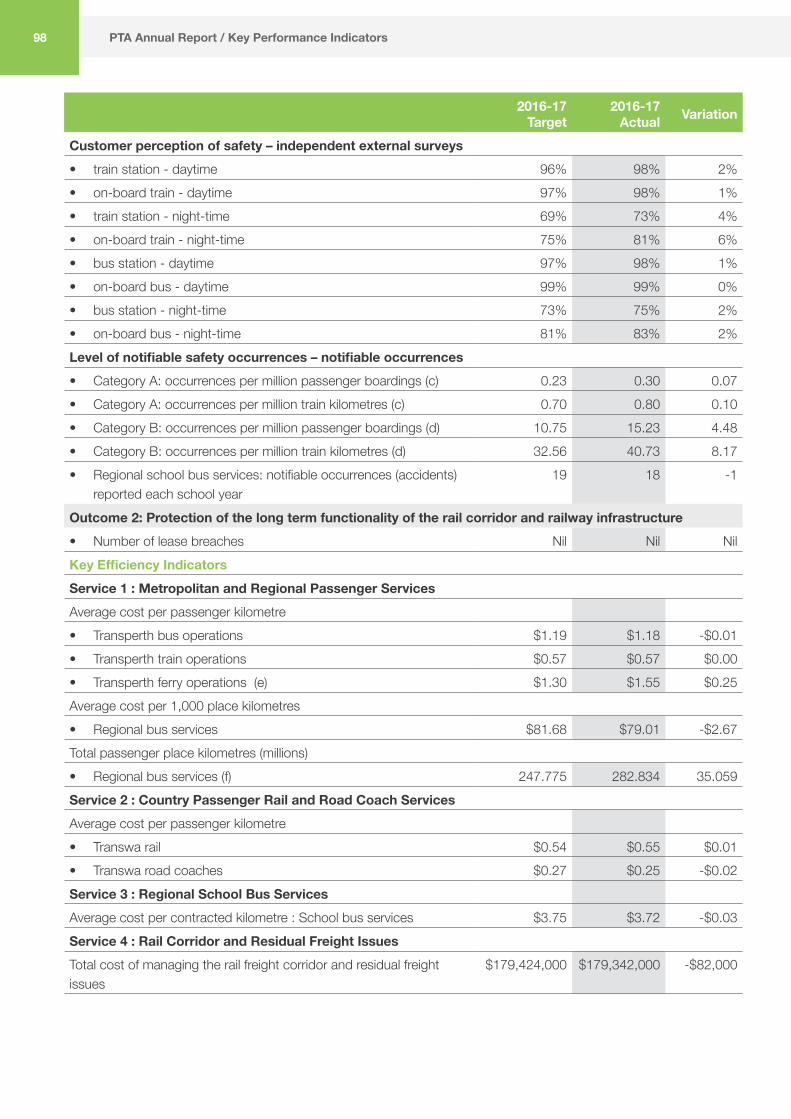
98
2016-17 Target
2016-17 Actual Variation
Customer perception of safety – independent external surveys• train station - daytime 96% 98% 2%• on-board train - daytime 97% 98% 1%• train station - night-time 69% 73% 4%• on-board train - night-time 75% 81% 6%• bus station - daytime 97% 98% 1%• on-board bus - daytime 99% 99% 0%• bus station - night-time 73% 75% 2%• on-board bus - night-time 81% 83% 2%Level of notifiable safety occurrences – notifiable occurrences• Category A: occurrences per million passenger boardings (c) 0.23 0.30 0.07• Category A: occurrences per million train kilometres (c) 0.70 0.80 0.10• Category B: occurrences per million passenger boardings (d) 10.75 15.23 4.48• Category B: occurrences per million train kilometres (d) 32.56 40.73 8.17• Regional school bus services: notifiable occurrences (accidents)
reported each school year 19 18 -1
Outcome 2: Protection of the long term functionality of the rail corridor and railway infrastructure• Number of lease breaches Nil Nil NilKey Efficiency IndicatorsService 1 : Metropolitan and Regional Passenger Services Average cost per passenger kilometre• Transperth bus operations $1.19 $1.18 -$0.01• Transperth train operations $0.57 $0.57 $0.00• Transperth ferry operations (e) $1.30 $1.55 $0.25Average cost per 1,000 place kilometres • Regional bus services $81.68 $79.01 -$2.67Total passenger place kilometres (millions)• Regional bus services (f) 247.775 282.834 35.059Service 2 : Country Passenger Rail and Road Coach Services Average cost per passenger kilometre• Transwa rail $0.54 $0.55 $0.01• Transwa road coaches $0.27 $0.25 -$0.02Service 3 : Regional School Bus ServicesAverage cost per contracted kilometre : School bus services $3.75 $3.72 -$0.03Service 4 : Rail Corridor and Residual Freight IssuesTotal cost of managing the rail freight corridor and residual freight issues
$179,424,000 $179,342,000 -$82,000
PTA Annual Report / Key Performance Indicators

99
Notes:
a. Passengers per service kilometre on Regional Town Buses were 17.43 per cent below the target mainly due to a 3.6 per cent decrease in patronage and a significant increase of 16.8 per cent in service kilometres as a result of the introduction of the newly subsidised Perth to Broome road coach service and the Kalgoorlie inter-town services operating from Kalgoorlie to Coolgardie and Kambalda.
b. The on time running results of the Prospector, MerredinLink and AvonLink were 55.49 per cent, 39.85 per cent and 26.81 per cent below the targets respectively mainly due to service disruptions associated with extensive track works carried out by Brookfield Rail around the Avon Valley section of the track.
c. The indicators for Category A incidents per million passenger boardings and per million train kilometres were 29.8 per cent and 14.09 per cent above the targets respectively mainly due to a 7.16 per cent decrease in boardings, 20 per cent increase in Category A incidents and 5.12 per cent increase in train kilometres.
d. The indicators for Category B incidents per million passenger boardings and per million train kilometres were 41.64 per cent and 25.10 per cent above the targets respectively mainly due to a 7.16 per cent decrease in total boardings, 31.52 per cent increase in Category B incidents and 5.12 per cent increase in train kilometres.
e. Ferry average costs per passenger kilometre were 19.5 per cent above the revised target mainly due to a 19.5 per cent increase in ferry total costs driven by the unanticipated repair costs to the MV Shelley Taylor-Smith.
f. Total passenger place kilometres of Regional Town buses exceeded the target by 14.15 per cent driven by a significant increase of 232.16 per cent (or 33.389 million) in inter-town place kilometres resulted from the introduction of the newly subsidised Perth to Broome road coach service, the Kalgoorlie inter-town services from Kalgoorlie to Coolgardie and Kambalda and larger capacity bus being used for the community bus service in Karratha.
PTA Annual Report / Key Performance Indicators

Certification of KPIsFor the year ended 30 June 2017I hereby certify that the key performance indicators are based on proper records, are relevant and appropriate for assisting users to assess the Public Transport Authority’s performance, and fairly represent the performance of the Public Transport Authority of Western Australia for the financial year ended 30 June 2017.
Richard Sellers Accountable Authority 5 September 2017
Audited KPI report
Measuring performance
Outcome 1: Accessible, reliable and safe public transport systemEFFECTIVENESS INDICATORSThe PTA’s effectiveness in providing an accessible, reliable and safe public transport system is measured using the following key effectiveness indicators for:
1. Use of public transport
2. Accessible public transport
3. Service reliability
4. Level of overall customer satisfaction
5. Customer perception of safety
6. Level of notifiable safety incidents.
100

101
1. Use of public transportThe use of public transport is measured by comparing the annual number of passengers carried with the number of service kilometres. Service kilometres are kilometres operated on scheduled passenger services and exclude “non-productive running” i.e. travelling to or from the depot to commence a service trip or re-positioning to commence another service trip.
The measure indicates the extent to which services provided, as represented by the number of kilometres operated, are being utilised. An increasing trend in the indicator will generally signify that patronage is rising at a rate greater than the rate of increase in service kilometres operated and represents an improvement in effectiveness as well as an increase in the use of public transport.
This effectiveness indicator is applied to each mode of public transport. The indicator is based on total boardings on Transperth services and includes fare-paying boardings plus free travel and transfers. Transfers are boardings which occur either between services within the same mode or between modes during the specified ticket transfer time.
Transperth bus services
0.0
0.3
0.6
0.9
1.2
1.5
2013-14 2014-15 2015-16 2016-17 2016-17Target
1.32 1.28 1.23 1.17 1.22
Passengers per service kilometre
Passengers per service kilometre on Transperth buses was 3.88 per cent below the 2016-17 target and 4.67 per cent below the 2015-16 result. This was mainly due to a 1.87 per cent increase in service kilometres and a 2.88 per cent decrease in bus patronage compared with 2015-16.
Since 2010-11, there has been a continuation of large annual increases in bus service kilometres due to the ongoing bus service expansion program which has made public transport more convenient, efficient, attractive and accessible to many more people in the inner and expanding outer suburbs.
In 2016-17, bus service kilometres increased by 1.87 per cent (or 1.254 million kilometres) to 68.237 million from 66.983m in 2015-16 largely due to additional buses services including the introduction of the new high-frequency 960 bus route and the 950 Superbus introduced in 2014-15, improved access to bus facilities and new bus interchanges at Aubin Grove Station.
However, total boardings on bus system in 2016-17 recorded a 2.88 per cent decrease from 82.391 million in 2015-16 to 80.017m and was 4.35 per cent below the 2016-17 target. Factors contributing to the decline in bus patronage include:
• declining population growth - in the year ending December 2016, WA population growth rate (mainly natural increase) was 0.66 per cent compared to 3.12 per cent in June 2012 when bus annual patronage recorded a 5.21 per cent increase (or 3.990 million).
• slowing economy in 2016-17 with continued high unemployment rate and office vacancy rate in Perth CBD impacting on work-related trips and patronage.
• decline of 3.1 per cent (approximately 1 million) in the total visitors to/within WA including overnight and days trip visitors in the year ending March 2017.
• decline in overseas migration compared to 2015-16 and a net loss from interstate migration recorded in the year ending December 2016.
• continuing low fuel price in an environment with over 1.5 million passenger vehicles on register in January 2017 following WA strongest growth rates of all States in passenger vehicle registrations between 2010 and 2015.
PTA Annual Report / Key Performance Indicators
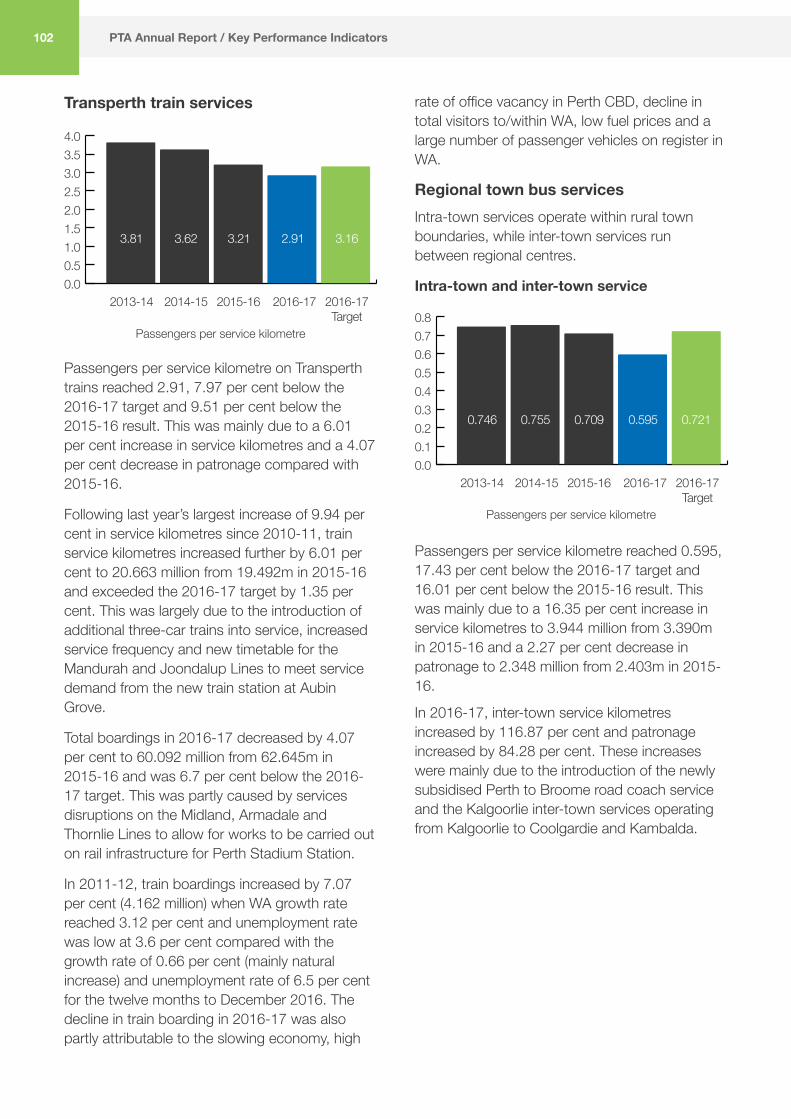
102
Transperth train services
0.00.51.01.52.02.53.03.54.0
2013-14 2014-15 2015-16 2016-17 2016-17Target
3.81 3.62 3.21 2.91 3.16
Passengers per service kilometre
Passengers per service kilometre on Transperth trains reached 2.91, 7.97 per cent below the 2016-17 target and 9.51 per cent below the 2015-16 result. This was mainly due to a 6.01 per cent increase in service kilometres and a 4.07 per cent decrease in patronage compared with 2015-16.
Following last year’s largest increase of 9.94 per cent in service kilometres since 2010-11, train service kilometres increased further by 6.01 per cent to 20.663 million from 19.492m in 2015-16 and exceeded the 2016-17 target by 1.35 per cent. This was largely due to the introduction of additional three-car trains into service, increased service frequency and new timetable for the Mandurah and Joondalup Lines to meet service demand from the new train station at Aubin Grove.
Total boardings in 2016-17 decreased by 4.07 per cent to 60.092 million from 62.645m in 2015-16 and was 6.7 per cent below the 2016-17 target. This was partly caused by services disruptions on the Midland, Armadale and Thornlie Lines to allow for works to be carried out on rail infrastructure for Perth Stadium Station.
In 2011-12, train boardings increased by 7.07 per cent (4.162 million) when WA growth rate reached 3.12 per cent and unemployment rate was low at 3.6 per cent compared with the growth rate of 0.66 per cent (mainly natural increase) and unemployment rate of 6.5 per cent for the twelve months to December 2016. The decline in train boarding in 2016-17 was also partly attributable to the slowing economy, high
rate of office vacancy in Perth CBD, decline in total visitors to/within WA, low fuel prices and a large number of passenger vehicles on register in WA.
Regional town bus servicesIntra-town services operate within rural town boundaries, while inter-town services run between regional centres.
Intra-town and inter-town service
0.00.10.20.30.40.50.60.70.8
2013-14 2014-15 2015-16 2016-17 2016-17Target
0.746 0.755 0.709 0.595 0.721
Passengers per service kilometre
Passengers per service kilometre reached 0.595, 17.43 per cent below the 2016-17 target and 16.01 per cent below the 2015-16 result. This was mainly due to a 16.35 per cent increase in service kilometres to 3.944 million from 3.390m in 2015-16 and a 2.27 per cent decrease in patronage to 2.348 million from 2.403m in 2015-16.
In 2016-17, inter-town service kilometres increased by 116.87 per cent and patronage increased by 84.28 per cent. These increases were mainly due to the introduction of the newly subsidised Perth to Broome road coach service and the Kalgoorlie inter-town services operating from Kalgoorlie to Coolgardie and Kambalda.
PTA Annual Report / Key Performance Indicators
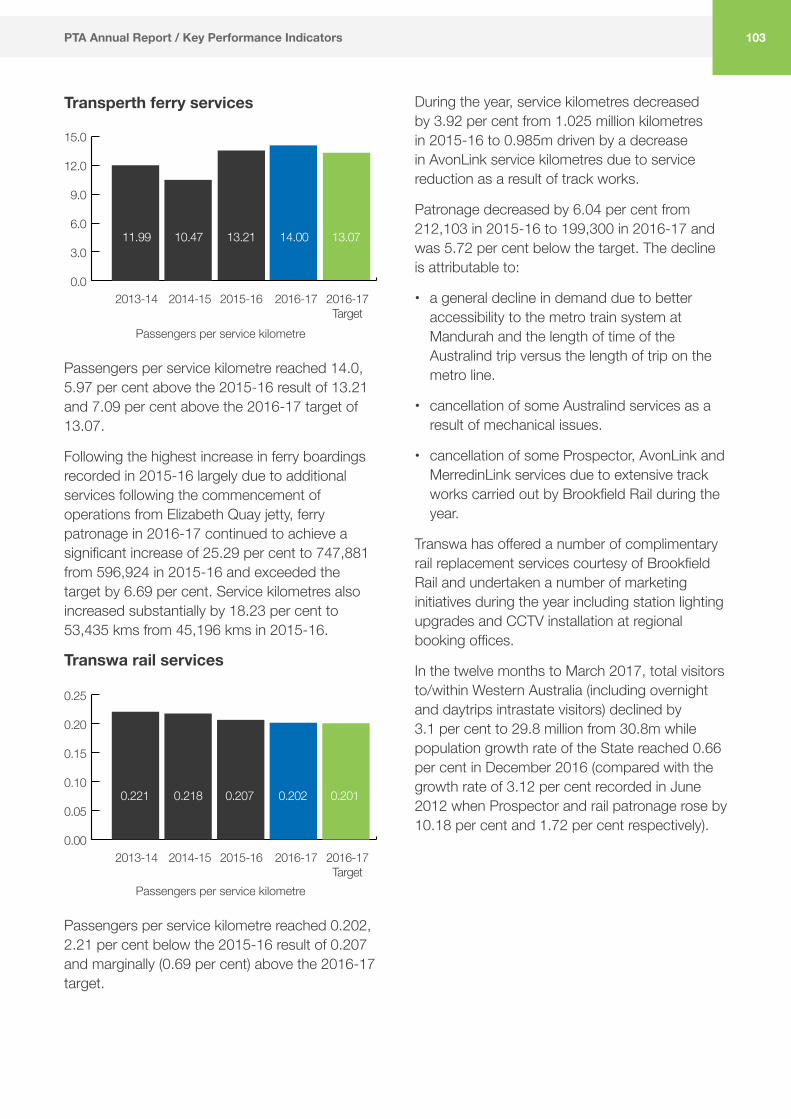
103
Transperth ferry services
0.0
3.0
6.0
9.0
12.0
15.0
2013-14 2014-15 2015-16 2016-17 2016-17Target
11.99 10.47 13.21 14.00 13.07
Passengers per service kilometre
Passengers per service kilometre reached 14.0, 5.97 per cent above the 2015-16 result of 13.21 and 7.09 per cent above the 2016-17 target of 13.07.
Following the highest increase in ferry boardings recorded in 2015-16 largely due to additional services following the commencement of operations from Elizabeth Quay jetty, ferry patronage in 2016-17 continued to achieve a significant increase of 25.29 per cent to 747,881 from 596,924 in 2015-16 and exceeded the target by 6.69 per cent. Service kilometres also increased substantially by 18.23 per cent to 53,435 kms from 45,196 kms in 2015-16.
Transwa rail services
0.00
0.05
0.10
0.15
0.20
0.25
2013-14 2014-15 2015-16 2016-17 2016-17Target
0.221 0.218 0.207 0.202 0.201
Passengers per service kilometre
Passengers per service kilometre reached 0.202, 2.21 per cent below the 2015-16 result of 0.207 and marginally (0.69 per cent) above the 2016-17 target.
During the year, service kilometres decreased by 3.92 per cent from 1.025 million kilometres in 2015-16 to 0.985m driven by a decrease in AvonLink service kilometres due to service reduction as a result of track works.
Patronage decreased by 6.04 per cent from 212,103 in 2015-16 to 199,300 in 2016-17 and was 5.72 per cent below the target. The decline is attributable to:
• a general decline in demand due to better accessibility to the metro train system at Mandurah and the length of time of the Australind trip versus the length of trip on the metro line.
• cancellation of some Australind services as a result of mechanical issues.
• cancellation of some Prospector, AvonLink and MerredinLink services due to extensive track works carried out by Brookfield Rail during the year.
Transwa has offered a number of complimentary rail replacement services courtesy of Brookfield Rail and undertaken a number of marketing initiatives during the year including station lighting upgrades and CCTV installation at regional booking offices.
In the twelve months to March 2017, total visitors to/within Western Australia (including overnight and daytrips intrastate visitors) declined by 3.1 per cent to 29.8 million from 30.8m while population growth rate of the State reached 0.66 per cent in December 2016 (compared with the growth rate of 3.12 per cent recorded in June 2012 when Prospector and rail patronage rose by 10.18 per cent and 1.72 per cent respectively).
PTA Annual Report / Key Performance Indicators

104
Transwa road coach services
0.000.010.020.030.040.050.060.070.08
2013-14 2014-15 2015-16 2016-17 2016-17Target
0.063 0.060 0.058 0.0574 0.057
Passengers per service kilometre
Passengers per service kilometre reached 0.057, marginally (0.64 per cent) below the 2015-16 result of 0.058 and (0.78 per cent) above the 2016-17 target.
This was due to a 1.4 per cent decline in patronage from 179,066 in 2015-16 to 176,564 in 2016-17 and a marginal (0.77 per cent) decrease in service kilometres from 3.097 million kilometres in 2015-16 to 3.074m.
Transwa are currently undertaking a number of route optimisation strategies to increase patronage including the introduction of the new state-of-the-art Volvo road coaches into services, new ticketing agents and CCTV installation at regional booking offices. During the year, OTR result of Road Coaches and overall satisfaction with Transwa services continued to remain high at above 90 per cent.
2. Accessible public transportAccessibility to public transport, in terms of service coverage, is measured as the proportion of Property Street Addresses (PSA) within the Perth Public Transport Area (PPTA) which are within 500 metres of a Transperth stop providing an acceptable level of service. The PPTA defines the core operational areas for Transperth services.
“Acceptable Service Level” (ASL) is defined as an hourly service during the day with at least three trips per hour (i.e. at 20-minute intervals) in the peak-flow direction in the morning and/or afternoon peaks, excluding dedicated school bus services.
The indicator uses PSA data from Landgate and service information and stop location data from the Transperth Route Information System (TRIS).
The measure demonstrates the extent to which the PTA meets its accessibility standards in the Perth metropolitan area.
0
20
40
60
80
100
2013-14 2014-15 2015-16 2016-17 2016-17Target
84.58% 85.01% 84.73% 84.74% 85%
The proportion of street addresses within the Perth Public Transport Area (PPTA) which are within 500 metres of a Transperth stop providing an acceptable level of service
Accessibility to public transport was 0.31 per cent below the 2016-17 target and marginally above the 2015-16 result mainly due to a 2.28 per cent increase in the number of PSAs within 500 metres of an ASL stop resulting from ongoing bus service expansion program.
In 2016-17, the total number of PSAs within the PPTA increased by 2.28 per cent to 998,993 from 976,768 in 2015-16. The number of PSAs within 500 metres of an ASL stop also increased to 846,547 from 827,638 in 2015-16.
The 2016-17 result of 84.74 per cent indicates that 846,547 PSAs in Perth, out of 998,993, have ready access to an acceptable level of public transport services (defined as an hourly service during the day with at least three trips per hour in peak flow direction in the morning and/or afternoon peaks).
PTA Annual Report / Key Performance Indicators

105
3. Service reliabilityAccording to an independent survey which measured customer satisfaction, service reliability is regarded as one of the most significant characteristics of a quality service. Service reliability is essentially a combination of two main factors, punctuality and consistency.
Services are considered to be punctual if they arrive within a defined period of time after the scheduled arrival time. This parameter is referred to as “On Time Running” (OTR).
Operation OTR parameterMetropolitan and Regional Passenger ServicesTransperth Trains 4 minutesTransperth Buses 4 minutesTransperth Ferries 3 minutesCountry Passenger Rail and Road Coach ServicesTranswa Rail
Prospector 15 minutesAustralind 10 minutesAvonLink 10 minutesMerredinLink 10 minutes
Road Coaches 10 minutesRegional school bus servicesDrop off no less than 10 minutes before school starts and pick up within 10 minutes of school ending
The ‘OTR’ measure demonstrates the extent to which the PTA meets its service reliability standards.
Transperth train services
0
20
40
60
80
100
2013-14 2014-15 2015-16 2016-17 2016-17Target
94.93% 95.02% 95.48% 95.80% 95%
Percentage of services arriving within ‘on-time arrival’ parameter
The OTR of Transperth trains in 2016-17 reached 95.8 per cent, marginally (0.33 per cent) above the 2015-16 result and (0.84 per cent) above the 2016-17 target, representing the highest results achieved since 2010-11.
This was due to significant decreases in the number of delays due to weather (31.9 per cent), passenger (24.29 per cent), electrical and mechanical issues (13.76 per cent) compared to 2015-16.
Factors affecting train service reliability include passenger related delays causing longer dwell times at stations, electrical and mechanical issues, special events and bad weather which resulted in slippery track conditions and trains travelling at a reduced speed.
PTA Annual Report / Key Performance Indicators

106
Transperth bus services
0
20
40
60
80
100
2013-14 2014-15 2015-16 2016-17 2016-17Target
81.22% 80.25% 85.14% 84.26% 85%
Percentage of services arriving within ‘on-time arrival’ parameter
The OTR of Transperth buses in 2016-17 reached 84.26 per cent, 1.04 per cent below the 2015-16 result, marginally (0.87 per cent) below the target but was higher than the results of the four years to 2014-15 due to the ongoing Bus Priority programs.
Transperth ferry services
0
20
40
60
80
100
2013-14 2014-15 2015-16 2016-17 2016-17Target
97.83% 92.03% 97.92% 96.49% 96%
Percentage of services arriving within ‘on-time arrival’ parameter
The OTR of Transperth ferries in 2016-17 remained high at 96.49 per cent, marginally (0.51 per cent) above the 2016-17 target and 1.46 per cent below the 2015-16 result. Since the commencement of operations from Elizabeth Quay Jetty in January 2016, ferry service kilometres increased significantly by 20 per cent in 2015-16 and 18.23 per cent in 2016-17.
Transwa rail servicesIndicators of the ‘OTR’ performance for Transwa rail services are reported separately for each service.
These services operate on the freight rail network which is managed and operated by Brookfield Rail Pty Ltd under a long-term lease.
a. Prospector
0
20
40
60
80
100
2013-14 2014-15 2015-16 2016-17 2016-17Target
81% 65% 48% 36% 80%
Percentage of services arriving within ‘on-time arrival’ parameter
The OTR of the Prospector reached 36 per cent, 25.45 per cent below the 2015-16 result and 55.49 per cent below the 2016-17 target mainly due to service delays resulting from crossings and track works occurring on the network.
During the year, Brookfield Rail carried out extensive maintenance work between Moondyne and Jumperkine which continued to impact adversely on the Prospector, AvonLink and MerredinLink services. The works have now been completed. The OTR result for 2017-18 is expected to be significantly higher.
b. Australind
0
20
40
60
80
100
2013-14 2014-15 2015-16 2016-17 2016-17Target
92% 93% 94% 88% 90%
Percentage of services arriving within ‘on-time arrival’ parameter
PTA Annual Report / Key Performance Indicators
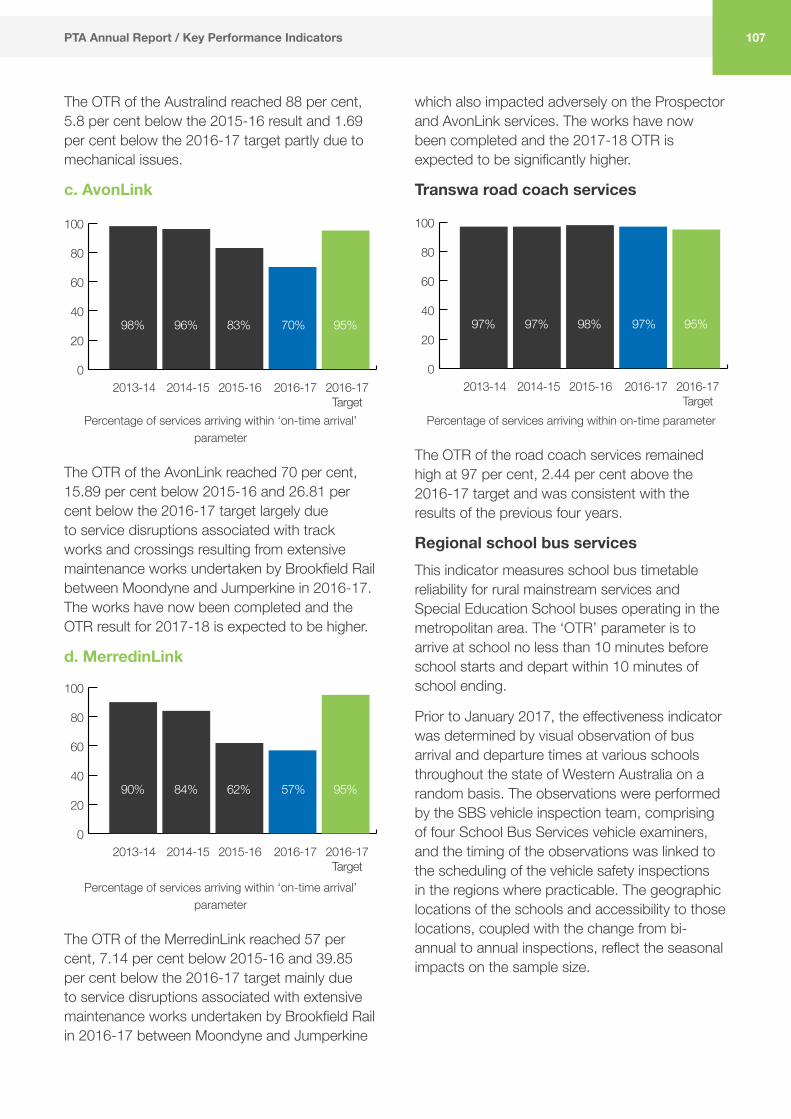
107
The OTR of the Australind reached 88 per cent, 5.8 per cent below the 2015-16 result and 1.69 per cent below the 2016-17 target partly due to mechanical issues.
c. AvonLink
0
20
40
60
80
100
2013-14 2014-15 2015-16 2016-17 2016-17Target
98% 96% 83% 70% 95%
Percentage of services arriving within ‘on-time arrival’ parameter
The OTR of the AvonLink reached 70 per cent, 15.89 per cent below 2015-16 and 26.81 per cent below the 2016-17 target largely due to service disruptions associated with track works and crossings resulting from extensive maintenance works undertaken by Brookfield Rail between Moondyne and Jumperkine in 2016-17. The works have now been completed and the OTR result for 2017-18 is expected to be higher.
d. MerredinLink
0
20
40
60
80
100
2013-14 2014-15 2015-16 2016-17 2016-17Target
90% 84% 62% 57% 95%
Percentage of services arriving within ‘on-time arrival’ parameter
The OTR of the MerredinLink reached 57 per cent, 7.14 per cent below 2015-16 and 39.85 per cent below the 2016-17 target mainly due to service disruptions associated with extensive maintenance works undertaken by Brookfield Rail in 2016-17 between Moondyne and Jumperkine
which also impacted adversely on the Prospector and AvonLink services. The works have now been completed and the 2017-18 OTR is expected to be significantly higher.
Transwa road coach services
0
20
40
60
80
100
2013-14 2014-15 2015-16 2016-17 2016-17Target
97% 97% 98% 97% 95%
Percentage of services arriving within on-time parameter
The OTR of the road coach services remained high at 97 per cent, 2.44 per cent above the 2016-17 target and was consistent with the results of the previous four years.
Regional school bus servicesThis indicator measures school bus timetable reliability for rural mainstream services and Special Education School buses operating in the metropolitan area. The ‘OTR’ parameter is to arrive at school no less than 10 minutes before school starts and depart within 10 minutes of school ending.
Prior to January 2017, the effectiveness indicator was determined by visual observation of bus arrival and departure times at various schools throughout the state of Western Australia on a random basis. The observations were performed by the SBS vehicle inspection team, comprising of four School Bus Services vehicle examiners, and the timing of the observations was linked to the scheduling of the vehicle safety inspections in the regions where practicable. The geographic locations of the schools and accessibility to those locations, coupled with the change from bi-annual to annual inspections, reflect the seasonal impacts on the sample size.
PTA Annual Report / Key Performance Indicators

108
In 2016, a restructure of the School Bus Services (SBS) staffing levels prompted a review of the business processes intrinsically linked to the existing service reliability indicator. From January 2017, the inspection function was transferred to the Department of Transport (DoT) as part of restructuring decision. The duties formerly undertaken by the SBS vehicle inspectors, including the updating of data beyond the July to December 2016 timeline, ceased to exist. An alternative mechanism for the data capture and reporting of on-time running will be implemented in 2017-18 i.e. “Satisfaction with School Bus availability at arrival/departure time”. This entails setting up a web based reporting tool that can be accessed in particular by parents and schools to report breaches of on-time arrivals and departures.
The following table shows five-year performance to December 31, 2016:
Year Number of observations
for compliance
with ‘on-time’ arrival
Observations that were compliant
2012-13 844 8422013-14 693 6932014-15 379 3722015-16 540 5312016-17 (Jul – Dec 2016)
255 253
During the six months to December 2016, 255 mainstream and education support services were randomly monitored for OTR of which 253 were within the time standard. The number of observations was within the acceptable limit of sampling error rate.
0
20
40
60
80
100
2013-14 2014-15 2015-16 2016-17 2016-17Target
100% 98.15% 98.33% 99.22% 98%
Percentage of services arriving within on-time parameter
The OTR for the six-month period reached 99.22 per cent, 0.9 per cent above the 2015-16 result, 1.24 per cent above the 2016-17 target and is consistent with the results of the previous six years.
PTA Annual Report / Key Performance Indicators

109
4. Level of overall customer satisfactionThe proportion of patrons who expressed overall satisfaction with their public transport service level measures the public perception of Transperth’s performance in providing a high-quality and attractive public transport service.
The measure for Transperth services is derived from an extensive annual survey conducted by independent pollsters. The survey, known as the ‘Passenger Satisfaction Monitor’ (PSM), provides an objective, unbiased view over time of patrons’ overall satisfaction with the system, e.g. safety, on-time running, courtesy of staff, service frequency and station amenities. The information is used by Transperth to develop strategies for improving service performance and infrastructure.
The pollsters interview a large sample of passengers in lengthy face-to-face surveys. Interviewers are assigned to various services and transit station locations over a four week period covering the working week and weekend.
Transperth train servicesFor the train PSM, a total of 1,012 train patrons were surveyed. The overall sample comprised of:
• Adults aged 18 years or over resident within the Perth metropolitan area;
• Current users of Transperth train services (excluding school students); and
• Patrons who travel on trains at least once per fortnight.
The sample error estimate was within ± 3 - 4 per cent and represents score differences required to reach the 95 per cent confidence level.
0
20
40
60
80
100
2013-14 2014-15 2015-16 2016-17 2016-17Target
89% 92% 92% 94% 90%
% of respondents either “very satisfied” or “satisfied”
Overall satisfaction reached 94 per cent, 4.44 per cent above the target in 2016-17 and 2.17 per cent above the 2015-16 and 2014-15 results of 92 per cent, which is the highest result achieved since 1994.
This was driven by high satisfaction among peak-time travellers recorded on all lines - Mandurah (96 per cent), Midland (94 per cent), Fremantle (93 per cent), Armadale (92 per cent) and Joondalup (91 per cent). Since 2012-13, overall satisfaction of peak-time travellers has increased significantly by 16.25 per cent (from 80 per cent in 2013 to 93 per cent in 2016-17).
The increase in overall satisfaction was mainly due to the increased benefits of using train services resulting from ongoing service expansion including the extension of the Joondalup Line from Clarkson to Butler in 2014-15, additional six-car and three-car trains introduced in 2015-16 and 2016-17, new timetable on the Mandurah and Joondalup Lines to meet service demand from the new Aubin Grove Station and a new multi-storey car park at Edgewater Station.
Satisfaction among off-peak travellers also remained very high at 93 per cent in 2016-17. The level of dissatisfaction was unchanged at two per cent compared to the previous two years, representing the lowest dissatisfaction level achieved since 2005-06. The main reasons for dissatisfaction related predominantly to off-peak frequency issues (0.7 per cent). The equal all-time low level of dissatisfaction achieved in 2016-17 and the previous two years is due to reduced crowding resulting from increased capacity and service frequency.
PTA Annual Report / Key Performance Indicators
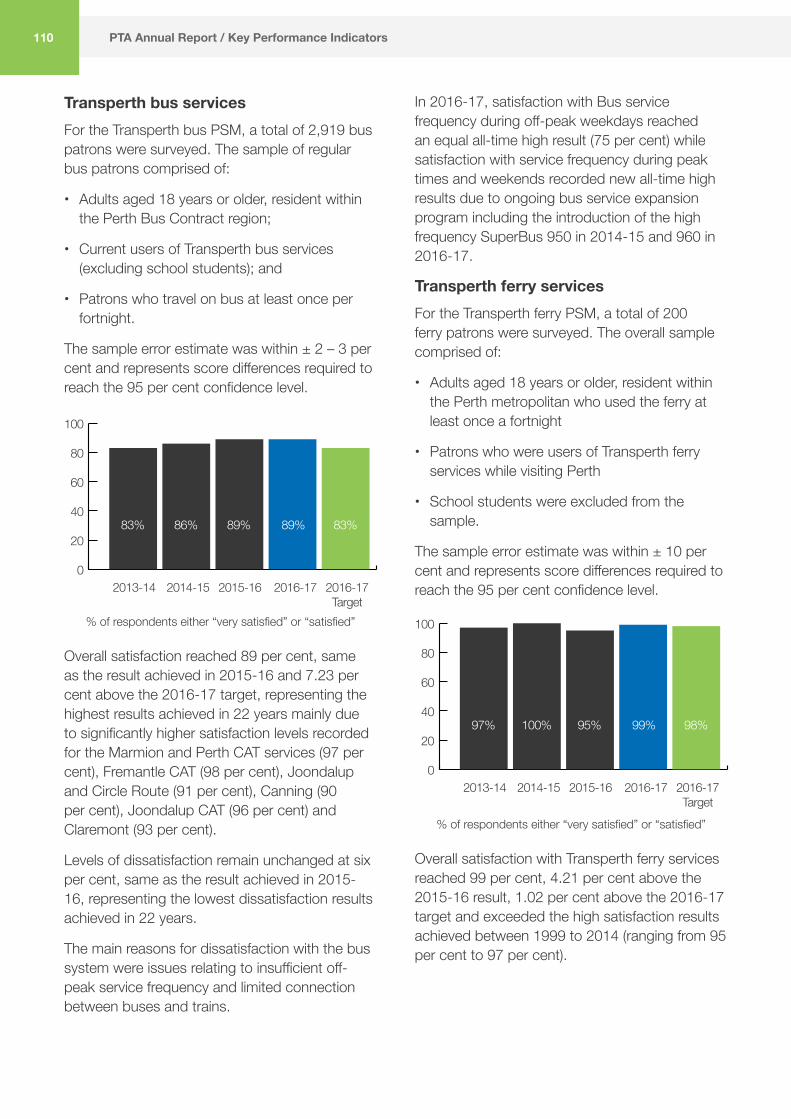
110
Transperth bus servicesFor the Transperth bus PSM, a total of 2,919 bus patrons were surveyed. The sample of regular bus patrons comprised of:
• Adults aged 18 years or older, resident within the Perth Bus Contract region;
• Current users of Transperth bus services (excluding school students); and
• Patrons who travel on bus at least once per fortnight.
The sample error estimate was within ± 2 – 3 per cent and represents score differences required to reach the 95 per cent confidence level.
0
20
40
60
80
100
2013-14 2014-15 2015-16 2016-17 2016-17Target
83% 86% 89% 89% 83%
% of respondents either “very satisfied” or “satisfied”
Overall satisfaction reached 89 per cent, same as the result achieved in 2015-16 and 7.23 per cent above the 2016-17 target, representing the highest results achieved in 22 years mainly due to significantly higher satisfaction levels recorded for the Marmion and Perth CAT services (97 per cent), Fremantle CAT (98 per cent), Joondalup and Circle Route (91 per cent), Canning (90 per cent), Joondalup CAT (96 per cent) and Claremont (93 per cent).
Levels of dissatisfaction remain unchanged at six per cent, same as the result achieved in 2015-16, representing the lowest dissatisfaction results achieved in 22 years.
The main reasons for dissatisfaction with the bus system were issues relating to insufficient off-peak service frequency and limited connection between buses and trains.
In 2016-17, satisfaction with Bus service frequency during off-peak weekdays reached an equal all-time high result (75 per cent) while satisfaction with service frequency during peak times and weekends recorded new all-time high results due to ongoing bus service expansion program including the introduction of the high frequency SuperBus 950 in 2014-15 and 960 in 2016-17.
Transperth ferry servicesFor the Transperth ferry PSM, a total of 200 ferry patrons were surveyed. The overall sample comprised of:
• Adults aged 18 years or older, resident within the Perth metropolitan who used the ferry at least once a fortnight
• Patrons who were users of Transperth ferry services while visiting Perth
• School students were excluded from the sample.
The sample error estimate was within ± 10 per cent and represents score differences required to reach the 95 per cent confidence level.
0
20
40
60
80
100
2013-14 2014-15 2015-16 2016-17 2016-17Target
97% 100% 95% 99% 98%
% of respondents either “very satisfied” or “satisfied”
Overall satisfaction with Transperth ferry services reached 99 per cent, 4.21 per cent above the 2015-16 result, 1.02 per cent above the 2016-17 target and exceeded the high satisfaction results achieved between 1999 to 2014 (ranging from 95 per cent to 97 per cent).
PTA Annual Report / Key Performance Indicators

During the year, satisfaction with ferry service frequency during peak times reached a new all-time high result of 99 per cent. Safety perception on board and at jetty during the day, availability of seats and cleanliness on board recorded a perfect satisfaction result of 100 per cent while satisfaction with punctuality and speed of the trip remain very high at 98 per cent.
Overall dissatisfaction decreased to one per cent from two per cent in 2015-16. Since the opening of Elizabeth Quay jetty in January 2016, ferry patronage continued to record substantial increases, 25.29 per cent in 2016-17 and 51.38 per cent in 2015-16 coincided with substantial increases in service kilometres.
Transwa train and road coach services An independent passenger satisfaction survey is undertaken annually for each service: Australind, Prospector, AvonLink, MerredinLink and Road Coach.
In 2016-17, a total of 1,269 country services patrons were surveyed via a self-completion questionnaire.
The sample error estimate was within ± 3 – 5 per cent and represents score differences required to reach the 95 per cent confidence level.
0
20
40
60
80
100
2013-14 2014-15 2015-16 2016-17 2016-17Target
90% 93% 91% 91% 92%
% of respondents either “very satisfied” or “satisfied”
Overall satisfaction reached 91 per cent, 1.09 per cent below the 2016-17 target and was consistent with the high results achieved in the previous eight years ranging from 90 per cent to 93 per cent.
PTA Annual Report / Key Performance Indicators 111

112
5. Customer perception of safetySafety perceptions are an important factor in the public deciding whether to use public transport. The PTA is continuing to invest in security-related infrastructure and uses risk based resource allocation to enhance security staffing in specific areas of vulnerability. This increase in presence at strategic times and locations has ensured that customers can see the tangible measures being taken to increase their safety.
Customer perceptions of safety are measured through data gathered in the Passenger Satisfaction Monitor (PSM) which distinguishes between on-train and on-bus and at stations, at night and during the day for the Transperth train and bus services.
Transperth train servicesCustomer perception of safety Daytime
0
20
40
60
80
100
2013-14 2014-15 2015-16
Stations
2016-17 2016-17Target
97% 98% 99% 98% 96%
0
20
40
60
80
100
2013-14 2014-15 2015-16
On-board trains
2016-17 2016-17Target
98% 98% 98% 98% 97%
The indicator for perceived safety at train stations during the day reached 98 per cent, 1.01 per cent below the 2015-16 result, 2.08 per cent above the 2016-17 target of 96 per cent and is consistent with the results of the past eight years ranging from 97 per cent to 99 per cent.
The indicator for perceived safety on board trains reached 98 per cent, the same as the results of the previous three years, 1.03 per cent above the 2016-17 target of 97 per cent and is consistent with the results of the past eleven years ranging from 98 per cent to 99 per cent.
Customer perception of safety Night-time
69% 72% 76% 73% 69%
0
20
40
60
80
100
2013-14 2014-15 2015-16
On-board trains
2016-17 2016-17Target
77% 78% 79% 81% 75%
0
20
40
60
80
100
2013-14 2014-15 2015-16
Stations
2016-17 2016-17Target
PTA Annual Report / Key Performance Indicators

113
The indicator for perceived safety at train stations at night reached 73 per cent, 5.8 per cent above the 2016-17 target, 3.95 per cent below the highest result of 76 per cent achieved in 2015-16 and remained higher than the results recorded since 1994.
The indicator for perceived safety on board trains reached 81 per cent, 2.53 per cent above the 2015-16 result of 79 per cent and 8 per cent above the 2016-17 target, representing the highest level achieved since 1994.
During the year, night-time safety perception on-board trains along the Fremantle, Midland and Mandurah lines recorded the highest results since 2008-09, representing increases of 7.14 per cent, 4.11 per cent and 2.38 per cent respectively over 2015-16. Safety perception on-board the Joondalup Line at night also recorded an improvement of 6.25 per cent while night-time perception at stations rose 12.5 per cent to the highest level since 2005-06.
Safety perception results continued to exceed respective targets in 2016-17 and the previous two years mainly due to ongoing effective measures taken by Transperth to address security concerns which include:
• Risk based resource allocation, ensuring a greater security presence on the Armadale line and mobile patrols being strategically located across the network
• Sophisticated CCTV system and major upgrades to station lighting
• Joint Police and PTA targeted operations and enhanced security coverage on late evening trains.
PTA Annual Report / Key Performance Indicators
Transperth bus servicesCustomer perception of safety Daytime
0
20
40
60
80
100
2013-14 2014-15 2015-16
At bus stations/interchanges
2016-17 2016-17Target
97% 97% 97% 98% 97%
0
20
40
60
80
100
2013-14 2014-15 2015-16
On-board buses
2016-17 2016-17Target
99% 99% 99% 99% 99%
The indicator for perceived safety at bus stations/interchanges during the day reached 98 per cent, 1.03 per cent above the 2016-17 target and exceeded the results of the previous eleven years.
The indicator for perceived safety on board buses reached 99 per cent, the same as the 2016-17 target and has remained unchanged since 2010-11.
In 2016-17, day-time safety perception on-board buses and at bus stations/interchanges in Joondalup, Marmion, Circle Route and Rockingham/Mandurah regions reached 100 per cent. Safety perception on-board buses in Claremont contract area remained unchanged at 100 per cent.

PTA Annual Report / Key Performance Indicators
Customer perception of safety Night-time
01020304050607080
2013-14 2014-15 2015-16
At bus stations/interchanges
2016-17 2016-17Target
75% 71% 76% 75% 73%
0
20
40
60
80
100
2013-14 2014-15 2015-16
On-board buses
2016-17 2016-17Target
84% 82% 84% 83% 81%
The indicator for perceived safety at bus stations/interchanges at night reached 75 per cent, 2.74 per cent above the 2016-17 target, 1.32 per cent below the highest result achieved in 2015-16 and remained higher than the results recorded between 2006 and 2013.
The indicator for perceived safety on board buses at night reached 83 per cent, 2.47 per cent above the 2016-17 target, 1.19 per cent below the highest level achieved in 2015-16 and 2013-14.
During the year, night-time safety perception at bus stations/interchanges along the Circle Route increased significantly by 17.07 per cent followed by Marmion (10.81 per cent), Claremont (9.59 per cent). Significant increases on-board buses at night were seen in Southern River/Armadale region (21.21 per cent), Rockingham/Mandurah (12.79 per cent) and Circle Route (12.2 per cent).
114
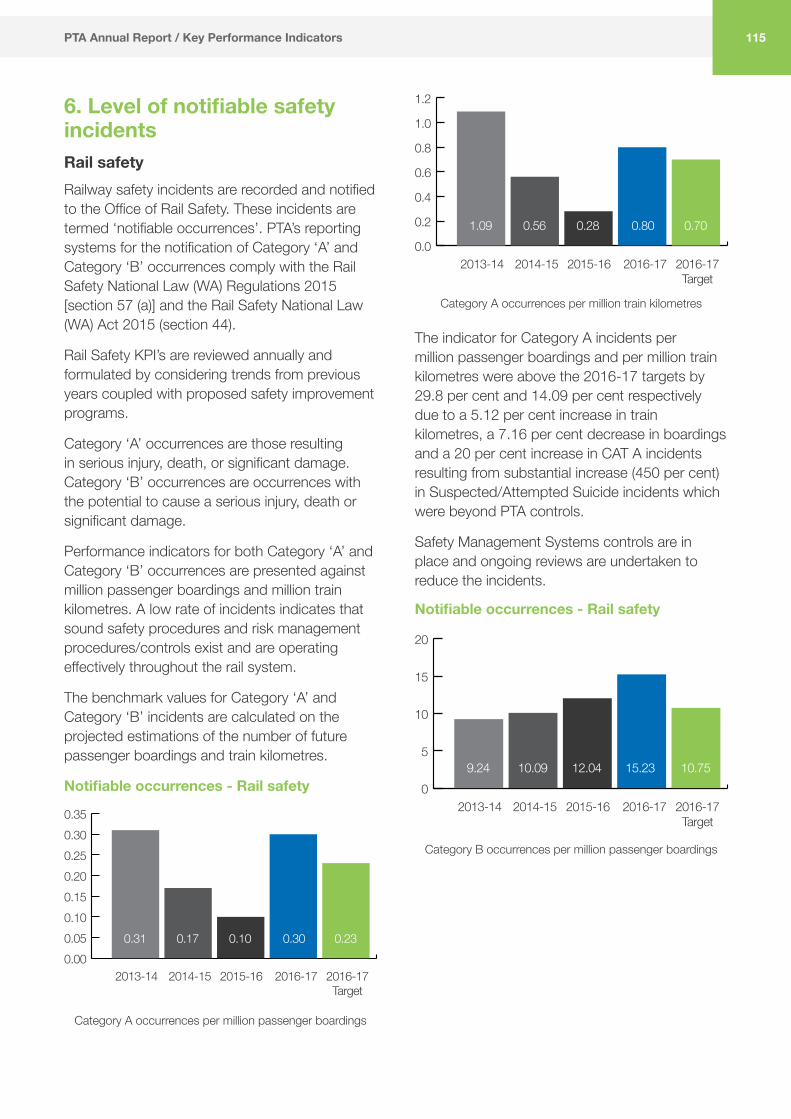
115
6. Level of notifiable safety incidents Rail safetyRailway safety incidents are recorded and notified to the Office of Rail Safety. These incidents are termed ‘notifiable occurrences’. PTA’s reporting systems for the notification of Category ‘A’ and Category ‘B’ occurrences comply with the Rail Safety National Law (WA) Regulations 2015 [section 57 (a)] and the Rail Safety National Law (WA) Act 2015 (section 44).
Rail Safety KPI’s are reviewed annually and formulated by considering trends from previous years coupled with proposed safety improvement programs.
Category ‘A’ occurrences are those resulting in serious injury, death, or significant damage. Category ‘B’ occurrences are occurrences with the potential to cause a serious injury, death or significant damage.
Performance indicators for both Category ‘A’ and Category ‘B’ occurrences are presented against million passenger boardings and million train kilometres. A low rate of incidents indicates that sound safety procedures and risk management procedures/controls exist and are operating effectively throughout the rail system.
The benchmark values for Category ‘A’ and Category ‘B’ incidents are calculated on the projected estimations of the number of future passenger boardings and train kilometres.
Notifiable occurrences - Rail safety
0.000.050.100.150.200.250.300.35
2013-14 2014-15 2015-16 2016-17 2016-17Target
0.31 0.17 0.10 0.30 0.23
Category A occurrences per million passenger boardings
PTA Annual Report / Key Performance Indicators
0.0
0.2
0.4
0.6
0.8
1.0
1.2
2013-14 2014-15 2015-16 2016-17 2016-17Target
1.09 0.56 0.28 0.80 0.70
Category A occurrences per million train kilometres
The indicator for Category A incidents per million passenger boardings and per million train kilometres were above the 2016-17 targets by 29.8 per cent and 14.09 per cent respectively due to a 5.12 per cent increase in train kilometres, a 7.16 per cent decrease in boardings and a 20 per cent increase in CAT A incidents resulting from substantial increase (450 per cent) in Suspected/Attempted Suicide incidents which were beyond PTA controls.
Safety Management Systems controls are in place and ongoing reviews are undertaken to reduce the incidents.
Notifiable occurrences - Rail safety
0
5
10
15
20
2013-14 2014-15 2015-16 2016-17 2016-17Target
9.24 10.09 12.04 15.23 10.75
Category B occurrences per million passenger boardings

116
0
10
20
30
40
50
2013-14 2014-15 2015-16 2016-17 2016-17Target
32.09 33.37 35.47 40.73 32.56
Category B occurrences per million train kilometres
The indicator for Category B incidents per million passenger boardings and per million train kilometres were 41.64 per cent and 25.10 per cent above the respective targets, 26.43 per cent and 14.84 per cent above the respective 2015-16 results.
This was mainly due to a 5.6 per cent increase in total train kilometres, a 21.27 per cent increase in CAT B and a 4.08 per cent decrease in train boardings compared with 2015-16.
During the year, total train kilometres increased further to 22.538 million from 21.342m in 2015-16 and exceeded the 2016-17 target by 5.12 per cent. This was largely due to ongoing service expansion with the introduction of additional three-car trains into service, increased service frequency and new timetable for the Mandurah and Joondalup Lines to meet service demand from the new Aubin Grove Station.
Additional Safety Management Systems controls and strategies have been introduced including safety education and campaign aimed at reducing the incidents, major lighting upgrades for stations and at pedestrian crossings on the Armadale Line.
Regional school bus services safetyAccidents attributable to all causes are notified to the PTA. The measure for the notifiable occurrences is expressed as the number of accidents (major and minor) reported during the school year.
PTA Annual Report / Key Performance Indicators
A low number of occurrences indicate that effective safety management procedures and controls exist and are being adhered to by school bus contractors and drivers throughout the regional school bus fleet.
0
5
10
15
20
2013-14 2014-15 2015-16 2016-17 2016-17Target
17 16 13 18 19
School bus services notifiable occurrences (accidents) reported each school year
The indicator for 2016-17 was 5.26 per cent below 2016-17 target and 38.46 per cent above the 2015-16 result.
During the year, there were 18 ‘on-road’ school bus accidents, comprising of 2 major and 16 minor accidents. Sixteen, or 89 per cent, of the accidents occurred through no fault of the school bus driver.
Of the 18 accidents, 13 occurred in regional Western Australia and 5 in metropolitan Perth.
School Bus Services continues to campaign and educate school bus contractors and drivers on road safety matters and the relative risks associated with accidents. Measures such as the requirement for all contractors to have in place a School Bus Contract Safety Management Plan (SMP) and regular random audits of the SMP for compliance are strategic and effective means of improving and maintaining road safety standards. As a result, the ratio of reported at fault accident cases have declined from previous years. This advocates that our school bus drivers and contractor appreciate the importance of adopting a safe system approach to road safety.

PTA Annual Report / Key Performance Indicators
EFFICIENCY INDICATORSThe PTA’s effectiveness in providing a cost efficient public transport system is measured using the following key efficiency indicators:
1. Average cost per passenger kilometre
2. Average cost per 1000 place kilometres
3. Total passenger place kilometres (millions)
4. Average cost per contracted kilometre
These measures are sensitive to changes in service kilometres and patronage. The past four years has seen significant increases in service kilometres with the roll out of additional bus services, the introduction of new six-car and three-car trains, the extension of the urban passenger line network to Butler, the new Aubin Grove Station and additional Park ‘n’ Ride at train stations. At the same time patronage has declined, reflecting the economic downturn of the State. The benefits of the States investment in public transport will be better reflected in future KPIs as patronage improves.
1. Average cost per passenger kilometreThis indicator measures the cost efficiency of providing passenger services, expressed as the cost of carrying one passenger over one kilometre.
TransperthPassenger kilometres are calculated by multiplying the number of total boardings by the average trip length.
The indicator measures the cost efficiency of the services, i.e. the trend in the cost of carrying one passenger over one kilometre. A declining trend indicates that the resources used to provide the services are being utilised in a cost efficient manner.
Transperth train services
0.0
0.1
0.2
0.3
0.4
0.5
0.6
2013-14 2014-15 2015-16 2016-17 2016-17Target
$0.46 $0.48 $0.50 $0.57 $0.50
Transperth Train Operations Average cost per passenger kilometre
The indicator reached $0.57, 13.38 per cent above the 2016-17 target and 12.26 per cent above the 2015-16 result. This was mainly due to a decrease in passenger kilometres and an increase in total costs over 2015-16.
During the year, passenger kilometres decreased by 3.41 per cent to 969.085 million from 1,003m in 2015-16 mainly due to a 4.07 per cent decrease in train patronage (particularly CBD commuter) and a 0.83 per cent increase in train average trip length compared with 2015-16.
117

118
Total cost of the services increased by 8.44 per cent to $549.366 million from $506.615m in 2015-16 and 5.40 per cent above the target. The increase in total costs over 2015-16 is driven by a 25.3 per cent increase in depreciation costs ($32.705m) following ongoing service expansion with the introduction of additional three-car trains into service, increased service frequency, new Aubin Grove Station and multi-storey carpark at Edgewater station.
Transperth bus services
0.0
0.2
0.4
0.6
0.8
1.0
1.2
2013-14 2014-15 2015-16 2016-17 2016-17Target
$0.97 $1.02 $1.11 $1.18 $1.18
Transperth Bus Operations Average cost per passenger kilometre
The indicator reached $1.18, 0.16 per cent below the 2016-17 target and 6.25 per cent above the 2015-16 result mainly due to a 3.01 per cent decrease in passenger kilometres and a 3.05 per cent increase in total costs over 2015-16.
In 2016-17, passenger kilometres decreased to 420.968 million from 434.051m in 2015-16. The decline in passenger kilometres was mainly due to a marginal (0.16 per cent) decrease in bus average trip length and a 2.88 per cent decrease in bus patronage.
Total cost was 4.4 per cent below the 2016-17 target and 3.05 per cent above the 2015-16 result. The increase in total costs over 2015-16 is driven by a 13.55 per cent increase in capital costs ($9.235 million) mainly due to depreciation associated with the new Bus Port and the useful life of buses and a 1.32 per cent increase ($5.437m) in operating costs partly due to an increase in bus service kilometres (1.87 per cent – 1.254m kms).
Transperth ferry services
0.0
0.5
1.0
1.5
2.0
2013-14 2014-15 2015-16 2016-17 2016-17Target
$1.57 $1.75 $1.34 $1.55 $1.01
Transperth Ferry Operations Average cost per passenger kilometre
The indicator reached $1.55, 53.26 per cent above the 2016-17 target and 15.19 per cent above the 2015-16 result. This was mainly due to significant increases in passenger kilometres and total costs of services compared with 2015-16.
During the year, passenger kilometres increased by 27.36 per cent to 1.077 million from 845,580 in 2015-16 mainly due to a 25.29 per cent increase in ferry patronage and a 1.65 per cent increase in ferry average trip length as a result of additional services since the commencement of operations from the Elizabeth Quay jetty in January 2016.
Total cost of ferry services also increased significantly by 46.71 per cent to $1.667 million from $1.136m in 2015-16 and exceeded the 2016-17 target by 64.07 per cent mainly due to a significant increase in maintenance costs associated with the MV Shelley Taylor-Smith.
PTA Annual Report / Key Performance Indicators

119
Transwa rail services
0.0
0.1
0.2
0.3
0.4
0.5
0.6
2013-14 2014-15 2015-16 2016-17 2016-17Target
$0.45 $0.45 $0.47 $0.55 $0.52
Transwa Rail Average cost per passenger kilometre
The indicator reached $0.55, 6.09 per cent above the 2016-17 target and 16.23 per cent above the 2015-16 result. This was mainly due to a 13.32 per cent increase in total costs and a 2.50 per cent decrease in passenger kilometres compared with 2015-16.
In 2016-17, total costs increased to $36.243 million from $31.982m in 2015-16 and was 2.79 per cent above the target due to a significant increase in railcar maintenance.
Passenger kilometres decreased to 65.698 million from 67.382m in 2015-16 primarily due to a 3.92 per cent decrease in service kilometres and a 6.04 per cent decrease in boardings due to service disruptions, decline in demand impacting on Australind patronage as a result of better accessibility from the metro train system at Mandurah (i.e. giving potential patrons additional routes for travel to Perth) and the length of time of the Australind trip versus the length of trip on the metro line.
Transwa road coach services
0.00
0.05
0.10
0.15
0.20
0.25
0.30
2013-14 2014-15 2015-16 2016-17 2016-17Target
$0.26 $0.25 $0.26 $0.25 $0.26
Transwa Road Coaches Average cost per passenger kilometre
The indicator reached $0.25, 2.25 per cent below the 2016-17 target and 2.24 per cent below the 2015-16 result. This was mainly due to a 3.07 per cent decrease in passenger kilometres and a 5.24 per cent decrease in total costs compared to 2015-16.
During the year, total costs decreased to $13.773 million from $14.534m in 2015-16 and was 8.93 per cent below the 2016-17 target due to decreases in overhead and road coach maintenance following the introduction of the new Volvo road coaches and the disposal of the old Scania coaches offset by increase in depreciation. Maintenance spending on the old fleet was restricted to essential repairs only.
Passenger kilometres decreased from 55.906 million in 2015-16 to 54.191m in 2016-17 due to decreases of 1.4 per cent in patronage and 0.77 per cent in service kilometres.
PTA Annual Report / Key Performance Indicators

PTA Annual Report / Key Performance Indicators
2. Average cost per 1000 place kilometresThis indicator measures the cost efficiency of providing the service per 1000 place kilometres and it is calculated for each mode by dividing total cost by place kilometres and multiplying by 1,000. Place kilometres are calculated by multiplying the average fleet capacity by the service kilometres.
Regional bus servicesIntra-town and inter-town services
0
20
40
60
80
100
2013-14 2014-15 2015-16 2016-17 2016-17Target
$70.93 $74.20 $74.07 $79.01 $92.93
Regional Town Bus Services Intra & Inter-Town
Cost per 1000 place kilometres
The indicator reached $79.01,14.98 per cent below the 2016-17 target and 6.67 per cent above the 2015-16 result due to the inclusion of the full depreciation costs of PTA owned assets (buses and depots) in all intra-town costs figures including the target. As a result, total costs increased by 22.06 per cent from $18.308 million in 2015-16 to $22.348m in 2016-17 including an increase of $206,000 associated with the newly subsidised Perth to Broome road coach service.
Total place kilometres also increased by 14.43 per cent to 282.834 million from 247.162m in 2015-16 mainly due to a significant 229.31 per cent increase in inter-town place kms following the introduction of the newly subsidised Perth to Broome road coach service and the Kalgoorlie inter-town services operating from Kalgoorlie to Coolgardie and Kambalda. Intra-town place kms also recorded an increase of 1.03 per cent over 2015-16 attributable to larger capacity bus being used for the community bus service in Karratha.
120
3. Total passenger place kilometres (millions)This indicator measures the total number of passengers that can be carried for the service kilometres.
It is calculated for each mode of transport by multiplying the average fleet capacity by the service kilometres and this represents the capacity provided on each mode.
The service kilometres for most intra-town services are calculated using the Transperth Route Information System (TRIS). The TRIS distance calculation basis includes the application of road centreline methodology and the use of more accurate regional mapping data as supplied by the Department of Land Administration.
Regional bus servicesIntra-town and inter-town services
0
50
100
150
200
250
300
2013-14 2014-15 2015-16 2016-17 2016-17Target
241.311 239.162 247.162 282.834 247.775
Regional Town Bus Services Intra-town and Inter-town
Total Passenger Place Kilometres (Millions)
The indicator reached 282.834 million, 14.43 per cent above the 2015-16 result of 247.162m.
This was mainly due to a significant 229.31 per cent increase in inter-town place kilometres over 2015-16 resulting from the introduction of the newly subsidised Perth to Broome road coach service, the Kalgoorlie inter-town services operating from Kalgoorlie to Coolgardie and Kambalda and the increase in place kilometres attributable to larger capacity bus being used for the community bus service in Karratha.

4. Average cost per contracted kilometreRegional school bus servicesThe cost of administering school bus services on a kilometre basis is calculated by dividing the total cost of school bus contracts and operating expenses by the total contracted kilometres.
0.00.51.01.52.02.53.03.54.0
2013-14 2014-15 2015-16 2016-17 2016-17Target
$3.68 $3.73 $3.76 $3.72 $3.77
Regional School Bus Services Average cost per contracted kilometre
The indicator reached $3.72, 1.37 per cent below the 2016-17 target and 1.03 per cent below the 2015-16 result due to a 1.12 per cent increase in contracted kilometres and a marginal (0.08 per cent) increase in costs over 2015-16.
During the year, contract kilometres increased to 33.796 million kilometres from 33.421m in 2015-16 due to ongoing expansion of the school bus network. On average, 26,700 regional and special education students of approximately 520 schools throughout the State accessed the school bus network each school day. In 2016-17, the total number of contracted school bus services increased to 969 and daily average contract kilometres rose 1.64 per cent to 173,314 kms from 170,518 in 2015-16.
Total costs increased slightly by 0.08 per cent from $125.566 million in 2015-16 to $125.663m and was 2.04 per cent below the target.
PTA Annual Report / Key Performance Indicators 121

122
Outcome 2: Protection of the long-term functionality of the rail corridor and railway infrastructureEFFECTIVENESS INDICATORThe most significant issue for this outcome is the management of the long-term lease of the rail freight infrastructure to Brookfield Rail Pty Ltd.
Brookfield Rail manages and operates the rail freight infrastructure under the terms of the Railway Infrastructure Lease. Under the Lease, Brookfield Rail is the ‘accredited owner’ of the infrastructure as defined in the Rail Safety Act 1998.
Brookfield Rail engages an independent expert, on a five-yearly basis, to review compliance to performance standards as defined within the conditions of the Track & Civil Infrastructure leased by the parties in the Rail Freight Corridor Land Use Agreement (Narrow Gauge) and Railway Infrastructure Lease Agreement and Rail Freight Corridor Land Use Agreement (Standard Gauge) and Railway Infrastructure Lease Agreement dated 2000.
PTA measures the effectiveness of the agreement by reviewing the Annual Corridor Ministers Report from the independent expert.
The last independent inspection was completed in May 2015. The results of this inspection did not indicate any cause for concern and confirmed that the rail corridor and infrastructure was being satisfactorily maintained. There has been no lease breach by the parties involved with the above agreements since 2009.
Cost efficiencyThe cost efficiency for the management of the long-term lease of the rail freight infrastructure to Brookfield Rail is monitored using the total cost of managing the rail corridor and residual freight issues.
0
50
100
150
200
2013-14 2014-15 2015-16 2016-17 2016-17Target
$134,212 $125,674 $179,309 $179,342 $183,323
Cost of managing rail corridor and residual freight issues management ($’000s)
The cost of managing the rail corridor and residual freight issues was marginally (0.02 per cent) above the 2015-16 result and 2.17 per cent below the 2016-17 target.
The result was $33,000 (0.02 per cent) above the 2015-16 result driven by a 42 per cent increase in supplies and services offset by a 4 per cent decrease in depreciation.
PTA Annual Report / Key Performance Indicators

123
04 Financial Report
124 PTA Annual Report / Financial Report
Photo: Matt Farr, TTO
125PTA Annual Report / Financial Statements
4.1 Financial StatementsFor the year ended 30 June 2017
Certification of financial statements ........ 126
Statement of comprehensive income....... 127
Statement of financial position ................. 128
Statement of changes in equity ................ 129
Statement of cash flows ............................ 130
Notes to the financial statements ............. 131
1. Australian Accounting Standards ............... 131
2. Summary of significant accounting policies 131
3. Judgements made by management in applying accounting policies ...................... 140
4. Key sources of estimation uncertainty ........ 140
5. Disclosure of changes in accounting policy
and estimates ............................................ 141
6. Employee benefits expense ....................... 147
7. Compensation of Key Management Personnel .................................................. 148
8. Supplies and services ................................ 149
9. Depreciation and amortisation expense ..... 149
10. Finance costs .......................................... 149
11. Grants and subsidies expense ................. 149
12. Other expenses ....................................... 150
13. Related party transactions ....................... 151
14. User charges and fees ............................. 152
15. Operating lease revenue .......................... 152
16. Commonwealth grants and contributions 152
17. Interest revenue ....................................... 152
18. Other revenue .......................................... 153
19. Net gain/(loss) on disposal/write-off of non-current assets .................................. 153
20. Income from State Government ............... 153
21. Restricted cash and cash equivalents ...... 154
22. Inventories ............................................... 154
23. Receivables ............................................. 154
24. Prepayments ........................................... 155
25. Amounts receivable for services (Holding Account) .................................... 155
26. Infrastructure, property, plant, equipment
and vehicles ............................................ 156
27. Financial assets and financial liabilities ..... 160
28. Fair value measurements ......................... 161
29. Intangible assets ...................................... 166
30. Non-current assets classified as held for sale ......................................................... 166
31. Impairment of assets ............................... 166
32. Payables .................................................. 167
33. Borrowings .............................................. 167
34. Provisions ................................................ 167
35. Other current liabilities ............................. 169
36. Deferred income – operating leases ......... 169
37. Equity ...................................................... 170
38. Notes to the statement of cash flows ....... 171
39. Commitments .......................................... 172
40. Contingent liabilities and contingent assets ...................................................... 173
41. Financial instruments ............................... 174
42. Supplementary financial information ......... 181
43. Events occurring after the end of the reporting period ....................................... 182
44. Explanatory statement ............................. 182
45. Schedule of income and expenses by service ..................................................... 188
46. Remuneration of auditor .......................... 189
47. Special purpose accounts ....................... 189
48. Act of Grace payments. ........................... 189
126
Certification of financial statementsFor the year ended 30 June 2017The accompanying financial statements of the Public Transport Authority of Western Australia have been prepared in compliance with the provisions of the Financial Management Act 2006 (WA) from proper accounts and records to present fairly the financial transactions for the financial year ended 30 June 2017 and the financial position as at 30 June 2017.
At the date of signing we are not aware of any circumstances which would render the particulars included in the financial statement misleading or inaccurate.
Richard Sellers Accountable Authority 5 September 2017
Kevin Kirk Chief Finance Officer 5 September 2017
PTA Annual Report / Financial Statements
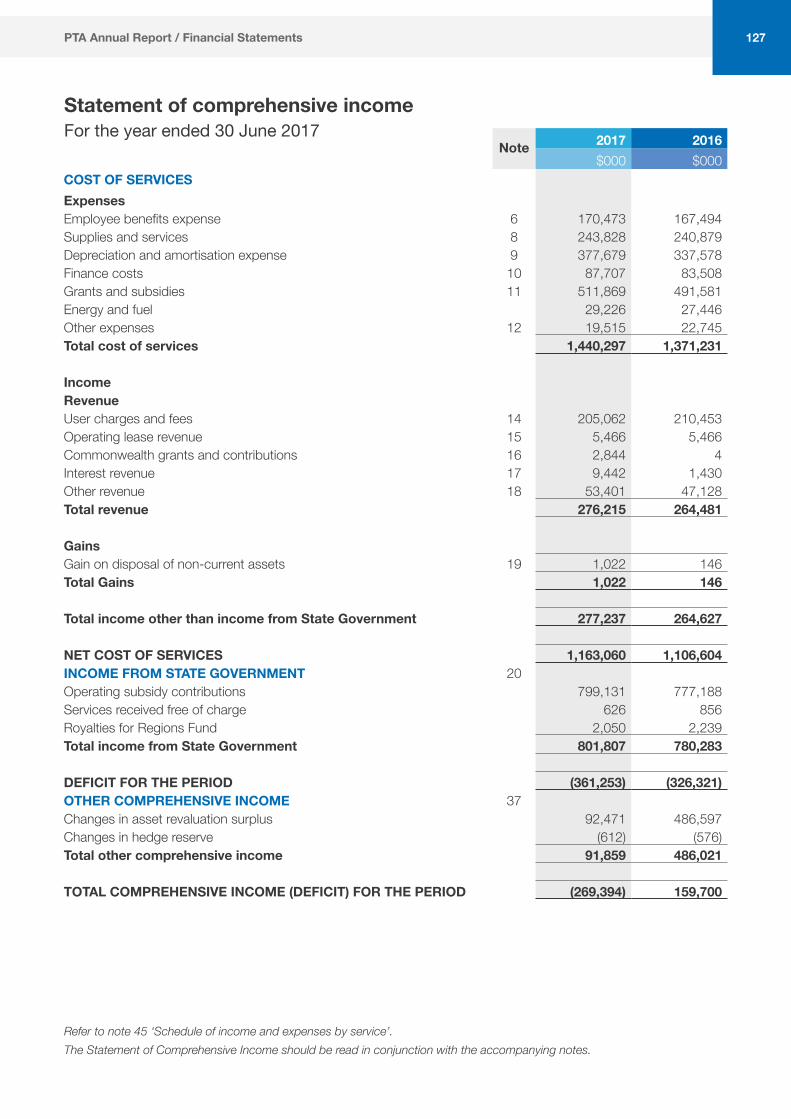
127
Statement of comprehensive incomeFor the year ended 30 June 2017
Note 2017 2016 $000 $000
COST OF SERVICESExpensesEmployee benefits expense 6 170,473 167,494Supplies and services 8 243,828 240,879Depreciation and amortisation expense 9 377,679 337,578Finance costs 10 87,707 83,508Grants and subsidies 11 511,869 491,581Energy and fuel 29,226 27,446Other expenses 12 19,515 22,745Total cost of services 1,440,297 1,371,231
IncomeRevenueUser charges and fees 14 205,062 210,453Operating lease revenue 15 5,466 5,466Commonwealth grants and contributions 16 2,844 4Interest revenue 17 9,442 1,430Other revenue 18 53,401 47,128Total revenue 276,215 264,481
GainsGain on disposal of non-current assets 19 1,022 146Total Gains 1,022 146
Total income other than income from State Government 277,237 264,627
NET COST OF SERVICES 1,163,060 1,106,604INCOME FROM STATE GOVERNMENT 20Operating subsidy contributions 799,131 777,188Services received free of charge 626 856Royalties for Regions Fund 2,050 2,239Total income from State Government 801,807 780,283
DEFICIT FOR THE PERIOD (361,253) (326,321)OTHER COMPREHENSIVE INCOME 37Changes in asset revaluation surplus 92,471 486,597Changes in hedge reserve (612) (576)Total other comprehensive income 91,859 486,021
TOTAL COMPREHENSIVE INCOME (DEFICIT) FOR THE PERIOD (269,394) 159,700
Refer to note 45 ‘Schedule of income and expenses by service’. The Statement of Comprehensive Income should be read in conjunction with the accompanying notes.
PTA Annual Report / Financial Statements

128
Statement of financial positionAs at 30 June 2017
Note 2017 2016 $000 $000
ASSETSCurrent AssetsCash and cash equivalents 38 89,470 132,671Restricted cash and cash equivalents 21 225,276 14,629Inventories 22 15,467 16,216Receivables 23 33,257 33,106Prepayments 24 26,186 14,953Amounts receivable for services 25 75,917 64,232Non-current assets classified as held for sale 30 0 0Current financial asset 27 0 56Total Current Assets 465,573 275,863
Non-Current AssetsRestricted cash and cash equivalents 21 3,823 2,960Amounts receivable for services 25 724,955 784,761Prepayments 24 0 5,600Infrastructure, property, plant, equipment and vehicles 26 7,486,182 7,135,500Non-current financial asset 27 0 362Intangible assets 29 9,972 10,798Total Non-Current Assets 8,224,932 7,939,981TOTAL ASSETS 8,690,505 8,215,844
LIABILITIESCurrent LiabilitiesPayables 32 109,109 102,779Borrowings 33 105,320 125,927Provisions 34 36,886 39,485Other current liabilities 35 621 2,056Deferred income operating lease 36 5,466 5,466Current financial liability 27 737 48Total Current Liabilities 258,139 275,761
Non-Current LiabilitiesBorrowings 33 2,034,920 1,981,003Provisions 34 14,096 13,470Deferred income operating lease 36 176,460 181,926Total Non-Current Liabilities 2,225,476 2,176,399
TOTAL LIABILITIES 2,483,615 2,452,160
NET ASSETS 6,206,890 5,763,684EQUITY 37Contributed equity 4,423,149 3,710,549Reserves 3,195,587 3,103,728Accumulated deficit (1,411,846) (1,050,593)TOTAL EQUITY 6,206,890 5,763,684
The Statement of Financial Position should be read in conjunction with the accompanying notes.
PTA Annual Report / Financial Statements
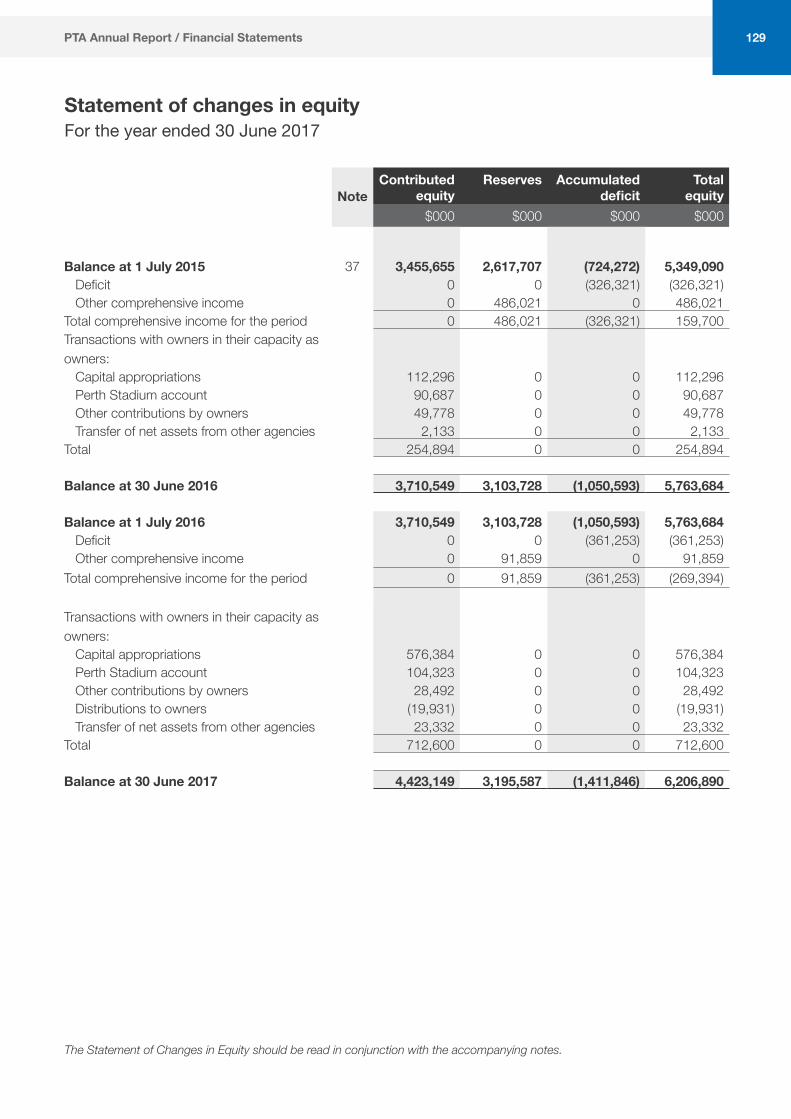
129
Statement of changes in equityFor the year ended 30 June 2017
NoteContributed
equity Reserves
Accumulated
deficit Total
equity $000 $000 $000 $000
Balance at 1 July 2015 37 3,455,655 2,617,707 (724,272) 5,349,090Deficit 0 0 (326,321) (326,321)Other comprehensive income 0 486,021 0 486,021
Total comprehensive income for the period 0 486,021 (326,321) 159,700Transactions with owners in their capacity as owners:
Capital appropriations 112,296 0 0 112,296Perth Stadium account 90,687 0 0 90,687Other contributions by owners 49,778 0 0 49,778Transfer of net assets from other agencies 2,133 0 0 2,133
Total 254,894 0 0 254,894
Balance at 30 June 2016 3,710,549 3,103,728 (1,050,593) 5,763,684
Balance at 1 July 2016 3,710,549 3,103,728 (1,050,593) 5,763,684Deficit 0 0 (361,253) (361,253)Other comprehensive income 0 91,859 0 91,859
Total comprehensive income for the period 0 91,859 (361,253) (269,394)
Transactions with owners in their capacity as owners:
Capital appropriations 576,384 0 0 576,384Perth Stadium account 104,323 0 0 104,323Other contributions by owners 28,492 0 0 28,492Distributions to owners (19,931) 0 0 (19,931)Transfer of net assets from other agencies 23,332 0 0 23,332
Total 712,600 0 0 712,600
Balance at 30 June 2017 4,423,149 3,195,587 (1,411,846) 6,206,890
The Statement of Changes in Equity should be read in conjunction with the accompanying notes.
PTA Annual Report / Financial Statements

130
Statement of cash flowsFor the year ended 30 June 2017
Note 2017 2016 $000 $000
CASH FLOWS FROM STATE GOVERNMENTOperating subsidy contributions 799,131 777,188Capital appropriation - other government agencies 23,956 39,696Capital appropriations 576,384 112,296Perth Stadium account 104,323 90,687Royalties for Regions Fund 6,586 12,321Holding account drawdowns 48,121 61,125Net cash provided by State Government 1,558,501 1,093,313CASH FLOWS FROM OPERATING ACTIVITIESPaymentsEmployee benefits (168,905) (166,621)Supplies and services (275,680) (264,584)Finance costs (86,805) (83,160)Grants and subsidies (506,999) (489,652)Receipts paid into consolidated account (3,743) (4,156)GST payments on purchases (137,102) (127,328)Other payments (15,836) (14,109)ReceiptsUser charges and fees 208,287 211,843Commonwealth grants and contributions 2,844 4Interest received 7,892 1,356GST receipts on sales 25,367 26,653GST receipts from taxation authority 113,288 91,306Other receipts 49,976 47,525Net cash used in operating activities 38 (787,416) (770,923)CASH FLOWS FROM INVESTING ACTIVITIESPaymentsPurchase of non-current physical assets (630,622) (554,943)ReceiptsProceeds from sale of non-current physical assets 536 7,822Net cash used in investing activities (630,086) (547,121)CASH FLOWS FROM FINANCING ACTIVITIESPaymentsRepayment of borrowings (193,065) (154,621)Other repayments (6,000) (5,600)ReceiptsProceeds from borrowings 226,375 395,000Net cash provided by financing activities 27,310 234,779Net increase in cash and cash equivalents 168,309 10,048Cash and cash equivalents at the beginning of the period 150,260 140,212CASH AND CASH EQUIVALENTS AT THE END OF THE PERIOD 38 318,569 150,260
The Statement of Cash Flows should be read in conjunction with the accompanying notes.
PTA Annual Report / Financial Statements

131
Notes to the financial statementsFor the year ended 30 June 2017
1. Australian Accounting StandardsGeneral
The Public Transport Authority of Western Australia’s (PTA) financial statements for the year ended 30 June 2017 have been prepared in accordance with Australian Accounting Standards. The term ‘Australian Accounting Standards’ includes Standards and Interpretations issued by the Australian Accounting Standards Board (AASB).
The PTA has adopted any applicable new and revised Australian Accounting Standards from their operative dates.
Early adoption of standards
The PTA cannot early adopt an Australian Accounting Standard unless specifically permitted by TI 1101 Application of Australian Accounting Standards and Other Pronouncements. There has been no early adoption of any other Australian Accounting Standards that have been issued or amended (but not operative) by the PTA for the annual reporting period ended 30 June 2017.
2. Summary of significant accounting policiesa) General statement
The PTA is a not-for-profit reporting entity that prepares general purpose financial statements in accordance with Australian Accounting Standards, the Framework, Statements of Accounting Concepts and other authoritative pronouncements of the AASB as applied by the Treasurer’s Instructions. Several of these are modified by the Treasurer’s Instructions to vary application, disclosure, format and wording.
The Financial Management Act 2006 and the Treasurer’s Instructions impose legislative provisions that govern the preparation of financial statements and take precedence over Australian Accounting Standards, the Framework,
Statements of Accounting Concepts and other authoritative pronouncements of the AASB.
Where modification is required and has had a material or significant financial effect upon the reported results, details of that modification and the resulting financial effect are disclosed in the notes to the financial statements.
b) Basis of preparation
The financial statements have been prepared on the accrual basis of accounting using the historical cost convention, except for land, buildings, rollingstock, vessels, buses and infrastructure which have been measured at fair value.
The accounting policies adopted in the preparation of the financial statements have been consistently applied throughout all periods presented unless otherwise stated.
The financial statements are presented in Australian dollars and all values are rounded to the nearest thousand dollars ($’000).
Note 3 ‘Judgements made by management in applying accounting policies’ discloses judgements that have been made in the process of applying the PTA’s accounting policies resulting in the most significant effect on amounts recognised in the financial statements.
Note 4 ‘Key sources of estimation uncertainty’ discloses key assumptions made concerning the future, and other key sources of estimation uncertainty at the end of the reporting period, that have a significant risk of causing a material adjustment to the carrying amounts of assets and liabilities within the next financial year.
c) Reporting entity
The PTA is the reporting entity and there are no other related or affiliated bodies.
d) Contributed equity
AASB Interpretation 1038 Contributions by Owners Made to Wholly-Owned Public Sector Entities requires transfers in the nature of equity contributions, other than as a result of a restructure of administrative arrangements, to be designated by the Government (the
PTA Annual Report / Notes to the Financial Statements

132
owner) as contributions by owners (at the time of, or prior to, transfer) before such transfers can be recognised as equity contributions. Capital appropriations have been designated as contributions by owners by TI 955 Contributions by Owners made to Wholly-Owned Public Sector Entities and have been credited directly to Contributed Equity.
The transfers of net assets to/from other agencies, other than as a result of a restructure of administrative arrangements, are designated as contributions by owners where the transfers are non-discretionary and non-reciprocal.
e) Income
Revenue recognition
Revenue is recognised and measured at the fair value of consideration received or receivable. Revenue is recognised for the major business activities as follows:
Sale of goods
Revenue is recognised from the sale of goods and disposal of other assets when the significant risks and rewards of ownership control transfer to the purchaser and can be measured reliably.
Provision of services
Revenue is recognised by reference to the stage of completion of the transaction.
Interest
Revenue is recognised as the interest accrues.
Lease income
Lease income from deferred operating leases is recognised as income on a straight-line basis over the term of the lease. (See note 15 ‘Operating lease revenue’ and note 36 ‘Deferred income – operating leases’).
Operating subsidy contributions
Operating subsidy contributions are recognised as revenues at fair value in the period in which the PTA gains control of the appropriated funds. The PTA gains control of appropriated funds at the time those funds are deposited to the bank account or credited to the Amounts Receivable for Services (holding account) held at Treasury. (See note 20 ‘Income from State Government’).
Grants, donations, gifts and other non-reciprocal contributions
Revenue is recognised at fair value when the PTA obtains control over the assets comprising the contributions, usually when cash is received.
Other non-reciprocal contributions that are not contributions by owners are recognised at their fair value. Contributions of services are only recognised when a fair value can be reliably determined and the services would be purchased if not donated.
Royalties for Regions funds are recognised as revenue at fair value in the period in which the PTA obtains control over the funds. The PTA obtains control of the funds at the time the funds are deposited into the PTA’s bank account.
Infringements
Infringements are recognised at the time payment is received. Outstanding infringements are not recognised as debts, as the future economic benefits are minimal and cannot be reliably measured at the end of the reporting period.
Gains
Realised and unrealised gains are usually recognised on a net basis. These include gains arising on the disposal of non-current assets and some revaluations of non-current assets.
f) Borrowing costs
All borrowing costs are recognised as expenses in the period in which they are incurred. (See note 3 ‘Judgements made by management in applying accounting policies’).
g) Infrastructure, property, plant and equipment and vehicles
Capitalisation/expensing of assets
Items of infrastructure, property, plant and equipment and vehicles costing $5,000 or more are recognised as assets and the cost of utilising assets is expensed (depreciated) over their useful lives. Items of infrastructure, property, plant and equipment and vehicles costing less than $5,000 are immediately expensed direct to the Statement of Comprehensive Income (other than where they form part of a group of similar items which are significant in total).
PTA Annual Report / Notes to the Financial Statements
133
Initial recognition and measurement
Infrastructure, property, plant and equipment and vehicles are initially recognised at cost.
For items of infrastructure, property, plant and equipment and vehicles acquired at no cost or for nominal cost, the cost is their fair value at the date of acquisition.
Subsequent measurement
Subsequent to initial recognition as an asset, the revaluation model is used for the measurement of land, buildings, freight network, urban rail system and bus infrastructure, rollingstock, vessels and buses. Land is carried at fair value less accumulated impairment losses. All assets except plant and equipment and motor vehicles are carried at fair value less accumulated depreciation and accumulated impairment losses. Plant and equipment and motor vehicles are stated at historical cost less accumulated depreciation and accumulated impairment losses.
Where market-based evidence is available, the fair value of land and buildings is determined on the basis of current market buying values determined by reference to recent market transactions. When buildings are revalued by reference to recent market transactions, the accumulated depreciation is eliminated against the gross carrying amount of the asset and the net amount restated to the revalued amount.
In the absence of market-based evidence, the fair value of land and buildings is determined on the basis of existing use. This normally applies where buildings are specialised or where land use is restricted. Fair value for existing use assets is determined by reference to the cost of replacing the remaining future economic benefits embodied in the asset, i.e. the depreciated replacement cost. Where the fair value of buildings is determined on the depreciated replacement cost basis, the gross carrying amount and the accumulated depreciation are restated proportionately.
Land controlled by the PTA including metropolitan and regional corridor land, not subject to commercial lease, is revalued on an annual basis by the Western Australian Land Information
Authority (Valuation Services) and recognised annually to ensure that the carrying amount does not differ materially from the asset’s fair value at the end of reporting period.
Land and buildings which are commercially leased are independently valued at fair value based on the capitalised value of current leases. Independent valuations are obtained annually.
Buildings, bus infrastructure and Transwa rollingstock are revalued at fair value using depreciated replacement cost by independent valuers, engineering and management professionals. Buses, vessels and urban rollingstock are revalued utilising internal resources at fair value using depreciated replacement cost. Valuations are obtained every three to five years. The fair value is based on depreciated replacement cost as the assets are specialised and limited market-based evidence of value is available.
Urban rail infrastructure, system infrastructure, and freight network infrastructure are revalued, at least once every five years, to its fair value based on depreciated replacement cost, as the assets are specialised and limited market-based evidence of value is available.
When assets carried at fair value are revalued, the accumulated depreciation is restated proportionately with the change in the gross carrying amount of the asset so that the carrying amount of the asset after revaluation equals its revalued amount.
Construction in progress is recognised at cost.
The most significant assumptions and judgements in estimating fair value are made in assessing whether to apply the existing use basis to assets and in determining estimated economic life. Professional judgement by the valuer is required where the evidence does not provide a clear distinction between market type assets and existing use assets.
PTA Annual Report / Notes to the Financial Statements

134
Derecognition
Upon disposal or derecognition of an item of property, plant and equipment, infrastructure and vehicles, any revaluation surplus relating to that asset is retained in the asset revaluation surplus.
The revaluation surplus included in equity in respect of an item of property, plant and equipment, infrastructure and vehicles may be transferred directly to retained earnings when the asset is derecognised. This may involve transferring the whole of the surplus when the asset is retired or disposed of.
Asset revaluation surplus
The asset revaluation surplus is used to record increments and decrements on the revaluation of non-current assets as described in note 26 ‘Infrastructure, property, plant, equipment and vehicles’.
Depreciation
All non-current assets having a limited useful life are systematically depreciated over their estimated useful lives in a manner which reflects the consumption of their future economic benefits.
Depreciation is calculated using the straight-line method, using rates which are reviewed annually. Estimated useful lives for each class of depreciable asset are:
Class of Asset Useful Life
Buildings 10 to 50 years
Rollingstock 10 to 45 years
Infrastructure 5 to 100 years
Plant, equipment and vehicles 3 to 40 years
Buses 10 to 45 years
Vessels 4 to 20 years
Assets under construction are not depreciated until they are available for use.
Land is not depreciated.
h) Intangible assets
Capitalisation/Expensing of assets
Acquisitions of intangible assets costing $5,000 or more and internally generated intangible assets costing $5,000 or more are capitalised. The cost of utilising the assets is expensed (amortised) over their useful lives. Costs incurred below these thresholds are immediately expensed directly to the Statement of Comprehensive Income.
Intangible assets are initially recognised at cost. For assets acquired at no cost or for nominal cost, the cost is their fair value at the date of acquisition.
The cost model is applied for subsequent measurement requiring the asset to be carried at cost less any accumulated amortisation and accumulated impairment losses.
Amortisation for intangible assets with finite useful lives is calculated for the period of the expected benefit (estimated useful life which is reviewed annually) on the straight-line basis. All intangible assets controlled by the PTA have a finite useful life and zero residual value.
The expected useful lives for each class of intangible asset are:
Class of Intangible asset Useful Life
Software* 2 to 5 years
Website costs 3 to 5 years
Licences 15 years
* Software that is not integral to the operation of any related hardware.
PTA Annual Report / Notes to the Financial Statements
135
Computer software
Software that is an integral part of the related hardware is recognised as property, plant and equipment. Software that is not an integral part of the related hardware is recognised as an intangible asset. Software costing less than $5,000 is expensed in the year of acquisition.
Website costs
Website costs are charged as expenses when they are incurred unless they relate to the acquisition or development of an asset when they may be capitalised or amortised. Costs in relation to feasibility studies in the planning phase prior to the decision to create a website, and ongoing costs of maintenance during the operating phase are expensed. Costs incurred in building or enhancing a website, to the extent that they represent probable future economic benefits that can be reliably measured, are capitalised.
Licences
Licences have a finite useful life and are carried at cost less accumulated amortisation and accumulated impairment losses.
i) Impairment of assets
Property, plant and equipment, infrastructure, vehicles and intangible assets are tested for any indication of impairment at the end of each reporting period. Where there is an indication of impairment, the recoverable amount is estimated. Where the recoverable amount is less than the carrying amount, the asset is considered impaired and is written down to the recoverable amount and an impairment loss is recognised. Where an asset measured at cost is written down to recoverable amount, an impairment loss is recognised in profit or loss. Where a previously revalued asset is written down to recoverable amount, the loss is recognised as a revaluation decrement in other comprehensive income. As the PTA is a not-for-profit entity, unless an asset has been identified as a surplus asset, the recoverable amount is the higher of an asset’s fair value less costs to sell and depreciated replacement cost.
The risk of impairment is generally limited to circumstances where an asset’s depreciation is
materially understated, where the replacement cost is falling or where there is a significant change in useful life. Each relevant class of assets is reviewed annually to verify that the accumulated depreciation/amortisation reflects the level of consumption or expiration of asset’s future economic benefits and to evaluate any impairment risk from falling replacement costs.
Intangible assets with an indefinite useful life and intangible assets not yet available for use are tested for impairment at the end of each reporting period irrespective of whether there is any indication of impairment.
The recoverable amount of assets identified as surplus assets is the higher of fair value less costs to sell and the present value of future cash flows expected to be derived from the asset. Surplus assets carried at fair value have no risk of material impairment where fair value is determined by reference to market-based evidence. Where fair value is determined by reference to the depreciated replacement cost, surplus assets are at risk of impairment and the recoverable amount is measured. Surplus assets at cost are tested for indications of impairments at the end of each reporting period.
j) Non-current assets (or disposal groups) classified as held for sale
Non-current assets (or disposal groups) held for sale are recognised at the lower of carrying amount and fair value less costs to sell, and are disclosed separately from other assets in the Statement of financial position. Assets classified as held for sale are not depreciated or amortised.
k) Leases
The PTA has entered into a number of operating lease arrangements where the lessor effectively retains materially all of the risks and benefits incidental to ownership of the items held under the operating leases. Operating leases are expensed on a straight-line basis over the term of the lease as this represents the pattern of benefits derived from the leased properties.
l) Deferred income operating leases
The sale of the Westrail Freight Business on 17 December 2000 included an operating lease of
PTA Annual Report / Notes to the Financial Statements

136
the freight network infrastructure for 49 years between the Western Australian Government Railways Commission (WAGR) – now Public Transport Authority of Western Australia (PTA) and Westnet Rail Pty Ltd – now Brookfield Rail Pty Ltd. The lease rentals were fully prepaid on 17 December 2000, and credited to deferred income operating leases. 133 grain receival sites were leased for a 99 year period in two tranches in 2003 and 2004. The rental for sites was prepaid and credited to deferred income operating leases. (See note 2(e)).
m) Financial instruments
In addition to cash and cash equivalents, the PTA has two categories of financial instruments:
• Loans and receivables; and
• Financial liabilities measured at amortised cost.
Financial instruments have been disaggregated into the following classes:
• Financial Assets
О Cash and cash equivalents
О Restricted cash and cash equivalents
О Receivables
О Amounts receivable for services
О Foreign exchange forward contracts
• Financial Liabilities
О Payables
О Other current liabilities
О Western Australian Treasury Corporation (WATC) loans
О Foreign exchange forward contracts
Initial recognition and measurement of financial instruments is at fair value which normally equates to the transaction cost or the face value. Subsequent measurement is at amortised cost using the effective interest method.
The fair value of short-term receivables and payables is the transaction cost or the face value because there is no interest rate applicable and
subsequent measurement is not required as the effect of discounting is not material.
n) Derivative financial instruments and hedge accounting
The PTA enters into foreign exchange forward contracts with the Western Australian Treasury Corporation to hedge its exposure to foreign currency risks. The foreign exchange forward contracts are designated as cash flow hedges and are entered into for periods with foreign currency exposure of the underlying transactions.
Initial recognition and subsequent measurement
The foreign exchange forward contracts are initially recognised at fair value on the date on which it is entered into and are subsequently remeasured at fair value. Any gains or losses arising from changes in the fair value are taken directly to profit or loss, except for the effective portion of cash flow hedges.
Cash flow hedges
Forward foreign exchange contracts are entered into as hedges to avoid or minimise possible adverse financial effects of movements in exchange rates. Such derivatives are stated at fair value. Changes in the fair value of derivatives that are designated and effective as hedges of future cash flows are recognised directly in other comprehensive income and the ineffective portion is recognised immediately in profit or loss.
When the hedged firm commitment results in the recognition of an asset or a liability, then, at the time the asset or liability is recognised, the associated gains or losses that had previously been recognised in other comprehensive income are included in the initial measurement of the acquisition cost or other carrying amount of the asset or liability. For all other cash flow hedges, the gains or losses that are recognised in other comprehensive income are reclassified to profit or loss in the same period in which the hedged firm commitment affects profit or loss.
When a hedging instrument expires or is sold, terminated, or exercised, or when a hedge no longer meets the criteria for hedge accounting,
PTA Annual Report / Notes to the Financial Statements
137
any cumulative gain or loss that was recognised in other comprehensive income at that time remains separately in equity until the forecast transaction occurs. When a forecast transaction is no longer expected to occur, the cumulative gain or loss that was recognised in other comprehensive income is immediately reclassified to profit or loss as a reclassification adjustment.
o) Cash and cash equivalents
For the purpose of the Statement of cash flows, cash and cash equivalents (and restricted cash and cash equivalents) assets comprise of cash on hand.
p) Accrued salaries
Accrued salaries (refer to note 32 ‘Payables’) represent the amount due to staff but unpaid at the end of the financial year. Accrued salaries are settled within a fortnight of the financial year end. The PTA considers the carrying amount of accrued salaries to be equivalent to its fair value.
q) Amounts receivable for services (Holding account)
The PTA received income from the State Government partly in cash and partly as an asset (holding account receivable) until 2011-12. From 2012-13, the PTA no longer receives funding into holding account receivable. The accrued amount appropriated is accessible on the emergence of the cash funding requirement to cover leave entitlements and asset replacement.
r) Inventories
Inventories are measured at the lower of cost and net realisable value. Costs are assigned by the method most appropriate to each particular class of inventory. Inventory recorded using the inventory control system is valued at the weighted average cost and the remainder is valued on a first in first out basis.
Inventories not held for resale are measured at cost unless they are no longer required, in which case they are measured at net realisable value.
s) Receivables
Receivables are recognised at original invoice amount less an allowance for any uncollectible amounts (i.e. impairment).
The collectability of receivables is reviewed on an ongoing basis and any receivables identified as uncollectible are written off against the allowance account. The allowance for uncollectible amounts (doubtful debts) is raised when there is objective evidence that the PTA will not be able to collect the debts. The carrying amount is equivalent to fair value as they are generally settled within 30 days.
t) Payables
Payables are recognised at the amounts payable when the PTA becomes obliged to make future payments as a result of a purchase of assets or services. The carrying amount is equivalent to fair value, as settlement is generally 30 days.
u) Borrowings
All loans payable are initially recognised at fair value, being the net proceeds received. Subsequent measurement is at amortised cost using the effective interest rate method.
v) Provisions
Provisions are liabilities of uncertain timing or amount and are recognised where there is a present legal or constructive obligation as a result of a past event and when the outflow of resources embodying economic benefits is probable and a reliable estimate can be made of the amount of the obligation. Provisions are reviewed at the end of each reporting period.
(i) Provisions - employee benefits
All annual leave and long service leave provisions are in respect of employees’ services up to the end of the reporting period.
Annual leave
Annual leave is not expected to be settled wholly within 12 months after the end of the reporting period and is therefore considered to be ‘other long-term employee benefits’. The annual leave liability is recognised and measured at the present value of amounts expected to be paid when the liabilities are settled using the remuneration rate expected to apply at the time of settlement.
When assessing expected future payments consideration is given to expected future
PTA Annual Report / Notes to the Financial Statements

138
wage and salary levels including non-salary components such as employer superannuation contributions, as well as the experience of employee departures and periods of service. The expected future payments are discounted using market yields at the end of the reporting period on national government bonds with terms to maturity that match, as closely as possible, the estimated future cash outflows.
The provision for annual leave is classified as a current liability as the PTA does not have an unconditional right to defer settlement of the liability for at least 12 months after the end of the reporting period.
Long service leave
The liability for long service leave is recognised at the face value of each employee’s long service leave entitlement based on remuneration rates current as at the end of the reporting period, adjusted for the employee’s age factor. This method is referred to as the shorthand method.
An actuarial assessment of long service leave undertaken by PricewaterhouseCoopers Actuaries at 30 June 2016 determined that the liability measured using the short-hand measurement technique above was not materially different from the liability determined using the present value of expected future payments. This calculation is consistent with the PTA’s experience of employee retention and leave taken.
Unconditional long service leave provisions are classified as current liabilities as the PTA does not have an unconditional right to defer the settlement of the liability for at least 12 months after the end of the reporting period. Pre-conditional and conditional long service leave provisions are classified as non-current liabilities because the PTA has an unconditional right to defer the settlement of the liability until the employee has completed the requisite years of service.
Sick leave
Liabilities for sick leave are recognised when it is probable that sick leave paid in the future will be greater than the entitlement that will accrue in the future.
Past history indicates that on average, sick leave taken each reporting period is less than the entitlement accrued. This is expected to continue in future periods. Accordingly, it is unlikely that existing accumulated entitlements will be used by employees and no liability for unused sick leave entitlements is recognised. As sick leave is non-vesting, an expense is recognised in the Statement of Comprehensive Income for this leave as it is taken.
Deferred leave
The provision for deferred leave relates to Public Service employees who have entered into an agreement to self-fund an additional 12 months leave in the fifth year of the agreement. The provision recognises the value of salary set aside for employees to be used in the fifth year. This liability is measured on the same basis as annual leave. Deferred leave is reported as a current provision as employees can leave the scheme at their discretion at any time.
Purchased leave
The provision for purchased leave relates to Public Service employees who have entered into an agreement to self-fund up to an additional eight weeks leave per calendar year. The provision recognises the value of salary set aside for employees and is measured at the nominal amounts expected to be paid when the liabilities are settled.
Superannuation
The Government Employees Superannuation Board (GESB) and other fund providers administer public sector superannuation arrangements in Western Australia in accordance with legislative requirements. Eligibility criteria for membership in particular schemes for public sector employees vary according to commencement and implementation dates.
Eligible employees contribute to the Pension Scheme, a defined benefit pension scheme closed to new members since 1987, or the Gold State Superannuation Scheme (GSS), a defined benefit lump sum scheme closed to new members since 1995.
PTA Annual Report / Notes to the Financial Statements

139
Employees commencing employment prior to 16 April 2007 who were not members of either the Pension Scheme or the GSS became non-contributory members of the West State Superannuation Scheme (WSS). Employees commencing employment on or after 16 April 2007 became members of the GESB Super Scheme (GESBS). From 30 March 2012, existing members of the WSS or GESBS and new employees have been able to choose their preferred superannuation fund provider. The PTA makes contributions to GESB or other fund providers on behalf of employees in compliance with the Commonwealth Government’s Superannuation Guarantee (Administration) Act 1992. Contributions to these accumulation schemes extinguish the PTA’s liability for superannuation charges in respect of employees who are not members of the Pension Scheme or GSS.
The GSS is a defined benefit scheme for the purposes of employees and whole-of-government reporting. However, it is a defined contribution plan for agency purposes because the concurrent contributions (defined contributions) made by the PTA to GESB extinguishes the agency’s obligations to the related superannuation liability.
The PTA has no liabilities under the Pension Scheme or the GSS. The liabilities for the unfunded Pension Scheme and the unfunded GSS transfer benefits attributable to members who transferred from the Pension Scheme, are assumed by the Treasurer. All other GSS obligations are funded by concurrent contributions made by the PTA to the GESB.
The GESB makes all benefit payments in respect of the Pension Scheme and GSS, and is recouped from the Treasurer for the employer’s share.
(ii) Provisions - other
Employment on-costs
Employment on-costs, including payroll tax and workers’ compensation insurance, are not employee benefits and are recognised separately as liabilities and expenses when the employment
to which they relate has occurred. Employment on-costs are included as part of ‘Other expenses’ and are not included as part of the PTA’s ‘Employee benefits expense’. The related liability is included in ‘Employment on-costs provision’.
Public liability
Provision is made for all outstanding public liability claims before 1 July 2005 worth less than $1 million. The amount of the provision is the estimated outstanding value of the claims at the end of the reporting period.
Workers’ compensation
Provision is made for all outstanding claims from periods before 1 July 1997 and any previous years fund contribution assessments based on claims experience and performance adjustment from RiskCover. The amount of the provision is the estimated outstanding value of claims plus any actuarial assessments of the previous years adjusted fund contribution at the end of the reporting period.
Contaminated sites
Provision is recognised for the sites that are classified as contaminated – remediation required or possibly contaminated – investigation required, and where the PTA has a liability in respect of investigation or remediation expenses. Estimates are based on the present value of expected future cash outflows.
w) Superannuation expense
The superannuation expense is recognised in the profit or loss in the Statement of Comprehensive Income and comprises employer contributions paid to the GSS (concurrent contributions), WSS, and the GESBS and other superannuation funds.
x) Assets and services received free of charge or for nominal cost
Assets or services received free of charge (except those designated as contribution from owners) or for nominal cost are recognised as income at the fair value of the assets and/or the fair value of those services that can be reliably measured and the PTA would otherwise pay for. A corresponding expense is recognised for services
PTA Annual Report / Notes to the Financial Statements
140
received. Receipts of assets are recognised in the Statement of financial position.
Assets or services received from other State Government agencies are separately disclosed under Income from State Government in the Statement of Comprehensive Income.
y) Comparative figures
Comparative figures are, where appropriate, reclassified to be comparable with the figures presented in the current financial year.
3. Judgements made by management in applying accounting policiesThe preparation of financial statements requires management to make judgements about the application of accounting policies that have a significant effect on the amounts recognised in the financial statements. The PTA evaluates these judgements regularly.
Borrowing costs
The PTA has made a determination to expense all borrowing costs associated with the construction of capital projects as allowed by the alternative accounting treatment under AASB 123 Borrowing Costs.
4. Key sources of estimation uncertaintyKey estimates and assumptions concerning the future are based on historical experience and various other factors that have a significant risk of causing a material adjustment to the carrying amount of assets and liabilities within the next financial year.
Long Service Leave
The PTA undertook an actuarial assessment of its long service leave provision in 2016 and is using employees’ age based factors for discounting its expected future payments between valuations. These factors incorporate a series of assumptions such as demographics, salary inflation, and market yields on Commonwealth Government bonds. Fluctuations in any of the assumptions used to calculate these factors may impact the provision for annual and long service leave.
Estimating useful life of key assets
The useful lives are estimated having regard to such factors as asset maintenance, rate of technical and commercial obsolescence, and asset usage. The useful lives of key assets are reviewed annually.
Workers’ compensation provision
The Workers’ Compensation Deposit Contributions are initially calculated on estimates of wages, prior year claims and budgeted investment income and are then adjusted on the actual outcomes of these factors for the period of cover. Workers’ Compensation Contributions are adjusted three years after the close of the period of cover and the PTA has made a provision based upon the RiskCover performance adjustment. The performance adjustment outcome for a year is influenced by the actual experience for a year being different to what was expected when the Deposit Fund Contribution was set. Differences can arise when the actual outcome is different from that originally projected, specifically in relation to number of claims received, cost of the claims, reinsurance costs and investment returns.
Contaminated sites provision
The contaminated sites provision was based on estimates made by management for investigation or remediation expenses of contaminated or suspected contaminated sites.
PTA Annual Report / Notes to the Financial Statements

141
5. Disclosure of changes in accounting policy and estimatesInitial application of an Australian Accounting Standard
The PTA has applied the following Australian Accounting Standards effective for annual reporting periods beginning on or after 1 July 2016 that impacted on the PTA.
AASB 1057 Application of Australian Accounting Standards
This Standard lists the application paragraphs for each other Standard (and Interpretation), grouped where they are the same. There is no financial impact.
AASB 2014-3 Amendments to Australian Accounting Standards – Accounting for Acquisitions of Interests in Joint Operations [AASB 1 & 11]
The PTA establishes Joint Operations in pursuit of its objectives and does not routinely acquire interests in Joint Operations. Therefore, there is no financial impact on application of the Standard.
AASB 2014-4 Amendments to Australian Accounting Standards – Clarification of Acceptable Methods of Depreciation and Amortisation [AASB 116 & 138]
The adoption of this Standard has no financial impact for the PTA as depreciation and amortisation is not determined by reference to revenue generation, but by reference to consumption of future economic benefits.
AASB 2014-9 Amendments to Australian Accounting Standards – Equity Method in Separate Financial Statements [AASB 1, 127 & 128]
This Standard amends AASB 127, and consequentially amends AASB 1 and AASB 128, to allow entities to use the equity method of accounting for investments in subsidiaries, joint ventures and associates in their separate financial statements. As the PTA has no joint ventures and associates, the application of the Standard has no financial impact.
AASB2015-1 Amendments to Australian Accounting Standards - Annual Improvements to Australian Accounting Standards 2012-2014 Cycle [AASB 1, 2, 3, 5, 7, 11, 110, 119, 121, 133, 134, 137 & 140]
These amendments arise from the issuance of International Financial Reporting Standard Annual Improvements to IFRSs 2012-2014 Cycle in September 2014, and editorial corrections. The PTA has determined that the application of the Standard has no financial impact.
AASB 2015-2 Amendments to Australian Accounting Standards - Disclosure Initiative: Amendments to AASB 101 [AASB 7, 101, 134 & 1049]
This Standard amends AASB 101 to provide clarification regarding the disclosure requirements in AASB 101. Specifically, the Standard proposes narrow-focus amendments to address some of the concerns expressed about existing presentation and disclosure requirements and to ensure entities are able to use judgement when applying a Standard in determining what information to disclose in their financial statements. There is no financial impact.
PTA Annual Report / Notes to the Financial Statements

142
AASB 2015-6 Amendments to Australian Accounting Standards - Extending Related Party Disclosures to Not-for-Profit Public Sector Entities [AASB 10, 124 & 1049]
The amendments extend the scope of AASB 124 to include application by not-for-profit public sector entities. Implementation guidance is included to assist application of the Standard by not-for-profit public sector entities. There is no financial impact.
AASB 2015-10 Amendments to Australian Accounting Standards - Effective Date of Amendments to AASB 10 & 128
This Standard defers the mandatory effective date (application date) of amendments to AASB 10 & AASB 128 that were originally made in AASB 2014-10 so that the amendments are required to be applied for annual reporting periods beginning on or after 1 January 2018 instead of 1 January 2016. There is no financial impact.
PTA Annual Report / Notes to the Financial Statements
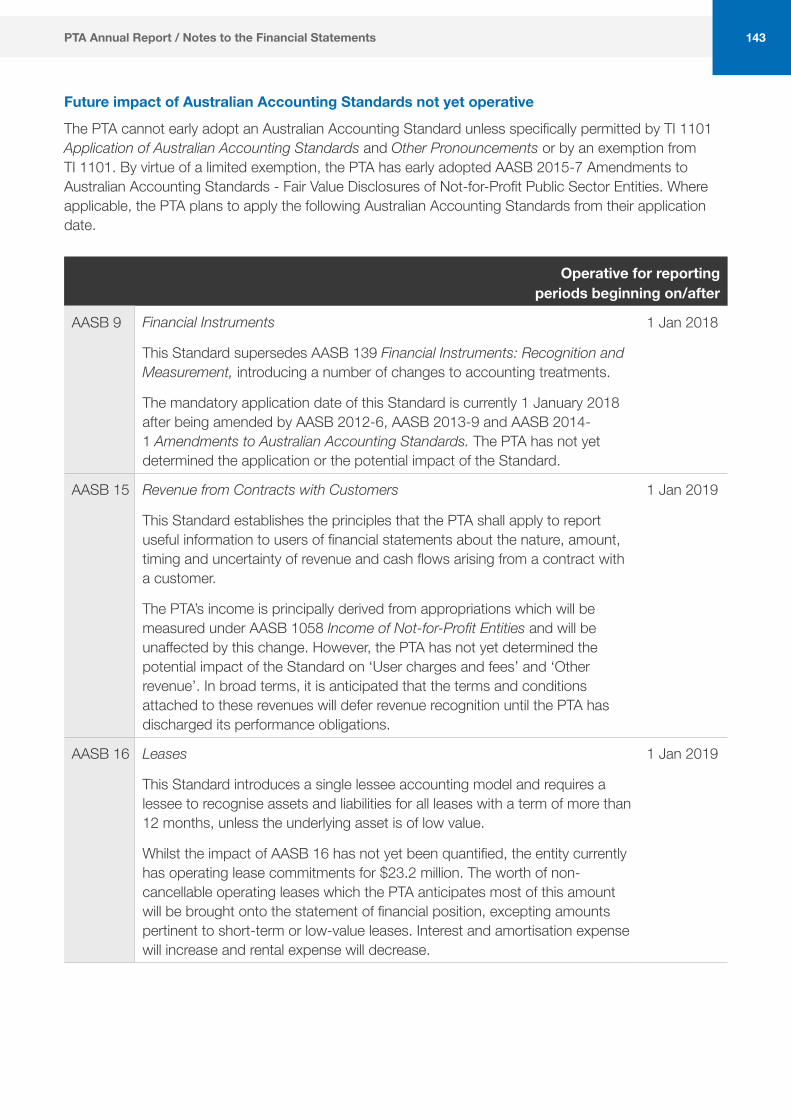
143
Future impact of Australian Accounting Standards not yet operative
The PTA cannot early adopt an Australian Accounting Standard unless specifically permitted by TI 1101 Application of Australian Accounting Standards and Other Pronouncements or by an exemption from TI 1101. By virtue of a limited exemption, the PTA has early adopted AASB 2015-7 Amendments to Australian Accounting Standards - Fair Value Disclosures of Not-for-Profit Public Sector Entities. Where applicable, the PTA plans to apply the following Australian Accounting Standards from their application date.
Operative for reporting periods beginning on/after
AASB 9 Financial Instruments
This Standard supersedes AASB 139 Financial Instruments: Recognition and Measurement, introducing a number of changes to accounting treatments.
The mandatory application date of this Standard is currently 1 January 2018 after being amended by AASB 2012-6, AASB 2013-9 and AASB 2014-1 Amendments to Australian Accounting Standards. The PTA has not yet determined the application or the potential impact of the Standard.
1 Jan 2018
AASB 15 Revenue from Contracts with Customers
This Standard establishes the principles that the PTA shall apply to report useful information to users of financial statements about the nature, amount, timing and uncertainty of revenue and cash flows arising from a contract with a customer.
The PTA’s income is principally derived from appropriations which will be measured under AASB 1058 Income of Not-for-Profit Entities and will be unaffected by this change. However, the PTA has not yet determined the potential impact of the Standard on ‘User charges and fees’ and ‘Other revenue’. In broad terms, it is anticipated that the terms and conditions attached to these revenues will defer revenue recognition until the PTA has discharged its performance obligations.
1 Jan 2019
AASB 16 Leases
This Standard introduces a single lessee accounting model and requires a lessee to recognise assets and liabilities for all leases with a term of more than 12 months, unless the underlying asset is of low value.
Whilst the impact of AASB 16 has not yet been quantified, the entity currently has operating lease commitments for $23.2 million. The worth of non- cancellable operating leases which the PTA anticipates most of this amount will be brought onto the statement of financial position, excepting amounts pertinent to short-term or low-value leases. Interest and amortisation expense will increase and rental expense will decrease.
1 Jan 2019
PTA Annual Report / Notes to the Financial Statements
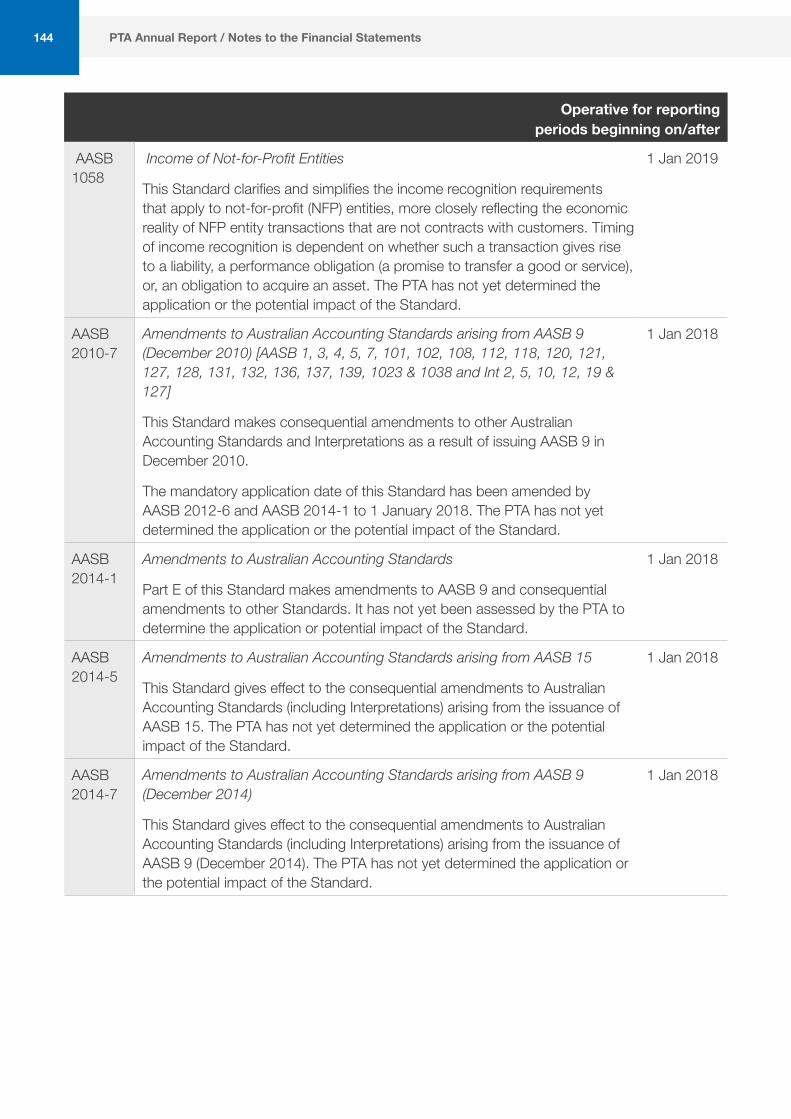
144
Operative for reporting periods beginning on/after
AASB 1058
Income of Not-for-Profit Entities
This Standard clarifies and simplifies the income recognition requirements that apply to not-for-profit (NFP) entities, more closely reflecting the economic reality of NFP entity transactions that are not contracts with customers. Timing of income recognition is dependent on whether such a transaction gives rise to a liability, a performance obligation (a promise to transfer a good or service), or, an obligation to acquire an asset. The PTA has not yet determined the application or the potential impact of the Standard.
1 Jan 2019
AASB 2010-7
Amendments to Australian Accounting Standards arising from AASB 9 (December 2010) [AASB 1, 3, 4, 5, 7, 101, 102, 108, 112, 118, 120, 121, 127, 128, 131, 132, 136, 137, 139, 1023 & 1038 and Int 2, 5, 10, 12, 19 & 127]
This Standard makes consequential amendments to other Australian Accounting Standards and Interpretations as a result of issuing AASB 9 in December 2010.
The mandatory application date of this Standard has been amended by AASB 2012-6 and AASB 2014-1 to 1 January 2018. The PTA has not yet determined the application or the potential impact of the Standard.
1 Jan 2018
AASB 2014-1
Amendments to Australian Accounting Standards
Part E of this Standard makes amendments to AASB 9 and consequential amendments to other Standards. It has not yet been assessed by the PTA to determine the application or potential impact of the Standard.
1 Jan 2018
AASB 2014-5
Amendments to Australian Accounting Standards arising from AASB 15
This Standard gives effect to the consequential amendments to Australian Accounting Standards (including Interpretations) arising from the issuance of AASB 15. The PTA has not yet determined the application or the potential impact of the Standard.
1 Jan 2018
AASB 2014-7
Amendments to Australian Accounting Standards arising from AASB 9 (December 2014)
This Standard gives effect to the consequential amendments to Australian Accounting Standards (including Interpretations) arising from the issuance of AASB 9 (December 2014). The PTA has not yet determined the application or the potential impact of the Standard.
1 Jan 2018
PTA Annual Report / Notes to the Financial Statements
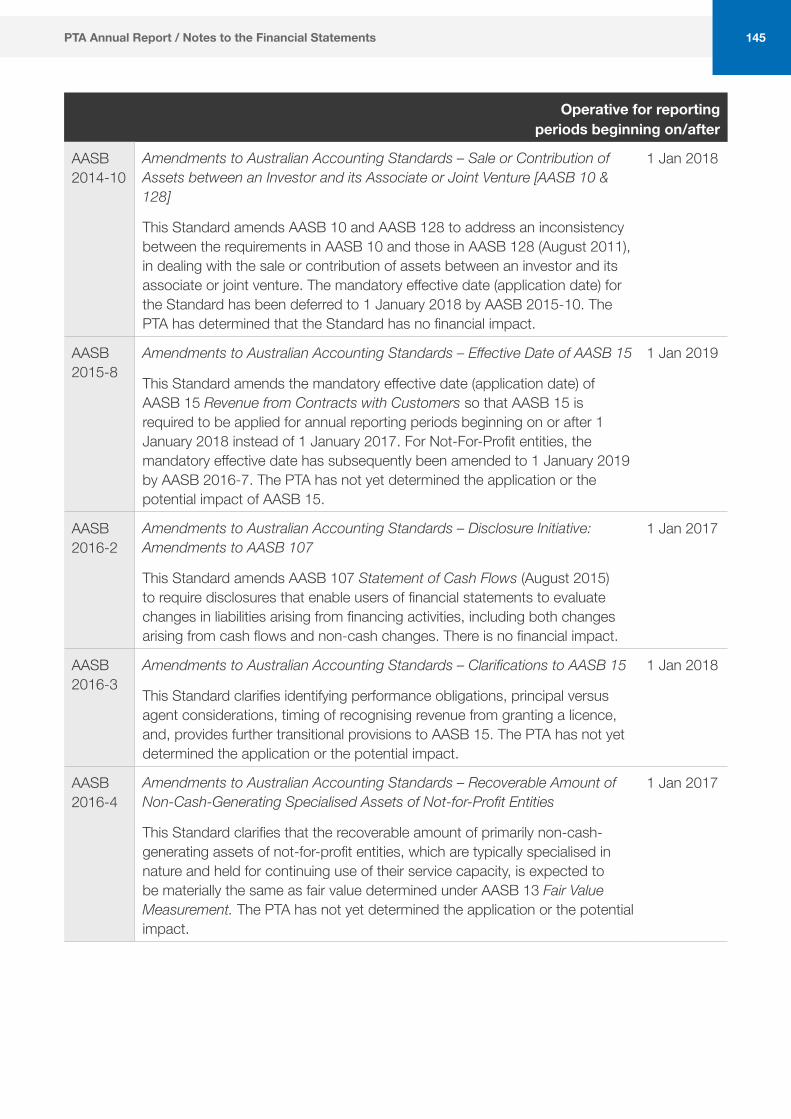
145
Operative for reporting periods beginning on/after
AASB 2014-10
Amendments to Australian Accounting Standards – Sale or Contribution of Assets between an Investor and its Associate or Joint Venture [AASB 10 & 128]
This Standard amends AASB 10 and AASB 128 to address an inconsistency between the requirements in AASB 10 and those in AASB 128 (August 2011), in dealing with the sale or contribution of assets between an investor and its associate or joint venture. The mandatory effective date (application date) for the Standard has been deferred to 1 January 2018 by AASB 2015-10. The PTA has determined that the Standard has no financial impact.
1 Jan 2018
AASB 2015-8
Amendments to Australian Accounting Standards – Effective Date of AASB 15
This Standard amends the mandatory effective date (application date) of AASB 15 Revenue from Contracts with Customers so that AASB 15 is required to be applied for annual reporting periods beginning on or after 1 January 2018 instead of 1 January 2017. For Not-For-Profit entities, the mandatory effective date has subsequently been amended to 1 January 2019 by AASB 2016-7. The PTA has not yet determined the application or the potential impact of AASB 15.
1 Jan 2019
AASB 2016-2
Amendments to Australian Accounting Standards – Disclosure Initiative: Amendments to AASB 107
This Standard amends AASB 107 Statement of Cash Flows (August 2015) to require disclosures that enable users of financial statements to evaluate changes in liabilities arising from financing activities, including both changes arising from cash flows and non-cash changes. There is no financial impact.
1 Jan 2017
AASB 2016-3
Amendments to Australian Accounting Standards – Clarifications to AASB 15
This Standard clarifies identifying performance obligations, principal versus agent considerations, timing of recognising revenue from granting a licence, and, provides further transitional provisions to AASB 15. The PTA has not yet determined the application or the potential impact.
1 Jan 2018
AASB 2016-4
Amendments to Australian Accounting Standards – Recoverable Amount of Non-Cash-Generating Specialised Assets of Not-for-Profit Entities
This Standard clarifies that the recoverable amount of primarily non-cash-generating assets of not-for-profit entities, which are typically specialised in nature and held for continuing use of their service capacity, is expected to be materially the same as fair value determined under AASB 13 Fair Value Measurement. The PTA has not yet determined the application or the potential impact.
1 Jan 2017
PTA Annual Report / Notes to the Financial Statements
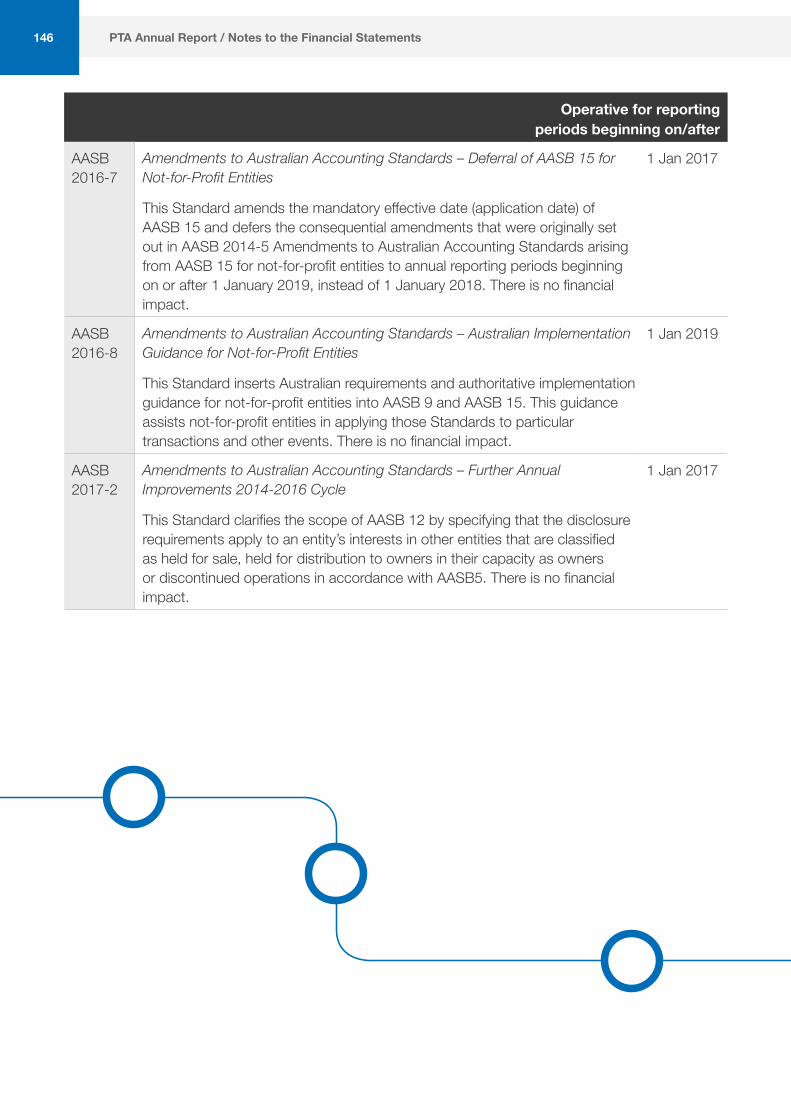
146
Operative for reporting periods beginning on/after
AASB 2016-7
Amendments to Australian Accounting Standards – Deferral of AASB 15 for Not-for-Profit Entities
This Standard amends the mandatory effective date (application date) of AASB 15 and defers the consequential amendments that were originally set out in AASB 2014-5 Amendments to Australian Accounting Standards arising from AASB 15 for not-for-profit entities to annual reporting periods beginning on or after 1 January 2019, instead of 1 January 2018. There is no financial impact.
1 Jan 2017
AASB 2016-8
Amendments to Australian Accounting Standards – Australian Implementation Guidance for Not-for-Profit Entities
This Standard inserts Australian requirements and authoritative implementation guidance for not-for-profit entities into AASB 9 and AASB 15. This guidance assists not-for-profit entities in applying those Standards to particular transactions and other events. There is no financial impact.
1 Jan 2019
AASB 2017-2
Amendments to Australian Accounting Standards – Further Annual Improvements 2014-2016 Cycle
This Standard clarifies the scope of AASB 12 by specifying that the disclosure requirements apply to an entity’s interests in other entities that are classified as held for sale, held for distribution to owners in their capacity as owners or discontinued operations in accordance with AASB5. There is no financial impact.
1 Jan 2017
PTA Annual Report / Notes to the Financial Statements

147
2017 2016 $000 $000
6. Employee benefits expenseWages and salaries (i) 156,083 153,190Superannuation - defined contribution plans (ii) 14,390 14,304
170,473 167,494
(i) Includes the value of the fringe benefit to the employee plus the fringe benefit tax component, leave entitlements including superannuation contribution component.
(ii) Defined contribution plans include West State, Gold State, GESBS and other eligible funds.
Employment on-costs expenses such as workers’ compensation insurance and payroll tax are included at note 12 ‘Other expenses’. Employment on-cost liability is included at note 34 ‘Provisions’.
PTA Annual Report / Notes to the Financial Statements
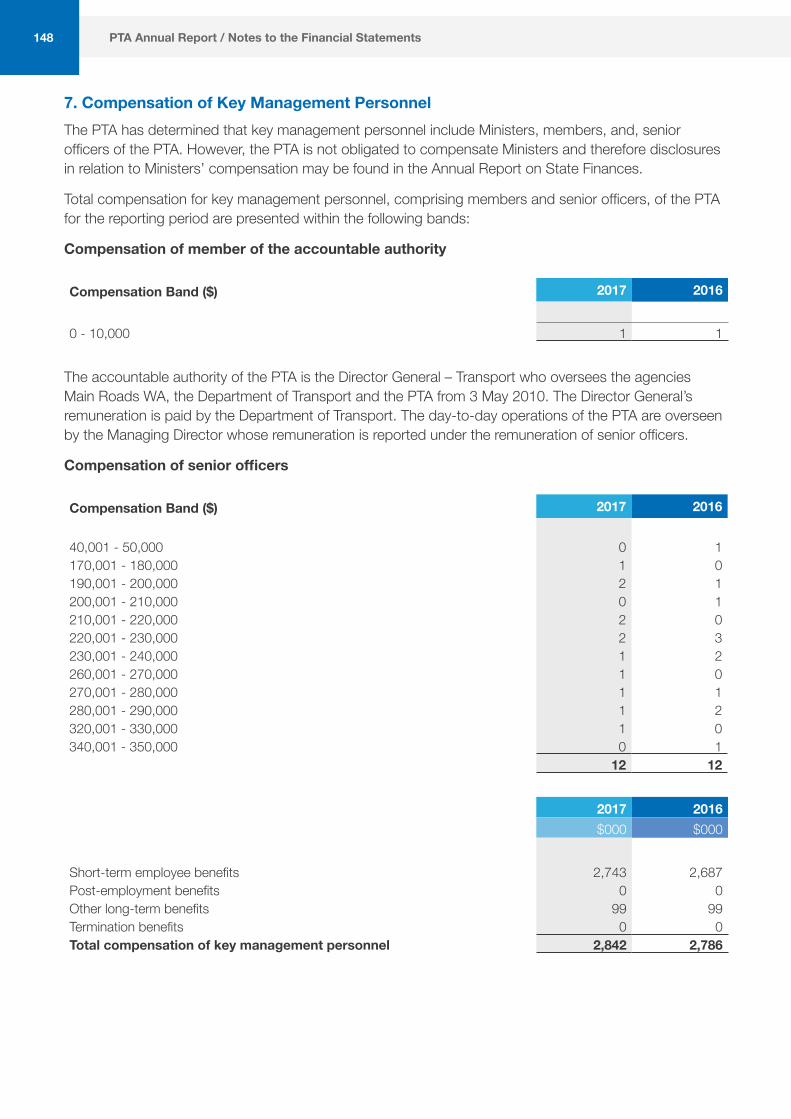
148
7. Compensation of Key Management PersonnelThe PTA has determined that key management personnel include Ministers, members, and, senior officers of the PTA. However, the PTA is not obligated to compensate Ministers and therefore disclosures in relation to Ministers’ compensation may be found in the Annual Report on State Finances.
Total compensation for key management personnel, comprising members and senior officers, of the PTA for the reporting period are presented within the following bands:
Compensation of member of the accountable authority
Compensation Band ($) 2017 2016
0 - 10,000 1 1
The accountable authority of the PTA is the Director General – Transport who oversees the agencies Main Roads WA, the Department of Transport and the PTA from 3 May 2010. The Director General’s remuneration is paid by the Department of Transport. The day-to-day operations of the PTA are overseen by the Managing Director whose remuneration is reported under the remuneration of senior officers.
Compensation of senior officers
Compensation Band ($) 2017 2016
40,001 - 50,000 0 1170,001 - 180,000 1 0190,001 - 200,000 2 1200,001 - 210,000 0 1210,001 - 220,000 2 0220,001 - 230,000 2 3230,001 - 240,000 1 2260,001 - 270,000 1 0270,001 - 280,000 1 1280,001 - 290,000 1 2320,001 - 330,000 1 0340,001 - 350,000 0 1
12 12
2017 2016 $000 $000
Short-term employee benefits 2,743 2,687Post-employment benefits 0 0Other long-term benefits 99 99Termination benefits 0 0Total compensation of key management personnel 2,842 2,786
PTA Annual Report / Notes to the Financial Statements
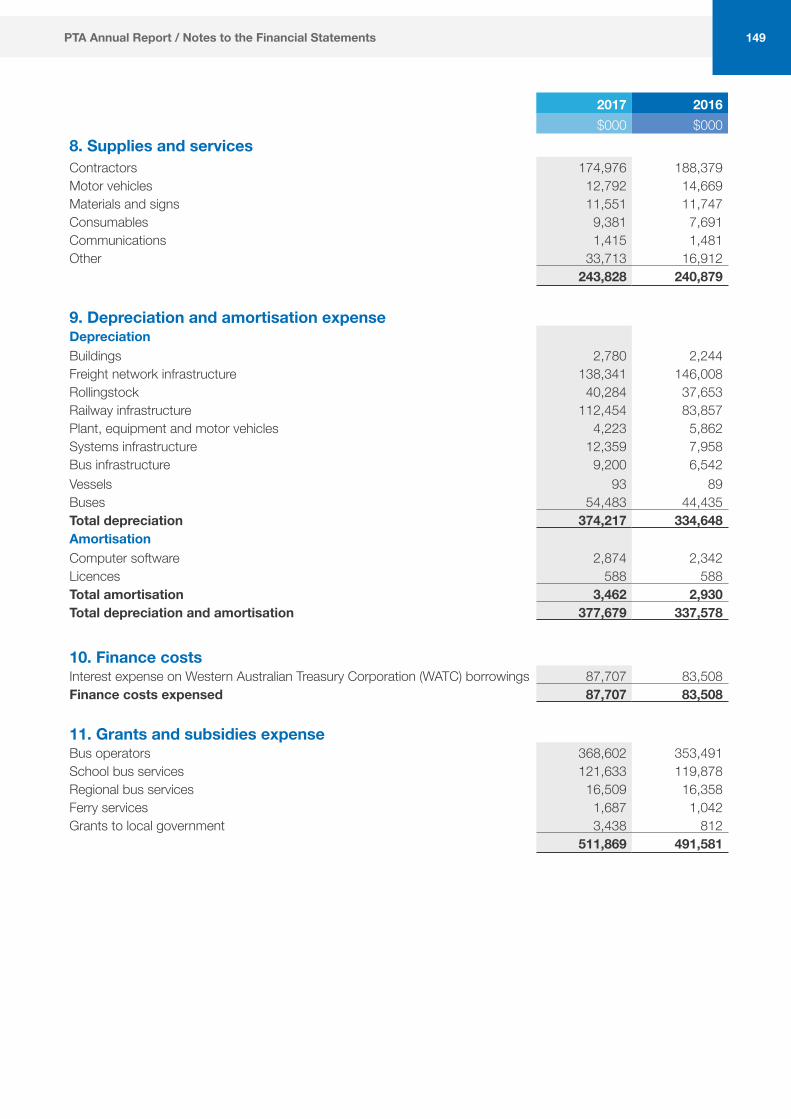
149
2017 2016 $000 $000
8. Supplies and servicesContractors 174,976 188,379Motor vehicles 12,792 14,669Materials and signs 11,551 11,747Consumables 9,381 7,691Communications 1,415 1,481Other 33,713 16,912
243,828 240,879 9. Depreciation and amortisation expenseDepreciationBuildings 2,780 2,244Freight network infrastructure 138,341 146,008Rollingstock 40,284 37,653Railway infrastructure 112,454 83,857Plant, equipment and motor vehicles 4,223 5,862Systems infrastructure 12,359 7,958Bus infrastructure 9,200 6,542Vessels 93 89Buses 54,483 44,435Total depreciation 374,217 334,648AmortisationComputer software 2,874 2,342Licences 588 588Total amortisation 3,462 2,930Total depreciation and amortisation 377,679 337,578
10. Finance costs Interest expense on Western Australian Treasury Corporation (WATC) borrowings 87,707 83,508Finance costs expensed 87,707 83,508
11. Grants and subsidies expenseBus operators 368,602 353,491School bus services 121,633 119,878Regional bus services 16,509 16,358Ferry services 1,687 1,042Grants to local government 3,438 812
511,869 491,581
PTA Annual Report / Notes to the Financial Statements

150
2017 2016 $000 $000
12. Other expensesPayroll tax 9,641 8,941Workers’ compensation 4,500 5,978Payment of infringements to consolidated account 3,743 4,156Ineffectiveness on currency forward contracts designated as cash flow hedge 220 89Net change in fair value of financial instruments at fair value through profit and loss
0 1,943
Audit fees 746 574Notional charges for services provided by government agencies 626 856Employment on-costs (i) 15 55Doubtful debts expense 24 153
19,515 22,745
(i) Includes workers’ compensation insurance and payroll tax relating to annual and long service leave. The on-costs liabilities associated with the recognition of annual and long service leave liabilities are included at note 34 ‘Provisions’. Superannuation contributions accrued as part of the provision for leave are employee benefits and are not included in employment on-costs.
PTA Annual Report / Notes to the Financial Statements

151
13. Related party transactionsThe PTA is a wholly owned and controlled entity of the State of Western Australia. In conducting its activities, the PTA is required to pay various taxes and levies based on the standard terms and conditions that apply to all tax and levy payers to the State and entities related to the State.
Related parties of the PTA include:
• all Ministers and their close family members, and their controlled or jointly controlled entities;
• all senior officers and their close family members, and their controlled or jointly controlled entities;
• other departments and public sector entities, including related bodies included in the whole of government consolidated financial statements;
• associates and joint ventures, that are included in the whole of government consolidated financial statements; and
• the Government Employees Superannuation Board (GESB).
Significant transactions with government related entities
Significant transactions include:
• service appropriations (Note 20);
• capital appropriations (Note 37);
• income from Royalties for Regions Fund (Note 20);
• superannuation payments to GESB (Note 6);
• lease rentals payments for accommodation and fleet leasing to the Department of Finance (Note 8);
• insurance payments to the Insurance Commission and Riskcover fund (Note 12);
• equity injections from Royalties for Regions Funds (Note 37); and remuneration for services provided by the Auditor General (Note 46).
• equity injections from Department of Transport (Note 37) and income for the Perth Central Area Transit (Note 14).
• transfer of assets to and from Main Roads WA (Note 37).
• payment to Main Roads WA for infrastructure projects (Note 8 and 26).
• prepayment made to Department of Sport and Recreation for the Perth Stadium project (Note 24).
• payments to the Department of Attorney General for the acquisition of land (Note 26).
• income from the Department of Education (DoE) for transport assistance programs (Note 14).
• payment to Synergy for the supply of electricity mainly for railcars.
• the drawdown and repayment of loans with the Western Australian Treasury Corporation for the purposes of funding the Asset Investments Program (Note 33).
• payment to the Department of Finance (Office of State Revenue) for payroll tax (Note 12).
Material transactions with related parties
No material transactions with related parties have occurred during the financial year.
PTA Annual Report / Notes to the Financial Statements

152
2017 2016 $000 $000
14. User charges and feesFare revenue 205,062 210,453
15. Operating lease revenueRental income from freight network infrastructure (i) 5,383 5,383Rental income from grain receival sites (ii) 83 83
5,466 5,466
(i) The sale of the Westrail Freight Business on 17 December 2000 included an operating lease of the freight network infrastructure for 49 years between the Western Australian Government Railways Commission (WAGR) – now Public Transport Authority of Western Australia (PTA) and Westnet Rail Pty Ltd – now Brookfield Rail Pty Ltd. The lease rentals were fully prepaid on 17 December 2000, and credited to deferred operating lease revenue.
(ii) A 99 year operating lease for 118 grain receival sites was entered into with Co-operative Bulk Handling (CBH) in 2003. Rental income for 99 years of $7.45 million was received in full at the commencement of the lease, and is accounted for as revenue over the 99 year lease period, with the prepaid portion shown as deferred income. (See note 36 ‘Deferred income – operating leases’). A further 99 year operating lease for 15 grain receival sites was entered into with CBH in 2004. Rental income for 99 years of $775,000 was received in full at the commencement of the lease, and is accounted for as revenue over the 99 year lease period, with the prepaid portion shown as deferred income. (See note 36 ‘Deferred income – operating leases’).
16. Commonwealth grants and contributionsChamber of Commerce and Industry - Apprenticeship Support Australia 11 4Commonwealth grant (via Treasury) - Nicholson Road grade separation 2,836 0Commonwealth grant - Grain Lines refund (3) 0
2,844 4
17. Interest revenueInterest revenue 9,442 1,430
Interest revenue is received quarterly from Department of Treasury calculated on the daily balance held in the interest bearing bank account. This includes interest earned on the funds received from the Commonwealth Government for the construction of the Forrestfield – Airport Link project (Note 47).
PTA Annual Report / Notes to the Financial Statements
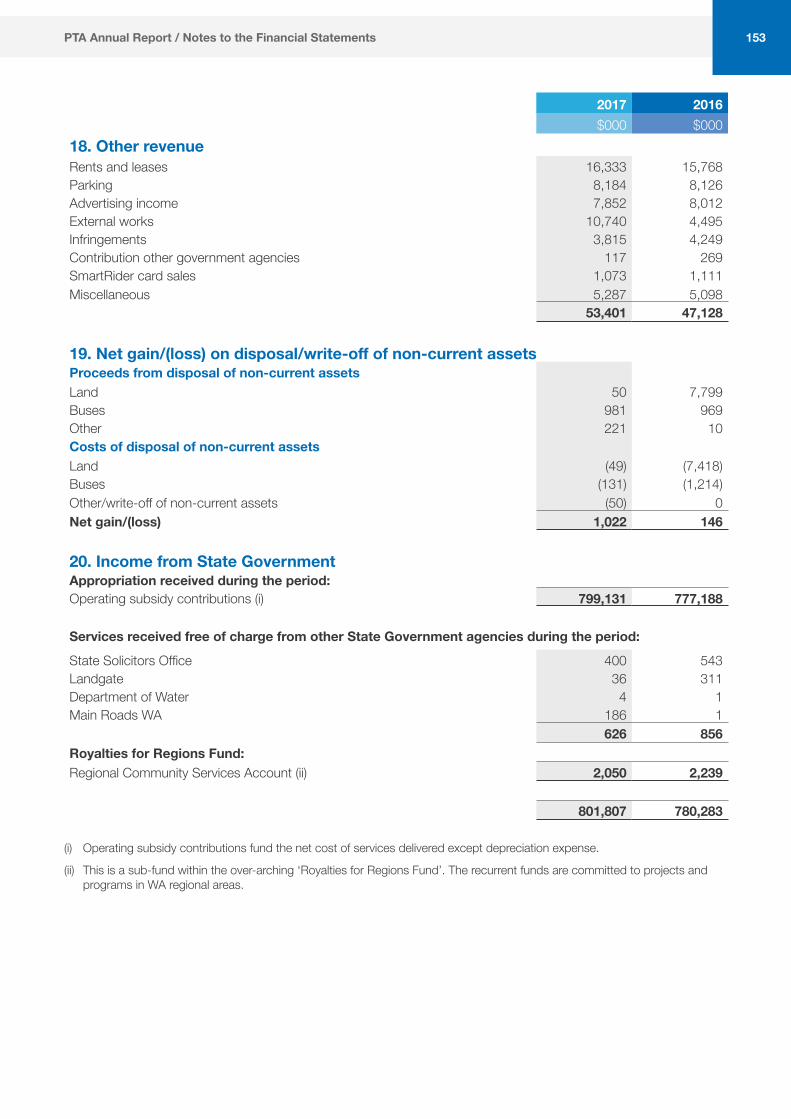
153
2017 2016 $000 $000
18. Other revenueRents and leases 16,333 15,768Parking 8,184 8,126Advertising income 7,852 8,012External works 10,740 4,495Infringements 3,815 4,249Contribution other government agencies 117 269SmartRider card sales 1,073 1,111Miscellaneous 5,287 5,098
53,401 47,128 19. Net gain/(loss) on disposal/write-off of non-current assetsProceeds from disposal of non-current assetsLand 50 7,799Buses 981 969Other 221 10Costs of disposal of non-current assetsLand (49) (7,418)Buses (131) (1,214)Other/write-off of non-current assets (50) 0Net gain/(loss) 1,022 146
20. Income from State GovernmentAppropriation received during the period:Operating subsidy contributions (i) 799,131 777,188
Services received free of charge from other State Government agencies during the period:
State Solicitors Office 400 543Landgate 36 311Department of Water 4 1Main Roads WA 186 1
626 856Royalties for Regions Fund:Regional Community Services Account (ii) 2,050 2,239
801,807 780,283
(i) Operating subsidy contributions fund the net cost of services delivered except depreciation expense.
(ii) This is a sub-fund within the over-arching ‘Royalties for Regions Fund’. The recurrent funds are committed to projects and programs in WA regional areas.
PTA Annual Report / Notes to the Financial Statements
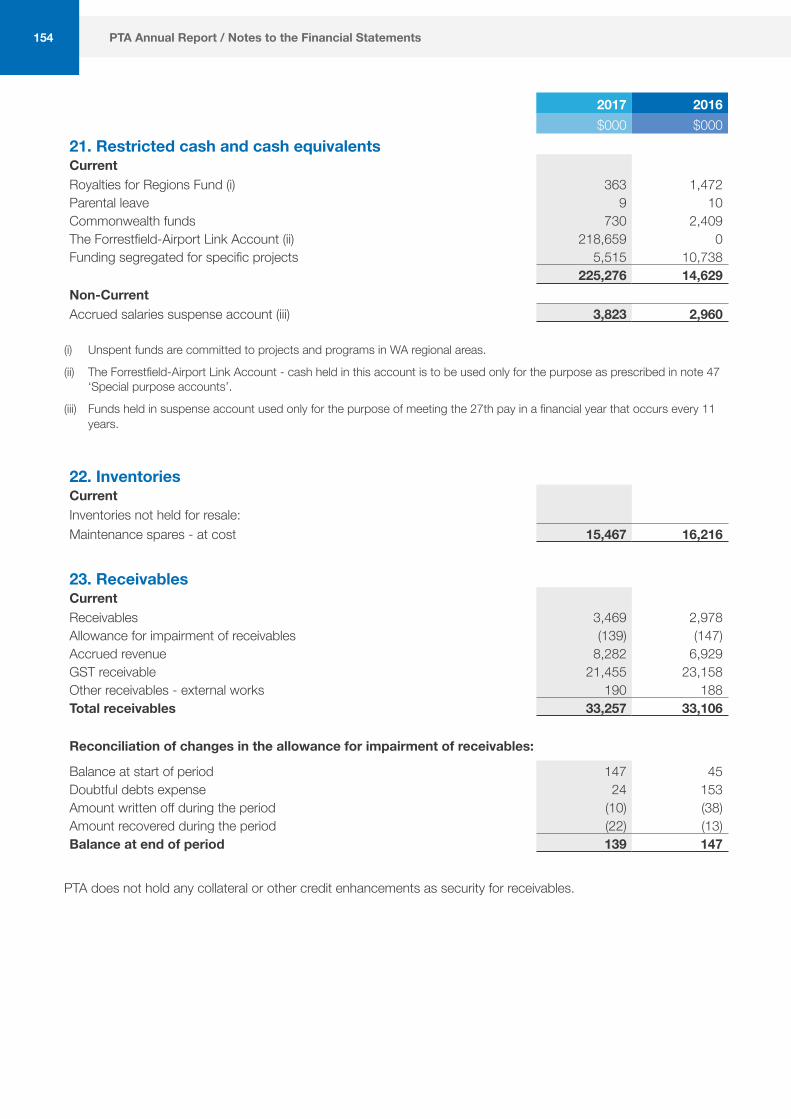
154
2017 2016 $000 $000
21. Restricted cash and cash equivalentsCurrentRoyalties for Regions Fund (i) 363 1,472Parental leave 9 10Commonwealth funds 730 2,409The Forrestfield-Airport Link Account (ii) 218,659 0Funding segregated for specific projects 5,515 10,738
225,276 14,629Non-CurrentAccrued salaries suspense account (iii) 3,823 2,960
(i) Unspent funds are committed to projects and programs in WA regional areas.
(ii) The Forrestfield-Airport Link Account - cash held in this account is to be used only for the purpose as prescribed in note 47 ‘Special purpose accounts’.
(iii) Funds held in suspense account used only for the purpose of meeting the 27th pay in a financial year that occurs every 11 years.
22. InventoriesCurrentInventories not held for resale:Maintenance spares - at cost 15,467 16,216
23. ReceivablesCurrentReceivables 3,469 2,978Allowance for impairment of receivables (139) (147)Accrued revenue 8,282 6,929GST receivable 21,455 23,158Other receivables - external works 190 188Total receivables 33,257 33,106
Reconciliation of changes in the allowance for impairment of receivables:
Balance at start of period 147 45Doubtful debts expense 24 153Amount written off during the period (10) (38)Amount recovered during the period (22) (13)Balance at end of period 139 147
PTA does not hold any collateral or other credit enhancements as security for receivables.
PTA Annual Report / Notes to the Financial Statements

155
2017 2016 $000 $000
24. PrepaymentsCurrent 26,186 14,953Non-current 0 5,600
26,186 20,553 25. Amounts receivable for services (Holding Account)Current 75,917 64,232Non-current 724,955 784,761
800,872 848,993 Represents the non-cash component of operating subsidy contributions. It is restricted in that it can only be used for asset replacement or payment of leave liability.
PTA Annual Report / Notes to the Financial Statements

156
26. I
nfra
stru
ctur
e, p
rope
rty,
pla
nt, e
quip
men
t and
veh
icle
s
2017
2016
Cos
t At
Fai
r Val
ue
Accu
mul
ated
de
prec
iatio
n C
arry
ing
amou
nt a
s at
30
Jun
e 20
17
Cos
t At
Fai
r Val
ue
Accu
mul
ated
de
prec
iatio
n C
arry
ing
amou
nt a
s at
30
Jun
e 20
16
$000
$000
$000
$000
$000
$000
$000
$000
Ow
ned
Asse
ts:
Land
(i)0
477,
380
047
7,38
00
399,
775
039
9,77
5Bu
ildin
gs (ii
)0
103,
021
77,4
0825
,613
099
,903
74,6
2825
,275
Freig
ht n
etw
ork
infra
stru
ctur
e (vi
)(x)
07,
634,
646
6,12
1,08
91,
513,
557
07,
620,
420
5,98
2,74
81,
637,
672
Rollin
gsto
ck (ii
i)0
1,45
6,28
868
8,38
276
7,90
60
1,21
8,02
152
4,55
069
3,47
1Ra
ilway
infra
stru
ctur
e (vi
i)0
4,62
9,74
81,
669,
079
2,96
0,66
90
4,50
9,46
31,
555,
388
2,95
4,07
5Pl
ant,
equi
pmen
t & m
otor
veh
icles
59,6
200
46,8
7112
,749
53,0
080
41,5
6611
,442
Syst
em In
frast
ruct
ure
(viii)
033
8,52
122
9,63
810
8,88
30
219,
983
136,
326
83,6
57Bu
s in
frast
ruct
ure
(ii)0
434,
395
128,
820
305,
575
025
0,97
611
9,62
013
1,35
6Ve
ssels
(v)
03,
579
2,49
11,
088
03,
579
2,39
81,
181
Buse
s (iv
)0
923,
136
433,
408
489,
728
086
2,85
041
5,98
444
6,86
6Co
nstru
ctio
n in
pro
gres
s (ix
)82
3,03
40
082
3,03
475
0,73
00
075
0,73
0
TOTA
L88
2,65
416
,000
,714
9,39
7,18
67,
486,
182
803,
738
15,1
84,9
708,
853,
208
7,13
5,50
0
Info
rmat
ion
on fa
ir va
lue
mea
sure
men
ts is
pro
vided
in n
ote
28.
PTA Annual Report / Notes to the Financial Statements

157
(i) Land controlled by the PTA has been revalued as at 1 July 2016 by the Western Australian Land Information Authority (Valuation Services) and Burgess Rawson. The valuations were performed during the year ended 30 June 2017 and recognised at 30 June 2017. The fair value was determined by reference to market values. See note 2(g). To ensure the valuations provided by Valuation Services were compliant at 30 June 2017 with the fair value requirements under AASB 116, Valuation Services provided the Department of Treasury with information that tracked the general movement in the market value of land and in building construction costs from 1 July 2016 (the date of valuation) to 30 June 2017. Department of Treasury reviewed the information and determined that the valuations provided by Valuation Services (as at 1 July 2016) were compliant with fair value requirements for 30 June 2017 reporting without further adjustment by reference to market values based on existing use. Land which is commercially leased was independently valued on the capitalised value of current lease by Burgess Rawson. The valuations were performed during the year ended 30 June 2017 and recognised at 30 June 2017.
(ii) Buildings and bus infrastructure have been revalued as at 30 June 2014 by independent valuers Ralph Beattie Bosworth at depreciated replacement cost which represents the fair value of the assets.
(iii) Rollingstock has been revalued as at 30 June 2017 by both independent valuers SNC-Lavalin Rail & Transit Pty Ltd and by taking up the PTA’s latest contract pricing from EDI Rail-Bombardier Transportation Pty Ltd at depreciated replacement cost which represents the fair value of the assets. SNC-Lavalin Rail & Transit Pty Ltd provided valuation advice for the Transwa rollingstock assets and the PTA’s latest contract pricing was utilised for the Perth metropolitan area rollingstock assets.
(iv) Buses have been revalued as at 30 June 2017 by taking up the PTA’s latest contract pricing from Volvo at depreciated replacement cost which represents the fair value of the assets.
(v) Vessels have been revalued as at 30 June 2014 by utilising internal expertise and adjusting for inflation to arrive at depreciated replacement cost which represents the fair value of the assets.
(vi) Freight network infrastructure has been revalued on 30 June 2015 by independent valuers Griffin Valuation Advisory at depreciated replacement cost which represents the fair value of the assets.
(vii) Railway infrastructure has been revalued on 30 June 2016 through a combination of an independent valuation by professionals Griffin Valuation Advisory and input from internal engineers at depreciated replacement cost which represents the fair value of the assets.
(viii) System infrastructure has been revalued on 30 June 2017 by independent valuation professionals GHD Pty Ltd at depreciated replacement cost which represents the fair value of the assets.
(ix) Construction in progress is valued at cost.
(x) The PTA entered into a finance lease with Karara Mining Limited and Gindalbie Metals Limited during the 2013 financial year. The lease is over a railway line from Tilley to Karara which was constructed by Karara for its exclusive use over the period of the lease term of 49 years. While legal ownership is vested in PTA, beneficial ownership is with Karara therefore the assets are not included in the freight network infrastructure balance however the asset will be transferred to PTA upon the expiry of the lease.
PTA Annual Report / Notes to the Financial Statements
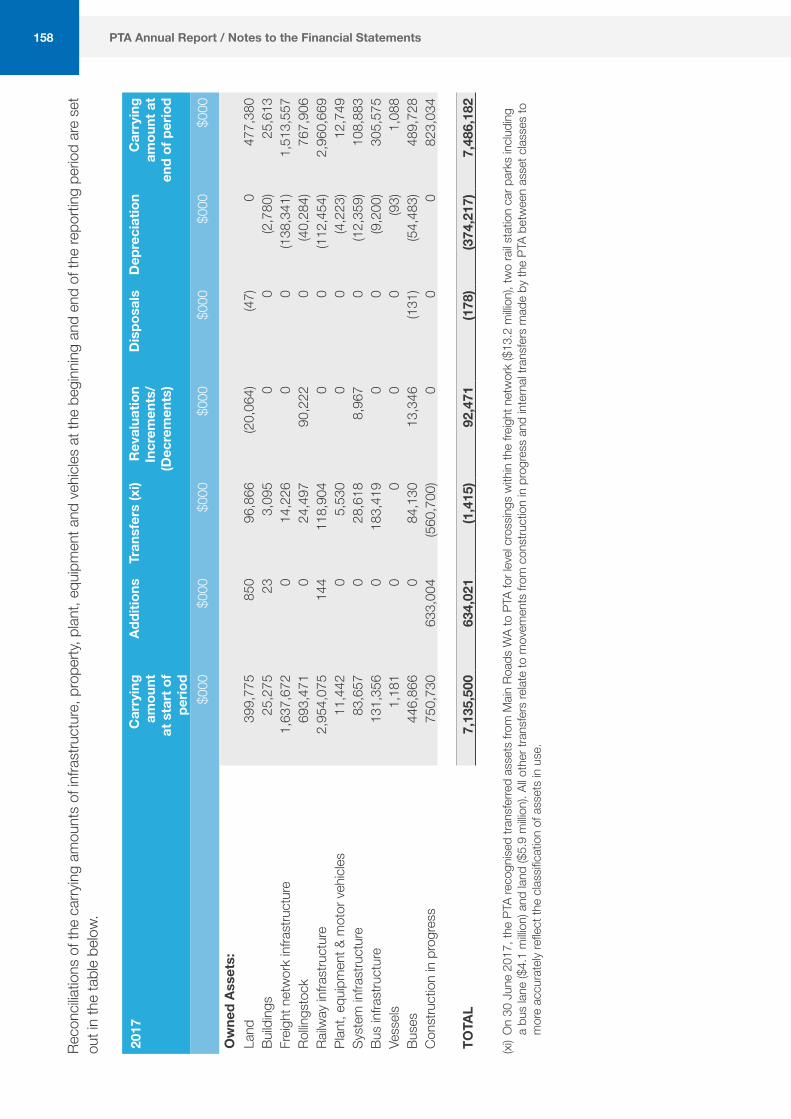
158
Reco
ncilia
tions
of t
he c
arry
ing
amou
nts
of in
frast
ruct
ure,
pro
perty
, plan
t, eq
uipm
ent a
nd v
ehicl
es a
t the
beg
inni
ng a
nd e
nd o
f the
repo
rting
per
iod
are
set
out i
n th
e ta
ble
belo
w.
2017
Car
ryin
g am
ount
at
sta
rt o
f pe
riod
Addi
tions
Tr
ansf
ers
(xi)
Rev
alua
tion
Incr
emen
ts/
(Dec
rem
ents
)
Dis
posa
ls
Dep
reci
atio
n
Car
ryin
g am
ount
at
end
of p
erio
d
$000
$000
$000
$000
$000
$000
$000
Ow
ned
Asse
ts:
Land
399,
775
850
96,8
66(2
0,06
4)(4
7)0
477,
380
Build
ings
25,2
7523
3,09
50
0(2
,780
)25
,613
Freig
ht n
etw
ork
infra
stru
ctur
e1,
637,
672
014
,226
00
(138
,341
)1,
513,
557
Rollin
gsto
ck69
3,47
10
24,4
9790
,222
0(4
0,28
4)76
7,90
6Ra
ilway
infra
stru
ctur
e2,
954,
075
144
118,
904
00
(112
,454
)2,
960,
669
Plan
t, eq
uipm
ent &
mot
or v
ehicl
es11
,442
05,
530
00
(4,2
23)
12,7
49Sy
stem
infra
stru
ctur
e 83
,657
028
,618
8,96
70
(12,
359)
108,
883
Bus
infra
stru
ctur
e13
1,35
60
183,
419
00
(9,2
00)
305,
575
Vess
els1,
181
00
00
(93)
1,08
8Bu
ses
446,
866
084
,130
13,3
46(1
31)
(54,
483)
489,
728
Cons
truct
ion
in p
rogr
ess
750,
730
633,
004
(560
,700
)0
00
823,
034
TOTA
L7,
135,
500
634,
021
(1,4
15)
92,4
71(1
78)
(374
,217
)7,
486,
182
(xi)
On
30 J
une
2017
, the
PTA
reco
gnise
d tra
nsfe
rred
asse
ts fr
om M
ain R
oads
WA
to P
TA fo
r lev
el cr
ossin
gs w
ithin
the
freig
ht n
etw
ork
($13
.2 m
illion
), tw
o ra
il sta
tion
car p
arks
inclu
ding
a
bus
lane
($4.
1 m
illion
) and
land
($5.
9 m
illion
). Al
l oth
er tr
ansf
ers
relat
e to
mov
emen
ts fr
om c
onst
ruct
ion
in p
rogr
ess
and
inte
rnal
trans
fers
mad
e by
the
PTA
betw
een
asse
t clas
ses
to
mor
e ac
cura
tely
refle
ct th
e cla
ssific
atio
n of
ass
ets
in u
se.
PTA Annual Report / Notes to the Financial Statements
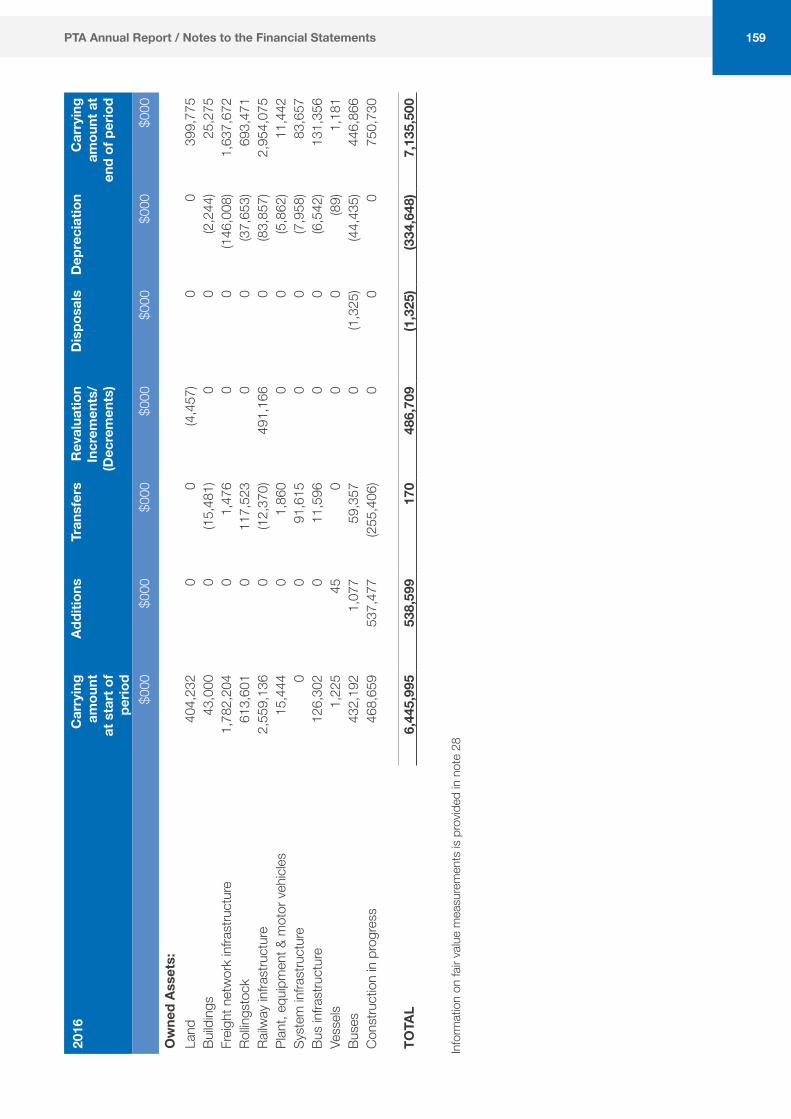
159
2016
Car
ryin
g am
ount
at
sta
rt o
f pe
riod
Addi
tions
Tran
sfer
s
Rev
alua
tion
Incr
emen
ts/
(Dec
rem
ents
)
Dis
posa
ls
Dep
reci
atio
n
Car
ryin
g am
ount
at
end
of p
erio
d
$000
$000
$000
$000
$000
$000
$000
Ow
ned
Asse
ts:
Land
404,
232
00
(4,4
57)
00
399,
775
Build
ings
43,0
000
(15,
481)
00
(2,2
44)
25,2
75Fr
eight
net
wor
k in
frast
ruct
ure
1,78
2,20
40
1,47
60
0(1
46,0
08)
1,63
7,67
2Ro
llings
tock
613,
601
011
7,52
30
0(3
7,65
3)69
3,47
1Ra
ilway
infra
stru
ctur
e2,
559,
136
0(1
2,37
0)49
1,16
60
(83,
857)
2,95
4,07
5Pl
ant,
equi
pmen
t & m
otor
veh
icles
15,4
440
1,86
00
0(5
,862
)11
,442
Syst
em in
frast
ruct
ure
00
91,6
150
0(7
,958
)83
,657
Bus
infra
stru
ctur
e12
6,30
20
11,5
960
0(6
,542
)13
1,35
6Ve
ssels
1,22
545
00
0(8
9)1,
181
Buse
s 43
2,19
21,
077
59,3
570
(1,3
25)
(44,
435)
446,
866
Cons
truct
ion
in p
rogr
ess
468,
659
537,
477
(255
,406
)0
00
750,
730
TOTA
L6,
445,
995
538,
599
170
486,
709
(1,3
25)
(334
,648
)7,
135,
500
Info
rmat
ion
on fa
ir va
lue
mea
sure
men
ts is
pro
vided
in n
ote
28
PTA Annual Report / Notes to the Financial Statements
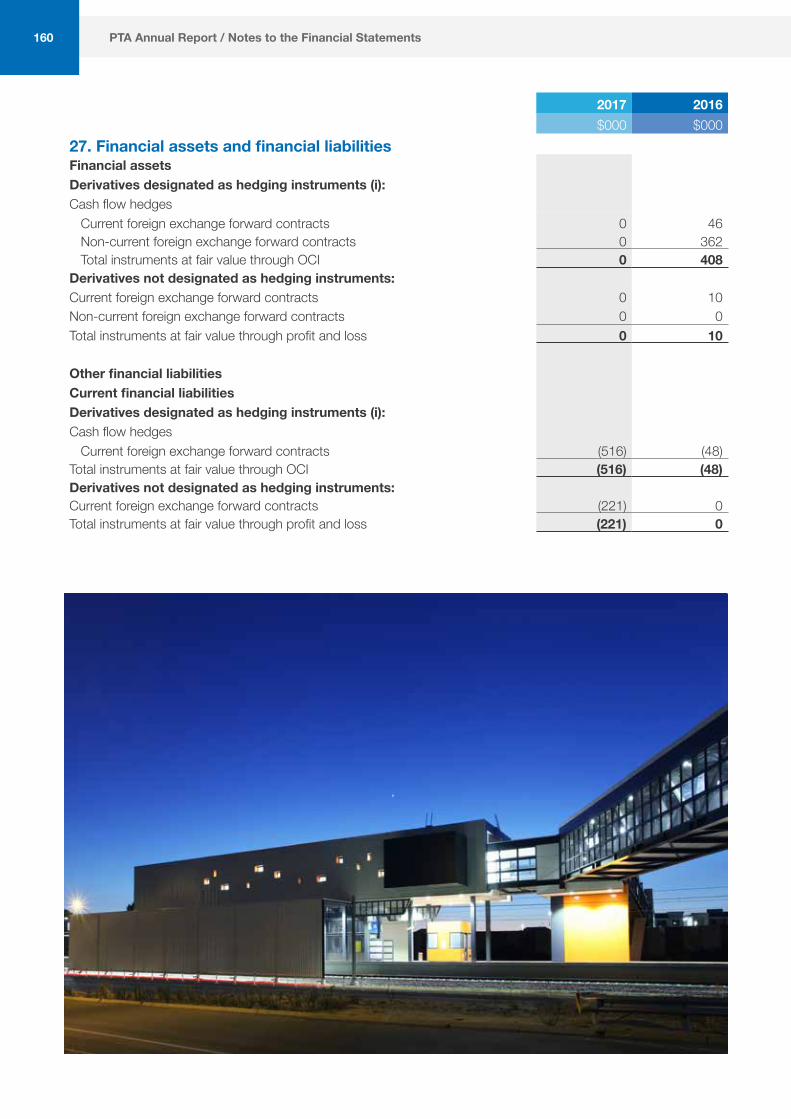
160
2017 2016 $000 $000
27. Financial assets and financial liabilities Financial assetsDerivatives designated as hedging instruments (i):Cash flow hedges
Current foreign exchange forward contracts 0 46Non-current foreign exchange forward contracts 0 362Total instruments at fair value through OCI 0 408
Derivatives not designated as hedging instruments:Current foreign exchange forward contracts 0 10Non-current foreign exchange forward contracts 0 0Total instruments at fair value through profit and loss 0 10
Other financial liabilitiesCurrent financial liabilitiesDerivatives designated as hedging instruments (i):Cash flow hedges
Current foreign exchange forward contracts (516) (48)Total instruments at fair value through OCI (516) (48)Derivatives not designated as hedging instruments:Current foreign exchange forward contracts (221) 0Total instruments at fair value through profit and loss (221) 0
PTA Annual Report / Notes to the Financial Statements
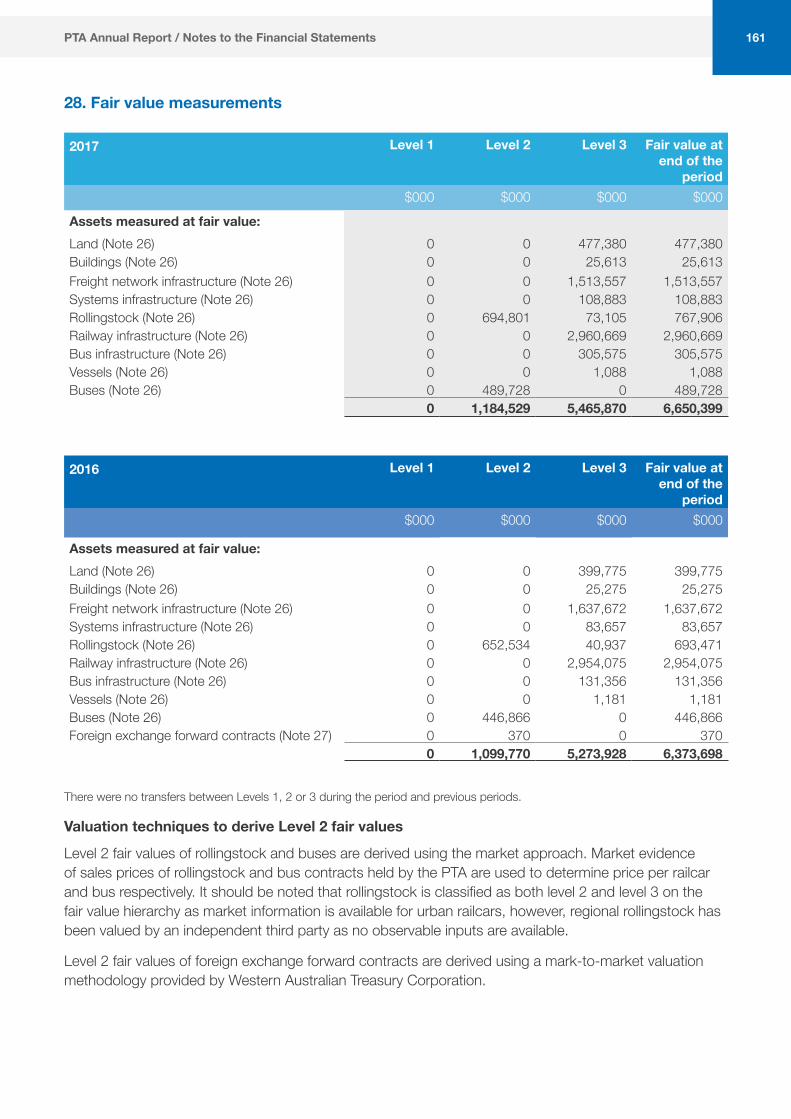
161
28. Fair value measurements 2017 Level 1 Level 2
Level 3
Fair value at
end of the period
$000 $000 $000 $000
Assets measured at fair value:Land (Note 26) 0 0 477,380 477,380Buildings (Note 26) 0 0 25,613 25,613Freight network infrastructure (Note 26) 0 0 1,513,557 1,513,557Systems infrastructure (Note 26) 0 0 108,883 108,883Rollingstock (Note 26) 0 694,801 73,105 767,906Railway infrastructure (Note 26) 0 0 2,960,669 2,960,669Bus infrastructure (Note 26) 0 0 305,575 305,575Vessels (Note 26) 0 0 1,088 1,088Buses (Note 26) 0 489,728 0 489,728
0 1,184,529 5,465,870 6,650,399 2016 Level 1
Level 2
Level 3
Fair value at end of the
period $000 $000 $000 $000
Assets measured at fair value:Land (Note 26) 0 0 399,775 399,775Buildings (Note 26) 0 0 25,275 25,275Freight network infrastructure (Note 26) 0 0 1,637,672 1,637,672Systems infrastructure (Note 26) 0 0 83,657 83,657Rollingstock (Note 26) 0 652,534 40,937 693,471Railway infrastructure (Note 26) 0 0 2,954,075 2,954,075Bus infrastructure (Note 26) 0 0 131,356 131,356Vessels (Note 26) 0 0 1,181 1,181Buses (Note 26) 0 446,866 0 446,866Foreign exchange forward contracts (Note 27) 0 370 0 370
0 1,099,770 5,273,928 6,373,698
There were no transfers between Levels 1, 2 or 3 during the period and previous periods.
Valuation techniques to derive Level 2 fair values
Level 2 fair values of rollingstock and buses are derived using the market approach. Market evidence of sales prices of rollingstock and bus contracts held by the PTA are used to determine price per railcar and bus respectively. It should be noted that rollingstock is classified as both level 2 and level 3 on the fair value hierarchy as market information is available for urban railcars, however, regional rollingstock has been valued by an independent third party as no observable inputs are available.
Level 2 fair values of foreign exchange forward contracts are derived using a mark-to-market valuation methodology provided by Western Australian Treasury Corporation.
PTA Annual Report / Notes to the Financial Statements
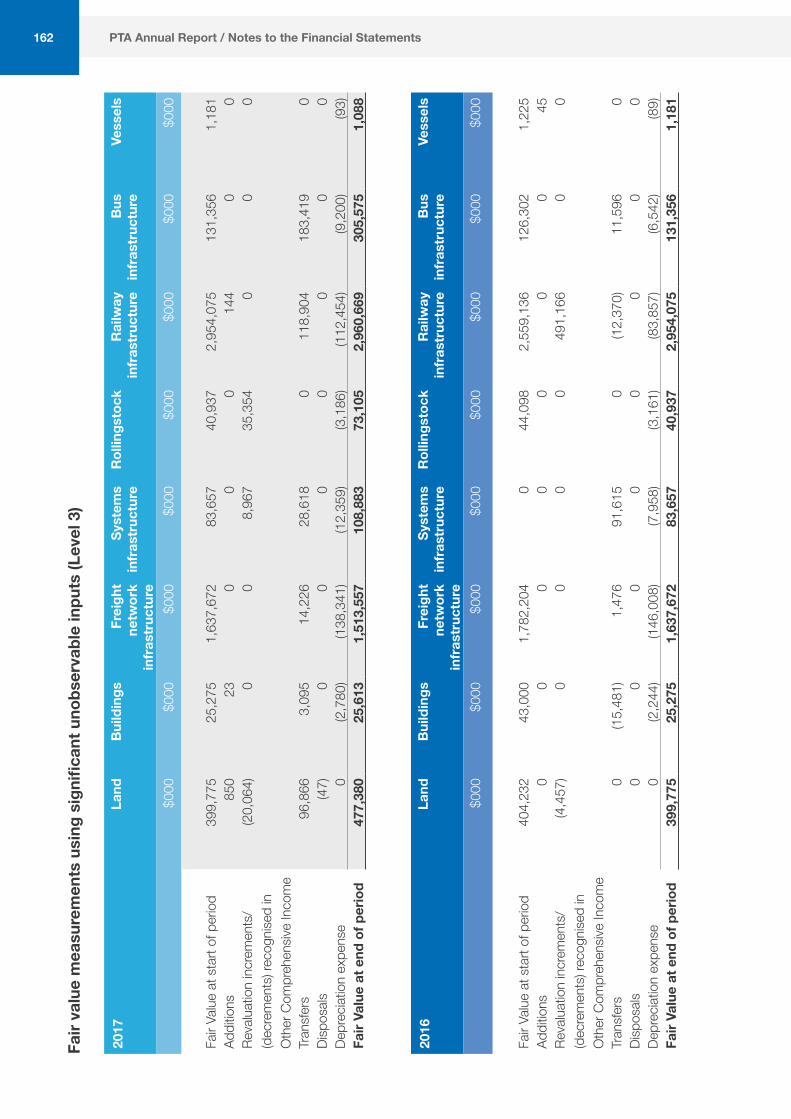
162
Fair
valu
e m
easu
rem
ents
usi
ng s
igni
fican
t uno
bser
vabl
e in
puts
(Lev
el 3
) 20
17La
nd
Build
ings
Fr
eigh
t ne
twor
k in
fras
truc
ture
Syst
ems
infr
astr
uctu
re
Rol
lings
tock
Rai
lway
in
fras
truc
ture
Bu
s in
fras
truc
ture
Vess
els
$000
$000
$000
$000
$000
$000
$000
$000
Fair
Valu
e at
sta
rt of
per
iod
399,
775
25,2
751,
637,
672
83,6
5740
,937
2,95
4,07
513
1,35
61,
181
Addi
tions
850
230
00
144
00
Reva
luat
ion
incr
emen
ts/
(dec
rem
ents
) rec
ogni
sed
in
Oth
er C
ompr
ehen
sive
Inco
me
(20,
064)
00
8,96
735
,354
00
0
Tran
sfer
s96
,866
3,09
514
,226
28,6
180
118,
904
183,
419
0Di
spos
als(4
7)0
00
00
00
Depr
eciat
ion
expe
nse
0(2
,780
)(1
38,3
41)
(12,
359)
(3,1
86)
(112
,454
)(9
,200
)(9
3)Fa
ir Va
lue
at e
nd o
f per
iod
477,
380
25,6
131,
513,
557
108,
883
73,1
052,
960,
669
305,
575
1,08
8
2016
Land
Bu
ildin
gs
Frei
ght
netw
ork
infr
astr
uctu
re
Syst
ems
infr
astr
uctu
re
Rol
lings
tock
Rai
lway
in
fras
truc
ture
Bu
s in
fras
truc
ture
Vess
els
$000
$000
$000
$000
$000
$000
$000
$000
Fair
Valu
e at
sta
rt of
per
iod
404,
232
43,0
001,
782,
204
044
,098
2,55
9,13
612
6,30
21,
225
Addi
tions
00
00
00
045
Reva
luat
ion
incr
emen
ts/
(dec
rem
ents
) rec
ogni
sed
in
Oth
er C
ompr
ehen
sive
Inco
me
(4,4
57)
00
00
491,
166
00
Tran
sfer
s0
(15,
481)
1,47
691
,615
0(1
2,37
0)11
,596
0Di
spos
als0
00
00
00
0De
prec
iatio
n ex
pens
e0
(2,2
44)
(146
,008
)(7
,958
)(3
,161
)(8
3,85
7)(6
,542
)(8
9)Fa
ir Va
lue
at e
nd o
f per
iod
399,
775
25,2
751,
637,
672
83,6
5740
,937
2,95
4,07
513
1,35
61,
181
PTA Annual Report / Notes to the Financial Statements

163
The PTA enters into derivative financial instruments with WATC. Foreign exchange forward contracts are valued using valuation techniques, which employs the use of market observable inputs. The most frequently applied valuation techniques include forward pricing using present value calculations. The models incorporate various inputs including the credit quality of counter parties, foreign exchange spot and forward rates, yield curves of the respective currencies, currency basis spreads between the respective currencies.
Valuation processes
There were no changes in valuation techniques during the period.
Transfers in and out of a fair value level are recognised on the date of the event or change in circumstances that caused the transfer. Transfers are generally limited to assets newly classified as non-current assets held for sale as Treasurer’s instructions require valuations of land, buildings and infrastructure to be categorised within Level 3 where the valuations will utilise significant Level 3 inputs on a recurring basis.
Buildings and Infrastructure (Level 3 fair values)
Fair value for existing use specialised buildings and infrastructure assets is determined by reference to the cost of replacing the remaining future economic benefits embodied in the asset, i.e. the depreciated replacement cost. Depreciated replacement cost is the current replacement cost of an asset less accumulated depreciation calculated on the basis of such cost to reflect the already consumed or expired economic benefit, or obsolescence, and optimisation (where applicable) of the asset. Current replacement cost is generally determined by reference to the market-observable replacement cost of a substitute asset of comparable utility and the gross project size specifications.
Valuation using depreciated replacement cost utilises the significant Level 3 input and consumed economic benefit/obsolescence of assets which are estimated by the professional valuation services. The fair value measurement
is sensitive to the estimate of consumption/obsolescence, with higher values of the estimate correlating with lower estimated fair values of buildings and infrastructure.
For some specialised buildings and infrastructure assets, the current replacement cost is determined by reference to the historical cost adjusted by relevant indices.
Land (Level 3 fair values)
Fair value for restricted use land is based on market value, by either using market evidence of sales of comparable land that is unrestricted less restoration costs to return the site to a vacant and marketable condition (low restricted use land), or, comparison with market evidence for land with low level utility (high restricted use land). Fair value is estimated by the Western Australia Land Information Authority (Valuation Services).
Significant Level 3 unobservable inputs used by the PTA are derived and evaluated as follows:
Selection of land with restricted utility
Fair value for restricted use land is determined by comparison with market evidence for land with low level utility. Relevant comparators of land with low level utility are selected by Western Australia Land Information Authority (Valuation Services).
Consumed economic benefit/obsolescence of asset
These are calculated by internal asset management experts with opinions taken under advice from external agencies when received in conjunction with valuation reports.
Replacement cost per square metre floor area (m2)
The costs of constructing specialised buildings with similar utility are extracted from 2014 valuation reports supplied by independent valuation experts Ralph Beattie Bosworth.
Replacement cost per individual items
The costs of significant specialised items for PTA buildings are extracted from 2014 valuation reports supplied by independent valuation experts Ralph Beattie Bosworth.
PTA Annual Report / Notes to the Financial Statements
164
Replacement cost per kilometre of network
The costs of kilometres of freight network are extracted from 2015 valuation reports supplied by independent valuation experts Griffin Valuation Advisory.
Replacement cost per kilometre of rail
The costs of kilometres of freight rail track are extracted from 2015 valuation reports supplied by independent valuation experts Griffin Valuation Advisory.
Replacement cost per cubic metre of ballast
The costs of cubic metre of ballast are extracted from 2015 valuation reports supplied by independent valuation experts Griffin Valuation Advisory.
Replacement cost per sleeper
The costs of sleeper are extracted from 2015 valuation reports supplied by independent valuation experts Griffin Valuation Advisory.
Replacement cost per individual items
The costs of significant specialised items for PTA system infrastructure are extracted from 2017 valuation reports supplied by independent valuation experts GHD Pty Ltd.
Replacement cost per kilometre of cabling
The costs of kilometres of cabling within system infrastructure are extracted from 2017 valuation reports supplied by independent valuation experts GHD Pty Ltd.
Replacement cost per railcar components
The costs of railcar components are extracted from 2017 valuation reports supplied by independent valuation experts SNC-Lavalin Rail & Transit Pty Ltd.
Tunnel Replacement cost per metre
The costs of tunnel replacement are extracted from 2016 valuation reports supplied by independent valuation experts Griffin Valuation Advisory.
Station Replacement cost per square metre floor area (m2)
The costs of station structures are extracted from 2016 valuation reports supplied by independent valuation experts Griffin Valuation Advisory.
Replacement cost per kilometre of rail line
The costs of kilometre of rail line are extracted from 2016 valuation reports supplied by independent valuation experts Griffin Valuation Advisory.
Replacement cost per signalling system
The costs of signalling systems are extracted from 2016 valuation reports supplied by independent valuation experts Griffin Valuation Advisory.
Replacement cost per sleeper
The costs of sleeper are extracted from 2016 valuation reports supplied by independent valuation experts Griffin Valuation Advisory.
Replacement cost per overhead traction wiring system
The costs of overhead traction wiring system are extracted from 2016 valuation reports supplied by independent valuation experts Griffin Valuation Advisory.
Movements in relevant CPI percentages over four financial years
The movements in relevant CPI percentages over the last four financial years are derived from taking the average movement in the Perth CPI and National Transport Price Index from June Quarter 2011 to the March Quarter 2015.
PTA Annual Report / Notes to the Financial Statements

165
Information about significant unobservable inputs (Level 3) in fair value measurement
Description Fair value
2017
Fair value
2016
Valuation technique(s)
Unobservable inputs
$000 $000
Land 477,380 399,775 Market approach
Selection of land with similar approximate utility
Buildings 25,613 25,275 Depreciated Replacement Cost
Consumed economic benefit/ obsolescence of assetReplacement cost per square metre floor area (m2)Replacement cost per individual items
Freight network infrastructure 1,513,557 1,637,672 Depreciated Replacement Cost
Consumed economic benefit/ obsolescence of assetReplacement cost per kilometre of networkReplacement cost per kilometre of railReplacement cost per cubic metres of ballastReplacement cost per sleeper
Systems infrastructure 108,883 83,657 Depreciated Replacement Cost
Consumed economic benefit/ obsolescence of assetReplacement cost per individual itemsReplacement cost per kilometre of cabling
Rollingstock 73,105 40,937 Depreciated Replacement Cost
Consumed economic benefit/ obsolescence of assetReplacement cost per railcar components
Railway infrastructure 2,960,669 2,954,075 Depreciated Replacement Cost
Consumed economic benefit/ obsolescence of assetReplacement cost per individual tunnelReplacement cost per station structureReplacement cost per kilometre of rail lineReplacement cost per signalReplacement cost per sleeperReplacement cost per kilometre of overhead traction wiring
Bus infrastructure 305,575 131,356 Depreciated Replacement Cost
Consumed economic benefit/ obsolescence of assetReplacement cost per square metre floor area (m2)Replacement cost per individual items
Vessels 1,088 1,181 Depreciated Replacement Cost
Consumed economic benefit/ obsolescence of assetMovements in relevant CPI percentages over 4 financial years
Reconciliations of the opening and closing balances are provided in Note 26.
PTA Annual Report / Notes to the Financial Statements
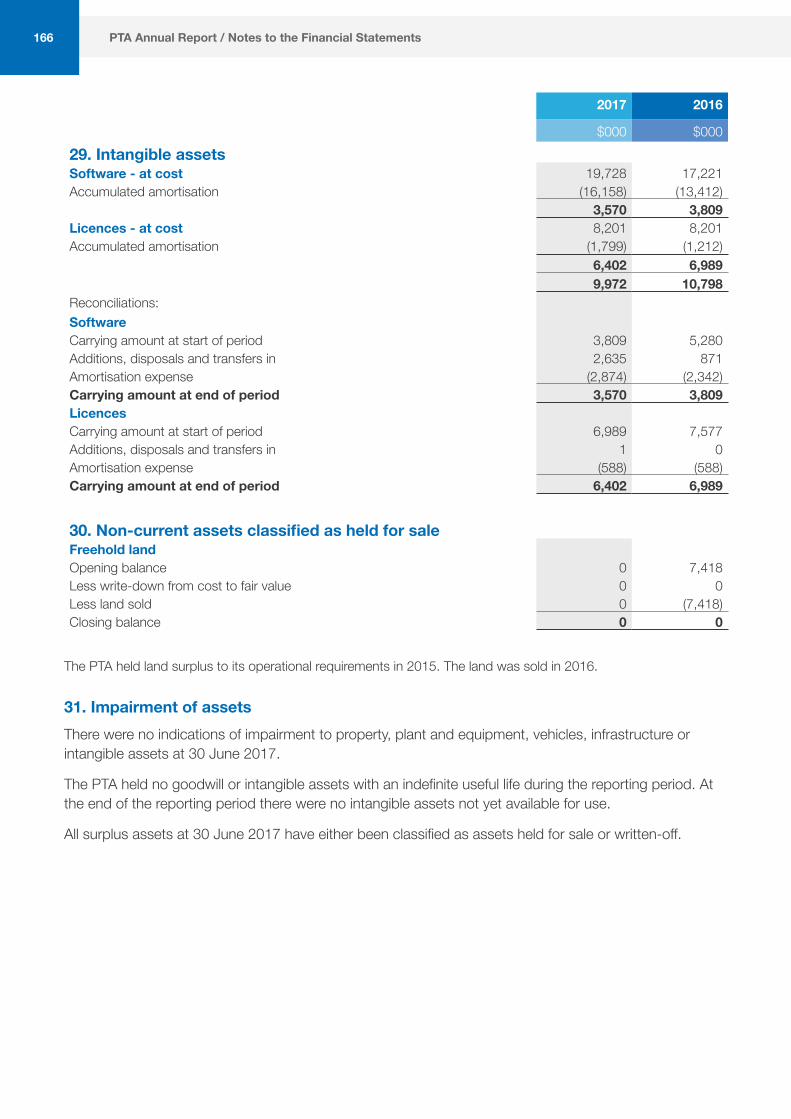
166
2017 2016
$000 $00029. Intangible assetsSoftware - at cost 19,728 17,221Accumulated amortisation (16,158) (13,412)
3,570 3,809Licences - at cost 8,201 8,201Accumulated amortisation (1,799) (1,212)
6,402 6,9899,972 10,798
Reconciliations:SoftwareCarrying amount at start of period 3,809 5,280Additions, disposals and transfers in 2,635 871Amortisation expense (2,874) (2,342)Carrying amount at end of period 3,570 3,809LicencesCarrying amount at start of period 6,989 7,577Additions, disposals and transfers in 1 0Amortisation expense (588) (588)Carrying amount at end of period 6,402 6,989
30. Non-current assets classified as held for saleFreehold landOpening balance 0 7,418Less write-down from cost to fair value 0 0Less land sold 0 (7,418)Closing balance 0 0
The PTA held land surplus to its operational requirements in 2015. The land was sold in 2016.
31. Impairment of assetsThere were no indications of impairment to property, plant and equipment, vehicles, infrastructure or intangible assets at 30 June 2017.
The PTA held no goodwill or intangible assets with an indefinite useful life during the reporting period. At the end of the reporting period there were no intangible assets not yet available for use.
All surplus assets at 30 June 2017 have either been classified as assets held for sale or written-off.
PTA Annual Report / Notes to the Financial Statements
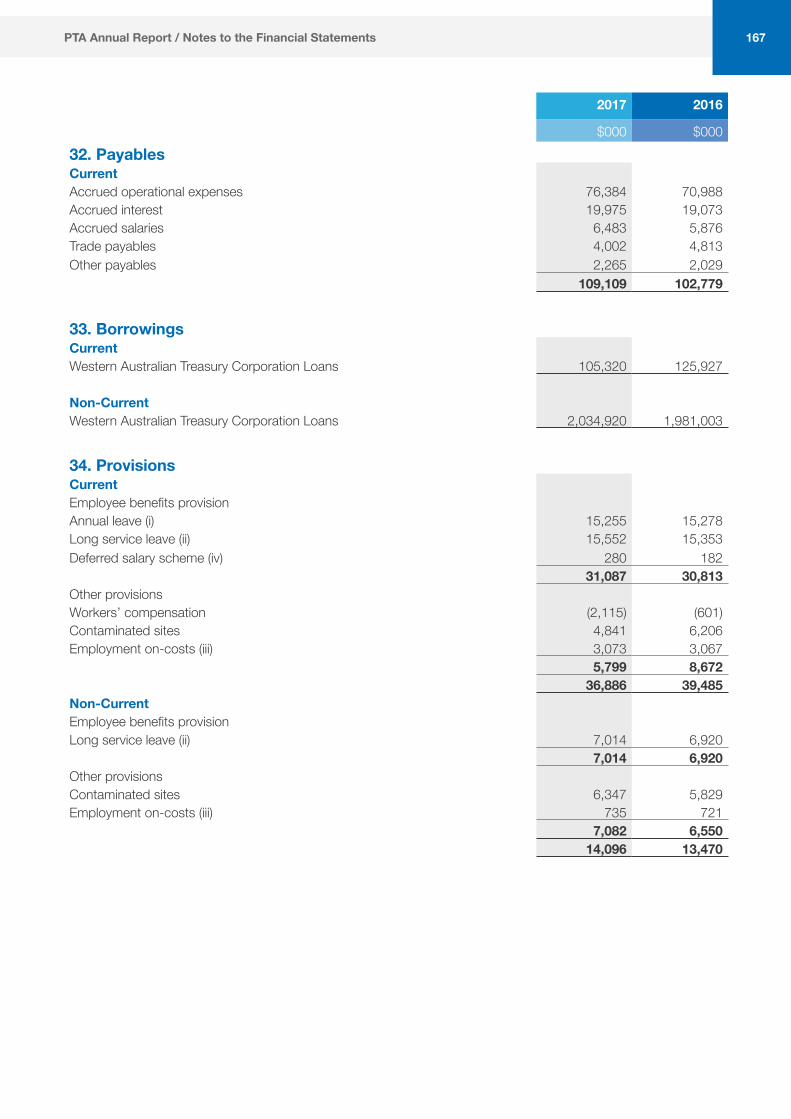
167
2017 2016
$000 $00032. PayablesCurrentAccrued operational expenses 76,384 70,988Accrued interest 19,975 19,073Accrued salaries 6,483 5,876Trade payables 4,002 4,813Other payables 2,265 2,029
109,109 102,779
33. BorrowingsCurrentWestern Australian Treasury Corporation Loans 105,320 125,927
Non-CurrentWestern Australian Treasury Corporation Loans 2,034,920 1,981,003
34. ProvisionsCurrentEmployee benefits provisionAnnual leave (i) 15,255 15,278Long service leave (ii) 15,552 15,353Deferred salary scheme (iv) 280 182
31,087 30,813Other provisionsWorkers’ compensation (2,115) (601)Contaminated sites 4,841 6,206Employment on-costs (iii) 3,073 3,067
5,799 8,67236,886 39,485
Non-CurrentEmployee benefits provisionLong service leave (ii) 7,014 6,920
7,014 6,920Other provisionsContaminated sites 6,347 5,829Employment on-costs (iii) 735 721
7,082 6,55014,096 13,470
PTA Annual Report / Notes to the Financial Statements

168
2017 2016
$000 $000(i) Annual leave liabilities have been classified as current as there is no unconditional right to defer settlement for at least 12
months after the end of the reporting period. Assessments indicate that actual settlement of liabilities is expected to occur as follows:
Within 12 months of the end of the reporting period 14,335 13,414More than 12 months after the end of the reporting period 920 1,864
15,255 15,278
(ii) Long service leave liabilities have been classified as current where there is no unconditional right to defer settlement for at least 12 months after the end of the reporting period. Assessments indicate that actual settlement of the liabilities is expected to occur as follows:
Within 12 months of the end of the reporting period 4,163 3,728More than 12 months after the end of the reporting period 18,402 18,545
22,565 22,273
(iii) The settlement of annual and long service leave liabilities gives rise to the payment of employment on-costs including payroll tax and workers’ compensation insurance. The provision is the present value of expected future payments.
The associated expense is disclosed in note 12 ‘Other expenses’.
(iv) Deferred salary scheme liabilities have been classified as current where there is no unconditional right to defer settlement for at least 12 months after the end of the reporting period. Actual settlement of the liabilities is expected to occur as follows:
Within 12 months of the end of the reporting period 280 182More than 12 months after the end of the reporting period 0 0
280 182
PTA Annual Report / Notes to the Financial Statements

169
2017 2016
$000 $000Movements in other provisions Movements in each class of provisions during the period, other than employee benefits, are set out below:Workers’ compensation provisionsCarrying amount at start of period (601) (2,214)Additional provisions recognised 4,501 5,979Payments/other sacrifices of economic benefit (6,015) (4,366)Carrying amount at end of period (2,115) (601)
Employment on-cost provisionCarrying amount at start of period 3,788 3,733Additional provisions recognised 1,941 1,950Payments/other sacrifices of economic benefit (1,921) (1,895)Carrying amount at end of period 3,808 3,788
Contaminated sites provisionCarrying amount at start of period 12,035 9,691Additional provisions recognised 3,655 6,241Payments/other sacrifices of economic benefit (4,502) (3,897)Carrying amount at end of period 11,188 12,035
Provision has been established to cover for the costs related to 95 contaminated and suspected contaminated sites.
35. Other current liabilitiesContractors’ deposits 586 1,996Payments held in suspense 26 50Parental leave 9 10
621 2,056
36. Deferred income – operating leasesCurrentFreight network infrastructure prepaid operating lease 5,383 5,383Co-operative Bulk Handling 99 year lease 83 83
5,466 5,466
Non-CurrentFreight network infrastructure prepaid operating lease 169,557 174,939Co-operative Bulk Handling 99 year lease 6,903 6,987
176,460 181,926
PTA Annual Report / Notes to the Financial Statements
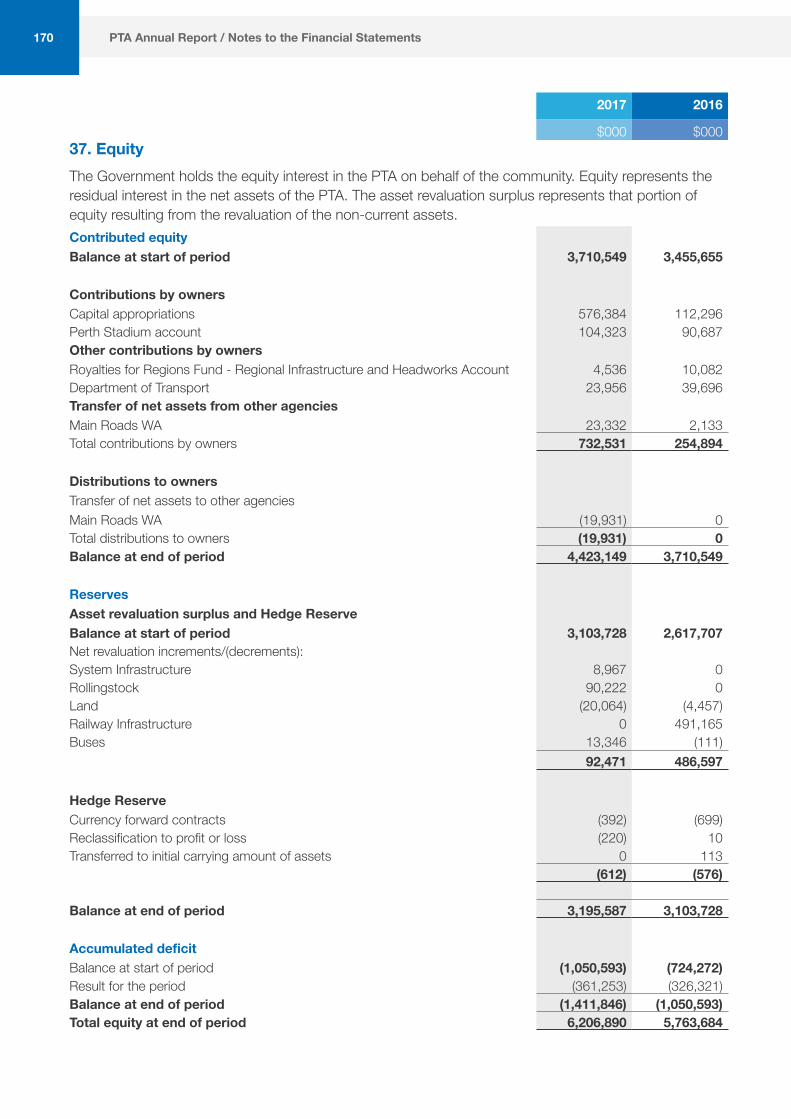
170
2017 2016
$000 $00037. EquityThe Government holds the equity interest in the PTA on behalf of the community. Equity represents the residual interest in the net assets of the PTA. The asset revaluation surplus represents that portion of equity resulting from the revaluation of the non-current assets.Contributed equityBalance at start of period 3,710,549 3,455,655
Contributions by ownersCapital appropriations 576,384 112,296Perth Stadium account 104,323 90,687Other contributions by ownersRoyalties for Regions Fund - Regional Infrastructure and Headworks Account 4,536 10,082Department of Transport 23,956 39,696Transfer of net assets from other agenciesMain Roads WA 23,332 2,133Total contributions by owners 732,531 254,894
Distributions to ownersTransfer of net assets to other agenciesMain Roads WA (19,931) 0Total distributions to owners (19,931) 0Balance at end of period 4,423,149 3,710,549
ReservesAsset revaluation surplus and Hedge ReserveBalance at start of period 3,103,728 2,617,707Net revaluation increments/(decrements):System Infrastructure 8,967 0Rollingstock 90,222 0Land (20,064) (4,457)Railway Infrastructure 0 491,165Buses 13,346 (111)
92,471 486,597
Hedge ReserveCurrency forward contracts (392) (699)Reclassification to profit or loss (220) 10Transferred to initial carrying amount of assets 0 113
(612) (576)
Balance at end of period 3,195,587 3,103,728
Accumulated deficitBalance at start of period (1,050,593) (724,272)Result for the period (361,253) (326,321)Balance at end of period (1,411,846) (1,050,593)Total equity at end of period 6,206,890 5,763,684
PTA Annual Report / Notes to the Financial Statements

171
2017 2016
$000 $00038. Notes to the statement of cash flowsReconciliation of cash and cash equivalents
Cash and cash equivalents at the end of the financial year as shown in the Statement of cash flows is reconciled to the related items in the Statement of financial position as follows:Cash and cash equivalents 89,470 132,671Restricted cash and cash equivalents (refer to note 21) 229,099 17,589
318,569 150,260Financing facilitiesThe PTA has a short-term liquidity facility of $200 million (2015-16: $200 million) with the WATC.Amounts drawn from this facility at June 30 0 0
The PTA has a working capital facility of $30 million (2015-16: $30 million) with the WATC.Amounts drawn from this facility at June 30 0 30,000
Reconciliation of net cost of services to net cash flows used in operating activities
Net cost of services (1,163,060) (1,106,604)Non cash items:Depreciation and amortisation expense 377,679 337,578Loss/(gain) on sale/write-off of non-current assets (1,022) (146)Services received free of charge 626 856Capitalised costs written off 726 0Net foreign exchange loss/(gain) 220 2,032Deferred lease income (5,466) (5,466)(Increase)/decrease in assets:Current receivables (i) (1,486) 995Current inventories 749 55Change in GST receivables/payments (ii) 1,703 (9,890)Increase/(decrease) in liabilities:Current payables (i) 5,323 5,282Current provisions (2,698) 3,171Other current liabilities (1,433) 463Non-current provisions 723 751
Net cash used in operating activities (787,416) (770,923)
(i) Note that Australian Taxation Office (ATO) receivable/payable in respect of GST and the receivable/payable in respect of the sale/purchase of non-current assets are not included in these items as they do not form part of the reconciling item.
(ii) This reverses out the GST in receivables and payables.
PTA Annual Report / Notes to the Financial Statements

172
2017 2016 $000 $000
39. Commitments
The commitments below are inclusive of GST.
Capital expenditure commitments:
Capital expenditure commitments, being contracted capital expenditure additional to the amounts reported in the financial statements, are payable as follows:Within one year 537,078 578,043Later than one year and not later than five years 634,857 1,015,706Later than five years 15,774 625
1,187,709 1,594,374
Non-cancellable operating lease commitments:
Commitments for minimum lease payments are payable as follows:
Within one year 4,500 818Later than one year and not later than five years 9,519 795Later than five years 9,215 0
23,234 1,613
The non-cancellable operating lease commitments disclosure for the current year increased due to a review of the new leases accounting standard.
Other expenditure commitments:
Other expenditure commitments contracted for at the end of the reporting period but not recognised as liabilities, are payable as follows:
Within one year 719,912 714,560Later than one year and not later than five years 2,175,160 2,425,765Later than five years 794,390 1,102,621
3,689,462 4,242,946
PTA Annual Report / Notes to the Financial Statements

40. Contingent liabilities and contingent assetsContingent liabilities
The following contingent liabilities are additional to the liabilities included in the financial statements:
Ligitation in progress
A claim has been lodged by a third party with the State Administrative Tribunal in relation to a taking order made by the PTA for the acquisition of land for the construction of public transport infrastructure. The claim is scheduled to be heard in the State Administrative Tribunal in February 2018. It is not possible to estimate the amount of any eventual payment in relation to the claim at balance sheet date.
Contaminated Sites
Under the Contaminated Sites Act 2003, the PTA is required to report known and suspected contaminated sites to the Department of Environment Regulation (DER). In accordance with the Act, DER classifies these sites on the basis of the risk to human health, the environment and environmental values. Where sites are classified as contaminated – remediation required or possibly contaminated – investigation required, the PTA may have a liability in respect of investigation or remediation expenses.
During the year two additional known or suspected contaminated sites owned or controlled by the PTA, or affected by activities on land owned or controlled by the PTA, were reported to the DER. Both sites have yet to be classified. The PTA is currently assessing the likely outcome of the classification process, and the potential financial effect. Whilst there is no possibility of reimbursement of any future expenses that may be incurred in the remediation of these sites, the PTA may apply for funding from the Contaminated Sites Management Account to undertake further investigative work or to meet remediation costs that may be required.
PTA Annual Report / Notes to the Financial Statements 173

174
41. Financial instrumentsa) Financial risk management objectives and policies
Financial instruments held by the PTA are cash and cash equivalents, restricted cash and cash equivalents, WATC borrowings, foreign exchange forward contracts, finance leases, receivables and payables. The PTA has limited exposure to financial risks. The PTA’s overall risk management program focuses on managing the risks identified below.
Credit risk
Credit risk arises when there is the possibility of the PTA’s receivables defaulting on their contractual obligations resulting in financial loss to the PTA.
The maximum exposure to credit risk at the end of the reporting period in relation to each class of recognised financial assets is the gross carrying amount of those assets inclusive of any allowance for impairment as shown in the table at note 41 ‘Financial instruments’ and note 23 ‘Receivables’.
Credit risk associated with the PTA’s financial assets is minimal because the main receivable is the amounts receivable for services (holding account). For receivables other than government, the PTA trades only with recognised, creditworthy third parties. The PTA has policies in place to ensure that sales of products and services are made to customers with an appropriate credit history. In addition, receivable balances are monitored on an ongoing basis with the result that the PTA’s exposure to bad debts is minimal. At the end of the reporting period there were no significant concentrations of credit risk.
Liquidity risk
Liquidity risk arises when the PTA is unable to meet its financial obligations as they fall due.
The PTA is exposed to liquidity risk through its trading in the normal course of business.
The PTA has appropriate procedures to manage cash flows including drawdown of appropriations by monitoring forecast cash flows to ensure that sufficient funds are available to meet its commitments.
PTA Annual Report / Notes to the Financial Statements
The PTA has a short-term liquidity facility of $200 million and a working capital facility of $30 million on which it can draw down to fund temporary cash shortfall.
Market risk
Market risk is the risk that changes in market prices such as foreign exchange rates and interest rates will affect the PTA’s income or the value of its holdings of financial instruments.
The PTA’s exposure to market risk for changes in interest relates primarily to the long-term debt obligations. The PTA’s borrowings are all obtained through WATC and are repayable at fixed rates with varying maturities. The risk is managed by WATC through portfolio diversification and variation in maturity dates. The PTA earns interest on the daily balance of its bank account.
Foreign currency risk
Foreign currency risk is the risk that the fair value or future cash flows of an exposure will fluctuate because of changes in foreign exchange rates. The PTA’s exposure to the risk of changes in foreign exchange rates relates primarily to the PTA’s Asset Investment Program activities (when capital expenditure is denominated in a foreign currency).
The PTA uses foreign exchange forward contracts to manage its foreign currency risk for transactions that are payable in a foreign currency.
The PTA enters into foreign exchange forward contracts with the Western Australian Treasury Corporation. Foreign exchange forward contracts are designated as hedging instruments in cash flow hedges of highly probable forecast purchases or firm commitment for future purchases in foreign currencies. The currencies giving rise to this risk are primarily Euro, British Pound and Swedish Krona.

175
While the PTA also enters into other foreign exchange forward contracts with the intention of reducing the foreign exchange risk of expected purchases, these other contracts are not designated in hedging relationships and are measured at fair value through profit or loss.
The PTA’s exposure to foreign currency risk at end of the reporting period was as follows, based on notional amounts in Australian dollars (AUD):
British Pound Euro Swedish Krona
2017 2016 2017 2016 2017 2016 $000 $000 $000 $000 $000 $000
Foreign currency forward contracts designated as hedging instruments
1,351 1,315 8,344 10,322 12,137 26,450
Settlement dates of foreign exchange forward contracts
2017 Notional Amount
AUD
Up to 1 month
1 to 3 months
3 months to 1 year
1 to 5 years
More than 5 years
$000 $000 $000 $000 $000 $000
British Pound 1,351 0 0 1,351 0 0Euro 8,344 0 2,763 5,581 0 0Swedish Krona 12,137 12,137 0 0 0 0
21,832 12,137 2,763 6,932 0 0
2016 Notional
Amount AUD
Up to 1 month
1 to 3 months
3 months to 1 year
1 to 5 years
More than 5 years
$000 $000 $000 $000 $000 $000
British Pound 1,315 1,315 0 0 0 0Euro 10,322 1,396 0 5,474 3,452 0Swedish Krona 26,450 14,313 0 0 12,137 0
38,087 17,024 0 5,474 15,589 0
PTA Annual Report / Notes to the Financial Statements
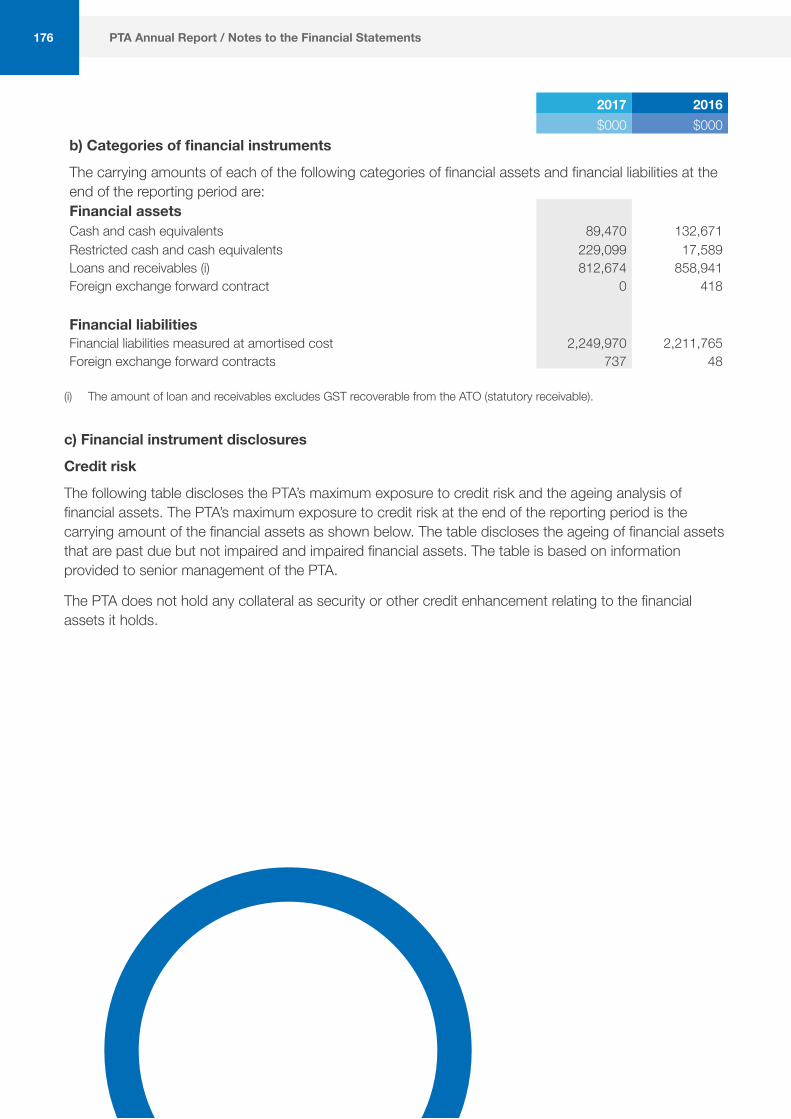
176
2017 2016 $000 $000
b) Categories of financial instruments
The carrying amounts of each of the following categories of financial assets and financial liabilities at the end of the reporting period are:Financial assetsCash and cash equivalents 89,470 132,671Restricted cash and cash equivalents 229,099 17,589Loans and receivables (i) 812,674 858,941Foreign exchange forward contract 0 418
Financial liabilitiesFinancial liabilities measured at amortised cost 2,249,970 2,211,765Foreign exchange forward contracts 737 48
(i) The amount of loan and receivables excludes GST recoverable from the ATO (statutory receivable).
c) Financial instrument disclosures
Credit risk
The following table discloses the PTA’s maximum exposure to credit risk and the ageing analysis of financial assets. The PTA’s maximum exposure to credit risk at the end of the reporting period is the carrying amount of the financial assets as shown below. The table discloses the ageing of financial assets that are past due but not impaired and impaired financial assets. The table is based on information provided to senior management of the PTA.
The PTA does not hold any collateral as security or other credit enhancement relating to the financial assets it holds.
PTA Annual Report / Notes to the Financial Statements
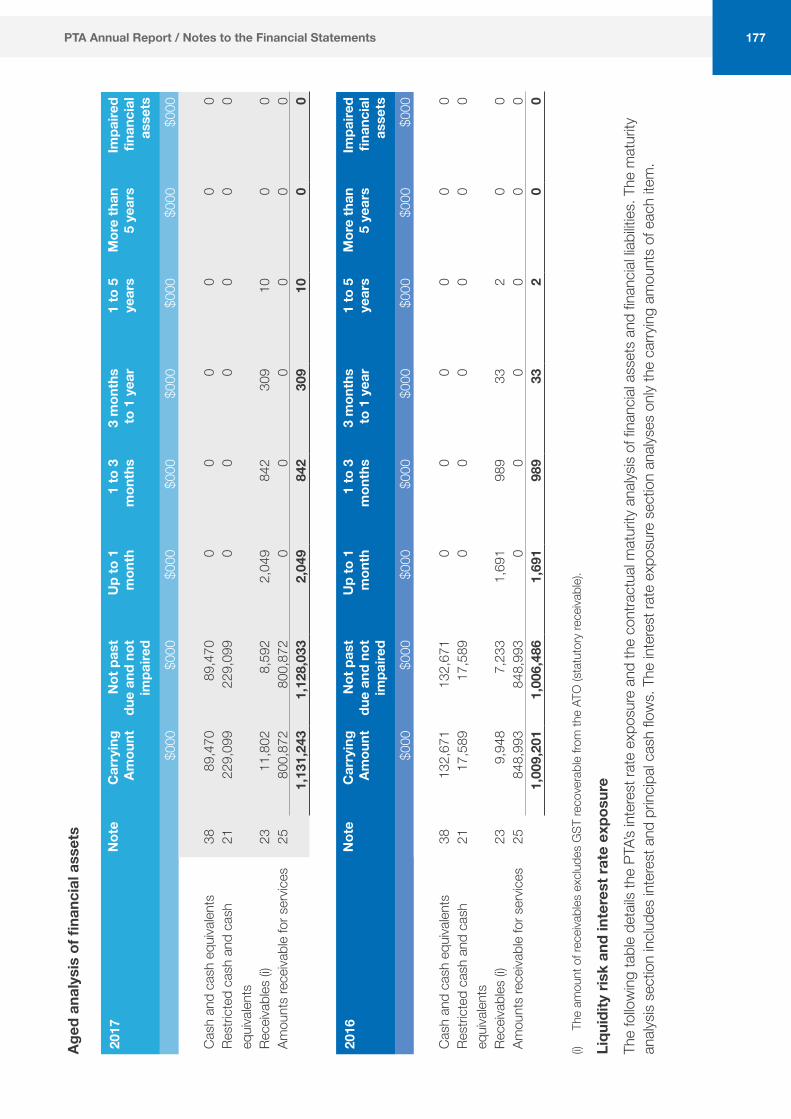
177
Aged
ana
lysi
s of
fina
ncia
l ass
ets
20
17N
ote
Car
ryin
g Am
ount
N
ot p
ast
due
and
not
impa
ired
Up
to 1
m
onth
1
to 3
m
onth
s
3 m
onth
s to
1 y
ear
1 to
5
year
s
Mor
e th
an
5 ye
ars
Impa
ired
finan
cial
as
sets
$000
$000
$000
$000
$000
$000
$000
$000
Cash
and
cas
h eq
uiva
lents
3889
,470
89,4
700
00
00
0Re
stric
ted
cash
and
cas
h eq
uiva
lents
2122
9,09
922
9,09
90
00
00
0
Rece
ivabl
es (i)
2311
,802
8,59
22,
049
842
309
100
0Am
ount
s re
ceiva
ble
for s
ervic
es25
800,
872
800,
872
00
00
00
1,13
1,24
31,
128,
033
2,04
984
230
910
00
2016
Not
eC
arry
ing
Amou
nt
Not
pas
t du
e an
d no
t im
paire
d
Up
to 1
m
onth
1
to 3
m
onth
s
3 m
onth
s to
1 y
ear
1 to
5
year
s
Mor
e th
an
5 ye
ars
Impa
ired
finan
cial
as
sets
$000
$000
$000
$000
$000
$000
$000
$000
Cash
and
cas
h eq
uiva
lents
3813
2,67
113
2,67
10
00
00
0Re
stric
ted
cash
and
cas
h eq
uiva
lents
2117
,589
17,5
890
00
00
0
Rece
ivabl
es (i)
239,
948
7,23
31,
691
989
332
00
Amou
nts
rece
ivabl
e fo
r ser
vices
2584
8,99
384
8,99
30
00
00
01,
009,
201
1,00
6,48
61,
691
989
332
00
(i) Th
e am
ount
of r
eceiv
ables
exc
lude
s G
ST re
cove
rabl
e fro
m th
e AT
O (s
tatu
tory
rece
ivabl
e).
Liqu
idity
risk
and
inte
rest
rate
exp
osur
e
The
follo
win
g ta
ble
deta
ils th
e PT
A’s in
tere
st ra
te e
xpos
ure
and
the
cont
ract
ual m
atur
ity a
nalys
is of
fina
ncial
ass
ets
and
finan
cial li
abilit
ies. T
he m
atur
ity
analy
sis s
ectio
n in
clude
s in
tere
st a
nd p
rincip
al ca
sh fl
ows.
The
inte
rest
rate
exp
osur
e se
ctio
n an
alyse
s on
ly th
e ca
rryin
g am
ount
s of
eac
h ite
m.
PTA Annual Report / Notes to the Financial Statements
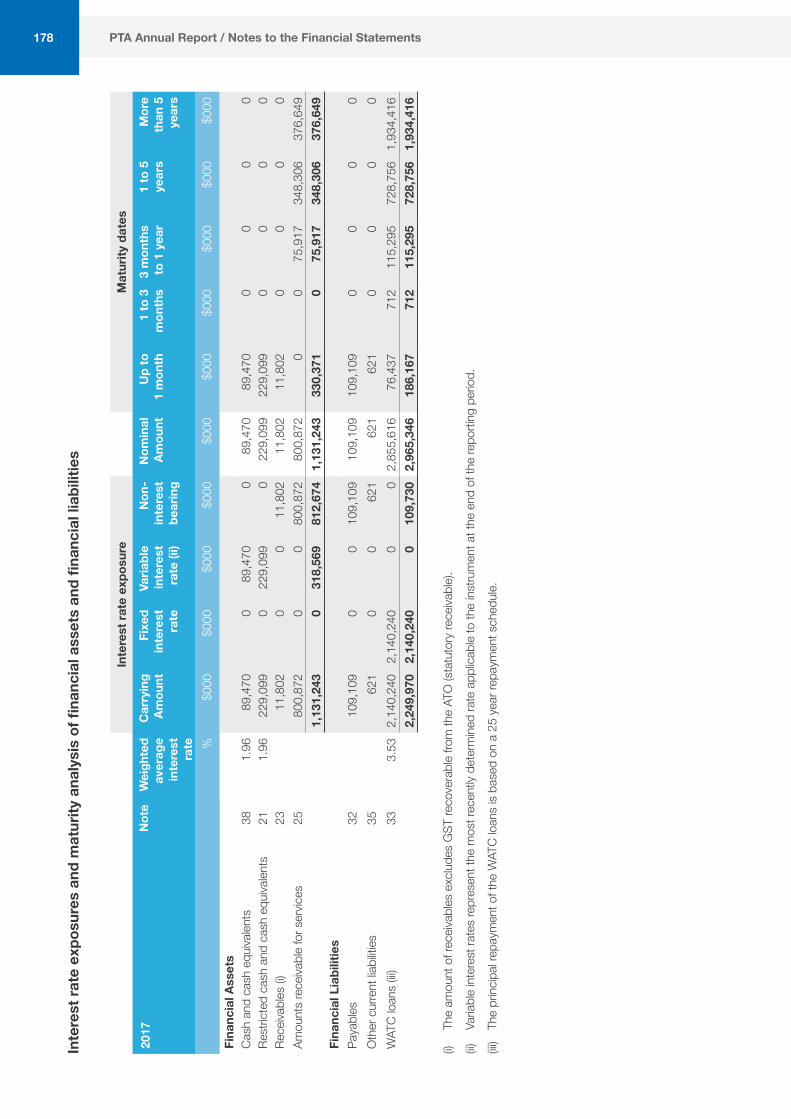
178
Inte
rest
rate
exp
osur
es a
nd m
atur
ity a
naly
sis
of fi
nanc
ial a
sset
s an
d fin
anci
al li
abili
ties
Inte
rest
rate
exp
osur
eM
atur
ity d
ates
2017
Not
eW
eigh
ted
aver
age
inte
rest
ra
te
Car
ryin
g Am
ount
Fixe
d in
tere
st
rate
Varia
ble
inte
rest
ra
te (i
i)
Non
-in
tere
st
bear
ing
Nom
inal
Am
ount
Up
to
1 m
onth
1
to 3
m
onth
s 3
mon
ths
to 1
yea
r1
to 5
ye
ars
Mor
e th
an 5
ye
ars
%$0
00$0
00$0
00$0
00$0
00$0
00$0
00$0
00$0
00$0
00
Fina
ncia
l Ass
ets
Cash
and
cas
h eq
uiva
lents
381.
9689
,470
089
,470
089
,470
89,4
700
00
0Re
stric
ted
cash
and
cas
h eq
uiva
lents
211.
9622
9,09
90
229,
099
022
9,09
922
9,09
90
00
0Re
ceiva
bles
(i)23
11,8
020
011
,802
11,8
0211
,802
00
00
Amou
nts
rece
ivabl
e fo
r ser
vices
2580
0,87
20
080
0,87
280
0,87
20
075
,917
348,
306
376,
649
1,13
1,24
30
318,
569
812,
674
1,13
1,24
333
0,37
10
75,9
1734
8,30
637
6,64
9Fi
nanc
ial L
iabi
litie
sPa
yabl
es32
109,
109
00
109,
109
109,
109
109,
109
00
00
Oth
er c
urre
nt lia
biliti
es35
621
00
621
621
621
00
00
WAT
C lo
ans
(iii)
333.
532,
140,
240
2,14
0,24
00
02,
855,
616
76,4
3771
211
5,29
572
8,75
61,
934,
416
2,24
9,97
02,
140,
240
010
9,73
02,
965,
346
186,
167
712
115,
295
728,
756
1,93
4,41
6 (i)
The
amou
nt o
f rec
eivab
les e
xclu
des
GST
reco
vera
ble
from
the
ATO
(sta
tuto
ry re
ceiva
ble)
.
(ii)
Varia
ble
inte
rest
rate
s re
pres
ent t
he m
ost r
ecen
tly d
eter
min
ed ra
te a
pplic
able
to th
e in
stru
men
t at t
he e
nd o
f the
repo
rting
per
iod.
(iii)
The
prin
cipal
repa
ymen
t of t
he W
ATC
loan
s is
base
d on
a 2
5 ye
ar re
paym
ent s
ched
ule.
PTA Annual Report / Notes to the Financial Statements
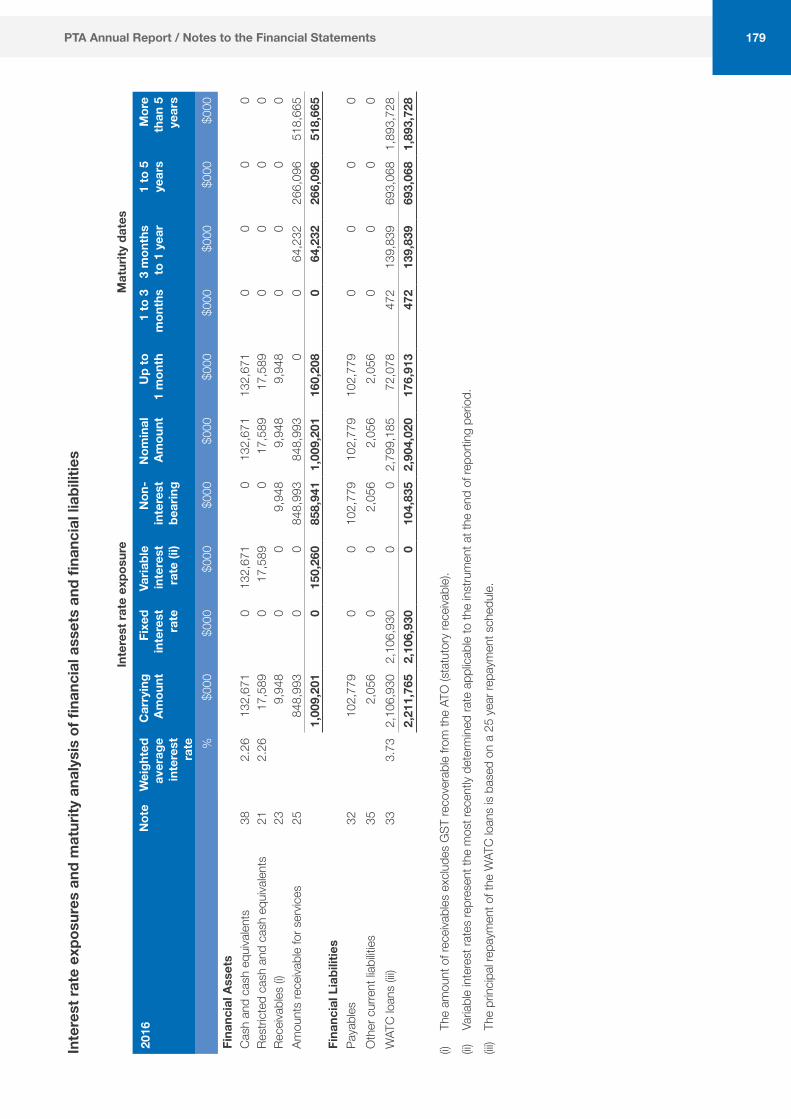
179
Inte
rest
rate
exp
osur
es a
nd m
atur
ity a
naly
sis
of fi
nanc
ial a
sset
s an
d fin
anci
al li
abili
ties
Inte
rest
rate
exp
osur
eM
atur
ity d
ates
2016
Not
eW
eigh
ted
aver
age
inte
rest
ra
te
Car
ryin
g Am
ount
Fixe
d in
tere
st
rate
Varia
ble
inte
rest
ra
te (i
i)
Non
-in
tere
st
bear
ing
Nom
inal
Am
ount
Up
to
1 m
onth
1
to 3
m
onth
s 3
mon
ths
to 1
yea
r1
to 5
ye
ars
Mor
e th
an 5
ye
ars
%$0
00$0
00$0
00$0
00$0
00$0
00$0
00$0
00$0
00$0
00Fi
nanc
ial A
sset
sCa
sh a
nd c
ash
equi
valen
ts38
2.26
132,
671
013
2,67
10
132,
671
132,
671
00
00
Rest
ricte
d ca
sh a
nd c
ash
equi
valen
ts21
2.26
17,5
890
17,5
890
17,5
8917
,589
00
00
Rece
ivabl
es (i)
239,
948
00
9,94
89,
948
9,94
80
00
0Am
ount
s re
ceiva
ble
for s
ervic
es25
848,
993
00
848,
993
848,
993
00
64,2
3226
6,09
651
8,66
51,
009,
201
015
0,26
085
8,94
11,
009,
201
160,
208
064
,232
266,
096
518,
665
Fina
ncia
l Lia
bilit
ies
Paya
bles
3210
2,77
90
010
2,77
910
2,77
910
2,77
90
00
0O
ther
cur
rent
liabi
lities
352,
056
00
2,05
62,
056
2,05
60
00
0W
ATC
loan
s (iii
)33
3.73
2,10
6,93
02,
106,
930
00
2,79
9,18
572
,078
472
139,
839
693,
068
1,89
3,72
82,
211,
765
2,10
6,93
00
104,
835
2,90
4,02
017
6,91
347
213
9,83
969
3,06
81,
893,
728
(i) Th
e am
ount
of r
eceiv
ables
exc
lude
s G
ST re
cove
rabl
e fro
m th
e AT
O (s
tatu
tory
rece
ivabl
e).
(ii)
Varia
ble
inte
rest
rate
s re
pres
ent t
he m
ost r
ecen
tly d
eter
min
ed ra
te a
pplic
able
to th
e in
stru
men
t at t
he e
nd o
f rep
ortin
g pe
riod.
(iii)
The
prin
cipal
repa
ymen
t of t
he W
ATC
loan
s is
base
d on
a 2
5 ye
ar re
paym
ent s
ched
ule.
PTA Annual Report / Notes to the Financial Statements

180
Interest rate sensitivity analysis
The following table represents a summary of the interest rate sensitivity of the PTA’s financial assets and liabilities at the end of the reporting period on the surplus for the period and equity for a 1% change in interest rates. It is assumed that the change in interest rates is held constant throughout the reporting period.
–100 basis points +100 basis points
2017 Carrying amount
Deficit Equity Deficit Equity
$000 $000 $000 $000 $000
Financial AssetsCash and cash equivalents 89,470 (895) (895) 895 895Restricted cash and cash equivalents 229,099 (2,291) (2,291) 2,291 2,291Total increase/(decrease) (3,186) (3,186) 3,186 3,186
–100 basis points +100 basis points
2016 Carrying amount
Deficit Equity Deficit Equity
$000 $000 $000 $000 $000
Financial AssetsCash and cash equivalents 132,671 (1,327) (1,327) 1,327 1,327Restricted cash and cash equivalents 17,589 (176) (176) 176 176Total increase/(decrease) (1,503) (1,503) 1,503 1,503
PTA Annual Report / Notes to the Financial Statements

181
Foreign currency sensitivity analysis
The following table represents a summary of the foreign currency rate sensitivity of the PTA’s financial assets and liabilities at the end of the reporting period on the surplus for the period and equity for a 10% change in foreign currency rates. It is assumed that the change in interest rates is held constant throughout the reporting period.
–10% +10%
2017 Deficit Equity Deficit Equity
$000 $000 $000 $000
Financial AssetsGBP - British Pound (135) (135) 135 135EUR - Euro (834) (834) 834 834SEK - Swedish Krona (1,214) (1,214) 1,214 1,214Total increase/(decrease) (2,183) (2,183) 2,183 2,183
–10% +10%
2016 Deficit Equity Deficit Equity
$000 $000 $000 $000
Financial AssetsGBP - British Pound (131) (131) 131 131EUR - Euro (1,032) (1,032) 1,032 1,032SEK - Swedish Krona (2,645) (2,645) 2,645 2,645Total increase/(decrease) (3,808) (3,808) 3,808 3,808
Fair values
All financial assets and liabilities recognised in the Statement of financial position, whether they are carried at cost or fair value, are recognised at amounts that represent a reasonable approximation of fair value unless otherwise stated in the applicable notes.
42. Supplementary financial information
2017 2016 $000 $000
Write offsPublic property written-off by the Executive Council during the period 0 539Revenue written-off (i) 11 38
11 577Losses through theft, defaults and other causesLoss of public moneys and public and other property through theft or default 0 0
(i) In 2016-17, $10,714 (2015-16: $37,644) of bad debts were written off.
PTA Annual Report / Notes to the Financial Statements
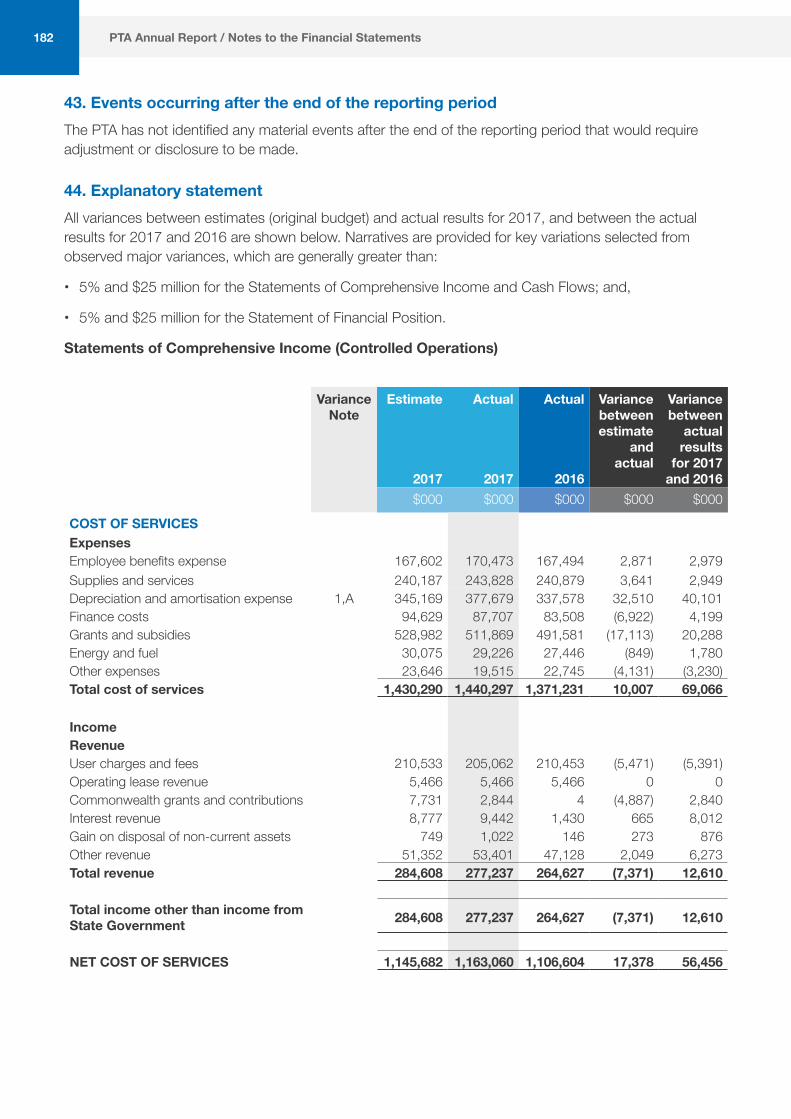
182
43. Events occurring after the end of the reporting periodThe PTA has not identified any material events after the end of the reporting period that would require adjustment or disclosure to be made.
44. Explanatory statementAll variances between estimates (original budget) and actual results for 2017, and between the actual results for 2017 and 2016 are shown below. Narratives are provided for key variations selected from observed major variances, which are generally greater than:
• 5% and $25 million for the Statements of Comprehensive Income and Cash Flows; and,
• 5% and $25 million for the Statement of Financial Position.
Statements of Comprehensive Income (Controlled Operations)
Variance
NoteEstimate
2017
Actual
2017
Actual
2016
Variance between estimate
and actual
Variance between
actual results
for 2017 and 2016
$000 $000 $000 $000 $000
COST OF SERVICESExpensesEmployee benefits expense 167,602 170,473 167,494 2,871 2,979Supplies and services 240,187 243,828 240,879 3,641 2,949Depreciation and amortisation expense 1,A 345,169 377,679 337,578 32,510 40,101Finance costs 94,629 87,707 83,508 (6,922) 4,199Grants and subsidies 528,982 511,869 491,581 (17,113) 20,288Energy and fuel 30,075 29,226 27,446 (849) 1,780Other expenses 23,646 19,515 22,745 (4,131) (3,230)Total cost of services 1,430,290 1,440,297 1,371,231 10,007 69,066
IncomeRevenueUser charges and fees 210,533 205,062 210,453 (5,471) (5,391)Operating lease revenue 5,466 5,466 5,466 0 0Commonwealth grants and contributions 7,731 2,844 4 (4,887) 2,840Interest revenue 8,777 9,442 1,430 665 8,012Gain on disposal of non-current assets 749 1,022 146 273 876Other revenue 51,352 53,401 47,128 2,049 6,273Total revenue 284,608 277,237 264,627 (7,371) 12,610
Total income other than income from State Government 284,608 277,237 264,627 (7,371) 12,610
NET COST OF SERVICES 1,145,682 1,163,060 1,106,604 17,378 56,456
PTA Annual Report / Notes to the Financial Statements

183
Variance Note
Estimate
2017
Actual
2017
Actual
2016
Variance between estimate
and actual
Variance between
actual results
for 2017 and 2016
$000 $000 $000 $000 $000
INCOME FROM STATE GOVERNMENTOperating subsidy contributions 806,539 799,131 777,188 (7,408) 21,943Services received free of charge 0 626 856 626 (230)Royalties for Regions Fund 2,052 2,050 2,239 (2) (189)Total income from State Government 808,591 801,807 780,283 (6,784) 21,524
DEFICIT FOR THE PERIOD (337,091) (361,253) (326,321) (24,162) (34,932)
OTHER COMPREHENSIVE INCOMEChanges in asset revaluation surplus 2,B 0 92,471 486,597 92,471 (394,126)Changes in hedge reserve 0 (612) (576) (612) (36)Total other comprehensive income/(loss)
0 91,859 486,021 91,859 (394,162)
TOTAL COMPREHENSIVE INCOME/(LOSS) FOR THE PERIOD (337,091) (269,394) 159,700 67,697 (429,094)
PTA Annual Report / Notes to the Financial Statements
Major Estimate and Actual (2017) Variance Narratives
1) Depreciation and amortisation expense increased by $32.5 million (9%) mainly due to the revaluation of railway infrastructure.
2) Changes in asset revaluation surplus increased by $91.5 million mainly due to the revaluation of system infrastructure, rollingstock and buses.
Major Actual (2017) and Comparative (2016) Variance Narratives
A) Depreciation and amortisation expense increased by $40.1 million (12%) mainly due to the revaluation of railway infrastructure and acquisition of a large number of replacement buses.
B) Changes in asset revaluation surplus decreased by $394.1 million (81%) due to the revaluation of different classes of assets. The railway infrastructure class was revalued in 2015-16 whereas the rolling stock, buses and system infrastructure were revalued in 2016-17.

184
Statement of Financial Position (Controlled Operations)
Variance
NoteEstimate
2017
Actual
2017
Actual
2016
Variance between estimate
and actual
Variance between
actual results
for 2017 and 2016
$000 $000 $000 $000 $000
ASSETSCurrent AssetsCash and cash equivalents C 93,836 89,470 132,671 (4,366) (43,201)Restricted cash and cash equivalents 3,D 399,885 225,276 14,629 (174,609) 210,647Inventories 16,270 15,467 16,216 (803) (749)Receivables 23,992 33,257 33,106 9,265 151Prepayments 17,384 26,186 14,953 8,802 11,233Amounts receivable for services 61,125 75,917 64,232 14,792 11,685Current financial asset 0 0 56 0 (56)Total Current Assets 612,492 465,573 275,863 (146,919) 189,710
Non-Current AssetsRestricted cash and cash equivalents 2,412 3,823 2,960 1,411 863Amounts receivable for services E 723,636 724,955 784,761 1,319 (59,806)Infrastructure, property, plant, equipment and vehicles
4,F 6,854,267 7,486,182 7,135,500 631,915 350,682
Intangible assets 12,369 9,972 10,798 (2,397) (826)Prepayments 11,600 0 5,600 (11,600) (5,600)Non-current financial asset 1,949 0 362 (1,949) (362)Total Non-Current Assets 7,606,233 8,224,932 7,939,981 618,699 284,951TOTAL ASSETS 8,218,725 8,690,505 8,215,844 471,780 474,661
LIABILITIESCurrent LiabilitiesPayables 111,067 109,109 102,779 (1,958) 6,330Borrowings 115,356 105,320 125,927 (10,036) (20,607)Provisions 38,144 36,886 39,485 (1,258) (2,599)Other current liabilities 1,821 621 2,056 (1,200) (1,435)Deferred income operating lease 4,358 5,466 5,466 1,108 0Current financial liability 81 737 48 656 689Total Current Liabilities 270,827 258,139 275,761 (12,688) (17,622)
Non-Current LiabilitiesBorrowings G 2,023,716 2,034,920 1,981,003 11,204 53,917Provisions 16,997 14,096 13,470 (2,901) 626Deferred income operating lease 176,460 176,460 181,926 0 (5,466)Total Non-Current Liabilities 2,217,173 2,225,476 2,176,399 8,303 49,077
TOTAL LIABILITIES 2,488,000 2,483,615 2,452,160 (4,385) 31,455
PTA Annual Report / Notes to the Financial Statements
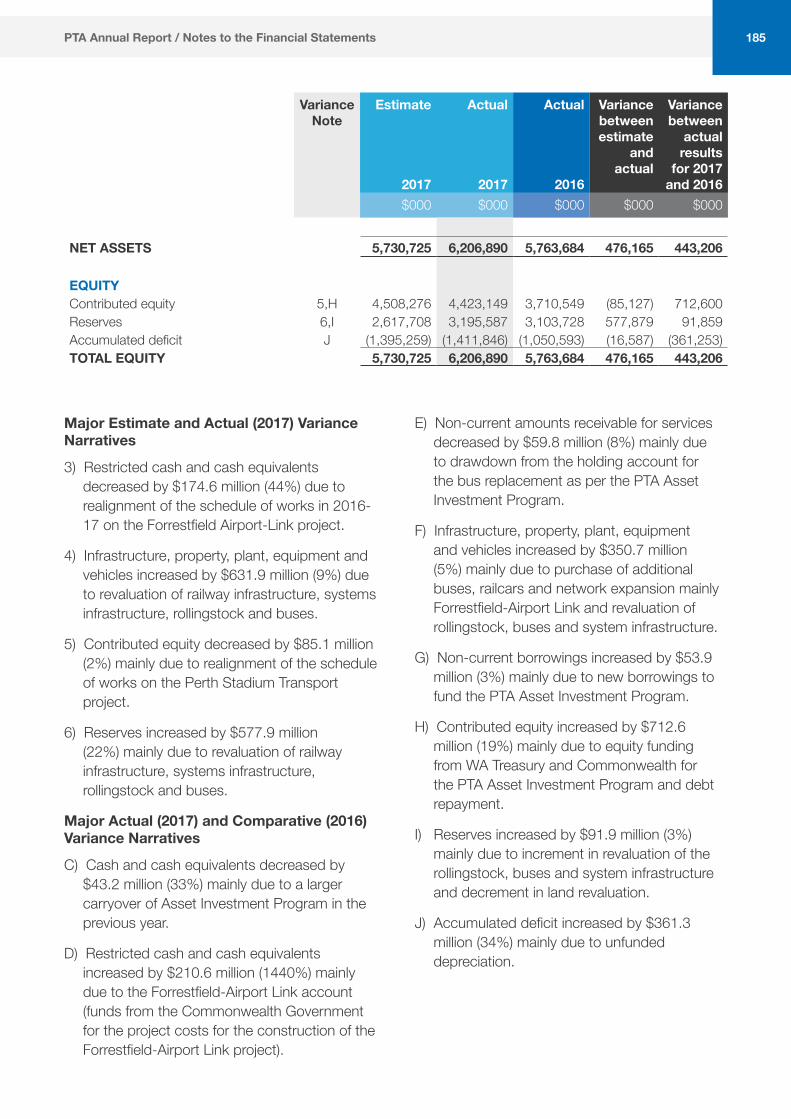
185
Variance Note
Estimate
2017
Actual
2017
Actual
2016
Variance between estimate
and actual
Variance between
actual results
for 2017 and 2016
$000 $000 $000 $000 $000
NET ASSETS 5,730,725 6,206,890 5,763,684 476,165 443,206
EQUITYContributed equity 5,H 4,508,276 4,423,149 3,710,549 (85,127) 712,600Reserves 6,I 2,617,708 3,195,587 3,103,728 577,879 91,859Accumulated deficit J (1,395,259) (1,411,846) (1,050,593) (16,587) (361,253)TOTAL EQUITY 5,730,725 6,206,890 5,763,684 476,165 443,206
PTA Annual Report / Notes to the Financial Statements
Major Estimate and Actual (2017) Variance Narratives
3) Restricted cash and cash equivalents decreased by $174.6 million (44%) due to realignment of the schedule of works in 2016-17 on the Forrestfield Airport-Link project.
4) Infrastructure, property, plant, equipment and vehicles increased by $631.9 million (9%) due to revaluation of railway infrastructure, systems infrastructure, rollingstock and buses.
5) Contributed equity decreased by $85.1 million (2%) mainly due to realignment of the schedule of works on the Perth Stadium Transport project.
6) Reserves increased by $577.9 million (22%) mainly due to revaluation of railway infrastructure, systems infrastructure, rollingstock and buses.
Major Actual (2017) and Comparative (2016) Variance Narratives
C) Cash and cash equivalents decreased by $43.2 million (33%) mainly due to a larger carryover of Asset Investment Program in the previous year.
D) Restricted cash and cash equivalents increased by $210.6 million (1440%) mainly due to the Forrestfield-Airport Link account (funds from the Commonwealth Government for the project costs for the construction of the Forrestfield-Airport Link project).
E) Non-current amounts receivable for services decreased by $59.8 million (8%) mainly due to drawdown from the holding account for the bus replacement as per the PTA Asset Investment Program.
F) Infrastructure, property, plant, equipment and vehicles increased by $350.7 million (5%) mainly due to purchase of additional buses, railcars and network expansion mainly Forrestfield-Airport Link and revaluation of rollingstock, buses and system infrastructure.
G) Non-current borrowings increased by $53.9 million (3%) mainly due to new borrowings to fund the PTA Asset Investment Program.
H) Contributed equity increased by $712.6 million (19%) mainly due to equity funding from WA Treasury and Commonwealth for the PTA Asset Investment Program and debt repayment.
I) Reserves increased by $91.9 million (3%) mainly due to increment in revaluation of the rollingstock, buses and system infrastructure and decrement in land revaluation.
J) Accumulated deficit increased by $361.3 million (34%) mainly due to unfunded depreciation.

186
Statement of Cash Flows (Controlled Operations)
Variance Note
Estimate
2017
Actual
2017
Actual
2016
Variance between estimate
and actual
Variance between
actual results
for 2017 and 2016
$000 $000 $000 $000 $000
CASHFLOWS FROM STATE GOVERNMENTOperating subsidy contributions 806,539 799,131 777,188 (7,408) 21,943Capital appropriation - other government agencies
20,423 23,956 39,696 3,533 (15,740)
Capital appropriations K 576,384 576,384 112,296 0 464,088Perth Stadium account 7 162,625 104,323 90,687 (58,302) 13,636Royalties for Regions Fund 6,582 6,586 12,321 4 (5,735)Holding account draw downs 64,232 48,121 61,125 (16,111) (13,004)Net cash provided by State Government
1,636,785 1,558,501 1,093,313 (78,284) 465,188
CASH FLOWS FROM OPERATING ACTIVITIESPaymentsEmployee benefits (166,741) (168,905) (166,621) (2,164) (2,284)Supplies and services (270,760) (275,680) (264,584) (4,920) (11,096)Finance costs (94,629) (86,805) (83,160) 7,824 (3,645)Grants and subsidies (528,983) (506,999) (489,652) 21,984 (17,347)Receipts paid into consolidated account (3,940) (3,743) (4,156) 197 413GST payments on purchases (121,308) (137,102) (127,328) (15,794) (9,774)Other payments (19,307) (15,836) (14,109) 3,471 (1,727)
ReceiptsUser charges and fees 210,533 208,287 211,843 (2,246) (3,556)Commonwealth grants and contributions 7,731 2,844 4 (4,887) 2,840Interest received 8,777 7,892 1,356 (885) 6,536GST receipts on sales 24,292 25,367 26,653 1,075 (1,286)GST receipts from taxation authority 97,016 113,288 91,306 16,272 21,982Other receipts 51,352 49,976 47,525 (1,376) 2,451Net cash used in operating activities (805,967) (787,416) (770,923) 18,551 (16,493)
CASHFLOWS FROM INVESTING ACTIVITIESPaymentsPurchase of non-current physical assets 8,L (571,745) (630,622) (554,943) (58,877) (75,679)ReceiptsProceeds from sale of non-current physical assets
749 536 7,822 (213) (7,286)
Net cash used in investing activities (570,996) (630,086) (547,121) (59,090) (82,965)
PTA Annual Report / Notes to the Financial Statements

187
Variance Note
Estimate
2017
Actual
2017
Actual
2016
Variance between estimate
and actual
Variance between
actual results
for 2017 and 2016
$000 $000 $000 $000 $000
CASH FLOWS FROM FINANCING ACTIVITIESPaymentsRepayment of borrowings 9,M (163,065) (193,065) (154,621) (30,000) (38,444)Other repayments (6,000) (6,000) (5,600) 0 (400)ReceiptsProceeds from borrowings 10,N 288,959 226,375 395,000 (62,584) (168,625)Net cash provided by financing activities
119,894 27,310 234,779 (92,584) (207,469)
Net increase/(decrease) in cash and cash equivalents
379,716 168,309 10,048 (211,407) 158,261
Cash and cash equivalents at the beginning of the period
116,417 150,260 140,212 33,843 10,048
CASH AND CASH EQUIVALENTS AT THE END OF THE PERIOD
496,133 318,569 150,260 (177,564) 168,309
PTA Annual Report / Notes to the Financial Statements
Major Estimate and Actual (2017) Variance Narratives
7) The Perth Stadium Transport account decreased by $58.3 million (36%) to align with the Stadium Transport construction program.
8) Purchase of non-current physical assets increased by $58.9 million (10%) to align with the scheduling of works for Forrestfield-Airport Link construction program offset by the scheduling of works for Perth Stadium Transport construction program.
9) Repayment of borrowings increased by $30 million (18%) mainly due to the repayment of the Working Capital Facility.
10) Proceeds from borrowings decreased by $62.6 million (22%) mainly due to lower Asset Investment Program funded by borrowings.
Major Actual (2017) and Comparative (2016) Variance Narratives
K) Capital appropriations increased by $464.1 million (413%) mainly due to funding received from the Commonwealth Government via Treasury for the Forrestfield-Airport Link project.
L) Purchase of non-current physical assets increased by $75.7 million (14%) mainly due to with the scheduling of works for Forrestfield-Airport Link construction program and other network expansion as per the PTA’s Asset Investment Program.
M) Repayment of borrowings increased by $38.4 million (25%) mainly due to the repayment of the Working Capital Facility.
N) Proceeds from borrowings decreased by $168.6 million (43%) mainly due to lower Asset Investment Program funded by borrowings.
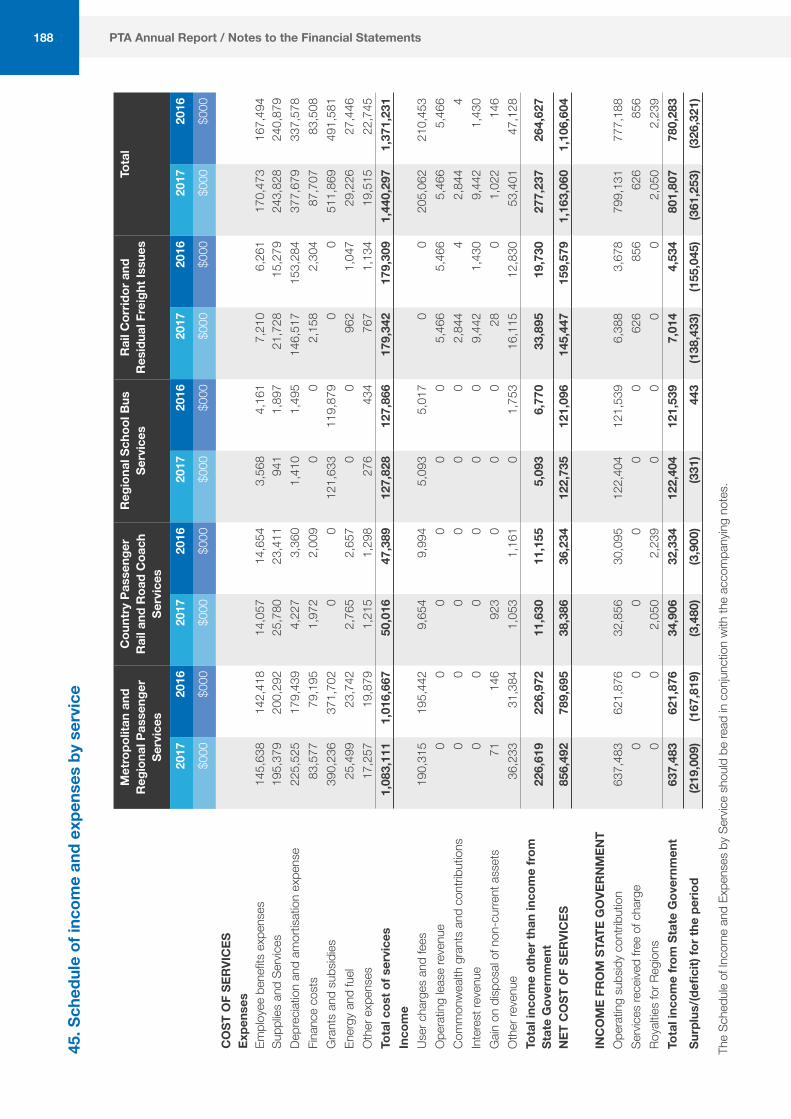
188
45. S
ched
ule
of in
com
e an
d ex
pens
es b
y se
rvic
e
Met
ropo
litan
and
R
egio
nal P
asse
nger
Se
rvic
es
Cou
ntry
Pas
seng
er
Rai
l and
Roa
d C
oach
Se
rvic
es
Reg
iona
l Sch
ool B
us
Serv
ices
Rai
l Cor
ridor
and
R
esid
ual F
reig
ht Is
sues
Tota
l
2017
2016
2017
2016
2017
2016
2017
2016
2017
2016
$000
$000
$000
$000
$000
$000
$000
$000
$000
$000
CO
ST O
F SE
RVIC
ESEx
pens
esEm
ploy
ee b
enefi
ts e
xpen
ses
145,
638
142,
418
14,0
5714
,654
3,56
84,
161
7,21
06,
261
170,
473
167,
494
Supp
lies
and
Serv
ices
195,
379
200,
292
25,7
8023
,411
941
1,89
721
,728
15,2
7924
3,82
824
0,87
9De
prec
iatio
n an
d am
ortis
atio
n ex
pens
e22
5,52
517
9,43
94,
227
3,36
01,
410
1,49
514
6,51
715
3,28
437
7,67
933
7,57
8Fi
nanc
e co
sts
83,5
7779
,195
1,97
22,
009
00
2,15
82,
304
87,7
0783
,508
Gra
nts
and
subs
idies
390,
236
371,
702
00
121,
633
119,
879
00
511,
869
491,
581
Ener
gy a
nd fu
el25
,499
23,7
422,
765
2,65
70
096
21,
047
29,2
2627
,446
Oth
er e
xpen
ses
17,2
5719
,879
1,21
51,
298
276
434
767
1,13
419
,515
22,7
45To
tal c
ost o
f ser
vice
s1,
083,
111
1,01
6,66
750
,016
47,3
8912
7,82
812
7,86
617
9,34
217
9,30
91,
440,
297
1,37
1,23
1In
com
eUs
er c
harg
es a
nd fe
es19
0,31
519
5,44
29,
654
9,99
45,
093
5,01
70
020
5,06
221
0,45
3O
pera
ting
lease
reve
nue
00
00
00
5,46
65,
466
5,46
65,
466
Com
mon
wea
lth g
rant
s an
d co
ntrib
utio
ns0
00
00
02,
844
42,
844
4In
tere
st re
venu
e0
00
00
09,
442
1,43
09,
442
1,43
0G
ain o
n di
spos
al of
non
-cur
rent
ass
ets
7114
692
30
00
280
1,02
214
6O
ther
reve
nue
36,2
3331
,384
1,05
31,
161
01,
753
16,1
1512
,830
53,4
0147
,128
Tota
l inc
ome
othe
r tha
n in
com
e fro
m
Stat
e G
over
nmen
t22
6,61
922
6,97
211
,630
11,1
555,
093
6,77
033
,895
19,7
3027
7,23
726
4,62
7
NET
CO
ST O
F SE
RVIC
ES85
6,49
278
9,69
538
,386
36,2
3412
2,73
512
1,09
614
5,44
715
9,57
91,
163,
060
1,10
6,60
4
INC
OM
E FR
OM
STA
TE G
OVE
RN
MEN
TO
pera
ting
subs
idy
cont
ribut
ion
637,
483
621,
876
32,8
5630
,095
122,
404
121,
539
6,38
83,
678
799,
131
777,
188
Serv
ices
rece
ived
free
of c
harg
e0
00
00
062
685
662
685
6Ro
yaltie
s fo
r Reg
ions
00
2,05
02,
239
00
00
2,05
02,
239
Tota
l inc
ome
from
Sta
te G
over
nmen
t63
7,48
362
1,87
634
,906
32,3
3412
2,40
412
1,53
97,
014
4,53
480
1,80
778
0,28
3
Surp
lus/
(defi
cit)
for t
he p
erio
d(2
19,0
09)
(167
,819
)(3
,480
)(3
,900
)(3
31)
443
(138
,433
)(1
55,0
45)
(361
,253
)(3
26,3
21)
The
Sche
dule
of In
com
e an
d Ex
pens
es b
y Se
rvice
sho
uld
be re
ad in
con
junc
tion
with
the
acco
mpa
nyin
g no
tes.
PTA Annual Report / Notes to the Financial Statements

189
2017 2016 $000 $000
46. Remuneration of auditorRemuneration paid or payable to the Auditor General in respect of the audit for the current financial year is as follows:Auditing the accounts, financial statements and key performance indicators 181 196
47. Special purpose accountsThe Forrestfield-Airport Link Account
A special purpose account was established under section 16(1) (c) of the FMA. The purpose of the account is to hold funds received from the Commonwealth Government towards project costs for the construction of the Forrestfield-Airport Link project. This also includes interest earned on the account balance throughout the year.Balance at start of period 0 0Receipts - Contribution from Commonwealth Government 490,000 0Interest earned 7,892 0Payments (279,233) 0Balance at end of period 218,659 0
48. Act of Grace paymentsNo Act of Grace payments made pursuant to authorisations given under section 80(1) of the Financial Management Act 2006. (2016: NIL)
PTA Annual Report / Notes to the Financial Statements

190
Glossary of terms
ACR Annual corridor report
ASL Acceptable service level
(an hourly service during the day with at least three trips, i.e. at 20-minute intervals, in the peak flow direction in the morning and afternoon peaks).
CaLD Culturally and linguistically diverse
CAT Central area transit
Category A Incident causing serious injury, death, or significant damage.
Category B Incident that may have the potential to cause a serious accident.
CCTV Closed-circuit television
Circle Route A high-frequency bus service connecting major shopping centres, universities, schools and colleges.
CLA Corridor lease agreement
CMR Central monitoring room
CNG Compressed natural gas
CRM Composite rate model
DAIP Disability Access and Inclusion Plan
DER Department of Environmental Regulation
DoE Department of Education
DoT Department of Transport
DPI Department of Planning and Infrastructure
DSMS Dynamic Stand Management System
ECM Evergreen contract model
EDRMS Electronic document records management system
EMS Environmental Management Systems
FAL Forrestfield-Airport Link
Fare-paying boardings
Covers only those people, standard fare or concession, who pay (either by tagging on or by the purchase of a cash ticket) as they enter the system.
FTZ Free Transit Zone
GPS Global Positioning System
HSE Health, safety and environment
190 PTA Annual Report / Glossary of Terms
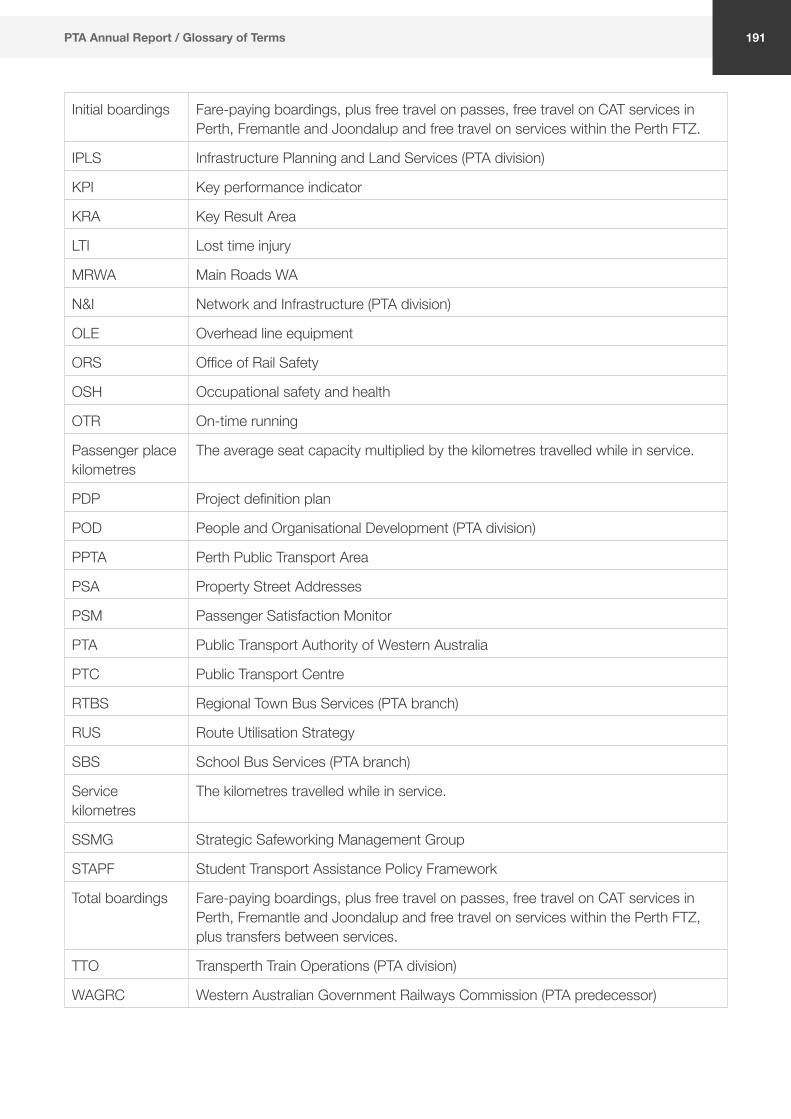
Initial boardings Fare-paying boardings, plus free travel on passes, free travel on CAT services in Perth, Fremantle and Joondalup and free travel on services within the Perth FTZ.
IPLS Infrastructure Planning and Land Services (PTA division)
KPI Key performance indicator
KRA Key Result Area
LTI Lost time injury
MRWA Main Roads WA
N&I Network and Infrastructure (PTA division)
OLE Overhead line equipment
ORS Office of Rail Safety
OSH Occupational safety and health
OTR On-time running
Passenger place kilometres
The average seat capacity multiplied by the kilometres travelled while in service.
PDP Project definition plan
POD People and Organisational Development (PTA division)
PPTA Perth Public Transport Area
PSA Property Street Addresses
PSM Passenger Satisfaction Monitor
PTA Public Transport Authority of Western Australia
PTC Public Transport Centre
RTBS Regional Town Bus Services (PTA branch)
RUS Route Utilisation Strategy
SBS School Bus Services (PTA branch)
Service kilometres
The kilometres travelled while in service.
SSMG Strategic Safeworking Management Group
STAPF Student Transport Assistance Policy Framework
Total boardings Fare-paying boardings, plus free travel on passes, free travel on CAT services in Perth, Fremantle and Joondalup and free travel on services within the Perth FTZ, plus transfers between services.
TTO Transperth Train Operations (PTA division)
WAGRC Western Australian Government Railways Commission (PTA predecessor)
191PTA Annual Report / Glossary of Terms

Public Transport Centre, West Parade, Perth, WA 6000 PO Box 8125, Perth Business Centre, Perth, WA 6849
Telephone (08) 9326 2000 [email protected] www.pta.wa.gov.au