Annual Report 2015 - SOMPOホールディングス
148
ANNUAL REPORT 2015 (INTEGRATED REPORT)
Transcript of Annual Report 2015 - SOMPOホールディングス
ANNUAL REPORT 2015(INTEGRATED REPORT)
AN
NU
AL
RE
PO
RT
2015
(INT
EG
RA
TE
D R
EP
OR
T)
15.09 501494 -0200Printed in Japan
(15080635)
26-1, Nishi-Shinjuku 1-chome, Shinjuku-ku,
Tokyo 160-8338, Japan
URL: http://www.sompo-hd.com/en/

SOMPO HOLDINGS will strive to contribute to the security,
health, and wellbeing of its customers and society as a whole by
providing insurance and related services of the highest quality
possible. Our goal is to always be the best customer service
provider both at home and abroad.
Symbol (Global Ring)
The red sphere symbolizes perfect harmony and stability, while simultaneously representing our nation of Japan. The
overlaid platinum ring is a leader guiding towards our future, representing SOMPO HOLDINGS’ future in connecting with
people of the world to create a “new level of trust”. Dynamic combination of the sphere and ring is an expression of our
vision to build a globally competitive company, as a leading brand in Japan.
Brand Slogan (Innovation for Wellbeing)
Express the width of our business domain in not only insurance but also related services and our will to be the best
customer service provider both at home and abroad.
SOMPO HOLDINGS is an abbreviation that represents the Company (Sompo Japan Nipponkoa Holdings, Inc.) and the Group
(Sompo Japan Nipponkoa Group).
In this age of uncertainty, we strive to bring peace of mind to your tomorrow.
To achieve this we are constantly innovating. From safety and security to health,
we seek to promote wellbeing in every aspect of your life.
Supporting you in Japan and throughout the world.
Innovation for Wellbeing : SOMPO HOLDINGS
Brand Statement

Editorial Policy
1. Report Purpose and Guidelines
This report aims to provide stakeholders with an outline of the Group, its business performance, and its management strategies in an easily understood manner. From the 2014 edition, we adopted the International Integrated Reporting Framework issued by the IIRC* as a guideline in preparing this integrated report that features both the financial and non-financial aspects of the Group’s business accomplishments, challenges, and strategies.* International Integrated Reporting Council: Established in 2010 to prepare an
international reporting framework for businesses.
2. Scope of Reporting
This report primarily features activities undertaken by Sompo Japan Nipponkoa Holdings, Inc., and its domestic and overseas Group members. In addition, the scope of reporting may include other significant events deemed to impact our operations.
3. Coverage Period
Fiscal 2014 (April 1, 2014 – March 31, 2015)However, with the aim of presenting the most current information, events that occurred after this period may be reported.
4. Frequency of Issuance
Once a year
5. Date of Issuance
Previous edition: September 2014Latest edition: September 2015Next edition: September 2016 (scheduled)
6. Forward-Looking Statements
This report contains certain forward-looking statements, based on information available at the time, relating to future plans and targets, and related operating invest-ments. We caution that there can be no assurance that such targets and plans can or will be achieved. Actual results or business plans may be affected by future changes in the business environment.
Contents
URL:
http://www.sompo-hd.com/en/csr/communications/report/
For further specific information on the CSR initiatives of the Group, we also disclose Corporate Responsibility Communication on our website.
Message from the Group CEO 2
Introduction 4
Our Management Strategy 4
Our Management Plan 6
Our Management Foundation 8
To Our Stakeholders 10
Interview with the Group CEO 10
Messages from Outside Directors 16
Review of Operations 19
Financial Highlights 20
At a Glance 22
Domestic P&C Insurance 24
Domestic Life Insurance 29
Overseas Insurance 32
Financial and Other Services 35
Management Foundation 37
Directors and Audit & Supervisory Board Members 38
Corporate Governance 44
Internal Controls and Compliance 49
Strategic Risk Management (ERM) 50
Strategy for Human Resources Management 54
Approach to CSR 56
Financial Section 59
Corporate Data 137
Financial Section
IntroductionTo O
ur Stakeholders
Review
of Operations
Managem
ent FoundationC
orporate Data
1ANNUAL REPORT 2015 ( INTEGRATED REPORT)
I would like to express my gratitude for the continued
support of all our stakeholders.
SOMPO HOLDINGS is steadily executing
strategies and initiatives in each business based on
its Medium-Term Management Plan. Fiscal 2015
is the critical culminating year of this plan, and
each business is on track to meet its respective
management targets.
In the mainstay domestic property and casualty
(P&C) insurance business, Sompo Japan Nipponkoa
was formed on September 1, 2014, through the
merger of Sompo Japan and Nipponkoa. Sompo
Japan Nipponkoa, already the largest domestic P&C
insurance company in terms of premiums written, will
lead the entire Group with the industry’s top service
quality and growth potential as the Group’s main
business driver.
In the domestic life insurance business, we
continue to experience steady growth through product
strategies focused on high margins and sales
We will at all times carefully consider the
interests of our customers when making
decisions that shape our business. We will
strive to contribute to the security, health, and
wellbeing of our customers and society as a
whole by providing insurance and related
services of the highest quality possible.
To provide the highest possible quality of service to our customers we will:
1. treat each and every customer with sincerity, and act in the knowledge that our every action as an individual shapes our entire reputation as a company;
2. act with initiative, set ourselves the highest goals, and always learn from our actions;
3. strive to be both prompt and clear in our dealings and activities; and,
4. act with the utmost integrity.
Group Action GuidelinesGroup Management Philosophy
2 Sompo Japan Nipponkoa Holdings, Inc.
To Become the Best Customer Service Provider Both at Home and Abroad
Message from the Group CEO

strategies that make maximum use of our network of P&C
insurance agencies. In addition, we are taking on new
challenges, such as launching internet sales of life
insurance, with the aim of accelerating the growth of this
business as the Group’s main earnings pillar.
In the overseas insurance business, we are making
selective and disciplined investments. In May 2014,
we officially entered the Lloyd’s insurance market in the
United Kingdom, and in March 2015, we decided to
invest in SCOR, a reinsurance company headquartered
in France. The strengths acquired in the new business
fields will help us achieve our management plan.
In financial and other services, we entered the home
remodeling business and commenced a capital and
business alliance agreement with Message, a major nursing
care company. We are proactively working to expand
into a variety of fields with the aim of becoming a corporate
group capable of providing products and services of the
highest quality, thereby contributing to the security,
health, and wellbeing of our customers.
As stated in the Group Brand Slogan, “Innovation for
Wellbeing,” we will not limit ourselves to being a provider
of insurance products but aim to position the Group as
the best customer service provider both at home and
abroad that has evolved to offer a wider range of
services aimed at providing even more customers with
security, health, and wellbeing. To achieve this goal, all
Group employees will work together to meet the high
expectations of all our stakeholders.
Looking ahead, we sincerely ask for your continued
support and encouragement.
September 2015
Kengo Sakurada
President & CEOSompo Japan Nipponkoa Holdings, Inc.
Our goal is to always be the best customer service provider both at home and abroad.
Group Vision
3ANNUAL REPORT 2015 ( INTEGRATED REPORT)

4 Sompo Japan Nipponkoa Holdings, Inc.
To Become the Best Customer Service Provider Both at Home and Abroad, We Are Innovating for Wellbeing
SOMPO HOLDINGS seeks to realize sustainable growth and greater corporate value,
based on striving to secure earnings from its domestic P&C insurance while aggressively
devoting greater management resources to growth fields such as domestic life insurance
and overseas insurance.
Megatrends Transforming the Business Environment
Looking ahead, we expect significant manage-
ment environment challenges in the domestic
P&C insurance market due to the on set of a
super-aging society, a decreasing population
resulting in fewer cars owned and housing
starts, in addition to the risk of large-scale
natural disasters.
Improving Profitability in Core Business
In light of these changes in the business environ-
ment, we are steadily executing initiatives to
improve profitability in the domestic P&C insurance
business, the driver of Group earnings. These
initiatives include pursuing synergies through the
September 2014 merger of Sompo Japan and
Nipponkoa as well as automobile insurance
product and premium rate revisions.
Domestic P&C Insurance
Strategy
Our Management Strategy
5ANNUAL REPORT 2015 ( INTEGRATED REPORT)
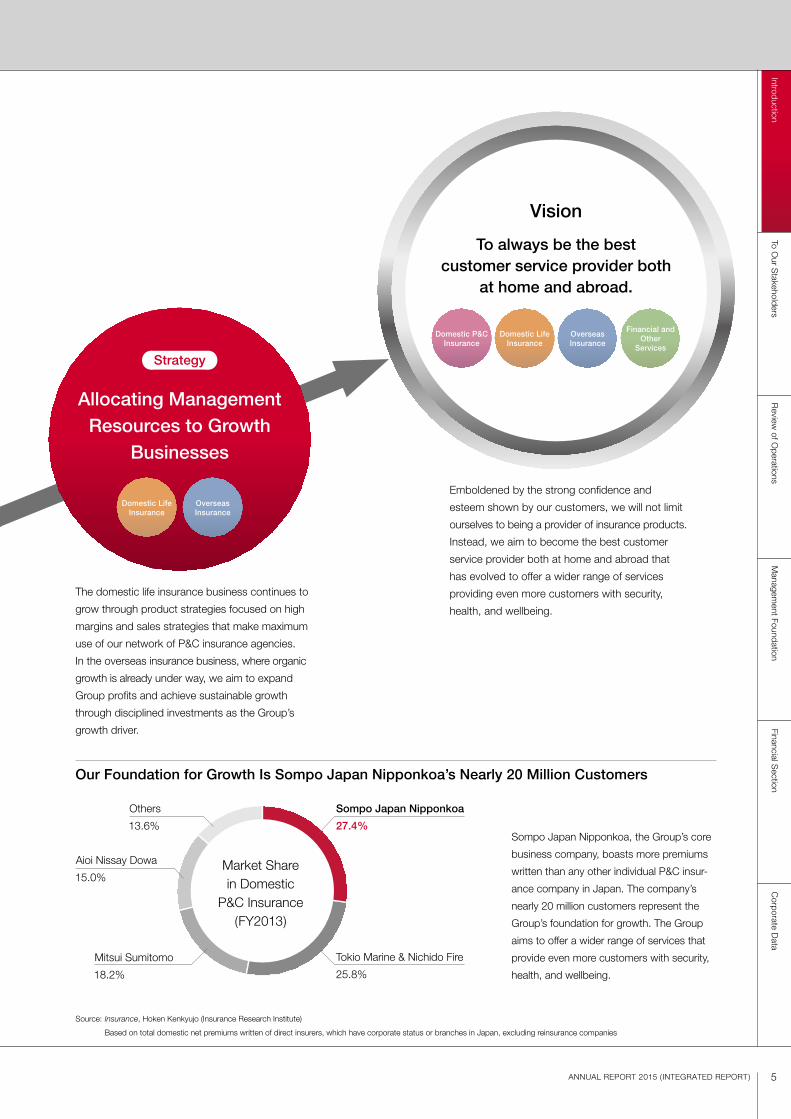
Vision
To always be the best customer service provider both
at home and abroad.
Emboldened by the strong confidence and
esteem shown by our customers, we will not limit
ourselves to being a provider of insurance products.
Instead, we aim to become the best customer
service provider both at home and abroad that
has evolved to offer a wider range of services
providing even more customers with security,
health, and wellbeing.
Sompo Japan Nipponkoa, the Group’s core
business company, boasts more premiums
written than any other individual P&C insur-
ance company in Japan. The company’s
nearly 20 million customers represent the
Group’s foundation for growth. The Group
aims to offer a wider range of services that
provide even more customers with security,
health, and wellbeing.
The domestic life insurance business continues to
grow through product strategies focused on high
margins and sales strategies that make maximum
use of our network of P&C insurance agencies.
In the overseas insurance business, where organic
growth is already under way, we aim to expand
Group profits and achieve sustainable growth
through disciplined investments as the Group’s
growth driver.
Allocating Management Resources to Growth
Businesses
Domestic Life Insurance
Overseas Insurance
Domestic P&C Insurance
Domestic Life Insurance
Overseas Insurance
Financial and Other
Services
Strategy
Source: Insurance, Hoken Kenkyujo (Insurance Research Institute)
Based on total domestic net premiums written of direct insurers, which have corporate status or branches in Japan, excluding reinsurance companies
Our Foundation for Growth Is Sompo Japan Nipponkoa’s Nearly 20 Million Customers
Sompo Japan Nipponkoa
27.4%
Tokio Marine & Nichido Fire
25.8%
Mitsui Sumitomo
18.2%
Aioi Nissay Dowa
15.0%
Others
13.6%
Market Share in Domestic
P&C Insurance (FY2013)
IntroductionTo O
ur Stakeholders
Review
of Operations
Managem
ent FoundationFinancial S
ectionC
orporate Data

6 Sompo Japan Nipponkoa Holdings, Inc.
Establishing a Clear Direction and Targets in Each Business to Promote Optimal Allocation of Management Resources
Our Management Plan
A Strict Focus on Efficiency through the Merger Maximizing cost reduction effects from
merger of Sompo Japan and Nipponkoa
Improving profitability through automobile
insurance product and premium rate revisions
Marketing our insurance through agencies
and direct sales to meet a variety of
customer needs
Steady Growth through Strategic Business Development Realizing steady growth through investments in
mature markets, including the Lloyd’s insurance
market in the United Kingdom, in addition to
initiatives aimed at organic growth within the Group
of the overseas insurance market
Continuing well-balanced investments, focusing
between emerging and developed markets
Overseas Insurance
Domestic P&C Insurance
FY2011
(71.3) billion yen
FY2015 (Forecast)
(Initial Plan)
116.7 billion yen
70.0 80.0
billion yen
Adjusted Profit
FY2011
(19.7) billion yen
FY2015 (Forecast)
(Initial Plan)
19.2 billion yen
14.0 20.0
billion yen
Fiscal 2015 is the final year of the current Medium-Term Management Plan.
Adjusted consolidated profit and adjusted consolidated ROE* are expected to surpass initial
plans. We are planning on further improving profit growth and capital efficiency (ROE).* See page 18 for the details on adjusted consolidated profit and adjusted consolidated ROE.
Adjusted Profit

IntroductionTo O
ur Stakeholders
Review
of Operations
Managem
ent FoundationFinancial S
ectionC
orporate Data
7ANNUAL REPORT 2015 ( INTEGRATED REPORT)
Financial and Other Services
Domestic Life Insurance
Establishing a Clear Direction and Targets in Each Business to Promote Optimal Allocation of Management Resources
Accelerate Growth with Steady and High Profitability Achieve sustained growth through product strategies that focus on such
high-margin products as protection-type products, and sales strategies
that make maximum use of our network of P&C insurance agencies.
Indispensable Roots of Growth for Evolving into the Best Customer Service Provider Developing asset management, defined contribution
pension, assistance, risk consulting, healthcare, nursing
care service, and home remodeling businesses to
contribute to the security, health, and wellbeing
of our customers
1.2 billion yen
0.1%
Adjusted consolidated profit in fiscal 2015 is
expected to exceed initial plans and amount to
228.0 billion yen mainly due to improved profits
in the domestic P&C insurance business.
Achievement of the Medium-Term Management Plan Culminating in Fiscal 2015
Trends in Adjusted Consolidated Profit and Forecast
FY2011
FY2011
228.0 billion yen
180.0 210.0 billion yen
FY2015 (Forecast)
(Initial Plan)
7.6%
over7%
FY2015 (Forecast)
(Initial Plan)
FY2011
100.0 billion yen
FY2015 (Forecast)
(Initial Plan)
90.0 billion yen
100.0 110.0
billion yen
FY2011
(7.6) billion yen
FY2015 (Forecast)
(Initial Plan)
2.4 billion yen
2.0 3.0
billion yen
(Billions of yen)
2011 2012 2013 2014 2015
1.2111.6
101.5
138.3
228.0
(Initial Plan) (Forecast)
Domestic P&C Insurance
Domestic Life Insurance
Overseas Insurance
Financial and Other Services(FY)
Adjusted Profit
Adjusted Profit
Adjusted Consolidated Profit
Adjusted Consolidated ROE
8 Sompo Japan Nipponkoa Holdings, Inc.
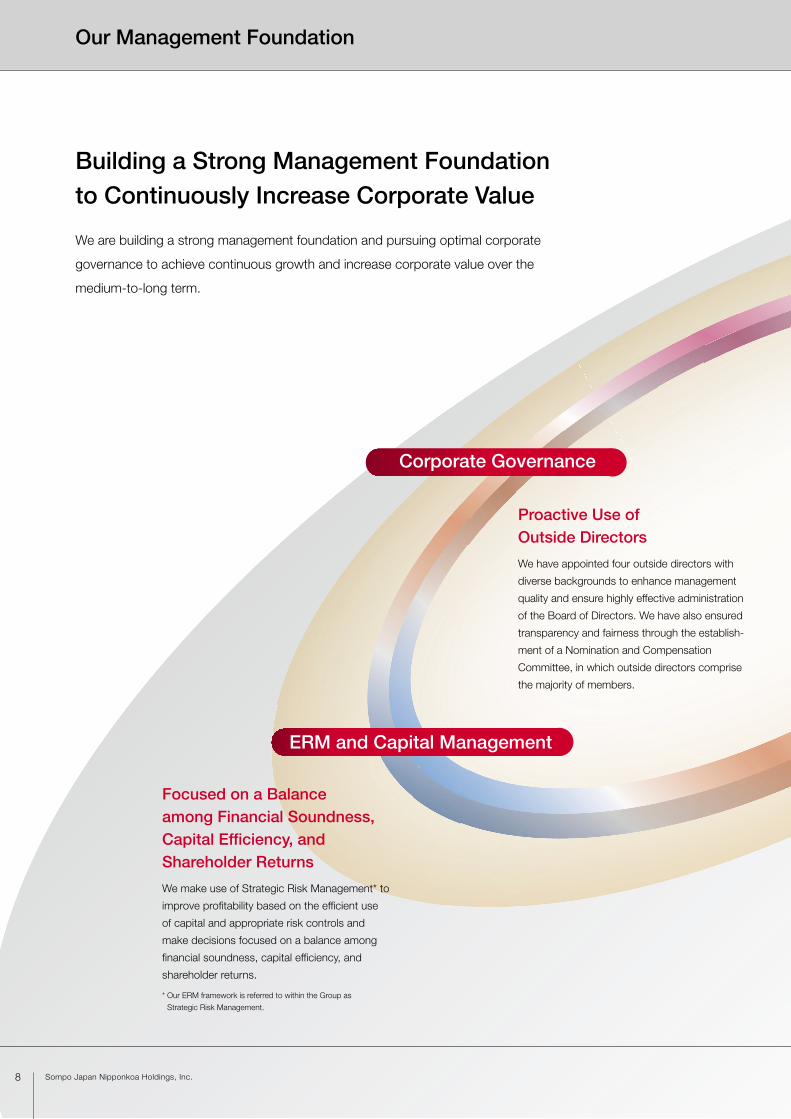
Focused on a Balance among Financial Soundness, Capital Efficiency, and Shareholder Returns
We make use of Strategic Risk Management* to
improve profitability based on the efficient use
of capital and appropriate risk controls and
make decisions focused on a balance among
financial soundness, capital efficiency, and
shareholder returns.
* Our ERM framework is referred to within the Group as
Strategic Risk Management.
Corporate Governance
Proactive Use of Outside Directors
We have appointed four outside directors with
diverse backgrounds to enhance management
quality and ensure highly effective administration
of the Board of Directors. We have also ensured
transparency and fairness through the establish-
ment of a Nomination and Compensation
Committee, in which outside directors comprise
the majority of members.
ERM and Capital Management
Our Management Foundation
Building a Strong Management Foundation to Continuously Increase Corporate Value
We are building a strong management foundation and pursuing optimal corporate
governance to achieve continuous growth and increase corporate value over the
medium-to-long term.

We are steadily improving our internal solvency
ratio, which indicates financial soundness.
While maintaining a set level of capital to
ensure business stability, we invest capital in
the highly profitable growth businesses of
domestic life and overseas insurance while
providing a balanced return to shareholders.
In the event capital reserves are generated,
we make effective use of that capital from the
perspective of improving ROE.
Internal Solvency Ratio Adjusted Consolidated ROE
IntroductionTo O
ur Stakeholders
Review
of Operations
Managem
ent FoundationFinancial S
ectionC
orporate Data
Note) The above figures for the internal solvency ratio are as of March 31 of each fiscal year.
2011 2012 2013 2014 2015
129%
0.1%
146%
5.4%
157%
4.3%
7.6% (Forecast)
Over 7%(Initial Plan)
170%
5.2%
9ANNUAL REPORT 2015 ( INTEGRATED REPORT)
Resolving Social Issues through Global Growth
While proactively engaging with stakeholders,
we attempt to resolve social issues through
initiatives in all our business processes and
the provision of products and services with
a view to increasing corporate value and new
value creation.
Diversity: An Important Management Strategy Vital for Group Growth
With “Diversity for Growth” as our slogan,
we promote careers for women through training
and support programs. In addition, we host
SOMPO Global University with the National
University of Singapore to cultivate global leaders.
Human Resources
CSR
(FY)
Improving Financial Soundness and ROE
Internal Solvency Ratio and Adjusted Consolidated ROE

In September 2014, the merger of Sompo Japan and Nipponkoa was completed as planned,
forming Sompo Japan Nipponkoa.
In terms of performance, the Medium-Term Management Plan remained on track mainly
due to the improving profitability of the domestic P&C insurance business. Ordinary profit almost
doubled, to 208.3 billion yen, and net income increased 10.1 billion yen, to 54.2 billion yen.
In the domestic P&C insurance business, led by the successful merger of Sompo Japan and Nipponkoa to
establish Sompo Japan Nipponkoa in September 2014, automobile insurance product and premium rate
revisions and other initiatives aimed at improving profitability resulted in a recovery that exceeded the original
plan. Although one-time costs arose as a result of the merger of the two companies, we were able to make
the most of the merger synergies anticipated. In the direct automobile insurance business, we also continued
to increase our market share of new policies by providing competitive products responding to customer needs.
In the domestic life insurance business, strong sales of “Shin Kenko no Omamori,” a new medical
insurance product providing wider coverage and lower insurance premiums, led to steady growth fueled by
improvement of efficiency and earnings.
In the overseas insurance business, taking part in the growing global market, we achieved higher
earnings than the target of the Medium-Term Management Plan due to profit contribution from Canopius
acquired in May 2014, among other factors.
Q. Looking back at fiscal 2014, what progress has been made in terms of the Medium-Term Management Plan?
A.
Kengo SakuradaPresident & CEO
Sompo Japan Nipponkoa Holdings, Inc.
We Are Evolving to Offer a Wider Range of Services
Aimed at Providing Even More Customers with Security, Health,
and Wellbeing.
10 Sompo Japan Nipponkoa Holdings, Inc.
Interview with the Group CEO

Q. What is the outlook for fiscal 2015?
A. Fiscal 2015 is the final year and the culmination of the current Medium-Term Management
Plan. Our results are expected to exceed the initial plan due to stable growth in each business
segment and improvement of capital efficiency.
In the domestic P&C insurance business, we strive to maintain and expand profitability through the
improvement of efficiency and other management efforts. In the domestic life insurance business, we are
targeting sustainable profit growth by utilizing our P&C insurance agency network and focusing on
high-margin protection-type products. In the overseas insurance business, although we have already
achieved our targets, we continue to promote our growth strategies, striking a balance between emerging
and developed markets.
Through these efforts, we expect to exceed the Medium-Term Management Plan targets, and
achieve adjusted consolidated profit of 228 billion yen and adjusted consolidated ROE of 7.6%.
For details regarding performance and strategies, please see the “Review of Operations” section
on pages 19 to 36.
Progress under the Medium-Term Management Plan
(Billions of yen) (%)
FY2011 FY2012 FY2013 FY2014 FY2015
1.2
111.6101.5
138.3
228.0
(100)
0
100
50
(50)
150
200
250
0
6.0
3.0
9.0
12.0
15.0
Total (Adjusted Consolidated
Profit)
11ANNUAL REPORT 2015 ( INTEGRATED REPORT)
Actual Actual Actual Actual Forecast Initial Plan
Domestic P&C Insurance (71.3) (8.9) 6.5 69.9 116.7 70.0-80.0
Domestic Life Insurance 100.0 107.8 85.7 47.4 90.0 100.0-110.0
Overseas Insurance (19.7) 11.8 7.8 18.6 19.2 14.0-20.0
Financial and Other Services (7.6) 0.7 1.5 2.3 2.4 2.0-3.0
Total (Adjusted Consolidated Profit) 1.2 111.6 101.5 138.3 228.0 180.0-210.0
Adjusted Consolidated ROE 0.1% 5.4% 4.3% 5.2% 7.6% Over 7%
Notes)1. Special factors, such as extraordinary losses related to the merger and impact of corporate income tax reduction, are excluded from the calculation of adjusted profit. The amounts after tax are 17.6 billion yen in fiscal 2012; 26.7 billion yen in fiscal 2013; and 80.0 billion yen in fiscal 2014 (no special factors are expected in fiscal 2015).2. Saison Automobile & Fire and Sonpo 24 were classified as financial and other services in fiscal 2011.3. Definitions of business segments, adjusted consolidated profit, and adjusted consolidated ROE are shown on page 18.
Domestic P&C Insurance Domestic Life Insurance
Overseas Insurance Financial and Other Services
Adjusted Consolidated ROE
(Billions of yen)
Financial Section
IntroductionTo O
ur Stakeholders
Review
of Operations
Managem
ent FoundationC
orporate Data

Q. What is the Group’s approach to corporate governance?
A. We place importance on strengthening relationships of mutual trust with all stakeholders.
In addition to clarifying, in the Corporate Governance Policy, basic policies related to the
overall governance structure and the governance mechanisms, the Group constantly pursues
optimal corporate governance and continuously strives to improve it further.
As for our corporate governance system, we decided to be a company with an Audit & Supervisory Board,
where the Board of Directors, which is responsible for important management decisions and supervision of
operations, and the Audit & Supervisory Board members and the Audit & Supervisory Board, which are
independent from the Board of Directors, strive to maintain and enhance the effectiveness of supervisory and
check and balance functions. We also adopted an Executive Officer System to facilitate quick decision
making and clarify authority and responsibility. A Nomination and Compensation Committee established as
the advisory body of the Board of Directors ensures transparency and fairness of decisions regarding the
Q. What is your vision for SOMPO HOLDINGS?
A. This is best expressed in our Group Management Philosophy of contributing to the security,
health, and wellbeing of our customers and society as a whole by providing insurance and
related services of the highest quality possible.
In keeping with this management philosophy, our aim is to go beyond insurance business
and evolve into a service provider that enables more customers to live with security, health,
and wellbeing amid a constantly changing environment.
Looking at the environment surrounding the Group over the medium-to-long term, we expect significant
changes in the years ahead due to the on set of a super-aging society and decreasing population in Japan,
the increasing frequency of large-scale natural disasters caused by climate change, and the rapid progress
of information technologies.
These changes in the environment present new risks resulting in new insurance needs. We consider
these changes to be business opportunities and aim to proactively take appropriate measures. Meanwhile,
although these environmental changes create business opportunities, the significant changes resulting from
a shrinking Japanese population, among other factors, mean that if we maintain a portfolio heavily weighted
toward the domestic insurance business, it may be difficult for us to achieve long-term sustainable growth.
Based on this awareness of the operating environment, we will develop businesses complementary to the
insurance business, going beyond insurance products and evolving to provide even more customers with a
wide range of services that enable them to live with security, health, and wellbeing.
12 Sompo Japan Nipponkoa Holdings, Inc.
Features of the Group’s Corporate Governance Structure
Nomination and
Compensation
Committee ensures
transparency and
fairness
Inclusion of
outside directors
possessing a wide
range of knowledge
and experience
Highly effective
operation of the Board
of Directors

appointment and treatment of directors and executive officers. The chairman and a majority of the committee
members are outside directors.
We believe our Board of Directors should be composed of highly skilled members possessing a diverse
range of perspectives and experiences enabling them to supervise operations and make important decisions.
As of June 30, 2015, our Board of Directors consisted of 12 members, of whom 8 are internal directors well-
versed in business operations and 4 are outside directors, 2 of whom are women, reflecting the importance
we place on diversity. With expertise in management strategy, such as the enhancement of organization and
consumer correspondence, as well as corporate law, information communication technologies, and a
variety of other areas, outside directors are responsible for supervising management and providing support
for management strategies and issues from an external, objective standpoint based on their wealth of
experience and comprehensive knowledge. We believe outside directors contribute significantly to improving
the effectiveness of our corporate governance.
We hold orientation meetings for outside directors and outside Audit & Supervisory Board members,
who have diverse backgrounds, and explain important proposals beforehand so that their opinions based
on their expertise enhance constructive and substantial discussions in the Board of Directors. Opinions and
questions from outside directors are shared with all directors in attendance, and Board of Directors and
orientation meetings are integrated to enhance the effectiveness of management by the Board of Directors.
We also provide opportunities for outside directors and the Group CEO to meet and freely exchange ideas.
Furthermore, in light of the intention behind the Corporate Governance Code, which went into effect
on June 1, 2015, we published a Corporate Governance Report detailing our initiatives in this area for the
edification of our stakeholders.
For details regarding corporate governance, please see pages 44 to 48.
Q. Can you explain Strategic Risk Management and how it is being implemented?
A. Strategic Risk Management* is a business management method for maximizing corporate
value and improving earnings through the effective use of capital and appropriate control of
risks. This method enables thorough management decision making focused on balancing
capital, risk, and return from the perspective of Group optimization.
We engage in Strategic Risk Management with the aim of maximizing corporate value and maintaining
financial soundness to continue providing services of the highest quality for customer security, health, and
wellbeing. Corporate management requires constant decision making based on facts and the utilization
of quantitative information; Strategic Risk Management is effective
for the establishment and dissemination of both.
The Strategic Risk Management approach is firmly entrenched
throughout the Group. When a business plan is formulated, we confirm
its validity quantitatively in terms of the future outlook of the Group’s
overall capital efficiency and financial soundness, as well as profitability
compared with risks in each business unit and insurance category.
We also make management decisions focused on balancing capital,
risk, and return with regard to individual policies, such as the strate-
gic-holding stock reductions, M&A, and reinsurance strategies.
Insurance company ERM was developed mainly in Europe.
Multiple discussions with Canopius management provided us with
13ANNUAL REPORT 2015 ( INTEGRATED REPORT)
Financial Section
IntroductionTo O
ur Stakeholders
Review
of Operations
Managem
ent FoundationC
orporate Data

Q. What is the Group’s strategy for human resources (HR) management?
A. Human resources are the driving force behind the Group’s transition to always being the best
customer service provider both at home and abroad. We practice thorough performance-based
HR management that maximizes the strengths of our diverse range of human resources
regardless of gender, nationality, or previous careers. We promote diversity through initiatives
that make use of the Group’s diverse human resources.
The creation of a foundation enabling the use of diverse human resources on a global Group-wide basis is
important for enhancing the human resource capabilities of the entire Group and driving Group growth.
To create this foundation, it is important to promote diversity and respect for the individuality of each
employee by practicing thorough performance-based HR management regardless of gender,
nationality, or previous careers. We believe this will enable the maximization of abilities across the Group
through human resources possessing a high market value and variety of strengths.
Specifically, we established the Group Personnel Vision and the Human Resource Strategy Committee
as a mechanism for discovering and cultivating human resources on a global Group-wide basis.
We discover talented personnel through the unified management of human resource information within
the Group and proactively conduct human resource exchanges across the entire Group globally. In October
2013, we established the Diversity Promotion Headquarters to promote initiatives aimed at defining
concrete objectives.
For details regarding our strategy for human resources, please see pages 54 to 55.
several reasons for incorporating ERM into Group operations. From the perspective of a “Center of
Excellence” to maximize the strengths of knowledgeable people and organizations, an ERM Regional Center
was established in London to promote and enhance uniform ERM throughout Europe and North America.
In the future, we plan to develop ERM frameworks in other regions.
We are cognizant that Group financial soundness has improved and a foundation has been established
for further growth. Looking ahead to the next Medium-Term Management Plan, we will expand the domestic
life insurance, overseas insurance, and financial and other services businesses with the aim of evolving into
the best customer service provider, while formulating optimized plans for maximizing corporate value in an
attempt to increase profits and diversification effects.
For details regarding ERM, please see pages 50 to 53.
* Our ERM framework is referred to within the Group as Strategic Risk Management.
Q. What is the purpose and context of Group CSR initiatives?
A. We engage in CSR not only to fulfill our corporate responsibility but also to enhance corporate
value and realize growth. Since fiscal 2014, we have identified Group Key Performance Indicators
(KPIs) for CSR in the aim of sharing and exerting unified efforts toward CSR goals, allowing the
Group to achieve greater non-financial performance.
Expectations are growing for global companies to take the lead in providing solutions to complex social
issues intertwined beyond national borders, involving natural disasters, a super-aging society, traffic safety,
poverty, infectious diseases, and human rights.
14 Sompo Japan Nipponkoa Holdings, Inc.

We clearly state CSR as the base of management, and the Group strives to develop and provide
products and services contributing to the resolution of social issues through its core insurance business and
to a wider range of businesses. Furthermore, we contribute to the realization of a resilient and sustainable
society through collaboration with local communities and corporate sponsorship* that supports education
and the creation of a prosperous society, and we promote efforts linked to our core business.
Going forward, we will enhance our CSR as a globally competitive Group, aiming to realize a sustainable
society and Group growth by providing solutions to social issues.
For details regarding CSR, please see pages 56 to 58.
Q. Finally, can you explain shareholder returns?
A. In line with profit growth, in fiscal 2014 we increased the annual dividend per share 10 yen,
to 70 yen, and conducted share buybacks amounting to 17.0 billion yen. In fiscal 2015, we plan
to increase the annual dividend per share for the second year in a row, to 80 yen.
In fiscal 2014, in accordance with adjusted profitability improvement, we increased the annual dividend per
share 10 yen, to 70 yen. In fiscal 2015, we intend to further raise the dividend in response to profit growth.
We plan to increase the annual dividend per share 10 yen, to 80 yen. In addition, shareholder returns based
on fiscal 2014 performance included share buybacks amounting to 17.0 billion yen, which resulted in a total
payout ratio of 50%.
Going forward, we plan to provide flexible shareholder returns, considering the management environment,
capital conditions, and the market environment from the perspective of shareholder value over the medium-
to-long term.
• Develop and provide products and services that contribute to security, health, and wellbeing
• Climate change countermeasures
• Environmental, social, and governance (ESG) investment
• Collaborate with NGOs / NPOs (philanthropy, corporate sponsorship*)
• Promote diversity
Resolve Social Issues
Sustainable Society
Group Growth
* Corporate activities to support culture and the arts
15ANNUAL REPORT 2015 ( INTEGRATED REPORT)
Trends in Total of Shareholder Returns
Reference
Adjusted Consolidated Profit (excluding the domestic life insurance business)
¥15.8 billion ¥90.8 billion ¥138.0 billion
Total Payout Ratio 219% 50% —
FY2013 FY2015 (Forecast)
FY2016(Onward)
24.7(¥60 pershare)
10.0
34.7
45.5
17.0
To bedetermined
28.5( ¥70 pershare)
32.3( ¥80 pershare)
FY2014
(Billions of yen)
Cash dividend
Share buybacks
Contemplate the capital policy in the course of considering the next management plan from FY2016 onward
Financial Section
IntroductionTo O
ur Stakeholders
Review
of Operations
Managem
ent FoundationC
orporate Data
16 Sompo Japan Nipponkoa Holdings, Inc.
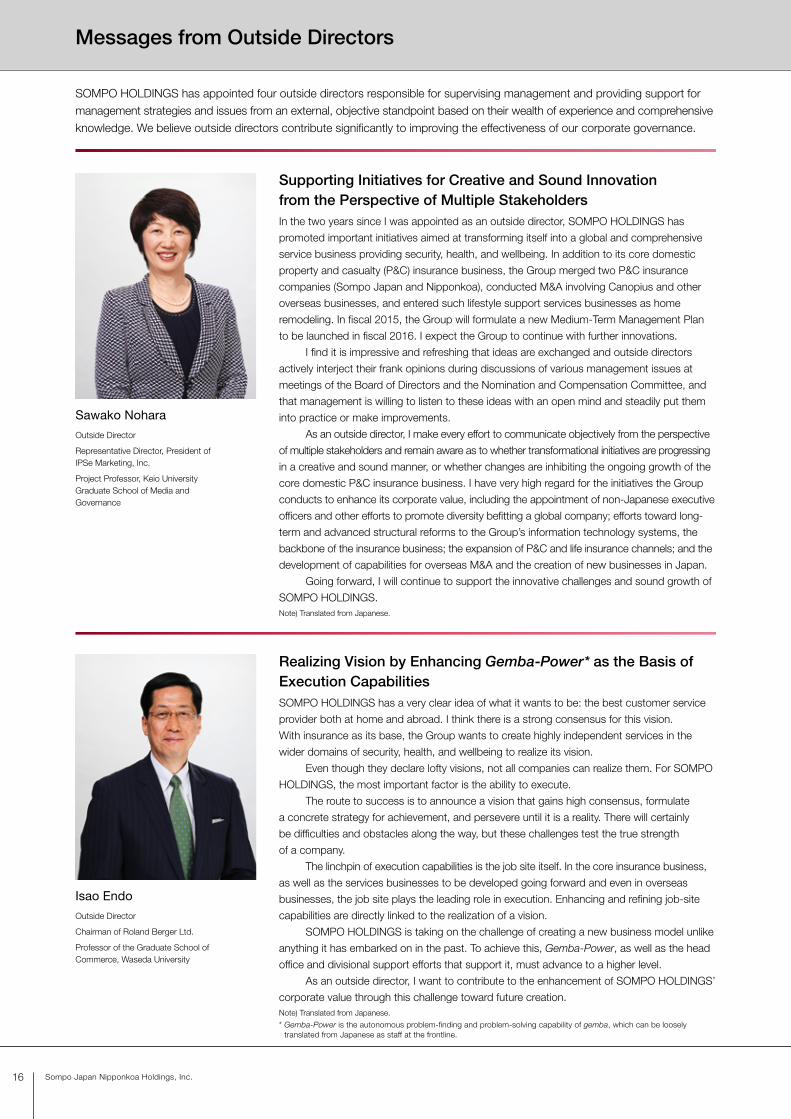
Isao Endo
Outside Director
Chairman of Roland Berger Ltd.
Professor of the Graduate School of Commerce, Waseda University
Sawako Nohara
Outside Director
Representative Director, President of IPSe Marketing, Inc.
Project Professor, Keio University Graduate School of Media and Governance
Supporting Initiatives for Creative and Sound Innovation from the Perspective of Multiple StakeholdersIn the two years since I was appointed as an outside director, SOMPO HOLDINGS has
promoted important initiatives aimed at transforming itself into a global and comprehensive
service business providing security, health, and wellbeing. In addition to its core domestic
property and casualty (P&C) insurance business, the Group merged two P&C insurance
companies (Sompo Japan and Nipponkoa), conducted M&A involving Canopius and other
overseas businesses, and entered such lifestyle support services businesses as home
remodeling. In fiscal 2015, the Group will formulate a new Medium-Term Management Plan
to be launched in fiscal 2016. I expect the Group to continue with further innovations.
I find it is impressive and refreshing that ideas are exchanged and outside directors
actively interject their frank opinions during discussions of various management issues at
meetings of the Board of Directors and the Nomination and Compensation Committee, and
that management is willing to listen to these ideas with an open mind and steadily put them
into practice or make improvements.
As an outside director, I make every effort to communicate objectively from the perspective
of multiple stakeholders and remain aware as to whether transformational initiatives are progressing
in a creative and sound manner, or whether changes are inhibiting the ongoing growth of the
core domestic P&C insurance business. I have very high regard for the initiatives the Group
conducts to enhance its corporate value, including the appointment of non-Japanese executive
officers and other efforts to promote diversity befitting a global company; efforts toward long-
term and advanced structural reforms to the Group’s information technology systems, the
backbone of the insurance business; the expansion of P&C and life insurance channels; and the
development of capabilities for overseas M&A and the creation of new businesses in Japan.
Going forward, I will continue to support the innovative challenges and sound growth of
SOMPO HOLDINGS.Note) Translated from Japanese.
Realizing Vision by Enhancing Gemba-Power* as the Basis of Execution CapabilitiesSOMPO HOLDINGS has a very clear idea of what it wants to be: the best customer service
provider both at home and abroad. I think there is a strong consensus for this vision.
With insurance as its base, the Group wants to create highly independent services in the
wider domains of security, health, and wellbeing to realize its vision.
Even though they declare lofty visions, not all companies can realize them. For SOMPO
HOLDINGS, the most important factor is the ability to execute.
The route to success is to announce a vision that gains high consensus, formulate
a concrete strategy for achievement, and persevere until it is a reality. There will certainly
be difficulties and obstacles along the way, but these challenges test the true strength
of a company.
The linchpin of execution capabilities is the job site itself. In the core insurance business,
as well as the services businesses to be developed going forward and even in overseas
businesses, the job site plays the leading role in execution. Enhancing and refining job-site
capabilities are directly linked to the realization of a vision.
SOMPO HOLDINGS is taking on the challenge of creating a new business model unlike
anything it has embarked on in the past. To achieve this, Gemba-Power, as well as the head
office and divisional support efforts that support it, must advance to a higher level.
As an outside director, I want to contribute to the enhancement of SOMPO HOLDINGS’
corporate value through this challenge toward future creation.Note) Translated from Japanese.
* Gemba-Power is the autonomous problem-finding and problem-solving capability of gemba, which can be loosely translated from Japanese as staff at the frontline.
Messages from Outside Directors
SOMPO HOLDINGS has appointed four outside directors responsible for supervising management and providing support for
management strategies and issues from an external, objective standpoint based on their wealth of experience and comprehensive
knowledge. We believe outside directors contribute significantly to improving the effectiveness of our corporate governance.

17ANNUAL REPORT 2015 ( INTEGRATED REPORT)
Scott Trevor Davis
Outside Director
Professor of the Department of Global Business, College of Business, Rikkyo University
Tamami Murata
Outside Director
Attorney at Law
Dialogue with Customers Linked to Realizing the Best Customer Service ProviderCorporate governance, compliance, and diversity are not corporate objectives; they are
indicators of appropriate management. Aiming to become the best customer service
provider, SOMPO HOLDINGS is on the right track in terms of a standard for verifying the
appropriateness of management.
On the other hand, the goal of becoming the best customer service provider might
seem slightly nonspecific—how exactly do we go about achieving this goal? It may seem
a bit vague in terms of how it relates to daily work duties.
At present, focusing on whether or not we are engaging customers in dialogue is of the
utmost importance. Dialogue with customers will reveal what SOMPO HOLDINGS is doing
right now and what it is attempting to accomplish. We can solicit feedback from customers
and incorporate their responses into future initiatives and considerations affecting the
business cycle.
For example, from the perspective of customers, no difference exists between not
buying a product because they do not think a good product exists, and not buying a product,
even though a good one exists, because of either a lack of information or the information was
not understood. Dialogue with customers is just as valuable as developing superior products
and services.
While offering proposals and advice regarding governance and compliance, I want to
enhance corporate value further through SOMPO HOLDINGS’ initiatives that consider and
reexamine the perspectives gleaned through dialogue with customers.Note) Translated from Japanese.
Becoming an Organization That Accomplishes Innovation for the FutureThis is a particularly important point in time for SOMPO HOLDINGS. The domestic insurance
market has matured and, although product development and service innovation will continue
to provide fresh opportunities within existing business models, it is clear that transformative
innovation holds the key to future growth.
SOMPO HOLDINGS’ management has developed a robust and comprehensive
strategy to consolidate its existing strengths, leverage them to create a seamless offering of
lifestyle support solutions through a series of strategic domestic partnerships, and establish
a global network of firms capable of realising synergies of closely coordinated and advanced
insurance services.
Success here will hinge on SOMPO HOLDINGS’ ability to maintain its tradition of deep
social awareness and embed this globally as an organizational capability, to combine the
knowledge of a diverse range of specialists with the frontline insights of regional businesses,
and to promote a genuine sense of ownership throughout the organization by which to
motivate constructive change.
To achieve these objectives, SOMPO HOLDINGS must become an organization wherein
diversity in nationality, gender, and previous professional experience become strategic
business assets, where transparency and objectivity define dealings with stakeholders, and
where the ability to promote wellbeing becomes a key factor in both the planning and
evaluation of business.
Financial Section
IntroductionTo O
ur Stakeholders
Review
of Operations
Managem
ent FoundationC
orporate Data

18 Sompo Japan Nipponkoa Holdings, Inc.
数数数数数数数数数数数数数数
Results for FY2014Adjusted consolidated profit ¥138.3 billion
= 5.2%
Consolidated net assets (excluding life insurance subsidiaries’ net assets) ¥1,486.5 billion + Catastrophic loss reserve (after tax) ¥383.8 billion
+ Reserve for price fluctuation (after tax) ¥31.5 billion + Life insurance subsidiaries’ EV ¥767.3 billion
Calculation Method for Adjusted Consolidated ROE
Adjusted Consolidated ROE = Adjusted consolidated profit/Adjusted consolidated net assets*2
(Denominators of adjusted consolidated ROE are the average of the balance at end/start of each fiscal year)
*2. Adjusted consolidated net assets = Consolidated net assets (excluding life insurance subsidiaries’ net assets) + Catastrophic loss reserve (after tax) + Reserve for price fluctuation (after tax) + Life insurance subsidiaries’ embedded value (EV)
Adjusted Consolidated Profit = Total of adjusted profit of business segments
Business segmentsDefinition of business segments for
calculating its adjusted profitCalculation method for adjusted profit
Domestic P&C Insurance Total of Sompo Japan Nipponkoa, Sonpo 24 and Saison Automobile & Fire (non-consolidated)
Net income+ Provisions for catastrophic loss reserve (after tax)+ Provisions for reserve for price fluctuation (after tax)– Gains/losses on sales of securities and impairment losses
on securities (after tax) – Special factors
Domestic Life Insurance Sompo Japan Nipponkoa Himawari Life Growth in embedded value (EV*1) – Capital transactions such as equity issuance– Changes in EV attributable to fluctuation of interest rates,
etc.
Overseas Insurance Overseas insurance subsidiaries Net income
Financial and Other Services
Financial services, Healthcare business, etc. Net income
*1. EV: In Europe and Canada, embedded value (EV) is adopted by life insurance companies as a principal indicator of financial soundness and corporate performance, with the aim of supplementing the information presented in corporate financial statements and notes. We place emphasis on market consistent embedded value (MCEV), an indicator aimed at assessing EV in a way consistent with the market value of financial products. With this in mind, Sompo Japan Nipponkoa Himawari Life calculates MCEV by combining its adjusted net worth and the present value of in-force business, including an evaluation of future profitability, with due consideration to business specific risk.
Domestic P&C InsuranceNet income ¥36.7 billion+ Provisions for catastrophic loss reserve (after tax) ¥(7.5) billion+ Provisions for reserve for price fluctuation (after tax) ¥6.3 billion– Gains/losses on sales of securities and impairment
losses on securities (after tax) ¥45.6 billion– Special factors ¥(80.0) billion
Total ¥69.9 billion
Domestic Life InsuranceGrowth in embedded value (EV) ¥39.5 billion– Capital transactions such as equity issuance ¥5.5 billion– Changes in EV attributable to fluctuation of
interest rates, etc. ¥(13.4) billion
Total ¥47.4 billion
Note) In calculating adjusted profit, special factors including a one-time merger cost of domestic P&C companies are excluded.
Results for FY2014
Adjusted Consolidated Profit and Adjusted Consolidated ROE
Calculation Method for Adjusted Consolidated Profit

Financial Section
IntroductionTo O
ur Stakeholders
Review
of Operations
Managem
ent FoundationC
orporate Data
事事事事Financial S
ectionIntroduction
To Our S
takeholdersR
eview of O
perationsM
anagement Foundation
Corporate D
ata
Review of Operations
19ANNUAL REPORT 2015 ( INTEGRATED REPORT)
Consolidated Indicators for SOMPO HOLDINGS
20 Sompo Japan Nipponkoa Holdings, Inc.
Millions of yenMillions of
U.S. dollars
FY2010 FY2011 FY2012 FY2013 FY2014 FY2014
Key Figures
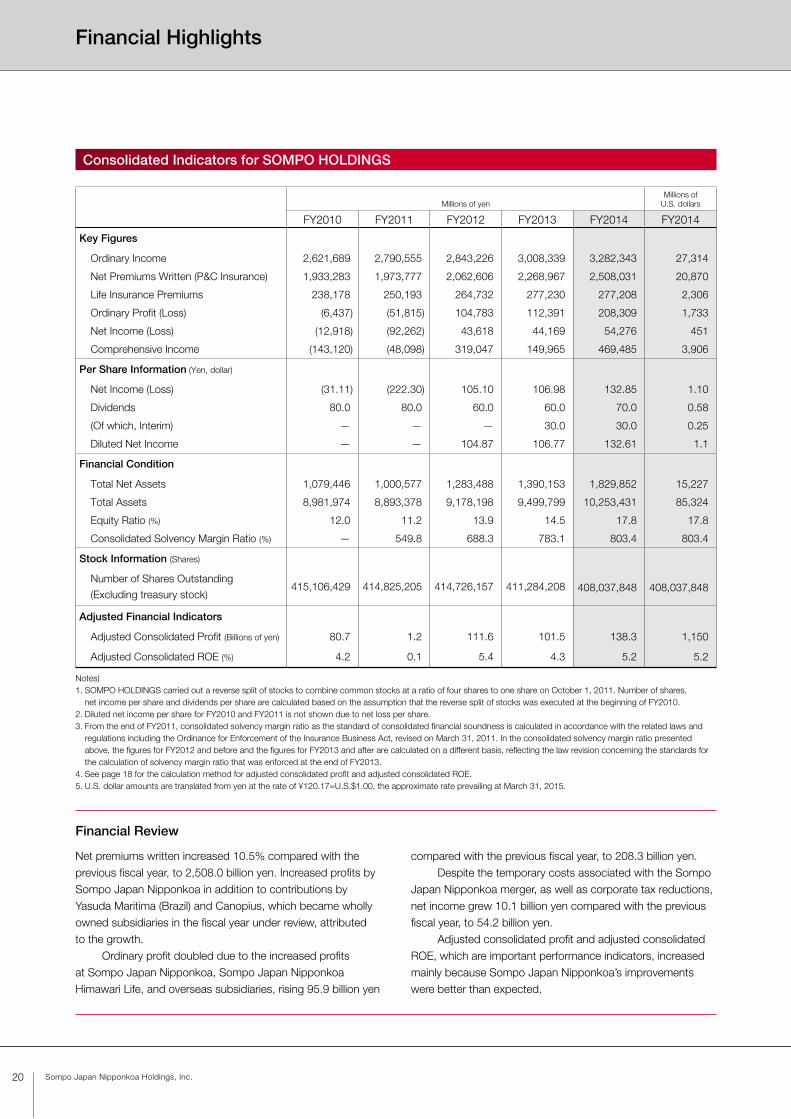
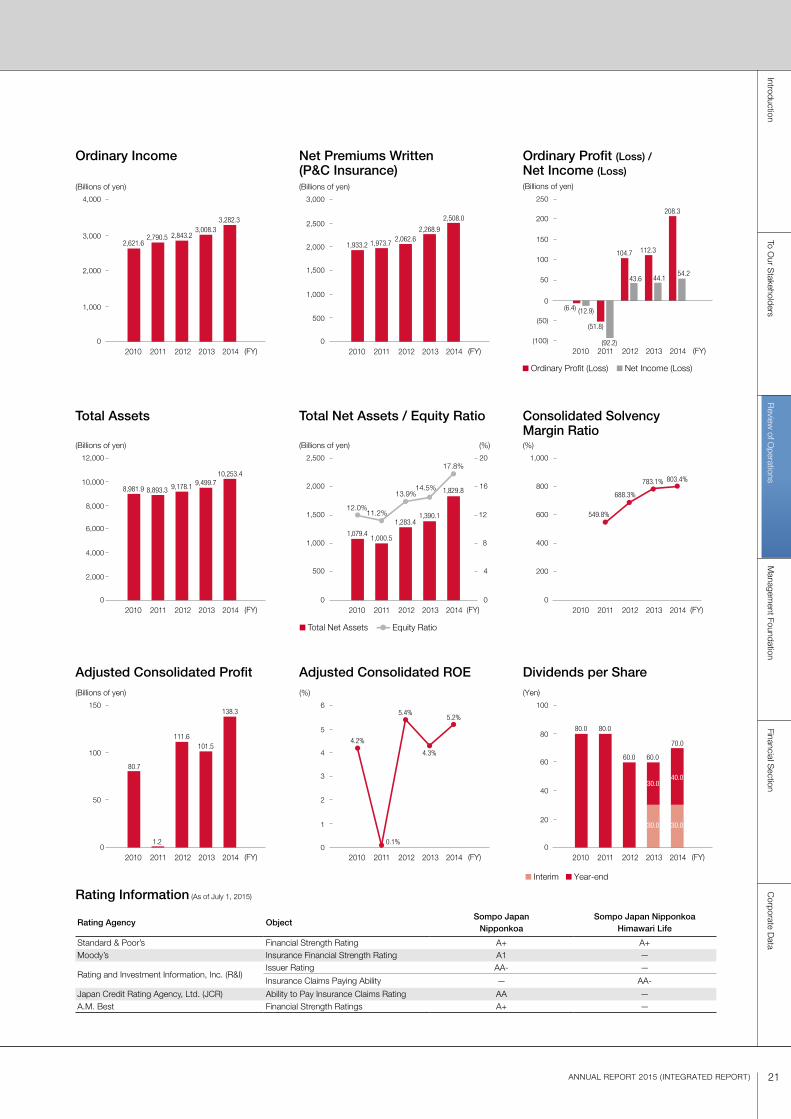
Ordinary Income 2,621,689 2,790,555 2,843,226 3,008,339 3,282,343 27,314
Net Premiums Written (P&C Insurance) 1,933,283 1,973,777 2,062,606 2,268,967 2,508,031 20,870
Life Insurance Premiums 238,178 250,193 264,732 277,230 277,208 2,306
Ordinary Profit (Loss) (6,437) (51,815) 104,783 112,391 208,309 1,733
Net Income (Loss) (12,918) (92,262) 43,618 44,169 54,276 451
Comprehensive Income (143,120) (48,098) 319,047 149,965 469,485 3,906
Per Share Information (Yen, dollar)
Net Income (Loss) (31.11) (222.30) 105.10 106.98 132.85 1.10
Dividends 80.0 80.0 60.0 60.0 70.0 0.58
(Of which, Interim) — — — 30.0 30.0 0.25
Diluted Net Income — — 104.87 106.77 132.61 1.1
Financial Condition
Total Net Assets 1,079,446 1,000,577 1,283,488 1,390,153 1,829,852 15,227
Total Assets 8,981,974 8,893,378 9,178,198 9,499,799 10,253,431 85,324
Equity Ratio (%) 12.0 11.2 13.9 14.5 17.8 17.8
Consolidated Solvency Margin Ratio (%) — 549.8 688.3 783.1 803.4 803.4
Stock Information (Shares)
Number of Shares Outstanding
(Excluding treasury stock)415,106,429 414,825,205 414,726,157 411,284,208 408,037,848 408,037,848
Adjusted Financial Indicators
Adjusted Consolidated Profit (Billions of yen) 80.7 1.2 111.6 101.5 138.3 1,150
Adjusted Consolidated ROE (%) 4.2 0.1 5.4 4.3 5.2 5.2
Notes)1. SOMPO HOLDINGS carried out a reverse split of stocks to combine common stocks at a ratio of four shares to one share on October 1, 2011. Number of shares,
net income per share and dividends per share are calculated based on the assumption that the reverse split of stocks was executed at the beginning of FY2010.2. Diluted net income per share for FY2010 and FY2011 is not shown due to net loss per share.3. From the end of FY2011, consolidated solvency margin ratio as the standard of consolidated financial soundness is calculated in accordance with the related laws and
regulations including the Ordinance for Enforcement of the Insurance Business Act, revised on March 31, 2011. In the consolidated solvency margin ratio presented above, the figures for FY2012 and before and the figures for FY2013 and after are calculated on a different basis, reflecting the law revision concerning the standards for the calculation of solvency margin ratio that was enforced at the end of FY2013.
4. See page 18 for the calculation method for adjusted consolidated profit and adjusted consolidated ROE.5. U.S. dollar amounts are translated from yen at the rate of ¥120.17=U.S.$1.00, the approximate rate prevailing at March 31, 2015.
Net premiums written increased 10.5% compared with the previous fiscal year, to 2,508.0 billion yen. Increased profits by Sompo Japan Nipponkoa in addition to contributions by Yasuda Maritima (Brazil) and Canopius, which became wholly owned subsidiaries in the fiscal year under review, attributed to the growth. Ordinary profit doubled due to the increased profits at Sompo Japan Nipponkoa, Sompo Japan Nipponkoa Himawari Life, and overseas subsidiaries, rising 95.9 billion yen
compared with the previous fiscal year, to 208.3 billion yen. Despite the temporary costs associated with the Sompo Japan Nipponkoa merger, as well as corporate tax reductions, net income grew 10.1 billion yen compared with the previous fiscal year, to 54.2 billion yen. Adjusted consolidated profit and adjusted consolidated ROE, which are important performance indicators, increased mainly because Sompo Japan Nipponkoa’s improvements were better than expected.
Financial Review
Financial Highlights
Financial Section
IntroductionTo O
ur Stakeholders
Review
of Operations
Managem
ent FoundationC
orporate Data
21ANNUAL REPORT 2015 ( INTEGRATED REPORT)
0
(Billions of yen)
(FY)2010 2011 2012 2013 2014
2,621.62,790.5 2,843.2
3,008.33,282.3
4,000
3,000
2,000
1,000
0
(Billions of yen)
(FY)2010 2011 2012 2013 2014
8,981.9 8,893.3 9,178.1 9,499.710,253.4
12,000
8,000
4,000
2,000
6,000
10,000
0
(Billions of yen)
(FY)2010 2011 2012 2013 2014
80.7
1.2
111.6101.5
138.3150
50
100
0
(Billions of yen)
(FY)2010 2011 2012 2013 2014
1,933.2 1,973.72,062.6
2,268.9
2,508.0
3,000
2,500
1,000
500
1,500
2,000
(Billions of yen) (%)
(FY)2010 2011 2012 2013 2014
1,079.4
12.0%11.2%
13.9%14.5%
17.8%
1,000.5
1,283.41,390.1
1,829.8
0
500
2,000
2,500
0
4
16
20
1,500 12
1,000 8
(%)
(FY)2010 2011 2012 2013 2014
4.2%
0.1%
5.4%
4.3%
5.2%
6
5
2
1
0
3
4
(Billions of yen)
(FY)2010 2011 2012 2013 2014
(12.9)(6.4)
(92.2)
44.1
112.3
54.2
208.3
43.6
104.7
(51.8)(50)
0
50
100
250
(100)
150
200
(%)
(FY)2010 2011 2012 2013 2014
803.4%783.1%
688.3%
549.8%
0
200
600
1,000
400
800
0
(Yen)
(FY)2010 2011 2012 2013 2014
80.080.0
70.0
60.0
30.0
30.0
40.0
30.0
60.0
100
80
40
20
60
Ordinary Income
Total Assets
Adjusted Consolidated Profit
Net Premiums Written (P&C Insurance)
Total Net Assets / Equity Ratio
Adjusted Consolidated ROE
Ordinary Profit (Loss) /Net Income (Loss)
Consolidated SolvencyMargin Ratio
Dividends per Share
Ordinary Profit (Loss) Net Income (Loss)
Total Net Assets Equity Ratio
Interim Year-end
Rating Information (As of July 1, 2015)
Rating Agency ObjectSompo Japan
NipponkoaSompo Japan Nipponkoa
Himawari Life
Standard & Poor’s Financial Strength Rating A+ A+Moody’s Insurance Financial Strength Rating A1 —
Rating and Investment Information, Inc. (R&I)Issuer Rating AA- —
Insurance Claims Paying Ability — AA-
Japan Credit Rating Agency, Ltd. (JCR) Ability to Pay Insurance Claims Rating AA —A.M. Best Financial Strength Ratings A+ —
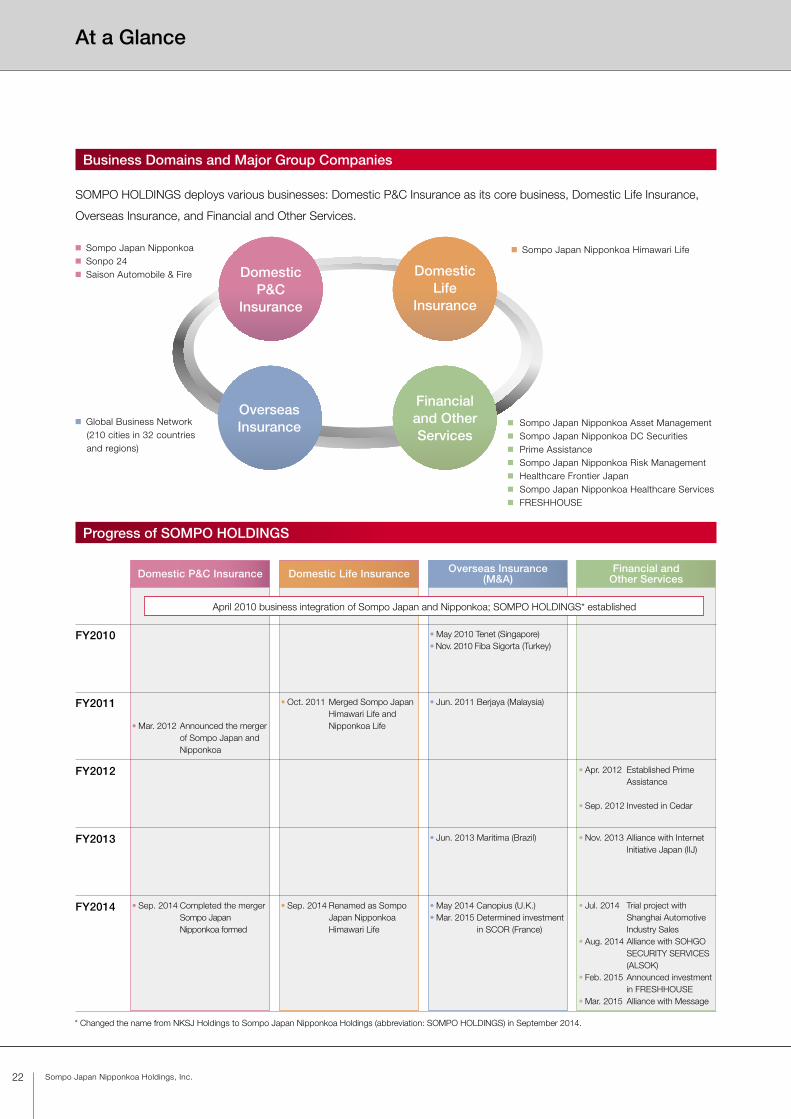
Business Domains and Major Group Companies
SOMPO HOLDINGS deploys various businesses: Domestic P&C Insurance as its core business, Domestic Life Insurance,
Overseas Insurance, and Financial and Other Services.
Progress of SOMPO HOLDINGS
Domestic P&C Insurance Domestic Life Insurance Overseas Insurance (M&A)
Financial and Other Services
FY2010 • May 2010 Tenet (Singapore)• Nov. 2010 Fiba Sigorta (Turkey)
FY2011 • Mar. 2012 Announced the merger
of Sompo Japan and Nipponkoa
• Oct. 2011 Merged Sompo Japan Himawari Life and Nipponkoa Life
• Jun. 2011 Berjaya (Malaysia)
FY2012 • Apr. 2012 Established Prime Assistance
• Sep. 2012 Invested in Cedar
FY2013 • Jun. 2013 Maritima (Brazil) • Nov. 2013 Alliance with Internet Initiative Japan (IIJ)
FY2014 • Sep. 2014 Completed the merger Sompo Japan
Nipponkoa formed
• Sep. 2014 Renamed as Sompo Japan Nipponkoa Himawari Life
• May 2014 Canopius (U.K.)• Mar. 2015 Determined investment
in SCOR (France)
• Jul. 2014 Trial project with Shanghai Automotive Industry Sales
• Aug. 2014 Alliance with SOHGO SECURITY SERVICES (ALSOK)
• Feb. 2015 Announced investment in FRESHHOUSE
• Mar. 2015 Alliance with Message
April 2010 business integration of Sompo Japan and Nipponkoa; SOMPO HOLDINGS* established
* Changed the name from NKSJ Holdings to Sompo Japan Nipponkoa Holdings (abbreviation: SOMPO HOLDINGS) in September 2014.
22 Sompo Japan Nipponkoa Holdings, Inc.
Financialand Other Services
DomesticLife
Insurance
DomesticP&C
Insurance
Overseas Insurance
■ Sompo Japan Nipponkoa■ Sonpo 24■ Saison Automobile & Fire
■ Sompo Japan Nipponkoa Himawari Life
■ Global Business Network (210 cities in 32 countries and regions)
■ Sompo Japan Nipponkoa Asset Management■ Sompo Japan Nipponkoa DC Securities■ Prime Assistance■ Sompo Japan Nipponkoa Risk Management■ Healthcare Frontier Japan■ Sompo Japan Nipponkoa Healthcare Services■ FRESHHOUSE
At a Glance

Financial Section
IntroductionTo O
ur Stakeholders
Review
of Operations
Managem
ent FoundationC
orporate Data
In the domestic P&C insurance business, the merger of Sompo Japan and Nipponkoa was carried out as planned and prof-
itability continued to improve, mainly in automobile insurance. New products were launched in the domestic life insurance
business, and the overseas insurance business expanded its business domain as the Group continued on a track toward
achieving the goals of the Medium-Term Management Plan.
In fiscal 2014, adjusted consolidated profit was 138.3 billion yen and adjusted consolidated ROE was 5.2%, mainly
because the domestic P&C insurance business significantly improved profitability. In fiscal 2015, the final year of the current
Medium-Term Management Plan, the Group expects to exceed the initial plan and realize adjusted consolidated profit of
228.0 billion yen and adjusted consolidated ROE of 7.6%.
Progress under the Management Plan
23ANNUAL REPORT 2015 ( INTEGRATED REPORT)
Adjusted Consolidated Profit Adjusted Consolidated ROE(Billions of yen)
2013 2014 2015(Initial Plan) (Forecast)
101.5138.3
180.0~210.0
228.0
(%)
2013 2014 2015
7.6 (Forecast)
Over 7.0(Initial Plan)
4.35.2
Domestic P&C Insurance Domestic Life Insurance Overseas Insurance Financial and Other Services
(FY) (FY)
Overseas Insurance
Adjusted Profit
¥18.6 billion ¥19.2 billion(FY2014) (FY2015 Forecast)
In addition to organic growth, successful M&A represented by Canopius led to the Group achieving the adjusted profit goal for the final year of the Medium-Term Management Plan (14.0 billion yen to 20.0 billion yen) one year early. Disciplined investments, such as the SCOR capital participation in March 2015, are aimed at further increasing profits.
Financial and Other Services
Adjusted Profit
¥2.3 billion ¥2.4 billion(FY2014) (FY2015 Forecast)
The Group’s efforts to develop service businesses compatible with the insurance business, based on the keywords of customers’ security, health, and wellbeing, are beginning to bear fruit. In February 2015, the Group entered the home remodeling business by acquiring FRESHHOUSE, as a subsidiary. In March 2015, the Group announced a capital and business alliance agreement with Message, a major nursing care company. The Group is transforming itself to offer services, including alliances with other companies providing advanced services, to satisfy its customers.
Domestic P&C Insurance
Adjusted Profit
¥69.9 billion ¥116.7 billion(FY2014) (FY2015 Forecast)
A concerted company-wide effort ensured the success of the September 2014 merger of Sompo Japan and Nipponkoa. Also, revisions of products and premium rates improved the profitability of automobile insurance significantly. As a result, the combined ratio improved beyond the level targeted when the Medium-Term Management Plan was formulated. In anticipation of future changes in the business environment, the Group is steadily increasing its market share of new policies through the direct marketing of automobile insurance. Further, taking advantage of opportunities technological innovation presents, the Group is proactively engaged in the telematics field.
Domestic Life Insurance
Adjusted Profit
¥47.4 billion ¥90.0 billion(FY2014) (FY2015 Forecast)
Medical insurance sales were strong due to the new product effect of sales launched in May 2014. In April 2015, Sompo Japan Nipponkoa Himawari Life introduced a simple underwriting medical insurance product in response to new customer needs. Going forward, the company will continue efforts aimed at expanding scale and profitability in this line.

24 Sompo Japan Nipponkoa Holdings, Inc.
Company Outlines
As of March 31, 2015
Sompo Japan Nipponkoa Insurance Inc. was formed on September 1, 2014,
through the merger of Sompo Japan and Nipponkoa. Centered on the P&C
insurance business, Sompo Japan Nipponkoa is innovating to be the best
customer service provider that offers advanced services supporting the security,
health, and wellbeing of its customers.
Sompo Japan Nipponkoa Insurance Inc.Establishment: October 1888
Capital: 70.0 billion yen
Shareholder: SOMPO HOLDINGS (100%)
Total assets: 7,326.2 billion yen
Net premiums written: 2,181.3 billion yen*
Head office: 26-1, Nishi-Shinjuku 1-chome, Shinjuku-ku, Tokyo
URL: http://www.sjnk.co.jp/english/
* Figures from April to August are the total of the former Sompo Japan and Nipponkoa. Figures from September to March are for Sompo Japan Nipponkoa.
With its intermediary agents introducing insurance products to customers, Sonpo
24 is involved in the direct marketing of automobile insurance through its website
and call centers. Together with these agents, Sonpo 24 cherishes building
relationships with each customer and is committed to remaining an approachable
and reliable partner.
Sonpo 24 Insurance Company LimitedEstablishment: December 1999
(operational kickoff: March 2001)
Capital: 19.0 billion yen
Shareholder: Sompo Japan Nipponkoa (100%)
Total assets: 22.1 billion yen
Net premiums written: 14.1 billion yen
Head office: Sunshine 60, 1-1, Higashi-Ikebukuro 3-chome,
Toshima-ku, Tokyo
URL: http://www.sonpo24.co.jp/
Saison Automobile & Fire mainly targets those in their 40s and 50s, a demo-
graphic group with lower accident rates, through the direct marketing of “Otona
no Jidosha Hoken” automobile insurance. Aiming to ensure that every policyholder
selects its products with confidence, Saison Automobile & Fire is striving to
provide high-quality services.
SAISON AUTOMOBILE AND FIRE INSURANCE COMPANY, LIMITEDEstablishment: September 1982 (operational kickoff: April 1983)
Capital: 23.6 billion yen
Shareholder: Sompo Japan Nipponkoa (99.28%)
Credit Saison (0.72%)
Total assets: 44.7 billion yen
Net premiums written: 22.3 billion yen
Head office: Sunshine 60, 1-1, Higashi-Ikebukuro 3-chome,
Toshima-ku, Tokyo
URL: http://www.ins-saison.co.jp/
Business Overview
Basic Strategies
A diverse range of customer needs are met by the Group’s core businesses as well as
Sompo Japan Nipponkoa, which was formed through a merger on September 1, 2014,
and markets products through insurance agencies; Sonpo 24, which sells insurance
products directly to customers marketed by agencies; and Saison Automobile & Fire,
which sells directly to customers. As the P&C insurance company with the largest
number of premiums written in Japan, Sompo Japan Nipponkoa attempts to maximize
profitability through the provision of high-quality products and services.
• Maximizing cost reduction effects from merger of Sompo Japan and Nipponkoa
• Improving profitability through automobile insurance product and premium
rate revisions
• Marketing our insurance through agencies and direct sales to meet a variety
of customer needs
Domestic P&C Insurance
Financial Section
IntroductionTo O
ur Stakeholders
Review
of Operations
Managem
ent FoundationC
orporate Data
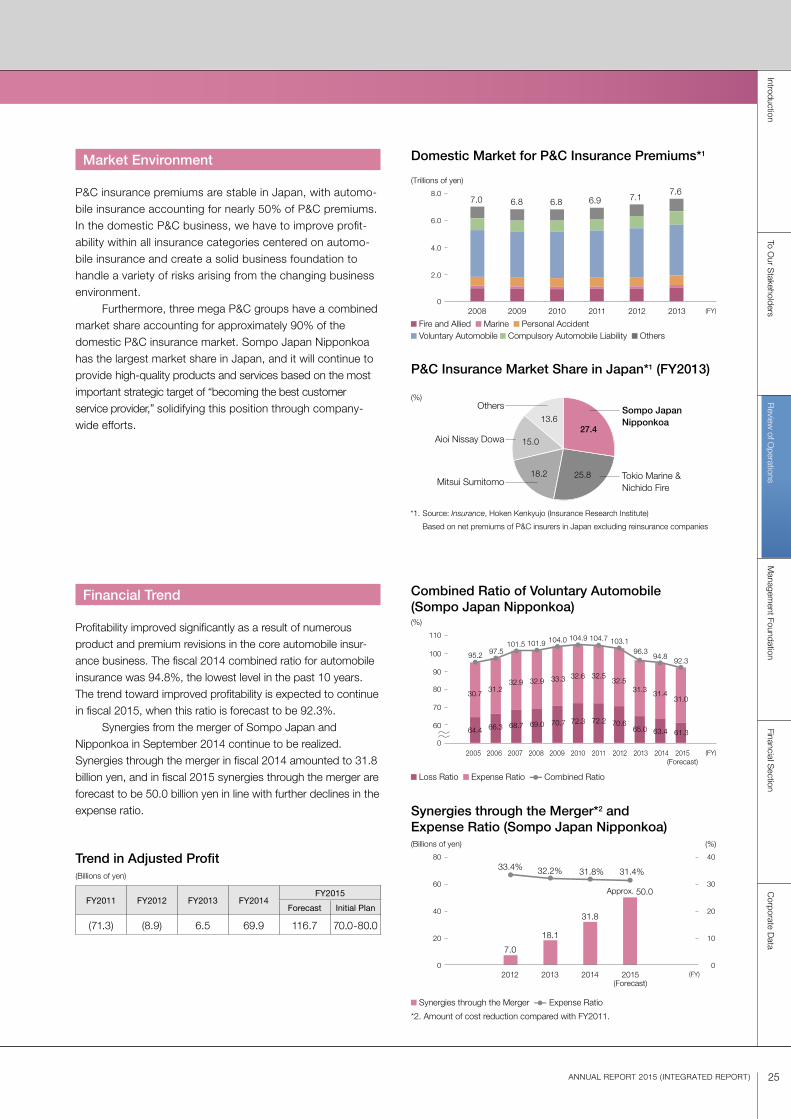
P&C insurance premiums are stable in Japan, with automo-bile insurance accounting for nearly 50% of P&C premiums. In the domestic P&C business, we have to improve profit-ability within all insurance categories centered on automo-bile insurance and create a solid business foundation to handle a variety of risks arising from the changing business environment. Furthermore, three mega P&C groups have a combined market share accounting for approximately 90% of the domestic P&C insurance market. Sompo Japan Nipponkoa has the largest market share in Japan, and it will continue to provide high-quality products and services based on the most important strategic target of “becoming the best customer service provider,” solidifying this position through company-wide efforts.
Profitability improved significantly as a result of numerous product and premium revisions in the core automobile insur-ance business. The fiscal 2014 combined ratio for automobile insurance was 94.8%, the lowest level in the past 10 years. The trend toward improved profitability is expected to continue in fiscal 2015, when this ratio is forecast to be 92.3%. Synergies from the merger of Sompo Japan and Nipponkoa in September 2014 continue to be realized. Synergies through the merger in fiscal 2014 amounted to 31.8 billion yen, and in fiscal 2015 synergies through the merger are forecast to be 50.0 billion yen in line with further declines in the expense ratio.
25ANNUAL REPORT 2015 ( INTEGRATED REPORT)
Market Environment
Financial Trend
Domestic Market for P&C Insurance Premiums*1
Combined Ratio of Voluntary Automobile (Sompo Japan Nipponkoa)
Synergies through the Merger*2 and Expense Ratio (Sompo Japan Nipponkoa)
Trend in Adjusted Profit(Billions of yen)
Fire and Allied Marine Personal Accident Voluntary Automobile Compulsory Automobile Liability Others
Loss Ratio Expense Ratio Combined Ratio
Synergies through the Merger Expense Ratio
*2. Amount of cost reduction compared with FY2011.
(FY)
(FY)
P&C Insurance Market Share in Japan*1 (FY2013)
27.4
25.818.2
15.0
13.6
(%)
Sompo Japan Nipponkoa
Tokio Marine & Nichido Fire
Mitsui Sumitomo
Aioi Nissay Dowa
Others
(Trillions of yen)7.6
6.9 7.17.0 6.8 6.8
0
8.0
2.0
4.0
2008 2009 2010 2011 2012 2013
6.0
(%)
95.2 97.5101.5 101.9 104.0 104.9 104.7 103.1
96.394.8
92.3
31.0
61.3
31.4
63.4
30.7
64.4
31.2
66.3
32.9
68.7
32.9
69.0
33.3
70.7
32.6
72.3
32.5
72.2
32.5
70.6
31.3
65.0
0
110
70
60
80
2005 2008 2010 2012 20142006 2007 2009 2011 2013 2015(Forecast)
90
100
(Billions of yen) (%)
7.0
18.1
31.8
Approx. 50.0
33.4% 32.2% 31.8% 31.4%
0
80
60
2012 2013 2014 2015(Forecast)
40
0
40
30
1020
20FY2011 FY2012 FY2013 FY2014
FY2015
Forecast Initial Plan
(71.3) (8.9) 6.5 69.9 116.7 70.0-80.0
(FY)
*1. Source: Insurance, Hoken Kenkyujo (Insurance Research Institute)
Based on net premiums of P&C insurers in Japan excluding reinsurance companies

26 Sompo Japan Nipponkoa Holdings, Inc.
Net Premiums Written
Non-Consolidated Indicators for Sompo Japan Nipponkoa
Millions of yenMillions of
U.S. dollars
FY2010 FY2011 FY2012 FY2013 FY2014 FY2014Net Premiums Written 1,877,255 1,911,760 1,966,224 2,082,193 2,181,302 18,151Net Claims Paid 1,215,405 1,432,552 1,280,410 1,236,052 1,305,471 10,863Net Loss Ratio 71.5% 81.9% 72.0% 65.7% 65.6% 65.6%Underwriting Expenses 645,300 644,067 657,442 670,925 693,647 5,772Net Expense Ratio 34.4% 33.7% 33.4% 32.2% 31.8% 31.8%Underwriting Result (110,841) (298,516) (106,339) 44,232 56,860 473Underwriting Profit (Loss) (34,708) (66,113) (16,918) (62,570) 45,232 376Combined Ratio 105.9% 115.6% 105.4% 97.9% 97.4% 97.4%Investment Assets 6,423,825 6,033,859 6,323,175 6,416,822 6,725,549 55,966Interest and Dividend Income 129,185 119,587 118,681 118,751 113,855 947Income Yield 2.17% 2.13% 2.24% 2.25% 2.19% 2.19%Investment Profit (Realized Basis) 128,959 117,576 211,240 241,646 197,674 1,644Realized Yield 2.19% 2.11% 4.01% 4.53% 3.77% 3.77%Investment Profit (Mark-to-Market Basis) (78,055) 133,851 512,187 328,911 671,576 5,588MTM Yield (1.15%) 2.15% 8.61% 5.21% 10.66% 10.66%Ordinary Profit (Loss) 20,222 (3,773) 129,639 117,765 195,134 1,623Net Income (Loss) 5,687 (60,103) 62,469 49,524 45,059 374Return on Equity (ROE) Sompo Japan 1.6% (5.9%) 4.5% 3.7%
3.3% 3.3%Nipponkoa (1.6%) (6.5%) 8.7% 5.0%
Non-Consolidated Solvency Margin Ratio
Sompo Japan 748.6% 502.5% 645.6% 713.3%716.3% 716.3%
Nipponkoa 642.9% 470.8% 534.0% 653.0%Total Net Assets 1,061,576 908,188 1,144,944 1,233,336 1,592,653 13,253Catastrophic Loss Reserve 660,739 586,201 550,113 562,089 550,851 4,583
Notes)1. Figures prior to August 2014, excluding ROE and the non-consolidated solvency margin ratio, are the total of Sompo Japan and Nipponkoa.2. ROE is calculated as net income/total net assets (average of totals at the start and end of the fiscal year).3. In the non-consolidated solvency margin ratios presented above, the figures for FY2010 and before and the figures for FY2011 and after are calculated on a different basis,
reflecting the law revision concerning the standards for the calculation of solvency margin ratio that was enforced at the end of FY2011.4. U.S. dollar amounts are translated from yen at the rate of ¥120.17=U.S.$1.00, the approximate rate prevailing at March 31, 2015.
(FY)
(Billions of yen)
2,181.3
1,877.2 1,911.7 1,966.22,082.1
0
2,500
1,000
500
2010 2011 2012 2013 2014
1,500
2,000
Breakdown of Net Premiums Written (FY2014)
(Billions of yen)
Fire and Allied 323.2 (14.8%)
Marine 52.5 (2.4%)
Personal Accident 185.2 (8.5%)
Voluntary Automobile 1,043.7 (47.9%)
Others 271.2 (12.4%)
Compulsory Automobile Liability 305.2 (14.0%)
Financial Review
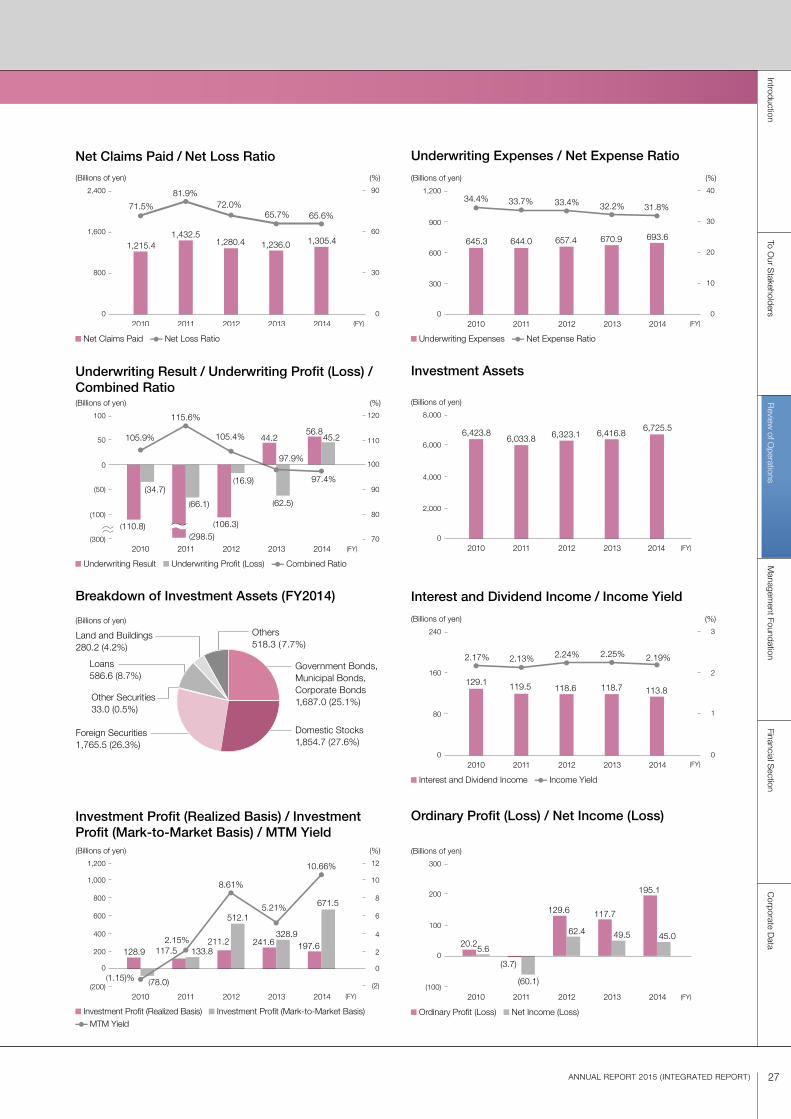
Net premiums written increased 4.8% compared with the previous period. Fire insurance performed strongly in the household, corporate, and assumed reinsurance categories. Automobile insurance revenues advanced due to product and premium revisions, and revenues rose thanks to a solid perfor-mance overall in other product lines. Although net claims paid increased, higher revenue from net premiums written improved the loss ratio 0.1 percentage point, to 65.6%.
Despite the impact of the consumption tax hike on underwriting business expenses, increased revenue from net premiums written improved the expense ratio 0.4 percentage point, to 31.8%. Led by significantly stronger underwriting profits, ordinary profit moved up 77.3 billion yen compared with the previous period, to 195.1 billion yen. At the same time, net income declined 4.4 billion yen compared with the previous period, to 45.0 billion yen, due to merger-related expenses and corpo-rate tax reductions.
Domestic P&C Insurance
Financial Section
IntroductionTo O
ur Stakeholders
Review
of Operations
Managem
ent FoundationC
orporate Data
27ANNUAL REPORT 2015 ( INTEGRATED REPORT)
Net Claims Paid / Net Loss Ratio Underwriting Expenses / Net Expense Ratio
Net Claims Paid Net Loss Ratio Underwriting Expenses Net Expense Ratio
(FY) (FY)
(Billions of yen) (%)
1,305.4
65.6%
1,215.4
71.5%
1,432.5
81.9%
1,280.4
72.0%
1,236.0
65.7%
0
2,400
800
2010 2011 2012 2013 2014
1,600
0
90
60
30
(Billions of yen) (%)
693.6
31.8%
645.3
34.4%
644.0
33.7%
657.4
33.4%
670.9
32.2%
0
1,200
600
900
300
2010 2011 2012 2013 20140
40
10
20
30
Breakdown of Investment Assets (FY2014)
Underwriting Result / Underwriting Profit (Loss) /Combined Ratio
Investment Assets
Underwriting Result Underwriting Profit (Loss) Combined Ratio
Interest and Dividend Income Income Yield
(FY) (FY)
(Billions of yen) (%)
105.9%
115.6%
105.4%
97.9%
97.4%
(110.8) (298.5)
(66.1)
(16.9)
(62.5)
(106.3)
(34.7)
44.256.8
45.2
0
100
(50)
(100)
2010 2011 2012 2013 2014
120
90
100
50 110
80
(300) 70
(Billions of yen)
6,725.56,423.86,033.8 6,323.1 6,416.8
0
8,000
4,000
2,000
2010 2011 2012 2013 2014
6,000
Interest and Dividend Income / Income Yield
(FY)
(Billions of yen) (%)
113.8129.1 119.5 118.6 118.7
2.24%2.17% 2.13% 2.25% 2.19%
0
240
80
2010 2011 2012 2013 20140
3
160 2
1
Investment Profit (Realized Basis) / Investment Profit (Mark-to-Market Basis) / MTM Yield
Ordinary Profit (Loss) / Net Income (Loss)
Investment Profit (Realized Basis) Investment Profit (Mark-to-Market Basis) MTM Yield
Ordinary Profit (Loss) Net Income (Loss)
(FY) (FY)
(Billions of yen) (%)
5.21%
10.66%
128.9 117.5 133.8211.2
512.1
241.6328.9
197.6
671.5
(78.0)(1.15)%
2.15%
8.61%
0
1,200
200
2010 2011 2012 2013 2014
12
2
400 4
600
800
6
0
8
1,000 10
(200) (2)
(Billions of yen)
117.7
20.25.6
129.6
62.4 49.5 45.0
195.1
(60.1)
(3.7)0
300
2010 2011 2012 2013 2014
100
200
(100)
Government Bonds, Municipal Bonds, Corporate Bonds 1,687.0 (25.1%)
Others518.3 (7.7%)
Domestic Stocks1,854.7 (27.6%)
Foreign Securities1,765.5 (26.3%)
Other Securities33.0 (0.5%)
Loans586.6 (8.7%)
Land and Buildings280.2 (4.2%)
(Billions of yen)

28 Sompo Japan Nipponkoa Holdings, Inc.
Provision of “Smiling Road” Safe Driving Support Services for Corporate CustomersIn March 2015, Sompo Japan Nipponkoa and Sompo Japan Nipponkoa Risk Management launched the provision of “Smiling Road” safe driving support services for corporate customers. This advanced service is the first in the insurance indus-try to support safe driving using big data analysis and telematics technologies. The provision of this service will reduce automo-bile accidents involving corporate activities and contribute to the realization of a society with security and wellbeing.
Domestic P&C Insurance
Topics
Note) Figures before fiscal 2013 are those of the surviving company, Sompo Japan.Note) Figures before fiscal 2013 are those of the surviving company, Sompo Japan.
Return on Equity (ROE) Non-Consolidated Solvency Margin Ratio
(FY) (FY)
(%)
1.6%
4.5%3.7% 3.3%
(5.9)%
6
0
(3)
(6)2010 2011 2012 2013 2014
3
(%)
716.3%748.6%
502.5%
645.6%713.3%
0
1,000
400
200
2010 2011 2012 2013 2014
600
800
GPS satellite Drive recorder
Drive recorder records driving information
Communication lines
Position information, images, etc.
Driving data
Driver
Corporate administrator
Mobile phone/ComputerDriving information notification delivered by e-mail or on web page
SmartphoneDriving information notification by dedicated app
ComputerTrip information for each driver is shown on the administrator screen
Information is analyzed at data center
Diagnostic results, etc.
Dangerous behaviors, etc.
“Smiling Road” Mechanism
Driver dedicated app screen image
Corporate administrator computer screen image
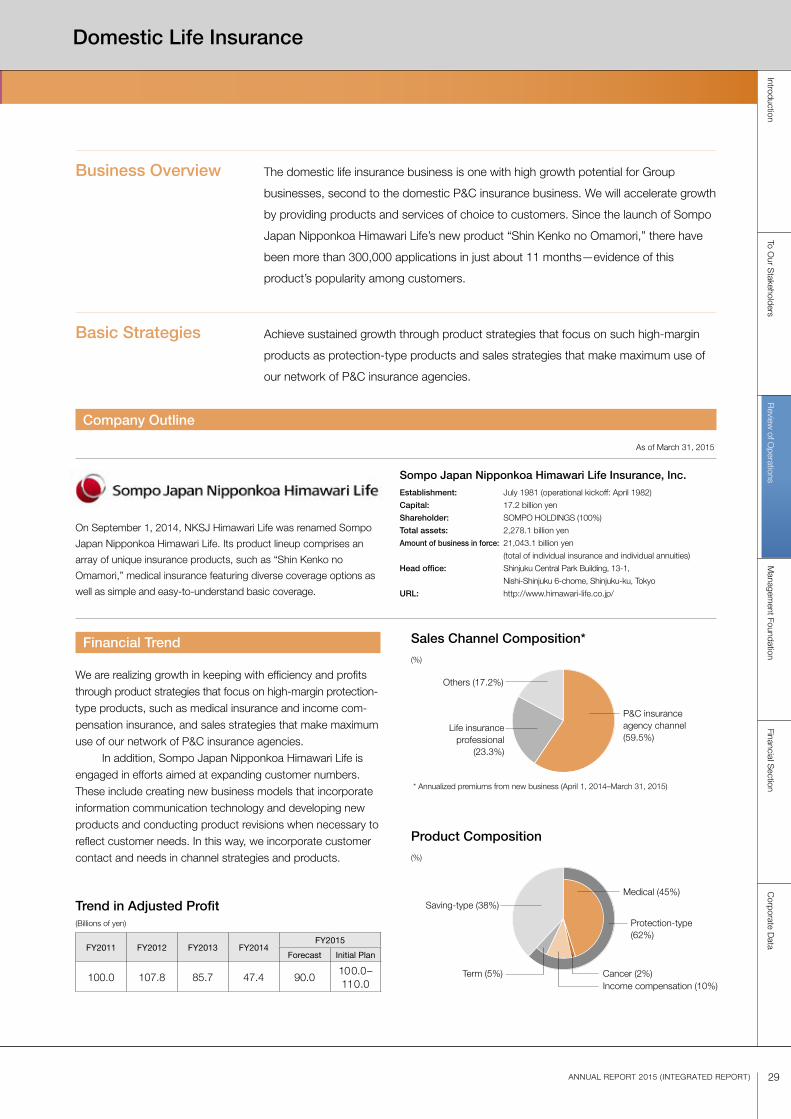
Financial Section
IntroductionTo O
ur Stakeholders
Review
of Operations
Managem
ent FoundationC
orporate Data
(%)
(%)
29ANNUAL REPORT 2015 ( INTEGRATED REPORT)
We are realizing growth in keeping with efficiency and profits through product strategies that focus on high-margin protection-type products, such as medical insurance and income com-pensation insurance, and sales strategies that make maximum use of our network of P&C insurance agencies. In addition, Sompo Japan Nipponkoa Himawari Life is engaged in efforts aimed at expanding customer numbers. These include creating new business models that incorporate information communication technology and developing new products and conducting product revisions when necessary to reflect customer needs. In this way, we incorporate customer contact and needs in channel strategies and products.
Financial Trend
Company Outline
As of March 31, 2015
On September 1, 2014, NKSJ Himawari Life was renamed Sompo
Japan Nipponkoa Himawari Life. Its product lineup comprises an
array of unique insurance products, such as “Shin Kenko no
Omamori,” medical insurance featuring diverse coverage options as
well as simple and easy-to-understand basic coverage.
Sompo Japan Nipponkoa Himawari Life Insurance, Inc.Establishment: July 1981 (operational kickoff: April 1982)
Capital: 17.2 billion yen
Shareholder: SOMPO HOLDINGS (100%)
Total assets: 2,278.1 billion yen
Amount of business in force: 21,043.1 billion yen
(total of individual insurance and individual annuities)
Head office: Shinjuku Central Park Building, 13-1,
Nishi-Shinjuku 6-chome, Shinjuku-ku, Tokyo
URL: http://www.himawari-life.co.jp/
Business Overview
Basic Strategies
The domestic life insurance business is one with high growth potential for Group
businesses, second to the domestic P&C insurance business. We will accelerate growth
by providing products and services of choice to customers. Since the launch of Sompo
Japan Nipponkoa Himawari Life’s new product “Shin Kenko no Omamori,” there have
been more than 300,000 applications in just about 11 months—evidence of this
product’s popularity among customers.
Achieve sustained growth through product strategies that focus on such high-margin
products as protection-type products and sales strategies that make maximum use of
our network of P&C insurance agencies.
Sales Channel Composition*
Product Composition
P&C insurance agency channel(59.5%)
Medical (45%)
Cancer (2%)Income compensation (10%)
Life insurance professional
(23.3%)
Term (5%)
Others (17.2%)
Saving-type (38%)
Protection-type(62%)
Trend in Adjusted Profit(Billions of yen)
FY2011 FY2012 FY2013 FY2014FY2015
Forecast Initial Plan
100.0 107.8 85.7 47.4 90.0100.0–110.0
* Annualized premiums from new business (April 1, 2014–March 31, 2015)
Domestic Life Insurance
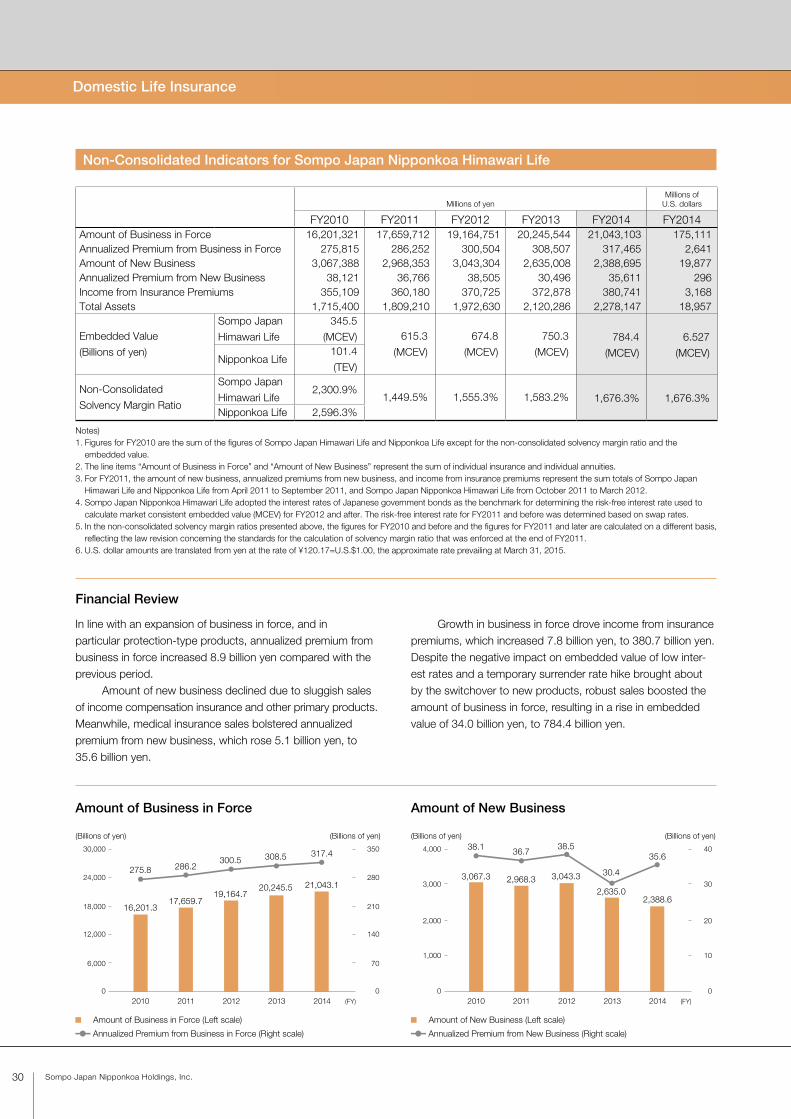
Domestic Life Insurance
30 Sompo Japan Nipponkoa Holdings, Inc.
Amount of Business in Force Amount of New Business
(Billions of yen) (Billions of yen)
275.8 286.2300.5 308.5 317.4
16,201.317,659.7
19,164.720,245.5 21,043.1
0
30,000
18,000
12,000
6,000
2010 2011 2012 2013 20140
350
210
24,000 280
140
70
(Billions of yen) (Billions of yen)38.1 36.7
38.5
30.4
2,388.6
3,067.3 2,968.3 3,043.3
2,635.0
35.6
0
4,000
2,000
1,000
2010 2011 2012 2013 20140
40
20
3,000 30
10
Amount of Business in Force (Left scale)
Annualized Premium from Business in Force (Right scale)
Amount of New Business (Left scale)
Annualized Premium from New Business (Right scale)
Non-Consolidated Indicators for Sompo Japan Nipponkoa Himawari Life
Millions of yenMillions of
U.S. dollars
FY2010 FY2011 FY2012 FY2013 FY2014 FY2014Amount of Business in Force 16,201,321 17,659,712 19,164,751 20,245,544 21,043,103 175,111Annualized Premium from Business in Force 275,815 286,252 300,504 308,507 317,465 2,641Amount of New Business 3,067,388 2,968,353 3,043,304 2,635,008 2,388,695 19,877Annualized Premium from New Business 38,121 36,766 38,505 30,496 35,611 296Income from Insurance Premiums 355,109 360,180 370,725 372,878 380,741 3,168Total Assets 1,715,400 1,809,210 1,972,630 2,120,286 2,278,147 18,957
Embedded Value
(Billions of yen)
Sompo Japan
Himawari Life
345.5
(MCEV) 615.3
(MCEV)
674.8
(MCEV)
750.3
(MCEV)784.4
(MCEV)
6.527
(MCEV)Nipponkoa Life
101.4
(TEV)
Non-Consolidated
Solvency Margin Ratio
Sompo Japan
Himawari Life2,300.9%
1,449.5% 1,555.3% 1,583.2% 1,676.3% 1,676.3%Nipponkoa Life 2,596.3%
Notes)1. Figures for FY2010 are the sum of the figures of Sompo Japan Himawari Life and Nipponkoa Life except for the non-consolidated solvency margin ratio and the
embedded value.2. The line items “Amount of Business in Force” and “Amount of New Business” represent the sum of individual insurance and individual annuities.3. For FY2011, the amount of new business, annualized premiums from new business, and income from insurance premiums represent the sum totals of Sompo Japan
Himawari Life and Nipponkoa Life from April 2011 to September 2011, and Sompo Japan Nipponkoa Himawari Life from October 2011 to March 2012.4. Sompo Japan Nipponkoa Himawari Life adopted the interest rates of Japanese government bonds as the benchmark for determining the risk-free interest rate used to
calculate market consistent embedded value (MCEV) for FY2012 and after. The risk-free interest rate for FY2011 and before was determined based on swap rates.5. In the non-consolidated solvency margin ratios presented above, the figures for FY2010 and before and the figures for FY2011 and later are calculated on a different basis,
reflecting the law revision concerning the standards for the calculation of solvency margin ratio that was enforced at the end of FY2011.6. U.S. dollar amounts are translated from yen at the rate of ¥120.17=U.S.$1.00, the approximate rate prevailing at March 31, 2015.
(FY) (FY)
In line with an expansion of business in force, and in particular protection-type products, annualized premium from business in force increased 8.9 billion yen compared with the previous period. Amount of new business declined due to sluggish sales of income compensation insurance and other primary products. Meanwhile, medical insurance sales bolstered annualized premium from new business, which rose 5.1 billion yen, to 35.6 billion yen.
Growth in business in force drove income from insurance premiums, which increased 7.8 billion yen, to 380.7 billion yen. Despite the negative impact on embedded value of low inter-est rates and a temporary surrender rate hike brought about by the switchover to new products, robust sales boosted the amount of business in force, resulting in a rise in embedded value of 34.0 billion yen, to 784.4 billion yen.
Financial Review

Financial Section
IntroductionTo O
ur Stakeholders
Review
of Operations
Managem
ent FoundationC
orporate Data
31ANNUAL REPORT 2015 ( INTEGRATED REPORT)
Income from Insurance Premiums Total Assets
(Billions of yen)
380.7355.1 360.1 370.7 372.8
0
400
200
100
2010 2011 2012 2013 2014
300
(Billions of yen)
2,278.1
1,715.4 1,809.21,972,6
2,120.2
0
2,500
1,000
500
2010 2011 2012 2013 2014
1,500
2,000
(FY) (FY)
Embedded Value Non-Consolidated Solvency Margin Ratio
(Billions of yen)
784.4
101.4
345.5
615.3674.8
750.3
0
1,000
400
200
2010 2011 2012 2013 2014
600
800
(%)
1,676.3%
2,300.9%
1,449.5%
1,555.3% 1,583.2%
0
2,500
1,000
500
2010 2011 2012 2013 2014
1,500
2,000
Sompo Japan Himawari Life Nipponkoa Life
Sompo Japan Nipponkoa Himawari Life
Note) The embedded value of Nipponkoa Life was calculated based on traditional embedded value (TEV), while the embedded values of Sompo Japan Himawari Life and Sompo Japan Nipponkoa Himawari Life have been calculated based on market consistent embedded value (MCEV).
Note) Figures for FY2010 were those of Sompo Japan Himawari Life, the surviving company.
(FY) (FY)
Over 300,000 Applications for Medical Insurance (2014)
In May 2014, Sompo Japan Nipponkoa Himawari Life released the new medical insurance product
“Shin Kenko no Omamori.” Aimed at “meeting a wide range of customer needs for protection at an
optimum price,” this new product offers enhanced coverage content in line with customer needs and
has adopted lower premiums. In the first 11 months since its launch, over 300,000 applications have
been received.
Introducing New Product in Simple Underwriting Medical Insurance
In April 2015, Sompo Japan Nipponkoa Himawari Life released “Shin Kenko no Omamori Heart,”
a new and simple underwriting medical insurance product.
Based on the concept of “providing peace of mind to people concerned about their health,”
Sompo Japan Nipponkoa Himawari Life reviewed protection, premium, and notification categories to
enable “Shin Kenko no Omamori Heart” to provide the same protection, even for customers who have
never before purchased insurance for health reasons.
Topics

32 Sompo Japan Nipponkoa Holdings, Inc.
Business Overview
Basic Strategies
As overseas insurance is an integral part of the Group’s growth strategy, we are investing
our business resources in countries and regions where potential for growth exists.
In May 2014, we acquired U.K.-based Canopius, a Lloyd’s insurer. Also, in April
2015, we became the leading shareholder of SCOR, a reinsurance company head-
quartered in France. We have been steadily expanding the overseas insurance business.
• Realizing steady growth through investments in mature markets, including the Lloyd’s
insurance market in the United Kingdom, in addition to initiatives aimed at organic
growth within the Group of the overseas insurance market
• Continuing well-balanced investments, focusing between emerging and
developed markets
Global Expansion
The Group boasts a global business network encompass-ing 210 cities in 32 countries and regions, including Europe, the Middle East, Africa, North America, Central and South America, Asia and Oceania. The size of premiums written* in each region is as follows.
■ Europe<Countries and Regions>
U.K., Guernsey, Ireland, Germany, Belgium, France, Netherlands, Italy, Spain, Swiss, Russia
2013 2014
4.0
91.4
(Billions of yen)
(FY)
<Main Operating Companies>• Sompo Japan Nipponkoa Insurance Company of
Europe Limited
• Canopius Group Limited
• Canopius Holdings UK Limited
• Canopius Managing Agents Limited
■ Middle East / Africa<Countries and Regions>
Turkey, United Arab Emirates, Republic of South Africa
2013 2014
18.4 22.8
(Billions of yen)
(FY)
<Main Operating Company>• Sompo Japan Sigorta Anonim Sirketi
* Premiums written are those underwritten only by foreign subsidiaries and, therefore, do not include those underwritten abroad by Sompo Japan Nipponkoa.
Overseas Insurance

Financial Section
IntroductionTo O
ur Stakeholders
Review
of Operations
Managem
ent FoundationC
orporate Data
33ANNUAL REPORT 2015 ( INTEGRATED REPORT)
Global Expansion
Market Emerging countries Developed countries
Business area Mainly retail Mainly specialty
Direction Mid-long term profit contribution Stable profit contribution
Target regions
Key regions Business platform development regions
U.S.A., Europe (Including the
reassurance field)
Brazil, Turkey, Malaysia
Other emerging countries
Already ranked around 10th in the market, aiming
to be a major player
Prior investment in high opportunity markets
Trend in Adjusted Profit(Billions of yen)
FY2011 FY2012 FY2013 FY2014FY2015
Forecast Initial Plan
(19.7) 11.8 7.8 18.6 19.2 14.0–20.0
In developed countries, the acquisition of Canopius enables the Group to make a full-scale entry into the overseas specialty market, while the investment in SCOR allows the Group to advance into the life reinsurance market, so it can expect contributions to stable growth going forward. At the same time, the Group aims to become a major player in the emerging countries of Brazil, Turkey, and Malaysia—important regions where it is already among the top 10 insurance companies.
May 2014
Canopius (U.K.)About ¥104.7 billion
March 2015
SCOR (France)Decided to invest*2
Major M&A since 2010
2013
Maritima (Brazil)¥25.1 billion*1
*1. Cumulative invested capital *2. Approx. ¥110.0 billon investment, assuming 15% of voting rights
2011
Berjaya (Malaysia)¥17.0 billion*1
2010
Fiba Sigorta (Turkey)¥27.4 billion
2010
Tenet (Singapore)¥6.4 billion
■ North America<Countries and Regions>
U.S.A., Canada
2013 2014
13.1 17.8(Billions of yen)
(FY)
<Main Operating Companies>• Sompo Japan Nipponkoa Holdings (Americas) Inc.*
• Sompo Japan Insurance Company of America
* On June 4, 2015, Sompo Japan Nipponkoa Holdings (Americas) Inc. changed its company name to Sompo America Holdings Inc.
■ Asia / Oceania<Countries and Regions>
Singapore, Malaysia, Indonesia, Thailand, Philippines, Vietnam, Myanmar, Cambodia, India, Australia, China, Taiwan, Korea
2013 2014
28.937.1
(Billions of yen)
(FY)
<Main Operating Companies>• Sompo Japan Nipponkoa Holdings (Asia) Pte. Ltd.
• Tenet Sompo Insurance Pte. Ltd.
• Berjaya Sompo Insurance Berhad
• Universal Sompo General Insurance Company Limited
• Sompo Japan Nipponkoa Insurance (China) Co., Ltd.
• Sompo Japan Nipponkoa Insurance (Hong Kong) Company Limited
■ Central and South America<Countries and Regions>
Brazil, Mexico, Bermuda
2013 2014
93.9
122.3
(Billions of yen)
(FY)
<Main Operating Companies>• Yasuda Marítima Seguros S.A.
• Yasuda Marítima Saude Seguros S.A.
• Canopius Reinsurance Limited*
* Premiums written are included in Europe.
(As of April 1, 2015)
Overseas Investment Strategy
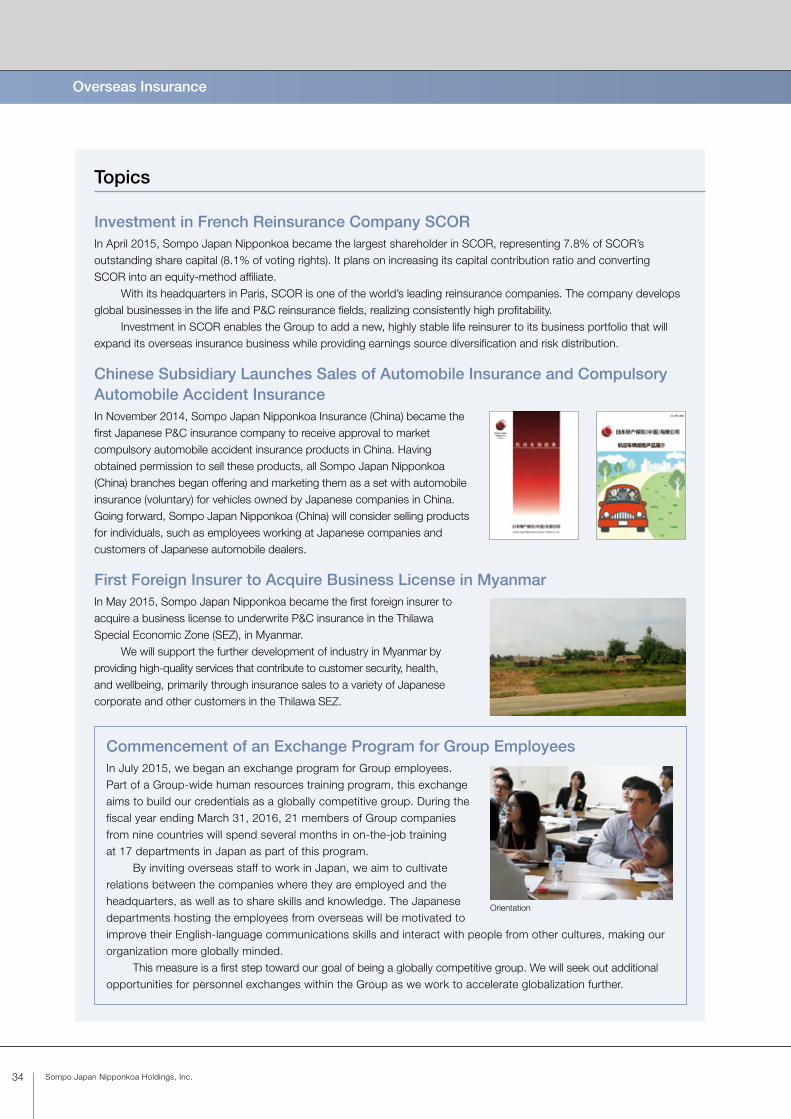
34 Sompo Japan Nipponkoa Holdings, Inc.
Overseas Insurance
Investment in French Reinsurance Company SCORIn April 2015, Sompo Japan Nipponkoa became the largest shareholder in SCOR, representing 7.8% of SCOR’s outstanding share capital (8.1% of voting rights). It plans on increasing its capital contribution ratio and converting SCOR into an equity-method affiliate. With its headquarters in Paris, SCOR is one of the world’s leading reinsurance companies. The company develops global businesses in the life and P&C reinsurance fields, realizing consistently high profitability. Investment in SCOR enables the Group to add a new, highly stable life reinsurer to its business portfolio that will expand its overseas insurance business while providing earnings source diversification and risk distribution.
Chinese Subsidiary Launches Sales of Automobile Insurance and Compulsory Automobile Accident InsuranceIn November 2014, Sompo Japan Nipponkoa Insurance (China) became the first Japanese P&C insurance company to receive approval to market compulsory automobile accident insurance products in China. Having obtained permission to sell these products, all Sompo Japan Nipponkoa (China) branches began offering and marketing them as a set with automobile insurance (voluntary) for vehicles owned by Japanese companies in China. Going forward, Sompo Japan Nipponkoa (China) will consider selling products for individuals, such as employees working at Japanese companies and customers of Japanese automobile dealers.
First Foreign Insurer to Acquire Business License in MyanmarIn May 2015, Sompo Japan Nipponkoa became the first foreign insurer to acquire a business license to underwrite P&C insurance in the Thilawa Special Economic Zone (SEZ), in Myanmar. We will support the further development of industry in Myanmar by providing high-quality services that contribute to customer security, health, and wellbeing, primarily through insurance sales to a variety of Japanese corporate and other customers in the Thilawa SEZ.
Topics
Commencement of an Exchange Program for Group EmployeesIn July 2015, we began an exchange program for Group employees. Part of a Group-wide human resources training program, this exchange aims to build our credentials as a globally competitive group. During the fiscal year ending March 31, 2016, 21 members of Group companies from nine countries will spend several months in on-the-job training at 17 departments in Japan as part of this program. By inviting overseas staff to work in Japan, we aim to cultivate relations between the companies where they are employed and the headquarters, as well as to share skills and knowledge. The Japanese departments hosting the employees from overseas will be motivated to improve their English-language communications skills and interact with people from other cultures, making our organization more globally minded. This measure is a first step toward our goal of being a globally competitive group. We will seek out additional opportunities for personnel exchanges within the Group as we work to accelerate globalization further.
Orientation
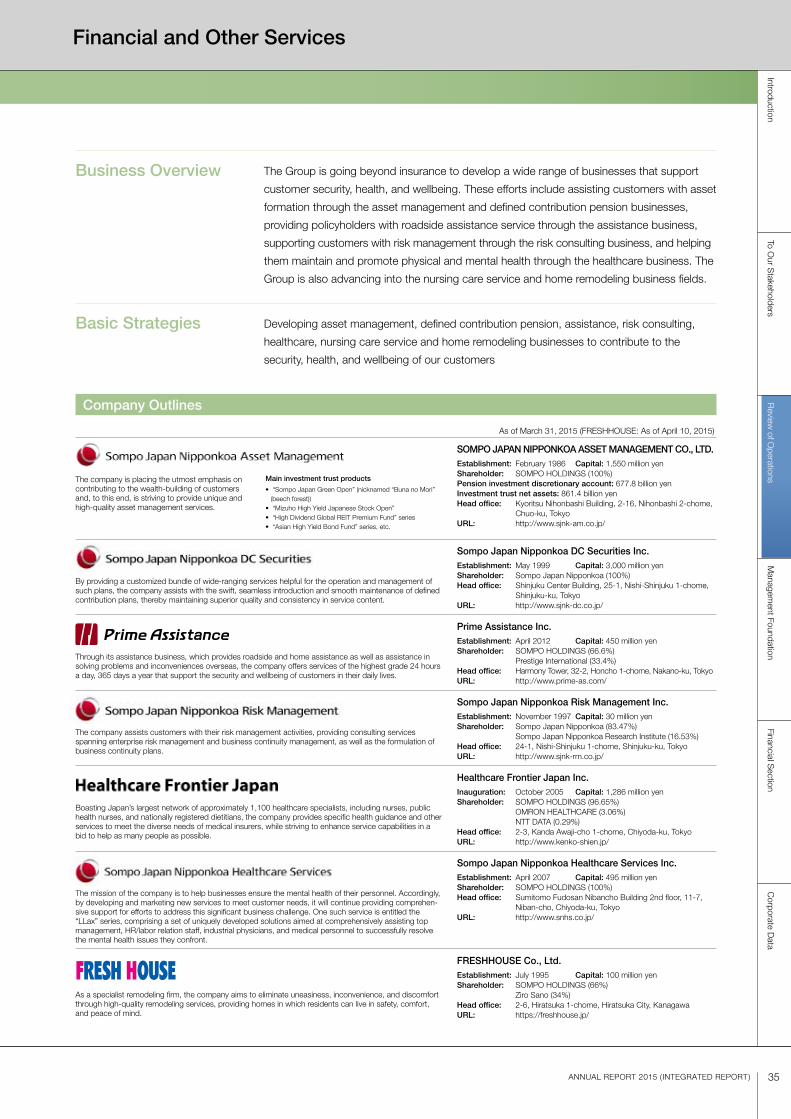
Financial Section
IntroductionTo O
ur Stakeholders
Review
of Operations
Managem
ent FoundationC
orporate Data
35ANNUAL REPORT 2015 ( INTEGRATED REPORT)
Business Overview The Group is going beyond insurance to develop a wide range of businesses that support
customer security, health, and wellbeing. These efforts include assisting customers with asset
formation through the asset management and defined contribution pension businesses,
providing policyholders with roadside assistance service through the assistance business,
supporting customers with risk management through the risk consulting business, and helping
them maintain and promote physical and mental health through the healthcare business. The
Group is also advancing into the nursing care service and home remodeling business fields.
Basic Strategies Developing asset management, defined contribution pension, assistance, risk consulting,
healthcare, nursing care service and home remodeling businesses to contribute to the
security, health, and wellbeing of our customers
Company Outlines
As of March 31, 2015 (FRESHHOUSE: As of April 10, 2015)
The company is placing the utmost emphasis on contributing to the wealth-building of customers and, to this end, is striving to provide unique and high-quality asset management services.
SOMPO JAPAN NIPPONKOA ASSET MANAGEMENT CO., LTD.Establishment: February 1986 Capital: 1,550 million yenShareholder: SOMPO HOLDINGS (100%)Pension investment discretionary account: 677.8 billion yenInvestment trust net assets: 861.4 billion yenHead office: Kyoritsu Nihonbashi Building, 2-16, Nihonbashi 2-chome, Chuo-ku, TokyoURL: http://www.sjnk-am.co.jp/
By providing a customized bundle of wide-ranging services helpful for the operation and management of such plans, the company assists with the swift, seamless introduction and smooth maintenance of defined contribution plans, thereby maintaining superior quality and consistency in service content.
Sompo Japan Nipponkoa DC Securities Inc.Establishment: May 1999 Capital: 3,000 million yenShareholder: Sompo Japan Nipponkoa (100%)Head office: Shinjuku Center Building, 25-1, Nishi-Shinjuku 1-chome, Shinjuku-ku, TokyoURL: http://www.sjnk-dc.co.jp/
Through its assistance business, which provides roadside and home assistance as well as assistance in solving problems and inconveniences overseas, the company offers services of the highest grade 24 hours a day, 365 days a year that support the security and wellbeing of customers in their daily lives.
Prime Assistance Inc.Establishment: April 2012 Capital: 450 million yenShareholder: SOMPO HOLDINGS (66.6%) Prestige International (33.4%)Head office: Harmony Tower, 32-2, Honcho 1-chome, Nakano-ku, TokyoURL: http://www.prime-as.com/
The company assists customers with their risk management activities, providing consulting services spanning enterprise risk management and business continuity management, as well as the formulation of business continuity plans.
Sompo Japan Nipponkoa Risk Management Inc.Establishment: November 1997 Capital: 30 million yenShareholder: Sompo Japan Nipponkoa (83.47%) Sompo Japan Nipponkoa Research Institute (16.53%)Head office: 24-1, Nishi-Shinjuku 1-chome, Shinjuku-ku, TokyoURL: http://www.sjnk-rm.co.jp/
Boasting Japan’s largest network of approximately 1,100 healthcare specialists, including nurses, public health nurses, and nationally registered dietitians, the company provides specific health guidance and other services to meet the diverse needs of medical insurers, while striving to enhance service capabilities in a bid to help as many people as possible.
Healthcare Frontier Japan Inc.Inauguration: October 2005 Capital: 1,286 million yenShareholder: SOMPO HOLDINGS (96.65%)
OMRON HEALTHCARE (3.06%) NTT DATA (0.29%)
Head office: 2-3, Kanda Awaji-cho 1-chome, Chiyoda-ku, TokyoURL: http://www.kenko-shien.jp/
The mission of the company is to help businesses ensure the mental health of their personnel. Accordingly, by developing and marketing new services to meet customer needs, it will continue providing comprehen-sive support for efforts to address this significant business challenge. One such service is entitled the “LLax” series, comprising a set of uniquely developed solutions aimed at comprehensively assisting top management, HR/labor relation staff, industrial physicians, and medical personnel to successfully resolve the mental health issues they confront.
Sompo Japan Nipponkoa Healthcare Services Inc.Establishment: April 2007 Capital: 495 million yenShareholder: SOMPO HOLDINGS (100%)Head office: Sumitomo Fudosan Nibancho Building 2nd floor, 11-7, Niban-cho, Chiyoda-ku, TokyoURL: http://www.snhs.co.jp/
As a specialist remodeling firm, the company aims to eliminate uneasiness, inconvenience, and discomfort through high-quality remodeling services, providing homes in which residents can live in safety, comfort, and peace of mind.
FRESHHOUSE Co., Ltd.Establishment: July 1995 Capital: 100 million yenShareholder: SOMPO HOLDINGS (66%) Ziro Sano (34%)Head office: 2-6, Hiratsuka 1-chome, Hiratsuka City, KanagawaURL: https://freshhouse.jp/
Main investment trust products
• “Sompo Japan Green Open” (nicknamed “Buna no Mori” (beech forest))
• “Mizuho High Yield Japanese Stock Open”• “High Dividend Global REIT Premium Fund” series• “Asian High Yield Bond Fund” series, etc.
Financial and Other Services
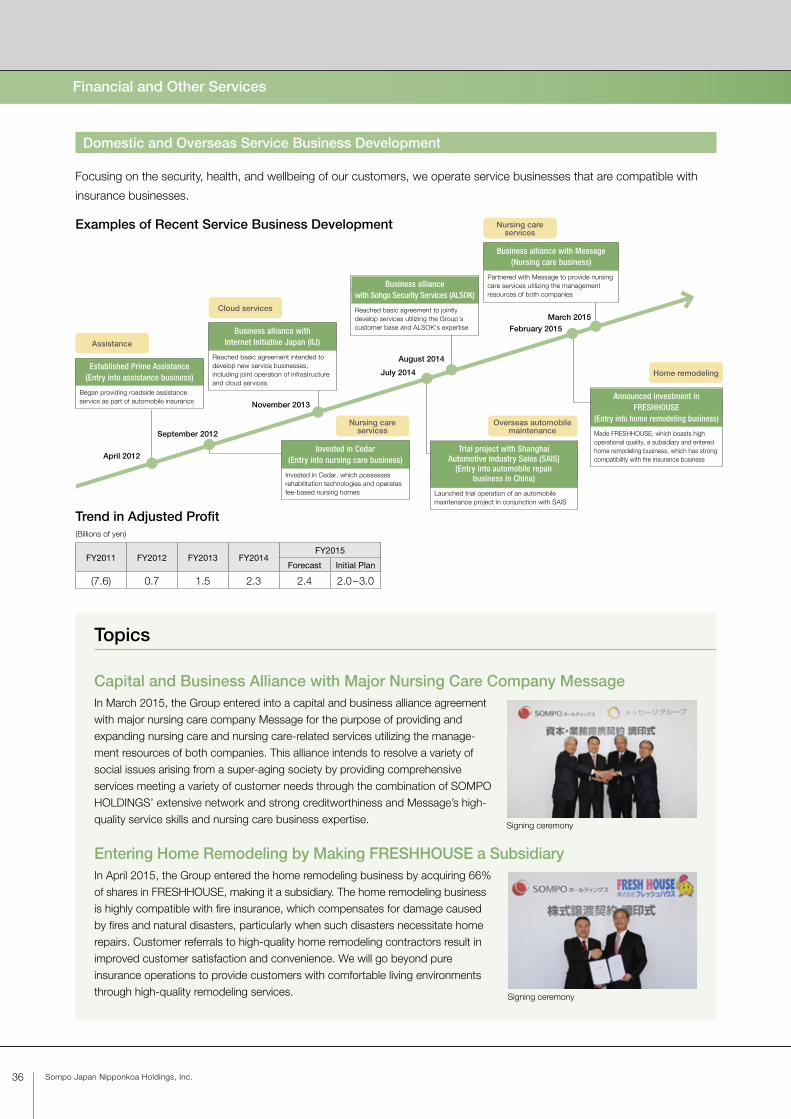
36 Sompo Japan Nipponkoa Holdings, Inc.
Capital and Business Alliance with Major Nursing Care Company MessageIn March 2015, the Group entered into a capital and business alliance agreement with major nursing care company Message for the purpose of providing and expanding nursing care and nursing care-related services utilizing the manage-ment resources of both companies. This alliance intends to resolve a variety of social issues arising from a super-aging society by providing comprehensive services meeting a variety of customer needs through the combination of SOMPO HOLDINGS’ extensive network and strong creditworthiness and Message’s high-quality service skills and nursing care business expertise.
Entering Home Remodeling by Making FRESHHOUSE a SubsidiaryIn April 2015, the Group entered the home remodeling business by acquiring 66% of shares in FRESHHOUSE, making it a subsidiary. The home remodeling business is highly compatible with fire insurance, which compensates for damage caused by fires and natural disasters, particularly when such disasters necessitate home repairs. Customer referrals to high-quality home remodeling contractors result in improved customer satisfaction and convenience. We will go beyond pure insurance operations to provide customers with comfortable living environments through high-quality remodeling services.
Topics
Signing ceremony
Signing ceremony
Domestic and Overseas Service Business Development
Focusing on the security, health, and wellbeing of our customers, we operate service businesses that are compatible with
insurance businesses.
Trend in Adjusted Profit(Billions of yen)
FY2011 FY2012 FY2013 FY2014FY2015
Forecast Initial Plan
(7.6) 0.7 1.5 2.3 2.4 2.0–3.0
Examples of Recent Service Business Development
August 2014
February 2015Business alliance withInternet Initiative Japan (IIJ)
Reached basic agreement intended to develop new service businesses, including joint operation of infrastructure and cloud services
November 2013
Cloud services
Business alliance with Message(Nursing care business)
Partnered with Message to provide nursing care services utilizing the management resources of both companies
March 2015
Nursing care services
Trial project with Shanghai Automotive Industry Sales (SAIS)
(Entry into automobile repairbusiness in China)
Launched trial operation of an automobile maintenance project in conjunction with SAIS
July 2014
Overseas automobile maintenance
Invested in Cedar(Entry into nursing care business)
Invested in Cedar, which possesses rehabilitation technologies and operates fee-based nursing homes
September 2012Nursing care
services
Established Prime Assistance(Entry into assistance business)
Began providing roadside assistance service as part of automobile insurance
April 2012
Assistance
Announced investment inFRESHHOUSE
(Entry into home remodeling business)
Made FRESHHOUSE, which boasts high operational quality, a subsidiary and entered home remodeling business, which has strong compatibility with fire insurance business
Home remodeling
Business alliancewith Sohgo Security Services (ALSOK)
Reached basic agreement to jointly develop services utilizing the Group’s customer base and ALSOK’s expertise
Financial and Other Services

ANNUAL REPORT 2015 ( INTEGRATED REPORT)
IntroductionIntroduction
Corporate D
ataFinancial S
ectionTo O
ur Stakeholders
Review
of Operations
Managem
ent FoundationFinancial S
ectionTo O
ur Stakeholders
Review
of Operations
Managem
ent Foundation
Management Foundation
37
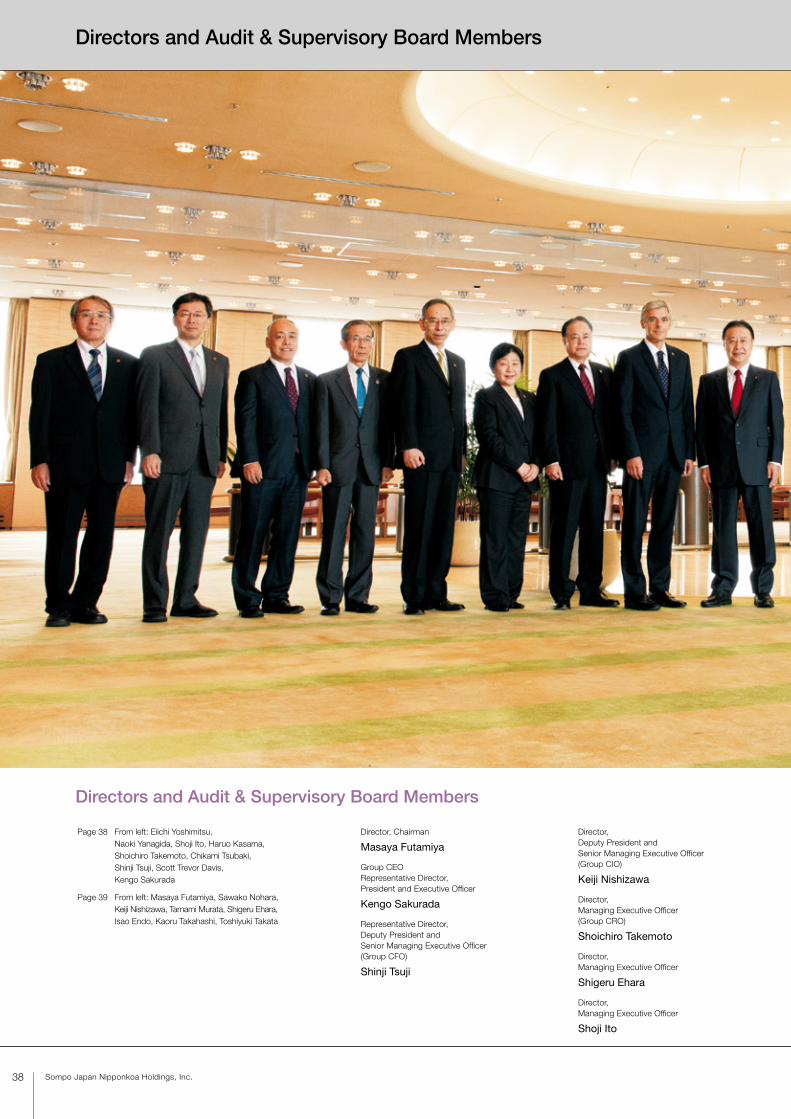
38 Sompo Japan Nipponkoa Holdings, Inc.
Director, Chairman
Masaya Futamiya
Group CEORepresentative Director,President and Executive Officer
Kengo Sakurada
Representative Director, Deputy President and Senior Managing Executive Officer(Group CFO)
Shinji Tsuji
Director, Deputy President and Senior Managing Executive Officer(Group CIO)
Keiji Nishizawa
Director, Managing Executive Officer(Group CRO)
Shoichiro Takemoto
Director, Managing Executive Officer
Shigeru Ehara
Director,Managing Executive Officer
Shoji Ito
Directors and Audit & Supervisory Board Members
Directors and Audit & Supervisory Board Members
Page 38 From left: Eiichi Yoshimitsu, Naoki Yanagida, Shoji Ito, Haruo Kasama, Shoichiro Takemoto, Chikami Tsubaki, Shinji Tsuji, Scott Trevor Davis, Kengo Sakurada
Page 39 From left: Masaya Futamiya, Sawako Nohara, Keiji Nishizawa, Tamami Murata, Shigeru Ehara, Isao Endo, Kaoru Takahashi, Toshiyuki Takata

As of July 1, 2015
39ANNUAL REPORT 2015 ( INTEGRATED REPORT)
Director
Kaoru Takahashi
Outside Director
Sawako Nohara
Outside Director
Isao Endo
Outside Director
Tamami Murata
Outside Director
Scott Trevor Davis
Audit & Supervisory Board Member (Full-Time)
Eiichi Yoshimitsu
Audit & Supervisory Board Member (Full-Time)
Toshiyuki Takata
Outside Audit & Supervisory Board Member
Chikami Tsubaki
Outside Audit & Supervisory Board Member
Haruo Kasama
Outside Audit & Supervisory Board Member
Naoki Yanagida
Financial Section
IntroductionTo O
ur Stakeholders
Review
of Operations
Managem
ent FoundationC
orporate Data

Directors (As of July 1, 2015)
40 Sompo Japan Nipponkoa Holdings, Inc.
Job Title Name (Date of Birth)
Summarized Resume Responsibilities
Director, Chairman
Masaya Futamiya(Feb. 25, 1952)
Apr. 1974 Joined The Nippon Fire & Marine Insurance Co., Ltd.Jun. 2003 Executive Officer, General Manager, Presidential Staff Office & IR Office of
NIPPONKOA Insurance Company, Limited (“NIPPONKOA”)Apr. 2004 Executive Officer, General Manager, Presidential Staff Office & CR Planning Department
of NIPPONKOAJun. 2004 Managing Executive Officer of NIPPONKOAJun. 2005 Director, Managing Executive Officer of NIPPONKOAJun. 2009 Representative Director, Senior Managing Executive Officer of NIPPONKOAJun. 2011 Director of the Company
Representative Director, President and Chief Executive Officer of NIPPONKOAApr. 2012 Representative Director, Chairman and Executive Officer of the CompanySep. 2014 Representative Director, President and Chief Executive Officer of Sompo Japan
Nipponkoa Insurance Inc. (current position)Apr. 2015 Representative Director, Chairman of the CompanyJun. 2015 Director, Chairman of the Company (current position)
Overall Management
Group CEORepresentative Director, President and Executive Officer
Kengo Sakurada(Feb. 11, 1956)
Apr. 1978 Joined The Yasuda Fire & Marine Insurance Co., Ltd.Jul. 2005 Executive Officer, General Manager, Financial Institutions Department of Sompo Japan
Insurance Inc. (“Sompo Japan”)Apr. 2007 Managing Executive Officer of Sompo JapanJun. 2007 Director, Managing Executive Officer of Sompo JapanApr. 2010 Director, Managing Executive Officer of the CompanyJul. 2010 Director, Executive Officer of the Company
Representative Director, President and Chief Executive Officer of Sompo JapanJun. 2011 Director of the CompanyApr. 2012 Representative Director, President and Executive Officer of the CompanySep. 2014 Representative Director, Chairman and Executive Officer of Sompo Japan Nipponkoa
Insurance Inc. (“Sompo Japan Nipponkoa”)Apr. 2015 Representative Director, Chairman of Sompo Japan NipponkoaJul. 2015 Group CEO, Representative Director, President and Executive Officer of the Company
(current position) Director, Chairman of Sompo Japan Nipponkoa (current position)
Overall Group Management (Chief Executive Officer)
Representative Director,Deputy President and Senior Managing Executive Officer
Shinji Tsuji(Dec. 10, 1956)
Apr. 1979 Joined The Yasuda Fire & Marine Insurance Co., Ltd.Apr. 2008 Executive Officer, General Manager, Customer Service Department of Sompo Japan
Insurance Inc. (“Sompo Japan”)Apr. 2009 Managing Executive Officer of Sompo Japan Jun. 2011 Director, Managing Executive Officer of the CompanyApr. 2012 Director, Senior Managing Executive Officer of the CompanyApr. 2014 Representative Director, Deputy President and Senior Managing Executive Officer of the
Company (current position)
Public Relations Department, Corporate Social Responsibility Department, Corporate Management Department, Investment Management Department, Accounting Department, Internal Audit Department (joint management)
Group CFO (Chief Financial Officer)
Director, Deputy President and Senior Managing Executive Officer
Keiji Nishizawa(Feb. 11, 1958)
Apr. 1980 Joined The Yasuda Fire & Marine Insurance Co., Ltd.Apr. 2008 Executive Officer, General Manager, Business Planning & Development Department
of Sompo Japan Insurance Inc. (“Sompo Japan”)Apr. 2010 Managing Executive Officer of Sompo JapanJun. 2010 Director, Managing Executive Officer of Sompo JapanOct. 2011 Director, Managing Executive Officer, General Manager, Automobile Underwriting
Department of Sompo JapanNov. 2011 Director, Managing Executive Officer of Sompo JapanJun. 2012 Director, Executive Officer of the CompanyApr. 2013 Director, Senior Managing Executive Officer of Sompo Japan
Senior Managing Executive Officer of NIPPONKOA Insurance Company, LimitedApr. 2014 Representative Director, Senior Managing Executive Officer of Sompo JapanSep. 2014 Representative Director, Senior Managing Executive Officer of Sompo Japan Nipponkoa
Insurance Inc. (“Sompo Japan Nipponkoa”)Apr. 2015 Director, Deputy President and Senior Managing Executive Officer of the Company
(current position) Representative Director, Deputy President and Senior Managing Executive Officer of
Sompo Japan Nipponkoa (current position)
IT Strategy Planning Department, New Business Development Department, Internal Audit Department (assistant)
Group CIO (Chief Information Officer)
Director,Managing Executive Officer
Shoichiro Takemoto(Jan. 20, 1955)
Apr. 1978 Joined The Yasuda Fire & Marine Insurance Co., Ltd.Oct. 2011 Executive Officer, General Manager, Risk Management Department of Sompo Japan
Insurance Inc. (“Sompo Japan”)Jun. 2012 Director, Executive Officer, General Manager, Risk Management Department of Sompo
JapanApr. 2013 Executive Officer of the Company
Director, Executive Officer of Sompo Japan Executive Officer of NIPPONKOA Insurance Company, Limited (“NIPPONKOA”)
Jun. 2013 Director, Executive Officer of the Company Director, Managing Executive Officer of Sompo Japan
Managing Executive Officer of NIPPONKOAApr. 2014 Director, Managing Executive Officer of the Company (current position)Sep. 2014 Director, Managing Executive Officer of Sompo Japan Nipponkoa Insurance Inc.
(current position)
Global Business Management Department, Corporate Legal Department, Internal Control Department, Risk Management Department, Internal Audit Department (joint management)
Group CRO (Chief Risk Officer)
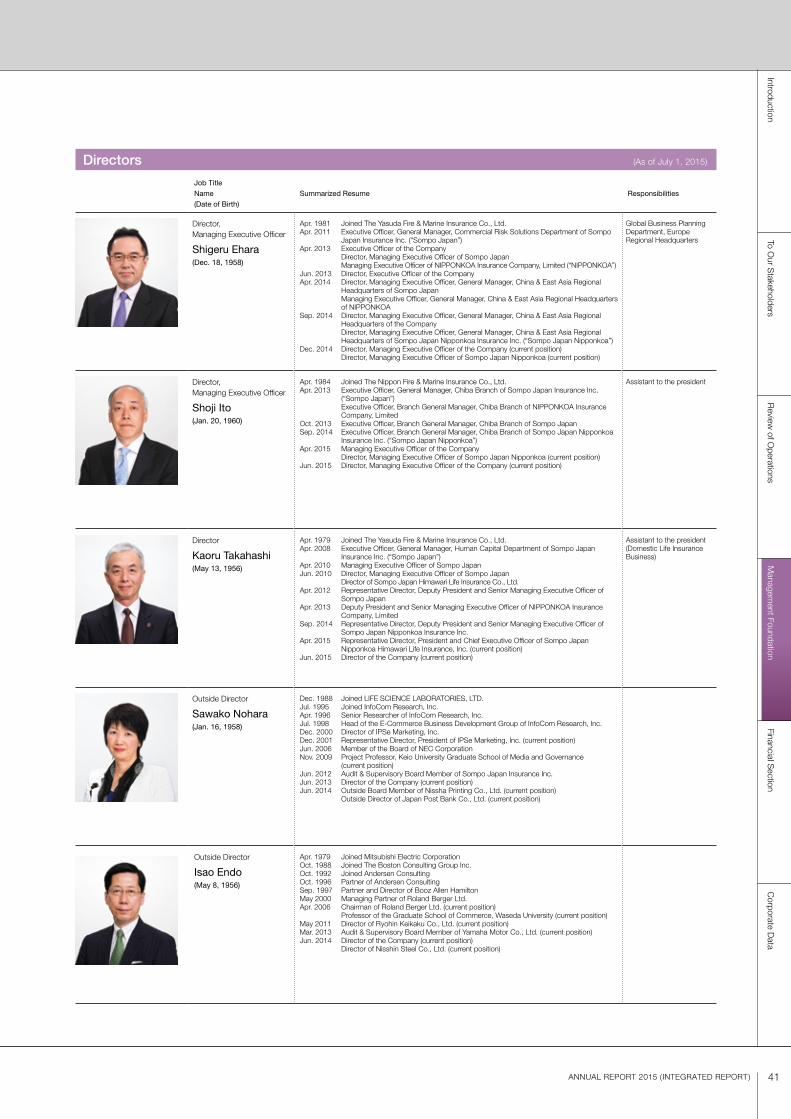
41ANNUAL REPORT 2015 ( INTEGRATED REPORT)
Job Title Name (Date of Birth)
Summarized Resume Responsibilities
Director,Managing Executive Officer
Shigeru Ehara(Dec. 18, 1958)
Apr. 1981 Joined The Yasuda Fire & Marine Insurance Co., Ltd.Apr. 2011 Executive Officer, General Manager, Commercial Risk Solutions Department of Sompo
Japan Insurance Inc. (“Sompo Japan”)Apr. 2013 Executive Officer of the Company
Director, Managing Executive Officer of Sompo Japan Managing Executive Officer of NIPPONKOA Insurance Company, Limited (“NIPPONKOA”)
Jun. 2013 Director, Executive Officer of the CompanyApr. 2014 Director, Managing Executive Officer, General Manager, China & East Asia Regional
Headquarters of Sompo Japan Managing Executive Officer, General Manager, China & East Asia Regional Headquarters of NIPPONKOA
Sep. 2014 Director, Managing Executive Officer, General Manager, China & East Asia Regional Headquarters of the Company Director, Managing Executive Officer, General Manager, China & East Asia Regional Headquarters of Sompo Japan Nipponkoa Insurance Inc. (“Sompo Japan Nipponkoa”)
Dec. 2014 Director, Managing Executive Officer of the Company (current position) Director, Managing Executive Officer of Sompo Japan Nipponkoa (current position)
Global Business Planning Department, Europe Regional Headquarters
Director,Managing Executive Officer
Shoji Ito(Jan. 20, 1960)
Apr. 1984 Joined The Nippon Fire & Marine Insurance Co., Ltd.Apr. 2013 Executive Officer, General Manager, Chiba Branch of Sompo Japan Insurance Inc.
(“Sompo Japan”) Executive Officer, Branch General Manager, Chiba Branch of NIPPONKOA Insurance Company, Limited
Oct. 2013 Executive Officer, Branch General Manager, Chiba Branch of Sompo JapanSep. 2014 Executive Officer, Branch General Manager, Chiba Branch of Sompo Japan Nipponkoa
Insurance Inc. (“Sompo Japan Nipponkoa”)Apr. 2015 Managing Executive Officer of the Company Director, Managing Executive Officer of Sompo Japan Nipponkoa (current position)Jun. 2015 Director, Managing Executive Officer of the Company (current position)
Assistant to the president
Director
Kaoru Takahashi(May 13, 1956)
Apr. 1979 Joined The Yasuda Fire & Marine Insurance Co., Ltd.Apr. 2008 Executive Officer, General Manager, Human Capital Department of Sompo Japan
Insurance Inc. (“Sompo Japan”)Apr. 2010 Managing Executive Officer of Sompo JapanJun. 2010 Director, Managing Executive Officer of Sompo Japan
Director of Sompo Japan Himawari Life Insurance Co., Ltd.Apr. 2012 Representative Director, Deputy President and Senior Managing Executive Officer of
Sompo JapanApr. 2013 Deputy President and Senior Managing Executive Officer of NIPPONKOA Insurance
Company, LimitedSep. 2014 Representative Director, Deputy President and Senior Managing Executive Officer of
Sompo Japan Nipponkoa Insurance Inc.Apr. 2015 Representative Director, President and Chief Executive Officer of Sompo Japan
Nipponkoa Himawari Life Insurance, Inc. (current position)Jun. 2015 Director of the Company (current position)
Assistant to the president (Domestic Life Insurance Business)
Outside Director
Sawako Nohara(Jan. 16, 1958)
Dec. 1988 Joined LIFE SCIENCE LABORATORIES, LTD. Jul. 1995 Joined InfoCom Research, Inc.Apr. 1996 Senior Researcher of InfoCom Research, Inc.Jul. 1998 Head of the E-Commerce Business Development Group of InfoCom Research, Inc.Dec. 2000 Director of IPSe Marketing, Inc.Dec. 2001 Representative Director, President of IPSe Marketing, Inc. (current position)Jun. 2006 Member of the Board of NEC CorporationNov. 2009 Project Professor, Keio University Graduate School of Media and Governance
(current position)Jun. 2012 Audit & Supervisory Board Member of Sompo Japan Insurance Inc.Jun. 2013 Director of the Company (current position)Jun. 2014 Outside Board Member of Nissha Printing Co., Ltd. (current position) Outside Director of Japan Post Bank Co., Ltd. (current position)
Outside Director
Isao Endo(May 8, 1956)
Apr. 1979 Joined Mitsubishi Electric CorporationOct. 1988 Joined The Boston Consulting Group Inc.Oct. 1992 Joined Andersen ConsultingOct. 1996 Partner of Andersen ConsultingSep. 1997 Partner and Director of Booz Allen HamiltonMay 2000 Managing Partner of Roland Berger Ltd.Apr. 2006 Chairman of Roland Berger Ltd. (current position)
Professor of the Graduate School of Commerce, Waseda University (current position)May 2011 Director of Ryohin Keikaku Co., Ltd. (current position)Mar. 2013 Audit & Supervisory Board Member of Yamaha Motor Co., Ltd. (current position)Jun. 2014 Director of the Company (current position)
Director of Nisshin Steel Co., Ltd. (current position)
Directors (As of July 1, 2015)
Financial Section
IntroductionTo O
ur Stakeholders
Review
of Operations
Managem
ent FoundationC
orporate Data
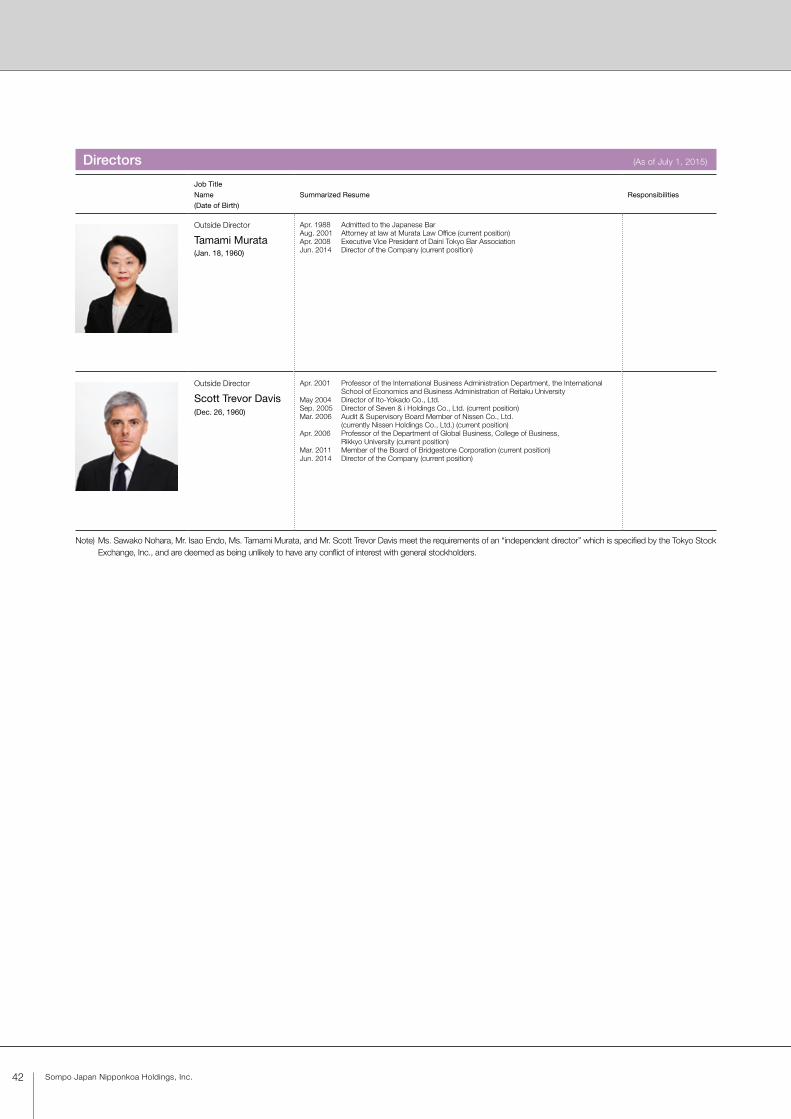
42 Sompo Japan Nipponkoa Holdings, Inc.
Directors (As of July 1, 2015)
Job Title Name (Date of Birth)
Summarized Resume Responsibilities
Outside Director
Tamami Murata(Jan. 18, 1960)
Apr. 1988 Admitted to the Japanese BarAug. 2001 Attorney at law at Murata Law Office (current position)Apr. 2008 Executive Vice President of Daini Tokyo Bar AssociationJun. 2014 Director of the Company (current position)
Outside Director
Scott Trevor Davis(Dec. 26, 1960)
Apr. 2001 Professor of the International Business Administration Department, the International School of Economics and Business Administration of Reitaku University
May 2004 Director of Ito-Yokado Co., Ltd.Sep. 2005 Director of Seven & i Holdings Co., Ltd. (current position)Mar. 2006 Audit & Supervisory Board Member of Nissen Co., Ltd.
(currently Nissen Holdings Co., Ltd.) (current position)Apr. 2006 Professor of the Department of Global Business, College of Business,
Rikkyo University (current position)Mar. 2011 Member of the Board of Bridgestone Corporation (current position)Jun. 2014 Director of the Company (current position)
Note) Ms. Sawako Nohara, Mr. Isao Endo, Ms. Tamami Murata, and Mr. Scott Trevor Davis meet the requirements of an “independent director” which is specified by the Tokyo Stock Exchange, Inc., and are deemed as being unlikely to have any conflict of interest with general stockholders.
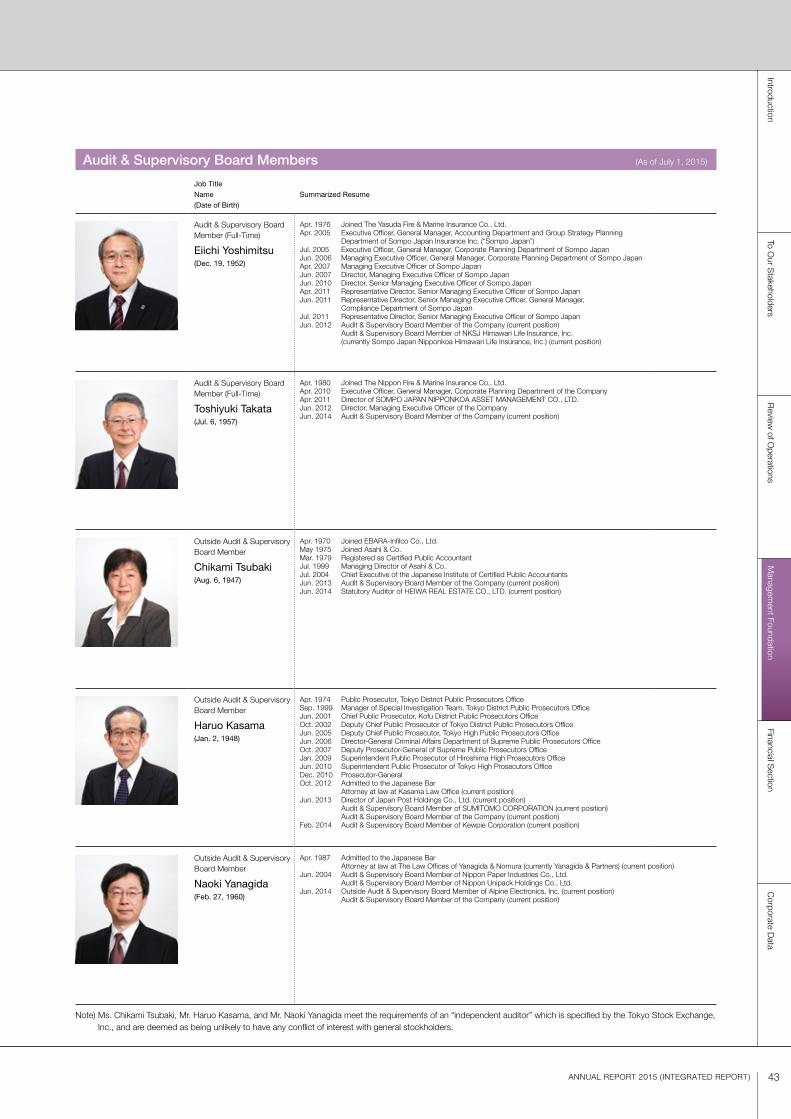
Job Title Name (Date of Birth)
Summarized Resume
Audit & Supervisory Board Member (Full-Time)
Eiichi Yoshimitsu(Dec. 19, 1952)
Apr. 1976 Joined The Yasuda Fire & Marine Insurance Co., Ltd.Apr. 2005 Executive Officer, General Manager, Accounting Department and Group Strategy Planning
Department of Sompo Japan Insurance Inc. (“Sompo Japan”)Jul. 2005 Executive Officer, General Manager, Corporate Planning Department of Sompo JapanJun. 2006 Managing Executive Officer, General Manager, Corporate Planning Department of Sompo JapanApr. 2007 Managing Executive Officer of Sompo JapanJun. 2007 Director, Managing Executive Officer of Sompo JapanJun. 2010 Director, Senior Managing Executive Officer of Sompo JapanApr. 2011 Representative Director, Senior Managing Executive Officer of Sompo JapanJun. 2011 Representative Director, Senior Managing Executive Officer, General Manager,
Compliance Department of Sompo JapanJul. 2011 Representative Director, Senior Managing Executive Officer of Sompo JapanJun. 2012 Audit & Supervisory Board Member of the Company (current position) Audit & Supervisory Board Member of NKSJ Himawari Life Insurance, Inc.
(currently Sompo Japan Nipponkoa Himawari Life Insurance, Inc.) (current position)
Audit & Supervisory Board Member (Full-Time)
Toshiyuki Takata(Jul. 6, 1957)
Apr. 1980 Joined The Nippon Fire & Marine Insurance Co., Ltd.Apr. 2010 Executive Officer, General Manager, Corporate Planning Department of the CompanyApr. 2011 Director of SOMPO JAPAN NIPPONKOA ASSET MANAGEMENT CO., LTD.Jun. 2012 Director, Managing Executive Officer of the CompanyJun. 2014 Audit & Supervisory Board Member of the Company (current position)
Outside Audit & Supervisory Board Member
Chikami Tsubaki(Aug. 6, 1947)
Apr. 1970 Joined EBARA-Infilco Co., Ltd.May 1975 Joined Asahi & Co.Mar. 1979 Registered as Certified Public AccountantJul. 1999 Managing Director of Asahi & Co. Jul. 2004 Chief Executive of the Japanese Institute of Certified Public AccountantsJun. 2013 Audit & Supervisory Board Member of the Company (current position)Jun. 2014 Statutory Auditor of HEIWA REAL ESTATE CO., LTD. (current position)
Outside Audit & Supervisory Board Member
Haruo Kasama(Jan. 2, 1948)
Apr. 1974 Public Prosecutor, Tokyo District Public Prosecutors OfficeSep. 1999 Manager of Special Investigation Team, Tokyo District Public Prosecutors OfficeJun. 2001 Chief Public Prosecutor, Kofu District Public Prosecutors OfficeOct. 2002 Deputy Chief Public Prosecutor of Tokyo District Public Prosecutors OfficeJun. 2005 Deputy Chief Public Prosecutor, Tokyo High Public Prosecutors OfficeJun. 2006 Director-General Criminal Affairs Department of Supreme Public Prosecutors OfficeOct. 2007 Deputy Prosecutor-General of Supreme Public Prosecutors OfficeJan. 2009 Superintendent Public Prosecutor of Hiroshima High Prosecutors OfficeJun. 2010 Superintendent Public Prosecutor of Tokyo High Prosecutors OfficeDec. 2010 Prosecutor-GeneralOct. 2012 Admitted to the Japanese Bar
Attorney at law at Kasama Law Office (current position)Jun. 2013 Director of Japan Post Holdings Co., Ltd. (current position)
Audit & Supervisory Board Member of SUMITOMO CORPORATION (current position) Audit & Supervisory Board Member of the Company (current position)Feb. 2014 Audit & Supervisory Board Member of Kewpie Corporation (current position)
Outside Audit & Supervisory Board Member
Naoki Yanagida(Feb. 27, 1960)
Apr. 1987 Admitted to the Japanese Bar Attorney at law at The Law Offices of Yanagida & Nomura (currently Yanagida & Partners) (current position)Jun. 2004 Audit & Supervisory Board Member of Nippon Paper Industries Co., Ltd. Audit & Supervisory Board Member of Nippon Unipack Holdings Co., Ltd.Jun. 2014 Outside Audit & Supervisory Board Member of Alpine Electronics, Inc. (current position) Audit & Supervisory Board Member of the Company (current position)
Note) Ms. Chikami Tsubaki, Mr. Haruo Kasama, and Mr. Naoki Yanagida meet the requirements of an “independent auditor” which is specified by the Tokyo Stock Exchange, Inc., and are deemed as being unlikely to have any conflict of interest with general stockholders.
Audit & Supervisory Board Members (As of July 1, 2015)
43ANNUAL REPORT 2015 ( INTEGRATED REPORT)
Financial Section
IntroductionTo O
ur Stakeholders
Review
of Operations
Managem
ent FoundationC
orporate Data

44 Sompo Japan Nipponkoa Holdings, Inc.
Corporate GovernanceThe Group considers continually improving the transparency and fairness of the Group’s corporate governance and
fulfilling its corporate social responsibility as essential to maintaining strong relations of trust with stakeholders.
The Group formulated its Corporate Governance Policy to clarify basic policies regarding the formation of the
overall vision for the governance structure and the governance framework. We continue to improve our corporate
governance and aim to establish optimal systems.
Corporate Governance
Organizational structure Company with an Audit & Supervisory Board
Chairman of the Board of Directors Kengo Sakurada
Number of Directors 12, of which 4 are Outside Directors
Number of Audit & Supervisory Board Members 5, of which 3 are Outside Audit & Supervisory Board Members
Board of Directors meetings Held 16 times Attendance: 100% of Directors, 95.0% of Audit & Supervisory Board Members* Orientation meetings for Outside Directors are held in conjunction with Board of Directors meetings to ensure
effective Board of Directors meeting operation.
* Please refer to Corporate Governance Policy 3 for details regarding Directors and Board of Directors meetings.
(Fiscal 2014 Results)
Audit & Supervisory Board meetings
Held 14 times Attendance: 100%* Please refer to Corporate Governance Policy 4 for details regarding Audit & Supervisory Board Members and
Audit & Supervisory Board meetings.
(Fiscal 2014 Results)
Voluntary committee equivalent to Nomination Committee and Compensation Committee
Nomination and Compensation Committee* Comprising 6 committee members (4 Outside Directors, 2 Internal Directors) and chaired by an Outside Director.* Please refer to Corporate Governance Policy 5 for details regarding Nomination and Compensation Committee.
Appointment of Directors and Audit & Supervisory Board Members
Formulates policies for appointment of officers through the resolution of the Board of Directors in light of advice from the Nomination and Compensation Committee, functioning as an advisory body to the Board of Directors* Please refer to Corporate Governance Policy 6 for details regarding policies for appointment of officers.
Number of Independent Directors and Independent Audit & Supervisory Board Members
4 Outside Directors and 3 Outside Audit & Supervisory Board Members* All Outside Directors and Audit & Supervisory Board Members are independent as defined by the Financial
Instruments and Exchange Act.* “Standards regarding Independence of Outside Directors and Outside Audit & Supervisory Board Members”
is disclosed in the Corporate Governance Report.
Determination of compensation, etc. Formulates policies on decisions pertaining to compensation for officers through the resolution of the Board of Directors in light of advice from the Nomination and Compensation Committee, functioning as an advisory body to the Board of Directors* Please refer to Corporate Governance Policy 8 for details regarding policies on decisions pertaining to
compensation for officers.
Corporate Governance Overview (As of July 1, 2015)

45ANNUAL REPORT 2015 ( INTEGRATED REPORT)
Sompo Japan Nipponkoa Holdings
Audit & Supervisory Board Members
Audit & Supervisory Board
Members: 5
Of which, Outside Members: 3*
* All 3 are deemed Independent Audit & Supervisory Board Members
Board of Directors (Directors)
Directors: 12
Of which, Outside Directors: 4*
* All 4 are deemed Independent Directors.
Group CEORepresentative Director,
President and Executive OfficerExecutive Officers in charge
Nomination and Compensation Committee
Directors: 6
Of which, Outside Directors: 4*
* All 4 are deemed Independent Directors.
Management Committee
Task-Specific Committees
Overseas CompaniesDomestic Group Companies
Independent Auditors
Staff of Audit & Supervisory Board
Internal Audit
New Business Development
Global Business Planning
Corporate Planning
Human Capital
Sompo Japan Nipponkoa
Subsidiaries, etc., of Sompo Japan Nipponkoa
Sompo Japan Nipponkoa Himawari Life
Other Directly Owned Subsidiaries
Global Business Management
Public Relations
Secretarial
The Americas Regional
Headquarters
Corporate Social Responsibility
Accounting
South Asia & Pacific Regional Headquarters
Corporate Management
Corporate Legal
China & East Asia Regional
Headquarters
IT Strategy Planning
Internal Control
Europe Regional Headquarters
Investment Management
Risk Management
Appointment /Dismissal
Appointment / DismissalAppointment /Dismissal
Auditing /Reporting
Selection / Dismissal /Supervising
Auditing /Reporting
Cooperation
Consultation /Advice
Appointment /Dismissal /Decision for
reappointment
Reporting
Auditing
AuditingSupervision-guidance /Approval-reporting
Supervision-guidance / Approval-reporting
Shareholders’ Meeting
Management Structure of Corporate Governance (As of July 1, 2015)
Financial Section
IntroductionTo O
ur Stakeholders
Review
of Operations
Managem
ent FoundationC
orporate Data
46 Sompo Japan Nipponkoa Holdings, Inc.
This policy establishes the framework and operational policy underpinning the basic views on corporate governance of the Sompo Japan Nipponkoa Group
(hereinafter “the Group”).
Corporate Governance Policy
1. Basic Views on Corporate GovernanceWe will at all times carefully consider the interests of our customers when making
decisions that shape our business. We will strive to contribute to the security,
health, and wellbeing of our customers and society as a whole by providing
insurance and related services of the highest quality possible.
Following the principles of the Group management philosophy, the Group
considers value creation for stakeholders in the administration of its business and
maintains and enforces the Group Action Guidelines as the standard of behavior
for the Group employees in Japan and worldwide with the business objectives of
realizing sustainable business growth to increase corporate value and fulfilling its
mission to be the best customer service provider both at home and abroad.
The Group considers continually improving the transparency and fairness of
the Group’s corporate governance and fulfilling its corporate social responsibility as
essential to maintaining strong relations of trust with stakeholders. The Board of
Directors has accordingly established the Corporate Governance Policy to clarify
basic policies regarding the formation of the overall vision for the governance
structure and the governance framework. We continue to improve our corporate
governance and aim to establish optimal systems.
2. Overall Governance OrganizationThe Group has elected to be a company with an Audit & Supervisory Board and
maintains and promotes effective oversight and auditing functions using a system
of corporate governance comprising the Board of Directors, which makes important
management decisions and oversees business execution, and Audit & Supervisory
Board members and an Audit & Supervisory Board that are independent from the
Board of Directors.
The Group also utilizes the executive officer system to enable swift decision-
making and to ensure the clarity of authority and responsibility.
The Board of Directors sets the Basic Policy on Internal Controls, which
serves as the foundation for the Basic Policy for Group Management. These
policies provide the framework for a highly transparent governance structure for the
Company and Group companies.
To ensure transparency in the appointment and treatment of directors, the
chairman and a majority of the members of the Nomination and Compensation
Committee, an advisory organ to the Board of Directors, are outside directors.
3. Directors and the Board of Directors(1) Role of directors and the Board of DirectorsThe Board of Directors performs its duties as stipulated by law, establishes
important items for management, and serves a supervisory function overseeing the
conditions of business execution.
The Board of Directors meeting, in principle, convenes on a monthly basis and
comprises an appropriate number of members to realize swift decision-making.
Preliminary briefing sessions are held with outside directors to provide details about
the discussion agenda with specific emphasis on the key agenda items. The
integration of the Board of Directors meeting and preliminary briefing session, which
includes communicating the opinions, questions, and other comments expressed
by the outside directors at the preliminary briefing sessions to all attending direc-
tors before the Board of Directors meeting, is intended to facilitate constructive
deliberations at the Board of Directors meeting and ensure the effectiveness of the
Board of Directors operations. Steps including convening meetings of the outside
directors and the Group CEO are implemented to facilitate open exchange of
opinions between the outside directors and the chief executive.
The directors apply their accumulated knowledge and experience to the
key issues for the Company to realize the proper execution of fair and effective
executive management.
(2) Directors numbers, composition, and term of officeThe number of directors shall not exceed 15, as stipulated in the Articles of
Association. When establishing the stipulation that the number of directors shall not
exceed 15, the Group took into account the need for swift and appropriate decision-
making and the scope of duties to be performed by the Board of Directors. Outside
directors are corporate managers or other people with extensive experience and a
wide range of perspectives able to apply outside viewpoints to various issues,
including legal affairs, consumer needs, and overseas business development.
To ensure full clarity of responsibility related to business matters in each fiscal
year, a director’s tenure ends at the close of the Ordinary General Meeting
of Shareholders held within the latest fiscal year that is within one year
of the appointment.
4. Audit & Supervisory Board Members and Audit & Supervisory Board
(1) Role of the Audit & Supervisory Board members and Audit & Supervisory BoardAudit & Supervisory Board members audit the work performance of the directors
through such activities as auditing the construction and maintenance conditions of
the Group internal control system and providing effective advice and recommenda-
tions to senior management that promotes the Group’s sustainable growth and
increases the corporate value over the medium- and long-term.
The Audit & Supervisory Board establishes the audit standards, basic policy
on audits, and auditing programs to make the above auditing activities functional
and effective and systematically conduct auditing operations.
The Audit & Supervisory Board sets an annual meeting schedule and endeavors
to realize full participation of all members and coordinates activities. Such endeavors
include distributing information materials before meetings to ensure members are
fully prepared to conduct thorough reviews and deliberations.
(2) Audit & Supervisory Board members numbers, composition, and term of officeThe number of Audit & Supervisory Board members shall not exceed seven,
as stipulated in the Articles of Association. The majority of Audit & Supervisory
Board members are outside directors, which strengthens their independence
from management.
The Group enhances effectiveness of monitoring by ensuring diversity among
Audit & Supervisory Board members through the organic combination of information-
gathering capabilities, Audit & Supervisory Board member independence, and full-time
employment as well as stronger cooperation with accounting auditors and the
inclusion of Audit & Supervisory Board members with accounting-related knowledge.
To ensure independence from management, and in accordance with the
Companies Act, Audit & Supervisory Board members’ term of office expires at the
conclusion of the General Meeting of Shareholders in the final fiscal year that ends
within four years of their appointment.
5. Nomination and Compensation CommitteeThe Nomination and Compensation Committee is established as an advisory body
to the Board of Directors intended to improve transparency and fairness regarding
director and executive officer nomination and compensation.
(1) Role of the committeeThe committee sets director and executive officer appointment policy and appoint-
ment standards, determines individuals to propose as candidates, conducts
director and executive officer evaluations and submits recommendations to the
Board of Directors for director compensation amounts and the compensation
structure, and contributes to the appointment and treatment of subsidiary directors
based on the subsidiary business content and scope.
(2) Committee structure and number of membersThe committee is comprised of members appointed from the Company’s directors
with outside directors representing the majority of members in order to ensure the
independence and neutrality of the members. The committee chairperson is an
outside director elected by the committee members.
6. Policies for Appointment of OfficersThe appointment of directors, executive officers, and Audit & Supervisory Board
members is conducted in accordance with the following policies for appointment
of officers. Directors and executive officers are nominated by the Board of Directors
based on discussions with the Nomination and Compensation Committee.
Furthermore, in the event that the Board of Directors’ appointment of an Audit &

47ANNUAL REPORT 2015 ( INTEGRATED REPORT)
Supervisory Board member is determined by resolution at the General Meeting of
Shareholders, an opportunity will be provided in advance for the Board of Directors
to discuss the candidate with the Audit & Supervisory Board to seek its approval.
(1) Policies for appointment of directors and Audit & Supervisory Board membersThe Company supervises and guides its subsidiaries, formulating management
strategies for subsidiaries engaged mainly in the P&C insurance business, as well
as comprehensive management strategies for the entire Group. The Company is
responsible for the execution and realization of these strategies.
From this perspective, the Board of Directors appoints directors based on
familiarity with the Company’s business, ensuring a balance between experience
and achievements without bias for an area of specialization. To facilitate objective
decision making with respect to management issues from a diverse and indepen-
dent focus and perspective, the Board of Directors includes multiple outside
directors with a wide range of knowledge and experience having backgrounds in
corporate management, academia, and the legal profession.
The Audit & Supervisory Board consists of Audit & Supervisory Board
members appointed on the basis of their solid knowledge of finance and accounting
and in consideration of an overall balance of backgrounds in corporate manage-
ment experience and the legal profession. Furthermore, the appointment of
directors and Audit & Supervisory Board members is based on appointment criteria
in consideration of Comprehensive Guidelines for Supervision of Insurance Companies.
The Group formulated outside director independence criteria as a standard for the
appointment of outside directors and outside Audit & Supervisory Board members.
(2) Policies for appointment of executive officersThe Group formulated a “desired image for executive officers” and “Policies for
appointment of executive officers” to identify the basic skills and qualifications
required and define the balance between experience and achievements when
appointing executive officers.
In addition, candidate assessments are conducted by outside institutions
directed by the Nomination and Compensation Committee through a process
that considers the executive officer candidate from a variety of perspectives to
determine appointment.
7. Policies for Training of OfficersTo facilitate a detailed understanding of the business environment surrounding the
Company, training is conducted for newly appointed outside directors and outside
Audit & Supervisory Board members covering a variety of topics, including the
current state of the Company and the P&C insurance industry, risk management,
overseas businesses, and the life insurance business. In addition, corporate officer
study groups are held regularly for executive directors so they can acquire knowledge
outside their areas of responsibility. Executive directors and Audit & Supervisory
Board members also attend seminars and meetings held by various associations
and organizations and participate in executive training.
In addition to executive officers, the aforementioned training cultivates
management-oriented thinking and leadership through education programs in
conjunction with outside specialized companies with the intent of cultivating the
next generation of managers.
8. Policies on Decisions pertaining to Compensation for OfficersCompensation for directors, executive officers, and Audit & Supervisory Board
members shall in the case of compensation of directors and executive officers be
determined by the Board of Directors after consultation with the Nomination and
Compensation Committee, and in the case of compensation of Audit &
Supervisory Board members be determined through discussion between the
Audit & Supervisory Board members, in accordance with the policies on decisions
pertaining to compensation for officers.
(1) Basic policyCompensation for directors and executive officers shall be in the form of a
compensation structure that gives them continuous incentive toward improving
the Company’s performance and contributes to improving corporate value over the
long term, and shall be a level of compensation that enables recruiting of superior
human resources, as indicated in items (2) and (3) below. Objectiveness and
transparency will be achieved by determining the specific level after deliberation
by the Nomination and Compensation Committee composed primarily by
outside members.
In principle the same structure shall be used for the structure of compensation
of directors and executive officers of subsidiaries.
Compensation of Audit & Supervisory Board members shall be in the form
of a compensation structure and level that is consistent with their duties and
responsibilities, while taking into consideration their independence.
(2) Compensation for directorsCompensation of directors shall consist of basic compensation and stock
compensation-type stock options.
Basic compensation shall consist of monthly compensation and performance-
linked compensation. Monthly compensation shall be determined at a fixed amount
depending on whether the person is an outside or internal director, or does or does
not have authority to represent the Company.
Performance-linked compensation shall be determined in accordance with
the performance of the Company, and shall be determined using the benchmarks
of the adjusted consolidated profit, net income for the period (consolidated) and
the rate of increase or decrease in net assets per share.
Stock compensation-type stock options shall be awarded in order to increase
the linking between compensation and increases in corporate value over the long
term. Nevertheless, stock compensation-type stock options and performance-linked
compensation will not be paid to outside directors.
Compensation as a director and compensation as an executive officer shall
be totaled and paid together to those directors who are serving concurrently as
executive officers.
(3) Compensation for executive officersCompensation of executive officers shall consist of basic compensation and stock
compensation-type stock options.
Basic compensation shall consist of monthly compensation and performance-
linked compensation. Monthly compensation shall be determined at a fixed amount
based on the position of the executive officer. Performance-linked compensation
shall be determined in accordance with corporate performance and individual
performance. Corporate performance-linked compensation shall be determined
using the benchmarks of the adjusted consolidated profit, net income for the
period (consolidated) and the rate of increase or decrease in net assets per share.
Individual performance-linked compensation shall be determined in accordance
with the performance evaluation of executive officers.
Stock compensation-type stock options shall be awarded in order to increase
the linking between compensation and increases in corporate value over the long term.
(4) Compensation for Audit & Supervisory Board membersCompensation of Audit & Supervisory Board members shall be determined at a fixed
amount through discussion between the Audit & Supervisory Board members, depend-
ing on whether the Audit & Supervisory Board member is full time or part-time.
9. Information DisclosureThe Company fulfills its responsibility to explain financial and non-financial informa-
tion, including management strategies, risks, and governance, through timely,
appropriate, equitable, and accurate disclosure. Disclosure systems, including
internal rules, shall be established to ensure that essential information is supplied
appropriately and promptly. As one aspect of this, the Disclosure Committee shall
be established to discuss material issues regarding disclosure.
10. Supervision Policies for Group CompaniesTo improve the Group’s corporate value, the Company shall take steps to supervise
the entire Group and foster organic links among its various business segments.
To achieve the above, SOMPO HOLDINGS shall establish structures, including
internal rules, to ensure its ability to conduct appropriately the business manage-
ment of companies within the Group.
The Company shall formulate a common management vision and basic
policies for the Group and notify these among Group companies. It shall supervise
Group companies’ management through monitoring and other means. The
Company shall also establish appropriate systems, including risk management
systems, regulatory compliance systems, conflict of interest control systems,
customer information management systems, and internal audit systems, in order
to ensure effectiveness of the internal control systems of Group companies.
Group companies shall formulate their own basic policies and business plans
on the basis of the Group’s basic policies and plans.
Financial Section
IntroductionTo O
ur Stakeholders
Review
of Operations
Managem
ent FoundationC
orporate Data
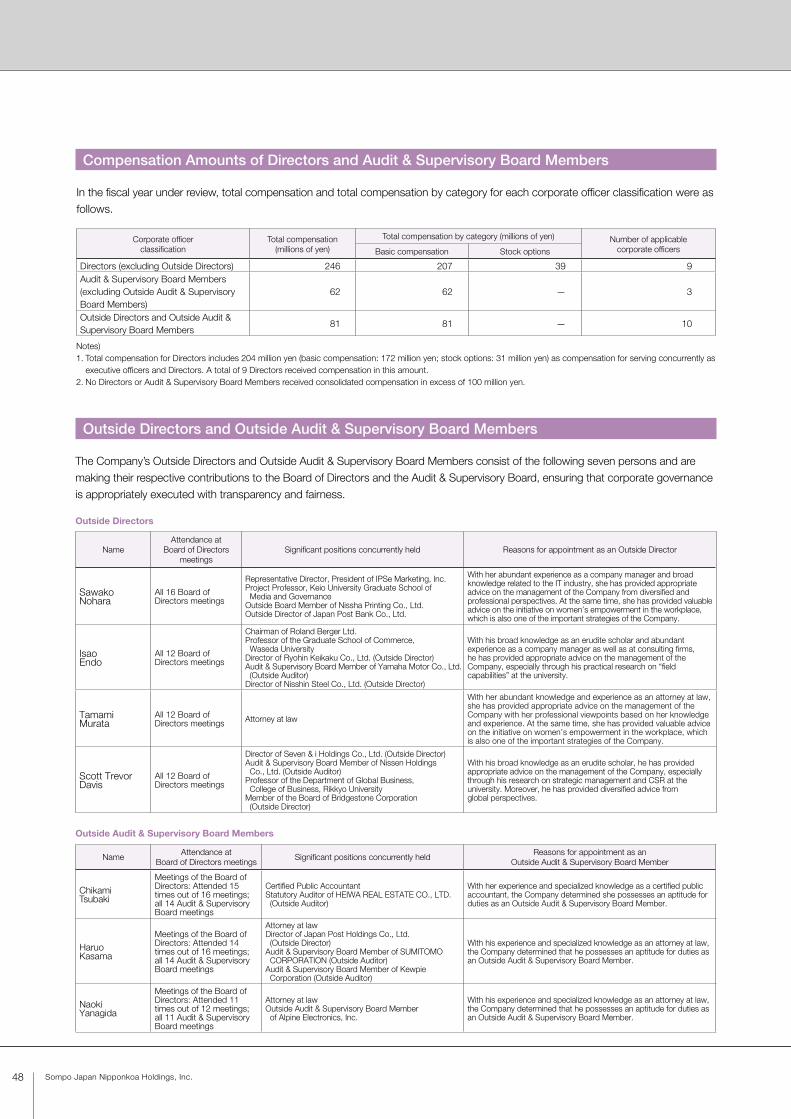
48 Sompo Japan Nipponkoa Holdings, Inc.
Outside Directors and Outside Audit & Supervisory Board Members
The Company’s Outside Directors and Outside Audit & Supervisory Board Members consist of the following seven persons and are making their respective contributions to the Board of Directors and the Audit & Supervisory Board, ensuring that corporate governance is appropriately executed with transparency and fairness.
Outside Directors
NameAttendance at
Board of Directors meetings
Significant positions concurrently held Reasons for appointment as an Outside Director
Sawako Nohara
All 16 Board of Directors meetings
Representative Director, President of IPSe Marketing, Inc.Project Professor, Keio University Graduate School of Media and GovernanceOutside Board Member of Nissha Printing Co., Ltd.Outside Director of Japan Post Bank Co., Ltd.
With her abundant experience as a company manager and broad knowledge related to the IT industry, she has provided appropriate advice on the management of the Company from diversified and professional perspectives. At the same time, she has provided valuable advice on the initiative on women’s empowerment in the workplace, which is also one of the important strategies of the Company.
Isao Endo
All 12 Board of Directors meetings
Chairman of Roland Berger Ltd.Professor of the Graduate School of Commerce, Waseda UniversityDirector of Ryohin Keikaku Co., Ltd. (Outside Director)Audit & Supervisory Board Member of Yamaha Motor Co., Ltd. (Outside Auditor)Director of Nisshin Steel Co., Ltd. (Outside Director)
With his broad knowledge as an erudite scholar and abundant experience as a company manager as well as at consulting firms, he has provided appropriate advice on the management of the Company, especially through his practical research on “field capabilities” at the university.
Tamami Murata
All 12 Board of Directors meetings Attorney at law
With her abundant knowledge and experience as an attorney at law, she has provided appropriate advice on the management of the Company with her professional viewpoints based on her knowledge and experience. At the same time, she has provided valuable advice on the initiative on women’s empowerment in the workplace, which is also one of the important strategies of the Company.
Scott Trevor Davis
All 12 Board of Directors meetings
Director of Seven & i Holdings Co., Ltd. (Outside Director)Audit & Supervisory Board Member of Nissen Holdings Co., Ltd. (Outside Auditor)Professor of the Department of Global Business, College of Business, Rikkyo UniversityMember of the Board of Bridgestone Corporation (Outside Director)
With his broad knowledge as an erudite scholar, he has provided appropriate advice on the management of the Company, especially through his research on strategic management and CSR at the university. Moreover, he has provided diversified advice from global perspectives.
Outside Audit & Supervisory Board Members
NameAttendance at
Board of Directors meetingsSignificant positions concurrently held
Reasons for appointment as an Outside Audit & Supervisory Board Member
Chikami Tsubaki
Meetings of the Board of Directors: Attended 15 times out of 16 meetings; all 14 Audit & Supervisory Board meetings
Certified Public AccountantStatutory Auditor of HEIWA REAL ESTATE CO., LTD. (Outside Auditor)
With her experience and specialized knowledge as a certified public accountant, the Company determined she possesses an aptitude for duties as an Outside Audit & Supervisory Board Member.
Haruo Kasama
Meetings of the Board of Directors: Attended 14 times out of 16 meetings; all 14 Audit & Supervisory Board meetings
Attorney at lawDirector of Japan Post Holdings Co., Ltd. (Outside Director)Audit & Supervisory Board Member of SUMITOMO CORPORATION (Outside Auditor)Audit & Supervisory Board Member of Kewpie Corporation (Outside Auditor)
With his experience and specialized knowledge as an attorney at law, the Company determined that he possesses an aptitude for duties as an Outside Audit & Supervisory Board Member.
Naoki Yanagida
Meetings of the Board of Directors: Attended 11 times out of 12 meetings; all 11 Audit & Supervisory Board meetings
Attorney at lawOutside Audit & Supervisory Board Member of Alpine Electronics, Inc.
With his experience and specialized knowledge as an attorney at law, the Company determined that he possesses an aptitude for duties as an Outside Audit & Supervisory Board Member.
Corporate officer classification
Total compensation (millions of yen)
Total compensation by category (millions of yen) Number of applicable corporate officersBasic compensation Stock options
Directors (excluding Outside Directors) 246 207 39 9Audit & Supervisory Board Members (excluding Outside Audit & Supervisory Board Members)
62 62 — 3
Outside Directors and Outside Audit & Supervisory Board Members
81 81 — 10
Notes)1. Total compensation for Directors includes 204 million yen (basic compensation: 172 million yen; stock options: 31 million yen) as compensation for serving concurrently as
executive officers and Directors. A total of 9 Directors received compensation in this amount.2. No Directors or Audit & Supervisory Board Members received consolidated compensation in excess of 100 million yen.
Compensation Amounts of Directors and Audit & Supervisory Board Members
In the fiscal year under review, total compensation and total compensation by category for each corporate officer classification were as follows.

49ANNUAL REPORT 2015 ( INTEGRATED REPORT)
Internal Controls
Compliance
The Company’s Board of Directors has resolved the Basic Policy on Internal Controls based on relevant laws and regulations, and the Group Management Philosophy for the purpose of ensuring that the Group’s business operations are appropriately performed and that corporate governance is continually reinforced and qualitatively improved. Under this basic policy, the Company continuously seeks to monitor and verify the Group’s control systems and works to improve related structures.
The Group aims to be a corporate group trusted by society by providing customers with the highest quality services and absolute peace of mind. Toward this end, the Group conducts appropriate corporate activities in compliance with laws, other applicable rules, societal norms, and corporate ethics, based on a constant recognition of the public mission of insurance and financial services businesses and social responsibility.
1. Formulation of Basic Policies and Code of Conduct
The Group has formulated the Sompo Japan Nipponkoa Group Basic Policy on Compliance and the Sompo Japan Nipponkoa Group Compliance Code of Conduct as Group-level policies. In line with these, all of the Group executives and employees now recognize compliance as a basic requirement for the administration of business operations, and they are working to implement effective compliance measures.
2. Promotion of Compliance through Compliance Programs
Each of the insurance companies in the Group works to resolve issues by formulating compliance programs for each business year. The Company monitors initiatives by these companies, including the progress made, and gives instruc-tions for improvement as necessary. The Company also shares information about initiatives being undertaken by Group insurance companies with Group subsidiaries to facilitate the resolution of compliance issues to support the development of the best practices.
3. Compliance CommitteeA Compliance Committee has been established to improve the effectiveness of compliance systems by deliberating on and checking related matters, such as the development of systems and implementation of measures by the Group companies. Members of the committee include directors and department heads from the Company, as well as compliance department heads from insurance companies in the Group. This committee works to improve the effectiveness of Group-level compliance activities by sharing up-to-date information and extending effective initiatives undertaken by individual companies across the Group.
4. Responding to Serious BreachesA system has been established requiring any Group company affected by serious compliance-related problems, including serious breaches, to report the matter to the Company. In such cases, the entire Group will work together to implement countermeasures based on multiple perspectives, and to maximize the effectiveness of customer-related actions and initiatives designed to prevent recurrences.
Financial Section
IntroductionTo O
ur Stakeholders
Review
of Operations
Managem
ent FoundationC
orporate Data
Internal Controls and Compliance

The Group Basic Policy on ERM
Maintain financial soundness
Improve profitability against risks
Improve capital efficiency
Capital
ReturnRisk
Risk Appetite Statement
Risk Appetite Principles
(The medium-to-long-term appetite related to financial soundness and profitability in risk-taking business domains)
The Group aims to:
(1) Become a globally competitive group, maximize corporate value by controlling the balance among capital, return and risk appropriately and improving capital efficiency,
(2) Gain greater profit by taking risks via financial and other services in addition to insurance underwriting and investment,
(3) Retain competitiveness among global insurers by maintaining financial soundness with a target credit rating of AA,
(4) Maintain the stable return ensuring group’s sustainable growth. Targeted adjusted ROE for FY2015 is over 7% on consolidated basis.
Risk-Taking Strategy
(Risk taking involving specific positions and target capital levels in each business domain)
Risk Tolerance
(Financial soundness required to execute Group strategies)
50 Sompo Japan Nipponkoa Holdings, Inc.
Strategic Risk Management (ERM)
Strategic Risk Management Systems
The Group strictly adheres to the framework of Strategic Risk Management (PDCA cycle) and systems defined in the Group Basic Policy on ERM. To systematize and clarify management
strategy from an ERM perspective, SOMPO HOLDINGS formulated the Risk Appetite Statement for risk taking to construct an appropriate risk portfolio.
Through value judgements based on the customer’s perspective, the Group maintains financial soundness and
aims to improve corporate value to continue providing high-quality services that contribute to customer security,
health, and wellbeing.
With the aim of maximizing Group corporate value, SOMPO HOLDINGS engages in Strategic Risk Management*
to improve profitability against risks, augment capital efficiency, and ensure financial soundness through the appropriate
control of capital and the risk-return balance.
Strategic Risk Management is used to identify significant risks from a variety of sources throughout the Group,
which has established an integrated risk control system to analyze, assess, and control risks while maintaining the
ability to accurately respond to risks when they occur.
* Our ERM framework is referred to within the Group as Strategic Risk Management.

Inform management vision and basic policies Monitoring and Managing, etc.
Reports on the status of risk management, etc.
SOMPO HOLDINGS
Subsidiaries, etc.
Board of Directors
Group CEO Management Committee
Group ERM Promotion Committee Risk Management Committee
Group CRO
Audit & Supervisory Board
Corporate Planning Dept, Corporate Management Dept, Risk Management Dept, etc.Internal Audit Department
51ANNUAL REPORT 2015 ( INTEGRATED REPORT)
The following system was created to manage unified Group-wide ERM activities.
1. Role of the CompanyHaving formulated the Group Basic Policy on ERM and Risk Appetite Statement, the Board of Directors determines man-agement strategy, business planning, and capital allocation. After discussions with the Management Committee, the Group CEO determines ERM policies for the fiscal year, risk tolerance response policies and countermeasures, and risk control policy. In addition, the Company established the Group ERM Promotion Committee and the Risk Management Committee to deliberate individual issues. The Group ERM Promotion Committee is tasked with holding management discussions regarding executing and increasing the efficacy of ERM and discusses matters related to risk-taking strategy and capital allocation. The Risk Management Committee is tasked with holding management discussions regarding the establishment and maintenance of risk manage-ment positions that function on a Group basis and discusses matters related to risk tolerance. These committees are chaired by the Group CRO and attended by directors responsible for the Corporate Planning and Corporate Management divisions.
The Company ensures that Group companies are thor-oughly aware of management strategy and the Group Basic Policy on ERM. Monitoring is regularly conducted and ERM deployed Group-wide in an effort to further heighten efficacy.
2. Role of Group CompaniesEach Group company has basic policies and rules on risk management formulated in reference to the Group Basic Policy on ERM, thereby developing risk management systems appropriate to the content, scale, and characteristics of their particular business activities and implementing autonomous risk management. In particular, the insurance subsidiaries place considerable emphasis on appropriately managing risks that could signifi-cantly affect their operations, such as insurance underwriting risk, asset management risk, operational risk, and liquidity risk, in ways tailored to their particular risk profile. SOMPO HOLDINGS established a structure to ensure that each Group company promptly reports matters that may significantly affect Group operations.
Financial Section
IntroductionTo O
ur Stakeholders
Review
of Operations
Managem
ent FoundationC
orporate Data

A stringent risk control system is the cornerstone of ERM
(3) Stress TestVerify risk mitigation measures, execute response measures as necessary
(4) Capital ManagementExecute response measures when inconsistent with risk tolerance
(5) Risk Limit ManagementExecute response measures when inconsistent with limit warning line
Appraisable Risks
Non-appraisable Risks
• Establish departments
responsible for all risks
• Establish risk owners (director
class) for particularly significant
risks
(1) Risk Assessment
• Formulate and execute
response measures
• Manage progress of response
measures
Monitoring and investigative research using outside information
Risk Identification Analysis and Assessment Management Framework Control
(2) Emerging Risk* Management
Risk MatrixSeverity
Likehood
* Newly discovered or changing risks caused by environmental changes
52 Sompo Japan Nipponkoa Holdings, Inc.
Strategic Risk Management
1. PDCA Cycle of Strategic Risk ManagementIn light of the Risk Appetite Statement, the Group formulates and executes business plans (Plan, Do), then regularly follows up (Check, Action) and incorporates the results into the next fiscal year’s business planning in an attempt to continuously enhance corporate value. With regard to business planning, in addition to forecasting Group-wide capital efficiency (ROE) and financial soundness, the Group confirms profitability in risk taking through the formulation of a compartmentalized risk-taking strategy and
conducts quantitative validation. To ensure capital is used effectively, the Group strategy is formulated in line with the four business units (the domestic P&C insurance business, the domestic life insurance business, the overseas insurance business, and the financial and other services business). Capital is allocated to each business unit based on growth and profitability. Each business unit manages its business in accordance with risk tolerance of allocated capital in an attempt to achieve profit objectives established in the business plan.
2. Risk Control SystemWithin ERM, the Group must comply with risk tolerance as well as utilize information based on accurate risk assessments conducted at each stage of the PDCA cycle for management
decision making. Through unified methods, SOMPO HOLDINGS has created and operates a stringent risk control system that enables comprehensive identification of and responses to risks surrounding the Group.
Risk Appetite Statement
PlanFormulate business plans for each business unit and allocate capital in accordance with risk appetite consistent with the Group’s Basic Strategies
DoBusiness operations in line with business plans and capital allocation
CheckPeriodic reviews of changes in the operating environment and progress in plans
ActionRevisions to the plans and capital allocation as needed
Capital Allocation
Domestic P&C Insurance
Domestic Life Insurance
Overseas Insurance
Financial and Other Services

53ANNUAL REPORT 2015 ( INTEGRATED REPORT)
Strategic Risk Management Deployment
As the environment surrounding the Group is changing from moment to moment, SOMPO HOLDINGS must respond to these changes by appropriately engaging in ERM. To this end, the Group must always be aware of issues affecting ERM and remain prepared to formulate fiscal policies and initiatives to continue its deployment. For fiscal 2015, optimal plans were formulated using quantitative information in preparation for the start of the new Medium-Term Management Plan in fiscal 2016. A medium-term PDCA was also created to heighten accuracy in the
plan’s achievement. In consideration of Group strategies targeting overseas business expansion, SOMPO HOLDINGS established the ERM Regional Center, in London, responsible for leading ERM in Europe and North America and making use of Canopius’ expertise. The ERM Regional Center is being used to acceler-ate Group deployment of ERM. Natural disasters pose a significant risk to the Group, thus SOMPO HOLDINGS devises elaborate flood and tsunami risk models to more accurately measure this threat.
(1) Risk AssessmentThe risk control system involves linked processes to identify, assess, evaluate, and control significant risks originating from a variety of sources, primarily as a risk assessment function. Risk assessment is conducted in a unified manner by Group companies and divisions positioned to be aware of compre-hensive risks, including emerging risks. Risk assessment involves categorizing the importance of risks according to a unified scale based on severity of impact and potential for occurrence. With regard to major risks in particular, risk owners (director class) are identified to clarify responsibilities regarding the implementation of response measures and progress on status management. In terms of management, risks are visualized unitarily, and a risk register is used as a framework for formu-lating and executing more comprehensive response measures.
(2) Emerging Risk ManagementAs with asbestos and similar issues, despite having a sufficient awareness of risks at a certain point in time, risks can manifest later that significantly impact management. The Group defines these emerging risks as “risks that could materialize or change due to changes in the operating environment and other factors,” which it manages appropriately to minimize unforeseen losses. Specifically, emerging risks are identified through risk man-agement and evaluated based on degree of impact, possibility of occurrence, and the expected number of years before developing into a serious risk. It is important to consider emerging risks in terms of not only avoiding losses but also future business opportunities. Risks expected to become serious in the next few years and risks facilitating the use of insurance products are being researched and studied using outside information and Group-wide monitoring.
(3) Stress TestTo accurately understand and manage events having a major impact on Group management, scenario stress tests, reverse stress tests, and sensitivity analyses are conducted on a Group-wide basis. SOMPO HOLDINGS also analyzes the degree of impact of risks on capital and implements response measures as necessary.
Scenario Stress Tests
Given the probability of different risks occurring simultaneously and the need to maintain a forward-looking perspective, management identifies potentially significant stress scenarios and evaluates the potential impact of such scenarios with the aim of verifying the efficacy of existing risk mitigation measures and reviewing response measures. Moreover, SOMPO HOLDINGS regularly verifies the appropriateness of stress scenarios to adequately respond to changes in the business environment.
Reverse Stress Tests
Conducted to prepare actions in advance and maintain an awareness of specific events that run counter to risk tolerance.
Sensitivity Analyses
Conducted with the aim of verifying the appropriateness of internal models through comparisons with business performance and an awareness of major risk factor fluctuations that impact capital and risks.
(4) Capital ManagementTo maintain the financial soundness (risk tolerance) necessary for executing Group strategy, the Group measures risks using the risk indicator Value at Risk (VaR) to determine the estimated levels of damage it may suffer at a holding period of one year, based on a confidence level equivalent to an AA rating. In this way, the Group manages risk so that it does not exceed capital. In addition, each business unit manages risk to ensure it does not run counter to the risk tolerance of allocated capital. We monitor the status of risk and capital of the Group and each business unit. A system is established so that when a risk of the Group or its business units appears likely to exceed capital, the Group will formulate and implement measures aimed at reducing risk or strengthening capital.
(5) Risk Limit ManagementIn the event of concentrated risk exposure, there is a possibility of events resulting in heavy losses, thus group-wide manage-ment is crucial. With regard to significant risks (credit risk concentration, reinsurance counterparty risk and overseas risk accumulation), SOMPO HOLDINGS establishes limits consistent with risk tolerance that are appropriately managed throughout the entire Group. A warning line is established to prevent management from exceeding limits. Risk limit management includes the formula-tion and implementation of response measures in the event the warning line is exceeded.
Financial Section
IntroductionTo O
ur Stakeholders
Review
of Operations
Managem
ent FoundationC
orporate Data

54 Sompo Japan Nipponkoa Holdings, Inc.
Group’s Strategy for Human Resources Management
Establishment of the Diversity Promotion Headquarters
Group Personnel Vision
The power of human resources is crucial for the creation of being the best customer service provider, contributing to the security, health, and wellbeing of our customers, both at home and abroad. Regardless of gender, nationality, previous careers, or other characteristics, human resource diversity enables the Group to hone its strengths throughout the world and drive Group growth.
Specifically, SOMPO HOLDINGS formulated a Group Personnel Vision and established the Human Resource Strategy Committee as a mechanism for discovering and cultivating personnel throughout the Group. Furthermore, Group-wide personnel exchanges are conducted to share skills and expertise on a global basis, developing human resources and optimizing employee placement.
Through diversity, as defined in the Group Personnel Vision, we aim to create a Group where the individuality and diversity of each employee is respected and their skills are utilized to full advantage. The Diversity Promotion Headquarters was established in October 2013 to accelerate diversity initiatives throughout the entire Group in an attempt to empower proactive employees without regard to their gender, nationality, previous careers, or
other characteristics, thereby transforming diversity into strength. The slogan “Diversity for Growth” was formulated with the intention of linking diversity to overall Group growth through the provision of high-quality services to customers.
Action and Achievement• We value achievement, factual understanding and action in our work.
• We value prompt action in our people.
Impartiality and Fairness
• We value workplaces wherein all people are treated fairly and impartially and wherein everyone may have the opportunity to realize their potential.
• We value people who demonstrate initiative and take challenges, not those who rest only on past achievements.
Openness• We value frank discussions and debate within transparent work environments based upon clear
rules and procedures.
Diversity• We value all our people as individuals, regardless of their gender, nationality, previous careers
or other characteristics.
Strategy for Human Resources Management

55ANNUAL REPORT 2015 ( INTEGRATED REPORT)
To promote women’s participation, SOMPO HOLDINGS is focusing efforts on the appointment of women in director and management positions. At present, two outside directors and one outside Audit & Supervisory Board member are women, while Sompo Japan Nipponkoa Insurance Inc. has an executive director and an outside director who are women. Regarding the appointment of female managers, the Group is targeting a female manager ratio of 10% by the end of fiscal 2015, and 30% by the end of fiscal 2020. As of April 1, 2015, there were 419 female managers, a ratio of 11.0%. Regarding specific initiatives, approximately 60 female employees have participated in our women’s management training course, a program for cultivating female employees to take on the management of departments, branches, or com-panies. SOMPO HOLDINGS also conducts level-based lectures focused on preparatory management training and career development training for women to promote the creation of a pool of future management candidates. In addition, during the two years since the introduction of a mentoring system, which
supports female employees with the assignment of an interde-partmental advisor other than a supervisor, 267 women throughout the Group have taken advantage of this program. As a result of these initiatives, proactive efforts to promote the participation of women have been received favorably. The Group received the Corporate Activity Award sponsored by the Tokyo Stock Exchange; Sompo Japan Nipponkoa was selected in the Diversity Management Selection 100 by the Ministry of Economy, Trade and Industry; and the Group was chosen as the Second Prize Winner in the Advanced Category at the 2015 J-Win Diversity Awards. As women’s participation continues to advance, the number of working mothers increases, and more fathers engage in childrearing, SOMPO HOLDINGS believes it is important to create a workplace where men and women can achieve a rewarding work-life balance. To this end, in April 2015 SOMPO HOLDINGS joined IKUBOSS, established by the NPO Fathering Japan.
Selected in the Diversity Management Selection 100
Development of Global Human Resources
Promotion of Women’s Social and Political Advancement
To realize the goal of becoming a globally competitive Group, SOMPO HOLDINGS supports the development of human resources that can gain traction in future Group management on a global basis. Main initiatives aimed at achieving this goal include lec-tures conducted at the in-house SOMPO Global University and tailored for personnel who are selected to participate from around the world. This program operates in conjunction with the National University of Singapore, one of the world’s top business schools, covering topics including “developing management awareness” and “overseas business experience” for enhancing both knowledge and practical skills. As of fiscal 2014, a total of 68 employees from 14 countries (including participants from outside the Group) have attended this program. Furthermore, we operate the Group Exchange Program in the aim of eliciting the strengths of human resources who are diverse in terms of gender, nationality, previous careers, or other characteristics. This program invites overseas staff from Group companies outside Japan to take up posts at departments
at headquarters in Japan. This program aims to build relations between Japanese and overseas Group companies and encourage a sharing of skills and knowledge. In addition, we aim to boost English communications skills at hosting departments in Japan and strengthen their intercultural competencies. The program began in fiscal 2014. In fiscal 2015, 21 overseas staff members from nine countries outside Japan will take up positions at 17 departments in Japan and undergo on-the-job training for a period of several months.
Going forward, to gain traction in business on a global basis, SOMPO HOLDINGS will promote human resources with knowledge and experi-ence offering a wide range of perspectives.
Received the Corporate Activity Award Joined IKUBOSSChosen as the Second Prize Winner in the Advanced Category at the 2015 J-Win Diversity Awards
Financial Section
IntroductionTo O
ur Stakeholders
Review
of Operations
Managem
ent FoundationC
orporate Data
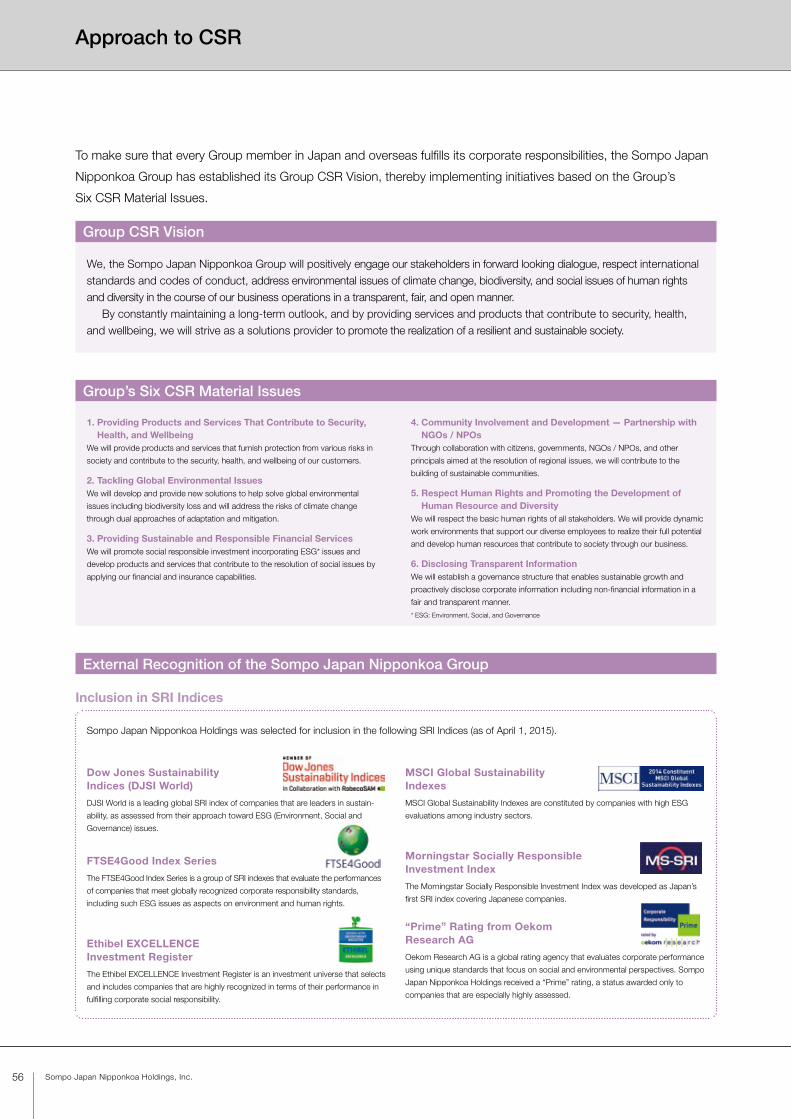
56 Sompo Japan Nipponkoa Holdings, Inc.
1. Providing Products and Services That Contribute to Security, Health, and Wellbeing
We will provide products and services that furnish protection from various risks in
society and contribute to the security, health, and wellbeing of our customers.
2. Tackling Global Environmental IssuesWe will develop and provide new solutions to help solve global environmental
issues including biodiversity loss and will address the risks of climate change
through dual approaches of adaptation and mitigation.
3. Providing Sustainable and Responsible Financial ServicesWe will promote social responsible investment incorporating ESG* issues and
develop products and services that contribute to the resolution of social issues by
applying our financial and insurance capabilities.
4. Community Involvement and Development — Partnership with NGOs / NPOs
Through collaboration with citizens, governments, NGOs / NPOs, and other
principals aimed at the resolution of regional issues, we will contribute to the
building of sustainable communities.
5. Respect Human Rights and Promoting the Development of Human Resource and Diversity
We will respect the basic human rights of all stakeholders. We will provide dynamic
work environments that support our diverse employees to realize their full potential
and develop human resources that contribute to society through our business.
6. Disclosing Transparent InformationWe will establish a governance structure that enables sustainable growth and
proactively disclose corporate information including non-financial information in a
fair and transparent manner.
* ESG: Environment, Social, and Governance
We, the Sompo Japan Nipponkoa Group will positively engage our stakeholders in forward looking dialogue, respect international standards and codes of conduct, address environmental issues of climate change, biodiversity, and social issues of human rights and diversity in the course of our business operations in a transparent, fair, and open manner. By constantly maintaining a long-term outlook, and by providing services and products that contribute to security, health, and wellbeing, we will strive as a solutions provider to promote the realization of a resilient and sustainable society.
Approach to CSR
Group CSR Vision
Group’s Six CSR Material Issues
External Recognition of the Sompo Japan Nipponkoa Group
Inclusion in SRI Indices
To make sure that every Group member in Japan and overseas fulfills its corporate responsibilities, the Sompo Japan
Nipponkoa Group has established its Group CSR Vision, thereby implementing initiatives based on the Group’s
Six CSR Material Issues.
Dow Jones Sustainability Indices (DJSI World)
DJSI World is a leading global SRI index of companies that are leaders in sustain-
ability, as assessed from their approach toward ESG (Environment, Social and
Governance) issues.
FTSE4Good Index Series
The FTSE4Good Index Series is a group of SRI indexes that evaluate the performances
of companies that meet globally recognized corporate responsibility standards,
including such ESG issues as aspects on environment and human rights.
Ethibel EXCELLENCE Investment Register
The Ethibel EXCELLENCE Investment Register is an investment universe that selects
and includes companies that are highly recognized in terms of their performance in
fulfilling corporate social responsibility.
MSCI Global Sustainability Indexes
MSCI Global Sustainability Indexes are constituted by companies with high ESG
evaluations among industry sectors.
Morningstar Socially Responsible Investment Index
The Morningstar Socially Responsible Investment Index was developed as Japan’s
first SRI index covering Japanese companies.
“Prime” Rating from Oekom Research AG
Oekom Research AG is a global rating agency that evaluates corporate performance
using unique standards that focus on social and environmental perspectives. Sompo
Japan Nipponkoa Holdings received a “Prime” rating, a status awarded only to
companies that are especially highly assessed.
Sompo Japan Nipponkoa Holdings was selected for inclusion in the following SRI Indices (as of April 1, 2015).
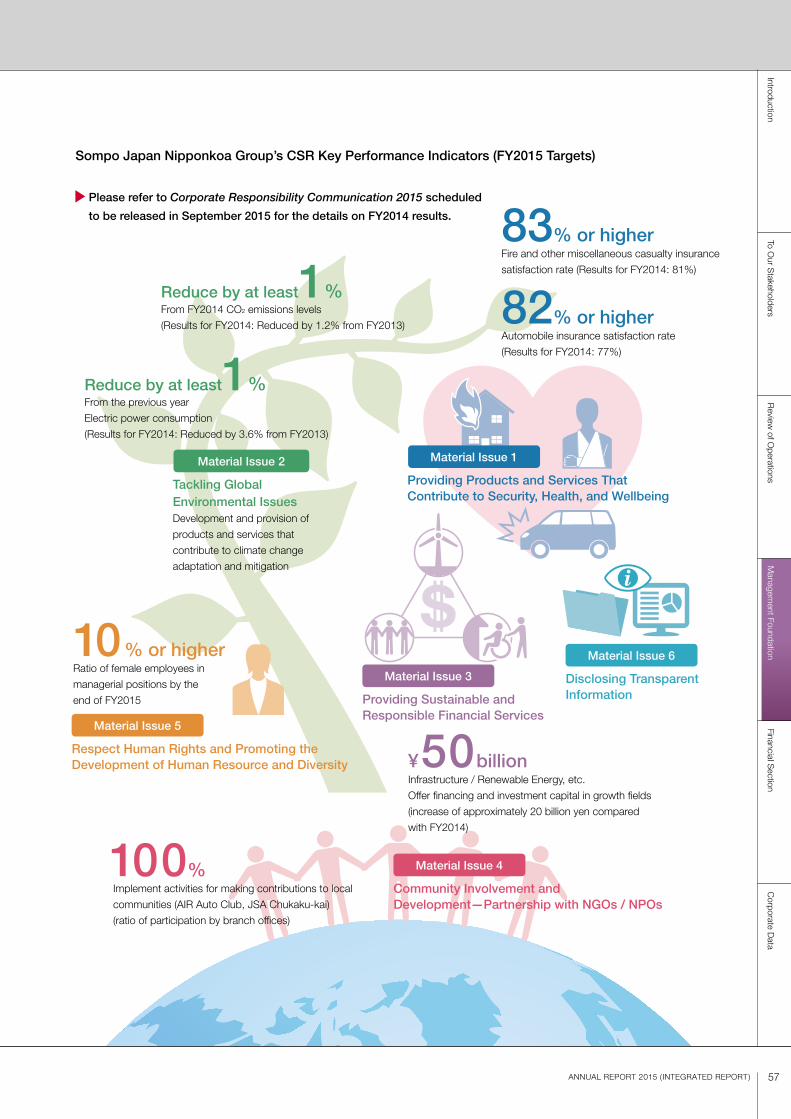
Sompo Japan Nipponkoa Group’s CSR Key Performance Indicators (FY2015 Targets)
Please refer to Corporate Responsibility Communication 2015 scheduled
to be released in September 2015 for the details on FY2014 results.
57ANNUAL REPORT 2015 ( INTEGRATED REPORT)
Reduce by at least1%From FY2014 CO2 emissions levels
(Results for FY2014: Reduced by 1.2% from FY2013)
Reduce by at least1%From the previous year
Electric power consumption
(Results for FY2014: Reduced by 3.6% from FY2013)
10% or higherRatio of female employees in
managerial positions by the
end of FY2015
¥50billionInfrastructure / Renewable Energy, etc.
Offer financing and investment capital in growth fields
(increase of approximately 20 billion yen compared
with FY2014)
82% or higherAutomobile insurance satisfaction rate
(Results for FY2014: 77%)
83% or higherFire and other miscellaneous casualty insurance
satisfaction rate (Results for FY2014: 81%)
100%Implement activities for making contributions to local
communities (AIR Auto Club, JSA Chukaku-kai)
(ratio of participation by branch offices)
Material Issue 2 Material Issue 1
Material Issue 6
Material Issue 3
Material Issue 5
Material Issue 4
Tackling GlobalEnvironmental IssuesDevelopment and provision of
products and services that
contribute to climate change
adaptation and mitigation
Providing Products and Services That Contribute to Security, Health, and Wellbeing
Disclosing TransparentInformationProviding Sustainable and
Responsible Financial Services
Respect Human Rights and Promoting the Development of Human Resource and Diversity
Community Involvement andDevelopment—Partnership with NGOs / NPOs
Financial Section
IntroductionTo O
ur Stakeholders
Review
of Operations
Managem
ent FoundationC
orporate Data
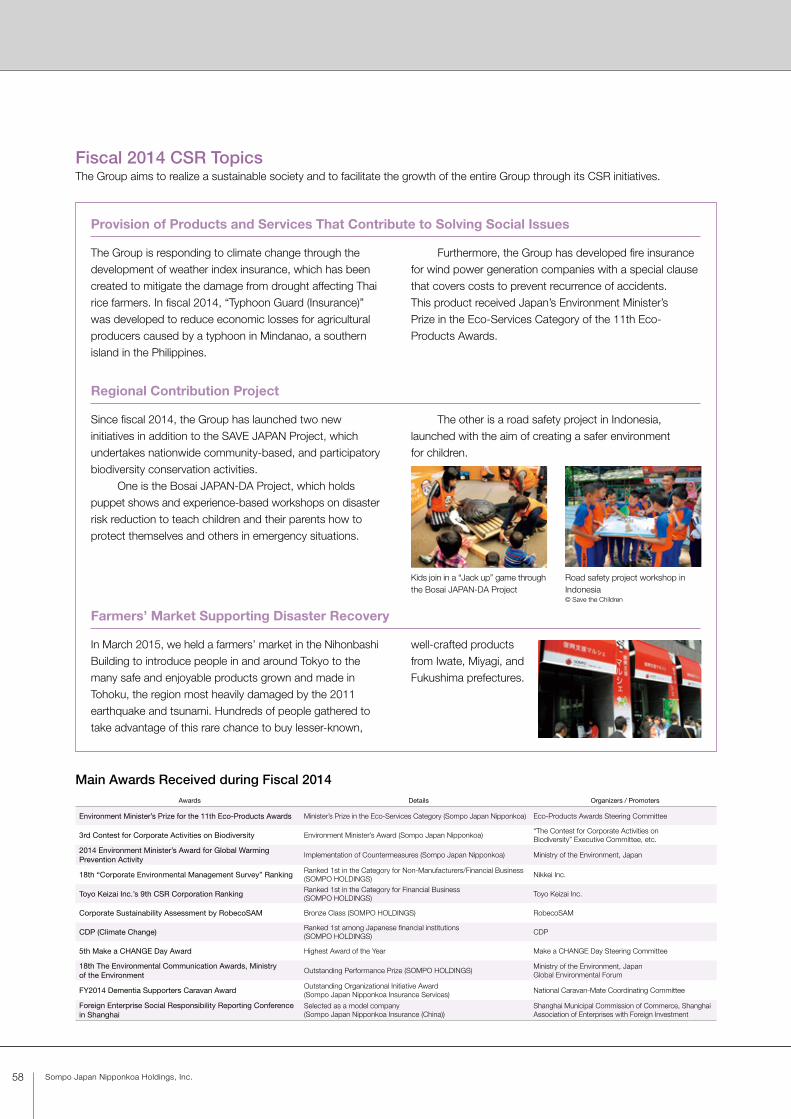
58 Sompo Japan Nipponkoa Holdings, Inc.
Fiscal 2014 CSR TopicsThe Group aims to realize a sustainable society and to facilitate the growth of the entire Group through its CSR initiatives.
Provision of Products and Services That Contribute to Solving Social Issues
The Group is responding to climate change through the development of weather index insurance, which has been created to mitigate the damage from drought affecting Thai rice farmers. In fiscal 2014, “Typhoon Guard (Insurance)” was developed to reduce economic losses for agricultural producers caused by a typhoon in Mindanao, a southern island in the Philippines.
Furthermore, the Group has developed fire insurance for wind power generation companies with a special clause that covers costs to prevent recurrence of accidents. This product received Japan’s Environment Minister’s Prize in the Eco-Services Category of the 11th Eco-Products Awards.
Regional Contribution Project
Since fiscal 2014, the Group has launched two new initiatives in addition to the SAVE JAPAN Project, which undertakes nationwide community-based, and participatory biodiversity conservation activities. One is the Bosai JAPAN-DA Project, which holds puppet shows and experience-based workshops on disaster risk reduction to teach children and their parents how to protect themselves and others in emergency situations.
The other is a road safety project in Indonesia, launched with the aim of creating a safer environment for children.
Farmers’ Market Supporting Disaster Recovery
In March 2015, we held a farmers’ market in the Nihonbashi Building to introduce people in and around Tokyo to the many safe and enjoyable products grown and made in Tohoku, the region most heavily damaged by the 2011 earthquake and tsunami. Hundreds of people gathered to take advantage of this rare chance to buy lesser-known,
well-crafted products from Iwate, Miyagi, and Fukushima prefectures.
Kids join in a “Jack up” game through the Bosai JAPAN-DA Project
Road safety project workshop in Indonesia © Save the Children
Main Awards Received during Fiscal 2014Awards Details Organizers / Promoters
Environment Minister’s Prize for the 11th Eco-Products Awards Minister’s Prize in the Eco-Services Category (Sompo Japan Nipponkoa) Eco-Products Awards Steering Committee
3rd Contest for Corporate Activities on Biodiversity Environment Minister’s Award (Sompo Japan Nipponkoa)“The Contest for Corporate Activities on Biodiversity” Executive Committee, etc.
2014 Environment Minister’s Award for Global Warming Prevention Activity
Implementation of Countermeasures (Sompo Japan Nipponkoa) Ministry of the Environment, Japan
18th “Corporate Environmental Management Survey” Ranking Ranked 1st in the Category for Non-Manufacturers/Financial Business (SOMPO HOLDINGS)
Nikkei Inc.
Toyo Keizai Inc.’s 9th CSR Corporation Ranking Ranked 1st in the Category for Financial Business (SOMPO HOLDINGS)
Toyo Keizai Inc.
Corporate Sustainability Assessment by RobecoSAM Bronze Class (SOMPO HOLDINGS) RobecoSAM
CDP (Climate Change) Ranked 1st among Japanese financial institutions (SOMPO HOLDINGS)
CDP
5th Make a CHANGE Day Award Highest Award of the Year Make a CHANGE Day Steering Committee
18th The Environmental Communication Awards, Ministry of the Environment
Outstanding Performance Prize (SOMPO HOLDINGS)Ministry of the Environment, Japan Global Environmental Forum
FY2014 Dementia Supporters Caravan Award Outstanding Organizational Initiative Award (Sompo Japan Nipponkoa Insurance Services)
National Caravan-Mate Coordinating Committee
Foreign Enterprise Social Responsibility Reporting Conference in Shanghai
Selected as a model company (Sompo Japan Nipponkoa Insurance (China))
Shanghai Municipal Commission of Commerce, Shanghai Association of Enterprises with Foreign Investment
Financial Section
Segment Overview (Unaudited) 60
Report of Independent Auditors 69
Consolidated Financial Statements 70
Balance Sheets and Statements of Income of Principal Consolidated Subsidiaries (Unaudited)(*)
118
Solvency Margin Ratio of Sompo Japan Nipponkoa Holdings, Inc. on a Consolidated Basis (Unaudited)
132
Solvency Margin Ratios of Principal Consolidated Subsidiaries (Unaudited)
134
ANNUAL REPORT 2015 ( INTEGRATED REPORT) 59
(*) The figures of “The Two Company Combined” in Sompo Japan Nipponkoa Insurance Inc. The amounts for the fiscal year ended March 31, 2014 in the balance sheet represent the combined
results of Sompo Japan Insurance Inc. (“Sompo Japan”) and NIPPONKOA Insurance Company, Limited (“NIPPONKOA”).
The amounts for the fiscal year ended March 31, 2014 in the statement of income represent the combined results of Sompo Japan and NIPPONKOA. In addition, the amounts for the fiscal year ended March 31, 2015 represent the amounts, which include the results of NIPPONKOA for the five months ended August 31, 2014.
Financial Section
IntroductionTo O
ur Stakeholders
Review
of Operations
Managem
ent FoundationC
orporate Data
Financial Section

60 Sompo Japan Nipponkoa Holdings, Inc.
Segment Overview (Unaudited)
Domestic P&C Insurance Business
1. Direct premiums written (including deposits of premiums by policyholders)
2. Net premiums written
3. Net claims paid
(Millions of yen)
Fiscal year ended March 31, 2014(April 1, 2013 to March 31, 2014)
Fiscal year ended March 31, 2015(April 1, 2014 to March 31, 2015)
Amount % of total amount% of year-on-year
changeAmount % of total amount
% of year-on-year change
Fire and allied lines insurance 383,107 16.05% 2.94% 392,860 15.97% 2.55%
Marine insurance 51,211 2.15 10.04 51,881 2.11 1.31
Personal accident insurance 283,841 11.89 (0.12) 295,162 12.00 3.99
Voluntary automobile insurance 1,039,318 43.54 3.60 1,074,162 43.67 3.35
Compulsory automobile liability insurance 325,990 13.66 10.64 324,060 13.17 (0.59)
Others 303,606 12.72 9.09 321,698 13.08 5.96
Total 2,387,075 100.00 4.74 2,459,825 100.00 3.05
Deposits of premiums by policyholders 140,943 5.90 (3.67) 144,213 5.86 2.32
Notes)1. Figures are amounts before the elimination of internal transactions between segments.2. Direct premiums written (including deposits of premiums by policyholders) is gross premiums written deducted by the sum of surrender benefits of direct policies and
other refunds of direct policies. (Includes deposits of premiums of saving type insurance policies)
(Millions of yen)
Fiscal year ended March 31, 2014(April 1, 2013 to March 31, 2014)
Fiscal year ended March 31, 2015(April 1, 2014 to March 31, 2015)
Amount % of total amount% of year-on-year
changeAmount % of total amount
% of year-on-year change
Fire and allied lines insurance 285,350 13.49% 12.00% 324,280 14.62% 13.64%
Marine insurance 45,674 2.16 14.67 52,554 2.37 15.06
Personal accident insurance 187,614 8.87 1.26 187,842 8.47 0.12
Voluntary automobile insurance 1,040,929 49.22 3.62 1,074,893 48.47 3.26
Compulsory automobile liability insurance 298,911 14.13 8.66 305,869 13.79 2.33
Others 256,463 12.13 8.28 272,384 12.28 6.21
Total 2,114,945 100.00 5.94 2,217,825 100.00 4.86
Note) Figures are amounts before the elimination of internal transactions between segments.
(Millions of yen)
Fiscal year ended March 31, 2014(April 1, 2013 to March 31, 2014)
Fiscal year ended March 31, 2015(April 1, 2014 to March 31, 2015)
Amount % of total amount% of year-on-year
changeAmount % of total amount
% of year-on-year change
Fire and allied lines insurance 178,250 14.21% (9.96)% 224,790 16.96% 26.11%
Marine insurance 25,522 2.03 18.79 28,774 2.17 12.74
Personal accident insurance 103,811 8.27 2.56 103,481 7.81 (0.32)
Voluntary automobile insurance 591,049 47.10 (4.80) 598,410 45.14 1.25
Compulsory automobile liability insurance 228,843 18.24 (0.93) 226,331 17.07 (1.10)
Others 127,354 10.15 2.11 143,908 10.86 13.00
Total 1,254,831 100.00 (3.27) 1,325,697 100.00 5.65
Note) Figures are amounts before the elimination of internal transactions between segments.

61ANNUAL REPORT 2015 ( INTEGRATED REPORT)
4. Investment assets
(Millions of yen)
As of March 31, 2014 As of March 31, 2015
Amount % of total amount Amount % of total amount
Deposits 334,152 4.85% 331,500 4.73%
Call loans 75,000 1.09 — —
Receivables under resale agreements 126,984 1.84 71,985 1.03
Receivables under securities borrowing transactions — — — —
Monetary receivables bought 16,951 0.25 14,234 0.20
Money trusts 97,819 1.42 111,162 1.59
Securities 4,688,727 68.00 5,007,561 71.46
Loans 570,866 8.28 567,641 8.10
Land & buildings 304,084 4.41 300,968 4.29
Total investment assets 6,214,585 90.13 6,405,054 91.40
Total net assets 6,895,325 100.00 7,007,807 100.00
Note) Figures are amounts before the elimination of internal transactions between segments.
5. Securities
(Millions of yen)
As of March 31, 2014 As of March 31, 2015
Amount % of total amount Amount % of total amount
Government bonds 1,200,421 25.60% 1,194,177 23.85%
Municipal bonds 27,192 0.58 18,248 0.36
Corporate bonds 583,031 12.43 511,495 10.21
Domestic stocks 1,532,072 32.68 1,810,840 36.16
Foreign securities 1,294,202 27.60 1,425,223 28.46
Others 51,806 1.10 47,576 0.95
Total 4,688,727 100.00 5,007,561 100.00
Notes)1. Figures are amounts before the elimination of internal transactions between segments.2. As of March 31, 2014, Others primarily comprised security investment trust beneficiary securities amounting to 39,065 million yen. As of March 31, 2015, Others primarily comprised security investment trust beneficiary securities amounting to 35,786 million yen.
Financial Section
IntroductionTo O
ur Stakeholders
Review
of Operations
Managem
ent FoundationC
orporate Data
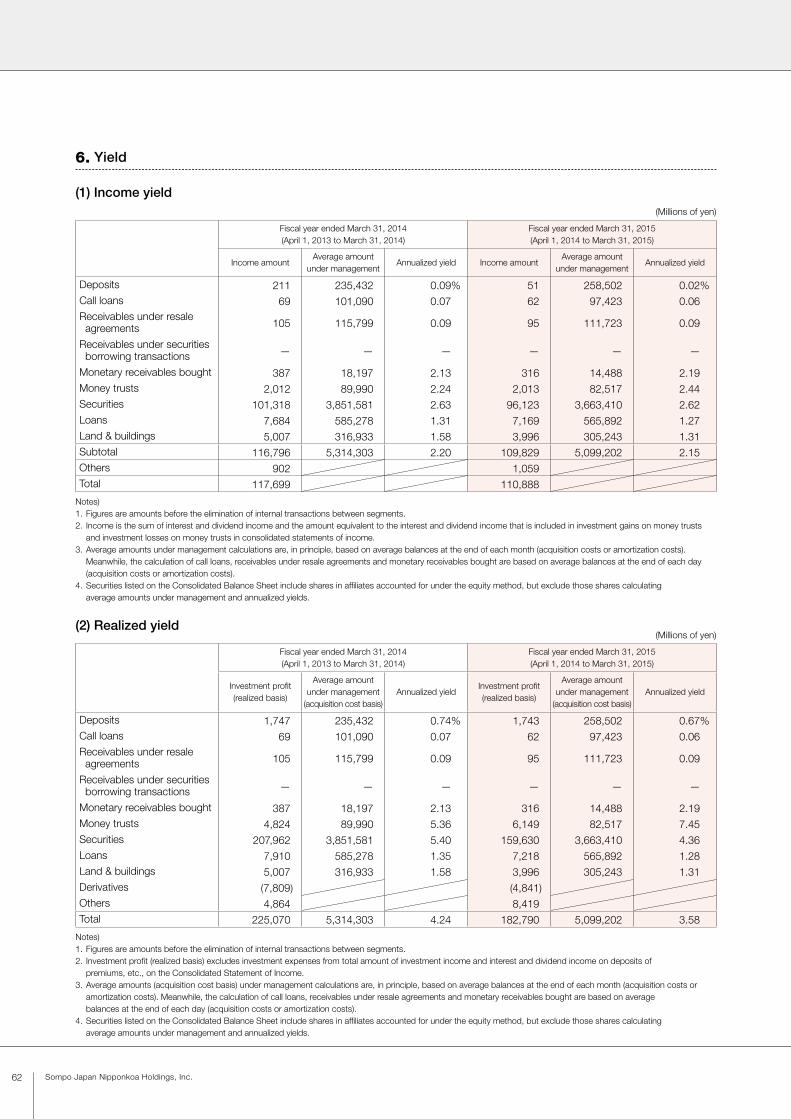
62 Sompo Japan Nipponkoa Holdings, Inc.
6. Yield
(1) Income yield
(2) Realized yield
(Millions of yen)
Fiscal year ended March 31, 2014(April 1, 2013 to March 31, 2014)
Fiscal year ended March 31, 2015(April 1, 2014 to March 31, 2015)
Income amountAverage amount
under managementAnnualized yield Income amount
Average amount under management
Annualized yield
Deposits 211 235,432 0.09% 51 258,502 0.02%Call loans 69 101,090 0.07 62 97,423 0.06Receivables under resale agreements 105 115,799 0.09 95 111,723 0.09
Receivables under securities borrowing transactions — — — — — —
Monetary receivables bought 387 18,197 2.13 316 14,488 2.19Money trusts 2,012 89,990 2.24 2,013 82,517 2.44Securities 101,318 3,851,581 2.63 96,123 3,663,410 2.62Loans 7,684 585,278 1.31 7,169 565,892 1.27Land & buildings 5,007 316,933 1.58 3,996 305,243 1.31Subtotal 116,796 5,314,303 2.20 109,829 5,099,202 2.15Others 902 1,059Total 117,699 110,888
Notes)1. Figures are amounts before the elimination of internal transactions between segments.2. Income is the sum of interest and dividend income and the amount equivalent to the interest and dividend income that is included in investment gains on money trusts
and investment losses on money trusts in consolidated statements of income.3. Average amounts under management calculations are, in principle, based on average balances at the end of each month (acquisition costs or amortization costs).
Meanwhile, the calculation of call loans, receivables under resale agreements and monetary receivables bought are based on average balances at the end of each day (acquisition costs or amortization costs).
4. Securities listed on the Consolidated Balance Sheet include shares in affiliates accounted for under the equity method, but exclude those shares calculating average amounts under management and annualized yields.
(Millions of yen)
Fiscal year ended March 31, 2014(April 1, 2013 to March 31, 2014)
Fiscal year ended March 31, 2015(April 1, 2014 to March 31, 2015)
Investment profit (realized basis)
Average amount under management
(acquisition cost basis)Annualized yield
Investment profit (realized basis)
Average amount under management
(acquisition cost basis)Annualized yield
Deposits 1,747 235,432 0.74% 1,743 258,502 0.67%Call loans 69 101,090 0.07 62 97,423 0.06Receivables under resale agreements 105 115,799 0.09 95 111,723 0.09
Receivables under securities borrowing transactions — — — — — —
Monetary receivables bought 387 18,197 2.13 316 14,488 2.19Money trusts 4,824 89,990 5.36 6,149 82,517 7.45Securities 207,962 3,851,581 5.40 159,630 3,663,410 4.36Loans 7,910 585,278 1.35 7,218 565,892 1.28Land & buildings 5,007 316,933 1.58 3,996 305,243 1.31Derivatives (7,809) (4,841)Others 4,864 8,419Total 225,070 5,314,303 4.24 182,790 5,099,202 3.58
Notes)1. Figures are amounts before the elimination of internal transactions between segments.2. Investment profit (realized basis) excludes investment expenses from total amount of investment income and interest and dividend income on deposits of
premiums, etc., on the Consolidated Statement of Income.3. Average amounts (acquisition cost basis) under management calculations are, in principle, based on average balances at the end of each month (acquisition costs or
amortization costs). Meanwhile, the calculation of call loans, receivables under resale agreements and monetary receivables bought are based on average balances at the end of each day (acquisition costs or amortization costs).
4. Securities listed on the Consolidated Balance Sheet include shares in affiliates accounted for under the equity method, but exclude those shares calculating average amounts under management and annualized yields.
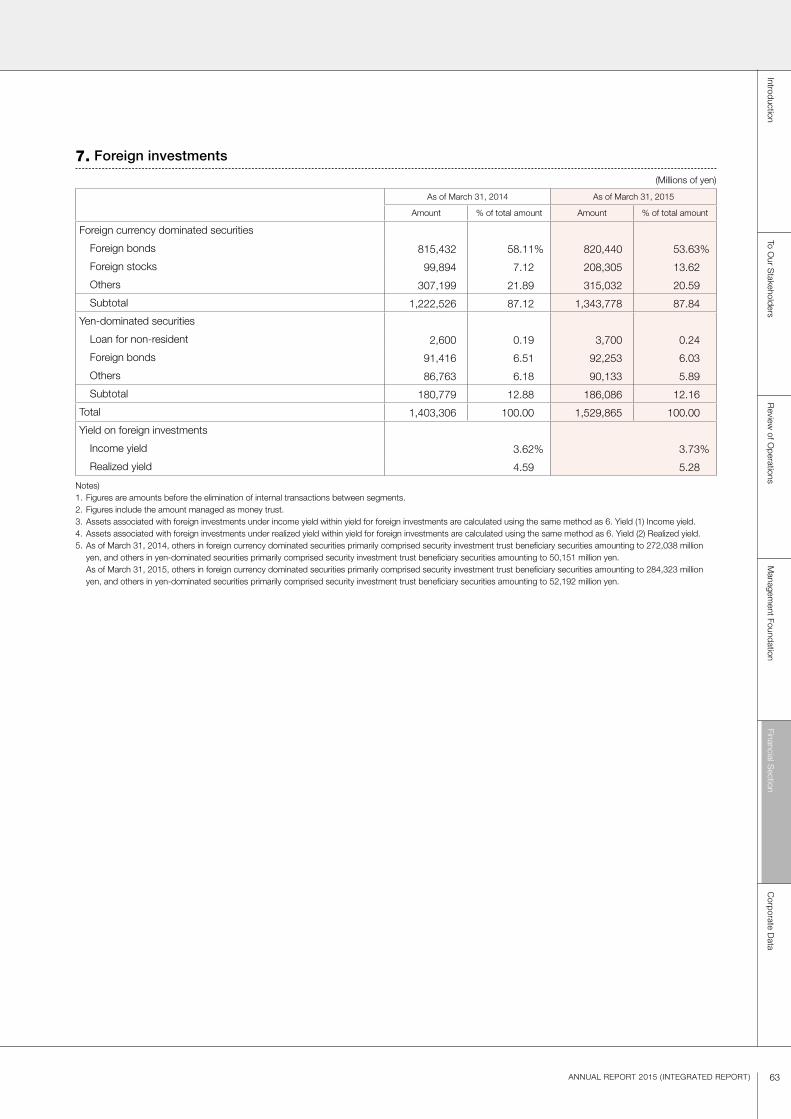
63ANNUAL REPORT 2015 ( INTEGRATED REPORT)
7. Foreign investments
(Millions of yen)
As of March 31, 2014 As of March 31, 2015
Amount % of total amount Amount % of total amount
Foreign currency dominated securities
Foreign bonds 815,432 58.11% 820,440 53.63%
Foreign stocks 99,894 7.12 208,305 13.62
Others 307,199 21.89 315,032 20.59
Subtotal 1,222,526 87.12 1,343,778 87.84
Yen-dominated securities
Loan for non-resident 2,600 0.19 3,700 0.24
Foreign bonds 91,416 6.51 92,253 6.03
Others 86,763 6.18 90,133 5.89
Subtotal 180,779 12.88 186,086 12.16
Total 1,403,306 100.00 1,529,865 100.00
Yield on foreign investments
Income yield 3.62% 3.73%
Realized yield 4.59 5.28
Notes)1. Figures are amounts before the elimination of internal transactions between segments.2. Figures include the amount managed as money trust.3. Assets associated with foreign investments under income yield within yield for foreign investments are calculated using the same method as 6. Yield (1) Income yield.4. Assets associated with foreign investments under realized yield within yield for foreign investments are calculated using the same method as 6. Yield (2) Realized yield.5. As of March 31, 2014, others in foreign currency dominated securities primarily comprised security investment trust beneficiary securities amounting to 272,038 million
yen, and others in yen-dominated securities primarily comprised security investment trust beneficiary securities amounting to 50,151 million yen. As of March 31, 2015, others in foreign currency dominated securities primarily comprised security investment trust beneficiary securities amounting to 284,323 million
yen, and others in yen-dominated securities primarily comprised security investment trust beneficiary securities amounting to 52,192 million yen.
Financial Section
IntroductionTo O
ur Stakeholders
Review
of Operations
Managem
ent FoundationC
orporate Data
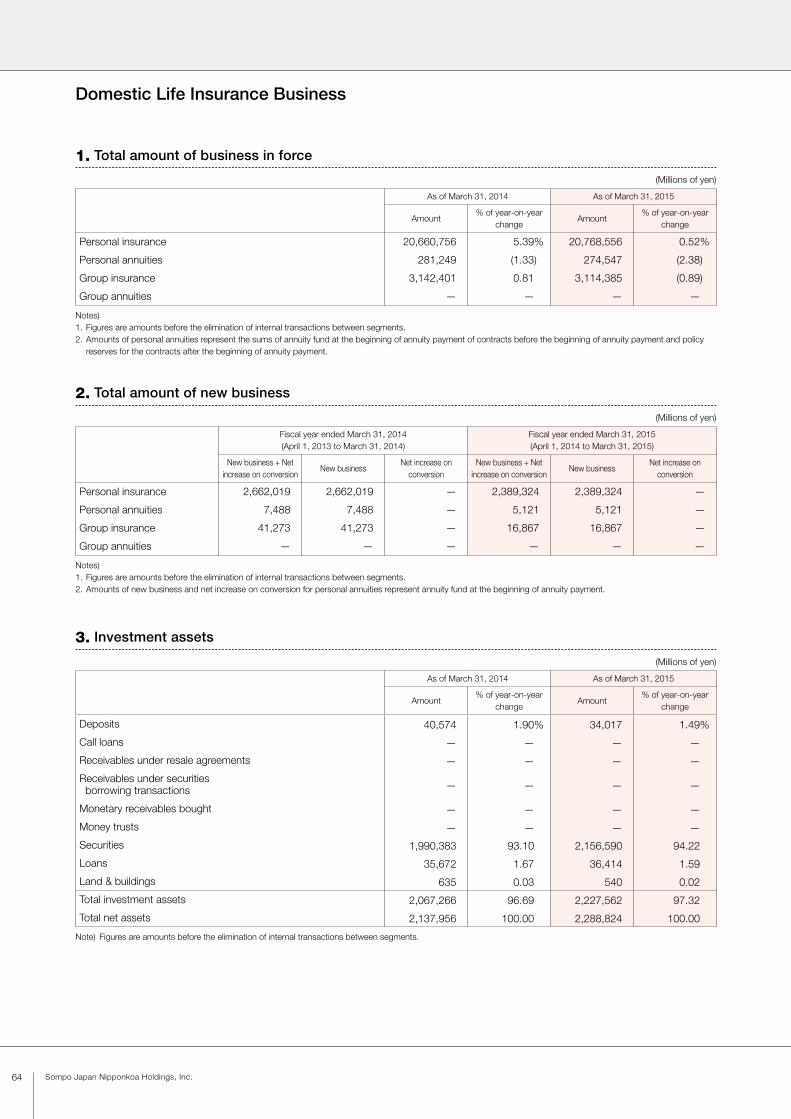
64 Sompo Japan Nipponkoa Holdings, Inc.
Domestic Life Insurance Business
1. Total amount of business in force
2. Total amount of new business
(Millions of yen)
As of March 31, 2014 As of March 31, 2015
Amount% of year-on-year
changeAmount
% of year-on-year change
Personal insurance 20,660,756 5.39% 20,768,556 0.52%
Personal annuities 281,249 (1.33) 274,547 (2.38)
Group insurance 3,142,401 0.81 3,114,385 (0.89)
Group annuities — — — —
Notes)1. Figures are amounts before the elimination of internal transactions between segments.2. Amounts of personal annuities represent the sums of annuity fund at the beginning of annuity payment of contracts before the beginning of annuity payment and policy
reserves for the contracts after the beginning of annuity payment.
(Millions of yen)
As of March 31, 2014 As of March 31, 2015
Amount% of year-on-year
changeAmount
% of year-on-year change
Deposits 40,574 1.90% 34,017 1.49%
Call loans — — — —
Receivables under resale agreements — — — —
Receivables under securities borrowing transactions — — — —
Monetary receivables bought — — — —
Money trusts — — — —
Securities 1,990,383 93.10 2,156,590 94.22
Loans 35,672 1.67 36,414 1.59
Land & buildings 635 0.03 540 0.02
Total investment assets 2,067,266 96.69 2,227,562 97.32
Total net assets 2,137,956 100.00 2,288,824 100.00
Note) Figures are amounts before the elimination of internal transactions between segments.
(Millions of yen)
Fiscal year ended March 31, 2014(April 1, 2013 to March 31, 2014)
Fiscal year ended March 31, 2015(April 1, 2014 to March 31, 2015)
New business + Net increase on conversion
New businessNet increase on
conversionNew business + Net
increase on conversionNew business
Net increase on conversion
Personal insurance 2,662,019 2,662,019 — 2,389,324 2,389,324 —
Personal annuities 7,488 7,488 — 5,121 5,121 —
Group insurance 41,273 41,273 — 16,867 16,867 —
Group annuities — — — — — —
Notes)1. Figures are amounts before the elimination of internal transactions between segments.2. Amounts of new business and net increase on conversion for personal annuities represent annuity fund at the beginning of annuity payment.
3. Investment assets
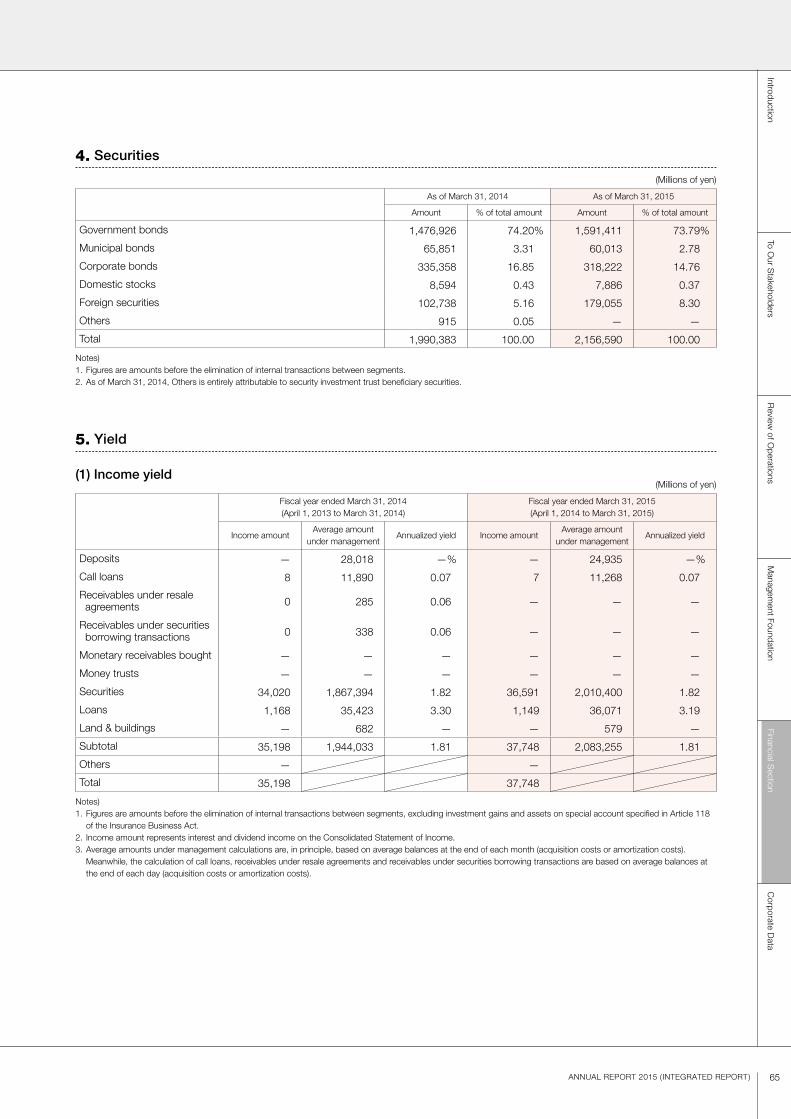
65ANNUAL REPORT 2015 ( INTEGRATED REPORT)
4. Securities
(Millions of yen)
As of March 31, 2014 As of March 31, 2015
Amount % of total amount Amount % of total amount
Government bonds 1,476,926 74.20% 1,591,411 73.79%
Municipal bonds 65,851 3.31 60,013 2.78
Corporate bonds 335,358 16.85 318,222 14.76
Domestic stocks 8,594 0.43 7,886 0.37
Foreign securities 102,738 5.16 179,055 8.30
Others 915 0.05 — —
Total 1,990,383 100.00 2,156,590 100.00
Notes)1. Figures are amounts before the elimination of internal transactions between segments.2. As of March 31, 2014, Others is entirely attributable to security investment trust beneficiary securities.
5. Yield
(1) Income yield(Millions of yen)
Fiscal year ended March 31, 2014(April 1, 2013 to March 31, 2014)
Fiscal year ended March 31, 2015(April 1, 2014 to March 31, 2015)
Income amountAverage amount
under managementAnnualized yield Income amount
Average amount under management
Annualized yield
Deposits — 28,018 —% — 24,935 —%
Call loans 8 11,890 0.07 7 11,268 0.07
Receivables under resale agreements 0 285 0.06 — — —
Receivables under securities borrowing transactions 0 338 0.06 — — —
Monetary receivables bought — — — — — —
Money trusts — — — — — —
Securities 34,020 1,867,394 1.82 36,591 2,010,400 1.82
Loans 1,168 35,423 3.30 1,149 36,071 3.19
Land & buildings — 682 — — 579 —
Subtotal 35,198 1,944,033 1.81 37,748 2,083,255 1.81
Others — —
Total 35,198 37,748
Notes)1. Figures are amounts before the elimination of internal transactions between segments, excluding investment gains and assets on special account specified in Article 118
of the Insurance Business Act.2. Income amount represents interest and dividend income on the Consolidated Statement of Income.3. Average amounts under management calculations are, in principle, based on average balances at the end of each month (acquisition costs or amortization costs). Meanwhile, the calculation of call loans, receivables under resale agreements and receivables under securities borrowing transactions are based on average balances at
the end of each day (acquisition costs or amortization costs).
Financial Section
IntroductionTo O
ur Stakeholders
Review
of Operations
Managem
ent FoundationC
orporate Data

66 Sompo Japan Nipponkoa Holdings, Inc.
6. Foreign investments
(Millions of yen)
As of March 31, 2014 As of March 31, 2015
Amount % of total amount Amount % of total amount
Foreign currency dominated securities
Foreign bonds 69,657 71.94% 145,577 84.18%
Foreign stocks — — — —
Others — — 58 0.03
Subtotal 69,657 71.94 145,635 84.22
Yen-dominated securities
Loan for non-resident — — — —
Foreign bonds 27,167 28.06 27,291 15.78
Others — — — —
Subtotal 27,167 28.06 27,291 15.78
Total 96,825 100.00 172,926 100.00
Yield on foreign investments
Income yield 2.25% 2.19%
Realized yield 2.08 2.17
Notes)1. Figures are amounts before the elimination of internal transactions between segments, excluding investment gains and assets on special account specified
in Article 118 of the Insurance Business Act.2. Assets associated with foreign loans and investments under income yield within yield on foreign investments are calculated using the same method
as 5. Yield (1) Income yield.3. Assets associated with foreign loans and investments under realized yield within yield on foreign investments are calculated using the same method
as 5. Yield (2) Realized yield.4. As of March 31, 2015, others in foreign currency dominated securities is entirely attributable to deposits.
(2) Realized Yield(Millions of yen)
Fiscal year ended March 31, 2014(April 1, 2013 to March 31, 2014)
Fiscal year ended March 31, 2015(April 1, 2014 to March 31, 2015)
Investment profit (realized basis)
Average amount under management
(acquisition cost basis)Annualized yield
Investment profit (realized basis)
Average amount under management
(acquisition cost basis)Annualized yield
Deposits — 28,018 —% 0 24,935 0.00%
Call loans 8 11,890 0.07 7 11,268 0.07
Receivables under resale agreements 0 285 0.06 — — —
Receivables under securities borrowing transactions 0 338 0.05 — — —
Monetary receivables bought — — — — — —
Money trusts — — — — — —
Securities 34,952 1,867,394 1.87 37,376 2,010,400 1.86
Loans 1,168 35,423 3.30 1,149 36,071 3.19
Land & buildings — 682 — — 579 —
Derivatives (67) (250)
Others (29) (39)
Total 36,033 1,944,033 1.85 38,244 2,083,255 1.84
Notes)1. Figures are amounts before the elimination of internal transactions between segments, excluding investment gains and assets on special account specified in Article 118
of the Insurance Business Act.2. Investment profit (realized basis) excludes investment expenses from investment income on the Consolidated Statement of Income.3. Average amounts (acquisition cost basis) under management calculations are, in principle, based on average balances at the end of each month (acquisition costs or
amortization costs). Meanwhile, the calculation of call loans, receivables under resale agreements and receivables under securities borrowing transactions are based on average balances at the end of each day (acquisition costs or amortization costs).

67ANNUAL REPORT 2015 ( INTEGRATED REPORT)
Overseas Insurance Business
(Reference) Overview of Entire Business
1. Direct premiums written (including deposits of premiums by policyholders)
2. Net premiums written
(Millions of yen)
Fiscal year ended March 31, 2014(April 1, 2013 to March 31, 2014)
Fiscal year ended March 31, 2015(April 1, 2014 to March 31, 2015)
Amount % of year-on-year change Amount % of year-on-year change
Net premiums written 154,022 132.82% 290,206 88.42%
Note) Figures are amounts before the elimination of internal transactions between segments.
(Millions of yen)
Fiscal year ended March 31, 2014(April 1, 2013 to March 31, 2014)
Fiscal year ended March 31, 2015(April 1, 2014 to March 31, 2015)
Amount % of total amount% of year-on-year
changeAmount % of total amount
% of year-on-year change
Fire and allied lines insurance 434,606 16.80% 8.61% 485,286 17.38% 11.66%
Marine insurance 72,430 2.80 19.67 89,043 3.19 22.94
Personal accident insurance 287,808 11.13 0.54 302,679 10.84 5.17
Voluntary automobile insurance 1,108,405 42.86 7.21 1,177,575 42.17 6.24
Compulsory automobile liability insurance 325,990 12.60 10.64 324,060 11.61 (0.59)
Others 357,113 13.81 16.54 413,496 14.81 15.79
Total 2,586,354 100.00 8.58 2,792,142 100.00 7.96
Deposits of premiums by policyholders 140,943 5.45 (3.67) 144,213 5.16 2.32
Notes)1. Figures are amounts before the elimination of internal transactions between segments.2. Direct premiums written (including deposits of premiums by policyholders) is gross premiums written deducted by the sum of surrender benefits of direct policies and
other refunds of direct policies. (Includes deposits of premiums of saving type insurance policies)
(Millions of yen)
Fiscal year ended March 31, 2014(April 1, 2013 to March 31, 2014)
Fiscal year ended March 31, 2015(April 1, 2014 to March 31, 2015)
Amount % of total amount% of year-on-year
changeAmount % of total amount
% of year-on-year change
Fire and allied lines insurance 311,417 13.73% 17.68% 396,516 15.81% 27.33%
Marine insurance 58,553 2.58 17.91 83,102 3.31 41.93
Personal accident insurance 190,743 8.41 2.06 195,249 7.78 2.36
Voluntary automobile insurance
1,108,121 48.84 7.21 1,178,030 46.97 6.31
Compulsory automobile liability insurance
298,911 13.17 8.66 305,869 12.20 2.33
Others 301,222 13.28 19.18 349,263 13.93 15.95
Total 2,268,967 100.00 10.00 2,508,031 100.00 10.54
Note) Figures are amounts before the elimination of internal transactions between segments.
Financial Section
IntroductionTo O
ur Stakeholders
Review
of Operations
Managem
ent FoundationC
orporate Data
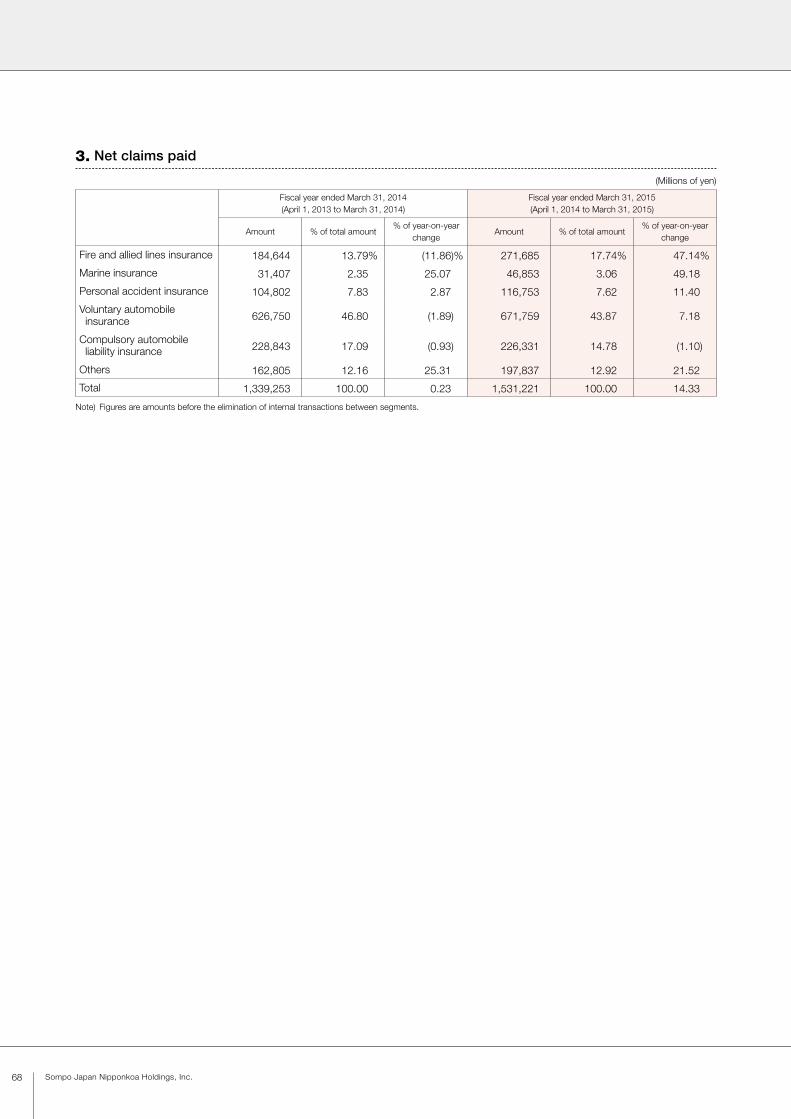
68 Sompo Japan Nipponkoa Holdings, Inc.
3. Net claims paid
(Millions of yen)
Fiscal year ended March 31, 2014(April 1, 2013 to March 31, 2014)
Fiscal year ended March 31, 2015(April 1, 2014 to March 31, 2015)
Amount % of total amount% of year-on-year
changeAmount % of total amount
% of year-on-year change
Fire and allied lines insurance 184,644 13.79% (11.86)% 271,685 17.74% 47.14%
Marine insurance 31,407 2.35 25.07 46,853 3.06 49.18
Personal accident insurance 104,802 7.83 2.87 116,753 7.62 11.40
Voluntary automobile insurance 626,750 46.80 (1.89) 671,759 43.87 7.18
Compulsory automobile liability insurance 228,843 17.09 (0.93) 226,331 14.78 (1.10)
Others 162,805 12.16 25.31 197,837 12.92 21.52
Total 1,339,253 100.00 0.23 1,531,221 100.00 14.33
Note) Figures are amounts before the elimination of internal transactions between segments.

69ANNUAL REPORT 2015 ( INTEGRATED REPORT)
Report of Independent AuditorsFinancial S
ectionIntroduction
To Our S
takeholdersR
eview of O
perationsM
anagement Foundation
Corporate D
ata

70 Sompo Japan Nipponkoa Holdings, Inc.
Consolidated Financial Statements
Consolidated Balance SheetSompo Japan Nipponkoa Holdings, Inc.
(Millions of yen)
Notes No.
As of March 31, 2014 As of March 31, 2015Increase
(Decrease)AmountComposition
ratioAmount
Compositionratio
Assets:
Cash and deposits *5 471,481 4.96% 523,465 5.11% 51,984
Call loans 75,000 0.79 — — (75,000)
Receivables under resale agreements 126,984 1.34 71,985 0.70 (54,998)
Monetary receivables bought 16,951 0.18 14,234 0.14 (2,717)
Money trusts 97,850 1.03 111,293 1.09 13,442
Securities *3, *5, *6 6,896,907 72.60 7,682,930 74.93 786,022
Loans *4, *8 606,541 6.38 604,058 5.89 (2,483)
Tangible fixed assets: *1, *2, *5 349,968 3.68 343,322 3.35 (6,646)
Land 184,801 180,226
Buildings 125,115 126,407
Leased assets 6,595 5,225
Construction in progress 5,370 3,825
Other tangible fixed assets 28,085 27,637
Intangible fixed assets: 66,904 0.70 100,230 0.98 33,326
Software 8,483 7,973
Goodwill 54,431 83,636
Other intangible fixed assets 3,988 8,620
Other assets 720,934 7.59 795,963 7.76 75,028
Net defined benefit asset 240 0.00 315 0.00 75
Deferred tax assets 63,095 0.66 11,560 0.11 (51,535)
Customers’ liabilities for acceptances and guarantees 12,299 0.13 — — (12,299)
Allowance for possible credit losses (5,360) (0.06) (5,928) (0.06) (567)
Total assets 9,499,799 100.00 10,253,431 100.00 753,631

71ANNUAL REPORT 2015 ( INTEGRATED REPORT)
Consolidated Balance Sheet (Continued)Sompo Japan Nipponkoa Holdings, Inc.
(Millions of yen)
Notes No.
As of March 31, 2014 As of March 31, 2015Increase
(Decrease)AmountComposition
ratioAmount
Compositionratio
Liabilities:
Underwriting funds: 7,301,760 76.86% 7,579,309 73.92% 277,548
Reserve for outstanding losses and claims 1,100,613 1,264,221
Underwriting reserves 6,201,146 6,315,087
Corporate bonds 261,560 2.75 135,958 1.33 (125,601)
Other liabilities *5 371,054 3.91 416,340 4.06 45,285
Net defined benefit liability 95,814 1.01 96,854 0.94 1,039
Reserve for retirement benefits to directors 58 0.00 64 0.00 5
Reserve for bonus payments 22,195 0.23 24,567 0.24 2,372
Reserve for bonus payments to directors 185 0.00 216 0.00 30
Reserves under the special laws: 43,790 0.46 53,553 0.52 9,762
Reserve for price fluctuation 43,790 53,553
Deferred tax liabilities 926 0.01 116,713 1.14 115,786
Acceptances and guarantees 12,299 0.13 — — (12,299)
Total liabilities 8,109,646 85.37 8,423,578 82.15 313,932
Net assets:
Shareholders’ equity:
Common stock 100,045 1.05 100,045 0.98 —
Capital surplus 438,536 4.62 438,306 4.27 (230)
Retained earnings 188,087 1.98 222,682 2.17 34,594
Treasury stock (9,825) (0.10) (19,067) (0.19) (9,242)
Total shareholders’ equity 716,845 7.55 741,967 7.24 25,122
Accumulated other comprehensive income:
Unrealized gains and losses on securities available for sale 659,375 6.94 1,048,718 10.23 389,342
Deferred gains and losses on hedges 7,205 0.08 8,085 0.08 880
Foreign currency translation adjustments (4,341) (0.05) 26,046 0.25 30,387
Remeasurements of defined benefit plans 3,120 0.03 (3,235) (0.03) (6,355)
Total accumulated other comprehensive income 665,360 7.00 1,079,614 10.53 414,254
Stock acquisition rights 1,851 0.02 1,550 0.02 (300)
Non-controlling interests 6,096 0.06 6,720 0.07 623
Total net assets 1,390,153 14.63 1,829,852 17.85 439,699
Total liabilities and net assets 9,499,799 100.00 10,253,431 100.00 753,631
Financial Section
IntroductionTo O
ur Stakeholders
Review
of Operations
Managem
ent FoundationC
orporate Data
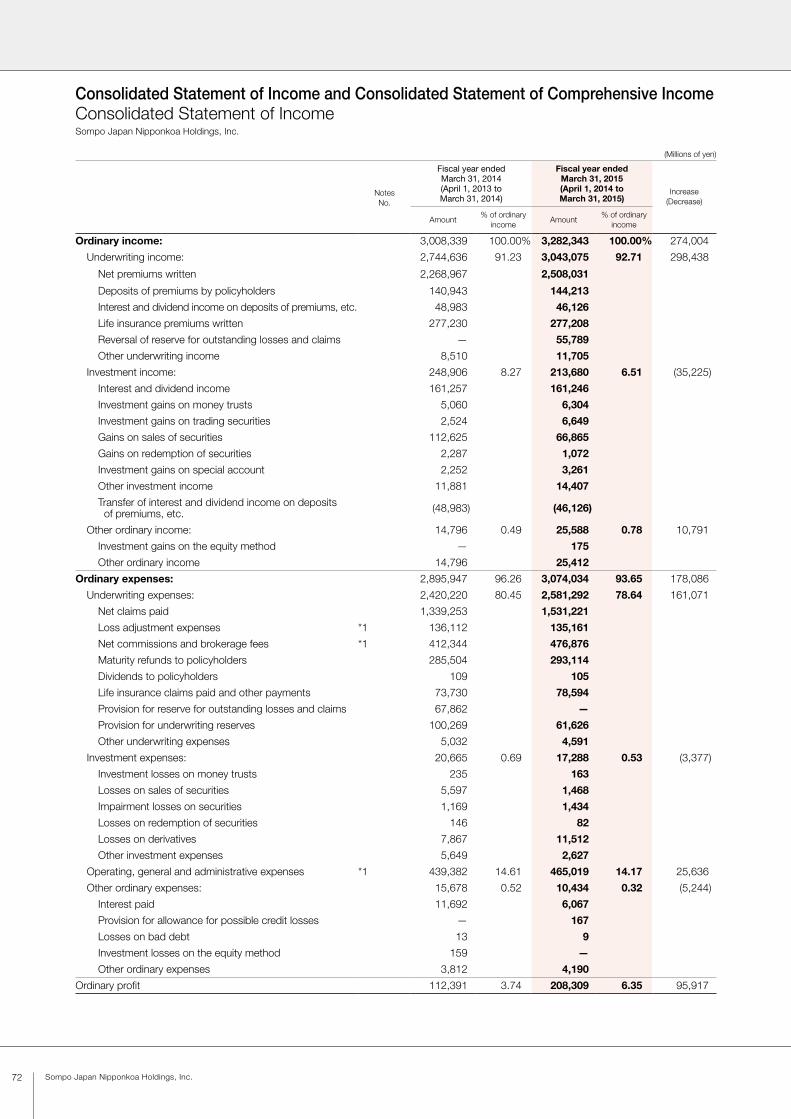
72 Sompo Japan Nipponkoa Holdings, Inc.
Consolidated Statement of Income and Consolidated Statement of Comprehensive Income Consolidated Statement of IncomeSompo Japan Nipponkoa Holdings, Inc.
(Millions of yen)
Notes No.
Fiscal year ended March 31, 2014(April 1, 2013 toMarch 31, 2014)
Fiscal year ended March 31, 2015(April 1, 2014 toMarch 31, 2015)
Increase (Decrease)
Amount% of ordinary
incomeAmount
% of ordinary income
Ordinary income: 3,008,339 100.00% 3,282,343 100.00% 274,004
Underwriting income: 2,744,636 91.23 3,043,075 92.71 298,438
Net premiums written 2,268,967 2,508,031
Deposits of premiums by policyholders 140,943 144,213
Interest and dividend income on deposits of premiums, etc. 48,983 46,126
Life insurance premiums written 277,230 277,208
Reversal of reserve for outstanding losses and claims — 55,789
Other underwriting income 8,510 11,705
Investment income: 248,906 8.27 213,680 6.51 (35,225)
Interest and dividend income 161,257 161,246
Investment gains on money trusts 5,060 6,304
Investment gains on trading securities 2,524 6,649
Gains on sales of securities 112,625 66,865
Gains on redemption of securities 2,287 1,072
Investment gains on special account 2,252 3,261
Other investment income 11,881 14,407
Transfer of interest and dividend income on deposits of premiums, etc. (48,983) (46,126)
Other ordinary income: 14,796 0.49 25,588 0.78 10,791
Investment gains on the equity method — 175
Other ordinary income 14,796 25,412
Ordinary expenses: 2,895,947 96.26 3,074,034 93.65 178,086
Underwriting expenses: 2,420,220 80.45 2,581,292 78.64 161,071
Net claims paid 1,339,253 1,531,221
Loss adjustment expenses *1 136,112 135,161
Net commissions and brokerage fees *1 412,344 476,876
Maturity refunds to policyholders 285,504 293,114
Dividends to policyholders 109 105
Life insurance claims paid and other payments 73,730 78,594
Provision for reserve for outstanding losses and claims 67,862 —
Provision for underwriting reserves 100,269 61,626
Other underwriting expenses 5,032 4,591
Investment expenses: 20,665 0.69 17,288 0.53 (3,377)
Investment losses on money trusts 235 163
Losses on sales of securities 5,597 1,468
Impairment losses on securities 1,169 1,434
Losses on redemption of securities 146 82
Losses on derivatives 7,867 11,512
Other investment expenses 5,649 2,627
Operating, general and administrative expenses *1 439,382 14.61 465,019 14.17 25,636
Other ordinary expenses: 15,678 0.52 10,434 0.32 (5,244)
Interest paid 11,692 6,067
Provision for allowance for possible credit losses — 167
Losses on bad debt 13 9
Investment losses on the equity method 159 —
Other ordinary expenses 3,812 4,190
Ordinary profit 112,391 3.74 208,309 6.35 95,917

73ANNUAL REPORT 2015 ( INTEGRATED REPORT)
Consolidated Statement of Income and Consolidated Statement of Comprehensive Income Consolidated Statement of Income (Continued)Sompo Japan Nipponkoa Holdings, Inc.
Consolidated Statement of Comprehensive IncomeSompo Japan Nipponkoa Holdings, Inc.
(Millions of yen)
Notes No.
Fiscal year ended March 31, 2014(April 1, 2013 toMarch 31, 2014)
Fiscal year ended March 31, 2015(April 1, 2014 toMarch 31, 2015)
Increase (Decrease)
Amount% of ordinary
incomeAmount
% of ordinary income
Extraordinary gains: 4,284 0.14% 1,476 0.04% (2,807)
Gains on disposal of fixed assets 3,926 1,334
Gains on negative goodwill — 0
Other extraordinary gains *3 358 140
Extraordinary losses: 47,518 1.58 105,258 3.21 57,739
Losses on disposal of fixed assets 3,240 1,645
Impairment losses *2 4,021 5,517
Provision for reserves under the special laws: 8,270 9,782
Provision for reserve for price fluctuation 8,270 9,782
Other extraordinary losses *4 31,985 88,314
Net income before income taxes and non-controlling interests 69,157 2.30 104,527 3.18 35,370
Income taxes 9,319 14,569
Deferred income taxes 14,921 34,892
Total income taxes 24,240 0.81 49,461 1.51 25,220
Net income before non-controlling interests 44,916 1.49 55,066 1.68 10,149
Income attributable to non-controlling interests 746 0.02 790 0.02 43
Net income 44,169 1.47 54,276 1.65 10,106
(Millions of yen)
Notes No.
Fiscal year ended March 31, 2014(April 1, 2013 toMarch 31, 2014)
Fiscal year ended March 31, 2015(April 1, 2014 toMarch 31, 2015)
Amount Amount
Net income before non-controlling interests 44,916 55,066
Other comprehensive income:
Unrealized gains and losses on securities available for sale 80,280 388,657
Deferred gains and losses on hedges (448) 880
Foreign currency translation adjustments 24,425 31,084
Remeasurements of defined benefit plans — (6,353)
Share of other comprehensive income of affiliates accounted for under the equity method 790 149
Total other comprehensive income *1 105,048 414,419
Comprehensive income 149,965 469,485
(Comprehensive income attributable to)
Comprehensive income attributable to shareholders of the parent 148,781 468,399
Comprehensive income attributable to non-controlling interests 1,183 1,086
Financial Section
IntroductionTo O
ur Stakeholders
Review
of Operations
Managem
ent FoundationC
orporate Data

74 Sompo Japan Nipponkoa Holdings, Inc.
Consolidated Statement of Changes in Net AssetsSompo Japan Nipponkoa Holdings, Inc.
Fiscal year ended March 31, 2014 (April 1, 2013 to March 31, 2014)
(Millions of yen)
Shareholders’ equity
Common stock
Capital surplus
Retained earnings
Treasury stock
Total shareholders’
equity
Balance at the beginning of the period 100,045 438,567 181,149 (1,122) 718,640
Cumulative effects of changes in accounting policies —
Restated balance 100,045 438,567 181,149 (1,122) 718,640
Changes during the period:
Dividends (37,231) (37,231)
Net income 44,169 44,169
Acquisition of treasury stock (9,242) (9,242)
Disposal of treasury stock (31) 539 508
Changes in the scope of consolidation —
Net changes in items other than shareholders’ equity
Total changes during the period — (31) 6,938 (8,702) (1,795)
Balance at the end of the period 100,045 438,536 188,087 (9,825) 716,845
Accumulated other comprehensive income
Stock acquisition
rights
Non- controlling interests
Total net assets
Unrealized gains and losses on securities available for sale
Deferred gains and losses on hedges
Foreign currency
translation adjustments
Remeasure-ments of defined
benefit plans
Total accumulated
other comprehensive
income
Balance at the beginning of the period 579,284 7,653 (29,309) — 557,628 2,027 5,191 1,283,488
Cumulative effects of changes in accounting policies —
Restated balance 579,284 7,653 (29,309) — 557,628 2,027 5,191 1,283,488
Changes during the period:
Dividends (37,231)
Net income 44,169
Acquisition of treasury stock (9,242)
Disposal of treasury stock 508
Changes in the scope of consolidation —
Net changes in items other than shareholders’ equity 80,091 (448) 24,968 3,120 107,731 (176) 905 108,460
Total changes during the period 80,091 (448) 24,968 3,120 107,731 (176) 905 106,665
Balance at the end of the period 659,375 7,205 (4,341) 3,120 665,360 1,851 6,096 1,390,153
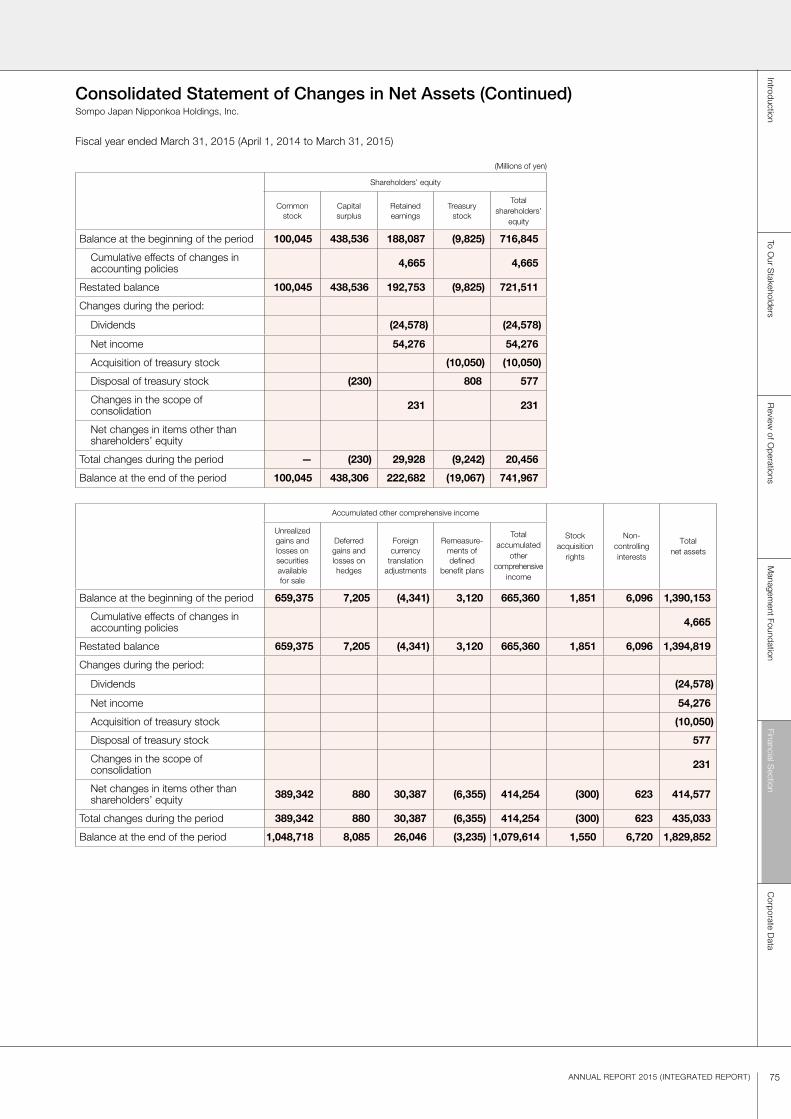
75ANNUAL REPORT 2015 ( INTEGRATED REPORT)
Consolidated Statement of Changes in Net Assets (Continued)Sompo Japan Nipponkoa Holdings, Inc.
Fiscal year ended March 31, 2015 (April 1, 2014 to March 31, 2015)
(Millions of yen)
Shareholders’ equity
Common stock
Capital surplus
Retained earnings
Treasury stock
Total shareholders’
equity
Balance at the beginning of the period 100,045 438,536 188,087 (9,825) 716,845
Cumulative effects of changes in accounting policies 4,665 4,665
Restated balance 100,045 438,536 192,753 (9,825) 721,511
Changes during the period:
Dividends (24,578) (24,578)
Net income 54,276 54,276
Acquisition of treasury stock (10,050) (10,050)
Disposal of treasury stock (230) 808 577
Changes in the scope of consolidation 231 231
Net changes in items other than shareholders’ equity
Total changes during the period — (230) 29,928 (9,242) 20,456
Balance at the end of the period 100,045 438,306 222,682 (19,067) 741,967
Accumulated other comprehensive income
Stock acquisition
rights
Non- controlling interests
Total net assets
Unrealized gains and losses on securities available for sale
Deferred gains and losses on hedges
Foreign currency
translation adjustments
Remeasure-ments of defined
benefit plans
Total accumulated
other comprehensive
income
Balance at the beginning of the period 659,375 7,205 (4,341) 3,120 665,360 1,851 6,096 1,390,153
Cumulative effects of changes in accounting policies 4,665
Restated balance 659,375 7,205 (4,341) 3,120 665,360 1,851 6,096 1,394,819
Changes during the period:
Dividends (24,578)
Net income 54,276
Acquisition of treasury stock (10,050)
Disposal of treasury stock 577
Changes in the scope of consolidation 231
Net changes in items other than shareholders’ equity 389,342 880 30,387 (6,355) 414,254 (300) 623 414,577
Total changes during the period 389,342 880 30,387 (6,355) 414,254 (300) 623 435,033
Balance at the end of the period 1,048,718 8,085 26,046 (3,235) 1,079,614 1,550 6,720 1,829,852
Financial Section
IntroductionTo O
ur Stakeholders
Review
of Operations
Managem
ent FoundationC
orporate Data

76 Sompo Japan Nipponkoa Holdings, Inc.
Consolidated Statement of Cash FlowsSompo Japan Nipponkoa Holdings, Inc.
(Millions of yen)
Notes No.
Fiscal year ended March 31, 2014(April 1, 2013 toMarch 31, 2014)
Fiscal year ended March 31, 2015(April 1, 2014 toMarch 31, 2015)
Increase (Decrease)
Amount Amount Amount
Cash flows from operating activities:
Net income before income taxes and non-controlling interests 69,157 104,527 35,370
Depreciation 20,633 21,628 995
Impairment losses 4,021 5,517 1,495
Amortization of goodwill 4,473 5,697 1,224
Gains on negative goodwill — (0) (0)
Increase (decrease) in reserve for outstanding losses and claims 68,039 (3,668) (71,707)
Increase (decrease) in underwriting reserves 96,668 61,820 (34,847)
Increase (decrease) in allowance for possible credit losses 80 561 480
Increase (decrease) in net defined benefit liability (3,080) (1,190) 1,890
Increase (decrease) in reserve for retirement benefits to directors 5 5 0
Increase (decrease) in reserve for bonus payments (903) 2,148 3,051
Increase (decrease) in reserve for bonus payments to directors (105) 30 136
Increase (decrease) in reserve for price fluctuation 8,270 9,782 1,511
Interest and dividend income (161,257) (161,246) 10
Losses (gains) on investment in securities (107,999) (64,939) 43,059
Interest expenses 11,692 6,067 (5,625)
Foreign exchange losses (gains) (6,958) (6,791) 167
Losses (gains) related to tangible fixed assets (684) 310 994
Losses (gains) related to loans 105 0 (104)
Investment losses (gains) on the equity method 159 (175) (335)
Decrease (increase) in other assets (other than investing and financing activities) (44,513) 3,366 47,879
Increase (decrease) in other liabilities (other than investing and financing activities) 19,717 14,350 (5,367)
Others 3,224 11,591 8,367
Subtotal (19,252) 9,392 28,645
Interest and dividend received 163,169 163,383 214
Interest paid (11,356) (8,059) 3,297
Income taxes paid (8,874) (11,945) (3,071)
Cash flows from operating activities 123,685 152,771 29,085
Cash flows from investing activities:
Net decrease (increase) in deposits 14,084 15,024 939
Proceeds from sales and redemption of monetary receivables bought 4,838 2,715 (2,123)
Increase in money trusts (36,464) (71,203) (34,738)
Decrease in money trusts 14,395 51,993 37,597
Purchase of securities (1,208,457) (1,019,888) 188,569
Proceeds from sales and redemption of securities 1,192,755 1,127,299 (65,456)
Loans made (160,420) (151,740) 8,679
Collection of loans 179,636 140,259 (39,376)
Net increase (decrease) in receivables under securities borrowing transactions and payables under securities lending transactions (10,040) — 10,040
Others (44,164) (54,921) (10,756)
Total of investment transactions (53,836) 39,538 93,374

77ANNUAL REPORT 2015 ( INTEGRATED REPORT)
Consolidated Statement of Cash Flows (Continued)Sompo Japan Nipponkoa Holdings, Inc.
(Millions of yen)
Notes No.
Fiscal year ended March 31, 2014(April 1, 2013 toMarch 31, 2014)
Fiscal year ended March 31, 2015(April 1, 2014 toMarch 31, 2015)
Increase (Decrease)
Amount Amount Amount
Total of operating activities and investment transactions as above 69,848 192,309 122,460
Acquisition of tangible fixed assets (22,387) (19,403) 2,984
Proceeds from sales of tangible fixed assets 13,901 3,566 (10,334)
Acquisition of stocks of subsidiaries resulting in changes in the scope of consolidation *2 (9,492) (97,412) (87,920)
Proceeds from sales of stocks of subsidiaries resulting in changes in the scope of consolidation — 2,664 2,664
Payments for sales of stocks of subsidiaries resulting in changes in the scope of consolidation — (919) (919)
Others (2,888) (2,410) 477
Cash flows from investing activities (74,704) (74,377) 326
Cash flows from financing activities:
Redemption of corporate bonds — (134,396) (134,396)
Proceeds from sales of treasury stock 3 2 (0)
Acquisition of treasury stock (9,242) (10,050) (807)
Dividends paid (37,183) (24,598) 12,584
Dividends paid to non-controlling shareholders (6) (2) 3
Others (4,044) (3,175) 868
Cash flows from financing activities (50,473) (172,221) (121,747)
Effect of exchange rate changes on cash and cash equivalents 9,302 8,679 (623)
Increase (decrease) in cash and cash equivalents 7,810 (85,148) (92,958)
Cash and cash equivalents at the beginning of the period 624,349 632,160 7,810
Decrease in cash and cash equivalents resulting from exclusion of consolidated subsidiaries — (3,438) (3,438)
Increase in cash and cash equivalents resulting from merger — 1,619 1,619
Cash and cash equivalents at the end of the period *1 632,160 545,192 (86,967)
Financial Section
IntroductionTo O
ur Stakeholders
Review
of Operations
Managem
ent FoundationC
orporate Data

78 Sompo Japan Nipponkoa Holdings, Inc.
Notes to the Consolidated Financial StatementsSompo Japan Nipponkoa Holdings, Inc.
1. Significant Accounting Policies for the Preparation of the Consolidated Financial Statements
1. Scope of consolidation(1) Number of consolidated subsidiaries: 84 companies
Name of major consolidated subsidiaries
Sompo Japan Nipponkoa Insurance Inc.
Sonpo 24 Insurance Company Limited
SAISON AUTOMOBILE AND FIRE INSURANCE COMPANY, LIMITED
Sompo Japan Nipponkoa Insurance Services Inc.
Sompo Japan Nipponkoa Himawari Life Insurance, Inc.
Sompo Japan Nipponkoa DC Securities Inc.
SOMPO JAPAN NIPPONKOA ASSET MANAGEMENT CO., LTD.
Healthcare Frontier Japan Inc.
Sompo Japan Nipponkoa Holdings (Americas) Inc.
Sompo Japan Insurance Company of America
Canopius Group Limited
Canopius Holdings UK Limited
Canopius Managing Agents Limited
Canopius Reinsurance Limited
Sompo Japan Nipponkoa Insurance Company of Europe Limited
Sompo Japan Sigorta Anonim Sirketi
Sompo Japan Nipponkoa Holdings (Asia) Pte. Ltd.
Tenet Sompo Insurance Pte. Ltd.
Berjaya Sompo Insurance Berhad
Sompo Japan Nipponkoa Insurance (China) Co., Ltd.
Sompo Japan Nipponkoa Insurance (Hong Kong) Company Limited
Yasuda Marítima Seguros S.A.
Yasuda Marítima Saude Seguros S.A.
Canopius Group Limited and its 60 group companies are included in the scope of consolidation during
the fiscal year ended March 31, 2015 because they became consolidated subsidiaries through the
acquisition of shares.
NIPPONKOA Insurance Company, Limited no longer exists due to a merger with Sompo Japan Insurance
Inc., which changed its name to Sompo Japan Nipponkoa Insurance Inc. on September 1, 2014.
Sompo Japan DIY Life Insurance CO., LTD. is excluded from the scope of consolidation during the fiscal
year ended March 31, 2015 because it is no longer a consolidated subsidiary due to the transfer of share.
Consolidated statement of income and consolidated statement of comprehensive income include income
and loss of Sompo Japan DIY Life Insurance CO., LTD. from April 1, 2014 to June 30, 2014.
NIPPONKOA Insurance Company (Asia) Limited is excluded from the scope of consolidation during the
fiscal year ended March 31, 2015 because the liquidation procedure has been substantially started and it
does not have a material impact. Consolidated statement of income and consolidated statement of
comprehensive income include income and loss of NIPPONKOA Insurance Company (Asia) Limited from
April 1, 2014 to June 30, 2014.
Yasuda Seguros S.A. no longer exists due to the merger with Marítima Seguros S.A. which changed its
name to Yasuda Marítima Seguros S.A. on October 21, 2014.
NKSJ Himawari Life Insurance, Inc. changed its name to Sompo Japan Nipponkoa Himawari Life Insurance,
Inc. on September 1, 2014. Sompo Japan DC Securities Inc. changed its name to Sompo Japan Nipponkoa
DC Securities Inc. on September 1, 2014. Sompo Japan Asia Holdings Pte. Ltd. changed its name to Sompo
Japan Nipponkoa Holdings (Asia) Pte. Ltd. on September 1, 2014. Sompo Japan Insurance (China) Co., Ltd.
changed its name to Sompo Japan Nipponkoa Insurance (China) Co., Ltd. on April 1, 2014. Marítima Saude
Seguros S.A. changed its name to Yasuda Marítima Saude Seguros S.A. on October 29, 2014.

79ANNUAL REPORT 2015 ( INTEGRATED REPORT)
(2) Names of major non-consolidated subsidiariesNames of major non-consolidated subsidiaries
• Sompo Japan Nipponkoa Insurance (Thailand) Public Company Limited
• Sompo Japan Nipponkoa Corporate Member Limited
As the non-consolidated subsidiaries do not have a material impact on reasonable judgment about the
financial conditions and results of operations of the Sompo Japan Nipponkoa Group (the “Group”) in terms
of total assets, ordinary income, net income or loss and retained earnings, etc. to the extent of equity position of
Sompo Japan Nipponkoa Holdings, Inc. (the “Company”), they are excluded from the scope of consolidation.
2. Application of the equity method(1) Number of affiliates accounted for under the equity method: 2 companies
• Hitachi Capital Insurance Corporation
• Universal Sompo General Insurance Company Limited
(2) The non-consolidated subsidiaries and affiliates (Sompo Japan Nipponkoa Insurance (Thailand) Public Company Limited and Sompo Japan Nipponkoa Corporate Member Limited, etc.) are not accounted for under the equity method as each company has a minor impact on the consolidated net income or loss and retained earnings, etc. and they also do not have a materiality as a whole.
(3) The Company holds 26.6% of voting rights of Japan Earthquake Reinsurance Co., Ltd. (“J.E.R.”) through its domestic consolidated property and casualty insurance subsidiaries. As J.E.R. is engaged in public business and the Company is not considered to have a material impact on J.E.R.’s decisions of finance, promotion and business strategy, J.E.R. is excluded from affiliates.
3. The fiscal year of consolidated subsidiariesThe balance sheet dates of the foreign consolidated subsidiaries are December 31. As the difference between
the balance sheet dates and the consolidated balance sheet date does not exceed three months, the financial
statements as of December 31 are used for the preparation of the consolidated financial statements.
Necessary adjustments are made for the significant transactions during the periods from the balance sheet
dates of the subsidiaries to the consolidated balance sheet date.
4. Accounting policies(1) Valuation policies and methods for securities
(a) Trading securities are carried at fair value.
Cost of sale is calculated based on the moving-average method.
(b) Bonds held to maturity are carried at amortized cost based on the moving-average method.
(c) Policy reserve matching bonds are carried at amortized cost based on the moving-average method in
accordance with “Temporary Treatment of Accounting and Auditing Concerning Policy Reserve Matching
Bonds in the Insurance Industry” (Japanese Institute of Certified Public Accountants Industry Audit
Practice Committee Report No.21).
The outline of risk management policy in relation to policy reserve matching bonds is as follows.
Domestic consolidated life insurance subsidiary sets up the sub-category for individual insurance depending
on line of business and investment policy, etc., and follows the management policy to match the duration of the
policy reserve in the sub-category with the duration of policy reserve matching bonds within a certain range.
Financial Section
IntroductionTo O
ur Stakeholders
Review
of Operations
Managem
ent FoundationC
orporate Data

80 Sompo Japan Nipponkoa Holdings, Inc.
(d) Stocks of non-consolidated subsidiaries and affiliates that are not accounted for under the equity
method are carried at cost based on the moving-average method.
(e) Securities available for sale (excluding securities available for sale which are considered extremely dif-
ficult to figure out their fair value) are carried at fair value based on the market price and other factors at
the end of the fiscal year.
Unrealized gains and losses are directly included in net assets and cost of sale is calculated based on
the moving-average method.
( f ) Securities available for sale which are considered extremely difficult to figure out their fair value are car-
ried at cost based on the moving-average method.
(g) Securities managed as trust assets in individually operated money trusts for primarily trading purposes
are carried at fair value.
(h) Securities managed as trust assets in individually operated money trusts classified as other than trading
purposes or held to maturity are carried on the same basis as that of securities available for sale.
(2) Valuation policies and methods for derivative transactionsDerivative transactions are carried at fair value.
(3) Depreciation methods of significant depreciable assets(a) Tangible fixed assets (excluding leased assets)
Depreciation of tangible fixed assets (excluding leased assets) held by the Company and its domestic
consolidated subsidiaries is calculated by using the declining-balance method, except for buildings
(excluding fixtures attached to buildings) acquired on or after April 1, 1998 whose depreciation is calcu-
lated by using the straight-line method.
Depreciation of tangible fixed assets (excluding leased assets) held by the foreign consolidated subsid-
iaries is mainly calculated by using the straight-line method.
(b) Intangible fixed assets
Amortization of software for internal use held by the consolidated subsidiaries is calculated by using the
straight-line method based on the estimated useful lives.
(4) Accounting policies for significant reserves(a) Allowance for possible credit losses
In order to provide for losses from defaults, the domestic consolidated insurance subsidiaries establish
allowance for possible credit losses in accordance with the internal standards for self-assessment of
assets and the policy of write-off and provision.
For claims against debtors that have legally, formally or substantially entered into bankruptcy, special
liquidation or whose notes have been under suspension at clearing houses, allowances are provided
based on the amount remaining after deduction of the estimated collectable amounts by the disposal of
collateral and by guarantees.
For claims against debtors that are highly likely to go bankrupt in the future, allowances are provided
based on the amount considered necessary according to overall solvency assessment of the debtor,
after deduction of estimated collectable amounts by disposal of collateral and by guarantees.
For claims other than those described above, allowances are provided based on the amount of claims
multiplied by the default rate, which is calculated based on historical credit loss experience for a certain
period in the past.
The departments responsible for respective assets assess relevant claim in accordance with the internal
standards for self-assessment of assets. The asset auditing department independently reviews the
results and allowances are provided based on the reviewed results.

81ANNUAL REPORT 2015 ( INTEGRATED REPORT)
The other consolidated subsidiaries determine mainly the collectability of the receivables respectively to
provide allowances to cover the estimated future losses.
(b) Reserve for retirement benefits to directors
In order to provide for retirement benefits to directors, the domestic consolidated subsidiaries record the
amount deemed accrued at the end of the fiscal year based on internal regulations.
(c) Reserve for bonus payments
In order to provide for employees’ bonus payments, reserve for bonus payments is recorded, with the
amount to be paid estimated at the end of the fiscal year.
(d) Reserve for bonus payments to directors
In order to provide for directors’ bonus payments, reserve for bonus payments to directors is recorded,
with the amount to be paid estimated at the end of the fiscal year.
(e) Reserve for price fluctuation
In order to provide for possible losses arising from price fluctuation of stock, etc., the domestic consoli-
dated insurance subsidiaries set aside reserves under Article 115 of the Insurance Business Act.
(5) Methods of accounting procedures for retirement benefits(a) Allocation method of projected retirement
Benefit formula method is mainly used for calculating retirement benefit obligation as the method for
attributing projected retirement benefits to the end of the current consolidated fiscal year.
(b) Amortization method of actuarial difference
Actuarial difference is mainly amortized from the following fiscal year by using the straight-line attribution
method over certain years (10 to 11 years) within the average remaining service years of employees in
each fiscal year when the difference occurs.
(Changes in accounting policies)
The Company has applied the “Accounting Standard for Retirement Benefits” (Accounting Standards Board
of Japan Statement No. 26, May 17, 2012, hereinafter “Retirement Benefits Accounting Standard”) and the
“Guidance on Accounting Standard for Retirement Benefits” (Accounting Standards Board of Japan
Guidance No. 25, May 17, 2012, hereinafter “Retirement Benefits Guidance”) with regard to the provisions
laid down in the main clause of Paragraph 35 of the Retirement Benefits Accounting Standard and the main
clause of Paragraph 67 of the Retirement Benefits Guidance, from the fiscal year ended March 31, 2015.
Accordingly, the Company reviewed the calculation method for retirement benefit obligation and service
cost, and changed the method of attributing expected benefit to periods from straight-line attribution
method or point method to benefit formula method. The Company also changed the way of determining
discount rate, from use of the number of years approximate to average remaining service period of employ-
ees as bond maturity, which is the basis of determining the discount rate, to use of a single weighted aver-
age discount rate reflecting the expected periods of payment of retirement benefits and amount of benefit
payment for each expected payment period.
Application of the Retirement Benefits Accounting Standard, etc. is in line with the transitional measures
provided in Paragraph 37 of the Retirement Benefits Accounting Standard. The impact from the change in
calculation method for retirement benefit obligation and service cost was recognized as retained earnings at
the beginning of the fiscal year ended March 31, 2015.
As a result, net defined benefit liability decreased by 6,733 million yen and retained earnings increased
by 4,665 million yen at the beginning of the fiscal year ended March 31, 2015. The impact on ordinary
profit and net income before income taxes and non-controlling interests for the fiscal year ended March 31,
2015 was immaterial.
Financial Section
IntroductionTo O
ur Stakeholders
Review
of Operations
Managem
ent FoundationC
orporate Data

82 Sompo Japan Nipponkoa Holdings, Inc.
(6) Significant hedge accountingGenerally the consolidated subsidiaries apply the exceptional treatment to certain interest rate swaps to
hedge cash flow fluctuation risk of floating-rate loans and bonds to the extent that such transactions meet
the conditions required for the application of the exceptional treatment.
The deferred hedge accounting method is applied to interest rate swaps to hedge interest rate fluctuation
risk related to long-term insurance contracts based on “The Accounting and Auditing Treatment on the
Application of the Financial Products Accounting Standard to the Insurance Industry” (Japanese Institute of
Certified Public Accountants Industry Audit Practice Committee Report No. 26, hereafter “Industry Audit
Practice Committee Report No. 26”).
The consolidated subsidiaries apply the fair value hedge accounting method to equity swaps for hedging
the future stock price fluctuation risks.
Generally the fair value hedge accounting method is applied to forward foreign exchanges, currency options
and currency swaps in order to reduce foreign exchange rate fluctuation risk on foreign currency denomi-
nated assets, etc. The assignment accounting as an exceptional treatment is applied to certain transactions
to the extent that such transactions meet the conditions required for application of the assignment account-
ing. Deferred hedge is applied to the part of foreign exchange forward contracts to fix yen denominated
cash flow from foreign currency denominated forecast transactions. The assignment accounting is applied
to currency swaps in order to reduce foreign exchange rate fluctuation risk on foreign currency denominated
corporate bonds issued by the domestic consolidated insurance subsidiary.
Hedge effectiveness is assessed by periodically comparing the accumulated fluctuations of the market value or
cash flows of the hedged item to those of the related hedging instrument for the period from the commencement
of the hedge to the date of assessment.
However, when the significant conditions are shared among the hedged item and the hedging instrument
and its effectiveness is obviously considered high, when interest rate swaps meet requirements for applying
the exceptional treatment or when certain transactions fulfill the required conditions to apply the assignment
accounting, the assessment of the hedge effectiveness is omitted.
The hedge effectiveness of interest rate swaps based on Industry Audit Practice Committee Report No. 26
is assessed by monitoring the interest rates which impact the calculation of theoretical prices of both
insurance liabilities as hedged item and interest rate swaps as hedging instrument which are grouped by
each remaining period.
(7) Method and period of amortization of goodwillGoodwill is amortized in equal installments over 20 years. Immaterial amounts of goodwill are amortized at
one time.
(8) Cash and cash equivalents in the consolidated statement of cash flowsCash and cash equivalents in the consolidated statement of cash flows consist of cash on hand, demand
deposits and short-term investments with original maturities or redemption of three months or less, which
can be cashed easily and have little risk of fluctuation in value.
(9) Accounting methods for consumption taxesThe Company and its domestic consolidated subsidiaries account for consumption taxes by using the
tax-excluded method, except for the domestic consolidated insurance subsidiaries’ expenses such as loss
adjustment expenses and operating, general and administrative expenses under the tax-included method.
Non-deductible consumption taxes relating to assets are included in other assets and amortized in equal
installments over 5 years.
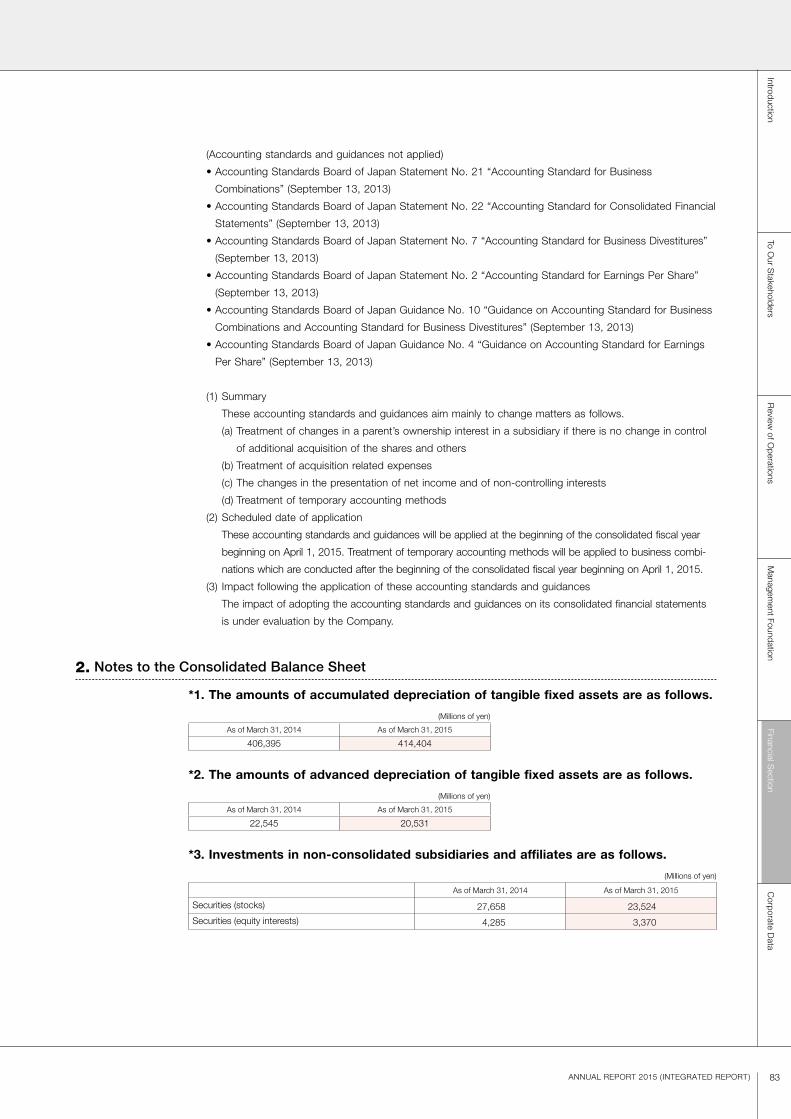
83ANNUAL REPORT 2015 ( INTEGRATED REPORT)
(Accounting standards and guidances not applied)
• Accounting Standards Board of Japan Statement No. 21 “Accounting Standard for Business
Combinations” (September 13, 2013)
• Accounting Standards Board of Japan Statement No. 22 “Accounting Standard for Consolidated Financial
Statements” (September 13, 2013)
• Accounting Standards Board of Japan Statement No. 7 “Accounting Standard for Business Divestitures”
(September 13, 2013)
• Accounting Standards Board of Japan Statement No. 2 “Accounting Standard for Earnings Per Share”
(September 13, 2013)
• Accounting Standards Board of Japan Guidance No. 10 “Guidance on Accounting Standard for Business
Combinations and Accounting Standard for Business Divestitures” (September 13, 2013)
• Accounting Standards Board of Japan Guidance No. 4 “Guidance on Accounting Standard for Earnings
Per Share” (September 13, 2013)
(1) Summary
These accounting standards and guidances aim mainly to change matters as follows.
(a) Treatment of changes in a parent’s ownership interest in a subsidiary if there is no change in control
of additional acquisition of the shares and others
(b) Treatment of acquisition related expenses
(c) The changes in the presentation of net income and of non-controlling interests
(d) Treatment of temporary accounting methods
(2) Scheduled date of application
These accounting standards and guidances will be applied at the beginning of the consolidated fiscal year
beginning on April 1, 2015. Treatment of temporary accounting methods will be applied to business combi-
nations which are conducted after the beginning of the consolidated fiscal year beginning on April 1, 2015.
(3) Impact following the application of these accounting standards and guidances
The impact of adopting the accounting standards and guidances on its consolidated financial statements
is under evaluation by the Company.
2. Notes to the Consolidated Balance Sheet
*1. The amounts of accumulated depreciation of tangible fixed assets are as follows.
(Millions of yen)
As of March 31, 2014 As of March 31, 2015
406,395 414,404
*2. The amounts of advanced depreciation of tangible fixed assets are as follows.
(Millions of yen)
As of March 31, 2014 As of March 31, 2015
22,545 20,531
*3. Investments in non-consolidated subsidiaries and affiliates are as follows.
(Millions of yen)
As of March 31, 2014 As of March 31, 2015
Securities (stocks) 27,658 23,524
Securities (equity interests) 4,285 3,370
Financial Section
IntroductionTo O
ur Stakeholders
Review
of Operations
Managem
ent FoundationC
orporate Data

84 Sompo Japan Nipponkoa Holdings, Inc.
*4. The amounts of loans to borrowers in bankruptcy, etc. are as follows.
(Millions of yen)
As of March 31, 2014 As of March 31, 2015
Loans to borrowers in bankruptcy 76 70
Overdue loans 748 572
Loans overdue for three months or more — 15
Restructured loans 74 60
Total 900 719
Note) Loans to borrowers in bankruptcy represent non-accrual loans which meet the events defined in Article 96, paragraph (1), item (iii) (a) to (e) (the maximum amount transferable to allowance for possible credit losses) or Article 96, paragraph (1), item (iv) of the “Order for Enforcement of the Corporation Tax Act” (Cabinet Order No.97 of 1965). Non-accrual loans are defined as loans (excluding the portion of the loans that were written off), on which accrued interest receivable is not recognized because payments of principal or interest are overdue for considerable periods and therefore are regarded as improbable.
Overdue loans represent non-accrual loans other than (a) loans to borrowers in bankruptcy or (b) loans on which grace on interest payments has been granted in order to assist or facilitate the restructuring of borrowers in financial difficulties.
Loans overdue for three months or more represent, among loans which are not included in loans to borrowers in bankruptcy or overdue loans, loans on which the payment of principal or interest has been delayed for three months or more from the date following the due date.
Restructured loans represent, among loans which are not included in any of the above categories, loans on which favorable terms for the benefit of borrowers such as interest exemption or reduction, grace on interest payments, grace on principal repayments or forgiveness of debts have been granted in order to assist or facilitate the restructuring of borrowers in financial difficulties.
*5. Pledged assets and secured debts are as follows.Pledged assets
(Millions of yen)
As of March 31, 2014 As of March 31, 2015
Deposits 3,880 22,627
Securities 86,419 289,278
Tangible fixed assets 2,799 2,796
Total 93,098 314,701
Note) Other than those mentioned above, stocks of subsidiaries and affiliates of 2,794 million yen are pledged as collateral as of March 31, 2014 and 2015, but the entire amount is eliminated for the preparation of the consolidated financial statements.
The above figures are collateral for the borrowings which are included in other liabilities and securities which are put into as deposited assets for overseas operation and others.
Secured debts
(Millions of yen)
As of March 31, 2014 As of March 31, 2015
Other liabilities (borrowings) 962 704
*6. The amounts of lending securities under loan agreements included in securities are as follows.
(Millions of yen)
As of March 31, 2014 As of March 31, 2015
392 2,701
7. Of the securities received as collateral under derivative transactions, those which the Group holds rights to dispose of by sale or provision of collateral at its discretion are as follows.
(Millions of yen)
As of March 31, 2014 As of March 31, 2015
Securities which the Group does not dispose of but retains 11,897 52,062
*8. The amounts of loan commitments outstanding are as follows.
(Millions of yen)
As of March 31, 2014 As of March 31, 2015
9,133 9,474

85ANNUAL REPORT 2015 ( INTEGRATED REPORT)
3. Notes to the Consolidated Statement of Income
*1. Main components of operating expenses are as follows.
(Millions of yen)
Fiscal year ended March 31, 2014(April 1, 2013 to March 31, 2014)
Fiscal year ended March 31, 2015(April 1, 2014 to March 31, 2015)
Agency commissions, etc. 405,239 462,356Salaries 220,006 214,938
Note) Operating expenses represent the sum of loss adjustment expenses, operating, general and administrative expenses and net commissions and brokerage fees included in the consolidated statement of income.
*2. Components of impairment losses are as follows.Fiscal year ended March 31, 2014 (April 1, 2013 to March 31, 2014)
Purpose of use Category LocationImpairment losses (millions of yen)
Land Buildings Total
Idle properties Land and buildings 40 properties, including land and buildings in Okayama 2,745 1,276 4,021
The domestic consolidated insurance subsidiaries categorize properties used for the insurance business as a
single asset group for the entire insurance business. Each property for rent, idle property and expected disposal
property is categorized as an individual asset group. The other consolidated subsidiaries categorize properties
used for the business as a single asset group for each subsidiary.
Concerning idle properties whose profitability is decreased significantly, due mainly to a decline in the prices of
land, the consolidated subsidiaries devalue the book value of those properties to the recoverable value. These
devaluations are recorded as impairment losses in extraordinary losses. The recoverable value is calculated by
using the net selling price. The net selling price is the appraisal value measured by the real estate appraisers.
Fiscal year ended March 31, 2015 (April 1, 2014 to March 31, 2015)
Purpose of use Category LocationImpairment losses (millions of yen)
Land Buildings Total
Idle properties Land and buildings 14 properties, including land and buildings in Kanagawa 4,163 1,087 5,250
Properties for rent Land and buildings Land and building in Nagano 162 103 266Total 4,325 1,191 5,517
The domestic consolidated insurance subsidiaries categorize properties used for the insurance business as a
single asset group for the entire insurance business. Each property for rent, idle property and expected disposal
property is categorized as an individual asset group. The other consolidated subsidiaries categorize properties
used for the business as a single asset group for each subsidiary.
Concerning idle properties whose profitability is decreased significantly, due mainly to a decline in the prices of
land, the consolidated subsidiaries devalue the book value of those properties to the recoverable value. For the
fiscal year ended March 31, 2015, these devaluations are recorded as impairment losses in extraordinary
losses. The recoverable value is calculated by using the net selling price. The net selling price is the appraisal
value measured by the real estate appraisers.
*3. Significant items in other extraordinary gains are as follows.
(Millions of yen)
Fiscal year ended March 31, 2014(April 1, 2013 to March 31, 2014)
Fiscal year ended March 31, 2015(April 1, 2014 to March 31, 2015)
Gains on reversal of stock acquisition rights 118 140
*4. Significant items in other extraordinary losses are as follows.
(Millions of yen)
Fiscal year ended March 31, 2014(April 1, 2013 to March 31, 2014)
Fiscal year ended March 31, 2015(April 1, 2014 to March 31, 2015)
Merger cost of domestic consolidated property and casualty insurance subsidiaries 23,155 87,106
Financial Section
IntroductionTo O
ur Stakeholders
Review
of Operations
Managem
ent FoundationC
orporate Data

86 Sompo Japan Nipponkoa Holdings, Inc.
4. Note to the Consolidated Statement of Comprehensive Income
5. Notes to the Consolidated Statement of Changes in Net Assets
*1. Reclassification adjustments and the related tax effects concerning other comprehensive income
(Millions of yen)
Fiscal year ended March 31, 2014(April 1, 2013 to March 31, 2014)
Fiscal year ended March 31, 2015(April 1, 2014 to March 31, 2015)
Unrealized gains and losses on securities available for sale
The amount occurred during the period 225,591 598,681
Reclassification adjustments (115,671) (78,949)
Before tax effects adjustments 109,920 519,732
Tax effects (29,639) (131,075)
Unrealized gains and losses on securities available for sale 80,280 388,657
Deferred gains and losses on hedges
The amount occurred during the period 710 3,627
Reclassification adjustments (1,460) (1,525)
Adjustment on the cost of the assets — (1,143)
Before tax effects adjustments (749) 959
Tax effects 301 (78)
Deferred gains and losses on hedges (448) 880
Foreign currency translation adjustments
The amount occurred during the period 24,425 31,224
Tax effects — (139)
Foreign currency translation adjustments 24,425 31,084
Remeasurements of defined benefit plans
The amount occurred during the period — (9,152)
Reclassification adjustments — 112
Before tax effects adjustments — (9,039)
Tax effects — 2,685
Remeasurements of defined benefit plans — (6,353)
Share of other comprehensive income of affiliates accounted for under the equity method
The amount occurred during the period 829 198
Reclassification adjustments (39) (48)
Share of other comprehensive income of affiliates accounted for under the equity method 790 149
Total other comprehensive income 105,048 414,419
Fiscal year ended March 31, 2014 (April 1, 2013 to March 31, 2014)
1. Type and number of shares outstanding and of treasury stock
Number of shares at the beginning of the period
(thousand shares)
Increase during the period
(thousand shares)
Decrease during the period
(thousand shares)
Number of shares at the end of the period(thousand shares)
Shares outstanding
Common stock 415,352 — — 415,352
Total 415,352 — — 415,352
Treasury stock
Common stock 626 3,732 290 4,068
Total 626 3,732 290 4,068
Notes)1. Breakdown of increase in treasury stock of common stock of 3,732 thousand shares is as follows. Increase due to acquisition of treasury stock in accordance with approval by board of directors: 3,716 thousand shares Increase due to purchase of shares less than a full trading unit: 16 thousand shares2. Breakdown of decrease in treasury stock of common stock of 290 thousand shares is as follows. Decrease due to disposal of treasury stock related to exercise of stock acquisition rights: 289 thousand shares Decrease due to sales of shares less than a full trading unit: 1 thousand shares
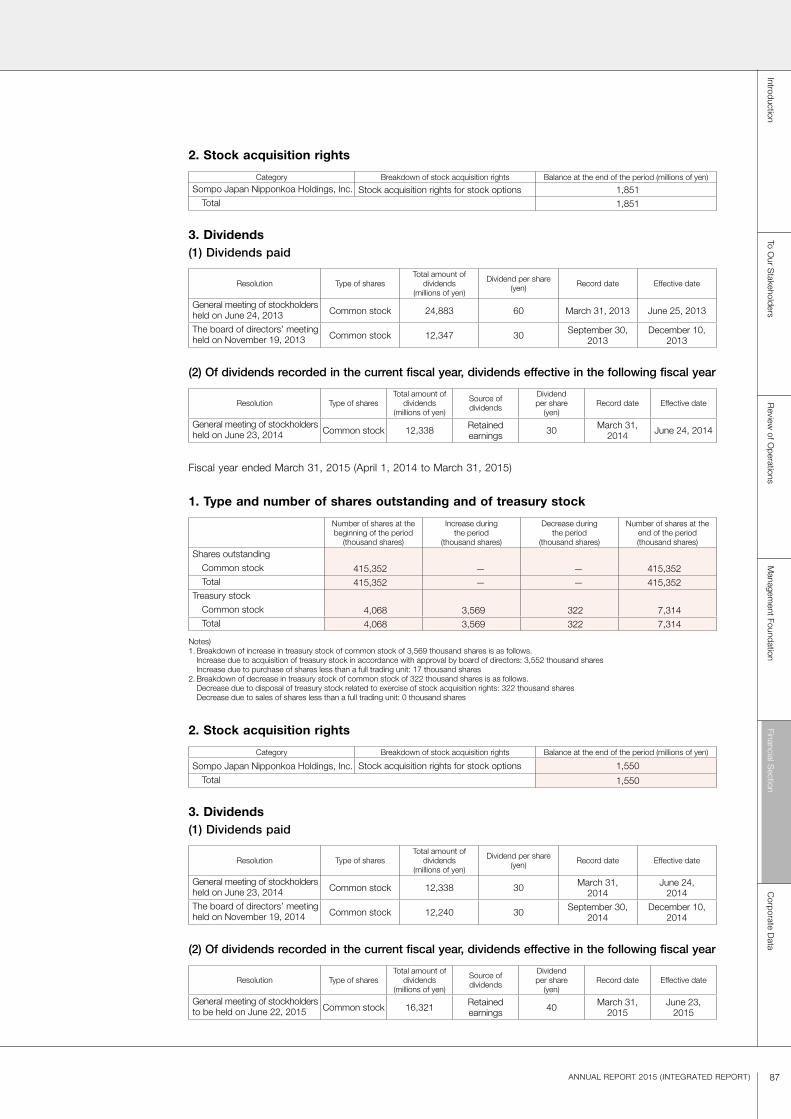
87ANNUAL REPORT 2015 ( INTEGRATED REPORT)
2. Stock acquisition rights
Category Breakdown of stock acquisition rights Balance at the end of the period (millions of yen)
Sompo Japan Nipponkoa Holdings, Inc. Stock acquisition rights for stock options 1,851Total 1,851
3. Dividends(1) Dividends paid
Resolution Type of sharesTotal amount of
dividends (millions of yen)
Dividend per share (yen) Record date Effective date
General meeting of stockholders held on June 24, 2013 Common stock 24,883 60 March 31, 2013 June 25, 2013
The board of directors’ meeting held on November 19, 2013 Common stock 12,347 30 September 30,
2013December 10,
2013
(2) Of dividends recorded in the current fiscal year, dividends effective in the following fiscal year
Resolution Type of sharesTotal amount of
dividends (millions of yen)
Source of dividends
Dividend per share
(yen)Record date Effective date
General meeting of stockholders held on June 23, 2014 Common stock 12,338 Retained
earnings 30 March 31, 2014 June 24, 2014
Fiscal year ended March 31, 2015 (April 1, 2014 to March 31, 2015)
1. Type and number of shares outstanding and of treasury stock
Number of shares at the beginning of the period
(thousand shares)
Increase during the period
(thousand shares)
Decrease during the period
(thousand shares)
Number of shares at the end of the period(thousand shares)
Shares outstanding
Common stock 415,352 — — 415,352Total 415,352 — — 415,352
Treasury stock
Common stock 4,068 3,569 322 7,314Total 4,068 3,569 322 7,314
Notes)1. Breakdown of increase in treasury stock of common stock of 3,569 thousand shares is as follows. Increase due to acquisition of treasury stock in accordance with approval by board of directors: 3,552 thousand shares Increase due to purchase of shares less than a full trading unit: 17 thousand shares2. Breakdown of decrease in treasury stock of common stock of 322 thousand shares is as follows. Decrease due to disposal of treasury stock related to exercise of stock acquisition rights: 322 thousand shares Decrease due to sales of shares less than a full trading unit: 0 thousand shares
2. Stock acquisition rights
Category Breakdown of stock acquisition rights Balance at the end of the period (millions of yen)
Sompo Japan Nipponkoa Holdings, Inc. Stock acquisition rights for stock options 1,550
Total 1,550
3. Dividends(1) Dividends paid
Resolution Type of sharesTotal amount of
dividends (millions of yen)
Dividend per share (yen) Record date Effective date
General meeting of stockholders held on June 23, 2014 Common stock 12,338 30 March 31,
2014June 24,
2014The board of directors’ meeting held on November 19, 2014 Common stock 12,240 30 September 30,
2014December 10,
2014
(2) Of dividends recorded in the current fiscal year, dividends effective in the following fiscal year
Resolution Type of sharesTotal amount of
dividends (millions of yen)
Source of dividends
Dividend per share
(yen)Record date Effective date
General meeting of stockholders to be held on June 22, 2015 Common stock 16,321 Retained
earnings 40 March 31, 2015
June 23, 2015
Financial Section
IntroductionTo O
ur Stakeholders
Review
of Operations
Managem
ent FoundationC
orporate Data

88 Sompo Japan Nipponkoa Holdings, Inc.
*1. Reconciliation of cash and cash equivalents at the end of the period to the line items represented in the consolidated balance sheet
(Millions of yen)
Fiscal year ended March 31, 2014(April 1, 2013 to March 31, 2014)
Fiscal year ended March 31, 2015(April 1, 2014 to March 31, 2015)
Cash and deposits 471,481 523,465
Call loans 75,000 —
Receivables under resale agreements 126,984 71,985
Securities 6,896,907 7,682,930
Time deposits with original maturities of more than 3 months (56,479) (79,415)
Securities other than cash equivalents (6,881,733) (7,653,774)
Cash and cash equivalents 632,160 545,192
*2. Main components of assets and liabilities of newly consolidated subsidiaries through the acquisition of shares The main components of assets and liabilities of a newly consolidated subsidiary, Canopius Group Limited,
at the commencement of the consolidation are as follows. The following also shows the acquisition cost of
the shares and net expenditure for the acquisition of those shares.
Assets: 327,481 million yen
Securities 202,112 million yen
Goodwill 29,259 million yen
Liabilities: (250,122) million yen
Underwriting funds (190,744) million yen
Non-controlling interests (154) million yen
Acquisition cost of the shares of the subsidiaries mentioned above 106,464 million yen
Cash and cash equivalents of the subsidiary mentioned above (9,051) million yen
Net: Expenditure for the acquisition of the subsidiary mentioned above 97,412 million yen
3. Significant non-cash transactionsNone.
4. Cash flows from investing activities include cash flows from investment activities conducted as a part of insurance business.
6. Notes to the Consolidated Statement of Cash Flows

89ANNUAL REPORT 2015 ( INTEGRATED REPORT)
7. Lease Transactions
Operating lease transactionsFuture lease payments related to non-cancelable operating leases
(Lessee)
(Millions of yen)
As of March 31, 2014 As of March 31, 2015
Due within one year 894 2,059
Due after one year 1,791 4,544
Total 2,686 6,604
(Lessor)
(Millions of yen)
As of March 31, 2014 As of March 31, 2015
Due within one year 632 633
Due after one year 3,658 2,964
Total 4,291 3,598
1. Overview of financial instruments(1) Our policy to manage financial instruments
As the Group is mainly engaged in insurance businesses and recognizes the characteristic of investment
fund for the insurance company, the Group manages the investment assets taking into consideration safety,
liquidity and profitability. Further, in order to appropriately manage investment assets related to long-term
insurance liabilities related to life insurance and savings-type insurance, the Group intends to stabilize
returns for the future maturity refunds to policyholders by the methodology based on ALM (integrated man-
agement of assets and liabilities).
In addition, with a view to strengthen the financial structure, the consolidated subsidiary increased its capital
substantively by the issuance of subordinated bond (i.e. hybrid finance) which is deemed as capital to some
extent by major credit rating agencies.
(2) The nature and risk of financial instrumentsAs financial instruments which the Group holds are mainly securities such as bonds and stocks, the Group
is exposed to risks (market risks) associated with price fluctuations of investments, which are influenced by
stock prices, interest rates and foreign exchange rates, as well as risks (liquidity risks) that securities may
not be traded or may be forced to be traded at far more unfavorable prices than under normal conditions
due to a market crisis and the like.
In addition, the securities and the loans which the Group holds are exposed to credit risk which would
cause a significant decrease in their value or uncollectible interest and principal due to the reasons such as
deterioration of creditworthiness and bankruptcy of the issuer and the borrower.
Regarding derivative transactions, the Group utilizes derivatives to hedge risks on assets held. These also
involve market risks and credit risks.
Please refer to the note on “(6) Significant hedge accounting” in “4. Accounting policies” in “1. Significant
Accounting Policies for the Preparation of the Consolidated Financial Statements” for derivative transactions
which hedge accounting is applied to.
8. Financial Instruments
Financial Section
IntroductionTo O
ur Stakeholders
Review
of Operations
Managem
ent FoundationC
orporate Data
90 Sompo Japan Nipponkoa Holdings, Inc.
(3) The risk management systems regarding financial instrumentsThe Company has established the risk management systems to appropriately identify, evaluate and control
risks and accurately respond when risks emerge through strategic risk management (ERM) designed to
maximize the Group’s corporate value, as described below.
With the aim of maintaining strategic risk management, the Company’s board of directors has established
the “Group Basic Policy on ERM,” which sets forth principles for accurately assessing the group-wide
status of risk exposure and managing the various types of risk in a comprehensive manner. With the aim of
enabling appropriate management decision making based upon assessment of group-wide risk, the Company
established Group ERM promotion committee and others. Moreover, the Risk Management Department
was established to promote the Company’s efforts to develop and enhance its risk management systems.
Through the comprehensive management model of investment risks, the Company manages market risk,
credit risk and real estate investment risk. In addition, the Company comprehensively manages risks, includ-
ing the risk of invested assets failing to yield assumed interest rates with regard to long-term insurance
liabilities related to savings-type insurance held by its insurance subsidiaries. The Company obtains invest-
ment assets information on a daily basis and quantifies investment risks. Further, the Company utilizes risk
management by setting stress scenarios to cover events that could cause a material impact on the Group’s
operations, and performing stress tests to assess and measure risks comprehensively.
As to credit risks, in order to avoid concentrating the risks on specific borrowers, the Company has set
credit limits and manages the risks appropriately for the whole Group.
As to liquidity risks, the Company has developed systems for its insurance subsidiaries to forecast pay-
ments for claims, etc. upon occurrence of liquidity risk scenarios, such as outbreak of catastrophe, and to
ensure liquidity assets so as to adequately secure enough to cope with these payments.
Each Group member has basic policies and rules on risk management formulated in reference to the Group
Basic Policy on ERM, thereby developing risk management systems appropriate to the content, scale, and
characteristics of their particular business activities and implementing autonomous risk management. In
addition, insurance subsidiaries place considerable emphasis on managing various types of risk in ways
tailored to their particular risk profile. By doing so, these subsidiaries are appropriately addressing risks that
could significantly affect their operations.
(4) Supplemental explanation about the fair value of financial instruments Other than the fair value of financial instruments based on the market price, fair value calculated reasonably is
included if the market price is not obtainable. In view that certain assumption is employed to measure the fair
value, the resulting value might differ depending on the assumption to be applied. “Notional amount” on each
table in notes on “Derivative Transactions” shows contract amounts or notional amounts of derivative transac-
tions. These amounts do not show the volume of market risk or credit risk regarding derivative transactions.

91ANNUAL REPORT 2015 ( INTEGRATED REPORT)
2. Fair value of financial instrumentsCarrying amount, fair value and unrealized gains and losses are as follows. Meanwhile, financial instruments
which are considered extremely difficult to figure out their fair value are not included in the following table.
(Please refer to Notes) 2 for details.)
As of March 31, 2014
(Millions of yen)
Carrying amount Fair value Unrealized gains and losses
(1) Cash and deposits 471,481 471,481 —
(2) Call loans 75,000 75,000 —
(3) Receivables under resale agreements 126,984 126,984 —
(4) Monetary receivables bought 16,951 16,951 —
(5) Money trusts 97,850 97,850 —
(6) Securities:
Trading securities 47,817 47,817 —
Bonds held to maturity 1,263,007 1,380,769 117,762
Securities available for sale 5,470,362 5,470,362 —
(7) Loans 606,541
Allowance for possible credit losses(*1) (201)
606,340 618,378 12,038
Total assets 8,175,794 8,305,595 129,800
(1) Corporate bonds 261,560 277,567 16,007
Total liabilities 261,560 277,567 16,007
Derivative transactions(*2):
Hedge accounting is not applied to 500 500 —
Hedge accounting is applied to [208] [208] —
Total derivative transactions 292 292 —
(*1) This figure represents deductions to loans as general and individual allowance for possible credit losses.(*2) This table collectively shows derivative transactions which are included in other assets and other liabilities. Net assets and liabilities from derivative
transactions are shown on the net basis. The items which are net debt in total are shown in the brackets [ ].
As of March 31, 2015
(Millions of yen)
Carrying amount Fair value Unrealized gains and losses
(1) Cash and deposits 523,465 523,465 —
(2) Receivables under resale agreements 71,985 71,985 —
(3) Monetary receivables bought 14,234 14,234 —
(4) Money trusts 111,293 111,293 —
(5) Securities:
Trading securities 284,672 284,672 —
Bonds held to maturity 1,246,637 1,434,768 188,131
Policy reserve matching bonds 75,497 78,479 2,981
Securities available for sale 5,995,331 5,995,331 —
(6) Loans 604,058
Allowance for possible credit losses(*1) (160)
603,897 627,273 23,375
Total assets 8,927,016 9,141,504 214,488
(1) Corporate bonds 135,958 145,181 9,222
Total liabilities 135,958 145,181 9,222
Derivative transactions(*2):
Hedge accounting is not applied to [5,110] [5,110] —
Hedge accounting is applied to 12,959 12,959 —
Total derivative transactions 7,848 7,848 —
(*1) This figure represents deductions to loans as general and individual allowance for possible credit losses.(*2) This table collectively shows derivative transactions which are included in other assets and other liabilities. Net assets and liabilities from derivative
transactions are shown on the net basis. The items which are net debt in total are shown in the brackets [ ].
Financial Section
IntroductionTo O
ur Stakeholders
Review
of Operations
Managem
ent FoundationC
orporate Data

92 Sompo Japan Nipponkoa Holdings, Inc.
Notes) 1. Calculation methods for the fair value of financial instruments Assets (1) Cash and deposits As all are short term and the fair value approximates the book value, the book value is presented as the fair value. (2) Receivables under resale agreements As all are short term and the fair value approximates the book value, the book value is presented as the fair value. (3) Monetary receivables bought The fair value is based on the price quoted by counterparties. (4) Money trusts The fair value of the financial instruments managed as trust asset is as follows. As bank deposit, etc. are short term and their fair value approximates
the book value, the book value is presented as the fair value. The fair value of the domestic bonds is based on the price at exchanges, the price released by Japan Securities Dealers Association and the price quoted by counterparties and others. The fair value of the domestic stocks is based on the price at exchanges. In addition, the fair value of foreign securities is based on the price at exchanges and others.
(5) Securities The fair value of the domestic bonds is based on the price at exchanges, the price released by Japan Securities Dealers Association and the price
quoted by counterparties. The fair value of the domestic stocks is based on the price at exchanges. In addition, the fair value of foreign securities is based on the price at exchanges and the price quoted by counterparties and others.
(6) Loans The fair value is the amount of future collection cash flow of each loan which is discounted by the risk free rate for the corresponding period, adding
credit risk premium and liquidity premium thereto. For the loans categorized as loans to borrowers in bankruptcy legally or substantially and borrowers who are highly probable to go bankrupt in the future, the fair values are the carrying amount less current estimated credit losses. Because the estimated credit losses are calculated based on the amount expected to be covered by collateral and guarantee, the fair value approximates the said amount.
Liabilities (1) Corporate bonds The fair value is based on the price at exchanges and others.
Derivative transactions Please refer to the notes on “Derivative Transactions.”
2. Carrying amounts of the financial instruments which are considered extremely difficult to figure out their fair value are as follows. These financial instru-ments are not included in “(5) Securities.”
(Millions of yen)
As of March 31, 2014 As of March 31, 2015Domestic bonds 0 0Domestic stocks 74,866 42,777Foreign securities 29,655 28,077Others 9,846 9,057
Total 114,369 79,912
As domestic stocks are unlisted stocks and do not have quoted market prices, they are not included in the scope of fair value disclosure.As foreign securities are unlisted stocks or investments mainly in unlisted stocks and do not have quoted market prices, they are not included in the scope of fair value disclosure. As others are investments mainly in real estate or in unlisted stocks and do not have quoted market prices, they are not included in the scope of fair value disclosure.
3. The redemption amounts after the consolidated balance sheet date for monetary receivables and fixed maturity securities
As of March 31, 2014(Millions of yen)
Due within 1 year Due after 1 year through 5 years
Due after 5 years through 10 years Due after 10 years
Deposits 463,680 5,977 1,736 —Call loans 75,000 — — —Receivables under resale agreements 126,985 — — —Monetary receivables bought 2 1,840 — 14,166Securities:
Bonds held to maturity: Government bonds 230 44,413 61,660 928,283Municipal bonds 6,400 4,965 — 44,400Corporate bonds 23,760 54,491 17,500 50,900Foreign securities 4,519 6,535 820 —
Fixed maturity securities available for sale: Government bonds 128,944 352,510 379,487 655,737Municipal bonds 9,248 11,316 2,000 12,200Corporate bonds 100,631 278,574 146,594 216,248Foreign securities 51,601 407,072 481,383 78,316Others 367 5,470 12,813 —
Loans(*)
158,282 292,864 107,438 47,028Total 1,149,654 1,466,031 1,211,433 2,047,280
(*) 522 million yen of loans whose redemption amounts are not estimable such as loans to borrowers in bankruptcy legally or substantially and to borrowers who are highly probable to go bankrupt in the future is not included.
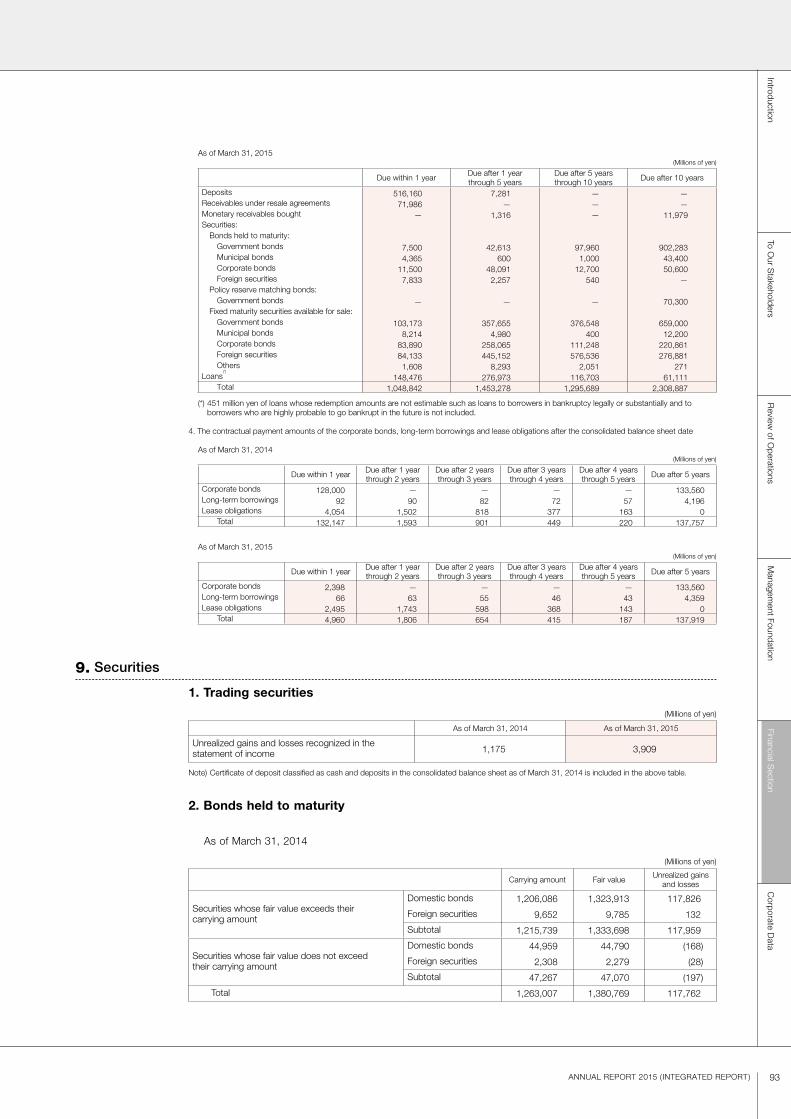
93ANNUAL REPORT 2015 ( INTEGRATED REPORT)
As of March 31, 2015(Millions of yen)
Due within 1 year Due after 1 year through 5 years
Due after 5 years through 10 years Due after 10 years
Deposits 516,160 7,281 — —Receivables under resale agreements 71,986 — — —Monetary receivables bought — 1,316 — 11,979Securities:
Bonds held to maturity:Government bonds 7,500 42,613 97,960 902,283Municipal bonds 4,365 600 1,000 43,400Corporate bonds 11,500 48,091 12,700 50,600Foreign securities 7,833 2,257 540 —
Policy reserve matching bonds:Government bonds — — — 70,300
Fixed maturity securities available for sale:Government bonds 103,173 357,655 376,548 659,000Municipal bonds 8,214 4,980 400 12,200Corporate bonds 83,890 258,065 111,248 220,861Foreign securities 84,133 445,152 576,536 276,881Others 1,608 8,293 2,051 271
Loans(*)
148,476 276,973 116,703 61,111Total 1,048,842 1,453,278 1,295,689 2,308,887
(*) 451 million yen of loans whose redemption amounts are not estimable such as loans to borrowers in bankruptcy legally or substantially and to borrowers who are highly probable to go bankrupt in the future is not included.
4. The contractual payment amounts of the corporate bonds, long-term borrowings and lease obligations after the consolidated balance sheet date
As of March 31, 2014(Millions of yen)
Due within 1 year Due after 1 yearthrough 2 years
Due after 2 yearsthrough 3 years
Due after 3 yearsthrough 4 years
Due after 4 yearsthrough 5 years Due after 5 years
Corporate bonds 128,000 — — — — 133,560Long-term borrowings 92 90 82 72 57 4,196Lease obligations 4,054 1,502 818 377 163 0
Total 132,147 1,593 901 449 220 137,757
As of March 31, 2015(Millions of yen)
Due within 1 year Due after 1 yearthrough 2 years
Due after 2 yearsthrough 3 years
Due after 3 yearsthrough 4 years
Due after 4 yearsthrough 5 years Due after 5 years
Corporate bonds 2,398 — — — — 133,560Long-term borrowings 66 63 55 46 43 4,359Lease obligations 2,495 1,743 598 368 143 0
Total 4,960 1,806 654 415 187 137,919
1. Trading securities
(Millions of yen)
As of March 31, 2014 As of March 31, 2015
Unrealized gains and losses recognized in the statement of income 1,175 3,909
Note) Certificate of deposit classified as cash and deposits in the consolidated balance sheet as of March 31, 2014 is included in the above table.
2. Bonds held to maturity
As of March 31, 2014
(Millions of yen)
Carrying amount Fair value Unrealized gains and losses
Securities whose fair value exceeds their carrying amount
Domestic bonds 1,206,086 1,323,913 117,826
Foreign securities 9,652 9,785 132
Subtotal 1,215,739 1,333,698 117,959
Securities whose fair value does not exceed their carrying amount
Domestic bonds 44,959 44,790 (168)
Foreign securities 2,308 2,279 (28)
Subtotal 47,267 47,070 (197)
Total 1,263,007 1,380,769 117,762
9. Securities
Financial Section
IntroductionTo O
ur Stakeholders
Review
of Operations
Managem
ent FoundationC
orporate Data

94 Sompo Japan Nipponkoa Holdings, Inc.
As of March 31, 2015
(Millions of yen)
Carrying amount Fair value Unrealized gains and losses
Securities whose fair value exceeds their carrying amount
Domestic bonds 1,236,030 1,424,142 188,112
Foreign securities 7,155 7,214 59
Subtotal 1,243,185 1,431,357 188,172
Securities whose fair value does not exceed their carrying amount
Domestic bonds — — —
Foreign securities 3,452 3,411 (41)
Subtotal 3,452 3,411 (41)
Total 1,246,637 1,434,768 188,131
3. Policy reserve matching bonds
As of March 31, 2014
None.
As of March 31, 2015
(Millions of yen)
Carrying amount Fair value Unrealized gains and losses
Securities whose fair value exceeds their carrying amount Domestic bonds 70,358 73,364 3,005
Securities whose fair value does not exceed their carrying amount Domestic bonds 5,139 5,114 (24)
Total 75,497 78,479 2,981
4. Securities available for sale
As of March 31, 2014
(Millions of yen)
Carrying amount Cost Unrealized gains and losses
Securities whose carrying amount exceeds their cost
Domestic bonds 2,344,132 2,233,901 110,230
Domestic stocks 1,384,548 669,238 715,309
Foreign securities 1,187,117 1,065,445 121,671
Others 45,291 39,316 5,974
Subtotal 4,961,088 4,007,903 953,185
Securities whose carrying amount does not exceed their cost
Domestic bonds 88,664 89,167 (502)
Domestic stocks 75,780 82,827 (7,046)
Foreign securities 348,569 359,678 (11,109)
Others 28,050 28,303 (252)
Subtotal 541,064 559,976 (18,912)
Total 5,502,153 4,567,879 934,273
Notes)1. Securities available for sale which are considered extremely difficult to figure out their fair value are not included in the above table.2. Certificate of deposit classified as cash and deposits and beneficial interests in the loan trusts classified as monetary receivables bought in the
consolidated balance sheet are included in “Others” above.

95ANNUAL REPORT 2015 ( INTEGRATED REPORT)
As of March 31, 2015
(Millions of yen)
Carrying amount Cost Unrealized gains and losses
Securities whose carrying amount exceeds their cost
Domestic bonds 2,329,103 2,178,105 150,997
Domestic stocks 1,741,289 686,530 1,054,758
Foreign securities 1,634,361 1,398,116 236,244
Others 35,506 29,656 5,850
Subtotal 5,740,261 4,292,408 1,447,852
Securities whose carrying amount does not exceed their cost
Domestic bonds 47,169 47,360 (191)
Domestic stocks 27,709 29,508 (1,798)
Foreign securities 177,929 183,151 (5,222)
Others 32,012 32,509 (497)
Subtotal 284,820 292,530 (7,709)
Total 6,025,081 4,584,939 1,440,142
Notes)1. Securities available for sale which are considered extremely difficult to figure out their fair value are not included in the above table.2. Certificate of deposit classified as cash and deposits and beneficial interests in the loan trusts classified as monetary receivables bought in the
consolidated balance sheet are included in “Others” above.
5. Securities available for sale sold during the fiscal years ended March 31, 2014 and 2015
Fiscal year ended March 31, 2014 (April 1, 2013 to March 31, 2014)
(Millions of yen)
Proceeds from sales Gains on sales Losses on sales
Domestic bonds 332,120 8,935 460
Domestic stocks 209,659 88,088 1,356
Foreign securities 128,162 9,157 3,746
Others 17,815 5,545 12
Total 687,757 111,726 5,575
Fiscal year ended March 31, 2015 (April 1, 2014 to March 31, 2015)
(Millions of yen)
Proceeds from sales Gains on sales Losses on sales
Domestic bonds 212,303 3,036 85
Domestic stocks 90,889 44,633 159
Foreign securities 185,872 16,224 903
Others 0 923 225
Total 489,065 64,817 1,374
6. Securities for which impairment losses are recognized during the fiscal years ended March 31, 2014 and 2015For the fiscal year ended March 31, 2014, impairment losses on securities available for sale (excluding
securities available for sale which are considered extremely difficult to figure out their fair value) amount to
1,080 million yen (domestic stocks: 199 million yen, foreign securities: 880 million yen), and impairment
losses on securities available for sale which are considered extremely difficult to figure out their fair value
amount to 89 million yen (domestic stocks: 82 million yen, foreign securities: 6 million yen).
For the fiscal year ended March 31, 2015, impairment losses on securities available for sale (excluding
securities available for sale which are considered extremely difficult to figure out their fair value) amount to
842 million yen (domestic stocks: 534 million yen, foreign securities: 307 million yen), and impairment losses
on securities available for sale which are considered extremely difficult to figure out their fair value amount to
118 million yen (domestic stocks only).
Basically, the Company and its domestic consolidated subsidiaries recognize impairment losses on securities
if fair value at the end of the fiscal year declines by 30% or more from their cost.
Financial Section
IntroductionTo O
ur Stakeholders
Review
of Operations
Managem
ent FoundationC
orporate Data
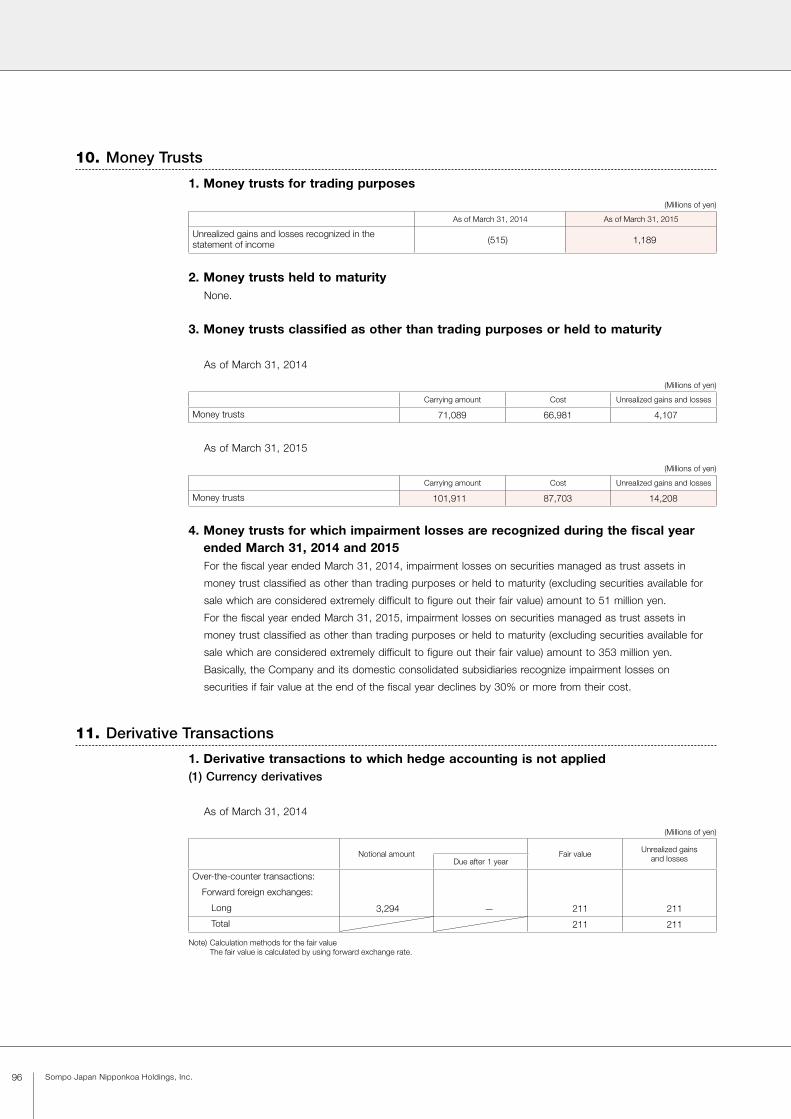
96 Sompo Japan Nipponkoa Holdings, Inc.
1. Money trusts for trading purposes
(Millions of yen)
As of March 31, 2014 As of March 31, 2015
Unrealized gains and losses recognized in the statement of income (515) 1,189
2. Money trusts held to maturityNone.
3. Money trusts classified as other than trading purposes or held to maturity
As of March 31, 2014
(Millions of yen)
Carrying amount Cost Unrealized gains and losses
Money trusts 71,089 66,981 4,107
As of March 31, 2015
(Millions of yen)
Carrying amount Cost Unrealized gains and losses
Money trusts 101,911 87,703 14,208
4. Money trusts for which impairment losses are recognized during the fiscal year ended March 31, 2014 and 2015For the fiscal year ended March 31, 2014, impairment losses on securities managed as trust assets in
money trust classified as other than trading purposes or held to maturity (excluding securities available for
sale which are considered extremely difficult to figure out their fair value) amount to 51 million yen.
For the fiscal year ended March 31, 2015, impairment losses on securities managed as trust assets in
money trust classified as other than trading purposes or held to maturity (excluding securities available for
sale which are considered extremely difficult to figure out their fair value) amount to 353 million yen.
Basically, the Company and its domestic consolidated subsidiaries recognize impairment losses on
securities if fair value at the end of the fiscal year declines by 30% or more from their cost.
1. Derivative transactions to which hedge accounting is not applied(1) Currency derivatives
As of March 31, 2014
(Millions of yen)
Notional amount Fair value Unrealized gains and lossesDue after 1 year
Over-the-counter transactions:
Forward foreign exchanges:
Long 3,294 — 211 211
Total 211 211
Note) Calculation methods for the fair value The fair value is calculated by using forward exchange rate.
10. Money Trusts
11. Derivative Transactions
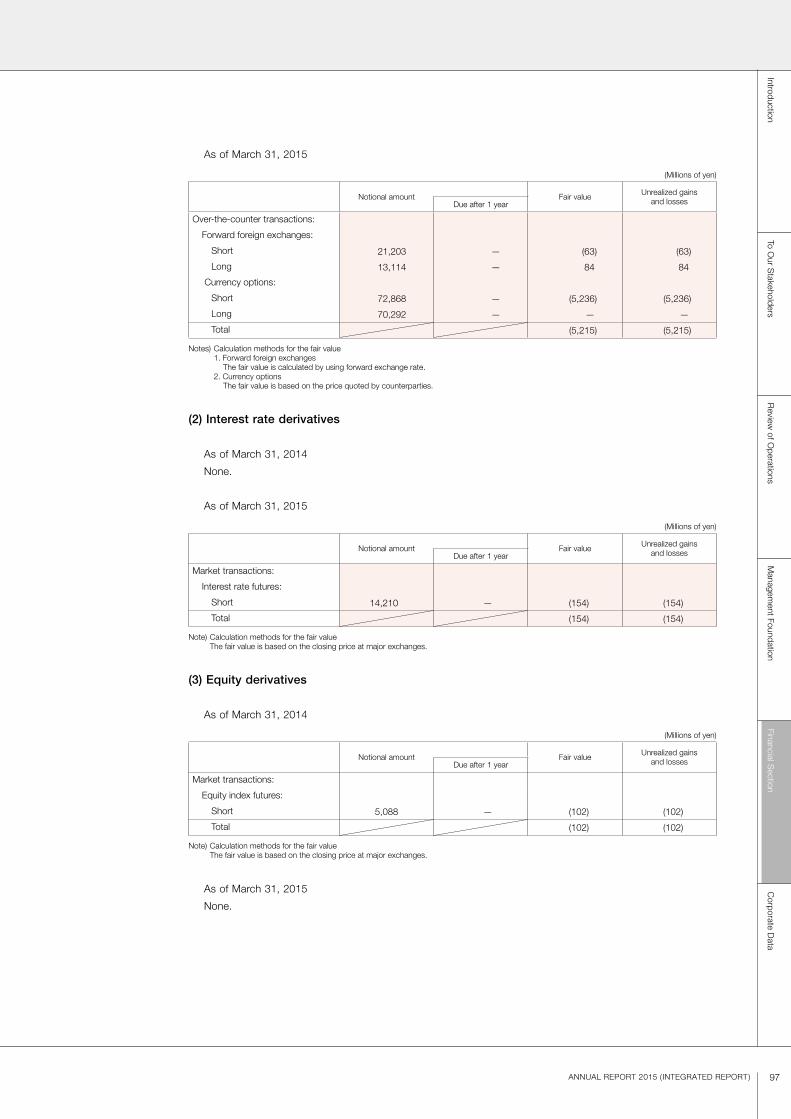
97ANNUAL REPORT 2015 ( INTEGRATED REPORT)
As of March 31, 2015
(Millions of yen)
Notional amount Fair value Unrealized gains and lossesDue after 1 year
Over-the-counter transactions:
Forward foreign exchanges:
Short 21,203 — (63) (63)
Long 13,114 — 84 84
Currency options:
Short 72,868 — (5,236) (5,236)
Long 70,292 — — —
Total (5,215) (5,215)
Notes) Calculation methods for the fair value 1. Forward foreign exchanges The fair value is calculated by using forward exchange rate. 2. Currency options The fair value is based on the price quoted by counterparties.
(2) Interest rate derivatives
As of March 31, 2014
None.
As of March 31, 2015
(Millions of yen)
Notional amount Fair value Unrealized gains and lossesDue after 1 year
Market transactions:
Interest rate futures:
Short 14,210 — (154) (154)
Total (154) (154)
Note) Calculation methods for the fair value The fair value is based on the closing price at major exchanges.
(3) Equity derivatives
As of March 31, 2014
(Millions of yen)
Notional amount Fair value Unrealized gains and lossesDue after 1 year
Market transactions:
Equity index futures:
Short 5,088 — (102) (102)
Total (102) (102)
Note) Calculation methods for the fair value The fair value is based on the closing price at major exchanges.
As of March 31, 2015
None.
Financial Section
IntroductionTo O
ur Stakeholders
Review
of Operations
Managem
ent FoundationC
orporate Data

98 Sompo Japan Nipponkoa Holdings, Inc.
(4) Bond derivatives
As of March 31, 2014
None.
As of March 31, 2015
(Millions of yen)
Notional amount Fair value Unrealized gains and lossesDue after 1 year
Market transactions:
Bonds futures:
Short 5,141 — (5) (5)
Long 2,032 — (3) (3)
Total (9) (9)
Note) Calculation methods for the fair value The fair value is based on the closing price at major exchanges.
(5) Others
As of March 31, 2014
(Millions of yen)
Notional amount Fair value Unrealized gains and lossesDue after 1 year
Over-the-counter transactions:
Weather derivatives:
Short 3,312 617 (66) 32
Earthquake derivatives:
Short 8,723 10 (24) 275
Long 6,885 6,426 481 (162)
Total 390 145
Notes) Calculation methods for the fair value 1. Weather derivatives
The fair value is calculated based on the contract term and other elements of the contract. 2. Earthquake derivatives
The fair value is calculated based on the contract term and other elements of the contract.
As of March 31, 2015
(Millions of yen)
Notional amount Fair value Unrealized gains and lossesDue after 1 year
Over-the-counter transactions:
Weather derivatives:
Short 2,590 342 (62) 11
Earthquake derivatives:
Short 8,284 10 (16) 262
Long 6,885 6,795 347 (304)
Total 269 (30)
Notes) Calculation methods for the fair value 1. Weather derivatives
The fair value is calculated based on the contract term and other elements of the contract. 2. Earthquake derivatives
The fair value is calculated based on the contract term and other elements of the contract.

99ANNUAL REPORT 2015 ( INTEGRATED REPORT)
2. Derivative transactions to which hedge accounting is applied(1) Currency derivatives
As of March 31, 2014
(Millions of yen)
Methods for hedge accounting Type Main hedged items Notional amount Fair value
Due after 1 yearDeferred hedge Forward foreign
exchanges:Foreign currency forecast transaction
Long 79,516 — 569 Fair value hedge Forward foreign
exchanges:Securities available for sale
Short 454,036 — (10,605)
Assignment accounting for forward foreign exchange contracts and others
Currency swaps
Foreign currency denominated corporate bonds (liabilities)
133,560 133,560 Note 2
Total (10,036)
Notes) 1. Calculation methods for the fair value The fair value of forward foreign exchanges is calculated by using forward exchange rate. 2. The fair value of forward foreign exchange contracts and others to which assignment accounting is applied is included in the fair value of foreign
currency denominated corporate bonds (liabilities) as they are accounted for as one together with. Therefore, their fair value is included in the fair value of the corporate bonds in “Financial Instruments.”
As of March 31, 2015
(Millions of yen)
Methods for hedge accounting Type Main hedged items Notional amount Fair value
Due after 1 yearDeferred hedge Forward foreign
exchanges:Foreign currency forecast transaction
Long 8,138 — 39Fair value hedge Forward foreign
exchanges:Securities available for sale
Short 536,132 — 1,602
Assignment accounting for forward foreign exchange contracts and others
Currency swaps
Foreign currency denominated corporate bonds (liabilities)
133,560 133,560 Note 2
Total 1,642
Notes) 1. Calculation methods for the fair value The fair value of forward foreign exchanges is calculated by using forward exchange rate. 2. The fair value of forward foreign exchange contracts and others to which assignment accounting is applied is included in the fair value of foreign
currency denominated corporate bonds (liabilities) as they are accounted for as one together with. Therefore, their fair value is included in the fair value of the corporate bonds in “Financial Instruments.”
(2) Interest rate derivatives
As of March 31, 2014
(Millions of yen)
Methods for hedge accounting Type Main hedged items Notional amount Fair value
Due after 1 year
Deferred hedge Interest rate swaps:Receipt fix / Payment float
Insurance liabilities
83,000 83,000 9,827Total 9,827
Note) Calculation methods for the fair value The fair value is calculated by discounting estimated future cash flow to the present value.
As of March 31, 2015
(Millions of yen)
Methods for hedge accounting Type Main hedged items Notional amount Fair value
Due after 1 year
Deferred hedge Interest rate swaps:Receipt fix / Payment float
Insurance liabilities
83,000 83,000 11,316Total 11,316
Note) Calculation methods for the fair value The fair value is calculated by discounting estimated future cash flow to the present value.
Financial Section
IntroductionTo O
ur Stakeholders
Review
of Operations
Managem
ent FoundationC
orporate Data

100 Sompo Japan Nipponkoa Holdings, Inc.
12. Retirement Benefits
1. Outline of retirement benefit plansIn addition to a defined contribution pension plan, Sompo Japan Nipponkoa Insurance Inc. which has been
consolidated subsidiary provides defined benefit plans with a lump-sum payments retirement plan, a contract-type
corporate pension plan and a self-administered corporate pension plan for both retired employees who are
already receiving pension and those who are eligible for employees’ benefits but have not yet reached the
pension commencement age. Sompo Japan Nipponkoa Insurance Inc. also sets up a retirement benefit trust.
The other domestic consolidated subsidiaries provide unfunded retirement plans with lump-sum payments as
defined benefit type in addition to defined contribution pension plans.
Certain foreign consolidated subsidiaries have retirement benefit plans such as defined contribution type and
defined benefit type.
Net defined benefit liability and retirement benefit expenses regarding certain retirement benefit plans are
calculated by the simplified accounting methods.
2. Retirement defined benefit plans(1) Reconciliation of beginning and ending balances of the retirement benefit obligation
(Millions of yen)
Fiscal year ended March 31, 2014(April 1, 2013 to March 31, 2014)
Fiscal year ended March 31, 2015(April 1, 2014 to March 31, 2015)
Retirement benefit obligation at the beginning of the period 186,276 185,380
Cumulative effects of changes in accounting policies — (6,733)
Restated balance 186,276 178,647
Service cost 7,892 8,736
Interest cost 2,526 2,172
The amount occurred of actuarial difference 4,166 22,421
Retirement benefit paid (16,140) (13,452)
Changes in the scope of consolidation — 1,456
Others 658 39
Retirement benefit obligation at the end of the period 185,380 200,021
Note) Retirement benefit expenses for retirement benefit plans under the simplified accounting methods are included in “Service cost.”
(2) Reconciliation of beginning and ending balances of plan assets
(Millions of yen)
Fiscal year ended March 31, 2014(April 1, 2013 to March 31, 2014)
Fiscal year ended March 31, 2015(April 1, 2014 to March 31, 2015)
Plan assets at the beginning of the period 85,012 89,806
Expected return on plan assets 702 848
The amount occurred of actuarial difference 5,369 13,346
The amount of employer contributions 407 484
Retirement benefit paid (2,304) (2,366)
Changes in the scope of consolidation — 1,589
Others 618 96
Plan assets at the end of the period 89,806 103,804

101ANNUAL REPORT 2015 ( INTEGRATED REPORT)
(3) Reconciliation of the ending balances of retirement benefit obligation and plan assets, and net defined
benefit liability and net defined benefit asset recorded on the consolidated balance sheet
(Millions of yen)
As of March 31, 2014 As of March 31, 2015
Funded retirement benefit obligation 175,751 191,519
Plan assets (89,806) (103,804)
85,945 87,714
Unfunded retirement benefit obligation 9,629 8,502
Asset ceiling adjustments — 321
Net liabilities and assets on the consolidated balance sheet 95,574 96,538
Net defined benefit liability 95,814 96,854
Net defined benefit asset (240) (315)
Net liabilities and assets on the consolidated balance sheet 95,574 96,538
(4) Components of retirement benefit expenses
(Millions of yen)
Fiscal year ended March 31, 2014(April 1, 2013 to March 31, 2014)
Fiscal year ended March 31, 2015(April 1, 2014 to March 31, 2015)
Service cost 7,892 8,736
Interest cost 2,526 2,172
Expected return on plan assets (702) (848)
Amortization of actuarial difference 1,646 120
Others (15) 6
Retirement benefit expenses for defined benefit plans 11,346 10,187
Notes) 1. Retirement benefit expenses for retirement benefit plans under simplified accounting methods are included in “Service cost.” 2. 8,487 million yen of special extra retirement payments relating to its call for voluntary retirement is recognized as other extraordinary losses
in addition to the above retirement benefit expenses during the fiscal year ended March 31, 2014.
(5) Remeasurements of defined benefit plans
Components of items (before tax effect deductions) recorded in remeasurements of defined benefit plans
are as follows.
(Millions of yen)
Fiscal year ended March 31, 2014(April 1, 2013 to March 31, 2014)
Fiscal year ended March 31, 2015(April 1, 2014 to March 31, 2015)
Actuarial difference — 9,039
Total — 9,039
(6) Accumulated remeasurements of defined benefit plans
Components of items (before tax effect deductions) recorded in accumulated remeasurements of defined
benefit plans are as follows.
(Millions of yen)
As of March 31, 2014 As of March 31, 2015
Unrecognized actuarial difference (4,545) 4,495
Total (4,545) 4,495
Financial Section
IntroductionTo O
ur Stakeholders
Review
of Operations
Managem
ent FoundationC
orporate Data

102 Sompo Japan Nipponkoa Holdings, Inc.
(7) Plan assets
(a) Main components of plan assets
The percentage shares of components by main asset class out of total plan assets are as follows.
(Proportion)
As of March 31, 2014 As of March 31, 2015
Bonds 13% 10%
Stocks 62% 65%
Joint investment assets 11% 10%
Life insurance general accounts 4% 4%
Cash and deposits 3% 3%
Others 6% 8%
Total 100% 100%
(b) Establishment of methods for the long-term expected rate of return on plan assets
In order to assume the long-term expected rate of return on plan assets, present and expected distri-
bution of plan assets and the long term expected rate of return on the multitude of assets in plan
assets are considered.
(8) Basis of actuarial assumptions
Major bases of actuarial assumptions are as follows.(Proportion)
Fiscal year ended March 31, 2014(April 1, 2013 to March 31, 2014)
Fiscal year ended March 31, 2015(April 1, 2014 to March 31, 2015)
Discount rateDomestic consolidated subsidiaries 0.8%— 1.5% 0.7%— 1.4%
Consolidated foreign subsidiaries 3.5%—12.3% 3.6%—11.9%
Long-term expected rate of return on plan assets
Domestic consolidated subsidiaries 0.0%— 1.5% 0.0%— 1.5%
Consolidated foreign subsidiaries 4.8%—12.3% 3.6%—11.9%
3. Defined contribution plansContributions paid to the defined contribution pension plan by consolidated subsidiaries amounts to
5,216 million yen for the fiscal year ended March 31, 2014 and amounts to 5,771 million yen for the fiscal
year ended March 31, 2015.

103ANNUAL REPORT 2015 ( INTEGRATED REPORT)
13. Stock Options
1. Recorded amount and account which includes stock option expense
(Millions of yen)
Fiscal year ended March 31, 2014(April 1, 2013 to March 31, 2014)
Fiscal year ended March 31, 2015(April 1, 2014 to March 31, 2015)
Operating, general and administrative expenses 447 410
2. Recorded amount on profit resulting from forfeiture of stock options
(Millions of yen)
Fiscal year ended March 31, 2014(April 1, 2013 to March 31, 2014)
Fiscal year ended March 31, 2015(April 1, 2014 to March 31, 2015)
Gains on reversal of stock acquisition rights 118 140
3. Contents, size and its changes of stock options(1) Contents of stock options
Stock options granted by the Company are as follows.
7th to 16th issue of stock acquisition rights of the Company are stock options transferred from Sompo
Japan Insurance Inc. (“Sompo Japan”) to the Company and 17th to 22nd issue of stock acquisition rights
of the Company are stock options transferred from NIPPONKOA Insurance Company, Limited
(“NIPPONKOA”) to the Company on the date of establishment of the Company, April 1, 2010. 23rd to 26th
issue of stock acquisition rights of the Company are stock options granted by the Company.
Title and number of granteesNumber of stock
options granted by types of shares
Grant date Exercise period
7th issue Directors and executive officers of Sompo Japan: 5 Others: 27
Common stock: 63,750 stocks Apr. 1, 2010 Apr. 1, 2010 –
Jun. 29, 2014
8th issue Directors and executive officers of Sompo Japan: 6 Others: 26
Common stock: 65,500 stocks Apr. 1, 2010 Apr. 1, 2010 –
Jun. 29, 2014
9th issue Directors and executive officers of Sompo Japan: 11 Others: 34
Common stock: 90,750 stocks Apr. 1, 2010 Apr. 1, 2010 –
Jun. 28, 2015
10th issue Directors and executive officers of Sompo Japan: 11 Others: 35
Common stock: 91,250 stocks Apr. 1, 2010 Apr. 1, 2010 –
Jun. 28, 2015
11th issue Directors and executive officers of Sompo Japan: 11 Others: 31
Common stock: 81,000 stocks Apr. 1, 2010 Apr. 1, 2010 –
Jun. 28, 2016
12th issue Directors and executive officers of Sompo Japan: 11 Others: 30
Common stock: 79,000 stocks Apr. 1, 2010 Apr. 1, 2010 –
Jun. 28, 2016
13th issue Directors and executive officers of Sompo Japan: 17 Others: 24
Common stock: 100,750 stocks Apr. 1, 2010 Apr. 1, 2010 –
Jun. 27, 2017
14th issue Directors and executive officers of Sompo Japan: 17 Others: 24
Common stock: 95,500 stocks Apr. 1, 2010 Apr. 1, 2010 –
Jun. 27, 2017
15th issue Directors and executive officers of Sompo Japan: 27 Others: 1
Common stock: 74,325 stocks Apr. 1, 2010 Apr. 1, 2010 –
Aug. 11, 2033
16th issue Directors and executive officers of Sompo Japan: 41 Others: 1
Common stock: 186,775 stocks Apr. 1, 2010 Apr. 1, 2010 –
Aug. 10, 2034
17th issue Directors and executive officers of NIPPONKOA: 5 Others: 7
Common stock: 35,775 stocks Apr. 1, 2010 Apr. 1, 2010 –
Jun. 29, 2024
18th issue Directors and executive officers of NIPPONKOA: 7 Others: 11
Common stock: 50,400 stocks Apr. 1, 2010 Apr. 1, 2010 –
Jun. 29, 2025
19th issue Directors and executive officers of NIPPONKOA: 12 Others: 2
Common stock: 27,675 stocks Apr. 1, 2010 Apr. 1, 2010 –
Mar. 27, 2027
20th issue Directors and executive officers of NIPPONKOA: 12 Others: 2
Common stock: 30,375 stocks Apr. 1, 2010 Apr. 1, 2010 –
Mar. 17, 2028
21st issue Directors and executive officers of NIPPONKOA: 16 Others: 3
Common stock: 61,875 stocks Apr. 1, 2010 Apr. 1, 2010 –
Mar. 16, 2029
22nd issue Directors and executive officers of NIPPONKOA: 21 Others: 3
Common stock: 88,425 stocks Apr. 1, 2010 Apr. 1, 2010 –
Oct. 7, 2029
Financial Section
IntroductionTo O
ur Stakeholders
Review
of Operations
Managem
ent FoundationC
orporate Data
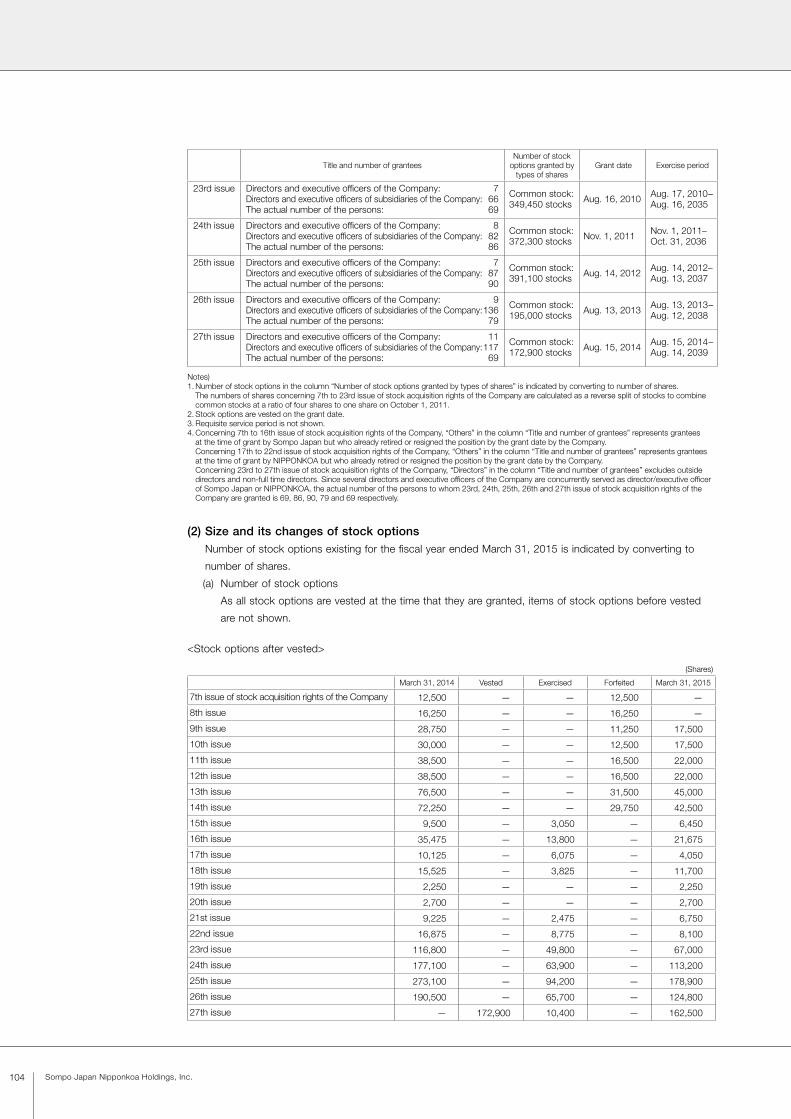
104 Sompo Japan Nipponkoa Holdings, Inc.
Title and number of granteesNumber of stock
options granted by types of shares
Grant date Exercise period
23rd issue Directors and executive officers of the Company: 7 Directors and executive officers of subsidiaries of the Company: 66 The actual number of the persons: 69
Common stock: 349,450 stocks Aug. 16, 2010 Aug. 17, 2010–
Aug. 16, 2035
24th issue Directors and executive officers of the Company: 8 Directors and executive officers of subsidiaries of the Company: 82 The actual number of the persons: 86
Common stock: 372,300 stocks Nov. 1, 2011 Nov. 1, 2011–
Oct. 31, 2036
25th issue Directors and executive officers of the Company: 7 Directors and executive officers of subsidiaries of the Company: 87 The actual number of the persons: 90
Common stock: 391,100 stocks Aug. 14, 2012 Aug. 14, 2012–
Aug. 13, 2037
26th issue Directors and executive officers of the Company: 9 Directors and executive officers of subsidiaries of the Company: 136 The actual number of the persons: 79
Common stock: 195,000 stocks Aug. 13, 2013 Aug. 13, 2013–
Aug. 12, 2038
27th issue Directors and executive officers of the Company: 11 Directors and executive officers of subsidiaries of the Company: 117 The actual number of the persons: 69
Common stock: 172,900 stocks Aug. 15, 2014 Aug. 15, 2014–
Aug. 14, 2039
Notes)1. Number of stock options in the column “Number of stock options granted by types of shares” is indicated by converting to number of shares.
The numbers of shares concerning 7th to 23rd issue of stock acquisition rights of the Company are calculated as a reverse split of stocks to combine common stocks at a ratio of four shares to one share on October 1, 2011.
2. Stock options are vested on the grant date.3. Requisite service period is not shown.4. Concerning 7th to 16th issue of stock acquisition rights of the Company, “Others” in the column “Title and number of grantees” represents grantees
at the time of grant by Sompo Japan but who already retired or resigned the position by the grant date by the Company. Concerning 17th to 22nd issue of stock acquisition rights of the Company, “Others” in the column “Title and number of grantees” represents grantees
at the time of grant by NIPPONKOA but who already retired or resigned the position by the grant date by the Company. Concerning 23rd to 27th issue of stock acquisition rights of the Company, “Directors” in the column “Title and number of grantees” excludes outside
directors and non-full time directors. Since several directors and executive officers of the Company are concurrently served as director/executive officer of Sompo Japan or NIPPONKOA, the actual number of the persons to whom 23rd, 24th, 25th, 26th and 27th issue of stock acquisition rights of the Company are granted is 69, 86, 90, 79 and 69 respectively.
(2) Size and its changes of stock optionsNumber of stock options existing for the fiscal year ended March 31, 2015 is indicated by converting to
number of shares.
(a) Number of stock options
As all stock options are vested at the time that they are granted, items of stock options before vested
are not shown.
<Stock options after vested>
(Shares)
March 31, 2014 Vested Exercised Forfeited March 31, 2015
7th issue of stock acquisition rights of the Company 12,500 — — 12,500 —
8th issue 16,250 — — 16,250 —
9th issue 28,750 — — 11,250 17,500
10th issue 30,000 — — 12,500 17,500
11th issue 38,500 — — 16,500 22,000
12th issue 38,500 — — 16,500 22,000
13th issue 76,500 — — 31,500 45,000
14th issue 72,250 — — 29,750 42,500
15th issue 9,500 — 3,050 — 6,450
16th issue 35,475 — 13,800 — 21,675
17th issue 10,125 — 6,075 — 4,050
18th issue 15,525 — 3,825 — 11,700
19th issue 2,250 — — — 2,250
20th issue 2,700 — — — 2,700
21st issue 9,225 — 2,475 — 6,750
22nd issue 16,875 — 8,775 — 8,100
23rd issue 116,800 — 49,800 — 67,000
24th issue 177,100 — 63,900 — 113,200
25th issue 273,100 — 94,200 — 178,900
26th issue 190,500 — 65,700 — 124,800
27th issue — 172,900 10,400 — 162,500
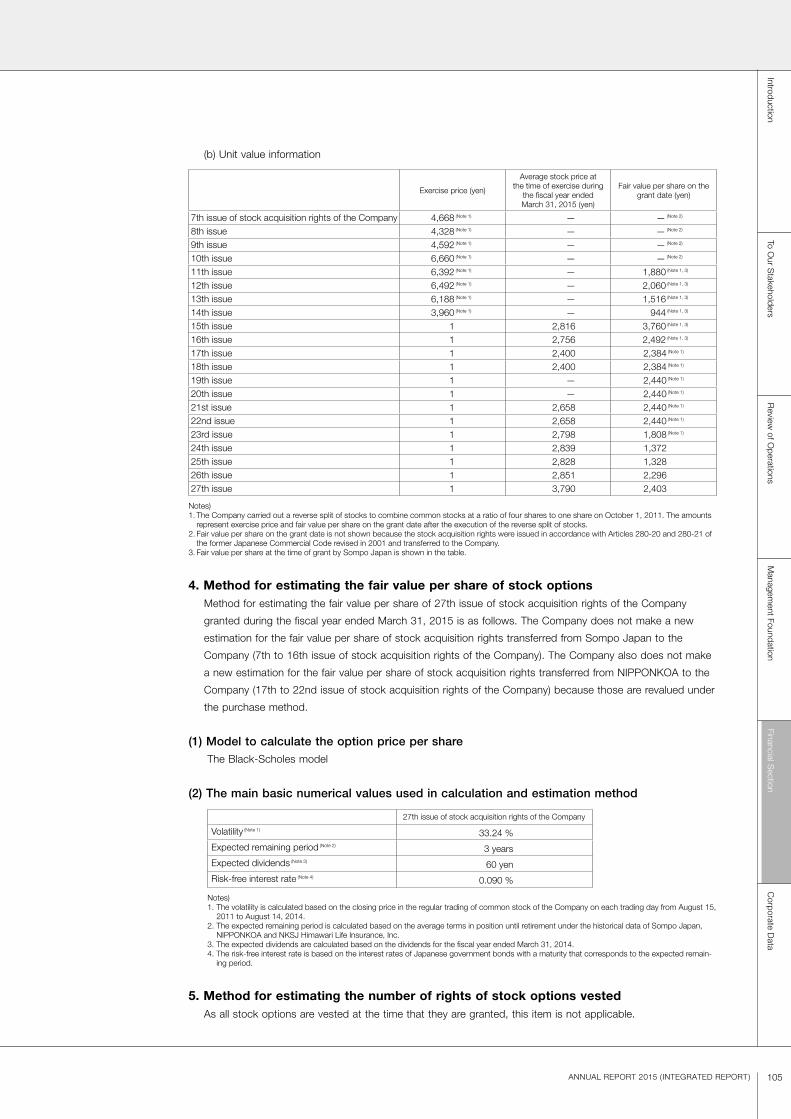
105ANNUAL REPORT 2015 ( INTEGRATED REPORT)
(b) Unit value information
Exercise price (yen)
Average stock price at the time of exercise during
the fiscal year ended March 31, 2015 (yen)
Fair value per share on the grant date (yen)
7th issue of stock acquisition rights of the Company 4,668 (Note 1) — — (Note 2)
8th issue 4,328 (Note 1) — — (Note 2)
9th issue 4,592 (Note 1) — — (Note 2)
10th issue 6,660 (Note 1) — — (Note 2)
11th issue 6,392 (Note 1) — 1,880 (Note 1, 3)
12th issue 6,492 (Note 1) — 2,060 (Note 1, 3)
13th issue 6,188 (Note 1) — 1,516 (Note 1, 3)
14th issue 3,960 (Note 1) — 944 (Note 1, 3)
15th issue 1 2,816 3,760 (Note 1, 3)
16th issue 1 2,756 2,492 (Note 1, 3)
17th issue 1 2,400 2,384 (Note 1)
18th issue 1 2,400 2,384 (Note 1)
19th issue 1 — 2,440 (Note 1)
20th issue 1 — 2,440 (Note 1)
21st issue 1 2,658 2,440 (Note 1)
22nd issue 1 2,658 2,440 (Note 1)
23rd issue 1 2,798 1,808 (Note 1)
24th issue 1 2,839 1,37225th issue 1 2,828 1,32826th issue 1 2,851 2,29627th issue 1 3,790 2,403
Notes)1. The Company carried out a reverse split of stocks to combine common stocks at a ratio of four shares to one share on October 1, 2011. The amounts
represent exercise price and fair value per share on the grant date after the execution of the reverse split of stocks.2. Fair value per share on the grant date is not shown because the stock acquisition rights were issued in accordance with Articles 280-20 and 280-21 of
the former Japanese Commercial Code revised in 2001 and transferred to the Company.3. Fair value per share at the time of grant by Sompo Japan is shown in the table.
4. Method for estimating the fair value per share of stock optionsMethod for estimating the fair value per share of 27th issue of stock acquisition rights of the Company
granted during the fiscal year ended March 31, 2015 is as follows. The Company does not make a new
estimation for the fair value per share of stock acquisition rights transferred from Sompo Japan to the
Company (7th to 16th issue of stock acquisition rights of the Company). The Company also does not make
a new estimation for the fair value per share of stock acquisition rights transferred from NIPPONKOA to the
Company (17th to 22nd issue of stock acquisition rights of the Company) because those are revalued under
the purchase method.
(1) Model to calculate the option price per shareThe Black-Scholes model
(2) The main basic numerical values used in calculation and estimation method
27th issue of stock acquisition rights of the Company
Volatility (Note 1) 33.24 %
Expected remaining period (Note 2) 3 years
Expected dividends (Note 3) 60 yen
Risk-free interest rate (Note 4) 0.090 %
Notes)1. The volatility is calculated based on the closing price in the regular trading of common stock of the Company on each trading day from August 15,
2011 to August 14, 2014.2. The expected remaining period is calculated based on the average terms in position until retirement under the historical data of Sompo Japan,
NIPPONKOA and NKSJ Himawari Life Insurance, Inc.3. The expected dividends are calculated based on the dividends for the fiscal year ended March 31, 2014.4. The risk-free interest rate is based on the interest rates of Japanese government bonds with a maturity that corresponds to the expected remain-
ing period.
5. Method for estimating the number of rights of stock options vestedAs all stock options are vested at the time that they are granted, this item is not applicable.
Financial Section
IntroductionTo O
ur Stakeholders
Review
of Operations
Managem
ent FoundationC
orporate Data
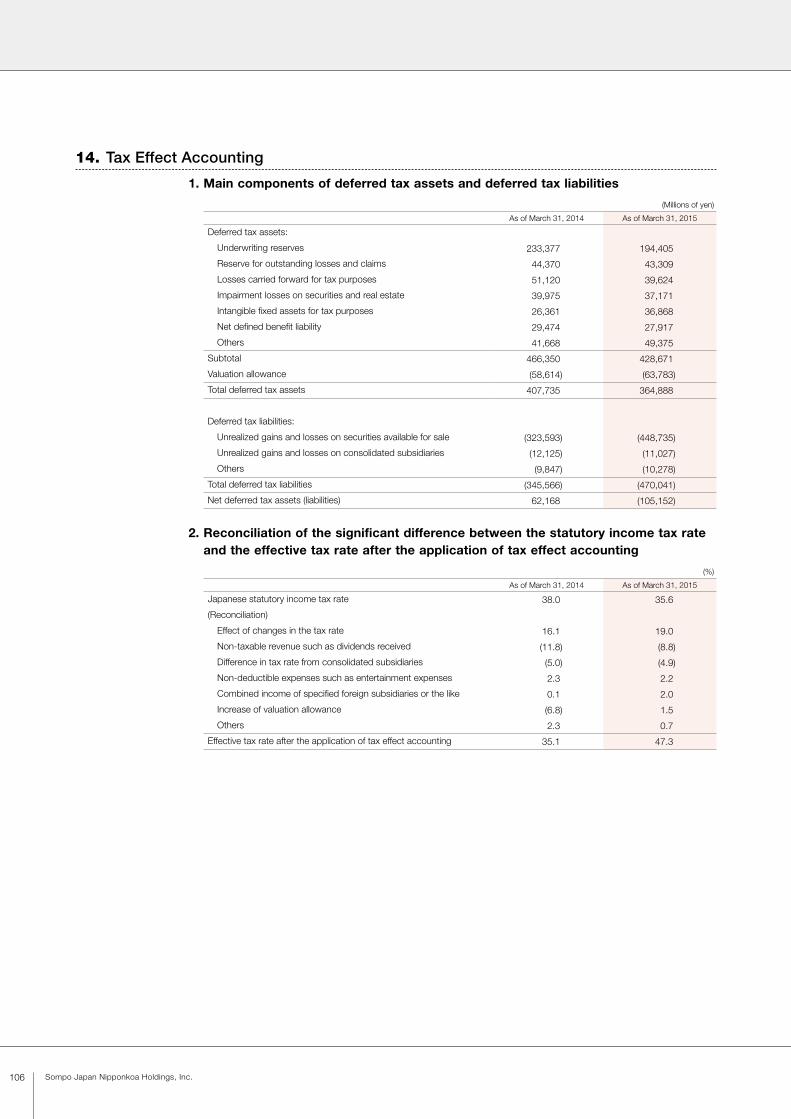
106 Sompo Japan Nipponkoa Holdings, Inc.
1. Main components of deferred tax assets and deferred tax liabilities
(Millions of yen)
As of March 31, 2014 As of March 31, 2015
Deferred tax assets:
Underwriting reserves 233,377 194,405
Reserve for outstanding losses and claims 44,370 43,309
Losses carried forward for tax purposes 51,120 39,624
Impairment losses on securities and real estate 39,975 37,171
Intangible fixed assets for tax purposes 26,361 36,868
Net defined benefit liability 29,474 27,917
Others 41,668 49,375
Subtotal 466,350 428,671
Valuation allowance (58,614) (63,783)
Total deferred tax assets 407,735 364,888
Deferred tax liabilities:
Unrealized gains and losses on securities available for sale (323,593) (448,735)
Unrealized gains and losses on consolidated subsidiaries (12,125) (11,027)
Others (9,847) (10,278)
Total deferred tax liabilities (345,566) (470,041)
Net deferred tax assets (liabilities) 62,168 (105,152)
2. Reconciliation of the significant difference between the statutory income tax rate and the effective tax rate after the application of tax effect accounting
(%)
As of March 31, 2014 As of March 31, 2015
Japanese statutory income tax rate 38.0 35.6
(Reconciliation)
Effect of changes in the tax rate 16.1 19.0
Non-taxable revenue such as dividends received (11.8) (8.8)
Difference in tax rate from consolidated subsidiaries (5.0) (4.9)
Non-deductible expenses such as entertainment expenses 2.3 2.2
Combined income of specified foreign subsidiaries or the like 0.1 2.0
Increase of valuation allowance (6.8) 1.5
Others 2.3 0.7
Effective tax rate after the application of tax effect accounting 35.1 47.3
14. Tax Effect Accounting
107ANNUAL REPORT 2015 ( INTEGRATED REPORT)
3. Revisions of deferred tax assets and deferred tax liabilities following changes in the corporate tax rate, etc. “Act on Partial Amendment to the Income Tax Act, etc.” (Act No. 9, 2015) was promulgated on March 31,
2015, and accordingly, a reduction in the corporate tax rate, etc. has been enforced from the fiscal year
beginning on or after April 1, 2015.
Accordingly, the effective statutory income tax rate has generally been changed from 30.7% used previously,
to 28.8%. The effective statutory income tax rate was used to calculate deferred tax assets and liabilities for
temporary differences expected to be reversed in the fiscal year beginning on or after April 1, 2015.
As a result of this change in the corporate tax rate, the net amount of deferred tax liabilities (net of deferred
tax assets) decreased by 6,398 million yen, underwriting reserves decreased by 2,530 million yen, deferred
income taxes increased by 20,680 million yen and net income decreased by 18,154 million yen.
1. Business combination through acquisitions(1) Summary of business combination
(a) The name of acquiree and its type of business
Canopius Group Limited: Overseas insurance business
(b) Major reason for business combination
The Sompo Japan Nipponkoa Group acquired the shares of Canopius Group Limited with aim of enter-
ing into the overseas specialty market on a full scale and of expanding its overseas insurance business.
Through the acquisition of Canopius, the Sompo Japan Nipponkoa Group intends to further increase its
group-wide competitiveness of the overseas insurance business through the sharing of Canopius’s skills
and know how with the Sompo Japan Nipponkoa Group, such as in relation to the M&A transactions,
techniques to enhance management of acquired entities and excellent HR strategy.
(c) Date of business combination
May 1, 2014
(d) Legal form of business combination
Acquisition of shares by cash
(e) Name of the entity after business combination
Canopius Group Limited
( f ) Percentage of voting rights acquired
100.0%
(g) Major reason for determination of the acquirer
Sompo Japan Nipponkoa Insurance Inc., which is a consolidated subsidiary of Sompo Japan Nipponkoa
Holdings, Inc., was determined as the acquirer because Sompo Japan Nipponkoa Insurance Inc.
acquired shares of Canopius Group Limited by cash.
15. Business Combination
Financial Section
IntroductionTo O
ur Stakeholders
Review
of Operations
Managem
ent FoundationC
orporate Data
108 Sompo Japan Nipponkoa Holdings, Inc.
(2) The period of financial result of the acquiree included in the consolidated financial statementsFrom April 1, 2014 to December 31, 2014
(3) Acquisition cost of the acquiree
Purchase price GBP 613 million
Direct cost for the acquisition GBP 10 million
Acquisition cost GBP 623 million
(4) Amount of goodwill, reason for recognizing goodwill, method and period of amortization(a) Amount of goodwill
GBP 173 million
(b) Reason for recognizing goodwill
The acquisition cost exceeded the net amounts of assets acquired and liabilities assumed.
(c) Method and period of amortization
Straight-line amortization over 20 years
(5) Amounts of assets acquired and liabilities assumed on the day of business combinationTotal assets: GBP 1,911 million
Securities: GBP 1,179 million
Total liabilities: GBP 1,460 million
Underwriting funds: GBP 1,113 million
(6) Approximate amounts of influence and its calculation method on the consolidated statement of income for the fiscal year ended March 31, 2015, assuming that the business integration was completed on the commencement date of the fiscal yearNet premiums written: 28,228 million Japanese yen
Ordinary profit: 2,097 million Japanese yen
Net income: 1,663 million Japanese yen
(Calculation methods for approximate amounts)
Approximate amounts of influence are the differences between the amount of net premiums written, ordinary profit
and net income based on the assumption that the business integration was completed on the commencement
date of the fiscal year and their corresponding amounts in the consolidated income statement of the acquirer.
Goodwill recognized at business combination has been amortized based on the assumption that this goodwill
was incurred on the commencement date of the fiscal year.
Please note that this note is unaudited.
2. Transactions under common control(1) Summary of transactions
(a) The name of subject companies and their type of business
Sompo Japan Insurance Inc.: Domestic property and casualty insurance business
NIPPONKOA Insurance Company, Limited: Domestic property and casualty insurance business
(b) Date of business combination
September 1, 2014

109ANNUAL REPORT 2015 ( INTEGRATED REPORT)
(c) Legal form of business combination
Sompo Japan Insurance Inc. (consolidated subsidiary of Sompo Japan Nipponkoa Holdings, Inc., surviving
company) merged with NIPPONKOA Insurance Company, Limited (consolidated subsidiary of Sompo
Japan Nipponkoa Holdings, Inc., merged company).
(d) Name of the entity after business combination
Sompo Japan Nipponkoa Insurance Inc.
(e) Other matters concerning the transactions
In light of changes in the challenging operating environment surrounding the property and casualty
insurance industry, Sompo Japan Nipponkoa Holdings, Inc. was established with the aim of maximizing
earnings power based on a strong business foundation where Sompo Japan Insurance Inc. and
NIPPONKOA Insurance Company, Limited can demonstrate, as a single company, the strengths they
have developed over the years.
(2) Summary of accounting treatmentThe transactions are accounted for at appropriate book value as common control transactions in accor-
dance with the “Accounting Standard for Business Combinations” (Accounting Standards Board of Japan
Statement No. 21, December 26, 2008) and the “Guidance on Accounting Standard for Business
Combinations and Accounting Standard for Business Divestitures” (Accounting Standards Board of Japan
Guidance No. 10, December 26, 2008).
3. Transactions under common control(1) Summary of transactions
(a) The name of subject companies and their type of business
Sompo Japan Nipponkoa Insurance Inc.: Domestic property and casualty insurance business
Sompo Japan Insurance Company of America: Overseas insurance business
(b) Date of business combination
September 1, 2014
(c) Legal form of business combination
Investment in-kind by Sompo Japan Nipponkoa Insurance Inc. (consolidated subsidiary of Sompo Japan
Nipponkoa Holdings, Inc.) of assets and liabilities held by its U.S. branch in Sompo Japan Insurance
Company of America (consolidated subsidiary of Sompo Japan Nipponkoa Holdings, Inc.)
(d) Other matters concerning the transactions
Sompo Japan Nipponkoa Insurance Inc. made an investment in-kind of assets and liabilities held by its
U.S. branch in Sompo Japan Insurance Company of America, with the aim of expanding operations to
be derived from the integration of sites in the United States.
(2) Summary of accounting treatmentThe transactions are accounted for at appropriate book value as common control transactions in accor-
dance with the “Accounting Standard for Business Combinations” (Accounting Standards Board of Japan
Statement No. 21, December 26, 2008), the “Accounting Standard for Business Divestitures” (Accounting
Standards Board of Japan Statement No. 7, December 26, 2008) and the “Guidance on Accounting
Standard for Business Combinations and Accounting Standard for Business Divestitures” (Accounting
Standards Board of Japan Guidance No. 10, December 26, 2008).
Financial Section
IntroductionTo O
ur Stakeholders
Review
of Operations
Managem
ent FoundationC
orporate Data
110 Sompo Japan Nipponkoa Holdings, Inc.
4. Transactions under common control(1) Summary of transactions
(a) The name of subject companies and their type of business
Yasuda Seguros S.A.: Overseas insurance business
Marítima Seguros S.A.: Overseas insurance business
(b) Date of business combination
October 21, 2014
(c) Legal form of business combination
Marítima Seguros S.A. (consolidated subsidiary of Sompo Japan Nipponkoa Holdings, Inc., surviving
company) merged with Yasuda Seguros S.A. (consolidated subsidiary of Sompo Japan Nipponkoa
Holdings, Inc., merged company).
(d) Name of the entity after business combination
Yasuda Marítima Seguros S.A.
(e) Other matters concerning the transactions
The insurance business in Brazil has been expanding an average 12% per year for last 10 years.
The market expansion has been supported by continuing economic growth in Brazil, and such growth is
expected to continue in the foreseeable future.
The Sompo Japan Nipponkoa Group has been operating its insurance business in Brazil for more than
50 years through Yasuda Seguros S.A. (founded in 1958). The Sompo Japan Nipponkoa Group has
been working on increasing the volume of gross premium, expanding its knowledge base, and improving
its business through Marítima Seguros S.A. (acquired share in 2009, acquired management rights in
2013), since the Sompo Japan Nipponkoa Group recognizes Brazil as an important region for global
business development.
The merger of Marítima Seguros S.A., having strength in personal line, and Yasuda Seguros S.A., having
strength in corporate line, will enable them to provide their services reciprocally.
(2) Summary of accounting treatmentThe transactions are accounted for at appropriate book value as common control transactions in accor-
dance with the “Accounting Standard for Business Combinations” (Accounting Standards Board of Japan
Statement No. 21, December 26, 2008) and the “Guidance on Accounting Standard for Business
Combinations and Accounting Standard for Business Divestitures” (Accounting Standards Board of Japan
Guidance No. 10, December 26, 2008).
Segment information1. Summary of reportable segments
The reportable segment of the Company is the component of the Sompo Japan Nipponkoa Group, for which
discrete financial information is available and whose operating results are periodically reviewed by the board
of directors to make decisions about resources to be allocated to the segment and assess its performance.
The respective group companies of the Company determine their comprehensive strategies for their operations
as independent management unit and roll out their operations under the group-wide management policy of
the Company.
Therefore, the Company is composed of business segments, which consist of the respective group companies
as minimum component. “Domestic P&C insurance business,” “Domestic life insurance business” and
“Overseas insurance business” are determined as the reportable segments. The Company, defined-contribution
pension business, asset management business and healthcare business and other services that are not
covered by the reportable segments are included in “Others.” The major companies which constitute the
reportable segments and “Others” are described below.
16. Segment information

111ANNUAL REPORT 2015 ( INTEGRATED REPORT)
“Domestic P&C insurance business” consists mainly of underwriting of property and casualty insurance,
investment, and related activities in Japan. “Domestic life insurance business” consists mainly of underwriting
of life insurance and investment activities in Japan, “Overseas insurance business” consists mainly
of underwriting of property and casualty insurance and investment activities overseas.
Major companies
Reportable segments
Domestic P&C insurance business Sompo Japan Nipponkoa Insurance Inc. (Note 1)Sonpo 24 Insurance Company LimitedSAISON AUTOMOBILE AND FIRE INSURANCE COMPANY, LIMITED
Domestic life insurance business Sompo Japan Nipponkoa Himawari Life Insurance, Inc. (Note 2)Sompo Japan DIY Life Insurance CO., LTD. (Note 3)
Overseas insurance business Sompo Japan Insurance Company of AmericaCanopius Group LimitedSompo Japan Sigorta Anonim SirketiYasuda Marítima Seguros S.A. (Note 4)
Others Sompo Japan Nipponkoa Holdings, Inc. (Note 2)Sompo Japan Nipponkoa DC Securities Inc. (Note 2)SOMPO JAPAN NIPPONKOA ASSET MANAGEMENT CO., LTD.Healthcare Frontier Japan Inc.
Notes)1. Sompo Japan Insurance Inc. merged on September 1, 2014 with NIPPONKOA Insurance Company, Limited and changed its name to Sompo Japan
Nipponkoa Insurance Inc. on the same date. Results of operations of NIPPONKOA Insurance Company, Limited from the beginning of the fiscal year to September 1, 2014 are included in the segment information.
2. NKSJ Himawari Life Insurance, Inc. changed its name to Sompo Japan Nipponkoa Himawari Life Insurance, Inc. on September 1, 2014. NKSJ Holdings, Inc. changed its name to Sompo Japan Nipponkoa Holdings, Inc. on September 1, 2014. Sompo Japan DC Securities Inc. changed its name to Sompo Japan Nipponkoa DC Securities Inc. on September 1, 2014.
3. Sompo Japan DIY Life Insurance CO., LTD. is excluded from the scope of consolidation for the fiscal year ended March 31, 2015 because it is no longer a consolidated subsidiary due to a transfer of shares. Results of operations of Sompo Japan DIY Life Insurance CO., LTD. from the beginning of the fiscal year to June 30, 2014 are included in the segment information.
4. Marítima Seguros S.A. merged on October 21, 2014 with Yasuda Seguros S.A. and changed its name to Yasuda Marítima Seguros S.A. on the same date. Results of operations of Yasuda Seguros S.A. from the beginning of the fiscal year to October 21, 2014 are included in the segment information.
(Changes in reportable segments)
As for the fiscal year ended March 31, 2015, reportable segments has been changed from two business lines,
which include “Property and casualty insurance business” and “Life insurance business” to three business lines,
which include “Domestic P&C insurance business,” “Domestic life insurance business” and “Overseas insurance
business.” Regarding this change, “Overseas insurance business” becomes an independent reportable segment,
due to an increase in its materiality. Segment information for the fiscal year ended March 31, 2014 is based on
the business lines after the changes.
2. Calculation methods for the amount of sales, income or loss, assets and other items by each reportable segmentThe accounting methods of reportable business segments are those mentioned in “1. Significant Accounting
Policies for the Preparation of the Consolidated Financial Statements.” Income or loss attributable to the
reportable segments is the amounts based on net income in the consolidated statements of income.
Income from internal transactions among segments is based on the price of transactions among third parties
and others.
(Application of accounting standard for retirement benefits)
As mentioned in “4. Accounting policies” in “1. Significant Accounting Policies for the Preparation of the
Consolidated Financial Statements,” the calculation method for retirement benefit obligation and service cost
was changed from the fiscal year ended March 31, 2015.
The impact of this revision on segment income and segment loss for the fiscal year ended March 31, 2015
was immaterial.
Financial Section
IntroductionTo O
ur Stakeholders
Review
of Operations
Managem
ent FoundationC
orporate Data

112 Sompo Japan Nipponkoa Holdings, Inc.
3. Information related to the amount of sales, income or loss, assets and other items by each reportable segment
Fiscal year ended March 31, 2014 (April 1, 2013 to March 31, 2014)
(Millions of yen)
Reportable segments
Others (Note 2) Total
Adjustments(Note 3)
Amount on the consolidated
financialstatements
(Note 4)
Domestic P&C insurance
business
Domestic life insurance business
Overseas insurance business
Total
Sales (Note 1):
Sales from transactions with external customers 2,114,945 273,733 157,519 2,546,198 8,635 2,554,834 453,504 3,008,339
Sales from internal transactions or transfers among segments
— — — — 4,114 4,114 (4,114) —
Total 2,114,945 273,733 157,519 2,546,198 12,750 2,558,948 449,390 3,008,339
Segment income (loss) 32,527 5,054 5,280 42,862 1,307 44,169 — 44,169
Segment assets 6,895,325 2,137,956 456,861 9,490,143 9,656 9,499,799 — 9,499,799
Other items:
Depreciation 17,780 1,499 1,277 20,557 75 20,633 — 20,633
Amortization of goodwill 177 1,872 2,423 4,473 — 4,473 — 4,473
Interest and dividend income 116,463 35,198 10,370 162,033 1 162,035 (777) 161,257
Interest paid 11,254 69 369 11,693 6 11,699 (6) 11,692
Investment gains (losses) on the equity method 71 — (231) (159) — (159) — (159)
Extraordinary gains (Note 5) 3,901 0 263 4,165 118 4,284 — 4,284
Extraordinary losses (Note 6): 46,945 546 22 47,515 3 47,518 — 47,518
Impairment losses 4,021 — — 4,021 — 4,021 — 4,021
Income tax expenses 17,574 4,621 1,707 23,902 337 24,240 — 24,240
Investment in affiliates accounted for under the equity method
1,030 — 1,058 2,088 — 2,088 — 2,088
Increase in tangible and intangible fixed assets 23,800 378 11,302 35,480 204 35,685 — 35,685
Notes)1. Sales amounts represent the following: Domestic P&C insurance business: Net premiums written Domestic life insurance business: Life insurance premiums written Overseas insurance business: Net premiums written and life insurance premiums written “Others” and amount on the consolidated financial statements: Ordinary income2. “Others” is business segments which are not included in reportable segments. It includes the Company (insurance holding company)
defined-contribution pension business, asset management business and healthcare business.3. Adjustments of sales are as follows. Ordinary income related to domestic P&C insurance business, domestic life insurance
business and overseas insurance business excluding net premiums written and life insurance premiums written: 453,504 million yen
Elimination of internal transactions among segments: (4,114) million yen4. Segment income (loss) is adjusted to net income in the consolidated statement of income. 5. Extraordinary gains for domestic P&C insurance business include 3,901 million yen of gains on disposal of fixed assets.6. Extraordinary losses for domestic P&C insurance business include 23,155 million yen of merger cost, and 8,830 million yen of special extra retirement
payments, etc. due to voluntary retirement program.
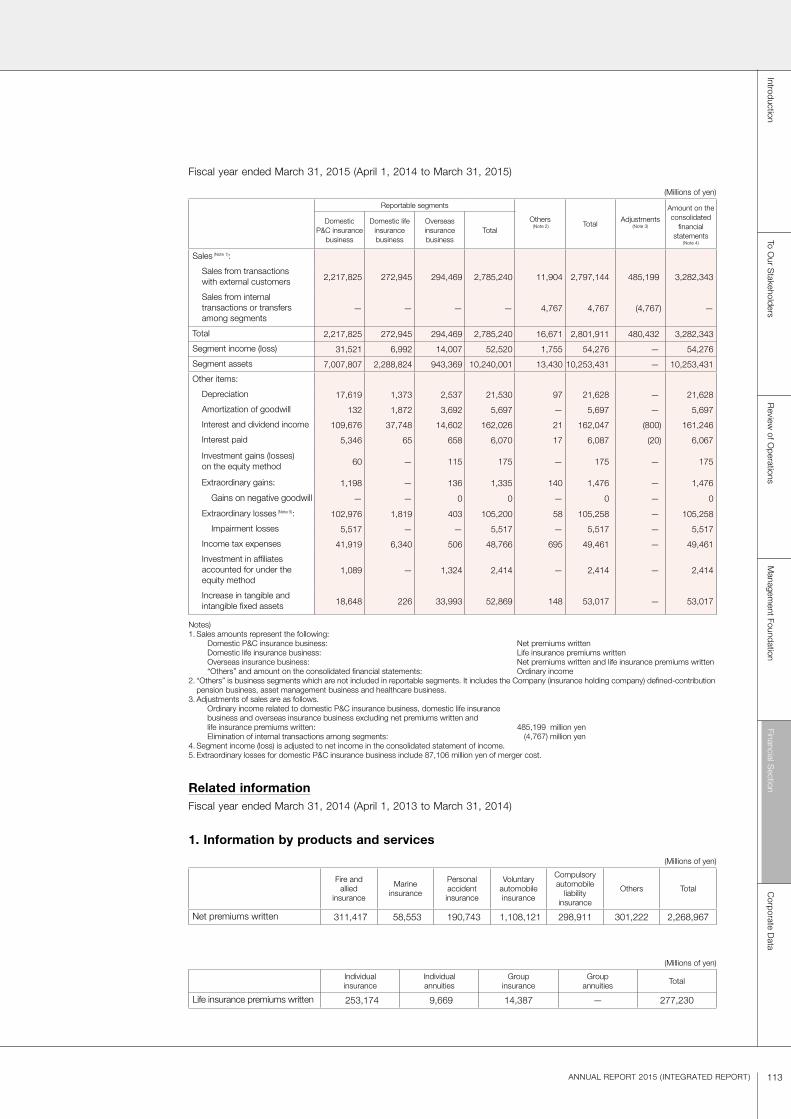
113ANNUAL REPORT 2015 ( INTEGRATED REPORT)
Fiscal year ended March 31, 2015 (April 1, 2014 to March 31, 2015)
(Millions of yen)
Reportable segments
Others (Note 2) Total
Adjustments(Note 3)
Amount on the consolidated
financialstatements
(Note 4)
Domestic P&C insurance
business
Domestic life insurance business
Overseas insurance business
Total
Sales (Note 1):
Sales from transactions with external customers 2,217,825 272,945 294,469 2,785,240 11,904 2,797,144 485,199 3,282,343
Sales from internal transactions or transfers among segments
— — — — 4,767 4,767 (4,767) —
Total 2,217,825 272,945 294,469 2,785,240 16,671 2,801,911 480,432 3,282,343
Segment income (loss) 31,521 6,992 14,007 52,520 1,755 54,276 — 54,276
Segment assets 7,007,807 2,288,824 943,369 10,240,001 13,430 10,253,431 — 10,253,431
Other items:
Depreciation 17,619 1,373 2,537 21,530 97 21,628 — 21,628
Amortization of goodwill 132 1,872 3,692 5,697 — 5,697 — 5,697
Interest and dividend income 109,676 37,748 14,602 162,026 21 162,047 (800) 161,246
Interest paid 5,346 65 658 6,070 17 6,087 (20) 6,067
Investment gains (losses) on the equity method 60 — 115 175 — 175 — 175
Extraordinary gains: 1,198 — 136 1,335 140 1,476 — 1,476
Gains on negative goodwill — — 0 0 — 0 — 0
Extraordinary losses (Note 5): 102,976 1,819 403 105,200 58 105,258 — 105,258
Impairment losses 5,517 — — 5,517 — 5,517 — 5,517
Income tax expenses 41,919 6,340 506 48,766 695 49,461 — 49,461
Investment in affiliates accounted for under the equity method
1,089 — 1,324 2,414 — 2,414 — 2,414
Increase in tangible and intangible fixed assets 18,648 226 33,993 52,869 148 53,017 — 53,017
Notes)1. Sales amounts represent the following: Domestic P&C insurance business: Net premiums written Domestic life insurance business: Life insurance premiums written Overseas insurance business: Net premiums written and life insurance premiums written “Others” and amount on the consolidated financial statements: Ordinary income2. “Others” is business segments which are not included in reportable segments. It includes the Company (insurance holding company) defined-contribution
pension business, asset management business and healthcare business.3. Adjustments of sales are as follows. Ordinary income related to domestic P&C insurance business, domestic life insurance
business and overseas insurance business excluding net premiums written and life insurance premiums written: 485,199 million yen
Elimination of internal transactions among segments: (4,767) million yen4. Segment income (loss) is adjusted to net income in the consolidated statement of income. 5. Extraordinary losses for domestic P&C insurance business include 87,106 million yen of merger cost.
Related informationFiscal year ended March 31, 2014 (April 1, 2013 to March 31, 2014)
1. Information by products and services
(Millions of yen)
Fire andallied
insurance
Marineinsurance
Personalaccidentinsurance
Voluntaryautomobileinsurance
Compulsoryautomobile
liabilityinsurance
Others Total
Net premiums written 311,417 58,553 190,743 1,108,121 298,911 301,222 2,268,967
(Millions of yen)
Individualinsurance
Individualannuities
Groupinsurance
Groupannuities Total
Life insurance premiums written 253,174 9,669 14,387 — 277,230
Financial Section
IntroductionTo O
ur Stakeholders
Review
of Operations
Managem
ent FoundationC
orporate Data
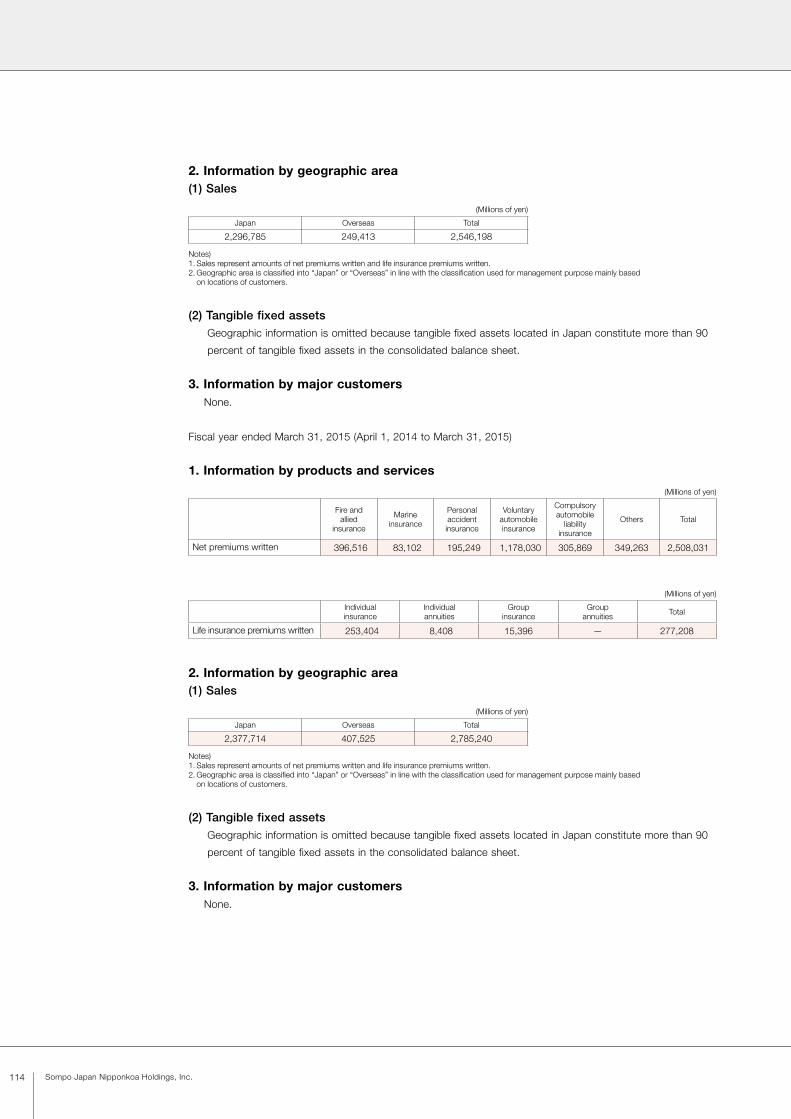
114 Sompo Japan Nipponkoa Holdings, Inc.
2. Information by geographic area(1) Sales
(Millions of yen)
Japan Overseas Total
2,296,785 249,413 2,546,198
Notes)1. Sales represent amounts of net premiums written and life insurance premiums written.2. Geographic area is classified into “Japan” or “Overseas” in line with the classification used for management purpose mainly based
on locations of customers.
(2) Tangible fixed assetsGeographic information is omitted because tangible fixed assets located in Japan constitute more than 90
percent of tangible fixed assets in the consolidated balance sheet.
3. Information by major customersNone.
Fiscal year ended March 31, 2015 (April 1, 2014 to March 31, 2015)
1. Information by products and services
(Millions of yen)
Fire andallied
insurance
Marineinsurance
Personalaccidentinsurance
Voluntaryautomobileinsurance
Compulsoryautomobile
liabilityinsurance
Others Total
Net premiums written 396,516 83,102 195,249 1,178,030 305,869 349,263 2,508,031
(Millions of yen)
Individualinsurance
Individualannuities
Groupinsurance
Groupannuities Total
Life insurance premiums written 253,404 8,408 15,396 — 277,208
2. Information by geographic area(1) Sales
(Millions of yen)
Japan Overseas Total
2,377,714 407,525 2,785,240
Notes)1. Sales represent amounts of net premiums written and life insurance premiums written.2. Geographic area is classified into “Japan” or “Overseas” in line with the classification used for management purpose mainly based
on locations of customers.
(2) Tangible fixed assetsGeographic information is omitted because tangible fixed assets located in Japan constitute more than 90
percent of tangible fixed assets in the consolidated balance sheet.
3. Information by major customersNone.
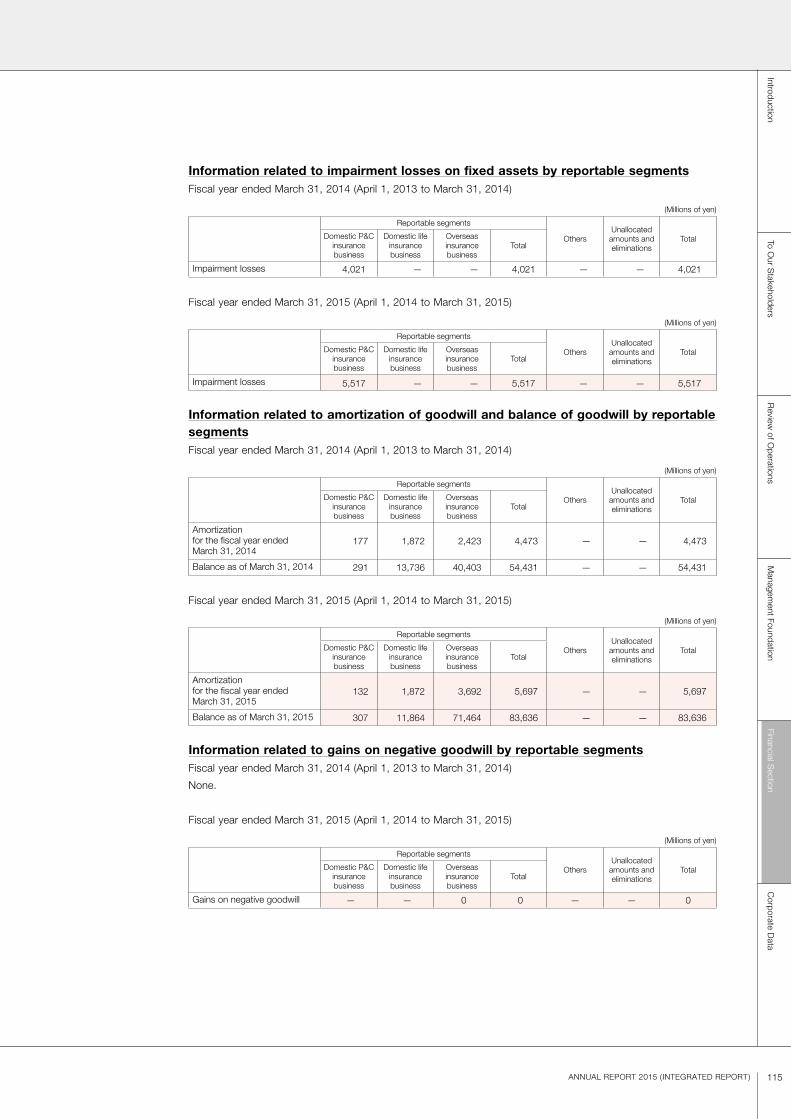
115ANNUAL REPORT 2015 ( INTEGRATED REPORT)
Information related to impairment losses on fixed assets by reportable segmentsFiscal year ended March 31, 2014 (April 1, 2013 to March 31, 2014)
(Millions of yen)
Reportable segments
OthersUnallocated
amounts andeliminations
TotalDomestic P&C insurance business
Domestic life insurance business
Overseas insurance business
Total
Impairment losses 4,021 — — 4,021 — — 4,021
Fiscal year ended March 31, 2015 (April 1, 2014 to March 31, 2015)
(Millions of yen)
Reportable segments
OthersUnallocated
amounts andeliminations
TotalDomestic P&C insurance business
Domestic life insurance business
Overseas insurance business
Total
Impairment losses 5,517 — — 5,517 — — 5,517
Information related to amortization of goodwill and balance of goodwill by reportable segmentsFiscal year ended March 31, 2014 (April 1, 2013 to March 31, 2014)
(Millions of yen)
Reportable segments
OthersUnallocated
amounts andeliminations
TotalDomestic P&C insurance business
Domestic life insurance business
Overseas insurance business
Total
Amortizationfor the fiscal year endedMarch 31, 2014
177 1,872 2,423 4,473 — — 4,473
Balance as of March 31, 2014 291 13,736 40,403 54,431 — — 54,431
Fiscal year ended March 31, 2015 (April 1, 2014 to March 31, 2015)
(Millions of yen)
Reportable segments
OthersUnallocated
amounts andeliminations
TotalDomestic P&C insurance business
Domestic life insurance business
Overseas insurance business
Total
Amortizationfor the fiscal year endedMarch 31, 2015
132 1,872 3,692 5,697 — — 5,697
Balance as of March 31, 2015 307 11,864 71,464 83,636 — — 83,636
Information related to gains on negative goodwill by reportable segmentsFiscal year ended March 31, 2014 (April 1, 2013 to March 31, 2014)
None.
Fiscal year ended March 31, 2015 (April 1, 2014 to March 31, 2015)
(Millions of yen)
Reportable segments
OthersUnallocated
amounts andeliminations
TotalDomestic P&C insurance business
Domestic life insurance business
Overseas insurance business
Total
Gains on negative goodwill — — 0 0 — — 0
Financial Section
IntroductionTo O
ur Stakeholders
Review
of Operations
Managem
ent FoundationC
orporate Data
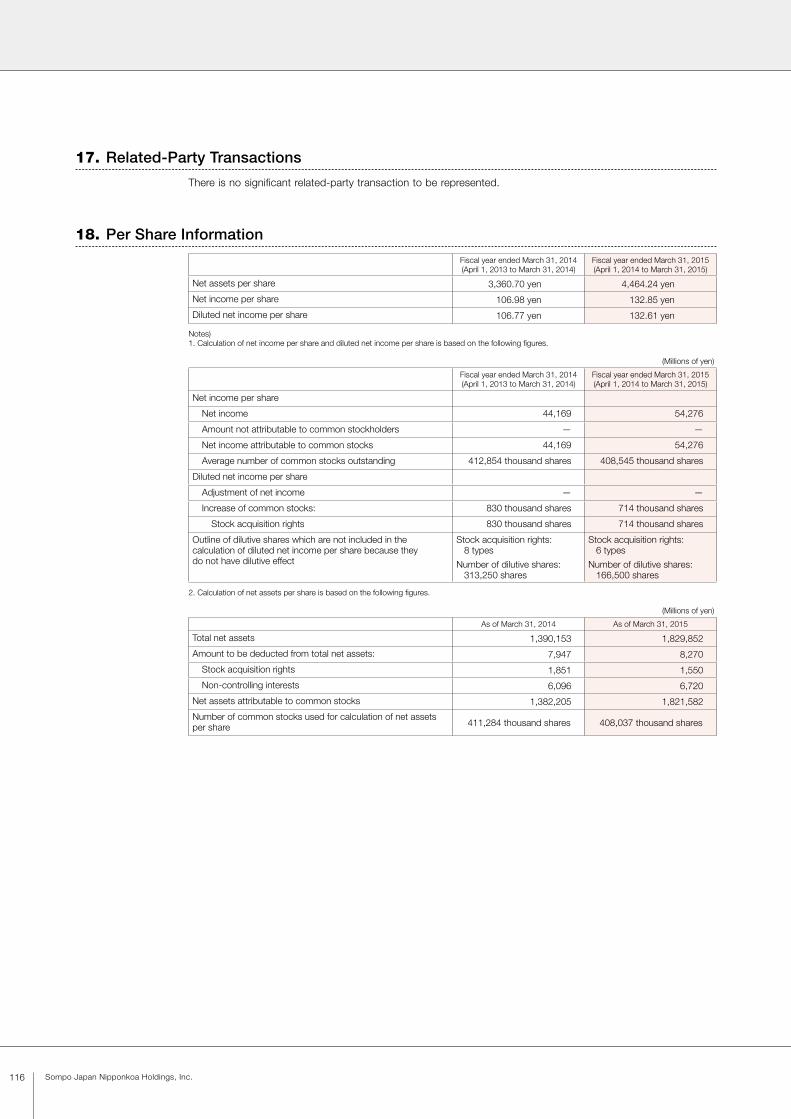
116 Sompo Japan Nipponkoa Holdings, Inc.
There is no significant related-party transaction to be represented.
Fiscal year ended March 31, 2014(April 1, 2013 to March 31, 2014)
Fiscal year ended March 31, 2015(April 1, 2014 to March 31, 2015)
Net assets per share 3,360.70 yen 4,464.24 yen
Net income per share 106.98 yen 132.85 yen
Diluted net income per share 106.77 yen 132.61 yen
Notes)1. Calculation of net income per share and diluted net income per share is based on the following figures.
(Millions of yen)
Fiscal year ended March 31, 2014(April 1, 2013 to March 31, 2014)
Fiscal year ended March 31, 2015(April 1, 2014 to March 31, 2015)
Net income per share
Net income 44,169 54,276
Amount not attributable to common stockholders — —
Net income attributable to common stocks 44,169 54,276
Average number of common stocks outstanding 412,854 thousand shares 408,545 thousand shares
Diluted net income per share
Adjustment of net income — —
Increase of common stocks: 830 thousand shares 714 thousand shares
Stock acquisition rights 830 thousand shares 714 thousand shares
Outline of dilutive shares which are not included in the calculation of diluted net income per share because they do not have dilutive effect
Stock acquisition rights: 8 types
Stock acquisition rights: 6 types
Number of dilutive shares: 313,250 shares
Number of dilutive shares: 166,500 shares
2. Calculation of net assets per share is based on the following figures.
(Millions of yen)
As of March 31, 2014 As of March 31, 2015
Total net assets 1,390,153 1,829,852
Amount to be deducted from total net assets: 7,947 8,270
Stock acquisition rights 1,851 1,550
Non-controlling interests 6,096 6,720
Net assets attributable to common stocks 1,382,205 1,821,582
Number of common stocks used for calculation of net assets per share 411,284 thousand shares 408,037 thousand shares
17. Related-Party Transactions
18. Per Share Information

117ANNUAL REPORT 2015 ( INTEGRATED REPORT)
Acquisition of treasury stockThe Company passed a resolution setting out details of the Company’s stock buybacks to be conducted in
accordance with Article 156 of the Companies Act applied pursuant to Article 165, paragraph 3, of that Act at
the Company’s Board of Directors meeting on May 20, 2015. The Company has been completed stock buybacks.
1. Details of the Company’s board of directors’ resolution (1) Reason for stock buybacks
While maintaining financial soundness and improving capital efficiency by investing on growing fields,
etc., the Company has a shareholder return policy of paying stable dividends, with the option of stock
buybacks depending on capital conditions. The Company has set a medium-term target of the shareholder
return for the total payout ratio of 50 percent of adjusted consolidated profit (excluding the domestic life
insurance business). In accordance with this policy, the Company would conduct stock buybacks as a
part of the shareholder return for the financial results of the fiscal year ended March 31, 2015.
(2) Details of stock buybacks
(i) Class of shares Common stock of the Company
(ii) Potential total number 5,666,666 shares (upper limit)
(iii) Total price 17,000,000,000 yen (upper limit)
(iv) Period May 21, 2015 — September 18, 2015
2. Details of result of stock buybacks (1) Class of shares Common stock of the Company
(2) Total number 4,094,400 shares
(3) Total price 18,499,839,400 yen
(4) Period May 21, 2015 — June 11, 2015
(5) Method Open-market transactions on the Tokyo Stock Exchange
“2. Details of result of stock buybacks” includes not only “1. Details of the Company’s board of directors’
resolution” but also details of implementation of the resolution passed at the same board of directors
meeting regarding acquisition of treasury stock for delivery upon the exercise of stock acquisition rights.
The total number of shares involved in the resolution, including treasury stock for delivery, is 6,166,666
shares (upper limit), and the total acquisition amount is 18,500,000,000 yen (upper limit).
19. Significant Subsequent Events
Financial Section
IntroductionTo O
ur Stakeholders
Review
of Operations
Managem
ent FoundationC
orporate Data
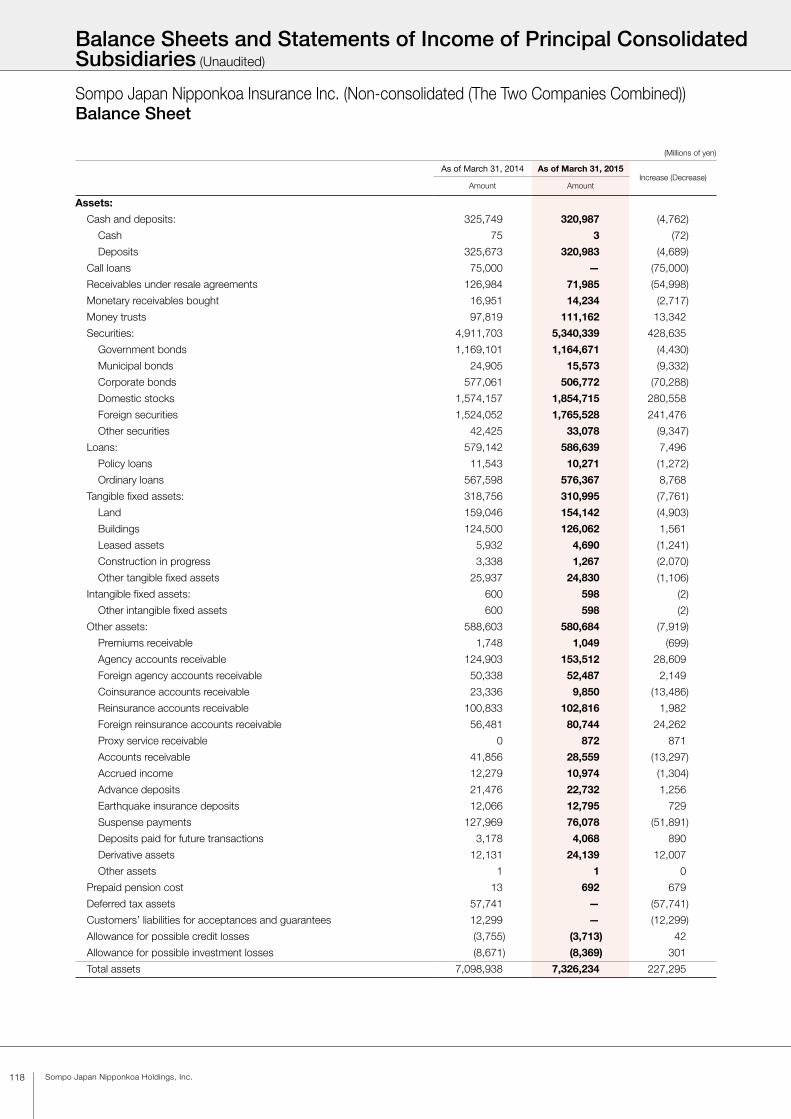
118 Sompo Japan Nipponkoa Holdings, Inc.
Balance Sheets and Statements of Income of Principal Consolidated Subsidiaries (Unaudited)
Sompo Japan Nipponkoa Insurance Inc. (Non-consolidated (The Two Companies Combined))Balance Sheet
(Millions of yen)
As of March 31, 2014 As of March 31, 2015Increase (Decrease)
Amount Amount
Assets:
Cash and deposits: 325,749 320,987 (4,762)
Cash 75 3 (72)
Deposits 325,673 320,983 (4,689)
Call loans 75,000 — (75,000)
Receivables under resale agreements 126,984 71,985 (54,998)
Monetary receivables bought 16,951 14,234 (2,717)
Money trusts 97,819 111,162 13,342
Securities: 4,911,703 5,340,339 428,635
Government bonds 1,169,101 1,164,671 (4,430)
Municipal bonds 24,905 15,573 (9,332)
Corporate bonds 577,061 506,772 (70,288)
Domestic stocks 1,574,157 1,854,715 280,558
Foreign securities 1,524,052 1,765,528 241,476
Other securities 42,425 33,078 (9,347)
Loans: 579,142 586,639 7,496
Policy loans 11,543 10,271 (1,272)
Ordinary loans 567,598 576,367 8,768
Tangible fixed assets: 318,756 310,995 (7,761)
Land 159,046 154,142 (4,903)
Buildings 124,500 126,062 1,561
Leased assets 5,932 4,690 (1,241)
Construction in progress 3,338 1,267 (2,070)
Other tangible fixed assets 25,937 24,830 (1,106)
Intangible fixed assets: 600 598 (2)
Other intangible fixed assets 600 598 (2)
Other assets: 588,603 580,684 (7,919)
Premiums receivable 1,748 1,049 (699)
Agency accounts receivable 124,903 153,512 28,609
Foreign agency accounts receivable 50,338 52,487 2,149
Coinsurance accounts receivable 23,336 9,850 (13,486)
Reinsurance accounts receivable 100,833 102,816 1,982
Foreign reinsurance accounts receivable 56,481 80,744 24,262
Proxy service receivable 0 872 871
Accounts receivable 41,856 28,559 (13,297)
Accrued income 12,279 10,974 (1,304)
Advance deposits 21,476 22,732 1,256
Earthquake insurance deposits 12,066 12,795 729
Suspense payments 127,969 76,078 (51,891)
Deposits paid for future transactions 3,178 4,068 890
Derivative assets 12,131 24,139 12,007
Other assets 1 1 0
Prepaid pension cost 13 692 679
Deferred tax assets 57,741 — (57,741)
Customers’ liabilities for acceptances and guarantees 12,299 — (12,299)
Allowance for possible credit losses (3,755) (3,713) 42
Allowance for possible investment losses (8,671) (8,369) 301
Total assets 7,098,938 7,326,234 227,295

119ANNUAL REPORT 2015 ( INTEGRATED REPORT)
(Millions of yen)
As of March 31, 2014 As of March 31, 2015Increase (Decrease)
Amount Amount
Liabilities:
Underwriting funds: 5,100,357 4,989,335 (111,021)
Reserve for outstanding losses and claims 960,821 928,513 (32,308)
Underwriting reserves 4,139,535 4,060,822 (78,713)
Corporate bonds 261,560 133,560 (128,000)
Other liabilities: 333,746 347,743 13,997
Coinsurance accounts payable 5,662 5,430 (232)
Reinsurance accounts payable 92,164 92,656 491
Foreign reinsurance accounts payable 25,012 31,569 6,557
Borrowings 4,592 4,635 42
Income taxes payable 5,762 6,367 604
Deposits received 4,736 4,483 (253)
Unearned income 1,372 405 (967)
Accounts payable 105,825 103,094 (2,730)
Suspense receipts 68,991 81,690 12,699
Derivative liabilities 11,663 10,749 (914)
Lease obligations 5,978 4,632 (1,345)
Asset retirement obligations 1,981 2,028 46
Other liabilities 0 — (0)
Reserve for retirement benefits 96,907 89,223 (7,683)
Reserve for bonus payments 19,616 19,223 (393)
Reserve for bonus payments to directors 86 109 23
Reserves under the special laws: 41,028 50,134 9,105
Reserve for price fluctuation 41,028 50,134 9,105
Deferred tax liabilities — 104,251 104,251
Acceptances and guarantees 12,299 — (12,299)
Total liabilities 5,865,602 5,733,581 (132,021)
Net assets:
Shareholders’ equity:
Common stock 161,249 70,000 (91,249)
Capital surplus: 45,931 121,180 75,249
Capital reserves 45,931 70,000 24,068
Other capital surplus — 51,180 51,180
Retained earnings: 273,963 291,394 17,430
Legal reserve 94,059 — (94,059)
Other retained earnings: 179,903 291,394 111,490
Reserve for advanced depreciation 4,337 4,361 24
General reserve 83,300 83,300 —
Retained earnings carried forward 92,266 203,732 111,465
Total shareholders’ equity 481,144 482,575 1,430
Valuation and translation adjustments:
Unrealized gains and losses on securities available for sale 744,986 1,101,992 357,006
Deferred gains and losses on hedges 7,205 8,085 880
Total valuation and translation adjustments 752,191 1,110,078 357,887
Total net assets 1,233,336 1,592,653 359,317
Total liabilities and net assets 7,098,938 7,326,234 227,295
Financial Section
IntroductionTo O
ur Stakeholders
Review
of Operations
Managem
ent FoundationC
orporate Data
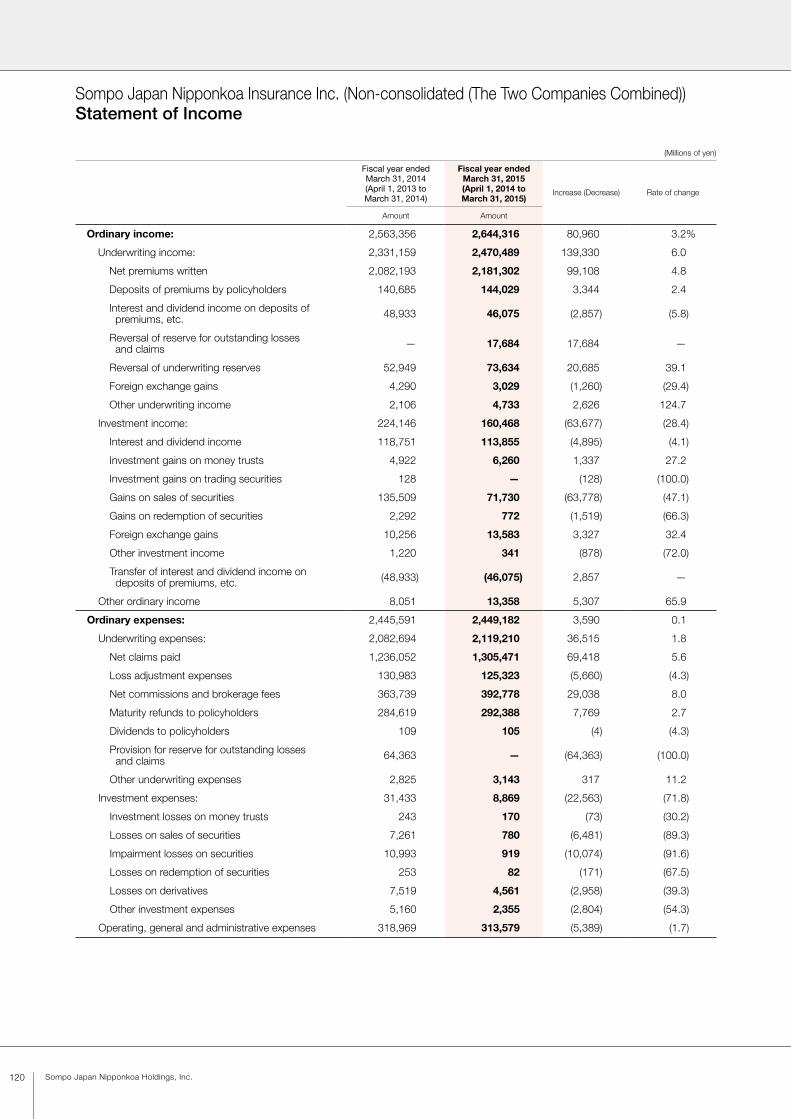
120 Sompo Japan Nipponkoa Holdings, Inc.
Sompo Japan Nipponkoa Insurance Inc. (Non-consolidated (The Two Companies Combined))Statement of Income
(Millions of yen)
Fiscal year endedMarch 31, 2014(April 1, 2013 toMarch 31, 2014)
Fiscal year endedMarch 31, 2015(April 1, 2014 toMarch 31, 2015)
Increase (Decrease) Rate of change
Amount Amount
Ordinary income: 2,563,356 2,644,316 80,960 3.2%
Underwriting income: 2,331,159 2,470,489 139,330 6.0
Net premiums written 2,082,193 2,181,302 99,108 4.8
Deposits of premiums by policyholders 140,685 144,029 3,344 2.4
Interest and dividend income on deposits of premiums, etc. 48,933 46,075 (2,857) (5.8)
Reversal of reserve for outstanding losses and claims — 17,684 17,684 —
Reversal of underwriting reserves 52,949 73,634 20,685 39.1
Foreign exchange gains 4,290 3,029 (1,260) (29.4)
Other underwriting income 2,106 4,733 2,626 124.7
Investment income: 224,146 160,468 (63,677) (28.4)
Interest and dividend income 118,751 113,855 (4,895) (4.1)
Investment gains on money trusts 4,922 6,260 1,337 27.2
Investment gains on trading securities 128 — (128) (100.0)
Gains on sales of securities 135,509 71,730 (63,778) (47.1)
Gains on redemption of securities 2,292 772 (1,519) (66.3)
Foreign exchange gains 10,256 13,583 3,327 32.4
Other investment income 1,220 341 (878) (72.0)
Transfer of interest and dividend income on deposits of premiums, etc. (48,933) (46,075) 2,857 —
Other ordinary income 8,051 13,358 5,307 65.9
Ordinary expenses: 2,445,591 2,449,182 3,590 0.1
Underwriting expenses: 2,082,694 2,119,210 36,515 1.8
Net claims paid 1,236,052 1,305,471 69,418 5.6
Loss adjustment expenses 130,983 125,323 (5,660) (4.3)
Net commissions and brokerage fees 363,739 392,778 29,038 8.0
Maturity refunds to policyholders 284,619 292,388 7,769 2.7
Dividends to policyholders 109 105 (4) (4.3)
Provision for reserve for outstanding losses and claims 64,363 — (64,363) (100.0)
Other underwriting expenses 2,825 3,143 317 11.2
Investment expenses: 31,433 8,869 (22,563) (71.8)
Investment losses on money trusts 243 170 (73) (30.2)
Losses on sales of securities 7,261 780 (6,481) (89.3)
Impairment losses on securities 10,993 919 (10,074) (91.6)
Losses on redemption of securities 253 82 (171) (67.5)
Losses on derivatives 7,519 4,561 (2,958) (39.3)
Other investment expenses 5,160 2,355 (2,804) (54.3)
Operating, general and administrative expenses 318,969 313,579 (5,389) (1.7)
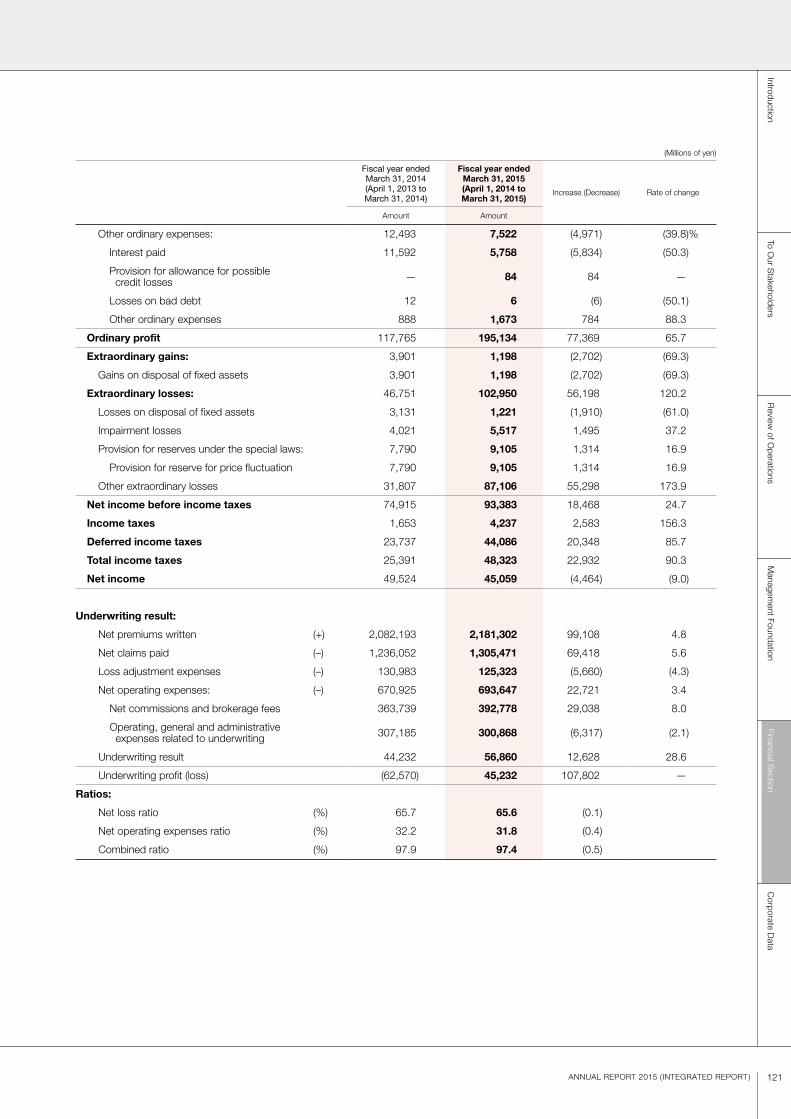
121ANNUAL REPORT 2015 ( INTEGRATED REPORT)
(Millions of yen)
Fiscal year endedMarch 31, 2014(April 1, 2013 toMarch 31, 2014)
Fiscal year endedMarch 31, 2015(April 1, 2014 toMarch 31, 2015)
Increase (Decrease) Rate of change
Amount Amount
Other ordinary expenses: 12,493 7,522 (4,971) (39.8)%
Interest paid 11,592 5,758 (5,834) (50.3)
Provision for allowance for possible credit losses — 84 84 —
Losses on bad debt 12 6 (6) (50.1)
Other ordinary expenses 888 1,673 784 88.3
Ordinary profit 117,765 195,134 77,369 65.7
Extraordinary gains: 3,901 1,198 (2,702) (69.3)
Gains on disposal of fixed assets 3,901 1,198 (2,702) (69.3)
Extraordinary losses: 46,751 102,950 56,198 120.2
Losses on disposal of fixed assets 3,131 1,221 (1,910) (61.0)
Impairment losses 4,021 5,517 1,495 37.2
Provision for reserves under the special laws: 7,790 9,105 1,314 16.9
Provision for reserve for price fluctuation 7,790 9,105 1,314 16.9
Other extraordinary losses 31,807 87,106 55,298 173.9
Net income before income taxes 74,915 93,383 18,468 24.7
Income taxes 1,653 4,237 2,583 156.3
Deferred income taxes 23,737 44,086 20,348 85.7
Total income taxes 25,391 48,323 22,932 90.3
Net income 49,524 45,059 (4,464) (9.0)
Underwriting result:
Net premiums written (+) 2,082,193 2,181,302 99,108 4.8
Net claims paid (–) 1,236,052 1,305,471 69,418 5.6
Loss adjustment expenses (–) 130,983 125,323 (5,660) (4.3)
Net operating expenses: (–) 670,925 693,647 22,721 3.4
Net commissions and brokerage fees 363,739 392,778 29,038 8.0
Operating, general and administrative expenses related to underwriting 307,185 300,868 (6,317) (2.1)
Underwriting result 44,232 56,860 12,628 28.6
Underwriting profit (loss) (62,570) 45,232 107,802 —
Ratios:
Net loss ratio (%) 65.7 65.6 (0.1)
Net operating expenses ratio (%) 32.2 31.8 (0.4)
Combined ratio (%) 97.9 97.4 (0.5)
Financial Section
IntroductionTo O
ur Stakeholders
Review
of Operations
Managem
ent FoundationC
orporate Data

122 Sompo Japan Nipponkoa Holdings, Inc.
Sonpo 24 Insurance Company Limited (Non-consolidated)Balance Sheet
(Millions of yen)
As of March 31, 2014 As of March 31, 2015Increase (Decrease)
Amount Amount
Assets:
Cash and deposits: 3,076 4,950 1,873
Deposits 3,076 4,950 1,873
Securities: 17,320 15,727 (1,592)
Government bonds 17,220 15,627 (1,592)
Other securities 100 100 —
Tangible fixed assets: 229 318 88
Buildings 22 18 (3)
Other tangible fixed assets 207 300 92
Other assets: 1,075 1,126 50
Accounts receivable 878 881 2
Accrued income 7 6 (1)
Advance deposits 171 171 (0)
Suspense payments 17 67 49
Total assets 21,703 22,123 420
Liabilities:
Underwriting funds: 13,232 14,494 1,262
Reserve for outstanding losses and claims 4,912 5,993 1,080
Underwriting reserves 8,319 8,501 181
Other liabilities: 2,168 2,257 88
Reinsurance accounts payable 6 2 (4)
Income taxes payable 42 41 (0)
Deposits received 8 8 (0)
Accounts payable 1,219 1,323 103
Suspense receipts 891 880 (10)
Reserve for retirement benefits 186 217 30
Reserve for bonus payments 93 96 3
Reserves under the special laws: 33 36 3
Reserve for price fluctuation 33 36 3
Deferred tax liabilities 8 5 (3)
Total liabilities 15,723 17,108 1,384
Net assets:
Shareholders’ equity:
Common stock 19,000 19,000 —
Capital surplus: 19,000 19,000 —
Capital reserves 19,000 19,000 —
Retained earnings: (32,040) (32,998) (958)
Other retained earnings: (32,040) (32,998) (958)
Retained earnings carried forward (32,040) (32,998) (958)
Total shareholders’ equity 5,959 5,001 (958)
Valuation and translation adjustments:
Unrealized gains and losses on securities available for sale 19 13 (5)
Total valuation and translation adjustments 19 13 (5)
Total net assets 5,979 5,015 (963)
Total liabilities and net assets 21,703 22,123 420

123ANNUAL REPORT 2015 ( INTEGRATED REPORT)
Sonpo 24 Insurance Company Limited (Non-consolidated)Statement of Income
(Millions of yen)
Fiscal year endedMarch 31, 2014(April 1, 2013 toMarch 31, 2014)
Fiscal year endedMarch 31, 2015(April 1, 2014 toMarch 31, 2015)
Increase (Decrease) Rate of change
Amount Amount
Ordinary income: 13,830 14,193 363 2.6%
Underwriting income: 13,808 14,174 365 2.6
Net premiums written 13,799 14,163 363 2.6
Interest and dividend income on deposits of premiums, etc. 8 10 1 16.9
Other underwriting income — 0 0 —
Investment income: 21 19 (1) (9.0)
Interest and dividend income 30 29 (0) (1.2)
Transfer of interest and dividend income on deposits of premiums, etc. (8) (10) (1) —
Other ordinary income 0 0 0 15.9
Ordinary expenses: 14,221 15,139 917 6.5
Underwriting expenses: 11,120 11,316 195 1.8
Net claims paid 7,922 8,090 167 2.1
Loss adjustment expenses 943 1,048 105 11.2
Net commissions and brokerage fees 913 914 0 0.1
Provision for reserve for outstanding losses and claims 886 1,080 194 21.9
Provision for underwriting reserves 453 181 (272) (60.0)
Other underwriting expenses 0 0 0 6.9
Operating, general and administrative expenses 3,101 3,823 721 23.3
Other ordinary expenses: 0 0 (0) (6.3)
Other ordinary expenses 0 0 (0) (6.3)
Ordinary loss (391) (945) (553) —
Extraordinary losses: 5 8 3 72.0
Losses on disposal of fixed assets 1 5 3 248.1
Provision for reserves under the special laws: 3 3 (0) (9.2)
Provision for reserve for price fluctuation 3 3 (0) (9.2)
Net loss before income taxes (396) (954) (557) —
Income taxes 3 3 — —
Total income taxes 3 3 — —
Net loss (400) (958) (557) —
Underwriting result:
Net premiums written (+) 13,799 14,163 363 2.6
Net claims paid (–) 7,922 8,090 167 2.1
Loss adjustment expenses (–) 943 1,048 105 11.2
Net operating expenses: (–) 4,012 4,734 721 18.0
Net commissions and brokerage fees 913 914 0 0.1
Operating, general and administrative expenses related to underwriting 3,099 3,820 721 23.3
Underwriting result 920 289 (631) (68.6)
Underwriting profit (loss) (412) (961) (549) —
Ratios:
Net loss ratio (%) 64.3 64.5 0.3
Net operating expenses ratio (%) 29.1 33.4 4.4
Combined ratio (%) 93.3 98.0 4.6
Financial Section
IntroductionTo O
ur Stakeholders
Review
of Operations
Managem
ent FoundationC
orporate Data

124 Sompo Japan Nipponkoa Holdings, Inc.
SAISON AUTOMOBILE AND FIRE INSURANCE COMPANY, LIMITED (Non-consolidated)Balance Sheet
(Millions of yen)
As of March 31, 2014 As of March 31, 2015Increase (Decrease)
Amount Amount
Assets:
Cash and deposits: 2,887 2,380 (506)
Cash 0 0 0
Deposits 2,887 2,380 (506)
Securities: 31,932 35,725 3,793
Government bonds 14,098 13,878 (220)
Municipal bonds 2,287 2,675 388
Corporate bonds 5,970 4,722 (1,247)
Domestic stocks 56 30 (26)
Foreign securities 238 20 (217)
Other securities 9,281 14,398 5,117
Loans: 7 2 (5)
Policy loans 7 2 (5)
Tangible fixed assets: 254 193 (61)
Buildings 51 50 (0)
Leased assets 200 136 (64)
Other tangible fixed assets 2 6 3
Intangible fixed assets: 3,449 3,199 (250)
Software 3,421 3,184 (237)
Leased assets 21 9 (11)
Other intangible fixed assets 5 4 (0)
Other assets: 3,202 3,207 5
Premiums receivable 1,220 1,114 (105)
Agency accounts receivable 54 54 (0)
Coinsurance accounts receivable 12 12 0
Reinsurance accounts receivable 86 247 161
Foreign reinsurance accounts receivable 113 64 (49)
Accounts receivable 363 487 124
Accrued income 54 47 (7)
Advance deposits 314 303 (10)
Suspense payments 982 875 (106)
Allowance for possible credit losses (0) (2) (1)
Total assets 41,733 44,706 2,973
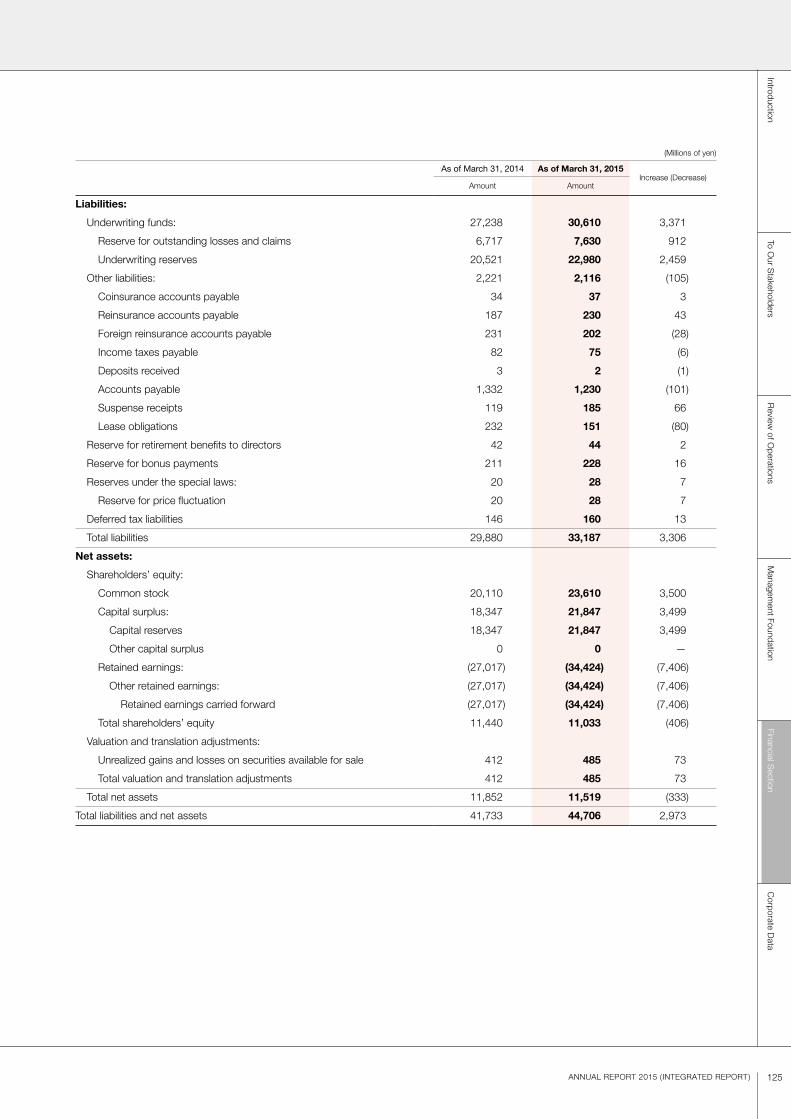
125ANNUAL REPORT 2015 ( INTEGRATED REPORT)
(Millions of yen)
As of March 31, 2014 As of March 31, 2015Increase (Decrease)
Amount Amount
Liabilities:
Underwriting funds: 27,238 30,610 3,371
Reserve for outstanding losses and claims 6,717 7,630 912
Underwriting reserves 20,521 22,980 2,459
Other liabilities: 2,221 2,116 (105)
Coinsurance accounts payable 34 37 3
Reinsurance accounts payable 187 230 43
Foreign reinsurance accounts payable 231 202 (28)
Income taxes payable 82 75 (6)
Deposits received 3 2 (1)
Accounts payable 1,332 1,230 (101)
Suspense receipts 119 185 66
Lease obligations 232 151 (80)
Reserve for retirement benefits to directors 42 44 2
Reserve for bonus payments 211 228 16
Reserves under the special laws: 20 28 7
Reserve for price fluctuation 20 28 7
Deferred tax liabilities 146 160 13
Total liabilities 29,880 33,187 3,306
Net assets:
Shareholders’ equity:
Common stock 20,110 23,610 3,500
Capital surplus: 18,347 21,847 3,499
Capital reserves 18,347 21,847 3,499
Other capital surplus 0 0 —
Retained earnings: (27,017) (34,424) (7,406)
Other retained earnings: (27,017) (34,424) (7,406)
Retained earnings carried forward (27,017) (34,424) (7,406)
Total shareholders’ equity 11,440 11,033 (406)
Valuation and translation adjustments:
Unrealized gains and losses on securities available for sale 412 485 73
Total valuation and translation adjustments 412 485 73
Total net assets 11,852 11,519 (333)
Total liabilities and net assets 41,733 44,706 2,973
Financial Section
IntroductionTo O
ur Stakeholders
Review
of Operations
Managem
ent FoundationC
orporate Data

126 Sompo Japan Nipponkoa Holdings, Inc.
SAISON AUTOMOBILE AND FIRE INSURANCE COMPANY, LIMITED (Non-consolidated)Statement of Income
(Millions of yen)
Fiscal year endedMarch 31, 2014(April 1, 2013 toMarch 31, 2014)
Fiscal year endedMarch 31, 2015(April 1, 2014 toMarch 31, 2015)
Increase (Decrease) Rate of change
Amount Amount
Ordinary income: 19,819 22,783 2,964 15.0%
Underwriting income: 19,250 22,595 3,344 17.4
Net premiums written 18,951 22,359 3,408 18.0
Deposits of premiums by policyholders 257 183 (74) (28.7)
Interest and dividend income on deposits of premiums, etc. 41 40 (0) (1.6)
Foreign exchange gains 0 0 0 77.5
Other underwriting income — 11 11 —
Investment income: 508 153 (355) (69.8)
Interest and dividend income 158 125 (33) (20.9)
Investment gains on money trusts 30 — (30) (100.0)
Investment gains on trading securities 0 — (0) (100.0)
Gains on sales of securities 323 35 (287) (89.1)
Gains on redemption of securities 24 13 (11) (45.4)
Other investment income 12 19 6 54.4
Transfer of interest and dividend income on deposits of premiums, etc. (41) (40) 0 —
Other ordinary income 59 34 (25) (41.8)
Ordinary expenses: 28,259 30,171 1,912 6.8
Underwriting expenses: 17,408 19,151 1,743 10.0
Net claims paid 10,997 12,350 1,352 12.3
Loss adjustment expenses 1,470 1,849 379 25.8
Net commissions and brokerage fees 1,355 849 (505) (37.3)
Maturity refunds to policyholders 885 725 (159) (18.0)
Provision for reserve for outstanding losses and claims 1,483 912 (571) (38.5)
Provision for underwriting reserves 1,211 2,459 1,247 102.9
Other underwriting expenses 4 4 (0) (2.8)
Investment expenses: 6 4 (2) (35.4)
Losses on sales of securities 1 — (1) (100.0)
Other investment expenses 5 4 (0) (15.5)
Operating, general and administrative expenses 10,776 10,978 201 1.9
Other ordinary expenses: 67 37 (30) (44.6)
Interest paid 8 6 (1) (23.1)
Provision for allowance for possible credit losses — 1 1 —
Other ordinary expenses 59 29 (30) (50.9)
Ordinary loss (8,439) (7,388) 1,051 —
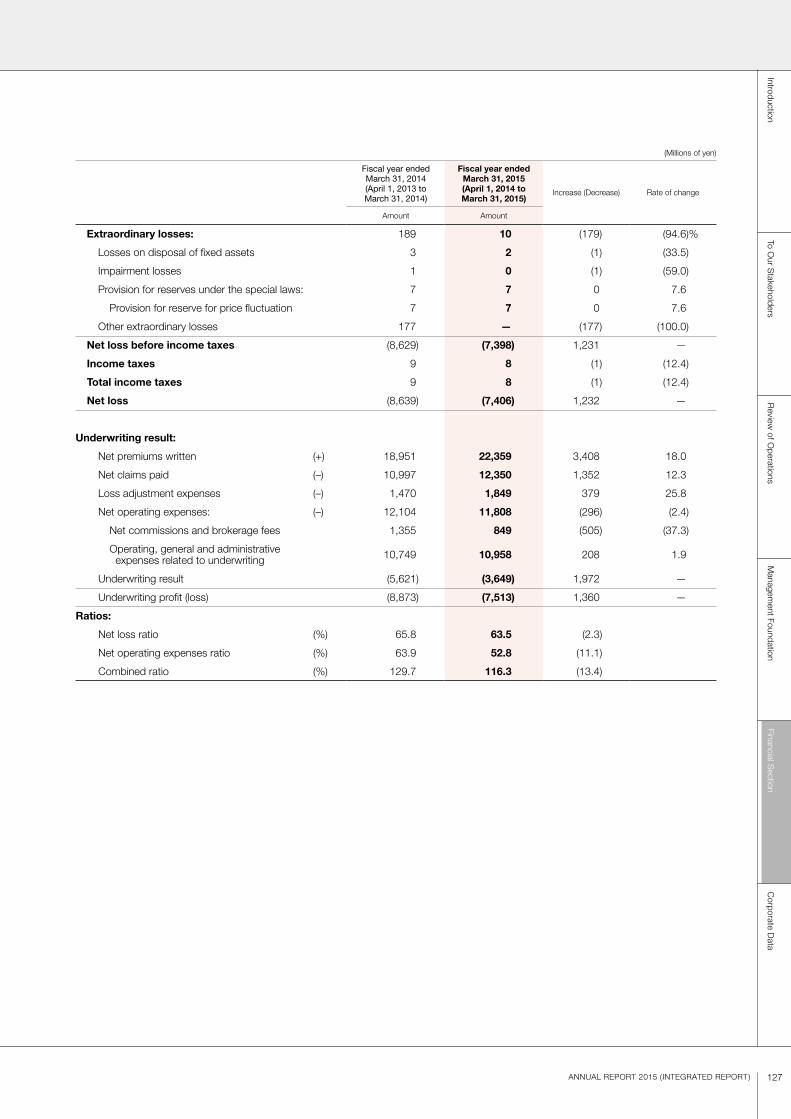
127ANNUAL REPORT 2015 ( INTEGRATED REPORT)
(Millions of yen)
Fiscal year endedMarch 31, 2014(April 1, 2013 toMarch 31, 2014)
Fiscal year endedMarch 31, 2015(April 1, 2014 toMarch 31, 2015)
Increase (Decrease) Rate of change
Amount Amount
Extraordinary losses: 189 10 (179) (94.6)%
Losses on disposal of fixed assets 3 2 (1) (33.5)
Impairment losses 1 0 (1) (59.0)
Provision for reserves under the special laws: 7 7 0 7.6
Provision for reserve for price fluctuation 7 7 0 7.6
Other extraordinary losses 177 — (177) (100.0)
Net loss before income taxes (8,629) (7,398) 1,231 —
Income taxes 9 8 (1) (12.4)
Total income taxes 9 8 (1) (12.4)
Net loss (8,639) (7,406) 1,232 —
Underwriting result:
Net premiums written (+) 18,951 22,359 3,408 18.0
Net claims paid (–) 10,997 12,350 1,352 12.3
Loss adjustment expenses (–) 1,470 1,849 379 25.8
Net operating expenses: (–) 12,104 11,808 (296) (2.4)
Net commissions and brokerage fees 1,355 849 (505) (37.3)
Operating, general and administrative expenses related to underwriting 10,749 10,958 208 1.9
Underwriting result (5,621) (3,649) 1,972 —
Underwriting profit (loss) (8,873) (7,513) 1,360 —
Ratios:
Net loss ratio (%) 65.8 63.5 (2.3)
Net operating expenses ratio (%) 63.9 52.8 (11.1)
Combined ratio (%) 129.7 116.3 (13.4)
Financial Section
IntroductionTo O
ur Stakeholders
Review
of Operations
Managem
ent FoundationC
orporate Data

128 Sompo Japan Nipponkoa Holdings, Inc.
Sompo Japan Nipponkoa Himawari Life Insurance, Inc. (Non-consolidated)Balance Sheet
(Millions of yen)
As of March 31, 2014 As of March 31, 2015Increase (Decrease)
Amount Amount
Assets:
Cash and deposits: 38,819 34,021 (4,797)
Cash 2 3 1
Deposits 38,816 34,017 (4,799)
Securities: 1,988,668 2,157,819 169,151
Government bonds 1,477,004 1,593,387 116,383
Municipal bonds 65,587 59,762 (5,824)
Corporate bonds 334,832 317,734 (17,098)
Domestic stocks 8,588 7,886 (701)
Foreign securities 102,655 179,048 76,393
Loans: 35,672 36,414 741
Policy loans 35,672 36,414 741
Tangible fixed assets: 1,228 1,065 (163)
Buildings 626 540 (86)
Leased assets 426 391 (35)
Other tangible fixed assets 175 133 (41)
Intangible fixed assets: 1,075 95 (979)
Software 1,075 95 (979)
Agency accounts receivable 125 115 (9)
Reinsurance accounts receivable 930 1,423 493
Other assets: 40,062 42,201 2,139
Accounts receivable 29,224 29,006 (218)
Prepaid expenses 1,267 1,481 214
Accrued income 5,414 6,127 712
Advance deposits 2,807 2,821 13
Derivative assets 86 995 909
Suspense payments 1,230 1,716 485
Other assets 30 53 22
Deferred tax assets 13,747 5,032 (8,715)
Allowance for possible credit losses (43) (41) 2
Total assets 2,120,286 2,278,147 157,861

129ANNUAL REPORT 2015 ( INTEGRATED REPORT)
(Millions of yen)
As of March 31, 2014 As of March 31, 2015Increase (Decrease)
Amount Amount
Liabilities:
Policy reserves: 1,995,280 2,119,354 124,074
Reserve for outstanding claims 31,850 34,091 2,241
Policy reserves 1,959,172 2,080,338 121,166
Reserve for dividends to policyholders 4,257 4,923 665
Agency accounts payable 3,253 4,340 1,087
Reinsurance accounts payable 1,026 1,047 20
Other liabilities: 13,353 18,957 5,604
Income taxes payable 3,068 3,890 822
Accounts payable 3,103 5,563 2,460
Accrued expenses 5,479 7,098 1,618
Deposits received 125 132 7
Derivative liabilities 262 1,072 810
Lease obligations 499 464 (35)
Suspense receipts 814 735 (79)
Reserve for bonus payments to directors 49 49 0
Reserve for retirement benefits 2,590 2,417 (172)
Reserves under the special laws: 2,688 3,353 665
Reserve for price fluctuation 2,688 3,353 665
Total liabilities 2,018,241 2,149,521 131,280
Net assets:
Shareholders’ equity:
Common stock 17,250 17,250 —
Capital surplus: 30,000 24,500 (5,500)
Capital reserves 10,000 11,100 1,100
Other capital surplus 20,000 13,400 (6,600)
Retained earnings: 28,448 38,571 10,122
Other retained earnings: 28,448 38,571 10,122
Reserve under Article 10 of the Supplementary Provisions of Ordinance for Enforcement of the Insurance Business Act 325 325 —
Retained earnings carried forward 28,123 38,246 10,122
Total shareholders’ equity 75,698 80,321 4,622
Valuation and translation adjustments:
Unrealized gains and losses on securities available for sale 26,345 48,304 21,958
Total valuation and translation adjustments 26,345 48,304 21,958
Total net assets 102,044 128,626 26,581
Total liabilities and net assets 2,120,286 2,278,147 157,861
Financial Section
IntroductionTo O
ur Stakeholders
Review
of Operations
Managem
ent FoundationC
orporate Data
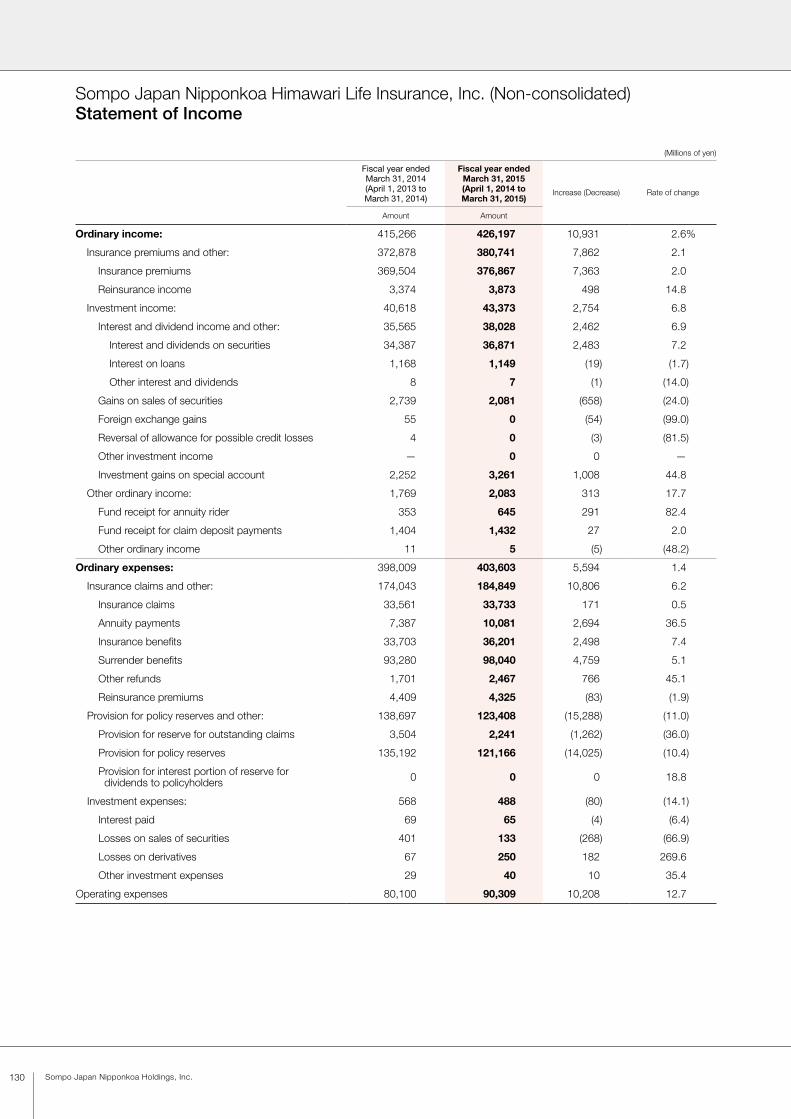
130 Sompo Japan Nipponkoa Holdings, Inc.
Sompo Japan Nipponkoa Himawari Life Insurance, Inc. (Non-consolidated)Statement of Income
(Millions of yen)
Fiscal year endedMarch 31, 2014(April 1, 2013 toMarch 31, 2014)
Fiscal year endedMarch 31, 2015(April 1, 2014 toMarch 31, 2015)
Increase (Decrease) Rate of change
Amount Amount
Ordinary income: 415,266 426,197 10,931 2.6%
Insurance premiums and other: 372,878 380,741 7,862 2.1
Insurance premiums 369,504 376,867 7,363 2.0
Reinsurance income 3,374 3,873 498 14.8
Investment income: 40,618 43,373 2,754 6.8
Interest and dividend income and other: 35,565 38,028 2,462 6.9
Interest and dividends on securities 34,387 36,871 2,483 7.2
Interest on loans 1,168 1,149 (19) (1.7)
Other interest and dividends 8 7 (1) (14.0)
Gains on sales of securities 2,739 2,081 (658) (24.0)
Foreign exchange gains 55 0 (54) (99.0)
Reversal of allowance for possible credit losses 4 0 (3) (81.5)
Other investment income — 0 0 —
Investment gains on special account 2,252 3,261 1,008 44.8
Other ordinary income: 1,769 2,083 313 17.7
Fund receipt for annuity rider 353 645 291 82.4
Fund receipt for claim deposit payments 1,404 1,432 27 2.0
Other ordinary income 11 5 (5) (48.2)
Ordinary expenses: 398,009 403,603 5,594 1.4
Insurance claims and other: 174,043 184,849 10,806 6.2
Insurance claims 33,561 33,733 171 0.5
Annuity payments 7,387 10,081 2,694 36.5
Insurance benefits 33,703 36,201 2,498 7.4
Surrender benefits 93,280 98,040 4,759 5.1
Other refunds 1,701 2,467 766 45.1
Reinsurance premiums 4,409 4,325 (83) (1.9)
Provision for policy reserves and other: 138,697 123,408 (15,288) (11.0)
Provision for reserve for outstanding claims 3,504 2,241 (1,262) (36.0)
Provision for policy reserves 135,192 121,166 (14,025) (10.4)
Provision for interest portion of reserve for dividends to policyholders 0 0 0 18.8
Investment expenses: 568 488 (80) (14.1)
Interest paid 69 65 (4) (6.4)
Losses on sales of securities 401 133 (268) (66.9)
Losses on derivatives 67 250 182 269.6
Other investment expenses 29 40 10 35.4
Operating expenses 80,100 90,309 10,208 12.7

131ANNUAL REPORT 2015 ( INTEGRATED REPORT)
(Millions of yen)
Fiscal year endedMarch 31, 2014(April 1, 2013 toMarch 31, 2014)
Fiscal year endedMarch 31, 2015(April 1, 2014 toMarch 31, 2015)
Increase (Decrease) Rate of change
Amount Amount
Other ordinary expenses: 4,599 4,547 (52) (1.1)%
Claim deposit payments 1,047 1,030 (17) (1.6)
Taxes 1,616 1,732 115 7.1
Depreciation 1,466 1,363 (102) (7.0)
Provision for reserve for retirement benefits 444 397 (46) (10.4)
Other ordinary expenses 24 22 (1) (7.5)
Ordinary profit 17,257 22,594 5,336 30.9
Extraordinary losses: 545 1,819 1,273 233.4
Losses on disposal of fixed assets and other 76 2 (74) (96.9)
Provision for reserves under the special laws: 469 665 196 41.9
Provision for reserve for price fluctuation 469 665 196 41.9
Other extraordinary losses — 1,151 1,151 —
Provision for reserve for dividends to policyholders 3,465 4,276 811 23.4
Net income before income taxes 13,246 16,498 3,251 24.5
Income taxes 5,051 6,228 1,177 23.3
Deferred income taxes 126 541 415 328.4
Total income taxes 5,177 6,770 1,592 30.8
Net income 8,068 9,727 1,659 20.6
Financial Section
IntroductionTo O
ur Stakeholders
Review
of Operations
Managem
ent FoundationC
orporate Data
132 Sompo Japan Nipponkoa Holdings, Inc.
Consolidated Solvency Margin Ratio
• Sompo Japan Nipponkoa Holdings, Inc. (the “Company”) calculates the consolidated solvency margin ratio
based on the provisions of Articles 210-11-3 and 210-11-4 of the Ordinance for Enforcement of the Insurance
Business Act and Public Notice No. 23 of the Financial Service Agency (2011).
• The Company which is the insurance holding company situated the top of the Sompo Japan Nipponkoa
Group (the “Group”). The Group is an insurance company group and operates property and casualty insurance
business and life insurance business at the Company's subsidiaries, etc.
• In addition to reserves to cover payments for claims, benefits and maturity refunds, etc., it is necessary for
insurance companies to maintain sufficient solvency in order to cover against risks which exceed their normal
estimates, i.e. occurrence of major catastrophes, fluctuation in mortality rate due to significant changes in key
environmental factors and big decline in value of assets held by insurance companies.
• (C) Consolidated Solvency Margin Ratio, which is calculated in accordance with the Insurance Business Act,
etc. is the ratio of "solvency margin of insurance company group by means of its capital, reserves, etc."
((A) Total Consolidated Solvency Margin) to "risks which will exceed its normal estimates" ((B) Total
Consolidated Risks).
• Although treatment regarding scope of calculation of consolidated solvency margin ratio is same as the
treatment of consolidated financial statements, subsidiaries under the Insurance Business Law with over 50
percent of voting right acquired by the Company are generally included in the calculation.
• Solvency margin ratio is one of the indicators for the regulatory authorities to monitor financial soundness of
insurance companies. Solvency margin ratio exceeding 200% would indicate adequate capability to meet
payments of possible insurance claims and others.
• The consolidated solvency margin ratio of the Company for the current fiscal year increased 20.3 points from
previous fiscal year to 803.4 percent due to the influence of the merger of Sompo Japan Insurance Inc. and
NIPPONKOA Insurance Company, Limited, and an increase in net unrealized gains on available-for-sale
securities and others.
Solvency Margin Ratio of Sompo Japan Nipponkoa Holdings, Inc. on a Consolidated Basis (Unaudited)

133ANNUAL REPORT 2015 ( INTEGRATED REPORT)
Sompo Japan Nipponkoa Holdings, Inc. (Consolidated)Consolidated Solvency Margin Ratio
(Millions of yen)
As of March 31, 2014 As of March 31, 2015
(A) Total Consolidated Solvency Margin 2,599,684 2,969,657
Capital and funds, etc. 661,050 657,402
Reserve for price fluctuation 43,790 53,553
Contingency reserve 26,596 27,338
Catastrophic loss reserve 579,759 569,247
General allowance for possible credit losses 1,422 2,067
Unrealized gains and losses on securities (before tax effect deductions) 842,009 1,304,372
Unrealized gains and losses on land 17,276 13,998
Total of unrecognized actual difference and unrecognized prior service costs (before tax effect deductions) 4,545 (4,512)
Surplus such as premium fund 129,606 132,485
Subordinated debt, etc. 261,560 133,560
Excess amount of surplus such as premium fund and subordinated debt, etc. which are excluded from total solvency margin — —
Total solvency margin related to small amount and short term insurance companies — —
Deductions 72,442 64,721
Others 104,510 144,864
(B) Total Consolidated Risks √(√R1
2+R22+R3+R4)2+(R5+R6+R7)2+R8+R9
663,862 739,252
Underwriting risk for property and casualty insurance business (R1) 187,832 205,647
Underwriting risk for life insurance business (R2) 13,758 13,806
Underwriting risk for third-sector insurance products including accident, sickness and nursing-care insurance (R3) 6,382 6,978
Underwriting risk related to small amount and short term insurance companies (R4) — —
Guaranteed interest rate risk (R5) 32,990 31,543
Guaranteed minimum benefit risk for life insurance policies (R6) 357 358
Investment risk (R7) 389,654 469,319
Business management risk (R8) 16,587 18,419
Major catastrophe risk for property and casualty insurance policies (R9) 181,607 176,196
(C) Consolidated Solvency Margin Ratio [(A) / {(B) × 1/2}] × 100 783.1% 803.4%
Note) The above amounts and figures are calculated based on provisions of Articles 210-11-3 and 210-11-4 of the Ordinance for Enforcement of the Insurance Business Act and Public Notice No. 23 of the Financial Service Agency (2011).
Financial Section
IntroductionTo O
ur Stakeholders
Review
of Operations
Managem
ent FoundationC
orporate Data

134 Sompo Japan Nipponkoa Holdings, Inc.
Non-consolidated Solvency Margin Ratio
• Domestic insurance companies calculates the non-consolidated solvency margin ratio based on the provisions
of Articles 86 and 87 of the Ordinance for Enforcement of the Insurance Business Act and Public Notice No.
50 of the Ministry of Finance (1996).
• In addition to reserves to cover payments for claims, benefits and maturity refunds, etc., it is necessary for
insurance companies to maintain sufficient solvency in order to cover against risks which exceed their normal
estimates, i.e. occurrence of major catastrophes, fluctuation in mortality rate due to significant changes in key
environmental factors and big decline in value of assets held by insurance companies.
• (C) Non-consolidated Solvency Margin Ratio, which is calculated in accordance with the Insurance Business
Act, etc. is the ratio of "solvency margin of insurance companies by means of their capital, reserves, etc."
((A) Total Non-consolidated Solvency Margin) to "risks which will exceed their normal estimates"
((B) Total Non-consolidated Risks).
• Solvency margin ratio is one of the indicators for the regulatory authorities to monitor the financial soundness
of insurance companies. Solvency margin ratio exceeding 200% would indicate adequate capability to meet
payments of possible insurance claims and others.
• The non-consolidated solvency margin ratio of Sompo Japan Nipponkoa Insurance Inc. for the current fiscal
year increased 3.0 points from previous fiscal year to 716.3 percent due to the influence of the merger with
NIPPONKOA Insurance Company, Limited, and an increase in net unrealized gains on available-for-sale
securities and others.
Sompo Japan Nipponkoa Insurance Inc. (Non-consolidated)
(Millions of yen)
As of March 31, 2014As of March 31, 2015Sompo Japan
Insurance Inc.NIPPONKOA Insurance
Company, Limited
(A) Total Non-consolidated Solvency Margin 1,636,131 724,387 2,683,345Capital and funds, etc. 275,199 205,944 482,575Reserve for price fluctuation 24,611 16,417 50,134Contingency reserve 611 9 611Catastrophic loss reserve 405,552 170,890 565,587General allowance for possible credit losses 148 39 203Unrealized gains and losses on securities (before tax effect deductions) 647,211 300,559 1,367,903
Unrealized gains and losses on land 21,421 17,709 35,852Excess amount of reserve for maturity refunds — — —Subordinated debt, etc. 261,560 — 133,560Excess amount of reserve for maturity refunds and subordinated debt, etc. which are excluded from total solvency margin
— — —
Deductions 67,066 11,769 81,916Others 66,880 24,587 128,834
(B) Total Non-consolidated Risks √(R1+R2)2+(R3+R4)2+R5+R6
458,707 221,843 749,202
Underwriting risk (R1) 113,713 57,602 176,741Underwriting risk for third-sector insurance products including accident, sickness and nursing-care insurance (R2)
— 0 —
Guaranteed interest rate risk (R3) 15,979 8,773 23,256Investment risk (R4) 298,150 133,222 512,131Business management risk (R5) 10,832 5,258 17,598Major catastrophe risk (R6) 113,795 63,349 167,796
(C) Non-consolidated Solvency Margin Ratio [(A) / {(B) × 1/2}] × 100 713.3% 653.0% 716.3%
Note) The above amounts and figures are calculated based on provisions of Articles 86 and 87 of the Ordinance for Enforcement of the Insurance Business Act and Public Notice No. 50 of the Ministry of Finance (1996).
Solvency Margin Ratios of Principal Consolidated Subsidiaries (Unaudited)
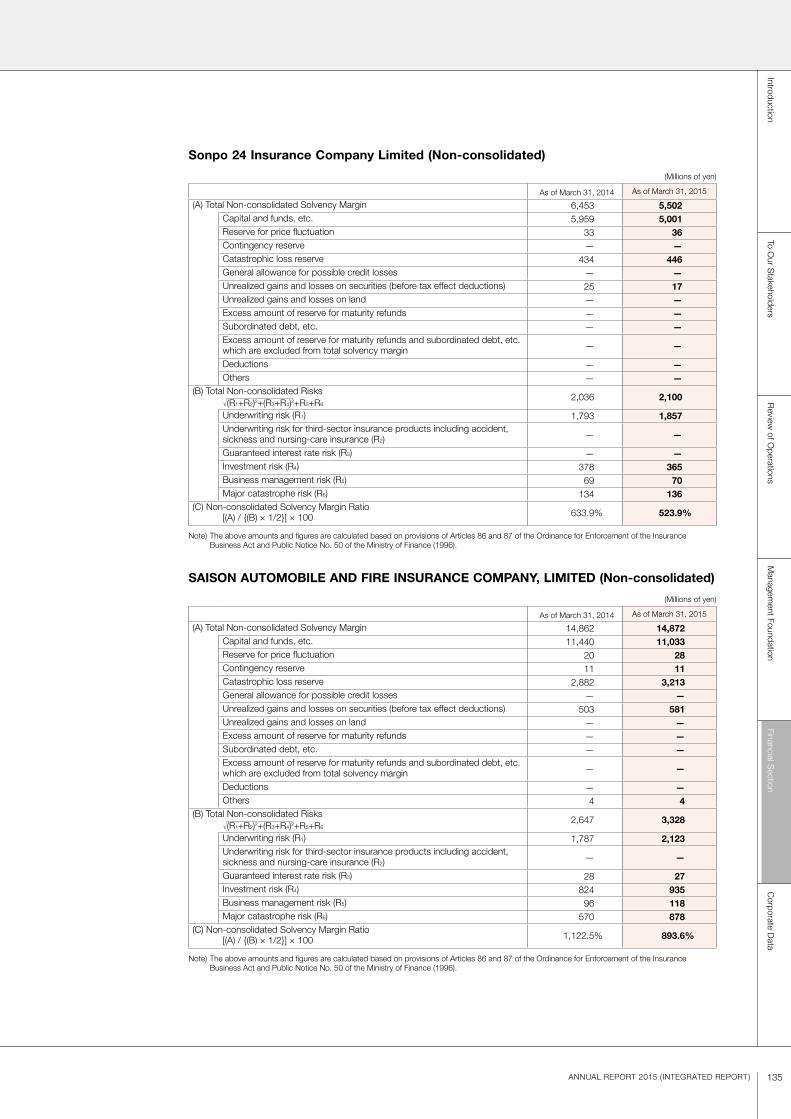
135ANNUAL REPORT 2015 ( INTEGRATED REPORT)
Sonpo 24 Insurance Company Limited (Non-consolidated)
(Millions of yen)
As of March 31, 2014 As of March 31, 2015
(A) Total Non-consolidated Solvency Margin 6,453 5,502Capital and funds, etc. 5,959 5,001Reserve for price fluctuation 33 36Contingency reserve — —Catastrophic loss reserve 434 446General allowance for possible credit losses — —Unrealized gains and losses on securities (before tax effect deductions) 25 17Unrealized gains and losses on land — —Excess amount of reserve for maturity refunds — —Subordinated debt, etc. — —Excess amount of reserve for maturity refunds and subordinated debt, etc. which are excluded from total solvency margin — —
Deductions — —Others — —
(B) Total Non-consolidated Risks √(R1+R2)2+(R3+R4)2+R5+R6
2,036 2,100
Underwriting risk (R1) 1,793 1,857Underwriting risk for third-sector insurance products including accident, sickness and nursing-care insurance (R2) — —
Guaranteed interest rate risk (R3) — —Investment risk (R4) 378 365Business management risk (R5) 69 70Major catastrophe risk (R6) 134 136
(C) Non-consolidated Solvency Margin Ratio [(A) / {(B) × 1/2}] × 100 633.9% 523.9%
Note) The above amounts and figures are calculated based on provisions of Articles 86 and 87 of the Ordinance for Enforcement of the Insurance Business Act and Public Notice No. 50 of the Ministry of Finance (1996).
SAISON AUTOMOBILE AND FIRE INSURANCE COMPANY, LIMITED (Non-consolidated)
(Millions of yen)
As of March 31, 2014 As of March 31, 2015
(A) Total Non-consolidated Solvency Margin 14,862 14,872Capital and funds, etc. 11,440 11,033Reserve for price fluctuation 20 28Contingency reserve 11 11Catastrophic loss reserve 2,882 3,213General allowance for possible credit losses — —Unrealized gains and losses on securities (before tax effect deductions) 503 581Unrealized gains and losses on land — —Excess amount of reserve for maturity refunds — —Subordinated debt, etc. — —Excess amount of reserve for maturity refunds and subordinated debt, etc. which are excluded from total solvency margin — —
Deductions — —Others 4 4
(B) Total Non-consolidated Risks √(R1+R2)2+(R3+R4)2+R5+R6
2,647 3,328
Underwriting risk (R1) 1,787 2,123Underwriting risk for third-sector insurance products including accident, sickness and nursing-care insurance (R2) — —
Guaranteed interest rate risk (R3) 28 27Investment risk (R4) 824 935Business management risk (R5) 96 118Major catastrophe risk (R6) 570 878
(C) Non-consolidated Solvency Margin Ratio [(A) / {(B) × 1/2}] × 100 1,122.5% 893.6%
Note) The above amounts and figures are calculated based on provisions of Articles 86 and 87 of the Ordinance for Enforcement of the Insurance Business Act and Public Notice No. 50 of the Ministry of Finance (1996).
Financial Section
IntroductionTo O
ur Stakeholders
Review
of Operations
Managem
ent FoundationC
orporate Data

136 Sompo Japan Nipponkoa Holdings, Inc.
Sompo Japan Nipponkoa Himawari Life Insurance, Inc. (Non-consolidated)
(Millions of yen)
As of March 31, 2014 As of March 31, 2015
(A) Total Non-consolidated Solvency Margin 255,250 298,297
Capital, etc. 75,698 80,321
Reserve for price fluctuation 2,688 3,353
Contingency reserve 25,475 26,715
General allowance for possible credit losses 13 7
Unrealized gains and losses on securities (90% of gain or 100% of loss) 34,098 61,059
Unrealized gains and losses on land (85% of gain or 100% of loss) — —
Excess amount of continued Zillmerized reserve 129,606 132,485
Subordinated debt, etc. — —
Excess amount of continued Zillmerized reserve and subordinated debt, etc. which are excluded from total solvency margin (25,368) (21,670)
Brought in capital, etc. — —
Deductions — —
Others 13,037 16,025
(B) Total Non-consolidated Risks √(R1+R8)2+(R2+R3+R7)2+R4
32,244 35,589
Underwriting risk (R1) 12,739 13,178
Underwriting risk for third-sector insurance products including accident, sickness and nursing-care insurance (R8) 6,290 6,978
Guaranteed interest rate risk (R2) 8,208 8,259
Guaranteed minimum benefit risk (R7) 357 358
Investment risk (R3) 16,366 19,533
Business management risk (R4) 879 966
(C) Non-consolidated Solvency Margin Ratio [(A) / {(B) × 1/2}] × 100 1,583.2% 1,676.3%
Notes) 1. The above amounts and figures are calculated based on provisions of Articles 86 and 87 of the Ordinance for Enforcement of the Insurance Business
Act and Public Notice No. 50 of the Ministry of Finance (1996).2. Guaranteed minimum benefit risk is calculated by using the standard method.

ココココココココココ
History of the Company 138
Corporate and Share Information 139
Status of Shares Held 141
The Company, Subsidiaries and Affiliates 142
ANNUAL REPORT 2015 ( INTEGRATED REPORT) 137
Corporate Data
ANNUAL REPORT 2015 ( INTEGRATED REPORT)
Financial Section
IntroductionTo O
ur Stakeholders
Review
of Operations
Managem
ent FoundationC
orporate Data
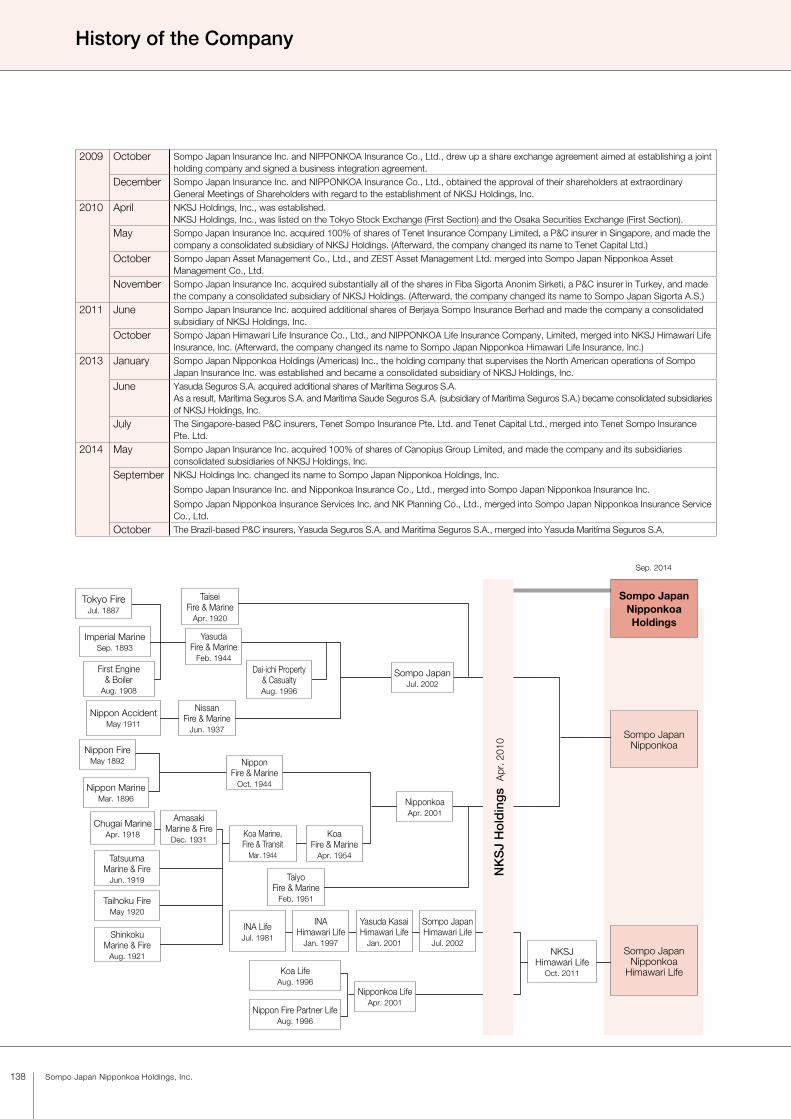
138 Sompo Japan Nipponkoa Holdings, Inc.
History of the Company
2009 October Sompo Japan Insurance Inc. and NIPPONKOA Insurance Co., Ltd., drew up a share exchange agreement aimed at establishing a joint holding company and signed a business integration agreement.
December Sompo Japan Insurance Inc. and NIPPONKOA Insurance Co., Ltd., obtained the approval of their shareholders at extraordinary General Meetings of Shareholders with regard to the establishment of NKSJ Holdings, Inc.
2010 April NKSJ Holdings, Inc., was established.NKSJ Holdings, Inc., was listed on the Tokyo Stock Exchange (First Section) and the Osaka Securities Exchange (First Section).
May Sompo Japan Insurance Inc. acquired 100% of shares of Tenet Insurance Company Limited, a P&C insurer in Singapore, and made the company a consolidated subsidiary of NKSJ Holdings. (Afterward, the company changed its name to Tenet Capital Ltd.)
October Sompo Japan Asset Management Co., Ltd., and ZEST Asset Management Ltd. merged into Sompo Japan Nipponkoa Asset Management Co., Ltd.
November Sompo Japan Insurance Inc. acquired substantially all of the shares in Fiba Sigorta Anonim Sirketi, a P&C insurer in Turkey, and made the company a consolidated subsidiary of NKSJ Holdings. (Afterward, the company changed its name to Sompo Japan Sigorta A.S.)
2011 June Sompo Japan Insurance Inc. acquired additional shares of Berjaya Sompo Insurance Berhad and made the company a consolidated subsidiary of NKSJ Holdings, Inc.
October Sompo Japan Himawari Life Insurance Co., Ltd., and NIPPONKOA Life Insurance Company, Limited, merged into NKSJ Himawari Life Insurance, Inc. (Afterward, the company changed its name to Sompo Japan Nipponkoa Himawari Life Insurance, Inc.)
2013 January Sompo Japan Nipponkoa Holdings (Americas) Inc., the holding company that supervises the North American operations of Sompo Japan Insurance Inc. was established and became a consolidated subsidiary of NKSJ Holdings, Inc.
June Yasuda Seguros S.A. acquired additional shares of Marítima Seguros S.A.As a result, Marítima Seguros S.A. and Marítima Saude Seguros S.A. (subsidiary of Marítima Seguros S.A.) became consolidated subsidiaries of NKSJ Holdings, Inc.
July The Singapore-based P&C insurers, Tenet Sompo Insurance Pte. Ltd. and Tenet Capital Ltd., merged into Tenet Sompo Insurance Pte. Ltd.
2014 May Sompo Japan Insurance Inc. acquired 100% of shares of Canopius Group Limited, and made the company and its subsidiaries consolidated subsidiaries of NKSJ Holdings, Inc.
September NKSJ Holdings Inc. changed its name to Sompo Japan Nipponkoa Holdings, Inc.
Sompo Japan Insurance Inc. and Nipponkoa Insurance Co., Ltd., merged into Sompo Japan Nipponkoa Insurance Inc.
Sompo Japan Nipponkoa Insurance Services Inc. and NK Planning Co., Ltd., merged into Sompo Japan Nipponkoa Insurance Service Co., Ltd.
October The Brazil-based P&C insurers, Yasuda Seguros S.A. and Maritíma Seguros S.A., merged into Yasuda Maritíma Seguros S.A.
Sep. 2014
Tokyo FireJul. 1887
TaiseiFire & Marine
Apr. 1920
Imperial MarineSep. 1893
YasudaFire & Marine
Feb. 1944First Engine
& BoilerAug. 1908
Dai-ichi Property& CasualtyAug. 1996
Sompo JapanJul. 2002
Nippon AccidentMay 1911
NissanFire & Marine
Jun. 1937
Nippon FireMay 1892 Nippon
Fire & MarineOct. 1944Nippon Marine
Mar. 1896
Chugai MarineApr. 1918
AmasakiMarine & Fire
Dec. 1931
TatsuumaMarine & Fire
Jun. 1919
Taihoku FireMay 1920
INA LifeJul. 1981
Koa Marine,Fire & Transit
Mar. 1944
KoaFire & Marine
Apr. 1954
NipponkoaApr. 2001
TaiyoFire & Marine
Feb. 1951
INAHimawari Life
Jan. 1997
Yasuda KasaiHimawari Life
Jan. 2001
Sompo JapanHimawari Life
Jul. 2002Shinkoku
Marine & FireAug. 1921
Koa LifeAug. 1996
Nipponkoa LifeApr. 2001
Nippon Fire Partner LifeAug. 1996
NKSJHimawari Life
Oct. 2011
NK
SJ
Ho
ldin
gs
Apr
. 201
0
Sompo JapanNipponkoaHoldings
Sompo JapanNipponkoa
Sompo JapanNipponkoa
Himawari Life

139ANNUAL REPORT 2015 ( INTEGRATED REPORT)
Corporate and Share Information
Share Information (As of July 1, 2015)
Corporate Data (As of July 1, 2015)
Matters for the General Meeting of Shareholders
1. Fiscal year: April 1 through March 31 of the following year
2. Annual General Meeting of Shareholders:
Held within 3 months of the end of each fiscal year
3. Record date for year-end dividends and voting rights:
March 31 Note) Record date for interim dividends: September 30
4. Share-trading lot size: 100
5. Shareholder registry administrator: Mizuho Trust & Banking Co., Ltd.
6. Public notices: Sompo Japan Nipponkoa Holdings issues public notices electronically (http://www.sompo-hd.com/)Note) If a public notice cannot be issued electronically, it will be published in the
Nihon Keizai Shimbun (newspaper).
7. Exchange listing: Tokyo Stock Exchange (First Section)
Company name: Sompo Japan Nipponkoa Holdings, Inc.
Date of establishment: April 1, 2010
Capital: 100 billion yen
Head office: 26-1, Nishi-Shinjuku 1-chome, Shinjuku-ku, Tokyo 160-8338, Japan Telephone: 03-3349-3000
Group CEO Representative Director, President and Executive Officer:
Kengo Sakurada
Employees: 440*
Business activities: Management of P&C insurance companies, life insurance companies, and other companies controlled as subsidiaries pursuant to the Insurance Business Law, and other related operations.
URL: http://www.sompo-hd.com/en/
Exchange listing: Tokyo Stock Exchange (First Section)
Independent auditors: Ernst & Young ShinNihon LLC
* As of March 31, 2015
The 5th General Meeting of Shareholders was held on June 22, 2015. The matters to be reported and the matters to be
resolved were as follows:
Matters to Be Reported1. Business report, the consolidated financial statements,
and the audit reports by the accounting auditors and the Audit & Supervisory Board for fiscal year 2014 (April 1, 2014, to March 31, 2015)
2. Financial statements for fiscal year 2014 (April 1, 2014, to March 31, 2015)
Matters to Be Resolved
Proposal No. 1 Disposition of Retained Earnings
Proposal No. 2 Appointment of 12 Directors
The proposals were approved as initially proposed.
Financial Section
IntroductionTo O
ur Stakeholders
Review
of Operations
Managem
ent FoundationC
orporate Data

140 Sompo Japan Nipponkoa Holdings, Inc.
Name of ShareholderNumber of Shares Held
(Thousands)Portion of Shares Outstanding (%)
STATE STREET BANK AND TRUST COMPANY 23,467 5.65
The Master Trust Bank of Japan, Ltd. (Trust account) 16,668 4.01
Japan Trustee Services Bank, Ltd. (Trust account) 13,713 3.30
Sompo Japan Nipponkoa Holdings Employee Shareholders Association 11,134 2.68
The Dai-ichi Life Insurance Company, Limited 10,227 2.46
NIPPON EXPRESS CO., LTD. 8,001 1.93
STATE STREET BANK AND TRUST COMPANY 505225 6,919 1.67
GOLDMAN SACHS INTERNATIONAL 6,554 1.58
THE BANK OF NEW YORK MELLON SA/NV 10 6,050 1.46
MELLON BANK, N.A. AS AGENT FOR ITS CLIENT MELLON OMNIBUS US PENSION 6,007 1.45
Notes) 1. In addition to the above, the Company holds 7,314 thousand shares of treasury stock (1.76%). 2. The number of shares held by The Dai-ichi Life Insurance Company, Limited, includes 4,492 thousand shares contributed by that company as trust assets for a
retirement benefit trust. (In the stockholder register, the shares are listed under the name Mizuho Trust & Banking Co., Ltd., Dai-ichi Life Insurance Retirement Benefit Trust)
Top 10 Shareholders (As of March 31, 2015)
Distribution and Shares (As of March 31, 2015)
1. Equity Shares(1) Type of shares Common shares
(2) Total number of authorized shares 1,200,000,000
(3) Total number of shares outstanding 415,352,294 (Including treasury stock)
(4) Total number of shareholders 45,796
2. Types of Shareholders
Number of ShareholdersNumber of Shares Held
(Thousands)Portion of Shares Outstanding (%)
National and Regional Governmental Organizations 2 8 0.00 Financial Institutions 166 139,071 33.48 Securities Companies 53 10,481 2.52 Other Corporations 1,088 37,114 8.94 Foreign Investors 622 178,128 42.89 Individuals and Others 43,865 50,547 12.17 Total 45,796 415,352 100.00

141ANNUAL REPORT 2015 ( INTEGRATED REPORT)
Top 50 Shareholders (Sompo Japan Nipponkoa) (As of March 31, 2015)
Status of Shares Held
The number of companies and carrying amount on the balance sheet in which equity investments are held for purposes other
than pure investment:
2,074 companies 1,883,220 million yen
Company Name Number of Shares (Shares)
Carrying Amount on the Balance Sheet
(Millions of yen)
Honda Motor Co., Ltd. 22,509,800 87,855
Canon Inc. 17,439,987 74,085
Hulic Co., Ltd. 47,578,800 64,278
Fuji Heavy Industries Ltd. 12,157,030 48,518
The Dai-ichi Life Insurance Company, Limited
25,000,000 43,637
Shin-Etsu Chemical Co., Ltd. 5,357,556 42,056
SCOR SE 9,450,000 38,688
Toyota Motor Corporation 4,340,318 36,384
Ajinomoto Co., Inc. 13,239,494 34,879
ITOCHU Corporation 26,336,714 34,277
NIPPON EXPRESS CO., LTD. 50,967,522 34,250
NISSAN MOTOR CO., LTD. 26,428,000 32,347
Marubeni Corporation 42,083,000 29,289
SUZUKI MOTOR CORPORATION 7,761,500 28,038
Murata Manufacturing Co., Ltd. 1,429,200 23,631
The Chiba Bank, Ltd. 26,537,968 23,406
SURUGA Bank Ltd. 8,829,848 22,030
Panasonic Corporation 12,800,000 20,185
JFE Holdings, Inc. 7,038,669 18,680
Kawasaki Heavy Industries, Ltd. 30,577,999 18,560
Nitto Denko Corporation 2,310,800 18,555
Aisin Seiki Co., Ltd. 4,100,000 17,876
Ricoh Company, Ltd. 13,398,414 17,525
YAMATO HOLDINGS CO., LTD. 6,033,900 16,725
Seven & i Holdings Co., Ltd. 3,153,702 15,935
Company Name Number of Shares (Shares)
Carrying Amount on the Balance Sheet
(Millions of yen)
Shionogi & Co., Ltd. 3,846,791 15,406
TOSHIBA CORPORATION 30,308,000 15,281
Nippon Paint Holdings Co., Ltd. 3,435,000 15,114
The Joyo Bank, Ltd. 23,178,000 14,324
SOHGO SECURITY SERVICES CO., LTD.
3,441,515 14,093
LPI Capital Berhad 28,353,600 13,840
NOK CORPORATION 3,571,400 12,928
JX Holdings, Inc. 27,518,225 12,718
Shiseido Company, Limited 5,934,497 12,658
The Hiroshima Bank, Ltd. 19,387,911 12,563
Komatsu Ltd. 5,231,448 12,359
East Japan Railway Company 1,221,200 11,772
Mazda Motor Corporation 4,586,840 11,187
T&D Holdings, Inc. 6,264,810 10,365
AEON CO., LTD. 7,729,735 10,195
NH Foods Ltd. 3,493,000 9,668
Ashikaga Holdings Co., Ltd. 19,000,000 9,595
Mizuho Financial Group, Inc. 45,141,010 9,529
The Bank of Kyoto, Ltd. 7,512,000 9,457
Tokyo Tatemono Co., Ltd. 10,484,000 9,225
YAMAZAKI BAKING CO., LTD. 4,253,396 9,217
ZENKOKU HOSHO Co., Ltd. 2,040,000 9,190
The Iyo Bank, Ltd. 6,293,421 8,980
NSK Ltd. 5,074,000 8,920
Bridgestone Corporation 1,841,000 8,866
• Specific shareholdersPurpose for which shares are held: To maintain and strengthen business relationships
• Shares subject to deemed holdingPurpose for which shares are held: To secure the ability to exercise voting rights
Company Name Number of Shares (Shares)
Carrying Amount on the Balance Sheet
(Millions of yen)
Honda Motor Co., Ltd. 8,900,000 34,736
Murata Manufacturing Co., Ltd. 550,000 9,094
Note) Specific shares for investment and shares subject to deemed holding have not been combined at the time of selecting the aforementioned companies recorded on the balance sheet.
Financial Section
IntroductionTo O
ur Stakeholders
Review
of Operations
Managem
ent FoundationC
orporate Data

142 Sompo Japan Nipponkoa Holdings, Inc.
The Company, Subsidiaries and Affiliates (As of March 31, 2015)
SOMPO HOLDINGS consists of 121 subsidiaries and 14 affiliates. The Group is engaged in domestic P&C insurance, domestic
life insurance, overseas insurance, and financial and other services. Major Group companies are as follows.
List of Group Companies
Domestic P&C Insurance
Domestic Life Insurance
Overseas Insurance
Financial and Other Services
Sompo Japan Nipponkoa Insurance, Inc. Sonpo 24 Insurance Company Limited SAISON AUTOMOBILE AND FIRE INSURANCE COMPANY, LIMITED Sompo Japan Nipponkoa Insurance Services Inc.
★ Hitachi Capital Insurance Corporation
Sompo Japan Nipponkoa Himawari Life Insurance, Inc.
Sompo Japan Nipponkoa Insurance Company of Europe Limited <U.K.> Canopius Holdings UK Limited <U.K.> Canopius Managing Agents Limited <U.K.> Canopius Group Limited <Guernsey> Sompo Japan Sigorta Anonim Sirketi <Turkey> Sompo Japan Nipponkoa Holdings (Americas) Inc. <U.S.A.> Sompo Japan Insurance Company of America <U.S.A.> Canopius Reinsurance Limited <Bermuda> Yasuda Marítima Seguros S.A. <Brazil> Yasuda Marítima Saude Seguros S.A. <Brazil> Sompo Japan Nipponkoa Holdings (Asia) Pte. Ltd. <Singapore> Tenet Sompo Insurance Pte. Ltd. <Singapore> Berjaya Sompo Insurance Berhad <Malaysia> Sompo Japan Nipponkoa Insurance (China) Co., Ltd. <China> Sompo Japan Nipponkoa Insurance (Hong Kong) Company Limited <China>
★ Universal Sompo General Insurance Company Limited <India>
Sompo Japan Nipponkoa DC Securities Inc. (Defined-Contribution Pension Plans) SOMPO JAPAN NIPPONKOA ASSET MANAGEMENT CO., LTD. (Asset Management) Healthcare Frontier Japan Inc. (Healthcare)
Note) The definitions of each sign are as follows. : Consolidated subsidiary ★: Affiliate accounted for under the equity method
So
mp
o J
apan
Nip
po
nko
a H
old
ing
s, In
c.
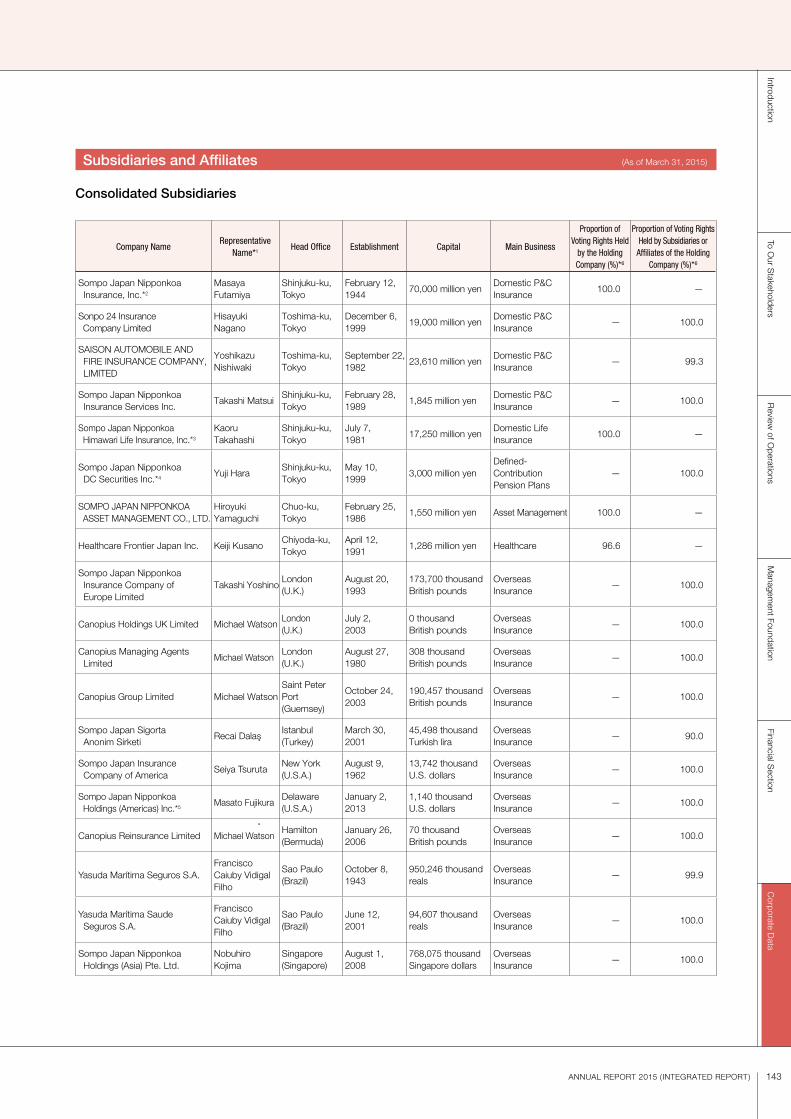
143ANNUAL REPORT 2015 ( INTEGRATED REPORT)
Subsidiaries and Affiliates (As of March 31, 2015)
Consolidated Subsidiaries
Company NameRepresentative
Name*1Head Office Establishment Capital Main Business
Proportion of Voting Rights Held
by the Holding Company (%)*6
Proportion of Voting Rights Held by Subsidiaries or
Affiliates of the Holding Company (%)*6
Sompo Japan Nipponkoa Insurance, Inc.*2
Masaya Futamiya
Shinjuku-ku, Tokyo
February 12, 1944
70,000 million yenDomestic P&C Insurance
100.0 —
Sonpo 24 Insurance Company Limited
Hisayuki Nagano
Toshima-ku, Tokyo
December 6, 1999
19,000 million yenDomestic P&C Insurance
— 100.0
SAISON AUTOMOBILE AND FIRE INSURANCE COMPANY, LIMITED
Yoshikazu Nishiwaki
Toshima-ku, Tokyo
September 22, 1982
23,610 million yenDomestic P&C Insurance
— 99.3
Sompo Japan Nipponkoa Insurance Services Inc.
Takashi MatsuiShinjuku-ku, Tokyo
February 28, 1989
1,845 million yenDomestic P&C Insurance
— 100.0
Sompo Japan Nipponkoa Himawari Life Insurance, Inc.*3
Kaoru Takahashi
Shinjuku-ku, Tokyo
July 7, 1981
17,250 million yenDomestic Life Insurance
100.0 —
Sompo Japan Nipponkoa DC Securities Inc.*4
Yuji HaraShinjuku-ku, Tokyo
May 10, 1999
3,000 million yenDefined-Contribution Pension Plans
— 100.0
SOMPO JAPAN NIPPONKOA ASSET MANAGEMENT CO., LTD.
Hiroyuki Yamaguchi
Chuo-ku, Tokyo
February 25, 1986
1,550 million yen Asset Management 100.0 —
Healthcare Frontier Japan Inc. Keiji KusanoChiyoda-ku, Tokyo
April 12, 1991
1,286 million yen Healthcare 96.6 —
Sompo Japan Nipponkoa Insurance Company of Europe Limited
Takashi YoshinoLondon (U.K.)
August 20, 1993
173,700 thousand British pounds
Overseas Insurance
— 100.0
Canopius Holdings UK Limited Michael WatsonLondon (U.K.)
July 2, 2003
0 thousand British pounds
Overseas Insurance
— 100.0
Canopius Managing Agents Limited
Michael WatsonLondon (U.K.)
August 27, 1980
308 thousand British pounds
Overseas Insurance
— 100.0
Canopius Group Limited Michael WatsonSaint Peter Port (Guernsey)
October 24, 2003
190,457 thousand British pounds
Overseas Insurance
— 100.0
Sompo Japan Sigorta Anonim Sirketi
Recai DalaIstanbul (Turkey)
March 30, 2001
45,498 thousand Turkish lira
Overseas Insurance
— 90.0
Sompo Japan Insurance Company of America
Seiya TsurutaNew York (U.S.A.)
August 9, 1962
13,742 thousand U.S. dollars
Overseas Insurance
— 100.0
Sompo Japan Nipponkoa Holdings (Americas) Inc.*5
Masato FujikuraDelaware (U.S.A.)
January 2, 2013
1,140 thousand U.S. dollars
Overseas Insurance
— 100.0
Canopius Reinsurance Limited Michael WatsonHamilton (Bermuda)
January 26, 2006
70 thousand British pounds
Overseas Insurance
— 100.0
Yasuda Marítima Seguros S.A.Francisco Caiuby Vidigal Filho
Sao Paulo (Brazil)
October 8, 1943
950,246 thousand reals
Overseas Insurance
— 99.9
Yasuda Marítima Saude Seguros S.A.
Francisco Caiuby Vidigal Filho
Sao Paulo (Brazil)
June 12, 2001
94,607 thousand reals
Overseas Insurance
— 100.0
Sompo Japan Nipponkoa Holdings (Asia) Pte. Ltd.
Nobuhiro Kojima
Singapore (Singapore)
August 1, 2008
768,075 thousand Singapore dollars
Overseas Insurance
— 100.0
Financial Section
IntroductionTo O
ur Stakeholders
Review
of Operations
Managem
ent FoundationC
orporate Data

144 Sompo Japan Nipponkoa Holdings, Inc.
Company NameRepresentative
Name*1Head Office Establishment Capital Main Business
Proportion of Voting Rights Held
by the Holding Company (%)*6
Proportion of Voting Rights Held by Subsidiaries or
Affiliates of the Holding Company (%)*6
Tenet Sompo Insurance Pte. Ltd.
Stella Tan Singapore (Singapore)
December 14, 1989
418,327 thousand Singapore dollars
Overseas Insurance
— 100.0
Berjaya Sompo Insurance Berhad
Patrick LohKuala Lumpur (Malaysia)
September 22, 1980
118,000 thousand ringgits
Overseas Insurance
— 70.0
Sompo Japan Nipponkoa Insurance (China) Co., Ltd.
Tadashi SatoDalian (China)
June 1, 2005
500,000 thousand Chinese yuan
Overseas Insurance
— 100.0
Sompo Japan Nipponkoa Insurance (Hong Kong) Company Limited
Takeshi Ishikawa
Hong Kong (China)
March 25, 1977
210,001 thousand Hong Kong dollars
Overseas Insurance
— 97.8
61 other companies
Equity-Method Affiliates
Company NameRepresentative
Name*1Head Office Establishment Capital Main Business
Proportion of Voting Rights Held
by the Holding Company (%)*6
Proportion of Voting Rights Held by Subsidiaries or
Affiliates of the Holding Company (%)*6
Hitachi Capital Insurance Corporation
Hiroshi HondaChiyoda-ku, Tokyo
June 21, 1994 6,200 million yenDomestic P&C Insurance
— 20.6
Universal Sompo General Insurance Company Limited
Onkar Nath Singh
Mumbai (India)
January 5, 2007
3,500,000 thousand rupee
Overseas Insurance
— 26.0
Note) “Subsidiaries and affiliates” include subsidiaries and affiliates as specified in the Insurance Business Law and the Enforcement Order for the Insurance Business Law.
*1. Names of representatives are as of July 1, 2015. *2. Sompo Japan Insurance Inc. and NIPPONKOA Insurance Company, Limited were merged into Sompo Japan Nipponkoa Insurance Inc. on September 1, 2014.*3. The company name was changed to Sompo Japan Nipponkoa Himawari Life Insurance, Inc. on September 1, 2014.*4. The company name was changed to Sompo Japan Nipponkoa DC Securities Inc. on September 1, 2014.*5. The company name was changed to Sompo America Holdings Inc. on June 4, 2015.*6. Figures in proportion of voting rights are rounded to the indicated decimal place.

ANNUAL REPORT 2015(INTEGRATED REPORT)
AN
NU
AL
RE
PO
RT
2015
(INT
EG
RA
TE
D R
EP
OR
T)
15.09 501494 -0200Printed in Japan
(15080635)
26-1, Nishi-Shinjuku 1-chome, Shinjuku-ku,
Tokyo 160-8338, Japan
URL: http://www.sompo-hd.com/en/