ANNUAL REPORT 2015 - Refining NZ · The Annual Report of The New Zealand Refining Company Limited...
84
ANNUAL REPORT 2015
Transcript of ANNUAL REPORT 2015 - Refining NZ · The Annual Report of The New Zealand Refining Company Limited...

ANNUAL REPORT 2015
REFININ
G N
Z ANN
UAL REPO
RT 2015

Directors’ statementThe Directors are responsible for the preparation of the financial statements and other information included in this Annual Report. The financial statements authorised for issue by the Board of Directors and dated on 23 February 2016, have been prepared in conformity with generally accepted accounting practice to give a true and fair view of the financial position of the Group and the results of its operations and cash flows.
The Company appoints an independent licensed auditor to audit the financial statements prepared by the Directors and to express an opinion on these financial statements. The independent licensed auditors’ report, which sets out their opinion and the basis of that opinion, is set out on page 31 of the Annual Report.
The Annual Report of The New Zealand Refining Company Limited is signed on behalf of the Board by:
S C ALLEN
P M SPRINGFORD
15 March 2016
About the coverThe Te Mahi Hou commemorative sculpture was unveiled on 10 March by Prime Minister, John Key to mark the official opening of our $365 million expansion project.
The sculpture depicts a koru enclosed by an open matau (fish hook) which, in Maori mythology, Maui used to pull up the land mass of the North Island. The open matau symbolises good fortune, strength, prosperity, determination, good health and guardianship. The koru symbolises new beginnings, growth and harmony.
The two metre high sculpture was carved by local artist, Aaron Ellis-Smith .

2 Chairman and CEO’s Report
4 Strategy
10 Scorecard
12 Governance
20 Shareholder Information
22 Directors’ Profiles
25 Leadership Team Profiles
30 Economic Performance
79 Trend Statement
80 Non-GAAP Information
81 Corporate Directory
Contents

Chairman and CEO’s Report 2015 was a remarkable year. The continued excellent running of the refinery’s processing units enabled the Company to capitalise on a strong margin environment to report a much improved Net Profit After Tax (NPAT) of $150.9 million for the year ended 31 December 2015 (2014: $10 million). The Company also re-entered the NZX50.
REFI
NIN
G N
Z A
NN
UA
L RE
PORT
201
5
2
CHAI
RMAN
AN
D C
EO’S
REP
ORT
* THE PROCESSING AGREEMENTS WITH OUR CUSTOMERS CONTAIN BOTH FLOOR AND MARGIN CAP CLAUSES, BOTH EFFECTIVE OVER A FULL CALENDAR YEAR. THE FEE FLOOR IS THE MINIMUM PROCESSING FEE DUE, FOR A CALENDAR YEAR. FOR 2015 IT WAS NZD128 MILLION. THE MARGIN CAP LIMITS THE GROSS REFINING MARGIN FOR EACH CUSTOMER TO A MAXIMUM OF USD9.00 PER BARREL OVER THE CALENDAR YEAR.

SIMON ALLEN CHAIRMAN
SJOERD POST CHIEF EXECUTIVE OFFICER
REFININ
G N
Z AN
NU
AL REPO
RT 2015
3
CHAIRM
AN AN
D CEO
’S REPORT
The Company is making a subtle change from ‘game changing’ major investments towards a more evenly spread capital growth spend in the region of $10-$50 million per annum. Going forward we will invest in a ‘funnel’ of sustainable, smaller growth projects with attractive payback periods. Some growth projects are already well advanced, notably the agreement signed with Vector in December which will double our access to natural gas in 2017. We are also continuing with our studies to enable bigger crude shipments while consulting tangata whenua and the wider community.
Hale and Twomey review Following a Hale and Twomey review of processing fees in September 2014, the Company has adopted their recommended change to the freight benchmark to better reflect the actual cost of crude freight. From January 2016 the freight benchmarks published by the Platts agency have replaced those published by the London Tanker Brokers Panel.
Staff share schemeIn 2015 we recognised the important contribution of Refining NZ employees to our success by enabling them to invest in the Company through an employee share purchase scheme. The first offer will be made in March 2016.
Shareholder returnsThe Directors resolved to pay a fully imputed final dividend of 20 cents per share to be paid on 24 March 2016, with a record date of 10 March 2016. With an interim dividend of five cents paid in September, the total dividend payment for the year is 25 cents.
Board changesIn April, Chairman and Independent Director David Jackson retired after 10 years. During his tenure David oversaw the approval and successful completion of a number of large capital projects, amounting to $735 million, all vital to ensure the ongoing feasibility and competitiveness of the Company. These included the cleans fuel project (Future Fuels) in 2005, the capacity expansion project (Point Forward) in 2009 and the gasoline production expansion project (Te Mahi Hou) in 2015. In May, Chevron New Zealand sold its shareholding in Refining NZ and Dean Gilbert resigned as director of the Company. Last month director Tim Wall resigned his position as Director. Thank you to David, Dean and Tim for their respective contributions and professionalism while serving on the Board.
Future outlook The Directors are confident that we are building a sustainable refining business, able to compete with Asia Pacific refiners, and to manage future market challenges. It’s clear that the way forward is based around team performance, solid reliability, outstanding product quality, and investment in growth.
Credit for one of our best ever set of results goes to the whole team (staff, management and contractors) for keeping the refinery running reliably and safely all year. Te Mahi Hou (TMH) was successfully commissioned at the end of November, on budget and three weeks early, after four years of design, planning, construction, and commissioning. Everyone who worked on this $365 million upgrade to our petrol manufacturing facility is to be congratulated for achieving this major milestone. TMH is key to our future growth and has already contributed greatly to Northland as well as the New Zealand economy.
In November, Refining NZ was awarded Most Improved Performance at the Deloitte Top 200 awards in Auckland. This high profile business accolade is just recognition for our hardworking team and what they have achieved over the past 12 months.
Health and safety The Company’s 2015 health and safety performance is outlined in the scorecard on page 10. Our performance in 2015 was notable for the 1.5 million hours the TMH team worked without a Lost Time Injury (LTI). They did that by remaining focused on the job at hand, identifying hazards in the work area, and always being aware of the fatal risks in a busy construction zone.
We are always looking to lift our health and safety performance and our 2016 Health and Safety Action Plan is squarely focused on improving both process and personal safety on site. We continue our preparation for the new health and safety legislation coming into force in April. DuPont was commissioned to review our health and safety management systems. The Board received overall positive feedback and we have agreed a seven point action plan to lift performance further.
Business environmentOur 2015 business performance was a significant improvement on 2014. This comes on the back of refining margins that remained at the cap*, or near cap levels for much of the year, and were held up by the continued strong global demand for petrol, particularly in the US, China and India – and low crude prices. The Gross Refining Margin (GRM) for 2015 averaged USD9.20 per barrel prior to cap or floor adjustment, (2014: USD4.96 per barrel). The margin generated above the cap, resulted in the processing fee being capped by $14 million for the year.
The refinery processed more crude oil than ever (42.6 million barrels), processing fee revenue increased significantly to $379.2 million (2014: $168.4 million) around $27 million better than the previous record in 2006. Our uplift over the Singapore Complex Margin improved to average USD4.45 per barrel (2014: USD3.46). Cash generation from operations at $265 million was up substantially (2014:$67 million) and meant we were able to complete TMH and reduce net borrowings to $193 million (2014: $315 million) – within the Company’s target gearing ratio (10-20%). The exchange rate also ran in our favour with the New Zealand dollar averaging USD0.70 for the year (2014: USD0.82).
StrategyIn October the Board reconfirmed the Company’s aspiration to be the fuels manufacturing and supply partner of choice for New Zealand and the supporting strategies behind that aspiration (see strategy section on page 4 for further detail).

4
STRA
TEg
yRE
FIN
ING
NZ
AN
NU
AL
REPO
RT 2
015

Operating in an ultra-competitive marketWe compete in one of the toughest regional markets in the world, against refiners many times larger and newer than ours at Marsden Point. In the past three to five years the Asia Pacific region has become ultra-competitive with new manufacturing capacity coming on stream. It means that our customers now have many more supply choices, especially with product exports from refineries in Korea, Singapore, India and the Middle East.
Globally, on the back of crude production growth in the US as a result of fracking, prices for crude and products have fallen sharply over the past 12-18 months. Product demand has increased in response to the drop in pump prices, particularly gasoline which has seen significant growth over the same period leading to strengthening refinery margins.
Our aspiration remains the same While refinery margins have strengthened, our competitors are working on improving their refineries to deliver even higher margins. Therefore, the imperative we face is to improve our competitiveness so that we can continue to operate a safe and reliable refining business that our customers and New Zealand turn to, and depend on, for high quality fuel products.
Our continued aspiration is to be the fuels manufacturing and supply partner of choice for New Zealand.
To achieve that aspiration we need to deliver three things:
• a world class safety and environmental performance
• a fuels offer that is competitive with Asia Pacific’s fuel manufacturers
• first quartile NZX50 returns for our shareholders.
StrategyAs a ‘toll refiner’ we can influence our customers’ decision (whether to make product at Marsden Point or to import from other refineries) by providing a compelling customer proposition based on three elements:
• Quality – a core strength of ours, continuing to produce on specification product for our customers
• Reliability – another core strength, the ongoing safe and reliable running of our processing units proven by a world class rate of unplanned downtime
• Price – where product quality and refinery reliability are ‘absolutes’ for being a supplier of choice, price is at the core of a competitive offer. This is an area needing our continued attention as a result of the changing competitive dynamic in the Asia Pacific region described earlier.
Our strategy Deliver a world-class health and safety performance We have created a culture of personal safety, but need to lift our performance if we are to become world-class. Stepping up our performance requires added focus on the safety of our refining processes and the personal safety of our people. Process safety is critical to the safe and reliable running of our refinery. We have made good progress in this space over the past few years, and are looking to raise the bar even higher.
An independent review by DuPont, while complimentary of our health and safety performance, has outlined a number of areas for us to ‘work on’ so that we can lift our game even further.
Deliver a world-class environmental performanceWe have facilities and management processes in place to minimise the impact of our refining activities on the surrounding environment. We need to stay in ‘sync’ with rising societal expectations by tightening our controls, improving on our housekeeping and exploring ways to further reduce the impact of our operations. Continuing to improve our environmental performance is a priority for our people, our community and our shareholders – and at the same time, makes good business sense.
5
STRATEgy
REFININ
G N
Z AN
NU
AL REPO
RT 2015

Embed a high-performance culture Breaking through to ‘world-class’ requires a culture of high performance throughout our business. We are in the process of shifting our culture from ‘do-it-yourself’ across all facets of the business, to being clear about our core competencies and working with ‘alliance’ partners to deliver best practice in areas that are not part of our core expertise.
In the areas of core competency, we continue to work on a culture of individual accountability for delivering on our promises (to remain safe, environmentally responsible, and to deliver value for our customers, shareholders and the community).
Finally, we continue to look at our core processes and procedures in pursuit of simplicity and ridding the business of duplication and waste. Building a culture of continuous improvement and embedding Lean principles is fundamental to our strategy – it’s how we do business.
Building a high performance culture is not something that can be achieved overnight or by any one person: it requires engagement, a team of talented and committed individuals, such as we have at Refining NZ, supported by the right structure for our business to meet the challenges ahead.
Build on the quality and reliability elements of our customer promise Competing successfully with the best in Asia Pacific starts with playing to our many strengths and continuing to do what we are good at:
• We have a history of investing in plant reliability and the production of quality cleaner fuels. Our operational availability compares well with refineries in the region of a similar size and complexity.
• We have a team of talented and committed people and a ‘fleet footed’ operation less affected by the internal ‘bureaucracy’ brought on by scale.
Improve our competitivenessIf we are to deliver value for our customers we need to maintain the relentless focus on our cost base and understand how we can produce more of the high-value products from the same barrel of crude oil. These two areas are crucial to delivering our value proposition to our customers, namely our competitiveness, and driving the activities set out in our action plan. Harnessing innovative ideas from both inside and outside the business continues to provide new opportunities to improve our business delivery.
REFI
NIN
G N
Z A
NN
UA
L RE
PORT
201
5
6
STRA
TEg
y

Our 2016 action plan While our aspiration and strategies remain unchanged, 2016 heralds a subtle strategic ‘shift in gears’ – a move from a world of asset integrity maintenance and occasional game changer projects (e.g. Future Fuels, Point Forward and TMH) to a world of more evenly spread growth capital spend on small to medium sized projects.
This is a result of the fact that we don’t see many large size game changers in our innovation funnel. Rather we see many small to medium sized opportunities to grow incremental margin and lift our ability to compete with imported fuel products.
In line with our strategy, the major areas of focus in 2016 are our Health, Safety and Environmental performance; embedding TMH and delivery of superior shareholder returns; continuing to scope and implement revenue growth opportunities that will lift our ability to compete with imported fuel products, and improving organisational performance.
1. Lift our HSE performance
MAINTAIN A SAFE WORKPLACE
New health and safety legislation in 2016 is set to strengthen the regulation of workplace safety, placing added responsibility on the Company’s management and Board to demonstrate that management processes are rigorous, in keeping with modern safety standards and that our people are engaged in making our site safer, particularly through participation in the Company’s Health and Safety Steering Committee.
We are gearing up for this change by being actively involved in the formulation of workplace safety standards, working closely with the new regulator, WorkSafe New Zealand. We continue to manage the process safety risk of our most critical assets and lift our reliability performance through an ongoing series of studies.
We will focus on implementation of the action points arising from the DuPont Process Safety review, as we look to ‘Lift our HSE performance’ even further.
MANAGE OUR ENVIRONMENTAL FOOTPRINT
We are conscious of our responsibility for minimising the impact of our 50-year-old refinery on the surrounding environment, and are continually looking to lift our environmental performance. This is underlined by a no spill policy across the refinery, and major project investment focused on cleaning and preventing hydrocarbons leaving the site, and bolstering the resilience of our water treatment systems.
REFININ
G N
Z AN
NU
AL REPO
RT 2015
7
STRATEgy
2. Embedding Te Mahi Hou and delivering superior shareholder returns
With the TMH project start-up late last year, we will look forward to the new potential and capability unlocked by this significant investment. Embedding TMH into ‘business as usual’ operations and extracting value by further optimising the Refinery configuration including TMH will be a key focus.
3. Improving our ability to compete and grow revenue
Tapping the knowledge of our team has generated a ‘funnel’ of business improvement ideas capable of lifting our performance across many aspects of our refining business, the fuels supply chain, and our offering to customers. On the back of our recent success in implementing smaller growth initiatives, we will focus on:
IMPROVING PROFITABILITY VIA SMALL TO MEDIUM MARGIN INITIATIVES
A number of smaller growth ideas in our development ‘funnel’ will be progressed from ideation to implementation and a number of trials will be conducted to increase margins. Feasibility studies of the most promising ideas to improve margins in the 2017-2020 timeframe will also be completed in 2016.
OBTAINING A GREATER SUPPLY OF NATURAL GAS
We have signed an agreement with Vector to double the refinery’s natural gas take by early 2017. This presents a significant margin opportunity.
BRINGING LARGER CRUDE CARGOES INTO MARSDEN POINT TO IMPROVE FREIGHT ECONOMICS
Moving up to half of our crude intake to shipments of around one million barrels (currently 500-700,000 barrels) is expected to significantly improve freight economics.
Engagement with local communities, hapu- and iwi continues in 2016, helped by our relationship with local hapu-, Patuharakeke. At the same time, a series of in-depth technical studies is expected to be completed during the first half of 2016 with a view to applying for consent in the second half of 2016.
Pursuing these key objectives has the potential to make our business more evenly spread than it has perhaps been in the past in terms of cash flow, capital investment profile and dividend returns to shareholders.
8
STRA
TEg
yRE
FIN
ING
NZ
AN
NU
AL
REPO
RT 2
015
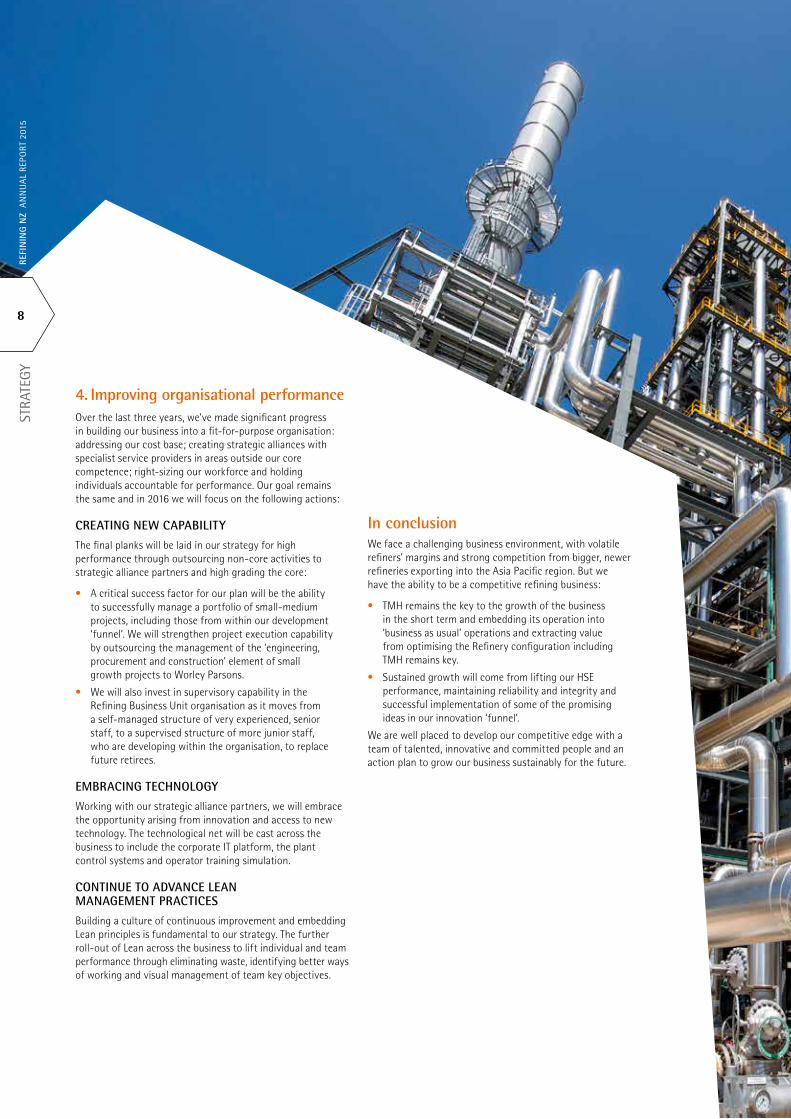
4. Improving organisational performanceOver the last three years, we’ve made significant progress in building our business into a fit-for-purpose organisation: addressing our cost base; creating strategic alliances with specialist service providers in areas outside our core competence; right-sizing our workforce and holding individuals accountable for performance. Our goal remains the same and in 2016 we will focus on the following actions:
CREATING NEW CAPABILITY
The final planks will be laid in our strategy for high performance through outsourcing non-core activities to strategic alliance partners and high grading the core:
• A critical success factor for our plan will be the ability to successfully manage a portfolio of small-medium projects, including those from within our development ‘funnel’. We will strengthen project execution capability by outsourcing the management of the ‘engineering, procurement and construction’ element of small growth projects to Worley Parsons.
• We will also invest in supervisory capability in the Refining Business Unit organisation as it moves from a self-managed structure of very experienced, senior staff, to a supervised structure of more junior staff, who are developing within the organisation, to replace future retirees.
EMBRACING TECHNOLOGY
Working with our strategic alliance partners, we will embrace the opportunity arising from innovation and access to new technology. The technological net will be cast across the business to include the corporate IT platform, the plant control systems and operator training simulation.
CONTINUE TO ADVANCE LEAN MANAGEMENT PRACTICES
Building a culture of continuous improvement and embedding Lean principles is fundamental to our strategy. The further roll-out of Lean across the business to lift individual and team performance through eliminating waste, identifying better ways of working and visual management of team key objectives.
In conclusionWe face a challenging business environment, with volatile refiners’ margins and strong competition from bigger, newer refineries exporting into the Asia Pacific region. But we have the ability to be a competitive refining business:
• TMH remains the key to the growth of the business in the short term and embedding its operation into ‘business as usual’ operations and extracting value from optimising the Refinery configuration including TMH remains key.
• Sustained growth will come from lifting our HSE performance, maintaining reliability and integrity and successful implementation of some of the promising ideas in our innovation ‘funnel’.
We are well placed to develop our competitive edge with a team of talented, innovative and committed people and an action plan to grow our business sustainably for the future.

9
STRATEgy
REFININ
G N
Z AN
NU
AL REPO
RT 2015
Vector GasIn December we signed an agreement with key supplier Vector to double the quantity of gas available to the refinery. Under the agreement Vector will upgrade its compression capacity on the northern pipeline at a total cost of around $25 million. The refinery currently takes 2-2.5 PJ/year of gas and when the transmission capacity is available in 2017, our gas take will rise to more than 5 PJ/year.
Natural gas is a cost effective and clean energy source. Based on current crude prices, doubling our gas take is expected to lift our GRM by a minimum of USD0.15 per barrel, and up to USD0.20-25 per barrel with crude at USD60–70 per barrel.
Construction of the new compressor unit at Henderson is expected to begin in September 2016.
Te Mahi HouIn late November we successfully commissioned our new petrol making facility, TMH, on budget and three weeks earlier than we had originally scheduled.
This major milestone for our highly professional project team followed four years of co-ordinating engineering design across three separate locations, securing critical components from across the globe and assembling them at Marsden Point. To do all of that and one week after start-up, produce on-spec gasoline is an outstanding achievement.
This major investment in national energy infrastructure has already contributed to Northland and to the New Zealand economy. TMH will lift the production of high quality petrol at Marsden Point by two million barrels and the total share of petrol made in New Zealand to around 65%. Through improved energy efficiency TMH also reduces our CO2 emissions by around 120,000 tonnes a year.
SJOERD POST CHIEF EXECUTIVE OFFICER
SIMON MACKENZIE GROUP CHIEF EXECUTIVE VECTOR

Scorecard
10
SCO
RECA
RDRE
FIN
ING
NZ
AN
NU
AL
REPO
RT 2
015
Quality and reliability
BUILD ON
ELEMENTS OF OUR CUSTOMER
PROMISE
Our 2015 performance at a glance
Environmental
DELIVER A WORLD CLASS
PERFORMANCE
UNIT OF MEASURE
2015 RESULT
2014 RESULT
TRCF, rolling 12-mth #/M hrs 6.61 4.31
LTIF, rolling 12-mth #/M hrs 0.51 0.96
Tier 1 process safety incidents # 1 1
Releases outside consent # 2 3
Unplanned process downtime
% 0.3 0.2
Product not on time, in full, on spec
# 3 4
NPAT (net profit after tax) NZ$M 151 10
Cash costs NZ$M 160 142
Energy Intensity Index (EII) 93.8 95.8
Health and safety
DELIVERINg WORLD CLASS
PERFORMANCE
Competitiveness
IMPROVE OUR
TRCF. Total Recordable Case Frequency. The sum of injuries resulting in fatalities, permanent total disabilities, lost workday cases and medical treatment cases per one million hours worked.
LTIF. Lost Time Injury Frequency. The sum of work related injury cases per one million hours worked, where the injured person is deemed medically unfit for any work as a result of the injury.
Tier 1 process safety incidents. An unplanned or uncontrolled loss of primary containment with the greatest consequences. Defined by the American Petroleum Institute’s recommended practice for process safety.
Energy Intensity Index (EII). A Solomon Associates measure of energy efficiency. A smaller number signifies better energy performance.
Cash costs. A reconciliation of the Non-GAAP ‘Cash costs’ to the audited financial statements is provided on page 80.

11
SCORECARD
REFININ
G N
Z AN
NU
AL REPO
RT 2015
UNIT OF MEASURE
2015 RESULT
2014 RESULT
TRCF, rolling 12-mth #/M hrs 6.61 4.31
LTIF, rolling 12-mth #/M hrs 0.51 0.96
Tier 1 process safety incidents # 1 1
Releases outside consent # 2 3
Unplanned process downtime
% 0.3 0.2
Product not on time, in full, on spec
# 3 4
NPAT (net profit after tax) NZ$M 151 10
Cash costs NZ$M 160 142
Energy Intensity Index (EII) 93.8 95.8
Our total recordable cases tracked upward during the year with 12 incidents reported in over two million work hours. These were a mix of injuries (e.g. cuts, strains and dust in eye) and while disappointing, most were minor with two injuries which could have had major consequences for the collegues involved. Note that our TRCF performance is over one million work hours (not 200,000 work hours as is the alternative norm within New Zealand).
While our statistics compare favourably within a New Zealand context, we remain committed to improving our performance as we strive to deliver a world-class health and safety performance. The learnings from 2015 incidents, together with the recommendations from the overall positive DuPont safety review, will be carried into the 2016 Health and Safety Action Plan.
Additional funds have been invested into ‘Kleenex’, the Company’s key strategic project focussed on improving our environmental performance with our progress reflected in an improved scorecard performance.
Unplanned downtime at 0.3% was critical to underscoring our reputation as a reliable supplier. Reliability is especially important to our customers with alternative supply ex Singapore or Korea difficult to secure at short notice.
NPAT of $151 million exceeded the 2015 profit matrix, issued at the start of the year, by around $5 million reflecting the positive impact of our record throughput of 42.6 million barrels.
2015 cash costs were higher than prior year for two reasons:
i) $9 million of positive one–offs in 2014 (stock provision release and defined benefit settlement) and
ii) extra costs in 2015 as a result of early commissioning of TMH and the feasibility study of dredging the entrance to Whangarei harbour.

REFI
NIN
G N
Z A
NN
UA
L RE
PORT
201
5
12
gO
VERN
ANCE
GovernanceRegulatory frameworkThe Company operates in New Zealand and is listed on the Main Board of the New Zealand Stock Exchange (NZX). It is subject to regulatory control and monitoring by both the NZX and the Financial Markets Authority (FMA). Appendix 16 of the NZX Listing Rules sets out some ‘Minimum Requirements’ for governance and the FMA has also re-issued in December 2014 ‘Principles and Guidelines – a handbook for directors, executives and advisors’.
Refining NZ meets the requirements of Appendix 16 apart from paragraph 2.7, which encourages Directors to take a portion of their remuneration under a ‘Performance Based Equity Security Compensation plan’. Directors of the Company do not receive any form of performance-based remuneration.
For the purposes of clause 30 of Schedule 4 of the Financial Markets Conduct Act 2013 (FMCA), Refining NZ informs its shareholders that, on and from 1 December 2016, the requirements of the FMCA will apply to Refining NZ. The only exception to this is that Part 7 of the FMCA (Financial Reporting) will apply to Refining NZ for the financial year ended 31 December 2015 (and future years). Therefore, Refining NZ’s financial statements for this period have been prepared in accordance with the requirements under Part 7 of the FMCA.
Refining NZ’s address is Port Marsden Highway, Ruakaka, New Zealand 0171.
Role of the BoardThe Board is responsible for setting the Company’s strategic direction and for providing oversight of the management of the Company, with the aim of increasing shareholder value and ensuring the obligations of the Company are properly met. The Board is accountable to shareholders for the performance of the Company, with day-to-day management of the Company delegated to the Chief Executive Officer (CEO).
The respective roles of the Board and management (the Leadership Team) are set out in the Board’s Charter.
Board structureThe Board currently consists of eight Directors. The Board maintains a skills matrix to ensure that all requisite skills and competencies are covered by the appointed Directors, including refinery or oil industry experience.
The number of Directors is determined by the Board, in accordance with the Company’s constitution, to ensure that it is large enough to provide a range of knowledge, views and experience relevant to the Company’s business.
Under the NZX Listing Rules, the Company is obliged to have at least three Independent Directors. As at 31 December 2015, the Company had four Independent Directors; Chairman, Simon Allen, Peter Springford, Vanessa Stoddart and Mark Tume.
Previously Mr Tume was treated as not Independent due to being the Chairman of Infratil and a Guardian of the New Zealand Superannuation Fund (both being major shareholders of Z Energy Limited, which is a substantial shareholder in Refining NZ). Infratil and the New Zealand Superannuation Fund sold down their respective shareholdings in Z Energy Limited on 6 October 2015 to a zero and 10.49% holding respectively. Following this change, the Board acknowledged Mr Tume as an Independent Director with effect from 8 December 2015.
The Company does not have a majority of Independent Directors or any Executive Directors.
Major shareholders (BP, ExxonMobil and Z Energy) do not have a constitutional right to appoint Directors, although it is accepted that they are entitled to representation. The Nomination and Remuneration Committee, using the same criteria as for all other Directors, considers nominations for these representatives as if they were non-representative Directors.
A number of the representative Directors have appointed Alternate Directors to act on their behalf and occupy their position for a period of time, if for any reason they are unavailable to attend Board meetings or otherwise act. An Alternate Director has the powers, rights, duties and responsibilities of a Director when acting in the place of an ordinarily appointed Director. However they are not entitled to receive remuneration from the Company or to be Chairman of the Company.
Each year the Board will appoint a Chairman from among the Independent Directors who is responsible for representing the Board to shareholders.
Directors will generally hold office for an initial three-year term following their appointment, subject to any obligation to retire by rotation in accordance with the Company’s constitution and the NZX Listing Rules. If a Director is appointed by the Board to fill a casual vacancy, that Director will hold office until the next Annual Meeting, but will be eligible for re-election at that meeting.
On their first appointment, Directors attend an induction programme aimed at deepening their understanding of the business and the environment and markets in which the Company operates. The Chairman oversees the design and implementation of the induction programme.
A Director can accept other Board appointments during their tenure on the Board, as long as the appointment is not in conflict with the Company’s business and does not adversely affect the Director’s performance. Directors must discuss any other appointments with the Chairman before accepting. A profile for each Director is set out on pages 22 to 24, outlining their individual experience, tenure and entries in the interest register.

13
gO
VERNAN
CEREFIN
ING
NZ A
NN
UA
L REPORT 2015

The Board met six times during the year and attendances at the meetings were as follows:
DATE OF APPOINTMENT BOARD OR RETIREMENT MEETINgS
ATTENDED POSSIBLE
INDEPENDENT
S C Allen 4 December 2014 6 6
D A Jackson Resigned 29 April 2015 2 2
P M Springford 1 August 2007 6 6
V C M Stoddart 20 May 2013 6 6
M Tume 1 August 2007 1 1
(independent from 8 December 2015, refer page 13)
NON-INDEPENDENT
BP
M H Elliott 3 May 2012 6 6
T J Wall Resigned 11 February 2016 6 6
CHEVRON
D B Gilbert Resigned 29 May 2015 2 2
Alternate
J G Venn Resigned 5 June 2015 - -
EXXONMOBIL
S J Brown 4 December 2014 6 6
A T Warrell 14 March 2012 5 6
Alternate
J R Crawford 15 December 2009 - -
Z ENERgy
M J Bennetts 10 May 2010 6 6
M Tume 1 August 2007 5 5
(non-independent to 8 December 2015, refer page 13)
REFI
NIN
G N
Z A
NN
UA
L RE
PORT
201
5
14
gO
VERN
ANCE

Board performanceThe Board periodically evaluates its own performance, and its own processes and procedures to ensure that they are appropriate to assist the Board in effectively fulfilling its role and meeting its duties. Individual Directors undertake a peer and self-assessment based on a methodology agreed by the Board.
Directors’ remunerationThe Board determines the level of remuneration paid to Directors within the amounts approved by shareholders (that is, from the approved collective pool). The current approved fee pool limit is $850,000 and was approved by shareholders at the Annual Meeting in April 2012. Directors’ remuneration is set at a level to remain comparable with other companies in New Zealand, taking into account the expertise, skills and responsibilities of Directors. Current Directors’ fees are set out in the following table.
FEES
Chairman $160,000
Independent Directors $80,000
Other Directors $60,000
Audit, Risk and Finance Committee Members $10,000
Nomination and Remuneration Committee Members $2,500
Where a shareholder is represented by two Directors on the Board, the fee for the second Director has been permanently waived.
Board members are also entitled to reimbursement for any direct costs incurred in carrying out their role as Directors, including travel costs. The remuneration and other benefits received by the individual Directors of the Company during the year were as follows:
DIRECTOR 2015 2014
INDEPENDENTS
S C Allen 133,333 5,370
D A Jackson (resigned 29 April 2015) 53,333 160,000
P M Springford 92,500 92,500
V C M Stoddart 82,500 82,500
M Tume - -
(independent from 8 December 2015, refer to page 13)
BP
M H Elliott
T J Wall(resigned 11 February 2016)
CHEVRON
D B Gilbert (resigned 29 April 2015) 26,042 60,000
EXXONMOBIL
S J Brown(appointed 4 December 2014)
A T Warrell
K E MacMillan (resigned 22 October 2014)
Z ENERGY
M J Bennetts
M Tume (to 8 December 2015, refer to page 13)
TOTAL 587,708 602,870
The Directors do not participate in any profit-based bonus system. No Director of the Company has received, or become entitled to receive, a benefit (other than a benefit included in the total emoluments received or due and receivable by Directors shown in this report). No loans have been made to Directors.
Directors’ and Officers’ InsuranceThe Company has arranged Directors’ and Officers’ Liability Insurance, which ensures that generally Directors will incur no monetary loss as a result of actions undertaken by them as Directors (including for Directors of the Company’s subsidiaries). Certain actions are specifically excluded, such as the incurring of penalties and fines which may be imposed in respect of breaches of the law.
60,000
62,500
70,000
70,000
70,000
70,000
REFININ
G N
Z AN
NU
AL REPO
RT 2015
15
gO
VERNAN
CE

Independent professional adviceWith the approval of the Chairman, Directors are entitled to seek independent professional advice on any aspect of their Director’s duties, at the Company’s expense.
Use of Company informationThe Board did not receive any notices from any Director of the Company or its subsidiaries during the year, requesting to use Company information received in their capacity as a Director, which would not otherwise have been available to them.
Sub-committees of the Board There are three Board sub-committees: the Audit, Risk and Finance Committee; the Nomination and Remuneration Committee; and the Independent Directors Committee.
AUDIT, RISK AND FINANCE COMMITTEE
The Audit, Risk and Finance Committee comprises between three to five Directors who have the appropriate financial expertise and understanding of the Company’s industry and with at least one member who is considered to be a ‘financial expert’.
The function of the Audit, Risk and Finance Committee is to oversee financial reporting, the treasury function, and the Company’s risk management and assurance programmes.
The Committee keeps under review the scope and results of audit work, the cost effectiveness, performance, independence and objectivity of the auditors. Members of the Committee review the financial statements and the NZX announcement of the financial results. During the year under review the Audit, Risk and Finance Committee met four times and attendances at the meetings were as follows:
ATTENDED POSSIBLE
S C Allen 4 4
D A Jackson (resigned 29 April 2015) 1 2
P M Springford 4 4
M Tume 4 4
T J Wall (resigned 11 February 2016) 4 4
NOMINATION AND REMUNERATION COMMITTEE
In respect of nominations, the responsibilities of the Committee are to identify and nominate, for the approval of the Board, candidates to fill Board vacancies and the position of CEO as and when they arise; to regularly review the structure, size and composition (including the skill, knowledge and experience) of the Board; to make recommendations to the Board regarding any changes; and to consider such other matters relating to Board nomination or succession issues as may be referred to it by the Board.
The Board has developed a skills matrix to assess capability of individual Board members and the Board as a whole. The matrix is used in considering suitability of potential candidates and includes generic requirements (capacity and commitment, behaviours and business skills) and specialist competencies. Nominations will be put to the Annual Meeting in accordance with the Company’s constitution and the NZX Listing Rules. The filling of casual vacancies must be approved by the Board and approved by shareholders at the next Annual Meeting.
In respect of remuneration, the responsibilities of the Committee are to review and approve the Company’s remuneration policy and to recommend to the Board, on an annual basis, any changes in Directors’ remuneration. The Committee also provides oversight of the Company’s Business Performance Factor which sets the base for any individual bonus payments under the Individual Performance Incentive Scheme and the award of shares to participating employees under the ‘DC12’ Employee Share Scheme.
The Nomination and Remuneration Committee also makes recommendations to the Board regarding the remuneration package of the CEO, including the payment of any Short-Term Incentive Payment and the remuneration packages of the Leadership Team who are profiled on pages 25 to 29.
The Committee reviews the People Strategy on an annual basis including changes to organisation structure, the capability development strategy and succession planning processes including succession planning for executive roles, diversity and inclusiveness initiatives and other strategic people priorities that arise from time to time.
The Nomination and Remuneration Committee met three times and attendance at the meetings was as follows:
ATTENDED POSSIBLE
S C Allen 3 3
D B Gilbert (resigned 29 May 2015) 1 2
D A Jackson (resigned 29 April 2015) 2 2
P M Springford 3 3
V C M Stoddart 3 3
M H Elliott (appointed 8 December 2015) - -
INDEPENDENT DIRECTORS’ COMMITTEE
The three largest shareholders of the Company are also major customers, either directly or through wholly owned subsidiaries, and have representation on the Board. This structure means that there are some matters where it is not allowed or appropriate to involve the full Board.
Clause 8.16.1 of the constitution allows for the Independent Directors to act as the Board in respect of these matters.
The Independent Directors are listed on pages 22 to 24. The roles of the Independent Directors are:
• to act as the Board in relation to those matters to be decided by the Board in which all of the other Directors have an interest which disqualifies them from forming part of the quorum and voting, and
REFI
NIN
G N
Z A
NN
UA
L RE
PORT
201
5
16
gO
VERN
ANCE

• to act as a Committee of the Board to deal with matters delegated or referred to it by the Board or the Leadership Team, including ensuring that issues concerning the major customers, and in particular any conflicts of interest, are dealt with in a transparent manner for the benefit of the Company as a whole.
The Independent Directors met four times during the year and attendance at the meetings was as follows:
ATTENDED POSSIBLE
S C Allen 4 4
D A Jackson (resigned 29 April 2015) - -
P M Springford 4 4
V C M Stoddart 4 4
M Tume 1 1
(from 8 December 2015 – refer to page 13)
Internal financial controlThe Board has overall accountability to shareholders and other stakeholders for the Company’s system of internal financial control. Responsibility for maintaining the requisite systems and processes is delegated to the Chief Executive Officer. The Company has a comprehensive management system which covers all aspects of the business. The management system incorporates internal financial and operational controls to:
• Facilitate effective and efficient operations
• Safeguard the Company’s assets
• Ensure proper accounting records are maintained, and
• Ensure that the financial information used within the business and for publication is reliable.
The Company is committed to maintaining management systems that meet the requirements of Occupational Health and Safety (NZS 4801), Environment (ISO 14001) and Quality (ISO 9001), all of these systems embedding continuous improvement processes.
Annual budgets, forecasts and reports on the strategic direction of the Company are regularly prepared by the Leadership Team for review by the Board. HSE (Health, Safety and Environment), financial and business performance reports are prepared monthly and reviewed by the Board throughout the year to monitor performance against HSE, financial and non-financial targets and strategic objectives.
Code of business conduct The Company has a Code of Business Conduct which applies to all Directors and employees. The Code of Business Conduct sets standards and expectations and also provides a decision framework to guide consistency of application, ensuring that decisions are consistent with the Company’s values, strategies, legal and policy obligations.
The Company has a ‘whistle blowing’ procedure and employees are responsible for reporting any breaches in the Code of Business Conduct of which they become aware to either their manager, manager’s manager or the Company’s Disclosure Officer. Any concerns can be raised anonymously with the Disclosure Officer.
Risk management and assuranceBusiness risk assessments are conducted by the Leadership Team and reported to the Board of Directors.
The Leadership Team and the Board obtain assurance over the adequacy of the Company’s management system from a variety of sources. The Company has an enterprise-wide audit programme, which verifies that operational controls are operating as documented and also assesses the efficiency and effectiveness of internal controls.
During 2015 the Company was subject to 25 audits by external parties, including audits conducted by the Company’s internal auditor, BDO Northland and 11 audits by in-house operational auditors. The summary results from audits were reported to the Leadership Team and the Audit, Risk and Finance Committee of the Board.
Share dealings To ensure compliance with the law around insider trading, the Company has issued a share trading policy applicable to Directors, officers and all employees. A Director or member of the Leadership Team can only enter into share transactions if prior approval has been given by the Company Secretary, or the Chairman, in the case of the Directors, CEO or Company Secretary, or the Chairman of the Audit, Risk and Finance Committee, in the case of the Chairman.
A listing of Directors’ and Leadership Team members’ shareholdings is included with their profiles on pages 22 to 29 of this Annual Report.
Disclosure of information to shareholdersRefining NZ is committed to keeping its shareholders informed and places a high degree of importance on open communication and transparent reporting and to providing comprehensive continuous disclosure to shareholders and other stakeholders, in compliance with the NZX Listing Rules.
A Half Year and Annual Report are published each year and posted on the Company’s website. Presentations to analysts are given following the Half Year and Full Year announcements to provide insight into the Company’s overall performance and market conditions. These presentations are also posted on the Company’s website and the NZX. The Company provides bi-monthly data on throughput, margins and processing fees, which enables stakeholders to assess the financial performance of the Company.
The Company Secretary takes primary responsibility for communications with the NZX in relation to NZX Listing Rules and disclosure obligations. Shareholders may raise matters for discussion at Annual Meetings.
The Company has made a number of disclosures to the NZX under the continuous disclosure rules. Details are available on the Company website at www.refiningnz.com and on the NZX’s website: www.nzx.com.
REFININ
G N
Z AN
NU
AL REPO
RT 2015
17
gO
VERNAN
CE

Role of the Leadership Team All Board authority conferred on the Leadership Team is delegated through the CEO. The Board and CEO agree specific goals and objectives directed towards the Company’s strategic aims. This will usually take the form of an annual performance contract under which the CEO is authorised to make any decision and take any action directed at achieving the Company’s strategic aims, within the CEO’s delegations of authority.
The CEO presents strategy and HSE, financial, operational and other reports and proposals to the Board at each meeting. In between meetings, the Chairman maintains an informal link between the Board and the CEO. The CEO keeps the Chairman informed on all important issues and the Chairman is available to provide counsel and advice to the CEO where appropriate. Only decisions of the Board acting as a body are binding on the CEO. Decisions of, or instructions by individual Directors, Officers or Committees cannot be given to the CEO and are not binding, except in those instances where specific authorisation is given by the Board.
A profile of the Leadership Team is provided on pages 25 to 29.
REMUNERATION
The Company’s Leadership Team is remunerated with a mix of base salary and benefits, and short-term performance incentives. The determination of fixed remuneration is based on responsibilities, individual performance and experience, and market data. At-risk/variable remuneration comprises individual performance rewards, based on:
• achievement of Company targets
• achievement of individual performance objectives, and
• values and behaviours demonstrated by the individual.
DIVERSITY
The following tables provide the proportion of women on the Board, women on the Leadership Team and total women in the organisation:
2015 2014
Directors Females 1 13% 1 9% Males 7 87% 10 91%
Leadership Team Females 2 22% 2 22% Males 7 78% 7 78%
IPL Directors Females 2 67% 1 33% Males 1 33% 2 67%
Workforce (excluding IPL & TMH) Females 34 10% 33 11% Males 295 90% 276 89%
New Zealand Stock Exchange and Statutory Information
REMUNERATION PROFILE
The following table shows the number of employees and former employees, not being Directors, who, in their capacity as employees, received remuneration and other benefits during 2015 of at least $100,000. The remuneration figures include all monetary payments actually made during the year and exclude amounts paid post 31 December 2015 that relate to performance during the 2015 financial year. No employees appointed as a Director of IPL, a subsidiary company of Refining NZ, receive or retain any remuneration or other benefits for holding this office.
$000 2015 2014
100-109 22 22110-119 21 21120-129 28 30130-139 28 25140-149 38 30150-159 24 39160-169 30 25170-179 22 18180-189 24 17190-199 22 16200-209 8 6210-219 4 9220-229 2 11230-239 4 2240-249 4 1250-259 3 1260-269 1 -270-279 2 1280-289 2 1300-309 - 1320-329 1 1330-339 1 -350-359 1 11,380–1,389 1 1
THE ABOVE ANALYSIS IS COMPILED ON A CASH BASIS; VARIABLE PERFORMANCE REWARDS (LINKED TO INDIVIDUAL AND BUSINESS PERFORMANCE FOR A FINANCIAL REPORTING PERIOD) ARE PAID SUBSEQUENT TO BALANCE DATE AND REPORTED AS PART OF THE REMUNERATION BANDING FOR THE FOLLOWING YEAR.
REFI
NIN
G N
Z A
NN
UA
L RE
PORT
201
5
18
gO
VERN
ANCE

REMUNERATION OF THE CHIEF EXECUTIVE OFFICER
The table below compares Sjoerd Post’s total reward for performance in 2014 with his total reward for performance in 2015. This has been prepared on an earnings or accruals basis and differs to the remuneration table on the previous page, which is prepared on a cash basis. The short-term incentive and a portion of the superannuation contribution are paid out in the year following the year in which they are earned. Sjoerd Post’s employment agreement for his role as Chief Executive Officer commenced on 14 January 2013. The key terms of employment and Sjoerd’s total remuneration are as follows:
2015 $000
2014 $000
• Base salary of $940,000 per annum, reviewed annually.
940 940
• In addition to his base salary, Sjoerd may also be paid an annual short-term incentive up to 60% of base salary per plan year subject to the achievement of agreed Key Performance Indicators (KPIs).
438 400
• Sjoerd may also be eligible for an additional discretionary bonus in the case of over performance of KPIs at the sole and absolute discretion of the Board.
- -
• Sjoerd is also entitled to participate in both the Company’s Private Car Travel Allowance Scheme and in the New Zealand Refining Company Staff Superannuation Plan in accordance with the plan rules and the relevant investment statement.
41 41
TOTAL 1,419 1,381
Either Refining NZ or Sjoerd can terminate his employment on six months’ notice. Refining NZ can also terminate his employment for redundancy or for ill health (on 12 and six months’ notice respectively).
DONATIONS
The Company made donations of $48,000 during the year ended 31 December 2015 (2014: $83,000).
AUDITORS
PricewaterhouseCoopers, whose remuneration for audit and other services is detailed in note 3 to the financial statements, have indicated their willingness to continue in office. Each service referred to in note 3 requires prior approval by the Audit, Risk and Finance Committee so that such service does not compromise auditor objectivity and independence. The Committee also reports to the Board on the quality and expertise of the auditor. The Committee also ensures that the auditor rotation provisions of the NZX Listing Rules are complied with.
NEW ZEALAND EXCHANGE WAIVERS
No NZX waivers were sought or granted in 2015. In 2015 the Company utilised an NZX waiver that was granted and disclosed in 1999 which allows the Company to price certain products in tiers for different quantities to incentivise customers to increase their use of the refinery.
CREDIT RATING
The Company does not have a credit rating.
Going concernThe Directors have considered whether it is appropriate to prepare the 2015 financial statements on the basis that the Company and the Group are going concerns. As part of its normal business practices, the Group prepares annual budgets and longer-term financial and business plans. In reviewing this information, the Directors are satisfied that the Company and the Group have adequate resources to continue in business for the foreseeable future. For this reason, the Directors continue to adopt the going concern basis in preparing the Group’s financial statements.
REFININ
G N
Z AN
NU
AL REPO
RT 2015
19
gO
VERNAN
CE

Twenty largest shareholdersAS AT 31 JANUARY 2016
SHAREHOLDERS TOTAL SHARES HELD % OF TOTAL
1 BP New Zealand Holdings Limited 66,240,021 21.19
2 Mobil Oil New Zealand Limited 53,760,000 17.20
3 Z Energy Limited 47,999,980 15.36
4 National Nominees New Zealand Limited – NZCSD 15,935,482 5.10
5 Citibank Nominees (New Zealand) Limited – NZCSD 11,275,291 3.61
6 HSBC Nominees (New Zealand) Limited – NZCSD 10,866,476 3.48
7 Accident Compensation Corporation – NZCSD 8,076,824 2.58
8 BNP Paribas Nominees (NZ) Limited – NZCSD 6,757,131 2.16
9 Custodial Services limited 4,505,303 1.44
10 Forsyth Barr Custodians Limited 4,497,814 1.44
11 HSBC Nominees (New Zealand) Limited – NZCSD 4,319,012 1.38
12 Masfen Securities Limited 3,274,539 1.05
13 J P Morgan Chase Bank – NZCSD 2,999,174 0.96
14 FNZ Custodians Limited 2,805,930 0.90
15 Walter Mick George Yovich + Jeanette Julia Yovich 2,172,758 0.70
16 Chester Perry Nominees Limited 2,000,000 0.64
17 Investment Custodial Services Limited 1,623,299 0.52
18 Investment Custodial Services Limited 1,561,430 0.50
19 Custodial Services Limited 1,189,946 0.38
20 BNP Paribas Nominees (NZ) Limited – NZCSD 1,122,138 0.36
TOTAL 252,982,548 80.95
In the above table, the shareholding of New Zealand Central Securities Depositary Limited (NZCSD) has been re-allocated to the applicable members of the NZCSD. The shareholder spread table groups shares held by NZCSD as a single legal holding.
Forsyth Barr Custodians Limited holdings are shown in the Geographical Spread table as being located in the South Island, however the beneficial owners may be more widely spread.
Shareholder Information
REFI
NIN
G N
Z A
NN
UA
L RE
PORT
201
5
20
SHAR
EHO
LDER
INFO
RMAT
ION

Shareholder spreadAS AT 31 JANUARY 2016
NO. OF SHARES SHAREHOLDERS % HOLDER SHARES % OF SHARES
1-499 178 3.94 46,886 0.01
500-999 235 5.21 163,235 0.05
1,000-1,999 619 13.72 837,286 0.27
2,000-4,999 1,271 28.18 4,129,184 1.32
5,000-9,999 847 18.78 5,728,647 1.84
10,000-49,999 1,175 26.05 21,945,467 7.02
50,000-99,999 98 2.17 6,302,384 2.02
100,000-499,999 63 1.40 10,123,417 3.24
500,000-999,999 9 0.20 6,610,025 2.11
1,000,000 upwards 16 0.35 256,689,922 82.12
TOTAL 4,511 100.00 312,576,453 100.00
Geographical spreadAS AT 31 JANUARY 2016
LOCATION SHAREHOLDERS % HOLDER SHARES % OF SHARES
Auckland (Greater) 1,479 32.79 210,189,092 67.24
Wellington (Greater) 566 12.55 58,123,688 18.60
Whangarei/Northland 527 11.68 10,752,289 3.44
Other North Island 893 19.80 17,473,014 5.59
South Island 932 20.66 14,422,800 4.61
Australia 61 1.35 1,249,683 0.40
Other Overseas 53 1.17 365,887 0.12
TOTAL 4,511 100.00 312,576,453 100.00
Substantial product holdersAS AT 31 DECEMBER 2015
The following shareholders hold 5% or more of the issued capital of the Company and have filed notices with the Company under the Financial Markets Conduct Act 2013 that they are substantial product holders in the Company.
NO. OF ORDINARY SHARES
BP New Zealand Holdings Limited 66,240,021
Mobil Oil NZ Limited 53,760,000
Z Energy Limited 47,999,980
The total number of quoted voting products of the Company on issue at 31 December 2015 and 31 January 2016 was 312,576,453 fully paid ordinary shares.
Shareholder Information
REFININ
G N
Z AN
NU
AL REPO
RT 2015
21
SHAREH
OLD
ER INFO
RMATIO
N

Michael Bennetts
BBS, Dip CM
Simon Allen BSc, BCom
CHAIRMAN INDEPENDENT DIRECTOR
Directors’ ProfilesProfessional Director with over 30 years commercial experience in the New Zealand and Australian Capital Markets.
Chief Executive of investment bank BZW and ABN AMRO in New Zealand for 21 years and has been actively involved in advising companies, Government and investors on matters relating to their strategies and capital markets participation.
Chair of Crown Fibre Holdings Limited, and St Cuthberts College.
Director of IAG New Zealand and a trustee of the Antarctic Heritage Trust.
Chief Executive for Z Energy Limited. Previously held senior roles with a global oil major in New Zealand, China, Singapore, South Africa, and the UK. Director experience in both private and public energy related companies in South Africa and Asia Pacific since 1998.
ENTITY INTERESTHarbour City Property Investments Limited DirectorAuckland Iron Works Limited DirectorPunakaiki Fund Limited Director & Shareholder
EQUITY INTEREST IN REFINING NZ2015: nil, (2014: nil)
Past governance roles include Auckland Healthcare Services Limited (Director), Financial Markets Authority (Chair), NZSE (Director) and NZX Limited (Chair), Auckland Council Investments Limited (Chair) along with a number of other unlisted companies.
ENTITY INTERESTCrown Fibre Holdings Limited ChairmanSt Cuthberts College ChairmanSimon Allen Consulting Limited DirectorIAG New Zealand DirectorAntarctic Heritage Trust Trustee
EQUITY INTEREST IN REFINING NZ2015: 35,000, (2014: nil)Purchased 35,000 shares on 20 February 2015 at $2.682 per share. Relevant interest: registered holder (as Trustee) and beneficiary of trust.
REFI
NIN
G N
Z A
NN
UA
L RE
PORT
201
5
22
DIR
ECTO
RS' P
ROFI
LES

Peter Springford
MBA
INDEPENDENT DIRECTOR
ENTITY INTERESTPaymark Limited DirectorBoard of Tertiary Education Commission CommissionerWarehouse Group Limited DirectorAlliance Group Limited DirectorDepartment of Conservation (Member) Audit, Risk and Finance CommitteeMinistry of Business, Innovation & Enterprise (Member) Audit, Risk and Finance Committee
EQUITY INTEREST IN REFINING NZ2015: nil, (2014: nil)
A director of The Warehouse Group Ltd, Paymark Ltd, and Alliance Group Ltd, Commissioner for The Tertiary Education Commission and member of MBIE and DOC Audit and Risk Committees amongst other positions. Previously Group General Manager Engineering and People Air New Zealand Ltd. and Chief Executive of the Australian Packaging Division of Carter Holt Harvey Ltd.
Chairman of McKechnie Aluminium Solutions and Nuplex Industries, and a number of unlisted companies. Independent Chair of Interplex Group Ltd an SGX listed company and a Trustee of Medicine Mondiale Trust. Previously was Managing Director & CEO of Carter Holt Harvey Ltd.
ENTITY INTERESTSpringford & Newick Ltd DirectorSpringford Family Trust TrusteeDunstan Trust TrusteeNZ Wood Products Limited DirectorNuplex Industries Ltd ChairmanNgarango Island Properties Ltd DirectorNew Zealand Frost Fans Limited DirectorOmahu Ventures Limited DirectorMcKechnie Aluminium Solutions Limited ChairmanInterplex Group Ltd ChairmanLoncel Technologies (2014) Ltd DirectorMondiale Technologies Ltd Trustee
EQUITY INTEREST IN REFINING NZ2015: 11,263, (2014: 11,263)
Vanessa Stoddart BCom/LLB (Hons),PgDip Professional Ethics
INDEPENDENT DIRECTOR
Stuart Brown BCom/LLB
Tax Manager, Australia Cluster for ExxonMobil. Joined ExxonMobil in 1996, and has held positions within ExxonMobil as Senior Tax Advisor and Tax Planning Manager. Currently Chairman of EECU Limited – an Australian credit union.
ENTITY INTERESTEECU Limited DirectorExxonMobil Superannuation Plan Pty Ltd Director
EQUITY INTEREST IN REFINING NZ2015: nil, (2014: nil)
REFININ
G N
Z AN
NU
AL REPO
RT 2015
23
DIRECTO
RS' PROFILES

Mark Tume BBS
INDEPENDENT DIRECTOR
Professional director with experience in the infrastructure, energy and financial sector. Directorships include NZ Oil and Gas, Infratil, and Guardians of New Zealand Superannuation.
ENTITY INTERESTLong Board Limited DirectorGuardians of NZ Superannuation DirectorInfratil Limited and Subsidiaries Chairman/ DirectorKoau Capital Partners Ltd DirectorMaori Trustee Advisory Board MemberYeo Family Trustee Limited DirectorNew Zealand Oil & Gas Limited and Subsidiaries DirectorThe Environmental Challenge Ltd Advisory Board MemberWelltest Limited DirectorRearden Capital Pty Limited DirectorRA 2014 Pty Limited DirectorRA (Holdings) 2014 Pty Limited Director
EQUITY INTEREST IN REFINING NZ2015: nil, (2014: nil)
Matthew Elliott BCom, Diploma of Commerce (post grad)
Andrew Warrell
BE (Mech) Hons, MIEAust, MBA
Vice President Fuels NZ and Managing Director BP New Zealand Limited. Joined BP in 1994 and has held positions in Retail, Sales and Marketing, General Management with BP in Australia, Fiji, USA and the UK. Previous governance experience in Australia and Fiji.
ENTITY INTERESTBP New Zealand Holdings Limited DirectorBP New Zealand Share Scheme Limited DirectorBP Oil New Zealand Limited DirectorBP Pacific Investments Limited DirectorCoro Trading NZ Limited DirectorEuropa Oil NZ Limited DirectorRD Petroleum Limited Director
EQUITY INTEREST IN REFINING NZ2015: nil, (2014: nil)
REFI
NIN
G N
Z A
NN
UA
L RE
PORT
201
5
24
DIR
ECTO
RS' P
ROFI
LES
Manager Refining Australia & New Zealand for ExxonMobil. Joined ExxonMobil in 1991 has extensive international experience in Refining, Supply, Strategic Planning, Investor Relations and Environmental Liability Management areas. Chairman of Australian Institute of Petroleum and Director of ExxonMobil’s Australian operating companies.
ENTITY INTERESTMobil Refining Australia Pty Ltd ChairmanMobil Oil Australia Pty Ltd DirectorVacuum Oil Company Pty Ltd DirectorW.A.G. Pipeline Pty Ltd ChairmanCrib Point Terminal Pty Ltd ChairmanExxonMobil Australia Pty Ltd DirectorAustralian Institute of Petroleum Chairman
EQUITY INTEREST IN REFINING NZ2015: nil, (2014: nil)
IPL DirectorsDenise Jensen CHAIRPERSON
Kate Dunn APPOINTED 4 SEPTEMBER 2015
William Parker
Peter Gubb ALTERNATE DIRECTOR

Sjoerd joined the company in January 2013. He has over 30 years’ international commercial business experience. Prior to joining Refining NZ, Sjoerd was a member of the Executive Team of Royal Dutch Shell’s Downstream (Refining, Trading, Distribution and Sales and Marketing) business responsible for the overall global Downstream Strategy and Portfolio activities. Sjoerd was also on the Boards of the European Refinery Association Europia and Technical Association CONCAWE. Prior to that he was the Head of Shell’s Global Aviation and Marine businesses and has held a variety of roles in Trading, Commercial Sales, Customer Service Management, Marketing and Sales, including assignments in New Zealand, Denmark and London. Born and raised in Holland, Sjoerd has considered New Zealand home since the mid 80’s. During the weekends Sjoerd enjoys spending time with his wife and two daughters. He also enjoys music, the visual arts and sailing.
EQUITY INTEREST IN REFINING NZ2015: 28,929, (2014: 28,929)Sjoerd Post
MSC (Mathematics)
CHIEF EXECUTIVE OFFICER
Leadership Team Profiles
Peter has held the position of Refining Manager since 2011. Prior to this, Peter progressed through Refining NZ holding various management roles within Operations, IT and Process Services. Peter also held the Leadership Team position of Quality, Health, Safety and Environment Manager. Prior to joining Refining NZ, Peter had previous process experience in the dairy industry.
Peter and his partner have two adult children. Outside of work he enjoys golf, watching rugby and enjoys getting out on the water for a spot of fishing.
RESPONSIBILITIES
• Refinery and marine/jetty operations
• Refinery to Auckland Pipeline operation and management
• Process engineering
• Process control
• Operational excellence
• Emergency services
EQUITY INTEREST IN REFINING NZ2015: nil (2014: nil)
Peter GubbREFININg MANAgER
REFININ
G N
Z AN
NU
AL REPO
RT 2015
25
LEADERSH
IP TEAM PRO
FILES

David has more than 30 years experience in the refining, oil and petrochemical industry. He joined Refining NZ in 1995 and has held various roles with the Company, including in Supply Planning, Commercial, Strategy and Business Development. In these roles he has engaged extensively with company customers and other business contacts locally and internationally. Prior to moving to New Zealand and joining the Company, David worked at Sasol in South Africa in roles at various seniority levels, starting as Process Engineer and concluding as Operations Manager.
David is married with an adult son. Outside of work he likes playing golf, participating in his club’s competitions, and also enjoys music.
RESPONSIBILITIES
• Customer relations
• Hydrocarbon supply chain and refinery production planning
• Commercial arrangements with oil companies, energy suppliers and other customers
• Strategy and business opportunity development
EQUITY INTEREST IN REFINING NZ2015: 10,643, (2014: 8,143)
Denise joined Refining NZ in 2005 and was appointed to the position of Chief Financial Officer in 2009 and Company Secretary in 2010. A Chartered Accountant with over 25 years experience, Denise brings to Refining NZ her passion for leading and managing change and using disciplined financial processes to drive performance and growth. Denise has a background in Auditing and is a member of the Chartered Accountants Australia New Zealand and the Institute of Directors. Denise has recently been appointed as a Director of the Northland District Health Board.
Outside of work Denise enjoys spending time with her husband and three adult children enjoying Northland’s outdoor lifestyle.
RESPONSIBILITIES
• Finance
• Business information systems
• Corporate administration
• Contracting and procurement
• Company secretarial
• Investor relations
• Risk and assurance
EQUITY INTEREST IN REFINING NZ2015: 13,929, (2014: 13,929)
David Gray BEng (Chemical) Hons, MBA
SUPPLy CHAIN AND BUSINESS OPTIMISATION MANAgER
Denise Jensen CA
CHIEF FINANCIAL OFFICER AND COMPANy SECRETARy
REFI
NIN
G N
Z A
NN
UA
L RE
PORT
201
5
26
LEAD
ERSH
IP T
EAM
PRO
FILE
S

Kate joined Refining NZ in January 2013 as a Human Resources specialist. Having worked off shore with Merrill Lynch and Glaxo Smith Klein, followed by time with Carter Holt Harvey and then 10 years with Fonterra, Kate brings with her a breadth of industry experience. Kate has a Masters and Post Graduate Diploma in Industrial and Organisational Psychology. Kate’s management roles have been in Human Resources, Lean Sigma and Change Management.
Weekends are spent supporting children’s sports and riding horses.
RESPONSIBILITIES
• Human resources
EQUITY INTEREST IN REFINING NZ2015: nil, (2014: nil)
Prior to joining Refining NZ, Rob had worked as a Project Engineer and Maintenance Manager in both the Paper and Steel Production industries in Australia and the UK.
Rob joined Refining NZ in 1995 and over the past 20 years has fulfilled several engineering, maintenance and project management positions.
In early 2006 Rob and his family travelled to Far Eastern Russia, where Rob was seconded on a four year assignment to work for Shell on the Sakhalin Island LNG project where he led the development, training and implementation of the new LNG maintenance organisation.
Rob was appointed to the Engineering Manager position in 2013 and enjoys applying his knowledge, skills and experience to improving the delivery of engineering and maintenance services to the benefit of Refining NZ.
RESPONSIBILITIES
• Asset integrity, reliability and performance
• Inspection, integrity assurance, compliance
• Capital and maintenance projects; design, construction, drafting
• Maintenance engineering, planning and scheduling, workshops and mobile equipment
• Discipline engineers and specialists – mechanical, electrical, instrumentation, control systems, civil and facilities
• Shutdowns and turnaround planning, scheduling and delivery
EQUITY INTEREST IN REFINING NZ2015: nil, (2014: nil)
Robin Baxter BEng
ENgINEERINg MANAgER
Kate DunnBEd, Masters of Applied Sciences, Post grad Dip Ind & Org Psych
HUMAN RESOURCES MANAgER
REFININ
G N
Z AN
NU
AL REPO
RT 2015
27
LEADERSH
IP TEAM PRO
FILES

Greg has over 20 years’ experience in corporate communications, gained predominantly in the UK where he worked in the FMCG and B2B sectors for national and global businesses – including Royal Mail, Dairy Crest, Unilever, BOC Industrial Gases. Greg returned to New Zealand with his family in 2008, to work as a media relations advisor for Bank of New Zealand. He joined Refining NZ in 2009 where his role encompasses all areas of external and internal communications. Greg joined the Leadership Team in 2013.
RESPONSIBILITIES
• External communications; corporate publications, Company announcements
• Public affairs; government, media, iwi and community relations
• Internal communications
EQUITY INTEREST IN REFINING NZ2015: nil, (2014: nil)
Julian joined Refining NZ in 2002 as a process engineer for the Semi Regeneration Platformer. Prior to that he worked, in South Africa, both as a process and a control engineer in Caltex and Sasol. From 2009-2012 he concentrated on operations being the Asset Manager for the Hydrocracking complex at Refining NZ. In 2013, he was appointed to the Leadership Team as HSSE Manager.
Julian is married with two sons. Outside of work he is a keen cyclist and a collector of antique clocks.
RESPONSIBILITIES
• Health and safety
• Process safety
• Environment
• Security
EQUITY INTEREST IN REFINING NZ2015: nil, (2014: nil)
Julian Young
PhD, BSc
HSSE MANAGER
Greg McNeill BA (History), Post grad Dip (Media),
Advanced Certificate of Marketing
COMMUNICATIONS AND EXTERNAL AFFAIRS MANAGER
28
LEAD
ERSH
IP T
EAM
PRO
FILE
SRE
FIN
ING
NZ
AN
NU
AL
REPO
RT 2
015

Dave joined Refining NZ in 1984 as an Operator at the age of 23.
He has held various management roles within the Company since 1994 mainly in Operations and Maintenance. In 2001, he and his family moved to Chicago where he was seconded for 18 months in an Engineering role. He travelled the world executing hydrocracker shutdowns and start-ups as a refinery specialist. More recently, he moved to Los Angeles for 2½ years to be the Refining NZ client representative for the TMH project at Worley Parsons engineering office before coming home and continuing on the project as the Construction Manager.
Outside of work, Dave is a dedicated husband, father of three and more recently, a grandfather. He is very keen on water sports especially surfing, diving and fishing. He loves building, light engineering and is passionate about motorsport. He owns and drives a 1969 Camaro, a motorbike, and is a past President of the NZ Offroad Association.
RESPONSIBILITIES
• As Project Director, to lead the Te Mahi Hou team through all phases to completion of the $365 million project.
EQUITY INTEREST IN REFINING NZ2015: nil, (2014: nil)
Dave Cunningham PROJECT DIRECTOR
29
LEADERSH
IP TEAM PRO
FILESREFIN
ING
NZ A
NN
UA
L REPORT 2015

Economic Performance
31 Independent Auditors’ Report
32 Income Statement
33 Statement of Comprehensive Income
34 Balance Sheet
36 Statement of Changes in Equity
37 Statement of Cash Flows
38 Notes to the Financial Statements 38 1 Summary of significant accounting policies
44 2 Segment information
46 3 Income and expenses
48 4 Income tax expense
49 5 Earnings per share
49 6 Trade and other receivables
50 7 Inventory
51 8 Disposal group held for sale
52 9 Property, plant and equipment
54 10 Trade and other payables
55 11 Bank borrowings
55 12 Income tax payable/(receivable)
56 13 Deferred tax
56 14 Restoration provision
57 15 Equity
57 16 Dividends
57 17 Capital expenditure commitments
58 18 Operating lease commitments
58 19 Contingent liabilities
59 20 Related parties
62 21 Events after balance sheet date
63 22 Reconciliation of net cash flow from operating activities to reported profit
64 23 Defined benefit obligation
72 24 Financial risk management
78 25 Derivative financial instruments
79 Trend Statement
80 Non-GAAP Information
81 Corporate Directory
REFI
NIN
G N
Z A
NN
UA
L RE
PORT
201
5
30
ECo
No
mIC
PER
FoRm
ANCE

Independent Auditors’ ReportTO THE SHAREHOLDERS OF THE NEW ZEALAND REFINING COMPANY LIMITED
REPORT ON THE CONSOLIDATED FINANCIAL STATEMENTS
We have audited the consolidated financial statements of The New Zealand Refining Company Limited (“the Company”) on pages 32 to 78, which comprise the balance sheet as at 31 December 2015, the income statement, the statement of comprehensive income, the statement of changes in equity and the statement of cash flows for the year then ended, and the notes to the financial statements that include a summary of significant accounting policies and other explanatory information for the Group. The Group comprises the Company and the entities it controlled at 31 December 2015 or from time to time during the financial year.
DIRECTORS’ RESPONSIBILITY FOR THE CONSOLIDATED FINANCIAL STATEMENTS
The Directors are responsible on behalf of the Company for the preparation and fair presentation of these consolidated financial statements in accordance with New Zealand Equivalents to International Financial Reporting Standards and for such internal controls as the Directors determine are necessary to enable the preparation of consolidated financial statements that are free from material misstatement, whether due to fraud or error.
AUDITORS’ RESPONSIBILITY
Our responsibility is to express an opinion on these consolidated financial statements based on our audit. We conducted our audit in accordance with International Standards on Auditing (New Zealand). These standards require that we comply with relevant ethical requirements and plan and perform the audit to obtain reasonable assurance about whether the consolidated financial statements are free from material misstatement.
An audit involves performing procedures to obtain audit evidence about the amounts and disclosures in the consolidated financial statements. The procedures selected depend on the auditors’ judgement, including the assessment of the risks of material misstatement of the consolidated financial statements, whether due to fraud or error. In making those risk assessments, the auditors consider the internal controls relevant to the Company’s preparation and fair presentation of the consolidated financial statements in order to design audit procedures that are appropriate in the circumstances, but not for the purpose of expressing an opinion on the effectiveness of the Company’s internal control. An audit also includes evaluating the appropriateness of accounting policies used and the reasonableness of accounting estimates, as well as evaluating the overall presentation of the consolidated financial statements.
We believe that the audit evidence we have obtained is sufficient and appropriate to provide a basis for our audit opinion.
We are independent of the Group. Our firm carries out other services for the Group in the areas of treasury market updates and AGM scrutineering. The provision of these other services has not impaired our independence.
OPINION
In our opinion, the consolidated financial statements on pages 32 to 78 present fairly, in all material respects, the financial position of the Group as at 31 December 2015, and its financial performance and cash flows for the year then ended in accordance with New Zealand Equivalents to International Financial Reporting Standards.
RESTRICTION ON USE OF OUR REPORT
This report is made solely to the Company’s shareholders, as a body, in accordance with the Companies Act 1993. Our audit work has been undertaken so that we might state those matters which we are required to state to them in an auditors’ report and for no other purpose. To the fullest extent permitted by law, we do not accept or assume responsibility to anyone other than the Company and the Company’s shareholders, as a body, for our audit work, for this report or for the opinions we have formed.
Chartered Accountants AUCKLAND 23 February 2016
REFININ
G N
Z AN
NU
AL REPO
RT 2015
31
ECONOM
IC PERFORMAN
CE

NOTE
GROUP 2015 $000
GROUP 2014 $000
INCOME
Operating revenue 3 445,186 230,557
Other income 3 1,563 1,066
Other gains 3 22 1,396
TOTAL INCOME 446,771 233,019
EXPENSES
Purchase of process materials and utilities 3 59,200 55,191
Materials and contractor payments 3 24,279 17,901
Wages, salaries and benefits 3 52,798 48,762
Depreciation and disposal costs 3 72,109 71,832
Other operating losses 3 10 416
Administration and other costs 3 25,958 22,447
TOTAL EXPENSES 234,354 216,549
NET PROFIT BEFORE FINANCE COSTS 212,417 16,470
FINANCE COSTS
Finance income (148) (333)
Finance cost 2,903 2,813
NET FINANCE COSTS 3 2,755 2,480
Net profit before income tax 3 209,662 13,990
Less income tax 4 58,731 3,967
NET PROFIT AFTER INCOME TAX 150,931 10,023
ATTRIBUTABLE TO:
Owners of the Parent 150,771 9,941
Non-controlling interest 160 82
150,931 10,023
EARNINGS PER SHARE FOR PROFIT ATTRIBUTABLE TO THE SHAREHOLDERS OF THE NEW ZEALAND REFINING COMPANY LIMITED:
CENTS CENTS
Basic earnings per share 5 48.2 3.2
Diluted earnings per share 5 48.2 3.2
THE ABOVE INCOME STATEMENT IS TO BE READ IN CONJUNCTION WITH THE NOTES ON PAGES 38 TO 78.
Income StatementFOR THE YEAR ENDED 31 DECEMBER 2015
REFI
NIN
G N
Z A
NN
UA
L RE
PORT
201
5
32
ECON
OMIC
PER
FORM
ANCE

Statement of Comprehensive IncomeFOR THE YEAR ENDED 31 DECEMBER 2015
NOTE
GROUP 2015 $000
GROUP 2014 $000
NET PROFIT AFTER INCOME TAX 150,931 10,023
OTHER COMPREHENSIVE INCOME
Items that will not be reclassified to the Income Statement
Defined benefit plan actuarial gain/(loss) 23(j) 8,213 (9,515)
Deferred tax on defined benefit actuarial (gain)/loss (2,300) 2,664
Total items that will not be reclassified to the Income Statement 5,913 (6,851)
Items that may be subsequently reclassified to the Income Statement
Movement in cash flow hedge reserve (5,167) (3,947)
Deferred tax on movement in cash flow hedge reserve 1,447 1,105
Total items that may be subsequently reclassified to the Income Statement (3,720) (2,842)
TOTAL OTHER COMPREHENSIVE INCOME/(LOSS), AFTER INCOME TAX 2,193 (9,693)
TOTAL COMPREHENSIVE INCOME FOR THE YEAR, AFTER INCOME TAX 153,124 330
ATTRIBUTABLE TO:
Owners of the Parent 152,964 248
Non-controlling interest 160 82
153,124 330
THE ABOVE STATEMENT OF COMPREHENSIVE INCOME IS TO BE READ IN CONJUNCTION WITH THE NOTES ON PAGES 38 TO 78.
REFININ
G N
Z AN
NU
AL REPO
RT 2015
33
ECONOM
IC PERFORMAN
CE
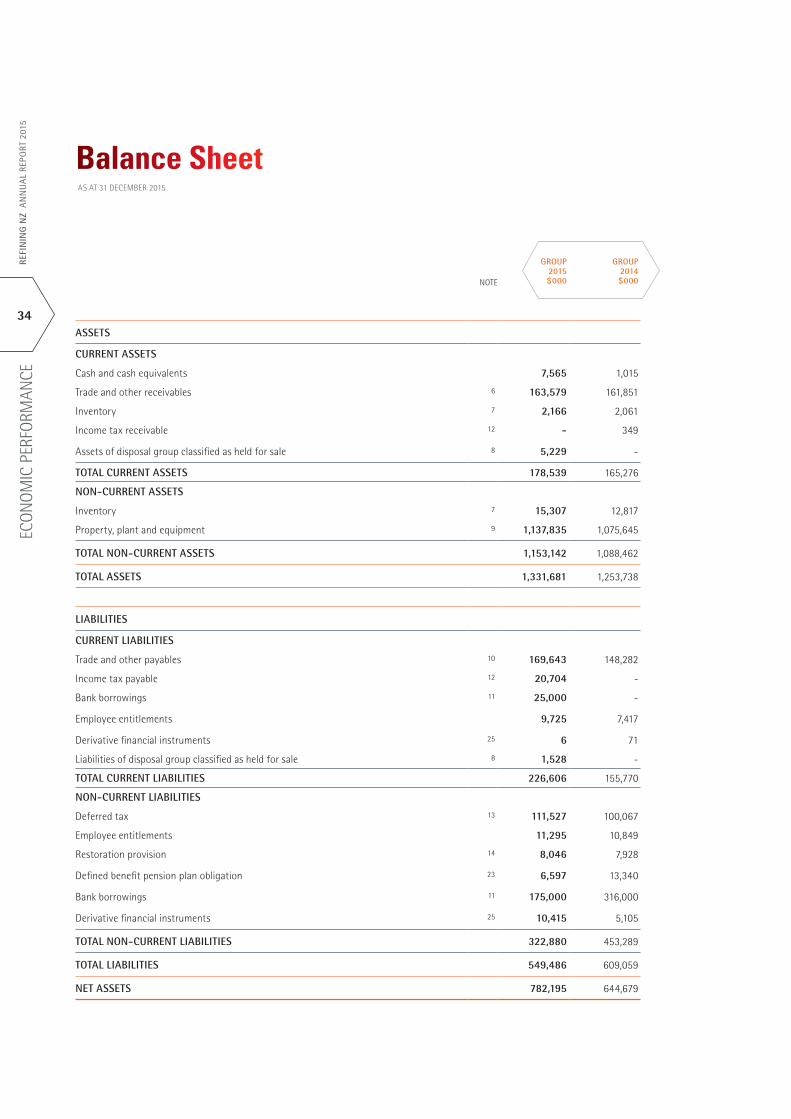
Balance SheetAS AT 31 DECEMBER 2015
NOTE
GROUP 2015 $000
GROUP 2014 $000
ASSETS
CURRENT ASSETS
Cash and cash equivalents 7,565 1,015
Trade and other receivables 6 163,579 161,851
Inventory 7 2,166 2,061
Income tax receivable 12 - 349
Assets of disposal group classified as held for sale 8 5,229 -
TOTAL CURRENT ASSETS 178,539 165,276
NON-CURRENT ASSETS
Inventory 7 15,307 12,817
Property, plant and equipment 9 1,137,835 1,075,645
TOTAL NON-CURRENT ASSETS 1,153,142 1,088,462
TOTAL ASSETS 1,331,681 1,253,738
LIABILITIES
CURRENT LIABILITIES
Trade and other payables 10 169,643 148,282
Income tax payable 12 20,704 -
Bank borrowings 11 25,000 -
Employee entitlements 9,725 7,417
Derivative financial instruments 25 6 71
Liabilities of disposal group classified as held for sale 8 1,528 -
TOTAL CURRENT LIABILITIES 226,606 155,770
NON-CURRENT LIABILITIES
Deferred tax 13 111,527 100,067
Employee entitlements 11,295 10,849
Restoration provision 14 8,046 7,928
Defined benefit pension plan obligation 23 6,597 13,340
Bank borrowings 11 175,000 316,000
Derivative financial instruments 25 10,415 5,105
TOTAL NON-CURRENT LIABILITIES 322,880 453,289
TOTAL LIABILITIES 549,486 609,059
NET ASSETS 782,195 644,679
REFI
NIN
G N
Z A
NN
UA
L RE
PORT
201
5
34
ECON
OMIC
PER
FORM
ANCE

Balance SheetAS AT 31 DECEMBER 2015
NOTE
GROUP 2015 $000
GROUP 2014 $000
EQUITY
Contributed equity 15 265,771 265,771
Cash flow hedge reserve 15 (7,503) (3,783)
Retained profits 523,200 382,068
EQUITY ATTRIBUTABLE TO OWNERS OF THE PARENT 781,468 644,056
Non-controlling interest 727 623
TOTAL EQUITY 782,195 644,679
THE BOARD OF DIRECTORS OF THE NEW ZEALAND REFINING COMPANY LIMITED AUTHORISED THESE FINANCIAL STATEMENTS FOR ISSUE ON 23 FEBRUARY 2016.
For and on behalf of the Board:
S C ALLEN DIRECTOR P M SPRINGFORD DIRECTOR
THE ABOVE BALANCE SHEET IS TO BE READ IN CONJUNCTION WITH THE NOTES ON PAGES 38 TO 78.
REFININ
G N
Z AN
NU
AL REPO
RT 2015
35
ECONOM
IC PERFORMAN
CE

ATTRIBUTABLE TO THE OWNERS OF THE PARENT
Statement of Changes in EquityFOR THE YEAR ENDED 31 DECEMBER 2015
GROUP
NOTE
CONTRIBUTED EQUITY
$000
CASH FLOW HEDGE
RESERVE $000
RETAINED PROFITS
$000
TOTAL $000
NON-CONTROLLING
INTEREST $000
TOTAL EQUITY
$000
AT 1 JANUARY 2014 212,400 (941) 378,960 590,419 682 591,101
COMPREHENSIVE INCOME
Net profit after income tax - - 9,941 9,941 82 10,023
Other comprehensive income
Foreign exchange hedges transferred to property, plant and equipment - 3,445 - 3,445 - 3,445
Foreign exchange contracts entered into during the year - (5) - (5) - (5)
Movement in value of foreign exchange contracts held throughout the year - 50 - 50 - 50
Interest rate swaps entered into during the year - (6,030) - (6,030) - (6,030)
Movement in value of interest rate swaps held throughout the year - (1,407) - (1,407) - (1,407)
Defined benefit actuarial loss 23(j) - - (9,515) (9,515) - (9,515)
Deferred tax on other comprehensive income - 1,105 2,664 3,769 - 3,769
TOTAL OTHER COMPREHENSIVE INCOME, AFTER INCOME TAX - (2,842) (6,851) (9,693) - (9,693)
TRANSACTIONS WITH OWNERS OF THE PARENT
Proceeds from issuance of shares 53,371 - - 53,371 - 53,371
Unclaimed dividends written back - - 18 18 - 18
Dividends paid - - - - (141) (141)
TOTAL TRANSACTIONS WITH OWNERS OF THE PARENT 53,371 - 18 53,389 (141) 53,248
AT 31 DECEMBER 2014 265,771 (3,783) 382,068 644,056 623 644,679
COMPREHENSIVE INCOME
Net profit after income tax - - 150,771 150,771 160 150,931
Other comprehensive income
Foreign exchange hedges transferred to property, plant and equipment - 150 - 150 - 150
Foreign exchange contracts entered into during the year - (17) - (17) - (17)
Movement in value of foreign exchange contracts held throughout the year - 104 - 104 - 104
Movement in value of interest rate swaps held throughout the year - (5,404) - (5,404) - (5,404)
Defined benefit actuarial gain 23(j) - - 8,213 8,213 - 8,213
Deferred tax on other comprehensive income - 1,447 (2,300) (853) - (853)
TOTAL OTHER COMPREHENSIVE INCOME, AFTER INCOME TAX - (3,720) 5,913 2,193 - 2,193
TRANSACTIONS WITH OWNERS OF THE PARENT
Value of employee services - - 75 75 - 75
Unclaimed dividends written back - - 2 2 - 2
Dividends paid 16 - - (15,629) (15,629) (56) (15,685)
TOTAL TRANSACTIONS WITH OWNERS OF THE PARENT - - (15,552) (15,552) (56) (15,608)
AT 31 DECEMBER 2015 265,771 (7,503) 523,200 781,468 727 782,195
THE ABOVE STATEMENT OF CHANGES IN EQUITY IS TO BE READ IN CONJUNCTION WITH THE NOTES ON PAGES 38 TO 78.
REFI
NIN
G N
Z A
NN
UA
L RE
PORT
201
5
36
ECON
OMIC
PER
FORM
ANCE

Statement of Cash FlowsFOR THE YEAR ENDED 31 DECEMBER 2015
NOTE
GROUP 2015 $000
GROUP 2014 $000
CASH FLOWS FROM OPERATING ACTIVITIES
Receipts from customers 445,983 200,959
Payments for supplies and expenses (107,493) (100,587)
Payments to employees (48,499) (48,212)
CASH GENERATED FROM OPERATIONS 289,991 52,160
Interest received 148 333
Interest paid (2,622) (2,283)
GST received 4,036 8,488
Income tax (paid)/received (26,998) 8,079
(25,436) 14,617
NET CASH INFLOW FROM OPERATING ACTIVITIES 22 264,555 66,777
CASH FLOWS FROM INVESTING ACTIVITIES
Payments for property, plant and equipment and computer software (128,635) (219,723)
Proceeds from sale of property, plant and equipment 2,656 12,381
NET CASH OUTFLOW FROM INVESTING ACTIVITIES (125,979) (207,342)
CASH FLOWS FROM FINANCING ACTIVITIES
(Repayments of)/proceeds from non-current bank borrowings (116,000) 88,000
Proceeds from share issue - 53,371
Unclaimed dividends 7 18
Dividends paid to shareholders 16 (15,629) -
Dividends paid to non-controlling interest (56) (141)
NET CASH OUTFLOW FROM FINANCING ACTIVITIES (131,678) 141,248
NET INCREASE IN CASH AND CASH EQUIVALENTS 6,898 683
Cash and cash equivalents at the beginning of the year 1,015 332
CASH AND CASH EQUIVALENTS AT THE END OF THE YEAR 7,913 1,015
CLASSIFIED AS:
Cash and cash equivalents 7,565 1,015
Cash and cash equivalents classified as held for sale 8 348 -
7,913 1,015
THE ABOVE STATEMENT OF CASH FLOWS IS TO BE READ IN CONJUNCTION WITH THE NOTES ON PAGES 38 TO 78.
THE CASH FLOWS ARE EXCLUSIVE OF GST.
REFININ
G N
Z AN
NU
AL REPO
RT 2015
37
ECONOM
IC PERFORMAN
CE

Notes to the Financial StatementsFOR THE YEAR ENDED 31 DECEMBER 2015
1 Summary of significant accounting policies
GENERAL INFORMATIONThe consolidated financial statements for the ‘Group’ are for the economic entity comprising The New Zealand Refining Company Limited (‘Parent’ or ‘Company’) and its subsidiary, Independent Petroleum Laboratory Limited.
The Group operates New Zealand’s only oil refinery, at Marsden Point near Whangarei. The Group is a toll refiner, and the crude oils and feedstocks refined into transport fuels are owned by the oil company customers with the Group earning a processing fee. The Group also owns and operates a pipeline, running from the refinery at Marsden Point to Wiri, located in South Auckland. This pipeline transports refined fuels for consumption within the Auckland market.
The New Zealand Refining Company Limited is incorporated in New Zealand, registered under the Companies Act 1993 and is a FMC Reporting Entity under Part 7 of the Financial Markets Conduct Act 2013 (‘FMC Act 2013’). The registered office is Marsden Point, Whangarei, New Zealand.
The Group is designated as a for profit entity for financial reporting purposes.
These financial statements were approved by the Directors on 23 February 2016.
The principal accounting policies adopted in the preparation of these financial statements are set out below. These policies have been consistently applied to all the years presented, unless otherwise stated.
(a) Basis of preparation of financial statements
Basis of preparation
These financial statements have been prepared in accordance with the requirements of the FMC Act 2013 and the NZX Main Board Listing Rules. In accordance with the FMC Act 2013, because Group financial statements are prepared and presented for The New Zealand Refining Company Limited and its subsidiary, separate financial statements for The New Zealand Refining Company Limited are no longer required to be prepared and presented. In accordance with this legislation, these financial statements comply with Generally Accepted Accounting Practice in New Zealand and the New Zealand equivalents to the International Financial Reporting Standards (‘NZ IFRS’). These financial statements also comply with International Financial Reporting Standards.
The historical cost convention, as modified by the revaluation of certain assets and liabilities as indicated in the specific accounting policies below, has been adopted during the preparation of these financial statements. These financial statements are presented in New Zealand dollars and all values are rounded to the nearest thousand dollars ($000), unless otherwise stated.
Comparatives for materials and administration expenses (note 3), totalling $447K have been updated to ensure consistency between financial reporting periods.
Comparatives for classification of inventory between current and non-current assets (note 7) totalling $12.8M, have been updated based on an assessment of expected future use.
Critical accounting estimates and judgements
The preparation of financial statements requires the use of certain critical accounting estimates. It also requires Management to exercise their judgement in the process of applying the Group’s accounting policies. Estimates and judgements are continually evaluated and are based on historical experience and other factors, including expectations of future events that are believed to be reasonable under the circumstances.
In the process of applying the Group’s accounting policies, the following areas involve judgement and assumptions that can significantly affect the amounts recognised in the financial statements:
(i) Property, plant and equipment
Judgements have been made in relation to the Group’s depreciation rates as per note 1(p). Management has also made judgements around the appropriateness and recoverability of the capital work in progress balance as at 31 December 2015.
(ii) Defined benefit pension plan obligation
The present value of the defined benefit pension plan obligation depends on a number of factors that are determined by an independent actuary using a number of assumptions. The assumptions include the expected rate of salary increases, mortality in retirement and an appropriate discount rate. Any changes in these assumptions will impact the carrying amount of pension obligations.
These assumptions are determined by the Company, in consultation with the independent actuary and are disclosed in note 23.
(iii) Restoration provision
The present value of the Group’s restoration provision depends on a number of assumptions including estimated timing, restoration costs and the discount rate used. Any changes in these assumptions will impact the carrying amount of the restoration provision. Management assesses the appropriateness of these at each balance date. The discount rate used is disclosed in note 14.
(iv) Inventory obsolescence provision
Management has written down the carrying value of some inventories to estimated net realisable value, taking into account the age and condition of individual inventory items held, of which estimates and assumptions had to be made. The obsolescence provision is disclosed in note 7 with any movement in the provision disclosed in note 3.
REFI
NIN
G N
Z A
NN
UA
L RE
PORT
201
5
38
ECON
OMIC
PER
FORM
ANCE

(b) Changes in accounting policies and disclosures
No new standards and amendments have been adopted by the Group for the year ended 31 December 2015.
The International Accounting Standards Board has issued a number of standards, amendments and interpretations which are not yet effective and which may have an impact on the Group’s financial statements. These are detailed below. The Group has not yet applied these in preparing these financial statements and will apply each standard in the period in which they become mandatory.
Standard Description Mandatory for Year Ending
NZ IFRS 9 ‘Financial Instruments – Classification and Measurement’. Addresses the classification, measurement and de-recognition of financial assets, financial liabilities, impairment of financial assets and hedge accounting.
31 December 2018
NZ IFRS 15 ‘Revenue from Contracts with Customers’. Establishes the framework for revenue recognition.
31 December 2018
NZ IFRS 16 ‘Leases’. Requires a lessee to recognise a lease liability reflecting future lease payments and a ‘right-of-use asset’ for virtually all lease contracts.
31 December 2019
The Group has not yet assessed the potential impact of these standards.
(c) Basis of consolidation
Subsidiaries are all entities over which the Group has control. The Group controls an entity when the Group is exposed to, or has rights to, variable returns from its involvement with the entity and has the ability to affect those returns through its power over the entity. Subsidiaries are fully consolidated from the date on which control is transferred to the Group. They are deconsolidated from the date that control ceases.
Intercompany transactions, balances and unrealised gains on transactions between Group companies are eliminated on consolidation. Unrealised losses are also eliminated unless the transaction provides evidence of the impairment of the asset transferred. Accounting policies of subsidiaries have been changed where necessary to ensure consistency with the policies adopted by the Group.
Transactions with non-controlling interests that do not result in loss of control are accounted for as equity transactions – that is, as transactions with the owners in their capacity as owners. The difference between fair value of any consideration paid and the relevant share acquired of the carrying value of net asset of the subsidiary is recorded in equity. Gains or losses on disposals to non-controlling interests are also recorded in equity.
(d) Segment reporting
Operating segments are reported in a manner consistent with the internal reporting provided to the chief operating decision-maker. The chief operating decision-maker, who is responsible for allocating resources and assessing performance of the operating segments, has been identified as the Leadership Team.
(e) Foreign currency translation
(i) Functional and presentation currency
Items included in the financial statements of each of the Group’s entities are measured in New Zealand dollars, being the currency of the primary economic environment in which the entity operates (‘the functional currency’). The Group financial statements are presented in New Zealand dollars, which is the presentation currency.
(ii) Transactions and balances
Foreign currency transactions are translated into the functional currency using the exchange rates prevailing at the dates of the transactions. Foreign exchange gains and losses resulting from the settlement of such transactions and from the translation at year-end exchange rates of monetary assets and liabilities denominated in foreign currencies are recognised in the Income Statement, except when deferred in other comprehensive income as qualifying cash flow hedges.
(f) Revenue recognition
Revenue comprises the fair value of the consideration received or receivable in the ordinary course of the Group’s activities for the sale of goods and services, excluding Goods and Services Tax (‘GST’) after eliminating sales within the Group. The Group recognises revenue when the amount of revenue can be reliably measured, it is probable that future economic benefits will flow to the entity and when specific criteria have been met for each of the Group’s activities as described below:
Operating revenue
(i) Processing fee (oil refining)
The processing fee is recognised when the Group has processed crude oil into refined products for the customer.
1 Summary of significant accounting policies cont.
Notes to the Financial StatementsFOR THE YEAR ENDED 31 DECEMBER 2015
REFININ
G N
Z AN
NU
AL REPO
RT 2015
39
ECONOM
IC PERFORMAN
CE

Notes to the Financial StatementsFOR THE YEAR ENDED 31 DECEMBER 2015
(ii) Pipeline fee (distribution)
The pipeline fee is recognised when the products have been transferred to the Wiri Oil terminal in South Auckland.
(iii) Wiri Oil terminal rental
Rental income from operating leases is recognised on a straight-line basis in accordance with the substance of the relevant agreements and in accordance with note 1(h).
Interest income
Interest income is recognised on a time proportion basis using the effective interest method.
(g) Income tax
The income tax expense for the year is the tax payable on the current year’s taxable income based on the New Zealand income tax rate adjusted by changes in deferred tax assets and liabilities attributable to temporary differences between the tax bases of assets and liabilities and their carrying amounts in the financial statements and to unused tax losses.
Deferred tax assets and liabilities are recognised for temporary differences at the tax rates expected to apply when the assets are recovered or liabilities are settled, based on those tax rates which are enacted or substantively enacted. The relevant tax rates are applied to the cumulative amounts of deductible and taxable temporary differences to measure the deferred tax assets or liabilities. An exception is made for certain temporary differences arising from the initial recognition of an asset or liability. No deferred tax asset or liability is recognised in relation to these temporary differences if they arose in a transaction, other than a business combination, that at the time of the transaction did not affect either accounting profit or taxable profit or loss.
Deferred tax assets are recognised for deductible temporary differences and unused tax losses only if it is probable that future taxable amounts will be available to utilise those temporary differences and losses.
Current and deferred tax balances attributable to amounts recognised in other comprehensive income or directly in equity are also recognised in other comprehensive income or directly in equity, respectively.
(h) Leases
Leases in which a significant portion of risks and rewards of ownership are retained by the lessor are classified as operating leases. Payments made under operating leases (net of any incentives received from the lessor) are charged to the Income Statement on a straight-line basis over the period of the lease.
When assets are leased out under an operating lease, the assets are included in the Balance Sheet as property, plant and equipment. Lease income is recognised over the term of the lease on a straight-line basis.
(i) Impairment of assets
(i) Non-financial assets
Non-financial assets are reviewed for impairment whenever events or changes in circumstances indicate that the carrying amount may not be recoverable. An impairment loss is recognised in the Income Statement for the amount by which the asset’s carrying amount exceeds its recoverable amount. The recoverable amount is the higher of an asset’s fair value less costs to sell and its value in use. For the purposes of assessing impairment, assets are grouped at the lowest levels for which there are separately identifiable cash flows (cash generating units). Non-financial assets that suffered an impairment are reviewed for possible reversal of the impairment at each reporting date.
(ii) Financial assets - assets carried at amortised cost
The Group assesses at the end of each reporting period whether there is objective evidence that a financial asset or group of financial assets is impaired. A financial asset or a group of financial assets is impaired and impairment losses are incurred only if there is objective evidence of impairment as a result of one or more events that occurred after the initial recognition of the asset (a ‘loss event’) and that loss event (or events) has an impact on the estimated future cash flows of the financial asset or group of financial assets that can be reliably estimated.
Evidence of impairment may include indications that the debtors or a group of debtors is experiencing significant financial difficulty, default or delinquency in interest or principal payments, the probability that they will enter bankruptcy or other financial reorganisation, and where observable data indicate that there is a measurable decrease in the estimated future cash flows, such as changes in arrears or economic conditions that correlate with defaults.
The amount of the loss is measured as the difference between the asset’s carrying amount and the present value of estimated future cash flows (excluding future credit losses that have not been incurred) discounted at the financial asset’s original effective interest rate and is recognised within administration and other costs in the Income Statement.
If, in a subsequent period, the amount of the impairment loss decreases and the decrease can be related objectively to an event occurring after the impairment was recognised (such as an improvement in the debtor’s credit rating), the reversal of the previously recognised impairment loss is recognised within ‘administration and other costs’ in the Income Statement.
(j) Cash and cash equivalents
Cash and cash equivalents includes cash on hand, deposits held at call with financial institutions, other short-term, highly liquid investments with original maturities of three months or less that are readily convertible to known amounts of cash and which are subject to an insignificant risk of changes in value, and bank overdrafts.
1 Summary of significant accounting policies cont.
REFI
NIN
G N
Z A
NN
UA
L RE
PORT
201
5
40
ECON
OMIC
PER
FORM
ANCE

(k) Trade and other receivables
Trade receivables are recognised initially at fair value and subsequently measured at amortised cost using the effective interest rate method, less impairment.
(l) Inventories
Inventories are stated at the lower of cost or net realisable value. Inventories comprise spare parts and consumables. Cost is determined using the weighted average cost method. Inventories are classified as current assets where usage is expected to be within 12 months, and as non-current assets where usage is expected after 12 months.
(m) Non-current assets (or disposal groups) held for sale
Non-current assets, or disposal groups comprising assets and liabilities, are classified as assets held for sale when their carrying amount is to be recovered principally through a sale transaction and a sale is considered highly probable. They are stated at the lower of carrying amount and fair value less costs to sell.
(n) Financial assets and liabilities
Classification
The classification of financial assets and liabilities depends on the purpose for which the financial assets and liabilities were acquired. Management determines the classification of the Group’s financial assets and liabilities at initial recognition. Financial assets are classified on initial recognition into the following categories: at fair value through profit or loss, loans and receivables, and available-for-sale financial assets. Financial liabilities are classified as either at fair value through profit or loss, or financial liabilities measured at amortised cost. The Group has not had any available-for-sale financial assets in the periods covered by these financial statements.
(i) Financial assets and liabilities at fair value through profit or loss
Financial assets and liabilities at fair value through profit or loss are financial assets and liabilities held for trading or designated as at fair value through profit and loss. Derivatives are also categorised as held for trading unless they are designated as hedges.
(ii) Loans and receivables
Loans and receivables are non-derivative financial assets with fixed or determinable payments that are not quoted in an active market. They are included in current assets, except for loans and receivables with maturities greater than 12 months after the balance sheet date. These are classified as non-current assets. The Group’s loans and receivables comprise ‘trade and other receivables’ and ‘cash and cash equivalents’ in the Balance Sheet.
(iii) Financial liabilities measured at amortised cost
Financial liabilities measured at amortised cost are non-derivative financial liabilities with fixed or determinable payments that are not quoted in an active market. Trade and other payables, borrowings and bank overdrafts are classified as financial liabilities measured at amortised cost.
Recognition and measurement
Regular purchases and sales of financial assets and liabilities are recognised on the trade-date, which is the date on which the Group commits to purchase or sell the asset or liability. Financial assets or liabilities are recognised initially at their fair values plus, in the case of a financial asset or liability not at fair value through profit or loss, transaction costs that are directly attributable to the acquisition or issue of the instrument. Financial assets and liabilities carried at fair value through profit or loss are initially recognised at fair value and transaction costs are expensed in the Income Statement.
After initial recognition, financial assets are measured at their fair values except for loans and receivables which are measured at amortised cost using the effective interest method. After initial recognition, financial liabilities are measured at amortised cost using the effective interest method except for financial liabilities at fair value through profit or loss.
Financial assets are derecognised when the rights to receive cash flows from the financial assets have expired or have been transferred and the Group has transferred substantially all risks and rewards of ownership. Financial liabilities are derecognised if the Group’s obligations specified in the contract expire or are discharged or cancelled.
(o) Derivative financial instruments and hedging activities
The Group uses forward exchange contracts and foreign exchange options to hedge certain capital purchases and interest rate swaps to manage interest rate risk.
These derivatives are initially recognised at fair value on the date a derivative contract is entered into and are subsequently remeasured at their fair value. The method of recognising the resulting gain or loss depends on whether the derivative is designated as a hedging instrument, and if so, the nature of the item being hedged.
The Group designates certain derivatives as hedges of a particular risk associated with a recognised asset or liability or a highly probable forecast transaction (cash flow hedge).
The Group documents at the inception of the transaction the relationship between hedging instruments and hedged items, as well as its risk management objectives and strategy for undertaking various hedging transactions. The Group also documents its assessment, both at hedge inception and on an ongoing basis, of whether the derivatives that are used in hedging transactions are highly effective in offsetting changes in fair values or cash flows of hedged items.
Notes to the Financial StatementsFOR THE YEAR ENDED 31 DECEMBER 2015
1 Summary of significant accounting policies cont.
REFININ
G N
Z AN
NU
AL REPO
RT 2015
41
ECONOM
IC PERFORMAN
CE

Notes to the Financial StatementsFOR THE YEAR ENDED 31 DECEMBER 2015
The full fair value of a hedging derivative is classified as a non-current asset or liability when the remaining hedged item is more than 12 months, and as a current asset or liability when the remaining maturity of the hedged item is less than 12 months. Trading derivatives are classified as a current asset or liability.
Cash flow hedge
The effective portion of changes in the fair value of derivatives that are designated and qualify as cash flow hedges is recognised in equity in the cash flow hedge reserve. The gain or loss relating to the ineffective portion is recognised immediately in other operating gains/losses in the Income Statement.
Amounts accumulated in equity are recycled in the Income Statement in the periods when the hedged item affects profit or loss.
However, when the forecast transaction that is hedged results in the recognition of a non-financial asset (for example, property, plant and equipment), the gains and losses previously deferred in equity are transferred from equity and included in the initial measurement of the cost of the asset. The deferred amounts are ultimately recognised in the Income Statement (for example, as depreciation).
When a hedging instrument expires or is sold, or when a hedge no longer meets the criteria for hedge accounting, any cumulative gain or loss existing in equity at that time remains in equity and is recognised when the forecast transaction is ultimately recognised in the Income Statement. When a forecast transaction is no longer expected to occur, the cumulative gain or loss that was reported in equity is immediately transferred to the Income Statement within ‘other operating losses’.
(p) Property, plant and equipment
The Group has eight classes of property, plant and equipment:
- Freehold land and improvements
- Buildings and jetties
- Refining plant
- Catalysts
- Refinery to Auckland Pipeline
- Wiri Oil terminal (leased)
- Equipment and vehicles
- Capital work in progress.
All classes of property, plant and equipment are initially recorded at cost. Cost includes expenditure that is directly attributable to the acquisition of the items. Cost may include transfers from equity of any gains/losses on qualifying cash flow hedges of foreign currency purchases of property, plant and equipment.
Subsequent costs are included in the assets’ carrying amount or recognised as a separate asset, as appropriate, only when it is probable that future economic benefits associated with the item will flow to the Group and the cost of the item can be measured reliably. The carrying amount of the replaced part is derecognised. All other subsequent costs are charged to the Income Statement during the financial period in which they are incurred.
Major inspections associated with planned plant shutdowns and tank maintenance are capitalised at cost and recognised in the carrying amount of the refining plant, provided the recognition criteria are met.
When an asset is disposed of, any gain or loss on disposal is calculated as the difference between the disposal proceeds and the carrying value of the asset, and is recognised within ‘other gains’ in the Income Statement.
Depreciation is provided on a straight-line basis on all property, plant and equipment other than freehold land, capital work in progress and precious metals (rhenium) contained in certain catalysts. The depreciation rates applied to allocate the assets’ cost less estimated residual value (which is zero in all cases except for catalyst containing precious metals), over the estimated useful lives, are as follows:
Useful lives (years)
Freehold improvements 20
Buildings and jetties 20
Refining plant:
• tankage 40-50
• rotating equipment 20-30
• piping 20-50
• vessels and columns 25-40
• instruments 10-15
• electrical and electrical cabling 15-25
• plant shutdown and tank maintenance 2-20
• other refining plant 10-65
Catalysts 3-10
Refinery to Auckland Pipeline 20-76
Wiri Oil terminal (leased) 20
Equipment and vehicles 3-7
Capital work in progress n/a
(q) Trade and other payables
These amounts represent liabilities for goods and services provided to the Group prior to the end of the financial year that are unpaid. The amounts are unsecured and are usually paid within 30 days of recognition.
Trade payables are initially recognised at the invoiced amount. Due to their short-term nature, trade payables are not subsequently re-measured at amortised cost (using the effective interest rate method), as the impact of using the effective interest rate method is not material.
1 Summary of significant accounting policies cont.
REFI
NIN
G N
Z A
NN
UA
L RE
PORT
201
5
42
ECON
OMIC
PER
FORM
ANCE

(r) Borrowings
Borrowings are initially recognised at fair value, net of transaction costs incurred. Borrowings are subsequently measured at amortised cost. Any difference between the proceeds (net of transaction costs) and the redemption amount is recognised in the Income Statement over the period of the borrowings using the effective interest method.
Borrowings are classified as current liabilities unless the Group has an unconditional right to defer settlement for at least 12 months after the balance sheet date.
Borrowing costs directly attributable to the acquisition, construction or production of a qualifying asset are capitalised as part of the cost of that asset.
(s) Provisions
Provisions are recognised when: the Group has a legal or constructive obligation as a result of past events; it is more likely than not that an outflow of resources will be required to settle the obligation; and the amount has been reliably estimated. Provisions are not recognised for future operating losses.
Where there are a number of similar obligations, the likelihood that an outflow will be required in settlement is determined by considering the class of obligations as a whole. A provision is recognised even if the likelihood of an outflow with respect to any one item included in the same class of obligations may be small.
Provisions are measured at the present value of the expenditures expected to be required to settle the obligation using a pre-tax rate that reflects current market assessments of the time value of money and the risks specific to the obligation. The increase in the provision due to passage of time is recognised as finance costs.
(t) Employee entitlements
(i) Wages and salaries, annual leave and sick leave
Liabilities for wages and salaries, including non-monetary benefits, annual leave and accumulating sick leave expected to be settled within 12 months of the balance sheet date are recognised in respect of employees’ services up to the balance sheet date and are measured at the amounts expected to be paid when the liabilities are settled. Liabilities for non-accumulating sick leave are recognised when the leave is taken and measured at the rates paid or payable.
(ii) Long-service leave and retirement bonus
Liabilities for long-service leave and retirement bonuses are based on an actuarial assessment and represent the present value of the estimated future cash outflows, which are expected as a result of employee services provided up to balance sheet date.
(iii) Pension obligations
The Group has both a defined benefit pension plan and defined contribution pension plan.
Defined benefit pension plan
The defined benefit pension plan defines an amount of pension benefit that an employee will receive on retirement, usually dependent on a combination of factors, such as age, years of service and compensation.
The liability recognised in the Balance Sheet in respect of the defined benefit pension plan is the present value of the defined benefit pension plan obligation at the balance sheet date less the fair value of plan assets.
The defined benefit pension plan obligation is calculated annually by independent actuaries using the projected unit credit method. The present value of the defined benefit pension plan obligation is determined by discounting the estimated future cash outflows using interest rates of government bonds that have terms to maturity approximating the terms of the related pension liability.
Actuarial gains and losses arising from experience adjustments and changes in actuarial assumptions are charged or credited to equity in other comprehensive income in the period in which they arise.
Past-service costs are recognised immediately in income.
The defined benefit pension plan was closed to new members on 31 December 2002.
Defined contribution pension plan
A defined contribution pension plan is a pension plan under which the Group pays fixed contributions into a separate entity. The Group has no legal or constructive obligations once the contributions have been paid. The contributions are recognised as an employee benefit expense when they are due. Prepaid contributions are recognised as an asset to the extent that a cash refund or a reduction in the future payments is available.
The defined contribution pension plan commenced on 1 January 2003.
Notes to the Financial StatementsFOR THE YEAR ENDED 31 DECEMBER 2015
1 Summary of significant accounting policies cont.
REFININ
G N
Z AN
NU
AL REPO
RT 2015
43
ECONOM
IC PERFORMAN
CE

1 Summary of significant accounting policies cont.
(iv) Medical plan
There is an arrangement in place for the Group to pay health insurance premiums in respect of 21 former and current employees when they retire. This arrangement is no longer offered to new employees. The medical plan is accounted for in a similar manner to the defined benefit pension plan (refer note t(iii)).
(v) Employee incentive schemes
The Group recognises a liability and an expense for employee incentive schemes, based on a formula that takes into consideration measures such as safety statistics, plant reliability and costs. The Group recognises a provision where contractually obliged or where there is past practice that has created a constructive obligation.
(vi) Employee share scheme
The Parent intends to introduce an equity-settled, share-based compensation plan in 2016, based on 2015 performance of the Parent. Under the plan, the Parent will award shares to participating employees; the fair value of which is recognised as an expense over the period that the shares vest to the participating employees, with a corresponding entry in the Statement of Changes in Equity.
(u) Dividends
Provision is made for the amount of any dividend declared on or before the balance sheet date but not distributed at balance sheet date.
(v) Contributed equity
Ordinary shares are classified as equity. Incremental costs directly attributable to the issue of new shares are shown in equity as a deduction, net of tax, from the proceeds.
(w) Earnings per share
Basic
Basic earnings per share is calculated by dividing the profit attributable to equity holders of the Company, by the weighted average number of ordinary shares outstanding during the year.
Diluted
Diluted earnings per share is calculated by adjusting the weighted average number of ordinary shares outstanding during the year to assume conversion of all diluted potential ordinary shares. The Company has no dilutive potential ordinary shares at 31 December 2015 (31 December 2014: nil).
Notes to the Financial StatementsFOR THE YEAR ENDED 31 DECEMBER 2015
(a) Description of segments
The Leadership Team is the chief operating decision-maker. This Team reviews the Group’s internal reporting in order to assess performance and allocate resources including the definition of the operating segments- oil refining and distribution. Management has determined the operating segments based on these reports.
The Leadership Team considers the business from an operations perspective and assesses the performance of ‘Oil Refining’ and ‘Distribution’.
Oil Refining
The Company owns and operates an oil refinery located at Marsden Point, 160 kilometres north of Auckland. The oil refinery is able to process a wide range of crude oil types imported from around the world.
Distribution
The Company owns infrastructure to support the distribution of manufactured products to its customers. The Refinery to Auckland Pipeline transfers product to the Wiri Oil terminal located in South Auckland (refer note 20(e)).
2 Segment information
Other
Other segments include the subsidiary company operations and properties. These have not been included in a reportable segment as they are not separately reported to the Leadership Team.
(b) Reporting measures
The performance of the operating segments is based on net profit after income tax. This information is measured in a manner consistent with that in the consolidated financial statements.
The Group manages assets and liabilities on a central basis and therefore does not provide any segment information of this nature.
REFI
NIN
G N
Z A
NN
UA
L RE
PORT
201
5
44
ECON
OMIC
PER
FORM
ANCE

Notes to the Financial StatementsFOR THE YEAR ENDED 31 DECEMBER 2015
2 Segment information cont.
(c) Segment results
31 DECEMBER 2015
OIL REFINING $000
DISTRIBUTION $000
OTHER $000
TOTAL $000
Total operating revenue 404,963 36,819 7,777 449,559
Inter-segment revenue - - (4,373) (4,373)
REVENUE FROM EXTERNAL CUSTOMERS 404,963 36,819 3,404 445,186
Other income - - 1,563 1,563
Other gains 59 - (37) 22
Finance income 138 - 10 148
Finance cost (2,869) - (34) (2,903)
Depreciation and disposal costs (64,856) (6,868) (385) (72,109)
Income tax (51,177) (7,304) (250) (58,731)
Net profit after income tax 129,495 18,782 2,654 150,931
31 DECEMBER 2014
OIL REFINING $000
DISTRIBUTION $000
OTHER $000
TOTAL $000
Total operating revenue 192,340 35,093 7,288 234,721
Inter-segment revenue - - (4,164) (4,164)
REVENUE FROM EXTERNAL CUSTOMERS 192,340 35,093 3,124 230,557
Other income - - 1,066 1,066
Other gains 1,396 - - 1,396
Finance income 323 - 10 333
Finance cost (2,777) - (36) (2,813)
Depreciation and disposal costs (64,568) (6,868) (396) (71,832)
Income tax 2,990 (6,822) (135) (3,967)
Net (loss)/profit after income tax (9,423) 17,543 1,903 10,023
Sales between segments are carried out at arm’s length. The revenue from external parties reported to the Leadership Team is measured in a manner consistent with that in the Income Statement. All revenue is generated in New Zealand.
Revenue derived from major customers, and the relevant operating segments is disclosed in note 20(a).
REFININ
G N
Z AN
NU
AL REPO
RT 2015
45
ECONOM
IC PERFORMAN
CE

Notes to the Financial StatementsFOR THE YEAR ENDED 31 DECEMBER 2015
NOTE
GROUP 2015 $000
GROUP 2014 $000
Net profit before income tax includes the following income and expenses:
OPERATING REVENUE
Processing fees 379,155 168,411
Natural Gas recovery 15,003 15,143
Other refining related income 10,805 8,786
Refining revenue 404,963 192,340
Distribution revenue 30,294 28,568
Operating lease income:
Wiri Oil land and plant 20(e) 6,525 6,525
Other 84 84
Other operating income 3,320 3,040
TOTAL OPERATING REVENUE 445,186 230,557
OTHER INCOME
Other income 1,563 1,066
TOTAL OTHER INCOME 1,563 1,066
OTHER GAINS
Gain on disposal of property, plant and equipment 22 1,396
TOTAL OTHER GAINS 22 1,396
TOTAL INCOME 446,771 233,019
And charging:
PURCHASE OF PROCESS MATERIALS AND UTILITIES 59,200 55,191
Contractor payments 20,199 15,788
Materials 6,822 6,950
Obsolescence provision released (2,742) (4,837)
TOTAL MATERIALS AND CONTRACTOR PAYMENTS 24,279 17,901
Wages and salaries 48,011 47,482
Defined contribution pension plan contributions 1,091 992
Defined benefit pension plan expense 23(i) 3,696 288
TOTAL WAGES, SALARIES AND BENEFITS 52,798 48,762
Depreciation: 9
Freehold improvements 1,361 1,361
Buildings and jetties 1,898 1,787
Refining plant 51,438 45,460
Catalysts 8,526 12,334
Refinery to Auckland Pipeline 5,260 6,483
Wiri Oil terminal (leased) 429 429
Equipment and vehicles 3,197 3,978
TOTAL DEPRECIATION 72,109 71,832
TOTAL DEPRECIATION AND DISPOSAL COSTS 72,109 71,832
3 Income and expenses
REFI
NIN
G N
Z A
NN
UA
L RE
PORT
201
5
46
ECON
OMIC
PER
FORM
ANCE

Notes to the Financial StatementsFOR THE YEAR ENDED 31 DECEMBER 2015
NOTE
GROUP 2015 $000
GROUP 2014 $000
Foreign exchange losses - unhedged 10 416
OTHER OPERATING LOSSES 10 416
Administration and other expenses 24,224 20,970
Auditors’ fees 3(a)
Audit of financial statements 190 130
Treasury market updates 8 31
AGM scrutineering 6 6
Other minor assurance activities - 7
Directors’ fees 588 603
Operating lease expenses:
Wiri Oil land rental 500 500
Other 394 117
Donations 48 83
TOTAL ADMINISTRATION AND OTHER COSTS 25,958 22,447
Interest expense:
Bank borrowings 16,900 16,464
Restoration provision finance charge 337 365
FINANCE COSTS
Less: amounts capitalised to qualifying assets (14,334) (14,016)
TOTAL FINANCE COST 2,903 2,813
Finance income:
Interest income on short-term bank deposits (148) (333)
TOTAL FINANCE INCOME (148) (333)
NET FINANCE COSTS 2,755 2,480
TOTAL COSTS 237,109 219,029
NET PROFIT BEFORE INCOME TAX 209,662 13,990
(a) Auditors’ fees
‘Audit of financial statements’ include the fees for the annual audit of the financial statements and the interim procedures performed in respect of the half year financial statements. The 2015 audit fee includes the audit of Independent Petroleum Laboratory Limited (IPL) for the current and prior two years, to enable audited financial statements to be provided as part of the sale process (refer note 8). Previously, the audit of IPL had been limited to the work required to enable the auditors to provide an opinion on the Group’s financial statements.
‘Treasury market updates’ relate to the fees paid for treasury advice. ‘AGM scrutineering’ comprises the fee charged for PricewaterhouseCoopers to act as scrutineers at the annual general meeting.
3 Income and expenses cont.
REFININ
G N
Z AN
NU
AL REPO
RT 2015
47
ECONOM
IC PERFORMAN
CE

Notes to the Financial StatementsFOR THE YEAR ENDED 31 DECEMBER 2015
(a) Reconciliation of income tax expense to tax rate applicable to profits
GROUP 2015 $000
GROUP 2014 $000
Net profit before income tax expense 209,662 13,990
Tax at the New Zealand corporate income tax rate of 28% (2014: 28%) 58,705 3,917
Tax effect of amounts which are either non-deductible or taxable in calculating taxable income:
Expenses not deductible for tax 26 17
Adjustments in respect of current income tax in respect of previous years - 95
Adjustments in respect of deferred tax in respect of previous years - (62)
INCOME TAX EXPENSE 58,731 3,967
NOTE
GROUP 2015 $000
GROUP 2014 $000
(b) Income tax expense
Income tax payable in respect of the current year 12 48,124 135
Income tax payable in respect of previous years 12 - 95
Deferred tax in respect of current year 13 10,607 3,799
Deferred tax in respect of previous years 13 - (62)
INCOME TAX EXPENSE 58,731 3,967
GROUP 2015 $000
GROUP 2014 $000
(c) Imputation credits available for subsequent reporting periods
BALANCE 31 DECEMBER 52,329 10,354
4 Income tax expense
REFI
NIN
G N
Z A
NN
UA
L RE
PORT
201
5
48
ECON
OMIC
PER
FORM
ANCE

Notes to the Financial StatementsFOR THE YEAR ENDED 31 DECEMBER 2015
5 Earnings per share
6 Trade and other receivables
Basic and diluted
Basic and diluted earnings per share are calculated by dividing the net profit after income tax by the weighted average number of ordinary shares on issue during the year.
GROUP 2015 $000
GROUP 2014 $000
NET PROFIT AFTER INCOME TAX 150,771 9,941
Weighted average number of ordinary shares on issue (thousands) 312,576 306,437
BASIC AND DILUTED EARNINGS PER SHARE 48.2 cents 3.2 cents
NOTE
GROUP 2015 $000
GROUP 2014 $000
Processing fees 31,975 32,960
Product distribution 2,992 2,793
Excise duty 10 123,857 120,386
Other 4,755 5,712
TOTAL TRADE AND OTHER RECEIVABLES 163,579 161,851
Trade and other receivables related party balances are disclosed in note 20(c).
REFININ
G N
Z AN
NU
AL REPO
RT 2015
49
ECONOM
IC PERFORMAN
CE

Notes to the Financial StatementsFOR THE YEAR ENDED 31 DECEMBER 2015
7 Inventory
GROUP 2015 $000
GROUP 2014 $000
INVENTORY
Current inventory:
Inventories at weighted average cost 2,733 2,213
Obsolescence provision (567) (152)
Total current inventory 2,166 2,061
Non-current inventory:
Inventories at weighted average cost 19,109 19,776
Obsolescence provision (3,802) (6,959)
Total non-current inventory 15,307 12,817
TOTAL INVENTORY 17,473 14,878
The consumption of inventories and any associated write downs are recognised as part of materials expense disclosed in note 3.
The split of inventory between current and non-current is estimated on the basis of an assessment of expected future usage and past actual usage.
Inventories are included in the negative pledge arrangement (refer note 11).
REFI
NIN
G N
Z A
NN
UA
L RE
PORT
201
5
50
ECON
OMIC
PER
FORM
ANCE

Notes to the Financial StatementsFOR THE YEAR ENDED 31 DECEMBER 2015
8 Disposal group held for sale
The Group’s subsidiary, Independent Petroleum Laboratory Limited and certain property, plant and equipment leased to this subsidiary by the Parent, is presented as a disposal group following commitment from Management to sell these assets. Efforts to sell the disposal group have commenced, and a sale is expected by 31 December 2016.
As at 31 December 2015 the disposal group comprised the following assets and liabilities.
GROUP 2015 $000
Assets classified as held for sale
Cash and cash equivalents 348
Trade and other receivables 1,212
Inventory 289
Property, plant and equipment 3,380
TOTAL 5,229
Liabilities classified as held for sale
Income tax payable 73
Trade and other payables 1,455
TOTAL 1,528
Cumulative income or expenses recognised in other comprehensive income
There are no cumulative income or expenses recognised in other comprehensive income relating to the disposal group.
REFININ
G N
Z AN
NU
AL REPO
RT 2015
51
ECONOM
IC PERFORMAN
CE
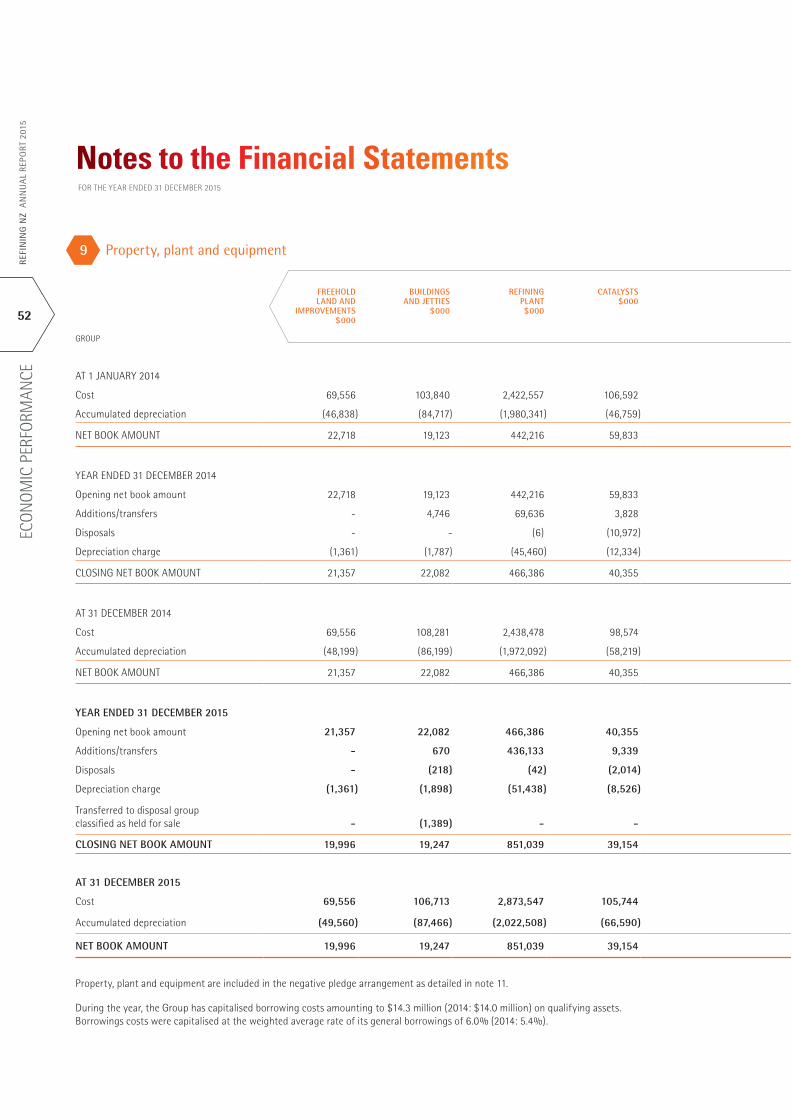
Notes to the Financial StatementsFOR THE YEAR ENDED 31 DECEMBER 2015
9 Property, plant and equipment
GROUP
FREEHOLD LAND AND
IMPROVEMENTS $000
BUILDINGS AND JETTIES
$000
REFINING PLANT $000
CATALYSTS $000
REFINERY TO AUCKLAND
PIPELINE $000
WIRI OIL TERMINAL (LEASED)
(NOTE 20(E)) $000
EQUIPMENT AND VEHICLES
$000
CAPITAL WORK IN PROGRESS
$000
TOTAL $000
AT 1 JANUARY 2014
Cost 69,556 103,840 2,422,557 106,592 221,971 44,169 82,788 255,129 3,306,602
Accumulated depreciation (46,838) (84,717) (1,980,341) (46,759) (92,289) (39,300) (75,825) - (2,366,069)
NET BOOK AMOUNT 22,718 19,123 442,216 59,833 129,682 4,869 6,963 255,129 940,533
YEAR ENDED 31 DECEMBER 2014
Opening net book amount 22,718 19,123 442,216 59,833 129,682 4,869 6,963 255,129 940,533
Additions/transfers - 4,746 69,636 3,828 29 - 9,591 130,100 217,930
Disposals - - (6) (10,972) - - (8) - (10,986)
Depreciation charge (1,361) (1,787) (45,460) (12,334) (6,483) (429) (3,978) - (71,832)
CLOSING NET BOOK AMOUNT 21,357 22,082 466,386 40,355 123,228 4,440 12,568 385,229 1,075,645
AT 31 DECEMBER 2014
Cost 69,556 108,281 2,438,478 98,574 222,000 44,169 86,912 385,229 3,453,199
Accumulated depreciation (48,199) (86,199) (1,972,092) (58,219) (98,772) (39,729) (74,344) - (2,377,554)
NET BOOK AMOUNT 21,357 22,082 466,386 40,355 123,228 4,440 12,568 385,229 1,075,645
YEAR ENDED 31 DECEMBER 2015
Opening net book amount 21,357 22,082 466,386 40,355 123,228 4,440 12,568 385,229 1,075,645
Additions/transfers - 670 436,133 9,339 - - 1,260 (307,016) 140,386
Disposals - (218) (42) (2,014) - - (433) - (2,707)
Depreciation charge (1,361) (1,898) (51,438) (8,526) (5,260) (429) (3,197) - (72,109)
Transferred to disposal group classified as held for sale - (1,389) - - - - (1,991) - (3,380)
CLOSING NET BOOK AMOUNT 19,996 19,247 851,039 39,154 117,968 4,011 8,207 78,213 1,137,835
AT 31 DECEMBER 2015
Cost 69,556 106,713 2,873,547 105,744 222,000 44,169 79,251 78,213 3,579,193
Accumulated depreciation (49,560) (87,466) (2,022,508) (66,590) (104,032) (40,158) (71,044) - (2,441,358)
NET BOOK AMOUNT 19,996 19,247 851,039 39,154 117,968 4,011 8,207 78,213 1,137,835
Property, plant and equipment are included in the negative pledge arrangement as detailed in note 11.
During the year, the Group has capitalised borrowing costs amounting to $14.3 million (2014: $14.0 million) on qualifying assets. Borrowings costs were capitalised at the weighted average rate of its general borrowings of 6.0% (2014: 5.4%).
REFI
NIN
G N
Z A
NN
UA
L RE
PORT
201
5
52
ECON
OMIC
PER
FORM
ANCE

9 Property, plant and equipment
GROUP
FREEHOLD LAND AND
IMPROVEMENTS $000
BUILDINGS AND JETTIES
$000
REFINING PLANT $000
CATALYSTS $000
REFINERY TO AUCKLAND
PIPELINE $000
WIRI OIL TERMINAL (LEASED)
(NOTE 20(E)) $000
EQUIPMENT AND VEHICLES
$000
CAPITAL WORK IN PROGRESS
$000
TOTAL $000
AT 1 JANUARY 2014
Cost 69,556 103,840 2,422,557 106,592 221,971 44,169 82,788 255,129 3,306,602
Accumulated depreciation (46,838) (84,717) (1,980,341) (46,759) (92,289) (39,300) (75,825) - (2,366,069)
NET BOOK AMOUNT 22,718 19,123 442,216 59,833 129,682 4,869 6,963 255,129 940,533
YEAR ENDED 31 DECEMBER 2014
Opening net book amount 22,718 19,123 442,216 59,833 129,682 4,869 6,963 255,129 940,533
Additions/transfers - 4,746 69,636 3,828 29 - 9,591 130,100 217,930
Disposals - - (6) (10,972) - - (8) - (10,986)
Depreciation charge (1,361) (1,787) (45,460) (12,334) (6,483) (429) (3,978) - (71,832)
CLOSING NET BOOK AMOUNT 21,357 22,082 466,386 40,355 123,228 4,440 12,568 385,229 1,075,645
AT 31 DECEMBER 2014
Cost 69,556 108,281 2,438,478 98,574 222,000 44,169 86,912 385,229 3,453,199
Accumulated depreciation (48,199) (86,199) (1,972,092) (58,219) (98,772) (39,729) (74,344) - (2,377,554)
NET BOOK AMOUNT 21,357 22,082 466,386 40,355 123,228 4,440 12,568 385,229 1,075,645
YEAR ENDED 31 DECEMBER 2015
Opening net book amount 21,357 22,082 466,386 40,355 123,228 4,440 12,568 385,229 1,075,645
Additions/transfers - 670 436,133 9,339 - - 1,260 (307,016) 140,386
Disposals - (218) (42) (2,014) - - (433) - (2,707)
Depreciation charge (1,361) (1,898) (51,438) (8,526) (5,260) (429) (3,197) - (72,109)
Transferred to disposal group classified as held for sale - (1,389) - - - - (1,991) - (3,380)
CLOSING NET BOOK AMOUNT 19,996 19,247 851,039 39,154 117,968 4,011 8,207 78,213 1,137,835
AT 31 DECEMBER 2015
Cost 69,556 106,713 2,873,547 105,744 222,000 44,169 79,251 78,213 3,579,193
Accumulated depreciation (49,560) (87,466) (2,022,508) (66,590) (104,032) (40,158) (71,044) - (2,441,358)
NET BOOK AMOUNT 19,996 19,247 851,039 39,154 117,968 4,011 8,207 78,213 1,137,835
REFININ
G N
Z AN
NU
AL REPO
RT 2015
53
ECONOM
IC PERFORMAN
CE

10 Trade and other payables
NOTE
GROUP 2015 $000
GROUP 2014 $000
Trade payables 35,786 27,896
Deconstruction provision 10,000 -
Excise duty 6 123,857 120,386
TOTAL TRADE AND OTHER PAYABLES 169,643 148,282
Trade and other payables related party balances are disclosed in note 20(d).
The deconstruction provision relates to the decommissioned Semi–Regeneration Platformer which the Group is now obligated to complete, following the commissioning of the Continuous Catalyst Regeneration Platformer in 2015. The deconstruction of the Semi–Regeneration Platformer will be completed in 2016.
Changes to excise duties have no direct impact on the results of the Group as they are collected from the oil companies (note 6) and paid to the New Zealand Customs Service on the same day each month.
Notes to the Financial StatementsFOR THE YEAR ENDED 31 DECEMBER 2015
REFI
NIN
G N
Z A
NN
UA
L RE
PORT
201
5
54
ECON
OMIC
PER
FORM
ANCE

11 Bank borrowings
GROUP 2015 $000
GROUP 2014 $000
BANK BORROWINGS
Current bank borrowings:
Revolving cash advances (expiry June 2016) 25,000 -
Total current bank borrowings 25,000 -
Non-current bank borrowings:
Revolving cash advances (expiry June 2016) - 53,500
Revolving cash advances (expiry June 2017) 25,000 112,500
Revolving cash advances (expiry December 2019) 50,000 50,000
Term Loan (expiry December 2020) 100,000 100,000
Total non-current bank borrowings 175,000 316,000
TOTAL BANK BORROWINGS 200,000 316,000
EFFECTIVE INTEREST RATE
Bank loans 6.4% 6.2%
UNDRAWN FACILITIES
The Group has the following undrawn borrowing facilities:
Revolving cash advances (expiry 2016) 75,000 46,500
Revolving cash advances (expiry 2017) 175,000 87,500
TOTAL UNDRAWN BORROWING FACILITIES 250,000 134,000
The carrying amounts of bank borrowings approximate their fair value. The borrowings are unsecured. The Parent borrows under a negative pledge arrangement which requires certain certificates and covenants. All these requirements have been met and no breaches of these covenants are forecast.
The Parent has the ability to determine which revolving cash advance facility will be drawn upon to meet funding requirements.
Notes to the Financial StatementsFOR THE YEAR ENDED 31 DECEMBER 2015
NOTE
GROUP 2015 $000
GROUP 2014 $000
AT 1 JANUARY (349) (8,658)
Income tax payable in respect of the current year 4(b) 48,124 135
Income tax payable in respect of previous years 4(b) - 95
Income tax (paid)/refunded (26,805) 8,079
Supplementary dividends (266) -
AT 31 DECEMBER 20,704 (349)
12 Income tax payable/(receivable)
REFININ
G N
Z AN
NU
AL REPO
RT 2015
55
ECONOM
IC PERFORMAN
CE

Notes to the Financial StatementsFOR THE YEAR ENDED 31 DECEMBER 2015
14 Restoration provision
GROUP 2015 $000
GROUP 2014 $000
AT 1 JANUARY 7,928 6,502
Finance charge 337 365
Change in assumptions – discount rate (219) 1,061
AT 31 DECEMBER 8,046 7,928
The restoration provision relates to restoration obligations in relation to a lease agreement for the seabed upon which the jetty is situated at Marsden Point. The lease agreement expires in 2025 and this provision will be utilised, at that time, if the lease is not renegotiated for a further term.
The restoration provision has been discounted using an interest rate of 4.5% (2014: 4.3%). This interest rate is set with reference to New Zealand Government Bonds as a risk free rate. The interest rate is reviewed annually and the provision is changed if there is any significant movement in interest rates.
1 GROUP
NOTE
DEPRECIATION $000
PROVISIONS $000
OTHER $000
TAX LOSSES $000
TOTAL $000
AT 1 JANUARY 2014 111,880 (8,655) (179) (2,947) 100,099
Deferred tax in respect of previous years 4 348 (95) (1,928) 1,613 (62)
Deferred tax in respect of current year 4 6,842 988 1,273 (5,304) 3,799
Deferred tax on items included in other comprehensive income - (481) (3,288) - (3,769)
AT 31 DECEMBER 2014 119,070 (8,243) (4,122) (6,638) 100,067
Deferred tax in respect of previous years 4 1,834 (37) (45) (1,752) -
Deferred tax in respect of current year 4 2,166 527 (476) 8,390 10,607
Deferred tax on items included in other comprehensive income - (136) 989 - 853
AT 31 DECEMBER 2015 123,070 (7,889) (3,654) - 111,527
The amount of the deferred tax balance expected to be utilised within one year is $5.4 million (2014: $2.5 million).
Deferred income tax assets are recognised for tax losses to the extent that the realisation of the related tax benefit through future taxable profits is probable.
13 Deferred tax
DEFERRED TAX LIABILITY/(ASSET)
REFI
NIN
G N
Z A
NN
UA
L RE
PORT
201
5
56
ECON
OMIC
PER
FORM
ANCE

15 Equity
GROUP 2015 $000
GROUP 2014 $000
Contributed equity 265,771 265,771
Cash flow hedge reserve (7,503) (3,783)
Contributed equity
At 31 December 2015 there were 312.6 million no par value shares authorised, issued and fully paid (2014: 312.6 million). All ordinary shares rank equally with one vote attached to each fully paid ordinary share.
Notes to the Financial StatementsFOR THE YEAR ENDED 31 DECEMBER 2015
17 Capital expenditure commitments
16 Dividends
CENTS PER SHARE
2015 CENTS
CENTS PER SHARE
2014 CENTS
TOTAL 2015 $000
TOTAL 2014 $000
Interim dividend for the year ended 31 December 2015 5.0 - 15,629 -
TOTAL 5.0 - 15,629 -
The dividends were fully imputed. Supplementary dividends of $0.266 million (2014: nil) were paid to shareholders who were not tax resident in New Zealand for which the Group received a foreign investor tax credit entitlement.
GROUP 2015 $000
GROUP 2014 $000
Capital expenditure contracted for in relation to property, plant and equipment at the end of the year but not yet incurred 15,912 34,739
REFININ
G N
Z AN
NU
AL REPO
RT 2015
57
ECONOM
IC PERFORMAN
CE

As Lessee
The Group leases a small number of equipment and vehicles under non-cancellable operating leases. The Group leases process industrial platinum under non-cancellable operating leases to be returned to the owners at the end of the lease periods, subject to renegotiation options.
The Group also leases land under a non-cancellable operating lease that expires in 2024 with no right of renewal.
The operating lease expenditure charged to the Income Statement during the year is disclosed in note 3.
GROUP 2015 $000
GROUP 2014 $000
Commitments for operating leases which are unable to be cancelled, fall due as follows:
- No later than one year 1,009 730
- One to five years 2,787 2,039
- Beyond five years 1,625 2,125
TOTAL 5,421 4,894
As Lessor
The Group leases land and refining plant to Wiri Oil Services Limited (refer to note 20) under a non-cancellable operating lease, which expires in 2024 with no right of renewal. The Group also leases land under an agreement that has two rights of renewal for 21 years each beyond the commitment shown below.
GROUP 2015 $000
GROUP 2014 $000
Commitments for operating leases where the Group is lessor are as shown below:
- No later than one year 6,609 6,609
- One to five years 26,434 26,434
- Beyond five years 21,248 27,857
TOTAL 54,291 60,900
18 operating lease commitments
Notes to the Financial StatementsFOR THE YEAR ENDED 31 DECEMBER 2015
The Group has no contingent liabilities at 31 December 2015 (2014: nil).
19 Contingent liabilities
REFI
NIN
G N
Z A
NN
UA
L RE
PORT
201
5
58
ECON
OMIC
PER
FORM
ANCE

Notes to the Financial StatementsFOR THE YEAR ENDED 31 DECEMBER 2015
The Group enters into transactions on an arm’s length basis with the oil companies who are also shareholders of the New Zealand Refining Company Limited (Parent).
On 27 May 2015, Chevron entered into a block trade agreement with Deustche Craigs Limited for the sale of Chevron’s 35,534,905 ordinary shares in the Parent. An institutional placement was completed on 3 June 2015, at which time Chevron ceased to be a related party and shareholder of the Parent. The Processing Fee Agreement remains in place between Chevron and the Parent. Details of shareholdings at 31 December are:
2015 %
2014 %
BP New Zealand Holdings Limited (BP) 21.19 21.19
Mobil Oil NZ Limited (Mobil) 17.20 17.20
Z Energy Limited (Z Energy) 15.36 15.36
Chevron New Zealand (Chevron) - 11.37
The Group also enters into transactions with Wiri Oil Services Limited (Wiri Oil), a company that is owned by shareholders of the Parent. Transactions with related parties are settled in cash on a monthly basis.
(a) Revenue from related parties
Revenue from the oil refining and distribution segments is derived from the oil companies as follows:
GROUP 2015 $000
GROUP 2014 $000
BP 113,695 62,092
Chevron (1 January 2015 to 3 June 2015) 33,020 44,917
Mobil 97,700 43,267
Z Energy 130,393 65,506
Wiri Oil 6,934 6,789
TOTAL 381,742 222,571
The Group has separate processing agreements with each of the four oil companies which have been in place since 1995. They are long-term “evergreen” contracts which continue unless renegotiated or terminated by mutual consent or by a customer on one year’s notice. 85% (2014: 73%) of the Group’s total operating revenue is earned from processing fees charged under those agreements.
20 Related parties
REFININ
G N
Z AN
NU
AL REPO
RT 2015
59
ECONOM
IC PERFORMAN
CE

20 Related parties cont.
(b) Operating costs
The Parent enters into other operational transactions with oil companies that are related to the refining process. The total value of these transactions is shown below.
GROUP 2015 $000
GROUP 2014 $000
BP 1,332 1,698
Chevron (1 January 2015 on 3 June 2015) 568 989
Mobil 1,450 843
Z Energy 1,740 2,137
TOTAL 5,090 5,667
(c) Accounts receivable
AMOUNTS OWING AT 31 DECEMBER ARE:
GROUP 2015 $000
GROUP 2014 $000
BP 36,802 48,465
Chevron - 28,455
Mobil 30,231 33,000
Z Energy 59,443 47,529
Wiri Oil 185 39
TOTAL 126,661 157,488
Excise duty is collected from the Oil Companies and paid to the New Zealand Customs Service on the same day each month (refer note 6) and is included in the above balances.
(d) Accounts payable
AMOUNTS PAYABLE AT 31 DECEMBER ARE:
GROUP 2015 $000
GROUP 2014 $000
BP 112 230
Chevron - 59
Mobil 118 81
Z Energy 172 233
TOTAL 402 603
Notes to the Financial StatementsFOR THE YEAR ENDED 31 DECEMBER 2015
REFI
NIN
G N
Z A
NN
UA
L RE
PORT
201
5
60
ECON
OMIC
PER
FORM
ANCE

20 Related parties cont.
(e) Wiri Oil terminal
The Parent leases land from Wiri Oil Services Limited (Wiri Oil) and owns the Wiri Oil terminal (plant) located on this land. The land and plant is leased back to Wiri Oil. The leases are non-cancellable operating leases, which expire in 2024 with no right of renewal. At the end of the lease term, ownership of the Wiri Oil terminal reverts to Wiri Oil Services Limited.
Operating lease income and expenses are disclosed in note 3.
(f) Insurance
A portion of the Group’s material damage and business interruption and contract works and liability insurance is held by companies related to shareholders. These companies received the following insurance premium paid by Parent.
GROUP 2015 $000
GROUP 2014 $000
BP - Jupiter Insurance Ltd 392 531
Chevron - Iron Horse - 248
Mobil – Ancon - 392
TOTAL 392 1,171
Notes to the Financial StatementsFOR THE YEAR ENDED 31 DECEMBER 2015
REFININ
G N
Z AN
NU
AL REPO
RT 2015
61
ECONOM
IC PERFORMAN
CE

20 Related parties cont.
(g) Key management personnel compensation and Directors’ fees
GROUP 2015 $000
GROUP 2014 $000
Salaries and other short-term employee benefits 3,484 3,313
Post-employment benefits 196 183
TOTAL KEY MANAGEMENT PERSONNEL COMPENSATION 3,680 3,496
Number of personnel at 31 December 9 9
Key management personnel includes all members of the Leadership Team. The above analysis is compiled on a cash basis; variable performance rewards (linked to individual and business performance for a financial reporting period) are paid subsequent to balance date and reported as part of payments to key management personnel for the following year.
Directors’ fees are disclosed in note 3.
(h) Defined benefit pension plan
For a description of this plan see note 23.
The Parent charges an administration fee to The New Zealand Refining Company Pension Fund of $26 thousand, (2014: $29 thousand).
Notes to the Financial StatementsFOR THE YEAR ENDED 31 DECEMBER 2015
21 Events after balance sheet date
The Group has declared a final dividend of 20 cents per share, fully imputed, payable 24 March 2016 (2014: nil).
REFI
NIN
G N
Z A
NN
UA
L RE
PORT
201
5
62
ECON
OMIC
PER
FORM
ANCE

GROUP 2015 $000
GROUP 2014 $000
NET PROFIT AFTER INCOME TAX 150,931 10,023
Adjusted for:
Depreciation and disposal costs 72,109 71,832
Gain on sale property, plant and equipment (22) (1,396)
Movement in deferred tax 11,460 (32)
Less deferred tax on items included in other comprehensive income (853) 3,769
Movement in provisions 118 1,426
Movement between defined benefit pension plan employer contributions and expense 1,954 (1,544)
Other non-cash movements 755 (1,060)
Impact of changes in working capital items
(Increase) in trade and other receivables (2,940) (61,803)
Increase in trade and other payables 22,814 34,520
(Less)/add included in property, plant and equipment (12,283) 3,286
Increase in employee entitlements 2,754 3,850
(Less) to comprehensive income (484) (1,718)
Increase in income tax 21,126 8,309
(Increase) in inventories (2,884) (2,685)
NET CASH INFLOW FROM OPERATING ACTIVITIES 264,555 66,777
Notes to the Financial StatementsFOR THE YEAR ENDED 31 DECEMBER 2015
22 Reconciliation of net cash flow from operating activities to reported profit
REFININ
G N
Z AN
NU
AL REPO
RT 2015
63
ECONOM
IC PERFORMAN
CE

23 Defined benefit obligation
Defined benefit pension plan
The Company contributes to a defined benefit pension plan (the ‘Plan’) for eligible employees. This Plan closed to new members on 31 December 2002. The last full actuarial valuation performed under the Superannuation Schemes Act 1989 was as at 31 March 2013. At each balance sheet date an accounting update is performed by an independent actuary in accordance with NZ IAS 19 ‘Employee Benefits’ for recording in the Balance Sheet.
Nature of benefits
At retirement, the 107 (2014: 111) active members have pension entitlements based on final salary and membership. Members may elect to exchange part of their pension for a cash lump sum. At 31 December 2015 the Plan had 106 (2014: 112) pensioners receiving regular pension payments. There were also five members receiving disability pensions, which can be paid from the Plan until normal retirement age.
Description of regulatory framework
The Financial Markets Conduct Act 2013 (the Act) governs the superannuation industry and provides the framework within which superannuation schemes operate. The New Zealand Refining Company Pension Plan must transition to the Act by 1 December 2016, and until such time continues to operate under the Superannuation Schemes Act 1989. The Act requires an actuarial valuation to be performed for each defined benefit superannuation scheme at least every three years to assess whether the Company’s current level of contributions to the Plan is sufficient to meet future obligations (funding valuation). For detail regarding the latest funding valuation see note 23(g).
The Financial Markets Authority licenses and supervises regulated superannuation schemes.
Description of other entities’ responsibilities for the governance of the Fund
The Trustees of the Fund are responsible for the governance of the Fund. The Trustees are appointed by the Company and have a legal obligation to act solely in the best interests of the Fund beneficiaries. The Trustees have the following roles:
• Administration of the Fund and payment to the beneficiaries from Plan assets when required in accordance with the Plan rules.
• Management and investment of the Plan assets.
• Compliance with superannuation law and other applicable regulations.
Description of risks
Under the defined benefit pension plan the Group has a legal obligation to pay further contributions if the Fund does not hold sufficient assets to pay all employees the benefits they are entitled to. There are a number of risks that could expose the Company to such a shortfall; the more significant risks being:
• Investment returns – the funding valuation assumes a certain return on assets, which will be available to fund liabilities. Lower than assumed returns could require the Company to increase contributions to offset the shortfall.
• Life expectancy – the majority of the Plan’s obligations are to provide benefits for the life of the member, so increases in life expectancy will result in an increase in the Plan’s liabilities.
The Plan liabilities are calculated, for financial reporting purposes, using a discount rate set with reference to New Zealand Government Bonds. A decrease in the government bond yield will increase Plan liabilities for financial reporting purposes, but not necessarily impact upon the funding requirements of the Company.
Notes to the Financial StatementsFOR THE YEAR ENDED 31 DECEMBER 2015
REFI
NIN
G N
Z A
NN
UA
L RE
PORT
201
5
64
ECON
OMIC
PER
FORM
ANCE

23 Defined benefit obligation cont.
Description of significant events
There were no Fund amendments, curtailments or settlements during 2015. During the 2014 year the Trustees of the New Zealand Refining Company Pension Fund offered all existing pensioners the choice of converting their future pension benefits to a one-off cash lump sum. The cash lump sum offered was calculated by the Plan’s actuary as the expected future cost to the Plan of providing individual pensioners their current pension. The expected future cost used individual pensioner details and those assumptions used for the actuarial valuation performed under the Superannuation Schemes Act to assess whether the Company’s current level of contributions to the Plan is sufficient to meet future obligations (the funding valuation). The Trustees also offered active members of the Fund an opportunity to withdraw their member contributions plus interest. Member’s accumulated service up to the date of withdrawal was reduced to reflect any withdrawal of funds. $10 million was paid out in pursuant to these cash offers. Settlement adjustments of $1.959 million ($2.9 million including contributions tax) were recognised in the Income Statement (see note 23(i)) and arose principally due to the different discount rates used in the determination of pension fund liabilities for funding and financial reporting purposes.
Medical plan
There is an arrangement in place for the Company to pay health insurance premiums in respect of a limited number of former employees and a limited number of current employees when they retire, until their death. All active members of the medical plan, and their spouses, are entitled to medical insurance from the member’s commencement of retirement until the member’s death. This arrangement is no longer offered to new employees. The total cost of providing this benefit met by the Company is the health insurance premium and fringe benefit tax associated with this benefit.
At each balance sheet date an accounting valuation is performed by an independent actuary in accordance with IAS 19 ‘Employee Benefits’ and includes fringe benefit tax. A summary of the valuation is provided below.
(a) Reconciliation of the liability recognised in the Balance Sheet
GROUP
MEDICAL PLAN 2015 $000
MEDICAL PLAN 2014 $000
PENSION PLAN 2015 $000
PENSION PLAN 2014 $000
Present value of the defined benefit obligation (5,560) (5,003) (89,565) (90,165)
Fair value of plan assets - - 85,145 81,227
DEFICIT (5,560) (5,003) (4,420) (8,938)
Contributions tax - - (2,177) (4,402)
LIABILITY IN THE BALANCE SHEET (5,560) (5,003) (6,597) (13,340)
The medical plan obligation is presented in the Balance Sheet within ‘employee entitlements’.
Notes to the Financial StatementsFOR THE YEAR ENDED 31 DECEMBER 2015
REFININ
G N
Z AN
NU
AL REPO
RT 2015
65
ECONOM
IC PERFORMAN
CE

23 Defined benefit obligation cont.
(b) Movements in the net liability recognised in the Balance Sheet
Defined benefit obligation
GROUP
NOTE
PRESENT VALUE OF
OBLIGATION $000
FAIR VALUE OF PLAN ASSETS
$000
TOTAL $000
At 1 January 2014 excluding taxes (88,155) 83,407 (4,748)
Current service cost (1,931) - (1,931)
Interest (expense)/income (4,205) 3,984 (221)
Adjustments arising from settlement of defined benefit obligations 12,001 (10,042) 1,959
Actual return on plan assets less interest income - 5,967 5,967
Actuarial gains/losses:
Actuarial losses arising from changes in financial assumptions (11,499) - (11,499)
Actuarial gains arising from liability experience 308 - 308
23(j) (11,191) - (11,191)
Contributions:
Employers (including taxes) - 1,227 1,227
Plan participants (699) 699 -
Benefits paid 3,871 (3,871) -
Premiums and expenses paid 144 (144) -
NET LIABILITY EXCLUDING TAXES 31 DECEMBER 2014 (90,165) 81,227 (8,938)
Notes to the Financial StatementsFOR THE YEAR ENDED 31 DECEMBER 2015
REFI
NIN
G N
Z A
NN
UA
L RE
PORT
201
5
66
ECON
OMIC
PER
FORM
ANCE

23 Defined benefit obligation cont. GROUP
NOTE
PRESENT VALUE OF
OBLIGATION $000
FAIR VALUE OF PLAN ASSETS
$000
TOTAL $000
At 1 January 2015 excluding taxes (90,165) 81,227 (8,938)
Current service cost (2,147) - (2,147)
Interest (expense)/income (3,455) 3,126 (329)
Actual return on plan assets less interest income - 3,172 3,172
Actuarial gains/losses:
Actuarial gains arising from changes in demographic assumptions 2,801 - 2,801
Actuarial losses arising from changes in financial assumptions (1,208) - (1,208)
Actuarial gains arising from liability experience 1,061 - 1,061
23(j) 2,654 - 2,654
Contributions:
Employers (including taxes) - 1,168 1,168
Plan participants (669) 669 -
Benefits paid 4,054 (4,054) -
Premiums and expenses paid 163 (163) -
NET LIABILITY EXCLUDING TAXES 31 DECEMBER 2015 (89,565) 85,145 (4,420)
Medical Plan
GROUP
PRESENT VALUE OF
OBLIGATION $000
FAIR VALUE OF PLAN ASSETS
$000
TOTAL $000
At 1 January 2014 (3,245) - (3,245)
Interest expense (165) - (165)
Actuarial losses arising from changes in financial assumptions (1,718) - (1,718)
Employer contributions - 125 125
Benefits paid 125 (125) -
NET LIABILITY 31 DECEMBER 2014 (5,003) - (5,003)
Notes to the Financial StatementsFOR THE YEAR ENDED 31 DECEMBER 2015
REFININ
G N
Z AN
NU
AL REPO
RT 2015
67
ECONOM
IC PERFORMAN
CE

GROUP
PRESENT VALUE OF
OBLIGATION $000
FAIR VALUE OF PLAN ASSETS
$000
TOTAL $000
At 1 January 2015 (5,003) - (5,003)
Interest expense (202) - (202)
Actuarial losses arising from changes in financial assumptions (484) (484)
Employer contributions - 129 129
Benefits paid 129 (129) -
NET LIABILITY 31 DECEMBER 2015 (5,560) - (5,560)
(c) Fair value of defined pension plan assets
GROUP 2015
TOTAL $000
QUOTED PRICES IN
ACTIVE MARKETS
$000
NO QUOTED PRICES IN
ACTIVE MARKETS
$000
Net current assets 445 - 445
Debt instruments 8,540 - 8,540
Investment Funds – Equities 33,240 33,240 -
Investment Funds – Property and Infrastructure 13,642 13,642 -
Investment Funds – Bonds 29,278 29,278 -
TOTAL ASSETS 85,145 76,160 8,985
The percentage invested in each asset class at the balance sheet date are:
PENSION PLAN 2015
PENSION PLAN 2014
Australasian Equity 11.0% 9.0%
International Equity 28.2% 45.7%
Fixed Income 34.6% 18.3%
Property and Infrastructure 16.1% 15.1%
Cash 10.1% 11.9%
The fair value of plan assets includes no amounts relating to:
• Any of the Group’s own financial instruments.
• Any property occupied by, or other assets used by, the Group.
23 Defined benefit obligation cont.
Notes to the Financial StatementsFOR THE YEAR ENDED 31 DECEMBER 2015
REFI
NIN
G N
Z A
NN
UA
L RE
PORT
201
5
68
ECON
OMIC
PER
FORM
ANCE

23 Defined benefit obligation cont.
Notes to the Financial StatementsFOR THE YEAR ENDED 31 DECEMBER 2015
(d) Principal actuarial assumptions at the balance sheet date
GROUP
MEDICAL PLAN 2015
MEDICAL PLAN 2014
PENSION PLAN 2015
PENSION PLAN 2014
Discount rate 4.2% 4.1% 3.8% 3.9%
Expected rate of future salary increases N/A N/A 3.0% 3.0%
Pension increases N/A N/A No provision No provision
Mortality in retirement New Zealand Life Tables 2012-2014
mortality table, set back by 1 year,
together with an age related future
mortality improvement scale
New Zealand Life Tables 2010-2012
mortality table, set back by 1 year,
together with an age related future
mortality improvement scale
New Zealand Life Tables 2012-2014
mortality table, set back by 1 year,
together with an age related future
mortality improvement scale
New Zealand Life Tables 2010-2012
mortality table, set back by 1 year,
together with an age related future
mortality improvement scale
Health insurance premium increase rate 7.0% 7.0% N/A N/A
Rate of Fringe Benefit Tax 49.25% 49.25% N/A N/A
REFININ
G N
Z AN
NU
AL REPO
RT 2015
69
ECONOM
IC PERFORMAN
CE

23 Defined benefit obligation cont.
Notes to the Financial StatementsFOR THE YEAR ENDED 31 DECEMBER 2015
(e) Sensitivity analysis
The sensitivity of the defined benefit obligation to changes in the principal assumptions is shown in the table below.
DEFINED BENEFIT OBLIGATION 2015
GROUP 2015
CHANGE IN
ASSUMPTION
INCREASE IN
ASSUMPTION
DECREASE IN
ASSUMPTION
Base case 89,565
Discount rate 1% 80,227 101,074
Life expectancy 1 year 90,865 88,241
Salary increases 1% 92,903 86,540
DEFINED BENEFIT OBLIGATION 2014
GROUP 2014
CHANGE IN
ASSUMPTION
INCREASE IN
ASSUMPTION
DECREASE IN
ASSUMPTION
Base case 90,165
Discount rate 1% 79,205 103,836
Life expectancy 1 year 91,667 88,620
Salary increases 1% 93,780 86,891
The above sensitivity analysis is based on a change in an assumption while holding all other assumptions constant. In practice, this is unlikely to occur, and changes in some of the assumptions may be correlated.
The methods and types of assumptions used in preparing the sensitivity analysis are consistent with those applied during the comparative reporting period.
(f) Maturity profile of defined benefit obligation
The average term at which the expected future discounted cash flows are due is 12 years (2014: 14 years). The average undiscounted expected term of all liabilities is 16.7 years (2014: 19 years).
(g) Funding arrangements
The Actuary determines the Pension Plan’s financial position (funding valuation) every three years in accordance with the Financial Markets Conduct Act 2013 and the Superannuation Schemes Act 1989. The last funding valuation was completed as at 31 March 2013, at which time the Plan was fully funded based on the assumptions used by the Actuary. These assumptions were consistent with those used in the NZ IAS 19 valuation at that time, except for the discount rate used to determine the present value of the defined benefit obligation (the funding valuation utilises the expected long-term future returns of the Plan and the accounting valuation utilises the risk free rate of return) and that the accounting valuation allows for future expected improvements in mortality rates. There have been further changes to the assumptions adopted in the NZ IAS 19 valuation and it is envisaged that these will be reflected in the next funding valuation.
The funding objective adopted at the 31 March 2013 funding valuation is to ensure that the Fund’s assets are not less than the value of accrued benefits.
REFI
NIN
G N
Z A
NN
UA
L RE
PORT
201
5
70
ECON
OMIC
PER
FORM
ANCE
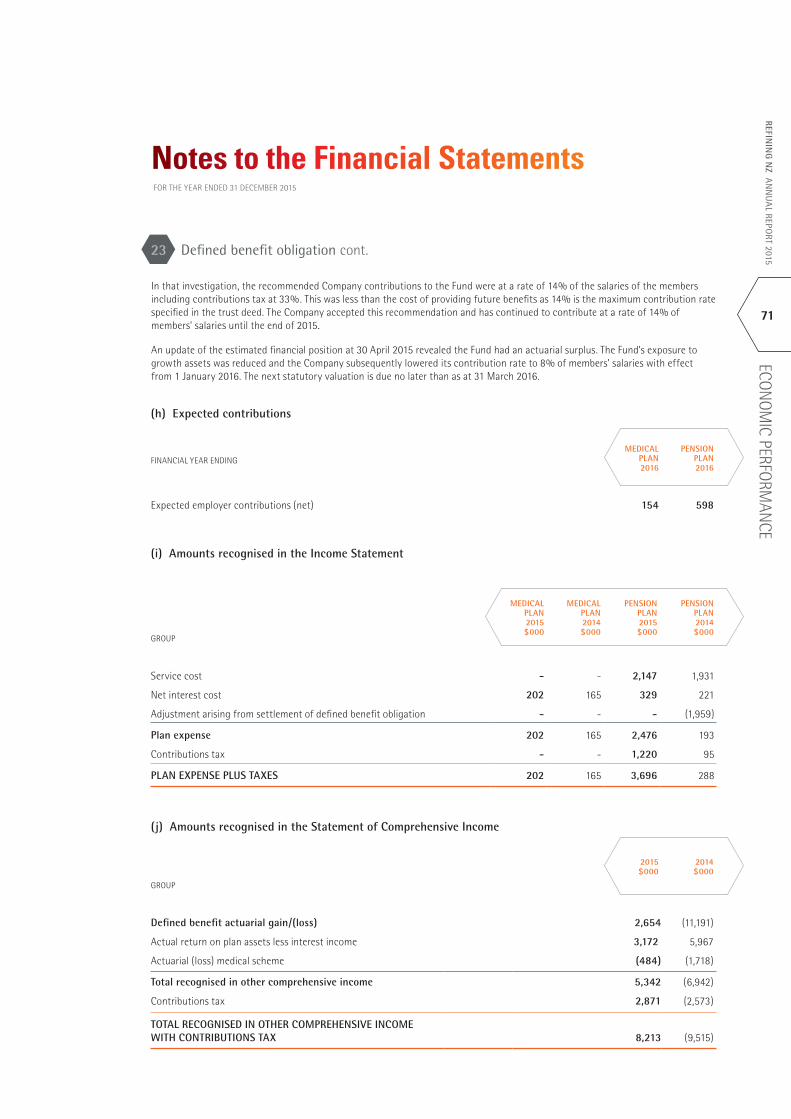
Notes to the Financial StatementsFOR THE YEAR ENDED 31 DECEMBER 2015
23 Defined benefit obligation cont.
(h) Expected contributions
FINANCIAL YEAR ENDING
MEDICAL PLAN 2016
PENSION PLAN 2016
Expected employer contributions (net) 154 598
(i) Amounts recognised in the Income Statement
GROUP
MEDICAL PLAN 2015 $000
MEDICAL PLAN 2014 $000
PENSION PLAN 2015 $000
PENSION PLAN 2014 $000
Service cost - - 2,147 1,931
Net interest cost 202 165 329 221
Adjustment arising from settlement of defined benefit obligation - - - (1,959)
Plan expense 202 165 2,476 193
Contributions tax - - 1,220 95
PLAN EXPENSE PLUS TAXES 202 165 3,696 288
(j) Amounts recognised in the Statement of Comprehensive Income
GROUP
2015 $000
2014 $000
Defined benefit actuarial gain/(loss) 2,654 (11,191)
Actual return on plan assets less interest income 3,172 5,967
Actuarial (loss) medical scheme (484) (1,718)
Total recognised in other comprehensive income 5,342 (6,942)
Contributions tax 2,871 (2,573)
TOTAL RECOGNISED IN OTHER COMPREHENSIVE INCOME WITH CONTRIBUTIONS TAX 8,213 (9,515)
In that investigation, the recommended Company contributions to the Fund were at a rate of 14% of the salaries of the members including contributions tax at 33%. This was less than the cost of providing future benefits as 14% is the maximum contribution rate specified in the trust deed. The Company accepted this recommendation and has continued to contribute at a rate of 14% of members’ salaries until the end of 2015.
An update of the estimated financial position at 30 April 2015 revealed the Fund had an actuarial surplus. The Fund’s exposure to growth assets was reduced and the Company subsequently lowered its contribution rate to 8% of members’ salaries with effect from 1 January 2016. The next statutory valuation is due no later than as at 31 March 2016.
REFININ
G N
Z AN
NU
AL REPO
RT 2015
71
ECONOM
IC PERFORMAN
CE

Notes to the Financial StatementsFOR THE YEAR ENDED 31 DECEMBER 2015
24 Financial risk management
The Group’s activities expose it to a variety of financial risks: market risk (including refining margin risk, currency risk, price risk and interest rate risk), credit risk, and liquidity risk.
Risk management is performed by Group Management who evaluate and hedge certain financial risks including currency risk and interest rate risk under a Treasury Policy that is approved by the Board of Directors.
MARKET RISK
(i) Refining margin risk
The refining margin (margin) generated by the Group is a key input to the calculation of the processing fee. The processing fee is set at 70% of the margin generated, subject to a fee floor and margin cap. This reflects that Refining NZ’s customers bear the risks and associated costs of crude purchasing, the finance and currency costs and risks associated with maintaining crude, feedstock and product inventories, shipping and demurrage risks and guaranteeing a minimum processing fee.
The margin is calculated as the typical market value of all the products produced, minus the typical market value of all the feedstock processed. The typical market value of products is determined by using quoted prices for the products in Singapore plus the typical freight cost to New Zealand plus product quality premia. The typical value of feedstock is determined by using the market value for crude oil and other feedstock at the point of purchase, plus the typical cost of freight to New Zealand.
Margin risk is the risk of volatility in the typical product and feedstock prices to which the Group is exposed. The Group’s revenue is likely to be impacted, favourably or unfavourably, during periods of market price volatility. The Group does not hedge this risk. The downside in the volatility of margin and foreign exchange risk is limited by the processing fee floor, which comes into effect if the total processing fee for a calendar year does not exceed a minimum value. This was approximately $128 million for 2015 (2014: $126 million) and is subject to annual Producers Price Index (PPI) based escalation.
The margin is subject to an annual cap of USD9.00 per barrel for each customer. The cap is calculated on an annual basis, but for invoicing and revenue recognition purposes, is calculated monthly on a year-to-date basis.
The processing fee is calculated on a two–monthly basis and is subject to the margin variability during each period.
(ii) Currency risk
The Group is exposed to foreign exchange risk as a result of the processing fee being calculated in US dollars and billed in New Zealand dollars. The exchange rate used to calculate the New Zealand dollar amount is based on the average spot rate throughout the relevant billing period. The currencies in which the Group primarily deals are US dollar, Pounds Sterling, Euro and Australian dollar.
The Group may enter into hedging agreements for revenue or operating expenditure with Board approval. The Group’s Treasury Policy requires that the Group enters into foreign exchange contracts for the purchase of all capital items over NZ$100 thousand, other than those capital items denominated in US dollars where the threshold is USD5 million. A higher threshold is applied to capital items denominated in US dollars because fluctuations in the New Zealand dollar cost of these items will be offset by changes in revenue. Foreign exchange instruments approved under the Group’s Treasury Policy are forward exchange contracts and currency options.
(iii) Price risk
The Group is exposed to commodity price risk in relation to the purchase of electricity. This exposure exists as a result of the Group purchasing electricity via the New Zealand Electricity Wholesale Market, which is subject to price volatility caused by both demand/supply and transmission constraints. The Group has entered into contracts with a fixed unit price in order to remove the volatility in the medium term.
(iv) Interest rate risk
The Group’s interest rate risk arises from short and long-term borrowings typically used to finance major capital projects. Borrowings are at variable rates, exposing the Group to interest rate risk. The Group’s Treasury Policy requires that the interest rate risk be managed to minimise the medium-term cost of borrowings. This is achieved by entering into hedging relationships to fix the interest rate on core debt within parameters outlined in the Treasury Policy.
REFI
NIN
G N
Z A
NN
UA
L RE
PORT
201
5
72
ECON
OMIC
PER
FORM
ANCE
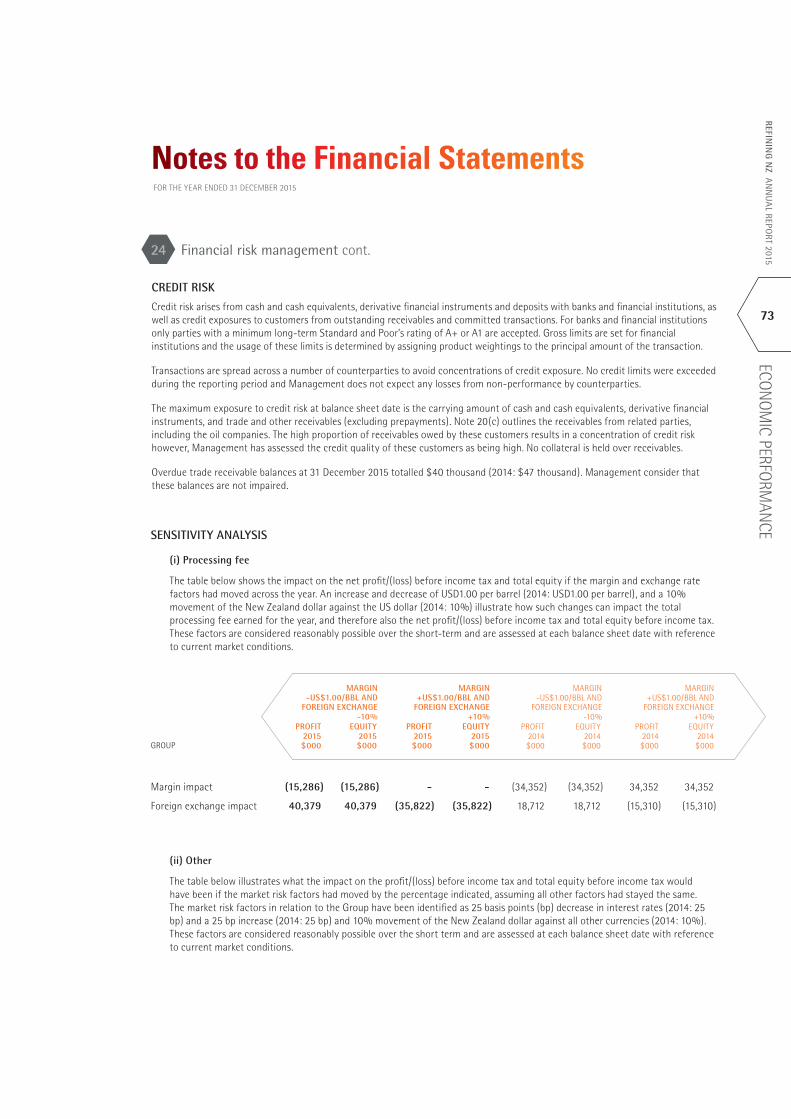
Notes to the Financial StatementsFOR THE YEAR ENDED 31 DECEMBER 2015
24 Financial risk management cont.
MARGIN-US$1.00/BBL AND
FOREIGN EXCHANGE-10%
MARGIN+US$1.00/BBL AND
FOREIGN EXCHANGE+10%
MARGIN-US$1.00/BBL AND
FOREIGN EXCHANGE-10%
MARGIN+US$1.00/BBL AND
FOREIGN EXCHANGE+10%
CREDIT RISK
Credit risk arises from cash and cash equivalents, derivative financial instruments and deposits with banks and financial institutions, as well as credit exposures to customers from outstanding receivables and committed transactions. For banks and financial institutions only parties with a minimum long-term Standard and Poor’s rating of A+ or A1 are accepted. Gross limits are set for financial institutions and the usage of these limits is determined by assigning product weightings to the principal amount of the transaction.
Transactions are spread across a number of counterparties to avoid concentrations of credit exposure. No credit limits were exceeded during the reporting period and Management does not expect any losses from non-performance by counterparties.
The maximum exposure to credit risk at balance sheet date is the carrying amount of cash and cash equivalents, derivative financial instruments, and trade and other receivables (excluding prepayments). Note 20(c) outlines the receivables from related parties, including the oil companies. The high proportion of receivables owed by these customers results in a concentration of credit risk however, Management has assessed the credit quality of these customers as being high. No collateral is held over receivables.
Overdue trade receivable balances at 31 December 2015 totalled $40 thousand (2014: $47 thousand). Management consider that these balances are not impaired.
SENSITIVITY ANALYSIS
(i) Processing fee
The table below shows the impact on the net profit/(loss) before income tax and total equity if the margin and exchange rate factors had moved across the year. An increase and decrease of USD1.00 per barrel (2014: USD1.00 per barrel), and a 10% movement of the New Zealand dollar against the US dollar (2014: 10%) illustrate how such changes can impact the total processing fee earned for the year, and therefore also the net profit/(loss) before income tax and total equity before income tax. These factors are considered reasonably possible over the short-term and are assessed at each balance sheet date with reference to current market conditions.
GROUP
PROFIT 2015 $000
EQUITY 2015 $000
PROFIT 2015 $000
EQUITY 2015 $000
PROFIT 2014 $000
EQUITY 2014 $000
PROFIT 2014 $000
EQUITY 2014 $000
Margin impact (15,286) (15,286) - - (34,352) (34,352) 34,352 34,352
Foreign exchange impact 40,379 40,379 (35,822) (35,822) 18,712 18,712 (15,310) (15,310)
(ii) Other
The table below illustrates what the impact on the profit/(loss) before income tax and total equity before income tax would have been if the market risk factors had moved by the percentage indicated, assuming all other factors had stayed the same. The market risk factors in relation to the Group have been identified as 25 basis points (bp) decrease in interest rates (2014: 25 bp) and a 25 bp increase (2014: 25 bp) and 10% movement of the New Zealand dollar against all other currencies (2014: 10%). These factors are considered reasonably possible over the short term and are assessed at each balance sheet date with reference to current market conditions.
REFININ
G N
Z AN
NU
AL REPO
RT 2015
73
ECONOM
IC PERFORMAN
CE

Notes to the Financial StatementsFOR THE YEAR ENDED 31 DECEMBER 2015
24 Financial risk management cont.
Interest rate
GROUP
CARRYING AMOUNT
2015 $000
-25BP PROFIT
2015 $000
-25BP EQUITY
2015 $000
+25BP PROFIT
2015 $000
+25BP EQUITY
2015 $000
CARRYING AMOUNT
2014 $000
-25BP PROFIT
2014 $000
-25BP EQUITY
2014 $000
+25BP PROFIT
2014 $000
+25BP EQUITY
2014 $000
Cash and cash equivalents 7,565 (19) (19) 19 19 1,015 (3) (3) 3 3
Term loan (200,000) - - - - (316,000) 790 790 (790) (790)
Derivative financial instruments (10,421) - (1,945) - 1,925 (5,176) - (2,219) - 2,190
TOTAL INCREASE/ (DECREASE) (19) (1,964) (19) 1,944 787 (1,432) (787) 1,403
Foreign exchange rates
GROUP
CARRYING AMOUNT
2015 $000
-10% PROFIT
2015 $000
-10% EQUITY
2015 $000
+10% PROFIT
2015 $000
+10% EQUITY
2015 $000
CARRYING AMOUNT
2014 $000
-10% PROFIT
2014 $000
-10% EQUITY
2014 $000
+10% PROFIT
2014 $000
+10% EQUITY
2014 $000
Cash and cash equivalents -other 7,565 4 4 (3) (3) 1,015 2 2 (2) (2)
Derivative financial instruments – USD (10,421) - 87 - (78) (5,176) - 448 - (368)
Trade and other payables - USD (169,643) (41) (41) 59 59 148,282 (107) (107) 111 111
TOTAL INCREASE/ (DECREASE) (37) 50 56 (22) (105) 343 109 (259)
LIQUIDITY RISK
The Group monitors rolling forecasts of liquidity requirements to ensure it has sufficient cash to meet operational needs while maintaining sufficient headroom on the Group’s undrawn borrowing facilities (note 11).
Surplus cash held by the Group over and above the balance required for working capital management is invested in interest bearing current accounts, time deposits, and money market deposits, choosing instruments with appropriate maturities or sufficient liquidity to provide sufficient headroom as determined by the above-mentioned forecasts.
The table below analyses the Group’s financial liabilities including gross and net settled derivative financial liabilities, into relevant maturity groupings, based on the remaining period at the balance sheet date to the contractual maturity date. The amounts disclosed in the table are the contractual undiscounted cash flows. The maturity date for bank borrowings is based on the next rollover date of the draw-downs, rather than the expiry of the facility.
Gross settled derivatives are foreign exchange contracts, with the inflow being based on the foreign currency converted at the closing spot rate. Net settled derivatives are interest rate swaps, with the floating rate being based on the most recent rate set. The notional amounts of derivatives are disclosed in note 25.
REFI
NIN
G N
Z A
NN
UA
L RE
PORT
201
5
74
ECON
OMIC
PER
FORM
ANCE

Notes to the Financial StatementsFOR THE YEAR ENDED 31 DECEMBER 2015
24 Financial risk management cont.
GROUP 2015
CARRYING AMOUNT
$000
CONTRACTUAL CASH FLOWS
$000
LESS THAN 6 MONTHS
$000
BETWEEN 6 MONTHS
-1 YEAR $000
BETWEEN 1-2
YEARS $000
BETWEEN 2-5 YEARS
$000
OVER 5 YEARS
$000
NON-DERIVATIVE FINANCIAL LIABILITIES
Trade and other payables (45,786) (45,786) (45,786) - - - -
Liabilities of disposal group (1,455) (1,455) (1,455) - - - -
Bank borrowings (200,000) (202,191) (202,191) - - - -
(247,241) (249,432) (249,432) - - - -
DERIVATIVE FINANCIAL INSTRUMENTS
Gross settled derivatives
Gross settled derivatives outflow - (953) (953) - - - -
Gross settled derivatives inflow - 942 942 - - - -
(6) (11) (11) - - - -
NET SETTLED DERIVATIVES (10,415) (11,444) (1,581) (1,581) (3,159) (5,123) -
GROUP 2014
CARRYING AMOUNT
$000
CONTRACTUAL CASH FLOWS
$000
LESS THAN 6 MONTHS
$000
BETWEEN 6 MONTHS
- 1 YEAR $000
BETWEEN 1-2
YEARS $000
BETWEEN 2-5 YEARS
$000
OVER 5 YEARS
$000
NON-DERIVATIVE FINANCIAL LIABILITIES
Trade and other payables (27,896) (27,896) (27,896) - - -
Bank borrowings (316,000) (320,025) (320,025) - - -
(343,896) (347,921) (347,921) - - -
DERIVATIVE FINANCIAL INSTRUMENTS
Gross settled derivatives
Gross settled derivatives outflow - (4,375) (112) (2,828) (1,435) - -
Gross settled derivatives inflow - 4,031 107 2,650 1,274 - -
(164) (344) (5) (178) (161) - -
NET SETTLED DERIVATIVES (5,012) (7,430) (702) (702) (1,405) (4,705) (1,164)
REFININ
G N
Z AN
NU
AL REPO
RT 2015
75
ECONOM
IC PERFORMAN
CE

Capital risk management
The Group’s objective when managing capital (net assets of the Group) is to safeguard the Group’s ability to continue as a going concern in order to provide returns for shareholders and benefit for other stakeholders and to maintain an appropriate capital structure. The Group borrows under a negative pledge arrangement (refer note 11). The Group monitors rolling forecasts which take into consideration the Group’s debt financing plans and covenant compliance, to ensure that it is able to continue meeting funding requirements.
In order to maintain or adjust the capital structure, the Group may adjust the amount of dividends paid to shareholders, return capital to shareholders, issue new shares or sell assets to reduce debt.
Financial instrument classification
All financial assets other than derivatives are classified as loans and receivables. All financial liabilities other than derivatives are classified as measured at amortised cost. The fair value of financial assets and liabilities approximates their carrying value.
GROUP 2015 $000
GROUP 2014 $000
Trade and other receivables 163,579 161,851
Cash and cash equivalents 7,565 1,015
TOTAL LOANS AND RECEIVABLES 171,144 162,866
Trade and other payables (45,786) (27,896)
Liabilities of disposal group (1,455) -
Bank borrowings (200,000) (316,000)
FINANCIAL LIABILITIES MEASURED AT AMORTISED COST (247,241) (343,896)
Derivative liabilities designated in hedging relationships
Forward foreign exchange contracts (6) (164)
Interest rate swaps (10,415) (5,012)
TOTAL DERIVATIVE LIABILITIES DESIGNATED IN HEDGING RELATIONSHIPS (10,421) (5,176)
Notes to the Financial StatementsFOR THE YEAR ENDED 31 DECEMBER 2015
24 Financial risk management cont.
REFI
NIN
G N
Z A
NN
UA
L RE
PORT
201
5
76
ECON
OMIC
PER
FORM
ANCE

Notes to the Financial StatementsFOR THE YEAR ENDED 31 DECEMBER 2015
24 Financial risk management cont.
Financial instruments are measured at fair value using the following fair value measurement hierarchy:
• Quoted prices (unadjusted) in active markets for identical assets or liabilities (level 1),
• Inputs other than quoted prices included within level 1 that are observable for the asset or liability, either directly (that is, as prices) or indirectly (that is, derived from prices) (level 2), and
• Inputs for the asset or liability that are not based on observable market data (that is, unobservable inputs) (level 3).
The Group’s financial instruments have been measured at the fair value measurement hierarchy of level 2 (2014: level 2).
Interest rate swaps and forward foreign exchange contracts are not traded in an active market and their fair value is determined by using valuation techniques. Specific valuation techniques used by the Group refer to observable market data and include:
• The fair value of interest rate swaps is calculated as the present value of the estimated future cash flows based on observable yield curves, and
• The fair value of forward foreign exchange contracts is determined using forward exchange rates at the balance sheet date, with the resulting value discounted back to present value.
REFININ
G N
Z AN
NU
AL REPO
RT 2015
77
ECONOM
IC PERFORMAN
CE

25 Derivative financial instruments
Notes to the Financial StatementsFOR THE YEAR ENDED 31 DECEMBER 2015
GROUP
2015 ASSETS
$000
2015 LIABILITIES
$000
2014 ASSETS
$000
2014 LIABILITIES
$000
Forward foreign exchange contracts – cash flow hedges - (6) - (164)
Interest rate swaps - cash flow hedges - (10,415) - (5,012)
TOTAL - (10,421) - (5,176)
Less non-current portion:
Forward foreign exchange contracts – cash flow hedges - - - (93)
Interest rate swaps – cash flow hedges - (10,415) - (5,012)
CURRENT PORTION - (6) - (71)
At balance sheet date all contracts had been designated as hedges (2014: all contracts). The full fair value of a hedging derivative is classified as a non-current asset or liability if the remaining maturity of the hedged item is more than 12 months and, as a current asset or liability, if the maturity of the hedged item is less than 12 months.
There was no ineffectiveness to be recorded from cash flow hedges (2014: nil).
The fair value of forward exchange contracts, interest rate swaps and currency options is based on accepted valuation methodologies.
Forward foreign exchange contracts
At 31 December 2015 the Group had entered into forward exchange contracts to sell the equivalent of $953 thousand (2014: $4.4 million). There were no currency options (2014: nil).
The forward exchange contracts are hedging committed or highly probable forecast purchases of property, plant and equipment denominated in foreign currency expected to occur at various dates with maturities up to May 2016. The forward exchange contracts are timed to mature when the liability is scheduled to be settled.
Interest rate swaps
Interest rate swaps are hedging highly probable cash flows associated with interest costs on borrowings and are used to convert floating rate positions into fixed rate positions. At 31 December 2015 the notional principal amounts of the outstanding interest rate swap contracts were $200 million (2014: $200 million), with final expiry dates in 2020. Fixed interest rates vary from 3.01% to 4.84% (2014: 3.01% to 4.84%) and the floating rates are Bank Bill Market (BKBM). Gains and losses on interest rate swap contracts recognised in the hedging reserve in equity as of 31 December 2015, will be continuously released to the Income Statement within finance cost until the repayment of the bank borrowings.
REFI
NIN
G N
Z A
NN
UA
L RE
PORT
201
5
78
ECON
OMIC
PER
FORM
ANCE

Trend StatementFOR THE YEAR ENDED 31 DECEMBER 2015
FINANCIAL PERFORMANCE
2015 $000
2014 $000
2013 $000
2012 RESTATED
$000
2011 $000
Total income 446,771 233,019 223,199 278,513 291,076
Total expenses 234,354 216,549 228,775 232,162 238,865
Net profit/(loss) before finance cost and income tax 212,417 16,470 (5,576) 46,351 52,211
Net finance cost 2,755 2,480 1,237 3,214 4,290
Net profit/(loss) before income tax 209,662 13,990 (6,813) 43,137 47,921
Income tax 58,731 3,967 (1,862) 12,084 13,402
Net profit/(loss) after income tax 150,931 10,023 (4,951) 31,053 34,519
FINANCIAL POSITION
2015 $000
2014 $000
2013 $000
2012 RESTATED
$000
2011 $000
Funds employed
Contributed equity 265,771 265,771 212,400 212,400 212,400
Retained profits 523,200 382,068 378,960 379,872 358,449
Other (6,776) (3,160) (259) (3,819) 228
Total equity 782,195 644,679 591,101 588,453 571,077
Loan funds – non-current 175,000 316,000 228,000 62,000 25,600
Other non-current liabilities 147,880 137,289 123,293 147,638 167,095
Total funds employed 1,105,075 1,097,968 942,394 798,091 763,772
Funds utilised
Non-current assets 1,153,142 1,088,462 942,444 802,766 770,412
Working capital^ (48,067) 9,506 (50) (4,675) (6,640)
Total funds utilised 1,105,075 1,097,968 942,394 798,091 763,772
^ 2015 INCLUDES $25 MILLION OF LOAN FACILITIES EXPIRING IN JUNE 2016. THE PARENT HAS THE ABILITY TO DETERMINE WHICH REVOLVING CASH ADVANCE FACILITY TO DRAW UPON TO MEET FUNDING REQUIREMENTS.
REFININ
G N
Z AN
NU
AL REPO
RT 2015
79
TREND STATEM
ENT

Trend StatementFOR THE YEAR ENDED 31 DECEMBER 2015
Non-GAAP Information
ANALYTICAL INFORMATION
2015 2014
2013
2012 RESTATED
2011
Number of shareholders 4,511 3,551 3,639 3,756 3,761
Earnings per share ($)* 0.482 0.032 (0.018) 0.111 0.123
Effective tax rate (%) 28 28 28 28 28
Net asset backing per share ($)* 2.53 2.08 2.11 2.12 2.04
Working capital ratio 0.8 1.1 1.0 1.0 0.9
DIVIDEND INFORMATION**
2015 2014
2013
2012 RESTATED
2011
Dividend per share (cents) 25 - 2 7 12
Dividend declared ($000) 78,144 - 5,600 19,600 33,600
Dividends declared per share
- interim (paid 24 September 2015) 5.0 cps - 2.0 cps 2.0 cps 3.0 cps
- final (payable 24 March 2016) 20.0 cps - - 5.0 cps 9.0 cps
Dividend cover 1.93 - (0.88) 1.58 1.03
MANUFACTURING
2015 2014 2013 2012 2011
Barrels processed – intake (000s barrels) 42,639 39,676 40,602 42,118 41,211
Gross refining margin (USD/barrel) 9.20 4.96 4.58 5.77 6.11
USD exchange rate (NZ$) 0.70 0.82 0.82 0.81 0.79
Pipeline throughput (000s barrels) 18,449 17,990 17,520 17,435 17,560
* EARNINGS PER SHARE FOR 2014 IS BASED ON A WEIGHTED AVERAGE CALCULATION OF SHARES.
** DIVIDEND INFORMATION IS STATED IN THE YEAR TO WHICH IT RELATES, RATHER THAN WHEN PAID.
Cash costs included in our Scorecard on page 10 are reconciled to the financial statements as shown in the table below.
2015 $MIL
2014 $MIL
Cash costs per Scorecard – Parent 160 142
Other operational losses - 1
Depreciation and disposal costs 72 72
Consolidation entries 2 2
Total expenses - audited financial statements 234 217
REFI
NIN
G N
Z A
NN
UA
L RE
PORT
201
5
80
TREN
D ST
ATEM
ENT

81
corpo
rate directo
ryREFIN
ING
NZ a
NN
Ua
L report 2015
ANNUAL GENERAL MEETINGWednesday 4 May at 2:00pmGallery Three Pullman HotelCorner Princes Street and Waterloo Quadrant Auckland 1010
PROXIES LODGEDBy 2.00pm 2 May 2016
2016 RESULTS ANNOUNCEDHalf year – August 2016Annual – Late February 2017
MANAGING YOUR SHAREHOLDING ONLINETo change your address, update your payment instructions and to view your registered details including transactions, please visit: www.computershare.co.nz/investorcentre.Please assist our registrar by quoting your CSN or shareholder number.
Financial calendar
REGISTERED OFFICEMarsden PointWhangarei
MAILING ADDRESSPrivate Bag 9024Whangarei 0148Telephone: +64 9 432 8311
WEBSITEwww.refiningnz.com
SHARE REGISTERComputershare Investor Services LimitedPrivate Bag 92119Auckland 1142Telephone: + 64 9 488 [email protected]
BANKERSANZ Bank New Zealand Limited Bank of New ZealandThe Bank of Tokyo-Mitsubishi UFJ, Limited
LEGAL ADVISERSMinter Ellison Rudd WattsChancery Green
AUDITORPricewaterhouseCoopers
CHAIRMANS C Allen (independent director)D A Jackson (resigned 29 April 2015)
INDEPENDENT DIRECTORSP M Springford V C M Stoddart M Tume (from 8 December 2015)
NON-INDEPENDENT DIRECTORSM J BennettsS J Brown M H Elliott A T Warrell D B Gilbert (resigned 29 May 2015)T J Wall (resigned 10 February 2016)
ALTERNATE DIRECTORSJ R Crawford J G Venn (resigned 5 June 2015)
CHIEF EXECUTIVE OFFICERS Post
COMPANY SECRETARYD M Jensen
Corporate directory

REFINING NZ
REFININ
G N
Z ANN
UAL REPO
RT 2015
Private Bag 9024 Whangarei 0148, NZt: +64 9 432 8311 e: [email protected] www.refiningnz.com
REFINING NZ