ANNUAL REPORT 2015 - Grieg Seafood 234343532363738393137303 t3o3t3a contents potential for further...
118
ANNUAL REPORT 2015 Grieg Seafood Rogaland // Grieg Seafood Finnmark // Grieg Seafood UK // Grieg Seafood B.C. // Ocean Quality AS
Transcript of ANNUAL REPORT 2015 - Grieg Seafood 234343532363738393137303 t3o3t3a contents potential for further...

ANNUAL REPORT
2015
Grieg Seafood Rogaland // Grieg Seafood Finnmark // Grieg Seafood UK // Grieg Seafood B.C. // Ocean Quality AS

2 A N N U A L R E P O R T 2 0 1 5
CONTENTSPOTENTIAL FOR FURTHER GROWTH 3KEY FIGURES 2015 4GRIEG SEAFOOD ROGALAND AS 5GRIEG SEAFOOD SHETLAND LTD 6GRIEG SEAFOOD FINNMARK AS 7GRIEG SEAFOOD BC LTD 8OCEAN QUALITY AS 9INVESTOR INFORMATION 10BOARD OF DIRECTORS REPORT 2015 11PRINCIPLES OF CORPORATE GOVERNANCE 2015 18
CONSOLIDATED STATEMENT OF PROFIT AND LOSS 26CONSOLIDATED COMPREHENSIVE INCOME STATEMENT 27CONSOLIDATED STATEMENT OF FINANCIAL POSITION 28CONSOLIDATED STATEMENT OF CHANGES IN EQUITY 30CONSOLIDATED CASH FLOW STATEMENT 32NOTES 33
PARENT COMPANY INCOME STATEMENT 88PARENT COMPANY BALANCE 89PARENT COMPANY CASH FLOW STATEMENT 90PARENT COMPANY CHANGE IN EQUITY 91NOTES 92
INDEPENDENT AUDITOR’S REPORT 117
SUSTAINABILITY REPORT - PLEASE REFER TO GRIEGSEAFOOD.COM
3G R I E G S E A F O O D 2 0 1 5
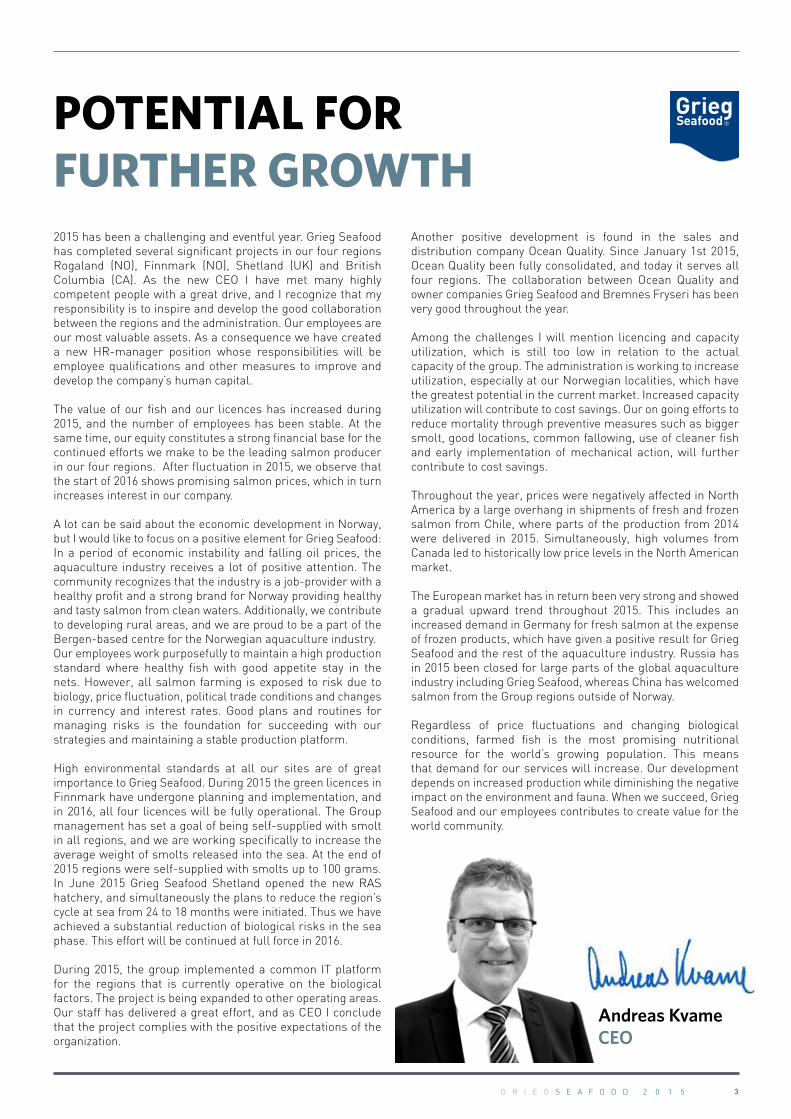
Andreas Kvame CEO
2015 has been a challenging and eventful year. Grieg Seafood has completed several significant projects in our four regions Rogaland (NO), Finnmark (NO), Shetland (UK) and British Columbia (CA). As the new CEO I have met many highly competent people with a great drive, and I recognize that my responsibility is to inspire and develop the good collaboration between the regions and the administration. Our employees are our most valuable assets. As a consequence we have created a new HR-manager position whose responsibilities will be employee qualifications and other measures to improve and develop the company’s human capital.
The value of our fish and our licences has increased during 2015, and the number of employees has been stable. At the same time, our equity constitutes a strong financial base for the continued efforts we make to be the leading salmon producer in our four regions. After fluctuation in 2015, we observe that the start of 2016 shows promising salmon prices, which in turn increases interest in our company.
A lot can be said about the economic development in Norway, but I would like to focus on a positive element for Grieg Seafood: In a period of economic instability and falling oil prices, the aquaculture industry receives a lot of positive attention. The community recognizes that the industry is a job-provider with a healthy profit and a strong brand for Norway providing healthy and tasty salmon from clean waters. Additionally, we contribute to developing rural areas, and we are proud to be a part of the Bergen-based centre for the Norwegian aquaculture industry.Our employees work purposefully to maintain a high production standard where healthy fish with good appetite stay in the nets. However, all salmon farming is exposed to risk due to biology, price fluctuation, political trade conditions and changes in currency and interest rates. Good plans and routines for managing risks is the foundation for succeeding with our strategies and maintaining a stable production platform.
High environmental standards at all our sites are of great importance to Grieg Seafood. During 2015 the green licences in Finnmark have undergone planning and implementation, and in 2016, all four licences will be fully operational. The Group management has set a goal of being self-supplied with smolt in all regions, and we are working specifically to increase the average weight of smolts released into the sea. At the end of 2015 regions were self-supplied with smolts up to 100 grams. In June 2015 Grieg Seafood Shetland opened the new RAS hatchery, and simultaneously the plans to reduce the region’s cycle at sea from 24 to 18 months were initiated. Thus we have achieved a substantial reduction of biological risks in the sea phase. This effort will be continued at full force in 2016.
During 2015, the group implemented a common IT platform for the regions that is currently operative on the biological factors. The project is being expanded to other operating areas. Our staff has delivered a great effort, and as CEO I conclude that the project complies with the positive expectations of the organization.
POTENTIAL FOR FURTHER GROWTH
Another positive development is found in the sales and distribution company Ocean Quality. Since January 1st 2015, Ocean Quality been fully consolidated, and today it serves all four regions. The collaboration between Ocean Quality and owner companies Grieg Seafood and Bremnes Fryseri has been very good throughout the year.
Among the challenges I will mention licencing and capacity utilization, which is still too low in relation to the actual capacity of the group. The administration is working to increase utilization, especially at our Norwegian localities, which have the greatest potential in the current market. Increased capacity utilization will contribute to cost savings. Our on going efforts to reduce mortality through preventive measures such as bigger smolt, good locations, common fallowing, use of cleaner fish and early implementation of mechanical action, will further contribute to cost savings.
Throughout the year, prices were negatively affected in North America by a large overhang in shipments of fresh and frozen salmon from Chile, where parts of the production from 2014 were delivered in 2015. Simultaneously, high volumes from Canada led to historically low price levels in the North American market.
The European market has in return been very strong and showed a gradual upward trend throughout 2015. This includes an increased demand in Germany for fresh salmon at the expense of frozen products, which have given a positive result for Grieg Seafood and the rest of the aquaculture industry. Russia has in 2015 been closed for large parts of the global aquaculture industry including Grieg Seafood, whereas China has welcomed salmon from the Group regions outside of Norway.
Regardless of price fluctuations and changing biological conditions, farmed fish is the most promising nutritional resource for the world’s growing population. This means that demand for our services will increase. Our development depends on increased production while diminishing the negative impact on the environment and fauna. When we succeed, Grieg Seafood and our employees contributes to create value for the world community.
4 A N N U A L R E P O R T 2 0 1 5
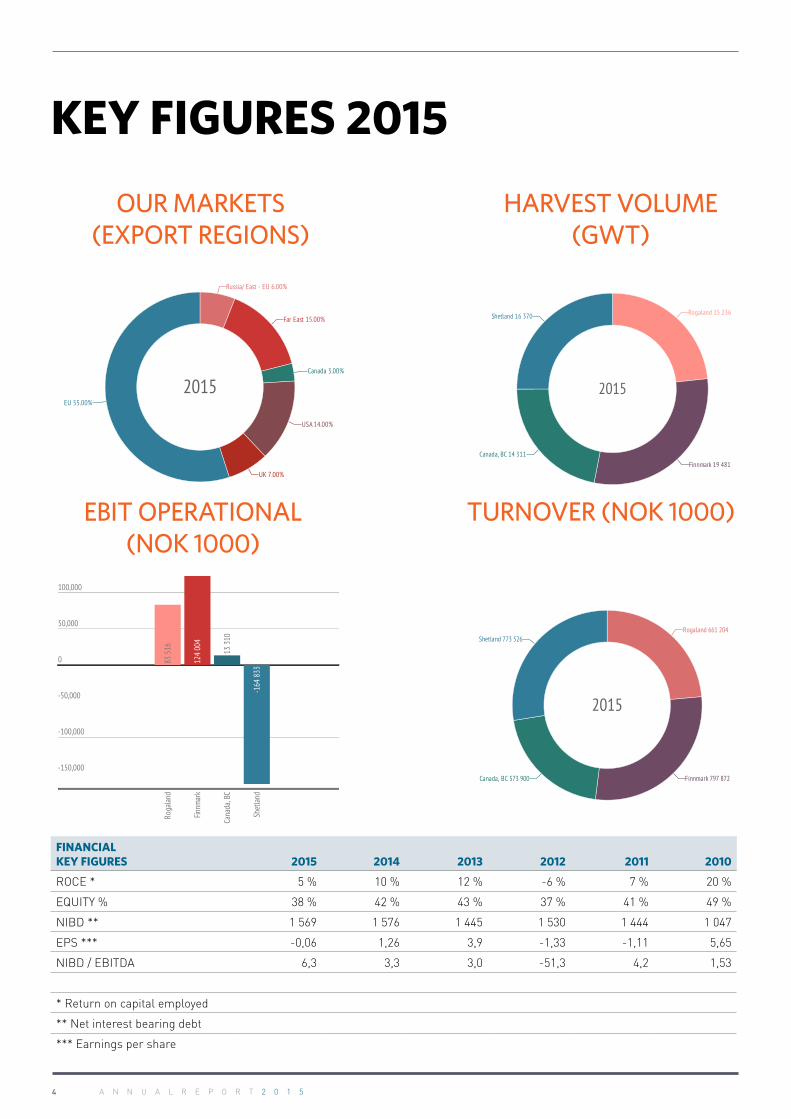
KEY FIGURES 2015
OUR MARKETS (EXPORT REGIONS)
HARVEST VOLUME (GWT)
TURNOVER (NOK 1000)EBIT OPERATIONAL (NOK 1000)
FINANCIALKEY FIGURES 2015 2014 2013 2012 2011 2010
ROCE * 5 % 10 % 12 % -6 % 7 % 20 %
EQUITY % 38 % 42 % 43 % 37 % 41 % 49 %
NIBD ** 1 569 1 576 1 445 1 530 1 444 1 047
EPS *** -0,06 1,26 3,9 -1,33 -1,11 5,65
NIBD / EBITDA 6,3 3,3 3,0 -51,3 4,2 1,53
* Return on capital employed
** Net interest bearing debt
*** Earnings per share

5G R I E G S E A F O O D 2 0 1 5
GRIEG SEAFOOD ROGALAND ASGrieg Seafood Rogaland ( GSFR ) farms salmon in Rogaland. The company has 20 growout licences and two smolt licences. The company has its own brood activity in Erfjord. All the fish produced at our own plants are processed at our own facilities.
The company has 102 employees in the region divided into four divisions (Broodstock, Hatcheries, Grow-out and Processing) Our operations are located in six municipalities in Rogaland and they contribute significant local value creation. Production capacity is estimated to be approximately 24,000 tonnes gutted weight. The company is Global GAP certified.
102 EMPLOYEES20 FARM SITES
ROGALAND 2015 2014 2013 2012 2011Harvest in tons GWE 15 236 12 778 15 088 19 247 15 986
Sales revenue TNOK 661 204 571 150 640 600 558 300 547 700
EBIT TNOK 83 516 77 835 144 800 50 800 104 200
EBIT /kg GWE 5,5 6,10 9,60 2,64 6,52
6 A N N U A L R E P O R T 2 0 1 5
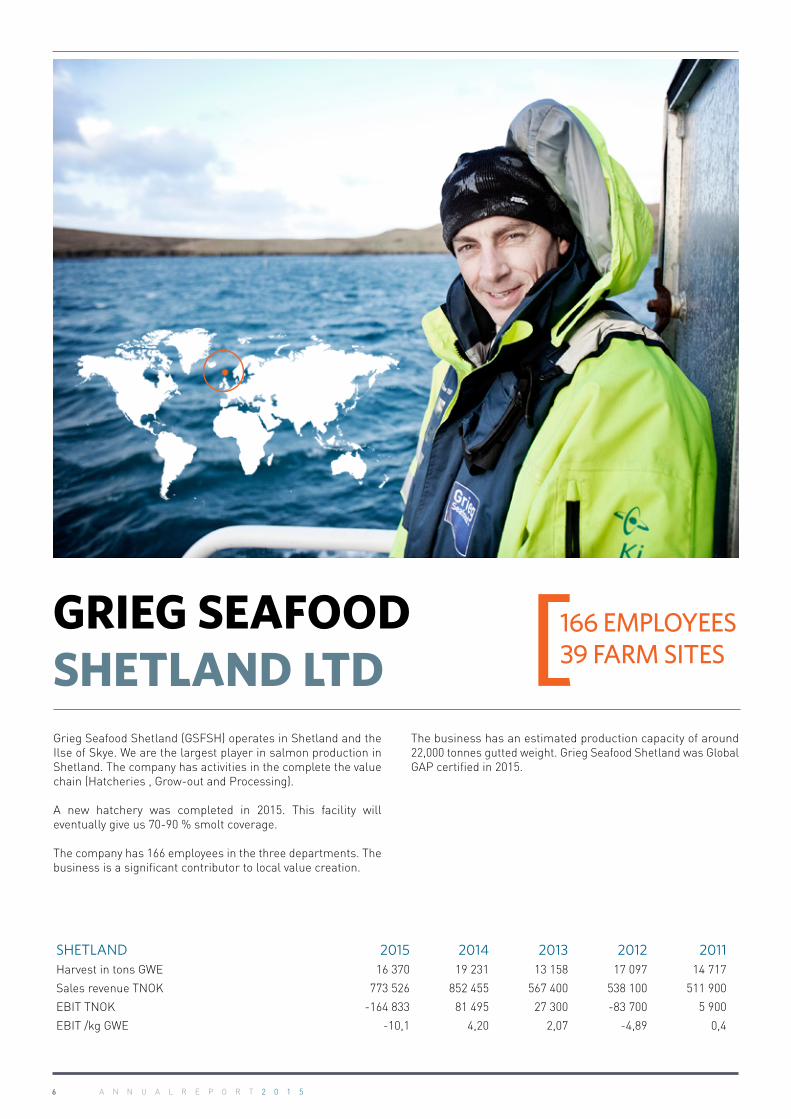
GRIEG SEAFOOD SHETLAND LTDGrieg Seafood Shetland (GSFSH) operates in Shetland and the Ilse of Skye. We are the largest player in salmon production in Shetland. The company has activities in the complete the value chain (Hatcheries , Grow-out and Processing).
A new hatchery was completed in 2015. This facility will eventually give us 70-90 % smolt coverage.
The company has 166 employees in the three departments. The business is a significant contributor to local value creation.
The business has an estimated production capacity of around 22,000 tonnes gutted weight. Grieg Seafood Shetland was Global GAP certified in 2015.
SHETLAND 2015 2014 2013 2012 2011Harvest in tons GWE 16 370 19 231 13 158 17 097 14 717
Sales revenue TNOK 773 526 852 455 567 400 538 100 511 900
EBIT TNOK -164 833 81 495 27 300 -83 700 5 900
EBIT /kg GWE -10,1 4,20 2,07 -4,89 0,4
166 EMPLOYEES39 FARM SITES
7G R I E G S E A F O O D 2 0 1 5
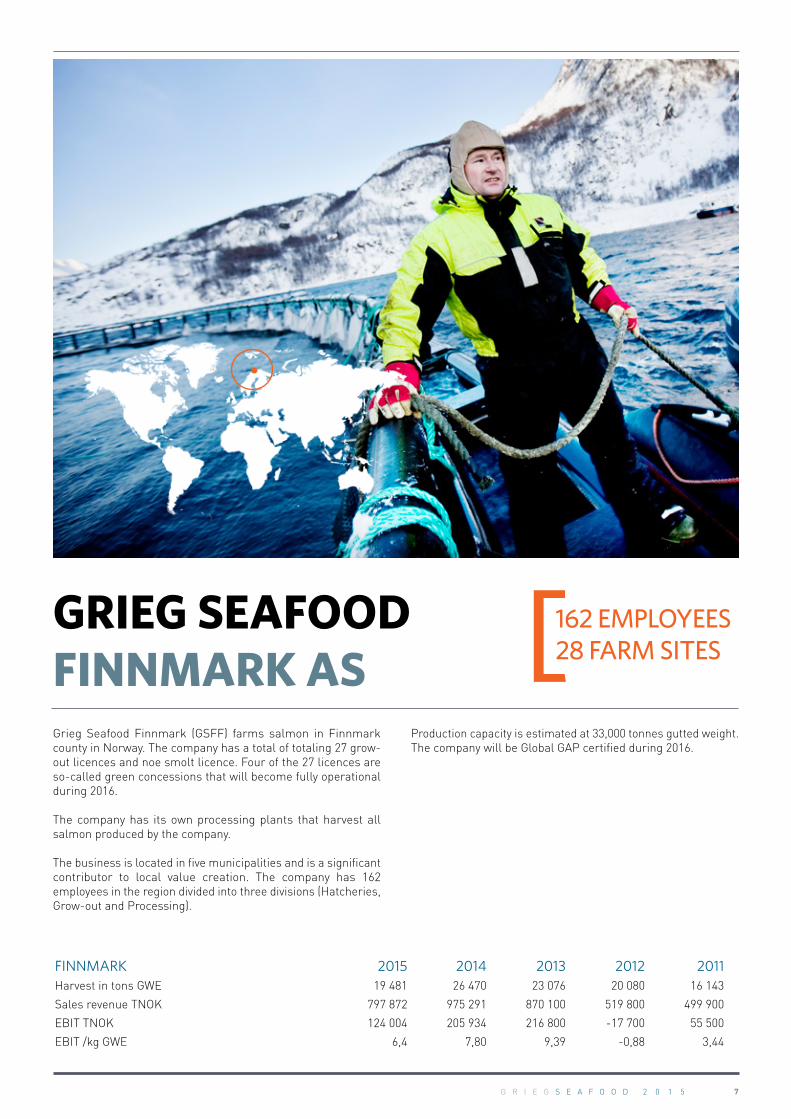
GRIEG SEAFOOD FINNMARK ASGrieg Seafood Finnmark (GSFF) farms salmon in Finnmark county in Norway. The company has a total of totaling 27 grow-out licences and noe smolt licence. Four of the 27 licences are so-called green concessions that will become fully operational during 2016.
The company has its own processing plants that harvest all salmon produced by the company.
The business is located in five municipalities and is a significant contributor to local value creation. The company has 162 employees in the region divided into three divisions (Hatcheries, Grow-out and Processing).
Production capacity is estimated at 33,000 tonnes gutted weight. The company will be Global GAP certified during 2016.
FINNMARK 2015 2014 2013 2012 2011Harvest in tons GWE 19 481 26 470 23 076 20 080 16 143
Sales revenue TNOK 797 872 975 291 870 100 519 800 499 900
EBIT TNOK 124 004 205 934 216 800 -17 700 55 500
EBIT /kg GWE 6,4 7,80 9,39 -0,88 3,44
162 EMPLOYEES28 FARM SITES

8 A N N U A L R E P O R T 2 0 1 5
GRIEG SEAFOOD BC LTDGrieg Seafood BC Ltd. farms salmon on the west and east sides of Vancouver Island as well on the Sunshine Coast just north of the city of Vancouver. There are currently a total of 22 marine farm licences and a land based hatchery located in Gold River.
Grieg Seafood BC Ltd. is committed to operating responsibly and meeting or exceeding all regulatory requirements. Grieg Seafood was the first salmon farming company in North America to be sourcing salmon from farms that were independently audited by the Best Aquaculture Practices certification program. Grieg Seafood BC has also been audited and approved by the Aquarium of the Pacific’s ‘Seafood for the Future’ responsible sourcing program.
Grieg Seafood BC had 105 employees in 2015, and the
production capacity of all licences is approximately 20.000 tonnes gutted weight.
BC 2015 2014 2013 2012 2011Harvest in tons GWE 14 311 6 257 6 739 13 576 13 236
Sales revenue TNOK 573 900 280 399 330 700 438 400 491 300
EBIT TNOK 13 310 -47 810 17 500 -32 200 38 000
EBIT /kg GWE 0,9 -7,60 -1,15 -2,37 2,87
105 EMPLOYEES22 FARM SITES

9G R I E G S E A F O O D 2 0 1 5
OCEAN QUALITY ASOcean Quality is the Norwegian sales company for Grieg Seafood ASA (60%) and Bremnes Fryseri AS (40%). The company was established in the fall of 2010 and has its main office in Bergen, Norway. In 2015 Ocean Quality established a subsidiary company in Canada. The company is managed from the main office in Vancouver. From 2015 Ocean Quality handled all fish sales for Grieg Seafood. At year-end 2015 the Group had 39 employees, of whom 27 men and 12 women.
The main strategy of the company is to become the market´s preferred supplier of seafood. The sales organisation of Ocean Quality carries out its services in accordance with high standards of seafood supply to our customers across the globe.
The quality of the products and our customer service emphasizes the following:
• Fresh and healthy products with desirable nutrition content• Customer requirements, reliability and year-round delivery• Full traceability and focus on food safety for finished
products and raw materials• Strict quality control and sustainable utilization of raw
materials• Fish health and protection of the environment

10 A N N U A L R E P O R T 2 0 1 5
INVESTOR INFORMATIONLargest shareholders of Grieg Seafood ASA at 31.12.2015Grieg Holdings ASDNB Nor Bank ASANordea Bank Norge ASAKontrari ASYstholmen ASOM Holding ASGrieg Seafood ASAState street Bank and Trust Co.Skandinaviska Enskilda Banken ABDNB Nor SMB
Analytics following the GSF stock
Nordea MarketsDnB NOR MarketsHandelsbankenEnskildaRS Pareto SecuritiesSwedbankCarnegie ASAABG Sunndal CollierFondsfinansSparebank 1 MarketsDanske Bank Markets

11G R I E G S E A F O O D 2 0 1 5
BOARD OF DIRECTORS REPORT 2015
GROUP ACTIVITIES AND LOCATIONGrieg Seafood ASA (”the Company”) is the parent Company of the Grieg Seafood Group (”the Group”). The Group’s business activities relate to production and trading in the sustainable farming of salmon, and in naturally related activities.
The Group is one of the world’s largest producers of farmed salmon, with a production capacity of around 90,000 tons gutted weight annually at full capacity. The Group has 100 licences for salmon production and five licences for smolt production. The Group shall be a leader in the area of aquaculture. The Group’s commercial development is based on profitable growth and the sustainable use of natural resources, as well as being a preferred supplier to selected customers.
The Group has operations in Finnmark and Rogaland in Norway, in British Columbia in Canada (BC) and in Shetland (UK). The Group owns 60% of the sales company Ocean Quality AS and the remaining 40% is owned by Bremnes Fryseri AS. Ocean Quality
has offices in Norway, Canada and Shetland (UK). The head office is located in Bergen, Norway.
Grieg Seafood ASA has been listed on the Oslo Stock Exchange since June 2007.
MAIN FEATURES OF 2015• 2015 was characterised by a fluctuating supply and price
determination in relation to the individual regions and relatively large price differences between the first and second half of the year. Supply was strong in Europe in the first half of the year, which led to pressure on prices. Supply was slightly below demand in the second half of the year, which entailed similarly very good prices towards the end of the year. The US market has been weak throughout 2015. Moreover, exchange rate fluctuations and a stronger GBP compared to NOK reduced Shetlands competitiveness and margins.
• A decision to sell the smokehouse and filleting plant in Shetland resulted in an impairment of the plant with MNOK 46.

12 A N N U A L R E P O R T 2 0 1 5
• Dividend was paid with NOK 0.5 per share in 2015.• The Group´s bank loans were expanded with MNOK 500 at
the end of the first half of the year. The bond loan of MNOK 400 was redeemed in December 2015.
• A new hatchery opened in Shetland. The plant is in full operation according to the strategy and will make us self-supplied with smolt.
• Production in Finnmark has been good and in line with plans. Production in Rogaland has been slightly lower than planned due to, a.o., PD and other biological challenges. Overall profitability in Norway is acceptable. Production in BC has been considerably better than in 2014 and reached normal production. Production in Grieg Seafood Shetland was good until the end of summer. At that point, algae imposed damage to the gills, which led to weak production throughout the remainder of the year. The Board has initiated a strategic review of the operations in Shetland.
• Towards year-end 2014, measures were initiated in order to reduce expenses and streamline operations. Subsequently, 2015 has focused on changes within operations, support functions and systems.
• As from 2015, Ocean Quality has been consolidated and accounted for as a subsidiary. Hence, comparable figures have been revised.
ACCOUNTS The consolidated financial statements are prepared in accordance with international accounting principles (IFRS).
RESULTSThe Group had a turnover of MNOK 4,609 in 2015, an increase of 12% compared with the previous year. The total harvest was 65,398 tons glutted weight (64,736 tons in 2014), an increase of 1%. 2015 was marked by high supply growth in the first half of 2015, followed by increasing prices at the end of the year in Norway. Major problems with lice for the industry in general has led to down-harvesting and thus lower supply at the end of the year, which has given a price increase in the last quarter of 2015. A strong GBP has changed the market situation and profitability in UK. Increased production in Chile in 2014 has affected the supply growth in 2015, which in turn has resulted in a weak market for salmon from Canada.
The operating result before fair value adjustment of biological assets was MNOK 48, compared to MNOK 343 in 2014. The operating margin before fair value adjustment of biological assets was 1.0% against 8.4% in 2014. EBIT per kilo (before fair value adjustment of biological assets) was 0.7 against 5.3 in 2014. The reduction in operating profit compared with 2014 is due to higher costs for harvested fish and high mortality in Shetland. The high production costs have persisted in 2015. Feed prices have increased due to the development in commodity prices and the weakening of NOK at year-end. Feed prices are sensitive to both marine and vegetable commodity prices, which vary with seasonal harvesting and production conditions. Treatment costs against lice and preparedness to manage and treat the causes of AGD (Amoebic gill disease) have entailed persistent high production costs for both Norway and the UK. Shetland has faced challenges in relation to algae in the second half of 2015. Low levels of oxygen in BC in Q2 resulted in high mortality. This has negatively affected the operating result. In 2014, the operating result included gains from sale of shares with MNOK 63.8.
The operating result after value adjustment of biological assets
was MNOK 81 against MNOK 219 in 2014. Net financial items showed a loss of MNOK 93 against a loss of MNOK 50 in 2014. Interest expenses are higher than in 2014 due to increased utilisation of credit facility as well as higher interest-bearing debt. In 2015, the Group has been granted a waiver from the original loan terms on the mortgage debt at year-end.
The Group had a positive net unrealised gain in 2015 of MNOK 29, against MNOK 46 in 2014, mainly due to current loans from the parent company in GBP and CAD.
Net tax income for the year was MNOK 14, against net tax cost of MNOK 28 in 2014. The effective tax rate of 147% for 2015 is due to change in tax rate in Norway and permanent differences.
Effective tax rate for 2014 was 16%. The Group as a whole has entered into tax position and MNOK 25 has been provisioned at year-end 2015 (MNOK 57 for 2014) for tax payable.
The Group’s result for 2015 was MNOK 4 after taxes versus MNOK 144 in 2014.
GRIEG SEAFOOD ASAThe financial statements for the parent company have been prepared in accordance with generally accepted accounting principles in Norway (NGAAP). The Company recorded an operating result for 2015 of MNOK -19 (MNOK -36). The improved operating result is due to, a.o., less exercised options during 2015 compared to 2014.
The Company has provided loans to subsidiaries in foreign currency which carry a positive unrealised net gain of MNOK 77 in 2015, which is MNOK 25 below 2014, due to a weakening of NOK against GBP throughout 2015. In 2015, a recognised group contribution of MNOK 39 (MNOK 34) contributes to the positive financial result, in addition to the gain on foreign currency. Interest expenses have increased compared to 2014 due to expanded financing frame as well as waiver granted for loan terms and thus increased margin.
The parent company’s profit after tax for the year was MNOK 40 against MNOK 59 in 2014.
SEGMENT REPORTRogalandOperating profit before fair value adjustment of biological assets was MNOK 84, corresponding to NOK 5.5/kg. The equivalent in 2014 was MNOK 78 (NOK 6.1/kg). Total harvested volume in 2015 was 15,236 tons. The decrease of the result is caused by higher costs on down-harvested fish, due to earlier incidents of algae, sea lice and PD (Pancreas Disease). 64% of the harvested volume was in the first half of the year. The output price is high due to down-harvesting of sites with PD (Pancreas Disease) in 2014. In the first half of 2015, real prices were lower than in the first half of the year. Due to PD in 2014, the harvested volume was lower than projected in 2015. PD and unusually low sea temperatures in the first half of the year, as well as bad weather conditions, entailed lower production in the sea. An underlying cost increase regarding treatment and preparedness to reduce PD, AGD and other biological challenges, has contributed to increased production costs. Rogaland uses wrasse agains sea lice, which has proved effective also in 2015. There are significant costs incurred, but this has yielded positive results in terms of low sea lice levels. Production at the hatchery has

13G R I E G S E A F O O D 2 0 1 5
been satisfactory in 2015.
Finnmark The operating result before fair value adjustment of biological assets was MNOK 124, corresponding to NOK 6.4/kg. The equivalent for 2014 was MNOK 206 (NOK 7.8/kg). Finnmark showed a high harvested volume in Q1 directed to a market with low prices and high costs for harvested fish. Harvesting was suspended in Q2. Both factors have affected the result negatively. A review of procedures and processes at the harvesting plant has been carried out in order to achieve higher efficiency and reduced costs. Due to sea lice challenges in Øksfjorden a decision has been made to fallow the whole area. Some harvesting was expedited from Q4 to Q3, which also entailed a lower margin. Total harvested volume in 2015 was 19,481 tons. Procuction in the sea has been satisfactorily throughout the year. The degree of disease has been low throughout the year, and the fish in sea maintains prime quality.
Finnmark has been awarded 4 green licences at year-end 2014. Production will be initiated in the course of 2016. Production in the hatchery still has potential to improve regarding attainment of proper weight of large smolt in due time, which will improve operations considerably.
BCThe operating result before fair value adjustment was MNOK 13, corresponding to NOK 0.9/kg, against MNOK -48 (NOK -7.8/kg) in 2014. The positive result is due to substantially higher harvesting volumes in 2015 compared to 2014, at 8,054 tons. In addition, there has been lower costs on harvested fish. During summer, low levels of oxygen generated high mortality, which has reduced the volume by approximately 1,000 tons. Investments have been made to decrease the risk of future biological irregularities in connection with low oxygen levels.
In 2014, it was decided to wound up the production of Pacific salmon. The last generation was harvested in Q3 2015. All frozen Coho from 2014 has been sold during 2015, which has affected the operating result negatively. By now, the company has exclusively Atlantic salmon.
Production in the sea has been good throughout 2015. The hatchery also had a healthy production. In 2014, agreements were implemented for external delivery of smolt, in order to ensure sufficient backup of smolt to avoid negative production impacts from new incidents of disease at the hatchery in 2015. This generates higher costs than normal related to smolt. As a result of the smolt delivery backup-system, Grieg Seafood has introduced the projected number of smolt in 2015. Total harvested volume in BC was 14,311 tons.
ShetlandIn Shetland the operating result before fair value adjustment was MNOK -165, corresponding to NOK -10.1/kg. The equivalent for 2014 was MNOK 81 (NOK 4.2/kg). 2015 has been a year of change in Shetland. The smokehouse and filleting plant is shut down, entailing an impairment of MNOK 46. Changes have been implemented in the harvesting line, and further adjustments will be considered to lower costs of processing. These modifications include downsizing of staff. Efforts are still made to keep as low as possible the levels of sea lice, which still is a challenge. High treatment expenses were incurred in order to maintain sea lice levels at a satisfactory level. There has been challenges with algae causing gill problems, mortality and high impairment costs, especially in the second half of the year.
Total harvested volume in 2015 was 16,370 tons, which is 2,861 tons below 2014. Gill damages in 2014 led to lower growth than normal and thus harvesting of small fish at a time of low market
prices for this fish size. High output prices on harvested fish have been the most significant factor for weak results.
An active effort is made to implement measures for increased production, decreased risk and reduced costs in Shetland in the upcoming period.
The hatchery was completed in 2015 and the production of smolt went according to plans throughout the second half of the year. Increased quality of the smolt in combination with minor transport time, should contribute to improve production significantly.
Ocean Quality AS GroupOcean Quality AS is the sales company owned by Grieg Seafood ASA (60%) and Bremnes Seashore AS (40%). The company was established in 2010 and has its main office in Bergen, Norway. As from 2015, Ocean Quality North America Inc. was established as a 100% owned subsidiary of Ocean Quality AS. Ocean Quality is from 2015 a subsidiary of Grieg Seafood ASA. Ocean Quality sells all fish for Bremnes Fryseri AS and for Grieg Seafood Norway, UK and BC. The Group has 39 employees, of whom 27 men and 12 women.
The revenue in 2015 was MNOK 4,543 against MNOK 3,555 in 2014. The Ocean Quality Group recorded an operating profit of MNOK 115 in 2015, against MNOK 27 in 2014 (before bonus to producer).
The establishing of the company both in UK and Canada has yielded synergies in terms of sale of varied sizes of salmon in different markets. 2015 opened with low earnings due to weak prices. Throughout the autumn of 2015, the Norwegian market has improved with higher prices. A larger volume than expected out of Chile has also generated lower prices in 2015 in the US market. As for UK, the strong GBP has negatively affected competitiveness in UK and real prices have remained low.
RESEARCH AND DEVELOPMENTGrieg Seafood utilises funds for research and development every year. This relates to various activities ranging from active participation in steering committees in national research projects to local test and trial projects in the regions. These activities focus on finding solutions to biological and technical challenges both short and long term, which in turn helps us increase the efficiency of daily operation of our plants. The Group is working on many different projects, ranging from improving fish health and welfare, efficient operation of large units, feeding control and optimisation of young fish production in large recycling plants.
BALANCE SHEETThe Group had total recorded assets of MNOK 5,936 as at 31. Dec 2015, against MNOK 5,352 at year-end 2014. Of this, goodwill accounted for MNOK 111 and licences MNOK 1,093. Investments in tangible fixed assets relate mainly to maintenance investments. Additional investments have been made to prepare the green licences in Finnmark. Fair value adjustment of biological assets was positive due to expected future sales prices that will exceed the accrued production costs.
Group equity at 31 Dec 2015 stood at MNOK 2,238, against

14 A N N U A L R E P O R T 2 0 1 5
MNOK 2,241 at year-end 2014. The equity ratio at year-end 2015 was 38% (42%).
FINANCE AND FUNDINGThe Group’s net interest-bearing debt including Ocean Quality Group is MNOK 1,907 at year-end 2015. This includes factoring liabilities of MNOK 338. The equivalent for 2014 was MNOK 1,771, of which factoring liabilities of MNOK 196. This equals an increase of MNOK 136. Net interest-bearing debt excluding factoring liabilities amounts to MNOK 1,569 (MNOK 1,576). The Group´s credit facility was expanded with MNOK 500 through an increase of the bank loan frame in June 2015. The bank syndicate consists of Nordea and Den Norske Bank after the amendment of the credit facility. The expansion of the credit facility was made in order to secure financing when the mortgage loan of MNOK 400 was fully redeemed in December 2015. The syndicated loan comprises a total frame of MNOK 1,910, of which a long-term credit facility of MNOK 700. There are no changes to the repayment profile. The revolving credit has been utilised with MNOK 450 at year-end. Further drawing rights amount to MNOK 250. The credit facility from the syndicate classifies as non-current, as there is no appointment to roll over the credit facility once a year. The term loan has been repaid with MNOK 90 in 2015. The Group mainly uses finance leasing by investing in new feeding barges and other operational equipment. Through the agreement with the bank syndicate, the Group has a leasing facility of MNOK 350. As at 31 December 2015, the leasing liabilities amount to MNOK 334. The Group was in breach with one of the loan covenants, i.e. NIBD/EBITDA at year-end. The Group has been granted a waiver from this covenant from Q4 until the end of Q1 2016. According to the loan
covenants, factoring is not regarded as interest-bearing debt. The equity is also estimated exclusive of Ocean Quality. Equity ratio thus stands at 41% with regards to loan covenants.
CASH FLOWThe net cash flow from operations was increased with MNOK 213 to MNOK 370 in 2015, up from MNOK 157 in 2014. The increase in working capital is related to increased accounts payable. Net cash flow from investment activities in 2015 was MNOK -317, against MNOK -233 in 2014. Investment payments related to fixed assets amounted to MNOK 264. The equivalent for 2014 was MNOK 303. Net cash flow from financing was MNOK 158 against MNOK 71 in 2014. There has been a net drawdown of debt as mentioned under “Funding”, implying a positive cash flow from financing in 2015 when compared to 2014. Increased factoring liabilities from 2014 also contribute to increased financing. For 2015 there was a net change in cash and cash equivalents of MNOK 211. As at 31 December 2015 the disposable cash balance was MNOK 392.
GRIEG SEAFOOD ASAThe parent company’s net cash flow from operations in 2015 was MNOK 105 against MNOK 107 in 2014. The cash flow from investing activities was negative with MNOK 3 against MNOK -121 in 2014. Net cash flow from financing activities was MNOK 10 (MNOK -8). In 2015, new long-term debt has been drawn down, and the mortgage loan has been fully redeemed. For 2015 there was a net change in cash and cash equivalents of MNOK 119.
15G R I E G S E A F O O D 2 0 1 5
As at 31 December 2015 the disposable cash balance was MNOK 215.
GOING CONCERN ASSUMPTIONForecasting is carried out, showing a positive and good cash flow based on conservative salmon price assumptions. Q1 2016 presents a very positive price increase both in the European, Asian and US markets, contributing to a positive cash flow. The number of large and robust smolt increases, which will decrease the risk of biological incidents. Shetland has shown weak results throughout 2015, and a strategic review of the whole region has been initiated. Several projects were completed in 2015 which results will manifest in 2016, both in the processing plants and for edible fish, in addition to administrative support functions like common ICT systems. The organisation stands more united because the support functions for Norway have been located to the main office. The purpose is to achieve an operational focus in the regions. The Group has honored its debt under the financing agreements and, by year-end, retains sufficient funding to complete its objectives.
It is the view of the Board that the financial statements give a true and fair presentation of the Group’s assets and liabilities, financial position and accounting results. Based on the above account of the Group’s results and position, and in accordance with the Norwegian Accounting Act, the Board confirms that the annual financial statements have been prepared on a going concern basis, and that the requirements for so doing are met.
ACCOUNTING RESULTS AND ALLOCATIONS – GRIEG SEAFOOD ASAThe Group´s strategy for dividend is that the annual dividend should correspond to around 25% of the Group’s profit after fair value adjustment for biomass and after tax. The Group has at year-end been granted a waiver from the loan covenant related to NIBD/EBITDA until the end of Q1 2016. Upon this condition, no provision has been made to pay dividend based on the statement for 2015. In 2015, a dividend of NOK 0.50 per share was paid, based on the 2014 statement, equivalent to appr. 25% of the profit for 2014.
The parent company, Grieg Seafood ASA, recorded a profit for 2015 of MNOK 40, which the Board proposes to the General Assembly to dispense as follows:
Transfer to retained equity MNOK 40Total dispensed MNOK 40
RISK AND RISK MANAGEMENTThe Group is exposed to risks in a number of areas, such as
biological production, changes in salmon prices, the risk of political trade barriers, as well as financial risks such as changes in interest, exchange rates and liquidity.
The Group’s internal control and risk exposure are subject to continuous observation and improvement, and the work of reducing risk in different areas has a high priority.
The management has set parameters for managing and eliminating most of the risks that could prevent the company from achieving its goals. For further information, we refer to the document of principle relating to corporate governances as practised by Grieg Seafood ASA.
Financial riskThe Group operates within an industry characterised by great volatility which entails greater financial risk. 2015 has continued a tight financial market, although providing a somewhat easier access to available liquidity in the market. The requirements for the borrower are still high. Financial and contractual hedging as is a matter of constant consideration, in combination with operational measures. The company draws up rolling liquidity forecasts extending over three years. These forecasts incorporate conservative assumptions for salmon prices, and this is applied as basis for calculating the liquidity requirement. This forecast forms the basis of the need for financial parameters. With the financing of the Group at year-end, the level of this risk is considered to be satisfactory. The bond loan was refinanced in 2015, and the company had installed an expanded financing frame, which has secured an adequate financing for the Group. At the end of Q4, the Group was granted a waiver until the end of Q1 2016. The new long-term financing agreement includes a revolving credit facility totaling MNOK 700. It is flexible, as it can be drawn down within 1 month or a longer period, depending on the Group´s need for liquidity. In 2015, drawdowns have been made within a 3 months´ period, corresponding to the period of the interest rate swap agreements. The following sections provide further information about the individual risk areas.
Currency riskIn converting the accounts of foreign subsidiaries, the Group’s greatest exposure relates to CAD and GBP. Our main strategy is to reduce the currency risk by funding the business in the local currency.All long-term loans from the parent company to subsidiaries are in the local currency and loans of this kind are regarded as a net investment, since the loans are not repayable to the parent company.The subsidiaries will always require long-term funding. The currency effect of the net investment is incorporated in the consolidated statement of comprehensive income (OCI).
Income for the Norwegian operation is denominated in NOK, and the translation risk is transferred to the sales company. The case is similar for UK and BC. BC sells in CAD denomination to the sales company, which in turn hedges against currency volatility in relation to CAD/USD. The Norwegian sales company likewise hedges against currency volatility in relation to EUR/NOK. At year-end, contracts are concluded until January 2017.
The currency situation is continuously assessed against the volatility of the currencies. The remaining net exposure is frequently monitored. For further information, refer to Note 3 to the consolidated financial statements.
Interest rate riskThe Group is exposed to interest rate risk through its loan activities and to fluctuating interest rate levels in connection with financing of its activities in all regions.
Most of the Group’s existing loans are based on floating rates,

16 A N N U A L R E P O R T 2 0 1 5
but separate fixed rate contracts have been entered into in order to reduce the interest rate risk. It is group policy to have a certain percentage of the Group’s interest-bearing debt hedged through interest rate swap agreements. A given proportion shall be at a floating rate, while consideration will be given to the use of hedging contracts for the remainder.
Liquidity riskThe Company´s equity ratio is reduced from 42% at year-end 2014 to 38% at year-end 2015.
Interest-bearing debt has increased mainly due to factoring liabilities. Ocean Quality has concluded agreements with factoring companies for Norway and UK, implying transfer of credit insured receivables to factoring company. This ensures early settlement of account receivables. This is a financial arrangement, as the factoring company does not acquire the substantial credit risk. The management monitors the Group’s liquidity reserve which comprises a loan facility and bank deposits, as well as cash equivalents based on expected cash flows. This is carried out at Group level in collaboration with the operating companies. The management and Board seek to maintain a high equity ratio in order to be well equipped to meet financial and operational challenges. Considering the dynamic nature of the industry, the Group aims to maintain flexibility of funding. An expanded financing frame was installed in June 2015, providing the Group with financing for redemption of the bond loan.
Operating riskOperating risk was adequately managed throughout 2015, less of Shetland and individual incidents in BC. The Board recognises the importance of focusing on further improvements related to biological development as well as focus on operational measures. One such measure aimed at bringing down the biological risk in all regions, is to increase the number of large smolt which in turn reduces production time in sea. A review of all three harvesting plants has been carried out with a focus on streamlining the harvesting lines in order to decrease cost of harvesting. The decision to exclusively produce Atlantic salmon and to discontinue Pacific salmon simplifies production in BC. The challenge for BC is low levels of oxygen in the sea, which has implied high mortality. Oxygen equipment will be acquired in order to reduce the negative effect. Otherwise, the production in BC has been good. Sea lice and algae still pose a challenge in Shetland. Procedures for managing sea lice have been implemented and are continuously monitored. Lumpfish is implemented as a treatment against sea lice, but it remains a challenge that UK has a lengthy approval process for new treatments, posing the risk that resistance arises. Monitoring of algae is another focus area. Termination of processing simplifies operations and allows for the focus to be shifted towards production in the sea. As for Rogaland, high sea temperatures have resulted in low growth rates and outbreak of PD and algae blooming, with subsequent high mortality.
Cooperation with other companies in this region is considered important in order to decrease the biological risk. A new structure of regions has been established and will take effect during 2017. Finnmark has experienced challenges arising from sea lice in Øksfjorden, where fallowing of the entire fjord was determined. The production has been good in the course of the year. Group policy maintans a zero tolerance for escape, and in 2015 this has been fulfilled in all regions. Staff training is emphasised in order to achieve improved biological knowledge and internal procedures.
Andreas Kvame was appointed new CEO and commenced in position on 1 June 2015. He holds extensive experience in
managing larger operational units in the aquaculture industry. The CEO has initiated operational measures in 2015, a.o. changes in the organisation aimed at sharpening the operational focus, through locating all staff functions in Bergen. All ICT systems have been standardised in the Group during 2015, a process starting ini 2014.
For further information about financial risks (currency, interest rate, credit and liquidity), refer to Note 3 to the consolidated financial statements.
CORPORATE SOCIAL RESPONSIBILITY AND SUSTAINABILITYThe Group´s main cost drivers, risks and opportunities are increasingly connected with managing our impact on the environment, our personnel and the local communities where we operate. Systematic efforts to secure a balanced sustainability are therefore fundamental in order to facilitate a long-term profitable growth. These efforts are increasingly material for the industry´s viability. The Group has in 2013 conducted an assessment in order to accentuate priority areas for sustainability, an assessment which has been further followed up in 2014 and 2015. Our priorities will ensure that our efforts respond to our main stakeholders´ expectations of us, as well as being resource efficient in terms of our strategy and long-term value creation. The priorities also take into account our long-term liabilities through Global Salmon Initiative. A comprehensive statement of the Group´s approach, efforts, results and ambitions towards sustainability priorities are available in the Sustainability report.
The Group´s sustainability priorities treated in the report are divided into the following main areas; External environment, working environment and social relations. Within external environment fish health, sea lice and escape are focus areas. In the domain of the soft factors, HSE and working environment are priorities. Social relations are divided into three main areas, comprising quality and food safety, the ripple effect in communities and anti-corruption.
EMPLOYEESOf the Group´s 684 employees at year-end 2015, 371 work in Norway, 200 in Shetland and 113 in Canada. The Board wishes to thank the employees for good work in the past year.
The Group has a majority of male managers and employees. In total, 556 men and 128 women are hired in the Group. The employee policy is to take the steps necessary to retain and attract qualified personnel of both genders.
Grieg Seafood’s position as an international concern is also reflected in the fact that 36 different nationalities are represented in the Group’s workforce. A total of 173 employees originate from a country different from the country where they work. The Group accepts no kind of discrimination related to gender, religion, cultural or ethnic background, disability or in any other way. Our aim is to conduct our activities on the basis of equality and respect. In terms of human rights and equal treatment, we are not exposed to substantial risk. A focused effort is made to secure equal treatment and to avoid discrimination.

17G R I E G S E A F O O D 2 0 1 5
In 2015, the incidence of short-term sick leave within the Group was 3.36% while the figure for long-term sick leave was 1.8%. For further information, refer to the Sustainability report, in the section about employee health, safety and working environment.
All management of human resources is managed locally according to local rules and instructions, and in accordance with Group guidelines. The working environment in the Group is considered satisfactory, at the same time as we work actively to reduce sick leave and injury. An HR director has been employed, scheduled to commence in position from May 2016, holding the responsibility to develop the human capital in the Group.
GRIEG SEAFOOD ASA The parent company had 20 employees in its main office in Bergen, of which five men and two women in senior positions. Short-term sick leave in the parent company was 1.04%, while long-term sick leave was 0.65%. No injuries/accidents were registered in the Company in 2015. The Company does not pollute the external environment.
CORPORATE GOVERNANCEThe activities of Grieg Seafood ASA are conducted in accordance with Norwegian law and regulations for good corporate governance (Norwegian Corporate Government Board’s Code of Practice). The Company seeks to comply with all relevant laws and regulations and the Norwegian Code of Practice for Corporate Governance. This also applies to all other companies which are controlled by the Group. The document of principle which is enclosed along with the Board of Directors Report therefore applies to all companies of the Group, in as far as it goes.
STATEMENT FROM THE BOARD OF DIRECTORS AND CEOWe hereby confirm that the financial statements for the period from 1 January to 31 December 2015 to the best of our knowledge have been prepared in accordance with applicable accounting standards and give a true and fair view of the Group and of the Group’s assets, liabilities, financial position and overall results. We also confirm that the Directors’ Report gives a true and fair view of the development and performance of the business and the position of the Company and the Group, as well as a description of the principal risks and uncertainties facing the Company and the Group.
POST-BALANCE SHEET DEVELOPMENTAt the beginning of 2016 the prices were increasing in the whole market, continuing this development throughout Q1. The biological situation has been good at the start of 2016 for Norway and BC. 10% of the fish harvested in BC in Q1 is sexually mature, which impacts the price negatively. A new contract for processing in BC from 2016 has been entered into, and the
delivery complies with the agreement. In the beginning of 2016, down-harvesting of fish in Shetland has been carried out with high costs. This has implied a negative margin, even though the prices have been relatively good during Q1 2016. The production in Norway has been adequate so far. The hatcheries both in Norway and Shetland deliver according to plans.
OUTLOOKThe fish farming industry is very volatile and it will always be considerable uncertainty when projecting for future conditions. At the entrance to 2016, the situation has changed due to emergence demands exceeding the expected harvesting volumes. This is caused by high down-harvesting due to sea lice throughout the autumn of 2015, both in Chile and Norway. In addition, Chile has reduced biomass volumes after large appearance of algae in 2016. There is an improvement of private economy among people in Europe and Asia, which spurs increased demand for salmon. The positive change of individual consumers´ eating habits all over the world is directed towards more fish than other foods, which has yielded a sustained higher demand.
Grieg Seafood expects a harvesting volume of 70,000 tons in 2016, in accordance with previously announced forecasts. This represents an increase of 4,600 tons (7%) from 2015. In Shetland, a shift in the production cycle from 24 to 18 months is being applied. This increases the turnover rate in sea and facilitates better exploitation of the prime localities.
The harvesting volume for the two Norwegian regions is expected to increase to 19,000 tons in Rogaland and 23,000 tons in Finnmark. The awarded 4 green licences underpin a considerable growth in Finnmark. There is a general focus on increasing MTB exploitation, as well as reducing production time in sea. As a part of this, a decision has been made to expand the smolt facility in Rogaland in 2016/2017.
In 2016, a strategic review of the company´s activities in Shetland has been initiated. Continuous efforts are made to improve internal procedures and training of staff.
Bergen, 6 April 2016The Board of Directors in Grieg Seafood ASA
Translated version - NOT TO BE SIGNED

18 A N N U A L R E P O R T 2 0 1 5
PRINCIPLES OF CORPORATE GOVERNANCE 2015Adopted by the Company’s Board of Directors on 20 April 2007 and updated on 22 January 2010, 4 April 2011, 22 March 2012, 22 March 2013, 1 April 2014, 23 March 2015, and 6 April 2016.
1. INTRODUCTION1.1 Presentation of Corporate GovernanceThe responsibility for ensuring that the company has good corporate governance rests with the Board. The board and management review and annually evaluates the company’s principles for corporate governance.
The Group’s Corporate Governance is based on the Norwegian Code of Practice for Corporate Governance (NUES) as recommended by the Norwegian Corporate Governance Board on 30 October 2014. The Grieg Seafood Group follows the current recommendation from NUES, and has updated existing rules and defined values in accordance with changes in NUES 2014.
The company complies with these recommendations according to the follow or explain principle. This means that the company should explain all points where the recommendations are not followed.
The Annual Report offers a full report on the company’s principles for corporate governance, which is available on www.griegseafood.com.
2. OPERATIONS
19G R I E G S E A F O O D 2 0 1 5
2.1 Grieg Seafood ASAThe Company is the parent company of a group where companies of this Group are engaged in the production and sale of seafood and naturally related activities.
The object of the Company is to engage in the production and sale of seafood and naturally related activities, including investment in companies engaged in the production and sale of seafood and other activities naturally related to similar companies.
The Company is established and registered in Norway and is required to comply with Norwegian law, including laws and regulations pertaining to companies and securities.
2.2 Grieg Seafood ASA’s vision and overall objectives
The Group aims to comply with all relevant laws and regulations and with the Norwegian Code of Practice for Corporate Governance. This also applies to all companies which are controlled by the Group. In as far as it goes, this document of principle therefore applies to all companies of the Group.
The Group’s core values are to be open, respectful and ambitious.
The Group shall be managed applying the following principles: • We shall be open and honest.• We shall become better day by day.• We do what we say.• We are positive and enthusiastic.• We care.
The Group is committed to the sustainable use of natural resources and the development of the organisation based on high ethical standards. Targets and detailed plans have been adopted for the implementation of initiatives in these areas.
The fish farmer has overall responsibility for the wellbeing of the fish and for ensuring that at all times the fish can be kept in their natural surroundings under optimal conditions. The Group selects locations where the water is as deep as possible and with good currents.
The Group has drawn up a designated health plan which stipulates how all production operations are to be performed. The fish shall be systematically examined by a veterinarian. The Group attaches great importance to preventive measures and a rapid reaction in the event of disease or pollution. This is important not only to protect the environment and fish health, but also to safeguard the quality and profitability of production. The work shall be performed in accordance with the Group’s designated health plan. Measures have been implemented to prevent the escape of farmed fish. The objective is to conduct operations that do not cause any lasting damage to the environment.
As a user of natural resources such as clean water and feed from wild fish, the Group has a responsibility which extends
beyond its own operations. The Group requires its feed suppliers to ensure that the feed is based on sustainable supplies of raw materials.
Starting with 2013, an own Sustainability report has been prepared, pointing out ten areas defining Grieg Seafood´s highest priorities for sustainability and social responsibility. The priorities were conducted according to guidelines developed by GSI (Global Reporting Initiative) of which Grieg Seafood is a member. The ten areas include both biology and social responsibility.
2.3 Management of the Company Control and management of the Company is divided between the shareholders, represented through the General Meeting, the Board of Directors and the managing director, and is exercised in accordance with prevailing company legislation.
Divergences from this Code of Practice: None.
3. GROUP EQUITY AND DIVIDEND POLICY3.1 Equity At any given time the Group shall have a level of equity which is appropriate in relation to the Group’s cyclical activities. The Board aims to consistently keep the equity in accordance with current loan terms, as a minimum.
3.2 DividendThe Group’s objective is to give the shareholders a competitive return on invested capital through dividend payments and value appreciation of the share, which is at least at the same level as other companies with comparable risk. The future dividend will depend on the Group’s future earnings, financial situation and cash flow. The Board believes that the dividend paid should develop in pace with the growth of the Group’s profits, while at the same time ensuring that equity is at a healthy and optimal level and that there are adequate financial resources to prepare the way for future growth and investment, and taking into account the wish to minimise capital costs. The Board believes it is natural that the average dividend, over a period of several years, should correspond to 25-35% pre-tax profit, adjusted for the accounting effect of fair value adjustment of biological assets.
3.3 Board authorisationThe Board will request the AGM to grant a general mandate to pay out dividends in the period until the next AGM. The Board´s proposal must be justified. The dividend will be based on the Group’s current policy in accordance with clause 3.2. Dividends should be awarded on the basis of the latest financial statements approved within the scope of the Public Companies Act. Upon granted authorisation, the Board determines from which date the shares are traded ex-dividend.The Board has general authorisation to increase the Company’s

20 A N N U A L R E P O R T 2 0 1 5
share capital through share subscription for a total amount not exceeding NOK 44 664 800 divided into not more than 11 162 200 shares of nominal value NOK 4 each.
This authorisation remains in effect until 30 June 2016 and replaces the authorisation approved by the Annual General Meeting (AGM) on 28 May 2015.
The Board has general authorisation to acquire the Company’s own shares in accordance with the provisions of chapter 9 of the Norwegian Public Limited Companies Act for an aggregate nominal amount not exceeding NOK 44 664 800. The Company shall pay not less than NOK 4 per share and not more than NOK 40 per share when acquiring its own shares.
This authorisation remains in effect until the next AGM, but not later than 30 June 2016.
The Company will observe the Code of Practice in respect of new proposals to authorise the Board to implement capital increases and acquire the Company’s own shares.
Divergences from the Code of Practice: None.
4. EQUAL TREATMENT OF SHAREHOLDERS. TRANSACTIONS WITH RELATED PARTIES 4.1 Share classThe Company has only one class of shares and all shares carry the same rights. At 31 December 2015 the Company had 11 166 200 outstanding shares.
4.2 Own sharesIf the Company trades in its own shares, the Code of Practice shall be observed.
At 31 December 2015 the Company owned 11 162 000 of its own shares.
4.3 Approval of agreements with shareholders and other related partiesAll transactions of no lesser significance between the Company and a shareholder, Board member or a senior employee (or their related parties) shall be subject to a value assessment by an independent third party. If the consideration exceeds one twentieth of the Company’s share capital, transactions of this kind shall be approved by the General Meeting, in so far as this is required under Section 3-8 of the Norwegian Public Limited Companies Act.
Board members and senior employees shall inform the Board if they have any significant interest in a transaction to which the Company is a party.
Divergences from the Code of Practice: None.
4.4 Capital increasesIn the event of a waiver of the shareholders’ preferential subscription right, the Code of Practice shall be observed.
5. NEGOTIABILITY OF THE SHARESThe Company’s shares shall be freely negotiable.
Divergences from the Code of Practice: None.
6. GENERAL MEETINGThe shareholders represent the Company’s highest decision-making body through the General Meeting.
The Company’s AGM shall be held each year before the end of June. The AGM shall consider and, if thought fit, adopt the annual financial statements, the annual report and the dividend, as well as deciding on other matters which under current laws and regulations pertain to the AGM.
The Board may convene an Extraordinary General Meeting (EGM) at whatever time it deems necessary or when such a meeting is required under current laws or regulations. The Company’s auditor and any shareholder or group of shareholders representing more than 5% of the Company’s share capital may require the Board to convene an EGM.
The Board calls General Meetings at least 21 days before the date of the meeting. During the same period, the notice of meeting and the documents pertaining to matters to be considered at the General Meeting shall be accessible on the Company’s homepage. The same applies to the nomination committee’s recommendation. When documents are made available in this manner the statutory requirements for distribution to shareholders do not apply. Still, a shareholder may claim to receive documents concerning matters to be considered at the General Meeting.
The deadline to register for the general meeting is set by the Board in the notice. Shareholders who are unable to attend may vote by proxy. An authorisation form containing a vote option for each issue will be enclosed with the notice of meeting and it will also be possible to give authorisation to the chairman of the Board or the managing director of the Company.
The Company will publish the Minutes of the General Meetings in accordance with the stock exchange regulations in addition to making them available for inspection at the Company’s registered offices.
The Board, the Nomination Committee and the auditor will be represented at the meeting and the Chairman will normally preside at the meeting.
The Board shall not make contact with the Company’s

21G R I E G S E A F O O D 2 0 1 5
shareholders outside the General Meeting in a manner which could be deemed to constitute differential treatment of shareholders or which could be in conflict with current laws or regulations.
Divergences from the Code of Practice: None.
7. NOMINATION COMMITTEEOn 13 February 2009 the AGM approved a resolution to establish a nomination committee. This is described in article 8 of the Article of Association. At the same time, the AGM adopted instructions for the nomination committee. According to the instructions, the election committee through its work should take care of the interests currently embodied in the Norwegian Code of Practice for Corporate Governance.
The present nomination committee was elected at the AGM on 28 May 2015 and comprises Marianne Johnsen (chair), Helge Nielsen and Tone Østensen, of whose Helge Nielsen and Tone Østensen are candidates for election in 2016. At least 2/3 of the members of the nominating committee shall be independent of the Board and may not be members of the Board. CEO cannot be a member of the nomination committee. The nomination committee shall have meetings with the directors, chief executive and relevant shareholders.
Details about the nomination committee members, including telephone number and email address, are available on the Company´s website.
The nomination committee´s recommendation to the General Assembly should be submitted in good time and follow the summons to the General Assembly, no later than 21 days before the meeting. The recommendation of the nomination committee must include information about the candidate´s impartiality, competence, age, education and professional experience. Upon proposal for re-election, the recommendation should include additional information about how long the candidate has been a board member, as well as details about participation in the board meetings.
When the recommendation comprises candidates to the nomination committee, it should include relevant information about these candidates.
The Company does not diverge from the Code of Practice.
8. CORPORATE ASSEMBLY AND BOARD OF DIRECTORS, COMPOSITION8.1 Number of Board membersThe Company has no corporate assembly. Under the Articles of Association the Board shall have up to seven members.
8.2 Election period
Board members are elected by the AGM for a period of two years.
8.3 Independent Board membersThe Board members are presented in the Annual Report and on the Company’s homepage, showing the Board members’ competence, relationship to main shareholders, and a description of Board members who are deemed to be independent. No overview of participation at Board meetings is included in the Annual Report. An overview of the Board members’ ownership of shares in the Company appears in the relevant note to the accounts in the Annual Report. The Company has no corporate assembly. The Company does not otherwise diverge from the Code of Practice.
There is compliance with the required number of independent Board members contained in the Code of Practice.
9. BOARD OF DIRECTORS9.1 Duties and work planThe Board has overall responsibility for the management of the Group and for overseeing the daily management and business activities. The Company shall be managed by an effective Board of Directors (the Board) who has shared responsibility for the success of the Company. The Board represents and is accountable to the Company’s shareholders.
Each year the Board shall draw up a work plan for its activities.
The Board’s duties include drawing up the Group’s strategy and ensuring that the adopted strategy is implemented, effective supervision of the managing director, control and supervision of the Group’s financial situation, internal control and the Company’s responsibility to and communication with the shareholders.
The Board shall initiate any investigations it considers necessary at any given time to perform its duties. The Board shall also initiate such investigation that is requested by one or more Board members.
Divergences from the Code of Practice: None.
9.2 InstructionsThe Board has drawn up instructions for its members and the Management which contain a more detailed description of the Board’s duties, meetings, the managing director’s duties in relation to the Board, the meeting schedule for the Board, participation, separate entries in the Minutes and duty of confidentiality.
The respective roles of the Board and the managing director are separate and there is a clear division of responsibility between the two. Separate instructions have been drawn up for the group managing director. He/she is responsible for the Company’s senior employees. The Board underlines that special care must be exercised in matters relating to financial reporting and remuneration to senior employees.

22 A N N U A L R E P O R T 2 0 1 5
In matters of importance where the chairman of the Board is or has been actively involved, Board discussions shall be chaired by the vice chairman.
The instructions for the Board and Management were last revised by the Board on 4 April 2011.
9.3 Annual assessmentEach year, in connection with the first Board meeting in the calendar year, the Board shall make an assessment of its work in the previous year.
9.4 Audit CommitteeThe Board has set up a sub-committee (audit committee) comprising a minimum of two and a maximum of three members elected from among the Board’s members, and has drawn up a mandate for its work.
The committee assists the Board in the work of exercising its supervisory responsibility by monitoring and controlling the financial reporting process, systems for internal control and financial risk management, external audits and procedures for ensuring that the Company complies with laws and statutory provisions, and with the Company’s own guidelines.
9.5 Remuneration CommitteeThe Board has set up a sub-committee (remuneration committee) comprising no less than two members. The committee shall hold discussions with the group managing director concerning his/her financial terms of employment. The committee shall submit a recommendation to the Board concerning all matters relating to the group managing director’s financial terms of employment.
The committee shall also keep itself updated on and propose guidelines for the determination of remuneration to senior employees in the Group. The committee is also the advisory body for the group managing director in relation to remuneration schemes which cover all employees to a significant extent, including the Group’s bonus system and pension scheme. Matters of an unusual nature relating to personnel policy or matters considered to entail an especially great or additional risk, should be put before the committee.
The composition of the committee is subject to assessment each year.
Divergences from the Code of Practice: None.
10. INTERNAL CONTROL AND RISK MANAGEMENTThe Board has a responsibility to ensure that the company has proper risk management and internal control adaptable to statutory provisions for the company. The Board conducts an annual evaluation of the most important risk areas and internal control.
Internal control means activities carried out by the Group to organise its business activities and procedures in order to safeguard its own values and those of its customers, and to realise adopted goals through appropriate operations. The achievement of these goals also requires systematic strategy work and planning, identification of risk, choice of risk profile, as well as establishing and implementing control measures to ensure that the goals are achieved.
The Group’s core values, external guidelines and social corporate responsibility constitute the external outer framework of internal control. The Group is decentralised and considerable responsibility and authority are therefore delegated to the regional operating units. Risk management and internal control are designed to take account of this.
Internal control is an on-going process that is initiated, implemented and monitored by the Company’s Board of Directors, management and other employees. Internal control is designed to provide reasonable assurance that the Company’s goals will be achieved in the following areas:
• Targeted, efficient and appropriate operations.• Reliable internal and external reporting.• Compliance with laws and regulations, including internal guidelines.
The audit committee updates the Board after each meeting.
Each year the auditor carries out a review of internal control which is an element of financial reporting. The auditor’s review is submitted to the audit committee.
The Company has established framework procedures to manage and eliminate most of the risk that could prevent a goal from being achieved. This includes a description of the Company’s risk management policy as well as all financial control processes. There is on-going risk assessment of the main transaction processes. Descriptions of the transaction processes are currently in preparation for each region, with the aim of clarifying key controls and ensuring that these controls are in place. This means assessing all processes to determine the probability of divergences arising, and how serious the economic consequences would be of any such divergence. The establishment of controls in each region is aimed at reducing the likelihood of divergences arising with major economic consequences.
The biological development in course of producing smolt and farming in the sea poses the greatest risk in the group. The Group therefore continuously and systematically works to develop processes that ensure animal welfare and reduce diseases and mortality, and so that “best practices” are being implemented at all levels. Control routines have been prepared, including conditions for the employees as well as safeguarding against escapes, animal welfare, pollution, water resources and food safety. Referring to the Sustainability report prepared annually, objectives, internal controls and measures are described within the company’s main focus areas.
The Group’s activities entail various kinds of financial risk:
23G R I E G S E A F O O D 2 0 1 5
Market risk (including foreign exchange risk, interest rate risk and price risk), credit risk and liquidity risk. The Group’s overall risk management plan focuses on the unpredictability of the capital markets and seeks to minimise the potential negative effects on the Group’s financial results. To some extent, the Group uses financial derivatives to hedge against some risks. Risk management is drawn up at Group level and involves identifying, evaluating and hedging financial risk in close cooperation with the Group’s operational units. The Board has established written principles for risk management related to foreign exchange and interest rate risk and the use of financial instruments.
The Board has established procedures for reporting within the Group:
• At the start of each year the Board adopts a budget for the year. Divergences from the budget are reported on a monthly basis.
• Forecasts are drawn up for the next three years and they are updated every month.
• Every month, each region submits a report containing given Key Performance Indicators (KPI). The main KPIs are: EBIT/kg, feed factor, production, production cost, harvest volume, harvest cost and fish health. Analyses are made and measured against budget figures and KPIs. The information form of the regions is summarised in a report submitted to the Board.
Each quarter, a risk assessment covering biology, feed, market, finance and Compliance is prepared. These areas are considered to pose the greatest risks for the Company. This can be changed from the changed situation. The risk assessment is reviewed by the Audit Committee in connection with quarterly reporting.
Divergences from the Code of Practice: None.
11. BOARD REMUNERATIONProposals concerning Board remuneration are submitted by the nomination committee. Remuneration to Board members is not linked to the Company’s results. None of the Board members have special duties in relation to the Company which are additional to those they have as Board members. Board remuneration shall be shown in the financial statements of both the Company and the Group.
Divergences from the Code of Practice: None.
12. REMUNERATION TO SENIOR EMPLOYEES12.1 Senior employeesThe group management consists of the group managing director, the director of operations and the financial director. The Group has an extended management group of ten, comprising the group managing director, the director of operations, the financial director, the group head of accounting, four regional managers (the respective managers of fish farming activities
in Rogaland, Finnmark, Shetland and British Columbia) and the two people responsible for feed/nutrition and biology, respectively.
The objective of the guidelines for determination of salary and other remuneration to senior employees within the Group is to attract people with the required competence and at the same time retain key personnel. The guidelines should also motivate the employees to work with a long-term perspective to enable the Group to achieve its goals.
The determination of salary and other remuneration to the Group’s senior employees is therefore based on the following guidelines:
• Salary and other remuneration shall be competitive and motivating for each manager and for everyone in the senior management group.
• Salary and other remuneration shall be linked to value creation generated by the Company for the shareholders.
• The principles used to determine salary and other remuneration shall be simple and understandable to employees, the shareholders and the public at large.
• The principles used to determine salary and other remuneration shall also be sufficiently flexible to allow adjustments to be made on an individual basis in the light of the results achieved and the contribution made by the individual to the development of the Group.
The salary paid to the members of the senior management group consists of a fixed and a variable element. Under the bonus scheme in force the variable salary under the scheme cannot exceed six times the monthly salary. Each year, information about the provisions of the bonus scheme is included in the Group declaration on the determination of salary to the senior management group and appears in the financial statements for the Group, note 16.
The Company´s Board approved the allocation of cash options based on the General Assembly´s resolution for the framework of the share and cash options programme. The last approval from the General Assembly was May 28 2015. The allocation from the Board has been approved on 20 April 2007, 6 May 2009, 27 March 2012, 22 March 2013 and 17 December 2013.The group managing director, the financial director, the operational director and the four regional managers are included in the share options programme. The options agreements have been entered into within the scope of the resolution adopted by the General Assembly. Minutes of this General Assembly can be accessed on the Company’s homepage.
This has been followed by the establishment of a synthetic options programme. Options agreements with members of the senior management group have been entered into within the framework of the adopted resolution.
Remuneration to the group managing director is determined at a meeting of the Board of Directors. The salary payable to the other members of the senior management group is determined by the group managing director. The group managing director shall discuss the remuneration which he/she proposes with the chairman of the Board before the amount of remuneration is

24 A N N U A L R E P O R T 2 0 1 5
determined.
General schemes for the allocation of variable benefits, including bonus schemes and options programmes, are determined by the Board. Schemes which entail an allotment of shares, subscription rights, options and other forms of remuneration related to shares or the development of the Company’s share price, are determined by the General Assembly. The Board´s declaration of management remuneration is a separate agenda paper of the General Assembly. The General Assembly votes separately on guidelines to guide the Board and remuneration comprising the synthetic options programme.
The Company has no divergences from the Code of Practice.
12.2 Severance payThe group managing director is entitled to 12 months’ severance pay after dismissal and 12 months salary during illness. A severance pay agreement has also been established for the CFO and COO providing for 12 months’ severance pay after dismissal. The acting resigning CEO is entitled to 18 months salary after dismissal or change in position or employment and 12 months’ salary during illness.
Divergences from the Code of Practice: None.
13. INFORMATION AND COMMUNICATION13.1 Financial informationThe Company shall at all times provide its shareholders, the Oslo Stock Exchange and the finance market in general (through the Oslo Stock Exchange information system) with timely and accurate information. The Board shall ensure that the quarterly reports from the Company give a correct and complete picture of the Group’s financial and commercial position and whether the Group’s operational and strategic objectives are being reached. Financial reporting shall also contain the Group’s realistic expectations of its commercial and performance-related development.
The Company publishes all information on its own homepage and in press releases. Quarterly reports, annual reports and press releases are presented as they arise on the Company’s homepage in accordance with the Company’s financial calendar.
The Company shall have an open and active policy in relation to investor relations and shall hold regular presentations in connection with the annual and interim results.
13.2 Shareholder informationThe Board shall ensure that information is provided on matters of importance for the shareholders and for the stock market’s assessment of the Company, its activities and results and that such information is made publicly available without undue delay. Publication shall take place in a reliable and comprehensive manner and by using information channels which ensure that everyone has equal access to the information.
All information shall be provided in both Norwegian and English. The Company has procedures to ensure that this is done. The chairman of the Board shall ensure that the shareholders’ views are communicated to the entire Board.
Divergences from the Code of Practice: None.
14. COMPANY TAKEOVER14.1 Change of control and takeovers The Company has no established mechanisms which can prevent or act as a deterrent to takeover bids, unless this has been resolved by the General Meeting by a majority of two thirds (of the votes cast and of the share capital represented). The Board will not use its authorisation to prevent a takeover bid without the approval of the General Meeting after the takeover bid has become known. If a takeover bid is received, the management and the Board will ensure that all shareholders are treated equally. The Board will obtain a value assessment from a competent independent party and advise the shareholders whether to accept or reject the bid. The shareholders will be advised of any difference of views among the Board members in the Board’s statement on the takeover bid.
The Board has in its Board meeting 13 October 2015 adopted some core principles for how the Board will act in the event of any persuasion offers. These core principles are in accordance with the recommendation of NUES.
Divergences from the Code of Practice: None.
15. AUDITORThe Board through its audit committee seeks to have a close and open cooperation with the Company’s auditor. Each year the audit committee obtains confirmation that the auditor meets the requirements of the Act on auditing and auditors concerning the independence and objectivity of the auditor.
The auditor’s schedule of audit work is submitted to the audit committee once a year. In particular, the audit committee considers whether, to a satisfactory extent, the auditor is performing a satisfactory control function.
Both the Company management and the auditor comply with guidelines issued by the Financial Supervisory Authority of Norway concerning the extent to which the auditor can provide advisory services.
The auditor attends Board meetings which deal with the annual financial statements. The audit committee has an additional meeting with the auditor at least once a year to review the auditor’s report on the auditor’s view of the Group’s accounting principles, risk areas and internal control procedures. Moreover, each year the Board has a meeting with auditor when neither the managing director nor anyone else from the management is present.

25G R I E G S E A F O O D 2 0 1 5
The auditor also attends meetings of the audit committee to consider relevant matters. The auditor’s fee appears in the relevant note in the annual report showing the division of the fee between audit and other services.
Divergences from the Code of Practice: None.
* * *Bergen, 6th of April 2016

26 A N N U A L R E P O R T 2 0 1 5 G R O U P
CONSOLIDATED STATEMENT OF PROFIT AND LOSSAmounts in NOK 1 000 Note 2015 REVISED 2014
Sales revenue 8 4 608 667 4 099 543
Other income 8 44 921 2 819
Other gains and losses 7, 8 -15 218 59 122
Share of profit from associated companies 7 6 994 3 576
Cost of sales 9 -2 738 926 -2 293 279
Salaries and personnel expenses 16/ 17 -409 432 -359 529
Other operating expenses 13/ 17/ 22/ 26 -1 235 695 -1 028 434
Operating profit/loss before depreciation and fair value adjustments of biological assets 261 311 483 820
Depreciation property, plant and equipment 11 -162 211 -135 495
Depreciation licences and other intangible assets 10 -5 163 -5 222
Depreciation property, plant and equipment, and intangible assets 10/11 -46 195 0
Operating profit/loss before fair value adjustment of biological assets 47 742 343 104
Fair value adjustment of biological assets 9 33 209 -123 737
Operating result 80 951 219 366
Share of profit/loss from associated companies 7 3 142 2 865
Financial income 25 38 056 57 245
Financial expenses 25 -131 357 -107 521
Net financial loss -93 301 -50 276
Profit before income tax -9 208 171 956
Income tax expense 15 13 574 -27 561
Profit for the year 4 366 144 395
Allocated to:
Controlling interests -6 626 138 806
Non-controlling interests 10 992 5 588
Earnings per share (NOK) 20 -0,06 1,26
Diluted earnings per share (NOK) 20 -0,06 1,26
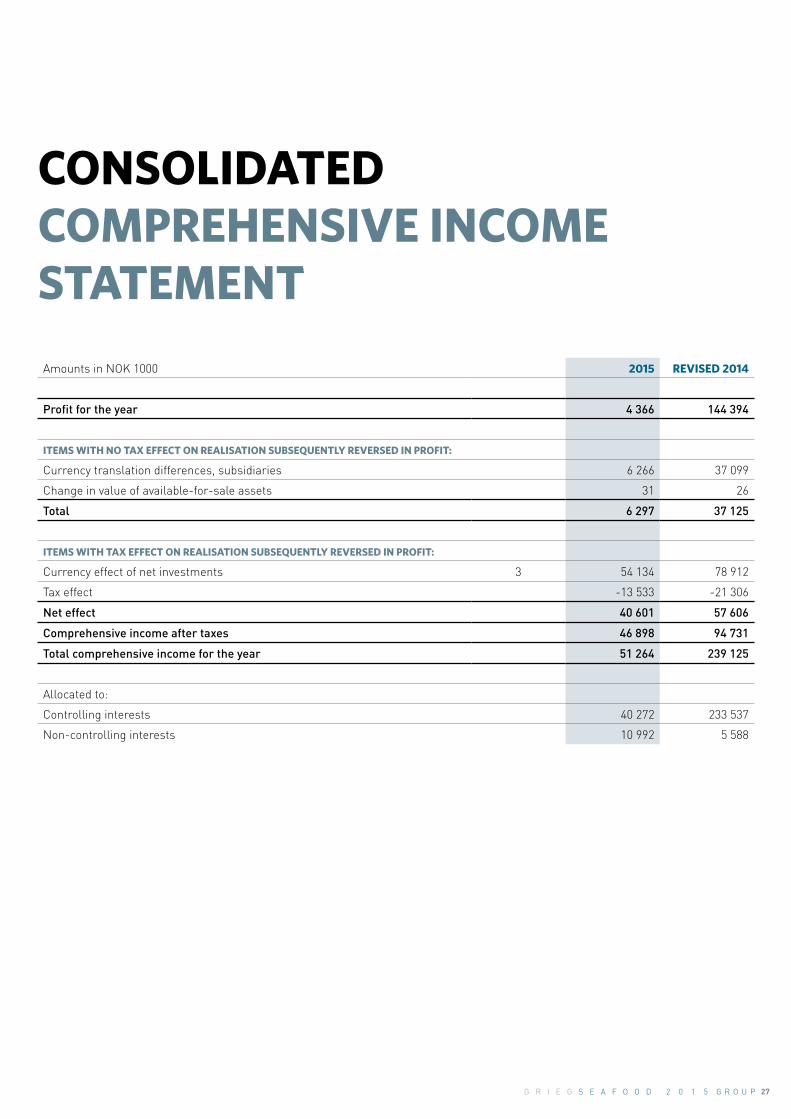
27G R I E G S E A F O O D 2 0 1 5 G R O U P
Amounts in NOK 1000 2015 REVISED 2014
Profit for the year 4 366 144 394
ITEMS WITH NO TAX EFFECT ON REALISATION SUBSEQUENTLY REVERSED IN PROFIT:
Currency translation differences, subsidiaries 6 266 37 099
Change in value of available-for-sale assets 31 26
Total 6 297 37 125
ITEMS WITH TAX EFFECT ON REALISATION SUBSEQUENTLY REVERSED IN PROFIT:
Currency effect of net investments 3 54 134 78 912
Tax effect -13 533 -21 306
Net effect 40 601 57 606
Comprehensive income after taxes 46 898 94 731
Total comprehensive income for the year 51 264 239 125
Allocated to:
Controlling interests 40 272 233 537
Non-controlling interests 10 992 5 588
CONSOLIDATED COMPREHENSIVE INCOME STATEMENT

28 A N N U A L R E P O R T 2 0 1 5 G R O U P
CONSOLIDATED STATEMENT OF FINANCIAL POSITIONAmounts in NOK 1000
ASSETS Note 31.12.15REVISED
31.12.2014REVISED
01.01.2014
Goodwill 10 110 647 108 708 107 310
Deferred tax assets 15 10 317 2 180 0
Licences 10 1 093 338 1 066 184 994 066
Other intangible assets 10 16 993 11 517 4 545
Property, plant and equipment 11 1 534 770 1 424 952 1 204 627
Investments in associated companies 7 25 947 22 379 28 058
Available-for-sale financial assets 1 426 1 518 1 392
Other non-current receivables 2 667 67 1 275
Total non-current assets 2 796 104 2 637 505 2 341 273
Inventories 9 90 867 91 016 75 009
Biological assets 9 1 929 115 1 844 097 1 766 332
Accounts receivable 3, 22 581 904 504 110 441 608
Other current receivables 23 145 767 93 371 98 171
Derivatives and other financial instruments 3, 14 0 0 2 806
Cash and cash equivalents 3, 21 392 020 181 498 182 258
Total current assets 3 139 673 2 714 092 2 566 184
Total assets 5 935 777 5 351 597 4 907 458
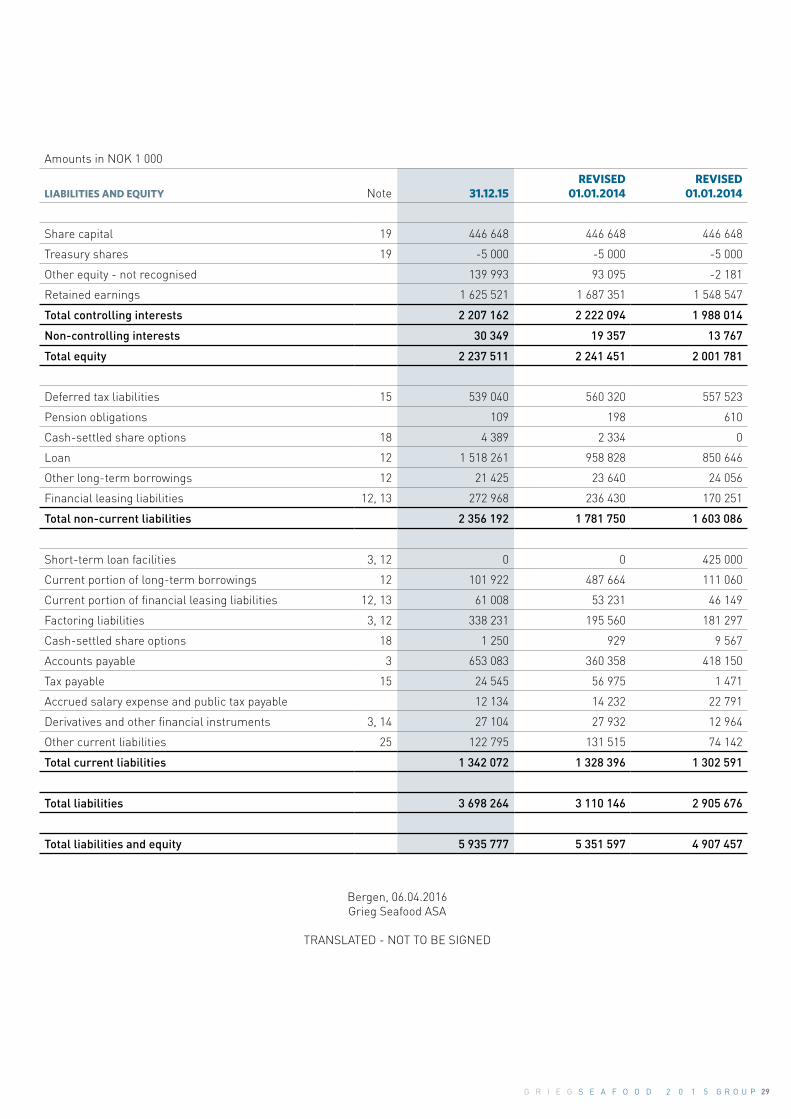
29G R I E G S E A F O O D 2 0 1 5 G R O U P
Amounts in NOK 1 000
LIABILITIES AND EQUITY Note 31.12.15REVISED
01.01.2014REVISED
01.01.2014
Share capital 19 446 648 446 648 446 648
Treasury shares 19 -5 000 -5 000 -5 000
Other equity - not recognised 139 993 93 095 -2 181
Retained earnings 1 625 521 1 687 351 1 548 547
Total controlling interests 2 207 162 2 222 094 1 988 014
Non-controlling interests 30 349 19 357 13 767
Total equity 2 237 511 2 241 451 2 001 781
Deferred tax liabilities 15 539 040 560 320 557 523
Pension obligations 109 198 610
Cash-settled share options 18 4 389 2 334 0
Loan 12 1 518 261 958 828 850 646
Other long-term borrowings 12 21 425 23 640 24 056
Financial leasing liabilities 12, 13 272 968 236 430 170 251
Total non-current liabilities 2 356 192 1 781 750 1 603 086
Short-term loan facilities 3, 12 0 0 425 000
Current portion of long-term borrowings 12 101 922 487 664 111 060
Current portion of financial leasing liabilities 12, 13 61 008 53 231 46 149
Factoring liabilities 3, 12 338 231 195 560 181 297
Cash-settled share options 18 1 250 929 9 567
Accounts payable 3 653 083 360 358 418 150
Tax payable 15 24 545 56 975 1 471
Accrued salary expense and public tax payable 12 134 14 232 22 791
Derivatives and other financial instruments 3, 14 27 104 27 932 12 964
Other current liabilities 25 122 795 131 515 74 142
Total current liabilities 1 342 072 1 328 396 1 302 591
Total liabilities 3 698 264 3 110 146 2 905 676
Total liabilities and equity 5 935 777 5 351 597 4 907 457
Bergen, 06.04.2016Grieg Seafood ASA
TRANSLATED - NOT TO BE SIGNED

30 A N N U A L R E P O R T 2 0 1 5 G R O U P
Amounts in NOK 1000 Note Share capital
Own shares
Other equity - not recognised
Retained equity
Non-controlling
interests Total equity
Equity at 01.01.2014 446 648 -5 000 -2 181 1 548 547 13 767 2 001 781
RESULT FOR 2014 138 806 5 588 144 395
Translation effects foreign currency 37 644 37 644
Net investment 57 606 57 606
Change in value in shares held for sale 15 26 0 26
Total comprehensive income 0 0 95 276 0 0 95 276
Total comprehensive income for 2014 0 0 95 276 138 806 5 588 239 671
Total equity from shareholders 2014 0 0 0 0 0 0
Total change in equity in 2014 0 0 95 276 138 806 5 588 239 671
Equity at 31.12.2014 446 648 -5 000 93 095 1 687 353 19 357 2 241 452
RESULT FOR 2015 -6 626 10 992 4 366
Translation effects foreign currency 6 266 6 266
Net investment 40 601 40 601
Change in value in shares held for sale 15 31 31
Total comprehensive income 0 0 46 898 0 0 46 898
Total comprehensive income for 2015 0 0 46 898 -6 626 10 992 51 264
Dividend paid -55 206 -55 206
Total equity from shareholders 2015 0 0 0 -55 206 0 -55 206
Total change in equity in 2015 0 0 46 898 -61 832 10 992 -3 942
Equity at 31.12.2015 446 648 -5 000 139 993 1 625 521 30 349 2 237 511
CONSOLIDATED STATEMENT OF CHANGES IN EQUITY
Booked amount on the line “Own shares” equals nominal value of parent company´s holding of own shares.

31G R I E G S E A F O O D 2 0 1 5 G R O U P
SPECIFICATION OF EQUITY ITEMS
Effect of share-based
remuneration Purchase of
own shares *)
Profit for the year - dividend
paid Total
Book value at 01.01.2014 1 094 -13 036 1 560 489 1 548 547
Change in 2014 0 0 138 806 138 806
Change in 2015 0 0 -61 832 -61 832
Book value at 31.12.2015 1 094 -13 036 1 637 463 1 625 521
SPECIFICATION OF OTHER EQUITY, NOT RECOGNISED Shares held for
sale Net investment Currency
conversion Total
Book value at 01.01.2014 711 17 766 -20 658 -2 181
Change in 2014 26 57 606 37 644 95 276
Change in 2015 31 40 601 6 266 46 898
Book value at 31.12.2015 768 115 973 23 252 139 993
*) Amount classified under “Purchase of own shares” is cost price in excess of nominal value. See also note 19.
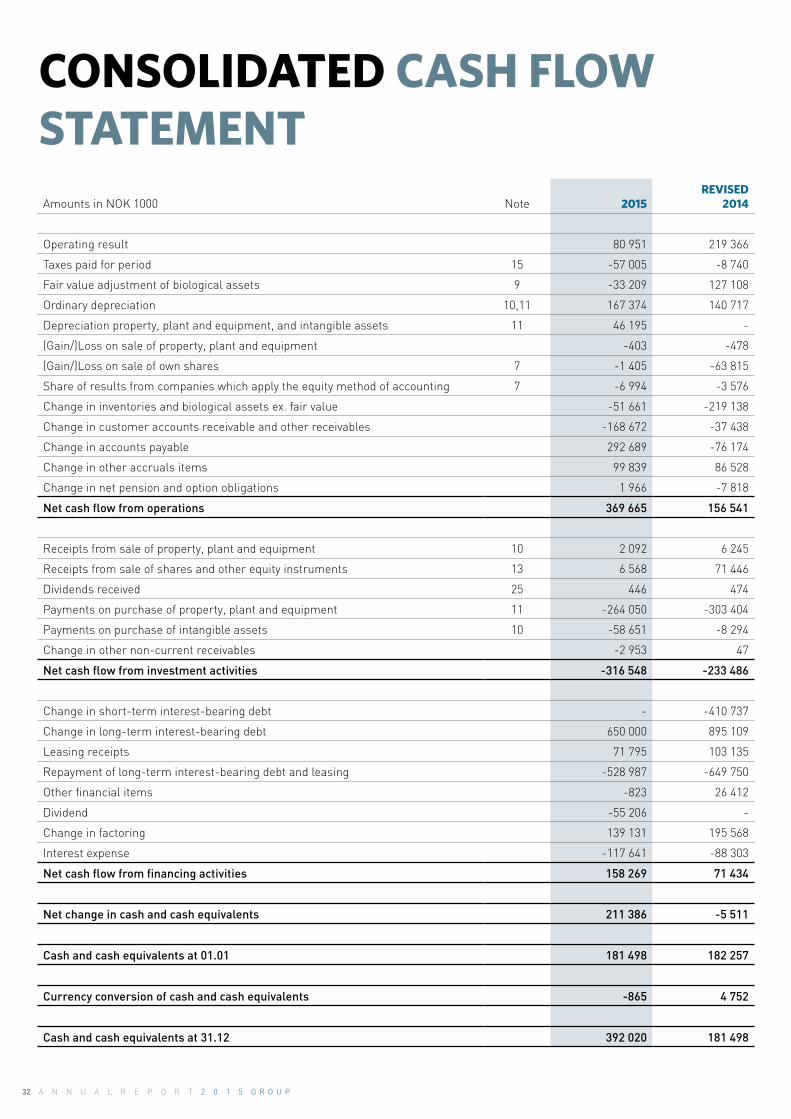
32 A N N U A L R E P O R T 2 0 1 5 G R O U P
CONSOLIDATED CASH FLOW STATEMENTAmounts in NOK 1000 Note 2015
REVISED2014
Operating result 80 951 219 366
Taxes paid for period 15 -57 005 -8 740
Fair value adjustment of biological assets 9 -33 209 127 108
Ordinary depreciation 10,11 167 374 140 717
Depreciation property, plant and equipment, and intangible assets 11 46 195 -
(Gain/)Loss on sale of property, plant and equipment -403 -478
(Gain/)Loss on sale of own shares 7 -1 405 -63 815
Share of results from companies which apply the equity method of accounting 7 -6 994 -3 576
Change in inventories and biological assets ex. fair value -51 661 -219 138
Change in customer accounts receivable and other receivables -168 672 -37 438
Change in accounts payable 292 689 -76 174
Change in other accruals items 99 839 86 528
Change in net pension and option obligations 1 966 -7 818
Net cash flow from operations 369 665 156 541
Receipts from sale of property, plant and equipment 10 2 092 6 245
Receipts from sale of shares and other equity instruments 13 6 568 71 446
Dividends received 25 446 474
Payments on purchase of property, plant and equipment 11 -264 050 -303 404
Payments on purchase of intangible assets 10 -58 651 -8 294
Change in other non-current receivables -2 953 47
Net cash flow from investment activities -316 548 -233 486
Change in short-term interest-bearing debt - -410 737
Change in long-term interest-bearing debt 650 000 895 109
Leasing receipts 71 795 103 135
Repayment of long-term interest-bearing debt and leasing -528 987 -649 750
Other financial items -823 26 412
Dividend -55 206 -
Change in factoring 139 131 195 568
Interest expense -117 641 -88 303
Net cash flow from financing activities 158 269 71 434
Net change in cash and cash equivalents 211 386 -5 511
Cash and cash equivalents at 01.01 181 498 182 257
Currency conversion of cash and cash equivalents -865 4 752
Cash and cash equivalents at 31.12 392 020 181 498
33G R I E G S E A F O O D 2 0 1 5 G R O U P
NOTE 1 GENERAL INFORMATIONGrieg Seafood ASA is an integrated Norwegian seafood company operating in the area of salmon farming and processing. Grieg Seafood ASA is a public limited company registered in Norway. Its head office is located at C. Sundtsgt. 17/19, Bergen, Norway. Grieg Seafood ASA was listed on the Oslo Stock Exchange on 21 June 2007. The Company has operations in Norway, the UK and Canada. The consolidated accounts are prepared in accordance with International Financial Reporting Stantards (IFRS) as adopted by EU, and approved by the Board of Directors 6 April 2016.
In the following, ”Group” is used to describe information related to the Grieg Seafood Group, whilst “the Company” is used for the parent company itself. All amounts are in NOK thousand unless stated otherwise. All amounts for 2014 are revised due to the full consolidation of Ocean Quality as from 1 January 2015. See note 6 for further information about the revision.

34 A N N U A L R E P O R T 2 0 1 5 G R O U P
NOTE 2 ACCOUNTING POLICIESThe principal accounting policies applied in the preparation of these consolidated financial statements are set out below. These policies have been consistently applied to all the periods presented, unless stated otherwise.
BASIS OF PREPARATIONThe consolidated financial statements of Grieg Seafood Group have been prepared in accordance with International Financial Reporting Standards (IFRS) as adopted by the EU.
The consolidated financial statements have been prepared under the historical cost convention, as modified by biological assets, available-for-sale financial assets, and financial assets/liabilities (including derivative instruments) at fair value through profit or loss. The preparation of financial statements in conformity with IFRS requires the use of estimates. It also requires management to exercise its judgement in the process of applying the Company’s accounting policies. The areas involving a higher degree of judgement or complexity, or areas where assumptions and estimates are significant to the consolidated financial statements, are described in note 4. CONSOLIDATION PRINCIPLES(A) SUBSIDIARIESSubsidiaries are all entities (including special purpose entities) over which the Group has control. A situation where the Group controls another entity arises when the Group is exposed to variability in returns from the entity, and has power to influence this return through its control of the entity.Subsidiaries are consolidated from the point when the group can exercise control and consolidation ends when control of the subsidiary terminates.
If the Company´s ownership exceeds 50 % but is below 100 % of the subsidiaries, the minority´s share of profit after tax and share of equity are posted on separate lines in the statement.
The purchase method of accounting is used for acquisitions. The cost of an acquisition is measured as the fair value of the assets and liabilities taken over, and equity instruments issued. The cost also includes the fair value of all assets and liabilities and contingent liabilities taken over by agreement. Identifiable assets, debt and contingent liabilities are booked at fair value on the date of acquisition. Non-controlling owner interests in the acquired entity are measured from time to time either at fair value, or as their proportion of net assets of the entity that has been acquired.
Costs related to acquisitions are charged as they arise.
In the case of a multi-stage acquisition, the proportion of ownership from an earlier purchase is re-stated at fair value at the date of control and the value change is recognised through profit or loss.
A contingent acquisition price is measured at fair value at the date of acquisition. Under IAS 39, subsequent changes in the contingent
acquisition price are recognised through profit or loss or are posted as a change in the comprehensive income statement where the contingent price is classified as an asset or a liability. There is no new value measurement of a contingent acquisition price classified as equity, and the subsequent settlement is charged against equity.
Intra-group transactions, balances, and unrealised gains between Group companies are eliminated. Unrealised loss is also eliminated. The accounts of subsidiaries are re-stated where necessary to ensure consistency with the accounting policies adopted by the Group.
(B) CHANGE IN OWNER INTERESTS IN SUBSIDIARIES WITHOUT LOSS OF CONTROLTransactions with non-controlling owners of subsidiaries, which do not entail a loss of control, are regarded as equity transactions. On the purchase of further shares from non-controlling owners, the difference between the consideration paid and the shares’ proportionate share of the net assets in the accounts of the subsidiary is recorded in the equity of the parent company’s owners. Similarly, any gain or loss on a sale to non-controlling owners is recorded in equity.
C) DIVESTMENT OF SUBSIDIARIESIn the event of loss of control, any remaining ownership interest is stated as fair value change through profit or loss. Thereafter, for accounting purposes, fair value is the acquisition cost either as an investment in an associated company, joint venture or a financial asset. Amounts previously recorded in a comprehensive income statement related to this company, are dealt with as if the Group had disposed of underlying assets and liabilities. This may mean that amounts previously recorded in a comprehensive income statement, are reclassified as part of the income statement.
(D) ASSOCIATED COMPANIESAssociated companies are entities over which the Group has significant influence, but not control. Significant influence is deemed to exist where the Group has between 20% and 50% of the voting rights. Investments in associates are recognised using the equity method. Investments in associates are initially recognised at cost, and the Group´s share of the results in subsequent periods is recognised through profit or loss. The amount recorded in the balance sheet includes implicit goodwill identified at the date of purchase.
Share of profit or losses of associates that are closely linked to the Group´s operations and thus are included in the value chain of the Group, are classified on a separate line included in the Group’s operating result.
In the event of a reduction in the owner interest in an associated company where the Group retains significant influence, only a proportionate part of amounts previously recognised in the comprehensive income statement is reclassified through profit or loss.

35G R I E G S E A F O O D 2 0 1 5 G R O U P
The Group’s share of profits or losses of associated companies is recognised in the income statement and is added to the value of the investment in the balance sheet. The Group’s share of the comprehensive results for the associated company is entered in the Group’s comprehensive income statement and is also added to the amount of the investment in the balance sheet. The Group’s share of a loss is not posted in the income statement if this means that the value of the investment in the balance sheet is negative (including the entity’s unhedged receivables), unless the group has undertaken obligations or made payments on behalf of the associate. The accounts of associated companies are re-stated where necessary to ensure consistency with the accounting policies adopted by the Group.
At the end of each accounting period, the Group determines if there is a need to write down the investment in the associated company. In such case, the amount of the write-down is calculated as the difference between the recoverable amount of the investment and its book value, and the difference is recorded on a separate line along with ”Share of results of associated companies”.
If a gain or a loss arises on transactions between the Group and its associated companies, only the proportionate amount related to shareholders outside the Group is recorded. Unrealised losses are eliminated unless there is a need to write down the asset that was the subject of the transaction. Accounting policies of associates are changed where necessary to ensure consistency with the accounting policies adopted by the Group. Gains and losses on dilution of assets of associated companies are posted in the income statement.
SEGMENT REPORTINGOperating segments are reported in a manner consistent with the internal reporting provided to the chief operating decision-maker. The chief operating decision-maker, who is responsible for allocating resources and assessing performance of the operating segments, has been identified as the Group management.
FOREIGN CURRENCY TRANSLATIONFunctional and presentation currency.The financial statements of each of the Group’s entities are generally measured using the currency of the economic area in which the entity operates (“the functional currency”). The consolidated financial statements are presented in Norwegian Kroner (NOK), which is the parent company’s functional and presentation currency.
TRANSACTIONS AND BALANCE SHEET ITEMSForeign currency transactions are translated into the functional currency using the exchange rates. Foreign exchange gains and losses resulting from the settlement of such transactions and from the translation of monetary assets and liabilities denominated in foreign currency at year-end at the exchange rate on the date of the balance sheet are recognised in the income statement.
GROUP COMPANIESThe income statements and balance sheets of the Group entities (none of which has the currency of a hyperinflationary economy) that have a functional currency different from the presentation currency are translated into the presentation currency as follows:(i) assets and liabilities are translated at the closing rate on the date of the balance sheet,(ii) income and expense items in the income statement are translated at average exchange rates for the period (if the average is not a reasonable estimate of the cumulative effects of using the transaction rate, the transaction rate is used)(iii) translation differences are recorded in comprehensive income and specified separately. When a foreign operation is sold, the exchange difference, which in previous periods was recorded in consolidated income, is not accrued. The accumulated exchange difference from the sale of the foreign operation is hence reversed in the consolidated income. Gain/loss from the sale is recognised on a basis of zero exchange difference. Gain/loss is recorded in the ordinary net profit.Goodwill and fair value adjustments of assets and liabilities on the
acquisition of a foreign entity are treated as assets and liabilities of the foreign entity and are translated into the functional currency at the closing rate.
PROPERTY, PLANT AND EQUIPMENTProperty, plant and equipment are stated at historical cost less depreciation and impairment. Historical cost includes expenditure that is directly attributable to the acquisition of the item. Acquisition cost may also include gains or losses transferred from equity as a result of hedging the cash flow in foreign currency on the purchase of property, plant and equipment.
Improvements are included in the asset’s carrying amount or recognised as a separate asset when it is probable that future economic benefits associated with the improvement will flow to the Group and the cost of the item can be reliably measured. All other repairs and maintenance are charged to the income statement during the financial period in which they are incurred.Land and buildings comprise mainly factories and offices. Land is not depreciated. Depreciation on other assets is calculated using the straight-line method to allocate cost less residual value over estimated useful lives, as follows:
• Buildings/real estate 10 - 50 år• Plants, barges, onshore power supply 5 - 30 years • Nets/cages/moorings 5 - 25 years• Other equipment 3 – 35 years
The assets’ useful lives and residual values are reviewed at each balance sheet date and adjusted, if necessary.
An asset’s carrying amount is written down to its recoverable amount if the carrying amount is greater than its estimated recoverable amount. Gains and losses on disposals are posted net in the income statement and correspond to the difference between the sale price and the carrying amount.
INTANGIBLE ASSETSIntangible assets, which arise internally within the Group, are not recognised. Goodwill and licences with an indefinite economic life are subject to annual impairment tests. Impairment tests are performed more frequently if indications of impairment exist. Amortised licences are tested for impairment only if there are indications that future earnings do not justify the asset’s balance sheet value.
GOODWILLGoodwill represents the excess of the cost of an acquisition over the fair value of the Group’s share of the net identifiable assets of the acquired entity at the date of acquisition. Goodwill on acquisitions of subsidiaries is classified as an intangible asset. Goodwill on the purchase of a share in an associated company is included in “investments in associates”. Goodwill is tested annually for impairment and carried at cost less accumulated impairment losses. Impairment losses on goodwill are not reversed. Gains and losses on the disposal of an entity include the carrying amount of goodwill relating to the entity sold.Goodwill is allocated to cash-generating units for the purpose of impairment testing. The allocation is made to those cash-generating units or groups of cash-generating units that are expected to benefit from the business combination in which the goodwill arose.
LICENCESFish quotas and fish farming licences that have an indefinite useful life are not amortised but reviewed for impairment annually, or more frequently if there are indications that the balance sheet value may have decreased.
The Group considers the following licences to have indefinite useful life:• Licences granted with indefinite useful life, where the company has no other contractual restrictions related to the use of the licence.

36 A N N U A L R E P O R T 2 0 1 5 G R O U P
• Licences granted with limited useful life, but where renewal from licence holders´ side can be arranged without substantial expenses.
Licences with a limited useful life are amortised over the useful lifetime. These regard water concessions for hatcheries and some specific grow-out licences. The following sections provide a description of concessions related to the segments Norway, UK (Shetland) and BC (Canada). Please refer to note 10 Intangible assets for an overview of the number and types of licences, as well as impairment testing.
NORWAYThe licencing regime for the production of salmon and trout in Norway has been introduced by the Parliament and adopted through the Aquaculture Act. The Ministry of Trade, Industry and Fisheries grants permits for aquaculture (licences). All aquaculture operations are subject to licencing and nobody can produce salmon/trout without permission from the authorities regardless of when the permit was issued, cf. Aquaculture Act § 4.The aquaculture permit entitles the production of salmon and trout in limited geographic areas (sites), with the current determined limitations of the permit scope. The Aquaculture Act is administered centrally by the Ministry of Trade, Industry and Fisheries, with the Directorate of Fisheries as the supervisory authority. Regionally, several industry authorities collectively manage a complete administrative and supervisory responsibility within the regulating range of the Aquaculture Act. The county is the regional administrative body, while the Directorate of Fisheries serves as appellate body in locality and licencing matters.
Grow-out licencesEach licence for salmon and trout in the sea is subject to a production limit in the form of “maximum allowed biomass” (“MTB”). MTB does not directly limit the number of tons of fish production within a year, but limits the amount of fish to keep in the sea at any time. Normally, a licence has a limit of 780 tons MTB, ref. the Salmon Allocation Regulation § 15 (“laksetildelingsforskriften”). Such licences are limited in number and only subject to application, following politically decided licencing rounds.
Hatchery licencesYoung salmon/trout are defined as eggs, juveniles, parr or smolts to be released in another locality ref. Salmon Allocation Regulation § 4 f. Such licences are not limited in number and thus subject to continuous application for new licences or changes to existing licences. Basically, it is not allowed to produce smolts over 250 grams, but the regulations allow for applications to produce a certain percentage of fish up to 1 kilogram.
R&D and broodstock licencesThese licences are not limited in number. Permissions are means-tested, meaning the applicant must demonstrate a need for the production of eggs, specific research projects or educational purposes. Broodstock licences include both land and sea phase, ie the broodfish and egg production belong to the same licencing consideration.
Harvesting cage licencesLicences utilised to cage setting of live fish for harvesting. These relate to specific locations.
Duration and renewalThe Ministry may in individual decisions or regulations specify further provisions on the contents of aquaculture licences, including scope, time limitations, etc., cf. the Aquaculture Act § 5, second paragraph. Still, the preparatory work for the Aquaculture Act specify that licences normally are granted without a time limit. Grieg Seafood’s general food fish licences and hatchery licences are not time limited under current regulations. After the reform in 2009, a number of licences were time limited, mainly to 15 years. As no government practices have been established related to renewal of broodstock licences, the current understanding is that expiration
of licences allows for application for renewal based on demand. A licence for harvesting cages is valid for 10 years and needs renewal upon expiration, given that the licence is still connected to an approved harvesting plant.
Disposal and withdrawalAll licences can be transferred and mortgaged according to the Aquaculture Act § 19. Transfers and mortgages must be registered in a separate register (the Aquaculture Register). It is not allowed to rent out licences or licence capacity.
The Aquaculture Act reviews the basis for withdrawal of an aquaculture licence. This states inter alia that there must be significant breaches of the terms of an aquaculture licence before it can be revoked.
UKGrieg Seafood Hjaltland UK Ltd (“Grieg UK”) has farms on both the west and east coast of Shetland, as well as the west coast of Scotland. In order to operate farms in Scotland, the following five licences must be in place:• Water Environment (Controlled activities) “CAR” licence –
issued by Scottish Environment Protection Agency (SEPA)• Planning permission – issued by local authorities (Town and
Country Planning Act)• Crown Estate Lease/Permission (The Crown Estate act 1961)• Aquaculture Production Business Licence (APB) – issued by
Aqua Animal Health• Marine Licence (Navigation) – issued by the Scottish government
For limitations related to production quantity, see table in note 10.
Duration and renewal• CAR licence – requires periodic inspection and monitoring. If a
substantial negative effect on the environment can be proven, as a consequence of the operation, the production volume can be reduced or, as a worst-case scenario, revoked.
• Planning Permission – indefinite duration, but if the plant is left unused for 3 consecutive years, the licence may be withdrawn
• Crown Estate Lease/Permission – 25 years of duration. Normal procedure is renewal of the licences upon expiration.
• APB – indefinite duration depending on compliance with the licence´s conditions.
• Marine Licence – required application for renewal every 6 years. This is normally a formality.
BCGrieg Seafood B.C. Ltd (“Grieg BC”) has farms on both the west and east coast of Vancouver Island. In order to operate farms in British Columbia, Canada, the following three licences must be in place:• Aquaculture licence – issued by Department of Fisheries and
Oceans• Licence of Occupation (Tenures) – issued by Ministry of Forest,
Lands and Natural Resource Operations• Navigation Water Permit – issued by Transport Canada
(Canadian public authorities)
For limitations related to production quantity, see table in note 10.
Duration and renewal• Aquaculture licence – duration of 1 year, renewal each year is
a formality.• Licence of Occupation – duration of between 2 and 20 years.
Renewal is applied for upon expiration.• Navigation Water Permit – duration of 5 years, but possible to
apply for renewal.
OTHER INTANGIBLE ASSETSAcquired customer portfolios and computer software licences are capitalised at cost and amortised over their estimated useful lives. Customer portfolios are capitalised at historical cost at the date of purchase. Amortisation is calculated using the straight-line method
37G R I E G S E A F O O D 2 0 1 5 G R O U P
over the estimated useful life, as follows:- Customer portfolios 6 years- Computer software 3-10 years
IMPAIRMENT OF NON-FINANCIAL ASSETSAssets that have an indefinite useful life are not amortised and are tested annually for impairment. Assets that are subject to amortisation are reviewed for impairment whenever there are indications that future earnings do not justify the carrying amount. An impairment loss is recognised for the amount by which the asset’s carrying amount exceeds its recoverable amount. The recoverable amount is the higher of an asset’s fair value less costs to sell and value in use. For the purposes of assessing impairment, assets are grouped at the lowest levels for which there are separately identifiable cash flows (cash-generating units). Non-financial assets, other than goodwill, that suffered an impairment are reviewed for indicators of possible reversal of the impairment at each reporting date.
FINANCIAL ASSETS/LIABILITIESThe Group classifies its financial assets in the following categories: At fair value through profit or loss, loans and receivables, and assets available for sale. The classification depends on the purpose for which the financial assets were acquired. The management determines the classification of its financial assets upon acquisition and re-evaluates this designation at every reporting date in case of material changes.
A) LOANS AND RECEIVABLESLoans and receivables are non-derivative financial assets with fixed or determinable payments that are not quoted in an active market. They are classified as current assets, except for maturities greater than 12 months after the balance sheet date. These are classified as non-current assets. Loans and receivables are classified as ‘other receivables’ in the balance sheet.At each balance sheet date the Group considers whether there is any objective evidence that the loans and receivables are impaired. Such objective evidence is, for instance:- breach of contract, such as a default or delinquency in payments,- the probability that the borrower will become insolvent or be subject to financial reorganisation.Loans and receivables are carried at amortised cost using the effective interest method.
B) AVAILABLE-FOR-SALE FINANCIAL ASSETSAvailable-for-sale financial assets are non-derivatives that are either designated in this category or not classified in any other category. They are included in non-current assets unless management intends to dispose of the investment within 12 months of the balance sheet date.
Available for-sale financial assets are stated at fair value. Change of value is recorded in consolidated total financial statement.
When securities classified as available-for-sale are sold or impaired, the accumulated fair value adjustments recognised in equity are included in the income statement as ‘other financial income/losses from investment in securities ’. Interest on available-for-sale securities calculated using the effective interest method is recognised in the income statement. Dividends on shares classified as available-for-sale are recognised in the income statement when the Group’s right to receive dividends is established. The fair values of quoted investments are based on current bid prices. If the market for a financial asset is not active (and for unlisted securities), the Group establishes fair value by using valuation techniques. These include recent transactions on market terms, reference to other instruments which are essentially the same, the use of discounted cash flows and options models.
The techniques used make maximum use of market and avoid company-specific information as much as possible.
Investments are derecognised when the rights to receive cash flows
from the investments have expired or have been transferred and the group has transferred substantially all risks and rewards of ownership. Regular purchases and sales of investments are recognised on trade-date – the date on which the Group commits to purchase or sell the asset. All financial assets which are not stated at fair value through profit or loss are initially recognised at fair value plus transaction costs.
At each balance sheet date the Group assesses whether there is objective evidence that a financial asset or a group of financial assets is impaired. In the case of shares classified as available for sale, a significant or prolonged decline in the fair value of the security below its cost is considered as an indicator that the securities are impaired. If any such evidence exists for available-for-sale financial assets, the cumulative loss – measured as the difference between the acquisition cost and fair value, less any impairment loss on that financial asset previously recognised through profit or loss – is removed from equity and recognised in the income statement. Impairment losses recognised in the income statement on shares and corresponding equity instruments are not reversed through the income statement. Impairment testing of accounts receivable is described below.
C) FINANCIAL ASSETS/LIABILITIES AT FAIR VALUE INCLUDED IN INCOME STATEMENT, INCLUDING DERIVATIVES AND HEDGINGFinancial equity classified as available-for-sale is recorded at fair value, whereas change of value is included in income statement.
The Group does not apply hedge accounting according to IAS 39. Derivatives are initially recognised at fair value on the date a derivative contract is entered into and are subsequently stated at fair value on an ongoing basis. Changes in the fair value of derivatives are posted net in the income statement under ‘other financial income/costs’. This includes derivatives intended for hedging purposes.
Assets/liabilities in this category are classified as current assets/short term debt when intended to be disposed of within 12 months, otherwise as non-current assets/liabilities.
INVENTORIESInventories are stated at the lower of cost and net realisable value. Cost is determined using the first-in, first-out (FIFO) method. The net realisable value is the estimated selling price, less processing and selling expenses.
BIOLOGICAL ASSETSThe accounting treatment of living fish by companies applying IFRS is regulated by IAS 41 Agriculture. IAS 41 comprises a hierarchy of methods for accounting measurement of biological assets. The basic principle is that such assets shall be measured at fair value. The model applied by the Group divides the fish into three weight categories and assumes the following:
1. Fish below 1 kilogram is recorded at accumulated cost. The best estimate for fair value is considered to be accumulated cost.
2. For fish between 1 and 4 kilograms the estimated fair value includes a proportionate part of the estimated profit.
3. For fish over 4 kilograms (fish ready for harvesting) the fair value is set at the net sale price on the basis of harvesting at the balance sheet date.
If the expected sale price is below the estimated cost, this will entail a negative value adjustment of biological assets, which is 100 % accrued. Upon estimating actual accumulated cost at the respective grow-out facility, direct costs (fish feeds a.o.) are allocated to the locality. Indirect costs are distributed across localities through a norm of distribution. Given unusual mortality rate, the cost is amortised. This applies only when mortality rate exceeds normal expectations. Financial costs are not allocated to cost.

38 A N N U A L R E P O R T 2 0 1 5 G R O U P
The sale price for fish ready for harvesting is based on spot prices, while the price of fish between 1 and 4 kilograms is based on forward prices and/or the most relevant price information that is available for the period when the fish is expected to be harvested.
The net sales are adjusted for quality differences (superior, ordinary and prod.), and for freight and sales commissions. Estimated harvesting expenses are also deducted. The volume is adjusted for gutting waste, as the price is measured for gutted weight.
Change in fair value of biological assets is recognised. The value adjustment is presented on the separate line “Fair value adjustment of biological assets.”
The Group applies an internal principle of impairment in the event of extraordinary mortality. Such impairments are recorded as they arise as part of the cost of sales in the income statement. Information on recorded fair value for extraordinary mortality is based on the same principle as estimating value-adjusted biological assets. For specification of annual extraordinary mortality, see note 9.
INDUSTRY GROUP FOR AQUACULTUREIn autumn 2014 the Fincancial Supervisory Authority of Norway (FSA) initiated an evaluation project related to parts of the financial reporting for aquaculture companies listed on the Oslo Stock Exchange. The purpose of the project was to assess whether the aquaculture industry practices a uniform and consistent reporting in accordance with IFRS. FSA published its final report on 17 November 2015 on its website (www.finanstilsynet.no). As a result of this review, the fish farming companies subject to the project, established an industry group for financial reporting, as a venue for discussions and common improvements of reporting.
The group has held several meetings during the autumn of 2015, and the two main agendas of the meetings were to:1) identify possible note improvements and policy applications, and2) develop a common model for fair value measurement of biomass in line with IAS 41.
Affiliated with the first agenda, the group has identified some areas for improvement, and some adjustments of the note disclosures and presentation with effect for the fiscal year 2015. Further standardisation of the note information with effect from the fiscal year 2016, is expected.
As for the other agenda, the industry group has initiated work on a common valuation model, and this work will continue in 2016. The group aims to have completed this work in time to effect the financial statements as of December 31, 2016.
The following companies participate in the industry group: Lerøy Seafood Group ASA, Grieg Seafood ASA, Salmar ASA, Cermaq AS, P/F Bakkafrost and Marine Harvest ASA.
ACCOUNTS RECEIVABLEAccounts receivable are generated from trading of goods or services within the ordinary operating cycle. Accounts receivable under normal terms of payment are recognised initially at nominal value. Longer terms of payment implies a subsequent measurement of net present value/discounting of the accounts receivable. A provision for impairment of accounts receivable is established when there is objective indication that the Group will not be able to collect all amounts due according to the original terms of trade. Significant financial difficulties affecting the debtor, the probability that the debtor will become insolvent or be subject to financial reorganisation, and default or delinquency in payments are considered indicators that the account receivable is impaired. The provision is the difference between nominal and recoverable amount, which is the present value of estimated future cash flows, discounted at the original effective interest rate. The amount of the provision is recognised in the income statement under ‘other operating expenses’.
CASH AND CASH EQUIVALENTSCash and cash equivalents include cash in hand, bank deposits, other short-term highly liquid investments with original maturities of three months or less, and bank overdrafts. Bank overdrafts are shown under borrowings included in current liabilities.
SHARE CAPITALOrdinary shares are classified as equity. Costs directly attributable to the issue of new shares or options, net of tax, are shown in equity as a deduction, net of tax, from the proceeds.
BORROWINGSBorrowings are recognised initially at fair value when the funds are received, net of transaction costs incurred. Borrowings are subsequently stated at amortised cost applying the effective interest method. Any difference between the proceeds (net of transaction costs) and the redemption value is recognised in the income statement over the period of the borrowings. Borrowings are classified as current liabilities unless the Group has an unconditional right to defer settlement of the liability for at least 12 months after the balance sheet date.
DEFERRED TAXDeferred tax is provided for in full at nominal values, using the liability method, on temporary differences arising between the value of assets and liabilities for tax and accounting purposes. Deferred tax is determined using tax rates and laws that have been enacted or substantially enacted by the balance sheet date and are expected to apply when the related deferred tax asset is realised or the deferred income liability is settled.
Deferred tax assets are offset against deferred tax liabilities to the extent that it is probable that future taxable income will be available, from which the temporary differences can be deducted.
Deferred tax is calculated on temporary differences arising on investments in subsidiaries and associates, except where the timing of the reversal of the temporary difference is controlled by the Group and it is probable that the temporary difference will not be reversed in the foreseeable future.
EMPLOYEE BENEFITSPENSION OBLIGATIONSEffective from 1 July 2009 the pension obligations of Grieg Seafood ASA have been based on a defined contribution based scheme for all employees, following the termination of a defined benefits based scheme. The Company’s pension scheme is in accordance with rules and regulations for mandatory occupational pensions. The premium is charged through operations as it arises in the profit and loss account. Employer’s social security contributions are charged on the basis of the pension premium paid.
Grieg Seafood Rogaland AS and Grieg Seafood Finnmark AS have a contractual early retirement pension scheme (AFP). The financial commitments associated with this scheme are included in the Group’s pension calculations. The AFP early retirement scheme follows the rules for public sector AFP, and both companies are members of the LO/NHO scheme. The pension payment calculations are based on standard assumtions relating to the development of mortality and disability as well as other factors such as age, years of service and remuneration.
The old AFP scheme has terminated, and the previous balance sheet obligation was therefore written back in 2010. This does not apply to that part of the obligation related to those who have already taken out a pension under the old scheme. On termination of the old AFP scheme LO/NHO required the member companies to cover the underfunding of the old scheme. Companies which have been members of LO/NHO must make a provision to cover the underfunding, with payment due over a 5-year period.
SHARE-BASED REMUNERATIONThe Group operates a share-based management remuneration plan

39G R I E G S E A F O O D 2 0 1 5 G R O U P
with settlement in cash. The fair value of the employee services received in exchange for the grant of the options is recognised as an expense. The total amount to be charged over the vesting period is calculated on the basis of the fair value of the options granted, excluding the impact of any non-market vesting conditions (for example, profitability and sales growth targets). Non-market vesting conditions are included in assumptions about the number of options that are expected to vest. At each balance sheet date, the company revises its estimates of the number of options that are expected to vest. It recognises the impact of the revision relative to original estimates, if any, in the income statement, with a corresponding adjustment to liability. The Black and Scholes option pricing model is used for valuation.
The company´s obligations are posted under long-term commitments if the latest possible redemption date exceeds one year.
TRANSACTIONS UNDER JOINT CONTROLOn the purchase of entities under joint control the Group has chosen to apply IFRS 3 as its accounting standard.The proceeds received net of any directly attributable transaction costs are credited to share capital (nominal value) and share premium when the options are exercised.
TERMINATION BENEFITSTermination benefits are payable when employment is terminated by the Group before the normal retirement date, or whenever an employee accepts voluntary redundancy in exchange for these benefits. The Group recognises termination benefits when it is demonstrably committed to either terminating the employment of current employees according to a detailed formal plan without the possibility of withdrawal, or providing termination benefits as a result of an offer made to encourage voluntary redundancy.
Profit sharing and bonus plansThe Group recognises a provision where it has a contractual obligation or where there is a past practice that has created a constructive obligation.
PROVISIONSProvisions (e.g. environmental improvements, restructuring costs and legal claims) are recognised when: • the Group has a present legal or constructive obligation as a
result of past events; • it is more likely than not that an outflow of resources will be
required to settle the obligation;• the amount of the obligation can be reliably estimated.
Restructuring provisions comprise lease termination penalties and employee termination payments. Provisions are not recognised for future operating losses.
Where there is a number of similar obligations, the likelihood that an outflow will be required in settlement is determined by considering the class of obligations as a whole. A provision is recognised even if the likelihood of an outflow with respect to any one item included in the same class of obligations may be small.Provisions are measured at the present value of the expenditures expected to be required to settle the obligation using a pre-tax discount rate that reflects the current market situation and the risks specific to the obligation. The increase in the provision due to the change in value because of passage of time is posted as a financial expense.
REVENUE RECOGNITIONRevenue comprises the fair value of the consideration received or receivable for the sale of goods and services. Revenue is shown net of value-added tax, returns, rebates and discounts and after eliminating intra-group sales. Revenue is recognised when it is reliably measured and it is reasonably assured that the economical assets will be transferred, i.e. when a group entity has delivered products to the customer, the customer has accepted the products
and collectability of the related receivables and when the risks and rewards have been transferred to the customer.
INTEREST INCOMEInterest income is recorded proportionately over time using the effective interest method. When a receivable is impaired, the Group reduces the carrying amount to its recoverable amount, being the estimated future cash flow discounted at the original effective interest rate. Interest income on impaired loans is recognised on the basis of the amortised cost and the original effective interest rate.
DIVIDEND INCOMEDividend income from investments under the cost method or available-for-sale is recognised when the right to receive payment is established. Dividend income from entities under the equity method are not being recognised but recorded as a reduction in the carrying value of the investment.
LEASESFINANCE LEASESLeases, or other arrangements as described in IFRIC 4, relating to property, plant and equipment where the Group has substantially all the risks and control, are classified as finance leases.Finance leases are capitalised at the lease’s commencement at the lower of the fair value of the leased property and the present value of the aggregate minimum lease payments. Each lease payment is allocated between an instalment element and an interest element so as to achieve a constant interest rate in the different periods on the outstanding lease obligation in the balance sheet. The lease obligation, less interest costs, is classified as other long-term debt. The interest expense is posted in the income statement as a financial expense over the lease period so as to achieve a constant interest expense on the outstanding obligation in each period. The property, plant and equipment acquired under finance leases is depreciated over the shorter of the useful life of the asset or the lease period.
OPERATING LEASESLeases, or other arrangements as described in IFRIC 4, in which a significant portion of the risks and rewards of ownership are retained by the lessor, are classified as operating leases. Payments made under operating leases (net of any financial incentives from the lessor) are charged to the income statement on a straight-line basis over the period of the lease.
DIVIDENDSDividends payable to the Company’s shareholders are recognised as a liability in the Group’s financial statements when the dividends are approved by the AGM.
BORROWING COSTSBorrowing costs incurred during the construction of operating assets are capitalised during the period of time that is required to complete and prepare the asset for its intended use. Other borrowing costs are charged in the income statement.
CONTINGENT ASSETS AND LIABILITIESContingent liabilities are defined as:1. possible obligations resulting from past events whose existence
depends on future events;2. obligations that are not recognised because it is not probable
that they will lead to an outflow of resources entailing financial benefits out of the company
3. obligations that cannot be measured with sufficient reliability.
Contingent liabilities are not recognised in the annual financial statements apart from contingent liabilities which are acquired through the acquisition of an entity. Significant contingent liabilities are disclosed, with the exception of contingent liabilities where the probability of the liability occurring is remote.
Contingent liabilities acquired through the purchase of operations are recognised at fair value even if the liability is not probable. The
40 A N N U A L R E P O R T 2 0 1 5 G R O U P
assessment of probability and fair value is subject to constant review. Changes in the fair value are recognised in the income statement.
A contingent asset is not recognised in the financial statements, but is disclosed if it is likely that a benefit will accrue to the Group.
CASH FLOW STATEMENTThe Group’s cash flow statement shows the overall cash flow broken down into operating, investing and financing activities by using the indirect method. The cash flow statement illustrates the effect of the various activities on cash and cash equivalents. Cash flows resulting from the disposal of operations are presented under investing activities.
EARNINGS PER SHAREEarnings per share are calculated by dividing the profit for the year allocated to the company’s shareholders by a weighted average of the number of issued ordinary shares during the year. Diluted earnings per share are calculated by adjusting the weighted average number of ordinary shares outstanding to assume conversion of all dilutive potential ordinary shares.
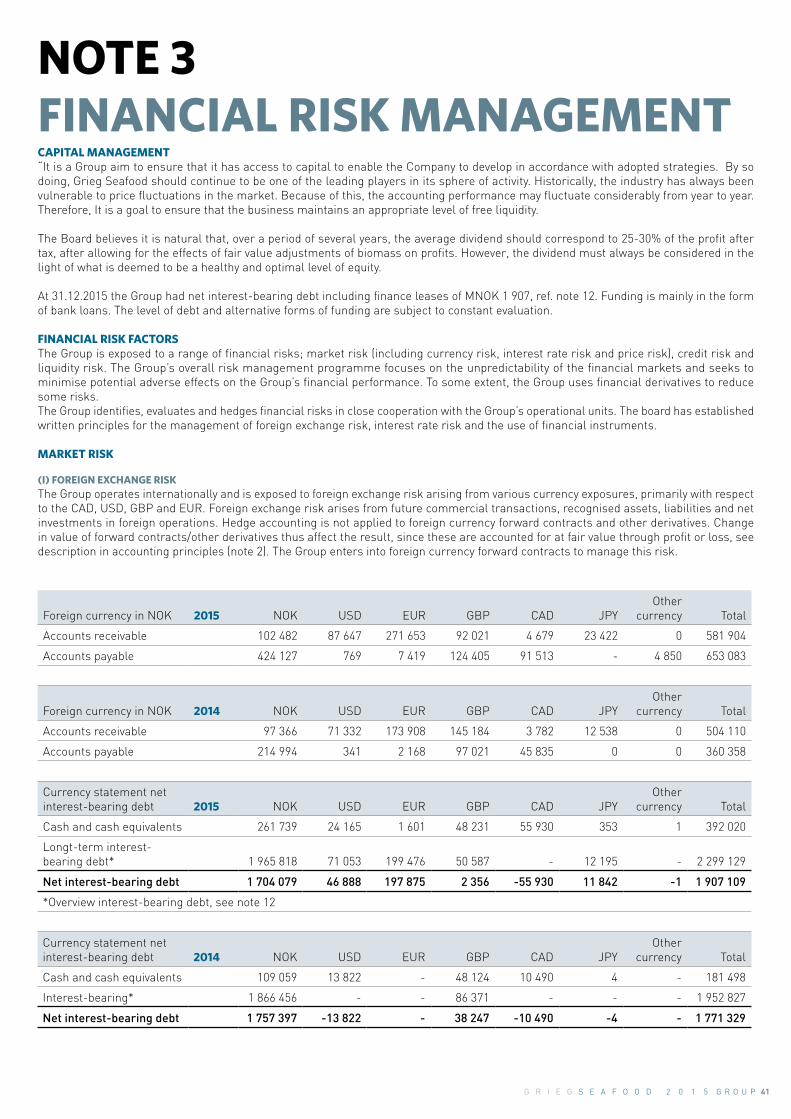
41G R I E G S E A F O O D 2 0 1 5 G R O U P
NOTE 3 FINANCIAL RISK MANAGEMENTCAPITAL MANAGEMENT “It is a Group aim to ensure that it has access to capital to enable the Company to develop in accordance with adopted strategies. By so doing, Grieg Seafood should continue to be one of the leading players in its sphere of activity. Historically, the industry has always been vulnerable to price fluctuations in the market. Because of this, the accounting performance may fluctuate considerably from year to year. Therefore, It is a goal to ensure that the business maintains an appropriate level of free liquidity.
The Board believes it is natural that, over a period of several years, the average dividend should correspond to 25-30% of the profit after tax, after allowing for the effects of fair value adjustments of biomass on profits. However, the dividend must always be considered in the light of what is deemed to be a healthy and optimal level of equity.
At 31.12.2015 the Group had net interest-bearing debt including finance leases of MNOK 1 907, ref. note 12. Funding is mainly in the form of bank loans. The level of debt and alternative forms of funding are subject to constant evaluation. FINANCIAL RISK FACTORS The Group is exposed to a range of financial risks; market risk (including currency risk, interest rate risk and price risk), credit risk and liquidity risk. The Group’s overall risk management programme focuses on the unpredictability of the financial markets and seeks to minimise potential adverse effects on the Group’s financial performance. To some extent, the Group uses financial derivatives to reduce some risks. The Group identifies, evaluates and hedges financial risks in close cooperation with the Group’s operational units. The board has established written principles for the management of foreign exchange risk, interest rate risk and the use of financial instruments. MARKET RISK
(I) FOREIGN EXCHANGE RISK The Group operates internationally and is exposed to foreign exchange risk arising from various currency exposures, primarily with respect to the CAD, USD, GBP and EUR. Foreign exchange risk arises from future commercial transactions, recognised assets, liabilities and net investments in foreign operations. Hedge accounting is not applied to foreign currency forward contracts and other derivatives. Change in value of forward contracts/other derivatives thus affect the result, since these are accounted for at fair value through profit or loss, see description in accounting principles (note 2). The Group enters into foreign currency forward contracts to manage this risk.
Foreign currency in NOK 2015 NOK USD EUR GBP CAD JPYOther
currency Total
Accounts receivable 102 482 87 647 271 653 92 021 4 679 23 422 0 581 904
Accounts payable 424 127 769 7 419 124 405 91 513 - 4 850 653 083
Foreign currency in NOK 2014 NOK USD EUR GBP CAD JPYOther
currency Total
Accounts receivable 97 366 71 332 173 908 145 184 3 782 12 538 0 504 110
Accounts payable 214 994 341 2 168 97 021 45 835 0 0 360 358
Currency statement net interest-bearing debt 2015 NOK USD EUR GBP CAD JPY
Other currency Total
Cash and cash equivalents 261 739 24 165 1 601 48 231 55 930 353 1 392 020
Longt-term interest-bearing debt* 1 965 818 71 053 199 476 50 587 - 12 195 - 2 299 129
Net interest-bearing debt 1 704 079 46 888 197 875 2 356 -55 930 11 842 -1 1 907 109
*Overview interest-bearing debt, see note 12
Currency statement net interest-bearing debt 2014 NOK USD EUR GBP CAD JPY
Other currency Total
Cash and cash equivalents 109 059 13 822 - 48 124 10 490 4 - 181 498
Interest-bearing* 1 866 456 - - 86 371 - - - 1 952 827
Net interest-bearing debt 1 757 397 -13 822 - 38 247 -10 490 -4 - 1 771 329
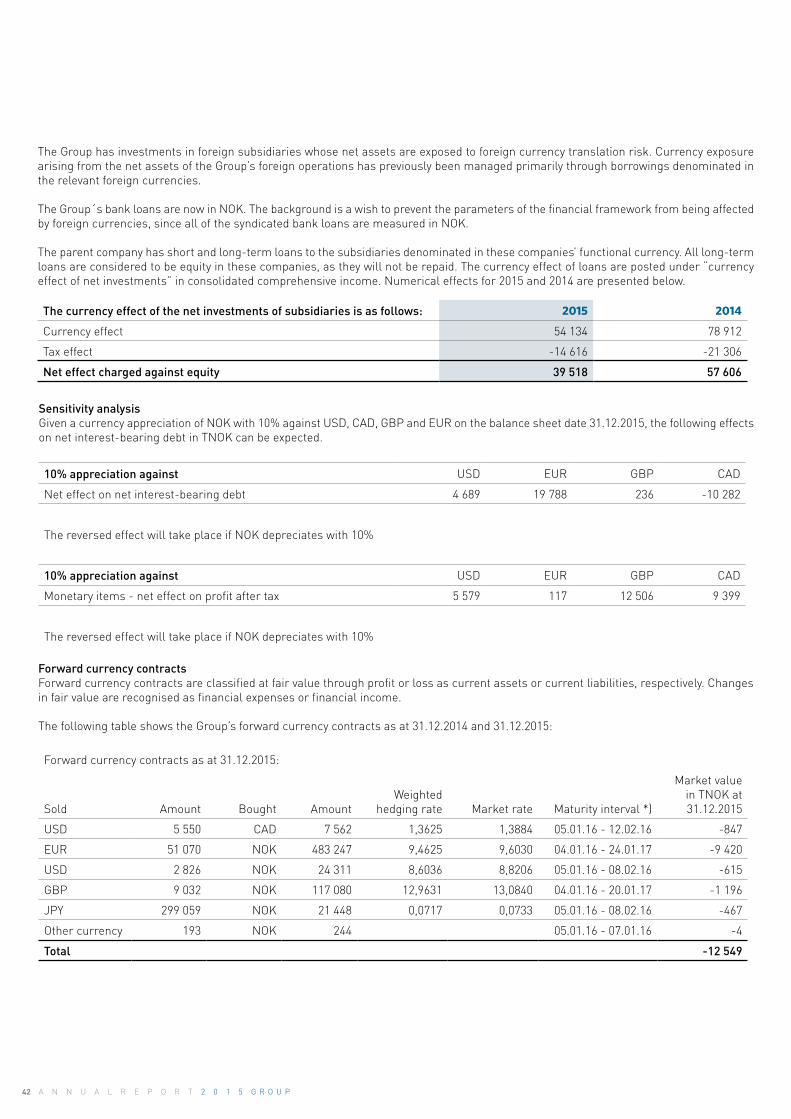
42 A N N U A L R E P O R T 2 0 1 5 G R O U P
The Group has investments in foreign subsidiaries whose net assets are exposed to foreign currency translation risk. Currency exposure arising from the net assets of the Group’s foreign operations has previously been managed primarily through borrowings denominated in the relevant foreign currencies.
The Group´s bank loans are now in NOK. The background is a wish to prevent the parameters of the financial framework from being affected by foreign currencies, since all of the syndicated bank loans are measured in NOK.
The parent company has short and long-term loans to the subsidiaries denominated in these companies’ functional currency. All long-term loans are considered to be equity in these companies, as they will not be repaid. The currency effect of loans are posted under “currency effect of net investments” in consolidated comprehensive income. Numerical effects for 2015 and 2014 are presented below.
The currency effect of the net investments of subsidiaries is as follows: 2015 2014
Currency effect 54 134 78 912
Tax effect -14 616 -21 306
Net effect charged against equity 39 518 57 606
Sensitivity analysisGiven a currency appreciation of NOK with 10% against USD, CAD, GBP and EUR on the balance sheet date 31.12.2015, the following effects on net interest-bearing debt in TNOK can be expected.
10% appreciation against USD EUR GBP CAD
Net effect on net interest-bearing debt 4 689 19 788 236 -10 282
The reversed effect will take place if NOK depreciates with 10%
10% appreciation against USD EUR GBP CAD
Monetary items - net effect on profit after tax 5 579 117 12 506 9 399
The reversed effect will take place if NOK depreciates with 10%
Forward currency contractsForward currency contracts are classified at fair value through profit or loss as current assets or current liabilities, respectively. Changes in fair value are recognised as financial expenses or financial income.
The following table shows the Group’s forward currency contracts as at 31.12.2014 and 31.12.2015:
Forward currency contracts as at 31.12.2015:
Sold Amount Bought AmountWeighted
hedging rate Market rate Maturity interval *)
Market value in TNOK at 31.12.2015
USD 5 550 CAD 7 562 1,3625 1,3884 05.01.16 - 12.02.16 -847
EUR 51 070 NOK 483 247 9,4625 9,6030 04.01.16 - 24.01.17 -9 420
USD 2 826 NOK 24 311 8,6036 8,8206 05.01.16 - 08.02.16 -615
GBP 9 032 NOK 117 080 12,9631 13,0840 04.01.16 - 20.01.17 -1 196
JPY 299 059 NOK 21 448 0,0717 0,0733 05.01.16 - 08.02.16 -467
Other currency 193 NOK 244 05.01.16 - 07.01.16 -4
Total -12 549

43G R I E G S E A F O O D 2 0 1 5 G R O U P
Forward currency contracts as at 31.12.2014:
Sold Amount Bought AmountWeighted
hedging rate Market rate Maturity interval *)
Market value in TNOK at 31.12.2014
USD 14 700 CAD 16 655 1,1326 1,1612 27.02.15 - 29.06.15 -2 695
EUR 30 353 NOK 268 825 8,7820 9,0400 02.01.15-23.01.15 -6 129
USD 9 197 NOK 65 730 6,9798 7,4500 02.01.15-23.01.15 -2 825
JPY 255 907 NOK 15 679 635 0,0609 -259
Other currency 39
Total -11 869
*) The maturity is stated in intervals where there are several contracts.
(II) PRICE RISK
The Group is exposed to fluctuations in the spot prices for salmon, which is mainly determined by the global supply of salmon. The effect of price changes is reduced by geographical diversification, but due to the long production cycle it can be difficult to respond rapidly to global trends in market prices. Salmon is mainly traded at spot prices, and an increase in the global supply of salmon can result in a decline in spot prices. When entering into a financial price contract, the buyer and the seller agree on a price and a fixed volume for future delivery. In 2015, the Group has no financial price contracts, but the sales company Ocean Quality AS has secured contracts with customers. The Group management continously analyses the price market and opportunities to enter into price contracts. In 2014, the Group entered into financial price contracts for 2015 of 1445 tons.
(III) INTEREST RATE RISK
As the Group has no significant interest-bearing assets, its income and operating cash flows are largely independent of changes in market rates. The Group’s interest rate risk arises from borrowings. Borrowings at variable rates expose the Group to cash flow interest rate risk. Fixed interest contracts are used to reduce this risk. The level of fixed interest loans is insignificant. The Group monitors its interest rate exposure continuously. The Group calculates the imact on profit and loss of a defined interest rate shift. For each simulation, the same change in the interest rate is used for all currencies. The scenarios are run only for liabilities which represent major interest-bearing positions.
Sensitivity calculations show the following expected values: If the interest rate had been 1% higher (lower) throughout the year, other things being equal, the pre-tax profit would have been reduced (increased) by MNOK 17,7 in 2015 and MNOK 14,2 in 2014 due to the floating rate of interest on loans and deposits. The sensitivity analysis is based on average net interest-bearing debt throughout 2015 and 2014, notwithstanding concluded interest rate swap agreements.
Amounts in NOK 1000 Increase/reduction in interest rate points 2015 2014
Effect on profit before income tax -/+ 1% -/+ 17 704 -/+ 14 214

44 A N N U A L R E P O R T 2 0 1 5 G R O U P
INTEREST RATE SWAP AGREEMENTS
The purpose of the Group’s risk management activities is to establish an overview of the financial risk that exists at any given time and to take protective steps which give more time to adapt to the changes that take place. With this purpose in mind, the Group has chosen to employ interest rate swap agreements to establish greater stability for the Group’s loan interest expenses on variable rate. The Group has decided that at any given time a certain percentage of its interest-bearing debt on variable rate in banks a.o. shall be hedged under interest rate swap agreements. A specific proportion will always be at a floating rate, while the remainder will be subject to possible hedging. This is under constant consideration, based on the market situation.
The interest rate swap agreements have a horizon of 2-4 years and whether these periods are to be rolled over is a matter of constant evaluation. The following table shows the Group’s interest rate swap agreements in TNOK, and the market value as at 31.12.2014 and 31.12.2015:
2015
Agreement Principal Fixed rateBasis of
floating rate Duration Market value
Fixed rate paid - floating rate received 400 000 1,69 Nibor 3 mth 27.03.19 -10 380
Fixed rate paid - floating rate received 200 000 2,34 Nibor 3 mth 17.10.16 -1 766
Fixed rate paid - floating rate received 200 000 2,40 Nibor 3 mth 16.08.16 -2 409
Total -14 555
The interest rate swap agreements are measured at market value excluding accrued interest.
2014
Agreement Principal Fixed rateBasis of
floating rate Duration Market value
Fixed rate paid - floating rate received 400 000 1,70 Nibor 3 mth 31.10.19 -8 603
Fixed rate paid - floating rate received 200 000 2,34 Nibor 3 mth 16.08.16 -4 315
Fixed rate paid - floating rate received 200 000 2,40 Nibor 3 mth 17.10.16 -4 980
Total -17 898
Similar to the forward currency contracts hedge accounting under IAS 39 is not applied to interest rate swap agreements. Change in value of interest rate swap agreements thus affect the result, since these are accounted for at fair value through profit or loss, see description in accounting principles (note 2). Recognised change in value (unrealized) is classified as financial income or expense.
FAIR VALUE, FINANCIAL ASSETS
Carrying value of derivatives and other financial instruments as at 31.12 is displayed below (TNOK). Carrying value equals fair value. Positive value is classified as assets, negative value is classified as liabilities in the balance.
2015 2014
Assets Short-term loan Assets Short-term loan
Forward currency contracts 0 -12 549 -11 869
Interest rate swap agreem. (3 contracts totalling MNOK 800 due in 2016 and 2019) 0 -14 555 0 -17 898
Financial salmon contracts 0 0 0 1 834
Sum financial instruments at fair value 0 -27 104 0 -27 932

45G R I E G S E A F O O D 2 0 1 5 G R O U P
CREDIT RISK
Credit risk is managed at Group level. Credit risk arises from transactions with derivatives and deposits in banks and financial institutions, as well as from transactions with customers, including accounts receivable and fixed contracts. The Group has procedures to ensure that products are only sold to customers with satisfactory creditworthiness. The company normally sells to new customers only on presentation of a letter of credit or upon advance payment. Credit insurance is used when deemed appropriate. For customers who have a reliable track record with the Group, sales up to a certain level agreed in advance are permitted without any security.
Factoring agreements have been concluded with Ocean Quality AS and Ocean Quality UK regarding accounts receivable, see further information in note 12. All production is sold to Ocean Quality Group which in turn sells to external customers. As from 2015, this also applies to production in BC, selling to Ocean Quality´s subsidiary in NA. It is the policy of Ocean Quality AS to secure the bulk of its sales through credit insurance and bank guarantees.
The book value of financial assets represents the maximum credit exposure. The maximum credit risk exposure as at 31.12.2015 was as follows:
Amounts in NOK 1000
NOTE 2015 2014
Accounts receivable 22 581 904 504 110
Other receivables 23 145 767 93 371
Cash and cash equivalents 21 392 020 181 498
Total 1 119 691 778 979
Other receivables relates mainly to prepayments and VAT receivable.
AGE DISTRIBUTION OF ACCOUNTS RECEIVABLE 2015 2014
Not due 460 807 158 298
Due 120 973 95 745
- 0-3 months 109 423 78 787
- more than 3 months 10 132 7 574
- more than 1 year 1 404 9 384
Total nominal value of accounts receivable 581 780 254 043
CHANGE IN PROVISION FOR BAD DEBTS 2015 2014
01.01. 1 704 4 420
Change in provision 3 275 2 715
At 31.12. 4 979 1 704

46 A N N U A L R E P O R T 2 0 1 5 G R O U P
LIQIDITY RISK The Group performs prudent liquidity risk management, which implies maintaining sufficient cash and marketable securities, the availability of funding through sufficient credit facilities and the ability to close our market positions when considered appropriate. Due to the dynamic nature of the underlying nature of the business, the Group aims to maintain flexibility in funding by keeping committed credit lines available. In June 2015 the Company´s bank loans were expanded by MNOK 500 to ensure financing upon expiration of bond loans totalling MNOK 400. Simultaneously, Danske Bank exited the bank syndicate, leaving DNB and Nordea with 50% each. The financing agreement consists of a total credit frame of MNOK 1 910, of which a long-term credit facility of MNOK 700. The Group redeemed the bond loan of MNOK 400 December 2015, by utilising the bank loan with MNOK 400. By year-end 2015, a total of MNOK 450 has been utilised of a total frame of MNOK 700. This credit facility is classified as non-current liability, as it matures with the maturity of the mortgage loan in June 2019. For further information about non-current liabilities, see note 12.
The management monitors the Group’s liquidity reserve comprising credit facilities (see note 12) and cash and cash equivalents (note 21) based on expected cash flows. This is generally carried out at Group level in cooperation with the operating companies.
The following table shows a specification of the Group’s financial liabilites that are not derivatives, classified by structure of maturity. The amounts in the table are undiscounted contractual cash flows. Note 12 shows the payment profile for the Group’s non-current liabilities.
31 December 2015 < 3 mth 3-12 mth 1-2 years 2-5 years Over 5 years Total
Long-term loan instalments 22 866 68 598 90 000 985 018 1 166 482
Loan interest - floating 11 909 34 627 42 778 60 967 150 281
Long-term credit facility 450 000 450 000
Short-term loan interest - floating 1 580 4 740 6 320 15 800 28 440
Finance leases 16 739 44 269 63 732 151 345 57 891 333 976
Finance lease interest 1 695 7 792 8 471 18 442 5 426 41 826
Accounts payable 652 106 235 742 0 0 653 083
Export credits 10 458 10 458
Factoring commitments 338 213 338 213
Total commitments 1 045 108 170 719 212 043 1 681 572 63 317 3 172 759
31 December 2014 < 3 mth 3-12 mth 1-2 years 2-5 years Over 5 years Total
Long-term loan instalments 2 904 464 761 91 464 667 363 24 485 1 250 977
Loan interest - floating 15 486 45 329 23 806 46 617 0 131 238
Long-term credit facility 0 0 0 200 000 0 200 000
Short-term loan interest - floating 1 580 4 740 6 320 15 800 0 28 440
Finance leases 13 936 40 347 51 606 110 174 73 598 289 661
Finance lease interest 3 080 8 642 9 772 21 097 9 124 51 715
Accounts payable 360 358 0 0 0 0 360 358
Export credits 9 527 9 527
Factoring commitments 195 560 195 560
Total commitments 592 904 573 346 182 968 1 061 051 107 207 2 517 476
Current and non current liabilities are met with available liquidity, available drawdown on short-term credit facility, as well as positive cash flows from operations.
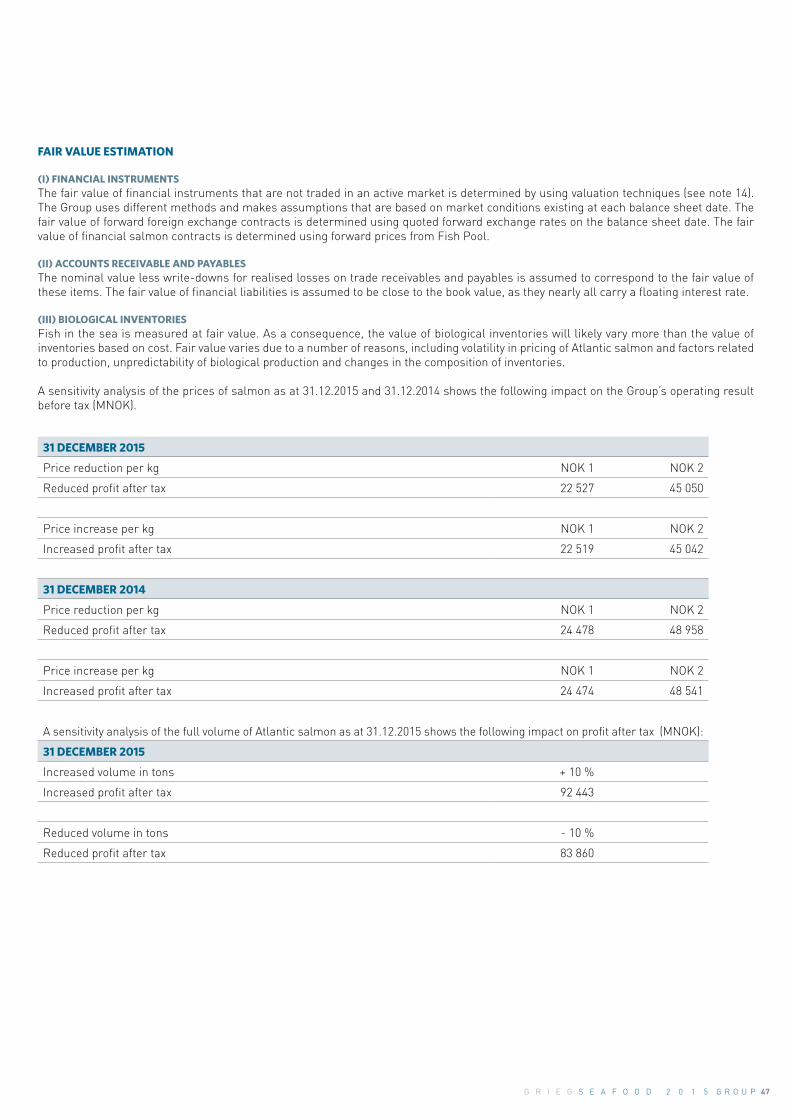
47G R I E G S E A F O O D 2 0 1 5 G R O U P
FAIR VALUE ESTIMATION (I) FINANCIAL INSTRUMENTSThe fair value of financial instruments that are not traded in an active market is determined by using valuation techniques (see note 14). The Group uses different methods and makes assumptions that are based on market conditions existing at each balance sheet date. The fair value of forward foreign exchange contracts is determined using quoted forward exchange rates on the balance sheet date. The fair value of financial salmon contracts is determined using forward prices from Fish Pool.
(II) ACCOUNTS RECEIVABLE AND PAYABLESThe nominal value less write-downs for realised losses on trade receivables and payables is assumed to correspond to the fair value of these items. The fair value of financial liabilities is assumed to be close to the book value, as they nearly all carry a floating interest rate.
(III) BIOLOGICAL INVENTORIESFish in the sea is measured at fair value. As a consequence, the value of biological inventories will likely vary more than the value of inventories based on cost. Fair value varies due to a number of reasons, including volatility in pricing of Atlantic salmon and factors related to production, unpredictability of biological production and changes in the composition of inventories.
A sensitivity analysis of the prices of salmon as at 31.12.2015 and 31.12.2014 shows the following impact on the Group’s operating result before tax (MNOK).
31 DECEMBER 2015
Price reduction per kg NOK 1 NOK 2
Reduced profit after tax 22 527 45 050
Price increase per kg NOK 1 NOK 2
Increased profit after tax 22 519 45 042
31 DECEMBER 2014
Price reduction per kg NOK 1 NOK 2
Reduced profit after tax 24 478 48 958
Price increase per kg NOK 1 NOK 2
Increased profit after tax 24 474 48 541
A sensitivity analysis of the full volume of Atlantic salmon as at 31.12.2015 shows the following impact on profit after tax (MNOK):
31 DECEMBER 2015
Increased volume in tons + 10 %
Increased profit after tax 92 443
Reduced volume in tons - 10 %
Reduced profit after tax 83 860

48 A N N U A L R E P O R T 2 0 1 5 G R O U P
NOTE 4 CRITICAL ACCOUNTING ESTIMATES AND JUDGEMENTSCRITICAL ACCOUNTING ESTIMATES AND ASSUMPTIONSThe management is required to make estimates and assumptions concerning the future which affect which accounting policies are to be used and reported amounts for assets, liabilities and contingent liabilities in the balance sheet, as well as income and expenses for the accounting year. Estimates, judgements and underlying assumptions are continuously evaluated and are based on historical experience and other factors, including expectations of future events that are believed to be reasonable under the present circumstances. The final results may diverge from these estimates. Changes in accounting estimates are included in the period when the estimates are changed.
ESTIMATED IMPAIRMENT OF GOODWILL, LICENCES AND PROPERTY, PLANT AND EQUIPMENTThe group tests annually whether goodwill and licences have suffered any impairment, in accordance with the accounting policy stated in note 2. The recoverable amounts of cash-generating units have been determined based on value-in-use calculations. These calculations require the use of estimates of future cash flows from the cash-generating unit, and the application of a discount rate in order to calculate the present value of future cash flows. Expectations of future cash flows will vary over time. Changes in market conditions and expected cash flows can result in future impairment. The value of long-term growth in demand, the competitive situation, the strength of the production link in the value chain and thereby also the expectations of the long-term profit margin are also of significance. The different parameters could variously affect the value of the licences over time. Any change in these critical assumptions will entail related write-downs, or the reversal of write-downs of the value of licences in accordance with the accounting policies described in note 2. Please also refer to note 10 for further remarks on tests related to value impairment.
BIOLOGICAL ASSETSThere are several factors which create uncertainty when estimating fair value of biological assets. Future prices, time of harvesting, carcass and the remaining production cost. Salmon prices are highly volatile. The sale prices for harvestable fish is based on forward-prices and/or the the most relevant price information available for the expected harvesting period. Changes in prices has the most significant impact on the estimated fair value of biological assets. Sensitivity analysis regarding changes in prices, see note 3. The assumption of harvesting the fish when it reaches 4 kg is also subject to uncertainty regarding the estimated growth. An estimated production cost is budgeted, which take into account estimated feed prices, cost related to treatment of lice and other preparedness to avoid biolgical incidents. There are uncertainty regarding the number of lice-treatments, the temperature in the sea and other weather conditions which influences the growth and production cost. Se note 2 for accounting policies and note 9 for more information about valuation of biological assets.

49G R I E G S E A F O O D 2 0 1 5 G R O U P
NOTE 5 CRITICAL ACCOUNTING ESTIMATES AND JUDGEMENTSGrieg Seafood Group consists of the following entities as at 31.12.2015:
Grieg Seafood Hjaltland UK Ltd including all subsidiary companies and Ocean Quality UK Ltd are resident in UK. Grieg Seafood BC Ltd and Ocean Quality North America Ltd are resident in Canada. The rest of the companies are resident in Norway. Grieg Seafood ASA has a 60% stake in Ocean Quality AS, the other subsidiaries are owned 100%.
GRIEG SEAFOOD ROGALAND AS
ERFJORDSTAMFISK AS
GRIEG SEAFOOD CANADA AS
GRIEG SEAFOOD FINNMARK AS
GRIEG SEAFOOD HJALTLAND UK LTD
GRIEG SEAFOOD SHETLAND UK LTD
OCEAN QUALITY AS
GRIEG SEAFOOD ASA
OCEAN QUALITY UK
DORMANT/ UNDER AVVIKLING
Hjaltland Hatcheries Ltd
Hjaltland Seafarms Ltd
Lerwick Fish Traders Ltd
Shetland Product
Vidlin Seafarms Ltd
Collarfirth Salmon Ltd
Fisholm Ltd
GRIEG SEAFOODBC LTD
OCEAN QUALITY NA
60%
GRIEG SEAFOOD ROGALAND AS
ERFJORD STAMFISK AS
GRIEG SEAFOODBC LTD
ROGALAND (NOR)
FINNMARK(NOR)
GRIEG SEAFOOD SHETLAND
OCEAN QUALITY UK
SHETLAND(UK)
BRITISH COLUMBIA(CAN)
OCEAN QUALITY NA
GRIEG SEAFOODFINNMARK AS
OCEAN QUALITY NOR
OCEAN QUALITY NOR
CORPORATE STRUCTURE
SEGMENT STRUCTURE

50 A N N U A L R E P O R T 2 0 1 5 G R O U P
NOTE 6 INFORMATION ABOUT OCEAN QUALITYAs from 2015, Ocean Quality AS Group (OQ) was accounted for as a subsidiary in accordance with IFRS 10. Grieg Seafood held a discussion with the Financial Supervisory Authority of Norway (FSA) from the autumn 2014, were questions were asked about the Group´s statement of its investment in Ocean Quality (OQ AS). Grieg Seafood has accepted FSA´s proposal. The accounts for 2014 have been restated in the annual report to be comparable with 2015.
OQ is owned 40 % by Bremnes Fryseri and 60 % by Grieg Seafood ASA. Grieg Seafood does not receive any of the profit from sale of fish from Bremnes Fryseri, as the result is based on a skewed distribution of profit from the delivered volume from each shareholder, respectively. Share of profit and share of equity in Bremnes Fryseri AS are presented as non-controlling interests.
As from 2015, OQ is reported as a segment, see note 8 for further information. The Group consists of Ocean Quality AS and its two fully owned subsidiaries Ocean Quality UK and Ocean Quality NA (North America). See note 5 for an overview of the corporate structure. Below stated the effect of revision shown for the income statement and balance sheet for 1.1.2014 and 31.12.2014.
Result GSF ASA Group Consolidation of OQ Revised 2014
Operating income 2 675 227 1 486 258 4 161 484
Operating expenses -2 193 761 -1 483 905 -3 677 666
EBITDA 481 466 2 353 483 819
Depreciation -140 609 -108 -140 717
Operating profit before fair value adjustment of biological assets 340 857 2 246 343 103
Fair value adjustment of biological assets -127 108 3 371 -123 737
Operating profit 213 749 5 617 219 366
Share of profit from associated companies 2 865 0 2 865
Net financial items -55 722 5 447 -50 275
Profit before tax 160 892 11 063 171 955
Tax -22 806 -4 755 -27 561
Profit of the year 138 086 6 308 144 394
ALLOCATION OF PROFIT OF THE YEAR:
Shareholders of parent company 138 086 720 138 806
Non-controlling interests 0 5 588 5 588

51G R I E G S E A F O O D 2 0 1 5 G R O U P
Result GSF ASA Group Consolidation of OQ Revised 2014
BALANCE 31.12.14
Deferred tax assets 0 2 180 2 180
Intangible assets 1 186 409 0 1 186 409
Non-current assets 1 424 562 390 1 424 952
Financial assets 43 522 -19 558 23 964
Inventories 1 932 347 2 766 1 935 113
Receivables 311 330 286 151 597 481
Cash and cash equivalents 144 003 37 495 181 498
Assets 5 042 172 309 424 5 351 597
Equity controlling interests 2 221 919 175 2 222 094
Equity non-controlling interests 19 357 19 357
Total equity 2 221 919 19 532 2 241 451
Pension liabilities and other liabilities 559 740 778 560 518
Other non-current liabilities 1 221 232 0 1 221 232
Current debt 1 039 281 289 114 1 328 395
Total equity and liabilities 5 042 172 309 424 5 351 597
BALANCE 01.01.14
Intangible assets 1 105 921 0 1 105 921
Non-current assets 1 204 207 420 1 204 627
Financial assets 44 375 -10 844 33 531
Inventories 1 840 347 994 1 841 341
Receivables 231 829 307 942 539 771
Cash and cash equivalents 163 913 18 344 182 257
Assets 4 590 593 316 856 4 907 449
Equity controlling interests 1 988 557 -543 1 988 014
Equity non-controlling interests 0 13 767 13 767
Total equity 1 988 557 13 224 2 001 781
Pension liabilities and other liabilities 557 960 173 558 133
Other non-current liabilities 1 044 953 0 1 044 953
Current debt 999 123 303 460 1 302 583
Total equity and liabilities 4 590 593 316 857 4 907 450
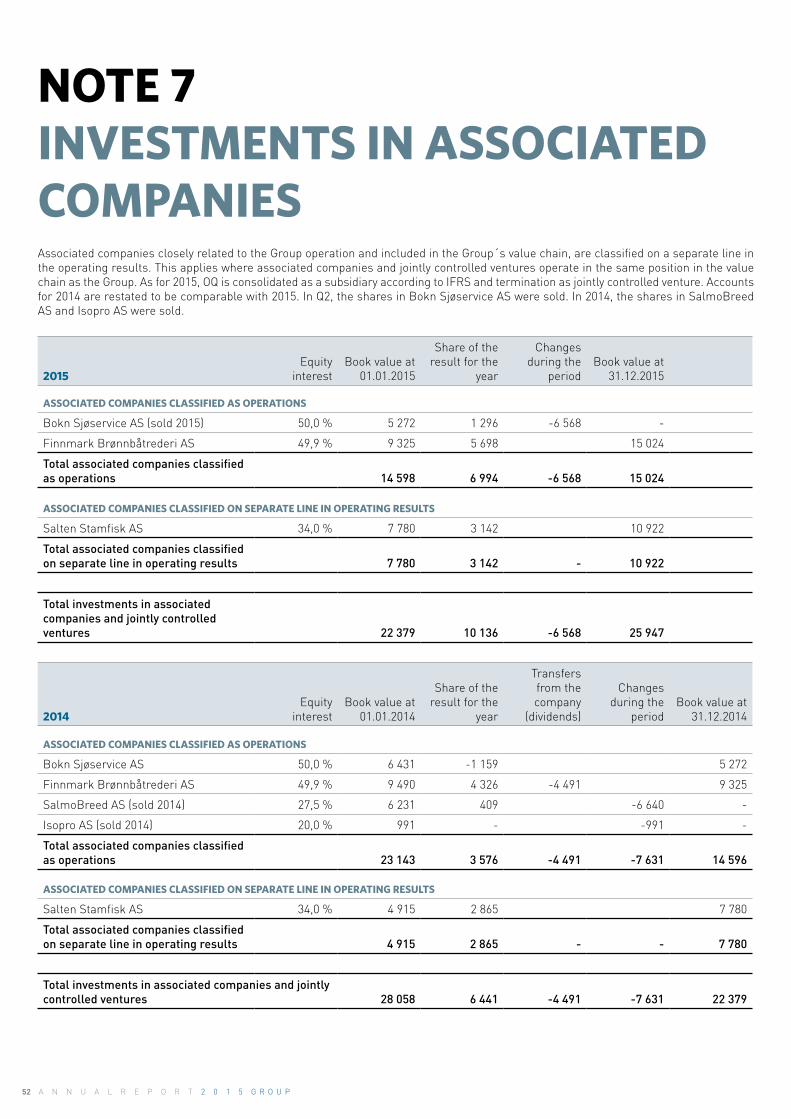
52 A N N U A L R E P O R T 2 0 1 5 G R O U P
NOTE 7 INVESTMENTS IN ASSOCIATED COMPANIESAssociated companies closely related to the Group operation and included in the Group´s value chain, are classified on a separate line in the operating results. This applies where associated companies and jointly controlled ventures operate in the same position in the value chain as the Group. As for 2015, OQ is consolidated as a subsidiary according to IFRS and termination as jointly controlled venture. Accounts for 2014 are restated to be comparable with 2015. In Q2, the shares in Bokn Sjøservice AS were sold. In 2014, the shares in SalmoBreed AS and Isopro AS were sold.
2015Equity
interestBook value at
01.01.2015
Share of the result for the
year
Changes during the
periodBook value at
31.12.2015
ASSOCIATED COMPANIES CLASSIFIED AS OPERATIONS
Bokn Sjøservice AS (sold 2015) 50,0 % 5 272 1 296 -6 568 -
Finnmark Brønnbåtrederi AS 49,9 % 9 325 5 698 15 024
Total associated companies classified as operations 14 598 6 994 -6 568 15 024
ASSOCIATED COMPANIES CLASSIFIED ON SEPARATE LINE IN OPERATING RESULTS
Salten Stamfisk AS 34,0 % 7 780 3 142 10 922
Total associated companies classified on separate line in operating results 7 780 3 142 - 10 922
Total investments in associated companies and jointly controlled ventures 22 379 10 136 -6 568 25 947
2014Equity
interestBook value at
01.01.2014
Share of the result for the
year
Transfers from the company
(dividends)
Changes during the
periodBook value at
31.12.2014
ASSOCIATED COMPANIES CLASSIFIED AS OPERATIONS
Bokn Sjøservice AS 50,0 % 6 431 -1 159 5 272
Finnmark Brønnbåtrederi AS 49,9 % 9 490 4 326 -4 491 9 325
SalmoBreed AS (sold 2014) 27,5 % 6 231 409 -6 640 -
Isopro AS (sold 2014) 20,0 % 991 - -991 -
Total associated companies classified as operations 23 143 3 576 -4 491 -7 631 14 596
ASSOCIATED COMPANIES CLASSIFIED ON SEPARATE LINE IN OPERATING RESULTS
Salten Stamfisk AS 34,0 % 4 915 2 865 7 780
Total associated companies classified on separate line in operating results 4 915 2 865 - - 7 780
Total investments in associated companies and jointly controlled ventures 28 058 6 441 -4 491 -7 631 22 379

53G R I E G S E A F O O D 2 0 1 5 G R O U P
Summarised preliminary financial information on individual associated companies, on 100% basis. All companies have the same financial year as the Group. Bokn Sjøservice AS is sold and removed from the list.
2015 Total assets at
31.12.2015Total liabilities at
31.12.2015Total equity at
31.12.2015Operating
incomePre-tax profit/
loss
Finnmark Brønnbåtrederi AS 53 299 34 610 18 689 17 408 6 175
Salten Stamfisk AS 60 562 38 086 22 476 60 461 10 747
2014 Total assets at
31.12.2014Total liabilities at
31.12.2014Total equity at
31.12.2014Operating
incomePre-tax profit/
loss
Bokn Sjøservice AS 14 463 1 556 13 085 9 352 139
Finnmark Brønnbåtrederi AS 49 090 27 617 21 473 15 887 4 175
Salten Stamfisk AS 58 047 43 987 14 060 55 787 8 344
Ocean Quality AS 171 475 145 119 26 355 2 989 984 15 781
SALE OF SHARES IN ASSOCIATED COMPANIES
Bokn Sjøservice AS Total 2015
Salmon Breed AS
Isopro AS Total 2014
Proceeds net of expenses 7 973 7 973 66 966 4 480 71 446
Book value on sales date -6 568 -6 568 -6 640 -991 -7 631
Book profit 1 405 1 405 60 326 3 489 63 815
All shares were sold in 2015. Book profit in the Group is included in other gains/losses in the operating income statement. In 2014, all shares in Salmon Breed AS and Isopro AS were sold. Book profit is includen in other gains/losses.
ASSOCIATED COMPANIES - CONDENSED FINANCIAL INFORMATION
All associated companies are accounted for using NGaap. There would be no significant differences if the financial statements were reported in accordance with IFRS. The accounts for 2015 are preliminary figures, except Finnmark Brønnbåtrederi AS, where the General Assembly has approved the statement.
(Amounts in TNOK) Finnmark Brønnbåtrederi AS Salten Stamfisk AS
CONDENSED BALANCE SHEET 2015 2014 2015 2014
Property, plant and equipment 137 36 270 35 765 20 115
Current assets 30 179 17 029 57 905 40 447
Total assets 30 316 53 299 93 670 60 562
Non-current liabilities - 22 311 14 111 9 468
Current liabilities 210 12 300 44 563 28 618
Equity 30 106 18 689 34 996 22 476
CONDENSED PROFIT AND LOSS ACCOUNT
Sales revenues 14 603 17 408 36 132 60 461
Operating expenses -2 399 -10 283 -31 595 -49 393
Profit before taxes 12 204 7 125 4 537 11 068
Net financial expenses -786 -950 -278 -322
Taxes 41 -2 617
Profit of the year after taxes 11 418 6 215 4 259 8 130
Dividend received from associated companies - 4 491 - -
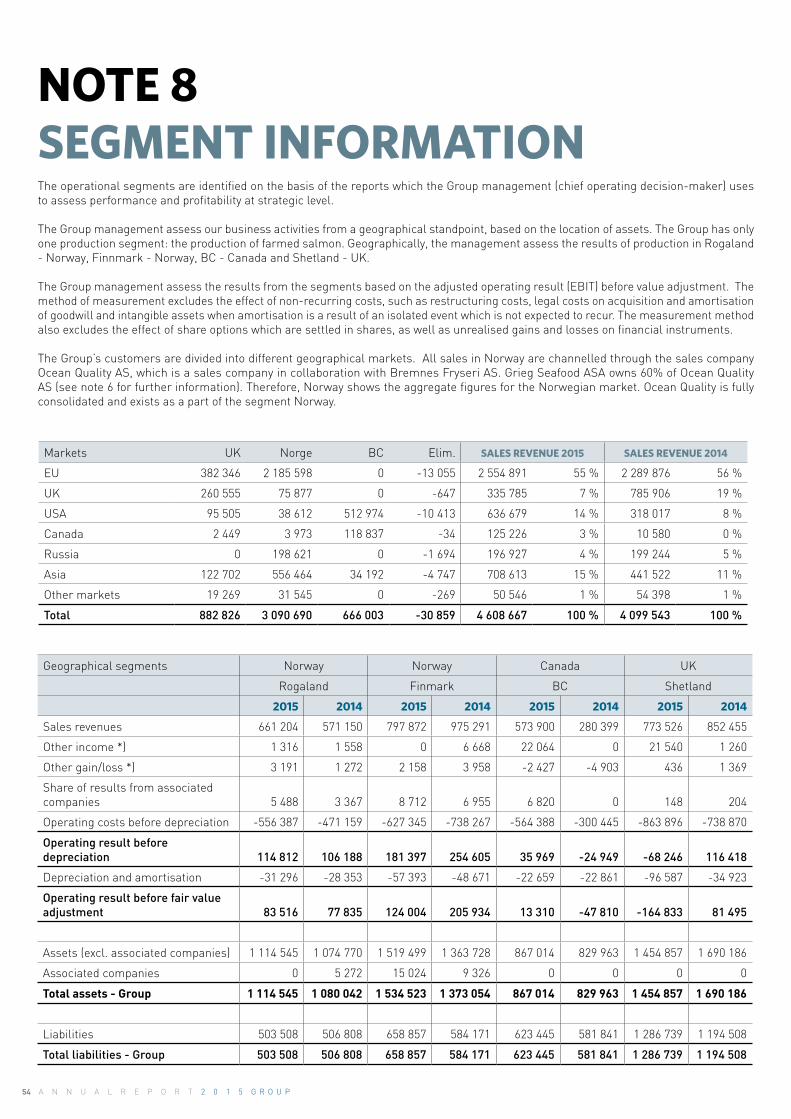
54 A N N U A L R E P O R T 2 0 1 5 G R O U P
NOTE 8 SEGMENT INFORMATIONThe operational segments are identified on the basis of the reports which the Group management (chief operating decision-maker) uses to assess performance and profitability at strategic level.
The Group management assess our business activities from a geographical standpoint, based on the location of assets. The Group has only one production segment: the production of farmed salmon. Geographically, the management assess the results of production in Rogaland - Norway, Finnmark - Norway, BC - Canada and Shetland - UK.
The Group management assess the results from the segments based on the adjusted operating result (EBIT) before value adjustment. The method of measurement excludes the effect of non-recurring costs, such as restructuring costs, legal costs on acquisition and amortisation of goodwill and intangible assets when amortisation is a result of an isolated event which is not expected to recur. The measurement method also excludes the effect of share options which are settled in shares, as well as unrealised gains and losses on financial instruments.
The Group’s customers are divided into different geographical markets. All sales in Norway are channelled through the sales company Ocean Quality AS, which is a sales company in collaboration with Bremnes Fryseri AS. Grieg Seafood ASA owns 60% of Ocean Quality AS (see note 6 for further information). Therefore, Norway shows the aggregate figures for the Norwegian market. Ocean Quality is fully consolidated and exists as a part of the segment Norway.
Markets UK Norge BC Elim. SALES REVENUE 2015 SALES REVENUE 2014
EU 382 346 2 185 598 0 -13 055 2 554 891 55 % 2 289 876 56 %
UK 260 555 75 877 0 -647 335 785 7 % 785 906 19 %
USA 95 505 38 612 512 974 -10 413 636 679 14 % 318 017 8 %
Canada 2 449 3 973 118 837 -34 125 226 3 % 10 580 0 %
Russia 0 198 621 0 -1 694 196 927 4 % 199 244 5 %
Asia 122 702 556 464 34 192 -4 747 708 613 15 % 441 522 11 %
Other markets 19 269 31 545 0 -269 50 546 1 % 54 398 1 %
Total 882 826 3 090 690 666 003 -30 859 4 608 667 100 % 4 099 543 100 %
Geographical segments Norway Norway Canada UK
Rogaland Finmark BC Shetland
2015 2014 2015 2014 2015 2014 2015 2014
Sales revenues 661 204 571 150 797 872 975 291 573 900 280 399 773 526 852 455
Other income *) 1 316 1 558 0 6 668 22 064 0 21 540 1 260
Other gain/loss *) 3 191 1 272 2 158 3 958 -2 427 -4 903 436 1 369
Share of results from associated companies 5 488 3 367 8 712 6 955 6 820 0 148 204
Operating costs before depreciation -556 387 -471 159 -627 345 -738 267 -564 388 -300 445 -863 896 -738 870
Operating result before depreciation 114 812 106 188 181 397 254 605 35 969 -24 949 -68 246 116 418
Depreciation and amortisation -31 296 -28 353 -57 393 -48 671 -22 659 -22 861 -96 587 -34 923
Operating result before fair value adjustment 83 516 77 835 124 004 205 934 13 310 -47 810 -164 833 81 495
Assets (excl. associated companies) 1 114 545 1 074 770 1 519 499 1 363 728 867 014 829 963 1 454 857 1 690 186
Associated companies 0 5 272 15 024 9 326 0 0 0 0
Total assets - Group 1 114 545 1 080 042 1 534 523 1 373 054 867 014 829 963 1 454 857 1 690 186
Liabilities 503 508 506 808 658 857 584 171 623 445 581 841 1 286 739 1 194 508
Total liabilities - Group 503 508 506 808 658 857 584 171 623 445 581 841 1 286 739 1 194 508

55G R I E G S E A F O O D 2 0 1 5 G R O U P
Segments OQ Group AS Others/eliminations *) Grieg Seafood Group
2015 2014 2015 2014 2015 2014
Sales revenues 4 542 946 3 555 371 -2 740 781 -2 135 123 4 608 667 4 099 543
Other income *) 0 0 0 -6 667 44 921 2 819
Other gain/loss *) -15 100 -9 174 -3 476 66 600 -15 218 59 122
Share of results from associated companies 0 0 -14 174 -6 950 6 994 3 576
Operating costs before depreciation -4 412 807 -3 519 073 2 640 770 2 086 573 -4 384 053 -3 681 241
Operating result before depreciation 115 039 27 124 -117 661 4 432 261 311 483 819
Depreciation and amortisation -359 -108 -5 275 -5 801 -213 569 -140 717
Operating result before fair value adjustment 114 680 27 016 -122 936 -1 369 47 742 343 103
Assets (excl. associated companies) 723 008 310 916 230 907 59 655 5 909 830 5 329 218
Associated companies 0 0 10 923 7 781 25 947 22 379
Total assets - Group 723 008 310 916 241 830 67 436 5 935 777 5 351 597
Liabilities 666 079 271 351 -40 364 -28 533 3 698 264 3 110 146
Total liabilities - Group 666 079 271 351 -40 364 -28 533 3 698 264 3 110 146
OPERATING RESULT FOR SEGMENTS 2015 2014
Operating result before fair value adjustment 47 742 343 103
Fair value adjustment of biological assets 33 209 -123 737
Operating result 80 951 219 366
Share of result from associated company (see note 7) 3 142 2 865
Net financial items (specification in note 25) -93 301 -50 276
Profit before income tax -9 208 171 955
Estimated taxes 13 574 -27 561
Profit for the year 4 366 144 394
*) Others/eliminations
Other items include the results of activities conducted by the parent company and other Group companies that are not geared for production. There is elimination of internal transactions between subsidiaries and parent company and other items belonging to the parent company. Other gains and losses on sale of shares, assets and foreign currency contracts. See note 7 for information about gains on sale of shares.
Other income is mainly the settlement of insurance and other services not directly related to production. The parent company owns software and other office equipment and has accounts payable and other current payables.

56 A N N U A L R E P O R T 2 0 1 5 G R O U P
NOTE 9 BIOLOGICAL ASSETS AND OTHER INVENTORIES
TONS TNOK
2015 2014 2015 2014
Biological assets at 01.01. 51 258 50 567 1 844 097 1 766 332
Currency translation differences N/A N/A 44 712 79 081
Increase due to purchases of fish 0 253 0 12 768
Increase due to production 121 323 80 962 2 382 410 2 044 136
Decrease due to extraordinary mortality/loss -3 265 -2 705 -104 526 -94 378
Decrease due to sales -124 492 -77 819 -2 268 770 -1 847 117
Fair value adjustment at 01.01 N/A N/A -281 285 -398 011
Fair value adjustment in connection with business acquisition N/A N/A N/A N/A
Fair value adjustment at 31.12 N/A N/A 312 479 281 285
Book value of biological assets at 31.12. 44 824 51 258 1 929 117 1 844 096
Recognised fair value adjustment of biological assets 33 209 -125 714
Gain & loss arising from price contracts - 1 977
Recognised fair value adjustment of biological assets incl. fair value of price hedging contracts 33 209 -123 737
The accounting treatment of live fish by companies applying IFRS is regulated by IAS 41 Agriculture. The basic principle is that such assets shall be measured at fair value. The fair value of biological assets (fish in the sea) for fish over 1 kg is based on forward prices from Fish Pool for Norway. For foreign countries, the most relevant price information that is available for the period when the fish is expected to be harvested, has been used. The price is adjusted proportionately to take account of how far the growth cycle has progressed. The price is adjusted for quality differences (superior, ordinary and process), together with the cost of logistics. The volume is adjusted for gutting loss. Fish in the sea with an average weight over 4 kg (mature fish) are assessed at their full value at the balance sheet day of harvesting. The best estimate for fish under 1 kg is considered to be the accumulated cost. Fish < 1 kg are included in the group which includes smolt and broodstock in the table. For further information, please refer to the note on accounting policies (note 2).
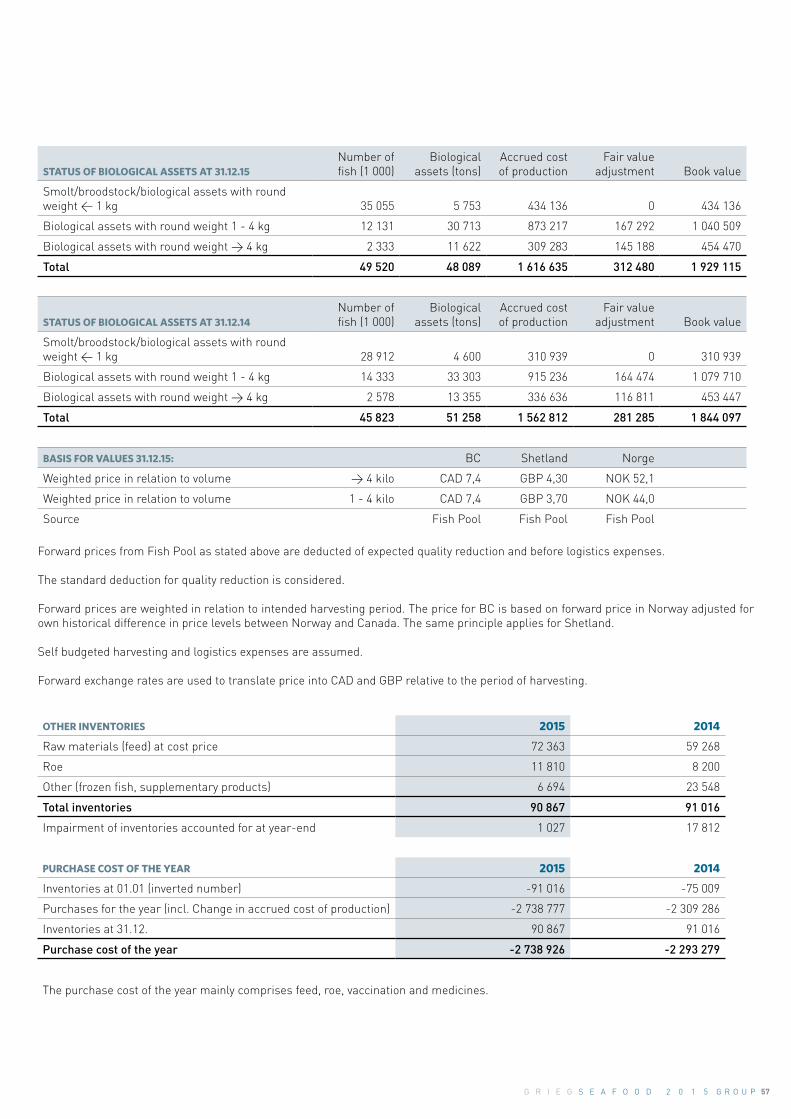
57G R I E G S E A F O O D 2 0 1 5 G R O U P
STATUS OF BIOLOGICAL ASSETS AT 31.12.15 Number of fish (1 000)
Biological assets (tons)
Accrued cost of production
Fair value adjustment Book value
Smolt/broodstock/biological assets with round weight < 1 kg 35 055 5 753 434 136 0 434 136
Biological assets with round weight 1 - 4 kg 12 131 30 713 873 217 167 292 1 040 509
Biological assets with round weight > 4 kg 2 333 11 622 309 283 145 188 454 470
Total 49 520 48 089 1 616 635 312 480 1 929 115
STATUS OF BIOLOGICAL ASSETS AT 31.12.14 Number of fish (1 000)
Biological assets (tons)
Accrued cost of production
Fair value adjustment Book value
Smolt/broodstock/biological assets with round weight < 1 kg 28 912 4 600 310 939 0 310 939
Biological assets with round weight 1 - 4 kg 14 333 33 303 915 236 164 474 1 079 710
Biological assets with round weight > 4 kg 2 578 13 355 336 636 116 811 453 447
Total 45 823 51 258 1 562 812 281 285 1 844 097
BASIS FOR VALUES 31.12.15: BC Shetland Norge
Weighted price in relation to volume > 4 kilo CAD 7,4 GBP 4,30 NOK 52,1
Weighted price in relation to volume 1 - 4 kilo CAD 7,4 GBP 3,70 NOK 44,0
Source Fish Pool Fish Pool Fish Pool
Forward prices from Fish Pool as stated above are deducted of expected quality reduction and before logistics expenses.
The standard deduction for quality reduction is considered.
Forward prices are weighted in relation to intended harvesting period. The price for BC is based on forward price in Norway adjusted for own historical difference in price levels between Norway and Canada. The same principle applies for Shetland.
Self budgeted harvesting and logistics expenses are assumed.
Forward exchange rates are used to translate price into CAD and GBP relative to the period of harvesting.
OTHER INVENTORIES 2015 2014
Raw materials (feed) at cost price 72 363 59 268
Roe 11 810 8 200
Other (frozen fish, supplementary products) 6 694 23 548
Total inventories 90 867 91 016
Impairment of inventories accounted for at year-end 1 027 17 812
PURCHASE COST OF THE YEAR 2015 2014
Inventories at 01.01 (inverted number) -91 016 -75 009
Purchases for the year (incl. Change in accrued cost of production) -2 738 777 -2 309 286
Inventories at 31.12. 90 867 91 016
Purchase cost of the year -2 738 926 -2 293 279
The purchase cost of the year mainly comprises feed, roe, vaccination and medicines.
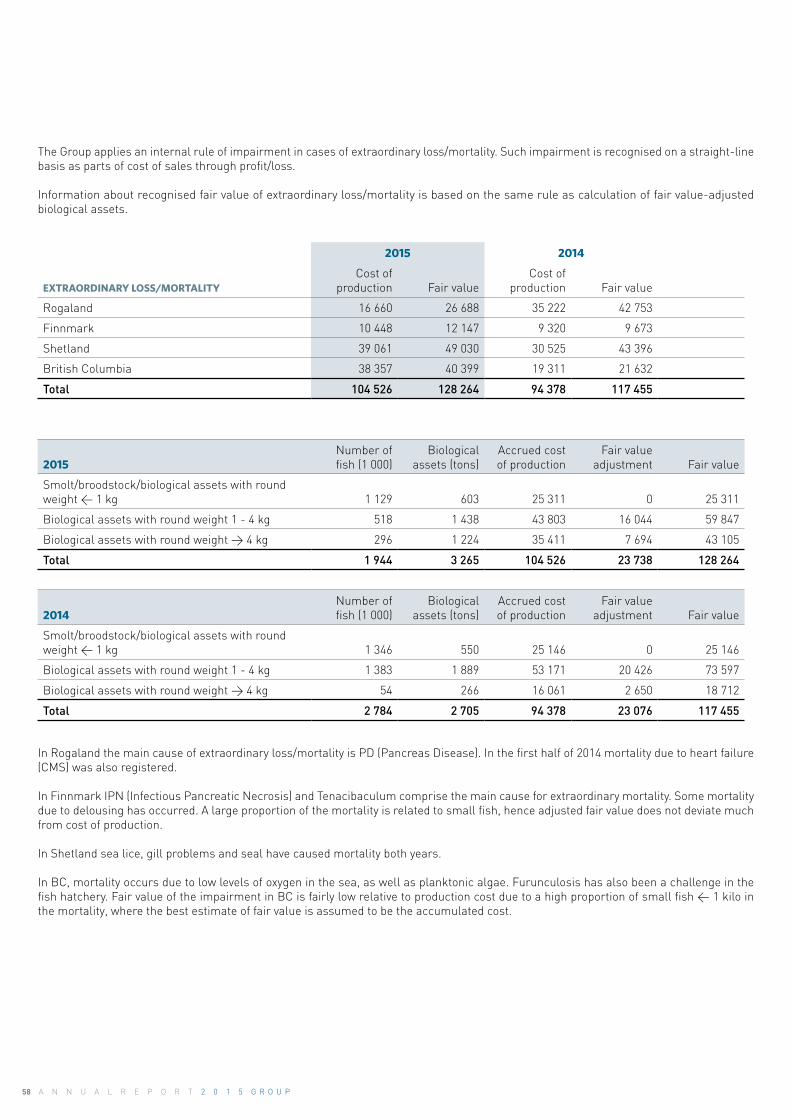
58 A N N U A L R E P O R T 2 0 1 5 G R O U P
The Group applies an internal rule of impairment in cases of extraordinary loss/mortality. Such impairment is recognised on a straight-line basis as parts of cost of sales through profit/loss. Information about recognised fair value of extraordinary loss/mortality is based on the same rule as calculation of fair value-adjusted biological assets.
2015 2014
EXTRAORDINARY LOSS/MORTALITY Cost of
production Fair value Cost of
production Fair value
Rogaland 16 660 26 688 35 222 42 753
Finnmark 10 448 12 147 9 320 9 673
Shetland 39 061 49 030 30 525 43 396
British Columbia 38 357 40 399 19 311 21 632
Total 104 526 128 264 94 378 117 455
2015 Number of fish (1 000)
Biological assets (tons)
Accrued cost of production
Fair value adjustment Fair value
Smolt/broodstock/biological assets with round weight < 1 kg 1 129 603 25 311 0 25 311
Biological assets with round weight 1 - 4 kg 518 1 438 43 803 16 044 59 847
Biological assets with round weight > 4 kg 296 1 224 35 411 7 694 43 105
Total 1 944 3 265 104 526 23 738 128 264
2014 Number of fish (1 000)
Biological assets (tons)
Accrued cost of production
Fair value adjustment Fair value
Smolt/broodstock/biological assets with round weight < 1 kg 1 346 550 25 146 0 25 146
Biological assets with round weight 1 - 4 kg 1 383 1 889 53 171 20 426 73 597
Biological assets with round weight > 4 kg 54 266 16 061 2 650 18 712
Total 2 784 2 705 94 378 23 076 117 455
In Rogaland the main cause of extraordinary loss/mortality is PD (Pancreas Disease). In the first half of 2014 mortality due to heart failure (CMS) was also registered.
In Finnmark IPN (Infectious Pancreatic Necrosis) and Tenacibaculum comprise the main cause for extraordinary mortality. Some mortality due to delousing has occurred. A large proportion of the mortality is related to small fish, hence adjusted fair value does not deviate much from cost of production.
In Shetland sea lice, gill problems and seal have caused mortality both years.
In BC, mortality occurs due to low levels of oxygen in the sea, as well as planktonic algae. Furunculosis has also been a challenge in the fish hatchery. Fair value of the impairment in BC is fairly low relative to production cost due to a high proportion of small fish < 1 kilo in the mortality, where the best estimate of fair value is assumed to be the accumulated cost.
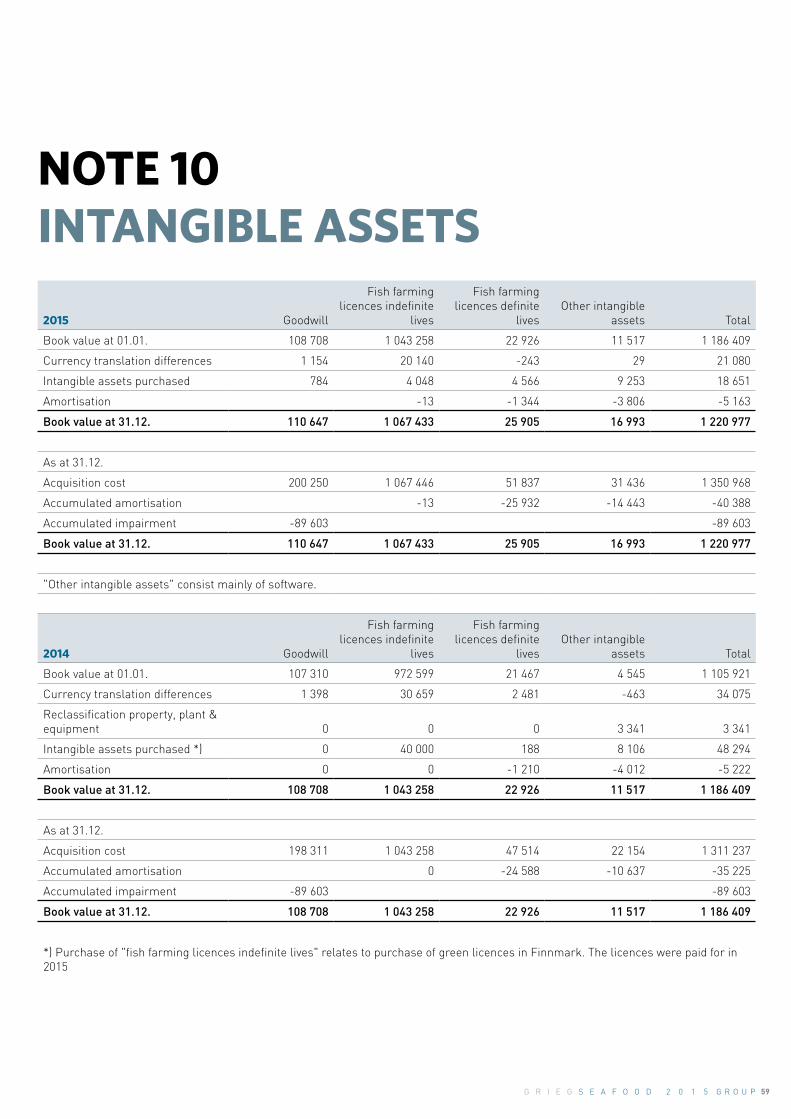
59G R I E G S E A F O O D 2 0 1 5 G R O U P
NOTE 10INTANGIBLE ASSETS
2015 Goodwill
Fish farming licences indefinite
lives
Fish farming licences definite
lives Other intangible
assets Total
Book value at 01.01. 108 708 1 043 258 22 926 11 517 1 186 409
Currency translation differences 1 154 20 140 -243 29 21 080
Intangible assets purchased 784 4 048 4 566 9 253 18 651
Amortisation -13 -1 344 -3 806 -5 163
Book value at 31.12. 110 647 1 067 433 25 905 16 993 1 220 977
As at 31.12.
Acquisition cost 200 250 1 067 446 51 837 31 436 1 350 968
Accumulated amortisation -13 -25 932 -14 443 -40 388
Accumulated impairment -89 603 -89 603
Book value at 31.12. 110 647 1 067 433 25 905 16 993 1 220 977
"Other intangible assets" consist mainly of software.
2014 Goodwill
Fish farming licences indefinite
lives
Fish farming licences definite
lives Other intangible
assets Total
Book value at 01.01. 107 310 972 599 21 467 4 545 1 105 921
Currency translation differences 1 398 30 659 2 481 -463 34 075
Reclassification property, plant & equipment 0 0 0 3 341 3 341
Intangible assets purchased *) 0 40 000 188 8 106 48 294
Amortisation 0 0 -1 210 -4 012 -5 222
Book value at 31.12. 108 708 1 043 258 22 926 11 517 1 186 409
As at 31.12.
Acquisition cost 198 311 1 043 258 47 514 22 154 1 311 237
Accumulated amortisation 0 -24 588 -10 637 -35 225
Accumulated impairment -89 603 -89 603
Book value at 31.12. 108 708 1 043 258 22 926 11 517 1 186 409
*) Purchase of "fish farming licences indefinite lives" relates to purchase of green licences in Finnmark. The licences were paid for in 2015

60 A N N U A L R E P O R T 2 0 1 5 G R O U P
LICENCES
The tables below display an overview of the different licences in the Group. See note 2 for further information about licences.
NORWAY: BC:
LICENCE CATEGORY Total number Total volume PLANT/AREA Capacity (tons)
Grow-out licences 37 33 435 tn Ahlstrom 1 100
R&D permit 1 780 tn Atrevida 3 300
Broodstock 3 2 340 tn Barnes bay 3 000
Smolt 4 12 700 000 fish Bennet Point 4 400
Harvesting cage 2 1 106 tn Conception 4 100
Culloden 1 500
UK: Esperanza 3 600
PLANT/AREA Capacity (tons) Gore 4 100
Hecate 4 000
Setterness and Gonfirth 22 297 Kunechin 1 500
Railsbrough and Wadbister Woe 1 843 Muchalat N. 4 100
North Havra 1 496 Muchalat S. 3 600
South of Linga and Foraness 3 845 Newcomb 1 000
West of Burwick and Merry Holm 2 672 Salten 1 500
Fish Holm 1 910 Site 13 900
Easter Score Holm, North Papa and Wester Quarff 4 925 Site 9 1 500
Whalsay, Swining 2 & 3 5 760 Streamer Point 3 600
Collafirth 3 1 500 Vantage 1 500
Gob na Hoe and Leinish (west of Scotland) 3 721 Williamson 3 900
Hillswick, Hamar, Roe Sound and Heights 2 247 Total 52 200
Spoose Holm and Setter 2 000
Haminavoe 1 910
Total 56 126
IMPAIRMENT TEST FOR GOODWILL AND LICENCES
Goodwill and licences were not impaired in 2015 or 2014. Goodwill and licences with an indefinite economic life are subject to an annual impairment test. Impairment tests are performed more frequently if there are indications of a decline in value. Licences with definite useful lives are tested for impairment only if there are indications of a decline in value. Estimated value in use is used as a basis for calculating the recoverable amount. Impairment occurs when the carrying value is higher than the recoverable amount.
Cash generating unit Location Book value of
related goodwill Book value of licences Total
BC - Canada Canada 10 159 159 510 169 669
Finnmark Norge 0 299 814 299 814
Shetland - UK UK 80 025 499 040 579 065
Rogaland (incl. Erfjord Stamfisk) Norge 20 463 134 974 155 437
Total value 110 647 1 093 338 1 203 985
Goodwill relates to the acquisition of the subsidiary companies. Goodwill is allocated to the Group’s cash-generating units (CGU) identified according to the operating segment. An annual impairment test for goodwill and licences has been carried out. The recoverable amount of a CGU is determined based on value-in-use calculations. These calculations use pre-tax cash flow projections based on financial budgets from the respective cash generating units covering a three-year period. Cash flows beyond the three-year period are extrapolated using the estimated growth rates stated below. The estimated growth rate corresponds with expected inflation.

61G R I E G S E A F O O D 2 0 1 5 G R O U P
THE ASSUMPTIONS USED FOR VALUE-IN-USE CALCULATIONS ARE AS FOLLOWS:
Unit BC - Canada Finnmark Shetland - UK Rogaland
Budget period 3 years 3 years 3 years 3 years
Increase in revenues in budget period 36 % 53 % 14 % 34 %
Ebitda margin 1) 23% - 13% 29% - 23% 12% -17% 27% -22%
Ebitda margin in terminal period 14 % 23 % 17 % 21 %
Harvest growth - tons 2) 27 % 56 % 27 % 35 %
Required rate of return 3) 8,5 % 8,5 % 8,5 % 8,5 %
Growth rate 4) 1,0 % 1,0 % 1,0 % 1,0 %
As stated above, the budget period/explicit period is 3 years. Estimated increase in revenue in the budget period thus indicates revenue increase in 2018 compared to income in 2015. Estimated future price levels are calculated from Fish Pool´s projections and takes into account quality reduction and freight. Other comments/explanations to assumptions in the impairment test is presented below; historical price levels and forward markets. 1. Budgeted EBITDA margin. The margin varies in the budget period, due to a.o. variations in estimated production. 2. The growth rate of the harvested volume in the budget period (nominal growth rate) measured against 2015 volume. Over time a
corresponding increase in output is assumed. 3. Weighted required return on capital employed before tax. Cash flow forecasts are thus estimated before taxes.4. Weighted average growth rate used to extrapolate cash flows beyond the budget period. In the years after 2018, the annual reinvestment
is assumed to be equal to the annual depreciation. EBITDA MARGIN IN BUDGET AND TERMINAL PERIOD The budgeted EBITDA margin is based on past performance, expected cost of production and expectations of market development. The increased harvest volume is based on an increase in utilisation of existing production capacity, reflecting the new smolt strategy. In the course of 2015 all of the regions have started to produce their own smolt in recycling plants. This will reduce the production cost pr. smolt and increase the quality of the smolt, which in turn will improve the biology in the sea. The use of different sizes of smolt and better planning of timing of seastocking, will give us a better utilisation of MTB. This will lead to increased production that will also contribute to reducing the cost measured per kg. For all regions, it is assumed a significant increase in harvest volumes in the budget period. Increased harvest volumes will contribute to increased earnings in the terminal.
Finnmark has been granted 4 green licences, and the expectation is to reach harvesting of more than 1,000 tons per year per licence. It is therefore assumed a significant increase in harvest volumes. In 2015, a restructuring of the localities has been implemented that will provide impact in the next few years. In Rogaland, an increase in harvest volumes is assumed through bringing down production time in sea by using larger smolts. In the UK, the hatchery has been completed, and a restructuring towards reduced time in sea from 24 months to 18 months will bring down the biological risk. The expected growth in BC’s revenue are significant and is related to the low prices in the USA in 2015. Therefore, a significant increase in the price is expected. Assumptions in the terminal are based on the budget for 2018, but with some adjustments to reflect EBIT/kg in the benchmark and the Group’s own historical results. The applied discount rates are pre-tax and reflect specific risks relating to the relevant operating segments. SENSITIVITY ANALYSIS Value-in-use is sensitive to changes in the assumptions made. The most important are requirement for return and Ebit per kg. The sensitivity analysis covers the entire period, including the terminal value. The conclusion of the analysis is no need for impairment in any of the segments, except for Shetland where an isolated change in assumptions by increasing 1.0% points in the requirement for return-rate or reduction in EBIT per kilo by -1, will result in impairments of respectivel 50 MNOK and 129 MNOK.

62 A N N U A L R E P O R T 2 0 1 5 G R O U P
NOTE 11TANGIBLE FIXED ASSETS
2015 Buildings/
property
Plant, equipment and other
fixtures Vessels/
barges Other
equipment Total
Book value at 01.01. 362 070 687 432 296 702 78 748 1 424 952
Currency translation differences 14 989 33 205 8 646 -76 56 764
Reclassification of fixed assets 28 030 -28 314 2 302 -2 017 0
Tangible fixed assets acquired *) 29 651 58 193 103 120 73 086 264 050
Tangibe fixed assets sold 0 -850 -1 556 -184 -2 590
Amortisation **) -46 195 -46 195
Depreciation -16 421 -69 056 -58 972 -17 763 -162 211
Book value 31.12. 418 318 634 414 350 242 131 795 1 534 770
AS AT 31.12.
Acquisition cost 597 809 1 329 725 825 186 250 378 3 003 098
Accumulated depreciation -179 491 -649 116 -474 945 -118 583 -1 422 134
Accumulated amortisation 0 -46 195 0 0 -46 195
Book value at 31.12. 418 318 634 414 350 242 131 795 1 534 770
Book value of finance leases included above 1 284 178 955 115 676 95 843 391 757
Depreciation of finance leases included above -33 -17 821 -16 367 -8 109 -20 958
Of which book value of property not depreciable 23 405
2014 Buildings/
property
Plant, equipment and other
fixtures Vessels/
barges Other
equipment Total
Book value at 01.01. 319 699 591 682 218 480 74 766 1 204 627
Currency translation differences 14 635 40 326 12 340 520 67 821
Reclassification of fixed assets 0 0 0 -3 341 -3 341
Tangible fixed assets acquired* 41 235 125 709 114 521 22 095 303 560
Tangibe fixed assets sold 0 -1 159 -2 696 -1 912 -5 767
Depreciation -12 994 -65 144 -43 921 -13 436 -135 495
Currency translation differences depreciation -505 -3 982 -2 022 56 -6 453
Book value at 31.12. 362 070 687 432 296 702 78 748 1 424 952
AS AT 31.12.
Acquisition cost 525 140 1 267 492 712 675 179 568 2 684 875
Accumulated depreciation -163 070 -580 060 -415 973 -100 820 -1 259 923
Book value at 31.12. 362 070 687 432 296 702 78 748 1 424 952
Book value of finance leases included above 1 317 190 980 102 337 41 231 335 865
Depreciation of finance leases included above -21 -25 085 -35 285 -5 280 -65 671
Of which book value of property not depreciable 27 988
*) Investments mainly comprise maintenance, plus investments in order to initiate production of the green licences in Finnmark.**) In Q3 2015, it was decided to sell the smokehouse and filleting production in Shetland. In this connection, impairment of equipment belonging to this production has been made.
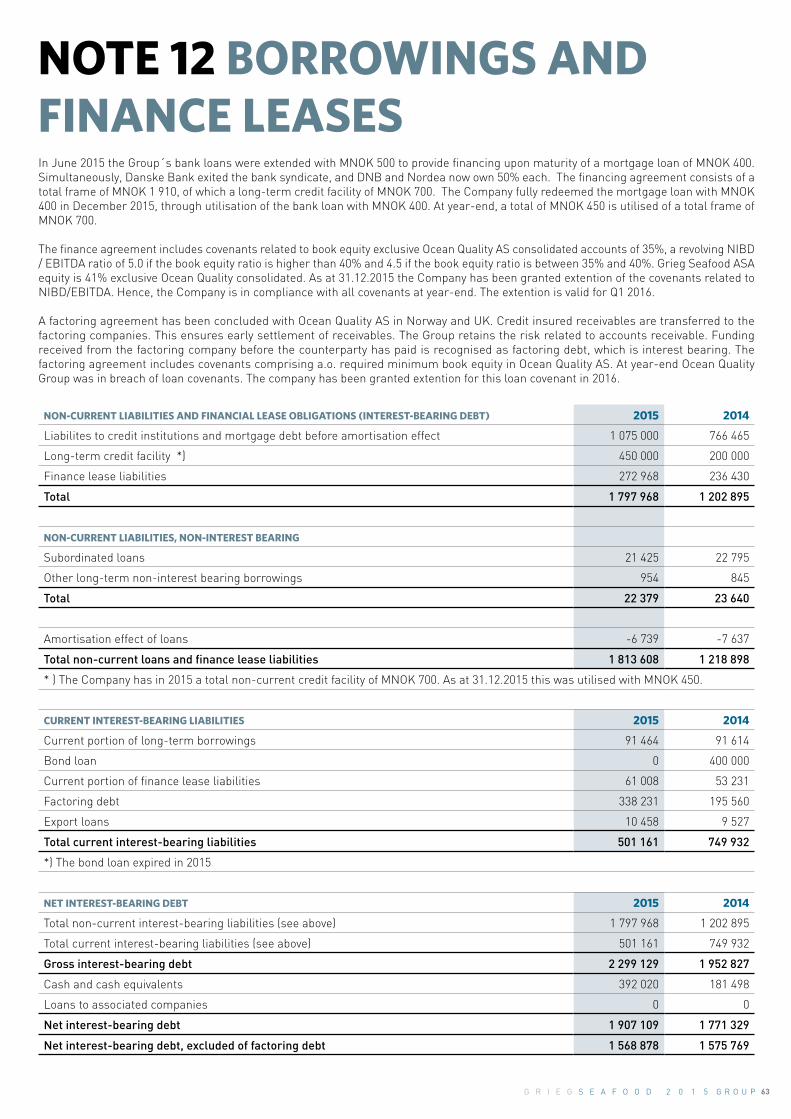
63G R I E G S E A F O O D 2 0 1 5 G R O U P
NOTE 12 BORROWINGS AND FINANCE LEASESIn June 2015 the Group´s bank loans were extended with MNOK 500 to provide financing upon maturity of a mortgage loan of MNOK 400. Simultaneously, Danske Bank exited the bank syndicate, and DNB and Nordea now own 50% each. The financing agreement consists of a total frame of MNOK 1 910, of which a long-term credit facility of MNOK 700. The Company fully redeemed the mortgage loan with MNOK 400 in December 2015, through utilisation of the bank loan with MNOK 400. At year-end, a total of MNOK 450 is utilised of a total frame of MNOK 700.
The finance agreement includes covenants related to book equity exclusive Ocean Quality AS consolidated accounts of 35%, a revolving NIBD / EBITDA ratio of 5.0 if the book equity ratio is higher than 40% and 4.5 if the book equity ratio is between 35% and 40%. Grieg Seafood ASA equity is 41% exclusive Ocean Quality consolidated. As at 31.12.2015 the Company has been granted extention of the covenants related to NIBD/EBITDA. Hence, the Company is in compliance with all covenants at year-end. The extention is valid for Q1 2016.
A factoring agreement has been concluded with Ocean Quality AS in Norway and UK. Credit insured receivables are transferred to the factoring companies. This ensures early settlement of receivables. The Group retains the risk related to accounts receivable. Funding received from the factoring company before the counterparty has paid is recognised as factoring debt, which is interest bearing. The factoring agreement includes covenants comprising a.o. required minimum book equity in Ocean Quality AS. At year-end Ocean Quality Group was in breach of loan covenants. The company has been granted extention for this loan covenant in 2016.
NON-CURRENT LIABILITIES AND FINANCIAL LEASE OBLIGATIONS (INTEREST-BEARING DEBT) 2015 2014
Liabilites to credit institutions and mortgage debt before amortisation effect 1 075 000 766 465
Long-term credit facility *) 450 000 200 000
Finance lease liabilities 272 968 236 430
Total 1 797 968 1 202 895
NON-CURRENT LIABILITIES, NON-INTEREST BEARING
Subordinated loans 21 425 22 795
Other long-term non-interest bearing borrowings 954 845
Total 22 379 23 640
Amortisation effect of loans -6 739 -7 637
Total non-current loans and finance lease liabilities 1 813 608 1 218 898
* ) The Company has in 2015 a total non-current credit facility of MNOK 700. As at 31.12.2015 this was utilised with MNOK 450.
CURRENT INTEREST-BEARING LIABILITIES 2015 2014
Current portion of long-term borrowings 91 464 91 614
Bond loan 0 400 000
Current portion of finance lease liabilities 61 008 53 231
Factoring debt 338 231 195 560
Export loans 10 458 9 527
Total current interest-bearing liabilities 501 161 749 932
*) The bond loan expired in 2015
NET INTEREST-BEARING DEBT 2015 2014
Total non-current interest-bearing liabilities (see above) 1 797 968 1 202 895
Total current interest-bearing liabilities (see above) 501 161 749 932
Gross interest-bearing debt 2 299 129 1 952 827
Cash and cash equivalents 392 020 181 498
Loans to associated companies 0 0
Net interest-bearing debt 1 907 109 1 771 329
Net interest-bearing debt, excluded of factoring debt 1 568 878 1 575 769
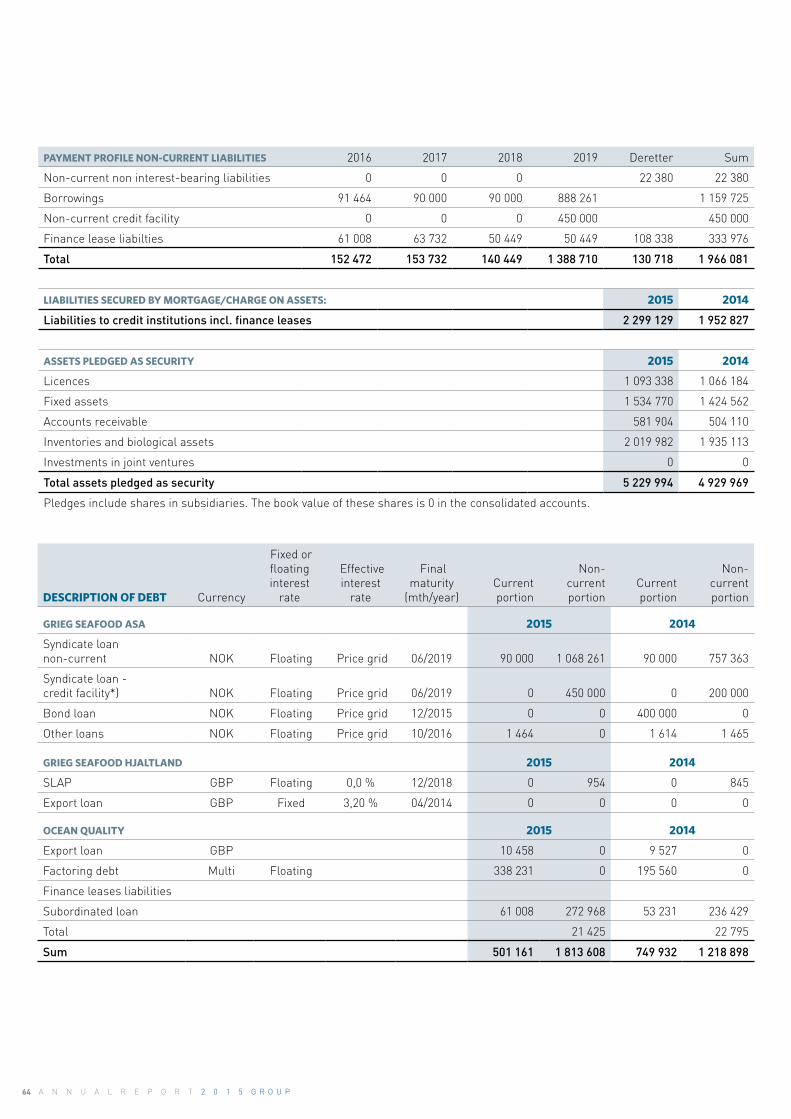
64 A N N U A L R E P O R T 2 0 1 5 G R O U P
PAYMENT PROFILE NON-CURRENT LIABILITIES 2016 2017 2018 2019 Deretter Sum
Non-current non interest-bearing liabilities 0 0 0 22 380 22 380
Borrowings 91 464 90 000 90 000 888 261 1 159 725
Non-current credit facility 0 0 0 450 000 450 000
Finance lease liabilties 61 008 63 732 50 449 50 449 108 338 333 976
Total 152 472 153 732 140 449 1 388 710 130 718 1 966 081
LIABILITIES SECURED BY MORTGAGE/CHARGE ON ASSETS: 2015 2014
Liabilities to credit institutions incl. finance leases 2 299 129 1 952 827
ASSETS PLEDGED AS SECURITY 2015 2014
Licences 1 093 338 1 066 184
Fixed assets 1 534 770 1 424 562
Accounts receivable 581 904 504 110
Inventories and biological assets 2 019 982 1 935 113
Investments in joint ventures 0 0
Total assets pledged as security 5 229 994 4 929 969
Pledges include shares in subsidiaries. The book value of these shares is 0 in the consolidated accounts.
DESCRIPTION OF DEBT Currency
Fixed or floating interest
rate
Effective interest
rate
Final maturity
(mth/year) Current
portion
Non-current portion
Current portion
Non-current portion
GRIEG SEAFOOD ASA 2015 2014
Syndicate loan non-current NOK Floating Price grid 06/2019 90 000 1 068 261 90 000 757 363
Syndicate loan - credit facility*) NOK Floating Price grid 06/2019 0 450 000 0 200 000
Bond loan NOK Floating Price grid 12/2015 0 0 400 000 0
Other loans NOK Floating Price grid 10/2016 1 464 0 1 614 1 465
GRIEG SEAFOOD HJALTLAND 2015 2014
SLAP GBP Floating 0,0 % 12/2018 0 954 0 845
Export loan GBP Fixed 3,20 % 04/2014 0 0 0 0
OCEAN QUALITY 2015 2014
Export loan GBP 10 458 0 9 527 0
Factoring debt Multi Floating 338 231 0 195 560 0
Finance leases liabilities
Subordinated loan 61 008 272 968 53 231 236 429
Total 21 425 22 795
Sum 501 161 1 813 608 749 932 1 218 898

65G R I E G S E A F O O D 2 0 1 5 G R O U P
BOOK VALUE OF GROUP LOANS BY CURRENCY (NOK): 31.12.15 NOK GBP Other
Syndicate loan non-current 1 158 261 1 158 261
Syndicate loan - credit facility*) 450 000 450 000
Bond loan - -
Other loans 2 418 1 464 954
Export loan 10 458 10 458
Factoring *) 338 231 59 746 50 587 227 897
Finance leases 333 976 293 218 40 758
Subordinated loan 21 425 21 425
Total borrowings and finance leases 2 314 769 1 962 690 124 182 227 897
*) Other currency effects comprise mainly EUR, JPY and USD
2015 2014
Average interest rate on loans and credit facility 4,70 % 5,18 %
By calculation of average interest-rate on loans and credit facilities the effect of interest-rate swap is taken into account.
BOOK VALUE AND FAIR VALUE OF BORROWINGS: Book value Fair value
2015 2014 2015 2014
Loan (non-current and credit facility) 1 608 261 1 047 363 1 608 261 1 047 363
Bond loan 0 400 000 0 412 000
Total 1 608 261 1 447 363 1 608 261 1 459 363
The book value of other loans is virtually the same as the fair value.
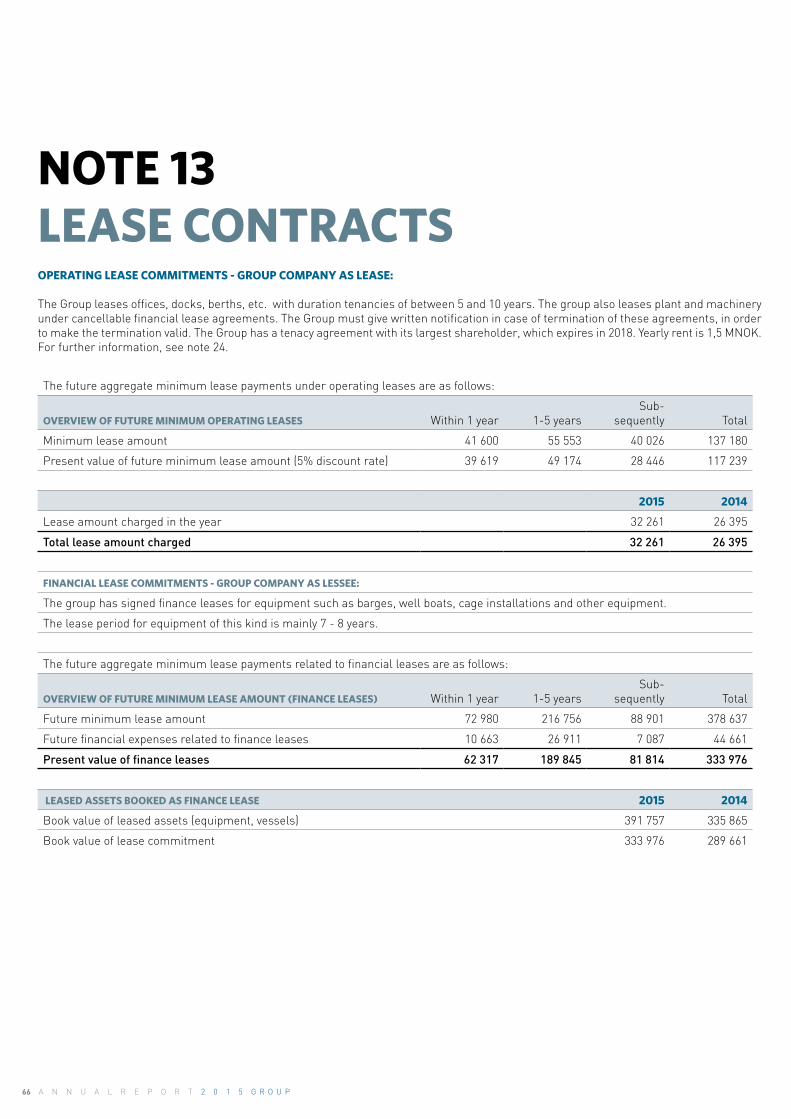
66 A N N U A L R E P O R T 2 0 1 5 G R O U P
NOTE 13LEASE CONTRACTSOPERATING LEASE COMMITMENTS - GROUP COMPANY AS LEASE: The Group leases offices, docks, berths, etc. with duration tenancies of between 5 and 10 years. The group also leases plant and machinery under cancellable financial lease agreements. The Group must give written notification in case of termination of these agreements, in order to make the termination valid. The Group has a tenacy agreement with its largest shareholder, which expires in 2018. Yearly rent is 1,5 MNOK. For further information, see note 24.
The future aggregate minimum lease payments under operating leases are as follows:
OVERVIEW OF FUTURE MINIMUM OPERATING LEASES Within 1 year 1-5 years Sub-
sequently Total
Minimum lease amount 41 600 55 553 40 026 137 180
Present value of future minimum lease amount (5% discount rate) 39 619 49 174 28 446 117 239
2015 2014
Lease amount charged in the year 32 261 26 395
Total lease amount charged 32 261 26 395
FINANCIAL LEASE COMMITMENTS - GROUP COMPANY AS LESSEE:
The group has signed finance leases for equipment such as barges, well boats, cage installations and other equipment.
The lease period for equipment of this kind is mainly 7 - 8 years.
The future aggregate minimum lease payments related to financial leases are as follows:
OVERVIEW OF FUTURE MINIMUM LEASE AMOUNT (FINANCE LEASES) Within 1 year 1-5 years Sub-
sequently Total
Future minimum lease amount 72 980 216 756 88 901 378 637
Future financial expenses related to finance leases 10 663 26 911 7 087 44 661
Present value of finance leases 62 317 189 845 81 814 333 976
LEASED ASSETS BOOKED AS FINANCE LEASE 2015 2014
Book value of leased assets (equipment, vessels) 391 757 335 865
Book value of lease commitment 333 976 289 661
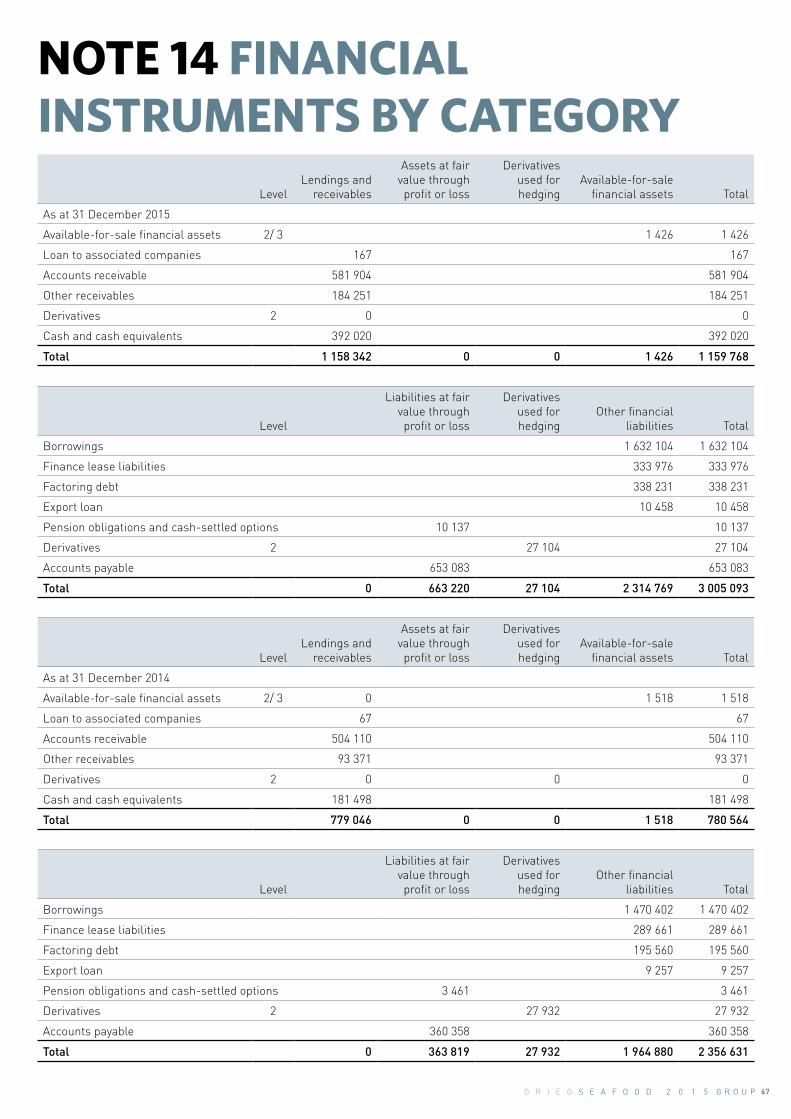
67G R I E G S E A F O O D 2 0 1 5 G R O U P
NOTE 14 FINANCIAL INSTRUMENTS BY CATEGORY Level
Lendings and receivables
Assets at fair value through profit or loss
Derivatives used for hedging
Available-for-sale financial assets Total
As at 31 December 2015
Available-for-sale financial assets 2/ 3 1 426 1 426
Loan to associated companies 167 167
Accounts receivable 581 904 581 904
Other receivables 184 251 184 251
Derivatives 2 0 0
Cash and cash equivalents 392 020 392 020
Total 1 158 342 0 0 1 426 1 159 768
Level
Liabilities at fair value through profit or loss
Derivatives used for hedging
Other financial liabilities Total
Borrowings 1 632 104 1 632 104
Finance lease liabilities 333 976 333 976
Factoring debt 338 231 338 231
Export loan 10 458 10 458
Pension obligations and cash-settled options 10 137 10 137
Derivatives 2 27 104 27 104
Accounts payable 653 083 653 083
Total 0 663 220 27 104 2 314 769 3 005 093
LevelLendings and
receivables
Assets at fair value through profit or loss
Derivatives used for hedging
Available-for-sale financial assets Total
As at 31 December 2014
Available-for-sale financial assets 2/ 3 0 1 518 1 518
Loan to associated companies 67 67
Accounts receivable 504 110 504 110
Other receivables 93 371 93 371
Derivatives 2 0 0 0
Cash and cash equivalents 181 498 181 498
Total 779 046 0 0 1 518 780 564
Level
Liabilities at fair value through profit or loss
Derivatives used for hedging
Other financial liabilities Total
Borrowings 1 470 402 1 470 402
Finance lease liabilities 289 661 289 661
Factoring debt 195 560 195 560
Export loan 9 257 9 257
Pension obligations and cash-settled options 3 461 3 461
Derivatives 2 27 932 27 932
Accounts payable 360 358 360 358
Total 0 363 819 27 932 1 964 880 2 356 631

68 A N N U A L R E P O R T 2 0 1 5 G R O U P
As stated in note 3, hedge accounting of derivatives (forward exchange contracts and interest rate swaps) is not applied. The purpose of these derivatives is to reduce the Group´s exposure to changes in floating interest rates and exchange rates. The derivatives are recognised at fair value on 31.12, and the value change is recognised through profit or loss. See note 3 for further details. See note 15 for further details on available-for-sale financial assets.
FAIR VALUE ASSESSMENTThe table above shows the fair value of financial instruments according to the valuation method used. The different levels are defined as follows:
Level 1 - Fair value based on the quoted price in an active market for an identical asset or liability.Level 2 - Fair value based on other observable factors than the quoted price (used in level 1) and either directly (price) or indirectly (derived from prices) for the asset/liability.Level 3 - Fair value based on factors not taken from observable markets (non-observable assumptions).
CREDITWORTHINESS OF FINANCIAL ASSETS The credit risk attached to financial instruments that have not matured or which have not been written down is shown by the internal classification of historical information on breaches of credit conditions. Further information about credit risk is provided in note 3.
2015 2014
ACCOUNTS RECEIVABLE
Counterparties with no external credit assessment
Group 1 *) 22 770 203 884
Group 2 445 074 221 172
Group 3 114 060 79 053
Total accounts receivable that have not been written down 581 904 504 110
BANK DEPOSITS
AAA 0 0
AA 392 020 181 498
A 0 0
Total bank deposits 392 020 181 498
LOANS TO RELATED PARTIES
Group 1 0 0
Group 2 167 67
Group 3 0 0
Total loans to related parties 167 67
Group 1 - new customers/related parties (less than 6 months).Group 2 - existing customers/related parties (more than 6 months) with no history of having breached credit conditions.Group 3 - existing customers/related parties (more than 6 months) with a history of one or more breaches of credit conditions. All amounts due have been paid in full after the breaches.
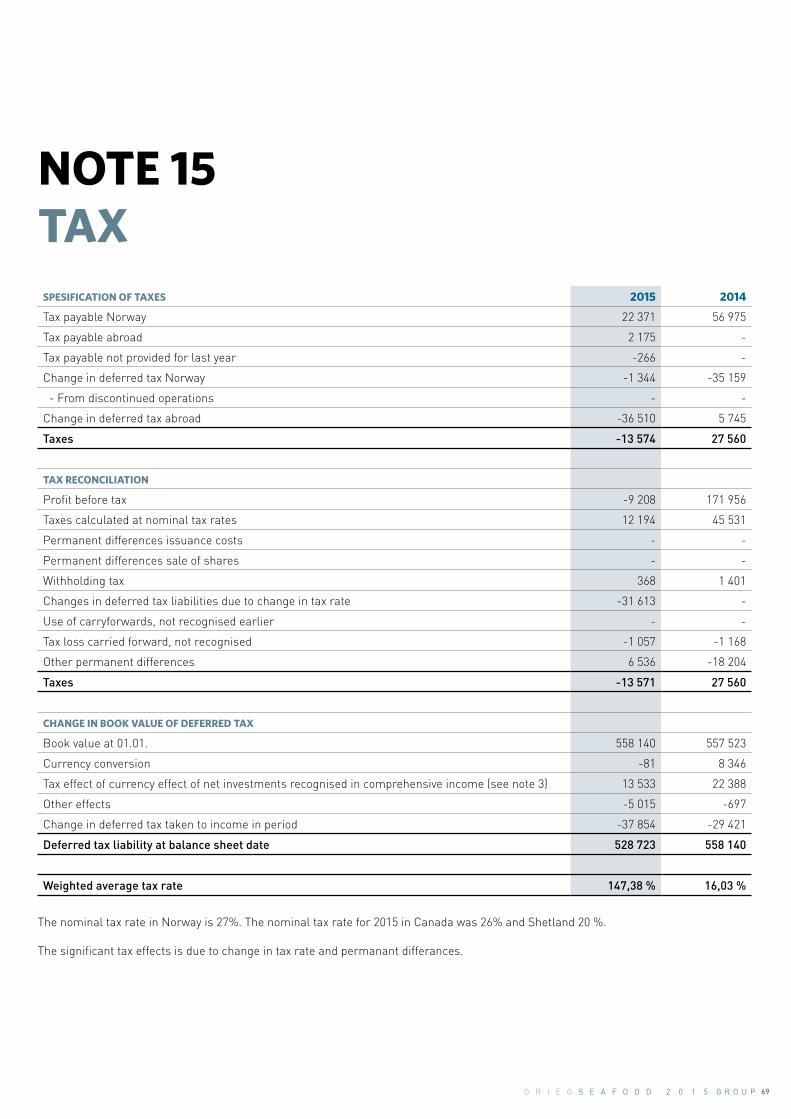
69G R I E G S E A F O O D 2 0 1 5 G R O U P
NOTE 15TAX
SPESIFICATION OF TAXES 2015 2014
Tax payable Norway 22 371 56 975
Tax payable abroad 2 175 -
Tax payable not provided for last year -266 -
Change in deferred tax Norway -1 344 -35 159
- From discontinued operations - -
Change in deferred tax abroad -36 510 5 745
Taxes -13 574 27 560
TAX RECONCILIATION
Profit before tax -9 208 171 956
Taxes calculated at nominal tax rates 12 194 45 531
Permanent differences issuance costs - -
Permanent differences sale of shares - -
Withholding tax 368 1 401
Changes in deferred tax liabilities due to change in tax rate -31 613 -
Use of carryforwards, not recognised earlier - -
Tax loss carried forward, not recognised -1 057 -1 168
Other permanent differences 6 536 -18 204
Taxes -13 571 27 560
CHANGE IN BOOK VALUE OF DEFERRED TAX
Book value at 01.01. 558 140 557 523
Currency conversion -81 8 346
Tax effect of currency effect of net investments recognised in comprehensive income (see note 3) 13 533 22 388
Other effects -5 015 -697
Change in deferred tax taken to income in period -37 854 -29 421
Deferred tax liability at balance sheet date 528 723 558 140
Weighted average tax rate 147,38 % 16,03 %
The nominal tax rate in Norway is 27%. The nominal tax rate for 2015 in Canada was 26% and Shetland 20 %. The significant tax effects is due to change in tax rate and permanant differances.

70 A N N U A L R E P O R T 2 0 1 5 G R O U P
DEFERRED TAX LIABILITIES Licences
Fixed assets
Biological assets
Receivables Inventory
Deferred capital gain
Current liabilities Total
2014
Opening balance at 01.01. 177 375 32 284 350 199 17 045 2 092 1 514 0 580 509
Taken to income in the period 67 9 065 -49 847 23 166 679 -295 - -17 165
Currency translation differences 7 107 1 008 7 953 - 293 - - 16 361
Other effects -4 447 6 2 201 9 - -10 - -2 241
Effect of business combinations - - - - - - - -
As at 31.12. 180 102 42 363 310 506 40 220 3 064 1 209 0 577 464
2015
Taken to income in the period -3 772 -1 557 -3 406 10 273 -1 257 -534 - -253
Currency translation differences 2 589 438 597 - -36 - - 3 588
Other effects - - 480 -65 777 - - 1 192
Effect of business combinations 739 - - - - - - 739
As at 31.12. 179 658 41 244 308 177 50 428 2 548 675 0 582 730
DEFFERED TAX ASSETSLoss carried
forwardFixed
assets Pensions ReceivablesLease
obligations Tax credits Other
liabilities Total
2014
Opening balance at 01.01. -21 283 -187 0 -423 -1 903 -6 282 7 092 -22 987
Taken to income in the period -8 738 134 - 238 2 019 643 -6 550 -12 255
Currency translation differences -7 063 53 0 - -115 -725 -164 -8 014
Other effects 24 068 - - - - - -135 23 933
Effect of business combinations -0 - - - - - - -
As at 31.12. -13 017 - 0 -185 - -6 364 243 -19 324
2015
Taken to income in the period -37 742 - - -260 - 6 324 -5 925 -37 603
Currency translation differences -3 727 - - - - 40 19 -3 668
Other effects 6 824 - - - - - -203 6 621
Effect of business combinations -32 - - - - - - -32
As at 31.12. -47 694 - - -445 - - -5 866 -54 006
2015 2014
Net deferred tax 528 723 558 140
Deferred tax assets is classified as non-current assets 10 317 2 180
Deferred tax liabilities is classified as non-current debt 539 040 560 320
Tax payable is classified as current debt 24 545 56 975
The tables below show the composition of deferred tax. The tax effects of taxable and deductible temporary differences are shown sparately. Deferred tax and deferred tax assets are offset. Both the Norwegian, Canadian and UK part of the Group, have a net deferred tax position. Deferred tax and deferred tax assets within Norway, Canada and UK can be set off.
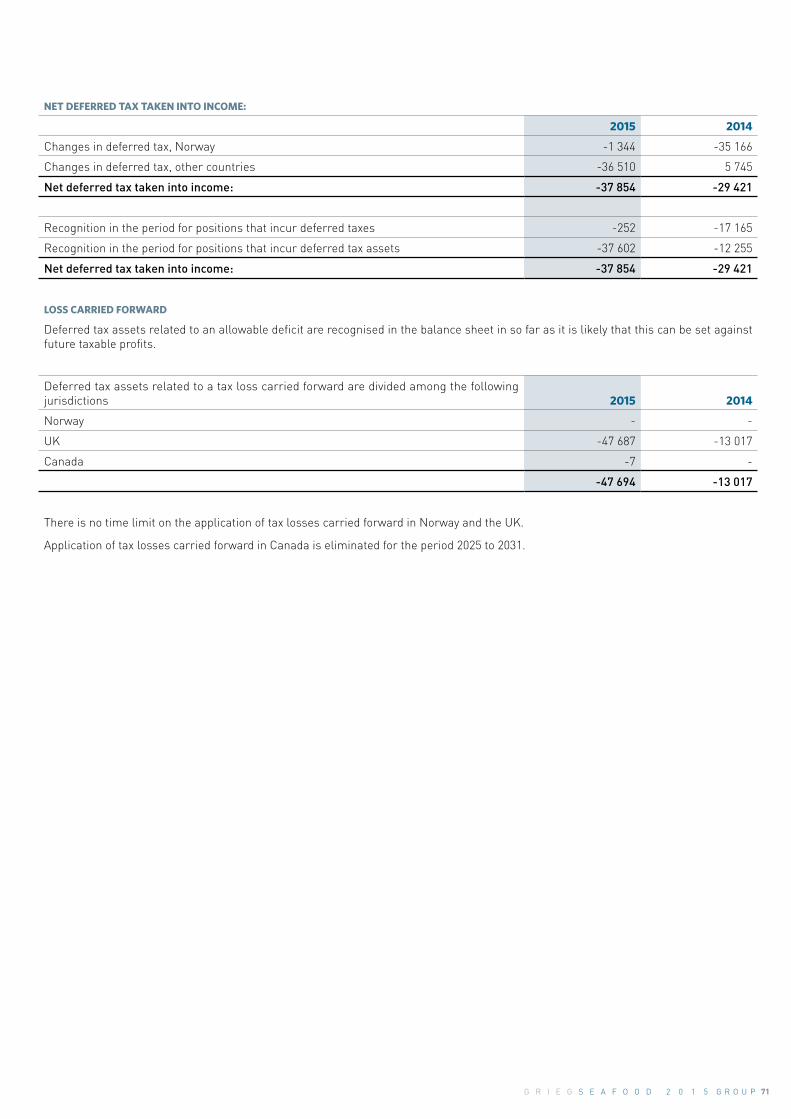
71G R I E G S E A F O O D 2 0 1 5 G R O U P
NET DEFERRED TAX TAKEN INTO INCOME:
2015 2014
Changes in deferred tax, Norway -1 344 -35 166
Changes in deferred tax, other countries -36 510 5 745
Net deferred tax taken into income: -37 854 -29 421
Recognition in the period for positions that incur deferred taxes -252 -17 165
Recognition in the period for positions that incur deferred tax assets -37 602 -12 255
Net deferred tax taken into income: -37 854 -29 421
LOSS CARRIED FORWARD
Deferred tax assets related to an allowable deficit are recognised in the balance sheet in so far as it is likely that this can be set against future taxable profits.
Deferred tax assets related to a tax loss carried forward are divided among the following jurisdictions 2015 2014
Norway - -
UK -47 687 -13 017
Canada -7 -
-47 694 -13 017
There is no time limit on the application of tax losses carried forward in Norway and the UK.
Application of tax losses carried forward in Canada is eliminated for the period 2025 to 2031.

72 A N N U A L R E P O R T 2 0 1 5 G R O U P
BOARD GUIDELINES AND PRINCIPLES FOR THE DETERMINATION OF SALARY AND OTHER REMUNERATION TO KEY PERSONNEL
In line with regulations issued pursuant to the Norwegian Public Limited Companies Act, the Board has drawn up the following declaration on guidelines and principles used to determine salary and other remuneration for key personnel.
The Group’s remuneration policy will continue to be based on the principle that the Group shall offer its employees a compensation package that is competitive and in accordance with local industry standards. Where appropriate, this may include incentive elements, and the basic salary shall reflect individual performance.
The components of remuneration shall consist of a fixed basic salary and other fixed remuneration elements. The latter may be a company car or car allowance, telephone and electronic communications, newspapers and similar benefits. As well as participating in the Company’s ordinary group life insurance and defined contribution based pension scheme up to 12G, the CEO has a separate salary compensation agreement for pension benefits exceeding 12G. CEO has a special cash bonus for 2015 and 2016 which assumes that the CEO is in position at the time of payment. CEO is entitled to a rolling 12 months’ severance pay calculated from the termination date. Termination date is considered the expiration date of the notice. CEO has six months notice. Upon termination of the employment contract a separate agreement on severance pay will be entered into. COO and CFO are entitled to 12 months’ pay after termination or changes in employment/position.
Grieg Seafood has an annual bonus scheme based on a combination of earnings and personal performance. For the management team the annual bonus has a limit of maximum 6 months’ fixed salary.
A synthetic option scheme (hereafter called “”cash option””) for the company’s management group was established in 2009 as a continuation of the expired option scheme from 2007. The cash options programme scheme requires the participants’ direct share ownership throughout the entire period of the programme. Those who are entitled to the options are required to use 50% of the net gain under the scheme to purchase shares until the share ownership has a value corresponding to 100% of the fixed annual salary. The gain under the synthetic option scheme cannot exceed 12 times the monthly salary per participant per year. The exercise price is increased by 0,5% each month. An option must be exercised not later than 24 months after the first exercise date.
The cash options programme corresponds to a total of 2.150 000 shares at year-end after exercise of 1.600.000 options in 2015. Options allocated in 2015 must be exercised not later than 1 June 2019. Throughout 2015, 250 000 options have been exercised.
CEO has a total of 400 000 cash-settled options at year-end. The last exercise date for CEO is 1 June 2019.
For information about remuneration of the Group management, see note 17.
For further information about options, see note 18.
NOTE 16 DECLARATION ON DETERMINATION OF SALARY AND OTHER REMUNERATION TO SENIOR EMPLOYEES

73G R I E G S E A F O O D 2 0 1 5 G R O U P
NOTE 17 PAYROLL, FEES, NUMBER OF EMPLOYEES ETC.
Note 2015 2014
Salaries 337 591 307 430
Social security costs 26 654 21 700
Share options granted to directors and key employees (incl. social security costs) 18 3 819 8 507
Pension costs 8 983 6 969
Other personnel costs 32 384 14 923
Total 409 432 359 529
Average number of employees 681 686
The Board's guidelines and principles for determination of salary and other remuneration to key employees are detained in note 16.
As at 31.12.2015 no loans were provided to Group employees.
Accumulated costs related to salaries, pension costs and other remuneration to the CEO, other senior employees and board members in 2015 were as follows:
REMUNERATION TO SENIOR OFFICERS IN 2015 IN TNOK Salary Bonus
Retained, not yet paid
Options exercised
during year Other
remuneration Total
Andreas Kvame (CEO from 01.06.2015) 1 369 456 0 9 1 834
Morten Vike (CEO until 17.10.2014) *) 4 414 0 1 488 928 104 6 934
Atle Harald Sandtorv (CFO) 1 988 119 0 146 2 253
Knut Utheim (COO) 1 701 89 0 139 1 929
Total remuneration including social security costs 12 950
M.Vike has received severance pay according to agreement. The expense was provided for in 2014 but paid in 2015.
BOARD MEMBERS
Per Grieg jr. 1) 405 405
Wenche Kjølås 2) 245 245
Karin Bing Orgland 245 245
Asbjørn Reinkind 1) 274 274
Ola Braanaas 1) 222 222
Total remuneration including social security costs 1 392
Recognision of synthetic options not declared throughout the year, are not included in the above list.
1) Remuneration for work done in the remuneration committee is included in the payment to Per Grieg jr. with NOK 11 410, in the payment to Asbjørn Reinkind with NOK 11 410, and in the payment to Ola Braanaas with NOK 11 410.
2) Remuneration for work done in the audit committee is included in the payment to Wenche Kjølås with NOK 34 230, and to Karin Bing-Orgland with NOK 34 230.
These amounts include social security costs.

74 A N N U A L R E P O R T 2 0 1 5 G R O U P
Accumulated costs related to salaries, pension costs and other remuneration to the CEO, other senior employees and board members in 2014 were as follows:
REMUNERATION TO SENIOR OFFICERS IN 2014 IN TNOK Salary Bonus Retained, not
yet paid *)
Options exercised
during year Other
remuneration Total
Morten Vike (resigned as CEO 17.10.2014) 3 149 442 6 075 7 542 306 17 514
Atle Harald Sandtorv (CFO/acting CEO) 1 779 248 119 0 144 2 290
Knut Utheim (COO from 01.04.2014) 1 126 0 89 0 99 1 314
Total remuneration including social security costs 21 118
*) Retained, not yet paid benefits to former CEO, see note 16
BOARD MEMBERS
Per Grieg jr. 1) 406 406
Terje Ramm - until 11.06.2014 2) 102 102
Wenche Kjølås 2) 246 246
Karin Bing Orgland 1) og 2) 236 236
Asbjørn Reinkind 1) 275 275
Ola Braanaas -from 11.06.2014 1) 130 130
Total remuneration including social security costs 1 395
Recognision of synthetic options not declared throughout the year, are not included in the above list.
1) Remuneration for work done in the remuneration committee is included in the payment to Per Grieg jr. with TNOK 11, in the payment to Asbjørn Reinkind with TNOK 11, in the payment to Karin Bing Orgland with TNOK 6, and in the payment to Ola Braanaas with TNOK 7.
2) Remuneration for work done in the audit committee is included in the payment to Terje Ramm with TNOK 14, in the payment to Wenche Kjølås with TNOK 34, and in the payment to Karin Bing-Orgland with TNOK 19.
These amounts include social security costs.
SPECIFICATION OF AUDITORS' FEES 2015 2014
AUDIT FEES
Group auditor 2 176 2 078
Other auditors 777 798
OTHER ASSURANCE SERVICES
Group auditor 139 216
Other auditors 0 0
TAX ADVICE
Group auditor 415 280
Other auditors 160 238
OTHER SERVICES
Group auditor 431 261
Other auditors 144 145
Total - Group auditor 3 162 2 835
Total - other auditors 1 082 1 181
Total 4 243 4 016

75G R I E G S E A F O O D 2 0 1 5 G R O U P
NOTE 18 EQUITY AND CASH-BASED REMUNERATION (OPTIONS)The Company has issued options to the management group and regional directors. The options’ strike price is the stock market price on the date of issue increased by 0.5% per month until exercise date. Equity options have been allocated in the period 29 June 2007 until 1 June 2008 with the first due for exercise 29 June 2010 and last due 27 February 2012. As per 31.12.2015 no equity options are available for excercise. As from 2009 an option scheme with settlment in cash has been established for the management and regional directors. The last allocation was in 2015, totalling 1.600 000 options. The last due is 1 June 2019. The options have 2 years of duration, where 50 % is exercised each year. Employees taken on after the first allocation of options have been allocated options on taking up employment. The Black & Scholes option pricing model is used to calculate the market value. A brokerage firm is used to carry out the calculations.
The table below illustrates the movement in outstanding options throughout 2014 and 2015.
OVERVIEW 2015Option category
Outstanding options at 31.12.2014
Granted options
Exercised options
Cancelled options
Expired options
Outstanding options at 31.12.2015
Of which cash- settled
Andreas Kvame (CEO)Cash settlement 400 000 400 000 400 000
Morten Vike (former CEO)*
Cash settlement 200 000 200 000
Atle Harald Sandtorv (CFO)
Cash settlement 100 000 200 000 300 000 300 000
Knut Utheim (COO)Cash settlement 100 000 200 000 300 000 300 000
OthersCash settlement 400 000 800 000 50 000 1 150 000 1 150 000
Total 800 000 1 600 000 250 000 - - 2 150 000 2 150 000
*) Morten Vike resigned 17.10.14. All options could be exercised latest at 31.05.2015.
OVERVIEW 2014Option category
Outstanding options at 31.12.2014
Granted options
Exercised options
Cancelled options
Expired options
Outstanding options at 31.12.2015
Of which cash- settled
Morten Vike (former CEO)*
Cash settlement 600 000 - 400 000 - - 200 000 200 000
Atle Harald Sandtorv (CFO/acting CEO)
Cash settlement 100 000 - - - - 100 000 100 000
Knut Utheim (COO)Cash settlement - 100 000 - - - 100 000 100 000
OthersCash settlement 750 000 200 000 400 000 100 000 50 000 400 000 400 000
Total 1 450 000 300 000 800 000 100 000 50 000 800 000 800 000
*) Morten Vike resigned 17.10.14. All options could be exercised latest at 31.05.2015.

76 A N N U A L R E P O R T 2 0 1 5 G R O U P
Expiry date: Year - month
Strike price NOK per share as at 31.12.2015
Strike price NOK per share as at 31.12.2014 OPTIONS
Allocation: Year - month 2015 2014
2013 - 12 2016 - 06 24,97 23,55 150 000 250 000
2013 - 12 2017- 06 24,97 23,55 150 000 250 000
2014 - 04 2016 - 06 24,99 23,58 50 000 100 000
2014 - 04 2017 - 06 24,99 23,58 100 000 100 000
2014 - 07 2017 - 06 31,55 29,77 100 000 100 000
2015 - 06 2019 - 06 26,27 1 600 000
Total 2 150 000 800 000
2015 2014
Cash-based options available for settlement 450 000 250 000
Weighted average outstanding contract period 24,93 23,48
2015Option
category
Listed price on
allocation
Calculated value per option on allocation
Calculated total
value on allocation*)
Total value of all options at
01.01.2015
Change in
provision OB - IB *)
Exercised options
2015
Acc. cost charged against
equity at 31.12.2015
Book liability cash
settlement at 31.12.2015
Former employees with expired options
Equity option 6 887 6 887
Andreas Kvame (CEO)
Cash settlement 25,50 3,36 1 342 - 579 579
Morten Vike (former CEO)**
Cash settlement 22,22 3,94 788 929 -929 813 -
Atle Harald Sandtorv (CFO)
Cash settlement 22,22 3,94 394 491 148 639
Atle Harald Sandtorv (CFO)
Cash settlement 25,50 3,97 793 - 353 353
Knut Utheim (COO)
Cash settlement 22,56 4,78 478 429 233 662
Knut Utheim (COO)
Cash settlement 25,50 3,97 793 - 353 353
Other options allocated in 2013
Cash settlement 22,22 3,94 1 181 957 293 1 250
Other options allocated in 2014
Cash settlement 22,56 4,24 424 397 -82 199 315
Other options allocated in 2014
Cash settlement 28,90 4,20 420 60 146 206
Other options allocated in 2015
Cash settlement 25,50 3,60 2 876 - 1 282 1 282
Total 9 490 10 150 2 376 1 013 6 887 5 639
*) The amounts are exclusive of social security cost.
**) Morten Vike resigned 17.10.14. All options could be exercised latest at 31.05.2015.

77G R I E G S E A F O O D 2 0 1 5 G R O U P
2014Option
category
Listed price on
allocation
Calculated value per option on allocation
Calculated total
value on allocation*)
Total value of all options at
01.01.2014
Change in
provision OB - IB *)
Exercised options
2014
Acc. cost charged against
equity at 31.12.2014
Book liability cash
settlement at
31.12.2014
Morten Vike (CEO)**
Eq. based option 13,20 3,74 1 123 1 122 - 1 122
Former employees where option has expired
Eq. based option 23,00 5,86 2 346 2 346 - 2 346
OthersEq. based
option 23,00 5,72 4 005 3 419 - 3 419
Morten Vike (former CEO)**
Cash settlem. 6,83 1,78 712 4 906 -4 906 6 610 0
Morten Vike (former CEO)**
Cash settlem. 22,22 3,94 788 29 900 929
Atle Harald Sandtorv (CFO/acting CEO)
Cash settlem. 22,22 3,94 394 14 477 491
Knut Utheim (COO)
Cash settlem. 22,56 4,78 478 - 429 429
Other options allocated in 2010
Cash settlem. 16,50 6,66 666 301 -301 0
Other options allocated in 2012
Cash settlem. 6,83 1,78 1 424 4 277 -4 277 6 645 0
Other options allocated in 2013
Cash settlem. 22,22 3,94 1 181 41 916 957
Other options allocated in 2014
Cash settlem. 22,56 4,24 424 - 397 397
Other options allocated in 2014
Cash settlem. 28,90 2,74 274 - 60 60
Total 13 815 16 455 -6 305 13 255 6 887 3 263
*) The amounts are exclusive of social security cost.
**) Morten Vike resigned 17.10.14. All options could be exercised latest at 31.05.2015.
ACCRUED COST IS DIVIDED AS FOLLOWS: 2015 2014 CLASSIFICATION IN ACCOUNTS
Change in provisions 1 797 -6 305 Other provisions for liabilities
Exercised options during year 2 022 13 255 Payroll & social costs/ bank
Total cost excl. social security costs 3 819 6 951
Social security costs 560 1 557 Public taxes payable
Total cost incl. social security costs 4 379 8 507 Payroll and social security costs
The costs related to cash-based remuneration in 2015 is TNOK 3 819. This is charged in the income statement as a personnel cost. Social security contributions are provided for an ongoing basis based on the fair value of the options.
At 31 December 2015 outstanding options with the right to cash settlement were stated at TNOK 5 639 of which TNOK 1 250 is classified as current liabilities as the options expire in 2016. TNOK 4 389 is non-current liabilities as at 31.12.2015. Options issued are cancelled when employment terminates.
ESTIMATES USED IN CALCULATIONS ON ALLOCATION OF OPTIONS
Anticipated volatility (%) 36,36
Risk-free rate of interest (%) 0,69
Estimated qualification period (years) 2,92
The estimated qualification period for the options is based on historical data, and does not necessarily represent an indication of the future. In order to estimate volatility, the management has applied historical volatility for comparable listed companies.
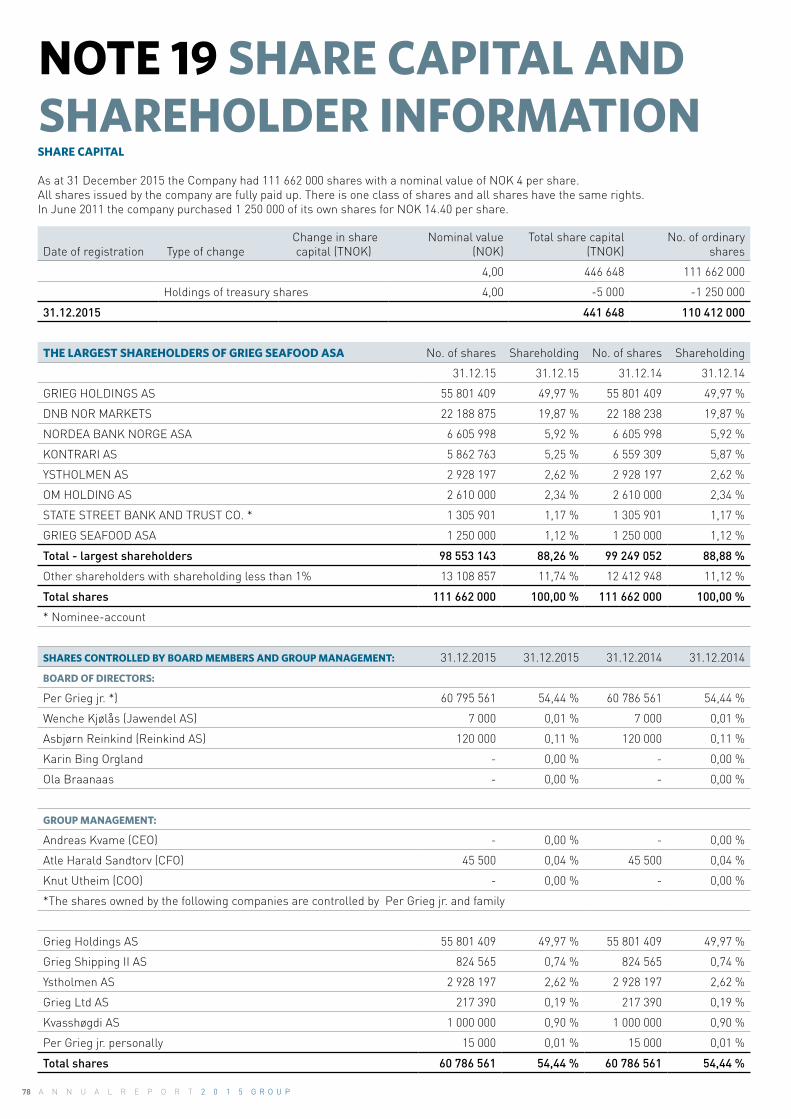
78 A N N U A L R E P O R T 2 0 1 5 G R O U P
NOTE 19 SHARE CAPITAL AND SHAREHOLDER INFORMATIONSHARE CAPITAL
As at 31 December 2015 the Company had 111 662 000 shares with a nominal value of NOK 4 per share.All shares issued by the company are fully paid up. There is one class of shares and all shares have the same rights. In June 2011 the company purchased 1 250 000 of its own shares for NOK 14.40 per share.
Date of registration Type of change Change in share
capital (TNOK) Nominal value
(NOK) Total share capital
(TNOK) No. of ordinary
shares
4,00 446 648 111 662 000
Holdings of treasury shares 4,00 -5 000 -1 250 000
31.12.2015 441 648 110 412 000
THE LARGEST SHAREHOLDERS OF GRIEG SEAFOOD ASA No. of shares Shareholding No. of shares Shareholding
31.12.15 31.12.15 31.12.14 31.12.14
GRIEG HOLDINGS AS 55 801 409 49,97 % 55 801 409 49,97 %
DNB NOR MARKETS 22 188 875 19,87 % 22 188 238 19,87 %
NORDEA BANK NORGE ASA 6 605 998 5,92 % 6 605 998 5,92 %
KONTRARI AS 5 862 763 5,25 % 6 559 309 5,87 %
YSTHOLMEN AS 2 928 197 2,62 % 2 928 197 2,62 %
OM HOLDING AS 2 610 000 2,34 % 2 610 000 2,34 %
STATE STREET BANK AND TRUST CO. * 1 305 901 1,17 % 1 305 901 1,17 %
GRIEG SEAFOOD ASA 1 250 000 1,12 % 1 250 000 1,12 %
Total - largest shareholders 98 553 143 88,26 % 99 249 052 88,88 %
Other shareholders with shareholding less than 1% 13 108 857 11,74 % 12 412 948 11,12 %
Total shares 111 662 000 100,00 % 111 662 000 100,00 %
* Nominee-account
SHARES CONTROLLED BY BOARD MEMBERS AND GROUP MANAGEMENT: 31.12.2015 31.12.2015 31.12.2014 31.12.2014
BOARD OF DIRECTORS:
Per Grieg jr. *) 60 795 561 54,44 % 60 786 561 54,44 %
Wenche Kjølås (Jawendel AS) 7 000 0,01 % 7 000 0,01 %
Asbjørn Reinkind (Reinkind AS) 120 000 0,11 % 120 000 0,11 %
Karin Bing Orgland - 0,00 % - 0,00 %
Ola Braanaas - 0,00 % - 0,00 %
GROUP MANAGEMENT:
Andreas Kvame (CEO) - 0,00 % - 0,00 %
Atle Harald Sandtorv (CFO) 45 500 0,04 % 45 500 0,04 %
Knut Utheim (COO) - 0,00 % - 0,00 %
*The shares owned by the following companies are controlled by Per Grieg jr. and family
Grieg Holdings AS 55 801 409 49,97 % 55 801 409 49,97 %
Grieg Shipping II AS 824 565 0,74 % 824 565 0,74 %
Ystholmen AS 2 928 197 2,62 % 2 928 197 2,62 %
Grieg Ltd AS 217 390 0,19 % 217 390 0,19 %
Kvasshøgdi AS 1 000 000 0,90 % 1 000 000 0,90 %
Per Grieg jr. personally 15 000 0,01 % 15 000 0,01 %
Total shares 60 786 561 54,44 % 60 786 561 54,44 %

79G R I E G S E A F O O D 2 0 1 5 G R O U P
NOTE 20EARNINGS PER SHARE AND DIVIDEND PER SHARE
BASIS FOR CALCULATION OF EARNINGS PER SHARE 2015 2014
Earnings for the year (majority share) -6 626 138 806
Number of shares at Jan 1 111 662 000 111 662 000
Effect of treasury shares (see note 19) -1 250 000 -1 250 000
Average number of outstanding shares during the year 110 412 000 110 412 000
Adjustment for effect of share options 0 0
Diluted average number of outstanding shares during the year 110 412 000 110 412 000
Earnings per share -0,06 1,26
Diluted earnings per share -0,06 1,26
Proposed dividend per share 0,00 0,50

80 A N N U A L R E P O R T 2 0 1 5 G R O U P
NOTE 21CASH AND CASH EQUIVALENTS
2015 2014
Restricted deposits related to employees' tax deduction 8 318 7 580
Restricted bank deposits related to clearing account for financial price contracts*) 1 513 937
Other cash and bank deposits 382 189 172 981
Total 392 020 181 498
*) The restricted deposits are "base" and "portofolio" margin requirements related to financial salmon price contracts in the Norwegian part of the Group.
The Group's currency and interest rate exposure is described in note 3.

81G R I E G S E A F O O D 2 0 1 5 G R O U P
NOTE 22ACCOUNTS RECEIVABLE
2015 2014
Accounts receivable at nominal value 586 883 505 814
Provision for bad debts -4 979 -1 704
Accounts receivable at 31.12. 581 904 504 110
For information about the age distribution of accounts receivable and the Group's exposure to credit risk related to outstanding receivables, please refer to note 3.
RECORDED BAD DEBTS ARE STATED AS FOLLOWS: 2015 2014
Change in provision for bad debts 3 275 1 733
Year´s actual losses 1 741 1 282
Filed on previous loss provisions 0 -404
Recognised losses on receivables 5 016 2 611
Losses on receivables is recognised as other operating expenses

82 A N N U A L R E P O R T 2 0 1 5 G R O U P
2015 2014
VAT receivable etc. 83 870 49 038
Pre-paid expenses 30 484 32 504
Insurance claims 22 237 0
Other current receivables 9 176 11 828
Other current receivables at 31.12. 145 767 93 371
NOTE 23 OTHER CURRENT RECEIVABLES
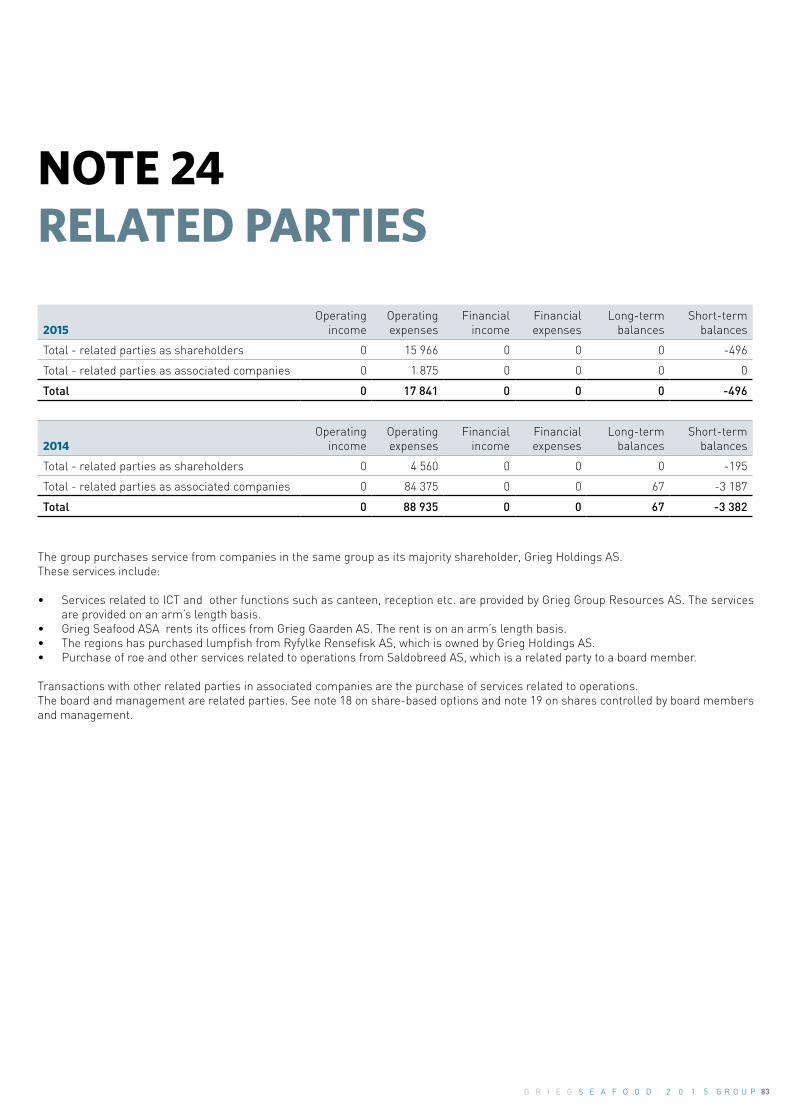
83G R I E G S E A F O O D 2 0 1 5 G R O U P
NOTE 24 RELATED PARTIES
2015 Operating
income Operating expenses
Financial income
Financial expenses
Long-term balances
Short-term balances
Total - related parties as shareholders 0 15 966 0 0 0 -496
Total - related parties as associated companies 0 1 875 0 0 0 0
Total 0 17 841 0 0 0 -496
2014 Operating
income Operating expenses
Financial income
Financial expenses
Long-term balances
Short-term balances
Total - related parties as shareholders 0 4 560 0 0 0 -195
Total - related parties as associated companies 0 84 375 0 0 67 -3 187
Total 0 88 935 0 0 67 -3 382
The group purchases service from companies in the same group as its majority shareholder, Grieg Holdings AS.These services include:
• Services related to ICT and other functions such as canteen, reception etc. are provided by Grieg Group Resources AS. The services are provided on an arm’s length basis.
• Grieg Seafood ASA rents its offices from Grieg Gaarden AS. The rent is on an arm’s length basis.• The regions has purchased lumpfish from Ryfylke Rensefisk AS, which is owned by Grieg Holdings AS.• Purchase of roe and other services related to operations from Saldobreed AS, which is a related party to a board member.
Transactions with other related parties in associated companies are the purchase of services related to operations.The board and management are related parties. See note 18 on share-based options and note 19 on shares controlled by board members and management.
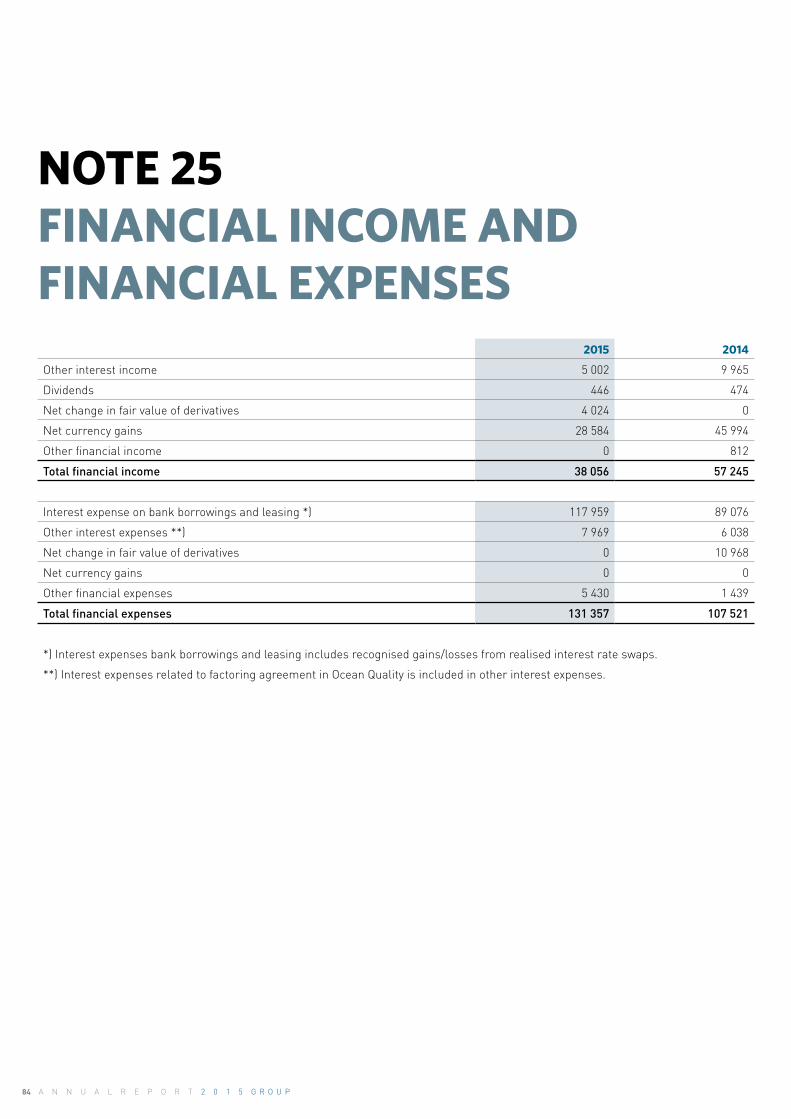
84 A N N U A L R E P O R T 2 0 1 5 G R O U P
NOTE 25 FINANCIAL INCOME AND FINANCIAL EXPENSES
2015 2014
Other interest income 5 002 9 965
Dividends 446 474
Net change in fair value of derivatives 4 024 0
Net currency gains 28 584 45 994
Other financial income 0 812
Total financial income 38 056 57 245
Interest expense on bank borrowings and leasing *) 117 959 89 076
Other interest expenses **) 7 969 6 038
Net change in fair value of derivatives 0 10 968
Net currency gains 0 0
Other financial expenses 5 430 1 439
Total financial expenses 131 357 107 521
*) Interest expenses bank borrowings and leasing includes recognised gains/losses from realised interest rate swaps.
**) Interest expenses related to factoring agreement in Ocean Quality is included in other interest expenses.

85G R I E G S E A F O O D 2 0 1 5 G R O U P
NOTE 26 OTHER OPERATING EXPENSES
2015 2014
Maintenance costs 191 413 161 500
Electricity and fuel 49 822 51 205
Lease expenses 48 547 37 209
Insurance 28 191 36 834
Outsourced services 57 672 38 498
IT expenses 17 882 16 755
Travel costs 15 084 10 320
Marketing costs 7 008 5 610
Transportation costs includin air cargo 276 659 237 438
Other operating expenses 543 417 433 066
Total other operating expenses 1 235 695 1 028 434
Included in "other operating expenses" are packaging, oxygen, chemicals, vaccines, customs duty, fuel, loss on receivables, other office costs, phone, charges.

86 A N N U A L R E P O R T 2 0 1 5 G R O U P
NOTE 27 OTHER CURRENT LIABILITIESSpecification of other current liabilities 2015 2014
Accrued expenses *) 107 661 82 037
Other current liabilities **) 15 135 49 478
Other current liabilities 122 795 131 515
*) Accrued expenses relate to accrual of interest, other operating expenses and insurance.
**) Included in other non-current liabilities in 2014 is purchase of "green licences" for TNOK 40 000, where the arrangement was finally clarified towards year-end 2014.
NOTE 28 POST-BALANCE SHEET EVENTSThere have been no events after balance sheet date which materially impact the 2015 statement or the evaluation of the Group.

87G R I E G S E A F O O D 2 0 1 5 G R O U P
NOTE 29 NEW ACCOUNTING STANDARDSA) NEW AND AMENDED STANDARDS ADOPTED IN 2015 In 2015, no new standards have been adopted. New requirements for disclosures are set out in IFRS 8 Operating Segments. The additional requirements take effect from 01.01.2015 and regard reporting of assessments about operating segments and reconciliation of assets on segment level against Company level. If multiple segments have been merged to form an aggregation of segments, a short description should disclose the various segments and the economic indicators which have been assessed to constitute economic similarities that justify an aggregation into one segment. Upon periodic reporting of segment assets to the chief operator (Group management), the disclosure must demonstrate a reconciliation of assets on segment level against assets on Company level. Grieg Seafood has only one production segment, farmed salmon; hence, the amendment will not have any effect on the disclosure information. IFRS 2 has been amended so that the vesting conditions for share-based remuneration are divided into conditions attached to respectively service and achievement. This will have no significant effect on the financial statements because the option schemes only have conditions attached to service. B) NEW STANDARDS AND INTERPRETATIONS NOT YET ADOPTED A series of new standards, amendments of standards and interpretations of existing standards are mandatory for future financial statements. Among those the Group has decided not to implement early, the essential are disclosed below. IFRS 9 Financial instruments includes requirements for classification, measurement and recognition of financial assets and liabilities, as well as general hedge accounting. The complete version of IFRS 9 was issued in July 2014. It replaces the items of IAS 39 relating to similar issues. According to IFRS 9 financial assets are classified in three categories: Fair value through other comprehensive income, fair value through profit/loss, and amortised cost. The measurement category is determined on initial recognition of the asset. The classification depends on the entity’s business model for managing its financial instruments and the characteristics of the cash flows of each instrument. Equity instruments should initially be measured at fair value through profit/loss. The company may opt to present value changes through other comprehensive income, but the option is irreversible as gain/loss from subsequent sales cannot be reclassified through profit/loss. Impairment due to credit risk should be recognised on basis of expected loss rather than the current model where losses must be incurred. Regarding financial obligations the standard materially proceeds with the requirements of IAS39. The biggest modification regards use of the fair value-option for financial obligations, in which case the amount of change in fair value attributable to changes in own credit risk should be presented in other comprehensive income.IFRS 9 simplifies the requirements for hedge accounting by aligning hedge effectiveness more closely with the risk management and allow for increased assessment. Simultaneous hedge documentation is still required. The standard takes effect as from the fiscal year 2018, but earlier application is permitted. The Group still has not fully assessed the effects of IFRS 9. IFRS15 Revenue from contracts with customers regards recognition of revenue.The standard requires a separation of customer contracts into each performance obligation. A performance obligation can be a good or service. Revenue is recognised when control over a good or service is passed to a customer, and the customer has the ability to direct the use of and obtain the benefit from the good or service.
The standard replaces IAS 18 Revenue and IAS 11 Construction Contracts and related interpretations. The standard takes effect for the fiscal year 2017, but early implementation is permitted. The Group still has not fully assessed the effects of IFRS 15. IAS 1 has been amended in order to allow the Company to consider to a greater degree whether information is essential or not. The amendment provides more flexibility and an opportunity to omit disclosure of information which the Company itself deems insignificant. This may entail less disclosure information on areas which the Company deems less significant. There are no other standards or interpretations that still have not taken effect that are expected to materially impact the financial statement of the Group.
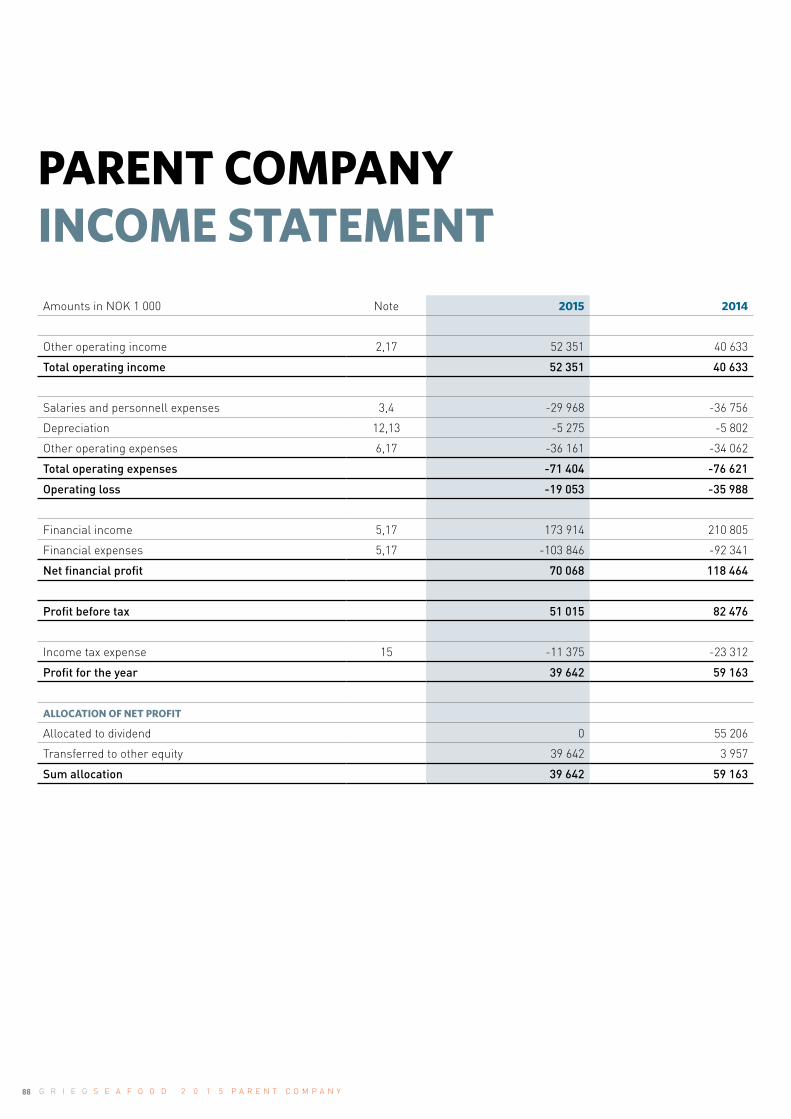
88 G R I E G S E A F O O D 2 0 1 5 P A R E N T C O M P A N Y
Amounts in NOK 1 000 Note 2015 2014
Other operating income 2,17 52 351 40 633
Total operating income 52 351 40 633
Salaries and personnell expenses 3,4 -29 968 -36 756
Depreciation 12,13 -5 275 -5 802
Other operating expenses 6,17 -36 161 -34 062
Total operating expenses -71 404 -76 621
Operating loss -19 053 -35 988
Financial income 5,17 173 914 210 805
Financial expenses 5,17 -103 846 -92 341
Net financial profit 70 068 118 464
Profit before tax 51 015 82 476
Income tax expense 15 -11 375 -23 312
Profit for the year 39 642 59 163
ALLOCATION OF NET PROFIT
Allocated to dividend 0 55 206
Transferred to other equity 39 642 3 957
Sum allocation 39 642 59 163
PARENT COMPANY INCOME STATEMENT
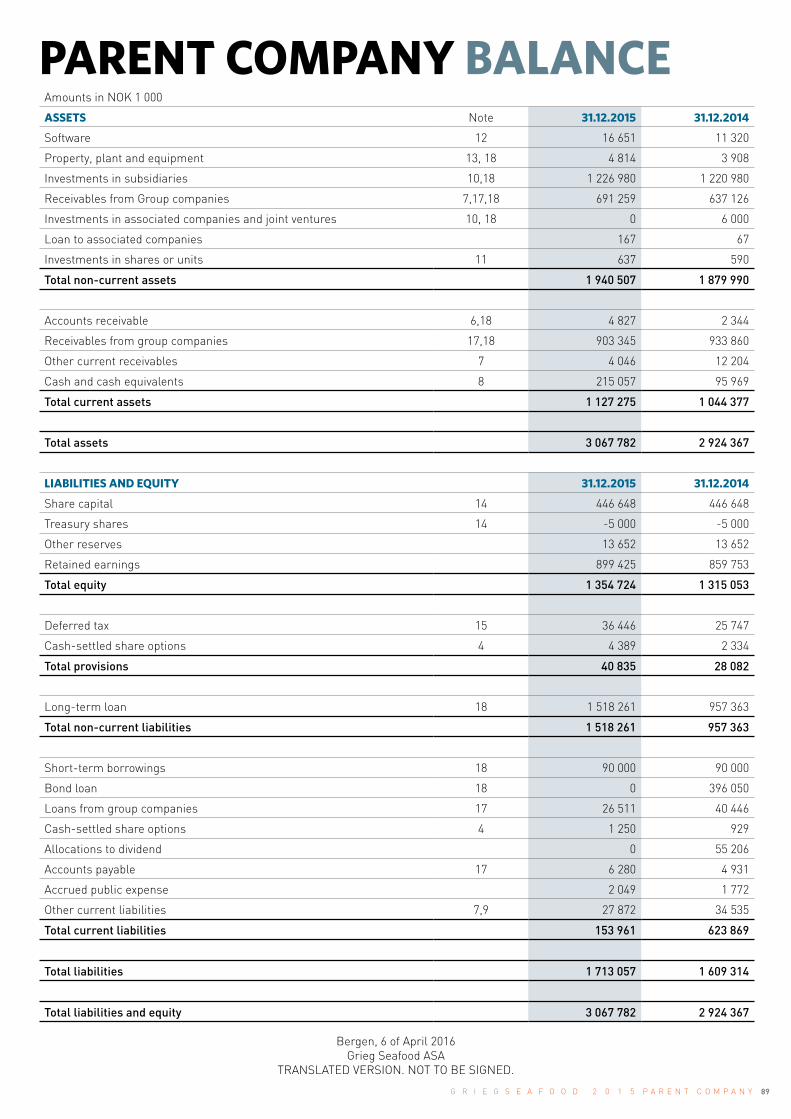
89G R I E G S E A F O O D 2 0 1 5 P A R E N T C O M P A N Y
PARENT COMPANY BALANCEAmounts in NOK 1 000
ASSETS Note 31.12.2015 31.12.2014
Software 12 16 651 11 320
Property, plant and equipment 13, 18 4 814 3 908
Investments in subsidiaries 10,18 1 226 980 1 220 980
Receivables from Group companies 7,17,18 691 259 637 126
Investments in associated companies and joint ventures 10, 18 0 6 000
Loan to associated companies 167 67
Investments in shares or units 11 637 590
Total non-current assets 1 940 507 1 879 990
Accounts receivable 6,18 4 827 2 344
Receivables from group companies 17,18 903 345 933 860
Other current receivables 7 4 046 12 204
Cash and cash equivalents 8 215 057 95 969
Total current assets 1 127 275 1 044 377
Total assets 3 067 782 2 924 367
LIABILITIES AND EQUITY 31.12.2015 31.12.2014
Share capital 14 446 648 446 648
Treasury shares 14 -5 000 -5 000
Other reserves 13 652 13 652
Retained earnings 899 425 859 753
Total equity 1 354 724 1 315 053
Deferred tax 15 36 446 25 747
Cash-settled share options 4 4 389 2 334
Total provisions 40 835 28 082
Long-term loan 18 1 518 261 957 363
Total non-current liabilities 1 518 261 957 363
Short-term borrowings 18 90 000 90 000
Bond loan 18 0 396 050
Loans from group companies 17 26 511 40 446
Cash-settled share options 4 1 250 929
Allocations to dividend 0 55 206
Accounts payable 17 6 280 4 931
Accrued public expense 2 049 1 772
Other current liabilities 7,9 27 872 34 535
Total current liabilities 153 961 623 869
Total liabilities 1 713 057 1 609 314
Total liabilities and equity 3 067 782 2 924 367
Bergen, 6 of April 2016Grieg Seafood ASA
TRANSLATED VERSION. NOT TO BE SIGNED.
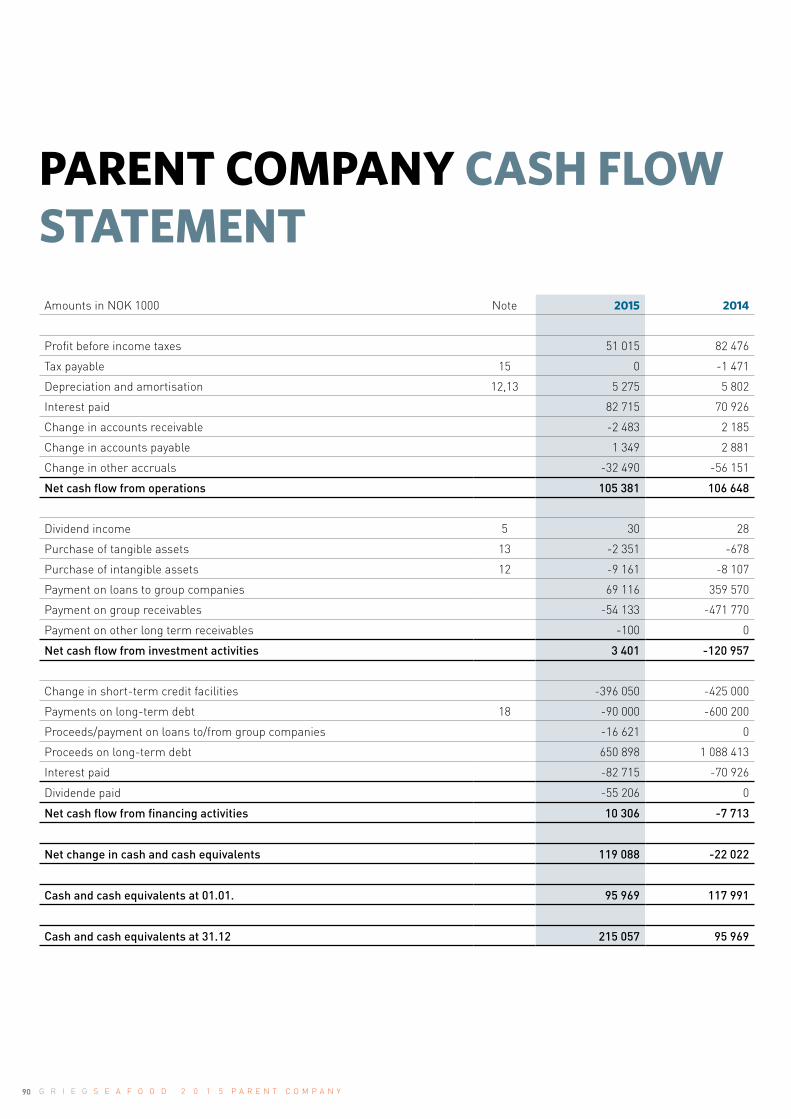
90 G R I E G S E A F O O D 2 0 1 5 P A R E N T C O M P A N Y
PARENT COMPANY CASH FLOW STATEMENTAmounts in NOK 1000 Note 2015 2014
Profit before income taxes 51 015 82 476
Tax payable 15 0 -1 471
Depreciation and amortisation 12,13 5 275 5 802
Interest paid 82 715 70 926
Change in accounts receivable -2 483 2 185
Change in accounts payable 1 349 2 881
Change in other accruals -32 490 -56 151
Net cash flow from operations 105 381 106 648
Dividend income 5 30 28
Purchase of tangible assets 13 -2 351 -678
Purchase of intangible assets 12 -9 161 -8 107
Payment on loans to group companies 69 116 359 570
Payment on group receivables -54 133 -471 770
Payment on other long term receivables -100 0
Net cash flow from investment activities 3 401 -120 957
Change in short-term credit facilities -396 050 -425 000
Payments on long-term debt 18 -90 000 -600 200
Proceeds/payment on loans to/from group companies -16 621 0
Proceeds on long-term debt 650 898 1 088 413
Interest paid -82 715 -70 926
Dividende paid -55 206 0
Net cash flow from financing activities 10 306 -7 713
Net change in cash and cash equivalents 119 088 -22 022
Cash and cash equivalents at 01.01. 95 969 117 991
Cash and cash equivalents at 31.12 215 057 95 969

91G R I E G S E A F O O D 2 0 1 5 P A R E N T C O M P A N Y
PARENT COMPANY CHANGE IN EQUITY
Amounts in NOK 1000 Share capital Other paid
in equity Other equity Total equity
Equity at 01.01.2014 441 648 13 652 855 773 1 311 073
PROFIT FOR THE YEAR 2014 59 163 59 163
Other gains recorded in equity 22 22
Allocations to dividend -55 206 -55 206
Equity at 31.12.2014 441 648 13 652 859 752 1 315 053
PROFIT FOR THE YEAR 2015 39 642 39 642
Other gains/losses recorded in equity 31 31
Allocations to dividend 0 0
Equity at 31.12.2015 441 648 13 652 899 425 1 354 725

92 G R I E G S E A F O O D 2 0 1 5 P A R E N T C O M P A N Y
NOTE 1 ACCOUNTING POLICIES
The annual financial statements have been prepared in accordance with the Norwegian Accounting Act and generally accepted accounting principles in Norway. All amounts are in TNOK, unless stated otherwise. REVENUE RECOGNITIONRevenue from sales of goods is recognised at the time of delivery. Revenue from the sales of services is recognised when the services are executed. The share of sales revenue associated with future service is recorded in the balance sheet as deferred sales revenue and is recognised as revenue at the time of execution. CLASSIFICATION AND VALUATION OF BALANCE SHEET ITEMSAssets intended for long-term ownership or use are classified as fixed assets. Assets related to the normal operating cycle, are classified as current assets. Receivables are classified as current assets if they are expected to be repaid within 12 months after the transaction date. Similar criteria apply to liabilities. Current assets are valued at the lower of cost and fair value. Short-term liabilities are recognised in the balance sheet at nominal value. Fixed assets are carried at historical cost. Fixed assets whose value will deteriorate are depreciated on a straight line basis over the asset’s estimated useful life. Fixed assets are written down to fair value where this is required by accounting rules.Nominal amounts are discounted if the interest rate element is significant. INTANGIBLE ASSETSExpenditure on intangible assets is recognised to the extent that future economic benefits from the development of identifiable intangible assets and costs can be measured reliably. Otherwise, the costs are expensed as they arise. Capitalised development is amortised over the useful life. FIXED ASSETSFixed assets are recognised in the balance sheet and depreciated on a straight line basis over the estimated useful life, providing the asset has an expected useful life of more than 3 years and a cost price which exceeds TNOK 15. Maintenance costs are charged as they arise as operating expenses, while improvements and additions are added to the acquisition cost and depreciated at the same pace as the asset. The distinction between maintenance and improvements is made with regard to the asset’s relative condition
at the original purchase date. Leased assets are recognised as fixed assets if the lease contract is considered to be a finance lease. SUBSIDIARIES, ASSOCIATED COMPANIES AND JOINT VENTURESInvestments in subsidiaries, associated companies and joint ventures are valued at cost in the company accounts. The investment is valued at the cost of acquiring the shares, providing a write-down has not been necessary. Group contributions to subsidiaries, with tax deducted, are recognised as increases in the purchase cost of the shares. Dividends and group contributions are recognised in the same year as they are recognised in the subsidiary/ associated company accounts. If dividends/group contributions materially exceed retained earnings after acquisition, the exceeding amount is regarded as reimbursement of invested capital and the distribution will reduce the recorded value of the acquisition in the balance sheet. Group contributions received are recognised as other financial income. IMPAIRMENT OF FIXED ASSETSImpairment tests are performed if it is indicated that the carrying amount of a non-current asset exceeds the estimated fair value. The test is performed on the lowest level of fixed assets at which independent cash flows can be identified. If the carrying amount is higher than both the fair value less selling costs and the recoverable amount (net present value of future use/ownership), the asset is written down to the higher of fair value less selling costs and the recoverable amount. TRADE AND OTHER RECEIVABLESTrade and other receivables are recognised in the balance sheet at nominal value after deduction of provision for bad debts. The provision for bad debts is estimated on the basis of an individual assessment of each major receivable. An additional general provision is made for the remainder of the receivables based on estimated expected losses. SHORT-TERM INVESTMENTSShort-term investments (shares and investments which are considered current assets) are carried at the lower of average purchase cost and net realisable value on the balance sheet date. Dividends and other distributions received are recognised as other financial income.
93G R I E G S E A F O O D 2 0 1 5 P A R E N T C O M P A N Y
PENSIONSThe company’s pension schemes meet the requirements of the mandatory Occupatonal Pension Act. The premium is paid through operations and is charged as it arises. Social security costs are charged on the basis of the pension premium paid. GROUP BANK ACCOUNTS SYSTEM – DEPOSIT AND LOANGrieg Seafod ASA operates as an internal bank for the subsidiaries. Grieg Seafood borrows funds under the agreement from the financial institutions and lends these funds onwards to the group companies. The Company has set up a group account system (multi-accounts) in which Grieg Seafood ASA is the legal account holder and where deposits and loans are recognised as intercompany transactions. All group companies are jointly and severally responsible to the financial institutions for the whole amount of the commitment under the scheme. FOREIGN CURRENCYAll foreign currency transaction are translated into NOK at the date of the transaction. All monetary items in foreign currency are translated at the balance sheet date. Derivatives are stated at fair value and value changes are recognised in the income statement. CASH-BASED REMUNERATIONThe Company has a share-based remuneration scheme with settlement in cash. The Company’s estimated liability is posted under current or non-current liabilities based on estimated settlement date. The cost for the year is charged in the income statement. DERIVATIVESForward currency contractsRealised gains are recorded in the income statement as financial income. The fair value of the contracts is stated on the basis of the exchange rate at balance sheet date for 2015. Interest rate swapsInterest rate swap contracts are stated at the lowest value principle. TAXESThe tax expense in the income statement consists of both taxes payable for the accounting period and changes in deferred tax during the period. Deferred tax is calculated as relevant rate of the
temporary differences between the value of assets and liabilities for tax purposes and any allowable loss to be carried forward at year-end in the financial statements. Temporary differences, both positive and negative, are offset within the same period. Deferred tax assets are recorded in the balance sheet when it is more likely than not that the tax assets will be utilised. Deferred tax assets and deferred tax liabilities are presented net in the balance sheet. Tax on group contributions given, booked as an increase in the purchase price of shares in other companies, and tax on group contribution received booked directly against equity, have been booked directly against tax items in the balance sheet (offset against tax payable if the group contribution has affected tax payable, and offset against deferred taxes if the group contribution has affected deferred taxes). CASH FLOW STATEMENTThe cash flow statement has been prepared according to the indirect method. Cash and cash equivalents include cash, bank deposits and other short-term highly liquid investments which entail no appreciable exchange rate risk and with maturities of 3 months or less from the purchase date.

94 G R I E G S E A F O O D 2 0 1 5 P A R E N T C O M P A N Y
NOTE 2 OPERATING INCOMEAmounts in NOK 1000
OPERATING INCOME CONSISTS OF 2015 2014
Administrative services - Grieg Seafood Group 52 351 37 534
Other operating income 0 3 099
Total other operating income, see note 17 52 351 40 633

95G R I E G S E A F O O D 2 0 1 5 P A R E N T C O M P A N Y
NOTE 3 PAYROLL, FEES, NO. OF EMPLOYEES Amounts in NOK 1000 Note 2015 2014
Wages and salaries 20 170 23 553
Social security costs 3 388 3 916
Shares options for directors and key personnel 4 3 819 6 951
Pension costs - defined contribution plans 1 702 1 508
Other personnel costs 889 828
Total 29 968 36 756
Average number of employees 20 16
The Company has a pension scheme covering all employees at 31.12.2015. The pension scheme is funded and managed through an insurance company.
The board’s guidelines and principles for the determination of salary and other remuneration to the management group are included in the financial statements for the group.
The accumulated cost of salaries, pensions and other benefits to the CEO, CFO, COO and board members in 2015 were as follows:
REMUNERATION TO SENIOR EMPLOYEES IN 2015 (TNOK) Salary Bonus
Accumulated, not yet paid*)
Options exercised
during year Other
benefits Total
Andreas Kvame (CEO as from 01.06.2015) 1 369 456 0 0 9 1 834
Morten Vike (resigned as CEO 17.10.2014) 4 414 0 1 488 928 104 6 934
Atle Harald Sandtorv (CFO) 1 988 119 0 0 146 2 253
Knut Utheim (COO as from 01.04.2014) 1 701 89 0 0 139 1 929
Total remuneration incl. social security costs 12 950
*) The amount consists of accumulated, not paid benefits to former CEO
BOARD MEMBERS
Per Grieg jr. 1) 405 405
Wenche Kjølås 2) 245 245
Karin Bing-Orgland 245 245
Asbjørn Reinkind 1) 274 274
Ola Braanaas 222 222
Total remuneration incl. social security costs 1 392
1) The payment for work done in the remuneration committee is included in the remuneration to Per Grieg jr. with NOK 11 410, to Asbjørn Reinkind with NOK 11 410 and to Ola Braanaas with NOK 11 410.
2) The payment for work done in the audit committee is included in the remuneration to Wenche Kjølås with NOK 34 230 and to Karin Bing-Orgland with NOK 34 230. The amounts include social security costs.

96 G R I E G S E A F O O D 2 0 1 5 P A R E N T C O M P A N Y
The accumulated cost of salaries, pensions and other benefits to the CEO, CFO, COO and to Board members in 2014 were as follows:
REMUNERATION TO SENIOR EMPLOYEES IN 2014 (TNOK) Salary Bonus
Accumulated not paid
Options exercised
during year Other
benefits Total
Morten Vike (CEO) 3 149 442 6 075 7 542 306 17 514
Atle Harald Sandtorv (CFO) 1 777 248 119 0 144 2 288
Knut Utheim (COO) 1 126 0 89 0 99 1 314
Total remuneration incl. social security costs 21 116
BOARD MEMBERS
Per Grieg jr. 1) 406 406
Terje Ramm - until 11.06.2014 2) 102 102
Wenche Kjølås 2) 246 246
Karin Bing-Orgland 1) og 2) 236 236
Asbjørn Reinkind 1) 275 275
Ola Braanaas - as from 11.06.2014 1) 130 130
Total remuneration incl. social security costs 1 395
1) The payment for work done in the remuneration committee is included in the remuneration to Per Grieg jr. with NOK 11 409, to Asbjørn Reinkind with NOK 11 409, to Karin Bing-Orgland with NOK 5 705, and to Ola Braanaas with NOK 6 655.
2) The payment for work done in the audit committee is included in the remuneration to Terje Ramm with NOK 14 250, to Wenche Kjølås with NOK 34 200, and to Karin-Bing Orgland with NOK 18 999. The amounts include social security costs. .
SPECIFICATION OF AUDITOR'S FEE 2015 2014
Statutory audit 910 774
Tax advisory fee 90 111
Other services 129 318
Total 1 129 1 202

97G R I E G S E A F O O D 2 0 1 5 P A R E N T C O M P A N Y
NOTE 4 SHARE-BASED REMUNERATION (OPTIONS)The company has a share-based options programme for the management group and regional directors. The options’ strike price is the stock market price on the date of issue increased by 0.5% per month until exercise date. Equity-based options have been allocated in the period 29.06.2007 until 01.06.2008 with the first expiry date 29.06.2010 and the last 27.02.2012. As at 31.12.2015 there are no equity options outstanding for exercise.
Since 2009 the Company has issued cash-based options to the management group and regional directors. The last allocation was in 2015, totalling 1 600 000 options. The last exercise date is 31.05.2019. The options have 2 years’ duration, where 50% is invested each year. Employees taken on after the first allocation of options have been allocated options on taking up employment.
The Black & Scholes option pricing model is used to calculate the market value. A brokerage firm is used to carry out the calculations.
The table below illustrates the movement in outstanding options throughout 2014 and 2015.
OVERVIEW 2015Option
category
Outstanding options
31.12.2014Granted options
Exercised options
Cancelled options
Expired options
Outstanding options at
31.12.2015
Of which cash-
settled
Andreas Kvame (CEO)Cash
settlement 400 000 400 000 400 000
Morten Vike (former CEO)*Cash
settlement 200 000 200 000
Atle Harald Sandtorv (CFO)Cash
settlement 100 000 200 000 300 000 300 000
Knut Utheim (COO)Cash
settlement 100 000 200 000 300 000 300 000
OthersCash
settlement 400 000 800 000 50 000 1 150 000 1 150 000
Total 800 000 1 600 000 250 000 - - 2 150 000 2 150 000
*) Morten Vike resigned at 17.10.14. All options could be exercised until latest 31.05.2015.
OVERVIEW 2014Option
category
Outstanding options
31.12.2013Granted options
Exercised options
Cancelled options
Expired options
Outstanding options at
31.12.2014
Of which cash-
settled
Morten Vike (former CEO)*Cash
settlement 600 000 - 400 000 - - 200 000 200 000
Atle Harald Sandtorv (CFO/acting CEO)
Cash settlement 100 000 - - - - 100 000 100 000
Knut Utheim (COO)Cash
settlement - 100 000 - - - 100 000 100 000
OthersCash
settlement 750 000 200 000 400 000 100 000 50 000 400 000 400 000
Total 1 450 000 300 000 800 000 100 000 50 000 800 000 800 000
*) Morten Vike resigned at 17.10.14. All options could be exercised until latest 31.05.2015.
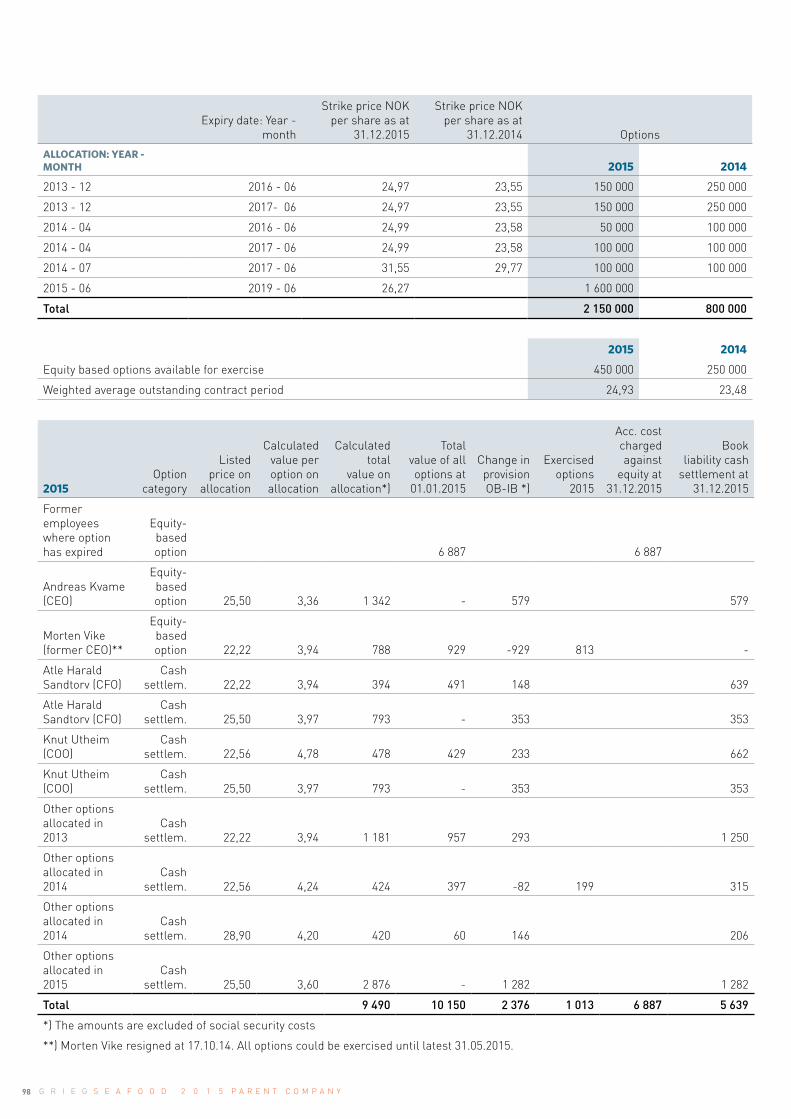
98 G R I E G S E A F O O D 2 0 1 5 P A R E N T C O M P A N Y
Expiry date: Year - month
Strike price NOK per share as at
31.12.2015
Strike price NOK per share as at
31.12.2014 Options
ALLOCATION: YEAR - MONTH 2015 2014
2013 - 12 2016 - 06 24,97 23,55 150 000 250 000
2013 - 12 2017- 06 24,97 23,55 150 000 250 000
2014 - 04 2016 - 06 24,99 23,58 50 000 100 000
2014 - 04 2017 - 06 24,99 23,58 100 000 100 000
2014 - 07 2017 - 06 31,55 29,77 100 000 100 000
2015 - 06 2019 - 06 26,27 1 600 000
Total 2 150 000 800 000
2015 2014
Equity based options available for exercise 450 000 250 000
Weighted average outstanding contract period 24,93 23,48
2015Option
category
Listed price on
allocation
Calculated
value per option on allocation
Calculated total
value on allocation*)
Total value of all options at
01.01.2015
Change in provision OB-IB *)
Exercised options
2015
Acc. cost charged against
equity at 31.12.2015
Book liability cash
settlement at 31.12.2015
Former employees where option has expired
Equity-based option 6 887 6 887
Andreas Kvame (CEO)
Equity-based option 25,50 3,36 1 342 - 579 579
Morten Vike (former CEO)**
Equity-based option 22,22 3,94 788 929 -929 813 -
Atle Harald Sandtorv (CFO)
Cash settlem. 22,22 3,94 394 491 148 639
Atle Harald Sandtorv (CFO)
Cash settlem. 25,50 3,97 793 - 353 353
Knut Utheim (COO)
Cash settlem. 22,56 4,78 478 429 233 662
Knut Utheim (COO)
Cash settlem. 25,50 3,97 793 - 353 353
Other options allocated in 2013
Cash settlem. 22,22 3,94 1 181 957 293 1 250
Other options allocated in 2014
Cash settlem. 22,56 4,24 424 397 -82 199 315
Other options allocated in 2014
Cash settlem. 28,90 4,20 420 60 146 206
Other options allocated in 2015
Cash settlem. 25,50 3,60 2 876 - 1 282 1 282
Total 9 490 10 150 2 376 1 013 6 887 5 639
*) The amounts are excluded of social security costs
**) Morten Vike resigned at 17.10.14. All options could be exercised until latest 31.05.2015.
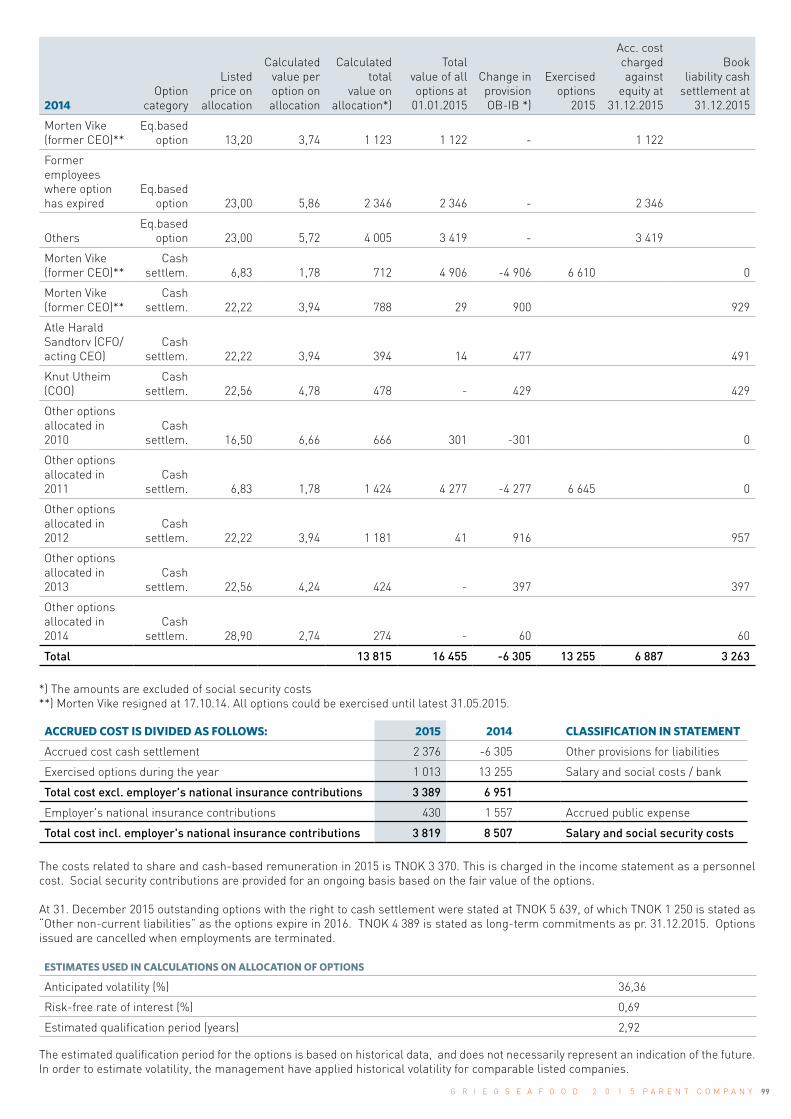
99G R I E G S E A F O O D 2 0 1 5 P A R E N T C O M P A N Y
2014Option
category
Listed price on
allocation
Calculated
value per option on allocation
Calculated total
value on allocation*)
Total value of all options at
01.01.2015
Change in provision OB-IB *)
Exercised options
2015
Acc. cost charged against
equity at 31.12.2015
Book liability cash
settlement at 31.12.2015
Morten Vike (former CEO)**
Eq.based option 13,20 3,74 1 123 1 122 - 1 122
Former employees where option has expired
Eq.based option 23,00 5,86 2 346 2 346 - 2 346
OthersEq.based
option 23,00 5,72 4 005 3 419 - 3 419
Morten Vike (former CEO)**
Cash settlem. 6,83 1,78 712 4 906 -4 906 6 610 0
Morten Vike (former CEO)**
Cash settlem. 22,22 3,94 788 29 900 929
Atle Harald Sandtorv (CFO/acting CEO)
Cash settlem. 22,22 3,94 394 14 477 491
Knut Utheim (COO)
Cash settlem. 22,56 4,78 478 - 429 429
Other options allocated in 2010
Cash settlem. 16,50 6,66 666 301 -301 0
Other options allocated in 2011
Cash settlem. 6,83 1,78 1 424 4 277 -4 277 6 645 0
Other options allocated in 2012
Cash settlem. 22,22 3,94 1 181 41 916 957
Other options allocated in 2013
Cash settlem. 22,56 4,24 424 - 397 397
Other options allocated in 2014
Cash settlem. 28,90 2,74 274 - 60 60
Total 13 815 16 455 -6 305 13 255 6 887 3 263
*) The amounts are excluded of social security costs **) Morten Vike resigned at 17.10.14. All options could be exercised until latest 31.05.2015.
ACCRUED COST IS DIVIDED AS FOLLOWS: 2015 2014 CLASSIFICATION IN STATEMENT
Accrued cost cash settlement 2 376 -6 305 Other provisions for liabilities
Exercised options during the year 1 013 13 255 Salary and social costs / bank
Total cost excl. employer's national insurance contributions 3 389 6 951
Employer's national insurance contributions 430 1 557 Accrued public expense
Total cost incl. employer's national insurance contributions 3 819 8 507 Salary and social security costs
The costs related to share and cash-based remuneration in 2015 is TNOK 3 370. This is charged in the income statement as a personnel cost. Social security contributions are provided for an ongoing basis based on the fair value of the options.
At 31. December 2015 outstanding options with the right to cash settlement were stated at TNOK 5 639, of which TNOK 1 250 is stated as “Other non-current liabilities” as the options expire in 2016. TNOK 4 389 is stated as long-term commitments as pr. 31.12.2015. Options issued are cancelled when employments are terminated.
ESTIMATES USED IN CALCULATIONS ON ALLOCATION OF OPTIONS
Anticipated volatility (%) 36,36
Risk-free rate of interest (%) 0,69
Estimated qualification period (years) 2,92
The estimated qualification period for the options is based on historical data, and does not necessarily represent an indication of the future. In order to estimate volatility, the management have applied historical volatility for comparable listed companies.

100 G R I E G S E A F O O D 2 0 1 5 P A R E N T C O M P A N Y
NOTE 5 FINANCIAL INCOME AND FINANCIAL EXPENSESAmounts in NOK 1000 2015 2014
Interest income from group companies 55 823 51 104
Other interest income 0 2 086
Other financial income from subsidiaries 0 2 591
Group contribution from subsidiaries 39 091 33 651
Dividend 30 28
Unrealised value changes derivatives, see note 9 2 316 0
Unrealised value changes long-term borrowings group 54 134 78 912
Net gains/losses 22 520 42 434
Total financial income 173 914 210 805
Interest expenses from group companies 529 311
Loan interest expenses 101 444 80 454
Other interest expenses 1 263 21
Unrealised value changes derivatives, see note 9 0 10 968
Other financial expenses 610 587
Total financial expenses 103 846 92 341
Net financial items 70 067 118 464
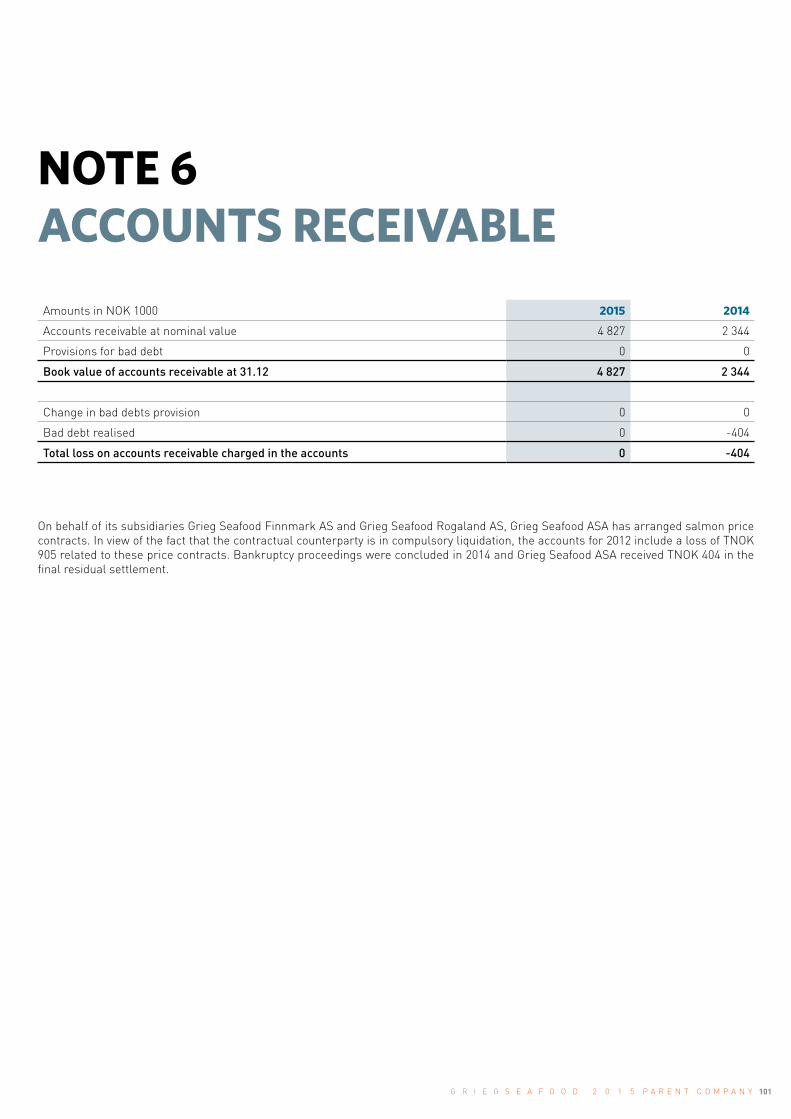
101G R I E G S E A F O O D 2 0 1 5 P A R E N T C O M P A N Y
Amounts in NOK 1000 2015 2014
Accounts receivable at nominal value 4 827 2 344
Provisions for bad debt 0 0
Book value of accounts receivable at 31.12 4 827 2 344
Change in bad debts provision 0 0
Bad debt realised 0 -404
Total loss on accounts receivable charged in the accounts 0 -404
NOTE 6 ACCOUNTS RECEIVABLE
On behalf of its subsidiaries Grieg Seafood Finnmark AS and Grieg Seafood Rogaland AS, Grieg Seafood ASA has arranged salmon price contracts. In view of the fact that the contractual counterparty is in compulsory liquidation, the accounts for 2012 include a loss of TNOK 905 related to these price contracts. Bankruptcy proceedings were concluded in 2014 and Grieg Seafood ASA received TNOK 404 in the final residual settlement.
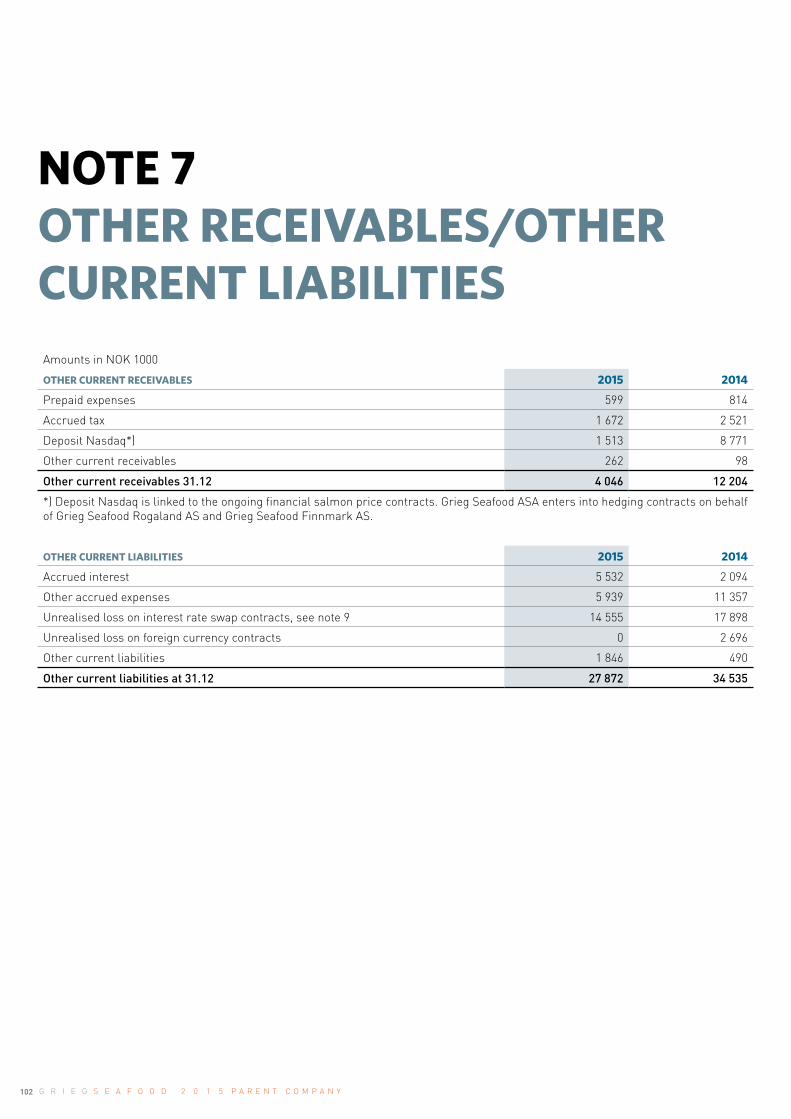
102 G R I E G S E A F O O D 2 0 1 5 P A R E N T C O M P A N Y
NOTE 7 OTHER RECEIVABLES/OTHER CURRENT LIABILITIESAmounts in NOK 1000
OTHER CURRENT RECEIVABLES 2015 2014
Prepaid expenses 599 814
Accrued tax 1 672 2 521
Deposit Nasdaq*) 1 513 8 771
Other current receivables 262 98
Other current receivables 31.12 4 046 12 204
*) Deposit Nasdaq is linked to the ongoing financial salmon price contracts. Grieg Seafood ASA enters into hedging contracts on behalf of Grieg Seafood Rogaland AS and Grieg Seafood Finnmark AS.
OTHER CURRENT LIABILITIES 2015 2014
Accrued interest 5 532 2 094
Other accrued expenses 5 939 11 357
Unrealised loss on interest rate swap contracts, see note 9 14 555 17 898
Unrealised loss on foreign currency contracts 0 2 696
Other current liabilities 1 846 490
Other current liabilities at 31.12 27 872 34 535

103G R I E G S E A F O O D 2 0 1 5 P A R E N T C O M P A N Y
NOTE 8 RESTRICTED BANK DEPOSITSAmounts in NOK 1000 2015 2014
Restricted deposits related to employees' tax deductions 1 295 1 079
Restricted account Nasdaq *) 1 513 937
Other bank deposits 212 249 93 953
Total 215 057 95 969
*) Restricted amounts to financial salmon price contracts. Grieg Seafood ASA enters into hedging contracts on behalf of Grieg Seafood Rogaland AS and Grieg Seafood Finnmark AS.
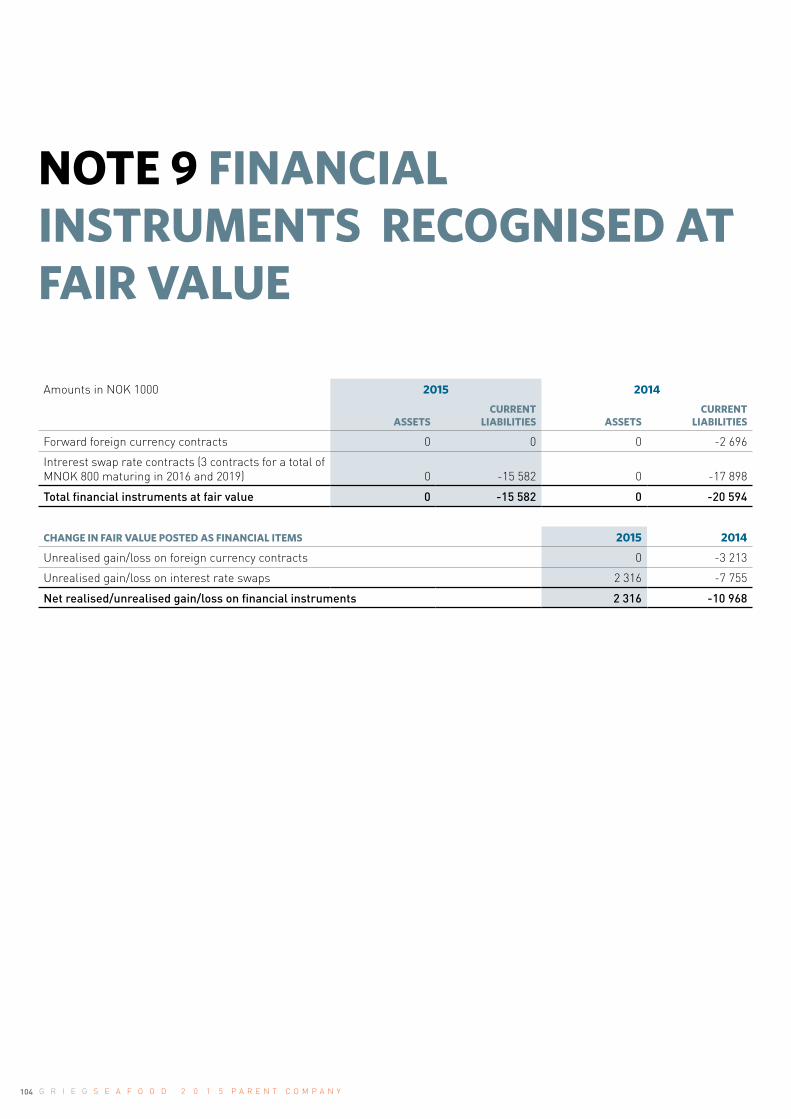
104 G R I E G S E A F O O D 2 0 1 5 P A R E N T C O M P A N Y
NOTE 9 FINANCIAL INSTRUMENTS RECOGNISED AT FAIR VALUE
Amounts in NOK 1000 2015 2014
ASSETS CURRENT
LIABILITIES ASSETS CURRENT
LIABILITIES
Forward foreign currency contracts 0 0 0 -2 696
Intrerest swap rate contracts (3 contracts for a total of MNOK 800 maturing in 2016 and 2019) 0 -15 582 0 -17 898
Total financial instruments at fair value 0 -15 582 0 -20 594
CHANGE IN FAIR VALUE POSTED AS FINANCIAL ITEMS 2015 2014
Unrealised gain/loss on foreign currency contracts 0 -3 213
Unrealised gain/loss on interest rate swaps 2 316 -7 755
Net realised/unrealised gain/loss on financial instruments 2 316 -10 968
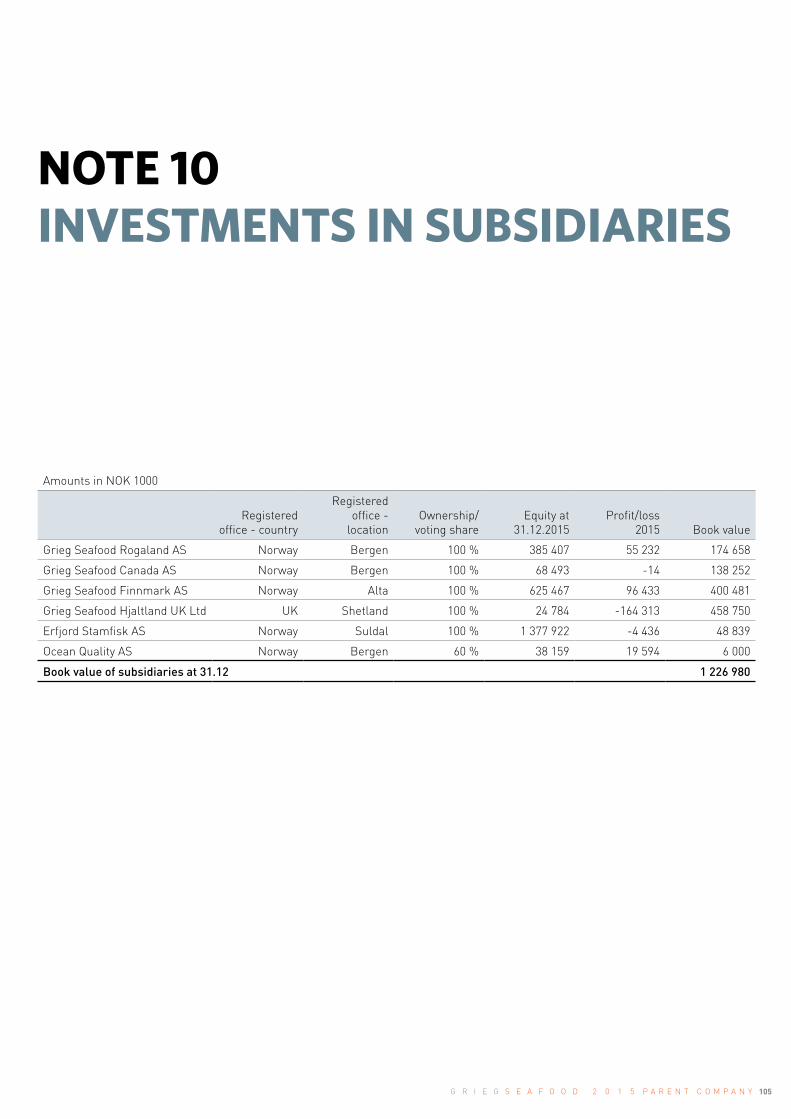
105G R I E G S E A F O O D 2 0 1 5 P A R E N T C O M P A N Y
NOTE 10 INVESTMENTS IN SUBSIDIARIES
Amounts in NOK 1000
Registered office - country
Registered office -
location Ownership/
voting shareEquity at
31.12.2015Profit/loss
2015 Book value
Grieg Seafood Rogaland AS Norway Bergen 100 % 385 407 55 232 174 658
Grieg Seafood Canada AS Norway Bergen 100 % 68 493 -14 138 252
Grieg Seafood Finnmark AS Norway Alta 100 % 625 467 96 433 400 481
Grieg Seafood Hjaltland UK Ltd UK Shetland 100 % 24 784 -164 313 458 750
Erfjord Stamfisk AS Norway Suldal 100 % 1 377 922 -4 436 48 839
Ocean Quality AS Norway Bergen 60 % 38 159 19 594 6 000
Book value of subsidiaries at 31.12 1 226 980

106 G R I E G S E A F O O D 2 0 1 5 P A R E N T C O M P A N Y
Amounts in NOK 1000
INVESTMENTS IN SHARES Registered
office - country
Registered office -
location Ownership/
voting share No. of shares Acquisition cost Book value
Finnøy Næringspark AS Norge Finnøy 7,14 % 100 103 103
DN Global Allokering Norge Oslo - 3 038 630 444
Codfarmers ASA Norge Oslo 0,00 % 500 156 4
CO2 AS Norge Lindås 10,00 % 2 20 20
Norsk Villaksforvaltning Norge Førde 15,15 % 5 50 50
Fiskeriforum Vest Norge Bergen 20,00 % 20 16 16
Book value of shares at 31.12 637
NOTE 11 INVESTMENTS IN SHARES

107G R I E G S E A F O O D 2 0 1 5 P A R E N T C O M P A N Y
NOTE 12 INTANGIBLE ASSETS
2014 SOFTWARE
Book value at 01.01 4 373
Book value 01.01 reclassified intangible assets 3 341
Intangible assets acquired 8 107
Amortisation -4 501
Book value at 31.12 11 320
As at 31.12.
Acquisition cost 23 703
Accumulated amortisation -12 383
Book value at 31.12 11 320
Economic lifetime/amortisation plan 3 - 10 years
2015 SOFTWARE
Book value at 01.01. 11 320
Intangible assets acquired 9 161
Amortisation -3 830
Book value at 31.12 16 651
As at 31.12.
Acquisition cost 32 864
Accumulated amortisation -16 213
Book value at 31.12 16 651
Economic lifetime/amortisation plan 3 - 10 years

108 G R I E G S E A F O O D 2 0 1 5 P A R E N T C O M P A N Y
NOTE 13 TANGIBLE FIXED ASSETS
2014 PLANT, EQUIPMENT AND OTHER
FIXTURES ETC.
Book value at 01.01 7 871
Book value 01.01 reclassified intangible assets -3 341
Tangible fixed assets acquired 678
Depreciation -1 301
Book value at 31.12. 3 908
As at 31.12.
Acquisition cost 10 678
Accumulated depreciation -6 770
Book value at 31.12 3 908
Economic lifetime/amortisation plan 3-5 years
2015 PLANT, EQUIPMENT AND OTHER
FIXTURES ETC.
Book value at 01.01 3 908
Tangible fixed assets acquired 2 351
Depreciation -1 446
Book value at 31.12 4 814
As at 31.12.
Acquisition cost 13 030
Accumulated depreciation -8 216
Book value at 31.12 4 814
Economic lifetime/amortisation plan 3-5 years
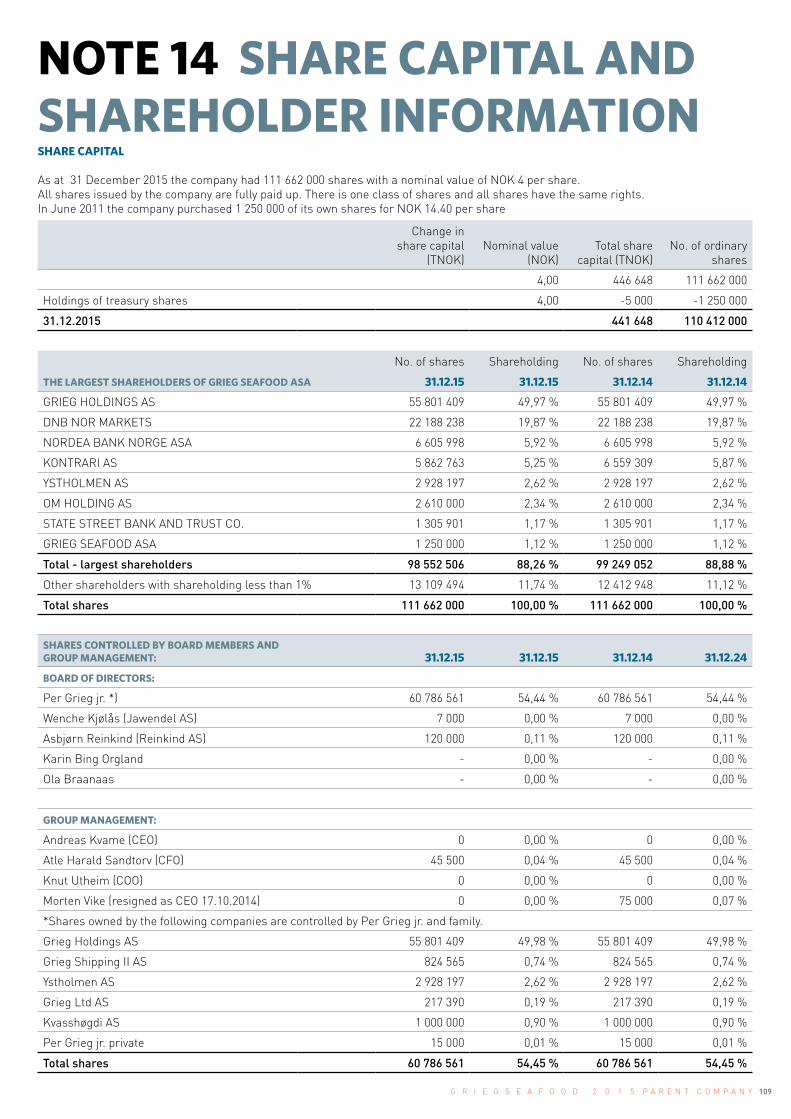
109G R I E G S E A F O O D 2 0 1 5 P A R E N T C O M P A N Y
NOTE 14 SHARE CAPITAL AND SHAREHOLDER INFORMATIONSHARE CAPITAL
As at 31 December 2015 the company had 111 662 000 shares with a nominal value of NOK 4 per share.All shares issued by the company are fully paid up. There is one class of shares and all shares have the same rights. In June 2011 the company purchased 1 250 000 of its own shares for NOK 14.40 per share
Change in share capital
(TNOK) Nominal value
(NOK) Total share
capital (TNOK) No. of ordinary
shares
4,00 446 648 111 662 000
Holdings of treasury shares 4,00 -5 000 -1 250 000
31.12.2015 441 648 110 412 000
No. of shares Shareholding No. of shares Shareholding
THE LARGEST SHAREHOLDERS OF GRIEG SEAFOOD ASA 31.12.15 31.12.15 31.12.14 31.12.14
GRIEG HOLDINGS AS 55 801 409 49,97 % 55 801 409 49,97 %
DNB NOR MARKETS 22 188 238 19,87 % 22 188 238 19,87 %
NORDEA BANK NORGE ASA 6 605 998 5,92 % 6 605 998 5,92 %
KONTRARI AS 5 862 763 5,25 % 6 559 309 5,87 %
YSTHOLMEN AS 2 928 197 2,62 % 2 928 197 2,62 %
OM HOLDING AS 2 610 000 2,34 % 2 610 000 2,34 %
STATE STREET BANK AND TRUST CO. 1 305 901 1,17 % 1 305 901 1,17 %
GRIEG SEAFOOD ASA 1 250 000 1,12 % 1 250 000 1,12 %
Total - largest shareholders 98 552 506 88,26 % 99 249 052 88,88 %
Other shareholders with shareholding less than 1% 13 109 494 11,74 % 12 412 948 11,12 %
Total shares 111 662 000 100,00 % 111 662 000 100,00 %
SHARES CONTROLLED BY BOARD MEMBERS AND GROUP MANAGEMENT: 31.12.15 31.12.15 31.12.14 31.12.24
BOARD OF DIRECTORS:
Per Grieg jr. *) 60 786 561 54,44 % 60 786 561 54,44 %
Wenche Kjølås (Jawendel AS) 7 000 0,00 % 7 000 0,00 %
Asbjørn Reinkind (Reinkind AS) 120 000 0,11 % 120 000 0,11 %
Karin Bing Orgland - 0,00 % - 0,00 %
Ola Braanaas - 0,00 % - 0,00 %
GROUP MANAGEMENT:
Andreas Kvame (CEO) 0 0,00 % 0 0,00 %
Atle Harald Sandtorv (CFO) 45 500 0,04 % 45 500 0,04 %
Knut Utheim (COO) 0 0,00 % 0 0,00 %
Morten Vike (resigned as CEO 17.10.2014) 0 0,00 % 75 000 0,07 %
*Shares owned by the following companies are controlled by Per Grieg jr. and family.
Grieg Holdings AS 55 801 409 49,98 % 55 801 409 49,98 %
Grieg Shipping II AS 824 565 0,74 % 824 565 0,74 %
Ystholmen AS 2 928 197 2,62 % 2 928 197 2,62 %
Grieg Ltd AS 217 390 0,19 % 217 390 0,19 %
Kvasshøgdi AS 1 000 000 0,90 % 1 000 000 0,90 %
Per Grieg jr. private 15 000 0,01 % 15 000 0,01 %
Total shares 60 786 561 54,45 % 60 786 561 54,45 %
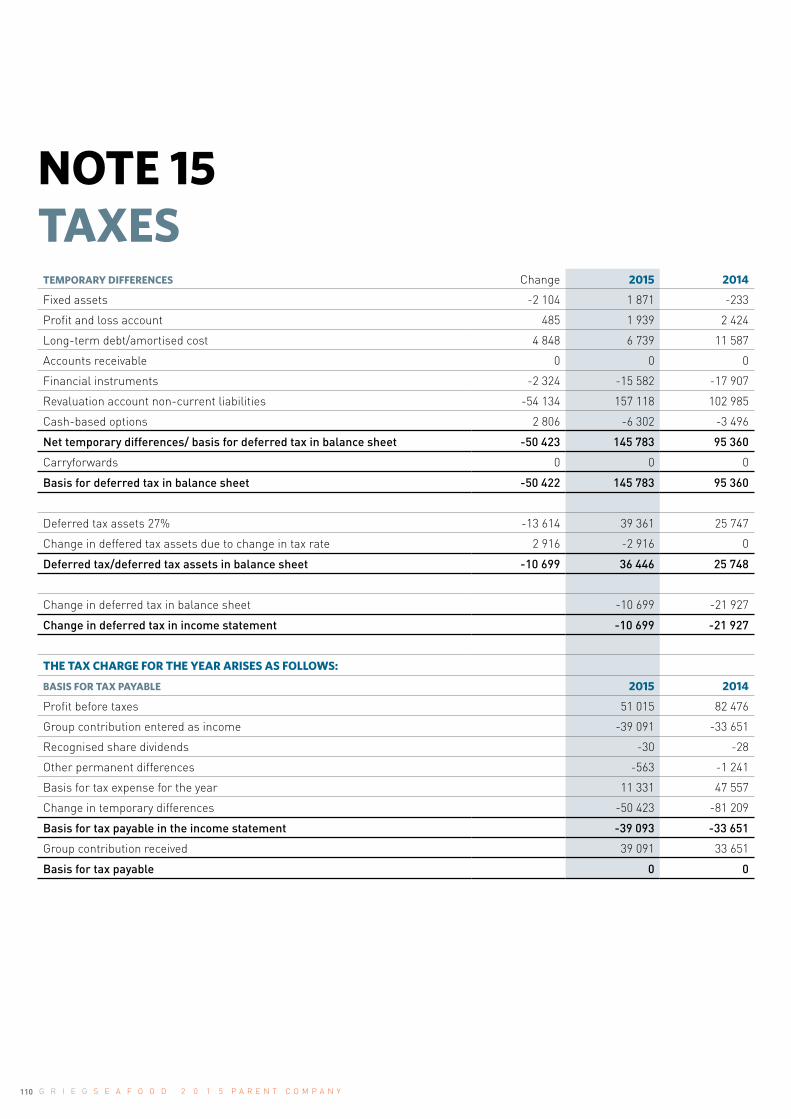
110 G R I E G S E A F O O D 2 0 1 5 P A R E N T C O M P A N Y
NOTE 15 TAXES
TEMPORARY DIFFERENCES Change 2015 2014
Fixed assets -2 104 1 871 -233
Profit and loss account 485 1 939 2 424
Long-term debt/amortised cost 4 848 6 739 11 587
Accounts receivable 0 0 0
Financial instruments -2 324 -15 582 -17 907
Revaluation account non-current liabilities -54 134 157 118 102 985
Cash-based options 2 806 -6 302 -3 496
Net temporary differences/ basis for deferred tax in balance sheet -50 423 145 783 95 360
Carryforwards 0 0 0
Basis for deferred tax in balance sheet -50 422 145 783 95 360
Deferred tax assets 27% -13 614 39 361 25 747
Change in deffered tax assets due to change in tax rate 2 916 -2 916 0
Deferred tax/deferred tax assets in balance sheet -10 699 36 446 25 748
Change in deferred tax in balance sheet -10 699 -21 927
Change in deferred tax in income statement -10 699 -21 927
THE TAX CHARGE FOR THE YEAR ARISES AS FOLLOWS:
BASIS FOR TAX PAYABLE 2015 2014
Profit before taxes 51 015 82 476
Group contribution entered as income -39 091 -33 651
Recognised share dividends -30 -28
Other permanent differences -563 -1 241
Basis for tax expense for the year 11 331 47 557
Change in temporary differences -50 423 -81 209
Basis for tax payable in the income statement -39 093 -33 651
Group contribution received 39 091 33 651
Basis for tax payable 0 0
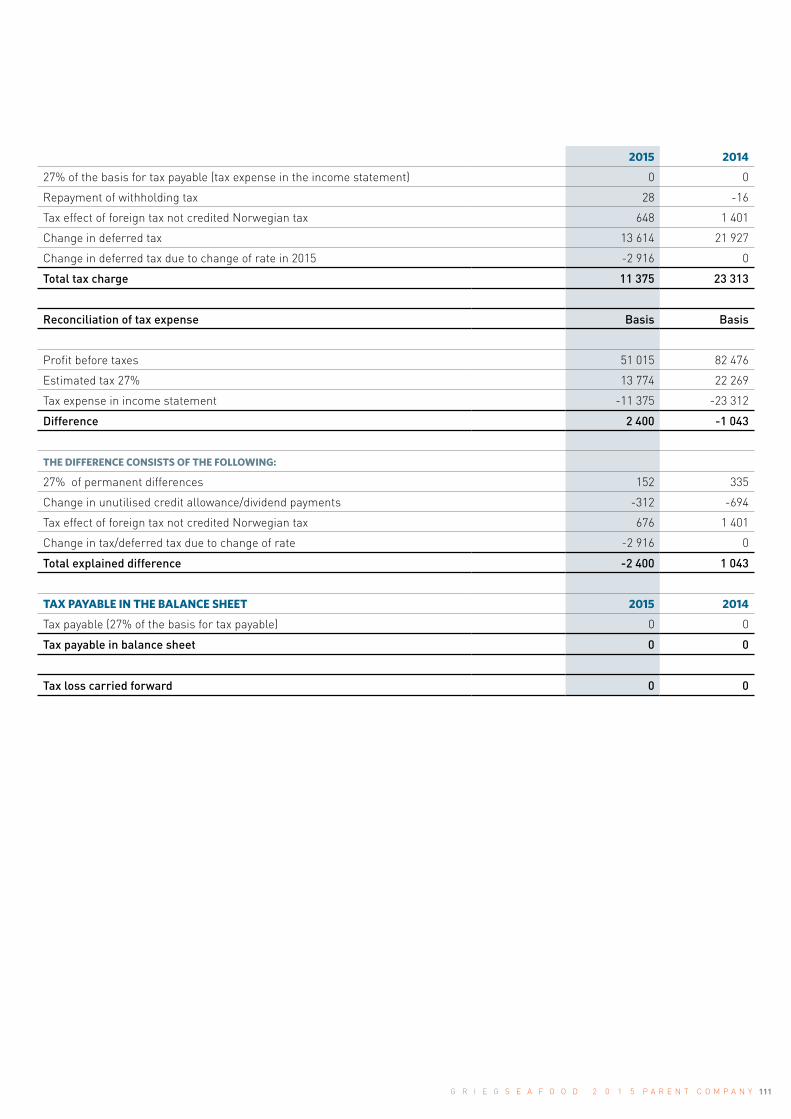
111G R I E G S E A F O O D 2 0 1 5 P A R E N T C O M P A N Y
2015 2014
27% of the basis for tax payable (tax expense in the income statement) 0 0
Repayment of withholding tax 28 -16
Tax effect of foreign tax not credited Norwegian tax 648 1 401
Change in deferred tax 13 614 21 927
Change in deferred tax due to change of rate in 2015 -2 916 0
Total tax charge 11 375 23 313
Reconciliation of tax expense Basis Basis
Profit before taxes 51 015 82 476
Estimated tax 27% 13 774 22 269
Tax expense in income statement -11 375 -23 312
Difference 2 400 -1 043
THE DIFFERENCE CONSISTS OF THE FOLLOWING:
27% of permanent differences 152 335
Change in unutilised credit allowance/dividend payments -312 -694
Tax effect of foreign tax not credited Norwegian tax 676 1 401
Change in tax/deferred tax due to change of rate -2 916 0
Total explained difference -2 400 1 043
TAX PAYABLE IN THE BALANCE SHEET 2015 2014
Tax payable (27% of the basis for tax payable) 0 0
Tax payable in balance sheet 0 0
Tax loss carried forward 0 0

112 G R I E G S E A F O O D 2 0 1 5 P A R E N T C O M P A N Y
GUARANTEES
As at 31.12.2015 GSF ASA had a guarantee commitment of MNOK 190 in connection with leasing contracts with SF Finans AS, on behalf of subsidiaries.
GUARANTOR
Grieg Seafood ASA served as guarantor on behalf of Grieg Seafood Finnmark AS, Grieg Seafood Rogaland AS and Erfjord Stamfisk AS in connection with an extension of credit for the purchase of fish feed from Skretting. The total amount is MNOK 115, with maturity on 30.06.2016.
NOTE 16 GARANTEES, GUARANTOR

113G R I E G S E A F O O D 2 0 1 5 P A R E N T C O M P A N Y
NOTE 17 RELATED PARTIES
Amounts in NOK 1000
2015
Operating
income
Operating expenses
Financial income
Financial expenses
Current receivables,
group companies
Non-current
receivables, group
companies Current
receivables
Current liabilities to group
companies
Total related parties - group companies 52 351 782 55 823 -529 903 345 691 259 4 827 -26 511
Total related parties - shareholders 0 5 373 0 0 0 0 0 -492
Total 52 351 6 155 55 823 -529 903 345 691 259 4 827 -27 003
2014
Operating
income
Operating expenses
Financial income
Financial expenses
Current receivables,
group companies
Non-current
receivables, group
companies Current
receivables
Current liabilities to group
companies
Total related parties - group companies 37 534 1 626 51 104 311 933 860 637 126 1 901 40 446
Total related parties - joint venture 3 099 0 0 0 0 0 146 0
Total related parties - shareholders 0 4 560 0 0 0 0 297 -195
Total 40 633 6 186 51 104 311 933 860 637 126 2 344 40 251
The company purchases services from companies controlled by Grieg Seafood ASA´s majority shareholder, Grieg Holdings AS. These services include• Services related to ICT and other functions such as book-keeping, canteen, reception etc., provided by Grieg Group Resources AS on
an arm’s length basis. • Grieg Seafood ASA rents its offices from Grieg Gaarden KS, based on an arm’s length. • The parent company provides a range of services to the subsidiaries. The services include administrative services and services related
to the parent provision of non-current loans and short-term credit facilities to the subsidiaries. The interest is on an arm´s length basis.
• As from 2015, Ocean Quality AS is classified as a subsidiary to Grieg Seafood ASA. Grieg Seafood ASA enters into hedging contracts on behalf of Grieg Seafood Rogaland AS and Grieg Seafood Finnmark AS. The arrangement is intended to reduce these companies´ exposure to salmon prices. The agreements with the subsidiaries are priced on the basis of a “back to back” arrangement.
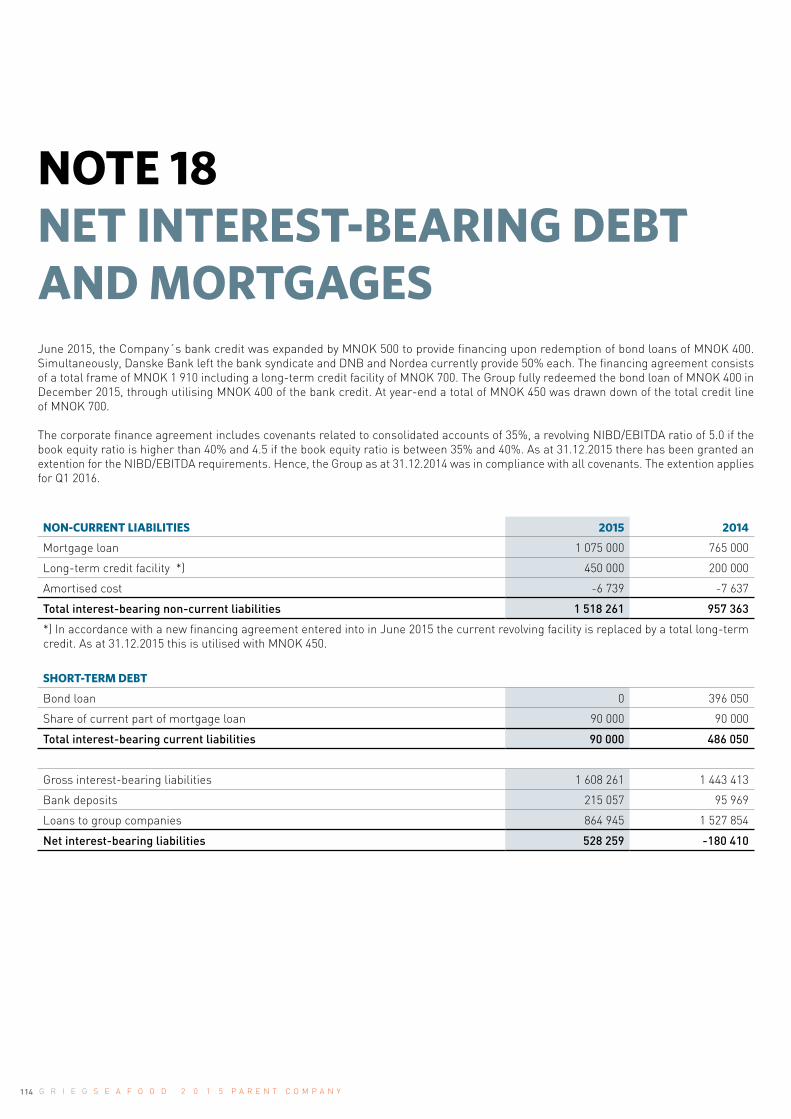
114 G R I E G S E A F O O D 2 0 1 5 P A R E N T C O M P A N Y
NOTE 18 NET INTEREST-BEARING DEBT AND MORTGAGES
NON-CURRENT LIABILITIES 2015 2014
Mortgage loan 1 075 000 765 000
Long-term credit facility *) 450 000 200 000
Amortised cost -6 739 -7 637
Total interest-bearing non-current liabilities 1 518 261 957 363
*) In accordance with a new financing agreement entered into in June 2015 the current revolving facility is replaced by a total long-term credit. As at 31.12.2015 this is utilised with MNOK 450.
SHORT-TERM DEBT
Bond loan 0 396 050
Share of current part of mortgage loan 90 000 90 000
Total interest-bearing current liabilities 90 000 486 050
Gross interest-bearing liabilities 1 608 261 1 443 413
Bank deposits 215 057 95 969
Loans to group companies 864 945 1 527 854
Net interest-bearing liabilities 528 259 -180 410
June 2015, the Company´s bank credit was expanded by MNOK 500 to provide financing upon redemption of bond loans of MNOK 400. Simultaneously, Danske Bank left the bank syndicate and DNB and Nordea currently provide 50% each. The financing agreement consists of a total frame of MNOK 1 910 including a long-term credit facility of MNOK 700. The Group fully redeemed the bond loan of MNOK 400 in December 2015, through utilising MNOK 400 of the bank credit. At year-end a total of MNOK 450 was drawn down of the total credit line of MNOK 700.
The corporate finance agreement includes covenants related to consolidated accounts of 35%, a revolving NIBD/EBITDA ratio of 5.0 if the book equity ratio is higher than 40% and 4.5 if the book equity ratio is between 35% and 40%. As at 31.12.2015 there has been granted an extention for the NIBD/EBITDA requirements. Hence, the Group as at 31.12.2014 was in compliance with all covenants. The extention applies for Q1 2016.

115G R I E G S E A F O O D 2 0 1 5 P A R E N T C O M P A N Y
MATURITY PROFILE - NON-CURRENT LIABILITIES 2015 2016 2017 2018SUBSE-
QUENTLY TOTAL
Mortgage loan 90 000 90 000 90 000 90 000 798 261 1 068 261
Long-term credit facility *) 450 000 450 000
Total 90 000 90 000 90 000 90 000 1 248 261 1 518 261
*) In accordance with a new financing agreement entered into in June 2015 the current revolving facility is replaced by a total long-term credit. As at 31.12.2015 this is utilised with MNOK 450.
LIABILITIES SECURED BY MORTGAGE 2015 2014
Liabilities to credit institutions 1 608 261 1 055
Total liabilities 1 608 261 1 055
BOOK VALUE OF ASSETS PLEDGED AS SECURITY
Shares in subsidiaries 1 226 980 1 220 980
Shares in joint ventures - 6 000
Fixed assets 4 814 3 908
Accounts receivable 4 827 2 344
Loans to group companies 864 945 1 527 854
Total assets pledged as security 2 101 566 2 761 086
In addition, pledges to banks include fixed assets, licences, inventories and accounts receivables from subsidiaries.
2015 2014
TYPE OF DEBT Currency Interest rate Maturity Current
portion
Non-current portion
Current portion
Non-current portion
Syndicated long-term loan NOK Floating 06/2019 90 000 1 518 261 90 000 757 363
Syndicated loan revolving credit NOK Floating 06/2019 200 000
Bond loan NOK Floating 12/2015 396 050
Total 90 000 1 518 261 486 050 957 363
AVERAGE INTEREST RATE ON SYNDICATED LOANS, 2015
31.12.15 NOK CAD GBP USD
Syndicated long-term loan 1 158 261 1 158 261
Syndicated loan revolving credit 450 000 450 000
Total loans 1 608 261 1 608 261 0 0 0
2015 2014
Average rate of interest (adjusted with effect of interest swap) 4,70 % 5,18 %

116 G R I E G S E A F O O D 2 0 1 5 P A R E N T C O M P A N Y
NOTE 19 POST-BALANCE SHEET EVENTS Since the closing of accounts at year-end 2015 there have been no events which could materially affect the accounts for 2015.

117G R I E G S E A F O O D 2 0 1 5 P A R E N T C O M P A N Y
PricewaterhouseCoopers AS, Sandviksbodene 2A, Postboks 3984 - Sandviken, NO-5835 Bergen T: 02316, org. no.: 987 009 713 MVA, www.pwc.no Statsautoriserte revisorer, medlemmer av Den norske Revisorforening og autorisert regnskapsførerselskap
To the Annual Shareholders' Meeting of Grieg Seafood ASA
Independent auditor’s report
Report on the Financial Statements
We have audited the accompanying financial statements of Grieg Seafood ASA, which comprise the financial statements of the parent company and the financial statements of the group. The financial statements of the parent company comprise the balance sheet as at 31 December 2015, and the income statement, statement of changes in equity and cash flow statement, for the year then ended, and a summary of significant accounting policies and other explanatory information. The financial statements of the group comprise the balance sheet at 31 December 2015, income statement, statement of comprehensive income, changes in equity and cash flow for the year then ended, and a summary of significant accounting policies and other explanatory information.
The Board of Directors and the Managing Director’s Responsibility for the Financial Statements
The Board of Directors and the Managing Director are responsible for the preparation and fair presentation of the financial statements of the parent company in accordance with Norwegian Accounting Act and accounting standards and practices generally accepted in Norway, and for the preparation and fair presentation of the financial statements of the group in accordance with International Financial Reporting Standards as adopted by EU and for such internal control as the Board of Directors and the Managing Director determine is necessary to enable the preparation of financial statements that are free from material misstatement, whether due to fraud or error.
Auditor’s Responsibility
Our responsibility is to express an opinion on these financial statements based on our audit. We conducted our audit in accordance with laws, regulations, and auditing standards and practices generally accepted in Norway, including International Standards on Auditing. Those standards require that we comply with ethical requirements and plan and perform the audit to obtain reasonable assurance about whether the financial statements are free from material misstatement.
An audit involves performing procedures to obtain audit evidence about the amounts and disclosures in the financial statements. The procedures selected depend on the auditor’s judgment, including the assessment of the risks of material misstatement of the financial statements, whether due to fraud or error. In making those risk assessments, the auditor considers internal control relevant to the entity’s preparation and fair presentation of the financial statements in order to design audit procedures that are appropriate in the circumstances, but not for the purpose of expressing an opinion on the effectiveness of the entity’s internal control. An audit also includes evaluating the appropriateness of accounting policies used and the reasonableness of accounting estimates made by management, as well as evaluating the overall presentation of the financial statements.
We believe that the audit evidence we have obtained is sufficient and appropriate to provide a basis for our audit opinion.

118 G R I E G S E A F O O D 2 0 1 5 P A R E N T C O M P A N Y
Independent auditor's report - 2015 - Grieg Seafood ASA, page 2
(2)
Opinion on the financial statements of the parent company
In our opinion, the financial statements of the parent company are prepared in accordance with the law and regulations and present fairly, in all material respects, the financial position for Grieg Seafood ASA as at 31 December 2015, and its financial performance and its cash flows for the year then ended in accordance with the Norwegian Accounting Act and accounting standards and practices generally accepted in Norway.
Opinion on the financial statements of the group
In our opinion, the financial statements of the group are prepared in accordance with the law and regulations and present fairly, in all material respects, the financial position of the group Grieg Seafood ASA as at 31 December 2015, and its financial performance and its cash flows for the year then ended in accordance with International Financial Reporting Standards as adopted by EU.
Report on Other Legal and Regulatory Requirements
Opinion on the Board of Directors' report and the statement on Corporate Governance
Based on our audit of the financial statements as described above, it is our opinion that the information presented in the Board of Directors report and in the statement on Corporate Governance concerning the financial statements, the going concern assumption and the proposal for the allocation of the profit is consistent with the financial statements and complies with the law and regulations.
Opinion on Registration and Documentation
Based on our audit of the financial statements as described above, and control procedures we have considered necessary in accordance with the International Standard on Assurance Engagements ISAE 3000 “Assurance Engagements Other than Audits or Reviews of Historical Financial Information”, it is our opinion that management has fulfilled its duty to produce a proper and clearly set out registration and documentation of the company’s accounting information in accordance with the law and bookkeeping standards and practices generally accepted in Norway.
Bergen, 6 April 2016 PricewaterhouseCoopers AS Jon Haugervåg State Authorised Public Accountant (Norway) Note: This translation from Norwegian has been prepared for information purposes only.