ANNUAL REPORT 2015 - Finbar
49
ANNUAL REPORT 2015
Transcript of ANNUAL REPORT 2015 - Finbar
ANNUAL REPORT 2015
An
nu
al R
ep
or
t 20
15

Finbar Group Limited 1
developing
better
lifestyles

2 Annual Report 2015 Finbar Group Limited 3
CONTENTS
The Year at a Glance 4
Key Financial Results 5
Chairman’s Report 6
Managing Director’s Report 8
Finbar Overview 10
Key Achievements 12
Developing Better Lifestyles 15
Development Overview 16
Finbar’s Regional Projects 26
Finbar’s Investment Properties 27
Financial Report 28
CORPORATE DETAILS
Directors
Mr John Chan (Executive Chairman)
Mr Darren Pateman (Managing Director)
Mr John Boon Heng Cheak
Mr Kee Kong Loh
Mr Lee Verios
Company Secretary
Mr Anthony Hewett
ABN
97 009 113 473
Principal Registered Office
Finbar Group Limited Level 6 181 Adelaide Terrace EAST PERTH WA 6004
PO Box 3380 EAST PERTH WA 6892
Telephone: +61 8 6211 3300 Facsimile: +61 8 9221 8833 Email: [email protected] Website: www.finbar.com.au
Share Registry
Computershare Investor Services Pty Ltd Level 11 172 St Georges Terrace PERTH WA 6000 Telephone: +61 8 9323 2000
Auditors
KPMG 235 St Georges Terrace PERTH WA 6000
www.finbar.com.au
4 Annual Report 2015 Finbar Group Limited 5
THE YEAR AT A GLANCE
OTHER FACTS AND FIGURES
2% Interest
32% Subi Strand
5% AU3%
52 Mill Point Road
1% Pelago
32% Toccata
26% Spring View
Towers
1% Adagio
28% Fairlanes
41% Pelago
2% Other
29% Gateway
Source of Rental Earnings
Source of Development Earnings
Source of All Earnings
84% Developments
8% Rental
6% Management
Fees
KEY FINANCIAL RESULTS
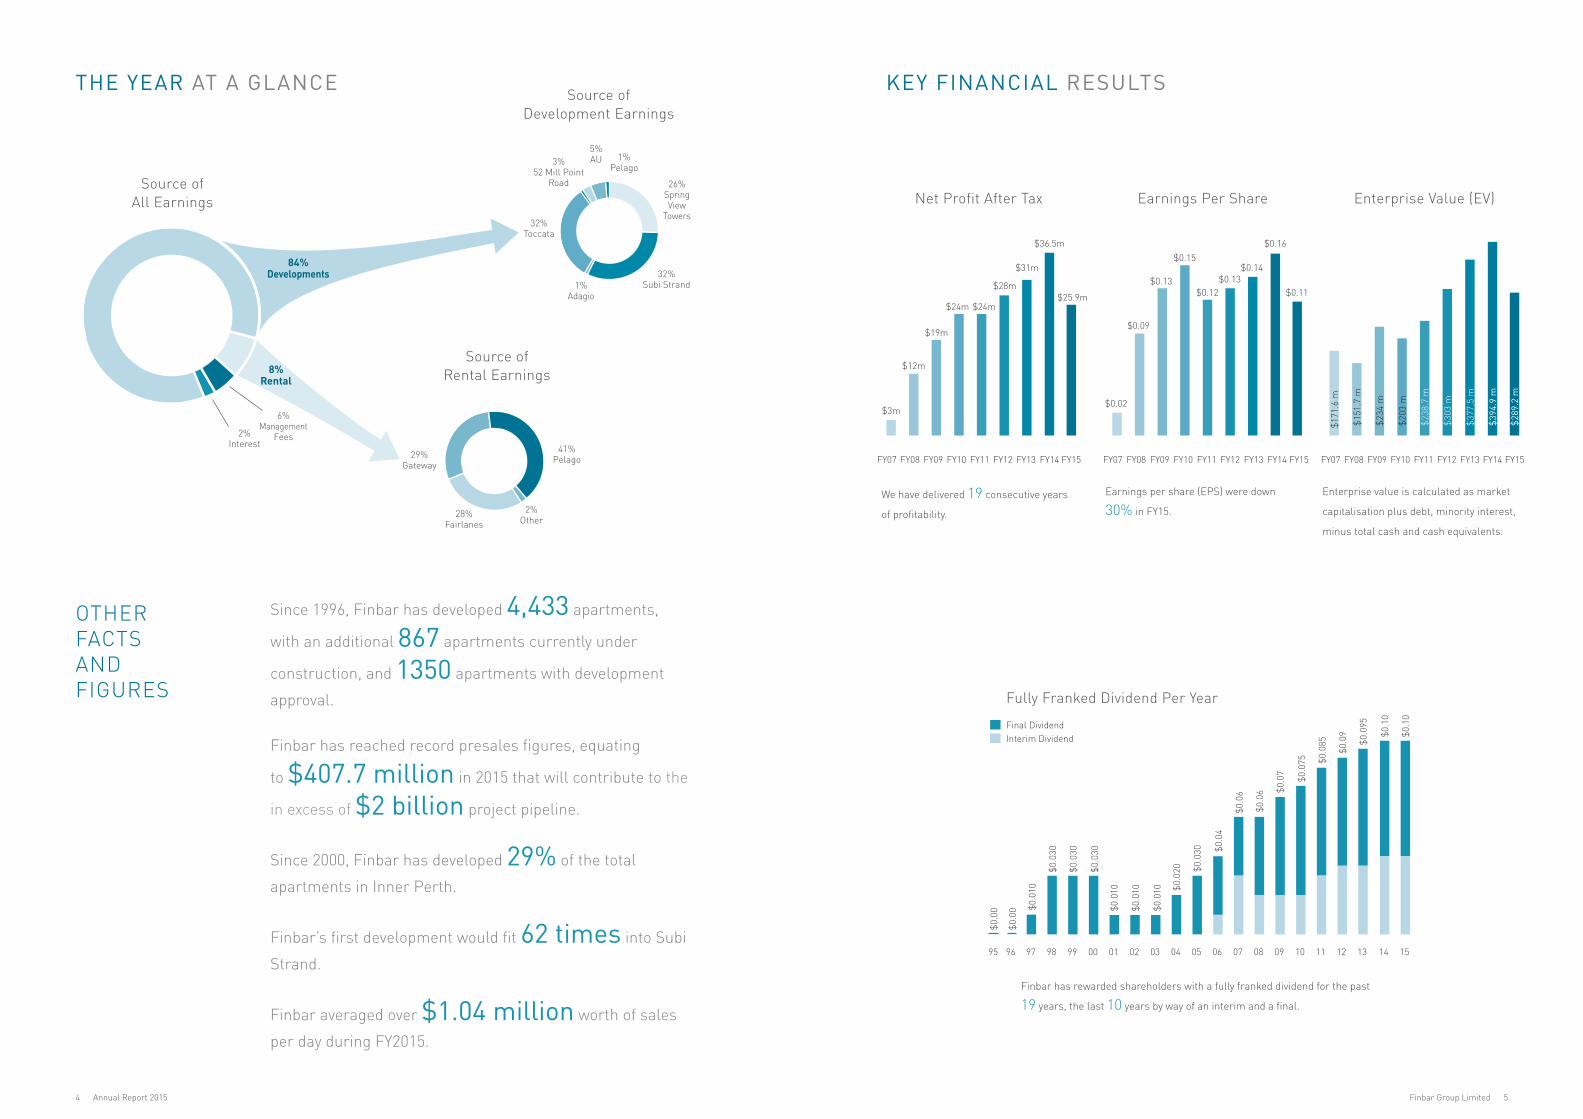
We have delivered 19 consecutive years
of profitability.
Earnings per share (EPS) were down
30% in FY15.
Finbar has rewarded shareholders with a fully franked dividend for the past
19 years, the last 10 years by way of an interim and a final.
$0.16
$0.11
Net Profit After Tax
$0.02
$0.09
$0.13$0.12
$0.15
$0.13$0.14
FY07 FY08 FY09 FY10 FY11 FY12 FY13 FY14 FY15
$3m
$12m
$19m
$24m$25.9m
$24m
$28m
$31m
$36.5m
FY07 FY08 FY09 FY10 FY11 FY12 FY13 FY14 FY15
Earnings Per Share
Enterprise value is calculated as market
capitalisation plus debt, minority interest,
minus total cash and cash equivalents.
Enterprise Value (EV)
FY07 FY08 FY09 FY10 FY11 FY12 FY13 FY14 FY15
$377
.5 m
$394
.9 m
$289
.2 m
$238
.7 m
$234
m
$151
.7 m
$203
m
$171
.6 m
$303
m
Interim DividendFinal Dividend
Fully Franked Dividend Per Year
95 0496 0597 0698 0799 0800 0901 1002 1103 12 13 14 15
$0.0
30
$0.0
30
$0.0
30
$0.0
10
$0.0
0
$0.0
0
$0.0
6
$0.0
4
$0.0
10
$0.0
10
$0.0
10 $0.0
20
$0.0
6 $0.0
7
$0.0
75 $0.0
85
$0.0
9
$0.0
95
$0.1
0
$0.1
0
$0.0
30
Since 1996, Finbar has developed 4,433 apartments,
with an additional 867 apartments currently under
construction, and 1350 apartments with development
approval.
Finbar has reached record presales figures, equating
to $407.7 million in 2015 that will contribute to the
in excess of $2 billion project pipeline.
Since 2000, Finbar has developed 29% of the total
apartments in Inner Perth.
Finbar’s first development would fit 62 times into Subi
Strand.
Finbar averaged over $1.04 million worth of sales
per day during FY2015.

6 Annual Report 2015 Finbar Group Limited 7
Dear Shareholder
As we celebrate our 20th year as a residential property developer in Western Australia, I am delighted to present your company’s 2015 Annual Report.
We have had a successful year, completing a number of major projects and seeing several projects enter the construction phase or receive development approval. As a result, the growth is set to continue as we build on our enviable reputation as one of Perth’s most successful residential property developers.
Finbar Group’s net profit after tax for the 12 months to 30 June 2015 was $25.9m million. While the Board regards this as a respectable result, there is no escaping the fact that – as previously flagged to the market – it is down slightly on last year’s profit. This can largely be attributed to timing issues, reflecting the fact that as our projects get larger and more complex, the time lapse until the receipt of sales revenue tends to increase.
However, I am very pleased to report that we can maintain a dividend of 10 cents per share, to be paid to shareholders in September. Very importantly, we are able to pay this dividend while retaining our strong cash position, ensuring we are well capitalised to fund future growth. Your company remains in an excellent position with a strong balance sheet and a conservative approach to financing our projects.
Twenty years of success is something that everyone involved in the Finbar story can take some measure of pride in.
Over the past two decades we have completed 4,433 units in Western Australia, putting us very much at the forefront of our industry. Thousands of people are now enjoying the amenities of the properties we have brought to market.
As we move forward, one of the opportunities we have identified is to increase our level of repeat sales. Approximately five per cent of Finbar apartments are currently purchased by repeat buyers but we believe we can significantly improve this percentage in future due to our strong brand reputation and buyer experience when purchasing a Finbar property.
Therefore, we will shortly be launching the Finbar Loyalty Club which is an exclusive incentives program designed to reward our past customers and shareholders. This will offer a range of benefits for repeat customers and shareholders as well as those who refer friends and family to us. We are also developing a member showroom at the entrance to our corporate office which will give us an extra edge in our marketing endeavours.
A significant factor in our success to date has been the partnerships that we have formed to jointly fund our projects. While we are continuing to work closely with our highly-valued Western Australian partners, we are also continuing to attract interest from overseas companies who wish to partner with Finbar as a result of our strong brand and enviable track record. In the 2015 financial year we have secured Perth Upper China as our latest partner.
Perth Upper China is based in China, and therefore will be a valuable partner for us as we seek further assistance to market projects in Western Australia to potential Chinese buyers. This new partnership in China complements our other existing international partnerships in Singapore, Indonesia, and Malaysia.
Shareholders can be assured that the Board and indeed the entire company is committed to delivering value through maintaining our relationships with our quality venture partners, as part of our overall strategy to achieve continued growth.
In closing, on behalf of the Board I wish to place on my record our appreciation of the endeavours of our Managing Director, his management team and indeed the entire Finbar staff for their hard work over the past 12 months. This has enabled us to build on our strong reputation and continue to exceed the expectations of our customers.
We look forward to many more decades of growth to come.
CHAIRMAN’S REPORT
Over the past two decades we have completed 4,433 units in Western Australia,
putting us very much at the forefront of our industry.
John Chan Executive Chairman 11 September 2015
Subi Strand Apartments
between Roydhouse Street
& Hood Street in Subiaco,
was completed in May 2015.

8 Annual Report 2015 Finbar Group Limited 9
I am delighted to report that we achieved another solid year of profitability for the financial year ended 30 June 2015 (FY15) which was supported by a record cash position of approximately $69 million and the largest level of pre-sale contracts in our history.
The timing of the construction and completion cycle in FY15 provided us with less assistance to the reported net profit than in previous years. As our projects become larger, the time gap for the receipt of sales revenue increases meaning that sales revenue may not always fall neatly inside a reporting period and provide a smooth level of earnings growth. However, Finbar’s record cash position and strong support from our financiers ensure we are well capitalised to fund our current pipeline of large scale projects under construction while continuing to assess a steady deal-flow of new acquisition opportunities.
Finbar continued to meet Western Australia’s growing demand for quality apartment developments in FY15 with the completion of Spring View Towers, Subi Strand and Toccata projects on time and on budget, representing a total end sales value of approximately $350.3 million. Each one of these projects has stood on its own merits by achieving a strong profit margin and contributing to the Company’s overall profitability.
As part of our conservative financial approach, the outstanding debt on all three projects was retired upon settlement to support the next cycle of acquisitions and project commencements underpinning our future growth.
During the second half of FY15, we commenced on the Linq, Unison on Tenth and Aurelia projects to join the Norwood, Arbor North and Concerto projects also under construction. Finbar is still achieving steady sales progress across all projects in the marketing phase, despite softer local market conditions. In addition to the support we are receiving from local buyers, we are also recording a growing interest from overseas buyers in the Perth market as apartments remain their preferred choice of accommodation.
Since September 2014, we have received eight development approvals for the Civic Heart, Aurelia, Linq, Motive, Sunago, Aire West Perth, Lot 1014, and Port Hedland (first stage). Springs projects which have a combined project end value of more than $1.06 billion. The stand out development approval during FY15 was the Civic Heart project in South Perth which has an end value of $414.4 million. This project represents our highest value single stage development to date with a marketing launch anticipated to commence by the time you receive this report, construction expected in early 2016 and final delivery of the project forecast mid-2018.
It is one of the most exciting projects in our company’s history given the design elements, the scale and size of the development and the importance of what we are providing to the community of South Perth.
These eight projects combined account for 1,422 apartments and approximately 15,000m2 of commercial space which are forecast to contribute significantly to Finbar’s earnings over the next few years. Again, the scale and size of these projects illustrates the new levels we are now committing ourselves to, following the significant increase in demand for more sophisticated inner city apartment living in Perth in recent years and the need to meet this long term supply trend.
On the back of reaching a 10 ten year exclusivity agreement in February 2014 with Hanssen Pty Ltd, we have continued to forge a stronger and closer relationship with our long standing primary building contractor. Hanssen has invested further capital in equipment exclusively designed for use in Finbar projects during FY15 which has further increased our competitive cost advantage and established the type of alliance that would be very difficult and expensive to replicate elsewhere. During FY15, Hanssen has become a significant shareholder in Finbar which aligns the interests of our primary contractor to the group’s long term financial success and secures sufficient resources for us to develop our increasing project pipeline over the medium to long term.
Finbar is in an enviable position with a record $2.321 billion project pipeline of which $961.8 million has already received development approval and $595 million is currently under construction. With our strong balance sheet, pipeline of projects under construction and record pre-sale contracts levels, we remain extremely well placed to meet our medium and long term growth ambitions.
The Western Australian Government’s in-fill policy continues to be aligned with Finbar’s core strategy of providing long term sustainable residential apartment development in an effort to slowdown the rapid rate of urban sprawl occurring across Perth’s outer suburbs. Apartments currently account for approximately 20 per cent of the overall Perth accommodation market which is low relative to other capital cities in Australia, which are nearer to the 50 per cent level. This difference signifies the opportunity for the Perth apartment sector to grow its market share in the years ahead and close the gap with other capital cities while confirming our long held strategy of focusing solely on the apartment market in Western Australia.
We are very proud of our unblemished track record for completing every one of our projects on time and on budget. This reinforces our reputation as Western Australia’s most trusted and leading apartment developer and justifies why we are still the brand of choice for apartment buyers in this State.
Our record cash position of approximately $69 million at the end of FY15 was founded on the cash generative nature of our projects completed during the year and places us in the privileged position of being able to recycle our capital into large scale projects while maintaining a strong balance sheet and enhancing our earnings growth in the next few years.
In December 2014, we activated an on-market share buy-back scheme to enable the Company to acquire up to a maximum of 12 million shares within a 12 month period. Given the high level of cash reserves and strong cashflow generation from project settlements, the Board considered it prudent to activate this buy-back scheme as an effective method of returning capital to shareholders where the share price is trading at a significant discount to the intrinsic value of the Company. We are pleased to report that a total of 950,000 shares were bought back and cancelled between December 2014 and 30 June 2015, although we emphasise that the buy-back scheme does not impact Finbar’s ongoing capital requirements for existing projects nor does it affect our financial capacity to identify and secure new project growth opportunities.
In terms of our FY16 profit guidance, we consider that there will be an improvement in the net profit compared to FY15 based on the current sales environment and projects due for completion by 30 June 2016.
On a final note, I would sincerely like to thank all our staff, building contractors, service providers, consultants, and joint venture partners who have contributed to yet another financially successful year for the group.
Finbar is in an enviable position with a record project pipeline in excess of
$2 billion dollars, of which $962 million has already received development
approval and $595 million is currently under construction.
Civic Heart
on the corner of Mill Point Road
and Labouchere Road in South
Perth launched September 2015.
MANAGING DIRECTOR’S REPORT
Darren Pateman Managing Director 11 September 2015

10 Annual Report 2015 Finbar Group Limited 11
Defined by its strong population growth, high standard of living and employment opportunities, WA offers Finbar the
opportunity to create projects which combine the convenience of work location and lifestyle. Backed by a strong balance
sheet and healthy cashflows, the Company has a multitude of projects in the pipeline within the inner city area of Perth
and regions creating a more enticing, vibrant and unique place to live. Finbar has a collaborative approach through valued
relationships to leverage growth while sharing project risk and profitability.
FINBAR OVERVIEW
Our Business
ϐ Retains a strong brand and a highly regarded reputation in WA
ϐ Operates on a low cost base providing attractive profit margins and shareholder returns
ϐ Maintains exemplary relationships with suppliers and stakeholders
ϐ Manages a pipeline of projects to ensure economies of scale and future growth
Our Projects
ϐ Represent some of Perth’s most prestigious and well-appointed lifestyle apartments
ϐ Remain committed to creating progressive and innovative designs which represent value for money
ϐ Offer a successful fusion of residential, office and public space
ϐ Focus on reducing the impact on the local environment through high density apartment living and innovative construction techniques
Our Commitment
ϐ Our reputation and reliability is built on successfully delivering 100% of our projects as promised
ϐ Our commitment to our customers, shareholders, State and local government and the environment has seen Finbar remain WA’s largest and most trusted apartment developer
ϐ Finbar remains dedicated to the WA apartment market and believes in continuing what we know best in order to serve our customers and shareholders better through continuous organic growth
Our Investment Properties
ϐ Include the Fairlanes and Pelago buildings leased to reputable and proven businesses and individuals
ϐ Provide consistent annual revenues from investments
ϐ Ensure these additional revenue streams contribute to and smooth annual earnings
ϐ Represent the development and retention of Finbar built assets
Our Future
ϐ Our vision is to remain WA’s leading medium to high density apartment developer
ϐ Continue to focus development efforts in and around the Perth CBD
ϐ Sustain and enhance the quality of inner city living for current and future generations
ϐ Enhance and develop relationships with local government and our venture partners
Our People
ϐ A team of 19 full time staff based in East Perth
ϐ 1 full time in Karatha
ϐ Include a management team with strong leadership skills and excellent track record
ϐ Are led by experienced and long serving management focusing on decisions that benefit the company for the long term.
ϐ Complete 1st development
ϐ Maiden net profit ($0.7m)
ϐ Maiden dividend (1c per share)
ϐ Relocate to Bluewater building, South Perth (6 staff)
ϐ $100m market capitalisation
ϐ Finish Westralian, first luxury project on Terrace Road
ϐ $20m net profit milestone
ϐ Secure first Pilbara project, Pelago West, Karratha
ϐ 2,000 apartment milestone
ϐ Complete company’s first Pilbara project
ϐ 3,000 apartment milestone
ϐ Fairlanes awarded Winner UDIA High Density Development
ϐ Relocate to Fairlanes Building (13 staff)
ϐ Launched WA’s tallest residential building, Concerto
ϐ Secured single largest project to date, Civic Triangle
ϐ Record $36.5m after tax profit
ϐ St Marks awarded Winner UDIA High Density Development and Urban Renewal
ϐ Record launch at Aurelia, with $66 million sales in the 1st month
ϐ Completed Finbar’s largest development to date, Subi Strand
ϐ Spring View Towers awarded Winner UDIA High Density Development
Finbar is one of Perth’s most successful and agile lifestyle property developers leading the way in the
development of medium to high density residential apartments and commercial property in Western Australia.
1995 1997 2001 2006 2010 2012 2014 2015
ϐ Lists on ASX as Property Development Company operating out of 2 bedroom Como apartment
ϐ Commence 1st development project, Seville on the Point, South Perth

12 Annual Report 2015 Finbar Group Limited 13
A Year of Consolidation
Finbar has enjoyed a respectable financial year with the completion of three key projects amounting to $350.3 million, the successful marketing launch of five projects with pre-sale contracts totalling $316.9 million, and the development approval of eight projects valued at $1.06 billion. All of these projects combined are anticipated to contribute significantly to Finbar’s earnings for FY16 and beyond.
Finbar is now committed to an increased size and scale of project as demand continues to rise for the inner city apartment lifestyle in Perth. As Western Australia’s most trusted and leading apartment developer, Finbar specialises in meeting this rising demand by locating prime sites in inner city areas, obtaining development approval and then completing each project on time and on budget to an exemplary standard with a view to deliver long term shareholder value. The FY15 period is an excellent example of how Finbar executed this strategy through the successful completion and launch of five projects on sites previously acquired by the Company or it’s venture partners.
KEY ACHIEVEMENTS
FY15 has been a strong year of
project construction and completions.
Growth Pipeline of Projects
Since Finbar entered the property development sector in 1995, the Company has completed 59 projects with a total end value of $2.5 billion. The current project pipeline in excess of $2 billion dollars underpins Finbar’s medium to long term earnings growth which is further supported by a record cash position and a conservative approach towards financing projects.
Completions and Settlements
Finbar continued to meet the increasing demand for quality apartment developments in Perth during FY15 with the completion of Subi Strand, Toccata and Spring View Towers projects. All three projects produced strong profit margins and largely contributed to Finbar’s FY15 net profit of $25.9 million.
Subi Strand is Finbar’s largest single stage development to date and reached practical completion within 17 months. This achievement highlights the Company’s maturity as a developer to deliver increasingly large scale projects within tight timeframes and add further credibility to our reputation as Western Australia’s most trusted and leading apartment developer.
Located in East Perth, Toccata is a luxury residential apartment development that was completed on time and budget in June 2015. It represents stage two of the redevelopment of the former ABC Site with the final stage, Concerto, now under construction.
Spring View Towers was completed in October 2014 and represents the first development to be completed within the Springs precinct in Rivervale. The Springs precinct is a landmark metropolitan activity centre delivered by Landcorp and the City of Belmont as part of the State Government’s Directions 2031 and Beyond policy. Spring View Towers was awarded the City of Belmont’s 2014 Opportunity Award in recognition of the high quality development and its level of amenities that will benefit the future residents and City of Belmont, and 2015 UDIA awards for excellence high density development.
Launches
Subi Strand
ϐ $164.9 million project end value.
ϐ 245 residential apartments with 19 ground floor commercial lots.
ϐ Contributed to FY15 earnings.
Toccata
ϐ $85.5 million project end value.
ϐ 45 residential apartments with 2 ground floor commercial lot.
ϐ Contributed to FY15 earnings.
Spring View Towers
ϐ $99.9 million projected end value.
ϐ 188 residential apartments across two towers.
ϐ Contributed to FY15 earnings.
Motive
ϐ $81.8 million project end value.
ϐ 143 residential apartments over 2 towers
ϐ Forecast to contribute to FY17 earnings.
Aurelia
ϐ Refer page 14.
Linq
ϐ Refer page 14.
Unison on Tenth
ϐ Refer page 14.
Concerto
ϐ Refer page 14.

14 Annual Report 2015 Finbar Group Limited 15
Construction Commencements
Successful marketing launches during FY15 occurred at the Concerto, Linq, Unison on Tenth, Aurelia and Motive projects, thereby allowing four of these projects to join the Norwood and Arbor North projects under construction. As a result of this intensive marketing phase, Finbar increased its total pre-sale contracts value to $407.7 million recording the largest pre-sales level in the Company’s history with a 23 per cent increase on the previous financial year.
A total of eight development approvals were received between September 2014 and August 2015 including the Civic Heart, Aurelia, Lot 1014, Linq, Motive, Sunago, Aire West Perth and Port Hedland (first stage) projects. These approvals have a combined project end value of approximately $1.06 billion. With an anticipated completion date of mid-2019, the Civic Heart project in South Perth has an end value of $414.4 million and will represent Finbar’s highest value single stage development to date. This is one of the most challenging and exciting projects in the Company’s history in terms of the development’s design, size, scale and importance to the local community of South Perth.
Finbar’s venture partners also acquired two sites for redevelopment in East Perth and South Perth during FY15 which have a combined project value of $210 million and comprise more than 250 apartments. Both marketing launches in these two popular inner city areas are anticipated to commence in 2016 once development approval has taken place.
KEY ACHIEVEMENTS
The Perth Apartment Market
A research report compiled by the Master Builders Association (MBA) and Y Research in 2015 highlighted that 20 per cent of new dwellings in Perth would be apartments by 2020, which is double the level recorded five years ago.
Despite an increase in supply of apartments coming onto the market in Perth since the beginning of 2014, we are witnessing an adjustment phase to meet the significant underlying demand for the product over the next few years. This increase in supply offers suitable downsizing opportunities to owner occupiers as well as affordable projects for first home buyers.
Perth now reflects a maturing apartment market which is supported by an increasing acceptance towards higher-density living, a greater diversity of product on offer and a growing shift in sentiment towards apartment lifestyle. Apartment sales in Perth still represent a low percentage of total dwellings compared to other capital cities in Australia but this gap is expected to narrow significantly over the next five to ten years.
The Directions 2031 report published by the Western Australian government in 2010 sets up a planning framework to prepare for the Perth metropolitan region population reaching 2.2 million by 2031 and 3.5 million by 2050. This region currently stretches for more than 150 kilometres along the coastline and signifies that Perth has become a sprawling city where greenfield development accounts for almost three quarters of all new development. The report highlights that this urban sprawl is not sustainable which creates a need for a more consolidated metropolitan area through greater infill and residential density serviced by a more efficient use of existing infrastructure.
Finbar’s strategy is firmly aligned to the Western Australian Government’s in-fill policy of providing long term sustainable residential apartment development to slowdown urban sprawl in the outer suburbs while maintaining the Company’s unblemished track record for completing each project on time and budget to an exemplary standard.
developing better lifestyles
As Western Australia’s Largest
And Most Trusted Apartment
Developer, Finbar Is Committed
To Developing Better Lifestyles.
Concerto
ϐ $199 million project end value.
ϐ 226 residential apartments with 1 ground floor commercial lot.
ϐ Forecast to contribute to FY17 earnings.
Unison on Tenth
ϐ $83.4 million projected end value.
ϐ 167 residential apartments with 2 commercial lots.
ϐ Forecast to contribute to FY16 earnings.
Aurelia
ϐ $134.6 million project end value.
ϐ 118 residential apartments with 20 commercial lots.
ϐ Forecast to contribute to FY17 earnings.
Under Construction
Arbor North
ϐ $75.6 million project end value.
ϐ 154 residential apartments.
ϐ Forecast to contribute to FY16 earnings.
Norwood
ϐ $36.2 million projected end value.
ϐ 59 residential apartments with 4 commercial lots.
ϐ Forecast to contribute to FY16 earnings.
Linq
ϐ $66.2 million project end value.
ϐ 112 residential apartments with 4 commercial lots.
ϐ Forecast to contribute to FY16 earnings.
16 Annual Report 2015 Finbar Group Limited 17
DEVELOPMENT OVERVIEW
Metropolitan Projects
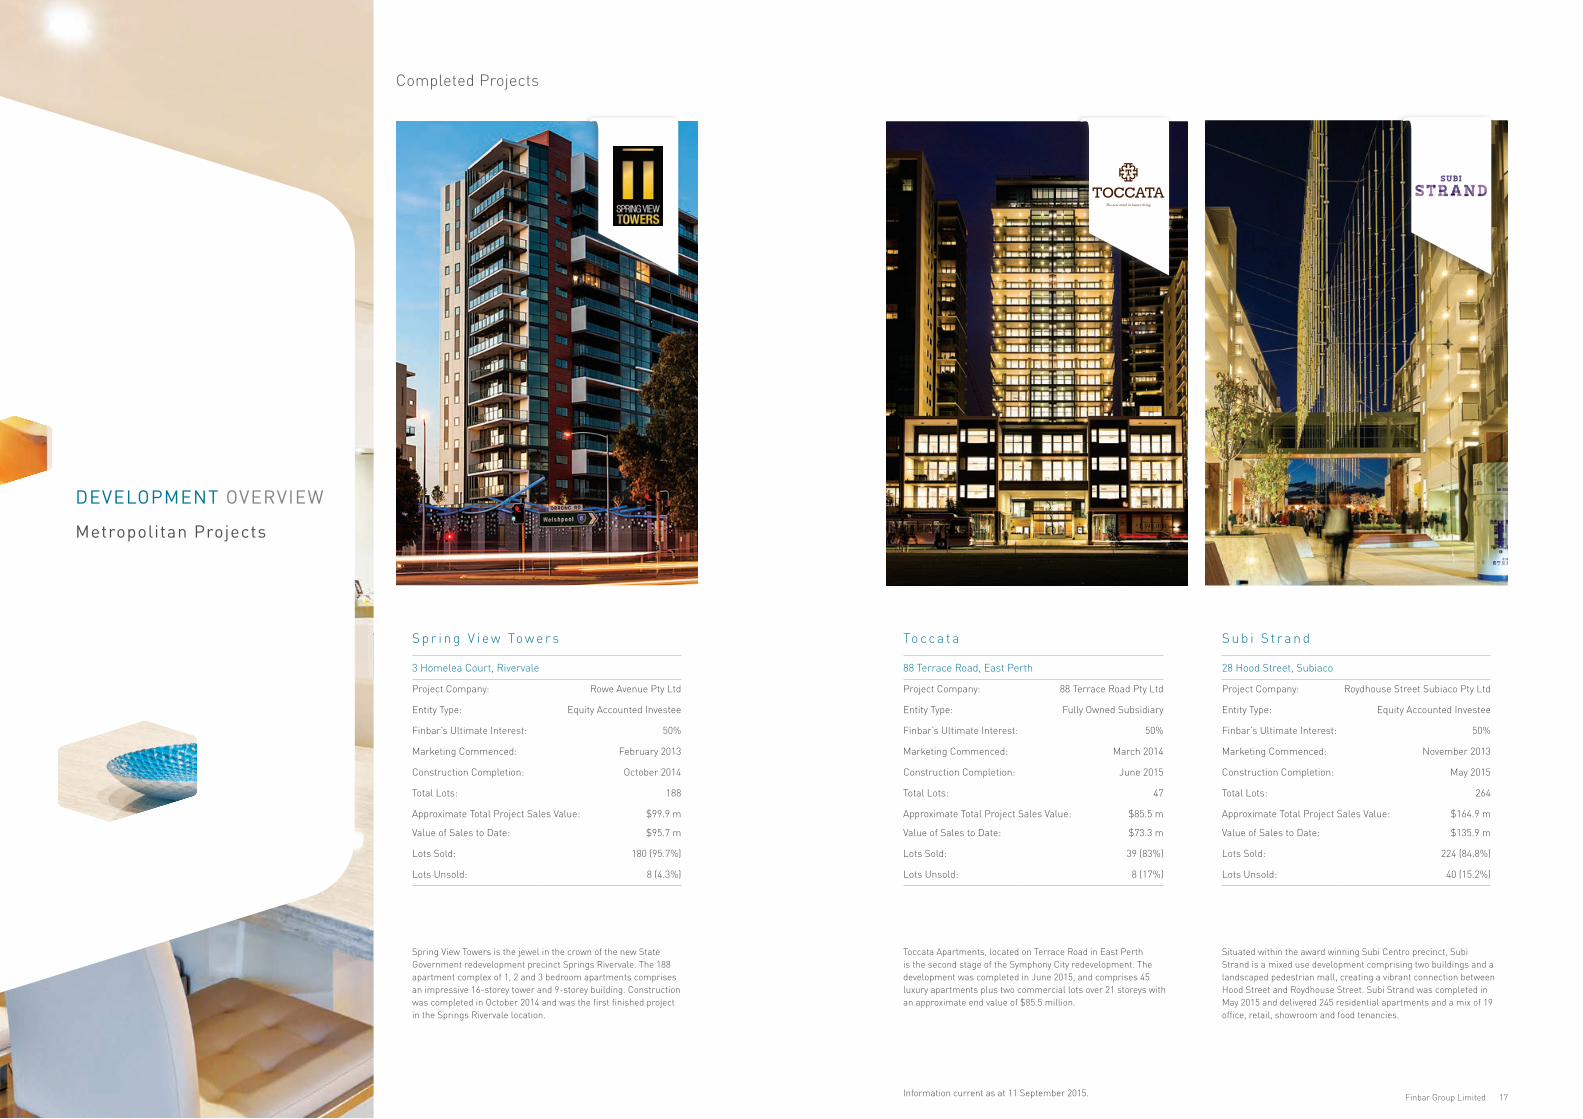
Completed Projects
Spring View Towers is the jewel in the crown of the new State Government redevelopment precinct Springs Rivervale. The 188 apartment complex of 1, 2 and 3 bedroom apartments comprises an impressive 16-storey tower and 9-storey building. Construction was completed in October 2014 and was the first finished project in the Springs Rivervale location.
S p r i n g V i e w To w e r s
3 Homelea Court, Rivervale
Project Company: Rowe Avenue Pty Ltd
Entity Type: Equity Accounted Investee
Finbar’s Ultimate Interest: 50%
Marketing Commenced: February 2013
Construction Completion: October 2014
Total Lots: 188
Approximate Total Project Sales Value: $99.9 m
Value of Sales to Date: $95.7 m
Lots Sold: 180 (95.7%)
Lots Unsold: 8 (4.3%)
Toccata Apartments, located on Terrace Road in East Perth is the second stage of the Symphony City redevelopment. The development was completed in June 2015, and comprises 45 luxury apartments plus two commercial lots over 21 storeys with an approximate end value of $85.5 million.
To c c a t a
88 Terrace Road, East Perth
Project Company: 88 Terrace Road Pty Ltd
Entity Type: Fully Owned Subsidiary
Finbar’s Ultimate Interest: 50%
Marketing Commenced: March 2014
Construction Completion: June 2015
Total Lots: 47
Approximate Total Project Sales Value: $85.5 m
Value of Sales to Date: $73.3 m
Lots Sold: 39 (83%)
Lots Unsold: 8 (17%)
Information current as at 11 September 2015.
Situated within the award winning Subi Centro precinct, Subi Strand is a mixed use development comprising two buildings and a landscaped pedestrian mall, creating a vibrant connection between Hood Street and Roydhouse Street. Subi Strand was completed in May 2015 and delivered 245 residential apartments and a mix of 19 office, retail, showroom and food tenancies.
S u b i S t r a n d
28 Hood Street, Subiaco
Project Company: Roydhouse Street Subiaco Pty Ltd
Entity Type: Equity Accounted Investee
Finbar’s Ultimate Interest: 50%
Marketing Commenced: November 2013
Construction Completion: May 2015
Total Lots: 264
Approximate Total Project Sales Value: $164.9 m
Value of Sales to Date: $135.9 m
Lots Sold: 224 (84.8%)
Lots Unsold: 40 (15.2%)

18 Annual Report 2015 Finbar Group Limited 19
Under Construction Under Construction
With an estimated end value of $36.2 million, Norwood Perth is a boutique apartment project comprising a total of 59 residential apartments with four commercial lots. The development is placed on 2,828 square metres of prime land which is located on the corner of Lord and Windsor Streets in Perth.
N o r w o o d P e r t h
280 Lord Street, Perth
Project Company: 280 Lord Street Perth Pty Ltd
Entity Type: Fully Owned Subsidiary
Finbar’s Ultimate Interest: 50%
Marketing Commenced: October 2013
Estimated Completion: FY16
Total Lots: 63
Approximate Total Project Sales Value: $36.2 m
Value of Sales to Date: $26.9 m
Lots Sold: 48 (76.2%)
Lots Unsold: 15 (23.8%)
Arbor North is the first stage of Arbor at Springs, an exciting new apartment development in the dynamic Springs, Rivervale. Arbor North will have an approximated $75.6 million end project value comprising one and two bedroom apartments and was launched to the market in February 2014 and construction commenced in August 2014.
A r b o r N o r t h
Lot 1001 Rowe Avenue, Rivervale
Project Company: Lot 1001 - 1003 Rowe Avenue Pty Ltd
Entity Type: Equity Accounted Investee
Finbar’s Ultimate Interest: 50%
Marketing Commenced: February 2014
Estimated Completion: FY16
Total Lots: 154
Approximate Total Project Sales Value: $75.6 m
Value of Sales to Date: $53.4 m
Lots Sold: 111 (72.1%)
Lots Unsold: 43 (27.9%)
Information current as at 11 September 2015.
Situated on the corner of James and Fitzgerald Streets, this future development site is 2,119 sqm and will have an approximate end value of $66.2 million. The site is prime development land located 1 km from the Perth CBD, adjacent to public transport and the freeway system, while only a short walk from the Northbridge restaurant precinct. The development will also benefit from the completion of the Northbridge Link project.
L i n q
269 James Street, Northbridge
Project Company: 269 James Street Pty Ltd
Entity Type: Fully Owned Subsidiary
Finbar’s Ultimate Interest: 100%
Marketing Commenced: October 2014
Estimated Completion: FY16
Total Lots: 116
Approximate Total Project Sales Value: $66.2 m
Value of Sales Today: $35.5 m
Lots Sold: 69 (59.5%)
Lots Unsold: 47 (40.5%)
Unison on Tenth comprises 169 residential apartments plus two commercial lots on Tenth Avenue. The combined Unison development will consist of 347 one, two, and three bedroom apartments with four ground level commercial tenancies. Construction commenced in January 2015.
U n i s o n o n Te n t h
2 Tenth Avenue, Maylands
Project Company: 241 Railway Parade Pty Ltd
Entity Type: Fully Owned Subsidiary
Finbar’s Ultimate Interest: 50%
Marketing Commenced: August 2014
Estimated Completion: FY16
Total Lots: 169
Approximate Total Project Sales Value: $83.4 m
Value of Sales to Date: $41.9 m
Lots Sold: 84 (49.7%)
Lots Unsold: 85 (50.3%)

20 Annual Report 2015 Finbar Group Limited 21
Future Projects
Unison on Kennedy is part of the Unison project comprising 180 one, two, and three bedroom residential apartments plus two commercial lots on Kennedy Street. Unison will capitalise on its proximity to public transport, being located only 200 metres from Maylands railway station, and connecting directly to the Central Business District 4.5 kilometres away.
U n i s o n o n K e n n e d y
1 Kennedy Street, Maylands
Project Company: 241 Railway Parade Pty Ltd
Entity Type: Fully Owned Subsidiary
Finbar’s Ultimate Interest: 50%
Estimated Completion: FY18
Total Lots: 182
Approximate Total Project Sales Value: $85 m
Images are artist impressions only and are subject to change.
Information current as at 11 September 2015.
Under Construction
S u n a g o
36 Chester Avenue, Dianella
Project Company: 36 Chester Avenue Pty Ltd
Entity Type: Equity Accounted Investee
Finbar’s Ultimate Interest: 50%
Estimated Completion: FY17
Total Lots: 163
Approximate Total Project Sales Value: $72 m
Sunago will comprise of 163 one and two bedroom apartments with a range of living options available including City and district views from the seven storey tower, with the three level podium overlooking internal gardens, surrounding streets and parkland
Images are artist impressions only and are subject to change.
Concerto is the final crescendo to Finbar’s development vision of Symphony City, consisting of 227 apartments located on the former site of the Australian Broadcasting Corporation (ABC). Once complete, Concerto will be East Perth’s tallest apartment building consisting of New York-style studio, one and two bedroom apartments, plus luxury 2 and 3 bedroom tower apartments, and a bar/café on the ground floor.
C o n c e r t o
189 Adelaide Terrace, East Perth
Project Company: 88 Terrace Road Pty Ltd
Entity Type: Fully Owned Subsidiary
Finbar’s Ultimate Interest: 50%
Marketing Commenced: August 2014
Estimated Completion: FY17
Total Lots: 227
Approximate Total Project Sales Value: $199 m
Value of Sales to Date: $120.3 m
Lots Sold: 137 (60.4%)
Lots Unsold: 90 (39.6%)
The site is located in the midst of South Perth’s food and retail precinct which is just 250 metres from the South Perth foreshore. It will offer the opportunity to create a project with impressive views of the Swan River and the Perth City skyline. The development will consist of a mixed use high-rise building which has potential uses that include office, retail, and permanent residential. It is anticipated the end project value will exceed $134.6 million, construction commenced in June 2015.
A u re l i a
96 Mill Point Road, South Perth
Project Company: 96 Mill Point Road Pty Ltd
Entity Type: Fully Owned Subsidiary
Finbar’s Ultimate Interest: 50%
Marketing Commenced: February 2015
Estimated Completion: FY17
Total Lots: 138
Approximate Total Project Sales Value: $134.6 m
Value of Sales to Date: $90.6 m
Lots Sold: 97 (70.3%)
Lots Unsold: 41 (29.7%)

22 Annual Report 2015 Finbar Group Limited 23
Future Projects Future Projects
The Aire West Perth development will comprise of 178 residential one, two, and three bedroom apartments, 64 serviced apartments as well as two ground floor commercial lots within a 21 level building. Communal facilities will be located on a level 4 pool deck and include a 22 metre swimming pool, games room, meeting room, residents lounge, gym and sauna. Development approval was received in August 2015.
A i re We s t P e r t h
647 Murray Street, West Perth
Project Company: 647 Murray Street Pty Ltd
Entity Type: Equity Accounted Investee
Finbar’s Ultimate Interest: 50%
Estimated Completion: FY18
Total Lots: 244
Approximate Total Project Sales Value: $125 m
Arbor South is the second stage of the Arbor at Springs development which will comprise approximately 270 residential apartments with an estimated combined end value of approximately $136.5 million. It is expected that Arbor South will contribute $60.9 million to FY18.
A r b o r S o u t h
Lot 1002 -1003 Rowe Avenue, Rivervale
Project Company: Lot 1001 -1003 Rowe Avenue Pty Ltd
Entity Type: Equity Accounted Investee
Finbar’s Ultimate Interest: 50%
Estimated Completion: FY18
Total Lots: 116
Approximate Total Project Sales Value: $60.9 m
The site which is located just 200 metres from Finbar’s highly successful Spring View Towers project and 350 metres from Finbar’s new Arbor project. The development is located on a 4,000 square metre site situated on the corners of Brighton Road, Rowe Avenue, and Great Eastern Highway in the Springs subdivision in Rivervale. It is expected to yield in excess of 190 residential apartments with ground floor commercial space and will be situated at the main entrance to the Springs precinct. Development approval was received in August 2015.
L o t 1 0 1 4 S p r i n g s R i v e r v a l e
31 Rowe Avenue, Rivervale
Project Company: 31 Rowe Avenue Pty Ltd
Entity Type: Fully Owned Subsidiary
Finbar’s Ultimate Interest: 50%
Estimated Completion: FY18
Total Lots: 190
Approximate Total Project Sales Value: $97 m
Information current as at 11 September 2015.
Motive Apartments will be a 13 storey development with 143 residential apartments. Motive will comprise one and two bedroom apartments in addition to the resort-style facilities offered with every Finbar development. The 143 residential apartments will result in an estimated end value of approximately $81.8 million which is anticipated to contribute to Finbar’s earnings in FY17.
M o t i v e
172 Railway Parade, West Leederville
Project Company: 172 Railway Parade West Leederville Pty Ltd
Entity Type: Fully Owned Subsidiary
Finbar’s Ultimate Interest: 50%
Marketing Commenced: September 2014
Estimated Completion: FY17
Total Lots: 143
Approximate Total Project Sales Value: $81.8 m
Value of Sales to Date: $28.6 m
Lots Sold: 57 (39.9%)
Lots Unsold: 86 (60.1%)
Images are artist impressions only and are subject to change.
Images are artist impressions only and are subject to change.

24 Annual Report 2015 Finbar Group Limited 25
Future Projects Future Projects
Finbar is working to design and develop approximately 212 residential apartments plus two ground floor commercial lots on the site to create a project with an end value of circa $84 million.The site is prime development land located five kilometres from the Perth Central Business District and three kilometres from Perth Airport.
2 3 9 G re a t E a s t e r n H i g h w a y B e l m o n t
239 Great Eastern Highway, Belmont
Project Company: 239 Great Eastern Highway Pty Ltd
Entity Type: Fully Owned Subsidiary
Finbar’s Ultimate Interest: 100%
Estimated Completion: FY17
Total Lots: 214
Approximate Total Project Sales Value: $84 m
Great Eastern Hwy
Daly St
The Civic Triangle site is a 7,206 square metre site currently owned by the City of South Perth comprising nine separate lots bounded by Mends Street, Labouchere Road, and Mill Point Road. The project is set to be a vibrant mixed-use ‘civic heart’ development that incorporates retail, residential, commercial, and local public amenities. The project to comprise of 294 apartments, commercial space and local amenities with an estimated end value greater than $400 million.
This project is located just 150 metres from Langley Park and 300 metres from the Perth foreshore, the proposed apartments would enjoy expansive views of the City, the Swan River, Heirisson Island and the Burswood Peninsula. The project is anticipated to consist of 32 level apartment building that will comprise approximately 247 residential apartments with ground floor commercial lots.
C i v i c H e a r t
1 Mends Street, South Perth
Project Company: 1 Mends Street Pty Ltd
Entity Type: Fully Owned Subsidiary
Finbar’s Ultimate Interest: 50%
Marketing Commenced: September 2015
Estimated Completion: FY19
Total Lots: 313
Approximate Total Project Sales Value: $414.4 m
Value of Sales to Date: $27.02 m
Lots Sold: 22 (7.03%)
Lots Unsold: 291 (92.97%)
6 3 A d e l a i d e Te r r a c e
63 Adelaide Terrace, East Perth
Project Company: 63 Adelaide Terrace Pty Ltd
Entity Type: Fully Owned Subsidiary
Finbar’s Ultimate Interest: 50%
Estimated Completion: FY17
Total Lots: 251
Approximate Total Project Sales Value: $162 m
Information current as at 11 September 2015.
Images are artist impressions only and are subject to change.
Images are artist impressions only and are subject to change.
In March 2015 Finbar acquired the property adjoining Finbar’s Aurelia project. The site comprises 1,782 square metres of land which Finbar intends to develop into a mixed use project which will comprise of approximately 43 luxury residential apartments along with approximately 1,800 square metres of ground floor retail and level one office space.
5 H a r p e r Te r r a c e
5 Harper Terrace, South Perth
Project Company: Finbar Sub 103 Pty Ltd
Entity Type: Fully Owned Subsidiary
Finbar’s Ultimate Interest: 100%
Estimated Completion: FY17
Total Lots: 44
Approximate Total Project Sales Value: $45 m
Images are artist impressions only and are subject to change.

Future Projects
Finbar recently acquired 4 vacant sites located on the corners of Rowe Avenue and Homelea Court and comprise a total of 3,770 square metres of land which Finbar intends to amalgamate to develop a project consisting of approximately 185 apartments within a 10 level building. The proposed apartment project has an estimated end value of approximately $82.8 million.
2 H o m e l e a C o u r t
Cnr Rowe Avenue and Homelea Court, Rivervale
Project Company: Finbar Sub 100 Pty Ltd
Entity Type: Fully Owned Subsidiary
Finbar’s Ultimate Interest: 100%
Estimated Completion: FY18
Total Lots: 185
Approximate Total Project Sales Value: $82.8 m
Finbar Group Limited 2726 Annual Report 2015
Finbar’s Regional Projects Finbar’s Investment Properties
The Anchorage project is situated directly opposite the Port Hedland Yacht Club and overlooks the proposed Spoilbank Marina precinct.A development approval has been received for the first stage of a four stage development, the plans of which comprise 109 one and two bedroom apartments along with six commercial tenancies including a café fronting Sutherland Street and the oceanfront. The combined project is expected to have an end value of approximately $308 million.
The aquisition of the land and project commencement is subject to achieving suitable presale viability.
A n c h o r a g e ( S t a g e 1 )
Sutherland & Morgans Street, Port Hedland
Project Company: Finbar Port Hedland Pty Ltd
Entity Type: Fully Owned Subsidiary
Finbar’s Ultimate Interest: 100%
Estimated Completion: FY19
Total Lots: 115
Approximate Total Project Sales Value: $77 m
Information current as at 11 September 2015.
P e l a g o
Sharpe Avenue, Karratha
Total Lots: 122
Residential Lots: 101
Commercial Lots: 21
Passing Rent: $6.09 m
Lots Leased: 101 (82.8%)
The Pelago complex (East and West) was completed in November 2013 and comprises of a combined 288 residential apartments and 22 commercial tenancies. As part of it’s broader strategy to smooth earnings and provide consistent annual revenues from investments, Finbar has retained 101 residential apartments and 21 commercial tenancies. These tenancies are leased to reputable and proven businesses and individuals.
Fa i r l a n e s
181 Adelaide Terrace, East Perth
Total NLA: 7,586 sqm
Office NLA: 6,991 sqm
Retail NLA: 595 sqm
Passing Rent: $3.75 m
Area Leased: 7,019 sqm (92.5%)
Fairlanes was completed in April 2012 and comprises of 5 levels of office space with ground floor retail totalling 7,586 sqm NLA. As part of it’s broader strategy to smooth earnings and provide consistent annual revenues from investments, Finbar has retained the commercial space. Major tenants include Finbar, Downers EDI, Transfield Services and other professional businesses.

28 Annual Report 2015
FINANCIAL
REPORT
2015
Directors’ Report (including Corporate Governance Statement) 30
Consolidated Statement of Profit or Loss
and Other Comprehensive Income 46
Consolidated Statement of Changes in Equity 47
Consolidated Statement of Financial Position 48
Consolidated Statement of Cash Flows 49
Notes to the Consolidated Financial Statements 50
Directors’ Declaration 88
Independent Auditor’s Report 89
Lead Auditor’s Independence Declaration 91
ASX Additional Information 92
FINANCIAL REPORT
For the Year Ended 30 June 2015

Directors’ Report 3130 Annual Report 2015 | Finbar Group Limited
1 Directors
The Directors of the Company at any time during or since the end of the financial year are:
Executive Director and Chairman
John CHAN - BSc, MBA, MAICD Director since 27 April 1995 Chairman since 15 July 2010
John Chan is Executive Director and Chairman of Finbar, and a Director of its Subsidiaries and equity accounted investees.
John was appointed director in 1995 and was instrumental in re-listing Finbar on the ASX as a property development company. Prior to joining Finbar, John headed several property and manufacturing companies both in Australia and overseas.
John holds a Bachelor of Science from Monash University in Melbourne and a Master of Business Administration from the University of Queensland. John is a Member of the Australian Institute of Company Directors, is a Trustee for the Western Australian Chinese Chamber of Commerce, and is a former Senate Member of Murdoch University.
Managing Director
Darren John PATEMAN - EMBA, GradDipACG, Director since 6 November 2008 ACSA, AGIA, MAICD, AFAIM Managing Director since 15 July 2010
Darren Pateman is the Managing Director of Finbar and a Director of Finbar’s Subsidiaries and equity accounted investees.
Darren commenced with Finbar prior to its relisting on the ASX as a property development company in 1995 and in this time has played a primary role in developing Finbar’s systems, strategy and culture.
Darren has held several positions in his 20 years with the company which has given Darren an intimate knowledge of the key aspects of Finbar’s business. Darren was formerly Company Secretary from 1996 to 2010, Chief Executive Officer from 2008 to 2010, and was appointed Managing Director on 15 July 2010.
Darren is a Chartered Secretary and holds an Executive Master of Business Administration from the University of Western Australia and a Graduate Diploma in Applied Corporate Governance (GradDipACG). Darren is an Associate of the Institute of Chartered Secretaries and Administrators, a Member of the Australian Institute of Company Directors and an Associate Fellow of the Australian Institute of Management.
Non-executive Director
John Boon Heng CHEAK - B Eco Director since 28 April 1993
John Cheak joined the Board in 1993 and has extensive experience in the governance of companies in property development and marine transportation sectors.
John has a Bachelor of Economics degree from the University of Western Australia and is a Singapore citizen.
Non-executive Director
Kee Kong LOH - B Acc, CPA Director since 28 April 1993
Kee Kong Loh joined the Board in April 1993 and has substantial experience in the governance of companies in property development, marine transportation, and electronics manufacturing sectors. He has a degree in accountancy from the University of Singapore and is a member of the Institute of Certified Public Accountants of Singapore.
Loh is a director of PCI Limited (Singapore) which is a publicly listed company in Singapore, where he is a resident.
Non-executive (Independent) Director
Lee VERIOS - LLB, MAICD Director since 6 December 2011
Lee Verios joined the Board in December 2011. He is a well credentialed commercial lawyer having practised in Western Australia for over 40 years.
Until his retirement from practising law in 2010, Lee was partner in the international law firm of Norton Rose and the leader of their Commercial Property division in Perth. Throughout his legal career, Lee has held senior management roles in each of the firms of which he has been a member.
In addition to his legal practice, Lee is an experienced company director, having held positions in a variety of public and private enterprises. He has been a director of privately owned investment company Wyllie Group Pty Ltd since July 2004, and is a Non-Executive Director of ASX listed Decmil Group Limited, a civil engineering and construction company.
Lee is a member of the Australian Institute of Company Directors, the Hellenic Australian Chamber of Commerce and Industry and was previously Chairman of the Australian Indonesian Business Council (WA Branch).
Directors’ Report
The Directors present their report together with the consolidated financial report of the Group, comprising Finbar Group Limited (‘the Company’), its subsidiaries and the Group’s interest in equity accounted investees for the financial year ended 30 June 2015 and the independent auditor’s report thereon.
Contents Page
1 Directors 31
2 Company Secretary 32
3 Directors’ Meetings 32
4 Corporate Governance Statement 32
4.1 Board of Directors 33
4.2 Remuneration Committee 33
4.3 Remuneration Report - Audited 34
4.3.1 Principles of Remuneration - Audited 34
4.3.2 Directors’ and Executive Officers’ Remuneration - Audited 35
4.3.3 Analysis of Bonuses included in Remuneration Report - Audited 37
4.3.4 Directors’ and Executives Interests 37
4.3.5 Equity Instruments - Audited 38
4.4 Audit Committee 38
4.5 Risk Management 38
4.6 Ethical Standards 39
4.7 Communication with Shareholders 40
4.8 Diversity 40
5 Principal Activities 40
6 Operating and Financial Review 41
7 Dividends 44
8 Events Subsequent to Reporting Date 44
9 Likely Developments 44
10 Directors’ Interests 44
11 Indemnification and Insurance of Officers and Auditors 45
12 Non-audit Services 45
13 Lead Auditor’s Independence Declaration 45

Directors’ Report 3332 Annual Report 2015 | Finbar Group Limited
Directors’ Report (continued)
2 Company Secretary
The Company Secretary of the Company at any time during or since the end of the financial year is:
Anthony David HEWETT - MBusLaw (Curtin), GradDipACG, FCSA, FGIA, MSAA Company Secretary since 5 February 2013
Anthony Hewett is the Company Secretary of Finbar, and of Finbar’s Subsidiaries and Jointly Controlled entities. Anthony has served in the role of company secretary for more than a decade for a number of Western Australian based listed and unlisted organisations. In addition to his company secretarial roles, Anthony has developed considerable experience in a variety of managerial, operational, and compliance oriented roles within a range of financial services businesses and not-for profit organisations and has been involved in the establishment and management of both a Charitable Foundation and Private Charitable Trust in Western Australia.
Anthony is a Chartered Secretary and holds a Master of Business Law from Curtin University, a Graduate Diploma in Applied Corporate Governance (GradDipACG) from the Governance Institute of Australia.
In addition, Anthony also holds qualifications in Building Design and Drafting, Financial Services, Leadership and Training. Anthony is a Fellow of the Institute of Chartered Secretaries and Administrators (FCSA), a Fellow of the Governance Institute of Australia (FGIA) and a Master Stockbroking, Stockbrokers Association of Australia (MSAA).
3 Directors’ Meetings
The number of Directors’ meetings attended by each of the Directors of the Company during the financial year are:
Director
Board Meetings
Held
Board Meetings Attended
Resolutions Without
Meetings
Audit Committee
Meetings Held
Audit Committee Meetings Attended
Remuneration Committee
Meetings Held
Remuneration Committee Meetings Attended
John CHAN 4 4 9 N/A N/A N/A N/A
Darren John PATEMAN 4 4 8 N/A N/A N/A N/A
John Boon Heng CHEAK 4 4 10 2 2 2 2
Kee Kong LOH 4 4 10 2 2 2 2
Lee VERIOS 4 3 10 2 1 2 1
4 Corporate Governance Statement
The Board (‘Board’) of Finbar Group Limited (‘Finbar’ or ‘the Company’), its subsidiaries and Equity Accounted Investees (collectively the Group) is committed to maintaining a high standard of corporate governance in the conduct of the organisation’s business in order to create and deliver value to shareholders. In this regard, Finbar has established a corporate governance framework, including corporate governance policies and charters to assist in this commitment. A copy of these policies and charters are available from the governance page of Finbar’s website, www.finbar.com.au and are referenced throughout this document where relevant.
The framework is reviewed and revised in response to changes to law, developments in corporate governance best practice and changes to the Finbar business environment.
As a listed entity, Finbar is required to comply with Australian laws including the Corporations Act 2001 (Cth) and the Australian Securities Exchange Listing Rules, and to report against the ASX Corporate Governance Council’s Principles and Recommendations.
In March 2014, the ASX Corporate Governance Council released its third edition of the ASX Principles, which included the requirement for listed entities to provide an Appendix 4G - Key to Disclosures Corporate Governance Council Principles and Recommendations. The Board considers that it has complied with its obligations under the ASX Principles during the period and this Corporate Governance Statement reports on the organisations approach to Corporate Governance.
4.1 Board of Directors
Role of the Board
The Board Charter sets out the Board’s role, powers and duties, and establishes the functions reserved for the Board and those which are delegated to the management. The Board’s primary role is the protection and enhancement of long-term shareholder value. To fulfil this role, the Board is responsible for the overall corporate governance of the Group.
The Board has delegated responsibility for the operation and administration of the Group to the Executive Chairman, the Managing Director and Senior Executives.
Composition of Board
The Board recognises the importance of ensuring that Directors are free from interests and relationships that could, or could reasonably be perceived to materially interfere with the Director’s ability to exercise independent judgement and act in the Group’s best interests.
Accordingly, the Board has adopted guidelines, set out in the Board Charter, which are used to determine the independence of the Directors.
Directors must keep the Board advised, on an ongoing basis, of any interest that could potentially conflict with those of the Group. Where the Board believes that a significant conflict exists for a Director on a Board matter, the Director concerned will be restricted from receiving materials, discussing or voting on the matter.
Details of each of the non-executive Directors (Independent) are set out in the Directors Report (page 31).
4.2 Remuneration Committee
The Remuneration Committee Charter sets out the Remuneration Committee’s role, powers and duties, and establishes the functions delegated to the Committee by the Board. The Remuneration Committee reviews and makes recommendations to the Board on remuneration packages and policies applicable to the Executive Officers and Directors themselves of the Company and of other Group Executives. It is also responsible for share option schemes, incentive performance packages, superannuation entitlements, retirement and termination entitlements, fringe benefits policies and professional indemnity and liability insurance policies.
The following directors serve on the Remuneration Committee:
• Kee Kong LOH (Chairman) - Non-executive Director
• Lee VERIOS - Non-executive Independent Director
• John Boon Heng CHEAK - Non-executive Director
The Remuneration Committee Charter sets out the process for the periodical evaluation of the performance of the Executive Chairman and Managing Director. These evaluations have been conducted during the period.
The Remuneration Committee Charters sets out the process for the periodical evaluation of the performance of the Senior Executives. The Remuneration Committee in consultation with the Executive Chairman and Managing Director are responsible for the periodical evaluation of the performance of the Senior Executives. These evaluations have been conducted during the period.
Finbar has a written agreement, either in the form of an employment contract or letter of employment, with each Executive Director and Senior Executive which sets out the terms of their appointment.
A copy of the Remuneration Committee Charter is available on Finbar’s website www.finbar.com.au.
Directors’ Report 3534 Annual Report 2015 | Finbar Group Limited
Directors’ Report (continued)
4 Corporate Governance Statement (continued)
4.3 Remuneration Report - Audited
4.3.1 Principles of Remuneration - Audited
Remuneration of Directors and Executives is referred to as remuneration as defined in AASB 124 and Section 300A of the Corporations Act 2001.
Key management personnel have authority and responsibility for planning, directing and controlling the activities of the Group, including Directors of the Company and other Executives. Key management personnel comprise the Directors of the Company and Executives for the Company and the Group including the S300A Executives.
Remuneration levels for key management personnel and the secretary of the Company, and key management personnel and secretaries of the Group, are competitively set to attract and retain appropriately qualified and experienced Directors and Executives. The Remuneration Committee periodically obtains independent advice on the appropriateness of remuneration packages of both the Company and the Group given trends in comparative companies both locally and internationally and the
objectives of the Company’s remuneration strategy.
The remuneration structures explained below are designed to attract suitably qualified candidates, reward the achievement of strategic objectives, and achieve the broader outcome of creation of value for shareholders. The remuneration structures take into account:
• the capability and experience of the key management personnel;
• the key management personnel’s ability to control the Group’s performance;
• the key management personnel’s contribution to revenue and future earnings potential;
• project outcomes;
• the key management personnel’s length of service; and
• the Group’s performance including:
– the Group’s earnings;
– the growth in share price and delivering constant returns on shareholder wealth; and
– the amount of incentives within each key management person’s remuneration.
Remuneration packages include a mix of fixed and variable remuneration, short-term performance-based incentives and can include long-term performance-based incentives.
Fixed Remuneration
Fixed remuneration consists of base remuneration (which is calculated on a total cost basis and includes any FBT charges related to employee benefits including motor vehicles), as well as employer contributions to superannuation funds.
Remuneration levels are reviewed annually through a process that considers individual, segment and overall performance of the Group. In addition, where appropriate, external consultants provide analysis and advice to ensure the Directors’ and Senior Executives’ remuneration is competitive in the market place. A Senior Executive’s remuneration is also reviewed on promotion.
Performance Linked Remuneration
Performance linked remuneration includes short-term incentives and can include long-term incentives and are designed to reward key management personnel for meeting or exceeding their financial and personal objectives. The short-term incentive (STI) is an ‘at risk’ bonus provided in the form of cash, whilst the long-term incentive (LTI) is provided as shares or options over ordinary shares of the Company under the rules of the Employee Incentive Plan 2013 and Director Share Plan 2014. As at 30th June 2015 there were no options in issue.
Short-term Incentive
The Remuneration Committee has elected to set the primary financial performance objective of ‘profit before tax’ as the key measure for the calculation of the short term incentives of key management personnel. The non-financial objectives vary with position and responsibility and include measures such as those outlined above. The STI for the current period was wholly based on a percentage of ‘profit before tax’. Contractual amounts are accrued in the current year and discretionary amounts are accounted for in the year of payment.
At the end of the financial year the Remuneration Committee assess the actual performance of the Group, the relevant segment and the individual key management personnel contribution to the Group. The performance evaluation in respect of the year ended 30 June 2015 has taken place in accordance with this process.
Long-term Incentive
Incentive shares or options issued under the Employee Incentive Plan 2013 or Director Share Plan 2014 are made in accordance with thresholds set in the plans approved by shareholders at the relevant Annual General Meeting, subject to the Board’s discretion.
Short-term and Long-term Incentive Structure
The Remuneration Committee considers that the above performance-linked remuneration structure is generating the desired outcome. The evidence of this is in respect to the long term historical profit and dividend growth of the Company, coupled with the long term retention of key management personnel resulting in the retention of Company intellectual property.
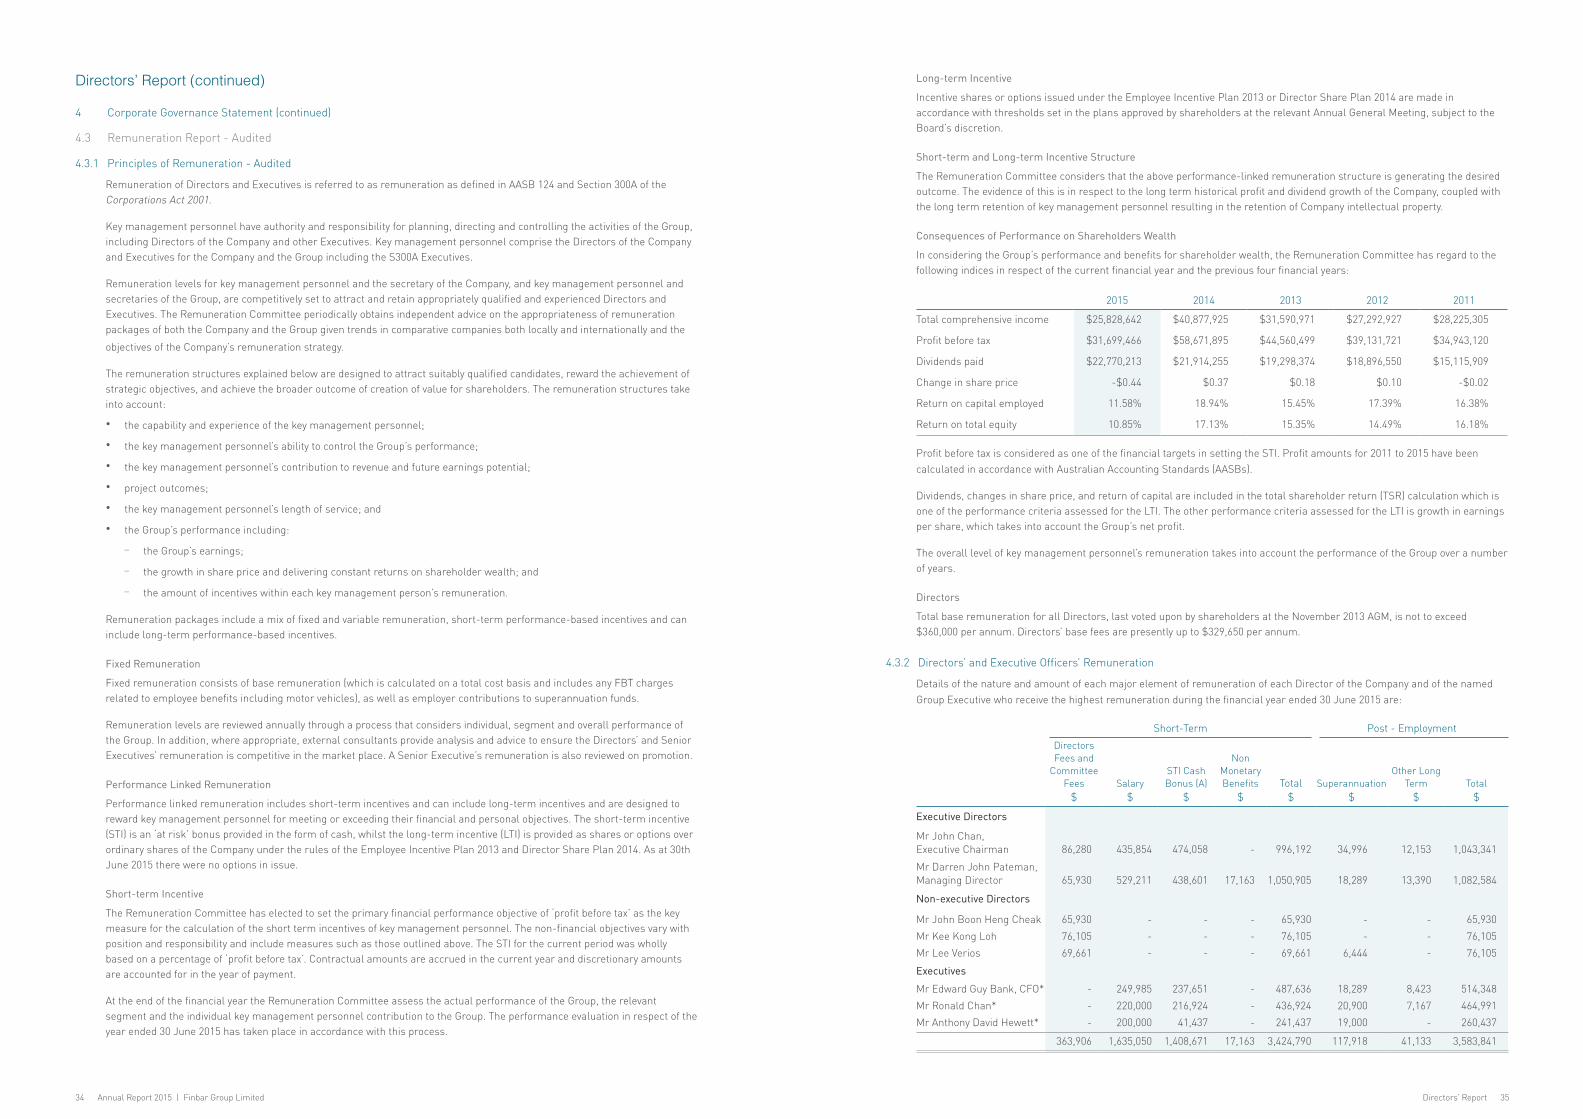
Consequences of Performance on Shareholders Wealth
In considering the Group’s performance and benefits for shareholder wealth, the Remuneration Committee has regard to the following indices in respect of the current financial year and the previous four financial years:
2015 2014 2013 2012 2011
Total comprehensive income $25,828,642 $40,877,925 $31,590,971 $27,292,927 $28,225,305
Profit before tax $31,699,466 $58,671,895 $44,560,499 $39,131,721 $34,943,120
Dividends paid $22,770,213 $21,914,255 $19,298,374 $18,896,550 $15,115,909
Change in share price -$0.44 $0.37 $0.18 $0.10 -$0.02
Return on capital employed 11.58% 18.94% 15.45% 17.39% 16.38%
Return on total equity 10.85% 17.13% 15.35% 14.49% 16.18%
Profit before tax is considered as one of the financial targets in setting the STI. Profit amounts for 2011 to 2015 have been calculated in accordance with Australian Accounting Standards (AASBs).
Dividends, changes in share price, and return of capital are included in the total shareholder return (TSR) calculation which is one of the performance criteria assessed for the LTI. The other performance criteria assessed for the LTI is growth in earnings per share, which takes into account the Group’s net profit.
The overall level of key management personnel’s remuneration takes into account the performance of the Group over a number of years.
Directors
Total base remuneration for all Directors, last voted upon by shareholders at the November 2013 AGM, is not to exceed $360,000 per annum. Directors’ base fees are presently up to $329,650 per annum.
4.3.2 Directors’ and Executive Officers’ Remuneration
Details of the nature and amount of each major element of remuneration of each Director of the Company and of the named Group Executive who receive the highest remuneration during the financial year ended 30 June 2015 are:
Short-Term Post - Employment
Directors Fees and
Committee Fees
$Salary
$
STI Cash Bonus (A)
$
Non Monetary Benefits
$Total
$Superannuation
$
Other Long Term
$Total
$
Executive Directors
Mr John Chan, Executive Chairman 86,280 435,854 474,058 - 996,192 34,996 12,153 1,043,341
Mr Darren John Pateman, Managing Director 65,930 529,211 438,601 17,163 1,050,905 18,289 13,390 1,082,584
Non-executive Directors
Mr John Boon Heng Cheak 65,930 - - - 65,930 - - 65,930
Mr Kee Kong Loh 76,105 - - - 76,105 - - 76,105
Mr Lee Verios 69,661 - - - 69,661 6,444 - 76,105
Executives
Mr Edward Guy Bank, CFO* - 249,985 237,651 - 487,636 18,289 8,423 514,348
Mr Ronald Chan* - 220,000 216,924 - 436,924 20,900 7,167 464,991
Mr Anthony David Hewett* - 200,000 41,437 - 241,437 19,000 - 260,437
363,906 1,635,050 1,408,671 17,163 3,424,790 117,918 41,133 3,583,841

Directors’ Report 3736 Annual Report 2015 | Finbar Group Limited
Directors’ Report (continued)
4 Corporate Governance Statement (continued)
4.3 Remuneration Report - Audited (continued)
4.3.2 Directors’ and Executive Officers’ Remuneration (continued)
Details of the nature and amount of each major element of the emolument of each Director of the Company and the named Officers of the Group receiving the highest remuneration during the financial year 30 June 2014 are:
Short-Term Post - Employment
Directors Fees and
Committee Fees
$Salary
$
STI Cash Bonus (A)
$
Non Monetary Benefits
$Total
$Superannuation
$
Other Long Term
$Total
$
Executive Directors
Mr John Chan, Executive Chairman 86,280 390,190 667,253 - 1,143,723 24,960 6,589 1,175,272
Mr Darren John Pateman, Managing Director 65,930 473,849 533,802 - 1,073,581 17,776 17,857 1,109,214
Non-executive Directors
Mr John Boon Heng Cheak 65,930 - - - 65,930 - - 65,930
Mr Kee Kong Loh 76,105 - - - 76,105 - - 76,105
Mr Lee Verios 69,661 - - - 69,661 6,444 - 76,105
Executives
Mr Edward Guy Bank, CFO* - 222,574 346,819 - 569,393 17,776 6,838 594,007
Mr Ronald Chan* - 191,154 42,617 - 233,771 21,624 6,500 261,895
Mr Anthony David Hewett* - 165,577 31,240 - 196,817 18,206 - 215,023
363,906 1,443,344 1,621,731 - 3,428,981 106,786 37,784 3,573,551
* Excludes accrued annual leave of $134,324 (2014 : $107,020)
Notes in relation to the Table of Directors’ and Executive Officers’ Remuneration - Audited
(A) Short-term Incentive Cash Bonus:
The short-term incentive bonus is for performance during the respective financial years using the criteria set out on Page 34. Details of the Group’s policy in relation to the remuneration that is performance related is discussed on Page 34.
On 29th October 2014, Finbar Group Limited issued 250,000 fully paid ordinary shares to Darren Pateman as Director Incentive Shares under the rules of the Director Share Plan 2014. Payment was by way of an interest free loan of $360,000 which is repayable by 27th October 2019. The related benefit is disclosed in table 4.3.2 on Page 35.
4.3.3 Analysis of Bonuses included in Remuneration
Details of the vesting profile of the short term incentive bonuses awarded as remuneration to each Director of the Company and each of the named Group Executives are detailed below.
Short Term Incentive Bonus
Included in Remuneration
$% vested in year
%
Executive Directors
Mr John Chan 474,058 100%
Mr Darren John Pateman 438,601 100%
Executives
Mr Edward Guy Bank, CFO 237,651 100%
Mr Ronald Chan, COO 216,924 100%
Mr Anthony David Hewett, Company Secretary 41,437 100%
1,408,671 100%
Amounts included in remuneration for the financial year represent the amount of entitlements in the financial year based on achievement of personal goals and satisfaction of performance criteria, as per Short Term Incentives (page 34). Any discretionary amounts of executive bonuses are yet to be determined, and therefore may impact future financial years.
4.3.4 Directors’ and Executives Interests
Movement in Shares
The movement during the reporting period in the number of ordinary shares in Finbar Group Limited held, directly, indirectly or beneficially, by each key management person, including their related parties, is as follows:
Held at
1 July 2014 Purchases SalesHeld at
30 June 2015
Directors
Mr John Chan 24,439,516 400,000 - 24,839,516
Mr Darren John Pateman 2,330,153 381,536 - 2,711,689
Mr John Boon Heng Cheak 506,956 16,487 - 523,443
Mr Kee Kong Loh 2,000,904 - - 2,000,904
Mr Lee Verios 30,000 - - 30,000
Executives
Mr Edward Guy Bank 300,000 - - 300,000
Mr Ronald Chan 213,260 - - 213,260
Mr Anthony David Hewett 60,000 25,000 - 85,000
29,880,789 823,023 - 30,703,812
Held at
1 July 2013 Purchases SalesHeld at
30 June 2014
Directors
Mr John Chan 23,556,322 883,194 - 24,439,516
Mr Darren John Pateman 2,326,669 3,484 - 2,330,153
Mr John Boon Heng Cheak 495,074 11,882 - 506,956
Mr Kee Kong Loh 2,000,904 - - 2,000,904
Mr Lee Verios 30,000 - - 30,000
Executives
Mr Edward Guy Bank 300,000 - - 300,000
Mr Ronald Chan 213,260 - - 213,260
Mr Anthony David Hewett 20,000 40,000 - 60,000
28,942,229 938,560 - 29,880,789
No options for shares were granted to key management personnel as remuneration during the reporting period.
Directors’ Report 3938 Annual Report 2015 | Finbar Group Limited
Directors’ Report (continued)
4 Corporate Governance Statement (continued)
4.3 Remuneration Report - Audited (continued)
4.3.5 Equity Instruments
All options refer to options over ordinary shares of Finbar Group Limited, which are exercisable on a one-for-one basis under the Employee Incentive Plan 2013. At 30th June 2015 there were no options in issue.
4.4 Audit Committee
The Audit Committee Charter sets out the Audit Committee’s role, powers and duties, and establishes the functions delegated to the Audit Committee by the Board. The Audit Committee advises on the establishment and maintenance of a framework of internal control and appropriate ethical standards for the management of the Group.
A copy of the Audit Committee Charter is available on Finbar’s website www.finbar.com.au.
The following directors serve on the Audit Committee:
• Lee VERIOS (Chairman) - Non-executive Independent Director
• Kee Kong LOH - Non-executive Director
• John Boon Heng CHEAK - Non-executive Director
4.5 Risk Management
Oversight of the Risk Management Procedures
The Board has elected not to establish a separate Risk Committee to oversee risk management and instead the overall responsibility of risk management resides with the Board in its entirety. In this regard, risk management considerations form part of the Board’s discussions at scheduled meetings.
The Board oversees the establishment, implementation, and annual review of the Group’s risk management procedures. Management has established and implemented informal risk management procedures for assessing, monitoring and managing all risks including operational, financial reporting and compliance risks for the Group. The Managing Director and Chief Financial Officer provide assurance, in writing to the Board, that the financial risk management and associated compliance and controls have been assessed and found to be operating effectively.
Risk Management and Compliance Control
Comprehensive practices have been established to ensure:
• capital expenditure with respect to land acquisitions or development agreements obtain prior Board approval;
• financial exposures are controlled, including use of derivatives. Further details of the Group’s policies relating to interest rates management and credit risk are included in Notes 5 and 27 in the Notes to the Financial Statements;
• management systems are monitored and reviewed to achieve high standards of performance and compliance with regulations;
• business transactions are properly authorised and executed;
• the quality and integrity of personnel (see below);
• financial reporting accuracy and compliance with the financial reporting regulatory framework (see below);
• environmental regulation compliance (see page 39).
Quality and Integrity of Personnel
Training and development and appropriate remuneration and incentives with regular performance reviews create an environment of cooperation and constructive dialogue with employees and senior management.
Financial Reporting
The Managing Director and the Chief Financial Officer have provided assurance, in writing to the Board that the Group’s financial reports are founded on a sound system of risk management and internal compliance and control which implements the policies adopted by the Board.
There is a comprehensive accounting system. Monthly actual results are reported against budgets approved by the Directors and revised forecasts for the year are prepared regularly. Procedures are in place to ensure price sensitive information is reported to the Australian Securities Exchange (ASX) in accordance with Continuous Disclosure Requirements.
A review is undertaken at each half year end of all related party transactions.
Environmental Regulation
The Group’s operations are not subject to any significant environmental regulations under either Commonwealth or State legislation.
Compliance with the requirements of environmental regulations and with specific requirements of site environmental licences was substantially achieved across all operations with no instances of non-compliance in relation to licence requirements noted.
The Board is not aware of any significant breaches of environmental regulations during the period covered by this report.
4.6 Ethical Standards
All Directors, Managers and Employees are expected to act with the utmost integrity and objectivity, striving at all times to enhance the reputation and performance of the Group.
Conflict of Interest
Directors must keep the Board advised, on an ongoing basis, of any interest that could potentially conflict with those of the Group.
Where the Board believes that a significant conflict exists for a Director on a Board matter, the Director concerned does not receive the relevant Board papers and is not present at the meeting whilst the item is considered. Details of Director related entity transactions with the Company and the Group are set out in Note 31 in the Notes to the Financial Statements.
Code of Conduct
All Directors, Managers and Employees are expected to maintain high ethical standards including the following:
• aligning the behaviour of the Board and Management with the code of conduct by maintaining appropriate core Group values and objectives;
• fulfilling responsibilities to shareholders by delivering shareholder value;
• usefulness of financial information by maintaining appropriate accounting policies, practices and disclosure;
• fulfilling responsibilities to clients, customers and consumers by maintaining high standards of product quality, service standards, commitments to fair value, and safety of goods produced;
• employment practices such as occupational health and safety, employment opportunity, training and education support, community activities, sponsorships and donations;
• responsibilities to the individual, such as privacy, use of privileged or confidential information, and conflict resolution;
• managing actual or potential conflicts of interest;
• corporate opportunities such as preventing Directors and key executives from taking advantage of property, information or position for personal gain;
• confidentiality of corporate information;
• fair dealing;
• protection and proper use of the Group’s assets;
• compliance with laws;
• reporting unlawful or of unethical behaviour including protection of those who report violations in good faith.

Directors’ Report 4140 Annual Report 2015 | Finbar Group Limited
Directors’ Report (continued)
4 Corporate Governance Statement (continued)
4.6 Ethical Standards (continued)
Trading in General Company Securities by Directors and Employees
The key elements of the Trading in Company Securities by Directors and Employees policy are:
• identification of those restricted from trading - Directors and Senior Executives may acquire shares in the Company, but are prohibited from dealing in Company shares or exercising options:
• within two trading days after either the release of the Company’s half-year and annual results to the Australian Securities Exchange (‘ASX’), the Annual General Meeting or any major announcement;
• whilst in possession of price sensitive information not yet released to the market;
• raising the awareness of legal prohibitions including transactions with colleagues and external advisers;
• raising awareness that the Company prohibits those restricted from trading in Company shares as described above from entering into transactions such as margin loans that could trigger a trade during a prohibited period;
• requiring details to be provided of the trading activities of the Directors of the Company.
4.7 Communication with Shareholders
The Board is committed to ensuring that the Company complies with its continuous disclosure obligations and to facilitate this, has approved a Continuous Disclosure Policy that applies to all Group personnel, including the Directors and Senior Executives. The Board seeks to promote investor confidence by seeking to ensure that trading in the Company’s shares take place in an informed market.
Finbar provides information about itself, its activities and operations, and its governance via its website www.finbar.com.au.
A copy of the Group’s Market Disclosure Policy is available on Finbar’s website www.finbar.com.au.
4.8 Diversity
The Board has considered the recommendation to formulate strict measurable targets for the purposes of the assessment of gender diversity within the organisation. Given the small size and relatively stable nature of its workforce it has formed the view that at this time it would not be appropriate or practical to establish a written policy regarding gender diversity. The Board will review this position at least annually. However, generally, when selecting new employees or advancing existing employees, no consideration is given to gender, age or ethnicity, but instead selections are based upon individual achievements, skill and expertise.
Gender representation
2015 2014
Female Male Female Male
Board - 100% - 100%
Key Management Personnel - 100% - 100%
Senior Management 50% 50% 60% 40%
Group 50% 50% 55% 45%
5 Principal Activities
The principal activities of the Group during the course of the financial year continued to be property development and investment.
The Group’s focus is the development of medium to high-density residential buildings and commercial developments in Western Australia by way of direct ownership, ownership through fully owned Subsidiaries or by equity accounted investees (through companies registered specifically to conduct the development).
The Group holds rental property through 175 Adelaide Terrace Pty Ltd (wholly owned subsidiary of the Company) and Finbar Karratha Pty Ltd (wholly owned subsidiary of the Company).
There were no significant changes in the nature of the activities of the Group during the financial year.
6 Operating and Financial Review
Operating Results 2015 2014
Total comprehensive income attributable to Owners of the Group $25,896,656 $36,526,868
Shareholder Returns 2015 2014 2013 2012 2011
Total comprehensive income attributable to Owners of the Group $25,896,656 $36,526,868 $31,210,908 $28,300,279 $24,023,464
Basic EPS $0.11 $0.16 $0.14 $0.13 $0.13
Diluted EPS $0.11 $0.16 $0.14 $0.13 $0.13
Dividends paid $22,770,213 $21,914,255 $19,298,374 $18,896,550 $15,115,909
Dividends paid per share $0.10 $0.10 $0.09 $0.09 $0.085
Market price per share $1.19 $1.63 $1.26 $1.08 $0.98
Change in share price -$0.44 $0.37 $0.18 $0.10 -$0.02
Return on capital employed attributable to Owners of the Group 11.60% 17.62% 15.32% 17.80% 14.55%
Return on total equity attributable to Owners of the Group 10.90% 15.79% 15.39% 15.27% 14.11%
Returns to shareholders increase through net equity. Dividends for 2015 were fully franked and it is expected that dividends in future years will continue to be fully franked.
Key transactions that contributed to the consolidated net profit of the Company for the 2015 financial year were the completion of the Spring View Towers Apartments in Rivervale, Toccata Apartments in East Perth and Subi Strand Apartments in Subiaco as well as the ongoing rental of the Company’s commercial properties. See below for further information on the Company’s project completions.
Review of Operations
Finbar Group Limited’s (‘Finbar’ or ‘the Company’) core business lies in the development of medium to high density residential apartments and commercial property within the state of Western Australia. Finbar carries out its development projects in its own right or through incorporated special purpose entities and equity accounted investees, of which the Company either directly or indirectly holds interests in project profitability ranging between 50% and 100%.
The Company operates predominantly within the Perth CBD and surrounding areas.
Finbar’s business model involves the acquisition of suitable development land either directly or by way of an incorporated Special Purpose Vehicle or by development agreements with Land Owners. Equity partners are sought to allow the Company to leverage into larger development projects to take advantage of the benefits of economies of scale, and to help spread project risk.
Finbar outsources its design, sales and construction activities to external parties.
The administration of the companies along with the operating, investment, and acquisitions decisions are made by Finbar’s Board and Management. The Company employs 19 staff in its corporate offices in East Perth, Western Australia and 1 member of staff in its office in the Pilbara.
This outsourcing model ensures that the Company is and remains scalable, efficient and agile in a market where acquisition and project timing is critical in maintaining a competitive advantage, helping to protect margins and enhancing the returns Finbar can generate for its shareholders.
There have been no significant changes in the Company’s operating model that occurred during the relevant reporting period and the Company continued to develop and invest in built-form projects within Western Australia throughout the year as its core business.
Notwithstanding a subdued level of confidence nationally in the resources construction cycle in Western Australia, there remains strong support for the product offered by Finbar.
Directors’ Report 4342 Annual Report 2015 | Finbar Group Limited
Directors’ Report (continued)
6 Operating and Financial Review (continued)
Underlying state population growth continues to drive rental values and ownership demand. Combined with a low interest rate environment, Finbar expects a continued demand by owner occupiers which is supplemented by the property investor market.
Factors that may affect the Company’s profit are generally restricted to items that would be considered to reside outside of the control of the Board and Management and are, in general, movements in interest rates, government rebates and incentives, changes in taxation and superannuation laws, banking lending policies and their regulatory changes, global economic factors, resources sector activity, and employment rates.
The ability to source new viable development opportunities is central to Finbar’s ongoing success and the Board and Management has demonstrated a long track record of this ability.
The Board and Management control the Company’s key risks through the implementation of control measures which include; land acquisitions generally secured without the use of debt funding, development funding which is carried out utilising senior bank funding (no mezzanine) from major Australian banks, and the Company’s small and agile structure which can rapidly adapt to changes in market conditions.
There were no significant changes in the composition of overall assets and liabilities, with movements in assets from non-current to current and movements in liabilities from non-current to current as projects reach completion. There were no significant changes to funding strategy, or dividend policy during the relevant reporting period. The Company continued to focus on the generation of sales and rental revenue through property development and investment.
The Board and Management do not currently have the view that there is a requirement to reposition the Company’s overall business model. The Board and Management continuously monitor market fluctuations and conditions and implement appropriate strategies to benefit from and insulate the Company against changing market conditions.
Completed Projects
Pelago West - 23 Sharpe Avenue, Karratha : 1 settlement in the Pelago West project occurred in the reporting period with 99 sales in the completed 114 unit development now being achieved. The balance of apartments have been transferred to and are being held as investment property.
Pelago East - 26 Sharpe Avenue, Karratha : 5 settlements in the Pelago East project occurred in the reporting period with 87 sales in the 174 unit development now being achieved. The balance of apartments have been transferred to and are being held as investment property.
Ecco - 262 Lord Street, Perth : 4 settlements in the Ecco project occurred in the reporting period. 4 units remain for sale in the 98 unit development.
Lime - 189 Swansea Street, East Victoria Park : 1 unit settled in the reporting period. The company is pleased to report that the Lime development is now complete and the company holds no further stock for sale.
Adagio - 90 Terrace Road, East Perth : 1 settlement in the Adagio project occurred in the reporting period. The company is pleased to report that the development is now complete and the company holds no further stock for sale.
Au - 208 Adelaide Terrace & 311 Hay Street, East Perth : 24 settlements in the Au project occurred in the reporting period. 1 further unit has settled since the end of the reporting period. The company is pleased to report that the development is now complete and the company holds no further stock for sale.
Fifty Two Mill Point Rd - 52 Mill Point Road, South Perth : 5 settlements in the Fifty Two Mill Point Rd project occurred in the reporting period. The company is pleased to report that the development is now complete and the company holds no further stock for sale.
Spring View Towers - 3 Homelea Court, Rivervale : The completion of the Spring View Towers project occurred in the first half of the reporting period. 176 units have settled in the reporting period. 8 units remain for sale in the 188 unit development.
Subi Strand - Cnr Roydhouse Street & Hood Street, Subiaco : The completion of the Subi Strand project occurred in the second half of the reporting period. 189 units have settled in the reporting period. 42 units remain for sale in the 264 unit development.
Toccata - 88 Terrace Road, East Perth : The completion of the Toccata project occurred in the second half of the reporting period. 28 units have settled in the reporting period. 8 units remain for sale in the 47 unit development.
Currently Under Construction
Norwood - 280 Lord Street, Perth : Construction works at the Norwood development are expected to reach completion in the first half of the financial year ending 30 June 2016. To date 49 sales have been achieved in the 63 unit development.
Arbor North - Lot 1001-1003 Rowe Avenue, Rivervale : Construction works commenced during the reporting period with completion expected during the financial year ending 30 June 2016. To date 110 sales have been achieved in the 154 unit development.
Concerto & Harmony - 193 Adelaide Terrace, East Perth : Construction works commenced during the reporting period with completion expected during the financial year ending 30 June 2017. To date 133 sales have been achieved in the 227 unit development.
Unison - 241 Railway Avenue, Maylands : Construction works commenced during the reporting period with completion expected during the financial year ending 30 June 2016. To date 84 sales have been achieved in the 169 unit development
Linq - 269 James Street, Northbridge : Construction works commenced during the reporting period with completion expected during the financial year ending 30 June 2016. To date 69 sales have been achieved in the 116 unit development.
Aurelia - 96 Mill Point Road, South Perth : Construction works commenced during the reporting period with completion expected during the financial year ending 30 June 2017. To date 98 sales have been achieved in the 138 unit development.
Future Projects
Motive - 172 Railway Parade, West Leederville : Development Approval has been received. Marketing of the Motive project commenced in the first half of the reporting period. To date 53 sales have been achieved in the 143 unit development.
Sunago - 36 Chester Avenue, Dianella : Development Approval has been received for the development of 163 apartments. It is anticipated that marketing will commence in September 2015.
Civic Heart - 1 Mends Street, South Perth : Development Approval has been received for the development of 294 apartments with 11,900sqm of commercial and retail space. It is anticipated that marketing will commence in September 2015.
Springs Commercial - 2 Hawksburn Road, Rivervale : The company has not secured a lease to date which would underpin the viability of the development of a commercial building on this land. The company will continue to seek a leasing pre-commitment. If it is unsuccessful by the time the Arbor development nears completion, the company will consider seeking approval from the statutory authorities for the redesign into a residential apartment project.
Aire - 647-659 Murray Street, West Perth : Development Approval has been received for the development of 242 apartments with amenities and 2 commercial lots. It is anticipated that marketing will commence in the first half of the financial year ending 30 June 2016.
Anchorage - Lot 452 Sutherland Street, Port Hedland : Development Approval has been received for the first stage of a four stage development comprising 109 apartments plus six commercial tenancies. A wholly owned subsidiary of Finbar has contracted to purchase the development land subject to development approval and marketing success of the first stage. Now that approval has been received, Finbar will prepare to launch the first stage of the four stage project to the market in an effort to secure sufficient pre-sales to underpin the financial viability of the project.
Belmont - 239 Great Eastern Highway, Belmont : The company continues to work towards the lodgement of a Development Application for the site.
Springs Stage 3 - 31 Rowe Avenue, Rivervale : A Development Application has been lodged.
63 Adelaide Terrace, East Perth: A Development Application has been lodged.
5 Harper Terrace, South Perth: The company continues to work towards the lodgement of a Development Application for the site.
Arbor South - Lot 1001-1003 Rowe Avenue Rivervale : The company continues to work towards the lodgement of a Development Application for the site.
Investment Property
Gateway - 59 Albany Highway, Victoria Park : During the financial year, the Gateway building at 59 Albany Highway, East Victoria Park was sold for $72.8m. Settlement occurred in March 2015.
Fairlanes - 175 Adelaide Terrace, East Perth : The company continues to benefit from the investment income generated from the leased property. The property is currently 93% leased. The company continues to actively market the remaining tenancies for rental.
Pelago West Commercial - 23 Sharpe Avenue, Karratha : The company continues to benefit from the investment income generated by the commercial lots in the Pelago West development. The company has now leased 65% of the available commercial space within the Pelago West building.
Pelago East Commercial - 26 Sharpe Avenue, Karratha : The company continues to benefit from the investment income generated by the commercial lots in the Pelago East development. The company has now leased 70% of the available commercial space within the Pelago East building.
Pelago West Residential - 23 Sharpe Avenue, Karratha : The remaining 15 residential units at the Pelago West development have been moved to investment property in the reporting period. These are currently 80% leased.
Pelago East Residential - 26 Sharpe Avenue, Karratha : The remaining 87 residential units at the Pelago East development have been moved to investment property in the reporting period. These are currently 90% leased.
Significant Changes in State of Affairs
In the opinion of the Directors there were no significant changes in the state of affairs of the Group that occurred during the financial year under review.
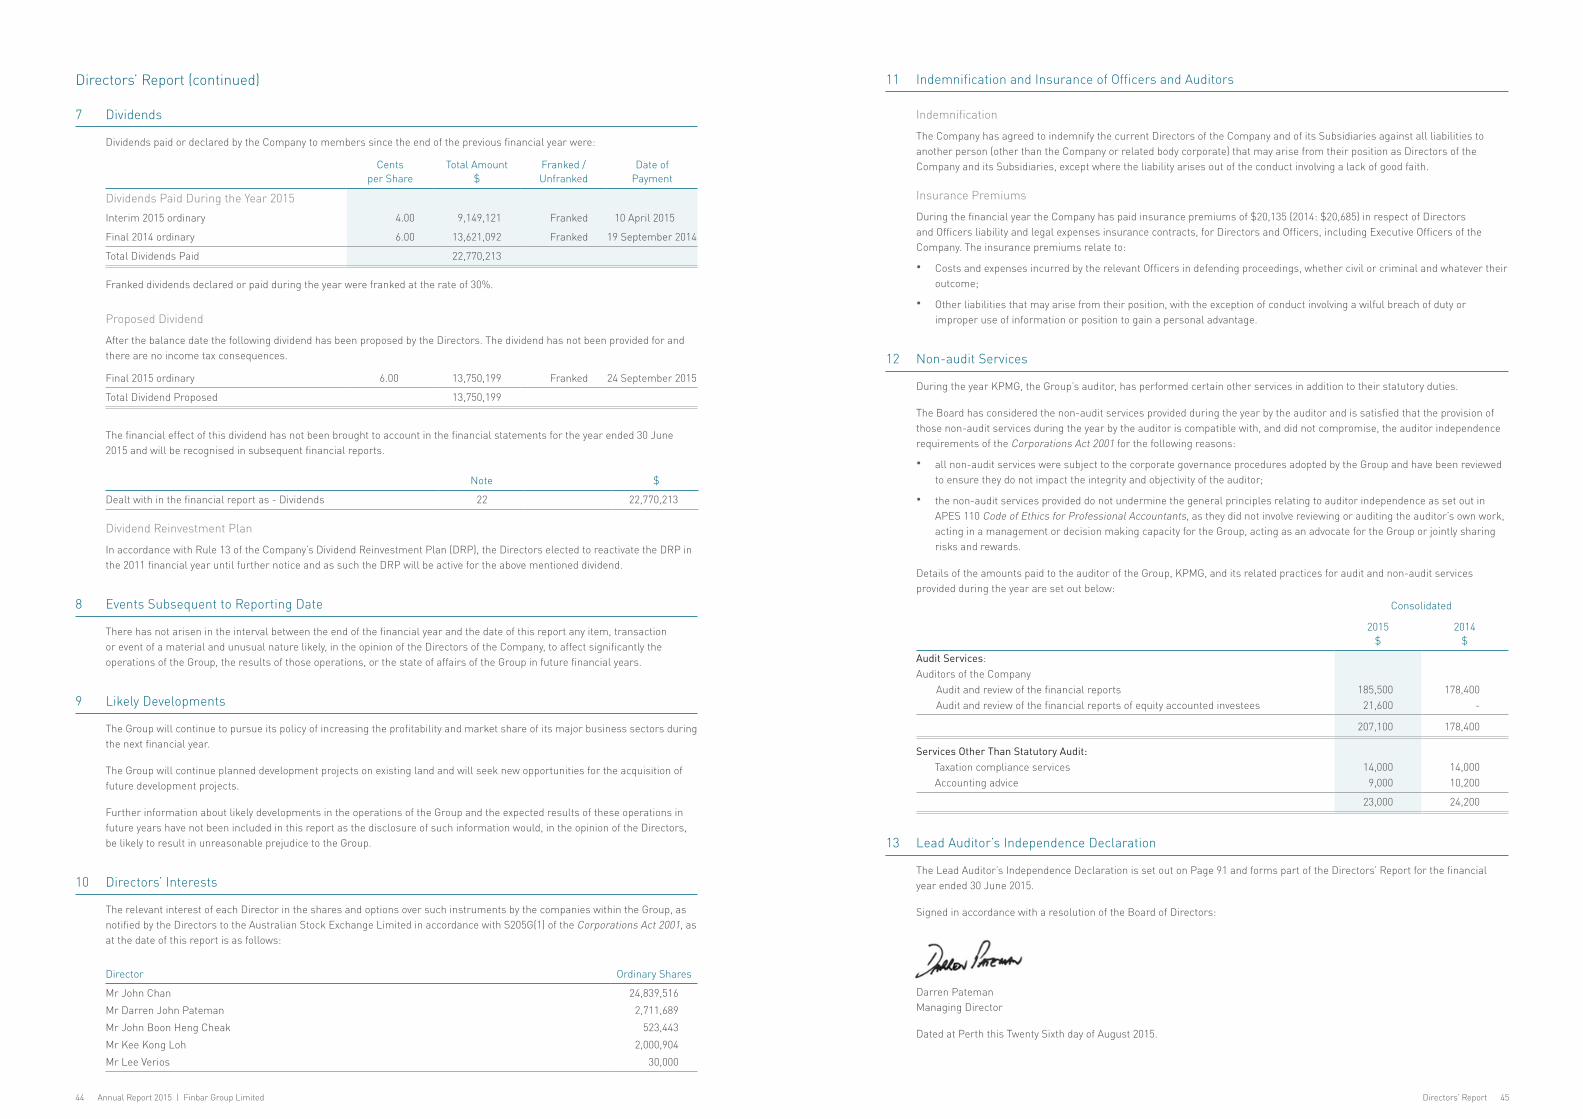
Directors’ Report 4544 Annual Report 2015 | Finbar Group Limited
Directors’ Report (continued)
7 Dividends
Dividends paid or declared by the Company to members since the end of the previous financial year were:
Cents
per Share Total Amount
$Franked / Unfranked
Date of Payment
Dividends Paid During the Year 2015
Interim 2015 ordinary 4.00 9,149,121 Franked 10 April 2015
Final 2014 ordinary 6.00 13,621,092 Franked 19 September 2014
Total Dividends Paid 22,770,213
Franked dividends declared or paid during the year were franked at the rate of 30%.
Proposed Dividend
After the balance date the following dividend has been proposed by the Directors. The dividend has not been provided for and there are no income tax consequences.
Final 2015 ordinary 6.00 13,750,199 Franked 24 September 2015
Total Dividend Proposed 13,750,199
The financial effect of this dividend has not been brought to account in the financial statements for the year ended 30 June 2015 and will be recognised in subsequent financial reports.
Note $
Dealt with in the financial report as - Dividends 22 22,770,213
Dividend Reinvestment Plan
In accordance with Rule 13 of the Company’s Dividend Reinvestment Plan (DRP), the Directors elected to reactivate the DRP in the 2011 financial year until further notice and as such the DRP will be active for the above mentioned dividend.
8 Events Subsequent to Reporting Date
There has not arisen in the interval between the end of the financial year and the date of this report any item, transaction or event of a material and unusual nature likely, in the opinion of the Directors of the Company, to affect significantly the operations of the Group, the results of those operations, or the state of affairs of the Group in future financial years.
9 Likely Developments
The Group will continue to pursue its policy of increasing the profitability and market share of its major business sectors during the next financial year.
The Group will continue planned development projects on existing land and will seek new opportunities for the acquisition of future development projects.
Further information about likely developments in the operations of the Group and the expected results of these operations in future years have not been included in this report as the disclosure of such information would, in the opinion of the Directors, be likely to result in unreasonable prejudice to the Group.
10 Directors’ Interests
The relevant interest of each Director in the shares and options over such instruments by the companies within the Group, as notified by the Directors to the Australian Stock Exchange Limited in accordance with S205G(1) of the Corporations Act 2001, as at the date of this report is as follows:
Director Ordinary Shares
Mr John Chan 24,839,516
Mr Darren John Pateman 2,711,689
Mr John Boon Heng Cheak 523,443
Mr Kee Kong Loh 2,000,904
Mr Lee Verios 30,000
11 Indemnification and Insurance of Officers and Auditors
Indemnification
The Company has agreed to indemnify the current Directors of the Company and of its Subsidiaries against all liabilities to another person (other than the Company or related body corporate) that may arise from their position as Directors of the Company and its Subsidiaries, except where the liability arises out of the conduct involving a lack of good faith.
Insurance Premiums
During the financial year the Company has paid insurance premiums of $20,135 (2014: $20,685) in respect of Directors and Officers liability and legal expenses insurance contracts, for Directors and Officers, including Executive Officers of the Company. The insurance premiums relate to:
• Costs and expenses incurred by the relevant Officers in defending proceedings, whether civil or criminal and whatever their outcome;
• Other liabilities that may arise from their position, with the exception of conduct involving a wilful breach of duty or improper use of information or position to gain a personal advantage.
12 Non-audit Services
During the year KPMG, the Group’s auditor, has performed certain other services in addition to their statutory duties.
The Board has considered the non-audit services provided during the year by the auditor and is satisfied that the provision of those non-audit services during the year by the auditor is compatible with, and did not compromise, the auditor independence requirements of the Corporations Act 2001 for the following reasons:
• all non-audit services were subject to the corporate governance procedures adopted by the Group and have been reviewed to ensure they do not impact the integrity and objectivity of the auditor;
• the non-audit services provided do not undermine the general principles relating to auditor independence as set out in APES 110 Code of Ethics for Professional Accountants, as they did not involve reviewing or auditing the auditor’s own work, acting in a management or decision making capacity for the Group, acting as an advocate for the Group or jointly sharing risks and rewards.
Details of the amounts paid to the auditor of the Group, KPMG, and its related practices for audit and non-audit services provided during the year are set out below:
Consolidated
2015 $
2014 $
Audit Services:Auditors of the Company
Audit and review of the financial reports 185,500 178,400 Audit and review of the financial reports of equity accounted investees 21,600 -
207,100 178,400
Services Other Than Statutory Audit:Taxation compliance services 14,000 14,000 Accounting advice 9,000 10,200
23,000 24,200
13 Lead Auditor’s Independence Declaration
The Lead Auditor’s Independence Declaration is set out on Page 91 and forms part of the Directors’ Report for the financial year ended 30 June 2015.
Signed in accordance with a resolution of the Board of Directors:
Darren Pateman Managing Director
Dated at Perth this Twenty Sixth day of August 2015.

46 Annual Report 2015 | Finbar Group Limited
Consolidated
2015 $
2014 $ Note
Revenue 7 89,360,407 275,247,830
Cost of sales (59,638,825) (204,631,575)
Gross Profit 29,721,582 70,616,255
Other income 8 4,511,357 1,812,865
Loss on disposal of investment property (828,628) -
Loss on disposal of shareholdings (614,390) -
Loss on disposal of property, plant & equipment - (582)
Administrative expenses (7,588,853) (7,228,044)
Advertising expenses (1,680,183) (741,461)
Other expenses 9 (6,891,635) (5,010,837)
Results from Operating Activities 16,629,250 59,448,196
Finance income 11 4,912,617 3,417,023
Finance costs 11 (3,236,964) (3,616,022)
Net Finance Income/(Costs) 1,675,653 (198,999)
Share of profit/(loss) of Equity Accounted Investees (net of income tax) 15 13,394,563 (577,302)
Profit before Income Tax 31,699,466 58,671,895
Income tax expense 12 (5,580,669) (17,857,793)
Profit for the year 26,118,797 40,814,102
Other comprehensive income
Items which will not be reclassified to profit or loss:
Revaluation of property, plant and equipment 8 (414,508) 91,175
Tax on items that will not be reclassified to profit or loss 12 124,353 (27,352)
Other comprehensive income for the year, net of income tax (290,155) 63,823
Total comprehensive income for the year 25,828,642 40,877,925
Profit attributable to:
Owners of the Group 26,186,811 36,463,045
Non-controlling interest (68,014) 4,351,057
Profit for the year 26,118,797 40,814,102
Total comprehensive income attributable to:
Owners of the Group 25,896,656 36,526,868
Non-controlling interest (68,014) 4,351,057
Total comprehensive income for the year 25,828,642 40,877,925
Earnings per Share:
Basic earnings per share (cents per share) 23 11.46 16.43
Diluted earnings per share (cents per share) 23 11.46 16.43
The Consolidated Statement of Profit or Loss and Other Comprehensive Income is to be read in conjunction with the Notes to the Financial Statements set out on Pages 50 to 87.
Consolidated Statement of Profit or Loss and Other Comprehensive IncomeFor the Year Ended 30 June 2015
Attributable to equity holders of the company
Share CapitalRetained Earnings
Asset Revaluation
Reserve Total
Non Controlling
InterestTotal
Equity
$ $ $ $ $ $
Balance as at 1 July 2013 137,779,605 63,616,005 1,395,971 202,791,581 3,011,877 205,803,458
Total comprehensive income for the year
Profit 36,463,045 36,463,045 4,351,057 40,814,102
Revaluation reserve transfer on disposal 34,023 (34,023) - -
Other comprehensive income - 63,823 63,823 - 63,823
Transactions with owners, recognised directly in equity
Issue of ordinary shares 13,908,273 13,908,273 13,908,273
Dividends to shareholders Note 22 (21,914,255) (21,914,255) (21,914,255)
Balance as at 30 June 2014 151,687,878 78,198,818 1,425,771 231,312,467 7,362,934 238,675,401
Balance as at 1 July 2014 151,687,878 78,198,818 1,425,771 231,312,467 7,362,934 238,675,401
Total comprehensive income for the year
Profit 26,186,811 26,186,811 (68,014) 26,118,797
Other comprehensive income (290,155) (290,155) - (290,155)
Transactions with owners, recognised directly in equity
Issue of ordinary shares 3,972,979 3,972,979 3,972,979
Buyback of shares (904,250) (904,250) (904,250)
Dividends to shareholders Note 22 (22,770,213) (22,770,213) (6,710,000) (29,480,213)
Balance as at 30 June 2015 154,756,607 81,615,416 1,135,616 237,507,639 584,920 238,092,559
Amounts are stated net of tax
The Consolidated Statement of Changes in Equity is to be read in conjunction with the Notes to the Financial Statements set out on Pages 50 to 87.
Consolidated Statement of Changes in EquityFor the Year Ended 30 June 2015
Financial Statements | Consolidated Statement of Changes in Equity 47

48 Annual Report 2015 | Finbar Group Limited
Consolidated
Note2015
$2014
$
ASSETS
Current Assets
Cash and cash equivalents 21a 68,998,846 60,914,484
Trade and other receivables 19 24,776,485 11,104,520
Inventories 18 47,474,982 75,768,509
Prepayments 20 41,792 92,044
Investments in Equity Accounted Investees 15 8,220,088 -
Other assets 16 232,290 352,454
Total Current Assets 149,744,483 148,232,011
Non Current Assets
Trade and other receivables 19 42,813,870 46,109,434
Inventories 18 26,097,480 11,771,124
Investment property 13 110,672,670 134,981,804
Prepayments 20 465,053 -
Investments in Equity Accounted Investees 15 4,129,886 -
Property, plant and equipment 14 13,490,430 12,325,927
Other assets 16 491,906 1,952,696
Total Non Current Assets 198,161,295 207,140,985
Total Assets 347,905,778 355,372,996
LIABILITIES
Current Liabilities
Trade and other payables 26 15,280,625 12,055,009
Loans and borrowings 24 31,850,251 -
Investments In Equity Accounted Investees 15 - 495,922
Current tax payable 17 4,245,964 13,500,733
Employee benefits 25 137,261 33,499
Total Current Liabilities 51,514,101 26,085,163
Non Current Liabilities
Loans and borrowings 24 53,047,730 78,379,122
Investments In Equity Accounted Investees 15 - 203,668
Deferred tax liabilities 17 5,102,343 11,831,928
Employee benefits 25 149,045 197,714
Total Non Current Liabilities 58,299,118 90,612,432
Total Liabilities 109,813,219 116,697,595
Net Assets 238,092,559 238,675,401
EQUITY
Share capital 22 154,756,607 151,687,878
Retained earnings 22 81,615,416 78,198,818
Reserves 22 1,135,616 1,425,771
Total Equity Attributable to Holders of the Group 237,507,639 231,312,467
Non-controlling interest 584,920 7,362,934
Total Equity 238,092,559 238,675,401
The Consolidated Statement of Financial Position is to be read in conjunction with the Notes to the Financial Statements set out on Pages 50 to 87.
Consolidated Statement of Financial PositionAs at 30 June 2015
Consolidated
Note2015
$2014
$
Cash Flows from Operating Activities
Cash receipts from customers 98,057,354 322,471,991
Cash paid to suppliers and employees (129,063,488) (191,371,153)
Cash (used in)/generated from Operating Activities (31,006,134) 131,100,838
Interest paid (4,141,441) (8,175,150)
Income tax paid (21,439,529) (10,710,723)
Net Cash (used in)/generated from Operating Activities 21b (56,587,104) 112,214,965
Cash Flows from Investing Activities
Interest received 5,002,313 2,498,277
Dividends received from Equity Accounted Investees 345,000 1,305,398
Acquisition of property, plant and equipment 14 (45,940) (300,659)
Proceeds from sale of investment property 13 72,172,844 -
Proceeds from/(Repayment of) loans to Equity Accounted Investees 7,454,740 (22,340,755)
Net Cash provided by/(used in) Investing Activities 84,928,957 (18,837,739)
Cash Flows from Financing Activities
Proceeds from issue of share capital 22 - 8,380,000
Repurchase of own shares 22 (904,250) -
Proceeds from borrowings 24 80,014,341 83,231,282
Repayment of borrowings 24 (73,500,347) (143,284,782)
Dividends paid (net of DRP) 22 (19,157,235) (16,385,983)
Dividends paid to minority shareholders 22 (6,710,000) -
Net Cash used in Financing Activities (20,257,491) (68,059,483)
Net increase in cash and cash equivalents 8,084,362 25,317,743
Cash and cash equivalents at 1 July 60,914,484 35,596,741
Cash and Cash Equivalents at 30 June 21a 68,998,846 60,914,484
Consolidated Statement of Cash FlowsFor the Year Ended 30 June 2015
The Consolidated Statement of Cash Flows is to be read in conjunction with the Notes to the Financial Statements set out on Pages 50 to 87.
Financial Statements | Consolidated Statement of Cash Flows 49
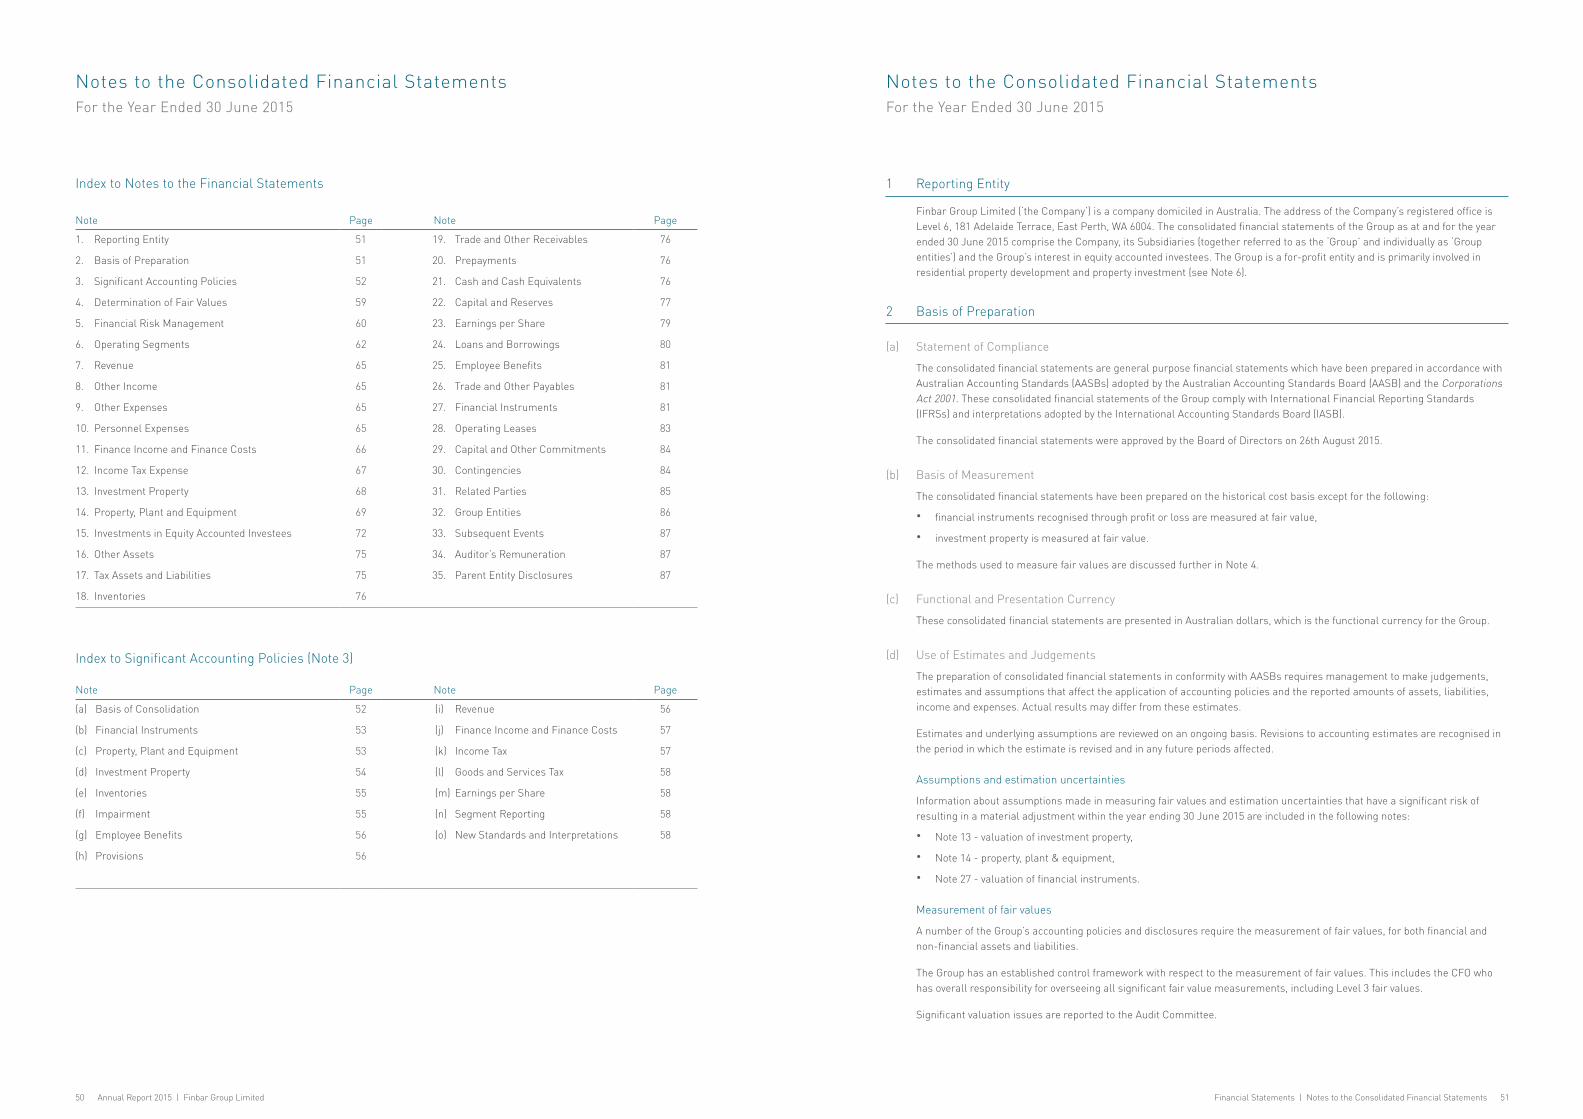
Notes to the Consolidated Financial StatementsFor the Year Ended 30 June 2015
Notes to the Consolidated Financial StatementsFor the Year Ended 30 June 2015
50 Annual Report 2015 | Finbar Group Limited Financial Statements | Notes to the Consolidated Financial Statements 51
Index to Notes to the Financial Statements
Note Page Note Page
1. Reporting Entity 51 19. Trade and Other Receivables 76
2. Basis of Preparation 51 20. Prepayments 76
3. Significant Accounting Policies 52 21. Cash and Cash Equivalents 76
4. Determination of Fair Values 59 22. Capital and Reserves 77
5. Financial Risk Management 60 23. Earnings per Share 79
6. Operating Segments 62 24. Loans and Borrowings 80
7. Revenue 65 25. Employee Benefits 81
8. Other Income 65 26. Trade and Other Payables 81
9. Other Expenses 65 27. Financial Instruments 81
10. Personnel Expenses 65 28. Operating Leases 83
11. Finance Income and Finance Costs 66 29. Capital and Other Commitments 84
12. Income Tax Expense 67 30. Contingencies 84
13. Investment Property 68 31. Related Parties 85
14. Property, Plant and Equipment 69 32. Group Entities 86
15. Investments in Equity Accounted Investees 72 33. Subsequent Events 87
16. Other Assets 75 34. Auditor’s Remuneration 87
17. Tax Assets and Liabilities 75 35. Parent Entity Disclosures 87
18. Inventories 76
Index to Significant Accounting Policies (Note 3)
Note Page Note Page
(a) Basis of Consolidation 52 (i) Revenue 56
(b) Financial Instruments 53 (j) Finance Income and Finance Costs 57
(c) Property, Plant and Equipment 53 (k) Income Tax 57
(d) Investment Property 54 (l) Goods and Services Tax 58
(e) Inventories 55 (m) Earnings per Share 58
(f) Impairment 55 (n) Segment Reporting 58
(g) Employee Benefits 56 (o) New Standards and Interpretations 58
(h) Provisions 56
1 Reporting Entity
Finbar Group Limited (‘the Company’) is a company domiciled in Australia. The address of the Company’s registered office is Level 6, 181 Adelaide Terrace, East Perth, WA 6004. The consolidated financial statements of the Group as at and for the year ended 30 June 2015 comprise the Company, its Subsidiaries (together referred to as the ‘Group’ and individually as ‘Group entities’) and the Group’s interest in equity accounted investees. The Group is a for-profit entity and is primarily involved in residential property development and property investment (see Note 6).
2 Basis of Preparation
(a) Statement of Compliance
The consolidated financial statements are general purpose financial statements which have been prepared in accordance with Australian Accounting Standards (AASBs) adopted by the Australian Accounting Standards Board (AASB) and the Corporations Act 2001. These consolidated financial statements of the Group comply with International Financial Reporting Standards (IFRSs) and interpretations adopted by the International Accounting Standards Board (IASB).
The consolidated financial statements were approved by the Board of Directors on 26th August 2015.
(b) Basis of Measurement
The consolidated financial statements have been prepared on the historical cost basis except for the following:
• financial instruments recognised through profit or loss are measured at fair value,
• investment property is measured at fair value.
The methods used to measure fair values are discussed further in Note 4.
(c) Functional and Presentation Currency
These consolidated financial statements are presented in Australian dollars, which is the functional currency for the Group.
(d) Use of Estimates and Judgements
The preparation of consolidated financial statements in conformity with AASBs requires management to make judgements, estimates and assumptions that affect the application of accounting policies and the reported amounts of assets, liabilities, income and expenses. Actual results may differ from these estimates.
Estimates and underlying assumptions are reviewed on an ongoing basis. Revisions to accounting estimates are recognised in the period in which the estimate is revised and in any future periods affected.
Assumptions and estimation uncertainties
Information about assumptions made in measuring fair values and estimation uncertainties that have a significant risk of resulting in a material adjustment within the year ending 30 June 2015 are included in the following notes:
• Note 13 - valuation of investment property,
• Note 14 - property, plant & equipment,
• Note 27 - valuation of financial instruments.
Measurement of fair values
A number of the Group’s accounting policies and disclosures require the measurement of fair values, for both financial and non-financial assets and liabilities.
The Group has an established control framework with respect to the measurement of fair values. This includes the CFO who has overall responsibility for overseeing all significant fair value measurements, including Level 3 fair values.
Significant valuation issues are reported to the Audit Committee.

Notes to the Consolidated Financial StatementsFor the Year Ended 30 June 2015
Notes to the Consolidated Financial StatementsFor the Year Ended 30 June 2015
52 Annual Report 2015 | Finbar Group Limited Financial Statements | Notes to the Consolidated Financial Statements 53
2 Basis of Preparation (continued)
(d) Use of Estimates and Judgements (continued)
When measuring the fair value of an asset or a liability, the Group uses market observable data as far as possible. Fair values are categorised into different levels in a fair value hierarchy based on the inputs used in the valuation techniques as follows.
• Level 1: quoted prices (unadjusted) in active markets for identical assets or liabilities
• Level 2: inputs other than quoted prices included in Level 1 that are observable for the asset or liability, either directly (i.e. as prices) or indirectly (i.e. derived from prices)
• Level 3: inputs for the asset or liability that are not based on observable market data (unobservable inputs)
If the inputs used to measure the fair value of an asset or a liability might be categorised in different levels of the fair value hierarchy, then the fair value measurement is categorised in its entirety in the same level of the fair value hierarchy as the lowest level input that is significant to the entire measurement.
The Group recognises transfers between levels of the fair value hierarchy at the end of the reporting period during which the change occurred.
(e) Changes in Accounting Policies
There have been no changes in accounting policies during the year.
3 Significant Accounting Policies
The accounting policies set out below have been applied consistently to all periods presented in these consolidated financial statements, and have been applied consistently by Group entities.
(a) Basis of Consolidation
(i) Subsidiaries
Subsidiaries are entities controlled by the Group. The Group controls an entity when it is exposed to or has rights to variable returns from its investment with the entity and has the ability to affect those returns through its power over the entity. The financial statements of Subsidiaries are included in the consolidated financial statements from the date that control commences until the date that control ceases. The accounting policies of subsidiaries have been changed when necessary to align them with the policies adopted by the Group.
(ii) Equity Accounted Investees
Equity accounted investees are those entities over whose activities the Group has joint control, established by contractual agreement and requiring unanimous consent for strategic and operating decisions. Investments in equity accounted investees are accounted for using the equity method (Equity Accounted Investees) and are initially recognised at cost. The consolidated financial statements include the Group’s share of the income and expenses and equity movements of Equity Accounted Investees, after adjustments to align the accounting policies with those of the Group, from the date that the joint control commences until the date the joint control ceases. When the Group’s share of losses exceeds its interest in an Equity Accounted Investee, the carrying amount of that interest is reduced to nil and the recognition of further losses is discontinued except to the extent that the Group has an obligation or has made payments on behalf of the Equity Accounted Investee. Investments in equity accounted investees are carried at the lower of the equity accounted amount and the recoverable amount. Investments in equity accounted investees are treated as current assets where it is expected that the investment will be realised within a twelve month time frame.
(iii) Joint Operations
A joint operation is carried on by each venturer using its own assets in pursuit of the joint operations. The consolidated financial statements include the assets that the group controls and the liabilities that it incurs in the course of pursuing the joint operation, and the expenses that the Group incurs and its share of the income that it earns from the joint operation.
(iv) Transactions Eliminated on Consolidation
Intra-group balances and transactions, and any unrealised gains and losses or income and expenses arising from intra-group transactions, are eliminated in preparing the consolidated financial statements. Unrealised gains arising from transactions with Equity Accounted Investees are eliminated against the investment to the extent of the Group’s interest in the Equity Accounted Investee. Unrealised losses are eliminated in the same way as unrealised gains, but only to the extent that there is no evidence of impairment. Gains and losses are recognised as the contributed assets are consumed or sold by the Equity Accounted Investee or, if not consumed or sold by the Equity Accounted Investee, when the Group’s interest in such entities is disposed of.
(b) Financial Instruments
(i) Non-derivative Financial Instruments
Non-derivative financial instruments comprise investments in equity and debt securities, trade and other receivables, cash and cash equivalents, loans and borrowings, and trade and other payables.
Non-derivative financial instruments are recognised initially at fair value plus, for instruments not at fair value through profit or loss, any directly attributable transaction costs, except as described below. Subsequent to initial recognition non-derivative financial instruments are measured as described below.
Cash and cash equivalents comprise cash balances and call deposits. Bank overdrafts that are repayable on demand and form an integral part of the Group’s cash management are included as a component of cash and cash equivalents for the purpose of the statement of cash flows.
Accounting for finance income and expense is discussed in Note 3(j).
Other
Other non-derivative financial instruments are measured at amortised cost using the effective interest method, less any impairment losses.
(ii) Derivative Financial Instruments
Derivatives are recognised initially at fair value; attributable transaction costs are recognised in profit or loss when incurred. Subsequent to initial recognition, derivatives are measured at fair value, and changes in fair value are recognised in profit or loss.
(iii) Share Capital
Ordinary shares Ordinary shares are classified as equity. Incremental costs directly attributable to the issue of ordinary shares and share options are recognised as a deduction from equity, net of any tax effects.
Repurchase of share capital When share capital recognised in equity is repurchased, the amount of the consideration paid, which includes directly attributable costs, net of any tax effects, is recognised as a deduction from equity.
Dividends Dividends are recognised as a liability in the period in which they are declared.
(c) Property, Plant and Equipment
(i) Recognition and Measurement
Items of plant and equipment are measured at cost or deemed cost less accumulated depreciation and impairment losses.
Cost includes expenditure that is directly attributable to the acquisition of the asset. The cost of self-constructed assets include the cost of materials, direct labour, any other costs directly attributable to bringing the asset to a working order for its intended use, the costs of dismantling and removing the items and restoring the site on which they are located, and capitalised borrowing costs (see page 54).
Items classified as property are measured at fair value. Refer Note (c) (iv).
Where parts of an item of property, plant and equipment have different useful lives, they are accounted for as separate items (major components) of property, plant and equipment.
Gains on disposal of an item of property, plant and equipment are determined by comparing the proceeds from disposal with the carrying amount of property, plant & equipment and are recognised net within “Other income” in profit or loss.
Losses on disposal of an item of property, plant and equipment are determined by comparing the proceeds from disposal with the carrying amount of property, plant & equipment and are recognised net within “Administrative expenses” in profit or loss.
When revalued assets are sold, the amounts included in the revaluation reserve are transferred to retained earnings.
In respect to borrowing costs relating to qualifying assets, the Group capitalises costs directly attributable to the acquisition, construction or production of a qualifying asset as part of the cost of the asset.

Notes to the Consolidated Financial StatementsFor the Year Ended 30 June 2015
Notes to the Consolidated Financial StatementsFor the Year Ended 30 June 2015
54 Annual Report 2015 | Finbar Group Limited Financial Statements | Notes to the Consolidated Financial Statements 55
3 Significant Accounting Policies (continued)
(ii) Reclassification to Investment Property
Property that is being constructed for future use as investment property is accounted for as property, plant and equipment until construction or development is complete, at which time it is remeasured to fair value and reclassified as investment property. Any gain or loss arising on remeasurement is recognised in profit or loss.
When the use of a property changes from owner-occupied to investment property, the property is remeasured to fair value and reclassified as investment property. Any loss is recognised in the revaluation reserve to the extent that an amount is included in revaluation reserve for that property, with any remaining loss recognised immediately in profit or loss. Any gain arising on revaluation is recognised in profit or loss to the extent the gain reverses a previous impairment loss on the property, with any remaining gain recognised in a revaluation reserve in equity.
(iii) Subsequent Costs
The cost of replacing part of an item of property, plant and equipment is recognised in the carrying amount of the item if it is probable that the future economic benefits embodied within the part will flow to the Group and its cost can be reliably measured. The carrying amount of the replaced part is derecognised. The costs of the day-to-day servicing of property, plant and equipment are recognised in profit or loss as incurred.
(iv) Revaluation Model to Property
After recognition as an asset, the Group has elected to carry an item of property whose fair value can be reliably measured shall be carried at a revalued amount, being its fair value at the date of the revaluation less any subsequent accumulated impairment losses. Revaluations are made with sufficient regularity to ensure that the carrying amount does not differ materially from that which would be determined using fair value at the end of the reporting period.
If an item of property is revalued, the entire class of property to which that asset belongs shall be revalued. Any gain or loss arising on remeasurement is recognised in other comprehensive income and asset revaluation reserve. Refer Note 4.
(v) Depreciation and Amortisation
Depreciation and amortisation is recognised in profit or loss on a straight-line basis over the estimated useful lives of each part of an item of property, plant and equipment. Assets are depreciated or amortised from the date of acquisition. Land is not depreciated.
The estimated useful lives in the current and comparative periods are as follows:
– Office property 40 years
– Office furniture and equipment, fixtures and fittings 5 - 25 years
– Plant and equipment 1 - 10 years
Depreciation and amortisation rates and methods are reviewed at each reporting date. When changes are made, adjustments are reflected prospectively in the current and future periods only.
(d) Investment Property
Investment property is property held either to earn rental income or for capital appreciation or for both, but not for sale in the ordinary course of business, used in the production or supply of goods and services or for administrative purposes. Investment property is measured at fair value (see Note 4) with any change therein recognised in profit or loss.
Cost includes expenditure that is directly attributable to the acquisition of the investment property. The cost of self-constructed investment property includes the cost of materials and direct labour, any other costs directly attributable to bringing the investment property to a working condition for their intended use and capitalised borrowing costs.
When the use of a property changes such that it is reclassified as property, plant or equipment, its fair value at the date of reclassification becomes its cost for subsequent accounting.
(e) Inventories
Inventories and work in progress, including land held for resale, are stated at the lower of cost and net realisable value.
Net realisable value is the estimated selling price in the ordinary course of business, less the estimated costs of completion and selling expenses.
Cost includes the cost of acquisition, development costs, holding costs and directly attributable interest on borrowed funds where the development is a qualifying asset. Capitalisation of borrowing costs is ceased during extended periods in which active development is interrupted. When a development is completed and ceases to be a qualifying asset, borrowing costs and other costs are expensed as incurred.
Current and Non-current Inventory Assets
Inventory is classified as current when it satisfies any of the following criteria:
• it is expected to be realised in, or is intended for sale or consumption in, the entity’s normal operating cycle;
• it is held primarily for the purpose of being traded; or
• it is expected to be realised within twelve months of the reporting date.
All other inventory is treated as non-current.
(f) Impairment
(i) Financial Assets (Including Receivables)
A financial asset not carried at fair value is assessed at each reporting date to determine whether there is any objective evidence that it is impaired. A financial asset is impaired if objective evidence indicates that a loss event has occurred after the initial recognition of the asset and the loss event had a negative effect on the estimated future cash flows of that asset that can be reliably measured.
Objective evidence that financial assets (including equity securities) are impaired can include default or delinquency by a debtor, restructuring of an amount due to the Group on terms the Group would not consider otherwise, indications that a debtor or issuer will enter bankruptcy, the disappearance of an active market for a security.
An impairment loss in respect of a financial asset measured at amortised cost is calculated as the difference between its carrying amount, and the present value of the estimated future cash flows discounted at the original effective interest rate. Losses are recognised in profit or loss and reflected in an allowance account against receivables. When a subsequent event causes the amount of impairment loss to decrease, the decrease in impairment loss is recognised through profit or loss.
(ii) Non-financial Assets
The carrying amounts of the Group’s non-financial assets other than investment property, inventories and deferred tax assets, are reviewed at each reporting date to determine whether there is any indication of impairment. If any such indication exists then the asset’s recoverable amount is estimated.
The recoverable amount of an asset or cash-generating unit is the greater of its value in use and its fair value less costs to sell. In assessing value in use, the estimated future cash flows are discounted to their present value using a pre-tax discount rate that reflects current market assessments of the time value of money and the risks specific to the asset. For the purpose of impairment testing, assets that cannot be tested individually are grouped together into the smallest group of assets that generates cash flow from continuing use that are largely independent of the cash flows of other assets or groups of assets (the “cash generating unit”).
An impairment loss is recognised if the carrying amount of an asset or its cash-generating unit exceeds its recoverable amount. Impairment losses are recognised in profit or loss.
Impairment losses recognised in prior periods are assessed at each reporting date for any indications that the loss has decreased or no longer exists. An impairment loss is reversed if there has been a change in the estimates used to determine the recoverable amount. An impairment loss is reversed only to the extent that the asset’s carrying amount does not exceed the carrying amount that would have been determined, net of depreciation or amortisation, if no impairment loss had been recognised.
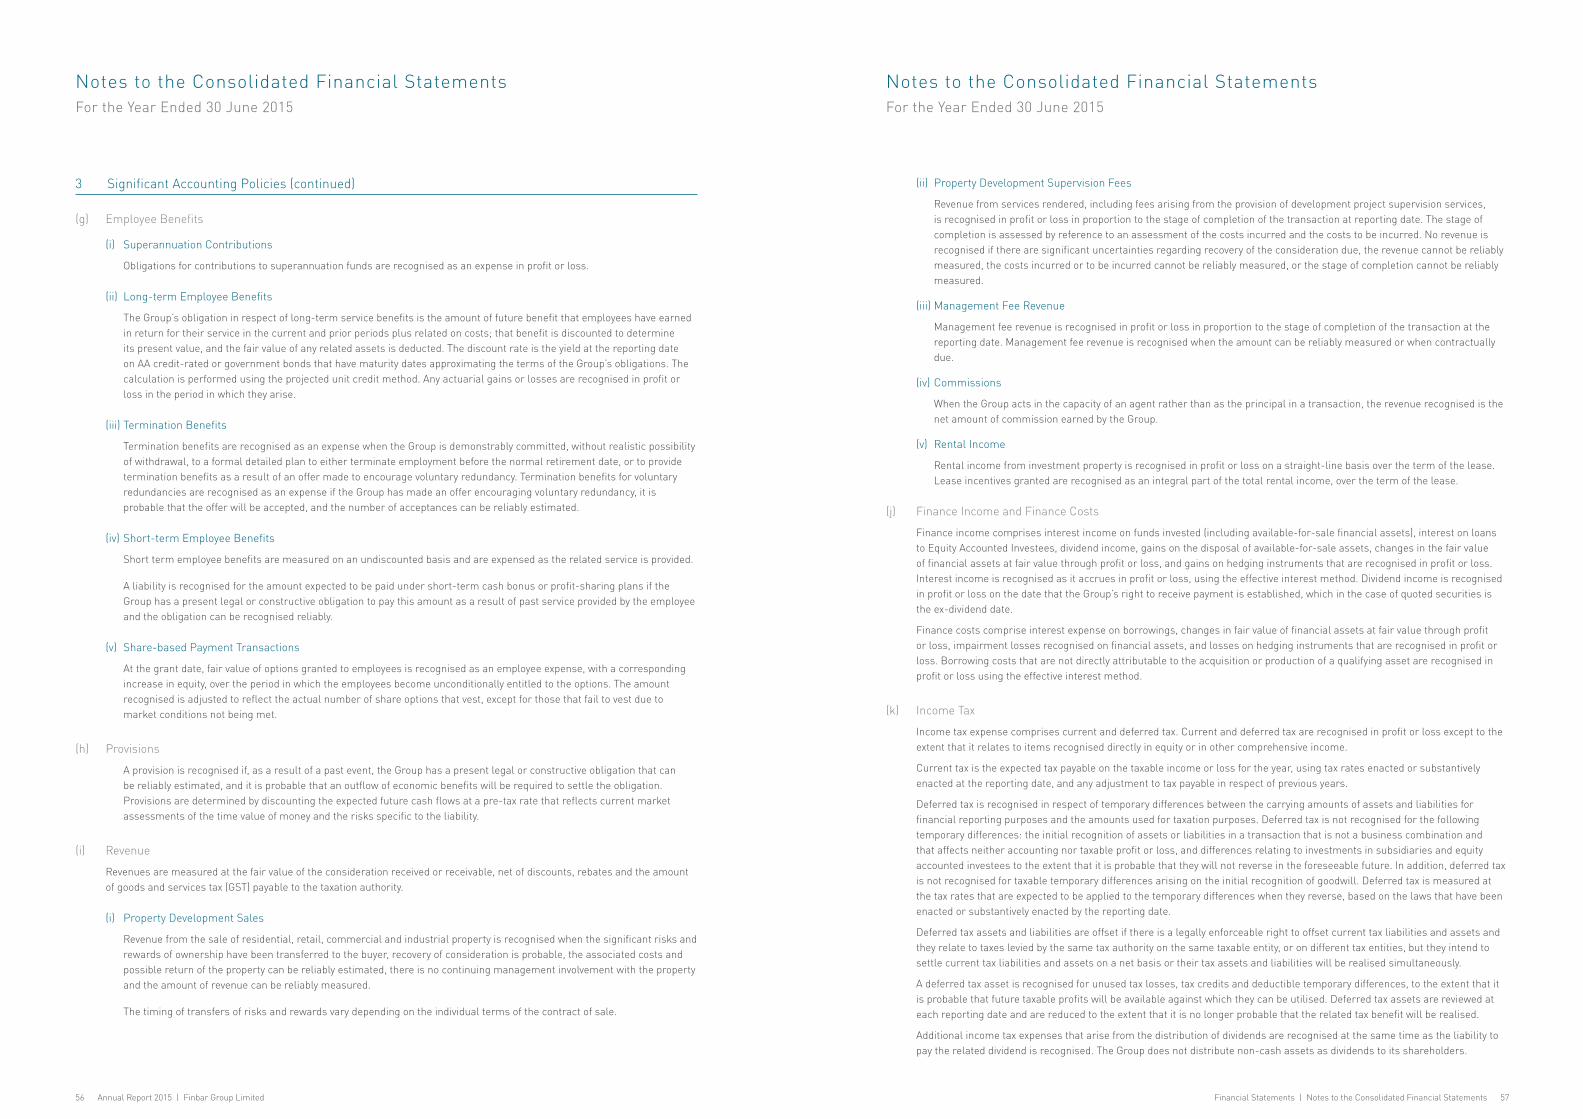
Notes to the Consolidated Financial StatementsFor the Year Ended 30 June 2015
Notes to the Consolidated Financial StatementsFor the Year Ended 30 June 2015
56 Annual Report 2015 | Finbar Group Limited Financial Statements | Notes to the Consolidated Financial Statements 57
3 Significant Accounting Policies (continued)
(g) Employee Benefits
(i) Superannuation Contributions
Obligations for contributions to superannuation funds are recognised as an expense in profit or loss.
(ii) Long-term Employee Benefits
The Group’s obligation in respect of long-term service benefits is the amount of future benefit that employees have earned in return for their service in the current and prior periods plus related on costs; that benefit is discounted to determine its present value, and the fair value of any related assets is deducted. The discount rate is the yield at the reporting date on AA credit-rated or government bonds that have maturity dates approximating the terms of the Group’s obligations. The calculation is performed using the projected unit credit method. Any actuarial gains or losses are recognised in profit or loss in the period in which they arise.
(iii) Termination Benefits
Termination benefits are recognised as an expense when the Group is demonstrably committed, without realistic possibility of withdrawal, to a formal detailed plan to either terminate employment before the normal retirement date, or to provide termination benefits as a result of an offer made to encourage voluntary redundancy. Termination benefits for voluntary redundancies are recognised as an expense if the Group has made an offer encouraging voluntary redundancy, it is probable that the offer will be accepted, and the number of acceptances can be reliably estimated.
(iv) Short-term Employee Benefits
Short term employee benefits are measured on an undiscounted basis and are expensed as the related service is provided.
A liability is recognised for the amount expected to be paid under short-term cash bonus or profit-sharing plans if the Group has a present legal or constructive obligation to pay this amount as a result of past service provided by the employee and the obligation can be recognised reliably.
(v) Share-based Payment Transactions
At the grant date, fair value of options granted to employees is recognised as an employee expense, with a corresponding increase in equity, over the period in which the employees become unconditionally entitled to the options. The amount recognised is adjusted to reflect the actual number of share options that vest, except for those that fail to vest due to market conditions not being met.
(h) Provisions
A provision is recognised if, as a result of a past event, the Group has a present legal or constructive obligation that can be reliably estimated, and it is probable that an outflow of economic benefits will be required to settle the obligation. Provisions are determined by discounting the expected future cash flows at a pre-tax rate that reflects current market assessments of the time value of money and the risks specific to the liability.
(i) Revenue
Revenues are measured at the fair value of the consideration received or receivable, net of discounts, rebates and the amount of goods and services tax (GST) payable to the taxation authority.
(i) Property Development Sales
Revenue from the sale of residential, retail, commercial and industrial property is recognised when the significant risks and rewards of ownership have been transferred to the buyer, recovery of consideration is probable, the associated costs and possible return of the property can be reliably estimated, there is no continuing management involvement with the property and the amount of revenue can be reliably measured.
The timing of transfers of risks and rewards vary depending on the individual terms of the contract of sale.
(ii) Property Development Supervision Fees
Revenue from services rendered, including fees arising from the provision of development project supervision services, is recognised in profit or loss in proportion to the stage of completion of the transaction at reporting date. The stage of completion is assessed by reference to an assessment of the costs incurred and the costs to be incurred. No revenue is recognised if there are significant uncertainties regarding recovery of the consideration due, the revenue cannot be reliably measured, the costs incurred or to be incurred cannot be reliably measured, or the stage of completion cannot be reliably measured.
(iii) Management Fee Revenue
Management fee revenue is recognised in profit or loss in proportion to the stage of completion of the transaction at the reporting date. Management fee revenue is recognised when the amount can be reliably measured or when contractually due.
(iv) Commissions
When the Group acts in the capacity of an agent rather than as the principal in a transaction, the revenue recognised is the net amount of commission earned by the Group.
(v) Rental Income
Rental income from investment property is recognised in profit or loss on a straight-line basis over the term of the lease. Lease incentives granted are recognised as an integral part of the total rental income, over the term of the lease.
(j) Finance Income and Finance Costs
Finance income comprises interest income on funds invested (including available-for-sale financial assets), interest on loans to Equity Accounted Investees, dividend income, gains on the disposal of available-for-sale assets, changes in the fair value of financial assets at fair value through profit or loss, and gains on hedging instruments that are recognised in profit or loss. Interest income is recognised as it accrues in profit or loss, using the effective interest method. Dividend income is recognised in profit or loss on the date that the Group’s right to receive payment is established, which in the case of quoted securities is the ex-dividend date.
Finance costs comprise interest expense on borrowings, changes in fair value of financial assets at fair value through profit or loss, impairment losses recognised on financial assets, and losses on hedging instruments that are recognised in profit or loss. Borrowing costs that are not directly attributable to the acquisition or production of a qualifying asset are recognised in profit or loss using the effective interest method.
(k) Income Tax
Income tax expense comprises current and deferred tax. Current and deferred tax are recognised in profit or loss except to the extent that it relates to items recognised directly in equity or in other comprehensive income.
Current tax is the expected tax payable on the taxable income or loss for the year, using tax rates enacted or substantively enacted at the reporting date, and any adjustment to tax payable in respect of previous years.
Deferred tax is recognised in respect of temporary differences between the carrying amounts of assets and liabilities for financial reporting purposes and the amounts used for taxation purposes. Deferred tax is not recognised for the following temporary differences: the initial recognition of assets or liabilities in a transaction that is not a business combination and that affects neither accounting nor taxable profit or loss, and differences relating to investments in subsidiaries and equity accounted investees to the extent that it is probable that they will not reverse in the foreseeable future. In addition, deferred tax is not recognised for taxable temporary differences arising on the initial recognition of goodwill. Deferred tax is measured at the tax rates that are expected to be applied to the temporary differences when they reverse, based on the laws that have been enacted or substantively enacted by the reporting date.
Deferred tax assets and liabilities are offset if there is a legally enforceable right to offset current tax liabilities and assets and they relate to taxes levied by the same tax authority on the same taxable entity, or on different tax entities, but they intend to settle current tax liabilities and assets on a net basis or their tax assets and liabilities will be realised simultaneously.
A deferred tax asset is recognised for unused tax losses, tax credits and deductible temporary differences, to the extent that it is probable that future taxable profits will be available against which they can be utilised. Deferred tax assets are reviewed at each reporting date and are reduced to the extent that it is no longer probable that the related tax benefit will be realised.
Additional income tax expenses that arise from the distribution of dividends are recognised at the same time as the liability to pay the related dividend is recognised. The Group does not distribute non-cash assets as dividends to its shareholders.

Notes to the Consolidated Financial StatementsFor the Year Ended 30 June 2015
Notes to the Consolidated Financial StatementsFor the Year Ended 30 June 2015
58 Annual Report 2015 | Finbar Group Limited Financial Statements | Notes to the Consolidated Financial Statements 59
3 Significant Accounting Policies (continued)
(l) Goods and Services Tax
Revenue, expenses and assets are recognised net of the amount of goods and services tax (GST), except where the amount of GST incurred is not recoverable from the Australian Taxation Office (ATO). In these circumstances, the GST is recognised as part of the cost of acquisition of the asset or as part of the expense.
Receivables and payables are stated with the amount of GST included. The net amount of GST recoverable from, or payable to, the ATO is included as a current asset or liability in the balance sheet.
Cash flows are included in the statement of cash flows on a gross basis. The GST components of cash flows arising from investing and financing activities which are recoverable from, or payable to, the ATO are classified as operating cash flows.
(m) Earnings per Share
The Group presents basic and diluted earnings per share (EPS) data for its ordinary shares. Basic EPS is calculated by dividing the profit or loss attributable to ordinary shareholders of the Company by the weighted average number of ordinary shares outstanding during the period. Diluted EPS is determined by adjusting the profit or loss attributable to ordinary shareholders and the weighted average number of ordinary shares outstanding for the effects of all dilutive potential ordinary shares, which comprise share options granted to employees.
(n) Segment Reporting
Determination and Presentation of Operating Segments
An operating segment is a component of the Group that engages in business activities from which it may earn revenues and incur expenses, including revenues and expenses that relate to transactions with any of the Group’s other components. An operating segment’s operating results are regularly reviewed by the Chief Operating Decision Maker (CODM) to make decisions about resources to be allocated to the segment and assess its performance, and for which discrete information is available.
Segment results that are reported to the CODM include items directly attributable to a segment as well as those that can be allocated on a reasonable basis. Unallocated items comprise mainly corporate assets (primarily the Group’s headquarters), head office expenses, and income tax assets and liabilities.
Segment capital expenditure is the total cost incurred during the period to acquire property, plant and equipment, and intangible assets other than goodwill.
(o) New Standards and Interpretations not yet Adopted
A number of new standards and amendments to standards are effective for annual periods beginning after 1 July 2015, however, the Group has not applied the following new or amended standards in preparing these consolidated financial statements. Those which may be relevant to the Group are set out below. The Group does not plan to adopt these standards early.
IFRS 9 Financial Instruments - published in July 2014, replaces the existing guidance in IAS 39 Financial Instruments: Recognition and Measurement. IFRS 9 includes revised guidance on the classification and measurement of financial instruments, including a new expected credit loss model for calculating impairment on financial assets, and the new general hedge accounting requirements. It also carries forward the guidance on recognition and derecognition of financial instruments from IAS 39. IFRS 9 is effective for annual reporting periods beginning on or after 1 January 2018, with early adoption permitted. The Group is assessing the potential impact on its consolidated financial statements resulting from the application of IFRS 9.
IFRS 15 Revenue from Contracts with Customers - IFRS 15 establishes a comprehensive framework for determining whether, how much and when revenue is recognised. It replaces existing revenue recognition guidance, including IAS 18 Revenue, IAS 11 Construction Contracts and IFRIC 13 Customer Loyalty Programmes. IFRS 15 is effective for annual reporting periods beginning on or after 1 January 2017, with early adoption permitted. The Group is assessing the potential impact on its consolidated financial statements resulting from the application of IFRS 15.
4 Determination of Fair Values
A number of the Group’s accounting policies and disclosures require the determination of fair value, for both financial and non-financial assets and liabilities. Fair values have been determined for measurement and/or disclosure purposes based on the following methods. Where applicable, further information about the assumptions made in determining fair values is disclosed in the notes specific to that asset or liability.
(a) Investment Property and Property carried at fair value
An external, independent valuation company, having appropriately recognised professional qualifications and recent experience in the location and category of the property being valued, values the Group’s investment property portfolio and property no less than once every three years. The fair values are based on market values, being the estimated amount for which a property could be exchanged on the date of the valuation between a willing buyer and a willing seller in an arm’s length transaction after proper marketing wherein the parties had each acted knowledgeably and willingly.
In the absence of current prices in an active market, the valuations are prepared by considering the aggregate of the estimated cash flows expected to be received from renting out the property. A yield that reflects the specific risks inherent in the net cash flows is then applied to the net annual cash flows to arrive at the property valuation.
Valuations reflect, where appropriate: the type of tenants actually in occupation or responsible for meeting lease commitments or likely to be in occupation after letting vacant accommodation, the allocation of maintenance and insurance responsibilities between the Group and the lessee, and the remaining economic life of the property. When rent reviews or lease renewals are pending with anticipated reversionary increases, it is assumed that all notices and where appropriate counter-notices, have been served validly and within the appropriate time.
Properties that have not been independently valued as at the balance sheet date are carried at fair value by way of directors confirmation.
(b) Trade and Other Receivables
The fair value of trade and receivables, excluding construction work in progress, is estimated as the present value of future cash flows, discounted at the market rate of interest at the reporting date. This fair value is determined for disclosure purposes.
(c) Derivatives
The fair value of interest rate swaps is based on quotation from the relevant financial provider.
(d) Share-based Payment Transactions
The fair value of employee stock options is measured using the Black-Scholes (or similar) option-pricing model. Measurement inputs include share price on measurement date, exercise price of the instrument, expected volatility (based on weighted average historic volatility adjusted for changes expected due to publicly available information), weighted average expected life of the instruments (based on historical experience and general option holder behaviour), expected dividends, and the risk-free interest rate (based on government bonds). Service and non-market performance conditions attached to the transactions are not taken into account in determining fair value.
(e) Financial Guarantees
For financial guarantee contracts liabilities, the fair value at initial recognition is determined using a probability weighted discounted cash flow approach. This method takes into account the probability of default by the guaranteed party over the term of the contact, the loss given default (being the proportion of the exposure that is not expected to be recovered in the event of default) and exposure at default (being the maximum loss at the time of default).
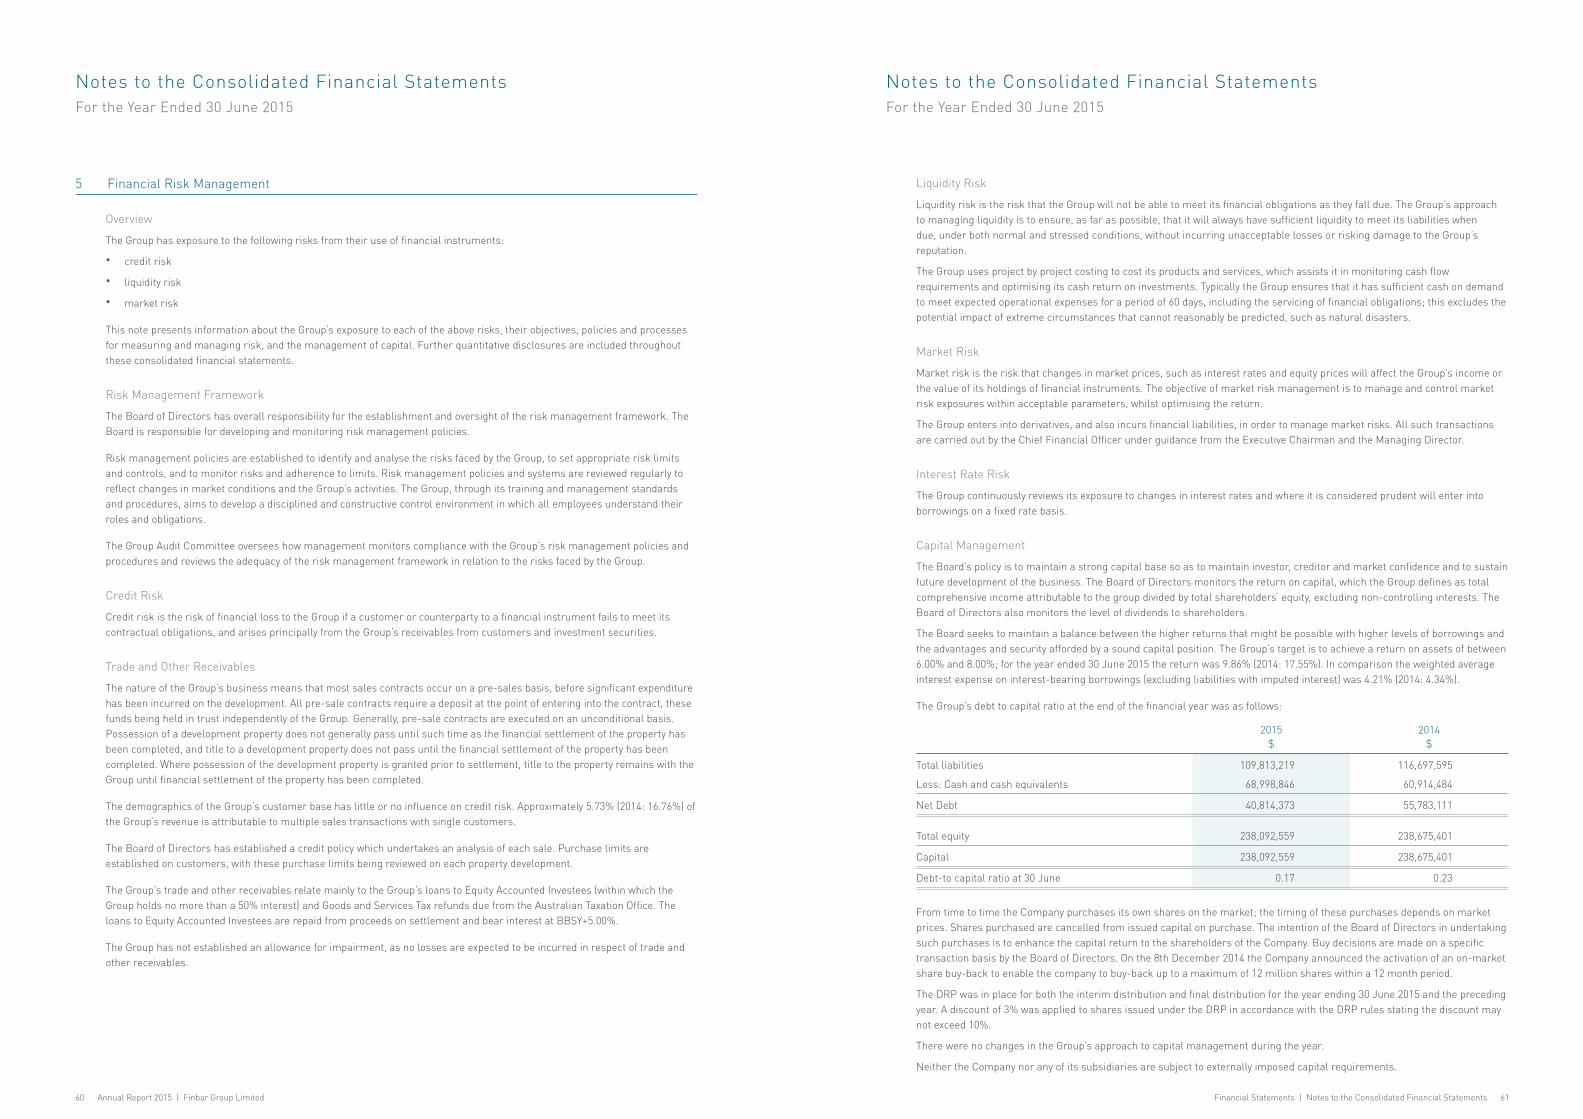
Notes to the Consolidated Financial StatementsFor the Year Ended 30 June 2015
Notes to the Consolidated Financial StatementsFor the Year Ended 30 June 2015
60 Annual Report 2015 | Finbar Group Limited Financial Statements | Notes to the Consolidated Financial Statements 61
5 Financial Risk Management
Overview
The Group has exposure to the following risks from their use of financial instruments:
• credit risk
• liquidity risk
• market risk
This note presents information about the Group’s exposure to each of the above risks, their objectives, policies and processes for measuring and managing risk, and the management of capital. Further quantitative disclosures are included throughout these consolidated financial statements.
Risk Management Framework
The Board of Directors has overall responsibility for the establishment and oversight of the risk management framework. The Board is responsible for developing and monitoring risk management policies.
Risk management policies are established to identify and analyse the risks faced by the Group, to set appropriate risk limits and controls, and to monitor risks and adherence to limits. Risk management policies and systems are reviewed regularly to reflect changes in market conditions and the Group’s activities. The Group, through its training and management standards and procedures, aims to develop a disciplined and constructive control environment in which all employees understand their roles and obligations.
The Group Audit Committee oversees how management monitors compliance with the Group’s risk management policies and procedures and reviews the adequacy of the risk management framework in relation to the risks faced by the Group.
Credit Risk
Credit risk is the risk of financial loss to the Group if a customer or counterparty to a financial instrument fails to meet its contractual obligations, and arises principally from the Group’s receivables from customers and investment securities.
Trade and Other Receivables
The nature of the Group’s business means that most sales contracts occur on a pre-sales basis, before significant expenditure has been incurred on the development. All pre-sale contracts require a deposit at the point of entering into the contract, these funds being held in trust independently of the Group. Generally, pre-sale contracts are executed on an unconditional basis. Possession of a development property does not generally pass until such time as the financial settlement of the property has been completed, and title to a development property does not pass until the financial settlement of the property has been completed. Where possession of the development property is granted prior to settlement, title to the property remains with the Group until financial settlement of the property has been completed.
The demographics of the Group’s customer base has little or no influence on credit risk. Approximately 5.73% (2014: 16.76%) of the Group’s revenue is attributable to multiple sales transactions with single customers.
The Board of Directors has established a credit policy which undertakes an analysis of each sale. Purchase limits are established on customers, with these purchase limits being reviewed on each property development.
The Group’s trade and other receivables relate mainly to the Group’s loans to Equity Accounted Investees (within which the Group holds no more than a 50% interest) and Goods and Services Tax refunds due from the Australian Taxation Office. The loans to Equity Accounted Investees are repaid from proceeds on settlement and bear interest at BBSY+5.00%.
The Group has not established an allowance for impairment, as no losses are expected to be incurred in respect of trade and other receivables.
Liquidity Risk
Liquidity risk is the risk that the Group will not be able to meet its financial obligations as they fall due. The Group’s approach to managing liquidity is to ensure, as far as possible, that it will always have sufficient liquidity to meet its liabilities when due, under both normal and stressed conditions, without incurring unacceptable losses or risking damage to the Group’s reputation.
The Group uses project by project costing to cost its products and services, which assists it in monitoring cash flow requirements and optimising its cash return on investments. Typically the Group ensures that it has sufficient cash on demand to meet expected operational expenses for a period of 60 days, including the servicing of financial obligations; this excludes the potential impact of extreme circumstances that cannot reasonably be predicted, such as natural disasters.
Market Risk
Market risk is the risk that changes in market prices, such as interest rates and equity prices will affect the Group’s income or the value of its holdings of financial instruments. The objective of market risk management is to manage and control market risk exposures within acceptable parameters, whilst optimising the return.
The Group enters into derivatives, and also incurs financial liabilities, in order to manage market risks. All such transactions are carried out by the Chief Financial Officer under guidance from the Executive Chairman and the Managing Director.
Interest Rate Risk
The Group continuously reviews its exposure to changes in interest rates and where it is considered prudent will enter into borrowings on a fixed rate basis.
Capital Management
The Board’s policy is to maintain a strong capital base so as to maintain investor, creditor and market confidence and to sustain future development of the business. The Board of Directors monitors the return on capital, which the Group defines as total comprehensive income attributable to the group divided by total shareholders’ equity, excluding non-controlling interests. The Board of Directors also monitors the level of dividends to shareholders.
The Board seeks to maintain a balance between the higher returns that might be possible with higher levels of borrowings and the advantages and security afforded by a sound capital position. The Group’s target is to achieve a return on assets of between 6.00% and 8.00%; for the year ended 30 June 2015 the return was 9.86% (2014: 17.55%). In comparison the weighted average interest expense on interest-bearing borrowings (excluding liabilities with imputed interest) was 4.21% (2014: 4.34%).
The Group’s debt to capital ratio at the end of the financial year was as follows:
2015 $
2014 $
Total liabilities 109,813,219 116,697,595
Less: Cash and cash equivalents 68,998,846 60,914,484
Net Debt 40,814,373 55,783,111
Total equity 238,092,559 238,675,401
Capital 238,092,559 238,675,401
Debt-to capital ratio at 30 June 0.17 0.23
From time to time the Company purchases its own shares on the market; the timing of these purchases depends on market prices. Shares purchased are cancelled from issued capital on purchase. The intention of the Board of Directors in undertaking such purchases is to enhance the capital return to the shareholders of the Company. Buy decisions are made on a specific transaction basis by the Board of Directors. On the 8th December 2014 the Company announced the activation of an on-market share buy-back to enable the company to buy-back up to a maximum of 12 million shares within a 12 month period.
The DRP was in place for both the interim distribution and final distribution for the year ending 30 June 2015 and the preceding year. A discount of 3% was applied to shares issued under the DRP in accordance with the DRP rules stating the discount may not exceed 10%.
There were no changes in the Group’s approach to capital management during the year.
Neither the Company nor any of its subsidiaries are subject to externally imposed capital requirements.

Notes to the Consolidated Financial StatementsFor the Year Ended 30 June 2015
Notes to the Consolidated Financial StatementsFor the Year Ended 30 June 2015
62 Annual Report 2015 | Finbar Group Limited Financial Statements | Notes to the Consolidated Financial Statements 63
6 Operating Segments
The Group operates predominantly in the property development sector and has identified 4 reportable segments, as described below, which are the Group’s 3 strategic business units, as well as the Corporate office. The strategic business units offer different products, and are managed separately because they require different technology, marketing strategies and have different types of customers. For each of the strategic business units, the Chief Operating Decision Maker (CODM) reviews internal management reports on a regular basis. The following describes the operations in each of the Group’s reportable segments:
• Residential apartment development in Western Australia,
• Commercial office/retail development in Western Australia,
• Rental of property in Western Australia.
• Corporate costs and net assets attributable to the corporate office.
Information about Reportable Segments For the Year ended 30 June 2015
Residential Apartment
Development $
Commercial Office/Retail Development
$
Rental of Property
$Corporate
$Total
$
External Revenues - Company and Subsidiaries 66,661,037 957,449 15,290,902 10,962,376 93,871,764
External Revenues - Equity Accounted Investees 93,032,180 1,098,500 11,078 - 94,141,758
External Revenues - Total 159,693,217 2,055,949 15,301,980 10,962,376 188,013,522
Interest Income 39,264 - - 4,873,353 4,912,617
Interest Expense - - - 3,028,170 3,028,170
Depreciation and Amortisation - - - 546,185 546,185
Reportable Segment Profit before Income Tax - Company and Subsidiaries 6,660,812 (62,180) 10,403,775 9,220,201 26,222,608
Reportable Segment Profit before Income Tax - Equity Accounted Investees 18,920,097 177,652 11,078 30,739 19,139,566
Reportable Segment Profit before Income Tax - Total 25,580,909 115,472 10,414,853 9,250,940 45,362,174
Reportable Segment Assets - Company and Subsidiaries 99,755,074 4,107,175 112,080,116 22,271,118 238,213,483
Reportable Segment Assets - Equity Accounted Investees 52,287,311 6,042,726 - - 58,330,037
Reportable Segment Liabilities - Company and Subsidiaries 44,958,871 2,383,915 51,725,000 1,397,126 100,464,912
Reportable Segment Liabilities - Equity Accounted Investees* 31,778,625 736,471 - - 32,515,096
Capital Expenditure - - - 308,150 308,150
* Excludes Liabilities payable to Finbar Group
Information about Reportable Segments For the Year ended 30 June 2014
Residential Apartment
Development $
Commercial Office/Retail Development
$
Rental of Property
$Corporate
$Total
$
External Revenues - Company and Subsidiaries 250,447,564 9,499,805 13,569,804 3,854,165 277,371,338
External Revenues - Equity Accounted Investees 4,421 1,679,000 - 22 1,683,443
External Revenues - Total 250,451,985 11,178,805 13,569,804 3,854,187 279,054,781
Interest Income 1,173,112 - - 2,243,911 3,417,023
Interest Expense - - - 3,604,246 3,604,246
Depreciation and Amortisation - 105,480 - 339,223 444,703
Reportable Segment Profit before Income Tax - Company and Subsidiaries 51,955,509 1,554,154 8,558,967 3,563,788 65,632,418
Reportable Segment Profit before Income Tax - Equity Accounted Investees (1,077,528) 159,205 (3,911) 144,496 (777,738)
Reportable Segment Profit before Income Tax - Total 50,877,981 1,713,359 8,555,056 3,708,284 64,854,680
Reportable Segment Assets - Company and Subsidiaries 97,104,385 2,035,541 137,496,804 20,821,892 257,458,622
Reportable Segment Assets - Equity Accounted Investees 62,147,450 1,850,942 - - 63,998,392
Reportable Segment Liabilities - Company and Subsidiaries 10,914,762 91,830 78,476,536 1,182,218 90,665,346
Reportable Segment Liabilities - Equity Accounted Investees* 44,333,816 992,551 - - 45,326,367
Capital Expenditure - - - 297,481 297,481
* Excludes Liabilities payable to Finbar Group
The Group’s share of revenues from equity accounted investees are reported in this table as they are managed by Finbar and reported to the CODM. Revenues from equity accounted investees are not reported in the statement of profit or loss and other comprehensive income.

Notes to the Consolidated Financial StatementsFor the Year Ended 30 June 2015
Notes to the Consolidated Financial StatementsFor the Year Ended 30 June 2015
64 Annual Report 2015 | Finbar Group Limited Financial Statements | Notes to the Consolidated Financial Statements 65
6 Operating Segments (continued)
Reconciliation of Reportable Segment Revenues, Profit or Loss, Assets and Liabilities
2015
$2014
$
Revenues
Total revenue for development reportable segments 82,909,388 273,517,173
Total revenue for other reportable segments 10,962,376 2,789,495
Consolidated Revenue 93,871,764 276,306,668
Total revenue for development reportable segments - Equity Accounted Investees 94,130,681 1,683,421
Total revenue for rental segments - Equity Accounted Investees 11,078 -
Total revenue for other reportable segments included in other income - Equity Accounted Investees - 22
Total Reportable Segments Revenue 188,013,522 277,990,111
Profit or Loss
Total profit or loss for reportable segments 45,362,174 64,710,206
Finance income - Company and Subsidiaries 4,912,617 3,417,023
Finance costs - Company and Subsidiaries (3,236,964) (3,616,022)
Unallocated amounts:
Administrative expenses (7,588,853) (6,984,092)
Revaluation of investment property (2,004,508) 754,027
Income tax applicable to share of profit of Equity Accounted Investees (5,745,001) 246,279
Consolidated Profit before Income Tax 31,699,466 58,527,421
Assets
Total assets for reportable segments 238,213,482 257,458,622
Cash and cash equivalents 68,998,846 60,914,484
Investments in Equity Accounted Investees 12,349,974 -
Other assets* 28,343,476 36,999,890
Consolidated Total Assets 347,905,778 355,372,996
Liabilities
Total liabilities for reportable segments 100,464,912 90,665,346
Investments in Equity Accounted Investees - 699,590
Other liabilities** 9,348,307 25,332,661
Consolidated Total Liabilities 109,813,219 116,697,597
Geographical information The Group operates predominantly in the one geographical segment of Western Australia.
* Includes receivables due to Finbar Group from Equity Accounted Investees** Includes liabilities payable to Finbar Group from Equity Accounted Investees
7 Revenue 2015
$2014
$
Property development sales 67,618,486 259,947,369
Rental Income 15,290,902 13,569,804
Supervision and management fees 6,451,019 1,730,657
Total Revenue 89,360,407 275,247,830
8 Other Income
Administration fees 152,075 131,075
Commission income 1,874 3,019
Management fees 4,342,188 924,744
Other 15,220 -
Total Other Income before revaluation 4,511,357 1,058,838
Revaluation of investment property - 754,027
Total Other Income 4,511,357 1,812,865
Revaluation increase of property (reported as other comprehensive income) - 91,175
9 Other Expenses
Revaluation decrease of investment property 2,004,508 -
Rental property expenses 4,887,127 5,010,837
Total Other Expenses 6,891,635 5,010,837
Revaluation decrease of property (reported as other comprehensive income) 414,508 -
10 Personnel Expenses
Wages and salaries 4,370,021 4,382,182
Superannuation contributions 236,328 222,247
Increase/(Decrease) in liability for annual leave 18,615 (5,878)
Increase in liability for long service leave 36,479 63,331
Directors fees 363,906 363,906
Non Executive Directors - superannuation contributions 6,444 6,444
Total Personnel Expenses 5,031,793 5,032,232

Notes to the Consolidated Financial StatementsFor the Year Ended 30 June 2015
Notes to the Consolidated Financial StatementsFor the Year Ended 30 June 2015
66 Annual Report 2015 | Finbar Group Limited Financial Statements | Notes to the Consolidated Financial Statements 67
11 Finance Income and Finance Costs2015
$2014
$
Recognised in Profit or Loss
Interest income on loans to Equity Accounted Investees 3,215,936 918,795
Interest income on loans 483,945 -
Interest income on bank deposits 1,173,472 1,325,116
Interest income on property settlements 39,264 1,173,112
Total Finance Income 4,912,617 3,417,023
Interest expense 3,028,170 3,604,246
Bank charges 208,794 11,776
Total Finance Costs 3,236,964 3,616,022
Net Finance Income/(Costs) 1,675,653 (198,999)
Analysis of Finance Costs
Total finance costs 4,404,674 7,183,030
Less:
Finance costs capitalised to inventory (1,167,710) (3,567,008)
Add:
Finance costs relating to property developments sold 2,356,690 2,030,702
5,593,654 5,646,724
Made up of:
Finance costs relating to property developments sold 2,356,690 2,030,702
Finance costs relating to administration 208,814 12,666
Finance costs relating to rental properties 3,028,150 3,603,356
5,593,654 5,646,724
Finance costs have been capitalised to work in progress at a weighted average rate of 4.21% (2014: 4.34%)
12 Income Tax Expense2015
$2014
$
Recognised in Income Statement
Current Tax Expense
Current year 12,619,913 15,206,719
Income tax recognised directly to equity 103,769 141,029
Adjustments for prior periods (334,691) -
Non-recoverable amounts 25,032 12,863
12,414,023 15,360,611
Deferred Tax Expense Movement
Origination and reversal of temporary differences (6,833,354) 2,497,181
(6,833,354) 2,497,181
Income Tax Expense excluding share of Income Tax on Equity Accounted Investees 5,580,669 17,857,792
Income tax relating to components of other comprehensive income (124,353) 27,352
Total Income Tax Expense excluding share of Income Tax on Equity Accounted Investees 5,456,316 17,885,144
Numerical Reconciliation between Tax Expense and Pre-tax Net Profit
Profit for the year 26,118,797 40,814,102
Total income tax expense 5,580,669 17,857,793
Profit excluding Income Tax 31,699,466 58,671,895
Income tax using the Group’s domestic rate of 30% (2014: 30%) 9,509,840 17,601,569
Increase in income tax expense due to:
Non-deductible expenses 398,857 70,171
Non-recoverable amounts 25,032 12,863
Decrease in income tax expense due to:
Tax effect of share of equity accounted investees (profit)/loss (4,018,369) 173,190
Total Income Tax Expense 5,915,360 17,857,793
Over provided in prior years (334,691) -
Total Income Tax Expense 5,580,669 17,857,793
Made up of:
Income Tax Expense excluding share of Income Tax on Equity Accounted Investees 5,580,669 17,857,792
Income tax relating to components of other comprehensive income (124,353) 27,352
5,456,316 17,885,145
Income Tax Recognised Directly in Equity
Decrease in income tax expense due to:
Tax incentives not recognised in income statement (103,769) (141,029)
Total Income Tax Recognised Directly in Equity (103,769) (141,029)

Notes to the Consolidated Financial StatementsFor the Year Ended 30 June 2015
Notes to the Consolidated Financial StatementsFor the Year Ended 30 June 2015
68 Annual Report 2015 | Finbar Group Limited Financial Statements | Notes to the Consolidated Financial Statements 69
13 Investment Property2015
$2014
$
13a Reconciliation of Carrying Amount
Balance at 1 July 134,981,804 122,102,119
Sale of Investment Property (73,000,000) - Transferred from Inventory 50,695,374 11,120,972 Transferred from Property, Plant and Equipment - 1,004,686 Change in fair value (2,004,508) 754,027
Balance at 30 June 110,672,670 134,981,804
Investment property comprises commercial properties at three developments and residential properties at two developments which are leased to third parties (see Note 28).
13b Measurement of fair values
(i) Fair Value Heirarchy
The fair value of investment property was determined by external, independent property valuers, having appropriate recognised professional qualifications and recent experience in the location and category of the property being valued or by director’s confirmation.
The fair value measurement for investment property of $110,672,670 has been categorised as a Level 3 fair value based on the inputs to the valuation technique used (see Note 2(d)).
(ii) Level 3 Fair Value
Table 13(a) shows a reconciliation from the opening balances to the closing balances for Level 3 fair values.
(iii) Valuation technique and significant unobservable inputs
The following table shows the valuation technique used in measuring the fair value of investment property, as well as the significant unobservable inputs used.
Valuation Technique Significant unobservable inputs Inter-relationship between key unobservable inputs and fair value measurement
Discounted cash flows: The valuation model considers the present value of net cash flows able to be generated from the property taking into account expected rental growth rate, void periods, occupancy rate, lease incentive costs, such as rent-free periods and other costs not paid by tenants. The expected net cash flows are discounted using risk-adjusted discount rates. Among other factors, the discount rate estimation considers the quality of a building and its location (prime vs secondary), tenant credit quality and lease terms.
Expected market rental growth 2.0%-5.0%, weighted average 3.0%
Void periods (average 6.3 months after the end of each lease)
Occupancy rate 94.71%
Rent-free periods (6-21 month period on certain new leases)
Risk-adjusted discounted rates (weighted average 8.75%).
The estimated fair value would increase (decrease) if: expected market rental growth were higher (lower); void periods were shorter (longer); the occupancy rate were higher (lower); rent-free periods were shorter (longer); or the risk-adjusted discount rate were lower (higher).
Capitalisation of income valuation: The capitalisation of income valuation method capitalises the current rent received, at a rate analysed from the most recent transactions of comparable property investments. The capitalisation rate used varies across properties. Valuations reflect, where appropriate, lease term remaining, the relationship of current rent to the market rent, location and prevailing investment market conditions.
Adopted capitalisation rate 10.0% - 10.5%
Gross rent per annum $44,625 - $211,200
Occupancy rate 76.25%
Lease term remaining (years) 0.5 - 4.2.
The estimated fair value would increase (decrease) if: the adopted capitalisation rate were higher (lower); the gross rent per annum were higher (lower); the occupancy rate were higher (lower) or; the lease term remaining were longer (shorter).
14 Property, Plant and Equipment
Cost or ValuationProperty
$
Office Furniture and Equipment
$
Plant and Equipment
$
Fixtures and Fittings
$Total
$
Balance at 1 July 2013 10,038,461 657,750 6,034,122 229,191 16,959,524
Additions - 32,229 265,252 - 297,481
Transferred to investment property (1,004,686) - - - (1,004,686)
Transferred from inventory 818,126 - - - 818,126
Change in fair value (68,126) - - - (68,126)
Reclassification (1,534,230) - 1,534,230 - -
Disposals - (1,043) - - (1,043)
Balance at 30 June 2014 8,249,545 688,936 7,833,604 229,191 17,001,276
Balance at 1 July 2014 8,249,545 688,936 7,833,604 229,191 17,001,276
Additions - 12,644 295,506 - 308,150
Disposals - - (137,965) (137,965)
Transferred from inventory 333,687 - 1,483,359 - 1,817,046
Change in fair value (573,809) - - - (573,809)
Balance at 30 June 2015 8,009,423 701,580 9,612,469 91,226 18,414,698
Depreciation
Balance at 1 July 2013 58,596 230,222 1,910,170 49,142 2,248,130
Reclassification (58,596) - 58,596 - -
Disposals - (468) - - (468)
Transferred from inventory - - 2,142,285 - 2,142,285
Revaluation (159,301) - - - (159,301)
Depreciation and amortisation charge for the year 159,301 85,363 79,645 120,394 444,703
Balance at 1 July 2014 - 315,117 4,190,696 169,536 4,675,349
Depreciation
Balance at 1 July 2014 - 315,117 4,190,696 169,536 4,675,349
Disposals - - - (137,965) (137,965)
Revaluation (159,301) - - - (159,301)
Depreciation and amortisation charge for the year 159,301 73,584 301,370 11,930 546,185
Balance at 30 June 2015 - 388,701 4,492,066 43,501 4,924,268
Carrying Amounts
At 1 July 2013 9,979,865 427,528 4,123,952 180,049 14,711,394
At 30 June 2014 8,249,545 373,819 3,642,908 59,655 12,325,927
At 1 July 2014 8,249,545 373,819 3,642,908 59,655 12,325,927
At 30 June 2015 8,009,423 312,879 5,120,403 47,725 13,490,430

Notes to the Consolidated Financial StatementsFor the Year Ended 30 June 2015
Notes to the Consolidated Financial StatementsFor the Year Ended 30 June 2015
70 Annual Report 2015 | Finbar Group Limited Financial Statements | Notes to the Consolidated Financial Statements 71
14 Property, Plant and Equipment (continued)
For each revalued class the carrying amount that would have been recognised had the assets been carried on historical cost basis are as follows:
Property
Revalued assets at deemed cost
Cost 6,372,030
Less accumulated depreciation (449,870)
Net book value at 30 June 2015 5,922,160
Measurement of fair values
(i) Fair Value Hierarchy
The fair value of property was determined by external, independent property valuers, having appropriate recognised professional qualifications and recent experience in the location and category of the property being valued or by director’s confirmation.
The fair value measurement for property of $8,009,423 has been categorised as a Level 3 fair value based on the inputs to the valuation technique used (see Note 2(d)).
(ii) Level 3 Fair Value
The following table shows a reconciliation from the opening balances to the closing balances for Level 3 fair values.
2015
$2014
$
Balance at 1 July 2014 8,249,545 10,038,461
Acquisitions and reclassification from inventory, property, plant and equipment 333,687 (1,720,790)
(Loss)/Gain included in ‘other income’ (414,508) 91,175
Depreciation (159,301) (159,301)
Balance at 30 June 2015 8,009,423 8,249,545
(iii) Valuation technique and significant unobservable inputs
The following table shows the valuation technique used in measuring the fair value of investment property, as well as the significant unobservable inputs used.
Valuation Technique Significant unobservable inputs Inter-relationship between key unobservable inputs and fair value measurement
Discounted cash flows: The valuation model considers the present value of net cash flows able to be generated from the property taking into account expected rental growth rate, void periods, occupancy rate, lease incentive costs, such as rent-free periods and other costs not paid by tenants. The expected net cash flows are discounted using risk-adjusted discount rates. Among other factors, the discount rate estimation considers the quality of a building and its location (prime vs secondary), tenant credit quality and lease terms.
Expected market rental growth 2.0%-5.0%, weighted average 3.0%
Void periods (average 6.3 months after the end of each lease)
Occupancy rate 94.71%
Rent-free periods (6-21 month period on certain new leases)
Risk-adjusted discounted rates (weighted average 8.75%).
The estimated fair value would increase (decrease) if: expected market rental growth were higher (lower); void periods were shorter (longer); the occupancy rate were higher (lower); rent-free periods were shorter (longer); or the risk-adjusted discount rate were lower (higher).
Capitalisation of income valuation: The capitalisation of income valuation method capitalises the current rent received, at a rate analysed from the most recent transactions of comparable property investments. The capitalisation rate used varies across properties. Valuations reflect, where appropriate, lease term remaining, the relationship of current rent to the market rent, location and prevailing investment market conditions.
Adopted capitalisation rate 10.0% - 10.5%
Gross rent per annum $44,625 - $211,200
Occupancy rate 76.25%
Lease term remaining (years) 0.5 - 4.2.
The estimated fair value would increase (decrease) if: the adopted capitalisation rate were higher (lower); the gross rent per annum were higher (lower); the occupancy rate were higher (lower) or; the lease term remaining were longer (shorter).

Notes to the Consolidated Financial StatementsFor the Year Ended 30 June 2015
Notes to the Consolidated Financial StatementsFor the Year Ended 30 June 2015
72 Annual Report 2015 | Finbar Group Limited Financial Statements | Notes to the Consolidated Financial Statements 73
15 Investments in Equity Accounted Investees
The Group’s share of profit in Equity Accounted Investees for the year was $13,394,563 (2014: Loss $577,302)
Equity Accounted Investees
The Group accounts for investments in Equity Accounted Investees using the equity method.
The Group has the following investments in Equity Accounted Investees (all stated at 100% of the values):
Current Assets
Non-current Assets Total Assets
2014 Ownership $ $ $
Equity Accounted Investees Assets
185 Swansea Street Pty Ltd* 50.00% 735,600 - 735,600
375 Hay Street Pty Ltd* 50.00% 33,770 - 33,770
406 & 407 Newcastle Street Pty Ltd* 50.00% 197,275 - 197,275
36 Chester Avenue Pty Ltd 50.00% 2,100 9,042,051 9,044,151
Rowe Avenue Pty Ltd 50.00% 64,082,381 1,416,796 65,499,177
Lot 1001 - 1003 Rowe Avenue Pty Ltd 50.00% 22,300 11,900,213 11,922,513
Roydhouse Street Subiaco Pty Ltd 50.00% 32,089,628 1,021,022 33,110,650
647 Murray Street Pty Ltd 50.00% 35,325 11,848,441 11,883,766
Finbar Sub 5050 Pty Ltd 50.00% - 211 211
97,198,379 35,228,734 132,427,113
Current Liabilities
Non-current Liabilities Total Liabilities
2014 Ownership $ $ $
Equity Accounted Investees Assets
185 Swansea Street Pty Ltd* 50.00% 75,689 22,718 98,407
375 Hay Street Pty Ltd* 50.00% 765 - 765
406 & 407 Newcastle Street Pty Ltd* 50.00% 5,051 - 5,051
36 Chester Avenue Pty Ltd 50.00% - 9,070,537 9,070,537
Rowe Avenue Pty Ltd 50.00% 65,269,082 1,060,785 66,329,867
Lot 1001 - 1003 Rowe Avenue Pty Ltd 50.00% 101,744 12,444,729 12,546,473
Roydhouse Street Subiaco Pty Ltd 50.00% 33,277,275 664,727 33,942,002
647 Murray Street Pty Ltd 50.00% 6,944 11,825,548 11,832,492
Finbar Sub 5050 Pty Ltd 50.00% - 701 701
98,736,550 35,089,745 133,826,295
15 Investments in Equity Accounted Investees (continued)
Current Assets
Non-current Assets Total Assets
2015 Ownership $ $ $
Equity Accounted Investees Assets
185 Swansea Street Pty Ltd* 50.00% 23,508 - 23,508
375 Hay Street Pty Ltd* 50.00% 12,130 - 12,130
406 & 407 Newcastle Street Pty Ltd* 50.00% 164,157 194 164,351
36 Chester Avenue Pty Ltd 50.00% 1,448 10,207,088 10,208,536
Rowe Avenue Pty Ltd 50.00% 12,031,871 3,758,999 15,790,870
Lot 1001 - 1003 Rowe Avenue Pty Ltd 50.00% 41,772,976 5,633,987 47,406,963
Roydhouse Street Subiaco Pty Ltd 50.00% 45,991,263 - 45,991,263
647 Murray Street Pty Ltd 50.00% 13,970 13,513,762 13,527,732
Finbar Sub 5050 Pty Ltd 50.00% 57 332 389
100,011,380 33,114,362 133,125,742
Current Liabilities
Non-current Liabilities Total Liabilities
2015 Ownership $ $ $
Equity Accounted Investees Liabilities
185 Swansea Street Pty Ltd* 50.00% 7,478 - 7,478
375 Hay Street Pty Ltd* 50.00% 1 - 1
406 & 407 Newcastle Street Pty Ltd* 50.00% 1 - 1
36 Chester Avenue Pty Ltd 50.00% 2,981 10,243,028 10,246,009
Rowe Avenue Pty Ltd 50.00% 4,504,374 384,091 4,888,465
Lot 1001 - 1003 Rowe Avenue Pty Ltd 50.00% 47,465,037 840,799 48,305,836
Roydhouse Street Subiaco Pty Ltd 50.00% 30,779,598 709,487 31,489,085
647 Murray Street Pty Ltd 50.00% 847 13,486,911 13,487,758
Finbar Sub 5050 Pty Ltd 50.00% - 1,162 1,162
82,760,317 25,665,478 108,425,795

Notes to the Consolidated Financial StatementsFor the Year Ended 30 June 2015
Notes to the Consolidated Financial StatementsFor the Year Ended 30 June 2015
74 Annual Report 2015 | Finbar Group Limited Financial Statements | Notes to the Consolidated Financial Statements 75
15 Investments in Equity Accounted Investees (continued)
Revenues ExpensesProfit/(Loss)
before income tax
2014 Ownership $ $ $
Profit/(Loss) Before Income Tax Recognised from Equity Accounted Investees
22 Plain Street Pty Ltd* 50.00% - 151 (151)
143 Adelaide Terrace Pty Ltd* 50.00% - 480 (480)
185 Swansea Street Pty Ltd* 50.00% 3,358,000 2,917,216 440,784
375 Hay Street Pty Ltd* 50.00% 8,842 6,295 2,547
406 & 407 Newcastle Street Pty Ltd* 50.00% - (34,105) 34,105
701 Wellington Street Pty Ltd* (De-registered) 50.00% - 4,672 (4,672)
36 Chester Avenue Pty Ltd 50.00% - 10,093 (10,093)
Rowe Avenue Pty Ltd 50.00% - 251,709 (251,709)
Lot 1001-1003 Rowe Avenue Pty Ltd 50.00% - 892,056 (892,056)
Roydhouse Street Subiaco Pty Ltd 50.00% - 1,160,509 (1,160,509)
647 Murray Street Pty Ltd 50.00% - (195,343) 195,343
Finbar Sub 5050 Pty Ltd 50.00% - 270 (270)
3,366,842 5,014,003 (1,647,161)
Revenues ExpensesProfit/(Loss)
before income tax
2015 Ownership $ $ $
Profit/(Loss) Before Income Tax Recognised from Equity Accounted Investees
185 Swansea Street Pty Ltd* 50.00% 630,000 574,519 55,481
375 Hay Street Pty Ltd* 50.00% (17,806) 3,070 (20,876)
406 & 407 Newcastle Street Pty Ltd* 50.00% - (3,037) 3,037
36 Chester Avenue Pty Ltd 50.00% - 15,837 (15,837)
Rowe Avenue Pty Ltd 50.00% 85,218,030 68,456,466 16,761,564
Lot 1001 - 1003 Rowe Avenue Pty Ltd 50.00% - 392,733 (392,733)
Roydhouse Street Subiaco Pty Ltd 50.00% 102,431,137 80,526,094 21,905,043
647 Murray Street Pty Ltd 50.00% - 16,145 (16,145)
Finbar Sub 5050 Pty Ltd 50.00% - 404 (404)
188,261,361 149,982,231 38,279,130
* Equity Accounted Investees entered into with Wembley Lakes Estates Pty Ltd. John Chan and Darren John Pateman have interests in but not control of Wembley Lakes Estates Pty Ltd.
16 Other Assets2015
$2014
$
Current
Capitalised lease incentives 232,290 352,454
Total Current Other Assets 232,290 352,454
Non Current
Establishment Fees - 28,682
Capitalised lease incentives 491,906 1,924,014
Total Non Current Other Assets 491,906 1,952,696
17 Tax Assets and Liabilities
The current tax liability for the Group of $4,245,964 (2014: $13,500,733) represents the amount of income taxes payable in respect of current and prior periods.
Recognised Deferred Tax Assets and Liabilities
Deferred tax assets and liabilities are attributable to the following:
Assets Liabilities Net
2015 2014 2015 2014 2015 2014
$ $ $ $ $ $
Inventories - - (4,959,239) (7,913,668) (4,959,239) (7,913,668)
Interest bearing loans and borrowings 929,769 643,437 - - 929,769 643,437
Revaluation of investment property - - (3,062,248) (7,180,402) (3,062,248) (7,180,402)
Other items 448,178 804,143 (46,524) (668,865) 401,654 135,278
Tax value of carry-forward losses recognised 1,587,721 2,483,427 - - 1,587,721 2,483,427
Tax assets/(liabilities) 2,965,668 3,931,007 (8,068,011) (15,762,935) (5,102,343) (11,831,928)
Set off of tax (2,965,668) (3,931,007) 2,965,668 3,931,007 - -
Net Tax Liabilities - - (5,102,343) (11,831,928) (5,102,343) (11,831,928)
Balance 1 July 2013
Recognised in Profit or Loss
Recognised in Equity
Balance 30 June 2014
$ $ $ $
Movement in Temporary Differences During the Year
Inventories 11,128,229 (3,214,561) - 7,913,668
Interest bearing loans and borrowings (3,048,881) 2,405,444 - (643,437)
Revaluation of investment property 6,926,842 253,560 - 7,180,402
Other items (437,988) 161,681 141,029 (135,278)
Tax value of carry-forward losses recognised (5,374,484) 2,891,057 - (2,483,427)
9,193,718 2,497,181 141,029 11,831,928
Balance 1 July 2014
Recognised in Profit or Loss
Recognised in Equity
Balance 30 June 2015
$ $ $ $
Inventories 7,913,668 (2,954,429) - 4,959,239
Interest bearing loans and borrowings (643,437) (286,332) - (929,769)
Revaluation of investment property 7,180,402 (4,118,154) - 3,062,248
Other items (135,278) (370,145) 103,769 (401,654)
Tax value of carry-forward losses recognised (2,483,427) 895,706 - (1,587,721)
11,831,928 (6,833,354) 103,769 5,102,343

Notes to the Consolidated Financial StatementsFor the Year Ended 30 June 2015
Notes to the Consolidated Financial StatementsFor the Year Ended 30 June 2015
76 Annual Report 2015 | Finbar Group Limited Financial Statements | Notes to the Consolidated Financial Statements 77
18 Inventories2015
$2014
$
Current
Work in progress 47,263,173 11,425,466
Completed stock 211,809 64,343,043
Total Current Inventories 47,474,982 75,768,509
Non Current
Work in progress 26,097,480 11,771,124
Total Non Current Inventories 26,097,480 11,771,124
During the year ended 30 June 2015 work in progress recognised as cost of sales by the Group amounted to $59,457,823 (2014: $215,000,136).
19 Trade and Other Receivables
Current
Other trade receivables 24,776,485 11,104,520
Total Current Trade and Other Receivables 24,776,485 11,104,520
Non Current
Other receivables 14,470,394 9,109,544
Amounts receivable from equity accounted investees 28,343,476 36,999,890
Total Non Current Trade and Other Receivables 42,813,870 46,109,434
Other receivables include a secured interest bearing loan of $8.38 million with a 5 year term at bank business interest rates.Amounts receivable from equity accounted investees bear interest at BBSY + 5.00%The Group’s exposure to credit risk and impairment losses to trade and other receivables are disclosed at Note 27.
20 Prepayments
Prepayment of operating expenses 465,053 -
Prepayment of sundry development expenses 41,792 92,044
Total Prepayments 506,845 92,044
Current 41,792 92,044
Non Current 465,053 -
506,845 92,044
21a Cash and Cash Equivalents
Bank balances 68,998,846 60,914,484
Cash and Cash Equivalents in the Statement of Cash Flows 68,998,846 60,914,484
The Group’s exposure to interest rate risk and a sensitivity analysis for financial assets and liabilities is disclosed at Note 27.
21b Reconciliation of Cash Flows from Operating Activities Note2015
$2014
$
Cash Flows from Operating Activities
Profit for the year 26,118,797 40,814,102
Adjustments for:
Depreciation and amortisation 14 546,186 444,703
Revaluation of investment property 8 2,004,508 (754,027)
Net financing (income)/expense 11 (1,675,653) 198,999
Share of net (profit)/loss of equity accounted investees (13,394,563) 577,302
Loss on disposal of property, plant & equipment - 582
Income tax expense 12 5,580,669 17,857,792
Operating Profit before Changes in Working Capital and Provisions 19,179,944 59,139,453
Change in trade and other receivables (14,506,737) 8,239,885
Change in current inventories 18 28,293,527 104,051,355
Change in non-current inventories 18 (14,326,356) (7,410,553)
Change in prepayments 20 (414,801) 288,908
Transferred from inventories to investment property 13 (50,695,374) (11,120,972)
Transferred from inventories to property, plant & equipment 14 (1,817,046) (818,126)
Change in provision for employee benefits 25 55,093 57,454
Change in trade and other payables 26 3,225,616 (21,326,566)
Cash (used in)/generated from Operating Activities (31,006,134) 131,100,838
Interest paid (4,141,441) (8,175,150)
Income taxes paid (21,439,529) (10,710,723)
Net Cash (used in)/generated from Operating Activities (56,587,104) 112,214,965
The increases and decreases in trade and other receivables as well as trade and other payables reflect only those changes that relate to operating activities. The remaining increases and decreases relate to investing activities.
Company Ordinary Shares
22 Capital and Reserves 2015 2014
Share Capital
On issue at 1 July 227,018,204 218,006,169
Issued under Dividend Reinvestment Plan 2,633,397 4,012,035
Bought back for cash - 5,000,000
Issued under Director Share Plan 250,000 -
Bought back for cash (731,624) -
On Issue at 30 June - Fully Paid 229,169,977 227,018,204
The Company does not have authorised capital or par value in respect of its issued shares.
The holders of ordinary shares are entitled to receive dividends as declared from time to time and are entitled to one vote per share at meetings of the Company. All shares rank equally with regard to the Company’s residual assets.

Notes to the Consolidated Financial StatementsFor the Year Ended 30 June 2015
Notes to the Consolidated Financial StatementsFor the Year Ended 30 June 2015
78 Annual Report 2015 | Finbar Group Limited Financial Statements | Notes to the Consolidated Financial Statements 79
22 Capital and Reserves (continued)
Cents per
ShareTotal Amount
$Franked / Unfranked
Date of Payment
Dividends
Dividends recognised in the current year by the Group are:
Dividends Paid During the Year 2015
Interim 2015 ordinary 4.00 9,149,121 Franked 10 April 2015
Final 2014 ordinary 6.00 13,621,092 Franked 19 September 2014
Total Amount 22,770,213
Dividends Paid During the Year 2014
Interim 2014 ordinary 4.00 8,833,887 Franked 17 April 2014
Final 2013 ordinary 6.00 13,080,368 Franked 11 September 2013
Total Amount 21,914,255
During the period a subsidiary paid dividends of $6,710,000 to minority shareholders.
Franked dividends declared or paid during the year were franked at the rate of 30%.
After 30 June 2015 the following dividend has been proposed by the Directors. The dividend has not been provided. The declaration and subsequent payment of dividends has no income tax consequences.
Proposed Dividend
Dividend proposed by the Group are:
Final 2015 ordinary 6.00 13,750,199 Franked 24 September 2015
Total Amount 13,750,199
The financial effect of this dividend has not been brought to account in the financial statements for the financial year ended 30 June 2015 and will be recognised in subsequent financial reports.
Dividend Reinvestment Plan
The Company has a dividend reinvestment plan under which holders of ordinary shares may elect to have all or part of their dividend entitlements satisfied by the issue of new ordinary shares rather than by being paid in cash.
In accordance with Rule 13 of the Company’s Dividend Reinvestment Plan (DRP), the Directors elected to reactivate the DRP in the 2011 financial year until further notice and as such the DRP will be active for the above mentioned dividend.
Company
2015 $
2014 $
Dividend Franking Account
30% franking credits available to shareholders of Finbar Group Limited for subsequent financial years 13,765,341 7,749,117
The above available amounts are based on the balance of the dividend franking account at year-end adjusted for:
a. franking credits that will arise from the payment of current tax liabilities;
b. franking debits that will arise from the payment of dividends recognised as a liability at the year-end;
c. franking credits that will arise from the receipt of dividends recognised as receivables at the year-end; and
d. franking credits that the entity may be prevented from distributing in subsequent years.
The ability to utilise the franking credits is dependent upon there being sufficient available profits to declare dividends. The impact on the dividend franking account of dividends proposed after the balance sheet date but not recognised as a liability is to reduce it by $5,892,942 (2014: $5,837,611).
Nature and purpose of reserveAsset revaluation reserveThe revaluation reserve relates to the revaluation of non investment property carried at fair value.
23 Earnings per Share
Basic Earnings per Share
The calculation of basic earnings per share at 30 June 2015 was based on the profit attributable to ordinary shareholders of $26,186,811 (2014: $36,463,045) and a weighted average number of ordinary shares on issue during the year ended 30 June 2015 of 228,439,088 (30 June 2014: 221,954,749), calculated as follows:
2015
$2014
$
Profit Attributable to Ordinary Shareholders 26,186,811 36,463,045
Weighted Average Number of Ordinary Shares
Issued ordinary shares at 1 July 227,018,204 218,006,169
Effect of share issue - Dividend Reinvestment Plan 19 September 2014 1,130,251 -
Effect of share issue - Director Share Plan 28 October 2014 167,808 -
Effect of share buyback 2 March 2015 (49,681) -
Effect of share buyback 3 March 2015 (29,817) -
Effect of share buyback 4 March 2015 (9,659) -
Effect of share buyback 5 March 2015 (15,041) -
Effect of share buyback 6 March 2015 (2,066) -
Effect of share issue - Dividend Reinvestment Plan 10 April 2015 262,037 -
Effect of share buyback 30 April 2015 (1,504) -
Effect of share buyback 18 May 2015 (12,138) -
Effect of share buyback 19 May 2015 (2,497) -
Effect of share buyback 20 May 2015 (6,740) -
Effect of share buyback 27 May 2015 (5,575) -
Effect of share buyback 18 June 2015 (3,477) -
Effect of share buyback 22 June 2015 (1,017) -
Effect of share issue - Dividend Reinvestment Plan 11 September 2013 - 2,272,812
Effect of share issue 17 March 2014 - 1,438,356
Effect of share issue - Dividend Reinvestment Plan 17 April 2014 - 237,412
Weighted Average Number of Ordinary Shares at 30 June 228,439,088 221,954,749
Basic Earnings per Share (cents per share) 11.46 16.43
Diluted Earnings per Share
The calculation of diluted earnings per share at 30 June 2015 was based on the profit attributable to ordinary shareholders of $26,186,811 (2014: $36,463,045) and a weighted average number of ordinary shares on issue during the year ended 30 June 2015 of 228,439,088 (30 June 2014: 221,954,749), calculated as follows:
Profit Attributable to Ordinary Shareholders (Diluted) 26,186,811 36,463,045
Weighted Average Number of Ordinary Shares (Diluted)
Weighted Average Number of Ordinary Shares (Diluted) at 30 June 228,439,088 221,954,749
Diluted Earnings per Share (cents per share) 11.46 16.43

Notes to the Consolidated Financial StatementsFor the Year Ended 30 June 2015
Notes to the Consolidated Financial StatementsFor the Year Ended 30 June 2015
80 Annual Report 2015 | Finbar Group Limited Financial Statements | Notes to the Consolidated Financial Statements 81
24 Loans and Borrowings 2015
$2014
$
This note provides information about the contractual terms of the Group’s interest-bearing loans and borrowings. For more information about the Group’s exposure to interest rate risk see Note 27.
Current liabilities
Commercial bills (Secured) 31,850,251 -
Total Current Interest Bearing Loans and Borrowings 31,850,251 -
Non-current liabilities
Commercial bills (Secured) 48,690,000 73,770,000
Shareholders loans to subsidiaries (Unsecured) 4,357,730 4,609,122
Total Non-current Interest Bearing Loans and Borrowings 53,047,730 78,379,122
2015 2014
Nominal
Interest Rate
Financial Year of
Maturity
Carrying Amount
$
Carrying Amount
$
Terms and debt repayment schedule
Terms and conditions of outstanding loans are as follows:
Commercial bills (Secured) BBSY+ 2.00% 2016 15,364,607 -
Commercial bills (Secured) BBSY+ 2.00% 2016 13,485,644 -
Commercial bills (Secured) BBSY+ 2.00% 2016 3,000,000 -
Current 31,850,251 -
Commercial bills (Secured) 5.66% 2016 - 43,770,000
Commercial bills (Secured) BBSY+2.00% 2017 22,690,000 4,000,000
Commercial bills (Secured) 5.66% 2018 26,000,000 -
Commercial bills (Secured) BBSY+1.25% 2018 - 26,000,000
Shareholder loans to subsidiaries (Unsecured)* BBSY+5.00% 2016 - 4,609,122
Shareholder loans to subsidiaries (Unsecured)* 6.00% 2017 2,783,640 -
Shareholder loans to subsidiaries (Unsecured)** 2017 350,690 -
Shareholder loans to subsidiaries (Unsecured)** 2018 1,223,400 -
Non Current 53,047,730 78,379,122
* These loans are from the non-controlling shareholder** These are non interest bearing loans
Financing Arrangements
Bank overdrafts
Bank overdrafts of the Subsidiaries are secured by a registered mortgage debenture over the Controlled entity’s assets and undertakings. Bank overdrafts are payable on demand and are subject to annual review.
Commercial bills
Commercial bills (refer Note 27) are denominated in Australian dollars.
The commercial bill loans of the Subsidiaries are secured by registered first mortgages over the development property land and buildings of the Controlled entity as well as a registered mortgage debenture over the Controlled entity’s assets and undertakings.
Shareholder Loans
Shareholder Loans are repayable upon the completion of the project.
25 Employee Benefits2015
$2014
$
Current
Liability for annual leave 52,114 33,499
Liability for long-service leave 85,147 -
137,261 33,499
Non Current
Liability for long-service leave 149,045 197,714
26 Trade and Other PayablesCurrent liabilities
Trade and other payables 14,401,165 10,481,723
Other payables and accrued expenses 879,460 1,573,286
Total Trade and Other Payables 15,280,625 12,055,009
At 30 June 2015, Consolidated trade and other payables include retentions of $184,041 (2014: $815,346) relating to construction contracts in progress.
The Group’s exposure to liquidity risk related to trade and other payables is disclosed at Note 27.
27 Financial Instruments
Credit Risk
Exposure to Credit Risk
The carrying amount of the Group’s financial assets represent the maximum credit exposure. The Group’s maximum exposure to credit risk at the reporting date was:
Carrying Amount
Note2015
$2014
$
Trade and other receivables - current 19 24,776,485 11,104,520
Trade and other receivables - non-current 19 42,813,870 46,109,434
Cash and cash equivalents 21a 68,998,846 60,914,484
136,589,201 118,128,438
The Group’s maximum exposure to credit risk for trade receivables at the reporting date by receivable category was:
Equity Accounted Investees 28,343,476 36,999,890
Working capital advances and bonds 1,975,503 772,283
Other receivables 14,470,394 9,109,104
GST refunds due and other trade debtors 22,800,982 10,332,677
67,590,355 57,213,954
Impairment Losses
None of the Group’s trade or other receivables are past due and based on historic default rates and security held the Group believes that no impairment allowance is necessary in respect of trade or other receivables.

Notes to the Consolidated Financial StatementsFor the Year Ended 30 June 2015
Notes to the Consolidated Financial StatementsFor the Year Ended 30 June 2015
82 Annual Report 2015 | Finbar Group Limited Financial Statements | Notes to the Consolidated Financial Statements 83
27 Financial Instruments (continued)
Liquidity Risk
The following are the contractual maturities of non-derivative financial liabilities, including estimated interest payments and excluding the impact of netting agreements:
Liquidity Risk Note
Carrying Amount
$
Contractual Cash Flows
$1 Year or Less
$1-3 Years
$
More than 3 Years
$
30 June 2015
Non-derivative Financial Liabilities
Secured bank loans:
Commercial bills 24 80,540,251 87,838,545 34,733,481 53,105,064 -
Shareholder Loans 24 4,357,730 4,858,785 167,018 4,691,767 -
Trade and other payables 26 15,280,625 15,280,625 15,280,625 - -
100,178,606 107,977,955 50,181,124 57,796,831 -
30 June 2014
Non-derivative Financial Liabilities
Secured bank loans:
Commercial bills 24 73,770,000 81,326,499 3,714,282 77,612,217 -
Shareholder Loans 24 4,609,122 5,313,566 355,133 4,958,433 -
Trade and other payables 26 12,055,009 12,055,009 12,055,009 - -
90,434,131 98,695,073 16,124,424 82,570,651 -
Carrying Amount
2015
$2014
$
Interest Rate Risk
Profile
At the reporting date the interest rate profile of the Group’s interest-bearing financial assets and liabilities was:
Variable Rate Instruments
Financial Assets 97,342,322 97,914,374
Financial Liabilities (84,897,981) (78,379,122)
12,444,341 19,535,252
Cash Flow Sensitivity Analysis for Variable Rate Instruments
A change of 100 basis points in interest rates would have (decreased)/increased the Group’s equity and profit or loss by the amounts shown below. This analysis assumes that all variables remain constant. The analysis is on the same basis for 2014.
Profit or Loss Equity
100bp Increase
$100bp Decrease
$100bp Increase
$100bp Decrease
$
30 June 2015
Variable rate instruments (938,027) 938,027 (938,027) 938,027
30 June 2014
Variable rate instruments (1,179,101) 1,179,101 (1,179,101) 1,179,101
(1,179,101) 1,179,101 (1,179,101) 1,179,101
Fair Values
Fair Values Versus Carrying Amounts
The fair values of financial assets and liabilities, as detailed below, are equal to the carrying amounts shown on the balance sheet:
Fair Values
2014
$2013
$
Trade and other receivables 67,590,355 57,213,954
Cash and cash equivalents 68,998,846 60,914,484
Secured bank loans (80,540,251) (73,770,000)
Unsecured shareholder loans (4,357,730) (4,609,122)
Trade and other payables (15,280,625) (12,055,009)
The methods and assumptions used to estimate the fair value of financial instruments are as follows:
Loans and receivables, payables and deferred income
Due to the short term nature of these financial rights and obligations, their carrying values approximate to their fair values.
Long term loans are secured and interest bearing at bank business interest rates.
Cash and short term deposits
The carrying amount is fair value due to the liquid nature of these assets.
Bank loans
The carrying amount is a reasonable approximation of fair value.
28 Operating Leases Note2015
$2014
$
Leases as Lessor
The Group leases out its investment properties held under operating leases.
Rental income received from investment property 15,023,526 13,569,804
Other rental property income received 267,376 -
7 15,290,902 13,569,804
Future minimum lease payments
At 30 June, the future minimum lease payments under non-cancellable leases are receivable as follows:
Less than one year 6,576,362 11,916,313
Between one and five years 14,740,325 42,304,521
More than 5 years - 13,925,817
21,316,687 68,146,651

Notes to the Consolidated Financial StatementsFor the Year Ended 30 June 2015
Notes to the Consolidated Financial StatementsFor the Year Ended 30 June 2015
84 Annual Report 2015 | Finbar Group Limited Financial Statements | Notes to the Consolidated Financial Statements 85
29 Capital and Other Commitments2015
$2014
$
Commitments and Contingent Liabilities
Property Development
Contracted but not provided for and payable:
Within one year 103,220,462 47,028,408
Later than one year 39,536,669 -
Total Property Development Commitments 142,757,131 47,028,408
Property Development - Equity Accounted Investees
Contracted but not provided for and payable:
Within one year 9,848,004 80,987,908
Total Property Development Commitments - Equity Accounted Investees 9,848,004 80,987,908
Group’s Share of Property Development - Equity Accounted Investees
Contracted but not provided for and payable:
Within one year 4,924,002 40,493,954
Total Share of Property Development Commitments - Equity Accounted Investees 4,924,002 40,493,954
Group’s Property Development Commitments including Equity Accounted Investees
Contracted but not provided for and payable:
Within one year 108,144,464 87,522,362
Later than one year 39,536,669 -
Total Property Development Commitments including Equity Accounted Investees 147,681,133 87,522,362
30 Contingencies
The Directors are of the opinion that provisions are not required in respect of these matters, as it is not probable that a future sacrifice of economic benefits will be required or the amount is not capable of reliable measurement.
Guarantees
The Company has guaranteed the bank facilities of certain equity accounted investees 5,000,000 -
31 Related Parties2015
$2014
$
The key management personnel compensation included in ‘personnel expenses’ is as follows:
Short term employee benefits 3,424,790 3,428,981
Other long term benefits 41,133 37,784
Post employment benefits 117,918 106,786
Employee benefits 3,583,841 3,573,551
Individual Directors and Executives Compensation Disclosures
Information regarding individual directors and executives compensation are provided in the Remuneration Report section of the Directors’ report on pages 34 to 37.
On 29th October 2014, Finbar Group Limited issued 250,000 fully paid ordinary shares to Darren Pateman as Director Incentive Shares under the rules of the Director Share Plan 2014. Payment was by way of an interest free loan of $360,000 which is repayable by 27th October 2019. The related benefit is disclosed on table 4.3.2 on page 35.
Apart from the details disclosed in this note and in note 15, no director has entered into a material contract with the Group since the end of the previous financial year and there were no material contracts involving directors’ interests existing at year-end.
Identity of Related Parties
The Group has a related party relationship with certain equity accounted investees (see Note 15) and with the Group’s key management personnel.
Other Related Party Transactions
Equity Accounted Investees
Loans are made by the Group to equity accounted investees for property development undertakings. Loans outstanding between the Group and joint ventures are interest bearing and are repayable at the completion of the equity accounted investees development project.
2015
$2014
$
As at 30 June the balance of these loans were as follows:
36 Chester Avenue Pty Ltd 4,197,639 3,727,627
Rowe Avenue Pty Ltd - 14,208,438
Roydhouse Street Subiaco Pty Ltd 7,232,115 11,211,017
Lot 1001 - 1003 Rowe Avenue Pty Ltd 10,782,642 2,159,255
647 Murray Street Pty Ltd 6,130,368 5,692,868
Finbar Sub 5050 Pty Ltd 712 685
28,343,476 36,999,890
In the financial statements of the Group, investments in equity accounted investees are carried at the lower of the equity accounted amount and the recoverable amount.
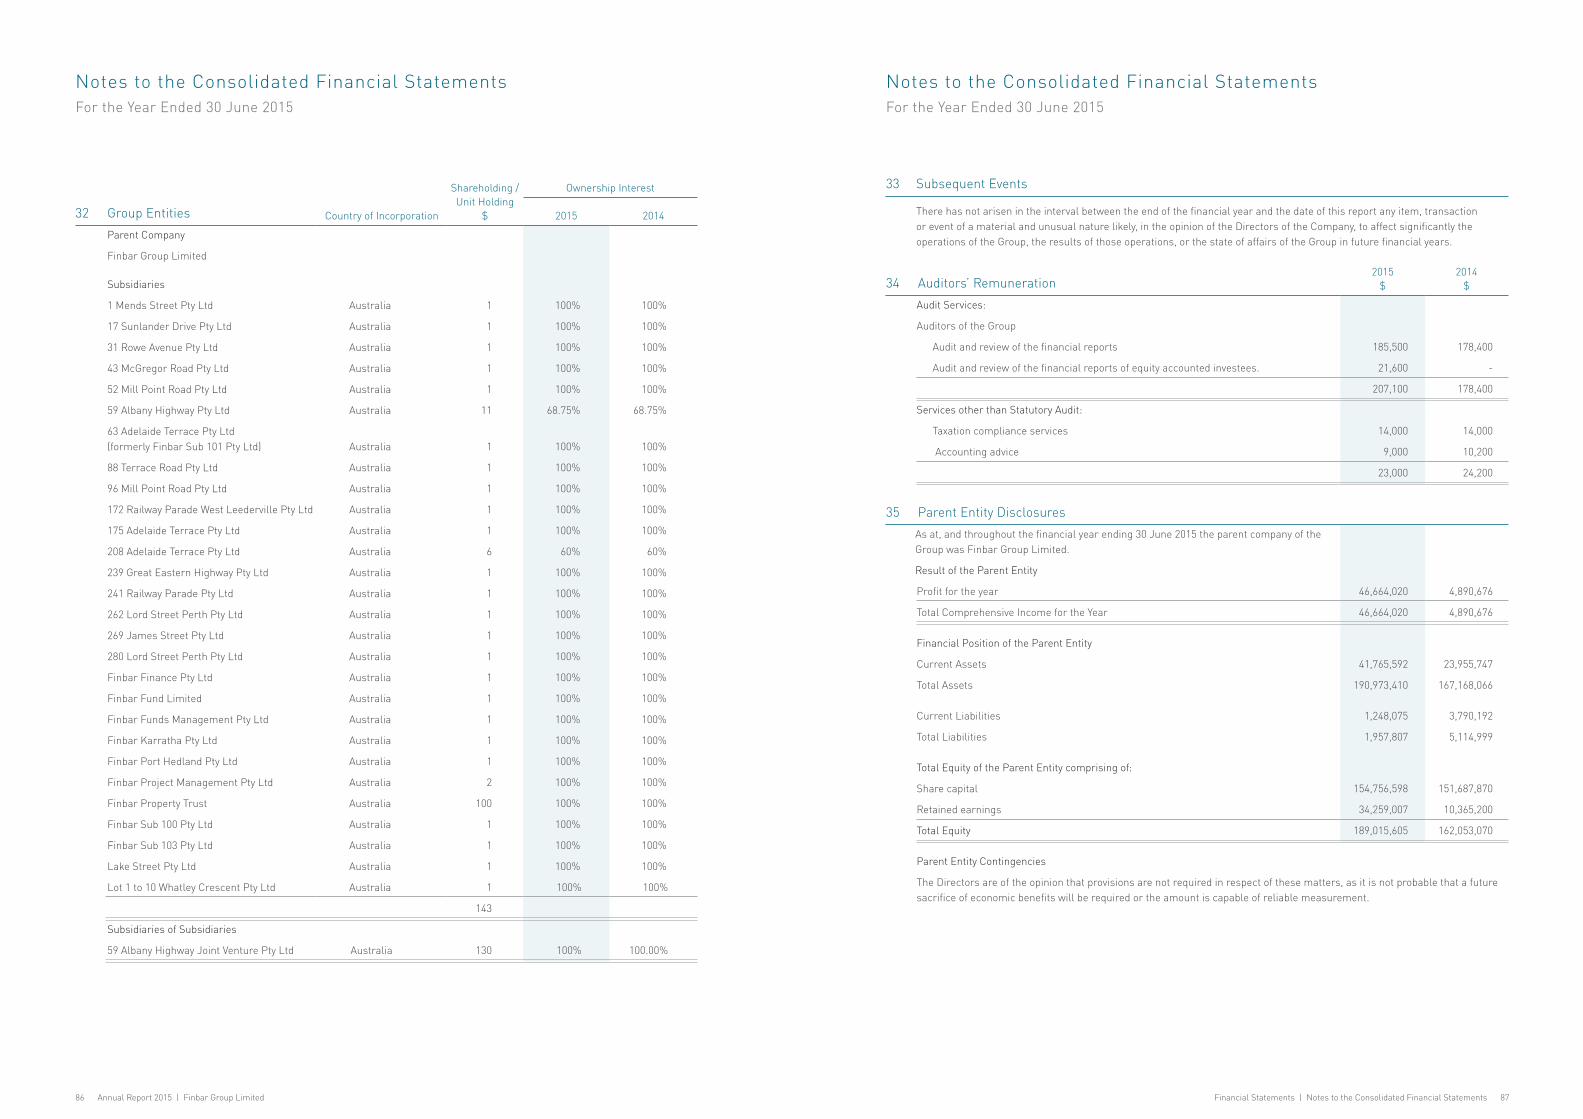
Notes to the Consolidated Financial StatementsFor the Year Ended 30 June 2015
Notes to the Consolidated Financial StatementsFor the Year Ended 30 June 2015
86 Annual Report 2015 | Finbar Group Limited Financial Statements | Notes to the Consolidated Financial Statements 87
32 Group Entities Country of Incorporation
Shareholding / Unit Holding
$
Ownership Interest
2015 2014
Parent Company
Finbar Group Limited
Subsidiaries
1 Mends Street Pty Ltd Australia 1 100% 100%
17 Sunlander Drive Pty Ltd Australia 1 100% 100%
31 Rowe Avenue Pty Ltd Australia 1 100% 100%
43 McGregor Road Pty Ltd Australia 1 100% 100%
52 Mill Point Road Pty Ltd Australia 1 100% 100%
59 Albany Highway Pty Ltd Australia 11 68.75% 68.75%
63 Adelaide Terrace Pty Ltd (formerly Finbar Sub 101 Pty Ltd) Australia 1 100% 100%
88 Terrace Road Pty Ltd Australia 1 100% 100%
96 Mill Point Road Pty Ltd Australia 1 100% 100%
172 Railway Parade West Leederville Pty Ltd Australia 1 100% 100%
175 Adelaide Terrace Pty Ltd Australia 1 100% 100%
208 Adelaide Terrace Pty Ltd Australia 6 60% 60%
239 Great Eastern Highway Pty Ltd Australia 1 100% 100%
241 Railway Parade Pty Ltd Australia 1 100% 100%
262 Lord Street Perth Pty Ltd Australia 1 100% 100%
269 James Street Pty Ltd Australia 1 100% 100%
280 Lord Street Perth Pty Ltd Australia 1 100% 100%
Finbar Finance Pty Ltd Australia 1 100% 100%
Finbar Fund Limited Australia 1 100% 100%
Finbar Funds Management Pty Ltd Australia 1 100% 100%
Finbar Karratha Pty Ltd Australia 1 100% 100%
Finbar Port Hedland Pty Ltd Australia 1 100% 100%
Finbar Project Management Pty Ltd Australia 2 100% 100%
Finbar Property Trust Australia 100 100% 100%
Finbar Sub 100 Pty Ltd Australia 1 100% 100%
Finbar Sub 103 Pty Ltd Australia 1 100% 100%
Lake Street Pty Ltd Australia 1 100% 100%
Lot 1 to 10 Whatley Crescent Pty Ltd Australia 1 100% 100%
143
Subsidiaries of Subsidiaries
59 Albany Highway Joint Venture Pty Ltd Australia 130 100% 100.00%
33 Subsequent Events
There has not arisen in the interval between the end of the financial year and the date of this report any item, transaction or event of a material and unusual nature likely, in the opinion of the Directors of the Company, to affect significantly the operations of the Group, the results of those operations, or the state of affairs of the Group in future financial years.
34 Auditors’ Remuneration2015
$2014
$
Audit Services:
Auditors of the Group
Audit and review of the financial reports 185,500 178,400
Audit and review of the financial reports of equity accounted investees. 21,600 -
207,100 178,400
Services other than Statutory Audit:
Taxation compliance services 14,000 14,000
Accounting advice 9,000 10,200
23,000 24,200
35 Parent Entity Disclosures
As at, and throughout the financial year ending 30 June 2015 the parent company of the Group was Finbar Group Limited.
Result of the Parent Entity
Profit for the year 46,664,020 4,890,676
Total Comprehensive Income for the Year 46,664,020 4,890,676
Financial Position of the Parent Entity
Current Assets 41,765,592 23,955,747
Total Assets 190,973,410 167,168,066
Current Liabilities 1,248,075 3,790,192
Total Liabilities 1,957,807 5,114,999
Total Equity of the Parent Entity comprising of:
Share capital 154,756,598 151,687,870
Retained earnings 34,259,007 10,365,200
Total Equity 189,015,605 162,053,070
Parent Entity Contingencies
The Directors are of the opinion that provisions are not required in respect of these matters, as it is not probable that a future sacrifice of economic benefits will be required or the amount is capable of reliable measurement.

88 Annual Report 2015 | Finbar Group Limited Independent Auditors’ Report 89
(1) In the opinion of the Directors of Finbar Group Limited (‘the Company’):
(a) The consolidated financial statements and notes that are contained in Pages 21 to 48 and the Remuneration report in the Directors’ report, set out on Pages 34 to 37, are in accordance with the Corporations Act 2001, including:
i) giving a true and fair view of the Group’s financial position as at 30 June 2015 and of its performance for the year ended on that date; and
ii) complying with Australian Accounting Standards (including the Australian Accounting Interpretations) and the Corporations Regulations 2001; and
(b) There are reasonable grounds to believe that the Company will be able to pay its debts as and when they become due and payable.
2. The Directors have been given the declarations required by Section 295A of the Corporations Act 2001 from the Managing Director and the Chief Financial Officer for the financial year ended 30 June 2015.
3. The Directors draw attention to Note 2(a) to the consolidated financial statements, which contains a statement of compliance with International Financial Reporting Standards.
Signed in accordance with a resolution of the Board of Directors:
Darren Pateman Managing Director
Dated at Perth this Twenty Sixth day of August 2015.
Directors’ Declaration Independent Auditors’ Reportto Members of Finbar Group Limited
Independent auditor’s report to the members of Finbar Group Limited
Report on the financial report We have audited the accompanying financial report of Finbar Group Limited (the company), which comprises the consolidated statement of financial position as at 30 June 2015, and consolidated statement of profit or loss and other comprehensive income, consolidated statement of changes in equity and consolidated statement of cash flows for the year ended on that date, Notes 1 to 35 comprising a summary of significant accounting policies and other explanatory information and the directors’ declaration of the Group comprising the company and the entities it controlled at the year’s end or from time to time during the financial year.
Directors’ responsibility for the financial report
The directors of the company are responsible for the preparation of the financial report that gives a true and fair view in accordance with Australian Accounting Standards and the Corporations Act 2001 and for such internal control as the directors determine is necessary to enable the preparation of the financial report that is free from material misstatement whether due to fraud or error. In Note 2(a), the directors also state, in accordance with Australian Accounting Standard AASB 101 Presentation of Financial Statements, that the financial statements of the Group comply with International Financial Reporting Standards.
Auditor’s responsibility
Our responsibility is to express an opinion on the financial report based on our audit. We conducted our audit in accordance with Australian Auditing Standards. These Auditing Standards require that we comply with relevant ethical requirements relating to audit engagements and plan and perform the audit to obtain reasonable assurance whether the financial report is free from material misstatement.
An audit involves performing procedures to obtain audit evidence about the amounts and disclosures in the financial report. The procedures selected depend on the auditor’s judgement, including the assessment of the risks of material misstatement of the financial report, whether due to fraud or error. In making those risk assessments, the auditor considers internal control relevant to the entity’s preparation of the financial report that gives a true and fair view in order to design audit procedures that are appropriate in the circumstances, but not for the purpose of expressing an opinion on the effectiveness of the entity’s internal control. An audit also includes evaluating the appropriateness of accounting policies used and the reasonableness of accounting estimates made by the directors, as well as evaluating the overall presentation of the financial report.
We performed the procedures to assess whether in all material respects the financial report presents fairly, in accordance with the Corporations Act 2001 and Australian Accounting Standards, a true and fair view which is consistent with our understanding of the Group’s financial position and of its performance.
We believe that the audit evidence we have obtained is sufficient and appropriate to provide a basis for our audit opinion.
KPMG, an Australian partnership and a member firm of the KPMG network of independent member firms affiliated with KPMG International Cooperative (“KPMG International”), a Swiss entity.
Liability limited by a scheme approved under Professional Standards Legislation.

90 Annual Report 2015 | Finbar Group Limited
Independent Auditors’ Report Lead Auditor’s Independence Declarationunder Section 307C of the Corporations Act 2001
Lead Auditor’s Independence Declaration 91
Lead Auditor’s Independence Declaration under Section 307C of the Corporations Act 2001
To: the directors of Finbar Group Limited
I declare that, to the best of my knowledge and belief, in relation to the audit for the financial year ended 30 June 2015 there have been:
(i) no contraventions of the auditor independence requirements as set out in the Corporations Act 2001 in relation to the audit; and
(ii) no contraventions of any applicable code of professional conduct in relation to the audit.
KPMG
Denise McComish Partner
Perth
26 August 2015
KPMG, an Australian partnership and a member firm of the KPMG network of independent member firms affiliated with KPMG International Cooperative (“KPMG International”), a Swiss entity.
Liability limited by a scheme approved under Professional Standards Legislation.
Independence
In conducting our audit, we have complied with the independence requirements of the Corporations Act 2001.
Auditor’s opinion In our opinion:
(a) the financial report of the Group is in accordance with the Corporations Act 2001, including:
(i) giving a true and fair view of the Group’s financial position as at 30 June 2015 and of its performance for the year ended on that date; and
(ii) complying with Australian Accounting Standards and the Corporations Regulations 2001.
(b) the financial report also complies with International Financial Reporting Standards as disclosed in Note 2(a).
Report on the remuneration report We have audited the Remuneration Report included in Section 4.3 of the directors’ report for the year ended 30 June 2015. The directors of the company are responsible for the preparation and presentation of the remuneration report in accordance with Section 300A of the Corporations Act 2001. Our responsibility is to express an opinion on the remuneration report, based on our audit conducted in accordance with auditing standards.
Auditor’s opinion
In our opinion, the remuneration report of Finbar Group Limited for the year ended 30 June 2015, complies with Section 300A of the Corporations Act 2001.
KPMG
Denise McComish Partner
Perth
26 August 2015

92 Annual Report 2015 | Finbar Group Limited
CORPORATE DIRECTORY
Offices and Officers
Directors
Mr John Chan (Executive Chairman) Mr Darren John Pateman (Managing Director) Mr John Boon Heng Cheak Mr Kee Kong Loh Mr Lee Verios
Company Secretary
Mr Anthony David Hewett
Principal Registered Office
Finbar Group Limited Level 6 181 Adelaide Terrace EAST PERTH WA 6004
PO Box 3380 EAST PERTH WA 6892
Telephone: +61 8 6211 3300 Facsimile: +61 8 9221 8833 Email: [email protected] Website: www.finbar.com.au
Share Registry
Computershare Investor Services Pty Ltd Level 11 172 St Georges Terrace PERTH WA 6000 Telephone: +61 8 9323 2000
Auditors
KPMG 235 St Georges Terrace PERTH WA 6000
developing better lifestyles
Additional information required by the ASX Limited Listing Rules and not disclosed elsewhere in this report is set out below.
Shareholdings (as at 30 June 2015)
Substantial Shareholders
The number of shares held by substantial shareholders and their associates are set out below:
Shareholder Name Number %
Chuan Hup Holdings 41,257,796 18.00 HSBC Custody Nominees (Australia) Limited 34,243,432 14.94 Zero Nominees Pty Ltd 11,881,243 5.18
Voting rights
Ordinary sharesRefer to Note 22 in the Notes to the Financial Statements.
Distribution of Equity Security Holders
RangeNumber of
HoldersOrdinary
Shares
1-1,000 417 168,195 1,001-5,000 741 2,267,780 5,001-10,000 479 3,767,371 10,001-100,000 796 22,155,861 100,001-over 115 200,810,770
2,548 229,169,977
The number of shareholders holding less than a marketable parcel of ordinary shares is 228.
Stock Exchange
The Company is listed on the Australian Securities Exchange. The Home exchange is Perth. ASX Code: FRI
Other information
Finbar Group Limited, incorporated and domiciled in Australia, is a publicly listed company limited by shares.
Twenty Largest Shareholders:
Number of Ordinary
Shares Held %
Chuan Hup Holdings Limited 41,257,796 18.00HSBC Custody Nominees (Australia) Limited 34,243,432 14.94Zero Nominees Pty Ltd 11,881,243 5.18Blair Park Pty Ltd 9,802,458 4.28JP Morgan Nominees Australia Limited 8,776,859 3.83Rubi Holdings Pty Ltd 7,950,000 3.47Apex Investments Pty Ltd 5,280,584 2.30Mrs Siew Eng Mah 5,091,662 2.22Hanssen Pty Ltd 5,000,000 2.18Forward International Pty Ltd 4,536,184 1.98Mr James Chan 4,301,465 1.883rd Wave Investors Ltd 3,370,000 1.47Mr Wan Kah Chan & Mrs Mui Tee Chan 3,358,350 1.47Mr Ah-Hwa Lim 3,151,445 1.38National Nominees Limited 3,010,933 1.31Citicorp Nominees Pty Limited 2,996,942 1.31Baguio International Limited 2,879,344 1.26Milton Corporation Limited 2,782,249 1.21Mr Guan Seng Chan 2,534,191 1.11HSBC Custody Nominees (Australia) Limited 2,485,217 1.08
Top 20 164,690,354 71.86
ASX Additional Information

Insig
ht C
om
mu
nica
tion
& D
esig
n