Annual Report 2014 - VTech · PDF fileAnnual Report 2014 VTech Holdings Limited Annual Report...
72
HKSE : 303 Annual Report 2014
Transcript of Annual Report 2014 - VTech · PDF fileAnnual Report 2014 VTech Holdings Limited Annual Report...

23rd Floor, Tai Ping Industrial Centre, Block 1
57 Ting Kok Road, Tai Po, New Territories, Hong Kong
Tel: (852) 2680 1000
Fax: (852) 2680 1300
Email: [email protected]
www.vtech.com
(Incorporated in Bermuda with limited liability)
HKSE : 303
Annual Report 2014
VTech Holdings Lim
itedA
nnual Report 2014
1 Corporate Profile
2 Financial Highlights
3 Letter to Shareholders
7 Management Discussion and Analysis
• Financial Review
• Review of Operations
14 Products and Services Overview
20 Year in Review
22 Sustainability
26 Investor Relations
29 Corporate Governance Report
33 Directors and Senior Management
35 Report of the Directors
39 Independent Auditor’s Report
40 Consolidated Financial Statements
43 Notes to the Financial Statements
67 VTech in the Last Five Years
68 Corporate Information
CONTENTS
Conc
ept &
Des
ign:
YEL
LOW
CRE
ATIV
E (H
K) L
IMIT
ED
ww
w.y
ello
wcr
eativ
e.co
m
A Chinese translation of this annual report may be obtained on request from Computershare Hong Kong Investor Services Limited,
Shops 1712-16, 17th Floor, Hopewell Centre, 183 Queen’s Road East, Wan Chai, Hong Kong. If there are any discrepancies between
the Chinese translation and the English version of this report and accounts, the English version shall prevail.
本年報備有中文譯本,請向位於香港灣仔皇后大道東183號合和中心17樓1712-16號舖香港中央證券登記有限公司索取。
本年報及賬目之中文譯本與英文本如有任何歧義,概以英文本為準。
Head Office
VTech Holdings Limited
23rd Floor, Tai Ping Industrial Centre
Block 1, 57 Ting Kok Road
Tai Po, New Territories
Hong Kong
Tel: (852) 2680 1000
Fax: (852) 2680 1300
Website: www.vtech.com
Email: [email protected]
Regional Offices
AustraliaVTech Telecommunications
(Australia) Pty Limited
24 Gilby Road, Mount Waverley
Victoria, 3149
Tel: (61) 1300 369 193
Fax: (61) 1300 304 600
Email: (Business Enquiry)
(Telstra product support)
CanadaVTech Technologies Canada Ltd.
12111 Jacobson Way
Richmond, British Columbia
V6W 1L5
Tel: (1) 604 273 5131
Fax: (1) 604 273 1425
Website: www.vtechcanada.com
Email: (Telecommunication Products)
(Electronic Learning Products)
ChinaVTech Electronics Industrial
(Shenzhen) Co., Ltd
District B-1, 7th Floor, VTech Research &
Development Building
Junction between Keji South 12th Road
and Gaoxin South 4th Avenue
Nanshan District, Shenzhen
Guangdong Province
Postcode: 518057
Tel: (86) 400 188 8628
Fax: (86) 755 8632 2069
Website: www.vtechchina.com.cn
Email: [email protected]
FranceVTech Electronics Europe S.A.S.
24, allée des Sablières
78290 Croissy-sur-Seine
Tel: (33) 1 30 09 88 00
Fax: (33) 1 30 09 87 80
Website: www.vtech-jouets.com
Email: [email protected]
GermanyVTech Electronics Europe GmbH
Martinstrasse 5
70794 Filderstadt
Tel: (49) 711 709 740
Fax: (49) 711 709 7449
Website: www.vtech.de
Email: [email protected]
JapanVTech Electronics (Japan) Inc.
3F, Shin-Osaka Building, 1-1-36
Nishiawaji, Higashiyodogawa-ku
Osaka 533-0031
Tel: (81) 6 4950 5100
Fax: (81) 6 4950 5101
Website: www.vtechjapan.com
VTech Communications Japan Ltd.
Okumura Building
3-14, Kanda Ogawamachi
Chiyoda-Ku, Tokyo 101-0052
Tel: (81) 3 3294 0740
Fax: (81) 3 3294 0785
Website: www.vtechcms.com
Email: [email protected]
NetherlandsVTech Electronics Europe B.V.
Copernicusstraat 7
6003 DE Weert
Industrial Estate Kampershoek
Tel: (31) 495 459 111
Fax: (31) 495 459 112
Website: www.vtechnl.com
Email: [email protected]
SpainVTech Electronics Europe, S.L.
Avda. de Aragón, 336 c/v Yécora
Oficina 1-Pol. Ind. Las Mercedes
28022 Madrid
Tel: (34) 91 312 0770
Fax: (34) 91 747 0638
Website: www.vtech.es
Email: [email protected]
United KingdomVTech Communications Limited
9, Manor Courtyard
Hughenden Avenue
High Wycombe
Buckinghamshire
HP13 5RE
Tel: (44) 1494 522 510
VTech Electronics Europe Plc
Napier Court
Abingdon Science Park
Abingdon, Oxfordshire, OX14 3YT
Tel: (44) 123 555 5545
Fax: (44) 123 554 6804
Website: www.vtechuk.com
Email: [email protected]
United StatesVTech Electronics North America, L.L.C.
1156 W Shure Drive, Suite 200
Arlington Heights, IL 60004
Tel: (1) 847 400 3600
Fax: (1) 847 400 3601
Website: www.vtechkids.com
Email: [email protected]
VTech Communications, Inc.
9590 S.W. Gemini Drive, Suite 120
Beaverton, OR 97008
Tel: (1) 503 596 1200
Fax: (1) 503 644 9887
Website: www.vtechphones.com
Email: [email protected]
VTech Telecom, L.L.C.
545 Concord Avenue, Suite 14
Cambridge, MA 02138
Tel: (1) 617 576 3300
Fax: (1) 617 576 7753
Website: www.vtechcms.com
Email: [email protected]
VTech Group of Companies

CORPORATE PROFILE
VTech is the global leader in electronic learning products from infancy to
preschool and the world’s largest manufacturer of cordless phones. It also
provides highly sought-after contract manufacturing services. Founded in 1976,
VTech’s mission is to design, manufacture and supply innovative and high
quality products in a manner that minimises any impact on the environment,
while creating sustainable value for its stakeholders and the community.
With headquarters in the Hong Kong Special Administrative Region and
state-of-the-art manufacturing facilities in China, VTech currently has operations
in 11 countries and regions. It employs approximately 30,000 employees,
including around 1,500 R&D professionals in R&D centres in Canada, Germany,
Hong Kong and China. This network allows VTech to stay abreast of the latest
technology and market trends throughout the world, while maintaining a
highly competitive cost structure.
The Group invests significantly in R&D and launches numerous new products
each year. VTech sells its products via a strong brand platform supported by an
extensive global distribution network of leading traditional and online retailers.
Shares of VTech Holdings Limited are listed on The Stock Exchange of
Hong Kong Limited (HKSE: 303).
1VTech Holdings Limited Annual Report 2014
Corporate Profile
2 VTech Holdings Limited Annual Report 2014
Financial Highlights
US$ million %
10
206.5
11
202.0
12
191.9
13
201.5*
14
203.3
0
50
100
150
200
250
0
4
8
12
16
20
13.5
11.810.8 10.8* 10.7
US$ million %
10
559.4
11
566.9
12
570.8
13
597.8
14
634.3
0
100
200
300
400
500
600
700
0
10
20
30
40
50
60
70
36.533.1 32.0 32.2 33.4
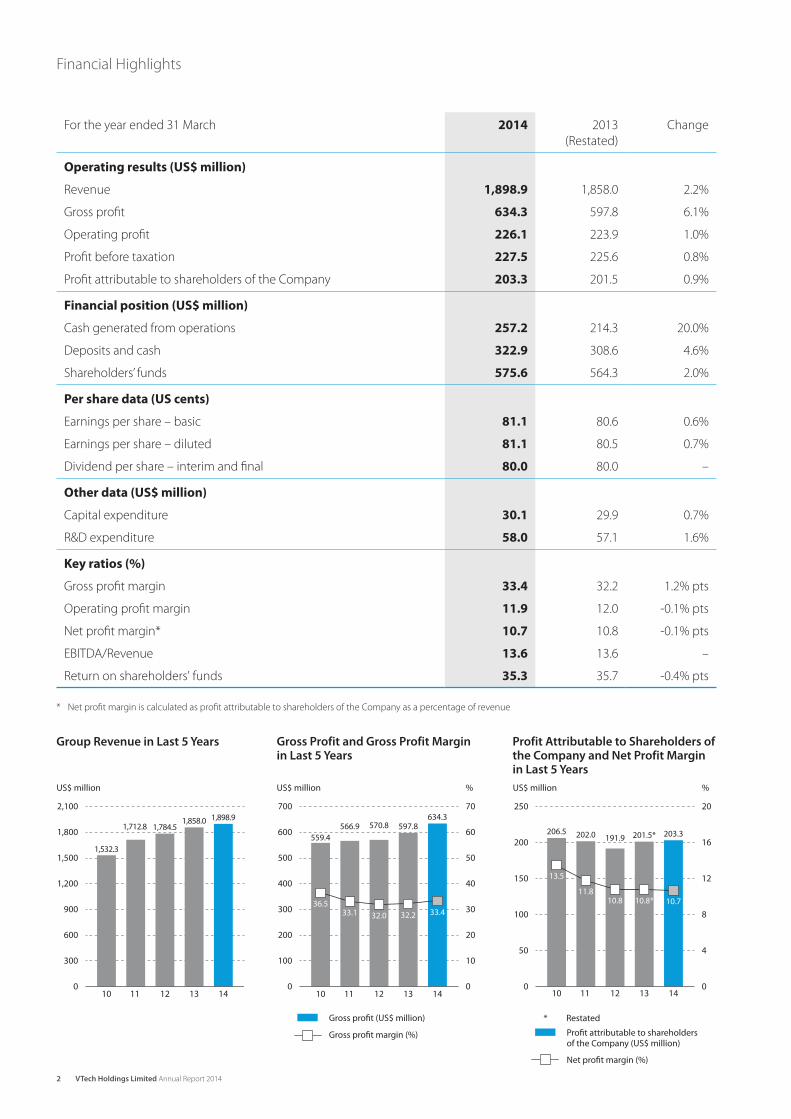
Group Revenue in Last 5 Years Gross Profit and Gross Profit Margin in Last 5 Years
Profit Attributable to Shareholders of the Company and Net Profit Margin in Last 5 Years
Profit attributable to shareholders of the Company (US$ million)
Net profit margin (%)
Gross profit (US$ million)
Gross profit margin (%)
* Restated
For the year ended 31 March 2014 2013
(Restated)
Change
Operating results (US$ million)
Revenue 1,898.9 1,858.0 2.2%
Gross profit 634.3 597.8 6.1%
Operating profit 226.1 223.9 1.0%
Profit before taxation 227.5 225.6 0.8%
Profit attributable to shareholders of the Company 203.3 201.5 0.9%
Financial position (US$ million)
Cash generated from operations 257.2 214.3 20.0%
Deposits and cash 322.9 308.6 4.6%
Shareholders’ funds 575.6 564.3 2.0%
Per share data (US cents)
Earnings per share – basic 81.1 80.6 0.6%
Earnings per share – diluted 81.1 80.5 0.7%
Dividend per share – interim and final 80.0 80.0 –
Other data (US$ million)
Capital expenditure 30.1 29.9 0.7%
R&D expenditure 58.0 57.1 1.6%
Key ratios (%)
Gross profit margin 33.4 32.2 1.2% pts
Operating profit margin 11.9 12.0 -0.1% pts
Net profit margin* 10.7 10.8 -0.1% pts
EBITDA/Revenue 13.6 13.6 –
Return on shareholders’ funds 35.3 35.7 -0.4% pts
* Net profit margin is calculated as profit attributable to shareholders of the Company as a percentage of revenue
US$ million
10
1,532.3
11
1,712.8
12
1,784.5
13
1,858.0
14
1,898.9
0
300
600
900
1,200
1,500
1,800
2,100

VTech delivered top-line growth across its major markets in
the financial year 2014, reporting record revenue despite a
generally soft retail environment. Gross margin continued to
improve, as material costs were lower. The Group’s efforts to
raise productivity through automation also began to bear fruit.
Profit attributable to shareholders of the Company, however,
showed lower growth due to higher advertising and promotion
expenses. During the financial year, the Group’s leadership in
core product categories was further strengthened.
Results and Dividend
Group revenue for the year ended 31 March 2014 increased by
2.2% to US$1,898.9 million. The increase was mainly attributable
to higher revenue in North America, Europe and Asia Pacific,
offsetting lower revenue in Other Regions.
Profit attributable to shareholders of the Company rose 0.9%
to US$203.3 million. During the financial year 2014, the Group
increased its advertising and promotion expenses to support
InnoTab® in the US in response to a competitive market. Basic
earnings per share grew by 0.6% to US81.1 cents, compared to
US80.6 cents in the previous financial year.
The Board of Directors has proposed a final dividend of
US64.0 cents per ordinary share, providing a full-year dividend
of US80.0 cents per ordinary share, the same as the dividend
paid in the financial year 2013.
Costs and Operations
The Group’s gross margin improved in the financial year 2014
as lower material costs more than offset higher labour costs
and manufacturing overheads. Material costs declined due to
subdued global demand and VTech’s efforts in re-engineering
products for lower cost. The Group also succeeded in reducing
the impact of the rise in the minimum wage in China, via its
initiatives to raise productivity through automation and process
improvement. As a result, VTech employed 11% fewer workers
on average compared with the previous financial year despite
output being higher. Manufacturing overheads increased
owing to higher production capacity, inflation in China and the
appreciation of the Renminbi.
Our Business
The Group’s sales composition continued to evolve in response
to changes in market demand.
In the financial year 2014, Electronic Learning Products
(ELPs) remained the Group’s largest product line, followed by
telecommunication (TEL) products and contract manufacturing
services (CMS).
Overall sales of the Group via e-tailers have risen strongly,
outpacing the traditional sales channels. Sales of content
downloaded from VTech’s app store, Learning Lodge™,
continued to see good growth.
Even though the European toy markets were generally down
or flat in the calendar year 2013, VTech ELPs outperformed in
the region to deliver 16.5% revenue growth. The Group was the
number one player in the overall Infant Toys category in France,
the UK and Germany in the calendar year 20131. Furthermore,
Storio® was the number one children’s educational tablet in
Europe for the second year in a row2. In the US, Go! Go! Smart
Wheels® delivered a strong performance in the financial
year 2014. Sales of InnoTab, however, were lower due to
competition from low-cost consumer electronics tablets. In the
financial year 2014, standalone products accounted for about
68% of total ELPs revenue, while platform products accounted
for approximately 32%, as compared with about 64% and 36%
respectively in the financial year 2013.
Dear Shareholders,
1 Source: NPD Group, Retail Tracking Service2 Source: NPD Group, Retail Tracking Service. Ranking based on total retail sales of
Storio for the combined market of France, the UK, Germany, Spain and Italy
3VTech Holdings Limited Annual Report 2014
Letter to Shareholders
In TEL products, the businesses in the US and Asia Pacific
posted good performances, partially offsetting the weakness in
Europe. In residential phones, the Group maintained its number
one position in the US3 and grew its share further as the
market continued to consolidate. Sales of commercial phones
and other telecommunication products continued to rise.
Among these, baby monitors and the cordless business phone
system, SynJ®, were the best performers. VTech also started
shipping ErisStation™, its first conference phone with wireless
microphones, to customers in the US and Europe in the
fourth quarter of the financial year. In the financial year 2014,
commercial phones and other telecommunication products
represented about 14% of total TEL products revenue, against
approximately 12% in the financial year 2013.
VTech CMS registered 7.2% revenue growth in the financial
year 2014, once again outperforming the global EMS market
and marking the 12th consecutive year of growth. Its strong
reputation and expertise in a number of product categories
enabled it to add new customers and expand geographically,
resulting in top-line growth in all regions.
Our Strategies
VTech’s proven strategy centres on four growth drivers: product
innovation, gains in market share, geographic expansion and
operational excellence.
Product Innovation has given the Group leadership in core
product categories, while acting as the driver for growth in the
new product areas.
VTech’s ELPs have benefited from tremendous growth in areas
beyond that of core learning and the Group will build on this
momentum by introducing new product ranges. The infant-
toddler vehicles line Go! Go! Smart Wheels and its playsets
were strong performers in the financial year 2014. Riding on
their success, the Group will increase its presence in the playset
arena with the launch of Go! Go! Smart Animals™ in the US and
Europe. More vehicles and playsets, meanwhile, will be added
to the Go! Go! Smart Wheels line. The Switch & Go Dinos® range
of vehicles for the preschool segment will expand further with
the introduction of Switch & Go Dinos Turbo, adding nine new
models to the range.
3 Source: MarketWise Consumer Insights, LLC
VTech will also continue to broaden its learning products
portfolio. More than 100 new standalone products targeting
infants, toddlers, preschoolers and grade-schoolers, will be
introduced globally this calendar year.
In platform products, VTech continues to innovate to capture
the latest trends. Kidizoom® Smart Watch, the world’s first
children’s smartwatch with a camera, will hit the shelves in
both the US and Europe this summer. To maintain momentum
in children’s tablets, the Group will upgrade InnoTab with new
versions, including InnoTab Max. With a 7” LCD screen and a
child-proof design, InnoTab Max has an upgraded processor
for an enhanced experience, backed by a rich and expert-
endorsed library of educational software titles.
For TEL products, growth will be driven by commercial phones
and other telecommunication products, which will see new
offerings across the spectrum during the financial year 2015.
Among them, a new range of small to medium sized business
(SMB) phones will be launched under the VTech brand. This
will include a new conference phone model with wireless
microphones, SIP (Session Initiation Protocol) phones and
a 4-line, SIP-based telephone system catering to the needs
of small businesses. VTech’s range of baby monitors will be
enhanced by the introduction of more video and audio models.
For connected home™ devices, in addition to Wi-Fi video
monitors, a new family of home monitoring devices based on
the DECT ULE (Ultra Low Energy) standard will be launched in
the second half of the financial year 2015.
In residential phones, the Group continues to develop products
with new styling and features. The DECT platform has been re-
engineered to make it more cost-competitive. This supports the
strategy to revitalise the European TEL products business and
strengthen VTech’s leadership position in the US. The Group
will also introduce new CAT-iq handsets in Europe offering
affordable, high-definition voice quality supporting multiple
lines during the financial year 2015.
VTech’s proven strategy centres on four
growth drivers: product innovation,
gains in market share, geographic
expansion and operational excellence.
4 VTech Holdings Limited Annual Report 2014
Letter to Shareholders

The ability to offer DFM (Design for Manufacturing), flexible
services and manufacturing know-how in a number of
product categories has made VTech CMS a leading contract
manufacturer. It has a dedicated manufacturing facility
offering reduced logistics and customs clearance costs for
customers wishing to distribute their products in China. The
Group’s stringent quality control system and experienced
staff allow it to handle low to medium volumes as well as a
high mix of different products. As in previous years, VTech
CMS received numerous customer service awards during the
financial year 2014.
Gains in Market Share will continue to be the growth driver for
the Group in the financial year 2015.
VTech continued to be the world’s largest player in ELPs from
infancy to preschool in the calendar year 20134. The pipeline of
new products will enable the Group to strengthen its market
leadership in the core learning area, while pursuing growth in
new areas.
In addition to leadership in ELPs, VTech remained the world’s
number one manufacturer of cordless telephones in the
calendar year 20135. In the calendar year 2014, further market
share gains are expected for TEL products in the US and Asia
Pacific. Market share in Europe and Other Regions will recover,
driven by new product launches and the signing of a major
new distributor for the Middle East.
The Group’s commitment to quality products and services has
enabled CMS to win market share year after year. According to
Manufacturing Market Insider, VTech CMS ranked among the
world’s top 50 EMS providers in the calendar year 2013. The
Group expects to continue to increase its CMS sales globally in
the financial year 2015.
Geographic Expansion will see more emphasis on expanding
outside North America and Western Europe, in order to capture
growth opportunities. In Asia Pacific, the potential in China is
huge and it will continue to be the most important market
for development. The developed markets in the region such
4 Source: MarketWise Consumer Insights, LLC and Retail Tracking Service of NPD Group. Ranking based on 2012 and 2013 total estimated annual retail sales in the combined toy categories of infant electronic learning and preschool electronic learning
5 Source: MZA Ltd, 2014
as Australia and Japan will continue to be a focus. The Group
will also extend its reach to other markets including Taiwan,
Malaysia and Korea. In Other Regions, the Group aims to grow
sales in Latin America and the Middle East.
Operational Excellence underpins VTech’s success. As costs in
China are set to rise further, operational efficiency is becoming
increasingly important. In addition to process improvement
and product optimisation for manufacturing, the Group will
increase its application of automation by deploying more
commercially available and in-house custom-made machines.
This will reduce the number of workers further, even as
output increases. The Group will also benefit from enhanced
competitiveness as automation improves product quality,
reduces time to market and increases flexibility in production.
Outlook
Economic recovery in the US appears to be on a sustainable
footing, while the economies of Western Europe are improving.
With a stabilised market environment and new products ready
to be launched, the Group is targeting further revenue growth
in the financial year 2015.
In addition to process improvement and
product optimisation for manufacturing,
the Group will increase its application
of automation by deploying more
commercially available and in-house
custom-made machines. This will reduce
the number of workers further, even as
output increases.
5VTech Holdings Limited Annual Report 2014
Sales of ELPs in the financial year 2015 are forecast to increase
as the strong momentum in standalone products carries
through. Innovative products including Go! Go! Smart
Animals and Switch & Go Dinos Turbo, as well as new core
learning products, will drive growth. Despite the introduction
of Kidizoom Smart Watch, sales of platform products are
still expected to be challenging. InnoTab will face rising
competition as more low-cost tablets are being introduced to
the consumer electronics aisles.
TEL products revenue is also expected to increase. Growth will
be driven by commercial phones and other telecommunication
products, as the Group introduces new products and makes
higher shipments of continuing products. Sales of residential
phones in Europe and Other Regions are expected to recover,
while in Asia Pacific growth will continue. In the US, although
the residential phone market will shrink further, VTech will
continue to increase its share.
CMS is expected to grow further in the financial year 2015.
Business with existing customers will increase, as the Group
continues to take market share from the competition. New
customers will add a further stimulus to growth. To cope
with higher expected demand over the next three years, the
Group plans to add a new CMS factory building. This will raise
manufacturing capacity by 25% once it enters operation in the
middle of the calendar year 2015.
Regarding costs, material prices are expected to hold broadly
steady, although labour costs and manufacturing overheads
in China will continue to rise. However, the Group’s gross profit
margin is expected to be stable as efficiency gains through
automation, process improvements and product optimisation
should offset higher costs in China.
As a global company that is part of the communities in which
it operates, VTech recognises the need to step up its effort
to achieve sustainable development. The goal is to design,
manufacture and supply innovative and high quality products
in a manner that minimises any impact on the environment,
while creating value for stakeholders and communities. To this
end, VTech will continue to incorporate sustainability concepts
into product design, improve energy and resource efficiency
in operations, and upgrade employees’ living and working
environments.
VTech’s product innovation and operational efficiency have
given it market-leading positions in a number of areas. It
continues to gain market share and expand geographically,
while maintaining a strong financial position. The Group will
continue to implement its sustainability strategies, while
exploring every avenue of potential growth to generate higher
returns for shareholders.
Finally, I wish to thank all the Group’s employees worldwide for
their dedication to ensuring another successful year for VTech,
my fellow directors for their counsel and all shareholders,
customers and suppliers for their support.
Allan Wong Chi Yun
Chairman
Hong Kong, 22 May 2014
VTech’s product innovation and
operational efficiency have given it
market-leading positions in a number
of areas. It continues to gain market
share and expand geographically, while
maintaining a strong financial position.
The Group will continue to implement
its sustainability strategies, while
exploring every avenue of potential
growth to generate higher returns for
shareholders.
6 VTech Holdings Limited Annual Report 2014
Letter to Shareholders

Operating Profit and Operating Profit Margin in Last 5 Years
Financial Overview
For the year ended 31 March 2014 2014 2013
(Restated)
Change
US$ million US$ million US$ million
Revenue 1,898.9 1,858.0 40.9
Gross profit 634.3 597.8 36.5
Gross profit margin 33.4% 32.2%
Total operating expenses (408.2) (373.9)* (34.3)
Total operating expenses as a percentage of revenue 21.5% 20.2% *
Operating profit 226.1 223.9 * 2.2
Operating profit margin 11.9% 12.0% *
Net finance income 1.4 1.7 (0.3)
Profit before taxation 227.5 225.6 * 1.9
Taxation (24.2) (24.1) (0.1)
Effective tax rate 10.6% 10.7% *
Profit for the year and attributable to shareholders of the Company 203.3 201.5 * 1.8
Net profit margin 10.7% 10.8% *
* Restated upon the adoption of IAS 19 (Revised 2011) as described in note B to the financial statements
Revenue
Group revenue for the year ended 31 March 2014 rose by 2.2% to US$1,898.9 million
over the previous financial year. The increase in revenue was largely driven by higher
sales in North America, Europe and Asia Pacific, which offset a decrease in revenue in
other regions.
2014 2013 Increase/(decrease)
US$ million % US$ million % US$ million %
North America 950.7 50.1% 933.4 50.2% 17.3 1.9%
Europe 791.8 41.7% 769.9 41.4% 21.9 2.8%
Asia Pacific 108.9 5.7% 99.8 5.4% 9.1 9.1%
Other regions 47.5 2.5% 54.9 3.0% (7.4) (13.5%)
1,898.9 100.0% 1,858.0 100.0% 40.9 2.2%
Gross Profit/Margin
Gross profit for the financial year 2014
was US$634.3 million, an increase of
US$36.5 million or 6.1% compared to
the US$597.8 million recorded in the
previous financial year. Gross profit
margin for the year rose from 32.2% to
33.4%. The decline in material costs offset
higher labour costs and manufacturing
overheads arising from the increase in
wages and production capacity, as well
as Renminbi appreciation during the
financial year 2014.
Operating Profit/Margin
Operating profit for the year ended
31 March 2014 was US$226.1 million,
an increase of US$2.2 million or 1.0%
over the previous financial year. The
improvement in operating profit was
mainly due to the increase in gross profit
and gross profit margin, which offset the
increase in total operating expenses.
Operating profit margin, however,
declined from 12.0% to 11.9%. It was
mainly due to the increase in total
operating expenses as a percentage
of Group revenue, which offset the
improvement in gross profit margin. The
ratio of EBITDA to revenue was 13.6%,
same as the last financial year.
Total operating expenses were US$408.2
million, an increase of 9.2% over the last
financial year. Correspondingly, total
operating expenses as a percentage of
Group revenue rose from 20.2% to 21.5%.
US$ million %
224.1 218.7209.5
223.9* 226.1
0
50
100
150
200
250
0
4
8
12
16
20
14.6
10 11
12.8
12
11.7
13
12.0*
14
11.9
Operating profit (US$ million)
Operating profit margin (%)
* Restated
7VTech Holdings Limited Annual Report 2014
Management Discussion and Analysis Financial Review

Dividend per Share in Last 5 Years
Basic Earnings per Share in Last 5 Years
Group R&D Expenditure in Last 5 Years
Selling and distribution costs rose by
10.2% from US$260.0 million in the
previous financial year to US$286.4
million in the financial year 2014. The
increase was mainly attributable to the
increased spending on advertising and
promotional activities by the Group,
especially for the children’s educational
tablets in response to the keen market
competition during the financial year.
As a percentage of Group revenue,
selling and distribution costs increased
from 14.0% to 15.1%.
Administrative and other operating
expenses increased from US$56.8 million
to US$63.8 million over the same period
last year, which was mainly due to the
increase in employee related costs. An
exchange loss of US$0.4 million arising
from the Group’s global operations in
the ordinary course of business was
also recorded in the financial year 2014,
which contrasted with an exchange gain
of US$0.4 million in the last financial
year. Administrative and other operating
expenses as a percentage of Group
revenue increased from 3.1% to 3.3%.
During the financial year 2014, the
research and development expense was
US$58.0 million, an increase of 1.6% over
the previous financial year. Research and
development expense as a percentage
of Group revenue was 3.1%, same as the
last financial year.
Profit Attributable to
Shareholders and Earnings
per Share
Profit attributable to shareholders of the
Company for the year ended 31 March
2014 was US$203.3 million, an increase
of US$1.8 million as compared to the last
financial year. Net profit margin, however,
decreased from 10.8% to 10.7%.
Taxation charges increased from
US$24.1 million in the last financial year
to US$24.2 million in the financial year
2014. The effective tax rate decreased
from 10.7% to 10.6%.
Basic earnings per share for the year
ended 31 March 2014 were US81.1 cents
as compared to US80.6 cents in the
previous financial year.
Dividends
During the financial year 2014, the Group declared and paid an interim dividend
of US16.0 cents per share, which aggregated to US$40.1 million. The Directors
have proposed a final dividend of US64.0 cents per share, which is estimated to be
US$160.6 million.
2014 2013
US cents US cents
Dividend per share
Interim 16.0 16.0
Final* 64.0 64.0
Total 80.0 80.0
* Final dividend proposed after the balance sheet date
US$ million
56.8 56.8 57.2 57.1 58.0
10 11 12 13 140
10
20
30
40
50
60
70
US cents
83.7 81.5 77.0 80.6* 81.1
10 11 12 13 140
20
40
60
80
100
US cents
78.0 78.0 76.0 80.0 80.0
10 11 12 13 140
20
40
60
80
100
* Restated
8 VTech Holdings Limited Annual Report 2014
Management Discussion and Analysis Financial Review

Deposits and Cash in Last 5 Years (As at 31 March)
Liquidity and Financial
Resources
Shareholders’ funds as at 31 March 2014
were US$575.6 million, an increase of
2.0% from US$564.3 million in the last
financial year. Shareholders’ funds per
share increased by 1.8% from US$2.25 to
US$2.29.
The Group had no borrowings as at
31 March 2013 and 31 March 2014.
The Group’s financial resources remain
strong. As at 31 March 2014, deposits
and cash increased from US$308.6
million to US$322.9 million, an increase
of 4.6% compared with the last financial
year-end-date. It was mainly due to
the increase in cash generated from
operations compared with the same
period last year. The Group has adequate
liquidity to meet its current and future
working capital requirements.
Analysis of Cash Flow from Operations
2014 2013
(Restated)
Change
US$ million US$ million US$ million
Operating profit 226.1 223.9 2.2
Depreciation and amortisation 31.3 29.3 2.0
EBITDA 257.4 253.2 4.2
Gain on disposal of tangible assets (0.1) (0.1) –
Working capital change (0.1) (38.8) 38.7
Cash generated from operations 257.2 214.3 42.9
The Group’s cash generated from operations for the year ended 31 March 2014 was
US$257.2 million, as compared to US$214.3 million in the previous financial year. The
increase was mainly attributable to the increase in EBITDA in the financial year 2014
and the lower working capital investment compared with the previous financial year.
Working Capital Change
Balance as at
31 March 2013
(Restated)
Hedging
and others
Working capital
change per
cash flow
Balance as at
31 March
2014
US$ million US$ million US$ million US$ million
Stocks 276.9 – (11.0) 265.9
Trade debtors 224.9 – (16.3) 208.6
Other debtors, deposits
and prepayments 32.2 (2.4) (2.6) 27.2
Trade creditors (176.2) – 35.4 (140.8)
Other creditors
and accruals (154.4) (4.2) (5.0) (163.6)
Provisions (28.2) – 0.3 (27.9)
Net obligations on
defined benefit
scheme (6.5) 5.2 (0.7) (2.0)
Total working capital 168.7 (1.4) 0.1 167.4
Stocks as of 31 March 2014 were US$265.9 million, decreased from US$276.9 million
as of 31 March 2013. The turnover days fell from 90 days to 87 days. The reduction
resulted from management’s effort to improve stock management.
As at 31 March 2014 and 2013
All figures are in US$ million unless stated otherwise 2014 2013
Stocks 265.9 276.9
Average stocks as a percentage of Group revenue 14.3% 13.9%
Turnover days 87 days 90 days
US$ million382.6
333.1 326.5
308.6322.9
10 11 12 13 140
50
100
150
200
250
300
350
400
9VTech Holdings Limited Annual Report 2014

Trade debtors as of 31 March 2014 were US$208.6 million, decreased from US$224.9
million as of 31 March 2013. Debtor turnover days improved from 62 days to 54 days.
The decrease in the trade debtor balance as at 31 March 2014 was mainly due to
continuous efforts to tighten debt collection and credit exposure management. The
amounts with overdue balances greater than 30 days accounted for 1.0% of the gross
trade debtors as of 31 March 2014.
As at 31 March 2014 and 2013
All figures are in US$ million unless stated otherwise 2014 2013
Trade debtors 208.6 224.9
Average trade debtors as a percentage of Group revenue 11.4% 11.7%
Turnover days 54 days 62 days
Other debtors, deposits and prepayments as of 31 March 2014 were US$27.2
million, compared to US$32.2 million as of 31 March 2013. The decline was mainly
attributable to the decrease in prepayments and the reversal of fair value gains on
forward foreign exchange contracts upon exercise.
Trade creditors as of 31 March 2014 were US$140.8 million, as compared to
US$176.2 million as of 31 March 2013. Creditor turnover days decreased from 85 days
to 78 days.
As at 31 March 2014 and 2013
All figures are in US$ million unless stated otherwise 2014 2013
Trade creditors 140.8 176.2
Turnover days 78 days 85 days
Other creditors and accruals as of
31 March 2014 were US$163.6 million,
increased from US$154.4 million as of
31 March 2013. The increase was largely
attributable to the increase in accruals
of advertising expenses and royalties, as
well as the increase in fair value losses on
forward foreign exchange contracts in
the financial year 2014.
Provisions as of 31 March 2014 were
US$27.9 million, as compared to US$28.2
million as of 31 March 2013.
Net obligations on defined benefit
scheme as of 31 March 2014 were
US$2.0 million, as compared to US$6.5
million as of 31 March 2013. The
decrease was mainly due to the
re-measurement of net liability of
defined benefit scheme.
Treasury Policies
The Group’s treasury policies are
designed to mitigate the impact
of fluctuations in foreign currency
exchange rates arising from the Group’s
global operations and to minimise
the Group’s financial risks. The Group
principally uses forward foreign
exchange contracts as appropriate for
risk management purposes only, for
hedging foreign exchange transactions
and for managing the Group’s assets
and liabilities. It is the Group’s policy not
to enter into derivative transactions for
speculative purposes.
Capital Expenditure
For the year ended 31 March 2014,
the Group invested US$30.1 million
in the purchase of tangible assets
including plant and machinery,
equipment, computer systems, as well
as the improvement of manufacturing
working environment. All of these
capital expenditures were financed from
internal resources.
Capital Commitments and
Contingencies
In the financial year 2015, the Group will
incur capital expenditure of US$34.7
million for ongoing business operations.
All of these capital expenditures will be
financed from internal resources.
As of the financial year end date, the
Group had no material contingencies.
10 VTech Holdings Limited Annual Report 2014
Management Discussion and Analysis Financial Review

NORTH AMERICAAs % of Group RevenueRevenue in North America in Last 5 Years
Management Discussion and Analysis Review of Operations
Group revenue in North America increased by 1.9% to
US$950.7 million in the financial year 2014, as higher revenue
from TEL products and CMS offset lower revenue from ELPs.
North America remained VTech’s largest market, accounting for
50.1% of Group revenue.
ELPs revenue in North America declined by 1.1% to
US$358.1 million, mainly because of lower sales of platform
products. InnoTab, the Group’s educational tablet for children,
has faced increasing competition in the US market. Sales of
MobiGo® 2 were lower due to the popularity of tablets, while
V.Reader® reached the end of its product life cycle.
Standalone products posted good growth, driven by strong
sell-through of Go! Go! Smart Wheels, infant products and
Switch & Go Dinos. The full launch of Go! Go! Smart Wheels
in all major retailers in the US boosted sales, following only
a limited launch in the financial year 2013. Its vehicles, Train
Station and Airport playsets were the best performers. The
range was cited in a number of top awards, including Walmart’s
Top 20 Toys “Chosen by Kids” and Amazon.com’s Holiday Toy
List. In infant products, Sit-to-Stand Learning Walker™ and
Alphabet Activity Cube™ performed especially well. Growth
in Switch & Go Dinos was driven by the introduction of new
models.
Revenue from TEL products in North America rose by 2.4% to
US$398.6 million, driven by higher sales of residential phones,
commercial phones and other telecommunication products.
Sales of residential phones grew as VTech gained further
market share as a result of the continuing consolidation of
brands in the market. This helped the Group to maintain its
number one position in the US residential phones market6.
6 Source: MarketWise Consumer Insights, LLC
Sales of commercial phones and other telecommunication
products also increased, as the existing product lines continued
to perform well, while the Group expanded its offering by
launching several new products.
For commercial phones and other telecommunication
products, positive momentum continued for the SMB phones,
SynJ and Syn248®. Higher sales were recorded for baby
monitors, as the Group expanded its distribution channels.
Hotel phones also saw growth, with VTech expanding its
customer base to an increasing number of the world’s leading
hotel chains. CareLine™ is VTech’s home safety telephone
system designed for seniors. This product line achieved
increased sales and received many favourable online reviews
during the financial year 2014.
The launch of ErisStation, the Group’s first conference phone,
in March 2014 was very successful. Featuring four DECT 6.0
microphones with Orbitlink Wireless Technology™, ErisStation
makes conversations more comfortable by letting meeting
participants spread out while allowing all parties to enjoy
interference-free, high-quality conference calls.
CMS revenue in North America increased by 6.5% to
US$194.0 million. Sales of professional audio equipment,
solid-state lighting, home appliances and communication
products were higher, offsetting lower sales of industrial
products. In professional audio equipment, the Group added
a new account and secured more orders from an existing
customer as it expanded its product portfolio to target a new
market segment. Solid-state lighting posted solid growth,
as the new client ramped up orders. Sales of home appliances
and communication products also increased, supported by
the customer’s new product launch and more orders of VoIP
(Voice over Internet Protocol) phones.
US$ million
10
872.6
11
874.9
12
903.5933.4 950.7
13 140
200
400
600
800
1,000
50.2%
FY2013 FY2014
50.1%
11VTech Holdings Limited Annual Report 2014
EUROPE
As % of Group RevenueRevenue in Europe in Last 5 Years
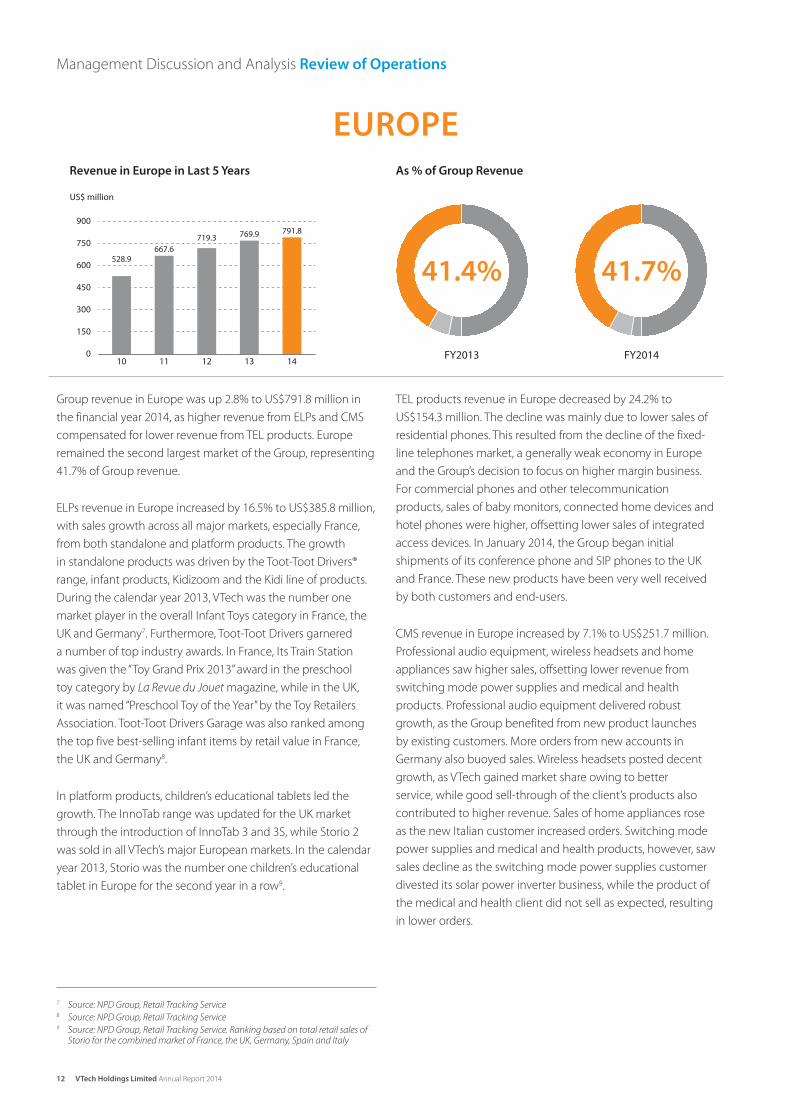
Group revenue in Europe was up 2.8% to US$791.8 million in
the financial year 2014, as higher revenue from ELPs and CMS
compensated for lower revenue from TEL products. Europe
remained the second largest market of the Group, representing
41.7% of Group revenue.
ELPs revenue in Europe increased by 16.5% to US$385.8 million,
with sales growth across all major markets, especially France,
from both standalone and platform products. The growth
in standalone products was driven by the Toot-Toot Drivers®
range, infant products, Kidizoom and the Kidi line of products.
During the calendar year 2013, VTech was the number one
market player in the overall Infant Toys category in France, the
UK and Germany7. Furthermore, Toot-Toot Drivers garnered
a number of top industry awards. In France, Its Train Station
was given the “Toy Grand Prix 2013” award in the preschool
toy category by La Revue du Jouet magazine, while in the UK,
it was named “Preschool Toy of the Year” by the Toy Retailers
Association. Toot-Toot Drivers Garage was also ranked among
the top five best-selling infant items by retail value in France,
the UK and Germany8.
In platform products, children’s educational tablets led the
growth. The InnoTab range was updated for the UK market
through the introduction of InnoTab 3 and 3S, while Storio 2
was sold in all VTech’s major European markets. In the calendar
year 2013, Storio was the number one children’s educational
tablet in Europe for the second year in a row9.
7 Source: NPD Group, Retail Tracking Service8 Source: NPD Group, Retail Tracking Service9 Source: NPD Group, Retail Tracking Service. Ranking based on total retail sales of
Storio for the combined market of France, the UK, Germany, Spain and Italy
TEL products revenue in Europe decreased by 24.2% to
US$154.3 million. The decline was mainly due to lower sales of
residential phones. This resulted from the decline of the fixed-
line telephones market, a generally weak economy in Europe
and the Group’s decision to focus on higher margin business.
For commercial phones and other telecommunication
products, sales of baby monitors, connected home devices and
hotel phones were higher, offsetting lower sales of integrated
access devices. In January 2014, the Group began initial
shipments of its conference phone and SIP phones to the UK
and France. These new products have been very well received
by both customers and end-users.
CMS revenue in Europe increased by 7.1% to US$251.7 million.
Professional audio equipment, wireless headsets and home
appliances saw higher sales, offsetting lower revenue from
switching mode power supplies and medical and health
products. Professional audio equipment delivered robust
growth, as the Group benefited from new product launches
by existing customers. More orders from new accounts in
Germany also buoyed sales. Wireless headsets posted decent
growth, as VTech gained market share owing to better
service, while good sell-through of the client’s products also
contributed to higher revenue. Sales of home appliances rose
as the new Italian customer increased orders. Switching mode
power supplies and medical and health products, however, saw
sales decline as the switching mode power supplies customer
divested its solar power inverter business, while the product of
the medical and health client did not sell as expected, resulting
in lower orders.
US$ million
10
528.9
11
667.6
12
719.3 769.9 791.8
13 140
150
300
600
450
900
750
41.4%
FY2013 FY2014
41.7%
12 VTech Holdings Limited Annual Report 2014
Management Discussion and Analysis Review of Operations

As % of Group RevenueRevenue in Asia Pacific in Last 5 Years
Revenue in Other Regions in Last 5 Years As % of Group Revenue
ASIA PACIFIC
OTHER REGIONS
Group revenue in Asia Pacific increased by 9.1% to US$108.9 million
during the financial year 2014, driven by higher sales among all
product lines. The region represented 5.7% of Group revenue.
ELPs revenue in Asia Pacific increased by 9.2% to
US$21.3 million. Strong growth was seen in China, boosted by
increasing revenues from traditional and online sales channels.
Higher sales were also recorded in Korea, as the Group made
some inroads in the market. Sales in Australia, however,
registered a decline during the financial year 2014.
Revenue from TEL products in the region grew by 8.7% to
US$41.1 million, mainly due to higher sales in Australia, China
and Japan. In Australia, sales rose as VTech increased its share of
the cordless phone market. The Group also started selling baby
monitors to Australian customers, adding to the growth in this
market. Sales in China climbed, as the Group increased market
penetration by introducing more VTech and AT&T branded
products. In Japan, sales growth was driven by the addition of
a new ODM (Original Design Manufacturing) customer.
CMS revenue in Asia Pacific rose by 9.4% to US$46.5 million.
Japan posted higher sales, driven by more orders for marine
radio and medical and health products. Australia also recorded
sales growth, with sales increases in professional audio
equipment, home appliances and medical and health products.
Sales in China and Korea, however, were lower as orders for
solid-state lighting and Bluetooth speakerphones declined.
Other Regions comprise Latin America, the Middle East and
Africa. Group revenue in Other Regions declined by 13.5% to
US$47.5 million, mainly due to lower sales of TEL products and
ELPs. These regions accounted for 2.5% of Group revenue.
ELPs revenue in Other Regions dropped 28.0% to US$13.4 million,
with all regions seeing sales declines, especially Latin America.
Revenue from TEL products in Other Regions fell 7.6% to
US$32.9 million, with Latin America and the Middle East
recording sales decreases during the financial year 2014.
CMS revenue in Other Regions was US$1.2 million in the
financial year 2014, as compared to US$0.7 million in the
financial year 2013.
US$ million
10
81.5
11
98.2
12
94.199.8
108.9
13 140
30
60
90
120
5.4%
FY2013 FY2014
5.7%
US$ million
10
49.3
11
72.1
12
67.6
54.9
47.5
13 140
20
40
60
80
3.0%
FY2013 FY2014
2.5%
13VTech Holdings Limited Annual Report 2014

ELECTRONIC LEARNING PRODUCTS
VTech’s strategy for ELPs is to apply the latest proven technology to innovative
educational toys that help kids learn and develop through fun and smart play.
These key figures testify to the success of the Group’s strategy
As % of Group Revenue
ELPs Revenue by Region
All figures are in US$ unless stated otherwise
ELPs Revenue in Last 5 Years
global player in ELPs
No.1player in infant toys in France, the UK and Germany
No.1
Asia Pacific
Other RegionsNorth America
358.1(-1.1% year-on-year)
million
385.8(+16.5% year-on-year)
million
21.3(+9.2% year-on-year)
million
13.4(-28.0% year-on-year)
million
Europe
US$ million
10
508.7
11
594.9
12
657.1
13
731.3
14
778.6
0
200
400
600
800
39.3%
FY2013 FY2014
41.0%
selling VTech ELPs in 24 languages
products shipped in FY2014
84 countries46 million
14 VTech Holdings Limited Annual Report 2014
Products and Services Overview
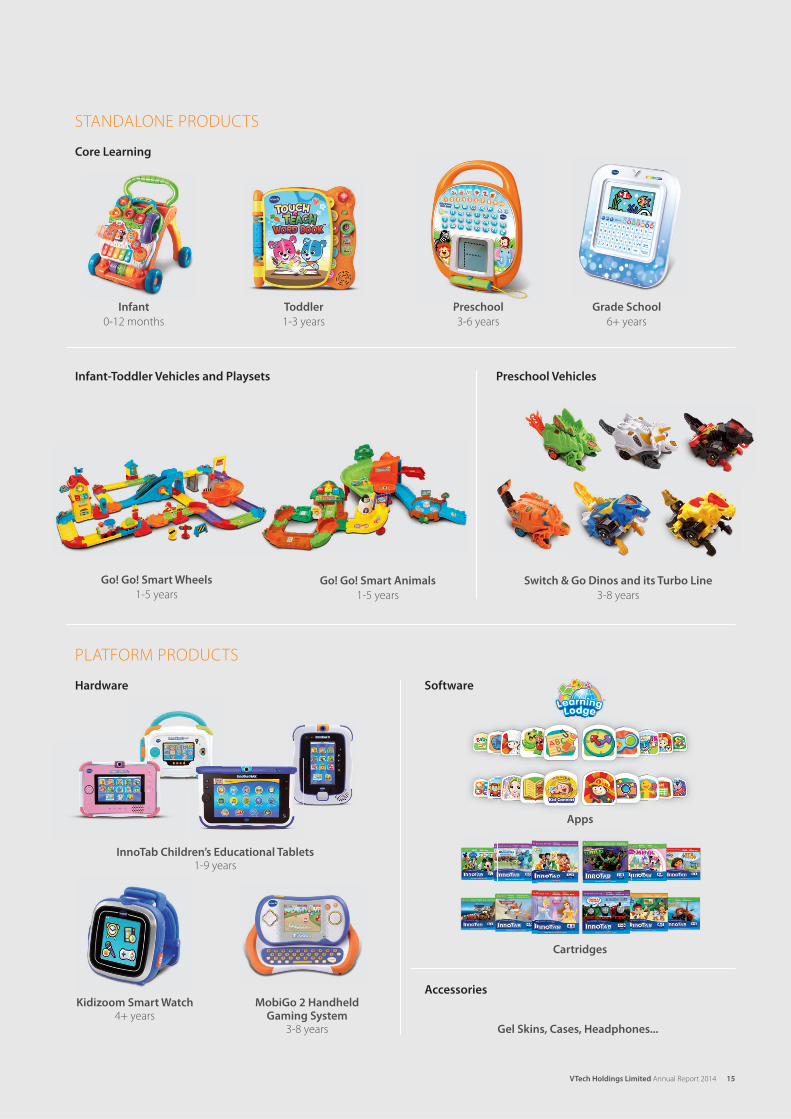
Infant-Toddler Vehicles and Playsets Preschool Vehicles
PLATFORM PRODUCTS
Core Learning
STANDALONE PRODUCTS
Hardware Software
Go! Go! Smart Wheels
1-5 years
InnoTab Children’s Educational Tablets1-9 years
MobiGo 2 Handheld Gaming System
3-8 years
Kidizoom Smart Watch4+ years
Go! Go! Smart Animals
1-5 years
Switch & Go Dinos and its Turbo Line
3-8 years
Infant
0-12 months
Preschool
3-6 years
Toddler
1-3 years
Grade School
6+ years
Preschool
Gel Skins, Cases, Headphones...
Accessories
Apps
Cartridges
15VTech Holdings Limited Annual Report 2014
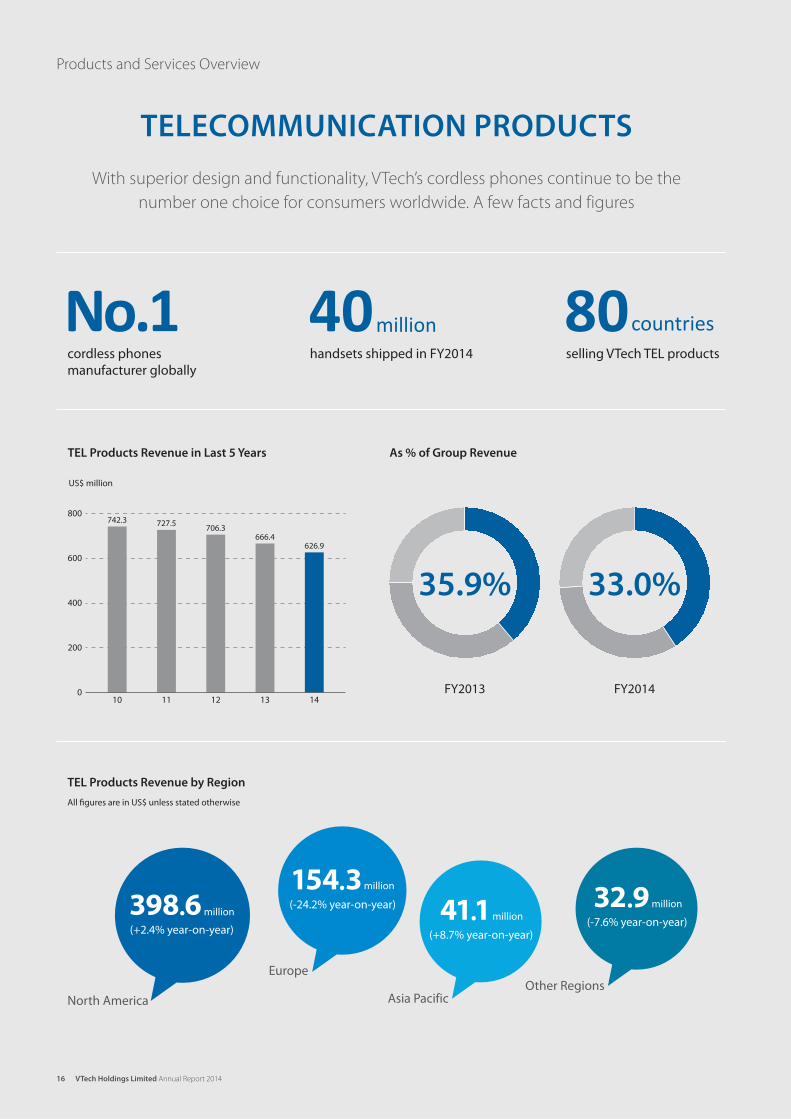
With superior design and functionality, VTech’s cordless phones continue to be the
number one choice for consumers worldwide. A few facts and figures
cordless phones manufacturer globally
No.1
TEL Products Revenue by Region
All figures are in US$ unless stated otherwise
TELECOMMUNICATION PRODUCTS
As % of Group RevenueTEL Products Revenue in Last 5 Years
North America
398.6(+2.4% year-on-year)
million
Europe
154.3(-24.2% year-on-year)
million
Asia Pacific
41.1(+8.7% year-on-year)
million
Other Regions
32.9(-7.6% year-on-year)
million
US$ million
10
742.3
11
727.5
12
706.3
13
666.4
14
626.9
0
200
400
600
800
35.9%
FY2013 FY2014
33.0%
selling VTech TEL productshandsets shipped in FY2014
40 80million countries
16 VTech Holdings Limited Annual Report 2014
Products and Services Overview

COMMERCIAL PHONES
OTHER TELECOMMUNICATION PRODUCTS
ErisStation
Conference phone with
wireless microphones
ErisTerminalTM
SIP deskset
SMB Phone
Hotel Phone Cordless Headset
Safe&Sound® Baby Monitor
Video and audio baby monitor
Integrated Access Device
A 3-in-1 device combining
VDSL modem, wireless router
and CAT-iq cordless handset
Connected Home Device
RESIDENTIAL PHONES
CareLine
Senior phone
17VTech Holdings Limited Annual Report 2014
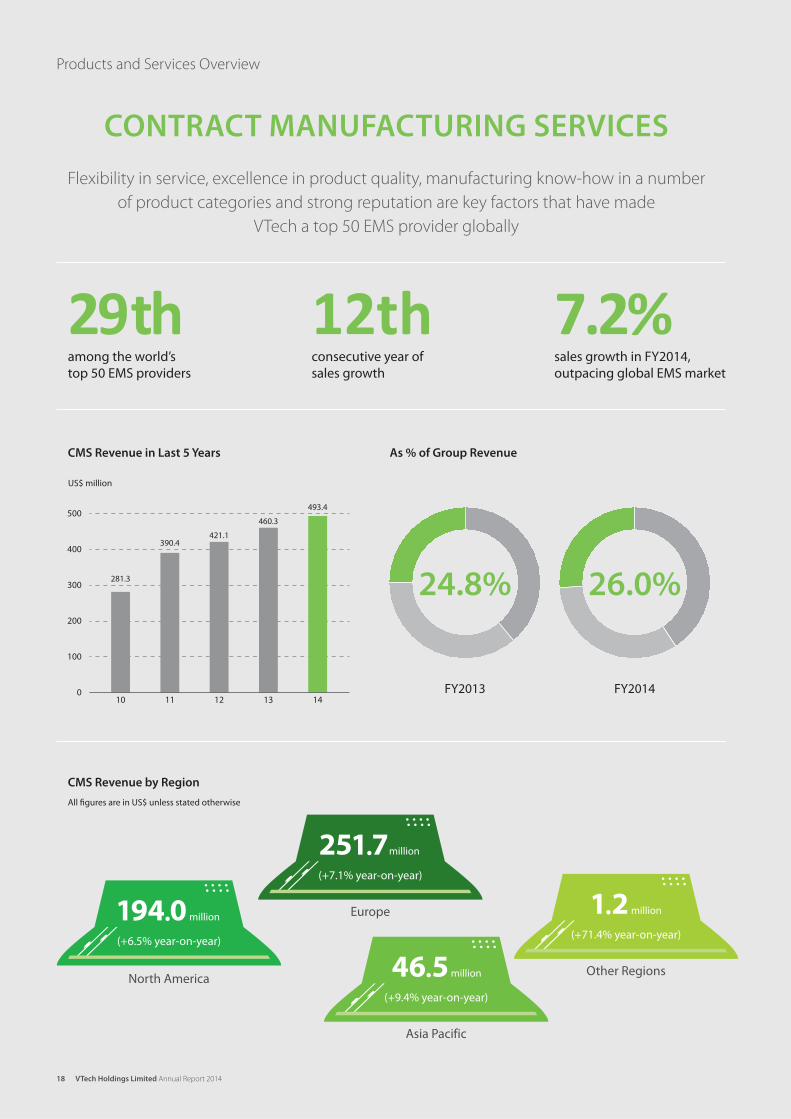
Flexibility in service, excellence in product quality, manufacturing know-how in a number
of product categories and strong reputation are key factors that have made
VTech a top 50 EMS provider globally
CONTRACT MANUFACTURING SERVICES
sales growth in FY2014, outpacing global EMS market
consecutive year of sales growth
29th 12th 7.2%among the world’s top 50 EMS providers
CMS Revenue by Region
All figures are in US$ unless stated otherwise
North America
As % of Group RevenueCMS Revenue in Last 5 Years
194.0(+6.5% year-on-year)
million
251.7(+7.1% year-on-year)
million
46.5(+9.4% year-on-year)
million
1.2(+71.4% year-on-year)
millionEurope
Asia Pacific
Other Regions
0
100
200
300
400
500
US$ million
10
281.3
11
390.4
12
421.1
13
460.3
14
493.4
24.8%
FY2013 FY2014
26.0%
18 VTech Holdings Limited Annual Report 2014
Products and Services Overview

MAIN PRODUCT CATEGORIES
MANUFACTURING EXCELLENCE
Professional Audio Equipment
Switching Mode Power Supplies
Wireless Products
Solid-State Lighting
19VTech Holdings Limited Annual Report 2014

The Group’s First
Conference Phone
The World No. 1
A World’s Top 50 EMS Provider
No. 1 in Infant Toys Category
VTech was the number one
player in the overall Infant
Toys category in France,
the UK and Germany in the
calendar year 201311.
Vendor of the Year
VTech Electronics North America, L.L.C.
was named “Vendor of the Year” by
Toys“R”Us in the US for the third year
in a row.
VTech Communications
Limited was ranked 29th
among the “Top 50 EMS
Providers in 2013” by
Manufacturing Market Insider
magazine.
For the fifth consecutive year,
VTech maintained its number
one position as manufacturer in
the global consumer cordless
telephony market in the
calendar year 201310.
In January 2014, VTech introduced ErisStation, its first
conference phone with wireless microphones, to the
European markets.
The Group achieved record
revenue for the fourth
consecutive year in the
financial year 2014.
Record Revenue
10 Source: MZA Ltd, 201411 Source: NPD Group, Retail Tracking Service
20 VTech Holdings Limited Annual Report 2014
Year in Review

Award-Winning Toys
Best Supplier
In the calendar year 2013, Storio was the number one
children’s educational tablet in Europe for the second
year in a row12.
Storio – No. 1 Children’s
Educational Tablet in EuropeVTech Communications
Limited received the
“Best Supplier” award
from customers in
wireless products and
professional audio
equipment.
Vendor of the Year
“Caring Company”
Recognition
VTech’s contribution to the Hong Kong
community was recognised by the Hong
Kong Council of Social Service and the
Group was named a “Caring Company” for
the sixth consecutive year.
In the financial year 2014, VTech received over 45
accolades from esteemed toy and parenting industry
experts, toy councils and retailers globally. This testifies
the Group’s success in developing innovative electronic
learning toys for children that are fun and educational.
The Safe&Sound Full Colour Video and
Audio Monitor VM321 was named a 2013
National Parenting Publications Award
(NAPPA) Silver winner, recognised for its
value and feature-packed, high-resolution
and full-motion capabilities.
Award-Winning Baby Monitor
12 Source: NPD Group, Retail Tracking Service. Ranking based on total retail sales of Storio for the combined market of France, the UK, Germany, Spain and Italy
VTech Technologies Canada
Limited was named “Vendor of
the Year – Best Service Levels”
by Staples, Inc. for the second
year in a row.
21VTech Holdings Limited Annual Report 2014

Since its inception in 1976, VTech has grown into the global
leader in electronic learning products from infancy to
preschool13, the world’s largest manufacturer of cordless
phones14, and a leading electronic manufacturing services
provider. As a global company and part of the communities
in which we operate, VTech recognises that we have to step
up our efforts to achieve sustainable development, with a
vision to design, manufacture and supply innovative and
high quality products in a manner that minimises any impact
on the environment, while creating sustainable value for our
stakeholders and the communities.
VTech published its first Sustainability Report for the financial
year 2013 (FY2013), included as a section in our Annual Report
2013. The purpose of the report is to inform our stakeholders
of our ongoing activities to conserve energy, protect the
environment and demonstrate the principles behind our
sustainability strategies.
With increasing interests of our stakeholders in our sustainable
development, we published our Sustainability Report for the
financial year 2014 (FY2014) to comprehensively introduce our
sustainability strategies and initiatives toward the societies and
environment in which we operate, and follow the Core option
of the Global Reporting Initiative Sustainability Reporting G4
Guideline (GRI G4 Guideline) and its principles to define the
report content.
We are pleased to announce that passing through the
FY2014, our approach and initiatives have become more
comprehensive and are generating meaningful benefits for our
stakeholders. Some of our major achievements are highlighted
in the Sustainability Report 2014, with a summary of the
activities and targets to be followed moving forward.
Full details of the VTech Sustainability Report 2014 are available
on www.vtech.com/en/about-vtech/sustainability.
13 Source: MarketWise Consumer Insights, LLC and Retail Tracking Service of NPD Group. Ranking based on 2012 and 2013 total estimated annual retail sales in the combined toy categories of infant electronic learning and preschool electronic learning
14 Source: MZA Ltd, 2014
VTech Risk Management and Sustainability Committee (RMSC)
Sustainability Sub-Committees
Sustainable Product Design
Design for the environment – incorporate
environmental solutions into product design.
Reduce the carbon footprint of the products
through choice of materials and eco design.
Customer Health
and Safety
Ensure product is of good
quality and compliant with
the highest safety standard.
Sustainable Manufacturing Process
Maximise resource efficiency (energy, water and
material used) throughout all VTech activities.
Minimise pollutant and GHG emissions throughout
manufacturing process and daily operation.
Sustainable Logistics
Improve efficiency and
reduce carbon emission of
the logistic chain.
Labour Practices and Decent Work Environment
Increase the internal capability of our labour force, and continue to provide a high standard of
working and living environment.
Promote equal opportunity, and ensure no discrimination, no harassment or abuse of employees.
Sustainable Supplier Management
Systematic supplier management procedure to ensure our entire production process
is of high quality, socially responsible and minimise the impact on the environment.
Social Investment, Donation and Philanthropy
Use resources to support the community.
Product Responsibility & Innovation
Environmental Protection
Community Investment
Workplace Quality
Sustainable Operating Practices
22 VTech Holdings Limited Annual Report 2014
Sustainability

Sustainability Strategies and Activities
Product Responsibility and Innovation
Product Design is the first stage of our
product life cycle and is where the greatest
sustainability gains can be achieved. We have
cross-functional teams to ensure that our products are of the
highest quality and are designed to minimise resource usage
throughout their life cycle.
VTech is committed to bringing high quality and safe products
to consumers around the world. All our products comply with
the highest levels of safety standards specified in the relevant
countries. Our manufacturing facilities are also certified with
Quality Management System: ISO9001. In addition, we have
strict quality and safety assurance programmes in place to
warrant that all our products meet the required specification
and are free from defects in both materials and workmanship at
the time of delivery.
While ensuring that our products are designed to be
intrinsically safe and have minimum impact on the
environment, we are also continually exploring opportunities,
using our expertise to provide products that enhance the well-
being of our customers and also benefit the society generally.
Our baby monitors help to reduce the stress of parenting,
our home safety telephone system helps senior citizens to
live independently, and our DECT cordless phones with low
radiation and less power consumption features compared
with the conventional models also help reduce impacts on
the environment.
VTech also uses its global leadership position in electronic
learning toys to engage children with sustainable growth, help
them to inspire their creativity and develop valuable skills from
the early age of their educational development. InnoTab comes
with fun and useful apps, and InnoTab users can download
more educational games, e-books, music, and videos from the
Learning Lodge website (www.VTechkids.com/download),
which have been designed for each child’s unique stage of
development. Our Go! Go! Smart Wheels with multi-vehicles
set, featuring a family car, truck, van, police car, ambulance and
fire truck, all interacting with different configured playsets, help
children understand the use of road transportation and the
different functions of vehicles in the community. The Go! Go!
Smart Wheels playsets can also be reconfigured with different
track shapes, or connected to other Go! Go! Smart Wheels
playsets to inspire the kids’ creativity.
Sustainability Management
At VTech, the Risk Management and Sustainability Committee
(RMSC) is chaired by Dr. Allan WONG Chi Yun with Dr. PANG
King Fai, Mr. Andy LEUNG Hon Kwong, and Mr. WONG Kai Man
as members – a mix of both executive and non-executive
directors. RMSC provides vision and strategic direction for
our sustainability activities to ensure that we stay on track
and in balance with the three sustainability dimensions of
economic, environmental and social impacts at all times.
The RMSC is also responsible for reviewing our sustainability
strategies and improvement activities, assessing how the
policies are implemented in achieving the sustainability goals
and targets, and monitoring the performance progress on a
biannual basis. We also have an escalation process in place
to ensure that any identified issues are dealt with at the
appropriate organisational level.
In order to ensure that our sustainability strategies are carried
out effectively and consistently throughout the organisation,
our RMSC has also formed the Sustainability Sub-Committees,
comprising key employees from the company’s different
product lines and the relevant departments. We have organised
our sustainability approach into five key areas across the
company (please refer to the table on page 22).
Stakeholder Engagement
Stakeholder engagement is the process through which we
stay connected with our customers, employees, shareholders,
investors, suppliers and the wider communities in which
we operate. We believe that the approach of stakeholder
engagement is integral to the development of our
sustainability strategy, and is a pre-requisite for our long-term
sustainable growth.
During the stakeholder engagement process, our
Sustainability Sub-Committees identified the broad topics
that the stakeholder groups are concerned with, and used a
materiality matrix to assess the material issues identified by
our stakeholders. An issue is classified as ‘material’ when it
substantially affects our long term commercial or operational
viability, with material impacts from economic, environmental
or social aspects. This matrix combines VTech’s approach
to identifying and assessing the material concerns of our
stakeholders, and our own materiality scoring methodology in
accordance with the principles outlined in GRI G4 Guideline.
23VTech Holdings Limited Annual Report 2014
Environmental Protection
In addition to making significant efforts
to design our products to minimise their
environmental impact, we also operate our
manufacturing processes and facilities in
the same manner. Our TEL and CMS manufacturing facilities
are certified with the ISO14001 standard for environmental
management, demonstrating that we are committed to
continuous improvement. Although our manufacturing
facilities are low risk in terms of pollution incidents compared
to many factories in China, we go beyond minimum
requirements. We are committed to the prevention of pollution
throughout our supply chain by engaging with our suppliers
and managing our logistics requirements to further minimise
our environmental impact and improve the energy efficiency of
our operations.
To achieve this, VTech has teams comprising individuals from
across the organisation. Our environmental policy is reviewed
annually to ensure that it is relevant and up to date.
Workplace Quality
VTech continually strives to provide a
supportive, pleasant and healthy workplace
for our staff, and to foster a caring
community in our working environment. We
care for our employees and recognise that having good staff
relations and a motivated workforce play a vital role in the
Group’s efficient operation.
All our manufacturing facilities are certified to meet the
international Occupational Health and Safety Standards (OHSAS
18001), with TEL and CMS manufacturing facilities also certified
with international standards of Social Accountability (SA8000),
and ELPs with International Council of Toy Industries standards
(ICTI CARE). All of these certifications demonstrate external
verification of our compliance with local laws and quality
working conditions. In order to ensure the effectiveness of
our workplace management system, we have cross-functional
teams and committees that meet quarterly, involving staff
representatives and managers, to assess risks, determine goals
and targets, and set up improvement projects and review
progress. The Sustainability Sub-Committees also undertake an
annual review and make improvement recommendations to
the functional team members.
At VTech, workplace safety is our number one priority. We are
committed to providing our employees with a healthy and
safe working environment. Our goal is to instill robust safety
measures at every level of the company and to ensure the
physical well-being of employees through the implementation
of our “Health and Safety” programme. Our activities in
operational health and safety resulted in a 33% reduction on
safety related incidents between FY2014 and FY2013.
VTech also recognises that a capable and motivated workforce
is integral to our success. We actively promote continuous
learning and provide different kinds of training programmes
for our employees, encouraging them to develop and advance
their careers in our company. These include general training
courses such as business skills and knowledge, effective
communication skills, foreign language and leadership courses.
Outdoor team building activities and off-site management
workshops are also arranged for the employees on specific
topics. Subsidised external professional courses are also
available for staff where the development needs match the
requirements of the company.
The key environmental impacts from VTech’s operations
relate to energy and water consumption, waste production
and logistics. We are committed to the following principles in
environmental protection:
Comply with all relevant environmental, legal and other
statutory requirements
Maintain an Environmental Management System in line with
the requirements of ISO14001:2004
Quantify and monitor the significant environmental impacts
of our activities, products and services, and set specific
targets for improvement in the respective areas and review
these annually
Integrate environmental objectives into our business
decisions in a cost effective manner
Require all staff to address environmental responsibilities
within normal operating procedures
Enhance awareness of environmental and resource
efficiency issues amongst our customers, staff and
stakeholders through improvement projects and
programmes in the respective areas
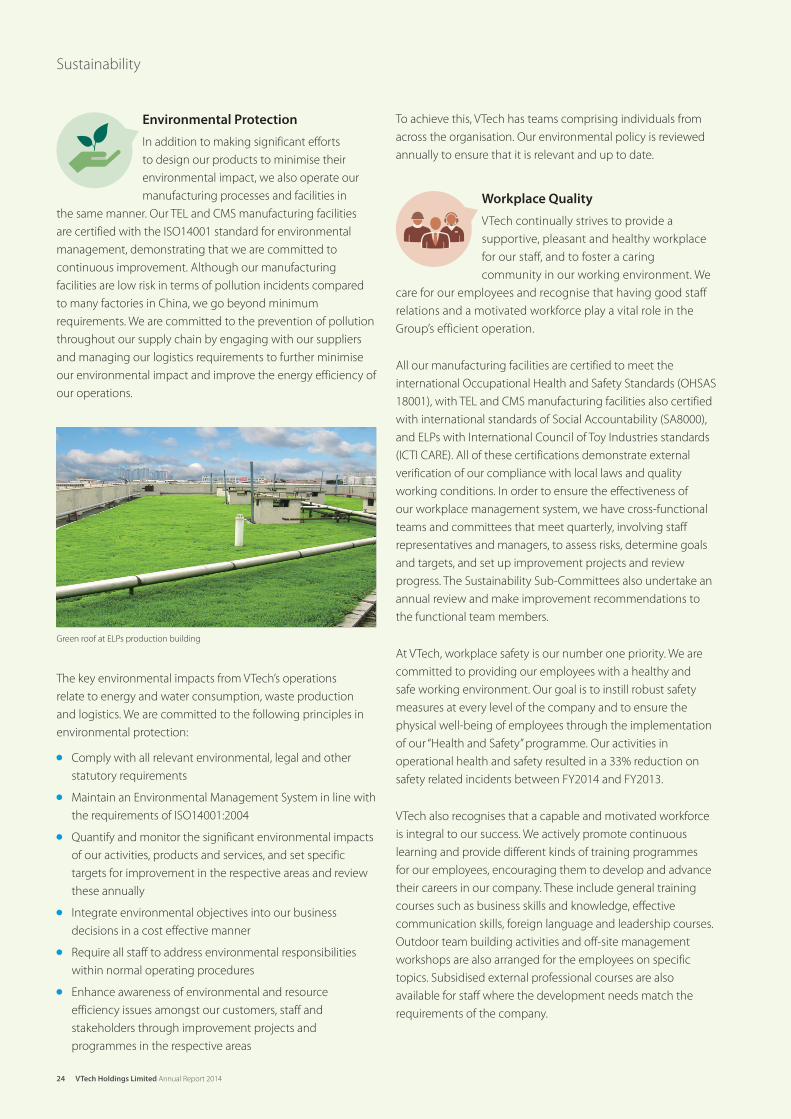
Green roof at ELPs production building
24 VTech Holdings Limited Annual Report 2014
Sustainability

New Territories Walk of Community Chest 2014
The majority of employees in our China manufacturing facilities
are from different provinces of the country. We recognise that
to make them feel at home and have a sense of belonging
while they are living in our dormitories are very important. In
FY2014, as part of our continuous improvement programme
for the living environment, we upgraded our dormitory
facilities and renovated the canteens to provide a relaxing
eating environment for our employees. To provide better
recreational experiences for our people, we also have installed
and upgraded a number of recreational facilities. These include
libraries, Internet rooms, sports facilities and a communal
vegetable garden. The latest employee survey results also
indicate an increase in overall satisfaction of our workers on the
living environment compared with the previous year.
Sustainable Operating Practices
VTech’s significant suppliers in the supply
chain include the manufacturers of PCBs
and other electronic components, of which
89% are located in China. Logistics providers
form the bulk of the latter part of the supply chain. We notice
that extreme events can delay the supply of materials and
given the nature of some of the major activities, may also pose
social and environmental risks. In order to mitigate the risks to
VTech and its customers, we have a supply chain management
system in place to monitor the supplier quality as well as their
environmental and ethical performance.
During FY2014, we continued to actively manage our supplier
base to mitigate our corporate risks, ensure continuity of
production, maintain quality supply and align the suppliers
with VTech’s core requirements. These include the examination
of their labour practices, health and safety systems,
environmental management and business ethical standards.
Each supplier is also given a risk category rating.
In FY2014, VTech audited 300 suppliers, a small number of
these were removed as approved suppliers due to their failures
to meet VTech’s required standards. We plan to carry on with
our audit schedule, and to extend the topics covered in order
to further improve the energy efficiency of our supplier base. By
using the knowledge gained internally, we believe that we can
further reduce the carbon footprint of the components in our
products, and help our suppliers reduce their environmental
impact while remaining cost competitive.
Community Investment
As a responsible corporate citizen, VTech uses
its resources to support the communities in
which it operates in a variety of ways, focusing
on innovation, helping people in need and
the general corporate philanthropy.
We also encourage our employees to participate in volunteering
events, which could provide an opportunity to connect them
outside the workplace, and inspire team-building experiences whilst
contributing to our local communities. In FY2014, VTech volunteers
continued to extend their care for our society, and we were awarded
as a “Caring Company” by The Hong Kong Council of Social Service
for the sixth consecutive year in recognition of our continuous
contributions to the Hong Kong community. Our Hong Kong and
China staff also joined the New Territories Walk of Community Chest
2014, and won the “Top Fund-raiser Award” with Third Runner-up
among the top five outstanding participating teams.
During FY2014, VTech Group made charitable and other
donations of over US$182,000 and contributed over 2,700
hours in volunteering community activities.
Living environment and recreational facilities
25VTech Holdings Limited Annual Report 2014
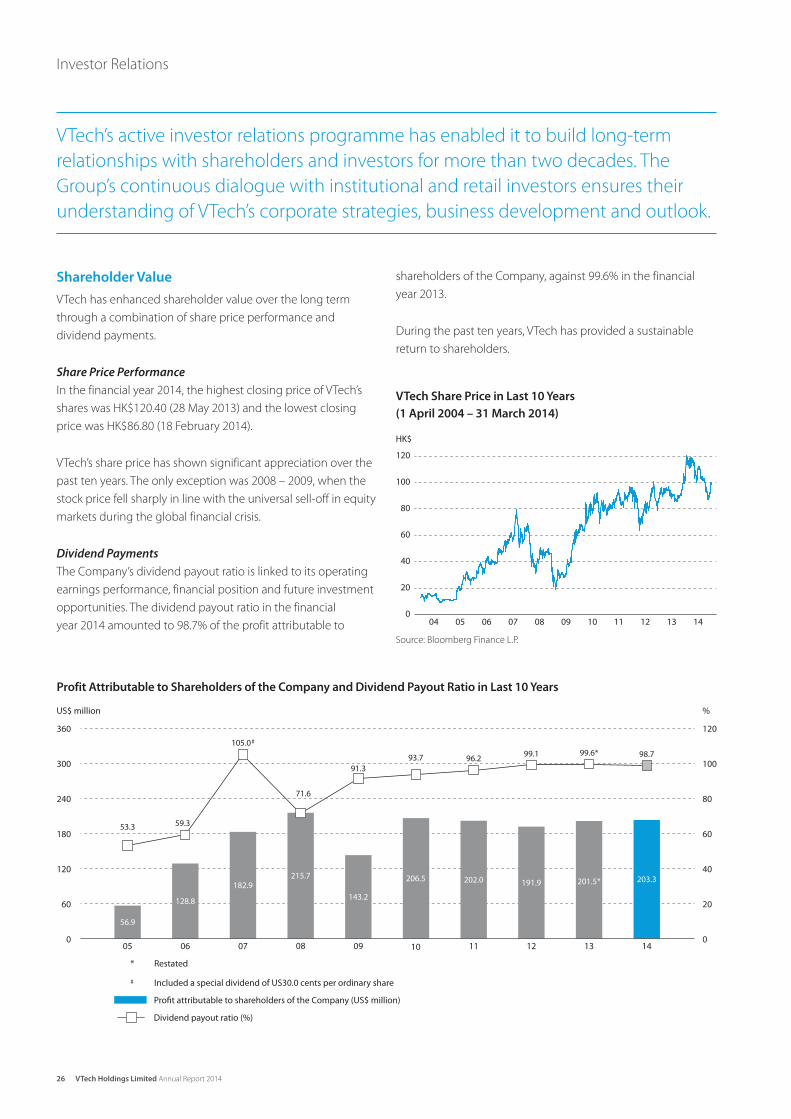
VTech Share Price in Last 10 Years
(1 April 2004 – 31 March 2014)
Source: Bloomberg Finance L.P.
Profit Attributable to Shareholders of the Company and Dividend Payout Ratio in Last 10 Years
Shareholder Value
VTech has enhanced shareholder value over the long term
through a combination of share price performance and
dividend payments.
Share Price Performance
In the financial year 2014, the highest closing price of VTech’s
shares was HK$120.40 (28 May 2013) and the lowest closing
price was HK$86.80 (18 February 2014).
VTech’s share price has shown significant appreciation over the
past ten years. The only exception was 2008 – 2009, when the
stock price fell sharply in line with the universal sell-off in equity
markets during the global financial crisis.
Dividend Payments
The Company’s dividend payout ratio is linked to its operating
earnings performance, financial position and future investment
opportunities. The dividend payout ratio in the financial
year 2014 amounted to 98.7% of the profit attributable to
VTech’s active investor relations programme has enabled it to build long-term
relationships with shareholders and investors for more than two decades. The
Group’s continuous dialogue with institutional and retail investors ensures their
understanding of VTech’s corporate strategies, business development and outlook.
shareholders of the Company, against 99.6% in the financial
year 2013.
During the past ten years, VTech has provided a sustainable
return to shareholders.
HK$
04 05 06 07 08 09 10 11 12 13 140
20
40
60
80
100
120
US$ million %
05 06 07 08 09 10 11 12 13 140
20
40
60
80
100
120
56.9
53.3
128.8
59.3
182.9
105.0#
215.7
71.6
143.2
91.3
206.5
93.7
202.0
96.2
191.9
99.1
201.5*
99.6*
203.3
98.7
0
60
120
180
240
300
360
* Restated
# Included a special dividend of US30.0 cents per ordinary share
Profit attributable to shareholders of the Company (US$ million)
Dividend payout ratio (%)
26 VTech Holdings Limited Annual Report 2014
Investor Relations
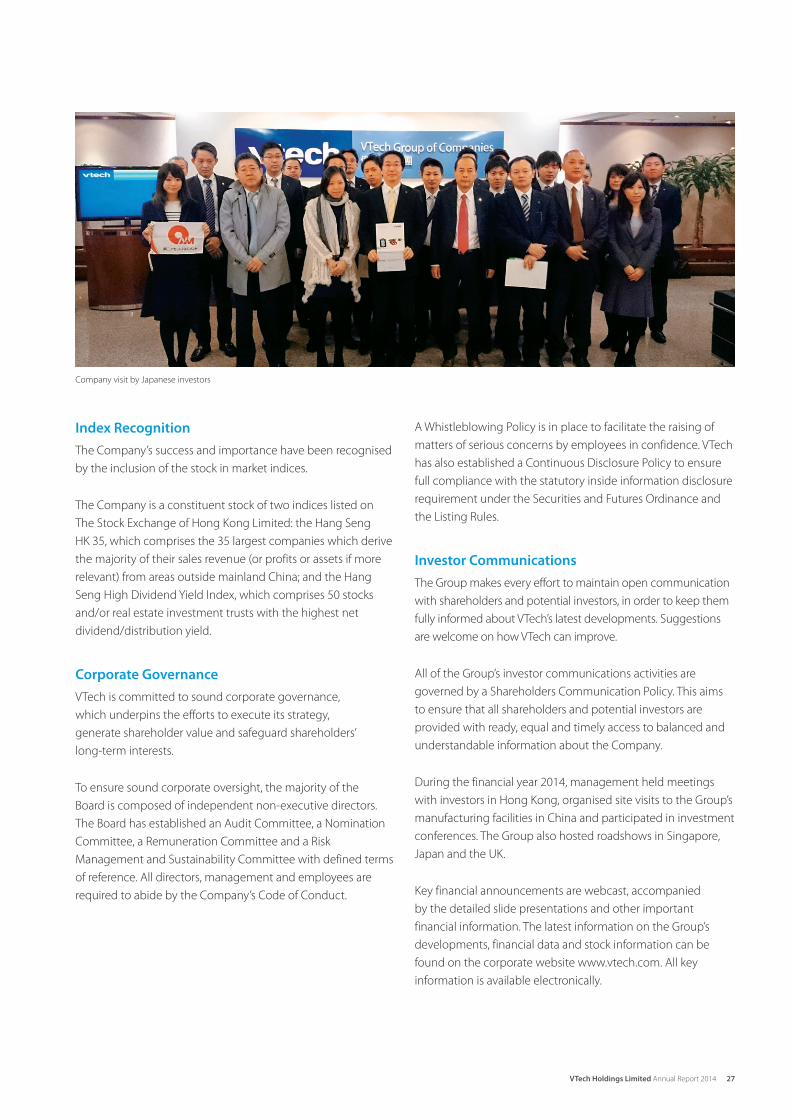
Index Recognition
The Company’s success and importance have been recognised
by the inclusion of the stock in market indices.
The Company is a constituent stock of two indices listed on
The Stock Exchange of Hong Kong Limited: the Hang Seng
HK 35, which comprises the 35 largest companies which derive
the majority of their sales revenue (or profits or assets if more
relevant) from areas outside mainland China; and the Hang
Seng High Dividend Yield Index, which comprises 50 stocks
and/or real estate investment trusts with the highest net
dividend/distribution yield.
Corporate Governance
VTech is committed to sound corporate governance,
which underpins the efforts to execute its strategy,
generate shareholder value and safeguard shareholders’
long-term interests.
To ensure sound corporate oversight, the majority of the
Board is composed of independent non-executive directors.
The Board has established an Audit Committee, a Nomination
Committee, a Remuneration Committee and a Risk
Management and Sustainability Committee with defined terms
of reference. All directors, management and employees are
required to abide by the Company’s Code of Conduct.
A Whistleblowing Policy is in place to facilitate the raising of
matters of serious concerns by employees in confidence. VTech
has also established a Continuous Disclosure Policy to ensure
full compliance with the statutory inside information disclosure
requirement under the Securities and Futures Ordinance and
the Listing Rules.
Investor Communications
The Group makes every effort to maintain open communication
with shareholders and potential investors, in order to keep them
fully informed about VTech’s latest developments. Suggestions
are welcome on how VTech can improve.
All of the Group’s investor communications activities are
governed by a Shareholders Communication Policy. This aims
to ensure that all shareholders and potential investors are
provided with ready, equal and timely access to balanced and
understandable information about the Company.
During the financial year 2014, management held meetings
with investors in Hong Kong, organised site visits to the Group’s
manufacturing facilities in China and participated in investment
conferences. The Group also hosted roadshows in Singapore,
Japan and the UK.
Key financial announcements are webcast, accompanied
by the detailed slide presentations and other important
financial information. The latest information on the Group’s
developments, financial data and stock information can be
found on the corporate website www.vtech.com. All key
information is available electronically.
Company visit by Japanese investors
27VTech Holdings Limited Annual Report 2014

Listing
Shares of VTech Holdings Limited are listed on The Stock
Exchange of Hong Kong Limited. It is a constituent of the
Hang Seng HK 35 and Hang Seng High Dividend Yield Index
Stock Code
The Stock Exchange of Hong Kong Limited: 303
Share Information
Board lot: 100 shares
Issued shares as at 31 March 2014: 250,872,133 shares
Dividend
Dividend per ordinary share for the year ended 31 March 2014
– Interim dividend: US16.0 cents per share
– Final dividend: US64.0 cents per share
Financial Calendar
Closure of Register of Members –
Annual General Meeting
2014 Annual General Meeting Closure of Register of Members –
Payment of Final Dividend
15 July – 18 July 2014 (both days inclusive)
18 July 2014 24 July 2014
Payment of Final Dividend 2014/2015 Interim Results
Announcement
4 August 2014 November 2014 May 2015
FY2015 Annual Results
Announcement
Share Registrars
Principal
MUFG Fund Services (Bermuda) Limited
26 Burnaby Street
Hamilton HM 11
Bermuda
Hong Kong Branch
Computershare Hong Kong Investor Services Limited
Shops 1712-16, 17th Floor, Hopewell Centre
183 Queen’s Road East, Wan Chai
Hong Kong
Tel: (852) 2862 8628
Fax: (852) 2865 0990
Email: [email protected]
Investor Relations Contact
Corporate Communications Department
23rd Floor, Tai Ping Industrial Centre, Block 1
57 Ting Kok Road
Tai Po, New Territories
Hong Kong
Tel: (852) 2680 1000
Fax: (852) 2680 1788
Email: [email protected]
Website
www.vtech.com/investors/stock-info
28 VTech Holdings Limited Annual Report 2014
Investor Relations
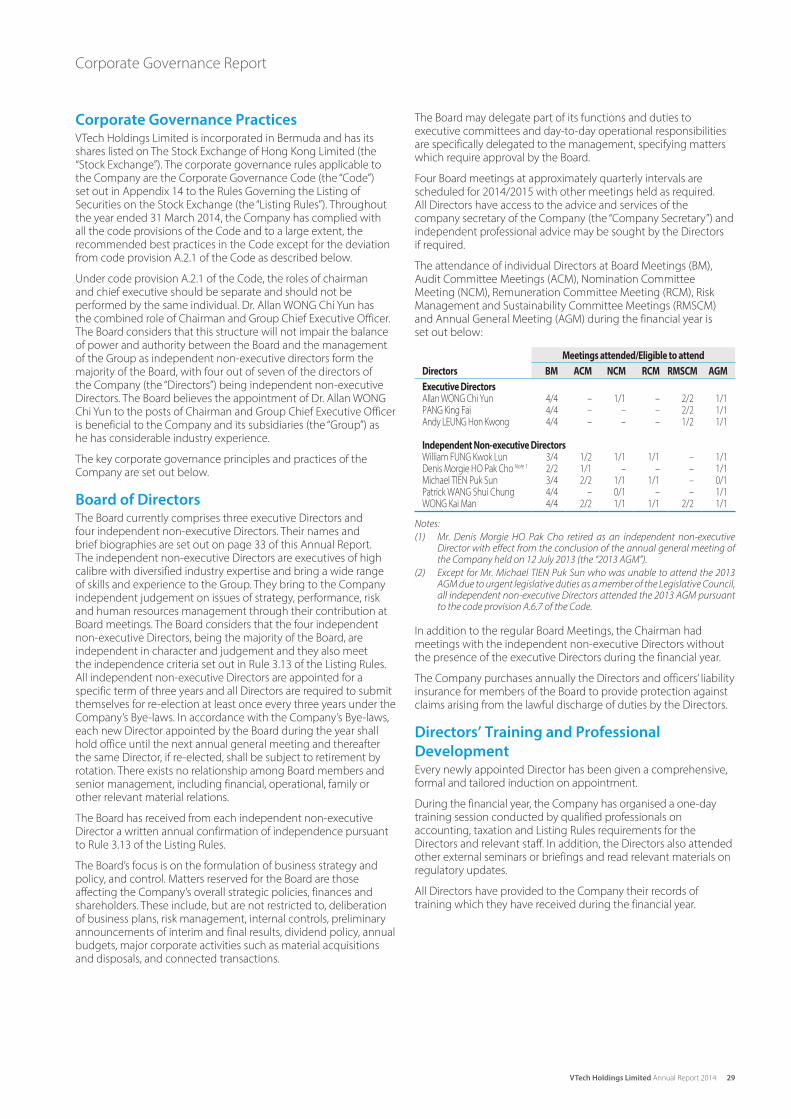
29VTech Holdings Limited Annual Report 2014
Corporate Governance Report
Corporate Governance PracticesVTech Holdings Limited is incorporated in Bermuda and has its shares listed on The Stock Exchange of Hong Kong Limited (the “Stock Exchange”). The corporate governance rules applicable to the Company are the Corporate Governance Code (the “Code”) set out in Appendix 14 to the Rules Governing the Listing of Securities on the Stock Exchange (the “Listing Rules”). Throughout the year ended 31 March 2014, the Company has complied with all the code provisions of the Code and to a large extent, the recommended best practices in the Code except for the deviation from code provision A.2.1 of the Code as described below.
Under code provision A.2.1 of the Code, the roles of chairman and chief executive should be separate and should not be performed by the same individual. Dr. Allan WONG Chi Yun has the combined role of Chairman and Group Chief Executive Officer. The Board considers that this structure will not impair the balance of power and authority between the Board and the management of the Group as independent non-executive directors form the majority of the Board, with four out of seven of the directors of the Company (the “Directors”) being independent non-executive Directors. The Board believes the appointment of Dr. Allan WONG Chi Yun to the posts of Chairman and Group Chief Executive Officer is beneficial to the Company and its subsidiaries (the “Group”) as he has considerable industry experience.
The key corporate governance principles and practices of the Company are set out below.
Board of DirectorsThe Board currently comprises three executive Directors and four independent non-executive Directors. Their names and brief biographies are set out on page 33 of this Annual Report. The independent non-executive Directors are executives of high calibre with diversified industry expertise and bring a wide range of skills and experience to the Group. They bring to the Company independent judgement on issues of strategy, performance, risk and human resources management through their contribution at Board meetings. The Board considers that the four independent non-executive Directors, being the majority of the Board, are independent in character and judgement and they also meet the independence criteria set out in Rule 3.13 of the Listing Rules. All independent non-executive Directors are appointed for a specific term of three years and all Directors are required to submit themselves for re-election at least once every three years under the Company’s Bye-laws. In accordance with the Company’s Bye-laws, each new Director appointed by the Board during the year shall hold office until the next annual general meeting and thereafter the same Director, if re-elected, shall be subject to retirement by rotation. There exists no relationship among Board members and senior management, including financial, operational, family or other relevant material relations.
The Board has received from each independent non-executive Director a written annual confirmation of independence pursuant to Rule 3.13 of the Listing Rules.
The Board’s focus is on the formulation of business strategy and policy, and control. Matters reserved for the Board are those affecting the Company’s overall strategic policies, finances and shareholders. These include, but are not restricted to, deliberation of business plans, risk management, internal controls, preliminary announcements of interim and final results, dividend policy, annual budgets, major corporate activities such as material acquisitions and disposals, and connected transactions.
The Board may delegate part of its functions and duties to executive committees and day-to-day operational responsibilities are specifically delegated to the management, specifying matters which require approval by the Board.
Four Board meetings at approximately quarterly intervals are scheduled for 2014/2015 with other meetings held as required. All Directors have access to the advice and services of the company secretary of the Company (the “Company Secretary”) and independent professional advice may be sought by the Directors if required.
The attendance of individual Directors at Board Meetings (BM), Audit Committee Meetings (ACM), Nomination Committee Meeting (NCM), Remuneration Committee Meeting (RCM), Risk Management and Sustainability Committee Meetings (RMSCM) and Annual General Meeting (AGM) during the financial year is set out below:
Meetings attended/Eligible to attend
Directors BM ACM NCM RCM RMSCM AGM
Executive DirectorsAllan WONG Chi Yun 4/4 – 1/1 – 2/2 1/1PANG King Fai 4/4 – – – 2/2 1/1Andy LEUNG Hon Kwong 4/4 – – – 1/2 1/1
Independent Non-executive DirectorsWilliam FUNG Kwok Lun 3/4 1/2 1/1 1/1 – 1/1Denis Morgie HO Pak Cho Note 1 2/2 1/1 – – – 1/1Michael TIEN Puk Sun 3/4 2/2 1/1 1/1 – 0/1Patrick WANG Shui Chung 4/4 – 0/1 – – 1/1WONG Kai Man 4/4 2/2 1/1 1/1 2/2 1/1
Notes:
(1) Mr. Denis Morgie HO Pak Cho retired as an independent non-executive Director with effect from the conclusion of the annual general meeting of the Company held on 12 July 2013 (the “2013 AGM”).
(2) Except for Mr. Michael TIEN Puk Sun who was unable to attend the 2013 AGM due to urgent legislative duties as a member of the Legislative Council, all independent non-executive Directors attended the 2013 AGM pursuant to the code provision A.6.7 of the Code.
In addition to the regular Board Meetings, the Chairman had meetings with the independent non-executive Directors without the presence of the executive Directors during the financial year.
The Company purchases annually the Directors and officers’ liability insurance for members of the Board to provide protection against claims arising from the lawful discharge of duties by the Directors.
Directors’ Training and Professional
DevelopmentEvery newly appointed Director has been given a comprehensive, formal and tailored induction on appointment.
During the financial year, the Company has organised a one-day training session conducted by qualified professionals on accounting, taxation and Listing Rules requirements for the Directors and relevant staff. In addition, the Directors also attended other external seminars or briefings and read relevant materials on regulatory updates.
All Directors have provided to the Company their records of training which they have received during the financial year.
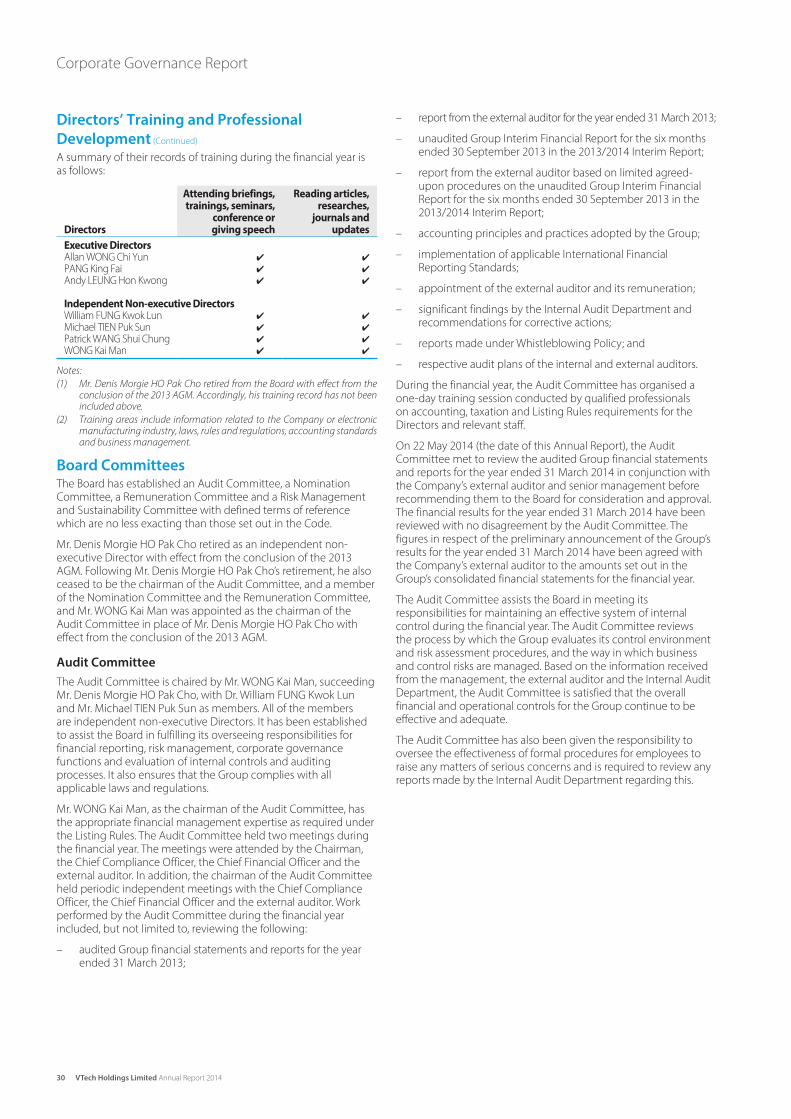
30 VTech Holdings Limited Annual Report 2014
Corporate Governance Report
– report from the external auditor for the year ended 31 March 2013;
– unaudited Group Interim Financial Report for the six months ended 30 September 2013 in the 2013/2014 Interim Report;
– report from the external auditor based on limited agreed-upon procedures on the unaudited Group Interim Financial Report for the six months ended 30 September 2013 in the 2013/2014 Interim Report;
– accounting principles and practices adopted by the Group;
– implementation of applicable International Financial Reporting Standards;
– appointment of the external auditor and its remuneration;
– significant findings by the Internal Audit Department and recommendations for corrective actions;
– reports made under Whistleblowing Policy; and
– respective audit plans of the internal and external auditors.
During the financial year, the Audit Committee has organised a one-day training session conducted by qualified professionals on accounting, taxation and Listing Rules requirements for the Directors and relevant staff.
On 22 May 2014 (the date of this Annual Report), the Audit Committee met to review the audited Group financial statements and reports for the year ended 31 March 2014 in conjunction with the Company’s external auditor and senior management before recommending them to the Board for consideration and approval. The financial results for the year ended 31 March 2014 have been reviewed with no disagreement by the Audit Committee. The figures in respect of the preliminary announcement of the Group’s results for the year ended 31 March 2014 have been agreed with the Company’s external auditor to the amounts set out in the Group’s consolidated financial statements for the financial year.
The Audit Committee assists the Board in meeting its responsibilities for maintaining an effective system of internal control during the financial year. The Audit Committee reviews the process by which the Group evaluates its control environment and risk assessment procedures, and the way in which business and control risks are managed. Based on the information received from the management, the external auditor and the Internal Audit Department, the Audit Committee is satisfied that the overall financial and operational controls for the Group continue to be effective and adequate.
The Audit Committee has also been given the responsibility to oversee the effectiveness of formal procedures for employees to raise any matters of serious concerns and is required to review any reports made by the Internal Audit Department regarding this.
Directors’ Training and Professional
Development (Continued)
A summary of their records of training during the financial year is as follows:
Directors
Attending briefings, trainings, seminars,
conference or giving speech
Reading articles, researches,
journals and updates
Executive DirectorsAllan WONG Chi Yun ✔ ✔
PANG King Fai ✔ ✔
Andy LEUNG Hon Kwong ✔ ✔
Independent Non-executive DirectorsWilliam FUNG Kwok Lun ✔ ✔
Michael TIEN Puk Sun ✔ ✔
Patrick WANG Shui Chung ✔ ✔
WONG Kai Man ✔ ✔
Notes:
(1) Mr. Denis Morgie HO Pak Cho retired from the Board with effect from the conclusion of the 2013 AGM. Accordingly, his training record has not been included above.
(2) Training areas include information related to the Company or electronic manufacturing industry, laws, rules and regulations, accounting standards and business management.
Board CommitteesThe Board has established an Audit Committee, a Nomination Committee, a Remuneration Committee and a Risk Management and Sustainability Committee with defined terms of reference which are no less exacting than those set out in the Code.
Mr. Denis Morgie HO Pak Cho retired as an independent non-executive Director with effect from the conclusion of the 2013 AGM. Following Mr. Denis Morgie HO Pak Cho’s retirement, he also ceased to be the chairman of the Audit Committee, and a member of the Nomination Committee and the Remuneration Committee, and Mr. WONG Kai Man was appointed as the chairman of the Audit Committee in place of Mr. Denis Morgie HO Pak Cho with effect from the conclusion of the 2013 AGM.
Audit Committee
The Audit Committee is chaired by Mr. WONG Kai Man, succeeding Mr. Denis Morgie HO Pak Cho, with Dr. William FUNG Kwok Lun and Mr. Michael TIEN Puk Sun as members. All of the members are independent non-executive Directors. It has been established to assist the Board in fulfilling its overseeing responsibilities for financial reporting, risk management, corporate governance functions and evaluation of internal controls and auditing processes. It also ensures that the Group complies with all applicable laws and regulations.
Mr. WONG Kai Man, as the chairman of the Audit Committee, has the appropriate financial management expertise as required under the Listing Rules. The Audit Committee held two meetings during the financial year. The meetings were attended by the Chairman, the Chief Compliance Officer, the Chief Financial Officer and the external auditor. In addition, the chairman of the Audit Committee held periodic independent meetings with the Chief Compliance Officer, the Chief Financial Officer and the external auditor. Work performed by the Audit Committee during the financial year included, but not limited to, reviewing the following:
– audited Group financial statements and reports for the year ended 31 March 2013;

31VTech Holdings Limited Annual Report 2014
Board Committees (Continued)
Nomination Committee
The Nomination Committee is chaired by Dr. William FUNG Kwok Lun with Mr. Denis Morgie HO Pak Cho (retired with effect from the conclusion of the 2013 AGM), Mr. Michael TIEN Puk Sun, Dr. Patrick WANG Shui Chung, Mr. WONG Kai Man and Dr. Allan WONG Chi Yun as members. The majority of the members of the Nomination Committee are independent non-executive Directors. It is responsible for reviewing the structure, size and diversity of the Board, and identifying and nominating candidates for appointment to the Board such that it has the relevant blend of skills, knowledge and professional experience. Candidates for appointment as Directors may be sourced internally or externally through various channels such as using the services of specialist executive search firms. The aim is to appoint individuals of the highest calibre in their areas of expertise and experience.
The Nomination Committee held one meeting during the financial year. The Nomination Committee reviewed the board diversity policy (the “Board Diversity Policy”) and the revised Nomination Committee Charter before recommending them to the Board for consideration and approval. The Nomination Committee also reviewed the structure, size and diversity of the Board.
Board Diversity
The Company sees increasing diversity at the Board level as an essential element to complement the Company’s corporate strategy. During the financial years, the Company has adopted a Board Diversity Policy which sets out the approach to achieve diversity on the Board.
The Nomination Committee monitors the implementation of the Board Diversity Policy and has responsibility in leading the progress for Board appointments. In designing the Board’s composition, Board diversity has been considered from a number of aspects, including but not limited to gender, age, cultural and educational background, skills, knowledge, industry and professional experience, business perspectives and the legitimate interests of the Company’s principal shareholders.
Selection of candidates for Board appointments will be considered taking into account a range of aspects described above. The ultimate decision will be based on merit and contribution that the selected candidates will bring to the Board.
Remuneration Committee
The Remuneration Committee is chaired by Mr. Michael TIEN Puk Sun with Dr. William FUNG Kwok Lun, Mr. Denis Morgie HO Pak Cho (retired with effect from the conclusion of the 2013 AGM) and Mr. WONG Kai Man as members. All of the members are independent non-executive Directors. It is responsible for reviewing and recommending all elements of the executive Directors and senior management remunerations to the Board.
The emoluments of Directors are based on skills, knowledge and performance, together with reference to the profitability of the Company, and prevailing market conditions. In addition, the Company has established a share option scheme to provide incentives and rewards to eligible participants, and a share purchase scheme to motivate employees and attract suitable personnel for continuous development of the Group.
The Remuneration Committee held one meeting during the financial year. The Remuneration Committee discussed and reviewed the policy for the remuneration of executive Directors and senior management, and the annual salaries increment and remuneration packages for executive Directors and senior management before recommending them to the Board for consideration and approval. The Remuneration Committee also reviewed and approved the shares to be awarded under the share purchase scheme.
Risk Management and Sustainability Committee
The Risk Management Committee was renamed as the Risk Management and Sustainability Committee on 15 May 2013. The Risk Management and Sustainability Committee is now responsible for monitoring and reviewing the risk management and sustainability strategy of the Group.
The Risk Management and Sustainability Committee is chaired by Dr. Allan WONG Chi Yun with Dr. PANG King Fai, Mr. Andy LEUNG Hon Kwong and Mr. WONG Kai Man as members. The Risk Management and Sustainability Committee held two meetings during the financial year to review the Group’s risk management, internal control systems, and sustainability strategy, policies and improvement activities.
The Risk Management and Sustainability Committee has developed a framework for the management and control of risks in the Group. Risks are being more formally identified and recorded in the Risk Register for key operations. This Risk Register is updated regularly and the major risks are being reviewed from time to time by the Risk Management and Sustainability Committee.
The Risk Management and Sustainability Committee ensures that any new and emerging risks are promptly identified, evaluated and appropriate actions are taken by the management. This requires the active and frequent participation by the process owner of each function in identifying risks affecting its business and implementing measures to reduce such risks, as well as the active monitoring on the progress of the improvement in internal control procedures.
The Risk Management and Sustainability Committee also determines the scope of the Sustainability Report, and monitors the sustainability targets and key performance indicators.
External AuditorThe Audit Committee reviews and monitors the external auditor’s independence and objectivity. It also meets with the external auditor to consider the nature, scope and results of its audit with senior management.
During the financial year, the fees in respect of audit services and tax services provided by KPMG, the external auditor, are shown in note 2 to the financial statements.
Responsibilities in respect of Financial
StatementsThe Directors are responsible for overseeing the preparation of the consolidated financial statements for the year ended 31 March 2014 to give a true and fair view of the state of affairs of the Group as at that date and of its profit and cash flows for the year then ended. In doing so, the Directors have adopted the appropriate accounting policies, applied them consistently in accordance with the International Financial Reporting Standards and made judgements and estimates that are prudent and reasonable in preparing the consolidated financial statements on the going concern basis.

32 VTech Holdings Limited Annual Report 2014
Corporate Governance Report
Responsibilities in respect of Financial Statements (Continued)
The Directors are responsible for ensuring the maintenance of proper accounting records, safeguarding of the assets of the Company and taking reasonable steps for the prevention and detection of fraud and other irregularities.
The statement by the external auditor of the Company regarding its responsibilities on the financial statements of the Group is set out in the Independent Auditor’s Report on page 39 of this Annual Report.
Company SecretaryThe Company Secretary is an employee of the Company, reports to the Chairman and is responsible for providing advices to the Board for ensuring the Board procedures are followed. The Company Secretary has taken no less than 15 hours of relevant professional training.
Internal ControlsThe Directors have the overall responsibility for internal control, including risk management, and set appropriate policies having regard to the objectives of the Group. The Board, through the Audit Committee, reviewed the overall effectiveness of the Group’s system of internal control over financial, operational and compliance issues, risk management process, information systems security and effectiveness of financial reporting and compliance with the Listing Rules, and is satisfied that such systems are effective and adequate. The Board also considered that the resources, qualifications and experience of staff of the Company’s accounting and financial reporting function, and their training programmes and budget were adequate.
The Group has put in place an organisational structure with formal and clearly defined lines of responsibility and delegation of authority. There are also established procedures for financial planning, capital expenditure, treasury transactions, information and reporting systems, and monitoring the Group’s businesses and their performance.
Internal Audit Department
The Internal Audit Department reviews the effectiveness of the internal control system. The Internal Audit Department carries out an annual risk assessment on each identified audit area and devises an annual audit plan according to the nature of business and risk exposures, and the scope of work includes financial and operational reviews. The audit plan is reviewed and agreed by the Audit Committee. In addition to the agreed schedule of work, the Internal Audit Department conducts other review and investigative work as may be required. The Audit Committee receives summary reports from the Internal Audit Department periodically while the results of internal audit reviews and responses to the recommended corrective actions are also reported to the executive Directors. The Internal Audit Department is also responsible for following up on the corrective actions to ensure that satisfactory controls are maintained.
Other Control and Management
Code of Conduct
The Company’s policy on code of conduct is also an important part of the Group’s internal control process. Employees are required to strictly follow the code of conduct to ensure the Group operates to the highest standards of business behaviour and ethics in our dealings with customers, business partners, shareholders, employees, and the business community. The policy is reinforced and monitored by an annual confirmation of compliance in writing.
Whistleblowing Policy
The Group maintains a Whistleblowing Policy to facilitate the raising of matters of serious concerns by employees in confidence. Procedures are established for employees to report complaints and suspected internal malpractices directly to the Chief Compliance Officer, who will review the complaints and determine the appropriate mode of investigation and subsequent corrective action. Recommendations on improvements are communicated to the respective department’s senior management for implementation. The Chief Compliance Officer reports the results of his review of the complaints received to the Audit Committee twice a year.
Model Code of Securities TransactionsThe Company has adopted the Model Code for Securities Transactions by Directors of Listed Issuers (the “Model Code”) set out in Appendix 10 to the Listing Rules regarding securities transactions by Directors and senior management. After specific enquiry, all Directors confirmed that they have complied with the required standard of dealings set out in the Model Code throughout the year ended 31 March 2014.
Continuous Disclosure PolicyThe Company has established a Continuous Disclosure Policy to set out the Company’s procedures for monitoring developments in our businesses for inside information and communicating such information to our shareholders, analysts, the media and other stakeholders in accordance with the statutory inside information disclosure requirement under the Securities and Futures Ordinance and the Listing Rules.
Shareholders’ RightsUnder the Company’s Bye-laws, in addition to regular annual general meeting, the Board, on the requisition of shareholders of the Company holding not less than one-tenth of the paid-up capital of the Company, may convene a special general meeting to address specific issues of the Company within 21 days from the date of deposit of written notice to the registered office of the Company. The requisition must state the purposes of the meeting, and must be signed by the requisitionist(s).
Shareholders holding not less than one-twentieth of the total voting rights of all the shareholders or not less than 100 shareholders may propose any resolution at the annual general meeting and circulate to other shareholders written statement with respect to the matter to be dealt with at the annual general meeting.
Shareholders may send their enquiries requiring the Board’s attention to the Company Secretary at the Company’s principal office address at 23rd Floor, Tai Ping Industrial Centre, Block 1, 57 Ting Kok Road, Tai Po, New Territories, Hong Kong.
Shareholders Communication PolicyThe Company has established a Shareholders Communication Policy to set out the procedures for providing shareholders and the investment community with ready, equal and timely access to balanced and understandable information about the Company. This is in order to enable shareholders to exercise their rights in an informed manner, and to allow shareholders and the investment community to engage actively with the Company.
Shareholders and the investment community may at any time make a request for publicly available Company information by email to [email protected], by post addressed to the Company’s principal office address, to the Investor Relations contact on the Company’s website or through the Company’s share registrar.
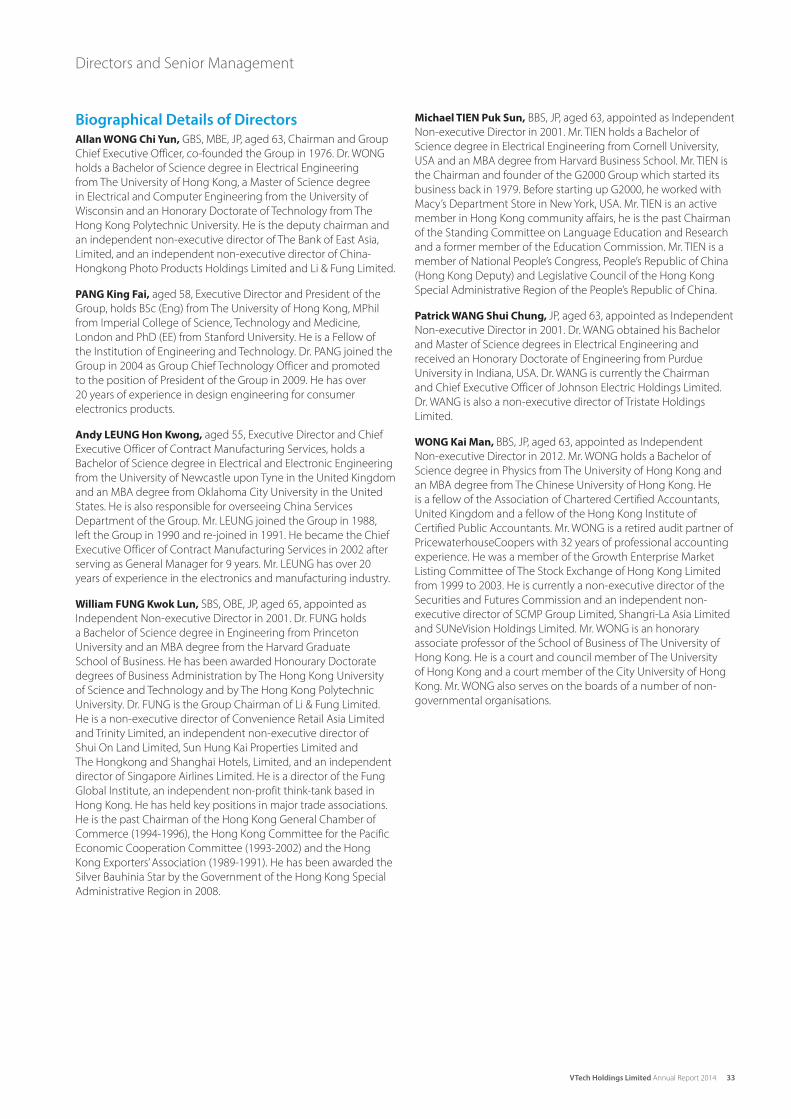
33VTech Holdings Limited Annual Report 2014
Directors and Senior Management
Biographical Details of Directors
Allan WONG Chi Yun, GBS, MBE, JP, aged 63, Chairman and Group
Chief Executive Officer, co-founded the Group in 1976. Dr. WONG
holds a Bachelor of Science degree in Electrical Engineering
from The University of Hong Kong, a Master of Science degree
in Electrical and Computer Engineering from the University of
Wisconsin and an Honorary Doctorate of Technology from The
Hong Kong Polytechnic University. He is the deputy chairman and
an independent non-executive director of The Bank of East Asia,
Limited, and an independent non-executive director of China-
Hongkong Photo Products Holdings Limited and Li & Fung Limited.
PANG King Fai, aged 58, Executive Director and President of the
Group, holds BSc (Eng) from The University of Hong Kong, MPhil
from Imperial College of Science, Technology and Medicine,
London and PhD (EE) from Stanford University. He is a Fellow of
the Institution of Engineering and Technology. Dr. PANG joined the
Group in 2004 as Group Chief Technology Officer and promoted
to the position of President of the Group in 2009. He has over
20 years of experience in design engineering for consumer
electronics products.
Andy LEUNG Hon Kwong, aged 55, Executive Director and Chief
Executive Officer of Contract Manufacturing Services, holds a
Bachelor of Science degree in Electrical and Electronic Engineering
from the University of Newcastle upon Tyne in the United Kingdom
and an MBA degree from Oklahoma City University in the United
States. He is also responsible for overseeing China Services
Department of the Group. Mr. LEUNG joined the Group in 1988,
left the Group in 1990 and re-joined in 1991. He became the Chief
Executive Officer of Contract Manufacturing Services in 2002 after
serving as General Manager for 9 years. Mr. LEUNG has over 20
years of experience in the electronics and manufacturing industry.
William FUNG Kwok Lun, SBS, OBE, JP, aged 65, appointed as
Independent Non-executive Director in 2001. Dr. FUNG holds
a Bachelor of Science degree in Engineering from Princeton
University and an MBA degree from the Harvard Graduate
School of Business. He has been awarded Honourary Doctorate
degrees of Business Administration by The Hong Kong University
of Science and Technology and by The Hong Kong Polytechnic
University. Dr. FUNG is the Group Chairman of Li & Fung Limited.
He is a non-executive director of Convenience Retail Asia Limited
and Trinity Limited, an independent non-executive director of
Shui On Land Limited, Sun Hung Kai Properties Limited and
The Hongkong and Shanghai Hotels, Limited, and an independent
director of Singapore Airlines Limited. He is a director of the Fung
Global Institute, an independent non-profit think-tank based in
Hong Kong. He has held key positions in major trade associations.
He is the past Chairman of the Hong Kong General Chamber of
Commerce (1994-1996), the Hong Kong Committee for the Pacific
Economic Cooperation Committee (1993-2002) and the Hong
Kong Exporters’ Association (1989-1991). He has been awarded the
Silver Bauhinia Star by the Government of the Hong Kong Special
Administrative Region in 2008.
Michael TIEN Puk Sun, BBS, JP, aged 63, appointed as Independent
Non-executive Director in 2001. Mr. TIEN holds a Bachelor of
Science degree in Electrical Engineering from Cornell University,
USA and an MBA degree from Harvard Business School. Mr. TIEN is
the Chairman and founder of the G2000 Group which started its
business back in 1979. Before starting up G2000, he worked with
Macy’s Department Store in New York, USA. Mr. TIEN is an active
member in Hong Kong community affairs, he is the past Chairman
of the Standing Committee on Language Education and Research
and a former member of the Education Commission. Mr. TIEN is a
member of National People’s Congress, People’s Republic of China
(Hong Kong Deputy) and Legislative Council of the Hong Kong
Special Administrative Region of the People’s Republic of China.
Patrick WANG Shui Chung, JP, aged 63, appointed as Independent
Non-executive Director in 2001. Dr. WANG obtained his Bachelor
and Master of Science degrees in Electrical Engineering and
received an Honorary Doctorate of Engineering from Purdue
University in Indiana, USA. Dr. WANG is currently the Chairman
and Chief Executive Officer of Johnson Electric Holdings Limited.
Dr. WANG is also a non-executive director of Tristate Holdings
Limited.
WONG Kai Man, BBS, JP, aged 63, appointed as Independent
Non-executive Director in 2012. Mr. WONG holds a Bachelor of
Science degree in Physics from The University of Hong Kong and
an MBA degree from The Chinese University of Hong Kong. He
is a fellow of the Association of Chartered Certified Accountants,
United Kingdom and a fellow of the Hong Kong Institute of
Certified Public Accountants. Mr. WONG is a retired audit partner of
PricewaterhouseCoopers with 32 years of professional accounting
experience. He was a member of the Growth Enterprise Market
Listing Committee of The Stock Exchange of Hong Kong Limited
from 1999 to 2003. He is currently a non-executive director of the
Securities and Futures Commission and an independent non-
executive director of SCMP Group Limited, Shangri-La Asia Limited
and SUNeVision Holdings Limited. Mr. WONG is an honorary
associate professor of the School of Business of The University of
Hong Kong. He is a court and council member of The University
of Hong Kong and a court member of the City University of Hong
Kong. Mr. WONG also serves on the boards of a number of non-
governmental organisations.
34 VTech Holdings Limited Annual Report 2014
Directors and Senior Management
North America
Nicholas P. DELANY, aged 62, President of VTech Communications,
Inc., is responsible for the Telecommunication Products in the
United States specifically business development, sales, customer
support, business intelligence processes, supply chain, logistics
management, IT, HR/Administration, finance and marketing. Prior
to joining the Group in 2000, Mr. DELANY had over 20 years of sales
and management experience in the industrial, retail, construction
and mining industries in Asia, Europe and South Africa. He also
has 10 years of experience in developing supply chain systems
with leading corporations in North America including The Stanley
Works, Inc. Mr. DELANY holds a Bachelor Degree in Marketing
and Financial Management from the University of South Africa
& Damlein College. He retired from the current position and was
appointed as Chairman of VTech USA Holdings, L.L.C. with effect
from 1 April 2014.
William TO, aged 57, President of VTech Electronics North America,
L.L.C., joined the Group in 1983. Mr. TO is responsible for the
Group’s Electronic Learning Products in the United States, Puerto
Rico and Mexico. He holds an MBA degree from the University
of Chicago.
Gordon CHOW, aged 58, President of VTech Technologies Canada
Ltd., is responsible for both the Telecommunication Products
and Electronic Learning Products in Canada. He established the
Canadian operations in 1986. Mr. CHOW holds a Bachelor of
Commerce degree from the University of British Columbia and
is a member of the Institute of Chartered Accountants of British
Columbia. Mr. CHOW has served as a member of the President’s
Advancement Council of British Columbia Institute of Technology
and a director of the BCIT Foundation. He was also a member of
the Royal Roads University – MBA Advisory Board, a director of the
Canadian Toy Association and a member of the Board of Governors
of Crofton House School in Vancouver.
Europe
Gilles SAUTIER, aged 58, European Chief Executive Officer, joined
the Group in 2000 and is responsible for Electronic Learning
Products in UK, France, Belgium, Holland, Luxembourg, Spain and
Germany and some export markets such as Italy and Portugal. He is
also responsible for the support centre in Holland which takes care
of finance, logistics management and IT systems for the European
sales companies. With over 30 years of experience in marketing,
sales and management in the toy industry, he held various
positions in Kenner-Parker, Spear’s Games, Ideal Toys and Majorette.
He holds a Bachelor degree in Law from the University of Paris and
an MBA degree from L’ ESSEC, a French business school.
Biographical Details of Senior Management
Group
TONG Chi Hoi, aged 49, President of Telecommunication Products,
is responsible for overseeing the Branded business and ODM
worldwide. Mr. TONG joined the Group in 2006. He has over
20 years of experience in the electronics and manufacturing
industry. Mr. TONG holds a First Class Honours Bachelor degree
in Electrical and Electronics Engineering from the University of
London. He is a member of The Institution of Engineering and
Technology.
CHU Chorng Yeong, aged 54, Group Chief Technology Officer,
is responsible for overseeing product development of the
Electronic Learning Products as well as contributing to the Group
in establishing technology strategies and product development
directions. Dr. CHU joined the Group in 2009, he holds a Bachelor
of Science degree in Computer Science from Columbia University,
MS and PhD in Electrical Engineering from Stanford University.
Prior to joining the Group, he held Senior Vice President positions
at SiS (a listed company in Taiwan) and ESS Technology (a listed
company in the United States). He had worked in the Silicon
Valley for 20 years specialising in integrated circuit and software
developments for the Consumer Electronics Industry.
Shereen TONG Ka Hung, aged 45, Group Chief Financial Officer,
is responsible for the Group accounting and tax, treasury and
financial as well as information technology and human resources
management functions. Ms. TONG joined the Group in 1994
and has held management positions in a number of areas
including internal audit and financial control of the Group. She
holds an MBA degree from Manchester Business School, UK,
Master of Science degree in Information Systems from The Hong
Kong Polytechnic University and Bachelor of Laws degree from
Manchester Metropolitan University, UK. She is an associate
member of Chartered Institute of Bankers, UK, Chartered Institute
of Management Accountants, UK and a fellow member of Hong
Kong Institute of Certified Public Accountants.
CHANG Yu Wai, aged 54, Company Secretary and Group Chief
Compliance Officer, joined the Group in 2000 after spending
8 years with one of the leading international accounting firms in
Hong Kong. He has over 15 years of experience in professional
accounting and auditing. He holds a Bachelor of Science degree
in Mathematics and Management Sciences from the University
of Manchester Institute of Science and Technology. Mr. CHANG
is a member of the Institute of Chartered Accountants in England
and Wales.

35VTech Holdings Limited Annual Report 2014
Report of the Directors
The Directors have the pleasure to present their report and the
audited financial statements of the Group for the year ended
31 March 2014.
Principal Activity
The principal activity of the Group is design, manufacture and
distribution of consumer electronic products.
Group Results and Dividends
The results of the Group for the year ended 31 March 2014 are set
out in the consolidated income statement on page 40.
An interim dividend of US16.0 cents (2013: US16.0 cents) per
ordinary share was paid to shareholders on 19 December 2013. The
Board has recommended the payment of a final dividend of US64.0
cents (2013: US64.0 cents) per ordinary share in respect of the year
ended 31 March 2014, payable on 4 August 2014 to shareholders
whose names appear on the register of members of the Company
as at the close of business on 24 July 2014 subject to the approval
of the shareholders of the Company at the forthcoming annual
general meeting of the Company (the “2014 AGM”).
The final dividend will be payable in United States dollars save that
those shareholders with a registered address in Hong Kong will
receive an equivalent amount in Hong Kong dollars which will be
calculated at the rate of exchange as quoted to the Company by
The Hongkong and Shanghai Banking Corporation Limited at its
middle rate of exchange prevailing on 22 July 2014.
Commentary on Performance
A commentary on the performance of the Group is included in the
Review of Operations set out on pages 11 to 13.
Group Financial Summary
A summary of the results and of the assets and liabilities of the
Group for the last five financial years is set out on page 67.
Tangible Assets
Details of the movements in tangible assets of the Group during
the financial year are shown in note 7 to the financial statements.
Share Capital and Share Options
Details of the movements in share capital and share options of the
Company during the financial year are set out in note 16 to the
financial statements.
Reserves
Movements in the reserves of the Group and the Company during
the financial year are set out in the consolidated statement of
changes in equity on page 42 and in note 17 to the financial
statements respectively.
Donations
During the financial year, the Group made charitable and other
donations in an aggregate of US$182,000.
Directors
The Directors who held office during the financial year and up to
22 May 2014 (the date of this Annual Report) were:
Executive Directors
Allan WONG Chi Yun Chairman and Group Chief Executive Officer
PANG King Fai
Andy LEUNG Hon Kwong
Independent Non-executive Directors
William FUNG Kwok Lun
Denis Morgie HO Pak Cho (retired with effect from
the conclusion of the 2013 AGM)
Michael TIEN Puk Sun
Patrick WANG Shui Chung
WONG Kai Man
At the 2014 AGM, Dr. Allan WONG Chi Yun, Mr. Andy LEUNG Hon
Kwong and Dr. Patrick WANG Shui Chung shall retire as Directors
by rotation in accordance with Bye-law 112 of the Company’s
Bye-laws and, being eligible, offer themselves for re-election as
Directors at the 2014 AGM.
Brief biographical details of Directors and senior management are
set out on pages 33 to 34 of this Annual Report.
Directors’ Service Contracts
None of the Directors has a service contract with any company
in the Group which is not determinable by the Group within
one year without payment of compensation, other than
statutory compensation.
The Director’s service contract entered into between the Company
and Dr. Allan WONG Chi Yun in 1999 has no expiry date, but can
be terminated by the giving of two months’ prior notice, and is
exempt from the shareholders’ approval requirement under Rule
13.68 of the Listing Rules.
Directors’ Interests in Contracts
No contracts of significance to which the Company, its subsidiaries,
its holding companies, its controlling shareholder, or the
subsidiaries of its controlling shareholder was a party and in which
a Director had a material interest, whether directly or indirectly,
subsisted at the end of or at any time during the financial year.
Directors’ Rights to Acquire Shares or
Debentures
Save for the share option scheme and the share purchase scheme
disclosed below and in note 16 to the financial statements, at
no time during the financial year was the Company, or any of its
subsidiaries or its holding companies, a party to any arrangement
which enables the Directors to acquire benefits by means of the
acquisition of shares in, or debenture of, the Company or any other
body corporate.
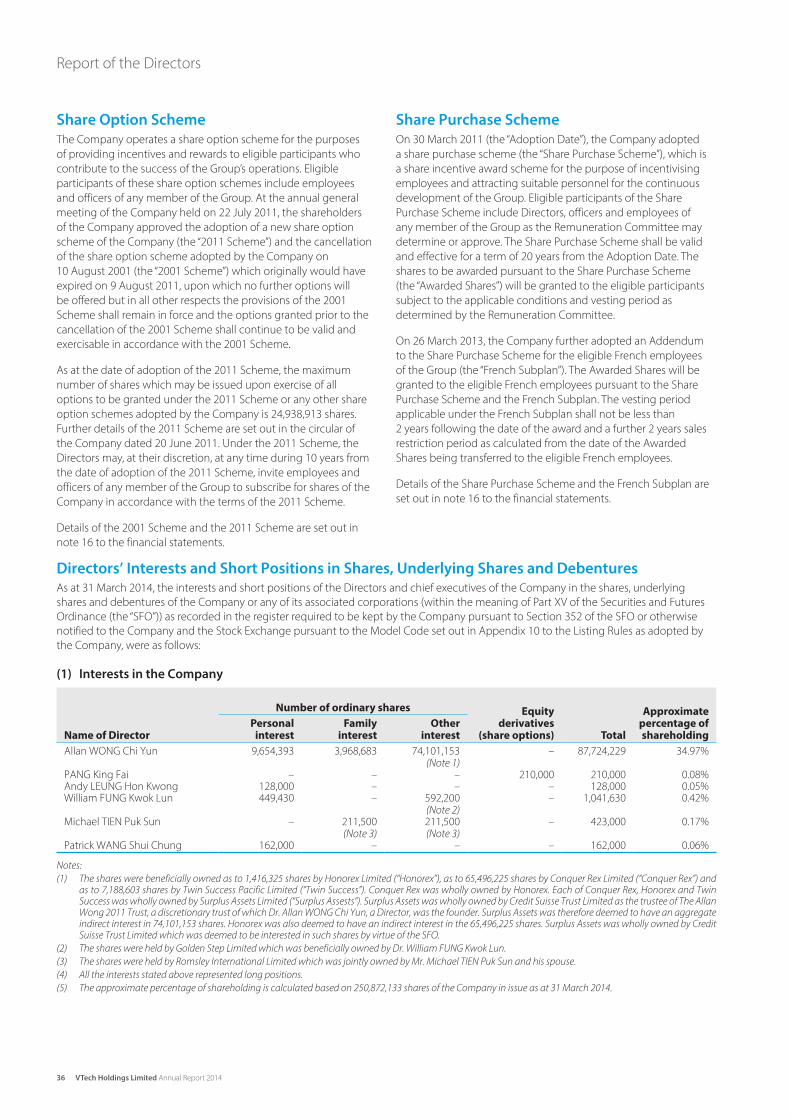
36 VTech Holdings Limited Annual Report 2014
Report of the Directors
Share Purchase Scheme
On 30 March 2011 (the “Adoption Date”), the Company adopted
a share purchase scheme (the “Share Purchase Scheme”), which is
a share incentive award scheme for the purpose of incentivising
employees and attracting suitable personnel for the continuous
development of the Group. Eligible participants of the Share
Purchase Scheme include Directors, officers and employees of
any member of the Group as the Remuneration Committee may
determine or approve. The Share Purchase Scheme shall be valid
and effective for a term of 20 years from the Adoption Date. The
shares to be awarded pursuant to the Share Purchase Scheme
(the “Awarded Shares”) will be granted to the eligible participants
subject to the applicable conditions and vesting period as
determined by the Remuneration Committee.
On 26 March 2013, the Company further adopted an Addendum
to the Share Purchase Scheme for the eligible French employees
of the Group (the “French Subplan”). The Awarded Shares will be
granted to the eligible French employees pursuant to the Share
Purchase Scheme and the French Subplan. The vesting period
applicable under the French Subplan shall not be less than
2 years following the date of the award and a further 2 years sales
restriction period as calculated from the date of the Awarded
Shares being transferred to the eligible French employees.
Details of the Share Purchase Scheme and the French Subplan are
set out in note 16 to the financial statements.
Share Option Scheme
The Company operates a share option scheme for the purposes
of providing incentives and rewards to eligible participants who
contribute to the success of the Group’s operations. Eligible
participants of these share option schemes include employees
and officers of any member of the Group. At the annual general
meeting of the Company held on 22 July 2011, the shareholders
of the Company approved the adoption of a new share option
scheme of the Company (the “2011 Scheme”) and the cancellation
of the share option scheme adopted by the Company on
10 August 2001 (the “2001 Scheme”) which originally would have
expired on 9 August 2011, upon which no further options will
be offered but in all other respects the provisions of the 2001
Scheme shall remain in force and the options granted prior to the
cancellation of the 2001 Scheme shall continue to be valid and
exercisable in accordance with the 2001 Scheme.
As at the date of adoption of the 2011 Scheme, the maximum
number of shares which may be issued upon exercise of all
options to be granted under the 2011 Scheme or any other share
option schemes adopted by the Company is 24,938,913 shares.
Further details of the 2011 Scheme are set out in the circular of
the Company dated 20 June 2011. Under the 2011 Scheme, the
Directors may, at their discretion, at any time during 10 years from
the date of adoption of the 2011 Scheme, invite employees and
officers of any member of the Group to subscribe for shares of the
Company in accordance with the terms of the 2011 Scheme.
Details of the 2001 Scheme and the 2011 Scheme are set out in
note 16 to the financial statements.
Directors’ Interests and Short Positions in Shares, Underlying Shares and Debentures
As at 31 March 2014, the interests and short positions of the Directors and chief executives of the Company in the shares, underlying
shares and debentures of the Company or any of its associated corporations (within the meaning of Part XV of the Securities and Futures
Ordinance (the “SFO”)) as recorded in the register required to be kept by the Company pursuant to Section 352 of the SFO or otherwise
notified to the Company and the Stock Exchange pursuant to the Model Code set out in Appendix 10 to the Listing Rules as adopted by
the Company, were as follows:
(1) Interests in the Company
Number of ordinary shares Equityderivatives
(share options) Total
Approximate percentage ofshareholdingName of Director
Personal interest
Family interest
Other interest
Allan WONG Chi Yun 9,654,393 3,968,683 74,101,153(Note 1)
– 87,724,229 34.97%
PANG King Fai – – – 210,000 210,000 0.08%Andy LEUNG Hon Kwong 128,000 – – – 128,000 0.05%William FUNG Kwok Lun 449,430 – 592,200
(Note 2)– 1,041,630 0.42%
Michael TIEN Puk Sun – 211,500(Note 3)
211,500(Note 3)
– 423,000 0.17%
Patrick WANG Shui Chung 162,000 – – – 162,000 0.06%
Notes:
(1) The shares were beneficially owned as to 1,416,325 shares by Honorex Limited (“Honorex”), as to 65,496,225 shares by Conquer Rex Limited (“Conquer Rex”) and as to 7,188,603 shares by Twin Success Pacific Limited (“Twin Success”). Conquer Rex was wholly owned by Honorex. Each of Conquer Rex, Honorex and Twin Success was wholly owned by Surplus Assets Limited (“Surplus Assests”). Surplus Assets was wholly owned by Credit Suisse Trust Limited as the trustee of The Allan Wong 2011 Trust, a discretionary trust of which Dr. Allan WONG Chi Yun, a Director, was the founder. Surplus Assets was therefore deemed to have an aggregate indirect interest in 74,101,153 shares. Honorex was also deemed to have an indirect interest in the 65,496,225 shares. Surplus Assets was wholly owned by Credit Suisse Trust Limited which was deemed to be interested in such shares by virtue of the SFO.
(2) The shares were held by Golden Step Limited which was beneficially owned by Dr. William FUNG Kwok Lun.
(3) The shares were held by Romsley International Limited which was jointly owned by Mr. Michael TIEN Puk Sun and his spouse.
(4) All the interests stated above represented long positions.
(5) The approximate percentage of shareholding is calculated based on 250,872,133 shares of the Company in issue as at 31 March 2014.

37VTech Holdings Limited Annual Report 2014
Directors’ Interests and Short Positions in Shares, Underlying Shares and Debentures (Continued)
(2) Share Options of the Company
Number of share options held
Name of Director Date of grant Exercise price Exercisable periodas at
1 April 2013as at
31 March 2014
PANG King Fai 17 April 2008 HK$41.07 23 April 2011 to 22 April 2013 128,000 –(Note 1)
9 April 2010 HK$85.35 13 April 2012 to 12 April 2014 256,000 210,000(Note 2)
Andy LEUNG Hon Kwong 9 April 2010 HK$85.35 13 April 2012 to 12 April 2014 128,000 –(Note 2)
Notes:
(1) The weighted average closing price per share of the Company immediately before the date on which options were exercised was HK$106.50.
(2) The weighted average closing price per share of the Company immediately before the date on which options were exercised was HK$116.90.
Save as disclosed above, as at 31 March 2014, none of the Directors and chief executives of the Company had any interest or short
positions in the shares, underlying shares and debentures of the Company or any of its associated corporations (within the meaning
of Part XV of the SFO) which were recorded in the register required to be kept by the Company pursuant to Section 352 of the SFO or
otherwise notified to the Company and the Stock Exchange pursuant to the Model Code.
Substantial Shareholdings
As at 31 March 2014, other than the interests of the Directors and chief executives of the Company disclosed above, shareholders who had
interests or short positions in the shares or underlying shares of the Company of 5% or more which fell to be disclosed to the Company
under Part XV of the SFO, or which were recorded in the register required to be kept by the Company pursuant to Section 336 of the SFO,
were as follows:
Name of shareholder CapacityNumber of
shares held
Approximate percentage of shareholding
Credit Suisse Trust Limited Interest of controlled corporation (Note 1) 74,101,153 29.54%Surplus Assets Limited Interest of controlled corporation (Note 1) 74,101,153 29.54%Honorex Limited Interest of controlled corporation (Note 1) 65,496,225 26.11%
Beneficial owner (Note 1) 1,416,325 0.56%Conquer Rex Limited Beneficial owner (Note 1) 65,496,225 26.11%Templeton Asset Management Limited Investment manager 35,046,900 13.97%The Capital Group Companies, Inc. Interest of controlled corporation 15,922,940 6.35%Pyrford International Limited Investment manager 12,584,861 5.02%
Notes:(1) The shares were beneficially owned as to 1,416,325 shares by Honorex, as to 65,496,225 shares by Conquer Rex and as to 7,188,603 shares by Twin Success.
Conquer Rex was wholly owned by Honorex. Each of Conquer Rex, Honorex and Twin Success was wholly owned by Surplus Assests. Surplus Assets was wholly owned by Credit Suisse Trust Limited as the trustee of The Allan Wong 2011 Trust, a discretionary trust of which Dr. Allan WONG Chi Yun, a Director, was the founder. Surplus Assets was therefore deemed to have an aggregate indirect interest in 74,101,153 shares. Honorex was also deemed to have an indirect interest in the 65,496,225 shares. Surplus Assets was wholly owned by Credit Suisse Trust Limited which was deemed to be interested in such shares by virtue of the SFO. Dr. Allan WONG Chi Yun’s founder interests in the 74,101,153 shares of the Company has also been disclosed under the section headed “Directors’ Interests and Short Positions in Shares, Underlying Shares and Debentures” in this Annual Report.
(2) All the interests stated above represented long positions.
Save as disclosed above, as at 31 March 2014, the Company had not been notified by any person (other than the Directors and chief
executives of the Company) who had interests or short positions in the shares and underlying shares of the Company which fell to be
disclosed to the Company under Part XV of the SFO or which were recorded in the register required to be kept by the Company pursuant
to Section 336 of the SFO.

38 VTech Holdings Limited Annual Report 2014
Report of the Directors
Public Float
Based on the information publicly available and within the
knowledge of the Directors, the Company has maintained at least
25% of the total issued share capital of the Company to be held by
the public at all times during the year ended 31 March 2014 and
up to the date of this Annual Report.
Management Contracts
No contracts concerning the management and administration of
the whole or any substantial part of the business of the Company
were entered into or existed during the year ended 31 March 2014.
Securities Purchase Arrangements
At the 2013 AGM, shareholders renewed the approval of a general
mandate authorising the Directors to effect repurchases of the
Company’s own shares up to a limit of 10% of the shares in issue as
at that date.
Purchase, Sale or Redemption of Listed Shares
The Company and its subsidiaries have not redeemed any of its
shares during the financial year. Neither the Company nor any of
its subsidiaries has purchased or sold any of the Company’s shares
during the financial year, except that the trustee of the Share
Purchase Scheme, pursuant to the rules and trust deed of the
Share Purchase Scheme, purchased on the Stock Exchange a total
of 69,000 Company’s shares at a consideration of US$1.0 million.
Major Customers and Suppliers
For the year ended 31 March 2014, the aggregate amount of
purchases attributable to the Group’s five largest suppliers
represented less than 30% of the Group’s total value of purchases.
The Group’s largest customer accounted for approximately 14.8%
of the Group’s revenue and the Group’s five largest customers
in aggregate accounted for approximately 34.0% of the Group’s
revenue during the financial year. None of the Directors, their
associates or any shareholder (who, to the knowledge of the
Directors, owns more than 5% of the Company’s share capital) had
an interest in the customers and the suppliers noted above.
Pre-emptive Rights
There is no provision for pre-emptive rights under the Bye-laws
of the Company and there are no statutory restrictions against
such rights under the laws of Bermuda in which the Company
is incorporated.
Auditor
The financial statements have been audited by KPMG, who shall retire
and, being eligible, offer itself for re-appointment at the 2014 AGM.
On behalf of the Board
Allan WONG Chi Yun
Chairman
Hong Kong, 22 May 2014
39VTech Holdings Limited Annual Report 2014
Independent Auditor’s Report
An audit involves performing procedures to obtain audit evidence
about the amounts and disclosures in the consolidated financial
statements. The procedures selected depend on the auditor’s
judgement, including the assessment of the risks of material
misstatement of the consolidated financial statements, whether
due to fraud or error. In making those risk assessments, the auditor
considers internal control relevant to the entity’s preparation of
the consolidated financial statements that give a true and fair view
in order to design audit procedures that are appropriate in the
circumstances, but not for the purpose of expressing an opinion
on the effectiveness of the entity’s internal control. An audit also
includes evaluating the appropriateness of accounting policies
used and the reasonableness of accounting estimates made by
the directors, as well as evaluating the overall presentation of the
consolidated financial statements.
We believe that the audit evidence we have obtained is sufficient
and appropriate to provide a basis for our audit opinion.
Opinion
In our opinion, the consolidated financial statements give a true
and fair view of the state of affairs of the Company and of the
Group as at 31 March 2014 and of the Group’s profit and cash
flows for the year then ended in accordance with International
Financial Reporting Standards and have been properly prepared
in accordance with the disclosure requirements of the Hong Kong
Companies Ordinance.
KPMG
Certified Public Accountants
8th Floor, Prince’s Building
10 Chater Road
Central, Hong Kong
22 May 2014
To the Shareholders of VTech Holdings Limited
(Incorporated in Bermuda with limited liability)
We have audited the consolidated financial statements of VTech
Holdings Limited (“the Company”) and its subsidiaries (together
the “Group”) set out on pages 40 to 66, which comprise the
consolidated and Company balance sheets as at 31 March 2014,
the consolidated income statement, the consolidated statement
of comprehensive income, the consolidated statement of changes
in equity and the consolidated statement of cash flows for the year
then ended and a summary of significant accounting policies and
other explanatory information.
Directors’ Responsibility for
the Consolidated Financial Statements
The directors of the Company are responsible for the preparation
of consolidated financial statements that give a true and fair view
in accordance with International Financial Reporting Standards
issued by the International Accounting Standards Board and
the disclosure requirements of the Hong Kong Companies
Ordinance and for such internal control as the directors determine
is necessary to enable the preparation of consolidated financial
statements that are free from material misstatement, whether due
to fraud or error.
Auditor’s Responsibility
Our responsibility is to express an opinion on these consolidated
financial statements based on our audit. This report is made solely
to you, as a body, in accordance with Section 90 of the Bermuda
Companies Act 1981, and for no other purpose. We do not assume
responsibility towards or accept liability to any other person for the
contents of this report.
We conducted our audit in accordance with International
Standards on Auditing issued by the International Auditing and
Assurance Standards Board. Those standards require that we
comply with ethical requirements and plan and perform the audit
to obtain reasonable assurance about whether the consolidated
financial statements are free from material misstatement.
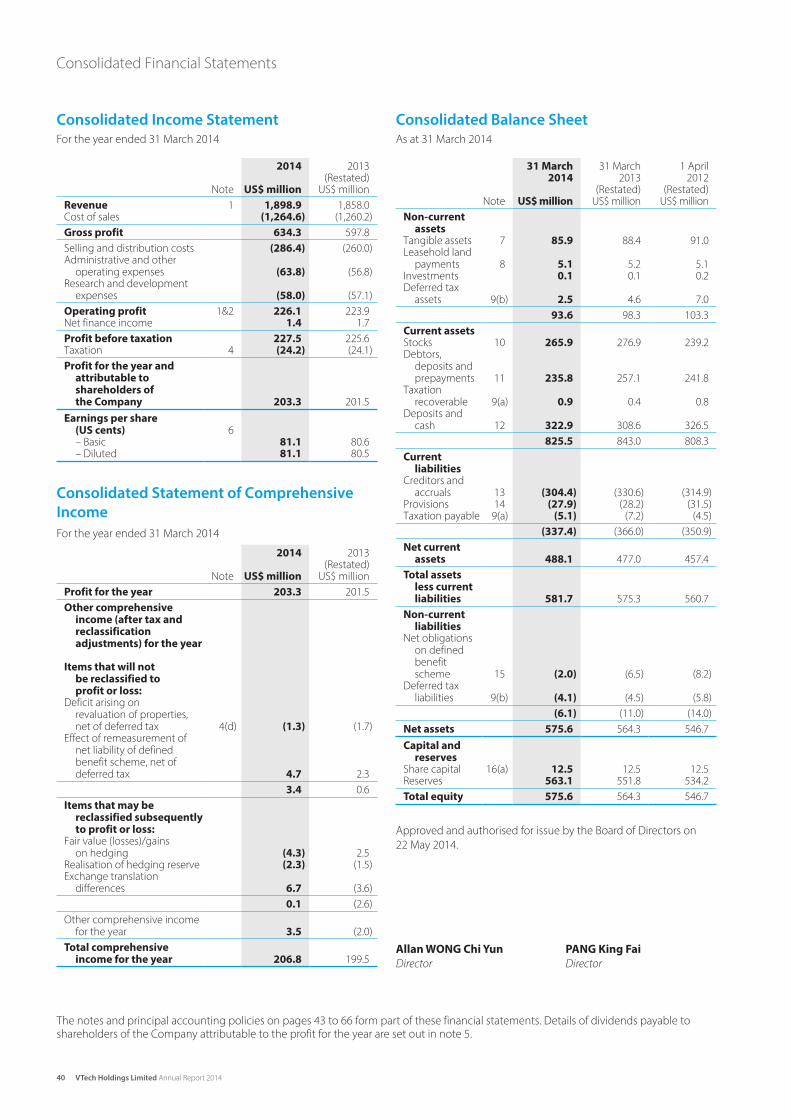
40 VTech Holdings Limited Annual Report 2014
Consolidated Financial Statements
Consolidated Income Statement
For the year ended 31 March 2014
2014 2013(Restated)
Note US$ million US$ million
Revenue 1 1,898.9 1,858.0Cost of sales (1,264.6) (1,260.2)
Gross profit 634.3 597.8
Selling and distribution costs (286.4) (260.0)Administrative and other
operating expenses (63.8) (56.8)Research and development
expenses (58.0) (57.1)
Operating profit 1&2 226.1 223.9Net finance income 1.4 1.7
Profit before taxation 227.5 225.6Taxation 4 (24.2) (24.1)
Profit for the year and attributable to shareholders of the Company 203.3 201.5
Earnings per share (US cents) 6– Basic 81.1 80.6– Diluted 81.1 80.5
Consolidated Statement of Comprehensive
Income
For the year ended 31 March 2014
2014 2013(Restated)
Note US$ million US$ million
Profit for the year 203.3 201.5
Other comprehensive income (after tax and reclassification adjustments) for the year
Items that will not be reclassified to profit or loss:
Deficit arising on revaluation of properties, net of deferred tax 4(d) (1.3) (1.7)
Effect of remeasurement of net liability of defined benefit scheme, net of deferred tax 4.7 2.3
3.4 0.6
Items that may be reclassified subsequently to profit or loss:
Fair value (losses)/gains on hedging (4.3) 2.5
Realisation of hedging reserve (2.3) (1.5)Exchange translation
differences 6.7 (3.6)
0.1 (2.6)
Other comprehensive income for the year 3.5 (2.0)
Total comprehensive income for the year 206.8 199.5
Consolidated Balance Sheet
As at 31 March 2014
31 March 31 March 1 April2014 2013 2012
(Restated) (Restated)Note US$ million US$ million US$ million
Non-current assets
Tangible assets 7 85.9 88.4 91.0Leasehold land
payments 8 5.1 5.2 5.1Investments 0.1 0.1 0.2Deferred tax
assets 9(b) 2.5 4.6 7.0
93.6 98.3 103.3
Current assetsStocks 10 265.9 276.9 239.2Debtors,
deposits and prepayments 11 235.8 257.1 241.8
Taxation recoverable 9(a) 0.9 0.4 0.8
Deposits and cash 12 322.9 308.6 326.5
825.5 843.0 808.3
Current liabilities
Creditors and accruals 13 (304.4) (330.6) (314.9)
Provisions 14 (27.9) (28.2) (31.5)Taxation payable 9(a) (5.1) (7.2) (4.5)
(337.4) (366.0) (350.9)
Net current assets 488.1 477.0 457.4
Total assets less current liabilities 581.7 575.3 560.7
Non-current liabilities
Net obligations on defined benefit scheme 15 (2.0) (6.5) (8.2)
Deferred tax liabilities 9(b) (4.1) (4.5) (5.8)
(6.1) (11.0) (14.0)
Net assets 575.6 564.3 546.7
Capital and reserves
Share capital 16(a) 12.5 12.5 12.5Reserves 563.1 551.8 534.2
Total equity 575.6 564.3 546.7
Approved and authorised for issue by the Board of Directors on
22 May 2014.
The notes and principal accounting policies on pages 43 to 66 form part of these financial statements. Details of dividends payable to shareholders of the Company attributable to the profit for the year are set out in note 5.
Allan WONG Chi Yun PANG King Fai
Director Director
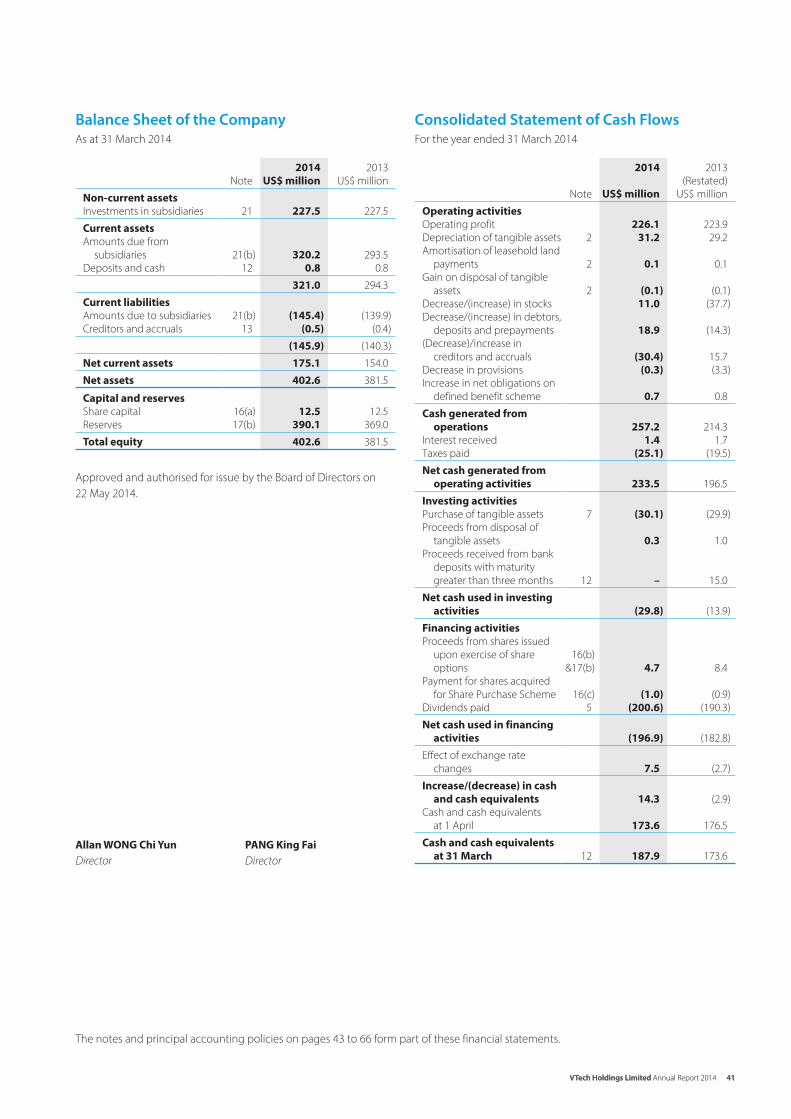
41VTech Holdings Limited Annual Report 2014 41VTech Holdings Limited Annual Report 2014
Balance Sheet of the Company
As at 31 March 2014
2014 2013
Note US$ million US$ million
Non-current assets
Investments in subsidiaries 21 227.5 227.5
Current assets
Amounts due from
subsidiaries 21(b) 320.2 293.5
Deposits and cash 12 0.8 0.8
321.0 294.3
Current liabilities
Amounts due to subsidiaries 21(b) (145.4) (139.9)
Creditors and accruals 13 (0.5) (0.4)
(145.9) (140.3)
Net current assets 175.1 154.0
Net assets 402.6 381.5
Capital and reserves
Share capital 16(a) 12.5 12.5
Reserves 17(b) 390.1 369.0
Total equity 402.6 381.5
Approved and authorised for issue by the Board of Directors on
22 May 2014.
Consolidated Statement of Cash Flows
For the year ended 31 March 2014
2014 2013
(Restated)
Note US$ million US$ million
Operating activities
Operating profit 226.1 223.9
Depreciation of tangible assets 2 31.2 29.2
Amortisation of leasehold land
payments 2 0.1 0.1
Gain on disposal of tangible
assets 2 (0.1) (0.1)
Decrease/(increase) in stocks 11.0 (37.7)
Decrease/(increase) in debtors,
deposits and prepayments 18.9 (14.3)
(Decrease)/increase in
creditors and accruals (30.4) 15.7
Decrease in provisions (0.3) (3.3)
Increase in net obligations on
defined benefit scheme 0.7 0.8
Cash generated from
operations 257.2 214.3
Interest received 1.4 1.7
Taxes paid (25.1) (19.5)
Net cash generated from
operating activities 233.5 196.5
Investing activities
Purchase of tangible assets 7 (30.1) (29.9)
Proceeds from disposal of
tangible assets 0.3 1.0
Proceeds received from bank
deposits with maturity
greater than three months 12 – 15.0
Net cash used in investing
activities (29.8) (13.9)
Financing activities
Proceeds from shares issued
upon exercise of share
options
16(b)
&17(b) 4.7 8.4
Payment for shares acquired
for Share Purchase Scheme 16(c) (1.0) (0.9)
Dividends paid 5 (200.6) (190.3)
Net cash used in financing
activities (196.9) (182.8)
Effect of exchange rate
changes 7.5 (2.7)
Increase/(decrease) in cash
and cash equivalents 14.3 (2.9)
Cash and cash equivalents
at 1 April 173.6 176.5
Cash and cash equivalents
at 31 March 12 187.9 173.6
The notes and principal accounting policies on pages 43 to 66 form part of these financial statements.
Allan WONG Chi Yun PANG King Fai
Director Director
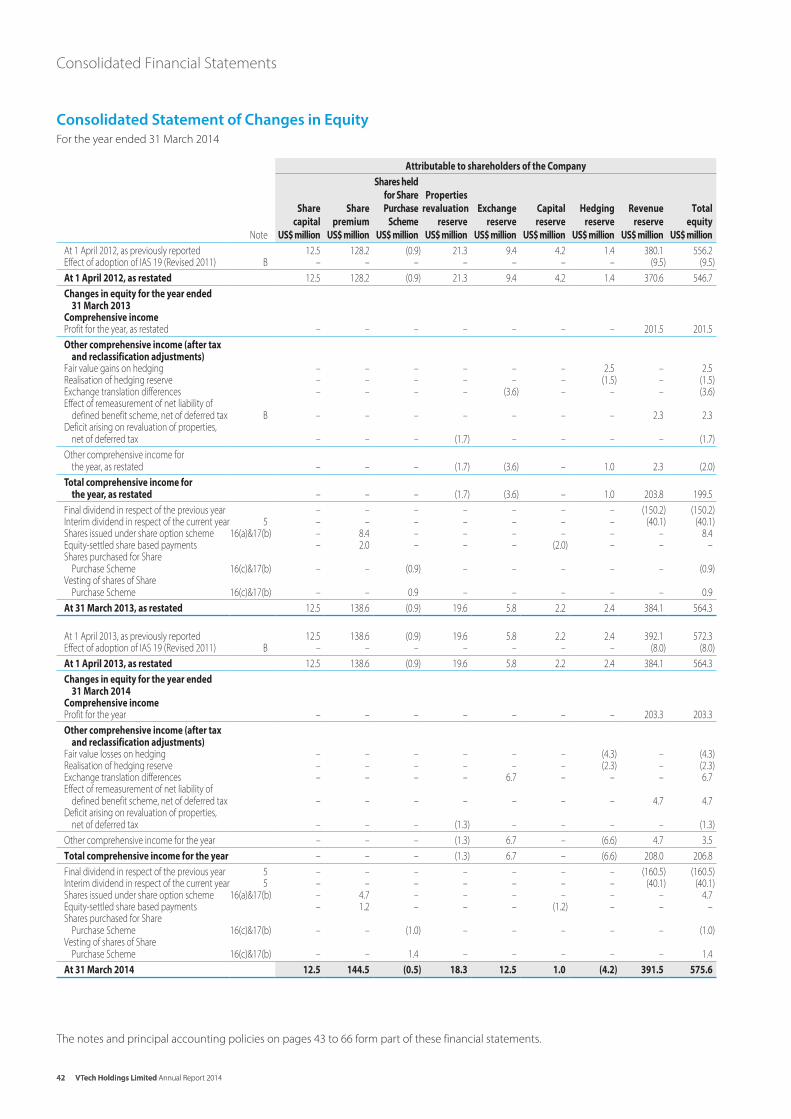
42 VTech Holdings Limited Annual Report 201442 VTech Holdings Limited Annual Report 2014
Consolidated Financial Statements
Consolidated Statement of Changes in Equity
For the year ended 31 March 2014
Attributable to shareholders of the Company
Note
Share
capital
US$ million
Share
premium
US$ million
Shares held
for Share
Purchase
Scheme
US$ million
Properties
revaluation
reserve
US$ million
Exchange
reserve
US$ million
Capital
reserve
US$ million
Hedging
reserve
US$ million
Revenue
reserve
US$ million
Total
equity
US$ million
At 1 April 2012, as previously reported 12.5 128.2 (0.9) 21.3 9.4 4.2 1.4 380.1 556.2Effect of adoption of IAS 19 (Revised 2011) B – – – – – – – (9.5) (9.5)
At 1 April 2012, as restated 12.5 128.2 (0.9) 21.3 9.4 4.2 1.4 370.6 546.7
Changes in equity for the year ended31 March 2013
Comprehensive incomeProfit for the year, as restated – – – – – – – 201.5 201.5
Other comprehensive income (after tax and reclassification adjustments)
Fair value gains on hedging – – – – – – 2.5 – 2.5Realisation of hedging reserve – – – – – – (1.5) – (1.5)Exchange translation differences – – – – (3.6) – – – (3.6)Effect of remeasurement of net liability of
defined benefit scheme, net of deferred tax B – – – – – – – 2.3 2.3Deficit arising on revaluation of properties,
net of deferred tax – – – (1.7) – – – – (1.7)
Other comprehensive income for the year, as restated – – – (1.7) (3.6) – 1.0 2.3 (2.0)
Total comprehensive income for the year, as restated – – – (1.7) (3.6) – 1.0 203.8 199.5
Final dividend in respect of the previous year – – – – – – – (150.2) (150.2)Interim dividend in respect of the current year 5 – – – – – – – (40.1) (40.1)Shares issued under share option scheme 16(a)&17(b) – 8.4 – – – – – – 8.4Equity-settled share based payments – 2.0 – – – (2.0) – – –Shares purchased for Share
Purchase Scheme 16(c)&17(b) – – (0.9) – – – – – (0.9)Vesting of shares of Share
Purchase Scheme 16(c)&17(b) – – 0.9 – – – – – 0.9
At 31 March 2013, as restated 12.5 138.6 (0.9) 19.6 5.8 2.2 2.4 384.1 564.3
At 1 April 2013, as previously reported 12.5 138.6 (0.9) 19.6 5.8 2.2 2.4 392.1 572.3Effect of adoption of IAS 19 (Revised 2011) B – – – – – – – (8.0) (8.0) At 1 April 2013, as restated 12.5 138.6 (0.9) 19.6 5.8 2.2 2.4 384.1 564.3 Changes in equity for the year ended
31 March 2014Comprehensive incomeProfit for the year – – – – – – – 203.3 203.3 Other comprehensive income (after tax
and reclassification adjustments)Fair value losses on hedging – – – – – – (4.3) – (4.3)Realisation of hedging reserve – – – – – – (2.3) – (2.3)Exchange translation differences – – – – 6.7 – – – 6.7Effect of remeasurement of net liability of
defined benefit scheme, net of deferred tax – – – – – – – 4.7 4.7Deficit arising on revaluation of properties,
net of deferred tax – – – (1.3) – – – – (1.3) Other comprehensive income for the year – – – (1.3) 6.7 – (6.6) 4.7 3.5 Total comprehensive income for the year – – – (1.3) 6.7 – (6.6) 208.0 206.8 Final dividend in respect of the previous year 5 – – – – – – – (160.5) (160.5)Interim dividend in respect of the current year 5 – – – – – – – (40.1) (40.1)Shares issued under share option scheme 16(a)&17(b) – 4.7 – – – – – – 4.7Equity-settled share based payments – 1.2 – – – (1.2) – – –Shares purchased for Share
Purchase Scheme 16(c)&17(b) – – (1.0) – – – – – (1.0)Vesting of shares of Share
Purchase Scheme 16(c)&17(b) – – 1.4 – – – – – 1.4 At 31 March 2014 12.5 144.5 (0.5) 18.3 12.5 1.0 (4.2) 391.5 575.6
The notes and principal accounting policies on pages 43 to 66 form part of these financial statements.

43VTech Holdings Limited Annual Report 2014
Notes to the Financial Statements
Principal Accounting Policies
A Principal Activities and Organisation
The Group’s principal activities and operating segments are set out in note 1 to the financial statements.
The Company was incorporated in Bermuda. In view of the international nature of the Group’s operations, the financial statements are presented in United States dollars.
B Statement of Compliance
These financial statements have been prepared in accordance with International Financial Reporting Standards (“IFRSs”) promulgated by the International Accounting Standards Board (“IASB”). IFRSs includes International Accounting Standards (“IASs”) and related Interpretations. These financial statements comply with the applicable disclosure requirements of the Hong Kong Companies Ordinance, which for this financial year and the comparative period continue to be those of the predecessor Companies Ordinance (Cap. 32), in accordance with transitional and saving arrangements for Part 9 of the new Hong Kong Companies Ordinance (Cap. 622), “ Accounts and Audit”, which are set out in sections 76 to 87 of Schedule 11 to that Ordinance. These financial statements also comply with the applicable disclosure provisions of the Rules Governing the Listing of Securities on The Stock Exchange of Hong Kong Limited (the “Listing Rules”).
The IASB has issued a number of new IFRSs and amendments to IFRSs that are first effective for the current accounting period of the Group and the Company. Of these, the following developments are relevant to the Group’s financial statements:
• IAS 1 (Amendment), Presentation of financial statements – Presentation of items of other comprehensive income
• IAS 19 (Revised 2011), Employee benefits
• IFRSs (Amendment), Annual improvements to IFRSs 2009-2011 cycle
• IFRS 7 (Amendment), Financial instruments: Disclosures – Offsetting financial assets and financial liabilities
• IFRS 10, Consolidated financial statements
• IFRS 12, Disclosure of interests in other entities
• IFRS 13, Fair value measurement
IAS 1 (Amendment), Presentation of financial statements
– Presentation of items of other comprehensive income
The amendments to IAS 1 require entities to present the items of other comprehensive income that would be reclassified to profit or loss in the future if certain conditions are met separately from those that would never be reclassified to profit or loss. The Group’s presentation of other comprehensive income in these financial statements has been modified accordingly.
IAS 19 (Revised 2011), Employee benefits
IAS 19 (Revised 2011) introduces a number of amendments to the accounting for defined benefit scheme. Among them, IAS 19 (Revised 2011) eliminates the “corridor method” under which the recognition of actuarial gains and losses relating to defined benefit scheme could be deferred and recognised in profit or loss over the expected average remaining service lives of employees. Under the revised standard, all actuarial gains and losses are required to be recognised immediately in other comprehensive income. IAS 19 (Revised 2011) also changed the basis for determining income from plan assets from expected return to interest income calculated at the liability discount rate, and requires immediate recognition of past service cost, whether vested or not.
As a result of the adoption of IAS 19 (Revised 2011), the Group has changed its accounting policy with respect to defined benefit scheme, for which the “corridor method” was previously applied. This change in accounting policy has been applied retrospectively by restating the balances at 1 April 2012 and 31 March 2013, and with consequential adjustments to comparatives for the year ended 31 March 2013 as follows:
As previously
reported
Effect of adoptionof IAS 19 (Revised
2011) As restatedUS$ million US$ million US$ million
Consolidated income statement for the year ended 31 March 2013
Administrative and other operating expenses (56.0) (0.8) (56.8)
Profit for the year 202.3 (0.8) 201.5Basic earnings per share
(US cents) 80.9 (0.3) 80.6Diluted earnings per share
(US cents) 80.8 (0.3) 80.5
Consolidated statement of comprehensive income for the year ended 31 March 2013
Effect of remeasurement of net liability of defined benefit scheme, net of deferred tax – 2.3 2.3
Total comprehensive income for the year 198.0 1.5 199.5
Consolidated balance sheet as at 31 March 2013
Deferred tax assets 3.7 0.9 4.6Debtors, deposits and
prepayments 259.5 (2.4) 257.1Net obligations on
defined benefit scheme – (6.5) (6.5)Revenue reserve 392.1 (8.0) 384.1
Consolidated balance sheet as at 1 April 2012
Deferred tax assets 5.9 1.1 7.0Debtors, deposits and
prepayments 244.2 (2.4) 241.8Net obligations on
defined benefit scheme – (8.2) (8.2)Revenue reserve 380.1 (9.5) 370.6
IFRSs (Amendment), Annual improvements to IFRSs 2009-2011 cycle
This cycle of annual improvements contains amendments to five standards with consequential amendments to other standards and interpretations. Among them,
(i) IAS 1 has been amended to clarify that an opening balance sheet is required only when a retrospective application of an accounting policy, a retrospective restatement or a reclassification has a material effect on the information presented in the opening balance sheet. The amendments also remove the requirement to present related notes to the opening balance sheet when such balance sheet is presented. Since the Group considers that the restatement resulting from the adoption of IAS 19 (Revised 2011) has a material impact on the opening financial position, an additional balance sheet as at 1 April 2012 has been presented in these financial statements.
44 VTech Holdings Limited Annual Report 2014
Notes to the Financial Statements
Principal Accounting Policies (Continued)
B Statement of Compliance (Continued)
IFRSs (Amendment), Annual improvements to IFRSs 2009-2011 cycle
(Continued)
(ii) IAS 34 has been amended to clarify that total assets for a particular reportable segment are required to be disclosed only if the amounts are regularly provided to the chief operating decision maker (CODM) and only if there has been a material change in the total assets for that segment from the amount disclosed in the last annual financial statements. The amendment also requires the disclosure of segment liabilities if the amounts are regularly provided to the CODM and there has been a material change in the amounts compared with the last annual financial statements. In respect of this amendment, the Group has continued to disclose segment assets and segment liabilities in note 1.
IFRS 7 (Amendment), Financial instruments: Disclosures
– offsetting financial assets and financial liabilities
The amendments to IFRS 7 require companies to disclose information about rights of offset and related arrangements for financial instruments under an enforceable master netting agreement or similar arrangement. The Group has outstanding derivative financial instruments presented as financial assets/liabilities in the consolidated balance sheet which are under master netting agreements. The amendments to IFRS 7 require retrospective application. The application of the amendments has had no impact on the results or financial position of the Group but results in additional disclosures in the Group’s consolidated financial statements.
IFRS 10, Consolidated financial statements
IFRS 10 replaces the requirements in IAS 27, Consolidated and separate financial statements relating to the preparation of consolidated financial statements and SIC 12 Consolidation – Special purpose entities. It introduces a single control model to determine whether an investee should be consolidated, by focusing on whether the entity has power over the investee, exposure or rights to variable returns from its involvement with the investee and the ability to use its power to affect the amount of those returns.
As a result of the adoption of IFRS 10, the Group has changed its accounting policy with respect to determining whether it has control over an investee. The adoption does not change any of the control conclusions reached by the group in respect of its involvement with other entities as at 1 April 2013.
IFRS 12, Disclosure of interests in other entities
IFRS 12 brings together into a single standard all the disclosure requirements relevant to an entity’s interests in subsidiaries, joint arrangements, associates and unconsolidated structured entities. The disclosures required by IFRS 12 are generally more extensive than those previously required by the respective standards. To the extent that the requirements are applicable to the Group, the Group has provided those disclosures in note 21.
IFRS 13, Fair value measurement
IFRS 13 replaces existing guidance in individual IFRSs with a single source of fair value measurement guidance. IFRS 13 also contains extensive disclosure requirements about fair value measurements for both financial instruments and non-financial instruments. To the extent that the requirements are applicable to the Group, the Group has provided those disclosures in notes 7 and 18.
The Group has not applied any new standard, amendment or interpretation that is not yet effective for the current accounting period (note 23).
C Basis of Preparation of the Financial Statements
These financial statements are prepared on the historical cost basis as modified by the revaluation of certain properties and derivative financial instruments stated at their fair value as explained in the accounting policies set out below.
The preparation of the financial statements in conformity with IFRSs requires management to make judgements, estimates and assumptions that affect the application of policies and reported amounts of assets, liabilities, income and expenses. The estimates and associated assumptions are based on historical experience and various other factors that are believed to be reasonable under the circumstances, the results of which form the basis of making the judgements about carrying values of assets and liabilities that are not readily apparent from other sources. Actual results may differ from these estimates.
The estimates and underlying assumptions are reviewed on an ongoing basis. Revisions to accounting estimates are recognised in the period in which the estimate is revised if the revision affects only that period or in the period of the revision and future periods if the revision affects both current and future periods.
Judgements made by management in the application of IFRSs that have significant effect on the financial statements and major sources of estimation uncertainty are discussed in note 24.
D Basis of Consolidation
The consolidated financial statements include the financial statements of the Company and its subsidiaries and structure entities. All significant inter-company balances and transactions and any unrealised gains arising from inter-company transactions are eliminated on consolidation.
Subsidiaries and structure entities are entities controlled by the Group. The Group controls an entity when it is exposed, or has rights, to variable returns from its involvement with the entity and has the ability to affect those returns through its power over the entity. When assessing whether the group has power, only substantive rights (held by the Group and other parties) are considered.
An investment in a subsidiary and a structured entity consolidated into the consolidated financial statements from the date that control commences until the date that control ceases. Intra-group balances, and transactions and cash flows and any unrealised profits arising from intra-group transactions are eliminated in full in preparing the consolidated financial statements. Unrealised losses resulting from intra-group transactions are eliminated in the same way as unrealised gains but only to the extent that there is no evidence of impairment. The assets and liabilities of the structured entity, VTech Share Purchase Scheme Trust, are included in the Group’s balance sheet and the shares held by the VTech Share Purchase Scheme Trust are presented as a deduction in equity as Shares held for Share Purchase Scheme.
45VTech Holdings Limited Annual Report 2014
Principal Accounting Policies (Continued)
D Basis of Consolidation (Continued)
Changes in the Group’s interests in a subsidiary that do not result in a loss of control are accounted for as equity transactions, whereby adjustments are made to the amounts of controlling and non-controlling interests within consolidated equity to reflect the change in relative interests, but no adjustments are made to goodwill and no gain or loss is recognised.
When the Group loses control of a subsidiary, it is accounted for as a disposal of the entire interest in that subsidiary, with a resulting gain or loss being recognised in profit or loss. Any interest retained in that former subsidiary at the date when control is lost is recognised at fair value and this amount is regarded as the fair value on initial recognition of a financial asset or, when appropriate, the cost on initial recognition of an investment in an associate or a jointly venture.
Investments in subsidiaries in the Company’s balance sheet are stated at cost less impairment losses (see note (K)).
E Revenue Recognition
Revenue is measured at the fair value of the consideration received or receivable. Provided it is probable that the economic benefits will flow to the Group and the revenue and costs, if applicable, can be measured reliably, revenue is recognised in profit or loss as follows:
i. Revenue from the sale of goods is recognised when the significant risks and rewards of ownership have been transferred to the buyer. Revenue is stated net of sales taxes, returns, rebates and discounts, after eliminating sales within the Group.
ii. Revenue from the provision of services is recognised when the services are rendered.
iii. Interest income is recognised as it accrues using the effective interest method.
iv. Dividend income is recognised when the Group’s right to receive payment is established.
F Research and Development
Research and development costs comprise all costs that are directly attributable to research and development activities or that can be allocated on a reasonable basis to such activities.
Expenditure on research activities is recognised as an expense in the period in which it is incurred.
Expenditure on development activities is capitalised only if the product or process is clearly defined, technically and commercially feasible, the attributable expenditure is separately identifiable and the Group has sufficient resources and the intention to complete development. The expenditure capitalised includes the cost of materials, direct labour and an appropriate proportion of overheads which are directly attributable to development activities. Capitalised development costs are stated at cost less accumulated amortisation and impairment losses (see note (K)). Development expenditure that does not meet the above criteria is recognised as an expense in the period in which it is incurred.
Amortisation is calculated to write off capitalised development costs on a straight-line basis over their estimated useful lives, commencing from the date when the products are put into commercial production.
G Translation of Foreign Currencies
Foreign currency transactions during the year are translated into United States dollars at the foreign exchange rates ruling at the transaction dates. Monetary assets and liabilities denominated in foreign currencies are translated into United States dollars at the foreign exchange rates ruling at the balance sheet date. Exchange gains and losses are recognised in profit or loss.
Non-monetary assets and liabilities that are measured in terms of historical cost in a foreign currency are translated using the foreign exchange rates ruling at the transactions dates. Non-monetary assets and liabilities denominated in foreign currencies that are stated at fair value are translated using the foreign exchange rates ruling at the dates the fair value was determined.
The results of foreign operations are translated into United States dollars at the exchange rates approximating the foreign exchange rates ruling at the dates of the transactions. Balance sheet items are translated into United States dollars at the closing foreign exchange rates at the balance sheet date.
On disposal of a foreign operation, the cumulative amount of the exchange differences relating to that foreign operation is reclassified from equity to profit or loss when the profit or loss on disposal is recognised.
H Tangible Assets and Depreciation
The following properties held for own use are stated at their revalued amount, being their fair value at the date of the revaluation less any subsequent accumulated depreciation:
– freehold land and buildings; and
– medium-term leasehold land and buildings.
Revaluations are performed with sufficient regularity to ensure that the carrying amount of these assets does not differ materially from that which would be determined using fair values at the balance sheet date.
The following items of tangible assets are stated at cost less accumulated depreciation and impairment losses (see note (K)):
– short-term leasehold buildings held for own use which are situated on leasehold land classified as held under operating leases; and
– other items of tangible assets.
Changes arising on the revaluation of properties held for own use are generally dealt with in other comprehensive income and are accumulated separately in equity in the property revaluation reserve. The only exceptions are as follows:
– When a deficit arises on revaluation, it will be charged to profit or loss to the extent that it exceeds the amount held in the reserve in respect of that same asset immediately prior to the revaluation; and
– When a surplus arises on revaluation, it will be credited to profit or loss to the extent that a deficit on revaluation in respect of that same asset had previously been charged to profit or loss.

46 VTech Holdings Limited Annual Report 2014
Notes to the Financial Statements
Principal Accounting Policies (Continued)
H Tangible Assets and Depreciation (Continued)
Depreciation is calculated to write off the cost or revalued amount of assets on a straight-line basis over their estimated useful lives which are as follows:
Freehold land is not depreciated.
Leasehold land Over the unexpired term of lease
Freehold buildings, medium-term and short-term leasehold buildings and leasehold improvements
10 to 50 years or lease term, if shorter
Moulds 1 yearMachinery and equipment 3 to 5 yearsComputers, motor vehicles,
furniture and fixtures3 to 7 years
Where parts of a tangible asset have different useful lives, the cost or valuation of the item is allocated on a reasonable basis between the parts and each part is depreciated separately. Both the useful life of an asset and its residual value, if any, are reviewed annually.
Gains or losses arising from the retirement or disposal of tangible assets are determined as the difference between the estimated net disposal proceeds and the carrying amount of the assets and are recognised in profit or loss on the date of retirement or disposal. Any related revaluation surplus is transferred from the revaluation reserve to revenue reserve and is not reclassified to profit or loss.
I Construction in Progress
Construction in progress represents land and buildings under development and are stated at cost less impairment losses (see note (K)). Cost comprises the construction costs of buildings and costs paid to acquire land use rights.
Building construction costs are transferred to leasehold buildings when the assets are completed and put into operational use and depreciation will be provided at the appropriate rates in accordance with the depreciation policies (see note (H)).
No depreciation or amortisation is provided in respect of construction in progress.
J Leases
Leases of tangible assets in terms of which that the Group assumes substantially all the risks and rewards of ownership are classified as finance leases. Tangible assets acquired by way of finance lease is stated at an amount equal to the lower of its fair value and the present value of the minimum lease payments at inception of the lease less accumulated depreciation and impairment losses (see note (K)). Finance charges are recognised in profit or loss in proportion of the capital balances outstanding.
Leases of assets under which substantially all the benefits and risks of ownership are effectively retained by the lessor are classified as operating leases. Payments made under operating leases (net of any incentives received from the lessor) are recognised in profit or loss on a straight-line basis over the period of the lease.
Leasehold land payments are up-front payments to acquire long-term leasehold interests in land. These payments are stated at cost and are amortised on a straight-line basis over the respective period of the leases.
When an operating lease is terminated before the lease period has expired, any payment required to be made to the lessor by way of penalty is recognised as an expense in the period in which the termination takes place.
K Impairment of Assets
(i) Impairment of debtors and other financial assets
Impairment losses for doubtful debts are recognised when there is objective evidence of impairment and are measured as the difference between the carrying amount of the financial asset and the estimated future cash flows, discounted at the asset’s original effective interest rate where the effect of discounting is material. Objective evidence of impairment includes observable data that comes to the attention of the Group about events that have an impact on the asset’s estimated future cash flows such as significant financial difficulty of the debtor.
Impairment losses for debtors whose recovery is considered doubtful but not remote are recorded using an allowance account. When the Group is satisfied that recovery is remote, the amount considered irrecoverable is written off against trade debtors directly and any amounts held in the allowance account relating to that debt are reversed. Subsequent recoveries of amounts previously charged to the allowance account are reversed against the allowance account. Other changes in the allowance account and subsequent recoveries of amounts previously written off directly are recognised in profit or loss.
(ii) Impairment of other assets
The carrying amounts of the Group’s assets including tangible assets, construction in progress, interest in subsidiaries and other investments, are reviewed at each balance sheet date to determine whether there is any indication of impairment. If any such indication exists, the asset’s recoverable amount is estimated.
– Calculation of recoverable amount
The recoverable amount is the greater of the asset’s fair value less costs of disposal and value in use. In assessing value in use, the estimated future cash flows are discounted to their present value using a pre-tax discount rate that reflects current market assessments of the time value of money and the risks specific to the asset. Where an asset does not generate cash inflows largely independent of those from other assets, the recoverable amount is determined for the smallest group of assets that generates cash inflows independently (i.e. a cash-generating unit).
– Recognition of impairment losses
An impairment loss is recognised as an expense in profit or loss whenever the carrying amount exceeds the recoverable amount.
– Reversal of impairment losses
An impairment loss is reversed if there has been a favourable change in the estimates used to determine the recoverable amount. A reversal of an impairment loss is limited to the asset’s carrying amount that would have been determined had no impairment loss been recognised in prior years. Reversals of impairment losses are credited to profit or loss in the year in which the reversals are recognised.
– Interim financial reporting and impairment
Under the Listing Rules, the Group is required to prepare an interim financial report in compliance with IAS 34, Interim Financial Reporting, in respect of the first six months of the financial year. At the end of the interim period, the Group applies the same impairment testing, recognition, and reversal criteria as it would at the end of the financial year.
47VTech Holdings Limited Annual Report 2014
Principal Accounting Policies (Continued)
L Other Investments
Other investments are initially stated at fair value, which is their transaction price unless fair value can be more reliably estimated using valuation techniques whose variables include only data from observable markets. Cost includes attributable transaction costs. Subsequently, other investments that do not have a quoted market price in an active market and whose fair value cannot be reliably measured are recognised in the balance sheet at cost less impairment losses (see note (K)).
M Stocks
Stocks are stated at the lower of cost and net realisable value. Cost is calculated on the weighted average or the first-in-first-out basis, and comprises materials, direct labour and an appropriate share of production overheads incurred in bringing the inventories to their present location and condition. Net realisable value is the estimated selling price in the ordinary course of business, less estimates of costs of completion and selling expenses.
When stocks are sold, the carrying amount of those stocks is recognised as an expense in the period in which the related revenue is recognised. The amount of any write-down of stocks to net realisable value and all losses of stocks are recognised as an expense in the period the write-down or loss occurs. The amount of any reversal of any write-down of stocks is recognised as a reduction in the amount of stocks as an expense in the period in which the reversal occurs.
N Trade and Other Debtors
Trade and other debtors are initially recognised at fair value and thereafter stated at amortised cost less allowance for impairment of doubtful debts, except where the debtors are interest-free loans made to related parties without any fixed repayment terms or the effect of discounting would be immaterial. In such cases, the receivables are stated at cost less allowance for impairment of doubtful debts (see note (K)).
O Cash and Cash Equivalents
Cash and cash equivalents comprise cash on hand, demand deposits with banks and other financial institutions, short-term highly liquid investments that are readily convertible into known amounts of cash and which are subject to an insignificant risk of changes in value and which have a maturity of three months or less at acquisition. Bank overdrafts that are repayable on demand and form an integral part of the Group’s cash management are also included as a component of cash and cash equivalents for the purpose of statement of cash flows.
P Trade and Other Creditors
Trade and other creditors are initially recognised at fair value and thereafter stated at amortised cost unless the effect of discounting would be immaterial, in which case they are stated at cost.
Q Provisions and Contingent Liabilities
(i) Financial guarantees issued
Financial guarantees are contracts that require the issuer (i.e. the guarantor) to make specified payments to reimburse the beneficiary of the guarantee (the “holder”) for a loss the holder incurs because a specified debtor fails to make payment when due in accordance with the terms of a debt instrument.
Where the Group issues a financial guarantee, the fair value of the guarantee (being the transaction price, unless the fair value can otherwise be reliably estimated) is initially recognised as deferred income within trade and other creditors. Where consideration is received or receivable for the issuance of the guarantee, the consideration is recognised in accordance with the Group’s policies applicable to that category of asset. Where no such consideration is received or receivable, an immediate expense is recognised in profit or loss on initial recognition of any deferred income.
(ii) Other provisions and contingent liabilities
Provisions are recognised for other liabilities of uncertain timing or amount when the Group has a legal or constructive obligation as a result of past events, it is probable that an outflow of economic benefits will be required to settle the obligation, and a reliable estimate of the amount of the obligation can be made.
The Group recognises the estimated liability on expected return claims with respect to products sold. This provision is calculated based on past experience of the level of repairs and returns.
The Group recognises the expected costs of accumulating compensated absences when employees render a service that increases their entitlement to future compensated absences, measured as the additional amount that the Group expects to pay as a result of the unused entitlement that has accumulated at the balance sheet date.
Where it is not probable that an outflow of economic benefits will be required, or the amount cannot be estimated reliably, the obligation is disclosed as a contingent liability, unless the probability of outflow of economic benefits is remote. Possible obligations, whose existence will only be confirmed by the occurrence or non-occurrence of one or more future events, are also disclosed as contingent liabilities unless the probability of outflow of economic benefits is remote.
R Income Tax
Income tax for the year comprises current tax and movements in deferred tax assets and liabilities. Current tax and movements in deferred tax assets and liabilities are recognised in profit or loss except to the extent that they relate to items recognised in other comprehensive income or directly in equity, in which case the relevant amounts of tax are recognised in other comprehensive income or directly in equity, respectively.
Current tax is the expected tax payable on the taxable income for the year, using tax rates enacted or substantively enacted at the balance sheet date, and any adjustment to tax payable in respect of previous years.
Deferred tax assets and liabilities arise from deductible and taxable temporary differences between the carrying amounts of assets and liabilities for financial reporting purposes and the tax bases respectively. Deferred tax assets also arise from unused tax losses and unused tax credits.
Apart from certain limited exceptions, all deferred tax liabilities and all deferred tax assets, to the extent that it is probable that future taxable profits will be available against which the asset can be utilised, are recognised. Future taxable profits that may be capable to support the recognition of deferred tax assets arising from deductible temporary differences include those that will arise from the reversal of existing taxable temporary differences.
The limited exceptions to recognition of deferred tax assets and liabilities are those temporary differences arising from goodwill not deductible for tax purposes and the initial recognition of assets or liabilities that affect neither accounting nor taxable profit (provided that they are not part of a business combination).

48 VTech Holdings Limited Annual Report 2014
Notes to the Financial Statements
Principal Accounting Policies (Continued)
R Income Tax (Continued)
The amount of deferred tax recognised is measured based on the expected manner of realisation or settlement of the carrying amount of the assets and liabilities, using tax rates enacted or substantively enacted at the balance sheet date. Deferred tax assets and liabilities are not discounted.
The carrying amount of a deferred tax asset is reviewed at each balance sheet date and is reduced to the extent that it is no longer probable that sufficient taxable profits will be available to allow the related tax benefit to be utilised. Any such reduction is reversed to the extent that it becomes probable that sufficient taxable profits will be available.
Additional income taxes that arise from the distribution of dividends are recognised when the liability to pay the related dividends is recognised.
Current tax balances and deferred tax balances, and movements therein, are presented separately from each other and are not offset. Current tax assets are offset against current tax liabilities, and deferred tax assets against deferred tax liabilities if, and only if, the Group has the legally enforceable right to set off current tax assets against current tax liabilities.
S Employee Benefits
The Group operates a number of defined contribution retirement schemes throughout the world, including Hong Kong, and a defined benefit retirement scheme in Hong Kong. The assets of all schemes are held separately from those of the Company and its subsidiaries.
(i) Defined contribution schemes
Contributions to the defined contribution schemes are at various funding rates that are in accordance with the local practice and regulations. Contributions relating to the defined contribution schemes are charged to profit or loss as incurred.
(ii) Defined benefit scheme
The Group’s net obligation in respect of defined benefit retirement scheme is calculated separately for each scheme by estimating the amount of future benefit that employees have earned in return for their service in the current and prior periods; that benefit is discounted to determine the present value and the fair value of any scheme assets is deducted. The calculation is performed by a qualified actuary using the projected unit credit method. When the calculation results in a benefit to the Group, the recognised asset is limited to the present value of economic benefits available in the form of any future refunds from the scheme or reductions in future contributions to the scheme.
Service cost and net interest expense (income) on the net defined benefit liability (asset) are recognised in profit or loss and allocates by function as part of “cost of sales”, “selling and distribution costs” or “administrative and other operating expenses”. Current service cost is measured as the increase in the present value of the defined benefit obligation resulting from employee service in the current period. When the benefits of a scheme are changed, or when a scheme is curtailed, the portion of the changed benefit related to past service by employees, or the gain or loss on curtailment, is recognised as an expense in profit or loss at the earlier of when the scheme amendment or curtailment occurs and when related restructuring costs or termination benefits are recognised. Net interest expense (income) for the period is determined by applying the discount rate used to measure the defined benefit obligation at the beginning of the reporting period to the net defined benefit liability (asset). The discount rate is the yield at the end of the reporting period on high quality corporate bonds that have maturity dates approximating the terms of the Group’s obligations.
Remeasurements arising from defined benefit retirement
scheme are recognised in other comprehensive income and
reflected immediately in revenue reserve. Remeasurements
comprise actuarial gains and losses, the return on scheme
assets (excluding amounts included in net interest on the net
defined benefit liability (asset)) and any change in the effect of
the asset ceiling (excluding amounts included in net interest
on the net defined benefit liability (asset)).
(iii) Equity and equity related compensation benefits
For share options granted under the 2001 Scheme and 2011
Scheme, the fair value of share options granted to employees
is recognised as an employee cost with a corresponding
increase in a capital reserve within equity. The fair value is
measured at grant date using the Black-Scholes option pricing
model, taking into account the terms and conditions upon
which the options were granted. Where the employees have
to meet vesting conditions before becoming unconditionally
entitled to the share options, the total estimated fair value of
the share option is spread over the vesting period, taking into
account the probability that the options will vest.
During the vesting period, the number of share options
that is expected to vest is reviewed. Any adjustment to the
cumulative fair value recognised in prior years is charged/
credited to the consolidated income statement for the year of
the review, unless the original employee expenses qualify for
recognition as an asset, with a corresponding adjustment to
the capital reserve. On vesting date, the amount recognised
as an expense is adjusted to reflect the actual number of
share options that vest (with a corresponding adjustment to
the capital reserve) except where forfeiture is only due to not
achieving vesting conditions that relate to the market price
of the Company’s shares. The equity amount is recognised in
the capital reserve until either the option is exercised (when
it is transferred to the share premium account) or the option
expires (when it is released directly to revenue reserve).
At the end of the reporting period, the Group revises its
estimates of the number of shares of the Company granted
under the Share Purchase Scheme (“Awarded Shares”) that
are expected to ultimately vest. Any resulting adjustment to
the cumulative fair value recognised in prior years is charged/
credited to employee share-based compensation expense in
the current year, with a corresponding adjustment to capital
reserve.
T Share held for Share Purchase Scheme
Where the VTech Share Purchase Scheme Trust purchases shares of
the Company from the market, the consideration paid, including
any directly attributable incremental costs, is presented as Shares
held for Share Purchase Scheme and deducted from total equity.
Upon vesting, the related costs of the vested Awarded Shares
recognised as employee share-based compensation expenses are
credited to Shares held for Share Purchase Scheme and decrease
in revenue reserve for shares purchased through reinvesting
dividends received on the vested Awarded Shares.
For vesting of forfeited or unallocated shares regranted, the
related costs of the forfeited or unallocated shares regranted are
credited to Shares held for Share Purchase Scheme, and the related
fair value of the shares regranted are debited to capital reserve.
The difference between the cost and the fair value of the shares
regranted is credited to share premium if the fair value is higher
than the cost or debited against revenue reserve if the fair value is
less than the cost.
49VTech Holdings Limited Annual Report 2014
Principal Accounting Policies (Continued)
U Derivative Financial Instruments
Derivative financial instruments are recognised initially at fair value. At each balance sheet date the fair value is remeasured. The gain or loss on remeasurement to fair value is recognised immediately in profit or loss, except where the derivatives qualify for cash flow hedge accounting or hedge the net investment in a foreign operation, in which case recognition of any resultant gain or loss depends on the nature of the item being hedged.
Cash flow hedges
Where a derivative financial instrument is designated as a hedge of the variability in cash flows of a recognised asset or liability or a highly probable forecast transaction or the foreign currency risk of a committed future transaction, the effective portion of any gains or losses on remeasurement of the derivative financial instrument to fair value are recognised in other comprehensive income and accumulated separately in equity in the hedging reserve. The ineffective portion of any gain or loss is recognised immediately in profit or loss.
If a hedge of a forecast transaction subsequently results in the recognition of a non-financial asset or non-financial liability, the associated gain or loss is reclassified from equity to be included in the initial cost or other carrying amount of the non-financial asset or liability.
If a hedge of a forecast transaction subsequently results in the recognition of a financial asset or a financial liability, the associated gain or loss is reclassified from equity to profit or loss in the same period or periods during which the asset acquired or liability assumed affects profit or loss (such as when interest income or expense is recognised).
For cash flow hedges, other than those covered by the preceding two policy statements, the associated gain or loss is reclassified from equity to profit or loss in the same period or periods during which the hedged forecast transaction affects profit or loss.
When a hedging instrument expires or is sold, terminated or exercised, or the entity revokes designation of the hedge relationship but the hedged forecast transaction is still expected to occur, the cumulative gain or loss at that point remains in equity until the transaction occurs and it is recognised in accordance with the above policy. If the hedged transaction is no longer expected to take place, the cumulative unrealised gain or loss is reclassified from equity to profit or loss immediately.
V Interest-bearing Borrowings
Interest-bearing borrowings are recognised initially at fair value less attributable transaction costs. Subsequent to initial recognition, interest-bearing borrowings are stated at amortised cost with any difference between the amount initially recognised and redemption value being recognised in profit or loss over the period of the borrowings, together with any interest and fees payable, using the effective interest method.
W Dividends
Dividends proposed or declared after the balance sheet date are not recognised as a liability at the balance sheet date.
X Segment Reporting
Operating segments, and the amounts of each segment item reported in the financial statements, are identified from the financial information provided regularly to the Group’s most senior executive management for the purposes of allocating resources to, and performance assessment.
Individually material operating segments are not aggregated for financial reporting purposes unless the segments have similar economic characteristics and are similar in respect of the nature of products and services, the nature of production processes, the type or class of customers, the methods used to distribute the products or provide the services, and the nature of the regularity environment. Operating segments which are not individually material may be aggregated if they share a majority of these criteria.
Y Related Parties
(a) A person, or a close member of that person’s family, is related to the Group if that person:
(i) has control or joint control over the Group;
(ii) has significant influence over the Group; or
(iii) is a member of the key management personnel of the Group or the Group’s parent.
(b) An entity is related to the Group if any of the following conditions apply:
(i) The entity and the Group are members of the same group (which means that each parent, subsidiary and fellow subsidiary is related to the others).
(ii) One entity is an associate or joint venture of the other entity (or an associate or joint venture of a member of a group of which the other entity is a member).
(iii) Both entities are joint ventures of the same third party.
(iv) One entity is a joint venture of a third entity and the other entity is an associate of the third entity.
(v) The entity is a post-employment benefit plan for the benefit of employees of either the Group or an entity related to the Group.
(vi) The entity is controlled or jointly controlled by a person identified in (a).
(vii) A person identified in (a)(i) has significant influence over the entity or is a member of the key management personnel of the entity (or of a parent of the entity).
Close members of the family of a person are those family members who may be expected to influence, or be influenced by, that person in their dealings with the entity.
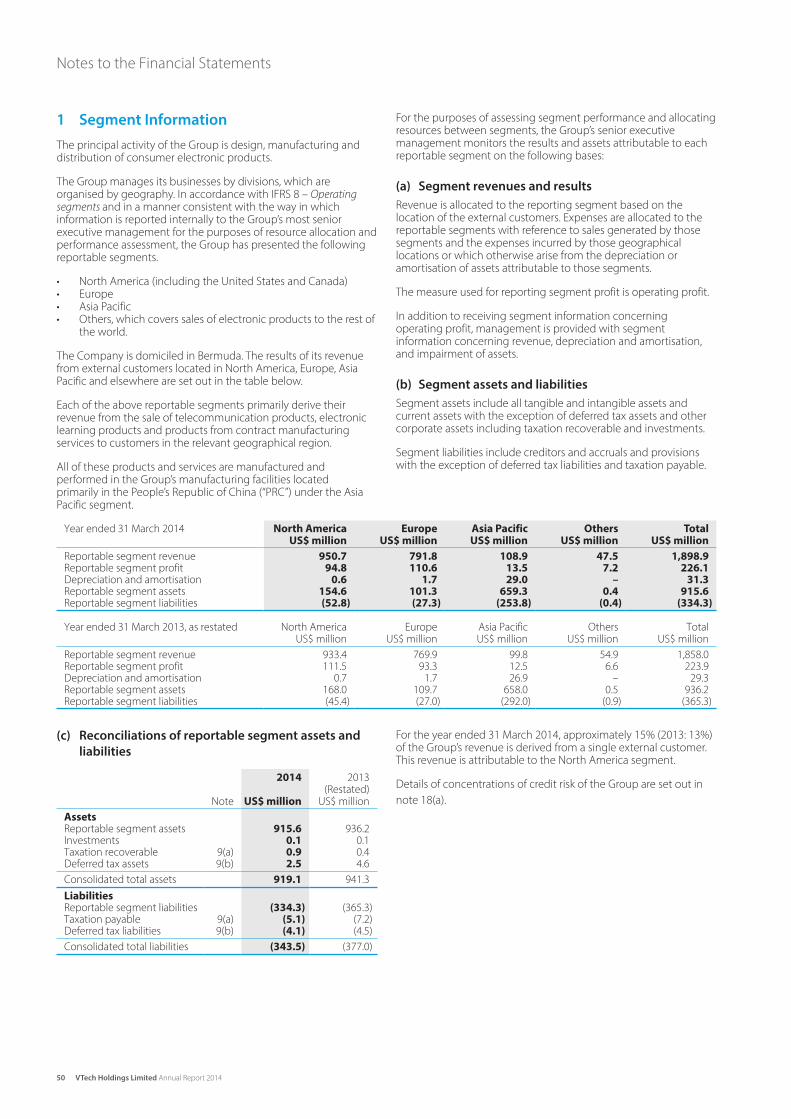
50 VTech Holdings Limited Annual Report 2014
Notes to the Financial Statements
1 Segment Information
The principal activity of the Group is design, manufacturing and distribution of consumer electronic products.
The Group manages its businesses by divisions, which are organised by geography. In accordance with IFRS 8 – Operating segments and in a manner consistent with the way in which information is reported internally to the Group’s most senior executive management for the purposes of resource allocation and performance assessment, the Group has presented the following reportable segments.
• North America (including the United States and Canada)• Europe• Asia Pacific• Others, which covers sales of electronic products to the rest of
the world.
The Company is domiciled in Bermuda. The results of its revenue from external customers located in North America, Europe, Asia Pacific and elsewhere are set out in the table below.
Each of the above reportable segments primarily derive their revenue from the sale of telecommunication products, electronic learning products and products from contract manufacturing services to customers in the relevant geographical region.
All of these products and services are manufactured and performed in the Group’s manufacturing facilities located primarily in the People’s Republic of China (“PRC”) under the Asia Pacific segment.
For the purposes of assessing segment performance and allocating resources between segments, the Group’s senior executive management monitors the results and assets attributable to each reportable segment on the following bases:
(a) Segment revenues and results
Revenue is allocated to the reporting segment based on the location of the external customers. Expenses are allocated to the reportable segments with reference to sales generated by those segments and the expenses incurred by those geographical locations or which otherwise arise from the depreciation or amortisation of assets attributable to those segments.
The measure used for reporting segment profit is operating profit.
In addition to receiving segment information concerning operating profit, management is provided with segment information concerning revenue, depreciation and amortisation, and impairment of assets.
(b) Segment assets and liabilities
Segment assets include all tangible and intangible assets and current assets with the exception of deferred tax assets and other corporate assets including taxation recoverable and investments.
Segment liabilities include creditors and accruals and provisions with the exception of deferred tax liabilities and taxation payable.
Year ended 31 March 2014 North AmericaUS$ million
EuropeUS$ million
Asia PacificUS$ million
OthersUS$ million
TotalUS$ million
Reportable segment revenue 950.7 791.8 108.9 47.5 1,898.9Reportable segment profit 94.8 110.6 13.5 7.2 226.1Depreciation and amortisation 0.6 1.7 29.0 – 31.3Reportable segment assets 154.6 101.3 659.3 0.4 915.6Reportable segment liabilities (52.8) (27.3) (253.8) (0.4) (334.3)
Year ended 31 March 2013, as restated North America US$ million
Europe US$ million
Asia PacificUS$ million
OthersUS$ million
Total US$ million
Reportable segment revenue 933.4 769.9 99.8 54.9 1,858.0Reportable segment profit 111.5 93.3 12.5 6.6 223.9Depreciation and amortisation 0.7 1.7 26.9 – 29.3Reportable segment assets 168.0 109.7 658.0 0.5 936.2Reportable segment liabilities (45.4) (27.0) (292.0) (0.9) (365.3)
(c) Reconciliations of reportable segment assets and
liabilities
Note
2014
US$ million
2013 (Restated)
US$ million
AssetsReportable segment assets 915.6 936.2Investments 0.1 0.1Taxation recoverable 9(a) 0.9 0.4Deferred tax assets 9(b) 2.5 4.6
Consolidated total assets 919.1 941.3
LiabilitiesReportable segment liabilities (334.3) (365.3)Taxation payable 9(a) (5.1) (7.2)Deferred tax liabilities 9(b) (4.1) (4.5)
Consolidated total liabilities (343.5) (377.0)
For the year ended 31 March 2014, approximately 15% (2013: 13%) of the Group’s revenue is derived from a single external customer. This revenue is attributable to the North America segment.
Details of concentrations of credit risk of the Group are set out in
note 18(a).

51VTech Holdings Limited Annual Report 2014
2 Operating ProfitOperating profit is arrived at after charging/(crediting) the following:
Note
2014
US$ million
2013(Restated)
US$ million
Staff related costs– salaries and wages 272.9 267.3– pension costs: defined
contribution schemes 15(a) 14.5 11.4– pension costs: defined
benefit scheme 15(b) 2.0 2.2– severance payments 2.5 1.0– share-based payment
expenses 1.4 0.9
293.3 282.8
Cost of inventories 10(b) 1,264.6 1,260.2Depreciation of tangible assets 7 31.2 29.2Amortisation of leasehold land
payments 8 0.1 0.1Gain on disposal of tangible
assets (0.1) (0.1)Auditors’ remuneration
– audit services 0.8 0.8– audit related services 0.1 0.1– tax services 0.5 0.4
Note
2014
US$ million
2013(Restated)
US$ million
Operating leases charges: minimum lease payments
– land and buildings 16.0 15.0
– others 3.0 2.2
Impairment loss of trade debtors 11(b) 0.6 1.7
Impairment loss of trade debtors written back 11(b) (0.7) –
Royalties 22.2 21.1
Provision for defective goods returns 14 26.4 25.4
Net foreign exchange loss/(gain) 0.4 (0.4)
Net loss/(gain) on forward foreign exchange contracts
– Net gain on cash flow hedging instruments reclassified from equity (2.3) (1.5)
– Net loss/(gain) on forward foreign exchange contracts 0.5 (0.8)
3 Directors’ Emoluments and Individuals with Highest EmolumentsDirectors’ remunerations disclosed pursuant to section 78 of Schedule 11 to the new Hong Kong Companies Ordinance (Cap. 622), with reference to section 161 of the predecessor Hong Kong Companies Ordinance (Cap. 32) is as follows:
Directors’ emoluments
Fees
Salaries, allowances
and benefits in kind
Discretionary bonuses
Contributions to retirement
benefit schemes
Share-based payments (vii)
2014 Total
US$ million US$ million US$ million US$ million US$ million US$ million
Executive Directors (i)Allan WONG Chi Yun (iii) – 0.9 2.0 0.1 – 3.0PANG King Fai – 0.5 1.5 – – 2.0Andy LEUNG Hon Kwong – 0.5 1.7 – – 2.2
Independent Non-executive Directors (ii)
William FUNG Kwok Lun – – – – – –Denis Morgie HO Pak Cho (iv) – – – – – –Michael TIEN Puk Sun – – – – – –Patrick WANG Shui Chung – – – – – –WONG Kai Man (v) – – – – – –
– 1.9 5.2 0.1 – 7.2
Fees
Salaries, allowances
and benefits in kind
Discretionary bonuses
Contributions to retirement
benefit schemes
Share-based payments (vii)
2013Total
US$ million US$ million US$ million US$ million US$ million US$ million
Executive Directors (i)Allan WONG Chi Yun (iii) – 0.9 2.1 0.1 – 3.1PANG King Fai – 0.5 0.7 – – 1.2Andy LEUNG Hon Kwong – 0.5 0.8 – – 1.3
Independent Non-executive Directors (ii)
William FUNG Kwok Lun – – – – – –Denis Morgie HO Pak Cho – – – – – –David SUN Tak Kei (vi) – – – – – –Michael TIEN Puk Sun – – – – – –Patrick WANG Shui Chung – – – – – –WONG Kai Man (v) – – – – – –
– 1.9 3.6 0.1 – 5.6

52 VTech Holdings Limited Annual Report 2014
Notes to the Financial Statements
4 Taxation
Note2014
US$ million2013
US$ million
Current tax– Hong Kong 15.3 16.4– Overseas 7.3 6.3
Over-provision in respect of prior years– Hong Kong (0.1) (0.1)
Deferred tax– Origination and reversal of
temporary differences 9(b) 1.7 1.5 24.2 24.1
(a) Hong Kong Profits Tax has been calculated at the rate of 16.5% (2013: 16.5%) on the estimated assessable profit for the year.
(b) Overseas taxation has been calculated at the rates of taxation prevailing in the countries in which the Group operates.
(c) Reconciliation between the effective income tax rate and the statutory domestic income tax rate:
The consolidated effective income tax rate for the year ended 31 March 2014 was 10.6% (2013: 10.7%, as restated). The effective income tax rate is reconciled to the statutory domestic income tax rate as follows:
2014
%
2013 (Restated)
%
Statutory domestic income tax rate 16.5 16.5Difference in overseas income tax rates 1.4 1.2Tax effect of non-temporary differences (6.8) (6.6)Others (0.5) (0.4) Effective income tax rate 10.6 10.7
(d) Included in the consolidated statement of comprehensive income for the year ended 31 March 2014 was US$1.3 million (2013: US$1.7 million) related to the deficit on revaluation of properties which was derived at after the related tax credit of US$0.4 million (2013: US$0.6 million).
5 Dividends
Note2014
US$ million2013
US$ million
Interim dividend of US16.0 cents (2013: US16.0 cents) per share declared and paid 17 40.1 40.1
Final dividend of US64.0 cents (2013: US64.0 cents) per share proposed after the balance sheet date 17 160.6 160.2
The final dividend proposed after the balance sheet date has not been recognised as a liability at the balance sheet date.
At a meeting held on 15 May 2013, the Directors proposed a final dividend of US64.0 cents per ordinary share for the year ended 31 March 2013, which was estimated to be US$160.2 million at the time calculated on the basis of the ordinary shares in issue as at 31 March 2013. The final dividend was approved by shareholders at the annual general meeting on 12 July 2013. As a result of shares issuance upon exercise of share options during the period between 1 April 2013 and 12 July 2013, the final dividend paid in respect of the year ended 31 March 2013 totaled US$160.5 million.
3 Directors’ Emoluments and Individuals
with Highest Emoluments (Continued)
Directors’ emoluments (Continued)
Notes:
(i) The directors’ fee paid to each executive Director was US$30,000 (2013: US$30,000) per annum.
(ii) The emoluments paid to each independent non-executive Director was US$30,000 (2013: US$30,000) per annum, pro-rata to their length of service during the year.
(iii) The emoluments paid to Dr. Allan WONG Chi Yun included housing benefit of HK$3,600,000 for the year ended 31 March 2014 (2013: HK$3,600,000), which was based on the lease agreement entered by the Company with Aldenham Company Limited (“Aldenham”). Aldenham is an indirect wholly owned subsidiary of a discretionary trust of which Dr. Allan WONG Chi Yun, a Director, was the founder.
(iv) Mr. Denis Morgie HO Pak Cho retired as an independent non-executive Director with effect from the conclusion of the 2013 AGM.
(v) Mr. WONG Kai Man was appointed as an independent non-executive Director on 19 September 2012.
(vi) Dr. David SUN Tak Kei resigned as an independent non-executive Director with effect from 30 June 2012.
(vii) Share-based payments represent the fair value of share options granted to the Directors which were charged to the consolidated income statement in accordance with the accounting policy set out in Note (S).
Individuals with highest emoluments
Of the five individuals with the highest emoluments, three (2013: three) are Directors whose emoluments are set out above. The aggregate of the emoluments in respect of the other two (2013: two) individuals are as follows:
2014US$ million
2013US$ million
Salaries, allowances and benefits in kind 1.0 1.0Discretionary bonuses 2.2 1.1Contribution to retirement
benefit schemes – –Share-based payments – – 3.2 2.1
The emoluments fell within the following bands:
2014 Individuals
2013 Individuals
US$897,001 – 961,000 – 1961,001 – 1,025,000 1 –1,153,001 – 1,217,000 – 12,241,001 – 2,305,000 1 –
2 2
During the years ended 31 March 2013 and 31 March 2014, there were no amounts paid to Directors and individuals for compensation for loss of office and inducement for joining the Group.
Emoluments of senior management
Other than the Directors’ remuneration and emoluments of five highest individuals disclosed in note 3, the emoluments of the senior management whose profiles are included in Directors and Senior Management section of this Annual Report fell within the following bands:
2014 Individuals
2013 Individuals
US$257,001 – 321,000 – 1321,001 – 385,000 1 –385,001 – 449,000 1 1449,001 – 513,000 1 2513,001 – 577,000 2 –577,001 – 641,000 – 2833,001 – 897,000 1 –
6 6

53VTech Holdings Limited Annual Report 2014
6 Earnings Per Share
The calculations of basic and diluted earnings per share are based
on the Group’s profit attributable to shareholders of the Company
of US$203.3 million (2013: US$201.5 million, as restated).
The calculation of basic earnings per share is based on the
weighted average of 250.7 million (2013: 250.1 million) ordinary
shares in issue during the year after adjusting for shares held for
Share Purchase Scheme.
The calculation of diluted earnings per share is based on 250.8
million (2013: 250.3 million) ordinary shares which is the weighted
average number of ordinary shares in issue during the year after
adjusting for shares held for Share Purchase Scheme and the
number of dilutive potential ordinary shares under the Company’s
share option scheme.
2014 2013(Restated)
Profit attributable to shareholders (US$ million) 203.3 201.5
Weighted average number of ordinary shares in issue less shares held for Share Purchase Scheme (in million) 250.7 250.1
Effect of deemed issue of shares under the Company’s share option scheme for nil consideration (in million) 0.1 0.2
Weighted average number of ordinary shares (diluted) (in million) 250.8 250.3
Diluted earnings per share(US cents) 81.1 80.5
7 Tangible Assets
Land andbuildings
US$ million
Leaseholdimprovements
US$ million
Moulds,machinery
andequipmentUS$ million
Computers,motor
vehicles,furniture
and fixturesUS$ million
Constructionin progressUS$ million
TotalUS$ million
Cost or valuationAt 1 April 2012 70.6 13.0 278.0 119.4 6.9 487.9Additions – 0.3 19.6 10.0 – 29.9Disposals (0.4) (0.4) (19.2) (10.2) – (30.2)Revaluation (note (a)) (2.5) – – – – (2.5)Effect of changes in exchange rates (0.2) 0.1 0.2 0.2 – 0.3
At 31 March 2013 and 1 April 2013 67.5 13.0 278.6 119.4 6.9 485.4Additions – 2.8 17.4 9.9 – 30.1Disposals – – (10.9) (2.1) – (13.0)Revaluation (note (a)) (2.0) – – – – (2.0)Effect of changes in exchange rates 0.8 (0.1) 0.3 0.6 – 1.6
At 31 March 2014 66.3 15.7 285.4 127.8 6.9 502.1
Accumulated depreciation and impairment
At 1 April 2012 26.8 7.8 252.6 102.8 6.9 396.9Charge for the year 2.0 1.0 17.5 8.7 – 29.2Written back on disposals (0.4) (0.4) (19.2) (9.3) – (29.3)Revaluation (note (a)) (0.2) – – – – (0.2)Effect of changes in exchange rates 0.1 0.1 0.1 0.1 – 0.4
At 31 March 2013 and 1 April 2013 28.3 8.5 251.0 102.3 6.9 397.0Charge for the year 2.2 1.0 17.3 10.7 – 31.2Written back on disposals – – (10.8) (2.0) – (12.8)Revaluation (note (a)) (0.3) – – – – (0.3)Effect of changes in exchange rates 0.1 (0.1) 0.3 0.8 – 1.1
At 31 March 2014 30.3 9.4 257.8 111.8 6.9 416.2
Net book value at 31 March 2014 36.0 6.3 27.6 16.0 – 85.9
Net book value at 31 March 2013 39.2 4.5 27.6 17.1 – 88.4
Cost or valuation of tangible assets is analysed as follows:
At cost 42.3 15.7 285.4 127.8 6.9 478.1At professional valuation (note (a)) 24.0 – – – – 24.0
66.3 15.7 285.4 127.8 6.9 502.1
Note:
(a) Revaluation of properties
The medium-term leasehold land and buildings held by the Group for own use was revalued as at 31 March 2012 on a market value basis by reference to recent market transactions in comparable properties. The valuations were carried out by independent qualified firms of surveyors, Vigers Appraisal & Consulting Limited who is an associate member of the Hong Kong Institute of Surveyors with recent experience in the location and category of property being valued.
The freehold land and buildings held by the Group for own use was revalued as at 31 March 2014 on a market value basis by reference to market rental of comparable properties. The valuations were carried out by independent qualified firms of surveyors Habets & Straten Makelaars/Taxateurs o.g. with recent experience in the location and category of property being valued.
The deficit arising from the revaluation of properties of US$1.3 million (2013: US$1.7 million), net of deferred tax of US$0.4 million (2013: US$0.6 million) (note 9(b)) have been recognised in other comprehensive income for the year ended 31 March 2014 and accumulated in the property revaluation reserve of the Group (note 17(c)).
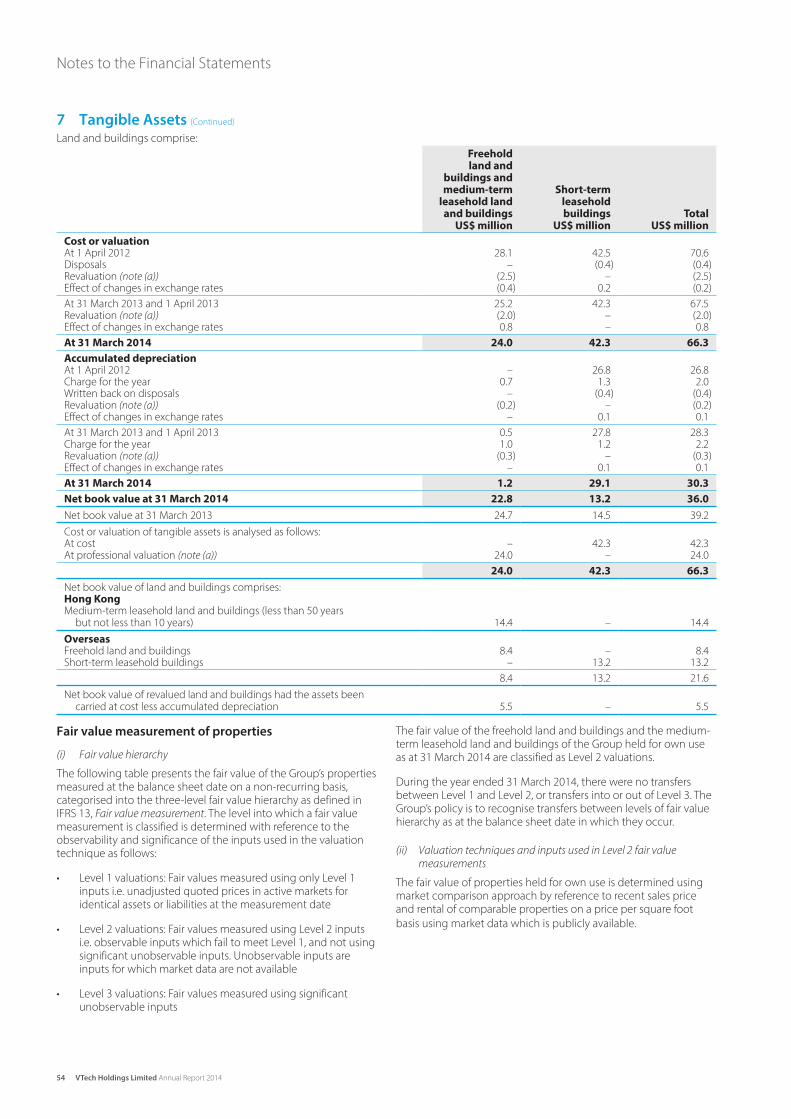
54 VTech Holdings Limited Annual Report 2014
Notes to the Financial Statements
7 Tangible Assets (Continued)
Land and buildings comprise:
Freeholdland and
buildings andmedium-term
leasehold landand buildings
US$ million
Short-termleaseholdbuildings
US$ millionTotal
US$ million
Cost or valuationAt 1 April 2012 28.1 42.5 70.6Disposals – (0.4) (0.4)Revaluation (note (a)) (2.5) – (2.5)Effect of changes in exchange rates (0.4) 0.2 (0.2)
At 31 March 2013 and 1 April 2013 25.2 42.3 67.5Revaluation (note (a)) (2.0) – (2.0)Effect of changes in exchange rates 0.8 – 0.8
At 31 March 2014 24.0 42.3 66.3
Accumulated depreciationAt 1 April 2012 – 26.8 26.8Charge for the year 0.7 1.3 2.0Written back on disposals – (0.4) (0.4)Revaluation (note (a)) (0.2) – (0.2)Effect of changes in exchange rates – 0.1 0.1
At 31 March 2013 and 1 April 2013 0.5 27.8 28.3Charge for the year 1.0 1.2 2.2Revaluation (note (a)) (0.3) – (0.3)Effect of changes in exchange rates – 0.1 0.1
At 31 March 2014 1.2 29.1 30.3
Net book value at 31 March 2014 22.8 13.2 36.0
Net book value at 31 March 2013 24.7 14.5 39.2
Cost or valuation of tangible assets is analysed as follows:At cost – 42.3 42.3At professional valuation (note (a)) 24.0 – 24.0
24.0 42.3 66.3
Net book value of land and buildings comprises:Hong KongMedium-term leasehold land and buildings (less than 50 years
but not less than 10 years) 14.4 – 14.4
OverseasFreehold land and buildings 8.4 – 8.4Short-term leasehold buildings – 13.2 13.2
8.4 13.2 21.6
Net book value of revalued land and buildings had the assets beencarried at cost less accumulated depreciation 5.5 – 5.5
Fair value measurement of properties
(i) Fair value hierarchy
The following table presents the fair value of the Group’s properties measured at the balance sheet date on a non-recurring basis, categorised into the three-level fair value hierarchy as defined in IFRS 13, Fair value measurement. The level into which a fair value measurement is classified is determined with reference to the observability and significance of the inputs used in the valuation technique as follows:
• Level 1 valuations: Fair values measured using only Level 1 inputs i.e. unadjusted quoted prices in active markets for identical assets or liabilities at the measurement date
• Level 2 valuations: Fair values measured using Level 2 inputs i.e. observable inputs which fail to meet Level 1, and not using significant unobservable inputs. Unobservable inputs are inputs for which market data are not available
• Level 3 valuations: Fair values measured using significant unobservable inputs
The fair value of the freehold land and buildings and the medium-term leasehold land and buildings of the Group held for own use as at 31 March 2014 are classified as Level 2 valuations.
During the year ended 31 March 2014, there were no transfers between Level 1 and Level 2, or transfers into or out of Level 3. The Group’s policy is to recognise transfers between levels of fair value hierarchy as at the balance sheet date in which they occur.
(ii) Valuation techniques and inputs used in Level 2 fair value measurements
The fair value of properties held for own use is determined using market comparison approach by reference to recent sales price and rental of comparable properties on a price per square foot
basis using market data which is publicly available.
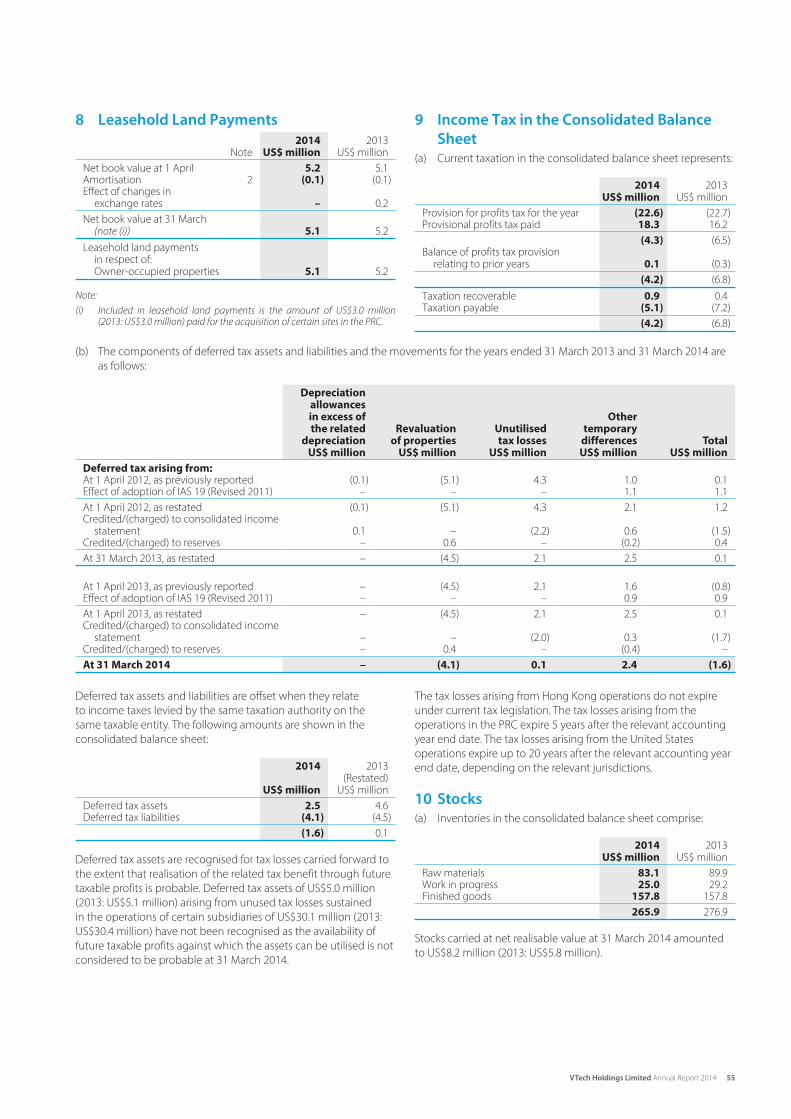
55VTech Holdings Limited Annual Report 2014
8 Leasehold Land Payments
Note2014
US$ million2013
US$ million
Net book value at 1 April 5.2 5.1Amortisation 2 (0.1) (0.1)Effect of changes in
exchange rates – 0.2 Net book value at 31 March
(note (i)) 5.1 5.2 Leasehold land payments
in respect of:Owner-occupied properties 5.1 5.2
Note:
(i) Included in leasehold land payments is the amount of US$3.0 million(2013: US$3.0 million) paid for the acquisition of certain sites in the PRC.
(b) The components of deferred tax assets and liabilities and the movements for the years ended 31 March 2013 and 31 March 2014 are
as follows:
Depreciationallowancesin excess ofthe related
depreciationUS$ million
Revaluationof properties
US$ million
Unutilisedtax losses
US$ million
Othertemporary
differencesUS$ million
TotalUS$ million
Deferred tax arising from:At 1 April 2012, as previously reported (0.1) (5.1) 4.3 1.0 0.1Effect of adoption of IAS 19 (Revised 2011) – – – 1.1 1.1
At 1 April 2012, as restated (0.1) (5.1) 4.3 2.1 1.2Credited/(charged) to consolidated income
statement 0.1 – (2.2) 0.6 (1.5)Credited/(charged) to reserves – 0.6 – (0.2) 0.4
At 31 March 2013, as restated – (4.5) 2.1 2.5 0.1
At 1 April 2013, as previously reported – (4.5) 2.1 1.6 (0.8)Effect of adoption of IAS 19 (Revised 2011) – – – 0.9 0.9 At 1 April 2013, as restated – (4.5) 2.1 2.5 0.1Credited/(charged) to consolidated income
statement – – (2.0) 0.3 (1.7)Credited/(charged) to reserves – 0.4 – (0.4) – At 31 March 2014 – (4.1) 0.1 2.4 (1.6)
9 Income Tax in the Consolidated Balance
Sheet
(a) Current taxation in the consolidated balance sheet represents:
2014 US$ million
2013 US$ million
Provision for profits tax for the year (22.6) (22.7)Provisional profits tax paid 18.3 16.2
(4.3) (6.5)Balance of profits tax provision
relating to prior years 0.1 (0.3) (4.2) (6.8)
Taxation recoverable 0.9 0.4Taxation payable (5.1) (7.2)
(4.2) (6.8)
Deferred tax assets and liabilities are offset when they relate
to income taxes levied by the same taxation authority on the
same taxable entity. The following amounts are shown in the
consolidated balance sheet:
2014
US$ million
2013 (Restated)
US$ million
Deferred tax assets 2.5 4.6Deferred tax liabilities (4.1) (4.5)
(1.6) 0.1
Deferred tax assets are recognised for tax losses carried forward to
the extent that realisation of the related tax benefit through future
taxable profits is probable. Deferred tax assets of US$5.0 million
(2013: US$5.1 million) arising from unused tax losses sustained
in the operations of certain subsidiaries of US$30.1 million (2013:
US$30.4 million) have not been recognised as the availability of
future taxable profits against which the assets can be utilised is not
considered to be probable at 31 March 2014.
The tax losses arising from Hong Kong operations do not expire
under current tax legislation. The tax losses arising from the
operations in the PRC expire 5 years after the relevant accounting
year end date. The tax losses arising from the United States
operations expire up to 20 years after the relevant accounting year
end date, depending on the relevant jurisdictions.
10 Stocks
(a) Inventories in the consolidated balance sheet comprise:
2014US$ million
2013 US$ million
Raw materials 83.1 89.9Work in progress 25.0 29.2Finished goods 157.8 157.8
265.9 276.9
Stocks carried at net realisable value at 31 March 2014 amounted
to US$8.2 million (2013: US$5.8 million).
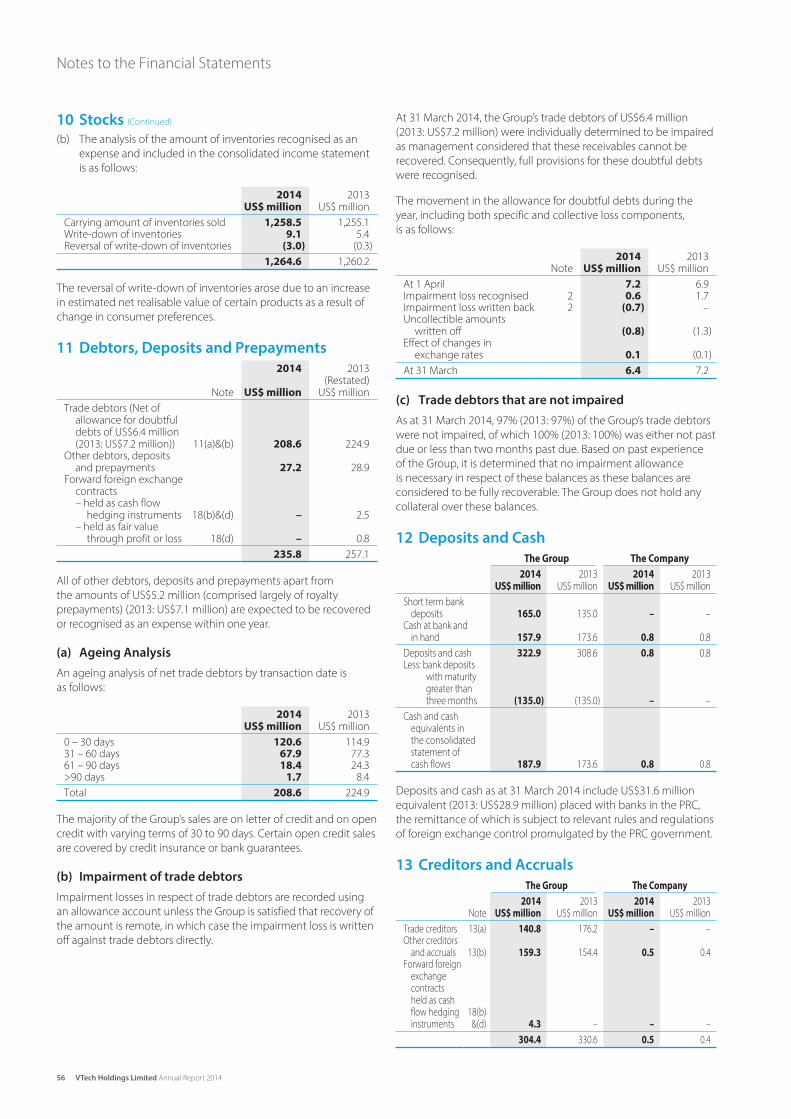
56 VTech Holdings Limited Annual Report 2014
Notes to the Financial Statements
10 Stocks (Continued)
(b) The analysis of the amount of inventories recognised as an
expense and included in the consolidated income statement
is as follows:
2014US$ million
2013 US$ million
Carrying amount of inventories sold 1,258.5 1,255.1Write-down of inventories 9.1 5.4Reversal of write-down of inventories (3.0) (0.3)
1,264.6 1,260.2
The reversal of write-down of inventories arose due to an increase
in estimated net realisable value of certain products as a result of
change in consumer preferences.
11 Debtors, Deposits and Prepayments
Note
2014
US$ million
2013 (Restated)
US$ million
Trade debtors (Net of allowance for doubtful debts of US$6.4 million (2013: US$7.2 million)) 11(a)&(b) 208.6 224.9
Other debtors, deposits and prepayments 27.2 28.9
Forward foreign exchange contracts– held as cash flow
hedging instruments 18(b)&(d) – 2.5– held as fair value
through profit or loss 18(d) – 0.8 235.8 257.1
All of other debtors, deposits and prepayments apart from
the amounts of US$5.2 million (comprised largely of royalty
prepayments) (2013: US$7.1 million) are expected to be recovered
or recognised as an expense within one year.
(a) Ageing Analysis
An ageing analysis of net trade debtors by transaction date is
as follows:
2014US$ million
2013 US$ million
0 – 30 days 120.6 114.931 – 60 days 67.9 77.361 – 90 days 18.4 24.3>90 days 1.7 8.4 Total 208.6 224.9
The majority of the Group’s sales are on letter of credit and on open
credit with varying terms of 30 to 90 days. Certain open credit sales
are covered by credit insurance or bank guarantees.
(b) Impairment of trade debtors
Impairment losses in respect of trade debtors are recorded using
an allowance account unless the Group is satisfied that recovery of
the amount is remote, in which case the impairment loss is written
off against trade debtors directly.
At 31 March 2014, the Group’s trade debtors of US$6.4 million
(2013: US$7.2 million) were individually determined to be impaired
as management considered that these receivables cannot be
recovered. Consequently, full provisions for these doubtful debts
were recognised.
The movement in the allowance for doubtful debts during the
year, including both specific and collective loss components,
is as follows:
Note2014
US$ million2013
US$ million
At 1 April 7.2 6.9Impairment loss recognised 2 0.6 1.7Impairment loss written back 2 (0.7) –Uncollectible amounts
written off (0.8) (1.3)Effect of changes in
exchange rates 0.1 (0.1) At 31 March 6.4 7.2
(c) Trade debtors that are not impaired
As at 31 March 2014, 97% (2013: 97%) of the Group’s trade debtors
were not impaired, of which 100% (2013: 100%) was either not past
due or less than two months past due. Based on past experience
of the Group, it is determined that no impairment allowance
is necessary in respect of these balances as these balances are
considered to be fully recoverable. The Group does not hold any
collateral over these balances.
12 Deposits and Cash
The Group The Company
2014US$ million
2013US$ million
2014US$ million
2013US$ million
Short term bank deposits 165.0 135.0 – –
Cash at bank and in hand 157.9 173.6 0.8 0.8
Deposits and cash 322.9 308.6 0.8 0.8Less: bank deposits
with maturity greater than three months (135.0) (135.0) – –
Cash and cash equivalents in the consolidated statement of cash flows 187.9 173.6 0.8 0.8
Deposits and cash as at 31 March 2014 include US$31.6 million
equivalent (2013: US$28.9 million) placed with banks in the PRC,
the remittance of which is subject to relevant rules and regulations
of foreign exchange control promulgated by the PRC government.
13 Creditors and Accruals
The Group The Company
Note2014
US$ million2013
US$ million2014
US$ million2013
US$ million
Trade creditors 13(a) 140.8 176.2 – –Other creditors
and accruals 13(b) 159.3 154.4 0.5 0.4Forward foreign
exchange contracts held as cash flow hedging instruments
18(b)&(d) 4.3 – – –
304.4 330.6 0.5 0.4
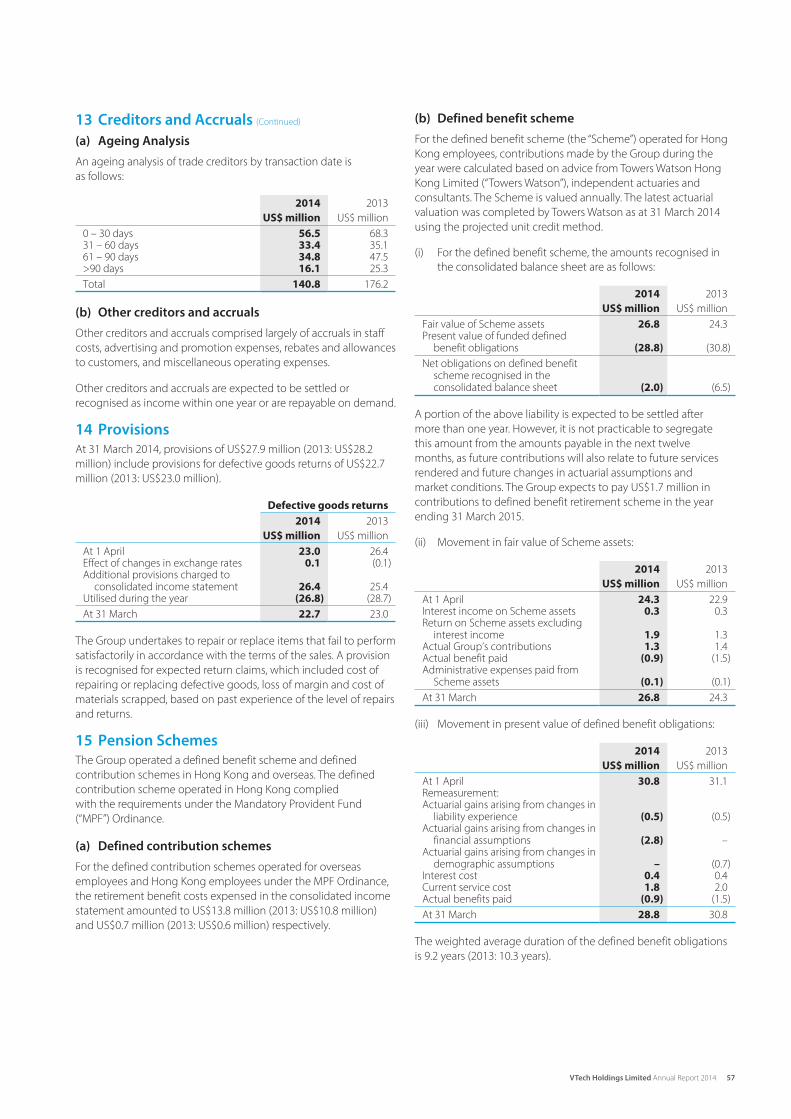
57VTech Holdings Limited Annual Report 2014
13 Creditors and Accruals (Continued)
(a) Ageing Analysis
An ageing analysis of trade creditors by transaction date is
as follows:
2014
US$ million
2013
US$ million
0 – 30 days 56.5 68.331 – 60 days 33.4 35.161 – 90 days 34.8 47.5>90 days 16.1 25.3 Total 140.8 176.2
(b) Other creditors and accruals
Other creditors and accruals comprised largely of accruals in staff
costs, advertising and promotion expenses, rebates and allowances
to customers, and miscellaneous operating expenses.
Other creditors and accruals are expected to be settled or
recognised as income within one year or are repayable on demand.
14 Provisions
At 31 March 2014, provisions of US$27.9 million (2013: US$28.2
million) include provisions for defective goods returns of US$22.7
million (2013: US$23.0 million).
Defective goods returns
2014
US$ million
2013
US$ million
At 1 April 23.0 26.4Effect of changes in exchange rates 0.1 (0.1)Additional provisions charged to
consolidated income statement 26.4 25.4Utilised during the year (26.8) (28.7) At 31 March 22.7 23.0
The Group undertakes to repair or replace items that fail to perform
satisfactorily in accordance with the terms of the sales. A provision
is recognised for expected return claims, which included cost of
repairing or replacing defective goods, loss of margin and cost of
materials scrapped, based on past experience of the level of repairs
and returns.
15 Pension Schemes
The Group operated a defined benefit scheme and defined
contribution schemes in Hong Kong and overseas. The defined
contribution scheme operated in Hong Kong complied
with the requirements under the Mandatory Provident Fund
(“MPF”) Ordinance.
(a) Defined contribution schemes
For the defined contribution schemes operated for overseas
employees and Hong Kong employees under the MPF Ordinance,
the retirement benefit costs expensed in the consolidated income
statement amounted to US$13.8 million (2013: US$10.8 million)
and US$0.7 million (2013: US$0.6 million) respectively.
(b) Defined benefit scheme
For the defined benefit scheme (the “Scheme”) operated for Hong
Kong employees, contributions made by the Group during the
year were calculated based on advice from Towers Watson Hong
Kong Limited (“Towers Watson”), independent actuaries and
consultants. The Scheme is valued annually. The latest actuarial
valuation was completed by Towers Watson as at 31 March 2014
using the projected unit credit method.
(i) For the defined benefit scheme, the amounts recognised in
the consolidated balance sheet are as follows:
2014
US$ million
2013
US$ million
Fair value of Scheme assets 26.8 24.3Present value of funded defined
benefit obligations (28.8) (30.8) Net obligations on defined benefit
scheme recognised in the consolidated balance sheet (2.0) (6.5)
A portion of the above liability is expected to be settled after
more than one year. However, it is not practicable to segregate
this amount from the amounts payable in the next twelve
months, as future contributions will also relate to future services
rendered and future changes in actuarial assumptions and
market conditions. The Group expects to pay US$1.7 million in
contributions to defined benefit retirement scheme in the year
ending 31 March 2015.
(ii) Movement in fair value of Scheme assets:
2014
US$ million
2013
US$ million
At 1 April 24.3 22.9Interest income on Scheme assets 0.3 0.3Return on Scheme assets excluding
interest income 1.9 1.3Actual Group’s contributions 1.3 1.4Actual benefit paid (0.9) (1.5)Administrative expenses paid from
Scheme assets (0.1) (0.1) At 31 March 26.8 24.3
(iii) Movement in present value of defined benefit obligations:
2014
US$ million
2013
US$ million
At 1 April 30.8 31.1Remeasurement:Actuarial gains arising from changes in
liability experience (0.5) (0.5)Actuarial gains arising from changes in
financial assumptions (2.8) –Actuarial gains arising from changes in
demographic assumptions – (0.7)Interest cost 0.4 0.4Current service cost 1.8 2.0Actual benefits paid (0.9) (1.5) At 31 March 28.8 30.8
The weighted average duration of the defined benefit obligations
is 9.2 years (2013: 10.3 years).
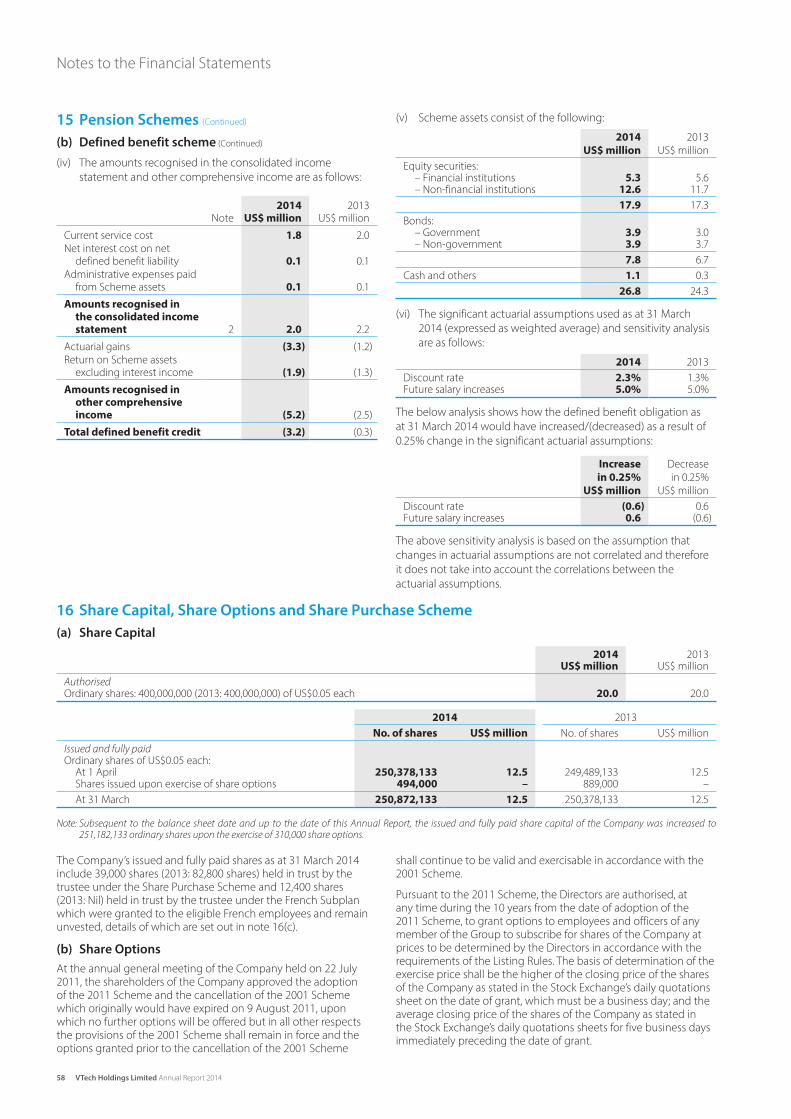
58 VTech Holdings Limited Annual Report 2014
Notes to the Financial Statements
(v) Scheme assets consist of the following:
2014
US$ million
2013
US$ million
Equity securities:– Financial institutions 5.3 5.6– Non-financial institutions 12.6 11.7
17.9 17.3 Bonds:
– Government 3.9 3.0– Non-government 3.9 3.7
7.8 6.7 Cash and others 1.1 0.3
26.8 24.3
(vi) The significant actuarial assumptions used as at 31 March
2014 (expressed as weighted average) and sensitivity analysis
are as follows:
2014 2013
Discount rate 2.3% 1.3%Future salary increases 5.0% 5.0%
The below analysis shows how the defined benefit obligation as
at 31 March 2014 would have increased/(decreased) as a result of
0.25% change in the significant actuarial assumptions:
Increase
in 0.25%
US$ million
Decrease
in 0.25%
US$ million
Discount rate (0.6) 0.6Future salary increases 0.6 (0.6)
The above sensitivity analysis is based on the assumption that
changes in actuarial assumptions are not correlated and therefore
it does not take into account the correlations between the
actuarial assumptions.
15 Pension Schemes (Continued)
(b) Defined benefit scheme (Continued)
(iv) The amounts recognised in the consolidated income
statement and other comprehensive income are as follows:
Note2014
US$ million2013
US$ million
Current service cost 1.8 2.0
Net interest cost on net defined benefit liability 0.1 0.1
Administrative expenses paid from Scheme assets 0.1 0.1
Amounts recognised in the consolidated income statement 2 2.0 2.2
Actuarial gains (3.3) (1.2)
Return on Scheme assets excluding interest income (1.9) (1.3)
Amounts recognised in other comprehensive income (5.2) (2.5)
Total defined benefit credit (3.2) (0.3)
16 Share Capital, Share Options and Share Purchase Scheme
(a) Share Capital
2014 2013US$ million US$ million
AuthorisedOrdinary shares: 400,000,000 (2013: 400,000,000) of US$0.05 each 20.0 20.0
2014 2013 No. of shares US$ million No. of shares US$ million
Issued and fully paidOrdinary shares of US$0.05 each:
At 1 April 250,378,133 12.5 249,489,133 12.5Shares issued upon exercise of share options 494,000 – 889,000 – At 31 March 250,872,133 12.5 250,378,133 12.5
Note: Subsequent to the balance sheet date and up to the date of this Annual Report, the issued and fully paid share capital of the Company was increased to 251,182,133 ordinary shares upon the exercise of 310,000 share options.
The Company’s issued and fully paid shares as at 31 March 2014 include 39,000 shares (2013: 82,800 shares) held in trust by the trustee under the Share Purchase Scheme and 12,400 shares (2013: Nil) held in trust by the trustee under the French Subplan which were granted to the eligible French employees and remain unvested, details of which are set out in note 16(c).
(b) Share Options
At the annual general meeting of the Company held on 22 July 2011, the shareholders of the Company approved the adoption of the 2011 Scheme and the cancellation of the 2001 Scheme which originally would have expired on 9 August 2011, upon which no further options will be offered but in all other respects the provisions of the 2001 Scheme shall remain in force and the options granted prior to the cancellation of the 2001 Scheme
shall continue to be valid and exercisable in accordance with the 2001 Scheme.
Pursuant to the 2011 Scheme, the Directors are authorised, at any time during the 10 years from the date of adoption of the 2011 Scheme, to grant options to employees and officers of any member of the Group to subscribe for shares of the Company at prices to be determined by the Directors in accordance with the requirements of the Listing Rules. The basis of determination of the exercise price shall be the higher of the closing price of the shares of the Company as stated in the Stock Exchange’s daily quotations sheet on the date of grant, which must be a business day; and the average closing price of the shares of the Company as stated in the Stock Exchange’s daily quotations sheets for five business days immediately preceding the date of grant.
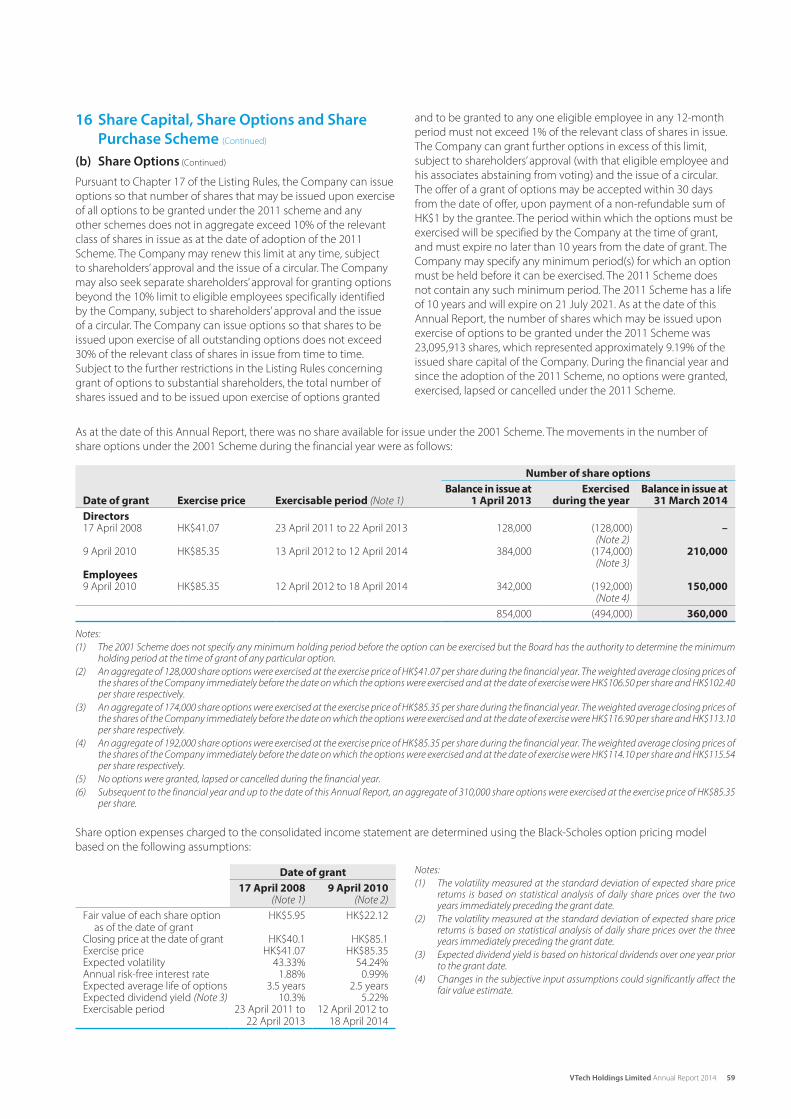
59VTech Holdings Limited Annual Report 2014
16 Share Capital, Share Options and Share
Purchase Scheme (Continued)
(b) Share Options (Continued)
Pursuant to Chapter 17 of the Listing Rules, the Company can issue
options so that number of shares that may be issued upon exercise
of all options to be granted under the 2011 scheme and any
other schemes does not in aggregate exceed 10% of the relevant
class of shares in issue as at the date of adoption of the 2011
Scheme. The Company may renew this limit at any time, subject
to shareholders’ approval and the issue of a circular. The Company
may also seek separate shareholders’ approval for granting options
beyond the 10% limit to eligible employees specifically identified
by the Company, subject to shareholders’ approval and the issue
of a circular. The Company can issue options so that shares to be
issued upon exercise of all outstanding options does not exceed
30% of the relevant class of shares in issue from time to time.
Subject to the further restrictions in the Listing Rules concerning
grant of options to substantial shareholders, the total number of
shares issued and to be issued upon exercise of options granted
and to be granted to any one eligible employee in any 12-month
period must not exceed 1% of the relevant class of shares in issue.
The Company can grant further options in excess of this limit,
subject to shareholders’ approval (with that eligible employee and
his associates abstaining from voting) and the issue of a circular.
The offer of a grant of options may be accepted within 30 days
from the date of offer, upon payment of a non-refundable sum of
HK$1 by the grantee. The period within which the options must be
exercised will be specified by the Company at the time of grant,
and must expire no later than 10 years from the date of grant. The
Company may specify any minimum period(s) for which an option
must be held before it can be exercised. The 2011 Scheme does
not contain any such minimum period. The 2011 Scheme has a life
of 10 years and will expire on 21 July 2021. As at the date of this
Annual Report, the number of shares which may be issued upon
exercise of options to be granted under the 2011 Scheme was
23,095,913 shares, which represented approximately 9.19% of the
issued share capital of the Company. During the financial year and
since the adoption of the 2011 Scheme, no options were granted,
exercised, lapsed or cancelled under the 2011 Scheme.
As at the date of this Annual Report, there was no share available for issue under the 2001 Scheme. The movements in the number of
share options under the 2001 Scheme during the financial year were as follows:
Number of share options
Balance in issue at Exercised Balance in issue atDate of grant Exercise price Exercisable period (Note 1) 1 April 2013 during the year 31 March 2014
Directors17 April 2008 HK$41.07 23 April 2011 to 22 April 2013 128,000 (128,000) –
(Note 2)9 April 2010 HK$85.35 13 April 2012 to 12 April 2014 384,000 (174,000) 210,000
(Note 3)Employees9 April 2010 HK$85.35 12 April 2012 to 18 April 2014 342,000 (192,000) 150,000
(Note 4)
854,000 (494,000) 360,000
Notes:
(1) The 2001 Scheme does not specify any minimum holding period before the option can be exercised but the Board has the authority to determine the minimum holding period at the time of grant of any particular option.
(2) An aggregate of 128,000 share options were exercised at the exercise price of HK$41.07 per share during the financial year. The weighted average closing prices of the shares of the Company immediately before the date on which the options were exercised and at the date of exercise were HK$106.50 per share and HK$102.40 per share respectively.
(3) An aggregate of 174,000 share options were exercised at the exercise price of HK$85.35 per share during the financial year. The weighted average closing prices of the shares of the Company immediately before the date on which the options were exercised and at the date of exercise were HK$116.90 per share and HK$113.10 per share respectively.
(4) An aggregate of 192,000 share options were exercised at the exercise price of HK$85.35 per share during the financial year. The weighted average closing prices of the shares of the Company immediately before the date on which the options were exercised and at the date of exercise were HK$114.10 per share and HK$115.54 per share respectively.
(5) No options were granted, lapsed or cancelled during the financial year.
(6) Subsequent to the financial year and up to the date of this Annual Report, an aggregate of 310,000 share options were exercised at the exercise price of HK$85.35 per share.
Share option expenses charged to the consolidated income statement are determined using the Black-Scholes option pricing model
based on the following assumptions:
Date of grant
17 April 2008 9 April 2010(Note 1) (Note 2)
Fair value of each share option as of the date of grant
HK$5.95 HK$22.12
Closing price at the date of grant HK$40.1 HK$85.1Exercise price HK$41.07 HK$85.35Expected volatility 43.33% 54.24%Annual risk-free interest rate 1.88% 0.99%Expected average life of options 3.5 years 2.5 yearsExpected dividend yield (Note 3) 10.3% 5.22%Exercisable period 23 April 2011 to
22 April 201312 April 2012 to
18 April 2014
Notes:
(1) The volatility measured at the standard deviation of expected share price returns is based on statistical analysis of daily share prices over the two years immediately preceding the grant date.
(2) The volatility measured at the standard deviation of expected share price returns is based on statistical analysis of daily share prices over the three years immediately preceding the grant date.
(3) Expected dividend yield is based on historical dividends over one year prior to the grant date.
(4) Changes in the subjective input assumptions could significantly affect the fair value estimate.
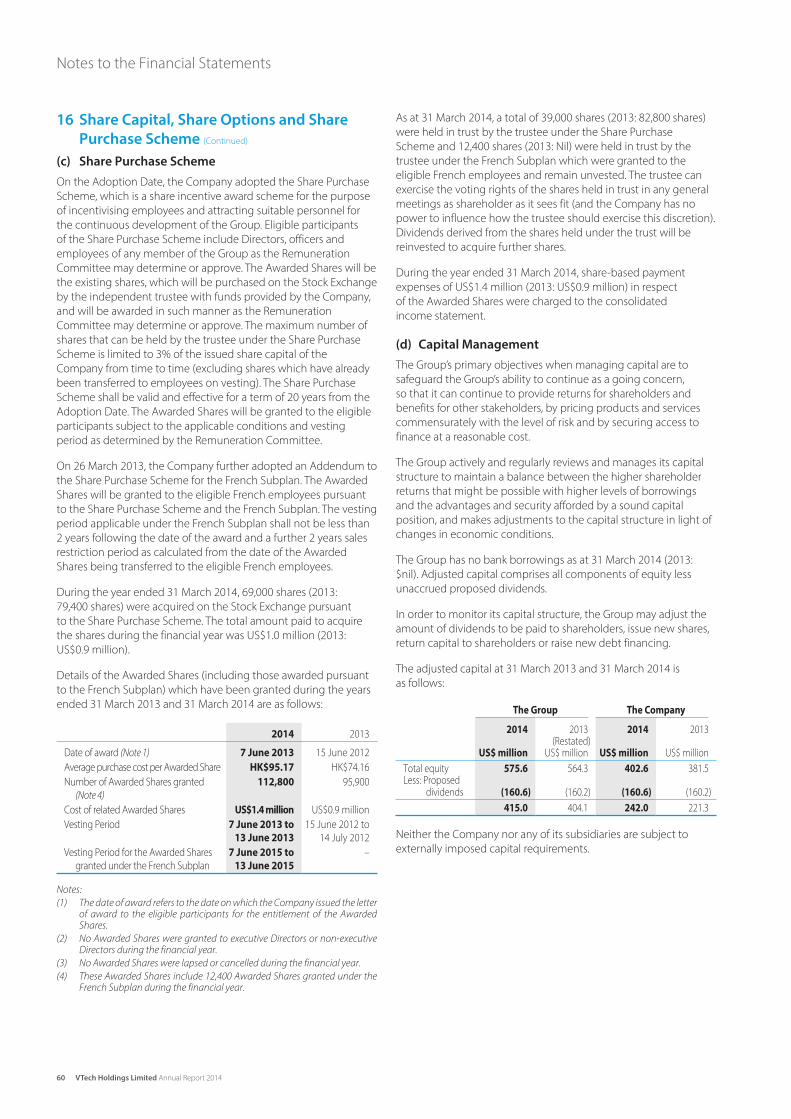
60 VTech Holdings Limited Annual Report 2014
Notes to the Financial Statements
16 Share Capital, Share Options and Share
Purchase Scheme (Continued)
(c) Share Purchase Scheme
On the Adoption Date, the Company adopted the Share Purchase
Scheme, which is a share incentive award scheme for the purpose
of incentivising employees and attracting suitable personnel for
the continuous development of the Group. Eligible participants
of the Share Purchase Scheme include Directors, officers and
employees of any member of the Group as the Remuneration
Committee may determine or approve. The Awarded Shares will be
the existing shares, which will be purchased on the Stock Exchange
by the independent trustee with funds provided by the Company,
and will be awarded in such manner as the Remuneration
Committee may determine or approve. The maximum number of
shares that can be held by the trustee under the Share Purchase
Scheme is limited to 3% of the issued share capital of the
Company from time to time (excluding shares which have already
been transferred to employees on vesting). The Share Purchase
Scheme shall be valid and effective for a term of 20 years from the
Adoption Date. The Awarded Shares will be granted to the eligible
participants subject to the applicable conditions and vesting
period as determined by the Remuneration Committee.
On 26 March 2013, the Company further adopted an Addendum to
the Share Purchase Scheme for the French Subplan. The Awarded
Shares will be granted to the eligible French employees pursuant
to the Share Purchase Scheme and the French Subplan. The vesting
period applicable under the French Subplan shall not be less than
2 years following the date of the award and a further 2 years sales
restriction period as calculated from the date of the Awarded
Shares being transferred to the eligible French employees.
During the year ended 31 March 2014, 69,000 shares (2013:
79,400 shares) were acquired on the Stock Exchange pursuant
to the Share Purchase Scheme. The total amount paid to acquire
the shares during the financial year was US$1.0 million (2013:
US$0.9 million).
Details of the Awarded Shares (including those awarded pursuant
to the French Subplan) which have been granted during the years
ended 31 March 2013 and 31 March 2014 are as follows:
2014 2013
Date of award (Note 1) 7 June 2013 15 June 2012
Average purchase cost per Awarded Share HK$95.17 HK$74.16
Number of Awarded Shares granted
(Note 4)
112,800 95,900
Cost of related Awarded Shares US$1.4 million US$0.9 million
Vesting Period 7 June 2013 to
13 June 2013
15 June 2012 to
14 July 2012
Vesting Period for the Awarded Shares
granted under the French Subplan
7 June 2015 to
13 June 2015
–
Notes:
(1) The date of award refers to the date on which the Company issued the letter of award to the eligible participants for the entitlement of the Awarded Shares.
(2) No Awarded Shares were granted to executive Directors or non-executive Directors during the financial year.
(3) No Awarded Shares were lapsed or cancelled during the financial year.
(4) These Awarded Shares include 12,400 Awarded Shares granted under the French Subplan during the financial year.
As at 31 March 2014, a total of 39,000 shares (2013: 82,800 shares)
were held in trust by the trustee under the Share Purchase
Scheme and 12,400 shares (2013: Nil) were held in trust by the
trustee under the French Subplan which were granted to the
eligible French employees and remain unvested. The trustee can
exercise the voting rights of the shares held in trust in any general
meetings as shareholder as it sees fit (and the Company has no
power to influence how the trustee should exercise this discretion).
Dividends derived from the shares held under the trust will be
reinvested to acquire further shares.
During the year ended 31 March 2014, share-based payment
expenses of US$1.4 million (2013: US$0.9 million) in respect
of the Awarded Shares were charged to the consolidated
income statement.
(d) Capital Management
The Group’s primary objectives when managing capital are to
safeguard the Group’s ability to continue as a going concern,
so that it can continue to provide returns for shareholders and
benefits for other stakeholders, by pricing products and services
commensurately with the level of risk and by securing access to
finance at a reasonable cost.
The Group actively and regularly reviews and manages its capital
structure to maintain a balance between the higher shareholder
returns that might be possible with higher levels of borrowings
and the advantages and security afforded by a sound capital
position, and makes adjustments to the capital structure in light of
changes in economic conditions.
The Group has no bank borrowings as at 31 March 2014 (2013:
$nil). Adjusted capital comprises all components of equity less
unaccrued proposed dividends.
In order to monitor its capital structure, the Group may adjust the
amount of dividends to be paid to shareholders, issue new shares,
return capital to shareholders or raise new debt financing.
The adjusted capital at 31 March 2013 and 31 March 2014 is
as follows:
The Group The Company
2014 2013 2014 2013(Restated)
US$ million US$ million US$ million US$ million
Total equity 575.6 564.3 402.6 381.5Less: Proposed
dividends (160.6) (160.2) (160.6) (160.2) 415.0 404.1 242.0 221.3
Neither the Company nor any of its subsidiaries are subject to
externally imposed capital requirements.
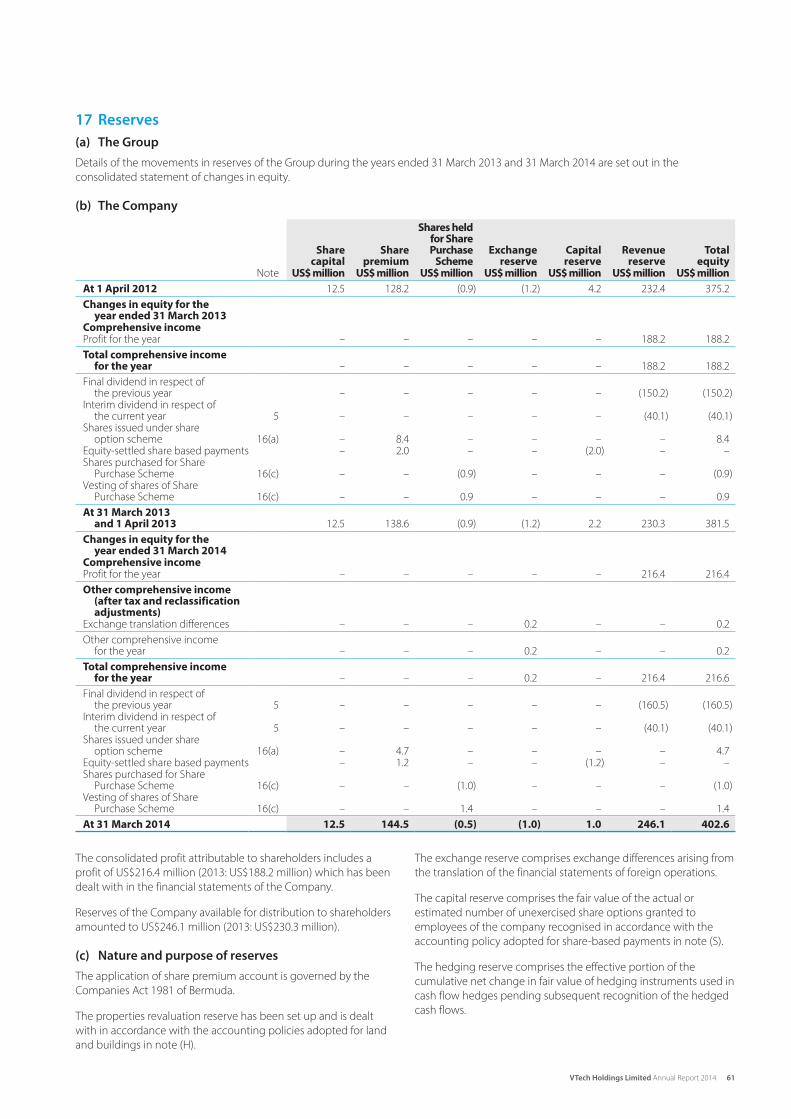
61VTech Holdings Limited Annual Report 2014
17 Reserves
(a) The Group
Details of the movements in reserves of the Group during the years ended 31 March 2013 and 31 March 2014 are set out in the
consolidated statement of changes in equity.
(b) The Company
Share capital
Share premium
Shares held for Share Purchase
SchemeExchange
reserveCapital reserve
Revenue reserve
Total equity
Note US$ million US$ million US$ million US$ million US$ million US$ million US$ million
At 1 April 2012 12.5 128.2 (0.9) (1.2) 4.2 232.4 375.2 Changes in equity for the
year ended 31 March 2013Comprehensive incomeProfit for the year – – – – – 188.2 188.2 Total comprehensive income
for the year – – – – – 188.2 188.2 Final dividend in respect of
the previous year – – – – – (150.2) (150.2)Interim dividend in respect of
the current year 5 – – – – – (40.1) (40.1)Shares issued under share
option scheme 16(a) – 8.4 – – – – 8.4Equity-settled share based payments – 2.0 – – (2.0) – –Shares purchased for Share
Purchase Scheme 16(c) – – (0.9) – – – (0.9)Vesting of shares of Share
Purchase Scheme 16(c) – – 0.9 – – – 0.9 At 31 March 2013
and 1 April 2013 12.5 138.6 (0.9) (1.2) 2.2 230.3 381.5 Changes in equity for the
year ended 31 March 2014Comprehensive incomeProfit for the year – – – – – 216.4 216.4 Other comprehensive income
(after tax and reclassification adjustments)
Exchange translation differences – – – 0.2 – – 0.2 Other comprehensive income
for the year – – – 0.2 – – 0.2 Total comprehensive income
for the year – – – 0.2 – 216.4 216.6 Final dividend in respect of
the previous year 5 – – – – – (160.5) (160.5)Interim dividend in respect of
the current year 5 – – – – – (40.1) (40.1)Shares issued under share
option scheme 16(a) – 4.7 – – – – 4.7Equity-settled share based payments – 1.2 – – (1.2) – –Shares purchased for Share
Purchase Scheme 16(c) – – (1.0) – – – (1.0)Vesting of shares of Share
Purchase Scheme 16(c) – – 1.4 – – – 1.4 At 31 March 2014 12.5 144.5 (0.5) (1.0) 1.0 246.1 402.6
The consolidated profit attributable to shareholders includes a
profit of US$216.4 million (2013: US$188.2 million) which has been
dealt with in the financial statements of the Company.
Reserves of the Company available for distribution to shareholders
amounted to US$246.1 million (2013: US$230.3 million).
(c) Nature and purpose of reserves
The application of share premium account is governed by the
Companies Act 1981 of Bermuda.
The properties revaluation reserve has been set up and is dealt
with in accordance with the accounting policies adopted for land
and buildings in note (H).
The exchange reserve comprises exchange differences arising from
the translation of the financial statements of foreign operations.
The capital reserve comprises the fair value of the actual or
estimated number of unexercised share options granted to
employees of the company recognised in accordance with the
accounting policy adopted for share-based payments in note (S).
The hedging reserve comprises the effective portion of the
cumulative net change in fair value of hedging instruments used in
cash flow hedges pending subsequent recognition of the hedged
cash flows.
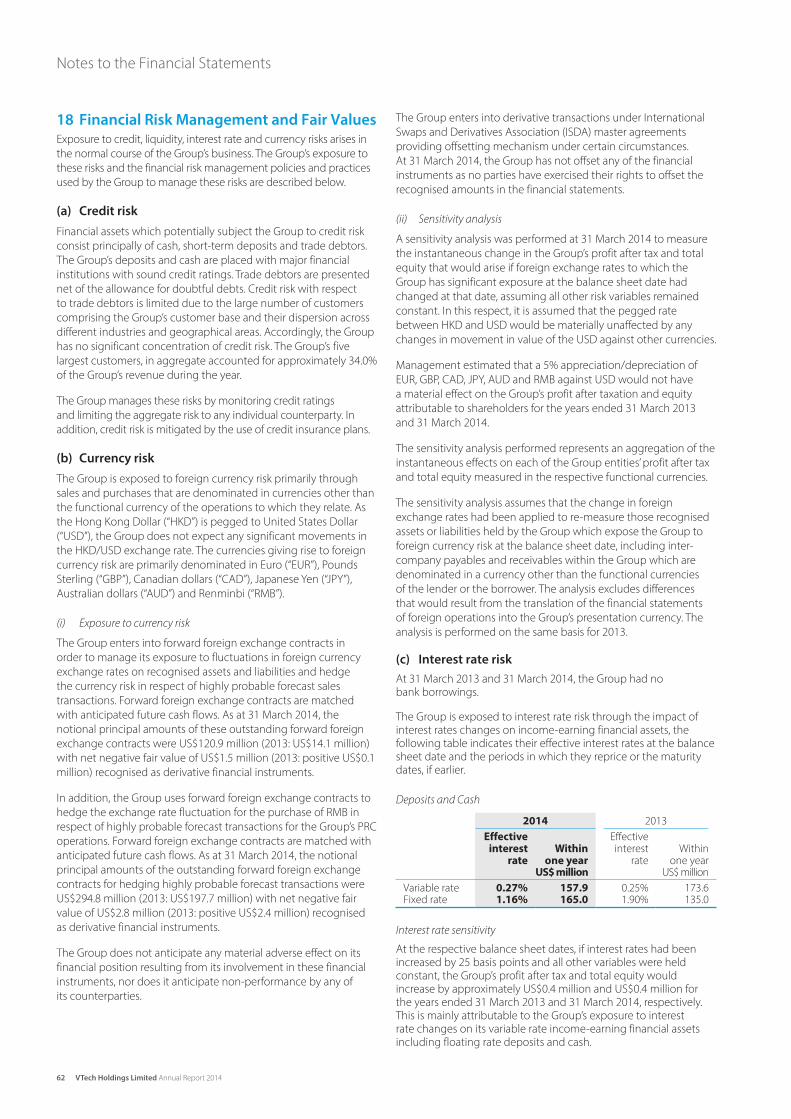
62 VTech Holdings Limited Annual Report 2014
Notes to the Financial Statements
18 Financial Risk Management and Fair Values
Exposure to credit, liquidity, interest rate and currency risks arises in
the normal course of the Group’s business. The Group’s exposure to
these risks and the financial risk management policies and practices
used by the Group to manage these risks are described below.
(a) Credit risk
Financial assets which potentially subject the Group to credit risk
consist principally of cash, short-term deposits and trade debtors.
The Group’s deposits and cash are placed with major financial
institutions with sound credit ratings. Trade debtors are presented
net of the allowance for doubtful debts. Credit risk with respect
to trade debtors is limited due to the large number of customers
comprising the Group’s customer base and their dispersion across
different industries and geographical areas. Accordingly, the Group
has no significant concentration of credit risk. The Group’s five
largest customers, in aggregate accounted for approximately 34.0%
of the Group’s revenue during the year.
The Group manages these risks by monitoring credit ratings
and limiting the aggregate risk to any individual counterparty. In
addition, credit risk is mitigated by the use of credit insurance plans.
(b) Currency risk
The Group is exposed to foreign currency risk primarily through
sales and purchases that are denominated in currencies other than
the functional currency of the operations to which they relate. As
the Hong Kong Dollar (“HKD”) is pegged to United States Dollar
(“USD”), the Group does not expect any significant movements in
the HKD/USD exchange rate. The currencies giving rise to foreign
currency risk are primarily denominated in Euro (“EUR”), Pounds
Sterling (“GBP”), Canadian dollars (“CAD”), Japanese Yen (“JPY”),
Australian dollars (“AUD”) and Renminbi (“RMB”).
(i) Exposure to currency risk
The Group enters into forward foreign exchange contracts in
order to manage its exposure to fluctuations in foreign currency
exchange rates on recognised assets and liabilities and hedge
the currency risk in respect of highly probable forecast sales
transactions. Forward foreign exchange contracts are matched
with anticipated future cash flows. As at 31 March 2014, the
notional principal amounts of these outstanding forward foreign
exchange contracts were US$120.9 million (2013: US$14.1 million)
with net negative fair value of US$1.5 million (2013: positive US$0.1
million) recognised as derivative financial instruments.
In addition, the Group uses forward foreign exchange contracts to
hedge the exchange rate fluctuation for the purchase of RMB in
respect of highly probable forecast transactions for the Group’s PRC
operations. Forward foreign exchange contracts are matched with
anticipated future cash flows. As at 31 March 2014, the notional
principal amounts of the outstanding forward foreign exchange
contracts for hedging highly probable forecast transactions were
US$294.8 million (2013: US$197.7 million) with net negative fair
value of US$2.8 million (2013: positive US$2.4 million) recognised
as derivative financial instruments.
The Group does not anticipate any material adverse effect on its
financial position resulting from its involvement in these financial
instruments, nor does it anticipate non-performance by any of
its counterparties.
The Group enters into derivative transactions under International
Swaps and Derivatives Association (ISDA) master agreements
providing offsetting mechanism under certain circumstances.
At 31 March 2014, the Group has not offset any of the financial
instruments as no parties have exercised their rights to offset the
recognised amounts in the financial statements.
(ii) Sensitivity analysis
A sensitivity analysis was performed at 31 March 2014 to measure
the instantaneous change in the Group’s profit after tax and total
equity that would arise if foreign exchange rates to which the
Group has significant exposure at the balance sheet date had
changed at that date, assuming all other risk variables remained
constant. In this respect, it is assumed that the pegged rate
between HKD and USD would be materially unaffected by any
changes in movement in value of the USD against other currencies.
Management estimated that a 5% appreciation/depreciation of
EUR, GBP, CAD, JPY, AUD and RMB against USD would not have
a material effect on the Group’s profit after taxation and equity
attributable to shareholders for the years ended 31 March 2013
and 31 March 2014.
The sensitivity analysis performed represents an aggregation of the
instantaneous effects on each of the Group entities’ profit after tax
and total equity measured in the respective functional currencies.
The sensitivity analysis assumes that the change in foreign
exchange rates had been applied to re-measure those recognised
assets or liabilities held by the Group which expose the Group to
foreign currency risk at the balance sheet date, including inter-
company payables and receivables within the Group which are
denominated in a currency other than the functional currencies
of the lender or the borrower. The analysis excludes differences
that would result from the translation of the financial statements
of foreign operations into the Group’s presentation currency. The
analysis is performed on the same basis for 2013.
(c) Interest rate risk
At 31 March 2013 and 31 March 2014, the Group had no bank borrowings.
The Group is exposed to interest rate risk through the impact of interest rates changes on income-earning financial assets, the following table indicates their effective interest rates at the balance sheet date and the periods in which they reprice or the maturity dates, if earlier.
Deposits and Cash
2014 2013 Effective
interest rate
Withinone year
Effectiveinterest
rateWithin
one yearUS$ million US$ million
Variable rate 0.27% 157.9 0.25% 173.6Fixed rate 1.16% 165.0 1.90% 135.0
Interest rate sensitivity
At the respective balance sheet dates, if interest rates had been increased by 25 basis points and all other variables were held constant, the Group’s profit after tax and total equity would increase by approximately US$0.4 million and US$0.4 million for the years ended 31 March 2013 and 31 March 2014, respectively. This is mainly attributable to the Group’s exposure to interest rate changes on its variable rate income-earning financial assets including floating rate deposits and cash.
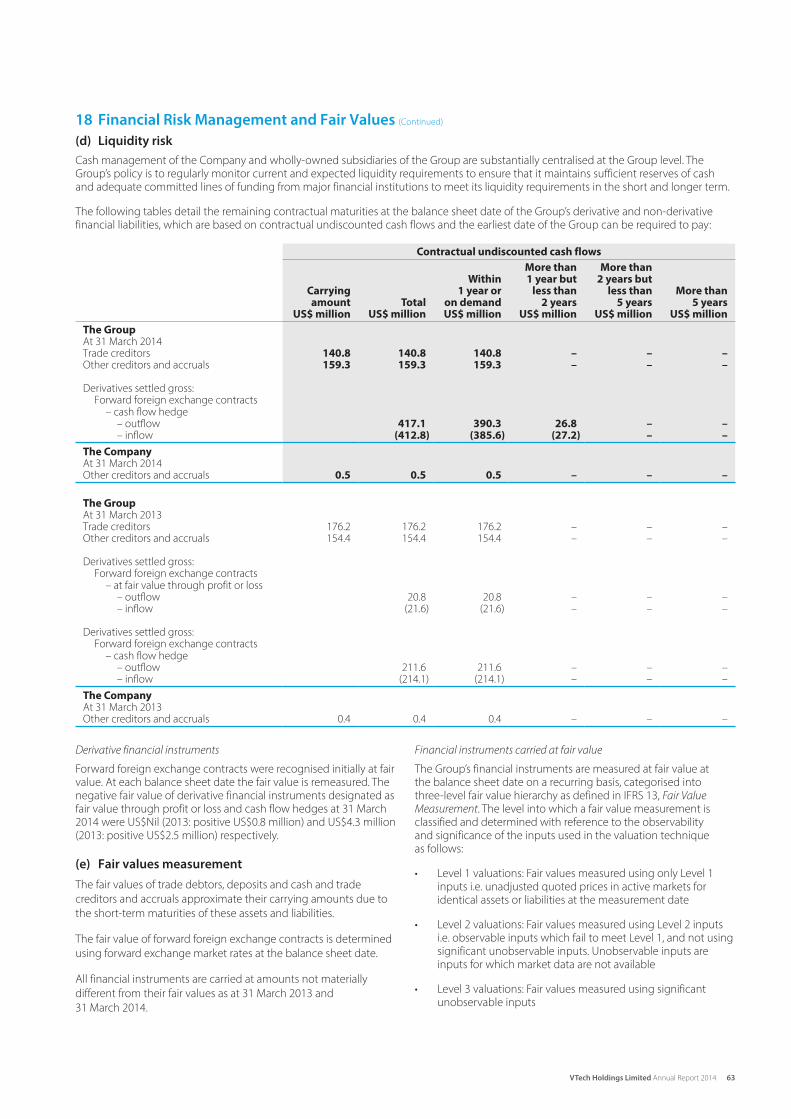
63VTech Holdings Limited Annual Report 2014
18 Financial Risk Management and Fair Values (Continued)
(d) Liquidity risk
Cash management of the Company and wholly-owned subsidiaries of the Group are substantially centralised at the Group level. The Group’s policy is to regularly monitor current and expected liquidity requirements to ensure that it maintains sufficient reserves of cash and adequate committed lines of funding from major financial institutions to meet its liquidity requirements in the short and longer term.
The following tables detail the remaining contractual maturities at the balance sheet date of the Group’s derivative and non-derivative financial liabilities, which are based on contractual undiscounted cash flows and the earliest date of the Group can be required to pay:
Contractual undiscounted cash flows
More than More thanWithin 1 year but 2 years but
Carrying 1 year or less than less than More thanamount Total on demand 2 years 5 years 5 years
US$ million US$ million US$ million US$ million US$ million US$ million
The GroupAt 31 March 2014Trade creditors 140.8 140.8 140.8 – – –Other creditors and accruals 159.3 159.3 159.3 – – –
Derivatives settled gross:Forward foreign exchange contracts
– cash flow hedge– outflow 417.1 390.3 26.8 – –– inflow (412.8) (385.6) (27.2) – –
The CompanyAt 31 March 2014Other creditors and accruals 0.5 0.5 0.5 – – –
The GroupAt 31 March 2013Trade creditors 176.2 176.2 176.2 – – –Other creditors and accruals 154.4 154.4 154.4 – – –
Derivatives settled gross:Forward foreign exchange contracts
– at fair value through profit or loss– outflow 20.8 20.8 – – –– inflow (21.6) (21.6) – – –
Derivatives settled gross:Forward foreign exchange contracts
– cash flow hedge– outflow 211.6 211.6 – – –– inflow (214.1) (214.1) – – –
The CompanyAt 31 March 2013Other creditors and accruals 0.4 0.4 0.4 – – –
Derivative financial instruments
Forward foreign exchange contracts were recognised initially at fair value. At each balance sheet date the fair value is remeasured. The negative fair value of derivative financial instruments designated as fair value through profit or loss and cash flow hedges at 31 March 2014 were US$Nil (2013: positive US$0.8 million) and US$4.3 million (2013: positive US$2.5 million) respectively.
(e) Fair values measurement
The fair values of trade debtors, deposits and cash and trade
creditors and accruals approximate their carrying amounts due to
the short-term maturities of these assets and liabilities.
The fair value of forward foreign exchange contracts is determined
using forward exchange market rates at the balance sheet date.
All financial instruments are carried at amounts not materially
different from their fair values as at 31 March 2013 and
31 March 2014.
Financial instruments carried at fair value
The Group’s financial instruments are measured at fair value at the balance sheet date on a recurring basis, categorised into three-level fair value hierarchy as defined in IFRS 13, Fair Value Measurement. The level into which a fair value measurement is classified and determined with reference to the observability and significance of the inputs used in the valuation technique as follows:
• Level 1 valuations: Fair values measured using only Level 1 inputs i.e. unadjusted quoted prices in active markets for identical assets or liabilities at the measurement date
• Level 2 valuations: Fair values measured using Level 2 inputs i.e. observable inputs which fail to meet Level 1, and not using significant unobservable inputs. Unobservable inputs are inputs for which market data are not available
• Level 3 valuations: Fair values measured using significant unobservable inputs

64 VTech Holdings Limited Annual Report 2014
Notes to the Financial Statements
18 Financial Risk Management and Fair Values (Continued)
(e) Fair values measurement (Continued)
Financial instruments carried at fair value (Continued)
At 31 March 2014, the fair values of the forward foreign exchange
contracts included in financial liabilities were US$4.3 million
(31 March 2013: US$3.3 million (financial assets)). At 31 March 2014
and 31 March 2013, the fair values of all forward foreign exchange
contracts were categorised as Level 2.
During the year ended 31 March 2014, there were no transfers
between Level 1 and Level 2, or transfers into or out of Level 3 fair
value hierarchy classifications.
The fair value of forward foreign exchange contracts in Level 2 is
determined by using the forward exchange rates at the balance
sheet date and comparing them to the contractual rates.
19 Commitments
2014 2013US$ million US$ million
(i) Capital commitments for property, plant and equipment
Authorised but not contracted for 27.3 25.7Contracted but not provided for 7.4 7.1
34.7 32.8
(ii) Operating lease commitmentsThe future aggregate minimum
lease payments under non-cancellable operating leases are as follows:
Land and buildingsIn one year or less 15.6 15.8Between one and two years 14.2 13.8Between two and five years 36.6 30.6In more than five years 24.4 28.2
90.8 88.4
In November 2010, the Group has entered into agreements with
an independent third party in the PRC to lease factory premises
in Houjie, Dongguan comprising several factory buildings. There
are a number of leases which expire in 2016, 2022, 2030 and
2031 respectively. The lease expiring in 2016 is not cancellable.
The lease expiring in 2022 can be cancelled on six months’ notice
without penalty. The lease expiring in 2030 and 2031 have a
non-cancellable period of first ten years. The operating lease
commitments above include total commitments over the non-
cancellable period of the lease terms.
In November 2010 and September 2013, the Group entered into
an agreement with an independent third party in the PRC whereby
the PRC party constructed in phases and leases to the Group a
production facility in Liaobu, Dongguan. There are a number of
leases which expire in 2020, 2030, 2031 and 2034 respectively. The
lease expiring in 2030 and 2034 have a non-cancellable period
of first ten years. The leases expiring in 2020 and 2031 are not
cancellable. The operating lease commitments above include total
commitments over the non-cancellable period of the lease terms.
Under a Brand License Agreement expiring on 31 March 2020, a
wholly-owned subsidiary of the Group is required to make royalty
payments to AT&T Intellectual Property II, L.P., calculated as a
percentage of net sales, as defined, of the relevant categories of
products, subject to certain minimum aggregate royalty payments.
The percentage of net sales payable varies over time and between
products. There is no maximum royalty payment. The annual
minimum royalty payment is determined based on a percentage of
the preceding year’s earned royalty payment (calculated based on
the preceding year’s net sales payable).
Certain wholly-owned subsidiaries of the Group (the “licensees”)
entered into certain licensing agreements with various third party
licensors for the granting of certain rights to use the relevant
cartoon characters in the Group’s electronic learning products.
Under these licensing agreements, the licensees are required to
make royalty payments to the licensors, calculated as a percentage
of net sales of the relevant character licensed products, subject to
certain minimum aggregate royalty payments. The percentage of
royalty payable varies over time and between licensed characters.
There is no maximum royalty payment. The aggregate minimum
royalty payments as at 31 March 2014 amount to US$2.2 million
(2013: US$2.5 million), of which US$1.4 million and US$0.8 million
are payable in the financial years ended 31 March 2015 and
2016 respectively.
20 Contingent Liabilities
The Directors have been advised that certain accusations of
infringements of patents have been lodged against the Company
and its subsidiaries. In the opinion of the legal counsel, it is too
early to evaluate the outcome of these claims and provisions have
been made only to the extent that the amounts can be reliably
estimated.
Certain subsidiaries of the Group are involved in litigation arising in
the ordinary course of their respective businesses. Having reviewed
the outstanding claims and taking into account of legal advice
received, the Directors are of the opinion that even if the claims are
found to be valid, there will be no material adverse effect on the
financial position of the Group.
As at 31 March 2014, there were contingent liabilities in respect
of guarantees given by the Company on behalf of subsidiaries
relating to overdrafts, short term loans and credit facilities of up
to US$353.4 million (2013: US$267.7 million). The Company has
not recognised any deferred income for the guarantees given in
respect of borrowings and other banking facilities for subsidiaries
as their fair value cannot be reliably measured and their transaction
price was US$Nil.
As at 31 March 2014, the Directors do not consider it is probable
that a claim will be made against the Company under any of
the guarantees.
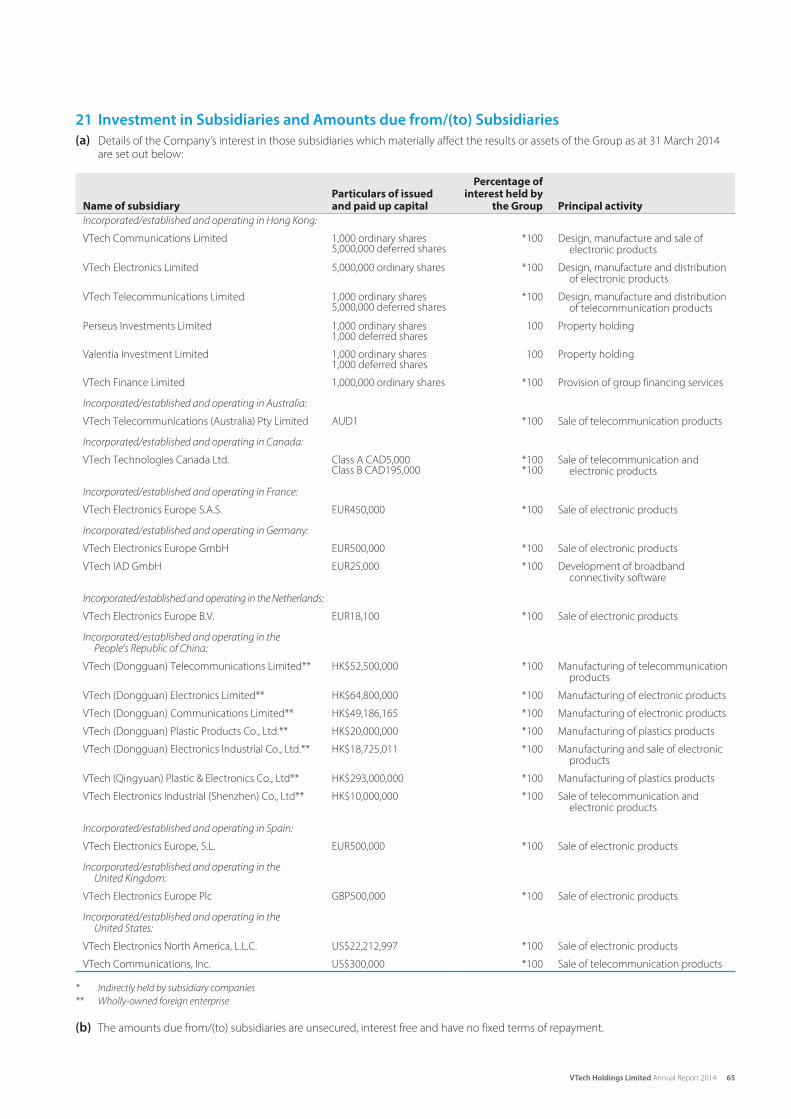
65VTech Holdings Limited Annual Report 2014
21 Investment in Subsidiaries and Amounts due from/(to) Subsidiaries
(a) Details of the Company’s interest in those subsidiaries which materially affect the results or assets of the Group as at 31 March 2014 are set out below:
Percentage ofParticulars of issued interest held by
Name of subsidiary and paid up capital the Group Principal activity
Incorporated/established and operating in Hong Kong:
VTech Communications Limited 1,000 ordinary shares *100 Design, manufacture and sale of electronic products5,000,000 deferred shares
VTech Electronics Limited 5,000,000 ordinary shares *100 Design, manufacture and distribution of electronic products
VTech Telecommunications Limited 1,000 ordinary shares *100 Design, manufacture and distribution of telecommunication products5,000,000 deferred shares
Perseus Investments Limited 1,000 ordinary shares 100 Property holding1,000 deferred shares
Valentia Investment Limited 1,000 ordinary shares 100 Property holding1,000 deferred shares
VTech Finance Limited 1,000,000 ordinary shares *100 Provision of group financing services
Incorporated/established and operating in Australia:
VTech Telecommunications (Australia) Pty Limited AUD1 *100 Sale of telecommunication products
Incorporated/established and operating in Canada:
VTech Technologies Canada Ltd. Class A CAD5,000 *100 Sale of telecommunication and electronic productsClass B CAD195,000 *100
Incorporated/established and operating in France:
VTech Electronics Europe S.A.S. EUR450,000 *100 Sale of electronic products
Incorporated/established and operating in Germany:
VTech Electronics Europe GmbH EUR500,000 *100 Sale of electronic products
VTech IAD GmbH EUR25,000 *100 Development of broadband connectivity software
Incorporated/established and operating in the Netherlands:
VTech Electronics Europe B.V. EUR18,100 *100 Sale of electronic products
Incorporated/established and operating in the People’s Republic of China:
VTech (Dongguan) Telecommunications Limited** HK$52,500,000 *100 Manufacturing of telecommunication products
VTech (Dongguan) Electronics Limited** HK$64,800,000 *100 Manufacturing of electronic products
VTech (Dongguan) Communications Limited** HK$49,186,165 *100 Manufacturing of electronic products
VTech (Dongguan) Plastic Products Co., Ltd.** HK$20,000,000 *100 Manufacturing of plastics products
VTech (Dongguan) Electronics Industrial Co., Ltd.** HK$18,725,011 *100 Manufacturing and sale of electronic products
VTech (Qingyuan) Plastic & Electronics Co., Ltd** HK$293,000,000 *100 Manufacturing of plastics products
VTech Electronics Industrial (Shenzhen) Co., Ltd** HK$10,000,000 *100 Sale of telecommunication and electronic products
Incorporated/established and operating in Spain:
VTech Electronics Europe, S.L. EUR500,000 *100 Sale of electronic products
Incorporated/established and operating in the United Kingdom:
VTech Electronics Europe Plc GBP500,000 *100 Sale of electronic products
Incorporated/established and operating in the United States:
VTech Electronics North America, L.L.C. US$22,212,997 *100 Sale of electronic products
VTech Communications, Inc. US$300,000 *100 Sale of telecommunication products
* Indirectly held by subsidiary companies
** Wholly-owned foreign enterprise
(b) The amounts due from/(to) subsidiaries are unsecured, interest free and have no fixed terms of repayment.
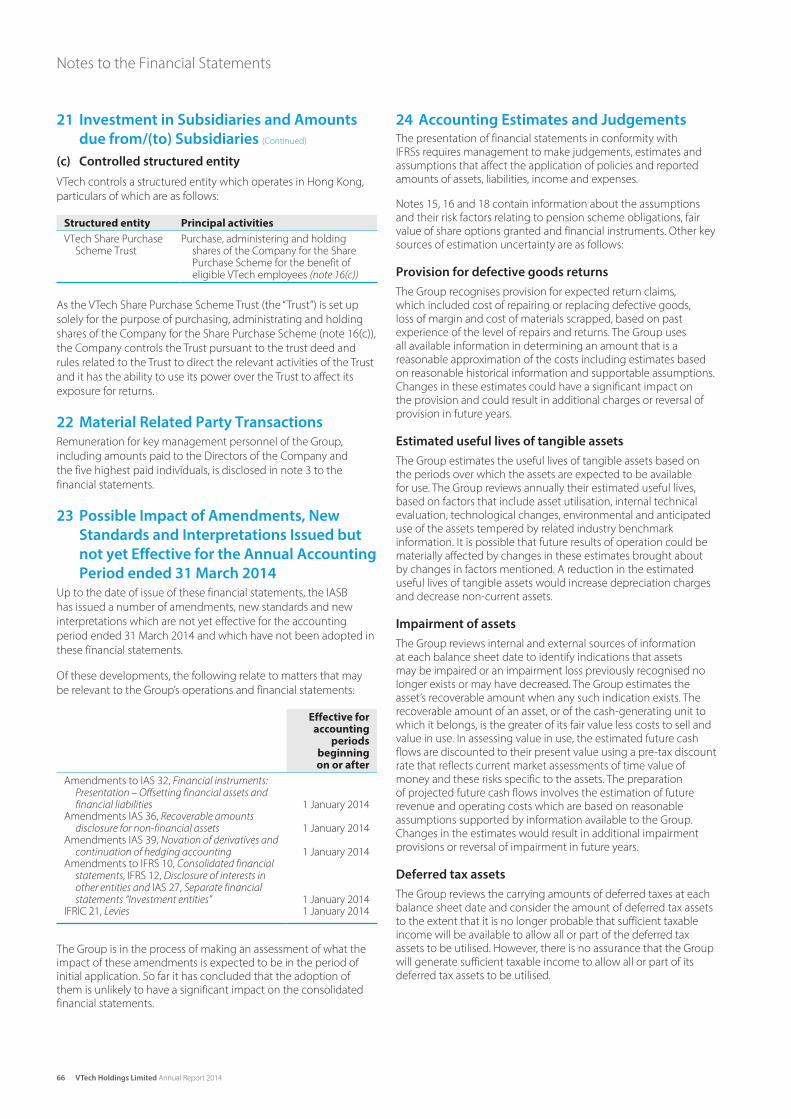
66 VTech Holdings Limited Annual Report 2014
Notes to the Financial Statements
21 Investment in Subsidiaries and Amounts
due from/(to) Subsidiaries (Continued)
(c) Controlled structured entity
VTech controls a structured entity which operates in Hong Kong,
particulars of which are as follows:
Structured entity Principal activities
VTech Share Purchase Scheme Trust
Purchase, administering and holding shares of the Company for the Share Purchase Scheme for the benefit of eligible VTech employees (note 16(c))
As the VTech Share Purchase Scheme Trust (the “Trust”) is set up
solely for the purpose of purchasing, administrating and holding
shares of the Company for the Share Purchase Scheme (note 16(c)),
the Company controls the Trust pursuant to the trust deed and
rules related to the Trust to direct the relevant activities of the Trust
and it has the ability to use its power over the Trust to affect its
exposure for returns.
22 Material Related Party Transactions
Remuneration for key management personnel of the Group,
including amounts paid to the Directors of the Company and
the five highest paid individuals, is disclosed in note 3 to the
financial statements.
23 Possible Impact of Amendments, New
Standards and Interpretations Issued but
not yet Effective for the Annual Accounting
Period ended 31 March 2014
Up to the date of issue of these financial statements, the IASB
has issued a number of amendments, new standards and new
interpretations which are not yet effective for the accounting
period ended 31 March 2014 and which have not been adopted in
these financial statements.
Of these developments, the following relate to matters that may
be relevant to the Group’s operations and financial statements:
Effective for accounting
periods beginning on or after
Amendments to IAS 32, Financial instruments: Presentation – Offsetting financial assets and financial liabilities 1 January 2014
Amendments IAS 36, Recoverable amounts disclosure for non-financial assets 1 January 2014
Amendments IAS 39, Novation of derivatives and continuation of hedging accounting 1 January 2014
Amendments to IFRS 10, Consolidated financial statements, IFRS 12, Disclosure of interests in other entities and IAS 27, Separate financial statements “Investment entities” 1 January 2014
IFRIC 21, Levies 1 January 2014
The Group is in the process of making an assessment of what the
impact of these amendments is expected to be in the period of
initial application. So far it has concluded that the adoption of
them is unlikely to have a significant impact on the consolidated
financial statements.
24 Accounting Estimates and JudgementsThe presentation of financial statements in conformity with
IFRSs requires management to make judgements, estimates and
assumptions that affect the application of policies and reported
amounts of assets, liabilities, income and expenses.
Notes 15, 16 and 18 contain information about the assumptions
and their risk factors relating to pension scheme obligations, fair
value of share options granted and financial instruments. Other key
sources of estimation uncertainty are as follows:
Provision for defective goods returns
The Group recognises provision for expected return claims,
which included cost of repairing or replacing defective goods,
loss of margin and cost of materials scrapped, based on past
experience of the level of repairs and returns. The Group uses
all available information in determining an amount that is a
reasonable approximation of the costs including estimates based
on reasonable historical information and supportable assumptions.
Changes in these estimates could have a significant impact on
the provision and could result in additional charges or reversal of
provision in future years.
Estimated useful lives of tangible assets
The Group estimates the useful lives of tangible assets based on
the periods over which the assets are expected to be available
for use. The Group reviews annually their estimated useful lives,
based on factors that include asset utilisation, internal technical
evaluation, technological changes, environmental and anticipated
use of the assets tempered by related industry benchmark
information. It is possible that future results of operation could be
materially affected by changes in these estimates brought about
by changes in factors mentioned. A reduction in the estimated
useful lives of tangible assets would increase depreciation charges
and decrease non-current assets.
Impairment of assets
The Group reviews internal and external sources of information
at each balance sheet date to identify indications that assets
may be impaired or an impairment loss previously recognised no
longer exists or may have decreased. The Group estimates the
asset’s recoverable amount when any such indication exists. The
recoverable amount of an asset, or of the cash-generating unit to
which it belongs, is the greater of its fair value less costs to sell and
value in use. In assessing value in use, the estimated future cash
flows are discounted to their present value using a pre-tax discount
rate that reflects current market assessments of time value of
money and these risks specific to the assets. The preparation
of projected future cash flows involves the estimation of future
revenue and operating costs which are based on reasonable
assumptions supported by information available to the Group.
Changes in the estimates would result in additional impairment
provisions or reversal of impairment in future years.
Deferred tax assets
The Group reviews the carrying amounts of deferred taxes at each
balance sheet date and consider the amount of deferred tax assets
to the extent that it is no longer probable that sufficient taxable
income will be available to allow all or part of the deferred tax
assets to be utilised. However, there is no assurance that the Group
will generate sufficient taxable income to allow all or part of its
deferred tax assets to be utilised.

67VTech Holdings Limited Annual Report 2014
VTech in the Last Five Years
Consolidated balance sheet as at 31 March
2010 2011 2012 2013 2014(Restated)
US$ million US$ million US$ million US$ million US$ million
Non-current assetsTangible assets 81.4 78.4 91.0 88.4 85.9Leasehold land payments 4.9 5.0 5.1 5.2 5.1Other non-current assets 5.8 5.6 6.1 4.7 2.6
92.1 89.0 102.2 98.3 93.6
Current assetsStocks 159.3 229.8 239.2 276.9 265.9Debtors, deposits and prepayments 211.4 225.0 244.2 257.1 235.8Deposits and cash 382.6 333.1 326.5 308.6 322.9Other current assets 0.7 0.3 0.8 0.4 0.9
754.0 788.2 810.7 843.0 825.5Current liabilities (324.9) (329.4) (350.9) (366.0) (337.4)
Net current assets 429.1 458.8 459.8 477.0 488.1
Total assets less current liabilities 521.2 547.8 562.0 575.3 581.7
Non-current liabilitiesNet obligation on defined benefit
scheme – – – (6.5) (2.0)Deferred tax liabilities (3.7) (3.9) (5.8) (4.5) (4.1)
(3.7) (3.9) (5.8) (11.0) (6.1)
Net assets/Total equity 517.5 543.9 556.2 564.3 575.6
Consolidated income statement for the years ended 31 March
2010 2011 2012 2013 2014(Restated)
US$ million US$ million US$ million US$ million US$ million
Revenue 1,532.3 1,712.8 1,784.5 1,858.0 1,898.9
Profit before taxation 225.5 220.3 211.6 225.6 227.5Taxation (20.2) (19.1) (19.7) (24.1) (24.2)
Profit for the year 205.3 201.2 191.9 201.5 203.3
Attributable to:Shareholders of the Company 206.5 202.0 191.9 201.5 203.3Non-controlling interests (1.2) (0.8) – – –
Profit for the year 205.3 201.2 191.9 201.5 203.3
Basic earnings per share (US cents) 83.7 81.5 77.0 80.6 81.1
Note:
In order to comply with IAS 19 (Revised 2011), Employees benefits, the Group changed its accounting policy with respect to defined benefit scheme in the financial year ended 31 March 2014. The change in accounting policy has been applied retrospectively. As a result, profit and net assets for the year ended 31 March 2013 has been restated. Details of the change in accounting policy are disclosed in note B to the financial statements. Figures for the year ended 31 March 2012 and prior years have not been restated as it would involve delay and expenses out of proportion to the benefits of shareholders.
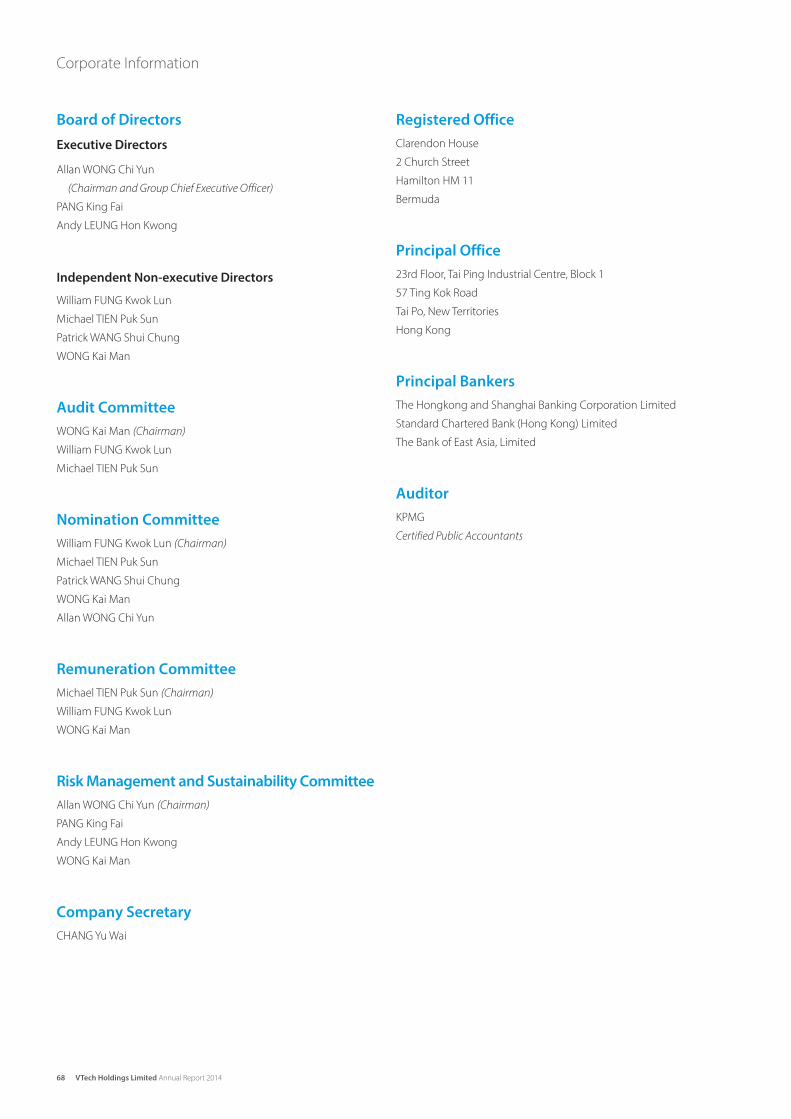
68 VTech Holdings Limited Annual Report 2014
Corporate Information
Board of Directors
Executive Directors
Allan WONG Chi Yun
(Chairman and Group Chief Executive Officer)
PANG King Fai
Andy LEUNG Hon Kwong
Independent Non-executive Directors
William FUNG Kwok Lun
Michael TIEN Puk Sun
Patrick WANG Shui Chung
WONG Kai Man
Audit Committee
WONG Kai Man (Chairman)
William FUNG Kwok Lun
Michael TIEN Puk Sun
Nomination Committee
William FUNG Kwok Lun (Chairman)
Michael TIEN Puk Sun
Patrick WANG Shui Chung
WONG Kai Man
Allan WONG Chi Yun
Remuneration Committee
Michael TIEN Puk Sun (Chairman)
William FUNG Kwok Lun
WONG Kai Man
Risk Management and Sustainability Committee
Allan WONG Chi Yun (Chairman)
PANG King Fai
Andy LEUNG Hon Kwong
WONG Kai Man
Company Secretary
CHANG Yu Wai
Registered Office
Clarendon House
2 Church Street
Hamilton HM 11
Bermuda
Principal Office
23rd Floor, Tai Ping Industrial Centre, Block 1
57 Ting Kok Road
Tai Po, New Territories
Hong Kong
Principal Bankers
The Hongkong and Shanghai Banking Corporation Limited
Standard Chartered Bank (Hong Kong) Limited
The Bank of East Asia, Limited
Auditor
KPMG
Certified Public Accountants
1 Corporate Profile
2 Financial Highlights
3 Letter to Shareholders
7 Management Discussion and Analysis
• Financial Review
• Review of Operations
14 Products and Services Overview
20 Year in Review
22 Sustainability
26 Investor Relations
29 Corporate Governance Report
33 Directors and Senior Management
35 Report of the Directors
39 Independent Auditor’s Report
40 Consolidated Financial Statements
43 Notes to the Financial Statements
67 VTech in the Last Five Years
68 Corporate Information
CONTENTS
Conc
ept &
Des
ign:
YEL
LOW
CRE
ATIV
E (H
K) L
IMIT
ED
ww
w.y
ello
wcr
eativ
e.co
m
A Chinese translation of this annual report may be obtained on request from Computershare Hong Kong Investor Services Limited,
Shops 1712-16, 17th Floor, Hopewell Centre, 183 Queen’s Road East, Wan Chai, Hong Kong. If there are any discrepancies between
the Chinese translation and the English version of this report and accounts, the English version shall prevail.
本年報備有中文譯本,請向位於香港灣仔皇后大道東183號合和中心17樓1712-16號舖香港中央證券登記有限公司索取。
本年報及賬目之中文譯本與英文本如有任何歧義,概以英文本為準。
Head Office
VTech Holdings Limited
23rd Floor, Tai Ping Industrial Centre
Block 1, 57 Ting Kok Road
Tai Po, New Territories
Hong Kong
Tel: (852) 2680 1000
Fax: (852) 2680 1300
Website: www.vtech.com
Email: [email protected]
Regional Offices
AustraliaVTech Telecommunications
(Australia) Pty Limited
24 Gilby Road, Mount Waverley
Victoria, 3149
Tel: (61) 1300 369 193
Fax: (61) 1300 304 600
Email: (Business Enquiry)
(Telstra product support)
CanadaVTech Technologies Canada Ltd.
12111 Jacobson Way
Richmond, British Columbia
V6W 1L5
Tel: (1) 604 273 5131
Fax: (1) 604 273 1425
Website: www.vtechcanada.com
Email: (Telecommunication Products)
(Electronic Learning Products)
ChinaVTech Electronics Industrial
(Shenzhen) Co., Ltd
District B-1, 7th Floor, VTech Research &
Development Building
Junction between Keji South 12th Road
and Gaoxin South 4th Avenue
Nanshan District, Shenzhen
Guangdong Province
Postcode: 518057
Tel: (86) 400 188 8628
Fax: (86) 755 8632 2069
Website: www.vtechchina.com.cn
Email: [email protected]
FranceVTech Electronics Europe S.A.S.
24, allée des Sablières
78290 Croissy-sur-Seine
Tel: (33) 1 30 09 88 00
Fax: (33) 1 30 09 87 80
Website: www.vtech-jouets.com
Email: [email protected]
GermanyVTech Electronics Europe GmbH
Martinstrasse 5
70794 Filderstadt
Tel: (49) 711 709 740
Fax: (49) 711 709 7449
Website: www.vtech.de
Email: [email protected]
JapanVTech Electronics (Japan) Inc.
3F, Shin-Osaka Building, 1-1-36
Nishiawaji, Higashiyodogawa-ku
Osaka 533-0031
Tel: (81) 6 4950 5100
Fax: (81) 6 4950 5101
Website: www.vtechjapan.com
VTech Communications Japan Ltd.
Okumura Building
3-14, Kanda Ogawamachi
Chiyoda-Ku, Tokyo 101-0052
Tel: (81) 3 3294 0740
Fax: (81) 3 3294 0785
Website: www.vtechcms.com
Email: [email protected]
NetherlandsVTech Electronics Europe B.V.
Copernicusstraat 7
6003 DE Weert
Industrial Estate Kampershoek
Tel: (31) 495 459 111
Fax: (31) 495 459 112
Website: www.vtechnl.com
Email: [email protected]
SpainVTech Electronics Europe, S.L.
Avda. de Aragón, 336 c/v Yécora
Oficina 1-Pol. Ind. Las Mercedes
28022 Madrid
Tel: (34) 91 312 0770
Fax: (34) 91 747 0638
Website: www.vtech.es
Email: [email protected]
United KingdomVTech Communications Limited
9, Manor Courtyard
Hughenden Avenue
High Wycombe
Buckinghamshire
HP13 5RE
Tel: (44) 1494 522 510
VTech Electronics Europe Plc
Napier Court
Abingdon Science Park
Abingdon, Oxfordshire, OX14 3YT
Tel: (44) 123 555 5545
Fax: (44) 123 554 6804
Website: www.vtechuk.com
Email: [email protected]
United StatesVTech Electronics North America, L.L.C.
1156 W Shure Drive, Suite 200
Arlington Heights, IL 60004
Tel: (1) 847 400 3600
Fax: (1) 847 400 3601
Website: www.vtechkids.com
Email: [email protected]
VTech Communications, Inc.
9590 S.W. Gemini Drive, Suite 120
Beaverton, OR 97008
Tel: (1) 503 596 1200
Fax: (1) 503 644 9887
Website: www.vtechphones.com
Email: [email protected]
VTech Telecom, L.L.C.
545 Concord Avenue, Suite 14
Cambridge, MA 02138
Tel: (1) 617 576 3300
Fax: (1) 617 576 7753
Website: www.vtechcms.com
Email: [email protected]
VTech Group of Companies

23rd Floor, Tai Ping Industrial Centre, Block 1
57 Ting Kok Road, Tai Po, New Territories, Hong Kong
Tel: (852) 2680 1000
Fax: (852) 2680 1300
Email: [email protected]
www.vtech.com
(Incorporated in Bermuda with limited liability)
HKSE : 303
Annual Report 2014
VTech Holdings Lim
itedA
nnual Report 2014