ANNUAL REPORT 2014 - Siem Offshore Depreciation and amortization -125,883 -75,841 ... Net cash flow...
105
ANNUAL REPORT 2014
Transcript of ANNUAL REPORT 2014 - Siem Offshore Depreciation and amortization -125,883 -75,841 ... Net cash flow...

SIEM OFFSHORE INC., ANNUAL REPORT 20145
ANNUAL REPORT 2014

SIEM OFFSHORE INC., ANNUAL REPORT 2014 6
Key Figures 3
Highlights 2014 5
New vessels Delivered in 2014 6
Newbuildings 8
Fleet List March 2015 10
Local presence in key markets 31.03.2015 12
This is Siem Offshore Inc. 14
Board of Director’s Report 16
Corporate Governance 22
Income Statements 25
Statements of Financial Position – Assets 26
Statements of Financial Position – Equity and Liabilities 27
Statements of Changes In Equity 28
Statements of Cash Flows 30
Notes to the Accounts 32
Corporate Social Responsibility 98
Auditor’s Report 100
Responsibility Statement 102
Board of Directors 103
Financial Calendar 104
CONTENTS

SIEM OFFSHORE INC., ANNUAL REPORT 20147
KEY FIGURES
(Amounts in USD 1,000) Consolidated
INCOME STATEMENTS Ref 2014 2013
Operating revenue 491,312 363,955 Operating expenses -297,187 -241,291 Operating margin (1) 194,125 122,663 Operating margin, % 40% 34%Depreciation and amortization -125,883 -75,841 Gain/(loss) on sale of assets 18,728 29,827 Gain on sale of interest rate derivatives (CIRR) 368 368 Gain/(loss) on currency exchange forward contracts -3,023 -7,756 Operating profit (2) 84,316 69,261 Operating profit margin, % 17% 19%Net financial items -12,685 -53,349 Result from associated companies 1,808 2,046 Profit /(loss) before taxes 73,439 17,959 Profit marging before taxes 15% 5%Tax benefit/(expense) -2,729 3,585 Net profit /(loss) 70,710 21,544 Minorities interest 12,563 -456 Net profit/(loss) attributable to shareholders 58,147 22,000 Net profit margin, % 12% 6%
Statements of Financial Position 12/31/14 12/31/13
Non-current assets 1,995,809 1,689,886 Current assets 264,774 194,696 Working capital (3) -17,419 21,112 Total assets 2,260,584 1,902,702 Shareholders’ equity 784,982 756,628 Non-current liabilities 1,154,742 935,231 Current liabilities 282,193 173,584 Total equity and liabilities 2,260,584 1,902,702
Statements of Cash Flows 2014 2013
Net cash flow from operations (4) 184,345 58,986 Net cash flow (4) 43,401 -9,028
Key Figures 2014 2013
Weighted average no. of outstanding shares (1,000) 387,591 389,078 Weighted average no. of diluted outstanding shares (1,000) 389,144 389,144 Earnings per share (USD) 0,15 0,06 Diluted earnings per share (USD 0,15 0,06 Cash flow per share in USD (5) 0,48 0,15 Share price per year end (USD) 0,54 1,59 Share price per year end (NOK) 4,04 9,65 Price/earnings per share (P/E) (6) 3,62 28,05 Price/cash flow per share (P/CF) (7) 1,14 10,42 Book shareholders’ equity per share (USD) (8) 2,03 2,00 Operating margin share (9) 0,50 0,32 Book equity ratio (10) 0,36 0,41 Liquidity ratio (11) 0,94 1,12

SIEM OFFSHORE INC., ANNUAL REPORT 2014 8
27 TOTAL
34 TOTAL
32 TOTAL
40 TOTAL
44 TOTAL
42 TOTAL
45 TOTAL
31/12/2005
31/12/2006
31/12/2007
31/12/2008
31/12/2009
31/12/2010
31/12/2011
Newbuildings Vessels in operation
27 TOTAL
34 TOTAL
32 TOTAL
40 TOTAL
44 TOTAL
45 TOTAL
42 TOTAL
0-51% 100%
31/12/2012
31/12/2005
31/12/2006
31/12/2007
31/12/2008
31/12/2009
31/12/2010
31/12/2011
31/12/2012 47 TOTAL
47 TOTAL
VESSELS
OWNERSHIP
31/12/2013 55 TOTAL
31/12/2013 55 TOTAL
Definitions (1) Earnings before interests, tax, depreciation and amortization (EBITDA) (2) Earnings before interests and taxes (EBIT) (3) Total current assets less total current liabilities (4) See Statements of Cash Flows for details (5) Net cash flow from operation divided on weighted average number of shares outstanding
(6) Stock Exchange price on December 31 divided on earnings per share (7) Stock Exchange price on December 31 divided on cash flow per share (8) Shareholders’ equity divided on number of outstanding shares (9) Operating margin divided on weighted average number of outstanding shares (10) Book equity divided on total assets (11) Current assets divided on current liabilities
31/12/2014 55 TOTAL
31/12/2014 55 TOTAL

SIEM OFFSHORE INC., ANNUAL REPORT 2014 5
REVENUE USD 1,000
491 312PROFIT BEFORE TAX USD 1,000
73 439EMPLOYEES
1 073VESSELS IN OPERATION
46
Contracts and vessels: Jan 14; Agreed a contract for the Plat-form Supply vessel (“PSV”) “Siem Atlas” for a firm period of two years, with options for two years to be mutually agreed, for operations offshore Brazil.
Jan 14; Sold and delivered the 2004-built PSV “Siddis Skipper”.
Feb 14; Ordered two well-intervention vessels scheduled for delivery in first and third quarter 2016. The two vessels shall be built at the Flensburger shipyard in Germany. Both vessels shall be chartered to Helix Energy Solutions Group for a firm period of seven years with options that can extend the charter period up to twenty-two years.
Apr 14; Siem Offshore Contractors GmbH (“SOC”), a wholly owned subsidi-ary of Siem Offshore Inc. was awarded a contract for the Nordsee One Offshore Wind Farm.
Apr 14; Received delivery of the installa-tion support vessel (“ISV”) “Siem Moxie”. The vessel shall primarily be utilised by SOC for project work within the subma-rine power cable installation, repair and maintenance segment.
May 14; Agreed a charter agreement for the Offshore Subsea Construction Vessel (“OSCV”) “Siem Stingray”. The agreement was made at market terms and for a firm period of three years with two yearly options. The charter commenced upon delivery of the vessel from the Norwegian yard.
May 14; Secunda Canada LP, which is 50% owned by Siem Offshore, was awarded a five-year firm contract for one newbuild AHTS vessel. The vessel shall be built at the Remontowa shipyard and be delivered in fourth quarter 2015.
May 14; Received delivery of the OSCV “Siem Spearfish”.
Jun 14; Extended firm contract for scien-tific core-drilling vessel “Joides Resolu-tion” by one year following the charterer’s exercise of the second of ten annual options.
Jun 14; Received delivery of the PSV “Siem Giant”.
July 14; Received delivery of the OSCV “Siem Stingray”.
July 14; Sold and delivered the 2007-built PSV “Siem Sailor”.
Aug 14; Entered into an agreement with Daya Materials Bhd. (“Daya”) in August 2014 for the sale of the two 2013-built
OSCVs “Siem Daya 1” and “Siem Daya 2”, which are currently chartered by Daya. Daya has been given 150 days from August 2014 to arrange for financing of the two vessels and delivery of the ves-sels is scheduled to take place latest by mid-April 2015. The en-bloc sales price is USD 282 million. The sale would generate a gain, which will be recorded at the deliv-ery of the vessels. The sales proceeds will be used to repay mortgage debt.
Nov 14; The PSV “Siem Symphony” was delivered from a Norwegian yard in November and commenced a four year contract.
Dec 14; The OSRV “Siem Maragogi” was delivered from a Brazilian yard in October and commenced an eight-year contract in December.
Dec 14; Agreed a three-year firm contract for the OSCV “Siem N-Sea” (ex. “Siem Stork”) with commencement 1 January 2015.
Dec 14; Received notices of termination from Karmorneftegaz SARL in respect of the seasonal work in Kara Sea for the year 2015 for the two AHTS vessels “Siem Topaz” and “Siem Amethyst” and for the PSV “Siem Pilot”.
Dec 14; The charterer declared three month extension until 9 June 2015 for the PSVs “Siem Hanne” and “Sophie Siem”.
HIGHLIGHTS 2014

SIEM OFFSHORE INC., ANNUAL REPORT 201466
NEW VESSELS DELIVERED IN 2014
Siem Giant – built by VARD Niterói, Brazil, delivered 16 June 2014
Siem Maragogi – built by ETP Shipyard, Brazil, delivered 23 October 2014
Siem Symphony – built by Hellesøy Yard, Norway, delivered 19 November 2014

SIEM OFFSHORE INC., ANNUAL REPORT 2014 7SIEM OFFSHORE INC., ANNUAL REPORT 2014 7
Siem Moxie – built by Fjellstrand, Norway, delivered 7 April 2014
Siem Spearfish – built by VARD Brattvaag, Norway, delivered 27 May 2014
Siem Stingray – built by VARD Brattvaag, Norway, delivered 24 July 2014

SIEM OFFSHORE INC., ANNUAL REPORT 20148
NEWBUILDINGS
Siem Pride delivery 2015
Siem TBN delivery 2016
Siem TBN delivery 2016
Siem TBN delivery 2016
Design: VS 4411 DF
Type: PSV
An exciting newbuilding program

SIEM OFFSHORE INC., ANNUAL REPORT 2014 9
Siem Marataizes delivery 2015Design: ULSTEIN P801
Type: OSRV
Siem Aimery delivery 2016
Design: VARD CLV 01
Type: CLV
Siem Helix 1 delivery 2016
Siem Helix 2 delivery 2016
Design: SALT 307 WIV
Type: WIV
TBN delivery 2015
Design: UT 782Wp
Type: AHTS

SIEM OFFSHORE INC., ANNUAL REPORT 20141010
VESSELS IN OPERATION MARCH 2015
Platform Supply Vessels (PSV) Large-size PSVs
Siem Symphony Siem Atlas Siem Giant Siem Hanne Siem Louisa Sophie Siem Siem Sasha Siddis Mariner Siem Pilot Hugin Explorer Siem Supplier Siem Carrier
Built: 2014 2013 2014 2007 2006 2006 2005 2011 2010 2006 1999 1996
Design: VS 4411 DF STX PSV 4700 STX PSV 4700 VS 470 MK II VS 470 MK II VS 470 MK II VS 470 MK II VS 485 VS 485 MT 6000 MK II MT 6000 VS 483
Dp Class: 2 2 2 2 2 2 1 2 2 2 2 2
LOA: 89.20 m 87.90 m 87.90 m 73.40 m 73.40 m 73.40 m 73.40 m 88.3 m 88.3 m 86.20 m 83.70 m 82.85 m
Breadth: 19.00 m 19.00 m 19.00 m 16.60 m 16.60 m 16.60 m 16.60 m 20 m 20 m 19.70 m 17.70 m 19.00 m
Draught: 7.40 m 6.60m 6.60 m 6.42 m 6.42 m 6.42 m 6.42 m approx 7.0 m approx 7.0 m 6.18 m 6.10 m 6.30 m
Dwt: 5,500 t 4700 T 4,700 T 3570 T 3570 T 3570 T 3570 T 4500 T 4500 T 3236 T 4250 T 4679 T
Accommodation: 25 34 34 34 34 34 34 64 64 56 20 23
Cargo Deck Area: 980 m2 1000 m2 usable 1000 m2 usable 680 m2 usable 680 m2 usable 680 m2 usable 680 m2 usable 970 m2 970 m2 935 m2 912 m2 840 m2
Ownership: 100% 100% 100% 100% 100% 100% 100% 51% 51% 100% 100% 100%
Offshore Subsea Construction Vessel (OSCV) & Multipurpose field & ROV Support Vessel (MRSV)
Anchor Handling Tug Supply Vessels (AHTS)
Siem Marlin Siem N-Sea Siem Daya 1 Siem Daya 2 Siem Spearfish Siem Stingray
Built: 2009 2009 2013 2013 2014 2014
Design: MT 6017 MK II MT 6017 MK II STX OSCV 11L STX OSCV 11L STX OSCV 03 STX OSCV 03
Dp Class: 2 2 2 2 2 2
LOA: 93.60 m 93.60 m 120.80 m 120.80 m 120.80 m 120.80 m
Breadth: 19.70 m 19.70 m 22.00 m 22.00 m 23.00 m 23.00 m
Draught: 6.30 m 6.30 m 6.60 m 6.60 m 6.60 m 6.60 m
Dwt: 4.500 t 4.500 t 5.000 t 5.000 t 5.000 t 5.000 t
Accommodation: 68 68 110 110 110 110
Cargo Deck Area: 1046 m2 1046 m2 1300 m2 1300 m2 1,300 m2 1,300 m2
Crane: 100 t Offshore/Subsea crane 100 t Offshore/Subsea crane 250 t Offshore/Subsea crane 250 t Offshore/Subsea crane 1 X 250 t AHC, 3,000 m 1 X 250 t AHC, 3,000 m
ROV Moonpool - - 7.2 X 7.2 7.2 X 7.2 7.2 X 7.2 m 7.2 X 7.2 m
Ownership: 100% 100% 100% 100% 100% 100%
Siem Amethyst Siem Opal Siem Garnet Siem Sapphire Siem Aquamarine Siem Topaz Siem Ruby Siem Diamond Siem Pearl Siem Emerald
Built: 2011 2011 2010 2010 2010 2010 2010 2010 2009 2009
Design: VS 491 CD VS 491 CD VS 491 CD VS 491 CD VS 491 CD VS 491 CD VS 490 CD VS 491 CD VS 491 CD VS 491 CD
Dp Class: 2 2 2 2 2 2 2 2 2 2
LOA: 91.00 m 91.00 m 91.00 m 91.00 m 91.00 m 91.00 m 91.00 m 91.00 m 91.00 m 91.00 m
Breadth: 22.00 m 22.00 m 22.00 m 22.00 m 22.00 m 22.00 m 22.00 m 22.00 m 22.00 m 22.00 m
Draught: 7.95 m 7.95 m 7.95 m 7.95 m 7.95 m 7.95 m 7.95 m 7.95 m 7.95 m 7.95 m
Dwt: 3800 T 3800 T 3800 T 3800 T 3800 T 3800 T 3800 T 3800 T 3800 T 3800 T
Accommodation: 60 60 60 60 60 60 60 60 60 60
Cargo Deck Area: 800 m2 800 m2 800 m2 800 m2 800 m2 800 m2 800 m2 800 m2 800 m2 800 m2
BHP: 28000 28000 28000 28000 28000 28000 28000 28000 28000 28000
Bollard Pull: 297 Te 297 Te 282 Te 301 Te 284 Te 306 Te 310 Te 284 Te 285 Te 281 Te
Ownership: 100% 0% 0% 100% 100% 100% 100% 100% 100% 100%

SIEM OFFSHORE INC., ANNUAL REPORT 2014 1111
Platform Supply Vessels (PSV) Large-size PSVs
Siem Symphony Siem Atlas Siem Giant Siem Hanne Siem Louisa Sophie Siem Siem Sasha Siddis Mariner Siem Pilot Hugin Explorer Siem Supplier Siem Carrier
Built: 2014 2013 2014 2007 2006 2006 2005 2011 2010 2006 1999 1996
Design: VS 4411 DF STX PSV 4700 STX PSV 4700 VS 470 MK II VS 470 MK II VS 470 MK II VS 470 MK II VS 485 VS 485 MT 6000 MK II MT 6000 VS 483
Dp Class: 2 2 2 2 2 2 1 2 2 2 2 2
LOA: 89.20 m 87.90 m 87.90 m 73.40 m 73.40 m 73.40 m 73.40 m 88.3 m 88.3 m 86.20 m 83.70 m 82.85 m
Breadth: 19.00 m 19.00 m 19.00 m 16.60 m 16.60 m 16.60 m 16.60 m 20 m 20 m 19.70 m 17.70 m 19.00 m
Draught: 7.40 m 6.60m 6.60 m 6.42 m 6.42 m 6.42 m 6.42 m approx 7.0 m approx 7.0 m 6.18 m 6.10 m 6.30 m
Dwt: 5,500 t 4700 T 4,700 T 3570 T 3570 T 3570 T 3570 T 4500 T 4500 T 3236 T 4250 T 4679 T
Accommodation: 25 34 34 34 34 34 34 64 64 56 20 23
Cargo Deck Area: 980 m2 1000 m2 usable 1000 m2 usable 680 m2 usable 680 m2 usable 680 m2 usable 680 m2 usable 970 m2 970 m2 935 m2 912 m2 840 m2
Ownership: 100% 100% 100% 100% 100% 100% 100% 51% 51% 100% 100% 100%
Anchor Handling Tug Supply Vessels (AHTS)
Siem Amethyst Siem Opal Siem Garnet Siem Sapphire Siem Aquamarine Siem Topaz Siem Ruby Siem Diamond Siem Pearl Siem Emerald
Built: 2011 2011 2010 2010 2010 2010 2010 2010 2009 2009
Design: VS 491 CD VS 491 CD VS 491 CD VS 491 CD VS 491 CD VS 491 CD VS 490 CD VS 491 CD VS 491 CD VS 491 CD
Dp Class: 2 2 2 2 2 2 2 2 2 2
LOA: 91.00 m 91.00 m 91.00 m 91.00 m 91.00 m 91.00 m 91.00 m 91.00 m 91.00 m 91.00 m
Breadth: 22.00 m 22.00 m 22.00 m 22.00 m 22.00 m 22.00 m 22.00 m 22.00 m 22.00 m 22.00 m
Draught: 7.95 m 7.95 m 7.95 m 7.95 m 7.95 m 7.95 m 7.95 m 7.95 m 7.95 m 7.95 m
Dwt: 3800 T 3800 T 3800 T 3800 T 3800 T 3800 T 3800 T 3800 T 3800 T 3800 T
Accommodation: 60 60 60 60 60 60 60 60 60 60
Cargo Deck Area: 800 m2 800 m2 800 m2 800 m2 800 m2 800 m2 800 m2 800 m2 800 m2 800 m2
BHP: 28000 28000 28000 28000 28000 28000 28000 28000 28000 28000
Bollard Pull: 297 Te 297 Te 282 Te 301 Te 284 Te 306 Te 310 Te 284 Te 285 Te 281 Te
Ownership: 100% 0% 0% 100% 100% 100% 100% 100% 100% 100%
Other
Brazil 31.03.2015
Fleet of 9 vessels
Canada 31.03.2015
Fleet of 6 vessels
JOIDES RESOLUTION BIG ORANGE XVIII
OSRV/FCS/FSV AHTS/PSV/Field support Scientific Core Drilling Ves-
sel (SCDV)
Well Stimulation Vessel
(WSV)
100% owned 50% owned 100% owned 41.3% owned
Installation Support Vessel (ISV)
Siem Moxie
Built: 2014
Design: SX 163 X-Bow
Dp Class: 2
LOA: 74.00 m
Breadth: 17.00 m
Draught: 6.40 m
Dwt: 2.835 t
Accommodation: 60
Cargo Deck Area: 200 m2 usable
Ownership: 100%

SIEM OFFSHORE INC., ANNUAL REPORT 201412 SIEM OFFSHORE INC., ANNUAL REPORT 201412
LOCAL PRESENCE IN KEY MARKETS 31.03.2015
Geograpicalfootprint
Kristiansand (HQ)
Siem Offshore offices:
• Kristiansand (Norway)• Rio de Janeiro, Macaé, Aracaju (Brazil)• Leer (Germany)• Groningen (The Netherlands)• Houston (USA)• Accra (Ghana)• Perth (Australia)• Gdynia (Poland)
Secunda Canada LP Offices(associated company):
• St. John´s, Halifax (Canada)
Leer
Groningen
Gdynia
St. John´s
Halifax
Houston
AracajuMacaé
Rio de Janeiro
Accra

SIEM OFFSHORE INC., ANNUAL REPORT 2014 13SIEM OFFSHORE INC., ANNUAL REPORT 2014 13
Perth
TOTAL EMPLOYEES
1073TOTAL NUMBER OF VESSELS
55VESSELS IN OPERATION
46
PSVs: 12AHTS: 10
OSCVs: 6CANADIAN FLEET: 6
OTHER: 12
VESSELS UNDER CONSTRUCTION
9PSVs: 4AHTS: 1WIVs: 2
OTHER: 2

SIEM OFFSHORE INC., ANNUAL REPORT 201414 SIEM OFFSHORE INC., ANNUAL REPORT 201414
Siem Offshore owns and operates one of the world’s most modern fleet of offshore support vessels, equipped to meet the increased requirements from clients and demands from operation in the harshest environments.
Siem Offshore had 46 vessels in operation and 9 vessels under construction by year-end 2014. Vessels in operation included two
anchor handling, tug, supply vessels oper-ated on behalf of a pool partner.
By end March 2015, the total fleet comprised of 55 vessels, including, among others the following owned ves-sels, sixteen Platform Supply Vessels (PSVs), six Offshore Subsea Construction Vessels (OSCVs), eight Anchor Handling, Tug, Supply vessels (AHTS vessels), two Well-Intervention Vessels (WIVs), one
THIS IS SIEM OFFSHORE INC.
Installation Support Vessel (ISV), one Cable Lay Vessel (CLV) and six Canadian flagged vessels comprising of both AHTS vessels and PSVs. The fleet provides a broad spectrum of services offered by a highly experienced and competent crew with a strong focus on Health, Safety, Environment and Quality.
The Company’s vision is to become the leading provider and the most attractive employer offering marine services to the offshore energy service industry. The Company shall deliver quality and reliable contracted services in a timely manner by
executing cost-efficient solutions devel-oped in active collaboration and coopera-tion with our customers.
Siem Offshore commenced operations with effect from 1 July 2005. The Com-pany is registered in the Cayman Islands and is listed on the Oslo Stock Exchange (OSE Symbol: SIOFF). The Company’s headquarters is located in Kristiansand, Norway and additional subsidiary offices are located in Brazil, Germany, the Nether-lands, Ghana, USA, Poland and Australia. The Company is tax resident in Norway.
Photographer: Arild Lillebø, Siem Amethyst

SIEM OFFSHORE INC., ANNUAL REPORT 2014 1515
We continuously work to
make the values part of the
daily life of the Company,
in particular in training of
leaders throughout the
organization. The values
are established to support
our present and future
business.
Our Values
CARINGWe encourage team spirit and knowledge sharing. We strive to perform our daily work correctly, safely and without caus-ing damage to people, environment and equipment.
COMPETITIVEWe behave in a pro-active manner and we are innovative in our way of thinking. Continuous improvement is our key to success.
COMMITTEDWe are driven by integrity. We step up and take charge to fulfil given promises.
2005 616
20 480200679 7992007
87 738200857 9342009
74 6412010
122 9522011
REVENUE
OPERATING MARGIN
2005 13 23373 5542006
159 3422007192 7732008
183 5582009228 302
340 6282010
2011
2005 3315272006
60020076422008
76220098282010
1 0732011
EMPLOYEES
Amounts in USD 1,000
110 3482012
368 2132012
1 0782012
363 9552013
122 6632013
1 1102013
491 3122014
194 1252014
1 0732014
Amounts in USD 1,000

SIEM OFFSHORE INC., ANNUAL REPORT 201416
The Company
All references to “Siem Offshore” and the “Company” shall mean Siem Offshore Inc. and its subsidiaries and associates un-less the context indicates otherwise. All references to “Parent” shall mean Siem Offshore Inc. as the parent company only.
Siem Offshore is registered in the Cay-man Islands and is listed on the Oslo Stock Exchange (OSE Symbol: SIOFF). The Company’s headquarters is located in Kristiansand, Norway and additional subsidiary offices are located in Brazil, Germany, the Netherlands, Ghana, USA, Canada, Cayman Islands and Australia. The parent company is tax resident in Norway.
The Company’s primary activity is to own and operate offshore support vessels (“OSVs”) for the offshore energy service industry. The Company is also engaged as a contractor within the European offshore wind farm market through its subsidi-ary, Siem Offshore Contractors with a primary focus on installation, post-lay trenching, termination and testing of
The Board of Directors of Siem Offshore Inc. (the “Board”) presents its report for the year ended 31 December 2014 to-gether with the audited consolidated financial statements and the audited financial statements for the parent company. The financial statements and related notes were authorised for issue by the Board on 13 April 2015 and will be presented to the shareholders for approval at the Annual General Meeting to be held 1 May 2015.
submarine composite cables.The OSV fleet comprises platform supply vessels (“PSVs”), anchor-handling, tug, supply vessels (“AHTS vessels”), offshore subsea construction vessels (“OSCVs”) and a variety of other service vessels. The Company had ownership in 44 vessels of which 9 vessels were under construc-tion at year-end 2014. The Company also operates two AHTS vessels on behalf of a pool partner. These two AHTS vessels are sister vessels to eight vessels owned by the Company, and all ten vessels are operated in a pool. During 2014, the total fleet of OSVs conducted operations in the North Sea, Arctic, West Africa, Middle East, the U.S. Gulf, Canada and Brazil.
The Company holds 50% ownership in the company Secunda Holdings Limited. Secunda owns and operates a harsh-weather fleet of six offshore support ves-sels and is a leader in support services for platform supply, anchor handling, rescue standby and towage in its primary area of operation outside the coast of Eastern Canada.
The Company holds a 60% ownership in the subsidiary Siem WIS AS. Siem WIS develops applications for managed pres-sure drilling based on a patented sealing technology.
The Company holds 100% ownership in Overseas Drilling Limited (“ODL”), which owns the scientific ocean drillship JOIDES Resolution. The JOIDES Resolution is one of the primary research vessels used to drill core samples in the ocean floor for an international research program.
In addition to the ownership and opera-tions of OSVs, the Company’s wholly-owned Brazilian subsidiary, Siem Offshore do Brasil S.A., provides specialized engineering to develop and implement combat management systems for vessels in the Brazilian navy. These activities were part of Siem Offshore do Brasil when it was initially acquired by the Company.
Financial results, Position andRisks IFRS
The financial statements for the Company and the Parent are prepared in accord-
THE BOARD OF DIRECTORS REPORT

SIEM OFFSHORE INC., ANNUAL REPORT 2014 17
ance with the International Financial Reporting Standards (“IFRS”) as adopted by the European Union.
Going-ConcernThe financial statements have been prepared under the assumption that the Company and the Parent are going-con-cerns. This assumption is based on the Company’s level of cash and cash equiva-lents at year-end, forecasted cash-flows, available credit facilities and the market value of its assets.
Income StatementThe Company had 46 offshore vessels in operation at year-end, including two AHTS vessels owned by the Company’s pool partner. The Company had 9 vessels under construction at the end of 2014, of which six vessels were under construc-tion in Poland, two in Germany and one in Brazil. These 9 vessels include one oil spill recovery vessel (“OSRV”) scheduled for delivery in 2015, four dual-fuel PSVs with one for delivery in 2015 and three in 2016, one Cable-Lay Vessel (“CLV”) for delivery in 2016, one AHTS vessel for delivery in 2015 and two Well-Interven-tion Vessels (“WIVs”) for delivery in 2016. The Company has sold two PSVs during 2014 and taken delivery of two large OSCVs, one PSV, one Installation Support Vessel (“ISV”) and one OSRV. All vessels delivered during 2014 have commenced long-term contracts, with the ISV being utilized by the subsidiary, Siem Offshore Contractors.
In 2014, the Company recorded operat-ing revenue of USD 491.3 million and a net profit attributable to shareholders of USD 58.2 million, or USD 0.15 per share, compared to operating revenue of USD 364.0 million and a net profit attributable to shareholders of USD 22.0 million, or USD 0.06 per share, in 2013.
The Company’s operating margin for 2014 was USD 194.1 million compared to USD 122.7 million in 2013. Net operat-ing margin as a percentage of operating
revenue was 40% in 2014 compared to 34% in 2013.
The Company’s operating profit for 2014 was USD 84.3 million compared to USD 69.3 million in 2013 and includes depreciation and amortisation of USD 96.9 million (2013: USD 75.8 million). The Company has conducted a review of vessel valuations and has recorded impairments of USD 29 million on certain Brazilian-built vessels. Net currency exchange (losses) of USD (3.0) million (2013: USD (7.8) million) were recorded on currency derivative contracts, of which USD 5.6 million was unrealised. The net gain on sale of asset was USD 18.7 mil-lion (2013: USD 29.8 million).
The Company’s net financial items were net expenses of USD (12.7) million (2013: USD (53.4) million) and includes a revalu-ation gain (loss) of non-USD currency items of USD 34.1 million (2013: USD (22.7) million) due to stronger USD dur-ing the period. Non-USD currency items are held to match short- and long-term liabilities, including off-balance sheet liabilities, in similar currency.
The Company’s net profit attributable to shareholders was USD 58.1 million or USD 0.15 per share (2013: USD 22.0 mil-lion, or USD 0.06 per share).
The Parent company is primarily a hold-ing company owing shares in operating subsidiaries. The Parent Company made an accumulated write-down of USD 49 million on the shares in the Brazilian subsidiary and the subsidiary owning the scientific core drilling vessel. The Board proposes that the net loss of the Parent of USD (64.5) million for 2014 be allocated to retained earnings and that no dividend to be paid for 2014. As of 31 December 2014, the retained earnings were USD 258.7 million.
Financial Position and Cash-FlowsTotal equity for the Company was USD 824 million at year-end 2014 (2013: USD 794 million), and the equity ratio was 36% (2013: 42%). Shareholders’ equity was USD 785 million (2013: 757 million), equivalent to USD 2.03 per share (2013: USD 1.98 per share).The cash position at year-end was USD 118 million (2013: USD 101 million).
The Company recorded USD 526 million as gross capital expenditures in fixed as-sets during 2014, of which USD 497 mil-lion relates to new vessels delivered from yards or vessels under construction, and USD 29 million relates to project specific investments in vessels and capitalised dry-dockings.
The Company had secured debt-financing for eight of the nine vessels under con-struction at year end. The debt financing for the AHTS vessel, to be owned by the 50% owned company Secunda, has been agreed in April 2015.
The gross interest-bearing debt and net interest-bearing debt at year-end were equivalent to USD 1.2 billion and USD 1.1 billion, respectively. The Company made total drawings in the equivalent of USD 448 million under credit facilities during the year. The weighted average cost of debt for the Company was approximately 4.5% p.a. at year-end.
The Company paid debt instalments in the equivalent of USD 132 million during the year, of which USD 35 million repre-sents extraordinary repayments due to sales of vessels.
The gross project cost for the remaining newbuilding program was USD 550 mil-lion at year-end 2014. Approximately USD 242 million of such future yard instal-ments are scheduled for payment during 2015 and USD 308 million are scheduled for payment in 2016.

SIEM OFFSHORE INC., ANNUAL REPORT 201418
BOARD OF DIRECTORS’ REPORT
The Company’s cash-flows are primar-ily denominated in USD, NOK, EUR and BRL. During 2014, the USD strengthened by 22.2% to the NOK, 12.1% to the BRL and 11.8% to EUR. The average recorded exchange rates were NOK/USD 0.1575, EUR/USD 1.3256 and BRL/USD 0.4240 (2013: NOK/USD 0.1700, EUR/USD 1.3300 and BRL/USD 0.4620).
The Company is exposed to changes in in-terest rates as approximately 32% of the interest-bearing debt is based on floating interest rates and primarily denominated in USD and NOK. The average 3-month USD LIBOR was 0.2337% p.a. during 2014 (0.2672% p.a. in 2013) and the average 3-month NIBOR was 1.70% p.a. during 2014 (1.75% p.a. in 2013). The Company held USD 270 million in interest rate swap agreements at year-end.
Financial Risks
Interest riskThe Company is exposed to changes in interest rates as approximately 32% of the long-term interest bearing debt was subject to floating interest rates at year-end 2014. The remaining part of the debt is subject to fixed interest rates.
Currency riskThe Company is exposed to currency risk as revenue and costs are denominated in various currencies. The Company is also exposed to currency risk due to future yard instalments in relation to shipbuilding contracts and long-term debt in various currencies. Forward exchange contracts are entered into in order to reduce the currency risk related to future cash flows.
Liquidity riskThe Company is financed by a combina-tion of debt and equity. If the Company fails to repay or refinance its credit facili-ties, additional equity financing may be required. There can be no assurance that the Company will be able to repay its debts or extend the debt repayment
schedule through re-financing of credit facilities. There is no assurance that the Company will not experience cash flow shortfalls exceeding the Company’s available funding sources or to remain in compliance with minimum cash require-ments or other covenants. Further, there is no assurance that the Company will be able to raise new equity or arrange new credit facilities on favourable terms and in amounts necessary to conduct its ongoing and future operations should this be required.
Yard riskThe process for construction of new ves-sels is associated with numerous risks. Among the most critical risk factors in relation to such construction is the risk of not receiving the vessels on time, at budget and with agreed specifications. In addition, there is the risk of yards expe-riencing financial or operational difficul-ties resulting in bankruptcy or otherwise adversely affecting the construction process. The Company has obtained certain guarantees of financial compen-sation including refund guarantees for vessel under construction in Poland in case of delays and non-delivery. Further, the Company has the right to cancel contracts if delivery of vessels is signifi-cantly delayed. However, no assurance can be given that all risks have been fully covered.
Operations
Fleet, Performance and EmploymentThe fleet in operation included twelve PSVs, six OSCVs, ten AHTS vessels of which two are owned by a pool-partner, six offshore support vessels in Canada, a fleet of nine crew/supply boats operated in Brazil, one well-stimulation vessel, one installation support vessel and one scientific core drilling vessel.
The PSV fleet earned operating rev-enues of USD 104.4 million and had 94% utilisation (2013: USD 94.6 million and 83%). The operating margin before
administrative expenses was USD 58.9 million (2013: USD 42.9 million) and the operating margin as a percentage of rev-enue was 56% (2013: 45%). The contract backlog at 31 December 2014 was 58% for 2015, 42% for 2016 and 25% for 2017.
The OSCV fleet earned operating rev-enues of USD 104.8 million and had 98% utilisation (2013: USD 41.4 million and 100%). The operating margin before administrative expenses was USD 71.2 million (2013: USD 26.9 million) and the operating margin as a percentage of rev-enue was 68% (2013: 65%). The contract backlog was 88% for 2015, 83% for 2016 and 77% for 2017.
The eight AHTS vessels owned by the Company earned operating revenues of USD 142.5 million and had 84% utilisation (2013: USD 131.9 and 86% utilization). The operating margin before administra-tive expenses was USD 77.5 million (2013: USD 67.9 million) and the operating mar-gin as a percentage of revenue was 54% (2013: 51%). The contract backlog was 15% for 2015 and 5% for 2016.
The fleet of smaller Brazilian-flagged vessels earned operating revenue of USD 19.4 million and had 91% utilisation (2013: USD 24.1 million and 92%). The operating margin before administrative expenses was USD (3.5) million (2013: USD 6.7 million) and the operating margin as a percentage of revenue was (18)% (2013: 28%). The contract backlog was 91% for 2015, 89% for 2016 and 89% for 2017.
The “Joides Resolution” recorded operat-ing revenues of USD 25.9 million (2013: USD 36.9 million) with an operating margin before administrative expenses of USD 12.9 million (2013: USD 20.4 million) and the operating margin as a percentage of revenue was 50% (2013: 55%).
Siem Offshore Contractors recorded operating revenues of USD 101.5 million. The projects within SOC are accounted

SIEM OFFSHORE INC., ANNUAL REPORT 2014 19
for using the percentage-of-completion method. Total project margin before ad-ministrative expense of USD 17.1 million was recognized on projects during 2014. Subject to a forecasted positive margin, project revenues are recorded at a similar figure as project costs until the project has reached minimum 25% comple-tion. This has an impact on the overall percentage of operating margin for Siem Offshore on a consolidated basis.
The total contract backlog of firm contracts for all vessels at 31 December 2014 was USD 1.55 billion (2013: USD 1.15 billion), including the firm con-tract for the “JOIDES Resolution”, the 41%-ownership in the “Big Orange XVIII”, the 50% ownership in Secunda and ves-sels under construction.
The total contract backlog is allocated with USD 276 million in 2015, USD 203 million in 2016 and USD 1.07 billion in 2017 and thereafter.
The total contract backlog of firm con-tracts for Siem Offshore Contractors at 31 December 2014 was USD 118 million (2013: USD 173 million). The contract backlog is allocated with USD 92 million in 2015 and USD 26 million in 2016. The contract backlog at year-end 2014 does not include the contract value of ap-proximately USD 70 million for Nordsee One OWF Inner Array Grid System project, which reached its final investment deci-sion in March 2015, nor the Veja Mate OWF Inner Array Grid System project in excess of USD 100 million in contract value awarded in April 2015.
QHSE
The Company’s target includes zero personal injuries, no damage to the environment and no damage to or loss of equipment and property.The good QHSE performance continued in 2014 with no serious incidents throughout the fleet. The safety records for the full year report no serious injury to personnel
or discharges to the environment.
By nature, anchor-handling is one of the most demanding operations in the offshore sector. Siem Offshore puts great emphasis on a safe work environment and appropriate time for adequate prepa-rations for every job operation.
An increase is seen in number of safety reports and the experience feedback to the fleet is a welcomed element to improve and ensure outstanding QHSE performance. On board and ashore we believe that the transfer of experience is an important factor to create a profes-sional QHSE culture and continuously improve our QHSE performance.
Siem WIS
Siem WIS has designed and developed a pressure control device (“PCD”) which can improve managed pressure drill-ing (“MPD”) operations. Global energy demand growth, combined with the need for increased oil recovery and increased number of deep sea and high pressure high temperature (“HPHT”) reservoirs, and greater emphasis on safety manage-ment will lead to increased demand for MPD services.
The MPD operations on the Romeo well commenced late October and were completed mid-January 2015. The MPD operation was successful and the PCD system is temporarily demobilized due to rig move and will be mobilized for the Julius well in April 2015.
The Gudrun project has been postponed several times, but commenced drilling in February 2015. The project might be completed without the requirement of MPD services.
The Valemon project has concluded the requirement for MPD and mobilization is estimated to commence in Septem-ber 2015. Siem Offshore’s accumulated investment in Siem WIS totals USD
15.6 million, whereof USD 8.8 million is recorded as intangible assets in the consolidated accounts.
Siem Offshore Contractors
GeneralSiem Offshore Contractors (“SOC”) com-menced the offshore execution during second and third quarter 2014 on two of its first projects within the European offshore wind farm market. The primary activities for SOC include the installa-tion, post-lay trenching, termination and testing of submarine composite cables forming the inner array grid of an offshore wind farm (“OWF”). SOC has been techni-cally successful in executing its planned work scope by utilising its fleet of large and high quality DP-2 installation ves-sels, in combination with its experienced offshore and onshore organisations.
Safety & EnvironmentHigh safety and environmental standards have been a first priority within SOC. Risk assessment processes and personnel training ensures that internal person-nel and subcontractors have a common safety first mentality, which has delivered zero loss time injuries this year. Environ-mental impact is a key area of impor-tance in a market focussed on renewable energy. SOC has developed standards to report and analyse the impact of cable installation activities on the environment. Positive feedback from clients on safety planning and execution demonstrates strength in this area.
ProjectsThe Amrumbank West OWF project for E.ON Kraftwerke GmbH involves the installation, post-lay trenching, termina-tion and testing of 86 inner array grid submarine composite cables within the German Bight sector of the North Sea. The installation of the cables was split in two campaigns. By year-end, 53 of the 86 cables were installed. All of the cables are now installed and the project is scheduled to be completed within second

SIEM OFFSHORE INC., ANNUAL REPORT 201420
BOARD OF DIRECTORS’ REPORT
quarter 2015 with a positive margin.
During a period of availability in between the two campaigns for the Amrumbank West OWF project, SOC performed cable installation works for E.ON Climate & Re-newables UK Ltd. The project involved the successful installation of 24 inner array grid submarine composite cables for the client in a two month period in challenging environmental conditions on the Humber Gateway OWF in the United Kingdom Sec-tor of the North Sea. The project produced operating revenues of approximately EUR 7 million and with a positive margin.
The Baltic 2 OWF project for EnBW Baltic 2 GmbH involves the installation, post-lay trenching, termination and testing of 86 inner array grid submarine composite cables within the German sector of the Baltic Sea. The planned commence-ment of the project was delayed, but the offshore execution became effective early third quarter 2014 and, by year-end, 61 of the 86 cables were installed. All cables are now installed and the project is sched-uled to be completed within third quarter 2015. A positive margin was recorded on the project in 2014, and a positive margin is scheduled to be recorded in 2015.
The Nordsee One OWF project for Nord-see One GmbH involves the EPIC-based supply and installation of 59 submarine composite cables forming the inner array grid of the Nordsee One OWF. The project achieved financial close in March 2015, whereby Canada-based Northland Power Inc. had previously acquired an 85% share of the project company, Nordsee One GmbH, from the project developer RWE Innogy GmbH in September 2014. The project involves the supply of submarine composite cables and related accessories as well as cable installation, post-lay trenching, termination and testing works and remains on track for mechanical completion by fourth quarter 2016. SOC has since second quarter 2014 been actively involved in engineering works for this project, whereby these are scheduled
for completion within the second quarter 2015.
In April 2015, SOC has been awarded the contract by Veja Mate Offshore Project GmbH for the EPIC-based supply and installation of 73 submarine composite cables with a total length of up to 97 km forming the inner array grid of the 400 MW Veja Mate OWF as located ap-proximately. 115km off the German coast within the German Bight sector of the North Sea. The project involves the supply of submarine composite cables and re-lated accessories as well as cable instal-lation, post-lay trenching, termination and testing works. The offshore installation is scheduled to commence in third quarter 2016 with mechanical completion being scheduled for second quarter 2017.
The Nordsee One OWF export cable project for TenneT Offshore GmbH repre-sents the consortium-based EPIC-based contract for the Nordsee One export cable system in partnership with J-Power Systems. Commencement of the offshore installation works is now expected to start in the third quarter 2016, with com-pletion scheduled in fourth quarter 2016. No margin will be recorded on this project in 2015.
Market OutlookTendering activities increased during the second half of 2014 and further tenders are expected during 2015. SOC has estab-lished itself as a predictable and reliable turnkey contractor within the offshore renewable energy industry and further contract awards are expected.
Shareholders and Corporate Governance
Shareholder InformationThe Company’s authorised share capital is USD 5,500,000.00 divided into 550,000,000 ordinary shares of a nominal value of USD 0.01 each. The issued share capital at 13 April 2015, based on the 387,591,640 Company shares issued and
outstanding, is USD 387,591,380 The Company’s shares are listed on the Oslo Stock Exchange with the ticker symbol SIOFF. The largest shareholder of the Company is Siem Europe S.a r.l., a wholly-owned subsidiary of Siem Industries Inc., with 34.2% of the shares at 13 April 2015. During 2014, the closing share price reached a high of NOK 10.40, a low of NOK 3.04, and closed at NOK 4.04 at year-end.
Corporate GovernanceThe Company has implemented guidelines for corporate governance based on the recommendations and guidelines given by the Oslo Stock Exchange. The purpose of these guidelines is to clarify the division of roles between shareholders, the General Meeting, Board of Directors and day-to-day Management beyond what follows from the legislation. A detailed summary of our corporate governance principles may be found in a separate section of the annual report.
The Working Environment and the Employees
The Company seeks to provide a work-place with equal opportunities. We seek to treat current and prospective employees fairly with respect to salaries, promotions and recruitment. The Company offers its employees a sound working environment. We also give possibilities for professional development where men and women are treated equally and where there is no discrimination.
The sick leave for the onshore and offshore employees was 1.7% and 2.8%, respectively.
No incidents or work-related accidents resulted in significant material damage or personal injury occured during the year.
The development of the onshore and off-shore organizations continues in order to prepare for increased future activities. The knowledge of the crew is vital for a

SIEM OFFSHORE INC., ANNUAL REPORT 2014 21
Eystein Eriksrud Kristian Siem Michael DeloucheChairman Director Director(Sign.) (Sign.) (Sign.)
John C. Wallace David MullenDirector Director(Sign.) (Sign.)
Terje SørensenChief Executive Officer(Sign.)
13 April 2015
safe and secure operation of any vessel. Such knowledge includes good seaman-ship and understanding of the demand-ing assignments to be executed. This knowledge of capabilities and limitations of the vessels and equipment, and respect of circumstances that may affect a safe execution is vital.
Outlook
There is a high focus on cost-cutting among oil companies following the signifi-cant decline in the oil price. The number of vessels trading the North Sea spot mar-ket is increasing while the activity level is expected to decrease. We are prepared to see a weaker market the next couple of years, which may lead to lay-up of ves-sels. Scrapping of older vessels and delay or cancellation of new vessels from yards will contribute to a more balanced market. Any material and sustainable increase in the oil price will have a positive impact on the demand for offshore support vessels.

SIEM OFFSHORE INC., ANNUAL REPORT 201422
Statement of Policy on Corporate Governance The principles for corporate governance adopted by the Company are based on the “Norwegian Recommendation for Corporate Governance” issued on the 30 October 2014.
As a company incorporated in the Cayman Islands, Siem Offshore Inc. is an exempted company duly incorporated under the laws of the Cayman Islands and subject to Cayman Island laws and regulations with respect to corporate governance. Cayman Islands corporate law is to a great extent based on English Law. In addition, due to the Company’s listing on the Oslo Stock Exchange, certain aspects of Norwegian Securities law apply to the Company and there is a requirement to adhere to the Norwegian Code of Practice for Corporate Governance.
The Norwegian Code of Practice for Cor-porate Governance is publicly available at www.nues.no in both Norwegian and English languages. Due to new provisions implemented in the Norwegian Account-ing Act, compliance with the regulations for Corporate Governance reporting is now a legal requirement provided that it does not conflict with the Cayman Islands laws and regulations.
The Company endeavours to maintain high standards of corporate governance and is committed to ensuring that all shareholders of the Company are treated equally and the same information is communicated to all shareholders at the same time.
Corporate Governance is subject to an-nual assessment and review by the Board of Directors.
The Board of Directors has reviewed this statement. It is the opinion of the Board of Directors that the Company complies
with the Norwegian Code of Practice for Corporate Governance.
This statement is structured in accord-ance with The Norwegian Code of Practice for Corporate Governance.
Business
Cayman Islands laws and regulation do not require the objects clause of the Com-panies Memorandum and Articles of Asso-ciation to be clearly defined. The Company has however adopted clear objectives and strategies for its business.
Siem Offshore aims to grow the company within offshore support vessels, both organically and through combination with other operators, in order to achieve economies of scale and stronger presence in the market.
Siem Offshore aims to become a preferred supplier of marine services to the energy industry based on quality and reliability and to provide cost-efficient solutions to its customers by understanding their operation and applying technology and experience.
The Company builds its business around a motivated workforce with the appropriate technical solutions. This creates sustain-able value for all shareholders.Reference is made to the Board of Direc-tors report for detailed information.
Equity and Dividends
The priorities for the use of Company funds are determined by the Board of Directors and recommendations of Man-agement influenced by existing conditions. At present, priorities for use of funds in order of importance are investment opportunities in the business, repayment of debt and the return of capital to the shareholders in form of share buy-back or dividends.
The Board’s mandate to increase the Company’s share capital is limited only to the extent of the authorized share capital of the Company with certain pre-emption rights for shareholders and in accordance with the Company’s Memorandum and Articles of Association which comply with Cayman Island law.
Under the Articles of Association, the Board can issue new shares, convertible bonds or warrants at any time within the limits of the authorized capital without the consent of the general meeting but with pre-emption rights for shareholders. A General Meeting has further authorized the Board to issue new shares without pre-emption rights to all shareholders up to a limit of 50% of Siem Offshore’ shares at the time the authorization was given. The Board holds authorization from the Annual General Meeting held on 10 May 2010 to issue 154,248,360 new shares. The authority gives the Board flexibility to finance investments, acquisitions and other business combinations on short no-tice through the issue of shares or certain
CORPORATE GOVERNANCE

SIEM OFFSHORE INC., ANNUAL REPORT 2014 23
other equity instruments in the Company. Furthermore, the Board considers the granting of a new standing authority at the time of holding an Annual General Meet-ing rather than convening an Extraordi-nary General Meeting at some future time to be in the best interests of the Company, as this will result in cost savings and more effective time management for both the Company’s senior management and its Shareholders.
Equal Treatment of Shareholders, Freely Tradable Shares and Transactions with Related Parties
The Company is committed to ensuring that all shareholders of the Company are treated equally and all the issued shares in Siem Offshore, at nominal value US$ 0.01 each, are freely tradable and carry equal rights with no restrictions on voting.Siem Industries Inc, which owns 34,1% of the Company, is represented by its Chair-man, Kristian Siem, Deputy CEO, Eystein Eriksrud and President, Michael Delouche, on the Board of Directors. The Company pays an annual fee to Siem Industries as compensation for directorships, provision of an office and presence in the Cayman Islands, and other services. The fee is adopted by the annual general meeting based on a recommendation from the in-dependent Board Members. Related party transactions are disclosed in the notes to the accounts.
Freely Negotiable Shares
All of the shares in the Company carry equal rights and are freely negotiable. The shares are traded according to normal market practice and no special limitations on transactions have been laid down in the Articles of Association.
General Meetings
The Annual General Meeting of the Com-pany will be held at the registered office of the Company on the Cayman Islands, 1 May 2015, at 9:30am Cayman Islands
local time and Shareholders can be represented by proxy. Notices of general meetings and related documents are made available to shareholders at the lat-est 17 days prior to meeting date. Notice of attendance by proxy is to be provided to either (1) the offices of Siem Offshore AS at Nodeviga 14, P.O. Box 425, Kristiansand 4664, Norway, telefax no. +47.37.40.62.86 or (2) the Company’s office at P.O. Box 10597, George Town, Grand Cayman KY1-1005, CAYMAN ISLANDS, telefax no. +1.345.946.3342, not less than 24 hours prior to the stated time of the annual general meeting. Shareholders are given the opportunity to vote on the election of board members.
Nomination Committee
The appointment of a nomination commit-tee is not a requirement under Cayman Islands Law.
Corporate Assembly and Board of Directors; Composition and Independ-ence
In the nominations to the Board of Direc-tors, the Board consults with the Com-pany’s major shareholders and ensures that the Board is constituted by Directors with the necessary expertise and capacity. There is no requirement under Cayman Islands Law for the Company to establish a corporate assembly.
Each Board member is elected for a term of 2 years or such shorter term as shall be specified in the ordinary resolution pursu-ant to which the Director shall be ap-pointed. Representatives of the Executive Management are not presently members of the Company’s Board of Directors.The Board of Directors as a group has extensive experience in areas which are important to Siem Offshore, including off-shore services, international shipping, ship broking, finance and corporate governance and restructuring.
Work of the Board of Directors
The Board monitors the performance of management through regular meet-ings and reporting. The Company has a Compensation Committee and an Audit Committee.
The Compensation Committee consists of two Directors. The mandate of the committee is to review and approve the compensation of the CEO and any bonuses to all executive personnel. Reference is also made to section 12, Remuneration of the Executive Management.
The Audit Committee consists of two Directors. The composition of the com-mittee meets the requirements of the Norwegian Code of Practice for Corporate Governance as regards independence. The committee’s mandate can be summarized as follows:
• Ascertain that the internal and external accounting reporting process are organized appropriately and carried out efficiently, and are of high professional quality.
• Monitor and assess the quality of the statutory audit of the Company’s finan-cial statements.
• Ensure the independence of the exter-nal auditor, including any additional ser-vices provided by the external auditor.
Risk Management and Internal Control
Internal controlA prerequisite for the Company’s system of decentralized responsibility is that the activities in every part of the Company meet general financial and non-financial requirements, and are carried out in ac-cordance with the Company’s common norms and values. The executive manage-ment of each subsidiary is responsible for risk management and internal control in the subsidiary with a view to ensuring 1) optimalisation of business opportunities,

SIEM OFFSHORE INC., ANNUAL REPORT 201424
2) targeted, safe, high-quality and cost-effective operations, 3) reliable financial reporting, 4) compliance with current legislation and regulations and 5) opera-tions in accordance with the Company’s governing documents, including ethical and social responsibility standards. The Company’s risk management system is fundamental to the achievement of these goals.
Financial reporting process The Company prepares and presents its financial statements in accordance with current IAS/IFRS rules. Financial informa-tion from subsidiaries is received each month in a reporting package in stand-ard format accommodated necessary information for preparing the consolidated financial statement for the Company. The reporting from the subsidiaries is extended in the year-end reporting process to meet various requirements for supplementary information. There are established routines to check the financial data in the received reporting packages to ensure the best quality for the consoli-dated figures for the Company.
Training and further development of ac-counting experience within the Company is provided locally by participating on vari-ous external courses on a regular basis.
Remuneration of the Board of Directors
The remuneration of the Board members reflect their experience and responsibili-ties, and is adopted by the annual general meeting based on the recommendation from the Board. The Board members do not have share options or profit-based remuneration.
The responsibility statement of the Board of Directors in this report and the notes to the accounts include information about the remuneration of the Board of Direc-tors.
Remuneration of the Executive Man-agement
The Company has a Compensation Com-mittee which reviews and approves the compensation of the CEO and the bonuses to all executive personnel. The Articles of Association of the Company permit the Board to approve the granting of share options to employees. A long-term share option program for 8 key employees of the company was introduced in Q1 2013. An additional share option program was im-plemented in Q2 2014 for 10 key employ-ees of the company. The remuneration of the CEO and the share option scheme are disclosed in the notes to the accounts.
The board of director’s statement on the remuneration of executive personnel is presented as a separate appendix to the agenda for the general meeting. The remuneration statement clearly states which aspects of the guidelines are advisory and which, if any, are binding. The general meeting will vote separately on each of these aspects of the guidelines.
Information and Communications
The Company has a policy of treating all its shareholders and other market partici-pants equally, and communicates relevant and objective information on significant developments which impact the Company in a timely manner.
The Company also seeks to ensure that its accounting and financial reporting are to the standards of our investors, and the Company presents its financial state-ments in accordance with the Internation-al Financial Reporting Standards (IFRS). The Audit Committee of the Board of Directors monitors the company’s report-ing on behalf of the Board.
Notices to the Oslo Stock Exchange and placements of notices and other infor-mation, including quarterly and annual reports, may be found on the Company’s
website (www.siemoffshore.com). The financial calendar for 2015 may be found on the Company’s website under “Investor Relations”.
Take-overs
The shares in the Company are freely trad-able and the Articles of Association of the Company does not hold specific defence mechanisms against take-over situations. In a take-over situation, the Board of Direc-tors will comply with relevant legislation.
Auditor
The Auditor of the Company is elected at the Annual General Meeting which also approves its remuneration. Details of the Company’s remuneration of the external auditor are given in the notes to the ac-counts.
The auditor reports to the Audit Commit-tee twice a year at a minimum, but more often if necessary. During the latter half of the year, the external auditor presents to the Audit Committee his assessment of risks, internal controls, risk areas and improvement potential in control systems and his audit plan for the following year. The second report to the Audit Committee is the presentation of Year-End Audit. The external auditor presents a summary of the audit process, including comments on audited internal control procedures and key issue in the financial reporting.
The Audit Committee also receives an annual independence reporting from the external auditor, confirming the external auditor’s independence with respect to the Company, within the meaning of the Norwegian Act on Auditing and Auditors. The confirmation also includes services delivered to the Company other than mandatory audit.
CORPORATE GOVERNANCE

SIEM OFFSHORE INC., ANNUAL REPORT 2014 25
INCOME STATEMENTS
PARENT COMPANY CONSOLIDATED
2014 2013 (Amounts in USD 1,000) Note 2014 2013
405 10,953 Operating revenue 4,23 491,312 363,955
-12,521 -18,774 Operating expenses 8,18,19,20,23 -297,187 -241,291
-12,116 -7,821 Operating margin 194,125 122,663
- -132 Depreciation and amortization 4,5 -96,883 -75,841
- - Impairment of vessels 4,5 -29,000 -
-49,000 - Impairment of shares in subsidiaries 4,5,6 - -
- - Gain/(loss) on sales of assets 25 18,728 29,827
368 368 Gain on sale of interest rate derivatives (CIRR) 12 368 368
- - Gain/(loss) on currency derivative contracts 28 -3,023 -7,756
-60,748 -7,584 Operating profit 4 84,316 69,261
FINANCIAL INCOME AND EXPENSES
4,162 9,586 Financial income 3,21 9,091 5,434
-12,704 -7,804 Financial expenses 3,21 -55,868 -36,132
4,842 1,219 Net currency gain/(loss) 21 34,092 -22,651
-3,700 3,001 Net financial items -12,685 -53,349
- - Result from associated companies 7 1,808 2,046
-64,448 -4,584 Profit /(loss) before taxes 73,439 17,959
- -261 Tax benefit/(expense) 11 -2,729 3,585
-64,448 -4,845 Net profit/(loss) 70,710 21,544
- - Attributable to non-controlling interest 12,563 -456
-64,448 -4,845 Attributable to shareholders of the Company 58,147 22,000
Weighted average number of outstanding shares (1,000) 387,591 389,078
Earnings per share: Basic (and Diluted) 22 0.15 0.06
COMPREHENSIVE INCOME STATEMENT
-64,448 -4,845 Net profit/(loss) 70,710 21,544
Other Comprehensive income
Items that will not be reclassified to profit or loss
- - Pension remeasurement gain (loss) 1,510 1,155
Items that may be subsequently reclassified to profit or loss
- - Cash flow hedges 12 -14,622 -
- - Currency translation differences 12 -11,100 -8,320
-64,448 -4,845 Total comprehensive income for the year 46,498 14,378
- - Attributable to non controlling-interest 12,270 -373
-64,448 -4,845 Attributable to shareholders of the Company 34,228 14,751

SIEM OFFSHORE INC., ANNUAL REPORT 201426
STATEMENTS OF FINANCIAL POSITIONASSETS
PARENT COMPANY CONSOLIDATED
12/31/2014 12/31/2013 (Amounts in USD 1,000) Note 12/31/2014 12/31/2013
NON-CURRENT INTANGIBLE ASSETS
- - Deferred tax asset 11 12,591 11,770
- - Intangible assets 5 25,937 29,737
- - Total non-current intangible assets 38,528 41,507
NON-CURRENT TANGIBLE ASSETS
- - Vessels under construction 5,17 130,515 127,711
- - Vessels and equipment 5 1,743,693 1,440,332
- - Capitalized project costs 5 10,965 11,027
- - Total non-current tangible assets 1,885,173 1,579,071
NON-CURRENT FINANCIAL ASSETS
741,348 752,155 Investment in subsidiaries 6 - -
- - Investment in associated companies 7 20,222 20,951
28,453 41,718 CIRR Loan deposit 12 28,453 41,718
30,053 47,094 Long-term receivables 9,14,29 23,432 6,639
799,854 840,967 Total non-current financial assets 72,108 69,308
799,854 840,967 Total non-current assets 1,995,809 1,689,886
CURRENT ASSETS
- 3,447 Accounts receivable 2,29 74,753 53,198
17,343 7,340 Other short-term receivables 9,14,23,29 63,877 32,737
- - Inventories 7,481 7,555
- - Derivative financial instruments 15,28,29 1,041 -
222,579 132,068 Cash 2,10,29 117,623 101,206
239,922 142,854 Total current assets 264,774 194,696
- - Asset held for sale 24,25,29 - 18,121
1,039,778 983,821 Total assets 2,260,584 1,902,702

SIEM OFFSHORE INC., ANNUAL REPORT 2014 27
PARENT COMPANY CONSOLIDATED
12/31/2014 12/31/2013 (Amounts in USD 1,000) Note 12/31/2014 12/31/2013
EQUITY
526,236 526,236 Paid-in capital 526,236 526,236
-22,302 -22,302 Other reserves -45,491 -19,769
258,675 324,612 Retained earnings 304,237 250,161
762,609 828,546 Shareholders' equity 26 784,982 756,628
- - Non-controlling interest 38,666 37,260
762,609 828,546 Total equity 823,649 793,888
LIABILITIES
Non-current liabilities
174,881 98,624 Borrowings 2,12,14 1,087,757 863,074
28,453 41,718 CIRR Loan 12,29 28,453 41,718
4,885 4,885 Tax liabilities 11 6,368 6,679
1,786 2,155 Deferred CIRR 12 1,786 2,155
- - Pension liabilities 8 3,812 2,778
- - Other non-current liabilities 14 26,565 18,826
210,005 147,381 Total non-current liabilities 1,154,742 935,231
Current liabilities
53 397 Accounts payable 2,29 10,781 16,253
- - Borrowings 2,12,14,29 126,603 98,426
- - Derivative financial instruments 15,28,29 16,732 11,085
-146 -673 Taxes payable 11 5,005 3,759
67,255 8,170 Other current liabilities 13,14,23 123,072 44,061
67,162 7,894 Total current liabilities 282,193 173,584
277,167 155,275 Total liabilities 14 1,436,935 1,108,815
1,039,778 983,821 Total equity and liabilities 2,260,584 1,902,702
- - Secured debt 12 1,227,605 968,868
106,131 120,291 Guarantees 16 141,691 154,317
STATEMENTS OF FINANCIAL POSITION EQUITY AND LIABILITIES

SIEM OFFSHORE INC., ANNUAL REPORT 20142828
STATEMENTS OF CHANGES IN EQUITY
CONSOLIDATED
(Amounts in USD 1,000) Total no. of shares Share capital Share premium reserves Exchange rate differences Other reserves Retained earnings Shareholders’ equity Non-controlling interest Total equity
Equity as of December 31, 2012 Restated 393,924,836 3,939 531,025 17 409 -28,775 225,824 749,423 36,975 786,397
Change previous periods -1,943 -1,943 -1,943
Net profit to shareholders 22,000 22,000 -456 21,544
Stock option expences 3,125 3,125 3,125
Comprehensive income -8,403 1,155 -7,249 83 -7,166
Share issues in partially owned subsidiaries 657 657
Buy-back of shares -6 333 456 -63 -8,664 -8,728 -8,728
Share issue costs
Equity as of December 31, 2013 387,591,380 3,876 522,361 9,005 -28,775 250,161 756,628 37,260 793,888
Change previous periods -1,510 -1,510 -1,510
Net profit to shareholders 58,147 58,147 12,563 70,710
Stock option expences 2,462 2,462 2,462
Currency translation differences -11,100 - -11,100 -293 -11,393
Pension remeasurement 1,510 1,510 1,510
Share issues in partially owned subsidiaries - 1,336 1,336
Cash flow hedge - - - -14,621 -14,621 - 14,621
Capital reduction in partially owned subsidiaries - -12,201 -12,201
Dividends paid -6,533 -6,533 -6,533
Share issue costs - -
Equity as of December 31, 2014 387,591,380 3,876 522,361 -2,095 -43,396 304,237 784,982 38,666 823,649
Share issues in partially owned subsidiaries 2013 2014
Minority share of new equity Siem Offshore Meling DA - -
Minority share of new equity Siem WIS AS 657 1,336
Minority share of new equity Næringsbygg Idrettsveien 13 DA - -
Total 3,456 1,336
PARENT COMPANY
Equity as of December 31, 2012 393,924,836 3,939 531,025 -100 -22,203 329,809 842,471
Other items -352 -352
Net profit -4,845 -4,845
Comprehensive income -
Buy-back of shares -6,333,456 -63 -8,664 -8,728
Share issue costs -
Effect of exchange rate differences -
Equity as of December 31, 2013 387,591,380 3,876 522,360 -100 -22,203 324,612 828,546
Other items, CIRR 368 368
Net profit -64,816 -64,816
Comprehensive income -
Buy-back of shares - - - -
Dividend paid -6,533 -6,533
Share option program 5,044 5,044
Share issue costs -
Effect of exchange rate differences -
Equity as of December 31, 2014 387,591,380 3,876 522,360 -100 -22,203 258,675 762,609

SIEM OFFSHORE INC., ANNUAL REPORT 2014 2929
CONSOLIDATED
(Amounts in USD 1,000) Total no. of shares Share capital Share premium reserves Exchange rate differences Other reserves Retained earnings Shareholders’ equity Non-controlling interest Total equity
Equity as of December 31, 2012 Restated 393,924,836 3,939 531,025 17 409 -28,775 225,824 749,423 36,975 786,397
Change previous periods -1,943 -1,943 -1,943
Net profit to shareholders 22,000 22,000 -456 21,544
Stock option expences 3,125 3,125 3,125
Comprehensive income -8,403 1,155 -7,249 83 -7,166
Share issues in partially owned subsidiaries 657 657
Buy-back of shares -6 333 456 -63 -8,664 -8,728 -8,728
Share issue costs
Equity as of December 31, 2013 387,591,380 3,876 522,361 9,005 -28,775 250,161 756,628 37,260 793,888
Change previous periods -1,510 -1,510 -1,510
Net profit to shareholders 58,147 58,147 12,563 70,710
Stock option expences 2,462 2,462 2,462
Currency translation differences -11,100 - -11,100 -293 -11,393
Pension remeasurement 1,510 1,510 1,510
Share issues in partially owned subsidiaries - 1,336 1,336
Cash flow hedge - - - -14,621 -14,621 - 14,621
Capital reduction in partially owned subsidiaries - -12,201 -12,201
Dividends paid -6,533 -6,533 -6,533
Share issue costs - -
Equity as of December 31, 2014 387,591,380 3,876 522,361 -2,095 -43,396 304,237 784,982 38,666 823,649
Share issues in partially owned subsidiaries 2013 2014
Minority share of new equity Siem Offshore Meling DA - -
Minority share of new equity Siem WIS AS 657 1,336
Minority share of new equity Næringsbygg Idrettsveien 13 DA - -
Total 3,456 1,336
PARENT COMPANY
Equity as of December 31, 2012 393,924,836 3,939 531,025 -100 -22,203 329,809 842,471
Other items -352 -352
Net profit -4,845 -4,845
Comprehensive income -
Buy-back of shares -6,333,456 -63 -8,664 -8,728
Share issue costs -
Effect of exchange rate differences -
Equity as of December 31, 2013 387,591,380 3,876 522,360 -100 -22,203 324,612 828,546
Other items, CIRR 368 368
Net profit -64,816 -64,816
Comprehensive income -
Buy-back of shares - - - -
Dividend paid -6,533 -6,533
Share option program 5,044 5,044
Share issue costs -
Effect of exchange rate differences -
Equity as of December 31, 2014 387,591,380 3,876 522,360 -100 -22,203 258,675 762,609

SIEM OFFSHORE INC., ANNUAL REPORT 201430
STATEMENTS OF CASH FLOWS
PARENT COMPANY CONSOLIDATED
2014 2013 (Amounts in USD 1,000) Note 2014 2013
CASH FLOW FROM OPERATIONS
-56,809 -3,367 Profit/(loss) before taxes, excluding interest 30 117,702 49,205
-11,801 -5,865 Interest paid -46,362 -32,325
- -2,404 Taxes paid -8,957 -9,832
- -3,777 Result from subsidiaries - -
- - Result from associated companies 7 -1,808 -2,046
- - Gain/(loss) on sale of assets 25 -18,728 -29,827
- - Impairment of vessels 5 29,000 -
- 132 Depreciation and amortization 5 96,883 75,841
49,000 - Impairment of shares in subsidiaries - -
2,462 3,125 Stock option expences 31 2,462 3,125
- - Effect of unreal. currency exchange forward contracts 28 5,612 12,200
-7,289 1,103 Changes in short-term receivables and payables 19,918 -17,536
-368 -368 CIRR -368 -368
0 297 Other changes -11,010 10,549
-24,805 -11,125 Net cash flow from operations 184,345 58,986
CASH FLOW FROM INVESTMENT ACTIVITIES
4,162 5,760 Interest received 4,171 5,339
- -236 Investment in fixed assets 4,5 -525,674 -329,413
- - Proceeds from sale of fixed assets 25 76,290 85,998
-17,041 - Received from long-term loan - -
-6,000 Investments in subsidiaries - -
- - Dividend from associated companies 7 278 90
- - Investments in associated companies 7 -12,201 -14,406
-12,879 -476 Net cash flow from investment activities -457,136 -252,392
CASH FLOW FROM FINANCING ACTIVITIES
-6,533 - Dividend payment -6,533 -
- - Proceeds from share issue in partly owned subsidiaries 1,336 657
- -8,728 Buyback of shares - -8,728
60,000 - Loan from shareholder - -
- - Proceeds from bankoverdraft 5,624 962
76,256 109,277 Proceeds from new long-term borrowing 12 447,701 320,319
- - Repayment of long-term borrowing 12 -131,936 -128,833
129,723 100,549 Net cash flow from financing activities 316,192 184,378
92,039 88,948 Net change in cash 43,401 -9,028
132,068 57,270 Cash at bank as of 1 January 101,206 107,068
-1,529 -14,150 Effect of exchange rate differences -26,985 3,166
222,579 132,068 Cash at bank as of 31 December 117,623 101,206

SIEM OFFSHORE INC., ANNUAL REPORT 2014 31
Photographer: Tove Hertzberg

SIEM OFFSHORE INC., ANNUAL REPORT 201432
Note 1 - Accounting Principles
NOTES TO THE ACCOUNTS
Photographer: Arild Lillebø
Siem Offshore owns and operates a fleet of offshore support vessels, including Platform Supply Vessels, Offshore Subsea Construction Vessels, Anchor Handling, Tug, Supply Vessels and Well-Intervention Vessels.
and listed on the Oslo Stock Exchange. The Company’s headquarters is located in Kristiansand, Norway and the Company is tax resident in Norway. All references to “Siem Offshore Inc.” and “Company” shall mean Siem Offshore Inc. and its subsidi-aries and associates unless the context indicates otherwise. All references to “Parent” shall mean Siem Offshore Inc. as
a parent company only. The principal accounting policies applied in preparation of these consolidated and parent financial statements are set out below. These policies have been consist-ently applied to all the years presented, unless otherwise stated.
Siem Offshore owns and operates a fleet of offshore support vessels, including Platform supply ves-sels, Offshore Subsea Construc-
tion Vessels, Anchor Handling, Tug, Supply Vessels and Well-Intervention Vessels. Siem Offshore Inc. commenced operations 1 July 2005, and is an exempted company under the laws of the Cayman Islands
1.1 General

SIEM OFFSHORE INC., ANNUAL REPORT 2014 33
1.2 Basis of preparation
The consolidated and parent company financial statements are prepared in accordance with International Financial Reporting Standards (IFRS) and IFRS Interpretations Committee (IFRS IC)interpretations as endorsed by the European Union.
The financial statements also include any additional applicable disclosures as required by Norwegian law and Oslo Stock Exchange regulations. The financial statements have been prepared under the historical cost convention, as modified by specific financial assets and financial li-abilities, namely derivative instruments, at fair value through profit or loss and deriva-tive instruments designated as hedges, which are initially at fair value through other comprehensive income (OCI). The financial statements have been prepared under the assumption of going-concern.
All figures are in USD thousands, unless otherwise stated.
Management is required to make esti-mates and assumptions that affect the re-ported amounts of assets and liabilities. In addition, the preparation of financial state-ments in conformity with IFRS requires the use of certain critical accounting estimates. It also requires management to exercise its judgment in the process of applying the Company’s accounting poli-cies. The areas involving a higher degree of judgment or complexity or areas where assumptions and estimates are significant to the consolidated financial statements are disclosed in note 3 Critical accounting estimates and judgments.
1.3 Changes in accounting policy and disclosures
(a) New standards, amendments and inter-pretations adopted by the Company The following standards have been adopted by the Group for the first time for the financial year beginning on or after 1
January 2014: IFRS 10, Consolidated financial state-ments builds on existing principles by identifying the concept of control as the determining factor in whether an entity should be included within the consolidated financial statements of the parent com-pany. The standard provides additional guidance to assist in the determination of control where this is difficult to assess. Adoption of IFRS 10 did not materially affect the Company.
IFRS 11, Joint arrangements focuses on the rights and obligations of the parties to the arrangement rather than its legal form. There are two types of joint arrange-ments: joint operations and joint ventures. Joint operations arise where the investors have rights to the assets and obligations for the liabilities of an arrangement. A joint operator accounts for its share of the assets, liabilities, revenue and expenses. Joint ventures arise where the investors have rights to the net assets of the ar-rangement; joint ventures are accounted for under the equity method. Proportional consolidation of joint arrangements is no longer permitted. The Company was not involved in any joint arrangements during 2014 or 2013.
IFRS 12, Disclosures of interests in other entities includes the disclosure require-ments for all forms of interests in other entities, including joint arrangements, associates, structured entities and other off-balance sheet vehicles.
IFRIC 21, Levies sets out the accounting for an obligation to pay a levy that is not income tax. The interpretation addresses what the obligating event is that gives rise to pay a levy and when a liability should be recognized. The Company is not currently subject to significant levies so the adoption impact of IFRIC 21 on the Company is not material.
Amendment to IAS 32, Financial in-struments: Presentation on offsetting financial assets and financial liabilities.
This amendment clarifies that the right of set-off must not be contingent on a future event. It must also be legally enforce-able for all counterparties in the normal course of business, as well as in the event of default, insolvency or bankruptcy. The amendment also considers settlement mechanisms. The amendment is relevant for the Company, specifically related to positions held in derivative contracts, but adoption of the amendment did not have a material effect on the financial state-ments.
Amendments to IAS 36, Impairment of assets on the recoverable amount disclosures for non-financial assets. This amendment removed certain disclosures of the recoverable amount of CGUs which had been included in IAS 36 by the issue of IFRS 13.
Amendment to IAS 39, Financial instru-ments: Recognition and measurement on the novation of derivatives and the continuation of hedge accounting. This amendment considers legislative changes to ‘over-the-counter’ derivatives and the establishment of central counterparties. Under IAS 39 novation of derivatives to central counterparties would result in discontinuance of hedge accounting. The amendment provides relief from discon-tinuing hedge accounting when novation of a hedging instrument meets specified criteria. The Company has applied the amendment and there has been no sig-nificant impact on the Company financial statements as a result.
(b) New standards, amendments and interpretations not yet adopted by the CompanyA number of new standards and amend-ments to standards and interpretations are effective for annual periods beginning after 1 January 2015, and have not been applied in preparing the consolidated and parent financial statements.

SIEM OFFSHORE INC., ANNUAL REPORT 201434
NOTES TO THE ACCOUNTS
None of these is expected to have a signifi-cant effect on the consolidated financial statements of the Company, except the following set out below:
IFRS 9, Financial instruments addresses the classification, measurement and rec-ognition of financial assets and financial liabilities. The complete version of IFRS 9 was issued in July 2014. It replaces the guidance in IAS 39 that relates to the clas-sification and measurement of financial instruments. IFRS 9 retains but simpli-fies the mixed measurement model and establishes three primary measurement categories: for financial assets: amortized cost, fair value through OCI and fair value through P&L.
The basis of classification depends on the entity’s business model and the contractual cash flow characteristics of the financial asset. Investments in equity instruments are required to be measured at fair value through profit or loss with the irrevocable option at inception to present changes in fair value in OCI not recycling. There is now a new expected credit losses model that replaces the incurred loss impairment model used in IAS 39. For financial liabilities there were no changes to classification and measurement except for the recognition of changes in own credit risk in other comprehensive income, for liabilities designated at fair value through profit or loss.
IFRS 9 relaxes the requirements for hedge effectiveness by replacing the bright line hedge effectiveness tests. It requires an economic relationship between the hedged item and hedging instrument and for the ‘hedged ratio’ to be the same as the one management actually use for risk management purposes. Contemporane-ous documentation is still required but is different to that currently prepared under IAS 39. The standard is effective for ac-counting periods beginning on or after 1 January 2018. Early adoption is permitted, dependent on EU approval. The Company is yet to assess IFRS 9’s full impact.
IFRS 15, Revenue from contracts with customers deals with revenue recognition and establishes principles for reporting useful information to users of financial statements about the nature, amount, tim-ing and uncertainty of revenue and cash flows arising from an entity’s contracts with customers.
Revenue is recognized when a customer obtains control of a good or service and thus has the ability to direct the use and obtain the benefits from the good or ser-vice. The standard replaces IAS 18 Rev-enue and IAS 11 Construction contracts and related interpretations. The standard is effective for annual periods beginning on or after 1 January 2017 and earlier application is permitted, dependent on EU approval. The Company is assessing the impact of IFRS 15.
There are no other IFRSs or IFRIC inter-pretations that are not yet effective that would be expected to have a material impact on the Company.
1.4 Consolidation
a) Subsidiaries Subsidiaries are entities over which the Parent has control. The Parent controls an entity when the Parent is exposed to, or has rights to, variable returns from its involvement with the entity and has the ability to affect those returns through its power over the entity. Subsidiaries are fully consolidated from the date on which control is transferred to the Company. They are deconsolidated from the date that control ceases.
The Company applies the acquisition method to account for business combina-tions. The consideration transferred for the acquisition of a subsidiary is the fair values of the assets transferred and the liabilities assumed from to the former owners of the acquirer and the equity interests issued by the Company. The consideration transferred includes the fair value of any asset or liability resulting
from a contingent consideration arrange-ment. Identifiable assets acquired and li-abilities and contingent liabilities assumed in a business combination are measured initially at their fair values at the acquisi-tion date. The Company recognizes any non-controlling interest in the acquiree on an acquisition-by-acquisition basis, either at fair value or at the non-controlling interest’s proportionate share of the rec-ognized amounts of acquiree’s identifiable net assets. Acquisition-related costs are expensed as incurred.
If the business combination is achieved in stages, fair value of the acquirer’s previ-ously held equity interest in the acquiree is remeasured to fair value at the acquisi-tion date through profit or loss.Any contingent consideration to be trans-ferred by the Company is recognized at fair value at the acquisition date. Sub-sequent changes to the fair value of the contingent consideration that is deemed to be an asset or liability is recognized in accordance with IAS 39 either in profit or loss or as a change to other comprehen-sive income. Contingent consideration that is classified as equity is not remeasured and its subsequent settlement is account-ed for within equity.
Intercompany transactions, balances, and unrealized gains on transactions between Company companies are eliminated. Unrealized losses are also eliminated. When necessary, amounts reported by subsidiaries have been adjusted to ensure consistency with the policies adopted by the Company. (b) Associated companies Associates are entities over which the Company has significant influence but not control, generally accompanying a share-holding of between 20% and 50% of the voting rights. Investments in associates are accounted for using the equity method of accounting and are initially recognized at cost. The Company’s investment in associates includes goodwill identified on acquisition. The share of profit or loss

SIEM OFFSHORE INC., ANNUAL REPORT 2014 35
The relevant exchange rates vs. USD are:
Average 2014 31.12.14
Average 2013 31.12.2013
NOK (Norwegian kroner) 0.1575 0.1345 0.1700 0.1643
EUR (Euros) 1.3256 1.2157 1.3300 1.3778
GBP (Pound Sterling) 1.6448 1.5567 1.5699 1.6524
REAS (Brazilian Reals) 0.4240 0.3765 0.4620 0.4268
recorded in the consolidated financial statements is based on the after-tax earn-ings of the associate.
The Company’s share of post-acquisition profit or loss is recognized in the income statement, and its share of post-acquisi-tion movements in other comprehensive income is recognized in other compre-hensive income with a corresponding adjustment to the carrying amount of the investment. When the Company’s share of losses in an associate equals or exceeds its interest in the associate, including any other unsecured receivables, the Com-pany does not recognize further losses unless it has incurred legal or constructive obligations or made payments on behalf of the associate.
Unrealized gains on transactions between the Company and its associates are eliminated to the extent of the Company’s interest in the associates. Unrealized losses are eliminated unless the transac-tion provides evidence of an impairment of the asset transferred. Accounting policies of associates have been changed where necessary to ensure consistency with the policies adopted by the Company.
1.5 Classification of items in the finan-cial statements
Assets designated for long-term owner-ship or use and receivables due later than one year after drawdown are classified as non-current assets. Other assets are classified as current assets. Liabilities due later than one year after the end of the reporting period are classified as non-current liabilities. Other liabilities are classified as current liabilities. All deriva-tive financial instruments are classified as current assets or current liabilities.
1.6 Segment reporting
Operating segments are reported in a manner consistent with the internal reporting provided to the chief operat-ing decision-maker. The chief operating
decision-maker, who is responsible for allocating resources and assessing per-formance of the operating segments, has been identified as the executive manage-ment team consisting of the CEO, CFO, CCO and COO.
The Company is organized into eight dif-ferent segments, platform supply vessels (“PSVs”), offshore subsea construction vessels (“OSCVs), anchor-handling tug supply vessels (“AHTS Vessels”), Other Vessels in Brazil (consisting of fast crew vessels (“FCVs”), fast supply vessels (“FSVs”) and oil spill recovery vessels (“OSRVs”)), Combat Management Systems (“CMS”), Submarine Power Cable Installa-tion, Scientific Core-Drilling and Other.
1.7 Foreign currency translation
(a) Functional and presentation currency Items included in the financial statements of each of the Company’s entities are measured using the currency of the pri-mary economic environment in which the entity operates (the “functional currency”). The consolidated financial statements are presented in USD, which is the Company’s presentation currency.
(b) Transactions and balances Foreign currency transactions are trans-lated into the functional currency using the exchange rates prevailing at the dates of the transactions. Foreign exchange gains and losses resulting from the
settlement of such transactions and from the translation at year-end exchange rates of monetary assets and liabilities denomi-nated in foreign currencies are recognized in the income statement line item Net currency gain / loss.
(c) Group companies The results and financial position of all the Group companies (none of which have the currency of a hyperinflationary economy) that have a functional currency differ-ent from the presentation currency are translated into the presentation currency as follows:
(i) assets and liabilities for each state-ment of financial position presented are translated at the closing rate at the date of that statement of financial position;
(ii) income and expenses for each income statement are translated at average ex-change rates (unless this average is not a reasonable approximation of the cumula-tive effect of the rates prevailing on the transaction dates, in which case income and expenses are translated at the dates of the transactions); and
(iii) all resulting exchange differences are recognized in other comprehensive income.
As part of the consolidation process, exchange differences arising from the translation of the net investment in foreign

SIEM OFFSHORE INC., ANNUAL REPORT 201436
NOTES TO THE ACCOUNTS
operations is recognized directly in Other comprehensive Income (OCI). When a foreign operation is sold, exchange dif-ferences previously recognized in OCI are reclassified to profit or loss and included in the gain or loss on sale.
Goodwill and fair value adjustments aris-ing on the acquisition of a foreign entity are treated as assets and liabilities of the foreign entity and translated at the closing rate. Exchange differences arising are recognized in OCI.
1.8 Non-current tangible assets and maintenance costs
Land and Buildings and Vessels are stated at their historical cost less accumulated depreciation and net of any impairment losses. All non-current tangible assets (excluding Land and Vessels under con-struction) are depreciated on a straight-line basis over the estimated remaining useful economic life of the asset. The ves-sel residual value is the estimated future sales price for steel less the estimated costs associated with scrapping a vessel. The residual value and expected useful life for all non-current tangible assets is reviewed annually and, where they differ significantly from previous estimates, the rate of depreciation charges is changed accordingly.
The vessels presently owned by the Company have an estimated economic life of 30 years. Some components of the vessels have a shorter economic life than 30 years. The vessels are decomposed into different components and each com-ponent is depreciated over its estimated economic life. Each part of a vessel that is significant to the total cost of the vessel is separately identified and depreciated over that component’s useful lifetime. Components with similar useful lives are included in one component. The Company has identified nine significant components relating to its different types of vessels. See note 5 for additional information. Dry-docking - In accordance with IAS 16
and the cost model, dry-docking costs are a separate component of the ship’s cost at purchase with a different pattern of ben-efits and are therefore initially recognized as a separate depreciable asset. Subse-quently, the cost of major renovations and periodic maintenance costs are capitalized as a dry-docking asset and depreciated over the useful life of the parts replaced. The useful life of the dry-docking costs will be the period until the next docking, normally between two to three years. Day-to-day maintenance costs are immediately expensed during the reporting period in which they are incurred.
Capitalized project cost - Certain vessel contracts require an investment prior to commencing the contract to fulfil require-ments set by the charterer. These invest-ments are capitalized and amortized over the term of the specific charter contract.Gains and losses on the sale of assets and disposals are determined by comparing the sales or disposal proceeds with the net carrying amount and are included in operating profit.
1.9 Newbuild contracts and borrowing costs
Installments on newbuild contracts are classified as non-current tangible assets. Direct costs related to the on-site supervi-sion and other pre-delivery construction costs are capitalized per vessel.
General and specific borrowing costs di-rectly related to the acquisition, construc-tion or production of qualifying vessels are added to the cost of those vessels, until such time as the vessels are substantially ready for their intended use or sale. All other borrowing costs are recognized in the profit or loss in the period in which they are incurred.
Interest expense eligible for capitalization is only adjusted for the effect of interest rate or cross-currency interest rate swaps that are designated and qualify as an ac-counting hedge under IAS 39. Currently
the Company does not have any interest rate or cross-currency swap contracts designated as hedges.
1.10 Impairment of non-financial as-sets Intangible assets that have an indefinite useful life or intangible assets not ready to use are not subject to amortization and are tested annually for impairment.
Assets that are subject to amortization are reviewed for impairment whenever events or changes in circumstances indicate that the carrying amount may not be recoverable. An impairment loss is recognized for the amount by which the asset’s carrying amount exceeds its recov-erable amount. The recoverable amount is the higher of an asset’s fair value less costs of disposal and value in use. The recoverable amount is established indi-vidually for all assets. In assessing value in use, the estimated future cash flows are discounted to their present value using a pre-tax discount rate that reflects current market assessments of the time and the risk specific to the asset that is considered impaired.
Prior impairments of non-financial assets (other than goodwill) are reviewed for possible reversal at each reporting date. A previously recognized impairment loss is reversed if there has been a change in the estimates used to determine the recoverable amount. Reversal of a previ-ously recognized impairment is limited to an amount that would make the carrying value of the asset equal to what it would have been had the initial impairment charge not occurred.
1.11 Intangible assets
Intangible assets that are acquired sepa-rately are measured on initial recognition at cost. The cost of intangible assets acquired in a business combination is recognized at fair value at the date of acquisition. Following initial recognition, intangible assets are carried at cost less

SIEM OFFSHORE INC., ANNUAL REPORT 2014 37
any accumulated amortization and any ac-cumulated impairment losses. Internally-generated intangible assets, excluding capitalized development costs, are not capitalized and expenditure is charged against profits in the year in which the expenditure is incurred. The useful lives of intangible assets are assessed to be either finite or indefinite. Intangible as-sets with finite lives are amortized over the useful economic life and assessed for impairment whenever there is an indication that the intangible asset may be impaired. The amortization period and the amortization method are reviewed annually. Changes in the expected useful life or the expected pattern of consump-tion of future economic benefits embodied in the asset is accounted for by changing the amortization period or method, as appropriate, and treated as a change in accounting estimate. The amortization ex-pense on intangible assets with finite lives is recognized in the income statement in the expense category consistent with the function of the intangible asset.
Intangible assets with indefinite useful lives are tested for impairment annually either individually or at the cash-gener-ating unit level. Such intangibles are not amortized. The useful life of an intangible asset with an indefinite life is reviewed an-nually to determine whether the indefinite life assessment continues to be support-able. If not, the change in the useful life assessment from indefinite to finite is made on a prospective basis.
Goodwill - Goodwill arises on the acquisi-tion of subsidiaries and represents the excess of the consideration transferred, the amount of any non-controlling interest in the acquiree and the acquisition-date fair value of any previous equity interest in the acquiree over the fair value of the identifiable net assets acquired. If the total of consideration transferred, non-control-ling interest recognized and previously held interest measured at fair value is less than the fair value of the net assets of the subsidiary acquired, in the case of a bar-
gain purchase, the difference is recognized directly in the income statement.
For the purpose of impairment testing, goodwill acquired in a business combi-nation is allocated to each of the CGUs, or groups of CGUs, that is expected to benefit from the synergies of the combina-tion. Each unit or group of units to which the goodwill is allocated represents the lowest level within the entity at which the goodwill is monitored for internal man-agement purposes. Goodwill is monitored at the operating segment level.
Goodwill impairment reviews are un-dertaken annually or more frequently if events or changes in circumstances indicate a potential impairment. The car-rying value of goodwill is compared to the recoverable amount, which is the higher of value in use and the fair value less costs to sell. Any impairment is recognized immediately as an expense and is not subsequently reversed.Trademarks and licenses - Separately ac-quired trademarks and licenses are shown at historical cost. Trademarks and li-censes acquired in a business combination are recognized at fair value at the acquisi-tion date. Trademarks and licenses have a finite useful life and are measured at cost less accumulated amortization. Amortiza-tion is calculated using the straight-line method to allocate the cost of trademarks and licenses over their estimated useful lives of three to seven years.
Research and development - Research and Development (R&D) relates to the development of a production method for drilling process; this R&D is part of the Other Segment.
1.12 Financial assets
1.12.1 ClassificationThe Company classifies its financial assets in the following two categories: Fi-nancial assets at fair value through profit or loss and Loans and receivables. The classification depends on the purpose for
which the financial assets were acquired. Management determines the classification of its financial assets at initial recognition and re-evaluates this designation at every reporting date.
(a) Financial assets at fair value through profit or lossFinancial assets at fair value through profit or loss are financial assets held for trading. The only financial assets in this category are derivative contracts, which are categorized as held for trading unless designated as hedges. Derivatives in this category are classified as current assets.
(b) Loans and receivables Loans and receivables are non-derivative financial assets with fixed or determinable payments that are not quoted in an ac-tive market. They are included in current assets, except for assets with maturities greater than 12 months after the reporting date. These are classified as non-current financial assets. The Company’s loans and receivables include accounts receiv-able, cash, short and long-term financial receivables and the CIRR loan deposit.
1.12.2 Recognition and measurement
Regular purchases and sales of financial assets are recognized on the trade-date – the date on which the Company commits to purchase or sell the asset. Investments are initially recognized at fair value plus transaction costs for all financial assets not carried at fair value through profit or loss. Financial assets carried at fair value through profit or loss are initially recog-nized at fair value, and transaction costs are expensed in the income statement. Financial assets are derecognized when the rights to receive cash flows from the investments have expired or have been transferred and the Company has trans-ferred substantially all risks and rewards of ownership. Loans and receivables are subsequently carried at amortized cost using the effective interest method.
Gains or losses arising from changes in

SIEM OFFSHORE INC., ANNUAL REPORT 201438
NOTES TO THE ACCOUNTS
the fair value of the ‘financial assets at fair value through profit or loss’ category are presented in the income statement within Operating profit as Gain/(Loss) on cur-rency currency derivative contracts and within net financial items for the interest rate and cross currency swap derivative contracts. See for note 21 for additional information.
1.13 Offsetting financial instruments
Financial assets and liabilities are offset and the net amount reported in the balance sheet when there is a legally enforceable right to offset the recognized amounts and there is an intention to settle on a net basis or realize the asset and set-tle the liability simultaneously. The legally enforceable right must not be contingent on future events and must be enforce-able in the normal course of business and in the event of default, insolvency or bankruptcy of the company or the coun-terparty. The Company has evaluated all of their derivative contract positions and does not currently have the right to offset the contracts, and therefore reports all derivative positions at gross amounts.
1.14 Inventories
Lubricating oil and bunkers inventories are valued at the lower of cost and net realiz-able value. Cost is determined using the weighted average cost method. Bunkers and lubricating oil inventories are an inte-gral part of the vessel, and not sold sepa-rately. Net realizable value is estimated based on commodity market prices.
1.15 Cash and cash equivalents
In the statement of cash flows, cash and cash equivalents includes cash in hand and other short-term highly-liquid invest-ments with original maturities of three months or less. Cash and cash equivalents in the State-ment of cash flows excludes restricted cash balances.
1.16 Accounts receivable
Accounts receivable are recognized initially at fair value and subsequently measured at amortized cost, less provi-sion for impairment. The interest factor for accounts receivable is considered to be insignificant and therefore not included in the measurement of amortized cost. In the case of an objective evidence of a fall in value, the difference between reported value and the present value of the ex-pected net future cash flows is reported as a loss. Provisions for losses are recognized when there are objective indicators that the Company will not receive settlement in accordance with the original contract terms. Significant financial problems facing the customer, probability that the customer will go bankrupt or undergo fi-nancial restructuring, postponements and non-payment are regarded as indicators that the customer receivable is impaired.
1.17 Share capital
Ordinary shares are classified as equity. Incremental costs directly attributable to the issue of new shares or options are shown in equity as a deduction, net of tax, from the proceeds. When any Company entity purchases its own shares, the consideration paid, including any directly attributable incremental costs (net of income taxes), is deducted as appropriate from share capital and share premium reserve and the shares are cancelled.
1.18 Borrowings
Borrowings are recognized initially at fair value, net of transaction costs incurred and are subsequently stated at amortized cost. Any difference between the proceeds (net of transaction costs) and the redemp-tion value is recognized in the income statement over the period of the borrow-ings using the effective interest method. Borrowings are classified as current liabilities unless the Company has an unconditional right to defer settlement of
the liability for at least 12 months after the reporting date.
1.19 Commercial Interest Reference Rate (CIRR) loan
The Company has applied for three Commercial Interest Reference Rate (CIRR) loans from the Norwegian Export Credit Agency. The duration of the loans is 12 years and the cash proceeds from the loans have been deposited in a fixed deposit account with a Norwegian bank at the same interest rate as the loans. The agreed periods of the deposits are identi-cal with the periods of the loans.
1.20 Taxation
The tax expense for the period comprises current and deferred tax. Tax is recognized in the income statement, except to the extent that it relates to items recognized in other comprehensive income or directly in equity. In this case, the tax is also rec-ognized in other comprehensive income or directly in equity, respectively.
Tax expense/benefit includes current taxes and the change in deferred taxes. Deferred income tax is provided for all temporary differences between the book value and the tax basis of assets and liabilities and for tax losses carried forward. Deferred tax assets made prob-able through prospective earnings that can be utilized against the tax reducing temporary differences are recognized as intangible assets. Deferred tax assets and deferred tax liabilities are recognized inde-pendently of when the differences will be reversed and, as a rule, at nominal value. Deferred tax assets and tax liabilities are measured on the basis of estimated future tax rate. Part of the Company’s activities under the Norwegian subsidiaries are structured to be in compliance with the regulations for the Norwegian Tonnage Tax Regime. The Company has estimated a tax rate of 0% for the companies subject to Norwegian Tonnage Tax Regime. Financial income

SIEM OFFSHORE INC., ANNUAL REPORT 2014 39
within the regime is taxable at a rate of 27%. For companies not included in the tonnage tax regime, the Company ap-plies a tax rate of 27%. The tax expense consists of taxes payable and changes in deferred tax assets/liabilities.
Deferred income tax is recognized on temporary differences arising between the tax bases of assets and liabilities and their carrying amounts in the consolidated financial statements. Deferred income tax is determined using tax rates (and laws) that have been enacted or substantively enacted by the balance sheet date and are expected to apply when the related deferred income tax asset is realized or the deferred income tax liability is settled.Deferred income tax assets are recog-nized only to the extent that it is probable that future taxable profit will be available against which the temporary differences can be utilized.
Deferred income tax liabilities are provid-ed on taxable temporary differences aris-ing from investments in subsidiaries and associates, except for deferred income tax liability where the timing of the reversal of the temporary difference is controlled by the Company and it is probable that the temporary difference will not reverse in the foreseeable future. Generally the Company is unable to control the reversal of the temporary difference for associates.
Deferred income tax assets are recog-nized on deductible temporary differences arising from investments in subsidiaries and associates only to the extent that it is probable the temporary difference will reverse in the future and there is sufficient taxable profit available against which the temporary difference can be utilized.
Deferred income tax assets and liabilities are offset when there is a legally enforce-able right to offset current tax assets against current tax liabilities and when the deferred income taxes assets and liabilities relate to income taxes levied by the same taxation authority on either the
same taxable entity or different taxable entities where there is an intention to set-tle the balances on a net basis.
1.21 Pension costs and obligations
The Company has a defined benefit plan for its employees in Norway. The pension scheme is financed through contributions to insurance companies or pension funds. A defined benefit plan defines the amount of pension benefit that an employee will receive on retirement, usually dependent on one or more factors such as age, years of service and compensation.
The liability recognized in the statement of financial position relating to defined benefit plans is the present value of the defined benefit obligation at the end of the reporting period less the fair value of the pension fund assets. The defined benefit obligation is calculated annually by an independent actuary on the basis of a linear model. The present value of the defined benefit obligation is determined by discounting the estimated future cash outflows based on the interest rate for Norwegian government bonds. Since Norwegian government bonds are not issued for terms exceeding 10 years, a supplement to this bond rate is calculated by means of estimation techniques to establish a discount rate that is approxi-mately the same as the term of the pen-sion obligation.
Past service costs are recognized immediately in income.
Actuarial gains and losses arising from experience adjustments and changes in actuarial assumptions are charged or credited to equity in other comprehensive income in the period in which they arise.
1.22 Derivative financial instruments and hedging activities
The Company enters into derivative instru-ments, primarily foreign currency con-tracts and interest rate swaps, to hedge
foreign currency exposures, for example related to operating expenses and vessel purchase commitments, and interest rate exposures primarily related to long-term borrowings. These derivatives are not designated as accounting hedges.
Derivatives are initially recognized at fair value on the date a derivative contract is entered into and are subsequently re-measured at their fair value. The method of recognizing the resulting gain or loss depends on whether the derivative is des-ignated as a hedging instrument, and if so, the nature of the item being hedged.
Management designates certain de-rivatives as hedges of a particular risk associated with a highly probable forecast transaction (cash flow hedge), specifi-cally the contractual future sales related to vessels chartered by the Brazilian subsidiary. The Brazilian entity documents at the inception of the transaction the relationship between the foreign currency derivatives (hedging instrument) and the hedged items (highly probable future sales), as well as its risk management ob-jectives and strategy for undertaking the various hedging transactions. The entity also documents its assessment, both at hedge inception and on an ongoing basis, of whether the derivatives that are used in the hedging transactions are highly effec-tive in offsetting changes in fair values or cash flows of hedged items.
The fair values of the foreign currency derivative instruments used for hedging purposes are disclosed in note 15. Move-ments on the hedging reserve in other comprehensive income are shown in note 15. The full fair value of a hedging deriva-tive is classified as a non-current asset or liability when the remaining hedged item is more than 12 months, and as a current asset or liability when the remaining maturity of the hedged item is less than 12 months.
The effective portion of changes in the fair value of derivatives that are designated

SIEM OFFSHORE INC., ANNUAL REPORT 201440
NOTES TO THE ACCOUNTS
and qualify as cash flow hedges is rec-ognized in other comprehensive income. The gain or loss relating to the ineffective portion is recognized immediately in the income statement.
Amounts accumulated in equity are reclassified to profit or loss in the periods when the forecast sale that is hedged takes place. When a hedging instru-ment expires or is sold, or when a hedge no longer meets the criteria for hedge accounting, any cumulative gain or loss existing in equity at that time remains in equity and is recognized when the forecast transaction is ultimately recognized in the profit or loss. When a forecast transac-tion is no longer expected to occur, the cumulative gain or loss that was reported in equity is immediately transferred to the income statement within Operating Margin.
1.23 Revenue recognition
The Company’s activity is to employ dif-ferent types of offshore support vessels, including PSVs, OSCVs, AHTS vessels, OSRVs, standby vessels and crew-boats and one scientific core-drilling vessel. In addition, the Company holds inter-est in one limited liability partnership with ownership in one well-stimulation vessel. In one of the subsidiaries of the Company, revenues are partly generated from income from construction contracts. Revenue comprises the fair value of the consideration received or receivable for the sale of goods and services in the ordinary course of the Company’s activi-ties. Revenue is shown net of value-added tax, withholding tax, returns, rebates and discounts and after elimination of sales within the Company. Revenue is recog-nized as follows:
Charter rate contracts Charter contracts are classified as operat-ing leases under IAS 17. Revenue derived from charter contracts is recognized in the period over the lease term on a straight-line basis. Related services are recog-
nized as revenue in accordance with the services being rendered.
Revenues from time charters and bare-boat charters accounted for as operating leases are recognized over the rental periods of such charters, as service is performed on a straight-line basis. Certain contracts include mobilization fees pay-able at the start of the contract, and are recognized as revenue in the mobiliza-tion period until contract commence-ment. In cases where the fee covers specific upgrades or equipment specific to the contract, the mobilization fees are recognized as revenue over the estimated contract period. The related investment is depreciated over the estimated contract period. In cases where the fee covers specific operating expenses at the start of the contract, the fees are recognized in the same period as the expenses.
Vessels without signed contracts in place at discharge have no revenue until the signing of a new contract. Charter-related expenses for vessels during idle time are expensed as incurred.
Construction contracts The Company accounts for long-term con-struction, engineering and project man-agement contracts on the percentage-of-completion basis as costs are incurred. Under this method, when the outcome of a construction contract can be estimated reliably and it is probably that the contract will be profitable, contract revenue is rec-ognized over the period of the contract by reference to the stage of completion.
In the beginning phase of a project, the profit on a contract is not able to be esti-mated reliably until progress has reached at least 25% completion. Therefore, until an estimate of 25% complete is possible, only contract expenses are recognized, but no profit margin. Contract costs are recognized as expenses by reference to the stage of completion of the contract activity at the end of the reporting period. When it is probable that a project will gen-
erate a loss (total contract costs are ex-pected to exceed total contract revenue), the total estimated loss is recognized as an expense immediately.
Interest income Interest income is recognized using the ef-fective interest method. When a receivable is impaired, the Company reduces the car-rying amount to its recoverable amount, which is determined as the estimated future cash flow discounted at original ef-fective interest rate of the instrument and continues unwinding the discount as inter-est income. Interest income on impaired loans and receivables is recognized using the original effective interest rate.
Dividend income Dividend income is recognized when the right to receive payment is established.
Rendering of services Service revenue is generally recognized when a signed contract or other persua-sive evidence of an arrangement exists, the service has been provided, the fee is fixed or determinable and collection of resulting receivables is reasonably as-sured. Other services are recognized on a percentage-of-completion basis. 1.24 Accounts payable
Accounts payables are obligations to pay for goods or services that have been acquired in the ordinary course of busi-ness from suppliers. Accounts payable are classified as current liabilities if payment is due within one year or less (or in the normal operating cycle of the business if longer). If not, they are presented as non-current liabilities. Accounts payable are recognized initially at fair value and subsequently measured at amortized cost using the effective interest method.
1.25 Earnings per share
Earnings per share are calculated by divid-ing the net profit/loss for shareholders of the Company by the weighted average

SIEM OFFSHORE INC., ANNUAL REPORT 2014 41
number of outstanding shares over the reporting period. Diluted earnings per share include the effect of the assumed conversion of potentially dilutive instru-ments such as employee stock options. The impact of share equivalents is com-puted using the treasury stock method for stock options.
1.26 Statement of Cash Flows
The Statements of cash flows are prepared in accordance with the indirect method.
1.27 Related party transactions
All transactions, agreements and busi-ness activities with related parties are determined on an arm’s length basis in a manner similar to transactions with third parties.
1. 28 Government grants
Grants relating to net wages arrangement in Norway are recognized as a reduction of wage cost.
1.29 Operating leases
Leases in which a significant portion of the risks and rewards of ownership have not been transferred to the Company are classified as operating leases. Payments made under operating lease agreements are classified in the income statement as operating expenses and recognized straight-line over the period of the lease.
1.30 Share-based payments
The Company operates an executive management equity-settled, share-based compensation plan, under which the entity receives services from ten top management employees (eight in 2013) as consideration for equity instruments (share-options) of the Company. The fair value of the employee services received in exchange for the grant of the options is recognized as an Operating Expense. For additional information see note 31 Share-based payments.
The total amount to be expensed is determined by reference to the fair value of the options granted at grant date, as determined using a Black-Scholes model. Exercise price is the stock price at date of The total expense is recognized over the vesting period, which is the period over which all of the specified vesting condi-tions are to be satisfied. The only condition for vesting is employment with the Com-pany; options vest over a five-year period after grant date.
At the end of each reporting period, the Company revises its estimates of the number of options that are expected to vest based on the non-market vesting conditions. It recognizes the impact of the revision to original estimates, if any, in the income statement, with a corresponding adjustment to equity. Each option gives the holder the right, but not the obligation, to acquire one share at the exercise price
on the terms and subject to the conditions set out in the Stock Option Plan.
When the options are exercised, the Par-ent issues new shares or re-issues treas-ury shares. The proceeds received net of any directly attributable transaction costs are credited to share capital (nominal value) and share premium.
The grant by the Company of options over its equity instruments to the employees of subsidiary undertakings in the Company is treated as a capital contribution. The fair value of employee services received, measured by reference to the grant date fair value, is recognized over the vesting period as an increase to investment in subsidiary undertakings, with a corre-sponding credit to equity in the parent entity accounts.
The social security contributions payable in connection with the grant of the share options is considered an integral part of the grant itself, and the charge will be treated as a cash-settled transaction.

SIEM OFFSHORE INC., ANNUAL REPORT 201442
2.1 Financial risk factors
The Company is exposed to a variety of financial risks through its ordinary operations and debt financing. Such risks include foreign exchange risk, interest rate risk, credit risk and liquidity risk. To man-age these risks, management reviews and
assesses its primary financial and market risks. Once risks are identified, appropriate action is taken to mitigate the identified risk. The Company’s risk management is exercised in line with guidelines approved by the Board.
2.2 Foreign exchange risks
USD is the reporting currency for the Company. Functional currency for the parent company and vessel-operating subsidiaries is USD, except for one of the Norwegian subsidiary where NOK is the functional currency, and the Brazilian
Financial assets in 2014 include derivatives related to hedging of foreign exchange risks. The derivatives in the sensitivity table include pathdependent options in which the value of the derivatives is influenced when the underlying reaches or fluctuates within, below or above specific barrier levels. The change in value of these derivatives will impact the profit of the Company. Financial liabilities in 2014 and 2013 consist of interest rate derivatives and are not influenced by movements in foreign exchange rates,and therefore not included in the table.
NOTES TO THE ACCOUNTS
Note 2 - Financial Risk Management
CONSOLIDATED Foreign exchange risk rate 10%
(Amounts in USD 1,000) +10% movements -10% movements
December 31, 2014Carrying
amount Profit/(loss) Equity Profit/(loss) Equity
Financial assets
Cash and cash equivalent 117,623 3,614 3,614 -3,614 -3,614
Derivatives 1,041 - - - -
Accounts receivable 74,753 1,292 1,292 -1,292 -1,292
Impact on financial assets before tax 193,417 4,907 4,907 -4,907 -4,907
Financial liabilities
Accounts payable 10,781 -1,583 -1,583 1,583 1,583
Derivatives 16,732 18,402 18,402 -21,016 -21,016
Borrowings 1,214,360 -51,399 -51,399 51,399 51,399
Impact on financial liabilities before tax 1,241,873 -34,580 -34,580 31,966 31,966
Income statement
Operating revenue 491,312 20,149 20,149 -20,149 -20,149
Operating expenses 297,187 -18,284 -18,284 18,284 18,284
Impact on operating result before tax 194,125 1,866 1,866 -1,866 -1,866
Total increase/decrease before tax -27,807 -27,807 25,193 25,193
Allocation per currency
NOK -21,985 -21,985 19,371 19,371
EUR 10,274 10,274 -10,274 -10,274
GBP 440 440 -440 -440
BRL -16,537 -16,537 16,537 16,537
Total increase/ decrease before tax -27,807 -27,807 25,193 25,193

SIEM OFFSHORE INC., ANNUAL REPORT 2014 43
subsidiary where BRL is the functional currency. Remaining subsidiaries use NOK and EUR as functional currency. The Company operates internationally and is exposed to foreign exchange risks arising from various currency exposures primary with respect to NOK, GBP, EUR and BRL. Foreign exchange risks can be divided into transaction risk from paying and receiving foreign currency and translation risk due to recognizing assets and liabilities in USD. The Company had in 2014 and 2013
mainly USD, NOK, EUR and BRL revenue and expenses. At year end, the Company had one ship-building contract with a Brazilian yard for the construction of one OSRV, shipbuild-ing contracts with a Polish yard for the construction of four PSVs and one CLV and shipbuilding contracts with a German yard for construction of two WIVs. The contract with the Brazilian yard is in USD, the contracts with the Polish- and Ger-man yards are in EUR. Further informa-
tion regarding these contracts is set out in Note 2.5 and Note 17. The Company is exposed to foreign exchange risk of its subsidiaries, including the development of the Brazilian Real. The following sensitivity table demon-strates the impact on the Company’s profit and equity before tax from potential changes to the exchange rates, all other variables held constant.
Note 2 - Financial Risk Management
CONSOLIDATED Foreign exchange risk rate 10%
(Amounts in USD 1,000) +10% movements -10% movements
December 31, 2013Carrying
amount Profit/(loss) Equity Profit/(loss) Equity
Financial assets
Cash and cash equivalent 101,206 2,473 2,473 -2,473 -2,473
Derivatives - - - - -
Accounts receivable 53,198 2,653 2,653 -2,653 -2,653
Impact on financial assets before tax 154,404 5,126 5,126 -5,126 -5,126
Financial liabilities
Accounts payable 16,253 -1,966 -1,966 1,966 1,966
Derivatives 11,085 -33,797 -33,797 29,343 29,343
Borrowings 961,500 -36,253 -36,253 36,253 36,253
Impact on financial liabilities before tax 988,838 -72,016 -72,016 67,562 67,562
Income statement
Operating revenue 363,955 16,834 16,834 -16,834 -16,834
Operating expenses 241,291 -19,235 -19,235 19,235 19,235
Impact on operating result before tax 122,663 -2,401 -2,401 2,401 2,401
Total increase/decrease before tax -69,290 -69,290 64,836 64,836
Allocation per currency
NOK -60,250 -60,250 55,797 55,797
EUR 2,079 2,079 -2,079 -2,079
GBP 450 450 -450 -450
BRL -11,569 -11,569 11,570 11,570
Total increase/ decrease before tax -69,290 -69,290 64,836 64,836

SIEM OFFSHORE INC., ANNUAL REPORT 201444
NOTES TO THE ACCOUNTS
PARENT COMPANY Foreign exchange risk rate 10%
(Amounts in USD 1,000) +10% movements -10% movements
December 31, 2014Carrying
amountProfit/(loss) Equity Profit/(loss) Equity
Financial assets
Cash and cash equivalent 222,579 15,217 15,217 -15,217 -15,217
Accounts receivable - - - - -
Impact on financial assets before tax 222,579 15,217 15,217 -15,217 -15,217
Financial liabilities
Accounts payable 53 -1 -1 1 1
Derivatives - - - - -
Borrowings 174,881 -20,334 -20,334 20,334 20,334
Impact on financial liabilities before tax 174,934 -20,334 -20,334 20,334 20,334
Income statement
Operating revenue 405 - - - -
Operating expenses 12,521 -1,156 -1,156 1,156 1,156
Impact on operating result before tax -12,116 -1,156 -1,156 1,156 1,156
Total increase/decrease before tax -6,273 -6,273 6,273 6,273
Allocation per currency
NOK -8,212 -8,212 8,212 8,212
EUR 1,916 1,916 -1,916 -1,916
GBP 23 23 -23 -23
Total increase/ decrease before tax -6,273 -6,273 6,273 6,273

SIEM OFFSHORE INC., ANNUAL REPORT 2014 45
PARENT COMPANY Foreign exchange risk rate 10%
(Amounts in USD 1,000) +10% movements -10% movements
December 31, 2013Carrying
amountProfit/(loss) Equity Profit/(loss) Equity
Financial assets
Cash and cash equivalent 132,068 7,946 7,946 -7,946 -7,946
Accounts receivable 3,447 - - - -
Impact on financial assets before tax 135,514 7,946 7,946 -7,946 -7,946
Financial liabilities
Accounts payable 397 -19 -19 19 19
Derivatives - - - - -
Borrowings 98,624 -14,034 -14,034 14,034 14,034
Impact on financial liabilities before tax 99,021 -14,053 -14,053 14,053 14,053
Income statement
Operating revenue 10,953 -2 -2 2 2
Operating expenses 18,774 -1,189 -1,189 1,189 1,189
Impact on operating result before tax -7,821 -1,191 -1,191 1,191 1,191
Total increase/decrease before tax -7,298 -7,298 7,298 7,298
Allocation per currency
NOK -7,324 -7,324 7,324 7,324
EUR -10 -10 10 10
GBP 36 36 -36 -36
Total increase/ decrease before tax -7,298 -7,298 7,298 7,298

SIEM OFFSHORE INC., ANNUAL REPORT 201446
NOTES TO THE ACCOUNTS
2.3 Credit risks
Concentration risksThe Company’s credit risk is primarily attributable to its trade and other short-term receivables and asset derivative positions. The derivative counterparties are large established financial institutions, and the counterparty risk for the asset de-
rivative positions are regarded as limited.The exposure to credit risk for trade and other short term receivables is measured on an ongoing basis and credit evaluations are performed for customers identified to be risky. The Company’s debtors are mainly major oil companies and offshore service companies, which are considered to be creditworthy third parties. Histori-
cally, the loss percentage has been low. Ongoing provisions are made and, on December 31, 2014, the provision for cer-tain accounts receivables which may not be paid in full was USD 9.5 million for the Company (2013: USD 7.0 million) and USD 751K for the Parent (2013: USD 0K). The table below presents the concentration risks for 2014 and 2013.
PARENT COMPANY CONSOLIDATED
(Amounts in USD 1,000) USD % of total USD % of total
Receivables on December 31, 2014
1 to 5 largest - - 50,454 67.5 %
6 to 10 largest - - 16,279 21.8 %
Others - - 8,020 10.7 %
Total accounts receivables - - 74,753 100%
(Amounts in USD 1,000) USD % of total USD % of total
Receivables on December 31, 2013
1 to 5 largest 3,447 100.0 % 32,311 60.7 %
6 to 10 largest - - 17,978 33.8 %
Others - - 2,909 5.5 %
Total accounts receivables 3,447 100% 53,198 100%

SIEM OFFSHORE INC., ANNUAL REPORT 2014 47
Trade and receivablesThe table below presents an aging analysis of the outstanding receivables at year end 2014 and 2013. Overdue receivables are followed up continually by Management. The Management considers the outstanding amounts to be recoverable.At year end 2014 the receivables were significantly higher than as for 2013. This was caused by sanctions affecting,receivables from the Kara-Sea project.Payments from Petrobras in Brazil was delayed due to formal approval requirements. The majority of these receivables have been paid in Q1 2015. The maximum exposure to credit risk at the reporting date is the carrying value of each class of accounts receivables mentioned above.
The carrying amount of the Company’s and Parent’s accounts receivables are denominated in the following currencies:
PARENT COMPANY CONSOLIDATED
(Amounts in USD 1,000) USD % of total USD % of total
Aging on December 31, 2014
Not due - - 28,392 38.0 %
Due up to 1 month - - 14,823 19.8 %
Due 1-4 months - - 12,409 16.6 %
Due more than 4 months - - 19,128 25.6 %
Total accounts receivables - - 74,753 100%
(Amounts in USD 1,000) USD % of total USD % of total
Aging on December 31, 2013
Not due - - 27,365 51.4 %
Due up to 1 month - - 16,511 31.0 %
Due 1-4 months - - 3,045 5.7 %
Due more than 4 months 3,447 100.0 % 6,276 11.8 %
Total accounts receivables 3,447 100% 53,198 100%
PARENT COMPANY CONSOLIDATED
(Amounts in USD 1,000) 2014 2013 2014 2013
Currency
USD - 3,447 61,830 26,670
NOK - - 1,947 10,123
EUR - - 5,606 10,999
GBP - - 2,386 2,015
BRL - - 2,984 3,391
Total accounts receivables - 3,447 74,753 53,198

SIEM OFFSHORE INC., ANNUAL REPORT 201448
2.4 Cash flow, interest risk and fair value
The Company is financed by debt and equity. If the Company fails to repay or refinance its loan facilities, additional eq-uity financing may be required. There can be no assurance that the Company will be able to repay its debts or extend re-payment schedules through re-financing
of its loan agreements or avoid net cash flow shortfalls exceeding the Company’s available funding sources or comply with minimum cash requirements. Further, there can be no assurance that the Company will be able to raise new equity, or arrange new borrowing facilities, on favourable terms and in amounts neces-sary to conduct its ongoing and future operations, should this be required.
In the event of insolvency, liquidation or similar event relating to a subsidiary of the Company, all creditors of such subsidiary would be entitled to payment in full out of the assets of such subsidiary before the Company, as a shareholder, would be entitled to any payments. De-faults by, or the insolvency of, a subsidiary of the Company could result in the obliga-tion of the Company to make payments
NOTES TO THE ACCOUNTS
CONSOLIDATED Interest rate risk (IR)
(Amounts in USD 1,000) -1% movements +1% movements
December 31, 2014Carrying
amount Profit/(loss) Equity Profit/(loss) Equity
Financial assets
Cash and cash equivalent 117,623 -1,176 -1,176 1,176 1,176
Impact on financial assets before tax 117,623 -1,176 -1,176 1,176 1,176
Financial liabilities
Borrowings 668,772 2,689 2,689 -2,320 -2,320
Impact on financial liabilities before tax 668,772 2,689 2,689 -2,320 -2,320
Total increase/decrease before tax 1,513 1,513 -1,144 -1,144
CONSOLIDATED Interest rate risk (IR)
(Amounts in USD 1,000) -1% movements +1% movements
December 31, 2013
Carrying amount Profit/(loss) Equity Profit/(loss) Equity
Financial assets
Cash and cash equivalent 101,206 -1,012 -1,012 1,012 1,012
Impact on financial assets before tax 101,206 -1,012 -1,012 1,012 1,012
Financial liabilities
Borrowings 629,221 -3,886 -3,886 3,350 3,350
Impact on financial liabilities before tax 629,221 -3,886 -3,886 3,350 3,350
Total increase/decrease before tax -4,898 -4,898 4,362 4,362
Borrowings in the tables above (both for 2014 and 2013) include only borrowings with floating interest. Above movements also include the effect of interest rate swaps entered into in order to hedge the floating interest risk. Market-to-mar-ket effects in relation to the interest rate swaps impacts the profit and loss following a change of +/- 1% in the interest rate. For more details, see Note 12

SIEM OFFSHORE INC., ANNUAL REPORT 2014 49
PARENT COMPANY Interest rate risk (IR)
(Amounts in USD 1,000) -1% movements +1% movements
December 31, 2014Carrying
amount Profit/(loss) Equity Profit/(loss) Equity
Financial assets
Cash and cash equivalent 222,579 -2,226 -2,226 2,226 2,226
Impact on financial assets before tax 222,579 -2,226 -2,226 2,226 2,226
Financial liabilities
Borrowings 174,881 1,749 1,749 -1,749 -1,749
Impact on financial liabilities before tax 174,881 1,749 1,749 -1,749 -1,749
Total increase/decrease before tax -477 -477 477 477
PARENT COMPANY Interest rate risk (IR)
(Amounts in USD 1,000) -1% movements +1% movements
December 31, 2013Carrying
amount Profit/(loss) Equity Profit/(loss) Equity
Financial assets
Cash and cash equivalent 132,068 -1,321 -1,321 1,321 1,321
Impact on financial assets before tax 132,068 -1,321 -1,321 1,321 1,321
Financial liabilities
Borrowings 98,624 986 986 -986 -986
Impact on financial liabilities before tax 98,624 986 986 -986 -986
Total increase/decrease before tax -335 -335 335 335
under parent company guarantees issued in favour of such subsidiary.
The Company is moreover exposed to changes in interest rates, which may affect the Company’s financial results. These risks are mainly related to the Company’s long term borrowings with floating interest rates. Further details of the Company’s borrowings are set out in Note 12.
Cash and cash equivalents are invested for short maturity periods, generally from 1 day to 3 months, which mitigates the potential interest rate risk.
The following sensitivity tables dem-onstrate the impact on the Company’s profit before tax and equity from a potential shift in interest rates, all other variables held constant.

SIEM OFFSHORE INC., ANNUAL REPORT 201450
NOTES TO THE ACCOUNTS
CONSOLIDATED
(Amounts in USD 1,000) 12/31/2014 12/31/2013
Book value Fair value Book value Fair value
Financial assets
CIRR loan deposit 28,453 30,114 41,718 42,580
Long-term receivables 23,432 23,432 6,639 6,639
Accounts receivables 74,753 74,753 53,198 53,198
Other short-term receivables 63,877 63,877 32,737 32,737
Derivative financial instruments 1,041 1,041 - -
Cash and cash equivalents 117,623 117,623 101,206 101,206
Total 309,179 310,840 235,498 236,360
Financial liabilities
Borrowings 1,214,360 1,250,847 961,500 970,585
CIRR loan 28,453 30,114 41,718 42,580
Other non-current liabilities 26,565 26,565 18,826 18,826
Accounts payable 10,781 10,781 16,253 16,253
Derivative financial instruments 16,732 16,732 11,085 11,085
Other current liabilities 123,072 123,072 44,061 44,061
Total 1,419,963 1,458,111 1,093,443 1,103,390
The Company’s financial assets are classified into the categories: assets at fair value through the profit and loss, loans and receivables. Financial liabilities are classified as liabilities at fair value through the profit and loss, and other financial liabilities. For further informa-tion about comparison by category, see Note 29.
The value of forward exchange contracts is set by comparing forward exchange rate and the rate on the reporting
date. The Company’s following financial instruments are not evaluated at fair value: accounts receivable, cash and cash equivalents, other short -term receivables, accounts payable and long-term liabilities with floating interest.
Because of the short term to maturity, the value of cash and cash equivalents entered into the Statements of Financial Position is almost the same as the fair value of these. Accordingly, the values of accounts receiva-bles and accounts payables are almost the
same as their fair values since they are entered on “normal” conditions.
The fair value of the Company’s non-current liabilities subjected to fixed interest rates is calculated by comparing the Company’s terms and market terms for liabilities with the same terms to maturity and credit risk.
The following tables display the booked value and the fair value of financial as-sets and financial liabilities.

SIEM OFFSHORE INC., ANNUAL REPORT 2014 51
PARENT COMPANY
(Amounts in USD 1,000) 12/31/2014 12/31/2013
Book value Fair value Book value Fair value
Financial assets
CIRR loan deposit 28,453 30,114 41,718 42,580
Long-term loan 30,053 30,053 47,094 47,094
Accounts receivable - - 3,447 3,447
Other short-term receivables 17,343 17,343 7,340 7,340
Cash and cash equivalents 222,579 222,579 132,068 132,068
Total 298,429 300,089 231,667 232,529
Financial liabilities
CIRR loan 28,453 30,114 41,718 42,580
Accounts payable 53 53 397 397
Other current liabilities 67,255 67,255 8,170 8,170
Total 95,761 97,422 50,285 51,147

SIEM OFFSHORE INC., ANNUAL REPORT 201452
2.5 Liquidity risk
The Company monitors its cash flow from operations closely and optimizes the working capital level of the individual companies and the Company as a whole. The Company funds are used for invest-ment opportunities in the business, yard instalments, scheduled repayments and repayments of debt and to general work-
ing capital purposes. The Company seeks to fix the majority of its fleet on long-term contracts. Vessels not fixed on long-term contracts are exposed to the volatility in the spot market. The Company will from time to time re-quire additional capital to take advantage of business opportunities. Historically the Company has managed to obtain
necessary financing in a timely manner on acceptable terms when needed. The tables below summarize the maturity profile of the Company’s financial li-abilities, and future commitments to the newbuilding program.The tables do not include future interest payments.
NOTES TO THE ACCOUNTS
PARENT COMPANY
December 31, 2014Less than 3
months3 to 12
months1 to 5 years Thereafter Total
Interest-bearing loans and borrowings - 5,691 197,643 - 203,334
Trade and other payables 53 - - - 53
Total 53 5,691 197,643 - 203,387
December 31, 2013
Interest-bearing loans and borrowings - 6,953 126,436 6,953 140,342
Trade and other payables 397 - - - 397
Total 397 6,953 126,436 6,953 140,739
CONSOLIDATED
December 31, 2014Less than 3
months3 to 12
months 1 to 5 years Thereafter Total
Interest-bearing loans and borrowings 23,085 291,508 775,086 166,379 1,256,058
Trade and other payables 10,781 - - - 10,781
Total 33,866 291,508 775,086 166,379 1,266,839
December 31, 2013
Interest-bearing loans and borrowings 31,414 76,294 726,630 176,247 1,010,586
Trade and other payables 16,253 - - - 16,253
Total 47,667 76,294 726,630 176,247 1,026,839
CONSOLIDATED
December 31, 2014Less than 3
months3 to 12
months1 to 5 years Thereafter Total
Yard instalments falling due 39,262 202,800 308,408 - 550,470
December 31, 2013
Yard instalments falling due 71,271 323,225 306,473 - 700,969

SIEM OFFSHORE INC., ANNUAL REPORT 2014 53
2.6 Capital risk management
The Company seeks to obtain long-term financing supported by long-term con-tracts, in order to reduce the frequency and risk associated with the refinancing of loans. Long-term charter parties will also enable a higher degree of debt-financing. The wholly-owned Norwegian company, Siem Offshore Rederi AS, has 7 ves-sels under construction in Poland and Germany at year end, which includes four dual-fuel PSVs, one CLV and two WIVs. First 10% to 20% of the contract price is or will be paid in accordance with agreed payment schedules and the remain-ing 80% to 90% will be paid at delivery. The Company has secured long-term employment for one PSV and for the two WIVs under construction. The CLV will be utilised by the Company’s wholly-owned subsidiary, Siem Offshore Contractors, for project work within the submarine power cable installation, repair and maintenance segment. The Company is in discussions for long-term contracts for the three dual fuelled PSVs.
The wholly-owned Brazilian subsidiary, Siem Offshore do Brasil SA, has one OSRV under construction in Brazil at year-
end. The OSRV is scheduled for delivery in 2015. The vessel shall commence an eight-year firm contract for Petrobras with options for additional eight-year periods.
The company has secured debt-financing for all of the eight wholly owned vessels under construction at year-end.
2.7 Risks related to loan agreements, restrictions on dividends and distribu-tion
The Company’s loan agreements include terms, conditions and covenants which impose restrictions on the operations of the Company. These restrictions may negatively affect the Company’s operations including, but not limited to, the Company’s ability to meet the fierce competition in the market in which it operates. 2.8 Risks related to possible tax li-abilities
The Company seeks to optimize its tax structure to minimize withholding taxes when operating vessels abroad, avoiding double taxation, and minimizing corporate tax paid by making optimal use of the
shipping taxation rules that apply. It is, however, a challenging task to optimize taxation, and there is always a risk that the Company may end up paying more taxes than the theoretical minimum, which may in turn affect the financial results negatively.
2.9 Long term contracts
The Company uses the percentage-of-completion method in accounting for its fixed price construction contracts related to the segment Submarine Power Cable Installation. Significant estimates are estimate of the percent complete and the overall margin.
The following sensitivity table demon-strates the impact on the Company’s profit and equity before tax from potential changes to the percentage of comple-tion and margin, all other variables held constant.
Consolidated
(Amounts in USD 1,000) Long term contracts
+1% movements -1% movements
December 31, 2014Estimated
total revenue Profit/(loss) Equity Profit/(loss) Equity
Progress reporting, effect from movement 150,166 1,502 1,502 -1,502 -1,502
Margin estimate, effect from movement - 1,502 1,502 -1,502 -1,502

SIEM OFFSHORE INC., ANNUAL REPORT 201454
Note 3 - Critical Accounting Estimates and Judgements
NOTES TO THE ACCOUNTS
IFRS requires management to make estimates and judgments that affect the reported amounts of assets and liabilities, as well as income and expenses in the financial statements. The final reported outcomes may deviate from the original estimates.
Certain amounts included in, or that have an effect on, the accounts and the as-sociated notes require estimation, which in turn entails that the Company must make assessments related to values and circumstances that are not known at the point in time when the accounts are pre-pared. A significant accounting estimate is an estimate that is important to provide a complete picture of the Company’s finan-cial position, which at the same time is the result of difficult, subjective and complex assessments performed by the manage-ment. Such estimates are often uncertain by nature. Management evaluates such estimates continuously based on histori-cal data and experience, consultation with experts, trend analysis and other fac-tors that are relevant for the individual estimate, including expectations of future events that are believed to be reasonable under the circumstances.
Estimates and assumptions that have a significant risk of causing a material adjustment to the carrying amounts of as-sets and liabilities within the next financial year, as well as judgments made by man-agement, in the process of applying the Company’s accounting policies, that have the most significant effect on the amounts recognized in the financial statements, are discussed below.
Revenue recognition – percentage-of-completion off-shore cable contracts The Company uses the percentage-of-completion method in accounting for its fixed price construction contracts related
to the segment Submarine Power Cable Installation. One significant estimate is an estimate of the percent complete. Man-agement estimates completion based on an assessment of certain technical criteria in the project execution plan that have to be met in order to achieve a certain level of percentage of completion, as opposed to using costs incurred as a measure of completion.
The primary risk in the execution of projects relates to the offshore installa-tion phase. Hence, profit margin is not recorded until the progress of the project has reached a stage of minimum 25 per-cent technically completion. The below table presents an example of the various stages during a project life.
As presented in the below table, the project shall need to progress into the cable-laying phase before the minimum 25 percentage of technical completion is reached. Prior to reaching a progress of minimum 25 percent technical comple-tion, and subject to a forecasted positive project margin, project revenue are ac-crued to match the actual costs incurred.
Periodical project margin is only re-corded when the overall project margin is forecasted to be positive, and when the execution of the project has reached such level of technical completion beyond 25 percent that the management is comfort-able to assess the financial outcome of the project.
The stages of completion for a project are as follows:
The sensitivity on the recorded revenue on long-term construction contracts would be +/- USD 14.9 million in 2014, if man-agement had estimated a 10% better/worse progress on the contracts per year-end 2014.
Vessels
Economic useful lifeThe level of depreciation expense is dependent, in part, upon the estimated useful life of the vessel. The useful life is estimated based on historical data, experi-ence related to the vessel and similar vessels. The estimate is reviewed and up-dated annually. A change in the estimate will affect depreciation prospectively in current and future reporting periods. Residual value The level of depreciation expense is dependent, in part, upon the estimated residual value. Management estimates a vessel’s residual value using their knowledge of the scrap value of vessels. The scrap value estimates are depend-ent on the price of steel. The scrap value estimate is based on the expected value at the end of the useful life of the vessel. Management performs an annual review
Project Progress - XItem
Project Progress - weighting
Project Management & XEngineering
2%
Pre-Installation Works 20%
Cable Lay 26%
Cable Termination 16%
Cold Commissioning 22%
Post Installation Works 14%

SIEM OFFSHORE INC., ANNUAL REPORT 2014 55
Photographer: Jarle Nyvoll, Siem Opal
and assessment of the vessel scrap value estimates. Residual value is subject to an annual reassessment.
Impairment of vessels On the reporting date, the Company has assessed whether there are any indica-tions that it may be necessary to write down a vessel. Indicators include external broker estimates, significant changes in charter hire contracts, day rates, operat-ing costs or adverse market conditions. When such indications exist, an impair-ment test is performed in accordance with Company policy.
The recoverable value of the vessel is estimated, and if the recoverable amount is less than the current carrying value, an impairment loss is recognized in the amount of the difference between carry-ing value and net realizable value. The re-coverable amount for vessels is estimated by means of broker estimates and value in use calculations based on projected discounted cash flows for the remaining charter hire period or over the next four
years if no charter contract exists, togeth-er with an assumption of a terminal value of the vessel. If a vessel is fixed on a long contract, the Company also estimates an excess value of the charter party and this value is discounted based on an estimated discount rate.
Impairment of goodwill and intangible assets
The Company tests whether goodwill and intangible assets have suffered any impairment in accordance with the ac-counting policy stated in note 1.11. The recoverable amounts of cash-generating unit have been determined based on value-in-use calculation. This calculation require the use of estimates (Note 5).
Hedge accounting
The Company uses hedge accounting for the Brazilian subsidiary, which has a func-tional currency of BRL. The designated cash-flow hedge is a foreign currency ex-posure of future USD charter hire revenue
as the hedged item and USD long-term debt the designated hedging instrument. Designation of the hedged item requires significant judgment in defining the future charter contract revenue as highly probable. Contracts have been written for vessels still under construction, and sometimes the delivery date of the vessel is delayed. Contracts have been agreed for a specific time period (e.g. four to five years) and have a renewal option.
Highly probable future charter revenue has been determined by management to include the renewal option period, based on the frequency of similar past transac-tions and for the contracts to be included in the designated hedge from the date of signing, even though the vessels are under construction. Siem Offshore has defined an effective hedge to be when the cash flows of the highly probable future trans-actions are higher than the cash flows of the hedging instrument for the same period. Effectiveness testing is performed using the Dollar Offset Method. See note 12 for additional information.

SIEM OFFSHORE INC., ANNUAL REPORT 201456
Note 4 - Segment Reporting
For reporting purposes, the Company is organised into seven segments, which are representative of its principal activities.NOTES TO THE ACCOUNTS
(Amounts in USD 1,000) CONSOLIDATED
Operating revenue by business area 2014 2013
PSV (1) 104,423 94,630
OSCV 104,844 41,407
AHTS Vessels (1) 142,480 131,894
Vessels in Brazil, Smaller built 19,351 24,103
Combat Management Systems 6,075 7,987
Submarine Power Cable Installation 101,479 23,151
Scientific Core-Drilling 25,914 36,898
Other 14,799 3,884
Intercompany elimination (1) -28,052 -
Total 491,312 363,955
Depreciation and amortisation by business area
PSV 23,434 21,288
OSCV 23,121 7,072
AHTS Vessels 38,230 38,883
Vessels in Brazil, Smaller built (2) 31,865 2,989
Submarine Power Cable Installation 1,530 440
Scientific Core-Drilling 3,490 3,264
Other 4,212 1,904
Total 125,883 75,841
The Company identifies its reportable seg-ments and discloses segment information under IFRS 8 Operating Segments which requires Siem Offshore Inc to identify its segments according to the organization and reporting structure used by management. Operating segments are components of a business that are evaluated regularly by the chief operating decision maker for the purpose of assessing performance and al-locating resources. The Company’s chief op-erating decision maker is the management board, comprised of the CEO, CFO, COO an CCO. Generally, financial information is required to be disclosed on the same basis that is used by the chief operating decision maker. The Company’s operating segments represent separately managed business areas with unique products serving different markets. The reportable segments are the seven business areas PSV, OSCV, AHTS Ves-sels, Other Vessels in Brazil, Combat Man-
agement Systems, Submarine Power Cable Installation, and Scientific Core-Drilling.
The PSV segment includes 12 Platform Supply Vessels. The OSCV segment includes four Offshore Subsea Construction Vessels and two Multipurpose field and ROV Support Vessels. The ATHS segment includes ten Anchor Handling and Tug Supply Vessels. The Segment of Other Vessels in Brazil consists of one Oilspill Recovery Vessel and eight smaller Platform Supply Vessels. Combat Management Systems is the activity of supplying software for a management system to the Brazilian Navy. Submarine Power Cable Installation comprises the activities of installation and maintenance of subsea power cables for offshore wind-farms. Scientific Core-Drilling is comprised of the activity of a scientific drillship which performs coredrilling. The segment Other is comprised of the ownership of Siem WIS
that develops applications for managed pressure drilling (“MPD”), and certain other activities. Siem Offshore Inc uses three measures of segment results, operating revenue, operat-ing margin and net profit. Intersegment sales and transfers reflect arm’s length prices as if sold or transferred to third parties at the time of inception of the internal contract, which may cover several years. Transfers of businesses or fixed assets within or between the segments are reported without recognizing gains or losses. Results of activities not considered part of Siem Offshore Inc.’s main operations as well as unallocated revenues, expenses, liabilities and assets are reported together with Other under the caption Other and eliminations.
The following tables include information about the Company’s operating segments.

SIEM OFFSHORE INC., ANNUAL REPORT 2014 57
Note 4 - Segment Reporting
For reporting purposes, the Company is organised into seven segments, which are representative of its principal activities.
(1) PSV and AHTS Vessels segments include I/C Revenues from contracting work for Submarine Power Cable Installation segments.(2) Including impairment of vessels at USD 29 millions.
Capital expenditures by business area 2014 2013
PSV (1) 85,269 41,252
OSCV (1) 282,786 204,786
AHTS Vessels 11,856 3,921
Vessels in Brazil, Smaller built (1) 79,944 65,237
Combat Management Systems - -
Submarine Power Cable Installation 58,808 4,113
Scientific Core Drilling 271 2,814
Other 6,740 7,289
Total 525,674 329,413
(1) Includes newbuilding program, in total: 337,157 301,520
Book value by business area 2014 2013
PSV (1) 385,870 343,463
OSCV (1) 569,040 310,401
AHTS Vessels 664,385 664,385
Vessels in Brazil, Smaller built (1) 105,880 112,938
Combat Management Systems - -
Submarine Power Cable Installation 72,666 21,977
Scientific Core Drilling 26,567 29,992
Other 60,765 95,915
Total 1,885,173 1,579,071
Other operating profit/(loss) includes, among others, gain of sale of interest rate derivatives (CIRR), gain/(loss) on currency exchange forward contracts and general and administration expenses
Operating profit/(loss) by business area
PSV (1) 35,437 21,640
OSCV 48,073 19,782
AHTS Vessels (1) 39,232 29,023
Vessels in Brazil, Smaller built (2) -35,343 3,750
Combat Management Systems -8 1,360
Submarine Power Cable Installation 15,581 3,425
Scientific Core-Drilling 9,429 17,139
Other -28,084 -26,857
Total 84,316 69,261

SIEM OFFSHORE INC., ANNUAL REPORT 201458
Note 5 - Vessels, Equipment, Project Cost and Intangible Assets
NOTES TO THE ACCOUNTS
PARENT COMPANY CONSOLIDATED
Vessels under construction
Vessels and equipment
Dry-docking (Amounts in USD 1,000)
Land and buildings
Vessels under construction
Vessels and equipment Drydocking
Capitalised project cost
- - Purchase cost on January 1, 2013 5,069 108,430 1,492,084 34,121 24,433
- - Capital expenditure 217 254,731 60,620 9,951 3,679
- - Movements between groups - - -18,068 - -
- - Vessels delivered in 2013 - -224,326 224,326 - -
- - The year’s disposal at cost - - -3,331 -4,779 -3,348
- - - Effect of exchange rate differences -433 -11,124 -29,947 -848 -
- - - Purchase cost on December 31, 2013 4,853 127,711 1,725,682 38,445 24,764
- - Accumulated depreciation on January 1, 2013 -326 - -243,278 -27,552 -12,280
- - The year’s depreciation -118 - -63,406 -6,467 -4,804
- - Movements between groups - -18 - -
- - The year’s disposal of acc. depreciation - - 3,253 4,549 3,348
- - - Effect of exchange rate differences 32 - 4,043 639 -
- - - Accumulated depreciation on December 31, 2013 -412 - -299,405 -28,831 -13,736
- - - Net book value on December 31, 2013 4,441 127,711 1,426,277 9,615 11,027
- - - Purchase cost on January 1, 2014 4,853 127,711 1,725,682 38,445 24,764
- - Capital expenditure 156 290,367 206,281 22,284 6,567
- - Additons from acquisition of companies - - - - -
- - Movements between groups - -4,073 24,918 - -
- - Vessels delivered in 2014 - -263,723 263,723 - -
- - The year’s disposal at cost - - -79,952 -4,894 -13,733
- - - Effect of exchange rate differences -881 -5,268 -56,558 -981 -
- - - Purchase cost on December 31, 2014 4,128 145,015 2,084,094 54,855 17,597
- - Accumulated depreciation on January 1, 2014 -412 - -299,405 -28,831 -13,736
- - The year’s depreciation -110 - -79,604 -9,359 -6,629
- - Impairment - 14,500 -14,500 - -
- - The year’s disposal of acc. depreciation - - 19,666 4,894 13,733
- - - Effect of exchange rate differences 90 - 7,462 727 -
- - - Accumulated depreciation on December 31, 2014 -433 -14,500 -366,382 -32,569 -6,632
- - - Net book value on December 31, 2014 3,695 130,515 1,717,712 22,285 10,965
Photographer: Arild Lillebø

SIEM OFFSHORE INC., ANNUAL REPORT 2014 59
The balance of capitalized project costs relate to specific contracts. The costs are amortized over the term of the specific charter contracts.
Note 5 - Vessels, Equipment, Project Cost and Intangible Assets
PARENT COMPANY CONSOLIDATED
Vessels under construction
Vessels and equipment
Dry-docking (Amounts in USD 1,000)
Land and buildings
Vessels under construction
Vessels and equipment Drydocking
Capitalised project cost
- - Purchase cost on January 1, 2013 5,069 108,430 1,492,084 34,121 24,433
- - Capital expenditure 217 254,731 60,620 9,951 3,679
- - Movements between groups - - -18,068 - -
- - Vessels delivered in 2013 - -224,326 224,326 - -
- - The year’s disposal at cost - - -3,331 -4,779 -3,348
- - - Effect of exchange rate differences -433 -11,124 -29,947 -848 -
- - - Purchase cost on December 31, 2013 4,853 127,711 1,725,682 38,445 24,764
- - Accumulated depreciation on January 1, 2013 -326 - -243,278 -27,552 -12,280
- - The year’s depreciation -118 - -63,406 -6,467 -4,804
- - Movements between groups - -18 - -
- - The year’s disposal of acc. depreciation - - 3,253 4,549 3,348
- - - Effect of exchange rate differences 32 - 4,043 639 -
- - - Accumulated depreciation on December 31, 2013 -412 - -299,405 -28,831 -13,736
- - - Net book value on December 31, 2013 4,441 127,711 1,426,277 9,615 11,027
- - - Purchase cost on January 1, 2014 4,853 127,711 1,725,682 38,445 24,764
- - Capital expenditure 156 290,367 206,281 22,284 6,567
- - Additons from acquisition of companies - - - - -
- - Movements between groups - -4,073 24,918 - -
- - Vessels delivered in 2014 - -263,723 263,723 - -
- - The year’s disposal at cost - - -79,952 -4,894 -13,733
- - - Effect of exchange rate differences -881 -5,268 -56,558 -981 -
- - - Purchase cost on December 31, 2014 4,128 145,015 2,084,094 54,855 17,597
- - Accumulated depreciation on January 1, 2014 -412 - -299,405 -28,831 -13,736
- - The year’s depreciation -110 - -79,604 -9,359 -6,629
- - Impairment - 14,500 -14,500 - -
- - The year’s disposal of acc. depreciation - - 19,666 4,894 13,733
- - - Effect of exchange rate differences 90 - 7,462 727 -
- - - Accumulated depreciation on December 31, 2014 -433 -14,500 -366,382 -32,569 -6,632
- - - Net book value on December 31, 2014 3,695 130,515 1,717,712 22,285 10,965

SIEM OFFSHORE INC., ANNUAL REPORT 201460
NOTES TO THE ACCOUNTS
The vessels are divided into the following components and economical lives:
Component Percentage of total Economic life
Hull 27.00% 30 years
Cargo equipment 17.00% 30 years
Marine equipment 10.00% 15 years
Crew equipment 9.00% 15 years
Engine 18.00% 30 years
Engine system 6.00% 30 years
Combined sewerage system 13.00% 30 years
Docking 2,5 years
Equipment 3 years
Intangible assets (Amounts in USD 1,000) GoodwillResearch and development
Trademarks and licences Total
Balance on January 1, 2013 18,788 3,354 9,864 32,006
Moved from Vessel and equipment - - -34 -34
Investments - 216 - 216
Effect of exchange rate differences 841 -291 -49 501
Purchase cost on December 31, 2013 19,629 3,279 9,781 32,689
Accumulated depreciation on January 1, 2013 - -883 -1,103 -1,986
Moved from Vessel and equipment - - - -
The year’s ordinary depreciation -941 -106 -1,047
Effect of exchange rate differences - 50 31 82
Accumulated depreciation on December 31, 2013 - -1,774 -1,177 -2,951
Net book value on December 31, 2013 19,629 1,505 8,604 29,737

SIEM OFFSHORE INC., ANNUAL REPORT 2014 61
Impairment
The Company recognized an impairment in the fourth quarter of 2014 amounting to USD 29 million related to two Oil Spill Recovery vessels (OSRV) and two PSV’s owned by the Brazilian subsidiary. The impairment includes one vessel that were under construction with an estimated completion and delivery date of third quarter 2015. During fourth quarter 2014 broker estimates, based on completed vessels in use but assuming no char-ter hire contracts in place, indicated a possible impairment as the broker fair value was lower than the vessels’
current carrying value. An impairment test using a value in use calculation and estimated future net cash flows based on actual agreed charter hire contracts, was performed. The internally estimated fair value, based on the net present value of the future cash flows, was higher than the broker estimates, but still lower than the carrying amount, by USD 29 million.
For all other vessels owned by the com-pany a value in use calculation has been made, where the value of the charter hire is based on the actual charter hire period, an anticipated utilization rate of 98.5%, operating expenses calculated per day,
based on historical data, and a pre-tax weighted average cost of capital (WACC) of 6.6%. The recoverable amount of each vessel, consisting of the fair market value of the vessels, estimated by different independent shipbrokers and the value in use calculation as per 31 December 2014 of the charter hire period commencing from 1 January 2015, exceeds the car-rying amount for all vessels as of 31 De-cember 2014. No impairment is therefore recognized as of year-end 2014 for other vessels owned by the Company.
Intangible assets (Amounts in USD 1,000) Goodwill Research and
developmentTrademarks and licences Total
Balance on January 1, 2014 19,628 3,278 9,782 32,688
Moved from Vessel and equipment - - - -
Investments - 19 - 19
Effect of exchange rate differences -2,310 -594 -98 -3,002
Purchase cost on December 31, 2014 17,318 2,704 9,684 29,705
Accumulated depreciation on January 1, 2014 - -1,773 -1,177 -2,951
Moved from Vessel and equipment - - - -
The year’s ordinary depreciation -1,074 -90 -1,163
Effect of exchange rate differences - 260 87 346
Accumulated depreciation on December 31, 2014 - 2,588 -1,180 -3,768
Net book value on December 31, 2014 17,318 116 8,503 25,937
Trademarks and licences refer to Siem WIS AS patented technology for the drilling industry. The figures include assets under develop-ment and developed assets, and the depreciation refers to developed assets that are not yet commercialized. Share issue in Siem WIS completed in 2014 appreciate the Company’s 60% owner share to USD 15,043. This value indicates that there is no impairment loss for the capitalized trademarks and licences.The carrying amount of goodwill is related to the Submarine Power Cable Installation Segment.

SIEM OFFSHORE INC., ANNUAL REPORT 201462
The book value in Siem Offshore do Brasil SA was increased with USD 28.6 million, Siem Offshore Management AS with USD 4.3 million and Siem Offshore Invest AS with USD 0.38 million in 2014. The above companies are owned by the Parent. In addition, the subsidiaries own the following companies:
Note 6 - Investment in Subsidiaries
NOTES TO THE ACCOUNTS
Company Registered office Share and voting rights
Consub Delaware LLC Delaware, USA 100%
Aracaju Serviços Auxiliares Ltda Rio de Janeiro, Brazil 100%
Siem Offshore Crewing AS Kristiansand, Norway 100%
Siem Meling Offshore DA Stavanger, Norway 51%
Næringsbygg Indrettsveien 13 DA Fjell, Norway 95%
Siem WIS AS Bergen, Norway 60%
Siem Offshore Maritime Personnel AS Kristiansand, Norway 100%
Siem Offshore Contractors GmbH Leer, Germany 100%
Siem Offshore Contractors EPS BV Glimmen, The Netherlands 100%
AHMTEC GmbH Leer, Germany 100%
Overseas Drilling Ltd Groningen, The Netherlands 100%
Siem Offshore Canada Inc Halifax, Canada 100%
Siem Offshore Poland Sp.z.O.O Gdynia, Poland 100%
Siem Offshore Australia Perth, Australia 100%
Siem Real Estate GmbH Leer, Germany 100%
Company (Amounts in USD 1,000) Registered officeOwnership and
voting share Revenue Net profit Share capital Book equity Cost price Book value
Siem Offshore AS Kristiansand, Norway 100% 11,176 -29 35 7,421 7,597 7,597
Siem Offshore Invest AS Kristiansand, Norway 100% 21,540 -17,151 898 94,673 97,117 77,117
Siem Offshore Rederi AS Kristiansand, Norway 100% 205,659 100,222 6,175 742,994 583,396 583,396
Siem Offshore do Brasil SA Rio de Janeiro, Brazil 100% 54,953 -24,458 97,169 2,606 96,741 67,741
Siem Offshore US Inc Delaware, USA 100% - -20 - 5,307 - -
Siem AHTS Pool AS Kristiansand, Norway 100% 125,370 5,206 17 6,304 21 21
DSND Subsea Ltd London, UK 100% - -5 0 -209 18,352 0
Siem Offshore Services AS Kristiansand, Norway 100% 34,486 3,989 18 4,252 292 292
Siem Offshore Management AS Kristiansand, Norway 100% 13,615 1,205 17 2,806 5,127 5,127
Siem Offshore Management (US) Inc Texas, USA 100% 454 47 1 173 1 1
Siem Offshore US Holding AS Kristiansand, Norway 100% - - 5 -196 5 5
Siem Offshore Crewing (CI) Inc Cayman Islands 100% 322 270 50 1,027 50 50
Total value recorded in the statement of financial position of the parent company 867,158 808,700 741,348

SIEM OFFSHORE INC., ANNUAL REPORT 2014 63
There are no significant restrictions within the group (eg statutory, contractual and regulatory restrictions) reducing the ability of the parent company or subsidiaries to transfer cash or other assets to or from other entities within the Group.
Except for certain regulations in Brazil as described below, there are no guarantees or other requirements that may restrict dividends and other capital distributions being paid, or loan and advances being made or repaid to or from other entities within the group.
Repayment of loans provided to the Brazilian subsidiary of the group may cause a withholding tax on the repaid amount.
The shares in Siem Offshore Brasil SA were written down by USD 29 million due to impairment of four vessels.The shares in Siem Offshore Invest AS were written down by USD 20 million due to overstatement of the share value in ODL.
Note 6 - Investment in Subsidiaries
Company (Amounts in USD 1,000) Registered officeOwnership and
voting share Revenue Net profit Share capital Book equity Cost price Book value
Siem Offshore AS Kristiansand, Norway 100% 11,176 -29 35 7,421 7,597 7,597
Siem Offshore Invest AS Kristiansand, Norway 100% 21,540 -17,151 898 94,673 97,117 77,117
Siem Offshore Rederi AS Kristiansand, Norway 100% 205,659 100,222 6,175 742,994 583,396 583,396
Siem Offshore do Brasil SA Rio de Janeiro, Brazil 100% 54,953 -24,458 97,169 2,606 96,741 67,741
Siem Offshore US Inc Delaware, USA 100% - -20 - 5,307 - -
Siem AHTS Pool AS Kristiansand, Norway 100% 125,370 5,206 17 6,304 21 21
DSND Subsea Ltd London, UK 100% - -5 0 -209 18,352 0
Siem Offshore Services AS Kristiansand, Norway 100% 34,486 3,989 18 4,252 292 292
Siem Offshore Management AS Kristiansand, Norway 100% 13,615 1,205 17 2,806 5,127 5,127
Siem Offshore Management (US) Inc Texas, USA 100% 454 47 1 173 1 1
Siem Offshore US Holding AS Kristiansand, Norway 100% - - 5 -196 5 5
Siem Offshore Crewing (CI) Inc Cayman Islands 100% 322 270 50 1,027 50 50
Total value recorded in the statement of financial position of the parent company 867,158 808,700 741,348

SIEM OFFSHORE INC., ANNUAL REPORT 201464
Figures for associated companies included in the consolidated accounts based on the equity accounting.
Note 7 - Investment in Associated Companies
NOTES TO THE ACCOUNTS
December 31, 2014 (Amounts in USD 1,000)
Company name
PR Tracer Offshore
ANS
KS Big Orange
XVIII
Rovde Industri-park AS
Sentosa Offshore
DIS
Secunda Holdings
LP Total
The year’s net profit after tax 1,666 591 43 1,546 2,349 6,195
Siem Offshore´s share of net profit 689 244 21 77 1,174 2,205
Adjustments consolidated accounts -77 - -17 - -304 -451
This year`s share of net profit after tax 612 244 4 77 871 1,808
Statement of financial position
Non.current assets 1,472 - 1,473 15,816 40,801 59,562
Current assets 624 135 406 22 33,605 34,792
Cash 1,657 2,203 15 1,155 1,625 6,655
Total assets 3,753 2,338 1,894 16,993 76,031 101,009
Equity 3,994 2,338 775 2,263 31,887 41,256
Non-current liabilities - - 1,075 14,606 27,703 43,384
Current liabilities -241 - 44 125 16,440 16,368
Total liabilities -241 - 1,119 14,731 44,143 59,752
Total equity and liabilities 3,753 2,338 1,894 16,993 76,031 101,009

SIEM OFFSHORE INC., ANNUAL REPORT 2014 65
Note 7 - Investment in Associated Companies
Company name Registered office Consolidated asOwner
interestVoting rights
Paid in capital
Issued, not paid in capital
PR Tracer Offshore ANS Kristiansand, Norway Equity accounting 41.33% 41.33% 1,633 -
KS Big Orange XVIII Kristiansand, Norway Equity accounting 41.33% 41.33% 8 5
Rovde Industripark AS Vanylven, Norway Equity accounting 50.00% 50.00% 222 -
Sentosa Offshore DIS Oslo, Norway Equity accounting 5.00% 5.00% 7,514 -
Secunda Holdings LP Halifax, Canada Equity accounting 50.00% 50.00% 15,519
Total 24,895 5
December 31, 2014 (Amounts in USD 1,000)
Company name PR Tracer Offshore
ANS
KS Big Orange
XVIII
Rovde Industri-park AS
Sentosa Offshore
DIS
Secunda Holdings
LP
Total
Siem Offshore’s share of booked equity 1,651 966 388 113 15,944 19,061
Added/reduced in the period
Adjustments IFRS and fair value in excess of book value
for vessel and goodwill as of December 31 - 373 162 144 482 1,161
Net book value in Siem Offshore as of December 31 1,651 1,339 550 257 16,246 20,222
Ownership interest 41,33% 41,33% 50% 5,00% 50%
Specification of changes net book value in Siem Offshore’s accounts
Net book value as of January 1 1,378 1,384 656 519 17,009 20,946
Investment in associated companies - - - -
This year’s share of net profit 689 244 21 77 1,174 2,206
Adjustments consolidated accounts -77 - 17 - -304 -398
Dividends - - - -278 - -278
Effect of exchange rate differences -339 -289 -112 -61 -1,454 -2,255
Net book value as of December 31 1,651 1,339 548 258 16,426 20,222
Of which:
Adjustments IFRS and fair value in excess of book value
for vessel and goodwill as of January 1 77 455 203 180 882 1,797
Excess value - - - - 993 993
Adjustment for depreciation IFRS -77 - -17 - -304 -398
Amortisation of fair value in excess of
book value for vessels and goodwill - - - - -
Effect of exchange rate differences - -82 -29 -36 -96 -243
Fair value in excess of book value forvessels and goodwill as of December. 31 - 373 157 144 482 1,156

SIEM OFFSHORE INC., ANNUAL REPORT 201466
NOTES TO THE ACCOUNTS
December 31, 2013 (Amounts in USD 1,000)
Company name
PR Tracer Offshore
ANS
KS Big Orange
XVIII
Rovde Ind.park
AS
Sentosa Offshore
DIS
Secunda Holdings
LP Total
Profit and loss account
The year’s net profit after tax 3,264 628 33 165 6,850 10,939
Siem Offshore´s share of net profit 1,349 259 17 8 3,425 5,058
Share of net result not included -2,564 -2,564
Adjustments consolidated accounts -328 - -13 - -111 -451
This year`s share of net profit after tax 1,021 259 4,120 8,244 750 2,043
Statement of financial position
Non Current assets - - 2,440 30,500 56,850 89,770
Current assets 2,931 2,249 21 421 13,231 18,853
Total assets 2,931 2,249 2,441 30,921 70,082 108,623
Equity 3,146 2,247 907 6,779 32,253 45,333
Non-current liabilities - - 1,496 23,956 28,133 53,585
Current liabilities -216 2 38 186 9,695 9,705
Total liabilities -216 2 1,534 24,142 37,828 63,290
Total equity and liabilities 2,931 2,249 2,441 30,921 70,082 108,623

SIEM OFFSHORE INC., ANNUAL REPORT 2014 67
Company name Consolidated as
Owner inter-
estVoting rights
Paid in capital
Issued, not paid in capital
PR Tracer Offshore ANS Equity accounting 41.33% 41.33% 1,633 -
KS Big Orange XVIII Equity accounting 41.33% 41.33% 8 5
Rovde Industripark AS Equity accounting 50.00% 50.00% 222 -
Sentosa Offshore DIS Equity accounting 5.00% 5.00% 7,514 -
Secunda Holdings LP Equity accounting 50.00% 50.00% 15,519
Total 24,895 5
Siem Offshore’s share of booked equity 1,300 929 453 339 16,127 19,148
Added/reduced in the period
Change of ownership or sale
Adjustments IFRS and fair value in excess of book value
for vessel and goodwill as of December 31 77 455 203 180 882 1,797
Net book value in Siem Offshore as of December 31 1,378 1,384 656 519 17,009 20,946
Ownership interest 41,33% 41,33% 50% 5,00% 50%
Specification of changes net book value in Siem Offshore’s accounts
Net book value as of January 1 1,615 1,239 713 655 0 4,222
Investment in associated companies -1,113 - - - 15,519 14,406
This year’s share of net profit 1,349 259 23 8 861 2,501
Adjustments consolidated accounts -328 - -12 - 882 542
Change of ownership or sale - - - - - -
Dividends - - - -90 - -90
Effect of exchange rate differences -145 -114 -68 -54 -253 -635
Net book value as of December 31 1,378 1,384 656 519 17,009 20,946
Of which:
Adjustments IFRS and fair value in excess of book value
for vessel and goodwill as of January 1 420 498 234 198 0 1,350
Excess value 0 0 0 0 993 993
Adjustment for depreciation IFRS -328 - -12 - -111 -451
Amortisation of fair value in excess of
book value for vessels and goodwill - - - - -
Effect of exchange rate differences -15 -42 -20 -18 0 -94
Fair value in excess of book value for vessels and goodwill as of December 31
77 455 203 180 882 1,797

SIEM OFFSHORE INC., ANNUAL REPORT 201468
NOTES TO THE ACCOUNTS
Note 8 - Pension Costs and Obligations
CONSOLIDATED
(Amounts in USD 1,000) 2014 2013
The amount recognized in the income statement is as follows:
Service cost 2,535 2,688
Interest expence 93 88
Administration cost 25 29
Social contribution 266 314
Impact of curtailment/settlement -768 -1,232
Net periodic pension cost (see Note 19) 2,151 1,887
The development in the defined benefit obligation is as follows:
Beginning of year 12,911 12,853
Current service cost 2,535 2,688
Interest expence 506 466
Aquisition (disposal) - -2,350
Payroll tax of employer contribution, assets -315 -437
Benefits paid -350 -386
Remeasurements loss/(gain) 42 840
Exchange differences -2,783 -763
End of year 12,546 12,911
The development in the fair value of plan assets is as follows:
Beginning of year 10,133 12,251
Interest income 413 378
Acquisition (disposal) - -3,933
Administration cost - -
Employer contribution 2,548 3,536
Payroll tax of employer contribution, assets -315 -437
Benefits paid -303 -297
Remeasurements loss/(gain) -1,803 -423
Exchange differences -1,938 -942
End of year 8,735 10,133
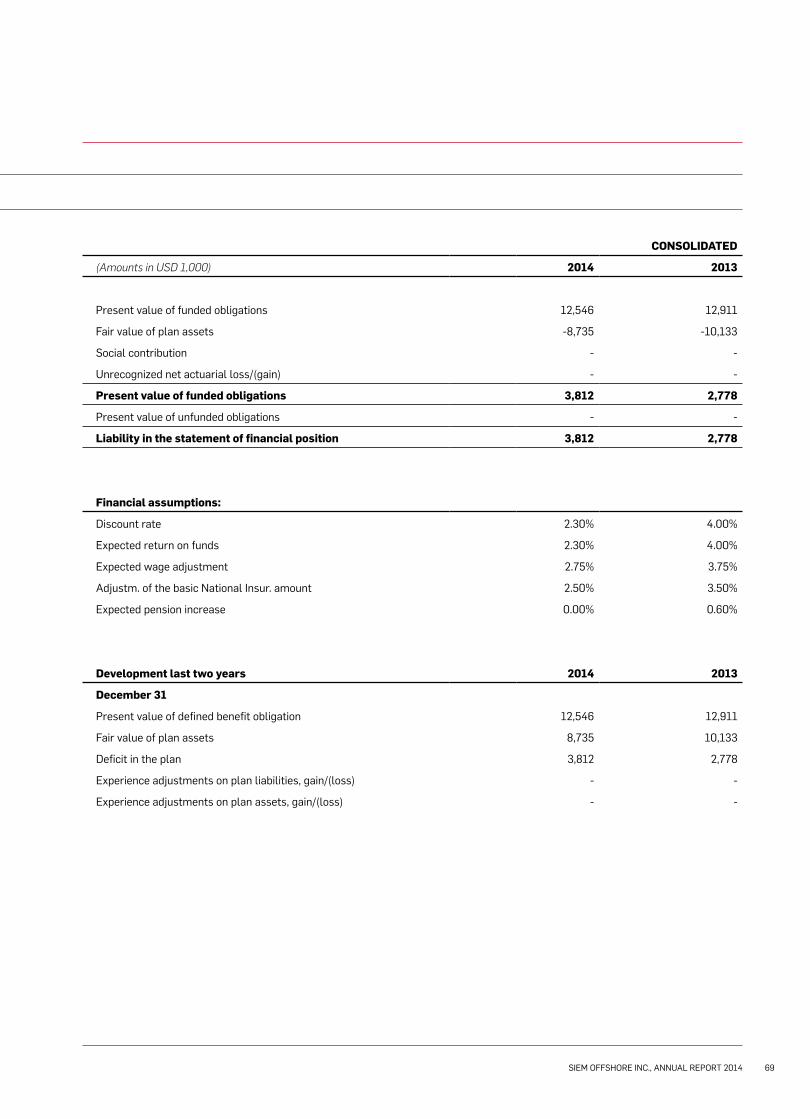
SIEM OFFSHORE INC., ANNUAL REPORT 2014 69
Note 8 - Pension Costs and Obligations
CONSOLIDATED
(Amounts in USD 1,000) 2014 2013
Present value of funded obligations 12,546 12,911
Fair value of plan assets -8,735 -10,133
Social contribution - -
Unrecognized net actuarial loss/(gain) - -
Present value of funded obligations 3,812 2,778
Present value of unfunded obligations - -
Liability in the statement of financial position 3,812 2,778
Financial assumptions:
Discount rate 2.30% 4.00%
Expected return on funds 2.30% 4.00%
Expected wage adjustment 2.75% 3.75%
Adjustm. of the basic National Insur. amount 2.50% 3.50%
Expected pension increase 0.00% 0.60%
Development last two years 2014 2013
December 31
Present value of defined benefit obligation 12,546 12,911
Fair value of plan assets 8,735 10,133
Deficit in the plan 3,812 2,778
Experience adjustments on plan liabilities, gain/(loss) - -
Experience adjustments on plan assets, gain/(loss) - -

SIEM OFFSHORE INC., ANNUAL REPORT 201470
USD 29,426 of the Company’s cash balance at years end was restricted funds of which USD 1,749 was for tax withholdings and USD 27,677 represented security for bank guarantees and loans.
NOTES TO THE ACCOUNTS
Note 9 - Receivables
Note 10 - Restricted Cash
(1) Outstanding insurance claims refer to breakdown expenses qualifying for insurance cover. The amount is less own deduction. (2) Other short term receivables includes loan to Secunda Holdings LP at USD 2.8 million, refunds from NIS/NOR at USD 1.0 million, reimbursables in Brazil at USD 1.9 million, AHTS Pool accruals at USD 5.4 million and other accruals at USD 1.9 million
PARENT COMPANY CONSOLIDATED
12/31/2014 12/31/2013 (Amounts in USD 1,000) 12/31/2014 12/31/2013
Long-term receivables
- - Deposits - -
3,807 5,354 Employee loans, see Note 19 4,076 5,683
26,246 41,740 Intercompany receivables - -
- - Project related prepayment - -
- - Other long term receivables (1) 19,354 956
30,053 47,094 Total long-term receivables 23,432 6,639
(1) Including long term loan USD 18.6 million to Siem Industries Inc.
12/31/2014 12/31/2013 Other short-term receivables 12/31/2014 12/31/2013
3 2 Prepaid expenses 29,150 9,253
- - Unbilled revenue 8,214 11,719
- - Outstanding insurance claims (1) 9,476 4,898
- - Prepaid income taxes and other taxes 3,755 4,264
- 107 VAT 242 84
17,340 5,098 Intercompany receivables - -
- 2,133 Other short-term receivables (2) 13,039 2,519
17,343 7,340 Total other short-term receivables 63,877 32,737

SIEM OFFSHORE INC., ANNUAL REPORT 2014 71
Note 11 - Taxes
CONSOLIDATED
(Amounts in USD 1,000) 2014 2013
Temporary differences
Deferred tax Time frame
Participation in limited liability companies Long - -
Operating assets Long -37,921 -39,922
Special tax account Long - -
Pension funds/obligations Long -3,812 -2,778
Other short-term differences Short - -
Other long-term differences Long 2,352 -3,745
Net temporary differences as of December 31 -39,381 -46,447
Tax loss carried forward -30,265 -21,851
Basis for deferred tax (tax asset) -69,646 -68,298
Deferred tax (tax asset) Norway -2,604 -1,758
Deferred tax (tax asset) Holland -3,785 -3,994
Deferred tax (tax asset) Germany -6,203 -6,019
Deferred tax (tax asset) -12,591 -11,770
Deferred tax asset recognized in statement of --financial position as of December 31
-12,591
-11,770
There are no tax assets in the parent company.
Deferred tax assets are recognized as intangible assets as it is probable through prospective earnings that it can be utilized.
The Company is subject to taxes in several jurisdictions, where significant judgment is required in calculating the tax provision for the Com-pany. There are several transactions for which the ultimate tax cost is uncertain and for which the Company makes provisions based on an as-sessment of internal estimates, tax treaties and tax regulations in countries of operation, and appropriate external advice. Where the final tax outcome of these matters is different from the amounts that were initially recorded, such difference will impact the tax charge in the period in which the outcome is determined.

SIEM OFFSHORE INC., ANNUAL REPORT 201472
NOTES TO THE ACCOUNTS
Overprovision in previous year relates to activity on Greenland for the subsidiary Overseas Drilling Limited.Actual tax liability was decreased compared to budget taking into consideration local tax legislation.
2014 2013
Tonnage tax regime in subsidiaries, as of January 1 39 964
Tax charge 2 39
Paid -15 -949
Effect of exchange rate differences -4 -15
Total tonnage tax in subsidiaries, as of December 31 22 39
Total tax consolidated 12/31/2014
(Amounts in USD 1,000)Tonnage tax
regime Other tax regimeTotal tax
liabilities
Long term tax liabilities falling due after 1 year - 6,368 6,368
Payable taxes falling due within 1 year 22 4,983 5,005
Tax liabilities 22 11,351 11,373
Tax expense 2014
(Amounts in USD 1,000)Tonnage tax
regime Other tax regimeTotal tax expense
Taxes payable 2 3,939 3,941
Change in deferred tax/deferred tax asset - -1,179 -1,179
Over/under provisions in previous year - -33 -33
Total 2 2,726 2,729
Total tax consolidated 12/31/2014
(Amounts in USD 1,000)Tonnage tax
regime Other tax regimeTotal tax li-
abilities
Long term tax liabilities falling due after 1 year - 6,679 6,679
Payable taxes falling due within 1 year 39 3,721 3,759
Tax liabilities 39 10,400 10,439
Tax expense 2013
(Amounts in USD 1,000)Tonnage tax
regime Other tax regimeTotal tax ex-
pense
Taxes payable 39 3,364 3,403
Change in deferred tax/deferred tax asset - -5,650 -5,650
Over/under provisions in previous year - -1,337 -1,337
Total 39 -3,624 -3,585

SIEM OFFSHORE INC., ANNUAL REPORT 2014 73
Total tax parent company
(Amounts in USD 1,000) 12/31/2014 12/31/2013
Long term tax liabilities falling due after 1 year 4,885 4,885
Payable taxes falling due within 1 year -146 -673
Tax liabilities 4,738 4,212
2014 2013
Taxes payable - 261
Total - 261
Photographer: Antonio Mladinov, Siem N-Sea
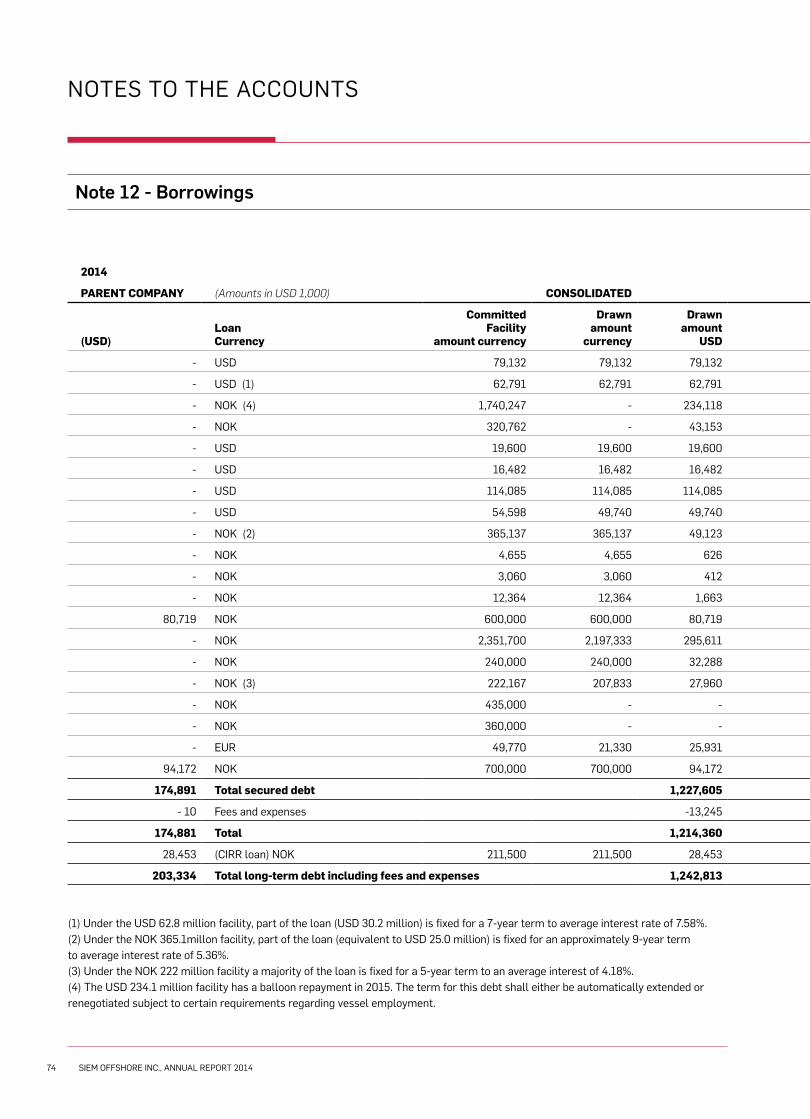
SIEM OFFSHORE INC., ANNUAL REPORT 201474
(1) Under the USD 62.8 million facility, part of the loan (USD 30.2 million) is fixed for a 7-year term to average interest rate of 7.58%. (2) Under the NOK 365.1millon facility, part of the loan (equivalent to USD 25.0 million) is fixed for an approximately 9-year term to average interest rate of 5.36%.(3) Under the NOK 222 million facility a majority of the loan is fixed for a 5-year term to an average interest of 4.18%.(4) The USD 234.1 million facility has a balloon repayment in 2015. The term for this debt shall either be automatically extended or renegotiated subject to certain requirements regarding vessel employment.
NOTES TO THE ACCOUNTS
Note 12 - Borrowings
2014
PARENT COMPANY (Amounts in USD 1,000) CONSOLIDATED December 31, 2014
(USD)LoanCurrency
Committed Facility
amount currency
Drawn amount
currency
Drawn amount
USD Fair value Interest rate Duration Instalments
- USD 79,132 79,132 79,132 79,132 Floating 2017 Quarterly
- USD (1) 62,791 62,791 62,791 67,251 Fixed and floating 2021 Semi annually
- NOK (4) 1,740,247 - 234,118 234,118 Floating 2015 Semi annually
- NOK 320,762 - 43,153 43,153 Floating 2022 Quarterly
- USD 19,600 19,600 19,600 19,600 Floating 2019 Semi annually
- USD 16,482 16,482 16,482 16,310 Fixed 2027 Monthly
- USD 114,085 114,085 114,085 115,824 Fixed 2028 Monthly
- USD 54,598 49,740 49,740 52,980 Fixed 2031 Monthly
- NOK (2) 365,137 365,137 49,123 51,811 Fixed and floating 2023 Semi annually
- NOK 4,655 4,655 626 626 Floating 2019 Quarterly
- NOK 3,060 3,060 412 412 Floating 2019 Monthly
- NOK 12,364 12,364 1,663 1,663 Floating 2019 Monthly
80,719 NOK 600,000 600,000 80,719 80,719 Floating 2018 Bullet
- NOK 2,351,700 2,197,333 295,611 305,205 Fixed 2018 Semi annually
- NOK 240,000 240,000 32,288 32,288 Floating 2019 Semi annually
- NOK (3) 222,167 207,833 27,960 29,653 Fixed or floating 2019 Semi annually
- NOK 435,000 - - - Fixed or floating 2027 Semi annually
- NOK 360,000 - - - Fixed or floating 2027 Semi annually
- EUR 49,770 21,330 25,931 25,931 Floating 2016 Bullet
94,172 NOK 700,000 700,000 94,172 94,172 Floating 2019 Bullet
174,891 Total secured debt 1,227,605 1,250,847
- 10 Fees and expenses -13,245 -13,245
174,881 Total 1,214,360 1,237,602
28,453 (CIRR loan) NOK 211,500 211,500 28,453 30,114 Fixed 2019 Semi annually
203,334 Total long-term debt including fees and expenses 1,242,813 1,267,716

SIEM OFFSHORE INC., ANNUAL REPORT 2014 75
Note 12 - Borrowings
2014
PARENT COMPANY (Amounts in USD 1,000) CONSOLIDATED December 31, 2014
(USD)LoanCurrency
Committed Facility
amount currency
Drawn amount
currency
Drawn amount
USD Fair value Interest rate Duration Instalments
- USD 79,132 79,132 79,132 79,132 Floating 2017 Quarterly
- USD (1) 62,791 62,791 62,791 67,251 Fixed and floating 2021 Semi annually
- NOK (4) 1,740,247 - 234,118 234,118 Floating 2015 Semi annually
- NOK 320,762 - 43,153 43,153 Floating 2022 Quarterly
- USD 19,600 19,600 19,600 19,600 Floating 2019 Semi annually
- USD 16,482 16,482 16,482 16,310 Fixed 2027 Monthly
- USD 114,085 114,085 114,085 115,824 Fixed 2028 Monthly
- USD 54,598 49,740 49,740 52,980 Fixed 2031 Monthly
- NOK (2) 365,137 365,137 49,123 51,811 Fixed and floating 2023 Semi annually
- NOK 4,655 4,655 626 626 Floating 2019 Quarterly
- NOK 3,060 3,060 412 412 Floating 2019 Monthly
- NOK 12,364 12,364 1,663 1,663 Floating 2019 Monthly
80,719 NOK 600,000 600,000 80,719 80,719 Floating 2018 Bullet
- NOK 2,351,700 2,197,333 295,611 305,205 Fixed 2018 Semi annually
- NOK 240,000 240,000 32,288 32,288 Floating 2019 Semi annually
- NOK (3) 222,167 207,833 27,960 29,653 Fixed or floating 2019 Semi annually
- NOK 435,000 - - - Fixed or floating 2027 Semi annually
- NOK 360,000 - - - Fixed or floating 2027 Semi annually
- EUR 49,770 21,330 25,931 25,931 Floating 2016 Bullet
94,172 NOK 700,000 700,000 94,172 94,172 Floating 2019 Bullet
174,891 Total secured debt 1,227,605 1,250,847
- 10 Fees and expenses -13,245 -13,245
174,881 Total 1,214,360 1,237,602
28,453 (CIRR loan) NOK 211,500 211,500 28,453 30,114 Fixed 2019 Semi annually
203,334 Total long-term debt including fees and expenses 1,242,813 1,267,716
The Company has a portfolio of bank loans secured with mortgage in vessels. The creditor and guarantors are in general first class commercial banks and state owned financial institutions with ratings on or above BBB- and AAA.As of year end, the Company had issued two high yield unsecured bonds of NOK 600 million and NOK 700 million respectively. The high yield unsecured bonds are listed on Oslo Stock Exchange, have no amortization and matures in 2018 and 2019.As of December 31 2014 all covenants requirements have been met.The Company has recieved waiver of financial covenant for the period of Q1 2015, from lenders and guarantors, for certain mortgage backed vessel financings.

SIEM OFFSHORE INC., ANNUAL REPORT 201476
(1) Under the USD 72.1 million facility, part of the loan (USD 34.9 million) is fixed for a 8-year term to average interest rate of 7.58%. (2) Under the NOK 625.7millon facility, part of the loan (equivalent to USD 34.2 million) is fixed for an approximately 10-year term to average interest rate of 5.36%.
The fair value of the current borrowings with floating interest equals their carrying amount, as the impact of discounting is not significant. The fair values are based on cash flows discounted using a rate based on the actual borrowing rates, and are within level 2 of the fair value hierarchy.The fair value of the current borrowings with fixed interest have been calculated by using the current market rate for similar loans, and are within level 2 of the fair value hierarchy.
NOTES TO THE ACCOUNTS
2013
PARENT COMPANY (Amounts in USD 1,000) CONSOLIDATED December 31, 2013
(USD)LoanCurrency
Committed Facility amount currency
Drawn amount currency
Drawn amount USD Fair value Interest rate Duration Instalments
- USD 90,437 90,437 90,437 90,437 Floating 2017 Quarterly
- USD (1) 72,124 72,124 72,124 77,797 Fixed and floating 2021 Semi annually
- NOK 1,609,207 - 264,511 264,511 Floating 2015 Semi annually
- NOK 296,402 - 48,721 48,721 Floating 2022 Quarterly
- USD 21,000 21,000 21,000 21,000 Floating 2019 Semi annually
- USD 23,162 18,173 18,173 16,925 Fixed 2027 Monthly
- USD 116,107 57,432 57,432 54,890 Fixed 2027 Monthly
- USD 58,879 47,990 47,990 47,543 Fixed 2030 Monthly
- NOK (2) 625,746 625,746 102,856 104,340 Fixed and floating 2022 Semi annually
- NOK 5,250 5,250 863 928 Fixed 2017 Quarterly
98,624 NOK 600,000 600,000 98,624 98,624 Floating 2018 Bullet
- NOK 1,657,771 889,050 146,136 144,868 Fixed 2018 Semi annually
- NOK 240,000 - - - Fixed or floating 2019 Semi annually
98,624 Total secured debt 968,868 970,585
- Fees and expenses -7,368 -7,368
98,624 Total 961,500 963,217
41,718 (CIRR loan) NOK 253,800 253,800 41,718 42,580 Fixed 2019 Semi annually
140,342 Total long-term debt including fees and expenses
1,003,218 1,005,797

SIEM OFFSHORE INC., ANNUAL REPORT 2014 77
2013
PARENT COMPANY (Amounts in USD 1,000) CONSOLIDATED December 31, 2013
(USD)LoanCurrency
Committed Facility amount currency
Drawn amount currency
Drawn amount USD Fair value Interest rate Duration Instalments
- USD 90,437 90,437 90,437 90,437 Floating 2017 Quarterly
- USD (1) 72,124 72,124 72,124 77,797 Fixed and floating 2021 Semi annually
- NOK 1,609,207 - 264,511 264,511 Floating 2015 Semi annually
- NOK 296,402 - 48,721 48,721 Floating 2022 Quarterly
- USD 21,000 21,000 21,000 21,000 Floating 2019 Semi annually
- USD 23,162 18,173 18,173 16,925 Fixed 2027 Monthly
- USD 116,107 57,432 57,432 54,890 Fixed 2027 Monthly
- USD 58,879 47,990 47,990 47,543 Fixed 2030 Monthly
- NOK (2) 625,746 625,746 102,856 104,340 Fixed and floating 2022 Semi annually
- NOK 5,250 5,250 863 928 Fixed 2017 Quarterly
98,624 NOK 600,000 600,000 98,624 98,624 Floating 2018 Bullet
- NOK 1,657,771 889,050 146,136 144,868 Fixed 2018 Semi annually
- NOK 240,000 - - - Fixed or floating 2019 Semi annually
98,624 Total secured debt 968,868 970,585
- Fees and expenses -7,368 -7,368
98,624 Total 961,500 963,217
41,718 (CIRR loan) NOK 253,800 253,800 41,718 42,580 Fixed 2019 Semi annually
140,342 Total long-term debt including fees and expenses
1,003,218 1,005,797

SIEM OFFSHORE INC., ANNUAL REPORT 201478
Prior to ordering vessels from Norwegian yards, the Company applied for fixed 12-year interest rate options related to the long-term financing of such vessels. The Company was granted such options for each of the relevant vessel by the Norwe-
gian Export Credit Agency. The Company made certain sale of the right to exercise such options to a first class international bank (the “Bank”). Long-term loans drawn from the Norwegian Export Credit Agency are placed as corresponding deposits in
the Bank as financial security for the loans drawn. Recognition of the gain, related to each option, is recorded over the term of any drawn loans.
NOTES TO THE ACCOUNTS
Unearned CIRR 2014 2013
Beginning of the year 2,155 2,523
Recognized in the profit and loss account -368 -368
Paid-back CIRR - -
Net unearned CIRR as of December 31 1,786 2,155
The book value of mortgaged assets consist of non-current tangible assets and portion of the accounts receivables and amounts to USD 1,764 million at year end.There are various financial covenants related to the Company’s debt agreements. The main prevailing covenants are:- equity ratio to total assets in excess of 30%- positive working capital- certain amount of freely available cash and bank deposit balance- debt service ratios and interest rate coverage
The Company and parent company are in compliance with the financial covenants as per December 31, 2014.
PARENT COMPANY CONSOLIDATED
(USD)Instalments per December 31, 2014 falling due over the next 5 years Mortgage debt
Other interest bearing debt Total
- 2015 308,902 - 308,902
- 2016 99,623 - 99,623
- 2017 118,926 - 118,926
80,719 2018 282,909 80,719 363,628
94,172 2019 75,975 94,172 170,147
- Thereafter 166,380 - 166,380
174,891 Total 1,052,714 174,891 1,227,605
CIRR loan (Both consolidated and parent company)
Total CIRR loan commitment 28,453 41,718
CIRR loan drawn on 31.12 28,453 41,718
Commitment as of December 31 - -
Cash-flow hedges
Siem Consub SA (subsidiary company in Brazil with Brazilian real as their func-tional currency) initiated hedge accounting 1 January 2014. The hedging instrument is 100% of the USD denominated long-term debt held by the Brazilian entity in
the amount of USD 187.7 million (included in the borrowings table above) and the hedged item is the USD foreign currency exposure related to future cash flows of highly probable contracted charter vessel revenue. The hedged item is the value of the first sales of the month from a portfo-lio of seven vessels sufficient to cover the
monthly debt payment. The prospective and retrospective effec-tiveness testing for the hedge falls within the accepted 80-120% range, as there is sufficient head-room in the effectiveness test even though two of the seven vessels were not yet operational in 2014 (due to delayed delivery dates). The effective por-

SIEM OFFSHORE INC., ANNUAL REPORT 2014 79
Siem Industries Inc. is the parent company of Siem Europe S.a.r.l. the Company’s largest shareholder with a holding of 34.39%, and is defined as a related party. The Company is obligated to Siem Industries Inc., for a fee of USD 250K (2013: USD 300K). This fee is the remuneration for the services of two of the Board members. This fee also covers office in the Cayman Islands and administrative expences.Details related to transactions, loans and remuneration to the executive Management and the board of directors are set out in Note 19. For Parent, all subsidiaries in Note 6 are also defined as related parties.
For other related parties, the following transactions were carried out:
Above service is provided to companies in which a Board member has an interest. Kristian Siem is the Chairman of Siem Industries Inc., which is controlled by a trust whose potential beneficiaries include members of Kristian Siem’s immediate family. Siem Industries holds an interest in Subsea 7. Siem Offshore LLC, 100% owned by the Company, has chartered one vessel to Subsea 7 during 2014.
Other accrued cost include accrued commission, purchase orders and other accrued cost. Other current liabilities include accrued salaries and incentive program, provision for operating expenses and other short term liabilities.
Note 13 - Other Current Liabilities
Note 14 - Related Party Transactions
PARENT COMPANY CONSOLIDATED
12/31/2014 12/31/2013 (Amounts in USD 1,000) 12/31/2014 12/31/2013
- - Non-interest-bearing short-term liabilities - -
- - Social security etc. 3,960 5,428
60,000 - Loan from shareholder 60,000 -
- - Unearned income 7,264 3,517
926 1,111 Accrued interest 13,869 11,780
80 201 Other accrued cost, mainly regarding operating expenses vessels 6,103 5,133
6,249 6,858 Other current liabilities 31,876 18,203
67,255 8,170 Total other current liabilities 123,072 44,061
CONSOLIDATED
Sales of services 2014 2013
(Amounts in USD 1,000)
Service to entity where director has ownership 8,556 2,796
Total 8,556 2,796
tion of the cash flow hedge, USD 14.6 mil-lion shown in OCI, is the effective portion of the loss on the hedging instrument. The hedge was not 100% effective, and a USD 6 million loss related to the ineffective-ness of the cash flow hedge is recognized over the profit or loss. USD 5.6 million was recycled from OCI to the profit or loss dur-ing 2014 in connection with this hedge.
Net investment hedge with internal loans
Currency translation differences of USD 11 million recognized as OCI include approximately USD 763 thousand of currency differences related to loans in USD from other Company entities to the Brazilian entity. These internal loans are
designated as a net investment hedge in accordance with IAS 21 and the currency gains and losses recognized in the Brazilian entity are appropriately shown as part of OCI, and will be recycled over profit or loss in the event that the Brazilian entity ceases to be a consolidated Company entity.

SIEM OFFSHORE INC., ANNUAL REPORT 201480
Service delivered from related parties is mainly cost for technical management, corporate management and delivered crew. The service is supported to Siem Meling Offshore DA, 51% owned by the Company, and is delivered by its partner in Siem Meling Offshore DA.
The Company holds a long-term loan to Rovde Industripark AS. Siem Offshore Invest AS owns 50% of Rovde Industripark AS.
NOTES TO THE ACCOUNTS
In Q3 2014, the vessel “Siem Sailor” was sold to a company controlled by O.H. Meling & Co AS at a price of NOK 295 million. The purchaser of the vessel is the 49% owner of Siem Meling Offshore DA, and is controlled by O.H Meling & Co AS.
CONSOLIDATED
Purchase of service 2014 2013
(Amounts in USD 1,000)
Service from related parties 11,351 14,098
Total 11,351 14,098
CONSOLIDATED
Sale of Vessel 2014 2013
(Amounts in USD 1,000)
Sale of vessel 47,447 84,200
Total 47,447 84,200
Balance items following purchase and sale of service: CONSOLIDATED
(Amounts in USD 1,000) 2014 2013
Accounts receivables 2,102 49
Accounts payable 250 2
Loans to related parties: CONSOLIDATED
(Amounts in USD 1,000) 2014 2013
Loan to associates
At January 1 308 436
Drawings - -
Instalments -22 -94
Interest charged 8 11
Interest received -8 -11
Exchange rate variations -53 -34
At December 31 233 308

SIEM OFFSHORE INC., ANNUAL REPORT 2014 81
Siem Meling Offshore DA had a long term-liability from its partner in Siem Meling Offshore DA. The whole loan has been repaid during the year.
The borrowing facility was on market terms of interest.
Short-term loanAt the end of 2014 a short-term loan of USD 60 million was drawn by Siem Offshore Inc. under a credit facility provided by Siem Indus-tries Inc. The short-term loan is on market terms of interest, and an interest of USD 158K has been booked as cost for 2014.
Following transactions with related parties were carried out for the parent company:
Service from subsidiaries consists of administrative and corporate services provided by Siem Offshore Management AS. All terms used for above transactions are at arms’ length.
Liability to related parties: CONSOLIDATED
(Amounts in USD 1,000) 2014 2013
Liability to related parties
At January 1 7,057 7,506
Drawings - -
Instalments -6,982 -
Interest expenses 53 315
Interest paid -53 -119
Exchange rate variations -75 -645
At December 31 0 7,057
PARENT COMPANY
(Amounts in USD 1,000) 2014 2013
Service from subsidiaries 10,086 10,075
Service from associates - 1,650
Total 10,086 11,725
Year-end balances arising from sales and purchases: PARENT COMPANY
(Amounts in USD 1,000) 2014 2013
Receivables from related parties
Subsidiaries 18,598 1,714
Associates 1,975 708
Total 20,573 2,422
Payables from related parties
Subsidiaries 5,737 8,948
Associates - -
Total 5,737 8,948

SIEM OFFSHORE INC., ANNUAL REPORT 201482
The loan to subsidiaries is held against Siem Offshore do Brasil SA on 31 December 2014.
Loan provided to associates is held against Siem Offshore Contractors GmbH, a company owned 100% by the subsidiary Siem Offshore Invest AS.
All loans are on market terms of interest.
NOTES TO THE ACCOUNTS
Loans to related parties: PARENT COMPANY
(Amounts in USD 1,000) 2014 2013
Loan to subsidiaries
At January 1 23,637 67,177
Drawings 2,500 -
Converted to shares -4,412 -45,353
Instalments - -
Interest charged 555 2,076
Interest received - -
Exchange rate variations -532 -263
At December 31 21,748 23,637
Loan to sub-subsidiaries
At January 1 18,104 17,052
Drawings 4,619 -
Converted to shares - -
Instalments -18,176 -
Interest charged 299 272
Interest received - -
Exchange rate variations -347 780
At December 31 4,498 18,104
Total loans to related parties
At January 1 41,740 84,229
Drawings 7,119 -
Converted to shares -4,412 -45,353
Instalments -18,176 -
Interest charged 854 2,348
Interest received - -
Exchange rate variations -879 517
At December 31 26,246 41,740

SIEM OFFSHORE INC., ANNUAL REPORT 2014 83
Forward currency contracts:
The nominal principal amount of the outstanding forward currency contracts on 31 December 2014 were USD 122.5 million (2013: 153.5 million) of which USD 58.4 million refers to EUR/USD contracts, USD 54.0 million refers to USD/NOK con-tracts, USD 7.0 million refers to GBP/USD contracts, USD 2.2 million refers to EUR/NOK contracts and USD 0.9 million refers to GBP/NOK contracts. Of the USD 54.0 million under the USD/NOK contracts, two USD 20.0 million positions are offsetting, such that the net position is USD 14.0 million. The forward currency contracts have been entered into in order to hedge primarily operating expenses in foreign currencies and committments related to vessels under construction.
Note 15 - Derivative Financial Instruments – Assets (Liabilities)
Currency options:
Currency options have been entered into in order to hedge operational currency exposure.These options are typically path-depend-ent options which include features related to situations where the underlying reaches or fluctuates within specific barrier levels. This enables the Company to hedge a range in the underlying currency rather than simply a level. Gains and losses are recognised in the profit and loss.
For further information regarding profit and loss effect on forward currency con-tracts and currency options, please see Note 28.
Interest rate swaps:
The nominal amounts of the outstand-ing interest rate swaps contracts on 31 December 2014 were USD 270.0 million (2013: USD 288.4 million).
At 31 December 2014, the fixed rates vary from 1.13% to 2.29%. The floating rate leg of the interest rate swaps are LIBOR. Gains and losses are recognised in the profit and loss under financial expenses.
Cross currency swaps:
Cross currency swaps have been entered into in order to hedge both interest and principal payments on long term debt financings denominated in other curren-cies than USD.
PARENT COMPANY CONSOLIDATED
12/31/2014 12/31/2013 (Amounts in USD 1,000) 12/31/2014 12/31/2013
Assets Liabilities Assets Liabilities
Forward currency contracts - 2,325 - -
- - Currency options - 10,292 - 6,810
- - Interest rate swaps - 4,683 - 4,275
- - Cross Currency Swap 1,041 - - -
- - Total derivative financial instruments 1,041 16,732 - 11,085

SIEM OFFSHORE INC., ANNUAL REPORT 201484
Capital expenditures contracted for at the reporting date but not yet paid is as follows:
(1) Contractual guarantees to the Brazilian Navy are issued by Siem Offshore do Brasil SA.(2) Contractual guarantees provided by Parent are security for one of the contracting parties of Siem Offshore Contractors GmbH.Such guarantees are for advance payments recieved at USD 27.3 million and performance guatantees at USD 109.3 million and guarantees related to tax cases in Brazil USD 4.7 million.
NOTES TO THE ACCOUNTS
Note 16 - Guarantees
Note 17 - Commitments
PARENT COMPANY CONSOLIDATED
12/31/2014 12/31/2013 (Amounts in USD 1,000) 12/31/2014 12/31/2013
- - Contractual guarantees to Brazilian Navy (1) 593 4,304
106,131 120,291 Contractual guarantees other (2) 141,315 150,014
106,131 120,291 Total guarantees 141,908 154,317
PARENT COMPANY CONSOLIDATED
12/31/2014 12/31/2013 (Amounts in USD 1,000) 12/31/2014 12/31/2013
- - Shipbuilding contracts with variation orders 678,076 847,961
- - Instalments paid 127,606 146,992
- - Unpaid instalments 550,470 700,969
Parent company Instalments falling due over the next 3 years CONSOLIDATED
12/31/2014 12/31/2013 (Amounts in USD 1,000) 12/31/2014 12/31/2013
2014 - 394,496
- - 2015 242,062 220,117
2016 308,408 86,356
- - Total 550,470 700,969

SIEM OFFSHORE INC., ANNUAL REPORT 2014 85
Note 18 - Operating Expenses
Note 19 - Salaries and Wages, Number of Employees
(1) Personnel expenses includes vessel crew expenses and part of general and administrative expenses, see Note 18.
Government grants is a special Norwegian seaman payroll and tax refund given to Norwegian Government grants is a special Norwe-gian seaman payroll and tax refund given to Norwegian
The average number of employees in the Company was 1,073 for 2014, including onshore and offshore employees. No employees are employed in the parent company.
PARENT COMPANY CONSOLIDATED
2014 2013 (Amounts in USD 1,000) 2014 2013
- 1,675 Vessel crew expenses 124,451 113,945
769 7,007 Other vessel operating expenses 35,523 45,568
- - Power Cable project cost 90,179 31,078
11,752 10,091 General and administration 47,033 50,701
12,521 18,774 Total operating expenses 297,187 241,291
CONSOLIDATED
(Amounts in USD 1,000) 2014 2013
Personnel expenses (1)
Salaries and wages 95,421 91,362
Government grants - net wages arrangement in Norway -5,457 -5,762
Payroll tax 14,309 13,614
Pension costs, see Note 8 2,151 1,887
Other benefit 4,147 2,929
Total personnel expenses 110,571 104,030

SIEM OFFSHORE INC., ANNUAL REPORT 201486
NOTES TO THE ACCOUNTS
Payroll registered to the executive management: (Amounts in USD 1,000) 2014 2013
Salary and other short term compensation 2,421 2,193
Total 2,421 2,193
Employees included in the above payroll in 2014 were five (2013: five).
Shares in the Company held by members of corporate management in 2014 were 2,618,161 (2013: 2,608,161).The Board of Directors of Siem Offshore Inc. has authorized the award of Stock Options to eight key employees of the Company. See Note 31 for more information.
Loan to executive management: (Amounts in USD 1,000) 2014 2013
Balance January 1 4,356 4,723
Changes in executive management - -
New loan raised 40 35
Instalments -310 -
Effect of currency differences -755 -402
Balance December 31 3,331 4,356
Amounts in USD 1,000
Name Salary paid Pension premium Other benefits Share options
2014
CEO Terje Sørensen 610.6 33.8 55.9 600,000
CFO Dagfinn B. Lie 310.5 31.1 12.5 400,000
COO Svein Erik Mykland 452.4 40.6 9.0 400,000
CCO Bernt Omdal 391.3 37.2 3.1 400,000
HR Tore B. Johannessen 388.6 41.0 3.7 400,000
2013
CEO Terje Sørensen 559.3 30.2 54.5 3.000,000
CFO Dagfinn B. Lie 307.6 27.0 12.3 2.000,000
COO Svein Erik Mykland 411.1 36.9 8.5 2.000,000
CCO Bernt Omdal 367.8 33.1 3.5 2.000,000
HR Tore B. Johannessen 298.0 3.5 3.5 2.000,000
Corporate management salaries and other benefits are presented in the table below:
Loan on December 31, 2014: (Amounts in USD 1,000) Amount Interest Terms
Loan to executive management 3,331 - Share loan (1).
Total 3,331

SIEM OFFSHORE INC., ANNUAL REPORT 2014 87
The Company has entered into different operating leases for office premises, office machines, and communication satellite equipment for the vessels. The leases also include a substitute vessel on a time charter party. The lease period for the lease agreements varies and most of the leases contain an option for extension.
The operating leases in the Parent for 2013 are related to charter of vessels and satellite equipment. One of the chartered vessels, “Siem Sasha” has been chartered on bareboat agreements from the subsidiary Siem Offshore Rederi AS. The contract was finished September 2013. The lease costs were as follows:
Note 20 - Operating Leases as Lessee
Auditor’s remuneration
PARENT COMPANY CONSOLIDATED
2014 2013 (Amounts in USD 1,000) 2014 2013
99 103 Audit Fee 528 579
60 51 Audit Fee Other 202 139
21 - Tax/Legal Assistance 116 127
- - Other consultants, Fees 56 28
180 155 Total auditor’s remuneration 902 873
PARENT COMPANY Fall due CONSOLIDATED
- 2015 1,787
- 2016 1,193
- 2017 and thereafter 1,859
- Total 4,839
As of 31 December 2014, the Company had some commitments relating to lease agreements which fall due as follows.
Net present value of future commitments relating to lease agreements are calculated to be USD 4,839 for the Company. There are no lease agreement for the Parent. The interest rate in the calculation of net present value is 5%.
Loan on December 31, 2013 (Amounts in USD 1,000) Amount Interest Terms
Loan to executive management 4,356 - Share loan (1).
Total 4,356
(1) Share loan: The loans are repayable by the employee when the employee’s shares in the company are realized or if the employee leaves the Company. Loans equivalent to USD 4 million are secured by pledges in relevant shares.The Remuneration paid to the Board of Directors in 2014 was USD 440K (2013: USD 437K).
PARENT COMPANY CONSOLIDATED
2014 2013 (Amounts in USD 1,000) 2014 2013
0 5,883 Annual lease payment on operational leases 4,020 8,763

SIEM OFFSHORE INC., ANNUAL REPORT 201488
NOTES TO THE ACCOUNTS
Note 21 - Financial Items
Note 22 - Earnings per Share
PARENT COMPANY CONSOLIDATED
2014 2013 (Amounts in USD 1,000) 2014 2013
Financial income
4,162 9,547 Interest income 4,188 5,360
- - Gain intercompany closure - -
- 39 Other financial income 4,903 74
4,162 9,586 Total financial income 9,091 5,434
Financial expenses
-11,801 -6,976 Interest expenses -48,451 -36,607
- - Interest rate SWAP -5,063 3,784
-903 -828 Other financial expenses -2,354 -3,309
-12,704 -7,804 Total financial expenses -55,868 -36,132
Other financial items
- - Loss on FX contracts -3,022 -7,756
4,842 1,219 Net currency gain/(loss) 37,114 -14,895
(Amounts in USD 1,000)
Earnings per share 2014 2013
Weighted average number of shares outstanding 387,591 389,078
Weighted average number of shares diluted 389,144 389,144
Result attributable to shareholders 58,147 22,000
Earnings per share attributable to equity shareholders 0.15 0.06
Earnings per share diluted attributable to equity shareholders 0.15 0.06
Option program to executive management, see note 19 and 31.

SIEM OFFSHORE INC., ANNUAL REPORT 2014 89
Contracts in progress refer to activity within the Combat Management Systems (CMS) and Cable Installation Segment, see Note 4.
At year-end 2014, the activity within CMS had five projects in progress. The degree of completion varies from 0.1% to 100%. Margin is calculated and included for all five projects. The activity within the Cable Installation Segment included six projects in progress at year-end 2014. These projects are in an various phases, and margin for 2014 is recognized only on projects with progress exceeding 45 %. All projects in progress at year-end 2014 are estimated to generate a positive contribution over the total project period. There are no contracts in progress in the Parent. See note 2.9 for analysis of sensitivity.
Note 23 - Contracts in Progress
CONSOLIDATED
Recognized Accumulated per
(Amounts in USD 1,000) 2014 12/31/2014
Revenue 105,789 148,755
Cost 94,261 132,612
Total 11,528 16,143
Assets / liabilities December 31, 2014
Unearned rev-enue
Accrued project cost Unbilled revenue
Revenue 21,549 - 14,918
Cost 22,521 -
Total 21,549 22,521 14,918
Recognized Accumulated per
(Amounts in USD 1,000) 2013 12/31/2013
Revenue 33,923 43,417
Cost 32,564 39,452
Total 1,360 3,966
Assets / liabilities December 31, 2013
Unearned revenue
Accrued project cost Unbilled revenue
Revenue 8,608 - 2,473
Cost 293 -
Total 8,608 293 2,473

SIEM OFFSHORE INC., ANNUAL REPORT 201490
Booked value for the vessel “Siddis Skipper” was transferred from fixed assets to asset held for sale in December 2013. The vessel was sold on January 8, 2014.
There is no asset held for sale in the parent company or group as of December 31, 2014.
2014:The net gain for the Company on sale of assets of 18.7million consist of gain from sale of the PSV “Siddis Skipper”, “Siem Sailor” by USD 17.9 million and other USD 0.7 million.
2013:The net gain for the Company on sale of assets consisted of gain from sale of the MRSV “Seven Sisters“ of USD 28.2 million and gain of sale of one smaller vessel in Brazil of USD 1.6 million.
NOTES TO THE ACCOUNTS
Note 25 - Other Gain/(Loss) on Sale of Assets
Note 24 - Asset Held for Sale
CONSOLIDATED
(Amounts in USD 1,000) 2014 2013
Purchase cost per January 1 18,121 -
Moved from Fixed asset - 18,121
Capital expenditure - -
The year’s disposal at cost - 18,121 -
Effect of exchange rate differences - -
Purchase cost per December 31 - 18,121
PARENT COMPANY CONSOLIDATED
2014 2013 (Amounts in USD 1,000) 2014 2013
- - Gain/(loss) on sale of assets, net 18,728 29,827
- - Gain/(loss) on sale of assets intercompany - -
- - Total 18,728 29,827

SIEM OFFSHORE INC., ANNUAL REPORT 2014 91
Siem Industries Inc. sold it’s holdings in the Company to Siem Europe S.a.r.l. on 30 December 2014, a wholly owned subsidiary.
Siem Europe S.a.r.l. is the main shareholder of Siem Offshore Inc. and is controlled by a trust whose potential beneficiaries include members of Kristian Siem’s immediate family. Kristian Siem, who is a Director of the Company, is also the Chairman of Siem Industries Inc.
Terje Sørensen is the CEO of the Company and held 1,950,000 shares on December 31, 2014.
Note 26 - Listing of the 20 Largest Shareholders as of December 31, 2014
SHAREHOLDER NUMBER OF SHARES OWNER INTEREST
SIEM EUROPE S.a.r.l. 133,279,421 34,39%
ACE CROWN INTERNATIONAL LIMITED 76,780,808 19,81%
FONDSFINANS SPAR 12,350,000 3,19%
SKAGEN KON-TIKI 10,977,629 2,83%
MP PENSJON PK 9,841,313 2,54%
WATERMAN HOLDING LTD 8,510,767 2,20%
SKAGEN VEKST 8,036,317 2,07%
DANSKE INVEST NORSKE INSTIT. II. 5,512,171 1,42%
OJADA AS 5,313,000 1,37%
VARMA MUTUAL PENSION INSURANCE 4,973,285 1,28%
JP MORGAN CLEARING CORP. 3,733,085 0,96%
MERRILL LYNCH,PIERCE,FENNER&S. INC 3,717,644 0,96%
FONDSAVANSE AS 3,366,602 0,87%
NORDEA BANK FINLAND PLC, MARKETS 3,324,600 0,86%
DANSKE INVEST NORSKE AKSJER INST 3,257,300 0,84%
ALTA INVEST SA 3,123,151 0,81%
PUMPØS AS 3,017,574 0,78%
VERDIPAPIRFONDET DNB SMB 2,970,000 0,77%
FONDSFINANS AS 2,939,932 0,76%
BERGEN KOMMUNALE PENSJONSKASSE 2,850,000 0,74%
Total 20 largest shareholders 307,874,599 79,43%
Other shareholders 79,716,781 20,57%
Total number of outstanding shares 387,591,380 100,00%

SIEM OFFSHORE INC., ANNUAL REPORT 201492
Expiring charter contracts with Petro-bras in Brazil
Petrobras informed in January 2015 that the current contracts for four AHTS vessels employed in Brazil will not be extended following contract expiry during February 2015. Petrobras took similar actions against all owners whose vessel contracts were expiring. Alternative employment shall be pursued globally for these four vessels.
Signed USD 350 million loan and guar-antee facility agreement
A USD 350 million loan and guarantee facility has been signed for two new well-intervention vessels (“WIVs”) under construction in Germany. The WIVs are scheduled for delivery during first half of 2016, and both WIVs shall commence 7-year charters upon delivery from the yard.
Further details related to the currency derivative contracts are set out in Note 15.
NOTES TO THE ACCOUNTS
Note 27 – Subsequent Events
Note 28 - Gain/(Loss) on Currency Derivative Contracts
Charter contract for “Siem Giant” in Brazil
A one year contract with Petrobras has been agreed for the PSV “Siem Giant”. The contract will commence no later than September 2015.Sale of two Offshore Subsea Construc-tion Vessels
Daya Materials Bhd. (“Daya”) has been given until mid-April to arrange for financ-ing and to pay the full 10% deposit on the two 2013-built OSCVs “Siem Daya 1” and “Siem Daya 2”, which are negotiated to be sold to Daya. The subsequent delivery of the vessels shall thereafter take place lat-est by mid July. The recent volatility in the market for offshore vessels has increased the uncertainty of this transaction to be concluded. Both vessels are on long-term charters to Daya.
Debt financing for three PSVs under construction in Poland
Debt financing obtained for the three dual-fuelled PSVs under construction in Poland.
Waiver of financial covenant
Recieved waiver of financial covenant for the period 1Q 2015, from lenders and guarantors, for certain mortgage backed vessel financings.Nordsee one offshore wind farm reached financial close
The financial close for the Nordsee one offshore wind farm was reached. The project includes contracting work for the wholly owned subsidiary of Siem Offshore Inc, Siem Offshore Contractors GmbH related to turnkey supply and installation package of the inner grid cable system.
Award of contract for the Veja Mate offshore wind farm
Siem Offshore Contractors GmbH award-ed the contract for the turnkey supply and installation package of the inner array grid cable system for the 400 MW Veja Mate Offshore Wind Farm. The contract, estimated at a value in excess of Euro 100 Million, highlights the continued growth in the Offshore Renewable Energy Market for the Siem Offshore group.
PARENT COMPANY CONSOLIDATED
2014 2013 (Amounts in USD 1,000) 2014 2013
- - Unrealized gain/(loss) -5,612 -12,200
- - Realized gain/(loss) 2,590 4,444
- - Total -3,023 -7,756

SIEM OFFSHORE INC., ANNUAL REPORT 2014 93
Below is a comparison by category for carrying amounts and fair values of all of the Company’s financial instruments.
(1) Prepayments do not qualify as a financial instrument and are not included in above amount. Excluded prepayments amount to USD 32,905, see Note 9.
(1) Non-financial liabilities do not qualify as a financial instrument and are not included in above amount. Excluded liabilities amount to USD 22,161 consisting of USD 10,438 in Taxes Payable, USD 2,778 in Pension Liability, USD 5,428 in Social Security Payable and USD 3,517 in Unearned Income. See Note 13 for information about Social Security Payable and Unearned Income.
(1) Prepayments do not qualify as a financial instrument and are not included in above amount. Excluded prepayments amount to USD 13,517, see Note 9.
Note 29 - Financial Instrument by Category
CONSOLIDATED
(Amounts in USD 1,000) December 31, 2014
Loans and receivables
Assets at fair value through the profit and loss
Available for sale Total
Assets as per statement of financial position
Financial assets held for sale - - - -
Derivative financial instruments 1,041 1,041 - 1,041
Trade and other receivables (1) 33,146 - - 33,146
Cash and cash equivalents 117,623 - - 117,623
Total 151,810 1,041 - 151,810
CONSOLIDATED
(Amounts in USD 1,000) December 31, 2014
Liabilities at fair value through the profit and loss
Other financial liabilities Total
Liabilities as per statement of financial position
Bank debts, bonds, loans and other payables (1) - 172,662 172,662
Derivative financial instruments 16,732 - 16,732
Total 16,732 172,662 189,394
CONSOLIDATED
(Amounts in USD 1,000)
December 31, 2013Loans and
receivablesAssets at fair value through
the profit and lossAvailable for
sale Total
Assets as per statement of financial position
Financial assets held for sale - - - -
Derivative financial instruments - - - -
Trade and other receivables (1) 120,775 - - 120,775
Cash and cash equivalents 101,206 - - 101,206
Total 221,981 - - 221,981

SIEM OFFSHORE INC., ANNUAL REPORT 201494
(1) Prepayments do not qualify as a financial instrument and are not included in above amount. Excluded prepayments amount to USD 3,480, see Note 9.
(1) Non-financial liabilities do not qualify as a financial instrument and are not included in above amount. Excluded liabilities amount to USD 22,161 consisting of USD 10,438 in Taxes Payable, USD 2,778 in Pension Liability, USD 5,428 in Social Security Payable and USD 3,517 in Unearned Income. See Note 13 for information about Social Security Payable and Unearned Income.
NOTES TO THE ACCOUNTS
CONSOLIDATED
(Amounts in USD 1,000)
December 31, 2013Liabilities at fair value
through the profit and lossOther financial
liabilities Total
Liabilities as per statement of financial position
Bank debts, bonds, loans and other payables (1) - 1,076,930 1,076,930
Derivative financial instruments 11,085 - 11,085
Total 11,085 1,076,930 1,088,015
PARENT COMPANY
(Amounts in USD 1,000) December 31, 2014
Loans andreceivables
Assets at fair value through the profit and loss
Available for sale Total
Assets as per statement of financial position
Derivative financial instruments - - -
Trade and other instruments (1) 76,636 76,636
Cash and cash equivalents 222, 579 222,579
Total 299,215 - - 299,215
PARENT COMPANY
(Amounts in USD 1,000) December 31, 2014
Liabilities at fair value through the profit and loss
Other financial liabilities Total
Liabilities as per statement of financial position
Bank debts, bonds, loans and other payables - 203,387 203,387
Derivative financial instruments - - -
Total - 203,387 203,387
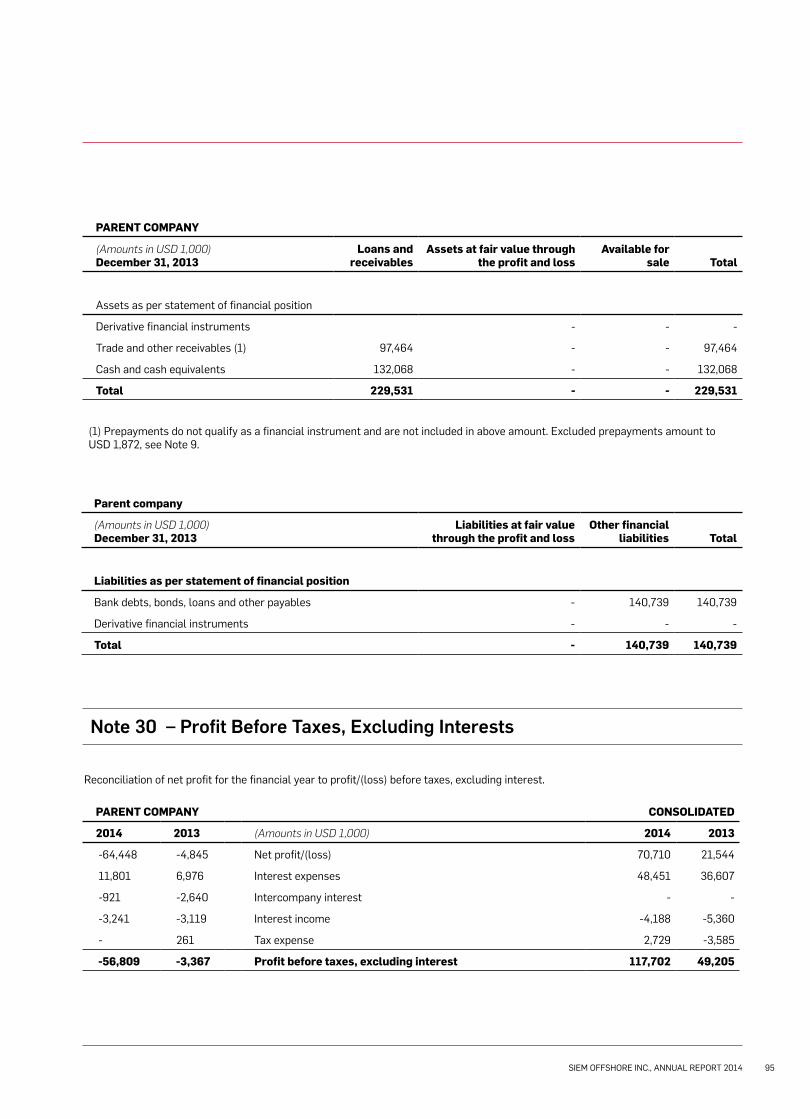
SIEM OFFSHORE INC., ANNUAL REPORT 2014 95
Reconciliation of net profit for the financial year to profit/(loss) before taxes, excluding interest.
Note 30 – Profit Before Taxes, Excluding Interests
(1) Prepayments do not qualify as a financial instrument and are not included in above amount. Excluded prepayments amount to USD 1,872, see Note 9.
PARENT COMPANY CONSOLIDATED
2014 2013 (Amounts in USD 1,000) 2014 2013
-64,448 -4,845 Net profit/(loss) 70,710 21,544
11,801 6,976 Interest expenses 48,451 36,607
-921 -2,640 Intercompany interest - -
-3,241 -3,119 Interest income -4,188 -5,360
- 261 Tax expense 2,729 -3,585
-56,809 -3,367 Profit before taxes, excluding interest 117,702 49,205
PARENT COMPANY
(Amounts in USD 1,000) December 31, 2013
Loans andreceivables
Assets at fair value through the profit and loss
Available for sale Total
Assets as per statement of financial position
Derivative financial instruments - - -
Trade and other receivables (1) 97,464 - - 97,464
Cash and cash equivalents 132,068 - - 132,068
Total 229,531 - - 229,531
Parent company
(Amounts in USD 1,000) December 31, 2013
Liabilities at fair value through the profit and loss
Other financial liabilities Total
Liabilities as per statement of financial position
Bank debts, bonds, loans and other payables - 140,739 140,739
Derivative financial instruments - - -
Total - 140,739 140,739

SIEM OFFSHORE INC., ANNUAL REPORT 201496
Note 31 – Share-based payments
2014 Share option program:
On the 02. April 2014, the Company entered into a Share option agreement with selected employees. The Board of Directors of Siem Offshore Inc. has authorized the award of 3,000,000 share options to ten key employees of the Company. The exercise price is NOK 9.07 per share. The exercise price of the granted options is equal to the market price of the shares on the date of the grant. The Options can be exercised as follows:
2017: 60% of the total number beginning on April 2nd 2017, less any options previously issued.
2018: 80% of the total number beginning on April 2nd 2018, less any options previously issued. 2019: 100% of the total number beginning on April 2nd 2019, less any options previ-ously issued.
The exercise period shall in no event be later than the date falling 10 years after the award date.
The group has no legal or constructive obligation to repurchase or settle the op-tions in cash.The weighted average fair value of options granted during the period determined using the Black-Scholes valuation model was NOK 3.65 per option.The significant inputs into the model were weighted average share price of NOK 9.07
at the grant date, exercise price of NOK 9.07, volatility of 23%, dividend yield of 0%, an expected option life of 10 years and an annual risk-free interest rate of 2.90%.
The volatility measured at the standard deviation of continuously compounded share returns is based on statistical analysis of daily share prices over the last three years.
Total expense recognised in the income statement for share options granted to certain employees is USD 0.1 million.
Value of employee services as per December 31, 2014 are recognized under Retained earnings at USD 0,391 and yield of 0%, an expected option life of 10 years and an annual risk-free interest rate of 2.90% first three years
NOTES TO THE ACCOUNTS
2013 Share option program:
On the 13 january 2013, the Company en-tered into a Share option agreement with selected employees. The Board of Direc-tors of Siem Offshore Inc. has authorized the award of 14,000,000 share options to eight key employees of the Company. The exercise price is NOK8.45 per share.The exercise price of the granted options is equal to the market price of the shares on the date of the grant.
2014: 20% of the total number beginning on January 18th 2014
2015: 40% of the total number beginning on January 18th 2015, less any options previously issued.
2016: 60% of the total number beginning on January 18th 2016, less any options previ-ously issued.
2017 80% of the total number beginning on January 18th 2017, less any options previ-ously issued.
2018: 100% of the total number beginning on January 18th 2018, less any options previ-ously issued.
The exercise period shall in no event be later than the date falling 10 years after the award date.
The group has no legal or constructive obligation to repurchase or settle the options in cash.No options were exercised during 2013.The weighted average fair value of options
granted during the period determined using the Black-Scholes valuation model was NOK 3.72 per option.
The significant inputs into the model were weighted average share price of NOK 8.45 at the grant date, exercise price of NOK 8.45, volatility of 23%, dividend yield of 0%, an expected option life of 10 years and an annual risk-free interest rate of 4.13%.
The volatility measured at the standard deviation of continuously compounded share returns is based on statistical analysis of daily share prices over the last three years.
Total expense recognised in the income statement for share options granted to certain employees is USD 0.2 million.Value of employee services as per December 31, 2013 are recognized under Retained earnings at USD 3,125.

SIEM OFFSHORE INC., ANNUAL REPORT 2014 97
Movements in the number of share options outstanding and their exercise prices are as follows:
Exercise price per share option, NOK (*weighted average)
Options Outstanding
At 1 January 2013 - -
Granted 8.45 14,000,000
Forfeited - -
Exercised - -
Expired - -
At 31 December 2013 8.45 14,000,000
At 1 January 2014 8.45 14,000,000
Granted 9.07 3,000,000
Forfeited - -
Exercised - -
Expired - -
At 31 December 2014* 8.56* 17,000,000
Options outstanding at year-end and exercisable total 2 800 000 options and nil options for2014 and 2013, respectively. Options expire 10 years after the date of grant.
*Weighted average price at 31 December 2014.
Options outstanding for key managment
Options out-standing as of 31 December 2013
Options out-standing as of 31 December 2014
Terje Sørensen, CEO 3,000,000 3,600,000
Dagfinn Lie, CFO 2,000,000 2,400,000
Svein Erik Mykland, COO 2,000,000 2,400,000
Bernt Omdal, CCO 2,000,000 2,400,000
Tore B. Johannessen, Global HR Director 2,000,000 2,400,000
Celso Costa, General manager 1,000,000 1,200,000
Lars Muck, General manager 1,000,000 1,200,000
Tor Helge Egeland, General manager 1,000,000 1,200,000
General managers - 200,000
Total outstanding 14,000,000 17,000,000

SIEM OFFSHORE INC., ANNUAL REPORT 201498
Statement on Social Responsibility As a company incorporated in the Cayman Islands, Siem Offshore Inc. (“The Com-pany”) is an exempted company duly in-corporated under the laws of the Cayman Islands and subject to Cayman Island laws and regulations with respect to corporate governance. Cayman Islands corporate law is to a great extent based on English Law. In addition, due to The Company being a Norwegian Tax Resident, the Norwegian Accounting law applies to The Company. According to the Norwegian Ac-counting Act $3-3c The Company should provide a statement on social responsibil-ity. The statement should include which actions are taken by The Company to integrate human rights, employee’s rights and social conditions, external environ-ment and the fight against corruption in its business strategies, daily operations and in relation to its interested parties.
The Board of Directors has reviewed this
CORPORATE SOCIAL RESPONSIBILITY
statement. It is the opinion of the Board of Directors that The Company com-plies with regulations in the Norwegian Accounting law with respect to Social Responsibility reporting.
Code of ConductThe Company has established a Code of Conduct policy expressing its non-toler-ance on corruption as well as dealing with ethical principles of the Company. The Company is fully committed to perform its business with integrity and transpar-ency throughout its global operations. As stated in the Code of Conduct Policy it is the policy of the Company to conduct its business in accordance with all applicable laws and regulations and in an ethically responsible manner.
Protection of health, safety and the prevention of pollution to the environment are primary goals of The Company. All of our employees and representatives must
conduct their duties and responsibilities in compliance with The Company’s policy on Health, Safety and Environment, applica-ble law and industry standards relating to health and safety in the workplace and prevention of pollution to the environment.
The Company has implemented policies and control procedures to ensure that only proper transactions are entered into by The Company, that such transactions have proper management approval, that such transactions are properly accounted for in the books and records of The Company, and the reports and financial statements of The Company are prepared in a timely manner, understandable and fully, fairly and accurately reflect such transactions.
The Company observes fair employment practices in every aspect of its business.
The Company conducts its business with honesty and integrity and competes fairly
MANGLER BILDE!
Happy JayNii football team, Accra, GhanaPhoto: Ellen Berchelmann

SIEM OFFSHORE INC., ANNUAL REPORT 2014 99
and ethically within the framework of the law. The Company has entered into agree-ments with well-known subcontractors for the delivery of technical management and crew management services to some of the Company’s vessels. The Company has also entered into shipbuilding contracts with high standard shipbuilding yards in Poland and Germany. These subcontrac-tors are subject to review on an ongoing basis. The Company expects that all of its business partners have the same ap-proach to business dealing.
Improper paymentsThe Code of Conduct does also include policies on improper payments. The Com-pany does not tolerate any actions / pay-ments which could be viewed as improper payments.
No gift, hospitality or travel benefit may be offered to or requested or accepted from any third party if that benefit could be seen to be disproportionately generous or otherwise be seen as something which may induce or make the recipient feel obliged to reciprocate by way of improp-erly performing his or her function.
The Company and its directors, officers and employees will not accept any gift, hospitality or travel benefit either directly or indirectly from business partners, against making commitment, recom-mending or promoting a certain conduct or position by The Company or otherwise seek to gain personal benefit in relation to The Company’s business dealings.
Likewise, the Company does not itself offer inducements to anyone associated with business partners to promote a cer-tain conduct or position by such business partner.
The Company and any of its people shall not pay money or provide gifts, entertain-ment, hospitality or any other thing or ser-vice of value to any Government Official. This prohibition extends to payments to consultants, agents or other intermediar-
ies when the payer knows or has reason to believe that some part of the payment will be used to bribe or otherwise influence a public official.Political contributions are not authorized.
Corporate Social Responsibility The Company respects and promotes harmonious working relationship with the local communities where it operates, but refrains from participating in local politics. The Company seeks to foster a sustain-able business for its many stakeholders.
The Company is fully committed to comply with local laws and regulations throughout its global operations.
The Company is committed to employ local staff where applicable and possible in all countries where it is operating and conducting business. The Company is committed to providing equal opportunity and fair treatment to all individuals on the basis of merit, without discrimination on the grounds of race, colour, religion, national origin, sex, pregnancy, age, dis-ability, marital status or other characteris-tics protected by applicable law.
The Company is dedicated in creating a high-quality working environment under which its people respect and trust each other such that everyone acts in an honest, friendly and proactive way with a responsible attitude and high moral standards. The Company prohibits bully-ing and harassment in any form including sexual, racial, ethnic, and other forms of harassment.
At Christmas 2012 The Company donated funds to Jaynii Streetwise in Ghana. No funds have been donated in 2014. Jaynii Streetwise is a charity and non-govern-mental organization founded in Ghana by Jay Borquaye and Emmanuel (Nii) Quartey in the deprived area of Jamestown (Ac-cra) with the aim of improving the lives of children and youth. Jaynii Streetwise was born out of their Jaynii Cultural Troupe, a traditional music and dance group which
has performed at countless functions lo-cally and internationally.
Over time, Jaynii has identified the need to support ongoing efforts by government and civil society to keep children off the streets and in school. As a poor, margin-alized and deprived area, many children are found walking on the beach and in the streets during school hours. Most of these children come from very deprived homes. So far Jaynii has identified fifty children aged between 4 to 16 years who have been enrolled into the Streetwise Project, based at Jaynii Beach, a small stretch of beach just below the Jamestown light-house which is now their centre.
These 24 girls and 26 boys, who were spending their childhood walking aim-lessly on the Jamestown Beach, are now enrolled at schools in the communities- Accra Sempe Primary School in Classes 1 to 6 and St. Thomas Day Care Centre. Jaynii, without assistance from parents, buys them school uniforms, shoes, bags and exercise books and registers them in school. After school hours, the children go to Jaynii Beach where they get fed as well as get extra classes, homework help and afternoon activities and entertain-ment.During 2013 the Company has also donated funds for the funeral and family support of passed away gardener of the Company’s office in Ghana.
The Company has furthermore previously donated funds to Pro Criança Cardíaca in Rio de Janeiro, Brasil, a non-profit organization helping children with heart diseases. Pro Criança Cardíaca is a hospi-tal founded in 1996 by Cardiologist Doctor Celia Rose. The mission of the organiza-tion is to provide medical care to cardiac children focusing in cardiac surgery and any other procedure that requires high technology treatment to children. No funds have been donated in 2014.The Company has also made donations to the Norwegian Salvation Army, Rednings-selskapet and the street magazine “Klar”.

SIEM OFFSHORE INC., ANNUAL REPORT 2014100
N O T E S T O T H E A C C O U N T S

SIEM OFFSHORE INC., ANNUAL REPORT 2014 101

SIEM OFFSHORE INC., ANNUAL REPORT 2014102
Eystein Eriksrud Kristian Siem John C. Wallace
Chairman Director Director
(Sign.) (Sign.) (Sign.)
Michael Delouche David Mullen Terje Sørensen
Director Director Chief Executive Officer
(Sign.) (Sign.) (Sign.)
We confirm, to the best of our knowledge that the financial statements for the period 1 January to 31 December 2014 have been prepared in accordance with current applicable ac-counting standards, and give a true and fair view of the assets, liabilities, financial position and profit or loss of the entity and the group taken as a whole. We also confirm that the Board of Directors’ Report includes a true and fair review of the develop-ment and performance of the business and the position of the entity and the group, together with a description of the principal risks and uncertainties facing the entity and the group.
13 April 2015
RESPONSIBILITY STATEMENT

SIEM OFFSHORE INC., ANNUAL REPORT 2014 103
Eystein Eriksrud (born 1970), ChairMr. Eriksrud is the Deputy CEO of Siem Industries Inc., the Company’s main shareholder. He is further the chairman of Electromagnetic Geoservices ASA and a director of Subsea7 Inc. Prior to joining Siem Industries in October 2011, he was partner of the Norwegian law firm Wier-sholm Mellbye & Bech since 2005 work-ing as a business lawyer with an interna-tionally oriented practice in mergers and acquisitions, company law and securities law, particularly in the shipping, offshore and oil service sectors. He was Group Company Secretary of the Kvaerner Group from 2000-2002 and served as Group General Counsel of the Siem Industries Group from 2002-2005. He has served on the boards of Privatbanken ASA and Tinfos AS as well as a number of other boards. Eriksrud is a Norwegian citizen.
Kristian Siem (born 1949), Board memberMr. Siem is chairman of Siem Industries Inc., Subsea 7 S.A. and Siem Industrikapi-tal AB and a director of Siem Shipping Inc., Flensburger Schiffbau-Gesellschaft mbH & Co. KG, North Atlantic Smaller Compa-nies Investment Trust plc. and NKT Hold-ing A/S. Mr. Siem is a Norwegian citizen.
BOARD OF DIRECTORS
Michael Delouche (born 1957), Board memberMr. Delouche is the president and the secretary of Siem Industries Inc. and is in charge of the Company’s operations at the head office in George Town, Cayman Islands. He is a director of Siem Shipping Inc. and a former director of Subsea 7 Inc. Mr. Delouche received degrees in civil engineering (structural) and business and was previously an audit manager with KPMG Peat Marwick LLP. Mr. Delouche is a US citizen.
David Mullen (born 1958), Board memberDavid Mullen is the founder and CEO of Shelf Drilling, an international shallow water drilling contractor. Since the com-pany’s inception in November 2012, David has lead Shelf Drilling through a series of complex transactions in establishing Shelf Drilling with a fleet of 37 Jack-ups and 1 swamp barge and 2 new build rigs under construction. Prior to Shelf Drilling, David was CEO of Wellsteam Holdings PLC, a UK-listed company that designs, manu-factures and services subsea pipeline products. From 2008 - 2010, David served as CEO of Ocean Rig ASA, a Norway-listed ultra-deep water drilling contractor. Prior to 2008 David held executive manage-ment positions with Transocean and Schlumberger Limited, including a 23 year career with Schlumberger Limited.
John C. Wallace (born 1938), Board memberJohn C. Wallace is a Chartered Account-ant having qualified with Pricewaterhouse-Coopers in Canada in 1963, after which he joined Baring Brothers & Co., Limited in London, England. Prior to his retirement in 2010, he served for over twenty-five years as Chairman of Fred. Olsen Ltd., a London-based corporation that he joined in 1968 and which specializes in the busi-ness of shipping, renewable energy and property development. He received his B. Comm degree majoring in Accounting and Economics from McGill University in 1959. In November 2004, he successfully com-pleted the International Uniform Certified Public Accountant Qualification Examina-tion and has received a CPA Certificate from the State of Illinois. Mr. Wallace also retired from the board of directors of Ganger Rolf ASA and Bonheur ASA, Oslo, both publicly-traded shipping companies with interests in offshore energy services and renewable energy. He is a Director of Callon Petroleum Co , USA where he is Chairman of the Audit Committee. He was inducted as a 2011 Industry Pioneer by the Offshore Energy Centre in Houston. Mr. Wallace is a Canadian citizen.
The Company has a Board of five Directors. Members of the Company’s management are not members of the Board, but the company’s management does attend Board meetings.

SIEM OFFSHORE INC., ANNUAL REPORT 2014104
Siem Offshore Inc. will release financial figures on the following dates in 2015:
Q1 2015 Wednesday 20 May
Q2 2015 Thursday 20 August
Q3 2015 Thursday 29 October
The Annual General Meeting of the company will be held on Friday 1 May 2015.
FINANCIAL CALENDAR 2015

SIEM OFFSHORE INC., ANNUAL REPORT 2014 105
INN
OVEN
TI
SIEM OFFSHORE INC., ANNUAL REPORT 2014
Siem Offshore Inc
c/o Siem Offshore ASNodeviga 144610 KristiansandNorway
Postal address:P.O. Box 425N-4664 Kristiansand S, Norway
Telephone: +47 38 60 04 00
Telefax: +47 37 40 62 86
E-mail: [email protected]
www.siemoffshore.com