ANNUAL REPORT 2014 - DFM
66
ANNUAL REPORT 2014 www.dfm.ae
Transcript of ANNUAL REPORT 2014 - DFM

ANNUAL REPORT2014
www.dfm.ae


Dubai Financial Market, P.O.Box: 9700, Dubai UAE. T: +971 4 305 5555; F: +971 4 305 5566; E: [email protected] | www.dfm.ae
Dubai Financial Market (PJSC)
Annual Report 2014


H. H. Sheikh Mohammed bin Rashid Al MaktoumUAE Vice President, Prime Minister and Ruler of Dubai

Board of Directors
Rashid Hamad Al ShamsiVice Chairman
Musabbah Mohammed Al QaiziBoard Member
Ali Rashid Al MazroeiBoard Member
H. E. Essa Abdulfattah KazimChairman
Mohammed Humaid Al MariBoard Member
Adil Abdullah Al FahimBoard Member

Chairman’s Statement
DFM PJSC Financial Performance Summary
Macroeconomic Developments and Market Environment
DFM PJSC Strategy
DFM Strategic Achievements in 2014
DFM Performance in 2014
Corporate Governance Report for 2014
Fatwa and Shari’a Supervisory Board Report for 2014
Financial Statements
01
03
06
10
12
17
20
32
33
Table of Contents

Dubai Financial Market (PJSC)Annual Report 2014
1
Chairman’s Statement
Dear Shareholders,In the Name of Allah, the Most Passionate, Most Merciful
It is our pleasure as the Chairman, Board members and Senior Management team to present the eighth annual report of Dubai Financial Market (PJSC), which addresses the key developments experienced by your Company during the year 2014, and the financial statements for the year ended December 31, 2014. I have the pleasure to review with you the most important achievements of 2014, which contributed to realize the goals of the growth strategy in Dubai Financial Market.
We believe that 2014 was a turning-point year in DFM’s journey of progress in light of the huge successes and achievements realized by your Company in 2014. Such progress came as a direct result of the effectiveness and success of the growth strategy adopted and supervised by the Board. Our strategy has enhanced the leading position of DFM among the major financial markets worldwide, thanks to its integrated infrastructure, high standard regulations and wide diversity of services it provides to all participant segments.
A combined set of factors paved the way for the success of our strategy and translated many of its goals into concrete reality. The most important of such factors is the prosperity and stability that our country is blessed with by Almighty Allah under the wise leaders who turned it into an oasis of safety and an attractive destination, amid a region troubled with regional developments and cross-border implications. Furthermore, we saw strong performance by our robust national economy that has been maintaining an average growth rate of 4.2% since 2010; and is more likely expected to record higher growth rates ranging between 4.5% and 5% for the year 2014 and the years to come. Naturally, the favorable situation of our country had a positive impact on the performance of listed companies, and enhanced the confidence of and demand by the investors in the Market.
The following summarizes the key milestones of a year loaded with achievements and developments:
I. DFM boosted its attractiveness to local and foreign investors when the UAE was classified as a global emerging market by leading international agencies such as MSCI and S&P Dow Jones, as they realized that the UAE market has an integrated structure in line with international best practices. Furthermore, such development was a solid indication of the consensus among international investment institutions on the opportunities available in the UAE Market as evident in the net foreign investment flowing to the DFM market that amounted to approximately AED 4 billion during 2014.
II. The huge demand by investors to the UAE market was reflected on the trading values and volumes, as the daily average trading value grew by 136.7% rising to AED 1.5 billion, versus AED 642 million recorded in 2013. The total trading value for the year grew by 138.6% rising to AED 381.5 billion, versus AED 159.8 billion recorded in 2013. In the same context, the daily average number of traded shares grew by 25% recording 639.5 million shares a day in 2014 versus 510.7 million shares a day in 2013. These figures reflect the high liquidity of DFM and the increasing turnout of investors, noting that DFM attracted nearly 27,000 new investors during 2014.
III. In 2014, DFM ended a four-year period of drought during which the IPOs vanished from the Market due to the global financial crisis repercussions, and because companies tended to slow down their plans in this area. The Market has experienced an impressive revival of IPOs in 2014 by listing the shares of four new joint-stock companies: Marka, Emaar Malls, Amanat Holding,
“We believe that 2014 was a turning-point year in DFM’s journey of progress in light of the huge successes and achievements realized by your Company in 2014”
H. E. Essa Abdulfattah KazimChairman

Dubai Financial Market (PJSC)Annual Report 2014
2
Cor
pora
te G
over
nanc
e R
epor
t fo
r 20
14C
hairm
an’s
Sta
tem
ent
DFM
PJS
C F
inan
cial
Per
form
ance
Sum
mar
yM
acro
econ
omic
Dev
elop
men
ts
and
Mar
ket
Env
ironm
ent
DFM
PJS
C
Str
ateg
yD
FM P
erfo
rman
ce
in 2
014
Fatw
a an
d S
hari’
a S
uper
viso
ry
Boa
rd R
epor
t fo
r 20
14Fi
nanc
ial
Sta
tem
ents
DFM
Str
ateg
ic
Ach
ieve
men
ts in
201
4C
orpo
rate
Gov
erna
nce
Rep
ort
for
2014
Dubai Financial Market (PJSC)Annual Report 2014
2
Cha
irman
’s
Sta
tem
ent
DFM
PJS
C F
inan
cial
Per
form
ance
Sum
mar
yM
acro
econ
omic
Dev
elop
men
ts
and
Mar
ket
Env
ironm
ent
DFM
PJS
C
Str
ateg
yD
FM P
erfo
rman
ce
in 2
014
Fatw
a an
d S
hari’
a S
uper
viso
ry
Boa
rd R
epor
t fo
r 20
14Fi
nanc
ial
Sta
tem
ents
DFM
Str
ateg
ic
Ach
ieve
men
ts in
201
4
and Dubai Parks & Resorts. The total capital of these four companies is over AED 22 billion, while the value of capital funds raised through the initial public offering of their shares amounted to AED 6 billion. We estimate that such powerful return heralds active years for this sector in light of the presence of many companies that are qualified to carry out public offerings and list on the DFM. Additionally, the attraction of companies operating in fast-growing sectors that are not represented in the Market, including education, health, retail and entertainment sectors, is the best proof of the efficiency of DFM’s strategy in this regard. We sought, and continue to seek, to realize the best possible representation of the key economy sectors.
IV. The pace of DFM’s efforts during 2014 was accelerated to provide smart e-services to all participants. DFM works on the introduction of all electronic services within an ambitious project in progress, namely the “Smart Borse” project including smart phone applications and online e-services. This leading project has four key strategic goals: develop smart solutions, streamline procedures, build partnerships with governmental institutions and companies concerned with technology development, and develop research capacities that contribute to creating smart solutions.
V. DFM introduced in 2014 two Beta versions of the smart phone application and the new website, in addition to the IPO electronic platform (eIPO), which achieved great success when it was used to conduct the recent IPOs, because it allows investors to take part in the IPOs electronically through a direct link with the receiving banks. Furthermore, it allows prompt completion of surplus refund amounts, allocation and listing in just a few days after the subscription end period.
VI. In 2014, DFM expanded its services provided to listed companies, as it efficiently carried out cash dividend distribution on behalf of eight listed companies with a total value of AED 2.25 billion through various distribution channels, including the iVESTOR Card. Additionally, DFM managed four General Assembly meetings for listed companies.
VII. In the context of its persistent pursuit to strengthen relations between the listed companies and international investors, as well as to provide an effective platform to demonstrate business developments, achievements and growth plans of such companies, DFM organized two international investor roadshows; the first was held in London in April 2014 and the other was held in New York in October 2014. Both conferences were big news, a great success and saw a large number of participants from investment institutions and funds in the emerging markets, which demonstrate an increasing interest in our markets following the classification of the UAE as a global emerging market.
VIII. DFM intensified its efforts in 2014 to achieve the vision of H.H. Sheikh Mohammed bin Rashid Al Maktoum, UAE Vice President, Prime Minister and Ruler of Dubai, to develop Dubai into the world’s Capital of Islamic Economy. To this end, in April 2014, DFM issued the Standard for Issuing, Acquiring and Trading Sukuk, which provides a reference framework for issuers and investors. This Standard represents a significant addition that contributes to enhancing the growth of the Islamic finance sector. Moreover, DFM has currently embarked upon preparing a hedging standard that will complement, along with the Sukuk Standard and Shares Standard issued in 2007, DFM’s framework platform of investment in accordance with Islamic Shari’a. DFM’s efforts to encourage Sukuk issuers in the UAE and abroad to list their issues in Dubai’s capital market succeeded in moving the total value of Sukuk listed in Dubai up to AED 88 billion (US$ 24 billion) versus AED 33 billion (US$ 9
billion) before the launch of the initiative early in 2013.
As to the financial performance of DFM in 2014, your Company started to reap the results of the successful growth strategy adopted by the Board, which enhanced the competitiveness of DFM at many levels, contributing to the flow of liquidity, accelerating its activity, and clearly reflecting on the overall financial results. DFM recorded net profits of AED 759.3 million versus AED 284.6 million in 2013. Total revenues amounted to AED 936.7 million during the year, versus AED 453.1 million in 2013. Such revenues consisted of AED 879.7 million from operations and AED 57 million from investments and others.
Finally, on behalf of the Company, I wish to extend our sincere appreciation to H. H. Sheikh Mohammed bin Rashid Al Maktoum, UAE Vice President, Prime Minister and Ruler of Dubai for his generous support to DFM. I also extend my gratitude to the DFM Fatwa and Shari’a Supervisory Board, all participants and the team for their dedicated efforts to attain the desired goals. I also extend our appreciation and gratitude to the distinguished shareholders who trusted us, and we promise them to live up to such trust and not spare any efforts to achieve further success in the near future, God willing.
Thank you,
H. E. Essa Abdulfattah KazimChairmanDubai Financial Market (PJSC)

Dubai Financial Market (PJSC)Annual Report 2014
3
DFM PJSC Financial Performance Summary
The Dubai Financial Market (PJSC) recorded a net profit of AED 759.3 million for the year 2014, compared to AED 284.6 million in 2013. This was in the context of increased operational trading activity driven by improved investor confidence in 2014 and the listed companies’ performance as well as respective dividend yields, which positively affected trading values and volume. The total trading value for the year jumped by 138.6% rising to AED 381.5 billion.
1. Net Profit
• The DFM Company annual net profit for the financial year ending 31/12/2014 amounted to AED 759.3 million, compared to AED 284.6 million in 2013, marking an improvement of 167%.
• The DFM (without its subsidiary) realized a net profit of AED 758.3 million in 2014, compared to a profit of AED 291.5 million in 2013, marking an increase of 160%.
Net Profit (Loss) of the Company (AED million)
2010 2011 2012 2013 2014 %
Total revenues (AED million) 260.5 176.5 191 453.1 936.7 107%
Total expenses (AED million) 181.6 183.4 155.8 168.5 177.4 5%
Net profit (loss) (AED million) 78.9 (6.9) 35.2 284.6 759.3 167%
Net profit before depreciation, amortization and interest (AED million)
171 89.5 108.1 353.7 828.1 134%
Total assets (AED million) 7,914.9 7,698 7,711.6 8,292.40 9,002.1 9%
Total liabilities (AED million) 360.4 196 233.5 340.3 571.5 68%
Shareholders’ equity without minority interest (AED million)
7,523.2 7,479 7,457.9 7,935.30 8,413.3 6%
Share price (AED) 1.51 0.84 1.02 2.47 2.01 -19%
Earnings per share (AED) 0.01 (0.001) 0.004 0.036 0.095 167%
Return on average shareholders’ equity 1% (0.091%) 0.47% 3.7% 9.3% 151%
Return on average assets 0.98% (0.088%) 0.46% 3.6% 8.78% 147%
Profit margin 30% -4% 18% 63% 81% 29%
Dividend payout - - - 140% 74% -47%
Key Financial Indicators
800
700
600
500
400
300
200
100
0
-100
First Quarter Second Quarter Third Quarter Fourth Quarter Total
2010 2011 2012 2013 2014
53.6
27.2
-3 1.1
78.9
2.2 14.7
-9.3
-14.
5
-6.930
.5
10.2
1.7
-3.8 35
.2
27
69.5
82.8 10
5.3
284.
6
215.
1
252.
5
153.
5
138.
2
759.
3
Dubai Financial Market (PJSC)Annual Report 2014
4
Cor
pora
te G
over
nanc
e R
epor
t fo
r 20
14C
hairm
an’s
Sta
tem
ent
DFM
PJS
C F
inan
cial
Per
form
ance
Sum
mar
yM
acro
econ
omic
Dev
elop
men
ts
and
Mar
ket
Env
ironm
ent
DFM
PJS
C
Str
ateg
yD
FM P
erfo
rman
ce
in 2
014
Fatw
a an
d S
hari’
a S
uper
viso
ry
Boa
rd R
epor
t fo
r 20
14Fi
nanc
ial
Sta
tem
ents
DFM
Str
ateg
ic
Ach
ieve
men
ts in
201
4
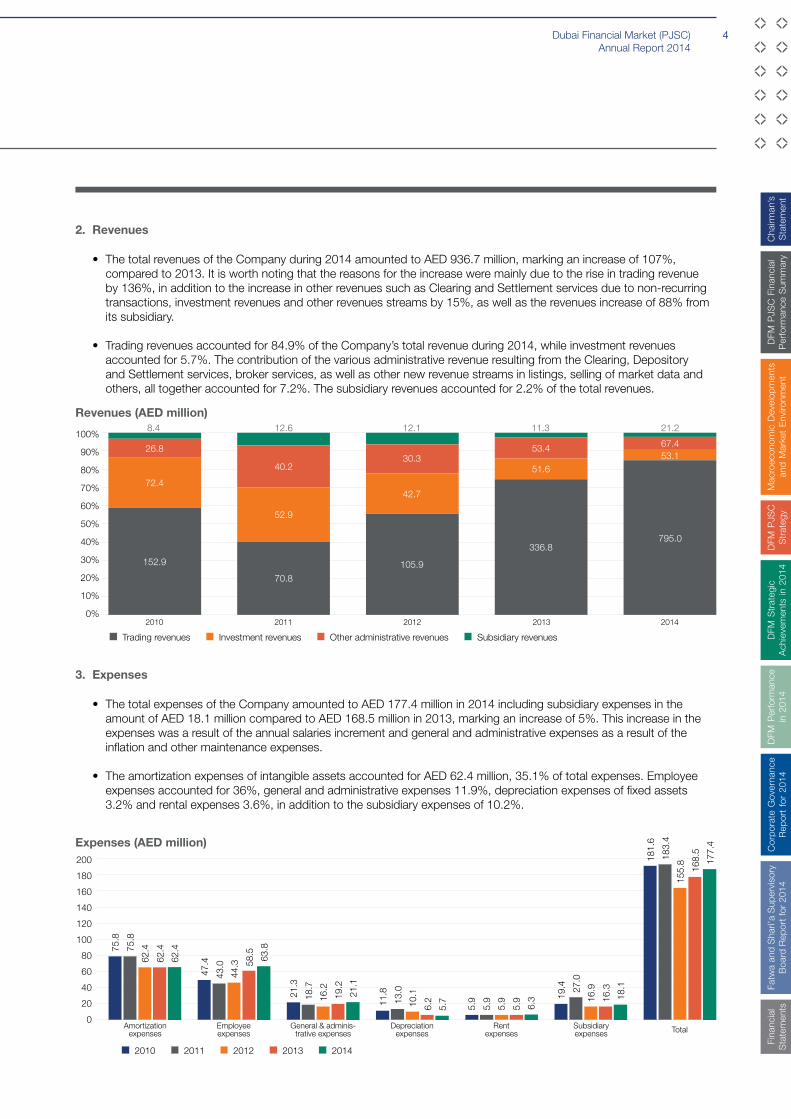
3. Expenses
• The total expenses of the Company amounted to AED 177.4 million in 2014 including subsidiary expenses in the amount of AED 18.1 million compared to AED 168.5 million in 2013, marking an increase of 5%. This increase in the expenses was a result of the annual salaries increment and general and administrative expenses as a result of the inflation and other maintenance expenses.
• The amortization expenses of intangible assets accounted for AED 62.4 million, 35.1% of total expenses. Employee expenses accounted for 36%, general and administrative expenses 11.9%, depreciation expenses of fixed assets 3.2% and rental expenses 3.6%, in addition to the subsidiary expenses of 10.2%.
2. Revenues
• The total revenues of the Company during 2014 amounted to AED 936.7 million, marking an increase of 107%, compared to 2013. It is worth noting that the reasons for the increase were mainly due to the rise in trading revenue by 136%, in addition to the increase in other revenues such as Clearing and Settlement services due to non-recurring transactions, investment revenues and other revenues streams by 15%, as well as the revenues increase of 88% from its subsidiary.
• Trading revenues accounted for 84.9% of the Company’s total revenue during 2014, while investment revenues accounted for 5.7%. The contribution of the various administrative revenue resulting from the Clearing, Depository and Settlement services, broker services, as well as other new revenue streams in listings, selling of market data and others, all together accounted for 7.2%. The subsidiary revenues accounted for 2.2% of the total revenues.
Revenues (AED million)
Expenses (AED million)
100%
90%
80%
70%
60%
50%
40%
30%
20%
10%
0%
Trading revenues Investment revenues Other administrative revenues Subsidiary revenues
2010 2011 2012 2013 2014
2010
Amortizationexpenses
Employeeexpenses
General & adminis-trative expenses
Depreciation expenses
Rentexpenses
Subsidiaryexpenses Total
2011 2012 2013 2014
70.8
105.9
42.7
30.3
336.8795.0
53.167.4
51.6
53.4
52.9
40.2
152.9
72.4
26.8
75.8
47.4
21.3
11.8
5.9 19
.4
181.
6
75.8
43.0
18.7
13.0
5.9
27.0
183.
4
62.4
44.3
16.2
10.1
5.9 16
.9
155.
8
62.4
58.5
19.2
6.2
5.9 16
.3
168.
5
62.4
63.8
21.1
5.7
6.3 18
.1
177.
4
12.68.4 12.1 11.3 21.2
200
180
160
140
120
100
80
60
40
20
0

Dubai Financial Market (PJSC)Annual Report 2014
5
FIRST EXCHANGE IN THE UAE Launched in 2000, the DFM has fast developed into a leading capital market across the region.
FIRST SHARI’A COMPLIANT EXCHANGE DFM has been operating according to Shari’a principles since 2007.
FIRST REGIONAL EXCHANGE TO BE PUBLICLY LISTED DFM is the first financial market to have offered its shares through an IPO in the Middle East.
FIRST ISLAMIC STANDARD FOR ISSUING, ACQUIRING & TRADING OF SHARES AND SUKUKDFM is constantly enhancing the regulatory environment of Islamic finance andcapital markets.
FIRST EXCHANGE TO DEVELOPeIPO PLATFORMA smart solution for IPO online subscription directly linked with receiving banks, enabling immediate listings after the IPO.
THE WORLD CLASSREGIONAL MARKETPLACE

Dubai Financial Market (PJSC)Annual Report 2014
6
Cor
pora
te G
over
nanc
e R
epor
t fo
r 20
14C
hairm
an’s
Sta
tem
ent
DFM
PJS
C F
inan
cial
Per
form
ance
Sum
mar
yM
acro
econ
omic
Dev
elop
men
ts
and
Mar
ket
Env
ironm
ent
DFM
PJS
C
Str
ateg
yD
FM P
erfo
rman
ce
in 2
014
Fatw
a an
d S
hari’
a S
uper
viso
ry
Boa
rd R
epor
t fo
r 20
14Fi
nanc
ial
Sta
tem
ents
DFM
Str
ateg
ic
Ach
ieve
men
ts in
201
4
Macroeconomic Developmentsand Market Environment
After the positive outlook that prevailed in early 2014 and optimism of improved global economic growth rates, especially in the developed countries, economic performance in most countries of the world was disappointing as of the second quarter, which necessitated revisiting the global economic growth forecasts, lowering it by 0.4 percentage points to 3.3%, the same growth achieved in 2013.
Such reassessment was made in light of the lower than expected economic performance in both the developed and “emerging and developing” economies as a result of the emergence of some risks that were not accounted for, most importantly the risk of expansion and severity of political tensions in many regions worldwide. Whilst the direct adverse impact of political tensions on the macroeconomic performance is still limited to the areas of conflict, the risks of spreading out to other countries cannot be ignored.
The latest available estimates indicate a slight improvement in the economic growth rate in the developed countries (from 1.4% in 2013 to 1.8% in 2014), as well as a minor slowdown in the growth rate of emerging and developing economies (from 4.7% to 4.4%). The divergence in growth rates was not limited to the two main groups of countries, but was noticed also among the countries within each group. At the level of developed countries, where the legacy pattern of boom and bust dominated their economic performance since the global financial crisis, estimates indicated improvement in the economic growth in the UK and some Euro Zone countries, especially Germany and Spain, while it indicated a decline in the Japanese economic growth and stability in the US economic growth. As for the countries with emerging and developing economies, it seems that they adapted to achieving growth rates less than the rates they recorded prior to the global economic crisis or those recorded during the recovery from the crisis. With the exception of India and the MENA countries, where estimates indicated higher economic growth rates in 2014 compared to the previous year, overall estimates indicated that economic growth will fall in the emerging and developing economies, especially in China, Latin America, and the Commonwealth of Independent States.
As to future forecasts, and notwithstanding the major challenges experienced in 2014, especially the rising severity and outspread of political tensions that prevailed in many regions worldwide, stimulating economic policies adopted by most countries started to pay off, particularly in the developed countries. The latest available forecasts show that the impact of these policies in 2015 will overcome the negative impact that may arise from challenges; and the result will be a rise in the growth rate of the global economy as well as both the developed economies and developing and emerging economies. The economic growth rate in the first group is expected to rise from 1.8% to 2.3% while in the other group, it is expected to rise from 4.4% to 5%.
Probably the most important factors supporting forecasts of improved economic growth rates in the developed countries is the continued efforts by these countries to adopt economic stimulating policies represented in flexible monetary policies and in mitigating strictly tightened fiscal policies.
As for the developing countries and countries of emerging economies, the improvement in growth rates will be supported by two sets of factors; the first is related to the unique status of each country while the second set emerges from global developments. The first set of factors includes the gradual mitigation of structural growth impairments in a number of developing countries, and the corrective exigencies of growth rates after they recorded levels well below the growth potentials in some countries. The second set of growth enabling factors, which are related to global developments, most prominently include the increased global demand arising from the improvement in economic growth rates in the
developed countries and the sharp decline in oil prices, which will reduce the burden on the budgets of oil-importing developing countries that will be able to direct a portion of their financial resources to investment and to stimulate local demand.
As for financial markets, the performance was positive in the vast majority of the financial markets in different countries, especially the countries of the region. During 2014, the stock exchange indices rose in 46 out of 62 WFE-member stock exchanges, while indices dropped in 15 stock exchanges. The Athens Exchange index recorded the sharpest decline at 28.9% while the Buenos Aires Stock Exchange index recorded the highest increase with 56.3%. The rise in share prices in the vast majority of the world stock exchanges reflected on the market value of such stock exchanges, where the market capitalization of stocks listed at the WFE-member stock exchanges rose from US$ 60.1 trillion by the end of 2013 to US$ 63.5 trillion by the end of 2014, marking an increase of 5.8%. The value of stocks traded in the WFE-member stock exchanges during 2014 amounted to US$78 trillion, marking an increase of 48.6% from its level recorded in the prior year.
In the UAE, the positive economic and investment climate still provides a solid driving force for the UAE economic performance for the third year in a row. On the one hand, the government maintained its commitment to continue its capital spending, especially on infrastructure projects, in accordance with previously approved plans and programs. In addition to the direct demand arising from capital expenditure, such commitment enhanced the confidence of the private sector in the growth trends of the national economy, encouraging it to take the initiative and expand its investment. On the other hand, the improvement in the financial and liquidity positions of banks operating in the UAE contributed to the provision of further flexibility to their credit policies. Accordingly, these banks continued

Dubai Financial Market (PJSC)Annual Report 2014
7
Macroeconomic Developmentsand Market Environment
the expansion of credit facilities at a faster pace compared to the prior year. With the increase in deposits with the banks operating in the UAE over the first eleven months of 2014 by approximately 11.5%, the banks managed to increase their credit facilities during the same period by 9.6% compared to a growth rate of 7.1% recorded during the same period of 2013. The bottom line is that such factors have collectively contributed to enhancing the performance of the national economy, where the latest available estimates indicate that the actual economic growth rate in the UAE during 2014 and 2015 will range between 4.5% and 5.0%.
Dubai was no exception, where the positive driving force marking the non-oil sectors for years continued to stimulate the economic growth in Dubai. According to the latest estimates, with a high degree of confidence, the real GDP growth in Dubai during 2014 is estimated to lie within the range expected for growth in the UAE (4.5% - 5.0%), which is the same level recorded for the past two years. One of the most significant observations that support these optimistic estimates of economic growth in Dubai is the continuous apparent activity in the real estate sector where the value of lands and properties sold during 2014, as registered with the Land Department, amounted to AED 112 billion. The year 2014 also witnessed the introduction of many real estate projects by the property developers. Moreover, a remarkable activity continued in the services sector in general and the trade sector, including its wholesale and retail branches, as well as tourism, transport, storage and communications in particular.
The performance of the UAE financial markets in the first half of 2014 continued its success realized in the prior year, placing them among the best financial markets worldwide in terms of performance. However, and similar to its impact on the vast majority of world exchanges, the sharp decline in oil prices during the last quarter of
the year have negatively affected the performance of the UAE’s stock exchanges. Nevertheless they ended the year recording a satisfactory positive performance. The Dubai Financial Market (DFM) General Index ended the year 2014 at 3774.0 points; recording an increase of 12%. Furthermore, the value of stocks traded on the DFM increased by 138.6%, amounting to AED 381.5 billion. The Abu Dhabi Securities Exchange index also recorded a growth rate of 5.6% in 2014, where the value of stocks traded amounted to AED 145.2 billion.
Future Outlook The DFM performance during 2014 and the attainment of a leading position worldwide was not a strike of luck but the outcome of confidence by local and global investors in the UAE markets on the one hand, and due to the ongoing initiatives in the area of developing the structural and legislative configuration of the market on the other hand. Regardless of the relatively high volatility the market had experienced during December 2014, and without ignoring the challenges facing financial markets in general, the DFM looks forward with optimism and expects the market to restore a reasonable level of activity during 2015. This optimism stems from a set of positive factors expected to contribute to the stimulation of the market activity, notably the following:
1. The UAE maintains an advanced position in terms of forecasted economic growth rates. Although international think tanks downgraded the projected economic growth rates in most of the developed and developing countries, they still confirm that the UAE national economy is qualified to continue growing at a relatively high rate, and that such growth in 2015 onward will be one of the highest growth rates at the regional and international level.
2. The UAE government is committed to the implementation of its already planned investment and construction projects, regardless of the recent developments in the world oil market. This commitment, which relies on the relatively huge financial reserves available to the government will, undoubtedly, enhance economic growth in the country, and help in restoring investors’ confidence in the UAE stock exchanges in a relatively short period, similar to what happened after the last global financial crisis.
3. Work on a number of initiatives and projects under the “Dubai: Capital of Islamic Economy” Strategy has come a long way, where some of these initiatives and projects are excepted to come into place in 2015, opening the door to broad prospects for the development and growth of Shari’a-compliant economic activities in Dubai and the UAE. The completion of such projects will promote foreign investment flows, a significant portion of which will be placed through the UAE financial markets, especially the DFM and NASDAQ Dubai.
4. The year 2014 also witnessed the active return of IPOs through the offering of shares for public subscription. The shares of four companies, namely: Marka, Emaar Malls, Amanat, and Dubai Parks, were offered and listed. The gross capital of these four companies amounts to AED 22.3 billion, out of which AED 6.12 billion were offered for public subscription. No doubt, the listing of these companies increases the investment opportunities available to DFM investors in addition to enhancing the diversity and depth of the structure of companies represented in the market by the entry of new sectors for the first time.
5. By the end of March 2014, Dubai launched a new integrated Shari’a-compliant Murabaha platform through the NASDAQ Dubai network to reinforce its position in the industry of Islamic economy. No doubt, this step will further promote the listing of Sukuk especially that the Islamic financial service sector is increasingly

Dubai Financial Market (PJSC)Annual Report 2014
8
Cor
pora
te G
over
nanc
e R
epor
t fo
r 20
14C
hairm
an’s
Sta
tem
ent
DFM
PJS
C F
inan
cial
Per
form
ance
Sum
mar
yM
acro
econ
omic
Dev
elop
men
ts
and
Mar
ket
Env
ironm
ent
DFM
PJS
C
Str
ateg
yD
FM P
erfo
rman
ce
in 2
014
Fatw
a an
d S
hari’
a S
uper
viso
ry
Boa
rd R
epor
t fo
r 20
14Fi
nanc
ial
Sta
tem
ents
DFM
Str
ateg
ic
Ach
ieve
men
ts in
201
4
becoming a key driving force with the ongoing improvement in economic conditions and the increased demand for Shari’a-compliant products, most importantly the Sukuk. This optimism is supported by the fact that during 2014, twelve Sukuk issues were listed on the DFM and NASDAQ Dubai, with a total value of US$ 8.8 billion.
6. In coordination and cooperation with the UAE stock exchanges, the Securities and Commodities Authority (SCA) launched the Second Market Platform for the listing and trading of shares of private shareholding companies. In addition to the fact that the introduction of this platform was a positive and important step towards the development of the UAE capital markets’ structure, its launch enhances the investment opportunities available and promotes transparency and efficiency in the pricing of such companies’ shares.
7. Internally the DFM continued the implementation of a group of new strategic initiatives to support the market structure to keep pace with international best practices and prepare the market for continuous operations and growth. The most significant initiatives include:
a. The approval and issuance of the Securities Lending and Borrowing Regulations at the end of January 2014.
b. The approval and issuance of the final draft of the DFM Standard for Issuing, Acquiring and Trading Sukuk, developed by the DFM Shari’a and Fatwa Supervisory Board, following a thorough study of the existing Sukuk standards and the Fatwas issued by trusted Fatwa bodies, as well as upon a close examination of all comments received on the first draft of the standard from various stakeholders and dealers.
c. The DFM approved 8 brokerage firms to practice Margin Trading.
d. The approval of 3 new brokerage firms to provide Direct Market Access (DMA) services, which allows external investors direct access to the brokerage firm account, and to buy or sell shares without the need for intervention by the relevant brokerage firm.
“During 2014, twelve Sukuk issues were listed on the DFM and NASDAQ Dubai, with a total value of US$ 8.8 billion.”

Dubai Financial Market (PJSC)Annual Report 2014
9
INTEGRITY
INNOVATION
CONFIDENTIALITY
EFFICIENCY
TRANSPARENCY
VISION
MISSION
“The World Class Regional Marketplace”
“To provide stakeholders with innovative services in conduct-ing trading, settlement and depository of securities, in an efficient, transparent and liquid environment”.
We believe the future depends onthe innovation we empower today.
We focus on building efficiency intoevery aspect of our operations.
We prioritise transparency acrossall our actions and decisions.
We conduct ourselves withunconditional integrity and ethics.
We accord the utmost confidentialityto our clients and their interests.

Dubai Financial Market (PJSC)Annual Report 2014
10
Cor
pora
te G
over
nanc
e R
epor
t fo
r 20
14C
hairm
an’s
Sta
tem
ent
DFM
PJS
C F
inan
cial
Per
form
ance
Sum
mar
yM
acro
econ
omic
Dev
elop
men
ts
and
Mar
ket
Env
ironm
ent
DFM
PJS
C
Str
ateg
yD
FM P
erfo
rman
ce
in 2
014
Fatw
a an
d S
hari’
a S
uper
viso
ry
Boa
rd R
epor
t fo
r 20
14Fi
nanc
ial
Sta
tem
ents
DFM
Str
ateg
ic
Ach
ieve
men
ts in
201
4
DFM PJSC Strategy
In 2011, the Board of Directors of Dubai Financial Market PJSC adopted a five-year strategic roadmap to drive growth, the fundamentals of which have been achieved in just four years.
The DFM Strategy 2015 stemmed from the vision and mission to strengthen its leading capital markets role.
The corporate culture of the DFM has been geared towards delivering the overall 2015 strategic objectives defined by DFM’s core values - integrity, efficiency, innovation, confidentiality and transparency.
Strategy 2015: The DFM’s continuous efforts to focus on delivering its 2015 strategy, has witnessed the fruits of its labor with the overachievement of numerous strategic initiatives delivered a year earlier of the projected target.
By 2014, the DFM has successfully diversified its revenue streams, developed and supplied innovative products and services, built a strong potential IPO pipeline supported by a number of issuer services for those willing to list, in addition to tremendous growth in trading activity, resulting in increased revenue and growth in shareholder-value.
The ongoing development efforts of the market infrastructure was further reflected with the upgrade of the market to “Emerging Market” status during 2014.
Summary of key achievements of the DFM Strategy 2015 include:
STRATEGIC VISION
MARKET INFRASTRUCTURE
SUPPLY(Equity Listings &
Financial instruments)
SERVICES(Innovative customer-
centric services)
DEMAND(Market access,
members & investors)STAKEHOLDER
VALUE
iVESTOR Card
Dividend distribution & smart AGM Services
eIPO Online Subscription Platform
New IPO Equity Listings
New Delivery v Payment (DVP)
New Securities, Lending & Borrowing (SLB)
Achieved G30 Compliance
MSCI Upgrade to “Emerging Market” Status
Shari’a Standards in Acquiring and Trading of Shares & Sukuk
eBroker Services
New eServices Portal
eSAR Issuer Service
Online Advertising
EFSAH Online Disclosure
eReports & Stock Portfolio
Direct Market Access (DMA)
DFM International investor roadshows
Expanded investor base with increased market activity and new IPOs
DFM Mobile Application
New enhanced DFM Website

Dubai Financial Market (PJSC)Annual Report 2014
11

Dubai Financial Market (PJSC)Annual Report 2014
12
Cor
pora
te G
over
nanc
e R
epor
t fo
r 20
14C
hairm
an’s
Sta
tem
ent
DFM
PJS
C F
inan
cial
Per
form
ance
Sum
mar
yM
acro
econ
omic
Dev
elop
men
ts
and
Mar
ket
Env
ironm
ent
DFM
PJS
C
Str
ateg
yD
FM P
erfo
rman
ce
in 2
014
Fatw
a an
d S
hari’
a S
uper
viso
ry
Boa
rd R
epor
t fo
r 20
14Fi
nanc
ial
Sta
tem
ents
DFM
Str
ateg
ic
Ach
ieve
men
ts in
201
4
DFM Strategic Achievements in 2014
A. World-Class Infrastructure
1. Issue of Securities Lending and Borrowing (SLB) Rules The Dubai Financial Market (DFM) issued in 2014 Securities Lending and
Borrowing Rules (SLB), as part of its continuous efforts to enhance the market infrastructure in line with international best practices. The SLB Rules were implemented during the first quarter of 2014, contingent on the readiness of market customers.
DFM’s model of SLB allows foreign securities lenders and borrowers to arrange for lending transactions based on practices applicable in international markets provided that they shall instruct their approved local Lending/Borrowing Agents to transfer the lent securities. However, local lending and borrowing business will be undertaken by approved Lending/Borrowing Agents, who can either be local brokers, local custodians or any entities as may be approved by the Securities and Commodities Authority (SCA). In the initial phase, securities lending and borrowing activities will be limited to Market Making activities and the settlement of unclosed transactions within the Delivery versus Payment (DvP) process.
The application of SLB Rules is a significant development for the market as it represents a key component of the infrastructure required to develop other instruments, including but not limited to Exchange-Traded Funds (ETFs) in the manner that will help diversify the range of products to be offered in the market and enhance the attraction of investments.
2. Application of the Pre-Closing Session Process In 2014, the DFM implemented the Pre-Closing Session Process to
determine the closing price of securities traded. This step comes in line with the DFM’s constant efforts to further enhance market infrastructure in line with international best practices in this area, noting that this mechanism is implemented in the majority of global developed exchanges. The Pre-Closing Session is timely introduced ahead of the upgrading of the UAE to MSCI’s Emerging Market category where a considerable segment of investment institutions, especially the so-called passive investors who rely on the index as a basis to distribute the assets of the investment portfolio. Hence, this process will attract such institutions and facilitate their business as it helps make the closing prices more logical and more convincing because it eliminates the effect of last trade price. Consequently, it makes the investment portfolio valuation by investors to be founded on more accurate and objective information.
It is worth noting that the Pre-Closing Session runs for 10 minutes from 01:50 to 02:00 p.m. It was implemented following intensive coordination and arrangements with the brokerage companies. The Pre-Closing Session enables brokers to place orders at the price per-defined by the investor so that orders are accumulated for execution by the market closing at 02.00 p.m. at a unified price that represents the average prices listed in the purchase and sale orders. The execution price is the closing price of the share.
3. Final Version of the Sukuk Issuing, Acquiring and Trading Standard Towards the completion of the Islamic finance standards system, and to
further establish Dubai’s position as the Capital of Islamic Economy, the DFM issued the final version of the “Standard for Issuing, Acquiring, and Trading Sukuk”, which is the first of its kind and the only integrated standard in this area. The issuing of this Standard is in line with the DFM’s continuous
efforts to enhance the standard frameworks applicable in the Islamic finance area and in the capital markets. The Sukuk Standard supplements and integrates with the Standard for Issuing, Acquiring, and Trading Shares issued by the DFM in 2007 following its transformation to the first capital market compatible with Islamic Shari’a worldwide, which contributed to attracting a large number of investors wishing to invest in Islamic financial instruments.
The Sukuk Issuing, Acquiring and Trading Standard is the outcome of intensive efforts and outstanding contributions of members of the DFM Shari’a and Fatwa Supervisory Board and Islamic finance experts who participated in the presentation session held by DFM and attended by many experts and participants in the area of Islamic financial services who demonstrated significant interaction with the Standard and presented many suggestions that were taken into consideration which led to issuing a highly comprehensive final version.
Furthermore, this Standard, being so comprehensive, will serve as the basic reference for the Islamic financial institutions, issuers and investors in the Sukuk area worldwide. It will encourage the issue of Sukuk instead of traditional bonds and will open the door for more creative financial instruments compatible with the Islamic Shari’a.
4. Approving Financial Brokerage Firms to Practice Margin Trading
The number of brokerage companies approved by the DFM to practice margin trading in the market increased to twenty-four. The DFM added 13 new brokerage firms to the list of margin trading brokers during 2014. Margin trading

Dubai Financial Market (PJSC)Annual Report 2014
13
DFM Strategic Achievements in 2014
allows brokerage firms to finance a portion of their clients’ investments in securities under the guarantee of such securities or any other guarantee in the cases exclusively listed in the decision of the Securities and Commodities Authority (SCA) on margin trading.
The total value of margin trading amounted to AED 153.4 billion in 2014, representing 20.6% of total value of shares traded in the market compared to AED 18.3 billion, representing 5.7% of the value of shares traded in the market in 2013.
5. Approval of New Brokerage Firms to Practice Direct Market Access (DMA)
In 2014, DFM approved three new brokerage companies to practice Direct Market Access in the market upon fulfillment of all requirements to add this activity to the list of services provided by such companies. The number of brokerage companies providing this service increased to nine. The DMA service allows brokerage companies to authorize one of the international brokers to execute sale and purchase orders directly in the DFM through a package of DMA programs allocated for the brokerage company as a form of online trading, which means that international brokers can trade directly in the market. This step reflects the increasing interest by international investors to invest in securities listed on the DFM.
6. Registration of Suppliers to Provide Electronic Services to Brokerage Firms
A new company was approved and added in 2014 to the list of licensed companies to provide e-services to brokerage firms, raising the number of companies providing such service to three. The service aims at regulating the process of providing order management systems and electronic trading solutions by
technology suppliers to DFM-approved brokerage companies in line with DFM’s efforts to promote excellence in the level of information technology services at brokerage companies, which positively reflects on investors.
7. Registration of Locally Listed Companies on the Electronic Disclosure System
Four locally listed companies were approved for addition on the Electronic Disclosure System “EFSAH”, an advanced and secure application that allows the public joint stock companies listed on the market to provide the highest level of efficiency and speed in publishing disclosures. Thus, all local listed companies were transferred to the electronic environment for disclosures, which represents a forward step in enhancing the efficiency and speed of disclosure compared to the previous approach where listed companies used to direct their disclosures to the market either by electronic mail or fax so that the market can re-publish and re-circulate them to the various stakeholders.
8. Contributing to Legislations and Laws Issued by SCA DFM played an effective role during 2014 with respect to the various
laws and legislations passed by the SCA in order to develop and regulate work-flows and transactions towards the best interest of the business and participants. Some of the key legislations and regulations include but are not limited to the launch of the Second Market as a trading platform for the private shareholding companies, Regulations on Brokers, Regulations on Covered Warrants, the Regulations on Sukuk, Regulations on Bonds, Regulations on Investment Management, as well as improvements to the margin trading regulations.
As part of DFM’s efforts to enhance its infrastructure according to international best practices, the market issued the following: settlement procedures on the Short Selling Regulation for Market Makers and DVP fail trades, new Regulation for Classification of Brokerage Companies, risk management policies for CSD operations and issued procedures for settlement of Rights Issues.
9. Strengthening Cooperation Ties with Regional and International Exchanges
As part of its efforts to promote cooperation and operational bonds with regional exchanges in general, and the GCC exchanges in particular, in 2014 DFM signed a memorandum of understanding with Bahrain Bourse (BHB) setting the framework for a qualitative shift at the level of stock transfers between the two exchanges through an electronic system that allows investors to transfer shares simply and swiftly. Both parties agreed to introduce an electronic system to be launched during the second half of 2015 to conduct stock transfers during the official working hours in both exchanges.
The electronic system will allow prompt execution of stock transfers between the DFM and BHB and will immediately confirm and approve such transfers in the system without the need for any official correspondence. This step will be the second of its kind as the DFM has been providing similar facilities with the Kuwait Clearing Company since 2013, which enhances DFM’s leading position as the preferred destination for GCC companies wishing to list their shares under the Dual Listing system.
On the other hand, DFM signed a memorandum of understanding with Korea Securities Depository (KSD) in the context of DFM’s efforts to
Dubai Financial Market (PJSC)Annual Report 2014
14
Cor
pora
te G
over
nanc
e R
epor
t fo
r 20
14C
hairm
an’s
Sta
tem
ent
DFM
PJS
C F
inan
cial
Per
form
ance
Sum
mar
yM
acro
econ
omic
Dev
elop
men
ts
and
Mar
ket
Env
ironm
ent
DFM
PJS
C
Str
ateg
yD
FM P
erfo
rman
ce
in 2
014
Fatw
a an
d S
hari’
a S
uper
viso
ry
Boa
rd R
epor
t fo
r 20
14Fi
nanc
ial
Sta
tem
ents
DFM
Str
ateg
ic
Ach
ieve
men
ts in
201
4
consolidate cooperation ties with the Korean company and expand its efforts aimed at developing the post-trade operations’ infrastructure in both the UAE and South Korea. Furthermore, DFM signed a mutual cooperation agreement with Misr for Central Clearing, Depository and Registry (MCDR) aiming to open new horizons for the companies listed on the DFM and Egyptian Exchange to benefit from the many advantages provided by both parties, in addition to promoting closer mutual cooperation in many areas including: dual or multi listing of securities, expertise in areas related to capital markets, and most importantly training, improving the proficiency and developing the skills of capital market employees and participants in both countries.
B. Launch of Digital Services to allow smooth and effective communication with DFM
DFM has embarked upon implementing the Smart Borse project in line with the vision of prudent leadership to turn Dubai into a smart city, and to cope with the increasing needs of customers. In this context, DFM seeks to accommodate all e-services that have been recently developed, including DFM smartphone applications and online services provided via the website as part of a smart and integrated interactive platform to be regularly developed and enhanced. The Smart Borse project has four key strategic objectives, including the development of smart solutions, streamlining of procedures, development of a partnership network with government institutions and companies concerned with technological advancement, and development of extensive research capabilities that help create smart solutions. In this context, the year 2014 has witnessed many development initiatives in the area of smart digital services including:
1. The Launch of the Pilot Version of DFM Smartphone Application DFM introduced the pilot version of its new smartphone application that
allows all traders access to review the stock portfolio details including the volume and value, as well as the charts relating to the portfolio performance in general, in addition to the latest market developments including price movement, indices, disclosures and news. Users can receive updates and data customized to their personal preferences. The application also includes introductory guides about DFM services and enables the users to perform real time communication with DFM and present their comments and opinions easily and safely.
It is worth noting that there has been an increasing demand by investors for such applications to follow up market activity and carry out trades. Trading via smartphone applications, provided by brokerage firms operating in the market, saw increasing demand. The total value of trades through smartphone amounted to AED 3.08 billion during 2014. They are expected to gain greater momentum over the coming stage as more companies provide this service.
2. Launch of DFM Website Demo The pilot version was launched on the new website of DFM in order to
enable investors to follow up real time data through multiple lists, determine their preferred stocks and monitor market depth so that they can make well-informed investment decisions, and allows users to follow up their investment portfolio and have access to the charts that explain the status of their investments in the market.
3. The IPO Platform (eIPO) The smart eIPO platform was
highly successful when used to conduct the IPOs of Marka and Emaar Malls. The eIPO enables investors to easily take part in initial public offerings through a direct link with the receiving banks and to pay due amounts through ATMs, online banking services, and iVESTOR card with ease and safety using the highest levels of security and confidentiality. It also enables the swift refund of excess money, allocation and listing a few days after the end of the IPO.
4. Integrated Solutions for General Assembly Management
DFM also introduced the electronic platform for registration in general assemblies, through which DFM provides listed companies and investors with an effective solution to manage and organize the events of general assemblies and facilitate the registration of shareholders, voting, and board of director’s elections. The platform also ensures accurate voting and production of statistical and supporting reports for general assembly meetings.
C. Strong return of Equity Listings and supporting Companies’ efforts to present their success stories
1. Listing of Four New Companies
Throughout the past few years, the DFM Management has been working on re-energizing the IPO sector by encouraging family and private companies to convert into public joint stock companies through IPOs and listing on the market. The key strategic objective of DFM is to achieve better representation of the Dubai

Dubai Financial Market (PJSC)Annual Report 2014
15
DFM Strategic Achievements in 2014
economic structure in the market by attracting companies that are active in key and fast-growing sectors such as retail, tourism, health and education, in addition to assisting companies operating in such sectors to benefit from the potentials and advantages of the capital market in order to grow. The DFM has a successful track record in performing this role with companies in many other sectors such as real estate, banking, transport and communications.
In this regard, four new public joint-stock companies were listed in 2014. Marka was the first company to be listed on DFM through an IPO since 2009, and was the first issuer of securities that conducted an IPO through DFM’s eIPO using a direct link with the receiving banks.
The shares of Amanat Holding Company were also listed, making it the first IPO to be listed on DFM for a company operating in healthcare and education. According to a survey conducted by the DFM, the healthcare and education sectors were ranked amongst the highest three sectors that investors wish to see listed on DFM through IPOs.
Emaar Malls Group (PJSC) was also listed. The new listing enhances the DFM’s leading position as a preferred listing destination for many leading companies, locally and regionally. The Emaar Malls IPO was the biggest IPO of its kind in the UAE since 2007. The IPO was conducted via the DFM’s eIPO through a direct link with the receiving banks, which also allows investors to apply for subscription through different electronic channels including ATMs, electronic banking services and the iVESTOR card, which contributed for the first time to the swift listing of the company once the subscription was completed.
The Dubai Parks & Resorts
shares were listed by DFM as one of the first companies operating in the area of entertainment parks to offer its shares through an IPO and apply for listing on DFM, opening the door for local and international investors to take part in the remarkable success story of Dubai. The Emirate has firmly established its position over the past years as a key tourist destination attracting visitors from all over the world. Dubai received 11 million visitors in 2013 with a growth rate of 10.6%.
The consecutive IPOs and listings in DFM in 2014 involves many implications including the robustness of the key potentials of the national economy with its various sectors, the great confidence of investors in the future prospects whether at the macroeconomic level or corporate performance level. It also reflects the confidence of issuers and investors in DFM as a leading platform for interaction between investors and companies, not only at the local level but also across the borders of the UAE, thanks to its integrated infrastructure, superior technical systems and sophisticated services.
2. Providing an effective process for communication between listed companies and international investors:
DFM international roadshows represent an effective platform for communication between its listed companies and international institutional investors amid increased interest of global fund managers in the Dubai Financial Market. DFM always ensures promoting the relation between its listed companies and institutional investors, particularly exposing these companies to new investors who have never invested in local markets. Moreover, the DFM implements best practices amongst its listed companies so that they are fully prepared to deal with more diversified and sophisticated investors. In this context, the Dubai Financial Market has organized the following international investor roadshows which have been running since 2007 in a pioneering step among regional financial markets.
I. DFM International Investor Conference in London DFM organized its International Investor Conference on 28th – 29th of
April 2014 in London in collaboration with Goldman Sachs International, with the participation of 13 public joint-stock companies listed on DFM and NASDAQ Dubai. The Conference was part of DFM’s efforts to provide listed companies with the opportunity to regularly showcase their strategies and growth potentials.
II. DFM International Investor Conference in New York DFM also organized its 2nd International Investor Conference in New
York on 13th -14th October 2014 with co-sponsorship from the Bank of America Merrill Lynch, following the outstanding success and significant positive outcome of the last two conferences held in New York in 2013 and in London in April 2014, and in light of the increasing interest by investors in DFM.
The timing of this Conference was perfect with accelerated positive developments taking place in the market in terms of renewed momentum of the IPOs sector and active trading movement amid the enormous interest in DFM by local and international investors and the outstanding success of the last two investor conferences held in New York and London, which reflects the continued acceleration of developments and pace of growth of the market, listed companies and overall national economy.

Dubai Financial Market (PJSC)Annual Report 2014
16
Cor
pora
te G
over
nanc
e R
epor
t fo
r 20
14C
hairm
an’s
Sta
tem
ent
DFM
PJS
C F
inan
cial
Per
form
ance
Sum
mar
yM
acro
econ
omic
Dev
elop
men
ts
and
Mar
ket
Env
ironm
ent
DFM
PJS
C
Str
ateg
yD
FM P
erfo
rman
ce
in 2
014
Fatw
a an
d S
hari’
a S
uper
viso
ry
Boa
rd R
epor
t fo
r 20
14Fi
nanc
ial
Sta
tem
ents
DFM
Str
ateg
ic
Ach
ieve
men
ts in
201
4
D. Supporting Achievements
1. Opening the Educational Trading Floor at AUD DFM opened an educational trading floor at the American University of
Dubai, making it the fifth floor supported by DFM as part of its pioneering educational initiatives amongst the regional capital markets. The initiative reaffirmed DFM’s pioneering role in this area and in line with its established commitment to Corporate Social Responsibility (CSR).
DFM launched its first educational floor at HCT-Dubai Men’s College in early 2012. A similar floor was inaugurated at the American University in the Emirates (AUE) in December 2014. DFM also supports the educational floors at the University of Sharjah (men and women) in conjunction with the Securities and Commodities Authority (SCA). All these floors achieved outstanding success and were received well and commended by the students and supervisors for the many benefits they bring about in terms of disseminating the financial culture, blending academic aspects with practical reality, and providing the students with the opportunity of interactive learning.
2. Signing a MoU with CBL International Education Dubai Financial Market signed a memorandum of understanding with
CBL International Education in 2014. The MoU defined the key areas of cooperation. Accordingly, DFM became the gold partner of CBL International Education’s academic programs in Dubai. Through this partnership, DFM will present Dubai as the financial hub in the Middle East to all visiting delegates from CBL-associated study programs abroad.
3. Participation in the Earth Hour Campaign DFM participated in the Earth Hour Campaign by turning off all unnecessary
lights and electrical equipment at its premises between 8:30 and 9:30 p.m. on 29th March 2014. DFM’s participation in the Earth Hour demonstrates its commitment to CSR and the preservation of the environment by limiting power consumption as much as possible.
4. Organizing a ‘Flag Day’ Ceremony DFM organized a special ceremony marking the ‘Flag Day’, an initiative
launched by H. H. Sheikh Mohammed bin Rashid Al Maktoum, UAE Vice President, Prime Minister and Ruler of Dubai, to celebrate the UAE flag through a series of events with the participation of all UAE citizens and residents. The ‘Flag Day’ is an annual national event celebrated by the UAE people to mark the anniversary of H. H. Sheikh Khalifa Bin Zayed Al Nahyan assuming the Presidency of the UAE on the 3rd of November.
5. Celebrating the 43rd National Day DFM organized a special ceremony on the occasion of the 43rd National
Day of the United Arab Emirates, amid huge participation by market staff, employees of the approved brokerage companies, and investors present in the trading floor.
The DFM premises and its trading floor were decorated with the UAE Flag. The trading session was opened with the UAE national anthem. The ceremony included a heritage competition and folklore shows, as well as honoring the winners of the competition, which was launched by DFM during the Flag Day to provide DFM employees with the opportunity to express their views of “The Happiest Nation” concept through words and images.
6. The Stock Game Competition As part of its efforts to promote
the culture of investment among the new generations and develop their skills and financial capabilities, DFM organized the 12th session of its annual Stock Game Competition with the participation of 3,233 school and university students in the UAE and abroad, marking an increase of 35% compared to the previous session. Contestants from 40 educational institutions took part in the new session. Eight foreign educational institutions took part in the competition, including four institutions participating for the first time, namely the Kingdom University of Bahrain, the German-Jordanian University of Jordan, Indira Management Institute of India, and UNC-Chapel Hill of the USA.
It is worthy of mentioning that the previous eleven sessions attracted nearly 19,227 students representing 268 educational institutions.
7. Summer Internship Program DFM has organized the 2014
Summer Internship Program for UAE students with the participation of students representing many schools and universities in the UAE, where they received training for 6 working hours on a daily basis over four weeks from 8.00 a.m. until 02.00 p.m.
DFM has been organizing this training program on a regular basis as part of its commitment to its CSR, and in light of the enormous success achieved by the program one year after another.
The program included many training modules on the capital market, including brokerage, IT and market research. The trainees participated in the DFM Stock Game Competition.

Dubai Financial Market (PJSC)Annual Report 2014
17
The Dubai Financial Market General Index increased by 12% to 3774 points at the end of this year compared to 3369.8 points at the end of 2013. At the sectorial level, indexes of three out of the nine sectors represented on DFM ended the year in the green, with the Banking sector increasing the most by 32.3%, followed by the Real Estate and Construction sector by 17.6% and Industrial sector by 17.5%. The Services, Insurance, Telecommunication, Consumer Staples & Discretionary, Financial and Investment Services and Transportation indices were down 54.6%, 29.4%, 24.3%, 16.2%, 6.4% and 5.6% respectively.
The market capitalization increased at the end of this year by 24.3% amounting to AED 322.6 billion compared to AED 259.6 billion at the end of the previous year. The value of shares traded during this year reached AED 381.5 billion, compared to AED 159.9 billion recorded during 2013, up 138.6%. The number of shares traded increased by 26.2% to reach 160.5 billion shares during this year compared to 127.2 billion shares that were traded during last year. The number of transactions executed during this year was up 80.4% to reach 2.4 million compared to 1.3 million deals carried out during the previous year.
As for the sectors’ contribution to trading volumes, the Real Estate and Construction sector ranked first in terms of the traded value, to reach AED 243.3 billion, or 63.8% of the total traded value in the market. The Banking sector ranked second at AED 60.9 billion (16%), followed by the Financial and Investment Services sector with AED 50.2 billion (13.1%), the Transportation sector with AED 13.6 billion (3.6%), the Insurance sector with AED 4.7 billion (1.2%), the Services sector with AED 4.4 billion (1.1%), the Telecommunication sector with AED 3.4 billion (0.9%), and the Consumer Staples & Discretionary with 1 billion (0.3%).
“The value of shares traded during this year reached AED 381.5 billion, compared to AED 159.9 billion recorded during 2013, up 138.6%.” DFM General Index 2014
6,000.000
5,500.000
5,000.000
4,500.000
4,000.000
3,500.000
3,000.000
Janu
ary
Febr
uary
March
April
MayJu
ne July
Augus
t
Septem
ber
Octobe
r
Novem
ber
Decem
ber
DFM Performance in 2014
Dubai Financial Market (PJSC)Annual Report 2014
18
Cor
pora
te G
over
nanc
e R
epor
t fo
r 20
14C
hairm
an’s
Sta
tem
ent
DFM
PJS
C F
inan
cial
Per
form
ance
Sum
mar
yM
acro
econ
omic
Dev
elop
men
ts
and
Mar
ket
Env
ironm
ent
DFM
PJS
C
Str
ateg
yD
FM P
erfo
rman
ce
in 2
014
Fatw
a an
d S
hari’
a S
uper
viso
ry
Boa
rd R
epor
t fo
r 20
14Fi
nanc
ial
Sta
tem
ents
DFM
Str
ateg
ic
Ach
ieve
men
ts in
201
4
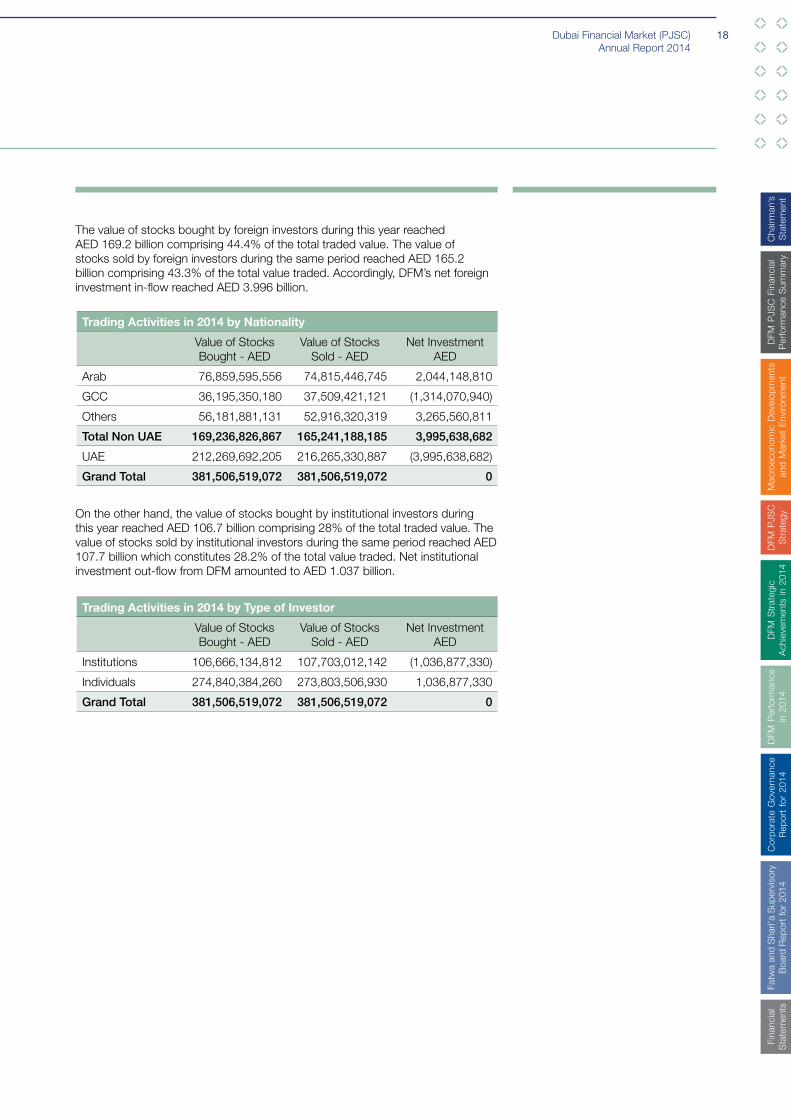
Trading Activities in 2014 by Nationality
Value of Stocks Bought - AED
Value of Stocks Sold - AED
Net Investment AED
Arab 76,859,595,556 74,815,446,745 2,044,148,810
GCC 36,195,350,180 37,509,421,121 (1,314,070,940)
Others 56,181,881,131 52,916,320,319 3,265,560,811
Total Non UAE 169,236,826,867 165,241,188,185 3,995,638,682
UAE 212,269,692,205 216,265,330,887 (3,995,638,682)
Grand Total 381,506,519,072 381,506,519,072 0
Trading Activities in 2014 by Type of Investor
Value of Stocks Bought - AED
Value of Stocks Sold - AED
Net Investment AED
Institutions 106,666,134,812 107,703,012,142 (1,036,877,330)
Individuals 274,840,384,260 273,803,506,930 1,036,877,330
Grand Total 381,506,519,072 381,506,519,072 0
On the other hand, the value of stocks bought by institutional investors during this year reached AED 106.7 billion comprising 28% of the total traded value. The value of stocks sold by institutional investors during the same period reached AED 107.7 billion which constitutes 28.2% of the total value traded. Net institutional investment out-flow from DFM amounted to AED 1.037 billion.
The value of stocks bought by foreign investors during this year reached AED 169.2 billion comprising 44.4% of the total traded value. The value of stocks sold by foreign investors during the same period reached AED 165.2 billion comprising 43.3% of the total value traded. Accordingly, DFM’s net foreign investment in-flow reached AED 3.996 billion.

Dubai Financial Market (PJSC)Annual Report 2014
19
Dubai Financial Market (PJSC)Annual Report 2014
20
Cor
pora
te G
over
nanc
e R
epor
t fo
r 20
14C
hairm
an’s
Sta
tem
ent
DFM
PJS
C F
inan
cial
Per
form
ance
Sum
mar
yM
acro
econ
omic
Dev
elop
men
ts
and
Mar
ket
Env
ironm
ent
DFM
PJS
C
Str
ateg
yD
FM P
erfo
rman
ce
in 2
014
Fatw
a an
d S
hari’
a S
uper
viso
ry
Boa
rd R
epor
t fo
r 20
14Fi
nanc
ial
Sta
tem
ents
DFM
Str
ateg
ic
Ach
ieve
men
ts in
201
4
Corporate Governance Report for 2014
1. Corporate Governance Practices
Pursuant to the responsibility of the Board of Directors towards shareholders and its duty to protect and promote the value of the shareholders’ equity, the management of Dubai Financial Market (DFM) has endeavored to apply the rules and principles of corporate governance set forth in the Ministerial Resolution No. 518 of 2009 in an effective and transparent manner. To this end, the DFM has ensured the following:
• The Board of Directors has complied with the requirement to hold 6 meetings during the year as per meeting calendar.
• The Board members have complied with the annual disclosure of their independence during 2014, and the disclosure of any change affecting their independence, including their membership on other boards.
• The Board members have complied with the requirement to disclose their trades and trades of their first-degree relatives in the shares of the DFM company.
• The Audit Committee held 5 meetings, the Nomination and Remuneration Committee held one meeting, and one meeting for the Investment Committee. The Committees performed their duties, submitted written reports to the Board of Directors on their results and recommendations and followed up with implementation.
• DFM has complied with the disclosure of the quarterly and annual financial statements within the legal timeline.
• DFM has already complied with the requirement to appoint an Investor Relations Officer and launched an investor relations website for the purpose.
• The Board reviewed and approved the authority matrix of the Executive Management.
• The Board reviewed the Governance Manual and adopted new risk management policies and procedures for operations and private listing and trading rules on 11/12/2014, market making rules on 23/4/2013, updates on investment policy on 27/10/2010, human resources on 11/12/2014 and other polices during the year.
• Launched a board satisfaction online survey that evaluates how the board functions. The survey is developed by an independent company and covers issues like preparation for meeting, agenda, material of discussion, running the meeting, minutes of the meeting, follow up on resolutions, board committees, awareness, communication and interaction with executive management, board secretary role, board web portal, learning and development. Results demonstrated that 93% of the board members are satisfied with the board performance. Such results are to be discussed in the board meeting.
2. Trading in the Company’s Shares by Board Members and their First-degree Relatives during 2014
The members of the Board of Directors comply with the provisions of Article 17 of the Cabinet Decision No (12) of 2000 concerning the regulations on the listing of securities and commodities, and the applicable policy concerning their trading in the Company’s shares as contained in the Company’s Market Control Procedures and Corporate Governance Guide by obtaining the required approvals from the regulatory authorities. They also comply with the period of ban on dealings stipulated in Article 14 of the Securities and Commodities Authority’s (SCA) regulations as to Trading, Clearing, Settlement, Transfer of Ownership and Custody of Securities. The Board members also undertake to disclose their trading and the trading of their first-degree relatives annually.
According to the Board members’ statements in January 2015, none of the board members, neither their first-degree relatives conducted trading on DFM shares during the year.
In addition to the approved policy pertaining to the Board members’ dealings, the Company adopts a policy for its employees’ trading in the shares of DFM listed companies (including the Company’s shares). Under the Administrative Decision No. 6 of 2012 issued by the Company’s Management, all DFM employees are regarded as insiders in the listed companies and are required to provide their own investor number and that of their minor children to the Human Resources Department. Any employee wishing to trade (in person or through a third party), must complete a special form prepared for this purpose and submit the completed form to the Market Control department for approval. The department shall, in turn, ensure that the request does not include any legal restraints, especially the period of ban on trading.

Dubai Financial Market (PJSC)Annual Report 2014
21
The period of ban on trading was specified under Article 14 of the SCA Regulations pertaining to Trading, Clearing, Settlement, Transfer of Ownership and Custody of Securities as follows:
• Ten (10) working days prior to disclosing any important information, which affects the share price, unless the information was a result of urgent and unexpected events.
• Fifteen (15) days prior to the end of the quarterly, half-yearly or annual financial period and until the financial statements are disclosed.
Without prejudice to Articles 14 and 17 above, the Company employees are permitted to trade in the Company›s shares for only 30 days after each period of ban. The brokerage firms were instructed to reject any transactions by the Company employees unless they had obtained the required approvals from the DFM Market Control department.
3. Formation of the Board of Directors
As per the Decree issued by HH Sheikh Mohammed bin Rashid Al Maktoum, UAE Vice President, Prime Minister of Dubai on 22/12/2013, the board consist of the following members:
Name TitleIndependent / Non Independent
Executive / Non Executive
Date of first election
Membership period from date of first election until 31/12/2014
*H. E. Essa Abdulfattah Kazim
ChairmanNon-Independent
Executive 16/01/2007 8 years
Rashid Hamad Al Shamsi
Vice Chairman Independent Non-Executive 16/01/2007 8 years
Mussabeh Mohammed Al Qaizi
Director Independent Non-Executive 22/12/2013 1 year
Ali Rashid Al Mazroei
Director Independent Non-Executive 21/04/20104 years and 8 months
Adil Abdullah Al Fahim
Director Independent Non-Executive 21/04/20104 years and 8 months
Mohammed Humaid Al Mari
Director Independent Non-Executive 21/04/20104 years and8 months
*As per the Decree issued by H. H. Sheikh Mohammed bin Rashid Al Maktoum, UAE Vice President, Prime Minister and Ruler of Dubai on 22/10/2013, H. E. Essa Kazim has been appointed as Chairman of DFM.
All the Board members are UAE citizens with the required expertise and skills as follows:
H. E. Essa Abdulfattah KazimH.E. Essa Kazim is Governor of the Dubai International Financial Centre (DIFC), Chairman of the Dubai Financial Market (DFM) and Member of the Dubai Supreme Fiscal Committee.
H.E. Kazim began his career at the UAE Central Bank in 1988 and moved to the Dubai Department of Economic Development as Director of Planning and Development in 1993. He was subsequently appointed as Director General of the DFM from 1999 to 2006.
H.E. Kazim holds an honorary Doctorate from Coe College, a Master’s degree in Economics from the University of Iowa, a Master’s degree in Total Quality Management from the University of Wollongong, and a Bachelor’s degree from Coe College.
H.E. Kazim currently sits on a number of official advisory committees and boards; he is a Member of the Higher Board of Directors of the Dubai International Financial Centre (DIFC), Chairman of the DIFC Authority Board of Directors, Chairman of the DIFC Investments Board of Directors, Board Member of the Dubai Economic Council, Board Member of NASDAQ Dubai, Board Member of Noor Bank, Board Member of NASDAQ, Board Member of Etisalat, and Member of the Board and Secretary General of the Dubai Islamic Economy Development Centre.
Essa Kazim also serves as a Board Member for a number of educational institutions, both in the region and around the world.
Corporate Governance Report for 2014

Dubai Financial Market (PJSC)Annual Report 2014
22
Cor
pora
te G
over
nanc
e R
epor
t fo
r 20
14C
hairm
an’s
Sta
tem
ent
DFM
PJS
C F
inan
cial
Per
form
ance
Sum
mar
yM
acro
econ
omic
Dev
elop
men
ts
and
Mar
ket
Env
ironm
ent
DFM
PJS
C
Str
ateg
yD
FM P
erfo
rman
ce
in 2
014
Fatw
a an
d S
hari’
a S
uper
viso
ry
Boa
rd R
epor
t fo
r 20
14Fi
nanc
ial
Sta
tem
ents
DFM
Str
ateg
ic
Ach
ieve
men
ts in
201
4
Rashid Hamad Al ShamsiMr. Rashid Hamad Al Shamsi is Vice Chairman of Dubai Financial Market since the year 2007.
Mr. Al Shamsi is the founding partner of MEECON, an architectural and engineering project management consultancy, and owner of Al Shamsi Property Management Company in Dubai. He graduated from the University of South Carolina, USA, with a Bachelor’s degree in Civil Engineering in 1982 and occupies / has occupied the following positions:
• Former Member of the Board of Directors of the Emirates General Transport Corporation.
• Former Member of the Board of Directors of Gulf Navigation (PJSC).• Member of the Board of Directors of NASDAQ Dubai.• Mr. Al Shamsi was actively engaged in the marketing and distribution of energy-
related products for over 22 years.• General Manager of Emirates General Petroleum Corporation (Emarat) from
2002 to 2008, chairing several Emarat joint ventures and subsidiary companies.• Former member of the Board of Directors of Dubai Chamber of Commerce and
Industry from 1991 to 1997.• Former member of the Board of Directors of Dubai Mercantile Exchange.• Former CEO of Sama Dubai, the international real estate development arm of
Dubai Holding.
Mohammed Humaid Al MariMr. Al Mari is a Financial and Administrative expert with more than 20 years of experience in both public and private sectors. He graduated from Mohammed Bin Rashid’s Program for Leadership Development, Government Leaders Category. He also holds an MBA from the American University in Dubai since 2004 and a Bachelor’s degree in Accounting from the United Arab Emirates University in Al Ain since 1990. Mr. Al Mari started his professional career as an employee at the Land Department in 1986 and holds / has held the following positions since then:
• Assistant CEO for Finance and Support Services at the Mohammed Bin Rashid Housing Establishment since August 2009.
• Founding Partner in Faris & Co. Public Accountants since 1995.• Member of Takaful Al Emarat PJSC Board of Directors since April 2012.• CFO at the Roads and Transport Authority from June 2006 to August 2009.• Assistant General Manager of the Dubai Transport Authority from March 2005
to June 2006.• Member of the Board of Directors of the Dubai Development Board from
December 2005 to April 2008.• CFO and CAO of the Land Department from November 2000 to March 2005.
Mr. Al Mari has the following professional memberships:• Certified Public Accountant since 1990.• Member of the UAE Accountants and Auditors Association since 1997.• Member of the Culture and Science Symposium in Dubai since its inception.• Honored with the Sheikh Rashid Award for Educational Excellence for
completing an MBA degree at the American University in Dubai.• Holds an Institutional Leadership Certificate from the Leadership and Learning
Center in Florida, USA.• NLP practitioner certified by Richard Bandler through the McClendon &
Associates Institute.• Holds a Self-Hypnosis Practitioner Diploma from Proud foot School of Clinical
Hypnosis and Psychotherapy.
Adil Abdullah Al FahimMr. Al Fahim has occupied many leadership positions in Dubai Government and obtained a number of academic and professional qualifications. He has graduated at the faculty of Commerce at the Ain Shams University in Cairo. A holder of the CPA (Certified Public Accountant, USA), CFE (Certified Fraud Examiner, USA), CFC (Certified Financial Consultant, Canada) and ACL (Audit Command Language) Certified Trainer Qualifications.
He is the Winner of the Financial Thought Leader MENA for the year 2012. Recipient of the IIA Lifetime Achievement Award (2013) from the Institute of Internal Auditors. He has articles discussing major economic events affecting global economic development.
He holds / has held the following positions:• Member of the Dubai Government
“Planning & Budget Development and Automation Committee”.
• Member of the Dubai Government “Financial Planning Committee”.
• Member of the Board of Directors of “Dubai Financial Market”.
• Deputy CEO for financial affairs and procurement at Dubai Airports Company.
• Director of internal Audit at the Department of Finance, Dubai at H.H Ruler of Dubai Court.
• Deputy Director of Performance Control, Information Systems Audit and Training Department at H.H Ruler of Dubai Court.
• Director General of the UAE Accountants and Auditors Association (2000-2002)
• Member of the Board of Directors and President of the Conferences Committee in the UAE “Accountants and Auditors Associations” (2002-2004).
• President of the “American Institute of internal Auditors” (IIA) USA - Emirates Branch (2006-2007).
• Senior Vice President, “Internationally Certified Fraud Examiner” (CFE) USA - Emirates Branch.
• Member and Secretary of the UAE “Auditors’ Registration Committee”.

Dubai Financial Market (PJSC)Annual Report 2014
23
• UAE Representative of the AGCC “E-Commerce Committee”.
• Financial Expert & Arbitrator at Dubai Courts.
He also has the following Professional memberships:• Certified Public Accountant (CPA).• Certified Fraud Examiner (CFE).• Certified Financial Consultant (CFC) -
Canada.• Certified Audit Command Language
(ACL) Trainer – Belgium• Founding member of the UAE
Accountants and Auditors Association.
• Member of the Judges Assistant Category in the Experts list of technical consultants adopted by Dubai Courts.
• Information Systems Audit and Control Association (USA).
• Institute of Internal Audit (USA).• American Society for Quality (USA).• Association of Financial
Professionals in Hospitality and Technology Affairs for the Hotel Sector.
• The Canadian Association of Financial Consultants.
Ali Rashid Al MazroeiMr. Ali Al Mazroei is the Director & Group CFO of Bahri & Mazroei Trading Company. The group was established in 1968 in Dubai as general investments group and is currently one of the effective leading groups in the UAE. Mr. Al Mazroei undertakes administrative and financial affairs of the company’s activities in Commerce, Real Estate, Manufacturing, and Tourism & Travel. From 2000 to 2007, Mr. Al Mazroei held various functional and administrative positions at CitiBank Group in Dubai, as a Resident Vice President in the Financial Control Unit in Citibank, he headed the Planning & Analysis Dept for Middle East, Turkey, & Africa as well as Director of the SME Department.
Mr. Al Mazroei is also Member of the Board of Directors of Dubai Financial Market, National Bonds Corporation (P.S.C.), and Emirates Investment and Development (P.S.C.).
Mr. Al Mazroei holds a Bachelor in Business Administration from the American University in Dubai and Masters in Business Administration from Southern New Hampshire University, USA.
Musabbah Mohammed Al QaiziMr. Mussabeh Al Qaizi has over 20 years of hands-on experience, the majority of which were in the field of information technology where he supervised and directly managed several multi-tasked teams and individuals. He graduated with a Bachelor’s degree in Computer Information Systems from Arkansas University, USA, in 1991.
Mr. Al Qaizi holds / has held the following positions: • Head of E-Banking Services and IT at Dubai Islamic Bank as well as other
leadership positions such as member of the Board of Directors of the Islamic Financial Services (a subsidiary of Dubai Islamic Bank) and Member of the Automation Committee at the Dubai Islamic Bank, which plays a vital role in coordinating and aligning the bank’s comprehensive strategy with the latest IT developments.
• Managed the Dubai Ports Authority IT Department as Support Supervisor and subsequently as Head of the IT Department. Throughout his seven years of working at Dubai Ports World, he gained extensive hands-on experience and knowledge from dealing with the various functional departments thereof.
• Mr. Al Qaizi joined Dubai Islamic Bank in 1999 as Head of the Cards Unit which he developed in two years.
• Head of Information Systems Department at the Dubai Islamic Bank between 2001 and 2008. During this period, he was able to build and support the information systems infrastructure and hence gain wide ranging hands-on experience in project management at various banking levels.
• Since 2008, based within the E-Banking Operations Unit, Mr. Al Qaizi has been developing various channels to connect customers to the bank. In recognition of the great development, which he achieved in this field, his project was named Project of the Year for 2009, as well as Best Unique E-Banking System Project at Dubai Islamic Bank.
Remuneration of the Board members and allowances for attending the meetings of the Board and the Board CommitteesBy virtue of the provisions of Articles 33 and 67 of the Company’s Articles of Association, and in compliance with Article 118 of the Commercial Companies Law No. 8 of 1984 and its amendments, and Article 7 of the Ministerial Resolution No. 518, the Board of Directors’ remuneration is equal to 10% of the net profit of the DFM Company after the deduction of costs, expenses, and statutory legal reserve as well as distribution of dividends equal to 5% of the Company’s capital, subject to the approval of the Ordinary General Assembly. In its meeting on 08/01/2011, the Board of Directors set a remuneration of AED 300,000 per member after obtaining the shareholders approval during the General Assembly.During its meeting held on 26/2/2012, the Board has approved the recommendation submitted by the Nomination & Remuneration Committee regarding the Board and Committee meetings’ attendance allowance. The approved allowance is AED 15,000 for Board meetings and AED 6,000 for Committee meetings attendance in person and AED 2,000 for attending meetings via conference call or video conference. Furthermore, the board in the meeting held on 11/12/2014 and based on recommendations of Nomination & Remuneration committee in its meeting dated 11/11/2014 approved monthly allowances of AED 25,000 for the chairman for the additional tasks assigned to him.
The Board is proposing a total of AED 1,800,000 remuneration for the year 2014. (300,000 per director). A total amount of AED 663,000 was disbursed for attendance allowances, as follows:
Corporate Governance Report for 2014

Dubai Financial Market (PJSC)Annual Report 2014
24
Cor
pora
te G
over
nanc
e R
epor
t fo
r 20
14C
hairm
an’s
Sta
tem
ent
DFM
PJS
C F
inan
cial
Per
form
ance
Sum
mar
yM
acro
econ
omic
Dev
elop
men
ts
and
Mar
ket
Env
ironm
ent
DFM
PJS
C
Str
ateg
yD
FM P
erfo
rman
ce
in 2
014
Fatw
a an
d S
hari’
a S
uper
viso
ry
Boa
rd R
epor
t fo
r 20
14Fi
nanc
ial
Sta
tem
ents
DFM
Str
ateg
ic
Ach
ieve
men
ts in
201
4
Meeting Type BODAudit
Committee
Nomination & Remuneration
Committee
Investment Committee
Total
H. E. Essa Abdulfattah Kazim 90,000 6,000 96,000
Rashid Hamad Al Shamsi 90,000 6,000 6,000 102,000
*Abdul Jalil Yousuf Darwish 15,000 15,000
Mohammed Humaid Al Mari 90,000 30,000 120,000
*Mussabeh Mo-hammed Al Qaizi 75,000 75,000
*Majid Saif Al Ghurair 15,000 15,000
Ali Rashid Al Mazroei 90,000 24,000 6,000 120,000
Adil Abdullah Al Fahim 90,000 24,000 6,000 120,000
*Before the decree.The total amount of the chairman monthly allowances is AED 300,000.
Meetings of the Board of Directors during the Fiscal YearThe Board of Directors held 6 meetings during 2014 as follows:
Personal Attendance
Date of the Meeting
30/1/2014 16/3/2014 23/4/2016 17/7/2014 27/10/2014 11/12/2014
H. E. Essa Abdulfattah Kazim
Rashid Hamad Al Shamsi
*Abdul Jalil Yousuf Darwish
Mohammed Humaid Al Mari
*Mussabeh Mo-hammed Al Qaizi
*Majid Saif Al Ghurair
Ali Rashid Al Mazroei
Adil Abdullah Al Fahim
*Before the decree.
Duties and Functions Assigned by the Board of Directors to the Executive ManagementAs per the resolution of the Board, the Executive Management was assigned the following duties and functions:
• The CEO was authorized to represent the Company before the courts. His signature was authenticated by the notary public to sign agreements on behalf of the Chairman of the Board of Directors to facilitate the Company’s business.
• Prepare feasibility studies in relation to the Company’s projects.
• Develop internal policies and bylaws to regulate the work.
• Approve work procedures, administrative circulars and decisions governing the work environment.
• Form, change and dissolve executive committees.
• Approve the direct order purchasing authority up to AED 50,000 for the Head of Purchasing and Contracting, up to AED 250,000 for the Head of Corporate Services and up to AED 500,000 for CEO.
• Approve the authority of the CEO to contract through tendering up to AED 1 million.
• Approve the authority of the CEO to contract through limited or public bidding up to AED 5 million.
• It is the authority of the Head of Corporate Services to sign approved contracts up to AED 5 million in value and the authority of the CEO to sign approved contracts up to AED 50 million.
• The CEO and the head of the concerned sector have the authority to sign memorandums of understanding, limited representation agreements and sub-deposit agreements.
• The CEO has the authority to rent the market spaces and determine the rent value.
• The CEO approves the results of the annual fixed asset count.
• The decision to dispose of fully depreciated (retired) assets is taken by the CEO.
• It is the authority of the CEO to determine the service fees and

Dubai Financial Market (PJSC)Annual Report 2014
25
penalties, and to update the list of fees according to the market data.
• The head of the concerned sector has the authority to impose penalties / fines on brokerage firms.
• The Head of Corporate Services in conjunction with the head of the concerned sector have the authority to cancel the first violation, and the authority of the CEO to cancel the second violation.
• The Head of Corporate Services is authorized to write off receivables up to AED 20,000 in a year.
• The CEO is authorized to exempt investors, upon a request to be submitted by them, from the fees of services provided to them based on fixed percentage and depending on the transaction value.
• Head of CSD division authorized to exempt official and government entities from certain transaction fees.
• The CEO has the authority to invest in short-term deposits of unlimited amounts pursuant to recommendations from the Internal Investment Committee, including liquidating the deposit before its maturity.
• Invest in long-term investments (deposits) up to 50 million is within CEO authority in accordance with the Investment Committee recommendation and investment policy.
• In the event of incomplete quorum of a Board meeting, the CEO is authorized to sign the reviewed interim financial statements after their approval by the Audit Committee.
• The authority to sign cheques and bank transfers up to AED 50 million is within the responsibility of the Executive Management.
• Renewal of bank facilities with unlimited amount is within CEO authority.
• Transfer of allocated budget between different items is within CEO approval.
The Senior Executive Management of the Company consists of 5 senior management staff. The following table shows the names, positions, dates of appointment, gross salaries and allowances of the senior management staff in the Company:
Name PositionDate of Appointment
*Gross salaries and allowances paid in 2014 (AED)
Retirement & Social Security Contributions (AED)
Total Bonuses paid in 2014 (AED)
Hassan Abdul Rahman Al Serkal
Executive VicePresident – COO Head of Operations Division
01/06/1999 1,077,360 128,186 233,280
Maryam Mohammed Fikri
Executive Vice President - COO Head of Clearing, Settlement and Depository Division
01/06/1999 1,000,005 128,186 233,280
Ahmad MohammedAl Jaziri
Senior Vice President - Head of Corporate Services Division
01/06/1999 894,440 113,082 207,840
Jamal Ibrahim Al Khadhar
Senior Vice President - Head of Human Resources and Strategic Planning Division
01/06/1999 944,105 113,082 207,840
Fahima Abdul Razzaq Al Bastaki
Senior Vice President - Head of Business Development Division
22/05/2004 925,928 108,834 201,480
*Includes education allowance, tickets, and bonus.
Corporate Governance Report for 2014

Dubai Financial Market (PJSC)Annual Report 2014
26
Cor
pora
te G
over
nanc
e R
epor
t fo
r 20
14C
hairm
an’s
Sta
tem
ent
DFM
PJS
C F
inan
cial
Per
form
ance
Sum
mar
yM
acro
econ
omic
Dev
elop
men
ts
and
Mar
ket
Env
ironm
ent
DFM
PJS
C
Str
ateg
yD
FM P
erfo
rman
ce
in 2
014
Fatw
a an
d S
hari’
a S
uper
viso
ry
Boa
rd R
epor
t fo
r 20
14Fi
nanc
ial
Sta
tem
ents
DFM
Str
ateg
ic
Ach
ieve
men
ts in
201
4
Related Party TransactionsRelated parties comprise companies under common ownership or management, key management, businesses controlled by shareholders and directors as well as businesses over which they exercise significant influence. Key management personnel include the CEO and heads of various divisions. During the year, the Group entered into transactions with related parties in the ordinary course of business. These transactions were carried out at mutually agreed terms and conditions. The transactions with related parties and balances arising from these transactions are as follows:
2014AED’000
Compensation of key management personnel
Salaries and Short-term benefits 7,770
General pension and social security 721
Board of Directors
- Remuneration to the NASDAQ Board 943
- Meeting allowance for the Group Balances 1,339
Balances
Due from related parties
Parent
Investment deposits (Note 7) 50,452
Accrued income on investment deposits 552
Other related parties
Managed funds (Note 6) 286,776
Cash and bank balances 149,341
Investment deposits (Note 7) 1,447,092
Investment deposits include AED 100 million (31 December 2013: AED 50 million) placed as collateral with related parties.
Due to related parties
Parent
Expenses paid on behalf of the Group 5,482
Subordinated loan 23,282
Ultimate controlling party
Dubai Government -
Transactions during the year2014
AED’000
Investment income 18,404
Interest expense 1,014
The remuneration of directors and other members of key management during the period were as follows:
In the initial public offering in 2006, 20% of the share capital amounting to AED 1,600,000,000 was offered for public subscription for the credit of Dubai Government, of which AED 48.5 million due to Dubai Government was paid during the year. The balance did not bear any profit.
The subordinated loan has been provided by Borse Dubai Ltd., to NASDAQ Dubai Limited through the Company (Note 1). The subordinated loan is unsecured, has no fixed repayment date and bears interest at 12 month LIBOR plus 3.25% per annum and is subordinated to the rights of all other creditors of the subsidiary.
4. The External Auditor
PricewaterhouseCoopers is one of the major firms operating in the field of professional services. It consists of a network of companies operating in 158 countries, and employing more than 180,000 employees dedicated to providing audit, taxation and consulting services. The company was established in the Middle East more than forty years ago. It has offices in Bahrain, Egypt, Iraq, Jordan, Kuwait, Lebanon, Libya, Oman, Palestine, Qatar, Saudi Arabia, United Arab Emirates and Yemen, with more than 2,500 employees. The company has been operating in the United Arab Emirates for more than 30 years through its offices in Abu Dhabi, Dubai and Sharjah, which collectively have more than 700 partners, executive directors and employees.
Fees and costs of the audits and other services provided by the external auditorBased on the recommendations of the Audit Committee during its meeting held on 22/1/2014, the Board’s approval of the Audit Committee’s recommendations during its meeting held on 30/1/2014, and the shareholders approval during the Ordinary General Assembly held on 2/3/2014, PricewaterhouseCoopers was reappointed as auditor for the year

Dubai Financial Market (PJSC)Annual Report 2014
27
2014 for fees of AED 183,500. PwC was the auditor since 2012. No other external auditors were appointed for any services during 2014.
Moreover, PricewaterhouseCoopers was appointed as an external auditor for Borse Dubai (DFM’s parent company) for fees of AED 120,000 and for NASDAQ Dubai for fees of AED 130,000 for the year 2014.
5. The Audit Committee
The Audit Committee was reformed in accordance with the Board of Directors’ decision during its meetings held on 16/3/2014. The Audit Committee consists of the following members:
• Mohammad Humaid Al Mari - Chairman
• Ali Rashid Al Mazroei - Member• Adil Abdullah Al Fahim - Member
All the committee members are non-executive and independent as well as accounting and financial experts. In compliance with the Ministerial Resolution No. 518 of 2009 and pursuant to its mandated duties, the Audit Committee was assigned the following duties:
1. Implementing the policy related to contracting with an external auditor, monitoring their independence and discussing the nature and scope of the auditing process and reviewing the communications and action plan of the external auditor on 22/1/2014 and ensuring that the Finance Department and executive departments respond to the external auditor inquiries and requirements.
2. Monitoring the soundness of the company financial statements and reports (annual, semi-annual and quarterly) and reviewing them as part of its regular work during the year, with particular focus on the following:
• Highlighting items subject to Board assessment. • Significant adjustments resulting from the audit. • The assumption of going concern. • Complying with the accounting standards decided by the Authority. • Complying with the listing and disclosure rules as well as other legal
requirements related to the preparation of financial reports.
3. Meeting with the external auditor on a quarterly basis to discuss the quarterly and annual financial statements as well as the report submitted to the Senior Management.
4. Reviewing the Company’s financial control, internal control and risk management systems as well as efficiency of Internal Control Department, appointing required resources and approving internal audit plan prepared on the basis of risk approach related to each division / department of DFM and NASDAQ Dubai on 22/1/2014 and followed up on the plan progress on a quarterly basis.
5. Reviewing and enhancing the Company’s financial and accounting policies and procedures and operating risks procedures.
6. Coordinating with the Company’s Board of Directors and Executive Management, and discuss the reports of the Internal Control and Financial Control Department and follow up on the corrective actions on a quarterly basis.
7. Setting guidelines which enable the Company’s employees to confidentially report any possible violations in the financial reports, internal control or other issues, as well as the steps which allow the independent and fair investigation of such violations. The staff appointed for this purpose can be reached by email: [email protected], telephone: +971 4 305 5665 or fax: +971 4 305 5584.
8. Monitoring the Company’s compliance with the standards of professional behavior.
The Audit Committee held five meetings in 2014. The following table highlights the date of each meeting and the personal attendance:
Personal Attendance
Date of the Meeting
22/1/2014 20/4/2014 15/7/2014 21/10/2014 27/11/2014
Mohammed Humaid Al Mari
*Adil Abdullah Al Fahim -
*Ali Rashid Al Mazroei -
*Due to other commitments (Justified).
Corporate Governance Report for 2014

Dubai Financial Market (PJSC)Annual Report 2014
28
Cor
pora
te G
over
nanc
e R
epor
t fo
r 20
14C
hairm
an’s
Sta
tem
ent
DFM
PJS
C F
inan
cial
Per
form
ance
Sum
mar
yM
acro
econ
omic
Dev
elop
men
ts
and
Mar
ket
Env
ironm
ent
DFM
PJS
C
Str
ateg
yD
FM P
erfo
rman
ce
in 2
014
Fatw
a an
d S
hari’
a S
uper
viso
ry
Boa
rd R
epor
t fo
r 20
14Fi
nanc
ial
Sta
tem
ents
DFM
Str
ateg
ic
Ach
ieve
men
ts in
201
4
6. The Nomination and Remuneration Committee:
The Nomination and Remuneration Committee was reformed by virtue of the Board’s decision taken during its meetings held on 16/3/2014. It consists of the following non-executive and independent directors:
• Rashid Hamad Al Shamsi - Chairman• Adil Abdullah Al Fahim - Member• Ali Rashid Al Mazroei - Member
By virtue of Ministerial Resolution No. 518 and as per its duties, the Committee performed the following tasks:• Verified the independence of the DFM Board members for the year 2014
through forms which was completed and signed by each independent member.
• Endorsed Human Resources policies on 11/11/2014.• Verified that the remunerations and benefits granted to the Senior Executive
Management are reasonable and in line with the Company’s performance.• Assessed the performance appraisal and increment of the last year.• Determined the Company’s needs for competencies at the Senior Executive
Management level and employee level, and determined the basis for choosing them, as well as the employee training policy on 11/11/2014.
The Nomination and Remuneration Committee held one meeting during 2014 on 11/11/2014 with full quorum.
7. The Internal Control System:
a. The Board of Directors’ acknowledgment of its responsibility for the Internal Control System
The Board of Directors acknowledges its responsibility for the internal control system in the Company and for reviewing it and ensuring its effectiveness through the Internal Control Department (ICD). The ICD, in turn, submits regular reports in accordance with standard No. 2060 of international standards for the Professional Practice of Internal Auditing issued by the Institute of Internal Auditors in the USA to the Board of Directors and Executive Management on the objectives, authorities and responsibilities of the internal audit activity, as well as the achievements against the approved plan. The ICD also evaluates how adequate and effective are the internal control systems within the company and its subsidiaries.
b. Work Mechanism of the Internal Control Department: The Internal Control Department reports administratively to the Senior
Management of the Company, and functionally to the Board of Directors through the Audit Committee in such a manner to ensure its independence. In performing its duties, the ICD applies the latest international standards issued by the IIA of the USA as well as international best practices in the following areas:
• Preparing the department’s Balanced Scorecard in conformity with the Company’s strategic plan.
• Performing the required updates for the internal audit manual and charter to be consistent with the latest international standards as approved by the Audit Committee. In addition to creating workflow for the audit manual for simplicity of operation.
• Developing an audit plan based on the risks related to every sector / department / section in order to prioritize the sections with high risks. The plan is discussed with the CEO and approved by the Audit Committee and
Board of Directors. • At the end of each audit,
preparing an audit report for every audited department whereby the objectives, scope, methodology and findings of the audit are presented. The reports also evaluate the notes in terms of the risk levels, in addition to an extensive assessment of the audited sector or department according to the assessment matrix.
• Submitting to DFM and NASDAQ Dubai Audit Committees all the internal control and follow-up reports as well as the executive measures taken by the concerned department to enhance its internal control during the year. This enables the Audit Committees to assess the internal control of their respective companies and raise the necessary recommendations and decisions to the Board of Directors.
• 88% of the endorsed audit plan was implemented including financial audits, Shari’a audits, compliance with the rules, regulations and policies, and work procedures, as well as information security and risks.
• The ICD submitted a number of recommendations that have been agreed upon with the different audited sectors during 2014, whether at DFM or NASDAQ Dubai. Such recommendations helped in strengthening the internal control environment and minimized the risks in line with the internal audit objective of adding value to the company and its shareholders by improving the effectiveness and efficiency of corporate governance, risk management and control in the company.
• The ICD followed up on the implementation of corrective actions according to the reports issued by the internal and external auditors.
• The ICD prepared quality reports on assurances during the year to ensure the efficiency of the

Dubai Financial Market (PJSC)Annual Report 2014
29
completed audit assignments and the availability of permanent and temporary files for each assignment in line with international best practices.
• Coordinating with the external auditor, Financial Audit Department, quality auditors, as well as SCA inspectors.
• Offering consulting services with the aim of developing and improving work procedures in a manner which does not compromise the independence of the auditors, and in accordance with the stipulations of the work charter of the ICD.
• Monitoring the communication channels used for confidential reporting.
• Preparing the Corporate Governance Report for the year 2014 in light of the provisions of the Ministerial Resolution No. 518 circulated by the SCA.
The Internal Control Department comprises five qualified employees as follows:
Name: Asma Saeed LootahJob Title: Vice President - Secretary of the Board of Directors and Head of the Internal Control Department.
Qualifications:• Master of Finance from E. Philip
Saunders College of Business, Rochester Institute of Technology - May 2011.
• Certified Management Accountant (CMA) - February 2001.
• Certified Lead Quality Auditor in ISO 9001:2000 from IRCA - May 2004.
• Bachelor degree from the Higher Colleges of Technology - Dubai Women’s College - 2001.
• Higher Diploma in Accounting from the Higher Colleges of Technology - Dubai Women’s College - 2000.
• RIT Dubai Alumni President Chapter since March 2014
• Member of the AAA.• Member of the ICSA Gulf Forum.
The Internal Control Department is supported by a qualified team consisting of the following staff members:• Reda Farouq Shehata: Deputy Manager - Internal and Shari’a Section/
Internal Control, holder of CIB 2013, CRMA and CFC 2012, Higher Diploma in Financial Accounting from Ain Shams University - 2003, and a Bachelor’s degree in Accounting from Ain Shams University - 1998.
• Mohammad Ahmed Assaleh: Deputy Manager - Compliance Section/Internal Control, holds an ACCA certificate - 2009, CRMA - 2012 and a Bachelor’s degree in Accounting from Yarmouk University - 2003.
• Farah Hani Al Ananni: Senior Auditor / Internal Control, holder of CPA -2010 and a Bachelor’s degree in Accounting from Jordanian University – 2007.
• Khadijah Al Mazroei: Executive in Shari’a section, holder of Bachelor degree in finance from Al Ain University – 2012.
Handling any major problems in the Company or those disclosed in the annual reports and accountsThe Company was not subject to any significant risks during 2014; however, and pursuant to the ICD work guide, the Department deals with any problems the Company may face through the following process:• Determine the nature of the problem and classify it in terms of level of risk
through determining the size of the problem and its negative consequences that may affect the Company.
• Communicate with the respective departments through the heads of various divisions and the CEO to discuss the remedy and solution for the problem and make the necessary recommendations.
• Report the matter along with the related recommendations to the Audit Committee, which in turn, after discussion and assessment of the situation, forwards the matter to the Board of Directors to inform it about the problem and take the appropriate decision thereon.
• The Department follows up the implementation of the approved solution.• Communicate with the external auditor of the company, if required.
8. Since its inception and through 2014, the Company has not committed any violations.
9. DFM’s Corporate Social Responsibility in 2014
• Entering into cooperation agreements with the American University in the UAE and AUD, and CBL International to enhance the students’ knowledge and awareness in January.
• Launching Earth Hour Campaign in March.• Launching Health Day for the Company‘s employees and business partners in
May.• Organizing the 12th session of the DFM Student Stock Game in April.• Sponsoring Dubai International Holy Qur’an Award Ceremony in July.• Organizing UAE Sukya initiative in July.• Organizing the DFM Summer Stock Game for summer trainee students held
at DFM in August.• Organizing an Education Day in November.• Launching the initiation of “Why are we one of the happiest people in the
world?” in November.• Organizing the National Day event for DFM employees and brokers in
December.• Organizing the campaign of more power – more giving.• Providing free lectures: regularly organizing and preparing free technical and
financial workshops for students.
Corporate Governance Report for 2014
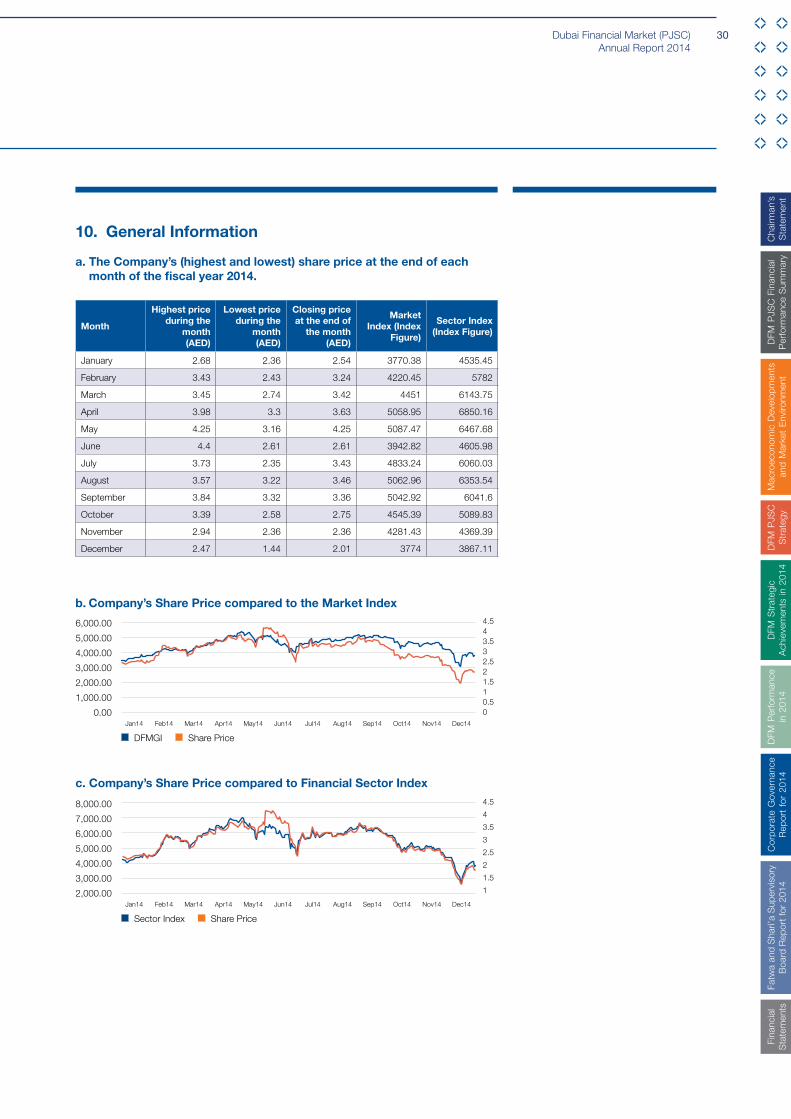
Dubai Financial Market (PJSC)Annual Report 2014
30
Cor
pora
te G
over
nanc
e R
epor
t fo
r 20
14C
hairm
an’s
Sta
tem
ent
DFM
PJS
C F
inan
cial
Per
form
ance
Sum
mar
yM
acro
econ
omic
Dev
elop
men
ts
and
Mar
ket
Env
ironm
ent
DFM
PJS
C
Str
ateg
yD
FM P
erfo
rman
ce
in 2
014
Fatw
a an
d S
hari’
a S
uper
viso
ry
Boa
rd R
epor
t fo
r 20
14Fi
nanc
ial
Sta
tem
ents
DFM
Str
ateg
ic
Ach
ieve
men
ts in
201
4
10. General Information
a. The Company’s (highest and lowest) share price at the end of each month of the fiscal year 2014.
Month
Highest price during the
month (AED)
Lowest price during the
month (AED)
Closing price at the end of
the month (AED)
Market Index (Index
Figure)
Sector Index (Index Figure)
January 2.68 2.36 2.54 3770.38 4535.45
February 3.43 2.43 3.24 4220.45 5782
March 3.45 2.74 3.42 4451 6143.75
April 3.98 3.3 3.63 5058.95 6850.16
May 4.25 3.16 4.25 5087.47 6467.68
June 4.4 2.61 2.61 3942.82 4605.98
July 3.73 2.35 3.43 4833.24 6060.03
August 3.57 3.22 3.46 5062.96 6353.54
September 3.84 3.32 3.36 5042.92 6041.6
October 3.39 2.58 2.75 4545.39 5089.83
November 2.94 2.36 2.36 4281.43 4369.39
December 2.47 1.44 2.01 3774 3867.11
b. Company’s Share Price compared to the Market Index
c. Company’s Share Price compared to Financial Sector Index
6,000.00
5,000.00
4,000.00
3,000.00
2,000.00
1,000.00
0.00
4.543.532.521.510.50
Jan14 Feb14 Mar14 Apr14 May14 Jun14 Jul14 Aug14 Sep14 Oct14 Nov14 Dec14
DFMGI Share Price
8,000.00
7,000.00
6,000.00
5,000.00
4,000.00
3,000.00
2,000.00
4.5
4
3.5
3
2.5
2
1.5
1
Jan14 Feb14 Mar14 Apr14 May14 Jun14 Jul14 Aug14 Sep14 Oct14 Nov14 Dec14
Sector Index Share Price

Dubai Financial Market (PJSC)Annual Report 2014
31
No Description Nationality Shares Ownership %
1 Company Arabic 5,357,698 0.067
2 Company Gulf 50,227,152 0.6279
3 Company Foreign 365,118,182 4.564
4 Company Local 6,807,450,992 85.0932
5 Government Local 3,579,363 0.0447
6 Government Foreign 714,216 0.0089
7 Individual Arabic 110,047,476 1.3756
8 Individual Gulf 28,071,646 0.3509
9 Individual Foreign 93,123,337 1.164
10 Individual Local 536,309,938 6.7039
d. Distribution of shareholders’ ownership according to the trading activities on 31/12/2014 and settlement thereof on 05/01/2015.
e. Borse Dubai owns 6,370,000,000 DFM shares, accounting for 79.63% of the Company’s shares.
f. No events that can be described as material occurred in the Company during 2014.
Essa Abdulfattah KazimChairman
2/2/2015
Corporate Governance Report for 2014
Dubai Financial Market (PJSC)Annual Report 2014
32
Cor
pora
te G
over
nanc
e R
epor
t fo
r 20
14C
hairm
an’s
Sta
tem
ent
DFM
PJS
C F
inan
cial
Per
form
ance
Sum
mar
yM
acro
econ
omic
Dev
elop
men
ts
and
Mar
ket
Env
ironm
ent
DFM
PJS
C
Str
ateg
yD
FM P
erfo
rman
ce
in 2
014
Fatw
a an
d S
hari’
a S
uper
viso
ry
Boa
rd R
epor
t fo
r 20
14Fi
nanc
ial
Sta
tem
ents
DFM
Str
ateg
ic
Ach
ieve
men
ts in
201
4
During 2014, the DFM Fatwa and Shari’a Supervisory Board conducted the following activities:
1. DFM Standards
1.1. The Fatwa and Shari’a Supervisory Board issued the DFM Sukuk Standard, after modifying it in light of the suggestions and remarks received from Shari’a, law, and economics scholars as well as bankers. The Board has supervised its translation and publication.
1.2. The Board has started the preliminary studies for issuing the DFM Standard for hedging, which is currently under active discussions among the Board members. Once finalized in form and content, a time will be set to hold a hearing session to be attended by a select group of Shari’a, law, finance and economics scholars.
2. Shari’a Auditing
The Fatwa and Shari’a Supervisory Board has reviewed the Shari’a auditing reports prepared by the Shari’a Auditing Section, which were presented on a quarterly basis. The Board has provided the necessary recommendations before their adoption.
3. Fatwas The Fatwa and Shari’a Supervisory Board has commented on all queries
raised during the year, whether from the DFM management or from other concerned external parties.
4. Companies Classification
The Board has reviewed and adopted the classifications of companies listed in both Dubai Financial Market and NASDAQ Dubai, by Shari’a compliance. Such classification is prepared as usual by the Shari’a Auditing Section in accordance with the DFM Standard for the Acquisition and Trading of Shares.
5. Zakat Accounting for 2014
The Board has reviewed and adopted the calculation of Zakat for DFM, payable for the year 2014, prepared by the Shari’a Auditing Section, in light of the DFM Zakat balance sheet. Based on this, it has invited DFM shareholders to pay the Zakat during the Annual Meeting scheduled for 2015.
6. Calculation of Income Non-Permissible by Shari’a for the year 2014.
The Board has reviewed and adopted the total balance of non-permissible income for the year 2014 and the proportion that should be excluded by each share, in order to call upon shareholders to pay it.
We conclude by praying to God for guidance in our steps and making our endeavors in the service of Islam and Muslims successful.
Fatwa & Shari’a Supervisory Board Report for 2014

Dubai Financial Market (PJSC)Annual Report 2014
33
Independent Auditor’s Report
Consolidated Statement of Financial Position
Consolidated Income Statement
Consolidated Statement of Comprehensive Income
Consolidated Statement of Changes in Equity
Consolidated Statement of Cash Flows
Notes to the Consolidated Financial Statements
34
35
36
37
38
39
40
Financial Statements

Dubai Financial Market (PJSC)Annual Report 2014
34
Cor
pora
te G
over
nanc
e R
epor
t fo
r 20
14C
hairm
an’s
Sta
tem
ent
DFM
PJS
C F
inan
cial
Per
form
ance
Sum
mar
yM
acro
econ
omic
Dev
elop
men
ts
and
Mar
ket
Env
ironm
ent
DFM
PJS
C
Str
ateg
yD
FM P
erfo
rman
ce
in 2
014
Fatw
a an
d S
hari’
a S
uper
viso
ry
Boa
rd R
epor
t fo
r 20
14Fi
nanc
ial
Sta
tem
ents
DFM
Str
ateg
ic
Ach
ieve
men
ts in
201
4
Independent Auditor’s Report
Independent auditor’s report to the shareholders of Dubai Financial Market PJSC
Report on the consolidated financial statementsWe have audited the accompanying consolidated financial statements of Dubai Financial Market PJSC (DFM) and its subsidiaries (together the “Group”), which comprise the consolidated statement of financial position as at 31 December 2014, and the consolidated statements of income, comprehensive income, changes in equity and cash flows for the year then ended, and a summary of significant accounting policies and other explanatory information.
Management’s responsibility for the consolidated financial statements Management is responsible for the preparation and fair presentation of the consolidated financial statements in accordance with International Financial Reporting Standards, and for such internal control as management determines is necessary to enable the preparation of consolidated financial statements that are free from material misstatement, whether due to fraud or error.
Auditor’s responsibilityOur responsibility is to express an opinion on the consolidated financial statements based on our audit. We conducted our audit in accordance with International Standards on Auditing. Those standards require that we comply with ethical requirements and plan and perform the audit to obtain reasonable assurance about whether the consolidated financial statements are free from material misstatement.
An audit involves performing procedures to obtain audit evidence about the amounts and disclosures in the consolidated financial statements. The procedures selected depend on the auditor’s judgment, including the assessment of the risks of material misstatement of the consolidated financial statements, whether due to fraud or error. In making those risk assessments, the auditor considers internal control relevant to the entity’s preparation and fair presentation of the consolidated financial statements in order to design audit procedures that are appropriate in the circumstances, but not for the purpose of expressing an opinion on the effectiveness of the entity’s internal control. An audit also includes evaluating the appropriateness of accounting policies used and the reasonableness of accounting estimates made by management, as well as evaluating the overall presentation of the consolidated financial statements.
We believe that the audit evidence we have obtained is sufficient and appropriate to provide a basis for our audit opinion.
OpinionIn our opinion, the accompanying consolidated financial statements present fairly, in all material respects, the financial position of the Group as at 31 December 2014 and its financial performance and its cash flows for the year then ended in accordance with International Financial Reporting Standards.
Report on other legal and regulatory requirementsAs required by the UAE Federal Law No (8) of 1984, as amended, we report in respect of DFM that:
(i) we have obtained all the information we considered necessary for the purpose of our audit;
(ii) the financial statements comply, in all material respects, with the applicable provisions of the UAE Federal Law No. (8) of 1984, as amended and the Articles of Association of DFM;
(iii) DFM has maintained proper books of account and the financial statements are in agreement therewith;
(iv) the financial information included in the Chairman’s report and Directors’ report is consistent with the books of account of DFM; and
(v) nothing has come to our attention,
which causes us to believe that DFM has breached any of the applicable provisions of the UAE Federal Law No. (8) of 1984, as amended, or of its Articles of Association which would materially affect its activities or its financial position as at 31 December 2014
PricewaterhouseCoopers02 February 2015
Paul SuddabyRegistered Auditor Number 309Dubai, United Arab Emirates

Dubai Financial Market (PJSC)Annual Report 2014
35
Consolidated Statement of Financial PositionAs at 31 December 2014
ASSETS Notes2014
AED’0002013
AED’000
Non-current assets
Goodwill 4 2,878,874 2,878,874
Other intangible assets 4 2,384,295 2,446,658
Property and equipment 5 15,269 11,539
Other financial assets measured at fair value through other comprehensive income (FVTOCI) 6 718,060 587,941
Investment deposits 7 742,168 725,378
Total non-current assets 6,738,666 6,650,390
Current assets
Prepaid expenses and other receivables 8 27,172 40,935
Investment deposits 7 2,038,101 1,493,429
Cash and bank balances 9 198,208 107,629
Total current assets 2,263,481 1,641,993
Total assets 9,002,147 8,292,383
EQUITY AND LIABILITIES
Equity
Share capital 10 8,000,000 8,000,000
Treasury shares (4,364) (4,364)
7,995,636 7,995,636
Investments revaluation reserve – FVTOCI 11 (693,199) (789,102)
Statutory reserve 11 354,929 278,998
Retained earnings 755,917 449,684
Equity attributable to owners of the company 8,413,283 7,935,216
Non-controlling interest 17,354 16,838
Total equity 8,430,637 7,952,054
Non-current liabilities
Subordinated loan 15 23,282 22,268
Provision for employees’ end of service indemnity 12 12,006 9,838
Total non-current liabilities 35,288 32,106
Current liabilities
Payables and accrued expenses 13 501,484 238,163
Dividends payable 14 29,256 19,231
Due to related parties 15 5,482 50,829
Total current liabilities 536,222 308,223
Total liabilities 571,510 340,329
Total equity and liabilities 9,002,147 8,292,383
These consolidated financial statements were approved on 02 February 2015 by the Board of Directors and signed on its behalf by:
H. E. Essa Abdulfattah KazimChairman
The accompanying notes form an integral part of these financial statements.

Dubai Financial Market (PJSC)Annual Report 2014
36
Cor
pora
te G
over
nanc
e R
epor
t fo
r 20
14C
hairm
an’s
Sta
tem
ent
DFM
PJS
C F
inan
cial
Per
form
ance
Sum
mar
yM
acro
econ
omic
Dev
elop
men
ts
and
Mar
ket
Env
ironm
ent
DFM
PJS
C
Str
ateg
yD
FM P
erfo
rman
ce
in 2
014
Fatw
a an
d S
hari’
a S
uper
viso
ry
Boa
rd R
epor
t fo
r 20
14Fi
nanc
ial
Sta
tem
ents
DFM
Str
ateg
ic
Ach
ieve
men
ts in
201
4
For the year ended 31 December 2014
Notes2014
AED’0002013
AED’000
Income
Trading commission fees 806,049 341,645
Brokerage fees 13,216 12,520
Ownership transfer and mortgage fees 50,286 36,317
Other fees 19,460 14,537
Operating income 889,011 405,019
Investment income 16 54,438 53,373
Other income 3,827 368
Total income 947,276 458,760
Expenses
General and administrative expenses 17 (124,071) (114,243)
Amortization of intangible assets 4 (62,363) (62,363)
Interest expense 15 (1,014) (971)
Total expenses (187,448) (177,577)
Net profit for the year 759,828 281,183
Attributable to:
Owners of the Company 759,312 284,633
Non-controlling interest 516 (3,450)
759,828 281,183
Earnings per share – AED 18 0.095 0.035
Consolidated Income Statement
The accompanying notes form an integral part of these financial statements.

Dubai Financial Market (PJSC)Annual Report 2014
37
Consolidated Statement of Comprehensive IncomeFor the year ended 31 December 2014
2014AED’000
2013AED’000
Net profit for the year 759,828 281,183
Other comprehensive income/(loss)
Items that will not be reclassified to profit or loss
Fair value changes on financial assets measured at fair value through other comprehensive income (FVTOCI)
88,056 213,714
Total comprehensive income for the year 847,884 494,897
Attributable to:
Owners of the Company 847,368 498,347
Non-controlling interest 516 (3,450)
Total comprehensive income for the year 847,884 494,897
The accompanying notes form an integral part of these financial statements.

Dubai Financial Market (PJSC)Annual Report 2014
38
Cor
pora
te G
over
nanc
e R
epor
t fo
r 20
14C
hairm
an’s
Sta
tem
ent
DFM
PJS
C F
inan
cial
Per
form
ance
Sum
mar
yM
acro
econ
omic
Dev
elop
men
ts
and
Mar
ket
Env
ironm
ent
DFM
PJS
C
Str
ateg
yD
FM P
erfo
rman
ce
in 2
014
Fatw
a an
d S
hari’
a S
uper
viso
ry
Boa
rd R
epor
t fo
r 20
14Fi
nanc
ial
Sta
tem
ents
DFM
Str
ateg
ic
Ach
ieve
men
ts in
201
4
Consolidated Statement of Changes in EquityFor the year ended 31 December 2014
Sha
re c
apita
lTr
easu
ry
shar
esIn
vest
men
ts
reva
luat
ion
re-
serv
e FV
TOC
I
Sta
tuto
ry
rese
rve
Ret
aine
d ea
rnin
gsA
ttrib
utab
le to
ow
ners
of t
he
com
pany
Non
-co
ntro
lling
inte
rest
Tota
l
AE
D’0
00A
ED
’000
AE
D’0
00A
ED
’000
AE
D’0
00A
ED
’000
AE
D’0
00A
ED
’000
As
at 1
Jan
uary
201
38,
000,
000
(4,3
64)
(1,0
02,8
16)
250,
535
214,
516
7,45
7,87
120
,288
7,47
8,15
9
Net
pro
fit fo
r th
e ye
ar-
--
-28
4,63
328
4,63
3(3
,450
)28
1,18
3
Oth
er c
ompr
ehen
sive
loss
for
the
year
--
213,
714
--
213,
714
-21
3,71
4
Tota
l com
preh
ensi
ve lo
ss fo
r th
e ye
ar-
-21
3,71
4-
284,
633
498,
347
(3,4
50)
494,
897
App
ropr
iatio
n of
non
-sha
ri’a
com
plia
nt
inco
me
(Not
e 20
)-
--
-(2
1,00
2)(2
1,00
2)-
(21,
002)
Tran
sfer
to s
tatu
tory
rese
rve
--
-28
,463
(28,
463)
--
-
As
at 3
1 D
ecem
ber
201
38,
000,
000
(4,3
64)
(789
,102
)27
8,99
844
9,68
47,
935,
216
16,8
387,
952,
054
As
at 1
Jan
uary
201
48,
000,
000
(4,3
64)
(789
,102
)27
8,99
844
9,68
47,
935,
216
16,8
387,
952,
054
Net
pro
fit fo
r th
e ye
ar-
--
-75
9,31
275
9,31
251
675
9,82
8
Oth
er c
ompr
ehen
sive
inco
me
for
the
year
--
88,0
56-
-88
,056
-88
,056
Tota
l com
preh
ensi
ve in
com
e fo
r th
e ye
ar-
-88
,056
-75
9,31
284
7,36
851
684
7,88
4
App
ropr
iatio
n of
non
-sha
ri’a
com
plia
nt
inco
me
(Not
e 20
and
13)
--
--
(15,
697)
(15,
697)
-(1
5,69
7)
Div
iden
ds d
ecla
red,
net
of a
ppro
pria
tion
of n
on-s
hari’
a co
mpl
iant
inco
me
(Not
e 14
an
d 20
)-
--
-(3
53,6
04)
(353
,604
)-
(353
,604
)
Rea
lised
loss
on
disp
osal
of i
nves
tmen
ts-
-7,
847
-(7
,847
)-
--
Tran
sfer
to s
tatu
tory
rese
rve
(Not
e 11
)-
--
75,9
31(7
5,93
1)-
--
As
at 3
1 D
ecem
ber
201
48,
000,
000
(4,3
64)
(693
,199
)35
4,92
975
5,91
78,
413,
283
17,3
548,
430,
637
The accompanying notes form an integral part of these financial statements.

Dubai Financial Market (PJSC)Annual Report 2014
39
Consolidated Statement of Cash Flows
Notes2014
AED’0002013
AED’000
Cash flows from operating activities
Net profit for the year 759,828 281,183
Adjustments for:
Depreciation of property and equipment 5 6,476 6,998
Provision for employees’ end of service indemnity 12 2,672 2,042
Amortization of intangible assets 4 62,363 62,363
Write off property and equipment 5 14 -
Interest expense 15 1,014 971
Income on investment deposits 16 (44,862) (48,449)
Dividend income 16 (30,569) (4,924)
Fair value loss on initial recognition 16 20,993 -
Operating cash flow before changes in operating assets and liabilities 777,929 300,184
Increase in prepaid expenses and other receivables 13,055 (21,052)
Increase in due to a related party 15 (45,347) 498
Increase in payables and accrued expenses 293,810 82,997
Cash generated from operations 1,039,447 362,627
Employees’ end of service indemnity paid 12 (504) (498)
Net cash generated from operating activities 1,038,943 362,129
Cash flows from investing activities
Proceeds from sale and redemption of investments 19,180 353,266
New investments (exclude non cash transaction) (12,366) -Purchase of property and equipment 5 (10,220) (3,873)
Net investment deposits (excluding cash and cash equivalents & non cash transaction) 7 (458,672) (571,420)
Investment deposit income received 42,907 49,454
Dividend received 16 30,569 4,924
Net cash used in investing activities (388,602) (167,649)
Cash flows from financing activities
Dividends paid to shareholders 10 (343,576) (146)
Distribution of non-Shari’a compliant income to shareholders 10,20 (46,186) -Net cash used in financing activities (389,762) (146)
Net increase in cash and cash equivalents 260,579 194,334
Cash and cash equivalents at the beginning of the year 426,679 232,345
Cash and cash equivalents at the end of the year 9 687,258 426,679
For the year ended 31 December 2014
The accompanying notes form an integral part of these financial statements.

Dubai Financial Market (PJSC)Annual Report 2014
40
Cor
pora
te G
over
nanc
e R
epor
t fo
r 20
14C
hairm
an’s
Sta
tem
ent
DFM
PJS
C F
inan
cial
Per
form
ance
Sum
mar
yM
acro
econ
omic
Dev
elop
men
ts
and
Mar
ket
Env
ironm
ent
DFM
PJS
C
Str
ateg
yD
FM P
erfo
rman
ce
in 2
014
Fatw
a an
d S
hari’
a S
uper
viso
ry
Boa
rd R
epor
t fo
r 20
14Fi
nanc
ial
Sta
tem
ents
DFM
Str
ateg
ic
Ach
ieve
men
ts in
201
4
1. Establishment and operations
Dubai Financial Market (DFM) - PJSC (the “Company”) is a public joint stock company incorporated in the Emirate of Dubai – United Arab Emirates, pursuant to decree No. 62 for the year 2007 issued by the Ministry of Economy on February 6, 2007, and is subject to the provisions of the U.A.E. Federal law No. 8 for the year 1984 and its amendments.
The licensed activities of the Company are trading in financial instruments, acting as a commercial, industrial and agricultural holding and trust company, financial investment consultancy, and brokerage in local and foreign shares and bonds. In accordance with its Articles of Association, the Company complies with the provisions of Islamic Shari’a in all its activities and operations and invests its funds in accordance with these provisions.
The Company’s shares are listed on the Dubai Financial Market (“DFM”). The Company currently operates the Dubai stock exchange, related clearing house and carries out investment activities on its own
behalf.
The registered address of the Company is Dubai World Trade Center, Sheikh Zayed Road, P.O. Box 9700, Dubai.
The ultimate parent and controlling party is the Government of Dubai which owns 79.63% of DFM through Borse Dubai Limited (the “Parent”), a Government of Dubai entity.
These consolidated financial statements comprise DFM – (PJSC) and its subsidiaries (together referred to as “the Group”). Details of the subsidiaries are as follows:
NASDAQ Dubai Limited has the following subsidiary:
2. Summary of significant accounting policies
The principal accounting policies applied in the preparation of these consolidated financial statements are set out below. These policies have been consistently applied to all the years presented, unless otherwise stated.
2.1 Basis of preparation
These consolidated financial statements have been prepared in accordance with International Financial Reporting Standards (IFRSs) and IFRIC interpretations. These consolidated financial statements have been prepared under the historical cost convention, as modified by the revaluation of other financial assets measured at fair value through other comprehensive income (FVTOCI) following early adoption of IFRS 9 in 2009.
The preparation of these consolidated financial statements in conformity with IFRS requires the use of certain critical accounting estimates. It also requires management to exercise its judgement in the process of applying the Group’s accounting policies. The areas involving a higher degree of judgement or complexity, or areas where assumptions and estimates are significant to the consolidated financial statements are disclosed in Note 3.
2.2 New and revised IFRS standards effective for accounting periods beginning 1 January 2014
The following applicable new standards and amendments to existing standards have been published and are effective for the Group’s accounting periods beginning on 1 January 2014.
• Amendment to IAS 32, ‘Financial instruments: Presentation’, on asset and liability offsetting: These amendments are to the application guidance in IAS 32 and clarify some of the requirements for offsetting financial assets and financial liabilities on the balance sheet.
Company name Activity Country of incorporation Ownership held
NASDAQ Dubai Limited* Electronic Financial Market U.A.E. 67%
Company name Activity Country of incorporation Ownership held
NASDAQ Dubai Guardian Limited
Bare nominee solely on behalfof NASDAQ Dubai Limited
U.A.E. 100%
*The remaining 33% is held by Borse Dubai Limited.
Notes to the Consolidated Financial StatementsFor the year ended 31 December 2014
Dubai Financial Market (PJSC)Annual Report 2014
41
• Amendments to IAS 36, ‘Impairment of assets’ on recoverable amount disclosures: This amendment addresses the disclosure of information about the recoverable amount of impaired assets if that amount is based on fair value less costs of disposal, including the discount rate used if the recoverable amount is determined using a present value technique.
• Amendment to IFRS 10 ‘Consolidated Financial Statements’, IFRS 12’ Disclosure of Interests in Other Entities’ and IAS 27 ‘Separate Financial Statements’ on consolidation for investment entities : The amendments give an exception to entities that meet an ‘investment entity’ definition and which display particular characteristics. These amendments mean that many investment funds and similar entities will be exempt from consolidating most of their subsidiaries. Instead, they will measure them at fair value through profit or loss. Changes have also been made IFRS 12 to introduce disclosures that an investment entity needs to make. These relate only to investment entities, therefore will not apply to the Group.
Management has assessed the impact of the above new standards and amendments to an existing standard and has concluded that there is no significant impact expected from the new standards and amendments on the Group’s consolidated financial statements.
2.3 New and revised IFRS standards not effective for accounting periods beginning 1 January 2014 and not
early adopted by the Group
• Amendment to IFRS 8, ‘Operating segments’ (Effective 1 July 2014 (Annual Improvements 2012)): Amended to require disclosure of the judgements made by management in applying the aggregation criteria to operating segments. It is also amended to require a reconciliation of segment assets to the entity’s assets when segment assets are reported.
• Amendment to IAS 16 ‘Property, Plant and Equipment’ and IAS 38 ‘Intangible Assets’ (Effective 1 July 2014 (Annual Improvements 2012)): Both standards are amended to clarify how the gross carrying amount and the accumulated depreciation are treated where an entity uses the revaluation model.
• Amendment to IAS 16, ‘Property, plant and equipment’ and IAS 38, ‘Intangible assets’ regarding depreciation and amortization (Effective 1 January 2016): This amendment clarifies that revenue is generally presumed to be an inappropriate basis for measuring the consumption of the economic benefits embodied in an intangible asset. The presumption may only be rebutted in certain limited circumstances.
• Amendments to IAS 19 ‘Employee benefits’ regarding employee or third party contributions to defined benefit plans. (Effective 1 July 2014): The amendment applies to contributions from employees or third parties to defined benefit plans. It distinguishes between contributions linked to service only in the period in which they arise and those linked to service in more than one period. Entities with plans that require contributions that vary with service will be required to recognise the benefit of those contributions over employee’s working lives.
• Amendments to IAS 19,’Employee benefits’ (Effective 1 July 2016 (Annual Improvements 2014):The amendment clarifies, when determining the discount rate for post-employment benefit obligations, that it is the currency that the liabilities are denominated in that is important, not the country where they arise.
• Amendments to IAS 24 ‘Related parties’ regarding key management personnel (Effective annual periods commencing 1 July 2014 (Annual Improvements 2012)): As a related party, an entity that provides key management personnel services to the reporting entity or to the parent of the reporting entity (the ‘management entity’). Disclosure of the amounts charged to the reporting entity is required.
• IFRS 7,’Financial instruments: Disclosures’ Effective 1 July 2016 (Annual improvements 2012-2014) The amendment related to servicing contracts requires that if an entity transfers a financial asset to a third party under conditions which allow the transferor to derecognise the asset, IFRS 7 requires disclosure of all types of continuing involvement that the entity might still have in the transferred assets.
• IFRS 9 ‘Financial instruments’ (Effective 1 January 2018): The complete version of IFRS 9 replaces most of the guidance in IAS 39. IFRS 9 retains but simplifies the mixed measurement model and establishes three primary measurement categories for financial assets: amortised cost, fair value through OCI and fair value through P&L. The basis of classification depends on the entity’s business model and the contractual cash flow characteristics of the financial asset. Investments in equity instruments are required to be measured at fair value through profit or loss with the irrevocable option at inception to present changes in fair value in OCI. There is now a new expected credit losses model that replaces the incurred loss impairment model used in IAS 39. For financial liabilities there were no changes to classification and measurement except for the recognition of changes in own credit risk in other comprehensive income, for liabilities designated at fair value, through profit or loss. IFRS 9 relaxes the requirements for hedge effectiveness by replacing the bright line hedge effectiveness tests. It requires an economic relationship between the hedged item and hedging instrument and for the ‘hedged ratio’ to be the same as the one management actually use for risk management purposes. Contemporaneous documentation is still required but is different to that currently prepared under IAS 39. Earlier application is permitted. If an entity elects to early adopt IFRS 9, it must adopt all of the requirements at the same time with the following exception: Entities, such as DFM, with a date of initial adoption before 1 February 2015 continue to have the option to apply the standard in phases until 1 February 2015. The Group has
Notes to the Consolidated Financial Statements (contd..)
For the year ended 31 December 2014

Dubai Financial Market (PJSC)Annual Report 2014
42
Cor
pora
te G
over
nanc
e R
epor
t fo
r 20
14C
hairm
an’s
Sta
tem
ent
DFM
PJS
C F
inan
cial
Per
form
ance
Sum
mar
yM
acro
econ
omic
Dev
elop
men
ts
and
Mar
ket
Env
ironm
ent
DFM
PJS
C
Str
ateg
yD
FM P
erfo
rman
ce
in 2
014
Fatw
a an
d S
hari’
a S
uper
viso
ry
Boa
rd R
epor
t fo
r 20
14Fi
nanc
ial
Sta
tem
ents
DFM
Str
ateg
ic
Ach
ieve
men
ts in
201
4
early adopted the November 2009 classification and measurement version of IFRS 9. Since this adoption was before 1 February 2015, the Group is not required to early adopt the phases pertaining to impairment and hedging issued in July 2014. Accordingly, the Group continues to apply the impairment provisions of IAS 39.
• IFRS 13 ‘Fair Value Measurement’ (Effective 1 July 2014 (Annual improvements 2012)): The standard clarifies that (a) issuing IFRS 13 and amending IFRS 9 and IAS 39 did not remove the ability to measure certain short-term receivables and payables on an undiscounted basis (amends basis for conclusions only) (b) clarify the scope of the portfolio exception in paragraph 52.
• IFRS 15 ‘Revenue from contracts with customers’ (Effective 1 January 2017): This standard replaces IAS 11, ‘Construction contracts’, IAS 18,’Revenue’ and related interpretations. Revenue is recognised when a customer obtains control of a good or service and thus has the ability to direct the use of and obtain the benefits from the good or service. The core principle of IFRS 15 is that an entity recognises revenue to depict the transfer of promised goods or services to customers in an amount that reflects the consideration to which the entity expects to be entitled in exchange for those goods or services. IFRS 15 also includes a cohesive set of disclosure requirements that will result in an entity providing users of financial statements with comprehensive information about the nature, amount, timing and uncertainty of revenue and cash flows arising from the entity’s contracts with customers.
Management has assessed the impact of the above new standards and amendments to existing standards and has concluded that there is no significant impact expected from the amendments on the Group’s consolidated financial statements. There are no other IFRSs interpretations that are not yet effective that would be expected to have a material impact on the Group.
2.4 Consolidation
Subsidiaries Subsidiaries are all entities (including structured entities) over which the group has control. The group controls an entity when the
group is exposed to, or has rights to, variable returns from its involvement with the entity and has the ability to affect those returns through its power over the entity. The existence and effect of potential voting rights that are currently exercisable or convertible are considered when assessing whether the Group controls another entity.
Subsidiaries are fully consolidated from the date on which control is transferred to the Group. They are deconsolidated from the date that control ceases.
The Group applies the acquisition method to account for business combinations. The consideration given for the acquisition of a subsidiary is the fair values of the assets transferred, the liabilities incurred to the former owners of the acquiree and the equity interests issued by the Group. The consideration given includes the fair value of any asset or liability resulting from a contingent consideration arrangement. Identifiable assets acquired and liabilities and contingent liabilities assumed in a business combination are measured initially at their fair values at the acquisition date. The Group recognises any non-controlling interest in the acquiree on an acquisition-by-acquisition basis, either at fair value or at the non-controlling interest’s proportionate share of the recognised amounts of acquiree’s identifiable net assets.
Acquisition-related costs are expensed as incurred.
If the business combination is achieved in stages, the carrying value of the acquirer’s previously held equity interest in the acquiree is re-measured to fair value at the acquisition date; any gains or losses arising from such re-measurement are recognised in the consolidated income statement.
Goodwill is initially measured as the excess of the aggregate of the consideration given and the fair value of non-controlling interest over the net identifiable assets acquired and liabilities assumed. If this consideration is lower than the fair value of the net assets of the subsidiary acquired, the difference is recognised in the consolidated income statement.
Income and expenses of subsidiaries acquired or disposed of during the year are included in the consolidated income statement from the effective date of acquisition and up to the effective date of disposal, as appropriate.
Inter-company transactions, balances, income and expenses on transactions between Group companies are eliminated. Profits and losses resulting from intercompany transactions are also eliminated. Accounting policies of subsidiaries have been changed where necessary to ensure consistency with the policies adopted by the Group.

Dubai Financial Market (PJSC)Annual Report 2014
43
2.5 Intangible assets
Intangible assets acquired in a business combination are recognised at fair value at the acquisition date. Intangible assets have a finite useful life and are carried at cost less accumulated amortisation and impairment. Intangible assets are amortised over their estimated useful lives, using the straight-line method as follows:
The amortisation period and method are reviewed and adjusted, as appropriate, at each consolidated statement of financial position date.
2.6 Goodwill
Goodwill represents the excess of the consideration transferred over interest in net fair value of the net identifiable assets, liabilities and contingent liabilities of the acquiree and the fair value of the non-controlling interest in the acquiree.
Goodwill impairment reviews are undertaken annually or more frequently if events or changes in circumstances indicate a potential impairment. The carrying value of goodwill is compared to the recoverable amount, which is the higher of value in use and the fair value less costs to sell. Any impairment is recognised immediately as an expense and is not subsequently reversed.
2.7 Property and equipment
Property and equipment are carried at cost less accumulated depreciation and any identified impairment loss. The initial cost of property and equipment comprises its purchase price and any directly attributable costs of bringing the asset to its working condition and location for its intended use.
Subsequent costs are included in the asset’s carrying amount or recognized as a separate asset, as appropriate, only when it is probable that future economic benefits associated with the item will flow to the Group and the cost of the item can be measured reliably. All other repairs and maintenance costs are charged to the consolidated income statement when incurred.
Depreciation is calculated using the straight-line method to allocate the assets’ cost to their residual values over their estimated useful lives as follows:
The assets’ residual values and useful lives are reviewed, and adjusted if appropriate, at the end of each reporting period.
An asset’s carrying amount is written down immediately to its recoverable amount if the asset’s carrying amount is greater than its estimated recoverable amount.
The gain or loss arising on the disposal of an item of property and equipment is determined as the difference between the sales proceeds and the carrying amount of the asset and is recognised in the consolidated income statement.
Capital work in progress is stated at cost and is transferred to the appropriate asset category when it is brought into use and is depreciated in accordance with the Group’s accounting policy.
2.8 Due from financial institutions and investment deposits
Amounts due from financial institutions and investment deposits are initially recognized at fair value and measured subsequently at amortised cost using the effective interest method. Impairment of amounts due from financial institutions and investment deposits is assessed as outlined in the accounting policy on financial assets.
Years
License to operate as a Stock Exchange 50
Relationship with market participants (Brokers) 10
Historical trading database 5
Years
Computers and information systems 3-5
Leasehold improvements 4
Furniture and office equipment 3-10
Motor vehicles 4
Notes to the Consolidated Financial Statements (contd..)
For the year ended 31 December 2014
Dubai Financial Market (PJSC)Annual Report 2014
44
Cor
pora
te G
over
nanc
e R
epor
t fo
r 20
14C
hairm
an’s
Sta
tem
ent
DFM
PJS
C F
inan
cial
Per
form
ance
Sum
mar
yM
acro
econ
omic
Dev
elop
men
ts
and
Mar
ket
Env
ironm
ent
DFM
PJS
C
Str
ateg
yD
FM P
erfo
rman
ce
in 2
014
Fatw
a an
d S
hari’
a S
uper
viso
ry
Boa
rd R
epor
t fo
r 20
14Fi
nanc
ial
Sta
tem
ents
DFM
Str
ateg
ic
Ach
ieve
men
ts in
201
4
2.9 Financial instruments
Financial assets and financial liabilities are recognised when the Group becomes a party to the contractual provisions of the instrument.
Financial assets and financial liabilities are initially measured at fair value and the difference between the fair value and the consideration given or received is recognised in the income statement. Transaction costs that are directly attributable to the acquisition or issue of financial assets and financial liabilities (other than financial assets and financial liabilities at fair value through profit or loss) are added to or deducted from the fair value of the financial assets or financial liabilities, as appropriate, on initial recognition. Transaction costs directly attributable to the acquisition of financial assets or financial liabilities at fair value through profit or loss are recognised immediately in the consolidated income statement.
2.10 Financial assets
All regular way purchases or sales of financial assets are recognised and derecognised on a trade date basis. Regular way purchases or sales are purchases or sales of financial assets that require delivery of assets within the time frame established by regulation or convention in the marketplace.
All recognised financial assets are subsequently measured at either amortised cost or fair value, depending on the classification of the financial assets.
Classification of financial assets Debt instruments that meet the following conditions are subsequently measured at amortised cost less impairment (except
for debt instruments that are designated as at fair value through profit or loss on initial recognition to eliminate an accounting mismatch):
• the asset is held within a business model whose objective is to hold assets in order to collect contractual cash flows; and • the contractual terms of the instrument give rise to cash flows on specified dates that are solely payments of principal and
interest on the principal amount outstanding.
Debt instruments that do not meet the amortised cost criteria are measured at fair value through profit or loss (FVTPL). In addition, debt instruments that meet the amortised cost criteria but are designated as at FVTPL are measured at fair value through income statement. A debt instrument may be designated as at FVTPL upon initial recognition if such designation eliminates or significantly reduces a measurement or recognition inconsistency that would arise from measuring assets or liabilities or recognising the gains and losses on them on different bases. Debt instruments are reclassified from amortised cost to FVTPL when the business model is changed such that the amortised cost criteria are no longer met.
All other financial assets are subsequently measured at fair value.
Amortised cost and effective interest method The effective interest method is a method of calculating the amortised cost of a debt instrument and of allocating interest income
and expenses over the relevant period. The effective interest rate is the rate that exactly discounts estimated future cash receipts and payments (including all fees and points paid or received that form an integral part of the effective interest rate, transaction costs and other premiums or discounts) through the expected life of the debt instrument, or, where appropriate, a shorter period, to the net carrying amount.
Financial assets at fair value through other comprehensive income (FVTOCI) On initial recognition, equity instruments are recorded at fair value through profit or loss (FVTPL) however the Group can make
an irrevocable election (on an instrument-by-instrument basis) to designate investments in equity instruments as at FVTOCI. Designation at FVTOCI is not permitted if the equity investment is held for trading.
A financial asset is held for trading if:
• it has been acquired principally for the purpose of selling it in the near term; or • on initial recognition it is part of a portfolio of identified financial instruments that the Group manages together and has
evidence of a recent actual pattern of short-term profit taking; or • it is a derivative that is not designated or effective as a hedging instrument, or a financial guarantee.
Investments in equity instruments at FVTOCI are initially measured at fair value plus transaction costs. Subsequently, they are measured at fair value with gains and losses arising from changes in fair value recognised in other comprehensive income and accumulated in the investments revaluation reserve.
The cumulative gain or loss is not reclassified to consolidated income statement on disposal of the investments.

Dubai Financial Market (PJSC)Annual Report 2014
45
The Group has designated all investments in equity instruments that are not held for trading as at FVTOCI on initial application of IFRS 9.
Dividends on these investments in equity instruments are recognised in the consolidated income statement when the Group’s right to receive the dividends is established. Dividends earned are recognised in the consolidated income statement and are included in the ‘investment income’ (Note 16).
Derecognition of financial assets The Group derecognises a financial asset only when the contractual rights to the cash flows from the asset expire, or when it
transfers the financial asset and substantially all the risks and rewards of ownership of the asset to another entity. If the Group neither transfers nor retains substantially all the risks and rewards of ownership and continues to control the transferred asset, the Group recognises its retained interest in the asset and an associated liability for amounts it may have to pay. If the Group retains substantially all the risks and rewards of ownership of a transferred financial asset, the Group continues to recognise the financial asset and also recognises a collateralised borrowing for the proceeds received.
On derecognition of a financial asset measured at amortised cost, the difference between the asset’s carrying amount and the fair value of the consideration received and receivable is recognised in the consolidated income statement.
On derecognition of a financial asset that is classified as FVTOCI, the cumulative gain or loss previously accumulated in the investments valuation reserve is reclassified to retained earnings.
Impairment of financial assets Financial assets that are measured at amortised cost are assessed for impairment at the end of each reporting period. Financial
assets are considered to be impaired when there is objective evidence that the estimated future cash flows of the asset have been affected as a result of one or more events that occurred after the initial recognition of the financial assets.
Objective evidence of impairment could include:
• significant financial difficulty of the issuer or counterparty; or • breach of contract, such as a default or delinquency in interest or principal payments; or • it becoming probable that the borrower will enter bankruptcy or financial re-organisation; or • the disappearance of an active market for that financial asset because of financial difficulties.
The amount of the impairment loss recognised is the difference between the asset’s carrying amount and the present value of estimated future cash flows reflecting the amount of collateral and guarantee, discounted at the financial asset’s original effective interest rate.
2.11 Financial liabilities
All financial liabilities are subsequently measured at amortised cost using the effective interest method.
Derecognition of financial liabilities The Group derecognises financial liabilities when, and only when, the Group’s obligations are discharged, cancelled or they expire.
The difference between the carrying amount of the financial liability derecognised and the fair value of the consideration paid and payable, including any non-cash assets transferred or liabilities assumed, is recognised in the consolidated income statement.
2.12 Cash and cash equivalents
For the purpose of the consolidated statement of cash flows, cash and cash equivalents comprise cash on hand, current, saving and mudarabah accounts with banks and bank deposits with an original maturity of less than three months.
2.13 Trade receivables
Trade receivables are recognized initially at fair value and subsequently measured at amortized cost using the effective interest method, less provision for impairment. A provision for impairment of trade receivables is established when there is objective evidence that the Group will not be able to collect all amounts due according to the original terms of the receivables. Significant financial difficulties of the debtor, probability that the debtor will enter bankruptcy or financial reorganisation, and default or delinquency in payments (more than 90 days overdue) are considered indicators that the trade receivable is impaired.
The amount of the provision is the difference between the asset’s carrying amount and the present value of estimated future cash flows, discounted at the original effective interest rate. The carrying amount of the asset is reduced through the use of an allowance account, and the amount of the loss is recognised in the consolidated income statement. When a trade receivable is uncollectible, it is written off against the allowance account for trade receivables. Subsequent recoveries of amounts previously written off are credited in the consolidated income statement.
Notes to the Consolidated Financial Statements (contd..)
For the year ended 31 December 2014
Dubai Financial Market (PJSC)Annual Report 2014
46
Cor
pora
te G
over
nanc
e R
epor
t fo
r 20
14C
hairm
an’s
Sta
tem
ent
DFM
PJS
C F
inan
cial
Per
form
ance
Sum
mar
yM
acro
econ
omic
Dev
elop
men
ts
and
Mar
ket
Env
ironm
ent
DFM
PJS
C
Str
ateg
yD
FM P
erfo
rman
ce
in 2
014
Fatw
a an
d S
hari’
a S
uper
viso
ry
Boa
rd R
epor
t fo
r 20
14Fi
nanc
ial
Sta
tem
ents
DFM
Str
ateg
ic
Ach
ieve
men
ts in
201
4
2.14 Employees’ end of service indemnity and benefits
Provision is also made for the full amount of end of service benefit due to non-UAE national employees in accordance with the UAE Labour Law, for their period of service up to the end of the year. The provision relating to end of service benefit is disclosed as a non-current liability.
U.A.E. National employees in the United Arab Emirates are members of the Government-managed retirement pension and social security benefit scheme. As per Federal Labour Law No. 7 of 1999, the Group is required to contribute between 12.5% - 15% of the “contribution calculation salary” of U.A.E. payroll costs to the retirement benefit scheme to fund the benefits.
The employees are also required to contribute 5% of the “contribution calculation salary” to the scheme. The only obligation of the
Group with respect to the retirement pension and social security scheme is to make the specified contributions. The contributions are charged to the consolidated income statement.
2.15 Provisions
Provisions are recognised when the Group has a present obligation (legal or constructive) as a result of a past event, it is probable that the Group will be required to settle the obligation, and a reliable estimate can be made of the amount of the obligation.
The amount recognised as a provision is the best estimate of the consideration required to settle the present obligation at the reporting date, taking into account the risks and uncertainties surrounding the obligation. When a provision is measured using the cash flows estimated to settle the present obligation, its carrying amount is the present value of those cash flows (when the effect of the time value of money is material).
When some or all of the economic benefits required to settle a provision are expected to be recovered from a third party, a receivable is recognised as an asset if it is virtually certain that reimbursement will be received and the amount of the receivable can be measured reliably.
2.16 Offsetting financial instruments
Financial assets and liabilities are offset and the net amount reported in the consolidated statement of financial position when there is a legally enforceable right to offset the recognised amounts and there is an intention to settle on a net basis or realise the asset and settle the liability simultaneously.
2.17 Revenue recognition
Trading commission fees, ownership transfer and mortgage fees are recognized when the underlying trade or transfer has been consummated.
Brokers’ license fees are recognised on a straight line basis over the period of the license.
Dividend income is recognised when the right to receive payment is established.
Return on Islamic investment deposits are recognised on a time proportion basis and is based on the expected minimum rate of return specified in the investment agreement.
2.18 Foreign currency transactions
For the purpose of these consolidated financial statements UAE Dirhams (AED) is the functional and the presentation currency of the Group.
(a) Functional and presentation currency Items included in the consolidated financial statements are measured using the currency of the primary economic environment
in which the entity operates (‘the functional currency’). The consolidated financial statements are presented in UAE Dirhams (AED), which is the Group’s presentation currency.
(b) Transactions and balances Foreign currency transactions are translated into the functional currency using the exchange rates prevailing at the dates of
the transactions or valuation where items are re-measured. Foreign exchange gains and losses resulting from the settlement of such transactions and from the translation at year-end exchange rates of monetary assets and liabilities denominated in foreign currencies are recognised in the consolidated income statement.

Dubai Financial Market (PJSC)Annual Report 2014
47
3. Critical accounting estimates and judgments
In the application of the Group’s accounting policies, which are described in Note 2 to these consolidated financial statements, management is required to make judgments, estimates and assumptions about the carrying amounts of assets and liabilities that are not readily apparent from other sources. The estimates and associated assumptions are based on historical experience and other factors that are considered to be relevant. Actual results may differ from these estimates. The estimates and underlying assumptions are reviewed on an ongoing basis. Revisions to accounting estimates are recognised in the period in which the estimate is revised if the revision affects only that period, or in the period of the revision and future periods if the revision affects both current and future periods.
The following are the critical accounting estimates and judgments, that management has made in the process of applying the Group’s accounting policies and that have the most significant effect on the amounts recognised in consolidated financial statements.
Valuation of unquoted equity investments Valuation of unquoted equity investments is normally based on recent market transactions on an arm’s length basis, fair value of another
instrument that is substantially the same, expected cash flows discounted at current rates for similar instruments or other valuation models.
Intangible assets Management has estimated the useful lives of the intangible assets based on analysis of relevant factors relating to the expected period
over which the intangible assets are expected to generate cash inflows to the Group in the foreseeable future. Management assesses the estimated useful lives on a periodic basis.
Impairment for goodwill and intangibles Goodwill impairment reviews are undertaken annually or more frequently if events or changes in circumstances indicate a potential
impairment. The carrying value of goodwill is compared to the recoverable amount which is the higher of value in use and the fair value less costs of disposal. Any impairment is recognised immediately as an expense and is not subsequently reversed.
Intangible assets that are subject to amortisation are also tested annually for impairment. They are reviewed for impairment whenever events or changes in circumstances indicate that the carrying amount may not be recoverable. An impairment loss is recognised for the amount by which the assets carrying amount exceeds its recoverable amount. The recoverable amount is the higher of the assets fair value less costs of disposal and value in use. For the purposes of assessing impairment assets are grouped at the lowest levels for which there are largely independent cash inflows. Prior impairment of intangible assets are reviewed for possible reversal at each reporting date.
Depreciation of property and equipment The cost of property and equipment is depreciated over its estimated useful life, which is based on expected usage of the asset,
expected physical wear and tear, which depends on operational factors. The management has not considered any residual value as it is deemed immaterial. Management assesses the estimated useful lives on a periodic basis.
Allowance for doubtful debts At each reporting date, the management conducts a detailed review of receivable balances, an allowance for doubtful debts is
established based on this review, management experience and prevailing economic conditions.
Provision for end of service benefits At each reporting date a provision is made for the estimated liability in respect of employees’ entitlements to leave passage and leave pay
as a result of services rendered by the employees up to the reporting date.
Notes to the Consolidated Financial Statements (contd..)
For the year ended 31 December 2014

Dubai Financial Market (PJSC)Annual Report 2014
48
Cor
pora
te G
over
nanc
e R
epor
t fo
r 20
14C
hairm
an’s
Sta
tem
ent
DFM
PJS
C F
inan
cial
Per
form
ance
Sum
mar
yM
acro
econ
omic
Dev
elop
men
ts
and
Mar
ket
Env
ironm
ent
DFM
PJS
C
Str
ateg
yD
FM P
erfo
rman
ce
in 2
014
Fatw
a an
d S
hari’
a S
uper
viso
ry
Boa
rd R
epor
t fo
r 20
14Fi
nanc
ial
Sta
tem
ents
DFM
Str
ateg
ic
Ach
ieve
men
ts in
201
4
4. Goodwill and intangible assets
GoodwillLicense to
operate as a Stock Exchange
Relationshipswith marketparticipants
(Brokers)
Historical trading
databaseTotal
AED’000 AED’000 AED’000 AED’000 AED’000
Cost
At 1 January 2013 and 2014 2,878,874 2,824,455 58,744 67,455 5,829,528
At 31 December 2013 and 2014 2,878,874 2,824,455 58,744 67,455 5,829,528
Amortization
At 1 January 2013 - 338,934 35,244 67,455 441,633
Charge for the year 56,489 5,874 - 62,363
At 31 December 2013 - 395,423 41,118 67,455 503,996
At 1 January 2014 - 395,423 41,118 67,455 503,996
Charge for the year - 56,489 5,874 - 62,363
At 31 December 2014 - 451,912 46,992 67,455 566,359
Carrying amount
At 31 December 2014 2,878,874 2,372,543 11,752 - 5,263,169
At 31 December 2013 2,878,874 2,429,032 17,626 - 5,325,532
There was no evidence of impairment of the goodwill at 31 December 2014 on the basis that the fair value of the business, based on the Company’s quoted market price at 31 December 2014 was in excess of its net assets at that date.
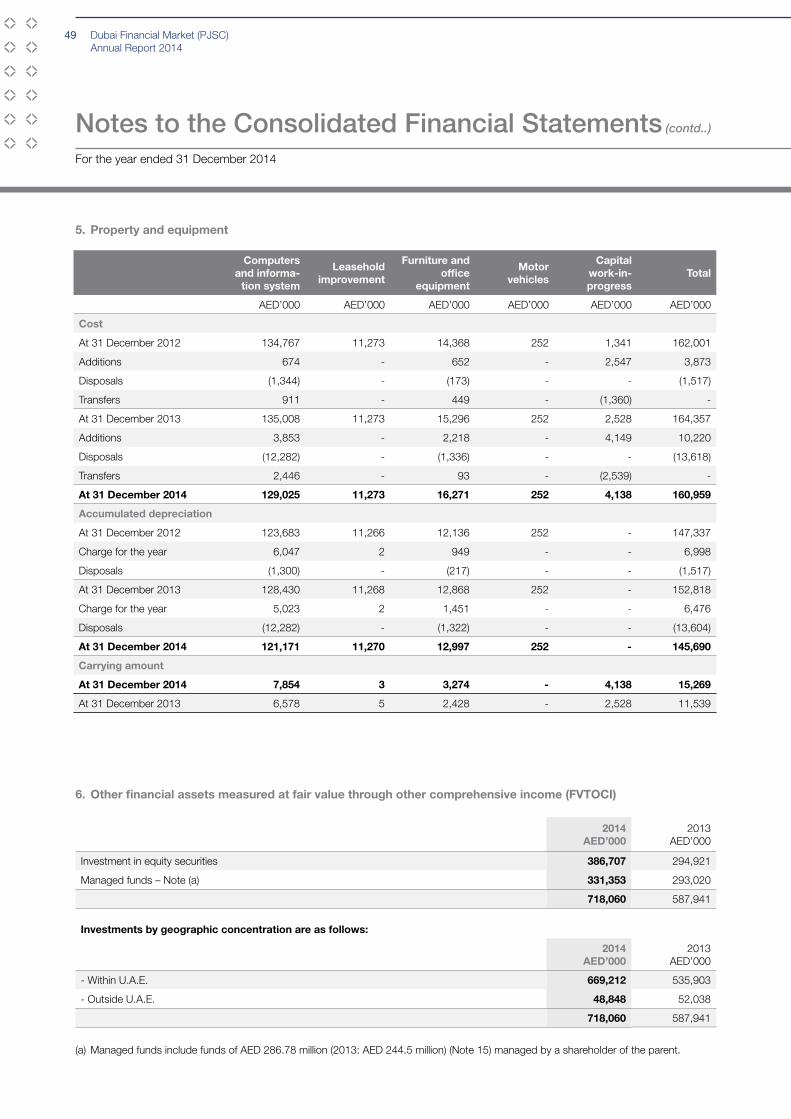
Dubai Financial Market (PJSC)Annual Report 2014
49
5. Property and equipment
6. Other financial assets measured at fair value through other comprehensive income (FVTOCI)
Computers and informa-
tion system
Leasehold improvement
Furniture and office
equipment
Motor vehicles
Capitalwork-in-progress
Total
AED’000 AED’000 AED’000 AED’000 AED’000 AED’000
Cost
At 31 December 2012 134,767 11,273 14,368 252 1,341 162,001
Additions 674 - 652 - 2,547 3,873
Disposals (1,344) - (173) - - (1,517)
Transfers 911 - 449 - (1,360) -
At 31 December 2013 135,008 11,273 15,296 252 2,528 164,357
Additions 3,853 - 2,218 - 4,149 10,220
Disposals (12,282) - (1,336) - - (13,618)
Transfers 2,446 - 93 - (2,539) -
At 31 December 2014 129,025 11,273 16,271 252 4,138 160,959
Accumulated depreciation
At 31 December 2012 123,683 11,266 12,136 252 - 147,337
Charge for the year 6,047 2 949 - - 6,998
Disposals (1,300) - (217) - - (1,517)
At 31 December 2013 128,430 11,268 12,868 252 - 152,818
Charge for the year 5,023 2 1,451 - - 6,476
Disposals (12,282) - (1,322) - - (13,604)
At 31 December 2014 121,171 11,270 12,997 252 - 145,690
Carrying amount
At 31 December 2014 7,854 3 3,274 - 4,138 15,269
At 31 December 2013 6,578 5 2,428 - 2,528 11,539
2014AED’000
2013AED’000
Investment in equity securities 386,707 294,921
Managed funds – Note (a) 331,353 293,020
718,060 587,941
Investments by geographic concentration are as follows:
2014AED’000
2013 AED’000
- Within U.A.E. 669,212 535,903
- Outside U.A.E. 48,848 52,038
718,060 587,941
(a) Managed funds include funds of AED 286.78 million (2013: AED 244.5 million) (Note 15) managed by a shareholder of the parent.
Notes to the Consolidated Financial Statements (contd..)
For the year ended 31 December 2014

Dubai Financial Market (PJSC)Annual Report 2014
50
Cor
pora
te G
over
nanc
e R
epor
t fo
r 20
14C
hairm
an’s
Sta
tem
ent
DFM
PJS
C F
inan
cial
Per
form
ance
Sum
mar
yM
acro
econ
omic
Dev
elop
men
ts
and
Mar
ket
Env
ironm
ent
DFM
PJS
C
Str
ateg
yD
FM P
erfo
rman
ce
in 2
014
Fatw
a an
d S
hari’
a S
uper
viso
ry
Boa
rd R
epor
t fo
r 20
14Fi
nanc
ial
Sta
tem
ents
DFM
Str
ateg
ic
Ach
ieve
men
ts in
201
4
7. Investment deposits
2014AED’000
2013AED’000
Current:
Investment deposits maturing in less than 3 months (Note 9) 708,021 508,021
Investment deposits maturing up to 1 year but more than 3 months – Note (a) 1,330,080 985,408
2,038,101 1,493,429
Non-current:
Investment deposits maturing above 1 year 742,168 725,378
2,780,269 2,218,807
(a) Investment deposits are placed with financial institutions in the UAE, and carry profit rates ranging from 1% to 5.5% (2013: 1% to 3.1%) per annum.
(b) Investment deposits of AED 136.73 million (2013: AED 86.73 million) have been pledged as collateral against unutilised bank overdraft facilities provided to the Group.
(c) Investment deposits maturing in less than three months include an amount of AED 489.05 million (31 December 2013: AED 319.05 million) with original maturities not exceeding three months (Note 9).
8. Prepaid expenses and other receivables
2014AED’000
2013AED’000
Accrued income on investment deposits 7,381 8,089
Accrued trading commission fees 4,494 7,627
Due from brokers 3,016 1,332
Prepaid expenses 6,697 6,400
Other financial assets (central counterparty) 3,196 14,892
Other receivables 2,602 4,687
27,386 43,027
Less: allowance for doubtful debts (214) (2,092)
27,172 40,935
Net movement in allowance for doubtful debts:
2014AED’000
2013 AED’000
Opening balance 2,092 2,808
Write off during the year (1,878) (716)
Closing balance 214 2,092

Dubai Financial Market (PJSC)Annual Report 2014
51
9. Cash and bank balances
2014AED’000
2013AED’000
Cash on hand 334 326
Bank balances:
Current accounts 20,182 23,800
Savings accounts 19,895 23,305
Mudarabah accounts 157,797 60,198
198,208 107,629
Add : Investment deposits with original maturities not exceeding three months (Note 7) 489,050 319,050
Cash and cash equivalents 687,258 426,679
The rate of return on the saving and mudarabah accounts is 0.15% to 0.35% per annum (31 December 2013: 0.25% to 0.35%).
Dividend payments amounting to AED 164.68 million (31 December 2013: AED nil) distributed by the Company on behalf of other companies remain unpresented to the Company’s banks as at 31 December 2014.
Notes to the Consolidated Financial Statements (contd..)
For the year ended 31 December 2014
10. Share capital
2014AED’000
2013AED’000
Authorised, issued and paid up share capital: 8,000,000,000 (2013: 8,000,000,000 shares) of AED 1 each (2013: AED 1 each)
8,000,000 8,000,000
During the year, the Company has distributed dividends of AED 399.8 million, including non-shari’a compliant income of AED 46.2 million (Note 20), representing AED 0.05 per share. The dividends were approved by the shareholders at the Annual General Meeting held on 3 March 2014.
11. Reserves
Statutory reserveIn accordance with the U.A.E. Federal Commercial Companies Law Number 8 of 1984, as amended, the Group has established a statutory reserve by appropriation of 10% of the Company’s net profit for each year which will be increased until the reserve equals 50% of the share capital. This reserve is not available for distribution, except as stipulated by the law.
Statutory reserveAED’000
Balance as of 31 December 2012 250,535
Transfer from net income for the year 28,463
Balance as of 31 December 2013 278,998
Transfer from net income for the year 75,931
Balance as of 31 December 2014 354,929
Investments revaluation reserve - FVTOCIThe investment revaluation reserve represents accumulated gains and losses arising on the revaluation of financial assets at fair value through other comprehensive income.

Dubai Financial Market (PJSC)Annual Report 2014
52
Cor
pora
te G
over
nanc
e R
epor
t fo
r 20
14C
hairm
an’s
Sta
tem
ent
DFM
PJS
C F
inan
cial
Per
form
ance
Sum
mar
yM
acro
econ
omic
Dev
elop
men
ts
and
Mar
ket
Env
ironm
ent
DFM
PJS
C
Str
ateg
yD
FM P
erfo
rman
ce
in 2
014
Fatw
a an
d S
hari’
a S
uper
viso
ry
Boa
rd R
epor
t fo
r 20
14Fi
nanc
ial
Sta
tem
ents
DFM
Str
ateg
ic
Ach
ieve
men
ts in
201
4
12. Provision for employees’ end of service indemnity
2014AED’000
2013AED’000
Balance at the beginning of the year 9,838 8,294
Charged during the year 2,672 2,042
Paid during the year (504) (498)
Balance at the end of the year 12,006 9,838
13. Payables and accrued expenses
14. Dividends payable
During the year, the Company has distributed dividends of AED 399.8 million (2013: AED Nil). The dividends were approved by the shareholders at the Annual General Meeting held on 3 March 2014. The payable balance represents dividends which have not been claimed by the investors since 2007.
2014AED’000
2013AED’000
Dividends payable on behalf of companies listed on the DFM 105,580 75,850
iVESTOR cards 256,845 41,402
Members’ margin deposits 78,432 20,159
Other financial liabilities (central counterparty) 3,196 14,892
Accrued expenses and other payables 16,644 17,252
Unearned revenue 9,800 7,209
Brokers’ retention 18,604 18,583
Due to U.A.E. Securities and Commodities Authority 12,383 12,327
Non-shari’a compliant income (Note 20) - 30,489
501,484 238,163

Dubai Financial Market (PJSC)Annual Report 2014
53
Transactions during the year2014
AED’0002013
AED’000
Investment income 18,404 16,906
Interest expense 1,014 971
The remuneration of directors and other members of key management during the period were as follows:
15. Related party transactions
Related parties comprise companies under common ownership or management, key management, businesses controlled by shareholders and directors as well as businesses over which they exercise significant influence. Key management personnel include the CEO and heads of various divisions. During the year, the Group entered into transactions with related parties in the ordinary course of business. These transactions were carried out at mutually agreed terms and conditions. The transactions with related parties and balances arising from these transactions are as follows:
2014AED’000
2013AED’000
Compensation of key management personnel
Salaries and short-term benefits 7,770 7,971
General pension and social security 721 906
Board of Directors
- Remuneration to the NASDAQ Board 943 1,152
- Meeting allowance for the Group 1,339 1,314
Balances
Due from related parties
Parent
Investment deposits (Note 7) 50,452 145,781
Accrued income on investment deposits 552 2,720
Other related parties
Managed funds (Note 6) 286,776 244,499
Cash and bank balances 149,341 68,561
Investment deposits (Note 7) 1,447,092 912,846
Investment deposits include AED 100 million (31 December 2013: AED 50 million) placed as collateral with related parties.
2014AED’000
2013AED’000
Due to related parties
Parent
Expenses paid on behalf of the Group 5,482 2,329
Subordinated loan 23,282 22,268
Ultimate controlling party
Dubai Government - 48,500
In the initial public offering in 2006, 20% of the share capital amounting to AED 1,600,000,000 was offered for public subscription for the credit of Dubai Government, of which AED 48.5 million due to the Dubai Government was paid in the year. The balance did not bear any profit.
The subordinated loan has been provided by Borse Dubai Ltd., to NASDAQ Dubai Limited through the Company (Note 1). The subordinated loan is unsecured, has no fixed repayment date and bears interest at 12 month LIBOR plus 3.25% per annum and is subordinated to the rights of all other creditors of the subsidiary.
Notes to the Consolidated Financial Statements (contd..)
For the year ended 31 December 2014

Dubai Financial Market (PJSC)Annual Report 2014
54
Cor
pora
te G
over
nanc
e R
epor
t fo
r 20
14C
hairm
an’s
Sta
tem
ent
DFM
PJS
C F
inan
cial
Per
form
ance
Sum
mar
yM
acro
econ
omic
Dev
elop
men
ts
and
Mar
ket
Env
ironm
ent
DFM
PJS
C
Str
ateg
yD
FM P
erfo
rman
ce
in 2
014
Fatw
a an
d S
hari’
a S
uper
viso
ry
Boa
rd R
epor
t fo
r 20
14Fi
nanc
ial
Sta
tem
ents
DFM
Str
ateg
ic
Ach
ieve
men
ts in
201
4
16. Investment income2014
AED’0002013
AED’000
Return on investment deposits 44,862 48,449
Dividends 30,569 4,924
Fair value loss (20,993) -
54,438 53,373
17. General and administrative expenses2014
AED’0002013
AED’000
Payroll and other benefits 78,714 71,667
Rent 7,919 7,582
Depreciation 6,476 6,998
Professional expenses 1,894 1,550
Maintenance expenses 13,260 11,187
Telecommunication expenses 3,379 2,254
iVESTOR expenses 2,436 2,911
Other 9,993 10,094
124,071 114,243
18. Earnings per share2014 2013
Net profit for the year attributable to the owners of the Company (AED’000) 759,312 284,633
Authorised, issued and paid up share capital (’000) 8,000,000 8,000,000
Less: Treasury shares (’000) (4,364) (4,364)
Number of shares issued (’000) 7,995,636 7,995,636
Earnings per share - AED 0.095 0.035
19. Commitments 2014
AED’0002013
AED’000
Commitments for the purchase of property and equipment 3,544 7,927
The Company also has a commitment of AED 148 million to acquire the remaining 33% of NASDAQ Dubai Limited which is required to be settled on the completion of the acquisition on a date to be mutually agreed with Borse Dubai Limited.

Dubai Financial Market (PJSC)Annual Report 2014
55
Year AED’000
2011 9,487
2012 21,002
2013 15,697
46,186
20. Non Shari’a compliant income
Non-Shari’a compliant income as approved by the Company’s Shari’a and Fatwa Supervisory Board, has been appropriated from retained earnings for distribution by the Group to its shareholders towards disbursement by the shareholders for charitable purposes. Based on the ruling of the Shari’a and Fatwa Supervisory Board, it is the sole responsibility of the individual shareholders to donate their respective shares of this amount for charitable purposes. Non-Shari’a compliant income of AED 46.2 million relating to the following years has been distributed by the Company to the shareholders in 2014 (Note 10).
Non-Shari’a compliant income of AED 15.7 million relating to 2013 has been appropriated from the retained earnings for the current year and that relating to 2011 and 2012 was appropriated in prior years.
21. Financial risk management objectives
21.1 Financial risk factors
The Group’s activities expose it to a variety of financial risks and those activities involve the analysis, evaluation, acceptance and management of some degree of risk or combination of risks. Taking risk is core to the financial business, and operational risks are an inevitable consequence of being in business. The Group’s aim is therefore to achieve an appropriate balance between risk and return and minimize potential adverse effects on the Group’s financial performance.
The Group’s risk management policies are designed to identify and analyze these risks, to set appropriate risk limits and controls, and to monitor the risks. The Group regularly reviews its risk management policies to reflect changes in markets, products and emerging best practice.
The Group finance department monitors and manages the financial risks relating to the operations of the Group through internal risk reports which analyse exposures by degree and magnitude of risks. These risks include market risk (including foreign exchange risk, and price risk and interest rate risk), credit risk and liquidity risk.
21.2 Market risk
(a) Foreign exchange risk The Group’s activities are not exposed to the financial risks of changes in foreign currency exchange rates because
substantially all the financial assets and liabilities are denominated in United Arab Emirates Dirhams (AED) or US Dollars to which the AED is pegged.
(b) Price risk The Group is exposed to equity price risks arising from equity investments. The Group does not actively trade in these
investments.
Equity price sensitivity analysis
The sensitivity analyses below have been determined based on the exposure to equity price risk at the reporting date.
If equity prices had been 5% higher/lower:
• Investment revaluation reserve would increase/decrease by AED 36 million (2013: AED 29 million) as a result of the changes in fair value of the investments.
(c) Profit rate risk Profit rate risk is the risk that the value of the future cash flows for the financial instruments will fluctuate due to changes in
market profit rates. Most of the financial assets and financial liabilities of the Group carry fixed rate of profit and therefore, the Group is not exposed to any significant cash flow risk.
Notes to the Consolidated Financial Statements (contd..)
For the year ended 31 December 2014
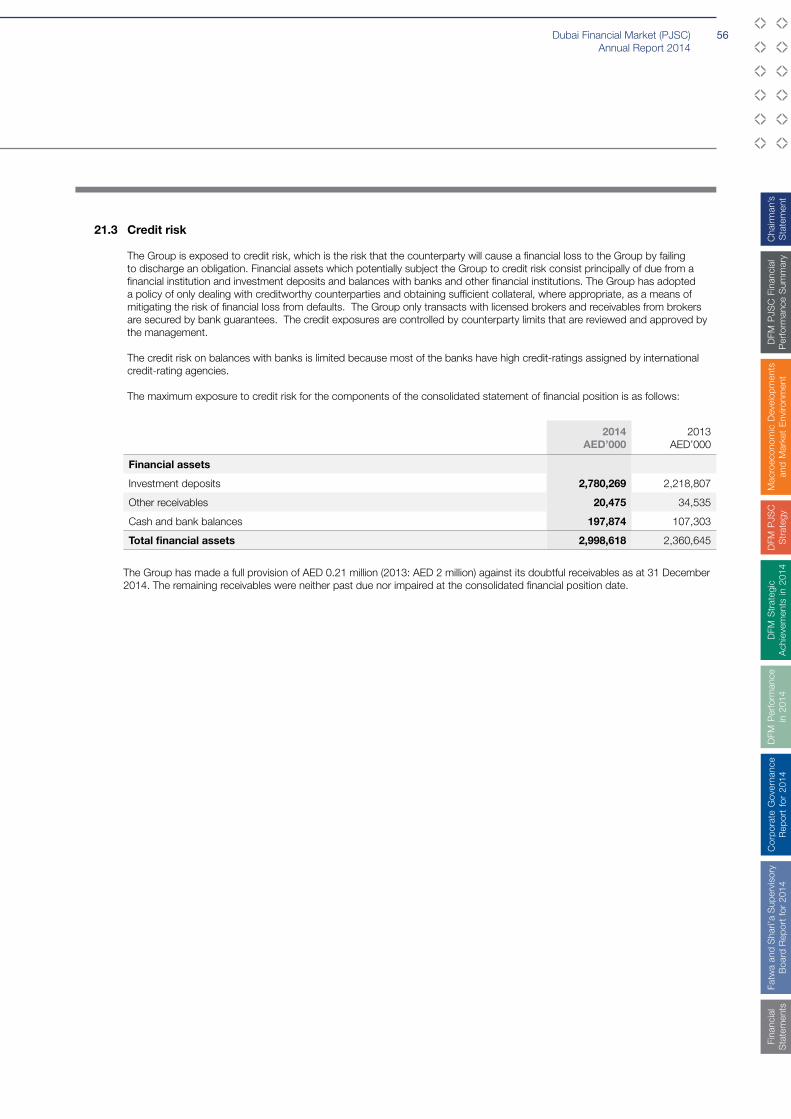
Dubai Financial Market (PJSC)Annual Report 2014
56
Cor
pora
te G
over
nanc
e R
epor
t fo
r 20
14C
hairm
an’s
Sta
tem
ent
DFM
PJS
C F
inan
cial
Per
form
ance
Sum
mar
yM
acro
econ
omic
Dev
elop
men
ts
and
Mar
ket
Env
ironm
ent
DFM
PJS
C
Str
ateg
yD
FM P
erfo
rman
ce
in 2
014
Fatw
a an
d S
hari’
a S
uper
viso
ry
Boa
rd R
epor
t fo
r 20
14Fi
nanc
ial
Sta
tem
ents
DFM
Str
ateg
ic
Ach
ieve
men
ts in
201
4
21.3 Credit risk
The Group is exposed to credit risk, which is the risk that the counterparty will cause a financial loss to the Group by failing to discharge an obligation. Financial assets which potentially subject the Group to credit risk consist principally of due from a financial institution and investment deposits and balances with banks and other financial institutions. The Group has adopted a policy of only dealing with creditworthy counterparties and obtaining sufficient collateral, where appropriate, as a means of mitigating the risk of financial loss from defaults. The Group only transacts with licensed brokers and receivables from brokers are secured by bank guarantees. The credit exposures are controlled by counterparty limits that are reviewed and approved by the management.
The credit risk on balances with banks is limited because most of the banks have high credit-ratings assigned by international credit-rating agencies.
The maximum exposure to credit risk for the components of the consolidated statement of financial position is as follows:
2014AED’000
2013AED’000
Financial assets
Investment deposits 2,780,269 2,218,807
Other receivables 20,475 34,535
Cash and bank balances 197,874 107,303
Total financial assets 2,998,618 2,360,645
The Group has made a full provision of AED 0.21 million (2013: AED 2 million) against its doubtful receivables as at 31 December 2014. The remaining receivables were neither past due nor impaired at the consolidated financial position date.

Dubai Financial Market (PJSC)Annual Report 2014
57
21.4 Liquidity risk management
The ultimate responsibility for liquidity risk management rests with the board of directors, which has built an appropriate liquidity risk management framework for the management of the Group’s short, medium and long-term funding and liquidity management requirements. The Group manages liquidity risk by maintaining adequate reserves, by continuously monitoring forecast and actual cash flows and by matching the maturity profiles of financial assets and liabilities.
The following tables detail the Group’s remaining contractual maturity for its non-derivative financial liabilities. The tables have been drawn up based on the undiscounted cash flows of financial liabilities based on the remaining contractual maturities at the date of the consolidated statement of financial position.
The liquidity profile of financial liabilities were as follows:
21.5 Fair value of financial instruments
The Group’s financial assets and financial liabilities comprise of cash and bank balances, investment deposits, receivables and payables whose maturity is short term. Long term investment deposits carry market rates of return. Consequently their fair value approximates the carrying value stated in the consolidated statement of financial position.
The Group has classified fair value measurements using a fair value hierarchy that reflects the significance of the inputs used in making the measurements. The fair value hierarchy has the following levels:
• Quoted prices (unadjusted) in active markets for identical assets or liabilities (level 1). • Inputs other than quoted prices included within level 1 that are observable for the asset or liability, either directly (that is, as
prices) or indirectly (that is, derived from prices) (level 2). • Inputs for the asset or liability that are not based on observable market data (that is, unobservable inputs) (level 3).
The fair value of financial instruments traded in active markets is based on quoted market prices at the consolidated statement of financial position date. A market is regarded as active if quoted prices are readily and regularly available from an exchange, dealer, broker, industry group, pricing service, or regulatory agency, and those prices represent actual and regularly occurring market transactions on an arm’s length basis. These instruments are included in level 1. Instruments included in level 1 comprise primarily quoted equity investments classified as fair value through other comprehensive income.
The fair value of financial instruments that are not traded in an active market (for example, over-the-counter derivatives) is determined by using valuation techniques. These valuation techniques maximise the use of observable market data where it is available and rely as little as possible on entity specific estimates. If all significant inputs required to fair value an instrument are observable, the instrument is included in level 2. These investments comprise funds the fair values of which are based on the net asset value provided by the fund managers.
Within 3 months
3 to 6months
6 to 12months
1 to 5years
Over5 years
Total
31 December 2014 AED’000 AED’000 AED’000 AED’000 AED’000 AED’000
Financial liabilities
Payables and accrued expenses 520,940 - - - - 520,940
Subordinated loan - - - 23,282 - 23,282
Due to a related party - - 5,482 - - 5,482
Provision for employees end of service benefits
- - - - 12,006 12,006
Total financial liabilities 520,940 - 5,482 23,282 12,006 561,710
31 December 2013
Financial liabilities
Payables and accrued expenses 250,185 - - - - 250,185
Subordinated loan - - - 22,268 - 22,268
Due to a related party - - 50,829 - - 50,829
Provision for employees end of service benefits
- - - - 9,838 9,838
Total financial liabilities 250,185 - 50,829 22,268 9,838 333,120
Notes to the Consolidated Financial Statements (contd..)
For the year ended 31 December 2014

Dubai Financial Market (PJSC)Annual Report 2014
58
Cor
pora
te G
over
nanc
e R
epor
t fo
r 20
14C
hairm
an’s
Sta
tem
ent
DFM
PJS
C F
inan
cial
Per
form
ance
Sum
mar
yM
acro
econ
omic
Dev
elop
men
ts
and
Mar
ket
Env
ironm
ent
DFM
PJS
C
Str
ateg
yD
FM P
erfo
rman
ce
in 2
014
Fatw
a an
d S
hari’
a S
uper
viso
ry
Boa
rd R
epor
t fo
r 20
14Fi
nanc
ial
Sta
tem
ents
DFM
Str
ateg
ic
Ach
ieve
men
ts in
201
4
If one or more of the significant inputs is not based on observable market data, the instrument is included in level 3. Level 3 assets represent unquoted private equity and mutual fund investments whose fair value is determined based on varying unobservable assumptions which depend on a broad range of macroeconomic factors. The carrying values of these investments are adjusted as follows:
• Private equity investments - using the latest available net book value and market approach using prevailing secondary market prices of similar instruments
• Mutual funds - based on the net asset value derived from the EBITDA/PE multiple or value per share provided by the fund managers.
There were no changes in valuation techniques during the period.
The following table presents the Group’s assets and liabilities that are measured at fair value at 31 December 2014 and 31 December 2013.
31 December 2014
Level 1AED’000
Level 2AED’000
Level 3AED’000
TotalAED’000
Financial assets at fair value through other comprehensive income
- Equities 328,889 - 57,818 386,707
- Managed funds - 323,008 8,345 331,353
Total 328,889 323,008 66,163 718,060
31 December 2013
Level 1AED’000
Level 2AED’000
Level 3AED’000
TotalAED’000
Financial assets at fair value through other comprehensive income
- Equities 286,248 - 8,673 294,921
- Managed funds - 281,946 11,074 293,020
Total 286,248 281,946 19,747 587,941
There are no transfers between Level 1 and Level 2 during the year.
Reconciliation of Level 3 fair value measurements of financial assetsMeasured at FVTOCI
Unquoted equities
2014AED’000
2013AED’000
Opening balance 19,747 60,436
Addition during the year 48,882 -
Disposal during the year (3,449) -
Transfer from level 3 to level 2 - (35,013)
Unrealised gains/(losses) in other comprehensive loss 983 (5,676)
Closing balance 66,163 19,747
Sensitivity analysis for level 3 itemsLevel 3 assets represent unquoted equity and mutual fund investments whose fair value is determined based on varying unobservable assumptions which depend on a broad range of macroeconomic factors.

Dubai Financial Market (PJSC)Annual Report 2014
59
22. Financial assets and liabilities
Financial assets by category2014
AED’0002013
AED’000
Assets as per consolidated statement of financial position
Financial assets measured at fair value through other comprehensive income (FVTOCI) 718,060 587,941
Amortised cost
Cash and bank balances 198,208 107,629
Investment deposits 2,780,269 2,218,807
Other receivables 20,475 34,535
2,998,952 2,360,971
Financial liabilities by category2014
AED’0002013
AED’000
Liabilities as per consolidated statement of financial position
Other financial liabilities at amortised cost
Payables and accrued expenses 520,940 250,185
Subordinated loan 23,282 22,268
Due to a related party 5,482 50,829
Provision for employee’s end of service benefits 12,006 9,838
561,710 333,120
23. Capital risk management
The Group’s objectives when managing capital are to safeguard the Group’s ability to continue as a going concern in order to provide returns for shareholders and benefits for other stakeholders and to maintain an optimal capital structure to reduce the cost of capital.
In order to maintain or adjust the capital structure, the Group may adjust the amount of dividends paid to shareholders, return capital to shareholders, issue new shares or sell assets to reduce debt.
24. Segment reporting
Following the management approach to IFRS 8, operating segments are reported in accordance with the internal reporting provided to the Board of Directors (the chief operating decision-maker), which is responsible for allocating resources to the reportable segments and assesses its performance. The Group is managed as one unit and therefore the Board of Directors are of the opinion that the Group is engaged in a single segment of operating a stock exchange and related clearing house.
25. Reclassifications
Certain corresponding figures have been reclassified, where necessary, to conform to the current period presentation. Management believes that the current period presentation provides more meaningful information to the users of the interim condensed consolidated financial statements.
Notes to the Consolidated Financial Statements (contd..)
For the year ended 31 December 2014


![Guided drives DFM/DFM-B · Guided drives DFM/DFM-B Product range overview Function Version Type Piston Stroke Variable stroke [mm] [mm] [mm] Double-acting DFM basic version with recirculating](https://static.fdocuments.in/doc/165x107/60075e4355302d48df775d82/guided-drives-dfmdfm-b-guided-drives-dfmdfm-b-product-range-overview-function.jpg)