Annual Report 2011–2012 - Illinois · 2 Illinois Innovation Index Annual Report 2011–2012 Table...
97
Illinois Innovation Index Annual Report 2011–2012
-
Upload
duongxuyen -
Category
Documents
-
view
216 -
download
3
Transcript of Annual Report 2011–2012 - Illinois · 2 Illinois Innovation Index Annual Report 2011–2012 Table...

Illinois Innovation Index
Annual Report2011–2012

Illinois Innovation Index Annual Report 2011–20122

The Illinois Innovation Index is an information resource that provides analysis and insights on business development and economic activity in our state.
The purpose of the Innovation Index is to engage and educate a broad community of businesses, investors, researchers, policymakers, and educators through the analysis, benchmark- ing, and promotion of innovation and entrepreneurial activity metrics throughout metropolitan Chicago and Illinois. The Innovation Index is a highly visual tool that provides immediate perspective on regional and statewide economic conditions and an ongoing data archive for public use. The Index regularly features related innovation metrics along with news and statistical insights.
The Illinois Innovation Index is brought to you by:
In partnership with:
Chicagoland Chamber of Commerce
Chicago Metropolitan Agency for Planning
Illinois Science & Technology Coalition
World Business Chicago
Illinois Innovation Network

Illinois Innovation Index Annual Report 2011–20122
Table of contents
Introductory letter
Foreword: “The state of innovation in Illinois,”
by Howard Tullman
A year of the Illinois Innovation Index
September 2011
October 2011
November 2011
December 2011
January 2012
February 2012
March 2012
April 2012
May 2012
June 2012
July 2012
August 2012
News and events
3
4
6
7
10
15
22
28
34
40
48
56
64
71
76
84

33
Dear Colleagues,
Nearly every state is focused on promoting innovation. With such a far-reaching concept, however,
progress can be a noble if somewhat amorphous goal. To be successful, leaders must have a
strong vision, rally numerous stakeholders to their cause, and be able to demonstrate progress.
Accomplishing all three is a difficult challenge.
When Governor Pat Quinn convened the Illinois Innovation Council in February 2011, it signaled
a new approach. The council, which is made up of business executives and entrepreneurs as
well as leaders from science, technology, and academia, was formed to connect the dots between
these sectors and to create a more welcoming environment for entrepreneurs and start-ups.
A critical component of this effort was to gain a better understanding of where Illinois is excelling
and where it can improve. At the same time, our organizations began meeting to discuss col-
laborative approaches that could achieve shared goals: to measure and communicate the status of
innovation in metropolitan Chicago and Illinois more effectively and to provide better access
to data for analysis by policymakers and the public. These two paths converged, and the Illinois
Innovation Index was born.
Although our respective organizations—the Chicagoland Chamber of Commerce, Chicago Metro-
politan Agency for Planning (CMAP), Illinois Science & Technology Coalition (ISTC), and World
Business Chicago (WBC)—are experienced in working with entities to promote economic
development and steer companies toward resources and programs, we hadn’t been accustomed
to working with one another on this type of project. In that regard, the Index represents an
unprecedented collaboration among our agencies.
Over the past twelve months, we’ve established a set of benchmarks to measure the progress of
Chicago, the region, and the state. Going forward, the Index will move to a quarterly publication
schedule and revisit metrics on economic development, human capital, knowledge transfer,
and the dynamism of the state’s industries. We are also developing a new data dashboard as part
of MetroPulse (metropulsechicago.org) that will provide users with easy access to the data
featured in the Index.
As you read through our annual report, know that our work to date is just the beginning—the
foundation for more expansive conversations about how we can work together to maintain and
enhance the reputation of Chicago and Illinois as U.S. leaders in innovation.
Thanks for your support of the Illinois Innovation Index.
Sincerely,
Gerald J. RoperPresident and CEO
Chicagoland Chamber of Commerce
Randall BlankenhornExecutive Director
Chicago Metropolitan Agency for Planning
Mark HarrisPresident and CEO
Illinois Science & Technology Coalition
Rita AthasPresident
World Business Chicago

Illinois Innovation Index Annual Report 2011–20124
Howard Tullman
The state of innovation in the State of Illinois
is great. And here’s the thing: because
Governor Quinn convened the Illinois Innova-
tion Council, because four organizations
came together to develop and publish the
Illinois Innovation Index (a longtime pet
project of Lance Pressl), and because of the ter-
rific private-sector work by Matt Moog and
the Built in Chicago team, we actually know
what we’re talking about. We’re not asking
fairy-tale questions or relying on the kind of
made-up metrics that have in the past been
the traditional fare for politicians, government
agencies, and other community boosters.
Hopefully, those unhappy days are behind us.
And the best news is that, as the Index has dem-
onstrated, we’ve actually got the goods right
here in metropolitan Chicago and Illinois: real
growth, real innovation, tremendous expan-
sion in new businesses, and real results―all
concretely documented for the first time. I’m
especially sensitive to this situation because I’ve
recently returned from an “innovation” confer-
ence in another state where one of the featured
speakers baldly asserted that his community
was the nation’s leader in start-ups and innova-
tion. Then he smiled and said that if all the
folks there just kept repeating his factoid with a
straight face, one of these days it might be true.
And pigs might also fly. Now, there’s nothing
wrong with aiming high and shooting for the
stars, but you need actual results to back
up the stories you’re telling. You actually lose
credibility (and your most important audiences)
if you try to manufacture movement and
momentum where neither exists.
What’s so exciting to me about the documented
progress we’re making in Chicago and Illinois
is that―in some very smart ways―we’re using
technology and new digital media to help us
keep score. I’ve always said that, in every busi-
ness, what gets measured is what gets done,
and absolutely everything can be measured. By
creating some standard reporting formats in
the Index and encouraging the unprecedented
collaboration of a number of the state’s crucial
business, planning, and economic development
organizations, we have created an impor-
tant new tool to raise awareness and promote
innovation. We’re seeing this innovation
spread beyond the obvious high-tech sectors
to enhance critical infrastructure assets and
address other needs regarding our roads, rail,
airports, and broadband―all critical elements
to keep Illinois on the cutting edge.
Now, I’m not pretending that the Index auto-
matically makes everything clear and obvious.
There will still be plenty of false starts and
unfocused efforts. Until September of last year,
when the Index was first published, I’d say
that we didn’t know much about what we didn’t
know. In addition, while we’ll never be big
boasters or blowhards (it’s just not the Mid-
western way), we are getting a little more
comfortable about telling our stories and tooting
our own horns. Even more important, we
have finally started to believe that anything
that’s worth doing is worth failing at as long
as you give it the old college try. I don’t think
we’ll ever be celebrating failure around these
parts, but we’re getting smarter and smarter
about failing fast and that―along with
ferocious persistence―is the essential compo-
nent for eventual start-up success.
The state of innovation in Illinois

5
Now that we have a clearer, much-improved
view of where we’re headed, we have to under-
stand that there’s a great deal of work still
ahead of us―as individual businesses, as a com-
munity, and as a state. We must all work
together to build a sustainable, supportive, and
vibrant entrepreneurial environment that fos-
ters continued growth and critical job creation.
In addition, we have to be sure that we don’t get
entirely lost in the numbers. Measuring more
is pretty easy; measuring better is much harder
because it requires value judgments. And bet-
ter, in the end, is all that really matters.
People perform best when they know what is
expected of them and are told honestly how
they are doing. We need to be certain that we
continue to recognize, acknowledge, and
praise the people and companies that are mak-
ing a difference in our state and in our
economy. The Index is one of the ways we can
“keep score” and make sure that we keep
moving forward and demonstrating our prog-
ress to the broader public.
We need to give everyone a real stake and
a sense of ownership in this journey because,
without the help and encouragement of the
public, we can’t really accomplish our larger
goals, which will ultimately benefit every-
one. You never know where your next idea or
inspiration may come from: it’s almost cer-
tainly not exclusively from within the four walls
of your own business. Therefore, it’s critical
to broaden the reach and scope of all the net-
works we’re creating. True innovation is
change that creates a new and higher level of
performance and productivity. As we seek
to accomplish far more with far less, continued
innovation is clearly the key.
I want to close my comments with two final
suggestions for the path ahead.
First, we need to concentrate on doing what we
do better than anyone else. We can’t chase
too many rabbits or we’ll end up hungry with
none. So it’s critically important that we
avoid the wild pursuit of too many different
ideas, since trying to be all things to all people
is a formula for certain failure. We want to
be known as the “go-to” people, the “go-to” city
and the “go-to” state for a few, important,
sustainable and long-term industries where we
can optimize the competitive advantages that
we already have. What’s the right number? No
fewer than we can handle and no more than
we can afford.
Second, what are these areas? Transportation/
logistics, finance (such as Chicago Board
Options Exchange/Chicago Mercantile
Exchange), management consulting, advanced
manufacturing, digital media, health care,
pure science (Argonne), data centers, energy
storage, and education. Let’s focus on our
history, strengths, and the amazing combina-
tion of industry, schools, and talent to build
the best and most successful businesses and
institutions in these spaces.
Let’s have the courage and the discipline to
avoid spreading ourselves too thin and
competing in areas where we will never make
a material difference. I know it’s hard to say,
but if you’re interested in fashion, advertising,
or journalism, you need to get to New York.
Wanna build rockets and space shuttles? Get
yourself to Denver, the new center of gravity
for our entire space program. Wanna make a
difference in Chicago and Illinois? Go with
what we already do so well and commit to mak-
ing it better.
Howard Tullman is the president and chief executive officer of the Tribeca Flashpoint Media Arts Academy and a member of the Illinois Innovation Council.

Illinois Innovation Index Annual Report 2011–20126
A year of the Illinois Innovation Index
September 2011–August 2012

7
Since June 2009, venture capital has been flow-
ing into Illinois at record levels. In 2010, venture
capital firms invested more than $1.4 billion in
Illinois businesses, eclipsing the previous record
of 2003 by more than $325 million. The first
In the numbers
Venture capital investment in Illinois businesses hits record levels
Venture capital: Total equity invested in Illinois, yearly totals 2002−2011, in�ation adjusted
0
200
400
600
800
1000
1200
1600
2002 2003 2004 2005 2006 2007 2008 2009 2010 2011
$ million
RecessionDecember 2007−June 2009
1400
2010$1.458 billion
*2011 includes total investment for �rst two quarters only.
2011$864.5 million year to date*
Source: Data generously provided by the Illinois Venture Capital Association.
two quarters of 2011 have continued this trend,
with nearly $865 million invested so far. The
Chicago metropolitan statistical area accounted
for nearly all of the investment.
September 2011
Illinois Innovation Index Annual Report 2011–20128
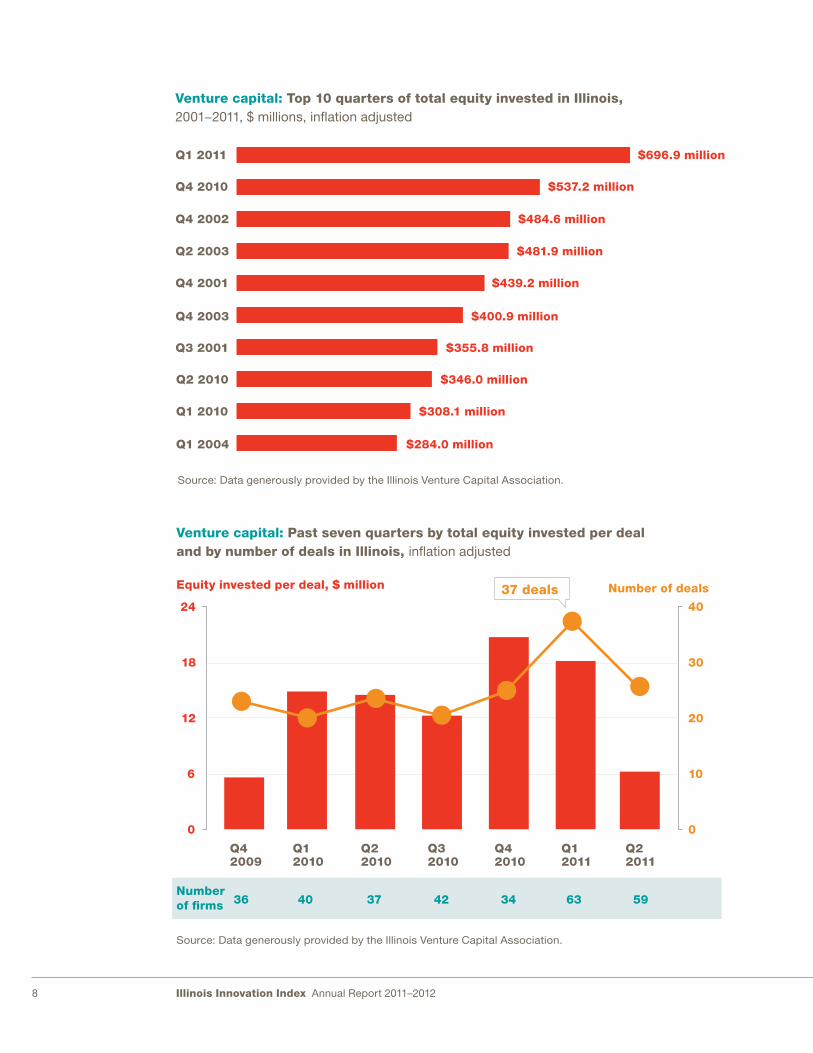
Q1 2011
Venture capital: Top 10 quarters of total equity invested in Illinois, 2001−2011, $ millions, in�ation adjusted
Q4 2010
Q4 2002
Q2 2003
Q4 2001
Q4 2003
Q3 2001
Q2 2010
Q1 2010
Q1 2004
$696.9 million
$537.2 million
$484.6 million
$481.9 million
$439.2 million
$400.9 million
$355.8 million
$346.0 million
$308.1 million
$284.0 million
Source: Data generously provided by the Illinois Venture Capital Association.
Number of deals
Q42009
Venture capital: Past seven quarters by total equity invested per deal and by number of deals in Illinois, in�ation adjusted
0
6
12
18
24
0
10
20
30
40
Equity invested per deal, $ million
Q12010
Q22010
Q32010
Q42010
Q12011
Q22011
37 deals
Number of firms 36 40 37 42 34 63 59
Source: Data generously provided by the Illinois Venture Capital Association.
9
While investment in Q1 2011 far exceeded
previous quarters, a prolonged decline during
the recent recession shows the vulnerability
of venture capital investment to larger economic
cycles; it also underscores the importance of
counteracting these external factors.
There were a record 37 deals in the first quarter
of this year, an encouraging indication of the
level of innovation and investment activity in the
state. Over the past seven quarters, there have
been more than 20 VC deals per quarter, and the
average equity per deal has increased signifi-
cantly compared with previous years.
As rising uncertainty in global markets clouds
the long-term economic outlook for the
United States, Illinois should continue to create
a welcoming environment for innovation.
Spotlight
Transferring Telecoms
Neutral Tandem is a premier independent
telecommunications tandem company deliver-
ing more affordable services to consumers.
Neutral Tandem provides the switches, or tan-
dems, that transfer calls from one carrier
to another—a service previously provided only
by existing telecom companies.
Today, from its Chicago headquarters, Neutral
Tandem provides services to nine of the
top ten U.S. wireless carriers, which account
for 95 percent of the country’s total wireless
subscribers.
neutraltandem.com
Neutral Tandem began with one innovator
working from a kitchen table and is now
posting annual revenues of nearly $200 million.
But before raising more than $90 million
in an initial public offering, Neutral Tandem
relied on three rounds of VC funding to
expand its network, enhance its technology,
and create national marketing initiatives.

Illinois Innovation Index Annual Report 2011–201210
Results from the 2011 Illinois Entrepreneurial
Survey show a sense of optimism among
Chicago’s emerging innovation ecosystem as
entrepreneurs seek to develop and expand
their businesses. Built in Chicago, the Chicago-
land Entrepreneurial Center, the Chicago
Innovation Awards, the Illinois Science & Tech-
nology Coalition, the Illinois Technology
Association, Startup Illinois, and World Busi-
ness Chicago joined forces on the survey, which
was developed to gauge the entrepreneurial
landscape in Chicago and Illinois.
Drawing on a cross-section of perspectivesThe survey targeted leaders of active entrepre-
neurial ventures and was conducted from
June to August of this year. In all, it drew res-
ponses from 136 business leaders across a
diverse range of industries, from software to
education and healthcare. Notably, nearly
80 percent of survey respondents founded their
business in the past five years, highlighting
the growing community of talent and leadership
in Illinois.
In the numbers
Recent statewide survey reveals optimism among emerging entrepreneurs and highlights growth opportunities
Survey question: Please describe your industry (check all that apply) number of responses = 174
1 Includes recycling, renewable energy, and other environmentally friendly technologies.2 Online technologies and products, such as apps, that are designed and marketed to consumers.3 Such as software, digital media and advertising, and e-commerce.4 Includes industries such as education, business technology, IT services, life sciences, telecom, and transportation.
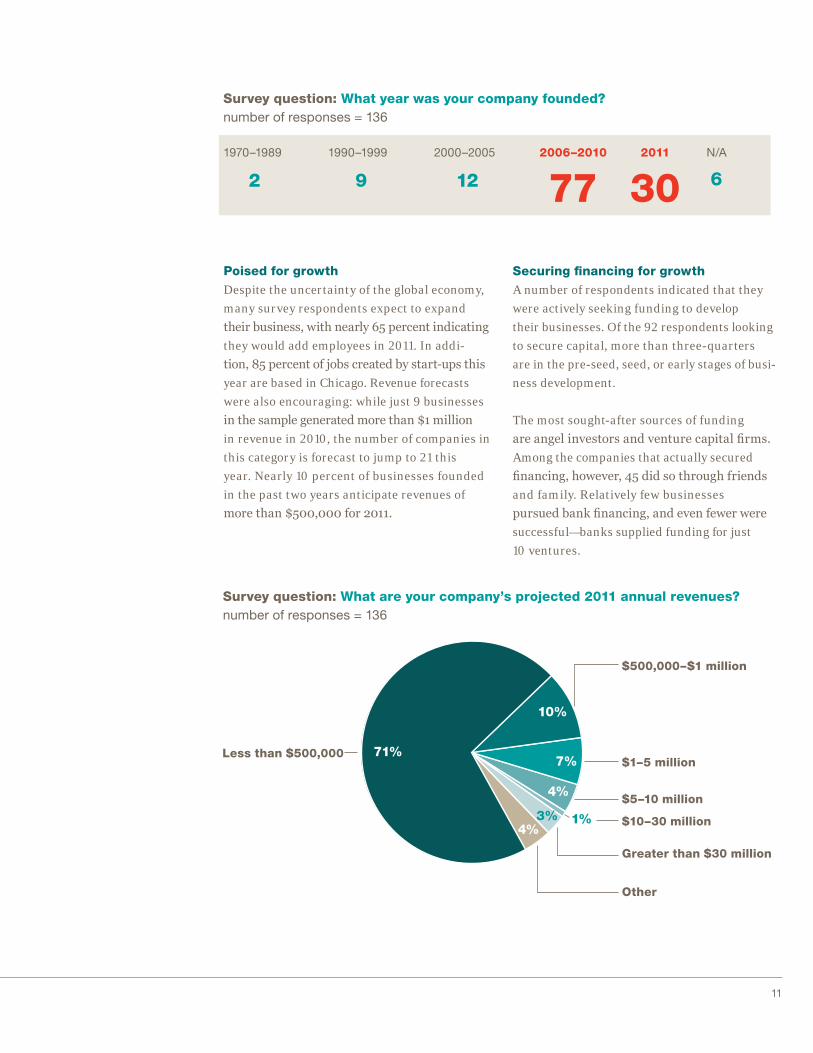
Survey question: What year was your company founded?number of responses = 136
Other4
Healthcare technology 9
Financial services technology 13
Digital3 19
Consulting/agency 16
Consumer Web2 29
Consumer products 16
Retail 10
Clean tech1 14
Mobile 13
35
1970–1989 1990–1999 2000–2005 2006–2010 2011 N/A
2 9 12 77 30 6
October 2011
11
Survey question: Please describe your industry (check all that apply) number of responses = 174
1 Includes recycling, renewable energy, and other environmentally friendly technologies.2 Online technologies and products, such as apps, that are designed and marketed to consumers.3 Such as software, digital media and advertising, and e-commerce.4 Includes industries such as education, business technology, IT services, life sciences, telecom, and transportation.
Survey question: What year was your company founded?number of responses = 136
Other4
Healthcare technology 9
Financial services technology 13
Digital3 19
Consulting/agency 16
Consumer Web2 29
Consumer products 16
Retail 10
Clean tech1 14
Mobile 13
35
1970–1989 1990–1999 2000–2005 2006–2010 2011 N/A
2 9 12 77 30 6
Poised for growth Despite the uncertainty of the global economy,
many survey respondents expect to expand
their business, with nearly 65 percent indicating
they would add employees in 2011. In addi-
tion, 85 percent of jobs created by start-ups this
year are based in Chicago. Revenue forecasts
were also encouraging: while just 9 businesses
in the sample generated more than $1 million
in revenue in 2010, the number of companies in
this category is forecast to jump to 21 this
year. Nearly 10 percent of businesses founded
in the past two years anticipate revenues of
more than $500,000 for 2011.
Securing financing for growthA number of respondents indicated that they
were actively seeking funding to develop
their businesses. Of the 92 respondents looking
to secure capital, more than three-quarters
are in the pre-seed, seed, or early stages of busi-
ness development.
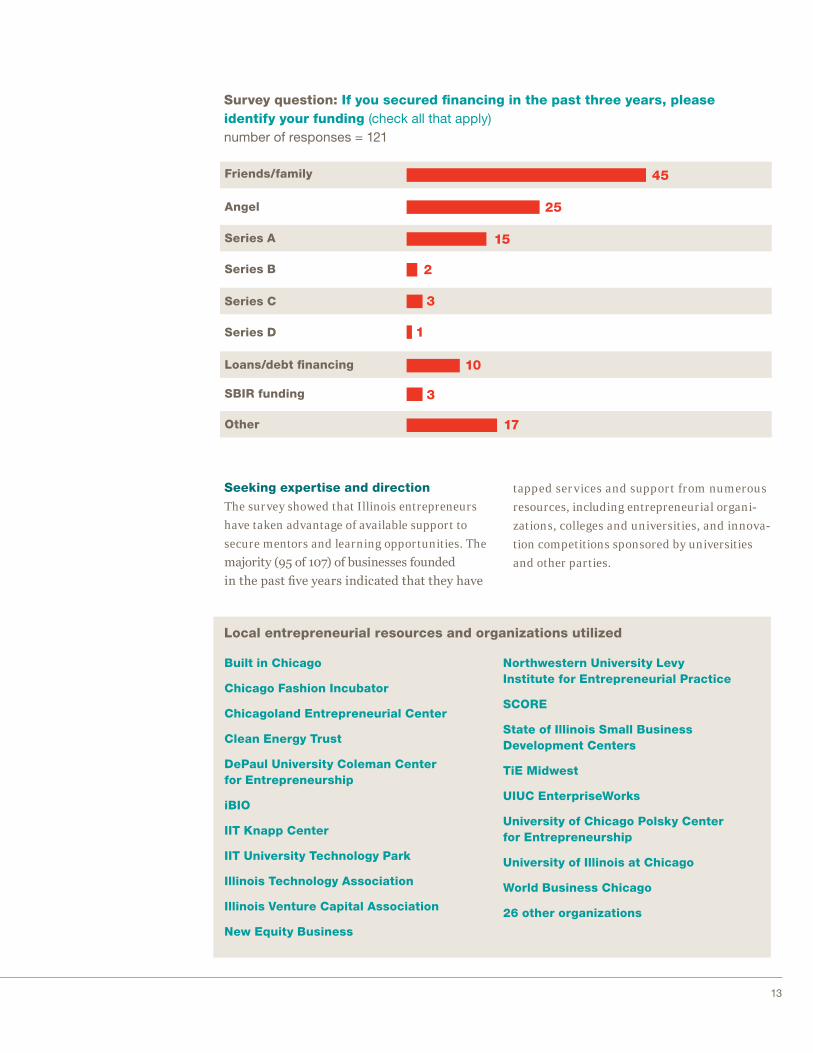
The most sought-after sources of funding
are angel investors and venture capital firms.
Among the companies that actually secured
financing, however, 45 did so through friends
and family. Relatively few businesses
pursued bank financing, and even fewer were
successful—banks supplied funding for just
10 ventures.
Less than $500,000
Survey question: What are your company’s projected 2011 annual revenues?number of responses = 136
$500,000–$1 million
$1–5 million
$5–10 million
$10–30 million
Greater than $30 million
71%
10%
7%
4%
4%3% 1%
Other

Illinois Innovation Index Annual Report 2011–201212
Early stage (funds to initiate commercial sales)
Survey question: If you are currently looking for funding, which of the following best describes the round of funding you are seeking?number of responses = 92
Pre-seed stage(proof of concept, early production development, no market studies)
Second stage (working capital for expan-sion of a company)
Seed stage (product development, market studies, and marketing, commercial launch planning)
Third stage (working capital for major expansion of a company)
46% 16%
7%
23%
5%
2%1%
Other
Bridge financing(�nancing for a company expecting to be pro�table or “go public” within 6 months to a year)
Source: 2011 Illinois Entrepreneurial Survey
Survey question: Are you currently seeking investment capital? (check all that apply) number of responses = 261
Not currently seeking 52
Government 17
Bank loan 14
Angel 64
Private equity 20
Venture capital 53
Friends/family 34
Other 7
Survey question: If you secured financing in the past three years, please identify your funding (check all that apply) number of responses = 121
Loans/debt financing 10
Other 17
Series D 1
Series C 3
Angel 25
Series B 2
Series A 15
Friends/family 45
SBIR funding 3
13
Survey question: Are you currently seeking investment capital? (check all that apply) number of responses = 261
Not currently seeking 52
Government 17
Bank loan 14
Angel 64
Private equity 20
Venture capital 53
Friends/family 34
Other 7
Survey question: If you secured financing in the past three years, please identify your funding (check all that apply) number of responses = 121
Loans/debt financing 10
Other 17
Series D 1
Series C 3
Angel 25
Series B 2
Series A 15
Friends/family 45
SBIR funding 3
Seeking expertise and directionThe survey showed that Illinois entrepreneurs
have taken advantage of available support to
secure mentors and learning opportunities. The
majority (95 of 107) of businesses founded
in the past five years indicated that they have
tapped services and support from numerous
resources, including entrepreneurial organi-
zations, colleges and universities, and innova-
tion competitions sponsored by universities
and other parties.
Local entrepreneurial resources and organizations utilized
Built in Chicago
Chicago Fashion Incubator
Chicagoland Entrepreneurial Center
Clean Energy Trust
DePaul University Coleman Center for Entrepreneurship
iBIO
IIT Knapp Center
IIT University Technology Park
Illinois Technology Association
Illinois Venture Capital Association
New Equity Business
Northwestern University Levy Institute for Entrepreneurial Practice
SCORE
State of Illinois Small Business Development Centers
TiE Midwest
UIUC EnterpriseWorks
University of Chicago Polsky Center for Entrepreneurship
University of Illinois at Chicago
World Business Chicago
26 other organizations

Illinois Innovation Index Annual Report 2011–201214
Power2Switch is an online platform that allows
businesses and individuals to compare prices
from electricity suppliers in Illinois. The site
provides tools to compare price and contract
terms from numerous suppliers, allowing cus-
tomers to make an educated decision about
their supplier. Its free, user-friendly, Web-based
service has helped businesses to track savings
as well as energy and carbon usage. Since sup-
pliers compete for business, customers can
reduce their rates by up to 30 percent. Through
Power2Switch, one McDonald’s franchisee
is saving $127,000 across his locations.
Power2Switch was launched in Chicago in
2010 by University of Chicago Booth School of
Business alumni Seyi Fabode and Phil Nevels.
The company has worked with the Chicagoland
Entrepreneurial Center for the past year to
connect to mentors and resources, resulting
in significant revenue growth and market
traction. Power2Switch was also one of ten com-
panies selected for a highly competitive
Excelerate 2011 program.
Spotlight
Power2Switch
power2switch.com
need for office space and professional services.
Similarly, tools that connect ideas and entre-
preneurs to capital more effectively could help
increase the volume of start-ups.
Nurturing innovation in IllinoisThe entrepreneurial and innovation community
should take several important actions to build
on the current momentum. Respondents are
seeking better access to experienced entre-
preneurial advice and guidance, including ways
to connect with local Fortune 500 leaders.
In addition, survey participants expressed a
Source: All data are from the 2011 Illinois
Entrepreneurial Survey.

15
With the fifth-largest GDP in the United States,
Illinois remains an economic powerhouse: in
2009, its nonagricultural employment stood at
more than 5.1 million, accounting for nearly
4.5 percent of the nation’s total employment.
However, total employment didn’t grow from
1998 to 2009. As businesses become intercon-
nected across regions, stakeholders need a
more detailed picture to determine where energy
should be focused to achieve economic devel-
opment and job creation.
This dynamic speaks to why clusters have
emerged as a new and more revealing
measure of economic performance and a way
to focus resources. According to Harvard
Business School’s Cluster Mapping Project
(clustermapping.us/index.html), a cluster is
composed of “a geographically proximate group
of interconnected companies and associated
institutions in a particular field, including
product producers, service providers, suppliers,
universities, and trade associations.” Firms
in industry clusters can gain a competitive
advantage from their close geographic proxim-
ity, which can promote cooperation, compe-
tition, and innovation.
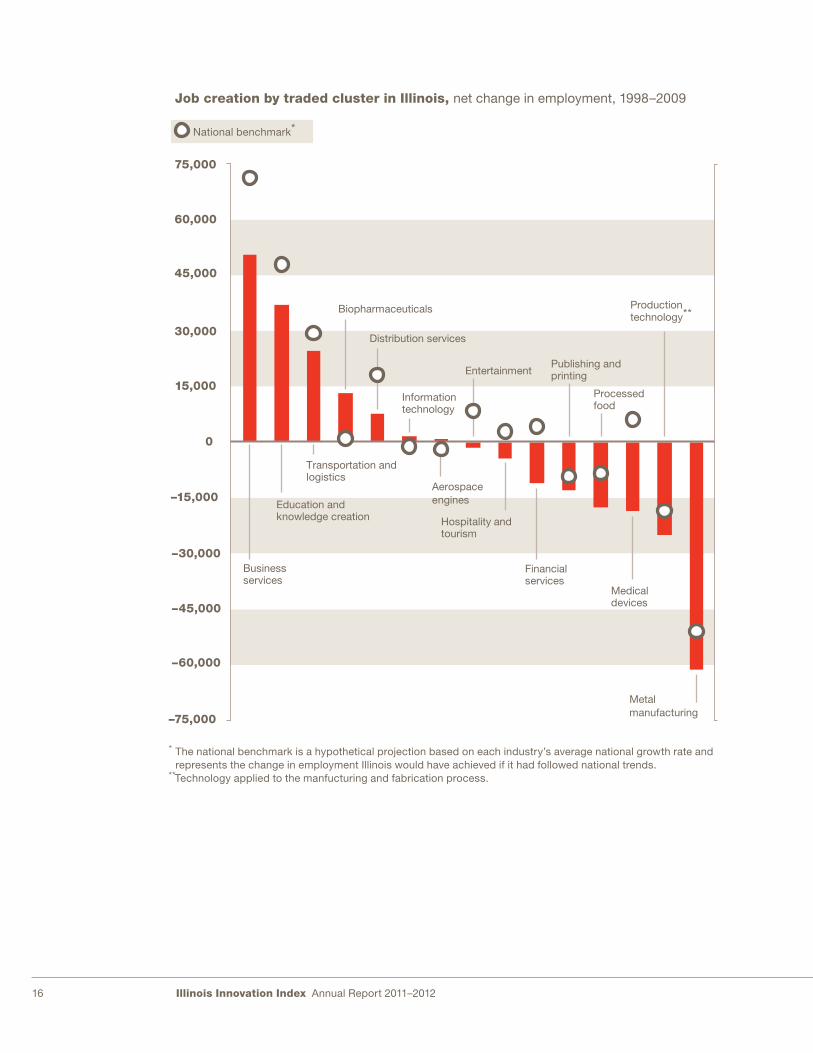
Performance by cluster in IllinoisTo understand Illinois’ performance, we
selected 15 diverse clusters and compared their
growth with the national benchmark. A look
at the state’s employment growth by cluster
reveals mixed news. The majority of clusters
that experienced growth, including high-
wage clusters such as business services, infor-
mation technology, and distribution services,
still lagged behind the national averages. In the
clusters that suffered job losses, these numbers
outpaced the benchmark.
In the numbers
National cluster mapping reveals Illinois’ economic strengths as well as opportunities
November 2011
Illinois Innovation Index Annual Report 2011–201216
Job creation by traded cluster in Illinois, net change in employment, 1998–2009
Metal manufacturing
0
15,000
45,000
30,000
60,000
75,000
–45,000
–30,000
–60,000
–75,000
Business services
Education and knowledge creation
Transportation and logistics
Biopharmaceuticals
Distribution services
Information technology
Entertainment
Aerospace engines
Hospitality and tourism
Financial services
Publishing and printing
Processed food
Medical devices
Production technology**
–15,000
National benchmark*
* The national benchmark is a hypothetical projection based on each industry’s average national growth rate and represents the change in employment Illinois would have achieved if it had followed national trends.**Technology applied to the manfucturing and fabrication process.

17
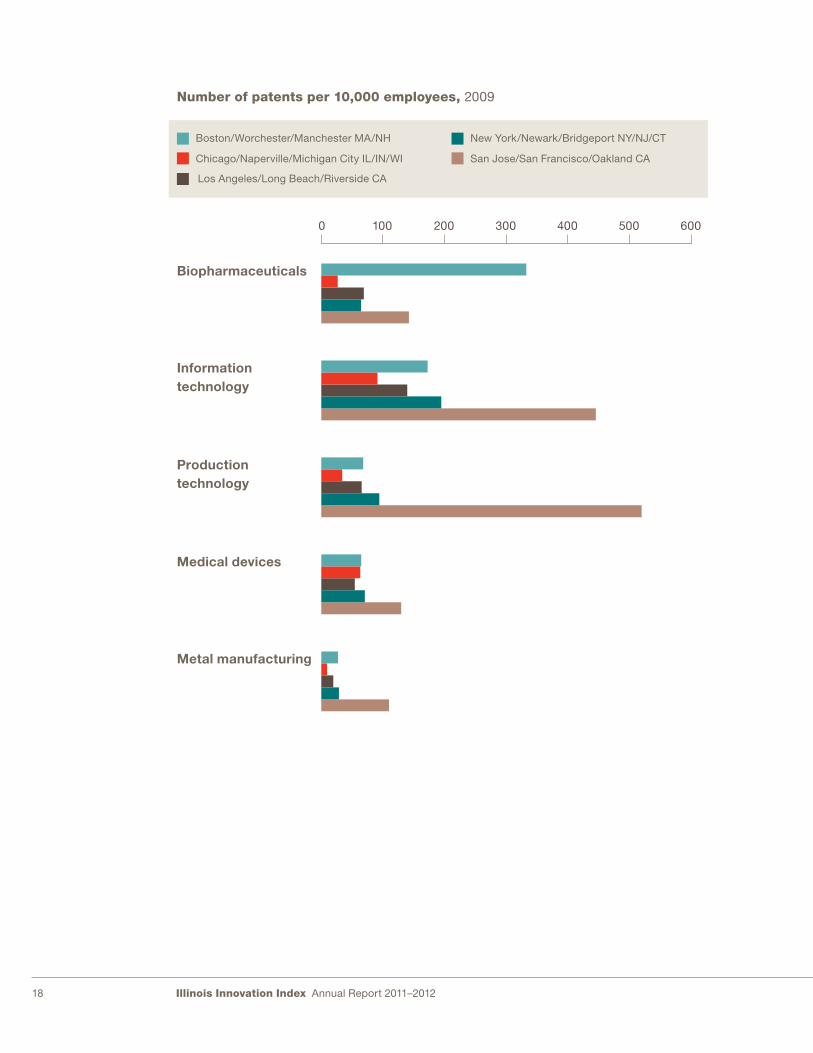
How the Chicago Economic Area stacks up with other regionsAs the Chicago Economic Area1 represents
75 percent of the state’s population and nearly
80 percent of its economic activity, com-
paring the Chicago Economic Area with other
regions highlights strengths and weaknesses.
A review of selected clusters by share of national
employment and the number of patents pro-
duced can indicate the concentration of certain
types of high-skilled, high-wage positions.
For instance, the Chicago region has captured
a significant share of national employment in
selected clusters, but it has a disproportionately
low number of patents per 10,000 people com-
pared with other regions. These data provide a
snapshot of existing concentrations and point
to several sectors that could be cultivated for
accelerated growth.
Biopharmaceuticals
Information technology
Production technology
Medical devices
Metal manufacturing
San Jose/San Francisco/Oakland CA
Boston/Worchester/Manchester MA/NH New York/Newark/Bridgeport NY/NJ/CT
Chicago/Naperville/Michigan City IL/IN/WI
Los Angeles/Long Beach/Riverside CA
Share of national employment, 2009
0 2 4 6 8 2010 12 14 16 18
Illinois Innovation Index Annual Report 2011–201218
Biopharmaceuticals
Information technology
Production technology
Medical devices
Metal manufacturing
San Jose/San Francisco/Oakland CA
Boston/Worchester/Manchester MA/NH New York/Newark/Bridgeport NY/NJ/CT
Chicago/Naperville/Michigan City IL/IN/WI
Los Angeles/Long Beach/Riverside CA
Number of patents per 10,000 employees, 2009
0 100 200 300 400 500 600

19
What we can learn from one clusterIn the biopharmaceutical cluster, for example,
the Chicago region has experienced significant
growth over the past decade. While total
national employment grew by just 7,000 jobs
from 1998 to 2009, the region added 17,000 jobs
Share of national employment, biopharmaceuticals, 1998–2009, percent
35%
30%
25%
20%
15%
10%
5%
0
1998 1999 2000 2001 2002 2003 2004 2005 2006 2007 2008 2009
Chicago/Naperville/Michigan City IL/IN/WI
Los Angeles/Long Beach/Riverside CA
New York/Newark/Bridgeport NY/NJ/CT
Philadelphia/Camden/Vineland PA/NJ/DE/MD
San Jose/San Francisco/Oakland CA
+ 17,055 jobs
– 24,167 jobs
+ 1,108 jobs
+ 16,719 jobs
+ 1,458 jobs
during this period. Its strong network of
educational institutions, research facilities,
advocacy organizations, and global corporations
act as a magnet to attract other businesses
and investment.

Illinois Innovation Index Annual Report 2011–201220
Pursuing a coordinated strategy to spur growth and innovationGiven our regional advancement in fostering
selected clusters, academic, corporate, and
public sector organizations should continue to
work collaboratively to identify and support
the needs of each cluster by applying the suc-
cessful strategies deployed to nurture bio-
pharmaceuticals. With thoughtful, deliberate,
and sustained support for self-perpetuating
ecosystems, leaders can ensure that research
connects with market opportunity and is
supported by capital and talent. Industry stake-
holders and policy makers could harness
Illinois’ demonstrated advantages—agriculture,
an educated workforce, and a diversified
economy—by implementing measures to develop
related industry clusters. Organizations that
promote research technology and its applications
can work to position the state for future
growth in clusters that will benefit dispropor-
tionately from targeted support.
1 The geography used in this analysis is the Chicago
Economic Area, which is defined by the U.S. Bureau
of Economic Analysis as 21 counties in Illinois, 5
counties in Indiana, and 1 county in Wisconsin.
Source: Prof. Michael E. Porter, Cluster Mapping
Project, Institute for Strategy and Competitiveness,
Harvard Business School; Richard Bryden, Project
Director. Copyright 2011 by the President and Fellows
of Harvard College. All rights reserved.

Horizon Pharma, Inc., headquartered in
Deerfield, Ill., is a biopharmaceutical company
developing and commercializing innovative
medicines to target unmet therapeutic needs in
arthritis, pain, and inflammatory diseases.
Horizon Pharma relocated to the Chicagoland
area from Palo Alto, CA, in July 2008.
With the help of the Illinois Department of
Commerce and Economic Opportunity and
the Illinois Science Technology Park Incubator,
the company began operations at the Illinois
Science and Technology Park in Skokie, Ill.
In July 2011, Horizon raised $49.5 million
through an IPO and began trading on
the Nasdaq Global Market under the symbol
“HZNP.” In less than four months, the
company has grown to 160 global employees,
from 50.
The company will soon launch its first product
in the United States, DUEXIS®, a single-
tablet combination of ibuprofen and famotidine
approved to relieve the signs and symptoms
of rheumatoid arthritis and osteoarthritis and to
decrease the risk of developing upper gastro-
intestinal ulcers.
The company’s second product candidate,
LODOTRA®, a modified-release formulation
of low-dose prednisone for treating
active rheumatoid arthritis, is marketed in
16 European countries and is currently
under review by the U.S. FDA.
Spotlight
Horizon Pharma
horizonpharma.com
21

Illinois Innovation Index Annual Report 2011–201222
Throughout Illinois’ rich history of innovation,
private and public organizations have
conducted groundbreaking research and intro-
duced technologies that have enhanced
quality of life around the world. With more than
440 corporate R&D facilities and more than
200 academic, government, and not-for-profit
research institutions, Illinois has one of the
strongest concentrations of research institutions
in the United States.
The amount of funding Illinois captures has
a direct and indirect impact on economic
development. According to multipliers developed
under the auspices of the U.S. Department of
Commerce’s Bureau of Economic Analysis, every
$1 million in academic R&D spending sup-
ports 36 direct/indirect jobs on average across
the United States.1 In 2009, academic R&D
expenditures totaled $2.1 billion for the state.
Total R&D performance2 for Illinois in 2007,3
including public and private sector expenditures,
was $14.3 billion.
As the November edition of the Index illustrated,
creating a nurturing environment for innova-
tion requires a sustained and coordinated effort
among industry, government, nonprofits, and
higher education. Federal labs conduct critical
basic and applied research and generate
extensive additional economic opportunity in the
region, while universities play a similar role
and serve as a magnet for innovation: they attract
not only the world’s top minds but also compa-
nies looking for a deep pool of qualified workers.
In 2009, Argonne National Laboratory and
Fermilab captured nearly $875 million in federal
funding and millions more in industry-sponsored
research. A report by the Anderson Economic
Group revealed that in 2010, the two labs gener-
ated economic output totaling $1.34 billion
and household earnings of $410.3 million while
supporting the employment of 9,481 people
in Illinois.
Beyond their economic impact these facilities
have achieved important scientific break-
throughs. Over the past several years, scientists
at Argonne, for instance, invented a new
nanotechnology technique critical to the develop-
ment of the battery system that is now power-
ing the Chevrolet Volt.
Research institutions rely on a range of funding
sources to fulfill their mission. The National
Science Foundation’s Survey of Research and
Development Expenditures for colleges and
universities highlights the multiple stakeholders
that must work together to support innovation.
In the numbers
R&D funding for Illinois universities and research institutions drives innovation
Illinois´ R&D institutions set the pace in the MidwestR&D expenditures by FFRDC by institution, top 15, 2009
1. Los Alamos National Laboratory, NM $2,172 billion
9. Brookhaven National Laboratory, NY $569 million
10. Argonne National Laboratory, IL $543 million
11. Idaho National Laboratory, ID $388 million
12. National Cancer Institute at Frederick, MD $378 million
13. Fermi National Accelerator Laboratory, IL $377 million
14. SLAC National Accelerator Laboratory, CA $294 million
15. National Renewable Energy Research Laboratory, CO $274 million
December 2011
23
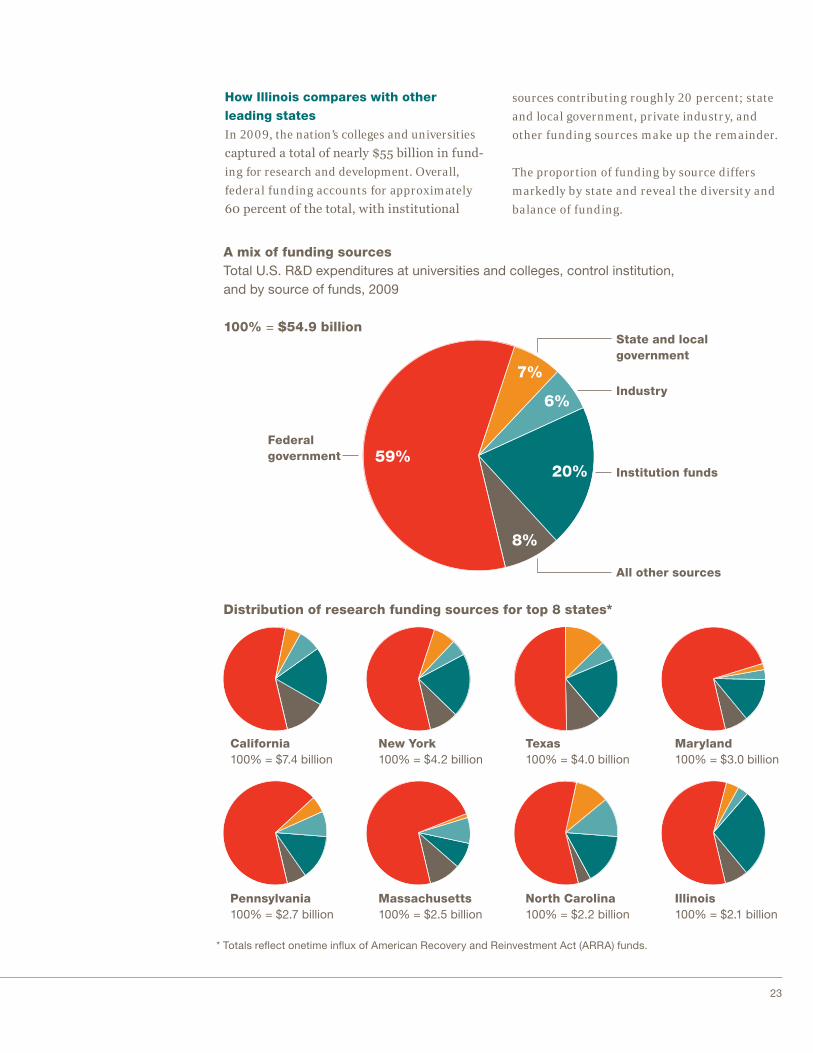
How Illinois compares with other leading statesIn 2009, the nation’s colleges and universities
captured a total of nearly $55 billion in fund-
ing for research and development. Overall,
federal funding accounts for approximately
60 percent of the total, with institutional
sources contributing roughly 20 percent; state
and local government, private industry, and
other funding sources make up the remainder.
The proportion of funding by source differs
markedly by state and reveal the diversity and
balance of funding.
A mix of funding sourcesTotal U.S. R&D expenditures at universities and colleges, control institution, and by source of funds, 2009
Distribution of research funding sources for top 8 states*
* Totals re�ect onetime in�ux of American Recovery and Reinvestment Act (ARRA) funds.
100% = $54.9 billion
Federal government 59%
State and local government
Institution funds
All other sources
Industry7%
6%
20%
8%
California100% = $7.4 billion
New York100% = $4.2 billion
Texas100% = $4.0 billion
Maryland100% = $3.0 billion
Pennsylvania100% = $2.7 billion
Massachusetts100% = $2.5 billion
North Carolina100% = $2.2 billion
Illinois100% = $2.1 billion

Illinois Innovation Index Annual Report 2011–201224
Funding distribution by educational institutionAmong the 696 institutions listed in the NSF
sample, Illinois has four colleges and univer-
sities in the top decile and nine in the top third.
A closer look at how these institutions allocate
their resources reveals where the state’s R&D
activity is concentrated. Life sciences (such
as biology, physiology, and biochemistry), math
and computer sciences, and engineering are
all well represented. In addition, the top Illinois
institutions have received more than $60 mil-
lion in funding for environmental sciences pro-
grams. The concentration in fields with great
applied potential speaks to the practical nature
of the research conducted in Illinois.
Fueling the next generation of innovationR&D expenditures at Illinois universities and colleges, ranked by science and engineering �eld, 2009, percent
$564 million
$515 million
$378 million
$342 million
$66 million
$35 million
$32 million
$23 million
$21 million
University of Illinois, Urbana–Champaign
Southern Illinois University, Carbondale
Illinois Institute of Technology
Northern Illinois University, DeKalb
Southern Illinois University, Edwardsville
University of Illinois, Chicago
Northwestern University
Loyola University
University of Chicago
Rank InstitutionAll R&D expenditures
27
30
48
57
159
201
209
232
239
Social sciences
Environmental sciences
PsychologyLife sciences
Math/computer sciences
Physical sciences
Engineering
Sciences—not classi�ed
Source: National Science Foundation

25
A strong regional anchor for research and innovationIllinois leads the Midwest in R&D funding, and
its East North Central region, also comprising
Indiana, Michigan, Ohio, and Wisconsin, ranks
third out of ten regions nationally, with nearly
$8 billion in funding. Each of these states bene-
fits not only from strong federal support but
also robust institutional resources.
The lack of forward-facing federal science
and technology investment is already eroding
U.S. primacy in this area, and more talent is
now concentrated in Asia and Europe, where
this type of investment remains a priority.
The effect is clear in Illinois, where Tevatron,
Fermilab’s particle accelerator, was shut
down in September, and the long-term federal
funding picture is unclear.
Strong regional commitment to R&DTotal R&D expenditures at universities and colleges, by geographic division, state, and source of funds, 2009
Outlying areas(including Guam, Puerto Rico, and the Virgin Islands)$133 million
New England$4.0 billion
Middle Atlantic$7.9 billion
South Atlantic$10.8 billion
East North Central$8.0 billion
East South Central$2.6 billion
West North Central$3.5 billion
West South Central$5.2 billion
Mountain$3.4 billion
Pacific$9.6 billion
East North Central All university/ State and local states college R&D government funding
Illinois $2.1 billion $77.4 millionIndiana $1.0 billion $56.5 millionMichigan $1.7 billion $59.2 millionOhio $1.9 billion $209.4 millionWisconsin $1.2 billion $46.7 million

Illinois Innovation Index Annual Report 2011–201226
Other competing states have taken measures to
bolster funding sources. For instance, Ohio
leads the region by a wide margin in funds from
state and local governments to support inno-
vation as a result of its Third Frontier program,
which was reapproved by voters in May 2010
in spite of the economic recession.4
A recent Illinois public opinion survey found
that 92 percent of respondents believe it’s
important for Illinois to be a leader in health
R&D,5 a cluster in which the state has excelled
over the past decade. Leaders from business,
industry, and education could work together
to identify other opportunities that could benefit
from greater support.
1 The Association of American Universities developed
this economic multiplier using methods established
by the Bureau of Economic Analysis (BEA) at the U.S.
Department of Commerce. In the 1970s, BEA developed
the Regional Input-Output Modeling System (RIMS),
which updated to RIMS II in 1997. For more information
see www.bea.gov/regional/rims/brfdesc.cfm.
2 The sum of R&D funding from industry, government,
and nonprofits.
3 The most recent year tracked by NSF data,
acording to www.nsf.gov/statistics/states/show
.cfm?stateID=53,14&year=0
4 According to SRI International, the firm hired by the Third
Frontier to conduct an economic impact study, from
2003 through 2008, the Third Frontier and Ohio univer-
sities invested $681 million in research, development,
and commercialization projects at academic,
research, and development institutions and companies,
entrepreneur-development organizations, and venture
capital funds.
5 Illinois Global Health poll, November 2010.
Source: National Science Foundation’s Survey of
Research and Development Expenditures for colleges
and universities
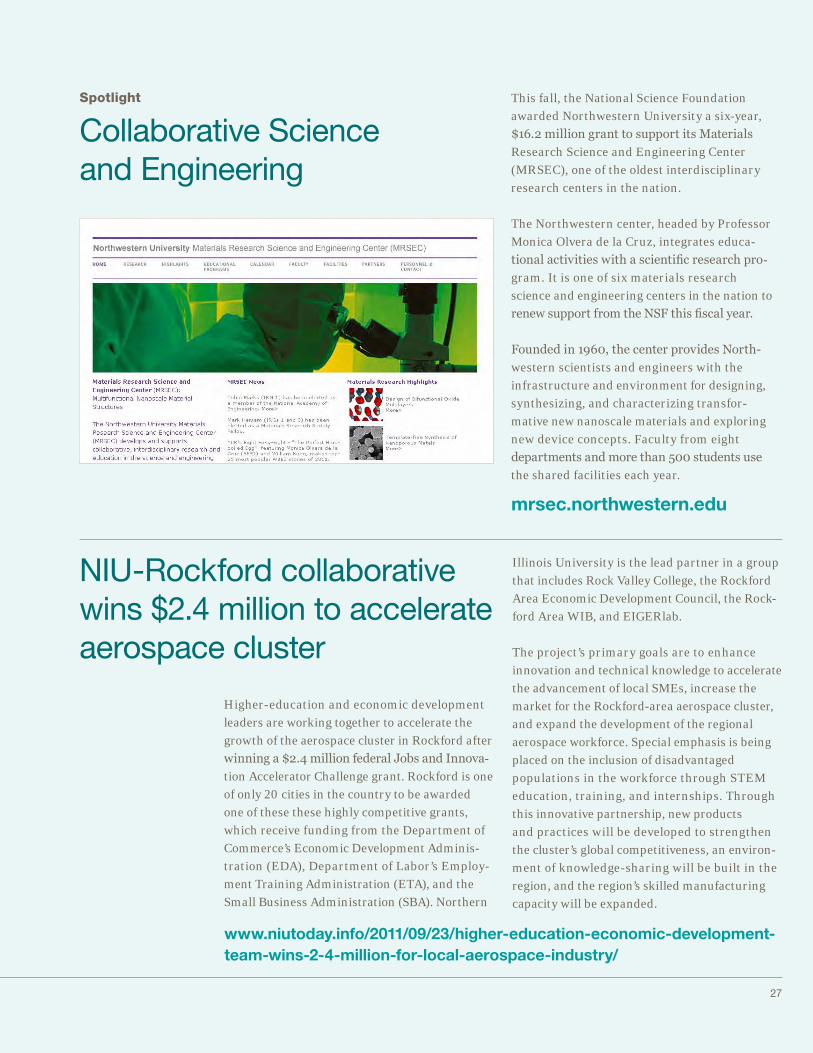
This fall, the National Science Foundation
awarded Northwestern University a six-year,
$16.2 million grant to support its Materials
Research Science and Engineering Center
(MRSEC), one of the oldest interdisciplinary
research centers in the nation.
The Northwestern center, headed by Professor
Monica Olvera de la Cruz, integrates educa-
tional activities with a scientific research pro-
gram. It is one of six materials research
science and engineering centers in the nation to
renew support from the NSF this fiscal year.
Founded in 1960, the center provides North-
western scientists and engineers with the
infrastructure and environment for designing,
synthesizing, and characterizing transfor-
mative new nanoscale materials and exploring
new device concepts. Faculty from eight
departments and more than 500 students use
the shared facilities each year.
Spotlight
Collaborative Science and Engineering
mrsec.northwestern.edu
Higher-education and economic development
leaders are working together to accelerate the
growth of the aerospace cluster in Rockford after
winning a $2.4 million federal Jobs and Innova-
tion Accelerator Challenge grant. Rockford is one
of only 20 cities in the country to be awarded
one of these these highly competitive grants,
which receive funding from the Department of
Commerce’s Economic Development Adminis-
tration (EDA), Department of Labor’s Employ-
ment Training Administration (ETA), and the
Small Business Administration (SBA). Northern
NIU-Rockford collaborative wins $2.4 million to accelerate aerospace cluster
www.niutoday.info/2011/09/23/higher-education-economic-development-team-wins-2-4-million-for-local-aerospace-industry/
Illinois University is the lead partner in a group
that includes Rock Valley College, the Rockford
Area Economic Development Council, the Rock-
ford Area WIB, and EIGERlab.
The project’s primary goals are to enhance
innovation and technical knowledge to accelerate
the advancement of local SMEs, increase the
market for the Rockford-area aerospace cluster,
and expand the development of the regional
aerospace workforce. Special emphasis is being
placed on the inclusion of disadvantaged
populations in the workforce through STEM
education, training, and internships. Through
this innovative partnership, new products
and practices will be developed to strengthen
the cluster’s global competitiveness, an environ-
ment of knowledge-sharing will be built in the
region, and the region’s skilled manufacturing
capacity will be expanded.
27

Illinois Innovation Index Annual Report 2011–201228
Many factors contribute to a state’s capacity
to create a positive business climate, and recent
data on the establishment of new businesses,
company growth, and business relocations to
and from the state show positive momentum
and provide a snapshot of opportunities for
improvement. These metrics provide important
perspective on efforts to support economic
development and innovation. As the data illus-
trate, job creation from the establishment
and expansion of companies outweighs the
number gained or lost as a result of companies
moving to and from the state. Nonetheless, a
diverse business support ecosystem requires a
cross-section of emerging and mature busi-
nesses for stability.
A launch pad for entrepreneurs In 2011, more than 13,000 new businesses
were established in the seven-county Chicago
metropolitan region, generating almost
23,000 jobs. The two largest industries—profes-
sional, scientific, and technical services and
administrative and support services—accounted
for nearly 30 percent of all new businesses
and more than a quarter of new employees. The
distribution of new business starts across
industries generally followed the pattern of all
businesses, with a few notable differences.
For instance, professional, technical, and scienti-
fic services accounted for 18.6 percent of
new business starts, well above the 14.3 percent
of established businesses in this industry.
This weighting points to the burgeoning strength
of Illinois’ technology-driven entrepre-
neurial ecosystem, which is benefiting from the
sustained support of public leaders.
In the numbers
Illinois gaining momentum in new business establishments and high-growth sectors
January 2012

29
Share of new business starts and jobs by industry* compared with total established businesses and jobs, northeastern Illinois,** 2011
Professional, scientific, and technical services
Administrative and support services
Ambulatory health care services
Merchant wholesalers, durable goods
Real estate
Specialty trade contractors
Securities, commodity contracts, and other financial investments and related activities
Construction of buildings
Support activities for transportation
Merchant wholesalers, nondurable goods
Percent of total
0 2 4 6 2010 12 14 16 188
New businesses
All employeesNew employees
All businesses
* North American Industry Classi�cation System (NAICS) categories** Data are for seven-county Chicago metropolitan area.
Source: Dun & Bradstreet
Illinois Innovation Index Annual Report 2011–201230
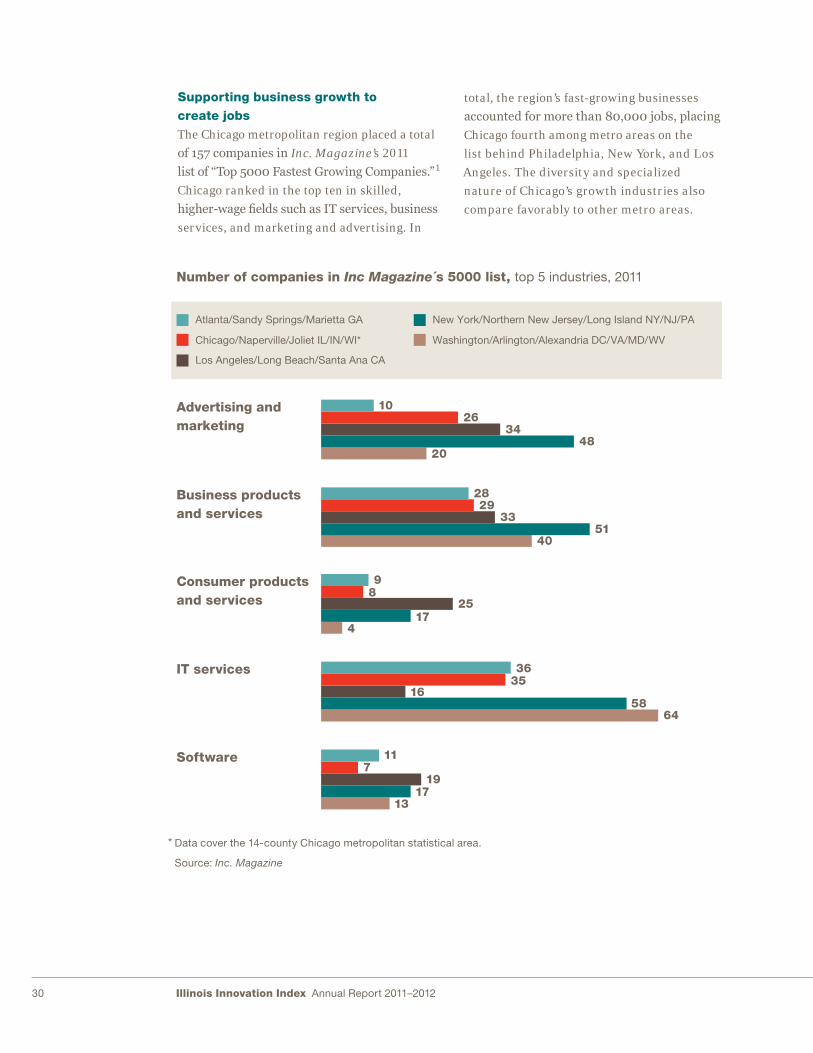
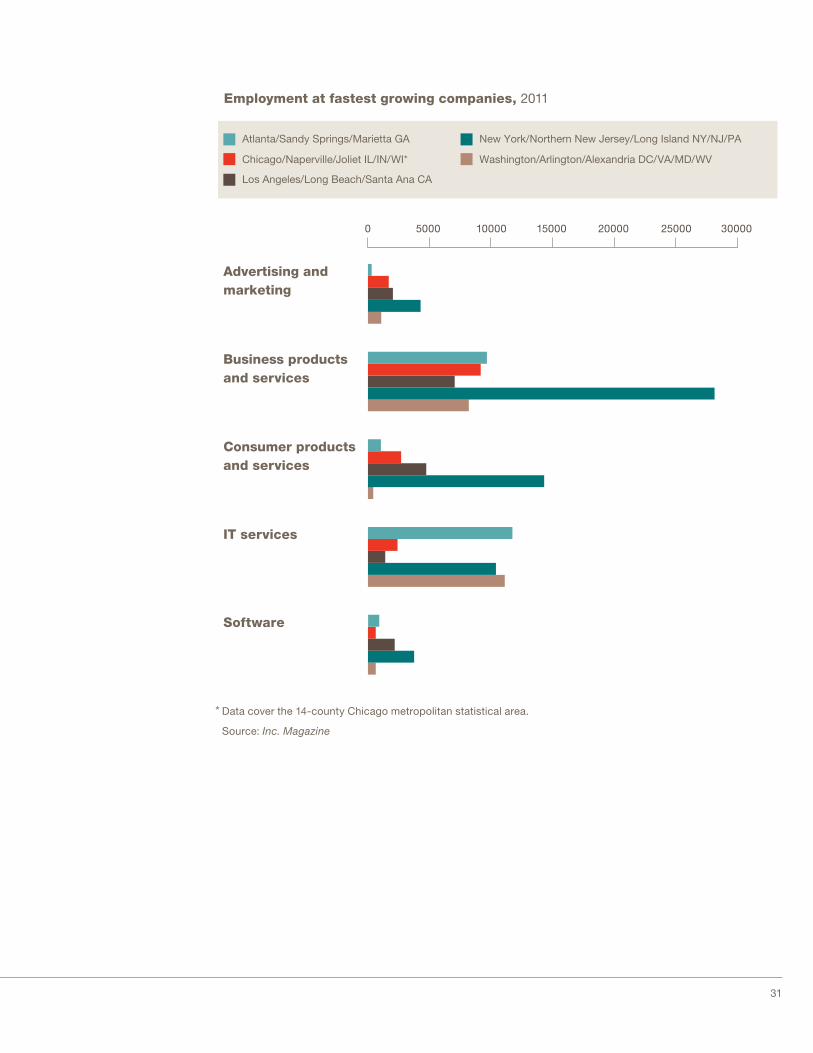
Supporting business growth to create jobsThe Chicago metropolitan region placed a total
of 157 companies in Inc. Magazine’s 2011
list of “Top 5000 Fastest Growing Companies.”1
Chicago ranked in the top ten in skilled,
higher-wage fields such as IT services, business
services, and marketing and advertising. In
total, the region’s fast-growing businesses
accounted for more than 80,000 jobs, placing
Chicago fourth among metro areas on the
list behind Philadelphia, New York, and Los
Angeles. The diversity and specialized
nature of Chicago’s growth industries also
compare favorably to other metro areas.
Advertising and marketing
Business products and services
Consumer products and services
IT services
Software
Washington/Arlington/Alexandria DC/VA/MD/WV
Atlanta/Sandy Springs/Marietta GA New York/Northern New Jersey/Long Island NY/NJ/PA
Chicago/Naperville/Joliet IL/IN/WI*
Los Angeles/Long Beach/Santa Ana CA
Number of companies in Inc Magazine´s 5000 list, top 5 industries, 2011
1026
3448
20
2829
3351
40
98
2517
4
3635
1658
64
117
1917
13
* Data cover the 14-county Chicago metropolitan statistical area.
Source: Inc. Magazine
31
Employment at fastest growing companies, 2011
* Data cover the 14-county Chicago metropolitan statistical area.
Source: Inc. Magazine
Advertising and marketing
Business products and services
Consumer products and services
IT services
Software
Washington/Arlington/Alexandria DC/VA/MD/WV
Atlanta/Sandy Springs/Marietta GA New York/Northern New Jersey/Long Island NY/NJ/PA
Chicago/Naperville/Joliet IL/IN/WI*
Los Angeles/Long Beach/Santa Ana CA
0 5000 10000 15000 20000 25000 30000
Illinois Innovation Index Annual Report 2011–201232
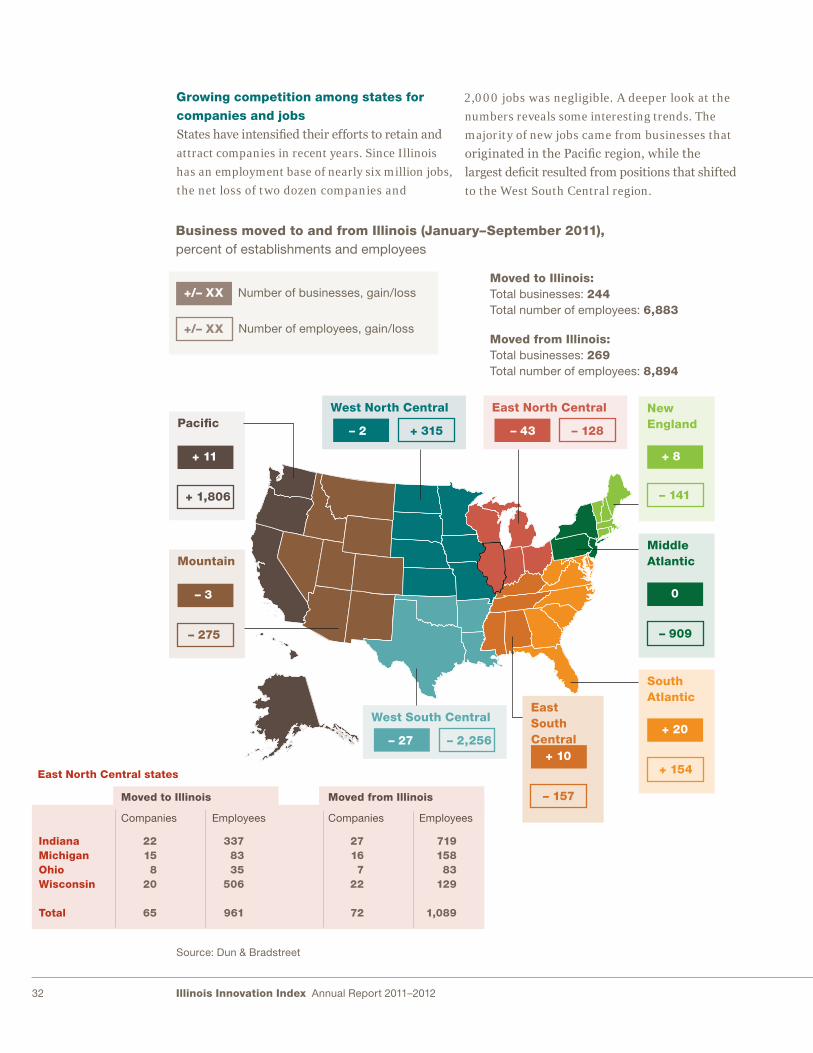
Growing competition among states for companies and jobsStates have intensified their efforts to retain and
attract companies in recent years. Since Illinois
has an employment base of nearly six million jobs,
the net loss of two dozen companies and
2,000 jobs was negligible. A deeper look at the
numbers reveals some interesting trends. The
majority of new jobs came from businesses that
originated in the Pacific region, while the
largest deficit resulted from positions that shifted
to the West South Central region.
Business moved to and from Illinois (January–September 2011), percent of establishments and employees
West North CentralPacific
Moved to Illinois:Total businesses: 244 Total number of employees: 6,883
Moved from Illinois:Total businesses: 269 Total number of employees: 8,894
East North Central states
Moved to Illinois Moved from Illinois
Number of businesses, gain/loss
Number of employees, gain/loss
Source: Dun & Bradstreet
+/– XX
+/– XX
+ 11
+ 1,806
Mountain
– 3
– 275
– 2 + 315
New England
+ 8
– 141
Middle Atlantic
0
– 909
West South Central
– 27 – 2,256
East South Central
+ 10
– 157
East North Central
– 43 – 128
South Atlantic
+ 20
+ 154
Companies Employees
IndianaMichiganOhioWisconsin
Total
22158
20
65
3378335
506
961
Companies Employees
27167
22
72
71915883
129
1,089
33
The numbers within the East North Central
region reveal that the aggressive campaigns by
Illinois’ neighbors to lure companies failed to
make a significant impact on employment. The
defection of jobs to Indiana was largely miti-
gated by new positions crossing the border from
Wisconsin. Further, nearly as many businesses
moved from Indiana to Illinois as vice versa.
1 Inc. Magazine assesses companies based on revenue
growth over a three-year period. To be eligible for
the list, applicants must have had revenues of at least
$100,000 in 2007 and more than $2 million in 2010.
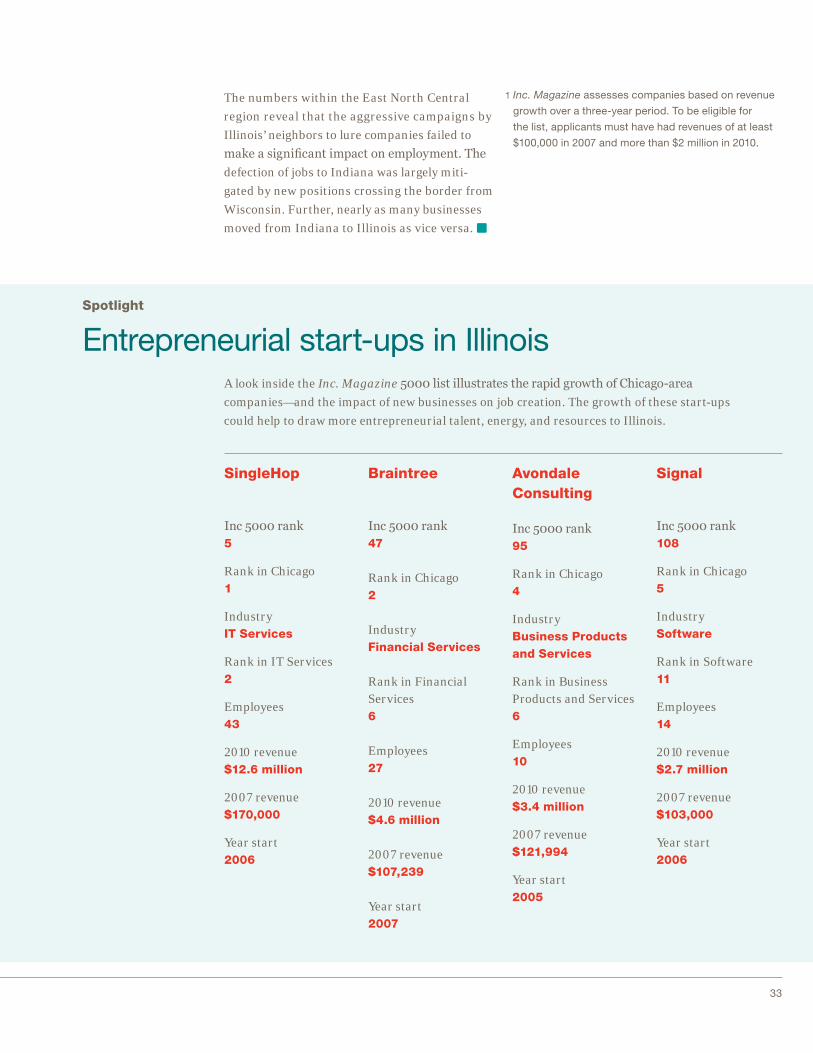
A look inside the Inc. Magazine 5000 list illustrates the rapid growth of Chicago-area
companies—and the impact of new businesses on job creation. The growth of these start-ups
could help to draw more entrepreneurial talent, energy, and resources to Illinois.
Spotlight
Entrepreneurial start-ups in Illinois
Signal
Inc 5000 rank 108
Rank in Chicago 5
Industry Software
Rank in Software 11
Employees 14
2010 revenue $2.7 million
2007 revenue $103,000
Year start 2006
SingleHop
Inc 5000 rank 5
Rank in Chicago 1
Industry
IT Services
Rank in IT Services 2
Employees 43
2010 revenue $12.6 million
2007 revenue $170,000
Year start 2006
Braintree
Inc 5000 rank 47
Rank in Chicago 2
Industry Financial Services
Rank in Financial Services 6
Employees 27
2010 revenue $4.6 million
2007 revenue $107,239
Year start 2007
Avondale Consulting
Inc 5000 rank 95
Rank in Chicago 4
Industry Business Products and Services
Rank in Business Products and Services 6
Employees 10
2010 revenue $3.4 million
2007 revenue $121,994
Year start 2005

Illinois Innovation Index Annual Report 2011–201234
Research and development is an essential
component in bringing promising ideas from
concept to market. Although the public sector
in the United States provides critical R&D
funding to a range of organizations,1 private
sources account for an increasing proportion
of total R&D spending. Since the 1980s, private
R&D has comprised at least 50 percent of all
R&D outlays, rising to $247.4 billion—62 percent
of the U.S. total in 2009.
Private sector plays a leading role in R&D Illinois is a top performer in private R&D
spending. According to a National Science Foun-
dation (NSF) survey conducted in 2007,2 the
state ranked seventh in the United States, with
$11.4 billion (up from $7.3 billion in 1998).
The same survey showed 2,691 businesses con-
ducted private R&D in Illinois, an average
of $4.2 million per company. Two categories―
computer/electronic products and chemical
manufacturing―made up nearly 60 percent of
Illinois private R&D spending.
While Illinois companies contributed 4 percent
of all U.S. private R&D spending in 2006,3
the state accounted for a greater share of nation-
al spending in a number of industries, includ-
ing machinery (13 percent), food research (11
percent), and electrical equipment (8 percent).
In the numbers
Building on Illinois’ strengths in private R&D spending
1999 2000 2001* 2002 2003 2004 2005 2006 20071998
Private R&D in Illinois, 1999–2007, $ billions
$12.0
$10.0
$8.0
$6.0
$4.0
$2.0
$0
* Beginning in 2001, excludes federally funded research and development centers.
Note: The R&D in this table is the industrial R&D performed within company facilities funded from all sources.
Source: Division of Science Resources Statistics, National Science Foundation, Survey of Industrial Research and Development
$7.3
$11.4
February 2012

35
On December 16, 2011, Governor Quinn signed
legislation (SB 397) that extends the Illinois
R&D tax credit for five years, allowing eligible
companies to earn credits on their state income
taxes for spending increases on research and
development. The bill also removes a provision
that would have prevented R&D credit car-
ryforwards from being used after the credit’s
expiration.
Chicago’s R&D cluster In 2010, more than 700 companies with R&D
operations were based in Illinois. Of these
companies, 431 (including 150 biotech estab-
lishments) were located in the Chicago metro-
politan statistical area (MSA). While other major
MSAs experienced slow to moderate growth in
R&D business establishments over the past
decade, Chicago’s numbers remained largely flat.
The region is an important research center for
testing in food (such as Kraft and the Wrigley
Global Innovation Center) and pharmaceuticals
(Abbott and Takeda, for example). Private
R&D employers in the Chicago region span a
range of industries including technology
(Alcatel-Lucent, 3,400 employees), oil and gas
(BP Global Fuels Division, 1,600), product
testing and certification (Underwriters Labora-
tories, 1,600), and chemicals (Nalco, 1,200).
Major R&D employers*
* Total employment at companies reporting “commercial physical research” as primary industry in Cook, DeKalb, DuPage, Grundy, Kane, Kendall, Lake, McHenry and Will counties in Illinois.
Source: Manufacturers’ News, Inc.
100Intertek Testing Service, NA, Inc., Arlington Heights
Alcatel-Lucent, Naperville 3,400
Facility Number of employees
BP, Global Fuels Division, Naperville 1,600
Underwriters Laboratories, Inc., Northbrook 1,600
Nalco Company, Naperville 1,200
Pepsi Beverages Company, Barrington 265
Continental Teves, Inc., Telematics Div., Deer Park 250
Gas Technology Institute, Des Plaines 250
Global Innovation Center (Wrigley), Chicago 250
Silliker, Inc., Chicago Heights 120
APP Pharmaceutical, LLC, Skokie 100
Crown Packaging Technology, Inc., Alsip 100
Nanosphere, Inc., Northbrook 100
SGS Northview Laboratories, Northbrook 90
Illinois Innovation Index Annual Report 2011–201236
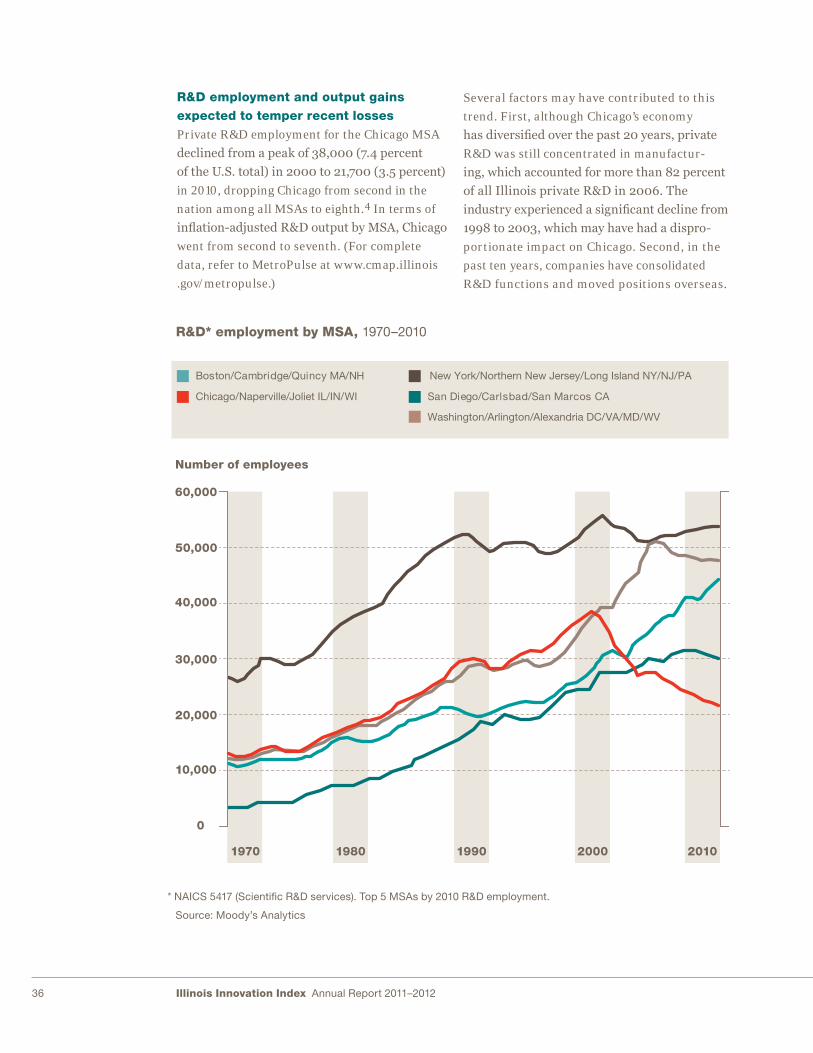
R&D employment and output gains expected to temper recent lossesPrivate R&D employment for the Chicago MSA
declined from a peak of 38,000 (7.4 percent
of the U.S. total) in 2000 to 21,700 (3.5 percent)
in 2010, dropping Chicago from second in the
nation among all MSAs to eighth.4 In terms of
inflation-adjusted R&D output by MSA, Chicago
went from second to seventh. (For complete
data, refer to MetroPulse at www.cmap.illinois
.gov/metropulse.)
Several factors may have contributed to this
trend. First, although Chicago’s economy
has diversified over the past 20 years, private
R&D was still concentrated in manufactur-
ing, which accounted for more than 82 percent
of all Illinois private R&D in 2006. The
industry experienced a significant decline from
1998 to 2003, which may have had a dispro-
portionate impact on Chicago. Second, in the
past ten years, companies have consolidated
R&D functions and moved positions overseas.
* NAICS 5417 (Scienti�c R&D services). Top 5 MSAs by 2010 R&D employment.
Source: Moody’s Analytics
R&D* employment by MSA, 1970–2010
Washington/Arlington/Alexandria DC/VA/MD/WV
Boston/Cambridge/Quincy MA/NH
San Diego/Carlsbad/San Marcos CAChicago/Naperville/Joliet IL/IN/WI
New York/Northern New Jersey/Long Island NY/NJ/PA
60,000
50,000
40,000
30,000
20,000
10,000
0
1980 1990 2000 20101970
Number of employees
37
Last, R&D positions have shifted from urban to
rural areas as companies sought to reduce
costs. It’s unclear how much these factors con-
tributed to the drop in R&D employment
for the Chicago MSA, and further research is
required to identify the causes.
Based on data from Economic Modeling
Specialists Inc. (EMSI), Manpower, a workforce
solutions and services provider, projects the
decline in R&D employees in Chicago has
leveled off and will surpass 25,000 employees
by 2021.
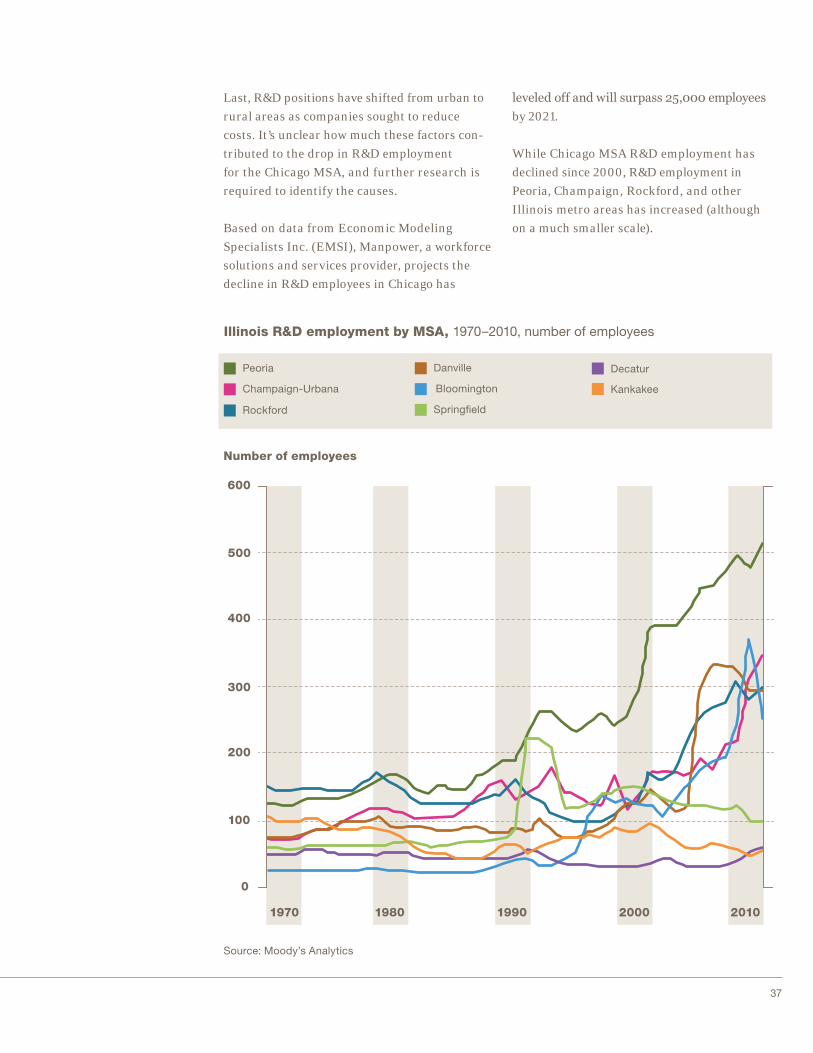
While Chicago MSA R&D employment has
declined since 2000, R&D employment in
Peoria, Champaign, Rockford, and other
Illinois metro areas has increased (although
on a much smaller scale).
Illinois R&D employment by MSA, 1970–2010, number of employees
DecaturPeoria
Spring�eld
Champaign-Urbana Bloomington Kankakee
Rockford
Danville
600
500
400
300
200
100
0
1980 1990 2000 20101970
Number of employees
Source: Moody’s Analytics

Illinois Innovation Index Annual Report 2011–201238
Illinois’ private-sector R&D performance was
mixed over the past decade. While R&D spend-
ing—especially among the state’s top industries—
is comparatively high and trending upward,
employment fell off dramatically after 2000,
mostly in the Chicago MSA. It is expected to
rebound somewhat in the coming decade. R&D
GDP also decreased after 2000, but at nearly
half the rate of employment, suggesting that the
state’s private R&D economy has become signi-
ficantly more efficient, if less robust.
1 Refer to the December 2011 Innovation Index #4 for
more information on funding at universities and research
laboratories. (www.illinoisinnovation.com/wp-content/
uploads/2012/01/IIC_Email_December-2011_VFINAL-
2withlinks.pdf)
2 The most recent year for which data are available.
3 The most recent year for which industry-specific data
are available.
4 These figures refer to the North American Industry
Classification System (NAICS) code 5417, Scientific
R&D services. This industry group covers organizations
engaged in conducting original investigation under-
taken on a systematic basis to gain new knowledge
and/or the application of research findings to or
other scientific knowledge for the creation of new or
significantly improved products or processes. The
industries within this industry group are defined on the
basis of the domain of research, that is, on the
scientific expertise of the establishment.

39
AllCell Technologies is part of a growing
Illinois ecosystem in energy storage. Founded in
2001, AllCell has developed high-power
lithium-ion battery packs that can be used in
hybrid and electric automobiles, light electric
vehicles (including electric scooters and bikes),
and for renewable energy storage.
AllCell’s patented phase change material (PCM)
surrounds each lithium-ion cell to absorb
and conduct heat away from the battery and also
effectively doubles the life of the cells while
preventing fire or damage. The PCM technology
is based on material developed at the Illinois
Institute of Technology’s (IIT) electrochemical
engineering labs; AllCell was the first tenant
in the state-funded incubator at University
Technology Park at IIT.
The global market for electric-vehicle energy
storage devices is expected to grow from
$7.7 billion in 2010 to $14.5 billion in 2015, with
batteries made for electric bikes and scooters
accounting for $10.9 billion of that figure.
In October 2011, Illinois Governor Pat Quinn
visited AllCell’s facility in Chicago to announce
a $460,000 grant, which was combined with
private funds to support a $1 million project to
increase production capacity and install roof-
top solar panels at the company’s manufacturing
facility. The project has already created new
full- and part-time jobs, with more hiring planned
for later this year.
Spotlight
AllCell Technologies, LLC
allcelltech.com

Illinois Innovation Index Annual Report 2011–201240
Utility patent output1 is one of the leading indi-
cators of innovation, reflecting several factors:
the concentration of companies in innovation-
focused industries such as semiconductors or
pharmaceuticals; the level of public and private
sector R&D funding; and partnerships between
the private sector and research institutions.
As a product of these economic assets contrib-
uting to entrepreneurship and high-tech
employment, patent output is a good compara-
tive measure of the relative robustness and
dynamism of specific innovation ecosystems.
As this month’s Index reveals, Illinois has
consistently ranked among the top ten states for
patent output, and targeted efforts to sup-
port innovation can help Illinois maintain its
position.
A broad base of innovationOver the past five years, 579 private and public
organizations from Chicago have been
granted patents, including 407 in 2010—more
than any year since 2006. From 2006 to 2010,
Chicago ranked seventh among metropolitan
statistical areas (MSAs) by patent output, with
2,933 patents granted in 2010 alone.
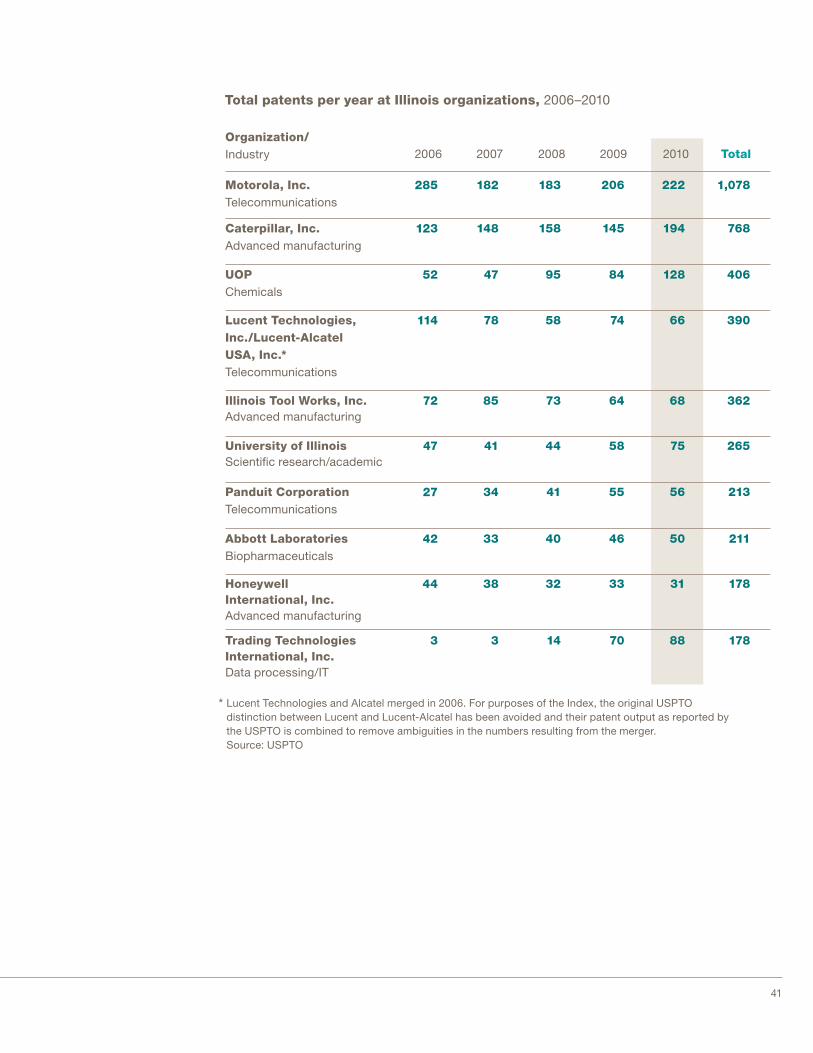
Companies such as Motorola, Lucent Tech-
nologies, Abbott Laboratories, UOP, and Illinois
Tool Works have led the region, generating
steady levels of patent output since the mid-
1990s. More recently, Caterpillar, University of
Illinois, and Trading Technologies International
have joined the list, emerging as significant
contributors to Illinois’ innovation ecosystem.
In the numbers
Using patent output to gauge Illinois’ innovation trajectory
Source: USPTO
2,689 2,933 2,3122,1922,314
Chicago MSA total patent output, 2006–2010
2007 2008 2009 20102006
Yearly ranking
Total number of patents
5
7
7
7
8
March 2012
41
178Trading Technologies International, Inc.Data processing/IT
Total patents per year at Illinois organizations, 2006–2010
Motorola, Inc.Telecommunications
1,078
Organization/Industry 2006 2007 2008 2009 2010 Total
Caterpillar, Inc.Advanced manufacturing
768
UOPChemicals
406
Lucent Technologies, Inc./Lucent-Alcatel USA, Inc.*Telecommunications
390
Panduit CorporationTelecommunications
213
Abbott LaboratoriesBiopharmaceuticals
211
Honeywell International, Inc.Advanced manufacturing
178
88
222
194
128
66
56
50
31
70
206
145
84
74
55
46
33
14
183
158
95
58
41
40
32
3
182
148
47
78
34
33
38
3
285
123
52
Illinois Tool Works, Inc.Advanced manufacturing
3626864738572
University of IllinoisScienti�c research/academic
2657558444147
114
27
42
44
* Lucent Technologies and Alcatel merged in 2006. For purposes of the Index, the original USPTO distinction between Lucent and Lucent-Alcatel has been avoided and their patent output as reported by the USPTO is combined to remove ambiguities in the numbers resulting from the merger. Source: USPTO
Illinois Innovation Index Annual Report 2011–201242
Staying competitive With a 9 percent growth in patent output from
2006 to 2010, Chicago is one of the top MSAs
for innovation. However, when compared with
MSAs such as Boston, New York, San Diego,
and San Jose, which have surpassed their
2006, pre-recession level of patent output by
24 to 35 percent, Chicago’s growth has been
relatively flat. The rapid growth in patent
output in other major MSAs is driven by large
clusters of biopharmaceuticals and telecom-
munications companies. In smaller MSAs such
as Austin and Minneapolis, semiconductor
patenting has been particularly strong.
Communications is a major industry in Chi-
cago despite a decrease in patenting output,
especially in multiplex communications,2
which dipped from 174 patents in 2006 to 117
in 2010. Meanwhile, Boston, Los Angeles,
New York, and San Francisco have seen sub-
stantial growth in multiplex communications―
the fastest growing subclass of communica-
tions technology by number of patents.
Growth in some Chicago industries has offset
decreases in others. For example, financial and
data processing expanded more rapidly than
any other industry in the Chicago MSA, growing
from 29 patents in 2006 to 199 by 2010. Simi-
larly, MSAs such as New York and Los Angeles
expanded rapidly in data processing patents
focused on proprietary analytical technologies
in the finance industry. This technological sub-
class of patents has become a major contributor
to patent output in the most innovative MSAs.

43
Source: USPTO
Patent output by metropolitan statistical area (MSA)
Top ten MSAs by patent output, 2010
Seattle/Tacoma/Bellevue WA
San Jose/Sunnyvale/Santa Clara CA
San Francisco/Oakland/Fremont CA
San Diego/Carlsbad/San Marcos CA
New York/Northern New Jersey/Long IslandNY/NJ/PA
Minneapolis/St. Paul/Bloomington MN WI
Los Angeles/Long Beach/Santa Ana CA
Chicago/Joliet/Naperville IL IN WI
Boston/Cambridge/Quincy MA NH
Austin/Round Rock/San Marcos TX
MSA Number of patents
10,074
6,290
4,992
4,330
4,052
2,993
2,449
2,827
2,933
6,383
1
2
3
4
5
6
7
8
9
10
Top ten MSAs as percent of national total, 2010
21%
Top ten MSAs
Rest of nation 79%
100% = 219,614Total number of patents
5% San Jose MSA 3% New York MSA 3% San Francisco MSA 2% Los Angeles MSA2% Boston MSA 2% Seattle MSA 1% San Diego MSA
1% Chicago MSA 1% Minneapolis MSA1% Austin MSA

Illinois Innovation Index Annual Report 2011–201244
Boosting the region’s prospects In an analysis of patent growth and diversity,
McKinsey & Company categorized Chicago as
a “silent lake”—an innovation stage character-
ized by low growth and dominated by very
large established companies. In that study,
Chicago scored low on momentum but demon-
strated strong diversity in a handful of sectors,
particularly communications and advanced
manufacturing.
In some cases, a powerhouse innovator can
boost a state’s output so significantly as to
skew its place in the rankings, as Microsoft has
in Washington, where it accounted for more
than 3,000 patents, or two-thirds of the state’s
total.3 Illinois’ patent landscape is not depen-
dent on a single company or industry; the state
has a broad base that can serve as a dynamic
source of innovation—an integral component
in continued growth.
Maintaining performance and catalyzing new growthSimilar to Chicago, Illinois has high total pat-
ent output but its growth is slowing. Since the
early 1960s, Illinois has ranked in the top ten
states by total patent output, and from 2006 to
2010 it ranked seventh by number of patents
granted. In spite of this strong performance,
Illinois’ position has slipped over the past
decade. Illinois’ total patent output decreased
5.7 percent from 2000 to 2010, and the state
has yet to exceed its high water mark for the
decade of 3,832 patents in 2000.
Illinois’ patenting activity has expanded far
beyond its base of manufacturing and agricul-
ture to include business services, life sciences,
education, and other industries. A few of Illi-
nois’ tech-based clusters—biopharmaceuticals,
information technology, and aerospace—also
showed growth from 1998 to 2009.4 However,
greater output in these and other high-growth
industries would translate to greater over-
all patent activity. One initiative promoting
growth in research, product development,
and company acceleration is the Illinois Sci-
ence and Energy Innovation Trust, which will
provide $22.5 million in capital and resources
to support or utilize innovative technologies
or other methods of modernizing the state’s
electric grid.

45
World Business Chicago’s recently released Plan
for Economic Growth and Jobs includes
strategies to support the region’s entrepreneurial
community and strengthen the connection
between research institutions and private indus-
try to boost innovation. The recent OECD
report on the Chicago tri-state metropolitan area
featured in this issue’s News section, as well
as CMAP’s GO TO 2040 plan, have also con-
cluded that Chicago and Illinois need to do more
to support cooperation between private indus-
try and local research institutions.
1 Patents can be classified as design, plant, or utility
patents. Utility patent trends are commonly used as an
indicator in innovation research. According to the U.S.
Patent and Trademark Office (USPTO), a utility patent
is “granted to anyone who invents or discovers any new,
useful, and non-obvious process, machine, article of
manufacture, or composition of matter, or any new and
useful improvement thereof.” All mentions of patent
output in this issue refer to utility patent output only.
2 Technologies that allow for multiple sources of
analog signals or digital data to be combined into one
signal. This communication technology is essential
to digitization.
3 Matthew Finnegan, “U.S. claims record number of patents
in 2010, IBM leads,” Techeyenet.com, January 10, 2011.
4 See the November edition of the Innovation Index for
more information on Illinois’ clusters.
Source: USPTO
Illinois in comparison to top five states by patent output, 1963–2010
Washington
California
TexasIllinois
New York
Massachusetts
30,000
25,000
20,000
15,000
10,000
5,000
0
1973 1983 1993 201020031963
Number of patents

46 Illinois Innovation Index Annual Report 2011–2012
Chicago Innovation Mentors (CIM) connects the
Chicago area’s leading universities, innova-
tive scientists, talented students, and research
funds with the technology-driven needs
of today’s market. Founded by Northwestern
University, the University of Chicago, the
University of Illinois, and the iBIO® Institute,
CIM helps to catalyze the commercialization
of university technology in the Chicago area.
CIM’s ultimate goal is to help ventures obtain
patents, license intellectual property, raise
capital, form partnerships, and launch compa-
nies that offer viable products and services.
Launched in 2010 with an initial focus on
biomedical and healthcare opportunities, CIM
matches experienced and supportive mentor-
ship teams with innovators at a wide range of
stages, from earliest idea to company forma-
tion. Prospective mentees―a faculty member,
graduate/post-graduate student, or business
manager affiliated with one of the sponsoring
universities―serve as lead project director.
Mentors work on a voluntary basis and include
founders, CEOs, chief technical officers,
and directors of companies. CIM addresses a
perceived gap in the ability of entrepreneurs to
commercialize technologies from Chicago’s
universities on a consistent and wide-ranging
basis. To date, CIM has matched 78 mentors
with 33 active ventures. CIM will eventually add
other institutions to build a more robust pipe-
line of translational research projects.
Spotlight
Chicago Innovation Mentors
chicagoinnovationmentors.org

47
IllinoisVentures is a seed and early-stage tech-
nology investment firm conceived and launched
by the University of Illinois in 2006. Current
investments reflect targeted practice areas in
energy, device physics, advanced materials,
biotechnology, medical devices and instrumen-
tation, homeland security, and software. The
firm brings together leading researchers and
entrepreneurs to develop and articulate con-
cepts, vision, and intellectual property including
patents in dynamic companies with high
growth potential. IllinoisVentures uses work
conducted at Midwest universities and federal
laboratories to start and build companies. Since
being founded, the firm has led or collaborated
on the initial funding for more than 40 new
ventures focused on scientific and technological
innovation across multiple domains.
IllinoisVentures
illinoisventures.com

Illinois Innovation Index Annual Report 2011–20126
A year of the Illinois Innovation Index
September 2011–August 2012

7
Since June 2009, venture capital has been flow-
ing into Illinois at record levels. In 2010, venture
capital firms invested more than $1.4 billion in
Illinois businesses, eclipsing the previous record
of 2003 by more than $325 million. The first
In the numbers
Venture capital investment in Illinois businesses hits record levels
Venture capital: Total equity invested in Illinois, yearly totals 2002−2011, in�ation adjusted
0
200
400
600
800
1000
1200
1600
2002 2003 2004 2005 2006 2007 2008 2009 2010 2011
$ million
RecessionDecember 2007−June 2009
1400
2010$1.458 billion
*2011 includes total investment for �rst two quarters only.
2011$864.5 million year to date*
Source: Data generously provided by the Illinois Venture Capital Association.
two quarters of 2011 have continued this trend,
with nearly $865 million invested so far. The
Chicago metropolitan statistical area accounted
for nearly all of the investment.
September 2011

Illinois Innovation Index Annual Report 2011–20128
Q1 2011
Venture capital: Top 10 quarters of total equity invested in Illinois, 2001−2011, $ millions, in�ation adjusted
Q4 2010
Q4 2002
Q2 2003
Q4 2001
Q4 2003
Q3 2001
Q2 2010
Q1 2010
Q1 2004
$696.9 million
$537.2 million
$484.6 million
$481.9 million
$439.2 million
$400.9 million
$355.8 million
$346.0 million
$308.1 million
$284.0 million
Source: Data generously provided by the Illinois Venture Capital Association.
Number of deals
Q42009
Venture capital: Past seven quarters by total equity invested per deal and by number of deals in Illinois, in�ation adjusted
0
6
12
18
24
0
10
20
30
40
Equity invested per deal, $ million
Q12010
Q22010
Q32010
Q42010
Q12011
Q22011
37 deals
Number of firms 36 40 37 42 34 63 59
Source: Data generously provided by the Illinois Venture Capital Association.

19
What we can learn from one clusterIn the biopharmaceutical cluster, for example,
the Chicago region has experienced significant
growth over the past decade. While total
national employment grew by just 7,000 jobs
from 1998 to 2009, the region added 17,000 jobs
Share of national employment, biopharmaceuticals, 1998–2009, percent
35%
30%
25%
20%
15%
10%
5%
0
1998 1999 2000 2001 2002 2003 2004 2005 2006 2007 2008 2009
Chicago/Naperville/Michigan City IL/IN/WI
Los Angeles/Long Beach/Riverside CA
New York/Newark/Bridgeport NY/NJ/CT
Philadelphia/Camden/Vineland PA/NJ/DE/MD
San Jose/San Francisco/Oakland CA
+ 17,055 jobs
– 24,167 jobs
+ 1,108 jobs
+ 16,719 jobs
+ 1,458 jobs
during this period. Its strong network of
educational institutions, research facilities,
advocacy organizations, and global corporations
act as a magnet to attract other businesses
and investment.

Illinois Innovation Index Annual Report 2011–201248
The globalization of commerce and economic
growth in emerging countries create valuable
opportunities for companies that can produce
goods to meet the demand of international
markets. From 2010 to 2011, exports generated
more than 46 percent of the U.S. economy’s
total growth―their largest share since 1929. U.S.
exports supported 10.7 million jobs in 2010,
and wages at exporting companies are, on aver-
age, 11 percent higher than those of non-
exporting companies.1
A number of factors―such as the levels of
innovation, patenting, and clustering―affect a
region’s volume of exports, which fuel the
jobs, infrastructure, and global profile that con-
tribute to broader economic health. Exports
make up a significant share of the Illinois econ-
omy―8.3 percent, ranking it 19th among all
states. Illinois’ strength as an exporter, driven by
the Chicago metropolitan region, positions it
well to serve emerging markets, while support-
ing job retention and creation in key exporting
industries.
Illinois’ strong export performance In 2011, Illinois was among five states that
generated nearly half the nation’s total export
value.2 Over the past decade, the contribution
of these states to the national total has
remained remarkably consistent. Texas gained
4 percent of national exports from 2001 to
2011 (largely the result of petroleum exports,
which grew by 143 percent from 2009 to 2011),
while California lost nearly 4 percent during
that period. Illinois’ share grew slightly to
4.4 percent, from 4.2 percent. Although the
share of national exports among the top
five states shifted over the past decade, they
experienced overall growth, as illustrated
in the following graph.
Illinois had the second-highest concentration
of manufacturing exports of the top five
exporting states in 2011. More than 90 percent
of Illinois’ goods export value was in manu-
facturing-related commodities such as dump
trucks (6.4 percent of the state total), light
petroleum-based oils (3.9 percent), natural
uranium compounds, alloys and ceramics
(1.8 percent), automotive parts (1.6 percent),
and aircraft parts (1.4 percent).3
In the numbers
Robust manufacturing puts Illinois among nation’s export leaders
April 2012

49
Total export value by state, top 5 states, 2001–2011
California
WashingtonIllinois
Texas
New York
250
200
150
100
50
0
2002 2003 2004 201120052001 2007 2008 2009 20102006
$ billions
Source: U.S. Census Bureau, Foreign Trade Division
Manufactured goods’ share of total state exports by export value, top 5 states, 2011, percent
Manufacturing Non-manufacturing
Source: U.S. Census Bureau, Foreign Trade Division
California WashingtonIllinoisTexas New York
91.5% 91.1% 83.5% 80.1% 75.2%

Illinois Innovation Index Annual Report 2011–201250
Metro areas drive U.S. exports Metropolitan areas are especially critical
to export production, generating 84 percent of
U.S. export sales in 2010. The majority of
this activity has occurred in large metros. The
largest 100 metropolitan statistical areas
(MSAs) by population produced more than
65 percent of the nation’s exports of goods and
services in 2010.
A 2012 Brookings Institution report4 examined
the contributions to total national exports
made by the largest 100 MSAs in 2010 (the latest
year examined by Brookings). Chicago ranked
third in total export value with $53.9 billion
and total jobs supported by the region’s exports
(376,100), including 197,600 jobs in the indus-
tries producing the exported good or service.
From 2009 to 2010, the Chicago MSA’s total
export value rose by a greater percentage
than that of Los Angeles and New York. As a
result, Chicago improved its annualized
growth rate ranking among the top 100 MSAs
to 34, from 56.
1–5% 23.5%6–10% 16–20%11–15%
Source: Brookings Institution; U.S. Census Foreign Trade Division; Moody’s Economy.com
Export share of output for states, 2011, and selected MSAs, 2010
Export share of state output
Export % of MSA output New York 6.7%
Export % of MSA output Chicago10.9%
Export % of MSA output Houston14%
Export % of MSA output Dallas13%
Export % of MSA output Los Angeles10.9%
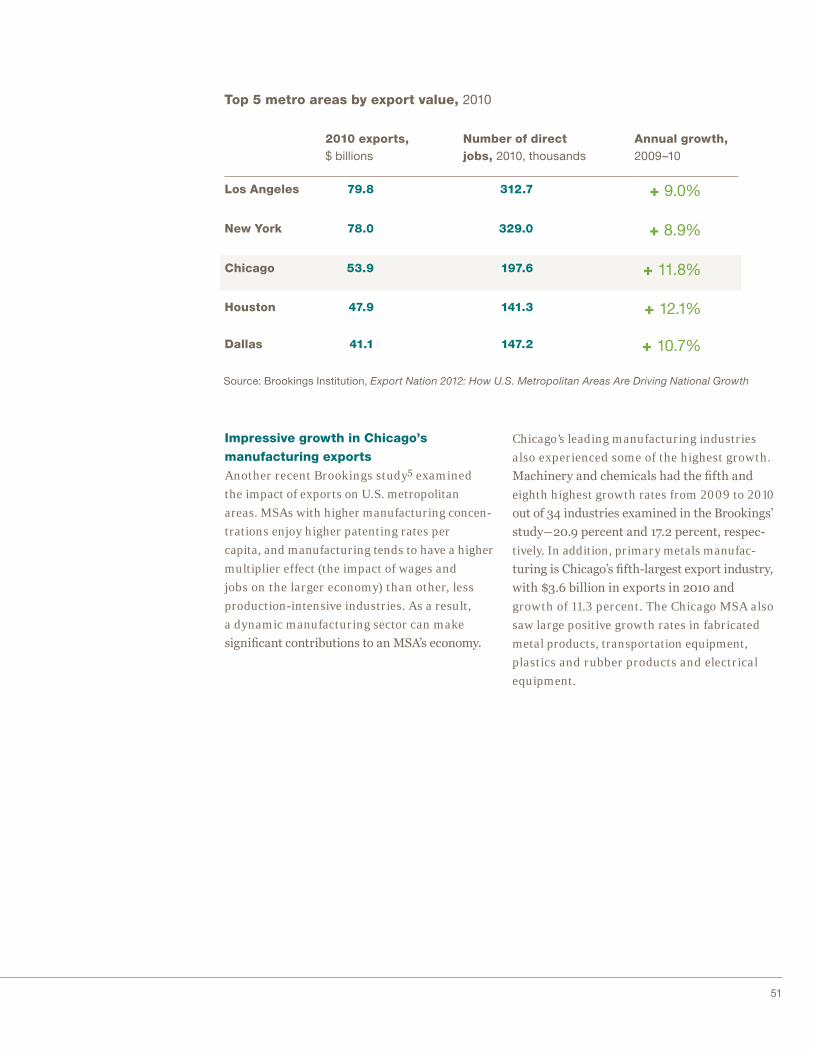
51
Source: Brookings Institution, Export Nation 2012: How U.S. Metropolitan Areas Are Driving National Growth
Top 5 metro areas by export value, 2010
Los Angeles + 9.0%
2010 exports, $ billions
Annual growth, 2009–10
Number of direct jobs, 2010, thousands
New York + 8.9%
Chicago + 11.8%
Houston + 12.1%
312.7
329.0
197.6
141.3
79.8
78.0
53.9
47.9
Dallas + 10.7%147.241.1
Impressive growth in Chicago’s manufacturing exports Another recent Brookings study5 examined
the impact of exports on U.S. metropolitan
areas. MSAs with higher manufacturing concen-
trations enjoy higher patenting rates per
capita, and manufacturing tends to have a higher
multiplier effect (the impact of wages and
jobs on the larger economy) than other, less
production-intensive industries. As a result,
a dynamic manufacturing sector can make
significant contributions to an MSA’s economy.
Chicago’s leading manufacturing industries
also experienced some of the highest growth.
Machinery and chemicals had the fifth and
eighth highest growth rates from 2009 to 2010
out of 34 industries examined in the Brookings’
study―20.9 percent and 17.2 percent, respec-
tively. In addition, primary metals manufac-
turing is Chicago’s fifth-largest export industry,
with $3.6 billion in exports in 2010 and
growth of 11.3 percent. The Chicago MSA also
saw large positive growth rates in fabricated
metal products, transportation equipment,
plastics and rubber products and electrical
equipment.

Illinois Innovation Index Annual Report 2011–201252
Chicago MSA export totals, by industry, 2011
Chemicals
Travel/tourism
Machinery
Business services
Primary metal
Royalties
Electrical equipment
Transportation equipment
Freight/port services
Plastics and rubber products
Insurance services
Paper
Education
Telecom services
Agriculture
Printing/related support activities
Financial services
Computers/ electronics
Petroleum/coal products
Food
Medical equipment, sporting goods
Fabricated metal products
Total exports, billions
0 1 2 3 654 987
Source: BEA; BLS; Brookings Institution, Export Nation 2012: How U.S. Metropolitan Areas Are Driving
National Growth; IRS; Moodys Analytics; NAFSA; USITC
Nonmetallic mineral products
Annual growth, 2009–10
+ 20.9%
+ 17.2%
+ 5.7%
+ 2.6%
+ 11.3%
+ 8.4%
+ 18.8%
+ 1.3%
+ 13.2%
+ 12.9%
+ 12.1%
+ 18.5%
+ 7.4%
+ 15.5%
+ 16.3%
+ 16.2%
– 2.2%
+ 13.3%
+ 5.7%
+ 8.4%
+ 14.9%
+ 3.0%
+ 24.1%

53
The federal government is seeking to double
U.S. exports by 2014 through the National
Export Initiative, creating an opportunity for
Illinois and Chicago.6 Since the state’s top
export destinations―Canada ($19.2 billion),
Mexico ($5.7 billion), China ($3.9 billion),
Australia ($3.7 billion), and Brazil ($2.6 billion)―
include two rapidly growing BRIC7 nations,
Illinois is well positioned to benefit from their
continued expansion.
1 Brookings Institution, Export Nation: How U.S. Metros
Lead National Export Growth and Boost Competitive-
ness, (2010); and Export Nation 2012: How U.S. Metro-
politan Areas Are Driving National Growth (2012).
2 All export values in this report refer to “origin of
movement” data—all commodities are counted by the
location where they are produced, not by the loca-
tion from which they are shipped. Further, “re-export”
values, defined as exports that have previously entered
the United States and undergone no change in form
or condition at the time of exportation, have been ex-
cluded from all totals and analyses, with the exception
of trade partner and specific commodity references.
Chicago MSA export totals, by industry, 2011
Chemicals
Travel/tourism
Machinery
Business services
Primary metal
Royalties
Electrical equipment
Transportation equipment
Freight/port services
Plastics and rubber products
Insurance services
Paper
Education
Telecom services
Agriculture
Printing/related support activities
Financial services
Computers/ electronics
Petroleum/coal products
Food
Medical equipment, sporting goods
Fabricated metal products
Total exports, billions
0 1 2 3 654 987
Source: BEA; BLS; Brookings Institution, Export Nation 2012: How U.S. Metropolitan Areas Are Driving
National Growth; IRS; Moodys Analytics; NAFSA; USITC
Nonmetallic mineral products
Annual growth, 2009–10
+ 20.9%
+ 17.2%
+ 5.7%
+ 2.6%
+ 11.3%
+ 8.4%
+ 18.8%
+ 1.3%
+ 13.2%
+ 12.9%
+ 12.1%
+ 18.5%
+ 7.4%
+ 15.5%
+ 16.3%
+ 16.2%
– 2.2%
+ 13.3%
+ 5.7%
+ 8.4%
+ 14.9%
+ 3.0%
+ 24.1%
3 “U.S. Census Bureau, Foreign Trade Division statistics
reflect goods exports only. The other sources in this
issue—the Brookings Institution’s reports from 2010
and 2012—reflect exports of goods and services. See
Export Nation (2012) for a detailed explanation of the
differences between the two sources.”
4 Brookings Institution, Export Nation (2012)
5 Brookings Institution, Export Nation (2010)
6 On April 13, Mayor Rahm Emanuel announced a Chi-
cago Export Strategy that will double the exports of
Chicago’s small and medium sized businesses in the
next five years.
7 The BRIC countries are Brazil, Russia, India, and
China.
Chicago MSA export totals, by industry, 2011
Chemicals
Travel/tourism
Machinery
Business services
Primary metal
Royalties
Electrical equipment
Transportation equipment
Freight/port services
Plastics and rubber products
Insurance services
Paper
Education
Telecom services
Agriculture
Printing/related support activities
Financial services
Computers/ electronics
Petroleum/coal products
Food
Medical equipment, sporting goods
Fabricated metal products
Total exports, billions
0 1 2 3 654 987
Source: BEA; BLS; Brookings Institution, Export Nation 2012: How U.S. Metropolitan Areas Are Driving
National Growth; IRS; Moodys Analytics; NAFSA; USITC
Nonmetallic mineral products
Annual growth, 2009–10
+ 20.9%
+ 17.2%
+ 5.7%
+ 2.6%
+ 11.3%
+ 8.4%
+ 18.8%
+ 1.3%
+ 13.2%
+ 12.9%
+ 12.1%
+ 18.5%
+ 7.4%
+ 15.5%
+ 16.3%
+ 16.2%
– 2.2%
+ 13.3%
+ 5.7%
+ 8.4%
+ 14.9%
+ 3.0%
+ 24.1%

54
Chicago-based Coyote Logistics is one of
North America’s fastest growing logistics com-
panies. In 2011, Coyote relocated its head-
quarters to Chicago’s Green Exchange building,
and this year it will be hiring an additional
400 employees, bringing the total number of
jobs in Chicago to more than 1,000. Coyote
leverages proprietary transportation technology
tools and networks to create truckload, inter-
modal, less than truckload, and total managed
solutions for supply chains in virtually every
industry including food and beverage, forest
products, metals, plastics, consumer products,
and government services.
In 2011, Coyote ranked among Inc. Magazine’s
500 Fastest Growing Companies for the third
consecutive year and received the Chicago
Tribune Top Work Place award for midsize
companies. CEO Jeff Silver was awarded Ernst
& Young’s Entrepreneur of the Year.
In addition to Coyote’s expansion plans in
the city, Mayor Emanuel recently announced
that the company will be a private sector
partner with the City Colleges of Chicago’s (CCC)
new “Career and Academic Pathways” initia-
tive. Building on Chicago’s strength as a national
logistics industry hub, Coyote will help CCC
develop a new transportation, distribution, and
logistics curriculum for Olive Harvey College.
Coyote employees will also mentor, guest lecture,
recruit, and help prepare students for private
sector job opportunities in Chicago’s expanding
logistics sector.
Spotlight
Coyote Logistics
coyotelogistics.com
Illinois Innovation Index Annual Report 2011–2012

Mi-Jack Products, with corporate headquarters
in south suburban Hazel Crest, has been
conceptualizing and manufacturing material
handling equipment since 1954. The com-
pany’s Rubber Tire Gantry cranes, now in use
on six continents, are recognized interna-
tionally for their role in the modern transforma-
tion of America’s intermodal industry.
Their cranes have changed the standard for
modern material handling practices by
increasing the possibilities for yard storage and
layout potential.
Mi-Jack’s newly created Applied Technologies
division is responsible for incorporating
configurable technology solutions that include
GPS and RF for remote crane operation,
equipment positioning, inventory management
and auto guided steering. Recent innova-
tions include the manufacture of the world’s
first electric hybrid intermodal crane
and a hybrid retrofit system for port cranes.
Mi-Jack
mi-jack.com
55

Illinois Innovation Index Annual Report 2011–201256
Today’s economy is driven by massive amounts
of information being exchanged among busi-
nesses around the world. Companies from start-
ups to major corporations rely on high-speed
connections to support new technology, knowl-
edge and data sharing, and collaboration—
key components for innovation. For these
reasons, the deployment of broadband Internet
connections, which are faster and more
dependable than dial-up access, has become an
important indicator of a state’s innovation
climate.
Studies1 have shown a strong link between
broadband access and economic growth.
Therefore, a state’s ability to support these con-
nections has a direct impact on its economic
growth, business climate, and level of innova-
tion. Illinois has steadily increased broad-
band access to businesses and residences, but
further improvement is needed in both speed
and availability.
How Illinois stacks up Broadband deployment (availability) and
adoption (subscribers) vary considerably across
the country. States with the highest access
rates, such as Connecticut, Massachusetts, and
New Hampshire, tend to have relatively
small rural populations. Despite Illinois’ large
rural areas, broadband deployment and
adoption among its households have kept pace
with national levels.
The share of broadband subscribers in Illinois
increased from 52 percent of total households
in 2007 to 69 percent by 2010,2 matching the
median adoption rate for the country as a
whole but still falling behind 23 states. Chicago’s
broadband levels are similar to statewide
figures, with 68 percent of residents using broad-
band at home, up from 61 percent in 2009.3
In the numbers
How broadband deployment supports innovation in Illinois
May 2012
Guest contributors:

57
State download speed map
Source: broadbandillinois.org
No Service
>/= 768 Kbps; < 1.5 Mbps
>/= 1.5 Kbps; < 3 Mbps
>/= 3 Kbps; < 6 Mbps
>/= 6 Kbps; < 10 Mbps
>/= 10 Kbps / < 25 Mbps
>/= 25 Kbps / < 50 Mbps
>/= 50 Kbps / < 100 Mbps
>/= 100 Kbps / < 1 Gbps
> 1 Gbps

Illinois Innovation Index Annual Report 2011–201258
Broadband adoption by households, top 5 states and Illinois
Source: Federal Communications Commission
Utah
New Hampshire
Connecticut
Illinois
Washington
Massachusetts
80%
78%
75%
69%
77%
76%
Broadband adoption by Illinois businesses In Illinois, commercial Internet subscribers as
a share of total subscribers have risen from
14 percent in 2008 to 21 percent in 2010. This
rapid growth in commercial connections―
more than double the national median growth
rate of 2.9 percent during this period―suggests
that Illinois businesses are increasingly using
the Internet to support commerce, research,
and innovation.
The average speed for commercial connections
in Illinois equaled the national median for
both small and large businesses. However, the
average connection speed for Illinois’ small
businesses is 3.8 mbps, falling short of the
5 mbps level needed to share large amounts of
data. Enhancing commercial speed would
enable more small companies to provide inno-
vative services in growing fields such as
education, energy efficiency, healthcare, and
building control and management.4
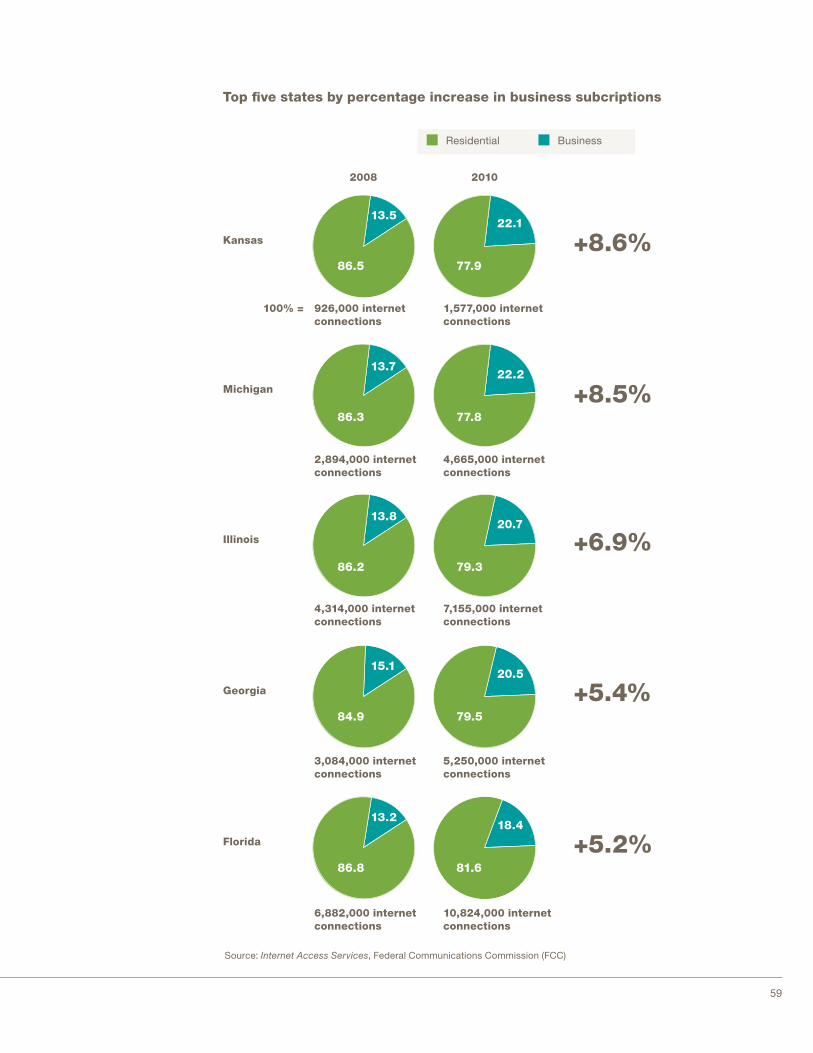
59
Top five states by percentage increase in business subcriptions
Kansas
2008 2010
+8.6%
Michigan +8.5%
Illinois +6.9%
Georgia +5.4%
Florida +5.2%
Residential Business
926,000 internet connections
1,577,000 internet connections
86.5
13.5
77.9
22.1
86.3
13.7
77.8
22.2
86.2
13.8
79.3
20.7
84.9
15.1
79.5
20.5
86.8
13.2
81.6
18.4
2,894,000 internet connections
4,665,000 internet connections
4,314,000 internet connections
7,155,000 internetconnections
3,084,000 internetconnections
5,250,000 internetconnections
6,882,000 internetconnections
10,824,000 internetconnections
Source: Internet Access Services, Federal Communications Commission (FCC)
100% =
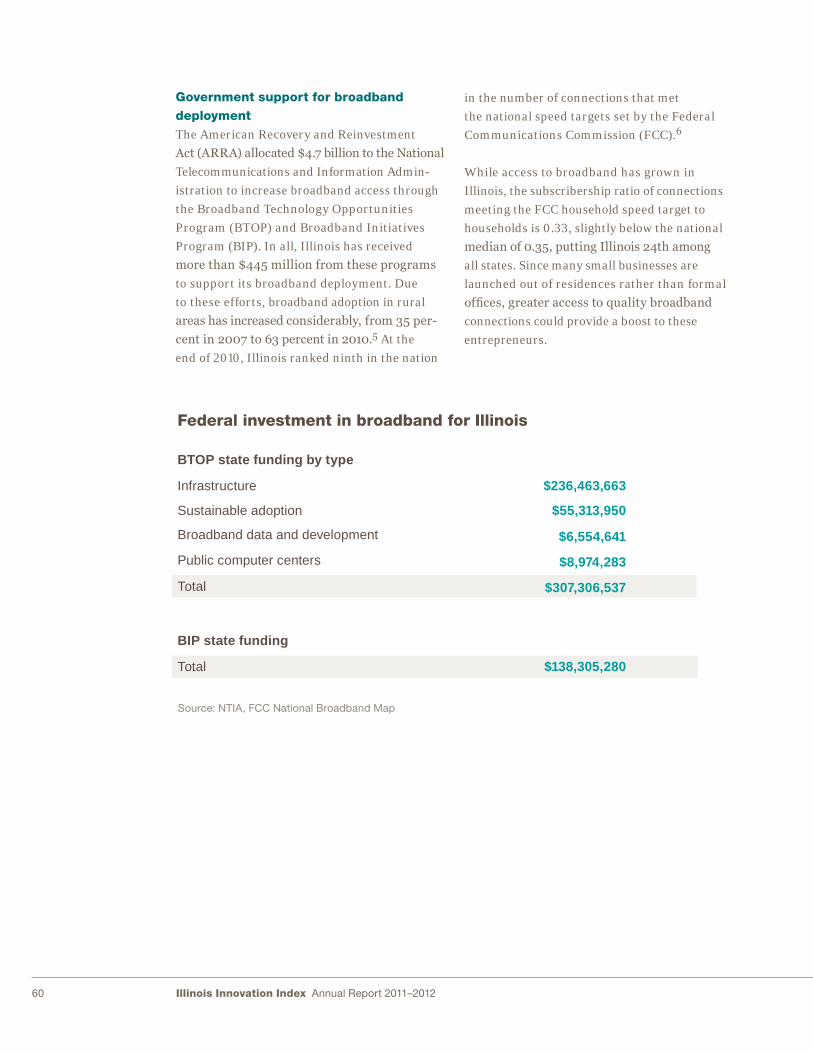
Illinois Innovation Index Annual Report 2011–201260
Government support for broadband deploymentThe American Recovery and Reinvestment
Act (ARRA) allocated $4.7 billion to the National
Telecommunications and Information Admin-
istration to increase broadband access through
the Broadband Technology Opportunities
Program (BTOP) and Broadband Initiatives
Program (BIP). In all, Illinois has received
more than $445 million from these programs
to support its broadband deployment. Due
to these efforts, broadband adoption in rural
areas has increased considerably, from 35 per-
cent in 2007 to 63 percent in 2010.5 At the
end of 2010, Illinois ranked ninth in the nation
in the number of connections that met
the national speed targets set by the Federal
Communications Commission (FCC).6
While access to broadband has grown in
Illinois, the subscribership ratio of connections
meeting the FCC household speed target to
households is 0.33, slightly below the national
median of 0.35, putting Illinois 24th among
all states. Since many small businesses are
launched out of residences rather than formal
offices, greater access to quality broadband
connections could provide a boost to these
entrepreneurs.
Federal investment in broadband for Illinois
BTOP state funding by type
Infrastructure
Sustainable adoption
Broadband data and development
Public computer centers
Total
BIP state funding
Total
Source: NTIA, FCC National Broadband Map
$236,463,663
$55,313,950
$6,554,641
$8,974,283
$307,306,537
$138,305,280
61
The rise of mobile broadbandBased on current trends, mobile broadband
networks, which are being enhanced to support
smartphones and tablets, will likely replace
fixed connections as the preferred mode of
accessing the Internet. The Brookings Institution
projects that mobile broadband will account
for 80 percent of total broadband subscriptions
within the next four years.7
The relatively low cost of mobile technologies
has helped improve Internet access. A Febru-
ary 2012 Pew Research study found that nearly
46 percent of U.S. adults have smartphones
compared with just 17 percent two years ago.8
Statistics on mobile broadband adoption
in Chicago indicate a similar trend. In 2011,
40 percent of adults in Chicago used a
cell phone to connect to the Internet, up from
26 percent in 2009.9 As mobile broadband
adoption accelerates, it will create opportunities
for entrepreneurs and start-ups to develop
mobile commerce applications that could
redefine industries such as financial services,
education, and healthcare.
Looking aheadIn the coming years, Illinois will have to expand
broadband networks across the state, assist
businesses in securing access to high-speed
broadband, and track mobile broadband
adoption to ensure funds are being allocated to
support emerging technologies.
1 See, for example, Jed Kolko, Does Broadband Boost
Local Economic Development? Public Policy Institute
of California, January 2010; and Robert Crandall,
William Lehr and Robert Litan, The Effects of Broad-
band Deployment on Output and Employment: A Cross-
sectional Analysis of U.S. Data, the Brookings
Institution, June 2007.
2 Digital Nation: Expanding Internet Usage, National
Telecommunications and Information Administration,
February 17, 2011.
3 Mossberger, Tolbert and Redlawsk, 2011 Chicago
City-Wide Broadband Survey.
4 The State of New Hampshire Broadband Action Plan.
p. 36.
5 U.S. Census Bureau, Current Population Survey.
6 The FCC has set targets of 4 Mbps down/1 Mbps up
(actual) speeds for broadband availability.
7 Testimony by Darrell West of the Brookings Institution
to the U.S. House Subcommittee on Healthcare and
Technology, February 15, 2012.
8 Pew Research Center’s “Internet and American
Life Project,” April 26-May 22, 2011, and January 20–
February 19, 2012 tracking surveys.
9 Mossberger, Tolbert and Redlawsk, 2011 Chicago
City-Wide Broadband Survey.

62
The StarLight facility uses paths of over
100 gigabits per second (Gbps) to link all major
advanced global research networks. With
funding from the National Science Foundation,
StarLight was designed and developed by
researchers for researchers. StarLight also sup-
ports multiple advanced national and inter-
national network experimental research
testbeds. StarLight is home to StarWave, which
is being designed as the world’s first multi-
100 Gbps exchange, with capacity for switching
more terabits per second (Tbps) than any
other communications facility.
Illinois Innovation Index Annual Report 2011–2012
Chicago has become a center of next-generation
communication services and facilities that
support data-intensive science. One innovative
project is the StarLight International/National
Communications Exchange Facility, the world’s
premier hub for global advanced research
networks, located at Northwestern University’s
downtown Chicago campus.
Spotlight
StarLight
startap.net/starlight
Led by Server Farm Realty and slated to open
in June 2012, 840 South Canal Street is a
state-of-the art data and trading center serving
Chicago’s 120 million square feet of downtown
office space. By creating routes that are secure,
resilient, and dependable, 840 South Canal
will provide a robust infrastructure platform
for the city’s key industries such as financial
and legal services, healthcare IT, media, tech-
nology, and trading.
840 South Canal Street
worldbusinesschicago.com/news/840-south-canal-street
840 South Canal represents a multibillion
dollar investment in downtown Chicago that
is forecast to create more than 1,000 con-
struction jobs as well as many positions in the
advanced fields of technology and data
management. Aside from the jobs created
to construct 840 South Canal, each additional
1 megawatt of dedicated service represents
$111 million of investment over a 15-year
period, generating more than $1 million in
annual telecom tax revenue.

63
Through the Illinois Jobs Now! capital program,
the State of Illinois has launched construc-
tion of more than 4,100 miles of new fiber optic
cable across the state, representing more than
$300 million in combined state, federal, and
private investment. This effort will connect
nearly 5,000 community anchor institutions to
ultra-high-speed networks.
The Gigabit Communities Challenge, a subset
of this initiative, will award up to $4 million
in funding for plans to build ultra-high-speed
broadband connections in Illinois neighbor-
hoods. The contest is open to any private or
public organization and will provide seed
funding awards to build or expand broadband
networks in Illinois. Each viable proposal
must connect at least 1,000 end users to an
ultra-high-speed broadband network.
Gigabit Communities Challenge
worldbusinesschicago.com/ news/gigabit-communities- challenge

Illinois Innovation Index Annual Report 2011–201264
As technology has become the foundation of
business, from collaboration software in knowl-
edge industries to the programs that manage
operations at manufacturing facilities, the eco-
nomy increasingly requires a highly educated
workforce whose skills can adapt to the chang-
ing needs of employers. Recent reports1 point
to human capital as a leading component in the
economic growth of the Chicago region
and Illinois as a whole. Even though the state’s
unemployment rate tracks the national aver-
age, Illinois currently has 140,000 unfilled jobs.
Therefore, post-secondary programs must
equip graduates with the skills they need—not
only to fill open positions but also to drive
innovation. The concentration of degrees in
science, technology, engineering, and math
(STEM) serves as an important gauge of a state’s
ability to develop the right mix of talent and
ultimately create and attract new, high-tech
businesses and jobs. In recent years, the per-
centage of Illinois graduates completing
STEM degrees has trailed the national average,
but new initiatives at the state and local
levels are addressing this challenge aggressively.
Recent trends in the completion of STEM degrees In Illinois, the number of STEM degrees
conferred peaked at 20,248 in 2003 and then
declined steadily through 2007. Recent years
have shown signs of life, however. From 2009
to 2010, the number of STEM degrees rose by
nearly 5 percent, reaching 18,400 in 2010. They
still made up just 11 percent of all degrees
in Illinois that year, slightly below the national
average of 14 percent.
In the numbers
Driving innovation in Illinois by increasing STEM attainment
June 2012
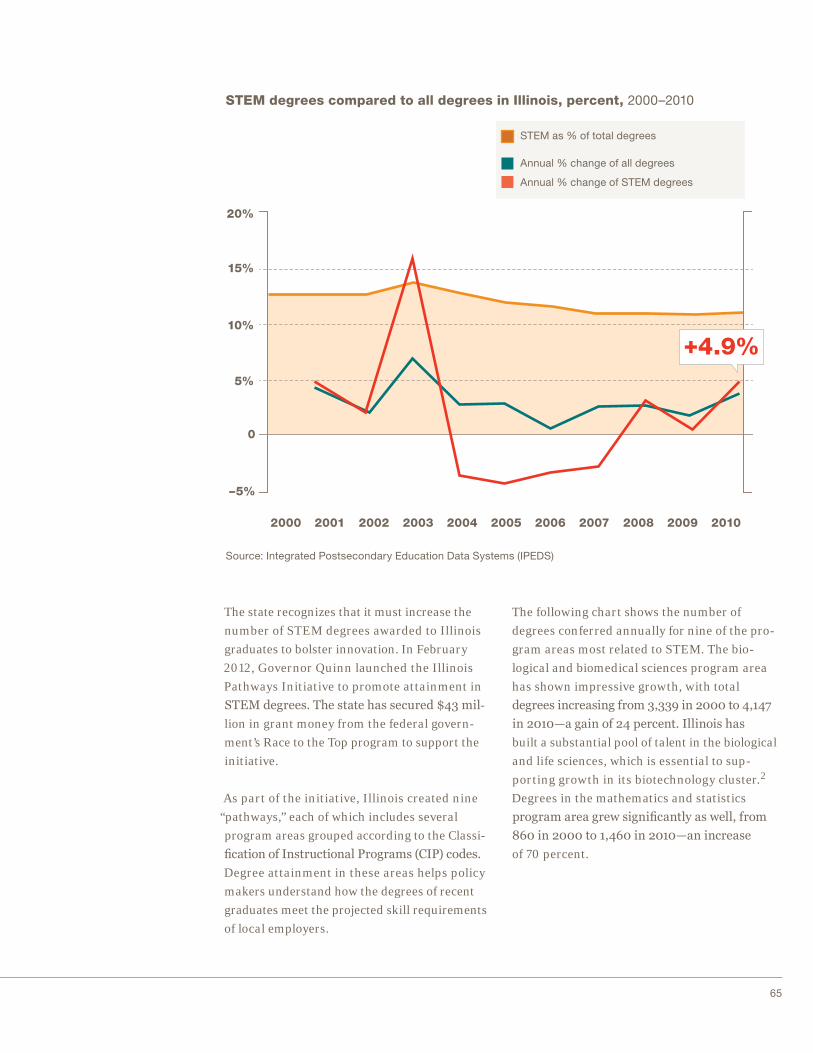
65
STEM degrees compared to all degrees in Illinois, percent, 2000–2010
STEM as % of total degrees
Annual % change of all degrees
Annual % change of STEM degrees
20%
15%
10%
5%
0
–5%
2001 2002 2003 201020042000 2006 2007 2008 20092005
Source: Integrated Postsecondary Education Data Systems (IPEDS)
+4.9%
The state recognizes that it must increase the
number of STEM degrees awarded to Illinois
graduates to bolster innovation. In February
2012, Governor Quinn launched the Illinois
Pathways Initiative to promote attainment in
STEM degrees. The state has secured $43 mil-
lion in grant money from the federal govern-
ment’s Race to the Top program to support the
initiative.
As part of the initiative, Illinois created nine
“pathways,” each of which includes several
program areas grouped according to the Classi-
fication of Instructional Programs (CIP) codes.
Degree attainment in these areas helps policy
makers understand how the degrees of recent
graduates meet the projected skill requirements
of local employers.
The following chart shows the number of
degrees conferred annually for nine of the pro-
gram areas most related to STEM. The bio-
logical and biomedical sciences program area
has shown impressive growth, with total
degrees increasing from 3,339 in 2000 to 4,147
in 2010—a gain of 24 percent. Illinois has
built a substantial pool of talent in the biological
and life sciences, which is essential to sup-
porting growth in its biotechnology cluster.2
Degrees in the mathematics and statistics
program area grew significantly as well, from
860 in 2000 to 1,460 in 2010—an increase
of 70 percent.

Illinois Innovation Index Annual Report 2011–201266
Source: Integrated Postsecondary Education Data Systems (IPEDS)
7000
6000
Number of degrees by STEM-related program area in Illinois, 2000–2010
3000
2000
5000
4000
1000
0
20022001 2003 201020042000 2006 2007 2008 20092005
Number of degrees
Computer/information science/support services
Mathematics/statisticsBiological/biomedical sciences
Engineering technologies/engineering-related �elds
Engineering
Associates degrees
Communications technologies/technicians and support services
Physical sciences
Science technologies/technicians
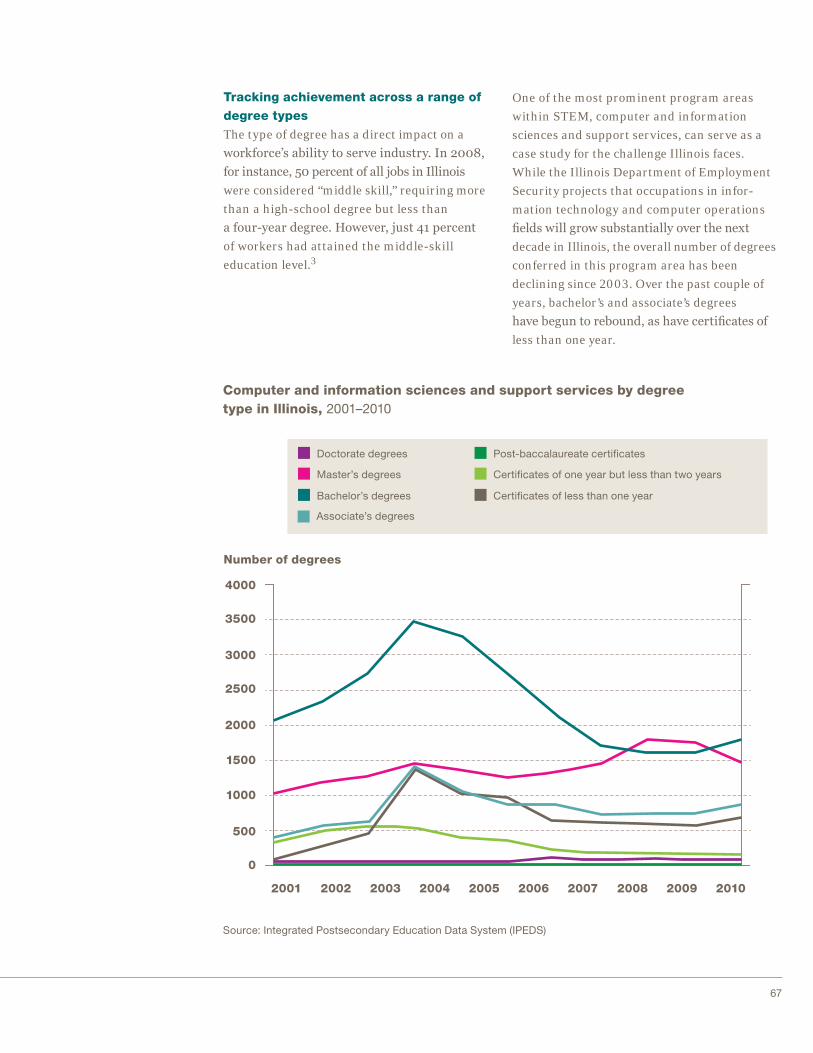
67
Tracking achievement across a range of degree typesThe type of degree has a direct impact on a
workforce’s ability to serve industry. In 2008,
for instance, 50 percent of all jobs in Illinois
were considered “middle skill,” requiring more
than a high-school degree but less than
a four-year degree. However, just 41 percent
of workers had attained the middle-skill
education level.3
One of the most prominent program areas
within STEM, computer and information
sciences and support services, can serve as a
case study for the challenge Illinois faces.
While the Illinois Department of Employment
Security projects that occupations in infor-
mation technology and computer operations
fields will grow substantially over the next
decade in Illinois, the overall number of degrees
conferred in this program area has been
declining since 2003. Over the past couple of
years, bachelor’s and associate’s degrees
have begun to rebound, as have certificates of
less than one year.
3500
3000
4000
Computer and information sciences and support services by degree type in Illinois, 2001–2010
1500
1000
2500
2000
500
0
2002 2003 201020042001 2006 2007 2008 20092005
Number of degrees
Source: Integrated Postsecondary Education Data System (IPEDS)
Doctorate degrees
Certi�cates of one year but less than two yearsMaster’s degrees
Post-baccalaureate certi�cates
Bachelor’s degrees
Associate’s degrees
Certi�cates of less than one year
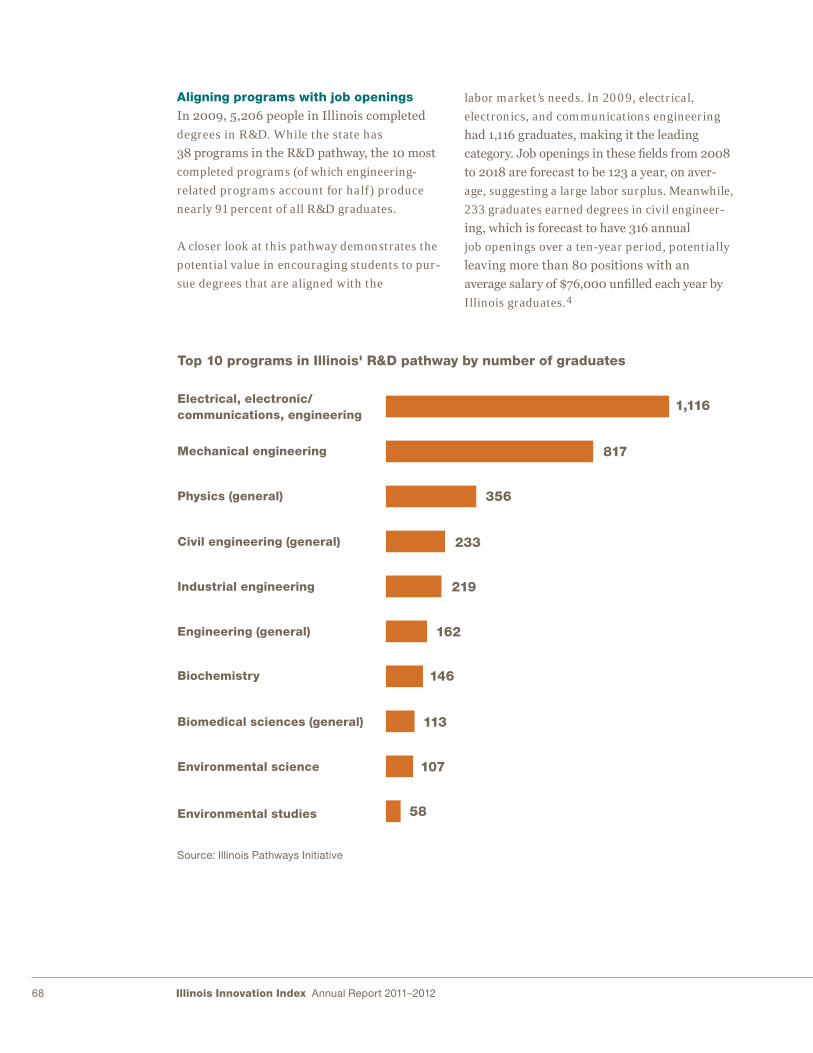
Illinois Innovation Index Annual Report 2011–201268
Aligning programs with job openingsIn 2009, 5,206 people in Illinois completed
degrees in R&D. While the state has
38 programs in the R&D pathway, the 10 most
completed programs (of which engineering-
related programs account for half) produce
nearly 91 percent of all R&D graduates.
A closer look at this pathway demonstrates the
potential value in encouraging students to pur-
sue degrees that are aligned with the
labor market’s needs. In 2009, electrical,
electronics, and communications engineering
had 1,116 graduates, making it the leading
category. Job openings in these fields from 2008
to 2018 are forecast to be 123 a year, on aver-
age, suggesting a large labor surplus. Meanwhile,
233 graduates earned degrees in civil engineer-
ing, which is forecast to have 316 annual
job openings over a ten-year period, potentially
leaving more than 80 positions with an
average salary of $76,000 unfilled each year by
Illinois graduates.4
Top 10 programs in Illinois' R&D pathway by number of graduates
Source: Illinois Pathways Initiative
Electrical, electronic/communications, engineering
Mechanical engineering
Physics (general)
Civil engineering (general)
Industrial engineering
Engineering (general)
Biomedical sciences (general)
Environmental science
Environmental studies
Biochemistry
1,116
817
219
356
233
162
146
58
113
107

69
Bridging the labor gap in STEM fieldsTo promote college and career readiness for all
students, the Pathways Initiative helps connect
educational institutions and business so that
they can work together to develop curricula and
job-training programs. This coordination
between public and private sectors at the state
and local levels will be vital in raising the
number of qualified graduates across STEM
degrees.
However, more progress must be made in align-
ing the skills of the workforce with the
demands of the job market. Key opportunities
include increasing overall funding for STEM
programs and focusing training on the
attainment of midlevel certificates for industry-
specific skills.
1 GO TO 2040, the Chicago Metropolitan Agency
for Planning; OECD Territorial Reviews: The Chicago
Tri-State Metropolitan Area, the Organisation for
Economic Co-operation and Development; and A
Plan for Economic Growth and Jobs, World Business
Chicago.
2 For more on clusters in Illinois, see the November
edition of the Index.
3 National Skills Coalition report on Illinois.
4 Illinois Pathways Initiative.

70 Illinois Innovation Index Annual Report 2011–2012
Illinois is home to many firms that are growing
and innovating. Excel Foundry and Machine,
a manufacturer of aftermarket parts for open-
pit mining equipment, is in the midst of a
$15 million expansion, but growth has been
impeded by a shortage of high-skilled, high-tech
employees. Instead of developing its own
on-the-job training program, Excel has part-
nered with Illinois Central College in East
Peoria to use the existing curriculums and
instructors to train students for jobs on its
factory floor. These types of partnerships aim
to help advanced manufacturers and other
growing industries across the state build the
workforce they need to thrive and innovate.
Spotlight
Excel Foundry and Machine partners with Illinois Central College
pbs.org/newshour/bb/ business/jan-june12/skillsgap_ 03-27.html
On Chicago’s West Side, Austin Polytechnical
Academy is preparing students for college and
careers in manufacturing by requiring students
to take three-to-four years of pre-engineering
classes in addition to traditional subjects.
In their junior year, students may obtain up to
two nationally recognized credentials from the
National Institute for Metalworking Skills.
Austin Polytech has partnered with Wood Dale–
based Matrix Tooling Inc. to research one of
the specialty medical devices it manufactures.
Matrix Tooling President and co-founder Paul
Ziegenhorn hopes it will spark interest among
students to pursue a career in high-tech
manufacturing.
Austin Polytechnical Academy’s focus on manufacturing
chicagobusiness.com/article/ 20120316/NEWS05/120319812/ how-one-manufacturer-is- looking-to-cure-a-labor-shortage

71
Chicago’s vast talent pool ranks among the most
diverse in the nation: no industry in the
Chicago region employs more than 13 percent
of the 4.29 million workers here. Since new
ideas often arise from the interaction among
workers in different industries, the region’s
economic diversity is an important driver
of innovation. However, an economy as large
and complex as Chicago’s requires equally
sophisticated ways for employers to find the
right talent―and for job seekers to find the
right opportunities. Since rising to prominence
in the late 1990s, online job boards have
offered companies a direct connection to quali-
fied employees and a vital tool for individuals
to extend the reach of their job search.
Beyond the primary goal of linking employers
and job seekers―job boards account for 1 in
5 hires1―online postings can also provide insight
into hiring trends. New technology is able to
mine and analyze data from the nation’s largest
job boards, providing metrics on talent supply
and employer demand in real time.2 The volume
and type of job postings in the Chicago metro-
politan statistical area (MSA), particularly in
tech-related fields such as IT and computer
programming, suggest movement in the sectors
that drive innovation. Similarly, the clear
demand for healthcare workers3 and industrial
engineers also reflects activity in innovative
industries.
Top positions and employers In 2011, the Chicago area had a monthly average
of 123,668 online postings for all occupations.
Among the top 25 occupations, IT-related fields4
accounted for nearly 14,000 average monthly
postings—11 percent of total postings. The
occupation with the most openings in the
Chicago region was computer systems analyst,
with Web developer and computer software
engineer ranking third and tenth, respectively.
In the numbers
Using online job postings to track Chicago’s labor supply and demand
July 2012
HWOL data generously provided by: Chicago Cook Workforce Partnership
Top ten occupations for Chicago metro, 2011, monthly average
Source: The Conference Board Help Wanted Online (HWOL) data series
Occupation
1. Computer systems analysts
2. Registered nurses
3. Web developers
4. Retail salespersons
5. First-line supervisors/managers of retail sales workers
6. Marketing managers
7. Truck drivers, heavy and tractor-trailer
8. Customer service representatives
9. Accountants
10. Computer software engineers, applications
Postings
4,067
3,772
3,642
3,031
2,840
2,801
2,485
2,357
2,353
2,127

Illinois Innovation Index Annual Report 2011–201272
The top 35 companies by job postings were
distributed across a number of sectors, includ-
ing healthcare, business services, finance,
and retail. The top 10 companies accounted for
approximately 5 percent of total postings for
the year. Advocate Health Care led with more
than 1,100 average job postings per month
in 2011; IBM was the top technology company,
at number six.
Allegis and Kforce, two staffing firms that
specialize in placing IT, healthcare, and tech-
nical workers, ranked fourth and seventh,
respectively. Lingering economic uncertainty
has led many companies to alter their approach
to hiring, relying more heavily on staffing
companies and a contingent labor force.
505
451
386
Top 10 companies by number of online postings in Chicago metro, 2011, monthly average
Company
1. Advocate Health Care
2. Deloitte
3. JPMorgan Chase
4. Allegis Group
5. Sears
6. IBM
7. Kforce
8. Walgreens
9. Staples
10. Accenture
Postings
= 100 postings
1,110
740
901
664
483
417
371
Source: The Conference Board Help Wanted Online (HWOL) data series

73
Chicago’s deep, experienced talent poolThe quality of the region’s workforce is a pri-
mary driver of business investment.5 In 2011,
for example, World Business Chicago worked
with companies in sectors from finance and
healthcare to manufacturing and green tech-
nology that cited “workforce” as the second most
important reason (after “location”) for expan-
sion in Chicago.
Monster.com analyzed Chicago’s labor market
and highlighted several notable findings.6 More
than half of the region’s talent pool is concen-
trated in three types of occupations: office/
administration (23 percent), management
(21 percent), and computer and mathematical
(10 percent).
Chicago benefits from an experienced workforce,
according to Monster.com’s analysis of online
resumes. The study found that the majority of
Chicago’s online job seekers—55 percent—
have more than seven years of work experience.
One-quarter of candidates had in excess of
15 years of experience—comparable to other
major U.S. metro areas. As the following chart
illustrates, Monster.com’s analysis uncovered
a gap between labor demand and supply,
especially in middle-skilled jobs.7
According to Monster.com, the education level
of Chicago’s workforce is also an important
advantage. Overall, 33.4 percent8 of Chicago
MSA residents have a bachelor’s degree or
higher—putting the region 11th among MSAs
with a workforce of more than 1 million. In
2011, more than half of Chicago metro job seek-
ers had at least a bachelor’s degree.
Chicago years of work experience, job postings vs. new resumes, 2010, percent
Source: Monster.com Chicago Job Conditions Report, 2011
15 years+
10+ to 15 years
7+ to 10 years
5+ to 7 years
2+ to 5 years
1+ to 2 years
Less than 1 year
1%25%
5%17%
8%13%
24%12%
37%18%
15%8%
10%7%
Job postings New resumes

74 Illinois Innovation Index Annual Report 2011–2012
Capturing the value of online job metricsOnline job postings offer an interesting oppor-
tunity to research and track current labor
market trends in real time. Data from online
job boards, when combined with more estab-
lished employment indicators from sources such
as the U.S. Census and Bureau of Labor
Statistics, can provide a more complete picture
of the region’s labor market. As the posting
data become better reconciled with more con-
ventional sources and more sophisticated
analyses emerge, online postings will provide
a valuable tool to track labor market trends
and gauge the region’s standing in innovative
industries.
1 2012 Sources of Hire: Channels That Influence,
CareerXRoads, July 2012.
2 While online job listings don’t include all jobs and job
seekers—for example, some employers (construction,
agriculture, manufacturing) and applicants (those without
Internet access; refer to the May Index) are not posting
jobs/resumes—they can reflect dynamism in the job mar-
ket and provide a snapshot for the depth of talent, con-
centration of certain types of jobs, and the hiring trends
within industries. The Conference Board attempts to filter
out duplicate listings so that job postings represent new
ads only.
The Chicago Workforce Investment Council
(CWIC), which will soon to be merged into the
Chicago Cook Workforce Partnership, uses
Help Wanted Online (HWOL) data to analyze
thousands of recent postings across various
Internet job boards. This research helps to
provide a better understanding of current
job demand and employer needs in the city of
Chicago, Cook County, and the Chicago metro
region. Each quarter, CWIC publishes a report,
Where Are the Jobs? which highlights the top
20 occupations, top 10 employers, and top
positions in demand.
Spotlight
CWIC report: Where Are the Jobs?
The reports are available for download:http://cwic.org/Resources.aspx
3 Health information management is a growing field of
innovation: according to the Bureau of Labor Statistics,
the demand for medical records and health information
technicians is forecast to increase by 21 percent from
2010 to 2020.
4 The top 25 also included computer support specialists
(#12) and network and computer systems administrators
(#14).
5 OECD Tri-State Territorial Review; CMAP, GO TO 2040;
World Business Chicago, A Plan for Economic Growth
and Jobs.
6 Monster.com Chicago Job Conditions Report, 2011.
7 Refer to the June Index, which highlighted the efforts to
increase middle-skill attainment. 8 According to the 2010 five-year ACS for the Chicago
MSA.

75
As the jobs data show, Chicago is a leader in
the healthcare industry and a hotbed for
tech start-ups. Healthbox, a first-of-its-kind
program for the healthcare industry, was
launched in Chicago in January 2012 to
strengthen the connection between these two
vibrant industries. The company provides
seed money, mentoring, networking, and other
services to healthcare start-ups to support
their rapid development and growth. Nina
Nashif is one of the leaders behind Healthbox
and its parent company, Sandbox Industries.
The inaugural class of ten start-ups from across
the United States each received $50,000
from Healthbox in seed capital (in exchange for
a 7 percent equity stake), as well as access to
companies including Walgreens and Blue Cross
Blue Shield, large hospitals, and professionals
from across the healthcare spectrum. According
to Nashif, “That’s the force behind Healthbox;
it’s not just venture capital but healthcare
expertise that entrepreneurs can tap. These
start-ups will make invaluable connections, any
one of which could lead to customers for their
products.” The 2012 class, which includes PUSH
Wellness and SwipeSense, graduated in April
2012. Healthbox is seeking to bring ten new
companies to Chicago in 2013.
Healthbox
healthboxaccelerator.com

Illinois Innovation Index Annual Report 2011–201276
Academic institutions have become increasingly
central to driving innovation and contributing
to economic development. Over the past decade,
the transfer and commercialization of research
(tech transfer) at Illinois universities have
intensified: the state ranked among the nation’s
leaders in tech transfer and in 2011 saw an
unprecedented number of start-ups based on
technology developed at Illinois’ universities.1
However, other states’ academic institutions con-
tinue to outperform Illinois,’ indicating more
must be done to spur innovation.
Patent output at Illinois universities Both invention disclosures2 and patents
awarded to Illinois’ universities have increased
significantly over the past decade. The volume
of invention disclosures climbed steadily
from approximately 500 each year in the early
2000s to 700 per year by 2010.3 Similarly, the
number of patents awarded per year to Illinois
academic institutions nearly doubled, grow-
ing from 109 in 2001 to 200 in 2011.4
In 2008, the most recent year for which data
on patents per science and engineering
(S&E) doctorate holder in academia is available,
Illinois’ S&E academic researchers had the
eighth highest patent output in the nation at
11.4 patents for every 1,000 S&E doctorate
holders in academia, compared with the national
average of 9.7.5 This represents a 54 percent
jump from 1997 to 2008, the largest among the
top ten states.
In the numbers
Focus on technology transfer accelerates research activity at Illinois universities
August 2012
Tech transfer data generously provided by the Association of University Technology Managers (AUTM)
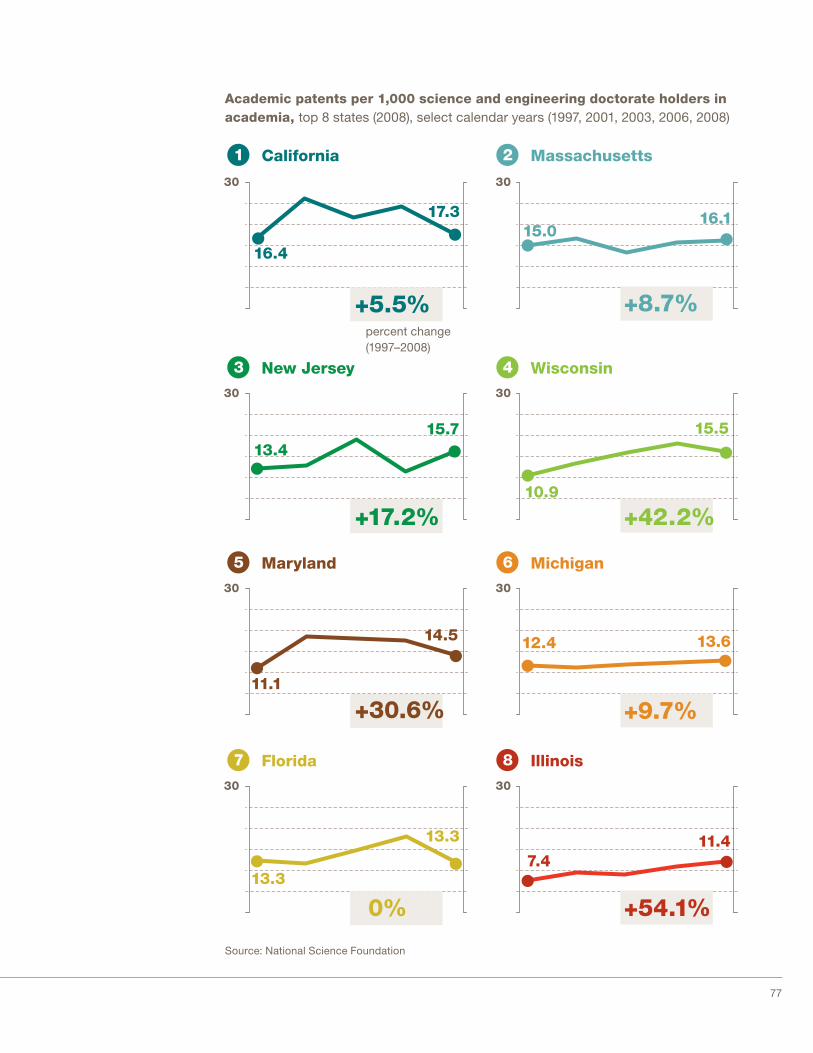
77
Source: National Science Foundation
Academic patents per 1,000 science and engineering doctorate holders in academia, top 8 states (2008), select calendar years (1997, 2001, 2003, 2006, 2008)
California1 Massachusetts2
New Jersey3 Wisconsin4
30 30
percent change (1997–2008)
Maryland5 Michigan6
30 30
Florida7 Illinois8
30 30
30
16.4
17.3
30
15.016.1
13.415.7
10.9
15.5
11.1
14.5
+5.5% +8.7%
+17.2% +42.2%
12.4 13.6
13.3
13.3
7.411.4
+30.6% +9.7%
0% +54.1%

Illinois Innovation Index Annual Report 2011–201278
Technology licensing and commerciali- zationA university’s success in producing and market
ing in-demand technology can be measured
by its licensing of patented technologies to com-
panies. From 2007 to 2010, Illinois universi-
California 432 466
2007 2008 2009 2010
417 461
Florida 133 133 162 177
Minnesota 145 128 131 146
North Carolina 299 243 290 237
Illinois 130 138 111 142
Massachusetts 527 476 528 494
New York 230 253 242 278
Pennsylvania 185 217 221 279
Texas 291 312 296 296
Source: AUTM, U.S. Licensing Activity Survey, and university-reported data for Illinois
Technology licenses and options, top U.S. states, 2007–2010 (�scal years)
ties licensed a total of approximately 130 tech-
nologies per year compared with less than
120 per year in the early part of the decade.
Illinois hit a decade-high in 2010, with
142 executed licenses and options.

79
In spite of the higher volume, Illinois univer-
sities and research hospitals executed relatively
few licenses and options compared with other
innovative states of a similar population, such
as North Carolina and Pennsylvania. Licenses
and options executed by performer (private and
Technology licenses and options by performer, top U.S. states, 2010 (�scal year)
Massachusetts =494
California =461
New York
North Carolina
Texas
Pennsylvania
Florida
Minnesota
Illinois
=278
=237
=296
=279
=177
=146
=142
* University �gures include medical schools af�liated with those universities. For instance, licensing and options for Duke University include Duke’s medical school. Source: AUTM, U.S. Licensing Activity Survey and University reported data for this issue
275 17742
21 176264
36 66177
63 16550
52
11
233
113124
15918
2
7373
7268
Research hospitals and medical centers*
Public universities
Private universities
public universities, non-university research
hospitals, and medical centers) have remained
relatively constant from 2007 to 2010, the
most recent period for which comparative data
are available. The following exhibit shows
the breakdown for 2010, a representative year.

Illinois Innovation Index Annual Report 2011–201280
University start-upsFrom 2006 to 2011, at least 122 university start-
ups6 were founded in Illinois, with 27 estab-
lished in 2011, a new record.7 This growth was
driven primarily by increased commerciali-
zation of research over the past decade at the
University of Illinois, Northwestern University,
the University of Chicago, and Southern Illinois
University. Of the 115 start-ups (out of 122)
for which detailed information is available,
86 companies (75 percent) are still active,
and 84 percent of these are based in Illinois
(with concentrations in Champaign and
northern Cook County).
More than 40 percent of the active start-ups
are in biomedical applications, ranging from
therapeutic and diagnostic methods to
new drugs. The majority of federal funding
for university-based research is in the bio-
logical sciences; biotechnology patents make up
the majority of patents granted to universities.
Large federal investments in super computing
and the mathematical sciences at the Univer-
sity of Illinois have also led to several software
and IT-based start-ups. Imaging technology,
an often overlooked field with potential applica-
tions in multiple industries, accounts for
eleven start-ups in our sample. In addition,
seven start-ups use nanotechnology for
applications in clean technology, advanced
manufacturing, and biomedicine.
*University �gures include medical schools af�liated with those universities. For instance, licensing and options for Duke University include Duke’s medical school. Source: AUTM, U.S. Licensing Activity Survey and University reported data for this issue
Industry focus of active university start-ups created from 2006 to 2011
Biomed35 companies
100% = 86 active companies
Source: Companies in this sample include all active startups to emerge from Northwestern, University of Champaign–Urbana, University of Illinois Chicago, Illinois Institute of Technology, and Southern Illinois University. Due to incomplete information on operational status, sample does not include startups from University of Chicago
41%
Software and IT21 companies24%
13%
9%13%Advanced manufacturing11 companies
Clean tech8 companies
Other11 companies
81
Maintaining momentum in tech transferInvention disclosures and academic patenting
are at an all-time high, and more high-
tech start-ups based on university research are
being created in Illinois than ever before.
Progress can be sustained and further encour-
aged by increasing support for publicly
funded universities and research hospitals, and
introducing policies that promote the geo-
graphical concentration of high-tech companies.
These efforts are essential to create a cluster
of high-tech start-ups that will accelerate inno-
vation, facilitate tech transfer and commer-
cialization, and spur economic growth in
Illinois.8
1 AUTM data vary from year to year because the number
of university respondents fluctuates. However, institu-
tions that account for the majority of technology transfer
activity in each state are consistently represented in
the survey for the period of time we examined.
2 An invention disclosure occurs when a researcher
officially announces a potential discovery to a technol-
ogy transfer office (TTO) and establishes for the legal
record the time of the invention’s conception.
3 Association of University Technology Managers (AUTM),
U.S. Licensing Activity Survey.
4 United States Patent and Trademark Office (USPTO).
5 National Science Foundation, Science & Engineering
Indicators, 2012.
6 University start-ups are defined as companies that are
established based on technologies licensed by univer-
sity TTOs.
7 Figures come from AUTM and are supplemented by
additional data reported by universities. Data on
start-ups created out of the University of Chicago in
2011 were not available.
8 Alan Thomas, “Start-up Efficiency Benchmarking,”
extract from internal white paper presented at UChica-
goTech. University of Chicago, 2007.
MethodologyFigures for invention disclosures, licenses and options executed, and start-ups in Illinois are primarily based on data provided by AUTM through the STATT 3.1 database. This information was supplemented by survey data on Illinois universities for which tech transfer data wasn’t available for each of the years discussed in this study (2006–2010).
The Illinois Science & Technology Coalition (ISTC) surveyed tech transfer offices at Southern Illinois University, Northern Illinois University, Illinois Institute of Technology, Loyola University of Chicago, and Rush University Medical Center. To make the supplemental data comparable and consistent with AUTM data, universities were asked to provide information only for financial years and only for metrics included in AUTM’s STATT 3.1 database.
Since the AUTM survey offers a more comprehensive list of research institutions for other states, we included supplemental data on all major research universities and institutions with a TTO to provide the most complete picture of tech transfer activity in Illinois.

82 Illinois Innovation Index Annual Report 2011–2012
Established in 2003, Ocean Tomo, LLC, provides
financial products and services related to
intellectual property (IP), including expert testi-
mony, valuation, research, ratings, invest-
ments, risk management, and transactions.
Ocean Tomo assists clients—corporations,
law firms, governments and institutional inves-
tors—in realizing value from their intellec-
tual capital.
From its inception, Ocean Tomo has dedicated
itself to providing a truly global platform
for value and wealth creation in the intellectual
property world. Most recently, the company
entered into a joint Technology Transfer Service
Center with the Shenzhen United Property
and Share Rights Exchange (UPEX) in China.
Based in both Chicago and Shenzhen, the Tech-
nology Exchange Center supports IP-driven
businesses in the United States seeking entry
into the Chinese market and provides simi-
lar services to Chinese companies seeking to
expand into the United States. By serving
as a bridge for easier technological and entre-
preneurial transfer, Ocean Tomo’s alliance
with UPEX facilitates the exchange of innova-
tion across country borders and provides
companies with capital and opportunities to
build international businesses through IP
joint ventures.
Spotlight
Ocean Tomo
oceantomo.com
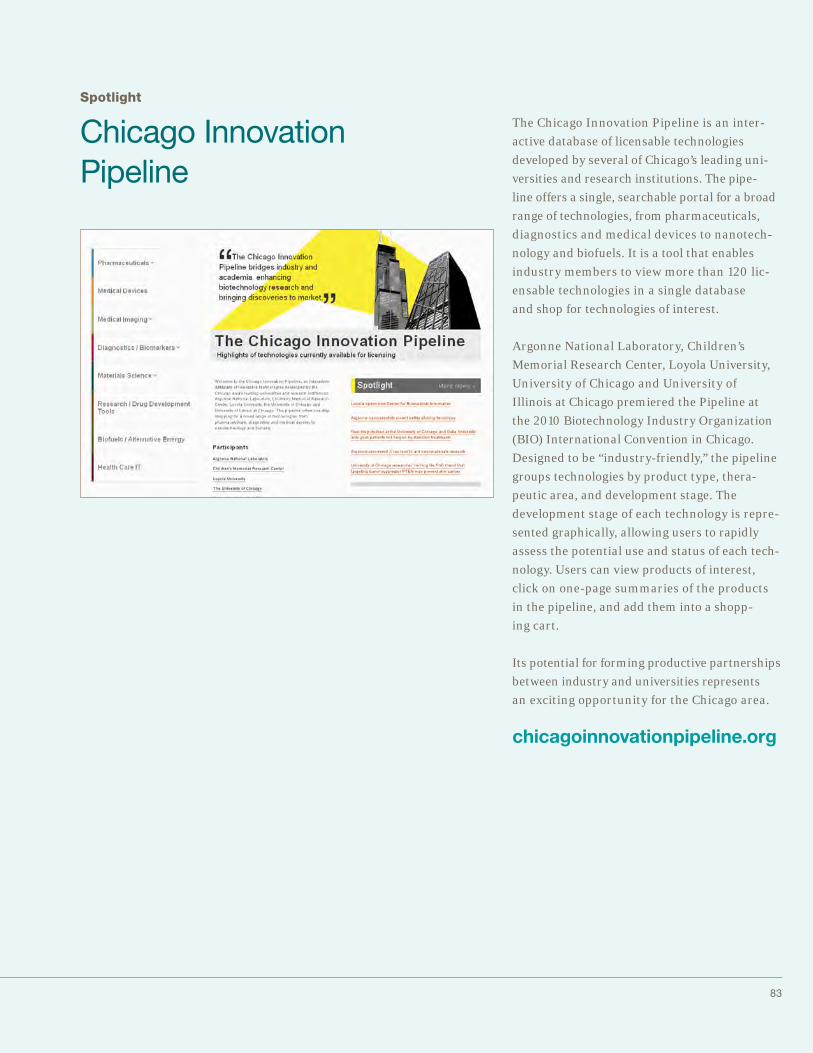
83
The Chicago Innovation Pipeline is an inter-
active database of licensable technologies
developed by several of Chicago’s leading uni-
versities and research institutions. The pipe-
line offers a single, searchable portal for a broad
range of technologies, from pharmaceuticals,
diagnostics and medical devices to nanotech-
nology and biofuels. It is a tool that enables
industry members to view more than 120 lic-
ensable technologies in a single database
and shop for technologies of interest.
Argonne National Laboratory, Children’s
Memorial Research Center, Loyola University,
University of Chicago and University of
Illinois at Chicago premiered the Pipeline at
the 2010 Biotechnology Industry Organization
(BIO) International Convention in Chicago.
Designed to be “industry-friendly,” the pipeline
groups technologies by product type, thera-
peutic area, and development stage. The
development stage of each technology is repre-
sented graphically, allowing users to rapidly
assess the potential use and status of each tech-
nology. Users can view products of interest,
click on one-page summaries of the products
in the pipeline, and add them into a shopp-
ing cart.
Its potential for forming productive partnerships
between industry and universities represents
an exciting opportunity for the Chicago area.
Spotlight
Chicago Innovation Pipeline
chicagoinnovationpipeline.org
84
News and eventsSeptember 2011–August 2012
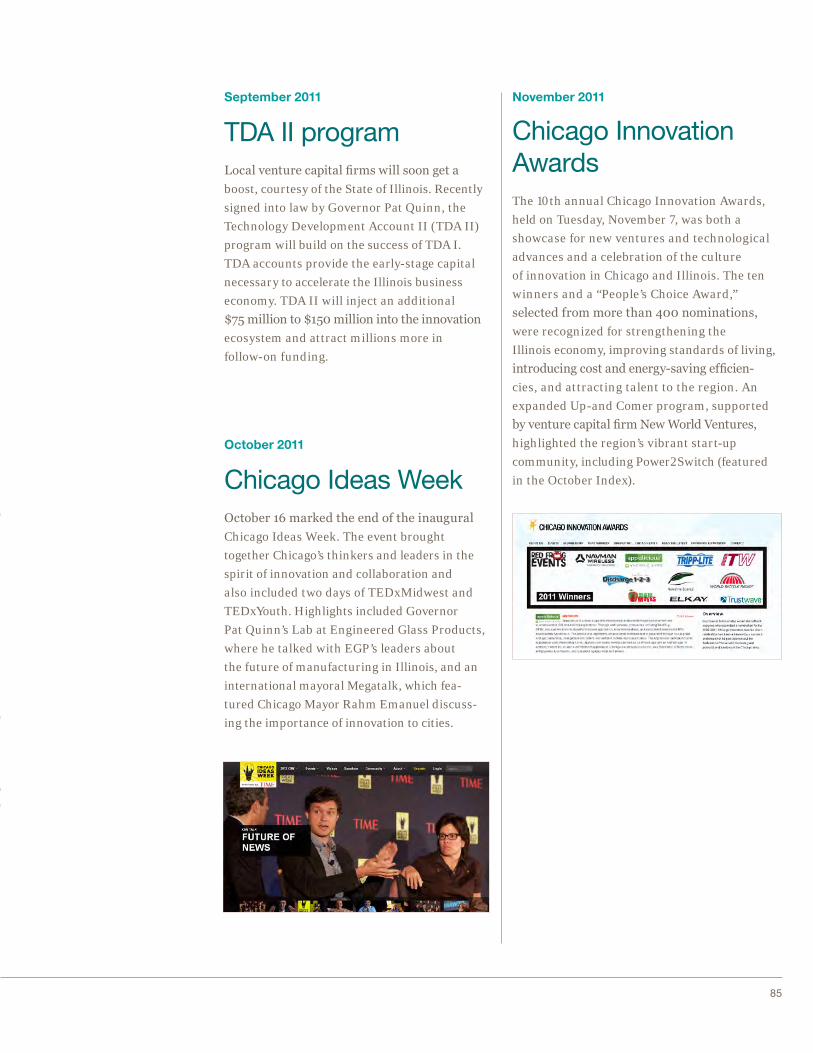
85
September 2011
TDA II programLocal venture capital firms will soon get a
boost, courtesy of the State of Illinois. Recently
signed into law by Governor Pat Quinn, the
Technology Development Account II (TDA II)
program will build on the success of TDA I.
TDA accounts provide the early-stage capital
necessary to accelerate the Illinois business
economy. TDA II will inject an additional
$75 million to $150 million into the innovation
ecosystem and attract millions more in
follow-on funding.
October 2011
Chicago Ideas WeekOctober 16 marked the end of the inaugural
Chicago Ideas Week. The event brought
together Chicago’s thinkers and leaders in the
spirit of innovation and collaboration and
also included two days of TEDxMidwest and
TEDxYouth. Highlights included Governor
Pat Quinn’s Lab at Engineered Glass Products,
where he talked with EGP’s leaders about
the future of manufacturing in Illinois, and an
international mayoral Megatalk, which fea-
tured Chicago Mayor Rahm Emanuel discuss-
ing the importance of innovation to cities.
November 2011
Chicago InnovationAwardsThe 10th annual Chicago Innovation Awards,
held on Tuesday, November 7, was both a
showcase for new ventures and technological
advances and a celebration of the culture
of innovation in Chicago and Illinois. The ten
winners and a “People’s Choice Award,”
selected from more than 400 nominations,
were recognized for strengthening the
Illinois economy, improving standards of living,
introducing cost and energy-saving efficien-
cies, and attracting talent to the region. An
expanded Up-and Comer program, supported
by venture capital firm New World Ventures,
highlighted the region’s vibrant start-up
community, including Power2Switch (featured
in the October Index).

Illinois Innovation Index Annual Report 2011–201286
© University of Illinois at Urbana-Champaign
December 2011
University of Illinois honored with 2011 Outstanding Research Park awardThe Research Park at the University of Illinois
at Urbana-Champaign was named the 2011
Outstanding Research Park by the Association
of University Research Parks (AURP) during
its annual Awards of Excellence ceremony on
December 1. The AURP Awards of Excellence,
now in their 16th year, recognize the achieve-
ments of research parks and industry veterans
and encourage the development of best
practices among research and science parks.
The Outstanding Research/Science Park
Achievement Award recognizes parks that excel
in bringing technology from the laboratory
to economically viable business activities, thus
promoting the growth of businesses, jobs,
and public revenue.
The U of I’s Research Park, which opened a
decade ago, is now home to more than 90 com-
panies employing more than 1,200 people. It
provides internship opportunities for students,
resources for faculty to commercialize new
technology in conjunction with academic work,
and engagement opportunities for companies
that want to collaborate with the University
of Illinois.
February 2012
1871 launched to promote innovation and support entrepreneursLast month, Chicago welcomed the official
launch of 1871, a nonprofit community
enterprise featuring a 50,000-square-foot
location for startups and entrepreneurs.
The organization is the culmination of an
unprecedented collaborative effort of hundreds
of leaders from Chicago’s digital community.
From its offices on the 12th floor of the Merchan-
dise Mart, 1871 will provide an ecosystem of
supportive minds and creative thinkers for start-
ups and individuals―designers, developers, and
innovators―who set their sights on solving chal-
lenging problems. The organization’s name
is a nod to the year of the Great Chicago Fire
and the city’s brilliant engineers, architects and
inventors who joined forces to rebuild Chicago.
Longtime entrepreneurial champion, venture
capitalist, and current World Business Chicago
board member J.B. Pritzker conceived of
1871 and committed the resources to establish
the organization. His vision was to draw on
all parts of the community―universities, serial
entrepreneurs, civic organizations, investors,
designers, corporate leaders, and beyond.
In his State of the State address on February 1,
Governor Pat Quinn announced that the
state would invest $2.3 million in the center.
With venture capital funding on the rise in
Chicago, 1871 will be a critical asset to harness
innovation in the city. The Chicagoland Entre-
preneurial Center will manage 1871, which will
be a vital addition to Chicago’s innovation
landscape. The organization is set to open in the
spring and is currently taking applications.

87
March 2012
OECD Study Recommends Regional Cooperation to Realize Innovation PotentialOn March 9, 2012, the Organisation for
Economic Co-operation and Development
(OECD), in tandem with the Chicagoland
Chamber of Commerce, released The Chicago
Tri-State Metropolitan Area, United States
report, the 23rd OECD territorial review and
the first of its kind in the United States.
At the report release event, OECD Secretary-
General Angel Gurría noted that the region
derives its economic power from a strong manu-
facturing base and capacity for innovation, as
well as human capital that is young, ethnically
diverse, and educated. The secretary-general
noted, “One thing we’ve learned: what happens
in the Chicago region affects the economy of
the entire country.” However, the region faces
several challenges―most acutely, its consis-
tently high unemployment and a lack of dyna-
mism to propel the economy forward.
The tri-state study classifies the Chicago region
as a high-performing “Industrial Production
Zone” but reveals that Chicago falls short com-
pared with other areas it labels “Knowledge
and Technology Hubs.” The region could achieve
higher levels of success by increasing invest-
ment in R&D and patent activity and improv-
ing coordination among entities within the
tri-state region.
April 2012
Governor Quinn Convenes Export Advisory CouncilOn April 3, Governor Pat Quinn convened the
first meeting of the Illinois Export Advisory
Council. This new organization will support the
governor’s ambitious goal of doubling Illinois’
exports by the end of 2014, mirroring national
targets set by President Obama. The council
will provide state policy and program recom-
mendations and advise the governor on
advocacy positions on federal trade policy. The
council’s efforts seek to build on Illinois’ com-
petitive strengths in the international market-
place and the 29 percent growth in exports
achieved in 2011.
The council is scheduled to meet once a quarter
and will work with the Illinois departments of
Commerce and Economic Opportunity (DCEO)
and Agriculture (IDOA). Navistar chairman and
CEO Daniel C. Ustian heads the group, which
consists of 21 prominent private and public
sector leaders who will serve as international
ambassadors for Illinois, working with their
peers in the private sector to promote exports
by Illinois companies as well as attract new
companies to the state.

Illinois Innovation Index Annual Report 2011–201288
June 2012
Reinventing City Colleges of ChicagoThe shortage of qualified workers in Chicago
coupled with low graduation rates at City
Colleges of Chicago has spurred a reinvention
of these institutions. The effort’s primary
goal is to ensure that students succeed and are
prepared for jobs in the 21st century. To achieve
this objective, City Colleges has implemented
the “College to Career” program: employers
inform the colleges about the positions
they want to fill and the required skills and
competencies. Many companies have dedi-
cated staff to develop curriculum or teach some
of the classes.
Over the course of the next five years, six of
the seven city colleges will be transformed into
highly specialized, industry-specific training
institutions linked directly to growing indus-
tries in the Chicago region. Two colleges have
already launched programs―a health academy
at Malcolm X College and a transportation,
distribution, and logistics program at Olive-
Harvey College.
July 2012
IllinoisJobLink.com connects businesses and qualified candidatesOn December 13, 2011, the Illinois Depart-
ment of Employment Security (IDES) launched
IllinoisJobLink.com. The website is a free
resource that connects employers with job
seekers. Companies can use the site to post job
openings and search thousands of resumes
for talented, skilled employees. Currently, more
than 19,000 businesses have registered
and posted 116,000 positions; individuals have
uploaded approximately 72,500 resumes.
IDES employment service staff conduct
regular outreach to businesses, colleges, tech-
nical schools, chambers of commerce, and
economic development organizations. In addi-
tion, IDES has resources in place at the local
level to assist employers in posting jobs, match
qualified candidates, and set up job inter-
views. The IDES team also works to identify tax
credits of up to $9,600 per employee available
to businesses.

89

90Copyright © 2012. All rights reserved
illinoisinnovation.com/innovationindex