ANNUAL REPORT 2011 · Nabegataki Falls (Oguni-machi, Aso-gun, Kumamoto Prefecture) 1 The Higo Bank,...
44
ANNUAL REPORT 2011 Nabegataki Falls (Oguni-machi, Aso-gun, Kumamoto Prefecture)
Transcript of ANNUAL REPORT 2011 · Nabegataki Falls (Oguni-machi, Aso-gun, Kumamoto Prefecture) 1 The Higo Bank,...

ANNUAL REPORT 2011 Nabegataki Falls (Oguni-machi, Aso-gun, Kumamoto Prefecture)

1The Higo Bank, Ltd. Annual Report 2011
Profile
The Higo Bank is a regional bank whose main busi-
ness base is Kumamoto Prefecture in central Kyushu.
Possessing a varied sweep of natural beauty, includ-
ing the volcano Mt. Aso, which boasts the world’s
largest caldera, and the scenic Amakusa area with its
200 islands of widely varying sizes, the prefecture is
home to thriving agricultural, forestry, and fisheries
industries.
In recent years, Kumamoto Prefecture has
become a center for leading-edge industries, notably
semiconductors, for which it has been called “Japan’s
Silicon Valley.” The number of high-tech companies
setting up shop in Kumamoto is still on the increase,
and is expected to contribute greatly to the area’s
development in the near future.
The center of Kumamoto city has also been see-
ing the successive start-ups of a number of redevel-
opment projects, and accelerating progress is being
made in bolstering the city’s transport infrastructure.
The Kyushu Shinkansen Line from Fukuoka to
Kagoshima opened in March 2011, and the construc-
tion of a modern road traffic network, principally to
feed the Kyushu Expressway is progressing.
These conditions offer many opportunities to vital-
ize the region by cultivating small and medium-sized
mainstay businesses and promoting new businesses
to support these new industries. Kumamoto is home
to many new industries, and we have a support orga-
nization in which the public and private sectors work
together, called the Kumamoto Prefecture Business
Promotion Support Center. The center was estab-
lished with funds from the Kumamoto prefectural
government and the Higo Bank.
In addition to our main work of banking opera-
tions, we also put our energy into creating a better
living environment for the prefecture’s citizens by
supporting organizations such as The Distribution
Economics Institute of Kumamoto Area. Higin Capital
Co., Ltd., established in 1996, also cooperates with
these organizations to provide comprehensive sup-
port to match the growth stage of local companies.
The Bank has continued to be active in support-
ing cultural events such as concerts and art exhibits
as well as in promoting environmental conservation
efforts, with the establishment of the Higo Water
Resources Protection Foundation. The Bank is
commuted to a wide range of social contribution
activities.
ContentsProfile ................................................................................ 1Message from the President ........................................ 2Management Policy ...................................................... 3Results (Non-Consolidated) .......................................... 5Excellent Financial Indicators ..................................... 6Environmental Initiative ............................................... 8Corporate Data ............................................................... 9Service Network ............................................................ 10Financial Section .......................................................... 11

2The Higo Bank, Ltd. Annual Report 2011
Message from the President
In the first half of fiscal 2010, ended March 31, 2011, with the Japanese economy maintaining an upward trend in exports and production, corporate profits improved substantially and consumer spending also followed a moderate upswing. In the second half of the fiscal year, overseas economies, particularly in Asia, rebounded and there were various economic stimulus benefits. Despite signs of recovery up to the second half, some production activities declined significantly due to supply chain disruption and electrical supply restrictions caused by the Great East Japan Earthquake. As a result, momentum was weak in the second half. Meanwhile, within the prefecture, the economy continued to recover modestly until the second half due to better employment and income conditions, strong home investment, private capital investment, and other factors. However, at the end of fiscal 2010, the prefecture faced downward economic pressure owing to a drop in some production in manufacturing industries in the prefecture caused by the impact of the earth-quake disaster and rapidly cooling business and consumer sentiment. Amid these circumstances, the Bank has been implementing its Fifth Medium-term Management Plan entitled “Rebuilding the customer first principle — The rediscovery of home” since April 2010. Under the theme “the rediscovery of home,” we have rebuilt the “customer-first” management philosophy to provide financial services from the customers’ point of view with the goal of creating even stronger relationships with customers and the community. In Kumamoto, the opening of the Kyushu Shinkansen Line, in March 2011, the project to elevate the existing JR Line and Kumamoto’s becoming a designated city by government ordinance in 2012 were major turning points for Kumamoto Prefecture. Taking this as an opportunity, all executives and employees are working to achieve a banking group that will contribute to the entire region. We are doing everything we can to surpass the expectations of our stakeholders. We hope that our shareholders will continue to favor us with their support and encouragement in our future endeavors.
July 2011
Takahiro Kai, President

3The Higo Bank, Ltd. Annual Report 2011
Management Policy
Fifth Medium-term Management Plan
In the continuing harsh environment that surrounds financial institutions, we believe it is more important than ever to provide financial services that are closely linked to the region. We must understand things from the customers’ perspective and come up with the most appropriate and timely measures so that our relationship of trust with the customer is further strengthened. In recognition of this, the Bank launched its Fifth Medium-term Management Plan (Rebuilding the customer-first principle — The rediscovery of home) in April 2010. By subjecting the Plan to thorough market research and analysis within the prefecture we seek to further solidify our relationship with the customer.
Rebuilding the Principle of Putting the Customer-First — The Rediscovery of HomeThe theme of our Fifth Medium-term Management Plan is a bi-directional concept that puts the corporate phi-
losophy of “putting the customer-first” into practice through the “rediscovery of home.” At the same time, by
conducting research that helps us to rediscover our market (home), we build a better customer-first approach.
The Five Years from April 1, 2010 to March 31, 2015Looking ahead, in light of social infrastructure developments such as the opening of the Kyushu Shinkansen
Line and Kumamoto becoming a designated city by government ordinance, we forecast a major turnaround
for Kumamoto over the medium to long term. This requires a management plan that is based on a long-term
vision. Therefore, we have decided to implement our plan over a five-year period, divided into two phases,
Phase 1 (two years) and Phase 2 (three years).
Plan Period
Theme

4The Higo Bank, Ltd. Annual Report 2011
1. Sound and Strong Management Practices for Strategic Improvement Ensure earnings based on the soundness of our assets and human resources
2. Expand and Deepen Business Relations with Local-area Customers Increase and deepen transactional relations so that customers use all of the Bank’s financial products.
3. Develop Independent and Creative Talent Develop employees that are capable of independent thought and action
Basic Policy
1. Rebuild Sales Structure Beginning with the Customer: “Customer & Market Oriented” We provide optimal financial services to our customers and inform them of all of our financial products as we work to
improve customer convenience through the promotion of our branch infrastructure and paperless banking. In this way, we are rebuilding our sales structure beginning with the customer. To ensure the soundness of the structure, we will improve customer protection and management preparedness.
2. Pursue Business Reform through Information and Communication Technology: “Computer and Communication Oriented”
While upgrading our systems infrastructure and developing our IT-based operational structure, we will develop a framework that provides customers with optimal financial services through trouble-free and intelligent communica-tions, thereby improving service quality and productivity.
3. Demonstrate the Independence, Spontaneity, Autonomy and Self Help that Underpin Creativity: “Creative Man-Power Oriented”
Throughout the organization, the Bank employs a host of training activities to develop a sense of responsibility and creativity within our personnel. In this way, we will foster an environment throughout the Group that encourages professional development. Through the high-level capabilities and specialized expertise they develop, our employees will provide services that meet customers’ expectations.
Strategy
1. Core targets
Gross business profit Net income ROA (net income basis) Tier I ratio Adjusted OHR
¥61.5 billion ¥10.0 billion 0.26% 12.4% 62.0%
2. Sub-targets
Increase in total funds under management Ratio of non-performing loans
+¥200.0 billion 2.2%
* Total funds under management: The total balance of deposits and balance of assets under management is the Bank’s own indicator.
Financial Targets (Fiscal 2011)
Management Policy

5The Higo Bank, Ltd. Annual Report 2011
Results (Non-Consolidated)
Deposits and Loans
DepositsAs a result of closely tailoring its marketing initiatives to customer and regional needs, Higo Bank increased total deposits by ¥98 billion, or 2.9%, to ¥3,507 billion. The term-end balance of negotiable certificates of deposit stood at ¥135 billion. As a result, the term-end balance of deposits, including negotiable certificates of deposit, stood at ¥3,643 billion, up ¥149 billion, or 4.3%.
LoansThe Bank responded proactively to the needs of local SMEs, public bodies and retail banking customers (indi-viduals). As a result, loans outstanding increased by ¥66 billion, or 2.9%, compared with the previous term-end, to ¥2,326 billion.
Earnings
Net business profitDespite a decline in gross business profit, net business profit increased ¥0.9 billion, to ¥21.3 billion year on year due to expense reductions and decreased provision of reserve for possible loan losses (recorded to extraordinary profit due to excess reversal).
Net incomeNet income for the term increased ¥4.1 billion, to ¥10.8 bil-lion, due to the reversal of reserve for possible loan losses.
DepositsBalance at term end (Unit: ¥ billion)
Fiscal0
1,000
2,000
3,000
4,000
2010200820072006
3,1983,5073,4083,316
2009
3,246
LoansBalance at term end (Unit: ¥ billion)
Fiscal0
500
1,000
1,500
2,500
2,000
200820072006 2010
2,1122,3262,2602,266
2009
2,182
Net business profitBalance at term end (Unit: ¥ billion)
0
5.0
10.0
15.0
25.0
20.0
200820072006 2010
14.6
21.320.417.5
Fiscal2009
14.3
Net incomeBalance at term end (Unit: ¥ billion)
Fiscal0
2.0
4.0
6.0
8.0
12.0
10.0
200820072006
10.8
6.7
4.6
8.5
2010
7.2
2009

6The Higo Bank, Ltd. Annual Report 2011
Higo Bank has an Excellent Reputation as a Financially Sound Bank Carrying Few Non-Performing LoansDisclosure of Claims under the Financial Reconstruction Law (non-consolidated)
As of March 31, 2011 (billions of yen)
Loan balance
Coverage by collateral and guarantees
Reserve for possible loan losses
Coverage ratio
Loans to borrowers under bankruptcy proceedings and equivalent loans 5.4 3.6 1.8 100.0%Loans at risk 32.9 21.0 9.6 93.4%Loans requiring caution 19.4 10.6 4.3 77.1%Subtotal 57.7 35.2 15.8 88.5%Normal loans 2,283.7 Note: Figures have been rounded down to the nearest ¥100 million.
Fractions in the coverage ratios up to 0.04 have been rounded down, and from 0.05 upward have been rounded up.Total 2,341.5
Higo Bank carries a total of ¥57.7 billion in non-performing loans for which disclosure is mandatory under the Financial Reconstruction Law, accounting for 2.47% of its total loans and claims — a low level for a Japanese regional bank. Of these non-performing loans, 88.5% are covered by collateral, guarantees, and the reserve for possible loan losses, providing a sufficient buffer for the Bank. On a consolidated basis, the Bank carries a total of ¥59.7 billion in non-performing loans, accounting for 2.53% of the credit portfolio.
Total 2.47%
Loans requiring caution: 0.23%Loans at risk: 1.41%Loans to borrowers under bankruptcy proceedings and equivalent loans: 0.83%
Normal assets: 97.53%
Explanation of terms
Loans to borrowers under bankruptcy proceedings and equivalent loans This category indicates loans to borrowers undergoing bank-ruptcy proceedings or corporate rehabilitation, or loans to borrowers in a state of virtual bankruptcy.
Loans at riskThis category indicates loans to borrowers who, while not yet in a state of bankruptcy, are suffering from a severe deterioration in financial conditions and are very likely to be unable to repay outstanding loans.
Loans requiring cautionThis category indicates loans for which no repayments, includ-ing payments of interest, have been made for 3 months or more, or whose repayment conditions have been eased.
Excellent Financial Indicators
7The Higo Bank, Ltd. Annual Report 2011
One of the Highest Capital Ratios Among Japan’s Regional BanksThe capital ratio is the ratio of a bank’s regulatory capital (capital stock, retained earnings and other items) to total risk-weighted assets, including loans, marketable securities and others. This figure is important for banks as an indicator of their financial soundness. As of March 31, 2011, Higo Bank’s capital ratio was 13.39% based on domestic standards. This is one of the highest ratios of any regional bank in Japan, and is far above the 4% standard for capital adequacy under the Prompt Corrective Action measures. Using only Tier I capital, which includes common stock and certain other elements of equity, the capital ratio stands at 12.43%.
* With effect from the term ended March 2007, capital adequacy calculations have been made in line with the new Basel II standards relating to banks’ regulatory capital. The new standards allow banks to adopt more sophisti-cated methods for calculating capital adequacy. The Bank has employed the standardized approach for the calculation of the credit risk amount and the basic indication approach for the calculation of the operational risk amount.
* Risk-weighted assets are calculated by multiplying assets and the credit equiv-alents of off-balance-sheet transactions by a risk factor that varies depending on the credit quality of each asset.
* Tier I capital is a core item within owned capital and is composed of capital stock, additional paid-in capital and retained earnings.
Capital Ratio(Unit: %)
0
2
4
6
8
10
14
12
Fiscal 2010
DomesticStandards4%
Fiscal 2008
13.39%12.84%12.20%
Fiscal 2009
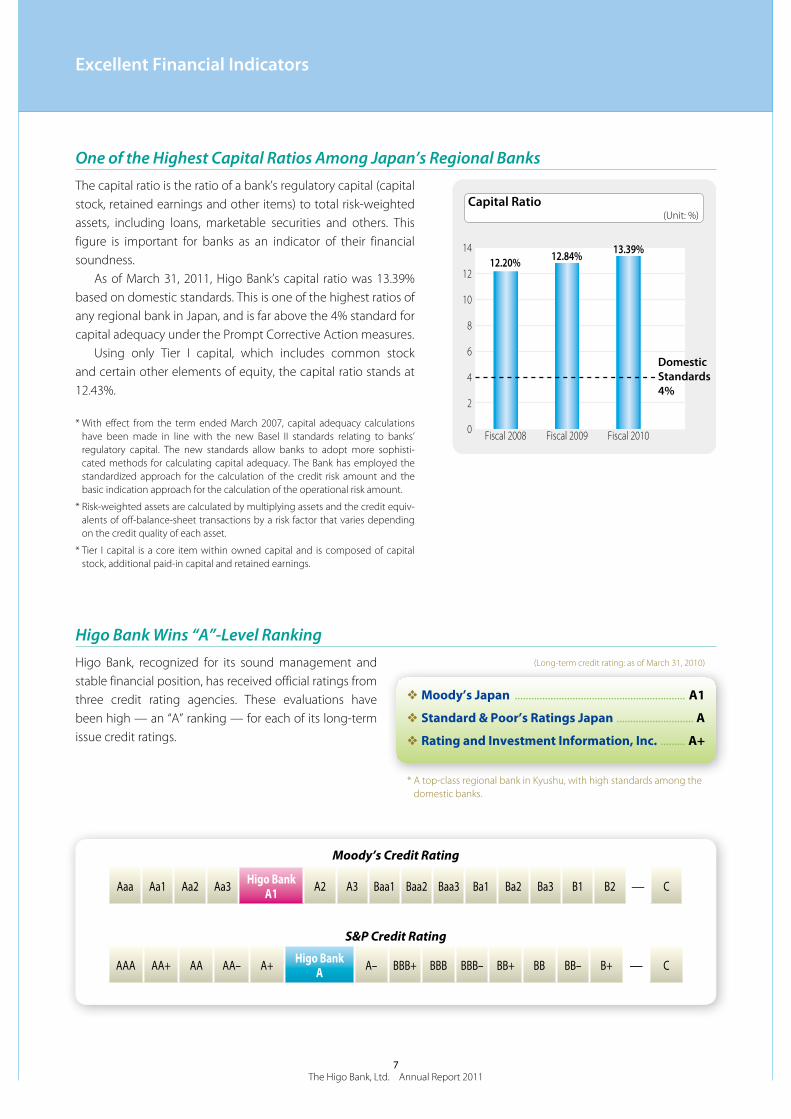
Higo Bank Wins “A”-Level RankingHigo Bank, recognized for its sound management and stable financial position, has received official ratings from three credit rating agencies. These evaluations have been high — an “A” ranking — for each of its long-term issue credit ratings.
Aaa Aa1 Aa2 Aa3 Higo Bank A1 A2 A3 Baa1 Baa2 Baa3 Ba1 Ba2 Ba3 B1 B2 — C
AAA AA+ AA AA– A+ Higo Bank A A– BBB+ BBB BBB– BB+ BB BB– B+ — C
Moody’s Credit Rating
S&P Credit Rating
❖ Moody’s Japan .............................................................. A1
❖ Standard & Poor’s Ratings Japan ............................ A
❖ Rating and Investment Information, Inc. ......... A+
(Long-term credit rating: as of March 31, 2010)
* A top-class regional bank in Kyushu, with high standards among the domestic banks.
Excellent Financial Indicators
8The Higo Bank, Ltd. Annual Report 2011
Environmental Initiative
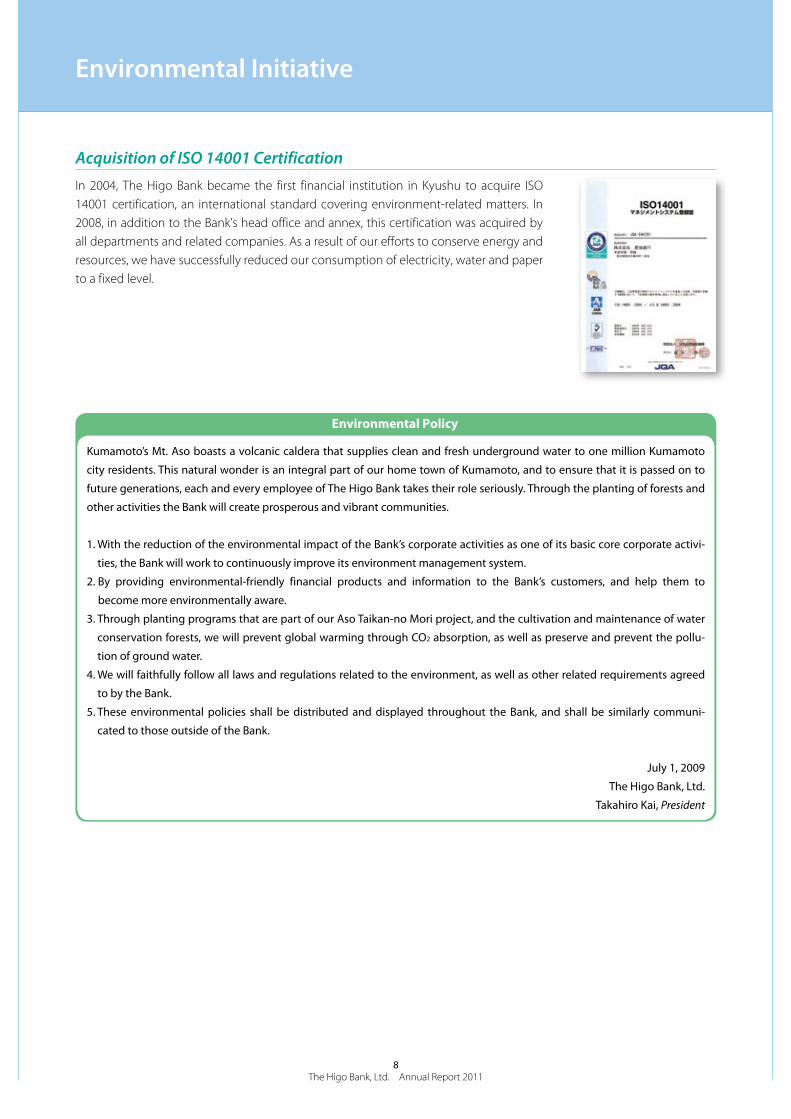
Acquisition of ISO 14001 CertificationIn 2004, The Higo Bank became the first financial institution in Kyushu to acquire ISO 14001 certification, an international standard covering environment-related matters. In 2008, in addition to the Bank’s head office and annex, this certification was acquired by all departments and related companies. As a result of our efforts to conserve energy and resources, we have successfully reduced our consumption of electricity, water and paper to a fixed level.
Environmental Policy
Kumamoto’s Mt. Aso boasts a volcanic caldera that supplies clean and fresh underground water to one million Kumamoto
city residents. This natural wonder is an integral part of our home town of Kumamoto, and to ensure that it is passed on to
future generations, each and every employee of The Higo Bank takes their role seriously. Through the planting of forests and
other activities the Bank will create prosperous and vibrant communities.
1. With the reduction of the environmental impact of the Bank’s corporate activities as one of its basic core corporate activi-
ties, the Bank will work to continuously improve its environment management system.
2. By providing environmental-friendly financial products and information to the Bank’s customers, and help them to
become more environmentally aware.
3. Through planting programs that are part of our Aso Taikan-no Mori project, and the cultivation and maintenance of water
conservation forests, we will prevent global warming through CO2 absorption, as well as preserve and prevent the pollu-
tion of ground water.
4. We will faithfully follow all laws and regulations related to the environment, as well as other related requirements agreed
to by the Bank.
5. These environmental policies shall be distributed and displayed throughout the Bank, and shall be similarly communi-
cated to those outside of the Bank.
July 1, 2009
The Higo Bank, Ltd.
Takahiro Kai, President

9The Higo Bank, Ltd. Annual Report 2011
Corporate Data
Established: July 25, 1925Total Assets: ¥3,929.5 billionDeposits: ¥3,507.6 billionLoans and Bills Discounted: ¥2,326.5 billionCapital Stock: ¥18.1 billion
Capital Ratio: 13.39% (domestic standards)Number of Employees: 2,277Number of Offices: 123(Head Office and 116 domestic branches, 6 sub-branches and 1 overseas representative office)
(As of March 31, 2011)
Board of Directors and Corporate Auditors (As of June 25, 2011)
Chairman Hiroo OguriPresident and Representative Director Takahiro KaiExecutive Vice President and Representative Director Hiroo NagataSenior Executive Managing Officer and Director Masaaki EguchiExecutive Managing Officer and Directors Katsuhiko Oda Shiichiro Shimoyama Toyonori UenoExecutive Officer and Directors Yusuke Okazaki Shoji Kojima Yoshihiro Iwamoto Tsuyoshi MogamiStanding Corporate Auditors Katsutoshi Yoshizu Junichi NishimotoOutside Corporate Auditors Akira Kawakami Toshitaka Manabe Yoshihiro KataokaExecutive Managing Officer Hiroshi SakaiExecutive Officers Yasuaki Yamamoto Yoshikazu Miyata Toshiro Kunitake Hiroshi Takii Yasuo Kobayashi Kazunori Tomita
Principal Shareholders (As of March 31, 2011)
NameNumber of shares
(thousand)Equity stake
(%)Meiji Yasuda Life Insurance Co. 11,621 4.88Mizuho Corporate Bank, Ltd. 10,053 4.22Higo Bank Employees’ Shareholding Association 8,221 3.45Takara Kogyo Co., Ltd. 7,683 3.23Japan Trustee & Services Bank, Ltd. (trust account) 6,171 2.59The Bank of Fukuoka, Ltd. 5,864 2.46The Dai-ichi Mutual Life Insurance Company 5,371 2.25The Master Trust Bank of Japan, Ltd. (Trust account) 4,654 1.95Sompo Japan Insurance Inc. 3,854 1.62The Eighteenth Bank, Limited 3,433 1.44Total 66,927 28.14
Organization
BOARD OF DIRECTORS
GENERAL MEETING OF SHAREHOLDERS
BOARD OF CORPORATE AUDITORS
MANAGEMENT COMMITTEE
BRANCH SUPPORT CENTER
SECRETARIATGENERAL PLANNING DIVISION
BUSINESS PROMOTION DIVISIONBUSINESS INTELLIGENCE DIVISIONPUBLIC INSTITUTIONS DIVISION
FINANCIAL MARKETS DIVISION
LOAN ADMINISTRATION DIVISIONLOAN DIVISIONBRANCHESOPERATIONS ADMINISTRATION DIVISIONCENTRALIZED AFFAIRS OFFICE
INTERNAL AUDIT DIVISIONAUDITORS’ OFFICE
PERSONNEL DIVISIONCOMPUTER SYSTEMS DIVISION
GENERAL ADMINISTRATION DIVISIONBUSINESS ADMINISTRATION DIVISIONCUSTOMERS’ OFFICE

10The Higo Bank, Ltd. Annual Report 2011
Service Network
Head Office1, Renpeicho, Kumamoto 860-8615Phone: (096) 325-2111
Operations Administration Division1, Renpeicho, Kumamoto 860-8615Phone: (096) 326-8646Facsimile: (096) 326-8027
Foreign Exchange Offices Head Office1, Renpeicho, Kumamoto 860-8615Phone: (096) 326-8642
Tokyo BranchMuromachi Higashi Mitsui Bldg 17F, 2-1, Nihombashi Muromachi 2-chome Chuo-ku, Tokyo 103-0022Phone: (03) 3277-1589
Osaka BranchNM Plaza Midosuji 6F,6-3, Awaji-cho 3-chome, Chuo-ku, Osaka 541-0047Phone: (06) 6208-6551
Fukuoka Branch8-1, Daimyo 2-chome,Chuo-ku, Fukuoka 810-0041Phone: (092) 741-7935
Kagoshima Branch1-3, Yamanokuchicho,Kagoshima 892-0844Phone: (099) 223-7221
Suidocho Branch3-31, Kamitoricho,Kumamoto 860-0845Phone: (096) 352-3111
Tamana Branch548, Takase, Tamana 865-0025Phone: (0968) 73-2151
Ozu Branch213-1, Muro, Ozumachi 869-1235Phone: (096) 293-3131
Matsubase Branch920-1, Matsubase Matsubasemachi, Uki, 869-0502Phone: (0964) 32-1121
Yatsushiro Branch3-25, Honmachi 2-chome,Yatsushiro 866-0861Phone: (0965) 32-3171
Amakusa Branch6-1, Minamishinmachi, Amakusa 863-0031Phone: (0969) 22-2151

11The Higo Bank, Ltd. Annual Report 2011
Consolidated Balance Sheets
Millions of yenThousands of
U.S. dollars (Note 1)2011 2010 2011
ASSETS:Cash and due from banks (Notes 4 and 16) ............................................................. ¥ 236,120 ¥ 204,008 $ 2,839,688Call loans and bills bought (Note 16) ........................................................................... 28,866 57,216 347,157Monetary claims purchased ............................................................................................... 1,076 1,337 12,951Trading assets (Note 17) ....................................................................................................... 1,304 1,190 15,684Money held in trust (Note 6) .............................................................................................. 4,292 4,343 51,622Securities (Notes 5, 9 and 16) ............................................................................................. 1,272,250 1,194,692 15,300,667Loans and bills discounted (Notes 7, 10 and 16) ................................................... 2,325,979 2,260,131 27,973,300Foreign exchange assets ...................................................................................................... 5,668 2,939 68,177Other assets .................................................................................................................................. 16,553 17,632 199,083Fixed assets (Notes 8 and 15) ............................................................................................ 42,353 42,671 509,366Intangible assets (Notes 8 and 15) ................................................................................. 6,171 5,819 74,216Deferred tax assets (Note 14) ............................................................................................. 2,442 4,824 29,370Customers’ liabilities for acceptances and guarantees ..................................... 12,135 14,744 145,950Reserve for possible loan losses (Note 16)................................................................. (23,326) (25,388) (280,530)
Total assets ............................................................................................................................. ¥3,931,889 ¥3,786,162 $47,286,707
LIABILITIES AND EQUITY:Liabilities:
Deposits (Notes 9 and 16) .................................................................................................... ¥3,641,753 ¥3,490,313 $43,797,401Call money and bills sold ..................................................................................................... 10,234Borrowing under securities lending transactions (Note 9) ............................. 5,814 8,761 69,927Trading liabilities (Note 17) ................................................................................................. 231 91 2,782Borrowed money (Note 9) ................................................................................................... 5,000 60,132Other liabilities ............................................................................................................................ 19,486 22,772 234,349Reserve for employees’ retirement benefits (Note 11) ...................................... 8,141 8,204 97,918Reserve for directors’ and corporate auditors’ retirement benefits ........... 610 525 7,345Reserve for contingent losses ............................................................................................ 369 495 4,449Reserve for repayments for dormant deposits ....................................................... 528 567 6,359Deferred tax liabilities related to land revaluation................................................ 7,125 7,231 85,699Acceptances and guarantees ............................................................................................ 12,135 14,744 145,950
Total liabilities ....................................................................................................................... 3,701,199 3,563,943 44,512,317
Equity (Note 12):Common stock
authorized, 482,858,000 shares; issued, 237,785,291 shares in 2011 and 2010 ................................................... 18,128 18,128 218,026
Capital surplus ............................................................................................................................. 8,133 8,133 97,817Retained earnings (Note 19) ............................................................................................... 181,918 173,172 2,187,830Treasury stock at cost, 3,156,533 shares in 2011 and 1,460,842 shares in 2010 .................................................................................................... (1,552) (907) (18,675)Accumulated other comprehensive income:
Unrealized gains (losses) on available-for-sale securities (Note 5) ...... 17,243 16,315 207,372Deferred gains (losses) on derivatives under hedge accounting ........ (539) (36) (6,489)Excess of land revaluation ............................................................................................ 5,460 5,599 65,665
Total accumulated other comprehensive income ................................ 22,163 21,878 266,548Minority interests in consolidated subsidiaries ...................................................... 1,899 1,814 22,843
Total equity ............................................................................................................................ 230,690 222,219 2,774,390Total liabilities and equity ............................................................................................. ¥3,931,889 ¥3,786,162 $47,286,707
See notes to consolidated financial statements.
March 31, 2011 and 2010
The Higo Bank, Ltd. and Consolidated Subsidiaries

12The Higo Bank, Ltd. Annual Report 2011
Consolidated Statements of IncomeYears ended March 31, 2011 and 2010
Millions of yenThousands of
U.S. dollars (Note 1)2011 2010 2011
Income:Interest on loans and discounts ....................................................................................... ¥40,952 ¥42,875 $492,509Interest and dividends on securities ............................................................................. 16,724 15,177 201,135Other interest income ............................................................................................................ 487 1,103 5,865Fees and commissions income ........................................................................................ 10,647 10,745 128,057Trading income .......................................................................................................................... 74 110 896Other operating income ....................................................................................................... 3,956 3,284 47,588Other income .............................................................................................................................. 2,712 2,989 32,625
Total income ......................................................................................................................... 75,556 76,286 908,679
Expenses:Interest on deposits ................................................................................................................. 3,113 5,923 37,450Interest expenses ...................................................................................................................... 2,021 1,908 24,314Fees and commissions expenses .................................................................................... 3,477 3,470 41,826Other operating expenses ................................................................................................... 3,795 1,003 45,642General and administrative expenses .......................................................................... 40,038 40,364 481,517Provision of reserve for possible loan losses ............................................................ 3,061Losses on impairment of long-lived assets ............................................................... 232 38 2,797Other expenses (Note 13) .................................................................................................... 6,275 9,685 75,468
Total expenses ..................................................................................................................... 58,954 65,457 709,016
Income before income taxes and minority interests ........................................ 16,601 10,828 199,662
Income taxes (Note 14):Current ............................................................................................................................................. 3,909 4,275 47,020Deferred .......................................................................................................................................... 1,709 (297) 20,554
Net income before minority interests .......................................................................... 10,982 132,086Minority interests in net income ....................................................................................... 87 133 1,049Net income ......................................................................................................................................... ¥10,895 ¥ 6,716 $131,036
Yen U.S. dollars
Per share of common stock (Note 2 (o)):Basic net income ....................................................................................................................... ¥46.01 ¥28.41 $0.55Cash dividends applicable to the year ......................................................................... 8.00 7.50 0.09
See notes to consolidated financial statements.
The Higo Bank, Ltd. and Consolidated Subsidiaries
13The Higo Bank, Ltd. Annual Report 2011
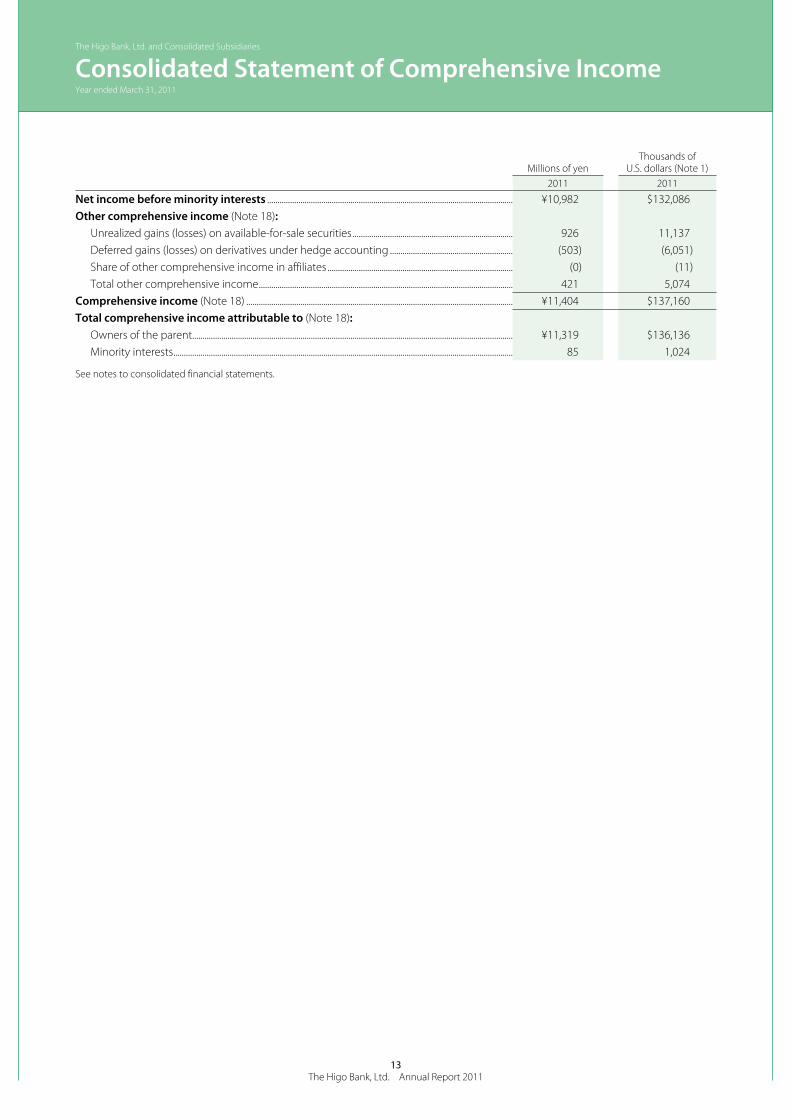
Consolidated Statement of Comprehensive IncomeYear ended March 31, 2011
The Higo Bank, Ltd. and Consolidated Subsidiaries
Millions of yenThousands of
U.S. dollars (Note 1)2011 2011
Net income before minority interests ...................................................................................................................... ¥10,982 $132,086 Other comprehensive income (Note 18):
Unrealized gains (losses) on available-for-sale securities ............................................................................. 926 11,137 Deferred gains (losses) on derivatives under hedge accounting ........................................................... (503) (6,051)Share of other comprehensive income in affiliates ......................................................................................... (0) (11)Total other comprehensive income .......................................................................................................................... 421 5,074
Comprehensive income (Note 18) ................................................................................................................................ ¥11,404 $137,160 Total comprehensive income attributable to (Note 18):
Owners of the parent.......................................................................................................................................................... ¥11,319 $136,136 Minority interests ................................................................................................................................................................... 85 1,024
See notes to consolidated financial statements.
14The Higo Bank, Ltd. Annual Report 2011
Thousands Millions of yen
Outstanding number of shares of
common stockCommon
stockCapital surplus
Retained earnings
Treasury stock
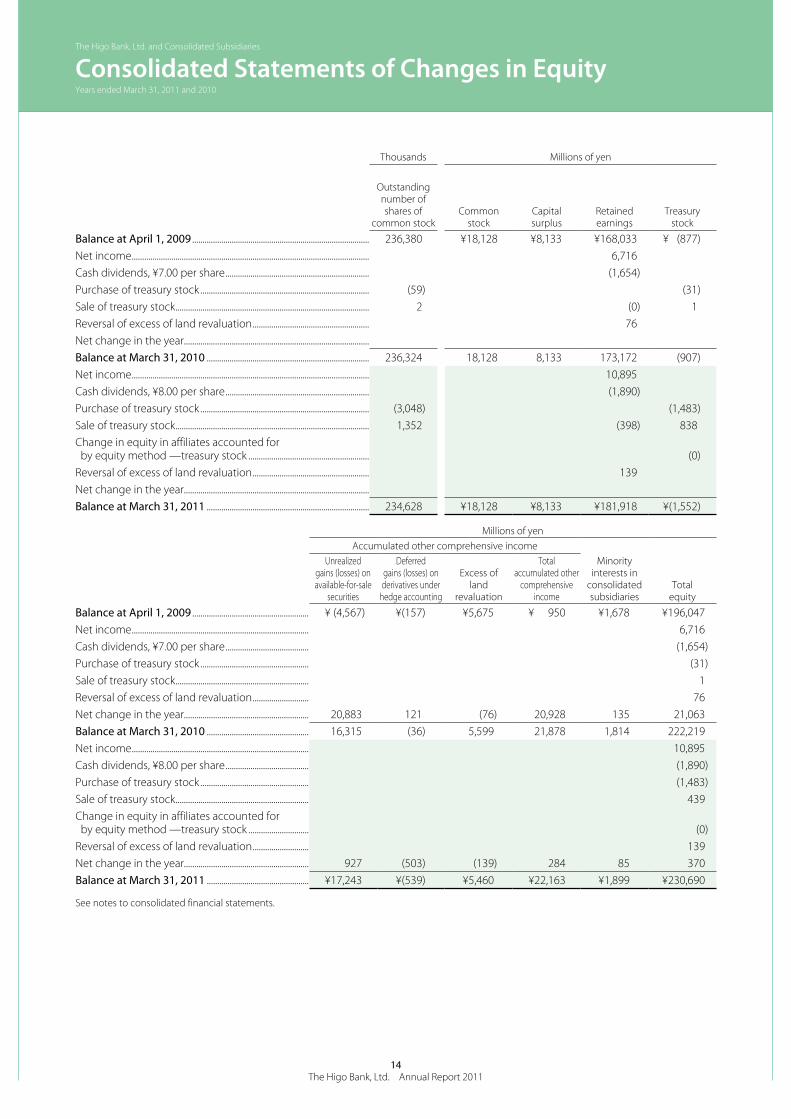
Balance at April 1, 2009 ..................................................................................... 236,380 ¥18,128 ¥8,133 ¥168,033 ¥ (877)Net income .................................................................................................................. 6,716Cash dividends, ¥7.00 per share ..................................................................... (1,654)Purchase of treasury stock ................................................................................. (59) (31)Sale of treasury stock ............................................................................................. 2 (0) 1Reversal of excess of land revaluation ........................................................ 76Net change in the year.........................................................................................Balance at March 31, 2010 .............................................................................. 236,324 18,128 8,133 173,172 (907)Net income .................................................................................................................. 10,895Cash dividends, ¥8.00 per share ..................................................................... (1,890)Purchase of treasury stock ................................................................................. (3,048) (1,483)Sale of treasury stock ............................................................................................. 1,352 (398) 838Change in equity in affiliates accounted for by equity method —treasury stock .......................................................... (0)Reversal of excess of land revaluation ........................................................ 139Net change in the year.........................................................................................Balance at March 31, 2011 .............................................................................. 234,628 ¥18,128 ¥8,133 ¥181,918 ¥(1,552)
Millions of yenAccumulated other comprehensive income
Unrealized gains (losses) on available-for-sale
securities
Deferred gains (losses) on derivatives under
hedge accounting
Excess of land
revaluation
Total accumulated other
comprehensive income
Minority interests in
consolidated subsidiaries
Total equity
Balance at April 1, 2009 ........................................................ ¥ (4,567) ¥(157) ¥5,675 ¥ 950 ¥1,678 ¥196,047Net income ..................................................................................... 6,716Cash dividends, ¥7.00 per share ........................................ (1,654)Purchase of treasury stock .................................................... (31)Sale of treasury stock ................................................................ 1Reversal of excess of land revaluation ........................... 76Net change in the year............................................................ 20,883 121 (76) 20,928 135 21,063Balance at March 31, 2010 ................................................. 16,315 (36) 5,599 21,878 1,814 222,219Net income ..................................................................................... 10,895Cash dividends, ¥8.00 per share ........................................ (1,890)Purchase of treasury stock .................................................... (1,483)Sale of treasury stock ................................................................ 439Change in equity in affiliates accounted for by equity method —treasury stock ............................. (0)Reversal of excess of land revaluation ........................... 139Net change in the year............................................................ 927 (503) (139) 284 85 370Balance at March 31, 2011 ................................................. ¥17,243 ¥(539) ¥5,460 ¥22,163 ¥1,899 ¥230,690
See notes to consolidated financial statements.
Consolidated Statements of Changes in EquityYears ended March 31, 2011 and 2010
The Higo Bank, Ltd. and Consolidated Subsidiaries

15The Higo Bank, Ltd. Annual Report 2011
Thousands of U.S. dollars (Note 1)
Common stock
Capital surplus
Retained earnings
Treasury stock
Balance at March 31, 2010 ................................................................................................................ $218,026 $97,817 $2,082,645 $(10,918)Net income .................................................................................................................................................... 131,036Cash dividends, $0.09 per share ....................................................................................................... (22,736)Purchase of treasury stock ................................................................................................................... (17,836)Sale of treasury stock ............................................................................................................................... (4,788) 10,079Change in equity in affiliates accounted for by equity method —treasury stock ............................................................................................ (0)Reversal of excess of land revaluation .......................................................................................... 1,672Net change in the year...........................................................................................................................Balance at March 31, 2011 ................................................................................................................ $218,026 $97,817 $2,187,830 $(18,675)
Thousands of U.S. dollars (Note 1)Accumulated other comprehensive income
Unrealized gains (losses) on available-for-sale
securities
Deferred gains (losses) on derivatives under
hedge accounting
Excess of land
revaluation
Total accumulated other
comprehensive income
Minority interests in
consolidated subsidiaries
Total equity
Balance at March 31, 2010 ................................................. $196,222 $ (437) $67,338 $263,122 $21,819 $2,672,513Net income ..................................................................................... 131,036Cash dividends, $0.09 per share ........................................ (22,736)Purchase of treasury stock .................................................... (17,836)Sale of treasury stock ................................................................ 5,290Change in equity in affiliates accounted for by equity method —treasury stock ............................. (0)Reversal of excess of land revaluation ........................... 1,672Net change in the year............................................................ 11,150 (6,051) (1,672) 3,425 1,024 4,450Balance at March 31, 2011 ................................................. $207,372 $(6,489) $65,665 $266,548 $22,843 $2,774,390
See notes to consolidated financial statements.
Consolidated Statements of Changes in EquityYears ended March 31, 2011 and 2010
The Higo Bank, Ltd. and Consolidated Subsidiaries

16The Higo Bank, Ltd. Annual Report 2011
Consolidated Statements of Cash FlowsYears ended March 31, 2011 and 2010
Millions of yenThousands of
U.S. dollars (Note 1)
2011 2010 2011Operating activities:
Income before income taxes and minority interests ............................................. ¥ 16,601 ¥ 10,828 $ 199,662Adjustments for:
Income taxes paid..................................................................................................................... (4,399) (3,549) (52,914)Depreciation and amortization ........................................................................................ 2,982 2,740 35,865Losses on impairment of long-lived assets ............................................................... 232 38 2,797(Decrease) increase in reserve for possible loan losses ..................................... (2,062) 79 (24,804)Decrease in reserve for employees’ retirement benefits .................................. (62) (167) (753)Increase in reserve for directors’ and corporate auditors’ retirement benefits ......................................................... 84 36 1,021Decrease in reserve for contingent losses ................................................................. (125) (194) (1,507)(Decrease) increase in reserve for repayments for dormant deposits ..... (38) 130 (466)Interest and dividend income ........................................................................................... (58,164) (59,156) (699,511)Interest expenses ...................................................................................................................... 5,135 7,832 61,764Losses on securities ................................................................................................................. 5,147 3,839 61,907Losses on money held in trust .......................................................................................... 42 19 511Net decrease (increase) in trading assets ................................................................... 44 (165) 537Net (increase) decrease in loans and bills discounted ....................................... (66,259) 4,838 (796,866)Net increase in deposits ........................................................................................................ 151,440 125,611 1,821,288Net increase in borrowed money (excluding subordinated borrowings) ...................................................................... 5,000 60,132Net decrease (increase) in due from banks (excluding deposits paid to the Bank of Japan) .................................................. 88,156 (50,943) 1,060,204Net decrease in call loans and others ........................................................................... 28,611 29,577 344,099Net decrease in call money and others ....................................................................... (10,234) (21,730) (123,083)Net (decrease) increase in borrowing under securities lending transactions ............................................................................................................. (2,947) 8,761 (35,447)Interest income (cash basis) ............................................................................................... 58,463 59,479 703,103Interest expense (cash basis) ............................................................................................. (6,292) (8,223) (75,673)Other ................................................................................................................................................. (394) 4,742 (4,738)
Total adjustments .............................................................................................................. 194,360 103,597 2,337,466Net cash provided by operating activities ......................................................... 210,962 114,426 2,537,128
Investing activities:Payments for purchases of securities ........................................................................... (552,363) (428,105) (6,642,981)Proceeds from sales of securities .................................................................................... 368,242 135,345 4,428,656Proceeds from redemption of securities .................................................................... 99,470 186,333 1,196,275Proceeds from decrease in money held in trust .................................................... 3 4 36Payments for purchases of fixed assets ....................................................................... (1,104) (1,145) (13,285)Proceeds from sales of fixed assets ................................................................................ 222 129 2,676Payments for purchases of intangible assets ........................................................... (2,227) (2,670) (26,783)Proceeds from sales of intangible assets .................................................................... 0
Net cash used in investing activities ...................................................................... (87,756) (110,108) (1,055,405)
Financing activities:Cash dividends paid ................................................................................................................ (1,885) (1,650) (22,679)Payment for purchase of treasury stock ..................................................................... (1,483) (31) (17,836)Proceeds from sales of treasury stock .......................................................................... 439 1 5,290
Net cash used in financing activities ..................................................................... (2,929) (1,680) (35,225)
Foreign currency translation adjustments on cash and cash equivalents ... (8) (3) (100)Net increase in cash and cash equivalents ....................................................................... 120,267 2,634 1,446,396Cash and cash equivalents at beginning of year .......................................................... 67,671 65,036 813,846Cash and cash equivalents at end of year (Note 4) ..................................................... ¥187,939 ¥ 67,671 $2,260,243
See notes to consolidated financial statements.
The Higo Bank, Ltd. and Consolidated Subsidiaries
17The Higo Bank, Ltd. Annual Report 2011
1. Basis of Presenting Consolidated Financial Statements
The accompanying consolidated financial statements of The Higo Bank, Ltd. (the “Bank”) and consolidated subsidiaries
(together, the “Group”) have been prepared in accordance with the provisions set forth in the Japanese Financial Instruments
and Exchange Act, its related accounting regulations and the Enforcement Regulation for the Banking Law of Japan (the
“Banking Law”), and in conformity with accounting principles generally accepted in Japan, which are different in certain
respects as to application and disclosure requirements of International Financial Reporting Standards.
Under Japanese GAAP, a consolidated statement of comprehensive income is required from the fiscal year ended March 31,
2011 and has been presented herein. Accordingly, accumulated other comprehensive income is presented in the consoli-
dated balance sheet and the consolidated statement of changes in equity. Information with respect to other comprehensive
income for the year ended March 31, 2010 is disclosed in Note 18. In addition, “net income before minority interests” is
disclosed in the consolidated statement of income from the year ended March 31, 2011.
In preparing these consolidated financial statements, certain reclassifications and rearrangements have been made to the
consolidated financial statements issued domestically in order to present them in a form which is more familiar to readers
outside Japan. In addition, certain reclassifications have been made in the 2010 financial statements to conform to the clas-
sifications used in 2011.
Amounts of less than ¥1 million and $1 thousand have been omitted. As a result, the totals shown in the financial statements
and notes thereto do not necessarily agree with the sum of the individual account balances.
The consolidated financial statements are stated in Japanese yen, the currency of the country in which the Bank is
incorporated and operates. The translations of Japanese yen amounts into U.S. dollar amounts are included solely for the
convenience of readers outside Japan and have been made at the rate of ¥83.15 to $1, the approximate rate of exchange
at March 31, 2011. Such translations should not be construed as representations that the Japanese yen amounts could be
converted into U.S. dollars at that or any other rate.
2. Summary of Significant Accounting Policies
a. Consolidation
The consolidated financial statements include the accounts of the Bank and its six and seven significant subsidiaries as of
March 31, 2011 and 2010, respectively. The fiscal periods of all consolidated subsidiaries end on March 31.
HIGIN JCB Card Ltd., a former consolidated subsidiary, merged with Higin World Card CO., Ltd., another consolidated subsid-
iary, to form THE HIGIN CARD.CO., LTD. on October 1, 2010.
Under the control or influence concept, those companies in which the Bank, directly or indirectly, is able to exercise control
over operations are fully consolidated, and those companies over which the Group has the ability to exercise significant
influence are accounted for by the equity method.
Investment in an affiliated company is accounted for by the equity method. Investment in a remaining unconsolidated sub-
sidiary is stated at cost. If the equity method of accounting had been applied to the investment in this company, the effect on
the accompanying consolidated financial statements would not be material.
All significant intercompany balances and transactions have been eliminated in consolidation. All material unrealized profit
included in assets resulting from transactions within the Group is eliminated.
b. Cash and cash equivalentsCash and cash equivalents in the consolidated statements of cash flows are composed of cash on hand and due from the
Bank of Japan.
Notes to Consolidated Financial StatementsYears ended March 31, 2011 and 2010
The Higo Bank, Ltd. and Consolidated Subsidiaries

18The Higo Bank, Ltd. Annual Report 2011
c. Foreign currency translationThe Bank maintains its accounting records in Japanese yen. Foreign currency assets and liabilities are translated into
Japanese yen at the exchange rates prevailing on the balance sheet date.
d. Trading assets/liabilities and Trading income/expensesTrading transactions intended to take advantage of short-term fluctuations and arbitrage opportunities in interest rates,
currency exchange rates, market prices of securities and related indices are recognized on a trade date basis and recorded
in Trading assets or Trading liabilities on the consolidated balance sheets. Income or expenses generated on the relevant
trading transactions are recorded in Trading income or Trading expenses on the consolidated statements of income.
Securities and other monetary claims held for trading purposes are stated at fair value at the consolidated balance sheet
date. Derivative financial products, such as swaps, forward contracts and option transactions, are stated at their fair values,
assuming that such transactions were terminated and settled at the consolidated balance sheet date.
Trading income and Trading expenses include the interest received and interest paid during the fiscal year, the gains or
losses resulting from any change in the value of securities and other monetary claims between the beginning and the end of
the fiscal year and the gains or losses resulting from any change in the value of financial derivatives between the beginning
and the end of the fiscal year, assuming they were settled at the end of the fiscal year.
e. Financial instrumentsi ) Securities
Held-to-maturity debt securities are stated at amortized cost as determined by the moving average method. Available-for-
sale securities with market quotations are stated at the market prices prevailing on the balance sheet date. Cost of sales of
such securities is determined by the moving average method. Net unrealized gains or losses on these securities, net of taxes,
are reported in a separate component of equity. Available-for-sale securities, the market quotations of which are extremely
difficult to obtain are stated at cost or amortized cost as determined by the moving average method. For other than tempo-
rary declines in fair value, securities are reduced to net realizable value by a charge to income. Securities included in money
held in trusts managed separately, the primary objective of which is to invest, are stated at market prices.
ii) Derivatives
Derivatives other than those designated as “Trading assets and Trading liabilities” (see (d) Trading assets/liabilities and
Trading income/expenses) are stated at fair value, with changes in fair value included in net profit or loss for the period in
which they arise, except for derivatives that are designated as “hedging instruments” (see iii) Hedge accounting below).
iii) Hedge accounting
a) Hedge of interest rate risks
The Bank applies deferral hedge accounting to hedges of interest rate risk associated with financial assets and liabilities in
accordance with the Industry Audit Committee Report No. 24, “Accounting and Auditing Treatments on the Application
of Accounting Standards for Financial Instruments in the Banking Industry,” issued by the Japanese Institute of Certified
Public Accountants (the “JICPA”). Specific matching criteria are not measured at fair value, but the net payments or
receipts under the swap agreements are recognized and included in interest expenses or income.
b) Hedge of foreign currency exchange risks
The Bank applies the deferral method of hedge accounting for hedges of the risks arising from financial assets and
liabilities due to the fluctuation of foreign exchange rates which is described in “Treatment for Accounting and Auditing
of Application of Accounting Standard for Foreign Currency Transactions in Banking Industry” (the JICPA Industry Audit
Committee Report No. 25). The Bank assesses the effectiveness of hedging instruments executed for reducing the risk of
changes in currency exchange rates with currency swaps or foreign exchange swaps, by verifying that there exist foreign
currency positions of the hedging instruments corresponding to the foreign currency monetary assets and liabilities to be
hedged.
Notes to Consolidated Financial StatementsYears ended March 31, 2011 and 2010
The Higo Bank, Ltd. and Consolidated Subsidiaries
19The Higo Bank, Ltd. Annual Report 2011
f. Fixed assets and intangible assetsi) Fixed assets and intangible assets are stated at cost less accumulated depreciation
Depreciation of fixed assets owned by the Group is computed by the declining-balance method while the straight-line
method is applied to buildings acquired after April 1, 1998. The range of useful lives is principally from 20 to 50 years for
buildings and from 5 to 20 years for other fixed assets.
Amortization of intangible assets owned by the Group is computed by the straight-line method over the estimated useful lives
of the assets. Cost of computer software obtained for internal use is amortized over the estimated useful lives of five years.
Leased assets under finance lease transactions, in which substantial ownership is not deemed to be transferred, are depreci-
ated by the straight-line method over the lease term. The salvage value is either zero or guaranteed amounts if it is specified
in the lease contracts.
ii) Land revaluation
Under the “Law of Land Revaluation,” the Bank elected a one-time revaluation of its own-use land to a value based on real
estate appraisal information as of March 31, 1999.
The resulting excess of land revaluation represents unrealized appreciation of land and is stated, net of income taxes, as a
component of equity. There was no effect on the statement of income. Continuous readjustment is not permitted unless
the land value subsequently declines significantly such that the amount of the decline in value should be removed from the
excess of land revaluation account and related deferred tax liabilities.
The carrying amount of the land after the above one-time revaluation exceeded the fair value by ¥11,209 million ($134,804
thousand) and ¥9,908 million as of March 31, 2011 and 2010, respectively.
g. Long-lived assetsThe Group reviews its long-lived assets for impairment whenever events or changes in circumstance indicate the carrying
amount of an asset or asset group may not be recoverable. An impairment loss would be recognized if the carrying amount
of an asset or asset group exceeds the sum of the undiscounted future cash flows expected to result from the continued
use and eventual disposition of the asset or asset group. The impairment loss would be measured as the amount by which
the carrying amount of the asset exceeds its recoverable amount, which is the higher of the discounted cash flows from the
continued use and eventual disposition of the asset or the net selling price at disposition.
h. Reserve for possible loan lossesReserve for possible loan losses is provided as follows:
i ) The reserve for claims on debtors who are legally or substantially bankrupt is provided based on the amount remaining
after deducting the amount expected to be collected through the disposal of collateral or through the execution of
guarantees.
ii) The reserve for claims on debtors who are not currently legally bankrupt but are likely to become bankrupt is provided at
the amount considered necessary after due consideration of the results of a solvency assessment. The solvency assessment
identifies the amounts expected to remain after deducting the amounts expected to be collected through the disposal of
collateral or through the execution of guarantees.
iii) The reserve for claims on debtors other than the above is provided based on the loan-loss rates calculated using the
actual historical loss experience during a certain period in the past.
All claims are assessed by the branches and credit supervision divisions based on the internal rules for the self-assessment
of assets. The asset examination division, which is independent from the branches and credit supervision divisions,
examines these self-assessments, and the reserve is provided based on the examination results.
With respect to the claims with collateral or guarantees on debtors who are legally or substantially bankrupt, estimated
uncollectible amounts have been directly charged off against claims. The charge off amounted to ¥3,365 million ($40,473
thousand) and ¥5,054 million for the years ended March 31, 2011 and 2010, respectively.
Notes to Consolidated Financial StatementsYears ended March 31, 2011 and 2010
The Higo Bank, Ltd. and Consolidated Subsidiaries

20The Higo Bank, Ltd. Annual Report 2011
i. Bonuses to directors and corporate auditorsBonuses to directors and corporate auditors are accrued at the year end to which such bonuses are attributable.
j. Reserve for employees’ retirement benefitsReserve for retirement benefits, which is provided for the payment of employees’ retirement benefits, represents the
estimated present value of projected benefit obligations in excess of the fair value of the plan assets, taking into account
adjustments for unrecognized prior year service costs and unrecognized actuarial differences. Unrecognized prior service
costs and unrecognized actuarial differences are amortized on a straight-line basis over a period of ten years from the year
following the year in which they arise.
k. Reserve for directors’ and corporate auditors’ retirement benefitsReserve for directors’, corporate auditors’ and executive officers’ retirement benefits are provided at the amount that would
be required if all such persons retired at the balanced sheet date.
l. Reserve for contingent lossesUnder the joint responsibility system with governmental credit guarantee organizations, reserve for contingent losses is
provided for possible future payments to the organizations in an amount deemed necessary based on estimated losses in
the future.
m. Reserve for repayments for dormant depositsReserve for repayments for dormant deposits is provided for possible losses on future withdrawal of inactive deposits which
had been recognized as income.
n. LeasesIn March 2007, the Accounting Standards Board of Japan (the “ASBJ”) issued ASBJ Statement No. 13, “Accounting Standard
for Lease Transactions,” which revised the previous accounting standard for lease transactions issued in June 1993. The
revised accounting standard for lease transactions was effective for fiscal years beginning on or after April 1, 2008 with early
adoption permitted for fiscal years beginning on or after April 1, 2007.
The Group applied the revised accounting standard effective April 1, 2008. In addition, the Group accounted for leases
which existed at the transition date and do not transfer ownership of the leased property to the lessee as operating lease
transactions.
All other leases are accounted for as operating leases.
o. Per share informationThe computation of basic net income per share is based on the weighted average number of shares of common stock
outstanding during the year. The average number of common shares used in the computation was 236,806 thousand shares
and 236,360 thousand shares for the years ended March 31, 2011 and 2010, respectively.
Diluted net income per share is not disclosed for the years ended March 31, 2011 and 2010 because there are no potential
common shares.
Cash dividends per share presented in the accompanying consolidated statements of income are dividends applicable to
the respective years including dividends to be paid after the end of the year.
p. Income taxesThe provision for income taxes is computed based on the pretax income included in the consolidated statements of income.
The asset and liability approach is used to recognize deferred tax assets and liabilities for the expected future tax conse-
quences of temporary differences between the carrying amounts and the tax bases of assets and liabilities. Deferred taxes are
measured by applying currently enacted tax laws to the temporary differences.
Notes to Consolidated Financial StatementsYears ended March 31, 2011 and 2010
The Higo Bank, Ltd. and Consolidated Subsidiaries

21The Higo Bank, Ltd. Annual Report 2011
q. Appropriations of retained earningsAppropriations of retained earnings at each year end are reflected in the consolidated financial statements for the following
year upon shareholders’ approval.
r. New accounting pronouncements Accounting Changes and Error CorrectionsIn December 2009, the ASBJ issued ASBJ Statement No. 24 “Accounting Standard for Accounting Changes and Error
Corrections” and ASBJ Guidance No. 24 “Guidance on Accounting Standard for Accounting Changes and Error Corrections.”
Accounting treatments under this standard and guidance are as follows;
(1) Changes in Accounting Policies
When a new accounting policy is applied with revision of accounting standards, the new policy is applied retrospectively
unless the revised accounting standards include specific transitional provisions. When the revised accounting standards
include specific transitional provisions, an entity shall comply with the specific transitional provisions.
(2) Changes in Presentations
When the presentation of financial statements is changed, prior period financial statements are reclassified in accordance
with the new presentation.
(3) Changes in Accounting Estimates
A change in an accounting estimate is accounted for in the period of the change if the change affects that period only, and is
accounted for prospectively if the change affects both the period of the change and future periods.
(4) Corrections of Prior Period Errors
When an error in prior period financial statements is discovered, those statements are restated.
This accounting standard and the guidance are applicable to accounting changes and corrections of prior period errors
which are made from the beginning of the fiscal year that begins on or after April 1, 2011.
3. Accounting Change
Asset Retirement ObligationsIn March, 2008, the ASBJ published the accounting standard for asset retirement obligations, ASBJ Statement No. 18
“Accounting Standard for Asset Retirement Obligations” and ASBJ Guidance No. 21 “Guidance on Accounting Standard for
Asset Retirement Obligations.” The Group applied this accounting standard effective April 1, 2010. The effect of this change
was to decrease income before income taxes and minority interests by ¥139 million ($1,677 thousand).
4. Cash and Cash Equivalents
A reconciliation of the cash and cash equivalents balances in the consolidated statements of cash flows and the account
balances in the consolidated balance sheets were as follows:
Millions of yenThousands of
U.S. dollars2011 2010 2011
Cash and due from banks ..................................................................................... ¥236,120 ¥204,008 $2,839,688Foreign currency due from banks .................................................................... (47,472) (135,390) (570,925)Other due from banks ............................................................................................. (708) (946) (8,519)Cash and cash equivalents ................................................................................... ¥187,939 ¥ 67,671 $2,260,243
Notes to Consolidated Financial StatementsYears ended March 31, 2011 and 2010
The Higo Bank, Ltd. and Consolidated Subsidiaries
22The Higo Bank, Ltd. Annual Report 2011
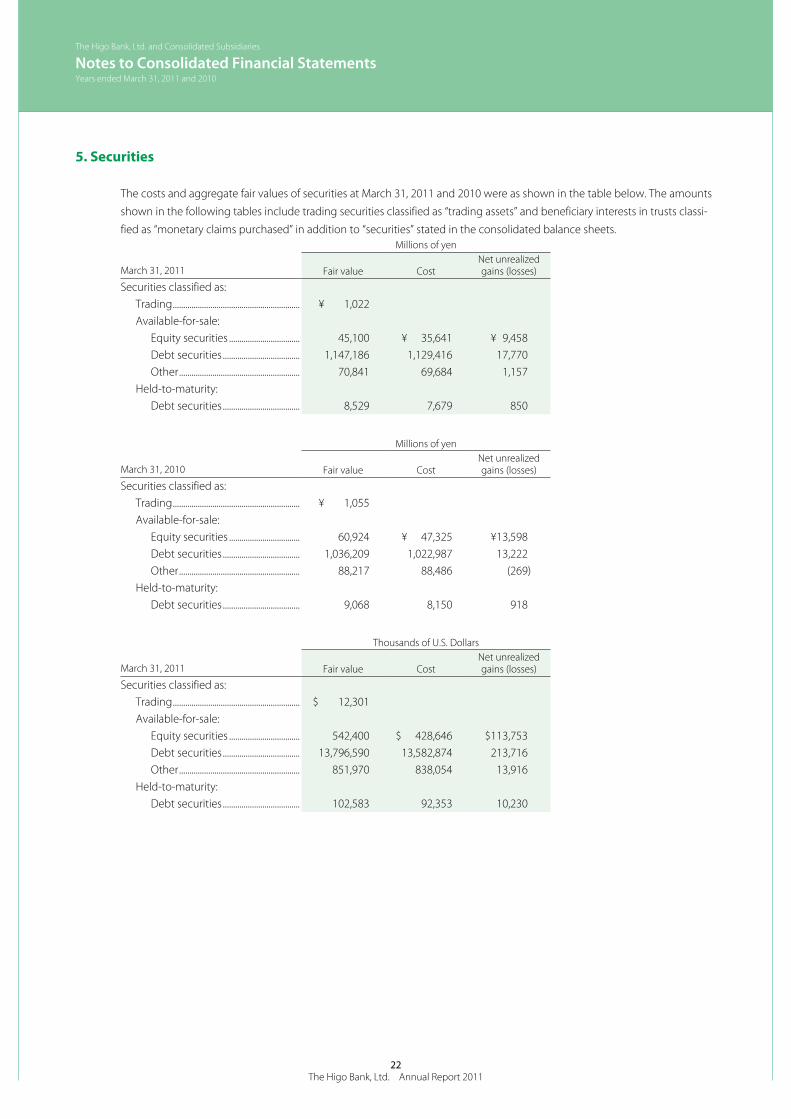
5. Securities
The costs and aggregate fair values of securities at March 31, 2011 and 2010 were as shown in the table below. The amounts
shown in the following tables include trading securities classified as “trading assets” and beneficiary interests in trusts classi-
fied as “monetary claims purchased” in addition to “securities” stated in the consolidated balance sheets.Millions of yen
March 31, 2011 Fair value CostNet unrealized gains (losses)
Securities classified as:Trading ............................................................. ¥ 1,022Available-for-sale:
Equity securities .................................. 45,100 ¥ 35,641 ¥ 9,458Debt securities ..................................... 1,147,186 1,129,416 17,770Other .......................................................... 70,841 69,684 1,157
Held-to-maturity:Debt securities ..................................... 8,529 7,679 850
Millions of yen
March 31, 2010 Fair value CostNet unrealized gains (losses)
Securities classified as:Trading ............................................................. ¥ 1,055Available-for-sale:
Equity securities .................................. 60,924 ¥ 47,325 ¥13,598Debt securities ..................................... 1,036,209 1,022,987 13,222Other .......................................................... 88,217 88,486 (269)
Held-to-maturity:Debt securities ..................................... 9,068 8,150 918
Thousands of U.S. Dollars
March 31, 2011 Fair value CostNet unrealized gains (losses)
Securities classified as:Trading ............................................................. $ 12,301Available-for-sale:
Equity securities .................................. 542,400 $ 428,646 $113,753Debt securities ..................................... 13,796,590 13,582,874 213,716Other .......................................................... 851,970 838,054 13,916
Held-to-maturity:Debt securities ..................................... 102,583 92,353 10,230
Notes to Consolidated Financial StatementsYears ended March 31, 2011 and 2010
The Higo Bank, Ltd. and Consolidated Subsidiaries

23The Higo Bank, Ltd. Annual Report 2011
The information of available-for-sale securities which were sold for the years ended March 31, 2011 and 2010 was as follows:Millions of yen
March 31, 2011 Proceeds Realized gains Realized losses
Available-for-sale:Equity securities ......................................... ¥ 12,423 ¥ 320 ¥(3,994)Debt securities ............................................ 333,952 2,466 (2,407)Other ................................................................. 20,313 260 (1,475)
Total ............................................................ ¥366,689 ¥3,047 ¥(7,877)
Millions of yenMarch 31, 2010 Proceeds Realized gains Realized losses
Available-for-sale:Equity securities ......................................... ¥ 13,508 ¥1,021 ¥ (618)Debt securities ............................................ 72,572 1,679 (213)Other ................................................................. 54,555 444 (5,541)
Total ............................................................ ¥140,636 ¥3,145 ¥(6,374)
Thousands of U.S. DollarsMarch 31, 2011 Proceeds Realized gains Realized losses
Available-for-sale:Equity securities ......................................... $ 149,408 $ 3,852 $(48,042)Debt securities ............................................ 4,016,263 29,667 (28,956)Other ................................................................. 244,303 3,127 (17,740)
Total ............................................................ $4,409,976 $36,648 $(94,739)
The impairment losses on available-for-sale equity securities for the years ended March 31, 2011 and 2010 were ¥314 million
($3,778 thousand) and ¥568 million, respectively.
Net unrealized gains (losses) on available-for-sale securities for the years ended March 31, 2011 and 2010 consisted of the
following:
Millions of yenThousands of
U.S. dollars2011 2010 2011
Valuation differences:Available-for-sale securities .......................................................................... ¥28,386 ¥26,551 $341,385Deferred tax liabilities ....................................................................................... (11,150) (10,241) (134,101)Minority interests ................................................................................................. (1)Unrealized gains (losses) on available-for-sale securities of affiliates attributable to the parent company ........................... 7 8 87
Net unrealized gains (losses) on available-for-sale securities ......... ¥17,243 ¥16,315 $207,372
6. Money Held in Trust
The carrying amounts and unrealized gains (losses) of money held in trust, as of March 31, 2011 and 2010, were as follows:
Money held in trust held for trading
Millions of yenThousands of
U.S. dollars2011 2010 2011
Carrying amounts ....................................................................................................... ¥4,292 ¥4,343 $51,622Unrealized gains (losses) credited to income ........................................... (1) 2 (23)
Notes to Consolidated Financial StatementsYears ended March 31, 2011 and 2010
The Higo Bank, Ltd. and Consolidated Subsidiaries

24The Higo Bank, Ltd. Annual Report 2011
7. Loans and Bills Discounted
Loans and bills discounted as of March 31, 2011 and 2010 included the following:
Millions of yenThousands of
U.S. dollars2011 2010 2011
Bankruptcy loans ........................................................................................................ ¥ 1,388 ¥ 2,507 $ 16,693Past due loans............................................................................................................... 36,043 35,714 433,469Loans past due for three months or more ................................................. 567 1,386 6,821Restructured loans ..................................................................................................... 18,859 8,444 226,816
Total ............................................................................................................................. ¥56,857 ¥48,051 $683,800
Bankruptcy loans represent non-accrual loans to borrowers who are legally bankrupt as defined in Article 96-1-3 and 4 of the
Japanese Tax Law Enforcement Regulation (Article 97 of 1965 Cabinet Order).
Past due loans represent non-accrual loans other than bankruptcy loans and loans for which payments of interest are
deferred in order to assist or facilitate the restructuring of borrowers in financial difficulties.
Loans past due for three months or more include loans for which payments of principal or interest are delinquent by three
months or more, as calculated from the day following the contracted payment date, but do not include bankruptcy loans or
past due loans.
Restructured loans represent loans on which contracts were amended in favor of borrowers (e.g., reduction of or exemption
from stated interest, deferral of interest payments, extension of maturity dates, renunciation of claims) in order to assist or
facilitate the restructuring of borrowers in financial difficulties.
Loans included discounted bills amounting to ¥15,332 million ($184,392 thousand) and ¥16,001 million as of March 31, 2011
and 2010, respectively. The Bank is entitled, without limitation, to sell or pledge these discounted bills.
8. Fixed Assets and Intangible Assets
Fixed assets as of March 31, 2011 and 2010 consisted of the following:
Millions of yenThousands of
U.S. dollars2011 2010 2011
Buildings........................................................................................................................... ¥ 8,752 ¥ 8,573 $103,094Land .................................................................................................................................... 29,099 29,467 349,960Lease assets .................................................................................................................... 453 466 5,457Construction in progress ....................................................................................... 8 108 100Other .................................................................................................................................. 4,220 4,055 50,754
Total ............................................................................................................................. ¥42,353 ¥42,671 $509,366
Accumulated depreciation at March 31, 2011 and 2010 amounted to ¥36,474 million ($438,660 thousand) and ¥36,279
million, respectively.
As of March 31, 2011 and 2010, deferred gains for tax purposes of ¥2,804 million ($33,729 thousand) and ¥2,801 million,
respectively.
Notes to Consolidated Financial StatementsYears ended March 31, 2011 and 2010
The Higo Bank, Ltd. and Consolidated Subsidiaries

25The Higo Bank, Ltd. Annual Report 2011
Intangible assets as of March 31, 2011 and 2010 consisted of the following:
Millions of yenThousands of
U.S. dollars2011 2010 2011
Software ........................................................................................................................... ¥5,975 ¥5,628 $71,864 Lease assets .................................................................................................................... 22 25 267Other .................................................................................................................................. 173 165 2,083
Total ............................................................................................................................. ¥6,171 ¥5,819 $74,216
9. Assets Pledged
Assets pledged as collateral were as follows:
Millions of yenThousands of
U.S. dollars2011 2010 2011
Securities .......................................................................................................................... ¥39,122 ¥34,971 $470,505
Liabilities related to the above assets pledged were as follows:
Millions of yenThousands of
U.S. dollars2011 2010 2011
Deposits............................................................................................................................ ¥21,231 ¥36,134 $255,337Borrowing under securities lending transactions .................................. 5,814 8,761 69,927Borrowed money ........................................................................................................ 5,000 60,132
In addition, securities totaling ¥123,264 million ($1,482,435 thousand) was pledged as collateral for settlement of exchange
as of March 31, 2011. Securities totaling ¥118,920 million was pledged as collateral for settlement of exchange, short-term
funding, derivatives or as variation margin as of March 31, 2010.
10. Commitment Line Agreements Related to Overdrafts and Loans
Commitment line agreements relating to overdrafts and loans represent agreements to allow customers to extend
overdrafts or loans up to agreed amounts at the customer’s request as long as no violation against the conditions of the
agreements exists.
Unused commitment lines under such agreements were as follows:
Millions of yenThousands of
U.S. dollars2011 2010 2011
Original maturity is within one year or the Bank can cancel at any time without any penalty ..................... ¥611,882 ¥607,346 $7,358,781Other .................................................................................................................................. 12,072 11,442 145,183
Total ............................................................................................................................. ¥623,954 ¥618,789 $7,503,965
The amount of unexercised commitment lines does not necessarily affect the future cash flows of the Group because most
such agreements are terminated without being exercised. Most of these agreements have provisions, which stipulate the
Group may deny extending loans or decrease the commitment line when there are certain changes in financial markets,
certain issues in securing loans and other reasons. The Group requests collateral in the form of premises or securities as
deemed necessary upon providing such commitments. In addition, the Group monitors the financial condition of customers
in accordance with its internal rules on a regular basis (semi-annually) and takes necessary measures including revisiting the
terms of commitments and other means to prevent credit losses.
Notes to Consolidated Financial StatementsYears ended March 31, 2011 and 2010
The Higo Bank, Ltd. and Consolidated Subsidiaries
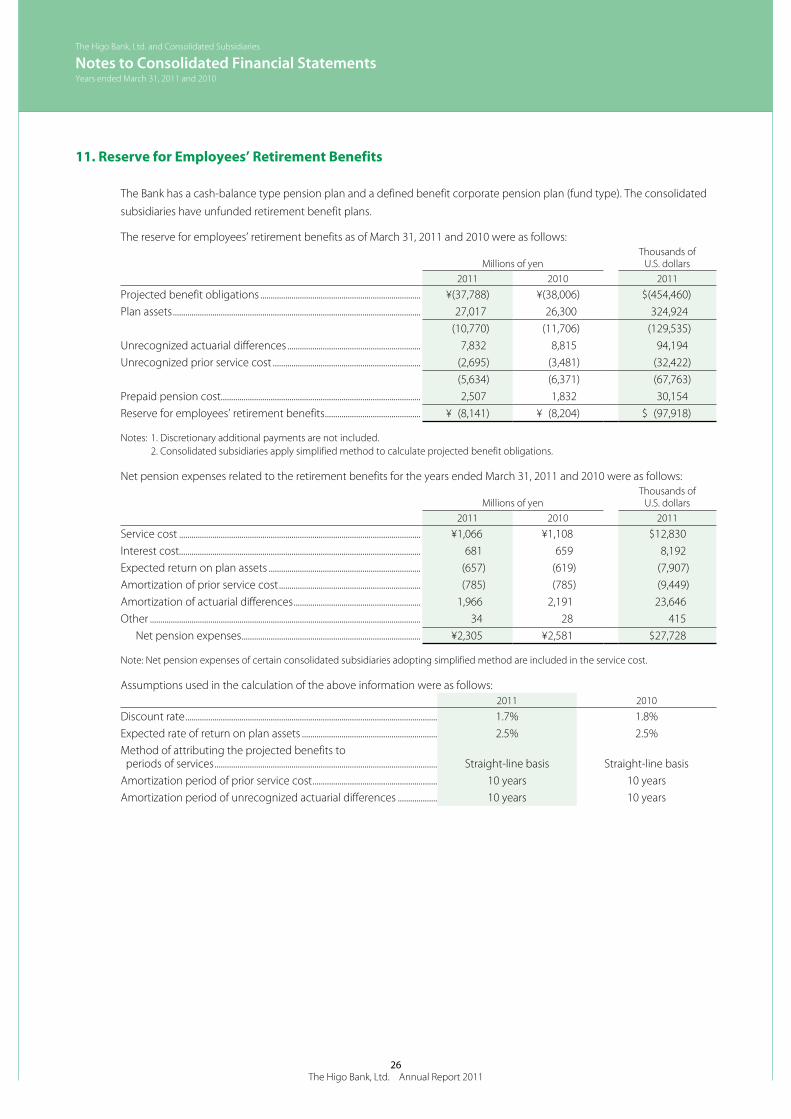
26The Higo Bank, Ltd. Annual Report 2011
11. Reserve for Employees’ Retirement Benefits
The Bank has a cash-balance type pension plan and a defined benefit corporate pension plan (fund type). The consolidated
subsidiaries have unfunded retirement benefit plans.
The reserve for employees’ retirement benefits as of March 31, 2011 and 2010 were as follows:
Millions of yenThousands of
U.S. dollars2011 2010 2011
Projected benefit obligations ............................................................................. ¥(37,788) ¥(38,006) $(454,460)Plan assets ....................................................................................................................... 27,017 26,300 324,924
(10,770) (11,706) (129,535)Unrecognized actuarial differences ................................................................ 7,832 8,815 94,194Unrecognized prior service cost ....................................................................... (2,695) (3,481) (32,422)
(5,634) (6,371) (67,763)Prepaid pension cost................................................................................................ 2,507 1,832 30,154Reserve for employees’ retirement benefits .............................................. ¥ (8,141) ¥ (8,204) $ (97,918)
Notes: 1. Discretionary additional payments are not included. 2. Consolidated subsidiaries apply simplified method to calculate projected benefit obligations.
Net pension expenses related to the retirement benefits for the years ended March 31, 2011 and 2010 were as follows:
Millions of yenThousands of
U.S. dollars2011 2010 2011
Service cost .................................................................................................................... ¥1,066 ¥1,108 $12,830Interest cost.................................................................................................................... 681 659 8,192Expected return on plan assets ......................................................................... (657) (619) (7,907)Amortization of prior service cost .................................................................... (785) (785) (9,449)Amortization of actuarial differences ............................................................. 1,966 2,191 23,646Other .................................................................................................................................. 34 28 415
Net pension expenses ...................................................................................... ¥2,305 ¥2,581 $27,728
Note: Net pension expenses of certain consolidated subsidiaries adopting simplified method are included in the service cost.
Assumptions used in the calculation of the above information were as follows:2011 2010
Discount rate ......................................................................................................................... 1.7% 1.8%Expected rate of return on plan assets ................................................................. 2.5% 2.5%Method of attributing the projected benefits to periods of services ........................................................................................................... Straight-line basis Straight-line basisAmortization period of prior service cost ............................................................ 10 years 10 yearsAmortization period of unrecognized actuarial differences ................... 10 years 10 years
Notes to Consolidated Financial StatementsYears ended March 31, 2011 and 2010
The Higo Bank, Ltd. and Consolidated Subsidiaries

27The Higo Bank, Ltd. Annual Report 2011
12. Equity
Japanese banks are subject to the Companies Act of Japan (the “Companies Act”) and the Banking Law. The significant provi-
sions in the Companies Act and the Banking Law that affect financial and accounting matters are summarized below:
(a) Dividends
Under the Companies Act, companies can pay dividends at any time during the fiscal year in addition to the year-end
dividend upon resolution at the shareholders meeting. For companies that meet certain criteria such as; (1) having the
Board of Directors, (2) having independent auditors, (3) having the Board of Corporate Auditors, and (4) the term of service
of the directors is prescribed as one year rather than two years of normal term by its articles of incorporation, the Board
of Directors may declare dividends (except for dividends in kind) at any time during the fiscal year if the company has
prescribed so in its articles of incorporation. The Bank meets all the above criteria.
The Companies Act permits companies to distribute dividends-in-kind (non-cash assets) to shareholders subject to a
certain limitation and additional requirements.
Semiannual interim dividends may also be paid once a year upon resolution by the Board of Directors if the articles of
incorporation of the company so stipulate. The Companies Act and the Banking Law provides certain limitations on the
amounts available for dividends or the purchase of treasury stock.
(b) Increases/decreases and transfer of common stock, reserve and surplus
The Banking Law requires that an amount equal to 20% of dividends must be appropriated as a legal reserve (a com-
ponent of retained earnings) or as additional paid-in capital (a component of capital surplus) depending on the equity
account charged upon the payment of such dividends until the total of aggregate amount of legal reserve and additional
paid-in capital equals 100% of common stock. Under the Companies Act, the total amount of additional paid-in common
and legal reserve may be reversed without limitation. The Companies Act also provides that common stock, legal reserve,
additional paid-in capital, other capital surplus and retained earnings can be transferred among the accounts under
certain conditions upon resolution of the shareholders.
(c) Treasury stock and treasury stock acquisition rights
The Companies Act also provides for companies to purchase treasury stock and dispose of such treasury stock by
resolution of the Board of Directors. The amount of treasury stock purchased cannot exceed the amount available for
distribution to the shareholders which is determined by specific formula. Under the Companies Act, stock acquisition
rights are presented as a separate component of equity. The Companies Act also provides that companies can purchase
both treasury stock acquisition rights and treasury stock. Such treasury stock acquisition rights are presented as a separate
component of equity or deducted directly from stock acquisition rights.
13. Other Expenses
Other expenses included losses on sales stocks and other securities in the amount of ¥5,584 million for the year ended March
31, 2010.
Notes to Consolidated Financial StatementsYears ended March 31, 2011 and 2010
The Higo Bank, Ltd. and Consolidated Subsidiaries
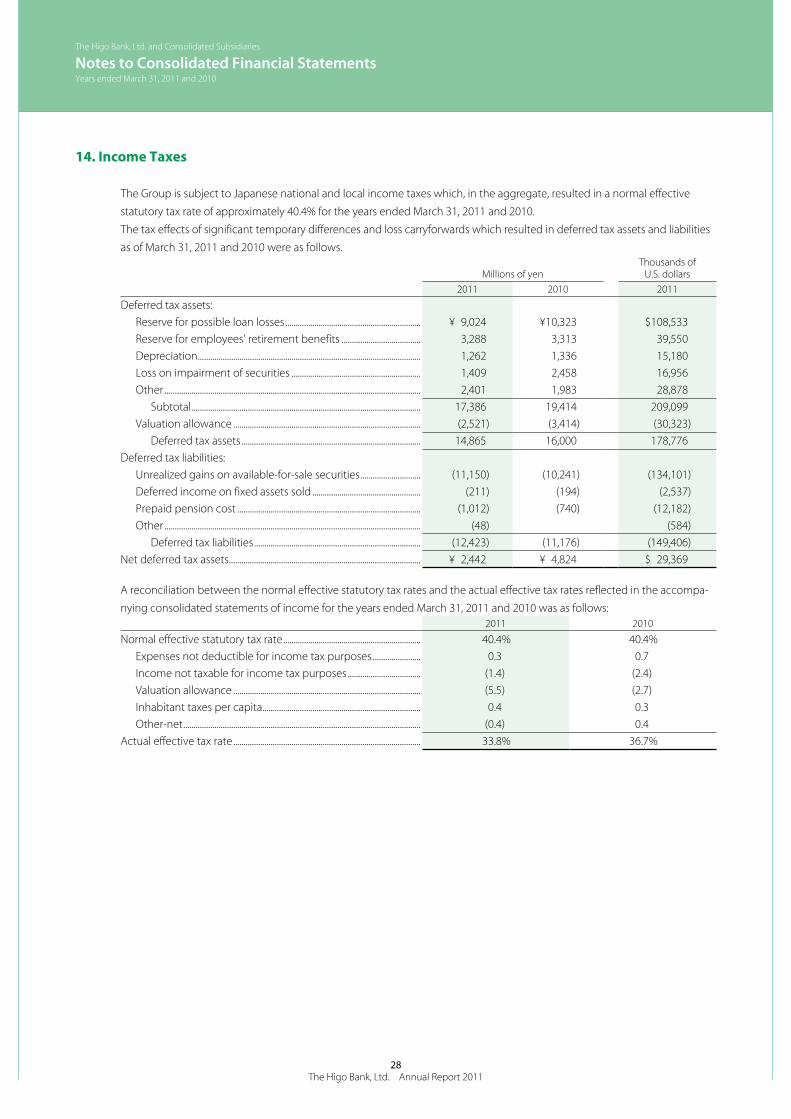
28The Higo Bank, Ltd. Annual Report 2011
14. Income Taxes
The Group is subject to Japanese national and local income taxes which, in the aggregate, resulted in a normal effective
statutory tax rate of approximately 40.4% for the years ended March 31, 2011 and 2010.
The tax effects of significant temporary differences and loss carryforwards which resulted in deferred tax assets and liabilities
as of March 31, 2011 and 2010 were as follows.
Millions of yenThousands of
U.S. dollars2011 2010 2011
Deferred tax assets:Reserve for possible loan losses ................................................................. ¥ 9,024 ¥10,323 $108,533Reserve for employees’ retirement benefits ...................................... 3,288 3,313 39,550Depreciation ........................................................................................................... 1,262 1,336 15,180Loss on impairment of securities .............................................................. 1,409 2,458 16,956Other ........................................................................................................................... 2,401 1,983 28,878
Subtotal .............................................................................................................. 17,386 19,414 209,099Valuation allowance .......................................................................................... (2,521) (3,414) (30,323)
Deferred tax assets ...................................................................................... 14,865 16,000 178,776Deferred tax liabilities:
Unrealized gains on available-for-sale securities ............................. (11,150) (10,241) (134,101)Deferred income on fixed assets sold .................................................... (211) (194) (2,537)Prepaid pension cost ........................................................................................ (1,012) (740) (12,182)Other ........................................................................................................................... (48) (584)
Deferred tax liabilities ................................................................................ (12,423) (11,176) (149,406)Net deferred tax assets ............................................................................................ ¥ 2,442 ¥ 4,824 $ 29,369
A reconciliation between the normal effective statutory tax rates and the actual effective tax rates reflected in the accompa-
nying consolidated statements of income for the years ended March 31, 2011 and 2010 was as follows:2011 2010
Normal effective statutory tax rate .................................................................. 40.4% 40.4%Expenses not deductible for income tax purposes ....................... 0.3 0.7Income not taxable for income tax purposes ................................... (1.4) (2.4)Valuation allowance .......................................................................................... (5.5) (2.7)Inhabitant taxes per capita ............................................................................ 0.4 0.3Other-net .................................................................................................................. (0.4) 0.4
Actual effective tax rate .......................................................................................... 33.8% 36.7%
Notes to Consolidated Financial StatementsYears ended March 31, 2011 and 2010
The Higo Bank, Ltd. and Consolidated Subsidiaries

29The Higo Bank, Ltd. Annual Report 2011
15. Leases
The Group leases certain equipment and other assets.
Total lease payments under finance leases for the years ended March 31, 2011 and 2010 were ¥569 million ($6,849 thousand)
and ¥740 million, respectively.
Pro forma information of leased property whose lease inception was before March 31, 2008
ASBJ Statement No. 13, “Accounting Standard for Lease Transactions” requires that all finance lease transactions should be
capitalized to recognize lease assets and lease obligations in the balance sheet. However, the ASBJ Statement No. 13 permits
leases without ownership transfer of the leased property to the lessee whose lease inception was before March 31, 2008
to be accounted for as operating lease transactions if certain “as if capitalized” information is disclosed in the note to the
financial statements. The Group applied the ASBJ Statement No. 13 effective April 1, 2008 and accounted for such leases as
operating lease transactions. Pro forma information of leased property whose lease inception was before March 31, 2008
such as acquisition cost, accumulated depreciation, obligations under finance leases, depreciation expense, interest expense
and other information of finance leases that do not transfer ownership of the leased property to the lessee on an “as if
capitalized” basis was as follows:
Millions of yenThousands of
U.S. dollars2011 2010 2011
Acquisition cost ........................................................................................................... ¥2,412 ¥3,106 $29,009Accumulated depreciation .................................................................................. (1,876) (2,067) (22,565)Net leased property .................................................................................................. ¥ 535 ¥1,039 $ 6,443Obligations under finance leases:
Due within one year .......................................................................................... ¥ 393 ¥ 526 $ 4,732Due after one year .............................................................................................. 194 587 2,333
Total ...................................................................................................................... ¥ 587 ¥1,114 $ 7,066Depreciation expense ............................................................................................. ¥ 503 ¥ 657 $ 6,055Interest expense .......................................................................................................... 40 69 492
Depreciation is computed based on the straight-line method over the lease term of the leased assets. Interest expense,
computed as total lease payments less acquisition cost of the leased assets, are allocated over the lease term, using the
interest method.
The minimum rental commitments under non-cancellable operating leases at March 31, 2011 and 2010 were as follows:
Millions of yenThousands of
U.S. dollars2011 2010 2011
Due within one year ................................................................................................. ¥ 99 $1,196Due after one year ..................................................................................................... 140 1,695
Total ............................................................................................................................. ¥240 $2,891
Notes to Consolidated Financial StatementsYears ended March 31, 2011 and 2010
The Higo Bank, Ltd. and Consolidated Subsidiaries

30The Higo Bank, Ltd. Annual Report 2011
16. Financial Instruments and Related Disclosures
In March 2008, the ASBJ revised ASBJ Statement NO. 10 “Accounting Standard for Financial Instruments” and issued ASBJ
Guidance NO. 19 “Guidance on Accounting Standard for Financial Instruments and Related Disclosures.” This accounting
standard and the guidance was applicable to financial instruments and related disclosures at the end of the fiscal years
ending on or after March 31, 2010. The Group applied the revised accounting standard and the guidance effective March 31,
2010.
(a) Bank policy for financial instruments
The main business of the Bank is procuring funds directly from deposits accepted from individual and corporate customers
and from financial markets including call money markets, and managing such funds in the form of loans and investments
in securities. Moreover, the Bank is engaged in a variety of services related to financial instruments including the trading of
stocks and bonds associated with securities investment, as well as over-the-counter sales of public debt securities.
The Bank’s major means of raising funds are accepting customer deposits (including negotiable certificates of deposit).
Deposits from individual customers in particular form a significant proportion of total deposits. In raising funds, the Bank
actively solicits fixed-term deposits to ensure funding stability. Some funds are raised directly from financial markets using
such means of funding as call money, as well as derivatives including currency swaps as a means of raising foreign currency
funds.
The Bank’s major means of operating funds are lending, followed by securities investment such as in stocks and bonds. Loans
are primarily provided to small- and medium-sized enterprises (SMEs) and individual customers in Kumamoto Prefecture,
loans are also provided to the public sector and to large corporations outside the Prefecture. Securities investments are
primarily investments in Japanese government bonds (JGBs) and public debt securities, the Bank also invests in corporate
bonds, stocks, foreign securities and other financial instruments.
As mentioned above, the Bank holds substantial financial assets and liabilities that are subject to fluctuations in interest rates
and prices. To protect itself from the negative effects of the fluctuations, the Bank practices Asset Liability Management
(ALM).
In addition, some of the subsidiaries that engage in credit card business and lending activities raise funds from borrowing,
and those that engage in the venture capital business invest in securities.
(b) Nature and extent of risks arising from financial instruments
i) Financial assets
The significant proportion of financial assets held by the Group is loans, which are primarily provided to domestic institu-
tions and individual customers. Loans are subject to credit risk, which represents loss on default caused by deteriorated
credit of the borrowers. Additionally, fixed interest rate loans are subject to market risk and their fair value is exposed to
risk of fluctuation in market interest rate.
The second largest proportion of financial assets held by the Group is securities, which include JGBs, stocks, foreign bonds
and investment trusts. Securities held by the Group are subject to market risk, and their fair value is exposed to risk of
fluctuation in variable risk factors including interest rates, stock prices and exchange rates. The Group is also subject to
the liquidity risk and their fair value is exposed to risk of fluctuation in market prices. Some securities, such as stocks and
bonds, are subject to credit risk, which represents loss on default caused by deteriorated credit of the issuers.
ii) Financial liabilities
Deposits and marketable funds procured are subject to liquidity risk, which represents the outflow of deposits and an
inability to raise needed funds caused by deteriorated credit of the Bank, as well as losses caused by having to make
transactions under unfavorable conditions. Some of the Group companies raise funds by borrowing, which are subject to
liquidity risk in turn.
In addition, funds procured at fixed interest rates are subject to market risk and their fair value is exposed to risk of fluctua-
tion in market interest rate.
Notes to Consolidated Financial StatementsYears ended March 31, 2011 and 2010
The Higo Bank, Ltd. and Consolidated Subsidiaries

31The Higo Bank, Ltd. Annual Report 2011
iii) Derivatives
The derivative transactions conducted by the Bank include interest rate swaps and currency swaps. The Bank applies
deferred hedge and specific matching criteria to transactions undertaken as hedges against risk and evaluates hedge
effectiveness on the basis of the market price fluctuation rate and the details of the contract. Derivative transactions are
subject to market risk associated with the deteriorating credit standing of the counter party and credit risk of default
of the contract and changing risk factors. The consolidated subsidiaries and the associated company do not undertake
derivative transactions.
(c) Risk management for financial instruments
i) Basic risk management policy
The Bank positions risk management as an important business challenge and enhances organization and system for man-
aging risk rigorously. By monitoring various types of risk properly and managing risk by responding to changing financial
conditions appropriately, we maintain and enhance the financial soundness of the Group companies and establish a
business foundation.
ii) Risks and the risk management system
To enhance the risk management system, the Bank has instituted “Integrated Risk Management Rules” which define risk
management policies each fiscal year for each type of risk — credit risk, market risk and liquidity risk, and define the risk
management organizations and corresponding authorities. With respect to risk management for operating divisions
such as divisions, sections, offices, branches, and Group companies, each headquarter division assumes functional
responsibility for risk management each type of risk. The Business Administration Division assumes overall control for risk
management of all banking-related risk and reports on the risk management status to the Board of Directors. In addition,
the Internal Audit Division, which is independent of the operating divisions, audits the risk management functions in
operating division and in Business Administration Division and reports the results to the Board of Directors.
iii) Integrated risk management
The Bank manages integrated risk in order to grasp and combine the various types of risk together in an integrated
manner and to manage it so that the overall volume of risk does not get too big for management to handle. In addition,
the Bank has introduced a system for allocating risk capital within the range of shareholders’ equity as a provision against
various types of risk, and is taking steps to ensure management soundness and to raise profitability and efficiency.
a) Credit risk
To enhance credit risk management, at headquarters, the Loan Division and the Loan Administration Division have been
separated from the business promotion division, and have been operating under a system of mutual checks and bal-
ances, resulting in rigorous loan assessment and management. In addition, the Loan Division manages loan balances and
the Board of Directors reviews the status of those balances so that loans are not biased to particular regions, businesses,
companies and groups.
A credit rating system has been introduced to accurately grasp the creditworthiness of customers and to refine our credit
risk management. Credit rating is a basic credit risk management concept and forms the basis of self-assessment. The
Bank has established an independent self-assessment division that performs audit and is working to enhance its functions
by giving it the ability to perform checks and balances at branches and the Loan Division.
Audits are carried out by our accounting auditors to confirm that our standards for in-house credit assessment are
appropriate, and that such standards are rigorously applied.
b) Market risk
The Bank determines risk acceptance and risk hedge policies in the comprehensive risk control committee and ALM
committee based on interest rate forecasts and profit targets through Value at Risk (VaR) method due to ensure stable
profitability.
Notes to Consolidated Financial StatementsYears ended March 31, 2011 and 2010
The Higo Bank, Ltd. and Consolidated Subsidiaries

32The Higo Bank, Ltd. Annual Report 2011
In the banking account and trading account, financial instruments influenced by interest rate risks are deposits, loans and
bills discounted, bonds and derivatives related to interest rate and financial instruments influenced by price volatility risks
are stocks, mutual funds related to stocks and derivatives related to stocks.
The Bank calculates VaR based on the historical simulation method (a holding period of from 10 days to 6 months, a
confidence interval of 99% and observation period of 5 years). As of March 31, 2011, VaR related to interest rate risks was
¥19,596 million ($235,678 thousand) and VaR related to price volatility risks was ¥17,741 million ($213,362 thousand).
The Bank performed back testing to validate VaR periodically. However, VaR measures the amount of market risk by
certain occurrence probabilities which are statistically calculated based on past market movements. Therefore, there are
cases in which VaR cannot capture risk under sudden and dramatic changes in market beyond normal circumstances. The
Bank does not do quantitative analysis to a part of financial instruments which are small in value and financial instruments
held by the consolidated subsidiaries and affiliated companies.
c) Liquidity risk
The General Planning Division manages liquidity risk. The General Planning Division also grasps and analyzes the uses
of funds on a daily, weekly, and monthly, and performs simulations the sources of funds. In addition, to provide for
contingencies, the Bank implements a three-phased system of cash management, depending on the relative tightness of
its cash position, so that it can swiftly respond to any situation. The Bank has also established action plans and a reporting
system.
(d) Supplemental explanation for fair value of financial instruments
Fair values of financial instruments include market prices as well as reasonably calculated prices in cases where there are
no market prices available. Since the calculations of the reasonably calculated prices are implemented under certain condi-
tions and assumptions, the result of calculations would differ if such calculations are made under different conditions and
assumptions.
(e) Fair value of financial instruments
Fair value and carrying amounts of financial instruments as of March 31, 2011 and 2010 are shown below. Immaterial
accounts on the consolidated balance sheet are not included in the table below. Some instruments, such as unlisted stocks,
whose fair value cannot be reliably determined, are not included in the table below (see Note 16(e) (Note 2)).Millions of yen
2011
Carrying amount
Fairvalue
Net unrealized gains (losses)
(1) Cash and due from banks .............................................................................. ¥ 236,120 ¥ 236,120(2) Call loans and bills bought ...........................................................................(3) Securities:
Held-to-maturity debt securities ............................................................... 7,679 8,529 ¥ 850Available-for-sale securities .......................................................................... 1,262,942 1,262,942
(4) Loans and bills discounted............................................................................ 2,325,979Reserve for possible loan losses (*1) ........................................................ (21,034)
2,304,945 2,333,899 28,954Total assets .............................................................................................................. 3,811,687 3,841,492 29,805
Deposits............................................................................................................................ 3,641,753 3,645,139 3,385Total liabilities ........................................................................................................ 3,641,753 3,645,139 3,385Derivatives (*2) ......................................................................................................
For which hedge accounting is not applied .............................. (433) (433)For which hedge accounting is applied ........................................ (1,460) (1,460)
Total............................................................................................................... ¥ (1,893) ¥ (1,893)
Notes to Consolidated Financial StatementsYears ended March 31, 2011 and 2010
The Higo Bank, Ltd. and Consolidated Subsidiaries

33The Higo Bank, Ltd. Annual Report 2011
Thousands of U.S. dollars2011
Carrying amount
Fairvalue
Net unrealized gains (losses)
(1) Cash and due from banks .............................................................................. $ 2,839,688 $ 2,839,688(2) Call loans and bills bought ...........................................................................(3) Securities:
Held-to-maturity debt securities ............................................................... 92,353 102,583 $ 10,230Available-for-sale securities .......................................................................... 15,188,728 15,188,728
(4) Loans and bills discounted............................................................................ 27,973,300Reserve for possible loan losses (*1) ........................................................ (252,974)
27,720,326 28,068,549 348,222Total assets .............................................................................................................. 45,841,096 46,199,549 358,452
Deposits............................................................................................................................ 43,797,401 43,838,119 40,717Total liabilities ........................................................................................................ 43,797,401 43,838,119 40,717Derivatives (*2) ......................................................................................................
For which hedge accounting is not applied .............................. (5,212) (5,212)For which hedge accounting is applied ........................................ (17,560) (17,560)
Total............................................................................................................... $ (22,773) $ (22,773)
*1. General reserve for possible loan losses and specific reserve for possible loan losses provided to loans and bills discounted are separately presented in the above table.
*2. Derivatives recorded in Trading assets, Trading liabilities, Other assets and Other liabilities are aggregated and shown herein. Assets and liabilities attributable to the derivative contracts are totally offset and the net liability position as a consequence of offsetting would be represented with brackets.
Millions of yen2010
Carrying amount
Fairvalue
Net unrealized gains (losses)
(1) Cash and due from banks .............................................................................. ¥ 204,008 ¥ 204,008(2) Call loans and bills bought ........................................................................... 57,216 57,216(3) Securities:
Held-to-maturity debt securities ............................................................... 8,150 9,068 ¥ 918Available-for-sale securities .......................................................................... 1,184,928 1,184,928
(4) Loans and bills discounted............................................................................ 2,260,131Reserve for possible loan losses (*1) ........................................................ (23,125)
2,237,006 2,264,550 27,544Total assets .............................................................................................................. 3,691,308 3,719,771 28,462
Deposits............................................................................................................................ 3,490,313 3,495,578 5,264Total liabilities ........................................................................................................ 3,490,313 3,495,578 5,264Derivatives (*2) ......................................................................................................
For which hedge accounting is not applied .............................. 869 869For which hedge accounting is applied ........................................ (1,503) (1,503)
Total............................................................................................................... ¥ (633) ¥ (633)
*1. General reserve for possible loan losses and specific reserve for possible loan losses provided to loans and bills discounted are separately presented in the above table.
*2. Derivatives recorded in Trading assets, Trading liabilities, Other assets and Other liabilities are aggregated and shown herein. Assets and liabilities attributable to the derivative contracts are totally offset and the net liability position as a consequence of offsetting would be represented with brackets.
Notes to Consolidated Financial StatementsYears ended March 31, 2011 and 2010
The Higo Bank, Ltd. and Consolidated Subsidiaries
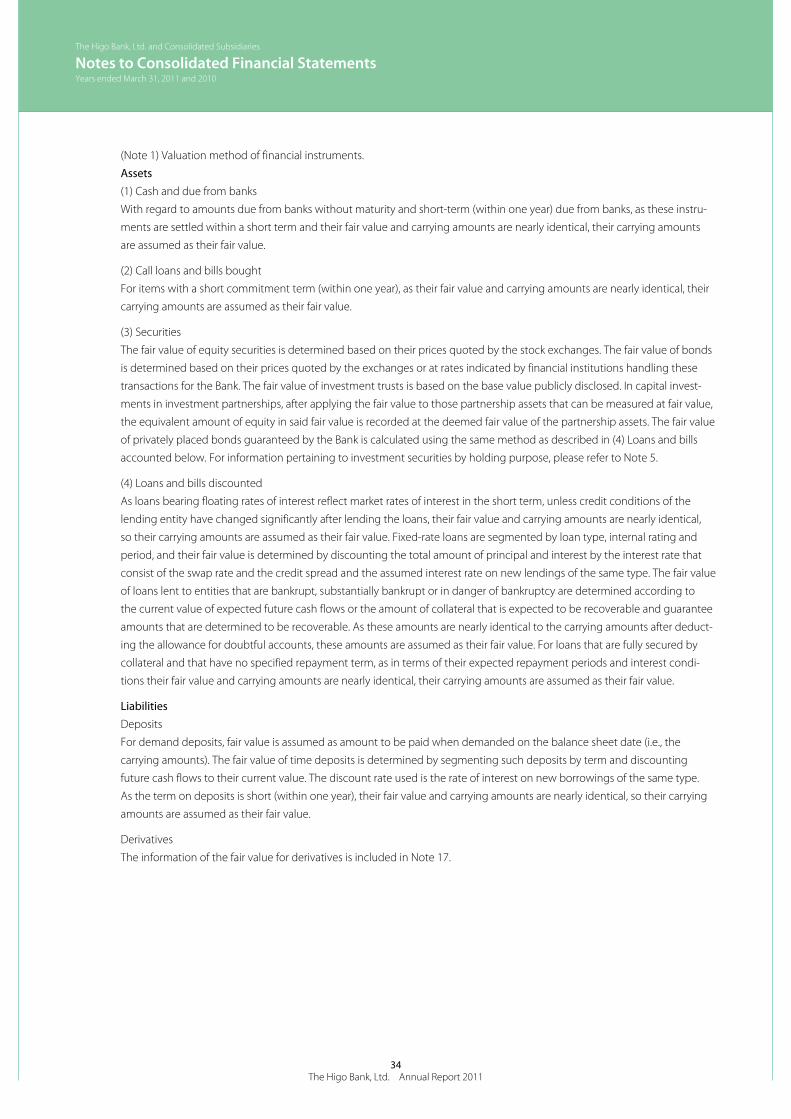
34The Higo Bank, Ltd. Annual Report 2011
(Note 1) Valuation method of financial instruments.
Assets(1) Cash and due from banks
With regard to amounts due from banks without maturity and short-term (within one year) due from banks, as these instru-
ments are settled within a short term and their fair value and carrying amounts are nearly identical, their carrying amounts
are assumed as their fair value.
(2) Call loans and bills bought
For items with a short commitment term (within one year), as their fair value and carrying amounts are nearly identical, their
carrying amounts are assumed as their fair value.
(3) Securities
The fair value of equity securities is determined based on their prices quoted by the stock exchanges. The fair value of bonds
is determined based on their prices quoted by the exchanges or at rates indicated by financial institutions handling these
transactions for the Bank. The fair value of investment trusts is based on the base value publicly disclosed. In capital invest-
ments in investment partnerships, after applying the fair value to those partnership assets that can be measured at fair value,
the equivalent amount of equity in said fair value is recorded at the deemed fair value of the partnership assets. The fair value
of privately placed bonds guaranteed by the Bank is calculated using the same method as described in (4) Loans and bills
accounted below. For information pertaining to investment securities by holding purpose, please refer to Note 5.
(4) Loans and bills discounted
As loans bearing floating rates of interest reflect market rates of interest in the short term, unless credit conditions of the
lending entity have changed significantly after lending the loans, their fair value and carrying amounts are nearly identical,
so their carrying amounts are assumed as their fair value. Fixed-rate loans are segmented by loan type, internal rating and
period, and their fair value is determined by discounting the total amount of principal and interest by the interest rate that
consist of the swap rate and the credit spread and the assumed interest rate on new lendings of the same type. The fair value
of loans lent to entities that are bankrupt, substantially bankrupt or in danger of bankruptcy are determined according to
the current value of expected future cash flows or the amount of collateral that is expected to be recoverable and guarantee
amounts that are determined to be recoverable. As these amounts are nearly identical to the carrying amounts after deduct-
ing the allowance for doubtful accounts, these amounts are assumed as their fair value. For loans that are fully secured by
collateral and that have no specified repayment term, as in terms of their expected repayment periods and interest condi-
tions their fair value and carrying amounts are nearly identical, their carrying amounts are assumed as their fair value.
LiabilitiesDeposits
For demand deposits, fair value is assumed as amount to be paid when demanded on the balance sheet date (i.e., the
carrying amounts). The fair value of time deposits is determined by segmenting such deposits by term and discounting
future cash flows to their current value. The discount rate used is the rate of interest on new borrowings of the same type.
As the term on deposits is short (within one year), their fair value and carrying amounts are nearly identical, so their carrying
amounts are assumed as their fair value.
Derivatives
The information of the fair value for derivatives is included in Note 17.
Notes to Consolidated Financial StatementsYears ended March 31, 2011 and 2010
The Higo Bank, Ltd. and Consolidated Subsidiaries

35The Higo Bank, Ltd. Annual Report 2011
(Note 2) Financial instruments, whose fair value cannot be reliably determined.
The following instruments are not included in “Assets (3) Securities” in the above table showing the fair value of financial
instruments as of March 31, 2011 and 2010.Carrying amount
Millions of yenThousands of
U.S. dollars2011 2010 2011
Unlisted stocks (*1, *2) ............................................................................................. ¥1,622 ¥1,607 $19,517Other (*1) ......................................................................................................................... 5 6 66
Total ............................................................................................................................. ¥1,628 ¥1,613 $19,584
*1. Fair value of unlisted stocks is exempt from disclosure because they do not have a market price and their fair value cannot be reliably determined.
*2. The Group wrote off unlisted stocks amounting to ¥3 million ($37 thousand) and ¥42 million for the years ended March 31, 2011 and 2010, respectively.
(Note 3) Maturity analysis for claims and securities with contractual maturities as of March 31, 2011Millions of yen
20111 year or less
Over 1 year to 3 years
Over 3 years to 5 years
Over 5 years to 7 years
Over 7 years to 10 years
Over 10 years
Due from banks ................................................ ¥195,614Securities
Held-to-maturity debt securities .... 496 ¥ 837 ¥ 5,618 ¥ 398 ¥ 330Municipal government bonds ... 117 235Corporate bonds ............................... 379 602 5,618 398 330
Available-for-sale securities with maturity ....................................................... 77,988 276,259 155,849 153,872 527,561 ¥ 17,380
Government bonds ......................... 12,318 114,609 52,023 82,052 413,507Municipal government bonds ... 35,906 39,720 56,448 35,354 65,507 16,897Corporate bonds ............................... 18,223 105,808 40,999 36,465 20,847 482
Loans and bills discounted (*1) .............. 373,420 414,522 335,104 214,709 229,679 431,161Total .................................................................. ¥647,518 ¥691,619 ¥496,572 ¥368,979 ¥757,570 ¥448,541
Thousands of U.S. dollars2011
1 year or less
Over 1 year to 3 years
Over 3 years to 5 years
Over 5 years to 7 years
Over 7 years to 10 years
Over 10 years
Due from banks ................................................ $2,352,548Securities
Held-to-maturity debt securities .... 5,967 $ 10,066 $ 67,564 $ 4,786 $ 3,968Municipal government bonds ... 1,409 2,826Corporate bonds ............................... 4,558 7,239 67,564 4,786 3,968
Available-for-sale securities with maturity ....................................................... 937,919 3,322,420 1,874,315 1,850,540 6,344,692 $ 209,026
Government bonds ......................... 148,148 1,378,350 625,661 986,797 4,973,033Municipal government bonds ... 431,832 477,698 678,878 425,191 787,821 203,218Corporate bonds ............................... 219,167 1,272,507 493,076 438,550 250,727 5,807
Loans and bills discounted (*1) .............. 4,490,924 4,985,241 4,030,125 2,582,190 2,762,233 5,185,339Total .................................................................. $7,787,360 $8,317,727 $5,972,005 $4,437,517 $9,110,894 $5,394,366
*1. Of loans and bills discounted, the portion whose timing of collection is unforeseeable, such as loans to “Legally bankrupt” borrowers, loans to “De facto bankrupt” borrowers and loans to “In danger of bankruptcy” borrowers, amounting to ¥37,431 million ($450,163 thousand), is not included in the above table. Loans that do not have contractual maturity, amounting to ¥289,950 million ($3,487,083 thousand), are not included either.
Notes to Consolidated Financial StatementsYears ended March 31, 2011 and 2010
The Higo Bank, Ltd. and Consolidated Subsidiaries
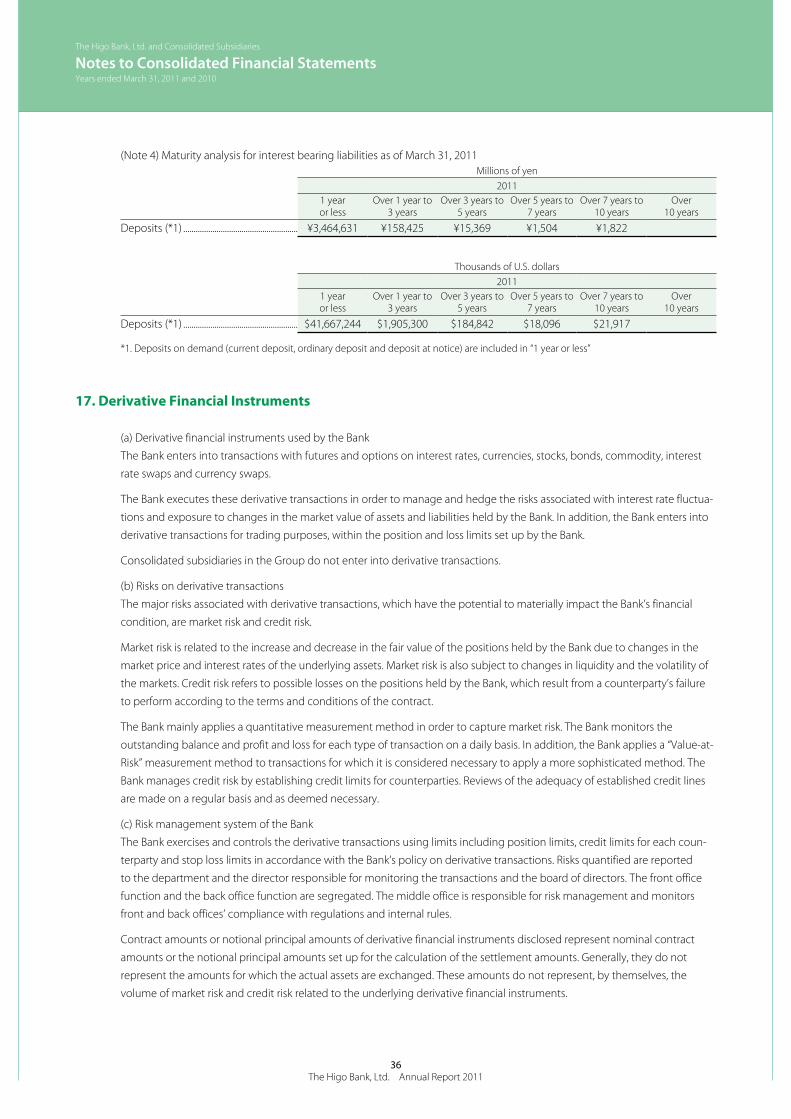
36The Higo Bank, Ltd. Annual Report 2011
(Note 4) Maturity analysis for interest bearing liabilities as of March 31, 2011Millions of yen
20111 year or less
Over 1 year to 3 years
Over 3 years to 5 years
Over 5 years to 7 years
Over 7 years to 10 years
Over 10 years
Deposits (*1) ....................................................... ¥3,464,631 ¥158,425 ¥15,369 ¥1,504 ¥1,822
Thousands of U.S. dollars2011
1 year or less
Over 1 year to 3 years
Over 3 years to 5 years
Over 5 years to 7 years
Over 7 years to 10 years
Over 10 years
Deposits (*1) ....................................................... $41,667,244 $1,905,300 $184,842 $18,096 $21,917
*1. Deposits on demand (current deposit, ordinary deposit and deposit at notice) are included in “1 year or less”
17. Derivative Financial Instruments
(a) Derivative financial instruments used by the Bank
The Bank enters into transactions with futures and options on interest rates, currencies, stocks, bonds, commodity, interest
rate swaps and currency swaps.
The Bank executes these derivative transactions in order to manage and hedge the risks associated with interest rate fluctua-
tions and exposure to changes in the market value of assets and liabilities held by the Bank. In addition, the Bank enters into
derivative transactions for trading purposes, within the position and loss limits set up by the Bank.
Consolidated subsidiaries in the Group do not enter into derivative transactions.
(b) Risks on derivative transactions
The major risks associated with derivative transactions, which have the potential to materially impact the Bank’s financial
condition, are market risk and credit risk.
Market risk is related to the increase and decrease in the fair value of the positions held by the Bank due to changes in the
market price and interest rates of the underlying assets. Market risk is also subject to changes in liquidity and the volatility of
the markets. Credit risk refers to possible losses on the positions held by the Bank, which result from a counterparty’s failure
to perform according to the terms and conditions of the contract.
The Bank mainly applies a quantitative measurement method in order to capture market risk. The Bank monitors the
outstanding balance and profit and loss for each type of transaction on a daily basis. In addition, the Bank applies a “Value-at-
Risk” measurement method to transactions for which it is considered necessary to apply a more sophisticated method. The
Bank manages credit risk by establishing credit limits for counterparties. Reviews of the adequacy of established credit lines
are made on a regular basis and as deemed necessary.
(c) Risk management system of the Bank
The Bank exercises and controls the derivative transactions using limits including position limits, credit limits for each coun-
terparty and stop loss limits in accordance with the Bank’s policy on derivative transactions. Risks quantified are reported
to the department and the director responsible for monitoring the transactions and the board of directors. The front office
function and the back office function are segregated. The middle office is responsible for risk management and monitors
front and back offices’ compliance with regulations and internal rules.
Contract amounts or notional principal amounts of derivative financial instruments disclosed represent nominal contract
amounts or the notional principal amounts set up for the calculation of the settlement amounts. Generally, they do not
represent the amounts for which the actual assets are exchanged. These amounts do not represent, by themselves, the
volume of market risk and credit risk related to the underlying derivative financial instruments.
Notes to Consolidated Financial StatementsYears ended March 31, 2011 and 2010
The Higo Bank, Ltd. and Consolidated Subsidiaries

37The Higo Bank, Ltd. Annual Report 2011
(d) Fair value of derivative financial instruments
Derivative transactions to which hedge accounting were not applied as of March 31, 2011 and 2010
i) Interest rate related transactionsMillions of yen
2011
Contractual value or notional principal
amount
Including over one
yearFair
value
Unrealized gains
(losses)
Interest rate swaps:Receive floating and pay fixed ........................................... ¥2,913 ¥2,913 ¥(63) ¥(63)
Thousands of U.S. dollars2011
Contractual value or notional principal
amount
Including over one
yearFair
value
Unrealized gains
(losses)
Interest rate swaps:Receive floating and pay fixed ........................................... $35,033 $35,033 $(766) $(766)
Notes: 1. Derivative transactions shown above are stated at fair value in the accompanying consolidated financial statements. 2. Fair values of above derivatives are based on quoted market prices, such as those of the Tokyo Financial Exchange Inc. 3. Calculation on quotation of fair value of above derivatives are based on the discounted present value method or option pricing
models, etc.
Millions of yen2010
Contractual value or notional principal
amount
Including over one
yearFair
value
Unrealized gains
(losses)
Interest rate swaps:Receive floating and pay fixed ........................................... ¥2,913 ¥2,913 ¥(78) ¥(78)
Notes: 1. Derivative transactions shown above are stated at fair value in the accompanying consolidated financial statements. 2. Fair values of above derivatives are based on quoted market prices, such as those of the Tokyo Financial Exchange Inc. 3. Calculation on quotation of fair value of above derivatives are based on the discounted present value method or option pricing
models, etc.
ii) Foreign exchange related transactionsMillions of yen
2011
Contractual value or notional principal
amount
Including over one
yearFair
value
Unrealized gains
(losses)
Currency swaps .................................................................................. ¥23,909 ¥23,909 ¥ 49 ¥ 49Foreign exchange forward contracts:
Selling ................................................................................................ 18,165 678 (432) (432)Buying ............................................................................................... 2,958 670 12 12
Notes to Consolidated Financial StatementsYears ended March 31, 2011 and 2010
The Higo Bank, Ltd. and Consolidated Subsidiaries

38The Higo Bank, Ltd. Annual Report 2011
Thousands of U.S. dollars2011
Contractual value or notional principal
amount
Including over one
yearFair
value
Unrealized gains
(losses)
Currency swaps .................................................................................. $287,547 $287,547 $ 600 $ 600Foreign exchange forward contracts:
Selling ................................................................................................ 218,463 8,155 (5,199) (5,199)Buying ............................................................................................... 35,578 8,064 153 153
Notes: 1. Derivative transactions shown above are stated at fair value in the accompanying consolidated financial statements. 2. Calculation or quotation of fair value of above derivatives are based on the discounted present value method, etc.
Millions of yen2010
Contractual value or notional principal
amount
Including over one
yearFair
value
Unrealized gains
(losses)
Currency swaps .................................................................................. ¥26,817 ¥19,378 ¥953 ¥953Foreign exchange forward contracts:
Selling ................................................................................................ 1,406 181 (25) (25)Buying ............................................................................................... 782 180 19 19
Notes: 1. Derivative transactions shown above are stated at fair value in the accompanying consolidated financial statements. 2. Calculation or quotation of fair value of above derivatives are based on the discounted present value method, etc.
Derivative transactions to which hedge accounting were applied as of March 31, 2011 and 2010
i) Interest rate related transactionsMillions of yen
2011
Hedged
item
Contractual value or notional principal amount
Including over one
yearFair
value
Deferred methodInterest rate swaps:
Receive floating and pay fixed ...................................
Loans and Bills discounted
Available-for-sale securities
(Debt securities)
¥124,106 ¥114,955 ¥ (893)
Specific matching criteriaInterest rate swaps:
Receive floating and pay fixed ................................... Loans and Billsdiscounted
77,172 76,041 (2,576)
Notes to Consolidated Financial StatementsYears ended March 31, 2011 and 2010
The Higo Bank, Ltd. and Consolidated Subsidiaries

39The Higo Bank, Ltd. Annual Report 2011
Thousands of U.S. dollars2011
Hedged
item
Contractual value or notional principal amount
Including over one
yearFair
value
Deferred methodInterest rate swaps:
Receive floating and pay fixed ...................................
Loans and Bills discounted
Available-for-sale securities
(Debt securities)
$1,492,564 $1,382,502 $(10,749)
Specific matching criteriaInterest rate swaps:
Receive floating and pay fixed ................................... Loans and Billsdiscounted
928,106 914,509 (30,988)
Notes: 1. As for interest rate swaps shown above, deferred hedge accounting is applied in accordance with JICPA Industry Audit Committee Report No. 24.
2. Fair values of above derivatives are based on quoted market prices, such as those of the Tokyo Financial Exchange Inc. 3. Calculation or quotation of fair value of above derivatives are based on the discounted present value method or option pricing
models, etc.
Millions of yen2010
Hedged
item
Contractual value or notional principal amount
Including over one
yearFair
value
Deferred methodInterest rate swaps:
Receive floating and pay fixed ...................................
Loans and Bills discounted
Available-for-sale securities
(Debt securities)
¥76,294 ¥71,766 ¥ (58)
Specific matching criteriaInterest rate swaps:
Receive floating and pay fixed ................................... Loans and Billsdiscounted
92,866 80,908 (2,346)
Notes: 1. As for interest rate swaps shown above, deferred hedge accounting is applied in accordance with JICPA Industry Audit Committee Report No. 24.
2. Fair values of above derivatives are based on quoted market prices, such as those of the Tokyo Financial Exchange Inc. 3. Calculation or quotation of fair value of above derivatives are based on the discounted present value method or option pricing
models, etc.
ii) Foreign exchange related transactionsMillions of yen
2011
Hedged
item
Contractual value or notional principal amount
Including over one
yearFair
value
Deferred method
Foreign exchange forward contracts .....................Foreign currency
call loans anddue from banks
¥39,005 ¥(566)
Notes to Consolidated Financial StatementsYears ended March 31, 2011 and 2010
The Higo Bank, Ltd. and Consolidated Subsidiaries

40The Higo Bank, Ltd. Annual Report 2011
Thousands of U.S. dollars2011
Hedged
item
Contractual value or notional principal amount
Including over one
yearFair
value
Deferred method
Foreign exchange forward contracts .....................Foreign currency
call loans anddue from banks
$469,096 $(6,811)
Notes: 1. As for currency swaps shown above, deferred hedge accounting is applied in accordance with JICPA Industry Audit Committee Report No. 25.
2. Calculation or quotation of fair value of above derivatives are based on the discounted present value method, etc.
Millions of yen2010
Hedged
item
Contractual value or notional principal amount
Including over one
yearFair
value
Deferred method
Foreign exchange forward contracts .....................Foreign currency
call loans anddue from banks
¥60,010 ¥(1,444)
Notes: 1. As for currency swaps shown above, deferred hedge accounting is applied in accordance with JICPA Industry Audit Committee Report No. 25.
2. Calculation or quotation of fair value of above derivatives are based on the discounted present value method, etc.
18. Comprehensive Income
Other comprehensive income for the year ended March 31, 2010 consists of the following:Millions of yen
2010
Other comprehensive income:Unrealized gains (losses) on available-for-sale securities ............................................................................................................. ¥20,879Deferred gains (losses) on derivatives under hedge accounting ........................................................................................... 121Share of other comprehensive income in associates ..................................................................................................................... 6Total other comprehensive income .......................................................................................................................................................... ¥21,006
Total comprehensive income for the year ended March 31, 2010 comprises the following:Millions of yen
2010
Total comprehensive income attributable to:Owners of the parent.......................................................................................................................................................................................... ¥27,721Minority interests ................................................................................................................................................................................................... 135Total comprehensive income ....................................................................................................................................................................... ¥27,857
Notes to Consolidated Financial StatementsYears ended March 31, 2011 and 2010
The Higo Bank, Ltd. and Consolidated Subsidiaries
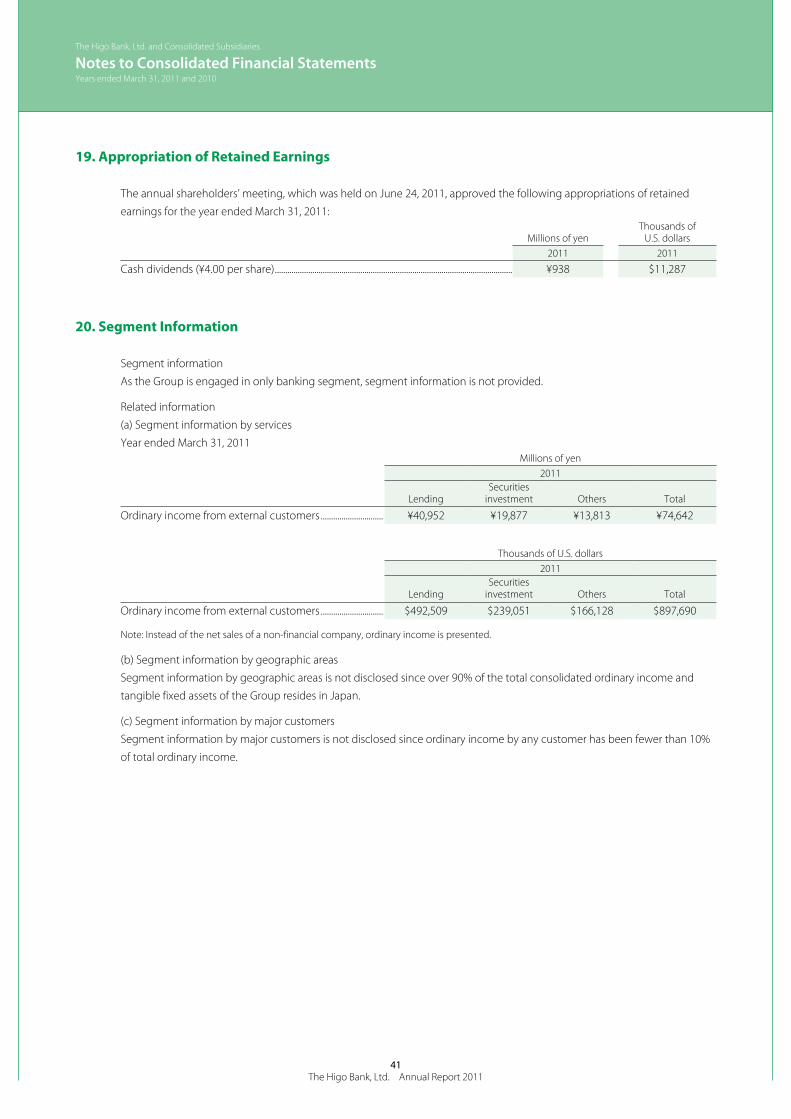
41The Higo Bank, Ltd. Annual Report 2011
19. Appropriation of Retained Earnings
The annual shareholders’ meeting, which was held on June 24, 2011, approved the following appropriations of retained
earnings for the year ended March 31, 2011:
Millions of yenThousands of
U.S. dollars2011 2011
Cash dividends (¥4.00 per share) .................................................................................................................. ¥938 $11,287
20. Segment Information
Segment information
As the Group is engaged in only banking segment, segment information is not provided.
Related information
(a) Segment information by services
Year ended March 31, 2011Millions of yen
2011
LendingSecurities
investment Others Total
Ordinary income from external customers .............................. ¥40,952 ¥19,877 ¥13,813 ¥74,642
Thousands of U.S. dollars2011
LendingSecurities
investment Others Total
Ordinary income from external customers .............................. $492,509 $239,051 $166,128 $897,690
Note: Instead of the net sales of a non-financial company, ordinary income is presented.
(b) Segment information by geographic areas
Segment information by geographic areas is not disclosed since over 90% of the total consolidated ordinary income and
tangible fixed assets of the Group resides in Japan.
(c) Segment information by major customers
Segment information by major customers is not disclosed since ordinary income by any customer has been fewer than 10%
of total ordinary income.
Notes to Consolidated Financial StatementsYears ended March 31, 2011 and 2010
The Higo Bank, Ltd. and Consolidated Subsidiaries

42The Higo Bank, Ltd. Annual Report 2011
Independent Auditors’ Report
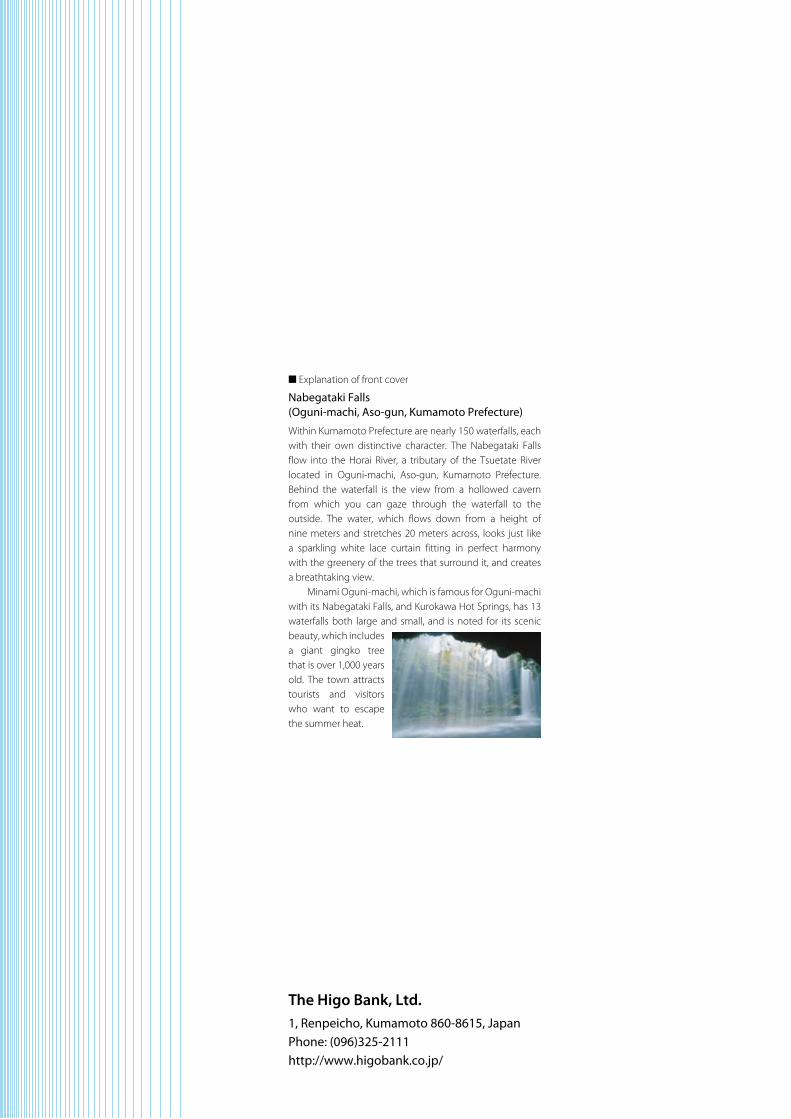
■ Explanation of front cover
Nabegataki Falls (Oguni-machi, Aso-gun, Kumamoto Prefecture)
Within Kumamoto Prefecture are nearly 150 waterfalls, each with their own distinctive character. The Nabegataki Falls flow into the Horai River, a tributary of the Tsuetate River located in Oguni-machi, Aso-gun, Kumamoto Prefecture. Behind the waterfall is the view from a hollowed cavern from which you can gaze through the waterfall to the outside. The water, which flows down from a height of nine meters and stretches 20 meters across, looks just like a sparkling white lace curtain fitting in perfect harmony with the greenery of the trees that surround it, and creates a breathtaking view. Minami Oguni-machi, which is famous for Oguni-machi with its Nabegataki Falls, and Kurokawa Hot Springs, has 13 waterfalls both large and small, and is noted for its scenic beauty, which includes a giant gingko tree that is over 1,000 years old. The town attracts tourists and visitors who want to escape the summer heat.
The Higo Bank, Ltd.1, Renpeicho, Kumamoto 860-8615, JapanPhone: (096)325-2111http://www.higobank.co.jp/