Annual Report 2011 AR 2011.pdf · Capitalization Ratio6 0.45x 0.41x figures in pesos 2011 2010 12...
70
2011 ANNUAL REPORT 1 KUO 2011 by UNLIMITED VISION Annual Report
Transcript of Annual Report 2011 AR 2011.pdf · Capitalization Ratio6 0.45x 0.41x figures in pesos 2011 2010 12...

2011 ANNUAL REPORT 1 KUO
2011
by
UNLIMITED VISION
Annual Report

IN A WORLD OF UNLIMITED POSSIBILITIES…
…there are always options for those who can act swiftly.
01 KUO2011 ANNUAL REPORT
At Grupo KUO, we look at things from many angles, always generating opportunities to find and apply creative solutions.

CHEMICAL
ELASTOMERS
DyNASOL
PLASTICS
MACRO-M
BIOENERGy
OTHERS
KUO AEROSPACE
CONSUMER
HERDEz DEL fUERTE
PORK MEAT
PARTICLE BOARD
AUTOMOTIVE
POWER SySTEMS
AfTERMARKET
Grupo KUO is an industrial and commercial holding company, with sales of approximately US $2.1 billion in 2011. The businesses in our portfolio hold a leadership position in the domestic and international markets where they compete across a range of industries. Grupo KUO has presence in more than 70 countries and employs more than 16,000 people from over 10 nationalities.
MISSION
To create value for our stakeholders sustainably and satisfactorily through the effective management of a dynamic business portfolio.
VISION
At Grupo KUO, we envision our growth and consolidation from the point of value creation, based on the following principles:
The pride we take in being socially responsible company that maintains a reputation of honesty, solidity and the ability to create value for stakeholders.Strong profitability of the company reflected in the sustainable generation of value by its businesses.The alliances we establish with our business partners and suppliers aimed at creating value for both parties.The satisfaction derived from exceeding customer’s expectations by being the best option in quality, service, innovation and technology.The strength that comes from being part of a world-class team of motivated professionals who see their constant readiness as a priority and who share Grupo KUO´s business objectives and values.An organization comprised of a dynamic portfolio of companies focused on creating sustainable value with an agile and flexible structure that can rapidly adapt to market demands.Our commitment to the communities where we operate, which is reflected in our active participation in their development.
Grupo KUO´s team consistently directs its actions and commitment towards the creation of value.
01 In a world of unlimited possibilities08 Letter from the Chairman and the CEO12 Where opportunities are multiplied14 We are reaching farther every day16 With a committed team18 We combine profitability and sustainability20 Executives21 Board of directors22 Committees23 Management’s discussion and analysis of results27 financial information

fINANCIAL HIGHLIGHTS
figures in millions of U.S. dollars1 2011 2010 2011 vs. 2010
Sales 2,157 1,784 21%
Exports2 1,027 829 24%
Result after General Expenses 127 98 30%
Operating Margin 6% 5%
EBITDA3 183 159 15%
Net Majority Result (Controlling Participation) 13 40 -68%
figures in millions of pesos 2011 2010 2011 vs. 2010
Sales 26,728 22,527 19%
Result after General Expenses 1,568 1,240 26%
Operating Margin 6% 6%
EBITDA3 2,260 2,008 13%
Net Majority Result (Controlling Participation) 130 506 -74%
Leverage Ratio4 2x 1.92x
Interest Coverage Ratio5 5.9x 5.9x
Capitalization Ratio6 0.45x 0.41x
figures in pesos 2011 2010
12 month Income per Share 0.28 1.11
Book Value per Share 12.73 11.20
Market Value per “B” Series Share 21.99 20.00
1 figures in U.S. dollars for this table for Sales, Result after General Expenses, EBITDA and Net Majority Result (Controlling Participation) are calculated on the basis of current pesos of each month divided by the average monthly exchange rate.
2 Export figures are calculated on the basis of actual sales invoiced in U.S. dollars.
3 The term EBITDA is used in this table according to the definition contained in our credit agreements: “Earnings after General Expenses before Depreciation and Amortization, before non-Cash items and including Pension Plan Liabilities” and is presented because the term provides useful information concerning our credit contracts. EBITDA should not be regarded as a substitute for profit or liquidity in our Consolidated Results Statement or any other financial Statement prepared in accordance with the fRS.
4 Debt-Cash / EBITDA for the last 12 months.
5 EBITDA for the last 12 months / Net Paid Interests for the last 12 months.
6 Debt for the last 12 months / Debt + Equity for the last 12 months.

2011 ANNUAL REPORT 02 KUO
WHERE OPPORTUNITIES ARE MULTIPLIED…

03 KUO2011 ANNUAL REPORT
…through acquisitions and strategic investments that lay the foundations for sustainable growth.

2011 ANNUAL REPORT 04 KUO
WE ARE REACHING FARTHER EVERY DAY…

05 KUO2011 ANNUAL REPORT
…by becoming global producers that can export technological know-how to other continents.

2011 ANNUAL REPORT 06 KUO
WITH A COMMITTED TEAM OF PEOPLE.

07 KUO2011 ANNUAL REPORT
Thanks to our people, we improve our results year after year.

2011 ANNUAL REPORT 08 KUO
We completed some major acquisitions in different industries that had one thing in common: they expanded our supply of products and sharpened our strategies on specialization, flexibility and service, which have characterized our performance in recent years and have consolidated our leadership.
In the Consumer Sector, the JV Herdez Del Fuerte completed three key transactions: the acquisition of Fresherized Foods through our subsidiary MegaMex in the United States, the purchase of 50% of the organic food company Aires de Campo®, and of the tuna boat Conquista. These acquisitions give us more opportunities to participate in a high-value U.S. market, establish our presence in the organic products market, which has a sizable growth potential in both domestic and foreign markets, and improve our profit margins, now that we can supply close to 90% of the volume of tuna for our brand name products.
To support the growth of this JV and improve service to our clients, we opened a new semi-automated distribution center in Teoloyucan, State of Mexico, with the capacity to move much more merchandise than any of our current facilities.
Our subsidiaries in the Automotive Sector have also been highly active in acquisitions. With the purchase of the FRITEC® brand aftermarket brake business, a leading Mexican manufacturer and with a strong presence
TO OUR SHAREHOLDERS, PARTNERS AND CLIENTS
2011 has been a very satisfactory year for Grupo KUO. Despite the challenges of a changing environment, our unlimited vision and keen focus on detecting new opportunities in high-potential global markets delivered not only very positive results but complemented our business portfolio, which gives us lasting solidity.
Fernando Senderos Mestre
09 KUO2011 ANNUAL REPORT
in export markets, the Aftermarket SBU bolstered its leadership in the spare parts market, as it can now offer clients a wider range of products and an increasingly differentiated service.
The Power Systems SBU incorporated dual-clutch transmission systems, placing it at the forefront of automotive technology with a type of transmission that combines greater fuel efficiency and superior driving comfort.
Our productive investments during the year also went to expanding and modernizing facilities in several of our business units, to technological research and development, and to various strategic projects that will contribute to sustained growth in the future.
In our Pork Meat SBU, the expansion of farms and processing plants, efficient management, and the opening of new MaxiCarne® stores propelled strong performance, despite an increase in grain prices resulting from the peso’s depreciation against the U.S. dollar. Another factor in the success of this SBU was an increase in exports to both Japan and Korea, which earned us the 2011 National Export Award.
In the Chemical Sector, the Elastomers SBU had a very good year, the result of implementing a project to develop specialty synthetic rubbers for the tire industry and optimizing production capacity through the use of dedicated production lines to manufacture its products.
Sales in the Plastics SBU increased in response to growing demand in key segments of the Mexican market coupled with stronger export performance, primarily to the United States and Latin America. At the same time, it continued to invest in researching higher value-added specialties that can improve profit margins.
We continue to support research and development in alternative technologies through our most recently created SBUs, Macro-M and Bioenergy. In 2011, the Bioenergy SBU validated its integral project to produce biofuel based on jatropha oil, a crop that thrives on non-farming land, and which has tremendous potential to contribute to a sustainable future.
All of the above proves that Grupo KUO has a solid and diversified base of products that have made it a major global seller. But our challenge going forward is to grow our share of international markets and become global producers.
Our recently-formed alliances with companies in China and India will allow us to venture further into fast-growing Asian markets. In China, the huge demand for synthetic rubber—both nitrile rubber and synthetic rubber in solution—and our joint ventures with GPRO Synthetic Rubber Co. Ltd. and Shanxi Northern Xing’an Chemical Industry Co. Ltd. not only open the doors to this growing market but provide a unique opportunity to export our technology and commercial experience supported by a guaranteed supply of raw material.

2011 ANNUAL REPORT 10 KUO
Furthermore, addressing the needs of the growing South Asian automotive market, we signed an agreement with the Indian firm Divgi Metalwares Pvt. Ltd. to create a JV in that country to assemble and sell manual transmissions and other components for cars and commercial vehicles. As in the former cases, Grupo KUO will export technology and know-how, while Divgi will contribute its commercial experience.
Besides fueling productive operations with acquisitions and fixed asset investments, we focused on developing our human capital, an invaluable component of our success. Our first-rate team is largely the reason we were able to deliver such positive results.
With all of this, despite the international economic turbulence that prevailed in the second half of the year, Grupo KUO’s actions were reflected in a year of excellent financial results. Revenues totaled US $2.1 billion, 21% more than the year before. EBITDA totaled US $183 million, 15% more than in 2010. We also strengthened the Group’s financial position by maintaining most of our debt at long term and competitive interest rates, which gives us the freedom to invest in consolidating our growth.
Juan Marco Gutiérrez Wanless
11 KUO2011 ANNUAL REPORT
Grupo KUO kept up a steady cash flow from operations, enough to finance our investments during the year. However, to ensure our capacity to meet our goals even under adverse economic circumstances, we negotiated committed lines of credit with various financial institutions that will be available throughout 2012.
We are proud to mention that because of our strict compliance with financial commitments and sound financial position, we received credit rating upgrades from the main rating agencies, while our stock price rose 10% during the year—from $20.00 pesos to $21.99 pesos—a sign of investors’ confidence in our ability to deliver consistent results.
Regarding to sustainability, we remain committed to operating in a manner respectful to the environment, continually developing new environmentally-friendly products, and acting as a socially responsible company by helping to improve conditions in the communities that surround our facilities.
After a year of opening ourselves to new options that strengthen our long-term strategy, our unlimited vision gives us the confidence that we have the technological and financial capacity to face the challenges of a possible recessive climate in the future, buttressed by the commitment of our valued team and by the trust and decisive support of our shareholders, partners, clients and suppliers. To all of you, we express our most heartfelt gratitude.
Fernando Senderos MestreChairman of the Board of Directors
Juan Marco Gutiérrez WanlessChief Executive Officer
In compliance with legal requirements and corporate bylaws, the Board of Directors of Grupo KUO carried out its responsibilities in 2011, having reviewed and approved the reports corresponding to this fiscal year, the external audit opinion and the executive management, concluding that the information contained therein reasonably reflects the progress, financial position and results of the company during this period.
2011 ANNUAL REPORT 12 KUO
…THROUGH ACqUISITIONS AND STRATEGIC PARTNERSHIPS THAT ExTEND OUR LEADERSHIP INTO NEW MARkETS.
WHERE OPPORTUNITIES ARE MULTIPLIED…
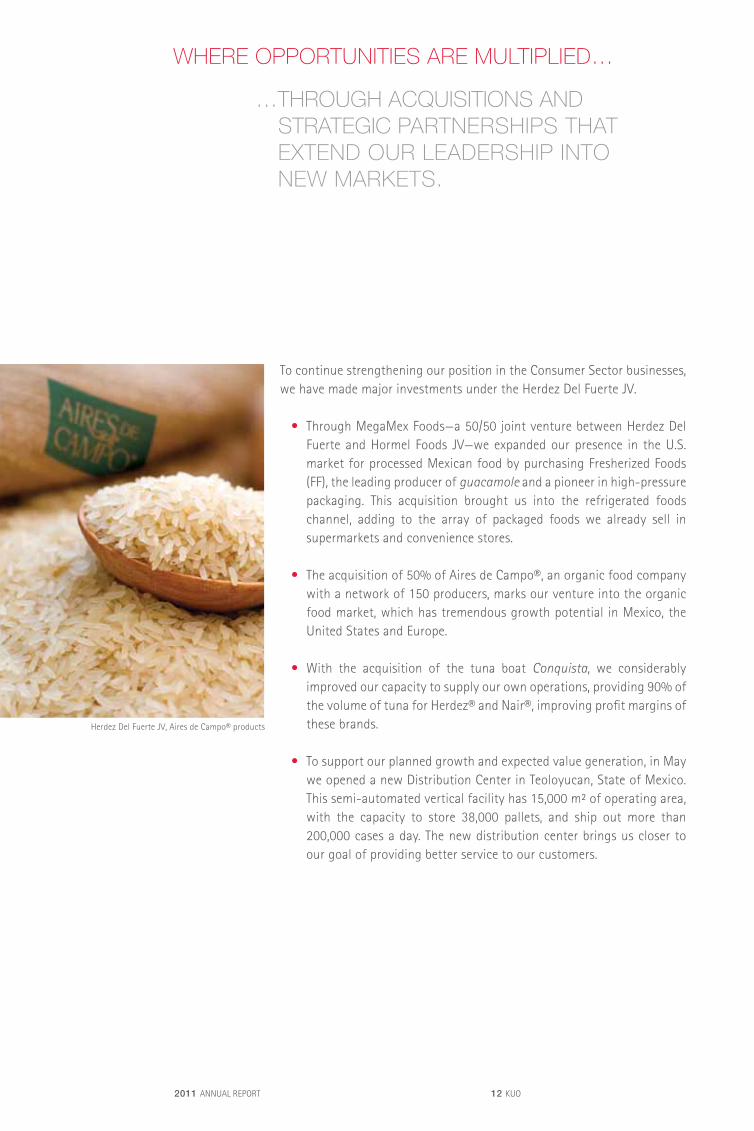
To continue strengthening our position in the Consumer Sector businesses, we have made major investments under the Herdez Del Fuerte JV.
• Through MegaMex Foods—a 50/50 joint venture between Herdez Del Fuerte and Hormel Foods JV—we expanded our presence in the U.S. market for processed Mexican food by purchasing Fresherized Foods (FF), the leading producer of guacamole and a pioneer in high-pressure packaging. This acquisition brought us into the refrigerated foods channel, adding to the array of packaged foods we already sell in supermarkets and convenience stores.
• The acquisition of 50% of Aires de Campo®, an organic food company with a network of 150 producers, marks our venture into the organic food market, which has tremendous growth potential in Mexico, the United States and Europe.
• With the acquisition of the tuna boat Conquista, we considerably improved our capacity to supply our own operations, providing 90% of the volume of tuna for Herdez® and Nair®, improving profit margins of these brands.
• To support our planned growth and expected value generation, in May we opened a new Distribution Center in Teoloyucan, State of Mexico. This semi-automated vertical facility has 15,000 m² of operating area, with the capacity to store 38,000 pallets, and ship out more than 200,000 cases a day. The new distribution center brings us closer to our goal of providing better service to our customers.
Herdez Del Fuerte JV, Aires de Campo® products
13 KUO2011 ANNUAL REPORT
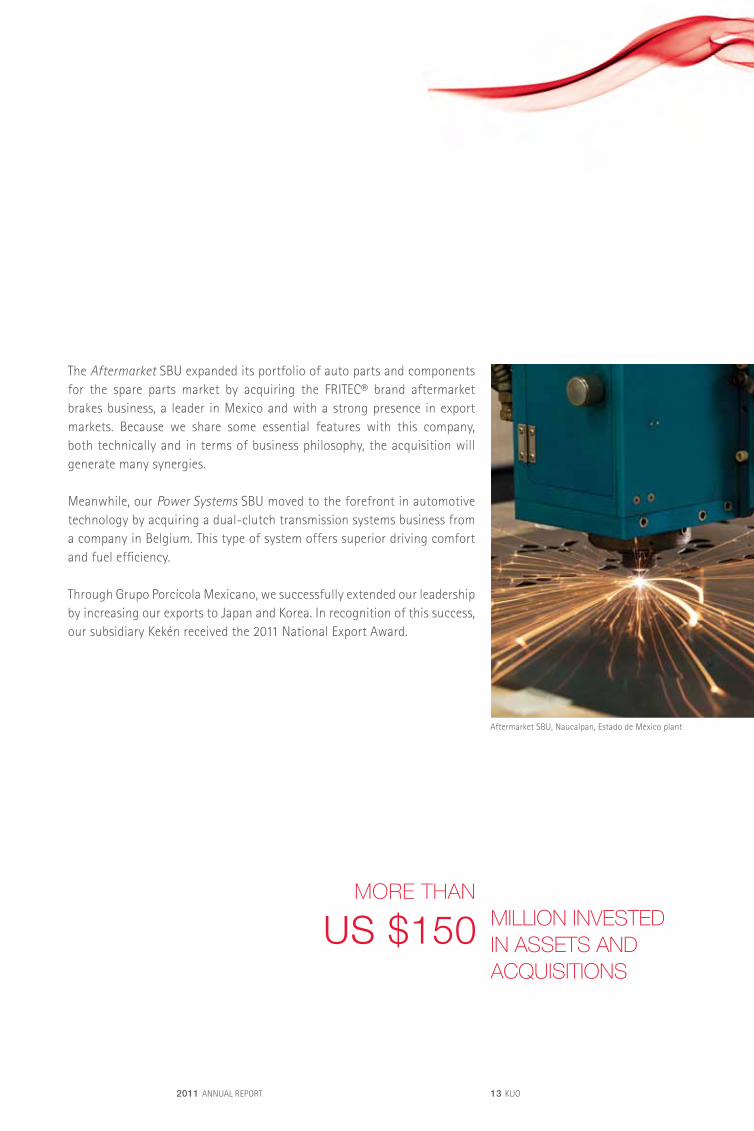
The Aftermarket SBU expanded its portfolio of auto parts and components for the spare parts market by acquiring the FRITEC® brand aftermarket brakes business, a leader in Mexico and with a strong presence in export markets. Because we share some essential features with this company, both technically and in terms of business philosophy, the acquisition will generate many synergies.
Meanwhile, our Power Systems SBU moved to the forefront in automotive technology by acquiring a dual-clutch transmission systems business from a company in Belgium. This type of system offers superior driving comfort and fuel efficiency.
Through Grupo Porcícola Mexicano, we successfully extended our leadership by increasing our exports to Japan and Korea. In recognition of this success, our subsidiary Kekén received the 2011 National Export Award.
Aftermarket SBU, Naucalpan, Estado de México plant
MILLION INVESTED IN ASSETS AND ACqUISITIONS
MORE THAN
US $150

2011 ANNUAL REPORT 14 KUO
…bY POSITIONING OURSELVES AS GLObAL PRODUCERS WHILE
STRENGTHENING OUR LEADERSHIP AS A GLObAL SELLER.
WE ARE REACHING FARTHER EVERY DAY…
Furthering our strategy of bolstering our presence in the fast-growing markets of Asia, where demand is already strong for some of our products, we have formed joint ventures to build plants in China and India.
In China, in the province of Liaoning, we began the construction of a 100,000 metric tons plant to manufacture synthetic rubber in solution under a joint venture between Dynasol (in turn a JV between Grupo KUO and Repsol) and the Chinese company Shanxi Northern Xing’an Chemical Industry Co. Ltd. This project requires a total investment of about US $225 million, 25% to be contributed by Grupo KUO, which will also supply technology and its commercial and operating experience, in a plant similar to its current facilities in Altamira, Tamaulipas.
Also in China, which buys more nitrile butadiene rubber than any other country in Asia, we established the company INSA GPRO Synthetic Rubber Co. Ltd. to set up a plant in Nanjing, with an investment of US $60 million and an initial production capacity of 30,000 metrics tons per year. This plant, slated for startup in 2012, will supply this market and other Asian countries. It will be equipped with innovative Mexican technology developed specifically to produce high-specialty rubbers for use in the automotive products, footwear, adhesives and sealants, among others, giving us a more competitive position in the market.
Elastomers SBU, Altamira, Tamaulipas plant

15 KUO2011 ANNUAL REPORT
Besides strengthening our global presence as a producer through joint ventures, we fortified Grupo KUO’s position as a global seller through several companies in the Chemical Sector.
The Elastomers SBU had a very good year because it was able to respond in a key moment of heavy demand fueled by a boom in the automotive and tire industries, a shortage of product on international markets and the high price of natural rubber. Besides these factors, this SBU has the advantage of its industry experience and market know-how. Also, it has a portfolio of synthetic rubber in emultion, which currently includes 140 products that are used in industries ranging from automotive production to food packaging and chewing gum.
The Plastics SBU, a leader in the polystyrene market with a wide range of specialty chemicals, had a very good year, so we plan to continue promoting the supply of specialty products with higher added value and better profit margins.
Another major agreement was the one we signed with Divgi Metalwares Pvt. Ltd. in India, a country whose automotive industry has huge development potential. This JV, which will assemble and sell manual transmissions and other components for cars and commercial vehicles in India, will give us access to a region where the automotive industry is growing at a speedy pace.
Power Systems SBU, Pedro Escobedo, Querétaro plant
WE HAVE PRESENCE IN
OVER 70 coUntrieS

2011 ANNUAL REPORT 16 KUO
WITH A COMMITTED TEAM.
Corpotate Headquarters, Mexico City Shared Services Center Offices, Querétaro
bEHIND GRUPO kUO’S FINANCIAL AND TECHNOLOGICAL SOLIDITY STANDS A MULTICULTURAL COMMITTED TEAM WITH STRONG VALUES.
EMPLOYEES OF MORE THAN 10 NATIONALITIES
16,652

17 KUO2011 ANNUAL REPORT
A multicultural talent for excellence in all the differing degrees of technological specialization required in our businesses sustains our leadership in various industries, as well as the quality of the service we provide to our end users.
Our strategic alignment allows us to identify and adjust processes, procedures, skills, abilities and know-how for each business that integrates Grupo KUO—from basic to cutting-edge technology, and from capital to labor-intensive processes—so training can be adjusted to suit the specific needs of each business unit.
We place a high priority on identifying, developing and promoting human capital, making our employees part of a system that prepares them to take on increasing responsibilities. Proof of our success is the high proportion of employees who make a career in the Group, some of whom came in as interns and now occupy top management positions.
Because of this platform that combines talent and a strategically differentiated portfolio, in 2011 Grupo KUO reported growth of 21% in consolidated sales and 15% in EBITDA. We also strengthened the Group’s financial position by maintaining most of our debt at long term and competitive interest rates, and generating enough cash flow to fund our acquisitions.
It is no surprise that we have been able to make a profit in a changing world. We have worked steadily to apply our vision for several years, managing our investments and divestitures according to a clear strategy.
Our investments in fixed assets, which totaled approximately US $150 million, were aligned with our strategy of entering or growing in certain industries and promoting organic growth in some business units.
It is also worth noting that, despite uncertainty in the markets and the risk aversion that prevailed throughout the year, our stock price grew 10% over the close of 2010.
Another achievement of the year was receiving credit rating upgrades from the main rating agencies, reflecting the confidence we have earned through consistent results, a sound financial position and a proven capacity to meet our financial commitments.
2011 ANNUAL REPORT 18 KUO
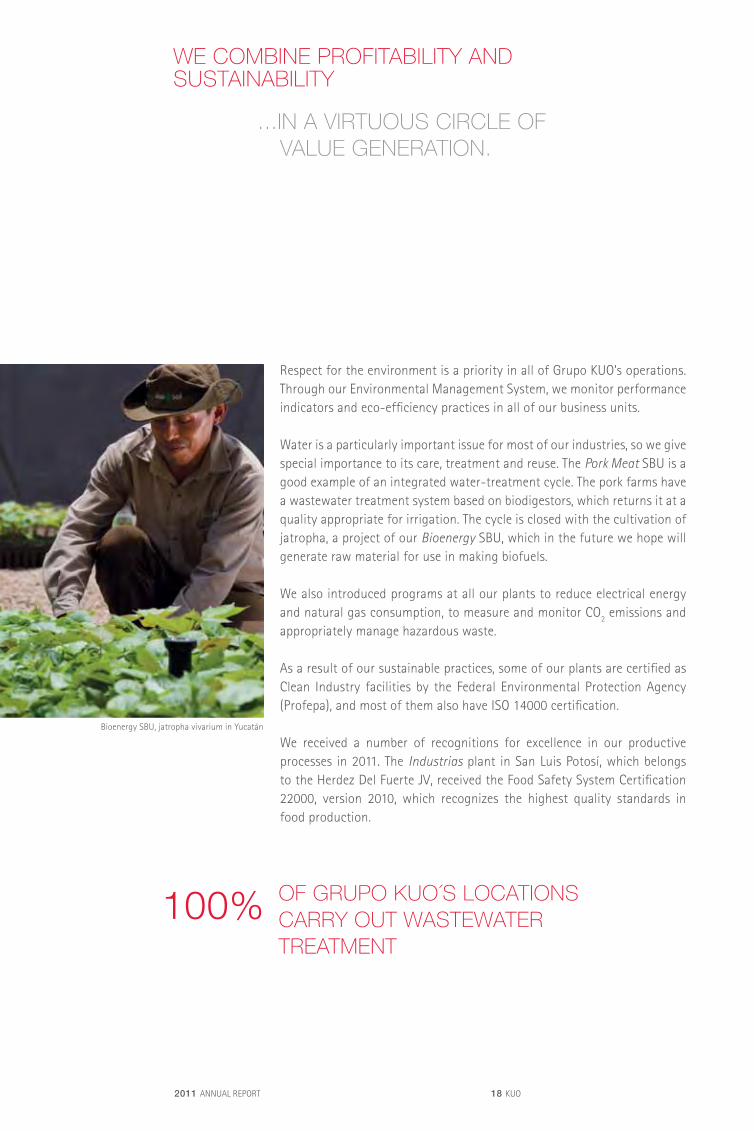
Respect for the environment is a priority in all of Grupo KUO’s operations. Through our Environmental Management System, we monitor performance indicators and eco-efficiency practices in all of our business units.
Water is a particularly important issue for most of our industries, so we give special importance to its care, treatment and reuse. The Pork Meat SBU is a good example of an integrated water-treatment cycle. The pork farms have a wastewater treatment system based on biodigestors, which returns it at a quality appropriate for irrigation. The cycle is closed with the cultivation of jatropha, a project of our Bioenergy SBU, which in the future we hope will generate raw material for use in making biofuels.
We also introduced programs at all our plants to reduce electrical energy and natural gas consumption, to measure and monitor CO
2 emissions and appropriately manage hazardous waste.
As a result of our sustainable practices, some of our plants are certified as Clean Industry facilities by the Federal Environmental Protection Agency (Profepa), and most of them also have ISO 14000 certification.
We received a number of recognitions for excellence in our productive processes in 2011. The Industrias plant in San Luis Potosí, which belongs to the Herdez Del Fuerte JV, received the Food Safety System Certification 22000, version 2010, which recognizes the highest quality standards in food production.
Bioenergy SBU, jatropha vivarium in Yucatán
WE COMbINE PROFITAbILITY AND SUSTAINAbILITY
...IN A VIRTUOUS CIRCLE OF VALUE GENERATION.
OF GRUPO kUO´S LOCATIONS CARRY OUT WASTEWATER TREATMENT
100%
19 KUO2011 ANNUAL REPORT
Also this year, Grupo KUO’s subsidiary Kekén received the National Agro-Food Award for the third year in a row from the President of Mexico and the Ministry of Agriculture (Sagarpa) in recognition of its production processes and merchandising of pork meat.
Because we are a Socially Responsible Company, we place great importance on education. Within the company we support our unionized personnel with programs that encourage them to complete their high school and preparatory school studies. We also provide scholarships for the children of employees that show academic excellence, among other activities.
Grupo KUO does not limit itself to supporting learning and excellence within the company; we also extend this concern to the communities neighboring our operations. We sponsor courses for the integral education of children, young people and adults in vulnerable communities. Furthermore, during the year, we made a number of donations to philanthropic organizations, foundations and endowments that promote community development.
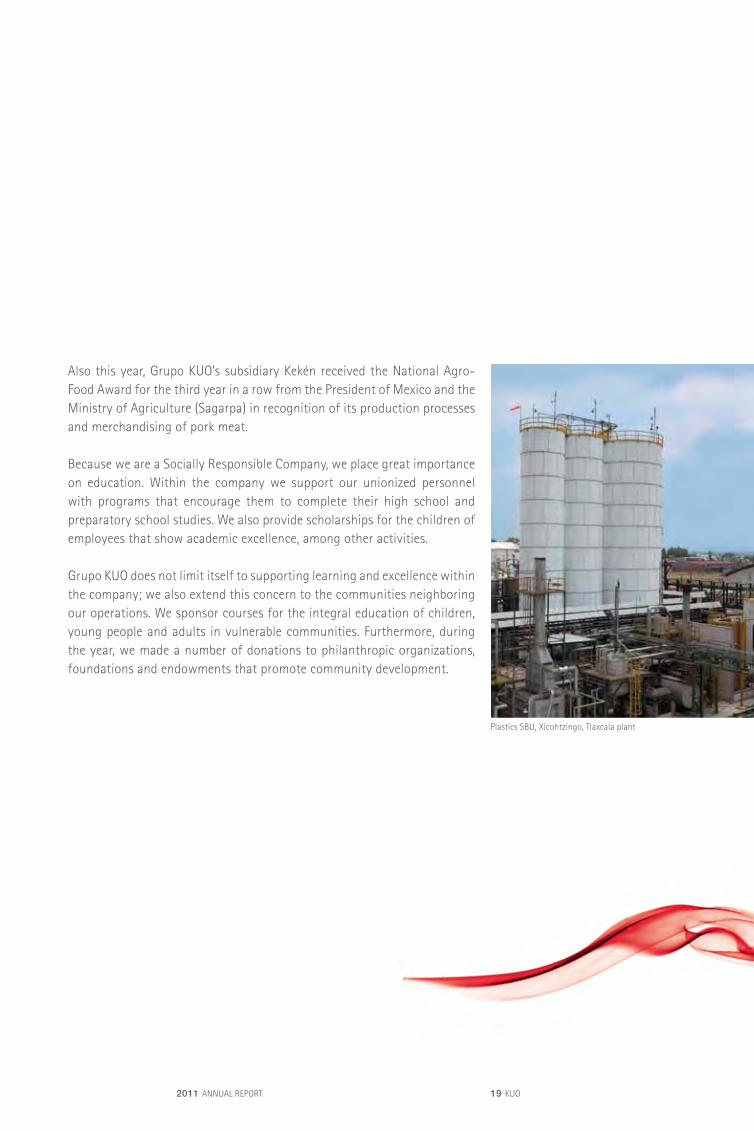
Plastics SBU, Xicohtzingo, Tlaxcala plant

2011 ANNUAL REPORT 20 KUO
Juan Marco Gutiérrez Wanless Chief Executive Officer
Alejandro de la Barreda Gómez Director of Operational Control
Ramón F. Estrada Rivero Director of Legal Affairs
Marco Antonio López Domínguez Chief Human Resources Officer
Adrián Ramírez Verdugo Chief Technology Officer
Marisol Vázquez-Mellado Mollón Chief Financial and Administration Officer
Eloy Vega Vera Director of Internal Audit
Benjamín Centurión Díaz Director SBU: Aftermarket
Claudio Freixes Catalán Director SBU: Pork Meat
Alfonso González Montiel Director SBU: Macro-M
Héctor Hernández-Pons Torres Director JV: Herdez Del Fuerte
Ignacio Marco Arboli Director SBU: Dynasol
Robert Anthony Neal* Director SBU: Power Systems
Roger Patrón González Director SBU: Particle Board
José Luis Pérez Fernández Director SBU: Bioenergy
César Ramos Valdés Director SBU: Plastics
Felipe Varela Hernández Director SBU: Elastomers
* Also responsible for KUO Aerospace
EXECUTIVES
21 KUO2011 ANNUAL REPORT
BOARD OF DIRECTORS
DIRECTORS ‘A’ SERIES
Fernando Senderos MestreChairman of the Board of Directorsand Chairman of the ExecutiveCommittee of Grupo KUO, S.A.B. deC.V. and DINE, S.A.B. de C.V.First elected in 1989*
Alberto Baillères González (I)Chairman of the Executive Committeeand Chairman of the Board of Directorsof Grupo Bal.First elected in 1973
Federico Fernández SenderosChairman of Grupo Sim, S.A. de C.V.First elected in 1993
Carlos Gómez y GómezChairman of the Board of Directors ofGrupo Financiero Santander.First elected in 1974
Juan Marco Gutiérrez WanlessChief Executive Officer of Grupo KUO,S.A.B. de C.V.First elected in 2007
Víctor Rivero Martín (I)Chief Executive Officer of Telehotel, S.A. de C.V.First elected in 2008
Ernesto Vega Velasco (I)Independent Business Consultant.First elected in 1976
(I) Independent Directors * Don Fernando Senderos Mestre was elected Director in 1974; in 1989 was elected Chairman of the Board of
Directors of DESC, Sociedad de Fomento Industrial, S.A. de C.V. (now Grupo KUO, S.A.B. de C.V.)
DIRECTORS ‘B’ SERIES
Rubén Aguilar Monteverde † (I)Independent Business Consultant.First elected in 1978
Andrés Baños SamblancatChief Executive Officer of DINE, S.A.B. de C.V.First elected in 2007
José Manuel Canal Hernando (I)Independent Business Consultant and Consultant on Corporate Governance Issues.First elected in 2006
Valentín Díez Morodo (I)Chairman of Grupo Nevadi Internacional,S.A. de C.V.First elected in 1999
Prudencio López Martínez (I)Chairman of the Board of Directorsof Sanvica, S.A. de C.V.First elected in 1982

2011 ANNUAL REPORT 22 KUO
CORPORATE PRACTICES COMMITTEE
Valentín Díez Morodo President
Víctor Rivero MartínErnesto Vega Velasco
AUDIT COMMITTEE
Prudencio López Martínez President
Rubén Aguilar Monteverde †José Manuel Canal HernandoErnesto Vega Velasco
EXECUTIVE COMMITTEE
Fernando Senderos MestrePresident
Federico Fernández SenderosJuan Marco Gutiérrez Wanless
Secretary of the Board of Directors
Ramón F. Estrada Rivero
COMMITTEES
23 KUO2011 ANNUAL REPORT
MANAGEMENT’S DISCUSSION AND ANALYSIS OF RESULTSAs of December 31, 2011
Except for the determination of EBITDA, all the figures in this section have been prepared in accordance with the Mexican Financial Reporting Standards (FRS) and are expressed in Mexican pesos ($) and U.S. dollars (US $) as indicated. The dollar figures are calculated by dividing current pesos of each month by the monthly average exchange rate. Export figures are determined on the basis of Actual Sales invoiced in U.S. dollars. Unless otherwise indicated, all percentage changes refer to 2011 figures compared to 2010.
The term EBITDA is used in this section according to the definition of our credit agreements: “Earnings after General Expenses before Depreciation and Amortization before non-Cash items and including Pension Plan Liabilities.” EBITDA should not be regarded as a substitute for profit or liquidity in our Consolidated Results Statement or any other Financial Statement prepared in accordance with the FRS.
TABLE 1. CONSOLIDATED RESULTSGrupo KUO, S.A.B. de C.V. and Subsidiaries(Figures in millions of U.S. dollars and millions of pesos)
2011 2010
Sales US$ 2,157 $ 26,728 US$ 1,784 $ 22,527
Exports 1,027 829
Results after general expenses 127 1,568 98 1,240
EBITDA 183 2,260 159 2,008
Controlling interest 13 130 40 506
Consolidated sales in dollars grew 21% over 2010, totaling US $2.16 billion, due to higher sales at KUO Chemical (30%), at KUO Consumer (18%) and KUO Automotive (4%). Export sales totaled US $1.03 billion and accounted for 48% of total sales, 2 percentage points higher than the 46% share reported the year before.
In peso terms, consolidated sales were 19% higher than in 2010, totaling $26.73 billion, because of higher sales at KUO Chemical (27%), at KUO Consumer (16%) and KUO Automotive (2%).
In dollars, results after general expenses and EBITDA were 30% and 15% higher, respectively, than in 2010, at US $127 million and US $183 million. In peso terms, these lines were 26% and 13% higher, respectively, totaling $1.57 billion and $2.26 billion. This was due primarily to the above-mentioned rise in sales, operating process efficiency and a focus on specialty products that bring higher margins, partially offset by a rise in the price of our most important raw materials.
In 2011, KUO Consumer accounted for 41% of consolidated EBITDA in dollars, KUO Chemical 40%, and KUO Automotive 19%.
Other expenses (net) totaled US $12 million ($143 million) due primarily to provisions for the payment of employee profit-sharing (PTU) and impairment charges for discontinued assets.
Comprehensive financing result in 2011 was a charge of US $99 million ($1.29 billion), primarily because of the peso’s devaluation against the dollar (a charge of US $49 million), from $12.3571 pesos per dollar at year-end 2010 to $13.8483 pesos at the close of 2011, in addition to US $50 million in net financial expenses. Note that much of the foreign-exchange loss was a non-cash entry, because most of our debt expires over the long term.

2011 ANNUAL REPORT 24 KUO
Income taxes in 2011 were a positive US $2 million, due to the favorable deferred tax of US $31 million generated by the activation of tax losses, because of better results by the businesses that held them in reserve, partially compensated by the income tax incurred of US $29 million originated by the period’s profits.
Net majority result (controlling participation) was US $13 million in 2011 ($130 million), even though the exchange rate rose by about 1.50 pesos per dollar, equivalent to a foreign-exchange loss of US $49 million. This was due primarily to profit generated in operations, partially offset by the comprehensive financing result.
TABLE 2. KUO CONSUMER(Figures in millions of U.S. dollars and millions of pesos)
2011 2010
Sales US$ 749 $ 9,312 US$ 636 $ 8,030
Exports 207 137
Results after general expenses 54 670 42 534
Operating margin 7% 7%
EBITDA 74 921 60 761
TABLE 3. BRANDED PRODUCTS(Figures in millions of U.S. dollars and millions of pesos)
2011 2010
Sales US$ 439 $ 5,459 US$ 394 $ 4,976
Results after general expenses 36 448 28 350
Operating margin 8% 7%
EBITDA 50 616 40 509
Note: The company MegaMex Foods, LLC (MegaMex) has a financial reporting schedule in the United States that results in some monthly figures being available at a date later than the closing of books at the Herdez Del Fuerte JV. Therefore, and as permitted by the Financial Reporting Standards, we opted to consolidate these companies with a one month lag, starting in 4Q11. This change will have a one-time impact, as only two months of MegaMex operations were consolidated during that quarter.
Sales of Branded Products in peso terms rose 10% from 2010, totaling $5.46 billion. This reflects an 11% increase in sales at the Herdez Del Fuerte JV (50% Joint Venture between KUO and Grupo Herdez, S.A.B. de C.V.), primarily because of a rise in exports to the United States, and, on the domestic front, the strong performance of the “Embasa®”, “Doña María®”, “Blasón®” and “Ocean Spray®” brands, and the distribution of Reynolds brand products. These results were complemented by the incorporation of Don Miguel Foods and Fresherized Foods operations (See footnote to Table 3). Additionally, the Particle Board SBU reported a 4% increase in sales, spurred on by a rise in exports to the U.S.A.
Dollar sales of Branded Products in 2011 totaled US $439 million, which is 11% higher than the US $394 million reported in 2010.
The result after general expenses and EBITDA in peso terms increased by 28% and 21%, respectively, over the 2010 figures. The growth was driven by a rise in profits at the Herdez Del Fuerte JV resulting from stronger sales, adequate control over operating expenses, and the integration of the operations mentioned above.
In dollar terms, result after general expenses and EBITDA increased by 29% and 25%, respectively.

2011 ANNUAL REPORT 25 KUO
TAbLE 4. PORK MEAT SbU(Figures in millions of U.S. dollars and millions of pesos)
2011 2010
Sales US$ 310 $ 3,852 US$ 242 $ 3,055
Results after general expenses 18 222 15 184
Operating margin 6% 6%
EbITDA 24 306 20 252
Sales in peso terms rose 26%, from $3.05 billion in 2010 to $3.85 billion in 2011, mainly because of higher volume and prices in both domestic and export markets, and stronger exports to Japan and Korea, which earned us the National Export Award for 2011. In the domestic market, we covered demand through new store openings and our distribution channels. In dollar terms, sales were 28% higher than in 2010, at US $310 million. The Pork Meat SbU continued its strategy of diversifying sales channels through an increasing presence in export markets while, on the domestic front, it opened 30 new stores in 2011, closing the year with a total of 170 in operation, strengthening its business position in high-value segments of the market.
Results after general expenses and EbITDA both rose 21% in peso terms, reflecting a rise in domestic and export sales, which partially offset the 43% rise in grain prices and 11% in the price of soy paste. In dollar terms, results after general expenses and EbITDA grew 20% (in both cases) over 2010, totaling US $18 million and US $24 million, respectively.
TAbLE 5. KUO ChEMICAL(Figures in millions of U.S. dollars and millions of pesos)
2011 2010
Sales US$ 1,076 $ 13,293 US$ 826 $ 10,437
Exports 632 500
Results after general expenses 55 672 39 496
Operating margin 5% 5%
EbITDA 73 890 62 781
KUO Chemical reported sales of US $1.08 billion for 2011, 30% higher than in 2010. The advance was fueled by a rise of about 27% in sales prices in all the SbUs, responding to increased costs on raw materials, combined with a 3% increase in sales volume; mainly in the Elastomers SbU, where demand was stronger from the tire refurbishing market and rubber industry, and in the Plastics SbU, also because of higher requirements from key sectors of the domestic market, and better export performance, primarily toward the U.S.A. and Latin America.
Peso sales totaled $13.29 billion, 27% more than the $10.44 billion reported one year earlier.
In dollars, the result after general expenses grew 41% over 2010, while EbITDA was 18% higher, attributable to higher sales, adequate expense controls, efficiencies, process improvements, consolidation of new markets, and a focus on higher-margin specialty products. These effects made up for part of the impact of rising prices on raw materials—54% for butadiene, 15% for styrene, 11% for acrylonitrile and 36% for conversion oil.
In pesos, results after general expenses rose 35% and EbITDA 14%, to $672 million and $890 million, respectively.

2011 ANNUAL REPORT 26 KUO
TAbLE 6. KUO AUTOMOTIvE(Figures in millions of U.S. dollars and millions of pesos)
2011 2010
Sales US$ 325 $ 4,025 US$ 313 $ 3,959
Exports 187 193
Results after general expenses 20 250 19 246
Operating margin 6% 6%
EbITDA 35 431 35 439
Sales in dollars by KUO Automotive were US $325 million in 2011, an increase of 4% over the US $313 million reported in 2010. This was the product of higher sales in the domestic and export markets in the Aftermarket SbU, due to an increased market share, the signing of new clients and integration of new applications; as well as a rise in sales of auto components and spare parts by the Power Systems SbU. In peso terms, KUO Automotive sales totaled $4.02 billion in 2011, 2% more than in 2010.
For 2011, the result after general expenses in dollar terms was US $20 million, 5% higher than the 2010 figure, and EbITDA was unchanged from its year-earlier level. This was due to a rise in sales volume and satisfactory expense controls, which offset an 11% rise in the price of steel.
In peso terms, the result after general expenses grew 2%, while EbITDA declined 2%.
Grupo KUO, S.A.b. de C.v. and Subsidiaries
Consolidated financial statements for the years ended December 31, 2011 and 2010, and independent auditors’ report dated February 8, 2012.
28 Letter of the audit committee
30 Letter of the corporate practices committee
32 Independent auditors’ report
34 Consolidated statements of financial position
35 Consolidated statements of operations
36 Consolidated statements of changes in stockholders’ equity
38 Consolidated statements of cash flows
39 Notes to consolidated financial statements
27 KUO2011 ANNUAL REPORT

2011 ANNUAL REPORT 28 KUO
Mexico City, February 21st, 2012.
To the board of Directors of Grupo KUO, S.A.b. de C.v.P r e s e n t
Pursuant to the provisions of article 43 subparagraph I of the Securities Market Law (Ley del Mercado de Valores) and the corporate bylaws of Grupo KUO, S.A.b. de C.v. (“KUO” or the “Company”), on behalf of the Audit Committee, I hereby inform you of the main activities that we carried out to give our opinion over the aspects of our concern during the fiscal year ended on December 31st, 2011.
To comply with the liabilities of the Committee, we regularly held meetings with the senior management of the Company, with the external auditors and the internal auditors, which allowed the Committee to perform the following activities:
1. The Committee adopted to advise the board of Directors to approve the following matters:
a. The hiring of Galáz, Yamazaki, Ruiz Urquiza, S.C. (Deloitte Touche Tohmatsu Limited), to perform the external audit works for the 2011 fiscal year.
b. The approval of certain Financial Information Rules and the improvements of others, which were binding for the Company as of January 1st, 2011, pursuant to the Consejo Mexicano para la Investigación y Desarrollo de Normas de Información Financiera, A.C.
2. During the interviews of the Committee with the external auditors, we reviewed the internal control commentaries and other observations and recommendations, such as transfer prices, conversion of foreign currencies, deterioration of long-term assets and policies on accounting estimates, as well as the follow up procedures performed by the internal auditors.
3. We reviewed the financial statements of the Company on each quarter of the 2011 fiscal year, the report of the external auditors and the accounting policies used on their preparation. After hearing the comments from the external auditors, we advised the board of Directors to approve their publication and to present the financial statements as of December 31st, 2010 for the consideration of the Shareholders’ Meeting.
4. The Committee was informed over the internal audit work program for the 2011 fiscal year and
we were informed in detail over its development, its findings and the regularization processes.
5. During the fiscal year, the Committee was informed of the review of the internal control and the risk management, as well as of the documentation of the processes from several businesses. The Committee followed-up on the observations and opportunities derived thereof.
6. The Committee was informed about the campaign for the circulation of KUO’s Code of Ethics and of the starting of the bi-annual review thereof.
LETTER OF ThE AUDIT COMMITTEE

2011 ANNUAL REPORT 29 KUO
7. During the fiscal year, the Committee was informed of the legal and environmental situation of KUO. No relevant observations resulted thereof.
8. The Committee was informed about the submission of the Annual Report, the Report on the Degree of Observation to the best Corporate Practices Code and the tax reports, including the studies of transfer prices with related parties.
9. Follow up was done on the procedure for claims received through the Feedback and Transparency System. No cases deserve further comments.
10. When necessary, we sought advice from the Committee members to obtain agreements and recommendations for the operation, administration and for the internal and external audit programs.
11. The Committee received periodic reports regarding the developments of the process that KUO and its subsidiaries are carrying out for the adoption of International Financial Reporting Standards, in terms established by the National banking and Securities Commission (Comisión Nacional Bancaria y de Valores).
12. The Committee was duly informed of the development of several association, investment and divestiture processes performed by KUO during 2011.
It is hereby acknowledged that the minutes of each meeting and the reports prepared during the year for the board of Directors’ Meetings were documented.
The opinions of the relevant directors of KUO were heard for the elaboration of this report, which are in accordance thereof.
Also, pursuant to the provisions of article 42, subparagraph II, section “e” of the Securities Market Law and the corporate bylaws of KUO, the Committee renders the following opinion in connection to the Report presented by the Chief Execute Officer over the fiscal year ended on December 31st, 2011: a) The accounting and information policies and criterions followed by the Company are adequate
and sufficient taking in consideration its specific circumstances.
b) The policies and criterions have been applied consistently with the information presented by the Chief Executive Officer.
c) As a consequence of subparagraphs “a” and “b” above, the information presented by the Chief Executive Officer reasonably reflects the financial situation and the results of the Company.
This opinion is rendered based on the report issued by Mr. Walter Fraschetto valdés, Partner of Galáz, Yamazaki, Ruiz Urquiza, S.C.
S i n c e r e l y,
Mr. Prudencio López MartínezChairman of the Audit Committee

2011 ANNUAL REPORT 30 KUO
LETTER OF ThE CORPORATE PRACTICES COMMITTEE
Mexico City, February 21st, 2012.
To the board of Directors ofGrupo KUO, S.A.b. de C.v.P r e s e n t
Pursuant to the provisions of article 43 subparagraph I of the Securities Market Law (Ley del Mercado de Valores) and the corporate bylaws of Grupo KUO, S.A.b. de C.v. (“KUO” or the “Company”), on behalf of the Corporate Practices Committee, I hereby inform you the main activities that we carried out to give our opinion over the aspects of our concern during the fiscal year ended on December 31st, 2011.
1. The Committee adopted to advise the board of Directors to approve the following matters:
a. The Compensation Policies for 2012, as well as adjustments to the applicable policies for 2011.
b. Remuneration to the Chairman of the board of Directors, and overall remuneration to the Chief Executive Officer of KUO.
2. The Corporate Practices Committee periodically knew of the hedge operations done by the Company, which have the purpose of giving certainty to the operation rather than being speculative.
3. The Committee was informed, among others, of the following matters:
a. The submission of the Annual Report, the Report on the Degree of Observation to the best Corporate Practices Code and the tax reports, including the studies of transfer prices with related parties.
b. The obtainment of a general liability insurance for board members and officers of KUO.
c. The new organizational structure in KUO.
d. The establishment of an association with the company “DIvGI METALWARES” for operations on the transmissions market in India.
e. The closing of the association with “REPSOL Nuevas Energías” by the bioenergy SbU.
f. The process for the acquisition by the Aftermarket SbU, of the “FRICCIONES TÉCNICAS Y MAQUINADOS” business, a leader company on the Mexican market of spare brakes.

2011 ANNUAL REPORT 31 KUO
g. The acquisition by the Power Systems SbU, of a business (“hDM”) dedicated to the technology for “dual clutch transmission”, located in belgium.
h. The acquisition of the company “FREShERIZED FOODS” (a leader company on the guacamole business in the United States), through “MEGAMEX FOODS”, a subsidiary of “hERDEZ DEL FUERTE”.
i. The association of “hERDEZ DEL FUERTE” in 50% of the company “AIRES DE CAMPO”.
j. The association of “DYNASOL” with the company Shanxi Northern Xing’an to install a synthetic rubber in solution plant in China.
k. The association of “INDUSTRIAS NEGROMEX” with the Chinese company “GPRO”, to access the Chinese market of nitrile rubber.
l. The decision to decentralize the research carried out on the group to transfer the liability to each one of the business units.
4. The Committee had no observations on the performance of the relevant officers.
5. The Committee did not receive requests regarding exemptions to directors, relevant officers or persons with decision-making authority in order to benefit from business opportunities that correspond to KUO or to the entities that it controls or over which it has a significant influence.
6. The Committee reviewed that the operations with related parties entered into by the Company were carried out in market conditions.
It is hereby evidenced that the above was previously documented in the minutes for each meeting and on the reports that were prepared during the year for the board of Directors’ meetings.
The opinions of the relevant officers of KUO were heard for the elaboration of this report, which are in accordance thereof.
S i n c e r e l y,
Mr. valentín Díez MorodoChairman of the Corporate Practices Committee

2011 ANNUAL REPORT 32 KUO
INDEPENDENT AUDITORS’ REPORTTo the board of Directors and Stockholders of Grupo KUO, S.A.b. de C.v.
We have audited the accompanying consolidated statements
of financial position of Grupo KUO, S.A.b. de C.v. and
subsidiaries (the “Company”) as of December 31, 2011 and
2010 and the related consolidated statements of operations,
changes in stockholders’ equity and cash flows for the years
then ended. These financial statements are the responsibility
of the Company’s management. Our responsibility is to
express an opinion on these financial statements based on
our audits. The financial statements of some subsidiaries of
the consumer sector members, whose assets and revenues
in 2010 representing 24% and 17% respectively, of the total
consolidated, were examined by other auditors in whose
unqualified opinions we based our opinion.
We conducted our audits in accordance with auditing
standards generally accepted in Mexico. Those standards
require that we plan and perform the audit to obtain
reasonable assurance about whether the financial
statements are free of material misstatement and that
they are prepared in accordance with Mexican Financial
2011 ANNUAL REPORT 33 KUO
Galaz, Yamazaki, Ruiz Urquiza, S.C.
Member of Deloitte Touche Tohmatsu Limited
C.P.C. Walter Fraschetto
February 8, 2012
Reporting Standards. An audit includes examining, on a test
basis, evidence supporting the amounts and disclosures in
the financial statements. An audit also includes assessing
the financial reporting standards used and significant
estimates made by management, as well as evaluating the
overall financial statement presentation. We believe that
our audits provide a reasonable basis for our opinion.
As mentioned in Note 4 to the consolidated financial
statements, the Company will adopt for the year ending
December 31, 2012 International Financial Reporting
Standards (“IFRS”).
In our opinion, based on our audits and the reports of
the other auditors as referenced above, such consolidated
financial statements present fairly, in all material respects,
the financial position of Grupo KUO, S.A.b. de C.v. and
subsidiaries as of December 31, 2011 and 2010, and the
results of their operations, changes in their stockholders’
equity and their cash flows for the years then ended, in
conformity with Mexican Financial Reporting Standards.
The accompanying consolidated financial statements have
been translated into English for the convenience of readers.

2011 ANNUAL REPORT 34 KUO
Grupo KUO, S.A.b. de C.v. and Subsidiaries
CONSOLIDATED STATEMENTS OF FINANCIAL POSITIONAs of December 31, 2011 and 2010(In thousands of Mexican pesos)
2011 2010AssetsCurrent assets:
Cash and cash equivalents Ps. 478,553 Ps. 863,091Accounts and notes receivable, net 4,811,819 3,790,574Accounts receivable from related parties 632,281 384,905Inventories, net 4,429,633 3,492,604biological assets 239,330 168,102Long lived assets available for sale 68,271 -Prepaid expenses 110,017 166,614
Total current assets 10,769,904 8,865,890
Property, plant and equipment, net 8,439,318 7,523,174biological assets – long-term 409,946 395,025Goodwill, net 1,149,069 771,100Other assets, net 1,201,044 981,798Account receivable from related party – long-term 380,828 154,464Deferred income taxes 377,425 380,681
Total Ps. 22,727,534 Ps. 19,072,132
Liabilities and stockholders’ equityCurrent liabilities:
bank loans and current portion of long-term debt Ps. 480,284 Ps. 54,767Notes and accounts payable to suppliers 4,409,820 3,847,912Other payables and accrued liabilities 1,596,187 1,399,915Accounts payable to related parties 2,585,483 1,586,251Statutory employee profit sharing 50,444 57,029
Total current liabilities 9,122,218 6,945,874
Long-term debt 5,242,329 4,571,495Derivative financial instruments 30,525 60,544Labor obligations and other long-term liabilities 756,145 750,096Account payable to related party – long-term 380,828 154,464Accrued account payables and liabilities 97,146 37,792Deferred statutory employee profit sharing - 3,552Tax consolidation deferred taxes 800,651 1,071,291
Total liabilities 16,429,842 13,595,108
Stockholders’ equity:Capital stock 18,583 19,088Paid-in surplus 2,870,007 2,932,393Retained earnings 1,944,679 1,865,836Translation effects of foreign operations 995,997 337,718Derivative financial instruments (20,005) (42,365)
Controlling interest 5,809,261 5,112,670Non-controlling interest 488,431 364,354
Total stockholders’ equity 6,297,692 5,477,024
Total Ps. 22,727,534 Ps. 19,072,132
See accompanying notes to the consolidated financial statements.

2011 ANNUAL REPORT 35 KUO
Grupo KUO, S.A.b. de C.v. and Subsidiaries
CONSOLIDATED STATEMENTS OF OPERATIONSFor the years ended December 31, 2011 and 2010(In thousands of Mexican pesos, except per share information)
2011 2010
Net sales Ps.
26,727,814 Ps. 22,527,389Cost of sales 21,458,796 17,974,462
Gross profit 5,269,018 4,552,927
General expenses:Administrative 1,388,716 1,264,756Selling 1,620,826 1,440,955Distribution 691,539 607,086
3,701,081 3,312,797Income after general expenses 1,567,937 1,240,130
Other expenses, net (142,359) (189,991)Net comprehensive financing cost (1,289,243) (334,643)Equity in (loss) income of associated companies and unconsolidated
subsidiaries (32,417) 27,646
Income before income taxes 103,918 743,142
Income taxes (benefit) expense (68,788) 377,256
Income from continuing operations 172,706 365,886
(Loss) Income Discontinued operations, net (3,287) 138,301
Consolidated net income Ps. 169,419 Ps. 504,187
Allocation of consolidated net income:Controlling interest Ps. 130,044 Ps. 505,889Non-controlling interest 39,375 (1,702)
Ps. 169,419 Ps. 504,187
Income per share:Income from continuing operations Ps. 0.38 Ps. 0.80
(Loss) Income from discontinued operations Ps. (0.01) Ps. 0.30
Controlling interest income Ps. 0.28 Ps. 1.11
Weighted average shares outstanding (thousands of shares) 456,366 456,366
See accompanying notes to the consolidated financial statements.

2011 ANNUAL REPORT 36 KUO
Grupo KUO, S.A.b. de C.v. and Subsidiaries
CONSOLIDATED STATEMENTS OF ChANGES IN STOCKhOLDERS’ EQUITY For the years ended December 31, 2011 and 2010(In thousands of Mexican pesos)
Number ofshares Capital stock
Paid insurplus
Retainedearnings
Translationeffects offoreign
operations
Derivativefinancial
instrumentsControlling
interestNon-controlling
interest
Totalstockholders’
equity
balances as of January 1, 2010 456,366,148 Ps.
19,593 Ps. 3,009,992 Ps. 1,395,935 Ps. 606,974 Ps. (38,708) Ps. 4,993,786 Ps. 376,263 Ps. 5,370,049
Capital distribution - (505) (77,599) (35,988) - - (114,092) - (114,092)
balances before comprehensive income 456,366,148 19,088 2,932,393 1,359,947 606,974 (38,708) 4,879,694 376,263 5,255,957
Subsidiaries’ translation effects of foreign operations - - - -
(269,256) - (269,256) (2,222) (271,478)
Subsidiaries’ financial instruments - - - - - (3,657) (3,657) 124 (3,533)
Consolidated net income - - - 505,889 - - 505,889 (9,811) 496,078
Comprehensive result - - - 505,889 (269,256) (3,657) 232,976 (11,909) 221,067
balances as of December 31, 2010 456,366,148 19,088 2,932,393 1,865,836 337,718 (42,365) 5,112,670 364,354 5,477,024
Capital distribution - (505) (62,386) (51,201) - - (114,092) - (114,092)
balances before comprehensive income 456,366,148 18,583 2,870,007 1,814,635 337,718 (42,365) 4,998,578 364,354 5,362,932
Subsidiaries’ translation effects of foreign operations - - - -
658,279 - 658,279 34,192 692,471
Subsidiaries’ financial instruments - - - - - 22,360 22,360 (1,369) 20,991
Consolidated net income - - - 130,044 - - 130,044 91,254 221,298
Comprehensive result - - - 130,044 658,279 22,360 810,683 124,077 934,760
balances as of December 31, 2011 456,366,148 Ps. 18,583 Ps. 2,870,007 Ps. 1,944,679 Ps. 995,997 Ps. (20,005) Ps. 5,809,261 Ps. 488,431 Ps. 6,297,692
See accompanying notes to the consolidated financial statements.

2011 ANNUAL REPORT 37 KUO
Number ofshares Capital stock
Paid insurplus
Retainedearnings
Translationeffects offoreign
operations
Derivativefinancial
instrumentsControlling
interestNon-controlling
interest
Totalstockholders’
equity
balances as of January 1, 2010 456,366,148 Ps.
19,593 Ps. 3,009,992 Ps. 1,395,935 Ps. 606,974 Ps. (38,708) Ps. 4,993,786 Ps. 376,263 Ps. 5,370,049
Capital distribution - (505) (77,599) (35,988) - - (114,092) - (114,092)
balances before comprehensive income 456,366,148 19,088 2,932,393 1,359,947 606,974 (38,708) 4,879,694 376,263 5,255,957
Subsidiaries’ translation effects of foreign operations - - - -
(269,256) - (269,256) (2,222) (271,478)
Subsidiaries’ financial instruments - - - - - (3,657) (3,657) 124 (3,533)
Consolidated net income - - - 505,889 - - 505,889 (9,811) 496,078
Comprehensive result - - - 505,889 (269,256) (3,657) 232,976 (11,909) 221,067
balances as of December 31, 2010 456,366,148 19,088 2,932,393 1,865,836 337,718 (42,365) 5,112,670 364,354 5,477,024
Capital distribution - (505) (62,386) (51,201) - - (114,092) - (114,092)
balances before comprehensive income 456,366,148 18,583 2,870,007 1,814,635 337,718 (42,365) 4,998,578 364,354 5,362,932
Subsidiaries’ translation effects of foreign operations - - - -
658,279 - 658,279 34,192 692,471
Subsidiaries’ financial instruments - - - - - 22,360 22,360 (1,369) 20,991
Consolidated net income - - - 130,044 - - 130,044 91,254 221,298
Comprehensive result - - - 130,044 658,279 22,360 810,683 124,077 934,760
balances as of December 31, 2011 456,366,148 Ps. 18,583 Ps. 2,870,007 Ps. 1,944,679 Ps. 995,997 Ps. (20,005) Ps. 5,809,261 Ps. 488,431 Ps. 6,297,692
2011 ANNUAL REPORT 38 KUO
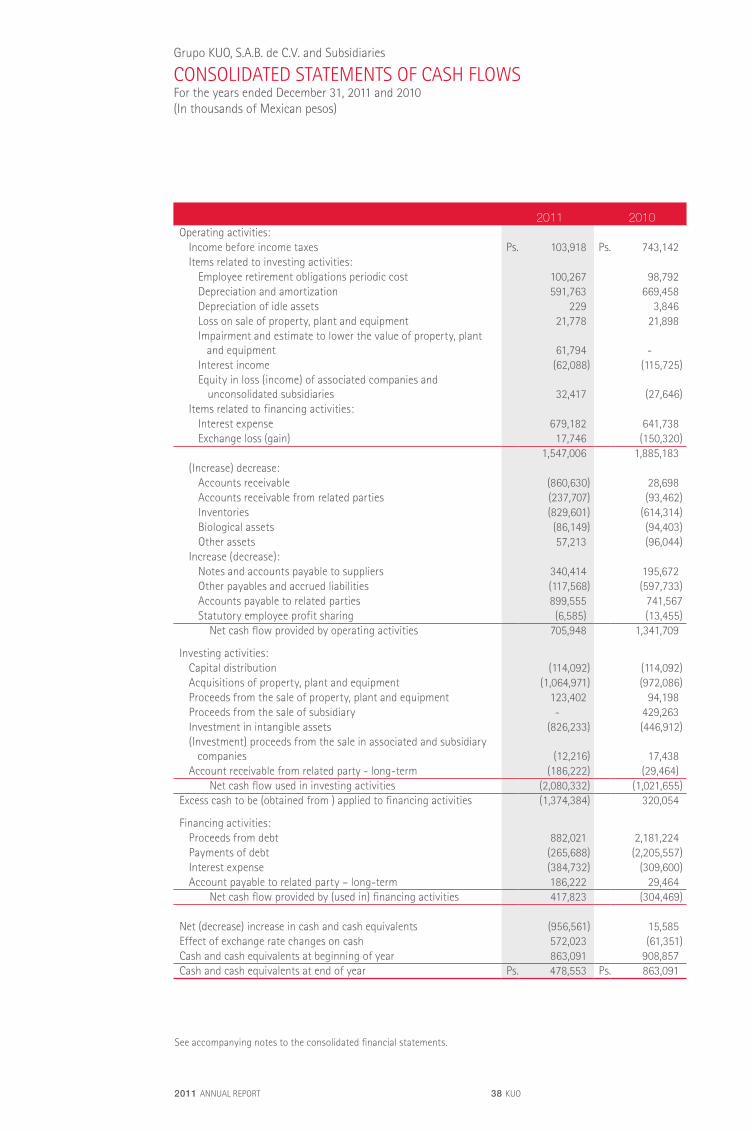
2011 2010Operating activities:
Income before income taxes Ps. 103,918 Ps. 743,142Items related to investing activities:
Employee retirement obligations periodic cost 100,267 98,792Depreciation and amortization 591,763 669,458Depreciation of idle assets 229 3,846Loss on sale of property, plant and equipment 21,778 21,898Impairment and estimate to lower the value of property, plant and equipment
61,794 -
Interest income (62,088) (115,725)Equity in loss (income) of associated companies and
unconsolidated subsidiaries 32,417 (27,646)Items related to financing activities:
Interest expense 679,182 641,738Exchange loss (gain) 17,746 (150,320)
1,547,006 1,885,183(Increase) decrease:
Accounts receivable (860,630) 28,698Accounts receivable from related parties (237,707) (93,462)Inventories (829,601) (614,314)biological assets (86,149) (94,403)Other assets 57,213 (96,044)
Increase (decrease):Notes and accounts payable to suppliers 340,414 195,672Other payables and accrued liabilities (117,568) (597,733)Accounts payable to related parties 899,555 741,567Statutory employee profit sharing (6,585) (13,455)
Net cash flow provided by operating activities 705,948 1,341,709
Investing activities:Capital distribution (114,092) (114,092)Acquisitions of property, plant and equipment (1,064,971) (972,086)Proceeds from the sale of property, plant and equipment 123,402 94,198Proceeds from the sale of subsidiary - 429,263Investment in intangible assets (826,233) (446,912)(Investment) proceeds from the sale in associated and subsidiary companies (12,216) 17,438Account receivable from related party - long-term (186,222) (29,464)
Net cash flow used in investing activities (2,080,332) (1,021,655)Excess cash to be (obtained from ) applied to financing activities (1,374,384) 320,054
Financing activities:Proceeds from debt 882,021 2,181,224Payments of debt (265,688) (2,205,557)Interest expense (384,732) (309,600)Account payable to related party – long-term 186,222 29,464
Net cash flow provided by (used in) financing activities 417,823 (304,469)
Net (decrease) increase in cash and cash equivalents (956,561) 15,585Effect of exchange rate changes on cash 572,023 (61,351)Cash and cash equivalents at beginning of year 863,091 908,857Cash and cash equivalents at end of year Ps. 478,553 Ps. 863,091
Grupo KUO, S.A.b. de C.v. and Subsidiaries
CONSOLIDATED STATEMENTS OF CASh FLOWSFor the years ended December 31, 2011 and 2010(In thousands of Mexican pesos)
See accompanying notes to the consolidated financial statements.
2011 ANNUAL REPORT 39 KUO
1. Principal activities and significant events
a. Activities - Grupo KUO, S.A.b. de C.v. (“KUO” or the “Company”) is the controlling stockholder of a group of companies engaged mainly in the manufacture and sale of consumer business, chemicals and auto parts.
b. Significant events -
I.- Acquisitions and / or creation of new companies -
- Tremec Drive Line Mechatronics - On December 29, 2011, KUO, through its subsidiary Transmisiones y Equipos Mecánicos, S.A. de C.v. and its branch in belgium, acquired the dual clutch transmissions (DCT) business through the purchase of the assets and technology of such transmission, which belonged to hoerbiger Drivetrain Mechatronics, b.v.b.A. (“hDM”).
- Acquisition of Fritec - On October 31, 2011, KUO, through its spares market subsidiaries, entered into a contract for the acquisition of the replacement brakes business under the brand name of Fritec®; the agreement will go into effect January 1, 2012.
- Joint Venture with Aires de Campo – On August 31, 2011, herdez del Fuerte (an associated company of KUO) entered into an agreement to acquire 50% of Aires de Campo, S.A. de C.v., a leading distributor of organic products in Mexico.
- Acquiring Avomex, Inc – On August 22, 2011, Megamex Foods, LLC (an associated company of KUO) concluded the acquisition of Avomex, Inc. (Fresherized Foods), a world leader in the production of processed avocado and guacamole, located in Texas, USA.
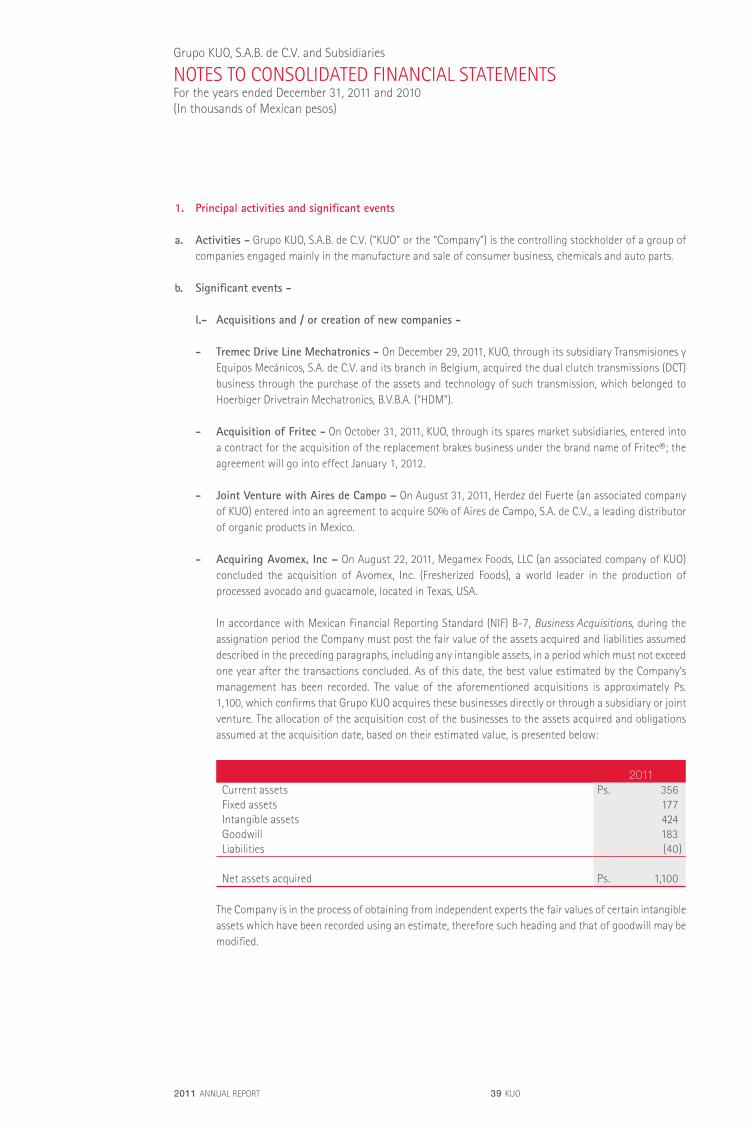
In accordance with Mexican Financial Reporting Standard (NIF) b-7, Business Acquisitions, during the assignation period the Company must post the fair value of the assets acquired and liabilities assumed described in the preceding paragraphs, including any intangible assets, in a period which must not exceed one year after the transactions concluded. As of this date, the best value estimated by the Company’s management has been recorded. The value of the aforementioned acquisitions is approximately Ps. 1,100, which confirms that Grupo KUO acquires these businesses directly or through a subsidiary or joint venture. The allocation of the acquisition cost of the businesses to the assets acquired and obligations assumed at the acquisition date, based on their estimated value, is presented below:
2011Current assets Ps. 356Fixed assets 177Intangible assets 424Goodwill 183Liabilities (40)
Net assets acquired Ps. 1,100
The Company is in the process of obtaining from independent experts the fair values of certain intangible assets which have been recorded using an estimate, therefore such heading and that of goodwill may be modified.
Grupo KUO, S.A.b. de C.v. and Subsidiaries
NOTES TO CONSOLIDATED FINANCIAL STATEMENTSFor the years ended December 31, 2011 and 2010(In thousands of Mexican pesos)

2011 ANNUAL REPORT 40 KUO
- Creation of INSA GPRO with Jiangsu GPRO - On September 22, 2011, KUO through its subsidiary KUO China, S.A de C.v., signed an agreement to form a 50/50 joint venture with the Chinese company Jiangsu GPRO Group Co. Ltd. (“GPRO”) (through its subsidiary Nanjing Jinling Plastic & Petrochemical Co., Ltd.). This agreement stipulates that KUO and GPRO will establish a company named INSA GPRO (Nanjing) Synthetic Rubber Co. Ltd. and that they will jointly invest US 60 million in a new plant located in Nanjing, in Jiangsu province, China, with an initial production capacity of 30,000 metric tons per year in its first phase. INSA (Industrias Negromex, S.A. de C.v.), a wholly-owned subsidiary of Grupo KUO, will contribute the technology for this new joint venture.
II.- Other important events:
- Bilateral Credit with Bancomext - On November 28, 2011, KUO signed a loan agreement for a committed line of credit with banco Nacional de Comercio Exterior, S.N.C. for US 50 million or its Mexican peso equivalent at the time of the disbursements; the disposition term is six months, which was executed in pesos on January 2, 2012, with expiration in four years. This credit will accrue interest at 1.175 percentage points above the TIIE rate.
- Bilateral Credit with Rabobank - On October 31, 2011, KUO, through its subsidiary Grupo Porcícola Mexicano, S.A. de C.v. entered into a loan agreement for a committed line of credit with Rabobank for US 50 million, with an 18 month disposition term. When the disposition deadline expires or the total credit line is disposed, whichever occurs first, the credit will begin its repayment period, defined semiannually, commencing in April 2014 and finishing in October 2016. The credit will earn interest at a three-month variable LIbOR rate plus 1.85 percentage points.
- KUO places Senior Notes - On November 25, 2010, KUO announced the successful placement of Ps. 700 million Senior Notes in Mexican markets, which are part of a Ps. 2 billion program. The Notes have a five year term, pay a variable interest rate of TIIE at 28 days plus 2.60% and are rated “bbb+(mex)” by Fitch Mexico and “mxbbb+” by Standard & Poor’s.
- Bond placement - On September 15, 2010, KUO completed the offering of US 50 million of additional Senior Notes due 2017, which was announced on September 10, 2010. The proceeds were used to partially prepay the syndicated loan executed by KUO in January 2008 which matures in 2013.
2. Summary of financial data by business segment
The presentation below sets forth certain financial information regarding the Company’s reportable segments. Intersegment transactions have been eliminated. Total assets represent those assets that are used in the operations of each reportable segment. Corporate assets are principally comprised of cash, available and long-term investments, recoverable taxes and fixed assets.
2011 Consumer Chemical Automotive Services TotalNet sales Ps. 9,249,440 Ps. 13,280,468 Ps. 4,024,786 Ps. 173,120 Ps. 26,727,814Income after general expenses 670,198 671,559 250,329 (24,149) 1,567,937Total assets 9,433,548 8,334,117 3,981,190 978,679 22,727,534Capital expenditures 608,110 279,676 177,185 - 1,064,971Interest income 6,357 3,607 - 52,124 62,088Interest expense 86,248 130,264 8,209 454,461 679,182Depreciation and amortization 222,942 216,203 132,001 20,617 591,763Impairment losses - 28,773 - 33,021 61,794Charge to cost of sales by conversion
effect - (5,550) (2,412) - (7,962)Employee retirement obligations
periodic cost 28,103 2,370 48,611 21,183 100,267
Cash flows from :Operating activities 43,201 132,475 612,123 (81,851) 705,948Investing activities (532,613) (317,791) (853,648) (376,280) (2,080,332)Financing activities 487,379 - 225,168 (294,724) 417,823

2011 ANNUAL REPORT 41 KUO
2010 Consumer Chemical Automotive Services TotalNet sales Ps. 8,030,423 Ps. 10,402,253 Ps. 3,957,902 Ps. 136,811 Ps. 22,527,389Income after general expenses 533,813 496,288 246,324 (36,295) 1,240,130Total assets 8,066,027 6,671,891 3,149,373 1,184,841 19,072,132Capital expenditures 669,230 211,707 91,149 - 972,086Interest income 11,823 4,424 13,109 86,369 115,725Interest expense 88,696 118,644 9,101 425,297 641,738Depreciation and amortization 201,129 275,610 164,043 28,676 669,458Charge to cost of sales by conversion
effect - 158 (17,976) - (17,818)Employee retirement obligations periodic cost 26,334 9,132 28,680 34,646 98,792
Cash flows from :Operating activities 1,079,361 275,454 (145,584) 132,478 1,341,709Investing activities (1,296,283) 55,034 146,030 73,564 (1,021,655)Financing activities 6,676 - - (311,145) (304,469)
3. Basis of presentation
a. Translation into English - The accompanying consolidated financial statements have been translated from Spanish into English for use outside of Mexico. These consolidated financial statements are presented on the basis of Mexican Financial Reporting Standards (“MFRS”, locally known as Normas de Información Financiera or “NIF’s”). Certain accounting practices applied by the Company that conform to MFRS may not conform to accounting principles generally accepted in the country of use.
b. Monetary unit of the financial statements - The financial statements and notes as of December 31, 2011 and 2010 and for the years then ended include balances and transactions denominated in Mexican pesos of different purchasing power.
c. Consolidation of financial statements - The consolidated financial statements included the financial statements of KUO and the subsidiaries in which it has majority share ownership and control.
The Company’s principal subsidiaries are:
2011 2010Consumer business -
Kekén, S.A. de C.v. and Subsidiaries (formerly Agrokén, S.A. de C.v.) 99.99% 99.99%herdez del Fuerte, S.A. de C.v. and Subsidiaries 50.00% 50.00%
Chemical business -KUO Concentradora, S.A. de C.v. and Subsidiaries 99.99% 99.99%Resirene, S.A. de C.v. and Subsidiary 99.99% 99.99%KUO Europa, S.L. and Subsidiary 99.99% 99.99%
Automotive business-Transmisiones y Equipos Mecánicos, S.A. de C.v. 99.91% 99.91%
KUO partially consolidates at 50% (shareholding), the financial statements of Dynasol (subsidiary of KUO Concentradora, S.A. de C.v.), Kuosol, S.A. de C.v. and herdez del Fuerte, based on the supplemental application of International Accounting Standard 31, Interests in Joint Ventures.
All significant intercompany transactions and balances have been eliminated in the accompanying consolidated financial statements. The equity in net income (loss) and changes in stockholders’ equity of those subsidiaries that were acquired or sold are included in the financial statements as of or up to the date on which the transactions took place.
Investments in associated companies and unconsolidated subsidiaries are accounted for using the equity method.
2011 ANNUAL REPORT 42 KUO
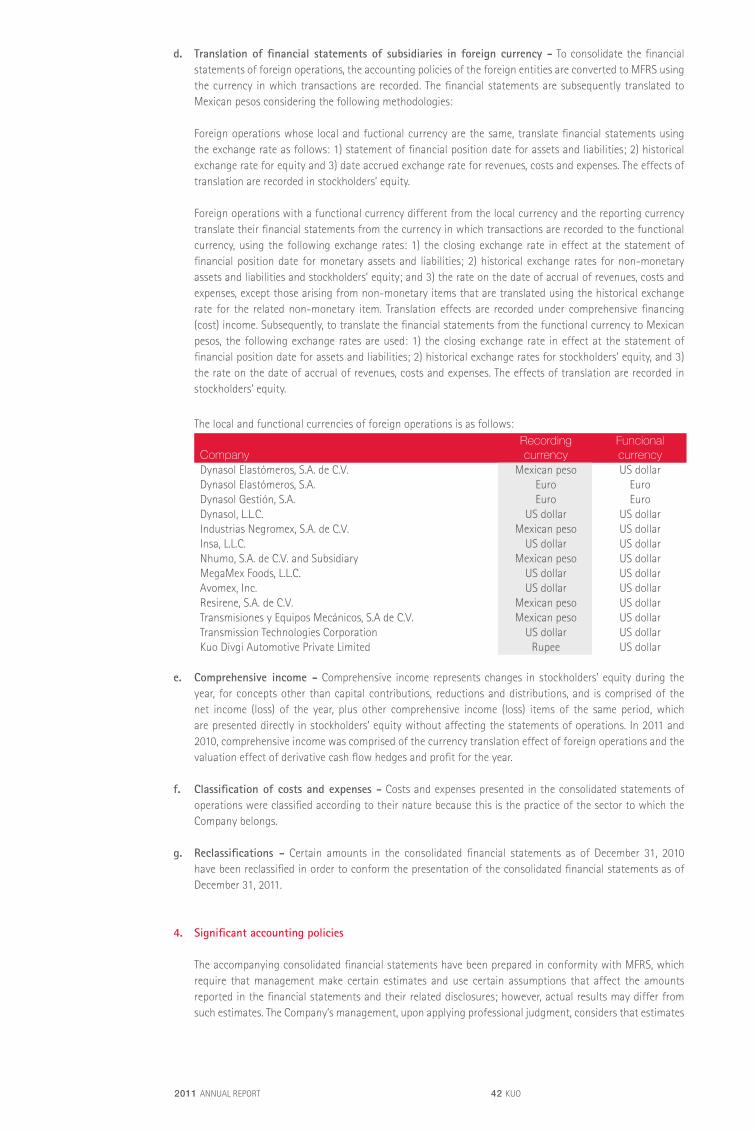
d. Translation of financial statements of subsidiaries in foreign currency - To consolidate the financial statements of foreign operations, the accounting policies of the foreign entities are converted to MFRS using the currency in which transactions are recorded. The financial statements are subsequently translated to Mexican pesos considering the following methodologies:
Foreign operations whose local and fuctional currency are the same, translate financial statements using the exchange rate as follows: 1) statement of financial position date for assets and liabilities; 2) historical exchange rate for equity and 3) date accrued exchange rate for revenues, costs and expenses. The effects of translation are recorded in stockholders’ equity.
Foreign operations with a functional currency different from the local currency and the reporting currency translate their financial statements from the currency in which transactions are recorded to the functional currency, using the following exchange rates: 1) the closing exchange rate in effect at the statement of financial position date for monetary assets and liabilities; 2) historical exchange rates for non-monetary assets and liabilities and stockholders’ equity; and 3) the rate on the date of accrual of revenues, costs and expenses, except those arising from non-monetary items that are translated using the historical exchange rate for the related non-monetary item. Translation effects are recorded under comprehensive financing (cost) income. Subsequently, to translate the financial statements from the functional currency to Mexican pesos, the following exchange rates are used: 1) the closing exchange rate in effect at the statement of financial position date for assets and liabilities; 2) historical exchange rates for stockholders’ equity, and 3) the rate on the date of accrual of revenues, costs and expenses. The effects of translation are recorded in stockholders’ equity.
The local and functional currencies of foreign operations is as follows:
CompanyRecording currency
Funcional currency
Dynasol Elastómeros, S.A. de C.v. Mexican peso US dollarDynasol Elastómeros, S.A. Euro EuroDynasol Gestión, S.A. Euro EuroDynasol, L.L.C. US dollar US dollarIndustrias Negromex, S.A. de C.v. Mexican peso US dollarInsa, L.L.C. US dollar US dollarNhumo, S.A. de C.v. and Subsidiary Mexican peso US dollarMegaMex Foods, L.L.C. US dollar US dollarAvomex, Inc. US dollar US dollarResirene, S.A. de C.v. Mexican peso US dollarTransmisiones y Equipos Mecánicos, S.A de C.v. Mexican peso US dollarTransmission Technologies Corporation US dollar US dollarKuo Divgi Automotive Private Limited Rupee US dollar
e. Comprehensive income - Comprehensive income represents changes in stockholders’ equity during the year, for concepts other than capital contributions, reductions and distributions, and is comprised of the net income (loss) of the year, plus other comprehensive income (loss) items of the same period, which are presented directly in stockholders’ equity without affecting the statements of operations. In 2011 and 2010, comprehensive income was comprised of the currency translation effect of foreign operations and the valuation effect of derivative cash flow hedges and profit for the year.
f. Classification of costs and expenses - Costs and expenses presented in the consolidated statements of operations were classified according to their nature because this is the practice of the sector to which the Company belongs.
g. Reclassifications - Certain amounts in the consolidated financial statements as of December 31, 2010 have been reclassified in order to conform the presentation of the consolidated financial statements as of December 31, 2011.
4. Significant accounting policies
The accompanying consolidated financial statements have been prepared in conformity with MFRS, which require that management make certain estimates and use certain assumptions that affect the amounts reported in the financial statements and their related disclosures; however, actual results may differ from such estimates. The Company’s management, upon applying professional judgment, considers that estimates

2011 ANNUAL REPORT 43 KUO
made and assumptions used were adequate under the circumstances. The significant accounting policies of the Company are as follows:
a. Changes in accounting polices:
beginning on January 1, 2011, the Company adopted the following new Interpretation to MFRS (“INIF”):
INIF - 19, Change due to the adoption of International Financial Reporting Standards. This INIF is applicable to publically traded entities that currently prepare financial statements under MFRS and are pending adoption of International Financial Reporting Standards (IFRS) pursuant to public reporting requirements of the Mexican Stock Exchange.
b. Recognition of the effects of inflation - Since the cumulative inflation for the three year periods preceding December 31, 2011 and 2010 was 11.79% and 14.48%, respectively, the economic environment may be considered non-inflationary in both years. Inflation rates for the years ended 2011 and 2010 were 3.82% and 4.40%, respectively.
beginning on January 1, 2008, the Company discontinued recognition of the effects of inflation in its financial statements. however, assets, liabilities and stockholders’ equity include the restatement effects recognized through December 31, 2007.
c. Cash and cash equivalents - Cash and cash equivalents consist mainly of bank deposits in checking accounts and short-term investments, highly liquid and easily convertible into cash, maturing within three months as of their acquisition date, which are subject to immaterial value change risks. Cash is stated at nominal value and cash equivalents are valued at fair value; any fluctuations in value are recognized in comprehensive financing (cost) income of the period.
d. Inventories and cost of sales - Inventories are stated at the lower of cost or realizable value.
e. Biological assets - These assets are valued in accordance with bulletin E-1 “Agriculture (Agribusiness Activities)” of the NIF. The Company has two principal biological assets: i) assets convertible directly into inventories, such as trees and hogs, which after a biological growth process are either harvested or slaughtered and are converted directly into inventories, are valued at fair value, and ii) assets convertible into “Production Plants”, which undergo a biological growth process and are converted into “producing plants” of other biological assets, such as jatropha; these are valued at fair value from the time they are planted until their production phase, because as of that date they begin to be amortized based on their useful production life.
f. Long lived assets available for sale - Long lived assets available for sale are stated at the lower of their net realizable value or their net carrying value. Net carrying value is comprised of initial acquisition cost plus restatement for the effects of inflation of balances from acquisitions made through December 31, 2007, using factors derived from the National Consumer Price Index (NCPI), less accumulated depreciation.
g. Property, plant and equipment - Property, plant and equipment are recorded at acquisition cost. Assets acquired in Mexico before December 31, 2007, were restated using the NCPI through that date. Through 2007, foreign fixed assets were recorded at acquisition cost and subsequently restated using the inflation of the country of origin and then converted into the Mexican pesos at the exchange rate as of the most recent statements of financial position presented.
Depreciation is calculated using the straight-line method applied to estimated useful lives based on the value of the asset net of estimated salvage value, which, depending on the asset category, fluctuates between 5% and 10% of corresponding value of the assets. In accordance with MFRS the Company makes a periodic review of estimated useful lives of property, plant and equipment, being 2011 the year of last revision.
h. Impairment of long-lived assets in use - The Company reviews the carrying amounts of long-lived assets in use when an impairment indicator suggests that such amounts might not be recoverable, considering the greater of the present value of future net cash flows or the net sales price upon disposal. Impairment is recorded when the carrying amounts exceed the greater of the aforementioned amounts. Impairment indicators considered for these purposes are, among others, operating losses or negative cash flows in the period if they are combined with a history or projection of losses, depreciation and amortization charged to
2011 ANNUAL REPORT 44 KUO
results, which in percentage terms in relation to revenues are substantially higher than that of previous years, obsolescence, reduction in the demand for the products manufactured, competition and other legal and economic factors. As of December 31, 2011, the Company recorded impairment charges of Ps. 61,794, and in 2010, the Company did not have impairment effects.
i. Derivative financial instruments - The Company uses interest rate swaps, that make their profile of interest payments from fixed to variable rate, in order to reduce their exposure to risks of volatility in interest rates, and foreign currency forward contracts to manage its exposure to foreign currency fluctuations and raw materials price hedges. These instruments are negotiated only with institutions of high repute and trading limits have been established for each institution. The Company’s policy is not to carry out transactions with derivative financial instruments for purposes of speculation.
The Company recognizes all assets or liabilities that arise from transactions with derivative financial instruments at fair value in the statement of financial position, regardless of its intented for holding them. Fair value is determined using recognized markets prices. If derivative financial instruments are not traded, fair value is determined by applying recognized valuation techniques.
When derivative financial instruments are entered into to hedge risks, and such derivatives meet all hedging
requirements, their designation is documented at the beginning of the hedging transaction, describing the transaction’s objective, characteristics, accounting treatment and how the effectiveness of the instrument will be measured.
Changes in the fair value of derivative instruments designated as hedges are recognized as follows: (1) for fair value hedges, changes in both the derivative instrument and the hedged item are stated at fair value and recognized in current earnings; (2) for cash flow hedges, changes in the effective portion are temporarily recognized as a component of other comprehensive income (loss) in stockholders’ equity and then reclassified to current earnings when affected by the hedged item. The ineffective portion of the change in fair value is immediately recognized in current earnings; (3) for hedges of an investment in a foreign subsidiary, the effective portion is recognized as a component of other comprehensive income (loss) as part of the cumulative translation adjustment. The ineffective portion of the gain or loss on the hedging instrument is recognized in current earnings, if it is a derivative financial instrument. Otherwise, it is recognized as a component of other comprehensive income (loss) until the investment is sold or transferred.
The Company discontinues hedge accounting when the derivative instrument matures, is sold, cancelled or exercised; when the derivative instrument does not reach a high percentage of effectiveness to compensate for changes in fair value or cash flows of the hedged item, or when the Company decides to cancel its designation as a hedge.
For cash flow hedges, upon discontinuing hedge accounting, the amounts recorded in stockholders’ equity as a component of other comprehensive income (loss) remain there until the time when the effects of the forecasted transaction or firm commitment affect current earnings. If it is not likely that the firm commitment or forecasted transaction will occur, the gains or losses accumulated in other comprehensive income (loss) are immediately recognized in current earnings. When the hedge of a forecasted transaction has proven satisfactory, but subsequently the hedge fails the effectiveness test, the cumulative effects recorded within other comprehensive income (loss) in stockholders’ equity are proportionately recorded in current earnings, to the extent that the forecasted asset or liability affects current earnings.
While certain derivative financial instruments are entered into for hedging purposes, they are not designated as hedges because they do not meet all of the requirements and are instead classified as trading for accounting purposes. Changes in fair value are recognized in current earnings as a component of comprehensive financing cost (income).
j. Embedded derivatives - The Company reviews all contracts entered into to identify embedded derivatives. When an embedded derivative is identified, it is subject to an evaluation to determine whether it meets the definition of an embedded derivative included in C-10. If the definition is met, the derivative is segregated from the host contract and stated at fair value. If the embedded derivative is classified as trading, any resulting gains or losses in fair value are recognized in current earnings. Changes in the fair value of embedded derivatives designated as hedging are recognized as follows: (1) for fair value hedges, changes in both the embedded derivative and the hedged item are stated at fair

2011 ANNUAL REPORT 45 KUO
value and recognized in current earnings; (2) for cash flow hedges, changes in the effective portion of the embedded derivative are temporarily recognized as a component of other comprehensive income and then reclassified to current earnings when affected by the hedged item. The ineffective portion of the change in fair value is immediately recognized in current earnings.
k. Goodwill - Goodwill represents the excess of cost over the fair value of the subsidiary’s shares, as of the date of acquisition. Through December 31, 2007, goodwill was restated using the NCPI. Goodwill is not amortized and is subject to impairment test, at least once a year.
l. Other assets - Other assets mainly consists of investments in shares of associated companies and unconsolidated subsidiaries, as well as patents, trademarks and costs associated with the issuance of debt, which are amortized over the life of the respective contracts.
m. Provisions - Provisions are recognized for current obligations that arise from a past event, that will probably result in the use of economic resources, and that can be reasonably estimated. The Company’s subsidiaries within the automotive segment guarantee their products for periods of two to four years against manufacturing defects. A guarantee provision is recognized at the time of the sale and it is determined based on the costs incurred in the prior three years.
n. Direct employee benefits - Direct employee benefits are calculated based on the services rendered by employees, considering the current salaries. The liability is recognized as it accrues. These benefits include mainly Statutory Employee Profit Sharing (“PTU”) payable, compensated absences, such as vacation and vacation premiums, and incentives.
o. Employee retirement obligations - Liabilities from seniority premiums, pension plans, postretirement benefits, such as medical and hospitalization services and severance payments are recognized as they accrue and are calculated by independent actuaries based on the projected unit credit method using nominal interest rates.
p. Statutory employee profit sharing - PTU is recorded in the results of the year in which it is incurred and presented under other income and expenses in the accompanying consolidated statements of operations. Deferred PTU is derived from temporary differences that result from comparing the accounting and tax bases of assets and liabilities and is recognized only when it can be reasonably assumed that a liability may be settled or a benefit is generated, and there is no indication that circumstances will change in such a way that the liabilities will not be paid or benefits will not be realized.
q. Income taxes - Income tax (“ISR”) and the business Flat Tax (“IETU”) are recorded in the results of the year they are incurred. To recognize deferred income taxes, based on its financial projections, the Company determines whether it expects to incur ISR or IETU and, accordingly, recognizes deferred taxes based on the tax it expects to pay. Deferred taxes are calculated by applying the corresponding tax rate to temporary differences resulting from comparing the accounting and tax bases of assets and liabilities and including, if any, future benefits from tax loss carryforwards and certain tax credits. Deferred tax assets are recorded only when there is a high probability of recovery.
r. Foreign currency transactions - Foreign currency transactions are recorded at the applicable exchange rate in effect at the transaction date. Monetary assets and liabilities denominated in foreign currency are translated into Mexican pesos at the applicable exchange rate in effect at the statement of financial position date. Exchange fluctuations are recorded as a component of net comprehensive financing cost in the consolidated statements of operations.
s. Revenue recognition - Revenues are recognized in the period in which the risks and rewards of ownership of the inventories are transferred to customers, which generally coincides with when the inventories are delivered or shipped to customers and the customer assumes responsibility for them.
t. Income per share - basic income per common share is calculated by dividing consolidated net income (loss) by the weighted average number of shares outstanding during the year.

2011 ANNUAL REPORT 46 KUO
5. Cash and cash equivalents
2011 2010Cash Ps. 212,953 Ps. 426,420Cash equivalents 265,600 436,671
Ps. 478,553 Ps. 863,091
6. Accounts and notes receivable
2011 2010Trade Ps. 4,544,081 Ps. 3,293,808Less- allowance for doubtful accounts (320,722) (227,451)
4,223,359 3,066,357Other debtors 322,955 509,137Recoverable taxes 265,505 215,080
Ps. 4,811,819 Ps. 3,790,574
During 2011 and 2010, certain subsidiaries sold accounts receivable without recourse at an average financial cost of 7.81% and 7.87% in Mexican pesos, respectively, and 3.81% and 3.87% in US dollars, respectively, with terms ranging between 34 and 87 days in 2011 and between 30 and 87 days in 2010. As of December 31, 2011 there were not balances of accounts receivable sold without recourse, the balance as of December 31, 2010 was Ps. 55,178.
7. Inventories
2011 2010Finished goods and work-in-process Ps. 2,492,412 Ps. 1,860,661Raw materials, supplies and other 2,109,765 1,745,558
4,602,177 3,606,219Less- allowance for slow-moving items (177,746) (126,658)
4,424,431 3,479,561Goods in transit 5,202 13,043
Ps. 4,429,633 Ps. 3,492,604
8. Biological assets
2011 2010beginning balance Ps. 563,127 Ps. 468,724Capitalized expenditures 660,719 615,089Changes in fair value 22,230 - Sales decrease (596,800) (520,686)Final balance Ps. 649,276 Ps. 563,127
biological assets Ps. 239,330 Ps. 168,102biological assets – long-term 409,946 395,025
Ps. 649,276 Ps. 563,127

2011 ANNUAL REPORT 47 KUO
As mentioned in Note 4e, at December 31, 2011 and 2010, the Company has two main biological assets: i) convertible assets directly in inventory and ii) convertible assets “Production Plants.”
Within the group of biological assets which are converted directly into inventories, the following risks were identified:
Principal risks in the hogs operation: The operation of raising and selling hogs and their derivatives is exposed to fluctuations in prices and sales volumes, as well as exchange fluctuations, the last of which refers to foreign sales. To control this risk, the Company controls the customers’ supply to maintain favorable operating conditions.
For this type of activity, the Company is subject to laws and regulations both in Mexico and in the countries where it operates. Therefore, environmental policies and procedures have been established, which are designed to ensure compliance with environmental and health laws and regulations. Furthermore, periodic reviews are conducted to timely identify and mitigate any environmental risk.
Principal risks in the operation of forestry plantations: The forestry biological assets are mainly exposed to risks derived from the forest fires season, therefore the Company establishes the plantations in different places so as to significantly minimize the risk. Also, it exercises strict control in the maintenance of the plantations, implementing pest control systems as much as naturally possible. Sampling is periodically taken to maintain the plantations in optimum conditions.
The Company is subject to health laws and regulations, therefore environmental policies and procedures have been established to ensure compliance with environmental and health laws and regulations; periodic reviews are conducted to timely identify and mitigate any environmental risk.
Within the group of biological assets which are converted into “Production Plants”, the following risks were identified:
The principal risks to which the jatropha plantations are exposed are related to compliance with environmental regulations and pest control, therefore the Company maintains strict environmental policies and periodically monitors the different plantations.
9. Long lived assets available for sale
2011 2010Machinery and laboratory equipment (i) Ps. 14,724 Ps. -vehicles (ii) 53,547 -
Ps. 68,271 Ps. -
At December 31, 2011, the Company decided that those assets that were no longer used in the normal operation of the Company should be classified as assets available for sale. These assets are classified into two types: i) Those whose operations were suspended definitively and ii) those whose operations were replaced by other property of similar nature.
i) Those whose operations were definitively suspended– This refers to the laboratory machinery and equipment of the Chemical sector whose operation was definitively suspended; due to the specialized nature of the equipment, it is estimated that they will be sold within a deadline not exceeding one year. The determination of the selling price was based on quotations of similar equipment in similar conditions.
ii) Those whose operations were substituted by another similar good– This refers to aircraft replaced by a newer model. It is expected that the sale transaction will be closed within a period not exceeding eight months. The selling price was established based on market quotations for similar models.
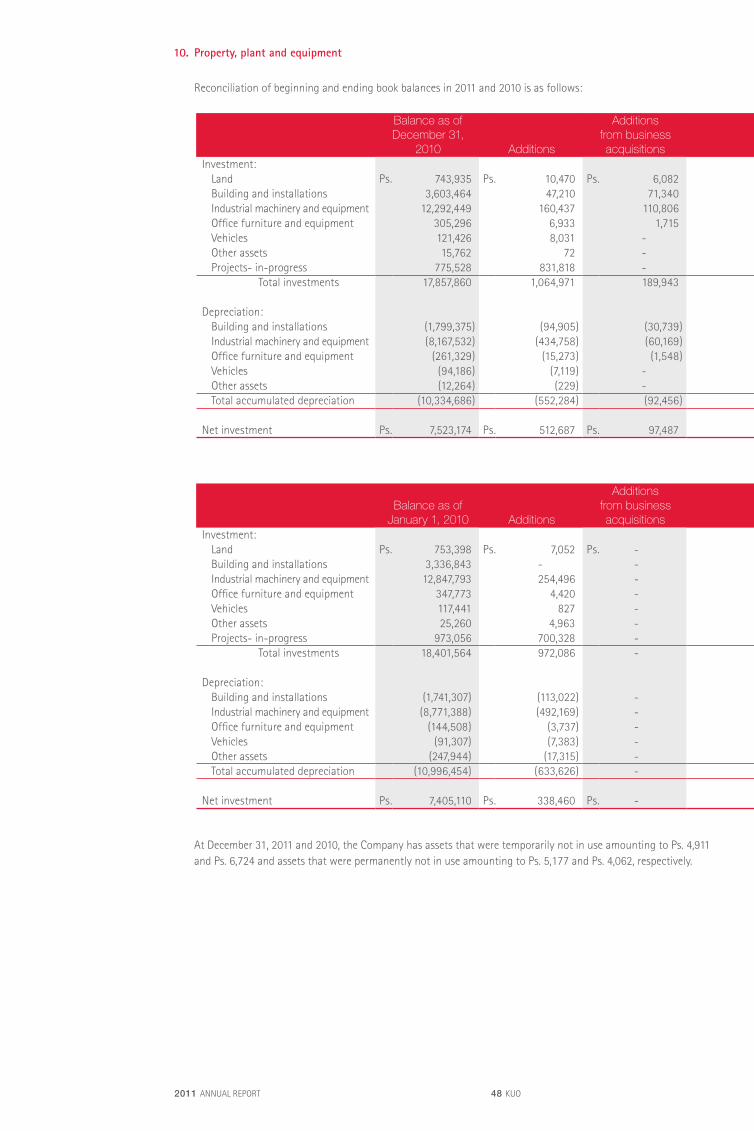
2011 ANNUAL REPORT 48 KUO
10. Property, plant and equipment
Reconciliation of beginning and ending book balances in 2011 and 2010 is as follows:
Balance as of December 31,
2010 Additions
Additions from business acquisitions Divestments
Long lived assets available for sale
Impairment effect Transferred assets
Translation effect
Balance as of December 31,
2011Investment:
Land Ps. 743,935 Ps. 10,470 Ps. 6,082 Ps. (14,117) Ps. (3,456) Ps. - Ps. 21,937 Ps. 5,909 Ps. 770,760building and installations 3,603,464 47,210 71,340 (61,299) (10,291) (72) 408,179 23,091 4,081,622Industrial machinery and equipment 12,292,449 160,437 110,806 (285,184) (136,451) (85,051) 430,969 1,342,140 13,830,115Office furniture and equipment 305,296 6,933 1,715 (5,469) - (409) 4,020 4,492 316,578vehicles 121,426 8,031 - (21,378) - - 2,600 755 111,434Other assets 15,762 72 - - (8,464) (48,342) - 56,898 15,926Projects- in-progress 775,528 831,818 - (14,572) - - (867,705) 3,368 728,437
Total investments 17,857,860 1,064,971 189,943 (402,019) (158,662) (133,874) - 1,436,653 19,854,872
Depreciation:building and installations (1,799,375) (94,905) (30,739) 53,597 4,058 30 - 8,939 (1,858,395)Industrial machinery and equipment (8,167,532) (434,758) (60,169) 184,314 82,646 42,877 - (829,647) (9,182,269)Office furniture and equipment (261,329) (15,273) (1,548) 3,788 - 371 - (2,164) (276,155)vehicles (94,186) (7,119) - 15,140 - - - (119) (86,284)Other assets (12,264) (229) - - 3,687 28,802 - (32,447) (12,451)Total accumulated depreciation (10,334,686) (552,284) (92,456) 256,839 90,391 72,080 - (855,438) (11,415,554)
Net investment Ps. 7,523,174 Ps. 512,687 Ps. 97,487 Ps. (145,180) Ps. (68,271) Ps. (61,794) Ps. - Ps. 581,215 Ps. 8,439,318
Balance as of January 1, 2010 Additions
Additions from business acquisitions Divestments
Long lived assets available for sale
Impairment effect Transferred assets
Translation effect
Balance as of December 31,
2010Investment:
Land Ps. 753,398 Ps. 7,052 Ps. - Ps. - Ps. - Ps. - Ps. - Ps. (16,515) Ps. 743,935building and installations 3,336,843 - - (52,688) - - 339,213 (19,904) 3,603,464Industrial machinery and equipment 12,847,793 254,496 - (846,621) - - 467,546 (430,765) 12,292,449Office furniture and equipment 347,773 4,420 - (20,311) - - 1,877 (28,463) 305,296vehicles 117,441 827 - (4,053) - - 7,549 (338) 121,426Other assets 25,260 4,963 - (42,025) - - 10,405 17,159 15,762Projects- in-progress 973,056 700,328 - (38,458) - - (826,590) (32,808) 775,528
Total investments 18,401,564 972,086 - (1,004,156) - - - (511,634) 17,857,860
Depreciation:building and installations (1,741,307) (113,022) - 40,484 - - - 14,470 (1,799,375)Industrial machinery and equipment (8,771,388) (492,169) - 830,993 - - - 265,032 (8,167,532)Office furniture and equipment (144,508) (3,737) - 7,832 - - - (120,916) (261,329)vehicles (91,307) (7,383) - 3,005 - - - 1,499 (94,186)Other assets (247,944) (17,315) - 5,746 - - - 247,249 (12,264)Total accumulated depreciation (10,996,454) (633,626) - 888,060 - - - 407,334 (10,334,686)
Net investment Ps. 7,405,110 Ps. 338,460 Ps. - Ps. (116,096) Ps. - Ps. - Ps. - Ps. (104,300) Ps. 7,523,174
At December 31, 2011 and 2010, the Company has assets that were temporarily not in use amounting to Ps. 4,911 and Ps. 6,724 and assets that were permanently not in use amounting to Ps. 5,177 and Ps. 4,062, respectively.

2011 ANNUAL REPORT 49 KUO
10. Property, plant and equipment
Reconciliation of beginning and ending book balances in 2011 and 2010 is as follows:
Balance as of December 31,
2010 Additions
Additions from business acquisitions Divestments
Long lived assets available for sale
Impairment effect Transferred assets
Translation effect
Balance as of December 31,
2011Investment:
Land Ps. 743,935 Ps. 10,470 Ps. 6,082 Ps. (14,117) Ps. (3,456) Ps. - Ps. 21,937 Ps. 5,909 Ps. 770,760building and installations 3,603,464 47,210 71,340 (61,299) (10,291) (72) 408,179 23,091 4,081,622Industrial machinery and equipment 12,292,449 160,437 110,806 (285,184) (136,451) (85,051) 430,969 1,342,140 13,830,115Office furniture and equipment 305,296 6,933 1,715 (5,469) - (409) 4,020 4,492 316,578vehicles 121,426 8,031 - (21,378) - - 2,600 755 111,434Other assets 15,762 72 - - (8,464) (48,342) - 56,898 15,926Projects- in-progress 775,528 831,818 - (14,572) - - (867,705) 3,368 728,437
Total investments 17,857,860 1,064,971 189,943 (402,019) (158,662) (133,874) - 1,436,653 19,854,872
Depreciation:building and installations (1,799,375) (94,905) (30,739) 53,597 4,058 30 - 8,939 (1,858,395)Industrial machinery and equipment (8,167,532) (434,758) (60,169) 184,314 82,646 42,877 - (829,647) (9,182,269)Office furniture and equipment (261,329) (15,273) (1,548) 3,788 - 371 - (2,164) (276,155)vehicles (94,186) (7,119) - 15,140 - - - (119) (86,284)Other assets (12,264) (229) - - 3,687 28,802 - (32,447) (12,451)Total accumulated depreciation (10,334,686) (552,284) (92,456) 256,839 90,391 72,080 - (855,438) (11,415,554)
Net investment Ps. 7,523,174 Ps. 512,687 Ps. 97,487 Ps. (145,180) Ps. (68,271) Ps. (61,794) Ps. - Ps. 581,215 Ps. 8,439,318
Balance as of January 1, 2010 Additions
Additions from business acquisitions Divestments
Long lived assets available for sale
Impairment effect Transferred assets
Translation effect
Balance as of December 31,
2010Investment:
Land Ps. 753,398 Ps. 7,052 Ps. - Ps. - Ps. - Ps. - Ps. - Ps. (16,515) Ps. 743,935building and installations 3,336,843 - - (52,688) - - 339,213 (19,904) 3,603,464Industrial machinery and equipment 12,847,793 254,496 - (846,621) - - 467,546 (430,765) 12,292,449Office furniture and equipment 347,773 4,420 - (20,311) - - 1,877 (28,463) 305,296vehicles 117,441 827 - (4,053) - - 7,549 (338) 121,426Other assets 25,260 4,963 - (42,025) - - 10,405 17,159 15,762Projects- in-progress 973,056 700,328 - (38,458) - - (826,590) (32,808) 775,528
Total investments 18,401,564 972,086 - (1,004,156) - - - (511,634) 17,857,860
Depreciation:building and installations (1,741,307) (113,022) - 40,484 - - - 14,470 (1,799,375)Industrial machinery and equipment (8,771,388) (492,169) - 830,993 - - - 265,032 (8,167,532)Office furniture and equipment (144,508) (3,737) - 7,832 - - - (120,916) (261,329)vehicles (91,307) (7,383) - 3,005 - - - 1,499 (94,186)Other assets (247,944) (17,315) - 5,746 - - - 247,249 (12,264)Total accumulated depreciation (10,996,454) (633,626) - 888,060 - - - 407,334 (10,334,686)
Net investment Ps. 7,405,110 Ps. 338,460 Ps. - Ps. (116,096) Ps. - Ps. - Ps. - Ps. (104,300) Ps. 7,523,174
At December 31, 2011 and 2010, the Company has assets that were temporarily not in use amounting to Ps. 4,911 and Ps. 6,724 and assets that were permanently not in use amounting to Ps. 5,177 and Ps. 4,062, respectively.

2011 ANNUAL REPORT 50 KUO
11. Other assets
2011 2010Patents and trademarks Ps. 765,081 Ps. 495,951Other assets 100,059 55,872Guarantee deposits 97,849 51,800Projects 89,623 108,492Works of art 76,883 76,883Commissions 38,554 43,582Installation costs to be amortized 31,714 31,689Investment in shares 1,281 117,529
Ps. 1,201,044 Ps. 981,798
12. Derivative financial instruments
The objective of the Company in executing contracts with derivative financial instruments is to partially cover the financial risk from exposures in the exchange rate, interest rates and prices of natural gas. The decision to take an economic or financial hedge reflects market conditions and the related expectation at a given date, as well as the domestic and international economic context of the economic indicators which influence the Company’s operations.
Transactions outstanding at year end, performed with foreign currency and/or interest rates forwards and swaps are summarized below:
Valuation as ofDecember 31, 2011
Notional Other comprehensive income (loss)Instrument
Amount in Thousands Unit Maturity
Assets (Liabilities)
Zero Cost Collar interest rate 11,250 Dollars January 2013 Ps. (5,834) Ps. (4,084)Zero Cost Collar interest rate 25,000 Dollars March 2013 (18,245) (12,772)Swap natural gas 240 MMbTU March 2012 (3,321) (1,693)Swap natural gas 300 MMbTU June 2012 (3,125) (1,456)
Total as of December 31, 2011 Ps. (30,525) Ps. (20,005)
Total as of December 31, 2010 Ps. (60,544) Ps. (42,365)
Certain of the Company’s subsidiaries have contracts that contain embedded derivative instruments; however, because these instruments cannot be separated from the host contract, under the guidelines of NIF C-10, they were not valued or recorded.
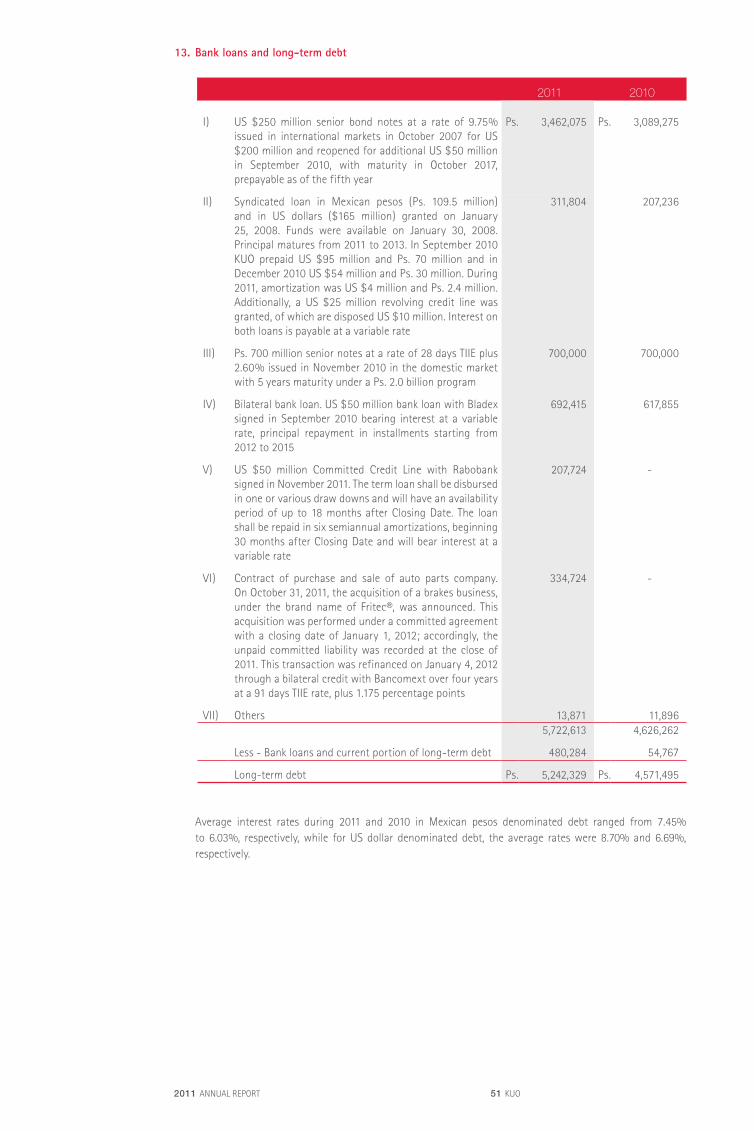
2011 ANNUAL REPORT 51 KUO
13. Bank loans and long-term debt
2011 2010
I) US $250 million senior bond notes at a rate of 9.75% issued in international markets in October 2007 for US $200 million and reopened for additional US $50 million in September 2010, with maturity in October 2017, prepayable as of the fifth year
Ps. 3,462,075 Ps. 3,089,275
II) Syndicated loan in Mexican pesos (Ps. 109.5 million) and in US dollars ($165 million) granted on January 25, 2008. Funds were available on January 30, 2008. Principal matures from 2011 to 2013. In September 2010 KUO prepaid US $95 million and Ps. 70 million and in December 2010 US $54 million and Ps. 30 million. During 2011, amortization was US $4 million and Ps. 2.4 million. Additionally, a US $25 million revolving credit line was granted, of which are disposed US $10 million. Interest on both loans is payable at a variable rate
311,804 207,236
III) Ps. 700 million senior notes at a rate of 28 days TIIE plus 2.60% issued in November 2010 in the domestic market with 5 years maturity under a Ps. 2.0 billion program
700,000 700,000
Iv) bilateral bank loan. US $50 million bank loan with bladex signed in September 2010 bearing interest at a variable rate, principal repayment in installments starting from 2012 to 2015
692,415 617,855
v) US $50 million Committed Credit Line with Rabobank signed in November 2011. The term loan shall be disbursed in one or various draw downs and will have an availability period of up to 18 months after Closing Date. The loan shall be repaid in six semiannual amortizations, beginning 30 months after Closing Date and will bear interest at a variable rate
207,724 -
vI) Contract of purchase and sale of auto parts company. On October 31, 2011, the acquisition of a brakes business, under the brand name of Fritec®, was announced. This acquisition was performed under a committed agreement with a closing date of January 1, 2012; accordingly, the unpaid committed liability was recorded at the close of 2011. This transaction was refinanced on January 4, 2012 through a bilateral credit with bancomext over four years at a 91 days TIIE rate, plus 1.175 percentage points
334,724 -
vII) Others 13,871 11,8965,722,613 4,626,262
Less - bank loans and current portion of long-term debt 480,284 54,767
Long-term debt Ps. 5,242,329 Ps. 4,571,495
Average interest rates during 2011 and 2010 in Mexican pesos denominated debt ranged from 7.45% to 6.03%, respectively, while for US dollar denominated debt, the average rates were 8.70% and 6.69%, respectively.
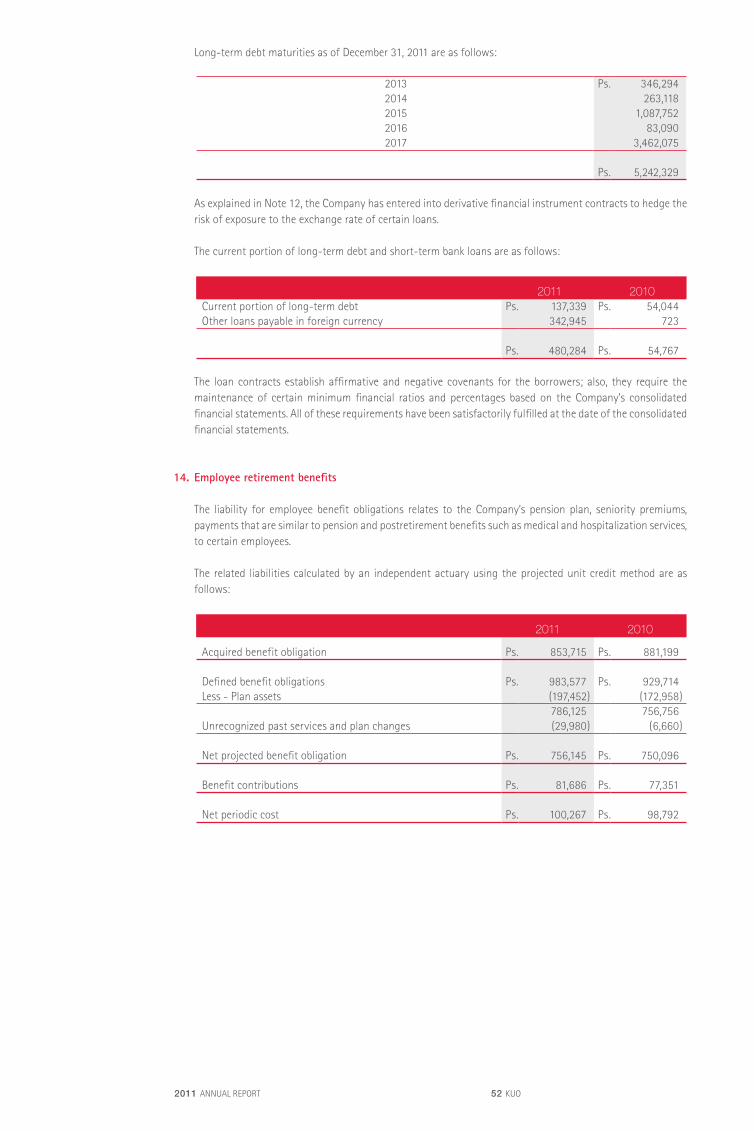
2011 ANNUAL REPORT 52 KUO
Long-term debt maturities as of December 31, 2011 are as follows:
2013 Ps. 346,2942014 263,1182015 1,087,7522016 83,0902017 3,462,075
Ps. 5,242,329
As explained in Note 12, the Company has entered into derivative financial instrument contracts to hedge the risk of exposure to the exchange rate of certain loans.
The current portion of long-term debt and short-term bank loans are as follows:
2011 2010Current portion of long-term debt Ps. 137,339 Ps. 54,044Other loans payable in foreign currency 342,945 723
Ps. 480,284 Ps. 54,767
The loan contracts establish affirmative and negative covenants for the borrowers; also, they require the maintenance of certain minimum financial ratios and percentages based on the Company’s consolidated financial statements. All of these requirements have been satisfactorily fulfilled at the date of the consolidated financial statements.
14. Employee retirement benefits
The liability for employee benefit obligations relates to the Company’s pension plan, seniority premiums, payments that are similar to pension and postretirement benefits such as medical and hospitalization services, to certain employees.
The related liabilities calculated by an independent actuary using the projected unit credit method are as follows:
2011 2010
Acquired benefit obligation Ps. 853,715 Ps. 881,199
Defined benefit obligations Ps. 983,577 Ps. 929,714Less - Plan assets (197,452) (172,958)
786,125 756,756Unrecognized past services and plan changes (29,980) (6,660)
Net projected benefit obligation Ps. 756,145 Ps. 750,096
benefit contributions Ps. 81,686 Ps. 77,351
Net periodic cost Ps. 100,267 Ps. 98,792

2011 ANNUAL REPORT 53 KUO
Rates utilized in the actuarial calculations recommended by the Mexican Association of Consultant Actuaries for 2011 and 2010 were as follows:
2011 2010Expected return on plan assets 3.00% 5.55%Interest rate 7.88% 8.13%Salary increase rate 4.50% 4.50%Postretirement benefits increase rate 6.09% 5.77%
The amortization periods of the transition asset of December 31, 2011 and 2010 are from 10 and 15 years.
15. Stockholders’ equity
As of December 31, capital stock is represented by:
2011 2010Shares Amount Shares Amount
Fixed portion -Nominative Series “A” shares (without
redemption rights and which must represent at least 51% of voting stock) 233,221,719 Ps. 9,497 233,221,719 Ps. 9,755
variable portion -Nominative Series “b” shares (with
redemption rights and which may not represent more than 49% of voting stock) 223,144,429 9,086 223,144,429 9,333
456,366,148 Ps. 18,583 456,366,148 Ps. 19,088
The annual net income of each of the companies is subject to the legal requirement that 5% thereof be transferred to a legal reserve each year, until the reserve equals 20% of capital stock. This reserve may not be distributed to stockholders during the existence of each Company, except in the form of a stock dividend. As of December 31, 2011 and 2010, the legal reserve of KUO was Ps. 3,794.
Stockholders’ equity, except restated paid-in capital and tax retained earnings, will be subject to income tax at the rate in effect when a dividend is distributed. Any tax paid on such distribution, may be credited against the income tax payable of the year in which the tax on the dividend is paid and the two fiscal years following such payment.
During the Annual Ordinary and Extraordinary General Stockholders’ Meeting held on April 13, 2011, the stockholders’ approved a cash distribution to stockholders of Ps. 114,092, which was applied as a reduction of capital stock account of Ps. 505, Paid-in surplus account of Ps. 62,386 and retained earnings of Ps. 51,201. The reduction to the capital stock of Ps. 505 is comprised of Ps. 258 of the fixed portion, and Ps. 247 of the variable portion. The reduction in capital stock does not result in a reduction in shares.
During the Annual Ordinary and Extraordinary General Stockholders’ Meeting held on April 21, 2010, the stockholders’ approved a cash distribution to stockholders of Ps. 114,092, which was applied as a reduction of capital stock account of Ps. 505, Paid-in surplus account of Ps. 77,599 and retained earnings of Ps. 35,988. The reduction to the capital stock of Ps. 505 is comprised of Ps. 258 of the fixed portion, and Ps. 247 of the variable portion. The reduction in capital stock does not result in a reduction in shares.

2011 ANNUAL REPORT 54 KUO
The balances of the stockholders’ equity tax accounts as of December 31, are:
2011 2010Contributed capital account Ps. 10,384,034 Ps. 10,115,985Consolidated net fiscal income account 589,166 563,494
Total Ps. 10,973,200 Ps. 10,679,479
As illustrated in the preceding table, the total amount of the balances of the stockholders’ equity tax accounts exceeds stockholders’ equity, according to the accompanying consolidated statements of financial position.
16. Balances and transactions in foreign currency
The Company valued its foreign currency assets and liabilities, represented mainly by US dollars, at the exchange rates effective at December 31, 2011 and 2010 of Ps.13.8483 and Ps.12.3571 per US $1.00, respectively. The Company expects to use foreign currency assets to settle foreign currency liabilities.
a. As of December 31, monetary assets and liabilities denominated in foreign currency were as follows:
In thousands of US dollars2011 2010
Current monetary assets- Ps. 15,615 Ps. 58,486Current monetary liabilities-
Interest-free 49,652 22,534Interest-bearing 9,200 4,000
58,852 26,534Long-term liabilities 327,800 312,000
386,652 338,534
Net monetary liability position in foreign currency Ps. (371,037) Ps. (280,048)
b. As of December 31, the foreign currency monetary position is as follows:
In thousands of US dollars2011 2010
Current monetary assets- Ps. 122,350 Ps. 160,001Current monetary liabilities-
Interest-free 298,812 221,783Interest-bearing 9,200 4,000
308,012 225,783Long-term liabilities 327,800 313,770
635,812 539,553
Net monetary liability position in foreign currency Ps. (513,462) Ps. (379,552)
As of February 8, 2012, the unaudited foreign exchange position is similar to that at year-end, and the exchange rate is 12.6472 Mexican pesos per US dollar.
c. During the years ended December 31, 2011 and 2010, the Company entered foreign currency transactions which were converted and reported in pesos at the exchange rate existing at the date of each transaction.
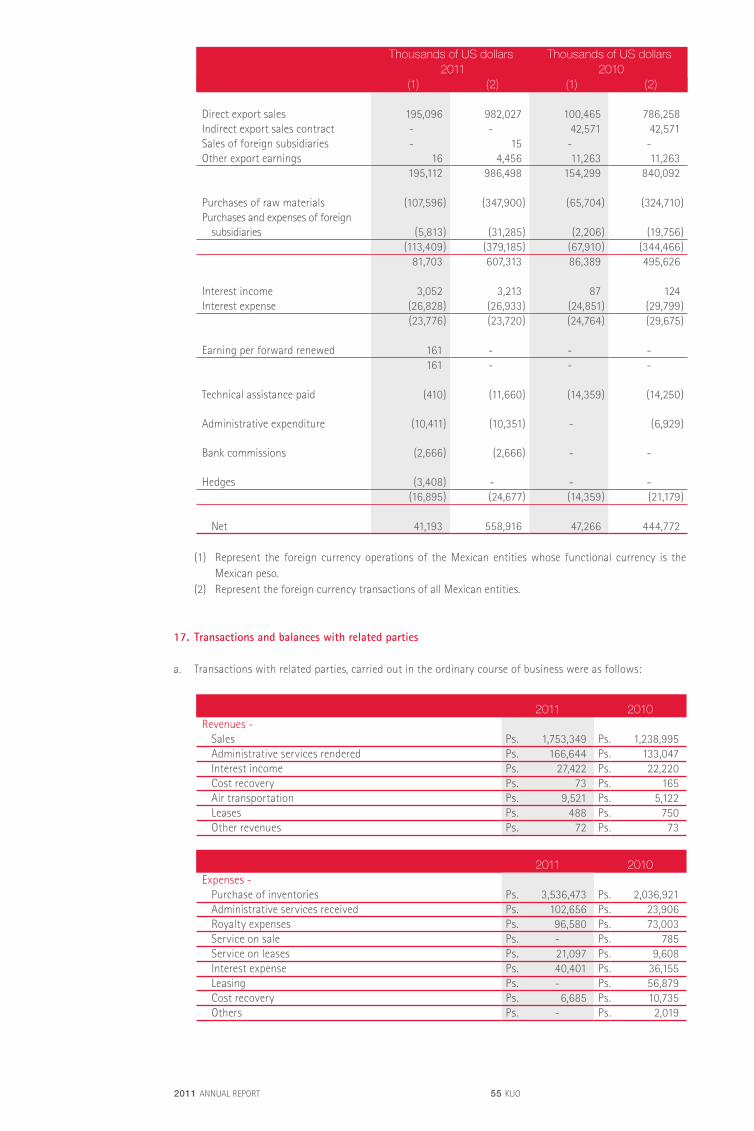
2011 ANNUAL REPORT 55 KUO
Thousands of US dollars Thousands of US dollars2011 2010
(1) (2) (1) (2)
Direct export sales 195,096 982,027 100,465 786,258Indirect export sales contract - - 42,571 42,571Sales of foreign subsidiaries - 15 - -Other export earnings 16 4,456 11,263 11,263
195,112 986,498 154,299 840,092
Purchases of raw materials (107,596) (347,900) (65,704) (324,710)Purchases and expenses of foreign
subsidiaries (5,813) (31,285) (2,206) (19,756)(113,409) (379,185) (67,910) (344,466)
81,703 607,313 86,389 495,626
Interest income 3,052 3,213 87 124Interest expense (26,828) (26,933) (24,851) (29,799)
(23,776) (23,720) (24,764) (29,675)
Earning per forward renewed 161 - - -161 - - -
Technical assistance paid (410) (11,660) (14,359) (14,250)
Administrative expenditure (10,411) (10,351) - (6,929)
bank commissions (2,666) (2,666) - -
hedges (3,408) -
- -
(16,895) (24,677) (14,359) (21,179)
Net 41,193 558,916 47,266 444,772
(1) Represent the foreign currency operations of the Mexican entities whose functional currency is the Mexican peso.
(2) Represent the foreign currency transactions of all Mexican entities.
17. Transactions and balances with related parties
a. Transactions with related parties, carried out in the ordinary course of business were as follows:
2011 2010Revenues -
Sales Ps. 1,753,349 Ps. 1,238,995Administrative services rendered Ps. 166,644 Ps. 133,047Interest income Ps. 27,422 Ps. 22,220Cost recovery Ps. 73 Ps. 165Air transportation Ps. 9,521 Ps. 5,122Leases Ps. 488 Ps. 750Other revenues Ps. 72 Ps. 73
2011 2010Expenses -
Purchase of inventories Ps. 3,536,473 Ps. 2,036,921Administrative services received Ps. 102,656 Ps. 23,906Royalty expenses Ps. 96,580 Ps. 73,003Service on sale Ps. - Ps. 785Service on leases Ps. 21,097 Ps. 9,608Interest expense Ps. 40,401 Ps. 36,155Leasing Ps. - Ps. 56,879Cost recovery Ps. 6,685 Ps. 10,735Others Ps. - Ps. 2,019
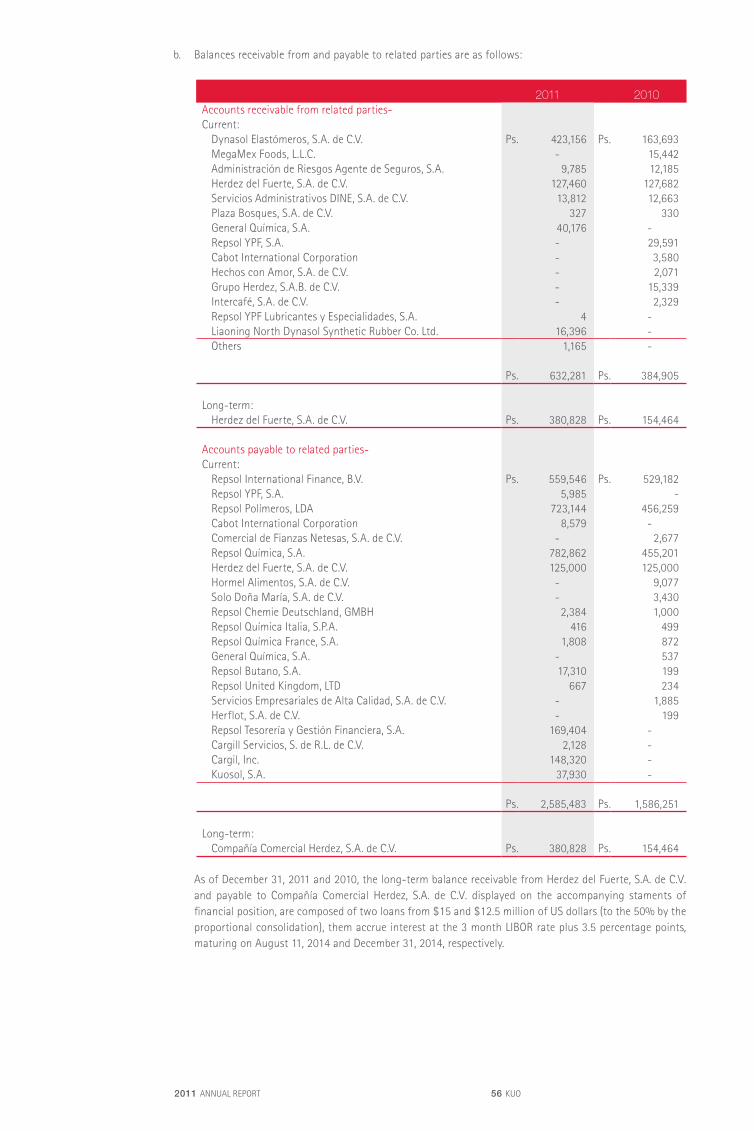
2011 ANNUAL REPORT 56 KUO
b. balances receivable from and payable to related parties are as follows:
2011 2010Accounts receivable from related parties-Current:
Dynasol Elastómeros, S.A. de C.v. Ps. 423,156 Ps. 163,693MegaMex Foods, L.L.C. - 15,442Administración de Riesgos Agente de Seguros, S.A. 9,785 12,185herdez del Fuerte, S.A. de C.v. 127,460 127,682Servicios Administrativos DINE, S.A. de C.v. 13,812 12,663Plaza bosques, S.A. de C.v. 327 330General Química, S.A. 40,176 -Repsol YPF, S.A. - 29,591Cabot International Corporation - 3,580hechos con Amor, S.A. de C.v. - 2,071Grupo herdez, S.A.b. de C.v. - 15,339Intercafé, S.A. de C.v. - 2,329Repsol YPF Lubricantes y Especialidades, S.A. 4 -Liaoning North Dynasol Synthetic Rubber Co. Ltd. 16,396 -Others 1,165 -
Ps. 632,281 Ps. 384,905
Long-term:herdez del Fuerte, S.A. de C.v. Ps. 380,828 Ps. 154,464
Accounts payable to related parties- Current:
Repsol International Finance, b.v. Ps. 559,546 Ps. 529,182Repsol YPF, S.A. 5,985 -Repsol Polímeros, LDA 723,144 456,259Cabot International Corporation 8,579 -Comercial de Fianzas Netesas, S.A. de C.v. - 2,677Repsol Química, S.A. 782,862 455,201herdez del Fuerte, S.A. de C.v. 125,000 125,000hormel Alimentos, S.A. de C.v. - 9,077Solo Doña María, S.A. de C.v. - 3,430Repsol Chemie Deutschland, GMbh 2,384 1,000Repsol Química Italia, S.P.A. 416 499Repsol Química France, S.A. 1,808 872General Química, S.A. - 537Repsol butano, S.A. 17,310 199Repsol United Kingdom, LTD 667 234Servicios Empresariales de Alta Calidad, S.A. de C.v. - 1,885herflot, S.A. de C.v. - 199Repsol Tesorería y Gestión Financiera, S.A. 169,404 -Cargill Servicios, S. de R.L. de C.v. 2,128 -Cargil, Inc. 148,320 -Kuosol, S.A. 37,930 -
Ps. 2,585,483 Ps. 1,586,251
Long-term:Compañía Comercial herdez, S.A. de C.v. Ps. 380,828 Ps. 154,464
As of December 31, 2011 and 2010, the long-term balance receivable from herdez del Fuerte, S.A. de C.v. and payable to Compañía Comercial herdez, S.A. de C.v. displayed on the accompanying staments of financial position, are composed of two loans from $15 and $12.5 million of US dollars (to the 50% by the proportional consolidation), them accrue interest at the 3 month LIbOR rate plus 3.5 percentage points, maturing on August 11, 2014 and December 31, 2014, respectively.

2011 ANNUAL REPORT 57 KUO
c. Employee benefits granted to Company key management were as follows:
2011 2010
Short term direct benefits Ps. 117,464 Ps. 163,074
based on performance and targets met, KUO grants a variable compensation to its executives, which is included in the amounts shown above.
The Company has implemented a retirement benefits contribution plan, consisting of a monthly contribution made by employees of up to 6% of gross wages, which is matched by the Company depending on the employee’s age and seniority. Upon retirement, employees may withdraw all the contributions made, plus the respective returns and, depending on age, seniority, and reasons for retirement, up to 100% of the contributions made by the Company and the related returns thereon.
18. Other expenses, net
As of December 31, other expenses are as follows:
2011 2010Impairment of long-lived assets Ps. (61,794) Ps. -Statutory employee profit sharing (41,712) (23,640)Non-ordinary severance payments - (64,484)Gain on sale of shares (227) -Loss on sale of property, plant and equipment (21,778) (21,898)Other expenses, net (22,157) (42,927)Tremec land sale transfer tax - (24,941)value Added Tax claim reserve - (12,101)Tax refund 5,309 -
Ps. (142,359) Ps. (189,991)
19. Net comprehensive financing cost
As of December 31, the net comprehensive financing cost is as follows:
2011 2010
Interest income Ps. 62,088 Ps. 115,725Interest expenses (679,182) (641,738)Exchange (loss) income, net (672,149) 191,370
Ps. (1,289,243) Ps. (334,643)
20. Income taxes
The Company is subject to ISR and IETU.
The ISR rate is 30% for 2011 and 2010; it will be 30% for 2012, 29% for 2013, and 28% for 2014.
On December 7, 2009, amendments to the ISR Law were published, to become effective beginning in 2010. These amendments state that: a) ISR relating to tax consolidation benefits obtained from 1999 through 2004 should be paid in installments beginning in 2010 through 2014, and b) ISR relating to tax benefits obtained in the 2005 tax consolidation and thereafter, should be paid during the sixth through the tenth year after that in which the benefit was obtained. Payment of ISR in connection with tax consolidation benefits obtained from 1982 (tax consolidation starting year) through 1998 may be required in those cases provided by law.
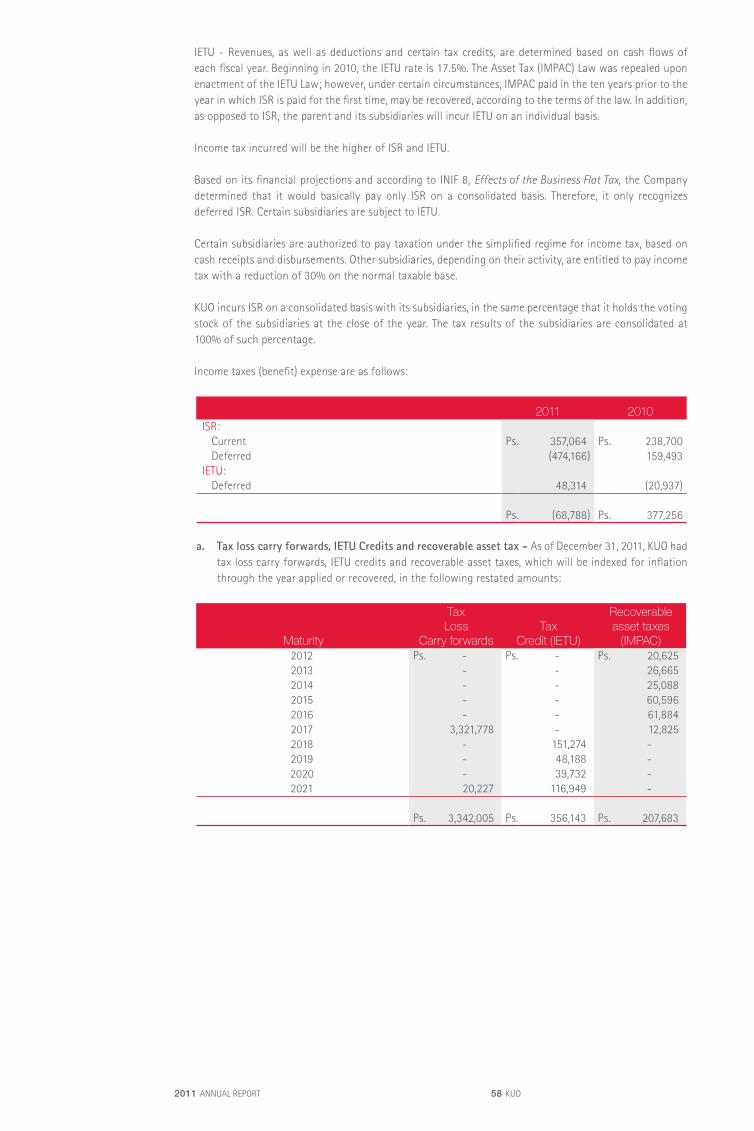
2011 ANNUAL REPORT 58 KUO
IETU - Revenues, as well as deductions and certain tax credits, are determined based on cash flows of each fiscal year. beginning in 2010, the IETU rate is 17.5%. The Asset Tax (IMPAC) Law was repealed upon enactment of the IETU Law; however, under certain circumstances, IMPAC paid in the ten years prior to the year in which ISR is paid for the first time, may be recovered, according to the terms of the law. In addition, as opposed to ISR, the parent and its subsidiaries will incur IETU on an individual basis.
Income tax incurred will be the higher of ISR and IETU.
based on its financial projections and according to INIF 8, Effects of the Business Flat Tax, the Company determined that it would basically pay only ISR on a consolidated basis. Therefore, it only recognizes deferred ISR. Certain subsidiaries are subject to IETU.
Certain subsidiaries are authorized to pay taxation under the simplified regime for income tax, based on cash receipts and disbursements. Other subsidiaries, depending on their activity, are entitled to pay income tax with a reduction of 30% on the normal taxable base.
KUO incurs ISR on a consolidated basis with its subsidiaries, in the same percentage that it holds the voting stock of the subsidiaries at the close of the year. The tax results of the subsidiaries are consolidated at 100% of such percentage.
Income taxes (benefit) expense are as follows:
2011 2010ISR:
Current Ps. 357,064 Ps. 238,700Deferred (474,166) 159,493
IETU:Deferred 48,314 (20,937)
Ps. (68,788) Ps. 377,256
a. Tax loss carry forwards, IETU Credits and recoverable asset tax - As of December 31, 2011, KUO had tax loss carry forwards, IETU credits and recoverable asset taxes, which will be indexed for inflation through the year applied or recovered, in the following restated amounts:
TaxLoss
Carry forwardsTax
Credit (IETU)
Recoverableasset taxes
(IMPAC)Maturity2012 Ps. - Ps. - Ps. 20,6252013 - - 26,6652014 - - 25,0882015 - - 60,5962016 - - 61,8842017 3,321,778 - 12,8252018 - 151,274 -2019 - 48,188 -2020 - 39,732 -2021 20,227 116,949 -
Ps. 3,342,005 Ps. 356,143 Ps. 207,683
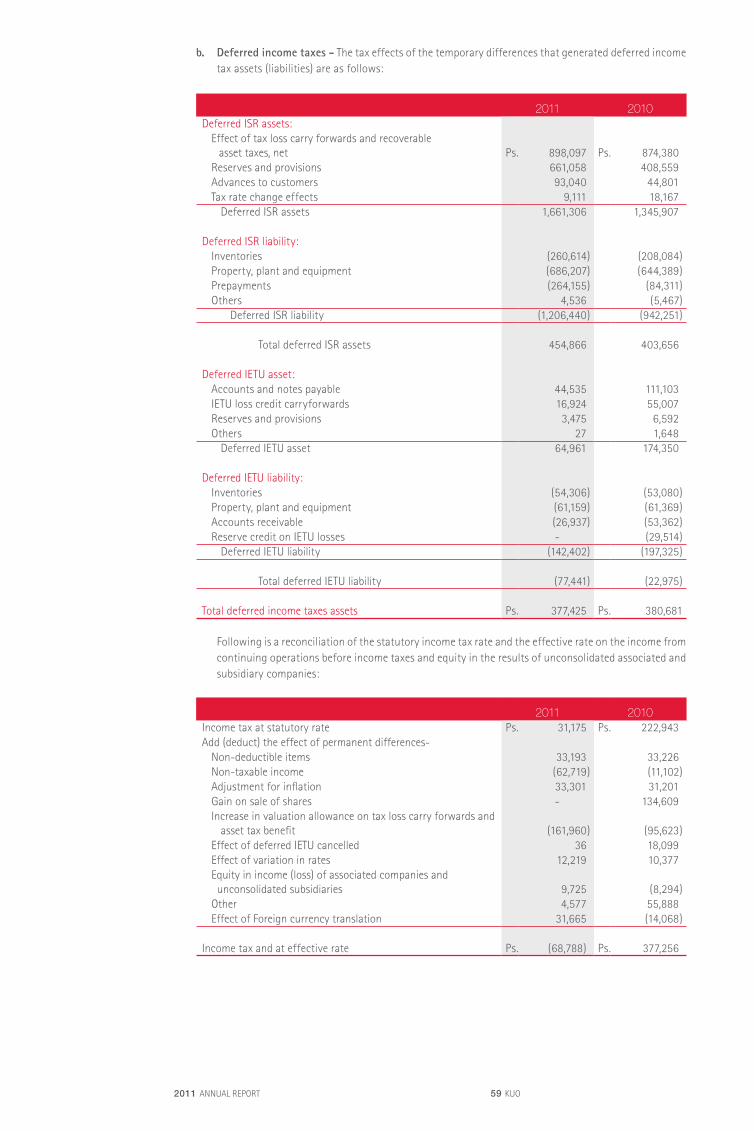
2011 ANNUAL REPORT 59 KUO
b. Deferred income taxes - The tax effects of the temporary differences that generated deferred income tax assets (liabilities) are as follows:
2011 2010Deferred ISR assets:
Effect of tax loss carry forwards and recoverableasset taxes, net Ps. 898,097 Ps. 874,380
Reserves and provisions 661,058 408,559Advances to customers 93,040 44,801Tax rate change effects 9,111 18,167
Deferred ISR assets 1,661,306 1,345,907
Deferred ISR liability:Inventories (260,614) (208,084)Property, plant and equipment (686,207) (644,389)Prepayments (264,155) (84,311)Others 4,536 (5,467)
Deferred ISR liability (1,206,440) (942,251)
Total deferred ISR assets 454,866 403,656
Deferred IETU asset:Accounts and notes payable 44,535 111,103IETU loss credit carryforwards 16,924 55,007Reserves and provisions 3,475 6,592Others 27 1,648
Deferred IETU asset 64,961 174,350
Deferred IETU liability:Inventories (54,306) (53,080)Property, plant and equipment (61,159) (61,369)Accounts receivable (26,937) (53,362)Reserve credit on IETU losses - (29,514)
Deferred IETU liability (142,402) (197,325)
Total deferred IETU liability (77,441) (22,975)
Total deferred income taxes assets Ps. 377,425 Ps. 380,681
Following is a reconciliation of the statutory income tax rate and the effective rate on the income from continuing operations before income taxes and equity in the results of unconsolidated associated and subsidiary companies:
2011 2010Income tax at statutory rate Ps. 31,175 Ps. 222,943Add (deduct) the effect of permanent differences-
Non-deductible items 33,193 33,226Non-taxable income (62,719) (11,102)Adjustment for inflation 33,301 31,201Gain on sale of shares - 134,609Increase in valuation allowance on tax loss carry forwards and
asset tax benefit (161,960) (95,623)Effect of deferred IETU cancelled 36 18,099Effect of variation in rates 12,219 10,377Equity in income (loss) of associated companies and unconsolidated subsidiaries 9,725 (8,294)Other 4,577 55,888Effect of Foreign currency translation 31,665 (14,068)
Income tax and at effective rate Ps. (68,788) Ps. 377,256

2011 ANNUAL REPORT 60 KUO
c. Tax consolidation - The balance of deferred tax liabilities as of December 31, 2011 and 2010, are as follows:
2011 2010Tax liability due to tax loss carryforwards Ps. 882,065 Ps. 1,071,291Less – short-term deferred tax liabilities 81,414 -Long-term deferred tax liability Ps. 800,651 Ps. 1,071,291
21. Discontinued operations
During the year 2011, the associated company herdez del Fuerte, S.A. de C.v. detected that certain businesses were not generating the results expected, therefore it closed the plants in veracruz and Mazatlán, which were relocated to the plants at San Luis Potosí and Chiapas, respectively. The expenses include the impairment of assets, dismantling expenses and employee final settlements.
In January 28, 2010 CIE bérriz exercised the purchase option granted acquiring from KUO Automotriz its equity in CIE Automotive México for US $54 million. With this transaction the joint venture between KUO Automotriz and CIE bérriz is concluded. On the same date, KUO sold Inmobiliaria el Puente.
The transactions described above are recognized as discontinued operations and the effects were recorded retroactively for comparison purposes. A summary of the statement of operations of these operations for the years ended December 31, is shown below:
2011 2010
Costs and expenses Ps. 4,762 Ps. -Net comprehensive financing result 13 485Other income, net 66 137,816Income tax (1,396) -
(Loss) income from discontinued operations Ps. (3,287) Ps. 138,301
22. Commitments and contingencies
a. Lease commitments - As of December 31, 2011 and 2010, the Company had operating lease commitments for equipment equal to Ps. 473,760 and Ps. 127,321, respectively, whose maturity dates are as follows:
Maturity 2011 20102011 Ps. - Ps. 49,4002012 103,844 39,0922013 89,102 26,3562014 68,490 10,5522015 39,284 1,9712016 24,372 -2017 22,872 -2018 22,872 -2019 22,872 -2020 22,872 -2021 22,872 -2022 22,872 -2023 11,436 -
Ps. 473,760 Ps. 127,371
2011 ANNUAL REPORT 61 KUO
Lease expenses recorded in the consolidated statements of operations during 2011 and 2010 were Ps. 49,400 and Ps. 104,996, respectively.
In May 2011, the Company signed an aircraft lease agreement with GE Capital CEF Mexico, S. de R.L. de C.v. The total amount of the lease is US $19.9 million payable in 48 quarterly installments of US $413 thousand with an optional prepayment feature during the life of the lease.
b. Contingencies - Certain subsidiaries are engaged in lawsuits as plaintiffs and defendants in the regular course of operations. These lawsuits always involve uncertainty, and some of them may result in adverse judgments for the companies. While it is impossible to determine the amount involved in pending lawsuits, management believes that based on the facts, any resulting liability would not materially affect the consolidated financial position or results of operations of the Company or its
subsidiaries.
23. Effects of adopting International Financial Reporting Standards
The National banking and Securities Commission (CNbv) requires certain entities that disclose their financial information to the public through the Mexican Stock Exchange (bMv), that beginning in 2012, they must prepare and disclose their financial information according to International Financial Reporting Standards (IFRS), issued by the International Accounting Standards board (IASb).
The consolidated financial statements for the year ending December 31, 2012 to be issued by the Company will be its first annual financial statements that comply with IFRS. The transition date is January 1, 2011 and, therefore, the year ended December 31, 2011 will be the comparative period established by IFRS 1, First-Time Adoption of International Financial Reporting Standards. According to IFRS 1, the Company will apply the relevant mandatory exceptions and certain optional exemptions to the retroactive application of IFRS.
The Company will apply the important mandatory exemptions to the retrospective application of IFRS as follows:
Calculate estimations – The estimates from the date of transition are consistent with estimates on that same date under the Mexican Financial Reporting Standards (MFRS), unless there is evidence of errors in these estimates.
Hedge accounting – Shall apply the hedge accounting only if the hedge relationship comply with the criteria of IFRS transition date.
Shares non-controlling – Prospectively shall apply certain recognition and presentation requirements relating to minority interest, from the transition date.
The Company has elected the following optional exemptions to the retrospective application of IFRS as follows:
Business combinations – Shall apply the exemption from business combinations. So business combinations have not been reformulated.
Cost assumed – Exemption will apply cost incurred. So we have chosen to use fair value at the transition date as the assumed cost for land, buildings and machinery. For other fixed assets has chosen to use the revalued amount under MFRS to the date of transition as the cost incurred.
Leases – Shall apply the exemption of leases. however, have not been identified current contracts to the date of transition that contain a lease based on the facts and circumstances at that time.

2011 ANNUAL REPORT 62 KUO
Employee benefits – Shall apply the exemption of employee benefits. So recognize all cumulative actuarial gains and losses at the date of transition.
Differences accumulated by the conversion effect – The exemption will apply to the accumulated differences by the effect of conversion. Therefore is adjusted to zero the conversion effect to the date of transition.
The Company will then summarize the main differences that it identified in its transition from MFRS to IFRS to the date of these consolidated financial statements, as well as an estimate of the significant impacts:
Property, plant and equipment - According to IFRS, has been chosen to use fair value at the date of transition as its cost assumed for land, buildings and machinery, consequently the effects who were recognized by the Company represented an increase in this balance for approximately Ps. 1,200 million.
Employee benefits - According to IFRS, provisions for labor termination indemnities are recognized until the Company has a demonstrable commitment to terminate the relationship with the employee or made an offer to encourage voluntary retirement and therefore, eliminated the recognized liability under MFRS of Ps. 15 million. IFRS also does not allow the recognition of assets and liabilities deferred PTU, therefore the recognized liability for deferred PTU under MFRS for Ps. 3 million, was eliminated.
Deferred taxes - Deferred taxes were recalculated with the adjusted book values of assets and liabilities in accordance with IFRS, which resulted in a reduction to retained earnings of approximately Ps. 300 million at the date of transition.
Differences accumulated by the conversion effect - According to IFRS, has been canceled the cumulative effect of conversion and was reclassified to retained earnings amounting to Ps. 300 million.
Financial liabilities - According to IFRS, was valued long-term debt at amortized cost using the effective rate method; the unfavorable effect recorded in the retained earnings was Ps. 4 million.
Other differences in presentation and disclosures in the financial - Generally, the disclosure requirements of IFRS are more extensive than those of MFRS, which may result in more revelations about the accounting policies, significant estimates and judgments, financial instruments and risk management, among others. Additionally, there may be differences in presentation, for example, IFRS requires the submission of a statement of comprehensive income, not required under MFRS.
The information presented in this note has been prepared in accordance with the standards and interpretations issued and outstanding, or issued and early adopted as of the date of preparation of these consolidated financial statements. The standards and interpretations that are applicable to December 31, 2012, including those that will be applicable as optional, are not known with certainty from the date of preparation of consolidated financial statements at December 31, 2011 and 2010, for that reason, the figures or information contained in this note could be modified.
Additionally, the accounting policies chosen by the Company may be modified as a result of changes in the economic or industry trends that are both observable after the issuance of these consolidated financial statements. The information presented in this note does not intend to comply with IFRS, as only one set of
2011 ANNUAL REPORT 63 KUO
financial statements comprising the statements of financial position, comprehensive income, changes in stockholders’ equity and cash flow, together with comparison information and explanatory notes can provide a fair presentation of the Company’s financial position, results of operations and cash flows under IFRS.
24. Financial statement issuance authorization
On February 8, 2012, the issuance of the consolidated financial statements was authorized by Juan Marco Gutiérrez Wanless, Chief Executive Officer of the Company. These consolidated financial statements are subject to the approval of the board of Directors at the General Ordinary Stockholders’ Meeting, where they may be modified, based on provisions set forth in the Mexican General Corporate Law.

De
sig
n:
ww
w.x
de
sig
n.c
om
.mx
INVESTOR’S INFORMATION
Corporate HeadquartersPaseo de los Tamarindos 400 B, piso 31Bosques de las LomasMéxico, D.F. 05120Tel. (52 55) 52.61.80.00
Independent AccountantsGaláz, Yamazaki, Ruiz Urquiza, S.C.Member of Deloitte Touche Tohmatsu LimitedPaseo de la Reforma 489CuauhtémocMéxico, D.F. 06500Tel. (52 55) 50.80.60.00
Investor RelationsInvestors and analysts please contact:Marisol Vázquez-Mellado M.Mariana Rojo [email protected]. (52 55) 52.61.80.00
Common Stock DataGrupo KUO, S.A.B. de C.V. “A” shares and “B” shares are listed and admitted for trading on the Bolsa Mexicana de Valores, S.A.B. de C.V.(The Mexican Stock Exchange) under the ticker symbol “KUO”
2011 ANNUAL REPORT 64 KUO
This annual report contains forward-looking statements which reflect the current opinions of Grupo KUO´s management regarding future events. The words “anticipate”, “believe”, “expect”, “hope”, “have the intention of”, “might”, “plan”, “should” and similar expressions generally indicate comments on expectations. These comments are subject to risks, uncertainties and changing circumstances. The final results may be materially different from current expectations due to several factors, which include, but are not limited to, global and local changes in politics, the economy, business, competition, market and regulatory factors, cyclical trends in the automobile parts and chemical sectors; as well as other factors that are highlighted under the title “Risk Factors” on the Annual Report submitted by Grupo KUO to the Mexican Securities and Exchange Commission (CNbv). Grupo KUO has no obligation whatsoever to update these comments on expectations. Any comment on expectations is valid only on the date on which it is made.
www.kuo.com.mx

2011 ANNUAL REPORT 66 KUO
www.kuo.com.mx