![Infl uence of translation effi ciency of homologous viral proteins … · 2019. 2. 27. · the total amount of [3H]methionine allowed us to determine whether EBNA1∆GA-GFP was synthesized](https://static.fdocuments.in/doc/165x107/60b40fa8d3784011ee68e859/infl-uence-of-translation-effi-ciency-of-homologous-viral-proteins-2019-2-27.jpg)
ANNUAl REpORT 2010–11 - City of Nedlands Report 2010-2011.pdf · of the City’s community...
92
ANNUAL REPORT 2010 –11 nedlands.wa.gov.au
Transcript of ANNUAl REpORT 2010–11 - City of Nedlands Report 2010-2011.pdf · of the City’s community...

ANNUAl REpORT 2010–11
nedlands.wa.gov.au


Report from mayor 2 – 3
Report from CEO 4 – 5
Your council 6 – 7
About the City of Nedlands
Organisational structure8 – 9
Infrastructure 10 – 13
Natural environment 14 – 17
Built environment 18 – 21
Community wellbeing 22 – 27
Governance 28 – 31
Community engagement 32 – 33
Economic development 34 – 37
Complaints register 38 – 39
Elected members attendance 40 – 41
Financial report 42 – 89
TABlE OF CONTENTs

REpORT FROm mAYOR
Mayor’s message Throughout the 2010–11 year your Council continued to develop and implement strategies to improve the delivery of service to its community. Council focused upon effi ciencies and core functions, and as a result many important projects were completed.
Engaging our communityIn september 2010, the City undertook an inspiring Community Visioning project, 2030: imagine, engage, create. The visioning project involved community members taking part in a series of community conversations with the aim of developing a shared vision for the future, which would be expressed in a community plan.
The Our Vision for 2030 Community plan demonstrates what can be achieved when a community comes together to create its own future. In taking on the 2030 project, the City’s goal and dream was to put the community in the driver’s seat. We wanted the community to work together for a shared vision that would play a part in the City’s major plans for the future.
SustainabilityOur natural environment was given a high priority within Council in the last fi nancial year. In June 2011 the City was awarded Waterwise Council status by the Water Corporation for its ongoing efforts to improve water management across its operations in the City.
Safer roadsIn the 2010–11 fi nancial year, your Council was active in reviewing strategic traffi c management issues throughout the City.
With its now well established Traffi c management Committee, investigations and reviews of strategic traffi c management issues such as Black spot projects, traffi c and parking hot-spots and safety issues are regularly undertaken.
HeritageIn June this year, restoration and refurbishment works commenced at the state heritage-listed site, The maisonettes. The City will spend approximately $325 000 on improvements to this historic building.
The City is a dynamic and
close-knit community
which has so much to be
proud of.
2
sheryl Froese, mayor
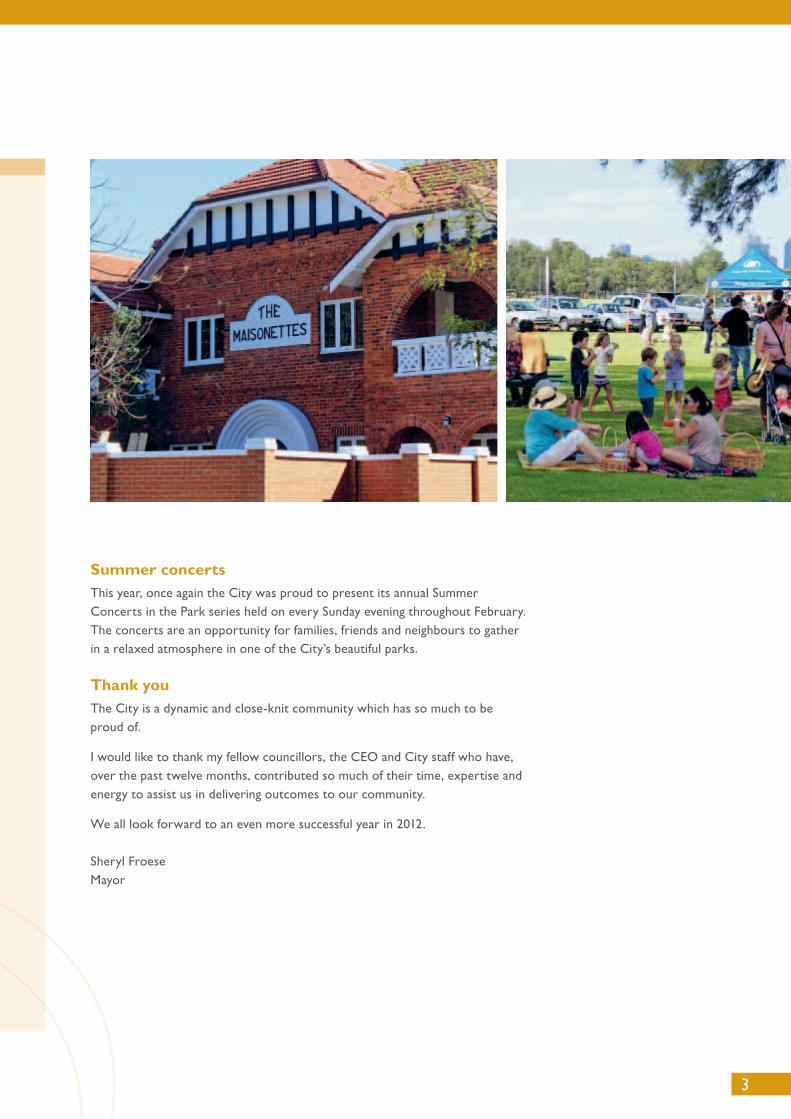
Summer concertsThis year, once again the City was proud to present its annual summer Concerts in the park series held on every sunday evening throughout February. The concerts are an opportunity for families, friends and neighbours to gather in a relaxed atmosphere in one of the City’s beautiful parks.
Thank youThe City is a dynamic and close-knit community which has so much to be proud of.
I would like to thank my fellow councillors, the CEO and City staff who have, over the past twelve months, contributed so much of their time, expertise and energy to assist us in delivering outcomes to our community.
We all look forward to an even more successful year in 2012.
sheryl Froesemayor
3
REpORT FROm CEO
CEO's message I am pleased to bring you the 2010–11 annual report. In doing so, I would like to thank my strong team of directors, managers and staff for their continued commitment, dedication and hard work over the past twelve months.
This year has once again seen some significant achievements against the City’s strategic plan 2008–13 and the City working with its community, neighbouring councils and state government. The strategic plan is a plan for the future and sets the strategic direction and key focus areas for Council and elected members. It is also the foundation for how the City develops its annual plans, service schedules and future budgets. The plan is focussed around the City’s infrastructure, natural environment, the built environment, community wellbeing and governance.
Local government reformThe 2010–11 financial year has represented a year of commitment and challenges. In 2010 the City entered into a Regional Transition Agreement with the City of subiaco, and undertook a business case for local government restructure.
The report of this process, prepared by KpmG, indicated substantial savings of $4.4 million annually and strategic advantages were achievable. An independent body will consider the future of this process.
Community engagementIn 2010, the City embarked upon its Community Visioning 2030 project. The 2030 project has been the City’s most significant community engagement project to date, and was based on a model developed in Oregon, UsA and adopted by a large number of councils around the world since. The local community responded strongly to the many consultation opportunities that the project provided, with over 2000 people providing input over a five month consultation period.
The next stage of the project will be the development of the Our Vision for 2030 Community plan. The community plan will provide key input towards the City’s strategic planning process, and the outcome of a 10 year City of Nedlands strategic plan.
It is an important time for the City to have a sound strategic plan in place. The City must be well prepared for many future challenges, including population pressures, infrastructure costs, environmental changes and local government reform.
The strategic plan is a plan for the future and sets the
strategic direction and
key focus areas for Council
and elected members.
4
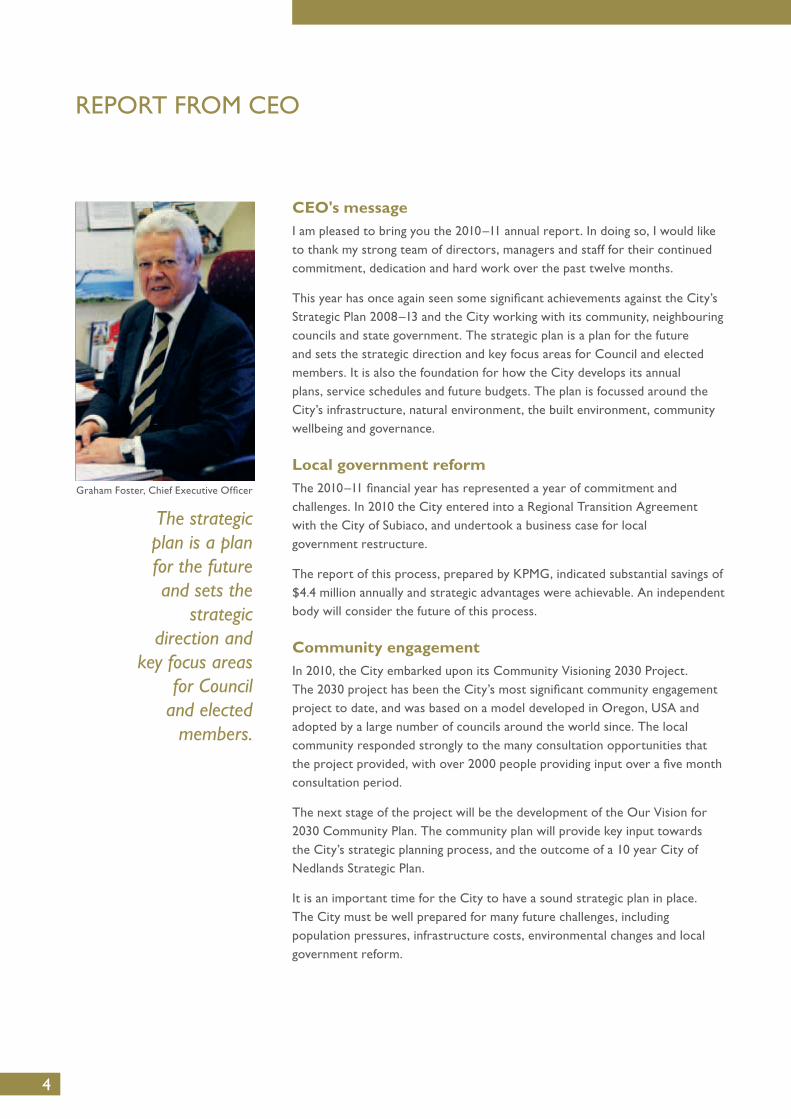
Graham Foster, Chief Executive Officer
Both the community plan and strategic plan will help ensure that the priorities of the City’s community continue to infl uence its future, regardless of the outcomes of any local government restructure, and will make an important contribution now and in the future.
Budget and expenditureIn the 2010–11 fi nancial year our total revenue budget was $25.17 million. The total revenue raised was $26.51 million, mainly through rates $15.44 million, grants and contributions $3.39 million and fees and charges $5.98 million.
The major areas of expenditure included recreation and culture $6.56 million, roads, footpaths and drainage $5.71 million, sanitation and town planning services $4.37 million, buildings and regulatory services $3.01 million and welfare services $2.23 million. Other areas of expenditure were law and public safety, health and governance.
In early 2011, the City was successful in obtaining $600 000 in grant funds that will go toward the planned upgrade of the John leckie pavilion. The full cost to upgrade the pavilion will be $2.8 million. This will be offset by the amount approved in grants. It is anticipated that the refurbishments to the pavilion will be completed in 2012.
The City faces many challenges and will continue to set aside funds for improvements to its parks, buildings, plant and equipment, and traffi c management projects such as upgrades to our roads, footpaths, drainage and kerbs. Often neglected in the past we can no longer afford to ignore the need to upgrade and improve our facilities. We will continue to provide a wide range of services for the community including child and youth services, aged care services, recreation programs, crime prevention, library services, waste collection, courses, activities and events.
In April this year the City took out a national communications award at the Government Communications Australia annual conference held in Canberra.The City was the only local government in Western Australia to win an award at this event. The award was presented for using a minimum budget to recreate its corporate branding of all its publications and website with particular attention to disability and accessibility requirements.
Finally, I want to thank our councillors, staff and members of our community groups who have all contributed to the liveability and amenity of our City, and to achieving our vision of making Nedlands an attractive City, with a strong sense of community and place.
Graham FosterChief Executive Offi cer
5
COUNCIl
The Strategic Plan 2008–13The City of Nedlands strategic plan 2008–13 is a plan for the future and sets the strategic direction and key focus areas for Council and elected members. It also becomes the foundation for how the City develops its annual plans, service schedules and future budgets.
The strategic plan has been developed by elected members, City staff and members of the community. The goals and strategies represent the type of City we want to become and what we need to do to get there.
The strategic plan is based on the following principles and assumptions:
• The City will provide services and infrastructure that support the development of inclusive communities and liveable neighbourhoods.
• The City will effectively and effi ciently plan and manage its resources in a transparent and accountable manner.
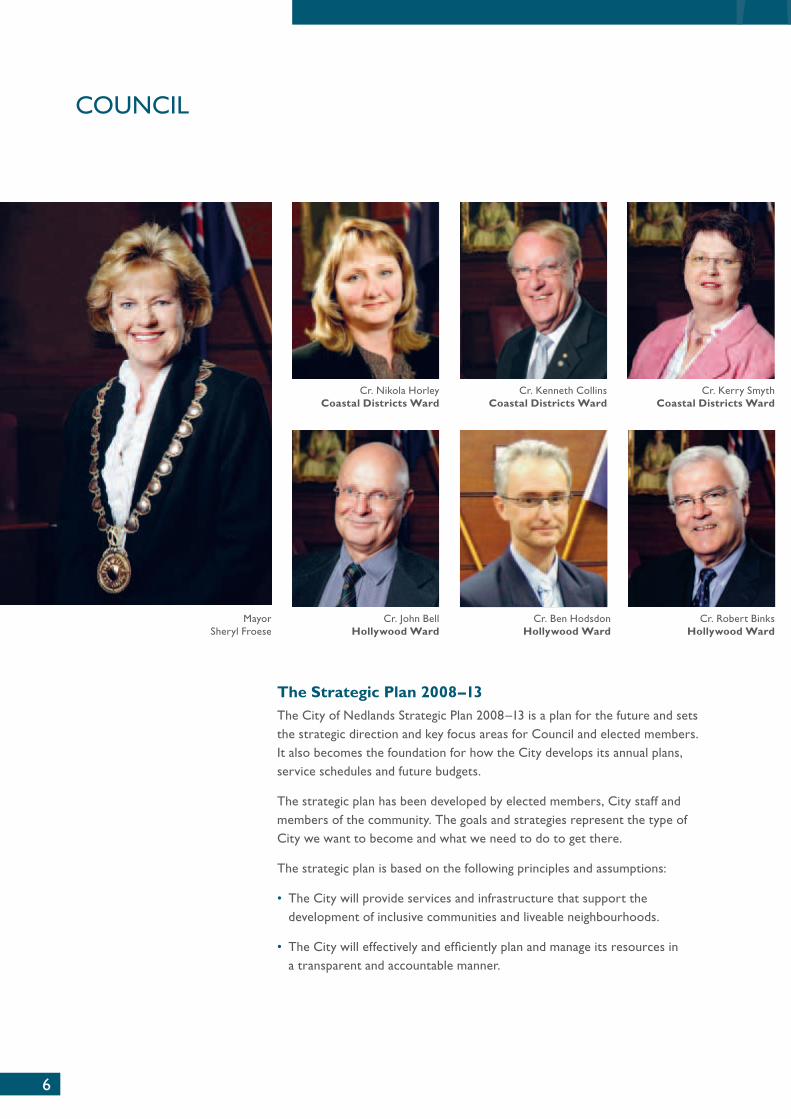
mayor sheryl Froese
Cr. John BellHollywood Ward
Cr. Nikola HorleyCoastal Districts Ward
Cr. Ben HodsdonHollywood Ward
Cr. Kenneth CollinsCoastal Districts Ward
Cr. Robert BinksHollywood Ward
Cr. Kerry smythCoastal Districts Ward
6
COUNCIl
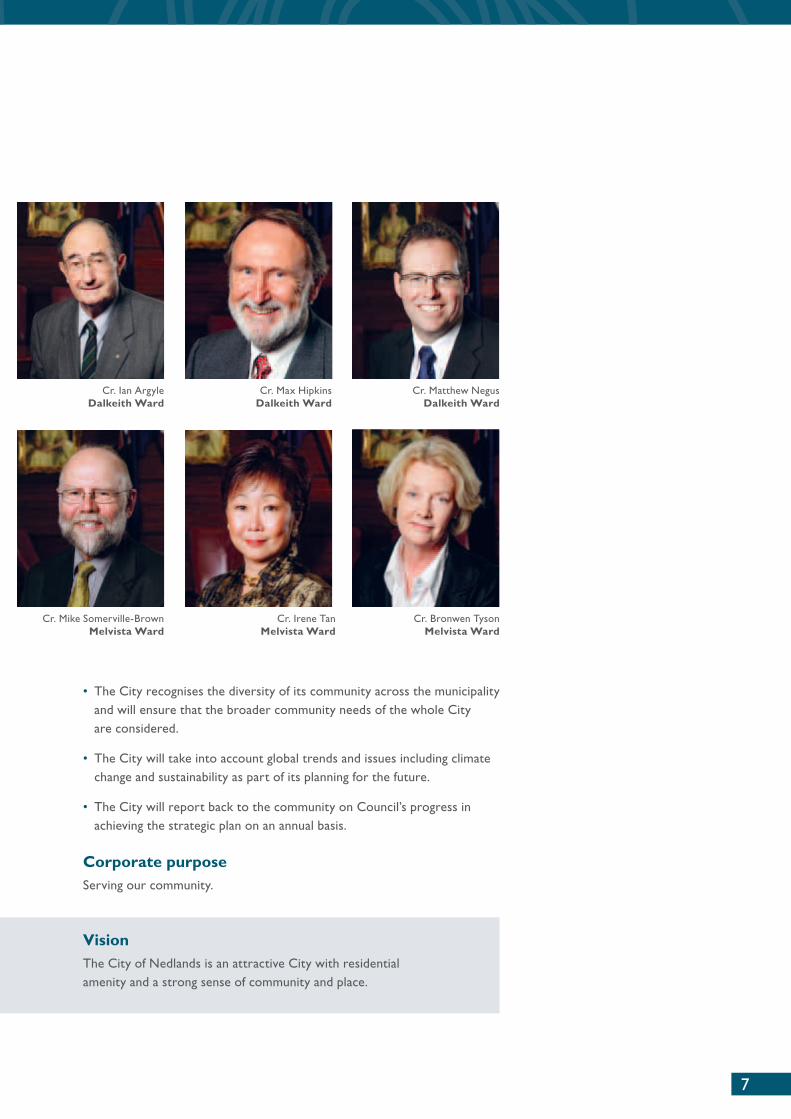
Cr. mike somerville-BrownMelvista Ward
Cr. Ian ArgyleDalkeith Ward
Cr. Irene TanMelvista Ward
Cr. max HipkinsDalkeith Ward
Cr. Bronwen TysonMelvista Ward
Cr. matthew NegusDalkeith Ward
• The City recognises the diversity of its community across the municipality and will ensure that the broader community needs of the whole City are considered.
• The City will take into account global trends and issues including climate change and sustainability as part of its planning for the future.
• The City will report back to the community on Council’s progress in achieving the strategic plan on an annual basis.
Corporate purposeserving our community.
VisionThe City of Nedlands is an attractive City with residential amenity and a strong sense of community and place.
7

Just 7 kilometres from perth, the City of Nedlands stretches from the banks of the beautiful swan River to the shores of the Indian Ocean.
The City is divided into four wards each represented by three councillors who are available to discuss and assist with any matters concerning your quality of life within the City.
People • population: 22 404
• Electors: 14 272
• suburbs: Dalkeith, Nedlands, Karakatta, mt Claremont, swanbourne and parts of Floreat and shenton park
Environment • Area: 21 square kilometres
• Fourteen major parks and reserves
• Area of parks, gardens, reserves and golf courses: 46 parks, gardens, reserves and bushlands totalling 314 ha
Other facts of interest
• Council established in 1893
• proclaimed as a City 1 July 1959
• Tourist attractions: river foreshore, water sports, swanbourne Beach, Allen park heritage area
Community events
• summer Concerts in the park series
• premier’s Australia Day Awards Ceremony
• Citizenship Ceremonies
• Remembrance Day Ceremony
The built form • Two libraries
• One senior citizens centre
• One child health centre
• Eight primary schools
• Two secondary colleges
• Two community centres
ABOUT THE CITY OF NEDlANDs
8

ORGANIsATIONAl sTRUCTURE
Chief Executive Offi cerGraham Foster
Director Community and strategyDarla Blake
Director Technical servicesIan Hamilton
manager HR and Organisational DevelopmentShelley Mettam
manager FinanceRajah Senathirajah
manager Corporate servicesJane Day
manager strategic planningGabriela Poezyn
manager statutory planningJennifer Heyes
manager property servicesMatthew Deal
manager sustainableNedlandsAndrew Melville
manager Community DevelopmentMarion Granich
manager Communityservice CentresPat Panayotou
A/managerEngineering servicesMaria Hulls
A/manager parksservicesAndrew Dickson
Director Corporate servicesMike Cole
Director Development servicesCarlie Eldridge
9

To provide functional infrastructure in order to enable safe, efficient and effective transport systems, and passive and active recreational opportunities.
Services provided under this key focus area:• parks services• asset management• special projects• engineering services• capital works• traffic management• parking strategy• road safety.
Parks servicesDuring 2010–11, the City completed 352 parks maintenance programs on time and within budget. maintenance programs included cleaning and rubbish removal, landscape maintenance, fertilising grounds, planting trees, turf renovations, weed control, watering and general maintenance.
Asset managementProvide and maintain quality passive and active recreational and leisure facilities and open space to meet community needs
It was identified that the City required a more considered approach towards the future management of assets within its parks and reserves. An extensive audit was initiated and is due to be completed next year. This will include a report on the condition of each asset, a recommended replacement priority program and a budget for the replacement program.
This year a parks and playgrounds assets audit was completed and compiled into the parks Asset Register. In 2011–12, the City will embark on an audit to compile a living Asset Register for the future strategic management of street trees and trees in parks and reserves throughout the City.
In 2009, the City secured a reliable supply of good quality groundwater for use in irrigating parks and reserves throughout the st Johns Wood Estate area in mt Claremont. This new supply replaced the previous groundwater resource, which had suffered from ongoing water quality issues and significant irrigation maintenance complications. To capitalise on the new water source, the City successfully undertook the cleaning of 32 kilometres of irrigation pipe that services 13 parks and numerous roadside verges in the area. The works included the installation of 81 isolation valves and flushing points, and has secured a more reliable supply of irrigation during the summer watering period.
Water conservation Implement a water plan to reduce water consumption
In June 2011 the City received Waterwise Council endorsement from the Department of Water, the Water Corporation and the International Council for local Environment Initiatives - local Governments for sustainability (IClEI). An important step in achieving this status was the development of a water conservation plan for using groundwater on parks and gardens. The City was also recognised for taking important steps in improving its irrigation of parks and gardens, including planting native and waterwise species in public open spaces.
The City implemented its Irrigation Operating strategy, as adopted by Council in 2009. The strategy is a multiple site management plan where operational tasks are applied to all irrigation systems operated by the City. Tasks involve irrigation scheduling, monitoring and reporting of ground water usage and irrigation hydrozoning.
INFRAsTRUCTURE
10

Parks capital worksImplement a capital works program based on fi ve and twenty year forward work schedules linked to the Strategic Financial Plan
The City’s capital works program for 2010–11 included:
• modifi cations to basketball courts at mt Claremont Community Centre
• new barbeque facilities at Blain park
• new synthetic cricket wicket at College park
• new bore at Genesta park
• new sports lighting designed to Australian standards at Highview park
• irrigation pipe cleaning at mt Claremont
• new hydrozoned irrigation system at Nedlands library surrounds
• a playground at Nedlands park
• renovation of four garden beds at peace memorial Rose Garden
• conversion of an old well to a new submersible bore at swanbourne Beach Reserve.
Engineering servicesThroughout 2010–11 the City improved road and footpath infrastructure networks by providing 6872 metres of road rehabilitation and resurfacing, 539 metres of new footpaths and 2628 metres of rehabilitated footpaths. The City’s fi ve year forward plan for road and footpath works is reviewed annually to ensure projects are on schedule and allowance is made for new priorities to be scheduled into the works program.
Capital works programImplement a capital works program based on fi ve and twenty year forward work schedules linked to the Strategic Financial Plan
The Alfred and montgomery roads intersection project was completed in June 2010. This federal government
11

funded Black spot program achieved an improvement in pedestrian safety, and reinforced the intersection with an lED signals upgrade including an overhead mast arm.
The City’s annual footpath rehabilitation program maintains community amenity throughout the City. In 2010–11 improvements took place at Beatrice Road, John XXIII, Elizabeth and Verdun streets, Dalkeith Road and stubbs Terrace.
In this fi nancial year's capital works program, all roads in the City that were resurfaced or rehabilitated, required extensive drainage improvements aimed to reduce the impact of fl ooding, improve road traffi c safety and to recharge the ground water system. Road improvements took place at various locations throughout the City, which included upgrading existing drainage, underaking kerbing and asphalt resurfacing works, traffi c management projects and the installation of fi ve new bus shelters.
In the 2010–11 fi nancial year a budget review of all the City’s drainage network was undertaken with Council allocating an additional $100 000 towards upgrades. Drainage was upgraded at Jenkins Avenue catchment and North Hollywood and Floreat precincts. A study was also undertaken on loftus and Napier streets drainage sumps.
The City undertook repairs at three locations along its river wall foreshore area during 2010–11. Repairs included a 50 metre section at paul Hasluck Reserve, a 10 metre section west of the Tawarri Function Centre jetty and a 100 metre section west of the Tawarri Function Cente. River wall urgent repairs remain a priority and will continue to receive upgrades on an as needs basis.
Black Spot fundingThe City successfully applied for Black spot funding to upgrade roads and intersections that will address commuter safety issues and crashes.
The following projects are proposed to be undertaken in 2011–12 subject to community consultation and main Roads Western Australia approval:
•upgrade to the intersection at stirling Highway, Broadway and Hampden Road
•installation of median islands at stirling Highway and Florence Road, Elizabeth and Tyrell streets, and princess and Florence roads
•upgrade to street lighting at Carrington and Broome streets, princess Road and Bruce street, and monash Avenue and Hampden Road
•installation of a roundabout at Bruce and Elizabeth streets.
Traffi c managementDevelop and implement an Integrated Transport Strategy for the City which promotes access to safe and integrated transport options
In 2008, the City established a Traffi c management Committee with the specifi c purpose to investigate and review strategic traffi c management issues within the municipality. Current projects under review by the committee include a Black spot program at the intersection of Broadway and stirling Highway, a City-wide traffi c and parking hot-spots analysis and corresponding action plan, a review of safety issues at the intersection of Broadway and Elizabeth street, a review implementation of parking restrictions in the Hollywood Ward and a review of the Parking and Parking Facilities Local Laws.
To keep in line with the National Road safety strategy 2011 –20 and the state government’s Towards Zero Road safety strategy, the City devised an educational strategy that outlines three key areas: Safe Roads, Safe Drivers = Saving Lives. This involved strategically mapping hotspots throughout the City and a workshop for traffi c and parking strategic planning. The educational strategy is proposed initially for a period of fi ve years, which coincides with road accident data released by main Roads WA.
INFRAsTRUCTURE
12

safe Roads, safe Drivers = saving lives
13

NATURAl ENVIRONmENT
To enhance and protect the City’s environmental assets to ensure management of natural resources and habitats, and environmental sustainability.
Services provided under this key focus area:• environment education• bushcare • environment planning• waste minimisation and management• sustainability • environmental health.
TravelSmartTravelsmart is a behaviour change program which aims to increase the number of people using alternative transport modes. The City is proud to have been involved with the program for ten years. Travelsmart was promoted at a number of events coordinated by the City and other local organisations throughout the year, including the summer Concerts in the park series and the 4sure Youth and skate Festival.
Community projects held throughout the year included:
• a cycle maintenance workshop for cyclists
• the continuation of the Waratah Walking Group and development of the Hollywood Walkers (in conjunction with the Heart Foundation)
• local schools promoting the Travelsmart message including, in-class activities and reward programs
• schools continued involvement in the walking school bus program
• the installation of bicycle u-rails at Hampden Road, supported by local businesses.
BushcareThe City’s bushcare program has involved the ongoing implementation of its Natural Area management plans. The City undertook controlling of priority weed species, re-vegetation of degraded bushland areas and greenways using locally occurring native species (24 000 seedlings planted), erosion control measures, and fi re management and feral animal control measures in the City’s bushland reserves.
The fi nal stage (stage three) of the point Resolution Foreshore stabilisation and Restoration project was completed with fi nal funding of $72138 received from the swan River Trusts Riverbank Grants scheme program. This was a joint initiative between the City, the Friends of point Resolution Reserve and the swan River Trust. The project stabilised and restored 210 linear metres of unstable foreshore and embankment. The City also received $20 000 from the swan River Trusts program to help stabilise the Waratah place river end foreshore and embankment.
The fi nal stage of the montgomery Avenue Greenway project was completed this year. Over 10 000 local native seedlings were planted to re-vegetate the grassed lawn area between st Johns Wood Boulevard and stephenson Avenue, and also near mt Claremont primary school. The greenway will assist with the City’s aims to protect biodiversity and will provide improved habitats for local fauna, increase the City’s capacity to absorb greenhouse gas emissions and reduce water consumption.
Waste minimisationThe City’s Waste minimisation strategic plan 2009–13 highlights the long-term strategy for continuous improvement of the City’s waste services, waste avoidance and resource recovery. This was benchmarked against best practice and sets targets for waste reduction, resource recovery and the diversion of waste from landfi ll disposal.
14

As part of the City’s commitment to waste recovery, in 2010–11 three portable recycling stations were designed and custom made for used and unwanted fl uorescent tubes and light globes, printer cartridges, batteries and mobile phones. These recycling stations are located at the City’s Administration Centre, Nedlands library and the mt Claremont Community Centre. The City is the fi rst Western Australian local government to design and introduce new custom made recycling stations. In its fi rst year, this new initiative managed to divert approximately 3 tonnes of recyclable materials from landfi ll.
The City is also actively engaged in collection and recycling of residential e-waste and metal. It is anticipated that up to 95 per cent recovery rate from all e-waste materials and commodities will be collected. Therefore, the City predicts a signifi cant reduction in the volume of e-waste going to landfi ll as a result of this initiative.
Throughout the year 6000 tonnes of general waste, 2900 tonnes of greenwaste, 2750 tonnes of recyclable material, 7 tonnes of e-waste, 3 tonnes of household batteries and 3 tonnes of metals were collected and processed. more than 5700 tonnes of material was diverted from landfi ll this year, compared to last year’s 5500 tonnes.
SustainabilityAs part of its involvement in the IClEI local Governments for sustainability, the City has almost completed milestone 4 of the Water Campaign, for community and corporate water quality and conservation. milestone 5 will see the City assess progress made since the program’s inception in 2003.
The City’s inaugural Waterwise Garden Competition opened in may, coinciding with the start of the Native plant subsidy scheme and the development of the City’s Waterwise demonstration garden on the stirling Highway verge outside the Administration Centre. The Native plant subsidy scheme saw 2100 plants being purchased by residents, plus plants going to Nedlands primary school and everlasting seeds to moerlina primary school.
15

Food surveillanceIn 2010 –11 the City saw its fi rst full year implementation of the state-wide food legislation which came into effect in October 2009. This involved the City submitting its fi rst food surveillance report to the Department of Health WA. The new legislation allows for greater fl exibility in meeting safe food outcomes for businesses, and has also introduced a food safety program for businesses that provide meals to persons more susceptible to food-borne illness.
Swimming pools and recreational watersAs required under the Department of Health WA aquatic facilities legislation, public swimming pools are tested monthly to ensure high water quality and safety for swimmers. In 2010–11 two public swimming pools revealed to have substandard bacterial water quality results. Both pools reopened after rectifi cation works and the receipt of satisfactory water quality results.
The City together with Department of Health WA took part in the annual Ocean sampling program for metropolitan recreational waters. The City performed water sampling at swanbourne Beach and submitted information to the department who is anticipated to produce a report for the results of the program in the near future.
This year found a number of residential properties illegally discharging their swimming pool water into the street and stormwater drains. This contravenes the City’s Health Local Laws 1997 for the disposal of liquid refuse, and as a consequence the City will look at implementing strategies to address the issue in 2011–12.
EnvironmentalIn 2010–11 the City had substantial input on a number of larger scale development applications to address matters such as noise, odour, plume modelling and construction management aspects. several development applications incorporated new technologies such as the DICOm waste treatment
NATURAl ENVIRONmENT
16

facility in shenton park, highlighting the diversity of land uses across the City.
In early 2011, the City received a number of complaints about excessive numbers of mosquitoes at pelican point Reserve, which is a renowned breeding ground for mosquitoes. The cities of Nedlands and subiaco have worked jointly to control mosquitoes at this site since 2008. Numbers of mosquitoes declined after a fresh larvicide treatment of the site in march 2011. Both cities look forward to a successful 2011–12 mosquito control season for the area.
The City liaised with the Department of Environment and Conservation (DEC) investigation, into a leaking unleaded petrol bowser from a club on foreshore land. The club was issued with a notice by DEC to clean up the site. public access was restricted while remediation works (excavation and safe removal of contaminate soil and groundwater) were underway, and fl oating booms were deployed for extra surety. Ongoing monitoring will continue at the site.
NoiseThe City continues to work with the community to address noise complaints. In 2010–11 a total of 98 noise complaints such as music and parties (residential and commercial), construction, air-conditioning, delivery vehicles and leaf blowers were received.
More than 5700 tonnes of material was diverted from landfi ll this year
17

THE BUIlT ENVIRONmENT
To provide a built environment and land use planning framework which offers diversity in housing choice, is environmentally responsible, provides a high level of amenity, consists of a variety of neighbourhoods with community identity, encourages economic activity in harmony with local amenity and enables appropriate facilities for community groups.
Services provided under this key focus area:• property services• statutory planning• strategic planning• building control services• sustainability.
Property servicesIn 2010–11 the City undertook signifi cant projects to improve built facility infrastructure within the municipality.
Community facility upgradesThe City completed the detailed architectural and relevant consultant drawings for the redevelopment of the John leckie pavilion. The City’s strategic Recreation plan nominated this location as one of the four main centres for community recreation to be centralised within the City. The other locations are Allen park, Highview park and Charles Court Reserve. Refurbishments to the John leckie pavilion are expected to be completed by the end of 2012.
Construction of the new mt Claremont Oval change rooms commenced in January. The new building will house two change rooms, ablution facilities, two storerooms, a kitchen and two universal public toilets. The new public toilets will be open for general public use, and are fi tted with automated locking devices. There were no change room facilities previously located at the oval.
Building maintenanceRefurbishment work of The maisonettes commenced in June this year. The City anticipates the building will be an example that places of heritage signifi cance can be restored and refurbished to a high standard, which will permit property owners to derive a relative rental return.
In addition, several maintenance projects were completed across the City at Drabble House, the City’s Administration Centre and Depot, Nedlands library, mt Claremont Community Centre, Allen park lower pavilion, JC smith pavilion and Dalkeith Hall.
Built facility asset managementThe City has commenced the progression towards complying with the Built Facility Asset management policy which was adopted by Council last year. The construction of the mt Claremont Oval change rooms, and the refurbishment of The maisonettes and John leckie pavilion are just a few projects that are planned for completion in the next fi nancial year. This will ensure that the City delivers on the directives of the strategic plan 2008–13.
Swimming pool inspectionsThe City performed 814 pool inspections during the year. In an effort to increase the compliance rate of pool barriers the frequency of inspections by the City was increased to a three-year cycle in 2002–03. The change has been successful with an increase in the compliance from 61 per cent in 2004–05 to 87 per cent in 2010–11.
18

In may 2011, a new requirement for the provision of universal access to buildings was introduced by the state government. The Access to premises standards 2010 requires that all commercial buildings provide signifi cant fi xtures and access for all people, so as to not discriminate against individuals that have mobility or vision impairment. This new standard bridges the gap between the overarching legislation of the Disability Discrimination Act 1992 and the requirements of the Building Code of Australia and Australian standard. These new requirements will place design and cost implications to the construction of new buildings, which the City has no jurisdiction to vary.
New building control legislation is proposed to be adopted by parliament in 2011. The new legislation will enable building designers and owners the opportunity to have their building permit applications certifi ed by private building surveyors or the relevant local government. The fl exibility of the new legislation may provide many new commercial opportunities the current legislation does not cater for.
Town planningPrepare and implement management plans for natural areas
A section 18 process under the Aboriginal Heritage Act 1972 was completed in regards to all the River Foreshore Reserves. This approval is one of a number of approvals required before the City is able to do work in the reserves.
Develop and implement a new planning scheme for the City
After Council adopted draft Town planning scheme 3 and the local planning strategy in 2009, the document was also referred for a legal review. Identifi ed legal changes were incorporated into the document and the updated version was forwarded to the Western Australian planning Commission (WApC) in september 2010.
The City has been working with the state government on the local planning strategy.
Building control statistics 2007–08 2008–09 2009–10 2010–11
Applications received 736 660 746 671
licences issued 545 515 580 506
New residences 86 69 59 55
Demolition licences 56 55 58 46
swimming pool licences 75 75 50 70
sign licences 7 11 8 1
Verge material licences 17 26 35 41
Amended building licences 35 30 33 30
Residential strata titles approved 4 4 0 1
Acknowledgements 16 7 2 1
Building approval certifi cates 24 29 27 26
Value of fees collected $524 129 $400 908 $558 354 $481 088
Value of all works $152 401 121 $98 113 410 $89 600 198 $86 660 975
Building control
19

Encourage the development of diverse residential and commercial areas to meet the future needs of the whole City
The design guidelines for the Waratah commercial area were completed and a scheme amendment to Town planning scheme 2 was initiated, advertised and forwarded to the WApC as scheme amendment 192. As the WApC recently returned the document requiring further advertising of proposed changes to the amendment, completion of this scheme amendment will progress into 2011 –12.
scheme amendment 193 was initiated and adopted by Council. This amendment seeks to streamline a number of anomalies in Town planning scheme 2 such as the zoning of the design guideline areas of Karella street and Dalkeith Road, and introduces parking restrictions on residential properties. The documentation has been forwarded to the WApC and it is expected that the amendment will be fi nalised in 2011–12.
Following a request for subdivision along Verdun street, the Council initiated scheme amendment 194 to change the zoning of all properties along this street to allow for subdivision. The matter has not progressed beyond advertising, as more comprehensive planning of the area is required.
Develop and implement precinct plans for key areas in the City
As part of the objective to provide housing diversity areas in Nedlands and to align with state government visions, a study was commenced to determine the future of the Broadway, Hampden Road, North Hollywood areas. Included in the study has been extensive community consultation to determine the needs and aspirations of the community. The study will continue through 2011 –12. Design guidelines for these areas are expected to be fi nalised by August 2012.
THE BUIlT ENVIRONmENT
20

Provide effi cient and integrated approvals system
The City processed and adopted an Outline Development plan that will guide the future development or land used by the Cancer Council and John XXIII College. While signifi cant progress was made in relation to the Outline Development plan for the old swanbourne Hospital, it is expected to be fi nalised in 2011–12.
The City commenced community consultation with the view of creating a local planning policy to guide development of the land located within the waste water treatment buffer area.
Town planning key factsNumber of applications determined in 2010 –11 for planning applications were:
•Council - 35 (5%)• Administration under delegation - 617 (95%)• Total - 652 (100%)
Council determined 60 per cent within statutory timeframes. Determined by delegated authority 99 per cent within statutory timeframes. Total fees received for development applications $561000. subdivisions - 22 applications, 86 per cent dealt with within statutory timeframes.
Town planning - State Administrative Tribunal (SAT) reviews • Eight reviews determined
• Three determined by sAT – all three upheld Councils decision
• Five determined by Council under reconsideration following mediation.
21

COmmUNITY WEllBEING
To provide a community where people have an opportunity to interact and enjoy a sense of belonging in order to promote healthy lifestyles, a safe and secure community and quality of life.
Services provided under this key focus area:• volunteering services• disability services• sport and recreation• child and youth services• seniors’ services• community events• crime prevention• library services• child care services• community care services.
Summer Concerts in the Park seriesEach year the City holds the summer Concerts in the park series every sunday evening throughout February. The concerts are an opportunity for families, friends and neighbours to gather in a relaxed atmosphere in one of the City’s beautiful parks. The 2011 summer concerts attracted more than 2400 people. Four concerts in total were held at lawler park, masons Gardens, Allen park and Dot Bennett park.
Community toursNedlands Going places Tours give residents an opportunity to enjoy a day out while getting to know other community members. The City hosted four tours this year including a Christmas in July, swan Valley, mandurah Canals and a visit to the perth ABC studios.
Grants received for community eventsThe City received various funding throughout the year. This included $15 296 from lotterywest for the summer Concerts in the park series, $818 from the Injury Control Council of WA for stay on Your Feet
week project, $1000 from Healthway for the youth and children pro sports program, $7000 from Healthway for the 4sure music and skate Festival and $1000 from the Department for Communities for National Youth Week.
Community grants fund
The City’s community grants fund is to provide small grants to community groups and organisations wishing to organise events and projects that benefi t and contribute to community spirit and help build a more inclusive community. The fund also aims to support the building of local relationships, networks, community interaction and the gathering and socialising of residents within their local communities. In 2010 –11 the City provided twelve grants totalling $7000.
Community hallsThe City has a number of community facilities including halls, pavilions and community centres, which are available for hire all year round. In 2010 –11 a number of these facilities received renovations including Allen park pavilion and Dalkeith Hall.
Crime prevention
The City’s safer Nedlands program continued to provide a range of crime prevention and community safety initiatives. This included a cyber safety information session held at John XXIII College with the Australian Federal police as guest speakers.
Community safety subsidies provided by the CityThe City continued its support to the safety House Association and Constable Care Child safety Foundation, by providing a subsidy to both organisations to enable them to provide safety and crime prevention information to children in local primary schools.
22
Disability accessThe City’s Disability Access and Inclusion plan outlines how the City ensures its services, buildings and information are accessible to people with disabilities. some access improvements in 2010 –11 included:
• Tresillian Community Centre’s external toilet was refurbished into a universal toilet.
• seats were installed with armrests to provide extra support for people with mobility impairments at pine Tree park.
• mt Claremont basketball courts were made accessible with the path widened at the entrance.
• A Braille plaque was installed at the newly donated artworks at Genesta park for the visually impaired, which has a description about the artwork and artist.
The Access Working Group continued to provide advice to the City on improving access and inclusion for people with disabilities. Individuals with experience in the fi eld of disability access, who live or work within the City, volunteered their time and expertise as members of this advisory body.
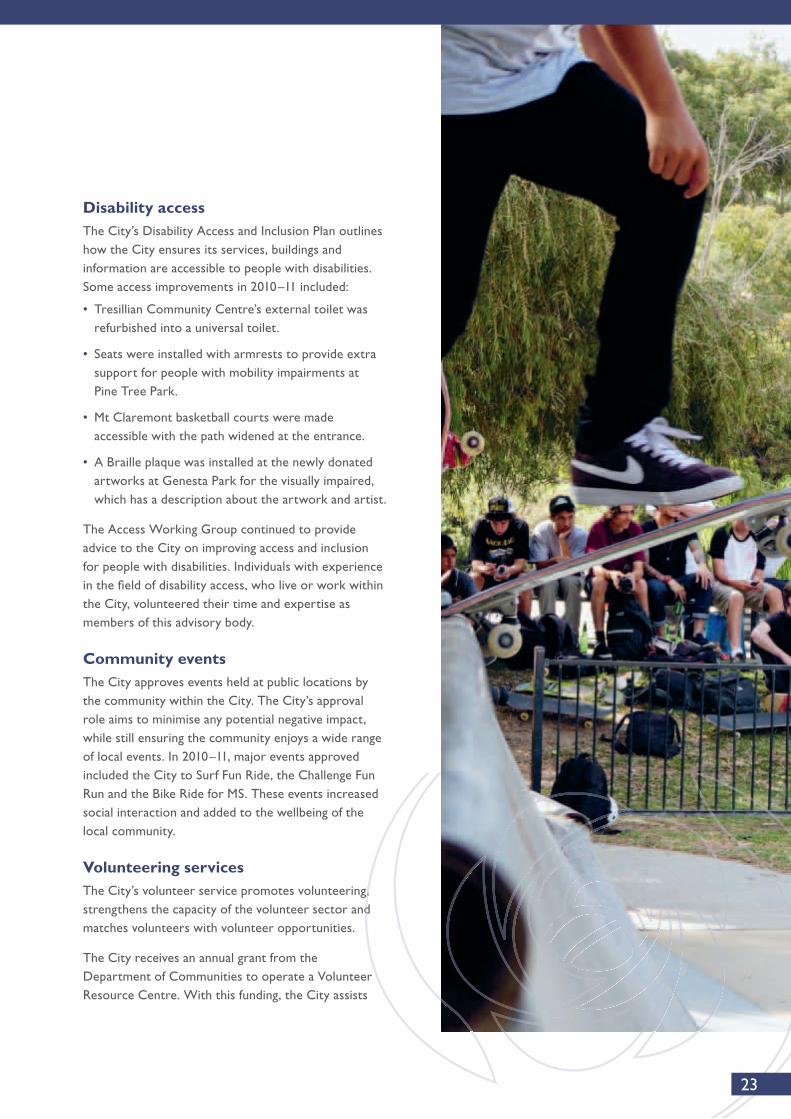
Community eventsThe City approves events held at public locations by the community within the City. The City’s approval role aims to minimise any potential negative impact, while still ensuring the community enjoys a wide range of local events. In 2010–11, major events approved included the City to surf Fun Ride, the Challenge Fun Run and the Bike Ride for ms. These events increased social interaction and added to the wellbeing of the local community.
Volunteering servicesThe City’s volunteer service promotes volunteering, strengthens the capacity of the volunteer sector and matches volunteers with volunteer opportunities.
The City receives an annual grant from the Department of Communities to operate a Volunteer Resource Centre. With this funding, the City assists
The City’s volunteer service promotes volunteering, strengthens the capacity of the volunteer sector and
23
COmmUNITY WEllBEING
local community organisations with fi nding volunteers and provides training and information.
The City’s volunteer service also places volunteers in positions within the City’s community service areas. This provides valuable experience to volunteers who help provide assistance to services within the organisation and its customers. The main body of these volunteers are attached to Nedlands Community Care and Nedlands library. Other areas include the Tresillian Community Centre, Volunteer Referral Centre and the City’s Administration Centre. In the last fi nancial year, volunteers donated an estimated 14 000 hours to the organisation, which equates to a dollar value of $336 000.
In 2010– 11, the invaluable contribution of volunteers within the community was recognised during the National Volunteer Week held in may. The City held a celebratory afternoon tea where over 60 volunteers attended and were acknowledged for their important contribution within the community. In addition, a breakfast was held in December to thank the City’s 94 registered volunteers for their tireless efforts and ongoing commitment.
Youth developmentThe City’s youth program encourages young people to be involved in their local community through a wide range of youth specifi c activities that support community wellbeing are safe and encourage active participation in the community.
This year the City provided a wide range of activities for children and young people including the Youth Arts Festival during National Youth Week, 4sure music and skate Festival held in December, skateboarding workshops and school holiday activities. Overall, participation rates increased this year with more than 3500 young people and children taking part in City run programs.
last year, the City introduced a new publication The Buzz! which provides details on activities, events and relevant information provided by the City specifi c to children, youth and families. The publication is produced quarterly for the school holidays.
The artistic talent of six local young people was recognised as part of the City’s annual art project. The artists designed and created an urban art mural on a wall at the mt Claremont Community Centre. The basis of the design was the participants’ visions for the year 2030.
The City’s Youth Advisory Council (YAC) consists of a group of local young people aged 12 to 21 who advise the City on youth issues, plan and deliver activities for local young people and encourage youth participation in the community. This year the YAC ran the fi rst 4sure music and skate Festival, and also supplied a range of giant games at the City’s summer concert held at Dot Bennett park.
The City continued to build on relationships with local schools through the implementation of the Engagement with local schools strategy. The strategy outlines the City’s approach to a more pro-active relationship with the 10 local schools within its boundaries. The City surveyed the schools on their level of satisfaction with service provided by the City throughout the year, resulting in an overall satisfaction rating of 86 per cent.
Sponsorships This year the City provided the following donations and subsidies:
• $10 800 to shenton Christian Council to assist with the provision of Chaplains at shenton College, mt Claremont and swanbourne primary schools.
• Thirty-two grants of $250 to individual young people for initiatives that connected them to their community, under the sponsorship of Youth Initiatives Fund.
24

Tresillian CentreThe City’s Tresillian Centre brings people together by providing art, craft and leisure courses, a variety of studio artists working on site, art exhibitions, a crèche and café. In 2010 –11 the Tresillian offered 297 art, craft, language and other leisure courses, with course participants expressing a 94 per cent satisfaction level. Income from courses this year was a record $182 675.
The table below shows an increase in the Tresillian Centre’s service delivery while maintaining a high level of customer satisfaction.
ExhibitionsThroughout 2010–11 a total of 14 exhibitions were held at the Tresillian. Of these, six were curated by the Tresillian and eight were provided by organisations or artists hiring Tresillian’s facilities.
The total revenue for exhibitions at the Tresillian this year was $72 307. The annual studio Artists’ Exhibition opened on Friday 22 October with 125 works by nine Tresillian studio artists, generating sales of $16 345. The 2011 Annual student and Tutor Exhibition opened on Friday 11 June, where students and tutors exhibited 276 items generating sales of $8970.
For the tenth consecutive year, the Tresillian Centre held an auction of demonstration artworks created by Brian simmonds in his popular Tresillian art classes. sales at auction totalled $6858.
Recreation servicesThe City’s 2011 sport Awards ceremony was held in April with local sporting clubs and community
Year 2008–09 2009 –10 2010 –11 % Change 2008 –09 to 2010 – 11
Number of courses 212 274 297 40 %
Room hire income $16 765 $22 545 $33 065 97 %
Customer satisfaction 94% 94% 94% 0 %
members attending. The biannual awards’ recognise the sporting achievements of local players, teams and individuals who have made outstanding contributions to the sporting industry.
The City continued to partner with the shire of peppermint Grove and towns of Claremont and mosman park to implement the sportslink program at presbyterian ladies’ College. This program has been developed by the Recreation and sport Network and is aimed at increasing participation in physical activity by children who are less likely to participate. It is an inclusive program that teaches basic sports skills and confi dence to children experiencing diffi culty with motor skills or with disabilities. Community participation funding from the Department of sport and Recreation was obtained to implement the program.
The City continued to support local clubs with two events held this year. In February, the City together with the Department of sport and Recreation held an information session on funding for sports facilities. The session provided information from how to apply
25

COmmUNITY WEllBEING
for fi nancial assistance to upgrading or constructing new facilities. In June this year, the cities of Nedlands and subiaco jointly hosted a sport and recreation club development workshop. The clubs shared discussions on key topics of club governance, working with and recruiting volunteers, fi nancial management and sponsorship and grants.
Subsidised progams
The City provided a subsidy of $7000 to the parents and Citizens Association at Hollywood and Nedlands primary schools. The subsidy ensures their swimming pools are made available to the public on a regular basis during November to April.
The City continued its support of two local cricket clubs who were given a subsidy to maintain two turf wickets at College park, plus one centre turf wicket and a training block at melvista Oval and Allen park. Claremont-Nedlands and swanbourne cricket clubs received the grants which reduces the maintenance for the City.
swanbourne-Nedlands surf life saving Club again received a grant to support patrolling of swanbourne Beach. The long standing agreement is linked with the closure of the kiosk at the beach, but provides support to those enjoying the facilities at swanbourne.
Customer satisfactionHaving surveyed the exclusive and non-exclusive use by clubs in the City, a signifi cant increase in satisfaction was achieved with the City’s service and facilities. satisfaction ratings increased from 64 per cent in 2009– 10 to 86 per cent in 2010 –11.
Grant successThe City has had a year of funding success to deliver projects to improve the City’s sporting facilities. The Department for sport and Recreation, Community sport and Recreation Facilities Fund (CsRFF) has been the major provider of funding and made a huge contribution to the health and wellbeing of the local
community. The following is a list of clubs who worked with the City to access funding:
• Nedlands Rugby Club received $160 000 from CsRFF and $50 000 from the City for upgrades to the clubhouse, changing rooms, toilets and outdoor area.
• Dalkeith Tennis Club received $123 471 from CsRFF and $144 000 from the City to upgrade the courts at the club.
• Dalkeith Nedlands Bowling Club received $8066 from CsRFF and $8067 from the City to upgrade the ladies toilets at the club.
• Nedlands Tennis Club received $64 000 from CsRFF and $64 000 from the City for the upgrade of two tennis courts, fencing and lighting.
subject to CsRFF funding being granted, the City has committed funds for Nedlands Croquet Club to place lighting in their grounds and endorsed lighting for UWA Hockey Club. The City was also successful in gaining a $55 000 grant from the federal government’s Regional and local Community Infrastructure Fund to place lighting on mt Claremont Oval.
Library services The City’s two libraries, Nedlands and mt Claremont have a combined membership of 10 595 members. In this fi nancial year, loans and renewals of books and other items exceeded 243 000 transactions. Over 4000 community members participated in library coordinated events.
ProgramsIn order to promote the City’s libraries, a variety of events and programs were held throughout the year. These included the subjects of Note series which presented a variety of assorted topics both educational and of entertainment value. Nedlands library continued to host meet the author events with various professional local and interstate authors attending as guest speakers.
26

In september 2010, the library held the second series of A Day of literary Feasting. This year’s program included an array of sessions for book-lovers, food writers and aspiring authors. In February this year, the local studies Collection embarked on their new memoirs for Your Family series of workshops. These monthly workshops were held in conjunction with the Royal Historical society of Western Australia.
The libraries also coordinated a range of reading and literacy programs throughout the year for children and young people. These included weekly storytime, pyjama storytime, baby rhyme time sessions and National simultaneous storytime. Once again a range of exciting school holiday activities also took place. These included activities with scitech, guest authors, theatre entertainment and writing workshops.
A new series of parenting workshops commenced this year at the libraries. The workshops held every quarter are aimed at parents with babies to toddlers.
Over the year, the libraries also provided their outreach services including the fortnightly Books on Wheels service for customers that are house-bound, and the weekly bus service offered to senior library members that are able bodied but don’t have their own transport.
Nedlands Community CareThroughout 2010–11 the City provided in-home care support for residents who are assessed as either frail aged, a younger person with a disability, or their carer. services included activities for dementia-specifi c clients, respite for carers, social support activities and transport to appointments. some activities held during the year included an open day with stalls and guest speakers, computer classes, Out and About Tours, Waratah Dinner Club, men’s group and new wellness activities such as ballroom dancing, mah-jong and porcelain painting.
Point Resolution Occasional Child Care CentreThe City’s point Resolution Occasional Child Care Centre (pROCC) provides occasional child care to residents of the City. many families enjoy the bright, comfortable environment at pROCC and the centre continued to develop programs which are designed to stimulate and engage children with age appropriate activities.
27
GOVERNANCE
To ensure that the processes of local government are delivered responsibly and in a transparent, consistent and an accountable manner.
Services provided under this key focus area:• records services• councillor support• fi nancial services• human resources• customer service• information technology• statutory approvals.
Records servicesIn the 2010–11 fi nancial year the City processed 34 615 pieces of incoming correspondence, which captured 15 896 pieces of that correspondence into the Electronic Document management system.
The City complies with the Freedom of Information Act 1992 by making information about City operations available in the form of an information statement. The City received 18 FOI applications in 2010–11.
Our peopleThe City has an increasing focus on encouraging wellness in employees. A number of initiatives were encouraged and contributed to, which supported the employees’ health and wellbeing. The City offered general health risk assessments, skin cancer screening and a fl u vaccination program to all staff.
The Employee Assistance program continued to be a success with employees and their families making use of the free, confi dential counselling service provided by ppC Worldwide. This additional support continues to be popular, it is well received by users and can provide timely support in times of need.
The City recognises the need for a workforce that is current in its knowledge with the ability to keep pace with contemporary needs. A wide range of training and development programs were rolled out across the City. These included:
• job specifi c training for outside and inside workers• fi rst aid training• supervisory training• local government training and information sessions• seminars and briefi ngs on a wide range of topics
across all functional areas• inducting and mentoring new staff.
28
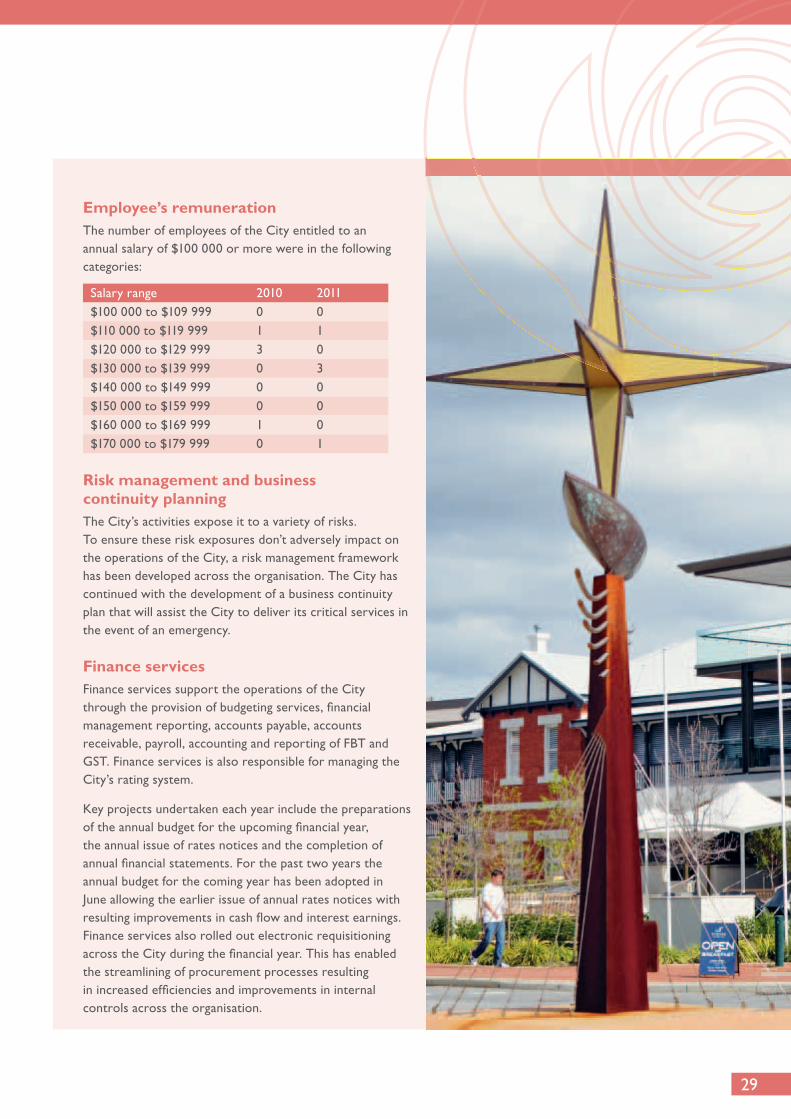
Employee’s remunerationThe number of employees of the City entitled to an annual salary of $100 000 or more were in the following categories:
salary range 2010 2011 $100 000 to $109 999 0 0 $110 000 to $119 999 1 1 $120 000 to $129 999 3 0 $130 000 to $139 999 0 3 $140 000 to $149 999 0 0 $150 000 to $159 999 0 0 $160 000 to $169 999 1 0 $170 000 to $179 999 0 1
Risk management and business continuity planningThe City’s activities expose it to a variety of risks. To ensure these risk exposures don’t adversely impact on the operations of the City, a risk management framework has been developed across the organisation. The City has continued with the development of a business continuity plan that will assist the City to deliver its critical services in the event of an emergency.
Finance servicesFinance services support the operations of the City through the provision of budgeting services, fi nancial management reporting, accounts payable, accounts receivable, payroll, accounting and reporting of FBT and GsT. Finance services is also responsible for managing the City’s rating system.
Key projects undertaken each year include the preparations of the annual budget for the upcoming fi nancial year, the annual issue of rates notices and the completion of annual fi nancial statements. For the past two years the annual budget for the coming year has been adopted in June allowing the earlier issue of annual rates notices with resulting improvements in cash fl ow and interest earnings. Finance services also rolled out electronic requisitioning across the City during the fi nancial year. This has enabled the streamlining of procurement processes resulting in increased effi ciencies and improvements in internal controls across the organisation.
29

GOVERNANCE
Compliance auditThe City achieved a rating of 97.9 per cent for the annual Compliance Audit Return for 2010. The six non-compliant issues were reported to Council at their meeting of 22 march 2011. For each item of non-compliance, the recommendations of the reviewer have been accepted and have since been implemented.
While not meeting 100 per cent, the completion of the Compliance Audit Return for 2010 demonstrated a high level of compliance by the City in all areas. The City has a proven internal culture of compliance and commitment towards best practice, and the management of the City is based on sound systems and procedures with an emphasis on good governance.
The completion of the annual return is on the basis of self assessment. The City, however, engages the services of an independent consultant. An independent assessment such as this, with resulting high level of compliance, helps to demonstrate good governance, compliance and best practice and also provides the CEO and Council with additional elements of awareness of compliance and accountability by staff.
Ranger servicesThe City’s rangers cover a wide range of issues from parking enforcement, animal control, fi re breaks and building compliance. A summary of some of their activities include:
Activity 2008–09 2009–10 2010–11
Number of dogs impounded 59 50 48
Number of complaints about barking 132 85 60
Number of inspections on vacant blocks for fi re breaks (non-compliant blocks)
55 92 62
Number of abandoned vehicles dealt with (impounded) 32 21 17
30

National competition policyThe Competition principles Agreement is an agreement between the commonwealth and state governments that stipulates the manner in which governments will apply competition policy principles to public sector organisations under their jurisdiction. While local governments are not a signatory to the agreement, they are bound to apply the same competition principles to their activities and functions by virtue of Clause 7 of the agreement.
Clause 7 obliges the state government, in consultation with local government, to apply competition principles to local government activities and functions. These principles are competitive neutrality, structural reform of public monopolies and legislation review.
Legislation reviewThe City’s Disability Access and Inclusion plan (DAIp) is a legislative requirement of the Disability Services Act 2006, which outlines how public authorities will make
their services, information and buildings accessible for people with disabilities. The City continues to meet its obligations outlined within the DAIp.
Record keepingGovernment legislation and regulations mandate the City’s roles and functions. The City creates and maintains compliant records of these activities to ensure suffi cient evidence of the City’s performance of these functions. The City’s records are consistent with any written law to which the City of Nedlands is subject when performing its functions.
New employees at the City are required to participate in an induction program on records management, to be made familiar with the fi ling system as well as the Electronic Data management system. staff are also inducted in their record keeping responsibilities.
File audits are conducted each quarter throughout the City including administration and offsite offi ces.
31
COmmUNITY ENGAGEmENT
To achieve a community which is informed and engaged in order to enable it to participate in decisions that affect the local area.
Services provided under this key focus area:• community engagement• communications and media.
2030 imagine, engage, createThe City undertook the community visioning project 2030 imagine, engage, create which was launched to the community at a family fun day at mt Claremont Community Centre in October 2010. This visioning project was designed to engage our community in creating a shared vision for the future that both the community and City could work towards together. The project was carried out in three stages.
stage one of the visioning project was the information gathering stage, where approximately 2100 participants provided over 8500 separate items of information. The consultation process and events were designed specifi cally for residents, local businesses, sporting clubs, community organisations, children, young people and seniors. The strategies used in consulting with these groups included workshops, surveys, sundowners, children’s art competition, community events and activities.
Four vision statements emerged from the consultation process:
• built environment• natural environment• transport • community connections.
stage two of the project was the Our 2030 Conference, which was held at the University Club of WA in February 2011. The 2030 vision statements were unveiled and conference attendees spent a full day developing specifi c strategies to achieve the statements.
stage three of the project will be the development of a community plan Our Vision 2030. A draft version of the community plan will be delivered to the community in 2011, where it will be open for comment. This draft will then be developed into the community’s fi nal document.
Communications and media The City’s Communication strategy sets a minimum standard for communicating with key stakeholders and outlined strategies to assent with the implementation of a customer-focused organisational culture.
Four key projects were highlighted to be implemented over the next two years to ensure clear, consistent messaging, the best use of communication resources and the timely, effective distribution of key information.
• Reaffi rm and communicate the City’s brand, functions services and identity.
• Improve the City’s relationship with the community and encourage community involvement.
• Deliver effective internal communication.
• Effectively utilise electronic media.
The effective implementation of this strategy requires a commitment to communication by both Council and staff at all levels and across all departments.
Various tools used to inform the public in the last fi nancial year included:
• full page advertisements published monthly in the Post Newspaper
• print advertisements in local papers on events, out-for comment projects and public notices
• media releases issued to all media outlets
• the City’s website
• community information notice boards
• two editions annually of the City’s newsletter distributed to all residents and businesses.
32

33
ECONOmIC DEVElOpmENT
To encourage an environment where local businesses can operate effi ciently and effectively, in harmony with residential amenity and which provides services to the local and broader community.
Services provided under this key focus area:• economic development.
Local Business AssociationDuring 2010–11 the City consulted with local businesses on preferred options for setting up a local business association. Three options were considered. setting up a completely new organisation, joining local Chambers of Commerce or joining an existing business association. local businesses decided to join forces with the subiaco Business Association (sBA). The City has taken up a membership with sBA, as have a number of local businesses.
34
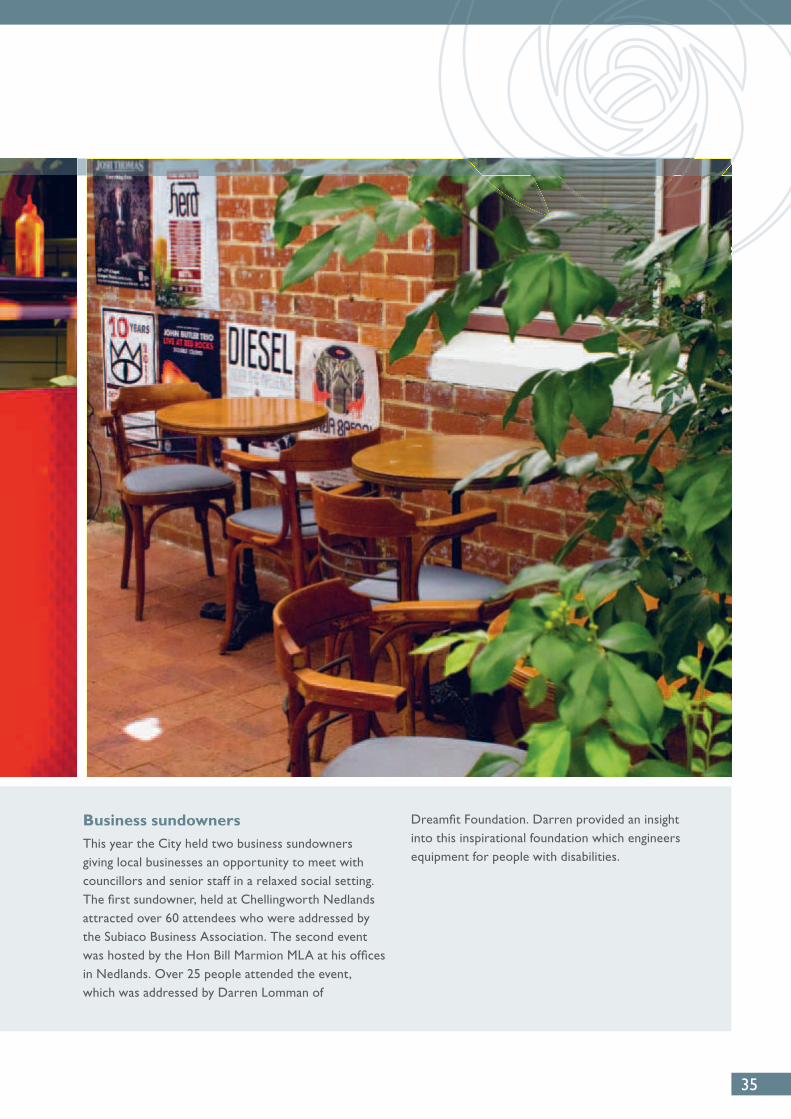
Business sundownersThis year the City held two business sundowners giving local businesses an opportunity to meet with councillors and senior staff in a relaxed social setting. The fi rst sundowner, held at Chellingworth Nedlands attracted over 60 attendees who were addressed by the subiaco Business Association. The second event was hosted by the Hon Bill marmion mlA at his offi ces in Nedlands. Over 25 people attended the event, which was addressed by Darren lomman of
Dreamfi t Foundation. Darren provided an insight into this inspirational foundation which engineers equipment for people with disabilities.
35

ECONOmIC DEVElOpmENT
Grant Amount Funding body
2011 summer Concerts in the park series $15 296 lotteryWest
Black spot – Hampden and Gordon roads $16 000 main Roads WA
Black spot – stirling Highway, Dalkieth Road $26 667 main Roads WA
Black spot – Alfred and Davies roads,
montgomery Avenue
$61 000 main Roads WA
Black spot – lemnos street, Brockway Road $24 000 main Roads WA
Road projects – stephenson Avenue $262 619 main Roads WA
Road projects – Underwood Avenue $427 569 main Roads WA
River Bank Funding - Waratah place $20 000 swan River Trust
River Bank Funding - point Resolution $72 138 swan River Trust
part of the funding for the refurbishment of
John leckie pavillion
$200 000 lotteryWest
mt Claremont Oval - lighting $55 000 Department of
Infrastructure, Transport,
Regional Development and
local Government
playground – Nedlands park Infant Health Centre $20 000 lotteryWest
protection of swanbourne dunes $20 454 Western Australian planning
Commission
Community safety and Crime prevention $10 200 Office of Crime prevention
Graffiti Collection Automation $15 386 Office of Crime prevention
4sure music and skate Festival $7000 Healthways
GrantsThe City secured more than $3 million in grant monies this financial year. Of the grants secured, a small number were recurring income, with the remainder representing one-off grants for specific projects. The one-off grants included:
36

37

COmplAINT REGIsTER
Council member about whom the complaint is made
Person making the complaint
Local government complaint no.
Description of minor breach
Action taken
Date the complaint was referred to the standards panel
Outcome of the standards panel consideration of the minor complaint
Cr. I. s. Argyle
mr. C. Courtney
sp 12 of 2010
Breach alleged to have occurred under the local Government (Rules of Conduct) Regulations 2007:Regulation 7 - securing personal advantage or disadvantaging others; andRegulation 11 - Non-disclosure of interest adverse to impartiality
1. Reported to standards panel.
10 march 2010 Notice of Finding: 8 march 2011 - The panel found that Councillor Argyle did not contravene regulation 7(1) or regulation 11 in the circumstances alleged in the complaint.
Cr. m.R. Hipkins
Cr. I. Tan sp 14 of 2010
Breach alleged to have occurred under the local Government (Rules of Conduct) Regulations 2007: Regulation 7 - securing personal advantage or disadvantaging others;
1. Reported to standards panel.
20 April 2010 Notice of Finding: 3 November 2010 - The local Government standards panel (the panel) has made a finding of minor breach in this matter - namely, that on 25 march 2010 Councillor Hipkins committed a minor breach by breaching regulation 7(1)(a) of the Regulations in that he made improper use of his office of Council member to gain directly or indirectly an advantage for ms margot Grace by voluntarily giving evidence for her in her application to the state Administrative Tribunal for a review of the decision by the City of Nedlands to refuse a development approval application for the use of the Feast Cafe premises in the Nedlands Village shopping centre as a cafe/restaurant with 48 seats. (the breach)
Cr. I. s. Argyle
mr. C. Courtney
sp 30 of 2010
Breach alleged to have occurred under the local Government (Rules of Conduct) Regulations 2007:Regulation 4 – Breach of meeting procedures local law (standing Orders)Regulation 7 - securing personal advantage or disadvantaging others; andRegulation 11 - Non-disclosure of interest adverse to impartiality
1. Reported to standards panel.
22 July 2010 Notice of Finding: 8 march 2011 - The panel found that Councillor Argyle did not contravene standing order 41(1) of the, City’s standings orders or any of regulations 6, 7 or 11 in the circumstances alleged in the complaint.
38

Council member about whom the complaint is made
Person making the complaint
Local government complaint no.
Description of minor breach
Action taken
Date the complaint was referred to the standards panel
Outcome of the standards panel consideration of the minor complaint
Cr. I. Tan mrs. K. Kikiros
sp 32 of 2010
Breach alleged to have occurred under the local Government (Rules of Conduct) Regulations 2007: Regulation 7 - securing personal advantage or disadvantaging othersRegulation 8 - misuse of local government resourcesRegulation 9 - prohibition against involvement in administrationRegulation 10 - Relations with local government employeesRegulation 11 - Non-disclosure of interest adverse to impartiality
1. Reported to standards panel.
2 August 2010 Notice of Finding: 18 April 2011 – The panel found that Councillor Tan did not commit any minor breach as alleged in the complaint.
Cr. I. Tan mr. K. W. Eastwood
sp 33 of 2010
Breach alleged to have occurred under the local Government (Rules of Conduct) Regulations 2007: Regulation 7 - securing personal advantage or disadvantaging othersRegulation 11 - Non-disclosure of interest adverse to impartiality
1. Reported to standards panel.
9 August 2010 Notice of Finding: 18 April 2011 – The panel found that Councillor Tan did not contravene regulation 7(1)(b) as alleged in the complaint.
Cr. m.R. Hipkins
ms s. minshall
sp 49 of 2010
Breach alleged to have occurred under the local Government (Rules of Conduct) Regulations 2007: Regulation 7 - securing personal advantage or disadvantaging others
1. Reported to standards panel.
8 september 2010
No outcome as at 30 June 2011.
Cr. m.R. Hipkins
mr. J. R. Anderson for Hadley Holdings
sp 52 of 2010
Breach alleged to have occurred under the local Government (Rules of Conduct) Regulations 2007: Regulation 7 - securing personal advantage or disadvantaging others
1. Reported to standards panel.
21 september 2010
No outcome as at 30 June 2011.
39
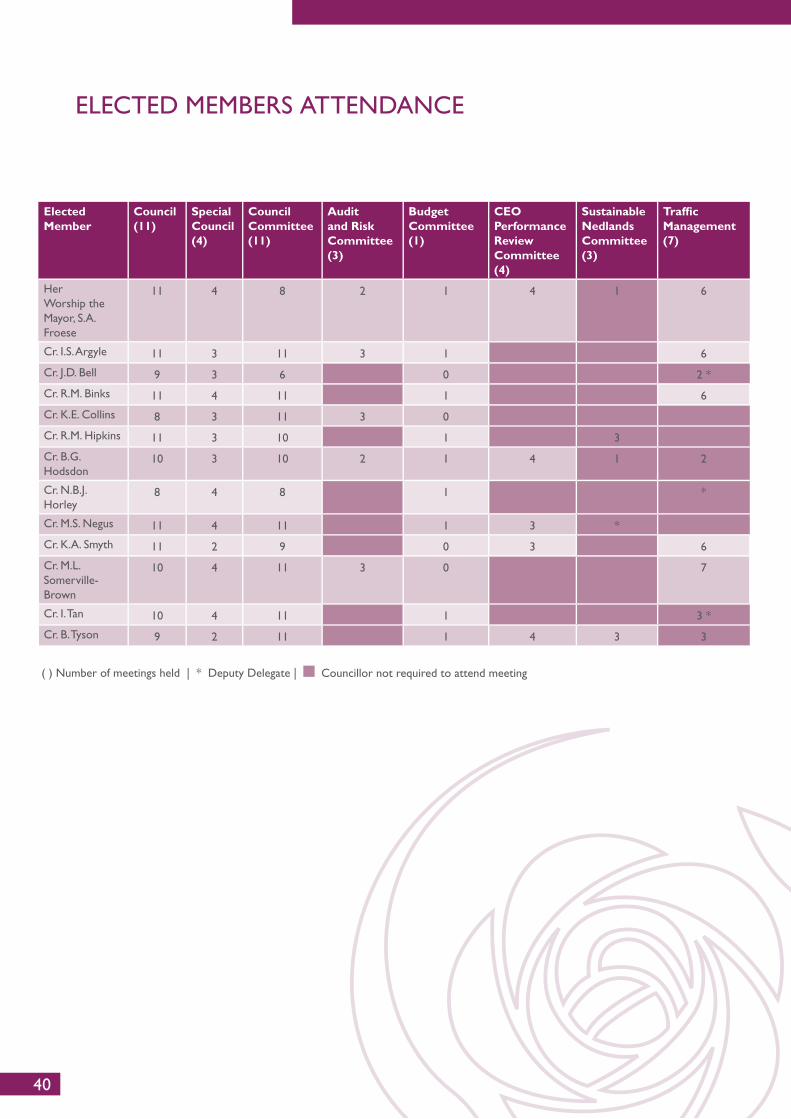
ElECTED mEmBERs ATTENDANCE
Elected Member
Council (11)
Special Council (4)
Council Committee (11)
Audit and Risk Committee (3)
Budget Committee (1)
CEO Performance Review Committee (4)
Sustainable Nedlands Committee (3)
Traffi c Management (7)
Her Worship the mayor, s.A. Froese
11 4 8 2 1 4 1 6
Cr. I.s. Argyle 11 3 11 3 1 6
Cr. J.D. Bell 9 3 6 0 2 *
Cr. R.m. Binks 11 4 11 1 6
Cr. K.E. Collins 8 3 11 3 0
Cr. R.m. Hipkins 11 3 10 1 3
Cr. B.G. Hodsdon
10 3 10 2 1 4 1 2
Cr. N.B.J. Horley
8 4 8 1 *
Cr. m.s. Negus 11 4 11 1 3 *
Cr. K.A. smyth 11 2 9 0 3 6
Cr. m.l. somerville-Brown
10 4 11 3 0 7
Cr. I. Tan 10 4 11 1 3 *
Cr. B. Tyson 9 2 11 1 4 3 3
( ) Number of meetings held | * Deputy Delegate | Councillor not required to attend meeting
40

( ) Number of meetings held | * Deputy Delegate | Councillor not required to attend meeting
Elected Member
Nedlands Cultural and Community Society (4)
Nedlands Aged Persons Homes Trust (Inc.) (11)
Swan River Trust Board (1)
WA Local Government Association – Central (5)
Western Suburbs District Planning Committee(Nil did not meet during this period)
Western Suburbs Regional Organisation of Councils (WESROC)(3)
Her Worship the mayor, s.A. Froese
4 3 3
Cr. I.s. Argyle
Cr. J.D. Bell 1
Cr. R.m. Binks
Cr. K.E. Collins *
Cr. R.m. Hipkins 5 *
Cr. B.G. Hodsdon 0 *
Cr. N.B.J. Horley 6
Cr. m.s. Negus *
Cr. K.A. smyth
Cr. m.l. somerville-Brown
Cr. I. Tan
Cr. B. Tyson 3
41

FINANCIAl REpORT
statement by Chief Executive Officer 43
statement of Comprehensive Income by Nature or Type 44
statement of Comprehensive Income by program 45
statement of Financial position 46
statement of Changes in Equity 47
statement of Cash Flows 48
Rate setting statement 49
Notes to and Forming part of the Financial Report 50 – 87
Independent Audit Report 88 – 89
42

City of Nedlands Financial Report 2010-2011
43
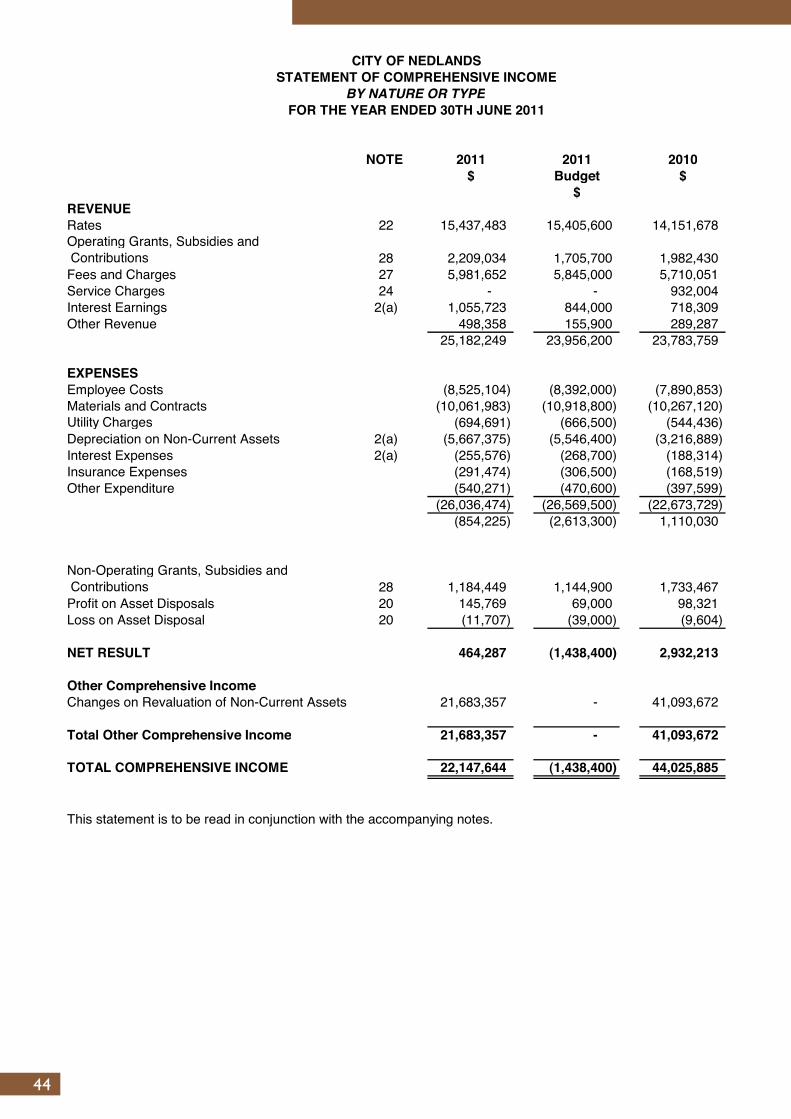
CITY OF NEDLANDSSTATEMENT OF COMPREHENSIVE INCOME
BY NATURE OR TYPEFOR THE YEAR ENDED 30TH JUNE 2011
NOTE 2011 2011 2010$ Budget $
$REVENUERates 22 15,437,483 15,405,600 14,151,678 Operating Grants, Subsidies and Contributions 28 2,209,034 1,705,700 1,982,430 Fees and Charges 27 5,981,652 5,845,000 5,710,051 Service Charges 24 - - 932,004 Interest Earnings 2(a) 1,055,723 844,000 718,309 Other Revenue 498,358 155,900 289,287
25,182,249 23,956,200 23,783,759
EXPENSESEmployee Costs (8,525,104) (8,392,000) (7,890,853) Materials and Contracts (10,061,983) (10,918,800) (10,267,120)Utility Charges (694,691) (666,500) (544,436) Depreciation on Non-Current Assets 2(a) (5,667,375) (5,546,400) (3,216,889) Interest Expenses 2(a) (255,576) (268,700) (188,314) Insurance Expenses (291,474) (306,500) (168,519) Other Expenditure (540,271) (470,600) (397,599)
(26,036,474) (26,569,500) (22,673,729)(854,225) (2,613,300) 1,110,030
Non-Operating Grants, Subsidies and Contributions 28 1,184,449 1,144,900 1,733,467 Profit on Asset Disposals 20 145,769 69,000 98,321 Loss on Asset Disposal 20 (11,707) (39,000) (9,604)
NET RESULT 464,287 (1,438,400) 2,932,213
Other Comprehensive IncomeChanges on Revaluation of Non-Current Assets 21,683,357 - 41,093,672
Total Other Comprehensive Income 21,683,357 - 41,093,672
TOTAL COMPREHENSIVE INCOME 22,147,644 (1,438,400) 44,025,885
This statement is to be read in conjunction with the accompanying notes.
Page 3
City of Nedlands Financial Report 2010-2011
44
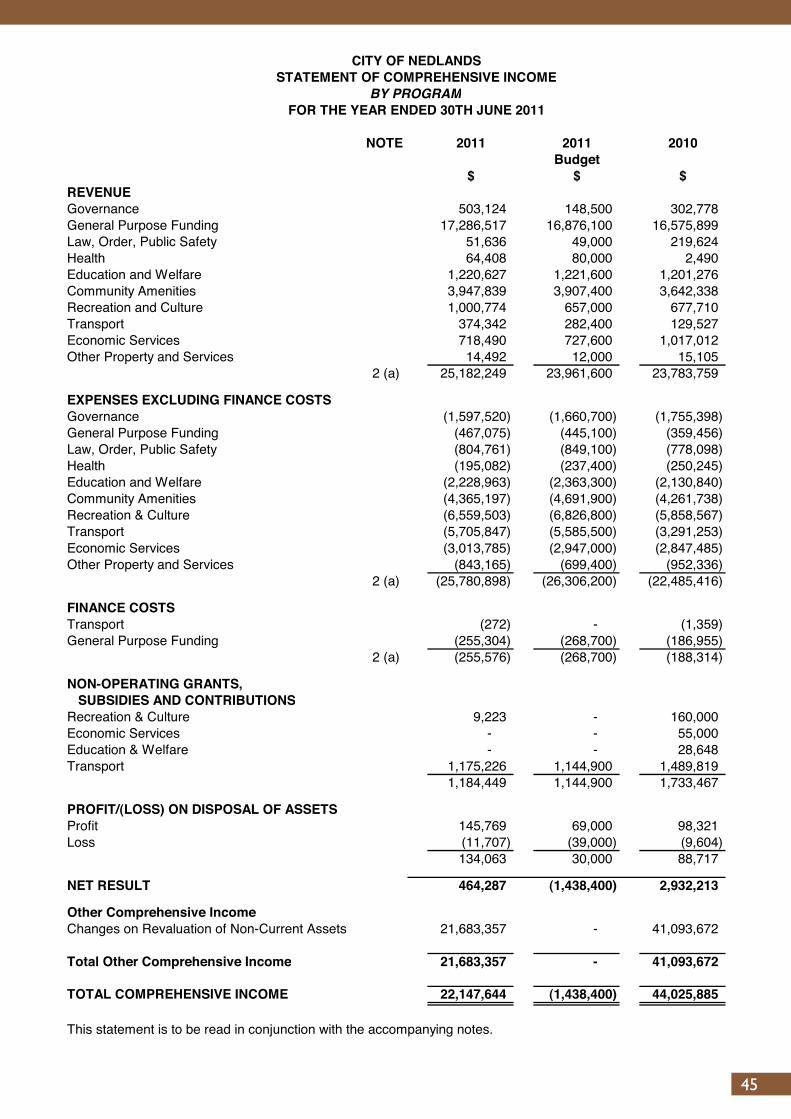
CITY OF NEDLANDSSTATEMENT OF COMPREHENSIVE INCOME
BY PROGRAMFOR THE YEAR ENDED 30TH JUNE 2011
NOTE 2011 2011 2010Budget
$ $ $REVENUEGovernance 503,124 148,500 302,778 General Purpose Funding 17,286,517 16,876,100 16,575,899 Law, Order, Public Safety 51,636 49,000 219,624 Health 64,408 80,000 2,490 Education and Welfare 1,220,627 1,221,600 1,201,276 Community Amenities 3,947,839 3,907,400 3,642,338 Recreation and Culture 1,000,774 657,000 677,710 Transport 374,342 282,400 129,527 Economic Services 718,490 727,600 1,017,012 Other Property and Services 14,492 12,000 15,105
2 (a) 25,182,249 23,961,600 23,783,759
EXPENSES EXCLUDING FINANCE COSTSGovernance (1,597,520) (1,660,700) (1,755,398) General Purpose Funding (467,075) (445,100) (359,456) Law, Order, Public Safety (804,761) (849,100) (778,098) Health (195,082) (237,400) (250,245) Education and Welfare (2,228,963) (2,363,300) (2,130,840) Community Amenities (4,365,197) (4,691,900) (4,261,738) Recreation & Culture (6,559,503) (6,826,800) (5,858,567) Transport (5,705,847) (5,585,500) (3,291,253) Economic Services (3,013,785) (2,947,000) (2,847,485) Economic Services (3,013,785) (2,947,000) (2,847,485) Other Property and Services (843,165) (699,400) (952,336)
2 (a) (25,780,898) (26,306,200) (22,485,416)
FINANCE COSTSTransport (272) - (1,359) General Purpose Funding (255,304) (268,700) (186,955)
2 (a) (255,576) (268,700) (188,314)
NON-OPERATING GRANTS, SUBSIDIES AND CONTRIBUTIONSRecreation & Culture 9,223 - 160,000 Economic Services - - 55,000 Education & Welfare - - 28,648 Transport 1,175,226 1,144,900 1,489,819
1,184,449 1,144,900 1,733,467
PROFIT/(LOSS) ON DISPOSAL OF ASSETSProfit 145,769 69,000 98,321 Loss (11,707) (39,000) (9,604)
134,063 30,000 88,717
NET RESULT 464,287 (1,438,400) 2,932,213
Other Comprehensive IncomeChanges on Revaluation of Non-Current Assets 21,683,357 - 41,093,672
Total Other Comprehensive Income 21,683,357 - 41,093,672
TOTAL COMPREHENSIVE INCOME 22,147,644 (1,438,400) 44,025,885
This statement is to be read in conjunction with the accompanying notes.
Page 4
City of Nedlands Financial Report 2010-2011
45

CITY OF NEDLANDSSTATEMENT OF FINANCIAL POSITION
AS AT 30TH JUNE 2011
NOTE 2011 2010$ $
CURRENT ASSETSCash and Cash Equivalents 3 11,649,263 10,027,708 Trade and Other Receivables 4 954,182 822,397 Inventories 5 12,539 17,083 TOTAL CURRENT ASSETS 12,615,984 10,867,188
NON-CURRENT ASSETSOther Receivables 4 261,190 313,488 Property, Plant and Equipment 6 56,108,872 33,562,969 Infrastructure 7 85,461,277 86,278,304 TOTAL NON-CURRENT ASSETS 141,831,339 120,154,761
TOTAL ASSETS 154,447,323 131,021,949
CURRENT LIABILITIESTrade and Other Payables 8 2,904,545 3,620,637 Borrowings 9 917,010 135,474 Provisions 10 1,251,732 1,172,233 TOTAL CURRENT LIABILITIES 5,073,287 4,928,344
NON-CURRENT LIABILITIESBorrowings 9 5,049,549 3,966,560 Provisions 10 160,291 110,494 TOTAL NON-CURRENT LIABILITIES 5,209,840 4,077,054
TOTAL LIABILITIES 10,283,127 9,005,398
NET ASSETS 144,164,196 122,016,552
EQUITYRetained Surplus 59,122,960 59,816,711 Reserves - Cash Backed 11 4,928,860 3,770,822 Reserves - Asset Revaluation 12 80,112,376 58,429,019 TOTAL EQUITY 144,164,196 122,016,552
This statement is to be read in conjunction with the accompanying notes.
Page 5
City of Nedlands Financial Report 2010-2011
46
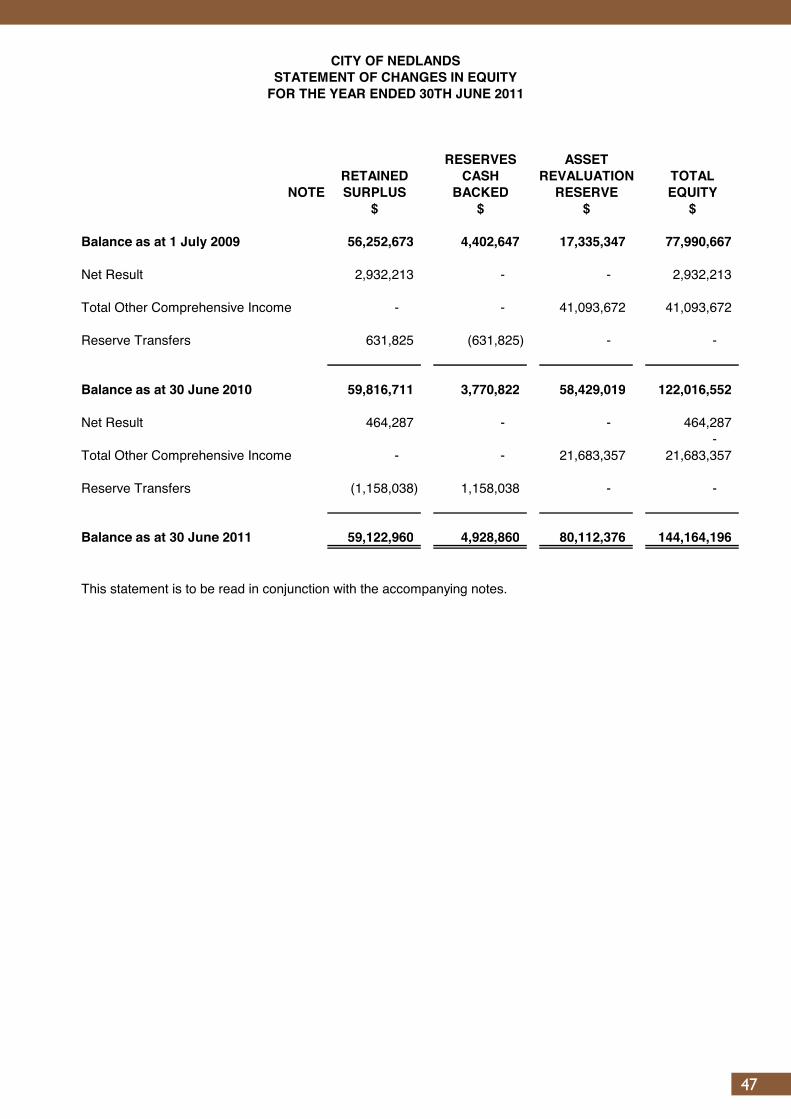
RESERVES ASSETRETAINED CASH REVALUATION TOTAL
NOTE SURPLUS BACKED RESERVE EQUITY$ $ $ $
Balance as at 1 July 2009 56,252,673 4,402,647 17,335,347 77,990,667
Net Result 2,932,213 - - 2,932,213
Total Other Comprehensive Income - - 41,093,672 41,093,672
Reserve Transfers 631,825 (631,825) - -
Balance as at 30 June 2010 59,816,711 3,770,822 58,429,019 122,016,552
Net Result 464,287 - - 464,287 -
Total Other Comprehensive Income - - 21,683,357 21,683,357
Reserve Transfers (1,158,038) 1,158,038 - -
Balance as at 30 June 2011 59,122,960 4,928,860 80,112,376 144,164,196
This statement is to be read in conjunction with the accompanying notes.
CITY OF NEDLANDSSTATEMENT OF CHANGES IN EQUITY
FOR THE YEAR ENDED 30TH JUNE 2011
Page 6
City of Nedlands Financial Report 2010-2011
47

CITY OF NEDLANDSSTATEMENT OF CASH FLOWS
FOR THE YEAR ENDED 30TH JUNE 2011
NOTE 2011 2011 2010Budget
$ $ $Cash Flows From Operating ActivitiesReceiptsRates 15,489,781 15,405,600 14,120,197 Operating Grants, Subsidies and Contributions 1,880,434 1,705,700 1,982,430 Fees and Charges 5,912,565 5,845,000 5,878,537 Service Charges - - 932,004 Interest Earnings 1,055,723 844,000 718,309 Goods and Services Tax - - - Other Revenue 448,748 155,900 289,287
24,787,251 23,956,200 23,920,764 PaymentsEmployee Costs (8,382,752) (8,392,000) (7,806,287) Materials and Contracts (10,395,321) (10,918,800) (9,687,554) Utility Charges (694,691) (666,500) (544,436) Insurance Expenses (291,474) (268,700) (168,519) Interest expenses (301,602) (306,500) (188,314) Goods and Services Tax (29,718) - (6,214) Other Expenditure (540,271) (470,600) (397,599)
(20,635,829) (21,023,100) (18,798,923)Net Cash Provided By (Used In)Operating Activities 13(b) 4,151,422 2,933,100 5,121,841
Cash Flows from Investing ActivitiesPayments for Purchase of Property, Plant & Equipment (2,557,845) (2,421,300) (1,375,494) Payments for Construction of Infrastructure (3,514,447) (5,321,800) (5,824,543) Non-Operating Grants, Subsidies and Contributions used for the Development of Assets 1,184,449 1,144,900 1,492,267 Proceeds from Sale of Plant & Equipment 493,450 299,100 361,444 Net Cash Provided By (Used In)Investing Activities (4,394,393) (6,299,100) (5,346,326)
Cash Flows from Financing ActivitiesRepayment of Debentures (127,971) (165,200) (1,306,444) Repayment of Finance Leases (7,504) - (13,975) Proceeds from New Debentures 2,000,000 2,000,000 2,000,000 Net Cash Provided By (Used In)Financing Activities 1,864,525 1,834,800 679,581
Net Increase (Decrease) in Cash Held 1,621,555 (1,531,200) 455,096 Cash at Beginning of Year 10,027,708 10,027,700 9,572,611 Cash and Cash Equivalents at the End of the Year 13(a) 11,649,263 8,496,500 10,027,708
This statement is to be read in conjunction with the accompanying notes.
Page 7
City of Nedlands Financial Report 2010-2011
48

City of Nedlands Financial Report 2010-2011
49

City of Nedlands Financial Report 2010-2011
50
1. SIGNIFICANT ACCOUNTING POLICIES (Continued)
(f) Inventories
General
Land Held for ResaleLand purchased for development and/or resale is valued at the lower of cost and net realisablevalue. Cost includes the cost of acquisition, development, borrowing costs and holding costsuntil Finance costs and holding charges incurred after development is completed are expensed.
Revenue arising from the sale of property is recognised in the statement of comprehensive incomeas at the time of signing an unconditional contract of sale.
Land held for resale is classified as current except where it is held as non-current based on Council's intentionto release for sale.
(g) Fixed Assets
Initial Recognition
RevaluationCertain asset classes may be revalued on a regular basis such that the carying values are not materiallydifferent from fair value. For infrastructure and other asset classes where no active market exists, fairvalue is determined to be the current replacement cost of an asset less, where applicable, accumulateddepreciation calculated on the basis of such cost to reflect the already consumed or expired futureeconomic benefits of the asset.
Those assets carried at a revalued amount, being their fair value at the date of revaluation less anysubsequent accumulated depreciation and accumulated impairment losses, are to be revalued withsufficient regularity to ensure the carrying amount does not differ materially from that determined usingfair value at reporting date.
Inventories are measured at the lower of cost and net realisable value.
Net realisable value is the estimated selling price in the ordinary course of business less the estimated costs of completion and the estimated costs necessary to make the sale.
Each class of fixed assets is carried at cost or fair value as indicated less, where applicable, any accumulated depreciation or impairment losses.
All assets are initially recognised at cost. Cost is determined as the fair value of the assets given as consideration plus costs incidental to the acquisition. For assets acquired at no cost or for nominal consideration, cost is determined as fair value at the date of acquisition. The cost of non-current assets constructed by the Council includes the cost of all materials used in construction, direct labour on the project and an appropriate proportion of variable and fixed overhead.
Increases in the carrying amount arising on revaluation of assets are credited to a revaluation
Any accumulated depreciation at the date of revaluation is eliminated against the gross carrying
Page 10
City of Nedlands Financial Report 2010-2011
51

1. SIGNIFICANT ACCOUNTING POLICIES (Continued)
(g) Fixed Assets (Continued)
Land under Roads
Depreciation of Non-Current AssetsAll non-current assets having a limited useful life are separately and systematically depreciatedover their useful lives in a manner which reflects the consumption of the future economic benefitsembodied in those assets.
Assets are depreciated from the date of acquisition or, in respect of internally constructed assets,from the time the asset is completed and held ready for use.
Depreciation is recognised on a straight-line basis, using rates which are reviewed each reportingperiod. Major depreciation periods are:
Buildings 50 yearsFurniture and Equipment 4 to 10 yearsPlant and Equipment 5 to 15 yearsSealed roads and streets formation not depreciated pavement 50 years seal - bituminous seals 20 years - asphalt surfaces 20 yearsGravel roads formation not depreciated pavement 50 years gravel sheet 12 yearsFormed roads (unsealed) formation not depreciated pavement 50 yearsFootpaths - slab 20 yearsSewerage piping 100 yearsWater supply piping and drainage systems 75 years
Consequently, any land under roads acquired on or after 1 July 2008 is not included as an asset of the Council.
In Western Australia, all land under roads is Crown Land, the responsibility for managing which, is vested in the local government.
In respect of land under roads acquired on or after 1 July 2008, as detailed above, Local Government (Financial Management) Regulation 16(a)(i) prohibits local governments from recognising such land as an asset.
Whilst such treatment is inconsistent with the requirements of AASB 1051, Local Government (Financial Management) Regulation 4(2) provides, in the event of such an inconsistency, the Local Government (Financial Management) Regulations prevail.
The assets residual values and useful lives are reviewed, and adjusted if appropriate, at the end of each reporting period.
Effective as at 1 July 2008, Council elected not to recognise any value for land under roads acquired on or before 30 June 2008. This accords with the treatment available in Australian Accounting Standard AASB1051 - Land Under Roads and the fact Local Government (Financial Management) Regulation 16(a)(i) prohibits local governments from recognising such land as an asset.
Page 11
City of Nedlands Financial Report 2010-2011
52

1. SIGNIFICANT ACCOUNTING POLICIES (Continued)
(g) Fixed Assets (Continued)
Depreciation of Non-Current Assets (Continued)
Capitalisation Threshold
(h) Financial Instruments
Initial Recognition and Measurement
Classification and Subsequent Measurement
(i) Financial assets at fair value through profit and loss
Financial assets and financial liabilities are recognised when the Council becomes a party to the contractual provisions to the instrument. For financial assets, this is equivalent to the date that the Council commits itself to either the purchase or sale of the asset (ie trade date accounting is adopted).
Fair value represents the amount for which an asset could be exchanged or a liability settled, between knowledgeable, willing parties. Where available, quoted prices in an active market are used to determine fair value. In other circumstances, valuation techniques are adopted.
Gains and losses on disposals are determined by comparing proceeds with with the carrying amount. These gains and losses are included in the statement of comprehensive income. When revalued assets are sold, amounts included in the revaluation surplus relating to that asset are transferred to retained earnings.
Expenditure on items of equipment under $500 is not capitalised. Rather, it is recorded on an asset inventory listing.
An asset's carrying amount is written down immediately to its recoverable amount if the asset's carrying amount is greater than its estimated recoverable amount.
Financial instruments are initially measured at fair value plus transaction costs, except where the instrument is classified 'at fair value through profit or loss', in which case transaction costs are expensed to profit or loss immediately.
Financial instruments are subsequently measured at fair value, amortised cost using the effective interest rate method or at cost.
Financial assets at fair value through profit or loss are financial assets held for trading. A financial asset is classified in this category if acquired principally for the purpose of selling in the short term. Assets in this category are classified as current assets.
The effective interest rate method is used to allocate interest income or interest expense over the relevant period and is equivalent to the rate that exactly discounts estimated future cash payments or receipts (including fees, transaction costs and other premiums or discounts) through the expected life (or when this cannot be reliably predicted, the contractual term) of the financial instrument to the net carrying amount of the financial asset or financial liability. Revisions to expected future net cash flows will necessitate an adjustment to the carrying value with a consequential recognition of an income or expense in profit or loss.
Amortised cost is calculated as:
(a) the amount in which the financial asset or financial liability is measured at initial recognition;
(b) less principal repayments;
(c) plus or minus the cumulative amortisation of the difference, if any, between the amount
(d) less any reduction for impairment.
Page 12
City of Nedlands Financial Report 2010-2011
53

1. SIGNIFICANT ACCOUNTING POLICIES (Continued)
(h) Financial Instruments (Continued)
(ii) Loans and receivables
(iii) Held-to-maturity investments
(iv) Available-for-sale financial assets
(v) Financial liabilities
Impairment
Non-derivative financial liabilities (excluding financial guarantees) are subsequently measured at amortised cost.
At the end of each reporting period, the Council assesses whether there is objective evidence that a financial instrument has been impaired. In the case of available-for-sale financial instruments, a prolonged decline in the value of the instrument is considered to determine whether impairment has arisen. Impairment losses are recognised in the statement of comprehensive income.
If the Council were to sell other than an insignificant amount of held-to-maturity financial assets, the whole category would be tainted and reclassified as available-for-sale.
Amortised cost is calculated as: (Continued)
Available-for-sale financial assets, are non-derivative financial assets that are either not suitable to be classified into other categories of financial assets due to their nature, or they are designated as such by management. They comprise investments in the equity of other entities where there is neither a fixed maturity nor fixed or determinable.
Available-for-sale financial assets are included in non-current assets, except for those which are expected to mature within 12 months after the end of the reporting period (classified as current assets).
Loans and receivables are non-derivative financial assets with fixed or determinable payments that are not quoted in an active market and are subsequently measured at amortised cost.
Loans and receivables are included in current assets, except for those which are not expected to mature within 12 months after the end of the reporting period (classified as non-current assets).
Held-to-maturity investments are non-derivative financial assets with fixed maturities and fixed or determinable payments and fixed maturities that the Council’s management has the positive intention and ability to hold to maturity.
Held-to-maturity financial assets are included in non-current assets, except for those which are expected to mature within 12 months after the end of the reporting period (classified as current assets).
Page 13
City of Nedlands Financial Report 2010-2011
54
1. SIGNIFICANT ACCOUNTING POLICIES (Continued)
(h) Financial Instruments (Continued)
(i) Estimation of Fair Value
(j) ImpairmentIn accordance with Australian Accounting Standards the Council's assets, other than inventories,are assessed at each reporting date to determine whether there is any indication they may be impaired.
Where such an indication exists, an estimate of the recoverable amount of the asset is madein accordance with AASB 136 'Impairment of Assets' and appropriate adjustments made.
An impairment loss is recognised whenever the carrying amount of an asset or its cash-generating unitexceeds its recoverable amount. Impairment losses are recognised in the statement of comprehensive income.
For non-cash generating assets such as roads, drains, public buildings and the like, value in use isrepresented by the depreciated replacement cost of the asset.
(k) Trade and Other PayablesTrade and other payables represent liabilities for goods and services provided to the Councilprior to the end of the financial year that are unpaid and arise when the Council becomesobliged to make future payments in respect of the purchase of these goods and services.The amounts are unsecured and are usually paid within 30 days of recognition.
Quoted market prices or dealer quotes for similar instruments are used for long-term debt instruments held. Other techniques, such as estimated discounted cash flows, are used to determine fair value for the remaining financial instruments.
The nominal value less estimated credit adjustments of trade receivables and payables are assumed to approximate their fair values. The fair value of financial liabilities for disclosure purposes is estimated by discounting the future contractual cash flows at the current market interest rate that is available to the Council for similar financial instruments.
The fair value of financial assets and financial liabilities must be estimated for recognition and measurement or for disclosure purposes.
The fair value of financial instruments traded in active markets is based on quoted market prices at the reporting date.
The fair value of financial instruments that are not traded in an active market is determined using valuation techniques. The Council uses a variety of methods and makes assumptions that are based on market conditions existing at each reporting date. These include the use of recent arm’s length transactions, reference to other instruments that are substantially the same, discounted cash flow analysis, and option pricing models making maximum use of market inputs and relying as little as possible on entity-specific inputs.
Page 14
City of Nedlands Financial Report 2010-2011
55
1. SIGNIFICANT ACCOUNTING POLICIES (Continued)
(l) Employee BenefitsThe provisions for employee benefits relates to amounts expected to be paid for long serviceleave, annual leave, wages and salaries and are calculated as follows:
(i) Wages, Salaries, Annual Leave and Long Service Leave (Short-term Benefits)The provision for employees’ benefits to wages, salaries, annual leave and long service leaveexpected to be settled within 12 months represents the amount the Council has a presentobligation to pay resulting from employees services provided to reporting date. The provision hasbeen calculated at nominal amounts based on remuneration rates the Council expects to payand includes related on-costs.
(ii) Long Service Leave (Long-term Benefits)
(m) Borrowing CostsBorrowing costs are recognised as an expense when incurred except where they are directlyattributable to the acquisition, construction or production of a qualifying asset. Where this isthe case, they are capitalised as part of the cost of the particular asset.
(n) ProvisionsProvisions are recognised when:
a) the Council has a present legal or constructive obligation as a result of past events; b) for which it is probable that an outflow of economic benefits will result to settle the obligation; and c) that outflow can be reliably measured.
Provisions are not recognised for future operationg losses.
(o) LeasesLeases of fixed assets, where substantially all the risks and benefits incidental to the ownershipof the asset, but not legal ownership, are transferred to the Council, are classified as financeleases. Finance leases are capitalised recording an asset and a liability equal to the present
Finance leases are capitalised recording an asset and a liability at the lower amounts equal to thefair value of the leased property or the present value of the minimum lease payments, including anyguaranteed residual values. Lease payments are allocated between the reduction of the lease liabilityand the lease interest expense for the period.
Leased assets are depreciated on a straight line basis over the shorter of their estimated useful livesor the lease term.
Lease payments for operating leases, where substantially all the risks and benefits remain with thelessor, are charged as expenses in the periods in which they are incurred.
Lease incentives under operating leases are recognised as a liability and amortised on a straight linebasis over the life of the lease term.
Provisions are measured using the best estimate of the amounts required to settle the obligation at the end of the reporting period.
The liability for long service leave is recognised in the provision for employee benefits and measured as the present value of expected future payments to be made in respect of services provided by employees up to the reporting date using the projected unit credit method. Consideration is given to expected future wage and salary levels, experience of employee departures and periods of service. Expected future payments are discounted using market yields at the reporting date on national government bonds with terms to maturity and currency that match as closely as possible, the estimated future cash outflows. Where the Council does not have the unconditional right to defer settlement beyond 12 months, the liability is recognised as a current liability.
Page 15
City of Nedlands Financial Report 2010-2011
56

1. SIGNIFICANT ACCOUNTING POLICIES (Continued)
(p) Joint VentureThe Council’s interest in a joint venture has been recognised in the financial statements byincluding its share of any assets, liabilities, revenues and expenses of the joint venture withinthe appropriate line items of the financial statement. The Council has no joint ventures.
(q) Rates, Grants, Donations and Other ContributionsRates, grants, donations and other contributions are recognised as revenues when the localgovernment obtains control over the assets comprising the contributions. Control over assetsacquired from rates is obtained at the commencement of the rating period or, where earlier, uponreceipt of the rates.
Where contributions recognised as revenues during the reporting period were obtained on thecondition that they be expended in a particular manner or used over a particular period, and thoseconditions were undischarged as at the reporting date, the nature of and amounts pertaining tothose undischarged conditions are disclosed in Note 2(c). That note also discloses the amountof contributions recognised as revenues in a previous reporting period which were obtained inrespect of the local government's operation for the current reporting period.
(r) Superannuation
(s) Current and Non-Current Classification
(t) Rounding Off FiguresAll figures shown in this annual financial report, other than a rate in the dollar, are rounded to thenearest dollar.
(u) Comparative FiguresWhere required, comparative figures have been adjusted to conform with changes in presentationfor the current financial year.
(v) Budget Comparative FiguresUnless otherwise stated, the budget comparative figures shown in this annual financial report relate to the revised budget estimate for the relevant item of disclosure.
In the determination of whether an asset or liability is current or non-current, consideration is given to the time when each asset or liability is expected to be settled. The asset or liability is classified as current if it is expected to be settled within the next 12 months, being the Council’s operational cycle. In the case of liabilities where the Council does not have the unconditional right to defer settlement beyond 12 months, such as vested long service leave, the liability is classified as current even if not expected to be settled within the next 12 months. Inventories held for trading are classified as current even if not expected to be realised in the next 12 months except for land held for resale where it is held as non-current based on Council’s intentions to release for sale.
The Council contributes to a number of superannuation funds on behalf of employees.
Page 16
City of Nedlands Financial Report 2010-2011
57

1. SIGNIFICANT ACCOUNTING POLICIES (Continued)
(w) New Accounting Standards and Interpretations for Application in Future Periods
Title and Topic Issued Applicable (*) Impact
(i) AASB 9 – Financial Instruments
December 2009 01 January 2013 Nil – The objective of this Standard is to improve and simplify the approach for classification andmeasurement of financial assets compared with the requirements of AASB 139. Given the nature of the financial assets of the Council, it is not anticipated the standard will have any material effect.
(ii) AASB 124 – Related Party Disclosures
December 2009 01 January 2011 Nil – It is not anticipated the Council will have any related parties as defined by the Standard.
(iii) AASB 1053 - Application of Tiers of Australian Accounting Standards
June 2010 01 July 2013Nil - Due to its nature and statutory requirements the Council will be deemed a Tier 1 entity and will continue to prepare general purpose financial statements.
(iv) AASB 2009 -12 Amendments to Australian Accounting Standards [AASB 5, 8, 108, 110, 112, 119, 133, 137, 139, 1023 &
December 2009 01 January 2011 Nil – The revisions embodied in this standard relate to standards which do not apply to local government (ie AASB8) or are largely editorial in nature and will have minimal effect (if any) on the accounting practices of the Council.
NOTES TO AND FORMING PART OF THE FINANCIAL REPORTCITY OF NEDLANDS
FOR THE YEAR ENDED 30TH JUNE 2011
Australian Accounting Standards and Interpretations that have recently been issued or amended but are not yet effective have not been adopted by the Council for the annual reporting period ending 30 June 2011.
Council's assessment of these new standards and interpretation is set out below:
119, 133, 137, 139, 1023 & 1031 and Interpretations 2, 4, 16, 1039 & 1052]
Council.
(v) AASB 2009– 11 Amendments to Australian Accounting Standards arising from AASB 9
December 2009 01 January 2013 Nil – The revisions embodied in this standard give effect to the consequential changes arising from the issuance of AASB 9 which is not anticipated to have any material effect on the Council (refer (i) above).
[AASB 1, 3, 4, 5, 7, 101, 102, 108, 112, 118, 121, 127, 128, 131, 132, 136, 139, 1023 & 1038 and Interpretations 10 & 12)
(vi) AASB 2010 - 2 Amendments to Australian Accounting Standards arising from Reduced Disclosure Requirements [AASB 1, 2, 3, 5, 7, 8, 101, 102, 107, 108, 110, 111, 112, 116, 117, 119, 121, 123, 124, 127, 128, 131, 133, 134, 136, 137, 138, 140, 141, 1050, & 1052 and Interpretations 2, 4, 5, 15, 17, 127, 129 & 1052]
June 2010 01 July 2013 Nil - None of these amendments will have any effect on the financial report as the standard does not apply in the case of general purpose financial statements.
(vii) AASB 2010 - 4 Further Amendments to Australian Accounting Standards arising from the Annual Improvements Project [AASB 1, 7, 101, 134, and Interpretation 13]
June 2010 01 January 2011 Nil - The revisions are part of the AASB's annual improvement project to help ensure consistency with presentation, recognition and measurement criteria of IFRSs. It is not anticipated these will have any effect on the Council.
Page 17
City of Nedlands Financial Report 2010-2011
58

1. SIGNIFICANT ACCOUNTING POLICIES (Continued)
(w) New Accounting Standards and Interpretations for Application in Future Periods (Continued)
Title and Topic Issued Applicable (*) Impact
(viii) AASB 2010 - 5 Amendments to Australian Accounting Standards [AASB 1, 3, 4, 5, 101, 107, 112, 118, 119, 121, 132, 133, 134, 137, 139, 140, 1023 & 1038 and Interpretations 112, 115, 127, 132 & 1042]
October 2010 01 January 2011 Nil - The revisions embodied in this standard are largely editorial in nature or relate to standards not applicable to the Council and will have minimal effect (if any) on the accounting practices of the Council.
(ix) AASB 2010 - 6 Amendments to Australian Accounting Standards - Disclosures on Transfers of Financial Assets [AASB 1 & 7]
November 2010 01 July 2011 Nil - The revisions embodied in this standard amend disclosures required on transfers of financial assets. The Council is not expected to have any qualifying transfers.
(x) AASB 2010 – 7 Amendments to Australian Accounting Standards arising from AASB 9 (December 2010)
December 2010 01 January 2013 Nil – The revisions embodied in this standard give effect to the consequential changes arising from the issuance of AASB 9 which is not anticipated to have any material effect on the Council (refer (i) above).
[AASB 1, 3, 4, 5, 7, 101, 102, 108, 112, 118, 121, 127, 128, 131, 132, 136, 139, 1023 & 1038 and Interpretations 10 & 12)
(xi) AASB 2010 - 8 Amendments to Australian Accounting
December 2010 01 January 2012 Nil - None of these amendments will have any effect on the financial report as none of the topics are relevant to Australian Accounting
Standards - Deferred Tax: Recovery of Underlying Assets [AASB 1 & 7]
the financial report as none of the topics are relevant to the operations of the Council.
AASB 2010 - 9 Amendments to Australian Accounting Standards - Severe Hyperinflation and Removal of Fixed Dates for First-time Adopters [AASB 1]
December 2010 01 July 2011 Nil - None of these amendments will have any effect on the financial report as none of the topics are relevant to the operations of the Council.
AASB 2009– 14 Amendments to Australian Interpretations – Prepayments of a Minimum Funding Requirement [AASB Interpretation 14]
December 2009 01 January 2011 Nil - None of these amendments will have any effect on the financial report as none of the topics are relevant to the operations of the Council.
AASB 2010 - 10 Further Amendments to Australian Accounting Standards - Removal of Fixed Dates for First-time Adopters [AASB 2009 - 11 & 2010 - 7]
December 2010 01 January 2013 Nil - None of these amendments will have any effect on the financial report as none of the topics are relevant to the operations of the Council.
Notes:
(*) Applicable to reporting periods commencing on or after the given date.
Page 18
City of Nedlands Financial Report 2010-2011
59

1. SIGNIFICANT ACCOUNTING POLICIES (Continued)
(x) Adoption of New and Revised Accounting Standards
AASB 2009 - 5AASB 2009 - 8AASB 2009 - 10AASB 2009 - 13AASB 2010 - 1AASB 2010 - 3
Interpretation 19
During the current year, the Council adopted all of the new and revised Australian Accounting Standards and Interpretations which became mandatory and which were applicable to its operations.
These new and revised standards were:
The standards adopted had a minimal effect on the accounting and reporting practices of the Council as they were either largely editorial in nature, were revisions to help ensure consistency with presentation, recognition and measurement criteria of IFRSs or related to topics not relevant to operations.
Page 19
City of Nedlands Financial Report 2010-2011
60

CITY OF NEDLANDSNOTES TO AND FORMING PART OF THE FINANCIAL REPORT
FOR THE YEAR ENDED 30TH JUNE 2011
2. REVENUE AND EXPENSES 2011 2010$ $
(a) Net Result
The Net Result includes:
(i) Charging as an Expense:
Auditors Remuneration- Audit 17,140 15,550
DepreciationBuildings 378,309 364,031 Furniture and Equipment 306,425 335,368 Plant and Equipment 651,178 599,966 Roads 3,306,904 1,092,904 Footpaths 392,573 370,677 Drainage 194,170 74,204 Street Furniture - 11,906 Parks, Gardens and Reserves 437,816 367,833
5,667,375 3,216,889 Interest Expenses (Finance Costs)Debentures & HP interest 255,576 188,314
255,576 188,314
(ii) Crediting as Revenue: 2011 2011 2010Budget
$ $ $Interest EarningsInvestments- Reserve Funds 230,212 210,000 209,429 - Other Funds 653,928 500,000 382,049 Other Interest Revenue (Refer Note 26) 171,583 134,000 126,830
1,055,723 844,000 718,309
Page 20
City of Nedlands Financial Report 2010-2011
61
CITY OF NEDLANDSNOTES TO AND FORMING PART OF THE FINANCIAL REPORT
STATEMENT BY CHIEF EXECUTIVE OFFICER
2. REVENUE AND EXPENSES (Continued)
(b) Statement of Objective
In order to discharge its responsibilities to the community, the City of Nedlands has developedoperational and financial objectives. These objectives have been established both on an overallbasis and for each of its broad activities/programs.
Council operations as disclosed in this report encompass the following service orientatedactivities/programs:
GOVERNANCE
GENERAL PURPOSE FUNDING
LAW, ORDER, PUBLIC SAFETY
Objective: To provide services to help ensure a safer and environmentally conscious community.
HEALTH
Objective: To provide services that will ensure a healthy environment.
Activities: Regulation and monitoring of food premises, and management of pest control.
EDUCATION AND WELFARE
COMMUNITY AMENITIES
Objective: To provide services that will assist the elderly to enjoy meaningful, independent living and child care services
Objective: To provide a decision making process for the efficient allocation of scarce resources.
Activities: Includes the activities of members of council, the administrative support available to the council for the provision of governance of the district, and corporate services.
Objective: To collect revenue to allow for the provision of services.
Activities: Rates, general purpose government grants, and interest revenue.
Activities: Supervision and enforcement of various local laws relating to fire prevention, animal control and protection of the environment and other aspects of public safety including emergency services.
Activities: Home and Community Care (HACC) services, Meals on Wheels, Seniors' activities and Occassional Child Care services.
Objective: To provide services required by the community.
Activities: Rubbish collection services, operation of rubbish disposal sites, litter control, construction and maintenance of urban storm water drains, protection of the environment and administration of town planning schemes, cemetery and public conveniences.
Page 21
City of Nedlands Financial Report 2010-2011
62
2. REVENUE AND EXPENSES (Continued)
(b) Statement of Objective (Continued)
RECREATION AND CULTURE
TRANSPORT
ECONOMIC SERVICES
OTHER PROPERTY AND SERVICES
Activities: Private works operation, plant repair and operation costs and infrastructure services
Objective: To establish and effectively manage infrastructure and resources which will help the social well being of the community.
Activities: Maintenance of public halls, civic centre, beaches, recreation centres and various sporting facilities. Provision and maintenance of parks, gardens and playgrounds. Operation of library, and facilitating of cultural activities.
Objective: To provide safe, effective and efficient transport services to the community.
Activities: Construction and maintenance of roads, streets, footpaths, depots, cycleways, parking facilities and traffic control. Cleaning of streets and maintenance of street trees, street lighting, drainage etc. Control of parking and enforcement of parking local laws.
Objective: To help promote the City and it's economic wellbeing.
Activities: Maintenance of the City's buildings and natural areas. Building control.
Objective: To monitor and control council's overheads operating accounts.
Page 22
City of Nedlands Financial Report 2010-2011
63

CIT
Y O
F N
EDLA
ND
SN
OTE
S TO
AN
D F
OR
MIN
G P
ART
OF
THE
FIN
ANC
IAL
REP
OR
TFO
R T
HE
YEAR
EN
DED
30T
H J
UN
E 20
11
2. R
EVEN
UE
AND
EXP
ENSE
S (C
ontin
ued)
(c)
Con
ditio
ns O
ver G
rant
s/C
ontr
ibut
ions
Ope
ning
Clo
sing
Clo
sing
Bal
ance
(*)
Rec
eive
d (+
)Ex
pend
ed (#
)B
alan
ce (*
)R
ecei
ved
(+)
Expe
nded
(#)
Bal
ance
Func
tion/
01/0
7/09
2009
/10
2009
/10
30/0
6/10
2010
/11
2010
/11
30/0
6/11
Gra
nt/C
ontr
ibut
ion
Activ
ity$
$$
$$
$$
Com
mun
ity D
evel
opm
ent
Gra
nts
Ope
ratio
n34
,046
29
,546
4,
500
Nat
ural
Are
as26
9,83
4
(234
,804
)
35
,030
10
3,94
8
134,
219
4,
759
Offi
ce o
f Crim
e Pr
even
tion
Gra
fffiti
Softw
are
15,3
86
-
15,3
86
Swan
Rive
r Tru
stR
iver w
all
250,
000
-
25
0,00
0
Tota
l-
269,
834
(234
,804
)
35
,030
40
3,38
0
16
3,76
5
27
4,64
5
Not
es:
(*) -
Gra
nts/
cont
ribut
ions
reco
gnis
ed a
s re
venu
e in
a p
revio
us re
porti
ng p
erio
d wh
ich
were
not
exp
ende
d at
the
clos
e of
the
prev
ious
repo
rting
per
iod.
(+) -
New
gra
nts/
cont
ribut
ions
whi
ch w
ere
reco
gnis
ed a
s re
venu
es d
urin
g th
e re
porti
ng p
erio
d an
d wh
ich
had
not y
et b
een
fully
exp
ende
d in
the
man
ner
spe
cifie
d by
the
cont
ribut
or.
(#) -
Gra
nts/
cont
ribut
ions
whi
ch h
ad b
een
reco
gnis
ed a
s re
venu
es in
a p
revio
us re
porti
ng p
erio
d or
rece
ived
in th
e cu
rrent
repo
rting
per
iod
and
whic
h we
re
e
xpen
ded
in th
e cu
rrent
repo
rting
per
iod
in th
e m
anne
r spe
cifie
d by
the
cont
ribut
or.
Page
23
City
of N
edla
nds
Fina
ncia
l Rep
ort
2010
-201
1
64

CITY OF NEDLANDSNOTES TO AND FORMING PART OF THE FINANCIAL REPORT
FOR THE YEAR ENDED 30TH JUNE 2011
2011 2010$ $
3. CASH AND CASH EQUIVALENTS
Unrestricted 5,022,545 4,701,945 Restricted 6,626,718 5,325,763
11,649,263 10,027,708The following restrictions have been imposed byregulations or other externally imposed requirements:
Plant Replacement Reserve 207,488 197,130 City Development Reserve 1,405,918 1,387,206 North St Reserve 1,014,393 638,357 Welfare Reserve 370,047 348,131 Services Reserve 1,137,417 268,218 Insurance Reserve 48,843 46,179 Waste Management Infrastructure Reserve 131,942 124,066 Building Replacement Reserve 512,405 666,886 Swanbourne Reserve 100,407 94,649 Adelma Account 101,481 Provision for Long Service Leave 160,291 110,494 Bonds and Deposits 1,161,440 1,444,447 Unspent Grants 274,645
6,626,718 5,325,763
4. TRADE AND OTHER RECEIVABLES
CurrentRates Outstanding 218,220 315,970 Sundry Debtors 497,199 297,408 Less: Provision for Doubtful Debts (11,473) (16,983) Other Receivables 32,982 38,465 GST Receivable 217,255 187,537
954,182 822,397 Non-CurrentRates Outstanding - Pensioners 261,190 313,488
261,190 313,488
5. INVENTORIES
CurrentFuel and Oil 12,539 17,083
12,539 17,083
Page 24
City of Nedlands Financial Report 2010-2011
65

CITY OF NEDLANDSNOTES TO AND FORMING PART OF THE FINANCIAL REPORT
FOR THE YEAR ENDED 30TH JUNE 2011
2011 2010$ $
6. PROPERTY, PLANT AND EQUIPMENT
Land - Independent Valuation 29,344,000 16,990,000 Less: Accumulated Depreciation - -
29,344,000 16,990,000
Buildings - Independent Valuation 22,690,000 14,744,013 Less: Accumulated Depreciation - (2,337,747)
22,690,000 12,406,265
Furniture and Equipment - Cost 3,604,793 3,467,745 Less: Accumulated Depreciation (2,797,564) (2,563,391)
807,229 904,354
Plant and Equipment - Cost 5,289,887 5,141,763 Less: Accumulated Depreciation (2,022,245) (1,879,414)
3,267,643 3,262,349
56,108,872 33,562,969
The valuations for land and buildings were carried out by Mr. Martin McEneaney (Licensed ValuerNo. 44551) on 30 June 2011.
Page 25
City of Nedlands Financial Report 2010-2011
66

CITY OF NEDLANDSNOTES TO AND FORMING PART OF THE FINANCIAL REPORT
FOR THE YEAR ENDED 30TH JUNE 2011
6a. PROPERTY, PLANT AND EQUIPMENT (Continued)
Movements in Carrying Amounts
Movement in the carrying amounts of each class of property, plant and equipment between the beginning and the end of the current financial year.
Land Buildings Furniture Plant& &
Equipment Equipment Total$ $ $ $ $
Balance as at the beginning 16,990,000 12,406,265 904,355 3,262,350 33,562,970of the year
Additions - 1,364,134 213,113 980,599 2,557,845
(Disposals) - - (3,814) (355,575) (359,389)
Revaluation - Increments 12,354,000 9,297,909 - 31,447 21,683,356
Depreciation (Expense) - (378,308) (306,425) (651,178) (1,335,911)
Carrying amount at the 29,344,000 22,690,000 807,229 3,267,643 56,108,872end of year
Page 26
City of Nedlands Financial Report 2010-2011
67

2011 2010$ $
7. INFRASTRUCTURERoads - Independent Valuation 67,965,325 66,000,000 Less Accumulated Depreciation (3,300,000) -
64,665,325 66,000,000
Footpaths - Cost 8,343,155 7,851,458 Less Accumulated Depreciation (2,048,422) (1,655,848)
6,294,734 6,195,610
Drainage - Independent Valuation 7,048,341 6,795,951 Less Accumulated Depreciation (194,170) -
6,854,171 6,795,951
Parks - Cost 7,254,839 6,461,284 Less Accumulated Depreciation (1,443,680) (1,120,616)
5,811,159 5,340,668
Reticulation - Cost 2,295,040 2,295,040 Less Accumulated Depreciation (678,814) (564,062)
1,616,226 1,730,978
Street Furniture - Cost 240,836 133,936 Less Accumulated Depreciation (117,832) (133,936)
123,005 -
Rights of Ways - Cost 159,987 159,987 Less Accumulated Depreciation (63,328) (56,424)
96,658 103,563
Sub-Total 85,461,277 86,166,770
Work-in-Progress - 111,525
Grand Total 85,461,277 86,278,304
Council has adopted a policy of re-valuing with sufficient regularity to ensure the carrying amountof each road asset is fairly stated at reporting date. The independent valuation was last carried outat 30 June 2010.
This policy also accords with AASB 116.
CITY OF NEDLANDSNOTES TO AND FORMING PART OF THE FINANCIAL REPORT
FOR THE YEAR ENDED 30TH JUNE 2011
Page 27
City of Nedlands Financial Report 2010-2011
68

CIT
Y O
F N
EDLA
ND
SN
OTE
S TO
AN
D F
OR
MIN
G P
ART
OF
THE
FIN
ANC
IAL
REP
OR
TFO
R T
HE
YEAR
EN
DED
30T
H J
UN
E 20
11
7a.
INFR
ASTR
UC
TUR
E (C
ontin
ued)
Mov
emen
ts in
Car
ryin
g Am
ount
s
Mov
emen
t in
the
carry
ing
amou
nts
of e
ach
clas
s of
infra
stru
ctur
e be
twee
n th
e be
ginn
ing
and
the
end
of th
e cu
rrent
fina
ncia
l yea
r.
Park
sR
ight
an
dSt
reet
of
Wor
k-in
Roa
dsFo
otpa
ths
Dra
inag
eO
vals
Ret
icul
atio
nFu
rnitu
reW
ays
Prog
ress
Tota
l$
$$
$$
$$
Bala
nce
at th
e be
ginn
ing
66,0
00,0
00
6,19
5,61
0
6,79
5,95
1
5,34
0,66
8
1,73
0,97
8
-
10
3,56
3
111,
525
86,2
78,3
04
of th
e ye
ar
Addi
tions
1,96
5,32
5
491,
697
252,
391
793,
555
-
12
3,00
5
-
(1
11,5
25)
3,
514,
447
Rev
alua
tion
- Inc
rem
ents
-
-
-
-
-
-
-
-
-
Dep
reci
atio
n (E
xpen
se)
(3,3
00,0
00)
(3
92,5
73)
(194
,170
)
(323
,064
)
(114
,752
)
-
(6
,904
)
-
(4,3
31,4
63)
Car
ryin
g am
ount
at t
he64
,665
,325
6,29
4,73
4
6,85
4,17
25,
811,
159
1,61
6,22
6
12
3,00
5
96
,659
-
85,4
61,2
77en
d of
yea
r
Page
28
City
of N
edla
nds
Fina
ncia
l Rep
ort
2010
-201
1
69
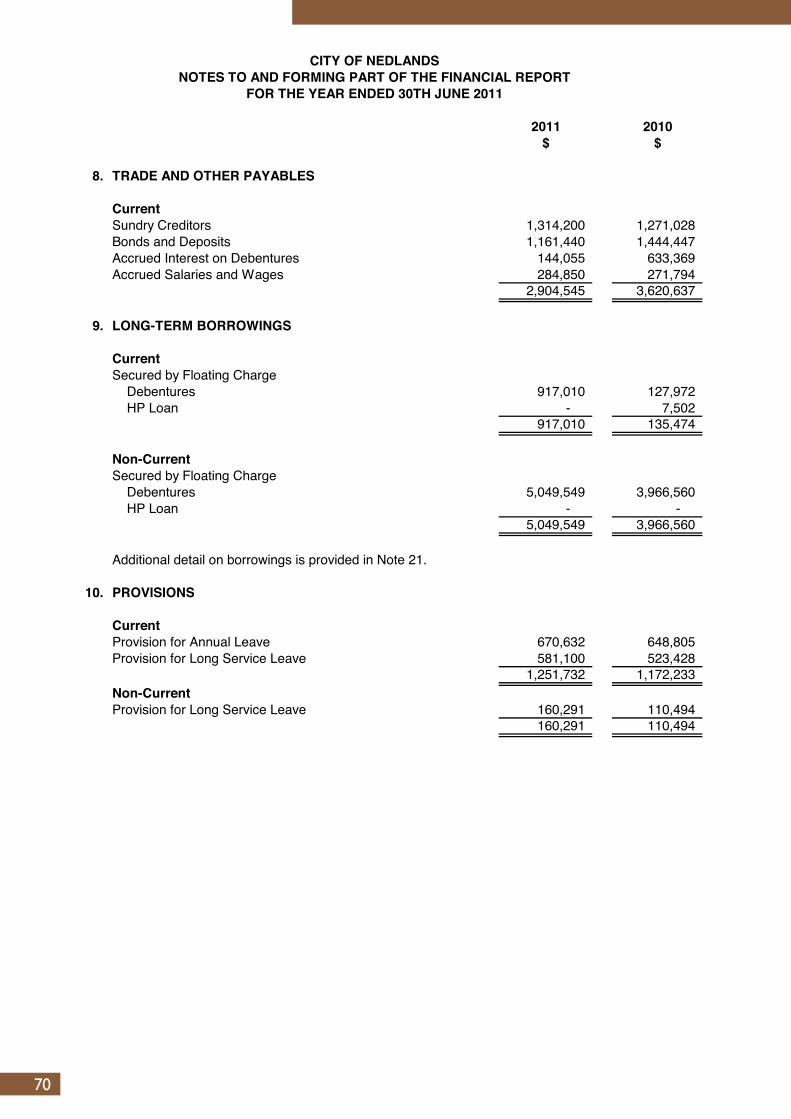
CITY OF NEDLANDSNOTES TO AND FORMING PART OF THE FINANCIAL REPORT
FOR THE YEAR ENDED 30TH JUNE 2011
2011 2010$ $
8. TRADE AND OTHER PAYABLES
CurrentSundry Creditors 1,314,200 1,271,028 Bonds and Deposits 1,161,440 1,444,447 Accrued Interest on Debentures 144,055 633,369 Accrued Salaries and Wages 284,850 271,794
2,904,545 3,620,637
9. LONG-TERM BORROWINGS
CurrentSecured by Floating Charge Debentures 917,010 127,972 HP Loan - 7,502
917,010 135,474
Non-CurrentSecured by Floating Charge Debentures 5,049,549 3,966,560 HP Loan - -
5,049,549 3,966,560
Additional detail on borrowings is provided in Note 21.
10. PROVISIONS
CurrentProvision for Annual Leave 670,632 648,805 Provision for Long Service Leave 581,100 523,428
1,251,732 1,172,233 Non-CurrentProvision for Long Service Leave 160,291 110,494
160,291 110,494
Page 29
City of Nedlands Financial Report 2010-2011
70
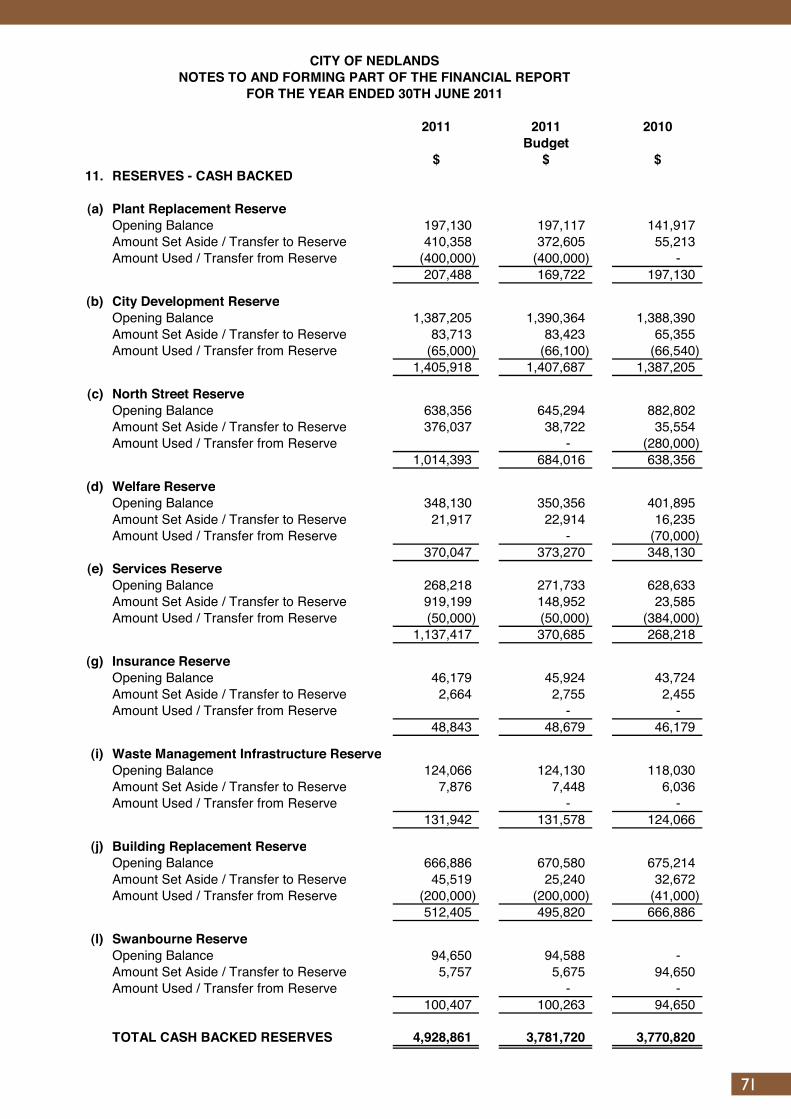
CITY OF NEDLANDSNOTES TO AND FORMING PART OF THE FINANCIAL REPORT
FOR THE YEAR ENDED 30TH JUNE 2011
2011 2011 2010Budget
$ $ $11. RESERVES - CASH BACKED
(a) Plant Replacement ReserveOpening Balance 197,130 197,117 141,917 Amount Set Aside / Transfer to Reserve 410,358 372,605 55,213 Amount Used / Transfer from Reserve (400,000) (400,000) -
207,488 169,722 197,130
(b) City Development ReserveOpening Balance 1,387,205 1,390,364 1,388,390 Amount Set Aside / Transfer to Reserve 83,713 83,423 65,355 Amount Used / Transfer from Reserve (65,000) (66,100) (66,540)
1,405,918 1,407,687 1,387,205
(c) North Street ReserveOpening Balance 638,356 645,294 882,802 Amount Set Aside / Transfer to Reserve 376,037 38,722 35,554 Amount Used / Transfer from Reserve - (280,000)
1,014,393 684,016 638,356
(d) Welfare ReserveOpening Balance 348,130 350,356 401,895 Amount Set Aside / Transfer to Reserve 21,917 22,914 16,235 Amount Used / Transfer from Reserve - (70,000)
370,047 373,270 348,130 (e) Services Reserve
Opening Balance 268,218 271,733 628,633 Amount Set Aside / Transfer to Reserve 919,199 148,952 23,585 Amount Used / Transfer from Reserve (50,000) (50,000) (384,000)
1,137,417 370,685 268,218
(g) Insurance ReserveOpening Balance 46,179 45,924 43,724 Amount Set Aside / Transfer to Reserve 2,664 2,755 2,455 Amount Used / Transfer from Reserve - -
48,843 48,679 46,179
(i) Waste Management Infrastructure ReserveOpening Balance 124,066 124,130 118,030 Amount Set Aside / Transfer to Reserve 7,876 7,448 6,036 Amount Used / Transfer from Reserve - -
131,942 131,578 124,066
(j) Building Replacement ReserveOpening Balance 666,886 670,580 675,214 Amount Set Aside / Transfer to Reserve 45,519 25,240 32,672 Amount Used / Transfer from Reserve (200,000) (200,000) (41,000)
512,405 495,820 666,886
(l) Swanbourne ReserveOpening Balance 94,650 94,588 - Amount Set Aside / Transfer to Reserve 5,757 5,675 94,650 Amount Used / Transfer from Reserve - -
100,407 100,263 94,650
TOTAL CASH BACKED RESERVES 4,928,861 3,781,720 3,770,820
Page 30
City of Nedlands Financial Report 2010-2011
71

CITY OF NEDLANDSNOTES TO AND FORMING PART OF THE FINANCIAL REPORT
FOR THE YEAR ENDED 30TH JUNE 2011
11. RESERVES - CASH BACKED (Continued)
All of the reserve accounts are supported by money held in financial institutions and match theamounts shown as restricted cash of this financial report.
In accordance with council resolutions in relation to each reserve account, the purpose for whichthe funds are set aside are as follows:
Plant Replacement ReserveTo provide for the replacement of Council's plant and equipment so that the cost is spreadover a number of years. The use of funds in this reserve is ongoing.
City Development ReserveTo fund the improvement of Property, Plant and Equipment. The use of funds in this reserve is ongoing.
North Street ReserveTo fund the operational and capital costs of community facilities in Mt Claremont,community and recreation facilities in Swanbourne and infrastructure generally.Use of this reserve is ongoing.
Welfare ReserveTo fund the operational and capital costs of welfare services. The use of funds in this reserve is ongoing.
Services ReserveTo provide funds for the purchase of land for parking areas, streets, depots etc. town planningschemes, valuation and legal expenses, items of works of an urgen nature such as drainage,street works, provision of street lighting and buildings maintenance.The use of funds in this reserve is ongoing.
Swanbourne ReserveSet-up during the year with proceeds of the insurance claim arising from the fire ofCouncil property in Swanbourne, for future development in that suburb.
Insurance ReserveTo cover any excess that may arise from having a performance based workers compensation premium.
Waste Management Infrastructure ReserveTo provide for the replacement of Council's Rubbish Bin stock so that the cost isspread over a number of years. The use of funds in this reserve is ongoing.
Building Replacement ReserveTo fund the upgrade and/or replacement of Council's buildings. The use of this reserve is ongoing.
Page 31
City of Nedlands Financial Report 2010-2011
72

CITY OF NEDLANDSNOTES TO AND FORMING PART OF THE FINANCIAL REPORT
FOR THE YEAR ENDED 30TH JUNE 2011
2011 2010$ $
12. RESERVES - ASSET REVALUATION
Asset revaluation reserves have arisen on revaluationof the following classes of non-current assets:
Revaluations prior to 30th June 2009 17,335,347 17,335,347
(a) LandOpening balance - - Revaluation Increment 12,354,000 - Revaluation Decrement - -
12,354,000 -
(b) BuildingsOpening balance - - Revaluation Increment 9,297,909 - Revaluation Decrement - -
9,297,909 -
(c) Plant & EquipmentOpening Balance - - Revaluation Increment 31,447 - Revaluation Decrement - -
31,447 -
(d) RoadsOpening Balance 39,126,980 - Revaluation Increment - 39,126,980 Revaluation Decrement - -
39,126,980 39,126,980
(e) DrainageOpening Balance 1,966,692 - Revaluation Increment - 1,966,692 Revaluation Decrement - -
1,966,692 1,966,692
TOTAL ASSET REVALUATION RESERVES 80,112,375 58,429,019
Page 32
City of Nedlands Financial Report 2010-2011
73
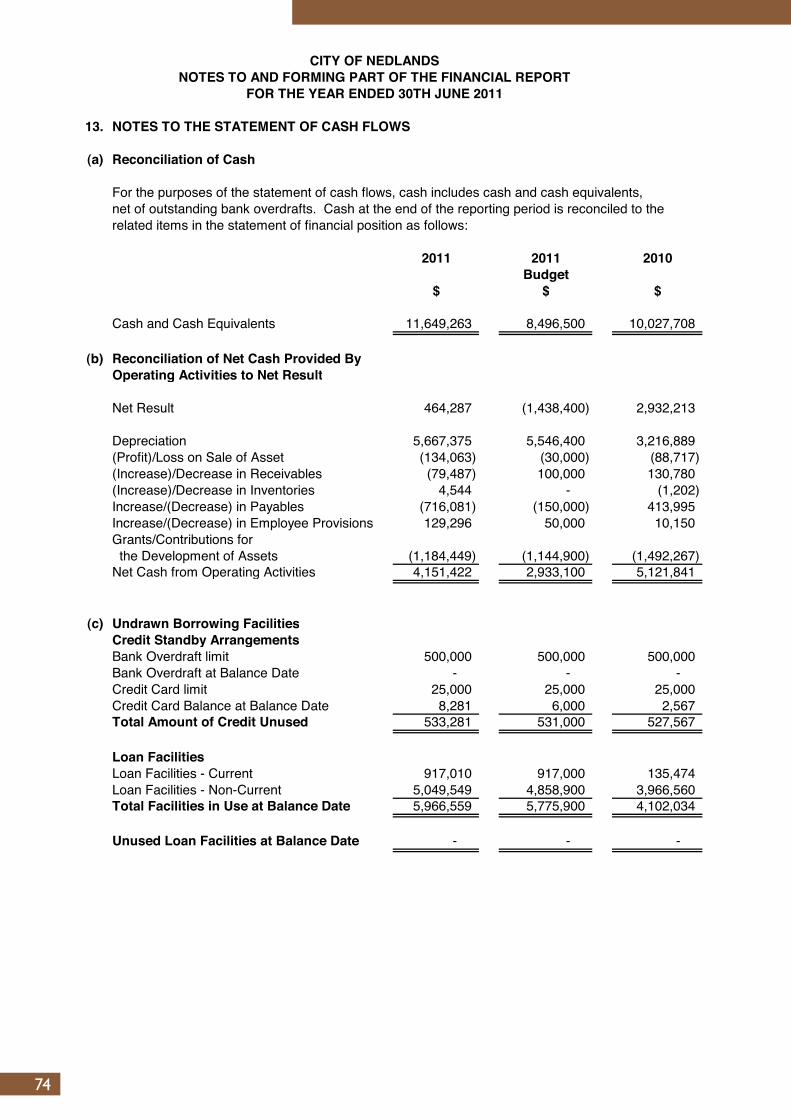
CITY OF NEDLANDSNOTES TO AND FORMING PART OF THE FINANCIAL REPORT
FOR THE YEAR ENDED 30TH JUNE 2011
13. NOTES TO THE STATEMENT OF CASH FLOWS
(a) Reconciliation of Cash
For the purposes of the statement of cash flows, cash includes cash and cash equivalents,net of outstanding bank overdrafts. Cash at the end of the reporting period is reconciled to therelated items in the statement of financial position as follows:
2011 2011 2010Budget
$ $ $
Cash and Cash Equivalents 11,649,263 8,496,500 10,027,708
(b) Reconciliation of Net Cash Provided ByOperating Activities to Net Result
Net Result 464,287 (1,438,400) 2,932,213
Depreciation 5,667,375 5,546,400 3,216,889 (Profit)/Loss on Sale of Asset (134,063) (30,000) (88,717) (Increase)/Decrease in Receivables (79,487) 100,000 130,780 (Increase)/Decrease in Inventories 4,544 - (1,202) Increase/(Decrease) in Payables (716,081) (150,000) 413,995 Increase/(Decrease) in Employee Provisions 129,296 50,000 10,150 Grants/Contributions for the Development of Assets (1,184,449) (1,144,900) (1,492,267) Net Cash from Operating Activities 4,151,422 2,933,100 5,121,841
(c) Undrawn Borrowing FacilitiesCredit Standby ArrangementsBank Overdraft limit 500,000 500,000 500,000 Bank Overdraft at Balance Date - - - Credit Card limit 25,000 25,000 25,000 Credit Card Balance at Balance Date 8,281 6,000 2,567 Total Amount of Credit Unused 533,281 531,000 527,567
Loan FacilitiesLoan Facilities - Current 917,010 917,000 135,474 Loan Facilities - Non-Current 5,049,549 4,858,900 3,966,560 Total Facilities in Use at Balance Date 5,966,559 5,775,900 4,102,034
Unused Loan Facilities at Balance Date - - -
Page 33
City of Nedlands Financial Report 2010-2011
74

CITY OF NEDLANDSNOTES TO AND FORMING PART OF THE FINANCIAL REPORT
FOR THE YEAR ENDED 30TH JUNE 2011
2011 2010$ $
14. CONTINGENT LIABILITIES
No claims outstanding.
15. CAPITAL AND LEASING COMMITMENTS
(a) Finance Lease Commitments
Nil
(b) Operating Lease Commitments
Non-cancellable operating leases contracted for but not capitalised in the accounts.
Payable:- not later than one year 90,038 27,440 - later than one year but not later than five years 96,918 39,243 - later than five years - -
186,956 66,683
(c) Capital Expenditure Commitments
Contracted for:- capital expenditure projects 215,413 466,000
Payable:- not later than one year 215,413 466,000
The capital expenditure project outstanding at the end of the current reporting period representsthe rennovation of the Maisonettes and the upgrade of Peace Memorial Rose Garden.
Page 34
City of Nedlands Financial Report 2010-2011
75
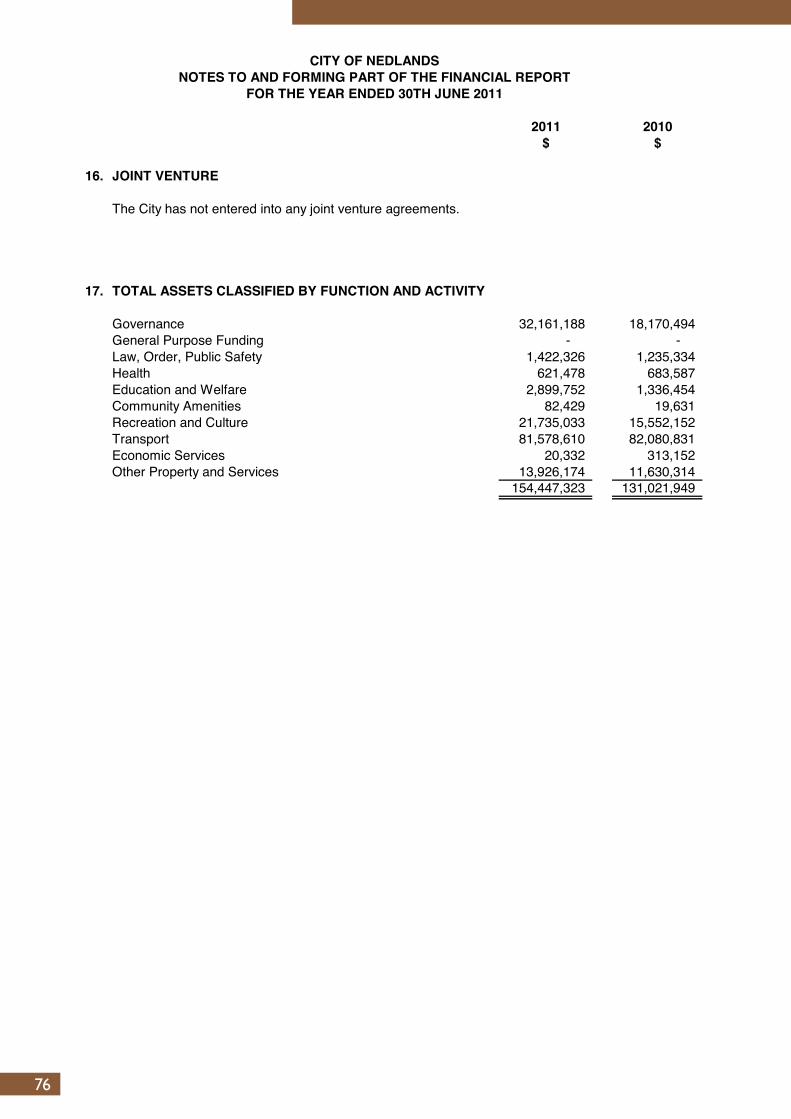
CITY OF NEDLANDSNOTES TO AND FORMING PART OF THE FINANCIAL REPORT
FOR THE YEAR ENDED 30TH JUNE 2011
2011 2010$ $
16. JOINT VENTURE
The City has not entered into any joint venture agreements.
17. TOTAL ASSETS CLASSIFIED BY FUNCTION AND ACTIVITY
Governance 32,161,188 18,170,494 General Purpose Funding - - Law, Order, Public Safety 1,422,326 1,235,334 Health 621,478 683,587 Education and Welfare 2,899,752 1,336,454 Community Amenities 82,429 19,631 Recreation and Culture 21,735,033 15,552,152 Transport 81,578,610 82,080,831 Economic Services 20,332 313,152 Other Property and Services 13,926,174 11,630,314
154,447,323 131,021,949
Page 35
City of Nedlands Financial Report 2010-2011
76
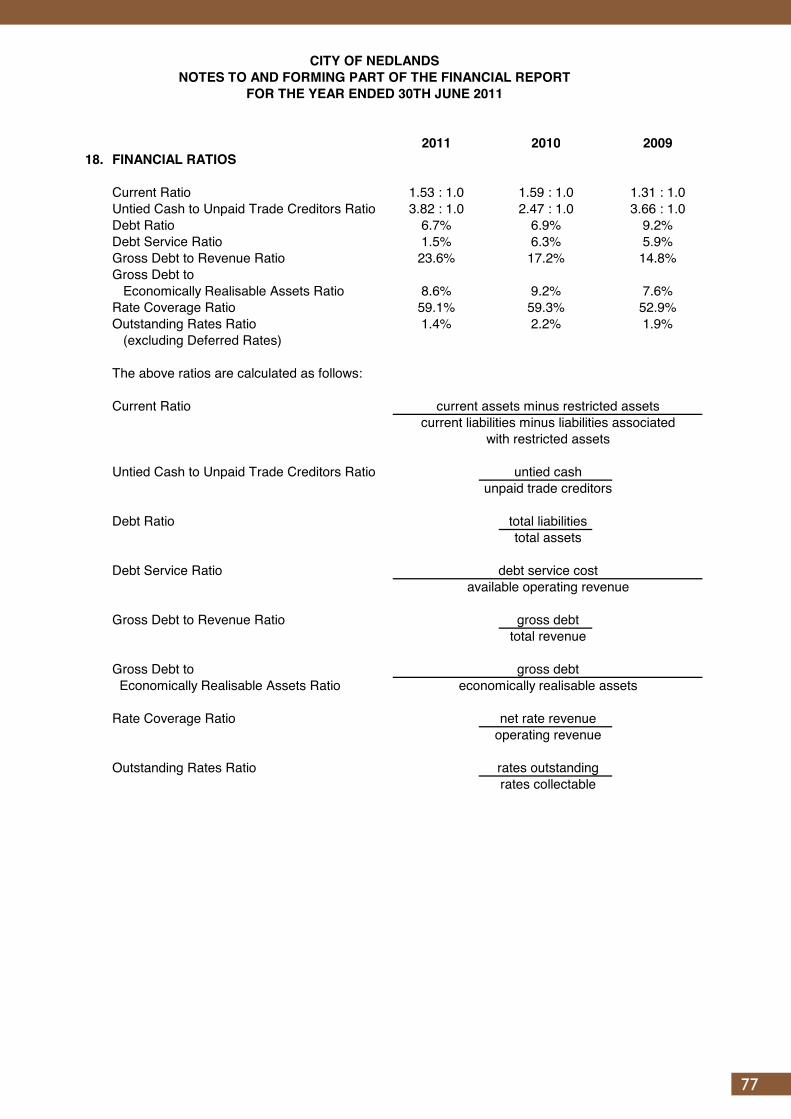
CITY OF NEDLANDSNOTES TO AND FORMING PART OF THE FINANCIAL REPORT
FOR THE YEAR ENDED 30TH JUNE 2011
2011 2010 200918. FINANCIAL RATIOS
Current Ratio 1.53 : 1.0 1.59 : 1.0 1.31 : 1.0Untied Cash to Unpaid Trade Creditors Ratio 3.82 : 1.0 2.47 : 1.0 3.66 : 1.0Debt Ratio 6.7% 6.9% 9.2%Debt Service Ratio 1.5% 6.3% 5.9%Gross Debt to Revenue Ratio 23.6% 17.2% 14.8%Gross Debt to
Economically Realisable Assets Ratio 8.6% 9.2% 7.6%Rate Coverage Ratio 59.1% 59.3% 52.9%Outstanding Rates Ratio 1.4% 2.2% 1.9%
(excluding Deferred Rates)
The above ratios are calculated as follows:
Current Ratio current assets minus restricted assetscurrent liabilities minus liabilities associated
with restricted assets
Untied Cash to Unpaid Trade Creditors Ratio untied cashunpaid trade creditors
Debt Ratio total liabilitiestotal assets
Debt Service Ratio debt service costavailable operating revenue
Gross Debt to Revenue Ratio gross debttotal revenue
Gross Debt to gross debt Economically Realisable Assets Ratio economically realisable assets
Rate Coverage Ratio net rate revenueoperating revenue
Outstanding Rates Ratio rates outstandingrates collectable
Page 36
City of Nedlands Financial Report 2010-2011
77

19. TRUST FUNDS
Funds held at balance date over which the Shire has no control and which are not included inthe financial statements are as follows:
Balance Amounts Amounts Balance1 July 2010 Received Paid 30 June 2011
$ $ $ $
Unclaimed Monies 20,777 30 (1,375) 19,432
Charity donation by staff 4,280 3,577 (1,146) 6,711 -
25,057 26,143
20. DISPOSALS OF ASSETS - 2010/11 FINANCIAL YEAR
The following assets were disposed of during the year.
Net Book Value Sale Price Profit (Loss)Actual Budget Actual Budget Actual Budget
$ $ $ $ $ $
Plant & Equipment 355,575 260,100 493,450 299,100 137,875 39,000
Furniture & Equipment 3,812 9,000 - - (3,812) (9,000)
359,387 269,100 493,450 299,100 134,063 30,000
CITY OF NEDLANDSNOTES TO AND FORMING PART OF THE FINANCIAL REPORT
FOR THE YEAR ENDED 30TH JUNE 2011
Page 37
City of Nedlands Financial Report 2010-2011
78

21.
INFO
RM
ATIO
N O
N B
OR
RO
WIN
GS
(a)
Rep
aym
ents
- D
eben
ture
sPr
inci
pal
New
Prin
cipa
lPr
inci
pal
Inte
rest
Loan
sR
epay
men
ts30
/06/
2011
Rep
aym
ents
Actu
alB
udge
tAc
tual
Bud
get
Actu
alB
udge
tPa
rtic
ular
s$
$$
$$
$$
$
Com
mun
ity A
men
ities
New
Bin
Sto
ck -
Loan
178
**65
8,10
5
60
,469
61,3
0059
7,63
6
59
7,70
0
37
,851
38,7
00R
oads
Infra
stru
ctur
e - L
oan
179*
*1,
436,
426
67
,502
67,5
00
1,
368,
924
1,
368,
900
85
,605
86,1
00Bu
ildin
gs &
Roa
ds -
Loan
180
**2,
000,
000
-
15
4,30
0
2,00
0,00
0
1,84
5,70
0
116,
933
112,
700
Build
ing
& In
frast
ruct
ure
- Loa
n 18
1**
2,00
0,00
0-
36
,400
2,00
0,00
0
1,96
3,60
0
14,9
1531
,200
4,09
4,53
1
2,00
0,00
012
7,97
131
9,50
0
5,96
6,56
0
5,77
5,90
0
255,
304
268,
700
** R
epay
men
ts fo
r loa
ns 1
78, 1
79, 1
80 a
nd 1
81 a
re fi
nanc
ed fr
om g
ener
al p
urpo
se re
venu
e.
(b)
New
Deb
entu
res
- 201
0/11
Amou
nt B
orro
wed
Inst
itutio
nLo
anTe
rmTo
tal
Inte
rest
Amou
nt U
sed
Bal
ance
Type
(Yea
rs)
Inte
rest
&R
ate
Uns
pent
Actu
alB
udge
tC
harg
es%
Actu
alB
udge
t$
Part
icul
ars/
Purp
ose
$$
$$
$
Build
ing
& In
frast
ruct
ure
- Loa
n 18
12,
000,
000
2,
000,
000
WA
Trea
sury
Fixe
d In
tere
st,
Prin
cipa
l &
Inte
rest
Pa
ymen
t 10
yea
rs67
4,41
9
5.
91 %
pa
2,00
0,00
02,
000,
000
-
(c)
Uns
pent
Deb
entu
res
Cou
ncil
had
no u
nspe
nt d
eben
ture
fund
s as
at 3
0th
June
201
1.
(d)
Ove
rdra
ftC
ounc
il ha
s no
t util
ised
an
over
draf
t fac
ility
durin
g th
e fin
anci
al y
ear a
lthou
gh a
n ov
erdr
aft f
acilit
y of
$50
0,00
0 wi
th th
e N
atio
nal A
ustra
lia B
ank
CIT
Y O
F N
EDLA
ND
SN
OTE
S TO
AN
D F
OR
MIN
G P
ART
OF
THE
FIN
ANC
IAL
REP
OR
TFO
R T
HE
YEAR
EN
DED
30T
H J
UN
E 20
11
Page
38
City
of N
edla
nds
Fina
ncia
l Rep
ort
2010
-201
1
79
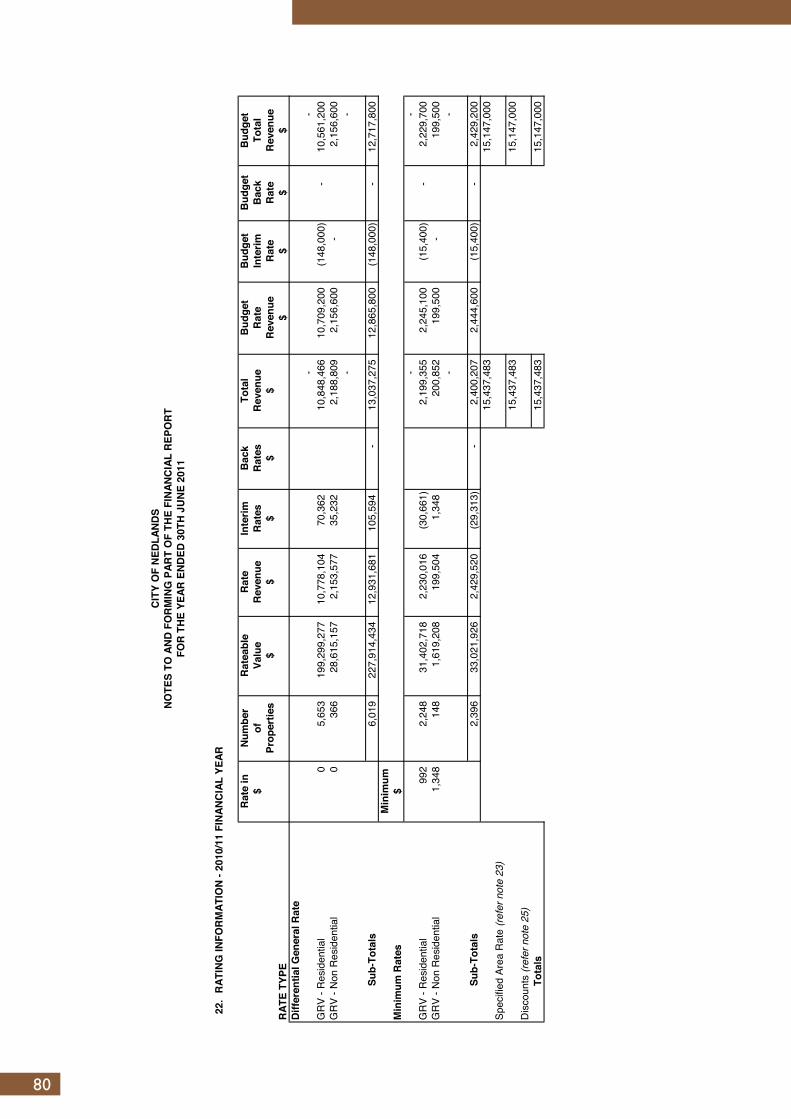
CIT
Y O
F N
EDLA
ND
SN
OTE
S TO
AN
D F
OR
MIN
G P
ART
OF
THE
FIN
ANC
IAL
REP
OR
TFO
R T
HE
YEAR
EN
DED
30T
H J
UN
E 20
11
22.
RAT
ING
INFO
RM
ATIO
N -
2010
/11
FIN
ANC
IAL
YEAR
Rat
e in
Num
ber
Rat
eabl
eR
ate
Inte
rimB
ack
Tota
lB
udge
tB
udge
tB
udge
tB
udge
t$
ofVa
lue
Rev
enue
Rat
esR
ates
Rev
enue
Rat
eIn
terim
Bac
kTo
tal
Prop
ertie
s$
$$
$$
Rev
enue
Rat
eR
ate
Rev
enue
RAT
E TY
PE$
$$
$D
iffer
entia
l Gen
eral
Rat
e-
-
G
RV
- Res
iden
tial
0
5,
653
199,
299,
277
10,7
78,1
0470
,362
10
,848
,466
10,7
09,2
00(1
48,0
00)
-
10
,561
,200
GR
V - N
on R
esid
entia
l0
366
28
,615
,157
2,15
3,57
735
,232
2,
188,
809
2,15
6,60
0-
2,
156,
600
--
Sub-
Tota
ls6,
019
227,
914,
434
12,9
31,6
8110
5,59
4
-
13
,037
,275
12,8
65,8
00(1
48,0
00)
-
12
,717
,800
Min
imum
Min
imum
Rat
es$
--
GR
V - R
esid
entia
l99
2
2,
248
31,4
02,7
182,
230,
016
(30,
661)
2,19
9,35
52,
245,
100
(15,
400)
-
2,
229,
700
GR
V - N
on R
esid
entia
l1,
348
14
8
1,61
9,20
819
9,50
41,
348
20
0,85
219
9,50
0-
19
9,50
0-
-
Sub-
Tota
ls2,
396
33,0
21,9
262,
429,
520
(29,
313)
-
2,40
0,20
72,
444,
600
(15,
400)
-
2,
429,
200
15,4
37,4
8315
,147
,000
Spec
ified
Are
a R
ate
(refe
r not
e 23
)15
,437
,483
15,1
47,0
00D
isco
unts
(ref
er n
ote
25)
Tota
ls15
,437
,483
15,1
47,0
00
Page
39
City
of N
edla
nds
Fina
ncia
l Rep
ort
2010
-201
1
80
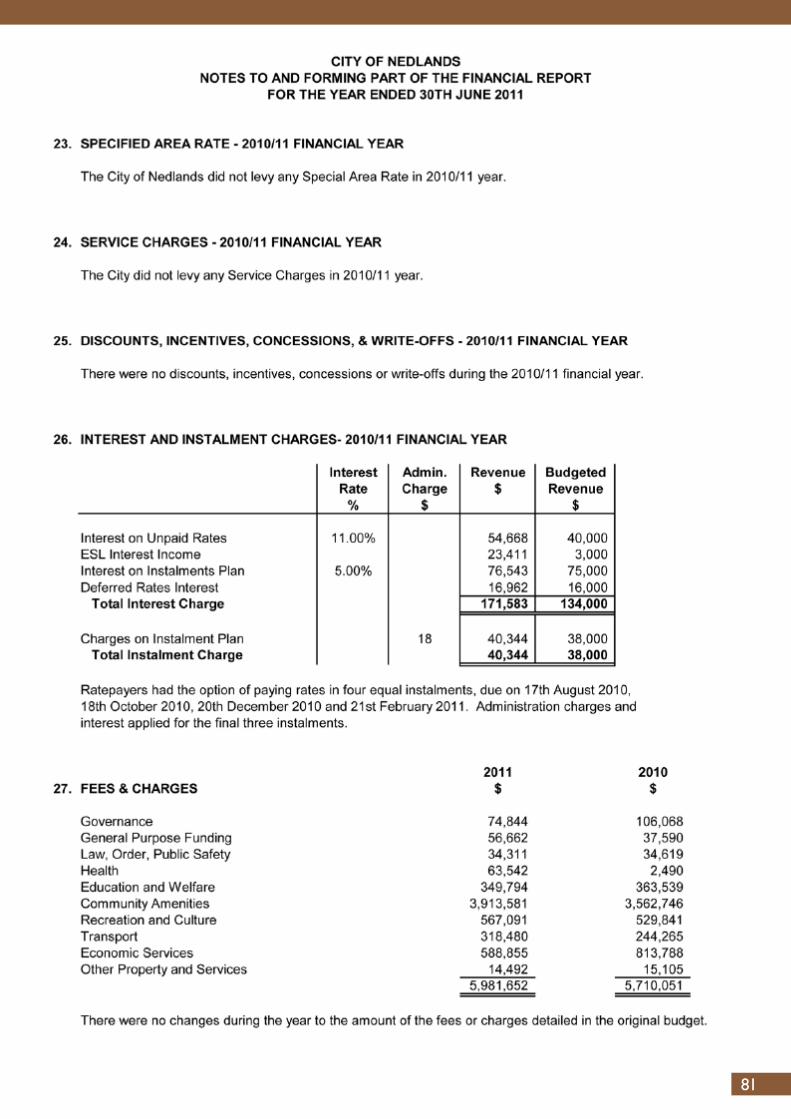
City of Nedlands Financial Report 2010-2011
81

City of Nedlands Financial Report 2010-2011
82

CITY OF NEDLANDSNOTES TO AND FORMING PART OF THE FINANCIAL REPORT
FOR THE YEAR ENDED 30TH JUNE 2011
33. FINANCIAL RISK MANAGEMENT
Financial risk management is carried out by the finance area under policies approved by the Council.
The Council held the following financial instruments at balance date:
Carrying Value Fair Value2011 2010 2011 2010
$ $ $ $Financial AssetsCash and cash equivalents 11,649,263 10,027,708 11,649,263 10,027,708Receivables 1,215,372 1,135,885 1,215,372 1,135,885
12,864,635 11,163,593 12,864,635 11,163,593
Financial LiabilitiesPayables 2,904,545 3,620,637 2,904,545 3,620,637Borrowings 5,966,559 4,102,034 4,218,769 3,386,329
8,871,104 7,722,671 7,123,314 7,006,966
Council’s activities expose it to a variety of financial risks including price risk, credit risk, liquidity risk and interest rate risk. The Council’s overall risk management focuses on the unpredictability of financial markets and seeks to minimise potential adverse effects on the financial performance of the Council.
Council does not engage in transactions expressed in foreign currencies and is therefore not subject to
Fair value is determined as follows:
- Cash and Cash Equivalents, Receivables, Payables - estimated to the carrying value which approximates net market value.
- Borrowings - estimated future cash flows discounted by the current market interest rates applicable to assets and liabilities with similar risk profiles.
Page 42
City of Nedlands Financial Report 2010-2011
83

CITY OF NEDLANDSNOTES TO AND FORMING PART OF THE FINANCIAL REPORT
FOR THE YEAR ENDED 30TH JUNE 2011
33. FINANCIAL RISK MANAGEMENT (Continued)
(a) Cash and Cash Equivalents
Cash and investments are also subject to interest rate risk – the risk that movements in interest ratescould affect returns.
Council’s objective is to maximise its return on cash and investments whilst maintaining an adequate level of liquidity and preserving capital. The finance manages the cash and investments portfolio with the assistance of independent advisers (where applicable). Council has an investment policy and the policy is subject to review by Council. An Investment Report is provided to Council on a monthly basis setting out the make-up and performance of the portfolio.
The major risk associated with investments is price risk – the risk that the capital value of investments may fluctuate due to changes in market prices, whether these changes are caused by factors specific to individual financial instruments of their issuers or factors affecting similar instruments traded in a market.
Another risk associated with cash and investments is credit risk – the risk that a contracting entity will not complete its obligations under a financial instrument resulting in a financial loss to Council.
Council manages these risks by diversifying its portfolio and only purchasing investments with high credit ratings or capital guarantees. Council also seeks advice from independent advisers (where applicable) before placing any cash and investments.
2011 2010$ $
Impact of a 2% (*) movement in interest rates on cashand investments:
- Equity 233,000 200,600 - Statement of Comprehensive Income 233,000 200,600
Notes: (*) Sensitivity percentages based on management’s expectation of future possible market movements.Recent market volatility has seen large market movements for certain types of investments.
before placing any cash and investments.
Page 43
City of Nedlands Financial Report 2010-2011
84

CITY OF NEDLANDSNOTES TO AND FORMING PART OF THE FINANCIAL REPORT
FOR THE YEAR ENDED 30TH JUNE 2011
33. FINANCIAL RISK MANAGEMENT (Continued)
(b) Receivables
There are no material receivables that have been subject to a re-negotiation of repayment terms.
The profile of the Council’s credit risk at balance date was:
2011 2010
The level of outstanding receivables is reported to Council monthly and benchmarks are set and monitored for acceptable collection performance.
Council makes suitable provision for doubtful receivables as required and carries out credit checks on most non-rate debtors.
Council’s major receivables comprise rates and annual charges and user charges and fees. The major risk associated with these receivables is credit risk – the risk that the debts may not be repaid. Council manages this risk by monitoring outstanding debt and employing debt recovery policies. It also encourages ratepayers to pay rates by the due date through incentives.
Credit risk on rates and annual charges is minimised by the ability of Council to recover these debts as a secured charge over the land – that is, the land can be sold to recover the debt. Council is also able to charge interest on overdue rates and annual charges at higher than market rates, which further encourages payment.
2011 2010
Percentage of Outstanding Rates and Annual Charges
- Excluding Deferred Pensioners 1.41% 2.23% - Including Deferred Pensioners 3.11% 4.45%
Percentage of Other Receivables
- Current 88.77% 85.05% - Overdue 11.23% 14.95%
Page 44
City of Nedlands Financial Report 2010-2011
85

33.F
INAN
CIA
L R
ISK
MAN
AGEM
ENT
(Con
tinue
d)
(c)
Paya
bles
Bor
row
ings
The
cont
ract
ual u
ndis
coun
ted
cash
flow
s of
Cou
ncil’s
Pay
able
s an
d Bo
rrowi
ngs
are
set o
ut in
the
Liqu
idity
Sen
sitiv
ity T
able
bel
ow:
Due
Due
Due
Tota
lC
arry
ing
with
inbe
twee
naf
ter
cont
ract
ual
valu
es1
year
1 &
5 y
ears
5 ye
ars
cash
flow
s$
$$
$$
2011
Paya
bles
2,90
4,54
5
-
-
2,
904,
545
2,90
4,54
5
Borro
wing
s1,
253,
389
3,54
9,03
0
2,81
6,36
2
7,61
8,78
1
5,
966,
560
4,
157,
934
3,54
9,03
02,
816,
362
10,5
23,3
26
8,87
1,10
5
2010
Paya
bles
3,62
0,63
7
-
-
3,
620,
637
3,62
0,63
7
Borro
wing
s37
8,48
2
3,21
1,52
1
1,73
2,82
8
5,32
2,83
1
4,
102,
034
3,
999,
119
3,21
1,52
11,
732,
828
8,94
3,46
8
7,72
2,67
1
CIT
Y O
F N
EDLA
ND
SN
OTE
S TO
AN
D F
OR
MIN
G P
ART
OF
THE
FIN
ANC
IAL
REP
OR
TFO
R T
HE
YEAR
EN
DED
30T
H J
UN
E 20
11
Paya
bles
and
bor
rowi
ngs
are
both
sub
ject
to liq
uidi
ty ri
sk –
that
is th
e ris
k th
at in
suffi
cien
t fun
ds m
ay b
e on
han
d to
mee
t pay
men
t obl
igat
ions
as
and
they
fall d
ue.
Cou
ncil m
anag
es th
is ri
sk b
y m
onito
ring
its c
ash
flow
requ
irem
ents
and
liqui
dity
leve
ls a
nd m
aint
aini
ng a
n ad
equa
te c
ash
buffe
r. P
aym
ent t
erm
s ca
n be
ext
ende
d an
d ov
erdr
aft f
acilit
ies
draw
n up
on if
requ
ired.
Page
45
City
of N
edla
nds
Fina
ncia
l Rep
ort
2010
-201
1
86

33.F
INAN
CIA
L R
ISK
MAN
AGEM
ENT
(Con
tinue
d)
(c)
Paya
bles
Bor
row
ings
(Con
tinue
d)
The
follo
wing
tabl
es s
et o
ut th
e ca
rryin
g am
ount
, by
mat
urity
, of t
he fi
nanc
ial in
stru
men
ts e
xpos
ed to
inte
rest
rate
risk
:W
eigh
ted
Aver
age
Effe
ctiv
e<1
yea
r>1
<2 y
ears
>2<3
yea
rs>3
<4 y
ears
>4<5
yea
rs>5
yea
rsTo
tal
Inte
rest
Rat
e$
$$
$$
$$
%Ye
ar E
nded
30
June
201
1
Paya
bles
Borro
wing
s
Fixe
d R
ate
Deb
entu
res
-
-
2,
000,
000
-
-
3,
966,
560
5,
966,
560
5.
91%
Wei
ghte
d Av
erag
e E
ffect
ive In
tere
st R
ate
5.78
%5.
97%
Year
End
ed 3
0 Ju
ne 2
010
Paya
bles
Borro
wing
s7,
503
-
-
-
-
-
7,50
3
9.64
%
Fixe
d R
ate
Deb
entu
res
-
-
-
2,
000,
000
-
2,09
4,53
1
4,09
4,53
1
5.91
%W
eigh
ted
Aver
age
Effe
ctive
Inte
rest
Rat
e9.
64%
5.78
%6.
03%
Borro
wing
s ar
e al
so s
ubje
ct to
inte
rest
rate
risk
– th
e ris
k th
at m
ovem
ents
in in
tere
st ra
tes
coul
d ad
vers
ely
affe
ct fu
ndin
g co
sts.
Cou
ncil m
anag
es th
is ri
sk b
y bo
rrowi
ng lo
ng te
rm a
nd fi
the
inte
rest
rate
to th
e si
tuat
ion
cons
ider
ed th
e m
ost a
dvan
tage
ous
at th
e tim
e of
neg
otia
tion.
CIT
Y O
F N
EDLA
ND
SN
OTE
S TO
AN
D F
OR
MIN
G P
ART
OF
THE
FIN
ANC
IAL
REP
OR
TFO
R T
HE
YEAR
EN
DED
30T
H J
UN
E 20
11
Page
46
City
of N
edla
nds
Fina
ncia
l Rep
ort
2010
-201
1
87

City of Nedlands Financial Report 2010-2011
88

City of Nedlands Financial Report 2010-2011
89

71 stirling Highway Nedlands WA 6009pO Box 9 Nedlands WA 6909
T 9273 3500F 9273 3670TTY 9273 3646
www. nedlands.wa.gov.au
This document is available in alternative formats upon request. printed on 100 per cent recycled paper.