ANNUAL REPORT 2010/11 - ca.go.ke · HRA Human Resources and Administration HSPA High Speed Packet...
76
REPORT ANNUAL Financial Year 2010/11 Opening your world
-
Upload
nguyenphuc -
Category
Documents
-
view
216 -
download
0
Transcript of ANNUAL REPORT 2010/11 - ca.go.ke · HRA Human Resources and Administration HSPA High Speed Packet...

REPORTANNUAL Financial Year
2010/11
Opening your world

OUR MISSIONTo facilitate access to communications
services through enabling regulation and catalyze the country’s socio-economic
development.
OUR VISIONAcess to communications services by
all in Kenya by 2030.
1
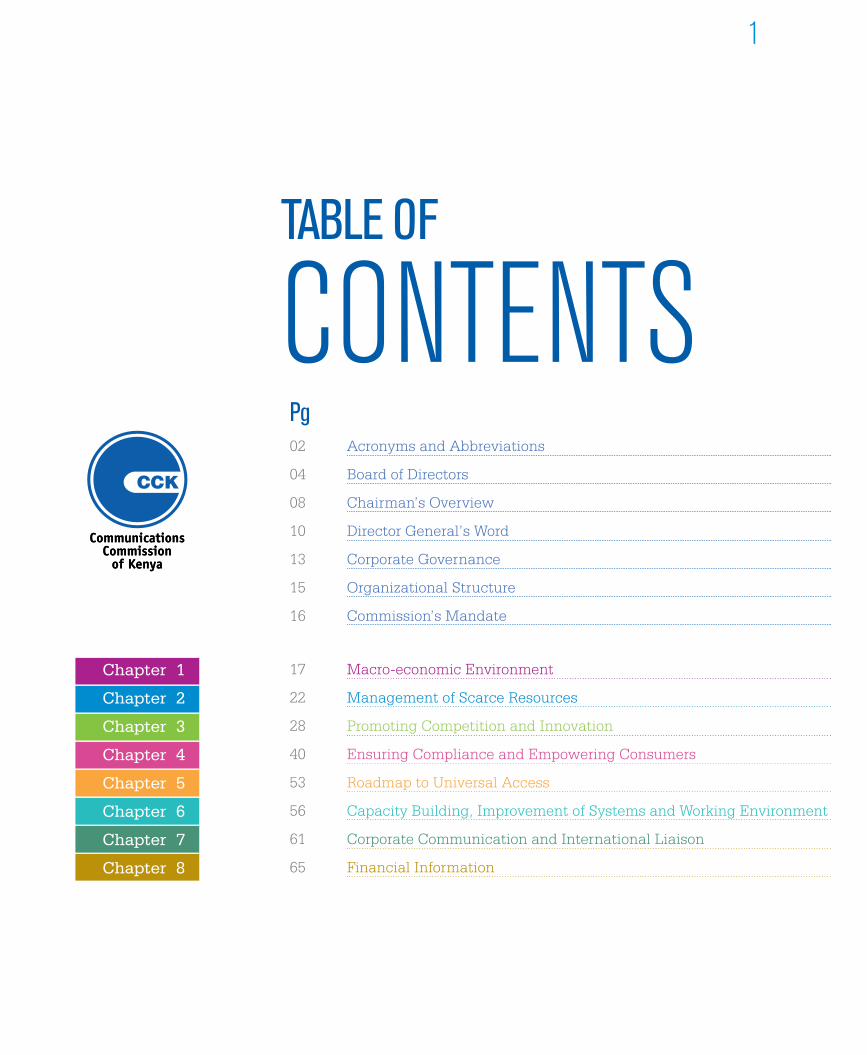
Acronyms and Abbreviations
Board of Directors
Chairman’s Overview
Director General’s Word
Corporate Governance
Organizational Structure
Commission’s Mandate
02
04
08
10
13
15
16
CONTENTSTABLE OF
Pg
Macro-economic Environment
Management of Scarce Resources
Promoting Competition and Innovation
Ensuring Compliance and Empowering Consumers
Roadmap to Universal Access
Capacity Building, Improvement of Systems and Working Environment
Corporate Communication and International Liaison
Financial Information
17
22
28
40
53
56
61
65
Chapter 1
Chapter 2
Chapter 3
Chapter 4
Chapter 5
Chapter 6
Chapter 7
Chapter 8
2G Second Generation3G Third Generation4G Fourth GenerationAIDS Acquired Immune Deficiency SyndromeARICEA Association of Regulators of Information
and Communications for Eastern and Southern Africa
ASK Agricultural Society of KenyaASP Application Service ProviderATU African Telecommunications UnionBCAC Broadcasting Content Advisory CouncilBPO Business Process OutsourcingBTS Base Transmitter StationsBUC Block Up ConverterCA Consumer AffairsCAP ChapterCB Citizen BandCCK Communications Commission of KenyaccTLD country code Top Level DomainCDMA Code Division Multiple AccessCEOs Chief Executive OfficersCIIP Critical Information Infrastructure
ProtectionCIRT Computer Incident Response TeamCPI Consumer Price IndexCPR Communication and Public RelationsCS Commission SecretaryCSP Content Service ProvidersCSR Corporate Social ResponsibilityCTMA Competition, Tariffs and Market
AnalysisCTO Commonwealth Telecommunications
OrganizationdBm Decibels (dB) measurement (m)DCNO Data Carrier Network OperatorDG Director-GeneralDMP Dominant Market PowerDPM Directorate of Personnel ManagementDR Disaster RecoveryDSL Digital Subscriber LineDTC Digital Television CommitteeDVB-T2 Digital Video Broadcast – Terrestrial 2nd
GenerationEAC East African CommunityEACO East African Communications
OrganizationEA-IGF East Africa Internet Governance ForumEASSY East African Sub-marine Cable SystemEDGE Enhanced Data Rates for GSM EvolutionESA European Space AgencyF&A Finance and AccountsFSM Frequency Spectrum ManagementFTR Fixed Termination RateFWA Fixed Wireless AccessGAAP Generally Accepted Accounting PracticeGbps Giga Bits Per SecondGDP Gross Domestic ProductGHz Giga HertzGIXP Government Internet Exchange PointGMPCS Global Mobile Personal Communications
by SatelliteGPRS General Packet Radio Service
GSM Global System For Mobile Communication
GSR Global Symposium for RegulatorsHF High FrequencyHIV Human Immuno-deficiency VirusHPA High Power AmplifierHR4ICT Human Resource for Information and
Communication TechnologyHRA Human Resources and AdministrationHSPA High Speed Packet AccessIAS Internal Audit ServiceIASs International Accounting StandardsIBC International Broadcasting ConventionIBGO Internet Backbone and Gateway
OperatorICANN Internet Corporation for Assigned
Names and NumbersICT Information and Communications
TechnologyIGF Internet Governance ForumIGS International Gateway Systems &
ServicesIMIS Integrated Management Information
SystemIP Internal ProtocolISO International Organization for
StandardizationISS International System and ServicesIT Information TechnologyITU International Telecommunication UnionIXP Internet Exchange PointKACC Kenya Anti Corruption CommissionKCCT Kenya College of Communications
TechnologyKE-CIRT Kenya national Computer Incident
Response TeamKECOSO Kenya Communications Sports
OrganizationKENIC Kenya Network Information CentreKES Kenya ShillingKIA Kenya Institute of AdministrationKICA Kenya Information and Communications
Act, Cap 411AK-IGF Kenya Internet Governance ForumKNBS Kenya National Bureau of StatisticsKNLS Kenya National Library ServicesKPIs Key Performance IndicatorsLA Legal AffairsLAN Local Area NetworkLCS Licensing, Compliance StandardsLLOs Local Loop OperatorsLRIC Long Run Incremental CostLTE Long Term EvolutionMACRA Malawi Communications Regulatory
AuthorityMbps Mega Bits Per SecondMHz Mega HertzMNDC Mobile National Destination CodesMNP Mobile Number PortabilityMOS Mean Opinion ScoreMOU Minutes of UseMoU Memorandum of Understanding
Acronyms and Abbreviations2

MSK Marketing Society of KenyaMTR Mobile Termination RateNACADAA National Campaign Against Drug Abuse AuthorityNACC National Aids Control CouncilNCPWDs National Council for Persons with DisabilitiesNFP Network Facility ProviderNFP T1 Network Facility Provider Tier 1NFP T2 Network Facility Provider Tier 2NFP T3 Network Facility Provider Tier 3NGN Next Generation NetworksNPC National Preparatory CommitteeNSS National Space SecretariatPAPU Pan African Postal UnionPBXs Private Branch ExchangesPCK Postal Corporation of KenyaPDNO Public Data Network OperatorPKI Public Key InfrastructurePOC Postal Operations CouncilPROC ProcurementPRS Premium Rate ServicesPRSK Public Relations Society of KenyaPSTN Public Switched Telephone NetworkPWDs Persons with DisabilitiesQMS Quality Management SystemQoS Quality of ServiceRRB Radio Regulations BoardRxLev Received signal levelSCR Submarine Cable Landing RightsSDR Software Defined RadiosSEACOM Sea Submarine CommunicationsSHF Super High FrequencySMS Short Message ServiceSOYA Sports Personality of the Year AwardSP-B&DM Special Projects, Broadcasting and Digital MigrationSSA Sub-Saharan AfricaTbps Tera Bits Per SecondTCRA Tanzania Communications Regulatory AuthorityTEAMS The East African Marine SystemTEC Telecommunications ContractorsTEV Telecommunications VendorsTKL Telkom Kenya LimitedTNA Training Needs AssessmentTP Technical PersonnelTV TelevisionUCC Uganda Communications CommissionUDPK United Disabled Persons of KenyaUHF Ultra High FrequencyUK United KingdomULF Unified Licensing FrameworkUN United NationsUPU Universal Postal UnionUSD United States DollarUSF Universal Service FundVAS Value Added ServicesVHF Very High FrequencyVOIP Voice over Internet ProtocolVSAT Very Small Aperture TerminalWIMAX Worldwide Interoperability for Microwave AccessWRC-12 World Radio Conference 2012WSIS World Summit on the Information SocietyWTDC World Telecommunications Development ConferenceZICTA Zambia Information and Communication Technology Authority
3CCK ANNUAL REPORT 2010-2011 3

Hon. Eng. Philip O. Okundi, EBS, HSC
CHAIRMANKariithi Njogu DIRECTOR
Eunice M. Ombati *DIRECTOREunice M. Ombati *DIRECTOR
Aloys .O. Ang’asa DIRECTOR
Charles J.K Njoroge, EBSDIRECTOR GENERAL
Joseph K. Kinyua, CBS DIRECTOR
Dr. Bitange Ndemo, EBS DIRECTOR

Peter L. Simani DIRECTOR
Dr. Monica Kerretts -Makau DIRECTOR
John Omo COMMISSION SECRETARY
Shakaba C. Induli, MBS ALTERNATE DIRECTOR(Ministry of Finance)
Henry Mungasia ALTERNATE DIRECTOR(Ministry of Information & Communications)
Francis W. WangusiAg. DIRECTORGENERAL(August 2011 to date)
Francis Kimemia, CBS DIRECTOR
Matei M. Ndeti DIRECTOR
Joe Kamau *DIRECTOR
Alice Munyua * DIRECTOR
* Retired before the end of the year under review. See profiles overleaf.
Profiles of CCK Board Members
Hon. Eng. Philip O. Okundi, EBS, HSC - Chairman Hon. Eng. Philip O. Okundi is the Chairman of the Board of Directors of the Communications Commission of Kenya. He was appointed to the position in October 2008. He holds a Msc. in Telecommunications Systems Engineering from the University of Essex and a BSc. in Electrical and Telecommunications Engineering from the University of Westminster. He is a fellow of the Institution of Engineers of Kenya and the UK, a registered Engineer and a Chartered Electrical Engineer (UK).
Mr. Charles J.K. Njoroge, EBS – Director-GeneralMr. Charles J.K. Njoroge is the Director-General and Chief Executive Officer of the Communications Commission of Kenya (CCK). He holds an M.A in Development Economics from Dalhousie University, Canada, a B.A in Economics from the University of Nairobi, Kenya, and a Postgraduate Certificate in Telecommunications Regulation from the University of Westminster, United Kingdom (UK). Mr. Njoroge was appointed to the position on 21st July 2008.
Dr. Bitange Ndemo, EBS - Permanent Secretary, Ministry of Information and CommunicationsDr. Bitange Ndemo is the Permanent Secretary in the Ministry of Information and Communications. He holds a PhD in Industrial Economics from the University of Sheffield in the UK, an MBA and Bachelor’s degree in Finance and Accounting from the University of Minnesota.
Mr. Joseph Kanja Kinyua, CBS - Permanent Secretary, Ministry of FinanceMr. Joseph K. Kinyua is the Permanent Secretary in the Ministry of Finance. He holds Bachelor’s and Master’s degrees in Economics from the University of Nairobi.
Mr. Francis T. Kimemia, CBS - Permanent Secretary Ministry of State for Provincial Administration & Internal SecurityMr. Kimemia is the Permanent Secretary in the Ministry of State in charge of Provincial Administration and Internal Security.
Ms. Alice Munyua – DirectorMs Munyua holds an M.A. in Social Communications from the Pontifical Gregorian University in Rome, Italy, and has also trained in gender mainstreaming, Internet law and negotiation skills at various reputable institutions. She joined the CCK Board
on 11th May 2005 and her second three-year term ended on 10th May 2011.
Mr. Kariithi Njogu – DirectorMr Kariithi holds two MSc. degrees in Human Biology and in Management and Organization Development from Loughborough University of Technology in the UK. He is serving his second term in the CCK Board, which he joined on 1st October 2006.
Ms. Eunice Maranya-Ombati – DirectorMs. Maranya-Ombati holds an MBA from USIU-San Diego and a BSC in Agriculture from University of Nairobi. She was appointed to the CCK Board on 19th November 2007 for a three-year term which ended on 30th October 2010.
Mr. Joe Kamau – DirectorMr. Joe Kamau holds an MBA in Finance from William Paterson University, USA, and a Bachelor of Business Administration of the University of Nairobi. He also has done various postgraduate courses in International Business. Mr. Kamau was appointed to the CCK Board on 19th November 2007 for a three-year term which ended on 30th October 2010.
Mr. Matei Mulili Ndeti – Director Mr. Ndeti holds a Msc. in Electrical Engineering from North Carolina A&T State University, USA, and a Bsc. in Systems Engineering from Wright State University in the USA. He was appointed to the CCK Board on 7th November 2008 for a three-year term.
Mr. Aloys .O. Ang’asa – Director Mr. Ang’asa holds a B.Ed (Economics) and MSc (Agricultural Economics) from the University of Nairobi. He has worked in the communications sector in various capacities for over 30 years and was appointed to the CCK Board on 21st February 2011 for a three-year term.
Dr. Monica Kerretts-Makau – Director Dr. Monicah Kerretts-Makau holds a Doctoral degree in Policy and Regulation with specialization in the Telecom sector from the University of New South, Wales, Sydney, Australia, an MSc in Business and Information Technology from Salford University – Greater Manchester in the UK, and a BA in Communications (Major) Cum Laude Honors from Daystar University, Kenya. She was appointed to the CCK Board on 21st February 2011 for a three-year term.
PROFILES OF CCK BOARD MEMBERS6

Mr. Peter Ldhituachi Simani - DirectorMr. Peter Ldhituachi Simani holds a Bachelor of Laws degree from the University of Nairobi, Diploma in Law from the Kenya School of Law and a Certificate of Proficiency in French. He is a member of the Law Society of Kenya, Commonwealth Lawyers Association, International Bar Association, International Commission of Jurists and the Association of European Lawyers. He was appointed to the CCK Board on 21st February 2011 for a three-year term.
Mr. Shakaba Chiboli Induli, MBS – Alternate DirectorMr. Shakaba Chiboli is the Director of Administration in the Ministry of Finance. He holds a Bachelor of Arts ( B.A. Hons) degree in Political Science, Literature and Linguistics from the University of Nairobi and a Master in Public Administration ( MPA) from Harvard University. He is the alternate Director to the Permanent Secretary in the Ministry of Finance.
Mr. Henry M. Mungasia – Alternate DirectorMr. Henry M. Mungasia is the Deputy Secretary in the Ministry of Information and Communications. He is a Bachelor of Arts ( Hons) graduate of the University of Nairobi. Mr. Mungasia has undertaken courses in Advanced Public Administration (APA) and in National Defence at the Kenya Institute of Administration and the National Defence College respectively. He is the alternate Director to the Permanent Secretary in the Ministry of Information and Communications.
Mr. John Omo – Commission SecretaryMr. John Omo holds a Master of Laws degree from the University of Sheffield, UK, and a first degree in Law from the University of Nairobi. He is the Secretary to the Board and Head of the Legal Affairs Division at CCK.
Francis W. Wangusi – Ag. Director GeneralMr. Wangusi holds a Master of Space Science (Satellite Communications) from the International Space University, France, and a Bachelor of Technology (Telecoms Engineering) from the University of Rome, Italy. He also holds a Chartered Engineering Certificate from the Engineering Council, United Kingdom. He was appointed to the position of Ag. Director General of CCK in August 2011.
7CCK ANNUAL REPORT 2010-2011

CHAIRMAN’SOVERVIEW
We facilitate access to communications services
through enabling regulation and catalyze the country’s
socio-economic development.
Hon. Eng. Philip O. OKundi, EBS, HSC

Chairman’s Overview
On behalf of the Board of Directors, I am greatly honoured to present to you the Commission’s annual report for the year ended 30th June 2011 as required under Section 22(1) of the Kenya Information and Communications Act, CAP 411A.
It has been yet another year of considerable achievement and progress in our quest to facilitate access to communications services through enabling regulation and catalysing the country’s socio economic development. The ICT sector has been driving economic growth over the last decade and is poised to continue doing so in the coming years.
The pace of growth in the ICT sector continued to surge during the year review. The mobile telecommunications subsector registered a 25% growth in service subscription to record 25.2million subscribers by 30th June 2011 up from 20.1 million the previous year.
The availability of the three sub-marine fibre optic cables has resulted in increased Internet speeds and amount of broadband available for users at reduced cost. The cables have provided numerous investment opportunities in the country and present great prospects for spurring economic growth. As at 30th June 2011, there were an estimated 12.538 million Internet users in the country up from 7.832 million the previous year.
To promote effective competition in the mobile sub-sector, the Commission developed guidelines on the implementation of Mobile Number Portability (MNP), paving way for implementation of the service in the country. The MNP service went live on 1st April 2011, according mobile service consumers the flexibility and convenience to retain subscriber numbers upon switching service providers.
During the year under review, the financial services sector adopted ICT-based innovations resulting in increased competition and efficiency gains. Mobile money transfer service offered by the four mobile networks and two of the licensed Content Service Providers (CSPs) has revolutionized the banking industry in Kenya, considerably reducing transaction costs and deepening financial inclusion. The country is now recognized globally as the innovation hub in the mobile finances market.
During the year under review, the Commission reviewed and updated the Network Cost Study, resulting in further reduction in interconnection rates for mobile, fixed and fixed transit termination. Subsequently, there has been considerable reduction of retail tariffs both for voice services and SMS, which has resulted in a significant increase in minutes of use on the mobile networks in the country.
Following the expansion of the mandate of the Commission vide the Kenya Communications Act, CAP 411A, the Commission commenced implementation of the Kenya Communications (Broadcasting)
Regulations, 2009. During the year under review, the Commission developed Broadcasting Guidelines, the Broadcasting Code of Practice and licensing framework for broadcasting services. The new regulatory framework shall be used to streamline and infuse order into the broadcasting industry.
In addition, the Commission continued coordinating seamless migration from analogue to digital TV broadcasting. The transition to digital TV broadcasting, scheduled to be completed by 2012, is expected to increase efficiency in the use of radio spectrum, increase content plurality and diversity and provide high quality digital signals. To enhance competition in the digital TV signal distribution in Kenya, the Commission commenced the process of licensing two additional national digital TV broadcasting signal distributors. The Commission also developed minimum technical specifications for DVB-T2 set-top boxes that will be used to access digital TV broadcast services.
In line with the provisions of the Kenya Information and Communications (Universal Access and Service) Regulations, 2010, the Commission set 1st January 2011 as the commencement date of receipt of contributions to the Universal Service Fund (USF) from the commercial licensees. In order to achieve transparency and promote accountability in the management and administration of the USF, the Commission initiated the development of an operations manual. The manual will provide the administrative framework and guidelines on processes such as selection criteria for USF projects and Fund disbursement mechanisms.
On the international scene, Kenya continued participating actively in relevant meetings and forums hosted by international organizations to which the country is affiliated. As a result of the goodwill cultivated over the years, the country was re-elected to the ITU Council and elected to the ITU Radio Regulations Board (RRB) during the ITU Plenipotentiary Conference 2010 held in Mexico. The Commission will continue to engage actively at the international arena with a view to ensuring that our regulatory regime in attuned to the international treaties and global best practice.
In conclusion, I would like to thank the Government, our stakeholders and the general public for the overwhelming support during the year. I would also like to commend the management and staff for their diligence and commitment under the stewardship of the Director-General. My deep appreciation is also extended to my fellow Board members for the invaluable guidance they have extended to the Commission’s leadership.
Hon. Eng. Philip OKundi, EBS, HSCChairman
9CCK ANNUAL REPORT 2010-2011

DIRECTOR GENERAL’SWORD
We facilitate access to communications services
through enabling regulation and catalyze the country’s
socio-economic development.
Francis W. Wangusi
Director General’s Word
The year under review witnessed positive growth in the postal, information and communication sector as an essential part of business and social life in the country. The growth was in tandem with the growth of the Kenyan economy which expanded by 5.6 percent in 2010 compared to 2.6 percent in 2009. The improved performance was as a result of consistent macroeconomic stability, increased credit to the private sector, low inflationary pressure and improved weather conditions.
The Transport and Communications sector recorded a 5.9 percent growth compared to 6.4 percent in 2009. The total output value for the sector grew by 9.5 percent to KES 594.6 billion in 2010. The telecommunications industry continued to post considerable growth spearheaded mainly by the mobile telephony segment which saw subscriber growth register a 15.9 percent increase. Overall, however, the postal and telecommunications sub-sector experienced a marginal decline in percentage contribution to GDP to 2.5 down from 2.6 in 2009.
Rapid changes and developments in Information and Communications Technology (ICT) have blurred the traditional lines between specific technologies and rendered technology based licensing untenable. With this in mind, the Commission introduced Unified Licensing Framework (ULF) in 2007, allowing licensees the benefits of expanded scope and flexibility. During the year under review, the number of licensees under the ULF increased to 844 from 610 the previous year, representing 38.4 percent growth.
The mobile market segment continued to thrive during the year under review. Mobile subscriptions grew significantly to stand at 25.2 million subscribers from 20.1 million recorded the previous year. This represented a growth of 25.6 percent.
Following the review of the mobile termination rates, the operators reduced both on-net and off-net tariffs in a bid to attract and retain customers on their respective networks. Mobile penetration increased from 51.2 percent in June 2010 to 63.6 percent as at 30th June 2011. This penetration rate was above the African penetration rate estimated by the International Telecommunication Union (ITU) to be 41 percent during the same period. During the year under review, mobile the number of money service subscribers were at 17,395,727 up from 10,615,386 the previous year, with Safaricom’s M-Pesa being the largest system, accounting for 82.4 per cent of mobile money transfer service subscriptions.
During the year under review, the Commission introduced Mobile Number Portability services which kicked off on 1stApril 2011. ‘Number yangu milele’ was the tagline of the media consumer awareness campaign that was funded and coordinated by the Commission. The campaign was aimed at sensitizing consumers on the porting procedures and the associated benefits. Using the porting service, consumers have the freedom of moving from one network to another while retaining their individual subscriber numbers.
Internet use in the country remained on an upward trend as more Kenyans relied on the service to conduct business and social activities. As at 30th June 2011, there were an estimated 12.538 million Internet users in the country up from 7.832 million the previous year. The growth in the data market is attributed to three mobile operators having rolled out 3G services. Mobile data/Internet subscriptions continued to dominate the Internet market, accounting for 98.4 percent of the total subscriptions during the period under review.
Demand for both television and radio frequencies remained high during the year under review. The Commission’s mandate in respect to regulating the broadcasting sector is relatively new having come under our ambit in 2009. To better understand competition within the sector, the Commission, during the year under review, requested for proposals for a competition study of the broadcasting sector in Kenya. The findings will be presented in the next financial year.
Further, the Commission developed a regulatory framework for the broadcasting sector, including licensing procedures as well as the Broadcasting Code and Broadcasting Guidelines. Migration to digital television is on course and the Commission continued to actively take part in the process by providing secretariat and logistical support to the Digital Television Committee (DTC). In the wake of the adoption of DVB T2 as the technology of choice in the migration to digital TV broadcasting, the Commission published the minimum technical specifications for the DVB-T2 standard and commenced the process of licensing two additional national digital TV broadcast signal distributors.
In the postal/courier sub-sector, the Commission licensed 17 new operators during the year under review, increasing the total number of licensees to 176 from 159 the previous year. The increase was attributed to enhanced monitoring
11CCK ANNUAL REPORT 2010-2011

and enforcement as well as sustained public awareness campaigns on the regulatory requirements. Intra-country postal/courier operators remained the largest category of operators at 99 accounting for 56.3 percent of the total number of licensed operators. The Commission also hosted the 3rd Postal/Courier Stakeholders Forum which emphasised the need for the postal/courier sector to adopt ICTs in their businesses.
The Commission continued to empower and equip consumers with skills and knowledge to enable them make better decisions regarding postal, information and communications services. During the year under review, the Commission developed consumer advisory materials and distributed them through universities, Mombasa International Show, Nairobi International Trade Fair and during other corporate events. In addition, the Commission engaged child online protection stakeholders in a workshop whose findings will further enrich the consumer advisory information.
The Kenya Information and Communications Act, Cap 411A, vests the Commission with the responsibility of managing and administering the Universal Service Fund (USF). During the year under review, the Commission undertook a number of initiatives aimed at achieving universal access to postal, information and communications services. These initiatives included the institutionalization and operationalization of the USF, identification of access gaps through studies and the implementation of universal access projects on a pilot basis.
During the year under review, the Commission continued to build capacity for its employees with 92.7 percent of the workforce being trained compared to 80.3 percent the previous year. The Commission staff were further sensitized on Behaviour Change and Prevention of Mother to Child Transmission of HIV/AIDS as well as on provision of services to Persons with Disabilities (PWDs) and Disability Mainstreaming. Capacity in the industry was also increased through courses offered in collaboration with partners such as International Telecommunication Union (ITU), Commonwealth Telecommunications Organization (CTO) and Universal Postal Union (UPU). Further, the Commission facilitated training for institutions and schools for PWDs under its Universal Service programmes.
During the year under review, the Commission upgraded its Quality Management System to the ISO 9001:2008 Standard. Awareness training for all staff was carried out following the upgrade.
As a responsible corporate citizen, the Commission carried out a number of CSR activities. During the festive season, the Commission spread cheer by giving food supplies and basic necessities to Shangilia Mtoto wa Africa Children’s Home, Muthaiga North Hospital (formerly Mathari Hospital) and the Missionaries of Charity Mother Teresa’s Home. The Commission also sponsored the Mater Heart Run, Sports Personality of the Year Award (SOYA) and Kalasha Awards.
The Commission continued to represent the Government of Kenya in international and regional meetings organised by affiliated intergovernmental organizations dealing with postal, and ICT matters. As the designated Government representative to affiliated international and regional bodies dealing with ICTs, the Commission met all its obligations to these organizations. The Commission also hosted a number of meetings, conferences, study group meetings and workshops in conjunction with the organizations affiliated to it. Most notable was the hosting, for the first time in Africa, of the UPU Conference in September 2010.
The year under review has been one of accomplishment for the postal and ICT industry. These achievements which would not have been possible without the Commission’s dedicated staff, partners and investors. I also wish to express my appreciation to the Commission’s Board of Directors and the Ministry for Information and Communications for their continued support.
Francis W. WangusiAg. Director General
DIRECTOR GENERAL’S WORD12
Corporate Governance
Corporate governance is critical to the success or failure of any organization. The Commission’s governance is vested in its Board of Directors whose powers are set out in the Kenya Information and Communications Act, CAP 411A. The Board is tasked, under the Act, with the twin functions of decision making and oversight.
The Board acknowledges the importance of good corporate governance in building a competitive postal and ICT industry, and enhancing stakeholder confidence in the regulatory environment. To this end, the Board provides the requisite leadership and strategic direction for the fulfilment of the Commisiion’s statutory mandate.
The Board conducts its business in accordance with best regulatory practice anchored in principles of accountability and transparency as well as compliance with relevant laws and regulations. In this regard, the Commission discharges its mandate based on strong corporate governance principles through application of high and consistent ethical standards.
The Board of Directors
1. Oversight Role of the Board of Directors In fulfilling its mandate, the Board of Directors is guided by a Board Charter which outlines its functions and responsibilities. The Charter outlines, among others, the Board’s obligations, Directors’ Code of Conduct and Ethics, and establishment of Board Committees.
The principal role and responsibility of the Board is to establish long-term goals of the Commission and ensure that effective plans are developed and implemented within a commonly agreed organizational structure. This entails among others:
(i) Exercising leadership, integrity and judgement in directing the Commission;
(ii) Setting the vision, mission and values of the Commission;
(iii) Developing strategies to achieve the Commission’s mandate;
(iv) Determining key performance indicators of the Commission, setting targets and monitoring performance;
(v) Ensuring that internal structures and policies are in place;
(vi) Identifying and managing key risk areas; and (vii) Ensuring preparation of annual financial
statements and reports, and disclosure of information to stakeholders.
2. Composition of the Board
During the year under review, the Commission’s Board comprised nine Directors, who possess knowledge and experience in matters relating to postal, broadcasting, radiocommunications, Information Technology, telecommunications, computer science, economics, ICT regulation and consumer protection.
The Director General is the Chief Executive Officer of the Commission and an ex-officio member of the Board. The Director General, therefore, provides the link between the Board of Directors and Staff.
3. Board Meetings
The Board is required to meet at least four times a year. Additional Board meetings are convened when necessary. During the year under review, the Board held 15 meetings.
4. Board Committees
Section 9 of the Kenya Information and Communications Act, Cap 411A, empowers the Board to form standing or ad hoc Committees and to delegate the exercise of any of its powers and performance of its functions or duties to such committees, member, officer, employee or agent of the Commission to enhance efficiency. To this end, the Board has four standing committees namely Finance, Technical, Staff and Audit committees.
The Finance Committee is responsible for, among others, accounting and financial management policies of the Commission. This Committee met four times in the year under review.
13CCK ANNUAL REPORT 2010-2011
The Technical Committee deals with regulatory issues including granting of licences, review of the market structure and regulatory interventions. During the year under review, this Committee met seven times.
The Staff Committee is responsible for development of human resources and related policies and their implementation. This Committee met three times during the year under review.
The Audit Committee reviews internal and external audit reports and recommendations thereof and ensures that appropriate remedial actions are promptly taken by management where necessary. This Committee met four times during the year.
5. Capacity Building
On appointment, Directors of the Board are taken through an induction programme aimed at enhancing their understanding of the Commission, its mandate and the business environment. Directors attend local, regional and international conferences, workshops and benchmark visits to other jurisdictions to gain better insights into global best practices in ICT regulation. The Commission facilitates training on corporate governance and further encourages the Directors to attend relevant training programmes aimed at broadening their knowledge.
During the year under review, the Directors participated in the following local and international training, conferences and exhibitions:
• SevendirectorsweretrainedinstrategicleadershipandchangemanagementattheKenyaInstituteof Administration (KIA), Nairobi;
• TwodirectorsattendedtheInternationalBroadcastingConvention(IBC2010)andExhibitioninAmsterdam, Netherlands;
• Twodirectorsattendedthe5thAnnualInternetGovernanceForuminVilnius,Lithuania;• TwodirectorsparticipatedinthePOST–EXPOandWorldPostalBusinessForuminCopenhagen,
Denmark; and• Twodirectorsattendedthe10thGlobalSymposiumforRegulators(GSR10)inDakar,Senegal.
BOARD OF DIRECTORS14

Organizational Structure
CPR Communication and Public Relations
IT Information Technology
IAS Internal Audit Services
PROC Procurement
CTMA Competition, Tariffs and Market Analysis
FSM Frequency Spectrum Management
LCS Licensing, Compliance and Standards
HRA Human Resource and Administration
F&A Finance and Accounts
CA Consumer Affairs
LA Legal Affairs
SP&B Special Projects and Broadcasting
BOARD
DIRECTOR GENERAL
ASSISTANTDIRECTOR
CPR
ASSISTANTDIRECTOR
IT
ASSISTANTDIRECTOR
IAS
MANAGERPROC
DIRECTORCTMA
DIRECTORFSM
DIRECTORLCS
DIRECTORHRA
DIRECTORF&A
DIRECTORCA
DIRECTORSP&B
COMMISSIONSECRETARY
LA

Commission’s Mandate
The Communications Commission of Kenya is the regulatory authority for the communications sector in Kenya. Established in 1999 by the Kenya Information and Communications Act, (KICA) No. 2 of 1998, the Commission’s initial mandate was regulation of the telecommunications and postal/courier sub-sectors, and the management of the country’s radiofrequency spectrum.
In recognition of the rapid changes and developments in technology which have blurred the traditional distinctions between telecommunications, Information Technology (IT) and broadcasting, the Government in January 2009 enacted the Kenya Communications (Amendment) Act, 2009. This statute enhanced the regulatory scope and jurisdiction of the Commission and effectively transformed it to a converged regulator. The Commission is now responsible for facilitating the development of the information and communications sectors (including broadcasting, multimedia, telecommunications and postal services) and electronic commerce through proper regulation.
The Kenya Communications Act, 1998, and the Kenya Communications (Amendment) Act, 2008, have been amalgamated into the Kenya Information and Communications Act, CAP 411A. This piece of legislation removes barriers to electronic transactions and introduces penalties to cybercrimes with the aim of minimizing fraud in electronic commerce. It also enhances some penalties for offences committed under the Act. It formally recognizes Internet domain resources within the regulatory framework. In addition, the Act provides for the establishment of Universal Service Fund (USF) to support widespread access to ICT services. It also establishes a Universal Service Advisory Council to manage and administer the Fund. The Act also enhances the competition framework in the ICT sector.
The responsibilities of the Commission include:
• Licensingallsystemsandservicesinthecommunicationsindustry,includingtelecommunications,postal/courier and broadcasting.
• Managingthecountry’sfrequencyspectrumandnumberingresources.• Facilitatingthedevelopmentofe-commerce.• Typeapproving/acceptingcommunicationsequipmentmeantforuseinthecountry.• Protectingconsumerrightswithinthecommunicationsenvironment.• Managingcompetitioninthesectortoensurealevelplayinggroundforallplayers.• Regulatingretailandwholesaletariffsforcommunicationsservices.• ManagingtheUniversalServiceFund.• Monitoringtheactivitiesoflicenseestoenforcecompliancewiththelicencetermsandconditions
as well as the law.
The Kenya Communications Regulations, 2001, were reviewed in 2009/2010 to bring them up to date with technological developments and changes in the policy and law. The Kenya Information and Communications Regulations, 2010, clarify and expound on the Act and cover the following areas: Electronic Transactions, Universal Access and Service, Consumer Protection, Dispute Resolution, Radio Communications and Frequency Spectrum Management, Licensing and Quality of Service, Postal and Courier Services, Fair Competition and Equality of Treatment, Broadcasting, Compliance Monitoring, Inspection and Enforcement, Type Approval, Tariff, Interconnection and Provision of Fixed Links, Access and Numbering.
COMMISSION’S MANDATE16

CHAPTER 1Macro-Economic Environment

1.1 Global Economy
During the period under review, the global economy continued to recover as the world Gross Domestic Product (GDP) grew by 4.6 percent in 2010 compared to a contraction of 1.0 percent recorded in 2009. The recovery was as a result of austerity measures put in place to counter the effects of the recession which commenced in 2008 coupled with stimulus policies; a rebound in demand for consumer goods; and increased trade. Emerging and developing economies continued with upward growth driven by vibrant domestic demand while advanced economies recovered and experienced positive growth in 2010 as a result of a recovering financial sector and improved labour market conditions. However, this growth is expected to decline in 2011 as a result of gradual tightening of monetary and fiscal policies; rising commodity prices; political turmoil in North Africa and Middle-East and the natural disaster and nuclear catastrophe in Japan.
In Sub-Saharan Africa (SSA), the real GDP is estimated to have expanded by 5.0 percent in 2010 compared to 2.8 percent in 2009. This was attributed to favourable economic climate, increased commodity demand from emerging economies and increased trade. The abundance of harvests led to a deceleration in consumer prices in SSA to stand at 7.5 percent compared to 10.4 percent in 2009. In the East African Community (EAC), the total real GDP for the five EAC Member countries increased by 5.4 percent in 2010 compared to 4.8 percent in 2009.
1.2 Global Postal, Information and Communication Technology Industry
The rapid uptake of mobile telephony, even in remote locations of low-income countries, has radically increased the potential for Information and Communication Technologies (ICTs) to play a constructive role in the fight against poverty. The scope for ICTs to improve the lives of the poor has expanded thanks to the emergence of many new and innovative applications and services, especially those linked to mobile telephony. The penetration level of the mobile telephony in the developing countries is much higher than it is for other competing services, such as fixed telephony, Internet, and broadband.
Traditional fixed telephony is facing growing economic pressure in finding new income streams as consumers take up competing wireless and cable
connections to access more and more services. In some countries, including Portugal and the United States, traditional fixed line operators have responded by investing in fibre access technologies and have seen their revenues increase as a result.
The Internet arena is expected to transform from one dominated by advanced countries to one where emerging economies are predominant. As more businesses and citizens in these economies go online and connectivity levels approach those of advanced markets, the global shares of Internet activity and transactions will increasingly shift toward the former. With the improvement in the speed and quality of broadband and the introduction of Web 2.0 technologies and applications, economic and social dynamics across the world are expected to change dramatically. These are anticipated to have massive implications in terms of productivity gains and new opportunities for individuals and businesses. This inflection point presents an opportunity for economies all over the globe to take decisive steps to gain competitive advantage that can be derived from widespread use of broadband networks.
ICT markets, such as international gateway, wireless local loop and the 3G markets, around the world are generally becoming more competitive. However, the fixed line market continues to lag behind other ICT markets in terms of competitiveness. Nevertheless, there has been an increase in the percentage of countries that have opened their fixed line markets to competition, although teledensity has remained relatively flat over the past 10 years. This stands in contrast to the exponential growth in mobile penetration over the same period and the continued growth of mobile broadband services, (Trends in Telecommunication Reform, 2010/11).
While the average penetration level of mobile broadband services was 5.4 subscriptions per 100 inhabitants in developing countries, it is 10 times higher in the developed world, at 51.1 per 100 inhabitants. The ongoing deployment of higher speed Third Generation (3G) mobile broadband networks such as Worldwide Interoperability for Microwave Access (WIMAX) and more recently High Speed Packet Access (HSPA+) and Long Term Evolution (LTE) systems will certainly contribute to greater levels of mobile broadband services uptake worldwide. Regulatory measures taken in selected countries such as spectrum re-farming (reallocation of a frequency band for a different use) and the licensing of 3G services, will also contribute to the
CHAPTER 1: MACRO-ECONOMIC ENVIRONMENT
Macro-economic Environment
18
accelerated growth of mobile broadband penetration. These regulatory measures have been complemented at the industry level by a move towards developing Next Generation Networks such as Fourth Generation (4G).
ICT revolution and market liberalization has had a considerable impact on the postal and courier industry. This has resulted in the reduction of postal monopolies and increased competition in this market segment. This has also convinced many governments that public postal operators must have autonomy and financial viability to compete effectively while at the same time providing universal postal service. To this end, governments have gone on to sponsor regulatory reforms and targeted investments in the public postal operator. The results of such reforms can be remarkable in terms of improving financial and operational performance and overall contribution to national economic growth.
Growing globalization and falling trade barriers have sparked off competition that goes beyond national postal marketplaces. Globally, many postal operators are taking advantage of more competitive and liberalized international postal services to establish mergers, alliances and joint ventures with their fellow operators and with the private sector. These joint efforts, if properly structured, can utilize the combined strengths of one or more players to produce a comprehensive service that is greater than the sum of its parts. It is noted that access to outside expertise and financing through such cooperative arrangements can be a significant element in rebuilding the postal business in developing countries.
Finally, the rapid advance of electronic Information Technologies poses the greatest threat to the traditional postal world. The increasing demand for faster, more affordable and flexible communications services means that postal services must embrace ICTs, electronic commerce and innovations to remain relevant in the global environment and keep up with today’s customer.
1.3 Local Environment
On the local scene, the economy recorded a growth of 5.6 percent in 2010 compared to 2.6 percent recorded in 2009. The improved performance was as a result of consistent macroeconomic stability, increased credit to the private sector, low inflationary pressure and improved weather conditions. The country also benefited from improved prices of the main exports and increased remittances from abroad as a result the global economic recovery. Despite the political campaigns associated with the 2010 constitutional referendum, business and customer confidence remained largely intact thereby boosting economic growth.
Real Gross Domestic Product (GDP) per capita increased by 2.7 percent from KES 35,470 in 2009 to KES 36,419 in 2010. This can be attributed to varying positive growth in all the sectors of the economy. Electricity and Water Supply, Mining and Quarrying, and Financial Intermediation showed most significant growth during the same period. Key sectors in the economy also performed well, with Agriculture and Forestry posting a significant growth of 6.3 percent in 2010 after two consecutive declines of 4.1 percent and 2.6 percent in 2008 and 2009, respectively.
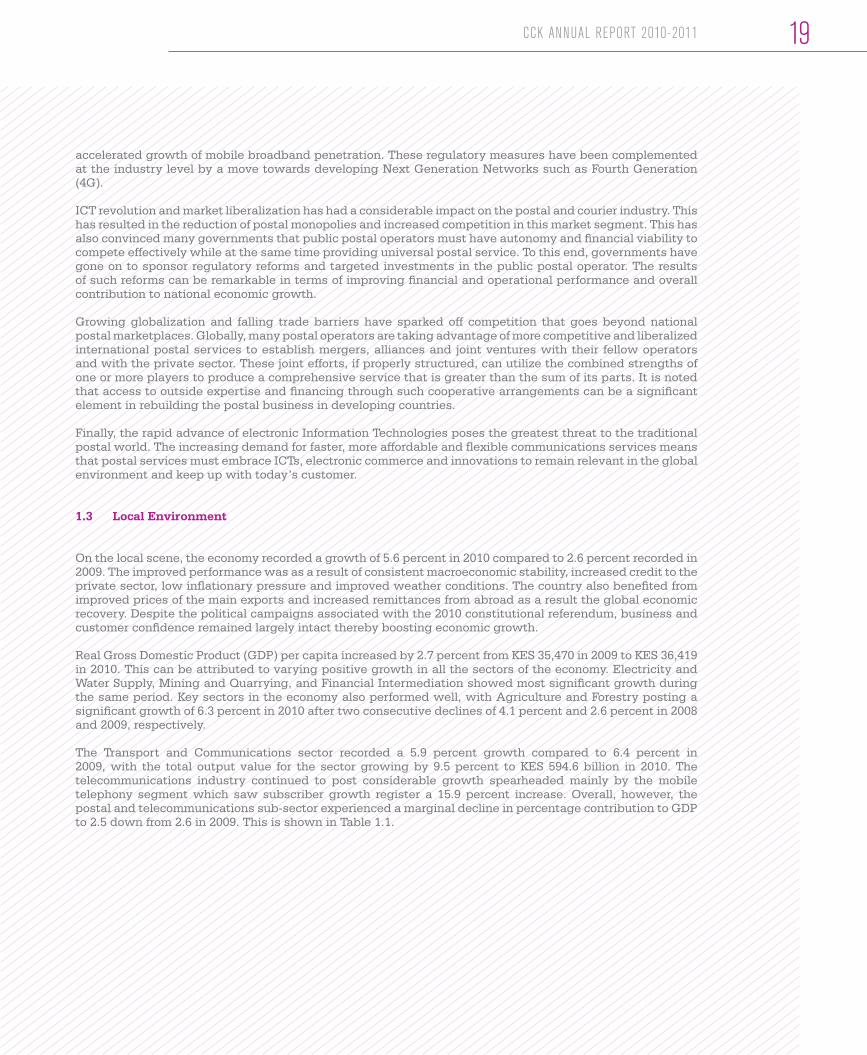
The Transport and Communications sector recorded a 5.9 percent growth compared to 6.4 percent in 2009, with the total output value for the sector growing by 9.5 percent to KES 594.6 billion in 2010. The telecommunications industry continued to post considerable growth spearheaded mainly by the mobile telephony segment which saw subscriber growth register a 15.9 percent increase. Overall, however, the postal and telecommunications sub-sector experienced a marginal decline in percentage contribution to GDP to 2.5 down from 2.6 in 2009. This is shown in Table 1.1.
19CCK ANNUAL REPORT 2010-2011
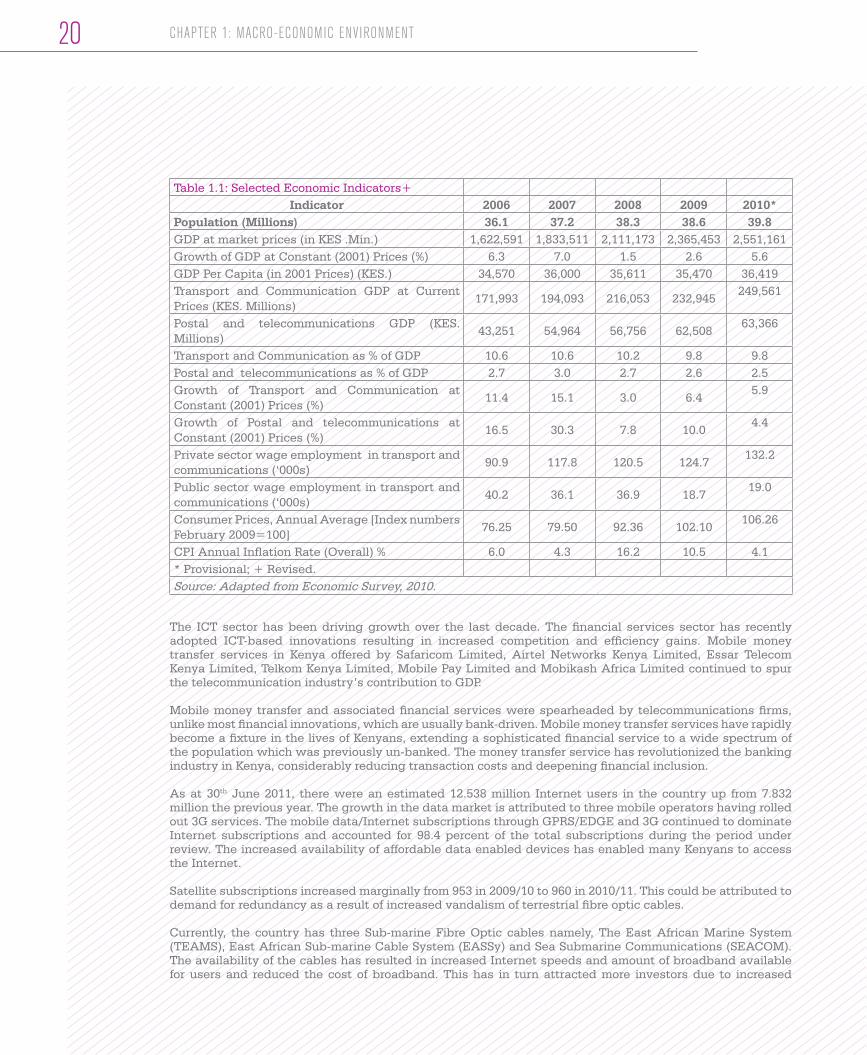
Table 1.1: Selected Economic Indicators+Indicator 2006 2007 2008 2009 2010*
Population (Millions) 36.1 37.2 38.3 38.6 39.8GDP at market prices (in KES .Min.) 1,622,591 1,833,511 2,111,173 2,365,453 2,551,161Growth of GDP at Constant (2001) Prices (%) 6.3 7.0 1.5 2.6 5.6GDP Per Capita (in 2001 Prices) (KES.) 34,570 36,000 35,611 35,470 36,419Transport and Communication GDP at Current Prices (KES. Millions)
171,993 194,093 216,053 232,945249,561
Postal and telecommunications GDP (KES. Millions)
43,251 54,964 56,756 62,50863,366
Transport and Communication as % of GDP 10.6 10.6 10.2 9.8 9.8Postal and telecommunications as % of GDP 2.7 3.0 2.7 2.6 2.5Growth of Transport and Communication at Constant (2001) Prices (%)
11.4 15.1 3.0 6.45.9
Growth of Postal and telecommunications at Constant (2001) Prices (%)
16.5 30.3 7.8 10.04.4
Private sector wage employment in transport and communications (‘000s)
90.9 117.8 120.5 124.7132.2
Public sector wage employment in transport and communications (‘000s)
40.2 36.1 36.9 18.719.0
Consumer Prices, Annual Average [Index numbers February 2009=100]
76.25 79.50 92.36 102.10106.26
CPI Annual Inflation Rate (Overall) % 6.0 4.3 16.2 10.5 4.1* Provisional; + Revised.Source: Adapted from Economic Survey, 2010.
The ICT sector has been driving growth over the last decade. The financial services sector has recently adopted ICT-based innovations resulting in increased competition and efficiency gains. Mobile money transfer services in Kenya offered by Safaricom Limited, Airtel Networks Kenya Limited, Essar Telecom Kenya Limited, Telkom Kenya Limited, Mobile Pay Limited and Mobikash Africa Limited continued to spur the telecommunication industry’s contribution to GDP.
Mobile money transfer and associated financial services were spearheaded by telecommunications firms, unlike most financial innovations, which are usually bank-driven. Mobile money transfer services have rapidly become a fixture in the lives of Kenyans, extending a sophisticated financial service to a wide spectrum of the population which was previously un-banked. The money transfer service has revolutionized the banking industry in Kenya, considerably reducing transaction costs and deepening financial inclusion.
As at 30th June 2011, there were an estimated 12.538 million Internet users in the country up from 7.832 million the previous year. The growth in the data market is attributed to three mobile operators having rolled out 3G services. The mobile data/Internet subscriptions through GPRS/EDGE and 3G continued to dominate Internet subscriptions and accounted for 98.4 percent of the total subscriptions during the period under review. The increased availability of affordable data enabled devices has enabled many Kenyans to access the Internet.
Satellite subscriptions increased marginally from 953 in 2009/10 to 960 in 2010/11. This could be attributed to demand for redundancy as a result of increased vandalism of terrestrial fibre optic cables.
Currently, the country has three Sub-marine Fibre Optic cables namely, The East African Marine System (TEAMS), East African Sub-marine Cable System (EASSy) and Sea Submarine Communications (SEACOM). The availability of the cables has resulted in increased Internet speeds and amount of broadband available for users and reduced the cost of broadband. This has in turn attracted more investors due to increased
CHAPTER 1: MACRO-ECONOMIC ENVIRONMENT20

international connectivity and created employment opportunities in the country.
The liberalized broadcasting sub-sector remained competitive with increased demand for both television and radio broadcasting frequencies and channels. In an effort to ensure a smooth transition from analogue to digital TV broadcasting, the Commission continued to provide secretariat services, budgetary and logistical support to the Digital Television Committee (DTC). The Commission also meet the cost of consumer awareness campaign on digital migration.
The Commission also commenced the process of licensing additional broadcast signal distributors. It also developed material for consumer education campaign, and published the minimum technical specifications for the Digital Video Broadcast – Terrestrial 2nd Generation (DVB-T2) standard. The transition from analogue to digital TV broadcasting scheduled to be completed by 2012 is expected to increase efficiency in the use of radio spectrum, increase content plurality and diversity and provide high quality digital signals.
Within the EAC, Kenya is largest economy contributing 40 percent to EAC’s total GDP. The coming into force of the EAC Common Market protocol in July 2010 widened the market and has helped Kenya expand trade with other EAC Member countries. The Common Market is further expected to boost trade within the region by removing tariff barriers to trade.
Economic performance indicators for the 2011/12 point to a possibility of suppressed level of economic activities as a result of escalating oil prices arising from political unrest in oil producing nations of North Africa and the Middle East; insufficient rains and drought; high food prices; and instability and volatility in the foreign exchange market.
The growth momentum experienced in 2010/11 is, therefore, likely to be slowed down by the aforementioned factors and as a result, the domestic economy is projected to grow by between 3.5 percent and 4.5 percent in the 2011/12. This growth is expected to be driven by successful implementation of the constitutional reforms which will send positive signals to the private sector and, therefore, boost business and investor confidence; large EAC common market and increased investment in infrastructure. The EAC common market is likely to increase its talent pool and, thus, could evolve into an ICT hub for the Continent.
21CCK ANNUAL REPORT 2010-2011

CHAPTER 2Management of Scarce Resources

The Commission is mandated to manage scarce radio frequency spectrum and numbering resources, which are essential for the provision of postal, information and communications services. As the postal, information and communications sector expanded, the Commission continued to receive and respond to the changing demands for public resources.
2.1 Frequency Management
The Commission plans, licenses, assigns, monitors, and coordinates the usage of the scarce frequency spectrum resources to ensure efficient utilization. During the year under review, the Commission assigned frequencies for various systems/services as follows:
2.1.1. Fixed Links
The Commission assigned a total of 1,994 frequencies to various operators for deployment of new links to facilitate provision of diverse communications services. A total of 229 fixed links were decommissioned mainly due to increased availability of optic fibre networks. Overall, the number of fixed links increased by 1,765, mainly as a result of expansion of mobile networks and increased vandalism of the core fibre network largely in urban areas. These are shown in Table 2.1.
Table 2.1: Fixed Links Frequency
BandNumber of new links
No. of decommissioned links
Growth in the No. of fixed links
Cumulative No. of fixed links
2009/10 2010/11 2009/10 2010/11 2009/10 2010/11 2010/11400MHz 28 0 0 0 28 0 01.5 GHz 0 0 70 0 -70 0 02GHz 0 0 6 0 -6 0 0
2.5GHz 0 0 4 0 -4 0 04GHz 0 0 11 0 -11 0 06GHz 8 2 48 0 -40 2 105
7/8GHz 208 382 143 50 65 332 1,16210.5GHz 0 0 9 0 -9 0 011 GHz 9 0 8 0 1 0 013GHz 347 144 207 71 140 73 73615GHz 157 1,181 1 86 156 1,095 2,24218GHz 0 2 2 1 -2 1 823GHz 63 232 3 21 60 211 32138GHz 3 51 0 0 3 51 43Total 823 1,994 512 229 311 1,765 4,617
Source: Communications Commission of Kenya
23CCK ANNUAL REPORT 2010-2011
Management of Scarce Resources
24
The total number of additional fixed links rose from 311 in 2009/10 to 1,765 in 2010/11. This is illustrated in Figure 2.1.
2006/7
2007/8
2008/9
2009/10
2010/11
Figure 2.1: Number of Additional Fixed Links
Fin
anci
al y
ear
Number
1765
311
253
372
331
0 200 400 600 800 1000 1200 1400 1600 1800
Source: Communications Commission of Kenya
2.1.2. Fixed Wireless Access Systems
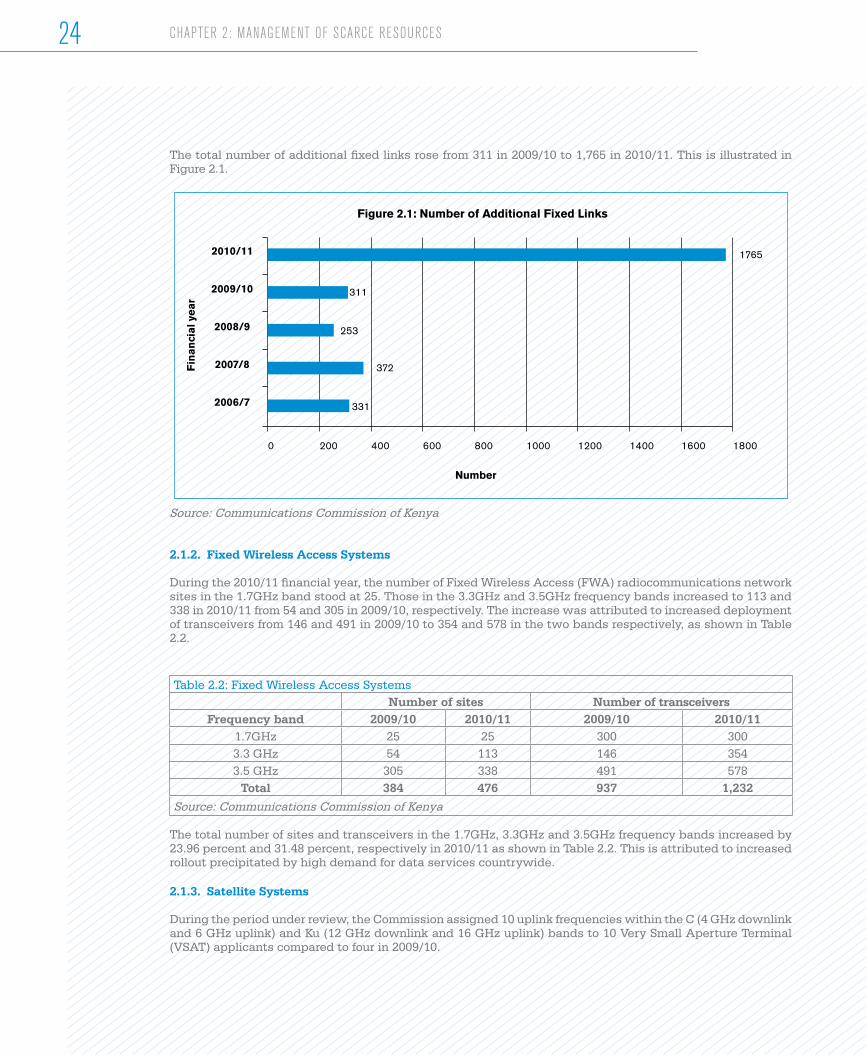
During the 2010/11 financial year, the number of Fixed Wireless Access (FWA) radiocommunications network sites in the 1.7GHz band stood at 25. Those in the 3.3GHz and 3.5GHz frequency bands increased to 113 and 338 in 2010/11 from 54 and 305 in 2009/10, respectively. The increase was attributed to increased deployment of transceivers from 146 and 491 in 2009/10 to 354 and 578 in the two bands respectively, as shown in Table 2.2.
Table 2.2: Fixed Wireless Access SystemsNumber of sites Number of transceivers
Frequency band 2009/10 2010/11 2009/10 2010/111.7GHz 25 25 300 3003.3 GHz 54 113 146 3543.5 GHz 305 338 491 578
Total 384 476 937 1,232Source: Communications Commission of Kenya
The total number of sites and transceivers in the 1.7GHz, 3.3GHz and 3.5GHz frequency bands increased by 23.96 percent and 31.48 percent, respectively in 2010/11 as shown in Table 2.2. This is attributed to increased rollout precipitated by high demand for data services countrywide.
2.1.3. Satellite Systems
During the period under review, the Commission assigned 10 uplink frequencies within the C (4 GHz downlink and 6 GHz uplink) and Ku (12 GHz downlink and 16 GHz uplink) bands to 10 Very Small Aperture Terminal (VSAT) applicants compared to four in 2009/10.
CHAPTER 2: MANAGEMENT OF SCARCE RESOURCES
2.1.4. Mobile Cellular Services
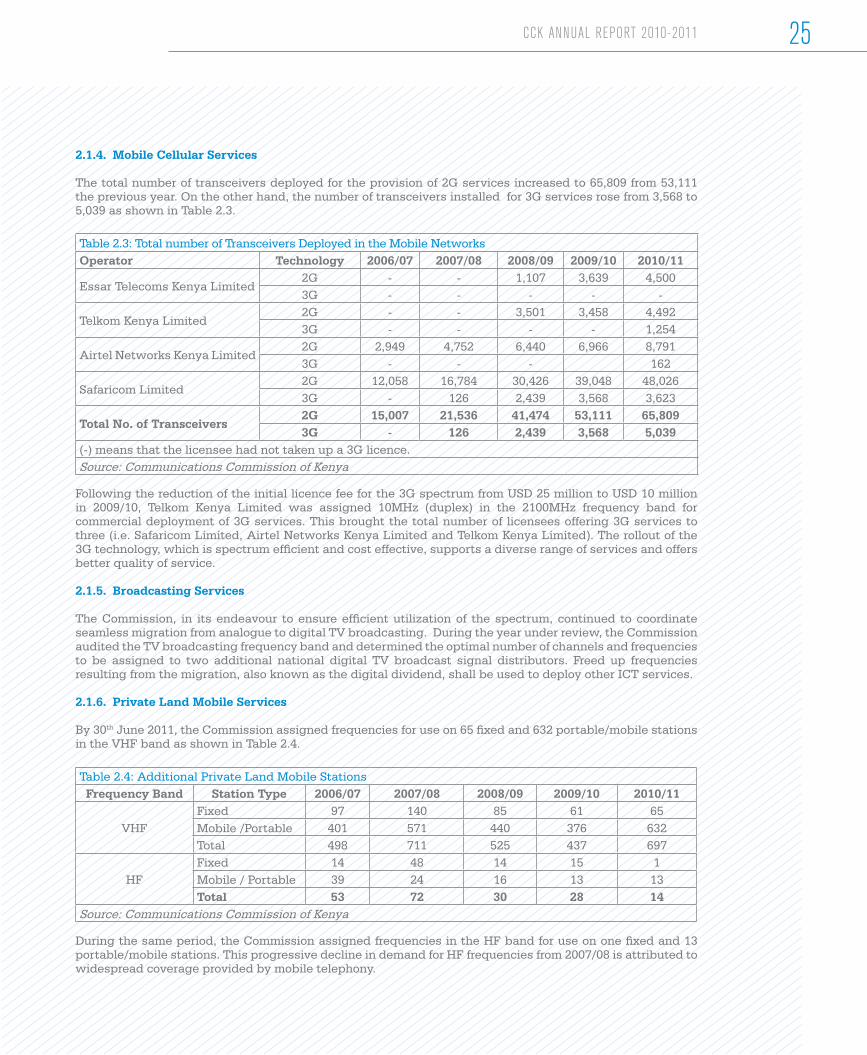
The total number of transceivers deployed for the provision of 2G services increased to 65,809 from 53,111 the previous year. On the other hand, the number of transceivers installed for 3G services rose from 3,568 to 5,039 as shown in Table 2.3.
Table 2.3: Total number of Transceivers Deployed in the Mobile NetworksOperator Technology 2006/07 2007/08 2008/09 2009/10 2010/11
Essar Telecoms Kenya Limited2G - - 1,107 3,639 4,5003G - - - - -
Telkom Kenya Limited 2G - - 3,501 3,458 4,4923G - - - - 1,254
Airtel Networks Kenya Limited 2G 2,949 4,752 6,440 6,966 8,7913G - - - 162
Safaricom Limited2G 12,058 16,784 30,426 39,048 48,0263G - 126 2,439 3,568 3,623
Total No. of Transceivers2G 15,007 21,536 41,474 53,111 65,8093G - 126 2,439 3,568 5,039
(-) means that the licensee had not taken up a 3G licence.Source: Communications Commission of Kenya
Following the reduction of the initial licence fee for the 3G spectrum from USD 25 million to USD 10 million in 2009/10, Telkom Kenya Limited was assigned 10MHz (duplex) in the 2100MHz frequency band for commercial deployment of 3G services. This brought the total number of licensees offering 3G services to three (i.e. Safaricom Limited, Airtel Networks Kenya Limited and Telkom Kenya Limited). The rollout of the 3G technology, which is spectrum efficient and cost effective, supports a diverse range of services and offers better quality of service.
2.1.5. Broadcasting Services
The Commission, in its endeavour to ensure efficient utilization of the spectrum, continued to coordinate seamless migration from analogue to digital TV broadcasting. During the year under review, the Commission audited the TV broadcasting frequency band and determined the optimal number of channels and frequencies to be assigned to two additional national digital TV broadcast signal distributors. Freed up frequencies resulting from the migration, also known as the digital dividend, shall be used to deploy other ICT services.
2.1.6. Private Land Mobile Services
By 30th June 2011, the Commission assigned frequencies for use on 65 fixed and 632 portable/mobile stations in the VHF band as shown in Table 2.4.
Table 2.4: Additional Private Land Mobile Stations Frequency Band Station Type 2006/07 2007/08 2008/09 2009/10 2010/11
VHFFixed 97 140 85 61 65Mobile /Portable 401 571 440 376 632Total 498 711 525 437 697
HFFixed 14 48 14 15 1Mobile / Portable 39 24 16 13 13Total 53 72 30 28 14
Source: Communications Commission of Kenya
During the same period, the Commission assigned frequencies in the HF band for use on one fixed and 13 portable/mobile stations. This progressive decline in demand for HF frequencies from 2007/08 is attributed to widespread coverage provided by mobile telephony.
25CCK ANNUAL REPORT 2010-2011

In addition, the Commission issued licences for 115 existing network expansions and downsizing. It also renewed 641 Land Mobile licences comprising 567 VHF and 74 HF networks, 714 Aircraft and 41 Amateur radio networks. In addition, the Commission cancelled 46 Land Mobile radio networks, comprising 18 VHF and 28 HF networks.
By 30th June 2011, the cumulative total of the number of authorised private radiocommunications networks is as shown in Table 2.5.
Table 2.5: Number of Private Radiocommunication StationsFrequency Band No. of Fixed Stations No. of Mobile/Portable Stations
2009/10 2010/11 2009/10 2010/1130-136 MHz 211 211 843 883
138-170 MHz 2,774 2,784 18,228 18,336170-470 MHz 411 428 7,627 7,720
Total 3,396 3,423 26,698 26,939Source: Communications Commission of Kenya
2.1.7. Radio Alarm Services
During the year under review, the Commission licensed 39 new alarm networks compared to four the previous year. As shown in Table 2.6, the total number of alarm units in the country increased from 30,429 in 2009/10 to 32,068 in 2010/11 as a result of increased demand for the alarm services.
Table 2.6: Number of Alarm Networks and UnitsFinancial Year No. of Alarm Networks No. of Alarm Units
2007/08 171 28,3962008/09 175 31,6802009/10 179 30,4292010/11 218 32,068
Source: Communications Commission of Kenya
The increased demand for alarm network units was more pronounced in major towns in Western and Central regions such as Nakuru, Eldoret, Kisumu, Kakamega, Bungoma, Nyeri and Embu due to a rise in the level of economic activities.
2.2. Management of Numbering Resources
The Commission manages numbering resources by planning and assigning these scarce resources to licensed telecommunication service providers. During the review period, the Commission assigned a total of 11,020,054 numbers to facilitate the rollout of various services. The numbering resources assigned, by category, are shown in Table 2.7.
Table 2.7: Numbering Resources Assigned Category 2006/07 2007/08 2008/09 2009/10 2010/11Mobile National Destination Codes 16 24 8 4 11Mobile Subscriber Number Capacity 16,000,000 24,000,000 8,000,000 4,000,000 11,000,000Numbers for Fixed Telephony 1,629,000 1,729,000 50,000 900,025 20,000Toll Free Numbers 5,010 15,010 50 1 20Premium Rate Numbers - - - 1,000 16National Signalling Point Codes 233 361 1 1 2International Signalling Point Codes 6 6 2 1 -Network Colour Codes - - 1 - -Short Codes for Voice - - - - 5Source: Communications Commission of Kenya
CHAPTER 2: MANAGEMENT OF SCARCE RESOURCES 26
During the review period, 11 Mobile National Destination Codes (MNDC), each with a capacity of 1 million numbers, were assigned up from four the previous year. This increase could be attributed to a rise in the number of new services and products, reduction in calling tariffs and increased offers by operators. The anticipated introduction of Mobile Number Portability (MNP) in the period under review might also have contributed to the application for more MNDCs by telecommunication operators.
The numbers assigned for fixed telephony dropped to 20,000 in 2010/11 from 900,025 the previous year. This was due to depressed demand for fixed line numbers. Toll free numbers (0800 range) assigned increased from one in 2009/10 to 20 in 2010/11. This was attributed to the increase in the number of Content Service Providers (CSPs) that required these numbers for their clientele. There was a decline in the premium rate numbers (0900 range) assigned from 1,000 recorded the previous year to 16 in 2010/11 due to shrinking demand for these numbers. CSPs source these numbers directly from mobile operators.
To ensure efficient utilization of the numbering resources, the Commission carried out a numbering audit in order to establish the level of usage. Out of a total of 58,283,418 assigned numbers, 40,221,940 were being utilized as at 30th June 2011, representing a utilization rate of 69.0 percent compared to 61.8 percent recorded the previous year. The increase in utilization rate by 7.2 percentage points could be attributed to the launch of various products and services by mobile operators.
The continued development of the postal, information and communications industry in Kenya is crucial to Kenya’s economic prosperity and international competitiveness. Recognising the importance of competition as a driver of good market outcomes such as low prices, affordability, growth, investment and innovation, the Commission continued to issue licences in various market segments. During the year under review, the Commission undertook various initiatives aimed at stimulating competition and innovation. The initiatives included studies on emerging issues in the industry and the review of the interconnection and infrastructure sharing framework.
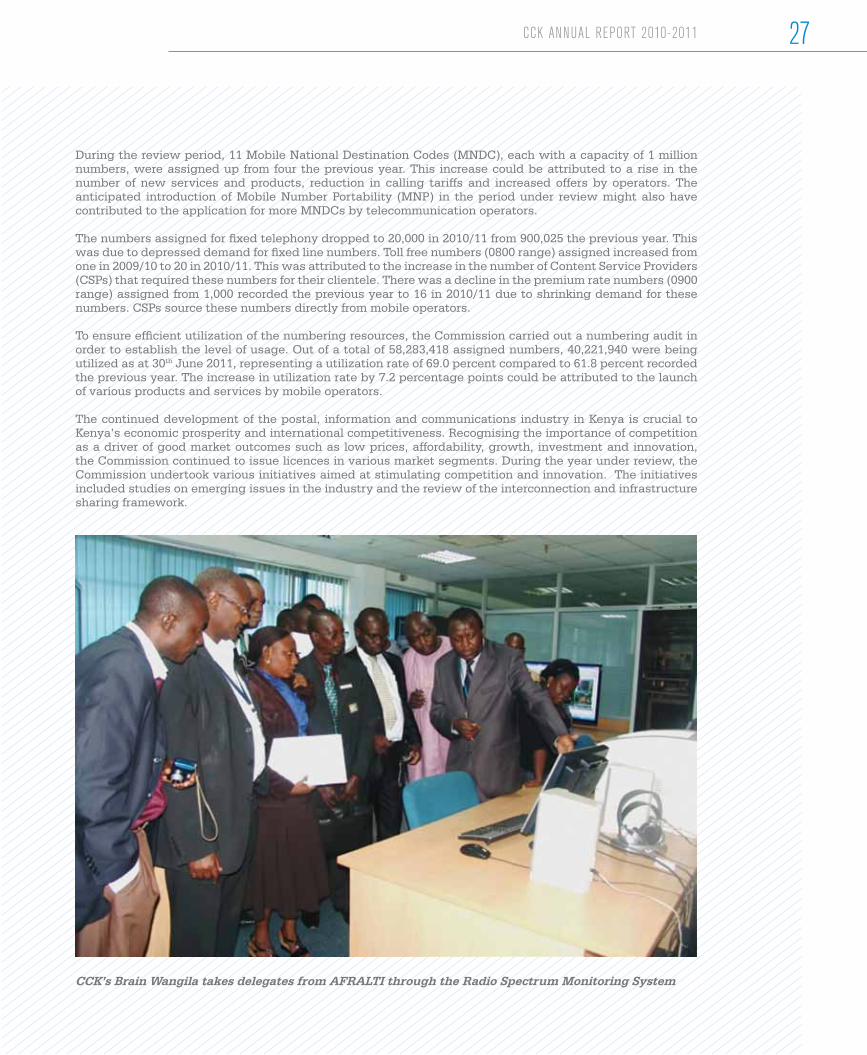
CCK’s Brain Wangila takes delegates from AFRALTI through the Radio Spectrum Monitoring System
27CCK ANNUAL REPORT 2010-2011

CHAPTER 3Promoting Competition and Innovation
3.1. Licensing and Network Expansions
The Commission continued to issue licences to new and existing players in the postal, information and telecommunications industry. As a result, there was an increase in the number of players, offering a diverse range of products and services thus expanding consumer choice. Further, during the year under review, the Commission commenced the process of evaluating the performance of some licensees whose licences were due for renewal. The Commission also reviewed the licence conditions of the Public Data Network Operators (PDNOs). 3.1.1. Telecommunications Licensing
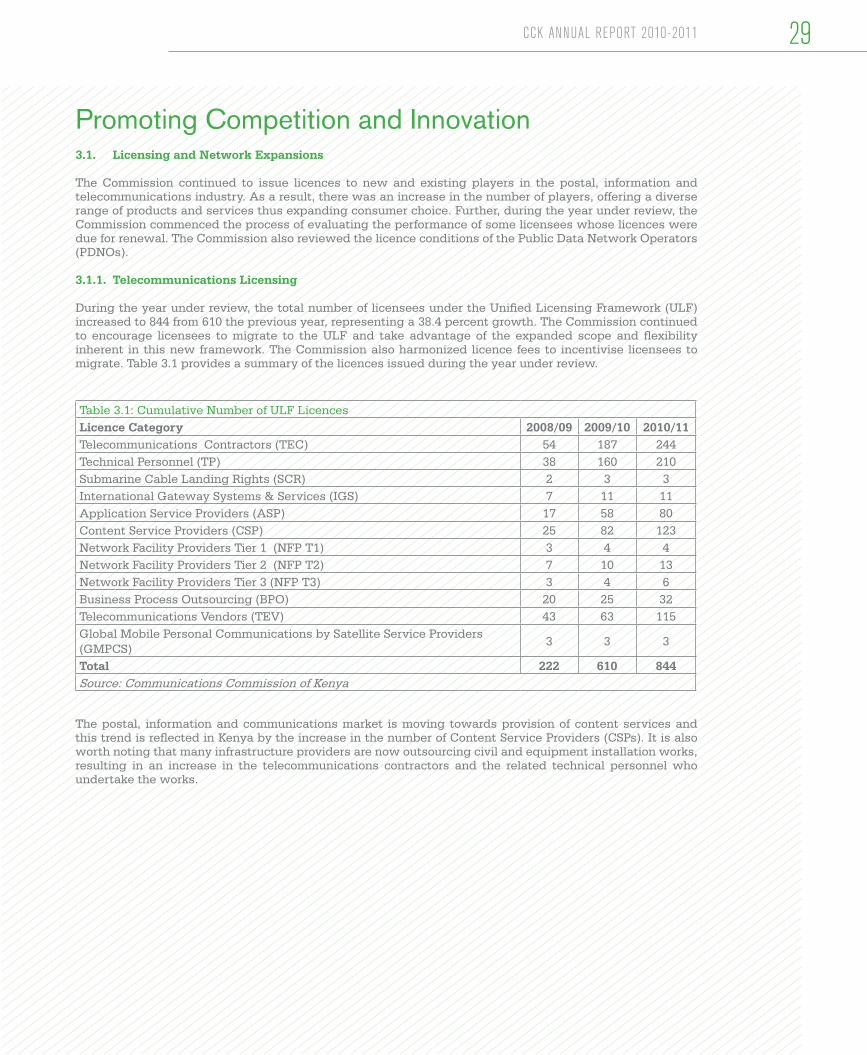
During the year under review, the total number of licensees under the Unified Licensing Framework (ULF) increased to 844 from 610 the previous year, representing a 38.4 percent growth. The Commission continued to encourage licensees to migrate to the ULF and take advantage of the expanded scope and flexibility inherent in this new framework. The Commission also harmonized licence fees to incentivise licensees to migrate. Table 3.1 provides a summary of the licences issued during the year under review.
Table 3.1: Cumulative Number of ULF Licences Licence Category 2008/09 2009/10 2010/11Telecommunications Contractors (TEC) 54 187 244Technical Personnel (TP) 38 160 210Submarine Cable Landing Rights (SCR) 2 3 3International Gateway Systems & Services (IGS) 7 11 11Application Service Providers (ASP) 17 58 80Content Service Providers (CSP) 25 82 123Network Facility Providers Tier 1 (NFP T1) 3 4 4Network Facility Providers Tier 2 (NFP T2) 7 10 13Network Facility Providers Tier 3 (NFP T3) 3 4 6Business Process Outsourcing (BPO) 20 25 32Telecommunications Vendors (TEV) 43 63 115Global Mobile Personal Communications by Satellite Service Providers (GMPCS)
3 3 3
Total 222 610 844Source: Communications Commission of Kenya
The postal, information and communications market is moving towards provision of content services and this trend is reflected in Kenya by the increase in the number of Content Service Providers (CSPs). It is also worth noting that many infrastructure providers are now outsourcing civil and equipment installation works, resulting in an increase in the telecommunications contractors and the related technical personnel who undertake the works.
29CCK ANNUAL REPORT 2010-2011
Promoting Competition and Innovation
30
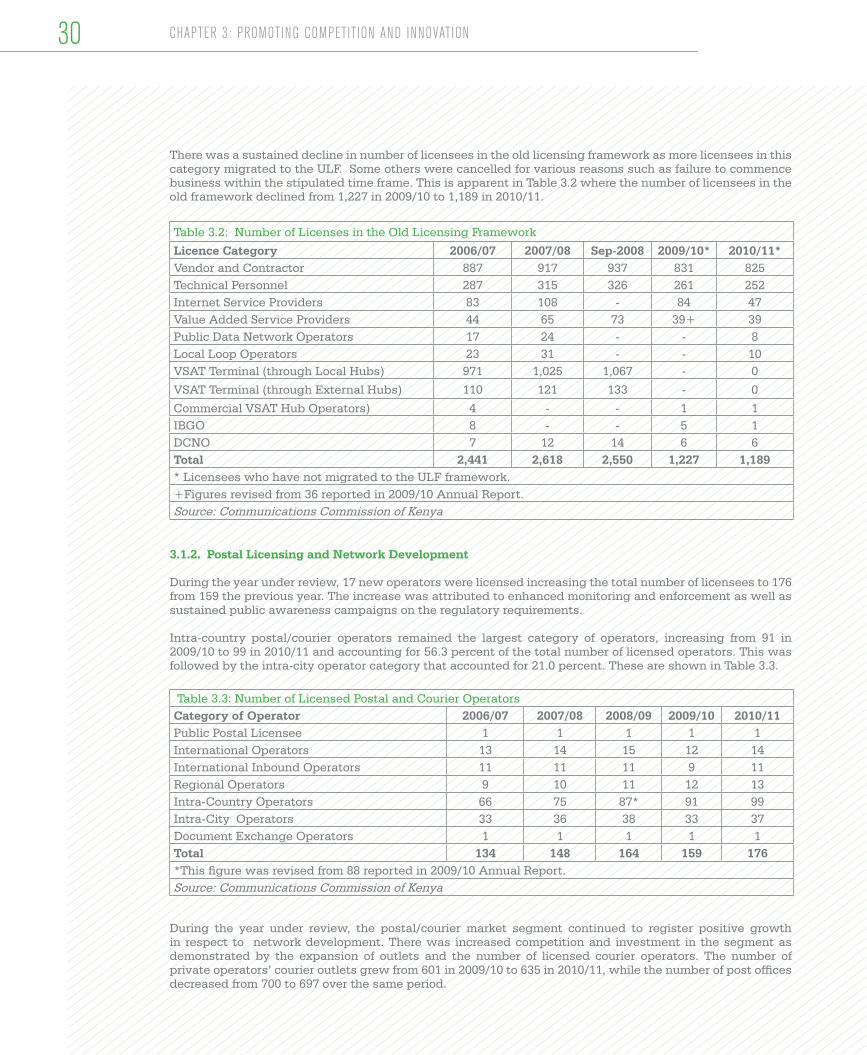
There was a sustained decline in number of licensees in the old licensing framework as more licensees in this category migrated to the ULF. Some others were cancelled for various reasons such as failure to commence business within the stipulated time frame. This is apparent in Table 3.2 where the number of licensees in the old framework declined from 1,227 in 2009/10 to 1,189 in 2010/11.
Table 3.2: Number of Licenses in the Old Licensing Framework
Licence Category 2006/07 2007/08 Sep-2008 2009/10* 2010/11*Vendor and Contractor 887 917 937 831 825Technical Personnel 287 315 326 261 252Internet Service Providers 83 108 - 84 47Value Added Service Providers 44 65 73 39+ 39Public Data Network Operators 17 24 - - 8Local Loop Operators 23 31 - - 10VSAT Terminal (through Local Hubs) 971 1,025 1,067 - 0
VSAT Terminal (through External Hubs) 110 121 133 - 0
Commercial VSAT Hub Operators) 4 - - 1 1IBGO 8 - - 5 1DCNO 7 12 14 6 6Total 2,441 2,618 2,550 1,227 1,189* Licensees who have not migrated to the ULF framework.+Figures revised from 36 reported in 2009/10 Annual Report. Source: Communications Commission of Kenya
3.1.2. Postal Licensing and Network Development
During the year under review, 17 new operators were licensed increasing the total number of licensees to 176 from 159 the previous year. The increase was attributed to enhanced monitoring and enforcement as well as sustained public awareness campaigns on the regulatory requirements.
Intra-country postal/courier operators remained the largest category of operators, increasing from 91 in 2009/10 to 99 in 2010/11 and accounting for 56.3 percent of the total number of licensed operators. This was followed by the intra-city operator category that accounted for 21.0 percent. These are shown in Table 3.3.
Table 3.3: Number of Licensed Postal and Courier OperatorsCategory of Operator 2006/07 2007/08 2008/09 2009/10 2010/11Public Postal Licensee 1 1 1 1 1International Operators 13 14 15 12 14International Inbound Operators 11 11 11 9 11Regional Operators 9 10 11 12 13Intra-Country Operators 66 75 87* 91 99Intra-City Operators 33 36 38 33 37Document Exchange Operators 1 1 1 1 1Total 134 148 164 159 176*This figure was revised from 88 reported in 2009/10 Annual Report.Source: Communications Commission of Kenya
During the year under review, the postal/courier market segment continued to register positive growth in respect to network development. There was increased competition and investment in the segment as demonstrated by the expansion of outlets and the number of licensed courier operators. The number of private operators’ courier outlets grew from 601 in 2009/10 to 635 in 2010/11, while the number of post offices decreased from 700 to 697 over the same period.
CHAPTER 3: PROMOTING COMPETITION AND INNOVATION
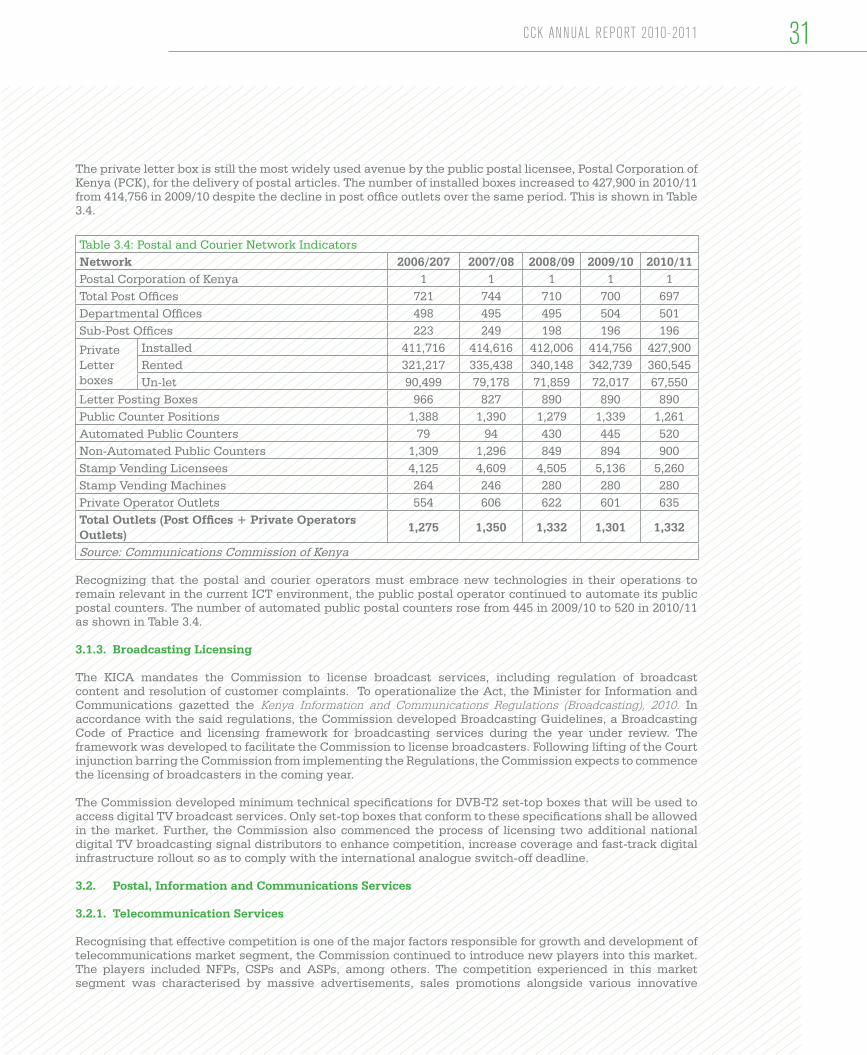
The private letter box is still the most widely used avenue by the public postal licensee, Postal Corporation of Kenya (PCK), for the delivery of postal articles. The number of installed boxes increased to 427,900 in 2010/11 from 414,756 in 2009/10 despite the decline in post office outlets over the same period. This is shown in Table 3.4.
Table 3.4: Postal and Courier Network IndicatorsNetwork 2006/207 2007/08 2008/09 2009/10 2010/11Postal Corporation of Kenya 1 1 1 1 1Total Post Offices 721 744 710 700 697Departmental Offices 498 495 495 504 501Sub-Post Offices 223 249 198 196 196
Private Letter boxes
Installed 411,716 414,616 412,006 414,756 427,900Rented 321,217 335,438 340,148 342,739 360,545Un-let 90,499 79,178 71,859 72,017 67,550
Letter Posting Boxes 966 827 890 890 890Public Counter Positions 1,388 1,390 1,279 1,339 1,261Automated Public Counters 79 94 430 445 520Non-Automated Public Counters 1,309 1,296 849 894 900Stamp Vending Licensees 4,125 4,609 4,505 5,136 5,260Stamp Vending Machines 264 246 280 280 280Private Operator Outlets 554 606 622 601 635Total Outlets (Post Offices + Private Operators Outlets)
1,275 1,350 1,332 1,301 1,332
Source: Communications Commission of Kenya
Recognizing that the postal and courier operators must embrace new technologies in their operations to remain relevant in the current ICT environment, the public postal operator continued to automate its public postal counters. The number of automated public postal counters rose from 445 in 2009/10 to 520 in 2010/11 as shown in Table 3.4.
3.1.3. Broadcasting Licensing
The KICA mandates the Commission to license broadcast services, including regulation of broadcast content and resolution of customer complaints. To operationalize the Act, the Minister for Information and Communications gazetted the Kenya Information and Communications Regulations (Broadcasting), 2010. In accordance with the said regulations, the Commission developed Broadcasting Guidelines, a Broadcasting Code of Practice and licensing framework for broadcasting services during the year under review. The framework was developed to facilitate the Commission to license broadcasters. Following lifting of the Court injunction barring the Commission from implementing the Regulations, the Commission expects to commence the licensing of broadcasters in the coming year.
The Commission developed minimum technical specifications for DVB-T2 set-top boxes that will be used to access digital TV broadcast services. Only set-top boxes that conform to these specifications shall be allowed in the market. Further, the Commission also commenced the process of licensing two additional national digital TV broadcasting signal distributors to enhance competition, increase coverage and fast-track digital infrastructure rollout so as to comply with the international analogue switch-off deadline.
3.2. Postal, Information and Communications Services
3.2.1. Telecommunication Services
Recognising that effective competition is one of the major factors responsible for growth and development of telecommunications market segment, the Commission continued to introduce new players into this market. The players included NFPs, CSPs and ASPs, among others. The competition experienced in this market segment was characterised by massive advertisements, sales promotions alongside various innovative
CCK ANNUAL REPORT 2010-2011 31

32
product and service offerings by both new and existing players.
3.2.1.1. Fixed Network Voice Services
Telkom Kenya Limited (TKL) and Flashcom Kenya Limited [a Local Loop Operator (LLO)] continued to be the only players in the fixed network voice services market in Kenya, with TKL holding 99 percent of the market share. During the year under review, the total fixed line (including wireless) subscribers shrank from 460,114 recorded in June 2010 to 379,301 in June 2011. This translated to a decrease in teledensity from 1.2 percent in 2009/10 to 0.95 percent in 2010/11. The fixed wireline capacity decreased from 421,528 to 400,764 during the same period as shown in Table 3.5.
Table 3.5: Fixed Network Growth Indicators
Financial Year 2006/07 2007/08 2008/09 2009/10 2010/11Wireline Capacity 505,103 512,281 485,581 421,528 400,764Wireline Connections 263,122 252,615 247,972 234,522 187,716Wireless Connections (Include LLO subscribers)
84,104 274,449 419,047 225,592 191,585
Total Connections (Wireline and Wireless)
347,226 527,064 696,501 460,114 379,301
Urban Wireline Connections 251,924 246,927 240,533 227,486 182,084Rural Wireline Connections 11,198 5,688 7,439 7,036 5,632International Outgoing Traffic (Minutes)
27,363,876 15,582,304 14,471,643 14,761,211 11,455,952
International Incoming Traffic (Minutes)
85,672,270 83,148,332 88,538,230 38,550,399 31,866,685
Traffic to Mobile networks (Minutes) 124,378,826 98,238,064 34,103,924 31,024,688 59,301,227Source: Communications Commission of Kenya
The fixed wireline connections in both urban and rural areas declined by 20 percent to stand at 182,084 and 5,632 in 2010/11 compared to 227,486 and 7,036, respectively recorded the previous year. The reduction in fixed line services could be attributable to increased competition from mobile service providers and high cost of maintaining fixed lines as a result of cable vandalism. Declining trends in wireline and fixed wireless connections are shown in Figure 3.1.
450,000
400,000
350,000
300,000
250,000
150,000
50,000
2006/7 2007/8 2008/9 2009/10 2010/11
0
100,000
200,000
Figure 3.1: Fixed Subscriber Growth Trend in the last Five Years
263,122
84,104
252,615
247,449
234,522
225,592
187,716
191,585
419,047
247,972
Wireline Connections Wireless Connections
Source: Communication Commission of Kenya
CHAPTER 3: PROMOTING COMPETITION AND INNOVATION
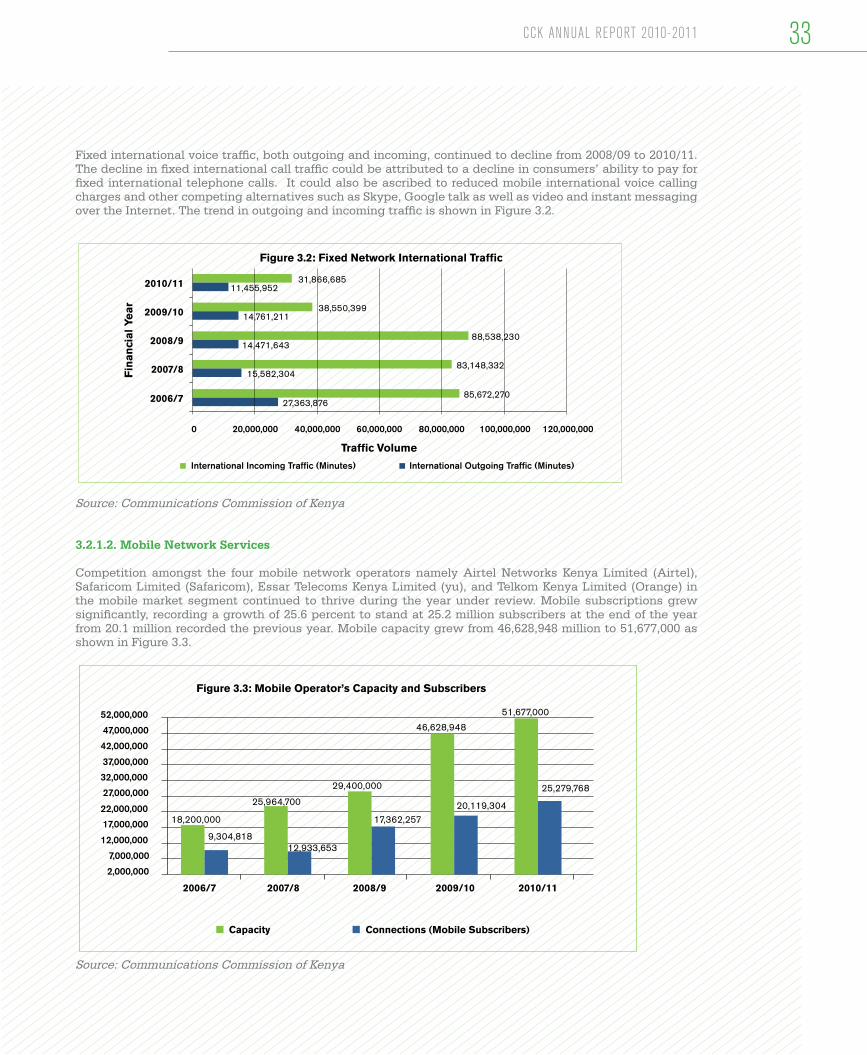
Fixed international voice traffic, both outgoing and incoming, continued to decline from 2008/09 to 2010/11. The decline in fixed international call traffic could be attributed to a decline in consumers’ ability to pay for fixed international telephone calls. It could also be ascribed to reduced mobile international voice calling charges and other competing alternatives such as Skype, Google talk as well as video and instant messaging over the Internet. The trend in outgoing and incoming traffic is shown in Figure 3.2.
2006/7
2007/8
2008/9
2009/10
2010/11
Figure 3.2: Fixed Network International Traffic
Fin
anci
al Y
ear
Traffic Volume
20,000,000 40,000,000 60,000,000 80,000,000 100,000,000 120,000,000
International Incoming Traffic (Minutes) International Outgoing Traffic (Minutes)
31,866,68511,455,952
38,550,39914,761,211
88,538,23014,471,643
83,148,33215,582,304
85,672,27027,363,876
0
Source: Communications Commission of Kenya
3.2.1.2. Mobile Network Services
Competition amongst the four mobile network operators namely Airtel Networks Kenya Limited (Airtel), Safaricom Limited (Safaricom), Essar Telecoms Kenya Limited (yu), and Telkom Kenya Limited (Orange) in the mobile market segment continued to thrive during the year under review. Mobile subscriptions grew significantly, recording a growth of 25.6 percent to stand at 25.2 million subscribers at the end of the year from 20.1 million recorded the previous year. Mobile capacity grew from 46,628,948 million to 51,677,000 as shown in Figure 3.3.
2006/7 2007/8 2008/9 2009/10 2010/11
Figure 3.3: Mobile Operator’s Capacity and Subscribers
52,000,000
47,000,000
42,000,000
37,000,000
32,000,000
27,000,000
22,000,000
17,000,000
12,000,000
7,000,000
2,000,000
Capacity Connections (Mobile Subscribers)
18,200,000
9,304,818
25,964,700
12,933,653
29,400,000
17,362,257
46,628,948
20,119,304
51,677,000
25,279,768
Source: Communications Commission of Kenya
33CCK ANNUAL REPORT 2010-2011

34
The operators reduced both on-net and off-net tariffs in a bid to attract and retain customers on their respective networks following the Commission’s intervention in lowering mobile termination rates. Subsequently, mobile penetration increased from 51.2 percent in June 2010 to 63.6 percent as at 30th June 2011. This penetration was above the African penetration rates estimated by ITU at 41 percent during the same period.
The proportion of pre-paid subscribers continued to overshadow post-paid subscriptions. Pre-paid subscribers accounted for 99 percent of the total mobile subscribers translating to 25.0 million subscribers out of the 25.2 million recorded during the period under review. The dominance of prepaid subscriptions may be attributed to the trend that the bulk of the mobile operators’ advertising, special offers and promotions are geared towards increasing the number of pre-paid subscribers. The high number of prepaid subscribers could also be attributable to prevalence of low denomination prepay calling cards, which are as low as KES 5.00 and, therefore, affordable to a majority of Kenyans.
As shown in Table 3.6, the volume of SMS messages decreased marginally by 0.015 percent to 2,622,821,774 down from 2,662,653,719 in June 2010.
Table 3.6: Mobile Network Growth IndicatorsType 2006/07 2007/08 2008/09 2009/10 2010/11
Capacity 18,200,000 25,964,700 29,400,000 46,628,948 47,677,000No. of Subscribers 9,304,818 12,933,653 17,362,257 20,119,304 25,279,768No. of Transceivers 15,007 21,662 43,913 56,679 70,848SMS 315,557,601 287,145,378 2,728,869,614 2,662,653,719 2,622,821,774Source: Communications Commission of Kenya
The reduction in SMS may be attributed to reduction in voice tariff calling rates that resulted from a reduction in interconnection rates during the year under review.
At the end of the period under review, mobile networks recorded increased international incoming traffic to the tune of 605,209,985 minutes up from 570,367,665 minutes recorded the previous year. On the other hand, international outgoing traffic increased to 505,840,566 minutes from 220,133,307 minutes during the same period. These represent increases in international incoming and outgoing traffic of 6 percent and 130 percent, respectively. The increase in international outgoing traffic could be attributed to a reduction in international calling rates by the four mobile operators to an average of KES 3.00 per minute in certain tariff bands (United States of America, India, China, and Canada).
3.2.1.3. Mobile Money Transfer Service
The use of mobile technology to provide money transfer services continued to expand. As at 30th June 2011, all the mobile operators had launched money transfer services. Safaricom’s M-Pesa, Zain’s Zap (now Airtel Money), Essar’s yu Cash, and TKL’s Orange Money (Iko Pesa) that were introduced in March, 2007; January, 2009; December, 2009 and November 2010 respectively. However, M-Pesa is by far the largest system, accounting for 82.4 percent of mobile money transfer service subscriptions. The number of money transfer subscriptions is shown in table 3.7.
Table 3.7: Mobile Money Transfer Service Subscribers*Operator June 2010 June 2011
Safaricom Limited (M-Pesa) 10,232,805 14,331,941Telkom Kenya Limited (Orange Money - Iko Pesa) - 117,091
Airtel Networks Kenya Limited (Airtel Money) 378,700 2,530,916
Essar Telecom Kenya Limited (yu Cash) 3,881 415,779Total Number of Subscribers 10,615,386 17,395,727* This excludes Mobikash Africa Limited and Mobile Pay Limited subscribersSource: Communications Commission of Kenya
Apart from mobile operators, Mobikash Africa Limited and Mobile Pay Limited, which are licensed CSPs also rolled out mobile money transfer services.
CHAPTER 3: PROMOTING COMPETITION AND INNOVATION
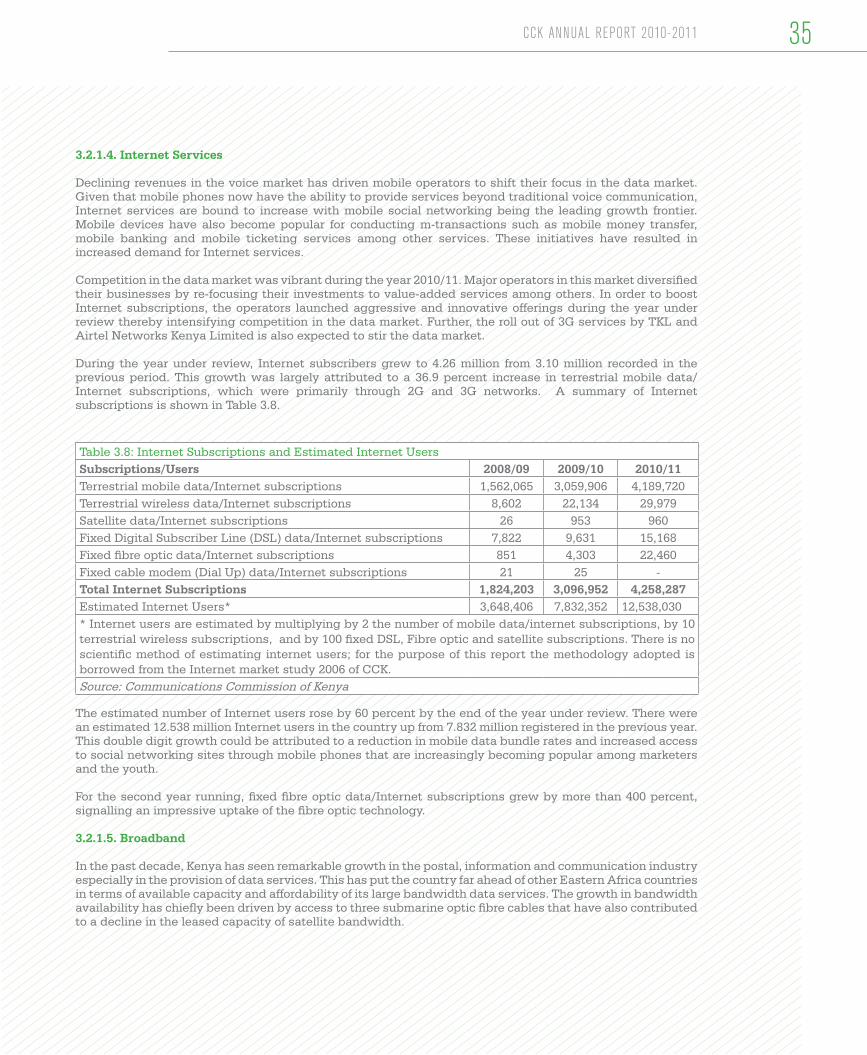
3.2.1.4. Internet Services
Declining revenues in the voice market has driven mobile operators to shift their focus in the data market. Given that mobile phones now have the ability to provide services beyond traditional voice communication, Internet services are bound to increase with mobile social networking being the leading growth frontier. Mobile devices have also become popular for conducting m-transactions such as mobile money transfer, mobile banking and mobile ticketing services among other services. These initiatives have resulted in increased demand for Internet services.
Competition in the data market was vibrant during the year 2010/11. Major operators in this market diversified their businesses by re-focusing their investments to value-added services among others. In order to boost Internet subscriptions, the operators launched aggressive and innovative offerings during the year under review thereby intensifying competition in the data market. Further, the roll out of 3G services by TKL and Airtel Networks Kenya Limited is also expected to stir the data market.
During the year under review, Internet subscribers grew to 4.26 million from 3.10 million recorded in the previous period. This growth was largely attributed to a 36.9 percent increase in terrestrial mobile data/Internet subscriptions, which were primarily through 2G and 3G networks. A summary of Internet subscriptions is shown in Table 3.8.
Table 3.8: Internet Subscriptions and Estimated Internet Users Subscriptions/Users 2008/09 2009/10 2010/11Terrestrial mobile data/Internet subscriptions 1,562,065 3,059,906 4,189,720Terrestrial wireless data/Internet subscriptions 8,602 22,134 29,979Satellite data/Internet subscriptions 26 953 960Fixed Digital Subscriber Line (DSL) data/Internet subscriptions 7,822 9,631 15,168Fixed fibre optic data/Internet subscriptions 851 4,303 22,460Fixed cable modem (Dial Up) data/Internet subscriptions 21 25 -Total Internet Subscriptions 1,824,203 3,096,952 4,258,287Estimated Internet Users* 3,648,406 7,832,352 12,538,030* Internet users are estimated by multiplying by 2 the number of mobile data/internet subscriptions, by 10 terrestrial wireless subscriptions, and by 100 fixed DSL, Fibre optic and satellite subscriptions. There is no scientific method of estimating internet users; for the purpose of this report the methodology adopted is borrowed from the Internet market study 2006 of CCK.Source: Communications Commission of Kenya
The estimated number of Internet users rose by 60 percent by the end of the year under review. There were an estimated 12.538 million Internet users in the country up from 7.832 million registered in the previous year. This double digit growth could be attributed to a reduction in mobile data bundle rates and increased access to social networking sites through mobile phones that are increasingly becoming popular among marketers and the youth.
For the second year running, fixed fibre optic data/Internet subscriptions grew by more than 400 percent, signalling an impressive uptake of the fibre optic technology.
3.2.1.5. Broadband
In the past decade, Kenya has seen remarkable growth in the postal, information and communication industry especially in the provision of data services. This has put the country far ahead of other Eastern Africa countries in terms of available capacity and affordability of its large bandwidth data services. The growth in bandwidth availability has chiefly been driven by access to three submarine optic fibre cables that have also contributed to a decline in the leased capacity of satellite bandwidth.
35CCK ANNUAL REPORT 2010-2011
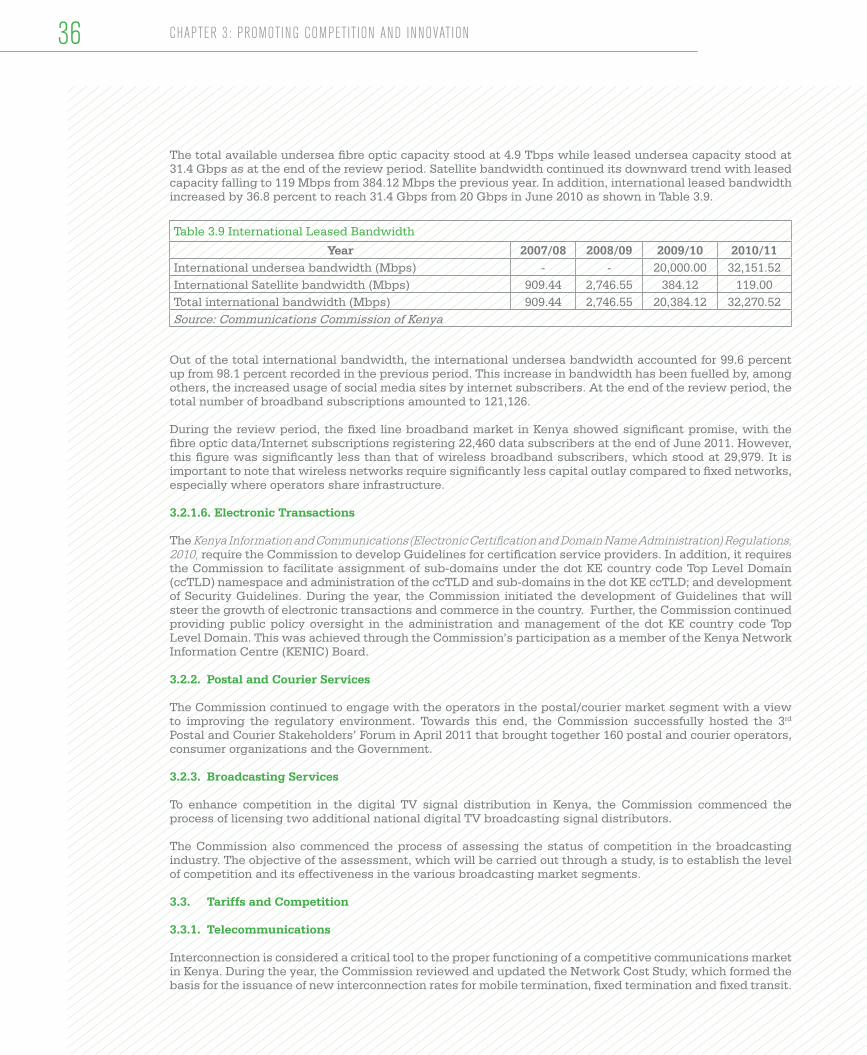
36
The total available undersea fibre optic capacity stood at 4.9 Tbps while leased undersea capacity stood at 31.4 Gbps as at the end of the review period. Satellite bandwidth continued its downward trend with leased capacity falling to 119 Mbps from 384.12 Mbps the previous year. In addition, international leased bandwidth increased by 36.8 percent to reach 31.4 Gbps from 20 Gbps in June 2010 as shown in Table 3.9.
Table 3.9 International Leased Bandwidth
Year 2007/08 2008/09 2009/10 2010/11International undersea bandwidth (Mbps) - - 20,000.00 32,151.52International Satellite bandwidth (Mbps) 909.44 2,746.55 384.12 119.00Total international bandwidth (Mbps) 909.44 2,746.55 20,384.12 32,270.52Source: Communications Commission of Kenya
Out of the total international bandwidth, the international undersea bandwidth accounted for 99.6 percent up from 98.1 percent recorded in the previous period. This increase in bandwidth has been fuelled by, among others, the increased usage of social media sites by internet subscribers. At the end of the review period, the total number of broadband subscriptions amounted to 121,126.
During the review period, the fixed line broadband market in Kenya showed significant promise, with the fibre optic data/Internet subscriptions registering 22,460 data subscribers at the end of June 2011. However, this figure was significantly less than that of wireless broadband subscribers, which stood at 29,979. It is important to note that wireless networks require significantly less capital outlay compared to fixed networks, especially where operators share infrastructure.
3.2.1.6. Electronic Transactions
The Kenya Information and Communications (Electronic Certification and Domain Name Administration) Regulations, 2010, require the Commission to develop Guidelines for certification service providers. In addition, it requires the Commission to facilitate assignment of sub-domains under the dot KE country code Top Level Domain (ccTLD) namespace and administration of the ccTLD and sub-domains in the dot KE ccTLD; and development of Security Guidelines. During the year, the Commission initiated the development of Guidelines that will steer the growth of electronic transactions and commerce in the country. Further, the Commission continued providing public policy oversight in the administration and management of the dot KE country code Top Level Domain. This was achieved through the Commission’s participation as a member of the Kenya Network Information Centre (KENIC) Board.
3.2.2. Postal and Courier Services
The Commission continued to engage with the operators in the postal/courier market segment with a view to improving the regulatory environment. Towards this end, the Commission successfully hosted the 3rd Postal and Courier Stakeholders’ Forum in April 2011 that brought together 160 postal and courier operators, consumer organizations and the Government.
3.2.3. Broadcasting Services
To enhance competition in the digital TV signal distribution in Kenya, the Commission commenced the process of licensing two additional national digital TV broadcasting signal distributors.
The Commission also commenced the process of assessing the status of competition in the broadcasting industry. The objective of the assessment, which will be carried out through a study, is to establish the level of competition and its effectiveness in the various broadcasting market segments.
3.3. Tariffs and Competition
3.3.1. Telecommunications
Interconnection is considered a critical tool to the proper functioning of a competitive communications market in Kenya. During the year, the Commission reviewed and updated the Network Cost Study, which formed the basis for the issuance of new interconnection rates for mobile termination, fixed termination and fixed transit.
CHAPTER 3: PROMOTING COMPETITION AND INNOVATION
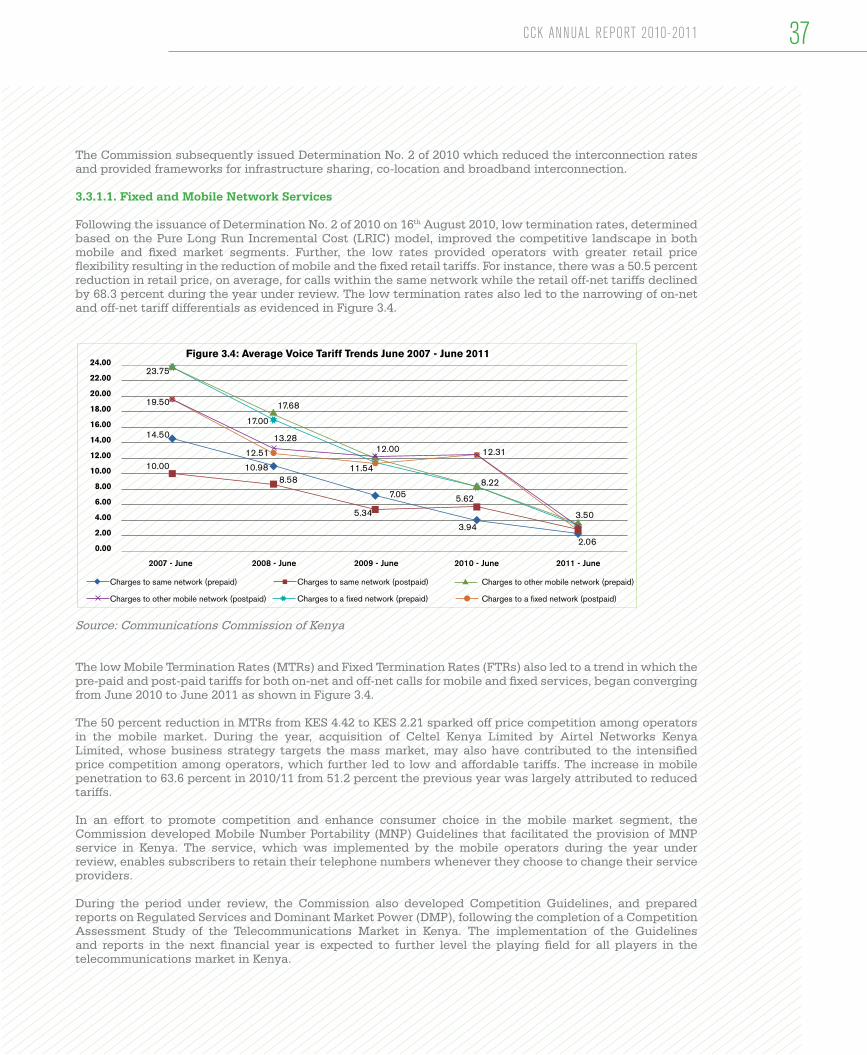
The Commission subsequently issued Determination No. 2 of 2010 which reduced the interconnection rates and provided frameworks for infrastructure sharing, co-location and broadband interconnection.
3.3.1.1. Fixed and Mobile Network Services
Following the issuance of Determination No. 2 of 2010 on 16th August 2010, low termination rates, determined based on the Pure Long Run Incremental Cost (LRIC) model, improved the competitive landscape in both mobile and fixed market segments. Further, the low rates provided operators with greater retail price flexibility resulting in the reduction of mobile and the fixed retail tariffs. For instance, there was a 50.5 percent reduction in retail price, on average, for calls within the same network while the retail off-net tariffs declined by 68.3 percent during the year under review. The low termination rates also led to the narrowing of on-net and off-net tariff differentials as evidenced in Figure 3.4.
24.00
22.00
20.00
18.00
16.00
14.00
12.00
10.00
8.00
6.00
4.00
2.00
0.00
2007 - June 2008 - June 2009 - June 2010 - June 2011 - June
Charges to same network (prepaid) Charges to same network (postpaid)
Charges to other mobile network (postpaid) Charges to a fixed network (prepaid)
Charges to other mobile network (prepaid)
Charges to a fixed network (postpaid)
23.75
17.68
17.00
13.28
12.51
10.988.58
12.00 12.31
11.54
7.058.22
5.62
3.943.50
2.06
5.34
19.50
14.50
10.00
Figure 3.4: Average Voice Tariff Trends June 2007 - June 2011
Source: Communications Commission of Kenya
The low Mobile Termination Rates (MTRs) and Fixed Termination Rates (FTRs) also led to a trend in which the pre-paid and post-paid tariffs for both on-net and off-net calls for mobile and fixed services, began converging from June 2010 to June 2011 as shown in Figure 3.4.
The 50 percent reduction in MTRs from KES 4.42 to KES 2.21 sparked off price competition among operators in the mobile market. During the year, acquisition of Celtel Kenya Limited by Airtel Networks Kenya Limited, whose business strategy targets the mass market, may also have contributed to the intensified price competition among operators, which further led to low and affordable tariffs. The increase in mobile penetration to 63.6 percent in 2010/11 from 51.2 percent the previous year was largely attributed to reduced tariffs.
In an effort to promote competition and enhance consumer choice in the mobile market segment, the Commission developed Mobile Number Portability (MNP) Guidelines that facilitated the provision of MNP service in Kenya. The service, which was implemented by the mobile operators during the year under review, enables subscribers to retain their telephone numbers whenever they choose to change their service providers.
During the period under review, the Commission also developed Competition Guidelines, and prepared reports on Regulated Services and Dominant Market Power (DMP), following the completion of a Competition Assessment Study of the Telecommunications Market in Kenya. The implementation of the Guidelines and reports in the next financial year is expected to further level the playing field for all players in the telecommunications market in Kenya.
37CCK ANNUAL REPORT 2010-2011

3.3.1.2. Internet and Broadband
Realizing that the Internet and broadband market segment was at a nascent stage, the Commission left competitive forces to spur the growth of this market. As a result, operators in this market segment offered innovative data products and services using several technologies such as optic fibre cable, WIMAX, Digital Subscriber Line (DSL) and VSAT.
Further, due to the low number of active copper lines in Kenya, wireless broadband became increasingly important during the period under review. Mobile operators continued to increase investment in the wireless broadband in their quest to diversify their businesses. This was informed by a 19 percent reduction in Minutes of Use (MOU) per subscriber per month coupled with low tariffs experienced during the review period.
The landing of three undersea optic fibre cables resulted in a significant reduction in wholesale prices for bandwidth. This reduction incentivized most operators to migrate from costly satellite to fibre for their international connectivity. Despite this reduction, there has not been a commensurate reduction in retail bandwidth other than increased speed of broadband services. However, the country is expected to benefit from the reduction in bandwidth prices and increased connectivity thereof in the coming years.
3.3.2. Postal and Courier Services
The Kenya Information and Communications Act, CAP 411A, provides for regulation of tariffs for reserved postal services which comprise postage of letters up to 350 grams, private letter box and bag rentals. During the year under review, the Commission undertook a review of reserved postal services with a view to proposing new charging mechanisms while at the same time guaranteeing the provision of universal services by the Postal Corporation of Kenya. The review of the reserved postal services is expected to be finalized in the coming financial year.
3.4. Emerging Issues and Innovations
The Commission researches on emerging issues and new technologies in the postal, information and communications industry with a view to keeping abreast of new developments and inform review of its regulatory framework. In this regard, the Commission generated information papers on Technology and Persons with Disabilities, Principles of Network Neutrality, Software Defined Radios as well as Broadband Strategy during the year under review.
3.4.1. Technology and Persons with Disabilities
Disability is an umbrella term, covering impairments of body functions or structure, activity limitations and participation restrictions with regard to involvement in life situations. Technology on the other hand, is much more than lack of Internet or computer access. It involves all the communication tools and assistive devices enabling a person with a disability to be independent and an active participant in all areas of the community. The Technology and Persons with Disabilities study was aimed at addressing prevention of disability, rehabilitation and equalization of opportunities using technology.
3..4.2. Principles of Network Neutrality
Network neutrality (Net Neutrality) is a principle that refers to equal and non-discriminatory access to the Internet by all users through any device. It may also be referred to as Internet neutrality or open access. The study, titled Principles of Network Neutrality, examined the possible application of this principle in Kenya.
3.4.3. Software Defined Radios
A Software Defined Radio (SDR) is defined as “Radio in which some or all of the physical layer functions are software defined”. SDR is a radio communication system where components that have typically been implemented in hardware (e.g. mixers, filters, amplifiers, modulators /demodulators, detectors) are instead implemented using software on a personal computer or embedded computing devices. SDR has the potential to reduce costs by providing end-users with access to ubiquitous wireless communications - enabling them to communicate with whoever they need, whenever they need to and in whatever manner is appropriate.
Despite these benefits, SDR technology presents regulatory challenges as SDR stations can be remotely programmed and can transmit within a frequency band in which there is no allocation assignment. This flexibility in changing service and the associated licensed parameters could be subject to abuse or unintentional use. Further, due to the software implementation, equipment type approval ceases to be relevant. The study on the Software Defined Radios, therefore, sought to review these and other regulatory challenges and proposed various solutions.
CHAPTER 3: PROMOTING COMPETITION AND INNOVATION 38

3.4.4. Broadband Strategy
Recognizing that broadband is a key driver to economic growth and national competitiveness, and can contribute to social and cultural development, the Commission developed a paper on broadband strategy. The paper proposes policy and regulatory thrust focusing on how to replicate the mobile revolution in the broadband market.
As at the end of the year, there were ongoing studies on Internet Protocol (IP) Interconnection, Critical Information Infrastructure Protection (CIIP) and Public Key Infrastructure (PKI).
Amb. Bishar Hussein, Chairman UPU Council of Administration, addresses delegates during the 3rd Annual Postal Courier Forum
CCK Director General, Mr. Charles Njoroge, presents Telkom Kenya CEO Mikhael Ghossein with a frequency licence for 3G services
39CCK ANNUAL REPORT 2010-2011

CHAPTER 4Ensuring Compliance and Empowering Consumers
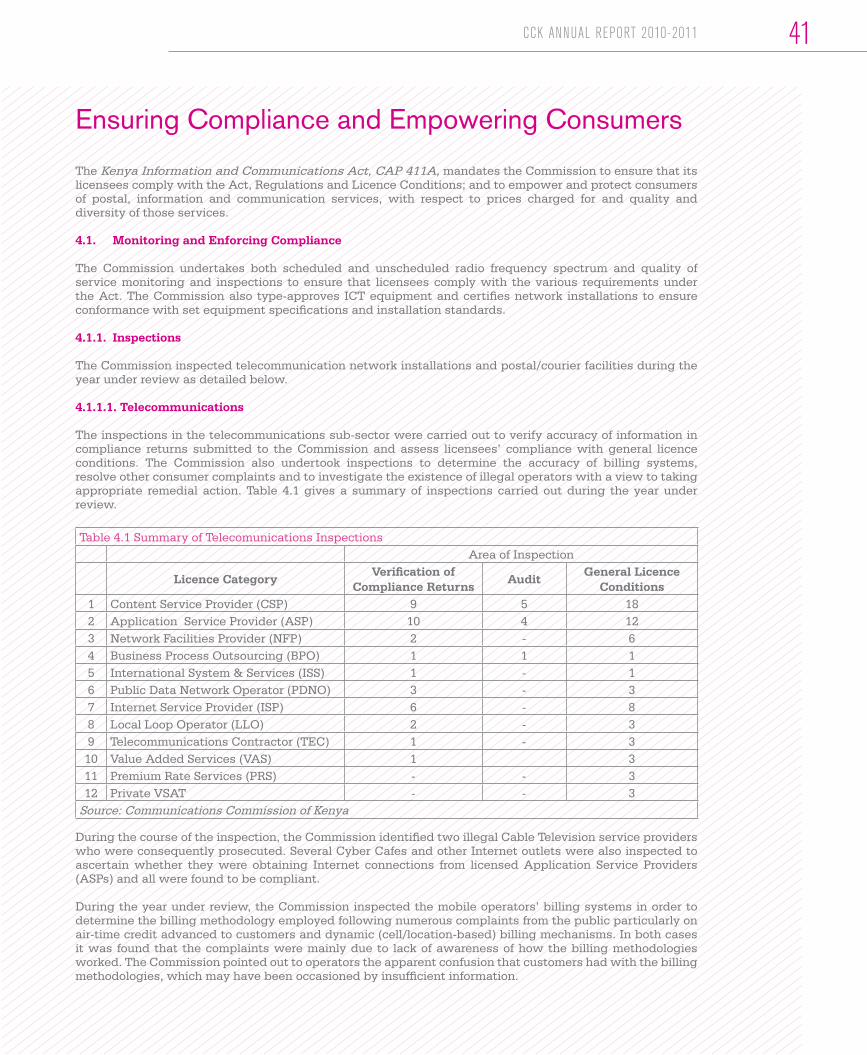
The Kenya Information and Communications Act, CAP 411A, mandates the Commission to ensure that its licensees comply with the Act, Regulations and Licence Conditions; and to empower and protect consumers of postal, information and communication services, with respect to prices charged for and quality and diversity of those services.
4.1. Monitoring and Enforcing Compliance
The Commission undertakes both scheduled and unscheduled radio frequency spectrum and quality of service monitoring and inspections to ensure that licensees comply with the various requirements under the Act. The Commission also type-approves ICT equipment and certifies network installations to ensure conformance with set equipment specifications and installation standards.
4.1.1. Inspections
The Commission inspected telecommunication network installations and postal/courier facilities during the year under review as detailed below.
4.1.1.1. Telecommunications
The inspections in the telecommunications sub-sector were carried out to verify accuracy of information in compliance returns submitted to the Commission and assess licensees’ compliance with general licence conditions. The Commission also undertook inspections to determine the accuracy of billing systems, resolve other consumer complaints and to investigate the existence of illegal operators with a view to taking appropriate remedial action. Table 4.1 gives a summary of inspections carried out during the year under review.
Table 4.1 Summary of Telecomunications InspectionsArea of Inspection
Licence CategoryVerification of
Compliance ReturnsAudit
General Licence Conditions
1 Content Service Provider (CSP) 9 5 182 Application Service Provider (ASP) 10 4 123 Network Facilities Provider (NFP) 2 - 64 Business Process Outsourcing (BPO) 1 1 15 International System & Services (ISS) 1 - 16 Public Data Network Operator (PDNO) 3 - 37 Internet Service Provider (ISP) 6 - 88 Local Loop Operator (LLO) 2 - 39 Telecommunications Contractor (TEC) 1 - 3
10 Value Added Services (VAS) 1 311 Premium Rate Services (PRS) - - 312 Private VSAT - - 3
Source: Communications Commission of Kenya
During the course of the inspection, the Commission identified two illegal Cable Television service providers who were consequently prosecuted. Several Cyber Cafes and other Internet outlets were also inspected to ascertain whether they were obtaining Internet connections from licensed Application Service Providers (ASPs) and all were found to be compliant.
During the year under review, the Commission inspected the mobile operators’ billing systems in order to determine the billing methodology employed following numerous complaints from the public particularly on air-time credit advanced to customers and dynamic (cell/location-based) billing mechanisms. In both cases it was found that the complaints were mainly due to lack of awareness of how the billing methodologies worked. The Commission pointed out to operators the apparent confusion that customers had with the billing methodologies, which may have been occasioned by insufficient information.
Ensuring Compliance and Empowering Consumers
41CCK ANNUAL REPORT 2010-2011
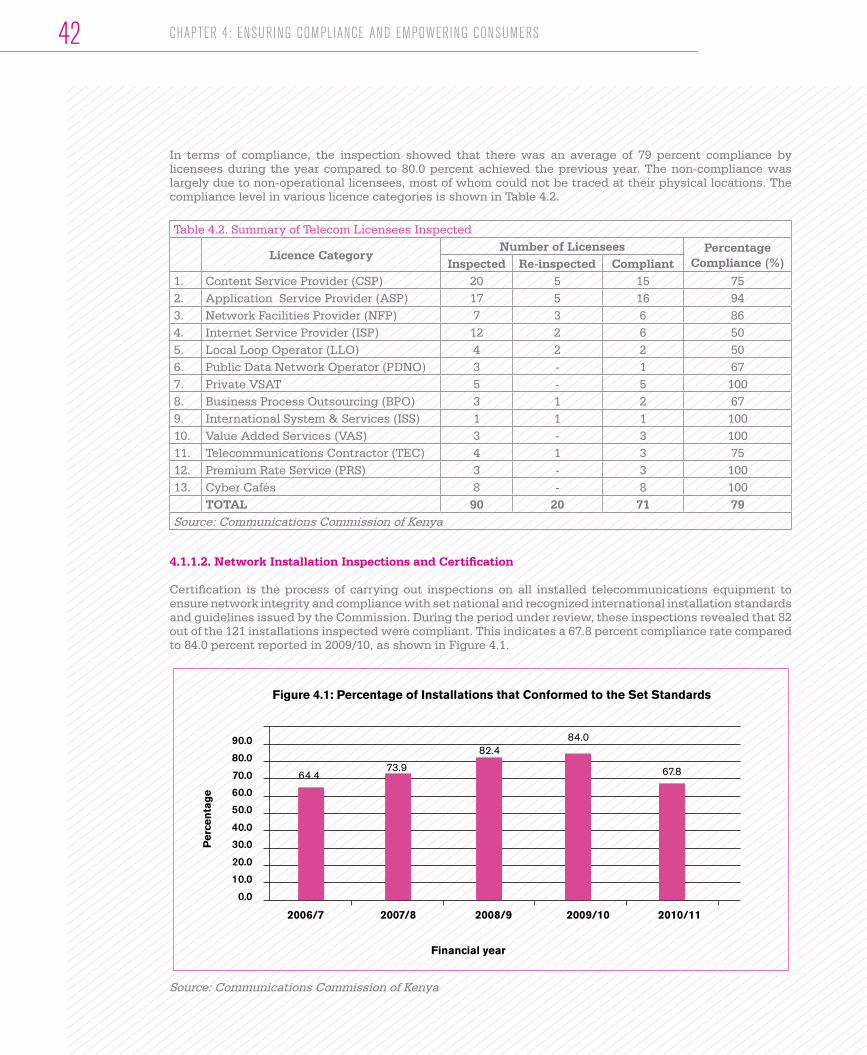
42
In terms of compliance, the inspection showed that there was an average of 79 percent compliance by licensees during the year compared to 80.0 percent achieved the previous year. The non-compliance was largely due to non-operational licensees, most of whom could not be traced at their physical locations. The compliance level in various licence categories is shown in Table 4.2.
Table 4.2. Summary of Telecom Licensees Inspected
Licence CategoryNumber of Licensees Percentage
Compliance (%)Inspected Re-inspected Compliant1. Content Service Provider (CSP) 20 5 15 752. Application Service Provider (ASP) 17 5 16 943. Network Facilities Provider (NFP) 7 3 6 864. Internet Service Provider (ISP) 12 2 6 505. Local Loop Operator (LLO) 4 2 2 506. Public Data Network Operator (PDNO) 3 - 1 677. Private VSAT 5 - 5 1008. Business Process Outsourcing (BPO) 3 1 2 679. International System & Services (ISS) 1 1 1 10010. Value Added Services (VAS) 3 - 3 10011. Telecommunications Contractor (TEC) 4 1 3 7512. Premium Rate Service (PRS) 3 - 3 10013. Cyber Cafés 8 - 8 100
TOTAL 90 20 71 79Source: Communications Commission of Kenya
4.1.1.2. Network Installation Inspections and Certification
Certification is the process of carrying out inspections on all installed telecommunications equipment to ensure network integrity and compliance with set national and recognized international installation standards and guidelines issued by the Commission. During the period under review, these inspections revealed that 82 out of the 121 installations inspected were compliant. This indicates a 67.8 percent compliance rate compared to 84.0 percent reported in 2009/10, as shown in Figure 4.1.
2006/7 2007/8 2008/9 2009/10 2010/11
Figure 4.1: Percentage of Installations that Conformed to the Set Standards
90.0
80.0
70.0
60.0
50.0
40.0
30.0
20.0
10.0
0.0
Financial year
64.473.9
82.484.0
67.8
Per
cen
tag
e
Source: Communications Commission of Kenya
CHAPTER 4: ENSURING COMPLIANCE AND EMPOWERING CONSUMERS

The 16.2 percentage point decline in the compliance rate could be attributed to an increase in number of installations done by unlicensed personnel.
Licensees whose installations were not compliant were directed to carry the requisite rectifications and inform the Commission upon completion for re-inspection while unlicensed personnel were warned and advised to apply for licences. Through public notices in the print media, the public was advised to only utilize services offered by licensed technical personnel. In addition, the Commission commenced the process of revising Guidelines for Installations of Telecommunication Equipment and its criteria of licensing Technical Personnel.
A total of 101 returns, 60 from telecommunications contractors and 41 from telecommunications technical personnel were received, analyzed and certificates issued to compliant licensees.
4.1.1.3. Radiocommunications
During the year, the Commission inspected a total of 645 radiocommunication networks up from 617 inspected the previous year. Table 4.3 gives a summary of inspections carried out.
Table 4.3: Number of Inspections Year 2006/07 2007/08 2008/09 2009/10 2010/11Land Mobile Networks 605 425 296 210 231Broadcast Transmitters 33 45 65 224 60Alarm Networks - - 149 183 176Fixed Link and Fixed Wireless Access (FWA) Sites - - - - 178Total 638 470 500 617 645Source: Communications Commission of Kenya
The inspections revealed that there was an improvement in compliance levels by licensees. In cases where non-compliance was identified, enforcement action was carried out which involved the issuance of violation notices to correct anomalies and the levying of penalties as prescribed in the L/C.
4.1.1.4. Postal and Courier Services
During the review period, inspection of postal and courier services was undertaken to confirm compliance with licence conditions and identify illegal operators. The Commission inspected a total of 109 postal and courier outlets countrywide out of which 80 percent (87 sites) were compliant. The licensees whose sites (22) were not compliant were directed to undertake corrective measures, which included displaying of tariffs and charging of correct tariffs. As at 30th June 2011, 80 percent of the previously non-compliant operators had complied.
The inspection also revealed a notable improvement in quality of service with mail largely being delivered within the stipulated standards. The number of licensees displaying service tariffs during the year rose to 90 percent from 80 percent the previous year. Furthermore, there were two illegal operators in Nairobi who were convicted for offering services without the requisite licences.
During the year under review, the number of postal and courier operators who submitted compliance returns increased to 109 from 50 the previous year. This could be attributed to sensitization exercises that were carried out among licensees.
4.1.2. Monitoring
4.1.2.1. Radiocommunications Monitoring
During the year ending 30th June 2011, there were a total of 39 cases of reported interference out of which the 33 were resolved.
43CCK ANNUAL REPORT 2010-2011

44
Table 4.4: Number of Frequency Interference CasesYear 2008/09 2009/10 2010/11
No. of CasesNo.
ResolvedNo. of Cases
No. Resolved
No. of Cases
No. Resolved
VHF, UHF and SHF 49 46 45 42 32 27HF 1 1 4 1 3 3Broadcasting 0 0 10 9 4 3Total 50 47 59 52 39 33Source: Communications Commission of Kenya
The six cases that remained unresolved were still undergoing investigation as some of these cases were reported in the last month of the financial year.
The Commission regularly undertakes frequency clearance to determine suitability and usage of a frequency band. During the year under review, a total number of 16 clearance cases were completed compared to 42 in the previous year. The frequencies in the HF, VHF and UHF frequency bands were cleared to facilitate assignment to private security firms, Government organs and diplomatic missions as shown in Table 4.5.
Table 4.5: Number of Frequency ClearancesYear 2008/09 2009/10 2010/11 V/U/SHF 37 39 15HF 7 3 1Total 44 42 16Source: Communications Commission of Kenya
4.1.2.2. Quality of Service Monitoring The Commission continued to exercise its regulatory mandate of protecting consumers by ensuring that they get quality telecommunications service. In this regard, quality of service monitoring was carried out on cellular mobile networks to verify compliance with the Quality of Service (QoS) targets in the operators’ licences and in response to consumer complaints. The measurements covered major towns, urban centres and highways/roads in the country. Where complaints were found to be genuine, operators were advised to improve quality of service in the affected areas. The results of the assessment and compliance status are summarized in the Table 4.7.
CHAPTER 4: ENSURING COMPLIANCE AND EMPOWERING CONSUMERS
The portable unit of the Quality of Service Monitoring System used to monitor quality of service in enclosed settings.
A visiting delegation follows explanations on the broadcasting logger at CCK offices.
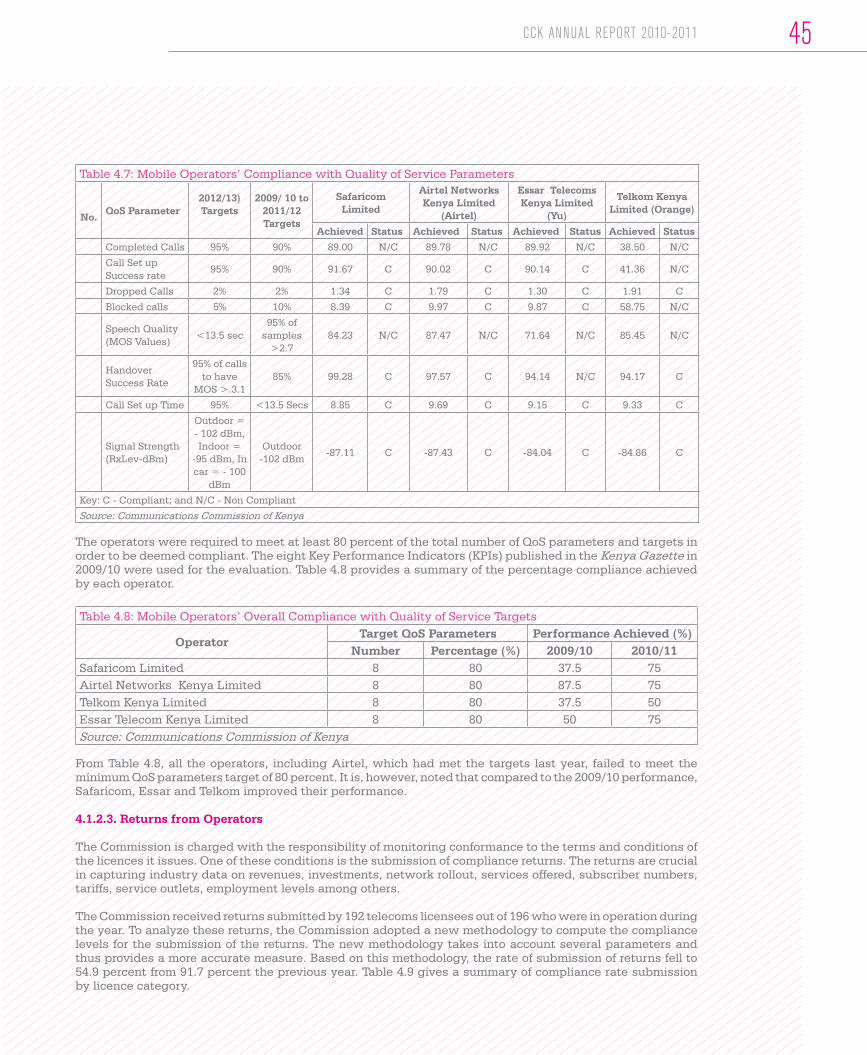
Table 4.7: Mobile Operators’ Compliance with Quality of Service Parameters
No.QoS Parameter
2012/13)Targets
2009/ 10 to 2011/12 Targets
Safaricom Limited
Airtel Networks Kenya Limited
(Airtel)
Essar Telecoms Kenya Limited
(Yu)
Telkom Kenya Limited (Orange)
Achieved Status Achieved Status Achieved Status Achieved StatusCompleted Calls 95% 90% 89.00 N/C 89.78 N/C 89.92 N/C 38.50 N/C
Call Set up Success rate
95% 90% 91.67 C 90.02 C 90.14 C 41.36 N/C
Dropped Calls 2% 2% 1.34 C 1.79 C 1.30 C 1.91 C
Blocked calls 5% 10% 8.39 C 9.97 C 9.87 C 58.75 N/C
Speech Quality (MOS Values)
<13.5 sec95% of
samples >2.7
84.23 N/C 87.47 N/C 71.64 N/C 85.45 N/C
Handover Success Rate
95% of calls to have
MOS >.3.185% 99.28 C 97.57 C 94.14 N/C 94.17 C
Call Set up Time 95% <13.5 Secs 8.85 C 9.69 C 9.15 C 9.33 C
Signal Strength (RxLev-dBm)
Outdoor = - 102 dBm, Indoor =
-95 dBm, In car = - 100
dBm
Outdoor -102 dBm
-87.11 C -87.43 C -84.04 C -84.86 C
Key: C - Compliant; and N/C - Non Compliant
Source: Communications Commission of Kenya
The operators were required to meet at least 80 percent of the total number of QoS parameters and targets in order to be deemed compliant. The eight Key Performance Indicators (KPIs) published in the Kenya Gazette in 2009/10 were used for the evaluation. Table 4.8 provides a summary of the percentage compliance achieved by each operator.
Table 4.8: Mobile Operators’ Overall Compliance with Quality of Service Targets
OperatorTarget QoS Parameters Performance Achieved (%)
Number Percentage (%) 2009/10 2010/11 Safaricom Limited 8 80 37.5 75Airtel Networks Kenya Limited 8 80 87.5 75Telkom Kenya Limited 8 80 37.5 50Essar Telecom Kenya Limited 8 80 50 75Source: Communications Commission of Kenya
From Table 4.8, all the operators, including Airtel, which had met the targets last year, failed to meet the minimum QoS parameters target of 80 percent. It is, however, noted that compared to the 2009/10 performance, Safaricom, Essar and Telkom improved their performance.
4.1.2.3. Returns from Operators
The Commission is charged with the responsibility of monitoring conformance to the terms and conditions of the licences it issues. One of these conditions is the submission of compliance returns. The returns are crucial in capturing industry data on revenues, investments, network rollout, services offered, subscriber numbers, tariffs, service outlets, employment levels among others.
The Commission received returns submitted by 192 telecoms licensees out of 196 who were in operation during the year. To analyze these returns, the Commission adopted a new methodology to compute the compliance levels for the submission of the returns. The new methodology takes into account several parameters and thus provides a more accurate measure. Based on this methodology, the rate of submission of returns fell to 54.9 percent from 91.7 percent the previous year. Table 4.9 gives a summary of compliance rate submission by licence category.
45CCK ANNUAL REPORT 2010-2011
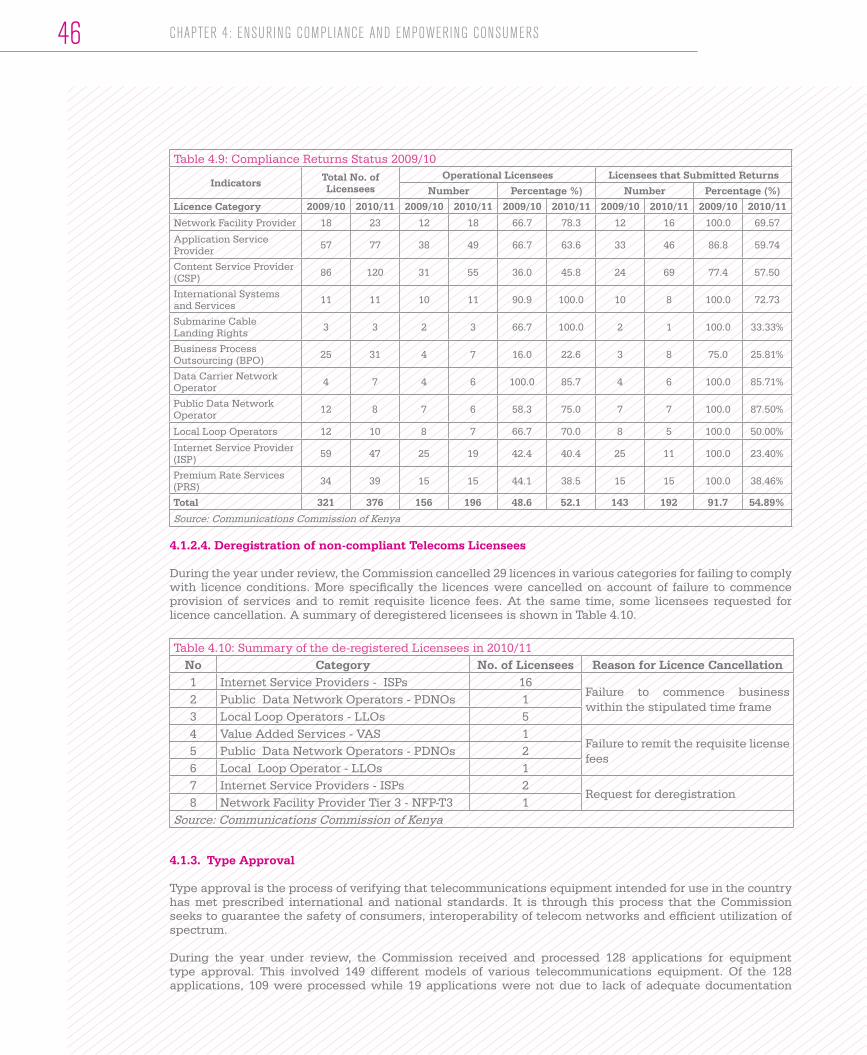
46
Table 4.9: Compliance Returns Status 2009/10
Indicators Total No. of Licensees
Operational Licensees Licensees that Submitted ReturnsNumber Percentage %) Number Percentage (%)
Licence Category 2009/10 2010/11 2009/10 2010/11 2009/10 2010/11 2009/10 2010/11 2009/10 2010/11
Network Facility Provider 18 23 12 18 66.7 78.3 12 16 100.0 69.57
Application Service Provider 57 77 38 49 66.7 63.6 33 46 86.8 59.74
Content Service Provider (CSP) 86 120 31 55 36.0 45.8 24 69 77.4 57.50
International Systems and Services 11 11 10 11 90.9 100.0 10 8 100.0 72.73
Submarine Cable Landing Rights 3 3 2 3 66.7 100.0 2 1 100.0 33.33%
Business Process Outsourcing (BPO) 25 31 4 7 16.0 22.6 3 8 75.0 25.81%
Data Carrier Network Operator 4 7 4 6 100.0 85.7 4 6 100.0 85.71%
Public Data Network Operator 12 8 7 6 58.3 75.0 7 7 100.0 87.50%
Local Loop Operators 12 10 8 7 66.7 70.0 8 5 100.0 50.00%
Internet Service Provider (ISP) 59 47 25 19 42.4 40.4 25 11 100.0 23.40%
Premium Rate Services (PRS) 34 39 15 15 44.1 38.5 15 15 100.0 38.46%
Total 321 376 156 196 48.6 52.1 143 192 91.7 54.89%
Source: Communications Commission of Kenya
4.1.2.4. Deregistration of non-compliant Telecoms Licensees
During the year under review, the Commission cancelled 29 licences in various categories for failing to comply with licence conditions. More specifically the licences were cancelled on account of failure to commence provision of services and to remit requisite licence fees. At the same time, some licensees requested for licence cancellation. A summary of deregistered licensees is shown in Table 4.10.
Table 4.10: Summary of the de-registered Licensees in 2010/11No Category No. of Licensees Reason for Licence Cancellation1 Internet Service Providers - ISPs 16
Failure to commence business within the stipulated time frame
2 Public Data Network Operators - PDNOs 13 Local Loop Operators - LLOs 54 Value Added Services - VAS 1
Failure to remit the requisite license fees
5 Public Data Network Operators - PDNOs 26 Local Loop Operator - LLOs 17 Internet Service Providers - ISPs 2
Request for deregistration8 Network Facility Provider Tier 3 - NFP-T3 1
Source: Communications Commission of Kenya
4.1.3. Type Approval
Type approval is the process of verifying that telecommunications equipment intended for use in the country has met prescribed international and national standards. It is through this process that the Commission seeks to guarantee the safety of consumers, interoperability of telecom networks and efficient utilization of spectrum.
During the year under review, the Commission received and processed 128 applications for equipment type approval. This involved 149 different models of various telecommunications equipment. Of the 128 applications, 109 were processed while 19 applications were not due to lack of adequate documentation
CHAPTER 4: ENSURING COMPLIANCE AND EMPOWERING CONSUMERS
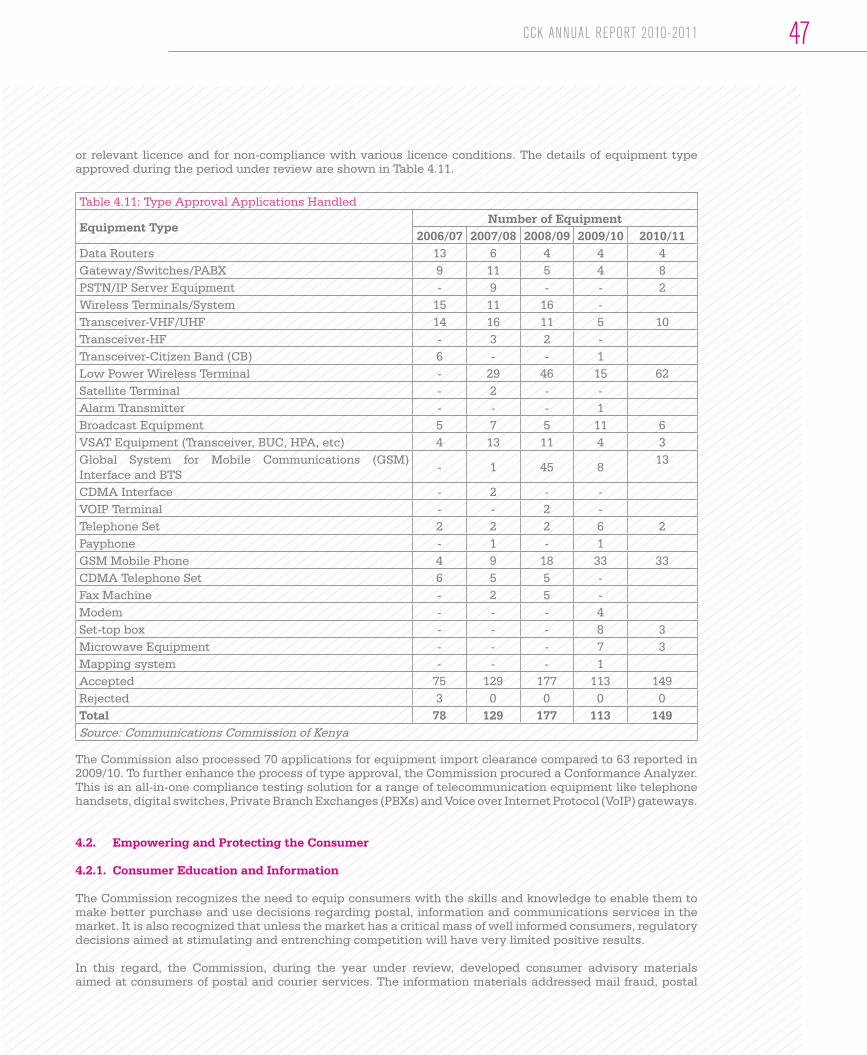
or relevant licence and for non-compliance with various licence conditions. The details of equipment type approved during the period under review are shown in Table 4.11.
Table 4.11: Type Approval Applications Handled
Equipment TypeNumber of Equipment
2006/07 2007/08 2008/09 2009/10 2010/11Data Routers 13 6 4 4 4Gateway/Switches/PABX 9 11 5 4 8PSTN/IP Server Equipment - 9 - - 2Wireless Terminals/System 15 11 16 -Transceiver-VHF/UHF 14 16 11 5 10Transceiver-HF - 3 2 -Transceiver-Citizen Band (CB) 6 - - 1Low Power Wireless Terminal - 29 46 15 62Satellite Terminal - 2 - -Alarm Transmitter - - - 1Broadcast Equipment 5 7 5 11 6VSAT Equipment (Transceiver, BUC, HPA, etc) 4 13 11 4 3Global System for Mobile Communications (GSM) Interface and BTS
- 1 45 813
CDMA Interface - 2 - -VOIP Terminal - - 2 -Telephone Set 2 2 2 6 2Payphone - 1 - 1GSM Mobile Phone 4 9 18 33 33CDMA Telephone Set 6 5 5 -Fax Machine - 2 5 -Modem - - - 4Set-top box - - - 8 3Microwave Equipment - - - 7 3Mapping system - - - 1Accepted 75 129 177 113 149Rejected 3 0 0 0 0Total 78 129 177 113 149Source: Communications Commission of Kenya
The Commission also processed 70 applications for equipment import clearance compared to 63 reported in 2009/10. To further enhance the process of type approval, the Commission procured a Conformance Analyzer. This is an all-in-one compliance testing solution for a range of telecommunication equipment like telephone handsets, digital switches, Private Branch Exchanges (PBXs) and Voice over Internet Protocol (VoIP) gateways.
4.2. Empowering and Protecting the Consumer
4.2.1. Consumer Education and Information
The Commission recognizes the need to equip consumers with the skills and knowledge to enable them to make better purchase and use decisions regarding postal, information and communications services in the market. It is also recognized that unless the market has a critical mass of well informed consumers, regulatory decisions aimed at stimulating and entrenching competition will have very limited positive results.
In this regard, the Commission, during the year under review, developed consumer advisory materials aimed at consumers of postal and courier services. The information materials addressed mail fraud, postal
47CCK ANNUAL REPORT 2010-2011
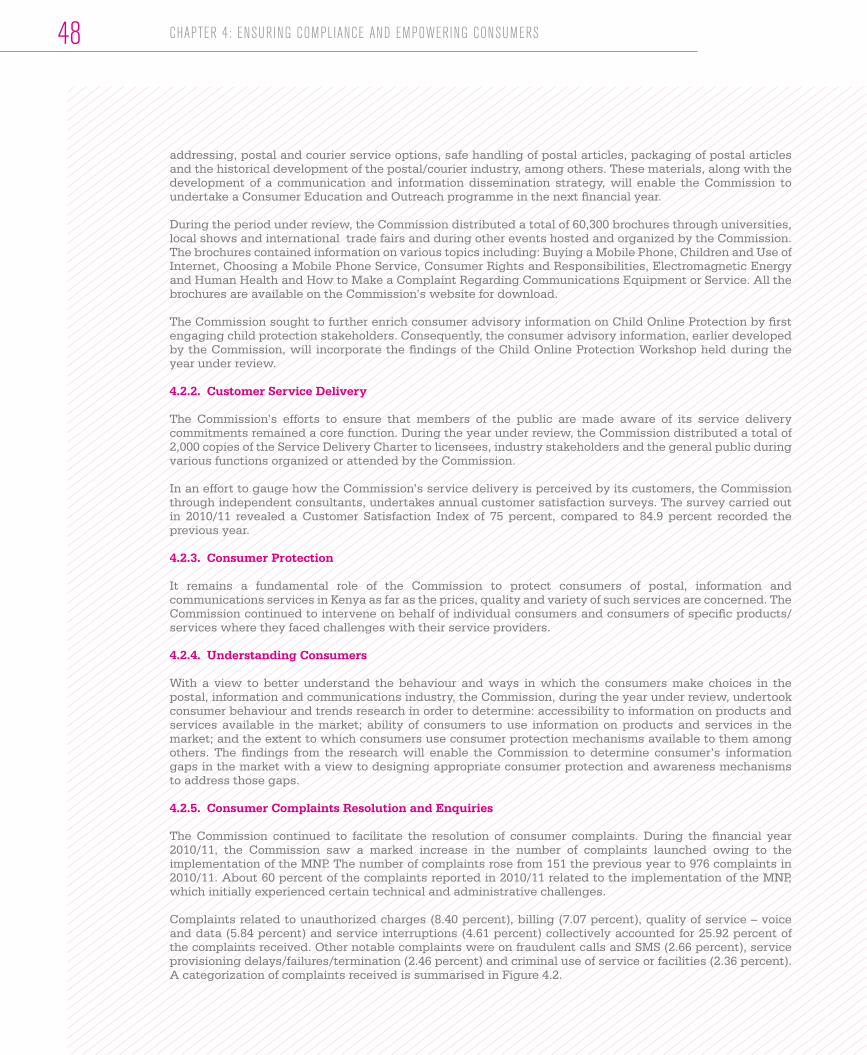
48
addressing, postal and courier service options, safe handling of postal articles, packaging of postal articles and the historical development of the postal/courier industry, among others. These materials, along with the development of a communication and information dissemination strategy, will enable the Commission to undertake a Consumer Education and Outreach programme in the next financial year.
During the period under review, the Commission distributed a total of 60,300 brochures through universities, local shows and international trade fairs and during other events hosted and organized by the Commission. The brochures contained information on various topics including: Buying a Mobile Phone, Children and Use of Internet, Choosing a Mobile Phone Service, Consumer Rights and Responsibilities, Electromagnetic Energy and Human Health and How to Make a Complaint Regarding Communications Equipment or Service. All the brochures are available on the Commission’s website for download.
The Commission sought to further enrich consumer advisory information on Child Online Protection by first engaging child protection stakeholders. Consequently, the consumer advisory information, earlier developed by the Commission, will incorporate the findings of the Child Online Protection Workshop held during the year under review.
4.2.2. Customer Service Delivery
The Commission’s efforts to ensure that members of the public are made aware of its service delivery commitments remained a core function. During the year under review, the Commission distributed a total of 2,000 copies of the Service Delivery Charter to licensees, industry stakeholders and the general public during various functions organized or attended by the Commission.
In an effort to gauge how the Commission’s service delivery is perceived by its customers, the Commission through independent consultants, undertakes annual customer satisfaction surveys. The survey carried out in 2010/11 revealed a Customer Satisfaction Index of 75 percent, compared to 84.9 percent recorded the previous year.
4.2.3. Consumer Protection
It remains a fundamental role of the Commission to protect consumers of postal, information and communications services in Kenya as far as the prices, quality and variety of such services are concerned. The Commission continued to intervene on behalf of individual consumers and consumers of specific products/services where they faced challenges with their service providers.
4.2.4. Understanding Consumers
With a view to better understand the behaviour and ways in which the consumers make choices in the postal, information and communications industry, the Commission, during the year under review, undertook consumer behaviour and trends research in order to determine: accessibility to information on products and services available in the market; ability of consumers to use information on products and services in the market; and the extent to which consumers use consumer protection mechanisms available to them among others. The findings from the research will enable the Commission to determine consumer’s information gaps in the market with a view to designing appropriate consumer protection and awareness mechanisms to address those gaps.
4.2.5. Consumer Complaints Resolution and Enquiries
The Commission continued to facilitate the resolution of consumer complaints. During the financial year 2010/11, the Commission saw a marked increase in the number of complaints launched owing to the implementation of the MNP. The number of complaints rose from 151 the previous year to 976 complaints in 2010/11. About 60 percent of the complaints reported in 2010/11 related to the implementation of the MNP, which initially experienced certain technical and administrative challenges.
Complaints related to unauthorized charges (8.40 percent), billing (7.07 percent), quality of service – voice and data (5.84 percent) and service interruptions (4.61 percent) collectively accounted for 25.92 percent of the complaints received. Other notable complaints were on fraudulent calls and SMS (2.66 percent), service provisioning delays/failures/termination (2.46 percent) and criminal use of service or facilities (2.36 percent). A categorization of complaints received is summarised in Figure 4.2.
CHAPTER 4: ENSURING COMPLIANCE AND EMPOWERING CONSUMERS
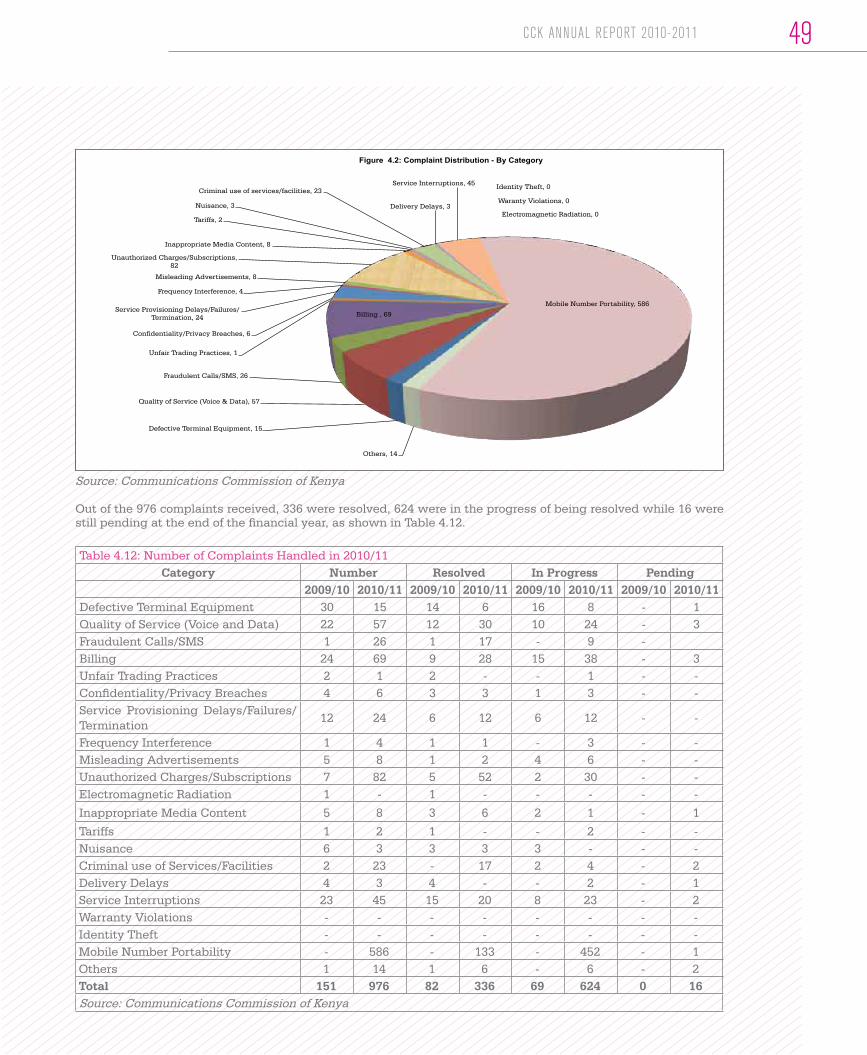
Defective Terminal Equipment, 15
Quality of Service (Voice & Data), 57
Fraudulent Calls/SMS, 26
Billing , 69
Unfair Trading Practices, 1
Confidentiality/Privacy Breaches, 6
Service Provisioning Delays/Failures/Termination, 24
Frequency Interference, 4
Misleading Advertisements, 8
Unauthorized Charges/Subscriptions, 82
Electromagnetic Radiation, 0
Inappropriate Media Content, 8
Tariffs, 2
Nuisance, 3
Criminal use of services/facilities, 23
Delivery Delays, 3 Waranty Violations, 0
Service Interruptions, 45 Identity Theft, 0
Mobile Number Portability, 586
Others, 14
Figure 4.2: Complaint Distribution - By Category
Source: Communications Commission of Kenya
Out of the 976 complaints received, 336 were resolved, 624 were in the progress of being resolved while 16 were still pending at the end of the financial year, as shown in Table 4.12.
Table 4.12: Number of Complaints Handled in 2010/11Category Number Resolved In Progress Pending
2009/10 2010/11 2009/10 2010/11 2009/10 2010/11 2009/10 2010/11Defective Terminal Equipment 30 15 14 6 16 8 - 1Quality of Service (Voice and Data) 22 57 12 30 10 24 - 3Fraudulent Calls/SMS 1 26 1 17 - 9 -Billing 24 69 9 28 15 38 - 3Unfair Trading Practices 2 1 2 - - 1 - -Confidentiality/Privacy Breaches 4 6 3 3 1 3 - -Service Provisioning Delays/Failures/Termination
12 24 6 12 6 12 - -
Frequency Interference 1 4 1 1 - 3 - -Misleading Advertisements 5 8 1 2 4 6 - -Unauthorized Charges/Subscriptions 7 82 5 52 2 30 - -Electromagnetic Radiation 1 - 1 - - - - -
Inappropriate Media Content 5 8 3 6 2 1 - 1
Tariffs 1 2 1 - - 2 - -Nuisance 6 3 3 3 3 - - -Criminal use of Services/Facilities 2 23 - 17 2 4 - 2Delivery Delays 4 3 4 - - 2 - 1Service Interruptions 23 45 15 20 8 23 - 2Warranty Violations - - - - - - - -Identity Theft - - - - - - - -Mobile Number Portability - 586 - 133 - 452 - 1Others 1 14 1 6 - 6 - 2Total 151 976 82 336 69 624 0 16Source: Communications Commission of Kenya
49CCK ANNUAL REPORT 2010-2011
50
The nature of the MNP complaints received by the Commission during the year under review included: consumer’s inability to receive calls and/or SMS’ from the network of former service provider; consumers ported without consent; consumer’s line being active on both the former and current network operator; and unethical marketing tactics to woo subscribers to port and attempted “win back” schemes by operators. The Commission resolved this matter by enforcing the Procedures and Guidelines for the Provision of Mobile Number Portability services in Kenya.
Complaints on unauthorized charges ranked second to MNP complaints. These complaints were attributed to increased violations of licence conditions by a number of CSPs, who appeared to have charged customers for content that was not requested for. The Commission facilitated refunds by the service providers in a number of cases and instituted measures that will lead to the streamlining of the provision of these services.
The overall complaints resolution rate was 34 percent in 2010/11 compared to 52 percent in 2009/10, respectively, as illustrated in Figure 4.3. The drop in the resolution rate was attributed to the large number of MNP complaints received during the last two months of the year, most of which were still undergoing resolution by the close of the year.
0
100
200
300
400
500
600
700
800
900
1000
Def
ecti
ve T
erm
inal
Eq
uip
men
t
Qua
lity
of S
ervi
ce (
Voi
ce &
Dat
a)
Frau
dul
ent
Cal
ls/S
MS
Bill
ing
Un
fair
Tra
din
g P
ract
ices
Con
fid
enti
alit
y/P
riva
cy B
reac
hes
Serv
ice
Pro
visi
onin
g D
elay
s/Fa
ilure
s/Te
rmin
atio
n
Freq
uen
cy I
nte
rfer
ence
Mis
lead
ing
Ad
vert
isem
ents
Un
auth
oriz
ed C
harg
es/S
ubsc
rip
tion
s
Ele
ctro
mag
net
ic R
adia
tion
Inap
pro
pri
ate
Med
ia C
onte
nt
Tari
ffs
Nui
san
ce
Cri
min
al u
se o
f ser
vice
s/fa
cilit
ies
Del
iver
y D
elay
s
War
anty
Vio
lati
ons
Serv
ice
Inte
rrup
tion
s
Iden
tity
The
ft
Mob
ile N
umb
er P
orta
bili
ty
Oth
ers
Tota
l
15
57
26
69
1 6 24
4 8
82
0 8 2 3 23
3 0
45
0
586
14
976
6 30
17 28 0 3 12 1 2
52
0 6 0 3 17
0 0 20
0
133
6
336
Nu
mb
er o
f C
omp
lain
ts
Figure 4.3 Complaint Resolution Rate - By Category
Received Resolved
Figure 4.3 Complaints Resolution Rate - By Category
Source: Communications Commission of Kenya
During the period under review, a total of 52 consumer enquiries were recorded most of which were related to the Commission’s services (32.7 percent) and broadcasting (23.1 percent) while enquiries on issues not relevant to the Commission accounted for 17.3 percent. Figure 4.4 provides more details on the consumer enquiries handled by the Commission in 2010/11.
CHAPTER 4: ENSURING COMPLIANCE AND EMPOWERING CONSUMERS

0
2
4
6
8
10
12
14
16
18
Freq
uen
cy
Ele
ctro
nic
Com
mer
ce
Bro
adca
stin
g
Com
mis
sion
's S
ervi
ces
Cou
rier
Ser
vice
s
Safe
Use
of F
acili
ties
an
d S
ervi
ces
Sub
scri
ber
Con
fid
enti
alit
y
Post
al S
ervi
ces
Dis
char
ge
of t
he C
omm
issi
on's
Man
dat
e
Mob
ile N
umb
er P
orta
bili
ty
Man
dat
e of
Com
mis
sion
Oth
ers
2 1
12
17
0
2 1
0
5
3
0
9
Nu
mb
er o
f In
qu
irie
s
Category of Inquiry
Figure 4.4: Number of Enquiries by Category
Source: Communications Commission of Kenya
Out of a total of 52 consumer enquiries received during the period under review, 80.8 percent were responded to, compared to 39 enquiries received in the previous year of which 94.9 percent were responded to as shown in Table 4.13.
Table 4.13: Number of Enquiries Handled in 2010/11
Category Number Resolved In Progress Pending
2009/10 2010/11 2009/10 2010/11 2009/10 2010/11 2009/10 2010/11Frequency 0 2 0 0 0 1 0 1E-Commerce 1 1 1 1 0 0 0 0Broadcasting 10 12 8 9 2 3 0 0Commission’s Services 7 17 7 16 0 1 0 0Courier Services 0 0 0 0 0 0 0 0Safe use of Facilities and Services 4 2 4 0 0 2 0 0Subscriber Confidentiality 1 1 1 1 0 0 0 0Postal Services 0 0 0 0 0 0 0 0Commission’s discharge of its mandate
2 5 2 4 0 1 0 0
Mobile Number Portability (MNP) 0 3 0 3 0 0 0 0Mandate of Commission 0 0 0 0 0 0 0 0Others 14 9 14 8 0 1 0 0Total 39 52 37 42 2 9 0 1As a Percentage of the Total Number of Complaints
100% 100% 94.9% 80.8% 5.1% 17.3% 0.0% 1.9%
Source: Communications Commission of Kenya
51CCK ANNUAL REPORT 2010-2011

The Kenya Information and Communications Act, CAP 411A, mandates the Commission to license broadcasting services, regulate content and resolve complaints regarding broadcasting services. During the year under review, the Commission inducted the Broadcasting Complaints Advisory Council (BCAC) on the Broadcasting Code of Practice. The role of BCAC is to advise the Commission’s Board on mechanisms of handling broadcasting complaints, administration of the broadcasting content aspects, and monitor broadcasters’ compliance with Broadcasting Code and Ethics. Further, the Commission processed queries on digital TV broadcasting services to prepare the country for smooth transition to digital TV broadcasting.
4.2.6. Environment, Health and Safety
The Internet revolution has had its positive impact in the society. Similarly, the society has also seen the detriments that the Internet can cause. In 2010/11, the Commission sought to create awareness on Child Online Protection by holding a stakeholder workshop on the subject. The workshop with the theme “Protecting Children in Cyberspace: Whose Responsibility Is It?.” brought together Government agencies, research organizations, academic institutions, consumer organizations, and the media to create awareness on child online protection and propose a way forward with regard to addressing the various issues, including the development of a framework, relating to children’s safety in cyberspace.
CHAPTER 4: ENSURING COMPLIANCE AND EMPOWERING CONSUMERS
Participants from Thawabu Primary School at the Child Online Protection workshop
52

53
CHAPTER 5Roadmap to Universal Access

The recognition of postal, information and communications industry as a key catalyst towards the realisation of Vision 2030 places Universal Access among the key development priorities for the country. The Universal Service Fund (USF) was established with a view to facilitating widespread access to postal, information and communications services and to promote innovation and capacity building in the ICT industry. The Kenya Information and Communications Act, Cap 411A, vests the Commission with a strategic role to manage and administer the Fund.
During the year under review, the Commission undertook a number of initiatives aimed at realising universal access to postal, information and communications services. These initiatives were the institutionalization and operationalization of the Fund, identification of access gaps through studies and the implementation of universal access projects on a pilot basis.
5.1. Institutionalization of the Universal Service Fund
The Kenya Information and Communications (Universal Access and Service) Regulations, 2010, require all licensees operating on commercial basis to contribute to the USF. During the year under review, the Commission set 1st January 2011 as the date of commencement of contributions to the Fund and notified all commercial licensees accordingly.
5.2. Operationalization of Universal Service Fund
In order to achieve transparency and promote accountability in the management and administration of the Universal Service Fund (USF), the Commission initiated the development of an operation manual. The manual will provide the administrative framework and guidelines on processes including selection criteria of USF projects and Fund disbursement mechanisms.
5.3. Studies
The Commission is mandated to address the challenges that the postal, information and communications industry faces including network roll-out, accessibility, affordability, capacity building and innovation within an enabling framework. In order to ensure that the USF meets its objectives, the Commission, during the year under review, concluded two studies that were aimed at assisting the Commission develop and implement effective, targeted and sustainable universal access programmes. These studies, which commenced in 2009/10, were the National ICT Survey and the ICT Access Gap Study.
5.3.1. The National ICT Survey
The National ICT Survey, which was conducted for the Commission by the Kenya National Bureau of Statistics (KNBS), provided critical inputs into the ICT Access Gaps Study. Further, the survey provided data on the usage of postal, information and communications services in the country.
5.3.2. The ICT Access Gaps Study
During the year under review, significant milestones were achieved in the Access Gap Study which was carried out by an independent consultant on behalf of the Commission. The study identified the access gaps in postal, voice and data services in the country. It also developed an access model that identified subsidy requirements to leverage high cost areas. The findings of the study will be shared with the industry in the next financial year.
5.4. Universal Access Pilot Projects
The Commission has been implementing a number of pilot projects which include a Web Portal for Persons with Disabilities (PWDs) and E-Resource Centres to provide a learning ground for future national roll out of similar projects.
5.4.1. Web Portal for Persons with Disabilities
During the year under review, the Commission made significant inroads into ICT access for PWDs. Recognizing that 3 million PWDs in the country face challenges in accessing information, the Commission in collaboration with United Disabled Persons of Kenya (UDPK) and the National Council for Persons with Disabilities (NCPWDs) provided support towards the establishment of a national Web Portal for PWDs.
The website will be a one-stop information services and communications channel that will support everyone involved in the disability field – persons with disabilities, caregivers, and those offering services to this special group.
The project aims at providing PWDs with an opportunity to participate in socio-economic development while allowing them to improve the quality of their lives by sharing experiences and accessing information irrespective of their geographic location. Through this project, Kenya joins such countries as South Africa and several West European countries that have taken the initiative to institute national web portals for their PWDs. Figure 3 shows a workshop for PWDs sponsored by the Commission to deliberate on the structure and content of the web portal.
CHAPTER 5: ROADMAP TO UN IVERSAL ACCESS
Roadmap to Universal Access
54

Participants in Persons With Disabilities Workshop sponsored by the Commission.
5.4.2. E-Resource Centres
Consistent with the strategic objective of facilitating increased access to postal, information and communication services through the establishment of public access points, the Commission entered into partnership with the Kenya National Library Services (KNLS) to set up e-Resource Centres in 10 rural community libraries located in Ditzoni, Kwale, Lagam, Habasweni, Mwingi, Muranga, Lusumu, Laikipia, Mandera and Werugha.
Kwale Community Library, Ukunda, South Coast.
Under this project the Commission supported the supply, delivery and installation of computer hardware and software including two-year Internet connectivity to the libraries. The libraries are expected to open the world and help build capacity for the local communities.
55CCK ANNUAL REPORT 2010-2011

CHAPTER 6Capacity-building, Improvement of Systems and Working Environment
For improved service delivery, it is critical that organizations strive to remain highly productive, adaptive and innovative. In this vein, the Commission continued to develop human capital, modernize the working environment, upgrade its quality management system and enhance its risk management whilst ensuring optimum utilization of its capacity and resources.
6.1. Human Capital Development
With the rapid change and complexity that characterizes the postal, information and communications industry, there is an ever-increasing demand to keep abreast with the innovations and emerging technologies in the industry. It is, therefore, necessary to invest in human capital to ensure synchrony with the dynamism in the industry. To this end, the Commission trains its staff and provides capacity-building opportunities for both industry and academia.
6.1.1. Human Resource Development
Taking cognizance of the need to retain a highly skilled and knowledgeable team, the Commission continued to implement its training and development policy. The policy is based on a well-designed Training Needs Assessment (TNA) coupled with an attractive employee career development and growth plan.
During the year under review, the total number of the Commission’s staff stood at 150, of which 40 percent were female. Commission staff were trained in a total of 139 courses of which 76 were on management, 25 on technical, 12 on leadership and governance, and 26 on development-related disciplines. The total number of staff trained in the year 2010/11 represented 92.7 percent of the workforce compared to 80.3 percent the previous year. This comprised 42 percent female and 58 percent male compared to 45 percent and 55 percent respectively who were trained in 2009/10.
During the period under review, the Commission revised its Service Delivery Charter with the participation of staff at various levels. The Commission also trained staff on the Charter. These initiatives were aimed at inculcating a culture of ownership of the Service Charter and enhancing service delivery standards among others. Other courses in which the Commission’s employees were trained included professional, integrity and procurement.
The job evaluation report which was finalized and submitted to the Commission by an independent consultant at the end of the financial year 2009/10 was considered by the Commission’s Management
during the year under review. The recommendations of the report will further be considered by the Board in 2011/12. It is recognized that a successful job evaluation exercise will translate into job enrichment; strategic rewards; competitive terms and conditions of service that attract, motivate and retain highly skilled staff.
The Commission will also update its organization structure in tandem with its expanded mandate, the country’s development strategy, Vision 2030, and the new Constitution.
6.1.2. Knowledge Transfer between Industry and Academia
The Commission continued to facilitate knowledge transfer between industry and academia in line with its policy of providing attachment and internship opportunities to students. Towards this end, 45 students comprising 41 percent female and 59 percent male were attached to the Commission. The students were drawn from local and regional private and public universities and other tertiary institutions. Most of these students were pursuing undergraduate programmes in engineering, commerce, finance, ICT, human resources, law, communication and public relations, economics and statistics. Additionally, three groups of college students were hosted on one-day familiarization visits to the Commission.
In order to leverage and bridge the gap between theory and practice, the Commission participated in curriculum development of the ICT sector in conjunction with the Directorate of Personnel Management (DPM) under the Ministry of Public Service. The curriculum developed was harmonized into the syllabus for the Diploma in Telecommunications Operation to be rolled out in Government Training Institutes.
6.1.3. Promoting Capacity-building in the Industry
The Commission collaborated with various bilateral donors/bodies such as the International Telecommunication Union (ITU), Commonwealth Telecommunications Organization (CTO), and the Universal Postal Union (UPU) in bridging the digital divide in Kenya. During the year under review, the Commission, in collaboration with its partners, conducted five capacity-building programmes for the industry. The programmes were: WIMAX; Beyond 4G Technologies; Market-based Spectrum Pricing; Talent Management and Business Continuity Process. The participants in these programmes were drawn from the industry, the Commission and other stakeholders.
Capacity-building, Improvement of Systems and Working Environment
57CCK ANNUAL REPORT 2010-2011

58
6.2. Improvement of the Working Environment
In a bid to ensure that its workforce is adaptive and motivated to change, the Commission embarked on structural and environmental changes to enhance efficiency through continuous improvement of its health, safety and environmental protocols. The Commission also maintained a corruption-free working environment to enhance productivity, efficiency and improve service delivery. The Commission also carried out staff and work environment satisfaction surveys.
6.2.1. Occupational Health and Safety
During the year under review, the Commission continued to improve the working environment both within and outside to enhance creativity and productivity. Potted plants were procured for the open work offices to improve the ambience. Obsolete items were disposed of, and office equipment and machinery serviced. The Commission’s property was well maintained through renewal of maintenance contracts and a car park shade was constructed for the Commission’s radio equipment vehicles.
To mitigate risk during power outages, the Commission embarked on the design and construction of an underground generator fuel tank at the Commission’s Headquarter premises. Further, the Commission, in line with its Health and Environmental Policy, ran an in-house training for its staff on fire safety including fire drills.
6.2.2. Campaign against HIV/AIDS
The Commission is committed to the fight against HIV/AIDS. During the year under review, specific emphasis was placed on prevention of HIV/AIDS infections. In this regard, the Commission in collaboration with the National Aids Control Council (NACC) carried out a sensitization workshop on Behaviour Change and Prevention of Mother to Child Transmission of HIV.
The Commission also set aside a budgetary allocation for HIV/AIDS campaign that was utilized in staff sensitization, and home and work place treatment. Its Peer Educators actively participated in the HIV/AIDS World Day.
6.2.3. Anti-Corruption Strategies
The Commission continued to ensure that it remains a corruption-free environment. During the period under review, the Commission continued to implement the Corruption Prevention plans and strategies coordinated by the Corruption Prevention and Integrity committees. Continuous awareness and sensitization was made available to staff through the use of the CCK Electronic Bulletin and
Intranet.
The Commission’s Management was trained on Integrity Testing, and one member of staff was appointed as an Integrity Programme Officer as a link with Kenya Anti Corruption Commission (KACC) in the establishment of the Integrity Testing Programme. The Commission engaged an independent consultant to carry out a Corruption Perception Survey. The survey results indicated that the prevalence of corruption at the Commission was low. The Commission will continue to pursue measures aimed at curbing corruption.
6.2.4. Prevention of Drug and Substance Abuse
The Commission continued to implement its Workplace Policy on Alcohol and Drug Abuse. During the year, the Commission contracted the National Campaign Against Drug Abuse Authority (NACADAA) to carry a baseline survey to establish the prevalence of alcohol and drug abuse at the workplace. The findings of the survey showed low prevalence of alcohol and drug abuse. The Commission’s employees were also sensitized and trained on drugs and substance abuse.
6.2.5. Gender and Disability Mainstreaming
The Commission’s policy on mainstreaming Persons with Disabilities (PWDs) is anchored on the Persons with Disabilities Act 2003. The policy reiterates the Commission’s commitment to being an equal opportunity employer and endeavours to promote inclusion in all its activities. The policy also seeks to address the barriers that may exclude people with disabilities from full and equal participation.
Through the National Council for Persons with Disabilities (NCPD), the Commission’s employees were trained on the provision of services to Persons with Disabilities (PWDs) and Disability Mainstreaming. The Commission also facilitated training to institutions and schools for PWDs under its Universal Service programme.
In mainstreaming gender, the Commission continued implementing its Gender Policy, by reviewing the gender distribution spread in its various committees to promote gender equity and balance during the main year. Further, employees were sensitized on gender streaming and a baseline survey to determine the level of Gender Mainstreaming in the Commission was conducted by an independent consultant. The results of the survey indicated that the staff composition at the Commission was relatively balanced in terms of gender with 40 percent being female and 60 percent male in line with the Constitutional requirement.
CHAPTER 6: CAPACITY-BU ILDING, IMPROVEMENT OF SYSTEMS AND WORKING ENVIRONMENT
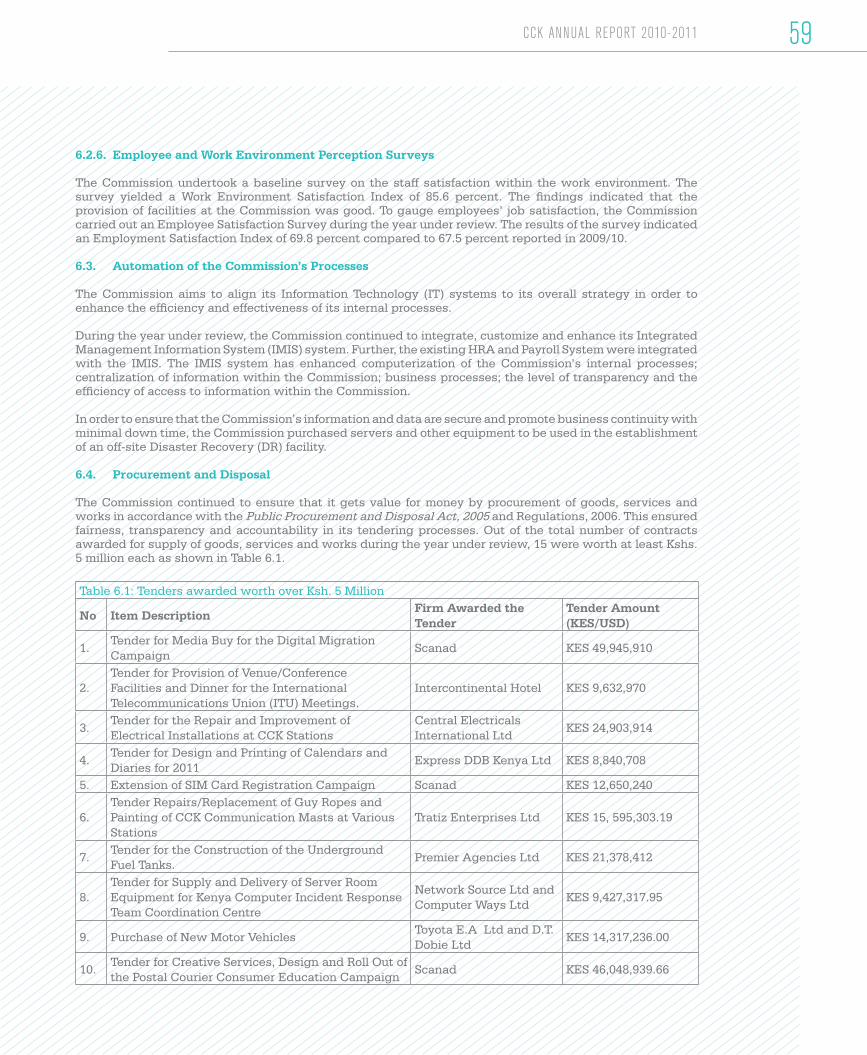
6.2.6. Employee and Work Environment Perception Surveys
The Commission undertook a baseline survey on the staff satisfaction within the work environment. The survey yielded a Work Environment Satisfaction Index of 85.6 percent. The findings indicated that the provision of facilities at the Commission was good. To gauge employees’ job satisfaction, the Commission carried out an Employee Satisfaction Survey during the year under review. The results of the survey indicated an Employment Satisfaction Index of 69.8 percent compared to 67.5 percent reported in 2009/10.
6.3. Automation of the Commission’s Processes
The Commission aims to align its Information Technology (IT) systems to its overall strategy in order to enhance the efficiency and effectiveness of its internal processes.
During the year under review, the Commission continued to integrate, customize and enhance its Integrated Management Information System (IMIS) system. Further, the existing HRA and Payroll System were integrated with the IMIS. The IMIS system has enhanced computerization of the Commission’s internal processes; centralization of information within the Commission; business processes; the level of transparency and the efficiency of access to information within the Commission.
In order to ensure that the Commission’s information and data are secure and promote business continuity with minimal down time, the Commission purchased servers and other equipment to be used in the establishment of an off-site Disaster Recovery (DR) facility.
6.4. Procurement and Disposal
The Commission continued to ensure that it gets value for money by procurement of goods, services and works in accordance with the Public Procurement and Disposal Act, 2005 and Regulations, 2006. This ensured fairness, transparency and accountability in its tendering processes. Out of the total number of contracts awarded for supply of goods, services and works during the year under review, 15 were worth at least Kshs. 5 million each as shown in Table 6.1.
Table 6.1: Tenders awarded worth over Ksh. 5 Million
No Item DescriptionFirm Awarded the Tender
Tender Amount (KES/USD)
1.Tender for Media Buy for the Digital Migration Campaign
Scanad KES 49,945,910
2.Tender for Provision of Venue/Conference Facilities and Dinner for the International Telecommunications Union (ITU) Meetings.
Intercontinental Hotel KES 9,632,970
3.Tender for the Repair and Improvement of Electrical Installations at CCK Stations
Central Electricals International Ltd
KES 24,903,914
4.Tender for Design and Printing of Calendars and Diaries for 2011
Express DDB Kenya Ltd KES 8,840,708
5. Extension of SIM Card Registration Campaign Scanad KES 12,650,240
6.Tender Repairs/Replacement of Guy Ropes and Painting of CCK Communication Masts at Various Stations
Tratiz Enterprises Ltd KES 15, 595,303.19
7.Tender for the Construction of the Underground Fuel Tanks.
Premier Agencies Ltd KES 21,378,412
8.Tender for Supply and Delivery of Server Room Equipment for Kenya Computer Incident Response Team Coordination Centre
Network Source Ltd and Computer Ways Ltd
KES 9,427,317.95
9. Purchase of New Motor VehiclesToyota E.A Ltd and D.T. Dobie Ltd
KES 14,317,236.00
10.Tender for Creative Services, Design and Roll Out of the Postal Courier Consumer Education Campaign
Scanad KES 46,048,939.66
59CCK ANNUAL REPORT 2010-2011
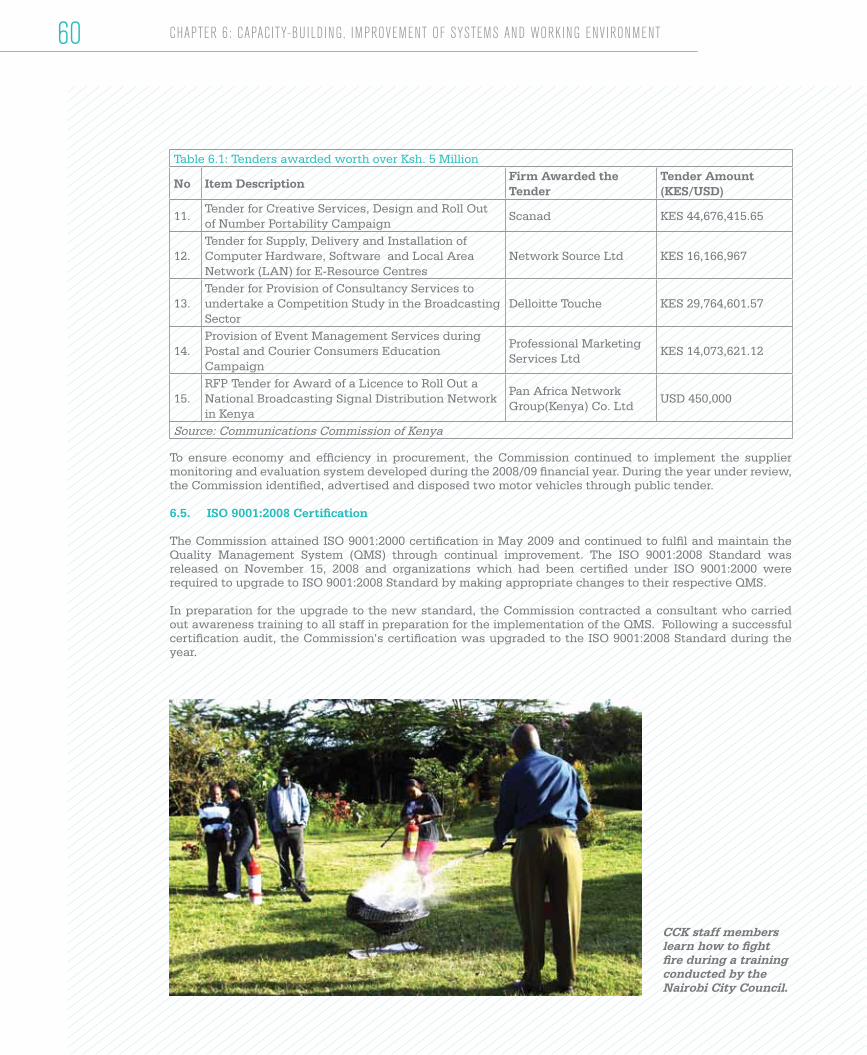
Table 6.1: Tenders awarded worth over Ksh. 5 Million
No Item DescriptionFirm Awarded the Tender
Tender Amount (KES/USD)
11.Tender for Creative Services, Design and Roll Out of Number Portability Campaign
Scanad KES 44,676,415.65
12.Tender for Supply, Delivery and Installation of Computer Hardware, Software and Local Area Network (LAN) for E-Resource Centres
Network Source Ltd KES 16,166,967
13.Tender for Provision of Consultancy Services to undertake a Competition Study in the Broadcasting Sector
Delloitte Touche KES 29,764,601.57
14.Provision of Event Management Services during Postal and Courier Consumers Education Campaign
Professional Marketing Services Ltd
KES 14,073,621.12
15.RFP Tender for Award of a Licence to Roll Out a National Broadcasting Signal Distribution Network in Kenya
Pan Africa Network Group(Kenya) Co. Ltd
USD 450,000
Source: Communications Commission of Kenya
To ensure economy and efficiency in procurement, the Commission continued to implement the supplier monitoring and evaluation system developed during the 2008/09 financial year. During the year under review, the Commission identified, advertised and disposed two motor vehicles through public tender.
6.5. ISO 9001:2008 Certification
The Commission attained ISO 9001:2000 certification in May 2009 and continued to fulfil and maintain the Quality Management System (QMS) through continual improvement. The ISO 9001:2008 Standard was released on November 15, 2008 and organizations which had been certified under ISO 9001:2000 were required to upgrade to ISO 9001:2008 Standard by making appropriate changes to their respective QMS.
In preparation for the upgrade to the new standard, the Commission contracted a consultant who carried out awareness training to all staff in preparation for the implementation of the QMS. Following a successful certification audit, the Commission’s certification was upgraded to the ISO 9001:2008 Standard during the year.
CHAPTER 6: CAPACITY-BU ILDING, IMPROVEMENT OF SYSTEMS AND WORKING ENVIRONMENT
CCK staff members learn how to fight fire during a training conducted by the Nairobi City Council.
60

61
CHAPTER 7Corporate Communication and International Liaison
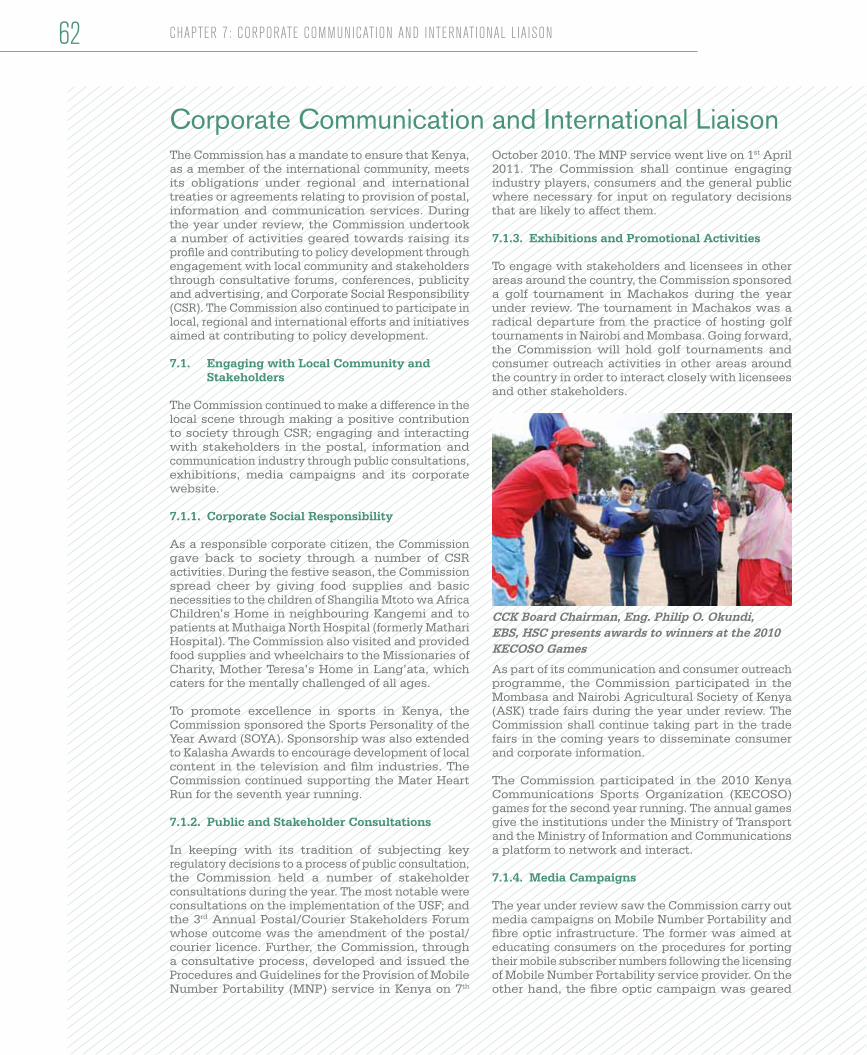
62
The Commission has a mandate to ensure that Kenya, as a member of the international community, meets its obligations under regional and international treaties or agreements relating to provision of postal, information and communication services. During the year under review, the Commission undertook a number of activities geared towards raising its profile and contributing to policy development through engagement with local community and stakeholders through consultative forums, conferences, publicity and advertising, and Corporate Social Responsibility (CSR). The Commission also continued to participate in local, regional and international efforts and initiatives aimed at contributing to policy development.
7.1. Engaging with Local Community and Stakeholders
The Commission continued to make a difference in the local scene through making a positive contribution to society through CSR; engaging and interacting with stakeholders in the postal, information and communication industry through public consultations, exhibitions, media campaigns and its corporate website.
7.1.1. Corporate Social Responsibility
As a responsible corporate citizen, the Commission gave back to society through a number of CSR activities. During the festive season, the Commission spread cheer by giving food supplies and basic necessities to the children of Shangilia Mtoto wa Africa Children’s Home in neighbouring Kangemi and to patients at Muthaiga North Hospital (formerly Mathari Hospital). The Commission also visited and provided food supplies and wheelchairs to the Missionaries of Charity, Mother Teresa’s Home in Lang’ata, which caters for the mentally challenged of all ages.
To promote excellence in sports in Kenya, the Commission sponsored the Sports Personality of the Year Award (SOYA). Sponsorship was also extended to Kalasha Awards to encourage development of local content in the television and film industries. The Commission continued supporting the Mater Heart Run for the seventh year running.
7.1.2. Public and Stakeholder Consultations
In keeping with its tradition of subjecting key regulatory decisions to a process of public consultation, the Commission held a number of stakeholder consultations during the year. The most notable were consultations on the implementation of the USF; and the 3rd Annual Postal/Courier Stakeholders Forum whose outcome was the amendment of the postal/courier licence. Further, the Commission, through a consultative process, developed and issued the Procedures and Guidelines for the Provision of Mobile Number Portability (MNP) service in Kenya on 7th
October 2010. The MNP service went live on 1st April 2011. The Commission shall continue engaging industry players, consumers and the general public where necessary for input on regulatory decisions that are likely to affect them.
7.1.3. Exhibitions and Promotional Activities
To engage with stakeholders and licensees in other areas around the country, the Commission sponsored a golf tournament in Machakos during the year under review. The tournament in Machakos was a radical departure from the practice of hosting golf tournaments in Nairobi and Mombasa. Going forward, the Commission will hold golf tournaments and consumer outreach activities in other areas around the country in order to interact closely with licensees and other stakeholders.
As part of its communication and consumer outreach programme, the Commission participated in the Mombasa and Nairobi Agricultural Society of Kenya (ASK) trade fairs during the year under review. The Commission shall continue taking part in the trade fairs in the coming years to disseminate consumer and corporate information.
The Commission participated in the 2010 Kenya Communications Sports Organization (KECOSO) games for the second year running. The annual games give the institutions under the Ministry of Transport and the Ministry of Information and Communications a platform to network and interact.
7.1.4. Media Campaigns
The year under review saw the Commission carry out media campaigns on Mobile Number Portability and fibre optic infrastructure. The former was aimed at educating consumers on the procedures for porting their mobile subscriber numbers following the licensing of Mobile Number Portability service provider. On the other hand, the fibre optic campaign was geared
Corporate Communication and International Liaison
CHAPTER 7: CORPORATE COMMUNICATION AND INTERNATIONAL LIAISON
CCK Board Chairman, Eng. Philip O. Okundi, EBS, HSC presents awards to winners at the 2010 KECOSO Games
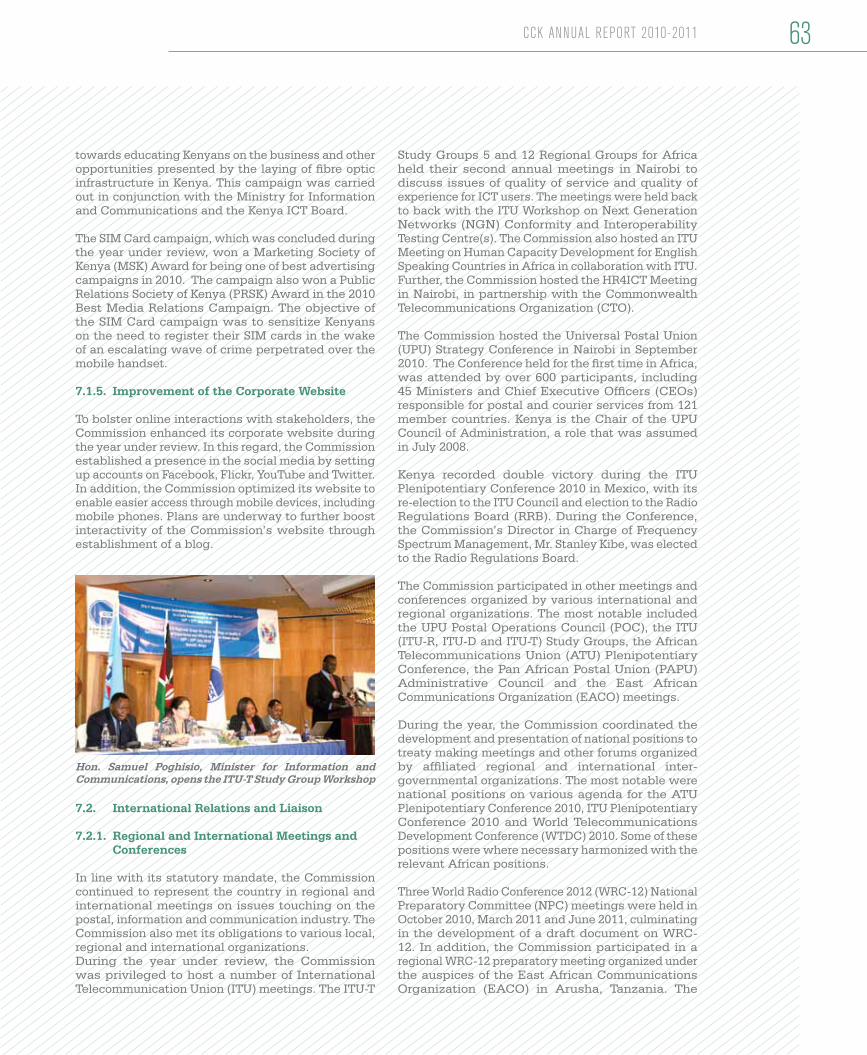
towards educating Kenyans on the business and other opportunities presented by the laying of fibre optic infrastructure in Kenya. This campaign was carried out in conjunction with the Ministry for Information and Communications and the Kenya ICT Board.
The SIM Card campaign, which was concluded during the year under review, won a Marketing Society of Kenya (MSK) Award for being one of best advertising campaigns in 2010. The campaign also won a Public Relations Society of Kenya (PRSK) Award in the 2010 Best Media Relations Campaign. The objective of the SIM Card campaign was to sensitize Kenyans on the need to register their SIM cards in the wake of an escalating wave of crime perpetrated over the mobile handset.
7.1.5. Improvement of the Corporate Website
To bolster online interactions with stakeholders, the Commission enhanced its corporate website during the year under review. In this regard, the Commission established a presence in the social media by setting up accounts on Facebook, Flickr, YouTube and Twitter. In addition, the Commission optimized its website to enable easier access through mobile devices, including mobile phones. Plans are underway to further boost interactivity of the Commission’s website through establishment of a blog.
7.2. International Relations and Liaison
7.2.1. Regional and International Meetings and Conferences
In line with its statutory mandate, the Commission continued to represent the country in regional and international meetings on issues touching on the postal, information and communication industry. The Commission also met its obligations to various local, regional and international organizations. During the year under review, the Commission was privileged to host a number of International Telecommunication Union (ITU) meetings. The ITU-T
Study Groups 5 and 12 Regional Groups for Africa held their second annual meetings in Nairobi to discuss issues of quality of service and quality of experience for ICT users. The meetings were held back to back with the ITU Workshop on Next Generation Networks (NGN) Conformity and Interoperability Testing Centre(s). The Commission also hosted an ITU Meeting on Human Capacity Development for English Speaking Countries in Africa in collaboration with ITU. Further, the Commission hosted the HR4ICT Meeting in Nairobi, in partnership with the Commonwealth Telecommunications Organization (CTO).
The Commission hosted the Universal Postal Union (UPU) Strategy Conference in Nairobi in September 2010. The Conference held for the first time in Africa, was attended by over 600 participants, including 45 Ministers and Chief Executive Officers (CEOs) responsible for postal and courier services from 121 member countries. Kenya is the Chair of the UPU Council of Administration, a role that was assumed in July 2008.
Kenya recorded double victory during the ITU Plenipotentiary Conference 2010 in Mexico, with its re-election to the ITU Council and election to the Radio Regulations Board (RRB). During the Conference, the Commission’s Director in Charge of Frequency Spectrum Management, Mr. Stanley Kibe, was elected to the Radio Regulations Board.
The Commission participated in other meetings and conferences organized by various international and regional organizations. The most notable included the UPU Postal Operations Council (POC), the ITU (ITU-R, ITU-D and ITU-T) Study Groups, the African Telecommunications Union (ATU) Plenipotentiary Conference, the Pan African Postal Union (PAPU) Administrative Council and the East African Communications Organization (EACO) meetings.
During the year, the Commission coordinated the development and presentation of national positions to treaty making meetings and other forums organized by affiliated regional and international inter-governmental organizations. The most notable were national positions on various agenda for the ATU Plenipotentiary Conference 2010, ITU Plenipotentiary Conference 2010 and World Telecommunications Development Conference (WTDC) 2010. Some of these positions were where necessary harmonized with the relevant African positions.
Three World Radio Conference 2012 (WRC-12) National Preparatory Committee (NPC) meetings were held in October 2010, March 2011 and June 2011, culminating in the development of a draft document on WRC-12. In addition, the Commission participated in a regional WRC-12 preparatory meeting organized under the auspices of the East African Communications Organization (EACO) in Arusha, Tanzania. The
63CCK ANNUAL REPORT 2010-2011
Hon. Samuel Poghisio, Minister for Information and Communications, opens the ITU-T Study Group Workshop
Commission also participated in the 2nd ITU Information meeting held in Geneva in November 2010, WRC-12 African Telecommunications Union (ATU) Preparatory Meeting in Abuja, Nigeria, in February 2011, and WRC -12 Conference Preparatory Meeting held in Geneva, Switzerland, in February 2011.
7.2.2. Benchmarking
The Commission hosted several delegations from the African region on benchmarking missions to share regulatory experiences in the postal, information and communications industry. The missions hosted were from the Uganda Communications Commission (UCC), Malawi Communications Regulatory Authority (MACRA), Zambia Information and Communication Technology Authority (ZICTA), and Tanzania Communications Regulatory Authority (TCRA). Some of the regulatory experiences shared included broadcasting regulation, quality of service, digital TV migration, spectrum management, SIM Card registration and Mobile Number Portability.
7.2.3. Subscriptions to Regional and International Organizations
As the Government’s designated liaison organization, the Commission during the year met its financial obligations to regional and international organizations dealing with postal, information and communications matters. These organizations include the EACO, PAPU, ATU, Association of Regulators of Information and Communications for Eastern and Southern Africa (ARICEA), ITU, CTO and UPU.
7.3. Industry Initiatives
The Commission took part in several forums aimed at developing the postal, information and communications industry.
During the year, the Commission participated in a number of Internet Governance Forum (IGF) meetings, including the Kenya Internet Governance Forum (K-IGF) and the East Africa Internet Governance Forum (EA-IGF). The Commission also participated in Internet Governance meetings organized by the United Nations (UN) Internet Governance Forum Secretariat as well as the Internet Corporation for Assigned Names and Numbers (ICANN). The forums provided a platform where issues relating to Internet public policy and management, and Internet number resources were discussed.
The Commission continued with the process of deploying a Government Internet Exchange Point (GIXP). During the year under review, the Commission set up the GIXP infrastructure. The infrastructure acts as a centralised clearing house for Government entities by facilitating direct connectivity of all the public entities in the country. It also enables easy exchange of traffic within Kenya while improving connectivity and service delivery. The GIXP is the second Internet Exchange Point (IXP) in the country, which also serves as redundancy and provides a backup facility.
In an effort to build confidence and security in the use of ICTs in the country in line with WTSA, WSIS and EACO declarations and resolutions, the Commission established a national Computer Incident Response Team (CIRT) known as the Kenya national Computer Incident Response Team (KE-CIRT). The team is responsible for monitoring and assessing cyber security threats, providing advice on improving cyber security. It also works with stakeholders in mitigating cyber crime as well as building capacity and sharing information on cyber security. The centre liaises with public and private institutions in management of cyber security in country.
The Commission continued to participate in the activities of a Multi-sectoral Taskforce on National Addressing System constituted in 2009/10. The Taskforce was mandated is to oversee the development of a National Physical Addressing System for Kenya. During the year, Commission participated in the preparation of a proposal to source support for the project. The project is expected to enhance street naming and numbering which will, among others, enhance door-to-door mail delivery.
During the period under review, the Commission participated in the setting up of the National Space Secretariat (NSS), which is chaired by the Ministry of State for Defence in Office of the President. Further, the Commission participated in drafting of the Renewal Agreement for Utilization of the San Marco Space Centre in Malindi, between the governments of Kenya and Italy. The Commission also took part in drafting of the Memorandum of Understanding (MoU) between the Government of Kenya and the European Space Agency (ESA) in the activities of outer space, which agreement is aimed at ensuring that Kenya remains on the map on matters of space science.
During the year under review, the Commission continued to play a key role in activities geared towards migrating the country to digital TV broadcasting. These activities included provision of logistical support to and hosting of the DTC Secretariat.
CHAPTER 7: CORPORATE COMMUNICATION AND INTERNATIONAL LIAISON64

65
CHAPTER 8Financial Information

66
8.1. Statements of Directors’ Responsibilities
The Kenya Information and Communications Act, Cap 411A, obligates the Board of Directors to cause to be kept proper books of accounts and records of income, expenditure, assets and liabilities of the Commission.
The Directors are also required to prepare and submit financial statements for each financial year, which include a statement of income and expenditure and a statement showing the assets and liabilities of the Commission as at the end of the financial year.
The Board of Directors accepts responsibility for the annual financial statements contained in this report which have been prepared using appropriate accounting policies supported by reasonable and prudent judgment and estimates, in conformity with Generally Accepted Accounting Practice (GAAP), International Accounting Standards (IAS) and in the manner required by the Kenya Information and Communications Act, Cap 411A.
Hon. Eng. Philip O. Okundi, EBS, HSC
................................................................(Chairman)
Francis W. Wangusi
..............................................................Ag. Director General
30th September, 2011Date .....................................................
Financial Information
CHAPTER 8: FINANCIAL INFORMATION
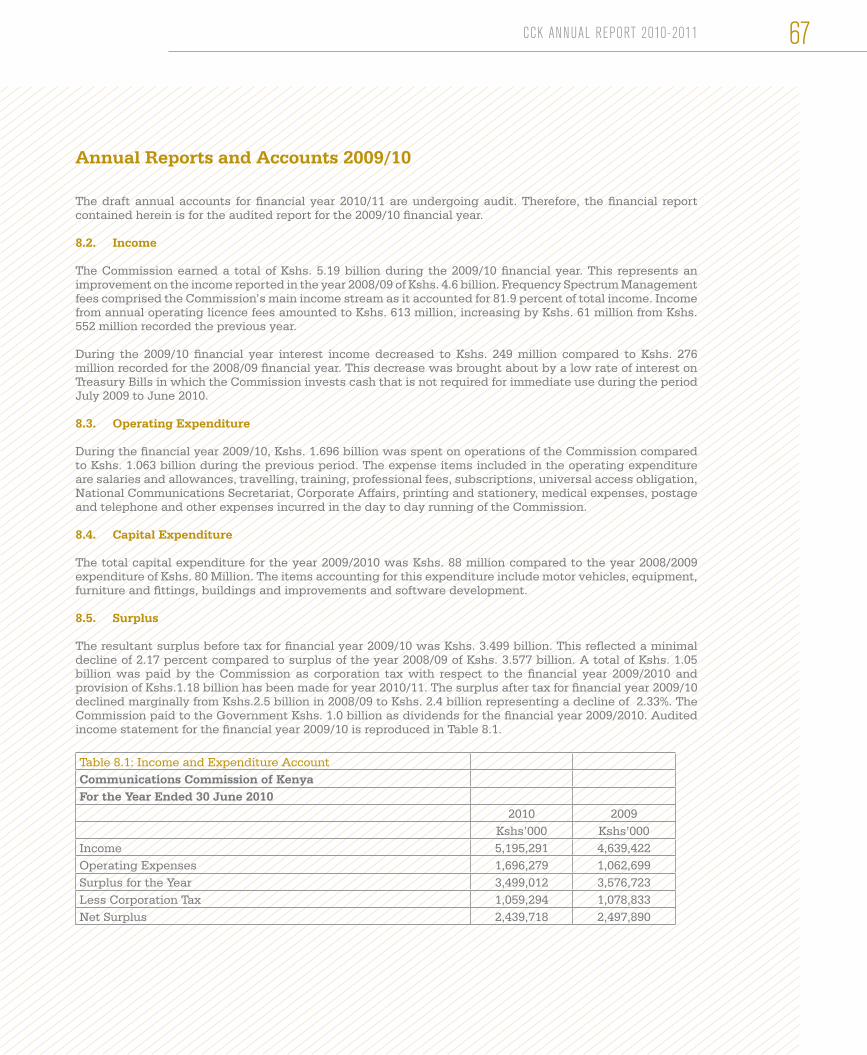
Annual Reports and Accounts 2009/10
The draft annual accounts for financial year 2010/11 are undergoing audit. Therefore, the financial report contained herein is for the audited report for the 2009/10 financial year.
8.2. Income
The Commission earned a total of Kshs. 5.19 billion during the 2009/10 financial year. This represents an improvement on the income reported in the year 2008/09 of Kshs. 4.6 billion. Frequency Spectrum Management fees comprised the Commission’s main income stream as it accounted for 81.9 percent of total income. Income from annual operating licence fees amounted to Kshs. 613 million, increasing by Kshs. 61 million from Kshs. 552 million recorded the previous year.
During the 2009/10 financial year interest income decreased to Kshs. 249 million compared to Kshs. 276 million recorded for the 2008/09 financial year. This decrease was brought about by a low rate of interest on Treasury Bills in which the Commission invests cash that is not required for immediate use during the period July 2009 to June 2010.
8.3. Operating Expenditure
During the financial year 2009/10, Kshs. 1.696 billion was spent on operations of the Commission compared to Kshs. 1.063 billion during the previous period. The expense items included in the operating expenditure are salaries and allowances, travelling, training, professional fees, subscriptions, universal access obligation, National Communications Secretariat, Corporate Affairs, printing and stationery, medical expenses, postage and telephone and other expenses incurred in the day to day running of the Commission.
8.4. Capital Expenditure
The total capital expenditure for the year 2009/2010 was Kshs. 88 million compared to the year 2008/2009 expenditure of Kshs. 80 Million. The items accounting for this expenditure include motor vehicles, equipment, furniture and fittings, buildings and improvements and software development.
8.5. Surplus
The resultant surplus before tax for financial year 2009/10 was Kshs. 3.499 billion. This reflected a minimal decline of 2.17 percent compared to surplus of the year 2008/09 of Kshs. 3.577 billion. A total of Kshs. 1.05 billion was paid by the Commission as corporation tax with respect to the financial year 2009/2010 and provision of Kshs.1.18 billion has been made for year 2010/11. The surplus after tax for financial year 2009/10 declined marginally from Kshs.2.5 billion in 2008/09 to Kshs. 2.4 billion representing a decline of 2.33%. The Commission paid to the Government Kshs. 1.0 billion as dividends for the financial year 2009/2010. Audited income statement for the financial year 2009/10 is reproduced in Table 8.1.
Table 8.1: Income and Expenditure AccountCommunications Commission of KenyaFor the Year Ended 30 June 2010
2010 2009Kshs’000 Kshs’000
Income 5,195,291 4,639,422Operating Expenses 1,696,279 1,062,699Surplus for the Year 3,499,012 3,576,723Less Corporation Tax 1,059,294 1,078,833Net Surplus 2,439,718 2,497,890
67CCK ANNUAL REPORT 2010-2011

8.6. Balance Sheet
The total assets of the Commission amounted to Kshs 8.6 billion during the 2009/10 financial year, comprising net non-current assets of Kshs. 1.43 billion, investment in Kenya College of Communications Technology (KCCT) of Kshs. 2.4 billion, cash and cash equivalent of Kshs 3.6 billion and net trade receivables of Kshs. 1.1 billion. The audited balance sheet statement for the financial year 2009/10 is reproduced in Table 8.2.
Table 8.2: Balance Sheet as at 30 June 2010Communications Commission of Kenya
2010 2009Kshs’000 Kshs’000
ASSETSNon Current AssetsProperty, plant and equipment 1,430,151 1,464,783Investment In KCCT 2,404,266 2,404,266
3,834,417 3,869,049Current AssetsTrade Receivables 1,123,793 920,685Cash and cash equivalent 3,679,023 4,635,702
4,802,816 5,556,387TOTAL ASSETS 8,637,233 9,425,436EQUITY AND LIABILITIESCapital and ReservesOwners Equity 741,965 741,965Revaluation Reserve 380,681 380,681Retained Surplus 6,276,953 4,837,235
7,399,599 5,959,881Current LiabilitiesProposed for Dividends 1,000,000 3,000,000Corporation Tax for the year 0 216,438Creditors 237,634 249,117
1,237,634 3,465,555TOTAL EQUITY AND LIABILITIES 8,637,233 9,425,436The accounts were approved by the Board of Directors on30th. September, 2010 and were signed on its behalf by:
Hon. Eng. Philip Okundi _________________ Francis W. Wangusi ________________Chairman Ag. Director General
8.7. Capital and Reserves
The capital and reserves amounted to Kshs.7.3 billion as at 30th June 2010. The current liabilities of the Commission at the close of the year 2009/10 stood at Kshs.1.2 billion, comprising proposed dividend to the Treasury and trade payables. An extract of the balance sheet statements for the financial year 2009/10 is reproduced in Table 8.2.
8.8. Annual Budget Estimates and Revised Budget
In accordance with Section 19 of the Kenya Information and Communications Act, Cap 411A, and the provisions of the Exchequer and Audit Regulations, the estimates of revenue and expenditure of the Commission for the year 2011/2012 were prepared and submitted to the Ministry of Information and Communications. The total income is estimated at Kshs. 6.1 billion, while operating expenditure is estimated at Kshs 1.7 billion. The total budgeted capital expenditure is Kshs. 199 million
CHAPTER 8: FINANCIAL INFORMATION68
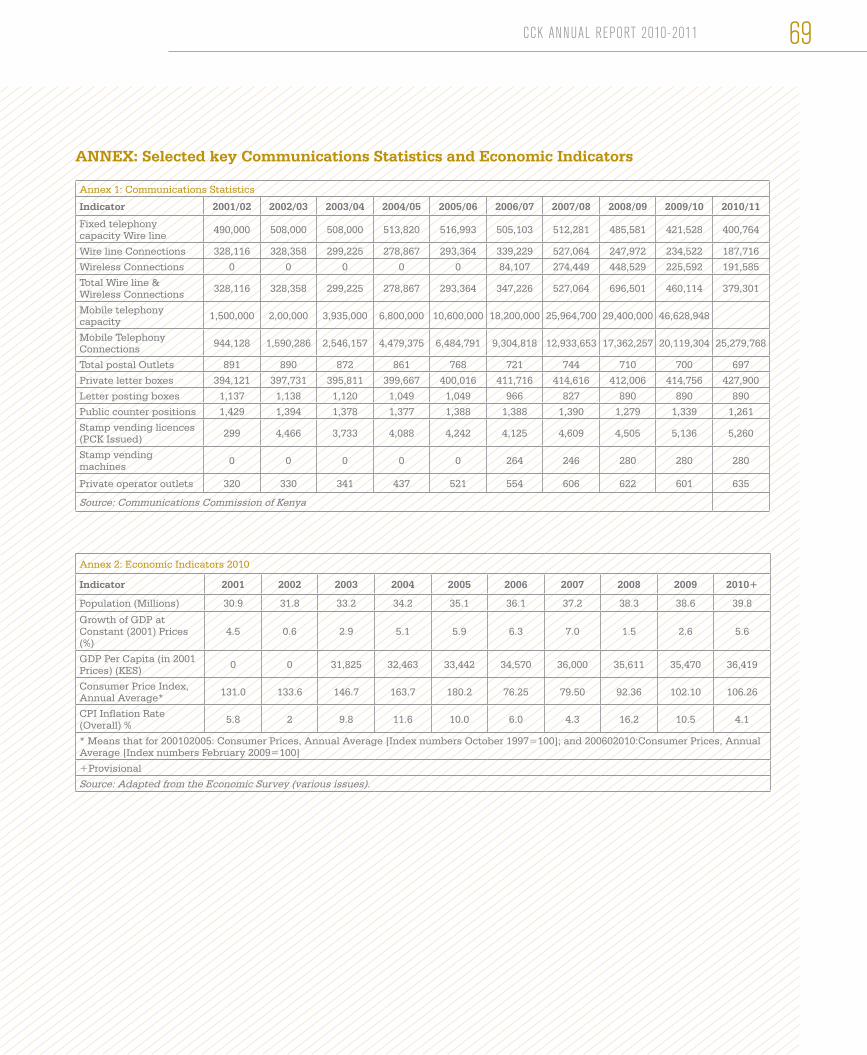
ANNEX: Selected key Communications Statistics and Economic Indicators
Annex 1: Communications Statistics
Indicator 2001/02 2002/03 2003/04 2004/05 2005/06 2006/07 2007/08 2008/09 2009/10 2010/11
Fixed telephony capacity Wire line 490,000 508,000 508,000 513,820 516,993 505,103 512,281 485,581 421,528 400,764
Wire line Connections 328,116 328,358 299,225 278,867 293,364 339,229 527,064 247,972 234,522 187,716
Wireless Connections 0 0 0 0 0 84,107 274,449 448,529 225,592 191,585
Total Wire line & Wireless Connections 328,116 328,358 299,225 278,867 293,364 347,226 527,064 696,501 460,114 379,301
Mobile telephony capacity 1,500,000 2,00,000 3,935,000 6,800,000 10,600,000 18,200,000 25,964,700 29,400,000 46,628,948
Mobile Telephony Connections 944,128 1,590,286 2,546,157 4,479,375 6,484,791 9,304,818 12,933,653 17,362,257 20,119,304 25,279,768
Total postal Outlets 891 890 872 861 768 721 744 710 700 697
Private letter boxes 394,121 397,731 395,811 399,667 400,016 411,716 414,616 412,006 414,756 427,900
Letter posting boxes 1,137 1,138 1,120 1,049 1,049 966 827 890 890 890
Public counter positions 1,429 1,394 1,378 1,377 1,388 1,388 1,390 1,279 1,339 1,261
Stamp vending licences (PCK Issued) 299 4,466 3,733 4,088 4,242 4,125 4,609 4,505 5,136 5,260
Stamp vending machines 0 0 0 0 0 264 246 280 280 280
Private operator outlets 320 330 341 437 521 554 606 622 601 635
Source: Communications Commission of Kenya
Annex 2: Economic Indicators 2010
Indicator 2001 2002 2003 2004 2005 2006 2007 2008 2009 2010+
Population (Millions) 30.9 31.8 33.2 34.2 35.1 36.1 37.2 38.3 38.6 39.8
Growth of GDP at Constant (2001) Prices (%)
4.5 0.6 2.9 5.1 5.9 6.3 7.0 1.5 2.6 5.6
GDP Per Capita (in 2001 Prices) (KES) 0 0 31,825 32,463 33,442 34,570 36,000 35,611 35,470 36,419
Consumer Price Index, Annual Average* 131.0 133.6 146.7 163.7 180.2 76.25 79.50 92.36 102.10 106.26
CPI Inflation Rate (Overall) % 5.8 2 9.8 11.6 10.0 6.0 4.3 16.2 10.5 4.1
* Means that for 200102005: Consumer Prices, Annual Average [Index numbers October 1997=100]; and 200602010:Consumer Prices, Annual Average [Index numbers February 2009=100]
+Provisional
Source: Adapted from the Economic Survey (various issues).
69CCK ANNUAL REPORT 2010-2011


Notes

Notes

IntegrityCommunication
InnovationDiligence
FairnessResults focusTeamworkRespect
Core Values

Communications Commission of KenyaP.O. Box 14448 Nairobi 00800
Tel: 4242000 Mobile: 0703042000 | 0736 121515 / 121414 | 0727 531278 / 531279CDMA Lines: 20-2441081/2/3/4 | 20-2655312 20-2672553/6/7 | 20-2464110Fax: +254 (20) 4242335E-mail: [email protected]
Website: www.cck.go.ke
Connect with us
Communications Commission of Kenya
@cck_kenya