Annual Report 2010 Nordea Bank Danmark · 31-12-2010 · Total operating income 18,291 17,772 3...
113
Annual Report 2010 Nordea Bank Danmark Business registration number 13522197
Transcript of Annual Report 2010 Nordea Bank Danmark · 31-12-2010 · Total operating income 18,291 17,772 3...

Annual Report 2010Nordea Bank Danmark
Business registration number 13522197

2Nordea Bank Danmark A/S . Annual Report 2010 2
Nordea Bank Danmark A/S is part of the Nordea Group.
Nordea’s vision is to be a Great European bank,
acknowledged for its people, creating superior value for
customers and shareholders. We are making it possible
for our customers to reach their goals by providing a wide
range of products, services and solutions within banking,
asset management and insurance. Nordea has around
11 million customers, approx. 1,400 branch offices and a
leading net banking position with 6.3 million e-customers
and a total market capitalisation of EUR 36bn. The Nordea
share is listed on the NASDAQ OMX Nordic Exchange
in Stockholm, Helsinki and Copenhagen.
ContentsKey financial figures . . . . . . . . . . . . . . . . 3
Business definitions . . . . . . . . . . . . . . . . 4
Nordea Bank Danmark Directors’ reportGroup organisation . . . . . . . . . . . . . . . . . 5
Comments on the income statement
(NBD Group) . . . . . . . . . . . . . . . . . . . . . . 5
Comments on the balance sheet
(NBD Group) . . . . . . . . . . . . . . . . . . . . . . 6
Off-balance sheet commitments
(Group) . . . . . . . . . . . . . . . . . . . . . . . . . . . 7
Capital adequacy and ratings . . . . . . . . . 8
Risk, liquidity and
capital management . . . . . . . . . . . . . . . . 8
Corporate social responsibility . . . . . . . 19
Human resources . . . . . . . . . . . . . . . . . . 19
Legal proceedings . . . . . . . . . . . . . . . . . 20
Subsequent events . . . . . . . . . . . . . . . . . 20
Outlook 2011 . . . . . . . . . . . . . . . . . . . . . 20
Financial statementsIncome statement . . . . . . . . . . . . . . . . . . 22
Statement of comprehensive income . 22
Balance sheet . . . . . . . . . . . . . . . . . . . . . 23
Statement of changes in equity . . . . . . 24
Cash flow statement . . . . . . . . . . . . . . . 27
5-year overview . . . . . . . . . . . . . . . . . . . 30
Notes to the financial statements . . . . . 32
Proposed distribution of earnings . . 110
Independent auditors’ report . . . . . . . 111
Management . . . . . . . . . . . . . . . . . . . . . 112
The following is a translation of the Danish
original document. The original Danish text
shall be the governing text for all purposes
and in case of any discrepancy the Danish
wording shall be applicable.

3Nordea Bank Danmark A/S . Annual Report 2010 3
Key financial figures
GroupBusiness volumes, key items (DKKm) 2010 2009 Change % 2008
Total operating income 18,291 17,772 3 13,727Total operating expenses -10,335 -10,458 -1 -8,526Profit before loan losses 7,956 7,314 9 5,201Net loan losses -3,399 -5,113 -34 -1,587Net profit for the year 3,480 1,450 140 2,721Loans to the public, DKKbn 679 670 1 613Deposits and borrowings from the public, DKKbn 347 324 7 316 of which savings deposits 257 248 4 270Equity, DKKbn 33 30 10 30Total assets, DKKbn 997 1,033 -3 900
Ratios and key figures (%)
Return on equity 11 .0 4 .8 9 .1Cost/income ratio 57 59 62Tier 1 capital ratio1 8 .9 8 .9 9 .4Total capital ratio2 15 .4 12 .0 12 .4Tier 1 capital1, DKKm 27,621 27,885 28,775Risk-weighted assets1, DKKbn 310 312 305Loan loss ratio, basis points 50 .8 77 .7 29 .8Number of employees1 (full-time equivalents) 7,968 7,964 7,810
1 End of the year .2 Total capital ratio for 2010 includes a new subordinated loan of EUR 1 .45bn (tier 2 capital) issued in February 2011 .
Parent companyBusiness volumes, key items (DKKm) 2010 2009 Change % 2008
Total operating income 15,693 16,044 -2 11,797Total operating expenses -9,856 -10,131 -3 -8,246Profit before loan losses 5,837 5,913 -1 3,551Net loan losses -3,172 -4,815 -34 -1,456Net profit for the year 2,099 600 250 1,556Loans to the public, DKKbn 361 369 -2 348Deposits and borrowings from the public, DKKbn 348 315 10 318Equity, DKKbn 24 22 9 23Total assets, DKKbn 892 924 -3 750
Ratios and key figures (%)
Return on equity 9 .1 2 .6 6 .6Cost/income ratio 63 63 70Tier 1 capital ratio1 8 .8 9 .7 9 .4Total capital ratio2 15 .6 13 .2 12 .5Tier 1 capital1, DKKm 26,711 28,411 27,818Risk-weighted assets1, DKKbn 305 292 298Loan loss ratio, basis points 86 .0 128 .1 49 .6Number of employees1 (full-time equivalents) 7,647 7,280 7,515
1 End of the year .2 Total capital ratio for 2010 includes a new subordinated loan of EUR 1 .45bn (tier 2 capital) issued in February 2011 .

4Nordea Bank Danmark A/S . Annual Report 2010 4
Business definitions
These definitions apply to the descriptions in the Annual Report .
Tier 1 capitalThe proportion of the capital base, which includes consolidated shareholders’ equity excluding proposed dividend, deferred tax assets as well as intangible assets in the banking operations and half of the expected shortfall deduction, – the negative difference between expected losses and provisions . Subsequent to the approval of the supervisory authorities, Tier 1 capital also includes qualified forms of subordinated loans . (Tier 1 capital contributions and hybrid capital loans) . The core Tier 1 capital constitutes the Tier 1 capital excluding hybrid capital loans .
Capital baseThe capital base includes the sum of the Tier 1 capital and the supplementary capital consisting of subordinated loans, after deduction for expected shortfall .
Risk-weighted assets Total assets and off-balance-sheet items valued on the basis of the credit and market risks as well as operational risks of the Groups undertakings, in accordance with regulations governing capital adequacy, excluding book value of shares which have been deducted from the capital base and intangible assets .
Tier 1 capital ratioTier 1 capital as a percentage of risk-weighted assets . The core Tier 1 ratio is calculated as core Tier 1 capital as a percentage of risk-weighted assets .
Total capital ratioCapital base as a percentage of risk-weighted assets .
Return on equityNet profit for the year excluding minority interests as a percentage of average equity for the year . Average equity including net profit for the year and dividend until paid, minority interests excluded .
Cost/income ratioTotal operating expenses divided by total operating income .
Loan loss ratioNet loan losses (annualised) divided by opening balance of loans to the public (lending) .
AbbreviationsAGM Annual General MeetingCEO Chief Executive OfficerCFO Chief Financial OfficerCRO Chief Risk OfficerECC Executive Credit CommitteeGEM Group Executive Management

5Nordea Bank Danmark A/S . Annual Report 2010
Throughout this report the terms ”Nordea Bank Danmark” and ”NBD” refer to Nordea Bank Danmark A/S and its subsidiaries . Nordea Bank Danmark A/S is a wholly-owned subsidiary of Nordea Bank AB (publ), the parent company of the Nordea Group . The Nordea Bank AB Group is referred to as ”Nordea” .
Nordea Bank Danmark A/S is domiciled in Copenhagen and its business registration number is 13522197 .
Group organisation
As part of Nordea, NBD operates in the banking business . All the operations of NBD are integrated in the operations of the Nordea Group, whose annual report, with activities and earnings reported by the customer areas, encompasses the operations of NBD in their entirety .
Subsidiaries and foreign branchesThe most significant subsidiaries are Nordea Kredit Realkreditaktieselskab, through which the bank carries on mortgage lending activities, and Nordea Finans Danmark A/S, through which the bank carries on financing, leasing and factoring activities .
NBD acquired Fionia Bank A/S in November 2009 . Fionia Asset Company A/S’s (formerly Fionia Bank) assets consist of a portfolio of bonds and a few properties . All banking activity was sold from Fionia Bank A/S to NBD as at 1 May 2010 . The integration of Fionia Bank in Nordea proceeded successfully, with all branches rebranded and customers moved to NBD’s systems during May 2010 . All products and services are now based on the NBD platform . In connection with the transfer of its banking activity Fionia Bank returned its banking licence .
NBD has no foreign branches .
Comments on the income statement (NBD Group)
NBD’s operating profit increased to DKK 4 .6bn (DKK 2 .2bn) (the comparative figures in brackets refer to 2009), up by 107% compared to 2009 . Net profit increased by 140% to DKK 3 .5bn (DKK 1 .5bn) . The realised post-tax return on equity was 11 .0% (4 .8%) .
Total operating income increased to DKK 18 .3bn (DKK 17 .8bn), up by 3% compared to 2009 . The increase is primarily due to increased net interest income and net fee and commission income . Total operating expenses decreased by 1% to DKK 10 .3bn (DKK 10 .5bn) primarily affected by the lower state guarantee commission expense in 4th quarter 2010 . Profit before loan losses increased by 9% to DKK 8 .0bn (DKK 7 .3bn) . Net loan losses decreased by DKK 1 .7bn to DKK 3 .4bn (DKK 5 .1bn) .
The result is largely in line with expectations .
Operating incomeTotal operating income increased by 3% to DKK 18 .3bn (DKK 17 .8bn), which is mainly related to increased net interest income and net fee and commission income .
Net interest income increased by 2% to DKK 11 .6bn (DKK 11 .4bn) . The increase in net interest income was mainly driven by higher lending and deposit volumes in Nordic Banking . The level of lending margins increased slightly, but deposit margins were lower than in 2009 . Lending to the public increased by 1% to DKK 679bn (DKK 670bn) . Lending to the public excluding reversed repurchase agreements increased by 6% . Deposits from the public increased by 7% to DKK 347bn (DKK 324bn) . Deposits from the public excluding repurchase agreements increased by 6% .
Net fee and commission income increased by 12% to DKK 4 .0bn (DKK 3 .6bn) . Savings related commissions increased by 10% to DKK 2 .5bn (DKK 2 .3bn) mainly due to higher asset management commissions . Lending related commissions increased by 7% to DKK 0 .8bn (DKK 0 .8bn) due to higher lending commission and guarantees and documentary payments . Other commission income increased by 25% to DKK 0 .4bn (DKK 0 .3bn) due to increased securitisation fees .
Total commission expenses decreased by 8% to DKK 0 .5bn (DKK 0 .6bn) .
Net result from items at fair value decreased by DKK 0 .3bn to DKK 1 .6bn (DKK 1 .9bn) mainly related to NBD’s own positions in Group Treasury . The strong performance in the customer-driven Capital Markets Products (CMP) from last year continued in 2010 . However, the result in CMP from fixed income
Nordea Bank DanmarkDirectors’ report

6Nordea Bank Danmark A/S . Annual Report 2010
products decreased somewhat . Net result from shares was positively affected by a fair value adjustment of the unlisted private equity company Axcel III .
Profit from companies accounted for under the equity method decreased to DKK 0 .2bn (DKK 0 .3bn) . Income under the equity method is primarily related to the portfolio of Nets Holding A/S and LR Realkredit . The decrease is attributable to Nets Holding A/S, whose net profit for the year is affected by costs in connection with the merger with Norwegian Nordito AS .
Other operating income increased by DKK 0 .2bn to DKK 0 .8bn (DKK 0 .6bn) due to miscellaneous items including income from group companies .
Operating expensesTotal operating expenses decreased by 1% to DKK 10 .3bn (DKK 10 .5bn) .
Staff costs at DKK 6 .0bn (DKK 6 .0bn) remained unchanged, as general wage inflation was offset by lower variable salaries, lower profit sharing and refund of payroll tax .
The number of full-time employees (FTEs) by end of the year was at the same level as last year at 7,968 (7,964) . The average number of full-time equivalent positions was 7,949 (7,785) .
Other expenses amounted to DKK 3 .1bn (DKK 3 .0bn), up by 4% compared to last year due to increased IT development and business consulting expenses . Other expenses were positive affected by VAT refunds .
Other operating expenses decreased by 25% to DKK 1 .0bn (DKK 1 .3bn) relating to lower guarantee commission expenses due to the expiry of the Danish state guarantee scheme on 30 September 2010 .
The cost/income ratio was down to 57% compared to 59% last year due to increased income .
Loan lossesNet loan losses decreased by 34% to DKK 3 .4bn (DKK 5 .1bn) due to lower provisions both for individually and collectively assessed loans .
Net loan losses included losses related to the Danish state guarantee scheme (Bank Package I)
of DKK 0 .8bn (DKK 0 .9bn) . The total provision for the Danish guarantee scheme amounted to DKK 1 .8bn (DKK 1 .1bn) .
The loan loss ratio amounted to 51 bp (78 bp) . Individual net loan losses amounted to 50 bp, compared to 61 bp last year, and net collective provisions amounted to 1 bp, compared to 17 bp last year .
Net loan losses as well as impaired loans stem from small and medium-sized corporate and agriculture customers . Larger companies with globalised competition have in most cases been able to alter their business models and remain profitable, whereas this has proven much harder for small and medium-sized corporates leading to a polarisation of the portfolio .
TaxesIncome tax expense was DKK 1 .1bn (DKK 0 .8bn) . The effective tax rate was 24% compared to 34% in 2009 . The effective tax rate for 2010 is positively affected by non-taxable income from companies accounted for under the equity method and a change in earlier years’ taxable income . The effective tax rate for 2009 was affected by a provision for tax claims . Net profitNet profit for the year increased to DKK 3 .5bn compared to DKK 1 .5bn last year primarily following the lower loans losses . The return on equity was 11 .0% (4 .8%) .
Comments on the balance sheet (NBD Group)
The total balance sheet decreased by DKK 36bn to DKK 997bn (DKK 1,033bn), or 3%, during 2010 . All balance sheet items in foreign currencies are translated into DKK at the actual year-end currency exchange rates . See Note 1 for more information regarding accounting policies .
In 2001 Nordea decided to implement a stepwise centralisation of some activities in Nordea Bank Finland (NBF), including transactions, risks and capital . In accordance with plans, NBD transferred at fair value a major part of Markets’ portfolio of interest-bearing securities to NBF in December 2010 . From December 2010 and onwards, repurchase agreements and reverse repurchase agreements are executed from NBF .
7Nordea Bank Danmark A/S . Annual Report 2010
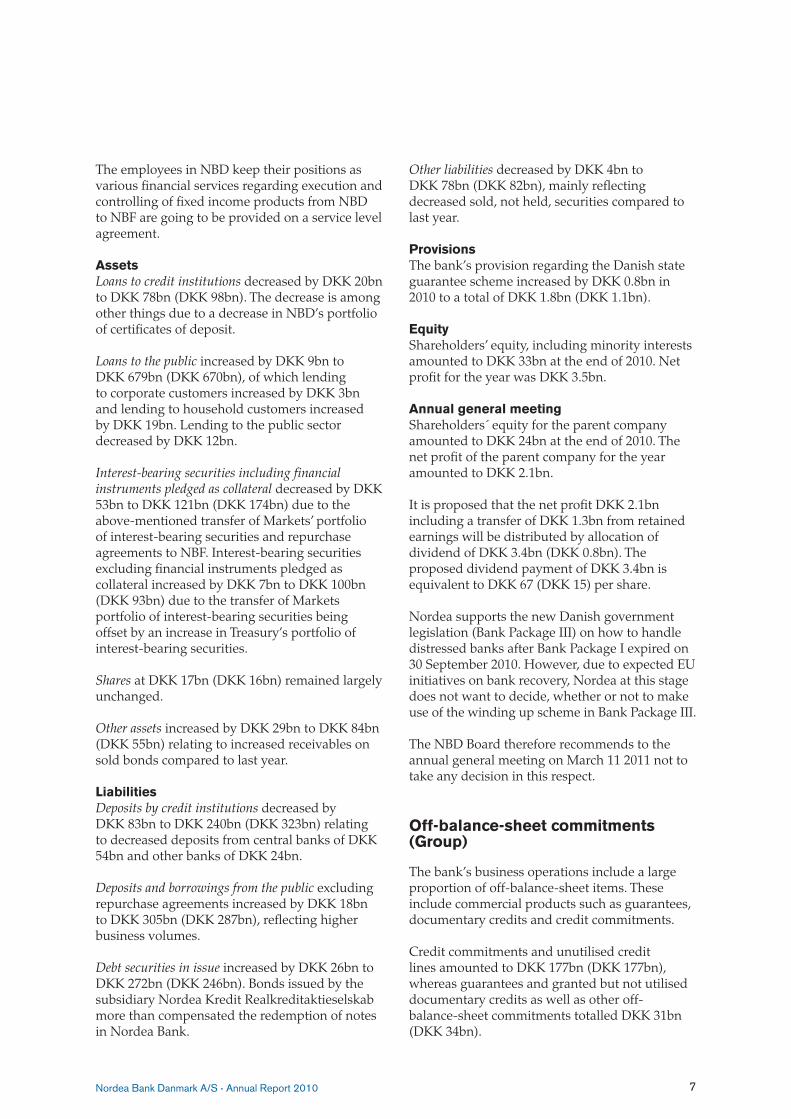
The employees in NBD keep their positions as various financial services regarding execution and controlling of fixed income products from NBD to NBF are going to be provided on a service level agreement .
AssetsLoans to credit institutions decreased by DKK 20bn to DKK 78bn (DKK 98bn) . The decrease is among other things due to a decrease in NBD’s portfolio of certificates of deposit .
Loans to the public increased by DKK 9bn to DKK 679bn (DKK 670bn), of which lending to corporate customers increased by DKK 3bn and lending to household customers increased by DKK 19bn . Lending to the public sector decreased by DKK 12bn .
Interest-bearing securities including financial instruments pledged as collateral decreased by DKK 53bn to DKK 121bn (DKK 174bn) due to the above-mentioned transfer of Markets’ portfolio of interest-bearing securities and repurchase agreements to NBF . Interest-bearing securities excluding financial instruments pledged as collateral increased by DKK 7bn to DKK 100bn (DKK 93bn) due to the transfer of Markets portfolio of interest-bearing securities being offset by an increase in Treasury’s portfolio of interest-bearing securities .
Shares at DKK 17bn (DKK 16bn) remained largely unchanged .
Other assets increased by DKK 29bn to DKK 84bn (DKK 55bn) relating to increased receivables on sold bonds compared to last year .
LiabilitiesDeposits by credit institutions decreased by DKK 83bn to DKK 240bn (DKK 323bn) relating to decreased deposits from central banks of DKK 54bn and other banks of DKK 24bn .
Deposits and borrowings from the public excluding repurchase agreements increased by DKK 18bn to DKK 305bn (DKK 287bn), reflecting higher business volumes .
Debt securities in issue increased by DKK 26bn to DKK 272bn (DKK 246bn) . Bonds issued by the subsidiary Nordea Kredit Realkreditaktieselskab more than compensated the redemption of notes in Nordea Bank .
Other liabilities decreased by DKK 4bn to DKK 78bn (DKK 82bn), mainly reflecting decreased sold, not held, securities compared to last year .
ProvisionsThe bank’s provision regarding the Danish state guarantee scheme increased by DKK 0 .8bn in 2010 to a total of DKK 1 .8bn (DKK 1 .1bn) .
EquityShareholders’ equity, including minority interests amounted to DKK 33bn at the end of 2010 . Net profit for the year was DKK 3 .5bn .
Annual general meetingShareholders´ equity for the parent company amounted to DKK 24bn at the end of 2010 . The net profit of the parent company for the year amounted to DKK 2 .1bn .
It is proposed that the net profit DKK 2 .1bn including a transfer of DKK 1 .3bn from retained earnings will be distributed by allocation of dividend of DKK 3 .4bn (DKK 0 .8bn) . The proposed dividend payment of DKK 3 .4bn is equivalent to DKK 67 (DKK 15) per share .
Nordea supports the new Danish government legislation (Bank Package III) on how to handle distressed banks after Bank Package I expired on 30 September 2010 . However, due to expected EU initiatives on bank recovery, Nordea at this stage does not want to decide, whether or not to make use of the winding up scheme in Bank Package III .
The NBD Board therefore recommends to the annual general meeting on March 11 2011 not to take any decision in this respect .
Off-balance-sheet commitments (Group)
The bank’s business operations include a large proportion of off-balance-sheet items . These include commercial products such as guarantees, documentary credits and credit commitments .
Credit commitments and unutilised credit lines amounted to DKK 177bn (DKK 177bn), whereas guarantees and granted but not utilised documentary credits as well as other off-balance-sheet commitments totalled DKK 31bn (DKK 34bn) .
8Nordea Bank Danmark A/S . Annual Report 2010
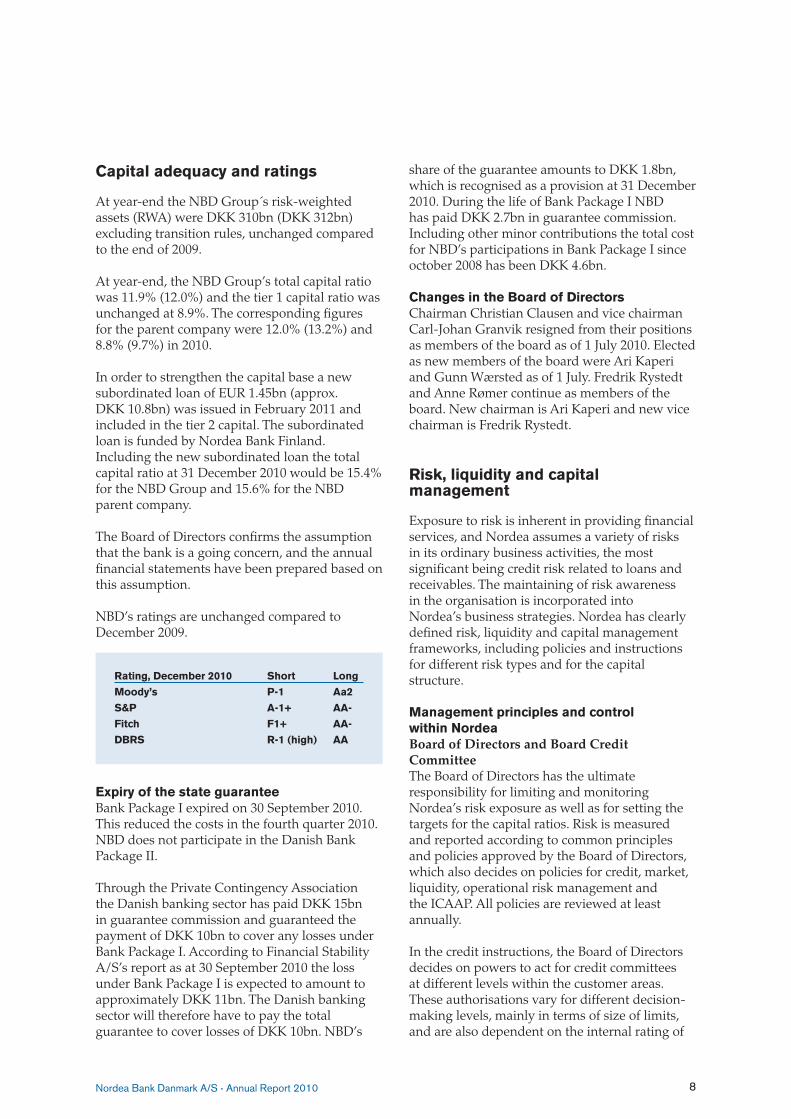
Capital adequacy and ratings
At year-end the NBD Group´s risk-weighted assets (RWA) were DKK 310bn (DKK 312bn) excluding transition rules, unchanged compared to the end of 2009 .
At year-end, the NBD Group’s total capital ratio was 11 .9% (12 .0%) and the tier 1 capital ratio was unchanged at 8 .9% . The corresponding figures for the parent company were 12 .0% (13 .2%) and 8 .8% (9 .7%) in 2010 .
In order to strengthen the capital base a new subordinated loan of EUR 1 .45bn (approx . DKK 10 .8bn) was issued in February 2011 and included in the tier 2 capital . The subordinated loan is funded by Nordea Bank Finland . Including the new subordinated loan the total capital ratio at 31 December 2010 would be 15 .4% for the NBD Group and 15 .6% for the NBD parent company .
The Board of Directors confirms the assumption that the bank is a going concern, and the annual financial statements have been prepared based on this assumption .
NBD’s ratings are unchanged compared to December 2009 .
Rating, December 2010 Short Long
Moody’s P-1 Aa2
S&P A-1+ AA-
Fitch F1+ AA-
DBRS R-1 (high) AA
Expiry of the state guaranteeBank Package I expired on 30 September 2010 . This reduced the costs in the fourth quarter 2010 . NBD does not participate in the Danish Bank Package II .
Through the Private Contingency Association the Danish banking sector has paid DKK 15bn in guarantee commission and guaranteed the payment of DKK 10bn to cover any losses under Bank Package I . According to Financial Stability A/S’s report as at 30 September 2010 the loss under Bank Package I is expected to amount to approximately DKK 11bn . The Danish banking sector will therefore have to pay the total guarantee to cover losses of DKK 10bn . NBD’s
share of the guarantee amounts to DKK 1 .8bn, which is recognised as a provision at 31 December 2010 . During the life of Bank Package I NBD has paid DKK 2 .7bn in guarantee commission . Including other minor contributions the total cost for NBD’s participations in Bank Package I since october 2008 has been DKK 4 .6bn .
Changes in the Board of DirectorsChairman Christian Clausen and vice chairman Carl-Johan Granvik resigned from their positions as members of the board as of 1 July 2010 . Elected as new members of the board were Ari Kaperi and Gunn Wærsted as of 1 July . Fredrik Rystedt and Anne Rømer continue as members of the board . New chairman is Ari Kaperi and new vice chairman is Fredrik Rystedt .
Risk, liquidity and capital management
Exposure to risk is inherent in providing financial services, and Nordea assumes a variety of risks in its ordinary business activities, the most significant being credit risk related to loans and receivables . The maintaining of risk awareness in the organisation is incorporated into Nordea’s business strategies . Nordea has clearly defined risk, liquidity and capital management frameworks, including policies and instructions for different risk types and for the capital structure .
Management principles and control within NordeaBoard of Directors and Board Credit CommitteeThe Board of Directors has the ultimate responsibility for limiting and monitoring Nordea’s risk exposure as well as for setting the targets for the capital ratios . Risk is measured and reported according to common principles and policies approved by the Board of Directors, which also decides on policies for credit, market, liquidity, operational risk management and the ICAAP . All policies are reviewed at least annually .
In the credit instructions, the Board of Directors decides on powers to act for credit committees at different levels within the customer areas . These authorisations vary for different decision-making levels, mainly in terms of size of limits, and are also dependent on the internal rating of

9Nordea Bank Danmark A/S . Annual Report 2010
customers . The Board of Directors also decides on the limits for market and liquidity risk in Nordea .
The Board Credit Committee monitors the development of the credit portfolio, including industry and major customer exposures, and confirms industry policies approved by the Executive Credit Committee (ECC) .
CEO and GEM The Chief Executive Officer (CEO) has the overall responsibility for developing and maintaining effective risk, liquidity and capital management principles and control .
The CEO in Group Executive Management (GEM) decides on the targets for Nordea’s risk management regarding Structural Interest Income Risk (SIIR) as well as, within the scope of resolutions adopted by the Board of Directors, the allocation of the market risk limits and liquidity risk limits to the risk-taking units Group Treasury and Markets . The limits are set in accordance with the business strategies and are reviewed at least annually . The heads of the units allocate the respective limits within the unit and may introduce more detailed limits and other risk mitigation techniques such as stop-loss rules .
The CEO and GEM regularly review reports on risk exposures and have established the following committees for risk, liquidity and capital management:
• The Asset and Liability Committee (ALCO), chaired by the Chief Financial Officer (CFO), prepares issues of major importance concerning Nordea’s financial operations, financial risks as well as capital management for decision by the CEO in GEM .
• The Risk Committee, chaired by the Chief Risk Officer (CRO), monitors developments of the different risks on an aggregated level .
• The GEM credit committee and the ECC, both chaired by the CRO, and the Group Credit Committee (GCC), chaired by the Chief Credit Officer (CCO), decide on major credit risk limits and industry policies for Nordea . Credit risk limits are granted as individual limits for customers or consolidated customer groups and as industry limits for certain defined industries .
CRO and CFO Two units, Group Risk Management and Group
Corporate Centre, are responsible for risk, capital, liquidity and balance sheet management . Group Risk Management, headed by the CRO, is responsible for the risk management framework, risk processes as well as the capital adequacy framework . Group Corporate Centre, headed by the CFO, is responsible for the capital policy, the composition of the capital base and for management of liquidity risk and structured interest income risk . Each customer area and product area are primarily responsible for managing the risks in its operations within the applicable limits and framework, including identification, control and reporting .
Monitoring and reporting The control environment in Nordea is based on the principles of segregation of duties . Monitoring and reporting of risk is conducted on a daily basis for market and liquidity risk, on a monthly and quarterly basis for credit risk and on a quarterly basis for operational risk .
Risk reporting is regularly made to GEM and to the Board of Directors . Group Internal Audit makes an independent evaluation of the processes regarding risk and capital management in accordance with the annual audit plan .
The Pillar 3 disclosure – Capital and risk management reportMore detailed information on risk and capital is presented in accordance with the Pillar 3 requirements of the CRD in the Basel II framework at www .nordea .com .
According to ”Bekendtgørelse om ledelse og styring af pengeinstitutter m .fl .” Nordea has appointed a Chief Risk Officer for NBD . The Chief Risk Officer reports to the Executive Management in NBD and is responsible for the overall Risk Management coordination in NBD .
Risk management Credit risk management Group Risk Management is responsible for the credit risk management framework, consisting of policies, instructions and guidelines for Nordea .
Each customer area and product area are primarily responsible for managing the credit risks in its operations, while Group Risk Management consolidates and monitors the credit risks on both Group and sub-levels .

10Nordea Bank Danmark A/S . Annual Report 2010
Within the powers to act granted by the Board of Directors, credit risk limits are approved by decision-making authorities on different levels in the organisation .
The credit decision-making structure has been adjusted effective from the fourth quarter of 2010 . The new Group Executive Management Credit Committee (GEM CC) has been added to decide on proposals containing major principle issues and the power to act for the Group Credit Committee has been increased . The changes will only impact the credit committees on Group level (ECC and GCC), and not the credit committees in the customer areas . The responsibility for a credit exposure lies with the customer responsible unit . Customers are assigned a rating or score in accordance with the Nordea framework for quantification of credit risk .
Credit risk definition and identification Credit risk is defined as the risk of loss if counterparts fail to fulfil their agreed obligations and the pledged collateral does not cover the claims . Credit risk stems mainly from various forms of lending, but also from guarantees and documentary credits, counterparty credit risk in derivatives contracts, transfer risk attributable to the transfer of money from another country and settlement risk . Risks in specific industries are followed by industry monitoring groups and managed through industry policies, which establish requirements and limits on the overall industry exposure .
Credit risk appetiteNordea has defined its credit risk appetite as an expected loan loss level of 25 bp over the cycle . Net loan losses over the past years show an average not exceeding this level .
Individual and collective assessment of impairment Throughout the process of identifying and mitigating credit impairments, Nordea works continuously to review the quality of credit exposures . Weak and impaired exposures are closely and continuously monitored and reviewed at least on a quarterly basis in terms of current performance, business outlook, future debt service capacity and the possible need for write downs .
An exposure is impaired, and a write-down is recognised, if there is objective evidence based on loss events or observable data that the
customer’s future cash flow has weakened to the extent that full repayment is unlikely, collateral included . The size of the write down is equal to the estimated loss being the difference between the carrying amount and the discounted value of the future cash flow, including the value of pledged collateral . Impaired exposures can be either performing or non-performing . Exposures that have been past due more than 90 days are automatically regarded as non-performing and reported as non-performing and impaired or not impaired depending on the deemed loss potential .
In addition to individual impairment testing of all individually significant customers, collective impairment testing is performed for groups of customers that have not been found to be impaired on individual level . Collective impairment is based on the migration of rated and scored customers in the credit portfolio as well as management judgement . The assessment of collective impairment reacts to up- and down-ratings of customers as well as new customers and customers leaving the portfolio . Also customers going to and from default affect the calculation . Collective impairment is assessed quarterly for each legal unit . The rationale for this two-step procedure with both individual and collective assessment is to ensure that all incurred losses are accounted for up to and including each balance sheet day .
Further information on credit risk is presented in Note 49 .
Credit portfolio Credit risk exposure is measured and presented as the principle amount of on-balance-sheet claims, that is loans to credit institutions and the public, and off-balance-sheet potential claims on customers and counterparts, net after allowances . NBD’s total credit risk exposure has decreased by 6% to DKK 1,088bn during 2010 (DKK 1,156bn) . The largest credit risk exposure is loans to the public, which in 2010 increased by 1% to DKK 679bn (DKK 670bn) .
Loans to corporate customers at the end of 2010 amounted to DKK 400bn (DKK 397bn), an increase of 1%, while lending to household customers increased by 7% to DKK 272bn (DKK 254bn) . The portion of total lending to the public going to corporate customers was 59% (59%) and to household customers 40% (38%) . Loans to

11Nordea Bank Danmark A/S . Annual Report 2010
credit institutions, mainly in the form of inter-bank deposits, amounted to DKK 78bn at the end of 2010 (DKK 98bn) .
Loans to corporate customers The main increases in the lending portfolio were in the sectors “Industrial commercial services”, “Real estate”, “Financial institutions” as well as in “Consumer staples (food, agriculture etc .)” . Financial institutions remains the largest sector in NBD’s lending portfolio, at DKK 99bn (DKK 97bn) . The portfolio predominantly comprises relatively large and financially strong companies .
The distribution of loans to corporates by size of loan shows a high degree of diversification where approx 52% (50%) of the corporate volume is for loans on a scale of up to EUR 50m per customer . See Note 49 . This distribution has been relatively stable in recent years .
Credit risk mitigation is an inherent part of the credit decision process . In every credit decision and review the valuation of collateral is considered as well as the adequacy of covenants and other risk mitigations .
Pledging of collateral is the main credit risk mitigation technique . In corporate exposures, the main collateral types are real estate mortgages, floating charges and leasing objects . Collateral coverage is higher for exposures to financially weaker customers than for those who are financially strong .
Regarding large exposures, syndication of loans is the primary tool for managing concentration risk while credit risk mitigation by the use of credit default swaps has been applied to a limited extent .
Covenants in credit agreements do not substitute collaterals but are an important complement to both secured and unsecured exposures . Most exposures of substantial size and complexity include appropriate covenants . Financial covenants are designed to react to early warning signs and are carefully monitored .
Loans to household customers In 2010, mortgage loans and consumer loans increased to DKK 185bn and DKK 88bn respectively . The proportion of mortgage loans of total household loans was 68% (69%) . Collateral coverage is high for mortgage loans to household customers, whereas consumer loans to this segment have a lower degree of collateral .
Geographical distribution Lending to the public by borrower domicile shows that the Nordic market accounts for 93% (93%) of which Denmark accounts for 91% . Other EU countries represent the main part of lending outside the Nordic countries .
Rating and scoring distributionOne way in which credit quality can be assessed is through analysis of the distribution across rating grades, for rated corporate customers and institutions, as well as risk grades for scored
Nordea Bank Danmark Group
Credit risk exposure and loans(excluding cash and balances at central banks and settlement risk exposure) 31 Dec 31 DecDKKm 2010 2009To credit institutions 77,898 97,826
To the public 679,315 669,735- of which corporate 400,270 397,069- of which household 272,400 253,610- of which public sector 6,645 19,056Total loans 757,213 767,562 Off-balance credit exposure1 207,891 211,000Counterparty risk exposure2 4,993 4,538Interest-bearing securities3 117,670 173,043Total credit risk exposure in the banking operations 1,087,767 1,156,143 1 Of which for corporate customers approx 90% .2 After close-out netting and collateral agreements, including current market value exposure as well as potential future exposure .3 Includes interest-bearing securities pledged as collateral in repurchase agreements .

12Nordea Bank Danmark A/S . Annual Report 2010
household and small business customers, that is retail exposures .
Following the economic recovery, improving credit quality was seen in 2010, mainly in the corporate credit portfolio . 67% (59%) of the corporate exposure was rated 4– or higher, with an average rating for this portfolio of 4 . Institutions and retail customers on the other hand exhibit a distribution that is biased towards the higher rating grades . The proportion of institutional exposure rated 5- or higher was 98% (96%) . 82% (81%) of the retail exposure was scored C- or higher, which indicates a probability of default of 1,2% or lower . Impaired loans are not included in the rating/scoring distributions .
Impaired loans Impaired loans gross increased during the year to DKK 13,236m from DKK 10,009m, corresponding to 173 bp of total loans . 71% of impaired loans gross are performing loans and 29% are non-performing loans . Impaired loans net after allowances for individually assessed impaired loans amounted to DKK 7,989m (DKK 5,769m), corresponding to 105 bp of total loans . Allowances for individually assessed loans increased to DKK 5,247m from DKK 4,240m .
Nordea Bank Danmark GroupExposure 31 Dec 2010, distributed by rating/risk grades
Rating grade
0
2
4
6
8
10
12
14
16
18
20
6+ 6- 5+ 5- 4 4- 3+ 3 3- 2+ 2 2- 1+ 5 6 4+ 1-1
% Corporate customers
0
2
4
6
8
10
12
14
A+ A- B+ B- C C-D+ D D-E+ E E- F+BA C+ F-F
%
Risk grade
Household customers
Allowances for collectively assessed loans increased to DKK 1,975m from DKK 1,894m . The provisioning ratio was 55% (61%) . The sectors with the largest increases in impaired loans were “Consumer staples”, “Household consumer lending” and “Retail trade” as well as “Other, public and organisations” .
Past due loans to corporate customers that are not considered impaired increased to DKK 10,125m (DKK 6,645m) . The volume of past due loans to household customers decreased to DKK 2,846m (DKK 3,249m) in 2010, see Note 49 .
Net loan losses Net loan losses were DKK 3,399m in 2010 (DKK 5,113m) . This corresponds to a loan loss ratio of 51 bp, including 11 bp of provisions related to the Danish guarantee scheme . DKK 2,241m
Nordea Bank Danmark GroupLoans to the public by industry 31 Dec 31 DecDKKm 2010 2009Energy (oil, gas etc) 24 19Metals and mining materials 122 123Paper and forest materials 1,980 1,825Other materials (chemical, building mat etc) 6,536 6,591Industrial capital goods 4,550 5,177Industrial commercial services etc 52,467 45,190Construction and engineering 9,638 9,239Shipping and offshore 10,292 11,105Transportation 5,904 6,605Consumer durables (cars, appliances etc) 4,042 4,351Media and leisure 7,388 7,737Retail trade 33,371 31,787Consumer staples (food, agriculture etc) 62,541 60,472Health care and pharmaceuticals 6,455 7,560Financial institutions 98,873 96,776Real estate management and investment 48,530 41,865IT software, hardware and services 6,810 5,672Telecommunication equipment 77 107Telecommunication operators 1,988 2,686Utilities (distribution and production) 7,783 5,868Other, public and organisations 30,899 46,312Corporate 400,270 397,069Household mortgages 184,607 173,809Household consumer 87,793 79,801Public sector 6,645 19,056Total 679,315 669,735

13Nordea Bank Danmark A/S . Annual Report 2010
(DKK 4,202m) relates to corporate customers and DKK 1,158m (DKK 911m) relates to household customers . The main losses were in the corporate sectors “Retail trade“, ”Industrial commercial services etc .” and “Financial Institutions” . The loan loss ratio in NBD Nordic Banking was 64 bp (94 bp) . Net loan losses as well as impaired loans continue to stem from a large number of smaller and medium-sized exposures rather than from a few large exposures .
Counterparty risk Counterparty risk is the risk that Nordea’s counterpart in a FX, interest rate, commodity, equity or credit derivative contract defaults prior to the maturity of the contract and that Nordea at that time has a claim on the counterpart . The net counterparty credit risk exposure at the end of 2010 was DKK 4 .99bn, of which the current
exposure represents DKK 2 .1bn . 94 .5% of the total exposure and 97 .5% of the current exposure were towards Financial institutions .
Market riskMarket risk is the risk of a loss in the market value of financial instruments as a result of movements in financial market variables . The customer-driven trading activity of Nordea Markets and the investment and liquidity buffer and funding activities in Group Treasury are the key contributors to market risk . For most other activities, the basic principle is that market risks are eliminated by matching assets, liabilities and off-balance-sheet items .
Market risk appetiteThe Board of Directors of Nordea has formulated market risk appetites for Nordea as a whole,
Nordea Bank Danmark GroupLoans to the public, impaired loans gross and allowances, by industry DKKm, 31 Dec 2010 Impaired loans Allowances Provisioning ratio %Energy (oil, gas etc) 0 0 -Metals and mining materials 1 1 -Paper and forest materials 51 9 17 .4Other materials (chemical, building materials etc) 220 154 70 .0Industrial capital goods 582 166 28 .6Industrial commercial services etc 647 494 76 .3Construction and engineering 610 294 48 .1Shipping and offshore 302 146 48 .4Transportation 157 108 68 .5Consumer durables (cars, appliances etc) 560 261 46 .6Media and leisure 288 135 46 .9Retail trade 1,316 890 67 .6Consumer staples (food, agriculture etc) 2,735 1,064 38 .9Health care and pharmaceuticals 44 27 61 .7Financial institutions 736 521 70 .8Real estate management and investment 1,272 428 33 .7IT software, hardware and services 272 120 44 .0Telecommunication equipment 1 1 90 .4Telecommunication operators 4 6 154 .8Utilities (distribution and production) 5 21 418 .3Other, public and organisations 999 576 57 .6Corporate 10,802 5,422 50.2Household mortgages 156 177 113 .9Household consumer 2,278 1,623 71 .3Public sector 0 0 -Total 13,236 7,222 54.6
Nordea Bank Danmark GroupImpaired loans, allowances and ratios
2010 2009Gross impaired loans, DKKm 13,236 10,009 of which performing 9,386 7,116 of which non-performing 3,850 2,893Total allowance rate 0.9% 0.8%Provisioning ratio 54 .6% 61 .3%
Nordea Bank Danmark GroupNet loan losses and loan loss ratios, bp
2010 2009Loan losses, DKKm 3,399 5,113Loan loss ratio 50 .8 77 .7 of which individual 49 .8 60 .7 of which collective 1 .0 17 .0Loan loss ratio, Nordic Banking 63 .5 93 .8

14Nordea Bank Danmark A/S . Annual Report 2010
covering the investment and liquidity buffer and funding activities of Group Treasury and the trading activities of Nordea Markets . For Group Treasury, market risk-related activities may not lead to a reported monthly loss in investment earnings exceeding EUR 150m or an accumulated loss exceeding EUR 250m at any time in a calendar year . Compliance with the risk appetite is ensured by market risk limits and stop-loss rules . For the trading activities in Nordea Markets, the risk appetite and the market risk limits are set in relation to the earnings these activities generate .
Market risk analysisThe total VaR was DKK 256m (DKK 573m) at the end of 2010, demonstrating a considerable diversification effect between interest rate, equity, credit spread and foreign exchange risk, as the total VaR is lower than the sum of the risk in the four categories .
The total interest rate VaR ended 2010 at DKK 208m (DKK 489m) . The net interest rate sensitivity was DKK -521m (DKK -1,473m) and the largest part of NBD’s interest rate sensitivity stemmed from interest rate positions in Danish Kroner and Swedish Kronor . The total gross sensitivity to a 1 percentage point parallel shift, which measures the development in the market value of NBD’s interest rate sensitive positions if interest rates were to move adversely for Nordea, was DKK 1,454m (DKK 1,514m) at the end of 2010 .
At the end of 2010, NBD’s equity VaR stood at DKK 86m (DKK 276m) .
Credit spread VaR ended 2010 at DKK 0 .1m (DKK 0 .1m) .
NBD’s foreign exchange VaR was DKK 20m (DKK 8m) at year-end .
The portfolio of less liquid alternative investments
constituted a fair value of DKK 4,942m (DKK 2,781m) at year-end . The net fair value of investments in hedge funds was DKK 1,780m (DKK 1,463m) at year-end, the fair value of investments in private equity funds was DKK 2,610m (DKK 1,318m), and the fair value of investments in credit funds was DKK 552m . All three types of investments are spread over a number of funds .
Operational risk Operational risk is defined as the risk of direct or indirect loss, or damaged reputation, resulting from inadequate or failed internal processes, from people and systems, or from external events . Operational risk includes compliance risk which is the risk of business not being conducted according to legal and regulatory requirements, market standards and business ethics .
Managing operational risk is part of the management’s responsibilities . Nordea’s network of Risk and Compliance Officers ensures that operational and compliance risk within Nordea is managed effectively in the business organisation, which represents the first line of defence .
In order to manage these risks Group Operational Risk Management, representing the second line of defence, has defined a common set of standards in the form of Group directives, active risk management processes and reporting requirements . The aim is a sound risk management culture with the objective of adhering to best practice regarding market conduct and ethical standards in all business activities . The key process for active risk management is the annual risk self-assessment process, which puts focus on identifying and following up on key risks, which are identified both through top-down division management involvement and bottom-up reuse of existing information from processes such as incident reporting, quality and risk analyses and product approvals .
Nordea Bank Danmark GroupConsolidated market risk figures 31 Dec 31 DecDKKm Measure 2010 2010 high 2010 low 2010 avg 2009Total Risk VaR 255 .5 720 .9 90 .3 322 .7 572 .9- Interest rate risk VaR 208 .4 492 .0 63 .2 208 .3 488 .7- Equity risk VaR 86 .0 453 .2 42 .3 190 .5 276 .4- Credit spread risk VaR 0 .1 20 .9 0 .1 1 .9 0 .1- Foreign exchange risk VaR 20 .1 33 .6 5 .8 15 .1 8 .3Diversification effect VaR 19% 54% 10% 25% 26%

15Nordea Bank Danmark A/S . Annual Report 2010
Group Internal Audit, representing the third line of defence, provides assurance to the Board of Directors on the risk management, control and governance processes .
Liquidity management Liquidity riskKey issues during 2010Nordea has during 2010 continued to benefit from its focus on prudent liquidity risk management, reflected by a diversified and strong funding base . Nordea had access to all relevant financial markets and was able to actively use all the funding programmes .
Extensive discussions on new liquidity risk regulation are ongoing among regulators, and Nordea is tightly participating in the discussions on several forums and is well prepared for potential changes .
Management principles and controlThe Board of Directors of Nordea has the ultimate responsibility for the asset and liability management of the Group i .e . limiting and monitoring Nordea’s structural risk exposures .
Risks in Nordea are measured and reported according to common principles and policies approved by the Board . The Board of Directors also decides on policies for liquidity risk management . These policies are reviewed at least annually .
The CEO in GEM decides on the targets for Nordea’s risk management regarding SIIR, as well as, within the scope of the resolutions adopted by the Board of Directors, the allocation of liquidity risk limits .
The Asset and Liability Committee (ALCO), chaired by the CFO, prepares issues of major importance concerning Nordea’s financial operations and financial risks for decision by CEO in GEM .
Group Treasury operationalises the targets and limits and develops the liquidity risk and SIIR management frameworks, which consists of policies, instructions and guidelines for the whole Group .
Liquidity risk managementLiquidity risk is the risk of being able to meet
liquidity commitments only at increased cost or, ultimately, being unable to meet obligations as they fall due . Nordea’s liquidity management is based on policy statements resulting in different liquidity risk measures, limits and organisational procedures .
Policy statements stipulate that Nordea’s liquidity management reflects a conservative attitude towards liquidity risk . Nordea strives to diversify the Group’s sources of funding and seeks to establish and maintain relationships with investors in order to manage market access .
A broad and diversified funding structure is reflected by the strong presence in Nordea’s four domestic markets in the form of a strong and stable retail customer base and the variety of funding programmes . Special focus is on the composition of the investor base in terms of geographical range and rating sensitivity .
Nordea publishes adequate information on the liquidity situation of Nordea to remain trustworthy at all times .
Nordea’s liquidity risk management includes stress testing and a business continuity plan for liquidity management .
Stress testing is defined as the evaluation of potential effects on a bank’s liquidity situation under a set of exceptional but plausible events . The stress test should identify events or influences that could affect the funding need or the funding price and seek to quantify the potential effects . The purpose of stress tests is to supplement the normal liquidity risk measurement and confirm that the business continuity plan is adequate in stressful events, and that the business continuity plan properly describes procedures to handle a liquidity crisis with minimal damage to Nordea . Nordea stress scenarios are based on an assessment of the particular events to which Nordea is presumed to be most vulnerable to take into account the current business structure and environment .
Nordea´s stress tests cover both idiosyncratic and market wide scenarios, as well as the combination of these .
Group Treasury is responsible for managing liquidity in Nordea and for compliance with the

16Nordea Bank Danmark A/S . Annual Report 2010
group-wide limits from the Boards of Directors, the CEO in GEM and ALCO .
Liquidity risk measurement methodsLiquidity risk management focuses on both short-term liquidity risk and long-term structural liquidity risk . In order to measure the exposure on both horizons, a number of liquidity risk measures have been developed covering all material sources of liquidity risk .
In order to avoid short-term funding pressures, Nordea measures the funding gap risk, which expresses the expected maximum accumulated need for raising liquidity in the course of the next 14 days . Cash flows from both on-balance-sheet and off-balance-sheet items are included .
The funding gap risk is measured and limited for each currency and as a total figure for all currencies combined . The total figure for all currencies combined is limited by the Board of Directors .
To ensure funding in situations where Nordea is in urgent need of cash and the normal funding sources do not suffice, Nordea holds a liquidity buffer . The limit is set by the Board of Directors for the minimum size of the liquidity buffer .
The liquidity buffer is set to ensure a total positive cash flow defined by the funding risk measurement and consists of high-grade liquid securities that can be sold or used as collateral in funding operations . The structural liquidity risk of Nordea is measured and limited by the Board of Directors through the net balance of stable funding, which is defined as the difference between stable liabilities and stable assets . These liabilities primarily comprise retail deposits, bank deposits and bonds with a remaining term to maturity longer than 6 months, and shareholders’ equity, while stable assets primarily comprise retail loans, other loans with a remaining term to maturity longer than 6 months and committed facilities .
ALCO has set as a target that the net balance of stable funding should be positive, which means that stable assets must be funded by stable liabilities .
Liquidity risk analysisThe short-term liquidity risk was held at moderate levels throughout 2010 . The average funding gap risk, that is the average expected need for raising liquidity in the course of the next 14 days, was DKK -34bn (DKK -17bn) . Nordea’s liquidity buffer was in the range DKK 92 - 170bn
16Nordea Bank Danmark A/S . Annual Report 2010
Nordea Bank Danmark Group
SIIR Risk, Gap analysis, 31 Dec 2010Re-pricing gap for increasing interest rates
Interest RateFixing Period Balance Within 3 3-6 6-12 1-2 2-5 >5 Non DKKm sheet months months months years years years re-pricing Total
AssetsInterest-bearing assets 878,094 592,003 17,136 44,349 15,692 20,642 136,769 51,503 878,094Non interest-bearing assets 118,637 - - - - - - 118,637 118,637Total assets 996,731 592,003 17,136 44,349 15,692 20,642 136,769 170,140 996,731
LiabilitiesInterest-bearing liabilities 867,960 610,748 11,890 28,463 34,866 19,749 133,731 28,513 867,960Non interest-bearing liabilities and equity 128,771 - - - - - - 128,771 128,771Total liabilities and equity 996,731 610,748 11,890 28,463 34,866 19,749 133,731 157,284 996,731
Off-balance sheetitems, net 12,241 2,449 -6,566 -4,928 -1,339 -1,857
Exposure -6,504 7,695 9,320 -24,103 -446 1,181 12,856 Cumulative exposure 1,191 10,512 -13,591 -14,037 -12,856 -

17Nordea Bank Danmark A/S . Annual Report 2010
(DKK 68 - 141bn) throughout 2010 with an average of DKK 116bn (DKK 103bn) . Nordea considers this a high level and it reflects the Group’s conservative attitude towards liquidity risk in general and towards unexpected liquidity events in particular .
Structural Interest Income Risk (SIIR)SIIR is the amount by which Nordea’s accumulated net interest income would change during the next 12 months if all interest rates changed by 1 percentage point . SIIR reflects the mismatch in the balance sheet items and the off-balance-sheet items when the interest rate repricing periods, volumes or reference rates of
assets, liabilities and derivatives do not match exactly . Nordea’s SIIR management is based on policy statements resulting in different SIIR measures, targets and organisational procedures . Policy statements focus on optimising financial structure, balanced risk taking and reliable earnings growth, the identification of all significant sources of SIIR, measurement under stressful market conditions and adequate public information . Group Treasury has the responsibility for the operational management of SIIR and for complying with Group-wide targets .
SIIR measurement methodsThe basic measures for SIIR are the two re-
Cash flow analysis
Group Within 3 3-12 1-5 >5 31 Dec 2010, DKKm months months years years TotalInterest-bearing financial assets 298,544 102,270 204,432 459,029 1,064,275Non-interest-bearing financial assets - - - 118,637 118,637Total financial assets 298,544 102,270 204,432 577,667 1,182,913 Interest-bearing financial liabilities 660,603 77,405 95,708 158,059 991,775Non-interest-bearing financial liabilities - - - 128,771 128,771Unrecognised guarantees and documentary credits 31,093 - - - 31,093Unrecognised credit commitments 176,798 - - - 176,798Total financial liabilities 868,494 77,405 95,708 286,830 1,328,437 Derivatives, cash inflow 10 4,074 165 83 4,332Derivatives, cash outflow -65 -4,231 -1,166 -609 -6,071Net exposure -55 -157 -1,001 -526 -1,739 Exposure -570,005 24,709 107,722 290,310 -147,264Cumulative exposure -570,005 -545,296 -437,574 -147,264
The table is based on contractual maturities for on-balance-sheet financial instruments . For derivatives, the expected cash inflows and outflows are disclosed for both derivative assets and derivative liabilities, as derivatives are managed on a net basis . Interest bearing financial assets and liabilities include interest on cash flows .
Within 3 3-12 1-5 >5 31 Dec 2009, DKKm months months years years TotalInterest-bearing financial assets 301,105 89,836 292,284 478,979 1,162,204Non-interest-bearing financial assets - - - 89,415 89,415Total financial assets 301,105 89,836 292,284 568,394 1,251,619 Interest-bearing financial liabilities 655,719 54,253 119,265 204,137 1,033,373Non-interest-bearing financial liabilities - - - 130,675 130,675Unrecognised guarantees and documentary credits 34,411 - - - 34,411Unrecognised credit commitments 176,589 - - - 176,589Total financial liabilities 866,719 54,253 119,265 334,812 1,375,048 Derivatives, cash inflow 82 126 186 74 469Derivatives, cash outflow -89 -335 -744 -394 -1,563Net exposure -7 -208 -558 -320 -1,094 Exposure -565,620 35,375 172,461 233,262 -124,523Cumulative exposure -565,620 -530,245 -357,785 -124,523
18Nordea Bank Danmark A/S . Annual Report 2010
pricing gaps measuring the effect on Nordea’s net interest income for a 12-month period of a 1 percentage point increase, or decrease, in all interest rates . The re-pricing gaps are calculated under the assumption that no new market transactions are made during the period . The main elements of customer behaviour and Nordea’s decision-making process concerning Nordea’s own rates are, however, taken into account . For example in a low interest rate environment, when rates are decreasing further, the total decrease of rates cannot be applied to non-maturity deposits since rates cannot be negative . Similarly in an increasing interest rate environment Nordea may choose not to increase interest rates on all customer deposits correspondingly .
SIIR analysisAt the end of the year, the SIIR for decreasing market rates was DKK 799m (DKK 551m) and the SIIR for increasing rates was DKK 49m (DKK 231m) . These figures imply that net interest income would decrease if interest rates fall and increase if interest rates rise .
Capital management
Capital managementNordea strives to attain efficient use of capital through active management of the balance sheet with respect to different asset, liability and risk categories .
The goal is to enhance returns to the shareholder while maintaining a prudent capital structure .
Individual solvency needInformation regarding the individual solvency need for the Nordea Bank Danmark Group and Nordea Bank Danmark A/S can be found at www .nordea .dk or at the investor relation webpage at www .nordea .com
Capital governanceThe Board of Directors decides ultimately on the targets for capital ratios and the capital policy of Nordea . The CEO in GEM decides on the overall framework of capital management .
Nordea’s ability to meet targets and to maintain minimum capital requirements is reviewed regularly within the Asset and Liability Committee (ALCO) .
Pillar 1Risk weighted assets (RWA) are calculated based on Pillar 1 requirements . NBD had 91% of the exposure covered by Internal Rating Based (IRB) approaches by the end of 2010 . Nordea will implement the IRB approach for some remaining portfolios .
Nordea is also approved to use its own internal Value-at-Risk (VaR) models to calculate capital requirements for the major part of the market risk in the trading books . For operational risk, the standardised approach is applied .
Pillar 2Nordea bases the internal capital requirements under the Internal Capital Adequacy Assessment Process (ICAAP) on Pillar 1 and Pillar 2 risks, which in practice means a combination of Capital Requirements Directive (CRD) risk definitions, Nordea’s Economic Capital (EC) framework and buffers for periods of economic stress .
The ICAAP describes Nordea’s management, mitigation and measurement of material risks and assesses the adequacy of internal capital by defining an internal capital requirement reflecting the risk appetite of the institution .
EC is based on quantitative models used to estimate the unexpected losses for each of the following major risk types: credit risk, market risk, operational risk and business risk . Additionally, the EC models explicitly account for interest rate risk in the banking book, market risk in the investment portfolios, risk in Nordea’s sponsored defined benefit pension plans, real estate risk and concentration risk .
In addition to calculating risk capital for its various risk types, Nordea conducts a comprehensive capital adequacy stress test process to analyse the effects of a series of global and local shock scenarios . The results of stress testing are considered, along with potential management intervention, in Nordea’s internal capital requirement . The internal capital requirement is a key component of Nordea’s capital ratio target setting .
Economic Profit (EP)Nordea uses EP as one of its financial performance indicators . EP is calculated as risk-adjusted profit less cost of equity .

19Nordea Bank Danmark A/S . Annual Report 2010
Risk-adjusted profit and EP are measures for shareholder value creation .
In investment decisions and customer relation-ships, EP drives and supports the right behaviour with a balanced focus on income, costs and risk . The EP model also captures both growth and return . EC and expected losses (EL) are input in the EP framework .
Capital adequacy ratios Group 31 Dec 31 DecDKKbn 2010 2009RWA Basel II (Pillar 1) excluding transition rules 310 312RWA including transition rules 409 390Regulatory capital requirement including transition rules 33 31Tier 1 capital 28 28Capital base 37 37Core tier 1 ratio excluding transition rules (%) 8 .9 8 .9Core tier 1 ratio including transition rules (%) 6 .8 7 .1Tier 1 ratio excluding transition rules (%) 8 .9 8 .9Tier 1 ratio including transition rules (%) 6 .8 7 .1Total capital ratio excl transition rules incl new subordinated loan1 (%) 15 .4 12 .0Total capital ratio excluding transition rules (%) 11 .9 12 .0Total capital ratio including transition rules (%) 9 .0 9 .6Capital base / Regulatory capital requirement including transition rules (%) 112 .8 119 .91 Total capital ratio at 31 December 2010 includes a new
subordinated loan of EUR 1 .45bn (tier 2 capital) issued in February 2011 .
Parent company 31 Dec 31 DecDKKbn 2010 2009RWA Basel II (Pillar 1) excluding transition rules 305 292RWA including transition rules 363 345Regulatory capital requirement including transition rules 29 28Tier 1 capital 27 28Capital base 37 39Core tier 1 ratio excluding transition rules (%) 8 .8 9 .7Core tier 1 ratio including transition rules (%) 7 .3 8 .2Tier 1 ratio excluding transition rules (%) 8 .8 9 .7Tier 1 ratio including transition rules (%) 7 .3 8 .2Total capital ratio excl transition rules incl new subordinated loan1 (%) 15 .6 13 .2Total capital ratio excluding transition rules (%) 12 .0 13 .2Total capital ratio including transition rules (%) 10 .1 11 .2Capital base / Regulatory capital requirement including transition rules (%) 125 .7 139 .91 Total capital ratio at 31 December 2010 includes a new
subordinated loan of EUR 1 .45bn (tier 2 capital) issued in February 2011 .
Capital baseCapital base (referred to as own funds in the CRD) is the sum of tier 1 capital and tier 2 capital after deductions .
Tier 1 capital is defined as capital of the same or close to the character of paid-up, capital-eligible reserves and a limited portion of hybrid capital loan (perpetual loans) instruments (maximum 50% of tier 1 if some specific criteria are fulfilled) . Profit may only be included after deduction of proposed dividend . Intangible assets and deferred tax assets are deducted from tier 1 .
Tier 2 comprises subordinated loans . The total tier 2 amount may not exceed tier 1 . The limits are set after deductions, that is investment in other financial companies .
Further informationFurther information on capital management and capital adequacy is presented in Note 39 Capital adequacy and in the disclosure in accordance with the Pillar 3 requirements of the CRD in the Basel II framework at www .nordea .com .
Corporate social responsibility
Nordea issues a Corporate Social Responsibility (CSR) report for 2010 based on the United Nations Principles for Responsible Investments . The report serves as Nordea’s annual Progress Report to the United Nations Global Compact and includes NBD .
The CSR report is available on the homepage www .nordea .com/csr .
Human resources
As a relationship bank, Nordea is committed to People, not least our employees . It is our skilled and dedicated employees and their ability to deliver great customer experiences that distinguish us from our competitors ad make Nordea Great .
People strategyNordea’s People strategy – emphasises that Nordea can reach its goals only if our employees reach theirs . This means that Nordea aims at providing oppportunities for our people to grow professionally by high ambitions and continuous

20Nordea Bank Danmark A/S . Annual Report 2010
development and at the same time live well-balanced lives . This mindset is ensured among all managers through leadership training and management programmes .
There are two main annual tools for follow up . The Employee Satisfaction Survey (ESI) is designed to give an overview of how our employees evaluate Nordea, and as a result identify and prioritise actions how to make Nordea Great .
The other tool is the mandatory Performance and Development Dialogue that takes place between immediate manager and employee, requiring preparation on both parts as weeel as follow-up throughout the year .
Focus on values and leadershipOur values and leadership are the strongest driver for both performance and for building our corporate culture . It takes Great leaders to build a Great European Bank . Great leadership in Nordea is the ability to engage and motivate people to reach out for our vision and the ability to create the right team to make it happen .
Opportunities to develop and growNordea aims at being a company with many possibilities for employees to develop within the Group . Development is a joint responsibility of the manager and the employee .
Nordea facilitates internal mobility . It is a strategic and nessesary precondition for our business . The pace of change within the financial industry is rapid . Changing demands create changing competencies and staffing needs . We continously need flexibility to find the right person for the right place to meet these external changes .
Profit-sharing schemeThe Profit Sharing scheme is capped and not based on the value of the Nordea share . It is a benefit, by which the employees get a part of the profit to encourage good performance and one Nordea team, which in turn will lead to better
profitability and make it more attractive to work within the Nordea Group .
For 2010, each employee can receive a maximum of EUR 3,200, of which EUR 2,000 is based on a pre-determined level of risk-adjusted profit, an additional EUR 600 based on the level of relative customer satisfaction and an additional EUR 600 based on Nordea’s relative performance compared to a Nordic peer group as measured by Total Shareholder Return .
Legal proceedings
Within the framework of the normal business operations, the Group faces a number of claims in lawsuits and other disputes, most of which involve relatively limited amounts . None of these disputes is considered likely to have any significant adverse effect on the Group or its financial position .
Subsequent events
NBD has provided a guarantee to the Danish guarantee scheme (Indskydergarantiordningen) . Please see note 37 for further comments .
A new subordinated loan of EUR 1 .45bn was issued in February 2011 . For further information regarding the effect on the capital base see section Capital adequacy and ratings on page 8 .
No further events have occurred after the balance sheet date, which may affect the assessment of the annual financial statements .
Outlook 2011
NBD expects the Danish macroeconomic recovery to continue in 2011, but the development is still somehow fragile and hence uncertainty remains .The level of activity in NBD will follow the development in 2010 through a prudent growth strategy balancing opportunities, risks and costs .

21Nordea Bank Danmark A/S . Annual Report 2010
Financial statements – Contents
Income statement
Statement of comprehensive income
Balance sheet
Statement of changes in equity
Cash flow statement
5-year overview
Notes to the financial statements
1 Accounting policies
Notes to the income statement 2 Net interest income
3 Net fee and commission income
4 Net result from items at fair value
5 Dividends
6 Other operating income
7 Staff costs
8 Other expenses
9 Depreciation, amortisation and impairment charges
of tangible and intangible assets
10 Net loan losses
11 Taxes
12 Commitments with the Board of Directors and the
Executive Management
Notes to the balance sheet and memorandum items 13 Loans and their impairment
14 Interest-bearing securities
15 Financial instruments pledged as collateral
16 Shares
17 Derivatives and hedge accounting
18 Fair value changes of the hedged items in portfolio
hedge of interest rate risk
19 Investments in group undertakings
20 Investments in associated undertakings
21 Intangible assets
22 Property and equipment
23 Leasing
24 Investment property
25 Other assets
26 Prepaid expenses and accrued income
27 Deposits by credit institutions
28 Deposits and borrowings from the public
29 Debt securities in issue
30 Other liabilities
31 Accrued expenses and prepaid income
32 Provisions
33 Retirement benefit obligations
34 Subordinated liabilities
35 Assets pledged as security for own liabilities
36 Other assets pledged
37 Contingent liabilities
38 Commitments
Other notes
39 Capital adequacy
40 Classification of financial instruments
41 Assets and liabilities at fair value
42 Assets and liabilities in foreign currencies
43 Obtained collaterals which are permitted to be sold
or repledged
44 Investments, customer bearing the risk
45 Maturity analysis for assets and liabilties
46 Related-party transactions
47 The Danish Financial Supervisory Authority’s
ratio system
48 Acquisitions
49 Credit risk disclosures

22Nordea Bank Danmark A/S . Annual Report 2010
Group Parent companyDKKm Note 2010 2009 2010 2009
Income statement
Operating income
Interest income 27,280 34,444 16,990 22,311Interest expense -15,639 -23,049 -7,920 -13,317Net interest income 2 11,641 11,395 9,070 8,994 Fee and commission income 4,535 4,161 4,755 4,449Fee and commission expense -506 -552 -364 -422Net fee and commission income 3 4,029 3,609 4,391 4,027 Net results from items at fair value 4 1,628 1,888 1,108 2,188Profit from companies accounted for under the equity method 20 219 250 - -Dividends 5 - - 203 156Other operating income 6 774 630 921 679Total operating income 18,291 17,772 15,693 16,044 Operating expenses
General administrative expenses: Staff costs 7 -6,001 -5,978 -5,733 -5,756 Other expenses 8 -3,086 -2,979 -2,930 -2,895Depreciation, amortisation and impairment charges of tangible and intangible assets 9, 21, 22 -235 -159 -180 -138Other operating expenses -1,013 -1,342 -1,013 -1,342Total operating expenses -10,335 -10,458 -9,856 -10,131
Profit before loan losses 7,956 7,314 5,837 5,913Net loan losses 10 -3,399 -5,113 -3,172 -4,815Operating profit 4,557 2,201 2,665 1,098
Income tax expense 11 -1,077 -751 -566 -498Net profit for the year 3,480 1,450 2,099 600
Attributable toShareholder of Nordea Bank Danmark A/S 3,480 1,450 2,099 600Non-controlling interests - - - -Total 3,480 1,450 2,099 600
Statement of comprehensive income
Group Parent companyDKKm 2010 2009 2010 2009
Net profit for the year 3,480 1,450 2,099 600
Currency translation differences during the year 16 -5 - -Available-for-sale investments: Valuation gains/losses during the year - 3 - 3 Tax on valuation gains/losses during the year - -1 - -1Other comprehensive income, net of tax 16 -3 - 2
Total comprehensive income 3,496 1,447 2,099 602
Attributable toShareholder of Nordea Bank Danmark A/S 3,496 1,447 2,099 602Non-controlling interests - - - -Total 3,496 1,447 2,099 602

23Nordea Bank Danmark A/S . Annual Report 2010
Balance sheet
Group Parent company 31 Dec 31 Dec 31 Dec 31 DecDKKm Note 2010 2009 2010 2009
Assets Cash and balances with central banks 3,213 2,914 3,213 2,799Loans to credit institutions 13 77,898 97,826 148,437 149,581Loans to the public 13 679,315 669,735 361,114 368,764Interest-bearing securities 14 99,833 92,632 160,121 159,715Financial instruments pledged as collateral 15 21,479 80,940 34,896 98,784Shares 16 16,949 16,433 16,392 16,079Derivatives 17 4,631 4,464 4,631 4,222Fair value changes of the hedged items in portfolio hedge of interest rate risk 18 305 310 305 310Investments in group undertakings 19 - - 16,579 10,349Investments in associated undertakings 20 521 410 160 114Intangible assets 21 2,791 2,301 2,761 945Property and equipment 22, 23 683 582 379 275Investment property 24 199 91 43 37Deferred tax assets 11 150 393 - -Current tax assets 11 1,071 1,831 1,279 2,161Retirement benefit assets 33 173 156 173 156Other assets 25 84,162 55,002 138,455 102,930Prepaid expenses and accrued income 26 3,358 6,913 3,323 7,178Total assets 996,731 1,032,933 892,261 924,399 Liabilities Deposits by credit institutions 27 239,805 322,816 277,900 342,756Deposits and borrowings from the public 28 346,942 323,894 348,020 315,340Debt securities in issue 29 271,709 246,061 - 11,151Derivatives 17 7,077 6,310 7,077 6,080Fair value changes of the hedged items in portfolio hedge of intrest rate risk 18 - 82 - 82Current tax liabilities 11 172 168 170 168Other liabilities 30 78,316 81,672 219,455 209,466Accrued expenses and prepaid income 31 7,307 9,964 3,750 5,361Deferred tax liabilities 11 801 654 39 53Provisions 32 2,079 1,557 2,678 2,143Retirement benefit obligations 33 37 46 37 46Subordinated liabilities 34 9,504 9,488 9,504 9,488Total liabilities 963,749 1,002,712 868,630 902,134 Equity Non-controlling interests 26 26 - -Share capital 5,000 5,000 5,000 5,000Other reserves -8 -24 - -Proposed dividends 3,350 750 3,350 750Retained earnings 24,614 24,469 15,281 16,515Total equity 32,982 30,221 23,631 22,265Total liabilities and equity 996,731 1,032,933 892,261 924,399 Assets pledged as security for own liabilities 35 460,909 453,339 171,009 184,616Other assets pledged 36 - - - -Contingent liabilities 37 31,093 34,411 125,321 133,574Commitments 38 176,798 176,589 184,105 182,557

24Nordea Bank Danmark A/S . Annual Report 2010
Statement of changes in equity
Group Attributable to the shareholder of Nordea Bank Danmark A/S
Other reserves Available- Translation for-sale Non- Share of foreign invest- Proposed Retained controlling Total DKKm capital operations ments dividends earnings Total interests equity
Balance at 1 Jan 2010 5,000 -24 - 750 24,469 30,195 26 30,221Net profit for the year - - - - 3,480 3,480 - 3,480
Currency translation differences during the year - 16 - - - 16 - 16Available-for-sale investments: Valuation gains/losses during the year - - - - - - - -
Tax on valuation gains/losses during the year - - - - - - - -
Other comprehensive income, net of tax - 16 - - - 16 - 16
Total comprehensive income - 16 - - 3,480 3,496 - 3,496Share-based payments - - - - 16 16 - 16Dividends paid - - - -750 - -750 - -750Proposed dividends - - - 3,350 -3,350 - - -Other changes - - - - - - - -Balance at 31 Dec 2010 5,000 -8 - 3,350 24,614 32,956 26 32,982
Attributable to the shareholder of Nordea Bank Danmark A/S Other reserves Available- Translation for-sale Non- Share of foreign invest- Proposed Retained controlling Total DKKm capital operations ments dividends earnings Total interests equity
Balance at 1 Jan 2009 5,000 -19 -2 1,500 23,758 30,237 26 30,263Net profit for the year - - - - 1,450 1,450 - 1,450
Currency translation differences during the year - -5 - - - -5 - -5Available-for-sale investments: Valuation gains/losses during the year - - 3 - - 3 - 3
Tax on valuation gains/losses during the year - - -1 - - -1 - -1
Other comprehensive income, net of tax - -5 2 - - -3 - -3
Total comprehensive income - -5 2 - 1,450 1,447 - 1,447Share-based payments - - - - 11 11 - 11Dividends paid - - - -1,500 - -1,500 - -1,500Proposed dividends - - - 750 -750 - - -Other changes - - - - - - - -Balance at 31 Dec 2009 5,000 -24 - 750 24,469 30,195 26 30,221

25Nordea Bank Danmark A/S . Annual Report 2010
Parent company Restricted equity1 Unrestricted equity Other reserves Translation Available- Share2 of foreign for-sale Proposed Retained TotalDKKm capital operations investments dividends4 earnings equity
Balance at 1 Jan 2010 5,000 - - 750 16,515 22,265Net profit for the year - - - - 2,099 2,099
Currency translation differences during the year - - - - - -Available-for-sale investments: Valuation gains/losses during the year - - - - - - Tax on valuation gains/losses during the year - - - - - -Other comprehensive income, net of tax - - - - - -
Total comprehensive income - - - - 2,099 2,099Share-based payments3 - - - - 16 16Dividends paid - - - -750 - -750Proposed dividends - - - 3,350 -3,350 -Other changes - - - - - -Balance at 31 Dec 2010 5,000 - - 3,350 15,281 23,631 Restricted equity1 Unrestricted equity Other reserves Translation Available- Share2 of foreign for-sale Proposed Retained TotalDKKm capital operations investments dividends4 earnings equity
Balance at 1 Jan 2009 5,000 - -2 1,500 16,654 23,152Net profit for the year - - - - 600 600
Currency translation differences during the year - - - - - -Available-for-sale investments: Valuation gains/losses during the year - - 3 - - 3 Tax on valuation gains/losses during the year - - -1 - - -1Other comprehensive income, net of tax - - 2 - - 2
Total comprehensive income - - 2 - 600 602Share-based payments3 - - - - 10 10Dividends paid - - - -1,500 - -1,500Proposed dividends - - - 750 -750 -Other changes - - - - - -Balance at 31 Dec 2009 5,000 - - 750 16,515 22,265
Description of items in the equity is included in Note 1 Accounting policies .
1 Restricted capital was at 31 Dec 2010 DKK 5,000m (31 Dec 2009: DKK 5,000m) . Unrestricted capital was 31 Dec 2010 DKK 18,631m (31 Dec 2009: DKK 17,265m) .
2 Total shares registered were 50 million (31 Dec 2009: 50 million) all fully owned by Nordea Bank AB, Stockholm, Sweden . Nominal amount per share is DKK 100 . All issued shares are fully paid . All shares are of the same class and hold equal rights . The annual report for Nordea Bank AB is available on www .nordea .com .
3 Refers to the Long Term Incentive Programme (LTIP) .4 The proposed divident payment of DKK 3,350m is equivalent to DKK 67 (DKK 15) per share .
Statement of changes in equity (cont.)
26Nordea Bank Danmark A/S . Annual Report 2010
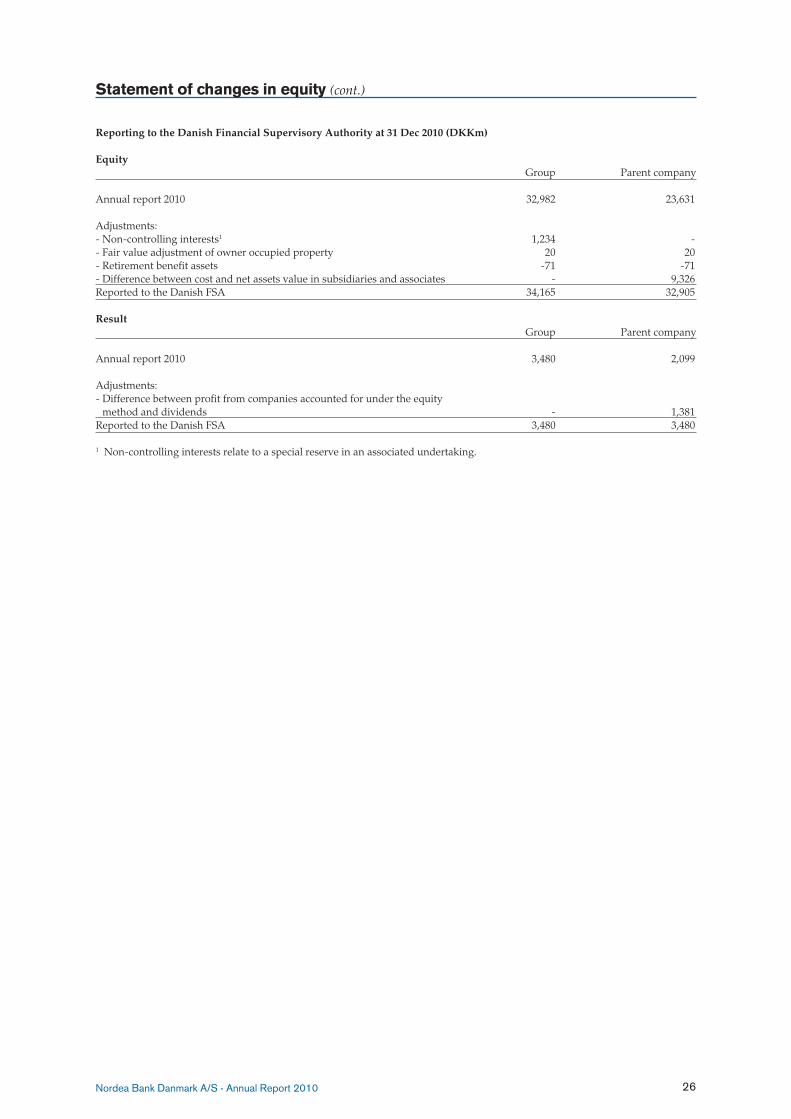
Reporting to the Danish Financial Supervisory Authority at 31 Dec 2010 (DKKm) Equity Group Parent company
Annual report 2010 32,982 23,631
Adjustments:- Non-controlling interests1 1,234 -- Fair value adjustment of owner occupied property 20 20- Retirement benefit assets -71 -71 - Difference between cost and net assets value in subsidiaries and associates - 9,326Reported to the Danish FSA 34,165 32,905 Result Group Parent company
Annual report 2010 3,480 2,099
Adjustments:- Difference between profit from companies accounted for under the equity
method and dividends - 1,381Reported to the Danish FSA 3,480 3,480
1 Non-controlling interests relate to a special reserve in an associated undertaking .
Statement of changes in equity (cont.)

27Nordea Bank Danmark A/S . Annual Report 2010
Group Parent company(DKKm) Note 2009 2008 2009 2008 Group Parent companyDKKm 2010 2009 2010 2009
Cash flow statement
Operating activities Operating profit 4,557 2,201 2,665 1,098Adjustments for items not included in cash flow 3,538 5,188 3,335 4,958Income taxes paid -152 -1,902 304 -1,512Cash flow from operating activities before changes in operating assets and liabilities 7,943 5,487 6,304 4,544 Changes in operating assets Change in loans to credit institutions 23,673 2,939 15,446 -33,292Change in loans to the public -12,090 -54,925 10,068 -23,472Change in interest-bearing securities -7,201 -11,898 -406 -15,293Change in financial assets pledged as collateral 59,461 -21,829 63,888 -39,039Change in shares -516 -4,790 -462 -4,443Change in derivatives, net 600 1,796 588 1,808Change in investment properties -108 -66 -6 -32Change in other assets -25,643 -31,690 -31,651 -56,533 Changes in operating liabilities Change in deposits by credit institutions -83,003 53,079 -64,856 80,089Change in deposits and borrowings from the public 23,048 8,041 24,900 -2,956Change in debt securities in issue 25,648 35,175 -11,151 11,151Change in other liabilities -5,753 24,136 7,995 83,274Change in provisions -350 - -352 -Cash flow from operating activities 5,709 5,455 20,305 5,806 Investing activities Acquisition of business operations -335 -2,015 1,813 -Sale of business operations - - - -Acquisition of investments in group undertakings - - -6,072 -2,129Acquisition of investments in associated undertakings -22 -36 -53 -5Sale of investments in associated undertakings 14 - 14 -Acquisition of property and equipment -247 -137 -210 -136Sale of property and equipment 18 9 5 5Acquisition of intangible assets -359 -290 -352 -280Sale of intangible assets - - - -Purchase/sale of other financial fixed assets - - - -Cash flow from investing activities -931 -2,469 -4,855 -2,545 Financing activities Issued/redeemed/amortised subordinated liabilities 16 -11 16 -11Dividend paid -750 -1,500 -750 -1,500Cash flow from financing activities -734 -1,511 -734 -1,511Cash flow for the year 4,044 1,475 14,716 1,750 Cash and cash equivalents at the beginning of year 13,035 11,560 13,952 12,202Cash and cash equivalents at the end of year 17,079 13,035 28,668 13,952Change 4,044 1,475 14,716 1,750 Comments on the cash flow statementThe cash flow statement has been prepared in accordance with IAS 7 . The cash flow statement shows inflows and outflows of cash and cash equivalents during the year . Nordea Bank Danmark’s cash flow has been prepared in accordance with the indirect method, whereby operating profit is adjusted for effects of non-cash transactions such as depreciation and loan losses . The cash flows are classified by operating, investing and financing activities .

28Nordea Bank Danmark A/S . Annual Report 2010
Cash flow statement (cont.)
Operating activitiesOperating activities are the principal revenue-producing activities and cash flows are mainly derived from the operating profit for the year with adjustment for items not included in cash flow and income taxes paid . Adjustment for non-cash items includes:
Group Parent companyDKKm 2010 2009 2010 2009
Depreciation 229 159 174 138Impairment charges 6 - 6 -Loan losses 3,399 5,113 3,172 4,815Change in provisions -26 17 -26 17Profit from associated and group undertakings minus dividends -89 -119 -16 -26Other 19 18 25 14Total 3,538 5,188 3,335 4,958 Changes in operating assets and liabilities consist of assets and liabilities that are part of normal business activities, such as loans, deposits and debt securities in issue . Changes in derivatives are reported net . Cash flow from operating activities includes interest payments received and interest expenses paid with the following amounts:
Group Parent companyDKKm 2010 2009 2010 2009
Interest payments received 30,803 32,733 20,827 20,897Interest expenses paid -18,350 -21,397 -9,611 -12,518 Investing activities Investing activities include acquisitions and disposals of non-current assets, like property and equipment, intangible and financial assets .
Aggregated cash flows arising from acquisition of business operations are presented separately and consist of:
Group Parent companyDKKm 20101 20091 20101 2009
Acquisition of business operationsCash and cash equivalents - 114 - -Loans to credit institutions - 3,796 - -Loans to the public 17 5,553 4,703 -Intangible assets 240 1,316 1,538 -Property & equipment - 265 13 -Other assets -202 669 14 -Total assets 55 11,713 6,268 -
Deposits and borrowings from the public - 8,869 7,780 -Other liabilities and provision -8 443 72 -Total liabilities -8 9,312 7,852 -
Purchase price paid 63 2,401 -1,584 -- here of to be paid in 2011 - - 229 -Cash and cash equivalents - 114 - -Purchase price regarding 2009 paid in 2010 -272 272 - -Net effect on cash flow 335 2,015 -1,813 -
1 The figures concerns the acquisition of Fionia Bank .

29Nordea Bank Danmark A/S . Annual Report 2010
Financing activities
Financing activities are activities that result in changes in equity and subordinated liabilities, such as new issues of shares, dividends and issued/redeemed/amortised subordinated liabilities . Cash and cash equivalents The following items are included in cash and cash equivalents assets: Group Parent company 31 Dec 31 Dec 31 Dec 31 DecDKKm 2010 2009 2010 2009
Cash and balances with central banks 3,213 2,914 3,213 2,799Loans to credit institutions, payable on demand 13,866 10,121 25,455 11,153Total 17,079 13,035 28,668 13,952
Cash comprises legal tender and bank notes in foreign currencies . Balances with central banks consist of deposits in accounts with central banks and postal giro systems under government authority, where the following conditions are fulfilled;- the central bank or the postal giro system is domiciled in the country where the institution is established - the balance on the account is readily available any time .
Loans to credit institutions, payable on demand include liquid assets not represented by bonds or other interest-bearing securities .
Cash flow statement (cont.)

30Nordea Bank Danmark A/S . Annual Report 2010
5-year overview Group
Income statement (DKKm) 2010 2009 2008 2007 2006 Net interest income 11,641 11,395 10,248 8,733 8,109Net fee and commission income 4,029 3,609 3,607 3,101 3,130Net result from items at fair value 1,628 1,888 -742 844 1,622Equity method 219 250 145 234 327Other income 774 630 469 380 188Total operating income 18,291 17,772 13,727 13,292 13,376 General administrative expenses: Staff costs -6,001 -5,978 -5,230 -4,885 -4,758 Other expenses -3,086 -2,979 -2,785 -2,765 -2,504Depreciation, amortisation and impairment charges of tangible and intangible assets -235 -159 -142 -108 -132Other operating expenses -1,013 -1,342 -369 - -Total operating expenses -10,335 -10,458 -8,526 -7,758 -7,394 Profit before loan losses 7,956 7,314 5,201 5,534 5,982Net loan losses -3,399 -5,113 -1,587 47 664Operating profit 4,557 2,201 3,614 5,581 6,646Income tax expense -1,077 -751 -893 -1,308 -1,770Net profit for the year 3,480 1,450 2,721 4,273 4,876 Balance sheet (DKKm) 2010 2009 2008 2007 2006 Loans to credit institutions 77,898 97,826 95,229 128,892 117,765Loans to the public 679,315 669,735 613,200 533,237 483,794Derivatives 4,631 4,464 4,314 3,872 2,053Other assets 234,887 260,908 186,921 171,942 199,779Total assets 996,731 1,032,933 899,664 837,943 803,391 Deposits by credit institutions 239,805 322,816 260,868 222,701 223,188Deposits and borrowings from the public 346,942 323,894 315,853 277,972 253,377Debt securities in issue 271,709 246,061 210,886 205,910 183,020Derivatives 7,077 6,310 4,364 3,659 1,946Subordinated liabilities 9,504 9,488 9,499 9,507 10,401Other liabilities 88,712 94,143 67,931 88,450 104,475Equity 32,982 30,221 30,263 29,744 26,984Total liabilities and equity 996,731 1,032,933 899,664 837,943 803,391 Ratios and key figures (%) 2010 2009 2008 2007 2006 Return on equity 11 .0 4 .8 9 .1 15 .1 19 .2Cost/income ratio 57 59 62 58 55Tier 1 capital ratio1 8 .9 8 .9 9 .4 8 .7 -Total capital ratio1 11 .9 12 .0 12 .4 11 .6 -Total capital ratio including new subordinated loan3 15 .4 12 .0 12 .4 11 .6 -Tier 1 capital1, DKKm 27,621 27,885 28,775 28,258 26,594Risk-weighted assets1, 2, DKKbn 310 312 305 325 376Loan loss ratio, basis points 50 .8 77 .7 29 .8 -1 .0 -15 .8Number of employees (full-time equivalents)1 7,968 7,964 7,810 7,469 7,307Average number of employees 7,949 7,785 7,583 7,373 7,308
1 End of year .2 RWA according to Basel I for the year 2006 .3 Total capital ratio at 31 December 2010 includes a new subordinated loan of EUR 1 .45bn (tier 2 capital) issued in February 2011 . The Danish Financial Supervisory Authority’s ratio system is shown in note 47 .

31Nordea Bank Danmark A/S . Annual Report 2010
5-year overviewParent company
Income statement (DKKm) 2010 2009 2008 2007 2006 Net interest income 9,070 8,994 7,623 6,467 6,270Net fee and commission income 4,391 4,027 4,044 3,497 3,438Net result from items at fair value 1,108 2,188 -436 967 1,711Dividends 203 156 70 130 536Other income 921 679 496 385 115Total operating income 15,693 16,044 11,797 11,446 12,070 General administrative expenses: Staff costs -5,733 -5,756 -5,054 -4,702 -4,582 Other expenses -2,930 -2,895 -2,699 -2,648 -2,341Depreciation, amortisation and impairment charges of tangible and intangible assets -180 -138 -124 -91 -110Other operating expenses -1,013 -1,342 -369 - -Total operating expenses -9,856 -10,131 -8,246 -7,441 -7,033 Profit before loan losses 5,837 5,913 3,551 4,005 5,037Net loan losses -3,172 -4,815 -1,456 116 666Operating profit 2,665 1,098 2,095 4,121 5,703Income tax expense -566 -498 -539 -1,054 -1,433Net profit for the year 2,099 600 1,556 3,067 4,270 Balance sheet (DKKm) 2010 2009 2008 2007 2006 Loans to credit institutions 148,437 149,581 114,160 147,221 132,054Loans to the public 361,114 368,764 348,467 293,869 268,897Derivatives 4,631 4,222 4,314 3,872 2,053Investments in group undertakings 16,579 10,349 7,990 8,001 8,158Other assets 361,500 391,483 274,906 228,396 253,158Total assets 892,261 924,399 749,837 681,359 664,320 Deposits by credit institutions 277,900 342,756 262,667 224,632 225,881Deposits and borrowings from the public 348,020 315,340 318,296 280,654 255,994Debt securities in issue - 11,151 - - -Derivatives 7,077 6,080 4,364 3,659 1,946Subordinated liabilities 9,504 9,488 9,499 9,507 10,401Other liabilities 226,129 217,319 131,859 139,124 147,887Equity 23,631 22,265 23,152 23,783 22,211Total liabilities and equity 892,261 924,399 749,837 681,359 664,320 Ratios and key figures (%) 2010 2009 2008 2007 2006 Return on equity 9 .1 2 .6 6 .6 13 .3 20 .4Cost/income ratio 63 63 70 65 58Tier 1 capital ratio1 8 .8 9 .7 9 .4 8 .5 -Total capital ratio1 12 .0 13 .2 12 .5 11 .5 -Total capital ratio including new subordinated loan3 15 .6 13 .2 12 .5 11 .5 -Tier 1 capital, DKKm 26,711 28,411 27,818 27,042 25,210Risk-weighted assets1, 2, DKKbn 305 292 298 317 346Loan loss ratio, basis points 86 .0 128 .1 49 .6 -4 .3 -29 .1Number of employees (full-time equivalents)1 7,647 7,280 7,515 7,177 6,991Average number of employees 7,523 7,441 7,297 7,074 6,998
1 End of year .2 RWA according to Basel I for the year 2006 .3 Total capital ratio at 31 December 2010 includes a new subordinated loan of EUR 1 .45bn (tier 2 capital) issued in February 2011 .
The Danish Financial Supervisory Authority’s ratio system is shown in note 47 .

Nordea Bank Danmark A/S . Annual Report 2010 32
1. Basis for presentationThe financial statements for Nordea Bank Danmark A/S and for the group are prepared in accordance with International Financial Reporting Standards (IFRS) and interpretations of such standards by the International Financial Reporting Interpretations Committee (IFRIC) as endorsed by the EU Commission and additional Danish disclosure requirements for annual reports laid down in the Danish IFRS Executive Order on financial services enterprises issued pursuant to the Danish Financial Business Act . The disclosures, required in the standards and legislation above, have been included in the notes, the Risk, liquidity and capital management section or in other parts of the “financial statements” .
On 10 February 2011 the Board of Directors approved the financial statements, subject to final approval of the Annual General Meeting on 11 March 2011 .
2. Comparative figuresThe comparative figures for 2009 include, unless otherwise stated, effects of changes in the presentation described in section 3 “Changed accounting policies and presentation” below .
3. Changed accounting policies and presentationThe accounting policies, basis for calculations and presentation are, in all material aspects, unchanged in comparison with the 2009 Annual Report, except for the classification of lending commissions in the income statement
and the categorisation of savings-related commissions within “Net fee and commission income” . These changes are further described below .
Below follows also a section covering other changes in IFRSs implemented in 2010, which have not had any significant impact, as well as a section covering forthcoming changes in IFRSs not yet implemented by Nordea Bank Danmark .
Classification of lending commissionsThe accounting treatment, including the classification in the income statement, of lending commissions depends on the purpose for which the commission is received . Commissions that are considered to be an integral part of the effective interest rate of a loan is included in the calculation of effective interest and classified as “Net interest income” in the income statement, while commissions considered to be compensation for performed services are classified as “Net fee and commission income” .
Judgement has to be exercised when deciding on whether or not a commission is to be included, and to what extent, in the calculation of the effective interest of a loan . Nordea Bank Danmark A/S has reassessed this judgement, which has led to a reclassification of commissions from “Net fee and commission income” to “Net interest income” .
The comparable figures have been restated accordingly and the impact is, together with the impact on 2010, disclosed in the below table .
Notes to the financial statements
Note 1 Accounting policies
Table of contents1 . Basis for presentation2 . Comparative figures3 . Changed accounting policies and presentation4 . Critical judgements and key sources of estimation
uncertainty5 . Principles of consolidation6 . Recognition of operating income and impairment7 . Recognition and derecognition of financial instruments
in the balance sheet8 . Translation of assets and liabilities denominated in
foreign currencies9 . Hedge accounting10 . Determination of fair value of financial instruments11 . Cash and cash equivalents12 . Financial instruments
13 . Loans to the public/credit institutions14 . Leasing15 . Intangible assets16 . Property and equipment17 . Investment property18 . Taxes19 . Employee benefits20 . Equity21 . Financial guarantee contracts and credit commitments22 . Share-based payment23 . Related party transactions24 . Segment reporting25 . Parent company
2010 2009 Pre-policyDKKm Restated change Restated Reported
GroupNet interest income 11,641 11,231 11,395 11,049Net fee and commission income 4,029 4,439 3,609 3,955
Parent Net interest income 9,070 8,660 8,994 8,648Net fee and commission income 4,391 4,801 4,027 4,373

Nordea Bank Danmark A/S . Annual Report 2010 33
Other changes in IFRSs implemented 2010The IASB has revised IFRS 3 “Business Combinations” and amended IAS 27 “Consolidated and Separate Financial Statements” . The revised and amended standards are applied prospectively for business combinations effected as from 1 January 2010, meaning that there has been no restatement of business combinations with acquisition dates prior to the implementation of this IFRS . The transition rules furthermore state that changes in recognised deferred tax assets, originating from business combinations effected before the application of this IFRS, are to be recognised in the income statement without any equivalent adjustments made to goodwill through the income statement, unless there is an impairment of goodwill . The impact on Nordea Bank Danmark A/S from the revised IFRS 3 and amended IAS 27 includes a broader definition of business combinations, the need to expense acquisition costs and continuous fair value adjustments of contingent considerations recognised in the income statement . The revised and amended standards have not had any impact on 2010, but can potentially have on subsequent periods .
The IASB has furthermore revised IFRS 1 “First-time Adoption of International Financial Reporting Standards”, amended IFRS 2 “Share-based Payment” (Group Cash-settled Share-based Payment Transactions), IAS 39 “Financial Instruments: Recognition and Measurement” (Eligible Hedged Items) as well as published “Improvements to IFRSs 2009”, IFRIC 12 “Service Concession Arrangements”, IFRIC 15 “Agreements for the Construction of Real Estate”, IFRIC 16 “Hedges of a Net Investment in a Foreign Operation”, IFRIC 17 “Distributions of Non-cash Assets to Owners” and IFRIC 18 “Transfers of Assets from Customers” . These revised and amended standards and improvements are effective for Nordea Bank Danmark A/S as from 1 January 2010, but have not had any significant impact on 2010 and are not expected to have a significant impact on subsequent periods .
Forthcoming changes in IFRSsIFRS 9 “Financial Instruments” (Phase 1)In 2009 IASB published a new standard on financial instruments . The standard is the first step in the replacement of IAS 39 “Financial instruments: Recognition and Measurement” and this first phase covers classification and measurement of financial assets . The effective date for Nordea Bank Danmark A/S is as from 1 January 2013, but earlier application is permitted . The EU Commission has not endorsed this standard for implementation in 2010 .
Nordea Bank Danmark A/S has, due to the fact that the standard is not yet endorsed by the EU Commission, not finalised the investigation of the impact on the period of initial application or on subsequent periods and can therefore not express an opinion on the impact on its capital adequacy .
Other forthcoming changes in IFRSsThe IASB has amended IAS 32 “Financial Instruments: Presentation”, with respect to classification of rights issues, IFRIC 14 “IAS 19 - The Limit on a Defined Benefit Asset, Minimum Funding Requirements and their Interaction”, revised IAS 24 “Related Party Disclosures” and published IFRIC 19 “Extinguishing Financial Liabilities with Equity Instruments” . Nordea Bank Danmark A/S has chosen not to implement these changes early . The amended, revised and published standards and interpretations will be applied retroactively as from 1 January 2011 . There is currently no identified significant impact on the period of initial application . The amendment of IAS 32 may affect future rights issues involving different currencies, whilst the revised IAS 24, amended IFRIC 14 and the published IFRIC 19 are not expected to have a significant impact on subsequent periods .
The IASB has furthermore published “Improvements to IFRSs” (2010) . These improvements are effective for Nordea Bank Danmark A/S as from 1 January 2011, but early application is allowed . These improvements are not expected to have a significant impact on the period of initial application or on subsequent periods .
IFRS 7 “Financial instruments: Disclosures” has in addition been amended by the IASB in order to increase the transparency in the reporting of transferred assets (“Disclosures – Transfers of Financial Assets”) . Nordea Bank Danmark A/S has chosen not to implement these changes early in 2010 . The amended standard is effective for NBD as from 1 January 2012 . The amended standard will, on the period of initial application and on subsequent periods, lead to an increased level of disclosure .
The above-mentioned revised and amended standards, improvements and interpretations not yet adopted, within the section “Other forthcoming changes in IFRSs”, are not, on the period of initial application or on subsequent periods, expected to have any significant impact on the capital adequacy .
Categorisation of savings-related commissionsThe categorisation of savings-related commissions within “Net fee and commission income” (Note 3) has been changed in order to be better aligned with the purpose for which the
fees are received . The comparable figures have been restated accordingly and the impact is, together with the impact on 2010, disclosed in the below table .
2010 2009 Pre-policyDKKm Restated change Restated Reported
GroupAsset Management commissions 764 430 580 291Brokerage 1,581 1,915 1,533 1,822
Parent Asset Management commissions 764 430 580 291Brokerage 1,564 1,898 1,532 1,821

Nordea Bank Danmark A/S . Annual Report 2010 34
4. Critical judgements and key sources of estimation uncertainty
The preparation of financial statements in accordance with generally accepted accounting principles requires, in some cases, the use of estimates and assumptions by management . The estimates are based on past experience and assumptions that management believes are fair and reasonable . These estimates and the judgement behind them affect the reported amounts of assets, liabilities and off-balance sheet items, as well as income and expenses in the financial statements presented . The actual outcome can later, to some extent, differ from the estimates and the assumptions made .
Certain accounting policies are considered to be particularly important to the financial position of Nordea Bank Danmark, since they require management to make difficult, complex or subjective judgements and estimates, the majority of which relate to matters that are inherently uncertain . These critical judgements and estimates are in particular associated with:• the fair value measurement of certain financial instruments .• the impairment testing of:
– goodwill and – loans to the public/credit institutions .
• claims in civil lawsuits .
Fair value measurementCritical judgement is exercised when determining the fair value of OTC derivatives and other financial instruments that lack quoted prices or recently observed market prices in the following areas:• The choice of valuation techniques• The determination of when quoted prices fail to represent
fair value (including the judgement of whether markets are active)
• The construction of fair value adjustments in order to incorporate relevant risk factors such as credit risk, model risk and liquidity risk
• The judgement of which market parameters are observable
In all of these instances, decisions are based upon professional judgement in accordance with Nordea Bank Danmark A/S’s accounting and valuation policies . In order to ensure proper governance, Nordea has a Group Valuation Committee that on an ongoing basis reviews critical judgements that are deemed to have a significant impact on fair value measurements .
See also the separate section 10 “Determination of fair value of financial instruments” and Note 41 “Assets and liabilities at fair value” .
Impairment testingGoodwillGoodwill is tested for impairment annually or more frequently if events or changes in circumstances indicate that it might be impaired . This consists of an analysis to assess whether the carrying amount of goodwill is fully recoverable . The determination of the recoverable amount involves establishing the value in use, measured as the present value of the cash flows expected from the cash-generating unit, to which the goodwill has been allocated .
The forecasts of future cash flows are based on Nordea Bank Danmark A/S’s best estimates of future revenues and expenses for the cash-generating units to which goodwill has been allocated . A number of assumptions and estimates have significant impact on these calculations and include parameters like macroeconomic assumptions, market growth,
business volumes, margins and cost effectiveness . Changes to any of these parameters, following changes in market conditions, competition, strategy or other factors, affect the forecasted cash flows . Under current market conditions such changes are not expected to lead to any significant impairment charges of goodwill, but may do so in subsequent periods .
See also the separate section 15 “Intangible assets” and Note 21 “Intangible assets” .
Loans to the public/credit institutionsWhen testing individual loans for impairment, the most critical judgement, containing the highest uncertainty, relates to the estimation of the most probable future cash flows generated from the customer .
When testing a group of loans collectively for impairment, the key aspect is to identify the events and/or the observable data that indicate that losses have been incurred in the group of loans . Assessing the net present value of the cash flows generated by the customers in the group contains a high degree of uncertainty when using historical data and the acquired experience when adjusting the assumptions based on historical data to reflect the current situation .
See also the separate section 13 “Loans to the public/credit institutions” and Note 13 “Loans and their impairment” .
Claims in civil lawsuitsWithin the framework of the normal business operations, Nordea Bank Danmark A/S faces a number of claims in civil lawsuits and disputes, most of which involve relatively limited amounts . Presently none of these disputes are considered likely to have any significant adverse effect on NBD or its financial position . See also Note 37 “Contingent liabilities” .
5. Principles of consolidation Consolidated entitiesThe consolidated financial statements include the accounts of the parent company Nordea Bank Danmark A/S and those entities that the parent company controls . Control is generally achieved when the parent company owns, directly or indirectly through group undertakings, more than 50 percent of the voting rights or otherwise has the power to govern the financial and operating policies of the entity .
All Group undertakings are consolidated using the purchase method . Under the purchase method, the acquisition is regarded as a transaction whereby the parent company indirectly acquires the subsidiary’s assets and assumes its liabilities and contingent liabilities . The acquisition cost to the Group is established in a purchase price allocation analysis . In such analysis, the cost of the business combination is established as the fair values of recognised identifiable assets, liabilities and contingent liabilities . The cost of the business combination is the aggregate of the fair values, at the date of exchange, of assets given, liabilities incurred or assumed and equity instruments issued by the acquirer, in exchange for the net assets acquired . Costs directly attributable to the business combination are expensed . When the cost of the business combination exceeds the net fair value of the identifiable assets, liabilities and contingent liabilities, the excess is reported as goodwill . If the difference is negative, such difference is immediately recognised in the income statement .

Nordea Bank Danmark A/S . Annual Report 2010 35
The Group undertakings are included in the consolidated accounts as from the date on which control is transferred to NBD and are no longer consolidated as from the date on which control ceases .
Equity and net income attributable to non-controlling interests are separately disclosed in the balance sheet, income statement and statement of comprehensive income .
In the consolidation process the reporting from the subsidiaries is adjusted to ensure consistency with IFRS principles applied by NBD .
Investments in associated undertakingsThe equity method of accounting is used for associated undertakings where the share of voting rights is between 20 and 50 per cent and/or where NBD has significant influence . Investments within NBD’s investment activities, which are classified as a venture capital organisation within NBD, are measured at fair value in accordance with the rules set out in IAS 28 and IAS 39 . Further information on the equity method is disclosed in section 6 “Recognition of operating income and impairment” .
Profits from companies accounted for under the equity method are reported post-tax in the income statement . Consequently, the tax expense related to these profits is not included in the income tax expense for NBD .
Special Purpose Entities (SPE)In accordance with IFRS Nordea Bank Danmark A/S does not consolidate SPEs’ assets and liabilities beyond its control . In order to determine whether NBD controls a SPE or not, NBD has to make judgements about risks and rewards and assess the ability to make operational decisions for the SPE in question .
When assessing whether Nordea Bank Danmark A/S should consolidate a SPE, a range of factors are evaluated . These factors include whether the activities of the SPE are in substance conducted on NBD’s behalf or if NBD has in substance the decision making powers, the rights to obtain the majority of the benefits or the majority of the residual- or ownership risks . NBD consolidates all SPEs where NBD has retained the majority of the risks and rewards . For the SPEs that are not consolidated the rationale is that NBD does not have any significant risks or rewards on these assets and liabilities .
Nordea Bank Danmark A/S has created a number of SPEs to allow clients to invest in assets invested in by the SPEs . Some SPEs invest in tradable financial instruments, such as shares and bond (mutual funds) . Other SPEs invest in structured credit products or acquire assets from customers of NBD . NBD is generally the investment manager and has sole discretion about investments and other administrative decisions . Typically, NBD will receive service and commission fees in connection to the creation of the SPEs, or because it acts as investment manager, custodian or in some other function . This in itself does not constitute a beneficial interest triggering consolidation . In some SPEs NBD has also supplied substantial parts of the funding in the form of fund units, loans or credit commitments . In these SPEs NBD has a beneficial interest and retains the majority of the risks and rewards, which is why these SPEs are consolidated . Note 19 “Investments In Group undertakings” lists the major subsidiaries in the NBD Group, including consolidated SPEs .
Principles of eliminationIntra-group transactions and balances between the consolidated group undertakings are eliminated .
Currency translation of foreign entitiesThe consolidated financial statements are prepared in Danish Kroner (DKK), the presentation currency of the parent company Nordea Bank Danmark A/S . The current method is used when translating the financial statements of foreign entities into DKK from their functional currency . The assets and liabilities of foreign entities have been translated at the closing rates, while items in the income statements and statements of comprehensive income are translated at the average exchange rate for the year . Translation differences are accounted for in other comprehensive income and are accumulated in the translation reserve in the equity .
Goodwill and fair value adjustments arising from the acquisition of group undertakings are treated as items in the same functional currency as the cash generating unit to which they belong and are also translated at the closing rate .
6. Recognition of operating income and impairment
Net interest incomeInterest income and expense are calculated and recognised based on the effective interest rate method or, if considered appropriate, based on a method that results in an interest income or interest expense that is a reasonable approximation of using the effective interest rate method as basis for the calculation .
Interest income and interest expense related to all balance sheet items in Markets are recognised in the income statement on the line “Net result from items at fair value” . Interest income and expense connected to internal placements by and internal funding of Markets are replaced with the related group external interest income and interest expense .
Net fee and commission incomeNBD earns commission income from different services provided to its customers . The recognition of commission income depends on the purpose for which the fees are received . Fees are either recognised as revenue when services are provided or in connection to the execution of a significant act . Fees received in connection to performed services are recognised as income in the period these services are provided . A loan syndication fee received as payment for arranging a loan as well as other fees received as payments for certain acts are recognised as revenue when the act has been completed, i .e . when the syndication has been finalised .
Commission expenses are transaction based and recognised in the period when the services are received .
Income from issued financial guarantees and expenses from bought financial guarantees are amortised over the duration of the instruments and classified as “Fee and commission income” and “Fee and commission expense” respectively .
Net result from items at fair valueRealised and unrealised gains and losses, including net interest in Markets on financial instruments measured at fair value, are recognised in the item “Net result from items at fair value” .
Realised and unrealised gains and losses derive from:• Shares/participations and other share-related instruments

Nordea Bank Danmark A/S . Annual Report 2010 36
• Interest-bearing securities and other interest-related instruments
• Other financial instruments, which contain credit derivatives as well as commodity instruments/derivatives
• Foreign exchange gains/losses• Investment properties, which include realised and
unrealised income, for instance revaluation gains and losses . This line also includes realised results from disposals as well as the running property yield stemming from the holding of investment properties .
“Net result from items at fair value” includes also losses from counterparty risk on instruments classified into the category Financial assets at fair value through profit or loss as well as impairment on instruments classified into the category Available for sale financial assets . Impairment losses from instruments within other categories are recognised in the items “Net loan losses” or “Impairment of securities held as financial non-current assets” (see also the sub-section “Net loan losses”) .
DividendsDividends received are recognised in the income statement as “Net result from items at fair value” and classified as “Shares/participations and other share-related instruments” in the note . Income is recognised in the period in which the right to receive payment is established .
Profit from companies accounted for under the equity methodThe profit from companies accounted for under the equity method is defined as the post-acquisition change in NBD’s share of net assets in the associated companies . NBD’s share of items accounted for in other comprehensive income in the associated companies is accounted for in other comprehensive income in NBD . Profits from companies accounted for under the equity method are, as stated in section 5 “Principles of consolidation” reported in the income statement post-tax . Consequently, the tax expense related to these profits is excluded from the income tax expense for NBD .
Fair values are, at acquisition, allocated to the associated company’s identifiable assets, liabilities and contingent liabilities . Any difference between NBD’s share of the fair values of the acquired identifiable net assets and the purchase price is goodwill or negative goodwill . Goodwill is included in the carrying amount of the associated company . Subsequently the investment in the associated company increases/decreases with NBD’s share of the post-acquisition change in net assets in the associated company and decreases through received dividends and impairment . An impairment charge can be reversed in a subsequent period .
The change in NBD´s share of the net assets is based on the external reporting of the associated companies and affects the financial statements of NBD in the period in which the information is available . The reporting from the associated companies is, if applicable, adjusted to comply with NBD’s accounting policies .
Other operating incomeNet gains from divestments of shares in subsidiaries and associated companies as well as other operating income, not related to any other income line, are generally recognised when it is probable that the benefits associated with the transaction will flow to NBD and if the significant risks and rewards have been transferred to the buyer (generally when the transactions are finalised) .
Net loan lossesImpairment losses from financial assets classified into the category Loans and receivables (see section 12 “Financial Instruments”), In the items “Loans to credit institutions” and “Loans to the public” in the balance sheet, are reported as “Net loan losses”, together with losses from financial guarantees . Losses are reported net of any collateral and other credit enhancements . NBD’s accounting policies for the calculation of impairment losses on loans can be found in section 13 “Loans to the public/credit institutions” .
Counterparty losses on instruments classified into the category Financial assets at fair value through profit or loss, including credit derivatives, as well as impairment on financial assets classified into the category Available for sale are reported under “Net result from items at fair value” .
7. Recognition and derecognition of financial instruments in the balance sheet
Derivative instruments, quoted securities and foreign exchange spot transactions are recognised on and derecognised from the balance sheet on the trade date . Other financial instruments are recognised on the balance sheet on the settlement date .
Financial assets, other than those for which trade date accounting is applied, are derecognised from the balance sheet when the contractual rights to the cash flows from the financial asset expire or are transferred to another party . The rights to the cash flows normally expire or are transferred when the counterparty has performed by eg repaying a loan to NBD, ie on the settlement date .
In some cases, NBD enters into transactions where it transfers assets that are recognised on the balance sheet, but retains either all or a portion of risks and rewards from the transferred assets . If all or substantially all risks and rewards are retained, the transferred assets are reclassified to the item “Financial instruments pledged as collateral” in the balance sheet . Transfers of assets with retention of all or substantially all risks and rewards include e .g . security lending agreements and repurchase agreements .
Financial liabilities, other than those for which trade date accounting is applied, are derecognised from the balance sheet when the liability is extinguished . Normally this occurs when NBD performs, for example when NBD repays a deposit to the counterpart, i .e . on settlement date .
For further information, see sections “Securities borrowing and lending agreements” and “Repurchase and reverse repurchase agreements” within 12 “Financial instruments”, as well as Note 43 “Obtained collaterals which are permitted to be sold or repledged” .
8. Translation of assets and liabilities denominated in foreign currencies
The functional currency of each entity is decided based upon the primary economic environment in which the entity operates .
Foreign currency is defined as any currency other than the functional currency of the entity . Foreign currency transactions are recorded at the exchange rate on the date of the transaction . Monetary assets and liabilities denominated in foreign currencies are translated at the exchange rate on the balance sheet date .
Nordea Bank Danmark A/S . Annual Report 2010 37
Exchange differences arising on the settlement of transactions at rates different from those at the date of the transaction, and unrealised translation differences on unsettled foreign currency monetary assets and liabilities, are recognised in the income statement in the item “Net result from items at fair value” .
Translation differences on financial instruments that are designated hedging instruments in a hedge of a net investment in a group undertaking are recognised in other comprehensive income, to the extent the hedge is effective . This is performed in order to offset the translation differences affecting other comprehensive income when consolidating the group undertaking into NBD . Any ineffectiveness is recognised in the income statement in the item “Net result from items at fair value” .
9. Hedge accountingIAS 39 includes principles and rules concerning accounting for hedging instruments and the underlying hedged item, so-called hedge accounting . All derivatives are measured at fair value . NBD applies the EU carve out version of IAS 39 for portfolio hedges of both assets and liabilities . The EU carve out macro hedging enables a group of derivatives (or proportions thereof) to be viewed in combination and designated as the hedging instrument and removes some of the limitations in fair value hedge accounting relating to hedging core deposits and under-hedging strategies .
The hedge accounting policy within NBD has been developed to fulfil the requirements set out in IAS 39 . NBD uses hedge accounting in order to have a symmetrical accounting treatment of the changes in fair value of the hedged item and changes in fair value of the hedging instruments and in order to hedge the exposure to variability in cash flows and net investments in foreign operations . The overall purpose is to have a true and fair presentation of NBD’s economical hedges in the financial statements . The overall operational responsibility to hedge positions and for hedge accounting lies within Group Treasury .
According to IAS 39 there are three forms of hedge accounting:• Fair value hedge accounting• Cash flow hedge accounting• Hedges of net investments
Fair value hedge accountingFair value hedge accounting is used when derivatives are hedging changes in fair value of a recognised asset or liability attributable to a specific risk . The risk of changes in fair value of assets and liabilities in NBD’s financial statements originates mainly from loans, securities and deposits with a fixed interest rate, causing interest rate risk . Changes in fair value from derivatives as well as changes in fair value of the hedged item attributable to the risks being hedged will be recognised separately in the income statement in the item “Net result from items at fair value” . Given an effective hedge, the two changes in fair value will more or less balance, meaning the net result will be close to zero . The changes in fair value of the hedged item attributable to the risks hedged with the derivative instrument are reflected in an adjustment to the carrying amount of the hedged item, which is also recognised in the income statement . The fair value change of the hedged item in a portfolio hedge of interest rate risks is reported separately from the portfolio in “Fair value changes of the hedged items in portfolio hedge of interest rate risk” in accordance with IAS 39 .
Fair value hedge accounting in NBD is performed mainly on a portfolio basis . The effectiveness of the hedging relationships is consequently measured and evaluated so that any ineffectiveness is affecting the income statement under the item “Net result from items at fair value” . Cash flow hedge accountingCash flow hedge accounting is used for the hedging of exposure to variations in future interest payments on asset or liabilities with variable interest rates . The portion of the gain or loss on the hedging instrument, that is determined to be an effective hedge, is recognised directly in other comprehensive income and accumulated in the hedge reserve in the equity . The ineffective portion of the gain or loss on the hedging instrument is recognised in the item “Net result from items at fair value” in the income statement .
Gains or losses on hedging instruments recognised directly in the hedge reserve in equity are recognised in the income statement in the same period as interest income or interest expense from the hedged asset or liability .
Hedges of net investmentsSee separate section 8 “Translation of assets and liabilities denominated in foreign currency” .
Hedging instrumentsThe hedging instruments used in NBD are predominantly interest rate swaps and currency interest rate swaps . Cash instruments are only used in a few transactions as hedging instruments when hedging currency risk .
Hedged itemsAccording to IAS 39 a hedged item can be a single asset or liability as well as a group of assets or liabilities with similar risk characteristics . Hedged items in NBD consist of both individual assets or liabilities and portfolios of assets or liabilities .
Hedge effectivenessThe application of hedge accounting requires the hedge to be highly effective . A hedge is regarded as highly effective if at inception and throughout its life it can be expected that changes in fair value of the hedged item as regards the hedged risk can be essentially offset by changes in fair value of the hedging instrument . The result should be within a range of 80–125 per cent .
When assessing hedge effectiveness retrospectively NBD measures the fair value of the hedging instruments and compares the change in fair value of the hedging instrument to the change in fair value of the hedged item . The effectiveness measurement is made on a cumulative basis .
If the hedge relationship does not fulfil the requirements, hedge accounting will be terminated . The change in the unrealised value of the derivatives will, prospectively from the last time it was last proven effective, be accounted for in the income statement at fair value through profit or loss . For fair value hedges, the change in the fair value on the hedged item, up to the point when the hedge relationship is terminated, is amortised to the income statement on a straight-line basis over the remaining maturity of the hedged item . In cash flow hedges, the cumulative gain or loss on the hedging instrument that has been recognised in other comprehensive income from the period when the hedge was effective is reclassified from equity to “Net result from

Nordea Bank Danmark A/S . Annual Report 2010 38
items at fair value” in the income statement if the hedged item is derecognised, cancelled or the expected transaction is no longer expected to occur . If the expected transaction is no longer highly probable, but is still expected to occur, the cumulative gain or loss on the hedging instrument that has been recognised in other comprehensive income from the period when the hedge was effective remains in other comprehensive income until the transaction occurs or is no longer expected to occur .
10. Determination of fair value of financial instruments
Financial assets and liabilities classified into the categories Financial assets/Financial liabilities at fair value through profit or loss (including derivative instruments) are recorded at fair value on the balance sheet with changes in fair value recognised in the income statement in the item “Net result from items at fair value” .
Fair value is defined by IAS 32 and IAS 39 as the amount for which an asset could be exchanged, or a liability settled, between knowledgeable, willing parties in an arm’s length transaction .
The existence of published price quotations in an active market is the best evidence of fair value and when they exist they are used to measure financial assets and financial liabilities . NBD is predominantly using published price quotations to establish fair value for items disclosed under the following balance sheet items:• Interest-bearing securities• Shares• Derivatives (listed derivatives)• Debt securities in issue (issued mortgage bonds in
Nordea Kredit Realkreditaktieselskab)
If quoted prices for a financial instrument fail to represent actual and regularly occurring market transactions or if quoted prices are not available, fair value is established by using an appropriate valuation technique . Valuation techniques can range from simple discounted cash flow analysis to complex option pricing models . Valuation models are designed to apply observable market prices and rates as input whenever possible, but can also make use of unobservable model parameters . NBD is predominantly using valuation techniques to establish fair value for items disclosed under the following balance sheet items:• Loans to the public (mortgage loans in the subsidiary
Nordea Kredit Realkreditaktieselskab)• Interest-bearing securities (when quoted prices in an active
market are not available)• Shares (when quoted prices in an active market are not
available)• Derivatives (OTC-derivatives)
Fair value is calculated as the theoretical net present value of the individual contracts, based on independently sourced market parameters and assuming no risks and uncertainties . This calculation is supplemented by a portfolio adjustment . The portfolio adjustment covers uncertainties associated with the valuation techniques, model assumptions and unobservable parameters as well as the portfolio’s counterparty credit risk and liquidity risk . An important part of the portfolio adjustment serves to adjust the net open market risk exposures from mid-prices to ask or bid prices (depending on the net position) . For different risk categories, exposures are aggregated and netted according to internal
guidelines and aggregated market price information on bid-ask spreads are applied in the calculation . Spreads are updated on a regular basis .
The portfolio adjustment for model risk comprises two components (the calculation principles are defined as part of the internal approval process for valuation models):• Benchmarking of the model output (market values) against
market information or against results from alternative models, where available
• Sensitivity calculations where unobservable parameters are varied to take other reasonable values
The portfolio adjustment for counterparty risk in OTC-derivatives is based on the current exposure towards each counterpart, the estimated potential future exposure as well as an estimate of the cost of hedging the counterparty risk . This cost of hedging is either based directly on market prices (where available) or on a theoretical calculation based on the internal credit rating of the counterpart .
For financial instruments, where fair value is estimated by a valuation technique, it is investigated whether the variables used in the valuation model are predominantly based on data from observable markets . By data from observable markets, NBD considers data that can be collected from generally available external sources and where these data are judged to represent realistic market prices . If non-observable data have a significant impact on the valuation, the instrument cannot be recognised initially at the fair value estimated by the valuation technique and any upfront gains are thereby deferred and amortised through the income statement over the contractual life of the Instrument . The deferred upfront gains are subsequently released to Income if the non-observable data become observable .
A breakdown of fair values of financial instruments measured on the basis of quoted prices in an active market for the same instrument (level 1), valuation techniques using observable data (level 2), and valuation techniques using non-observable data (level 3) is provided in Note 41 “Assets and liabilities at fair value” .
The valuation models applied by NBD are consistent with accepted economic methodologies for pricing financial instruments and incorporate the factors that market participants consider when setting a price .
New valuation models are subject to approval by Group Credit and Risk Control and all models are reviewed on a regular basis .
For further information, see Note 41 “Assets and liabilities at fair value” .
11. Cash and cash equivalentsCash and cash equivalents consist of cash and balances with central banks where the following conditions are fulfilled:• The central bank is domiciled in a country where NBD is
operating under a banking licence• The balance is readily available at any time
Cash and cash equivalents are financial instruments classified into the category “Loans and receivables”, see section 12 “Financial instruments” .
Nordea Bank Danmark A/S . Annual Report 2010 39
Loans to credit institutions payable on demand are also recognised as “Cash and cash equivalents” in the cash flow statement .
12. Financial instrumentsClassification of financial instrumentsEach financial instrument within the scope of IAS 39 has been classified into one of the following categories:
Financial assets:• Financial assets at fair value through profit or loss:
– Held for trading – Designated at fair value through profit or loss
(fair value option)• Loans and receivables• Held-to-maturity investments• Available-for-sale financial assets
Financial liabilities:• Financial liabilities at fair value through profit or loss:
– Held for trading – Designated at fair value through profit or loss
(fair value option)• Other financial liabilities
All financial assets and liabilities are initially measured at fair value . The classification of financial instruments into different categories forms the basis for how each instrument is subsequently measured in the balance sheet and how changes in its value are recognised . In Note 40 “Classification of financial instruments” the classification of the financial instruments in NBD’s balance sheet, into the different categories of IAS 39, is presented .
Financial assets and financial liabilities at fair value through profit or lossFinancial assets and financial liabilities at fair value through profit or loss are measured at fair value, excluding transaction costs . All changes in fair values are recognised directly in the income statement in the item “Net result from items at fair value” .
The category consists of two sub-categories: Held for trading and Designated at fair value through profit or loss (fair value option) .
The sub-category Held for trading mainly contains derivative instruments that are held for trading purposes, interest-bearing securities and shares within Markets and Treasury . It also contains trading liabilities such as short-selling positions .
The major parts of the financial assets/financial liabilities classified into the category Designated at fair value through profit or loss are mortgage loans and related issued bonds in the subsidiary Nordea Kredit Realkreditaktieselskab . Assets and liabilities in Nordea Kredit Realkreditaktieselskab are classified into the category Designated at fair value through profit or loss to eliminate or significantly reduce an accounting mismatch .
NBD also applies the fair value option to certain financial assets and financial liabilities related to Markets . The reason for the classification is that Markets is managing and measuring all its financial assets and liabilities at fair value . Consequently, all financial assets and financial liabilities in Markets are classified into the categories Financial assets/Financial liabilities at fair value through profit or loss .
Loans and receivablesLoans and receivables are non-derivative financial assets, with fixed or determinable payments, that are not quoted in an active market . These assets and their impairment are further described in the separate section 13 “Loans to the public/credit institutions” .
Held-to-maturity investmentsHeld-to-maturity investments are initially recognised in the balance sheet at the acquisition price, including transaction costs . Subsequent to initial recognition, the instruments within this category are measured at amortised cost . In an amortised cost measurement, the difference between acquisition cost and redemption value is amortised in the income statement over the remaining term using the effective interest rate method .
If more than an insignificant amount of the Held-to-maturity portfolio is sold or transferred, the Held-to-maturity category is tainted, except if the sale or transfer either occurs close to maturity or the call exercise date, after substantially all of the original principal has already been collected, or due to an isolated non-recurring event beyond the control of NBD .
NBD assesses at each reporting date whether there is any objective evidence that the asset is impaired . If there is such evidence, an impairment loss is recorded . The loss is calculated as the difference between the carrying amount and the present value of estimated future cash flows and is recognised as “Impairment of securities held as financial non-current assets” in the income statement . See section 13 “Loans to the public/credit institutions” for more information on the identification and measurement of objective evidence of impairment, which is also applicable for interest-bearing securities classified into the category “Held to maturity” .
Available-for-sale financial assets Available-for-sale financial assets are measured at fair value . Changes in fair values, except for interest, foreign exchange effects and impairment losses, are recognised directly in the revaluation reserves in the statement of comprehensive income . Interest is recognised in the item “Interest income” and foreign exchange effects and impairment losses in the item “Net result from items at fair value” .
When an available-for-sale financial asset is disposed of, the accumulated fair value changes that have previously been recognised in other comprehensive income are removed from equity and recognised in the income statement in the item “Net result from items at fair value” .
Available-for-sale financial assets are assessed at least annually in order to determine any need for impairment losses . If there is objective evidence of impairment, the accumulated loss that has been recognised in other comprehensive income is removed from equity and recognised as “Net result from items at fair value” in the income statement . The amount of the accumulated loss that is removed from equity is the difference between the asset’s acquisition cost and current fair value . For equity investments a prolonged and significant decline in the fair value, compared to the acquisition cost, is considered to be objective evidence of impairment . Objective evidence of impairment for a debt instrument is rather connected to a loss event, such as an issuer’s financial difficulties .

Nordea Bank Danmark A/S . Annual Report 2010 40
This category is used only to a very limited extent in Nordea Bank Danmark A/S . See also Note 40 “Classification of financial instruments” .
Other financial liabilitiesFinancial liabilities, other than those classified into the category Financial liabilities at fair value through profit or loss, are measured at amortised cost . Interest from Other financial liabilities is recognised in the item “Interest expense” in the income statement .
Hybrid (combined) financial instrumentsHybrid (combined) financial instruments are contracts containing a host contract and an embedded derivative instrument . Such combinations arise predominantly from the issuance of structured debt instruments, such as issued index-linked bonds .
Index-linked bonds issued by Group Treasury are considered to be part of the funding activities . The zero coupon bond is measured at amortised cost . The embedded derivatives in those instruments are separated from the host contract and accounted for as stand-alone derivatives at fair value, if the economic characteristics and risks of the embedded derivative are not closely related to the economic characteristics and risks of the host contract, and the embedded derivative actually meets the definition of a derivative instrument . Changes in fair values, of the embedded derivatives, are recognised in the income statement in the item “Net result from items at fair value” .
Index-linked bonds issued by Markets as part of the trading portfolio are classified into the category Held for trading, and the entire combined instrument, host contract together with the embedded derivative, is measured at fair value through profit or loss . Changes in fair values are recognised in the income statement in the item “Net result from items at fair value” .
Securities borrowing and lending agreementsGenerally, securities borrowing and securities lending transactions are entered into on a collateralised basis . Unless the risks and rewards of ownership are transferred, the securities are not recognised on or derecognised from the balance sheet . In cases where the counterpart is entitled to resell or repledge the securities, the securities are recognised on the balance sheet as “Financial instruments pledged as collateral” .
Securities in securities lending transactions are recognised off-balance sheet in the item “Assets pledged as security for own liabilities” .
Cash collateral advanced to the counterparts is recognised on the balance sheet as “Loans to credit institutions” or as “Loans to the public” . Cash collateral received from the counterparts is recognised on the balance sheet as “Deposits by credit institutions” or as “Deposits and borrowings from the public” .
Repurchase and reverse repurchase agreementsSecurities delivered under repurchase agreements and securities received under reverse repurchase agreements are not derecognised from or recognised on the balance sheet . In cases where the counterpart has the right to resell or repledge the securities, the securities are recognised on the balance sheet as “Financial instruments pledged as collateral” .
Securities delivered under repurchase agreements are recognised off-balance sheet in the item “Assets pledged as security for own liabilities” .
Cash received under repurchase agreements is recognised on the balance sheet as “Deposits by credit institutions” or as “Deposits and borrowings from the public” . Cash delivered under reverse repurchase agreements is recognised on the balance sheet as “Loans to credit institutions” or as “Loans to the public” .
Additionally, the sale of securities received in reverse repurchase agreements triggers the recognition of a trading liability (short sale) .
DerivativesAll derivatives are recognised on the balance sheet and measured at fair value . Derivatives with total positive fair values, including any accrued interest, are recognised as assets in the item “Derivatives” . Derivatives with total negative fair values, including any accrued interest, are recognised as liabilities in the item “Derivatives” .
Realised and unrealised gains and losses from derivatives are recognised in the income statement in the item “Net result from items at fair value” .
13. Loans to the public/credit institutionsFinancial instruments classified as “Loans to the public/credit institutions” in the balance sheet and into the category Loans and receivables are measured at amortised cost (see also the separate section 7 “Recognition and derecognition of financial instruments in the balance sheet” as well as Note 40 ”Classification of financial instruments”) .
NBD monitors loans as described in the separate section on risk, liquidity and capital management . Loans attached to individual customers or groups of customers are identified as impaired if the impairment tests indicate objective evidence of impairment .
Also interest-bearing securities classified into the category Held to maturity are held at amortised cost and the description below is valid also for the identification and measurement of impairment of these assets . Possible impairment losses on financial assets classified into the category Held to maturity are recognised as “Impairment of securities held as non-current financial assets” in the income statement .
Impairment test of individually assessed loans NBD tests significant loans for impairment on an individual basis . The purpose of the impairment tests is to find out whether the loans have become impaired . As a first step in the identification process for impaired loans, NBD monitors whether there are indicators of impairment (loss event) and whether these represent objective evidence of impairment . More information on the identification of loss events can be found in the Risk, liquidity and capital management section .
In the process to conclude whether there is objective evidence of impairment, an assessment is performed to estimate the most probable future cash flows generated by the customer . These cash flows are then discounted by the effective interest rate giving the net present value . Collateral received to mitigate the credit risk will be assessed at fair value . If the carrying amount of the loan is higher than the net present

Nordea Bank Danmark A/S . Annual Report 2010 41
value of the estimated future cash flows, including the fair value of the collateral, the loan is impaired .
Loans that are not individually impaired will be transferred to a group of loans with similar risk characteristics for a collective impairment test .
Impairment test of collectively assessed loans All loans that are not impaired on an individual basis are collectively assessed for impairment . The loans are grouped on the basis of similar credit risk characteristics that are indicative of the debtors´ ability to pay all amounts due according to the contractual terms . NBD monitors its portfolio through rating migrations and the credit decision and annual review process supplemented by quarterly risk reviews . Through these processes NBD identifies loss events indicating incurred losses in a group . A loss event is an event resulting in a deterioration of the expected future cash flows . Only loss events incurred up to the reporting date are included when performing the assessment of the group .
The objective of the group assessment process is to evaluate if there is a need to make a provision due to the fact that a loss event has occurred, which has not yet been identified on an individual basis . This period between the date when the loss event occurred and the date when it is identified on an individual basis is called “Emergence period” . The impairment remains related to the group of loans until the losses have been identified on an individual basis . The identification of the loss is made through a default of the engagement or by other indicators .
For corporate customers and bank counterparts, NBD uses the existing rating system as a basis when assessing the credit risk . NBD uses historical data on the probability of default to estimate the risk of default in a rating class . These loans are rated and grouped mostly based on the type of industry and/or sensitivity to certain macro parameters, for example the dependency on oil prices etc . Personal customers and small corporate customers are monitored through scoring models . These are based mostly on historical data, as default rates and loss rates given a default, and experienced judgement performed by management . Rating and scoring models are described in more detail in the separate section on risk, liquidity and capital management .
The collective assessment is performed through a netting principle, that is, when rated engagements are up-rated due to estimated increases in cash flows, this improvement will be netted against losses on loans that are down-rated due to estimated decreases in cash-flows . Netting is only performed within groups with similar risk characteristics where NBD assesses that the customers’ future cash flows are insufficient to service the loans in full .
Impairment lossIf the carrying amount of the loans is higher than the sum of the net present value of the estimated cash flows, including the fair value of the collateral and other credit enhancements, the difference is the impairment loss .
If the impairment loss is not regarded as final, the impairment loss is accounted for on an allowance account representing the accumulated impairment losses . Changes in the credit risk and accumulated impairment losses will be recorded as changes in the allowance account and as “Net loan losses”
in the income statement (see also section 6 “Recognition of operating income and impairment”) .
If the impairment loss is regarded as final, it is reported as a realised loss . A realised loss is recognised and the value of the loan and the related allowance for impairment loss are derecognised with a corresponding gain or loss recognised in the item “Net loan losses” in the income statement . An impairment loss is regarded as final when bankruptcy proceedings are taken against the obligor and the administrator has declared the financial outcome of the bankruptcy proceedings, or when NBD waives its claims either through a legally based or voluntary reconstruction or when NBD, for other reasons, deem it unlikely that the claim will be recovered .
Discount rateThe discount rate used to measure impairment is the original effective interest rate for loans attached to an individual customer or, if applicable, to a group of loans .
Restructured loansIn this context a restructured loan is defined as a loan where NBD has granted concessions to the obligor due to its deteriorated financial situation and where this concession has resulted in an impairment loss for NBD . After a reconstruction the loan is normally regarded as not impaired if it performs according to the new conditions . Concessions made in reconstructions are regarded as final losses unless NBD retains the possibility to regain the realised loan losses incurred . This is, in the event of a recovery, reported as recoveries of realised loan losses .
Assets taken over for protection of claimsIn a financial reconstruction the creditor may concede loans to the obligor and in exchange for this concession acquire an asset pledged for the conceded loans, shares issued by the obligor or other assets . Assets taken over for protection of claims are reported on the same balance sheet line as similar assets already held by NBD . For example a property taken over, not held for NBD’s own use, is reported together with other investment properties . At initial recognition, all assets taken over for protection of claims are recognised at fair value . The fair value of the asset on the date of recognition becomes its cost or amortised cost value, as applicable . In subsequent periods, assets taken over for protection of claims are valued in accordance with the valuation principles for the appropriate type of asset . Investment properties are then measured at fair value . Financial assets that are foreclosed are generally classified into the categories Available for sale or Designated at fair value through profit or loss (fair value option) (see section 12 “Financial instruments”) and measured at fair value . Changes in fair values are recognised in other comprehensive income for assets classified into the category Available for sale . For assets classified into the category Designated at fair value through profit or loss, changes in fair value are recognised in the income statement under the line “Net result from items at fair value” .
Any change in value, after the initial recognition of the asset taken over, is presented in the income statement in line with the Group’s presentation policies for the appropriate asset . Consequently, “Net loan losses” in the income statement is, after the initial recognition of the asset taken over, not affected by any subsequent remeasurement of the asset .

Nordea Bank Danmark A/S . Annual Report 2010 42
14. LeasingNBD as lessorFinance leasesNBD’s leasing operations mainly comprise finance leases . A finance lease is reported as a receivable from the lessee in the balance sheet item “Loans to the public” at an amount equal to the net investment in the lease . The lease payment, excluding cost of services, is recorded as repayment of principal and interest income . The income allocation is based on a pattern reflecting a constant periodic return on the net investment outstanding in respect of the finance lease .
Operating leasesAssets subject to operating leases in the balance sheet are reported in accordance with the nature of the assets, in general as property and equipment . Leasing income is recognised as income on a straight-line basis over the lease term . The depreciation of the leased assets is calculated on the basis of NBD’s depreciation policy for similar assets and reported as depreciation on property and equipment in the income statement .
NBD as lesseeFinance leasesIn the consolidated accounts finance leases are recognised as assets and liabilities in the balance sheet at the amount equal to the fair value, or if lower, the present value of the minimum lease payments of the leased assets at the inception of the lease . The assets are reported in accordance with the nature of the assets . Lease payments are apportioned between the finance charge and reduction of the outstanding liability . The finance charge is allocated to periods during the lease term so as to produce a constant periodic rate of interest on the remaining balance of the liability for each period . A finance lease also gives rise to a depreciation expense for the leased asset . The depreciation policy is consistent with that of the assets in own use . Impairment testing of leased assets is performed following the same principles as for similar owned assets .
Operating leasesFor operating leases the lease payments are recognised as expenses in the income statement on a straight-line basis over the lease term unless another systematic way better reflects the time pattern of the user’s benefit . The lease terms range between 3 to 25 years .
Operating leasing is mainly related to office premises contracts and office equipment contracts normal to the business .
Embedded leasesAgreements can contain a right to use an asset in return for a payment, or a series of payments, although the agreement is not in the legal form of a leasing contract . If applicable, these assets are separated from the contract and accounted for as leased assets .
15. Intangible assetsIntangible assets are identifiable, non-monetary assets without physical substance . The assets are under NBD’s control, which means that NBD has the power and rights to obtain the future economic benefits flowing from the underlying resource . The intangible assets in NBD mainly consist of goodwill, computer software and customer related intangible assets .
GoodwillGoodwill represents the excess of the cost of an acquisition over the fair value of NBD’s share of net identifiable assets of the acquired group undertaking/associated undertaking at the date of acquisition . Goodwill on acquisition of group undertakings is included in “Intangible assets” . Goodwill on acquisitions of associates is not recognised as a separate asset, but included in “Investments in associated undertakings” . Goodwill is tested annually for impairment, or more frequently if events or changes in circumstances indicate that it might be impaired . Goodwill is carried at cost less accumulated impairment losses . Impairment losses on goodwill cannot be reversed in subsequent periods . Goodwill related to associated companies is not tested for impairment separately, but included in the total carrying amount of the associated company . The policies covering impairment testing of associated companies are disclosed in section 6 “Recognition of operating income and impairment” .
Computer softwareCosts associated with maintaining computer software programs are recognised as expenses as incurred . Costs directly associated with major software development investments, with a useful life of three years or more and the ability to generate future economic benefits, are recognised as intangible assets . These costs include software development staff costs and overhead expenditure directly attributable to preparing the asset for use . Computer software also includes acquired software licences not related to the function of a tangible asset .
Amortisation is calculated on a straight-line basis over the useful life of the software, generally a period of 3 to 10 years .
Customer-related intangible assetsIn business combinations a portion of the purchase price is normally allocated to a customer-related intangible asset, if the asset is identifiable and under NBD’s control . An intangible asset is identifiable if it arises from contractual or legal rights, or is separable . The asset is amortised over its useful life .
Other intangible assetsExpenditure on acquired patents, trademarks and licences is capitalised and amortised using the straight-line method over their useful lives, generally 5 years .
Impairment Goodwill and other intangible assets with indefinite useful lives are not amortised but tested for impairment annually irrespective of any indications of impairment . Impairment testing is also performed more frequently if required due to indication of impairment . The impairment charge is calculated as the difference between the carrying amount and the recoverable amount .
At each balance sheet date, all intangible assets with definite useful lives are reviewed for indications of impairment . If such indications exist, an analysis is performed to assess whether the carrying amount of the intangible asset is fully recoverable .
The recoverable amount is the higher of fair value less costs to sell and the value in use of the asset or the cash-generating unit, which is defined as the smallest identifiable group of assets that generates cash inflows in relation to the asset . For goodwill, the cash-generating units are defined as the

Nordea Bank Danmark A/S . Annual Report 2010 43
customer areas by country . The value in use is the present value of the cash flows expected to be realised from the asset or the cash-generating unit . The cash flows are assessed based on the asset or cash-generating unit in its current condition and discounted at the Group’s defined post-tax average cost of equity . If the recoverable amount is less than the carrying amount, an impairment loss is recognised . See Note 21 “Intangible assets” for more information on the impairment testing .
16. Property and equipmentProperty and equipment includes own-used properties, leasehold improvements, IT equipment, furniture and other equipment . Items of property and equipment are measured at cost less accumulated depreciation and accumulated impairment losses . The cost of an item of property and equipment comprises its purchase price, as well as any directly attributable costs of bringing the asset to the working condition for its intended use . When parts of an item of property and equipment have different useful lives, they are accounted for as separate items .
Property and equipment is depreciated on a straight-line basis over the estimated useful life of the assets . The estimates of the useful life of different assets are reassessed on a yearly basis . Below follows the current estimates:Buildings 30–75 yearsEquipment 3–5 yearsLeasehold improvements Changes within buildings the
shorter of 10 years and the remaining lease term . New construction the shorter of the principles used for owned buildings and the remaining lease term . Fixtures installed in leased properties are depreciated over the shorter of 10-20 years and the remaining lease term .
At each balance sheet date, NBD assesses whether there is any indication that an item of property and equipment may be impaired . If any such indication exists, the recoverable amount of the asset is estimated and any impairment loss is recognised .
Impairment losses are reversed if the recoverable amount increases . The carrying amount is then increased to the recoverable amount, but can not exceed the carrying amount that would have been determined had no impairment loss been recognised .
17. Investment propertyInvestment properties are primarily properties held to earn rent and capital appreciation . Investment properties are measured at fair value . The best evidence of a fair value is normally given by quoted prices in an active market for similar property in the same location and condition . As these prices are rarely available, discounted cash flow projections based on reliable estimates of future cash flows are used .
Net rental income, gains and losses as well as fair value adjustments are recognised directly in the income statement as “Net result from items at fair value” .
18. TaxesIncome tax expense comprises current and deferred tax . Income tax expense is recognised in the income statement, except to the extent that the tax effect relates to items recognised in other comprehensive income or directly in equity, in which case the tax effect is recognised in other comprehensive income or in equity, respectively .
Current tax is the expected tax expense on the taxable income for the year, using tax rates enacted or substantively enacted at the reporting date, and any adjustment to tax payable in respect of previous years .
Deferred tax assets and liabilities are recognised, using the balance sheet method, for temporary differences between the carrying amounts of assets and liabilities for financial reporting purposes and the amounts used for taxation purposes . Deferred tax assets are recognised for the carry forward of unused tax losses and unused tax credits . Deferred tax is not recognised for temporary differences arising on initial recognition of assets or liabilities in a transaction that is not a business combination and that affects neither accounting nor taxable profit, and differences relating to investments in subsidiaries and associated companies to the extent that it is probable that they will not reverse in the foreseeable future . In addition, deferred tax is not recognised for taxable temporary differences arising on the initial recognition of goodwill .
Deferred tax is measured at the tax rates that are expected to be applied to the temporary differences when they reverse, based on the laws that have been enacted or substantively enacted at the reporting date . Deferred tax assets and liabilities are not discounted . A deferred tax asset is recognised to the extent that it is probable that future taxable profits will be available against which the temporary differences, tax losses carry forward and unused tax credits can be utilised . Deferred tax assets are reviewed at each reporting date and are reduced to the extent that it is no longer probable that the related tax benefit will be realised .
Current tax assets and current tax liabilities are offset when the legal right to offset exists . Deferred tax assets and liabilities are offset if there is a legally enforceable right to offset current tax liabilities and assets .
19. Employee benefitsAll forms of consideration given by NBD to its employees as compensation for services performed are employee benefits . Short-term benefits are to be settled within 12 months after the reporting period when the services have been performed . Post-employment benefits are benefits payable after the termination of the employment . Post-employment benefits in NBD consist only of pensions .
Short-term benefitsShort-term benefits consist mainly of fixed and variable salary . Both fixed and variable salaries are expensed in the period when the employees have performed services to NBD . NBD has also issued share-based payment programmes, which are further described in section 22 “Share-based payment” .
More information can be found in Note 7 “Staff costs” .
Post-employment benefitsPension plansNordea Bank Danmark A/S has various pension plans,

Nordea Bank Danmark A/S . Annual Report 2010 44
consisting of both defined benefit plans and defined contribution plans .
The major defined benefit plans are funded schemes covered by assets in pension funds/foundations . If the fair value of plan assets, associated with a specific pension plan, is lower than the gross present value of the defined benefit obligation, the net amount is recognised as a liability (defined benefit obligation) . If not, the net amount is recognised as an asset (defined benefit asset) . Non-funded pension plans are recognised as defined benefit obligations .
Most pensions in Nordea Bank Denmark A/S are based on defined contribution arrangements that hold no pension liability for NBD . NBD also contributes to public pension systems .
Pension costsThe pension calculations are carried out by pension plan in accordance with IAS 19 .
Obligations for defined contribution pension plans are recognised as an expense as the employee renders services to the entity and the contribution payable in exchange for that service becomes due . NBD’s net obligation for defined benefit pension plans is calculated separately for each plan by estimating the amount of future benefit that employees have earned for their service in the current and prior periods . That benefit is discounted to determine its present value . Any unrecognised prior service cost and the fair value of any plan assets are deducted . Actuarial calculations, performed annually, are applied to assess the present value of defined benefit obligations and related costs, based on several actuarial and financial assumptions (as disclosed in Note 33 “Retirement benefit obligations”) .
When establishing the present value of the obligation and the fair value of any plan assets, actuarial gains and losses may arise as a result of changes in actuarial assumptions and experience effects (actual outcome compared to assumptions) . The actuarial gains and losses are not recognised immediately in the income statement . Rather, only when the net cumulative unrecognised actuarial gain or loss exceeds a “corridor” equal to 10 % of the greater of either the present value of the defined benefit obligation or the fair value of the plan assets, is the excess recognised in the income statement over the expected average remaining service period of the employees participating in the plan . Otherwise, actuarial gains and losses are not recognised .
When the calculation results in a benefit to the NBD entity, the recognised asset is limited to the net total of any unrecognised actuarial losses, unrecognised past service costs and the present value of any future refunds from the plan or reductions in future contributions to the plan .
Social security contribution is calculated and accounted for based on the net recognised surplus or deficit by plan .
Discount rate in Defined Benefit PlansThe discount rate is determined by reference to high-quality corporate bonds, where a deep enough market for such bonds exists . Covered bonds are in this context considered to be corporate bonds . In countries where no such market exists the discount rate is determined by reference to government bond yields . The discount rate is determined with reference to corporate bonds .
20. EquityNon-controlling interestsNon-controlling interests comprise the portion of net assets of group undertakings not owned directly or indirectly by Nordea Bank Danmark A/S .
Other reservesOther reserves comprise income and expenses, net after tax effects that are reported in equity in accordance with IFRS . These reserves include reserves for cash flow hedges and for financial assets classified into the category Available for sale in accordance with IAS 39 as well as translation differences in accordance with IAS 21 .
Retained earningsRetained earnings comprise undistributed profits from previous years .
In addition, NBD’s share of the earnings in associated companies, after the acquisition date, that have not been distributed is included in retained earnings .
21. Financial guarantee contracts and credit commitments
Upon initial recognition, premiums received on issued financial guarantee contracts and credit commitments are recognised as deferred income on the balance sheet . The guarantees and irrevocable credit commitments are subsequently measured, and recognised on the balance sheet, at the higher of either the received fee less amortisation or a provision calculated as the discounted best estimate of the expenditure required to settle the present obligation . Changes in provisions are recognised in the income statement in the item “Net loan losses” .
Premiums received for financial guarantees are, as stated in section 6 “Recognition of operating income and impairment”, amortised over the guarantee period and recognised as ”Fee and commission income” in the income statement . Premiums received on credit commitments are amortised over the loan commitment period . The contractual amounts are recognised off-balance sheet, financial guarantees in the item “Contingent liabilities” and irrevocable credit commitments in the item “Commitments” .
22. Share-based paymentNordea has annually issued Long Term Incentive Programmes from 2007 through 2010 . Employees participating in these programmes are granted share-based and equity-settled rights, that is, rights to receive shares for free or to acquire shares in Nordea at a significant discount to the share price at grant date . According to IFRS 2, the value of such rights is to be expensed . The expense is based on the estimated fair value of each right at grant date . The total fair value of these rights is determined based on the group’s estimate of the number of rights that will eventually vest, which is reassessed at each reporting date, and is expensed on a straight-line basis over the vesting period . The vesting period is the period that the employees have to remain in service in Nordea in order for their rights to vest . Market performance conditions in D-rights are reflected as a probability adjustment to the initial estimate of fair value at grant date . There is no adjustment to the initial estimate of fair value at grant date . There is no adjustment (true-up) for differences between estimated and actual vesting due to market conditions .
For more information see Note 7 “Staff costs” .

Nordea Bank Danmark A/S . Annual Report 2010 45
23. Related party transactionsNBD defines related parties as• shareholders with significant influence• group undertakings and other group companies• associated undertakings• key management personnel• other related parties .
Shareholders with significant influenceShareholders with significant influence are shareholders that, by any means, have a significant influence over Nordea Bank Danmark A/S . Nordea Bank AB has a significant influence over Nordea Bank Danmark A/S .
Group undertakings and other group companiesFor the definition of group undertakings see section 5 “Principles of consolidation” . Further information on the undertakings included in the NBD Group is found in Note 19 “Investments in group undertakings” .
Other group companies consist of subsidiaries in Nordea Bank AB and which are not a part of the Nordea Bank Danmark Group .
Group internal transactions between legal entities are performed according to arm’s length principles in conformity with the OECD requirements on transfer pricing . These transactions are eliminated in the consolidated accounts .
Associated undertakingsFor the definition of associated undertakings see section 5 “Principles of consolidation” .
Further information on the associated undertakings included in the NBD Group is found in Note 20 “Investments in associated undertakings” .
Key management personnelKey management personnel includes the following positions:• the Board of Directors• the Executive Management .
For information about compensation, pensions and other transactions with key management personnel, see Note 7 “Staff costs” and Note 12 “Commitments with the Board of Directors and the Executive Management” .
Other related partiesOther related parties comprise close family members to individuals in key management personnel . Other related parties also include companies significantly influenced by key management personnel in the NBD Group as well as companies significantly influenced by close family members to these key management personnel . Other related parties also include NBD’s pension foundations .
Information concerning transactions between Nordea Bank Danmark A/S and other related parties is found in Note 46 “Related-party transactions” .
24. Segment reportingNordea Bank Danmark A/S does not have debt instruments traded in a public market . Segment reporting in accordance with IFRS 8 is therefore not required for Nordea Bank Danmark . For segment reporting for Nordea Bank AB Group see Note 2 in the financial statements for Nordea Bank AB .
25. Parent companyChanged accounting policies and presentationThe accounting policies, the basis for calculations and presentation, are, in all material aspects, unchanged in comparison with the 2009 Annual Report, except for the classification of lending commissions in the income statement . More information on the classification of lending commissions and the impact on the parent company in 2010 can be found in section 3 “Changed accounting policies and presentation” .
More information on other changes in IFRSs implemented in 2010, which have not had any significant impact on the parent company, as well as on forthcoming changes in IFRSs not yet implemented by NBD can also be found in section 3 “Changed accounting policies and presentation” . The conclusions in section 3 are, where applicable, relevant also for the parent company .
Accounting policies applicable to the parent company onlyInvestments in group undertakings and associated undertakingsThe parent company’s investments in subsidiaries and associated companies are recognised under the cost model . Impairment tests are performed according to IAS 36 “Impairment of Assets” . At each balance sheet date, all shares in subsidiaries and associated companies are reviewed for indications of impairment . If such indication exists, an analysis is performed to assess whether the carrying amount of each holding of shares is fully recoverable . The recoverable amount is the higher of fair value less costs to sell and the value in use . Any impairment charge is calculated as the difference between the carrying amount and the recoverable amount and classified as “impairment of securities held as financial non-current assets” .
Dividends paid by group undertakings and associated undertakings to the parent company are recognised in the bank’s profit when approved by the Annual General Meeting . Dividends from group undertakings and associated undertakings are recognised in the separate income line “Dividends” .
DividendsDividends paid to the shareholder of Nordea Bank Danmark A/S are recorded as a liability following the approval of the Annual General Meeting .

Nordea Bank Danmark A/S . Annual Report 2010 46
Note 2 Net interest income
Group Parent companyDKKm 2010 2009 2010 2009
Interest incomeLoans to credit institutions 983 1,089 1,064 1,145Loans to the public 20,496 25,592 10,011 12,086Interest-bearing securities 3,402 6,061 5,287 8,933Other interest income 2,399 1,702 628 147Total interest income 27,280 34,444 16,990 22,311
Interest expenseDeposits by credit institutions -1,682 -3,246 -1,862 -3,565Deposits and borrowings from the public -3,259 -6,107 -3,225 -6,120Debt securities in issue -8,072 -10,309 -192 -254Subordinated liabilities -179 -215 -179 -215Other interest expenses -2,447 -3,172 -2,462 -3,163Total interest expense -15,639 -23,049 -7,920 -13,317Net interest income 11,641 11,395 9,070 8,994
Interest income from financial instruments not measured at fair value through profit or loss amounts to DKK 11,515m (DKK 13,363m) for the group and DKK 10,685m (DKK 11,583m) for the parent company .Interest expenses from financial instruments not measured at fair value through profit or loss amounts to DKK -6,674m (DKK -11,584m) for the group and DKK -6,631m (DKK -11,438m) for the parent company .
Net interest income Interest income 27,047 34,125 16,990 22,311Leasing income, net 233 319 - -Interest expense -15,639 -23,049 -7,920 -13,317Total 11,641 11,395 9,070 8,994
Note 3 Net fee and commission income
Group Parent companyDKKm 2010 2009 2010 2009
Asset Management commissions 764 580 764 580Life insurance 35 39 35 39Brokerage 1,581 1,533 1,564 1,532Custody 145 143 145 143Deposits 23 25 23 25Total savings related commissions 2,548 2,320 2,531 2,319Payments 447 452 405 438Cards 289 279 284 274Total payment commissions 736 731 689 712Lending 410 381 250 252Guarantees and documentary payments 409 383 940 912Total lending related to commissions 819 764 1,190 1,164Other commission income 432 346 345 254Fee and commission income 4,535 4,161 4,755 4,449
Payment expenses -148 -182 -139 -178Other commission expenses -358 -370 -225 -244Fee and commission expenses -506 -552 -364 -422Net fee and commission income 4,029 3,609 4,391 4,027
Fee income, not included in determining the effective interest rate, from financial assets and liabilities not measured at fair value through profit or loss amount to DKK 433m (DKK 406m) for the group and DKK 273m (DKK 277m) for the parent company . The corresponding amount for fee expenses is DKK 0m (DKK 0m) .
Fee income, not included in determining the effective interest rate, from fiduciary activities that result in the holding or investing of assets on behalf of customers amount to DKK 2,380m (DKK 2,153m) for the group and DKK 2,363m (DKK 2,151m) for the parent company . The corresponding amount for fee expenses is DKK 0m (DKK 0m) .

Nordea Bank Danmark A/S . Annual Report 2010 47
Note 4 Net result from items at fair value
Group Parent companyDKKm 2010 2009 2010 2009
Shares/participations and other share-related instruments 1,512 531 737 527Interest-bearing securities and other interest-related instruments1 1,560 1,767 1,825 2,065Other financial instruments -1,620 -258 -1,649 -258Foreign exchange gains/losses 191 -149 198 -145Investment properties -15 -3 -3 -1Total 1,628 1,888 1,108 2,188
Net result from categories of financial instrumentsAvailable for sale assets, realised - 2 - 2Financial instruments designated at fair value through profit or loss -754 -1,210 -754 -1,210Financial instruments held for trading2 2,382 3,115 1,861 3,411Financial instruments under hedge accounting 8 -14 8 -14 of which net losses on hedging instruments -69 -41 -69 -41 of which net gains on hedged items 77 27 77 27Other -8 -5 -7 -1Total 1,628 1,888 1,108 2,188
1 Of which DKK 0m (DKK 0m) related to financial assets and DKK 0m (DKK 0m) related to financial liabilities held at amortised cost for the group .
2 Of which deffered day one profits amounts to DKK 0m for 2010 (DKK 0m) for the group .
Note 5 Dividends
Investments in group undertakings - - - -Investments in associated undertakings - - 203 156Total - - 203 156
Note 6 Other operating income
Income from group companies 511 417 664 528Disposals of tangible and intangible assets 2 1 2 1Other 261 212 255 150Total 774 630 921 679

Nordea Bank Danmark A/S . Annual Report 2010 48
Note 7 Staff costs
Group Parent companyDKKm 2010 2009 2010 2009
Salaries and remuneration (specification below) -4,799 -4,704 -4,565 -4,520Pension costs (specification below) -515 -440 -496 -422Social insurance contributions -453 -426 -444 -419Allocational profit-sharing foundation -50 -233 -49 -224Other staff costs -184 -175 -179 -171Total -6,001 -5,978 -5,733 -5,756
Salaries and remunerationTo the Executive Management1
- Fixed salary and benefits -16 -15 -16 -15- Variable salary 0 -2 0 -2Total -16 -17 -16 -17To other employees -4,783 -4,687 -4,549 -4,503Total -4,799 -4,704 -4,565 -4,520
Pension costsDefined benefits plans (note 33) 4 -5 4 -5The Executive Management2 -9 -8 -9 -8Defined contribution plans -510 -427 -491 -409Total -515 -440 -496 -422
Compensation etc to the Board of Directors and the Executive Management including pension1
The Executive Management -26 -25 -26 -25The Board of Directors 0 - 0 -Total -26 -25 -26 -25
1 The Executive Management include the Board of Directors and the Executive Management of the parent company Nordea Bank Danmark A/S (including former members of the Executive Management) . The Executive Management amounts in 2010 unchanged to 10 individuals in the Group and in the parent company . Exclusive long-term programmes .
2 Including former members of the Executive Management DKK 5m (2009: DKK 4m) .

Nordea Bank Danmark A/S . Annual Report 2010 49
Note 7 Staff costs (cont.)
Share-based payment
Group 2010 Matching Performance PerformanceConditional Rights LTIP 2010 Share Share I Share II
Granted 255,898 511,796 255,898Forfeited - - -Outstanding at end of year 255,898 511,796 255,898Of which currently exercisable - - -
2010 2009 Conditional Rights LTIP 2009 A Rights B-C Rights D Rights A Rights B-C Rights D Rights
Outstanding at the beginning of year 4,510 9,020 4,510 - - -Granted - - - 4,510 9,020 4,510Forfeited - -4,510 -2,706 - - -Outstanding at end of year 4,510 4,510 1,804 4,510 9,020 4,510Of which currently exercisable - - - - - -
2010 2009 Conditional Rights LTIP 2008 A Rights B-C Rights D Rights A Rights B-C Rights D Rights
Outstanding at the beginning of year 135,830 140,541 108,664 140,541 140,541 140,541Forfeited - -4,711 - -4,711 - -31,877Exercised -96,882 -98,623 -77,944 - - -Outstanding at end of year 38,948 37,207 30,720 135,830 140,541 108,664Of which currently exercisable 38,948 37,207 30,720 - - -
2010 2009 Conditional Rights LTIP 2007 A Rights B-C Rights D Rights A Rights B-C Rights D Rights
Outstanding at the beginning of year 59,681 59,628 59,438 122,349 119,644 122,349Forfeited - - - -1,473 -1,473 -1,473Exercised -46,828 -50,384 -47,993 -61,195 -58,543 -61,438Outstanding at end of year 12,853 9,244 11,445 59,681 59,628 59,438Of which currently exercisable 12,853 9,244 11,445 59,681 59,628 59,438

Nordea Bank Danmark A/S . Annual Report 2010 50
Note 7 Staff costs (cont.)
Share-based payment
Parent 2010 Matching Performance PerformanceConditional Rights LTIP 2010 Share Share I Share II
Granted 250,279 500,558 250,279Forfeited - - -Outstanding at end of year 250,279 500,558 250,279Of which currently exercisable - - -
2010 2009 Conditional Rights LTIP 2009 A Rights B-C Rights D Rights A Rights B-C Rights D Rights
Outstanding at the beginning of year - - - - - -Granted - - - - - -Forfeited - - - - - -Outstanding at end of year - - - - - -Of which currently exercisable - - - - - -
2010 2009 Conditional Rights LTIP 2008 A Rights B-C Rights D Rights A Rights B-C Rights D Rights
Outstanding at the beginning of year 132,751 137,462 106,201 137,462 137,462 137,462Forfeited - -4,711 - -4,711 - -31,261Exercised -93,803 -95,544 -75,481 - - -Outstanding at end of year 38,948 37,207 30,720 132,751 137,462 106,201Of which currently exercisable 38,948 37,207 30,720 - - -
2010 2009 Conditional Rights LTIP 2007 A Rights B-C Rights D Rights A Rights B-C Rights D Rights
Outstanding at the beginning of year 59,538 59,488 59,295 119,429 116,789 119,429Forfeited - - - -1,473 -1,473 -1,473Exercised -46,685 -50,244 -47,850 -58,418 -55,828 -58,661Outstanding at end of year 12,853 9,244 11,445 59,538 59,488 59,295Of which currently exercisable 12,853 9,244 11,445 59,538 59,488 59,295

Nordea Bank Danmark A/S . Annual Report 2010 51
Note 7 Staff costs (cont.)
Long Term Incentive ProgrammesParticipation in the Long Term Incentive programmes (LTIPs) requires that the participants take direct ownership by investing in Nordea shares .
LTIP 2010 Matching Performance Performance LTIP 2009 Share Share I Share II A Rights B-C Rights D Rights
Ordinary share per right 1 .00 1 .00 1 .00 1 .00 1 .00 1 .00Exercise price, EUR 0 .00 0 .00 0 .00 0 .77 0 .38 0 .38Grant date 13 May 2010 13 May 2010 13 May 2010 14 May 2009 14 May 2009 14 May 2009Vesting period, months 36 36 36 24 24 24Contractual life, months 36 36 36 48 48 48First day of exercise May 2013 May 2013 May 2013 April 2011 April 2011 April 2011Fair value at grant date, EUR 6 .75 6 .75 2 .45 4 .66 5 .01 1 .75
LTIP 2008 LTIP 2007 A Rights B-C Rights D Rights A Rights B-C Rights D Rights
Ordinary share per right 1 .30 1 .30 1 .30 1 .30 1 .30 1 .30Exercise price, EUR 2 .30 1 .53 1 .53 2 .53 1 .00 1 .00Grant date 13 May 2008 13 May 2008 13 May 2008 17 May 2007 17 May 2007 17 May 2007Vesting period, months 24 24 24 24 24 24Contractual life, months 48 48 48 48 48 48First day of exercise 29 April 2010 29 April 2010 29 April 2010 30 April 2009 30 April 2009 30 April 2009Fair value at grant date, EUR 7 .53 8 .45 4 .14 8 .76 10 .49 7 .76
Conditions and requirements For each ordinary share the participants lock in to the LTIPs, they are granted a conditional A-right/Matching Share to acquire or receive ordinary shares based on continued employment and the conditional B-D-rights/Performance Share I and II to acquire or receive additional ordinary shares based on fulfilment of certain performance conditions . The performance conditions for B- and C-rights and for Performance Share I comprise a target growth in risk adjusted profit per share (RAPPS) . Should the reported earnings per share (EPS) be lower than a predetermined level the participants are not entitled to exercise any B- or C-rights or Performance Share I . The performance condition for D-rights and for Performance Share II is market related and comprises growth in total shareholder return (TSR) in comparison with a peer group’s TSR .
When the performance conditions are not fully fulfilled, the rights that are no longer exercisable are shown as forfeited in the previous tables, as well as shares forfeited due to participants leaving the Nordea Group . The exercise price for the ordinary shares is adjusted for dividends, however never adjusted below a predetermined price . Furthermore the profit for each right is capped .

Nordea Bank Danmark A/S . Annual Report 2010 52
Note 7 Staff costs (cont.)
LTIP 2010 LTIP 2009 LTIP 2008
Service condition, A-D-rights/ Matching Share/Performance Share I and II
Employed within the Nordea Group during the three year vesting period .
Employed within the Nordea Group during the two year vesting period .
Employed within the Nordea Group during the two year vesting period .
Performance condition, B-rights/Performance Share I
Compound Annual Growth Rate in RAPPS from year 2009 (base year) to and including year 2012 . Full right to exercise will be obtained if the Compound Annual Growth Rate amount to or exceed 9% .
Increase in RAPPS 2009 compared to 2008 . Full right to exercise was obtained if RAPPS increased by 8% or more .
Increase in RAPPS 2008 compared to 2007 . Full right to exercise was obtained if RAPPS increased by 12% or more .
EPS knock out, B-rights/Performance Share I
Average reported EPS for 2010-2012 lower than EUR 0 .26 .
Reported EPS for 2009 lower than EUR 0 .17 .
Reported EPS for 2008 lower than EUR 0 .80 .
Performance condition, C-rights
- Increase in RAPPS 2010 compared to 2009 . Full right to exercise will be obtained if RAPPS increases by 8% or more .
Increase in RAPPS 2009 compared to 2008 . Full right to exercise was obtained if RAPPS increased by 12% or more .
EPS knock out, C-rights
- Reported EPS for 2010 lower than EUR 0 .17 .
Reported EPS for 2009 lower than EUR 0 .52 .
Performance conditions, D-rights/Performance Share II
TSR during 2010-2012 in comparison to a peer group . Full right to exercise will be obtained if Nordea is ranked number 1-5 .
TSR during 2009-2010 in comparison to a peer group . Full right to exercise will be obtained if Nordea is ranked number 1 .
TSR during 2008-2009 in comparison to a peer group . Full right to exercise was obtained if Nordea was ranked number 1 .
Cap The market value of the allotted shares is capped to the participant’s annual salary for year-end 2009 .
The profit per A-D-rights is capped to EUR 9 .59 per right .
The profit per A-D-rights is capped to EUR 21 .87 per right .
Exercise price adjustments
- The exercise price will be adjusted for dividends during the exercise period, however never adjusted below EUR 0 .10 .
The exercise price will be adjusted for dividends during the exercise period, however never adjusted below EUR 0 .10 .

Nordea Bank Danmark A/S . Annual Report 2010 53
Note 7 Staff costs (cont.)
Fair value calculations (Group/parent company)The fair value is measured through the use of generally accepted valuation models with the following input factors:
LITP 2010 LTIP 2009 LTIP 2008 LTIP 2007
Weighted average share price, EUR 6 .93 5 .79 11 .08 12 .33Right life, years 3 .00 2 .50 2 .50 3 .00Deduction of expected dividends No Yes Yes YesRisk free rate, % 1 .99 1 .84 3 .83 4 .20Expected volatility, % 40 .00 29 .00 21 .00 20 .00
Expected volatility is based on historical values . As the exercise price (zero for LTIP 2010) is significantly below the share price at grant date, the value has a limited sensitivity to expected volatility and risk-free interest . The fair value calculations are also based on estimated early exercise behaviour during the programme’s exercise windows, however not applicable for LTIP 2010 . The value of the D-rights/Performance Share II are based on market related conditions and fulfilment of the TSR targets has been taken into consideration when calculating the right’s fair value at grant . When calculating the impact from the TSR target it has been assumed that all possible outcomes have equal possibilities . Expenses Group Parent companyDKKm LTIP 2010 LTIP 2009 LTIP 2008 LTIP 2007 LTIP 2010 LTIP 2009 LTIP 2008 LTIP 2007
Expected expense 5 .13 0 .60 25 .85 16 .54 5 .02 - 25 .33 16 .46Maximum expense 5 .71 0 .89 39 .04 19 .52 5 .58 - 38 .14 19 .44Total expense 20101 5 .48 0 .22 10 .80 - 5 .36 - 10 .60 -Total expense 2009 - 0 .61 5 .99 4 .46 - - 5 .85 4 .35
1 Of which DKK 1 .7m (DKK 1 .1m) is related to the executive management and DKK 0 .0m (DKK 0 .0m) is related to the Board of Directors .
When calculating the expected expense an expected annual employee turnover of 5% has been used in LTIP 2010 . The expected expense is recognised over the vesting period of 36 months (LTIP 2010) and 24 months (LTIP 2009, 2008 and 2007) .

Nordea Bank Danmark A/S . Annual Report 2010 54
Note 8 Other expenses
Group Parent companyDKKm 2010 2009 2010 2009
Information technology1 -1,257 -1,071 -1,237 -1,049Marketing and entertainment2 -177 -146 -175 -143Postage, transportation, telephone and office expenses -382 -393 -370 -377Rents, premises and real estate -857 -816 -856 -815Disposals of tangible and intangible assets -2 -1 -2 -1Other2,3 -411 -552 -290 -510Total -3,086 -2,979 -2,930 -2,895
1 Refers to IT operations, service expenses and consultant fees .2 Comparative figures have been restated to reflect new categories in 2010 .3 Including fees and remuneration to auditors distributed as follows .
Auditors’ remunerationAuditing assignments -4 -4 -3 -3Audit-related services -1 0 -1 -Tax advisory services -1 -2 0 -2Other assignments 0 -1 0 -1Total remuneration of firms appointed at the Annual General Meeting to undertake the statutory audit -6 -7 -4 -6
Note 9 Depreciation, amortisation and impairment charges of tangible and intangible assets
Depreciation/amortisation Group Parent companyDKKm 2010 2009 2010 2009
Property and equipment (note 22)Equipment -124 -103 -105 -93Buildings -2 0 -1 0
Intangible assets (note 21)Goodwill - - - -Internally developed software -52 -34 -36 -34Other intangible assets -52 -22 -33 -11Total -229 -159 -174 -138
Impairment charges/Reversed impairment charges
Property and equipment (note 22)Equipment - - - -Buildings - - - -
Intangible assets (note 21)Goodwill - - - -Internally developed software -6 - -6 -Other intangible assets - - - -Total -6 - -6 - Total -235 -159 -180 -138

Nordea Bank Danmark A/S . Annual Report 2010 55
Note 10 Net loan losses
Net loan losses divided by class Group Parent companyDKKm 2010 2009 2010 2009
Loans to credit institutions 0 0 0 0- of which provisions - - - -- of which write-offs - - - -- of which allowances used for covering write-offs - - - -- of which reversals 0 0 0 0Loans to the public -2,527 -3,944 -2,284 -3,174- of which provisions -3,999 -4,744 -3,394 -3,885- of which write-offs -1,610 -1,464 -1,416 -1,329- of which allowances used for covering write-offs 1,353 1,171 1,180 1,068- of which reversals 1,565 954 1,215 844- of which recoveries 164 139 131 128Off-balance sheet items1 -872 -1,169 -887 -1,641- of which provisions -906 -1,251 -1,049 -1,722- of which write-offs -390 - -390 -- of which allowances used for covering write-offs 390 - 390 -- of which reversals 33 82 162 81Total -3,399 -5,113 -3,172 -4,815
Specification of Net loan losses Changes of allowance accounts in the balance sheet -3,306 -4,958 -3,066 -4,681- of which Loans, individually assessed2 -2,360 -2,689 -2,035 -2,329- of which Loans, collectively assessed2 -74 -1,100 -144 -711- of which Off-balance sheet items, individually assesed1 -880 -1,227 -955 -1,380- of which Off-balance sheet items, collectively assessed1 8 58 68 -261Changes directly recognised in the income statement -93 -155 -106 -134- of which realised loan losses, individually assessed -257 -293 -237 -261- of which realised loan losses, collectively assessed - - - -- of which realised recoveries, individually assessed 164 139 131 127- of which realised recoveries, collectively assessed - - - -Total -3,399 -5,113 -3,172 -4,815 1 Included in note 32 Provisions as “Transfer risk, off-balance”, “Individually and collectively assessed, off-balance sheet” and
“Other provisions” .2 Included in note 13 Loans and their impairment . Key ratios Loan loss ratio, basis points1 50 .8 77 .7 86 .0 128 .1- of which individual 49 .8 60 .7 84 .0 100 .2- of which collective 1 .0 17 .0 2 .0 27 .9
1 Net loan losses (annualised) divided by opening balance of loans to the public (lending) .

Nordea Bank Danmark A/S . Annual Report 2010 56
Note 11 Taxes
Income tax expense Group Parent companyDKKm 2010 2009 2010 2009 Current tax1 -687 -836 -580 -500Deferred tax1 -390 85 14 2Total -1,077 -751 -566 -498 1 Of which relating to prior years (see below)
The tax on the Group’s operating profit differs from the theoretical amount that would arise using the tax rate of Denmark as follows:
Profit before tax 4,557 2,201 2,665 1,098Tax calculated at a tax rate of 25% -1,139 -550 -666 -275Tax-exempt income 54 78 94 54Non-deductible expenses -29 -22 -28 -22Adjustments relating to prior years 44 -253 41 -251Not creditable foreign taxes -7 -4 -7 -4Tax charge -1,077 -751 -566 -498
Average effective tax rate 24% 34% 21% 45%

Nordea Bank Danmark A/S . Annual Report 2010 57
Note 11 Taxes (cont.)
Deferred tax Group Parent companyDKKm 2010 2009 2010 2009 Deferred tax expense (-)/income (+) Deferred tax due to temporary differences -390 85 14 2Deferred tax due to change of tax rate - - - -Income tax expense, net -390 85 14 2 Deferred tax assets Deferred tax assets due to temporary differences 150 393 - -Offset against tax liabilities - - - -Total 150 393 - -of which expected to be settled after more than 1 year 150 393 - - Deferred tax liabilities Deferred tax liabilities due to temporary differences -801 -654 -39 -53Offset against tax assets - - - -Total -801 -654 -39 -53of which expected to be settled after more than 1 year, gross -866 -756 -103 -153 Deferred tax assets (+)/liabilities (-), net Deferred tax assets/liabilities in loans to the public -545 -594 - -Deferred tax assets/liabilities in intangible assets -335 -199 -325 -192Deferred tax assets/liabilities in property and equipment 27 33 30 36Deferred tax assets/liabilities in retirement benefit obligations -43 -39 -43 -39Deferred tax assets/liabilities in other provisions 122 145 120 142Deferred tax assets/liabilities in unlisted shares -27 - 179 -Deferred tax assets due to tax loss 150 393 - -Deferred tax assets/liabilities, net -651 -261 -39 -53 Movements in deferred tax assets/liabilities, net are as follows: Deferred tax relating to items recognised in other comprehensive income - - - -Acquisition - 393 - -Deferred tax in the income statement -390 85 14 2At end of year -390 478 14 2 Current tax assets 1,071 1,831 1,279 2,161Of which expected to be settled after more than 1 year - - - -Current tax liabilities 172 168 170 168Of which expected to be settled after more than 1 year - - - - Unrecognised deferred tax assets Unused tax losses 401 482 - -Unused tax credits - - - -Total 401 482 - - There is no deferred tax relating to temporary differences associated with investments in group undertakings and associated undertakings except from private equity investments .
Deferred income tax assets are recognised for tax loss carry forwards only to the extent that realisation of the related benefit is probable . The tax asset recognised relates to Fionia Asset Company A/S .
Deferred income tax assets and liabilities are offset when there is a legally enforceable right to offset current tax assets against current tax liabilities and when the deferred tax income taxes related to the same fiscal authority .

Nordea Bank Danmark A/S . Annual Report 2010 58
Note 12 Commitments with the Board of Directors and the Executive Management
Loans to and charges or guarantees issued and related security established for the members of the bank’s Executive Management and Board of Directors and their family members: Group Parent company 31 Dec 31 Dec 31 Dec 31 Dec DKKm 2010 2009 2010 2009
Loans etc The Executive Management 5 5 0 0 The Board of Directors 5 5 0 0
Security The Executive Management 5 5 0 0 The Board of Directors 5 5 0 0
Interest income on these loans to members of the bank’s Executive Management and Board af Directors amounts to DKK 0 .3m (DKK 0 .6m) in the Group and DKK 0 .0m (DKK 0 .0m) in the parent company .
Loans to members of the bank’s Executives Management and Board of Directors consists of current accounts with overdraft facilities and mortgage loans with Nordea Kredit on terms based on market conditions . At the end of 2010 interest on the loans was payable at the rate of 2 .3-3 .2% and 2 .0-4 .0% per year, respectively . Loans to family members of the Executives Management and the Board of Directors are granted on the same terms .
Loans etc . to members of the Board of Directors in the parent company Nordea Bank AB consists of current accounts with overdraft facilities and mortgage loans with Nordea Kredit . At the end of 2010 the loans amounted in DKK 6m and interest on the loans was payable at a rate of 2-5% on terms based on market conditions .
The Group has not pledged any assets or other collateral or committed to contingent liabilities on behalf of any member of the Executive Management and Board of Directors and their family members .
Note 13 Loans and their impairment
Group Credit institutions The public1 Total 31 Dec 31 Dec 31 Dec 31 Dec 31 Dec 31 Dec DKKm 2010 2009 2010 2009 2010 2009Loans, not impaired 77,898 97,826 673,301 665,860 751,199 763,686Impaired loans: - - 13,236 10,009 13,236 10,009- of which performing - - 9,386 7,116 9,386 7,116- of which non-performing - - 3,850 2,893 3,850 2,893Loans before allowances 77,898 97,826 686,537 675,869 764,435 773,695
Allowances for individually assessed impaired loans - - -5,247 -4,240 -5,247 -4,240- of which performing - - -3,153 -2,829 -3,153 -2,829- of which non-performing - - -2,094 -1,411 -2,094 -1,411Allowances for collectively assessed impaired loans 0 0 -1,975 -1,894 -1,975 -1,894Allowances 0 0 -7,222 -6,134 -7,222 -6,134
Loans, carrying amount 77,898 97,826 679,315 669,735 757,213 767,561 1 Finance leases, where the Nordea Group is a lessor, are included in Loans to the public, see note 23 Leasing .

Nordea Bank Danmark A/S . Annual Report 2010 59
Note 13 Loans and their impairment (cont.)
Parent company Credit institutions The public Total 31 Dec 31 Dec 31 Dec 31 Dec 31 Dec 31 Dec DKKm 2010 2009 2010 2009 2010 2009Loans, not impaired 148,437 149,581 359,246 367,775 507,683 517,358Impaired loans: - - 8,082 5,681 8,082 5,681- of which performing - - 5,085 3,565 5,085 3,565- of which non-performing - - 2,997 2,116 2,997 2,116Loans before allowances 148,437 149,581 367,328 373,456 515,765 523,037 Allowances for individually assessed impaired loans - - -4,579 -3,293 -4,579 -3,293- of which performing - - -2,484 -1,534 -2,484 -1,534- of which non-performing - - -2,095 -1,759 -2,095 -1,759Allowances for collectively assessed impaired loans 0 0 -1,636 -1,399 -1,636 -1,399Allowances 0 0 -6,215 -4,692 -6,215 -4,692 Loans, carrying amount 148,437 149,581 361,114 368,764 509,551 518,345
Reconciliation of allowance accounts for impaired loans2
Group Credit institutions The public
Individually Collectively Individually CollectivelyDKKm assessed assessed Total assessed assessed TotalOpening balance at 1 Jan 2010 - 0 0 -4,240 -1,894 -6,134Provisions - 0 0 -3,127 -872 -3,999Reversals - 0 0 767 798 1,565Changes through the income statement - 0 0 -2,360 -74 -2,434Allowances used to cover write-offs - - - 1,353 - 1,353Translation differences - - - 0 -8 -8Closing balance at 31 Dec 2010 - 0 0 -5,247 -1,975 -7,222 Opening balance at 1 Jan 2009 - -1 -1 -2,333 -687 -3,020Provisions - 0 0 -3,387 -1,357 -4,744Reversals - 1 1 698 257 955Changes through the income statement - 1 1 -2,689 -1,100 -3,789Allowances used to cover write-offs - - - 1,171 - 1,171Other adjustments - - - -410 -86 -496Translation differences - - - 21 -21 0Closing balance at 31 Dec 2009 - 0 0 -4,240 -1,894 -6,134
2 See note 10 Net loan losses .
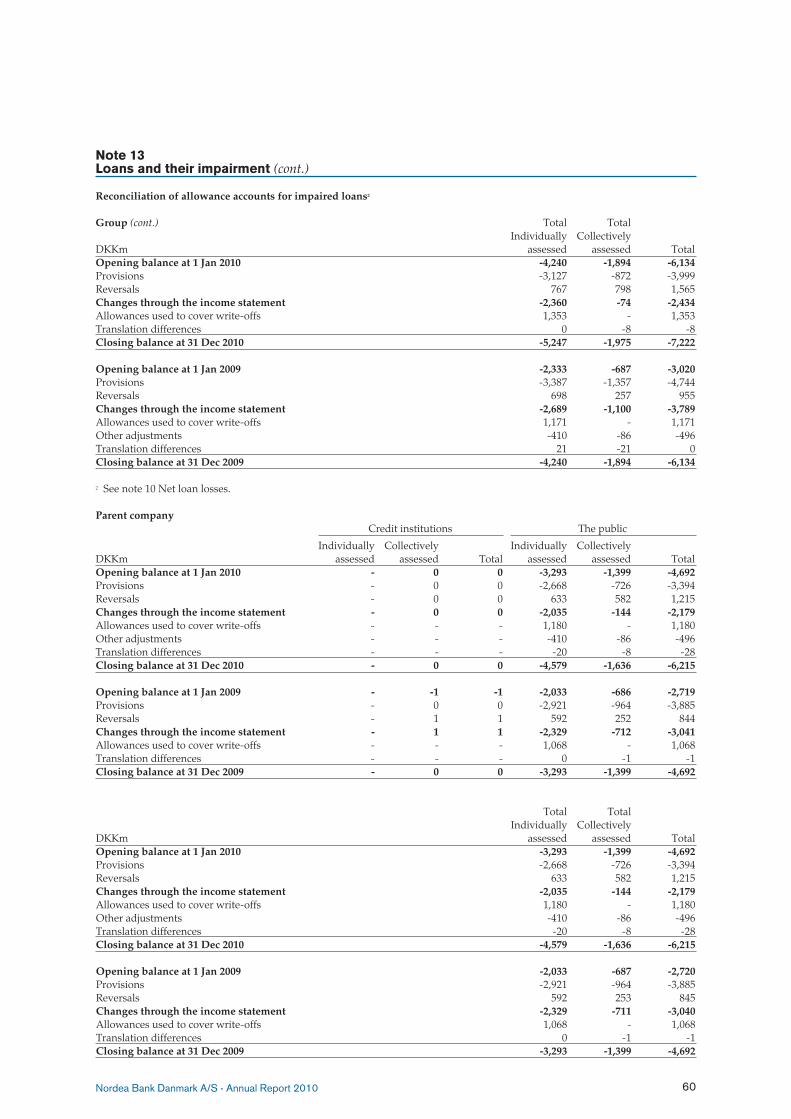
Nordea Bank Danmark A/S . Annual Report 2010 60
Note 13 Loans and their impairment (cont.)
Reconciliation of allowance accounts for impaired loans2
Group (cont.) Total Total Individually CollectivelyDKKm assessed assessed TotalOpening balance at 1 Jan 2010 -4,240 -1,894 -6,134Provisions -3,127 -872 -3,999Reversals 767 798 1,565Changes through the income statement -2,360 -74 -2,434Allowances used to cover write-offs 1,353 - 1,353Translation differences 0 -8 -8Closing balance at 31 Dec 2010 -5,247 -1,975 -7,222 Opening balance at 1 Jan 2009 -2,333 -687 -3,020Provisions -3,387 -1,357 -4,744Reversals 698 257 955Changes through the income statement -2,689 -1,100 -3,789 Allowances used to cover write-offs 1,171 - 1,171Other adjustments -410 -86 -496Translation differences 21 -21 0Closing balance at 31 Dec 2009 -4,240 -1,894 -6,134
2 See note 10 Net loan losses .
Parent company Credit institutions The public
Individually Collectively Individually CollectivelyDKKm assessed assessed Total assessed assessed TotalOpening balance at 1 Jan 2010 - 0 0 -3,293 -1,399 -4,692Provisions - 0 0 -2,668 -726 -3,394Reversals - 0 0 633 582 1,215Changes through the income statement - 0 0 -2,035 -144 -2,179Allowances used to cover write-offs - - - 1,180 - 1,180Other adjustments - - - -410 -86 -496Translation differences - - - -20 -8 -28Closing balance at 31 Dec 2010 - 0 0 -4,579 -1,636 -6,215
Opening balance at 1 Jan 2009 - -1 -1 -2,033 -686 -2,719Provisions - 0 0 -2,921 -964 -3,885Reversals - 1 1 592 252 844Changes through the income statement - 1 1 -2,329 -712 -3,041Allowances used to cover write-offs - - - 1,068 - 1,068Translation differences - - - 0 -1 -1Closing balance at 31 Dec 2009 - 0 0 -3,293 -1,399 -4,692
Total Total Individually CollectivelyDKKm assessed assessed TotalOpening balance at 1 Jan 2010 -3,293 -1,399 -4,692Provisions -2,668 -726 -3,394Reversals 633 582 1,215Changes through the income statement -2,035 -144 -2,179Allowances used to cover write-offs 1,180 - 1,180Other adjustments -410 -86 -496Translation differences -20 -8 -28Closing balance at 31 Dec 2010 -4,579 -1,636 -6,215 Opening balance at 1 Jan 2009 -2,033 -687 -2,720Provisions -2,921 -964 -3,885Reversals 592 253 845Changes through the income statement -2,329 -711 -3,040 Allowances used to cover write-offs 1,068 - 1,068Translation differences 0 -1 -1Closing balance at 31 Dec 2009 -3,293 -1,399 -4,692
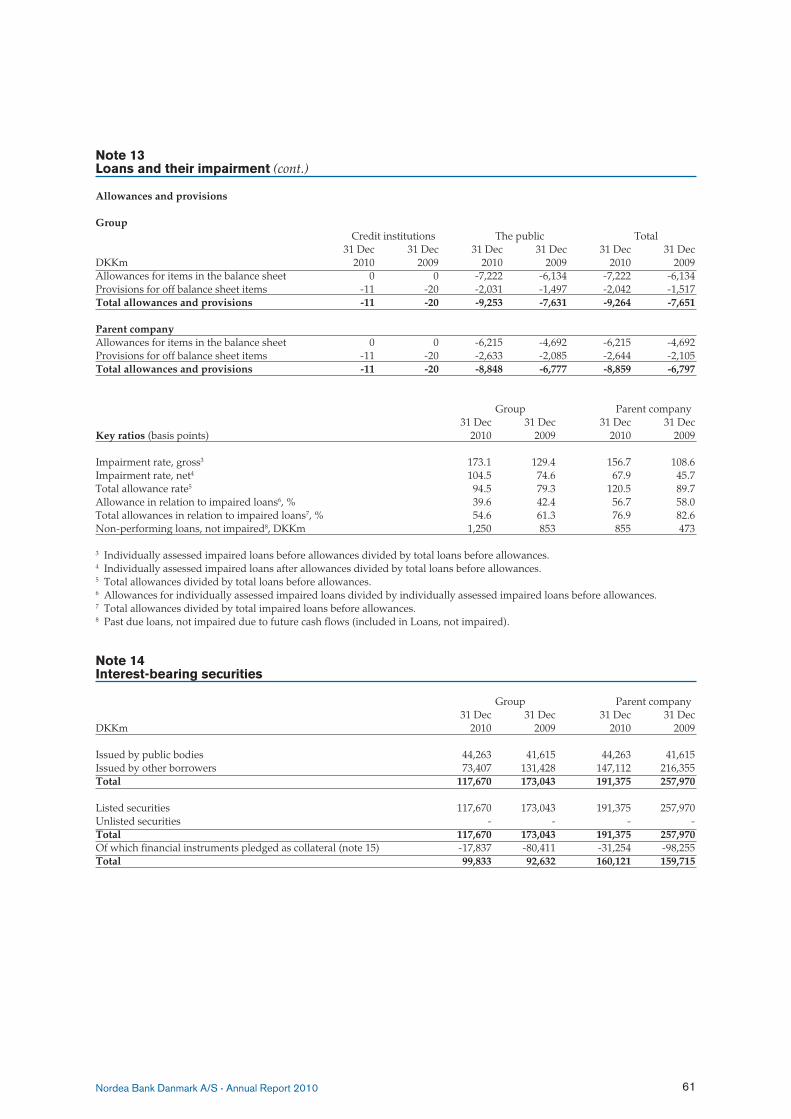
Nordea Bank Danmark A/S . Annual Report 2010 61
Note 13 Loans and their impairment (cont.)
Allowances and provisions
Group Credit institutions The public Total 31 Dec 31 Dec 31 Dec 31 Dec 31 Dec 31 Dec DKKm 2010 2009 2010 2009 2010 2009Allowances for items in the balance sheet 0 0 -7,222 -6,134 -7,222 -6,134Provisions for off balance sheet items -11 -20 -2,031 -1,497 -2,042 -1,517Total allowances and provisions -11 -20 -9,253 -7,631 -9,264 -7,651
Parent companyAllowances for items in the balance sheet 0 0 -6,215 -4,692 -6,215 -4,692Provisions for off balance sheet items -11 -20 -2,633 -2,085 -2,644 -2,105Total allowances and provisions -11 -20 -8,848 -6,777 -8,859 -6,797
Group Parent company 31 Dec 31 Dec 31 Dec 31 Dec Key ratios (basis points) 2010 2009 2010 2009
Impairment rate, gross3 173 .1 129 .4 156 .7 108 .6Impairment rate, net4 104 .5 74 .6 67 .9 45 .7Total allowance rate5 94 .5 79 .3 120 .5 89 .7Allowance in relation to impaired loans6, % 39 .6 42 .4 56 .7 58 .0Total allowances in relation to impaired loans7, % 54 .6 61 .3 76 .9 82 .6Non-performing loans, not impaired8, DKKm 1,250 853 855 473 3 Individually assessed impaired loans before allowances divided by total loans before allowances .4 Individually assessed impaired loans after allowances divided by total loans before allowances .5 Total allowances divided by total loans before allowances .6 Allowances for individually assessed impaired loans divided by individually assessed impaired loans before allowances .7 Total allowances divided by total impaired loans before allowances .8 Past due loans, not impaired due to future cash flows (included in Loans, not impaired) .
Note 14 Interest-bearing securities
Group Parent company 31 Dec 31 Dec 31 Dec 31 Dec DKKm 2010 2009 2010 2009
Issued by public bodies 44,263 41,615 44,263 41,615Issued by other borrowers 73,407 131,428 147,112 216,355Total 117,670 173,043 191,375 257,970
Listed securities 117,670 173,043 191,375 257,970Unlisted securities - - - -Total 117,670 173,043 191,375 257,970Of which financial instruments pledged as collateral (note 15) -17,837 -80,411 -31,254 -98,255Total 99,833 92,632 160,121 159,715
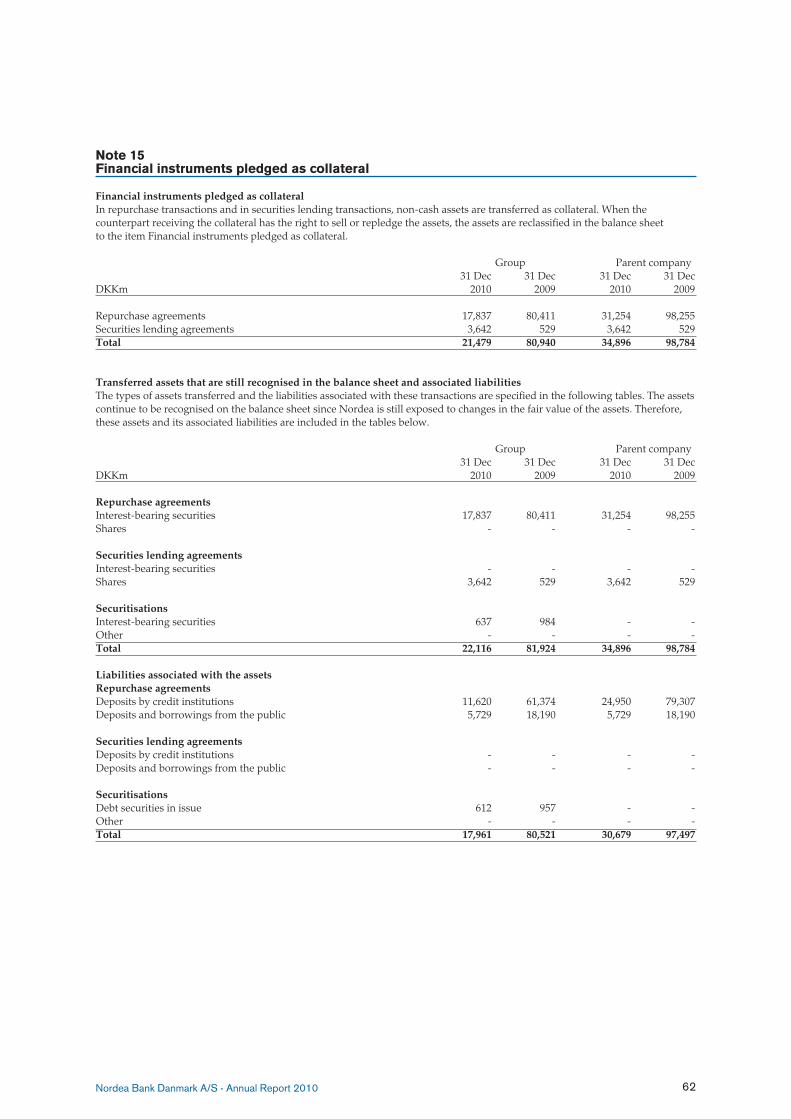
Nordea Bank Danmark A/S . Annual Report 2010 62
Note 15 Financial instruments pledged as collateral
Financial instruments pledged as collateralIn repurchase transactions and in securities lending transactions, non-cash assets are transferred as collateral . When the counterpart receiving the collateral has the right to sell or repledge the assets, the assets are reclassified in the balance sheet to the item Financial instruments pledged as collateral .
Group Parent company 31 Dec 31 Dec 31 Dec 31 Dec DKKm 2010 2009 2010 2009
Repurchase agreements 17,837 80,411 31,254 98,255Securities lending agreements 3,642 529 3,642 529Total 21,479 80,940 34,896 98,784
Transferred assets that are still recognised in the balance sheet and associated liabilitiesThe types of assets transferred and the liabilities associated with these transactions are specified in the following tables . The assets continue to be recognised on the balance sheet since Nordea is still exposed to changes in the fair value of the assets . Therefore, these assets and its associated liabilities are included in the tables below .
Group Parent company 31 Dec 31 Dec 31 Dec 31 Dec DKKm 2010 2009 2010 2009
Repurchase agreementsInterest-bearing securities 17,837 80,411 31,254 98,255Shares - - - -
Securities lending agreementsInterest-bearing securities - - - -Shares 3,642 529 3,642 529
SecuritisationsInterest-bearing securities 637 984 - -Other - - - -Total 22,116 81,924 34,896 98,784
Liabilities associated with the assetsRepurchase agreementsDeposits by credit institutions 11,620 61,374 24,950 79,307Deposits and borrowings from the public 5,729 18,190 5,729 18,190
Securities lending agreementsDeposits by credit institutions - - - -Deposits and borrowings from the public - - - -
SecuritisationsDebt securities in issue 612 957 - -Other - - - -Total 17,961 80,521 30,679 97,497

Nordea Bank Danmark A/S . Annual Report 2010 63
Note 16 Shares
Group Parent company 31 Dec 31 Dec 31 Dec 31 Dec DKKm 2010 2009 2010 2009
Shares held for trading 20,591 16,962 20,034 16,608Total 20,591 16,962 20,034 16,608
Listed shares 14,569 11,598 14,569 11,253Unlisted shares 6,022 5,364 5,465 5,355Total 20,591 16,962 20,034 16,608
Of which financial instruments pledged as collateral (note 15) -3,642 -529 -3,642 -529Total 16,949 16,433 16,392 16,079Of which expected to be settled after more than 1 year 3,475 2,478 2,919 2,469
Note 17 Derivatives and hedge accounting
Group Parent company Fair value Total nom Fair value Total nomDKKm, 31 Dec 2010 Positive Negative amount Positive Negative amount
Derivatives held for trading
Interest rate derivativesInterest rate swaps 238 3,184 902,292 238 3,184 902,292FRAs 3 6 4,000 3 6 4,000Futures and forwards 3,770 917 465,485 3,770 917 465,485Options 79 78 184 79 78 184Other - - - - - -Total 4,090 4,185 1,371,961 4,090 4,185 1,371,961 Equity derivatives Equity swaps - - - - - -Futures and forwards 127 123 3,593 127 123 3,593Options 12 12 0 12 12 0Other - - - - - -Total 139 135 3,593 139 135 3,593 Foreign exchange derivatives Currency and interest rate swaps 39 204 134,902 39 204 134,902Currency forwards - - - - - -Options - - - - - -Other - - - - - -Total 39 204 134,902 39 204 134,902 Credit derivatives Credit default swaps 157 2,053 5,591 157 2,053 5,591Total 157 2,053 5,591 157 2,053 5,591 Total derivatives held for trading 4,425 6,577 1,516,047 4,425 6,577 1,516,047

Nordea Bank Danmark A/S . Annual Report 2010 64
Note 17 Derivatives and hedge accounting (cont.)
Group Parent company Fair value Total nom Fair value Total nomDKKm, 31 Dec 2010 Positive Negative amount Positive Negative amount
Derivatives used for hedge accounting
Interest rate derivativesInterest rate swaps 24 427 13,654 24 427 13,654Options - - - - - -Total 24 427 13,654 24 427 13,654 Equity derivatives Options - - - - - -Total - - - - - - Foreign exchange derivatives Currency and interest rate swaps 182 73 14,801 182 73 14,801Currency forwards - - - - - -Total 182 73 14,801 182 73 14,801Total derivatives used for hedge accounting 206 500 28,455 206 500 28,455
Of which - Fair value hedges 206 500 28,455 206 500 28,455- Cash flow hedges - - - - - - Total derivatives held for trading 4,425 6,577 1,516,047 4,425 6,577 1,516,047Total derivatives used for hedge accounting 206 500 28,455 206 500 28,455Total derivatives 4,631 7,077 1,544,502 4,631 7,077 1,544,502

Nordea Bank Danmark A/S . Annual Report 2010 65
Note 17 Derivatives and hedge accounting (cont.)
Group Parent company Fair value Total nom Fair value Total nomDKKm, 31 Dec 2009 Positive Negative amount Positive Negative amount
Derivatives held for trading
Interest rate derivativesInterest rate swaps 525 2,123 795,629 448 2,009 792,073FRAs 5 3 4,000 - - -Futures and forwards 2,651 2,049 391,962 2,642 2,039 390,253Options 16 11 546 7 9 167Other - - - - - -Total 3,197 4,186 1,192,137 3,097 4,057 1,182,493
Equity derivativesEquity swaps - - - - - -Futures and forwards 441 485 10,835 441 485 10,835Options -1 10 0 -1 10 0Other - - - - - -Total 440 495 10,835 440 495 10,835
Foreign exchange derivativesCurrency and interest rate swaps 97 208 166,041 98 208 166,041Currency forwards 96 62 6,979 - - -Options 6 6 293 - - -Other 41 33 0 - - -Total 240 309 173,313 98 208 166,041
Credit derivativesCredit default swaps 418 842 28,278 418 842 28,278Total 418 842 28,278 418 842 28,278
Total derivatives held for trading 4,295 5,832 1,404,563 4,053 5,602 1,387,647

Nordea Bank Danmark A/S . Annual Report 2010 66
Note 17 Derivatives and hedge accounting (cont.)
Group Parent company Fair value Total nom Fair value Total nomDKKm, 31 Dec 2009 Positive Negative amount Positive Negative amount
Derivatives used for hedge accounting
Interest rate derivativesInterest rate swaps 165 434 40,177 165 434 40,177Options - - - - - -Total 165 434 40,177 165 434 40,177 Equity derivatives Options - - - - - -Total - - - - - - Foreign exchange derivatives Currency and interest rate swaps 4 44 4,960 4 44 4,960Currency forwards - - - - - -Total 4 44 4,960 4 44 4,960Total derivatives used for hedge accounting 169 478 45,137 169 478 45,137
Of which- Fair value hedges 169 478 45,137 169 478 45,137- Cash flow hedges - - - - - - Total derivatives held for trading 4,295 5,832 1,404,563 4,053 5,602 1,387,647Total derivatives used for hedge accounting 169 478 45,137 169 478 45,137Total derivatives 4,464 6,310 1,449,700 4,222 6,080 1,432,784

Nordea Bank Danmark A/S . Annual Report 2010 67
Note 18 Fair value changes of the hedged items in portfolio hedge of interest rate risk Assets Group Parent companyDKKm 2010 2009 2010 2009
Carrying amount at beginning of year 310 217 310 217Changes during the year: Revaluation of hedged items -17 93 -17 93Carrying amount at end of year 293 310 293 310
Liabilities
Carrying amount at beginning of year 82 -24 82 -24Changes during the year: Revaluation of hedged items -94 106 -94 106Carrying amount at end of year -12 82 -12 82
Net book value at end of year 305 228 305 228
The carrying amount at end of year represents accumulated changes in the fair value for those repricing time periods in which the hedged item is an asset respectively a liability .
Note 19 Investments in group undertakings
Parent company 31 Dec 31 Dec DKKm 2010 2009
Acquisition value at beginning of year 10,349 7,943Acquisitions during the year 6,072 2,401Reclassification 149 -Adjustment to equity lower of cost 9 5Acquisition value at end of year 16,579 10,349
Accumulated impairment charges at beginning of year - -Impairment charges during the year - -Translation differences - -Accumulated impairment charges at end of year - -
Total 16,579 10,349Of which, listed shares - -
The total amount is expected to be settled after more than 1 year .

Nordea Bank Danmark A/S . Annual Report 2010 68
Note 19 Investments in group undertakings (cont.)
Group companies Carrying Carrying amount amount Voting Number 2010 2009 power of Registration31 Dec 2010 of shares DKKm DKKm holding % Domicile number
Fionia Asset Company A/S 48,742,586 8,464 2,401 100 Copenhagen 31934745 Ejendomsselskabet Vestre Stationsvej 7, Odense A/S 34,266,112 - - 100 Glostrup 24205533 Ejendomsselskabet Fjordsgade 10, Odense A/S 500,000 - - 100 Glostrup 31346533Nordea Finans Danmark A/S 20,006 483 483 100 Høje-Taastrup 89805910Nordea Kredit Realkreditaktieselskab 17,172,500 7,428 7,428 100 Copenhagen 15134275Danbolig A/S 1 19 10 100 Copenhagen 13186502Structured Finance Servicer A/S 2 2 2 100 Copenhagen 24606910NJK1 ApS 12,500,000 159 - 100 Copenhagen 32771610Nordea Finance Ltd . 2 24 24 100 London 1654761 Hermes Mortgage Ltd . 5,000 - - 100 London 1620201 Nordea Nominees Ltd . 20,002 - - 100 London 1096657 Unidanmark Asset Company Ltd . 20,000 - - 100 London 984871Nordea Trade Services Ltd . 2 - - 100 Hong-Kong 04548614-003-10-0-09-7Total 16,579 10,349
Special Purpose Entities (SPE’s) - Consolidated
Nordea’s TotalDKKm, 31 Dec 2010 Purpose Duration investment assets
CMO Denmark A/S1 Collateralised > 5 years 68 129 mortgage obligationKalmar Structured Finance A/S2 Credit Linked Note Between 1-5 years 173 508Total 241 637
1 Collateralised Mortgage Obligations Denmark A/S (CMO Denmark A/S) was established with the purpose to issue CMOs in order to meet specific customer preferences in terms of credit risk, interest rate risk, prepayment risk, maturity etc . The SPE purchased a pool of mortgage bonds and reallocated the risks through tranching a similar bond issue (CMOs) . At year end 2010 the total notional of outstanding bonds were DKK 129m available to investors . Nordea holds bonds issued by CMO Denmark A/S as part of offering a secondary market for the bonds . The investment amounted to DKK 68m as of year end 2010 .
2 Kalmar Structured Finance A/S was established to allow customers to invest in structured products in the global credit markets . The SPE enters into Credit Default Swaps (CDS) and hereby acquires a credit risk on an underlying portfolio of names (like corporate names) and at the same time the SPE issues Credit Linked Notes (CLN) with a similar credit risk that reflects the terms in the CDSs . Nordea is the counterpart in the derivative transactions . The total notional of outstanding CLNs in this category was DKK 508m at year end 2010 . Nordea holds CLNs issued by the SPE as part of offering a secondary market for the notes . The investment amounted to DKK 173m at year end 2010 .

Nordea Bank Danmark A/S . Annual Report 2010 69
Note 20 Investments in associated undertakings
Group Parent company 31 Dec 31 Dec 31 Dec 31 Dec DKKm 2010 2009 2010 2009
Acquisition value at beginning of year 410 265 114 88Acquisitions during the year 22 36 53 5Sales during the year -14 - -14 -Share in earnings 219 250 - -Dividend received -190 -131 - -Adjustment to equity lower of cost - - 7 21Reclassifications - - - -Other operating income 60 - - -Translation differences 14 -10 - -Acquisition value at end of year 521 410 160 114
Accumulated impairment charges at beginning of year - - - -Translation differences - - - -Accumulated impairment charges at end of year - - - -Total 521 410 160 114Of which, listed shares - - - -
The total amount is expected to be settled after more than 1 year .
The associated undertakings’ aggregated balance sheets and income statements can be summarised as follows:
Group 31 Dec 31 Dec DKKm 2010 2009
Total assets 6,507 6,112 Total liabilities 4,758 4,478 Operating income 357 501 Operating profit 293 46 Nordeas’ share of contingent liabilities in associated undertakings amounts to DKK 406m (DKK 341m) .
Registration Voting powerDKKm, 31 Dec 2010 number Domicile Group Parent of holding %
Credit institutionsLR-realkredit 26045304 Copenhagen 92 27 39Total 92 27
OtherFleggaard Busleasing GmbH 134650777 Harrislee 6 - 39Agro & Ferm A/S 29636672 Esbjerg 0 0 34Ejendomsselskabet Axelborg I/S 79334413 Copenhagen 65 11 33Axcel IKU Invest A/S 24981800 Copenhagen 11 11 33Multidata Holding A/S 27226027 Ballerup 75 9 29KIFU-AX II A/S 25893662 Copenhagen 21 21 25E-nettet Holding A/S 28308019 Copenhagen 12 - 20Nordea Fleet (NF-fleet A/S) 29185263 Taastrup 2 - 20Bankernes Kontantservice A/S 33077599 Copenhagen 20 20 20Nets Holding A/S1 27225993 Ballerup 217 61 16Total 429 133
Total 521 160
The statutory information is available on request from Nordea Investor Relations .
1 Associated through voting power in the Nordea Group .

Nordea Bank Danmark A/S . Annual Report 2010 70
Note 21 Intangible assets
Group Parent company 31 Dec 31 Dec 31 Dec 31 Dec DKKm 2010 2009 2010 2009
Goodwill Roskilde Bank 135 135 135 135 Fionia Bank 1,177 936 1,177 -Goodwill, total 1,312 1,071 1,312 135 Internally developed software 1,054 753 1,023 713Other intangible assets 425 477 425 97Total 2,791 2,301 2,761 945 Goodwill1 Acquisition value at beginning of year 1,086 150 150 150Acquisitions during the year 241 936 1,177 -Acquisition value at end of year 1,327 1,086 1,327 150 Accumulated amortisation at beginning of year -15 -15 -15 -15Amortisation according to plan for the year - - - -Accumulated amortisation at end of the year -15 -15 -15 -15 Accumulated impairment charges at beginning of year - - - -Impairment charges during the year - - - -Translation differences - - - -Accumulated impairment charges at end of year - - - - Total 1,312 1,071 1,312 135 Internally developed software Acquisition value at beginning of year 890 614 825 560Acquisitions during the year 359 276 352 265Sales/disposals during year - - - -Reclassifications - - - -Translation differences - - - -Acquisition value at end of year 1,249 890 1,177 825 Accumulated amortisation at beginning of year -126 -82 -102 -68Amortisation according to plan for the year -52 -34 -36 -34Accumulated amortisation on sales/disposals during the year - - - -Reclassifications - -10 - -Translation differences - - - -Accumulated amortisation at end of year -178 -126 -138 -102 Accumulated impairment charges at beginning of year -11 -11 -11 -11Impairment charges during the year -6 - -6 -Translation differences - - - -Accumulated impairment charges at end of year -17 -11 -17 -11
Total 1,054 753 1,023 713 1 Excluding goodwill in associated undertakings .

Nordea Bank Danmark A/S . Annual Report 2010 71
Note 21 Intangible assets (cont.)
Group Parent company 31 Dec 31 Dec 31 Dec 31 Dec DKKm 2010 2009 2010 2009
Other intangible assetsAcquisition value at beginning of year 493 97 113 97Acquisitions during the year - 396 361 16Sales/disposals during the year - - - -Reclassifications - - - -Translation differences - - - -Acquisition value at end of year 493 493 474 113
Accumulated amortisation at beginning of year -16 -2 -16 -2Amortisation according to plan for the year -52 -22 -33 -11Accumulated amortisation on sales/disposals during the year - - - -Reclassifications - 8 - -3Translation differences - - - -Accumulated amortisation at end of year -68 -16 -49 -16
Accumulated impairment charges at beginning of year - - - -Impairment charges during the year - - - -Translation differences - - - -Accumulated impairment charges at end of year - - - -
Total 425 477 425 97
The total amount is expected to be settled after more than one year .
Impairment testA cash generating unit, defined as customer areas by country, is the basis for the goodwill impairment test .
Cash flows in the near future (between 2-5 years) are based on financial forecasts, derived from forecasted margins, volumes, sales and cost development . These input variables are based on historical data adjusted to reflect Nordea’s assumptions about the future . Longer term cash flows (up to 30 years) are based on estimated sector growth rates . For impairment testing a growth rate of 4-6% has been used for all cash generating units . Growth rates are based on historical data, updated to reflect the current situation .
Cash flows are risk adjusted using normalised loan losses .
The derived cash flows are discounted at the Group’s defined post-tax average cost of equity of 9 .5% (equal to what is used for internal performance management purposes) .
The impairment tests conducted in 2010 did not indicate any need for goodwill impairment .

Nordea Bank Danmark A/S . Annual Report 2010 72
Note 22 Property and equipment
Group Parent company 31 Dec 31 Dec 31 Dec 31 Dec DKKm 2010 2009 2010 2009
Property and equipment 683 582 379 275 Of which buildings for own use 283 262 14 14
EquipmentAcquisition value at beginning of year 877 927 794 853Acquisitions during the year1 224 155 223 136Sales/disposals during the year -68 -199 -49 -195Reclassifications 2 -6 -10 -Translation differences - - - -Acquisition value at end of year 1,035 877 958 794 Accumulated depreciation at beginning of year -557 -648 -532 -629Accumulated depreciation on sales/disposals during the year 50 190 44 190Reclassifications -5 4 - -Depreciations according to plan for the year -124 -103 -105 -93Translation differences - - - -Accumulated depreciation at end of year -636 -557 -593 -532
Accumulated impairment charges at beginning of year - - - -Impairment charges during the year - - - -Translation differences - - - -Accumulated impairment charges at end of year - - - -
Total 400 320 365 261
1 Of which acquisition through business combinations DKK 0m (DKK 17m) in the group and DKK 13m (DKK 0m) in the parent .
Land and buildingsAcquisition value at beginning of year 301 53 22 22Acquisitions during the year1 23 248 - -Sales/disposals during the year - - - -Reclassifications - - - -Translation differences - - - -Acquisition value at end of year 324 301 22 22
Accumulated depreciation at beginning of year -39 -39 -7 -7Accumulated depreciation on sales/disposals during the year - - - -Reclassifaciations - - - -Depreciation according to plan for the year -2 0 -1 0Translation differences - - - -Accumulated depreciation at end of year -41 -39 -8 -7
Accumulated impairment charges at beginning of year - - - -Impairment charges during the year - - - -Translation differences - - - -Accumulated impairment charges at end of year - - - -
Total 283 262 14 14
1 Of which acquisition through business combinations DKK 0m (DKK 248m) in the group and DKK 0m (DKK 0m) in the parent .
The total amount is expected to be settled after more than one year .

Nordea Bank Danmark A/S . Annual Report 2010 73
Note 23 Leasing
Nordea as a lessorFinance leasesThe Nordea Bank Danmark Group owns assets leased to customers under finance lease agreements . Finance lease agreements are reported as receivables from the lessee included in ”Loans to the public” (see note 13) at an amount equal to the net investment in the lease . The leased assets mainly comprise vehicles, machinery and other equipment . Reconciliation of gross investments and present value of future minimum lease payments
Group 31 Dec 31 Dec DKKm 2010 2009
Gross investments 6,838 7,343Less unearned finance income -417 -538Net investments in finance leases 6,421 6,805
Less unguaranteed residual values accruing to the benefit of the lessor - -Present value of future minimum lease payments receivable 6,421 6,805
Accumulated allowance for uncollectible minimum lease payments receivable - -
As of 31 December 2010 the gross investment and the net investment by remaining maturity was distributed as follows:
Group 31 Dec 2010 31 Dec 2010 Gross Net DKKm investment investment
2011 977 9442012 994 9492013 1,106 1,0402014 824 7502015 1,079 1,001Later years 1,858 1,737Total 6,838 6,421
Operating leases Nordea Bank Danmark has not entered into operating lease agreements .

Nordea Bank Danmark A/S . Annual Report 2010 74
Note 23 Leasing (cont.)
Nordea as a lessee Operating leases Nordea Bank Danmark has entered into operating lease agreements for premises and office equipment .
Group Parent company 31 Dec 31 Dec 31 Dec 31 Dec Leasing expenses during the year, DKKm 2010 2009 2010 2009
Leasing expenses during the year 477 424 491 424 of which minimum lease payments 460 410 475 410 of which contingent rents 16 14 16 14
Leasing income during the year regarding sublease payments 17 30 25 44
Future minimum lease payments under non-cancellable operating leases amounted to and are distributed as follows:
2011 337 3372012 335 3352013 202 2022014 200 2002015 195 195Later years 855 855Total 2,124 2,124
Total sublease payments expected to be received under non-cancellable subleases amounts to DKK 0m for the group and DKK 0m for the parent company .
Note 24 Investment property
Movement in the balance sheet Group Parent company 31 Dec 31 Dec 31 Dec 31 Dec DKKm 2010 2009 2010 2009
Carrying amount at beginning of year 91 25 37 5Acquisitions during the year 148 125 9 33Sales/disposals during the year -39 -59 -2 -1Net gains or losses from fair value adjustments - - - -Transfers/reclassifications during the year - - - -Translation differences - - - -Carrying amount at end of year 199 91 43 37
The total amount is expected to be settled after more than 1 year . Amounts recognised in the income statement
Rental income - - - -Direct operating expenses that generate rental income - - - -Direct operating expenses that did not generate rental income -15 -3 -3 -1Total -15 -3 -3 -1

Nordea Bank Danmark A/S . Annual Report 2010 75
Note 25 Other assets
Group Parent company 31 Dec 31 Dec 31 Dec 31 Dec DKKm 2010 2009 2010 2009
Claims on securities settlement proceeds1 81,716 53,441 137,376 101,914Other 2,446 1,561 1,079 1,016Total 84,162 55,002 138,455 102,930of which expected to be settled after more than 1 year 58 100 58 100
1 The amount reflects trade date accounting and primarily relates to receivables on sold bonds at year-end .
Note 26 Prepaid expenses and accrued income
Accrued interest income 2,816 6,339 2,856 6,693Prepaid expenses 542 574 467 485Total 3,358 6,913 3,323 7,178of which expected to be settled after more than 1 year 44 10 - -
Note 27 Deposits by credit institutions
Central banks 2,541 57,051 2,541 57,051Other banks 234,004 258,280 235,467 263,371Other credit institutions 3,260 7,485 39,892 22,334Total 239,805 322,816 277,900 342,756
Note 28 Deposits and borrowings from the public
Deposits from the public 304,393 287,135 305,471 278,581Borrowings from the public 42,549 36,759 42,549 36,759Total 346,942 323,894 348,020 315,340 Deposits are defined as funds in deposit accounts covered by the government deposit guarantee but also including amounts in excess of the individual amount limits . Individual pension savings (IPS) are also included . Portfolio schemes in Nordea Bank Danmark A/S of DKK 28,829m (DKK 25,131m) are also included in Deposits .
Note 29 Debt securities in issue
Bond loans 271,709 246,061 - 11,151Other - - - -Total 271,709 246,061 - 11,151
Note 30 Other liabilities
Liabilities on securities settlement proceeds1 29,225 27,646 171,291 155,506Sold, not held, securities 36,644 46,747 36,644 46,747Other 12,447 7,279 11,520 7,213Total 78,316 81,672 219,455 209,466of which expected to be settled after more than 1 year 167 111 97 93
1 The amount reflects trade date accounting and primarily relates to payables on purchased bonds at year-end .

Nordea Bank Danmark A/S . Annual Report 2010 76
Note 31 Accrued expenses and prepaid income
Group Parent company 31 Dec 31 Dec 31 Dec 31 Dec DKKm 2010 2009 2010 2009
Accrued interest 5,507 8,218 2,033 3,724Other accrued expenses 1,677 1,636 1,608 1,537Prepaid income 123 110 109 100Total 7,307 9,964 3,750 5,361of which expected to be settled after more than 1 year 48 - 48 -
Note 32 Provisions
Reserve for restructuring costs 33 37 33 37Transfer risks, off-balance 15 23 15 23Individually assessed, off-balance-sheet 216 433 558 702Collectively assessed, off-balance sheet - - 259 319Other 1,815 1,064 1,813 1,062Total 2,079 1,557 2,678 2,143
Movement in the balance sheet
Transfer Off balanceDKKm, 31 Dec 2010 Restructuring risks sheet Other Total
GroupAt beginning of year 37 23 433 1,064 1,557New provisions made - 1 154 751 906Provisions utilised - - -390 - -390Reversals -4 -9 -24 - -37Translation differences - - 42 - 42At end of year 33 15 216 1,815 2,079Of which expected to be settled after more than 1 year 0 10 92 0 102
Parent company At beginning of year 37 23 1,021 1,062 2,143New provisions made - 1 297 751 1,049Provisions utilised - - -390 - -390Reversals -4 -9 -153 - -166Translation differences - - 42 - 42At end of year 33 15 817 1,813 2,678Of which expected to be settled after more than 1 year 0 10 92 0 102 Provision for Transfer risk is related to off-balance sheet items . Transfer risk relating to loans is included in the item Allowances for collectively assessed impaired loans in note 13 . Provision for Transfer risk is depending on the volume of business with different countries .
Loan loss provisions for individually and collectively assessed off-balance sheet items (ie guarantees and L/C’s) amounted to DKK 216m (DKK 433m) in NBD Group and DKK 817m (DKK 1,021m) in parent company .
Other provisions in NBD Group and parent company primarily refers to state guarantee fees DKK 1,812m (DKK 1,060m) of which DKK 1,812m is expected to be settled during 2011 .

Nordea Bank Danmark A/S . Annual Report 2010 77
Note 33 Retirement benefit obligations
Group Parent company 31 Dec 31 Dec 31 Dec 31 Dec DKKm 2010 2009 2010 2009
Defined benefit plans, net asset 136 110 136 110Total 136 110 136 110
IAS 19 secures that the market based value of pension obligations net of plan assets backing these obligations will be reflected on the balance sheet . Some plans are funded schemes covered by assets in pension funds/foundations . Some other pension plans are recognised directly on the balance sheet as a liability .
Funded schemes
2010Members 59 Average member age 73 2009Members 59 Average member age 72
IAS 19 pension calculations and assumptions Calculations on major plans are performed by external liability calculators and are based on the actuarial assumptions fixed for each of the Group’s pension plans .
Assumptions
2010Discount rate 4 .0% Salary increase 3 .5% Inflation 2 .0% Expected return on assets before taxes 5 .0% 2009Discount rate 4 .5% Salary increase 3 .5% Inflation 2 .0% Expected return on assets before taxes 5 .5% The expected return on assets is based on long-term expectations for return on the different asset classes . On bonds, this is linked to the discount rate while equities and real estate have an added risk premium .
The discount rate has the most significant impact on the obligation and pension cost . If the discount rate is reduced the pension obligation will increase vice versa . Asset composition The combined return on assets in 2010 was 8 .6% (9 .5%) . At the end of the year, the equity exposure in pension funds/foundations represented 12% (7%) of total assets .
Asset composition in funded schemes (%) 2010 2009
Equity 12 7 Bonds 65 70 Other plan assets 23 23 Of which Nordea Bank AB shares 0 0

Nordea Bank Danmark A/S . Annual Report 2010 78
Note 33 Retirement benefit obligations (cont.)
Amounts recognised in the balance sheet Group Parent company 31 Dec 31 Dec 31 Dec 31 Dec DKKm 2010 2009 2010 2009
Pension Benefit Obligations 862 815 862 815Plan assets 927 886 927 886Total surplus/deficit(-) 65 71 65 71Of which unrecognised actuarial gains/losses(-) -71 -39 -71 -39Of which recognised in the balance sheet 136 110 136 110 - of which retirement benefit assets 173 156 173 156 - of which retirement benefit obligations 37 46 37 46 - of which related to unfunded plans (PBO) 37 46 37 46
Overview of surplus or deficit in the plans Total Total Total Total Total DKKm 2010 2009 2008 2007 2006
Pension Benefit Obligations 862 815 809 770 799Plan assets 927 886 826 822 841Funded status - surplus/deficit(-) 65 71 17 52 42
Changes in the Pension Benefit Obligations Group Parent company 31 Dec 31 Dec 31 Dec 31 Dec DKKm 2010 2009 2010 2009
Pension Benefit Obligations at 1 Jan 815 809 815 809Service cost 5 7 5 7Interest cost 31 31 31 31Pensions paid -58 -54 -58 -54Curtailments and settlements - - - -Past service cost - - - -Actuarial gains(-)/losses 69 22 69 22Pension Benefit Obligations at 31 Dec 862 815 862 815
Changes in the fair value of assetsAssets at 1 Jan 886 826 886 826Expected return on assets 40 33 40 33Pensions paid -48 -46 -48 -46Contributions 11 25 11 25Actuarial gains/losses(-) 38 48 38 48Plan assets at 31 Dec 927 886 927 886Actual return on plan assets 78 81 78 81 Overview of actuarial gains/losses Total Total Total Total Total DKKm 2010 2009 2008 2007 2006
Effects of changes in actuarial assumptions 0 0 -66 25 0Experience adjustments -31 26 8 -23 7- of which on plan assets 38 48 5 -22 -11- of which on plan liabilities -69 -22 3 -1 18Actuarial gains/losses -31 26 -58 2 7
Defined benefit pension cost The total net pension cost related to defined benefit plans recognised in the Group’s income statement (as staff costs) for the year is DKK 4m (DKK -5m) . Total pension costs comprise defined benefit pension costs as well as costs related to defined contribution plans . (See specification in note 7) .

Nordea Bank Danmark A/S . Annual Report 2010 79
Note 33 Retirement benefit obligations (cont.)
Group Parent company 31 Dec 31 Dec 31 Dec 31 Dec Recognised net defined benefit cost, DKKm 2010 2009 2010 2009
Service cost -5 -7 -5 -7Interest cost -31 -31 -31 -31Expected return on assets 40 33 40 33Recognised actuarial gains(-)/losses - - - -Pension cost on defined benefit plans 4 -5 4 -5
The pension cost is in line with what was expected at the start of the year . The net pension cost on defined benefit plans is expected to be on the same level in 2011 . NBD expects to contribute DKK 2m to its defined benefit plans in 2011 .
Key management personnelNordea Bank Danmark has pension obligations regarding present and former members of the Executive Management . Defined benefit plans for the Executive Management are funded, meaning that these obligations are backed with plan assets with fair value generally on a similar level as obligations except from DKK 37m (DKK 46m) booked as Retirement benefit obligations in the bank at the end of the year . Nordea Bank Danmark has no pensions obligations related to the Board of Directors .
Note 34 Subordinated liabilities
Group Parent company 31 Dec 31 Dec 31 Dec 31 Dec DKKm 2010 2009 2010 2009
Dated subordinated debenture loans - - - -Undated subordinated debenture loans - - - -Hybrid capital loans - - - -Other subordinated loans 9,504 9,488 9,504 9,488Total 9,504 9,488 9,504 9,488
These debenture loans are subordinated to other liabilities . Dated debenture loans entitle the lender to payment before undated subordinated loans and hybrid capital loans . Within each respective category, the loans entitle lenders to equal payment rights .
Pursuant to the Danish Financial Business Act repayment of subordinated loans may not take place at the initiative of the lender nor without the approval of the Danish Financial Supervisory Authority .
At 31 December 2010 5 loans - with terms specified below - were outstanding .
Issued by Year of issue Nom . value Book value Interest rate / maturity EURm DKKm (coupon)
Nordea Bank Danmark1 2006/2014 300 2,236 Floating rateNordea Bank Danmark2 2007/2015 300 2,236 Floating rateNordea Bank Danmark3 2009/2017 275 2,050 Floating rateNordea Bank Danmark4 2009/2017 200 1,491 Floating rateNordea Bank Danmark5 2010/2018 200 1,491 Floating rate
1 Call date on 26 May 2011 .2 Call date on 27 September 2012 .3 Call date on 28 May 2014 .4 Call date on 17 December 2014 .5 Call date on 24 June 2015 .

Nordea Bank Danmark A/S . Annual Report 2010 80
Note 35 Assets pledged as security for own liabilities
Group Parent company 31 Dec 31 Dec 31 Dec 31 Dec DKKm 2010 2009 2010 2009
Assets pledged for own liabilities Lease agreements - - - -Securities, etc1 131,748 162,090 166,132 179,934Loans to the public 324,284 286,567 - -Other pledged assets2 4,877 4,682 4,877 4,682Total 460,909 453,339 171,009 184,616
The above pledges pertain to the following liability and commitment items Deposits by credit institutions 86,375 123,715 120,758 141,879Deposits and borrowings from the public 42,313 36,667 42,313 36,667Debt securities in issue 271,097 233,953 - -Other liabilities and commitments - - - -Total 399,785 394,335 163,071 178,546
1 Assets pledged for own liabilities contain securities pledged as security in repurchase agreements and in securities borrowing . The transactions are conducted under standard agreements employed by financial markets participants . Counterparts in those transactions are credit institutions and the public . The transactions are typically short term with maturity within three months .
2 Other pledged assets relating to bonds had been transferred to the FUTOP Clearing Centre and clearing centres outside Denmark pursuant to margin requirements .
Note 36 Other assets pledged
Group Parent company 31 Dec 31 Dec 31 Dec 31 Dec DKKm 2010 2009 2010 2009
Other assets pledged1 Lease agreements - - - -Securities etc - - - -Other assets pledged - - - -Total - - - -
The above pledges pertain to the following liability andcommitment items2 Deposits by credit institutions - - - -Other liabilities and commitments - - - -Total - - - -
1 Collaterals pledged on behalf of other items other than the company’s own liabilities, eg, on behalf of a third party or on behalf of the company’s own contingent liabilities are accounted for under this item .
2 For undertakings of the company itself or for a third party .

Nordea Bank Danmark A/S . Annual Report 2010 81
Note 37 Contingent liabilities
Group Parent company 31 Dec 31 Dec 31 Dec 31 Dec DKKm 2010 2009 2010 2009
GuaranteesLoan guarantees 11,136 8,641 104,976 106,524Other guarantees 17,294 21,833 17,682 23,113Documentary credits 2,517 3,824 2,517 3,824Other contingent liabilities 146 113 146 113Total 31,093 34,411 125,321 133,574
In the normal business of Nordea, the bank issues various forms of guarantees in favour of the bank’s customers . Loan guarantees are given for customers to guarantee obligations in other credit and pension institutions . Other guarantees consist mainly of commercial guarantees such as bid guarantees, advance payment guarantees, warranty guarantees and export related guarantees . Contingent liabilities also include unutilised irrevocable import documentary credits and confirmed export documentary credits . These transactions are part of the bank services and support the bank’s customers . Guarantees and documentary credits are considered as off-balance-sheet items, unless there is a need for a provision to cover a probable loan loss that arises from the judgement that reimbursement will not be received .
As from the accounting period 2005 Nordea Bank Danmark A/S is taxed jointly with the Danish companies, branches etc of the Nordea Group, according to the new rules for joint taxation for 2005, and is liable for that part of the tax of the jointly taxed income concerning the company until payment to Nordea Bank Danmark A/S has taken place .
In terms of payroll tax and VAT, Nordea Bank Danmark A/S is registered jointly with Nordea, Branch of Nordea Bank AB, Sweden, the Danish PE agency of Nordea Bank Finland and with the majority of the Danish subsidiary undertakings in the Nordea Bank AB Group and these companies are jointly and severally liable for such taxes .
A limited number of employees are entitled to severance pay if they are dismissed before reaching their normal retirement age .
Other guarantees include a guarantee to the Danish guarantee scheme “Indskydergarantiordningen” . Amagerbanken has filed for bankruptcy on February 7, 2011 why the Danish guarantee scheme will be activated . Final losses have not yet been calculated why no provision have been provided .
Legal proceedingsWithin the framework of the normal business operations, the NBD Group faces claims in civil lawsuits and other disputes, most of which involve relatively limited amounts . None of these disputes is considered likely to have any significant adverse effect on the NBD Group or its financial position .
Note 38 Commitments
Group Parent company 31 Dec 31 Dec 31 Dec 31 Dec DKKm 2010 2009 2010 2009
Credit commitments1 176,798 176,589 184,105 182,557Other commitments - - - -Total 176,798 176,589 184,105 182,557
1 Including unutilised portion of approved overdraft facilities .
For information about derivatives, see note 17 .

Nordea Bank Danmark A/S . Annual Report 2010 82
Note 39 Capital adequacy
Reconciliation of exposure types to the balance sheet Group Parent company 31 Dec 31 Dec 31 Dec 31 DecDKKm 2010 2009 2010 2009Calculation of total capital baseEquity 32,982 30,221 23,631 22,265Minority interest 1,234 1,201 - -Equity method - - 9,326 7,930Fair value adjustment of owner occupied property 20 20 20 20Retirement benefit assets -71 -39 -71 -39Equity reported to the Danish FSA 34,165 31,403 32,905 30,176Proposed/actual dividend -3,350 -750 -3,350 -750Deferred tax assets -150 -393 - -Intangible assets -2,791 -2,301 -2,761 -945IRB provisions excess (+)/shortfall (–) -171 - - -Deduction for investments in credit institutions (50%) -74 -74 -74 -74Transferred to Tier 2 capital -20 - -20 -Other items, net 12 - 11 4Tier 1 capital (net after deduction) 27,621 27,885 26,711 28,411 – of which hybrid capital - - - -Tier 2 capital 9,525 9,508 9,525 9,508– of which perpetual subordinated loans - - - -IRB provisions excess (+)/shortfall (–) -171 100 391 750Deduction for investments in credit institutions (50%) -74 -74 -74 -74Other deduction - - - -Total capital base 36,900 37,419 36,553 38,595
Capital requirement and RWA
Group 31 Dec 31 Dec 31 Dec 31 Dec 2010 2010 2009 2009 Capital Basel II Capital Basel IIDKKm requirement RWA requirement RWACredit risk 21,898 273,730 21,840 273,000IRB foundation 19,901 248,763 20,143 251,784 - of which corporate 13,112 163,901 14,113 176,414 - of which institutions 594 7,430 668 8,348 - of which retail 5,877 73,466 5,196 64,947 - of which other 317 3,966 166 2,076
Standardised 1,997 24,967 1,697 21,216 - of which sovereign 522 6,526 153 1,914 - of which retail 13 164 475 5,939 - of which other 1,462 18,277 1,069 13,363
Market risk 708 8,850 1,118 13,976 - of which trading book, VaR 275 3,437 263 3,291 - of which trading book, non-VaR 433 5,413 804 10,050 - of which FX, non-VaR 0 0 51 635
Operational risk 2,178 27,224 1,985 24,818Standardised 2,178 27,224 1,985 24,818Total 24,784 309,804 24,944 311,794
Adjustment for transition rules Additional capital requirement according to transition rules 7,919 98,993 6,270 78,380Total 32,704 408,797 31,214 390,175
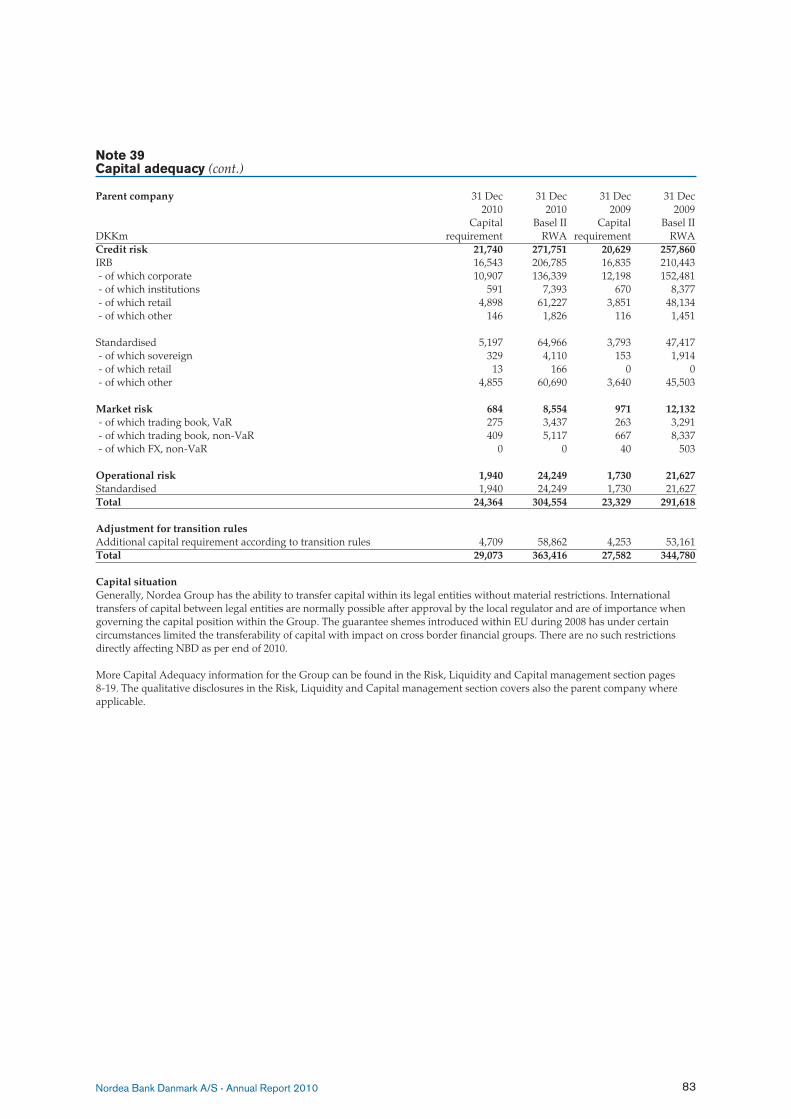
Nordea Bank Danmark A/S . Annual Report 2010 83
Note 39 Capital adequacy (cont.)
Parent company 31 Dec 31 Dec 31 Dec 31 Dec 2010 2010 2009 2009 Capital Basel II Capital Basel IIDKKm requirement RWA requirement RWACredit risk 21,740 271,751 20,629 257,860IRB 16,543 206,785 16,835 210,443 - of which corporate 10,907 136,339 12,198 152,481 - of which institutions 591 7,393 670 8,377 - of which retail 4,898 61,227 3,851 48,134 - of which other 146 1,826 116 1,451
Standardised 5,197 64,966 3,793 47,417 - of which sovereign 329 4,110 153 1,914 - of which retail 13 166 0 0 - of which other 4,855 60,690 3,640 45,503 Market risk 684 8,554 971 12,132 - of which trading book, VaR 275 3,437 263 3,291 - of which trading book, non-VaR 409 5,117 667 8,337 - of which FX, non-VaR 0 0 40 503 Operational risk 1,940 24,249 1,730 21,627Standardised 1,940 24,249 1,730 21,627Total 24,364 304,554 23,329 291,618 Adjustment for transition rules Additional capital requirement according to transition rules 4,709 58,862 4,253 53,161Total 29,073 363,416 27,582 344,780
Capital situationGenerally, Nordea Group has the ability to transfer capital within its legal entities without material restrictions . International transfers of capital between legal entities are normally possible after approval by the local regulator and are of importance when governing the capital position within the Group . The guarantee shemes introduced within EU during 2008 has under certain circumstances limited the transferability of capital with impact on cross border financial groups . There are no such restrictions directly affecting NBD as per end of 2010 .
More Capital Adequacy information for the Group can be found in the Risk, Liquidity and Capital management section pages 8-19 . The qualitative disclosures in the Risk, Liquidity and Capital management section covers also the parent company where applicable .

Nordea Bank Danmark A/S . Annual Report 2010 84
Note 40 Classification of financial instruments
Group Financial assets at fair value through profit or loss
Designated at fair value Deri- through vatives Non- Held to Held for profit used for Available financial DKKm, 31 Dec 2010 Loans maturity trading or loss hedging for sale assets Total
AssetsCash and balances with central banks 3,213 - - - - - - 3,213Loans to credit institutions 14,992 - 60,530 2,376 - - - 77,898Loans to the public 257,569 - 101,045 320,701 - - - 679,315Interest-bearing securities1 - 16,598 83,235 - - - - 99,833Financial instruments pledged as collateral - - 21,479 - - - - 21,479Shares1 - - 16,949 - - - - 16,949Derivatives - - 4,425 - 206 - - 4,631Fair value changes of the hedged items in portfolio hedge of interest rate risk 305 - - - - - - 305Investments in group undertakings - - - - - - - -Investments in associated undertakings - - - - - - 521 521Intangible assets - - - - - - 2,791 2,791Property and equipment - - - - - - 683 683Investment property - - - - - - 199 199Deferred tax assets - - - - - - 150 150Current tax assets - - - - - - 1,071 1,071Retirement benefit assets - - - - - - 173 173Other assets 84,162 - - - - - - 84,162Prepaid expenses and accrued income 3,122 - 236 - - - - 3,358Total 363,363 16,598 287,899 323,077 206 - 5,588 996,731
Financial liabilities at fair value through profit or loss
Designated at fair value Deri- through vatives Other Non- Held for profit used for financial financial DKKm, 31 Dec 2010 trading or loss hedging liabilities liabilities Total
LiabilitiesDeposits by credit institutions 85,827 18,279 - 135,699 - 239,805Deposits and borrowings from the public 42,313 42,753 - 261,876 - 346,942Debt securities in issue - 271,097 - 612 - 271,709Derivatives 6,577 - 500 - - 7,077Fair value changes of the hedged items in portfolio hedge of interest rate risk - - - - - -Current tax liabilities - - - - 172 172Other liabilities 36,644 - - 41,672 - 78,316Accrued expenses and prepaid income 3,657 - - 1,973 1,677 7,307Deferred tax liabilities - - - - 801 801Provisions - - - - 2,079 2,079Retirement benefit obligations - - - - 37 37Subordinated liabilities - - - 9,504 - 9,504Total 175,018 332,129 500 451,336 4,766 963,749
1 Interest-bearing securities and shares in customers’ portfolio schemes are classified as Held for Trading . See note 44 Investments, customer bearing the risk .

Nordea Bank Danmark A/S . Annual Report 2010 85
Note 40 Classification of financial instruments (cont.)
Group Financial assets at fair value through profit or loss
Designated at fair value Deri- through vatives Non- Held to Held for profit used for Available financial DKKm, 31 Dec 2009 Loans maturity trading or loss hedging for sale assets Total
AssetsCash and balances with central banks 2,914 - - - - - - 2,914Loans to credit institutions 5,539 - 57,012 35,275 - - - 97,826Loans to the public 247,528 - 123,569 298,638 - - - 669,735Interest-bearing securities1 - 17,396 75,236 - - - - 92,632Financial instruments pledged as collateral - - 80,940 - - - - 80,940Shares1 - - 16,433 - - - - 16,433Derivatives - - 4,295 - 169 - - 4,464Fair value changes of the hedged items in portfolio hedge of interest rate risk 310 - - - - - - 310Investments in group undertakings - - - - - - - -Investments in associated undertakings - - - - - - 410 410Intangible assets - - - - - - 2,301 2,301Property and equipment - - - - - - 582 582Investment property - - - - - - 91 91Deferred tax assets - - - - - - 393 393Current tax assets - - - - - - 1,831 1,831Retirement benefit assets - - - - - - 156 156Other assets 54,837 - 165 - - - - 55,002Prepaid expenses and accrued income 4,176 - 2,737 - - - - 6,913Total 315,304 17,396 360,387 333,913 169 - 5,764 1,032,933
Financial liabilities at fair value through profit or loss
Designated at fair value Deri- through vatives Other Non- Held for profit used for financial financial DKKm, 31 Dec 2009 trading or loss hedging liabilities liabilities Total
LiabilitiesDeposits by credit institutions 123,715 137,582 - 61,519 - 322,816Deposits and borrowings from the public 36,667 39,210 - 248,017 - 323,894Debt securities in issue - 233,953 - 12,108 - 246,061Derivatives 5,832 - 478 - - 6,310Fair value changes of the hedged items in portfolio hedge of interest rate risk - - - 82 - 82Current tax liabilities - - - - 168 168Other liabilities 46,966 - - 33,863 843 81,672Accrued expenses and prepaid income 4,746 - - 4,244 974 9,964Deferred tax liabilities - - - - 654 654Provisions - - - - 1,557 1,557Retirement benefit obligations - - - - 46 46Subordinated liabilities - - - 9,488 - 9,488Total 217,926 410,745 478 369,321 4,242 1,002,712
1 Interest-bearing securities and shares in customers’ portfolio schemes are classified as Held for Trading . See note 44 Investments, customer bearing the risk .

Nordea Bank Danmark A/S . Annual Report 2010 86
Note 40 Classification of financial instruments (cont.)
Parent company Financial assets at fair value through profit or loss
Designated at fair value Deri- through vatives Non- Held to Held for profit used for Available financial DKKm, 31 Dec 2010 Loans maturity trading or loss hedging for sale assets Total
AssetsCash and balances with central banks 3,213 - - - - - - 3,213Loans to credit institutions 26,581 - 119,480 2,376 - - - 148,437Loans to the public 257,512 - 101,045 2,557 - - - 361,114Interest-bearing securities1 - 16,598 143,523 - - - - 160,121Financial instruments pledged as collateral - - 34,896 - - - - 34,896Shares1 - - 16,392 - - - - 16,392Derivatives - - 4,425 - 206 - - 4,631Fair value changes of the hedged items in portfolio hedge of interest rate risk 305 - - - - - - 305Investments in group undertakings - - - - - - 16,579 16,579Investments in associated undertakings - - - - - - 160 160Intangible assets - - - - - - 2,761 2,761Property and equipment - - - - - - 379 379Investment property - - - - - - 43 43Deferred tax assets - - - - - - - -Current tax assets - - - - - - 1,279 1,279Retirement benefit assets - - - - - - 173 173Other assets 138,455 - - - - - - 138,455Prepaid expenses and accrued income 2,327 - 996 - - - - 3,323Total 428,393 16,598 420,757 4,933 206 - 21,374 892,261
Financial liabilities at fair value through profit or loss
Designated at fair value Deri- through vatives Other Non- Held for profit used for financial financial DKKm, 31 Dec 2010 trading or loss hedging liabilities liabilities Total
LiabilitiesDeposits by credit institutions 120,758 18,279 - 138,863 - 277,900Deposits and borrowings from the public 42,313 42,753 - 262,954 - 348,020Debt securities in issue - - - - - -Derivatives 6,577 - 500 - - 7,077Fair value changes of the hedged items in portfolio hedge of interest rate risk - - - - - -Current tax liabilities - - - - 170 170Other liabilities 36,644 - - 182,811 - 219,455Accrued expenses and prepaid income 13 - - 2,129 1,608 3,750Deferred tax liabilities - - - - 39 39Provisions - - - - 2,678 2,678Retirement benefit obligations - - - - 37 37Subordinated liabilities - - - 9,504 - 9,504Total 206,305 61,032 500 596,261 4,532 868,630
1 Interest-bearing securities and shares in customers’ portfolio schemes are classified as Held for Trading . See note 44 Investments, customer bearing the risk .

Nordea Bank Danmark A/S . Annual Report 2010 87
Note 40 Classification of financial instruments (cont.)
Parent company Financial assets at fair value through profit or loss
Designated at fair value Deri- through vatives Non- Held to Held for profit used for Available financial DKKm, 31 Dec 2009 Loans maturity trading or loss hedging for sale assets Total
AssetsCash and balances with central banks 2,799 - - - - - - 2,799Loans to credit institutions 6,509 - 107,797 35,275 - - - 149,581Loans to the public 241,118 - 123,570 4,076 - - - 368,764Interest-bearing securities1 - 17,396 142,319 - - - - 159,715Financial instruments pledged as collateral - - 98,784 - - - - 98,784Shares1 - - 16,079 - - - - 16,079Derivatives - - 4,053 - 169 - - 4,222Fair value changes of the hedged items in portfolio hedge of interest rate risk 310 - - - - - - 310Investments in group undertakings - - - - - - 10,349 10,349Investments in associated undertakings - - - - - - 114 114Intangible assets - - - - - - 945 945Property and equipment - - - - - - 275 275Investment property - - - - - - 37 37Deferred tax assets - - - - - - - -Current tax assets - - - - - - 2,161 2,161Retirement benefit assets - - - - - - 156 156Other assets 102,765 - 165 - - - - 102,930Prepaid expenses and accrued income 3,672 - 3,506 - - - - 7,178Total 357,173 17,396 496,273 39,351 169 - 14,037 924,399
Financial liabilities at fair value through profit or loss
Designated at fair value Deri- through vatives Other Non- Held for profit used for financial financial DKKm, 31 Dec 2009 trading or loss hedging liabilities liabilities Total
LiabilitiesDeposits by credit institutions 141,879 137,582 - 63,295 - 342,756Deposits and borrowings from the public 36,667 39,210 - 239,463 - 315,340Debt securities in issue - - - 11,151 - 11,151Derivatives 5,602 - 478 - - 6,080Fair value changes of the hedged items in portfolio hedge of interest rate risk - - - 82 - 82Current tax liabilities - - - - 168 168Other liabilities 46,986 - - 161,648 832 209,466Accrued expenses and prepaid income 39 - - 4,447 875 5,361Deferred tax liabilities - - - - 53 53Provisions - - - - 2,143 2,143Retirement benefit obligations - - - - 46 46Subordinated liabilities - - - 9,488 - 9,488Total 231,173 176,792 478 489,574 4,117 902,134
1 Interest-bearing securities and shares in customers’ portfolio schemes are classified as Held for Trading . See note 44 Investments, customer bearing the risk .

Nordea Bank Danmark A/S . Annual Report 2010 88
Note 40 Classification of financial instruments (cont.)
Loans designated at fair value through profit or loss
Group Parent company 31 Dec 31 Dec 31 Dec 31 Dec DKKm 2010 2009 2010 2009
Carrying amount 323,077 333,913 4,933 39,351Maximum exposure to credit risk 323,077 333,913 4,933 39,351Carrying amount of credit derivatives used to mitigate the credit risk - - - -
Financial liabilities designated at fair value through profit or loss
Changes in fair value attributable to changes in credit riskIssued mortgage bonds in the fully owned Danish subsidiary Nordea Kredit Realkreditaktieselskab are measured at fair value . Deposits etc . made by Markets as well as the funding of Markets operations are measured at fair value and classified into the category “Fair value through profit and loss” .
The change in fair value attributable to credit risk of the liabilities are for 2010 DKK -4,857m (DKK 3,808m) . The cumulative change since designation are DKK -3,231m (DKK 1,626m) . The calculation method of the fair value changes attributable to changes in market conditions is based on relevant benchmark interest rates in DKK and EUR, which is the average yield on Danish and German goverment bonds .
The change in fair value of loans in Nordea Kredit Realkreditaktieselskab that is attributable to changes in credit risk is for 2010 DKK -49m (DKK -498m) . The cumulative change since designation is DKK -625m (DKK -576m) .
Comparison of carrying amount and contractual amount to be paid at maturity
Group Parent company Amount Amount Carrying to be paid Carrying to be paid DKKm, 31 Dec 2010 amount at maturity amount at maturity
Financial liabilities at fair value through profit or loss 332,129 332,017 61,032 61,032
DKKm, 31 Dec 2009
Financial liabilities at fair value through profit or loss 410,745 411,942 176,792 176,792

Nordea Bank Danmark A/S . Annual Report 2010 89
Note 41 Assets and liabilities at fair value
Group 31 Dec 2010 31 Dec 2009 Carrying CarryingDKKm amount Fair value amount Fair value
Assets Cash and balances with central banks 3,213 3,213 2,914 2,914Loans to credit institutions 77,898 77,898 97,826 97,826Loans to the public 679,315 679,315 669,735 669,735Interest-bearing securities1 99,833 99,833 92,632 92,609Financial instruments pledged as collateral 21,479 21,479 80,940 80,940Shares1 16,949 16,949 16,433 16,433Derivatives 4,631 4,631 4,464 4,464Fair value changes of the hedged items in portfolio hedge of interest rate risk 305 305 310 310Investments in group undertakings - - - -Investments in associated undertakings 521 521 410 410Intangible assets 2,791 2,791 2,301 2,301Property and equipment 683 703 582 602Investment property 199 199 91 91Deferred tax assets 150 150 393 393Current tax assets 1,071 1,071 1,831 1,831Retirement benefit assts 173 173 156 156Other assets 84,162 84,162 55,002 55,002Prepaid expenses and accrued income 3,358 3,358 6,913 6,913Total assets 996,731 996,751 1,032,933 1,032,931 Liabilities Deposits by credit institutions 239,805 239,805 322,816 322,816Deposits and borrowings from the public 346,942 346,942 323,894 323,894Debt securities in issue 271,709 271,709 246,061 246,061Derivatives 7,077 7,077 6,310 6,310Fair value changes of the hedged items in portfolio hedge of interest rate risk - - 82 82Current tax liabilities 172 172 168 168Other liabilities 78,316 78,316 81,672 81,672Accrued expenses and prepaid income 7,307 7,307 9,964 9,964Deferred tax liabilities 801 801 654 654Provisions 2,079 2,079 1,557 1,557Retirement benefit obligations 37 37 46 46Subordinated liabilities 9,504 9,504 9,488 9,488Total liabilities 963,749 963,749 1,002,712 1,002,712
1 Include investments in interest-bearing securities and shares financed by customers’ portfolio schemes . See note 44 Investments, customer bearing the risk .

Nordea Bank Danmark A/S . Annual Report 2010 90
Note 41 Assets and liabilities at fair value (cont.)
Parent company 31 Dec 2010 31 Dec 2009 Carrying CarryingDKKm amount Fair value amount Fair value
AssetsCash and balances with central banks 3,213 3,213 2,799 2,799Loans to credit institutions 148,437 148,437 149,581 149,581Loans to the public 361,114 361,114 368,764 368,764Interest-bearing securities 160,121 160,121 159,715 159,692Financial instruments pledged as collateral 34,896 34,896 98,784 98,784Shares 16,392 16,392 16,079 16,079Derivatives 4,631 4,631 4,222 4,222Fair value changes of the hedged items in portfolio hedge of interest rate risk 305 305 310 310Investments in group undertakings 16,579 16,579 10,349 10,349Investments in associated undertakings 160 160 114 114Intangible assets 2,761 2,761 945 945Property and equipment 379 399 275 295Investment property 43 43 37 37Deferred tax assets - - - -Current tax assets 1,279 1,279 2,161 2,161Retirement benefit assets 173 173 156 156Other assets 138,455 138,455 102,930 102,930Prepaid expenses and accrued income 3,323 3,323 7,178 7,178Total assets 892,261 892,281 924,399 924,396 Liabilities Deposits by credit institutions 277,900 277,900 342,756 342,756Deposits and borrowings from the public 348,020 348,020 315,340 315,340Debt securities in issue - - 11,151 11,151Derivatives 7,077 7,077 6,080 6,080Fair value changes of the hedged items in portfolio hedge of interest rate risk - - 82 82Current tax liabilities 170 170 168 168Other liabilities 219,455 219,455 209,466 209,466Accrued expenses and prepaid income 3,750 3,750 5,361 5,361Deferred tax liabilities 39 39 53 53Provisions 2,678 2,678 2,143 2,143Retirement benefit obligations 37 37 46 46Subordinated liabilities 9,504 9,504 9,488 9,488Total liabilities 868,630 868,630 902,134 902,134 Estimation of fair value for financial instrumentsFinancial assets and financial liabilities in the balance sheet are generally measured at fair value, with the exception of loans, deposits and borrowings and issued securities .
The carrying amounts on loans, deposits and borrowings and issued securities are adjusted for the value of the fixed interest term, unless the interest rate risk is hedged, in order to estimate the fair values that are presented in the tables above . The value of the fixed interest term is a result of changes in the relevant market interest rates . The discount rates used are based on current market rates for each term . The fair value of the hedged interest rate risk is included in the balance sheet item “Fair value changes of the hedged items in portfolio hedge of interest rate risk” .
Fair value is estimated to be equal to the carrying amount for short-term financial assets and financial liabilities . The carrying amount is a reasonable approximation of fair value due to limited credit risk and short time to maturity .
Fair value is set to carrying amount, in the tables above, for assets and liabilities for which no reliable fair value has been possible to estimate . This is valid for the line items investments in associated undertakings, investments in group undertakings, intangible assets, property and equipment and provisions .
For further information about valuation of items normally measured at fair value, see note 1 Accounting policies .

Nordea Bank Danmark A/S . Annual Report 2010 91
Note 41 Assets and liabilities at fair value (cont.)
Deferred Day 1 profit or loss In accordance with the Group’s accounting policy as described in Note 1, if there are significant unobservable inputs used in the valuation technique, the financial instrument is recognised at the transaction price and any trade date profit is deferred . The table below shows the aggregate difference yet to be recognised in the income statement at the beginning and end of the period and a reconciliation of changes in the balance of this difference (movement of deferred Day 1 profit or loss) . Group Parent company 31 Dec 31 Dec 31 Dec 31 Dec DKKm 2010 2009 2010 2009
Amount at beginning of year - - - - Deferred profit/loss on new transactions - - - -Recognised in the income statement during the year - - - -Amount at end of year - - - - Determination of fair value from quoted market prices or valuation techniques Fair value measurements are categorised using a fair value hierarchy . The financial instruments carried at fair value have been categorised under the three levels of the IFRS fair value hierarchy that reflects the significance of inputs . The categorisation of these instruments is based on the lowest level input that is significant to the fair value measurement in its entirety . To categorise the instruments into the three levels, the relevant pricing models for each product is considered in combination with used input market data, the significance of derived input data, the complexity of the model and the accessible pricing data to verify model input . Although the complexity of the model is considered, a high complexity does not by default require that products are categorised into level 3 .
It is the use of model parameters and the extent of unobservability that defines the fair value hierarchy levels . For bonds the categorisation into the three levels are based on the internal pricing methodology . The bonds can either be directly quoted in active markets (level 1) or measured using a methodology giving a quote based on observable inputs (level 2) . Level 3 bonds are characterised by illiquidity .
Valuations of Private Equity Funds (PEF) and unlisted equities will in nature be more uncertain than valuations of more actively traded equity instruments . Emphasis is put on using a consistent approach across all assets and over time . The methods are consistent with the guideline “International Private Equity and Venture Capital Valuation Guidelines” issued by EVCA (European Venture Capital Association) . The EVCA guidelines are considered as best practice in the PEF industry . For US based funds, similar methods are applied .
Level 1 consist of financial assets and financial liabilities valued using unadjusted quoted prices in active markets for identical assets or liabilities . An active market for the asset or liability is a market in which transactions for the asset or liability occur with sufficient frequency and volume to provide pricing information on an ongoing basis .This category includes listed derivatives, listed equities, government bonds in developed countries, and most liquid mortgage bonds and corporate bonds where quotes in active markets exist .
Level 2 consists of financial assets and financial liabilities which do not have directly quoted market prices available from an active market . The fair values are estimated using a valuation technique or valuation model based on market prices or rates prevailing at the balance sheet date and any unobservable inputs are insignificant in the fair values . This is the case for the majority of Nordea’s OTC derivatives, securities purchased/sold under resale/repurchase agreements, securities borrowed/loaned and other instruments where an active markets supply the input to the valuation technique or model .
Level 3 consists of those types of financial instruments which fair values cannot be obtained directly from quoted market prices or indirectly using valuation techniques or models supported by observable market prices or rates . This is generally the case for private equity instruments in unlisted securities, private equity funds, hedge funds, and both more complex or less active markets supplying input to the technique or model for OTC derivatives, certain complex or structured financial instruments such as CLNs and illiquid bonds .
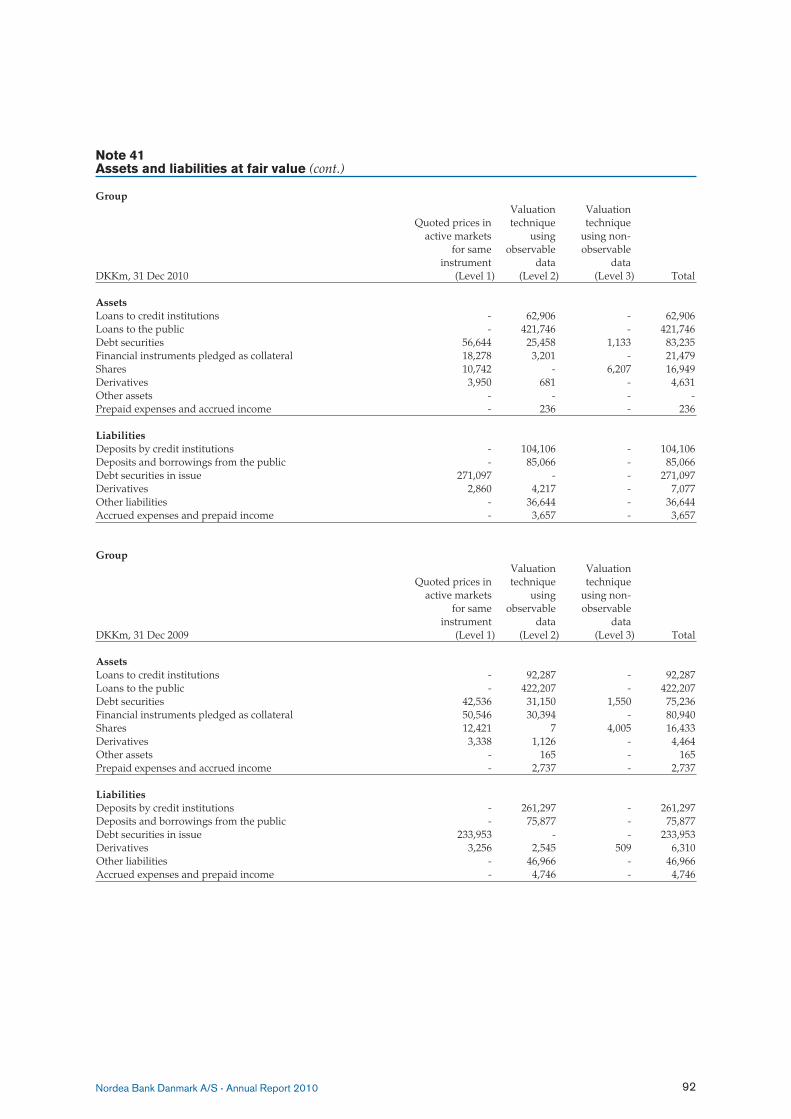
Nordea Bank Danmark A/S . Annual Report 2010 92
Note 41 Assets and liabilities at fair value (cont.)
Group Valuation Valuation Quoted prices in technique technique active markets using using non- for same observable observable instrument data data DKKm, 31 Dec 2010 (Level 1) (Level 2) (Level 3) Total
AssetsLoans to credit institutions - 62,906 - 62,906Loans to the public - 421,746 - 421,746Debt securities 56,644 25,458 1,133 83,235Financial instruments pledged as collateral 18,278 3,201 - 21,479Shares 10,742 - 6,207 16,949Derivatives 3,950 681 - 4,631Other assets - - - -Prepaid expenses and accrued income - 236 - 236 Liabilities Deposits by credit institutions - 104,106 - 104,106Deposits and borrowings from the public - 85,066 - 85,066Debt securities in issue 271,097 - - 271,097Derivatives 2,860 4,217 - 7,077Other liabilities - 36,644 - 36,644Accrued expenses and prepaid income - 3,657 - 3,657
Group Valuation Valuation Quoted prices in technique technique active markets using using non- for same observable observable instrument data data DKKm, 31 Dec 2009 (Level 1) (Level 2) (Level 3) Total
AssetsLoans to credit institutions - 92,287 - 92,287Loans to the public - 422,207 - 422,207Debt securities 42,536 31,150 1,550 75,236Financial instruments pledged as collateral 50,546 30,394 - 80,940Shares 12,421 7 4,005 16,433Derivatives 3,338 1,126 - 4,464Other assets - 165 - 165Prepaid expenses and accrued income - 2,737 - 2,737 Liabilities Deposits by credit institutions - 261,297 - 261,297Deposits and borrowings from the public - 75,877 - 75,877Debt securities in issue 233,953 - - 233,953Derivatives 3,256 2,545 509 6,310Other liabilities - 46,966 - 46,966Accrued expenses and prepaid income - 4,746 - 4,746

Nordea Bank Danmark A/S . Annual Report 2010 93
Note 41 Assets and liabilities at fair value (cont.)
Parent company Valuation Valuation Quoted prices in technique technique active markets using using non- for same observable observable instrument data data DKKm, 31 Dec 2010 (Level 1) (Level 2) (Level 3) Total
AssetsLoans to credit institutions - 121,856 - 121,856Loans to the public - 103,602 - 103,602Debt securities 130,350 12,040 1,133 143,523Financial instruments pledged as collateral 31,514 3,382 - 34,896Shares 10,741 - 5,651 16,392Derivatives 3,950 681 - 4,631Other assets - - - -Prepaid expenses and accrued income - 996 - 996 Liabilities Deposits by credit institutions - 139,037 - 139,037Deposits and borrowings from the public - 85,066 - 85,066Debt securities in issue - - - -Derivatives 2,860 4,217 - 7,077Other liabilities - 36,644 - 36,644Accrued expenses and prepaid income - 13 - 13
Parent company Valuation Valuation Quoted prices in technique technique active markets using using non- for same observable observable instrument data data DKKm, 31 Dec 2009 (Level 1) (Level 2) (Level 3) Total
AssetsLoans to credit institutions - 143,072 - 143,072Loans to the public - 127,646 - 127,646Debt securities 103,319 37,450 1,550 142,319Financial instruments pledged as collateral 66,372 32,412 - 98,784Shares 12,074 - 4,005 16,079Derivatives 3,095 1,127 - 4,222Other assets - 165 - 165Prepaid expenses and accrued income - 3,506 - 3,506 Liabilities Deposits by credit institutions - 279,461 - 279,461Deposits and borrowings from the public - 75,877 - 75,877Debt securities in issue - - - -Derivatives 3,026 2,545 509 6,080Other liabilities - 46,966 - 46,966Accrued expenses and prepaid income - 39 - 39
Transfers between level 1 and 2During the year, Nordea Group transferred debt securities of DKK 6,588m from level 1 to level 2 of the fair value hierarchy for financial assets and liabilities which are recorded at fair value . The transfer was an outcome of a further developed fair value hierarchy classification due to a more detailed assessment of the liquidity in the market . The fair values were consequently obtained using valuation techniques using observable market inputs .

Nordea Bank Danmark A/S . Annual Report 2010 94
Note 41 Assets and liabilities at fair value (cont.)
Movements in level 3 The following table shows a reconciliation of the opening and closing carrying amounts of level 3 financial assets and liabilities at fair value .
Group Fair value gains/losses recognised in the income statement during the year
DKKm, 31 Dec 2010 At 1 Jan 2010 Realised Unrealised1
Debt securities 1,550 18 160Shares 4,005 390 984Derivatives (net of assets and liabilities) 509 - -
Transfers At 31 into/out of Translation DecDKKm, 31 Dec 2010 (cont.) Purchases Sales level 3 differences 2010
Debt securities 442 -985 -52 - 1,133Shares 1,572 -739 - -5 6,207Derivatives (net of assets and liabilities) - - -509 - -
Fair value gains/losses recognised in the income statement during the year
DKKm, 31 Dec 2009 At 1 Jan 2009 Realised Unrealised1
Debt securities - - -Shares 1,882 12 614Derivatives (net of assets and liabilities) - - -
Transfers At 31 into/out of Translation DecDKKm, 31 Dec 2009 (cont.) Purchases Sales level 3 differences 2009
Debt securities - - 1,550 - 1,550Shares 348 -436 1,585 - 4,005Derivatives (net of assets and liabilities) - - 509 - 509
1 Relates to those assets and liabilities held at the end of the reporting period .
Fair value gains/losses recognised in the income statement during the year are included in “Net result from items at fair value” (see note 4) .

Nordea Bank Danmark A/S . Annual Report 2010 95
Note 41 Assets and liabilities at fair value (cont.)
Parent company Fair value gains/losses recognised in the income statement during the year
DKKm, 31 Dec 2010 At 1 Jan 2010 Realised Unrealised1
Debt securities 1,550 18 160Shares 4,005 25 586Derivatives (net of assets and liabilities) 509 - -
Transfers At 31 into/out of Translation DecDKKm, 31 Dec 2010 (cont.) Purchases Sales level 3 differences 2010
Debt securities 442 -985 -52 - 1,133Shares 1,572 -374 -158 -5 5,651Derivatives (net of assets and liabilities) - - -509 - -
Fair value gains/losses recognised in the income statement during the year
DKKm, 31 Dec 2009 At 1 Jan 2009 Realised Unrealised1
Debt securities - - -Shares 1,882 12 614Derivatives (net of assets and liabilities) - - -
Transfers At 31 into/out of Translation DecDKKm, 31 Dec 2009 (cont.) Purchases Sales level 3 differences 2009
Debt securities - - 1,550 - 1,550Shares 348 -436 1,585 - 4,005Derivatives (net of assets and liabilities) - - 509 - 509
1 Relates to those assets and liabilities held at the end of the reporting period .

Nordea Bank Danmark A/S . Annual Report 2010 96
Note 41 Assets and liabilities at fair value (cont.)
Sensitivity of level 3 financial instruments measured at fair value to changes in key assumptions Included in the fair value of financial instruments carried at fair value on the balance sheet are those estimated in full or in part using valuation techniques based on assumptions that are not supported by market observable prices or rates . There may be uncertainty about a valuation, resulting from the choice of valuation technique or model used, the assumptions embedded in those models, the extent to which inputs are not market observable, or as a result of other elements affecting the valuation technique . Portfolio adjustments are applied to reflect such uncertainties and are deducted from the fair values produced by the models or other valuation techniques . For further information see Note 1 section 10 “Determination of fair value of financial instruments” .
This disclosure shows the potential impact of the relative uncertainty in the fair value of financial instruments for which valuation is dependent on unobservable input parameters . The estimates disclosed below are likely to be greater than the true uncertainty in fair value of these instruments, as it is unlikely in practice that all unobservable parameters would be simultaneously at the extremes of their ranges of reasonably possible alternatives . The disclosure is neither predictive nor indicative of future movements in fair value . The following table shows the sensitivity of the fair value of level 3 instruments to changes in key assumptions, by class of instruments . Where the exposure to an unobservable parameter is offset across different instruments then only the net impact is disclosed in the table .
Group Parent company
Effect of reasonably possible Effect of reasonably possible alternative assumptions alternative assumptions Carrying Carrying DKKm, 31 Dec 2010 amount Favourable Unfavourable amount Favourable Unfavourable
Debt securities 1,133 57 -57 1,133 57 -57 Shares 6,207 646 -646 5,651 591 -591
DKKm, 31 Dec 2009
Debt securities 1,550 78 -78 1,550 78 -78Shares 4,005 400 -400 4,005 400 -400Derivatives (net of assets and liabilities) 509 36 -36 509 36 -36
In order to calculate the effect on level 3, fair values from altering the assumptions of the valuation technique or model, the sensitivity to unobservable input data is assessed . For the derivatives portfolio key inputs that are based on pricing model assumptions or unobservability of market data inputs are replaced by alternative estimates or assumptions and impact on valuation computed . The majority of the effect on the Derivatives are related to various types of correlations or correlation related inputs in credit derivatives, interest rate OTC derivatives or OTC structured equity derivatives . For the level 3 portfolios of shares and debt securities the fair value was increased and decreased with reasonable changes in market movements .

Nordea Bank Danmark A/S . Annual Report 2010 97
Note 42 Assets and liabilities in foreign currencies
Group DKKbn, 31 Dec 2010 EUR SEK DKK NOK USD Other Total
Total assets 179 65 708 4 28 13 997Total liabilities and equity -156 -46 -719 -1 -53 -22 -997Position not reported in the balance sheet -24 -18 11 -3 25 9 0Net position, currencies -1 1 0 0 0 0 0
DKKbn, 31 Dec 2009 EUR SEK DKK NOK USD Other Total
Total assets 181 137 661 3 31 20 1,033Total liabilities and equity -171 -88 -663 -3 -37 -71 -1,033Position not reported in the balance sheet -9 -49 1 0 6 51 0Net position, currencies 1 0 -1 0 0 0 0
Parent company
DKKbn, 31 Dec 2010 EUR SEK DKK NOK USD Other Total
Total assets 150 65 632 4 28 13 892Total liabilities and equity -127 -46 -643 -1 -53 -22 -892Position not reported in the balance sheet -24 -18 11 -3 25 9 0Net position, currencies -1 1 0 0 0 0 0
DKKbn, 31 Dec 2009 EUR SEK DKK NOK USD Other Total
Total assets 152 136 582 2 32 20 924Total liabilities and equity -145 -87 -581 -3 -38 -70 -924Position not reported in the balance sheet -8 -49 1 0 6 50 0Net position, currencies 1 0 -1 0 0 0 0

Nordea Bank Danmark A/S . Annual Report 2010 98
Note 43 Obtained collaterals which are permitted to be sold or repledged Nordea Bank Danmark obtains collaterals under reverse repurchase and securities borrowing agreements which, under the terms of the agreements, can be sold or repledged . Generally, the agreements require additional collateral to be provided if the value of the securities falls below a predetermined level . Under standard terms for most repurchase transactions, the recipient of collateral has an unrestricted right to sell or repledge it, subject to returning equivalent securities on settlement of the transactions . The fair value of the securities obtained as collateral under reverse repurchase and securities borrowing agreements are disclosed below .
Group Parent company 31 Dec 31 Dec 31 Dec 31 DecDKKm 2010 2009 2010 2009
Reverse repurchase agreementsReceived collaterals which can be repledged or sold 161,575 180,582 220,525 231,366 of which repledged or sold 113,911 63,835 134,877 81,679
Securities borrowing agreementsReceived collaterals which can be repledged or sold - - - - of which repledged or sold - - - -Total 161,575 180,582 220,525 231,366
Note 44 Investments, customer bearing the risk
Nordea Bank Danmark A/S’s assets and liabilities include customers’ portfolio schemes, the return on which correlates directly with the assets financed by these portfolio schemes . Since the assets and liabilities legally belong to Nordea Bank Danmark, these assets and liabilities are included in the bank’s balance sheet . A breakdown is shown below:
Group Parent company 31 Dec 31 Dec 31 Dec 31 DecDKKm 2010 2009 2010 2009
AssetsInterest-bearing securities 13,860 11,723 13,860 11,723Shares 13,611 11,437 13,611 11,437Other assets 4,501 6,606 4,501 6,606Total assets 31,972 29,766 31,972 29,766 Liabilities Deposits and borrowings from the public 28,829 25,131 28,829 25,131Other liabilities 3,143 4,635 3,143 4,635Total liabilities 31,972 29,766 31,972 29,766 Return to participants in portfolio schemes 2,934 4,237 2,934 4,237

Nordea Bank Danmark A/S . Annual Report 2010 99
Note 45 Maturity analysis for assets and liabilities
Group
Remaining maturity Payable Without on Maximum 3-12 1-5 More than fixed DKKm, 31 Dec 2010 Note demand 3 months months years 5 years maturity Total
Cash and balances with central banks 3,213 - - - - - 3,213Loans to credit institutions 13 13,866 59,975 3,007 840 210 - 77,898Loans to the public 13 80,824 107,319 13,267 58,373 419,532 - 679,315Interest bearing securities 14 - 20,051 40,470 14,930 24,382 - 99,833Financial instruments pledged as collateral 15 - 6,115 7,811 2,847 4,706 - 21,479Shares 16 - - - - - 16,949 16,949Derivatives 17 - 4,092 252 136 151 - 4,631Fair value changes of the hedged items in portfolio hedge of interest rate risk 18 - 1 24 174 106 - 305Total assets with fixed maturities 97,903 197,553 64,831 77,300 449,087 16,949 903,623
Non-financial assets 11, 19, 20, 21, 22, 23, 24, 33 - - - - - 5,588 5,588Other assets 25 - - - - - 84,162 84,162Prepaid expenses and accured income 26 - - - - - 3,358 3,358Total assets 97,903 197,553 64,831 77,300 449,087 110,057 996,731
Deposits by credit institutions 27 66,365 163,761 9,679 - - - 239,805Deposits and borrowings from the public 28 201,299 93,564 2,933 757 48,389 - 346,942- of which Deposits 201,062 51,251 2,933 757 48,389 - 304,392- of which Borowings 237 42,313 - - - - 42,550Debt securities in issue 29 - 52,258 30,130 33,928 155,393 - 271,709- of which Debt securities in issue - 52,258 30,130 33,928 155,393 - 271,709- of which Other - - - - - - -Derivatives 17 - 4,013 950 1,773 341 - 7,077Fair value changes of the hedged items in portfolio hedge of interest rate risk 18 - - - - - - -Subordinated liabilities 34 - - - 8,013 1,491 - 9,504Total liabilities with fixed maturities 267,664 313,596 43,692 44,471 205,614 - 875,037
Non-financial liabilities 11, 32, 33 - - - - - 3,089 3,089Other liabilities 30 - - - - - 78,316 78,316Accrued expenses and prepaid income 31 - - - - - 7,307 7,307Equity - - - - - 32,982 32,982Total liabilities and equity 267,664 313,596 43,692 44,471 205,614 121,694 996,731
Mortgage loans are match-funded and is undertaken on the basis of the statutory balance principle . The majority of these loans are long-term loans and is therefore categorised as >5 years in the Maturity analysis, while the debt securities in issue are allocated through the maturity distribution in comparison to the re-financing period .

Nordea Bank Danmark A/S . Annual Report 2010 100
Note 45 Maturity analysis for assets and liabilities (cont.)
Group
Remaining maturity Payable Without on Maximum 3-12 1-5 More than fixed DKKm, 31 Dec 2009 Note demand 3 months months years 5 years maturity Total
Cash and balances with central banks 2,914 - - - - - 2,914Loans to credit institutions 13 10,121 81,340 5,617 469 279 - 97,826Loans to the public 13 80,777 127,951 15,932 56,015 389,060 - 669,735Interest bearing securities 14 - 28,020 18,218 10,311 36,083 - 92,632Financial instruments pledged as collateral 15 - 24,552 16,752 9,481 30,155 - 80,940Shares 16 - - - - - 16,433 16,433Derivatives 17 - 3,414 739 167 144 - 4,464Fair value changes of the hedged items in portfolio hedge of interest rate risk 18 - 2 31 165 112 - 310Total assets with fixed maturities 93,813 265,278 57,289 76,608 455,833 16,433 965,254
Non-financial assets 11, 20, 21, 22, 23, 24 - - - - - 5,764 5,764Other assets 25 - - - - - 55,002 55,002Prepaid expenses and accured income 26 - - - - - 6,913 6,913Total assets 93,813 265,278 57,289 76,608 455,833 84,112 1,032,933
Deposits by credit institutions 27 49,159 256,886 15,289 1,482 - - 322,816Deposits and borrowings from the public 28 204,481 68,092 5,386 488 45,447 - 323,894- of which Deposits 204,481 31,788 4,931 488 45,447 - 287,135- of which Borowings - 36,304 455 - - - 36,759Debt securities in issue 29 - 37,521 11,343 37,667 159,530 - 246,061- of which Debt securities in issue - 37,521 11,343 37,667 159,530 - 246,061- of which Other - - - - - - -Derivatives 17 - 4,560 492 931 327 - 6,310Fair value changes of the hedged items in portfolio hedge of interest rate risk 18 - 2 71 9 - - 82Subordinated liabilities 34 - - 7,255 2,233 - - 9,488Total liabilities with fixed maturities 253,640 367,061 39,836 42,810 205,304 - 908,651
Non-financial liabilities 11, 32, 33 - - - - - 2,425 2,425Other liabilities 30 - - - - - 82,334 82,334Accrued expenses and prepaid income 31 - - - - - 9,302 9,302Equity - - - - - 30,221 30,221Total liabilities and equity 253,640 367,061 39,836 42,810 205,304 124,282 1,032,933

Nordea Bank Danmark A/S . Annual Report 2010 101
Note 45 Maturity analysis for assets and liabilities (cont.)
Parent company
Remaining maturity Payable Without on Maximum 3-12 1-5 More than fixed DKKm, 31 Dec 2010 Note demand 3 months months years 5 years maturity Total
Cash and balances with central banks 3,213 - - - - - 3,213Loans to credit institutions 13 25,455 118,926 3,007 840 209 - 148,437Loans to the public 13 86,295 114,376 12,130 48,641 99,672 - 361,114Interest bearing securities 14 - 32,159 64,909 23,946 39,107 - 160,121Financial instruments pledged as collateral 15 - 9,919 12,669 4,674 7,634 - 34,896Shares 16 - - - - - 16,392 16,392Derivatives 17 - 4,092 252 136 151 - 4,631Fair value changes of the hedged items in portfolio hedge of interest rate risk 18 - 1 24 174 106 - 305Total assets with fixed maturities 114,963 279,473 92,991 78,411 146,879 16,392 729,109
Non-financial assets 11, 19, 20, 21, 22, 23, 24, 33 - - - - - 21,374 21,374Other assets 25 - - - - - 138,455 138,455Prepaid expenses and accured income 26 - - - - - 3,323 3,323Total assets 114,963 279,473 92,991 78,411 146,879 179,544 892,261
Deposits by credit institutions 27 68,295 199,926 9,679 - - - 277,900Deposits and borrowings from the public 28 202,377 93,564 2,933 757 48,389 - 348,020- of which Deposits 202,140 51,251 2,933 757 48,389 - 305,470- of which Borowings 237 42,313 - - - - 42,550Debt securities in issue 29 - - - - - - -- of which Debt securities in issue - - - - - - -- of which Other - - - - - - -Derivatives 17 - 4,013 950 1,773 341 - 7,077Fair value changes of the hedged items in portfolio hedge of interest rate risk 18 - - - - - - -Subordinated liabilities 34 - - - 8,013 1,491 - 9,504Total liabilities with fixed maturities 270,672 297,503 13,562 10,543 50,221 - 642,501
Non-financial liabilities 11, 32, 33 - - - - - 2,924 2,924Other liabilities 30 - - - - - 219,455 219,455Accrued expenses and prepaid income 31 - - - - - 3,750 3,750Equity - - - - - 23,631 23,631Total liabilities and equity 270,672 297,503 13,563 10,543 50,221 249,760 892,261

Nordea Bank Danmark A/S . Annual Report 2010 102
Note 45 Maturity analysis for assets and liabilities (cont.)
Parent company
Remaining maturity Payable Without on Maximum 3-12 1-5 More than fixed DKKm, 31 Dec 2009 Note demand 3 months months years 5 years maturity Total
Cash and balances with central banks 2,799 - - - - - 2,799Loans to credit institutions 13 11,153 132,063 5,617 469 279 - 149,581Loans to the public 13 90,881 128,016 14,091 46,722 89,054 - 368,764Interest bearing securities 14 - 44,460 32,496 18,393 64,366 - 159,715Financial instruments pledged as collateral 15 - 32,171 19,790 11,201 35,622 - 98,784Shares 16 - - - - - 16,079 16,079Derivatives 17 - 3,326 676 124 96 - 4,222Fair value changes of the hedged items in portfolio hedge of interest rate risk 18 - 2 31 165 112 - 310Total assets with fixed maturities 104,833 340,038 72,701 77,074 189,530 16,079 800,254 Non-financial assets 11, 20, 21, 22, 23, 24 - - - - - 14,037 14,037Other assets 25 - - - - - 102,930 102,930Prepaid expenses and accured income 26 - - - - - 7,178 7,178Total assets 104,833 340,038 72,701 77,074 189,530 140,224 924,399 Deposits by credit institutions 27 47,438 278,549 15,289 1,480 - - 342,756Deposits and borrowings from the public 28 196,618 68,092 4,718 467 45,447 - 315,340- of which Deposits 196,618 31,788 4,261 467 45,447 - 278,581- of which Borrowings - 36,304 455 - - - 36,759Debt securities in issue 29 - - 11,151 - - - 11,151- of which Debt securities in issue - - 11,151 - - - 11,151- of which Other - - - - - - -Derivatives 17 - 4,490 444 867 279 - 6,080Fair value changes of the hedged items in portfolio hedge of interest rate risk 18 - 2 71 9 - - 82Subordinated liabilities 34 - - - 7,255 2,233 - 9,488Total liabilities with fixed maturities 244,056 351,133 31,671 10,078 47,959 - 684,897 Non-financial liabilities 11, 32, 33 - - - - - 2,410 2,410Other liabilities 30 - - - - - 210,128 210,128Accrued expenses and prepaid income 31 - - - - - 4,699 4,699Equity - - - - - 22,265 22,265Total liabilities and equity 244,056 351,133 31,671 10,078 47,959 239,502 924,399

Nordea Bank Danmark A/S . Annual Report 2010 103
Note 46 Related-party transactions
The information below is presented from a Bank Group and NBD perspective, meaning that the information shows the effect from related party transactions on the Bank Group and NBD figures .
Group Shareholders with Other Nordea Associated Other related significant influence Group Companies undertakings parties1
31 Dec 31 Dec 31 Dec 31 Dec 31 Dec 31 Dec 31 Dec 31 DecDKKm 2010 2009 2010 2009 2010 2009 2010 2009
AssetsLoans 1,471 15,943 35,529 10,769 884 260 0 5Interest-bearing securities - - 2,617 3,004 - - - -Shares - - - - - - - -Derivatives 0 0 587 1,151 - - - -Investments in associated undertakings - - - - - - - -Total assets 1,471 15,943 38,733 14,924 884 260 0 5
LiabilitiesDeposits 946 34,270 200,310 141,373 301 330 112 89Debt securities in issue 7,542 - 32,774 7,209 - - - -Derivatives - 0 3,918 2,845 - - - -Subordinated liabilities 9,504 9,488 - - - - - -Total liabilities 17,992 43,758 237,002 151,427 301 330 112 89
Off balanceContingent liabilities - - - 40 10 10 - -
Net interest income and interest expenseInterest income 60 89 60 100 18 0 0 0Interest expense -388 -492 -1,225 -1,641 -1 -3 -1 -2Net interest income and expense -328 -403 -1,165 -1,541 17 -3 -1 -2
1 Companies significantly influenced by key management personnel in Nordea Group as well as companies significantly influenced by close family members to these key management personnel are considered to be related parties to Nordea . Transactions with related companies are made in Nordea’s and the related companies’ ordinary course of business and on the same criteria and terms as those for comparable transactions with companies of similar standing . They did not involve more than normal risk-taking . The transactions are therefore not included in the table .
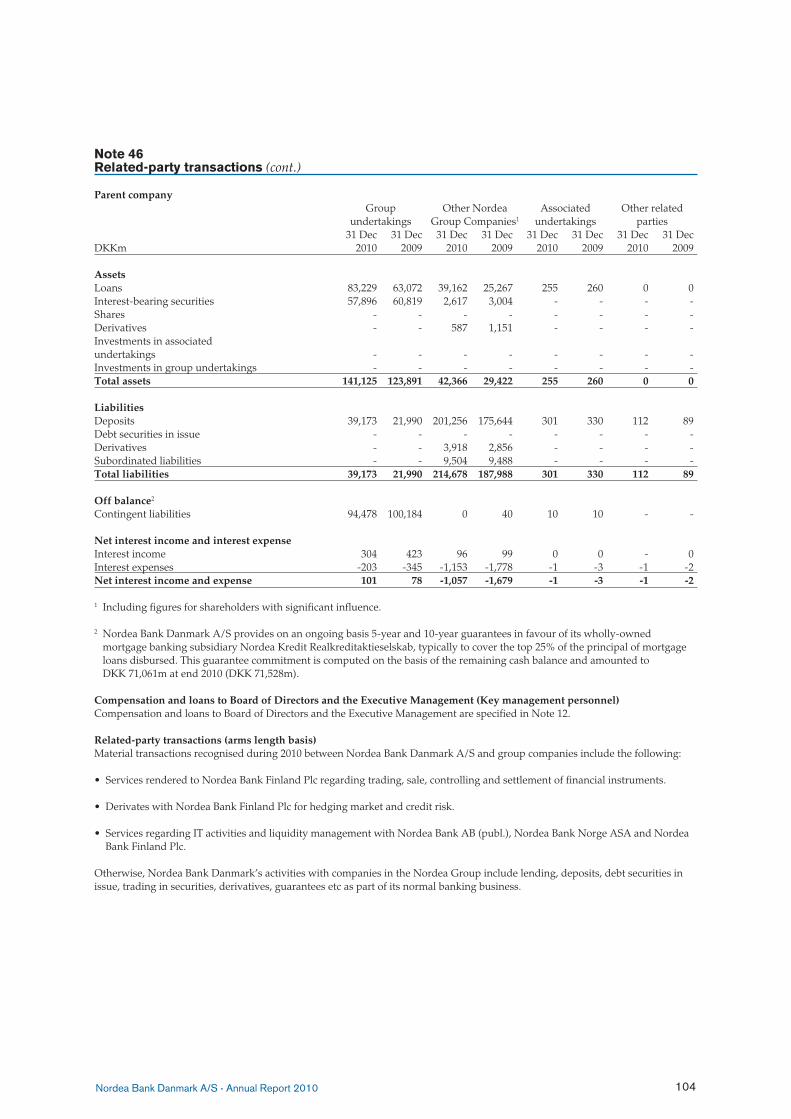
Nordea Bank Danmark A/S . Annual Report 2010 104
Note 46 Related-party transactions (cont.)
Parent company Group Other Nordea Associated Other related undertakings Group Companies1 undertakings parties 31 Dec 31 Dec 31 Dec 31 Dec 31 Dec 31 Dec 31 Dec 31 DecDKKm 2010 2009 2010 2009 2010 2009 2010 2009
AssetsLoans 83,229 63,072 39,162 25,267 255 260 0 0Interest-bearing securities 57,896 60,819 2,617 3,004 - - - -Shares - - - - - - - -Derivatives - - 587 1,151 - - - -Investments in associated undertakings - - - - - - - -Investments in group undertakings - - - - - - - -Total assets 141,125 123,891 42,366 29,422 255 260 0 0 Liabilities Deposits 39,173 21,990 201,256 175,644 301 330 112 89Debt securities in issue - - - - - - - -Derivatives - - 3,918 2,856 - - - -Subordinated liabilities - - 9,504 9,488 - - - -Total liabilities 39,173 21,990 214,678 187,988 301 330 112 89 Off balance2 Contingent liabilities 94,478 100,184 0 40 10 10 - -
Net interest income and interest expenseInterest income 304 423 96 99 0 0 - 0Interest expenses -203 -345 -1,153 -1,778 -1 -3 -1 -2Net interest income and expense 101 78 -1,057 -1,679 -1 -3 -1 -2
1 Including figures for shareholders with significant influence .
2 Nordea Bank Danmark A/S provides on an ongoing basis 5-year and 10-year guarantees in favour of its wholly-owned mortgage banking subsidiary Nordea Kredit Realkreditaktieselskab, typically to cover the top 25% of the principal of mortgage loans disbursed . This guarantee commitment is computed on the basis of the remaining cash balance and amounted to DKK 71,061m at end 2010 (DKK 71,528m) .
Compensation and loans to Board of Directors and the Executive Management (Key management personnel)Compensation and loans to Board of Directors and the Executive Management are specified in Note 12 .
Related-party transactions (arms length basis)Material transactions recognised during 2010 between Nordea Bank Danmark A/S and group companies include the following:
• Services rendered to Nordea Bank Finland Plc regarding trading, sale, controlling and settlement of financial instruments .
• Derivates with Nordea Bank Finland Plc for hedging market and credit risk .
• Services regarding IT activities and liquidity management with Nordea Bank AB (publ .), Nordea Bank Norge ASA and Nordea Bank Finland Plc .
Otherwise, Nordea Bank Danmark’s activities with companies in the Nordea Group include lending, deposits, debt securities in issue, trading in securities, derivatives, guarantees etc as part of its normal banking business .

Nordea Bank Danmark A/S . Annual Report 2010 105
Note 47 The Danish Financial Supervisory Authority’s ratio system
Nordea Bank Danmark Group% 2010 2009 2008 2007 2006
Capital ratios1
Total capital ratio 9 .0 9 .6 8 .6 9 .2 9 .8Tier 1 capital ratio 6 .8 7 .1 6 .5 6 .9 7 .1
EarningsPre-tax return on equity 14 .4 7 .3 12 .0 19 .7 26 .1Post-tax return on equity 11 .0 4 .8 9 .1 15 .1 19 .2Income/cost ratio (not %) 1 .33 1 .14 1 .36 1 .72 1 .98
Market riskInterest rate risk/tier 1 capital 1 .9 5 .3 2 .1 0 .9 2 .4Currency risk/tier 1 capital Indicator 1/tier 1 capital 2 .2 2 .3 1 .6 0 .8 2 .8 Indicator 2/tier 1 capital 0 .0 0 .0 0 .0 0 .0 0 .0
LiquidityExcess cover relative to statutory liquidity requirements 84 .6 128 .2 59 .3 113 .3 116 .8
Credit riskTotal amount of large exposures/capital base 73 .6 91 .0 68 .7 70 .7 89 .4Impairment ratio 1 .3 1 .0 0 .5 0 .4 0 .5Impairment ratio for the year 0 .2 0 .5 0 .2 0 .0 -0 .1Growth in loans and receivables for the year/loans and receivables at beginning of year 1 .4 9 .2 15 .0 10 .2 15 .4Gearing of loans and receivables relative to equity at end of year (not %) 20 .6 22 .2 20 .3 18 .0 17 .3
Nordea Bank Danmark A/S% 2010 2009 2008 2007 2006
Capital ratios1
Total capital ratio 10 .1 11 .2 9 .4 9 .9 10 .2Tier 1 capital ratio 7 .3 8 .2 7 .0 7 .4 7 .3
EarningsPre-tax return on equity 11 .6 4 .8 8 .9 17 .9 27 .2Post-tax return on equity 9 .1 2 .6 6 .6 13 .3 20 .4Income/cost ratio (not %) 1 .2 1 .1 1 .2 1 .6 1 .9
Market riskInterest rate risk/tier 1 capital 2 .0 5 .2 2 .1 0 .9 2 .6Currency risk/tier 1 capital Indicator 1/tier 1 capital 2 .7 1 .8 1 .1 0 .7 2 .7 Indicator 2/tier 1 capital 0 .1 0 .0 0 .0 0 .0 0 .0
LiquidityLoans and receivables+impairment charges/deposits 106 .0 134 .8 119 .0 112 .3 113 .8Excess cover relative to statutory liquidity requirements 107 .5 128 .2 84 .8 144 .0 145 .6
Credit riskTotal amount of large exposures/capital base 72 .6 82 .9 77 .6 81 .7 92 .8Impairment ratio 1 .8 1 .3 0 .7 0 .5 0 .6Impairment ratio for the year 0 .4 0 .7 0 .3 0 .1 -0 .2Growth in loans and receivables for the year/loans and receivables at beginning of year -2 .1 5 .8 18 .6 9 .2 17 .7Gearing of loans and receivables relative to equity at end of year (not %) 15 .3 16 .6 15 .1 9 .9 10 .0
1 Including transition rules .

Nordea Bank Danmark A/S . Annual Report 2010 106
Note 48 Acquisitions
Nordea acquired Fionia Bank on November 30, 2009 . The provisional purchase price allocation has been adjusted in 2010 to reflect new information about facts that existed at the acquisition date related to the tax situation in Fionia and also to reflect adjustments to the final purchase price paid . Nordea has reduced the value of tax losses carry forward the Group is estimated to utilize . The original and adjusted Purchase Price Allocation (PPA) is disclosed below .
Original Final DKKm PPA Adjustm . PPA
Loans 9,349 17 9,366Other assets 655 27 682Deposits from the public -8,869 8 -8,861Other liabilities -443 - -443Acquired net assets 692 52 744
Cost of combination 2,401 63 2,464
Surplus value 1,709 11 1,720
Allocation of surplus valueCustomer intangible 380 0 380Deferred tax asset 393 -229 164Goodwill 936 240 1,176

Nordea Bank Danmark A/S . Annual Report 2010 107
Note 49 Credit risk disclosures
GroupCredit risk management and credit risk analysis etc is described in the Risk, liquidity and capital management section pages 8-19 of the Board of Directors´ Report . Additional information on credit risk is also disclosed in the Capital and Risk management Report (Pillar 3) 2010, which is available at www .nordea .com . Much of the information in this note is collected from the Pillar 3 report in order to fulfil the disclosure requirement regarding credit risk in the Annual report . The Pillar 3 report contains the disclosures required by the Capital Requirements Directive (CRD), which is based on the Basel II framework . The pillar 3 disclosure is aligned to how Nordea manages credit risk and is believed to be the best way to explain the credit risk exposures in Nordea . Credit risk exposures occur in different forms and are divided into the following types: Exposure types
DKKm 31 Dec 2010 31 Dec 2009
On-balance sheet items 695,037 645,182Off-balance sheet items 90,203 81,807Securities financing 3,941 2,508Derivatives 3,169 13,572Exposure At Default (EAD) 792,349 743,069
Tables presented in this Note, containing exposure, are presented as Exposure At Default (EAD) . EAD is the exposure after applying credit conversion factors (CCF) .
Exposure classes split by exposure type
On-balance Off-balance Securities Total 31 Dec 2010, DKKm sheet items sheet items financing Derivatives exposure
Government, local authorities and central banks 29,522 903 850 0 31,276Institutions 78,361 2,084 514 2,734 83,693Corporate 237,032 57,488 2,577 432 297,529Retail 336,618 29,701 - 2 366,321Other 13,504 26 - - 13,530Total exposure 695,037 90,203 3,941 3,169 792,349
Exposure classes split by exposure type
On-balance Off-balance Securities Total 31 Dec 2009, DKKm sheet items sheet items financing Derivatives exposure
Government, local authorities and central banks 45,457 1,012 2,307 37 48,813Institutions 38,336 2,366 104 13,260 54,066Corporate 236,029 51,477 89 268 287,863Retail 313,186 26,847 7 7 340,047Other 12,174 105 1 - 12,280Total exposure 645,182 81,807 2,508 13,572 743,069

Nordea Bank Danmark A/S . Annual Report 2010 108
Note 49 Credit risk disclosures (cont.)
Exposure secured by collaterals, guarantees and credit derivatives - of which secured by guarantees - of which Original and credit secured by 31 Dec 2010, DKKm exposure EAD derivatives collateral
Government, local authorities and central banks 40,632 31,276 2,149 -Institutions 87,474 83,693 - 11Corporate 389,998 297,529 1,119 104,736Retail 378,977 366,321 66 267,188Other 13,924 13,530 - 1Total exposure 911,005 792,349 3,334 371,937
Exposure secured by collaterals, guarantees and credit derivatives - of which secured by guarantees - of which Original and credit secured by 31 Dec 2009, DKKm exposure EAD derivatives collateral
Government, local authorities and central banks 59,268 48,813 - -Institutions 55,778 54,066 3,735 7Corporate 391,346 287,863 975 97,053Retail 353,441 340,047 335 251,031Other 12,784 12,280 - 1,272Total exposure 872,617 743,069 5,045 349,363
Collateral distribution
31 Dec 2010 31 Dec 2009
Other Physical Collateral 3% 3%Receivables 0% 0%Residential Real Estate 71% 72%Commercial Real Estate 25% 24%Financial Collateral 1% 1%
Restructured loans
DKKm 31 Dec 2010 31 Dec 2009
Loans before restructuring, carrying amount - 143Loans after restructuring, carrying amount - 75
Assets taken over for protection of claims1
DKKm 31 Dec 2010 31 Dec 2009
Current assets, carrying amount:Land and buildings 181 90Shares and other participations 80 14Total 261 104
1 In accordance with Nordea’s policy for taking over assets for protection of claims, which is in compliance with the local Banking Business Act . Assets, used as collateral for the loan, are generally taken over when the customer is not able to fulfil its obligations to Nordea . The assets taken over are at the latest, disposed when full recovery is reached .

Nordea Bank Danmark A/S . Annual Report 2010 109
Note 49 Credit risk disclosures (cont.)
Past due loans, excl. impaired loans 31 Dec 2010 31 Dec 2009 Corporate Household Corporate HouseholdDKKm customers customers customers customers
6-30 days 5,935 1,578 3,925 39431-60 days 2,713 145 861 18061-90 days 384 187 148 1,232>90 days 1,093 936 1,711 1,443Total 10,125 2,846 6,645 3,249
Past due not impaired/loans in % 2 .53 1 .04 1 .67 1 .28
Loans to corporate customers, by size of loan
DKKm 31 Dec 2010 % 31 Dec 2009 %
0-10 (EURm) 159,228 39 .8 147,086 37 .010-50 (EURm) 48,679 12 .2 52,605 13 .350-100 (EURm) 26,152 6 .5 34,425 8 .7100-250 (EURm) 54,325 13 .6 46,601 11 .7250-500 (EURm) 34,504 8 .6 53,335 13 .4500- (EURm) 77,382 19 .3 63,018 15 .9Total 400,270 100 397,069 100
Interest-bearing securities 31 Dec 2010 31 Dec 2009 At fair At At fair At value amortised value amortisedDKKm cost cost
State and sovereigns 37,915 - 28,500 -Municipalities and other public bodies 11 - 137 -Mortgage institutions 32,179 16,598 29,741 17,396Other credit institutions 9,170 - 9,266 -Corporates 3,960 - 7,592 -Total 83,235 16,598 75,236 17,396
NBD’s portfolio of interest-bearing securities mainly consist of high graded securities .

Nordea Bank Danmark A/S . Annual Report 2010 110
Proposed distribution of earnings
According to the Parent company’s balance sheet, the following The Board of Directors proposes that the 2010 earningsamount is available for distribution by the Annual General are distributed as follows: Meeting of Shareholders:
DKKm DKKm
Retained earnings 16,532 Dividends paid to the shareholders 3,350Net profit for the year 2,099 To be carried forward 15,281Total 18,631 Total 18,631
The Parent company’s distributable earnings amount to DKK 18,631m . After the proposed distribution of earnings, the Parent company’s unrestricted shareholders’ equity amounts to DKK 15,281m .
Statement by the Board of Directors and the Executive ManagementThe Board of Directors and the Executive Management have today discussed and approved the annual report of Nordea Bank Danmark A/S for the financial year 2010 .
The annual report has been prepared in accordance with International Financial Reporting Standards as adopted by the EU and additional Danish disclosure requirements for annual reports of financial companies . It is our opinion that the consolidated financial statements and parent company financial statements give a true and fair view of the Group’s and the parent company’s financial position at 31 December 2010 and of the results of the Group’s and the parent company’s operations and cash flows for the financial year 1 January – 31 December 2010 .
Further, in our opinion, the Directors’ report provides a fair review of the development in the Group’s and the parent company’s operations and financial matters, the results of the Group’s and the parent company’s operations and financial position and describes the material risks and uncertainties affecting the Group and the parent company .
We propose to the Annual General Meeting that the annual report should be adopted .
Stockholm, 10 February 2011
Board of DirectorsAri Kaperi (Chairman) Fredrik Rystedt Gunn Wærsted
Anne Rømer
Executive ManagementPeter Schütze (Chairman) Peter Lybecker Michael Rasmussen

Nordea Bank Danmark A/S . Annual Report 2010 111
Independent auditors’ report
To the shareholders of Nordea Bank Danmark A/SWe have audited the consolidated financial statements and parent company financial statements of Nordea Bank Danmark A/S for 2010, pages 21-110 . The consolidated financial statements and parent company financial statements comprise income statement, statement of comprehensive income, balance sheet, cash flow statement, statement of changes in equity and notes for the Group as well as for the parent company . The consolidated financial statements and parent company financial statements have been prepared in accordance with International Financial Reporting Standards as adopted by the EU and additional Danish disclosure requirements for financial companies . In addition to our audit, we have read the Directors’ report in accordance with Danish disclosure requirements for financial companies and issued a statement in this regard .
Management’s responsibilityManagement is responsible for the preparation and fair presentation of consolidated financial statements and parent company financial statements in accordance with International Financial Reporting Standards as adopted by the EU and additional Danish disclosure requirements for financial companies . This responsibility includes: designing, implementing and maintaining internal control relevant to the preparation and fair presentation of consolidated financial statements and parent company financial statements that are free from material misstatement, whether due to fraud or error; selecting and applying appropriate accounting policies; and making accounting estimates that are reasonable in the circumstances . Further, it is the responsibility of Management to prepare a Directors’ report that gives a fair review in accordance with Danish disclosure requirements for financial companies .
Auditors’ responsibilityOur responsibility is to express an opinion on the consolidated financial statements and parent company financial statements based on our audit . We conducted our audit in accordance with Danish Standards on Auditing . Those standards require that we comply with ethical requirements and plan and perform the audit to obtain reasonable assurance whether the consolidated financial statements and parent company financial statements are free from material misstatement .
An audit involves performing procedures to obtain audit evidence about the amounts and disclosures in the consolidated financial statements and parent company financial statements . The procedures selected depend on the auditors’ judgement, including the assessment of the risks of material misstatement of the consolidated financial statements and parent company financial statements, whether due to fraud or error . In making those risk assessments, the auditors consider internal control relevant to the Company’s preparation and fair presentation of the consolidated financial statements and the parent company financial statements in order to design audit procedures that are appropriate in the circumstances, but not for the purpose of expressing an opinion on the effectiveness of the Company’s internal control . An audit also includes evaluating the appropriateness of accounting policies used and the reasonableness of accounting estimates made by Management, as well as evaluating the overall presentation of the consolidated financial statements and the parent company financial statements .
We believe that the audit evidence we have obtained is sufficient and appropriate to provide a basis for our audit opinion .Our audit did not result in any qualification .
OpinionIn our opinion, the consolidated financial statements and parent company financial statements give a true and fair view of the Group’s and the parent company’s financial position at 31 December 2010 and of the results of the Group’s and the parent company’s operations and cash flows for the financial year 1 January – 31 December 2010 in accordance with International Financial Reporting Standards as adopted by the EU and additional Danish disclosure requirements for financial companies .
Statement on the Management’s reviewPursuant to the Danish Financial Business Act, we have read the Directors’ report . We have not performed any other procedures in addition to the audit of the consolidated financial statements and parent company financial statements . On this basis, it is our opinion that the information given in the Directors’ report is consistent with the consolidated financial statements and parent company financial statements .
Copenhagen, 10 February 2011
KPMGStatsautoriseret Revisionspartnerselskab
Flemming Brokhattingen Anders Duedahl-Olesen State Authorised Public Accountant State Authorised Public Accountant

Nordea Bank Danmark A/S . Annual Report 2010 112
Board of Directors of Nordea Bank Danmark Ari Kaperi (Chairman and chairman of the audit committee) No external appointments Fredrik Rystedt No external appointments Gunn Wærsted No external appointments Anne Rømer (Member of the audit committee) No external appointments
Executive Management of Nordea Bank Danmark Peter SchützeInternal appointments A member of Nordea Bank AB’s Group Executive Management and Head of Nordic Banking .
External appointmentsChairman of the Board of Directors of ICC Danmark . Deputy Chairman of the Board of Directors of the Danish Bankers Association . A member of the Board of Directors of Copenhagen Business School . A member of the Board of Directors of Nordea-fonden . A member of the Boards of Directors of Danmark-Amerika Fondet, Tietgenfonden and Gösta Enboms Fond .
Peter LybeckerInternal appointmentsHead of Segment Corporate . Chairman of the Board of Directors of Fionia Asset Company A/S . Deputy Chairman of the Board of Directors of Nordea Kredit Realkreditaktieselskab . A member of the Boards of Directors of Nordea Finans Danmark A/S, Nordea Finans Sverige AB and Nordea Finance Finland Ltd . A member of the Board of Directors of Pensionskassen for direktører i Sparekassen SDS .
External appointmentsChairman of the Board of Directors of Nets Holding A/S . Deputy Chairman of the Boards of Directors of Multidata Holding A/S and Multidata A/S . Chairman of the Board of Directors of the Copenhagen Institute for Futures Studies . A member of the Boards of Directors of the Danish Securities Council and Insead International Council .
Michael RasmussenInternal appointmentsA member of Nordea Bank AB’s Group Executive Management and Head of Banking Products & Group Operations and Head of New European Markets . Chairman of the Board of Directors of Nordea Kredit Realkreditaktieselskab . Chairman of the Boards of Directors of Nordea Finans Danmark A/S, Nordea Finans Sverige AB and Nordea Finance Finland Ltd . A member of the Board of Directors of OJSC Nordea Bank .
External appointmentsChairman of the Boards of Directors of the Industrialisation Fund for Developing Countries, the Investment Fund for Central and Eastern Europe and the Investment Fund for Emerging Markets . A member of the Board of Directors of LR Realkredit A/S . A member of the Boards of Directors of Multidata Holding A/S and Multidata A/S . A member of the Board of Directors of Karl Pedersens og Hustrus Industrifond . A member of the Board of Directors of Danmarks Skibskredit A/S .
Management

Nordea Bank Danmark A/SBus reg no 13522197 CopenhagenStrandgade 3PO Box 850DK-0900 Copenhagen CTel +45 33 33 33 33Fax +45 33 33 63 63nordea.dk