ANNUAL REPORT 2010 - Draeger · ten new products for the firefighting market. SAFER EMERGENCY...
234
ANNUAL REPORT 2010
Transcript of ANNUAL REPORT 2010 - Draeger · ten new products for the firefighting market. SAFER EMERGENCY...

ANNUAL REPORT 2010

Headquarters Sales and service organizations Production plants Logistic centers
Dräger employs approximately 11,300 people worldwide and is active in more than190 countries across the globe. The company has sales and service subsidiaries in over 40 countries. Dräger has development and production facilities in Germany,the UK, the Czech Republic, Sweden, the USA, Brazil, South Africa, and China. As of December 31, 2010, 6,206 Dräger employees were working outside Germany.
EuropePlymouthBlyth Hagen Lübeck SvenljungaChomutovPolickaAmericas
PittsburghTelfordAndoverSão Paulo
DRÄGER WORLDWIDE
Headquarters, sales and service organizations, production plants, logistic centers
Asia Beijing Shanghai
AfricaKing William’s Town
DIV
ISIO
NS
AT
A G
LA
NC
E,
DR
ÄG
ER
WO
RLD
WID
E
Review of the year 2010
JANUARY
FEBRUARY
MA
RC
HA
PR
IL
MAY
JUNE JULY
AUGUST
SE
PTE
MB
ER
OC
TOB
ER
NOVEMBER
DECEMBER
2010
ITALY: Dräger receives an order from the petrochemical industry for delivery of severalhundred “Dräger X-am 2000” portable gas detectors.
01
“BABYLOG VN500” At a large-scale launchevent, Dräger presents its new ventilator for premature babies, “Babylog VN500”, todoctors and hospital managers from all over Europe.
02
OUTSTANDING PRODUCT DESIGN:
The Industrieforum Design in Hanover, Germany, honors the ventilators “Evita InfinityV500” and “Oxylog 3000 plus” with the iF product design award.
03
SHARE BUY-BACK: The buy-back of Siemens’shares in the medical division is success-fully completed, making Dräger once again soleproprietor of Dräger Medical AG & Co. KG.
04 LITTLE ONES AT THE CENTER:
With the website babyfirst.com, Dräger launches an interactive online platform all about premature babies for doctors, nurses and parents.
BOLSTERING OUR POSITION IN EUROPE:
Dräger opens a new subsidiary in Portugal.05ANNIVERSARY: In Lübeck, the 444,444thDräger Vapor rolls off the production lines. Thisevaporator for liquid anesthetics is used inanesthetic devices. Produced for the first timein 1958, it has been continually developed and enhanced since then.
LEASING CONTRACT: With a ten-year contract,Dräger takes on responsibility for the smoothrunning of the approximately 10,000 electro-medical devices owned by Gesundheit Nordhessen Holding AG in Kassel, Germany(GNH).
06 NEW BUILDING IN LÜBECK: Dräger lays thefoundation stone for a new production and logistics facility, in which around EUR 12 millionwill be invested.
INNOVATIONS AT INTERSCHUTZ: At theworld’s largest firefighting trade fair, Interschutzin Leipzig (Germany), Dräger showcases ten new products for the firefighting market.
SAFER EMERGENCY RESPONSE:
The fire service in Malaysia orders severalthousand sets of “Dräger PSS 90” compres-sed air breathing apparatus.
SUCCESSFUL CONCLUSION OF A LARGE-
SCALE PROJECT: In Oman, Dräger took careof planning, design, installation and commis-sioning of a breathing air supply system for anoil and gas processing plant.
MEDICA: Under the motto “Visualization forthe acute point of care”, Dräger appears at the Medica trade fair in Düsseldorf, Germany,with a range of applications to help doctorsand care personnel in their therapeutic deci-sion-making.
DRUG TEST: Dräger equips Poland’s policeforce with the drug testing device “DrägerDrugtest 5000” and several thousand testingkits.
CHINA: Dräger receives an order for severalhundred Alcotest devices for the Hong Kongpolice force.
PROTECTION FOR MINING: The miningindustry in the Czech Republic places an orderwith Dräger for oxygen emergency escape devices, in order to enhance miners' safety.
CHANGES IN THE EXECUTIVE BOARD:
New Executive Board member Anton Schrofnertakes charge of the Production and Logisticsfunction. Additionally, Dräger announces thatDr. Carla Kriwet will take over the ExecutiveBoard function for Sales and Marketing as ofJanuary 1, 2011.
DRÄGER MEDICAL GMBH: Dräger convertsDräger Medical AG & Co. KG into a limited liability company (Gesellschaft mit beschränk-ter Haftung, GmbH). This serves to simplify the Company’s shareholding structure and soreduce its complexity.
SHARE BUY-BACK: Drägerwerk AG & Co.KGaA replaces the cash settled option com -ponent of the purchase price for the 25 percent share in the medical division by issuing an equity settled option.
A SYSTEM SOLUTION FOR HOSPITALS:
Dräger helps a hospital in Trier, Germany, tobetter coordinate its inter-departmental cooperation, including equipping ten operatingrooms with Dräger medical technology and supplying over a hundred patient monitors.
CAPITAL INCREASE: Dräger completes thecapital increase, decided upon in June, in return for cash with subscription rights of holders of common and preferred shares.
AUSTRALIA: Dräger delivers the first con-signment of “Dräger PSS 7000” compressed air breathing apparatus to the West Australi-an Fire and Emergency Services as part of alarge-scale order.
12
11
10
09
08
07
RE
VIE
W O
F T
HE
YE
AR
20
10
2006 2007 2008 20091 2010
Medical division
Order intake € million 1,275.1 1,223.5 1,276.9 1,339.6 1,441.9
Orders on hand € million 209.0 190.9 219.8 300.5 280.6
Net sales € million 1,239.2 1,209.4 1,243.8 1,260.9 1,472.0
EBIT € million 112.7 81.1 75.5 76.7 186.6
in % of net sales (EBIT margin) % 9.1 6.7 6.1 6.1 12.7
Capital employed € million 656.7 601.1 641.6 546.6 514.7
EBIT / capital employed (ROCE) % 17.2 13.5 11.8 14.0 36.3
DVA 54.8 26.2 20.3 23.6 136.5
Headcount as of December 31 6,051 6,077 6,326 6,305 6,386
Safety division
Order intake € million 611.8 735.8 679.6 665.9 731.7
Orders on hand € million 106.2 200.4 181.2 140.7 142.3
Net sales € million 589.1 637.5 706.8 676.9 733.8
EBIT € million 54.9 69.4 61.0 30.2 61.0
in % of net sales (EBIT margin) % 9.3 10.9 8.6 4.5 8.3
Capital employed € million 213.6 220.1 223.8 190.1 181.6
EBIT / capital employed (ROCE) % 25.7 31.5 27.3 15.9 33.6
DVA 36.0 49.2 40.9 9.6 43.1
Headcount as of December 31 3,683 3,944 4,194 4,336 4,409
1 Due to the integration of Dräger Medical AG & Co. KG in September 2010, the previous year’s values were adjusted accordingly.
DIVISIONS OVER THE PAST FIVE YEARS

Drägerwerk AG & Co. KGaAMoislinger Allee 53–5523558 Lübeck, Germanywww.draeger.com
Corporate CommunicationsTel +49 451 882–2185Fax +49 451 882–3944
Investor RelationsTel +49 451 882–2685Fax +49 451 882–3296 90
70
301
AN
NU
AL
RE
PO
RT
2010
ANNUAL REPORT 2010
Dräger Group 2006 2007 2008 2009 2010
Order intake € million 1,865.0 1,933.9 1,930.4 1,978.3 2,145.5
Orders on hand € million 314.0 390.5 399.9 440.1 421.7
Net sales € million 1,801.3 1,819.5 1,924.5 1,911.1 2,177.3
EBITDA 1 € million 200.6 180.3 166.3 146.0 246.7
EBIT 2 € million 148.2 124.3 105.8 80.1 192.8
in % of net sales (EBIT margin) % 8.2 6.8 5.5 4.2 8.9
Interest result € million (28.3) (26.6) (27.8) (30.8) (39.1)
Income taxes € million (41.8) (33.0) (28.6) (16.8) (48.9)
Net profit € million 78.1 64.7 49.4 32.5 104.8
Of which attributable to shareholders € million 43.1 45.4 31.8 14.9 90.7
Earnings per share 3
per preferred share € 3.42 3.60 2.53 1.20 6.25
per common share € 3.36 3.54 2.47 1.14 6.19
Equity € million 576.9 545.2 553.8 393.8 636.6
Equity ratio % 35.3 33.3 33.5 20.9 32.2
Capital employed 4 € million 918.0 941.1 956.8 709.1 833.4
EBIT / capital employed (ROCE) % 16.1 13.2 11.1 11.3 23.1
Net financial debt € million 183.9 251.3 258.0 374.4 90.3
DVA 66.0 39.5 20.4 (1.8) 114.5
Headcount as of December 31 9,949 10,345 10,909 11,071 11,291
Drägerwerk AG & Co. KGaA dividends
Preferred share € 0.55 0.55 0.35 0.40 1.19
Common share € 0.49 0.49 0.29 0.34 1.13
1 EBITDA = Earnings before net interes result, income tsxes, depreciation, amortization2 EBIT = Earnings before net interest result and income taxes3 Conversion to a partnership limited by shares on December 14, 20074 Capital employed = Total assets less deferred tax assets, current securities, cash and cash equivalents and non-interest bearing liabilities
THE DRÄGER GROUP OVER THE PAST FIVE YEARS
Preliminaries 2010 January 14, 2011
Annual accounts press conference, Hamburg March 16, 2011
Analysts’ meeting, Frankfurt / Main March 16, 2011
Report as of March 31, 2011 May 4, 2011
Conference call, Lübeck May 4, 2011
Annual shareholders’ meeting, Lübeck May 6, 2011
Report as of June 30, 2011 August 4, 2011
Conference call, Lübeck August 4, 2011
Report as of September 30, 2011 November 3, 2011
Conference call, Lübeck November 3, 2011
FINANCIAL CALENDAR 2011

1
2010 was a record year for Dräger – the best fiscal year in t he 122-year history of the
Company. We did not expect such excellent results and our achievements are impressive:
– Our competitive edge got much keener than it was in 2009. Our turnaround program
alone had a positive ef fect on earnings by generating savings of more than EUR 100
million in 2010 – one year earlier than planned. And we also continued t o expand our
product portfolio.
– Our success also shows in the feedback from our customers: According to a represen-
tative poll answered by 5,000 customers world-wide, we have clearly improved our
market position compared to our competitors and continued to increase customer
satisfaction.
– Our EBIT margin of 8.9 percent (EBIT: EUR 192.8 million) more than doubles year
on year.
– We exceeded the EUR 2 billion sales mark, and with EUR 2.18 billion are 13.9 percent
up from the previous year.
– Net profit went up by around 223 percent to EUR 104.8 million and earnings per share
rose by EUR 5.05 to EUR 6.25.
– In line with our dividend policy, we will propose a dividend of E UR 1.13 per common
share and EUR 1.19 per preferred share (+232 percent and +198 percent respectively)
at the annual shareholders’ meeting.
– At the same time, we managed t o complete the buyback of the 25 percent Siemens
share in the medical division in 2010. Now we are 100 percent Dräger again!
– We successfully carried out a capital increase with a volume of around EUR 100 mil-
lion and simultaneously strengthened our orientation in the capital market by issuing
common shares.
– Our equity ratio went up from 20.9 percent to 32.2 percent as a result of this capital
increase and our excellent fiscal year 2010.
LETTER TO THE SHAREHOLDERS

2 LETTER TO THE SHAREHOLDERS
All in all, we were able to considerably increase our competitiveness, earning power,
growth potential and financing structure in 2010. Everything is perfect, you may
think – but that is not yet the case. Agreed, we recovered much more quickly from our
difficult period than anticipated. But everything I told you in my last letter about
fiscal year 2009 remains true: The financial crisis was not responsible for our period of
poor growth – we were. Our competitive position was in acute danger and we despe -
rately had to act with determination and speed. Without doubt, our turnaround program
helped to significantly improve the Company’s position compared to the previous year –
not least because we invested large sums int o research and development at the same
time. But it is also a f act that external influences and one-off effects provided us with
a lot of tailwind in 2010. And we will not make the mistake of being blinded by our record
year. The basic trend remains most important. Although it is definitively positive, it is
less strong than our sales and earnings growth makes it appear:
– Net of currency effects, sales did not increase by almost 14 percent but by 9.5 percent
instead.
– A large amount of orders on hand left over from the previous year, a steep rise in order
intake from large projects, the sale of software licenses and the extremely advantage-
ous product mix increased the positive development of EBIT.
– And despite the record year, we have not yet met our medium-term target of achieving
a sustainable EBIT margin of 10 percent and at the same time generating Company
growth that beats the market.
As the results in fiscal year 2010 exceeded our basic trend and we are planning to make
provisions in 2011 in order to achieve our medium-term sales and return target, our
EBIT margin forecast falls below that of the previous year. We aim to slightly increase
sales and achieve an EBIT margin of 7.5 percent to 8.5 percent – based on stable
exchange rates and constant growth in our markets. Is it entirely necessary to make such
provisions at the cost of our current profitability you may ask? Absolutely and definitely
yes. Because one thing has become cr ystal clear from our difficult period: If we want to
steel ourselves against the crises of tomorrow, we have to start creating an appropriate
structure today. “Technology for Life” for the future – for premature infants, critical care

STEFAN DRÄGER

4 LETTER TO THE SHAREHOLDERS
patients, the seriously ill, anesthetists, miners, fire fighters, and engineers working on
oil platforms.
In order to reach our goals, we’ll have to be able to recognize future market develop-
ments as early as possible and develop products and services to meet new demand –
more quickly and at a super ior quality than our competitors. These are abilities that will
define our sustained value for our customers, our employees and you, our Sharehol-
ders. This is why we will invest e ven more into research and development, implement
projects even more quickly and focus on improving our marketing and sales organiza-
tion. This is our investment in our futur e and sustainability. Choosing to do so was an
easy decision.
We want to ensure that Dräger will keep its place among the global market leaders in
generations to come, and that our “Technology for Life” will provide even more value
for our customers, employees and shareholders than it already does today.
Best regards,
Stefan Dräger

5
Dräger is “Technology for Life”. Every day, we commit all our pas-sion, knowledge and experience to our responsibility to make life thatbit better: with outstanding and innovative technology – one hundred percent in the service of life.
SHAREHOLDER INFORMATION
Letter to the shareholders 1
The Executive Board 8
Report of the Supervisory Board 10
Report of the Joint Committee 14
Corporate governance report 15
The Dräger shares 29
8

The 2D display isthe heart of the“SmartPilot View”. Itshows the progressof the patient’s anesthesia just likeon a map – at thecurrent point in timeand as a forecast. On the basis of
patient models, the “SmartPilot View”
calculates the typicalbehavior of medica -
tions and concentrationsof anesthetic and
pain-relieving substancesand how they are likely
to develop. Anesthetists can marksignificant events and medication givenmanually on a time-line during the courseof the anesthesia.
An at-a-glance overviewof the patient’s condition:
The “SmartPilot View”receives information on
vital signs from the monitor connected to it
and presents this information in its con-
text over time.
TRANSPARENCY IN ANESTHESIA: The “SmartPilot View” software calculates thecombined effect of anesthetic and pain medication and – like a navigationdevice, shows the calculated progress of anesthesia – at the current point intime and as a forecast. To its users, it acts as a guide that points the way – in both senses of the term.
*

7CONTENTS
SHAREHOLDER INFORMATION
Letter to the shareholders 1
The Executive Board 8
Report of the Supervisory Board 10
Report of the Joint Committee 14
Corporate governance report 15
The Dräger shares 29
100 % DRÄGER
Research and Development 38
Purchasing 42
Production 46
Service 50
Marketing 54
MANAGEMENT REPORT
MARKET ENVIRONMENT
Important changes in fiscal year 2010 61
Group structure 65
Control systems 66
Main accounting features of the internalcontrol and risk management system asit relates to the financial reporting process 67
Overall economic environment 69
BUSINESS PERFORMANCE
Business performance of the Dräger Group 74
Cash flow statement 79
Financial management of the Dräger Group 82
Business performance of the medical division 86
Business performance of the safety division 92
Business performance Drägerwerk AG &Co. KGaA / other companies 98
FUNCTIONAL AREAS
Research and development 99
Purchasing 102
8
37
61129
226
Quality, Corporate IT 103
Environmental protection 104
Production and logistics 106
Basic features of the remuneration system 107
Personnel 111
POTENTIAL
Opportunities and risks relatingto future development 114
Operational risks 116
Opportunities 119
Disclosures pursuant to Sec. 315 (4)of the German Commercial Code (HGB)and explanations of the general partner 119
Subsequent events, Outlook 123
ANNUAL FINANCIAL STATEMENTS
Consolidated income statement of the Dräger Group 129
Consolidated balance sheet of the Dräger Group 130
Consolidated statement of comprehensive income of the Dräger Group 132
Consolidated cash flow statement of the Dräger Group 133
Notes of the Dräger Group for 2010 134
Management compliance statement 216
Auditor’s opinion 217
Single entity financial statements ofDrägerwerk AG & Co. KGaA for 2010 (condensed) 219
The Company’s Boards 222
ADDITIONAL INFORMATION
Imprint 226
Financial calendar back cover
Review of key events in 2010 back cover

The Executive Board
Stefan Dräger assumed the position of Chairman of the Execu-tive Board in 2005 and has headed the Company ever since.He has been with Dräger since 1992 and became a memberof the Executive Board in 2003.
STEFAN DRÄGER
Dr. Herbert Fehrecke joined the Company in 2008. He isVice-Chairman of the Executive Board, responsible for the Research and Development, Purchasing, Quality and Cor porate IT.
DR. HERBERT FEHRECKE
Dr. Carla Kriwet joined the Dräger Executive Board in January2011 and leads the Sales and Marketing function.
DR. CARLA KRIWET
Gert-Hartwig Lescow has been responsible for the Company’sFinance function since 2008.
GERT-HARTWIG LESCOW
Anton Schrofner heads the Production and Logistics function.He joined the Company in September 2010.
ANTON SCHROFNER

FROM LEFT TO RIGHT: GERT-HARTWIG LESCOW,
DR. CARLA KRIWET, DR. HERBERT FEHRECKE,
STEFAN DRÄGER, ANTON SCHROFNER

10 REPORT OF THE SUPERVISORY BOARD
Report of the Supervisory Board
The Supervisory Board of Drägerwerk AG & Co. KGaA continued its trusting working relationship with the Executive Board. The Supervisory Boardwas involved in all decisions directly and in good time. The SupervisoryBoard’s work in fiscal year 2010 focused on implementing the turnaroundprogram and raising the capital stock.
Dear Shareholders,
In the fiscal year 2010, the Supervisory Board’s work cen-tered around implementing a capital increase which usedconditional capital and involved issuing additional votingcommon shares, the long-term strategic goals of the Com-pany, options for promoting regional growth, and the continuation of the program for improving earnings whichwas launched by the Executive Board in fiscal year 2009.
The Supervisory Board continued to carefully and regularlymonitor the work of the management in fiscal year 2010,in accordance with the law and the articles of association,and provided advice on the strategic development of theCompany as well as all major measures. The SupervisoryBoard was involved in all decisions of importance to theCompany. The extensive written and oral reports by themanagement formed the basis for these decisions. Evenoutside of Supervisory Board meetings, the Chairman ofthe Supervisory Board was regularly informed by theChairman of the Executive Board about current businessdevelopments and major transactions.
MEETINGS
At four regular meetings and one special meeting, theSupervisory Board dealt in detail with the business and
strategic development of the Dräger Group, the divisionsand their German and foreign subsidiaries, and closelyadvised the Executive Board on such matters. With theexception of the Supervisory Board member Thomas Rick-ers, no member took part in less than half of the Super -visory Board’s meetings. The Supervisory Board created afour-person committee for topics relating to the capitalincrease, and the committee held two telephone confer-ences.
FOCAL POINTS OF THE SUPERVISORY BOARD
DELIBERATIONS
One key topic on the agenda at several meetings was thecapital increase and issuance of 3,810,000 common shareswith subscription rights making partial use of approvedcapital. The Executive Board reported regularly on theprogress of this capital measure. After extensive sharing of information and careful deliberation, the SupervisoryBoard approved the capital increase during its specialmeeting on June 15, 2010, and created a four-person capi-tal increase committee to address resolutions arising during the implementation phase.
Another important topic was the turnaround program,which was launched by the Executive Board in 2009 withthe aim of improving earnings. The Supervisory Board

PROF. DR. NIKOLAUS SCHWEICKART

12
received detailed information on the status of each of theplanned measures at every regular meeting.
In its meeting on December 15, 2010, the Supervisory Boardapproved planning presented for fiscal year 2011. Addi-tionally, management gave an overview of the Company’sfinancing.
The Supervisory Board approved the transactions requir-ing authorization after careful consideration of the docu-ments provided by the Executive Board.
MATTERS RELATING TO THE EXECUTIVE BOARD
The Supervisory Board of Drägerwerk Verwaltungs AG,which is solely responsible for making decisions on Executive Board appointments, extended Gert-HartwigLescow’s term as Chief Financial Officer by another five years on May 6, 2010. At the same meeting, the Super-visory Board appointed Anton Schrofner to the Execu-tive Board to manage the Production and Logistics functionas from September 1, 2010.
Dr. Ulrich Thibaut, who was responsible for Research andDevelopment in the Executive Board, left the Company by his own request at the conclusion of the agreed contractperiod on June 30, 2010. He will be seeking new careerchallenges. The Supervisory Board thanked him for hissuccessful contribution to the Company. From that date, Dr. Herbert Fehrecke, responsible for Purchasing,Quality and IT, also assumed responsibility for Researchand Development.
At its meeting on September 15, 2010, the SupervisoryBoard of Drägerwerk Verwaltungs AG appointed Dr. Carla Kriwet to the Executive Board to manage the Marketingand Sales function starting January 1, 2011. Dr. DieterPruss, responsible for Sales and Marketing Safety Tech -nology, left the Company on December 31, 2010, accord-ing to his own wishes to take on new professional chal-
lenges. The Supervisory Board thanked both previous mem-bers of the Executive Board for their successful contribu-tion to the Company.
ACTIVITIES OF THE AUDIT COMMITTEE
The Audit Committee held four meetings in the year underreview and conducted two conference calls. Representa-tives of the statutory auditor and the internal audit depart -ment participated regularly in the Audit Committee meetings.
At its meetings, the Audit Committee reviewed the singleentity and group financial statements, the quarterlyreports as well as the profit appropriation proposal. In addi -tion, the Committee dealt with the Company’s financialreporting process and risk reporting as well as the auditactivities, programs and results of the internal auditdepartment in depth, and analyzed these elements. TheCommittee also carefully investigated the audit by the statutory auditor and its audit priorities and results.
The Audit Committee also informed the plenary Supervi-sory Board of the results of its deliberations.
CORPORATE GOVERNANCE AND EFFICIENCY AUDIT
The Supervisory Board regularly deals with the applicationand enhancement of corporate governance principleswithin the Dräger Group. The declaration of conformityhas been reproduced on page 16 of this annual report. We also evaluated our Supervisory Board activities in fiscalyear 2010 and conducted an internal efficiency audit.
SINGLE ENTITY AND GROUP FINANCIAL STATEMENTS
The statutory auditor elected by the annual shareholders’meeting, Frankfurt-based PricewaterhouseCoopersAktiengesellschaft Wirtschaftsprüfungsgesellschaft, wasappointed by the Supervisory Board to audit the finan-cial statements for fiscal year 2010. Subject of the auditwere the single entity financial statements of Drägerwerk
REPORT OF THE SUPERVISORY BOARD

13THE DRÄGER SHARESCORPORATE GOVERNANCEREPORT OF THE SUPERVISORY BOARD JOINT COMMITTEETHE EXECUTIVE BOARD
AG & Co. KGaA, prepared in accordance with German Com -mercial Code (HGB), as well as the group financial statements, prepared in accordance with IFRS, and themanagement reports of both Drägerwerk AG & Co. KGaA and the Dräger Group.
The auditors examined the single entity financial state-ments of Drägerwerk AG & Co. KGaA prepared in accor-dance with the provisions of the German CommercialCode, the IFRS group financial statements, as well as themanagement reports of both Drägerwerk AG & Co. KGaAand the Group, and issued an unqualified audit opinion.The auditors confirmed that the group financial state-ments prepared in accordance with IFRSs and the groupmanagement report conform with IFRSs as adopted by the EU. The auditors confirmed that both managementreports contain the supplementary disclosures pursuant to Secs. 289 (4) and 315 (4) HGB and that the ExecutiveBoard has implemented an efficient risk management system.
The members of the Supervisory Board carefully exam-ined the single entity and group financial statements andaccompanying management reports as well as the auditreports. Representatives of the statutory auditor attendedthe Audit Committee’s meeting on March 10, 2011, dur-ing which Dräger’s single entity and group financial state-ments were deliberated on, as well as the SupervisoryBoard’s meeting on March 11, 2010, to discuss the finan-cial statements. These representatives reported on theperformance of the audit and were available to provideadditional information. At these meetings, the Execu-tive Board explained the single entity financial statementsof Drägerwerk AG & Co. KGaA and the group financialstatements along with the risk management system. Onthe basis of the audit reports on the single entity andgroup financial statements and the management report,the Audit Committee came to the conclusion that both sets of financial statements with their respective manage-
ment reports give a true and fair view of the net assets,financial position and results of operations in accordancewith the applicable financial reporting framework. To do so, the Audit Committee deliberated on significant assetand liability items and their valuation as well as the presentation of the earnings position and the developmentof certain key figures. The chairman of the Audit Com -mittee reported on the discussions to the Supervisory Board.Further questions by members of the Supervisory Boardled to a more detailed discussion of the results. The Super -visory Board was convinced that the proposed dividendwas appropriate considering the net assets, financial posi-tion and results of operations. The liquidity of the Com -pany and the interests of the shareholders have been takeninto account in equal measure. There were no reser -vations concerning the effi ciency of the management’sactions.
Based on the conclusions drawn by the Audit Committeefollowing its own preliminary review and its own exam -ination, the Supervisory Board agreed with the audit con-clusion reached by the statutory auditors on the singleentity and group financial statements and managementreports. Following its own examination, the Supervi -sory Board raised no objections to the submitted sets offinancial statements and management reports.
The Supervisory Board reviewed and approved the singleentity financial statements of Drägerwerk AG & Co. KGaAprepared by the general partner and the group financialstatements of Drägerwerk AG & Co. KGaA as well as themanagement reports. The financial statements of Drägerwerk AG & Co. KGaA must be approved by the annualshareholders’ meeting. The Supervisory Board agreedwith the recommendation made by the general partner toapprove the financial statements of Drägerwerk AG & Co. KGaA. This also applies to the general partner’s pro-posal concerning the appropriation of net earnings.

14 REPORT OF THE SUPERVISORY BOARD | REPORT OF THE JOINT COMMITTEE | PARTNERSHIP LIMITED BY SHARES
Dear Shareholders,
Since the change in legal form to a partnership limited byshares in 2007, the Company has had a Joint Committee as an additional voluntary body which comprises four mem -bers of the Supervisory Board of the general partner andtwo members each representing the shareholders and theemployee representatives of the Supervisory Board ofDrägerwerk AG & Co. KGaA. The Chairman of the Super-visory Board, Prof. Dr. Nikolaus Schweickart, is the Chair-man of the Joint Committee. This Committee is responsi-ble for transactions requiring approval (pursuant to Sec. 111 [4] Sentence 2 AktG [“Aktiengesetz”: German StockCorporation Act]). The Joint Committee met five times in 2010, dealing in detail with the business and strategicdevelopment of the Dräger Group. The three-membercommittee established within the scope of the capital meas -ure held one telephone conference. After reviewing the documents provided by the Executive Board, the JointCommittee approved all transactions requiring author -ization. The implementation of a capital increase usingpart of the Company’s approved capital was a major focus. The resolution was based on regular, in-depth reportson the progress of the measure.
Lübeck, Germany, March 11, 2011
Prof. Dr. Nikolaus SchweickartChairman of the Joint Committee
Report of the Joint Committee
CONFLICTS OF INTEREST
There were no conflicts of interest involving members ofthe Executive and Supervisory Boards, which must be disclosed to the Supervisory Board without delay andabout which the annual shareholders’ meeting must be informed.
The Supervisory Board would like to express its recogni-tion of the Executive Board for its successful work in thisfiscal year. Furthermore, the Supervisory Board thanksmanagement and all employees, including employee rep-resentatives, for their hard work in the fiscal year 2010.
Lübeck, Germany, March 11, 2011
Prof. Dr. Nikolaus SchweickartChairman of the Supervisory Board

15THE DRÄGER SHARESCORPORATE GOVERNANCEREPORT OF THE SUPERVISORY BOARD JOINT COMMITTEETHE EXECUTIVE BOARD
Dräger has always attached great importance to corporategovernance as management and control which focuses on a responsible, transparent and long-term increase in thevalue of the Company. In an effort to emphasize this, wewill continue to apply the German Corporate GovernanceCode – which is only aimed at stock corporations – evenafter the transformation of Drägerwerk AG into DrägerwerkAG & Co. KGaA. The corporate governance report describesthe features of the management and control structure andthe significant rights of the shareholders in DrägerwerkAG & Co. KGaA and explains the special features comparedto a stock company.
Partnership limited by shares
“A partnership limited by shares (KGaA) is a company witha separate legal personality where at least one partner is fully liable to the company’s creditors (general partner)and the remaining shareholders have a financial interestin the capital stock, which is divided into shares, withoutbeing personally liable for the company’s liabilities (limited shareholders)” (Sec. 278 [1] AktG). Hence it is ahybrid between a stock corporation and a limited part -nership, with a greater emphasis on the stock corporationside. As is the case at a stock corporation, a partnership
limited by shares has a two-tier management and over sightstructure by law. The general partner manages the company and its operations, and the supervisory boardoversees the company’s management. Significant differ-ences compared to a stock corporation are the exis tence of a general partner, which manages operations, theabsence of an executive board, and the restriction of therights and obligations of the supervisory board. The supervisory board is not responsible for appointing the gen-eral partner or its management bodies or for determin-ing their contractual conditions, whereas in a stock corpo-ration it appoints the executive board. In a partner -ship limited by shares, the supervisory board is not legallyauthor ized to adopt rules of procedure for the compa -ny’s management or a catalog of transactions requiringapproval. There are also differences relating to the annual shareholders’ meeting. Certain resolutions mustbe approved by the general partner (Sec. 285 [2] AktG), in particular the resolution to approve the financial state-ments (Sec. 286 [1] AktG). Many of the recommenda -tions of the German Corporate Governance Code (here-inafter also referred to as the “Code”), which is designedfor stock corporations, can therefore only be applied by anal-ogy to a partnership lim ited by shares.
Corporate governance report
Corporate governance at Dräger represents responsible business manage-ment. It fosters trust among investors, customers, employees and the public. The recommendations of the German Corporate Governance CodeGovernment Commission are applied with only a few exceptions.

16 PARTNERSHIP LIMITED BY SHARES | DECLARATION OF CONFORMITY
The sole general partner of Drägerwerk AG & Co. KGaA isDrägerwerk Verwaltungs AG, which does not hold an equity interest and is a wholly-owned company of StefanDräger GmbH. Drägerwerk Verwaltungs AG manages the operations of Drägerwerk AG & Co. KGaA and repre-sents it. It acts through its Executive Board.
Stefan Dräger GmbH selects the six members of the Super -visory Board of Drägerwerk Verwaltungs AG. They are currently identical to the shareholder representatives onthe Supervisory Board of Drägerwerk AG & Co. KGaA. The Supervisory Board of Drägerwerk Verwaltungs AG doesnot have any employee representatives. It appoints theExecutive Board of Drägerwerk Verwaltungs AG.
The Supervisory Board of Drägerwerk AG & Co. KGaA,which has twelve members, has half of its members elected by employees. Its chief purpose is to oversee themanagement by the general partner. It cannot appoint or remove the general partner or its Executive Board. Noris it authorized to define a catalog of management transactions for the general partner which require theapproval of the Supervisory Board. Moreover, it is not the Supervisory Board but the annual shareholders’ meet-ing that must approve the financial statements of Drägerwerk AG & Co. KGaA.
Pursuant to Sec. 22 of the Company’s articles of associa-tion, a Joint Committee has been set up as a voluntary,additional body. It comprises eight members. Four mem-bers each are appointed by the Supervisory Boards ofDrägerwerk Verwaltungs AG and Drägerwerk AG & Co.KGaA. The Supervisory Board of Drägerwerk AG & Co.KGaA must appoint two shareholder representatives andtwo employee representatives. The Joint Committeedecides on the extraordinary management transactions bythe general partner which require approval as set out in Sec. 23 (2) of the articles of association of DrägerwerkAG & Co. KGaA.
Declaration of conformity
The joint declaration of conformity by the general partnerand the Supervisory Board of Drägerwerk AG & Co. KGaA was discussed and approved in the meeting of theSupervisory Board of the Company on December 15, 2010. It states that the recommendations of the GermanCorporate Governance Code Government Commissionwere applied with only a few exceptions.
The declaration was published on December 17, 2010, withthe following wording:
“The recommendations of the German Corporate Gover-nance Code Government Commission were designed with stock corporations in mind. Dräger applies these rec-ommendations to Drägerwerk Verwaltungs AG wher -ever they are relevant to the general partner and bodies ofthe AG & Co. KGaA following the change in legal form.
The general partner, represented by its Executive Board,and the Supervisory Board declare that Drägerwerk AG &Co. KGaA acted on the recommendations of the GermanCorporate Governance Code Government Commission, asamended on June 18, 2009, from the date of the issue of its previous declaration of conformity on December 16,2009 until July 2, 2010 and that since July 3, 2010, it has acted on the recommendations as amended on May 26,2010. This applies subject to the following exceptions:
1. Until the last shareholders’ meeting, the voting (limited)capital stock was solely owned directly or indirectly by the Dräger family. Therefore, the recommendationto appoint a corporate voting proxy for exercising thevoting right of shareholders on their instructions at theannual shareholders’ meeting was unnecessary (2.3.3clause 3 of the Code). A corporate voting proxy will beappointed in the future.

17THE DRÄGER SHARESCORPORATE GOVERNANCEREPORT OF THE SUPERVISORY BOARD JOINT COMMITTEETHE EXECUTIVE BOARD
2. When appointing the members of the Executive Board,the Supervisory Board of the general partner exclu -sively takes into account qualifications of the availablepersons and not their gender. In this respect, theSupervisory Board of the general partner does not com-ply with the recommendations stated in 5.1.2. clause 3 of the Code. As of January 1, 2011, one member of theExecutive Board will be a female who was chosen onthe grounds of her qualifications.”
The reasons for the aforementioned exceptions from cer-tain recommendations of the Code are largely explainedin the declaration of conformity.
SUPERVISORY BOARD
The Supervisory Board of Drägerwerk AG & Co. KGaA hastwelve members, half of whom are elected by sharehold-
ers and half by employees in accordance with the GermanCodetermination Act. Several members of the Super -visory Board hold or held high-ranking positions at othercompanies. The majority of the members of the Super -visory Board are independent of the Company for the pur-poses of the Corporate Governance Code. Where busi -ness relationships exist with Supervisory Board members,transactions are conducted on an arm’s length basis as between unrelated parties and do not affect the inde-pendence of the members. The Supervisory Board ofDrägerwerk Verwaltungs AG has six members who arealso the shareholder representatives on the Supervi -sory Board of Drägerwerk AG & Co. KGaA. The SupervisoryBoards of Drägerwerk AG & Co. KGaA and DrägerwerkVerwaltungs AG each appoint four members to the JointCommittee.
DRÄGERWERK AG & CO. KGAA
Drägerwerk AG & Co. KGaA
Supervisory Board of Drägerwerk Verwaltungs AG
Stefan Dräger GmbH
100%
Management / Representation
Drägerwerk Verwaltungs AG
Executive Board
General partner Decision on actions requiring approval
Oversight and appointment of the Executive Board
Oversight
Limited shareholders
Appointment
Appointment
Joint Committee
Supervisory Board of Drägerwerk AG & Co. KGaA
0%

18 DECLARATION OF CONFORMITY | INVESTOR RELATIONS
In its meeting on December 15, 2010, the SupervisoryBoard resolved to apply the following objectives when select-ing its members pursuant to 5.4.1 of the Code:
When proposing a new member, the Supervisory Board willbe guided by the following criteria that take into accountdiversity:– Professional and personal qualifications regardless of
gender– Business management experience in German and for-
eign companies with a global presence in various cultur-al regions
– Experienced representatives of family-owned as well aslisted companies
– Persons with proven track record in finance and account-ing and know-how in financing and capital market communication
– Experience in marketing and sales in diversified tech-nology companies
– Intellectually and financially independent persons witha high degree of personal integrity who do not have aconflict of interest with the Company
– Re-elected or newly elected members must be under 70 years of age at the time of the election.
The Supervisory Board of Drägerwerk AG & Co. KGaAmonitors and advises the Executive Board of the generalpartner in the management of the partnership limited by shares. The Supervisory Board regularly discusses busi-ness performance and plans as well as the implemen -tation of the business strategy based on written and oralreports by the Executive Board of the general partner. It reviews the financial statements of Drägerwerk AG &Co. KGaA and the Dräger Group.
In doing so, it takes into account the audit reports of thestatutory auditors and the results of the review by theAudit Committee. The Supervisory Board makes a recom-mendation to the annual shareholders’ meeting for a
resolution to approve the financial statements and thegroup financial statements.
The Joint Committee makes decisions on extraordinarymanagement transactions by the general partner. Theindividual transactions requiring approval are defined inSec. 23 (2) of the articles of association of the Company.
Appointing and removing members of the ExecutiveBoard of Drägerwerk Verwaltungs AG, which manages theoperations of Drägerwerk AG & Co. KGaA as the legal representative of the general partner, is the task of theSupervisory Board of Drägerwerk Verwaltungs AG.
In an effort to improve its effectiveness and efficiency, theSupervisory Board of Drägerwerk AG & Co. KGaA estab-lished an Audit Committee. This Committee consists ofthe Chairman of the Supervisory Board as well as four further members, two of which are shareholder represen-tatives and two employee representatives. The Supervi-sory Board ensures that the Committee members are inde -pendent and places great emphasis on their particularknowledge and experience in applying accounting stan-dards and internal control processes. The Audit Com -mittee monitors the adequacy and functionality of the Com -pany’s external and internal financial reporting system.Together with the statutory auditors, the Audit Committeediscusses the reports drawn up by the Executive Boardduring the year, the Company’s financial statements andaudit reports. On this basis, the Audit Committee draws up recommendations for the approval of the financial state -ments by the annual shareholders’ meeting. It deals with the Company’s internal control system and with theprocedure for recording risks, for risk control and riskmanagement. The internal audit department reports reg-ularly to the Audit Committee, and is engaged by thisCommittee to carry out audits as is deemed necessary. Ref -erence is also made to the report of the Supervisory Board.

19THE DRÄGER SHARESCORPORATE GOVERNANCEREPORT OF THE SUPERVISORY BOARD JOINT COMMITTEETHE EXECUTIVE BOARD
In addition, the Supervisory Board also established aNomination Committee in accordance with 5.3.3 of theCode. This Committee is charged with proposing suit-able candidates for election to the Supervisory Board. Onthis basis, the Supervisory Board compiles suggestions for the annual shareholders’ meeting.
MANAGEMENT
Drägerwerk Verwaltungs AG manages the operations ofDrägerwerk AG & Co. KGaA.
In its role as managing body of Drägerwerk AG & Co.KGaA and of the Dräger Group, the Executive Board ofDrägerwerk Verwaltungs AG governs corporate policy. It determines the Company’s strategic focus, plans and setsbudgets, approves resource allocation and monitors business performance. The Executive Board compiles theCompany’s quarterly reports, the financial statements of Drägerwerk AG & Co. KGaA and the group financial state -ments. It works closely with the oversight bodies. TheChairman of the Supervisory Boards of the Company andof the general partner works closely with the Chairman of the Executive Board of the general partner. He regularlyprovides up-to-date and comprehensive information on all issues relevant to the Company: strategy and its imple-mentation, planning, business performance, financialposition and results of operations as well as business risk.The Supervisory Board of Drägerwerk Verwaltungs AGapproved the rules of procedure for the Executive Boardat its meeting on December 14, 2008.
Investor relations
The capital increase with subscription rights concludedon June 30, 2010, increased the number of issued com-mon shares by 3,810,000 to 10,160,000. The newly issuedcommon shares have been traded on the German stockexchange since July 2, 2010, after the existing 6,350,000
common shares had been admitted to the market on June21, 2010. An additional 6,350,000 preferred shares are also being traded on the German stock exchange.Drägerwerk AG & Co. KGaA has a current total of16,510,000 shares, of which 71.46 percent are commonshares held by the Dräger family. Dräger reports to its shareholders on business performance, net assets, finan -cial position and results of operations in two quar-terly reports, one half-yearly report and the annual report.
The annual shareholders’ meeting is held in the first eightmonths of the fiscal year. The resolution on the approval of the financial statements of Drägerwerk AG & Co. KGaAis adopted at the annual shareholders’ meeting, amongstother things. In addition, the annual shareholders’ meet-ing votes on profit appropriation, the exoneration of thegeneral partner and of the Supervisory Board and the elec -tion of the statutory auditors. In addition, it also elects the shareholder representatives to the Supervisory Board,approves amendments to the articles of association andchanges in capital, which the general partner implements.The shareholders exercise their rights at the annualshareholders’ meeting in accordance with the legal require -ments and the Company’s articles of association. Inso-far as the resolutions of the annual shareholders’ meetingrelate to extraordinary transactions and core business,they also require the approval of the general partner.
In the course of our investor relations work, the Chairmanof the Executive Board and the CFO, as well as the otherExecutive Board members hold regular meetings with ana -lysts and institutional investors. Besides an annual ana-lysts’ conference, a conference call also takes place whenthe quarterly figures are announced or for other impor-tant events.
20 COMPLIANCE | REMUNERATION REPORT
Compliance
The general partner of Drägerwerk AG & Co. KGaA hasestablished guidelines in the form of business policies anda code of conduct which should ensure that business isconducted responsibly and in accordance with legal require -ments. These binding policies on law-abiding conduct,conflicts of interest, company property and insider tradingapply to all employees, as well as the Executive and Supervisory Boards.
Remuneration report
EXECUTIVE BOARD REMUNERATION
Dräger places great value on providing detailed informa-tion on the remuneration of the Executive Board as thisforms part of exemplary governance and also createstransparency for our shareholders.
This report gives an overview of the current level and struc-ture of Executive Board remuneration at Dräger. It also outlines the joint future remuneration systems forthe Executive Board members and top managers in the Group (Top Management Incentive – TMI). The mainfocus is on illustrating how Dräger complies with therequirements of the Act on the Appropriateness of Execu-tive Board Remuneration (VorstAG) and the German Corporate Governance Code (GCGC):– The remuneration structure is designed to support sus-
tainable business performance; – The variable remuneration component is based on a long-
term measurement period over several years; – Positive and negative business developments are taken
into consideration; – Remuneration is designed to appropriately reflect the
performance of each individual Executive Board member,the Company and the industry;
– No incentives are given that would encourage the takingof inappropriately high risks.
All employment contracts of the Executive Board membersof Drägerwerk Verwaltungs AG have been concluded with Drägerwerk Verwaltungs AG. The Supervisory Boardof Drägerwerk Verwaltungs AG determines the remu -neration of the Executive Board. Each contract expiresafter a different period of time either after three or fiveyears. Based on the resolution adopted at the annual share-holders’ meeting of Drägerwerk AG & Co. KGaA on June 2, 2006, the remuneration of individual members ofthe Executive Board for fiscal year 2010 may not be dis-closed, with the exception of that of the Chairman. Thisresolution had a term of five years and applies for the last time to fiscal year 2010. As from fiscal year 2011, remu-neration of all Executive Board members will be dis -closed individually.
Since 2010, Dräger has been using a holistic value man-agement approach with the aim of managing the Companywith the long-term and sustainable growth of its value in mind. Dräger Value Added (DVA) was introduced as akey performance indicator for measuring the Companyvalue. DVA corresponds to Group net profit less capitalcosts. DVA-driven management forms an integral part of all management processes. The maxim of value addedis particularly important for the definition of strategies,planning, regular reporting and when making investmentand business decisions. Consequently, performance-related variable remuneration of the Dräger managementalso reflects DVA. In the reporting period, the Companyalready adjusted the existing top management and Execu-tive Board remuneration systems by setting all quanti -tative targets so as to have a direct and positive impact onDVA. Dräger decided to implement a standard remu -neration system for top management and the ExecutiveBoard in 2011; its quantitative targets are mainly DVAtargets. Targets can also be defined on the basis of key per-formance indicators for individual functions.

21THE DRÄGER SHARESCORPORATE GOVERNANCEREPORT OF THE SUPERVISORY BOARD JOINT COMMITTEETHE EXECUTIVE BOARD
The Executive Board remuneration system applicable inthe reporting period and also the system applicable asfrom 2011 orient themselves by essential general condi-tions within the Company. These include Dräger’s sizeand global activities as well as its economic development.The general development of the economy and industriesare also taken into account. Another major aspect affectingthe remuneration of Executive Board members and topmanagers is the range of tasks, areas of responsibility andperformance of each individual person.
In the reporting period, total remuneration for ExecutiveBoard members comprised non-performance-related as well as performance-related components. Non-perform-ance related components include fixed basic remunera-tion and additional benefits and pension plans. Fixed basicremuneration and additional benefits are paid monthly.The percentage of fixed basic remuneration in total Exec-utive Board remuneration amounts to around 22 per -cent for the Chairman of the Executive Board and at least35 percent for all other Executive Board members. Thefocus for all Executive Board members is therefore on theperformance-related component. The performance-related component of the remuneration of active ExecutiveBoard members is pegged to individual targets. These targets include targets that can be quantified in terms ofbusiness and also individual quality targets. Quantifiabletargets pertain to key performance indicators such as Groupnet profit, days of net working capital and profit margin.One example for a quality target is the planned phase-outof old products. Dräger pays an annual pre-defined bonus for meeting these targets, which can be increasedor decreased, depending on whether the target has been exceeded or missed. If a target has been exceeded toa considerable extent, this bonus will be capped at doubleits original amount. If performance objectives are not met,no bonus is paid. The original amount of the individualbonus comes to around 50 to 60 percent of fixed annualremuneration for all Executive Board members. In
addition, individual Executive Board members receive apercentage-based share in net profit. This is 1 percent for the Chairman of the Executive Board and between 0.2percent and 0.3 percent for all other Executive Boardmembers entitled to a share in net profit. The share is dis-tributed annually after the financial statements have been approved.
Long-term incentive components were added to employ-ment contracts that were extended in fiscal year 2010 in line with the Act on the Appropriateness of ExecutiveBoard Remuneration (VorstAG). These targets alsoinclude qualitative and quantitative criteria. The time-frame in which these targets have to be met depends on the term of the contract of each Executive Board mem-ber. At the end of the contractual period, a pre-definedbonus is paid which can be increased or decreased depend-ing on whether the targets have been exceeded or missed.Dräger may issue a part payment according to the expect-
COMPOSITION OF TOTAL REMUNERATION FOR EXECUTIVE BOARD
Share in profits
Individual bonus
Long-term bonus (payable at end of contract)
Additional benefits
Basic salary

22 REMUNERATION REPORT
ed target achievement at the earliest after three-fifths ofthe contractual period has expired.
The original amount of the long-term bonus over the entirecontractual period (three to five years) is around 175 percent of basic remuneration for one year for the Chair-man of the Executive Board and between 100 percent and 150 percent for all other members of the ExecutiveBoard, for whom long-term targets were agreed in 2010.Dräger will pay the long-term incentive components earnedin 2010 together with the other variable remunerationonce the Executive Board remuneration system is beingchanged over. The Supervisory Board may choose to pay a special bonus for extraordinary performance or serv-ices rendered by individual Executive Board members in the respective reporting year. In the context of the sever-ance agreements concluded in 2010, other remunera-tion amounting to EUR 1,385,417 was recorded in thefinancial statements for fiscal year 2010.
The total remuneration for Executive Board members isshown in the following table:
Fringe benefits awarded to members of the ExecutiveBoard encompass private use of the company car they areeach provided with and payment of health, care and pension insurance premiums. The Company has taken outgroup accident insurance for Executive Board mem -bers. The Company pays the premium for the D&O liabili-ty insurance policy and legal expense insurance policy for economic loss claims for members of the ExecutiveBoard. In the opinion of the German tax authorities, this does not constitute part of the Executive Board’s remu-neration. The financial loss liability insurance includes a deductible, which was adjusted as from 2010 to one anda half times the amount of gross fixed annual remunera-tion in accordance with VorstAG.
In the fiscal year, no payments were made or promised bya third party to any member of the Executive Board in relation to his or her duties as member of the ExecutiveBoard. If Executive Board remuneration is paid by Drägerwerk Verwaltungs AG, pursuant to Sec. 11 (1) and(3) of the articles of association of Drägerwerk AG & Co. KGaA it is entitled to claim reimbursement fromDrägerwerk AG & Co. KGaA monthly. Pursuant to Sec. 11 (4) of the Company’s articles of association, the
2010 2009
Fixed Variable Other Total Fixed Variable Other Total
Incumbent members of the Executive Board 1,367,781 3,415,500 112,683 4,895,964 1,655,279 1,893,380 109,564 3,658,223
thereof:Chairman of theExecutive Board (571,451) (1,987,500) (10,648) (2,569,599) (426,213) (766,768) (10,523) (1,203,504)
Executive Board members departing during the reporting year 481,392 776,375 1,385,417 2,643,184 0 6,236 46,504 52,740
Total 1,849,173 4,191,875 1,498,100 7,539,148 1,655,279 1,899,616 156,068 3,710,963
EXECUTIVE BOARD REMUNERATION (€)

23THE DRÄGER SHARESCORPORATE GOVERNANCEREPORT OF THE SUPERVISORY BOARD JOINT COMMITTEETHE EXECUTIVE BOARD
general partner receives a fee for the management of the Company and the assumption of personal liability,regardless of profit and loss, of 6 percent of the equity disclosed in its financial statements, payable one week afterthe general partner prepares its financial statements. For fiscal year 2010, this remuneration amounts to EUR71 thousand (2009: EUR 67 thousand) plus any VATincurred.
Obligations from the pension plan remain at DrägerwerkAG & Co. KGaA pursuant to the terms and conditions of individual contracts. Defined benefit plans for membersof the Executive Boards are agreed individually, based on “Führungskräfteversorgung 2005”, which has been ineffect within the Group since January 1, 2006.
The defined benefits under the pension plans offered to themembers of the Executive Board are either fixed or based on the basic annual salary and years of service on theExecutive Board. The defined benefit is based on an annual contribution of up to 15 percent of the basic annu-al salary. Under the deferred compensation option, an additional annual contribution of up to 20 percent of thebasic annual remuneration can be made. Stefan Drägerreceives a further contribution of 50 percent from the Com -pany on deferred compensation, but no more than 8 percent of his basic annual salary. This top-up payment isonly made if consolidated EBIT equals 8 percent ormore of net sales.
Obligations to Executive Board members under pensionplans are stated in the financial statements 2010 at EUR 670,538 (2009: EUR 666,552), of which EUR 504,263(2009: EUR 376,180) for the Chairman. Pension obliga-tions to Executive Board members who retired in fiscal year2010 are recognized in provisions for former members of the Executive Board and their surviving dependents.
In fiscal year 2010, the Company made pension provisionscontributions of EUR 202,003 for members of the Execu-tive Board (2009: EUR 207,568), of which EUR 128,083was for the Chairman (2009: EUR 117,525).
EUR 2,963,612 was paid to former members of the Execu-tive Board and their surviving dependants (2009: EUR2,889,320).
Pension commitments to former members of the Execu-tive Board and their surviving dependants amounted toEUR 37,793,139 (2009: EUR 37,397,778).
NEW VARIABLE REMUNERATION STRUCTURE FOR EXEC-
UTIVE BOARD MEMBERS AND TOP MANAGERS
A new, standardized variable remuneration system forExecutive Board members and top managers, the “Top Management Incentive” (TMI), has come into forceas from fiscal year 2011. It applies exclusively to the variable remuneration component. Basic remuneration,additional benefits and any special bonuses remain unaffected. The ratio between non-performance-relatedand performance-related remuneration components also remains the same. The “profit share”, “individualbonus” and “long-term bonus” components have beencombined into two new target components. The followingillustrations show the increase of DVA and personal targets:

24 REMUNERATION REPORT
INCREASE OF DVA
Variable remuneration for Executive Board members focus-es on increasing the Company value within the scope ofTMI. Dräger has made it its goal to increase DVA between2010 and 2014. This value is divided into four equal parts.80 percent of the variable remuneration component forExecutive Board members is fundamentally dependent onachieving this DVA goal and is therefore based on a long-term, sustainability-focused measurement period.This portion corresponds to around 60 percent of totalremuneration of the Chairman of the Executive Boardand roughly 35 percent to 50 percent of total remunera -tion of all other Executive Board members. If a target hasbeen exceeded to a considerable extent, the bonus pay-ment will be capped at double its original amount. If thetarget has been missed by a long way, the bonus may notbe paid at all. If the DVA target is exceeded by more than200 percent or performance drops below 0 percent, a corresponding amount is recognized in the bonus reserve.This com ponent is described in more detail in a later part of this report.
KPI TARGETS FOR OPERATING FUNCTIONS
Dräger may set additional targets based on key perform-ance indicators (KPI) for Executive Board members who are responsible for operating functions. These targetsare to relate to the areas of responsibility of each mem -ber of the Executive Board and have a positive impact onDräger’s company targets. Each year, the SupervisoryBoard determines KPI targets in consultation with eachmember of the Executive Board. They should not exceedfive individual targets. 20 percent of variable remunerationcan be linked to KPI targets, corresponding to around 12 percent of total remuneration for the Executive Boardmembers responsible for operating functions. If KPItargets are set, the percentage of DVA targets is reducedby the percentage of KPI targets. Again, if a target hasbeen exceeded to a considerable extent, the bonus paymentwill be capped at double its original amount. If the targethas been missed by a long way, the bonus may not be paid at all. If the target is exceeded by more than 200 per-cent or performance drops below 0 percent, a corre -sponding amount is recognized in the bonus reserve. Thiscomponent is described in more detail in a later part of this report.
PERSONAL TARGETS
Each year, the Supervisory Board sets personal targets inconsultation with each member of the Executive Board.This may include targets such as creating a sustainableorganizational structure and increasing customer satis -faction. 20 percent of variable remuneration is linked topersonal targets. This corresponds to around 15 percent of total remuneration for the Chairman of the ExecutiveBoard and roughly 12 percent of total remuneration for all other Executive Board members. If a target has beenexceeded to a considerable extent, the bonus payment will be capped at double its original amount. If the targethas been missed by a long way, the bonus may not be paid at all. There are no plans to recognize a bonus reservefor personal targets.
TOP MANAGEMENT INCENTIVE
Share in profits
Individual bonus
Long-term bonus
DVA Dräger
Personal objectives
from 2011
Previous remuneration systemTMI
“Top Management Incentive”

25THE DRÄGER SHARESCORPORATE GOVERNANCEREPORT OF THE SUPERVISORY BOARD JOINT COMMITTEETHE EXECUTIVE BOARD
The same target structure as for Executive Board membersapplies to the members of the extended managementteam who are not part of the Executive Board. Their vari-able remuneration therefore also depends to 80 per -cent or 60 percent on the Group DVA. The system appliesto around 170 managers in the Group and has a descend-ing structure. The above standing table provides an over -view.
BONUS RESERVE
A bonus reserve was integrated in the future joint remuner-ation system for Executive Board members and top managers to further emphasize its sustainability. Bonuses
corresponding to 0 to 200 percent target achievement are paid annually. If DVA and KPI targets are exceeded(between 200 and 300 percent) or missed (between 0 and – 100 percent), the corresponding bonus amount isrecognized in the bonus reserve. The bonus reserve isheld and netted over the entire target period of four yearsso that it is possible to compensate for cases of exceeded or missed targets. The positive net amount of the bonusreserve is only distributed with the last bonus payment at the end of the target period. A negative amount is carriedforward to the next target period. The bonus reservetherefore lets Executive Board members and top managersshare in the opportunities and risks of Dräger’s medium
CRITERIA FOR TMI OBJECTIVES
Sales and Marketing Research and Development, Production, Central functionsLogistics, Purchasing, Quality, IT
Executive Board and Management Team
Level 1
Level 2
Level 3
1 Product categories or customer segments where relevant, otherwise DVA contribution marketing.
80 % DVA Group
20 % individual objectives
40 % DVA Group
20 % DVA Group
20 % individual objectives
40 % DVA contribution subsidiary /product category1
40 % DVA contribution region /marketing
20 % individual objectives
60 % DVA Group
20 % individual objectives
20 % KPIs
40 % DVA Group
40 % DVA Group
20 % individual objectives
40 % KPIs
40 % KPIs
20 % individual objectives
80 % DVA Group
20 % individual objectives
80 % DVA Group
20 % individual objectives
80 % DVA Group
20 % individual objectives
20 % DVA Group
20 % individual objectives
40 % DVA contribution subsidiary
20 % DVA contribution region / marketing
20 % DVA contribution region / marketing

26 REMUNERATION REPORT
term business performance. Particularly excellent perform-ance receives additional incen tives but at the same timethe taking of inappropriately high risks is discouraged assuch activities could deplete the bonus reserve.
LONG-TERM MEASUREMENT PERIOD
In future, Dräger will continue to set the period for DVAtargets at four years. This ensures that the remuneration of Executive Board members and top managers is alwaysbased on a long-term measurement period over severalyears, therefore creating an incentive to aim for a sustain-able positive business development. The Executive Boardregularly determines the four-year target as part of strate-gic development. The Supervisory Board approves thedefined target value and applies it as the basis for ExecutiveBoard remuneration.
SUPERVISORY BOARD REMUNERATION
The remuneration report also includes information on theshares owned by the members of the Executive and Super-visory Boards as defined above.
At the annual shareholders’ meeting of Drägerwerk AG &Co. KGaA on May 6, 2011, a proposal awarding the Supervisory Board total remuneration of EUR 631,750.00(2009: EUR 346,000.00) will be put to vote. Every mem -ber of the Supervisory Board receives basic remuneration,which is composed of a fixed amount of EUR 10,000.00(2009: EUR 10,000.00) and a variable amount of EUR31,500.00 (2009: EUR 9,750.00). This variable compo -nent amounts to 0.03 percent of net profit. Pursuant to Sec.21 (1) of the articles of association of Drägerwerk AG & Co. KGaA, the distribution of the remuneration of members
2010 2009
Fixed Variable Other Total Fixed Variable Other Total
Prof. Dr. Nikolaus Schweickart (Chairman of the Supervisory Board) 30,000 94,500 5,000 129,500 40,000 39,000 5,000 84,000Siegfrid Kasang (Vice Chairman) 15,000 47,250 0 62,250 20,000 19,500 0 39,500
Daniel Friedrich 10,000 31,500 0 41,500 10,000 9,750 0 19,750
Dr. Thorsten Grenz 10,000 31,500 10,000 51,500 10,000 9,750 10,000 29,750
Peter-Maria Grosse 10,000 31,500 0 41,500 10,000 9,750 0 19,750
Uwe Lüders 10,000 31,500 0 41,500 10,000 9,750 0 19,750
Walter Neundorf 10,000 31,500 5,000 46,500 10,000 9,750 5,000 24,750
Jürgen Peddinghaus 10,000 31,500 5,000 46,500 10,000 9,750 5,000 24,750
Dr. Klaus Rauscher 10,000 31,500 0 41,500 10,000 9,750 0 19,750
Thomas Rickers 10,000 31,500 0 41,500 10,000 9,750 0 19,750
Ulrike Tinnefeld 10,000 31,500 5,000 46,500 10,000 9,750 5,000 24,750
Dr. Reinhard Zinkann 10,000 31,500 0 41,500 10,000 9,750 0 19,750
Total 145,000 456,750 30,000 631,750 160,000 156,000 30,000 346,000
REMUNERATION OF THE SUPERVISORY BOARD (€)

27THE DRÄGER SHARESCORPORATE GOVERNANCEREPORT OF THE SUPERVISORY BOARD JOINT COMMITTEETHE EXECUTIVE BOARD
of the Supervisory Board is determined by a SupervisoryBoard resolution.
The Supervisory Board has adopted the following princi-ples for distribution: Its chairman is entitled to threetimes (previous year: four times) and the vice chairman toone and a half times (previous year: two times) theamount. The members of the Audit Committee receive anadditional EUR 5,000.00, and the Chairman of the Audit Committee an additional EUR 10,000.00. As from fis-cal year 2009, Supervisory Board members have not been receiving a per diem any more.
In the opinion of the German tax authorities, the premi-um for a D&O liability insurance policy and a legalexpense insurance policy for economic loss claims is notpart of the Supervisory Board’s remuneration. Thedeductible for Supervisory Board members is one and ahalf times their fixed annual salary.
In fiscal year 2010, the total remuneration of the six mem-bers of the Supervisory Board of the general partner,Drägerwerk Verwaltungs AG, amounted to EUR 135,000.00(2009: EUR 135,000.00). In addition, the SupervisoryBoard members receive annual flat fees for out-of-pocketexpenses totaling EUR 55,000.00. No remuneration waspaid to Supervisory Board members of Group companies.
SHARES OWNED BY THE EXECUTIVE AND SUPERVISORY
BOARDS
As of December 31, 2010, the members of the ExecutiveBoard of Drägerwerk Verwaltungs AG and their relatedparties directly held 6,000 preferred shares in DrägerwerkAG & Co. KGaA, equivalent to 0.04 percent of the Com -pany’s total shares, and 119,300 common shares, corre-sponding to 0.72 percent of the Company’s total shares. At the same time, the members of the Supervisory Boardand their related parties directly or indirectly held a total of 1,150 preferred shares, equivalent to 0.01 percent
of the Company’s total shares and 595 common shares, or 0.004 percent of the Company’s total shares.
Altogether, 67.19 percent of Drägerwerk AG & Co. KGaA’scommon shares are held by Dr. Heinrich Dräger GmbH,with 68.36 percent attributable to the Chairman of theExecutive Board Stefan Dräger under the terms of Sec. 22(1) Sentence 1 No. 1 WpHG (Wertpapierhandelsgesetz –German Securities Trading Act).
DIRECTORS’ DEALINGS
In fiscal year 2010, the Company was informed about busi-ness transactions with executive employees pursuant to Sec. 15a WpHG (Wertpapierhandelsgesetz – GermanSecurities Trading Act): Announcements of transac -tions with executive employees pursuant to Sec. 15a WpHG(Wertpapierhandelsgesetz – German Securities TradingAct) are published at www.dgap.de in the Directors’ Deal-ings section.

28 REMUNERATION REPORT | RELATED-PARTY TRANSACTIONS
Related-party transactions
Services were rendered for companies related to StefanDräger and for the Dräger Foundation totaling EUR 69thousand in fiscal year 2010 (2009: EUR 104 thousand).Claudia Dräger, Stefan Dräger’s wife, is an employee ofDrägerwerk AG & Co. KGaA. All transactions with relat-ed parties were conducted at arm’s length terms and con-ditions.
Lübeck, Germany, March 8, 2011
Drägerwerk AG & Co. KGaAThe general partner
Drägerwerk Verwaltungs AG
The Executive Board
Date Name ISIN Acquisition/sale Price Volume
€ €
Jun. 15, 2010 Dr. Heinrich Dräger GmbH DE 0005550602 Sale 41.00 42,607,200.00
Jun. 17, 2010 Stefan Dräger DE 0005550602 Acquisition 41.00 4,817,500.00
Jun. 17, 2010 Dr. Heinrich Dräger GmbH DE 0005550602 Sale 41.00 11,061,800.00
Jun. 21, 2010 Dr. Heinrich Dräger GmbH DE 000A1EMGX2 Acquisition 5.35 267,500.00
Jun. 23, 2010 Dr. Heinrich Dräger GmbH DE 000A1EMAB1 Acquisition 4.37 590,544.00
Jun. 30, 2010 Walter Neundorf DE 0005550602 Acquisition 42.70 10,701.69
Jun. 30, 2010 Walter Neundorf DE 0005550602 Acquisition 27.50 1,155.00
Jun. 30, 2010 Uwe Lüders DE 0005550602 Acquisition 27.50 8,250.00
Jul. 2, 2010 Stefan Dräger DE 0005550602 Acquisition 27.50 49,500.00
Jul. 2, 2010 Dr. Heinrich Dräger GmbH DE 0005550602 Acquisition 27.50 52,800,000.00
DIRECTORS’ DEALINGS

The Dräger shares
Positive annual result for Dräger shareholders: From the start of the year thepreferred shares outperformed the market. With a rise of 96 percent theirvalue increased significantly versus the benchmark indices DAX and TecDAX.The common shares were launched successfully on the stock market gainingover 8 percent compared to the initial listing price.
STOCK MARKETS
The international stock markets were rather cautious atthe beginning of 2010 in view of the deepening crises incertain countries, especially Greece and Portugal, whoseratings had been reduced by several rating agencies,adding fuel to the markets’ existing insecurities. The EUissued a Euro aid package of EUR 750 billion in May 2010.Although this provided the market with a short breather,it was unable to entirely disperse investors’ worriesabout the stability of the eurozone, as the extremely volatiledevelopment in May and June clearly showed. The basicdynamics of the markets started improving considerablystarting July 2010, except for a short drop in sentimentafter the US announced several unfavorable economicresults in August 2010 and new concerns about the liq -uidity of several European member states arose in Novem -ber 2010. The positive basic trend continued as manycompanies published surprisingly positive results in thesecond half of the year and market participants becameincreasingly confident about economic figures.
SHARE PRICE
On the first trading day of the year, the Dräger preferredshare came in at EUR 31.35, recording its annual low in2010 straight away. Unlike the international stock markets,the preferred share developed positively right from the
beginning. On February 18, 2010, the day the ad hoc reporton the preliminary figures for 2009 was released, theshare price had already risen to EUR 44.82, then climbedfurther to EUR 50.83 by the day of the annual accountspress conference on March 17, 2010. But the preferredshare was unable to avoid feeling some of the impact of the extremely volatile developments in the market fromApril to June: The share price stood at EUR 47.85 andEUR 46.50 respectively at the beginning of May, when the results for the first quarter were released and theannual shareholders’ meeting was held; EUR 53.41 onJune 14, 2010, the day of the ad hoc report on theincreased guidance, and EUR 53.19 on June 16, 2010, theday the ad hoc report on the capital increase was pub-lished.
Dräger common shares were listed at the stock exchangefor the first time in the history of the company on June 21,2010, closing their first day at EUR 46.50. In the wake ofthe initial listing of the common shares while their pricewas establishing itself in the market, both types of shareexperienced some considerable fluctuations on occasions.These however abated again at the beginning of July,aided by the overall positive developments in the generalmarket. On August 5, 2010, at the time the half-yearlyfinancial report was published, the preferred share was
29THE DRÄGER SHARESCORPORATE GOVERNANCEREPORT OF THE SUPERVISORY BOARD JOINT COMMITTEETHE EXECUTIVE BOARD

30 THE DRÄGER SHARES
already back up to EUR 63.00, recording its annual high at EUR 67.93 on October 12, 2010, after some fluctuationsin August and September. Contrary to devel opments in the market, the price of the preferred share took a tripsouth in the following weeks. On November 4, 2010, the day the report as of September 30, 2010, was released,it amounted to EUR 59.20, closing the year 2010 at EUR 61.40, a total plus of around 96 percent.
The common share also appreciated in value as fromJune 21, 2010: It recorded its annual high at EUR 55.29on August 9, 2010, and closed the year at EUR 50.00,about 8 percent higher than the closing price on the dayof the initial listing.
ANNUAL SHAREHOLDERS’ MEETING
Some 555 preferred and common shareholders attendedthe annual shareholders’ meeting of Drägerwerk AG &Co. KGaA on May 7, 2010, at the Lübeck Music and Con-gress Center. In total, 100 percent of the Company’s common shares and approximately 45.60 percent of itspreferred shares were represented. Around 218 preferredshareholders, in other words around 45.35 percent of pre-ferred shares, attended the separate meeting of preferredshareholders on the same day.
The annual shareholders’ meeting resolved to condition-ally increase the Company’s capital stock up to EUR3,200,000 by issuing up to 1,250,000 new no-par preferredbearer shares (no-par shares) in return for cash and/or contributions in kind (conditional capital). The condi-tional capital increase is only to be carried out in the case of warrant bonds with option rights guaranteed in the
DYNAMIC PERFORMANCE OF THE DRÄGER SHARES IN 2010
(indexed) in percent Dräger preferred shares Dräger common shares DAX TecDAX Ad-hoc reports
220
200
180
160
140
120
100
80
January February March April May June July August September October November December
June 21, 2010
Initial listing of
Dräger common
shares
August 5, 2010
Report as of June 30,
2010
November 4, 2010
Report as of
September 30, 2010
May 5, 2010
Report as of
March 31, 2010
February 18, 2010
Preliminary figures 2009

31THE DRÄGER SHARESCORPORATE GOVERNANCEREPORT OF THE SUPERVISORY BOARD JOINT COMMITTEETHE EXECUTIVE BOARD
form of warrants being issued and if the warrant holdersmake use of their option rights and the conditional capitalis required to meet these demands.
In addition, the annual shareholders’ meeting authorizedand instructed the Executive Board and SupervisoryBoard of Drägerwerk Verwaltungs AG to issue 25 bearerwarrant bonds with option rights and excluding sub -scription rights with a total nominal value of EUR 1,250,000and a nominal value of EUR 50,000 per unit to SiemensBeteiligungen Inland GmbH, in one tranche. The optionrights entitle each holder to receive 50,000 new no-parpreferred bearer shares (no-par shares) of the Companywith a pro-rata share in capital stock of EUR 128,000each.
The annual shareholders’ meeting also instructed theExecutive Board and Supervisory Board of DrägerwerkVerwaltungs AG to issue the warrant bonds with optionrights guaranteed in the form of warrants within a periodof three months after entering the resolution on the cre-ation of conditional capital into the commercial register.The resolution was registered on August 5, 2010, and thewarrant bonds issued on August 30, 2010, were redeemedearly on September 30, 2010. The option rights, however,continue to exist.
The vast majority (98.64 percent) of shareholders attend-ing the separate meeting of preferred shareholdersapproved the resolution of the annual shareholders’ meet-ing to authorize and instruct the Executive Board andSupervisory Board to issue warrant bonds with option rightsand excluding subscription rights. The resolution alsoprovided for the creation of conditional capital and corre-sponding amendments to the articles of association.
CAPITAL INCREASE
With effect from June 30, 2010, Drägerwerk AG & Co.KGaA increased its capital stock by issuing 3,810,000 new
no-par bearer shares. The transaction was implemented intwo stages: Firstly, the Company preplaced existing com-mon shares with institutional investors, then it carried outan authorized capital increase. All shareholders – in other words both preferred and common shareholders –received an indirect subscription right for new commonshares at a ratio of 10:3 at a subscription price of EUR 27.50each. The subscription rate for both share types totaled99.5 percent within the subscription period. Net proceedsless transaction fees came to around EUR 100 million.
According to the terms and conditions for series A, K and D participation certificates, if the Company carries outa capital increase and issues subscription rights for newshares to shareholders, holders of participation certificateshave the right to acquire further participation certifi -cates from participation capital, which must be increasedcorrespondingly – subject to the approval of the Compa-ny’s annual shareholders’ meeting. The terms and condi-tions for participation certificates prescribe that if theannual shareholders’ meeting does not approve this action,the Company must issue cash compensation to partici -pation certificate holders. The Company set aside a provi-sion of EUR 7.8 million to cover for this possibility onJune 30, 2010, which resulted in retained earnings decreas-ing by EUR 5.7 million, adjusted for a tax advantage.
For more details on the capital increase, please refer topages 61 et seq. of the management report.
SHAREHOLDER STRUCTURE
The capital stock of Drägerwerk AG & Co. KGaA amountsto EUR 42,265,600 and consists of 10,160,000 commonshares and 6,350,000 preferred shares with a mathemati-cal share in capital stock of EUR 2.56 each. On August 30,2010, Drägerwerk AG & Co. KGaA also issued share optionsfor a total of 1,250,000 non-voting preferred shares. Theshare options mature on April 30, 2015. The mathematicalshare in capital stock of the shares to be issued also

32 THE DRÄGER SHARES
comes to EUR 2.56 each. On August 5, 2010, the condition-al increase of the Company’s capital stock of EUR3,200,000 was entered in the commercial register in orderto be able to issue the share options.
The common shares were admitted to the regulated mar-ket in the Prime Standard subsection of Frankfurt Stock Exchange on June 21, 2010. According to DeutscheBörse AG, 71.46 percent of common shares are held by the Dräger family and the remaining 28.54 percent are infree float.
Around 67.19 percent of common shares of DrägerwerkAG & Co. KGaA are held by Dr. Heinrich Dräger GmbH.They account for almost the entire assets of this company.The majority of shares of Dr. Heinrich Dräger GmbH are held by members and companies of the Dräger family.
This structure places the voting rights associated with thecommon shares in the hands of the Dräger family. Mem-bers of the Dräger family also hold around 4.26 percent ofvoting rights in person, resulting in the family being in possession of 71.46 percent of voting rights in total. Inaccordance with Sec. 22 (1) Sentence 1 No. 1 WpHG(Wertpapierhandelsgesetz – German Securities TradingAct), the voting rights of Dr. Heinrich Dräger GmbH and Stefan Dräger GmbH as well as their majority share-
holder and the Dräger Foundation, Munich /Lübeck areto be counted towards those of Dr. Heinrich DrägerGmbH due to existing regulations. The voting rights ofStefan Dräger GmbH are to be allocated to Stefan Dräger pursuant to Sec. 22 (1) Sentence 1 No. 1 WpHG.
In addition, DWS Investment GmbH, Frankfurt/Main,announced on November 9, 2010, that it holds 335,000common shares and therefore 3.297 percent of votingrights.
The non-voting preferred shares are listed on the regu-lated market of Frankfurt Stock Exchange (Prime Standard) and on the regulated markets of the stock
Common shares Preferred shares
Securities identification number (WKN) 555060 555063
ISIN 1 DE0005550602 DE0005550636
Ticker symbol DRW DRW3
Reuters symbol DRWG.DE DRWG_p.DE
Bloomberg symbol DRW8 DRW3
Main stock exchange Frankfurt / Xetra Frankfurt / Xetra
1 International Stock Identification Number
DRÄGER SHARES – BASIC FIGURES
SHAREHOLDING OF DR. HEINRICH DRÄGER GMBH
58.73 % Stefan Dräger GmbH 1
23.15 % Dräger Foundation 2
18.12 % Successors of Heinrich Dräger 3
3
1
2

33THE DRÄGER SHARESCORPORATE GOVERNANCEREPORT OF THE SUPERVISORY BOARD JOINT COMMITTEETHE EXECUTIVE BOARD
exchanges in Berlin, Düsseldorf, Hamburg, Hanover and Munich. They are also included in the TecDAX shareindex of Deutsche Börse. 96.79 percent of non-voting preferred shares are in free float according to DeutscheBörse AG. As the shares take the form of bearer shares,the Company does not have a share register as would bethe case with registered shares.
The duty to report the acquisition or sale of voting rightsto an issuer pursuant to Secs. 21 et. seq. WpHG relatesexclusively to shares with voting rights and therefore doesnot apply to the non-voting Dräger preferred shares. No detailed information about the shareholder structureof Dräger preferred shares is therefore being provided at this point.
EARNINGS PER SHARE
Earnings per Dräger common share amounted to EUR6.19 for 2010 (2009: EUR 1.14). Earnings per preferredshare were higher, as the dividend claim is higher thanthat of common shareholders (EUR 6.25; 2009: EUR1.20).
Minority interests in net profit amounted to just EUR 2.2million in fiscal year 2010 (2009: EUR 13.5 million), as the portion of earnings from the medical division previ-ously attributable to Siemens expired after the acqui -sition of the 25 percent share in Dräger Medical AG & Co.KG. EUR 11.9 million of net profit was attributable to participation certificates (excluding minimum dividend,after taxes) (2009: EUR 4.1 million).
DIVIDENDS
The calculation of the dividend to be distributed to pre-ferred and common shareholders is based on certain factors: particularly profitability, financial position, capi-tal requirements, business outlook, the Company’s general economic environment and the share of net profitto be issued to participation certificate holders (includ -
ing minimum dividend). As participation certificates areentitled to receive ten times as much as the dividend paid to preferred shareholders, it must be rememberedwhen determining the dividend for preferred and com -mon shares that an increase in the dividends of these shareswill always result in an increase of the dividend for par -ticipation certificates. In the case of an increase of divi-dends, a little less than half of the total amount paid toparticipation certificate holders and shareholders togeth-er is generally paid to participation certificate holders.
In future fiscal years, Dräger plans to issue around 30 per-cent of group net profit (less minority interests) to theCompany’s shareholders and participation certificate hold-ers (corresponding to the share in net profits for par -ticipation certificates [without minimum dividend, aftertaxes]) once Dräger has achieved an equity ratio of 30 percent, sub ject to the above-mentioned determining fac-tors and the Company generating sufficient net earnings.
As Dräger’s equity ratio was 32.2 percent in fiscal year2010, exceeding this target value, the Executive Board ofthe general partner and the Supervisory Board of Drägerwerk AG & Co. KGaA suggested to distribute a divi-dend of EUR 1.13 per common share and EUR 1.19 per preferred share for fiscal year 2010 and to resolve thisdecision at the annual shareholders’ meeting. The divi-dend for series A, K and D participation certificates wouldtherefore be EUR 11.90 each, equating to a total dis -tribution rate of 30.12 percent based on group net profit(less minority interests).
ANALYSTS
The Company’s business performance is currently beingregularly monitored and covered by the following insti -tutions: Bankhaus Lampe, CA Cheuvreux, Commerzbank,Deutsche Bank, DZ Bank, equinet, fairesearch under CBSResearch, HSBC, LBBW, M.M. Warburg & Co., NORD/LB,Silvia Quandt & Cie., UniCredit and WestLB.

34
2010 2009
Common shares1
No. of shares as of December 31 No. 10,160,000 6,350,000
Annual high € 55.29 –
Annual low € 40.40 –
Share price as of December 31 € 50.00 –
Average daily trading volume 2 € 22,836 –
Earnings per common share € 6.19 1.14
Dividend per common share 3 € 1.13 0.34
Preferred shares
No. of shares as of December 31 No. 6,350,000 6,350,000
Annual high € 67.93 31.80
Annual low € 31.35 13.28
Share price as of December 31 € 61.40 29.89
Average daily trading volume 2 € 52,241 29,981
Earnings per preferred share € 6.25 1.20
Dividend per common share 3 € 1.19 0.40
Market capitalization 4 € 897,890,000 379,603,000
1 Initially listed at Frankfurt Stock Exchange on June 21, 2010. 3 2010: dividend proposed to the annual shareholders’ meeting2 All German stock exchanges (Source: designated sponsor) 4 In 2009, the market capitalization of common shares was based on the price of preferred shares
DRÄGER SHARES INDICATORS
THE DRÄGER SHARES

Dräger is a company with passion: the passion of more than 11,000 employees. They commit their enthusiasm, courage and perso nality to transforming technology into “Technology for Life”.

Additionally, up to threeDräger XXS miniaturesensors detect toxic gasesor give a warning of low oxygen.
A special dust- and water-proof membrane increases
the device’s durability and its suitability for use
in industrial settings, without impairing perme-
ability for gases andvapors.
The long-life infraredtechnology with its highlevel of measurement stability cuts maintenanceand operating costs.
THE HANDY MULTI-GAS DETECTOR “DRÄGER X-AM 5600” is ideal for personalprotection. This durable, waterproof device raises the alarm when it detects explosive, flammable or toxic gases and vapors and when oxygen is in short supply.Typical areas of use are sewage management, the chemical and petrochemicalindustries.
*

37100 % DRÄGER
RESEARCH AND PAGE 38DEVELOPMENT
If you’ve been developing medical technolo-gy for over 100 years, you can trust yourexperience – which doesn’t mean restingon your laurels. Frank Franz from Drägerbasic research is dedicated to developingnew technologies and innovative ideas.
PURCHASING PAGE 42
Buying at the most favorable price oftenmeans saving on quality. A practice Drägerwon’t countenance. Purchasing managerPetra Westphal is committed to balancingprice with quality, innovation and reliability.
PRODUCTION PAGE 46
Producing Technology for Life means bear-ing a lot of responsibility. Production employ-ee Claudia Laszig knows what’s essential in living up to this responsibility: quality with-out compromises and a team to rely on.
SERVICE PAGE 50
Highly sensitive technology must be handledwith utmost care. Questions or problemsrequire the right solution – which needs tobe found quickly and without hassle. This is Lars Hollenga’s mission: He gives adviceto Dräger service technicians over the phone.
MARKETING PAGE 54
Dräger products have a noble purpose tolive up to: They protect, support and savelives. They can only achieve this purpose if Dräger takes its target groups’ needs seri-ously. Maike Koch’s job is to find out whatcustomers really need.

100% Dräger
110 patentswere issued to Dräger by patent and trademark offices across the globe in 2010. In the same period, Dräger’s patent departments received morethan 90 reports of new inventions from their developers.
Life is all about progress. If you want to keep up, youhave to keep developing. This is why Dräger is work-ing every single day on helping shape the future withits products. In a place where ideas become reality: in Research and Development.

39 100 % DRÄGER
INVENTIONS ARISE WHERE promising ideas meet customerneeds. Basic research prepares new technologies for the productdevelopment stage.
Frank Franz loves new ideas. His job involves researchon innovative concepts and promising technologies –without knowing beforehand whether he will get a prod-uct out of it that is ready to be launched in the market.Frank Franz, Project Manager for technology projects inbasic research, is on the hunt for the product of thefuture – a mission as exciting as it is challenging. “In thevery early stages of development, we can afford to think through a range of different ideas and discard theones that don’t work. The more we invest in develop-ment, the less risk we can afford to take. This means ourjob is effectively to develop ideas to remove the risksfrom them,” Franz explains.
This was very much the case for the development of theso-called “SmartPilot View”. This software calculateshow certain pain medication and soporifics react withone another in the patient’s body under anesthetic. For the first time, the anesthetist can follow the progressof the anesthetic via an image on a monitor and adjustthe dosage as necessary. When basic research embarkedon this project, there were already scientific models in existence which described the way these medicationsreacted when combined. Mathematically correct – butpretty abstract. The big question was: Could this reallybecome a product? Frank Franz and his colleagues inthe interdisciplinary project team worked together withanesthetists to determine how the data needed to bevisually presented in order to be usable in hospitals. Assoon as initial simulations were available, the softwarewas tested on site. Frank Franz places a particularly highvalue on involving medics early on in development:“We’re the interface between science and its users. Weneed to know what’s really going to help those working
in hospitals. It’s the only way of eliminating the risk thatour product will miss the mark.”
As a qualified nurse and EMT, Frank Franz is very wellacquainted indeed with the working conditions of hisproducts’ users. It wasn’t until later on that he decidedto go to university and became a developer. What made him reorientate? “In the hospital, I worked withmedical technology every day and was always discov -ering ways in which products could be improved. Now,as a developer, I have the chance to make life easier for doctors and care personnel, and also to help patients.And in the end, that’s the way to save lives.” It is FrankFranz’s mission to do justice to this noble ideal, which iswhy he doesn’t withdraw into an ivory tower to work on his developments: “Dräger permits me to go off onceand again and spend a few days working in a criticalcare unit. While there, I observe what the issues are thataffect the people working there, which helps me to staydown to earth and reminds me of what we’re working for.”
“SmartPilotView” has proved a winner for Frank Franzand his colleagues. Not only did the software pass the technical risk analysis, but has made it from basicresearch through product development to marketlaunch stage. Frank Franz, however, isn’t taking thissuccess as a reason to rest on his laurels. He’salready developed and implemented a follow-up idea:“SmartPilot Xplore” – an app for iPhone and the iPodtouch, which simulates the way the “SmartPilotView”works and so not only supports sales teams, but alsohelps train medics to use the software. One idea of manywhich developers have found enthusiastic support for at Dräger. This support is a key source of motivation forFrank Franz in his work: “I have a lot of freedom to becreative and inventive, without losing sight of our users’needs. It’s a great feeling. What better technology canyou develop than Technology for Life? That’s 100 percentDräger.”

100 % DRÄGER
Sleeping throughout anesthesiaDräger’s “SmartPilotView” shows anesthetists a calculation of how deeplythe patient is anesthetized – at the current point in time and as a fore-cast – right from the point of administration of the medications. A greathelp for doctors in determining the correct dosage.

100% Dräger
3 Technology Dayswere organized by Dräger purchasing in 2010, during which 18 strategic sup -pliers demonstrated their technological expertise to Dräger experts. Thisgenerates new impulses for development and fosters supplier integration.
From materials for a new product and office chairsto IT services: Whenever Dräger spends money, the colleagues from Purchasing keep a close eye onproceedings. They coordinate all supplier contractsworldwide and buy in high quality at the best possibleprices.


43 100 % DRÄGER
2010 HAS SEEN A NEW ORGANIZATIONAL STRUCTURE FOR
PURCHASING AT DRÄGER. The Purchasing departments of all divisions are being brought together under one central man-agement. A new challenge – and a new opportunity.
It’s Petra Westphal’s dream job, the culmination of aDräger career in Purchasing spanning more than 20 years: As global Vice President Corporate Purchasingshe is responsible for purchasing around the world.“Purchasing is my passion. I can’t imagine a field in whichI could bring more added value to the Company. Here I can change things, really get things moving. That givesme job satisfaction.” One of the things Petra West -phal loves most about her job is the way in which Pur-chasing works with all functional areas across theGroup, nego tiating complex processes. Her task, work-ing together with one of her colleagues, is to preparethe department for the future, develop its strategy andplan its budget. Petra Westphal was involved in plan-ning and driving the reorganization into a central Pur-chasing department – a step taken with conviction. “I’m 100 percent behind the direction our Company iscurrently taking. I’m absolutely convinced it’s the rightthing,” Petra Westphal underlines.
Her trust is not misplaced: Purchasing has made thebiggest contribution to Dräger’s turnaround program formaking cost savings and improving efficiency. How did they do it? Petra Westphal is pleased to explain: “Bymerging departments into one, we created positiveeffects such as pooling the Company’s purchasing vol-ume, giving us a much stronger market position fromwhich to negotiate.” Concretely, Purchasing was able toagree better terms with suppliers and service providersand introduce new logistics models. Supplier manage-ment is now also coordinated centrally, with a group-wide overview containing all important information andevaluations on individual suppliers and service providersand giving answers to key questions such as: What can
the supplier do for us? How reliable, how innovative isit? The data, which are continuously updated and sub-jected to regular checks with the aid of market analyses,are the key basis for selecting the right suppliers – during development of new products, for example. “Whenselecting service providers, we place great value onstrategic partners that won’t just supply parts, but willalso contribute their technological know-how. We’reafter suppliers that know about our products and serv-ices and can meet our high quality standards. Theseneeds mean that we don’t always make price the deci-sive factor,” adds Petra Westphal.
In order to get the most out of the services provided bysuch carefully chosen partners, Dräger involves itsstrategic suppliers in its internal processes. An exampleof this is the development of Dräger’s electronic immo -bilizer ‘Dräger Interlock XT’, which works by measuringbreath alcohol concentration. As always, purchasing was an essential part of the development team – fromthe initial idea all the way through to additional devel -opments for individual countries. The suppliers, too, werein on the development process from the beginning, so that the best results could be achieved without los-ing time – purchasing work at its best. Dräger’s Pur-chasing team has set itself challenging objectives: Theiraim is to make a contribution towards getting new products onto the market more quickly, delivering themreliably to customers and making sure they offer highquality at a fair price.
This is the standard driving the daily work of Petra West -phal and her team as they master the central challengeof Purchasing: creating a synthesis of economy and quali-ty. Petra Westphal has no hesitation in pinpointing thisstandard as inherent to Dräger: “For me, 100 percentDräger means keeping costs as low as possible whilerefusing to compromise on quality. The bottom line isthat people’s lives depend on our products.”

100 % DRÄGER
First blow, then driveThe “Dräger Interlock XT” is a breath analyzer coupled with an auto -mobile immobilizer. When installed in a car, it can prevent accidents – by preventing inebriated drivers from even starting the engine.

100% Dräger
5,000 respiratory protection masksin various protection classes are produced by Dräger in an average working week. Wherever there’s danger in the air – be it from particles,vapors or gases – Dräger masks make breathing safe.
Nowhere else is Technology for Life as tangible asit is in Production. Here’s where Dräger makes prod-ucts to which people all over the world over entrusttheir lives.


47 100 % DRÄGER
THERE’S NO ALTERNATIVE TO EXCELLENT QUALITY if you don’t compromise on your own standard. Individual responsibilityand teamwork are key for Dräger’s production workers.
Claudia Laszig spends her working day making Tech-nology for Life. As a production worker helping to manufacture masks for Dräger, she works each day withher colleagues producing respiratory protection masksfrom the X-plore series. These masks are used primarilyin firefighting and industry – from metal processing, lacquering and shipbuilding to applications in the chem-ical and automotive industries. Using special filters, they protect their wearers from hazardous particles, gasesor vapors, making it possible for them to breathe safelyeven in the toughest of conditions.
Claudia Laszig is well aware of the responsibility borneby those who manufacture such sensitive products: “Weneed to keep focused and concentrate absolutely thewhole time while we’re working. After all, a respiratoryprotection mask is not a toy. The entire product needsto be absolutely perfect.” An insidious danger to productquality arises when production workers suffer fatiguedue to monotonous work. “Errors happen most easilywhen work becomes routine and your concentrationand attention begin to slide. We can’t afford for that tohappen,” explains Claudia Laszig.
Dräger prevents this danger by means of a specialwork flow: Every mask passes through six stages in itsprogress through the production line, with differentworkers performing tasks such as fitting visors, connec-tors and head straps, until finally the mask is completeand ready for shipping. So what’s special about it? Afterone-and-a-half hours working on a particular stage, the workers change places and move a stage further inthe production line, meaning that they work on allstages in the course of a working day. Claudia Laszig
appreciates these working conditions: “I’ve worked inother places where you spend eight hours a day in exact-ly the same place doing exactly the same thing againand again. That way of working doesn’t keep you on yourtoes. Your attention drifts. But here I get a lot of vari -ety in my work; it never gets dull.”
A further advantage of this way of working is thatemployees feel responsible for the entire mask and notjust for one stage of production, thus actively helping to shape product quality. To give employees furtherencour agement to take responsibility for quality, Dräger has adapted a clear and simple system from roadtraffic: traffic lights. Every production line has a set of them; when things are running normally, the lights aregreen. If a production worker finds a faulty part duringwork, he or she can set the traffic lights to amber to tellhis or her colleagues to be on the alert for other faultyparts. Should more be discovered, the workers switch thelights to red – and production stops, only to start upagain once all errors have been eliminated and all faultyparts replaced. Quality is always top priority.
“Dräger places a high value on our experience and ourviews as production workers,” emphasizes ClaudiaLaszig. “In doing this, the Company shows us that ouropinions count and are taken seriously.” In her view, this way of working together is the key to success: “Forme, Dräger is about quality and teamwork. We all need to pull together as a team – and then the productwill do its job as well.”

100 % DRÄGER
Making breathing safeThe “Dräger X-plore 5500” is the right choice when both high respiratoryprotection and a good view of the surroundings are important. Its special filters and chemical-resistant visor provide optimum protection forindustrial tasks.

100% Dräger
2,100 entriesis the current tally of a database in which Dräger archives all technicalquestions on its products that arise and the answers found – an invaluablehelp to TechLine staff in their daily work.
Each and every day, Dräger service technicians sup-port users of Dräger technology in hospitals. What the customers don’t see is that even behind the scenesthere are Dräger employees working away with pas-sion to find the right solution for every technical issue:the staff of the TechLine.


51 100 % DRÄGER
USERS NEED TO BE ABLE TO RELY ON MEDICAL TECHNOLOGY
AT ALL TIMES. If there is a problem at any point, a rapid remedyis essential. Dräger’s technical support service is a real safety net – Dräger’s commitment is to giving customers the best possi-ble support.
When Lars Hollenga’s phone rings, it usually meansthere’s a challenge in store for him. For two years now,he has been working on the TechLine, a support serv-ice for Dräger service technicians. He’s a great supportto his colleagues working in hospitals, with just oneexample being his help finding answers to technical ques-tions on products: How do I configure the neonatal ventilator? What does the warning on the display mean?Which spare part do I need?
The TechLine is currently manned by seven employees,all of whom have technical training; some worked astechnicians in hospital settings themselves before switch-ing to dispensing advice by phone. In other words, the TechLine staff are specialists with comprehensiveproduct know-how and thus on a level with the serv- ice technicians they advise. This task has little to dowith con ventional call center work, as Lars Hollengaexplains: “In terms of being contactable by phone, weare subject to internal standards that are just as strict as they would be in a typical call center. In every otherway, though, we’re much more of a competence cen -ter.” The service technicians agree: They can always relyon expert advice from the TechLine, a source of sup-port they are glad to have. “I’m always really pleased toget positive feedback from my colleagues on site,”enthuses Lars Hollenga. “They often express how grate-ful they are for our help.”
Lars Hollenga’s experience has now advanced to thepoint that he can answer many of his colleagues’ ques-tions straight away. If the problem proves trickier, he
promises to call back as soon as possible. “It’s often thecase that technicians call when they’ve already takenthe cover off the device. Then I need to provide themwith a speedy solution,” says Lars Hollenga. He is aidedin his search by a web-based database into which theTechLine staff enter all questions that have occurred sofar and the answers they found. There’s a good chancethat a similar case has occurred in the past: And even ifthe database can’t help, Lars Hollenga and his col-leagues are far from stumped. They can call on theexpertise of product specialists and developers, as he explains: “We work very closely together – hand inhand, in fact. When an issue comes up for the firsttime, it takes me a bit of time and trouble to find a suit-able solution, but next time I’ll be able to help rightaway.” It’s also useful that the TechLine staff have theirown lab available to them, containing most Drägerdevices. In this way, Lars Hollenga can test possible set -tings directly on the device itself and give the tech -nician practical, first-hand advice. “We then go throughthe individual steps of the process simultaneously with the device while we’re talking to each other,” hecomments.
All TechLine team members are aware of how vital precision is for the work of hospital technicians. LarsHollenga offers a comparison from his previous life as an IT service provider: “With computers, you can trydifferent ways of reaching your objective. With devicesthat are critical to life, like Dräger’s, that isn’t an option.There are no alternatives; we need the right solution.”For Lars Hollenga, finding the right solution is his essen-tial task. He will continue supporting his colleagues in the best possible way. For him, it’s an expression of afirm belief: “100 percent Dräger means doing all we can in-house to help our technicians out there in the fielddo a perfect job for the customer.”

100 % DRÄGER
Big help for little onesVentilating neonatals is an extremely difficult task. The “Babylog VN 500”rises to this challenge, providing comprehensive ventilation therapy for thesmallest of patients.

100% Dräger
40 visits to customersare clocked up on average by a Customer Process Monitoring Manager inthe course of a project. Through engaging in discussions and makingobservations, CPM managers discover what a product’s potential buyersrequire and wish for.
A company that wants to develop and sell productsis faced with one essential question: What do my customers want? Dräger has developed an outstand-ing method for finding that all-important answer: It’scalled Customer Process Monitoring.


55 100 % DRÄGER
SAFETY TECHNOLOGY ISN’T AN END IN ITSELF; its job is to protect lives. If we don’t know what our customers need, we will lose out. This is why Dräger takes time to ascertain customerneeds before it goes to the drawing board.
When Maike Koch tells people what she does for a living, she can often see a question mark appear abovetheir heads. She is a Customer Process Monitoring(CPM) Manager for Dräger. But what does that mean?What’s the job behind the abbreviation?
Her job is finding out for Dräger what customers need,to understand workflows on site, to ascertain what customers expect from the devices they rely in their day-to-day work. “Our aim is to develop solutions which give our customers the best possible support. There areplenty of manufacturers making good products. Whatwe need to do is provide something special, develop-ments that give the cus tomer extra benefits and set us apart from the competition. I call them ‘wow’ features,”Maike Koch explains. In her search for these “wow” features, Maike Koch places great value on listening care -fully and making precise observations. She visits hercustomers regularly, discusses with them their issues andwishes and watches them at work. This is vital becauseit’s often during these visits that she is able to notice dif -ficulties with workflows or with using devices, whichcould be resolved with a few simple adjustments to opti-mize the product or with a completely new concept.
Take the development of the Dräger X-am product fami-ly of portable gas detectors: In the past, Drägernoticed that industrial personnel were often carrying sev-eral detection devices for different gases around withthem in their shirt or lab coat pockets. This simple obser-vation led Dräger to draw several conclusions: “We now offer multi-gas detection devices which can detectup to six different gases at once,” Maike Koch explains.
“Additionally, toxic gases can get to the sensor from twosides, even when the device is being carried in a shirtpocket. The device warns in three ways: with sound, visu-ally and by vibrating.”
Customers are pleased about this interest in their dailywork: “I’m always welcome. Customers are happy that wewant to know their views. They like to discuss newideas with the potential to simplify processes or savethem time and money,” says Maike Koch.
The road from CPM Manager Maike Koch’s customervisit to a finished product is almost always a long one,which makes it vital for her to document every observa-tion precisely and analyze it carefully. This process also entails thinking about how prod ucts available todaymeet customer needs. Working closely with developersas well as product and market specialists, Maike Kochtakes a careful look at the competitive environment.Once all the results have been pulled together and allpros and cons weighed up, she passes her report tothe relevant product managers, who make sure the mar-ket requirements are included in the specifications that go to the development department.
Meanwhile, with the carefully researched product bursting with “wow” features still being firmly in the devel -opment stage, Maike Koch is embarking on her nextpro ject – with a different product, different areas of appli -cation and different customers. It’s this variety thatmakes her job so interesting; however diverse the prod-ucts and their users’ needs may be, one thing remainsconstantly true for Maike Koch: “Our products protectpeople from danger. We’re only fulfilling our objective to be 100 percent Dräger when we’re providing our cus-tomers with solutions that really support them.”

100 % DRÄGER
Sensitive “nose” to sniff out dangerCompact, light and easy to use, the waterproof gas detection device“Dräger X-am 5600” can sniff out up to six gases simultaneously, despiterough and tough industrial surroundings.

58
NOTE: The articles provide information on products and their possible applications ingeneral. They do not constitute any guarantee that a product has specific properties or ofits suitability for any specific purpose. All specialist personnel are required to make useexclusively of the skills they have acquired through their education and training and throughpractical experience. The views, opinions, and statements expressed by the persons named in the texts do not necessarily correspond to those of Drägerwerk AG & Co. KGaA.Such views, opinions, and statements are solely the opinion of the respective person. Not all of the products named in this report are available worldwide. Equipment packagescan vary from country to country. We reserve the right to make changes to products.

For Dräger, listening and understanding is just as important astaking action and developing solutions. We know what our customers need. Again and again, these needs inspire us to find solutionsthat make people's lives safer and their work easier.
MANAGEMENT REPORT
MARKET ENVIRONMENT
Important changes in fiscal year 2010 61
Group structure 65
Control system 66
Main accounting features of the internal control and risk management system as it relates to the financial reporting process 67
Overall economic environment 69
BUSINESS PERFORMANCE
Business performance of the Dräger Group 74
Cash flow statement 79
Financial management of the Dräger Group 82
Business performance of the medical division 86
Business performance of the safety division 92
Business performance of DrägerwerkAG & Co. KGaA / other companies 98
FUNCTIONAL AREAS
Research and development 99
Purchasing 102
Quality, Corporate IT 103
Environmental protection 104
Production and logistics 106
Basic features of the remuneration system 107
Personnel 111
POTENTIAL
Opportunities and risks relatingto future development 114
Operational risks 116
Opportunities 119
Disclosures pursuant to Sec. 315 (4)of the German Commercial Code (HGB)and explanations of the general partner 119
Subsequent events, Outlook 123
61

All important information ata glance and intuitiveguiding of the user – coreelements of the oper -ating concept, centeredon a color touchscreen. In neonatal intensive
care units, the “Babylog VN500” can
be fitted to flexible installation fixtures,
making optimum integration into work -
stations easy.
Reducing complexity: For example, screen
options, standard venti lation settings and
alarm configurations can be selected andtrans mitted to other
“Babylog VN500” ventilators.
High-performance high-frequency oscillation:Small tidal volumes athigh frequencies pro -tect premature babies’lungs from damage.
Support with workflows:with features such as
automatized suction pro-cedures and automatic
switching from daytime tonighttime functions.
EXPERIENCE SHOWS that premature babies and neonates with breathing prob-lems have particular needs. The “Babylog VN500” ventilator combines experience and expertise with up-to-the-minute technologies, heralding thebirth of a new era in neonatal ventilation.
*

61POTENTIALFUNCTIONAL AREASBUSINESS PERFORMANCEMARKET ENVIRONMENT
Important changes in fiscal year 2010
CAPITAL INCREASE
On June 30, 2010, Drägerwerk AG & Co. KGaA increasedits capital stock by EUR 9,753,600 to EUR 42,265,600 by issuing 3,810,000 new bearer common shares (no-parshares) with a share of EUR 2.56 each in capital stock(new common shares) with full dividend rights as from Jan-uary 1, 2010, in return for cash. Net proceeds amounted to around EUR 100 million after deducting transactioncosts (see Notes, pages 137 et seq.).
Drägerwerk AG & Co. KGaA implemented the transactionin two stages: The preplacement of existing commonshares was followed by a capital increase with subscriptionrights for all shareholders. On June 15, 2010, the man-dated banks Goldman Sachs International, London, GreatBritain, and M.M.Warburg & CO, Hamburg, Germany,assumed the contractual obli gation to implement the cap-ital increase and to take over the new common shares(hard underwriting) – subject to certain conditions andrights of withdrawal.
For the preplacement, the banks used a so-called acceler-ated bookbuilt offering (ABO) for selling a total of1,039,200 existing common shares without subscription
rights to institutional investors at EUR 41.00 each (ABO price). These common shares were previously heldby Dr. Heinrich Dräger GmbH.
The general partner of Drägerwerk AG & Co. KGaA,Drägerwerk Verwaltungs AG, used the authorization grant-ed by resolution of the annual shareholders’ meeting ofDrägerwerk AG & Co. KGaA on May 8, 2009. The annualshareholders’ meeting had authorized Drägerwerk Verwaltungs AG to increase the capital stock of the Com-pany by May 7, 2014, with the approval of the Supervi -sory Board of the Company, through a single or multipleissue of new bearer common shares (no-par shares) in return for cash and /or deposits in kind by up to EUR16,256,000 (authorized share capital).
The Company offered the new ordinary shares to theshareholders at a ratio of 10:3 at a subscription price ofEUR 27.50 each by way of an indirect subscription right(Sec. 186 [5] AktG [“Aktiengesetz”: German Stock Corpo-ration Act]). Subscription rights for preferred shares were traded on the regulated market (floor trading) atFrankfurt Stock Exchange between June 18, 2010 andJune 28, 2010, 24:00 hours. In the subscription period fromJune 17, 2010, to June 30, 2010, all previous subscriptionrights for common shares (1,905,000) as well as 1,886,037
Management report 2010 of the Dräger Group
2010 was an exceptional year in the 122-year history of Dräger. The excel-lent development of net sales and earnings originated from the strong orderintake in the fourth quarter of 2010, positive development in the Americasand Asia / Pacific regions and favorable currency effects. The turnaround pro-gram has also had a very positive impact.

62
of a total 1,905,000 subscription rights for preferredshares were exercised. The subscription rate thereforetotals 99.5 percent. The 18,963 unsubscribed new common shares were sold for EUR 41.00 each on July 2,2010 (rump placement).
Frankfurt Stock Exchange admitted the existing commonshares to the regulated market (Prime Standard) on June18, 2010, where they were quoted for the first time on Monday, June 21, 2010. After the capital increase had beenentered in the commercial register on June 30, 2010,Frankfurt Stock Exchange admitted the new commonshares to the regulated market (Prime Standard) on July 2, 2010, where they were quoted for the first time onJuly 5, 2010. All common shares as well as all preferredshares of Drägerwerk AG & Co. KGaA have therefore beenlisted for trading on the stock exchange.
The capital increase also has an effect with regard to par-ticipation certificates. If the Company carries out a capital increase with subscription rights for shareholders,holders of participation certificates of all three series are entitled to comparable subscription rights. Holders ofparticipation certificates have the right to acquire fur -ther participation certificates with subscription rights sim-ilar to those of the capital increase. The participation capital has to be increased accordingly. The subscriptionright and increase of participation capital are subject to the approval of the Company’s annual shareholders’ meet-ing as well as the exclusion or limitation of any otherlegal subscription rights, if this is necessary. In accordancewith the terms and conditions of participation certifi-cates, if the annual shareholders’ meeting does not approveof participation certificate holders exercising their sub-scription rights or if other legal subscription rights cannotbe excluded or limited to the required extent, the Com -pany must pay a cash compensation to the amount of theloss it deems participation certificate holders wouldincur through the capital increase in its reasonable discre-
tion (Sec. 315 BGB [“Bürgerliches Gesetzbuch”: GermanCivil Code]). Dräger recognized EUR 7.8 million in provisions for this contingency in 2010, which resulted inparticipation capital decreasing by EUR 5.7 million,adjusted for a tax advantage.
In addition, the annual shareholders’ meeting on May 7, 2010, resolved to conditionally increase the Company’scapital stock up to EUR 3,200,000 by issuing up to1,250,000 new no-par preferred bearer shares (no-parshares) in return for cash or contributions in kind (conditional capital). The conditional capital is used forissuing the option rights to Siemens.
PURCHASE OF THE 25 PERCENT SHARE IN DRÄGER
MEDICAL AG & CO. KG FROM SIEMENS
On March 26, 2010, the European Commission approvedthe purchase of all shares in Siemens Medical HoldingGmbH. The only condition for closing according to thepurchase agreement signed on December 29, 2009, has therefore been met. This agreement stipulates thatthe execution date is always the last day of a month (or the next business day, should this date be no businessday), whereby a minimum of five work ing days mustelapse between the approval date and the end of the month.For this reason, the transaction was executed on April 30, 2010. As previously explained in the annual report 2009,Dräger was already entitled to the acquired shares onDecember 31, 2009, from a financial point of view.
The purchase price of the 25 percent share in DrägerMedical AG & Co. KG comprised the following components:
– a cash settled component of EUR 175 million, – a vendor note of EUR 68.5 million divided into three
tranches of EUR 18.75 million (tranche I), EUR 40.0 million (tranche II) and EUR 9.75 million (tranche III),and
– a variable option component.
IMPORTANT CHANGES IN FISCAL YEAR 2010

63FUNCTIONAL AREASBUSINESS PERFORMANCEMARKET ENVIRONMENT
Dräger repaid the cash settled component on the effec-tive date as well as tranches I and II of the vendor note tothe total amount of EUR 58.75 million plus interest earlyon July 20, 2010, from the inflow of cash and cash equiva-lents provided by the capital increase.
The variable option was originally a cash settled option. In order to replace this, Dräger issued warrant bonds withoption rights guaranteed in the form of warrants to thetotal nominal value of EUR 1.25 million to Siemens onAugust 30, 2010. The option rights entitle their holders to acquire a total of 1.25 million preferred shares. Drägertherefore implemented the resolution of the annualshareholders’ meeting on May 7, 2010, which was approvedby the separate meeting of preferred shareholders.
The option rights had a strike price of EUR 64.12 onDecember 31, 2010, and expire on April 30, 2015. They aredivided into 25 individual options, entitling holders toacquire 50,000 preferred shares each. If one of the optionswas exercised by its holder, Dräger would issue new pre ferred shares from conditional capital. If all optionswere exercised, Drägerwerk AG & Co. KGaA wouldreceive EUR 80.15 million for issuing 1.25 million newpreferred shares on the balance sheet date.
As the option rights issued to Siemens had a higher fairvalue than the original cash settled option, Drägerreceived a EUR 8.5 million reduction on tranche III of thevendor note from Siemens, as agreed. Siemens paid thenominal value of the warrant bonds by offsetting it againstthe claim from tranche III of the vendor note. On Sep -tember 30, 2010, Dräger repaid the warrant bonds at theirnominal value plus interest to Siemens. With this trans -action, Dräger has now fully repaid all liabilities arisingfrom the acquisition of the 25 percent Siemens share in Dräger Medical AG & Co. KG.
The positive development of the preferred share comparedto December 31, 2009, increased the value of the origi -nally agreed option component during the course of thefiscal year. In the period January 1, 2010, until August 30, 2010, Dräger subsequently recognized EUR 11.8 mil-lion as an expense in other financial result (see page 153 in the notes). As from August 30, 2010, the option com-ponent did not have any further negative effect on earn-ings.
As the cash settled option was replaced with an equityinstrument on August 30, 2010, Drägerwerk AG & Co.KGaA was able to strengthen its equity base by an addition -al EUR 26.5 million.
NOTES TO THE TURNAROUND PROGRAM
With the help of the turnaround program that waslaunched in June 2009, Dräger has by now significantlyimproved its cost structure and at the same time invest-ed in future growth. The Company exceeded its originalgoal: achieving a positive, sustainable effect on earn -ings of EUR 100 million in 2011, measured against thenet sales, cost structure and exchange rates of 2008. But Dräger increased its profitability by EUR 107.3 millionbefore implementation costs in 2010 – one year earlierthan planned.
The extremely positive development of the turnaroundprogram continued in the fourth quarter of 2010. Com-pared to the same period of the previous year, Dräger realized additional earnings (cost savings and increasedefficiency of services) of EUR 4.4 million (4th quarter2009: EUR 33.7 million compared to 4th quarter 2008).Without taking into account the one-off payment to allemployees of German group companies in return for moreflexibility of the future collective agreement (“Zukunfts -tarifvertrag”), this sum would have been EUR 8.3 millionhigher. The implementation of improvement measuresincurred EUR 2.0 million in costs in the fourth quarter of2010 (4th quarter 2009: EUR 0.2 million).
POTENTIAL

64
In the full fiscal year 2010, the savings from turnaroundmeasures achieved by the Company were EUR 41.0 mil -lion higher than in the previous year (2009: EUR 69.0 mil-lion compared to 2008). Dräger generated the largest cost savings in the purchasing of production materials,other costs for goods and services as well as marketingand sales. The closure of the site in Best, Netherlands, andthe subsequent transfer of the production of emergencyventilators and other functions to Lübeck also created con-siderable savings. The turnaround program’s earningscontribution also included increases in the efficiency ofservices, in turn leading to increases in net sales and margins. The resulting effect amounted to EUR 1.3 million(2009: EUR 5.2 million). The Company spent EUR2.6 million (2009: EUR 18.5 million) on implementingimprovement measures in fiscal year 2010.
After margins and earnings had been stagnating or evendropping for several years, Dräger made the “turnaround”in 2010. Consequently, the program was discontinued at the end of fiscal year 2010. Individual, not yet fully imple-mented turnaround measures are being integrated inother improvement measures or in the course of day to daybusiness activities of each business function.
CHANGES IN THE EXECUTIVE BOARD OF DRÄGERWERK
VERWALTUNGS AG
On May 6, 2010, the Supervisory Board of Drägerwerk Verwaltungs AG extended the contract of Gert-HartwigLes cow, CFO, by five years until the end of March 2016.Gert-Hartwig Lescow has been a member of the ExecutiveBoard of Drägerwerk Verwaltungs AG since April 1, 2008.On the same day the Supervisory Board of DrägerwerkVerwaltungs AG appointed Anton Schrofner as member of the Executive Board. Anton Schrofner became responsi-ble for Production and Logistics on September 1, 2010. Dr. Herbert Fehrecke, Vice-Chairman of the ExecutiveBoard, formerly headed this area of responsibility and in addition to the functions Purchasing, Quality and IT
took on the responsibility for Research & Developmentfrom Dr. Ulrich Thibaut on July 1, 2010. Dr. Ulrich Thibautleft the Company on his own request on June 30, 2010, to take up new professional challenges.
At its meeting on September 15, 2010, the SupervisoryBoard of Drägerwerk Verwaltungs AG appointed Dr. CarlaKriwet as member of the Executive Board for Marketingand Sales as from January 1, 2011. As part of the strategicrealignment moving the Company to a shared func -tional structure, management positions in charge of thefunctions Finance, Research & Development, Purchas-ing, Production as well as Marketing & Sales across theentire Group have now been filled. Dr. Dieter Pruss, mem ber of the Executive Board of Drägerwerk VerwaltungsAG and CEO of Dräger Safety AG & Co. KGaA, left theCom pany at his own request on December 31, 2010, to takeon new professional challenges. He was appointed as amember of the Executive Board on April 1, 2008, and re -sponsible for Marketing and Sales in the safety division.
DRÄGER MEDICAL AG & CO. KG BECOMES
DRÄGER MEDICAL GMBH
The restructuring of Dräger Medical AG & Co. KG resolvedby Drägerwerk AG & Co. KGaA on August 31, 2010,became effective on September 20, 2010 (effective date).The legal successor of Dräger Medical AG & Co. KG is the former Dräger Medical Holding GmbH, now tradingas Dräger Medical GmbH since the effective date. Dräger Medical GmbH is a wholly-owned subsidiary ofDrägerwerk AG & Co. KGaA. The aim was to simplify the shareholder structure within the scope of the buybackof Siemens’ 25 percent share in the medical division.
IMPORTANT CHANGES IN FISCAL YEAR 2010 | GROUP STRUCTURE

65FUNCTIONAL AREASBUSINESS PERFORMANCEMARKET ENVIRONMENT
Group structure
The parent company of the Dräger Group is DrägerwerkAG & Co. KGaA. It holds all shares in Dräger Medical GmbHand Dräger Safety AG & Co. KGaA and therefore the parent companies of the medical and safety divisions. Apartfrom the investments in Dräger Medical GmbH andDräger Safety AG & Co. KGaA, Drägerwerk AG & Co. KGaAalso holds a few equity investments which do not formpart of the two divisions’ operations (see pages 211 et seq.in the notes). All the shareholdings which form part of the global operations of the two divisions are either direct-ly or indirectly owned by the respective parent.
At Drägerwerk AG & Co. KGaA, central services such asLegal, Tax, Internal Audit, Group Accounting, Group Controlling, Corporate Communications, Insurance, andInvestor Relations are organized as shared services, as are Corporate IT, Marketing Communications, CorporatePurchasing and Corporate Human Resources.
OPERATING ACTIVITIES OF THE MEDICAL DIVISON
The medical division develops, produces, and markets sys-tem solutions, equipment and services for the acute point of care (APOC) process chain. These include emer-gency care, perioperative care (in connection with theoperation), critical care and perinatal care (in connectionwith childbirth). The portfolio comprises products fortherapy, monitoring information management and processsupport. Dräger is one of the global market leaders with its products for ventilation, anesthetics, ongoing surveil-lance of vital signs as well as their accessories and con-sumables. In recent years, Dräger considerably improvedits market position as a system provider with productssuch as integrated IT solutions for the operating room andgas management systems.
Of the 6,386 people employed by the division worldwide(December 31, 2010), 54 percent work in Sales, Marketingand Service, 26 percent in Production, Quality Assurance,
GROUP STRUCTURE
Dräger Group
Dräger Medical GmbH
Shareholdingsin Germany and abroad
Dräger Safety AG & Co. KGaA
Shareholdingsin Germany and abroad
100 %**
All consolidated companies are listed on pages 211 et seq.in this annual report.
* Drägerwerk Verwaltungs AG is the general partner and does not hold any shares** After the acquisition contract for the purchase of the 25 percent share of Dräger
Medical AG & Co. KG became effective
100 %
Drägerwerk AG & Co. KGaA*
POTENTIAL

66
Logistics and Purchasing, 11 percent in Research & Devel-opment, and 9 percent in Administration.
The medical division has development centers and pro -duction plants in Germany (Lübeck), the Czech Republic(Policka), the US (Andover and Telford), and China(Shanghai).
The division is represented in around 190 countries on all continents and has sales and service subsidiaries in over40 countries.
OPERATING ACTIVITIES OF THE SAFETY DIVISION
The safety division develops, produces and markets prod-ucts, system solutions and services for personal protec-tion, gas detection technology and integrated hazard man-agement. Its customers come from industry, mining and public sectors such as fire departments, police anddisaster protection. The portfolio includes stationary and mobile gas detection systems, personal protectiveequipment, professional diving systems, alcohol and drug testing devices, a varied range of training and servic-es and also projects such as entire fire training systems.
Of the 4,409 people employed by the division worldwide(December 31, 2010), 49 percent work in Sales, Marketingand Service, 37 percent in Production, Quality Assurance,Logistics and Purchasing, 6 percent in Research & Devel-opment, and 8 percent in Administration.
The safety division has production sites in Germany(Lübeck and Hagen), Great Britain (Blyth and Plymouth),the Czech Republic (Chomutov) and Sweden (Svenl -junga) as well as Brazil (São Paulo), the US (Pittsburgh),China (Beijing) and South Africa (King William’s Town).
The division is represented in around 100 countries on allcontinents and has sales and service subsidiaries in over30 countries.
Control system
The internal control system supports management insecuring the long-term success of the Company. It compris-es budgets, actual cost calculations and forecasts withstrategic and operative elements. The strategic Companyplanning created in 2010 is based on value-driven Com -pany management. Its aim is to continuously and sustain-ably increase the Company’s value. As part of the strate -gic planning process, Dräger determines a medium-termtarget for the value of the whole Group and the divi-sions. Dräger’s value-driven key figure is called “DrägerValue Added” (DVA). It is the difference between EBITand interest on capital employed. In the sense of value-driv-en Company management, a rising DVA is equivalent to an increasing Company value. The DVA key figure alsoforms part of segment reporting (see page 200).
The expected market developments, technological trendsand their influence on products and services as well as the financial means of the Dräger Group flow into theCompany’s strategic plan. The results are condensed in a four-year plan and projected onto the fifth planning year. The Company sets out strategic measures and continu -ously monitors their implementation and value added.
As from 2011, Dräger is using DVA as the main key figurefor calculating variable remuneration for members of the Executive Board and executive employees. In order toimprove its forecasts and ability to act, Dräger will devel-op the forecast calculation into a rolling forecast calcula-tion.
The monthly group reporting includes the IFRS financialstatements of all of the group companies and shows thedevelopment of the net assets, financial position and resultsof operations of the Group, the divisions and other con-trolling units. This data is supplemented by a large amountof detailed information required for the management
GROUP STRUCTURE | CONTROL SYSTEM | MAIN ACCOUNTING FEATURES OF THE INTERNAL CONTROL AND RISK MANAGEMENT SYSTEM
67FUNCTIONAL AREASBUSINESS PERFORMANCEMARKET ENVIRONMENT
of the Group’s operating activities. Forecasts for estimat-ing the overall net earnings for the year are produced at regular intervals during the fiscal year. Reports preparedat least every six months which address the Company’ssignificant risks are a further component of the controlsystem. These reports are discussed during Executive and Supervisory Board meetings and are important as abasis for key decisions.
The most important key figures used to monitor the devel-opment of the Company and its divisions are net sales,EBIT, EBIT margin, return on capital employed (ROCE),as well as cash flow and key figures for capital employed.Order intake, orders on hand, sales outlooks and projectforecasts are important early indicators for future oper -ating performance. Early indicators for strategic develop-ment are development projects and their status, marketresponse to new products and the Company’s developmentand competitive position within the various regionalmarkets.
Further information on the management and controlstructure can be found in the corporate governancereport and online at www.draeger.com/investor_relations.
Main accounting features of the internalcontrol and risk management system as it relates to the financial reportingprocess
DEFINITIONS AND ELEMENTS OF THE INTERNAL
CONTROL AND RISK MANAGEMENT SYSTEM OF THE
DRÄGER GROUP
The internal control system of the Dräger Group includesall principles, processes and measures for guaranteeing theeffectiveness, efficiency and correctness of the financialreporting system and ensuring compliance with all relevantlegal requirements.
The internal control system of the Dräger Group compris-es internal controls as well as the monitoring system. The Executive Board of Drägerwerk Verwaltungs AG, inits role as management of Drägerwerk AG & Co. KGaA,specifically appointed the Group Controlling and GroupAccounting as responsible parties for the internal controlsystem of the Dräger Group.
The control system of the Dräger Group comprises bothprocess-integrated and process-independent measures.Manual process controls, such as a system of checks andbalances and automated IT process controls are bothessential parts of the process-integrated measures. In addi-tion, bodies like the Compliance Committee and spe -cific group functions like the central tax and group legaldepartments ensure process-integrated monitoring.
The Supervisory Board, particularly the Audit Committee of Drägerwerk AG & Co. KGaA, and Group Internal Auditimplement audit activities as part of the internal moni -toring system. The group internal audit department carriesout regular audits at foreign group companies and inLübeck. The auditor of the group financial statements car-ries out process-independent audit activities and istherefore part of the control system of the Company. Theaudit of the financial statements of the consolidated subsidiaries in particular is the most essential process-inde-pendent control measure of the group reporting process.
The risk management system is aimed at avoiding incor-rect entries during the group accounting process and the external reporting process. It comprises operationalrisk management and a group-wide systematic early-warning system.
USE OF IT SYSTEMS
The consolidated subsidiaries report data relevant to thereporting system in their individual financial statements.Dräger mainly uses the SAP and Microsoft standard soft-
POTENTIAL

MAIN ACCOUNTING FEATURES OF THE INTERNAL CONTROL AND RISK MANAGEMENT SYSTEM | OVERALL ECONOMIC ENVIRONMENT68
ware. Each month, the single entity financial statementsand additional, standardized information on the account-ing process are consolidated in the SAP EC-CS system.
Dräger uses a uniform accounts structure throughout theGroup, which also stipulates the reconciliation methods for items in the financial statements. Local accountingmethods are adjusted to comply with IFRS by making corresponding entries in the local accounting systems orby reporting an adjustment on a group level. Once theentry has been translated into the group currency euro, allinternal business transactions are consolidated.
The data is transferred from SAP EC-CS to SAP BusinessWarehouse so it can be analyzed. The internal auditdepartment assesses the IT environment, identifies poten-tial risks, regularly records them in the risk manage -ment system and reports them at least twice a year to theExecutive Board. In addition, the auditors of the groupfinancial statements carry out an independent audit ofthe entire IT control system, change management, IToperations, access to programs and data and system devel-opment once a year.
In fiscal year 2004, all of the IT activities at the Lübecksite were outsourced to the service provider Capgemini.Since 2007, the Company started carrying out selectedtasks in-house again or outsourced them to other serviceproviders. As a result, the central Corporate IT depart-ment developed its own capacities in selected areas andwill continue to do so in the future. External partners will continue operating technical systems at their comput-er centers.
ESSENTIAL REGULATORY MEASURES AND CONTROLS
FOR ENSURING COMPLIANCE AND RELIABILITY OF THE
GROUP FINANCIAL REPORTING SYSTEM
Dräger has an internal control system to ensure the com-pliance and reliability of the group financial reporting system and also to ensure that business transactions are
recorded completely and promptly and in accordancewith IFRS as well as commercial and tax laws. Pursuantto these regulations, Dräger carries out inventories, measures assets and liabilities and recognizes them in thegroup financial statements.
Amounts reported in the income statement are checkedto ensure they were recognized in the correct period. The Company ensures that reliable and traceable docu-mentation for the business transaction is attached to therecords. It is ensured that accounting transactions arepromptly and completely recorded by clearly allocatingresponsibilities and control of the process for preparingthe financial statements, by providing transparentaccounting and reporting guidelines, and by using reliableIT accounting systems in the group companies. In addition, the subsidiaries’ monthly reports are checked byGroup Controlling and reconciled with the plans.
Regular alignment meetings and institutionalized report-ing requirements within the Finance function ensurethat group-wide restructurings or changes are recordedpromptly in the group financial statements. When a new company has been acquired or founded, employeesfrom the Dräger departments provide employees in theAccounting department with training on the preparationof the financial statements according to IFRS, which isthe authoritative reporting standard in the Dräger Group,including the reporting system and reporting dates. If possible, the managers of the Accounting departmentsattend a central IFRS training seminar once a year, inorder to ensure a high quality standard.
Separating administrative, executive and authorizationfunctions by issuing different access profiles in theaccounting systems reduces the potential for fraudulentacts against the Company. IFRS are applied through -out the Group to ensure that all German and foreign sub-sidiaries consolidated in the group financial statements

69FUNCTIONAL AREASBUSINESS PERFORMANCEMARKET ENVIRONMENT
use the same standard. These policies apply to generalaccounting policies, balance sheet, income statement andnotes. They are regularly adjusted to comply with currentEU legislation.
Group accounting determines the scope of consolidationand the elements of the reporting packages the groupcompanies have to prepare. Prior to the preparation of thefinancial statements, the group companies and localauditing firms are provided with additional information –including schedule and deadlines – that enables them to prepare the financial statements in good time for the bal-ance sheet date and in accordance with the applicablereporting standards.
Each subsidiary sends its reporting package in electronicform to the employee of the Accounting department inLübeck responsible for the subsidiary in question who thentransfers the data into the standardized SAP EC-CS con -solidation system in Lübeck. The local auditors examineeach reporting package regarding compliance withDräger accounting policies and issue a comment, if nec-essary. By implementing the validation rules of the localreporting tool and SAP EC-CS, Dräger guarantees a highdegree of data quality. In addition, Central Accountingassesses the reporting packages based on internal Drägerchecklists.
Overall economic environment
The overall economic environment in 2010 was marked bya surprisingly strong recovery of the global economy aswell as increasingly restrictive monetary policies of manygovernments as a result of the debt crisis in the eurozone.
GLOBAL ECONOMY: UP 5.0 PERCENT
The global economy returned to an impressive growth pathin 2010. According to the International Monetary Fund
(IMF), the global economy grew by 5.0 percent (2009: –0.6percent). The economies of the industrialized and emerg-ing countries recorded strong growth, with momentumbeing considerably higher in emerging markets such asChina (10.3 percent) and India (9.7 percent). Especiallythe dynamic global trade, driven by the emerging coun-tries, and the economic stimulus packages issued by gov-ernments created momentum in the industrialized countries. In the opinion of the Kiel Institute for the WorldEconomy (IfW), the global economy entered into a “period of moderate expansion” in the second half of theyear. The stimuli lost their power and at the same time an increasing number of governments had to go back torestricting their monetary policies during the course of the year to counteract high government debt. To a largeextent, unemployment figures developed steadily aroundthe world. The central banks supported the real economyand the financial sector by providing an extremely largesupply of liquidity. The European Central Bank (ECB) keptits key interest rate for the eurozone at a historical low of 1.0 percent. The US Federal Reserve (Fed) also support-ed the entire economic development and the banking sector in particular by setting their key interest rate at 0.00to 0.25 percent and by issuing additional stimulus pack-ages as well as acquiring a huge amount of bonds (“quan-titative easing”). The People’s Bank of China, on the other hand, increase the reference rates for bank depositsand loans with maturities of one year on two occasions by a total of 50 basis points to 2.75 percent and 5.81 percentrespectively due to the rising pressure of inflation. Globalindustrial production lost much of its momentum duringthe course of 2010. While growth slowed down in theemerging markets, it stagnated in the industrialized coun-tries.
GERMANY: GROWTH DRIVER IN THE EUROZONE
The global economic recovery greatly stimulated the Ger-man economy as it is largely dependent on exports.According to Destatis, the positive international impulses
POTENTIAL

OVERALL ECONOMIC ENVIRONMENT70
and steep rise in domestic demand led to 3.6 percentgrowth (2009: – 4.7 percent). The German economy therefore recorded the largest growth in the eurozone andalso the steepest rise since the reunification. In com -parison, the gross domestic product (GDP) in the eurozonewent up by just 1.8 percent in 2010 according to the IMF (2009: – 4.1 percent). The economies in Greece, Ire-land, Portugal, Italy and Spain, which had to seriously cut their budgets, considerably slowed down growth in theeurozone. Industrial production in Germany alsoincreased the most compared to other European countries.Overall, the economic recovery in the eurozone stabi -lized the labor market. The imbalances within the euro-zone were reflected in a sinking unemployment rate inGermany and continuously high rates in countries such asSpain.
USA: GROWTH HAS LESS MOMENTUM
THAN IN GERMANY
After shrinking by 2.6 percent in 2009, the US economygrew by just 2.8 percent in 2010 according to the IMFdespite extensive economic stimulus packages and anexpansive monetary policy. The positive economic recovery was driven by corporate investments and a steeprise in private and government spending. But the hightrade deficit due to a significant rise in imports sloweddown this development.
EMERGING COUNTRIES: DYNAMIC GROWTH
The emerging countries once again developed very dynam-ically in 2010. The Halle Institute for Economic Research(IWH) even pointed out various signs of the economiesoverheating, resulting in the central banks starting to restrict their monetary policies. In addition, currencyappreciation slowed down the momentum. The Asia /Pacific region grew by 9.3 percent in 2010, compared to7.4 percent in 2009. The Japanese economy also profitedfrom the strong growth in the emerging countries and theexport in other Asian markets. The country’s GDP exceed -
ed that of the previous year by 4.3 percent after shrinkingby 6.3 percent the year before.
INFLATION: UP 1.5 PERCENT IN THE INDUSTRIALIZED
COUNTRIES
While inflation in China reached a relatively high level of 5.1 percent in November according to official informa-tion (December 2009: 4.6 percent), prices went up onlymoderately in the eurozone and the US in 2010. The annu-al inflation rate went up by an average 1.5 percent in the eurozone. In December, it reached 2.2 percent, for thefirst time in about two years exceeding the ECB target(2.0 percent). Prices for energy and food increased in par-ticular. In Germany, the average annual inflation rate was 1.1 percent. In the US, the inflation rate also rose to1.5 percent in the wake of the economic recovery.
COMMODITY PRICES: UP 30.7 PERCENT (IN EUR)
Commodity prices rose steeply in 2010 on account of theeconomy taking an upturn. The HWWI1 commodity priceindex (excluding energy prices) climbed by 21.0 percent in US dollars and 30.7 percent in euros between Januaryand December. The rise in demand occasioned by the economic recovery around the world particularly pushedup prices for commodities such as non-ferrous metalsconsiderably. In addition, supply shortages and speculationsin the commodity markets boosted prices.
CURRENCY: EURO DROPS 5.4 PERCENT AGAINST
US DOLLAR
The eurozone had to throw a EUR 750 billion safety net tocatch several EU member states and save them from their increasing debt crises. The liquidity problems ofGreece came to light in the spring of 2010 and severalother EU economies followed suit during the year. Thisled to high fluctuations of the euro at times. After incur -
1 Hamburg Institute of International Economics (Hamburgisches WeltWirtschaftsInstitut)

71FUNCTIONAL AREASBUSINESS PERFORMANCEMARKET ENVIRONMENT
ring considerable losses until mid June, the euro was ableto make up a lot of ground compared to the US dollaruntil the beginning of November. But the common curren-cy dropped again in the wake of the rising insecurity inthe eurozone towards the end of the year. On the first dayof trading in 2010, the euro closed at USD 1.4413 com-pared to USD 1.3362 on the last trading day. The euroreached its high on January 11, 2010, at USD 1.4514 and its low on June 7, at USD 1.1917. The average euroexchange rate was USD 1.32, around 5.4 percent lowerthan in the previous year. Measured against the currenciesof the 20 most important eurozone trade partners, theeuro’s nominal effective exchange rate was 4.0 percentdown on the average value in 2009 on January 12, 2010.
EFFECTS OF THE ECONOMIC ENVIRONMENT ON THE
DRÄGER GROUP
In fiscal year 2010, Dräger profited in particular from theemerging countries’ rapid return to growth and the corre-sponding catch-up effects in the industrialized countriesafter the economic downturn in 2009. Low interest ratescreated additional stimuli for demand as they provided cus-tomers with favorable financing terms. The debt-inducedrestrictive monetary policies of some countries like Italy
and Spain however slowed down demand from cus -tomer groups such as hospitals, fire fighting services andthe police force. The weakness of the euro had a positiveimpact on Dräger. Net of currency effects, net sales wouldhave risen by 9.5 percent instead of 13.9 percent andorder intake by merely 4.1 percent instead of 8.5 percent.Purchasing conditions were improved as part of the turnaround program and were able to make up for highercommodity prices.
MEDICAL DIVISION – INDUSTRY PERFORMANCE
Medical technology markets around the world wereimpacted by at times strong catch-up effects after the crisisyear 2009. The market in Germany and other parts ofEurope recovered considerably. In South Europe, on theother hand, governments’ efforts to consolidate theirbudgets made developments stagnate and many Europeangovernments cut their healthcare budgets. In the US,demand developed slowly in the first half of 2010, then roseagain to levels last seen in 2008. In the Asian and SouthAmerican emerging markets, strong population growthmade it necessary to invest in their healthcare infra -structures. As the GDP of these countries is increasingsignificantly, they are increasingly able to meet this need
MEDICAL DIVISION – INDUSTRY PERFORMANCE MARKET VOLUME PER REGION 2010
9 % (prior year: 9 %) Germany 1
27 % (prior year: 27 %) Rest of Europe 2
39 % (prior year: 38 %) Americas 3
21% (prior year: 21 %) Asia / Pacific 4
4 % (prior year: 5 %) Other 5
1
2
3
4
5
SAFETY DIVISION – INDUSTRY PERFORMANCE MARKET VOLUME PER REGION 2010
10 % (prior year: 10 %) Germany 1
27 % (prior year: 28 %) Rest of Europe 2
38 % (prior year: 38 %) Americas 3
21 % (prior year: 20 %) Asia / Pacific 4
4 % (prior year: 4 %) Other 5
1
2
3
4
5
POTENTIAL

OVERALL ECONOMIC ENVIRONMENT72
for investment themselves. Especially in China, the med-ical technology market continued growing strongly. Cus-tomers’ main investment criterion around the world isincreasing the efficiency of processes to remain com -petitive. The growing demand for all-in-one system solu-tions led to further consolidations on the supply side.
SAFETY DIVISION – INDUSTRY PERFORMANCE
Demand in the safety technology markets increased againafter stagnating in the previous year. Strong growth of the German economy revived demand accordingly, amongindustrial customers and public authorities alike. InSouth Europe, on the other hand, the market continuedto stagnate as a result of the financial crisis. The situa-tion in the US leveled out again at pre-crisis levels afterindustry inventories were stockpiled during the course of 2010. Public authority customers started placing an in -creasing number of orders again. In Asia, especially China and India developed a lot of momentum and werethe main drivers of a stable market development. Theexpansion of the industrial value added chain in the quick-ly growing emerging markets drove demand in industriessuch as the steel and chemical sectors. Globally, demandrose the most in countries with the strongest GDPgrowth, i. e. China, India and Brazil. Due to the economicdevelopment as well as rising living standards in thesecountries, investments were made in their infrastructuresand their fire fighting services and police forces. The consolidation of suppliers, which has been going on forsome years now, continued in 2010.

73POTENTIALFUNCTIONAL AREASBUSINESS PERFORMANCEMARKET ENVIRONMENT

BUSINESS PERFORMANCE OF THE DRÄGER GROUP74
Business performance of the Dräger Group
Fourth quarter Twelve months
2010 2009 Change in % 2010 2009 Change in %
Order intake € million 577.1 563.8 +2.4 2,145.5 1,978.3 +8.5
Orders on hand 1 € million 421.7 440.1 (4.2) 421.7 440.1 (4.2)
Net sales € million 635.3 562.8 +12.9 2,177.3 1,911.1 +13.9
EBITDA 2 € million 70.2 72.5 (3.1) 246.7 146.0 +68.9
Depreciation / amortization € million (14.1) (20.8) (32.1) (53.9) (65.9) (18.2)
EBIT 3 € million 56.1 51.7 +8.5 192.8 80.1 +140.6
Interest result € million (9.7) (9.0) +7.8 (39.1) (30.8) +26.8
Income taxes 7 € million (11.8) (15.0) (21.3) (48.9) (16.8) +190.6
Net profit 7 € million 34.6 27.7 +24.9 104.8 32.5 +222.8
Earnings per share 7
per preferred share € 1.53 1.20 +27.5 6.25 1.20 +420.8
per common share € 1.52 1.19 +27.7 6.19 1.14 +443.0
R&D costs € million 43.2 37.6 +15.0 148.4 149.4 (0.7)
Equity ratio 1 % 32.2 20.9 32.2 20.9
Cash flow from operating activities 7 € million 120.8 63.1 +91.5 219.1 193.5 +13.3
Net financial debt 1 € million 90.3 374.4 (75.9) 90.3 374.4 (75.9)
Investments € million 21.9 94.4 (76.8) 55.8 128.3 (56.5)
Capital employed 1, 4 € million 833.4 709.1 +17.5 833.4 709.1 +17.5
Net working capital 1, 5 € million 312.4 191.4 +63.2 312.4 191.4 +63.2
EBIT 3 / net sales % 8.8 9.2 8.9 4.2
EBIT 3 / Capital Employed 4 (ROCE) % 23.1 11.3
Net financial debt 1/ EBITDA 2 Factor 0.4 2.6
Gearing 6 Factor 0.1 1.0
DVA 114.5 (1.8)
Total headcount 1 11,291 11,071 +2,0 11,291 11,071 +2.0
1 Value as of December 312 EBITDA = Earnings before net interest result, income taxes, depreciation and amortization 3 EBIT = Earnings before net interest result and income taxes4 Capital employed = Total assets less deferred tax assets, current securities, cash and cash equivalents and non-interest bearing liabilities5 Net working capital = Current, non-interest bearing assets less current, non-interest bearing debt6 Gearing = Net financial debt / equity7 Due to the changes to the reporting methods for participation certificates in 2009, the quarterly figures in the previous year were adjusted accordingly.
BUSINESS PERFORMANCE OF THE DRÄGER GROUP

OVERVIEW
In 2010, Dräger increased net sales considerably by 9.5percent (net of currency effects) thanks to the global eco-nomic upturn and a 5.0 percent rise in the global GDP.Order intake went up 4.1 percent (net of currency effects)year-on-year. Orders on hand dropped by 8.5 percent (net of currency effects) compared to the high volume inthe previous year. The EBIT margin climbed from 4.2 percent on December 31, 2009, to 8.9 percent on Decem-ber 31, 2010. The reasons for this were a large rise in the percentage of new products, a favorable product mix,an improved cost position and also strong growth indemand, especially in Asia and the Americas. The weak-ness of the euro also had an extremely positive effect.
Net sales and order intake in both divisions went up in2010. Order intake in the medical division rose by 3.5 per-cent (net of currency effects) and net sales by 12.4 per-cent (net of currency effects). With 5,1 percent (net of cur-rency effects) order intake growth and 3.8 percent (net of currency effects) net sales growth, the safety division wasup on the previous year’s figures.
As a result of net sales increasing considerably and thanksto EUR 41.0 million in savings achieved under the turn-around program compared to 2009, Dräger recorded EBIT
of EUR 192.8 million in 2010 – one of the best results inthe 122-year history of the Company.
ORDER INTAKE
In fiscal year 2010, Dräger Group increased its orderintake by 4.1 percent (net of currency effects) comparedto the previous year. In the fourth quarter of 2010, theCompany was unable to keep up the growth momentumof the first nine months (6.8 percent). Order intake in the fourth quarter of 2010 was 2.7 percent (net of curren-cy effects) down year-on-year, one of the reasons beinglarge orders received in the previous year. In the full year2010, order intake in the medical division went up 3.5percent (net of currency effects), and the safety divisioneven recorded 5.1 percent (net of currency effects)growth. Dräger achieved by far the largest increases (netof currency effects) in the Americas (25.4 percent) andAsia / Pacific (8.6 percent) regions.
ORDERS ON HAND
As of December 31, 2010, orders on hand were down 8.5percent (net of currency effects) against the previousyear’s record figure. Order volume in the medical divisionfell by 11.1 percent (net of currency effects) due to anextraordinarily high number of orders received at the endof 2009, which could only be delivered and invoiced in
75FUNCTIONAL AREASBUSINESS PERFORMANCEMARKET ENVIRONMENT
Fourth quarter Twelve months
€ million 2010 20091 Change Net of 2010 20091 Change Net ofin % currency in % currency
effects in % effects in %
Germany 102.9 103.5 (0.6) (0.6) 428.2 415.3 3.1 3.1
Rest of Europe 233.8 254.4 (8.1) (10.3) 794.7 805.4 (1.3) (3.6)
Americas 119.2 103.0 15.7 5.2 475.7 354.3 34.3 25.4
Asia / Pacific 85.6 66.3 29.2 12.8 314.3 259.8 21.0 8.6
Other 35.6 36.7 (2.8) (6.3) 132.6 143.6 (7.6) (11.0)
Total order intake 577.1 563.8 2.4 (2.7) 2,145.5 1,978.3 8.5 4.1
1 Intercompany orders were allocated to the individual regions. Previous periods’ figures were adjusted accordingly.
ORDER INTAKE
POTENTIAL

BUSINESS PERFORMANCE OF THE DRÄGER GROUP76
2010. In the safety division, orders on hand at the end of2010 were 2.8 percent (net of currency effects) down year-on-year. At the end of 2010, equipment orders on handwent down, covering a 2.4-month period (December 31,2009: 3.0 months). This figure is based on the average netsales over the past twelve months.
NET SALES
Dräger increased net sales in fiscal year 2010 by 9.5 percent(net of currency effects) to EUR 2,177.3 million (2009:EUR 1,911.1 million). Net sales rose by 12.4 percent (netof currency effects) in the medical division year-on-year,and by 3.8 percent (net of currency effects) in the safetydivision. The considerably increase in demand in theAmericas and Asia / Pacific regions was the main growthdriver in both divisions. In the fourth quarter of 2010, net sales came to EUR 635.3 million, 7.7 percent (net ofcurrency effects) up on the same period in the previousyear but down on the average growth in the previous ninemonths.
EARNINGS
The steep rise in net sales, positive changes to the productmix, material cost savings and favorable currency effectsconsiderably pushed up the gross margin to 48.0 percent(2009: 43.5 percent). The business in deep sea diving
systems, on the other hand, pushed down earnings by EUR2.7 million in fiscal year 2010. In the previous year, deep seadiving systems were written down to the amount of EUR30.0 million. The turnaround program (cost savings andincrease in the efficiency of services) aided the increaseof the gross margin by contributing additional earnings ofEUR 41.0 million (without taking into account EUR 2.6million in implementation costs). Dräger generated thelargest cost savings in the purchasing of production materials, other costs for goods and services as well as in
€ million December 31, 2010 December 31, 20091 Change Net of currencyin % effects in %
Germany 71.1 77.2 (8.0) (8.0)
Rest of Europe 148.3 187.9 (21.1) (22.5)
Americas 98.4 73.2 34.6 25.2
Asia / Pacific 73.1 58.7 24.4 9.5
Other 30.9 43.1 (28.3) (30.2)
Total orders on hand 421.7 440.1 (4.2) (8.5)
1 Intercompany orders were allocated to the individual regions. Previous periods’ figures were adjusted accordingly.
ORDERS ON HAND
GROUP NET SALES BY REGION 2010
19.9 % (prior year: 21.0 %) Germany 1
38.3 % (prior year: 41.0 %) Rest of Europe 2
20.9 % (prior year: 18.2 %) Americas 3
14.1 % (prior year: 12.8 %) Asia / Pacific 4
6.7 % (prior year: 7.0 %) Other 5
Intercompany net sales were allocated to the individual regions.The previous periods’ figures were adjusted accordingly.
1
2
3
4
5

77POTENTIALFUNCTIONAL AREASBUSINESS PERFORMANCEMARKET ENVIRONMENT
a negative effect. Especially the functional areas Marketing,Sales and General Administration expanded their capac -ities in order to increase their level of customer care andidentify market trends at an early stage.
In 2010, Dräger invested the same amount as in the pre -vious year in research and development to increase the per-centage of new products in total net sales in the future.New products usually have much higher margins than theirpredecessors in the same category. The previous year’sfigures included one-off expenses of EUR 4.8 million forthe closure of the site in Best, Netherlands, and the dis -continuation of a development project in the medical divi-sion. Due to higher net sales, the ratio between researchand development and net sales went down to 6.8 percent(2009: 7.8 percent).
Group earnings before interest and taxes (EBIT) soared by140.6 percent to EUR 192.8 million (2009: EUR 80.1 million) and the EBIT margin increased to 8.9 percent(2009: 4.2 percent). On the one hand, EBIT in the med -ical division climbed by 143.3 percent to EUR 186.6 million(2009: EUR 76.7 million), on the other, EBIT in the safety division rose by 102.3 percent to EUR 61.0 million(2009: EUR 30.2 million).
Marketing and Sales. The closure of the site in Best,Netherlands, and the subsequent transfer of the productionof emergency ventilators and other functions to Lübeckalso created considerable savings. The savings from theturnaround program were unable to fully offset costincreases. This was due to factors such as foreign sub-sidiaries recognizing provisions for taxes and otherexpenses of EUR 14.6 million. The measurement of theoption component in connection with the reduction of the liabilities from tranche III resulted in additionaleffect of EUR 11.8 million. In addition, higher deferredtaxes on profit shares – including the one-off payment toall employees of German group companies of EUR 8.3million under the future collective agreement (“Zukunft-starifvertrag”) – had a negative impact on earnings. Due to the syndicated loan being repaid, EUR 4.5 millionwere recognized as expenses, which up to that point had been deferred over the term of the loan agreements.
Although functional costs rose by 11.4 percent in 2010compared to the previous year, this rise (net of currencyeffects) remained below the level of net sales growth. Com-pared to the previous year, the strong US dollar resulted in higher functional costs when translated into euros. Per-sonnel expense went up by 9.8 percent and this also had
Fourth quarter Twelve months
€ million 2010 20091 Change Net of 2010 20091 Change Net ofin % currency in % currency
effects in % effects in %
Germany 125.5 119.8 4.8 4.8 433.2 402.4 7.7 7.7
Rest of Europe 252.3 253.9 (0.6) (2.8) 834.1 783.5 6.5 4.2
Americas 129.7 86.2 50.5 37.7 455.6 347.6 31.1 22.2
Asia / Pacific 86.6 69.0 25.4 8.9 307.8 244.7 25.8 12.7
Other 41.2 33.9 21.5 18.2 146.5 132.9 10.2 6.7
Total orders on hand 635.3 562.8 12.9 7.7 2,177.3 1,911.1 13.9 9.5
1 Intercompany orders were allocated to the individual regions. Previous periods figures’ were adjusted accordingly.
NET SALES

BUSINESS PERFORMANCE OF THE DRÄGER GROUP | CASH FLOW STATEMENT78
The interest result dropped by 8.3 percent year-on-year,mainly due to the additional note loans taken out in April2009 totaling EUR 140.0 million and the vendor note fromSiemens, which started carrying interest as from April2010. The interest on tranches I and II of the vendor notewas recognized in the interest result until the repaymentdate on July 20, 2010, and the interest on tranche III untilSeptember 30, 2010. In addition, Dräger included loanorigination fees for the loan agreement concluded in Sep-tember 2009 with the Kreditanstalt für Wiederaufbau(KfW) until August 2010 and the syndicated loan conclud-ed in March 2010 until December 2010 in the interestresult. Please refer to pages 62 et seq. and 82 et seq. ofthis annual report for more information on the financ -ing structure and the purchase of the 25 percent share inDräger Medical AG & Co. KG (now: Dräger MedicalGmbH).
Compared to the prior year, the tax rate fell to 31.8 percent(2009: 34.1 percent) as Dräger Medical GmbH has beenincluded in the integrated fiscal unit of Drägerwerk AG &Co. KGaA since January 1, 2010. The operating expensesincurred by Drägerwerk AG & Co. KGaA and the income ofDräger Medical GmbH can therefore be offset for tax purposes in the future. In addition, tax loss carryforwards,which had previously been written down, were capital-ized as the earnings forecast was raised within the scope ofmid-term planning. This also lowered the tax burden infiscal year 2010.
INVESTMENTS
In fiscal year 2010, Dräger invested EUR 6.3 million (2009:EUR 84.0 million) in intangible assets. Figures for theprevious year included goodwill of EUR 74.8 million fromthe acquisition of the 25 percent share in Dräger MedicalAG & Co. KG from Siemens. Excluding this effect, invest-
2010 2009
Investments Depreciation / Investments Depreciation / amortization amortization
€ million € million € million € million
Intangible assets 6.3 10.1 84.0 17.1
Property, plant and equipment 49.5 43.8 44.3 48.8
December 31, 2010 December 31, 2009 Change
€ million € million %
Total assets 1,976.9 1,885.8 4.8
Equity 636.6 393.8 61.6
Equity ratio 32.2 % 20.9 %
Capital employed 833.4 709.1 17.5
Net financial debt 90.3 374.4 (75.9)
FINANCIAL FIGURES
INVESTMENTS / AMORTIZATION AND DEPRECIATION

79POTENTIALFUNCTIONAL AREASBUSINESS PERFORMANCEMARKET ENVIRONMENT
ments in intangible assets were at a similar level to theprevious year.
During the same period, Dräger invested EUR 49.5 mil-lion in property, plant and equipment (2009: EUR 44.3 mil-lion). These investments mainly related to replacements.Additions include EUR 6.9 million (prior to the pro ratadeduction of government grant) for a new production and logistics building for the Infrastructure Projects busi-ness at the site in Lübeck, which is scheduled to be completed in the first half of 2011. Total investments in thebuilding are likely to amount to around EUR 12 mil-lion. The state of Schleswig-Holstein will issue a grant of anexpected EUR 1.8 million for this project in the comingyears.
Depreciation on property, plant and equipment came toEUR 43.8 million and covered 88.5 percent of investments.
Cash flow statement
CASH FLOW STATEMENT
Due to the elimination of exchange rate effects, the under-lying changes recognized in the cash flow statement cannot be directly reconciled with the items of the pub-lished balance sheet.
In fiscal year 2010, cash flow from operating activities wentup by EUR 25.7 million to EUR 219.1 million. Earningsafter income taxes – adjusted for write-downs, changes toprovisions not recognized in income and other earningsnot affecting profit and loss – increased by EUR 125.1 mil-lion. In addition, trade payables rose by EUR 43.7 mil -lion at the end of the year due to high utilization of produc-tion capacities and the resulting increase in materialsused. This corresponds to a rise of EUR 41.2 million year-on-year. Consequently, inventories went up by EUR 42.6million. The Group continues to implement an effectivereceivables management and was therefore able to re -duce trade payables by EUR 2.2 million despite an increasein net sales in the fourth quarter of 2010. Other assetswent up by EUR 14.7 million on account of higher taxrefund claims (2009: EUR – 5.6 million).
Cash outflow from investing activities increased to EUR52.2 million (2009: EUR 42.4 million), primarily due to the investments in property, plant and equipment ofEUR 49.6 million (2009: EUR 42.6 million).
The purchase price for the 25 percent share in DrägerMedical AG & Co. KG (now: Dräger Medical GmbH) from Siemens in fiscal year 2009 amounted to EUR 250.6million. The cash component of EUR 175.0 million plus incidental purchase costs of EUR 0.9 million werefully repaid in fiscal year 2010. EUR 60.0 million of the
2005 2006 2007 2008 2009 2010
Cash flow from operative activities € million 50.2 95.7 165.0 104.7 193.5 219.1
Cash flow from investing activities € million (36.9) (59.8) (125.5) (76.2) (42.5) (52.2)
Free Cash flow € million 13.3 35.9 39.5 28.5 151.0 166.9
Cash flow from financing activities € million 6.5 (28.8) (56.0) (60.4) 64.9 (210.1)
Change in liquidity (excluding exchange rate effects) € million 19.8 7.1 (16.5) (31.9) 215.9 (43.2)
FINANCIAL POSITION OF THE DRÄGER GROUP

CASH FLOW STATEMENT80
vendor note of EUR 68.5 million was repaid in fiscal year2010. The remaining EUR 8.5 million were written off by Siemens as contractually agreed and will therefore nothave to be repaid. The variable option component of EUR 6.2 million will also not have to be repaid as this wasreplaced by an equity instrument and reclassified to equity on August 30, 2010, after being remeasured at EUR26.5 million. Consequently, only EUR 235.9 million of the purchase price totaling EUR 250.6 million for the Sie -mens share (total purchased interest: EUR 175.8 mil -lion) had to be paid in fiscal year 2010. As the remainingamount of EUR 14.7 million does not have to be repaid, it will no longer be recognized in the cash flow statement.The repayment of two note loans totaling EUR 45.0 mil-lion also resulted in cash outflow. The capital increase car-ried out at the end of June 2010, on the other hand,increased cash and cash equivalents by a total of EUR 100.4million (of which EUR 9.8 million in par value of theissued common shares). These transactions primarily ledto EUR 210.1 million cash outflow from financing acti vities in fiscal year 2010. Cash inflow in the previous
year mainly resulted from taking up a note loan of EUR 140.0 million and at the same time repaying a noteloan in the amount of EUR 25.0 million.
Cash and cash equivalents include EUR 10.2 million incash (2009: EUR 22.0 million) which is subject to restrictions. The main restrictions in both fiscal years per-tained to the disposal and export of foreign currencies of the Chinese and South African subsidiaries. In the pre-vious year, EUR 10.0 million had been deposited in anaccount subject to special restraints on disposal within thescope of the purchase of the 25 percent share fromSiemens.
Cash and cash equivalents amounted to EUR 320.0 million on December 31, 2010 (December 31, 2009: EUR344.1 million).
ADDED VALUE CREATED BY THE DRÄGER GROUP
The Dräger Group’s added value is calculated by deductinginput expenses such as the cost of materials, deprecia -
CASH FLOW RECONCILIATION
January to December 2010 in € million
600
550
500
450
400
350
300
250
200
150
100
50
344.1
219.1
Cash and cash equivalents as of December 31, 2009
Net cash provided byoperating activities
Net cash used in investing activities
Net cash provided by financing activities
Effect of exchange rates on cash andcash equivalents
Cash and cash equivalents as of December 31, 2010
(52.2)
(210.1)
19.1 320.0

81POTENTIALFUNCTIONAL AREASBUSINESS PERFORMANCEMARKET ENVIRONMENT
tion and amortization and other expenses from total oper-ating performance (net sales and other income). Theadded value is then broken down into the percentage attrib-utable to the Group’s major stakeholders, thus showingthe Dräger Group’s contribution to the income of the pub-lic and private sectors.
In 2010, Dräger created added value of EUR 943.2 million,a 24.4 percent increase on the previous year. The largestportion of this added value, EUR 728.9 million (77 per-cent), was attributable to Dräger employees (2009: EUR664.1 million; 88 percent). With a 2 percent increase inheadcount (annual average), added value per employee
amounted to EUR 84 thousand, a considerable 22 percentincrease on the previous year (2009: EUR 69 thousand).Expenses per employee increased by 8 percent to EUR 65thousand (2009: EUR 60 thousand) in the Dräger Group,which was attributable to currency effects and higher dis-tributions for variable remuneration.
EUR 307.4 million (51 percent) of personnel expenseswere attributable to Research & Development and Sales &Marketing employees. Another EUR 127.1 million (17 percent) relate to work performed on site for customers byservice technicians and equipment fitters. Overall, thisshows that two-thirds of employee contribution to added
ADDED VALUE STATEMENT OF THE DRÄGER GROUP
Figures in € million
Total operating performance 2,191.0 Added value 954.4 Employees 728.9
728.9Employees
61.5Government
41.2Lenders
18.0Participation certificate holders
2.2Minority interests
86.4 (11.9 %) Research and development
282.2 (38.7 %)Production and service
284.0 (38.9 %)Sales and marketing
83.6Company
19.0Shareholders
76.3 (10.5 %)Administration
642.6Cost of materials
53.8Depreciation /
amortization
540.2Other input expenses
954.4Added value
Creation Distribution Share in added valueEmployees

CASH FLOW STATEMENT | FINANCIAL MANAGEMENT OF THE DRÄGER GROUP82
value is still attributable to research and development and customer-related activities, thus highlighting the know-ledge and customer-oriented focus of the Company.
Financial management of the DrägerGroup
BORROWING
The capital increase, which was successfully carried out in June 2010, with net proceeds of around EUR 100 mil-lion, increased cash and cash equivalents of the DrägerGroup. The Company’s short-term operating requirementsare self-funded by means of cashpooling – and also byequalizing liquidity within the Group – and via bilateralcredit lines with various banks. On December 31, 2010,short-term loans amounted to around EUR 89.5 million.
The Company took out a syndicated loan of EUR 240 mil-lion with a term of three years on March 16, 2010, tosecure its working capital requirements in the mediumterm. Dräger terminated this loan on December 31, 2010, and replaced it with bilateral credit lines of EUR 240million – also with renowned international banks – and a term of five years.
Dräger regularly utilized the syndicated credit line duringits daily operations in the form of current accounts, guarantees and sureties in Germany and abroad. In addi-tion, one withdrawal of EUR 20 million was made from the cash credit for a period of one month in the first halfof 2010. This amount was fully repaid by the end of June2010. As a result of the capital increase successfully carriedout in June 2010 (please refer to pages 61 et seq. of this annual report for further information on the capitalin crease) and the positive business development of the Group, Dräger was able to return the EUR 50 milliontranche that was intended for financing note loans inAugust 2010. The Company also terminated the loan agree-
ment concluded with the KfW (Kreditanstalt für Wie -deraufbau) in September 2009 for a loan totaling EUR 50million under the bank’s 2009 special program “Inves -titionen”. The high volume of cash and cash equivalentsand strong cash inflow from operating activities made this additional option unnecessary. Dräger also fully repaidthe vendor note of EUR 68.5 million, which was in -cluded in the purchase price of the 25 percent share inDräger Medical AG & Co. KG and utilized as from the end of April 2010, by the end of September 2010 (pleaserefer to pages 62 et seq. of this management report fordetails on the purchase of the 25 percent share in DrägerMedical AG & Co. KG).
Dräger uses note loans to finance its operations in themedium and long term. This financing instrument has alow minimum volume and is highly flexible. The costs for issuing note loans are usually lower than those for issu-ing bonds. A note loan is rather more suited to smallerrefinancing volumes than a bond, for which a credit ratinghas to be obtained as well. At present, Dräger does nothave a rating from agencies such as Standard & Poor’s,Moody’s or Fitch.
Please refer to pages 181 et seq. of the notes for furtherdetails on Dräger Group’s loans and liabilities.
LIQUIDITY FORECAST
At the beginning of fiscal year 2010, the liquidity of DrägerGroup was impacted by the buyback of the 25 percentSiemens share in Dräger Medical AG & Co. KG, as the EUR175 million cash component included in the purchaseprice was repaid from existing cash and cash equivalentsat the end of April 2010. The positive business develop-ment and additional inflow of liquidity resulting from thecapital increase had a positive effect on cash and cashequivalents, which came to EUR 320.0 million at the endof the year (2009: EUR 344.1 million).

83POTENTIALFUNCTIONAL AREASBUSINESS PERFORMANCEMARKET ENVIRONMENT
For its medium and long term planning, Dräger forecastsa positive development of cash and cash equivalents,mainly on account of the anticipated steady growth of thecash flow from operating activities, which reflects theexpected business development and is supported by a slightincrease in capital employed. Cash outflow from invest-ing activities is likely to be only slightly higher than depre-ciation and amortization.
Future payment obligations from note loans falling due,which will result in payments of EUR 54.5 million in2011, EUR 55.0 million in 2012, and EUR 79.0 million in2013, as well as the planned dividend distributions willhave a negative impact on liquidity. In contrast, the repay-ment of the Siemens vendor note in fiscal year 2010 and the return and replacement of loans with high inter-est rates is going to positively impact future interest payments.
The short and medium term liquidity supply of DrägerGroup is secured by existing cash in hand and bank balances and the limits of the existing credit lines, of whichmost have a term of more than one year.
TASKS AND STRUCTURE OF THE TREASURY
DEPARTMENT
The treasury department is responsible for treasury management, secures the Group’s liquidity and credit facil-
ities and manages its interest and currency risks. Thedepartment acts as a service center with a focus on the cor-porate risks. The organizational structures and processesand the Group’s internal treasury policy ensure transparen-cy and security. The treasury back office, for example,checks and confirms all financial transactions. Treasurycontrolling monitors compliance with the limits avail-able and that the conditions agreed are in line with marketconditions.
DERIVATIVE FINANCIAL INSTRUMENTS
Dräger generally uses financial instruments for hedgingpurposes and not to optimize earnings, although the principles of economic efficiency are also applied to suchdecisions. Transactions of this type are selected and concluded in a uniform manner throughout the Group.
NET ASSETS
The Dräger Group’s equity rose by EUR 242.8 million toEUR 636.6 million in 2010, with the equity ratio increas-ing from 20.9 percent on December 31, 2009, to 32.2 percent. The capital increase carried out in June 2010,net profit of EUR 104.8 million and the option com -ponent, which was replaced by an equity instrument inAugust 2010, contributed to this development.
Total assets increased by EUR 91.1 million to EUR 1,976.9million in fiscal year 2010. An increase in inventory
Type of credit in € million Use Creditor
Commerzbank, Deutsche Bank, HSBC, Helaba, HSH Nordbank,
Cash 150 Providing required working capital plus another four banks
For use in daily Surety 90 business operations Commerzbank, Deutsche Bank and HSBC
BILATERAL CREDIT LINES

FINANCIAL MANAGEMENT OF THE DRÄGER GROUP84
levels (EUR +56.7 million) and receivables (EUR +21.8million) was faced by a decrease in cash and cash equiv -alents (EUR – 24.0 million). At the same time, equity wentup on the liabilities side (EUR +242.8 million) and othercurrent provisions (EUR +81.1 million) while other currentand non-current financial liabilities fell significantly(EUR – 239.6 million).
Non-current assets of EUR 681.0 million are fully fundedby the total non-current capital.
2005 2006 2007 2008 2009 2010
Non-current assets € million 478.4 497.6 566.4 577.4 657.7 681.0
Current assets € million 1,057.8 1,138.7 1,071.1 1,077.4 1,228.1 1,295.9
thereof cash and cash equivalents € million 182.7 185.6 160.7 125.2 344.1 320.0
Equity € million 539.6 576.9 545.2 553.8 393.8 636.6
Debt € million 996.6 1,059.4 1,092.3 1,101.0 1,492.0 1,340.3
thereof liabilities to banks € million 363.7 365.3 449.6 380.1 465.9 407.5
Total assets € million 1,536.2 1,636.3 1,637.5 1,654.8 1,885.8 1,976.9
Long-term equity-to-fixed-assets ratio 1 % 276.7 267.0 236.4 233.3 211.3 254.5
1 Long-term equity-to-fixed-assets ratio = Total equity and long-term debt divided by total intangible assets and property, plant and equipment
NET ASSETS OF THE DRÄGER GROUP

85POTENTIALFUNCTIONAL AREASBUSINESS PERFORMANCEMARKET ENVIRONMENT

BUSINESS PERFORMANCE OF THE MEDICAL DIVISION86
Business performance of the medical division
Fourth quarter Twelve months
2010 20096 Change in % 2010 20096 Change in %
Order intake € million 385.6 411.2 (6.2) 1,441.9 1,339.6 +7.6
Orders on hand 1 € million 280.6 300.5 (6.6) 280.6 300.5 (6.6)
Net sales € million 443.1 389.8 +13.7 1,472.0 1,260.9 +16.7
EBITDA 2 € million 64.8 69.0 (6.1) 209.8 110.6 +89.7
Depreciation / amortization € million (6.4) (12.4) (48,2) (23.2) (33.9) (31.7)
EBIT 3 € million 58.3 56.6 +3.1 186.6 76.7 +143.3
R&D costs € million 28.0 24.8 +12.8 101.1 107.8 (6.2)
Cash flow from operating activities € million 90.7 39.9 +127.5 178.4 153.1 +16.5
Investments € million 11.5 5.6 +103.6 29.1 20.8 +40.3
Capital employed 1, 4 € million 514.7 546.6 (5.8) 514.7 546.6 (5.8)
Net working capital 1, 5 € million 245.8 281.6 (12.7) 245.8 281.6 (12.7)
EBIT 3 / net sales % 13.2 14.5 12.7 6.1
EBIT 3 / capital employed 4 % 36.3 14.0
DVA 136.5 23.6
Total headcount 1 6,386 6,305 +1.3 6,386 6,305 +1.3
BUSINESS PERFORMANCE OF THE MEDICAL DIVISION
1 Value as of December 312 EBITDA = Earnings before net interest result, income taxes, depreciation and amortization3 EBIT = Earnings before net interest result and income taxes4 Capital Employed = Total assets less deferred tax assets, current securities, cash and cash equivalents and non-interest bearing liabilities5 Net working capital = Current, non-interest bearing assets less current, non-interest bearing debt6 Due to the integration of Dräger Medical AG & Co. KG in September 2010, the previous year’s values were adjusted accordingly.

87POTENTIALFUNCTIONAL AREASBUSINESS PERFORMANCEMARKET ENVIRONMENT
ORDER INTAKE
In fiscal year 2010, the medical division increased its orderintake by 3.5 percent (net of currency effects). Per -formance in the fourth quarter of 2010 was relatively weakhowever compared to the extremely positive devel -opment in the previous year (– 10.9 percent net of curren-cy effects). Total order volume in the medical divisionamounted to EUR 1,386.9 million (net of currency effects)in 2010 (2009: EUR 1,339.6 million).
In terms of products, the order volume increased par -ticularly in Anesthesia and Monitoring, Systems & IT. Anes-thesia benefited from factors such as the economic recovery in the US and also grew considerably in SouthAmerica due to extremely high demand in Brazil and Mexico. China once again contributed to the growing ordervolume. In Monitoring, Systems & IT, Dräger receivedlarge orders from the Ministry of Health in Brazil and theUnited States Department of Defense.
Lifecycle Solutions and Infrastructure Projects alsorecorded positive growth compared to the previous year,driven by projects. Due to orders in connection with the H1N1 virus (“swine flue”) in the second half of 2009
however, order intake in Ventilation was slightly downyear-on-year.
The positive development in Germany is mainly due togrowth in Lifecycle Solutions and Ventilation. Substantialcontracts for technical equipment management withSchleswig-Holstein University Hospital (UKSH) and Ge -sundheit Nordhessen Holding AG (GNH) increased theorder volume in Lifecycle Solutions. In addition, Drägerreceived several orders for ventilators in the fourth quarter of 2010. The medical division was neverthelessunable to repeat the volume of large orders received by Anesthesia and Monitoring, Systems & IT in the previ-ous year in the fourth quarter of 2010.
In the rest of Europe development of order intake was rel-atively weak, particularly due to the consolidation of government budgets and a high benchmark figure result-ing from an extraordinarily strong development in theprevious year in Spain as well as large project orders fromthe Ukraine and Turkey in the fourth quarter of 2009.Order intake in Russia, on the other hand, developed verypositively.
Fourth quarter Twelve months
€ million 2010 20091 Change Net of 2010 20091 Change Net ofin % currency in % currency
effects in % effects in %
Germany 67.8 70.5 (3.9) (3.9) 295.8 279.4 5.9 5.9
Rest of Europe 149.4 185.5 (19.5) (21.3) 504.7 534.5 (5.6) (7.7)
Americas 87.0 80.6 8.0 (1.8) 338.5 253.3 33.7 24.7
Asia / Pacific 57.0 45.6 25.0 9.9 208.8 171.4 21.8 10.9
Other 24.4 29.2 (16.2) (18.6) 94.1 101.2 (6.9) (9.2)
Total order intake 385.6 411.2 (6.2) (10.9) 1,441.9 1,339.6 7.6 3.5
1 Intercompany orders were allocated to the individual regions. Previous periods’ figures were adjusted accordingly.
ORDER INTAKE

BUSINESS PERFORMANCE OF THE MEDICAL DIVISION88
In the Americas region, order intake was 24.7 percent (netof currency effects) up on the poor performance in the crisis year 2009, mainly on account of the economicrecovery in the US and orders from the United StatesDepartment of Defense and the Ministry of Health in Brazil.In the US, order intake went up by 26.7 percent (net of currency effects). In the fourth quarter of 2010, orderintake in the Americas region was slightly down on the previous year (– 1.8 percent net of currency effects), asgrowth in the US (7.2 percent net of currency effects) was unable to fully compensate for the high order volumefrom Canada in the previous year.
Dräger also received a larger number of orders than last year in the Asia / Pacific region. The Chinese market isgrowing, especially on account of the country’s health-care reform, and India has a large backlog demand formedical equipment. Both factors are encouraging thisgrowth. In Australia, Dräger also received more orders asthe economy recovered slightly. In the fourth quarter of 2010, China and Australia were once again the mostimportant growth drivers in this region.
In the other countries region, which generated 6.5 percentin total order volume in 2010, order intake was 9.2 per-cent (net of currency effects) down year-on-year. Althoughthe order volume in Saudi Arabia rose steeply as a result
of orders being authorized that had been put on hold in2009, this was not enough to offset the low order intake in other countries within the region. Dräger had receiveda large order from Uzbekistan for anesthesia devices and an order for a neonatal care unit from an Egyptianhospital in 2009. The 18.6 percent decrease in the fourth quarter of 2010 originated from the basis effect ofthe large order from Uzbekistan.
ORDERS ON HAND
On December 31, 2010, orders on hand were EUR 280.6million (net of currency effects), 11.1 percent down onthe outstanding figure of EUR 300.5 million in 2009. Butnevertheless, this value was one of the highest recorded in recent years.
While orders on hand in the Americas region rose steeplydue to high demand from the US, they dropped signifi-cantly in the rest of Europe and other countries regions.Main reasons for the decrease in the rest of Europe were the delivery of a large order from the previous yearin the Ukraine and several orders from the previous year in connection with the H1N1 virus from Spain andFrance. In the other countries region, orders received in the previous year were delivered in several Arab coun-tries as well as a large order from Uzbekistan. The rise in orders on hand as a result of the authorization of orders
€ million December 31, 2010 December 31, 2009 1 Change Net of currencyin % effects in %
Germany 46.6 52.7 (11.5) (11.5)
Rest of Europe 84.7 116.3 (27.2) (28.7)
Americas 76.6 61.1 25.5 16.2
Asia / Pacific 50.9 41.8 21.6 8.3
Other 21.8 28.6 (23.7) (25.6)
Total orders on hand 280.6 300.5 (6.6) (11.1)
1 Intercompany orders were allocated to the individual regions. Previous periods’ figures were adjusted accordingly.
ORDERS ON HAND

89POTENTIALFUNCTIONAL AREASBUSINESS PERFORMANCEMARKET ENVIRONMENT
in Saudi Arabia did not compensate for orders on hand inthe previous year.
Equipment orders on hand covered a 2.5-month period(December 31, 2009: 3.6 months). Due to the signifi -cant increase in incoming orders at the end of 2009, it wasno longer possible to deliver orders from different prod-uct areas in fiscal year 2009. Coverage in the previous yearwas therefore extraordinarily high.
NET SALES
After a positive fourth quarter of 2010, the medical divisionincreased net sales by 12.4 percent (net of currencyeffects) in fiscal year 2010. In terms of products, net salesincreased, particularly in Monitoring, Systems & IT, Anesthesia and Ventilation. Similar to order intake, ordersfrom Brazil and the US were the main drivers of thisgrowth in Monitoring, Systems & IT. This area also grewsignificantly in Russia and France. Net sales from anes -thesia devices rose in all but the other countries region.The Americas region recorded the largest growth in thisarea, the main driver being the US. Some of the reasonsfor the rise in net sales in Ventilation were orders – such as in connection with the H1N1 virus – that could not bedelivered any more in the previous year. A large order
from Brazil and positive growth in China also affected thisdevelopment.
In Germany, net sales went up in the full year as well as in the fourth quarter of 2010, especially in Lifecycle Solu-tions, main driver being the contracts for equipmentmanagement described in the order intake section. ButDräger also recorded positive growth in all other busi -ness units.
MEDICAL DIVISION NET SALESBY REGION 2010
20.5 % (prior year: 21.1 %) Germany 1
36.4 % (prior year: 39.8 %) Rest of Europe 2
22.3 % (prior year: 19.1 %) Americas 3
13.9 % (prior year: 12.3 %) Asia / Pacific 4
6.9 % (prior year: 7.7 %) Other 5
Intercompany net sales were allocated to the individual regions.The previous periods’ figures were adjusted accordingly.
1
2
3
4
5
Fourth quarter Twelve months
€ million 2010 20091 Change Net of 2010 20091, 2 Change Net of in % currency in % currency
effects in % effects in %
Germany 88.0 74.5 18.1 18.1 301.3 265.8 13.4 13.4
Rest of Europe 176.2 180.4 (2.3) (4.4) 535.8 502.2 6.7 4.4
Americas 91.4 63.4 44.1 31.1 327.8 240.6 36.2 27.0
Asia / Pacific 58.9 46.7 26.2 10.5 204.9 154.9 32.3 20.2
Other 28.6 24.8 15.2 13.1 102.2 97.4 4.9 2.8
Total net sales 443.1 389.8 13.7 8.6 1,472.0 1,260.9 16.7 12.4
1 Intercompany orders were allocated to the individual regions. Previous periods’ figures were adjusted accordingly.2 Due to the integration of Dräger Medical AG & Co. KG in September 2010, the previous year’s values were adjusted accordingly.
NET SALES

BUSINESS PERFORMANCE OF THE MEDICAL DIVISION90
In the rest of Europe, net sales developed very differ -ently in individual countries but were slightly up year-on-year overall. Considerable growth in Russia and France and the delivery of a large order in Ukraine had a positiveimpact. A drop in net sales in Turkey, Italy and GreatBritain, on the other hand, had a negative effect. In thefourth quarter of 2010, net sales in the rest of Europewere down year-on-year despite extremely positive net salesin Russia, main reasons being dropping net sales inTurkey and the basis effect resulting from the delivery of a large order in Ukraine.
The largest growth in net sales – in the full year as well asin the fourth quarter of 2010 – was recorded in the Americas region. The recovery in the US (4th quarter 2010:+18.0 percent net of currency effects; 2010: +25.8 per-cent net of currency effects) and the above-mentionedorders from Brazil were the main drivers of this devel -opment.
The Asia / Pacific region once again recorded strong growth(net of currency effects) compared to the previous year. As in 2009, rising demand from China and India were themain growth drivers. Australia also put on a much bet -ter performance year-on-year in the fourth quarter of 2010,fuelled by its improved economic situation.
Net sales in the other countries region was slightly up on the previous year (net of currency effects) due to Drägerdelivering a considerable number of delayed orders toSaudi Arabia in the fourth quarter of 2010.
EARNINGS
In fiscal year 2010, the medical division generated a muchhigher gross margin than in the previous year. Main reasons were the rise in net sales, positive currency effects,a shift in the product mix towards the equipment busi-ness, which has stronger margins, momentum providedby new, innovative products and savings from the turn-around program.
Total functional costs in fiscal year 2010 were up on theprior year. Savings from the turnaround program, incomefrom the sale of software codes and lower expenses forefficiency improvement measures were unable to fully off-set a growth-related rise in costs, provisions for other taxes and currency effects.
Measures under the turnaround program (cost savings andincreased efficiency of services) contributed an addi -tional EUR 33.4 million to earnings compared to 2009. Themedical division’s total expenses for implementing theturnaround measures came to EUR 1.8 million in fiscalyear 2010 (2009: EUR 17.4 million). The increased effi-ciency in Marketing and Sales also helped to increase earn-ings.
Research and development costs decreased 6.2 percentcompared with the same period in 2009. It has to be takeninto account that figures in the previous year includedimpairment losses on patents and items of property, plantand equipment and also provisions for the closure of the site in Best, Netherlands. In addition, Dräger achievedsavings in the reporting period as a development project in the US was discontinued in mid 2009 in response tochanges in the market. Expenses for projects rose asplanned and increased research and development costs.As around 35 percent of research and development costs are incurred in the US, the rise of the average rateof the US dollar by roughly 5 percent year-on-year pushedup costs.
EBIT soared by 143.3 percent to EUR 186.6 million onaccount of these developments (2009: EUR 76.7 mil -lion), and the EBIT margin of 12.7 percent was significant-ly up on the previous year’s value of 6.1 percent.
The integration of Dräger Medical AG & Co. KG, the parentcompany of the medical division, in Dräger Medical Holding GmbH in September 2010 and subsequent renam-

91POTENTIALFUNCTIONAL AREASBUSINESS PERFORMANCEMARKET ENVIRONMENT
ing of the company into Dräger Medical GmbH have nomajor impact on EBIT and capital employed of the medicaldivision (see page 138 in the notes).
INVESTMENTS
In fiscal year 2010, the medical division invested EUR 29.1million in intangible assets and property, plant and equipment (2009: EUR 20.8 million), mainly in connec-tion with replacements. Additions included EUR 6.8 million for the construction of a new production and logis-tics building for the Infrastructure Projects business (see page 165 in the notes). The new building has a produc-tion hall and office space and will provide ideal workingconditions and improve logistics processes. Total invest-ment costs for this project are expected to be around EUR 12 million and the building is likely to be completedin the first half of 2011.
Due to impairment losses on items of property, plant andequipment and patents of EUR 8.3 million, the previousyear’s value was rather high at EUR 33.9 million. Depre-ciation and amortization therefore dropped by 31.6 per-cent to EUR 23.2 million in fiscal year 2010 and covered79.5 percent of investments.
NET ASSETS
Capital employed dropped by EUR 31.9 million to EUR514.7 million as of December 31, 2010 (2009: EUR 546.6million). A volume-related rise in inventories and receiv-ables was offset by relatively high current provisions andother liabilities and a rise in trade payables. The medi -cal division increased its days working capital (coverage ofworking capital) by 10.9 days to 122.1 days. Cash flowfrom operating activities amounted to EUR 178.4 millionat the end of the year (2009: EUR 153.1 million).

BUSINESS PERFORMANCE OF THE SAFETY DIVISION 92
Business performance of the safety division
Fourth quarter Twelve months
2010 2009 Change in % 2010 2009 Change in %
Order intake € million 199.0 159.9 +24.5 731.7 665.9 +9.9
Orders on hand 1 € million 142.3 140.7 +1.1 142.3 140.7 +1.1
Net sales € million 202.2 180.5 +12.0 733.8 676.9 +8.4
EBITDA 2 € million 19.1 7.5 +156.0 81.8 51.9 +57.7
Depreciation / amortization € million (5.2) (5.4) (3.9) (20.8) (21.7) (4.2)
EBIT 3 € million 13.9 2.1 +569.8 61.0 30.2 +102.3
R&D costs € million 13.6 11.8 +15.1 43.9 39.3 +11.9
Cash flow from operating activities € million 34.3 31.1 +10.1 74.3 73.8 +0.6
Investments € million 7.4 5.9 +23.8 21.0 18.8 +11.9
Capital employed 1, 4 € million 181.6 190.1 (4.4) 181.6 190.1 (4.4)
Net working capital 1, 5 € million 103.1 114.2 (9.7) 103.1 114.2 (9.7)
EBIT 3 / net sales % 6.9 1.2 8.3 4.5
EBIT 3 / capital employed 4 % 33.6 15.9
DVA 43.1 9.6
Total headcount 1 4,409 4,336 +1.7 4,409 4,336 +1.7
BUSINESS PERFORMANCE OF THE SAFETY DIVISION
1 Value as of December 312 EBITDA = Earnings before net interest result, income taxes, depreciation and amortization3 EBIT = Earnings before net interest result and income taxes4 Capital employed = Total assets less deferred tax assets, current securities, cash and cash equivalents and non-bearing liabilities5 Net working capital = Current, non-interest bearing assets less current, non-interest bearing debt

93POTENTIALFUNCTIONAL AREASBUSINESS PERFORMANCEMARKET ENVIRONMENT
ORDER INTAKE
Order intake in the safety division was up 5.1 percent (netof currency effects) year-on-year, mainly due to a verylarge number of orders received in the fourth quarter of2010. The safety division recorded a total order volume of EUR 700.0 million (net of currency effects) (2009: EUR665.9 million).
This growth was primarily driven by gas detection systems,alcohol testing devices and engineered solutions. Theportable gas detectors business profited from factors suchas growing demand from the industry in North America.Dräger also received large orders from the open cast min-ing industry in Australia and the mining industry in South Africa. The alcohol testing devices business record-ed particularly positive growth in Scandinavia. In theEngineered Solutions business, Dräger sold the compo-nents of a deep sea diving system, which the Company had been left with after the cancellation of a contract andwhich had been fully written off in the past, to a ship-wright in the US.
The stationary gas detection systems business also record-ed positive growth compared to the previous year. Due to orders in connection with the H1N1 virus (“swine flue”)
in the second half of 2009 however, order intake in thelight respiratory protection business was slightly down year-on-year.
Closing figures for the fiscal year 2010 were slightly downyear-on-year in Germany, the main reason being the large project for a fire simulation system at Leipzig Airportincluded in the previous year’s figures. Core businessdeveloped positively in 2010 with the Company receivingorders from the German Federal Agency for TechnicalRelief (Technisches Hilfswerk) for helmets as well as fromthe German Armed Forces (Bundeswehr) and the saltmining industry for oxygen self-rescuers as well as addition-al shutdown orders in the fourth quarter of 2010.
The positive development in the rest of Europe is mainlybased on the delivery of breathing apparatus to the Britishfire fighting services, which continues to be a lucrativebusiness. The new site in Aberdeen was also able to recorda steeper rise in orders from the oil and gas industry than expected. A Swedish automotive supplier placed anorder for further electronic immobilizers. Companies in the Norwegian oil and gas industry ordered portable gasdetectors and oxygen self-rescuers. But the much larger
Fourth quarter Twelve months
€ million 2010 20091 Change Net of 2010 20091 Change Net of in % currency in % currency
effects in % effects in %
Germany 42.4 40.3 5.2 5.0 160.1 162.8 (1.7) (1.7)
Rest of Europe 84.5 69.0 22.5 19.6 290.3 271.2 7.0 4.5
Americas 32.2 22.4 43.7 30.4 137.2 101.0 35.8 27.1
Asia / Pacific 28.7 20.7 38.6 19.3 105.6 88.5 19.3 4.1
Other 11.2 7.5 49.3 41.3 38.5 42.4 (9.2) (15.3)
Total net sales 199.0 159.9 24.5 18.4 731.7 665.9 9.9 5.1
1 Intercompany orders were allocated to the individual regions. Previous periods’ figures were adjusted accordingly.
ORDER INTAKE

BUSINESS PERFORMANCE OF THE SAFETY DIVISION 94
order volume in the fourth quarter of 2010 primarily result-ed from a basis effect: In the fourth quarter of the previ-ous year, orders in connection with deep sea diving systemswith a volume of EUR 6.1 million were cancelled.
In the Americas region, order intake was considerably upyear-on-year. Apart from orders in the US from the oil, gasand chemical industry for stationary gas detection sys-tems and by the mining industry for oxygen self-rescuers,Dräger also won tenders placed by the US Navy for divingapparatus and by the Anchorage Fire Department for res-piratory protection devices. Demand for portable gasdetectors, the electronic immobilizer and alcohol testingdevices added to the positive development. In the US, order intake went up by 42.3 percent (net of currencyeffects). This includes the order to the amount of EUR17.5 million for components of the deep sea diving systemthat was fully written off in the previous year and addi-tional services and components totaling EUR 2.5 million.Without this order, growth came to 12.2 percent (net ofcurrency effects). In South America, business in light res-piratory protection devices from Dräger’s own produc-tion plant in Brazil developed extremely positively. Orderintake in the Americas region rose by 27.1 percent (net of currency effects), considerably up on the previous year.One of the main reasons for this development was theeconomic recovery in the US in the fourth quarter of 2010.
Order intake in the Asia / Pacific region was also higherthan in the previous year. The Company won tenders for thedelivery of respiratory protection devices from Malaysia,New Zealand and Australia in the fourth quarter of 2010.Dräger also won a tender for alcohol testing devices fromVictoria Police in Australia. The safety division further morereceived various orders for light respiratory protectiondevices from Indonesia, and the Chinese mining industryordered respiratory protection devices.
The drop in the other countries region is primarily due toan extraordinarily high order volume from a petro -chem ical company in Oman in the previous year. The sub-sidiary in South Africa, however, developed very posi -tively thanks to orders for oxygen self-rescuers for the min-ing industry in the fourth quarter of 2010.
ORDERS ON HAND
Due to the high order intake in the fourth quarter of2009, orders on hand were 2.8 percent (net of currencyeffects) down year-on-year as of December 31, 2010. While orders on hand in Germany remained at almost thesame level as in the previous year, orders on hand in the rest of Europe dropped by 12.4 percent (net of currencyeffects), mainly as a result of additional deep sea divingsystems being invoiced. The total value of deep sea divingsystems in this region was EUR 16.2 million (2009: EUR 29.2 million). Orders on hand in the Americas region,
€ million December 31, 2010 December 31, 2009 1 Change Net of currencyin % effects in %
Germany 25.5 25.6 (0.4) (0.4)
Rest of Europe 63.6 71.6 (11.2) (12.4)
Americas 21.9 12.1 81.0 71.1
Asia / Pacific 22.2 16.9 31.4 12.4
Other 9.1 14.5 (37.2) (39.3)
Total orders on hand 142.3 140.7 1.1 (2.8)
1 Intercompany orders were allocated to the individual regions. Previous periods’ figures were adjusted accordingly.
ORDERS ON HAND

95POTENTIALFUNCTIONAL AREASBUSINESS PERFORMANCEMARKET ENVIRONMENT
on the other hand, profited from the order for deep seadiving components received in the second quarter of 2010.Dräger increased orders on hand in the Asia / Pacificregion by 12.4 percent (net of currency effects) thanks tothe large volume of orders received from Malaysia andChina in the fourth quarter. Compared to that, orders onhand in the other countries region fell by 39.3 percent(net of currency effects) due to a large project in Omanbeing invoiced. Equipment orders on hand covered a 2.3-month period (2009: 2.2 months).
NET SALES
Total net sales in the safety division went up by 3.8 percent(net of currency effects) year-on-year on account of thefourth quarter of 2010 seeing a very positive development.
In terms of products, net sales and order volume grew,particularly in the business units gas detection systems,alcohol testing devices and engineered solutions. Drägerdelivered portable gas detectors to the open cast miningindustry in Australia and the mining industry in SouthAfrica as well as alcohol testing devices to Sweden. In theEngineered Solutions business, Dräger delivered themajority of components of a deep sea diving system, whichthe Company had been left with after the cancellation
of a contract, to a shipwright in the US in the same yearthe order was received.
In Germany, the safety division achieved a slight increasein net sales and delivered a large number of compressedair breathing apparatus to the fire departments within amunicipality in Hesse, Germany, a training facility and a respi ratory protection maintenance facility to the Mühl-heim Fire Service, and oxygen self-rescuers to the potashand salt mining industry. In 2010, the high volume of net
SAFETY DIVISION NET SALES BY REGION 2010
21.8 % (prior year: 23.5 %) Germany 1
40.7 % (prior year: 41.9 %) Rest of Europe 2
17.4 % (prior year: 16.0 %) Americas 3
14.0 % (prior year: 13.3 %) Asia / Pacific 4
6.1 % (prior year: 5.3 %) Other 5
Intercompany net sales were allocated to the individual regions.The previous periods’ figures were adjusted accordingly.
1
2
3
4
5
Fourth quarter Twelve months
€ million 2010 20091 Change Net of 2010 20091 Change Net of in % currency in % currency
effects in % effects in %
Germany 47.4 49.0 (3.3) (3.3) 160.2 159.2 0.6 0.6
Rest of Europe 76.1 75.9 0.3 (2.0) 298.5 283.9 5.1 2.8
Americas 38.4 24.1 59.3 47.7 127.9 108.4 18.0 10.1
Asia / Pacific 27.7 22.4 23.7 5.4 102.9 89.9 14.5 (0.3)
Other 12.6 9.1 38.5 31.9 44.3 35.5 24.8 17.5
Total net sales 202.2 180.5 12.0 6.9 733.8 676.9 8.4 3.8
1 Intercompany orders were allocated to the individual regions. Previous periods’ figures were adjusted accordingly.
NET SALES

BUSINESS PERFORMANCE OF THE SAFETY DIVISION 96
sales in the personal protection business that it hadachieved in the previous year did not repeat itself.
Main reasons for net sales in the rest of Europe being up on the previous year were an extremely positive devel-opment of business in respiratory protection devices and stationary gas detection systems for the petrochemicalindustry in Great Britain. In Russia, Dräger invoiced further alcohol testing devices and products from the sta-tionary gas detection portfolio for the oil and gas indus -try. Stationary gas detection systems also recorded positivedevelopment again in Norway. Due to deep sea divingprojects having a higher share in net sales in the previousyear, whose effect the core business was unable to fullycompensate, net sales in the fourth quarter of 2010 wereslightly down year-on-year (net of currency effects).
In particular the partial delivery of components of a deepsea diving system that the Company had been left withafter the cancellation of a contract, deliveries of the elec-tronic immobilizer and alcohol testing devices in the US particularly contributed to the positive development inthe Americas region. In the core business, net sales from the delivery of Dräger tubes and single and multi gasdetection devices to the industry as well as deliveries ofcompressed air breathing apparatus to fire services devel-oped extremely positively. Net sales in the US grew by 18.8 percent (net of currency effects). In Argentina, Drägerdelivered alcohol testing devices to the police force.
In the fourth quarter of 2010, the partial delivery of com-ponents of a deep sea diving system that the Company had been left with after the cancellation of a contract, andthe slight economic recovery in the US were the princi-pal factors that contributed to a significant improvementcompared to the previous year.
Net sales in the Asia / Pacific region were almost the sameas in the previous year (net of currency effects). Com -
panies in the petrochemical and semiconductor industriesreceived stationary gas detection systems. In Australia, net sales focused on alcohol testing, respiratory protectionand gas detection devices, in China on respiratory pro -tection devices for the mining industry. In addition, Drägerinstalled a training facility for fire services in Malaysia,which it completed and handed to the customer in thefourth quarter of 2010.
As in the case of order intake, net sales in the other coun-tries region developed particularly positively in SouthAfrica, where Dräger managed to exceed net sales in theprevious year by 30 percent, mainly due to the delivery of alcohol testing devices, oxygen self-rescuers and lightrespiratory protection masks. In the fourth quarter of2010, Dräger completed a project for equipping a petro-chemical company in Oman with a low pressure supply system and subsequently expanding it with mobile air sup-ply units and handed it over to the customer.
EARNINGS
In fiscal year 2010, the safety division generated a muchhigher gross margin than in the previous year. The mainreasons for this development were the substitution of low-margin with high-margin products, positive currencyeffects and high capacity utilization of the production facil-ities. In addition, the business in deep sea diving systemspushed down earnings by EUR 2.7 million in fiscal year2010. In the previous year, three deep sea diving systemswere written down to a total amount of EUR 30.0 million.
The delivery of one of these three deep sea diving systemsto a Norwegian wharf took place in May 2010. In June2010, another deep sea diving system, which was complete-ly written off in 2009, was sold to a shipwright in the US. The sales generated additional net sales of EUR 13.1million, which was offset by comparatively low expenses in fiscal year 2010. The delivery of the remaining deep seadiving system is planned in fiscal year 2011.

97POTENTIALFUNCTIONAL AREASBUSINESS PERFORMANCEMARKET ENVIRONMENT
In fiscal year 2010, measures under the turnaround pro-gram (cost savings and increased efficiency of services)contributed an additional EUR 1.7 million to earningscompared to 2009. The Company did not incur any expens-es for the implementation of turnaround measures.
Research and development costs rose by 11.9 percent year-on-year to EUR 43.9 million as planned. Marketing, selling and administrative expenses were also considerablylower than in the previous year, aided by currency effects as well as a steep rise in personnel expenses resulting fromprofit shares distributed to all employees on account ofthe positive business development and the recruitment ofnew employees.
Due to the increase in business and a higher gross margin,EBIT in the safety division doubled to EUR 61.0 million(2009: EUR 30.2 million). The EBIT margin was therefore8.3 percent (2009: 4.5 percent).
INVESTMENTS
The safety division invested EUR 0.6 million (2009: EUR1.8 million) in intangible assets and EUR 20.4 million(2009: EUR 17.0 million) in items of property, plant andequipment. Depreciation and amortization of EUR 20.8million (2009: EUR 21.7 million) covered 99.0 percent ofthe investment volume (2009: 121.2 percent).
NET ASSETS
Capital employed went down as planned by 4.4 percent toEUR 181.6 million (2009: EUR 190.1 million). This devel-opment was aided by the small amount of tied up capi-tal. The improved business situation resulted in a rise ininventories. The safety division overcompensated for thiswith a low volume of trade receivables and a higher volumeof trade payables. The safety division increased its daysworking capital (coverage of working capital) by 17.4 daysto 99.4 days. Cash flow from operating activities amount -ed to EUR 74.3 million at the end of the year (2009: EUR73.8 million).

BUSINESS PERFORMANCE OF DRÄGERWERK AG & CO. KGAA / OTHER COMPANIES | RESEARCH AND DEVELOPMENT98
Business performance of Drägerwerk AG & Co. KGaA / other companies
Fourth quarter Twelve months
2010 20096 Change in % 2010 20096 Change in %
Order intake € million 5.5 4.2 +32.3 16.7 16.4 +1.7
Orders on hand 1 € million 0.0 0.0 +0.0 0.0 0.0 +0.0
Net sales € million 5.5 4.2 +32.3 16.7 16.4 +1.7
EBITDA 2 € million (82.3) (16.0) +413.9 76.2 14.7 +418.9
Depreciation / amortization € million (2.7) (3.0) (11.1) (10.0) (10.3) (2.8)
EBIT 3 € million (84.9) (19.1) +343.4 66.2 4.3 +1,454.3
R&D costs € million 1.7 1.0 +70.7 3.3 2.3 +44.1
Cash flow from operating activities 6, 7, 8 € million (79.6) (12.6) +531.7 41.5 3.1 +1,238.7
Investments € million 3.6 7.9 (54.3) 6.2 13.9 (55.2)
Capital employed 1, 4 € million 747.5 577.2 +29.5 747.5 577.2 +29.5
Net working capital 1, 5 € million (36.5) (209.3) (36.5) (209.3)
Total headcount 1 496 430 +15.3 496 430 +15.3
1 Value as of December 312 EBITDA = Earnings before net interest result, income taxes, depreciation and amortization3 EBIT = Earnings before net interest result and income taxes 4 Capital Employed = Total assets less deferred tax assets, current securities, cash and cash equivalents and non-interest bearing liabilities5 Net working capital = Current, non-interest bearing assets less current, non-interest bearing debt6 Due to the integration of Dräger Medical AG & Co. KG in September 2010, some companies are now being recognized in the financial
statements of the medical division. Previous year’s figures were adjusted accordingly. 7 The calculation of cash flow from operating activities for 2009 was adjusted for the buyback of the Siemens share.8 The fourth quarter of 2010 includes the loss from the integration of Dräger Medical AG & Co. KG.
BUSINESS PERFORMANCE OF DRÄGERWERK AG & CO. KGAA / OTHER COMPANIES

99POTENTIALFUNCTIONAL AREASBUSINESS PERFORMANCEMARKET ENVIRONMENT
Apart from fulfilling the core tasks of the Company,Drägerwerk AG & Co. KGaA provides services to the divi-sions and their group companies and monitors their risk management. This includes the services provided bythe Legal, Tax, Insurance, Treasury, Corporate Com -munications, Marketing Communications, Investor Rela-tions, Group Controlling, Group Accounting, CorporateIT, Corporate Human Resources, Corporate Purchasing,Internal Audit and Basic Research departments. The services to the divisions are closely coordinated with themand invoiced in accordance with arm’s length princi -ples, as between unrelated parties.
Corporate Communications, Marketing Communications,Corporate IT, Corporate Purchasing as well as CorporateHuman Resources (since January 1, 2011) are organized as shared services for all group companies at DrägerwerkAG & Co. KGaA. In order to make even better use ofeconomies of scope it is planned to extend the shared serv-ice activities to other suitable functions.
EBIT in this area increased by EUR 61.9 million to EUR66.2 million year-on-year (2009: EUR 4.3 million) and com-prised the operating results of the companies groupedhere and results from investments of EUR 120.4 million(2009: EUR 33.8 million). It includes the distribution of EUR 70.4 million by Dräger Medical AG & Co. KG toDräger Medical Holding GmbH for fiscal year 2009 (2009 for 2008: EUR 32.2 million). After the integrationof Dräger Medical AG & Co. KG in Dräger Medical Holding GmbH and the subsequent renaming of the com-pany to Dräger Medical GmbH, the control and profit and loss transfer agreement of Drägerwerk AG & Co. KGaAwas transferred to Dräger Medical GmbH. Dräger Medical GmbH therefore transferred its profit of EUR 19.8million in 2010 to Drägerwerk AG & Co. KGaA. DrägerSafety AG & Co. KGaA transferred EUR 29.6 million morethan in the previous year (2009: EUR 1.3 million).
In the fourth quarter of 2010, EBIT in this business unitwas negative, as the loss from the integration of DrägerMedical AG & Co. KG in Dräger Medical Holding GmbH onSeptember 20, 2010, of EUR 86.2 million reduced theprofit transfer to Drägerwerk AG & Co. KGaA in this quar-ter. This integration was not reported in the quarterlyreport on September 30, 2010, as there was insufficienttime to do so. The result excluding investment income is negative, as Drägerwerk AG & Co. KGaA in particularperforms group functions.
Drägerwerk AG & Co. KGaA incurred EUR 3.3 million(2009: EUR 2.3 million) in research and developmentcosts in fiscal year 2010. 48 employees (2009: 51 employees)worked in Basic Research in Lübeck on December 31,2010.
INVESTMENTS
In fiscal year 2010, Dräger invested EUR 4.8 million (2009:5.5 million) in intangible assets and EUR 1.5 million(2009: EUR 8.4 million) in items of property, plant andequipment.
RECONCILIATION OF FIGURES AT GROUP LEVEL
To reconcile figures at group level, consolidations betweenmedical, safety and Drägerwerk AG & Co. KGaA and other companies have to be accounted for (see page 200in the notes).
Research and development
In fiscal year 2010, research and development (R&D) costsamounted to EUR 148.4 million, almost the same as in the previous year (2009: EUR 149.4 million), correspon-ding to 6.8 percent of net sales (2009: EUR 7.8 percent). In the previous year, costs were higher due to the recogni-tion of a provision for the closure of the site in Best,

RESEARCH AND DEVELOPMENT100
Netherlands. The decision made in 2009 to discontinue adevelopment project in the US to account for changes in the market resulted in savings in 2010. Similar to theprevious year, around EUR 23 million, or 15.5 percent(2009: 15.4 percent) of these expenses were for servicesobtained from external research partners. On Decem -ber 31, 2010, 957 employees worked in the research depart-ments of the medical and safety divisions world-wide. On the same date, 48 people were employed in the centralresearch and development department (basic research) of Drägerwerk AG & Co. KGaA in Lübeck.
In fiscal year 2010, patent and trademark offices aroundthe world issued 110 new patents to Dräger. The Com -pany also applied for another 62 patents at internationalpatent and trademark offices.
The basic research department’s main task is to investigatenew technologies and develop technical solutions forpotential applications. These technologies are transferredto product development only once they have reached asufficiently high level of maturity. In 2010, basic researchgave six applications to the product development depart-ments of the divisions (2009: five applications). The focusin 2010 was on improving the efficiency of the develop-
ment processes. To this end, the strict portfolio manage-ment for technology development projects was contin -ued. This method makes it possible to prioritize the Group’sstrategic development projects on the basis of a compre-hensive assessment.
MEDICAL DIVISION
In 2009, this division achieved a record with twelve newdevices, including for the “Infinity” series, and elevennew products for Lifecycle Solutions, its focus in 2010 wason improving existing products, launching two new ven -tilators and further expanding the Lifecycle Solutions prod-uct portfolio:
– Dräger launched another “Infinity” product with the newventilator for premature infants and neonatals “Baby -log VN500”. It combines important ventilation methodssuch as conventional and non-invasive ventilation, high-frequency ventilation and oxygen therapy for prema-ture infants in one device.
– Dräger launched the new ventilator “Savina 300” in thefourth quarter of 2010. The cost-optimized device worksindependently from compressed air supplies and there-fore meets a requirement that is important in many mar-kets. For the first time, a device in this product group
R&D costs in € million 2005 2006 2007 2008 2009 2010
Medical division 79.9 89.3 89.1 104.7 107.8 101.1
in % of net sales 7.2 7.2 7.4 8.4 8.5 6.9
Safety division 27.4 28.3 31.2 34.6 39.3 43.9
in % of net sales 4.9 4.8 4.9 4.9 5.8 6.0
Drägerwerk AG & Co. KGaA 1.0 0.4 1.6 2.7 2.3 3.3
Dräger Group 108.3 118.0 121.9 142.0 149.4 148.4
in % of net sales 6.6 6.6 6.7 7.4 7.8 6.8
Headcount 791 896 949 1,058 992 1,005
RESEARCH AND DEVELOPMENT

101POTENTIALFUNCTIONAL AREASBUSINESS PERFORMANCEMARKET ENVIRONMENT
features the tried and tested Dräger operating concept ona 12” touchscreen.
– Several successfully completed development projects sup-ported the growth strategy in the Lifecycle Solutionsbusiness. Particularly innovative products such as the dis-posable expiration vent for the “Savina” and ”Evita” ventilator product families as well as other products com-plemented the portfolios for standard breathing tube systems and non-invasive ventilation masks.
– The “WiFi Alliance”, an international umbrella associa-tion for the harmonization of technological standards,issued the portable patient monitor “M300” with a WiFicertification. This proves that the system uses up-to-date transmission and safety technology for the encodedexchange of patient data within hospital WiFi networks.
In 2010, research and development again implementedmeasures for improving efficiency, which had previouslybeen determined as part of the turnaround program. The automation of test runs, for instance, reduced theeffort, time and money spent on testing new devices. In addition, a new software development method madecross-departmental project work a lot easier.
SAFETY DIVISION
The research and development department of the safetydivision launched an innovation campaign in 2010 andintroduced 18 new products. This is the largest number of new products in the history of the division. The mainfocus was on shortening development times and at thesame time maintaining or even improving the high levelof product quality.
The introduction of numerous new technologies was the main requirement for the development of innovativeproducts. The wireless transmission of signals for por -table gas detectors and the new inductive battery recharg-ing systems, which meet the stringent requirements foroperating in hazardous industrial environments prone toexplosions, are just two such examples.
The use and further development of nanotechnology-based materials make it possible to develop sensitive andcost-effective gas sensors and also the development ofhigh-performance absorption materials for new filteringsystems.
The use of innovative composites for protective clothingensures the safety of personnel under extreme conditionssuch as in the case of fires at high temperatures.
– In the industrial sector, Dräger launched the mobile gas detector “Dräger X-am 5600”, the world’s smallestsix-gas detector.
– The “Dräger X-zone 5000” is a portable area monitoringdevice that replaces conventional, stationary systems. An intelligent, radio-based alarm system makes it possibleto detect gases in large industrial facilities.
– The modern infrared technology of the “UCF” thermalimaging cameras provides fire fighters with a higherdegree of safety even when visibility is extremely low dueto smoke and fumes during the search for fire sources or missing persons, for instance.
– The chemical protective suits “CPS 7900” and “CPS5900” protect their wearers against hazardous chemicalsand at the same time offer a high degree of comfort.
– With the comfortable and flexible compressed air breath-ing apparatus platform “PSS 3000”, “PSS 5000” and“PSS 7000”, Dräger positioned itself as a provider of all-in-one solutions for the most varied requirements thatemergency personnel could have around the world.
– The “Bodyguard 1000” is a warning and safety systemthat makes it possible to quickly locate and rescue hurtemergency personnel who are no longer able to move.
– The especially light oxygen self-rescuer “Oxy 6000” sup-plies oxygen to mining personnel during their escapefrom hazardous environments in which smoke, poison-ous gases or lack of oxygen could endanger them. Thedevices can be used for ten years without requiring main-tenance.

RESEARCH AND DEVELOPMENT | PURCHASING | QUALITY | CORPORATE IT102
– Since 2010, Dräger has been using renewable raw mate-rials for producing the around 100 different types of respiratory protection filters for the European market.
Purchasing
NEW STRUCTURE
In addition to the original tasks of purchasing, purchas-ing management and its employees reorganized the struc-ture of Dräger purchasing in 2010. The buyback of theSiemens share made is possible to pool the purchasingdepartments of the medical division, safety division andDrägerwerk AG & Co. KGaA. The new purchasing structureCorporate Purchasing combines central purchasing functions of the Company to further increase the efficien-cy of purchasing.
The organization of production materials purchasing isnow divided into the two materials groups electronics and mechanics. Purchasers carry out analyses of the rele-vant markets on which they then base their materialsgroups strategy, Group-wide price negotiations and the con-clusion of contracts. The clear goal is to focus on strate -gic suppliers and create an ideal supplier base for the localpurchasing departments.
Another central purchasing unit is now responsible for car-rying out strategic tasks such as the purchasing of non-production materials (NPI), IT as well as processes, meth-ods and project management.
SUPPLIERS AS STRATEGIC PARTNERS
Another important component is the central supplier quali-ty management. The further development of the Drägerquality strategy for suppliers is at the heart of this function.Its aim is to ensure professional supplier management,including appraisal, authorization and qualification of theglobal supplier portfolio. The goal of the supplier quality
improvement program, specially developed for this task, is to optimize the Research and Development, Productionand Quality departments across the entire Group.
The safety and medical divisions in Lübeck both have astrong local purchasing organization with focus on inte-grating suppliers in development projects and ensuringlocal supplies. These organizations include specialists forthe most varied materials groups.
The separation of local and central tasks such as supplierdevelopment and management enables the departments to increase their focus on local challenges and support newproduct developments such as series productions to aneven greater extent. The goal is to implement projects evenmore quickly in the future. An important prerequisite is the early integration of suppliers from the time of the firstidea being generated to the launch of the product.
The purchasing departments of foreign production anddevelopment sites that have their own local purchasingmanagers are now part of the new organization and reportdirectly to the purchasing manager of Dräger Group.
The new purchasing organization offers even more possi-bilities for cooperations to suppliers, whether they arestrategic suppliers or specialist for certain technologies,which are integrated in development projects at an earlystage, or suppliers of modules and systems specializing inlarge volumes.
The advantages of cooperation, which already becameapparent during the turnaround program, can now beimplemented even more strongly in a central organi -zation and resulted in direct cost savings and increasedefficiency in 2010. The introduction of logistics models as well as cost and value analyses also contributed to thissuccess as did the measures taken by Purchasing for production and non-production materials / IT in order toimprove the cost position.

103POTENTIALFUNCTIONAL AREASBUSINESS PERFORMANCEMARKET ENVIRONMENT
Quality
Dräger once again increased its focus on quality in 2010with the help of the “six sigma” method, an importantinstrument. Experts within the Group who are trained in this method use the “DMAIC” approach (define – meas-ure – analyze – improve – control). One such example is the project for increasing the lifecycle and reliability ofproducts, which was carried out by both divisions andwhich was concluded in 2010. The relevant quality key fig -ures, such as the quality upon delivery or guaranteedcosts, have improved significantly. In 2010, Dräger madeimprovements to the product launch phase, during which the quality of a product is under an especially greatamount of scrutiny. In order to improve quality even further, the Company uses quality management instru-ments, in particular during the development process, and integrates high-capacity suppliers in these processesat an early stage. This range of measures will signifi -cantly lower the quality management costs of future prod-uct generations.
PRODUCT QUALITY AND -SAFETY
Effective production quality management systems areextremely important to Dräger’s profitability as they are a legal requirement in many countries for the launch of products such as medical technology. All 14 of Dräger’sproduction sites therefore implement a DIN EN ISO9001 certified quality management system. This representsa coverage of 100 percent.
The quality management systems of both divisions wereassessed and confirmed to be effective by internal andexternal audits in 2010. You can find more information on this subject on the Dräger website atwww.draeger.com/certificates.
Corporate IT
IT STRATEGY
In line with its IT strategy, Dräger continued improving the support of business processes by IT systems. The mainfocus was on the introduction and further development of the strategic applications SAP in China and MicrosoftCRM (customer relationship management) in Germany,Great Britain, Denmark, Sweden and Norway. Dräger alsorestructured the global IT organization.
IT HEADCOUNT
The number of people employed in the central servicefunction Corporate IT in Lübeck dropped from 97 to 93in 2010 due to some employees being transferred to Purchasing and Controlling under the new organizationalstructure. In the US, headcount remained the same at 24. Until 2012, the Group plans to significantly increaseits workforce in the SAP and CRM application manage-ment business units. The main focus is on providing com-prehensive support to end users as well as maintaining and repairing these systems. With these measures, the Com -pany is increasing its internal know-how in these strate-gic areas and will also considerably reduce the amount ofwork carried out by external service providers. Dräger will recruit part of the new workforce at foreign sites with-in the scope of the expansion of the global IT organiza-tion.
MAJOR IT PROJECTS IN 2010
Apart from the above-mentioned introduction of SAP andMicrosoft CRM, Dräger started a comprehensive project to pool the applications implemented by various externalservice providers with one new, global service provider. The new operating concept uses state-of-the-art hardwareand visualization technology. This project will enableDräger to considerably lower costs, reduce the complexityof the technological and organizational IT landscape and further increase IT security. Dräger will continue toupdate desktop hardware every 36 months.

CORPORATE IT | ENVIRONMENTAL PROTECTION 104
IT COSTS
IT costs in the Dräger Group amounted to around EUR80.2 million in 2010 (2009: around EUR 84.0 million).This represents some 3.7 percent of total net sales of the Dräger Group (2009: 4.4 percent). These costs breakdown between operating expenses of EUR 73.6 million(2009: EUR 74.5 million) and project expenses of EUR 6.6million (2009: EUR 9.5 million).
Environmental protection
Environmental protection was once again an importantissue at Dräger in 2010. Apart from the Dräger companiesat headquarters in Lübeck, another 18 Dräger compa -nies are now DIN EN ISO 14001:2005 certified. The healthand safety management systems of the safety division’ssubsidiaries also received the BS OHSAS 18001:2007 cer-tificate.
In 2009, the Company introduced a group-wide climatereporting system. It continued these measures in 2010and in turn was involved once again in the Carbon Disclo-sure Project (CDP). A total of 65 Dräger companies usedthe reporting system to determine their direct and indirectcarbon dioxide emissions generated by their energy con-sumption, heating, use of (company) vehicles and air trav-el. Almost 70,000 t CO2 were recorded, of which around50 percent were created in Germany and are divided asfollows:
ENERGY MANAGEMENT
As in the previous years, consumption figures for electrici-ty, water, natural gas, heating oil and waste volumesremained important for measuring the direct environmen-tal aspects at the Lübeck site. The key environmental data indicates that relative consumption dropped furtherin 2010. Although the comparatively cold winter monthsled to a significant rise in energy consumption, this wasmore than compensated by the net sales of the Drägerproduction companies growing by approximately 21 per-cent.
The volume of natural gas and heating oil purchased at theLübeck site in 2010 increased disproportionately littlecompared to net sales but still more than in the previousyear, amounting to 57.6 million KWh and divided into 97per cent natural gas and 3 percent heating oil. In absoluteterms, direct CO2 emissions of around 11,700 t rose by 4 percent compared to the previous year. This rise is exclu-sively due to the increased need for heating oil duringcold weather periods. Taking into account all different typesof weather conditions, the average heating energy con-
DIRECT AND INDIRECT CO2 EMISSIONS 20091
38 % (26,400 t) Electricity 1
14 % (9,600 t) Heating 2
29 % (19,900 t) Vehicles 3
19 % (13,000 t) Air travel 4
1 Data for each period becomes available in the middle of the following year.
1
2
3
4

105POTENTIALFUNCTIONAL AREASBUSINESS PERFORMANCEMARKET ENVIRONMENT
sumption was even reduced by 5 percent thanks to the sys-tematic energy management efforts of Dräger Gebäudeund Service GmbH. This corresponds to mathematical sav-ings of almost 600 t in CO2 emissions.
Dräger’s own, local gas-fuelled cogeneration plant produced a steady 6.3 million kWh/a of environmentally-friendly electricity. The effectiveness of the cogener -ation plant was therefore more than 86 percent. It is noteconomically viable to increase its operating time andtherefore annual electricity output as the Company has nouse for the byproduct heat during the summer months.
Water consumption rose steeply to over 94,000 m3, almostthe same level as in 2006. Net sales in the production of filter fleece and suction filters increased disproportion-ately caused the rise in water consumption despite pro-duction water being partially reused. The amount of wasterecorded by Dräger Abfallwirtschaftsverbands w. V.dropped to 3,950 t, 2 percent down on the previous year.More than 98 percent of waste is being reused or recy -cled. Improvements to the waste separation system reducedhousehold waste by almost 10 percent to 614 t.
PRODUCT-RELATED ENVIRONMENTAL PROTECTION
In 2010, product-related environmental protection focusedon compliance with statutory requirements resultingfrom the REACH EC Regulation1, the EU GHS (CLP) Reg-ulation, and the laws and regulations on packaging and the disposal of batteries.
By successfully registering calcium hydroxide, Dräger cre-ated an important condition for the legally compliant production and sales of soda lime within the statutory dead-line. Similarly, the registration of certain chemical inaccordance with EU GHS ensured that purchasing willcontinue to comply with legislation.
New raw materials and impregnating chemicals wereintroduced for the production of impregnated activated car-bon in the safety division. By taking this action, Drägertook preventative measures for the impending restrictionson SVHCs2 materials. In addition, the use of important
REDUCTION OF ENVIRONMENTAL LOAD IN RELATION TO NET SALES
(in %, reference year 1995 = 100 %)
90
80
70
60
50
40
30
20
10
Total solid waste CO2 emissions Water consumption Energy consumption A continuous decline in environmental load indices at the Lübeck site as measured against net sales
2000 2001 2002 2003 2004 2005 2006 2007 2008 2009 2010
1 REACH: registration, evaluation, authorization and restrictions of chemicals (VO [EG] No. 1907 / 2006); EU GHS: European globally harmonized system ofclassification and labeling of chemicals (VO [EG] No. 1272 / 2008; more oftenreferred to as CLP Regulation)
2 Substances of Very High Concern

ENVIRONMENTAL PROTECTION | PRODUCTION AND LOGISTICS | BASIC FEATURES OF THE REMUNERATION SYSTEM 106
raw coal made of coconut shells is based on renewableraw materials.
In the medical division, Dräger also takes ecologicalaspects into account for its product development and thesale of systems and devices. Life Cycle Assessments(LCAs) determine and evaluate the impact on the environ-ment from the production, use and disposal of severaldevices on the basis of recognized standards. Another LCAnow provides an ecological assessment of the gas supply systems installed in many hospitals.
As in the previous year, there were no environmental risksthat would have made it necessary to recognize provisionsas of the reporting date.
EMISSIONS OF HAZARDOUS SUBSTANCES AND TOXIC
MATERIALS
Installation and service work in most of the productiondepartments does not release any hazardous emissionsinto the air. For process security and product safety reasons,cleaning agents, adhesives and coatings that contain solvents are used in certain areas of some productiondepartments at the Lübeck site only. The associated emissions total less than 2.7 t per year and are thereforebelow the reporting thresholds established by the regula -tory authorities. This also applies to the anesthetic gasesused by the Company in small quantities for the purpose of calibrating anesthesia equipment. A recycling processreduces these emissions by approximately 60 percent.
Powerful extraction systems in the respective productiondepartments ensure that safe work conditions are main-tained for the employees working there. This is under-scored by the results of exposure measurements which fallfar below the legal workplace concentration limits. Regular examinations by a Company doctor and occupa-tional safety training are also provided.
The Company does not release any hazardous, reportableair emissions pursuant to the European hazardous emis-sion registry EPER.
Production and logistics
PRODUCTION – MEDICAL DIVISION
Dräger relocated the production of emergency ventila-tion devices from Best in the Netherlands to the Lübeck sitein the first six months of 2010. Notwithstanding a signi -ficant increase in the order volume, the smooth transfer ofthe production lines allowed equipment to be supplied to customers without disruptions. The Best site was closedat the end of June 2010 as planned. Consolidating the ventilation business area in Lübeck results in enduringeconomies of scope for production totaling approxi-mately EUR 1 million per year. The full amount will berealized starting in 2011.
Dräger implemented the new inventory management sys-tem for purchasing, production and logistics in Shanghai at the beginning of September. All production sites of themedical division have been using the same system withuniform, standardized processes ever since. Production inthe medical division has therefore established the prereq -uisites for smooth and efficient cooperation between all ofthe sites.
After a challenging year in 2009, production in the medicaldivision once again proved highly flexible in 2010. Dräger continuously expanded its production capacities inorder to reliably cover the unusually high order volume.With a simultaneous productivity improvement of approx-imately 5 percent, the Company increased the unit out -put of certain production lines by more than 30 percent.Among other measures, the Company implemented a second shift in some areas and hired new employees inorder to achieve this gain.

107POTENTIALFUNCTIONAL AREASBUSINESS PERFORMANCEMARKET ENVIRONMENT
PRODUCTION – SAFETY DIVISION
Technical acceptance of the fourth lime plant at theLübeck site was completed at the end of 2010. The plantis expected to commence operations in the spring of 2011 and will mainly produce soda lime for use in medicaldevices.
Preparations to set up a new production line for the pro-duction of filter paper for respiration filters and infusionpaper proceeded as planned. The further development of these core competencies is another investment in aprom ising production technology.
Dräger made major investments in the modernization ofmachinery for compressed air breathing apparatus pro-duction at the Blyth site. In doing so, Dräger was able tosignificantly improve efficiency at the site.
The building shell for the new production facility in Chinawas completed as planned. Commissioning is scheduled for mid-2011. In addition to growing demand from the localmarkets, the additional capacity is also intended to meetrising demand for products in the emerging markets ofdeveloping countries.
LOGISTICS
Dräger was also able to make major improvements to logis-tics processes and delivery performance in fiscal year2010. Achieving end-to-end transparency along the entirevalue added chain was a key focal point. Transport costsfell by approximately 9 percent compared to the previousyear. The uniform global sales budgeting process, whichincorporates the relevant information from all process par-ticipants and is centrally controlled, resulted in budgetdata of much higher quality. Flexibility was also improved,for example in the customer-specific delivery of largeorders. Based on these measures and better cooperationwith the suppliers, Dräger has stabilized the supply ofmaterials.
Basic features of the remuneration system for the Executive Board of Dräger werk Verwaltungs AG and theSupervisory Board of Drägerwerk AG & Co. KGaA
EXECUTIVE BOARD REMUNERATION
All employment contracts of the Executive Board membersof Drägerwerk Verwaltungs AG have been concluded with Drägerwerk Verwaltungs AG. The Supervisory Boardof Drägerwerk Verwaltungs AG determines the remu -neration of the Executive Board. Each contract expires aftera different period of time between three and five years.Based on the resolution adopted at the annual sharehold-ers’ meeting of Drägerwerk AG & Co. KGaA on June 2,2006, the remuneration of individual members of the Exec-utive Board for fiscal year 2010 may not be disclosed, with the exception of that of the Chairman. This resolutionhad a term of five years and applies for the last time to fiscal year 2010. As from fiscal year 2011, remuneration ofall Executive Board members will be disclosed individually.
During the course of fiscal year 2010, Dräger implementeda holistic value management approach with the aim ofmanaging the Company with the long-term and sustainablegrowth of its value in mind. Dräger Value Added (DVA)was introduced as a key performance indicator for meas-uring the Company value. DVA corresponds to Group net profit less capital costs. DVA-driven management formsan integral part of all management processes. Themaxim of value added is particularly important for the def-inition of strategies, planning, regular reporting andwhen making investment and business decisions. Conse-quently, performance-related variable remuneration ofthe Dräger management also reflects DVA. In the report-ing period, the Company already adjusted the existing top management and Executive Board remuneration sys-tems and included them in contracts for Executive Boardmembers that were extended in 2010, by setting all quan-

BASIC FEATURES OF THE REMUNERATION SYSTEM108
titative targets so as to have a direct and positive impact on DVA. Dräger decided to implement a standard remuner-ation system for top management and the ExecutiveBoard in 2011; its quantitative targets are mainly DVA tar-gets. Targets can also be defined on the basis of key per-formance indicators for individual functions.
The Executive Board remuneration system applicable inthe reporting period and also the system applicable asfrom 2011 orient themselves by essential general condi-tions within the Company. These include Dräger’s sizeand global activities as well as its economic development.The general development of the economy and industriesare also taken into account. Another major aspect affectingthe remuneration of Executive Board members and topmanagers is the range of tasks, areas of responsibility andperformance of each individual person.
In the reporting period, total remuneration for ExecutiveBoard members comprised non-performance-related aswell as performance-related components. Non-performancerelated components include fixed basic remuneration and additional benefits and pension plans. Fixed basicremu neration and additional benefits are paid monthly.The percentage of fixed basic remuneration in total Exec-utive Board remuneration amounts to around 22 per -cent for the Chairman of the Executive Board and at least35 percent for all other Executive Board members. Thefocus for all Executive Board members is therefore on theperformance-related component. The performance-related component of the remuneration of active ExecutiveBoard members is pegged to individual targets. These targets include targets that can be quantified in terms ofbusiness and also individual quality targets. Quantifi-able targets pertain to key performance indicators such asGroup net profit, days of net working capital and profitmargin. One example for a quality target is the plannedphase-out of old products. Dräger pays an annual pre-defined bonus for meeting these targets, which can be
increased or decreased, depending on whether the target has been exceeded or missed. If a target has beenexceeded to a considerable extent, this bonus will becapped at double its original amount. If the target has beenmissed by a long way, the bonus may not be paid at all. The original amount of the individual bonus comes toaround 50 to 60 percent of fixed annual remuneration for all Executive Board members. In addition, individualExecutive Board members receive a percentage-basedshare in net profit. This is 1 percent for the Chairman ofthe Executive Board and between 0.2 percent and 0.3 percent for all other Executive Board members entitled toa share in net profit. The share is distributed annually after the consolidated financial statements have beenapproved.
Long-term incentive components were added to employ-ment contracts that were extended in fiscal year 2010 in line with the Act on the Appropriateness of ExecutiveBoard Remuneration (VorstAG). These targets alsoinclude qualitative and quantitative criteria. The time-frame in which these targets have to be met depends on the term of the contract of each Executive Board mem-ber. At the end of the contractual period, a predefinedbonus is paid which can be increased or decreased depend-ing on whether the targets have been exceeded or missed.Dräger may issue a part payment according to the expect-ed target achievement at the earliest after three fifth of the contractual period has expired.
The original amount of the long-term bonus over the entirecontractual period (three to five years) is around 175 percent of basic remuneration for one year for the Chair-man of the Executive Board and between 100 percent and 150 percent for all other members of the ExecutiveBoard, for whom long-term targets were agreed in 2010.Dräger will pay the long-term incentive components earnedin 2010 together with the other variable remunerationonce the Executive Board remuneration system is being

109POTENTIALFUNCTIONAL AREASBUSINESS PERFORMANCEMARKET ENVIRONMENT
changed over. The Supervisory Board may choose to pay a special bonus for extraordinary performance or servicesrendered by individual Executive Board members in therespective reporting year. No further payments have beenpromised in the event of termination of appointment to the Executive Board. The Executive Board contracts donot provide for any severance entitlements. As from fiscalyear 2011, payments made due to the early termination ofan employment contract are capped at one annual salary.
Obligations from the pension plan remain at DrägerwerkAG & Co. KGaA pursuant to the terms and conditions ofindividual contracts. Defined benefit plans for members of the Executive Boards are agreed individually, based on“Führungskräfteversorgung 2005”, which has been ineffect within the Group since January 1, 2006. The definedbenefits under the pension plans offered to the mem-bers of the Executive Board are either fixed or based on thebasic annual salary and years of service on the ExecutiveBoard. The defined benefit is based on an annual contribu-tion of up to 15 percent of the basic annual salary. Underthe deferred compensation option, an additional annualcontribution of up to 20 percent of the basic annualremuneration can be made. Stefan Dräger receives a fur-ther contribution of 50 percent from the Company ondeferred compensation, but no more than 8 percent of hisbasic annual salary. This top-up payment is only made if consolidated EBIT equals 8 percent or more of net sales.
NEW VARIABLE REMUNERATION STRUCTURE FOR
EXECUTIVE BOARD MEMBERS AND TOP MANAGERS
A new, standardized variable remuneration system forExecutive Board members and top managers, the “TopManagement Incentive” (TMI), has come into force asfrom fiscal year 2011. It applies exclusively to the variableremuneration component. Basic remuneration, addi -tional benefits and any special bonuses remain unaffect-ed. The “profit share”, “individual bonus” and “long-term
bonus” components have been combined into two newtarget components.
INCREASE OF DVA
Variable remuneration for Executive Board members focus-es on increasing the Company value within the scope ofTMI. Dräger has made it its goal to increase DVA between2010 and 2014. This value is divided into four equalparts. 80 percent of the variable remuneration componentfor Executive Board members is essentially dependent on achieving this DVA goal and is therefore based on a long-term, sustainability-focused measurement period. Thisportion corresponds to around 60 percent of total remu-neration of the Chairman of the Executive Board androughly 35 percent to 50 percent of total remuneration ofall other Executive Board members. If a target has beenexceeded to a considerable extent, the bonus payment willbe capped at double its original amount. If the target has been missed by a long way, the bonus may not be paidat all. If the DVA target is exceeded by more than 200 percent or performance drops below 0 percent, a corre-sponding amount is recognized in the bonus reserve. This component is described in more detail in a later partof this report.
KPI TARGETS FOR OPERATING FUNCTIONS
Dräger may set additional targets based on key perform-ance indicators (KPI) for Executive Board members who are responsible for operating functions. These targetsare to relate to the areas of responsibility of each mem -ber of the Executive Board and have a positive impact onDräger’s company targets. Each year, the SupervisoryBoard determines KPI targets in consultation with eachmember of the Executive Board. They should not exceedfive individual targets. 20 percent of variable remunerationcan be linked to KPI targets, corresponding to around 12 percent of total remuneration for the Executive Boardmembers responsible for operating functions. If KPI

BASIC FEATURES OF THE REMUNERATION SYSTEM | PERSONNEL110
targets are set, the percentage of DVA targets is reducedby the percentage of KPI targets. Again, if a target hasbeen exceeded to a considerable extent, the bonus paymentwill be capped at double its original amount. If the tar-get has been missed by a long way, the bonus may not bepaid at all. If the target is exceeded by more than 200 percent or performance drops below 0 percent, a corre-sponding amount is recognized in the bonus reserve. This component is described in more detail in a later partof this report.
PERSONAL TARGETS
Each year, the Supervisory Board sets personal targets inconsultation with each member of the Executive Board.This may include targets such as creating a sustainableorganizational structure and increasing customer satis -faction. 20 percent of variable remuneration is linked topersonal targets. This corresponds to around 15 percent of total remuneration for the Chairman of the ExecutiveBoard and roughly 12 percent of total remuneration for all other Executive Board members. If a target has beenexceeded to a considerable extent, the bonus payment will be capped at double its original amount. If the targethas been missed by a long way, the bonus may not be paid at all. There are no plans to recognize a bonus reservefor personal targets.
The same target structure as for Executive Board mem-bers applies to the members of the extended managementteam who are not part of the Executive Board. Their vari-able remuneration therefore also depends to 80 percent or60 percent on the Group DVA. The system applies toaround 170 managers in the Group and has a descendingstructure.
BONUS RESERVE
A bonus reserve was integrated in the future joint remu-neration system for Executive Board members and topmanagers to further emphasize its sustainability. Bonusescorresponding to 0 percent to 200 percent target achieve-
ment are paid annually. If DVA and KPI targets are exceed-ed (between 200 percent and 300 percent) or missed(between 0 percent and 100 percent), the correspondingbonus amount is recognized in the bonus reserve. Thebonus reserve is held and netted over the entire target peri-od of four years so that it is possible to compensate for cases of exceeded or missed targets. The positive netamount of the bonus reserve is only distributed with the last bonus payment at the end of the target period. Anegative amount is carried forward to the next target period. The bonus reserve therefore lets Executive Boardmembers and top managers share in the opportunities and risks of Dräger’s medium term business performance.Particularly excellent performance receives additionalincentives but at the same time the taking of inappropri-ately high risks is discouraged as such activities coulddeplete the bonus reserve.
LONG-TERM MEASUREMENT PERIOD
In future, Dräger will continue to set the period for DVAtargets at four years. This ensures that the remuneration of Executive Board members and top managers is alwaysbased on a long-term measurement period over severalyears, therefore creating an incentive to aim for a sustain-able positive business development. The Executive Boardregularly determines the four-year target as part of strate-gic development. The Supervisory Board approves thedefined target value and applies it as the basis for Execu-tive Board remuneration.
SUPERVISORY BOARD REMUNERATION
The remuneration report also includes information on theshares owned by the members of the Executive and Supervisory Boards as defined above. Every member of theSupervisory Board receives basic remuneration, which is composed of a fixed amount of EUR 10,000.00 (2009:EUR 10,000.00) and a variable amount of EUR 31,500.00(2009: EUR 9,750.00). This variable component amountsto 0.03 percent of net profit.

111POTENTIALFUNCTIONAL AREASBUSINESS PERFORMANCEMARKET ENVIRONMENT
Pursuant to Sec. 21 (1) of the articles of association ofDrägerwerk AG & Co. KGaA, the distribution of the remu-neration of members of the Supervisory Board is deter-mined by a Supervisory Board resolution. The SupervisoryBoard has adopted the following principles for distribu-tion: Its chairman is entitled to three times (previous year:four times) and the vice chairman to one and a half times (previous year: two times) the amount. The membersof the Audit Committee receive an additional EUR5,000.00, and the Chairman of the Audit Committee anadditional EUR 10,000.00. As from fiscal year 2009,Supervisory Board members have not been receiving a perdiem any more.
Personnel
Dräger employed 240 more people in Germany in 2010than the previous year, while the number of employeesabroad fell by 20. Most of the new employees were hiredin Research & Development, Marketing & Sales, and Production. On December 31, 2010, a total of 55 percent(2009: 56.2 percent) of employees were working outsideGermany.
On December 31, 2010, headcount at Drägerwerk AG &Co. KGaA /other companies was up 66 employees compared to December 31, 2009. A major reason for thischange was the transfer of 39 employees in the Compa -ny’s medical service and Purchasing from the divisions toDrägerwerk AG & Co. KGaA for organizational reasons.Employees were also added in administrative functionssuch as Group Controlling and the Tax department.
The medical division hired a total of 81 additional employ-ees in 2010. This was mainly due to the addition of 68employees in Production as well as Research & Develop-ment at Dräger Medical GmbH. The increase in the number of employees in Sales, Service and Marketing at
the foreign subsidiaries was offset by a reduction in personnel at the foreign production company in Best (theNetherlands). 106 employees were released from theircontracts when the site was closed in fiscal year 2010. Newemployees were hired at the production sites in Shanghai,China, and Andover, USA.
Compared to December 31, 2009 the safety division added a total of 73 employees in fiscal year 2010. Most of the newemployees were hired in Germany in Logistics and Pro-duction as well as Sales & Marketing. Five employees wereadded in the safety division outside Germany.
The proportion of temporary staff at Dräger companieswith production operations totaled 11.8 percent as of the balance sheet date on December 31, 2010 (2009: 6.9percent). Thanks to the higher percentage of temporaryworkers, Dräger was flexible in response to the pronouncedincrease in the order volume in the course of fiscal year2010. The Company is working towards additional flexibil-ity models in relation to the future collective agreement(“Zukunftstarifvertrag”) concluded for the German Drägercompanies at the end of 2010.
Since the number of female graduates in technical occu -pations is lower, the proportion of women out of the over-all number of Dräger employees has remained steady atjust under 30 percent for years. The turnover rate fell to5.3 percent in 2010 compared to the previous year (2009: 5.5 percent). At 4.2 percent, the absenteeism ratefor employees in Germany was below the average formember operations of the NORDMETALL employers’association (4.7 percent).
Compared to 2009, there was a minor change in the aver-age age at Dräger from 41.2 to 41.6 years. In addition to thisconsistency, the age distribution is even across the vari-ous age classes. 15.2 percent of the employees are 30 yearsold or younger (2009: 17.1 percent); the typical age at

PERSONNEL112
the time of recruitment is over 25 due to the comparative-ly high level of education (without vocational training in Germany). 20.5 percent (2009: 18.0 percent) of employ-ees are between 50 and 60 years old.
The personnel cost ratio in 2010 was 33.0 percent (2009:35.0 percent).
DRÄGER IS AN ATTRACTIVE EMPLOYER
Highly qualified and dedicated employees are a scarceresource and essential to the success of the Company. Posi-tioning the Company as an attractive employer is a key factor in competing for skilled workers and senior manage-ment. According to a Trendence study (2010), Dräger
ranks 43rd for engineers and 71st for skilled IT workersamong the most popular employers across Germany.
Dräger once again presented itself to its target groups bymeans of advertisements and media relations on careertopics as well as attendance and presentations at universityfairs in 2010. However, the opinions of the target groups –even on topics related to employment – are increasinglyformed in social networks. This is why conditions for an expanded future presence on social platforms such asXING and Facebook were created in 2010.
Headcount as of the balance sheet date Headcount (average)
December 31, 2010 December 31, 2009 2010 2009
Medical division 6,386 6,305 6,357 6,302
Safety division 4,409 4,336 4,370 4,282
Drägerwerk AG & Co. KGaAand other companies 496 430 459 423
Dräger Group total 11,291 11,071 11,186 11,007
Germany 5,085 4,845 4,980 4,846
Other 6,206 6,226 6,206 6,161
Women 3,303 3,244 3,266 3,254
Men 7,988 7,827 7,920 7,753
Plus apprentices and trainees 329 330 307 298
Turnover in % of employees 5.3 5.5
Sick days in % of work days 3.2 3.0
Average age (years) 41.6 41.2
Personnel development costs in € million 12.3 10.6
thereof training expenses 6.8 6.2
WORKFORCE TREND

113POTENTIALFUNCTIONAL AREASBUSINESS PERFORMANCEMARKET ENVIRONMENT
PERSONNEL DEVELOPMENT
Dräger spent close to EUR 12.3 million on personnel devel-opment around the world in 2010 (2009: EUR 10.6 mil-lion). This also includes the cost of vocational training inGermany. Not only does this cover classic occupations tosecure the supply of new workers, it also includes variousdual study courses.
In order to prepare skilled workers and senior managementfor the increasingly complex requirements of global mar-kets, Dräger pursues targeted continuing education meas-ures with a number of incentives. Among other aspects,the need for continuing education is derived from talentmanagement and is also discussed and established inannual, structured employee interviews between the sen-ior manager and the employee.
A uniform structure of job levels and career paths has alsobeen implemented in the meantime: the senior manage-ment career, the career as project manager or the careeras specialist in a technical occupation. Targeted and sys-tematic personnel development measures are assigned toeach career path and each job level within the scope oftalent management in order to identify the employees who
are most able and willing to perform by means of a corre-sponding appraisal – in part with the involvement of theExecutive Board – and to support potential-based careerand succession planning. Talent management is a globalproject and has been implemented in 62 companies todate. The results are already having a positive impact whenfilling vacant positions in Germany and abroad.
OCCUPATIONAL HEALTH MANAGEMENT
A special responsibility for the health of employees isderived from the Company’s guiding philosophy “Technol-ogy for Life”. Dräger promotes the long-term health andperformance of employees within the scope of occupation-al health management at headquarters in Lübeck. Meas-ures include nutrition consulting, preventive healthcareand a broad selection of approximately 20 Company sports teams.
FUTURE COLLECTIVE AGREEMENT
In December 2010, Dräger concluded the negotiations fora future collective agreement (“Zukunftstarifvertrag”) for employees working under collective agreements in Ger-many. These negotiations had commenced in the previ-ous year. In the future, the Company will be able to hire
FTEs as of the balance sheet date FTEs on average
December 31, 2010 December 31, 2009 2010 2009
Medical division 6,202 6,097 6,147 6,089
Safety division 4,206 4,174 4,173 4,041
Drägerwerk AG & Co. KGaAand other companies 457 397 421 388
Dräger Group total 10,865 10,668 10,741 10,518
Germany 4,711 4,474 4,605 4,470
Other 6,154 6,194 6,136 6,048
* Full-time equivalent (basis in Germany: 40 hours) is a relative measurement used to determine resource capacity. It is a metric used to calculate the notional numberof full-time employees, involving the conversion of part-time staff to full-time terms.
EMPLOYEES – FULL TIME EQUIVALENTS (FTES)*

PERSONNEL | OPPORTUNITIES AND RISKS RELATING TO FUTURE DEVELOPMENT114
1.5 percent of the number of full-time employees start -ing in 2011 and hire all trainees who complete their train-ing for at least twelve months. The collective agreement is in force until December 2015.
Opportunities and risks relating to futuredevelopment
RISK AND OPPORTUNITY MANAGEMENT
The risk policies pursued by Dräger serve to effectivelyincrease the value of the Company by consistently tak -ing advantage of opportunities while recognizing and man-aging risks in a timely manner.
Risk and opportunity management at Dräger ensures aresponsible approach to dealing with the inevitable uncertainties of doing business. The system enables Drägerto meet its targets by consistently taking advantage ofopportunities without losing sight of the associated risks.Since risks are identified early and updated regularly as part of risk management, the Company can implementmeasures in a timely manner in order to ensure that the Company’s objectives are met. This applies in particu-lar to identifying developments that could threaten theexistence of Dräger. The Dräger risk management systemtherefore meets the requirements of the Control andTransparency Act (Gesetz zur Kontrolle und Transparenzim Unternehmensbereich – KonTraG).
The long-term basis for our opportunity management is thestrategic planning process and the resulting develop-ment and market positioning measures for products overtheir entire life cycles. In order to respond to marketchanges in a flexible manner, Dräger pursues the continu-ous improvement of Company structures and processes.
The risk management system comprises all measures thatallow us to identify, measure, monitor and manage poten-
new employees with more flexible working hours in order to respond to future market fluctuations more quick-ly. The main working conditions of all German Drägercompanies will also be standardized on the basis of the col-lective agreements of the metal processing and elec-trical industry in northern Germany. Service providers aresubject to a special collective agreement for the serviceindustry with a permanent minimum gap (“Abstandsge-bot”). In the future, both Christmas and vacation paywill be variable and classed as a special payment, taking intoaccount group net profit and income groups. The 2.7 percent pay rise planned for April 1, 2011 is being imple-mented one month early. Furthermore, all employees are receiving a one-time payment of up to EUR 1,250 forthe extremely successful 2010 fiscal year. Dräger will also determine the number of new trainees at the rate of
Occupation No.
Business / technical vocational training 72
Industrial business managers 60
Chemical laboratory assistants 7
Qualified warehouse logistics personnel 2
Shipping and logistics services business administrators 3
Industrial vocational training 55
Mechatronics 25
Devices and systems electronics engineers 23
Qualified warehouse personnel 5
Technical draftsmen / women 2
College and university studies 67
Bachelor of Science “industrial engineering” 35
Bachelor of Engineering “medical technology” 7
Bachelor of Science “computer science” 8
Bachelor of Engineering “mechanical engineering” 10
Bachelor of Engineering “electrical engineering” 6
Graduate business managers 1
Total apprentices in vocational careers 194
BREAKDOWN BY OCCUPATION AS OF DEC. 31, 2010

115POTENTIALFUNCTIONAL AREASBUSINESS PERFORMANCEMARKET ENVIRONMENT
tial strategic and operational risks at an early stage. Strate-gic corporate planning constitutes the basis for recog -nizing potential risks: even during the planning process,potential uncertainties are specified in the assumptionsunderlying the plans. The internal control system (see pages66 et seq.) continuously monitors these uncertainties and communicates potential uncertainties as part of regu-lar reporting. Group Controlling prepares the regular risk report twice a year; this is supplemented by ad-hocreporting. Material risks can therefore be addressed very quickly. The risks are reported using a bottom-upapproach based on specified risk categories and aggre -gated at the Com pany level. Information on risks and oppor-tunities flows to the respective process owners, the Executive Board and Supervisory Board and, if necessary,enables action to be taken at short notice. Risk manage-ment is complemented by the Internal Auditing departmentand the Supervisory Board, which regularly verifies theeffectiveness of the risk management system pursuant tothe regulations of Sec. 107 (3) of the German Stock Corporation Act (Aktiengesetz – AktG). The Dräger earlyrisk identification system is a part of the Dräger risk management system and remains part of the annual audit.
As a matter of course, the medical and safety divisions sub-mit their products and services to quality inspections and ongoing checks in accordance with stringent nationaland international standards, always in keeping with thespecial quality and risk orientation of these sectors (seepage 103).
The risks that may have an impact on Dräger as describedbelow are not necessarily the only risks Dräger is exposedto. Risks that are not known or have been consideredimmaterial as of the reporting date may also affect thebusiness activities of Dräger in the future.
OVERALL ECONOMIC RISKS
In the wake of the 2009 financial and economic crisis,global economic growth was strong in 2010. Notwithstand-
ing the pronounced recovery, capacity utilization in theprocessing industry remained below the long-term averagein 2010. While the financial markets have largely stabi-lized, the aftermath of the financial crisis has probably notbeen fully overcome. Major volatility in the money mar-ket continues. The possibility of a negative impact causedby the financial difficulties of certain European countriescannot be excluded. In view of the fact that global growthhas slowed considerably, the economic situation in mostindustrialized countries remains highly uncertain.
Natural disasters in countries rich in raw materials aswell as the artificial scarcity of commodities due to specu-lative transactions could lead to rising costs and supplybottlenecks in the commodities market.
By strengthening its global business, Dräger has achievedbroad regional diversification of net sales. The growth targets of the Dräger Group are still focused on the Ameri-cas and Asia. The production sites in the US, GreatBritain and China are instrumental in reducing the cur-rency risks associated with global business.
Numerous other factors such as global, political and cul-tural conflicts, including the situation in the Middle East, can affect macroeconomic developments and inter-national capital markets and shape demand for Drägerproducts and services.
STRATEGIC RISKS
The industries in which Dräger operates are consideredfuture-oriented with strong growth. Within each industry,further consolidation processes are expected that are likely to affect the structure and intensity of competition.The pooling of purchasing volumes due to the consoli -dation of hospitals or the establishment of purchasingcooperatives provides customers with more market power.We have also noticed a trend towards outsourcing sec-ondary and tertiary services (e. g. maintenance and repair),

OPPORTUNITIES AND RISKS RELATING TO FUTURE DEVELOPMENT | OPERATIONAL RISKS116
meaning that Dräger might only be able to act as a sub-contractor. Dräger is up against strong competitors, someof whom have access to extensive resources. New com -petitors, especially in Asia, have made significant qualityimprovements over the last few years and are offeringproducts in the lower and middle performance and pricegroup. The Dräger Group depends on the investmentbudgets of public authorities in both divisions since domes-tic and foreign public institutions make up a large pro -portion of the customer base. These include public hospi-tals, fire fighting services, the police force, the militaryand disaster management. Public spending cuts were evi-dent in numerous industrialized countries over the lastfew years, for example in the US and Europe. This trendcould continue given the current market environment.Dräger is meeting these challenges through customer ori-entation, innovation, high product and service quality and reliability as well as active consolidation where appli-cable in order to protect and strengthen the Company’smarket position.
Operational risks
SUPPLIER AND MATERIAL PRICE RISKS
The current and planned product portfolio requires exten-sive coordination with reliable and competent suppliers.Our suppliers are integrated into our processes, since thelevel of vertical integration in our business model hasbeen reduced to the necessary core technologies and theassembly of purchased parts and components. To man-age the risks this entails, information processes are struc-tured, the necessary internal and external interfaces inthe global processes are optimized and the performanceof external partners is carefully reviewed. Quality stan-dards safeguard the supplier selection and procurementprocesses. Our operating processes are always beingimproved.
Existing risks due to increases in the cost of metals in fis -cal year 2010 are expected to continue in 2011. The supplysituation in the area of electronic components remainsdifficult. As a safeguard against price increase, Dräger hasconcluded annual contracts with suppliers of electroniccomponents, electricity and, to a large extent, commodities.
PRODUCT LIFECYCLE RISKS
It is important for the profitability of the Company thatthe product portfolios of both divisions are up to date.Experience has shown that new products are more prof-itable than products in a later phase of the product life -cycle. This is why Dräger continuously invests in researchand development in order to keep the proportion of newproducts as high as possible. This necessitates making bothtop technological products and products which appeal to a large section of the market available in a timely man-ner. Together with technology, an excellent cost position is important for the market position and economic successof Dräger. This requires not only a high quality productportfolio in line with market requirements but also the abil-ity to control operating processes, from development,sales and order fulfillment through to maintenance of theproduct portfolio. Risks may therefore result from delayedproduct launches as well as changing market require-ments.
PROJECT RISKS
Projects account for a material proportion of business inthe Dräger divisions. Large-scale projects that require the highest technical standards and specific know-howbear particularly high levels of risk. The expected profitmargins may deviate from the actual margins for reasonssuch as cost changes or lost productivity. Possible risksinclude quality problems, the loss or shortage of qualifiedskilled workers, delivery problems on the part of suppli -ers or payment difficulties on the part of customers. If spe -cific contractual obligations are not met in a timely manner or at all, this can lead to contractual penalties,

117POTENTIALFUNCTIONAL AREASBUSINESS PERFORMANCEMARKET ENVIRONMENT
compensation claims or temporary measures. Risks are kept as low as possible with the help of project manage-ment standards and ongoing project controlling.
IT RISKS
The Group’s business processes require reliable, cost-effective IT systems. The breakdown of IT systems couldcompromise critical business processes (e. g. productionshutdown). Breakdowns could be caused by factors suchas overload or external hazards (virus attack).
Dräger has launched an initiative to further enhance ITsecurity. Focal points include improving numerous inter-nal IT business processes and risk management procedures.With the switch to a new service provider for the opera-tion of the computer center, which commenced in 2010,comprehensive measures were also launched to improvesecurity standards.
PERSONNEL RISKS
The remuneration systems and personnel developmentprograms are geared towards retaining employees, enhanc-ing their identification with the Company and motivat-ing them for maximum performance. Dräger invests inemployee qualification measures in order to counteractrisks due to employee turnover and the loss of know-howassociated with retirement. Among other things, Drägermaintains close contact with universities and actively pur-sues recruitment efforts in the face of increasing com -petition for highly qualified skilled workers and senior man-agement. Positioning the Company as an attractive employ-er is a key factor in successfully competing for skilled work-ers and senior management.
Remuneration risk with regards to the development of personnel expenses exists due to the possible cancellationof the collective pay agreement applicable to the GermanDräger companies effective March 31, 2012. New collec-tive agreements are to be expected for the subsequent
period. The terms and duration of pending collective agree-ments in the planning period are uncertain.
REGULATORY AND LEGAL RISKS
Dräger companies are subject to various and frequentlychanging legal provisions in all countries in whichDräger operates. The measures required for compliancecan generate considerable operating costs. Obligationscan arise from public law, such as tax law, or from civil law.Laws to protect intellectual property and third-party concessions, varying approval and licensing regulationsfor products, competition rules, regulations in connec-tion with awarding contracts, export control regulationsand more are also relevant to business operations.Drägerwerk AG & Co. KGaA is also subject to legal provi-sions governing capital markets.
The Dräger companies are currently involved in legal disputes and may be involved in legal disputes within thescope of their business activities in the future. To countersuch legal risks, Dräger has taken out liability insurancepolicies with coverage which the Executive Board of thegeneral partner considers appropriate and customary forthe industry.
In some regions, legal uncertainty could result fromDräger only having limited possibilities to assert its rights.
The control and prevention mechanisms of the compli-ance structure may not have been sufficient in the past ormay not be sufficient in the future to effectively protectDräger against legal violations. Dräger has implementedcompliance rules that apply throughout the Company.The business policies and a code of conduct are intendedto ensure that business is conducted responsibly and inaccordance with legal requirements.
Distribution partners may assert compensation or equal -ization claims against Dräger pursuant to the respectiveapplicable laws when their contracts are terminated.

OPERATIONAL RISKS | OPPORTUNITIES | DISCLOSURES PURSUANT TO SEC. 315 (4) HGB AND EXPLANATIONS OF THE GENERAL PARTNER118
Such claims are excluded in the distribution agreementsto the extent permitted by law. Contracts are concludedwith short terms, especially with new distribution partners.
Dräger endeavors to comply with all legal and regulatoryobligations; corresponding internal regulations and direc-tives are in place.
RISKS FROM FINANCIAL INSTRUMENTS
The aim of Dräger is to minimize liquidity risk and riskfrom financial instruments, i.e. interest rate, currencyand credit risk. Liquidity risk and interest rate risk arehedged centrally by Drägerwerk AG & Co. KGaA, where -as currency risk is the joint responsibility of DrägerwerkAG & Co. KGaA and the divisions. The credit risk withregard to cash investments and derivatives is mitigatedcentrally, while the credit risk from receivables fromoperating activities is the responsibility of the divisions.
The only derivatives transactions concluded by the Com-pany are for marketable hedging instruments contractedwith reputable banks as counterparties. Derivatives mayonly be traded by members of the Dräger Group if they arecovered by the treasury guidelines or have been approvedby the Executive Board.
Dräger relies on various financing instruments to reducethe level of liquidity risk: in addition to participation cer -tificates, Dräger Group has outstanding note loans withremaining terms of one to five years. Dräger has alsoentered into an agreement with select banks in 2010 togrant binding lines of credit to secure liquidity. The vol-ume of this line of credit is EUR 240 million. The respec-tive bilateral agreements have a term of five years.
Dräger is mainly exposed to interest rate risks in relation to the euro. The Company counteracts these risks with amix of financial liabilities at fixed and variable interest
rates. Part of the variable interest is hedged by interest ratecaps1. Cash investments are only made in the form ofovernight money at commercial banks with high creditratings.
Dräger manages currency risks associated with currenciesother than the euro by entering into forward2 and swap3
hedging transactions with selected banking partners, where-in the payment streams are hedged on a transaction-spe -cific basis. Details on the management of financial risksare found in the notes on pages 191 et seq.
OTHER RISKS
Dräger Group does not have unlimited liability coverageand therefore the risk exists that the liability insurance doesnot sufficiently cover any claims against the Company (e. g. in case of a class action lawsuit). However, the prob-ability of such a risk materializing is very remote.
The Dräger production facilities are subject to operatingand accident risks. Dräger addresses these risks with suitable measures. In addition to investments in occupa-tional safety and fire protection, these also includeobtaining comprehensive industrial insurance cover tofinancially secure the insurable operating risks andresulting sales risks.
OVERALL RISK
Overall, the most important of all risks facing the Groupare the strategic risks, especially those stemming fromconsolidation processes in the market that affect the com-petitive structure. However, this risk is mitigated both
1 Option transaction in the form of a contractually stipulated maximum interest rate.Buying a cap protects the buyer against possible interest rate increases.
2 Currency future. Contractual agreement between two parties to exchange twoagreed currency amounts on a specified future date and at an agreed exchangerate.
3 Simultaneous conclusion of a cash currency transaction and a currency future withthe same counterparty. The amount purchased in cash is sold on the future dateor vice versa.

119POTENTIALFUNCTIONAL AREASBUSINESS PERFORMANCEMARKET ENVIRONMENT
by the regional spread and the diversification of the prod-uct and service offerings of the Dräger Group. The per-formance risks from the completion of orders are wellspread and are therefore limited.
All in all, the risks to the Dräger Group are limited and,based on the information currently available, the contin-ued existence of the Company as a going concern is not atrisk.
Opportunities
EXPANSION OF LEADING MARKET POSITIONS
Based on net sales, Dräger considers itself one of the glob-al market leaders in many areas and product groups of its two divisions. The Company sees opportunities for thecontinued growth of its market share by building on outstanding technological know-how, high product quality,brand awareness and long-term customer relationships.In this context, Dräger focuses on attractive market seg-ments and niches where the Company sees above-average profitability and growth opportunities. Drägeralso strives to develop new markets by developing new products.
EXPANSION IN DEVELOPING AND EMERGING
COUNTRIES
Dräger is favorably positioned based on investments andrestructuring over the last few years, especially in sales andservice. Building on this foundation, Dräger sees oppor -tunities for profitable and sustained expansion in the rap-idly growing developing and emerging countries.
EXPANSION OF THE SERVICE AND ACCESSORIES
BUSINESS
Dräger intends to pursue the further growth of sales in thestable and attractive service and accessories business;here both divisions of the Company stand to benefit from
the large number of Dräger devices already in use.Growth of the service business is to be achieved throughthe further development of customer support followingequipment sales as well as service and product offeringsin the accessories and consumables business.
SYNERGIES BETWEEN THE DIVISIONS
Dräger strives to realize additional synergy potentialbetween both the medical and safety division. This is to beachieved, among other things, by creating a joint manage-ment for Marketing and Sales within the functional struc-ture as well as implementing a group-wide standard CRMsystem (customer relationship management) for bothdivisions. Dräger expects the implementation of the CRMwill enhance customer loyalty and allow target groups to be addressed more effectively in order to achieve addi-tional sales growth. In this context, Dräger also seespotential for improving margins and market shares byincreasing the effectiveness of Sales by adopting a holistic approach to managing the diversity of the variouscustomer segments and sales channels.
Disclosures pursuant to Sec. 315 (4) ofthe German Commercial Code (HGB)and explanations of the general partner
The following disclosures pursuant to Secs. 289 (4) and 315 (4) of the German Commercial Code (Handelsgesetz -buch – HGB) describe the conditions as they were on the balance sheet date. These disclosures are explained inindividual sections in accordance with Sec. 176 (1) Sen-tence 1 of the German Stock Corporation Act (Aktiengesetz– AktG).
COMPOSITION OF CAPITAL STOCK
The capital stock of Drägerwerk AG & Co. KGaA amounts to EUR 42,265,600. It consists of 10,160,000 voting bearercommon shares and 6,350,000 bearer preferred shares,

DISCLOSURES PURSUANT TO SEC. 315 (4) HGB AND EXPLANATIONS OF THE GENERAL PARTNER120
each with a EUR 2.56 share in capital stock. Shares of thesame type carry the same rights and obligations. Therights and obligations of the shareholders are laid downin the German Stock Corporation Act, in particular inSecs. 12, 53a et seq., 118 et seq. and 186 AktG, as well as inthe articles of association of the Company. As compensa-tion for the lack of voting rights, an advance dividend ofEUR 0.13 per preferred share is distributed from net earnings. If sufficient profits are available, a dividend ofEUR 0.13 per common share is then paid. Any profit inexcess of this amount, if distributed, is allocated so thatpreferred shares receive EUR 0.06 more than commonshares. If the profit is not sufficient to distribute theadvance dividend for preferred shares in one or more years,the amounts are paid from the profit of subsequent fiscal years before a dividend is paid on common shares. If the Company does not pay amounts in arrears in thenext year along with the full preferred dividend for thatyear, the preferred shareholders have voting rights until the arrears have been paid. In the event of liquida-tion, the preferred shareholders receive 25 percent of the net liquidation proceeds in advance. The remainingliquidation proceeds are distributed evenly to all shares.
RESTRICTIONS RELATING TO VOTING RIGHTS OR THE
TRANSFER OF SHARES
Legal structures at Dr. Heinrich Dräger GmbH effect thatneither Stefan Dräger nor Stefan Dräger GmbH, which he controls, have any influence on the exercise of the vot-ing rights of common shares held by Dr. Heinrich DrägerGmbH at the annual shareholders’ meeting of DrägerwerkAG & Co. KGaA for resolutions within the meaning of Sec. 285 (1) Sentence 2 AktG. There are no further restric-tions which relate to voting rights or the transfer ofshares, even though they could arise from agreementsbetween shareholders.
DIRECT OR INDIRECT SHAREHOLDINGS EXCEEDING
10 PERCENT
Approximately 67.19 percent of the common shares ofDrägerwerk AG & Co. KGaA, equivalent to 6,826,000 com-mon shares or 41.34 percent of the total capital stock,belong to Dr. Heinrich Dräger GmbH, Lübeck. 58.73 per-cent of its shares are held by Stefan Dräger GmbH,Lübeck, 23.15 percent by the Dräger Foundation Munich /Lübeck, and the remainder by various members of the Dräger family. Stefan Dräger GmbH is wholly ownedby Stefan Dräger, Lübeck. Stefan Dräger GmbH and Dr.Heinrich Dräger GmbH informed us in accordance withSec. 21 of the German Securities Trade Act (WpHG) that their share in the voting rights of Drägerwerk AG &Co. KGaA, Lübeck, equals 67.19 percent. Stefan Drägerand the Dräger Foundation Munich / Lübeck informed usin accordance with Sec. 21 WpHG (Wertpapierhandels -gesetz – German Securities Trading Act) that their sharein the voting rights of Drägerwerk AG & Co. KGaA,Lübeck, equals 68.36 percent (Stefan Dräger) and 67.31percent (Dräger Foundation), respectively. In accor -dance with Sec. 22 (1) Sentence 1 No. 1 WpHG, the votingrights of Dr. Heinrich Dräger GmbH are attributed to Stefan Dräger GmbH as the majority shareholder as wellas the Dräger Foundation, Munich / Lübeck based on provisions at the level of Dr. Heinrich Dräger GmbH. Thevoting rights of Stefan Dräger GmbH are to be attributed tothe shareholder Stefan Dräger pursuant to Sec. 22 (1)Sentence 1 No. 1 WpHG. Through Stefan Dräger GmbH,Stefan Dräger also holds all shares in Drägerwerk Verwaltungs AG, Lübeck, the general partner of DrägerwerkAG & Co. KGaA. This means Stefan Dräger is both a shareholder of the general partner and also common share-holder of Drägerwerk AG & Co. KGaA. In the cases cov-ered by Sec. 285 (1) Sentence 2 AktG he would thereforenot be entitled to vote. Legal structures at Dr. HeinrichDräger GmbH ensure that, for such resolutions, StefanDräger does not exert any influence on the exercise of the voting rights of common shares shares held by Dr. Heinrich Dräger GmbH.

121POTENTIALFUNCTIONAL AREASBUSINESS PERFORMANCEMARKET ENVIRONMENT
SHARES WITH SPECIAL RIGHTS CONFERRING CONTROL
There are no shares with special rights conferring controlor special controls over voting rights.
NATURE OF CONTROL OVER VOTING RIGHTS BY
EMPLOYEE SHAREHOLDERS WHO DO NOT DIRECTLY
EXERCISE THEIR CONTROL RIGHTS
The common shares are traded on German stockexchanges since June 21, 2010. If employees of the Com-pany or the Dräger Group wish to acquire shares in theCompany, they can purchase common shares with votingrights or preferred shares without voting rights on thestock exchange. Preferred shares do not confer any controlrights. Employees can exercise the control rights to which they are entitled through the ownership of commonshares with voting rights directly like other shareholders,subject to the applicable legal regulations and the provi-sions of the articles of association. Preferred shares do not confer any control rights.
APPOINTMENT AND REMOVAL OF MANAGEMENT AND
AMENDMENTS TO THE ARTICLES OF ASSOCIATION
In the legal form of a partnership limited by shares (KGaA),the general partner is authorized to manage and repre-sent the Company, a regulation derived from partnershiplaw. Drägerwerk Verwaltungs AG is the general partner of Drägerwerk AG & Co. KGaA. It acts through its Execu-tive Board. The Supervisory Board of Drägerwerk AG &Co. KGaA, which has half of its members elected by employ-ees, is not authorized to appoint or remove the generalpartner or its Executive Board. The general partner joinedthe Company by declaration of accession; it withdrawsfrom the Company in the cases defined under Article 14 (1)of the articles of association.
The general partner’s Executive Board, which is authorizedto manage and represent Drägerwerk AG & Co. KGaA, is appointed and removed pursuant to Secs. 84 and 85 AktGand Article 8 of the articles of association and bylaws
of Drägerwerk Verwaltungs AG. The Executive Board of thegeneral partner comprises at least two persons; the Supervisory Board of the general partner determines howmany other members there are. The Supervisory Board of the general partner, elected by its annual Shareholders’Meeting, is responsible for appointing and removingmembers of the Executive Board. It appoints members ofthe Executive Board for a maximum of five years. Repeatappointments or extensions of the term of office are per-missible.
The Supervisory Board of Drägerwerk AG & Co. KGaA is not authorized to adopt rules of procedure for manage-ment or to define a catalog of management transac -tions requiring approval. The Joint Committee – compris-ing four members of each of the Supervisory Boards of the Company and its general partner – and not the annualShareholders’ Meeting, decides on the managementtransactions by the general partner which require approvalas set out in Article 23 (2) of the articles of association of Drägerwerk AG & Co. KGaA. The Supervisory Board ofDrägerwerk AG & Co. KGaA represents the Company indealings with the general partner.
Pursuant to Secs. 133, 179, 278 (3) AktG, amendments tothe articles of association must be approved by the annualShareholders’ Meeting, which requires a simple majority of votes cast as well as a majority of at least three quartersof the capital stock represented upon adoption of the resolution. The articles of association may stipulate a differ-ent majority of capital stock, but for changes in the pur-pose of the Company this can only be a greater majority(Sec. 179 [2] Sentence 2 AktG). At Drägerwerk AG & Co.KGaA, pursuant to Article 30 (3) of the articles of associa-tion, resolutions by the Shareholders’ Meeting are adopt -ed by a simple majority of votes cast (simple voting majori-ty) if this does not conflict with any legal provisions, and if the law additionally requires a majority of capital theyare adopted by a simple majority of the capital stock

DISCLOSURES PURSUANT TO SEC. 315 (4) HGB AND EXPLANATIONS OF THE GENERAL PARTNER | SUBSEQUENT EVENTS | OUTLOOK122
represented upon adoption of the resolution (simple capi-tal majority). The Company has not made use of the possi-bility pursuant to Sec. 179 (2) Sentence 3 AktG to definefurther requirements in the articles of association foramendments to the same agreement. As well as the rele-vant majority of common shareholders, amendments to the articles of association also require the approval of thegeneral partner (Sec. 285 [2] AktG). Pursuant to Article 20 (7) of the articles of association of the Company, theSupervisory Board is authorized to make amendmentsand additions to the articles of association which relateonly to its wording.
POWER OF THE GENERAL PARTNER TO ISSUE OR BUY
BACK SHARES
According to the resolution passed by the Shareholders’Meeting of May 7, 2010 the general partner is authorizedand instructed to issue 25 bearer warrant bonds with atotal nominal value of EUR 1,250,000 and a nominal valueof EUR 50,000 each, with option rights and subject to the exclusion of subscription rights. The option rights enti-tle the holder to receive 50,000 new no-par preferredbearer shares (no-par shares) of the Company with a pro-rata share in capital stock of EUR 128,000 each.
The annual shareholders’ meeting resolved to condition-ally increase the Company’s capital stock by up to EUR3,200,000 by issuing up to 1,250,000 new no-par preferredbearer shares (no-par shares) in return for cash and / or contributions in kind (conditional capital). The condi-tional increase in capital is only to be implemented if warrant bonds with option rights guaranteed in the formof warrants are issued, the warrant holders exercise their option rights and the conditional capital is requiredfor said transactions.
The annual shareholders’ meeting also instructed theExecutive Board and Supervisory Board of the general part-ner to issue the warrant bonds over a period of threemonths after the resolution to create conditional capital
had been entered in the commercial register. The resolu-tion was recorded on August 5, 2010. The warrant bondsissued on August 30, 2010 were redeemed early by Drägeron September 30, 2010. The option rights remain in effect.
In accordance with the resolution agreed upon at theannual shareholders’ meeting on May 8, 2009, the gener-al partner is entitled to increase the Company’s capitaluntil May 7, 2014, with the approval of the SupervisoryBoard, by up to EUR 16,256,000.00 (approved capital) by issuing new bearer common shares (no-par value shares)in return for cash and / or contributions in kind, in either one or several tranches. The shareholders must begiven subscription rights. Under certain circumstances,the general partner is entitled to exclude the shareholders’subscription right, with approval of the SupervisoryBoard. The general partner utilized this authorization whenincreasing the Company’s capital to EUR 9,753,600 on June 30, 2010, by issuing 3,810,000 new no-par bearershares (no-par shares) in return for cash with subscrip-tion rights.
The authorization granted by the annual shareholders’meeting on May 8, 2009, to the general partner to buyback preferred shares up to 10 percent of capital stockexpired on November 7, 2010.
MATERIAL ARRANGEMENTS MADE BY THE COMPANY
SUBJECT TO A CHANGE OF CONTROL IN THE WAKE OF
A TAKEOVER BID
The Company has not made any material arrangementssubject to a change of control in the wake of a takeover bid.
COMPENSATION AGREEMENTS MADE BY THE COMPANY
WITH MEMBERS OF THE EXECUTIVE BOARD OF THE
GENERAL PARTNER OR EMPLOYEES IN THE EVENT OF
A TAKEOVER BID
There are no agreements in place in the Dräger Groupwith members of the Executive Board of the general part-ner or employees in the event of a takeover bid.

123POTENTIALFUNCTIONAL AREASBUSINESS PERFORMANCEMARKET ENVIRONMENT
Subsequent events
There were no significant events in the new fiscal year upto the time the management report was prepared.
DISTRIBUTIONS
The general partner and the Supervisory Board of Lübeckbased Drägerwerk AG & Co. KGaA propose to distribute out of the net earnings of Drägerwerk AG & Co. KGaA ofEUR 75.7 million for fiscal year 2010 a cash dividend ofEUR 1.19 per preferred share and EUR 1.13 per commonshare, hence a total of EUR 19.0 million, and carry for-ward the balance of EUR 56.7 million. The preferred sharedividend also governs the dividend for participation cer -tificates, which will amount to EUR 11.90 each – ten timesthe preferred share dividend.
Outlook
FUTURE MARKET ENVIRONMENT
Overall economic conditions in 2011 are expected to bedefined by moderate but stable growth of the global economy, fiscal policies that tend to be restrictive andongoing uncertainty about the stability of the eurozone.
According to World Bank forecasts, global economic growthwill slow down in 2011 compared to the previous yearafter the catch-up effects in 2010. The global gross domes-tic product is expected to increase by approximately 3.3 percent. Growth is once again expected to be driven bythe highly dynamic economies of developing countries, so that the International Monetary Fund (IMF) expects aglobal economic recovery of the two tiers. According tothe forecast, the economy of China will grow by a dispro-portionate 8.7 percent. The World Bank expects growth of 8.0 percent for the South Asia / Pacific region as a whole.Economic growth in the industrialized countries isexpected to be robust at a rate of 2.4 percent, even though
it will slow down as the impact of catch-up effects inregards investments continues to decline. While the USshould be able to sustain its growth rate of 2.8 per -cent, the Japanese economy is expected to lose speed notice-ably (1.8 percent). However, the US government hasannounced plans to reduce its deficit to USD 533 billionor 3 percent of the gross domestic product by 2013 (2010: USD 1.65 trillion). This is to be achieved by reduc-ing military spending, raising taxes for high earners and cutting certain government programs.
The World Bank forecasts global economic performance to improve by an average of 3.6 percent in 2012. The maincontributions will come from the emerging and develop -ing countries with growth of 6.1 percent, whereby China(+8.4 percent) and India (+8.7 percent) are expected tomake major contributions. The World Bank only expects aplus of 2.7 percent in the major industrialized countries for 2012. With growth of 2.0 percent, the World Bank con-siders the potential of the eurozone for 2012 to be evenweaker.
STRONG GROWTH IN GERMANY CONTINUES
The high divergence of economic developments in theeurozone is expected to continue in 2011. In the view of Allianz Global Investors, solid economic developmentsin the core countries with Germany as the driving forcewithin Europe are expected, while this trend may be over-shadowed by the consolidation of public budgets requiredin other countries. The overall economic recovery is there-fore anticipated to remain slow. Allianz Global Investorsbelieves that monetary policies will tend to continue sup-porting expansion as the pace of global economic growthslows down in 2011 and pressure from inflation will be com-paratively low as a result.
For Germany, the banks and research institutes surveyedby the Centre for European Economic Research (Zen -trum für Europäische Wirtschaftsforschung – ZEW) expect

OUTLOOK124
GDP in 2011 to increase by 2.4 percent on average (as ofJanuary 2011). While the German government is forecast-ing comparatively rapid growth in the range of 2.1 to 2.4 percent in 2011, government estimates for 2012 arelower with a plus of just 1.6 to 1.9 percent.
In addition to the dynamic development of exports, privateconsumption is expected to make a bigger contributiontowards economic expansion in 2011. The German Insti-tute for Economic Research (Deutsches Institut fürWirtschaftsforschung – DIW) expects GDP growth in theeurozone to slow down slightly to 1.3 percent compared to 1.7 percent last year. However, the DIW points out thatthe risks associated with economic development remainhigh. The measures implemented to stabilize the eurozoneto date merely address the symptoms, rather than elimi-nating the underlying causes of the debt crisis in the euro-zone.
FUTURE SITUATION OF THE MEDICAL TECHNOLOGY
INDUSTRY
Countries in the EU have implemented consolidation pro-grams in the wake of the economic crisis. Among otherthings, these programs also aim at enhanced efficiency inhospital operations. This results in rising demand for systems and services. Dräger is favorably positioned in thismarket segment compared to the competition. The mar -ket trend already observed in Germany over the last fewyears is expected to continue in 2011. The EU is also subsidizing the regional expansion of healthcare systemswith programs such as the European Regional Devel -opment Fund, which has earmarked EUR 5 billion forinvestments in the healthcare infrastructure during the period from 2007 to 2013. In contrast to the overalltrend, South Europe, which is still struggling with theeffects of the financial crisis, is expected to record ratherlittle growth.
Healthcare reforms in the US, the world’s largest salesmarket for the medical division, are not expected to affect
Dräger since the program mainly focuses on improvingbasic medical care of Americans who are currently unin-sured and is therefore typically outside the hospital market.
According to the German professional association Spectarisand the German Healthcare Export Group, the medicaldivision can expect the positive trend in demand from theemerging and developing countries to continue. This isbased on investment programs focusing on the respectivehealthcare systems. For example, Latin America is focus -ing on growth in many parts of the healthcare sector sothat sales opportunities are expected to be favorable. Positive developments are also anticipated in other devel-oping countries.
The positive trend in Asia is likely to continue as well. Analysts are convinced that the trend in China will be sus-tained over the long term and expect the healthcare sector to grow by 20 percent annually. However, some ofthese investments are earmarked for the development of basic medical care which is frequently inaccessible toimported products. Forecasts for the Middle East andNorth Africa cannot be made at this time based on currentpolitical events. However, a slump in demand appearshighly likely until new power structures have become estab-lished.
From an overall perspective, competition in the medicaltechnology market is expected to remain high. Never -theless, Dräger expects developments for the medical divi-sion to be positive in 2011.
FUTURE SITUATION OF THE SAFETY TECHNOLOGY
INDUSTRY
Dräger expects restrained positive developments in thesafety technology markets for 2011. The cautious expec -tations are based on continued high and fluctuating rawmaterial prices as well as the ongoing global economicand financial risks, among other factors. Since the currentsituation differs widely between regions, developments

125POTENTIALFUNCTIONAL AREASBUSINESS PERFORMANCE
in the customer segments of the safety division are alsoexpected to be inconsistent.
The steel trade association expects an increase in globaldemand for 2011, driven by consumption in the emergingAsian countries. Even though it is not expected to reachthe pre-crisis level in 2011, the recovery of the steel indus-try in Germany and the US should continue. The umbrel-la association of the electrical engineering and electronicsindustry expects growth of 4 percent for the industrial-ized countries while the emerging and developing coun-tries should grow by 10 percent and 8 percent respec -tively. The chemical industry association has expressedsimilar expectations. Due to the limited growth oppor -tunities of the industrialized countries, it expects slowergrowth in Germany. The petrochemical industry is fac-ing the possibility of consolidation. This is based on fallingdemand for oil products as more fuel-efficient enginesand heating systems are implemented in the industrializedcountries. Refinery capacities are no longer fully utilized so that closures appear likely if demand remains flat. TheFinancial Times Deutschland is predicting that refiner-ies in Asia will supply the European market in the future.According to a statement released by Business MonitorInternational, this also applies to the US where a signifi-cant reduction in capacity is expected by 2015. A long-term market shift to the emerging and developing coun-tries in Asia is therefore expected for Dräger in this cus-tomer segment.
Dräger expects global demand for fire fighting equipmentto stagnate, although with regional differences. With a volume of USD 390 million in government subsidy pro-grams for rescue organizations and fire departments up to the end of 2011, the US has reduced investments in2010 compared to average spending over the previousyears. The development and expansion of the fire fightingservices in China continues, albeit at a lower level com-pared to the US. Stable demand is expected in the saturat-ed environment of Germany.
The overall outlook for the markets in the industry mix ispositive, with differences by customer segments.
FUTURE SITUATION OF THE COMPANY
Dräger expects its order volume in fiscal year 2011 to growat least at the pace of overall economic growth (WorldBank forecast: +3.3 percent). This is based on the assump-tion of a stabilizing economy in Europe, continued economic recovery in North America, sustained marketgrowth in developing countries and stable exchange rates. Lifecycle Solutions and Infrastructure Projects willdrive growth in the medical division and compensate forthe expected slowdown in the equipment business. Drägerexpects further increases in the business volume for thesafety division, especially in the fields of gas and alcoholmeasuring technology. While the Occupational SafetyEquipment business could reach the previous year’s level,the volume for Engineered Solutions is expected todecrease.
Net sales growth in 2011 is expected to be one to two per-centage points down on order intake growth as net sales in 2010 benefited from above-average order intake in thefourth quarter of 2009.
The gross margin of the medical division may drop slight-ly in 2011. This is due to the expected changes in the product mix and some one-off transactions in the previousyear with above-average margins such as the sale of ventilators in connection with the H1N1 virus. While thenew products of both divisions brought to market in previous years as well as a higher proportion of transac-tions with industrial customers in the safety divisionshould generally improve the margin, the Company doesnot expect to fully offset the effects in the medical divi-sion with a negative margin impact. Based on plannedincreases in product development investments, the expansion of the sales organization and improvements tothe group-wide IT infrastructure, Dräger expects a
MARKET ENVIRONMENT

OUTLOOK126
group EBIT margin between 7.5 percent and 8.5 percentfor fiscal year 2011 (2010: 8.9 percent).
Following the significant reduction in financial liabili-ties and the refinancing transactions in December, inter-est expense in 2011 will come in below the previous year’s value – assuming that interest rates remain constant– and is expected to total approximately EUR 30 million(2010: EUR 39.1 million). The tax rate in fiscal year 2011is expected to be in the range of 32 to 34 percent thanksto the simplification of the tax structure in 2010 (includ-ing the creation of a tax group between Drägerwerk AG &Co. KGaA and Dräger Medical GmbH).
Dräger forecasts sustained high cash inflow from operatingactivities based on the expected profitability trend in 2011. The investment volume is expected to slightly exceeddepreciation and amortization, as it has in previous years, and should total approximately EUR 60 million toEUR 70 million. Net cash inflow is expected to be positiveeven after the repayment of two note loans totaling EUR 54.5 million planned for 2011 as well as the planneddistribution.
Net debt of the Company should continue to decrease in fiscal year 2011 with an overall stable capital structure(December 31, 2010: EUR 90.3 million). Based on theexpectation of high operating cash flow and the existingcredit lines, additional refinancing should not berequired in 2011. However, the Company continues to pur-sue efforts to improve capital efficiency and reducefinancing costs.
For fiscal year 2012, the Company expects sales growthslightly in excess of market developments and an increasein the group EBIT margin compared to 2011 in both divisions, assuming the economic recovery in the marketsrelevant to Dräger continues. The Company is planning
to grow faster than the market over the medium term, witha sustained EBIT margin of at least 10 percent.
FORWARD-LOOKING STATEMENTS
This management report contains forward-looking state-ments. The statements are based on the current expec -tations, presumptions, and forecasts of the Executive Boardof Drägerwerk Verwaltungs AG as well as the informa-tion available to it to date. The forward-looking statementsdo not provide any warranty for the future developmentsand results contained therein. Rather, the future develop-ments and results are dependent on a number of factors;they entail various risks and uncertainties and are basedon assumptions which could prove to be incorrect. TheExecutive Board is under no obligation to update the for-ward-looking statements contained in this report.
Lübeck, Germany, March 8, 2011
Drägerwerk AG & Co. KGaA
The general partnerDrägerwerk Verwaltungs AGrepresented by its Executive Board
Stefan DrägerHerbert FehreckeCarla KriwetGert-Hartwig LescowAnton Schrofner

Dräger is first choice when it comes to protecting, supportingand saving life. Our products need to be absolutely reliable at all times. This is why they don’t just meet legal requirements. They do more –quality made by Dräger.
ANNUAL FINANCIAL STATEMENTS
Consolidated income statement of the Dräger Group 129
Consolidated balance sheet of the Dräger Group 130
Consolidated statement of comprehensive income of the Dräger Group 132
Consolidated cash flow statementof the Dräger Group 133
Notes of the Dräger Group for 2010 134
Management compliance statement 216
Auditor’s opinion 217
Single entity financial statements ofDrägerwerk AG & Co. KGaA for 2010 (condensed) 219
The Company’s Boards 222
129
´
AN
NU
AL
FIN
AN
CIA
L S
TAT
EM
EN
TS

Easily adjustable 5-point straps to ensurethe mask fits.
The visor’s special designgives the wearer an
almost completely naturalfield of vision.
Carefully selected maskmaterials provide pro -tection from toxic and nox-ious substances evenwhere temperatures areextreme.
A wide range of respi -ratory filters protects thewearer from numerousgases, vapors and parti-cles.
A triple sealing contouroffers absolute protection
with just one mask size, no matter how the
wearer’s face is shaped.
FULL-FACE MASKS FROM DRÄGER have been synonymous with safe breathingfor decades, all over the world. The “Dräger X-plore 6000” series, in combi -nation with a wide range of respiratory filters, provides protection from numeroustoxic and noxious substances. Typical areas of use are the oil and gas industry,the petrochemical industry, agriculture and construction.
*
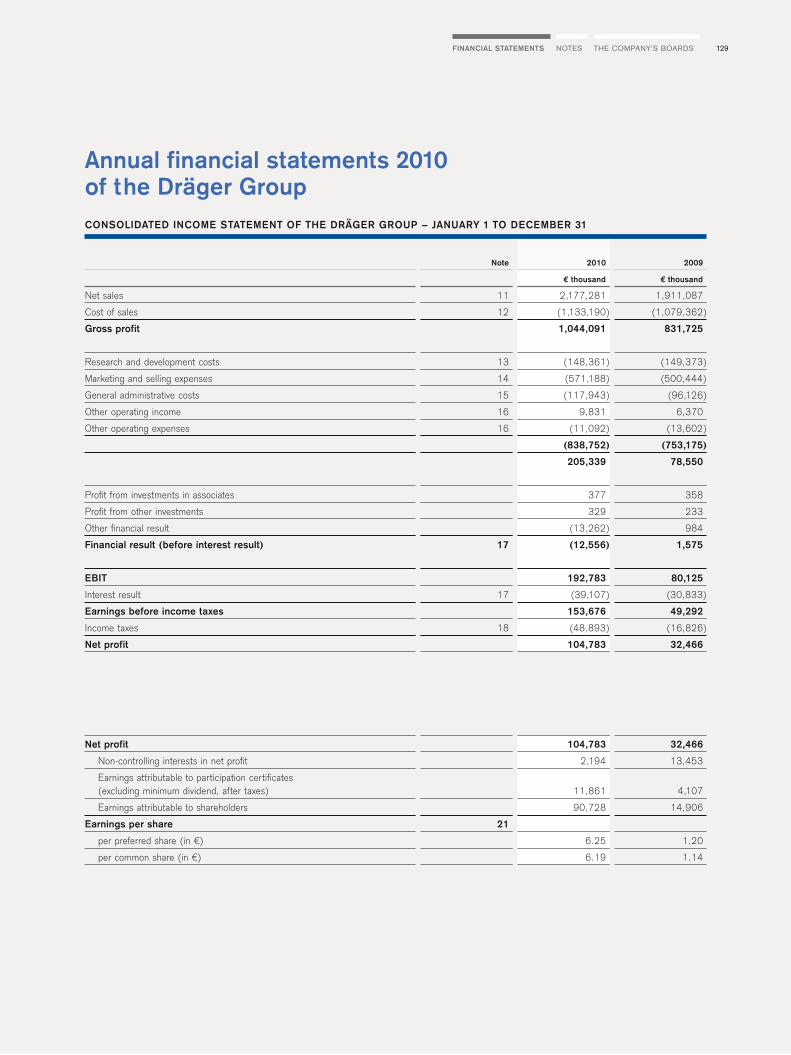
129
Note 2010 2009
€ thousand € thousand
Net sales 11 2,177,281 1,911,087
Cost of sales 12 (1,133,190) (1,079,362)
Gross profit 1,044,091 831,725
Research and development costs 13 (148,361) (149,373)
Marketing and selling expenses 14 (571,188) (500,444)
General administrative costs 15 (117,943) (96,126)
Other operating income 16 9,831 6,370
Other operating expenses 16 (11,092) (13,602)
(838,752) (753,175)
205,339 78,550
Profit from investments in associates 377 358
Profit from other investments 329 233
Other financial result (13,262) 984
Financial result (before interest result) 17 (12,556) 1,575
EBIT 192,783 80,125
Interest result 17 (39,107) (30,833)
Earnings before income taxes 153,676 49,292
Income taxes 18 (48,893) (16,826)
Net profit 104,783 32,466
Net profit 104,783 32,466
Non-controlling interests in net profit 2,194 13,453
Earnings attributable to participation certificates (excluding minimum dividend, after taxes) 11,861 4,107
Earnings attributable to shareholders 90,728 14,906
Earnings per share 21
per preferred share (in €) 6.25 1.20
per common share (in €) 6.19 1.14
CONSOLIDATED INCOME STATEMENT OF THE DRÄGER GROUP – JANUARY 1 TO DECEMBER 31
Annual financial statements 2010 of the Dräger Group
THE COMPANY’S BOARDSNOTESFINANCIAL STATEMENTS

BALANCE SHEET 130
Note December 31, 2010 December 31, 2009
€ thousand € thousand
Assets
Intangible Assets 22 277,351 278,889
Property, plant and equipment 23 253,715 245,933
Investments in associates 24 904 757
Other non-current financial assets 25 11,403 11,668
Deferred tax assets 26 109,502 94,778
Other non-current assets 27 28,160 25,651
Non-current assets 681,035 657,676
Inventories 28 356,666 299,942
Trade receivables and receivablesfrom construction contracts 29 533,163 511,411
Other current financial assets 30 22,514 28,695
Cash and cash equivalents 31 320,037 344,051
Current tax refund claims 13,027 6,0691
Other current assets 32 50,465 37,9841
Current assets 1,295,872 1,228,152
Total assets 1,976,907 1,885,828
CONSOLIDATED BALANCE SHEET OF THE DRÄGER GROUP

131
Note December 31, 2010 December 31, 2009
€ thousand € thousand
Equity and liabilities
Capital Stock 42,266 32,512
Capital reserves 158,098 39,449
Reserves retained from earnings, incl. group result 380,285 303,326
Participation capital 35 50,404 56,086
Other comprehensive income 111 (42,043)
Non-controlling interests 34 5,399 4,490
Equity 33 636,563 393,820
Liabilities from participation certificates 35 29,916 28,739
Provisions for pensions and similar obligations 36 183,448 170,173
Other non-current provisions 37 44,973 35,332
Non-current interest-bearing loans 38 318,042 382,283
Other non-current financial liabilities 39 6,893 79,798
Deferred tax liabilities 40 2,581 17,952
Other non-current liabilities 715 666
Non-current liabilities 586,568 714,943
Current income tax provisions 41 41,584 29,0481
Other current provisions 37 226,026 157,4311
Current loans and liabilities to banks 42 89,496 83,597
Trade payables 43 171,301 127,141
Other current financial liabilities 43 68,499 235,170
Current income tax liabilities 18,552 5,4291
Other current liabilities 44 138,318 139,2491
Current liabilities 753,776 777,065
Total equity and liabilities 1,976,907 1,885,828
1 Income tax provisions as well as income tax refund claims and liabilities are recognized separately from other tax provisions as well as other tax refund claims and liabilities.Previous year’s figures were adjusted accordingly (see Notes 32, 41 and 44).
THE COMPANY’S BOARDSNOTESFINANCIAL STATEMENTS

132 STATEMENT OF COMPREHENSIVE INCOME | CONSOLIDATED CASH FLOW STATEMENT OF THE DRÄGER GROUP
2010 2009
€ thousand € thousand
Net profit 104,783 32,466
Currency translation adjustment for foreign subsidiaries 31,784 5,638
Change in the fair value of financial instruments recognized directly in equity (443) (77)
Deferred taxes on changes in the fair value of financial instruments recognized directly in equity 141 18
Actuarial gains / losses from defined benefit pension plans (13,258) (7,093)
Deferred taxes on actuarial gains / losses from defined benefit pension plans 3,244 2,261
Total income and expenses after taxes recognized in equity 21,468 747
Net profit and total income and expenses after taxes recognized directly in equity 126,251 33,213
of which earnings attributable to non-controlling investments 2,247 12,526
of which earnings attributable to participation certificates (excluding minimum dividend, after taxes) 11,861 4,107
of which earnings attributable to shareholders 112,143 16,580
CONSOLIDATED STATEMENT OF COMPREHENSIVE INCOME OF THE DRÄGER GROUP

133
2010 2009
€ thousand € thousand
Operating activities
Group net profit 104,783 32,466
+ Write-down / write-up of non-current assets 53,737 65,810
+ Increase in provisions 81,793 22,585
– Other non-cash income / expenses (23,913) (29,563)
+ Loss from the disposal of non-current assets 794 1,747
–/+ Increase / decrease in inventories (42,611) 33,109
+ Decrease in trade receivables 2,198 40,532
–/+ Increase / decrease in other assets (14,656) 5,577
+ Increase in trade payables 43,738 2,568
+ Increase in other liabilities 13,278 18,621
Cash inflow from operating activities 219,141 193,452
Investing activities
– Cash outflow for investments in intangible assets (6,797) (8,835)
+ Cash inflow from the disposal of intangible assets 26 1,260
– Cash outflow for investments in property, plant and equipment (49,563) (42,626)
+ Cash inflow from disposals of property, plant and equipment 2,082 9,178
– Cash outflow for investments in non-current financial assets (195) (496)
+ Cash inflow from the disposal of non-current financial assets 2,241 13
– Cash outflow from the acquisition of subsidiaries 0 (930)
Cash outflow from investing activities (52,206) (42.436)
Financing activities
– Distribution of dividends (including dividends for participation certificates) (9,806) (8,464)
+ Cash provided by raising loans 342 139,521
– Cash used to redeem loans (49,166) (31,587)
– Net balance of other liabilities to banks (13,857) (22,331)
– Net balance of finance lease liabilities repaid / incurred (853) (1,823)
+ Cash inflows from capital increases 100,445 786
– Cash outflows from the purchase of the 25 percent share in Dräger Medical AG & Co. KG (now: Dräger Medical GmbH) (235,872) 0
– Proft distributed to non-controlling interests (1,337) (11,246)
Cash inflow / outflow from financing activities (210,104) 64,856
Change in cash and cash equivalents in the fiscal year (43,169) 215,872
+/– Effect of exchange rates on cash and cash equivalents 19,155 3,011
+ Cash and cash equivalents at the beginning of the fiscal year 344,051 125,168
Cash and cash equivalents as of December 31 of the fiscal year 320,037 344,051
CONSOLIDATED CASH FLOW STATEMENT OF THE DRÄGER GROUP
THE COMPANY’S BOARDSNOTESFINANCIAL STATEMENTS

NOTES OF THE DRÄGER GROUP FOR 2010134
Other comprehensive income
Capital Capital Reservess Partici- Actuarial Currency Derivative Total Total Non- Equitystock reserves retained pation gains and translation financial other equity of controlling
from capital losses differences instruments compre- share- interestsearnings recognized hensive holder
incl. Group directly income Drägerwerkresult in equity AG & Co.
KGaA
€ thousand € thousand € thousand € thousand € thousand € thousand € thousand € thousand € thousand € thousand € thousand
Jan. 1, 2009 32,512 38,867 290,913 56,086 (6,334) (37,034) (349) (43,717) 374,661 179,142 553,803
Total income and expensesrecognized in equity 19,013 (4,391) 6,106 (41) 1,674 20,687 12,526 33,213
Capital increase 582 0 582 582
Distributions (8,464) 0 (8,464) (11,246) (19,710)
Buy-back Siemens share 0 0 (175,784) (175,784)
Changes in thescope of consoli-dation / other 1,864 0 1,864 (148) 1,716
Dec. 31, 2009 32,512 39,449 303,326 56,086 (10,725) (30,928) (390) (42,043) 389,330 4,490 393,820
Reclassification ofactuarial gains /losses recognizeddirectly in equity (10,725) 10,725 10,725 0
Capital increase incl. cashcompensation for paticipation certificate holders 9,754 92,109 (5,682) 0 96,181 96,181
Option componentPurchase price Siemens share(equity settledoption) 26,540 0 26,540 26,540
Total incomeand expensesrecognizedin equity 92,575 31,731 (302) 31,429 124,004 2,247 126,251
Distributions (9,806) 0 (9,806) (1,337) (11,143)
Changes in thescope of consoli-dation / other 4,915 0 4,915 (1) 4,914
Dec. 31, 2010 42,266 158,098 380,285 50,404 0 803 (692) 111 631,164 5,399 636,563
CONSOLIDATED STATEMENT OF CHANGES IN EQUITY OF THE DRÄGER GROUP

Notes of the Dräger Group for 2010
GENERAL
The Dräger Group is managed by Drägerwerk AG & Co. KGaA, Moislinger Allee 53–55, D-23542 Lübeck, Germany. Drägerwerk AG & Co. KGaA is entered in the commercialregister of the Local Court of Lübeck under HR B No. 7903 HL. The financial statementsare published in electronic form in the Federal Gazette. The Group’s business activitiesand structure are described in the management report as well as segment reporting ofthis annual report.
BASIS OF PREPARATION OF THE GROUP FINANCIAL STATEMENTS
As in 2009, Drägerwerk AG & Co. KGaA prepared its group financial statements for fiscalyear 2010 in accordance with International Financial Reporting Standards (IFRS) promulgated by the International Accounting Standards Boards (IASB) and the interpre-tations of the International Financial Reporting Interpretations Committee (IFRIC).Drägerwerk AG & Co. KGaA applied all the IFRS adopted by the IASB as of December 31,2010, to its 2010 group financial statements provided that these standards were endorsed by the European Commission and published in the Official Journal of the European Unionby the date of publication of the group financial statements and application of such standards is mandatory for fiscal year 2010.
Dräger has applied the following new or revised standards issued by the IASB for the firsttime in fiscal year 2010:
– According to the new regulations of IFRS 3 “Business Combinations” and IAS 27 “Con-solidated and Separate Financial Statements”, non-controlling interests have to bemeasured either at fair value (“full goodwill method”) or at the relative fair value of theacquired assets and assumed liabilities. The recognition of successively acquired interests results in existing interests being remeasured and recognized in income at thetime control is obtained. Successively acquired interests that do not affect the status of an entity are treated as transactions between providers of equity capital (“entity con-cept”). Components of the contingent purchase price are also remeasured and recog-nized in income. Incidental purchase costs are recognized as expenses at the time theyare incurred.
– The amended IAS 39 “Financial Instruments: Recognition and Measurement” did not include any changes to the rules on hedge accounting. These were merely explainedin more detail.
– Small changes of standards under the “Improvements to IFRS (2009)” are applied ifthey are relevant to the Dräger Group’s financial statements.
The following financial reporting standards, applicable for the first time or revised in fiscal year 2010, are not relevant for the Dräger Group or had no significant impact on theGroup’s net assets, financial position and results of operations.
2
1
135THE COMPANY’S BOARDSNOTESFINANCIAL STATEMENTS

NOTES OF THE DRÄGER GROUP FOR 2010136
– IFRIC 17 “Distributions of Non-cash Assets to Owners” regulates the distribution ofassets to the owners of an entity.
– IFRIC 18 “Transfers of Assets from Customers” deals with utility sector contracts. Itclarifies the requirements of IFRS for agreements in which an entity receives from acustomer an item of property, plant and equipment or cash for the acquisition of anitem of property, plant and equipment that the entity must then use either to connectthe customer to a network or to provide the customer with ongoing access to a supply of goods or services (such as a supply of electricity, gas or water).
– The amendment of IFRS 1 “Additional Exemptions for First-time Adopters (revised2009)” pertains to the exemption from the retrospective application of IFRS for oil andgas assets when using the full cost method of accounting. According to IFRIC 4, enti-ties with existing leasing contracts are also exempt from reclassifying these agreementspursuant to IFRS if their classification was already carried out in compliance with theprevious versions of IFRS.
– IFRS 2 “Group cash-settled Share-based Payment Transactions” regulates the recogni-tion of share-based payment agreements in which an entity receives goods or servicesand payment is not made by the entity itself. The amendments also include the integra-tion of guidelines from IFRIC 8 and IFRIC 11 in IFRS 2.
The following new standards and amendments to existing standards issued by the IASBwhich have already been endorsed and which become effective for fiscal years beginningon or after February 1, 2010, were not applied in these financial statements:
– Amendments to IFRS 1 “Limited Exemption from Comparative IFRS 7 Disclosures(revised 2010)”
– Amendments to IAS 32 “Classification of Rights Issues (revised 2009)”– IAS 24 “Related Party Disclosures (revised 2009)”– Improvements to IFRS (2010)– Amendments to IFRIC 14 “IAS 19 – The Limit of a Defined Benefit Asset, Minimum
Funding Requirements and their Interaction”– IFRIC 19 “Extinguishing Financial Liabilities with Equity Instruments”
Voluntary early adoption would not have had any significant effects on the financial state-ments.
The provisions of Art. 4 EC Regulation No. 1606 / 2002 of the European Parliament incon junction with Sec. 315a HGB (Handelsgesetzbuch – German Commercial Code) governing a company’s exemption from its obligation to prepare group financial statementsin accordance with German commercial law have been met. To ensure that the groupfinancial statements are equivalent to consolidated financial statements prepared in accor - dance with the German Commercial Code, all disclosures and explanations required by German commercial law above and beyond the provisions of the IFRS have been pro-vided in accordance with Sec. 315a HGB.

The group financial statements were prepared in euros. Unless stated otherwise, all figureswere disclosed in thousands of euros (EUR thousand); rounding differences may arise as a result. The balance sheet is classified according to the current / non-current distinc-tion; the income statement was prepared according to the cost of sales method. Wherecertain items of the financial statements have been grouped with a view to enhancing thetransparency of presentation, they are disclosed separately in the notes. The single entityfinancial statements of the companies included in consolidation, with the exception of twominor companies (2009: three), were prepared as of the balance sheet date of the groupfinancial statements on the basis of uniform accounting policies.
CAPITAL INCREASE
On June 30, 2010, Drägerwerk AG & Co. KGaA increased its capital stock by EUR 9,753,600to EUR 42,265,600 by issuing 3,810,000 new no-par bearer shares (no-par shares) with a share of EUR 2.56 each in capital stock (new common shares) with full dividend rightsas from January 1, 2010, in return for cash. Net proceeds amounted to EUR 100.4 mil-lion after deducting EUR 4.6 million in transaction fees.
Drägerwerk AG & Co. KGaA implemented the transaction in two stages: The preplace-ment of existing common shares was followed by a capital increase with subscriptionrights. On June 15, 2010, the issuing banks Goldman Sachs International, London, GreatBritain, and M.M.Warburg & CO, Hamburg, Germany, assumed the contractual obliga-tion to implement and take over the new common shares (hard underwriting) – subjectto certain conditions and rights of withdrawal.
For the preplacement, the banks used a so-called accelerated bookbuilt offering (ABO)for selling a total of 1,039,200 existing common shares without subscription rights toinstitutional investors at EUR 41.00 each (ABO price). These common shares were previ-ously held by Dr. Heinrich Dräger GmbH.
The general partner of Drägerwerk AG & Co. KGaA, Drägerwerk Verwaltungs AG, used the authorization issued by resolution of the annual shareholders’ meeting ofDrägerwerk AG & Co. KGaA on May 8, 2009. The annual shareholders’ meeting hadauthorized Drägerwerk Verwaltungs AG to increase the capital stock of the Company byMay 7, 2014, with the approval of the Supervisory Board of the Company, through a single or multiple issue of new bearer common shares (no-par shares) in return for cashand / or deposits in kind by up to EUR 16,256,000 (authorized share capital).
The Company offered the new ordinary shares to the shareholders at a ratio of 10:3 ata subscription price of EUR 27.50 each by way of an indirect subscription right (Sec. 186 [5] AktG [“Aktiengesetz”: German Stock Corporation Act]). Subscription rights forpreferred shares were traded on the regulated market (floor trading) at Frankfurt StockExchange between June 18, 2010 and June 28, 2010, 24:00 hours. In the subscription periodfrom June 17, 2010, to June 30, 2010, all previous subscription rights for common shares(1,905,000) as well as 1,886,037 of a total 1,905,000 subscription rights for preferred shareswere exercised. The subscription rate therefore totals 99.5 percent. The 18,963 unsub-scribed new common shares were sold for EUR 41.00 each on July 2, 2010 (rump place-ment).
Frankfurt Stock Exchange admitted the existing common shares to the regulated market(Prime Standard) on June 18, 2010, where they were listed for the first time on June 21,2010. After the capital increase had been entered in the commercial register on June 30,
3
137THE COMPANY’S BOARDSNOTESFINANCIAL STATEMENTS

NOTES OF THE DRÄGER GROUP FOR 2010138
2010, Frankfurt Stock Exchange admitted the new common shares to the regulated market (Prime Standard) on July 2, 2010, where they were listed for the first time on July5, 2010. All common shares as well as all preferred shares of Drägerwerk AG & Co. KGaAhave therefore been listed for trading on the stock exchange.
The capital increase also has an effect on participation certificates. According to theterms and conditions of series A, K and D participation certificates, if the Company carries out a capital increase and issues subscription rights for new shares to sharehold-ers, holders of participation certificates have comparable subscription rights. They areentitled, for instance, to acquire further participation certificates at terms and conditionscomparable to those of the capital increase. Participation capital must be increased correspondingly. The subscription right and increase of participation capital is subject tothe Company’s annual shareholders’ meeting giving its approval and the exclusion orlimitation of any other legal subscription rights, if necessary.
In accordance with the terms and conditions of participation certificates, if the annualshareholders’ meeting does not approve of participation certificate holders exercisingtheir subscription rights or if other legal subscription rights cannot be excluded or limitedto the required extent, the Company must issue cash compensation to the amount of the loss it deems participation certificate holders would incur through the capital increase(Sec. 315 BGB [“Bürgerliches Gesetzbuch”: German Civil Code]). The Company recog-nized EUR 7.8 million in provisions to cover for this contingency in the financial statements2010, which resulted in participation capital decreasing by EUR 5.7 million, adjusted for a tax advantage.
In addition, the annual shareholders’ meeting on May 7, 2010, resolved to conditionallyincrease the Company’s capital stock up to EUR 3,200,000 by issuing up to 1,250,000new no-par preferred bearer shares (no-par shares) in return for cash and / or contribu-tions in kind (conditional capital). The conditional capital was used for issuing theoption rights to Siemens.
DRÄGER MEDICAL AG & CO. KG BECOMES DRÄGER MEDICAL GMBH
The restructuring of Dräger Medical AG & Co. KG resolved by Drägerwerk AG & Co. KGaAon August 31, 2010, became effective on September 20, 2010 (effective date). The legalsuccessor of Dräger Medical AG & Co. KG is the former Dräger Medical Holding GmbH,now trading as Dräger Medical GmbH since the effective date. Dräger Medical GmbH is a wholly-owned subsidiary of Drägerwerk AG & Co. KGaA. The aim was to simplify theshareholder structure within the scope of the buyback of Siemens’ 25 percent share inthe medical division.
PURCHASE OF THE 25 PERCENT SHARE IN DRÄGER MEDICAL AG & CO. KG
(NOW: DRÄGER MEDICAL GMBH) FROM SIEMENS
On March 26, 2010, the European Commission approved the purchase of all shares inSiemens Medical Holding GmbH. The only condition for rendering the purchase effectiveaccording to the purchase agreement signed on December 29, 2009, has therefore beenmet. This agreement stipulates that the execution date is always the last day of a month(or the next business day, should this date fall outside ordinary business hours), whereby a minimum of five working days must elapse between the approval date and the end of themonth. For this reason, the transaction was executed on April 30, 2010. As previously
4
5

explained in the annual report 2009, Dräger was already entitled to the acquired shareson December 31, 2009, from a financial point of view.
The purchase price of the 25 percent share in Dräger Medical AG & Co. KG (now: DrägerMedical GmbH) comprised the following components:
– a cash settled component of EUR 175 million, – a vendor note of EUR 68.5 million divided into three tranches of EUR 18.75 (tranche I),
EUR 40.0 million (tranche II) and EUR 9.75 million (tranche III), and – a variable option component.
Dräger repaid the cash settled component on the effective date as well as tranches I and IIof the vendor note to the total amount of EUR 58.75 million plus interest early on July20, 2010, from the inflow of cash and cash equivalents provided by the capital increase.
The variable option was originally a cash settled option. In order to replace this,Dräger issued warrant bonds with option rights guaranteed in the form of warrants to thetotal nominal value of EUR 1.25 million to Siemens on August 30, 2010. The optionrights entitle their holders to acquire a total of 1.25 million preferred shares. Dräger there -fore implemented the resolution of the annual shareholders’ meeting on May 7, 2010,which was approved by the separate meeting of preferred shareholders.
The option rights were exercised at EUR 64.12 on December 31, 2010, and expire onApril 30, 2015. They are divided into 25 individual options, entitling holders to acquire50,000 preferred shares each. If one of the options was exercised by its holder, Drägerwould issue new preferred shares from conditional capital. If all options were exercised,Dräger Medical AG & Co. KG (now: Dräger Medical GmbH) would receive EUR 80.15million for issuing 1.25 million new preferred shares on the balance sheet date.
As the option rights issued to Siemens had a higher fair value than the original cashsettled option, Dräger received a EUR 8.5 million reduction on tranche III of the vendornote from Siemens, as agreed. Siemens paid the nominal value of the warrant bonds by offsetting it against the payable from tranche III of the vendor note. On September 30,2010, Dräger repaid the warrant bonds at their nominal value plus interest to Siemens.With this transaction, Dräger has now fully repaid all liabilities arising from the acquisi-tion of the 25 percent Siemens share in Dräger Medical AG & Co. KG (now: Dräger Medical GmbH).
The positive development of the preferred share compared to December 31, 2009,increased the value of the originally agreed option component during the course of thefiscal year. In the period January 1, 2010, until August 30, 2010, Dräger subsequently recognized EUR 11.8 million as an expense in other financial result (see also Note 17).
The cash settled option was replaced with an equity instrument on August 30, 2010.This enabled Drägerwerk AG & Co. KGaA to strengthen its equity base by EUR 26.5 millionand changes in value will no longer impact earnings.
139THE COMPANY’S BOARDSNOTESFINANCIAL STATEMENTS

NOTES OF THE DRÄGER GROUP FOR 2010140
SCOPE OF CONSOLIDATION
The consolidated group of Drägerwerk AG & Co. KGaA is composed of the following entities:
Besides as Drägerwerk AG & Co. KGaA, fully consolidated companies include all sub-sidiaries in which Drägerwerk AG & Co. KGaA holds a direct or indirect majority of votingrights and is therefore able to govern financial and operating policies so as to obtain benefit from their activities.
Drägerwerk AG & Co. KGaA indirectly exerts a significant influence on its associates.Associates are accounted for according to the equity method.
The consolidated group includes four real estate companies (2009: three) and still twoother special purpose entities (SPEs) whose assets are attributable in substance to theGroup.
The consolidated companies of the Dräger Group as of December 31, 2010, are listedunder Note 53.
EFFECTS OF THE CHANGES IN THE SCOPE OF CONSOLIDATION
There was no significant impact on the Group’s net assets, financial position and resultsof operations as a result of the change to the scope of consolidation in fiscal year 2010.The effects between the divisions are explained in the segment report.
CONSOLIDATION PRINCIPLES
Purchases are accounted for according to the acquisition method. On initial consolidationof subsidiaries, the identifiable assets and liabilities (including contingent liabilities) are measured at their fair values at the date on which control of the subsidiary is obtained.The excess of the cost of the investment over the acquirer’s interest in the net fair value of the identifiable assets and liabilities is recognized as goodwill. Incidental purchase costsare recognized as expenses at the time they are incurred. Adjustments to components of the contingent purchase price that are recognized as expenses at the time of acquisitionare to be recognized in income. Non-controlling interests have to be measured either at fair value (“full goodwill method”) or at the relative fair value of the acquired assetsand assumed liabilities.
8
6
Germany Abroad Total
Drägerwerk AG & Co. KGaA and fully consolidated companies
January 1, 2010 27 98 125
Newly formed entities 1 2 3
Business combinations / liquidation (6) (2) (8)
December 31, 2010 22 98 120
Associates
January 1, 2010 / December 31, 2010 1 1 2
Total 23 99 122
SCOPE OF CONSOLIDATION
7

Goodwill is subject to an annual impairment test pursuant to IAS 36 (impairment-onlyapproach). Any excess of the Group’s share in equity over the cost of the investment isrecognized in profit or loss at the date of acquisition.
If interests were acquired successively but without change of status, costs were offsetdirectly against goodwill and all relevant non-controlling interests (“modified parentcompany method”) until fiscal year 2009. As from fiscal year 2010, these acquired intereststhat do not affect the status of an entity are treated as transactions between providers of equity capital (“entity concept”). The carrying amounts of assets and liabilities remainthe same. The value shift between Dräger and the non-controlling investments is recordeddirectly in equity.
Any non-controlling interests in equity are shown in the consolidated balance sheet assuch (see also Note 34).
When swapping or exchanging shares or in similar transactions, the fair value of theshares given is attributed to the shares received. Any resulting step-ups in fair value aretransferred to retained earnings without affecting income.
For associates, the cost of investments is adjusted to reflect their share in net profit or loss for the period and dividend distributions. The goodwill is included in the carryingvalues of the investments. Impairments are accounted for separately.
Intercompany receivables and liabilities are netted (elimination of intercompany balances). The carrying values of assets from intercompany goods and services are adjustedfor unrealized intercompany profits and losses (elimination of intercompany profits andlosses); therefore, these assets are measured at group cost. For associates, elimination ofintercompany profits and losses is waived due to immateriality.
Internal net sales are eliminated. Any other intercompany income and expenses aremutually offset (elimination of income and expenses). Deferred tax assets or liabilitiesfrom consolidation entries that affect profit or loss are recognized whenever differencesin tax expenses or income are expected to reverse in subsequent years.
CURRENCY TRANSLATION
In the single entity financial statements of Drägerwerk AG & Co. KGaA and its subsidiaries,foreign currency transactions are translated at the mean exchange rate at the date of initial recognition. They are recognized promptly after each transaction.
Exchange differences from the settlement of monetary items in foreign currenciesduring the year and the measurement of open foreign currency positions at the rate onthe balance sheet date are recognized in profit or loss.
The foreign consolidated subsidiaries prepare their financial statements in the localcurrency in which they mainly operate (functional currency). These financial statementsare translated into the group reporting currency, the euro, at the mean exchange rate onthe balance sheet date (closing rate) for assets and liabilities and at the annual averagerate for the items of the income statement. All resulting translation differences are recog-nized under other comprehensive income.
To account for the effects of inflation, the financial statements and comparative figuresof foreign entities operating in a hyperinflationary environment and reporting in a currency of a hyperinflationary economy are restated in terms of the measuring unit cur-rent on the balance sheet date pursuant to IAS 29 using a general price index for thecountry in question. One operating subsidiary in Venezuela (2009: no subsidiary) had its
141
9
THE COMPANY’S BOARDSNOTESFINANCIAL STATEMENTS

NOTES OF THE DRÄGER GROUP FOR 2010142
registered office in a hyperinflationary economy in the year under review. The effects ofinflation were not recognized as the subsidiary is of only minor importance to the Group.
The exchange gains / losses on operating foreign currency items included in cost ofsales and in functional costs gave rise to expenses of EUR 5,259 thousand (2009: EUR 36thousand). The exchange gains / losses on foreign currency items disclosed in the finan-cial result led to expenses of EUR 795 thousand (2009: income of EUR 1,077 thousand).
Currency translation for foreign subsidiaries gave rise to an increase in other com -prehensive income of EUR 31,731 thousand as of the balance sheet date (2009: EUR6,106 thousand).
The major group currencies and their exchange rates developed as follows:
ACCOUNTING POLICIES
The single entity financial statements of Drägerwerk AG & Co. KGaA and its consolidatedGerman and foreign subsidiaries as of December 31 of the fiscal year are prepared onthe basis of uniform accounting policies and included in the group financial statements.The following accounting policies are applied:
Intangible assetsGroup-controlled intangible assets from which future economic benefits are expected to flow to the Group and which can be reliably measured are recognized at cost lessstraight-line amortization over their expected useful lives. Borrowing costs that are mate-rial and directly attributable to the acquisition, construction or production of a quali -fying asset are capitalized as part of the cost of that asset in accordance with IAS 23.
Purchased and internally developed software not disclosed under inventories is recog-nized as a separate asset unless it is an integral part of the related hardware. Costsincurred for changing existing software systems (e. g. new versions) are recognized asexpenses. Costs incurred in connection with the installation and implementation of purchased software are classed as incidental purchase costs of the same.
Internal development costs are recognized as an asset if the asset’s future economicbenefit is sufficiently probable. However, due to strict legal and safety requirements forDräger Group products, this means that the product must have already been approvedfor sale in the major markets. Until all criteria for recognition as an asset are met, inter-nal development costs are expensed as incurred (just as research costs).
Intangible assets generally have a useful life of four years, patents and trademarks areamortized over their term (eleven years on average) using the straight line method.
Closing rate Average rate
€ 1 = Dec. 31, 2010 Dec. 31, 2009 2010 2009
USA USD 1.34 1.44 1.32 1.40
UK GBP 0.86 0.89 0.86 0.89
Japan JPY 108.65 133.16 115.27 130.69
People’s Republic of China CNY 8.82 9.84 8.93 9.54
CURRENCIES / EXCHANGE RATES
10

Goodwill recognized as an intangible asset is disclosed at cost less accumulated impair-ment losses. Under IAS 36, amortization is no longer charged on a systematic basis.
Property, plant and equipmentItems of property, plant and equipment are stated at cost less accumulated depreciationand accumulated impairment losses.
The cost of purchase of an item of property, plant and equipment includes its purchaseprice and any costs directly attributable to bringing the asset to the location and condi-tion necessary for it to be capable of operating in the manner intended. Production costscomprise direct and overhead costs attributable to production as well as proportionaldepreciation. Borrowing costs that are material and directly attributable to the acquisition,construction or production of a qualifying asset are capitalized as part of the cost of that asset in accordance with IAS 23. Subsequent expenditure incurred after the assetshave been put into operation and which serves to maintain these assets, such as ongo-ing repairs and maintenance and overhaul costs, is charged as expense in the period inwhich the costs are incurred. Whenever it is probable that the expenditure will result in future economic benefits in excess of the originally assessed standard of performanceof the existing asset flowing to the Company, the expenditure is recognized as an addi-tional cost of property, plant and equipment.
Depreciation is computed on a straight-line basis over the following estimated usefullives:
– Office and factory buildings 20 to 40 years– Other buildings 15 to 20 years– Production plant and machinery 5 to 8 years– Other plant, factory and office equipment 2 to 15 years
Where significant parts of property, plant and equipment contain components with sub-stantially different useful lives, such components are recorded separately and depreciatedover their useful lives.
The useful life and depreciation methods used for property, plant and equipment arereviewed annually to ensure that the method and period of depreciation are consistentwith the expected pattern of economic benefits from items of property, plant and equip-ment.
Assets under construction are stated at cost. Low-value assets (costing less than EUR500) are fully expensed in the year of their addition and recognized as disposals in thestatement of changes in non-current assets.
Investment allowances Investment allowances (government grants) for assets are deducted from the carryingvalue of the relevant asset. Grants are therefore recognized in profit or loss through areduced depreciation charge over the useful life of the depreciable asset.
143THE COMPANY’S BOARDSNOTESFINANCIAL STATEMENTS

NOTES OF THE DRÄGER GROUP FOR 2010144
Impairment losses on intangible assets and property, plant and equipment If there are external or internal indicators of impairment of intangible assets or property,plant and equipment pursuant to IAS 36.12 on the balance sheet date, these items are subjected to an impairment test pursuant to IAS 36. If the carrying value of the assetexceeds its recoverable amount (the higher of its value in use and net realizable value), an impairment loss is charged. If no future cash flows independently generated from otherassets can be attributed to individual assets, the recoverable amount is tested for impair-ment on the basis of the cash-generating unit to which the asset belongs.
An impairment test is performed annually on goodwill and intangible assets with inde -terminable useful lives. The impairment test for goodwill is performed on the basis of the cash generating unit to which the asset belongs. The discounted cash flow methodbased on the operational four-year plan and an assumed sustained growth of 1 percent in the subsequent period is used to test the goodwill of the individual cash generatingunits. A risk-adjusted interest rate is used for discounting. Goodwill is based on the oper -ating business segments in accordance with IFRS 8.
If the reasons for an impairment loss cease to apply, write-ups are performed, exceptin the case of goodwill.
Financial instruments A financial instrument is any contract that gives rise to a financial asset of one entity anda financial liability or equity instrument of another entity.
The following items in particular are recognized as financial assets: investments inassociates, other investments, securities, loans and other receivables, derivative financialassets, other financial assets and cash and cash equivalents.
The following items are recognized as financial liabilities: liabilities to banks, loan liabilities, trade payables, derivative financial liabilities and other financial liabilities. Allfinancial assets and liabilities may be classified, upon initial recognition, at fair valuethrough profit or loss if they fulfill the requirements of the IASB (fair value option). Thisoption has not been exercised by the Dräger Group to date.
For purchases at normal market conditions or sales of financial assets (purchases orsales of assets that have to be delivered within the statutory or conventional time scaleapplicable to the location where the transaction took place), the settlement date is rele-vant (in other words the date on which the asset is delivered to or supplied by Dräger).
Financial assets Loans and receivables are non-derivative financial assets with fixed or determinable pay-ments that are not quoted in an active market. After initial recognition, loans and receivables are recognized at amortized cost less any impairment losses and discounting(effective interest method).
Impairment losses are charged on loans and receivables when there is objective evi-dence that the amount is not fully recoverable (i. e. it is highly probable that the borrowerwill become insolvent or the obligor is in considerable financial difficulties). The carry-ing values of loans and receivables are generally adjusted through the use of allowanceaccounts. If loans and receivables are classified as having a high probability of beinguncollectible, they are derecognized.

The effects of the impairment loss and of the application of the effective interest methodare recognized in profit or loss.
Securities with fixed or determinable payments and fixed maturity that the Dräger Grouphas the positive intent and ability to hold to maturity are classified as held-to-maturityinvestments and recognized at amortized cost using the effective interest method.
Available-for-sale financial assets are those non-derivative financial assets that are designated as available for sale and are not classified as belonging to any of the other cat-egories. This category comprises investments in associates that are not accounted for in accordance with the equity method due to immateriality as well as other investmentsand securities. They are measured at fair value or, if not determinable, at amortized cost. Unrealized gains and losses from the change in fair value are recorded in equity, tak-ing the tax effects into account. Changes in fair value are not recognized in profit or loss until the asset is permanently impaired or sold.
Financial assets held for or due in more than twelve months are disclosed as non-cur-rent financial assets.
Financial liabilities After initial recognition, financial liabilities are disclosed at amortized cost (amountrepayable).
Non-current liabilities that do not bear interest or bear interest at a rate substantiallybelow market rates are disclosed at present value. Premiums and discounts are allocatedover the term of the liability using the effective interest method.
Financial liabilities held for or due in more than twelve months are disclosed as non-current financial liabilities.
Fair value of financial assets and liabilities Where the fair value of financial assets and liabilities is disclosed or stated, it is alwaysderived from the market or stock exchange value. In the absence of an active market, thefair value is determined according to recognized methods of financial mathematics.
Derivative financial instruments The Dräger Group uses derivatives as part of its risk management to hedge currency andinterest rate risks.
Derivatives are recognized at fair value. For derivative financial instruments thatmeet the hedge accounting criteria of IAS 39, the changes in fair value are recognizeddepending on the type of hedge.
In a hedge of the exposure to changes in fair value of a recognized asset or liability(fair value hedge), the changes in the fair value of both the hedged item and the derivativeare recognized in profit or loss. Changes in the fair value of the exposure to variability in future cash flows (cash flow hedge) are recognized directly under equity, taking taxeffects into account, if the hedge is effective. These amounts are not removed from equity and recognized in profit or loss until the hedged item affects profit or loss. Changesin the fair value of derivatives used to hedge future cash flows between group compa-nies are recognized as cash flow hedges if they fulfill the relevant criteria.
Derivative financial instruments that are not designated as effective hedging instru-ments in accordance with IAS 39 are classified as held for trading and recognized at fair
145THE COMPANY’S BOARDSNOTESFINANCIAL STATEMENTS

146 NOTES OF THE DRÄGER GROUP FOR 2010
value, or, if not determinable, at amortized cost. The fair value of listed derivatives is the positive or negative market value. In the absence of a market value, the fair value isdetermined according to recognized methods of financial mathematics.
In hedging foreign currency risks posed by recognized assets or recognized liabilities,the Dräger Group does not use hedge accounting in accordance with IAS 39 to recog-nize hedges as the profit or loss from the currency translation of the hedged item pursuantto IAS 21 affects the income statement at the same time as the profit or loss from themeasurement of the hedging instrument.
We refer to Note 45 for details of the nature and scope of the Dräger Group’s existingfinancial instruments.
Construction contracts In accordance with IAS 11, construction contracts are recognized using the stage of com-pletion method. The stage of completion which has to be established to this end in thecase of fixed price contracts is determined using the cost-to-cost method (input-basedmethod). This method determines the stage of completion based on the costs incurred as of the balance sheet date in relation to the estimated total cost. If the outcome of aconstruction contract can be estimated reliably, the revenues are recorded at theamount of contract costs incurred plus a profit margin. The contracts are recognizedunder receivables from construction contracts or, if a loss is expected, under liabilitiesfrom construction contracts. Prepayments are deducted from the receivable. If the pre-payments exceed the receivable, the balance is recognized under liabilities.
Inventories Inventories comprise raw materials, consumables and supplies, work in process and fin-ished goods and merchandise. They are measured at the lower of average cost and netrealizable value. Cost comprises production-related full costs calculated on the basis ofnormal capacity utilization. In addition to direct materials and production costs, itincludes materials and production overheads as well as special direct production costsallocable to the production process. Depreciation on items of property, plant and equip-ment used in the production process is also included. Borrowing costs that are materialand directly attributable to the acquisition, construction or production of a qualifyingasset are capitalized as part of the cost of that asset in accordance with IAS 23.
Net realizable value is the estimated selling price in the ordinary course of businessless the estimated costs of completion and the estimated costs necessary to make thesale. Unrealizable inventories are written off.
Finished goods and merchandise also comprise loan and demo equipment. 25 per-cent straight-line depreciation is charged annually for the decrease in the net realizablevalue of these items.
Cash and cash equivalents Cash and cash equivalents comprise cash in hand and bank balances, including short-term deposits.

Participation capital In accordance with IAS 32 and IAS 39, the individual Dräger participation certificateseries are recognized pursuant to the commercial value of their contractual agreements.Series A certificates must generally be classified as equity; however, they include an obligation with a value to the amount of the minimum return which is recognized as lia-bility.
Series K and D certificates are generally classified as debt, but the premium on theissue price exceeding Dräger’s obligation is recognized as equity.
Effects recognized in equity reflect the participation certificates’ equity component(including deferred tax effects) and corresponding past compounding effects.
The components recognized as debt are measured at amortized cost using the effec-tive interest method (present value of repayment obligation). Please refer to Note 35 forfurther information on the individual Dräger participation certificate series.
The compounding of liabilities from participation certificates to the amount of theeffective interest rate and the minimum dividend for series A and K are included in theinterest expense of the period in question. The dividend for series D certificates and the amount exceeding the minimum dividend for series A and K certificates are paid withequity capital.
Provisions for pensions and similar obligations Provisions for pension obligations and similar obligations are calculated according to IAS 19 using the projected unit credit method allowing for future adjustments to salariesand pensions and employee turnover.
The provisions were measured on the basis of pension reports. The Dräger Group hasdecided to exercise the option under IAS 19.93A of fully recognizing actuarial gains or losses in equity immediately, taking account of deferred taxes. The actuarial gains orlosses recognized in equity are reconciled in a separate statement of recognized incomeand expenses presented before the notes.
The interest portions contained in pension expenses are disclosed in interest and sim-ilar expenses and netted with the expected return on plan assets.
With effect as of December 2007, funds from the German pension plan were paid intoa new fund including a settlement account and secured in favor of the employees via acontractual trust arrangement (CTA), meaning that they only serve to cover and financethe Company’s direct pension obligations in Germany.
Any excess of plan assets over the pension obligations is recognized as an asset at amaximum of the present value of the economic benefit to the Company (due to a refundof contributions or reduction of future contributions) plus any past service cost not yetrecognized (asset ceiling).
Other provisions A provision is recognized when, and only when, the entity has a present obligation (legalor constructive) to a third party as a result of a past event and it is probable that an out-flow of resources embodying economic benefits will be required to settle the obligation,and a reliable estimate can be made of the amount of the obligation. Provisions are stated at the amount expected to be required to settle the obligation. Non-current provi-sions are discounted to the balance sheet date using appropriate market rates.
147THE COMPANY’S BOARDSNOTESFINANCIAL STATEMENTS

NOTES OF THE DRÄGER GROUP FOR 2010148
Deferred taxes Deferred taxes are recognized for differences between the IFRS financial statements andthe tax accounts of the consolidated companies as well as for consolidation entries andloss carryforwards.
The deferred taxes are measured at the amount expected to be paid or recovered insubsequent fiscal years. Deferred tax assets are only recognized if it is sufficiently probablethat they will be realized. Deferred tax assets and liabilities are only netted if they relate to the same taxation authority.
Leases Leases are all agreements whereby the lessor conveys to the lessee in return for paymentthe right to use an asset for an agreed period of time.
A) FINANCE LEASES
Dräger Group as lessee At inception of the lease, finance leases are recognized as assets and liabilities in the bal-ance sheet at amounts equal at the inception of the lease to the fair value of the leasedproperty or, if lower, at the present value of the minimum lease payments. In calculatingthe present value of the minimum lease payments, the discount factor is the interest rate implicit in the lease if this is practicable to determine. If this is not the case, the lessee’sincremental borrowing rate is used. Initial direct costs are included as part of the asset.Lease payments are apportioned between the finance charge and the reduction of the out -standing liability. The finance charge is allocated to periods during the lease term so as to produce a constant periodic rate of interest on the remaining balance of the liabilityfor each period.
A finance lease gives rise to a depreciation expense for the recognized asset as well asa finance expense for each period. The depreciation policy for leased assets is consistentwith that for corresponding depreciable assets which are owned by the Company.
Dräger Group as lessor Assets held under a finance lease are recognized in the balance sheet and presented as areceivable at an amount equal to the net investment (present value of the gross invest-ment) in the lease. The recognition of finance income is based on a pattern reflecting aconstant periodic rate of return on the lessor’s net investment outstanding in respect of the finance lease. Initial direct costs are capitalized and allocated as an expense overthe term of the lease.
B) OPERATING LEASES
Dräger Group as lessee Leases of assets under which substantially all the risks and rewards of ownership areeffectively retained by the lessor are classified as operating leases. Lease payments underan operating lease are recognized as an expense.

149
Dräger Group as lessor Assets subject to operating leases are presented in the balance sheet according to thenature of the asset. Lease income from operating leases is recognized in profit or loss ona straight-line basis over the lease term.
Use of estimates and assumptions In preparing the group financial statements in accordance with IFRS, assumptions andestimates have to be made which have an effect on the recognition of assets and liabili-ties, the disclosure of contingent liabilities as of the balance sheet date and the recognitionof income and expenses. Actual amounts may differ from these assumptions and esti-mates.
The estimates pertain to the following areas in particular:
As part of the annual assessment of the recoverable amount of capitalized goodwill,Dräger’s management uses estimates to arrive at its conclusions. Management uses datafrom internal analyses and forecasts with regards to anticipated earnings trends anddata from external information sources with regards to other analysis parameters.
Other assumptions and estimates mainly relate to the determination of useful livesthroughout the Group and the liquidability of receivables. At least once a year, the Groupassesses the applied useful lives and carries out adjustments if necessary. Useful lives are determined on the basis of market observations and empirical values.
Customer-specific construction contracts are recognized using the stage of completionmethod. The most important measurements used for the careful determination of thestage of completion include total costs, total revenues and risks related to the contract aswell as other estimates. Management continuously assesses all estimates made in con-nection with such construction contracts.
Defined benefit pension plans and similar obligations are recognized in accordancewith actuarial methods. This method is based on actuarial assumptions such as the dis-count rate, expected return on plan assets, wage and salary trends, increases in pensionand employee turnover. The recognized discount factors are calculated on the basis of theeffective market return on high-quality corporate bonds. The expected return on planassets is determined using a standard calculation, taking into account historical long-termassumptions. Deviations of actuarial assumptions from actual developments could haveserious implications for the measurement of defined pension plans and similar obligations.
The Group has set aside provisions for various risks. The likelihood of these provi-sions being used is assessed on the basis of previous experience and assessments of indi-vidual business transactions. Adjusting events were taken into account accordingly.
The Group has to pay income taxes in several countries. This involves a specific calcu-lation of the expected actual income tax exposure for each tax object and an assessment of temporary differences resulting from the different treatment of certain items for IFRSand tax reporting purposes. Management has to make assumptions when calculatingeffective and deferred taxes. Tax estimates are made in accordance with local laws.
THE COMPANY’S BOARDSNOTESFINANCIAL STATEMENTS
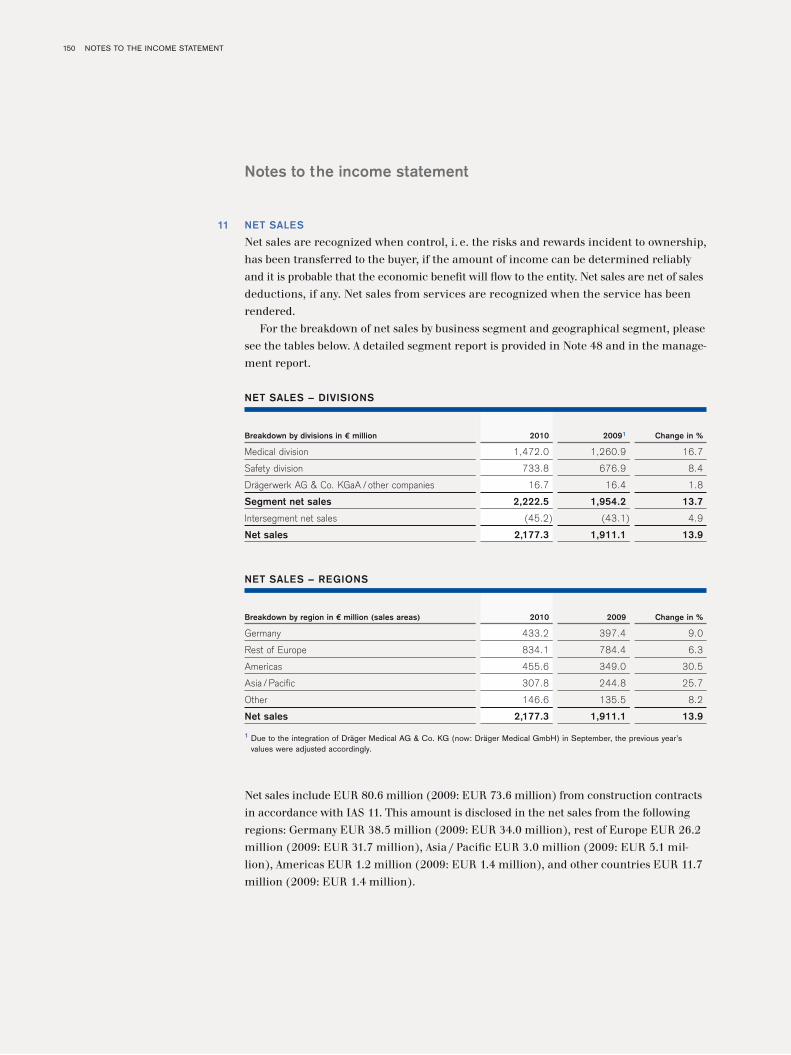
NOTES TO THE INCOME STATEMENT 150
Notes to the income statement
NET SALES
Net sales are recognized when control, i. e. the risks and rewards incident to ownership,has been transferred to the buyer, if the amount of income can be determined reliablyand it is probable that the economic benefit will flow to the entity. Net sales are net of salesdeductions, if any. Net sales from services are recognized when the service has been rendered.
For the breakdown of net sales by business segment and geographical segment, pleasesee the tables below. A detailed segment report is provided in Note 48 and in the manage-ment report.
Net sales include EUR 80.6 million (2009: EUR 73.6 million) from construction contractsin accordance with IAS 11. This amount is disclosed in the net sales from the followingregions: Germany EUR 38.5 million (2009: EUR 34.0 million), rest of Europe EUR 26.2million (2009: EUR 31.7 million), Asia / Pacific EUR 3.0 million (2009: EUR 5.1 mil-lion), Americas EUR 1.2 million (2009: EUR 1.4 million), and other countries EUR 11.7million (2009: EUR 1.4 million).
11
Breakdown by divisions in € million 2010 20091 Change in %
Medical division 1,472.0 1,260.9 16.7
Safety division 733.8 676.9 8.4
Drägerwerk AG & Co. KGaA / other companies 16.7 16.4 1.8
Segment net sales 2,222.5 1,954.2 13.7
Intersegment net sales (45.2) (43.1) 4.9
Net sales 2,177.3 1,911.1 13.9
Breakdown by region in € million (sales areas) 2010 2009 Change in %
Germany 433.2 397.4 9.0
Rest of Europe 834.1 784.4 6.3
Americas 455.6 349.0 30.5
Asia / Pacific 307.8 244.8 25.7
Other 146.6 135.5 8.2
Net sales 2,177.3 1,911.1 13.9
1 Due to the integration of Dräger Medical AG & Co. KG (now: Dräger Medical GmbH) in September, the previous year’s values were adjusted accordingly.
NET SALES – DIVISIONS
NET SALES – REGIONS

151THE COMPANY’S BOARDSNOTESFINANCIAL STATEMENTS
COST OF SALES
Cost of sales comprises direct materials, direct labor, special direct production costs,inventory allowances, production overheads (including amortization of production relatedintangible assets and depreciation of property, plant and equipment as well as costs of internal transportation until delivery to the sales depot), materials overheads, cost ofwarranties and other cost of sales.
The costs of sales also include inventory variances, measurement differences andscrapping. Income from the reversal of previously impaired inventories reduces the costof sales.
Any borrowing costs included in the valuation of inventories are contained in the cost of sales at the time of delivery or performance.
RESEARCH AND DEVELOPMENT COSTS
Research and development costs comprise all costs incurred during the research anddevelopment process, including registration costs, costs of prototypes and the costs of thefirst series, if they are not capitalized as separate development costs.
MARKETING AND SELLING EXPENSES
Marketing expenses comprise all costs associated with corporate marketing and productmarketing, including expenses for advertising and trade fairs.
Selling expenses include the costs of sales management, logistics costs, where theyrelate to the sales depot or shipping, and the costs of the internal and external salesforce, including order processing. The costs of the sales companies are allocated to sell-ing expenses, unless they belong to the cost of sales.
Income arising in direct connection with the costs is netted.
GENERAL ADMINISTRATIVE EXPENSES
General administrative expenses comprise the costs of administrative activities not relat-ed to other functions. This includes in particular the cost of management, corporatecontrolling, legal, accounting and consulting fees, audit fees and general infrastructurecosts.
Income arising in direct connection with the costs is netted.
13
14
15
12

NOTES TO THE INCOME STATEMENT 152
OTHER OPERATING INCOME / EXPENSES
FINANCIAL RESULT 17
16
2010 2009
Income from investments in associates 286 286
Write-ups on investments in associates 91 72
Profit from investments in associates 377 358
Income from other investments 329 233
Profit from other investments 329 233
Net result from foreign exchange transactions (795) 1,077
Write-ups on other financial assets 7 3
Other financial income 10,042 552
Other financial expenses (22,516) (648)
Other financial result (13,262) 984
Financial result (before interest result) (12,556) 1,575
FINANCIAL RESULT (BEFORE INTEREST RESULT)
2010 2009
Reversal of bad debt allowances 3,031 3,235
Rental income 2,370 2,895
Gains on the disposal of non-current assets 4,430 240
Other operating income 9,831 6,370
Allocations to bad debt allowances and write-downs on receivables 8,298 10,059
Expenses for leased assets 1,047 1,556
Losses on the disposal of non-current assets 1,747 1,987
Other operating expenses 11,092 13,602
OTHER OPERATING INCOME / EXPENSES

153
Other financial income in fiscal year 2010 included a EUR 8.5 million reduction ontranche III of the vendor note that Siemens issued to Dräger as agreed (see also Note 5).
Other financial expenses, on the other hand, included the recognition of the optioncomponent agreed with Siemens in the amount of EUR 20.3 million in income during theperiod from January 1, 2010, to August 30, 2010, due to the positive development of thepreferred share compared to December 31, 2009 (offset against the previously mentionedincome of EUR 8.5 million from the reduction of the vendor note, the amount recog-nized in income is therefore EUR 11.8 million; see also Note 5).
The rise in other interest and similar expenses is due to costs incurred for issuing loansin the amount of EUR 3.1 million (2009: EUR 0.7 million), mainly in connection with a syndicated credit line, which was replaced with a bilateral credit line in December2010 (see also information on liquidity risk in Note 45). In addition, interest on the liabilities to Siemens of EUR 1.9 million pushed up other interest and similar expensesin fiscal year 2010 (see also Note 5).
2010 2009
Income from other securities and loans 111 230
Interest income from bank balances 2,058 2,157
Income from interest hedges 129 9
Interest contained in lease payments 135 185
Other interest and similar income 1,428 1,199
Interest and similar income 3,861 3,780
Interest expenses from bank liabilities (20,761) (20,290)
Other interest and similar expenses (11,244) (3,282)
Expenses from interest hedges (509) (467)
Interest contained in lease payments (230) (218)
Interest portion contained in pension provisons (8,500) (8,698)
Distribution for participation certificates (547) (547)
Compounding of participation certificates (1,177) (1,111)
Interest and similar expenses (42,968) (34,613)
Interest result (39,107) (30,833)
INTEREST RESULT
THE COMPANY’S BOARDSNOTESFINANCIAL STATEMENTS

NOTES TO THE INCOME STATEMENT 154
INCOME TAXES
Deferred tax expenses include taxes of EUR 344 thousand (2009: EUR 204 thousand)from the change in tax rates.
A deferred tax liability of EUR 2,861 thousand (2009: EUR 2,657 thousand) was recog-nized for temporary differences in connection with retained profits of foreign sub-sidiaries.
Payment of dividends to the shareholders of the parent companies does not have anyincome tax consequences.
18
2010 2009
Current tax expense (72,031) (40,972)
Deferred income / expense from temporary differences 12,784 12,883
Deferred tax expense / income from loss carryforwards 10,354 11,263
Deferred tax expense / income 23,138 24,146
Income taxes (48,893) (16,826)
COMPOSITION OF TAX EXPENSE
2010 2009
Earnings before income taxes 153,676 49,292
Expected income tax expense (tax rate: 30.92 %; 2009: 30.92 %) (47,517) (15,241)
Reconciliation:
Effects from other periods (8,513) (1,974)
Effect from change in tax rates (344) (204)
Effect from different tax rates 4,646 11,161
Tax effect of non-deductible expenses and tax-free income (15,920) (26,915)
Recognition and measurement of deferred tax assets 19,143 16,729
Other tax effects (388) (382)
Recognized income tax expenses (48,893) (16,826)
Effective tax rate (%) overall 31.8 34.1
RECONCILIATION OF EXPECTED INCOME TAX EXPENSE TO RECOGNIZED INCOME TAX EXPENSE

155
The parent company’s tax rate of 30.92 percent (2009: 30.92 percent) was used as theexpected tax rate. The expected tax rate is composed of a corporate income tax componentof 15.83 percent (including the 5.5 percent solidarity surcharge) (2009: 15.83 percent)and a trade tax component of 15.09 percent (2009: 15.09 percent).
After the purchase of the 25 percent share in Dräger Medical AG & Co. KG fromSiemens in 2009, the Dräger Group assumed a 100 percent corporate income tax liability.Due to the integration of Dräger Medical & Co. KG in the former Dräger Medical Holding GmbH (now: Dräger Medical GmbH) effective according to civil law on Septem-ber 20, 2010, and effective for tax purposes retroactively from January 1, 2010, the Company’s net profit in 2010 is directly subject to corporate income tax.
The following deferred tax assets and deferred tax liabilities relate to recognition andmeasurement differences in the individual balance sheet items:
THE COMPANY’S BOARDSNOTESFINANCIAL STATEMENTS

156 NOTES TO THE INCOME STATEMENT
The recoverable amount of the recognized deferred tax assets on recognized tax loss carry -forwards and temporary differences at the consolidated companies is tested for impair-ment and written down where necessary once a year on the basis of the future taxableprofit, which in 2010 was determined on the basis of a five-year operating plan takingrisk markdowns into account.
Deferred tax assets Deferred tax liabilities
2010 2009 2010 2009
Intangible Assets 10,161 14,434 4,786 4,931
Property, plant and equipment 2,481 1,472 8,497 8,637
Other non-current financial assets 7 10,3711 322 358
Other non-current assets 8,7701 438 873 2,901
Non-current assets 21,419 26,715 14,478 16,827
Inventories 13,431 13,541 2,350 1,446
Trade receivablesand receivables from construction contracts 4,230 2,881 5,696 1,874
Other current financial assets 557 367 1,820 2,290
Other current assets 554 346 2,419 441
Current assets 18,772 17,135 12,285 6,051
Liabilities from participation certificates 0 0 13,877 14,241
Provisions for pensions and similar obligations 9,904 6,812 8,727 8,030
Other non-current provisions 7,285 6,368 232 281
Non-current interest-bearing loans 1,790 3,915 158 276
Other non-current financial liabilities 1,534 625 259 293
Non-current liabilities 20,513 17,720 23,253 23,121
Other current provisions 15,675 8,081 832 1,801
Current loans and liabilities to banks 2,105 293 16 7
Trade payables 162 227 363 35
Liabilities from construction contracts 4,216 3,389 0 0
Other current financial liabilities 12,186 7,509 721 2,379
Other current liabilities 3,952 3,926 9,385 10,988
Current liabilities 38,296 23,425 11,317 15,210
Tax loss carryforwards 46,706 35,802 0 0
Gross amount 145,706 120,797 61,333 61,209
Netting (66,457) (57,752) (66,457) (57,752)
Deferred taxes from consolidation entries 30,253 31,733 7,705 14,495
Carrying amount 109,502 94,778 2,581 17,952
1 The adjustment between “Other non-current financial assets” and “Other non-current assets” mainly results from the shares in the restricted fund set up exclusively forDräger, which were recognized in financial assets for tax purposes in the previous year. In 2010, these were recognized as other assets.
DEFERRED TAX ASSETS / DEFERRED TAX LIABILITIES

157
The deferred taxes on consolidation entries mainly relate to deferred taxes from theelimination of intercompany profits in inventories as well as in intangible assets andproperty, plant and equipment.
Deferred taxes are determined on the basis of the tax rates which, under the legisla-tion in force, apply in the individual countries at the time of realization or which areexpected.
The Dräger Group recognized deferred tax assets on corporate income tax loss carry-forwards of EUR 73,783 thousand (2009: EUR 83,862 thousand) as of December 31,2010. Of these, loss carryforwards of EUR 62,816 thousand (2009: EUR 53,889 thousand)can be used indefinitely; the others expire in a maximum of 20 years.
Previously unrecognized corporate income tax loss carryforwards of EUR 2,174 thou-sand were considered to meet recognition criteria and deferred tax assets of EUR 554thousand were recognized as a result of the merger of two Dutch subsidiaries.
Deferred tax assets on trade tax loss carryforwards of EUR 169,651 thousand (2009:EUR 112,152 thousand) were recognized, of which EUR 135,220 thousand (2009: EUR 85,502 thousand) related to Drägerwerk AG & Co. KGaA, whose total trade tax losscarryforwards were considered to meet recognition criteria in 2010. The trade tax losscarryforwards expire in a maximum of ten years. Deferred taxes were recognized on losscarryforwards of EUR 18,685 thousand (2009: EUR 18,677 thousand) of a US companywhich is subject to state tax of an average of 4.30 percent (2009: 4.54 percent). The losscarryforwards expire in a maximum of 20 years.
No deferred tax assets were recognized for corporate income tax loss carryforwards of EUR 39,812 thousand (2009: EUR 95,558 thousand) and trade tax loss carryforwardsof EUR 6,399 thousand (2009: EUR 101,842 thousand). All of these unused tax loss car -ryforwards can be used indefinitely.
As a result of the interest ceiling rule, introduced as part of the corporate tax reform in2008, deferred taxes on deductible interest totaling EUR 42,837 thousand (2009: EUR11,637 thousand) was capitalized. In the previous year, no deferred tax assets were recog-nized for deductible interest of EUR 12,355 thousand. Despite losses in the current and / or previous year, deferred tax assets of EUR 12,586 thousand (2009: EUR 15,259thousand) were recognized for loss carryforwards and temporary differences as the companies in question are expected to generate taxable profits in the future.
The income from the reversal of a previous valuation adjustment on deferred tax assetscame to EUR 26,783 thousand in fiscal year 2010 (2009: EUR 21,086 thousand).
Current income taxes of EUR 5,932 thousand (2009: EUR 1,000 thousand) and deferredtaxes of EUR 712 thousand (2009: EUR 0 thousand) were recognized directly in equity. These principally pertain to transaction fees incurred in connection with the cap-ital increase and the share of the dividend for participation certificates relating to theequity component.
The deferred tax assets recognized in equity increased by EUR 3,385 thousand (2009:increased by EUR 2,279 thousand) during the period and mainly concerned the recogni-tion of actuarial gains and losses directly in equity.
THE COMPANY’S BOARDSNOTESFINANCIAL STATEMENTS

NOTES TO THE INCOME STATEMENT 158
PERSONNEL EXPENSES / HEADCOUNT
Personnel expenses include the remuneration of the members of the Executive Board ofthe general partner Drägerwerk Verwaltungs AG, Lübeck. Please refer to our commentsin the remuneration report (Note 50).
Please see the comments in the management report for more information on the devel-opment of headcount.
19
2010 2009
Wages and salaries 610,197 553,459
Social security taxes and related employee benefits 106,726 97,391
Pension expenses 11,936 12,960
728,859 663,810
PERSONNEL EXPENSES
2010 2009
Germany 5,085 4,845
Abroad 6,206 6,226
Total headcount 11,291 11,071
Production and customer service 6,008 6,046
Other 5,283 5,025
Total headcount 11,291 11,071
2010 2009
Germany 4,980 4,846
Abroad 6,206 6,161
Total headcount 11,186 11,007
Production and customer service 5,950 5,727
Other 5,236 5,280
Total headcount 11,186 11,007
HEADCOUNT (AVERAGE)
HEADCOUNT AS OF THE BALANCE SHEET DATE

159
AMORTIZATION OF INTANGIBLE ASSETS AND DEPRECIATION OF PROPERTY,
PLANT AND EQUIPMENT
EUR 21,554 thousand in amortization and depreciation charges is contained in cost ofsales (2009: EUR 25,092 thousand), EUR 2,760 thousand in research and developmentcosts (2009: EUR 8,216 thousand), EUR 10,493 thousand in marketing and sellingexpenses (2009: EUR 10,081 thousand) and EUR 19,056 thousand in general administra -tive expenses (2009: EUR 22,496 thousand).
In fiscal year 2010, no impairment losses were charged on intangible assets or property,plant and equipment. In the previous year, impairment losses of EUR 3,803 thousandwere charged on intangible assets, which were included in research and development costsof fiscal year 2009. In addition, impairment losses of EUR 4,529 thousand were charged on property, plant and equipment in the previous year, of which EUR 3,095 thousand wascontained in cost of sales, EUR 277 thousand in marketing and selling expenses, EUR740 thousand in general administrative expenses and EUR 417 thousand in research anddevelopment costs. The previous year’s impairment losses were applied as part of theannual impairment test and relate exclusively to monitoring systems & IT functions ofthe medical division.
20
2010 2009
Intangible assets 10,091 17,051
Property, plant and equipment 43,772 48,834
53,863 65,885
DEPRECIATION / AMORTIZATION
THE COMPANY’S BOARDSNOTESFINANCIAL STATEMENTS

NOTES TO THE INCOME STATEMENT 160
EARNINGS / DIVIDEND PER SHARE
The general partner Drägerwerk Verwaltungs AG and the Supervisory Board of DrägerwerkAG & Co. KGaA will propose to the annual shareholders’ meeting on May 6, 2011, to distribute around 30 percent of net profit in fiscal year 2010 less the share in net profit ofnon-controlling investments to the shareholders and holders of participation certificates of Drägerwerk AG & Co. KGaA.
2010 2009
Net profit 104,783 32,466
Earnings attributable to non-controlling interests (2,194) (13,453)
Earnings attributable to participation certificates (excluding minimum dividend, after taxes) (11,861) (4,107)
Earnings attributable to shareholders 90,728 14,906
EUR 1.191 (2009: EUR 0.40) cash dividend for 6,350,000 preferred shares 7,557 2,540
EUR 1.131 (2009: EUR 0.34) dividendfor 6,350,000 common shares until June 30, 2010, andfor 10,160,000 common shares as from Juli 1, 2010 2
(2009: 6,350,000 common shares) 9,328 2,159
Earnings per share 2 16,885 4,699
Earnings after dividends attributable to shareholders 2 73,843 10,207
thereof attributable to 6,350,000 preferred shares 32,106 5,104
thereof attributable to 10,160,000 common shares (2009: 6,350,000 common shares) 41,737 5,103
Distribution of earnings attributable to shareholders
for preferred shares 39,663 7,644
Dividends 7,557 2,540
Earnings after dividends attributable to shareholders 32,106 5,104
for common shares 51,065 7,262
Dividends 2 9,328 2,159
Earnings after dividends attributable to shareholders 2 41,737 5,103
Earnings per preferred share (in €) 6.25 1.20
Earnings per common share (in €) 6.19 1.14
1 Proposed dividends2 For the calculation of earnings per share, shares issued as part of the capital increase are included on a pro-rata basis. The
resulting dividend is only a mathematical value and differs from the proposed dividend totaling EUR 19,037 thousand (of whichEUR 11,481 thousand for limited capital stock).
EARNINGS / DIVIDEND PER SHARE
21

161
The structure of the proposed distribution is as follows:
The proposed distribution corresponds to 30.12 percent of net profit less the share in netprofit of non-controlling investments.
In accordance with the resolution agreed upon at the annual shareholders’ meeting on May 8, 2009, the general partner is entitled to increase the capital of Drägerwerk AG &Co. KGaA until May 7, 2014, with the approval of the Supervisory Board, by up to EUR16,256,000 (authorized share capital) by issuing new bearer common shares (no-parshares) in return for cash and / or contributions in kind, in either one or several tranches.In accordance with the articles of association, the general partner is not entitled to excludethe shareholders’ subscription right for exercising option and / or conversion rights orfulfill conversion obligations from participation certificates.
With effect from June 30, 2010, Drägerwerk AG & Co. KGaA therefore increased itscapital stock by issuing 3,810,000 new no-par bearer shares (no-par shares) with a pro-ratashare of EUR 2.56 each in capital stock (new common shares) with full dividend rights as from January 1, 2010.
Drägerwerk AG & Co. KGaA has issued 1,413,425 participation certificates for whichthe holder receives either ten common or preferred shares per certificate or ten timesthe current stock market price of preferred shares upon termination. The factor 10 is dueto the share split, which did not apply to the participation certificates (please refer to the information on participation certificates provided in Note 35).
Diluted earnings per share do not have to be calculated, as the owners of the partici-pation certificates do not have the right to exchange the participation certificates againstshares and Drägerwerk AG & Co. KGaA does not intend exercising its calling right.
Likewise, the possibility of acquiring treasury shares cannot lead to dilution due to theprovisions governing the use of such shares.
The option rights issued to Siemens also did not cause any dilution as of the balancesheet date.
Number of shares Dividend per share Dividends in € less taxes Totaland minimum
dividends
Common shares 10,160,000 1.13 11,480,800.00 11,480,800.00
Preferred shares 6,350,000 1.19 7,556,500.00 7,556,500.00
Participation certificates 1,413,425 11.90 16,819,757.50 (4,958,985.27) 11,860,772.23
30,898,072.23
CALCULATION OF PROPOSED DISTRIBUTION
THE COMPANY’S BOARDSNOTESFINANCIAL STATEMENTS

NOTES TO THE CONSOLIDATED BALANCE SHEET162
Notes to the consolidated balance sheet
INTANGIBLE ASSETS
Goodwill Patents Purchased Internally Payments made 2010trademarks software generated Total
and intangiblelicenses assets
Cost
January 1, 2010 265,903 16,457 72,124 17,525 358 372,367
Additions 7 67 4,981 26 1,226 6,307
Disposals (435) (271) (2,398) 0 0 (3,104)
Reclassifications 0 11 520 0 (29) 502
Currency translations effects 1,653 1,321 1,150 51 0 4,175
December 31, 2010 267,128 17,585 76,377 17,602 1,555 380,247
Accumulated amortizationand impairment losses
January 1, 2010 7,671 12,454 60,705 12,648 0 93,478
Additions (amortization) 0 1,055 6,483 2,553 0 10,091
Disposals (435) (271) (2,303) 0 0 (3,009)
Currency translations effects 557 811 928 40 0 2,336
December 31, 2010 7,793 14,049 65,813 15,241 0 102,896
Net carrying value 259,335 3,536 10,564 2,361 1,555 277,351
INTANGIBLE ASSETS AS OF DECEMBER 31, 2010
22

163
Goodwill Patents Purchased Internally Payments made 2009trademarks software generated Total
and intangiblelicenses assets
Cost
January 1, 2009 189,770 20,944 69,651 14,802 472 295,639
Additions 75,618 1,227 4,086 2,965 106 84,002
Disposals 0 (5,266) (2,371) (222) (113) (7,972)
Reclassifications 0 0 462 0 (114) 348
Changes in the scope of consolidation 0 0 41 0 0 41
Currency translations effects 515 (448) 255 (20) 7 309
December 31, 2009 265,903 16,457 72,124 17,525 358 372,367
Accumulated amortizationand impairment losses
January 1, 2009 7,493 12,246 54,231 10,108 0 84,078
Additions (amortization) 0 2,112 8,426 2,710 0 13,248
Additions (impairment losses) 0 3,803 0 0 0 3,803
Disposals 0 (5,266) (2,124) (154) 0 (7,544)
Reclassifications 0 0 (7) 0 0 (7)
Changes in the scope of consolidation 0 0 20 0 0 20
Currency translations effects 178 (441) 159 (16) 0 (120)
December 31, 2009 7,671 12,454 60,705 12,648 0 93,478
Net carrying value 258,232 4,003 11,419 4,877 358 278,889
INTANGIBLE ASSETS AS OF DECEMBER 31, 2009
Goodwill mainly resulted from the transfer in fiscal year 2003 of the “ElectromedicalSystems” business unit of Siemens Medical Solutions to Dräger Medical GmbH. Goodwillincreased further on account of the buyback of Siemens’ 35 percent share in DrägerMedical AG & Co. KG (now: Dräger Medical GmbH) in fiscal years 2007 and 2009.
The amortization of intangible assets is contained in the cost of sales and the otherfunctional costs.
For more information on impairment losses in the previous year, please refer to Note 20.
The discounted cash flow method is used for measuring the recoverable amount ofgoodwill by determining the net realizable value, based on the operational four-year planfor the individual cash generating units. The business segments form the basis for thecash generating units. The main planning assumptions are market growth, developmentof market shares, price trends and the discount rate. In the current planning, a discountrate of 6.1 percent and a growth rate of 1 percent were taken into account for perpetualannuity. These assumptions are backed up by external sources of information on marketdevelopment. No impairment loss was required on the basis of this multi-year plan. Evenif the perpetual annuity was to grow by 0 percent and the discount rate were to increase by another 2 percentage points, no impairment loss would have to be recognized.
THE COMPANY’S BOARDSNOTESFINANCIAL STATEMENTS

NOTES TO THE CONSOLIDATED BALANCE SHEET164
As of December 31, 2010, goodwill was made up of EUR 257.2 million for the medicaldivision (2009: EUR 256.1 million) and EUR 2.1 million for the safety division andDrägerwerk AG & Co. KGaA (2009: EUR 2.1 million).
PROPERTY, PLANT AND EQUIPMENT23
Land, equivalent Production plant Other plant, Leased assets Prepayments 2010titles, and and machinery factory and (Finance lease) made and assets Totalbuildings office under
equipment construction
Cost
January 1, 2010 302,101 88,210 225,767 5,338 6,328 627,744
Additions 2,941 4,891 21,168 823 19,716 49,539
Disposals (3,543) (1,526) (18,609) (629) (265) (24,572)
Reclassifications 433 3,494 2,221 471 (7,121) (502)
Currency translations effects 4,354 2,651 6,317 12 165 13,499
December 31, 2010 306,286 97,720 236,864 6,015 18,823 665,708
Accumulated depreciationand impairment losses
January 1, 2010 152,964 67,369 158,689 2,715 74 381,811
Additions (amortization) 10,988 7,016 24,908 860 0 43,772
Write-ups (15) 0 0 0 0 (15)
Disposals (2,481) (1,166) (18,019) (627) 0 (22,293)
Reclassifications (25) 82 (308) 251 0 0
Currency translations effects 2,109 2,050 4,539 20 0 8,718
December 31, 2010 163,540 75,351 169,809 3,219 74 411,993
Net carrying value 142,746 22,369 67,055 2,796 18,749 253,715
PROPERTY, PLANT AND EQUIPMENT AS OF DECEMBER 31, 2010

165
Land, equivalent Production plant Other plant, Leased assets Prepayments 2009titles, and and machinery factory and (Finance lease) made and assets Totalbuildings office under
equipment construction
Cost
January 1, 2009 299,424 81,692 220,501 5,038 11,811 618,466
Additions 2,618 4,375 28,290 1,622 7,423 44,328
Disposals (5,094) (3,737) (29,823) (1,270) (355) (40,279)
Reclassifications 3,398 4,347 4,923 (171) (12,845) (348)
Change in consolidated group 0 48 19 128 0 195
Currency translations effects 1,755 1,485 1,857 (9) 294 5,382
December 31, 2009 302,101 88,210 225,767 5,338 6,328 627,744
Accumulated depreciationand impairment losses
January 1, 2009 141,744 60,646 152,803 2,774 0 357,967
Additions (amortization) 11,007 7,339 25,127 832 0 44,305
Additions (impairment losses) 868 1,506 2,081 0 74 4,529
Disposals (1,752) (3,253) (22,525) (885) 0 (28,415)
Reclassifications 64 0 17 (74) 0 7
Change in consolidated group 0 39 14 76 0 129
Currency translations effects 1,033 1,092 1,172 (8) 0 3,289
December 31, 2009 152,964 67,369 158,689 2,715 74 381,811
Net carrying value 149,137 20,841 67,078 2,623 6,254 245,933
PROPERTY, PLANT AND EQUIPMENT AS OF DECEMBER 31, 2009
The assets leased under finance leases mainly comprise factory and office equipment(also see Note 46).
The increase in prepayments made and assets under construction to the amount ofEUR 5,892 thousand pertains to the new production and logistics building for the Infra-structure Projects business that is being built in Lübeck. Additions for this constructionproject include EUR 27 thousand in borrowing costs. The underlying capitalization rateis between 1.9 percent and 2.04 percent. Government grants of EUR 1.0 million for thisbuilding were deducted from the previous carrying value. Finance for this building hasbeen secured with a mortgage of EUR 10.8 million.
For more information on impairment losses in the previous year, please refer to Note 20.
INVESTMENTS IN ASSOCIATES
As in prior years, Drägerwerk AG & Co. KGaA holds shares in two companies over whichit has indirect significant influence. These entities are included as associates in thegroup financial statements according to the equity method (over 20 percent interest).
24
THE COMPANY’S BOARDSNOTESFINANCIAL STATEMENTS

NOTES TO THE CONSOLIDATED BALANCE SHEET166
OTHER NON-CURRENT FINANCIAL ASSETS
No risks have been identified relating to the non-current receivables. It was thus not nec-essary to recognize specific bad debt allowances.
The non-current positive fair values of derivatives are primarily derived from interestrate hedges relating to the repurchase of the 10 percent share in Dräger Medical AG &Co. KG (now: Dräger Medical GmbH) from Siemens in fiscal year 2007.
For more information on finance lease receivables, please refer to our comments onthe recognition of finance leases by the lessor (Note 46).
DEFERRED TAX ASSETS
Deferred tax assets are explained in Note 18.
OTHER NON-CURRENT ASSETS
Other non-current assets contain the available excess of plan assets over pension obligationstotaling EUR 13,593 thousand (2009: EUR 9,806 thousand, see also Note 36).
For assets leased under operating leases, we refer to our comments in Note 46.
26
27
25
2010 2009
Trade receivables 4,140 1,033
Other loans 3,199 5,050
Finance lease receivables (lessor) 1,396 2,435
Positive fair values of derivates 248 168
All other non-current financial assets 2,420 2,982
11,403 11,668
OTHER NON-CURRENT FINANCIAL ASSETS
2010 2009
Equipment leased out 9,362 8,867
All other non-current assets 18,798 16,784
28,160 25,651
OTHER NON-CURRENT ASSETS

167
INVENTORIES
The carrying value of inventories written down to their net realizable value as of Decem-ber 31, 2010, is EUR 33,951 thousand (2009: EUR 46,151 thousand).
Impairment losses of EUR 8,825 thousand (2009: EUR 25,180 thousand) were chargedon inventories in the fiscal year and recognized in cost of sales. In addition, EUR 4,473thousand (2009: EUR 1,535 thousand) of impairments recognized in previous years werereversed. Finished goods and merchandise comprise loan equipment and demo equip-ment lent to customers in the short term worth EUR 32,958 thousand (2009: EUR 28,961thousand). Loan and demo equipment is taken over by the customers after a short periodof time and is therefore disclosed in inventories. Appropriate allowances were made forwear and tear over the period of use.
TRADE RECEIVABLES AND RECEIVABLES FROM CONSTRUCTION CONTRACTS
The risks associated with trade receivables are adequately accounted for by bad debtallowances. Bad debt allowances developed as follows:
29
28
2010 2009
Finished goods and merchandise 170,488 146,698
Work in progress 60,318 42,470
Raw materials, consumables and supplies 98,872 89,311
Payments made 26,988 21,463
356,666 299,942
INVENTORIES
2010 2009
Trade receivables 514,592 492,210
Receivables from construction contracts 18,571 19,201
533,163 511,411
TRADE RECEIVABLES AND CONSTRUCTION CONTRACTS
THE COMPANY’S BOARDSNOTESFINANCIAL STATEMENTS

NOTES TO THE CONSOLIDATED BALANCE SHEET168
The remaining credit risk from trade receivables after specific bad debt allowances is as follows, according to the age of the receivables:
In addition to costs incurred for the contracts, receivables from construction contractsinclude the corresponding profit and were offset against prepayments received.
The cost incurred for the contracts in process plus the corresponding profit accordingto the percentage of completion method amount to EUR 40,454 thousand (2009: EUR 42,082 thousand) as of the balance sheet date and were offset against prepaymentsof EUR 25,546 thousand (2009: EUR 38,436 thousand). This led to receivables from construction contracts of EUR 18,571 thousand (2009: EUR 19,201 thousand) and liabil-ities from prepayments on construction contracts of EUR 3,664 thousand (2009: EUR 15,555 thousand).
No specific bad debt allowances were recognized on receivables from constructioncontracts. There are no overdue receivables which require bad debt allowances.
2010 2009
January 1 30,580 25,745
Allocation 8,193 9,806
Utilization (5,328) (2,474)
Reversal (2,069) (2,716)
Change in consolidated group 0 81
Currency translations effects 1,348 138
December 31 32,724 30,580
SPECIFIC BAD DEBT ALLOWANCES
2010 2009
Receivables not impaired or overdue 368,261 356,229
Receivables subject to bad debt allowances 10,354 7,240
Overdue receivables not subject to bad debt allowances
– less than 30 days 58,638 59,409
– between 30 and 59 days 20,066 20,443
– between 60 and 89 days 15,660 14,079
– between 90 and 119 days 11,645 11,426
– more than 120 days 48,539 42,585
154,548 147,942
Carrying amount 533,163 511,411
AGING OF OVERDUE RECEIVABLES NOT SUBJECT TO BAD DEBT ALLOWANCES

169
OTHER CURRENT FINANCIAL ASSETS
For more information on finance lease receivables, please refer to our comments on therecognition of finance leases by the lessor (Note 46).
For the derivative financial instruments recognized as other financial assets, pleaserefer to the table of derivative financial instruments in the Dräger Group presented inNote 45.
Notes receivable chiefly stem from the Turkish, Chinese, Japanese and Spanish sub-sidiaries where the bill of exchange is a common method of payment.
Only a minimal amount of specific bad debt allowances has been recognized for cur-rent assets. There are no overdue receivables which require bad debt allowances.
CASH AND CASH EQUIVALENTS
Cash and cash equivalents comprise cash in hand and balances at various banks in dif-ferent currencies. Cash and cash equivalents which were subject to restrictions as of thebalance sheet date amount to EUR 10,175 thousand (2009: EUR 22,026 thousand). As of December 31, 2009, these included EUR 10 million deposited in a bank account subjectto special restraints on disposal, which was established as part of the share acquisition in Dräger Medical AG & Co. KG (now: Dräger Medical GmbH) and which was paid in fis-cal year 2010.
OTHER CURRENT ASSETS
31
32
30
2010 2009
Positive fair values of derivates 1,562 3,284
Notes receivable 14,765 15,309
Receivables from employees 1,873 2,602
Finance lease receivables (lessor) 879 4,362
Receivables from associates 646 758
Other 2,789 2,380
22,514 28,695
OTHER CURRENT FINANCIAL ASSETS
2010 2009
Prepaid expenses 21,118 17,299
Other tax refund claims 16,865 10,0701
Other 12,482 10,615
50,465 37,9841 Other tax refund claims are recognized in other current assets separately from income tax refund claims. The prior-year figures
were adjusted accordingly.
OTHER CURRENT ASSETS
THE COMPANY’S BOARDSNOTESFINANCIAL STATEMENTS

NOTES TO THE CONSOLIDATED BALANCE SHEET170
Only a minimal amount of specific bad debt allowances has been recognized for othercurrent assets.
EQUITY
For the breakdown and changes in equity in fiscal years 2009 and 2010, please see thestatement of changes in equity of the Dräger Group.
Capital stockIn accordance with the resolution agreed upon at the annual shareholders’ meeting onMay 8, 2009, the general partner is entitled to increase the capital of Drägerwerk AG & Co. KGaA until May 7, 2014, with the approval of the Supervisory Board, by up toEUR 16,256,000.00 (authorized share capital) by issuing new bearer common shares (no-par value shares) in return for cash and / or contributions in kind, in either one orseveral tranches.
With effect from June 30, 2010, Drägerwerk AG & Co. KGaA increased its capital stockby issuing 3,810,000 new no-par bearer shares (no-par shares) and raised the number of limited no-par bearer shares from 6,350,000 to 10,160,000. The number of preferredshares remains 6,350,000.
At the same time, the existing 6,350,000 no-par bearer shares were admitted to theregulated market of Frankfurt Stock Exchange on June 18, 2010.
The capital increase put up the capital stock of Drägerwerk AG & Co. KGaA from EUR 32,512 thousand to EUR 42,266 thousand. Drägerwerk Verwaltungs AG, the generalpartner, holds no shares in capital.
All shares have been fully paid in. As before, the preferred shares are traded on thecapital market. The new common shares were first admitted to the regulated market(Prime Standard) on July 2, 2010.
Other than voting rights, the preferred shares have the same rights as those attachedto the common shares. As compensation for the lack of voting rights, an advance divi-dend of EUR 0.13 per preferred share is distributed from net earnings.
If sufficient profits are available, a dividend of EUR 0.13 per common share is then paid.Any profit in excess of this amount, if distributed, is allocated so preferred shares receiveEUR 0.06 more than common shares.
If the profit is not sufficient to distribute the advance dividend for preferred shares inone or more years, the amounts are paid from the profit of subsequent fiscal years beforea dividend is paid on common shares.
If amounts in arrears are not paid in the next year along with the full preferred dividendfor that year, the preferred shareholders have voting rights until the arrears have beenpaid.
In the event of liquidation, the preferred shareholders receive 25 percent of net liqui-dation proceeds in advance. The remaining liquidation proceeds are distributed evenlyto all shares.
The annual shareholders’ meeting on May 7, 2010, resolved to conditionally increasethe Company’s capital stock up to EUR 3,200,000 by issuing up to 1,250,000 new no-parpreferred bearer shares (no-par shares) in return for cash and / or contributions in kind(conditional capital). The conditional capital was used for issuing the option rights toSiemens.
Drägerwerk AG & Co. KGaA does not grant any share-based payments (share optionplan).
33

171
Capital reserves The capital reserves originated from share premiums from Drägerwerk AG & Co. KGaA’sestablishment (transformation) in 1970 and from capital increases in 1979, 1981, 1991and 2010.
The new common shares were offered to the shareholders at a ratio of 10:3 at a subscrip-tion price of EUR 27.50 each by way of an indirect subscription right (Sec. 186 [5] AktG[“Aktiengesetz”: German Stock Corporation Act]). In the subscription period from June 17,2010 to June 30, 2010, all previous subscription rights for common shares (1,905,000) as well as 1,886,037 of a total 1,905,000 subscription rights for preferred shares were exer -cised. The subscription rate therefore totals 99.5 percent. The premium of the sharesplaced on June 30, 2010, is calculated from the issue price of EUR 27.50 less par value ofEUR 2.56. Taking into account transaction fees of EUR 3,150 thousand, EUR 91,398thousand were therefore added to capital reserves on June 30, 2010. The 18,963 unsub-scribed new common shares were sold for EUR 41.00 each on July 2, 2010. When deducting the par value of EUR 2.56 per share, the premium totaled EUR 729 thousandfor which transaction fees of EUR 18 thousand were incurred. Capital therefore went up by another EUR 711 thousand in the third quarter of 2010. Overall, capital reserves roseby EUR 92,109 thousand after deducting EUR 3,168 thousand in transaction fees in June and July 2010.
In addition, the cash settled option was transformed into an equity settled option,increasing other capital reserves by EUR 26,540 thousand.
January 1, 2010 39,449
Increase of capital reserves 2010 118,649
158,098
CAPITAL RESERVES AS OF DECEMBER 31, 2010
Premium Amount in €Number per share in € thousand
New common shares (total) 3,810,000
Common shares not yet placed as of June 30, 2010 (18,963)
Common shares placed as of June 30, 2010 3,791,037 24.94 94,548
Common shares placed on July 5, 2010 18,963 38.44 729
Less transaction fees, taking into account tax advantage (3,168)
Issue of new common shares 92,109Replacement of option component with equity component 26,540
Increase of capital reserves in fiscal year 2010 118,649
INCREASE OF CAPITAL RESERVES AS OF DECEMBER 31, 2010
THE COMPANY’S BOARDSNOTESFINANCIAL STATEMENTS

NOTES TO THE CONSOLIDATED BALANCE SHEET172
At the 2009 annual shareholders’ meeting, the majority shareholder Stefan Drägerannounced that he was waiving his indirect entitlement to a dividend. He repaid the divi-dend of EUR 581,492 in July and August, 2009. The capital stock of Drägerwerk AG & Co. KGaA increased correspondingly in the previous year.
Retained earnings Retained earnings comprise the earnings generated until fiscal year 2010 by the compa-nies included in the group financial statements, where they were not attributed to minorityinterests or paid as a dividend by Drägerwerk AG & Co. KGaA.
Deferred taxes on participation capital recognized in equity are stated in this item. Actuarial gains / losses from the Company’s pension provisions, including deferred
taxes, are also included in retained earnings.
Participation capital Please refer to Note 35 for details on participation capital.
Other comprehensive income
In fiscal year 2010, the fair values of financial instruments to the amount of EUR 952thousand (2009: EUR 461 thousand) were recognized directly in equity. In addition, EUR509 thousand (2009: EUR 384 thousand) were reclassified from equity to the interestresult due to interest hedging.
Capital management One of Dräger’s most important goals is to increase the business value. The key functionof capital management in this respect is to minimize the cost of capital while ensur-ing solvency at all times by coordinating of the due dates of financial liabilities with theexpected free cash flow and creating sufficient liquidity reserves.
Capital is monitored regularly using various key metrics, which include gearing andthe equity ratio. Dräger’s medium-term goal is to achieve an equity ratio of 35 percent.
2010 2009
Currency translation adjustment 803 (30,928)
Fair value of financial instruments (989) (546)
Actuarial gains and losses from pension plans recognized directly in equity 0 (15,760)1
Deferred taxes recognized directly in equity 297 5,1911
111 (42,043)
1 The actuarial gains / losses from pension plans, including deferred taxes, are included in retained earnings as from fiscal year2010.
OTHER COMPREHENSIVE INCOME

173
The Dräger Group’s equity and liabilities broke down as follows as of the balance sheetdate:
In fiscal year 2010, the equity of Dräger Group increased, particularly due to the capitalincrease and net profit achieved. In addition, the transformation of the cash settledoption (from the purchase of the 25 percent Siemens share in Dräger Medical AG & Co.KG (now: Dräger Medical GmbH)) into an equity settled option put up equity. The equity ratio therefore rose from 20.9 percent to 32.2 percent.
The Dräger Group’s gearing had developed as follows as of the balance sheet date:
2010 2009
€ million € million
Equity interest held by shareholders of Drägerwerk AG & Co. KGaA 631.2 389.3
+ Non-controlling interests 5.4 4.5
Equity of the Dräger Group 636.6 393.8
Share of total equity and liabilities 32.2 % 20.9 %
Non-current liabilities 586.5 714.9
Current liabilities 753.8 777.1
Total liabilities 1,340.3 1,492.0
Share of total equity and liabilities 67.8 % 79.1 %
Total equity and liabilities 1,976.9 1,885.8
EQUITY AND LIABILITIES
2010 2009
€ million € million
Non-current interest-bearing loans 318.0 382.3
+ Current loans and liabilities to banks 89.5 83.6
+ Current and non-current liabilities from finance leases 2.8 2.9
+ Liabilities from the buy-back of shares in Dräger Medical AG & Co. KG (now: Dräger Medical GmbH) 0.0 249.7
Cash and cash equivalents (320.0) (344.1)
Net financial debt 90.3 374.4
Equity 636.6 393.8
Gearing (net financial debt / equity) 0.1 1.0
GEARING
THE COMPANY’S BOARDSNOTESFINANCIAL STATEMENTS

NOTES TO THE CONSOLIDATED BALANCE SHEET174
NON-CONTROLLING INTERESTS
The non-controlling interests mostly relate to the following subsidiaries:
PARTICIPATION CAPITAL / LIABILITIES FROM PARTICIPATION CERTIFICATES 35
34
Non-controlling interests thereof net profit
2010 2009 2010 2009
Dräger Medical AG & Co. KG (now: Dräger Medical GmbH) 0 0 0 10,011
Shanghai Dräger Medical Instrument Co. Ltd. 3,446 2,180 1,413 879
Dräger Medical South Africa 1,375 1,153 299 505
Draeger Medikal Ticaret ve Servis (1,125) 408 (582) 1,106
Dräger Safety MSI GmbH 242 304 63 56
Draeger Arabia Co. Ltd. 1,017 166 866 992
Other 444 279 135 (96)
5,399 4,490 2,194 13,453
NON-CONTROLLING INTERESTS
Number Par value Premium Payments received thereof recognized thereof recognizedas debt in equity
€ € € € €
Series Auntil June 1991 315,600 8,066,736.00 12,353,585.70 20,420,321.70 6,839,001.70 13,581,320.00
Series Kuntil June 27,1997 105,205 2,689,039.80 1,758,718.44 4,447,758.24 2,657,581.09 1,790,177.15
Series Duntil June 28, 1997 992,620 25,371,367.20 24,557,921.23 49,929,288.43 9,215,196.34 40,714,092.09
1,413,425 36,127,143.00 38,670,225.37 74,797,368.37 18,711,779.13 56,085,589.24
Accumulated interest effect until 2009 10,026,901.87 –
Recognition as of December 31, 2009 28,738,681.00 56,085,589.24
Compounding 2010 1,177,139.54 –
Compensation for participation certificate holders – (5,682,300.00)
Recognition as of December 31, 2010 29,915,820.54 50,403,289.24
PARTICIPATION CAPITAL

175
No participation certificates were issued in fiscal year 2010. Drägerwerk AG & Co. KGaA does not intend to terminate the participation certificates.
If the participation certificate holder exercises the calling right, the amount repayableshall equal the average mean rate of the last three months at the Hamburg Stock Exchangeor a maximum of the weighted average issue price of the corresponding tranche. Series K may be terminated for the first time as of December 31, 2021, with five years’ notice; theperiod of termination thereafter is again five years.
Series D may be terminated for the first time as of December 31, 2026. Series D par-ticipation certificates share in losses. The proportionate loss attributable to the participa-tion capital is offset by future profits. The cases in which the minimum return is notpaid are the same as those in which the preferred dividend is not paid. As with the subse-quent payment of preferred dividends, the dividend for participation certificates is paid in arrears.
The dividend for participation certificates is 10 times the preferred share dividend, as the par value of the securities was originally identical, but the arithmetic par value ofthe preferred share has since been reduced to one tenth of the original par value.
The capital increase carried out in 2010 also affects participation certificates, as theterms and conditions for participation certificates provide similar subscription rights forholders of series A, K and D participation certificates in the case of a capital increasewith subscription rights for shareholders. Holders of participation certificates have theright to acquire further participation certificates with subscription rights similar tothose of the capital increase. The participation capital has to be increased accordingly.The subscription right and increase of participation capital are subject to the approval of the Company’s annual shareholders’ meeting as well as the exclusion or limitation of
2010 2009
Number Price Fair value Price Fair valueDec. 31 Dec. 31
€ € € €
Series A until June 1991 315,600 113.50 35,820,600.00 44.37 14,003,172.00
Series K until June 1997 105,205 112.00 11,782,960.00 40.25 4,234,501.25
Series D from June 28, 1997 992,620 117.50 116,632,850.00 40.49 40,191,183.80
1,413,425 164,236,410.00 58,428,857.05
FAIR VALUE
Termination right Termination right Loss share Minimum return Dividend for participation certificatesof Drägerwerk of participation
AG & Co. KGaA certificate owner
€
Series A yes no no 1.30 Dividend on preferred share x 10
Series K yes yes no 1.30 Dividend on preferred share x 10
Series D yes yes yes – Dividend on preferred share x 10
PARICIPATION CAPITAL CONDITIONS
THE COMPANY’S BOARDSNOTESFINANCIAL STATEMENTS

NOTES TO THE CONSOLIDATED BALANCE SHEET176
any other legal subscription rights, if this is necessary. In accordance with the terms andconditions of participation certificates, if the annual shareholders’ meeting does notapprove of participation certificate holders exercising their subscription rights or if otherlegal subscription rights cannot be excluded or limited to the required extent, the Com -pany must issue cash compensation to the amount of the loss it deems participation cer-tificate holders would incur through the capital increase (Sec. 315 BGB [“BürgerlichesGesetzbuch”: German Civil Code]). Dräger recognized EUR 7.8 million in provisions forthis contingency in 2010, which resulted in participation capital after taxes decreasingby EUR 5.7 million.
For details, please refer to the terms and conditions of series A, K and D participationcertificates.
PROVISIONS FOR PENSIONS AND SIMILAR OBLIGATIONS
As of December 31, 2010, the Dräger Group mainly had defined benefit pension plans andsimilar obligations in addition to a small number of defined contribution pension plans.
Defined benefit pension plans and similar obligations Under the Group’s defined benefit pension plans, provisions for pensions and similarobligations have been accrued for benefits payable in the form of old-age, disability andsurviving dependent pensions. The amount of the obligations is determined using theprojected unit credit method. The obligations are partly funded by plan assets.
The Dräger Group has decided to exercise the option under IAS 19.93A of disregardingthe 10 percent corridor and fully recognizing actuarial gains or losses in equity immedi-ately, taking account of deferred taxes. The actuarial gains or losses recognized in equityare reconciled in the separate statement of income and expenses recognized directly inequity.
The defined benefit pension plans of the German companies account for some 90 percent (2009: 95 percent) of the provisions for pensions and similar obligations disclosedas of the balance sheet date. As of January 1, 2005, the new company pension plans“Rentenplan 2005” for almost all employees of the Dräger Group’s German subsidiariesand “Führungskräfteversorgung 2005” for top management came into effect, supersed-ing the former “Versorgungsordnung ’90” and “Ruhegeldordnung ’90” schemes.
Under the old pension plan, employees received pensions based on their salaries andperiod of employment. As part of the transition to the new plan, employees were guaran-teed a pension based on the old plan for their years of service prior to the transition.
The new plan is now composed of the employer-funded basic level, the employee-fund-ed top-up level (deferred compensation) and the employer-funded supplementary level.
The pension cost for the employer-funded basic level is based on the respectiveemployee’s income. The employee funded top-up level allows employees to increase theirpension entitlement through deferred compensation.
The contribution made at the employer-funded supplementary level depends on theemployee contribution through deferred compensation and on the Company’s businessperformance (EBIT).
Since December 2007, these funds from the pension plan as well as the employee contributions from the respective fiscal year have been paid into a new fund (WKN [secu-rities identification number] AOHG1B) and secured in favor of the employees via a con-
36

177
tractual trust arrangement (CTA), meaning that they only serve to cover and finance theCompany’s direct pension obligations. The employees’ pension accounts have a mini-mum guaranteed return of 2.75 percent. Hence, the assets of this fund fulfill the criteriaof plan assets pursuant to IAS 19, the EUR 27,944 thousand (2009: EUR 25,181 thou-sand) in assets secured by the CTA were offset against the gross pension obligations infiscal year 2010.
The available excess of plan assets over the relevant pension obligations totaling EUR13,593 thousand (2009: EUR 9,806 thousand) is disclosed under other non-current assets.
The changes in the projected benefit obligation and plan assets are as follows:
2010 2009
Defined Similar Total Defined Similar Totalbenefit plans obligations benefit plans obligations
Changes in the projected benefit obligation
Projected benefit obligation as of January 1 225,167 6,225 231,392 210,551 4,288 214,839
Service cost 2,622 315 2,937 2,916 284 3,200
Interest expense 11,257 277 11,534 10,787 308 11,095
Actuarial gains / losses 6,931 456 7,387 9,963 284 10,247
Benefits paid (11,301) (255) (11,556) (10,824) (479) (11,303)
Employee contributions 2,182 0 2,182 2,226 0 2,226
Transfer of obligations and other effects 0 0 0 (602) 1,540 938
Currency changes 7,027 0 7,027 150 0 150
Projected benefit obligation as of December 31 243,885 7,018 250,903 225,167 6,225 231,392
thereof with plan assets 78,195 2,514 80,709 63,176 1,891 65,067
of which without fund assets 165,690 4,504 170,194 161,991 4,334 166,325
Change in plan assets
Fair value of plan assets as of January 1 70,608 76 70,684 56,942 0 56,942
Expected return on plan assets 3,025 0 3,025 2,398 0 2,398
Actuarial gains / losses (5,871) 0 (5,871) 3,154 0 3,154
Employer contributions 5,268 0 5,268 7,110 0 7,110
Employee contributions 2,164 0 2,164 2,209 0 2,209
Benefits paid (1,118) (47) (1,165) (911) (31) (942)
Transfer of obligations and other effects (6) 0 (6) (418) 107 (311)
Currency changes 6,620 0 6,620 124 0 124
Plan assets as of December 31 80,690 29 80,719 70,608 76 70,684
Funding status
Other amounts stated in the balance sheet 20 (349) (329) 9 (350) (341)
Net obligation as of December 31 163,215 6,640 169,855 154,568 5,799 160,367
thereof:
Available excess of plan assets 13,593 0 13,593 9,806 0 9,806
Provisions for pensions and similar obligations 176,808 6,640 183,448 164,374 5,799 170,173
CHANGES IN THE PROJECTED BENEFIT OBLIGATIONS AND PLAN ASSETS
THE COMPANY’S BOARDSNOTESFINANCIAL STATEMENTS

NOTES TO THE CONSOLIDATED BALANCE SHEET178
The current component of provisions for pensions and similar obligations amounts toEUR 11,935 thousand (2009: EUR 11,214 thousand).
The obligations similar to pensions of EUR 6,640 thousand (2009: EUR 5,799 thou-sand) mainly comprise obligations to employees based on local regulations governing thedeparture of employees from the Company.
Plan assets are composed as follows:
The expense for defined benefit pension plans is made up as follows:
The expected return on plan assets and the interest expense on the pension obligationsare disclosed as a net total under interest expenses (Note 17).
The actual losses on plan assets totaled EUR 2,846 thousand (2009: return on planassets of EUR 5,552 thousand).
For fiscal year 2011, additions to plan assets are expected to amount to EUR 9,139thousand (2009: EUR 7,241 thousand for fiscal year 2010).
The following pension payments are to be expected for fiscal years 2011 to 2015:
2010 2009
Shares and securities 72 % 66 %
Real estate 23 % 25 %
Other assets 5 % 9 %
COMPOSITION OF FUND ASSETS
2010 2009
Defined Similar Total Defined Similar Totalbenefit plans obligations benefit plans obligations
Current service cost 2,622 315 2,937 2,916 284 3,200
Interest expense on obligations 11,257 277 11,534 10,787 308 11,095
Expected return on plan assets (3,025) 0 (3,025) (2,398) 0 (2,398)
Other effect on profit or loss 28 0 28 (143) 0 (143)
10,882 592 11,474 11,162 592 11,754
EXPENSES FOR DEFINED BENEFIT PLANS AND SIMILAR OBLIGATIONS
2011 2012 2013 2014 2015
Anticipated pension payments 11,935 12,471 12,569 12,840 13,619
ANTICIPATED PENSION PAYMENTS

179
The following actuarial assumptions were made in measuring the projected benefit obli-gation:
A discount rate of 5.25 percent, a future increase in wages and salaries of 3.0 to 4.0 per-cent, a future increase in pensions of 1.0 to 2.0 percent, an average employee turnover of3.0 percent, and an expected return on plan assets of 3.5 percent are applicable to theGerman companies, to which around 90 percent (2009: 95 percent) of pension obligationsare allocable. The 2005 G Heubeck mortality table has been used as a basis of calcula-tion.
The discount rate reflects the effective market return on high-quality corporate bonds(calculated on the basis of modified iBoxx indices) with the same term as the pensionobligations as of the balance sheet date.
The expected return on plan assets was based on the assumption of a long-term trendof 3.5 percent for shares and securities and 4.5 percent for real estate. Interest on otherassets is expected to amount to 4.75 percent.
In fiscal year 2010, additional benefits of EUR 1,292 thousand (2009: EUR 2,524 thou-sand) were paid out to pensioners.
The experience adjustments of defined benefit obligations and plan assets amounted to:
In the above table, an increase in defined benefit obligations and a decrease of plan assets(both actuarial losses) are preceded by a plus sign.
2010 2009
Discount rate 2.50 – 5.25 % 3.00 – 5.50 %
Future wage and salary increases 0.00 – 4.00 % 0.00 – 4.25 %
Future pension increases 0.00 – 3.00 % 0.00 – 3.00 %
Average employee turnover 0.00 – 7.00 % 0.00 – 7.00 %
Expected income from fund assets 3.50 – 4.75 % 3.50 – 5.60 %
ACTUARIAL ASSUMPTIONS
2010 2009
Defined benefit obligations 140 4.383
Plan assets (fair value) 5,871 (3,154)
6,011 1,229
EXPERIENCE ADJUSTMENTS
THE COMPANY’S BOARDSNOTESFINANCIAL STATEMENTS

NOTES TO THE CONSOLIDATED BALANCE SHEET180
The projected benefit obligation and plan assets have changed as follows in recent years:
Defined contribution plans In addition to the defined benefit plans and similar obligations described above, somecompanies in the Dräger Group sponsor defined contribution plans based on local prac-tice and regulations.
The cost of defined contribution plans came to EUR 7,678 thousand in fiscal year2010 (2009: EUR 7,379 thousand).
OTHER NON-CURRENT AND CURRENT PROVISIONS (EXCLUDING INCOME TAX
PROVISIONS)
Provisions for personnel and welfare obligations were mainly recognized to cover bonus-es and sales compensation as well as phased retirement and long-service awards.
The warranty provisions were measured by reference to the warranty claims made inthe past and specific known risks.
Provisions for other obligations in the normal course of business include provisions ofEUR 7.8 million for potential cash compensation to be paid to holders of series A, K
37
2010 2009 2008 2007 2006
Projected benefit obligations 243,885 225,167 210,551 207,701 218,652
Plan assets (fair value) 80,690 70,608 56,942 43,895 29,380
Total projected benefit obligations and plan assets 163,195 154,559 153,609 163,806 189,272
thereof:
Unfunded obligations 176,788 164,365 163,678 165,557 189,272
Available excess of plan assets 13,593 9,806 10,069 1,751 0
MULTI-YEAR OVERVIEW OF DEFINED BENEFIT PENSION PLANS
Provisions Warranty Provisions Provisions Provisions 2010for provisions for for for other Total
personnel potential commissions obligations and welfare losses in the normal obligations course of
business
January 1, 2010 78,538 35,716 11,483 6,915 60,111 192,7631
Allocation 84,422 15,885 1,822 4,605 82,981 189,715
Unwinding of the discount 980 0 789 0 0 1,769
Utilization (54,443) (11,977) (1,275) (4,583) (34,812) (107,090)
Reversal (4,909) (1,483) (502) (1,378) (5,385) (13,657)
Change in consolidated group 172 94 0 0 (295) (29)
Currency translations effects 2,863 1,895 0 519 2,251 7,528
December 31, 2010 107,623 40,130 12,317 6,078 104,851 270,999
1 Income tax provisions are recognized separately from other provisions. The prior-year figures were adjusted accordingly.
OTHER PROVISIONS

181
and D participation certificates. In accordance with the terms and conditions of participa -tion certificates, cash compensation must be paid to holders of participation certificates if the subscription rights to be granted on new participation certificates at conditions sim -ilar to those of the capital increase are being disapproved by the annual shareholders’meeting or cannot be issued for any other reason.
Additional provisions of around EUR 11 million were recognized for legal disputeswithin a South American company. Existing risks were assessed by international lawyersand auditors and provisions were set aside accordingly. According to the informationavailable to the Company at this point in time, no further risks exist in addition to thosefor which provisions were accrued that would have a material adverse effect on the Company’s net assets, financial position and results of operations. Foreign subsidiariesalso set aside provisions for other taxes to the amount of EUR 13.8 million.
In addition, obligations in the normal course of business were mainly covered by pro-visions for customer bonuses, sales commissions, audit of financial statements, litigationcosts and risks, rental obligations and purchase guarantees.
The expected utilization of other provisions is as follows:
NON-CURRENT INTEREST-BEARING LOANS
The non-current note loans in place as of the balance sheet date are not subject to anycontractually agreed termination options.
38
Up to 1 year 1 to 5 years Over 5 years Total
Provisions for personnel and welfare obligations 83,710 18,743 5,170 107,623
Warranty provisions 40,130 0 0 40,130
Provisions for potential losses 1,418 2,070 8,829 12,317
Provisions for commissions 6,078 0 0 6,078
Provisions for other obligations in thenormal course of business 95,584 9,267 0 104,851
226,920 30,080 13,999 270,999
OTHER PROVISIONS BY MATURITY
2010 2009
1 to 5 years Over 5 years Total 1 to 5 years Over 5 years Total
Non-current liabilities to banks 12,422 35,633 48,055 19,505 38,671 58,176
Note loansa) issued in 2005 54,937 0 54,937 84,876 0 84,876
b) issued in 2007 99,957 0 99,957 74,901 24,980 99,881
c) issued in 2009 115,093 0 115,093 78,158 61,192 139,350
282,409 35,633 318,042 257,440 124,843 382,283
NON-CURRENT INTEREST-BEARING LOANS
THE COMPANY’S BOARDSNOTESFINANCIAL STATEMENTS

NOTES TO THE CONSOLIDATED BALANCE SHEET182
Variable interest rates are partly hedged. Please see our information on derivative financialinstruments (Note 45).
Liabilities to banks arising from the construction of the medical division’s new officeand laboratory building that was completed in 2008 have been collateralized by a mort-gage of EUR 55 million. The finance for the new production and logistics building for theInfrastructure Projects business in Lübeck has been secured with a mortgage of EUR10.8 million. There are no other mortgages on land and buildings or assignments as secu -rity for recognized liabilities.
OTHER NON-CURRENT FINANCIAL LIABILITIES
For an explanation of finance lease liabilities, please refer to our comments on recognitionof finance leases by the lessee (Note 46).
Other non-current financial liabilities in the previous year mainly comprise the vendornote of EUR 68.5 million and the variable purchase price component of EUR 6.2 millionpayable to Siemens from the acquisition of Siemens Medical Holding GmbH (pleaserefer to Note 5 for more information). EUR 60.0 million of the vendor note was repaid. Theremaining EUR 8.5 million were written off by Siemens as contractually agreed and this amount was recognized in income. The variable purchase price component of EUR6.2 million was remeasured at a total of EUR 26.5 million on August 30, 2010, and transferred directly to equity.
DEFERRED TAX LIABILITIES
Deferred tax assets are explained in Note 18.
39
40
2010 2009
1 to 5 years Over 5 years Total 1 to 5 years Over 5 years Total
Finance lease liabilities (lessee) 1,831 150 1,981 1,521 561 2,082
Negative fair value of derivativefinancial instruments 40 1,184 1,224 0 0 0
All other non-current liabilities 1,742 1,946 3,688 41,732 35,984 77,716
3,613 3,280 6,893 43,253 36,545 79,798
OTHER NON-CURRENT FINANCIAL LIABILITIES

183
CURRENT INCOME TAX PROVISIONS
CURRENT LOANS AND LIABILITIES TO BANKS
In fiscal year 2010, note loans of EUR 45.0 million were paid and note loans of EUR 54.5million were reclassified from non-current to current liabilities.
Variable interest rates are partly hedged. Please see our information on derivativefinancial instruments (Note 45).
ALL OTHER CURRENT FINANCIAL LIABILITIES 43
42
41
January 1, 2010 29,048
Allocation 24,735
Utilization (14,365)
Currency translations effects 2,166
December 31, 2010 41,584
CURRENT INCOME TAX PROVISIONS
2010 2009
Liabilities to banks 35,048 38,621
Note loans 54,448 44,976
89,496 83,597
CURRENT LOANS AND LIABILITIES TO BANKS
2010 2009
Trade payables to third parties 171,301 127,141
Other current financial liabilities
Other liabilities to employees and for social security 31,483 29,078
Liabilities to Drägerwerk Verwaltungs AG 7,214 3,701
Negative fair values of derivate financial instruments 3,283 4,864
Finance lease liabilities (lessee) 865 790
Distribution for participation capital 547 547
Liabilities to associates 36 6
Liabilities to Siemens 0 175,000
Other liabilities 25,071 21,184
68,499 235,170
239,800 362,311
ALL OTHER CURRENT FINANCIAL LIABILITIES
THE COMPANY’S BOARDSNOTESFINANCIAL STATEMENTS

NOTES TO THE CONSOLIDATED BALANCE SHEET184
Liabilities to Siemens recognized in the previous year from the purchase of SiemensMedical Holding GmbH (cash component of the purchase price) to the amount of EUR 175 million were fully repaid in fiscal year 2010 (please refer to our comments inNote 5).
For the derivative financial instruments recognized as other financial liabilities,please refer to the table of derivative financial instruments in the Dräger Group presentedin Note 45.
For an explanation of finance lease liabilities, please refer to our comments on recog-nition of finance leases by the lessee (Note 46).
OTHER CURRENT LIABILITIES
Liabilities from construction contracts are the result of higher project development costsfor a deep sea diving system (2009: two deep sea diving systems) in the safety division.
Prepayments received include prepayments on construction contracts of EUR 3,664thousand (2009: EUR 15,555 thousand) in accordance with IAS 11 which exceeded therespective recognized value of the contract.
44
2010 2009
Prepayments received 51,320 61,408
Deferred income 36,360 30,310
Liabilities from construction contracts 13,636 10,960
Other tax liabilities 34,433 34,6961
Other current liabilities 2,569 1,875
138,318 139,2491
1 Other liabilities are recognized in other current liabilities separately from income tax liabilities. The prior-year figures were adjusted accordingly.
OTHER CURRENT LIABILITIES

185THE COMPANY’S BOARDSNOTESFINANCIAL STATEMENTS

NOTES TO THE CONSOLIDATED BALANCE SHEET186
FINANCIAL INSTRUMENTS
Structure of financial instruments and their measurement The structure of financial instruments in the Group, and therefore the basis for theirmeasurement as well as their reconciliation to the Group balance sheet, was as followsas of the balance sheet date:
45
Financial instruments Other Total
Measurement Measurement in accordance with IAS 39 in accordance with other IAS
Fair Value Fair Value Amortized Amortized (Amortized) (Amortized)cost cost cost cost
(Held for (Available (Loans and (Held to in accordance in accordanceTrading) for Sale) Receivables) Maturity) with IAS 17 with IAS 28
Intangible Assets – – – – – – 277,351 277,351
Property, plant and equipment – – – – – – 253,715 253,715
Investments in associates – – – – – 904 – 904
Other non-currentfinancial assets 248 8911 8,868 – 1,395 – – 11,403
Tax refund claims – – – – – – 0 0
Deferred tax assets – – – – – – 109,502 109,502
Other non-current assets – – – – – – 28,160 28,160
Inventories – – – – – – 356,666 356,666
Trade receivables andconstruction contracts – – 533,163 – – – – 533,163
Other currentfinancial assets 1,562 – 20,073 – 879 – – 22,514
Cash and cash equivalents – – 320,037 – – – – 320,037
Tax refund claims – – – – – – 13,027 13,027
Other current assets – – – – – – 50,465 50,465
Total assets 1,810 891 882,141 0 2,274 904 1,088,886 1,976,907
1 Including investments of EUR 269 thousand, which are measured at amortized cost as their fair value cannot be determined.
FINANCIAL INSTRUMENTS AS OF DECEMBER 31, 2010 – ASSETS

187
Financial instruments Other Total
Measurement Measurement in accordance with IAS 39 in accordance with other IAS
Fair Value Amortized Fair Value (Amortized)cost cost
(Held for (OtherTrading) Liabilities)
Equity – – – – 636,563 636,563
Liabilities from participation certificates – 29,916 – – – 29,916
Provisions for pensions and similar obligations – – 183,448 – – 183,448
Other non-current provisions – – – – 44,973 44,973
Non-current interest-bearing loans – 318,042 – – – 318,042
Other non-current financial liabilities 40 3,688 – 1,981 1,184 6,893
Deferred tax liabilities – – – – 2,581 2,581
Other non-current liabilities – – – – 715 715
Current income tax provisions – – – – 41,584 41,584
Current provisions – – – – 226,026 226,026
Current loans and liabilities to banks – 89,496 – – – 89,496
Trade payables – 171,301 – – – 171,301
Other current financial liabilities 3,283 64,351 – 865 – 68,499
Income tax liabilities – – – – 18,552 18,552
Other current liabilities – – – – 138,318 138,318
Total equity and liabilities 3,323 676,794 183,448 2,846 1,110,496 1,976,907
FINANCIAL INSTRUMENTS AS OF DECEMBER 31, 2010 – EQUITY AND LIABILITIES
THE COMPANY’S BOARDSNOTESFINANCIAL STATEMENTS

NOTES TO THE CONSOLIDATED BALANCE SHEET188
Financial instruments Other Total
Measurement Measurement in accordance with IAS 39 in accordance with other IAS
Fair Value Fair Value Amortized Amortized (Amortized) (Amortized)cost cost cost cost
(Held for (Available (Loans and (Held to in accordance in accordanceTrading) for Sale) Receivables) Maturity) with IAS 17 with IAS 28
Intangible Assets – – – – – – 278,889 278,889
Property, plant and equipment – – – – – – 245,933 245,933
Investments in associates – – – – – 757 – 757
Other non-currentfinancial assets 168 8521 8,212 0 2,435 – – 11,668
Tax refund claims – – – – – – 0 0
Deferred tax assets – – – – – – 94,778 94,778
Other non-current assets – – – – – – 25,651 25,651
Inventories – – – – – – 299,942 299,942
Trade receivables andconstruction contracts – – 511,411 – – – – 511,411
Other currentfinancial assets 3,284 – 21,050 – 4,361 – – 28,695
Cash and cash equivalents – – 344,051 – – – – 344,051
Income tax refund claims – – – – – – 6,069 6,0692
Other current assets – – – – – – 37,984 37,9842
Total assets 3,452 852 884,724 0 6,796 757 989,246 1,885,828
1 Including investments of EUR 252 thousand, which are measured at amortized cost as their fair value cannot be determined.2 Income tax refund claims are recognized separately from other tax refund claims. The prior-year figures were adjusted accordingly.
FINANCIAL INSTRUMENTS AS OF 31, 2009 – ASSETS

The measurement categories are explained in our comments on the measurement offinancial assets and liabilities in Note 10 of this annual report.
189
Financial instruments Other Total
Measurement Measurement in accordance with IAS 39 in accordance with other IAS
Fair Value Amortized Fair Value (Amortized)cost cost
(Held for (OtherTrading) Liabilities)
Equity – – – – 393,820 393,820
Liabilities from participation certificates – 28,739 – – – 28,739
Provisions for pensions and similar obligations – – 170,173 – – 170,173
Other non-current provisions – – – – 35,332 35,332
Non-current interest-bearing loans – 382,283 – – – 382,283
Other non-current financial liabilities – 77,716 – 2,082 – 79,798
Deferred tax liabilities – – – – 17,952 17,952
Other non-current liabilities – – – – 666 666
Current income tax provisions – – – – 29,048 29,0481
Current provisions – – – – 157,431 157,431
Current loans and liabilities to banks – 83,597 – – – 83,597
Trade payables – 127,141 – – – 127,141
Other current financial liabilities 3,940 229,516 – 790 924 235,170
Income tax liabilities – – – – 5,429 5,4291
Other current liabilities – – – – 139,249 139,2491
Total equity and liabilities 3,940 928,992 170,173 2,872 779,851 1,885,828
1 Other tax liabilities are recognized in other current liabilities separately from income tax liabilities. The prior-year figures were adjusted accordingly.
FINANCIAL INSTRUMENTS AS OF DECEMBER 31, 2009 – EQUITY AND LIABILITIES
THE COMPANY’S BOARDSNOTESFINANCIAL STATEMENTS

NOTES TO THE CONSOLIDATED BALANCE SHEET190
In the following table, the carrying values of financial assets and liabilities are comparedwith their fair values:
Fair value measurement of financial instrumentsFinancial instruments recognized at fair value were allocated to the following levels ofthe fair value hierarchy:
Level 1:Prices in the active markets are assumed for identical financial assets or financial liabilities.
Level 2: Uses input factors that do not include any listed prices taken into consideration in level 1but which can be directly (i. e. price) or indirectly (i.e. derived from prices) observed forfinancial assets or financial liabilities.
Level 2010 2009
Assets measured at fair value
Derivatives with positive fair value (non-current) Level 2 248 168
Derivatives with positive fair values (current) Level 2 1,562 3,284
Securities (non-current) Level 1 622 600
Liabilities measured at fair value
Derivatives with negative fair value (non-current) Level 2 1,224 0
Derivatives with negative fair value (current) Level 2 3,283 4,864
2010 2009
Carrying Fair value Carrying Fair valuevalue value
Financial assets
Investments in associates 904 904 757 757
Trade receivables 533,163 533,163 511,411 511,411
Other financial assets 33,917 33,984 40,363 40,436
Cash and cash equivalents 320,037 320,037 344,051 344,051
Financial liabilities
Liabilities from participation certificates 29,916 29,916 28,739 28,739
Loans and liabilities to banks 407,538 421,905 465,880 470,877
Trade receivables 171,301 171,301 127,141 127,141
Other financial liabilities 75,392 75,748 314,968 315,308
CARRYING VALUES AND FAIR VALUES OF FINANCIAL ASSETS / LIABILITIES
FAIR VALUE MEASUREMENT OF FINANCIAL INSTRUMENTS

Level 3: Uses factors not based on observable market data for the measurement of financialassets and financial liabilities (unobservable input factors). Dräger Group does not holdany level 3 financial instruments.
No material reclassifications between level 1 and level 2 were carried out in the pasttwo fiscal years.
Net profit / loss from financial instruments The net profit / loss from financial instruments recognized in profit or loss in fiscal year2010 is summarized below (by measurement category):
The net profit / loss of the financial assets and liabilities in the “held for trading” categorycomprises profit and loss from changes in fair value as well as interest income / expensesfor these assets and liabilities. The net profit / loss in the category loans and receivablescontains impairment losses of EUR 8,298 thousand (2009: EUR 10,059 thousand).
Interest income / expenses from financial instruments In fiscal year 2010, interest income / expenses from financial instruments not measuredat fair value through profit or loss was as follows:
Financial risk management As an international company, the Dräger Group is especially exposed to exchange rateand interest rate risks, in addition to liquidity risks. The aim of financial risk managementis to mitigate these market risks arising in the course of operating and financial activi-
191
2010 2009
Interest income
Loans and Receivables 2,289 2,446
Available for Sale 14 63
2,303 2,509Interest expenses
Other Liabilities (22,715) (22,165)
(20,412) (19,656)
INTEREST INCOME / EXPENSES FROM FINANCIAL INSTRUMENTS
2010 2009
Financial assets and financial liabilities held for trading (8,453) (3,788)
Loans and receivables (4,833) (5,790)
Available-for-sale financial assets 14 63
Other financial liabilities 584 608
(12,688) (8,907)
NET PROFIT / LOSS BY MEASUREMENT CATEGORY
THE COMPANY’S BOARDSNOTESFINANCIAL STATEMENTS

NOTES TO THE CONSOLIDATED BALANCE SHEET192
ties. Derivative financial instruments are used to hedge the currency and interest exposureof current and forecast transactions. Derivatives are only transacted with banks of primestanding.
Financial risk management is based on the annually revised strategic plans of the Groupand divisions and the resultant short and medium-term plans. Financial risk manage-ment of liquidity and interest rate risk is implemented centrally at Drägerwerk AG & Co.KGaA, whereas currency risk management based on regular risk reports is the jointresponsibility of Drägerwerk AG & Co. KGaA and its divisions. Please see our comments inthe management report for more general information on risk management (see pages 67 et seq.).
Liquidity risk Drägerwerk AG & Co. KGaA mitigates its liquidity risk by diversifying the maturity struc-ture of its financing instruments. These include in particular participation certificatesand note loans due in one to five years. Drägerwerk AG & Co. KGaA also has various non-current and current liabilities to banks as well as a liquidity reserve comprising freelyavailable credit facilities with numerous banks with which it has concluded bilateral agree -ments. Due to the maturity structure of these financing instruments, Drägerwerk AG &Co. KGaA has only a limited repricing risk.
A syndicated credit line with an original total volume of EUR 240 million and a matu-rity of three years was obtained during the purchase of the Siemens share in March2010. The outstanding amount of EUR 190 million was repaid early in December 2010and replaced with bilateral credit lines of EUR 240 million and a term of five years.
The following analysis of the maturities of financial liabilities (contractually agreed,non-discounted payments) shows the influence on the Group’s liquidity situation:
2011 2012 2013 from 2016 Totalto 2015
Financial liabilities held for trading 3,283 11 29 0 3,323
Other financial liabilities
Liabilities from participation certificates 547 547 1,641 62,037 64,772
Loans and liabilities to banks 89,548 59,774 228,204 41,698 419,224
Trade payables and payablesfrom construction contracts 184,937 188 94 0 185,219
Liabilities to employees 31,483 151 19 1,946 33,599
Finance lease liabilities 865 752 1,463 157 3,237
Other liabilities 33,481 1,763 2,199 3,686 41,129
340,861 63,175 233,620 109,524 747,180
344,144 63,186 233,649 109,524 750,503
MATURITIES OF FINANCIAL LIABILITIES 2010

Cash outflow from currency hedges of EUR 123.1 million (2009: EUR 174.5 million) facedcash inflow of EUR 119.4 million (2009: EUR 169.9 million) as of December 31, 2010.
Currency risk The Group’s currency risks within the meaning of IFRS 7 relate to the financial instru-ments used in connection with operating activities or investing and financing activities.Drägerwerk AG & Co. KGaA mainly counters any risk that remains after offsetting cashinflows and outflows in the same foreign currency by entering into derivatives.
In order to better illustrate existing currency risks, the effects of hypothetical changesin relevant currencies on net profit and equity are discussed below on the basis of a cur-rency sensitivity analysis. For this purpose, it was assumed that most monetary financialinstruments are already denominated in the functional currency or have been convertedinto the functional currency using derivative financial instruments. Currency risks there -fore lie in the remaining unhedged financial instruments in foreign currencies inrespect of which currency fluctuations affect profit or loss.
If the euro were up / down 10 percent against the US dollar, the main foreign currencyin the Dräger Group, as of the balance sheet date, with all other variables remaining the same, earnings after taxes (pursuant to IFRS 7) would be EUR 0.5 million higher(2009: EUR 1.5 million higher) / EUR 0.6 million lower (2009: EUR 1.8 million lower).
Interest rate risk As well as variable rate non-current receivables and liabilities from operations, variablerate non-current loan liabilities also give rise to an interest rate risk due to changes inmarket rates. Drägerwerk AG & Co. KGaA counters this risk with a combination of fixedand variable rate financial liabilities and by using interest rate caps.
Changes in the market interest rates for primary financial instruments with fixed inter -est only affect the Group’s profit or loss if such instruments are recognized at fair value.Thus none of the fixed-interest financial instruments recognized at amortized cost posesan interest rate risk that would affect cash flows.
In order to better illustrate existing interest rate risks, the effects of hypotheticalchanges in market interest rates on net profit and equity are discussed below on the basis
193
2010 2011 2012 from 2015 Totalto 2014
Financial liabilities held for trading 3,940 0 0 0 3,940
Other financial liabilities
Liabilities from participation certificates 547 547 1,641 62,174 64,909
Loans and liabilities to banks 83,597 65,554 196,878 132,057 478,086
Trade payables and payablesfrom construction contracts 138,101 0 0 0 138,101
Liabilities to employees 29,077 118 0 33 29,228
Finance lease liabilities 790 637 1,392 684 3,503
Other liabilities 200,438 4,137 49,252 35,708 289,535
452,550 70,993 249,163 230,656 1,003,362
456,490 70,993 249,163 230,656 1,007,302
MATURITIES OF FINANCIAL LIABILITIES 2009
THE COMPANY’S BOARDSNOTESFINANCIAL STATEMENTS

NOTES TO THE CONSOLIDATED BALANCE SHEET194
of an interest rate sensitivity analysis. For this purpose, it was assumed that interest ratechanges affect primary financial instruments measured at fair value and derivative finan -cial instruments that are not part of a hedging relationship, whose changes in value arerecognized in profit or loss. Derivative financial instruments that are part of a cash flowhedge are also affected by interest rate changes, with the changes in value recognizeddirectly in equity.
A hypothetical increase / decrease of 100 basis points in market interest rates as of thebalance sheet date, with all other variables remaining the same, would increase /decrease earnings before taxes by EUR 1,282 thousand (2009: EUR 487 thousand) andincrease equity by EUR 1,278 thousand (2009: EUR 1,319 thousand) / decrease equity by EUR 1,438 thousand (2009: EUR 1,506 thousand).
Credit risk The maximum exposure to credit risk is represented by the carrying value of each financialasset, including financial derivatives, in the balance sheet. The Group does not expectany counterparties to derivatives to fail to meet their obligations as they consist exclusivelyof prime financial institutions. Consequently, the Group considers that its maximumexposure is reflected by the amount of trade receivables and other current assets, net ofvaluation adjustments recognized as of the balance sheet date.
Derivative financial instruments Derivative financial instruments are recognized at fair value, and resulting unrealizedgains and losses are recognized in profit or loss as part of the cost of sales or the financialresult providing the instruments are not part of a cash flow hedge. If a derivative finan-cial instrument serves as a cash flow hedge, the unrealized gains and losses are recognizeddirectly in equity.
The following positions were held as of the balance sheet date:
Nominal Volume Fair value
Positive Negative
December 31, 2010
Currency hedges 120,722 1,562 3,257
Interest rate caps 123,500 248 0
Interest rate swaps 19,983 0 1,250
264,205 1,810 4,507
December 31, 2009
Currency hedges 388,560 3,284 3,940
Interest rate caps 105,000 168 0
Interest rate swaps 20,968 0 924
514,528 3,452 4,864
DERIVATIVE FINANCIAL INSTRUMENTS

The positive fair values of the derivatives are disclosed as current and non-current finan-cial assets, the negative fair values as current and non-current financial liabilities. The currency hedges cover selected foreign currency cash flows from operating activitiesover the next four years (2009: next twelve months). Currency hedging mainly relates to operations in US dollars and to a lesser extent to operations in pounds sterling, Australiandollars as well as dividends distributed in Swiss francs.
In order to offset the effects of future changes to interest rates on cash flows, the Groupconcluded interest rate swaps and interest rate caps. The interest rate hedges haveremaining terms of up to two years (interest rate caps) or 13 years (interest rate swaps).For the swap, the only contract for which the Group uses hedge accounting, the Grouppays variable interest and in turn receives fixed interest. Interest rate swaps are recognizedat fair value. The ineffective part of the changes in fair value is recognized in income.
LEASES
The contracts recognized under IFRIC 4 as leases are explained below.
Lessee – finance leases Property leased by the Dräger Group primarily includes machinery and equipment. Themost significant obligations assumed under the lease terms, other than the rental paymentsthemselves, are the upkeep of the facilities and equipment, insurance and taxes on capital. Lease terms generally range from one to five years with options to renew at vary-ing conditions.
The Group had no finance leases with conditional payments in the fiscal year or theprior year.
For a list of assets used under finance leases, please see our explanations in connectionwith the statement of non-current assets in Notes 22 and 23.
Minimum lease payments for the above finance leases are as follows:
No future income from non-cancelable subleases was expected as of December 31, 2010,as in the previous year.
46
195
2010 2009
During the first year 1,262 991
From the second to the fifth year 2,215 2,029
After five years 157 684
Minimum lease payments 3,634 3,704
During the first year 865 790
From the second to the fifth year 1,831 1,521
After five years 150 561
Present value of minimum lease payments 2,846 2,872
Interest portion contained in the minimum lease payments 788 832
MINIMUM LEASE PAYMENTS
THE COMPANY’S BOARDSNOTESFINANCIAL STATEMENTS

NOTES TO THE CONSOLIDATED BALANCE SHEET196
Lessee – operating leases Drägerwerk AG & Co. KGaA and its subsidiaries have various operating lease agreementsfor buildings, machinery, office equipment and other facilities and equipment. Most leases contain renewal options. Some of the leases contain escalation clauses and providefor contingent rents based on percentages of net sales derived from assets held underoperating leases. Lease conditions do not contain restrictions concerning dividends, addi -tional debt or further leasing.
Lease expenses comprise the following:
Future minimum lease payments outstanding under non-cancelable operating leases areas follows:
Total expected future minimum income from subleases under non-cancelable operatingleases amounted to EUR 94 thousand as of December 31, 2010 (2009: EUR 37 thousand).
Lessor – finance leases The Dräger Group’s main finance leases relate to medical equipment of the medicaldivision and solutions and personal protection products of the safety division. A receivablewas recognized equal to the present value of the minimum lease payments.
2010 2009
Basic lease costs 47,347 42,545
Contingent costs 116 149
Income from subleases (115) (376)
47,348 42,318
LEASING EXPENSES
2010 2009
During the first year 35,890 35,107
From the second to the fifth year 43,387 41,706
After five years 38,561 19,435
Minimum lease payments 117,838 96,248
MINIMUM LEASE PAYMENTS

Receivables from future lease payments outstanding are shown below:
As in the previous year, bad debt allowances for uncollectible minimum lease paymentswere not required as of December 31, 2010.
Lessor – operating leases The Dräger Group’s main operating leases relate to medical equipment of the medicaldivision and solutions and gas detection products of the safety division.
The following table shows the assets leased out under operating leases:
Future minimum lease payments outstanding under non-cancelable operating leases areas follows:
197
2010 2009
During the first year 1,011 4,603
From the second to the fifth year 1,225 2,295
After five years 385 492
Total gross investments in finance leases 2,621 7,390
During the first year 879 4,362
From the second to the fifth year 1,084 2,051
After five years 312 384
Present value of minimum lease payments outstandingas of the balance sheet date 2,275 6,797
Unearned finance income 346 593
RECEIVABLES FROM FUTURE LEASE PAYMENTS OUTSTANDING
2010 2009
Equipment 34,832 27,836
Accumulated depreciation (25,470) (18,969)
Net carrying value 9,362 8,867
OPERATING LEASES
2010 2009
During the first year 6,396 4,065
From the second to the fifth year 31,193 6,530
37,589 10,595
MINIMUM LEASE PAYMENTS
THE COMPANY’S BOARDSNOTESFINANCIAL STATEMENTS

NOTES TO THE CONSOLIDATED BALANCE SHEET | OTHER FINANCIAL OBLIGATIONS198
As in the prior year, no contingent rents were recognized in profit or loss in fiscal year2010.
CONTINGENT LIABILITIES AND OTHER FINANCIAL OBLIGATIONS
EUR 7,709 thousand (2009: EUR 4,758 thousand) of guarantees were given as part ofphased retirement agreements.
Other financial obligations
A) RENTAL AND LEASE AGREEMENTS
For other financial obligations from rental and lease agreements, please refer to ourcomments in Note 48 (lessee – operating leases).
B) PURCHASE OBLIGATIONS
In line with the usual requirements, Drägerwerk AG & Co. KGaA has also entered intopurchase obligations with other service providers in order to guarantee the availability ofIT services. Due to the centralization of IT activities at Drägerwerk AG & Co. KGaA, the Company assumed all existing long-term obligations to IT service providers of themedical and safety divisions.
As a result of outstanding orders, the Group had obligations to purchase intangibleassets of EUR 1,225 thousand (2009: EUR 797 thousand) and items of property, plantand equipment of EUR 7,289 thousand (2009: EUR 3,485 thousand) as of December 31,2010.
C) INVESTMENT ALLOWANCE FOR MOLVINA
Based on the decision of Investitionsbank Schleswig Holstein on November 1, 2005, DrägerMedical GmbH and MOLVINA Vermietungsgesellschaft mbH & Co. Finkenstraße KG,both jointly and severally liable, were granted an allowance for investment costs of EUR7,829 thousand for the medical division’s new building, which has been fully paid out.The grant can only be used for this specific purpose and is subject to the fulfillment ofspecific conditions, all of which relate to Dräger’s use of the building. If these condi-tions are not fulfilled within the contractually stipulated period of seven years (ending2015), the amount paid out must be repaid.
D) INVESTMENT ALLOWANCE FOR DRENITA
Based on the decision of Investitionsbank Schleswig Holstein on August 18, 2010, DrägerMedical GmbH and DRENITA Grundstücks-Vermietungsgesellschaft mbH & Co. KG,
47
2010 2009
Guarantees 7,709 4,758
7,709 4,758
CONTINGENT LIABILITIES

199
both jointly and severally liable, were granted an allowance for investment costs of a maxi -mum of EUR 2,230 thousand for the new production and logistics building for the Infra-structure projects business in Lübeck. If the full amount is used, EUR 450 thousand willbe paid out in 2012 and EUR 1,780 thousand in 2013. The grant can only be used for this specific purpose and is subject to the fulfillment of specific conditions, all of whichrelate to Dräger’s use of the build ing. If these conditions are not fulfilled within the contractually stipulated period of five years (ending 2016), the amount paid out must berepaid.
E) ACQUISITION OF A COMPANY
There are outstanding variable purchase price payments from the acquisition of a com-pany effective January 1, 2009. The payment is agreed at 2.5 percent of net sales in 2010which are due 30 days after the annual shareholders’ meeting at which the financialstatements 2010 are approved.
F) LITIGATION
Companies of the Dräger Group were involved in litigation and claims for damages inconnection with business activities as of December 31, 2010. The Executive Board of the general partner believes that the outcome of such litigation and claims will not haveany further material adverse effect on the Company’s net assets, financial position orresults of operations over and above the provisions which have already been recognized.
THE COMPANY’S BOARDSNOTESFINANCIAL STATEMENTS

SEGMENT REPORT200
SEGMENT REPORT
Drägerwerk AG & Co. KGaA reports on the medical and safety divisions. The ExecutiveBoard bases its business decisions on information provided by these two operating seg-ments. Drägerwerk AG & Co. KGaA / other companies comprises all group companiesthat are not directly allocated to one of the two operating segments. These companiesmainly deal with strategic cross segment controls or real estate management.
48
BUSINESS PERFORMANCE OF THE SEGMENTS
Medical division
2010 20091
Order intake € million 1,441.9 1,339.6
Orders on hand € million 280.6 300.5
Net sales € million 1,472.0 1,260.9
thereof intersegment net sales € million 1.6 2.1
thereof third party net sales € million 1,470.4 1,258.8
EBITDA € million 209.8 110.6
Depreciation / amortization € million 23.2 25.6
Impairment losses € million – 8.3
EBIT € million 186.6 76.7
Interest result € million
Income taxes € million
Net profit € million
thereof profit / loss from investments in associates € million
Research and development expenses € million 101.1 107.8
Cash flow from operating activities € million 178.4 153.1
Capital employed € million 514.7 546.6
Assets € million 959.2 880.6
thereof investments in associates – –
Liabilities € million 396.4 308.5
Net financial debt € million
Investments € million 29.1 20.8
Non-cash expenses € million 167.5 133.4
EBIT / net sales % 12.7 6.1
EBIT / capital employed % 36.3 14.0
Net financial debt Factor
Gearing factor Factor
DVA € million 136.5 23.6
Headcount as of December 31 6,386 6,305
1 Due to the integration of Dräger Medical GmbH (previously: Dräger Medical AG & Co. KG) in September, the previous year’s values were adjusted accordingly.

The medical division develops, produces, and markets system solutions, equipment andservices for the optimization of processes at the acute point of care. These include emer-gency care, perioperative care (in connection with the operation), critical care and alsoperinatal care (in connection with childbirth). The safety division develops, produces andmarkets products, system solutions and services for personal protection, gas detection
201
Safety division Drägerwerk AG & Co. KGaA / Consolidation Dräger Groupother companies
2010 2009 2010 20091 2010 2009 2010 2009
731.7 665.9 16.7 16.4 (44.8) (43.6) 2,145.5 1,978.3
142.3 140.7 – – (1.2) (1.1) 421.7 440.1
733.8 676.9 16.7 16.4 (45.2) (43.1) 2,177.3 1,911.1
29.2 27.7 14.3 13.3 (45.2) (43.1) – –
704.5 649.2 2.4 3.1 – – 2,177.3 1,911.1
81.8 51.9 76.2 14.7 (121.1) (31.2) 246.7 146.0
20.8 21.7 10.0 10.3 (0.1) – 53.9 57.6
– – – – – – – 8.3
61.0 30.2 66.2 4.3 (121.0) (31.1) 192.8 80.1
(39.1) (30.8)
(48.9) (16.8)
104.8 32.5
0.4 0.4
43.9 39.3 3.3 2.3 – – 148.4 149.4
74.3 73.8 41.5 3.1 (75.0) (36.6) 219.1 193.5
181.6 190.1 747.5 577.2 (610.4) (604.8) 833.4 709.1
357.6 336.9 832.8 915.1 (636.1) (707.9) 1,513.4 1,424.8
0.6 0.5 0.3 0.3 – – 0.9 0.8
165.8 139.7 51.0 308.3 (1.5) (19.6) 611.8 736.9
90.3 374.4
21 18.8 6.2 13.9 (0.5) 74.8 55.8 128.3
56.8 59.6 30.8 12.7 – (0.1) 255.1 205.6
8.3 4.5 – – – – 8.9 4.2
33.6 15.9 – – – – 23.1 11.3
0.4 2.6
0.1 1.0
43.1 9.6 – – – – 114.5 (1.8)
4,409 4,336 496 430 – – 11,291 11,071
THE COMPANY’S BOARDSNOTESFINANCIAL STATEMENTS

SEGMENT REPORT202
technology and comprehensive hazard management. Its customers come from industry,mining and public sectors such as fire departments, police and disaster protection.
Consolidation amounts essentially relate to elimination of order intake and net salesbetween segments, the elimination of income from investments and, in the case ofassets, the effects of consolidation of investments.
The segment reports were prepared in accordance with IFRS as applied in the groupfinancial statements.
The key figures from the segment report are as follows:
2010 2009
€ million € million
Net profit 104.8 32.5
+ Interest result 39.1 30.8
+ Income taxes 48.9 16.8
EBIT 192.8 80.1
+ Depreciation / amortization 53.9 57.6
+ Impairment losses 0.0 8.3
EBITDA 246.7 146.0
EBIT / EBITDA
2010 2009
€ million € million
Total assets 1,976.9 1,885.8
– Deferred tax assets (109.5) (94.8)
– Cash and cash equivalents (320.0) (344.1)
– Non-interest bearing liabilities (714.0) (737.8)
Capital Employed 833.4 709.1
CAPITAL EMPLOYED
2010 2009
€ million € million
Total assets 1,976.9 1,885.8
– All other financial assets (4.1) (5.9)
– Deferred tax assets (109.5) (94.8)
– Tax refund claims (current and non-current) (29.9) (16.2)
– Cash and cash equivalents (320.0) (344.1)
Assets 1,513.4 1,424.8
ASSETS

Gearing is the ratio of net financial debt to equity.The business performance of the individual segments is detailed in the management
report. Services rendered between the divisions follow the arm’s length principle.
203
2010 2009
€ million € million
Liabilities recognized in the balance sheet 1,340.4 1,492.0
– Provisions for pensions and similar obligations (183.4) (170.2)
– Tax liabilities, tax provisions, tax accruals and deferred tax liabilities (105.0) (87.4)
– Interest-bearing liabilities (440.2) (497.5)
Liabilities 611.8 736.9
LIABILITIES
2010 2009
€ million € million
Non-current interest-bearing loans 318.0 382.3
+ Current loans and liabilities to banks 89.5 83.6
Finance leases 2.8 2.9
+ Liabilities from the buy-back of the shares in Dräger Medical AG & Co. KG 0.0 249.7
– Cash and cash equivalents (320.0) (344.1)
Net financial debt 90.3 374.4
NET FINANCIAL DEBT
2010 2009
€ million € million
Write-downs on inventories 20.6 37.6
+ Losses from bad debt allowances 8.3 10.1
+ Allocations to provisons 226.2 157.9
Non-cash expenses 255.1 205.6
NON-CASH EXPENSES
THE COMPANY’S BOARDSNOTESFINANCIAL STATEMENTS
2010 2009
€ million € million
EBIT 192.7 80.1
– Cost of capital (78.2) (81.9)
DVA 114.5 (1.8)
DVA

SEGMENT REPORT204
Medical division
2010 20091
Net sales by region € million 1,472.0 1,260.9
Germany € million 301.3 265.8
Rest of Europe € million 535.8 502.2
Americas € million 327.8 240.6
Asia / Pacific € million 204.9 154.9
Other € million 102.2 97.4
Assets1 by region € million 959.7 880.5
Germany € million 457.9 301.2
Rest of Europe € million 258.2 379.9
Americas € million 142.5 118.2
Asia / Pacific € million 86.2 68.6
Other € million 14.9 12.6
Investments2 by region € million 29.1 20.8
Germany € million 18.2 11.5
Rest of Europe € million 4.8 3.9
Americas € million 4.1 3.5
Asia / Pacific € million 1.7 1.7
Other € million 0.3 0.2
1 Due to the integration of Dräger Medical GmbH (previously: Dräger Medical AG & Co. KG) in September, the previous year’s values were adjusted accordingly.2 Excluding other financial assets, tax refund claims and non-interest-bearing assets3 Intangible assets and property, plant and equipment
SEGMENT PERFORMANCE BY REGION

205
Safety division Drägerwerk AG & Co. KGaA / Consolidation Dräger Groupother companies
2010 20091 2010 20091 2010 20091 2010 20091
733.8 676.9 16.7 16.4 (45.2) (43.7) 2,177.3 1,910.5
160.2 159.2 16.7 16.4 (45.2) (43.7) 433.0 397.7
298.5 283.9 – – – – 834.3 786.1
127.9 108.4 – – – – 455.7 349.0
102.9 89.9 – – – – 307.8 244.8
44.3 35.5 – – – – 146.5 132.9
357.5 336.9 832.8 821.5 (636.7) (614.0) 1,513.3 1,424.9
157.7 146.3 830.2 819.1 (748.5) (621.2) 697.3 645.4
111.7 112.4 – – 116.5 10.2 486.4 502.5
47.7 47.1 2.6 2.4 (4.1) (2.5) 188.7 165.2
35.7 27.4 – – (0.3) (0.4) 121.6 95.6
4.7 3.7 – – (0.3) (0.1) 19.3 16.2
21.0 18.8 6.2 13.9 (0.5) 74.8 55.8 128.3
12.1 11.4 6.1 13.6 (0.5) 74.7 35.9 111.2
4.4 5.0 – – – – 9.2 8.9
1.5 1.4 0.1 0.3 – – 5.7 5.2
2.5 0.9 – – – – 4.2 2.6
0.5 0.1 – – – 0.1 0.8 0.4
THE COMPANY’S BOARDSNOTESFINANCIAL STATEMENTS

NOTES TO CONSOLIDATED BALANCE SHEET206
NOTES TO THE CASH FLOW STATEMENT
The consolidated cash flow statement is presented separately in the management report.The cash flows are broken down according to net cash provided by / used in operatingactivities (using the indirect method), investing activities and financing activities. Due tothe elimination of exchange rate effects, the underlying changes recognized in the cashflow statement cannot be directly reconciled with the items of the published balance sheet.
The purchase price for the 25 percent share in Dräger Medical AG & Co. KG (now:Dräger Medical GmbH) from Siemens in fiscal year 2009 amounted to EUR 250.6 million.The cash component of EUR 175.0 million plus incidental purchase costs of EUR 0.9million were fully repaid in fiscal year 2010. EUR 60.0 million of the vendor note of EUR68.5 million was repaid in fiscal year 2010. The remaining EUR 8.5 million were written off by Siemens as contractually agreed and will therefore not have to be repaid.The variable option component of EUR 6.2 million will also not have to be repaid as this was replaced by an equity instrument and reclassified to equity on August 30, 2010,after being remeasured at EUR 26.5 million. Consequently, only EUR 235.9 million of the purchase price totaling EUR 250.6 million for the Siemens share (total purchasedinterest: EUR 175.8 million) had to be paid in fiscal year 2010. As the remaining amount of EUR 14.7 million does not have to be repaid it will no longer be recognized in the cashflow statement. The repayment of two note loans totaling EUR 45.0 million also result-ed in cash outflow. The capital increase carried out at the end of June 2010, on the otherhand, increased cash and cash equivalents by a total of EUR 100.4 million (of whichEUR 9.8 million in par value of the issued common shares). These transactions princi-pally led to EUR 210.1 million cash outflow from financing activities in fiscal year 2010.Cash inflow in the previous year mainly resulted from taking up a note loan of EUR 140.0million and at the same time repaying a note loan in the amount of EUR 25.0 million.
The cash flow from operating activities includes EUR 43,255 thousand (2009: EUR34,662 thousand) in income taxes paid, EUR 3,650 thousand (2009: EUR 3,779 thousand)in interest received, and EUR 30,792 thousand (2009: EUR 18,769 thousand) in inter-est paid.
Cash and cash equivalents include EUR 10,175 thousand in cash (2009: EUR 22,026thousand) which is subject to restrictions. The changes in the cash flow statement areexplained in the management report.
Unused credit lines came to EUR 230.1 million as of December 31, 2010 (2009: EUR258.1 million) and are subject to restrictions applicable in the market.
REMUNERATION OF THE EXECUTIVE AND SUPERVISORY BOARDS
Executive Board remuneration All employment contracts of the Executive Board members of Drägerwerk Verwaltungs AG have been concluded with Drägerwerk Verwaltungs AG. The Supervisory Board ofDrägerwerk Verwaltungs AG determines the remuneration of the Executive Board. Eachcontract expires after a different period of time between three and five years. Based on the resolution adopted at the annual shareholders’ meeting of Drägerwerk AG & Co.KGaA on June 2, 2006, the remuneration of individual members of the Executive Board for fiscal year 2010 may not be disclosed, with the exception of that of the Chairman.This resolution had a term of five years and applies for the last time to fiscal year 2010.
50
49

As from fiscal year 2011, remuneration of all Executive Board members will be disclosedindividually.
In the reporting period, total remuneration for Executive Board members comprisednon-performance-related as well as performance-related components. Non-perform-ance related components include fixed basic remuneration and additional benefits andpension plans. Fixed basic remuneration and additional benefits are paid monthly.
The total remuneration for Executive Board members is shown in the following table:
Variable remuneration includes long-term incentive components of EUR 315 thousand.
Fringe benefits awarded to members of the Executive Board encompass private use of thecompany car they are each provided with and payment of health, care and pension insurance premiums. The Company has taken out group accident insurance for ExecutiveBoard members. The Company pays the premium for the D&O liability insurance policy and legal expense insurance policy for economic loss claims for members of theExecutive Board. In the opinion of the German tax authorities, this does not constitute part of the Executive Board’s remuneration. The financial loss liability insurance includesa deductible, which was adjusted as from 2010 to one and a half times the amount ofgross fixed annual remuneration in accordance with VorstAG.
As part of the severance agreements concluded in 2010, other remuneration of EUR 1,385,417 was recognized in the consolidated financial statements 2010.
In the fiscal year, no payments were made or promised by a third party to any memberof the Executive Board in relation to his or her duties as member of the Executive Board. If Executive Board remuneration is paid by Drägerwerk Verwaltungs AG, pursuantto Sec. 11 (1) and (3) of the articles of association of Drägerwerk AG & Co. KGaA it isentitled to claim reimbursement from Drägerwerk AG & Co. KGaA monthly. Pursuant toSec. 11 (4) of the Company’s articles of association, the general partner receives a fee for the management of the Company and the assumption of personal liability, regardlessof profit and loss, of 6 percent of the equity disclosed in its financial statements, payableone week after the general partner prepares its financial statements. For fiscal year 2010,this remuneration amounts to EUR 71 thousand (2009: EUR 67 thousand) plus any VAT incurred.
207THE COMPANY’S BOARDSNOTESFINANCIAL STATEMENTS
2010 2009
Fixed Variable Other Total Fixed Variable Other Total
Incumbent members of of the Executive Board 1,367,781 3,415,500 112,683 4,895,964 1,655,279 1,893,380 109,564 3,658,223
thereof:Chairman of the Executive Board (571,451) (1,987,500) (10,648) (2,569,599) (426,213) (766,768) (10,523) (1,203,504)
Executive Board membersremoved during the currentfiscal year 481,392 776,375 1,385,417 2,643,184 0 6,236 46,504 52,740
Total 1,849,173 4,191,875 1,498,100 7,539,148 1,655,279 1,899,616 156,068 3,710,963
EXECUTIVE BOARD REMUNERATION (€)

NOTES TO CONSOLIDATED BALANCE SHEET208
Obligations from the pension plan remain at Drägerwerk AG & Co. KGaA pursuant to theterms and conditions of individual contracts. Defined benefit plans for members of the Executive Boards are agreed individually, based on “Führungskräfteversorgung 2005”,which has been in effect within the Group since January 1, 2006. The defined benefitsunder the pension plans offered to the members of the Executive Board are either fixedor based on the basic annual salary and years of service on the Executive Board. Thedefined benefit is based on an annual contribution of up to 15 percent of the basic annualsalary. Under the deferred compensation option, an addi tional annual contribution of up to 20 percent of the basic annual remuneration can be made. Stefan Dräger receivesa further contribution of 50 percent from the Company on deferred compensation, but no more than 8 percent of his basic annual salary. This top-up payment is only madeif consolidated EBIT equals 8 percent or more of net sales.
Obligations to Executive Board members under pension plans are stated in the finan-cial statements 2010 at EUR 670,538 (2009: EUR 666,552), of which EUR 504,263(2009: EUR 376,180) for the Chairman. Pension obligations to Executive Board memberswho retired in fiscal year 2010 are recognized in provisions for former members of the Executive Board and their surviving dependents. In fiscal year 2010, the Companymade pension provisions contributions of EUR 202,003 for members of the ExecutiveBoard (2009: EUR 207,568), of which EUR 128,083 was for the Chairman (2009: EUR117,525). EUR 2,963,612 was paid to former members of the Executive Board and theirsurviving dependants (2009: EUR 2,889,320). Pension committments to former membersof the Executive Board and their surviving dependants amounted to EUR 37,793,139(2009: EUR 37,397,778).
Supervisory Board remuneration The remuneration report also includes information on the shares owned by the membersof the Supervisory Board of Drägerwerk AG & Co. KGaA.
At the annual shareholders’ meeting of Drägerwerk AG & Co. KGaA on May 6, 2011, a proposal awarding the Supervisory Board total remuneration of EUR 631,750.00 (2009:EUR 346,000.00) will be put to vote. Every member of the Supervisory Board receivesbasic remuneration, which is composed of a fixed amount of EUR 10,000.00 (2009: EUR10,000.00) and a variable amount of EUR 31,500.00 (2009: EUR 9,750.00) This variablecomponent amounts to 0.03 percent of net profit. Pursuant to Sec. 21 (1) of the articles ofassociation of Drägerwerk AG & Co. KGaA, the distribution of the remuneration of mem-bers of the Supervisory Board is determined by a Supervisory Board resolution.
The Supervisory Board has adopted the following principles for distribution:Its chairman is entitled to three times (previous year: four times) and the vice chair-
man to one and a half times (previous year: two times) the set amount. The members of the Audit Committee receive an additional EUR 5,000.00 and the chairman of the AuditCommittee an additional EUR 10,000.00. As from fiscal year 2009, Supervisory Boardmembers have not been receiving a per diem any more.

209
In the opinion of the German tax authorities, the premium for a D&O liability insurancepolicy and a legal expense insurance policy for economic loss claims is not part of theSupervisory Board’s remuneration. The deductible for Supervisory Board members is oneand a half times their fixed annual salary.
In fiscal year 2010, the total remuneration of the six members of the Supervisory Boardof the general partner, Drägerwerk Verwaltungs AG, amounted to EUR 135 thousand(2009: EUR 135 thousand). In addition, the Supervisory Board members receive annualflat fees for out-of-pocket expenses totaling EUR 55 thousand.
No remuneration was paid to Supervisory Board members of Group companies.
SHARES OWNED BY THE EXECUTIVE AND SUPERVISORY BOARDS
As of December 31, 2010, the members of the Executive Board of Drägerwerk Verwal-tungs AG and their related parties directly held 6,000 preferred shares in Drägerwerk AG &Co. KGaA, equivalent to 0.04 percent of the Company’s total shares, and 119,300 com-mon shares, corresponding to 0.72 percent of the Company’s total shares.
Dr. Heinrich Dräger GmbH holds around 67.19 percent of common shares of Drägerwerk AG & Co. KGaA with 68.36 percent of voting rights attributable to the Chair-man of the Executive Board Stefan Dräger, whereby 67.19 percent are attributable to him in accordance with the terms of Sec. 22 (1) Sentence 1 No. 1 WpHG (Wertpapier-handelsgesetz – German Securities Trading Act).
On December 31, 2010, the members of the Supervisory Board and their related par-ties directly or indirectly held a total of 1,150 preferred shares, equivalent to 0.01 percentof the Company’s total shares and 595 common shares (directly or indirectly), corre-sponding to 0.004 percent of the Company’s total shares.
51
THE COMPANY’S BOARDSNOTESFINANCIAL STATEMENTS
2010 2009
Fixed Variable Other Total Fixed Variable Other Total
Prof. Dr.Nikolaus Schweickart(Chairman) 30,000 94,500 5,000 129,500 40,000 39,000 5,000 84,000
Siegfried Kasang(Vice-Chairman) 15,000 47,250 0 62,250 20,000 19,500 0 39,500
Daniel Friedrich 10,000 31,500 0 41,500 10,000 9,750 0 19,750
Dr. Thorsten Grenz 10,000 31,500 10,000 51,500 10,000 9,750 10,000 29,750
Peter-Maria Grosse 10,000 31,500 0 41,500 10,000 9,750 0 19,750
Uwe Lüders 10,000 31,500 0 41,500 10,000 9,750 0 19,750
Walter Neundorf 10,000 31,500 5,000 46,500 10,000 9,750 5,000 24,750
Jürgen Peddinghaus 10,000 31,500 5,000 46,500 10,000 9,750 5,000 24,750
Dr. Klaus Rauscher 10,000 31,500 0 41,500 10,000 9,750 0 19,750
Thomas Rickers 10,000 31,500 0 41,500 10,000 9,750 0 19,750
Ulrike Tinnefeld 10,000 31,500 5,000 46,500 10,000 9,750 5,000 24,750
Dr. Reinhard Zinkann 10,000 31,500 0 41,500 10,000 9,750 0 19,750
Total 145,000 456,750 30,000 631,750 160,000 156,000 30,000 346,000
SUPERVISORY BOARD REMUNERATION (€)
NOTES TO CONSOLIDATED BALANCE SHEET210
Related-party transactions Services were rendered for companies related to Stefan Dräger and for the Dräger Foun-dation totaling EUR 69 thousand in the fiscal year 2010 (2009: EUR 104 thousand). Claudia Dräger, Stefan Dräger’s wife, is an employee of Drägerwerk AG & Co. KGaA.
All transactions with related parties were conducted at arm’s length terms and condi-tions.
FURTHER INFORMATION
Auditor’s fee The total fee charged by the auditor – PricewaterhouseCoopers Aktiengesellschaft Wirt -schaftsprüfungsgesellschaft – in fiscal year 2010 for the audit of the group financial state-ments amounted to EUR 917 thousand (2009: EUR 914 thousand) for the audit of thefinancial statements, EUR 11 thousand for tax consultancy (2009: EUR 197 thousand)and EUR 1,374 thousand (2009: EUR 102 thousand) for other audit services. Other audit services included EUR 1,051 thousand in connection with the capital increase andthe case-based insurance covering the maximum liability
Corporate governance declaration Drägerwerk AG & Co. KGaA’s declaration of conformity under the terms of Sec. 161 AktG(Aktiengesetz – German Stock Corporation Act) has been issued and made available to the shareholders at www.draeger.com (please also see the corporate governance report).
Annual document in accordance with Sec. 10 of the German Securities Prospectus Act(Wertpapierprospektgesetz – WpPG) Shareholders can now access the annual document in accordance with Sec. 10 WpPG of Drägerwerk AG & Co. KGaA online at www.draeger.com in the “Investors” section (Corporate Governance, annual document).
52

211THE COMPANY’S BOARDSNOTESFINANCIAL STATEMENTS
CONSOLIDATED COMPANIES OF THE DRÄGER GROUP
Name and registered office Capital stock Share-in holding
LCU thousand in %
Germany
Dräger Medical GmbH, Lübeck EUR 200 100
Dräger Safety AG &Co. KGaA, Lübeck EUR 25,739 100
Dräger Medical Deutschland GmbH, Lübeck EUR 2,000 100
Dräger Electronics GmbH, Lübeck EUR 2,000 100
Dräger Medizin System Technik GmbH, Lübeck EUR 1,023 100
Dräger Safety Verwaltungs AG, Lübeck EUR 1,000 100
Dräger TGM GmbH, Lübeck EUR 767 100
Draeger Safety MSI GmbH, Hagen EUR 1,000 90
Dräger Medical ANSY GmbH, Lübeck EUR 500 100
Dräger Interservices GmbH, Lübeck EUR 256 100
Dräger Gebäude und Service GmbH, Lübeck EUR 250 100
Dräger Medical International GmbH, Lübeck EUR 100 100
MAPRA Assekuranzkontor GmbH, Lübeck1 EUR 55 49
Fachklinik für Anästhesie und Intensivmedizin Vahrenwald GmbH, Lübeck EUR 26 100
Dräger Energie GmbH, Lübeck EUR 25 100
FIMMUS Grundstücks-Vermietungs GmbH, Lübeck EUR 25 100
Dräger Finance Services GmbH & Co. KG, Bad Homburg v.d. Höhe (SPE)2 EUR 511 953
OPTIO Grundstücks-Verwaltungsgesellschaft mbH & Co. KG, Grünwald (SPE)2 EUR 26 983
FIMMUS Grundstücks-Vermietungsgesellschaft mbH & Co. Objekt Lübeck KG, Lübeck (SPE)2 EUR 10 1003
HAMUS Grundstücks-Vermietungsgesellschaft mbH & Co. Objekt Lübeck KG, Düsseldorf (SPE)2 EUR 10 1003
MOLVINA Vermietungsgesellschaft mbH & Co. Objekt Finkenstraße KG, Lübeck (SPE)2 EUR 5 1003
DRENITA Grundstücks-Vermietungsgesellschaft mbH & Co.Objekt Fertigung Dräger Medizintechnik KG (SPE)2 EUR 10 1003
Europe
Belgium Dräger Medical Belgium NV, Wemmel EUR 1,503 100
Dräger Safety Belgium NV, Wemmel EUR 789 100
Bulgaria Draeger Medical Bulgaria EOOD, Sofia BGN 705 100
Draeger Safety Bulgaria EOOD, Sofia BGN 500 100
Denmark Dräger Safety Danmark A/S, Herlev DKK 5,000 100
Dräger Medical Danmark A/S, Allerod DKK 4,100 100
Finland Dräger Suomi Oy, Helsinki EUR 802 100
1 These companies are treated as associates as defined by IAS 28.2 These companies were consolidated as special purpose entities pursuant to SIC 12 in conjunction with IAS 27.3 in the limited shares
CONSOLIDATED COMPANIES
53

NOTES TO CONSOLIDATED BALANCE SHEET212
Name and registered office Capital stock Share-in holding
LCU thousand in %
Europe (continued)
France Dräger Médical SAS, Antony EUR 8,000 100
Draeger Safety France SAS, Strasbourg EUR 1,470 100
AEC SAS, Antony EUR 70 100
Greece Draeger Hellas A.E. for Products of Medical and Safety Technology EUR 1,000 100
Great Britain Draeger Safety UK Ltd., Blyth GBP 7,589 100
Draeger Medical UK Ltd., Hemel Hempstead GBP 4,296 100
Ireland Draeger Medical Ireland Ltd., Dublin EUR 25 100
Italy Draeger Medical Italia S.p.A., Corsico-Milano EUR 7,400 100
Draeger Safety Italia S.p.A., Corsico-Milano EUR 1,033 100
Croatia Dräger Medical Croatia d.o.o., Zagreb HRK 4,182 100
Dräger Safety d.o.o., Zagreb HRK 2,300 100
Netherlands Dräger ST-Holding Nederland B.V., Zoetermeer EUR 10,819 100
Dräger Medical B.V., Best EUR 1,460 100
W.S.P. Safety Equipment B.V., Rotterdam EUR 18 100
W.S. Poppeliers Brandblusmaterialen B.V., Rotterdam EUR 18 100
Safety Service Center B.V., Rotterdam EUR 18 100
Dräger Finance B.V., Zoetermeer EUR 11 100
Dräger MT-Holding Nederland B.V., Zoetermeer EUR 18 100
Dräger Safety Nederland B.V., Zoetermeer EUR 18 100
Dräger Medical Netherlands B.V., Zoetermeer EUR 18 100
Norway Dräger Safety Norge AS, Oslo NOK 1,129 100
Dräger Medical Norge AS, Drammen NOK 16,371 100
Austria Dräger Medical Austria GmbH, Vienna EUR 2,000 100
Dräger Safety Austria GmbH, Vienna EUR 500 100
Poland Dräger Polska sp.zo.o., Bydgoszcz PLN 4,655 100
Dräger Safety Polska sp.zo.o., Bydgoszcz PLN 1,000 100
Portugal Dräger Portugal, LDA, Lisbon EUR 1,000 100
Romania Dräger Medical Romania SRL, Bukarest RON 205 100
Dräger Safety Romania SRL, Bukarest RON 1,540 100
Russia Draeger Medizinskaja Technika ooo, Moscow RUB 3,600 100
Sweden Dräger Safety Sverige AB, Svenljunga SEK 6,000 100
Dräger Medical Sverige AB, Bromma SEK 2,000 100
ACE Protection AB, Svenljunga SEK 100 100
Switzerland Dräger Medical Schweiz AG, Liebefeld-Bern CHF 3,000 100
Dräger Safety Schweiz AG, Dietlikon CHF 1,000 100
Dräger Finanz AG, Zug CHF 500 100
Slovakia Dräger Slovensko s.r.o., Piestany EUR 597 100
Slovenia Dräger Slovenija d.o.o., Ljubljana-Crnuce EUR 344 100
Serbia Draeger Tehnika d.o.o., Beograd RSD 21,385 100
Spain Dräger Medical Hispania SA, Madrid EUR 3,606 100
Dräger Safety Hispania SA, Madrid EUR 2,404 100
CONSOLIDATED COMPANIES

213THE COMPANY’S BOARDSNOTESFINANCIAL STATEMENTS
Name and registered office Capital stock Share-in holding
LCU thousand in %
Europe (continued)
Czech Republic Dräger Medical s.r.o., Prague CZK 18,314 100
Dräger Safety s.r.o., Prague CZK 29,186 100
Dräger-Busch Helmets Production s.r.o., Chomutov CZK 14,000 51
Danisevsky spol. s.r.o., Policka CZK 5,000 100
Turkey Draeger Medikal Ticaret ve Servis Limited Sirketi, Istanbul TRY 1,270 67
Draeger Safety Koruma Teknolojileri Limited Sirketi, Ankara TRY 70 90
Hungary Dräger Safety Hungaria Kft., Budapest HUF 66,300 100
Dräger Medical Hungary Kft., Budapest HUF 94,800 100
Africa
South Africa Dräger South Africa (Pty.) Ltd., Bryanston ZAR 4,000 100
Dräger Medical South Africa (Pty.) Ltd., Johannesburg ZAR 1 69
Dräger Safety Zenith (Pty.) Ltd., King William’s Town ZAR 5,000 100
Americas
Argentina Dräger Medical Argentina S.A., Buenos Aires ARS 4,281 100
Brazil Dräger do Brasil Ltda., São Paulo BRL 27,021 100
Dräger Industria e Comércio Ltda., São Paulo BRL 8,132 100
Dräger Safety do Brasil Ltda., São Paulo BRL 12,142 100
Chile Dräger Medical Chile Ltda., Santiago CLP 1,284,165 100
Canada Draeger Safety Canada Ltd., Mississauga / Ontario CAD 2,280 100
Draeger Medical Canada Inc., Richmond Hill / Ontario CAD 2,000 100
Columbia Draeger Colombia SA, Bogota D.C. COP 1,500,000 100
Mexico Draeger Safety S.A. de C.V., Queretaro MXN 50 100
Dräger Medical Mexico S.A. de C.V., Mexico D.F.D. MXN 50 100
Peru Draeger Peru S.A.C. PEN 900 100
USA Draeger Medical, Inc., Telford USD 356 100
Draeger Safety, Inc., Pittsburgh USD 400 100
Draeger Safety Diagnostics, Inc., Durango USD 1 100
Draeger Medical Systems, Inc., Telford USD 1 100
Draeger Interservices, Inc., Pittsburgh USD 40 100
Venezuela Draeger Medical Venezuela S.A., Caracas VEF 460 100
CONSOLIDATED COMPANIES

NOTES TO CONSOLIDATED BALANCE SHEET214
Name and registered office Capital stock Share-in holding
LCU thousand in %
Asia / Australia
People’s Republic of China Shanghai Dräger Medical Instrument Co., Ltd., Shanghai CNY 22,185 67,5
Beijing Fortune Draeger Safety Equipment Co., Ltd., Beijing CNY 15,238 96,2
Dräger Medical Equipment (Shanghai) Co., Ltd., Shanghai CNY 3,311 100
Draeger Medical Hong Kong Limited, Wanchai HKD 500 100
Draeger Medical Systems (Shanghai) Co., Ltd., Shanghai CNY 70,000 100
India Joseph Leslie Drager Mfg., Pvt. Ltd., Mumbai1 INR 2,500 36
Draeger Medical (India) Pvt. Ltd., Mumbai INR 150,000 100
Indonesia PT Draegerindo Jaya, Jakarta IDR 3,384,000 100
PT Draeger Medical Indonesia, Jakarta IDR 18,321,000 100
Japan Draeger Medical Japan Ltd., Tokyo JPY 549,000 100
Draeger Safety Japan Ltd., Tokyo JPY 81,000 100
Saudi Arabia Draeger Arabia Co. Ltd., Riyadh SAR 2,000 51
Singapore Draeger Safety Asia Pte. Ltd., Singapore SGD 3,800 100
Draeger Medical South East Asia Pte. Ltd., Singapore SGD 2,000 100
South Korea Draeger Medical Korea Co., Ltd., Seoul KRW 2,100,010 100
Taiwan Draeger Safety Taiwan Co., Ltd., Hsinchu City TWD 5,000 100
Draeger Medical Taiwan Ltd., Taipei TWD 10,000 100
Thailand Draeger Medical (Thailand) Ltd., Bangkok THB 3,000 100
Draeger Safety (Thailand) Ltd., Bangkok THB 15,796 100
Vietnam Draeger Medical Vietnam Co., Ltd., Ho Chi Minh City VND 4,555,478 100
Australia Draeger Safety Pacific Pty. Ltd., Notting Hill AUD 5,875 100
Draeger Medical Australia Pty. Ltd., Notting Hill AUD 3,800 100
New Caledonia Draeger NC SARL, Noumea XPF 1,000 100
1 These companies are treated as associates as defined by IAS 28.
CONSOLIDATED COMPANIES

215THE COMPANY’S BOARDSNOTESFINANCIAL STATEMENTS
SUBSEQUENT EVENTS
Drägerwerk Verwaltungs AG as general partner and the Supervisory Board of Lübeck-basedDrägerwerk AG & Co. KGaA propose to distribute out of the net earnings of EUR 75.7million for fiscal year 2010 a dividend of EUR 1.19 per preferred share (2009: EUR 0.40)and EUR 1.13 per common share (2009: EUR 0.34), hence a total EUR 19.0 million, and carry forward the balance of EUR 56.7 million to new account. The preferred sharedividend also governs the dividend for participation certificates, which will amount toEUR 11.90 each (2009: EUR 4.00). Participation certificates entitle the holder to a divi-dend 10 times the preferred share dividend since their arithmetic par value is 10 timesthat of a preferred share. On March 16, 2011, the Executive Board is approving the publi-cation of the group financial statements of Drägerwerk AG & Co. KGaA for fiscal year2010.
Lübeck, Germany, March 8, 2011
The general partner Drägerwerk Verwaltungs AGrepresented by its Executive Board
Stefan Dräger Herbert Fehrecke Carla KriwetGert-Hartwig Lescow Anton Schrofner
54
MANAGEMENT COMPLIANCE STATEMENT | AUDITOR’S OPINION 216
Management compliance statement
We confirm to the best of our knowledge that, in accordance with the applicable finan-cial reporting framework, the group financial statements give a true and fair view of thenet assets, financial position and results of operations of the Group, the group manage-ment report presents business performance including business results and the situationof the Group so as to give a true and fair view, and that the significant opportunities andrisks relating to the Group’s development have been described.
Lübeck, Germany, March 8, 2011
The general partnerDrägerwerk Verwaltungs AGrepresented by its Executive Board
Stefan Dräger Herbert Fehrecke Carla KriwetGert-Hartwig Lescow Anton Schrofner

217THE COMPANY’S BOARDSNOTESFINANCIAL STATEMENTS
AUDITOR’S OPINION
We have audited the group financial statements prepared by Drägerwerk AG & Co. KGaA,Lübeck, comprising the balance sheet, the income statement, the consolidated state-ment of comprehensive income, the statement of changes in equity, the cash flow state-ment, and the notes to the financial statements, together with the group managementreport for the fiscal year from January 1 to December 31, 2010. The preparation of the groupfinancial statements and the group management report in accordance with IFRS asadopted by the EU and the additional requirements of German commercial law pursuantto Sec. 315a (1) of the German Commercial Code (Handelsgesetzbuch – HGB) is theresponsibility of the management of the managing general partner. Our responsibility isto express an opinion on the group financial statements and the group managementreport based on our audit.
We conducted our audit of the group financial statements in accordance with Sec. 317HGB and German generally accepted standards for the audit of financial statementspromulgated by the Institut der Wirtschaftsprüfer (Institute of Public Auditors in Germany)(IDW). Those standards require that we plan and perform the audit such that misstate-ments materially affecting the presentation of the net assets, financial position and resultsof operations in the group financial statements in accordance with the applicable finan-cial reporting framework and in the group management report are detected with reason-able assurance.
Knowledge of the business activities and the economic and legal environment of theGroup and expectations as to possible misstatements are taken into account in the deter-mination of audit procedures. The effectiveness of the accounting-related internal con-trol system and the evidence supporting the disclosures in the group financial statementsand the group management report are examined primarily on a test basis within theframework of the audit. The audit includes assessing the annual financial statements ofthose entities included in consolidation, the determination of entities to be included inconsolidation, the accounting and consolidation principles used and significant estimatesmade by management of the managing general partner as well as evaluating the over-all presentation of the group financial statements and the group management report.We believe that our audit provides a reasonable basis for our opinion.
Our audit has not led to any reservations.

AUDITOR’S OPINION | SINGLE ENTITY FINANCIAL STATEMENTS OF DRÄGERWERK AG & CO. KGAA FOR 2010 (CONDENSED) 218
In our opinion, based on the findings of our audit, the group financial statements complywith IFRSs as adopted by the EU and the additional requirements of German com -mercial law pursuant to Sec. 315a (1) HGB and give a true and fair view of the net assets,financial position and results of operations of the Group in accordance with theserequirements. The group management report is consistent with the group financial state -ments and as a whole provides a suitable view of the Group’s position and suitably presents the opportunities and risks relating to future development.
Hamburg, March 9, 2011
PricewaterhouseCoopers
AktiengesellschaftWirtschaftsprüfungsgesellschaft
Andreas Borcherding Dr. Andreas FockeWirtschaftsprüfer Wirtschaftsprüfer(German Public Auditor) (German Public Auditor)

219THE COMPANY’S BOARDSNOTESFINANCIAL STATEMENTS
Single entity financial statements of Drägerwerk AG & Co. KGaA for 2010(condensed)
The single entity financial statements of Drägerwerk AG & Co. KGaA have been preparedin accordance with the provisions of the German Commercial Code (Handelsgesetzbuch– HGB).
In line with the discussion on the reporting methods for participation certificates accord -ing to the German Commercial Code and the opinions prevailing in professional literature, Drägerwerk AG & Co. KGaA has been recognizing series A and K participationcertificates as debt since fiscal year 2009.
Drägerwerk AG & Co. KGaA disclosed a net profit of EUR 19.5 million for fiscal year2010 (2009: net loss of EUR 21.2 million).
The increase in net profit was chiefly attributable to the risen investment result whichstems from the higher distribution by Dräger Safety AG & Co. KGaA and Dräger MedicalGmbH.
Including the profit of EUR 56.3 million brought forward from the prior year, Drägerwerk AG & Co. KGaA reported net earnings of EUR 75.7 million. Drägerwerk Verwaltungs AG as general partner and the Supervisory Board of Drägerwerk AG & Co.KGaA propose to distribute out of the net earnings a cash dividend of EUR 19.0 million(EUR 1.13 per common share, EUR 1.19 per preferred share) and carry forward to new account the balance of EUR 56.7 million.
A dividend of 10 times the preferred share dividend will be paid for participation certifi-cates since their arithmetic par value is 10 times that of a preferred share. Based on theproposed dividend, the dividend for participation certificates will be EUR 11.90 per cer -tificate. As from fiscal year 2010, the dividend for series A and K participation certificatesis being recognized in interest expense. The distribution for series D participation cer -tificates is shown in a separate line, “Distribution for participation capital”, in the incomestatement, after taxes and before net profit / loss. The complete financial statements,including an unqualified opinion from the auditor of Drägerwerk AG & Co. KGaA, will bepublished in the electronic version of the German Federal Gazette under HR B No. 7903HL. A hard copy may be requested from Drägerwerk AG & Co. KGaA or a copy downloadedon the internet at www.draeger.com.
€
EUR 1.13 dividend for 10,160,000 common shares 11,480,800,00
EUR 1.19 dividend for 6,350,000 preferred shares 7,556,500,00
PROPOSED APPROPRIATION OF NET EARNINGS

SINGLE ENTITY FINANCIAL STATEMENTS OF DRÄGERWERK AG & CO. KGAA FOR 2010 (CONDENSED) 220
2010 2009
€ thousand € thousand
Other operating income 123,369 97,746
Personnel expenses (36,114) (30,315)
Amortization of intangible assetsand depreciation of property, plant and equipment (6,435) (7,306)
Other operating expenses (143,888) (94,474)
Income from a profit transfer agreement 120,751 32,930
Income from other investments 271 280
Interest result (36,173) (18,081)
Results from ordinary operations 21,781 (19,220)
Extraordinary income 1,957 0
Extraordinary expenses (16,482) 0
Extraordinary result (14,525) 0
Income taxes 24,335 3,403
Other taxes (315) 311
Profit before distribution for participation capital 31,276 (15,506)
Distribution for participation capital (11,812) (5,654)
Net profit / loss 19,464 (21,160)
Profit brought forward from previous year 56,280 82,139
Net earnings 75,744 60,979
INCOME STATEMENT OF DRÄGERWERK AG & CO. KGAA FROM JANUARY 1 TO DECEMBER 31

221THE COMPANY’S BOARDSNOTESFINANCIAL STATEMENTS
2010 2009
€ thousand € thousand
Assets
Intangible assets 5,598 4,524
Property, plant and equipment 38,125 41,672
Financial assets 852,567 855,794
Non-current assets 896,290 901,990
Trade receivables 347 114
All other receivables and other assets 135,195 150,277
Receivables and other assets 135,542 150,391
Cash and cash equivalents 196,415 236,738
Current assets 331,957 387,129
Prepaid expenses 6,541 6,323
Deferred tax assets 69,421 0
Excess of plan assets over pension liability 1,113 0
Total assets 1,305,322 1,295,442
BALANCE SHEET OF DRÄGERWERK AG & CO. KGAA
2010 2009
€ thousand € thousand
Equity and liabilities
Capital stock, conditional capital: € 3,200 thousand 42,266 32,512
Capital reserves 161,266 39,449
Retained earnings 199,191 160,477
Other retained earnings 199,191 160,477
Net earnings 75,744 60,979
Participation capital – par value: € 25,371 thousand (Series D) 49,929 49,929
Equity 528,396 343,346
Provisions for pensions and similar obligations 85,871 73,910
Tax provisions 8,395 2,242
Other provisions 32,390 18,193
Provisions 126,656 94,345
Participation capital – par value: € 10,756 thousand (Series A+K) 24,868 24,868
Liabilities to banks 325,399 371,732
Trade payables 15,153 15,652
All other liabilities 284,850 445,499
Liabilities 650,270 857,751
Total equity and liabilities 1,305,322 1,295,442
BALANCE SHEET OF DRÄGERWERK AG & CO. KGAA

THE COMPANY’S BOARDS222
The Company’s Boards
SUPERVISORY BOARD OF DRÄGERWERK AG & CO. KGAA
Chairman
Prof. Dr. h. c. mult. Nikolaus SchweickartLawyer, Bad HomburgFormer Chairman of the Executive Board of ALTANA AG, Bad Homburg
Supervisory Board memberships:– Drägerwerk Verwaltungs AG, Lübeck (Chairman)– GEBB GmbH, Cologne (Chairman)
Memberships on comparable boards of German or foreigncompanies:– Diehl Group, Nuremberg (Chairman of the Advisory Board)– Fraport AG, Frankfurt am Main (Economic Advisory Board)– Max-Planck-Innovations GmbH (Advisory Board),
since March 1, 2010
Vice-Chairman
Siegfrid KasangWorks Council Chairman of Dräger Medical GmbH, LübeckGroup Works Council Chairman of the medical divisionGroup Works Council Chairman of Drägerwerk AG & Co. KGaA, Lübeck
Supervisory Board memberships:– Dräger Medical Verwaltungs AG, Lübeck, until September 20, 2010
(Vice-Chairman)– Dräger Medical GmbH, Lübeck, since November 9, 2010
(Vice-Chairman)
Daniel FriedrichDistrict secretary of the metalworkers’ union IG Metall Küste,Hamburg
Supervisory Board memberships:– Dräger Medical Verwaltungs AG, Lübeck, until September 20, 2010– Dräger Medical GmbH, Lübeck, since November 9, 2010
Dr. Thorsten GrenzChairman of the management teamVeolia Umweltservice GmbH, Hamburg
Supervisory Board membership:– Drägerwerk Verwaltungs AG, Lübeck
Peter-Maria Grosse Works Council Chairman of Dräger Safety AG & Co. KGaA, Lübeck
Supervisory Board membership:Dräger Safety AG & Co. KGaA, Lübeck
Uwe LüdersChairman of the Executive Board of L. Possehl & Co. mbH, Lübeck
Supervisory Board memberships:– Nordex AG, Norderstedt (Chairman)– Drägerwerk Verwaltungs AG, Lübeck
Memberships on comparable boards of German or foreigncompanies:– Commerzbank AG, Frankfurt am Main (Central Advisory Board)
Walter Neundorf Officer of Dräger Medical GmbH, Lübeck
Jürgen PeddinghausSelf-employed business consultant, Hamburg
Supervisory Board memberships:– Faber-Castell AG, Nuremberg (Chairman)– Jungheinrich AG, Hamburg (Chairman)– May Holding GmbH & Co. KG, Erftstadt (Chairman)– Drägerwerk Verwaltungs AG, Lübeck– Zwilling J. A. Henckels AG, Solingen
Prof. Dr. Klaus RauscherFormer Chairman of the Management Board of Vattenfall EuropeAG, Berlin
Supervisory Board memberships:– Endi AG, Halle (Chairman)– Deutsche Annington Immobilien GmbH, Düsseldorf– Drägerwerk Verwaltungs AG, Lübeck
Memberships on comparable boards of German or foreigncompanies:– Bayern LB, Munich (Economic Advisory Council)– Consileon GmbH, Karlsruhe (Advisory Board)– IVG Immobilien AG, Bonn (Advisory Board)– Landis + Gyr AG, Zug / Switzerland (Advisory Board)– MCF Corporate Finance GmbH, Hamburg (Advisory Board),
since January 1, 2010– Verbundnetzgas, Leipzig (Advisory Board)

223
Thomas Rickers1st Delegate of the metalworkers’ union IG Metall, Lübeck / Wismar,Lübeck
Supervisory Board memberships:– Dräger Medical Verwaltungs AG, Lübeck, until September 20, 2010– Dräger Medical GmbH, Lübeck, since November 9, 2010
Ulrike TinnefeldWorks Council Vice-Chairperson and Group Works Council Vice-Chairperson of Dräger Safety AG & Co.KGaA, LübeckGroup Works Council Vice-Chairperson ofDrägerwerk AG & Co. KGaA, Lübeck, since March 30, 2010
Supervisory Board membership:– Dräger Safety AG & Co. KGaA, Lübeck
Dr. Reinhard ZinkannManaging Partner of Miele & Cie. KG, Gütersloh
Supervisory Board memberships:– Falke KGaA, Schmallenberg (Chairman)– Drägerwerk Verwaltungs AG, Lübeck
Memberships on comparable boards of German or foreigncompanies:– Allianz Global Corporate & Specialty AG, Munich (Advisory Board)– Ardex GmbH, Witten (Advisory Board)– Commerzbank AG, Düsseldorf (Regional Advisory Board),
previously Allianz Dresdner Bank AG– Krombacher Brauerei GmbH & Co. KG, Kreuztal-Krombach
(Advisory Board), since January 1, 2011– Nobilia-Werke J. Stickling GmbH & Co. KG, Verl (Advisory Board)– Unternehmensgruppe Graf von Oeynhausen-Sierstorpff GmbH &
Co. KG Holding, Bad Driburg (Advisory Board)– Viessmann-Werke GmbH & Co. KG, Allendorf (Advisory Board)
Members of the Audit Committee:Dr. Thorsten Grenz (Chairman)Walter NeundorfJürgen PeddinghausProf. Dr. Nikolaus SchweickartUlrike Tinnefeld
Members of the Nomination Committee:Prof. Dr. Nikolaus Schweickart (Chairman)Uwe LüdersDr. Reinhard Zinkann
Members of the Joint Committee:Representatives of Drägerwerk Verwaltungs AG:Dr. Thorsten GrenzUwe LüdersJürgen PeddinghausProf. Dr. Klaus Rauscher
Representatives of Drägerwerk Verwaltungs AG:Prof. Dr. Nikolaus Schweickart (Chairman)Siegfrid KasangThomas RickersDr. Reinhard Zinkann
THE COMPANY’S BOARDSNOTESFINANCIAL STATEMENTS

THE COMPANY’S BOARDS224
MEMBERS OF THE EXECUTIVE BOARD OFDRÄGERWERK VERWALTUNGS AG, ACTING FORDRÄGERWERK AG & CO. KGAA
Stefan DrägerChairman of the Executive BoardCEO medical division until September 20, 2010CEO safety division since January 1, 2011
Chairman of the Executive Board of Drägerwerk Verwaltungs AG,Lübeck (general partner of Drägerwerk AG & Co. KGaA)Chairman of the Executive Board of Dräger Medical VerwaltungsAG, Lübeck (general partner of Dräger Medical AG & Co. KG) untilSeptember 20, 2010Chairman of the Executive Board of Dräger Safety Verwaltungs AG,Lübeck, since January 1, 2011 (general partner of Dräger Safety AG & Co. KGaA)
Supervisory Board memberships:– Dräger Safety AG & Co. KGaA, Lübeck (Chairman), until
December 15, 2010– Dräger Safety Verwaltungs AG, Lübeck (Chairman), until
December 15, 2010– Dräger Medical GmbH, Lübeck (Chairman), since October 29,
2010– Sparkasse zu Lübeck, Lübeck, since April 27, 2010
Memberships on comparable boards of German or foreigncompanies:– Commerzbank AG, Hamburg (Advisory Board) – HDI-Gerling Industrieversicherung AG, Hanover (Advisory Board)– IKB Deutsche Industriebank AG, Düsseldorf (Advisory Board)
Dr. Herbert FehreckePurchasing, Quality and IT / Research and Development since July 1,2010 / Production and Logistics until August 31, 2010Vice-Chairman of the Executive Board
Vice-Chairman of the Executive Board of Drägerwerk Verwaltungs AG, Lübeck(general partner of Drägerwerk AG & Co. KGaA)
Memberships on comparable boards of German or foreigncompanies:– IK Investmentpartners, Hamburg (Advisory Board), since
December 2, 2010
Dr. Carla Kriwet (since January 1, 2011)
Marketing and Sales
Member of the Executive Board of Drägerwerk Verwaltungs AG,Lübeck (general partner of Drägerwerk AG & Co. KGaA)
Gert-Hartwig Lescow CFOCFO medical division until September 20, 2010
Member of the Executive Board of Drägerwerk Verwaltungs AG,Lübeck (general partner of Drägerwerk AG & Co. KGaA)Member of the Executive Board of Dräger Medical Verwaltungs AG,Lübeck (general partner of Dräger Medical AG & Co. KG) until September 20, 2010
Supervisory Board memberships:Dräger Safety AG & Co. KGaA, LübeckDräger Safety Verwaltungs AG, LübeckDräger Medical GmbH, Lübeck, since October 29, 2010
Memberships on comparable boards of German or foreigncompanies: Deutsche Bank AG, Frankfurt (Advisory Board)
Dr. Dieter Pruss (until December 31, 2010)
Marketing and Sales safety division
Member of the Executive Board of Drägerwerk Verwaltungs AG,Lübeck (general partner of Drägerwerk AG & Co. KGaA)Chairman of the Executive Board of Dräger Safety Verwaltungs AG,Lübeck (general partner of Dräger Safety AG & Co. KGaA)
Supervisory Board memberships:Dräger Medical Verwaltungs AG, Lübeck, until September 20, 2010Dräger Medical GmbH, Lübeck, from October 29 – December 17, 2010Dräger Medical Deutschland GmbH, Lübeck, until December 17, 2010
Anton Schrofner (since September 1, 2011)
Production and Logistics
Member of the Executive Board of Drägerwerk Verwaltungs AG,Lübeck (general partner of Drägerwerk AG & Co. KGaA)
Supervisory Board memberships:Dräger Medical GmbH, Lübeck, from October 29 – November 26,2010
Dr. Ulrich Thibaut (until June 30, 2010)
Research and development
Member of the Executive Board of Drägerwerk Verwaltungs AG,Lu ̈beck (general partner of Drägerwerk AG & Co. KGaA)

225THE COMPANY’S BOARDSNOTESFINANCIAL STATEMENTS

IMPRINT226
Imprint
Drägerwerk AG & Co. KGaACorporate CommunicationsMoislinger Allee 53–5523558 Lübeck, Germanywww.draeger.com
Concept and designHeisters & Partner,Büro für Kommunikationsdesign, Mainz, Germany
PublicationMarch 16, 2011
ReproductionsGold GmbH, Munich, Germany
Printed byDräger + Wullenwever pm GmbH & Co. KG, Lübeck,Germany
PhotosDrägerwerk AG & Co. KGaA

Drägerwerk AG & Co. KGaAMoislinger Allee 53–5523558 Lübeck, Germanywww.draeger.com
Corporate CommunicationsTel +49 451 882–2185Fax +49 451 882–3944
Investor RelationsTel +49 451 882–2685Fax +49 451 882–3296 90
70
301
AN
NU
AL
RE
PO
RT
2010
ANNUAL REPORT 2010
Dräger Group 2006 2007 2008 2009 2010
Order intake € million 1,865.0 1,933.9 1,930.4 1,978.3 2,145.5
Orders on hand € million 314.0 390.5 399.9 440.1 421.7
Net sales € million 1,801.3 1,819.5 1,924.5 1,911.1 2,177.3
EBITDA 1 € million 200.6 180.3 166.3 146.0 246.7
EBIT 2 € million 148.2 124.3 105.8 80.1 192.8
in % of net sales (EBIT margin) % 8.2 6.8 5.5 4.2 8.9
Interest result € million (28.3) (26.6) (27.8) (30.8) (39.1)
Income taxes € million (41.8) (33.0) (28.6) (16.8) (48.9)
Net profit € million 78.1 64.7 49.4 32.5 104.8
Of which attributable to shareholders € million 43.1 45.4 31.8 14.9 90.7
Earnings per share 3
per preferred share € 3.42 3.60 2.53 1.20 6.25
per common share € 3.36 3.54 2.47 1.14 6.19
Equity € million 576.9 545.2 553.8 393.8 636.6
Equity ratio % 35.3 33.3 33.5 20.9 32.2
Capital employed 4 € million 918.0 941.1 956.8 709.1 833.4
EBIT / capital employed (ROCE) % 16.1 13.2 11.1 11.3 23.1
Net financial debt € million 183.9 251.3 258.0 374.4 90.3
DVA 66.0 39.5 20.4 (1.8) 114.5
Headcount as of December 31 9,949 10,345 10,909 11,071 11,291
Drägerwerk AG & Co. KGaA dividends
Preferred share € 0.55 0.55 0.35 0.40 1.19
Common share € 0.49 0.49 0.29 0.34 1.13
1 EBITDA = Earnings before net interes result, income tsxes, depreciation, amortization2 EBIT = Earnings before net interest result and income taxes3 Conversion to a partnership limited by shares on December 14, 20074 Capital employed = Total assets less deferred tax assets, current securities, cash and cash equivalents and non-interest bearing liabilities
THE DRÄGER GROUP OVER THE PAST FIVE YEARS
Preliminaries 2010 January 14, 2011
Annual accounts press conference, Hamburg March 16, 2011
Analysts’ meeting, Frankfurt / Main March 16, 2011
Report as of March 31, 2011 May 4, 2011
Conference call, Lübeck May 4, 2011
Annual shareholders’ meeting, Lübeck May 6, 2011
Report as of June 30, 2011 August 4, 2011
Conference call, Lübeck August 4, 2011
Report as of September 30, 2011 November 3, 2011
Conference call, Lübeck November 3, 2011
FINANCIAL CALENDAR 2011

Headquarters Sales and service organizations Production plants Logistic centers
Dräger employs approximately 11,300 people worldwide and is active in more than190 countries across the globe. The company has sales and service subsidiaries in over 40 countries. Dräger has development and production facilities in Germany,the UK, the Czech Republic, Sweden, the USA, Brazil, South Africa, and China. As of December 31, 2010, 6,206 Dräger employees were working outside Germany.
EuropePlymouthBlyth Hagen Lübeck SvenljungaChomutovPolickaAmericas
PittsburghTelfordAndoverSão Paulo
DRÄGER WORLDWIDE
Headquarters, sales and service organizations, production plants, logistic centers
Asia Beijing Shanghai
AfricaKing William’s Town
DIV
ISIO
NS
AT
A G
LA
NC
E,
DR
ÄG
ER
WO
RLD
WID
E
Review of the year 2010
JANUARY
FEBRUARY
MA
RC
HA
PR
IL
MAY
JUNE JULY
AUGUST
SE
PTE
MB
ER
OC
TOB
ER
NOVEMBER
DECEMBER
2010
ITALY: Dräger receives an order from the petrochemical industry for delivery of severalhundred “Dräger X-am 2000” portable gas detectors.
01
“BABYLOG VN500” At a large-scale launchevent, Dräger presents its new ventilator for premature babies, “Babylog VN500”, todoctors and hospital managers from all over Europe.
02
OUTSTANDING PRODUCT DESIGN:
The Industrieforum Design in Hanover, Germany, honors the ventilators “Evita InfinityV500” and “Oxylog 3000 plus” with the iF product design award.
03
SHARE BUY-BACK: The buy-back of Siemens’shares in the medical division is success-fully completed, making Dräger once again soleproprietor of Dräger Medical AG & Co. KG.
04 LITTLE ONES AT THE CENTER:
With the website babyfirst.com, Dräger launches an interactive online platform all about premature babies for doctors, nurses and parents.
BOLSTERING OUR POSITION IN EUROPE:
Dräger opens a new subsidiary in Portugal.05 ANNIVERSARY: In Lübeck, the 444,444thDräger Vapor rolls off the production lines. Thisevaporator for liquid anesthetics is used inanesthetic devices. Produced for the first timein 1958, it has been continually developed and enhanced since then.
LEASING CONTRACT: With a ten-year contract,Dräger takes on responsibility for the smoothrunning of the approximately 10,000 electro-medical devices owned by Gesundheit Nordhessen Holding AG in Kassel, Germany(GNH).
06 NEW BUILDING IN LÜBECK: Dräger lays thefoundation stone for a new production and logistics facility, in which around EUR 12 millionwill be invested.
SAFER EMERGENCY RESPONSE:
The fire service in Malaysia orders severalthousand sets of “Dräger PSS 90” compres-sed air breathing apparatus.
SUCCESSFUL CONCLUSION OF A LARGE-
SCALE PROJECT: In Oman, Dräger took careof planning, design, installation and commis-sioning of a breathing air supply system for anoil and gas processing plant.
MEDICA: Under the motto “Visualization forthe acute point of care”, Dräger appears at the Medica trade fair in Düsseldorf, Germany,with a range of applications to help doctorsand care personnel in their therapeutic deci-sion-making.
DRUG TEST: Dräger equips Poland’s policeforce with the drug testing device “DrägerDrugtest 5000” and several thousand testingkits.
CHINA: Dräger receives an order for severalhundred Alcotest devices for the Hong Kongpolice force.
PROTECTION FOR MINING: The miningindustry in the Czech Republic places an orderwith Dräger for oxygen emergency escape devices, in order to enhance miners' safety.
CHANGES IN THE EXECUTIVE BOARD:
New Executive Board member Anton Schrofnertakes charge of the Production and Logisticsfunction. Additionally, Dräger announces thatDr. Carla Kriwet will take over the ExecutiveBoard function for Sales and Marketing as ofJanuary 1, 2011.
DRÄGER MEDICAL GMBH: Dräger convertsDräger Medical AG & Co. KG into a limited liability company (Gesellschaft mit beschränk-ter Haftung, GmbH). This serves to simplify the Company’s shareholding structure and soreduce its complexity.
SHARE BUY-BACK: Drägerwerk AG & Co.KGaA replaces the cash settled option com -ponent of the purchase price for the 25 percent share in the medical division by issuing an equity settled option.
A SYSTEM SOLUTION FOR HOSPITALS:
Dräger helps a hospital in Trier, Germany, tobetter coordinate its inter-departmental cooperation, including equipping ten operatingrooms with Dräger medical technology and supplying over a hundred patient monitors.
CAPITAL INCREASE: Dräger completes thecapital increase, decided upon in June, in return for cash with subscription rights of holders of common and preferred shares.
AUSTRALIA: Dräger delivers the first con-signment of “Dräger PSS 7000” compressed air breathing apparatus to the West Australi-an Fire and Emergency Services as part of alarge-scale order.
12
11
10
09
08
07
RE
VIE
W O
F T
HE
YE
AR
20
10
2006 2007 2008 20091 2010
Medical division
Order intake € million 1,275.1 1,223.5 1,276.9 1,339.6 1,441.9
Orders on hand € million 209.0 190.9 219.8 300.5 280.6
Net sales € million 1,239.2 1,209.4 1,243.8 1,260.9 1,472.0
EBIT € million 112.7 81.1 75.5 76.7 186.6
in % of net sales (EBIT margin) % 9.1 6.7 6.1 6.1 12.7
Capital employed € million 656.7 601.1 641.6 546.6 514.7
EBIT / capital employed (ROCE) % 17.2 13.5 11.8 14.0 36.3
DVA 54.8 26.2 20.3 23.6 136.5
Headcount as of December 31 6,051 6,077 6,326 6,305 6,386
Safety division
Order intake € million 611.8 735.8 679.6 665.9 731.7
Orders on hand € million 106.2 200.4 181.2 140.7 142.3
Net sales € million 589.1 637.5 706.8 676.9 733.8
EBIT € million 54.9 69.4 61.0 30.2 61.0
in % of net sales (EBIT margin) % 9.3 10.9 8.6 4.5 8.3
Capital employed € million 213.6 220.1 223.8 190.1 181.6
EBIT / capital employed (ROCE) % 25.7 31.5 27.3 15.9 33.6
DVA 36.0 49.2 40.9 9.6 43.1
Headcount as of December 31 3,683 3,944 4,194 4,336 4,409
1 Due to the integration of Dräger Medical AG & Co. KG in September 2010, the previous year’s values were adjusted accordingly.
DIVISIONS OVER THE PAST FIVE YEARS

Drägerwerk AG & Co. KGaAMoislinger Allee 53–5523558 Lübeck, Germanywww.draeger.com
Corporate CommunicationsTel +49 451 882–2185Fax +49 451 882–3944
Investor RelationsTel +49 451 882–2685Fax +49 451 882–3296 90
70
301
AN
NU
AL
RE
PO
RT
2010
ANNUAL REPORT 2010
Dräger Group 2006 2007 2008 2009 2010
Order intake € million 1,865.0 1,933.9 1,930.4 1,978.3 2,145.5
Orders on hand € million 314.0 390.5 399.9 440.1 421.7
Net sales € million 1,801.3 1,819.5 1,924.5 1,911.1 2,177.3
EBITDA 1 € million 200.6 180.3 166.3 146.0 246.7
EBIT 2 € million 148.2 124.3 105.8 80.1 192.8
in % of net sales (EBIT margin) % 8.2 6.8 5.5 4.2 8.9
Interest result € million (28.3) (26.6) (27.8) (30.8) (39.1)
Income taxes € million (41.8) (33.0) (28.6) (16.8) (48.9)
Net profit € million 78.1 64.7 49.4 32.5 104.8
Of which attributable to shareholders € million 43.1 45.4 31.8 14.9 90.7
Earnings per share 3
per preferred share € 3.42 3.60 2.53 1.20 6.25
per common share € 3.36 3.54 2.47 1.14 6.19
Equity € million 576.9 545.2 553.8 393.8 636.6
Equity ratio % 35.3 33.3 33.5 20.9 32.2
Capital employed 4 € million 918.0 941.1 956.8 709.1 833.4
EBIT / capital employed (ROCE) % 16.1 13.2 11.1 11.3 23.1
Net financial debt € million 183.9 251.3 258.0 374.4 90.3
DVA 66.0 39.5 20.4 (1.8) 114.5
Headcount as of December 31 9,949 10,345 10,909 11,071 11,291
Drägerwerk AG & Co. KGaA dividends
Preferred share € 0.55 0.55 0.35 0.40 1.19
Common share € 0.49 0.49 0.29 0.34 1.13
1 EBITDA = Earnings before net interes result, income tsxes, depreciation, amortization2 EBIT = Earnings before net interest result and income taxes3 Conversion to a partnership limited by shares on December 14, 20074 Capital employed = Total assets less deferred tax assets, current securities, cash and cash equivalents and non-interest bearing liabilities
THE DRÄGER GROUP OVER THE PAST FIVE YEARS
Preliminaries 2010 January 14, 2011
Annual accounts press conference, Hamburg March 16, 2011
Analysts’ meeting, Frankfurt / Main March 16, 2011
Report as of March 31, 2011 May 4, 2011
Conference call, Lübeck May 4, 2011
Annual shareholders’ meeting, Lübeck May 6, 2011
Report as of June 30, 2011 August 4, 2011
Conference call, Lübeck August 4, 2011
Report as of September 30, 2011 November 3, 2011
Conference call, Lübeck November 3, 2011
FINANCIAL CALENDAR 2011