Annual Report 2010 - Bourse · Financial Report Management report Anheuser-Busch InBev is a ......
82
1 Annual Report 2010
Transcript of Annual Report 2010 - Bourse · Financial Report Management report Anheuser-Busch InBev is a ......

1
Annual Report 2010

2
Financial Report Management report
Anheuser-Busch InBev is a publicly traded company (Euronext: ABI) based in Leuven, Belgium, with an American Depositary Receipt secondary listing on the New York Stock Exchange (NYSE: BUD). It is the leading global brewer and one of the world's top five consumer products companies. A true consumer-centric, sales driven organization, AB InBev manages a portfolio of well over 200 beer brands that includes global flagship brands Budweiser®, Stella Artois® and Beck’s®, fast growing multi-country brands like Leffe® and Hoegaarden®, and strong “local champions” such as Bud Light®, Skol®, Brahma®, Quilmes®, Michelob®, Harbin®, Sedrin®, Klinskoye®, Sibirskaya Korona®, Chernigivske®, and Jupiler®, among others. In addition, the company owns a 50 percent equity interest in the operating subsidiary of Grupo Modelo, Mexico's leading brewer and owner of the global Corona® brand. AB InBev’s dedication to heritage and quality is rooted in brewing traditions that originate from the Den Hoorn brewery in Leuven, Belgium, dating back to 1366 and the pioneering spirit of the Anheuser & Co brewery, which traces its origins back to 1852 in St. Louis, USA. Geographically diversified with a balanced exposure to developed and developing markets, AB InBev leverages the collective strengths of its approximately 114 000 employees based in operations in 23 countries across the world. The company strives to be the Best Beer Company in a Better World. In 2010, AB InBev realized 36.3 billion US dollar revenue. For more information, please visit: www.ab-inbev.com. The following management report should be read in conjunction with Anheuser-Busch InBev’s audited consolidated financial statements.
A number of acquisitions, divestitures and joint ventures influenced Anheuser-Busch InBev’s profit and financial profile over the past years.
On 18 November 2008, InBev announced the completion of its combination with Anheuser-Busch, following approval from shareholders of both companies. Anheuser-Busch’s results are included in Anheuser-Busch InBev’s result as from this date. The combination creates the global leader in beer and one of the world’s top five consumer products companies. InBev changed its name to Anheuser-Busch InBev to reflect the heritage and traditions of Anheuser-Busch.
Following the Anheuser-Busch acquisition and the resulting increased leverage, the group performed a series of assets disposals. Pursuant to the disposal program AB InBev divested during 2009 its 27% stake in Tsingtao (China), Oriental Brewery (Korea), four metal beverage can lid manufacturing plants from the US metal packaging subsidiary, Busch Entertainment Corporation, the Central European Operations, the Tennent’s Lager brand and associated trading assets in Scotland, Northern Ireland and the Republic of Ireland and the Labatt USA distribution rights.
Effective from 1 January 2010 onward, AB InBev has updated its segment reporting for purposes of internal review by senior management. This presentation (further referred to as the “Reference base”) treats all 2009 divestitures as if they had closed on 1 January 2009. In addition, certain intra–group transactions, which were previously recorded in the zones, are recorded in the Global Export and Holding Companies segment, thus with no impact at the consolidated level. The tables in this management report provide the segment information per zone for 2009 in the format that is used by management as of 2010 to monitor performance. The differences between the 2009 Reference base and the 2009 audited income statement as Reported represent the effect of divestitures.
Further details on the acquisitions and disposals of subsidiaries during 2010 and 2009 are disclosed in Note 6 Acquisitions and disposals of subsidiaries.
In the rest of this document we refer to Anheuser-Busch InBev as “AB InBev” or “the company”.

3
Selected financial figures
To facilitate the understanding of AB InBev’s underlying performance, the comments in this management report, unless otherwise indicated, are based on organic and normalized numbers. “Organic” means the financials are analyzed eliminating the impact of changes in currencies on translation of foreign operations, and scopes. Scopes represent the impact of acquisitions and divestitures other than those eliminated from the Reference base, the start up or termination of activities or the transfer of activities between segments, curtailment gains and losses and year over year changes in accounting estimates and other assumptions that management does not consider as part of the underlying performance of the business.
To facilitate the understanding of AB InBev’s underlying performance the selected income statement figures also include a comparison versus the results of the Reference base 2009. Whenever used in this report, the term “normalized” refers to performance measures (EBITDA, EBIT, Profit, EPS) before non-recurring items. Non-recurring items are either income or expenses which do not occur regularly as part of the normal activities of the company. They are presented separately because they are important for the understanding of the underlying sustainable performance of the company due to their size or nature. Normalized measures are additional measures used by management, and should not replace the measures determined in accordance with IFRS as an indicator of the company’s performance, but rather should be used in conjunction with the most directly comparable IFRS measures.
The tables below set out the components of AB InBev’s operating income and operating expenses, as well as the key cash flow figures.
Million US dollar 2010 % 2009
Reported %
2009 Reference
base % Revenue1 ........................................................... 36 297 100% 36 758 100% 33 862 100%
Cost of sales ........................................................ (16 151) 44% (17 198) 47% (15 532) 46%
Gross profit ....................................................... 20 146 56% 19 560 53% 18 330 54% Distribution expenses............................................ (2 913) 8% (2 671) 7% (2 533) 7% Sales and marketing expenses ............................... (4 712) 13% (4 992) 14% (4 618) 14% Administrative expenses........................................ (1 960) 6% (2 310) 6% (2 227) 7% Other operating income/(expenses)........................ 604 2% 661 2% 649 2% Normalized profit from operations (Normalized
EBIT)................................................................. 11 165 31% 10 248 28% 9 600 28% Non-recurring items.............................................. (268) 1% 1 321 3%
Profit from operations (EBIT)............................ 10 897 30% 11 569 31%
Depreciation, amortization and impairment ...... 2 788 8% 2 818 8% 2 537 7%
Normalized EBITDA ........................................... 13 869 38% 13 037 35% 12 109 36%
EBITDA.............................................................. 13 685 38% 14 387 39%
Normalized profit attributable to equity
holders of AB InBev........................................... 5 040 14% 3 927 11% Profit attributable to equity holders of AB InBev ........................................................... 4 026 11% 4 613 13%
1 Turnover less excise taxes. In many jurisdictions, excise taxes make up a large proportion of the cost of beer charged to our customers.

4
Million US dollar 2010 2009
Reported Operating activities Profit ..................................................................................................................................... 5 762 5 877 Interest, taxes and non-cash items included in profit ................................................................... 8 503 7 353 Cash flow from operating activities before changes in working capital and use of
provisions............................................................................................................................. 14 265 13 230 Change in working capital......................................................................................................... 226 787 Pension contributions and use of provisions ................................................................................ (519) (548) Interest and taxes (paid)/received............................................................................................. (4 450) (4 345) Dividends received .................................................................................................................. 383 - Cash flow from operating activities ...................................................................................... 9 905 9 124
Investing activities Net capex............................................................................................................................... (2 123) (1 386) Acquisition and sale of subsidiaries, net of cash acquired/disposed of, and purchase and sale of non-controlling interest .................................................................................................................. (62) 4 586 Proceeds from the sale of associates and assets held for sale........................................................ 146 1 813 Investment in short term debt securities .................................................................................... (604) - Other .................................................................................................................................... 97 256 Cash flow from investing activities....................................................................................... (2 546) 5 269
Financing activities Dividends paid ........................................................................................................................ (1 924) (1 313) Net (payments) on/proceeds from borrowings ............................................................................ (4 290) (11 793) Net proceeds from the issue of share capital............................................................................... 215 76 Other (including net financing cost other than interest) ................................................................ (758) (66) Cash flow from financing activities....................................................................................... (6 757) (13 096)
Net increase/(decrease) in cash and cash equivalents ........................................................ 602 1 297
Financial performance
To facilitate the understanding of AB InBev’s underlying performance the company is presenting in this management report the 2009 consolidated volumes and results up to Normalized EBIT on a Reference base and as such these financials are included in the organic growth calculations. The profit, cash flow and balance sheet are presented as Reported in 2009. Both from an accounting and managerial perspective, AB InBev is organized along seven business zones. Upon the acquisition of Anheuser-Busch, the Anheuser-Busch businesses are reported according to their geographical presence in the following segments: the US beer business and Modelo are reported in zone North America, the UK business is reported in zone Western Europe, the Harbin and the Budweiser China business are reported in zone Asia Pacific and the Export and Packaging businesses are reported in the Global Export and Holding Companies segment.
AB INBEV WORLDWIDE
2009 Reference
base Scope1 Currency
translation Organic growth 2010
Organic growth %
Volumes (thousand hectoliters)....... 391 070 (501) - 8 349 398 918 2.1% Revenue....................................... 33 862 (305) 1 255 1 485 36 297 4.4% Cost of sales ................................. (15 532) (68) (377) (175) (16 151) (1.1)% Gross profit .................................. 18 330 (373) 879 1 310 20 146 7.2% Distribution expenses..................... (2 533) 11 (140) (250) (2 913) (9.9)% Sales & marketing expenses ........... (4 618) 129 (133) (90) (4 712) (2.0)% Administrative expenses................. (2 227) 29 (49) 287 (1 960) 12.8% Other operating income/(expenses). 649 (89) 32 12 604 2.4% Normalized EBIT ........................... 9 600 (292) 588 1 269 11 165 13.6% Normalized EBITDA ....................... 12 109 (140) 645 1 256 13 869 10.6% Normalized EBITDA margin............. 35.8% 38.2% 209 bp
In 2010 AB InBev delivered EBITDA growth of 10.6%, while its EBITDA margin increased 209 bp, closing the year at 38.2%.
Consolidated volumes increased 2.1% and soft drinks volume grew 3.8%. AB InBev’s focus brands grew 4.8%. Focus brands are those with the highest growth potential within each relevant consumer segment and where AB InBev makes the greatest marketing investment.
AB InBev’s revenue grew by 4.4% compared to the previous year.
AB InBev’s total Cost of Sales (CoS) increased 1.1% and decreased 1.2% per hectoliter organically. On a constant geographic basis, Cost of Sales per hectoliter increased 0.6% in 2010 with higher raw material and packaging costs in Latin America North and South offsetting procurement savings and the implementation of best practices programs in North America and Western Europe.
1 See Glossary.
5
VOLUMES
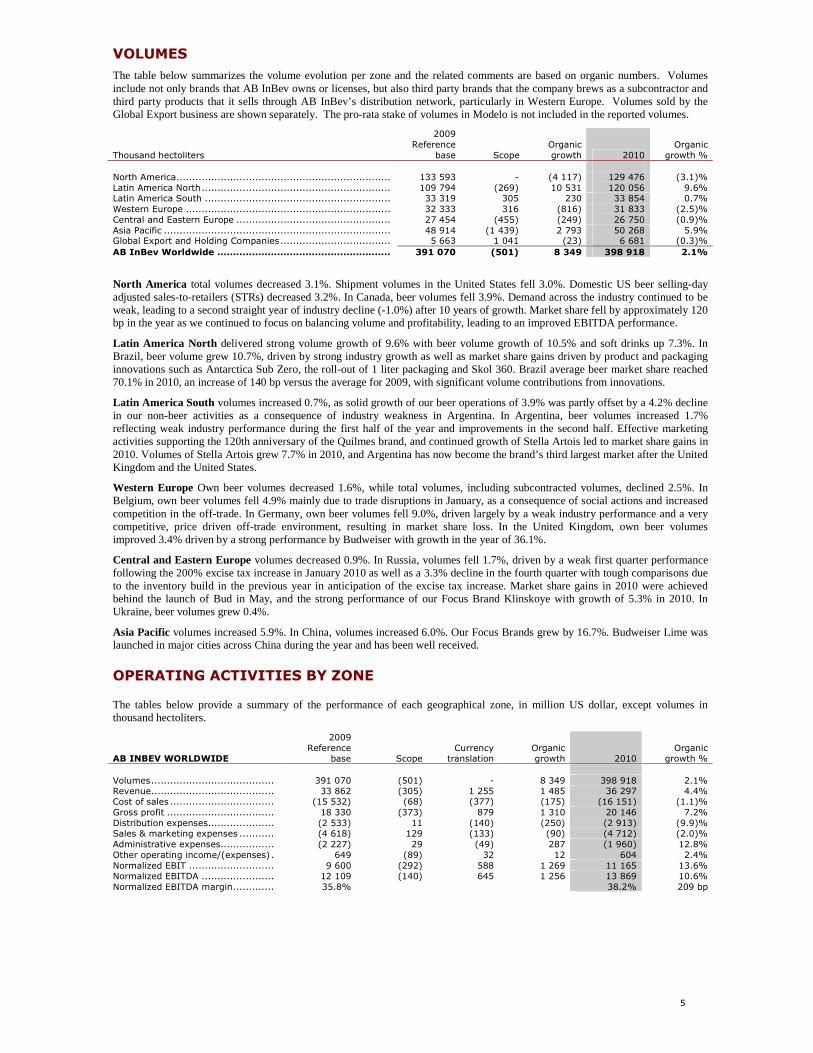
The table below summarizes the volume evolution per zone and the related comments are based on organic numbers. Volumes include not only brands that AB InBev owns or licenses, but also third party brands that the company brews as a subcontractor and third party products that it sells through AB InBev’s distribution network, particularly in Western Europe. Volumes sold by the Global Export business are shown separately. The pro-rata stake of volumes in Modelo is not included in the reported volumes.
Thousand hectoliters
2009 Reference
base Scope Organic growth 2010
Organic growth %
North America.................................................................... 133 593 - (4 117) 129 476 (3.1)% Latin America North............................................................ 109 794 (269) 10 531 120 056 9.6% Latin America South ........................................................... 33 319 305 230 33 854 0.7% Western Europe ................................................................. 32 333 316 (816) 31 833 (2.5)% Central and Eastern Europe ................................................. 27 454 (455) (249) 26 750 (0.9)% Asia Pacific ........................................................................ 48 914 (1 439) 2 793 50 268 5.9% Global Export and Holding Companies................................... 5 663 1 041 (23) 6 681 (0.3)% AB InBev Worldwide ....................................................... 391 070 (501) 8 349 398 918 2.1%
North America total volumes decreased 3.1%. Shipment volumes in the United States fell 3.0%. Domestic US beer selling-day adjusted sales-to-retailers (STRs) decreased 3.2%. In Canada, beer volumes fell 3.9%. Demand across the industry continued to be weak, leading to a second straight year of industry decline (-1.0%) after 10 years of growth. Market share fell by approximately 120 bp in the year as we continued to focus on balancing volume and profitability, leading to an improved EBITDA performance.
Latin America North delivered strong volume growth of 9.6% with beer volume growth of 10.5% and soft drinks up 7.3%. In Brazil, beer volume grew 10.7%, driven by strong industry growth as well as market share gains driven by product and packaging innovations such as Antarctica Sub Zero, the roll-out of 1 liter packaging and Skol 360. Brazil average beer market share reached 70.1% in 2010, an increase of 140 bp versus the average for 2009, with significant volume contributions from innovations.
Latin America South volumes increased 0.7%, as solid growth of our beer operations of 3.9% was partly offset by a 4.2% decline in our non-beer activities as a consequence of industry weakness in Argentina. In Argentina, beer volumes increased 1.7% reflecting weak industry performance during the first half of the year and improvements in the second half. Effective marketing activities supporting the 120th anniversary of the Quilmes brand, and continued growth of Stella Artois led to market share gains in 2010. Volumes of Stella Artois grew 7.7% in 2010, and Argentina has now become the brand’s third largest market after the United Kingdom and the United States.
Western Europe Own beer volumes decreased 1.6%, while total volumes, including subcontracted volumes, declined 2.5%. In Belgium, own beer volumes fell 4.9% mainly due to trade disruptions in January, as a consequence of social actions and increased competition in the off-trade. In Germany, own beer volumes fell 9.0%, driven largely by a weak industry performance and a very competitive, price driven off-trade environment, resulting in market share loss. In the United Kingdom, own beer volumes improved 3.4% driven by a strong performance by Budweiser with growth in the year of 36.1%.
Central and Eastern Europe volumes decreased 0.9%. In Russia, volumes fell 1.7%, driven by a weak first quarter performance following the 200% excise tax increase in January 2010 as well as a 3.3% decline in the fourth quarter with tough comparisons due to the inventory build in the previous year in anticipation of the excise tax increase. Market share gains in 2010 were achieved behind the launch of Bud in May, and the strong performance of our Focus Brand Klinskoye with growth of 5.3% in 2010. In Ukraine, beer volumes grew 0.4%.
Asia Pacific volumes increased 5.9%. In China, volumes increased 6.0%. Our Focus Brands grew by 16.7%. Budweiser Lime was launched in major cities across China during the year and has been well received.
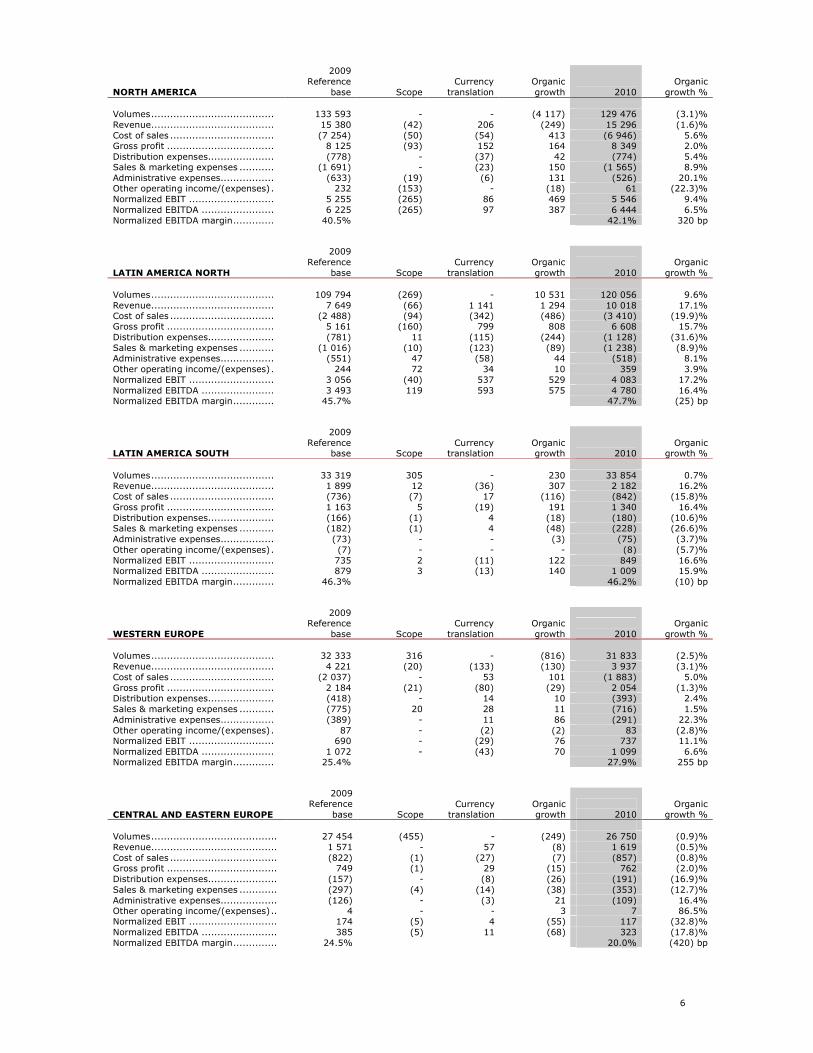
OPERATING ACTIVITIES BY ZONE
The tables below provide a summary of the performance of each geographical zone, in million US dollar, except volumes in thousand hectoliters.
AB INBEV WORLDWIDE
2009 Reference
base Scope Currency
translation Organic growth 2010
Organic growth %
Volumes....................................... 391 070 (501) - 8 349 398 918 2.1% Revenue....................................... 33 862 (305) 1 255 1 485 36 297 4.4% Cost of sales ................................. (15 532) (68) (377) (175) (16 151) (1.1)% Gross profit .................................. 18 330 (373) 879 1 310 20 146 7.2% Distribution expenses..................... (2 533) 11 (140) (250) (2 913) (9.9)% Sales & marketing expenses ........... (4 618) 129 (133) (90) (4 712) (2.0)% Administrative expenses................. (2 227) 29 (49) 287 (1 960) 12.8% Other operating income/(expenses). 649 (89) 32 12 604 2.4% Normalized EBIT ........................... 9 600 (292) 588 1 269 11 165 13.6% Normalized EBITDA ....................... 12 109 (140) 645 1 256 13 869 10.6% Normalized EBITDA margin............. 35.8% 38.2% 209 bp
6
NORTH AMERICA
2009 Reference
base
Scope Currency
translation Organic growth
2010
Organic growth %
Volumes....................................... 133 593 - - (4 117) 129 476 (3.1)% Revenue....................................... 15 380 (42) 206 (249) 15 296 (1.6)% Cost of sales ................................. (7 254) (50) (54) 413 (6 946) 5.6% Gross profit .................................. 8 125 (93) 152 164 8 349 2.0% Distribution expenses..................... (778) - (37) 42 (774) 5.4% Sales & marketing expenses ........... (1 691) - (23) 150 (1 565) 8.9% Administrative expenses................. (633) (19) (6) 131 (526) 20.1% Other operating income/(expenses). 232 (153) - (18) 61 (22.3)% Normalized EBIT ........................... 5 255 (265) 86 469 5 546 9.4% Normalized EBITDA ....................... 6 225 (265) 97 387 6 444 6.5% Normalized EBITDA margin............. 40.5% 42.1% 320 bp
LATIN AMERICA NORTH
2009 Reference
base
Scope Currency
translation Organic growth
2010
Organic growth %
Volumes....................................... 109 794 (269) - 10 531 120 056 9.6% Revenue....................................... 7 649 (66) 1 141 1 294 10 018 17.1% Cost of sales ................................. (2 488) (94) (342) (486) (3 410) (19.9)% Gross profit .................................. 5 161 (160) 799 808 6 608 15.7% Distribution expenses..................... (781) 11 (115) (244) (1 128) (31.6)% Sales & marketing expenses ........... (1 016) (10) (123) (89) (1 238) (8.9)% Administrative expenses................. (551) 47 (58) 44 (518) 8.1% Other operating income/(expenses). 244 72 34 10 359 3.9% Normalized EBIT ........................... 3 056 (40) 537 529 4 083 17.2% Normalized EBITDA ....................... 3 493 119 593 575 4 780 16.4% Normalized EBITDA margin............. 45.7% 47.7% (25) bp
LATIN AMERICA SOUTH
2009 Reference
base
Scope Currency
translation Organic growth
2010
Organic growth %
Volumes....................................... 33 319 305 - 230 33 854 0.7% Revenue....................................... 1 899 12 (36) 307 2 182 16.2% Cost of sales ................................. (736) (7) 17 (116) (842) (15.8)% Gross profit .................................. 1 163 5 (19) 191 1 340 16.4% Distribution expenses..................... (166) (1) 4 (18) (180) (10.6)% Sales & marketing expenses ........... (182) (1) 4 (48) (228) (26.6)% Administrative expenses................. (73) - - (3) (75) (3.7)% Other operating income/(expenses). (7) - - - (8) (5.7)% Normalized EBIT ........................... 735 2 (11) 122 849 16.6% Normalized EBITDA ....................... 879 3 (13) 140 1 009 15.9% Normalized EBITDA margin............. 46.3% 46.2% (10) bp
WESTERN EUROPE
2009 Reference
base
Scope Currency
translation Organic growth
2010
Organic growth %
Volumes....................................... 32 333 316 - (816) 31 833 (2.5)% Revenue....................................... 4 221 (20) (133) (130) 3 937 (3.1)% Cost of sales ................................. (2 037) - 53 101 (1 883) 5.0% Gross profit .................................. 2 184 (21) (80) (29) 2 054 (1.3)% Distribution expenses..................... (418) - 14 10 (393) 2.4% Sales & marketing expenses ........... (775) 20 28 11 (716) 1.5% Administrative expenses................. (389) - 11 86 (291) 22.3% Other operating income/(expenses). 87 - (2) (2) 83 (2.8)% Normalized EBIT ........................... 690 - (29) 76 737 11.1% Normalized EBITDA ....................... 1 072 - (43) 70 1 099 6.6% Normalized EBITDA margin............. 25.4% 27.9% 255 bp
CENTRAL AND EASTERN EUROPE
2009 Reference
base
Scope Currency
translation Organic growth
2010
Organic growth %
Volumes........................................ 27 454 (455) - (249) 26 750 (0.9)% Revenue........................................ 1 571 - 57 (8) 1 619 (0.5)% Cost of sales .................................. (822) (1) (27) (7) (857) (0.8)% Gross profit ................................... 749 (1) 29 (15) 762 (2.0)% Distribution expenses...................... (157) - (8) (26) (191) (16.9)% Sales & marketing expenses ............ (297) (4) (14) (38) (353) (12.7)% Administrative expenses.................. (126) - (3) 21 (109) 16.4% Other operating income/(expenses).. 4 - - 3 7 86.5% Normalized EBIT ............................ 174 (5) 4 (55) 117 (32.8)% Normalized EBITDA ........................ 385 (5) 11 (68) 323 (17.8)% Normalized EBITDA margin.............. 24.5% 20.0% (420) bp

7
ASIA PACIFIC
2009 Reference
base
Scope Currency
translation Organic growth
2010
Organic growth %
Volumes....................................... 48 914 (1 439) - 2 793 50 268 5.9% Revenue....................................... 1 720 (162) 28 181 1 767 11.6% Cost of sales ................................. (947) 27 (16) (73) (1 008) (7.9)% Gross profit .................................. 773 (134) 12 108 759 16.9% Distribution expenses..................... (120) - (2) (19) (140) (15.9)% Sales & marketing expenses ........... (493) 119 (7) (58) (439) (15.6)% Administrative expenses................. (132) 1 (1) (16) (148) (12.2)% Other operating income/(expenses). 37 - 1 10 47 26.8% Normalized EBIT ........................... 65 (13) 2 25 79 47.7% Normalized EBITDA ....................... 259 (16) 5 44 292 18.3% Normalized EBITDA margin............. 15.0% 16.5% 94 bp
GLOBAL EXPORT AND HOLDING
COMPANIES
2009 Reference
base
Scope Currency
translation Organic growth
2010
Organic growth %
Volumes....................................... 5 663 1 041 - (23) 6 681 (0.3)% Revenue....................................... 1 423 (26) (8) 90 1 479 6.4% Cost of sales ................................. (1 249) 57 (7) (7) (1 206) (0.6)% Gross profit .................................. 174 31 (15) 83 273 40.3% Distribution expenses..................... (114) - 3 5 (106) 4.0% Sales & marketing expenses ........... (164) 4 3 (17) (174) (10.4)% Administrative expenses................. (324) - 8 23 (292) 7.1% Other operating income/(expenses). 53 (7) (1) 9 54 20.4% Normalized EBIT ........................... (375) 29 (1) 103 (245) 29.7% Normalized EBITDA ....................... (204) 25 (5) 107 (77) 59.7%
REVENUE
Full year 2010 consolidated revenue grew 4.4% to 36 297m US dollar, with revenue per hectoliter increase of 2.3%. On a constant geographic basis revenue growth per hectoliter improved 3.6% in 2010 reflecting selective price increases in the latter part of the year.
COST OF SALES
Consolidated cost of sales (“CoS”) for 2010 increased 1.1% and decreased 1.2% per hectoliter. On a constant geographic basis, CoS per hectoliter increased 0.6% with higher raw material and packaging costs in Latin America North and South offsetting procurement savings and the implementation of best practices programs in North America and Western Europe.
OPERATING EXPENSES
Total operating expenses increased 0.5% in 2010.
Distribution expenses increased 9.9% in 2010, driven by higher transport tariffs in Russia and Ukraine, and higher transportation costs in Brazil and China related to geographic expansion.
Sales and marketing expenses increased 2.0% in 2010, with higher investments in the first half of the year due to the timing of activities compared to the previous year. These higher investments were partially offset by reductions of non-working money, especially in the United States.
Administrative expenses decreased 12.8% in 2010 with continued fixed cost savings across our business, and lower accruals for variable compensation compared to 2009.
Other operating income/expenses amounted to 604m US dollar in 2010 compared to 649m US dollar in 2009.
NORMALIZED PROFIT FROM OPERATIONS BEFORE DEPRECIATION AND
AMORTIZATION (NORMALIZED EBITDA)
2010 EBITDA grew 10.6% to 13 869m US dollar, with EBITDA margin of 38.2% compared to 35.8% in 2009, up 209 bp organically.
• North America EBITDA increase of 6.5% to 6 444m US dollar in 2010. EBITDA margin improved from 40.5% in 2009 to 42.1% in 2010, attributable to revenue per hectoliter growth, lower cost of sales reflecting synergy savings and efficiency gains, and decreased operating expenses as a result of lower overhead costs;
• Latin America North EBITDA rose 16.4% to 4 780m US dollar with a slight EBITDA margin contraction of 25 bp to 47.7%, as higher input costs and distribution expenses offset revenue growth and savings in administrative expenses;
• Latin America South EBITDA rose 15.9% to 1 009m US dollar in 2010. EBITDA margin was essentially flat, as both higher cost of sales and sales and marketing expenses to support our brands, offset revenue per hectoliter growth in line with inflation;
• Western Europe EBITDA increased 6.6% to 1 099m US dollar, and the EBITDA margin improved 255 bp to 27.9%;

8
• Central and Eastern Europe EBITDA decreased 17.8% to 323m US dollar mainly due to delayed price increases to compensate the excise tax increase and higher transport tariffs, which led to higher distribution expenses;
• Asia Pacific achieved EBITDA growth of 18.3% to 292m US dollar driven by gross profit expansion and operational efficiencies partially offset by higher investments behind the growth of our brands;
• Global Export and Holding Companies, reported an EBITDA of (77)m US dollar in 2010, an improvement of 107m US dollar compared to 2009, due to lower corporate expenses and revenue growth of US packaging activities.
RECONCILIATION BETWEEN NORMALIZED EBITDA AND PROFIT
ATTRIBUTABLE TO EQUITY HOLDERS
Normalized EBITDA and EBIT are measures utilized by AB InBev to demonstrate the company’s underlying performance.
Normalized EBITDA is calculated excluding the following effects from profit attributable to equity holders of AB InBev: (i) Non-controlling interest, (ii) Income tax expense, (iii) Share of results of associates, (iv) Net finance cost, (v) Non-recurring net finance cost, (vi) Non-recurring items (including non-recurring impairment) and (vii) Depreciation, amortization and impairment.
Normalized EBITDA and EBIT are not accounting measures under IFRS accounting and should not be considered as an alternative to Profit attributable to equity holders as a measure of operational performance or as an alternative to cash flow as a measure of liquidity. Normalized EBITDA and EBIT do not have a standard calculation method and AB InBev’s definition of Normalized EBITDA and EBIT may not be comparable to that of other companies.
Million US dollar Notes 2010
2009 Reported
Profit attributable to equity holders of AB InBev................................................ 4 026 4 613 Non-controlling interest.......................................................................................... 1 736 1 264 Profit .................................................................................................................. 5 762 5 877
Income tax expense .............................................................................................. 12 1 920 1 786 Share of result of associates ................................................................................... 16 (521) (513) Non-recurring net finance cost ................................................................................ 11 925 629 Net finance cost .................................................................................................... 11 2 811 3 790 Non-recurring items (including non-recurring impairment) ......................................... 8 268 (1 321) Normalized EBIT................................................................................................. 11 165 10 248 Depreciation, amortization and impairment .............................................................. 2 704 2 789 Normalized EBITDA ............................................................................................ 13 869 13 037
Non-recurring items are either income or expenses which do not occur regularly as part of the normal activities of the company. They are presented separately because they are important for the understanding of the underlying sustainable performance of the company due to their size or nature. Details on the nature of the non-recurring items are disclosed in Note 8 Non-recurring items.
PROFIT
Normalized profit attributable to equity holders of AB InBev was 5 040m US dollar (normalized EPS 3.17 US dollar) in 2010, compared to 3 927m US dollar (normalized EPS 2.48 US dollar) in 2009 (on a Reported base). Profit attributable to equity holders of AB InBev for 2010 was 4 026m US dollar, compared to 4 613m US dollar in 2009 (on a Reported base) and includes the following impacts:
� Net finance cost (excluding non-recurring net finance cost): 2 811m US dollar in 2010 compares to 3 790m US dollar in 2009 as Reported. This decrease is mainly the result of lower net interest charges as a result of reduced net debt levels and lower accretion expenses as bank borrowings are being reduced as a percentage of total debt, favorable foreign exchange variances arising from EUR/USD currency fluctuations and gains from derivative contracts entered into to hedge risks associated with different share-based compensation programs;
• Non-recurring net finance cost: consists of incremental accretion expenses of 192m US dollar in 2010, and a one-time mark-to-market adjustment of 733m US dollar in 2010 as certain interest rate swaps hedging borrowings under our 2008 and 2010 senior bank facilities are no longer effective as a result of the repayment and refinancing of these facilities. While the accretion expense is a non-cash item, the cash equivalent of the negative mark-to-market adjustment is spread over the period 2010 to 2014;
• Share of result of associates: 521m US dollar in 2010 compared to 513m US dollar in 2009 as Reported, attributable to the result of Grupo Modelo in Mexico;
• Income tax expense: 2010 income tax expense of 1 920m US dollar compares with 1 786m US dollar in 2009. The effective tax rate increased from 25.0% in 2009 to 26.8% in 2010 primarily due to the non-deductibility of certain non-recurring charges associated with the refinancing and repayment of our senior facilities. Excluding the effect of non-recurring items, the normalized effective tax rate was 24.8% in 2010 versus 28.1% in 2009. The company continues to benefit at the AmBev level from the impact of interest on equity payments and tax deductible goodwill from the merger between InBev Holding Brazil and AmBev in 2005 and the acquisition of Quinsa in 2006;
• Profit attributable to non-controlling interests: 1 736m US dollar in 2010, an increase from 1 264m US dollar in 2009 as a result of the strong performance of AmBev and currency translation effects.

9
IMPACT OF FOREIGN CURRENCIES
Foreign currency exchange rates have a significant impact on AB InBev’s financial statements. The following table sets forth the percentage of its revenue realized by currency for the years ended 31 December 2010 and 2009 Reference base:
2010
2009 Reference base
US dollar .......................................................................................................................... 40.4% 43.7% Brazilian real .................................................................................................................... 26.7% 21.4% Euro ................................................................................................................................ 7.6% 9.1% Canadian dollar ................................................................................................................. 5.7% 5.7% Chinese yuan.................................................................................................................... 4.8% 5.1% Argentinean peso .............................................................................................................. 3.5% 3.4% Russian ruble .................................................................................................................... 3.3% 3.4% Other............................................................................................................................... 8.0% 8.2%
The following table sets forth the percentage of its normalized EBITDA realized by currency for the periods ended 31 December 2010 and 2009 Reference base:
2010
2009 Reference base
US dollar .......................................................................................................................... 40.5% 45.3% Brazilian real .................................................................................................................... 34.7% 29.2% Canadian dollar ................................................................................................................. 6.3% 6.5% Euro ................................................................................................................................ 5.4% 5.5% Argentinean peso .............................................................................................................. 3.6% 3.9% Chinese yuan.................................................................................................................... 2.2% 2.3% Russian ruble .................................................................................................................... 1.6% 2.3% Other............................................................................................................................... 5.7% 5.0%
The fluctuation of the foreign currency rates had a positive translation impact on AB InBev’s 2010 revenue of 1 255m US dollar (versus a negative impact in 2009 of 2 680m US dollar), Normalized EBITDA of 645m US dollar (versus a negative impact in 2009 of 977m US dollar) and Normalized EBIT of 588m US dollar (versus a negative impact in 2009 of 758m US dollar).
AB InBev’s profit (after tax) has been positively affected by the fluctuation of foreign currencies for 558m US dollar (versus a negative impact in 2009 of 599m US dollar), while the positive translation impact on its EPS base (profit attributable to equity holders of AB InBev) was 357m US dollar or 0.22 per share (versus a negative impact in 2009 of 441m US dollar or 0.28 per share).
The impact of the fluctuation of the foreign currencies on AB InBev’s net debt is (725)m US dollar (decrease of net debt) and on its equity 939m US dollar (increase of equity). In 2009 there was an impact of 897m US dollar (increase of net debt) and 2 216m US dollar (increase of equity), respectively.
Liquidity position and capital resources
CASH FLOWS
Million US dollar 2010 2009
Reported Cash flow from operating activities ..................................................................................... 9 905 9 124 Cash flow from investing activities...................................................................................... (2 546) 5 269 Cash flow from financing activities...................................................................................... (6 757) (13 096) Net increase/(decrease) in cash and cash equivalents ................................................. 602 1 297

10
Cash flows from operating activities
Million US dollar 2010 2009
Reported Profit .............................................................................................................................. 5 762 5 877 Interest, taxes and non-cash items included in profit ............................................................ 8 503 7 353 Cash flow from operating activities before changes in working capital and use of provisions...................................................................................................................... 14 265 13 230
Change in working capital.................................................................................................. 226 787 Pension contributions and use of provisions ......................................................................... (519) (548) Interest and taxes (paid)/received...................................................................................... (4 450) (4 345) Dividends received ........................................................................................................... 383 - Cash flow from operating activities ............................................................................... 9 905 9 124
AB InBev’s cash flow from operating activities reached 9 905m US dollar in 2010 compared to 9 124m US dollar in 2009, the reported figures of 2009 including the cash generated from operating activities of the businesses disposed in 2009. The increase is mainly explained by an increase in normalized EBITDA and dividends received from Modelo.
AB InBev devotes substantial efforts to the efficient use of its working capital, especially those elements of working capital that are perceived as ‘core’ (including trade receivables, inventories and trade payables). The changes in working capital contributed 226m US dollar to the operational cash flow in 2010. This change includes 143m US dollar cash outflow from derivatives. Excluding the impact of the derivatives, the change in working capital would have resulted in 369m US dollar cash impact.
Cash flow from investing activities
Million US dollar 2010
2009 Reported
Net capex.......................................................................................................................... (2 123) (1 386) Acquisition and sale of subsidiaries, net of cash acquired/disposed of, purchase and sale of non-controlling interest ....................................................................................................... (62) 4 586 Proceeds from the sale of associates and assets held for sale................................................... 146 1 813 Investment in short term debt securities ............................................................................... (604) - Other ............................................................................................................................... 97 256 Cash flow from investing activities.................................................................................. (2 546) 5 269
Net cash used in investing activities was 2 546m US dollar in 2010 as compared to net cash received of 5 269m US dollar in 2009. The 2009 cash flow is mainly explained by the disposal program AB InBev executed in 2009. Pursuant to this disposal program AB InBev divested during 2009 its 27% stake in Tsingtao (China), Oriental Brewery (Korea), four metal beverage can lid manufacturing plants from the US metal packaging subsidiary, Busch Entertainment Corporation, the Central European Operations, the Tennent’s Lager brand and associated trading assets in Scotland, Northern Ireland and the Republic of Ireland and the Labatt USA distribution rights.
Further details on acquisitions and disposals of subsidiaries and on the purchase and sale of non-controlling interests are disclosed respectively in Note 6 Acquisitions and disposals of subsidiaries, in Note 14 Goodwill and in Note 23 Changes in equity and earnings per share. Further detail on the disposal of assets held for sale and investments in associates are disclosed respectively in Note 22 Assets and liabilities held for sale and in Note 16 Investment in associates.
During 2010 the company invested 604m US dollar in Brazilian real denominated government debt securities in order to facilitate liquidity and capital preservation. These investments are of highly liquid nature.
AB InBev’s net capital expenditures amounted to 2 123m US dollar in 2010 and 1 386m US dollar in 2009. The increase was primarily related to higher investments in the growth regions of Brazil and China. Out of the total capital expenditures of 2010 approximately 53% was used to improve its production facilities while 38% was used for logistics and commercial investments. Approximately 9% was used for improving administrative capabilities and purchase of hardware and software.
Cash flow from financing activities
Million US dollar 2010 2009
Reported Dividends paid ................................................................................................................... (1 924) (1 313) Net (payments) on/proceeds from borrowings ....................................................................... (4 290) (11 793) Net proceeds from the issue of share capital.......................................................................... 215 76 Other (including net financing cost other than interest) ........................................................... (758) (66) Cash flow from financing activities.................................................................................. (6 757) (13 096)
The cash outflow from AB InBev’s financing activities amounted to 6 757m US dollar in 2010, as compared to a cash outflow of 13 096m US dollar in 2009. The 2010 cash flow from financing activities reflects higher dividend pay outs as compared to 2009, net repayments from borrowings as well as settlements of derivatives not part of a hedging relationship. In 2009, the cash flow from financing activities was primarily due to the effect of the deleveraging program, resulting in higher payments on borrowings.
AB InBev’s cash, cash equivalents and short term investments in debt securities less bank overdrafts as at 31 December 2010 amounted to 5 138m US dollar. As of 31 December 2010, the company had an aggregate of 568m US dollar available under committed short-term credit facilities and an aggregate of 8 587m US dollar available under committed long-term credit facilities. Although AB InBev may borrow such amounts to meet its liquidity needs, the company principally relies on cash flows from operating activities to fund its continuing operations.

11
CAPITAL RESOURCES AND EQUITY
AB InBev’s net debt decreased to 39 704m US dollar as of 31 December 2010, from 45 174m US dollar as of 31 December 2009.
Net debt is defined as non-current and current interest-bearing loans and borrowings and bank overdrafts minus debt securities and cash. Net debt is a financial performance indicator that is used by AB InBev’s management to highlight changes in the company’s overall liquidity position. The company believes that net debt is meaningful for investors as it is one of the primary measures AB InBev’s management uses when evaluating its progress towards deleveraging.
Apart from operating results net of capital expenditures, the net debt is mainly impacted by dividend payments to shareholders of AB InBev and AmBev (1 924m US dollar); the payment of interest and taxes (4 450m US dollar); and the impact of changes in foreign exchange rates (725m US dollar decrease of net debt).
To finance the acquisition of Anheuser-Busch, AB InBev entered into a 45 billion US dollar senior facilities agreement, of which 44 billion US dollar was ultimately drawn (the “2008 senior credit facility”) and a 9.8 billion US dollar bridge facility agreement, enabling the company to consummate the acquisition, including the payment of 52.5 billion US dollar to shareholders of Anheuser-Busch, refinancing certain Anheuser-Busch indebtedness, payment of all transaction charges, fees and expenses and accrued but unpaid interest to be paid on Anheuser-Busch’s outstanding indebtedness. On 18 December 2008, AB InBev repaid the debt it incurred under the bridge facility with the net proceeds of the rights issue and cash proceeds received by AB InBev from pre-hedging the foreign exchange rate between the euro and the US dollar in connection with the rights issue. As of December 2009, AB InBev has refinanced approximately 27 billion US dollar of the 44 billion US dollar debt incurred under the 2008 senior credit facility with the proceeds of several debt capital markets offerings and the proceeds from the disposal program. As of 31 December 2010, AB InBev fully refinanced the debt incurred under the 2008 senior credit facility with the proceeds from new senior credit facilities, from other debt market offerings, and from cash generated from operations.
Net debt to normalized EBITDA as of 31 December 2010 was 2.86 (as of 31 December 2009: 3.73 on the Reference base).
Consolidated equity attributable to equity holders of AB InBev as at 31 December 2010 was 35 259m US dollar, compared to 30 318m US dollar as at 31 December 2009. The combined effect of the strengthening of mainly the closing rates of the Brazilian real, the Canadian dollar, the Chinese yuan, the Mexican peso and the Ukrainian hryvnia and the weakening of mainly the closing rates of the Argentinean peso, the euro, the pound sterling and the Russian ruble resulted in a foreign exchange translation adjustment of 939m US dollar. Further details on equity movements can be found in the consolidated statement of changes in equity.
Further details on interest bearing loans and borrowings, repayment schedules and liquidity risk, are disclosed in Note 24 Interest-bearing loans and borrowings and Note 29 Risks arising from financial instruments.
Research and development
Given its focus on innovation, AB InBev places a high value on research and development. In 2010 AB InBev expensed 184m US dollar in research and development, compared to 159m US dollar in 2009. Part of this was spent in the area of market research, but the majority is related to innovation in the areas of process optimization and product development.
Research and development in process optimization is primarily aimed at capacity increase (plant debottlenecking and addressing volume issues, while minimizing capital expenditure), quality improvement and cost management. Newly developed processes, materials and/or equipment are documented in best practices and shared across business zones. Current projects range from malting to bottling of finished products.
Research and development in product innovation covers liquid, packaging and draft innovation. Product innovation consists of breakthrough innovation, incremental innovation and renovation (that is, implementation of existing technology). The main goal for the innovation process is to provide consumers with better products and experiences. This implies launching new liquid, new packaging and new draught products that deliver better performance both for the consumer and in terms of financial results, by increasing AB InBev's competitiveness in the relevant markets. With consumers comparing products and experiences offered across very different drink categories and the offering of beverages increasing, AB InBev's research and development efforts also require an understanding of the strengths and weaknesses of other drink categories, spotting opportunities for beer and developing consumer solutions (products) that better address consumer need and deliver better experience. This requires understanding consumer emotions and expectations. Sensory experience, premiumization, convenience, sustainability and design are all central to AB InBev's research and development efforts.
Knowledge management and learning is also an integral part of research and development. AB InBev seeks to continuously increase its knowledge through collaborations with universities and other industries.
AB InBev's research and development team is briefed annually on the company's and the business zones' priorities and approves concepts which are subsequently prioritized for development. Launch time, depending on complexity and prioritization, usually falls within the next calendar year.
The Global Innovation and Technology Center (“GITeC”), located in Leuven, accommodates the Packaging, Product, Process Development teams and facilities such as Labs, Experimental Brewery and the European Central Lab, which also includes Sensory Analysis. In addition to GITeC, AB InBev also has Product, Packaging and Process development teams located in each of the six AB InBev geographic regions focusing on the short-term needs of such regions.
12
Risks and uncertainties
Under the explicit understanding that this is not an exhaustive list, AB InBev’s major risk factors and uncertainties are listed below. There may be additional risks which AB InBev is unaware of. There may also be risks AB InBev now believes to be immaterial, but which could turn out to have a material adverse effect. Moreover, if and to the extent that any of the risks described below materialize, they may occur in combination with other risks which would compound the adverse effect of such risks. The sequence in which the risk factors are presented below is not indicative of their likelihood of occurrence or of the potential magnitude of their financial consequence.
RISKS RELATING TO AB INBEV AND THE BEER AND BEVERAGE INDUSTRY
AB InBev relies on the reputation of its brands and its success depends on its ability to maintain and enhance the image and reputation of its existing products and to develop a favorable image and reputation for new products. An event, or series of events, that materially damages the reputation of one or more of AB InBev's brands could have an adverse effect on the value of that brand and subsequent revenues from that brand or business. Further, any restrictions on the permissible advertising style, media and messages used or the introduction of similar restrictions may constraint AB InBev’s brand building potential and thus reduce the value of its brands and related revenues.
AB InBev may not be able to protect its current and future brands and products and defend its intellectual property rights, including trademarks, patents, domain names, trade secrets and know-how, which could have a material adverse effect on its business, results of operations, cash flows or financial condition, and in particular, on AB InBev’s ability to develop its business.
Certain of AB InBev's operations depend on independent distributors' or wholesalers’ efforts to sell AB InBev's products and there can be no assurance that such distributors will not give priority to AB InBev's competitors. Further, any inability of AB InBev to replace unproductive or inefficient distributors could adversely impact AB InBev's business, results of operations and financial condition.
Changes in the availability or price of raw materials, commodities and energy could have an adverse effect on AB InBev's results of operations to the extent that AB InBev fails to adequately manage the risks inherent in such volatility, including if AB InBev’s hedging and derivative arrangements do not effectively or completely hedge changes in commodity prices.
AB InBev relies on key third parties, including key suppliers for a range of raw materials for beer and soft drinks, and for packaging material. The termination of or material change to arrangements with certain key suppliers or the failure of a key supplier to meet its contractual obligations could have a material impact on AB InBev's production, distribution and sale of beer and soft drinks and have a material adverse effect on AB InBev's business, results of operations, cash flows or financial condition. In addition, a number of key brand names are both licensed to third-party brewers and used by companies over which AB InBev does not have control. To the extent that one of these key brand names or joint ventures, investments in companies in which AB InBev does not own a controlling interest and AB InBev’s licensees are subject to negative publicity, it could have a material adverse effect on AB InBev’s business, results of operations, cash flows or financial condition.
Competition in its various markets could cause AB InBev to reduce pricing, increase capital investment, increase marketing and other expenditures, prevent AB InBev from increasing prices to recover higher cost and thereby cause AB InBev to reduce margins or lose market share, any of which could have a material adverse effect on AB InBev's business, financial condition and results of operations.
The continued consolidation of retailers in markets in which AB InBev operates could result in reduced profitability for the beer industry as a whole and indirectly adversely affects AB InBev’s financial results. AB InBev could incur significant costs as a result of compliance with, and/or violations of or liabilities under, various regulations that govern AB InBev's operations. Also, public concern about beer and soft drink consumption (e.g. concerns over alcoholism, under age drinking or obesity) and any resulting restrictions may cause the social acceptability of beer and soft drink to decline significantly and consumption trends to shift away from these products, which would have a material adverse effect on AB InBev’s business, financial condition and results of operations. AB InBev's operations are subject to environmental regulations, which could expose it to significant compliance costs and litigation relating to environmental issues.
Antitrust and competition laws and changes in such laws or in the interpretation and enforcement thereof as well as being subject to regulatory scrutiny, could have a material adverse effect on AB InBev's business.
Negative publicity regarding AB InBev's products and brands (e.g. because of concerns over alcoholism, under age drinking or obesity) or publication of studies indicating a significant risk in using AB InBev’s products generally or changes in consumer perceptions in relation to AB InBev’s products could adversely affect the sale and consumption of AB InBev’s products and could harm its business, results of operations, cash flows or financial condition. Demand for AB InBev's products may be adversely affected by changes in consumer preferences and tastes. Consumer preferences and tastes can change in unpredictable ways. Failure by AB InBev to anticipate or respond adequately to changes in consumer preferences and tastes could adversely impact AB InBev's business, results of operations and financial condition.
The beer and beverage industry may be subject to changes in taxation, which makes up a large proportion of the cost of beer charged to consumers in many jurisdictions. Increases in excise and other indirect taxes applicable to AB InBev’s products tend to adversely affect AB InBev’s revenue or margins both by reducing overall consumption and by encouraging consumers to switch to lower-taxed categories of beverages. An increase in beer excise taxes or other taxes could adversely affect the financial results of AB InBev as well as its results of operations.

13
Seasonal consumption cycles and adverse weather conditions in the markets in which AB InBev operates may result in fluctuations in demand for AB InBev's products and therefore may have an adverse impact on AB InBev's business, results of operations and financial condition.
A substantial portion of AB InBev’s operations are carried out in emerging European, Asian and Latin American markets. AB InBev’s operations and equity investments in these markets are subject to the customary risks of operating in developing countries, which include, amongst others, potential political and economic uncertainty, application of exchange controls, nationalization or expropriation, crime and lack of law enforcement. Such emerging market risks could adversely impact AB InBev’s business, results of operations and financial condition.
If any of AB InBev products is defective or found to contain contaminants, AB InBev may, despite of it having certain product liability insurance policies in place, be subject to product recalls or other liabilities, which could adversely impact its business, reputation, prospects, results of operations and financial condition. AB InBev may not be able to obtain the necessary funding for its future capital or refinancing needs and it faces financial risks due to its level of debt and uncertain market conditions. AB InBev may be required to raise additional funds for AB InBev’s future capital needs or refinance its current indebtedness through public or private financing, strategic relationships or other arrangements and there can be no assurance that the funding, if needed, will be available on attractive terms, or at all. AB InBev has incurred substantial indebtedness in connection with the Anheuser-Busch acquisition. AB InBev financed the Anheuser-Busch acquisition in part with fully committed credit facilities. Although AB InBev repaid the debt incurred under the bridge facility and it refinanced the debt incurred under the 2008 senior acquisition facilities, AB InBev will still have an increased level of debt after the acquisition, which could have significant adverse consequences on AB InBev, including (i) increasing its vulnerability to general adverse economic and industry conditions, (ii) limiting its flexibility in planning for, or reacting to, changes in its business and the industry in which AB InBev operates; (iii) impairing its ability to obtain additional financing in the future, (iv) requiring AB InBev to issue additional equity (potentially under unfavorable market conditions), and (v) placing AB InBev at a competitive disadvantage compared to its competitors that have less debt. AB InBev's ability to repay its outstanding indebtedness will be dependent upon market conditions. Unfavorable conditions could increase costs beyond what is currently anticipated and these costs could have a material adverse impact on AB InBev’s cash flows, results of operations or both. Further, AB InBev reduced the amount of dividends it paid in the first years after the closing of the Anheuser-Busch acquisition, and may continue to restrict the amount of dividends it will pay as a result of AB InBev’s level of debt and its strategy to reduce the leverage of AB InBev. Further, a credit rating downgrade could have a material adverse effect on AB InBev’s ability to finance its ongoing operations or to refinance its existing indebtedness. In addition, a failure of AB InBev to raise additional equity capital or debt financing or to realize proceeds from asset sales when needed could adversely impact its business, results of operations and financial condition. AB InBev’s results could be negatively affected by increasing interest rates. Although AB InBev enters into interest rate swap agreements to manage its interest rate risk and also enters into cross-currency interest rate swap agreements to manage both its foreign currency risk and interest-rate risk on interest-bearing financial liabilities, there can be no assurance that such instruments will be successful in reducing the risks inherent in exposures to interest rate fluctuations.
AB InBev results of operations are affected by fluctuations in exchange rates. Any change in exchange rates between AB InBev’s operating companies’ functional currencies and the US dollar will affect its consolidated income statement and balance sheet when the results of those operating companies are translated into US dollar for reporting purposes. Also, there can be no assurance that the policies in place to manage commodity price and foreign currency risks to protect AB InBev’s exposure will be able to successfully hedge against the effects of such foreign exchange exposure, particularly over the long-term. Further, financial instruments to mitigate currency risk and any other efforts taken to better match the effective currencies of AB InBev’s liabilities to its cash flows could result in increased costs.
The ability of AB InBev’s subsidiaries to distribute cash upstream may be subject to various conditions and limitations. The inability to obtain sufficient cash flows from its domestic and foreign subsidiaries and affiliated companies could adversely impact AB InBev’s ability to pay its substantially increased debt resulting from the Anheuser-Busch acquisition and otherwise negatively impact its business, results of operations and financial condition.
Failure to generate significant cost savings and margin improvement through initiatives for improving operational efficiency could adversely affect AB InBev’s profitability and AB InBev’s ability to achieve its financial goals. AB InBev may not be able to successfully carry out further acquisitions and business integrations or restructuring. AB InBev cannot make further acquisitions unless it can identify suitable candidates and agree on terms with them. Such transactions involve a number of risks and may involve the assumption of certain liabilities, which may have a potential impact on AB InBev’s financial risk profile. Further, the price AB InBev may pay in any future acquisition may prove to be too high as a result of various factors.
After the completion of the transaction, if the integration of businesses meets with unexpected difficulties, or if the business of AB InBev does not develop as expected, impairment charges on goodwill or other intangible assets may be incurred in the future which could be significant and which could have an adverse effect on AB InBev's results of operations and financial condition.
Although AB InBev’s operations in Cuba are quantitatively immaterial, its overall business reputation may suffer or it may face additional regulatory scrutiny as a result of its activities in Cuba based on Cuba’s identification as a state sponsor of terrorism and target of US economic and trade sanctions. If investors decide to liquidate or otherwise divest their investments in companies that have operations of any magnitude in Cuba, the market in and value of AB InBev’s securities could be adversely impacted. In addition, US legislation known as the “Helms-Burton Act” authorizes private lawsuits for damages against anyone who traffics in property confiscated without compensation by the Government of Cuba from persons who at the time were, or have since become, nationals of the United States. Although this section of the Helms-Burton Act is currently suspended, claims accrue notwithstanding the suspension and may be asserted if the suspension is discontinued. AB InBev has received notice of claims purporting to be made under the Helms-Burton Act. AB InBev is currently unable to express a view as to the validity of such claims, or as to the standing of the claimants to pursue them.
14
AB InBev may not be able to recruit or retain key personnel and successfully manage them, which could disrupt AB InBev’s business and have an unfavorable material effect on AB InBev’s financial position, its income from operations and its competitive position.
Further, AB InBev may be exposed to labor strikes, disputes and work stoppages or slowdown, within its operations or those of its suppliers, or an interruption or shortage of raw materials for any other reason that could lead to a negative impact on AB InBev’s costs, earnings, financial condition, production level and ability to operate its business. AB InBev’s production may also be affected by work stoppages or slowdowns that affect its suppliers, as a result of disputes under existing collective labor agreements with labor unions, in connection with negotiations of new collective labor agreements, as a result of supplier financial distress, or for other reasons. A work stoppage or slowdown at AB InBev’s facilities could interrupt the transport of raw materials from its suppliers or the transport of its products to its customers. Such disruptions could put a strain on AB InBev’s relationships with suppliers and clients and may have lasting effects on its business even after the disputes with its labor force have been resolved, including as a result of negative publicity. Information technology failures or interruptions could disrupt AB InBev’s operations and could have a material adverse effect on AB InBev’s business, results of operations, cash flows or financial condition. AB InBev’s business and operating results could be negatively impacted by social, technical, natural, physical or other disasters. AB InBev’s insurance coverage may not be sufficient. Should an uninsured loss or a loss in excess of insured limits occur, this could adversely impact AB InBev’s business, results of operations and financial condition. AB InBev is exposed to the risk of a global recession or a recession in one or more of its key markets, and to credit and capital market volatility and economic and financial crisis, which could result in lower revenue and reduced profit, as beer consumption in many of the jurisdictions in which AB InBev operates is closely linked to general economic conditions and changes in disposable income. A continuation or worsening of the levels of market disruption and volatility seen in the last three years could have an adverse effect on AB InBev’s ability to access capital, on its business, results of operations and financial condition, and on the market price of its shares and ADSs. AB InBev is now, and may in the future be, a party to legal proceedings and claims, including collective suits (class actions), and significant damages may be asserted against it. Given the inherent uncertainty of litigation, it is possible that AB InBev might incur liabilities as a consequence of the proceedings and claims brought against it, which could have a material adverse effect on AB InBev’s business, results of operations, cash flows or financial position. Important contingencies are disclosed in Note 32 Contingencies of the consolidated financial statements.
RISKS ARISING FROM FINANCIAL INSTRUMENTS
Note 29 of the 2010 consolidated financial statements on Risks arising from financial instruments contains detailed information on the company’s exposures to financial risks and its risk management policies.
Events after the balance sheet date
Please refer to Note 34 Events after the balance sheet date of the consolidated financial statements.
Corporate governance
For the required information with respect to Corporate Governance, please refer to the Corporate Governance section of AB InBev's annual report.

15
Statement of the Board of Directors
The board of directors of AB InBev SA/NV certifies, on behalf and for the account of the company, that, to their knowledge, (a) the financial statements which have been prepared in accordance with International Financial Reporting Standards give a true and fair view of the assets, liabilities, financial position and profit or loss of the company and the entities included in the consolidation as a whole and (b) the management report includes a fair review of the development and performance of the business and the position of the company and the entities included in the consolidation as a whole, together with a description of the principal risks and uncertainties they face.
16
Independent auditors’ report

17

18
Consolidated financial statements
Consolidated income statement
For the year ended 31 December Million US dollar Notes 2010 20091 Revenue ................................................................................................. 36 297 36 758 Cost of sales ............................................................................................. (16 151) (17 198) Gross profit ............................................................................................ 20 146 19 560
Distribution expenses................................................................................. (2 913) (2 671) Sales and marketing expenses .................................................................... (4 712) (4 992) Administrative expenses............................................................................. (1 960) (2 310) Other operating income/(expenses)............................................................. 7 604 661 Profit from operations before non-recurring items................................. 11 165 10 248
Restructuring (including impairment losses) ................................................. 8 (252) (153) Fair value adjustments............................................................................... 8 - (67) Business and asset disposal (including impairment losses) ............................. 8 (16) 1 541 Profit from operations ........................................................................... 10 897 11 569 Finance cost ............................................................................................. 11 (3 336) (4 137) Finance income ......................................................................................... 11 525 347 Non-recurring finance cost.......................................................................... 8 (925) (629) Net finance cost ..................................................................................... (3 736) (4 419)
Share of result of associates ....................................................................... 16 521 513 Profit before tax ..................................................................................... 7 682 7 663
Income tax expense .................................................................................. 12 (1 920) (1 786) Profit ...................................................................................................... 5 762 5 877
Attributable to: Equity holders of AB InBev ................................................................. 4 026 4 613 Non-controlling interest...................................................................... 1 736 1 264 Basic earnings per share ............................................................................ 23 2.53 2.91 Diluted earnings per share.......................................................................... 23 2.50 2.90 Basic earnings per share before non-recurring items2 .................................... 23 3.17 2.48 Diluted earnings per share before non-recurring items² ................................. 23 3.13 2.47
Consolidated statement of comprehensive income
For the year ended 31 December Million US dollar
2010
20091
Profit ..................................................................................................................... 5 762 5 877 Other comprehensive income: Exchange differences on translation of foreign operations (gains/(losses))....................... 606 2 146 Cash flow hedges Recognized in equity.............................................................................................. (120) 729 Removed from equity and included in profit or loss.................................................... 892 478 Removed from equity and included in the initial cost of inventories.............................. - (37) Actuarial gains/(losses)............................................................................................. (191) 134 Share of other comprehensive income of associates ..................................................... 385 322 Other comprehensive income, net of tax ............................................................... 1 572 3 772
Total comprehensive income................................................................................. 7 334 9 649
Attributable to:
Equity holders of AB InBev................................................................................... 5 571 8 168 Non-controlling interest ....................................................................................... 1 763 1 481
The accompanying notes are an integral part of these consolidated financial statements.
1 Reclassified to conform to the 2010 presentation. 2 Basic earnings per share and diluted earnings per share before non-recurring items are not defined metrics in IFRS. Refer to Note 23 Changes in equity and earnings
per share for more details.

19
Consolidated statement of financial position
The accompanying notes are an integral part of these consolidated financial statements.
As at 31 December Million US dollar Notes 2010
2009
ASSETS Non-current assets Property, plant and equipment ............................................................... 13 15 893 16 461 Goodwill .............................................................................................. 14 52 498 52 125 Intangible assets.................................................................................. 15 23 359 23 165 Investments in associates ..................................................................... 16 7 295 6 744 Investment securities ........................................................................... 17 243 277 Deferred tax assets .............................................................................. 18 744 949 Employee benefits ................................................................................ 25 13 10 Trade and other receivables................................................................... 20 1 700 1 941 101 745 101 672 Current assets Investment securities ........................................................................... 17 641 55 Inventories.......................................................................................... 19 2 409 2 354 Income tax receivable........................................................................... 366 590 Trade and other receivables................................................................... 20 4 638 4 099 Cash and cash equivalents..................................................................... 21 4 511 3 689 Assets held for sale .............................................................................. 22 32 66 12 597 10 853
Total assets ....................................................................................... 114 342 112 525
EQUITY AND LIABILITIES Equity Issued capital ...................................................................................... 23 1 733 1 732 Share premium .................................................................................... 17 535 17 515 Reserves ............................................................................................. 2 335 623 Retained earnings ................................................................................ 13 656 10 448 Equity attributable to equity holders of AB InBev ............................. 35 259 30 318
Non-controlling interest .................................................................... 3 540 2 853 38 799 33 171
Non-current liabilities Interest-bearing loans and borrowings .................................................... 24 41 961 47 049 Employee benefits ................................................................................ 25 2 746 2 611 Deferred tax liabilities ........................................................................... 18 11 909 12 495 Trade and other payables ...................................................................... 28 2 295 1 979 Provisions............................................................................................ 27 912 966 59 823 65 100
Current liabilities Bank overdrafts ................................................................................... 21 14 28 Interest-bearing loans and borrowings .................................................... 24 2 919 2 015 Income tax payable .............................................................................. 478 526 Trade and other payables ...................................................................... 28 12 071 11 377 Provisions............................................................................................ 27 238 308 15 720 14 254
Total equity and liabilities ................................................................. 114 342 112 525

20
Consolidated statement of changes in equity
Attributable to equity holders of AB InBev
Million US dollar
Issued capital
Share premium
Treasury shares
Share- based
payment reserves
Translation reserves
Hedging reserves
Actuarial gains/ (losses)
Other reserves
Retained earnings
Total
Non-controlling interest
Total equity
As per 1 January 2009 .............................................. 1 730 17 477 (997) 123 1 027 (2 242) (712) (446) 6 482 22 442 1 989 24 431
Profit......................................................................... - - - - - - - - 4 613 4 613 1 264 5 877 Other comprehensive income Exchange differences on translation of foreign operations (gains/(losses)) ........................................ - - - - 1 894 - - - - 1 894 252 2 146 Cash flow hedges ..................................................... - - - - - 1 190 - - - 1 190 (20) 1 170 Actuarial gains/(losses) ............................................. - - - - - - 165 - (16) 149 (15) 134 Share of other comprehensive income of associates...... - - - - 322 - - - - 322 - 322
Total comprehensive income..................................... - - - - 2 216 1 190 165 - 4 597 8 168 1 481 9 649 Shares issued.............................................................. 2 38 - - - - - - - 40 - 40 Dividends.................................................................... - - - - - - - - (669) (669) (722) (1 391) Share-based payments ................................................. - - - 145 - - - - - 145 10 155 Treasury shares ........................................................... - - 338 - - - - (184) - 154 (3) 151 Scope and other changes .............................................. - - - - - - - - 38 38 98 136 As per 31 December 2009......................................... 1 732 17 515 (659) 268 3 243 (1 052) (547) (630) 10 448 30 318 2 853 33 171
Attributable to equity holders of AB InBev
Million US dollar
Issued capital
Share premium
Treasury shares
Share- based
payment reserves
Translation reserves
Hedging reserves
Actuarial gains/ (losses)
Other reserves
Retained earnings
Total
Non-controlling interest
Total equity
As per 1 January 2010 .............................................. 1 732 17 515 (659) 268 3 243 (1 052) (547) (630) 10 448 30 318 2 853 33 171
Profit......................................................................... - - - - - - - - 4 026 4 026 1 736 5 762
Other comprehensive income
Exchange differences on translation of foreign operations (gains/(losses)) ........................................ - - - - 554 - - - - 554 52 606 Cash flow hedges ..................................................... - - - - - 746 - - - 746 26 772 Actuarial gains/(losses) ............................................. - - - - - - (140) - - (140) (51) (191) Share of other comprehensive income of associates...... - - - - 385 - - - - 385 - 385
Total comprehensive income..................................... - - - - 939 746 (140) - 4 026 5 571 1 763 7 334
Shares issued.............................................................. 1 20 - - - - - - - 21 - 21 Dividends.................................................................... - - - - - - - - (857) (857) (1 119) (1 976) Share-based payments ................................................. - - - 111 - - - - - 111 15 126 Treasury shares ........................................................... - - 71 - - - - (15) - 56 4 60 Scope and other changes .............................................. - - - - - - - - 39 39 24 63 As per 31 December 2010......................................... 1 733 17 535 (588) 379 4 182 (306) (687) (645) 13 656 35 259 3 540 38 799
The accompanying notes are an integral part of these consolidated financial statements.

21
Consolidated cash flow statement
For the year ended 31 December Million US dollar Notes 2010 20091 OPERATING ACTIVITIES Profit .................................................................................................... 5 762 5 877 Depreciation, amortization and impairment ................................................ 10 2 788 2 818 Impairment losses on receivables, inventories and other assets .................... 150 167 Additions/(reversals) in provisions and employee benefits ............................ 373 188 Non-recurring finance cost........................................................................ 11 925 629 Net finance cost ...................................................................................... 11 2 811 3 790 Loss/(gain) on sale of property, plant and equipment and intangible assets.... (113) (189) Loss/(gain) on sale of subsidiaries, associates and assets held for sale........... (58) (1 555) Equity-settled share-based payment expense ............................................. 26 156 208 Income tax expense ................................................................................ 12 1 920 1 786 Other non-cash items included in the profit ................................................ 72 24 Share of result of associates ..................................................................... 16 (521) (513) Cash flow from operating activities before changes in working capital and use of provisions ........................................................................... 14 265 13 230 Decrease/(increase) in trade and other receivables...................................... (190) 149 Decrease/(increase) in inventories............................................................. (134) 301 Increase/(decrease) in trade and other payables ......................................... 550 337 Pension contributions and use of provisions ................................................ (519) (548) Cash generated from operations .......................................................... 13 972 13 469
Interest paid........................................................................................... (2 987) (2 908) Interest received..................................................................................... 219 132 Dividends received .................................................................................. 383 - Income tax paid ...................................................................................... (1 682) (1 569)
CASH FLOW FROM OPERATING ACTIVITIES ......................................... 9 905 9 124
INVESTING ACTIVITIES Proceeds from sale of property, plant and equipment and of intangible assets. 221 327 Proceeds from sale of assets held for sale................................................... 121 877 Proceeds from sale of associates ............................................................... 25 936 Sale of subsidiaries, net of cash disposed of ............................................... 6 9 5 232 Acquisition of subsidiaries, net of cash acquired .......................................... 6 (37) (608) Purchase of non-controlling interest........................................................... 23 (34) (38) Acquisition of property, plant and equipment and of intangible assets............ 13-15 (2 344) (1 713) Investment in short term debt securities .................................................... 17 (604) - Net proceeds/(acquisition) of other assets .................................................. 81 227 Net repayments/(payments) of loans granted ............................................. 16 29 CASH FLOW FROM INVESTING ACTIVITIES.......................................... (2 546) 5 269
FINANCING ACTIVITIES Net proceeds from the issue of share capital............................................... 23 215 76 Proceeds from borrowings ........................................................................ 27 313 27 834 Payments on borrowings .......................................................................... (31 603) (39 627) Cash net finance costs other than interests................................................. (754) (62) Payment of finance lease liabilities............................................................. (4) (4) Dividends paid ........................................................................................ (1 924) (1 313) CASH FLOW FROM FINANCING ACTIVITIES.......................................... (6 757) (13 096)
Net increase/(decrease) in cash and cash equivalents ........................ 602 1 297
Cash and cash equivalents less bank overdrafts at beginning of year ............. 3 661 2 171 Effect of exchange rate fluctuations ........................................................... 234 193 Cash and cash equivalents less bank overdrafts at end of year ............ 21 4 497 3 661
The accompanying notes are an integral part of these consolidated financial statements.
1 Reclassified to conform to the 2010 presentation.

22
Notes to the consolidated financial statements
Corporate information................................................................................................................................................ 1
Statement of compliance............................................................................................................................................ 2
Summary of significant accounting policies ................................................................................................................... 3
Use of estimates and judgments ................................................................................................................................. 4
Segment reporting .................................................................................................................................................... 5
Acquisitions and disposals of subsidiaries ..................................................................................................................... 6
Other operating income/(expenses)............................................................................................................................. 7
Non-recurring items................................................................................................................................................... 8
Payroll and related benefits ........................................................................................................................................ 9
Additional information on operating expenses by nature................................................................................................. 10
Finance cost and income ............................................................................................................................................ 11
Income taxes............................................................................................................................................................ 12
Property, plant and equipment .................................................................................................................................... 13
Goodwill ................................................................................................................................................................... 14
Intangible assets....................................................................................................................................................... 15
Investment in associates............................................................................................................................................ 16
Investment securities ................................................................................................................................................ 17
Deferred tax assets and liabilities ................................................................................................................................ 18
Inventories............................................................................................................................................................... 19
Trade and other receivables........................................................................................................................................ 20
Cash and cash equivalents.......................................................................................................................................... 21
Assets and liabilities held for sale ................................................................................................................................ 22
Changes in equity and earnings per share .................................................................................................................... 23
Interest-bearing loans and borrowings ......................................................................................................................... 24
Employee benefits ..................................................................................................................................................... 25
Share-based payments .............................................................................................................................................. 26
Provisions................................................................................................................................................................. 27
Trade and other payables ........................................................................................................................................... 28
Risks arising from financial instruments ....................................................................................................................... 29
Operating leases ....................................................................................................................................................... 30
Collateral and contractual commitments for the acquisition of property, plant and equipment, loans to customers and other .. 31
Contingencies ........................................................................................................................................................... 32
Related parties.......................................................................................................................................................... 33
Events after the balance sheet date ............................................................................................................................. 34
AB InBev companies .................................................................................................................................................. 35
23
1. CORPORATE INFORMATION
Anheuser-Busch InBev is a publicly traded company (Euronext: ABI) based in Leuven, Belgium, with an American Depositary Receipt secondary listing on the New York Stock Exchange (NYSE: BUD). It is the leading global brewer and one of the world's top five consumer products companies. A true consumer-centric, sales driven organization, AB InBev manages a portfolio of well over 200 beer brands that includes global flagship brands Budweiser®, Stella Artois® and Beck’s®, fast growing multi-country brands like Leffe® and Hoegaarden®, and strong “local champions” such as Bud Light®, Skol®, Brahma®, Quilmes®, Michelob®, Harbin®, Sedrin®, Klinskoye®, Sibirskaya Korona®, Chernigivske®, and Jupiler®, among others. In addition, the company owns a 50 percent equity interest in the operating subsidiary of Grupo Modelo, Mexico's leading brewer and owner of the global Corona® brand. AB InBev’s dedication to heritage and quality is rooted in brewing traditions that originate from the Den Hoorn brewery in Leuven, Belgium, dating back to 1366 and the pioneering spirit of the Anheuser & Co brewery, which traces its origins back to 1852 in St. Louis, USA. Geographically diversified with a balanced exposure to developed and developing markets, AB InBev leverages the collective strengths of its approximately 114 000 employees based in operations in 23 countries across the world. The company strives to be the Best Beer Company in a Better World. In 2010, AB InBev realized 36.3 billion US dollar revenue. For more information, please visit: www.ab-inbev.com. The consolidated financial statements of the company for the year ended 31 December 2010 comprise the company and its subsidiaries (together referred to as “AB InBev” or the “company”) and the company’s interest in associates and jointly controlled entities. The financial statements were authorized for issue by the board of directors on 2 March 2011.
2. STATEMENT OF COMPLIANCE
The consolidated financial statements are prepared in accordance with International Financial Reporting Standards as issued by the International Accounting Standards Board (‘IASB”) and in conformity with IFRS as adopted by the European Union up to 31 December 2010 (collectively “IFRS”). AB InBev did not apply any European carve-outs from IFRS. AB InBev has not applied early any new IFRS requirements that are not yet effective in 2010.
3. SUMMARY OF SIGNIFICANT ACCOUNTING POLICIES
(A) BASIS OF PREPARATION AND MEASUREMENT
Depending on the applicable IFRS requirements, the measurement basis used in preparing the financial statements is cost, net realizable value, fair value or recoverable amount. Whenever IFRS provides an option between cost and another measurement basis (e.g. systematic re-measurement), the cost approach is applied.
(B) FUNCTIONAL AND PRESENTATION CURRENCY
Effective 1 January 2009, the company changed the presentation currency of the consolidated financial statements from the euro to the US dollar, reflecting the post-Anheuser-Busch acquisition profile of the company’s revenue and cash flows, which are now primarily generated in US dollar and US dollar-linked currencies. AB InBev believes that this change provides greater alignment of the presentation currency with AB InBev’s most significant operating currency and underlying financial performance. Unless otherwise specified, all financial information included in these financial statements have been stated in US dollar and has been rounded to the nearest million. The functional currency of the parent company is the euro.
(C) USE OF ESTIMATES AND JUDGMENTS
The preparation of financial statements in conformity with IFRS requires management to make judgments, estimates and assumptions that affect the application of policies and reported amounts of assets and liabilities, income and expenses. The estimates and associated assumptions are based on historical experience and various other factors that are believed to be reasonable under the circumstances, the results of which form the basis of making the judgments about carrying values of assets and liabilities that are not readily apparent from other sources. Actual results may differ from these estimates.
The estimates and underlying assumptions are reviewed on an ongoing basis. Revisions to accounting estimates are recognized in the period in which the estimate is revised if the revision affects only that period or in the period of the revision and future periods if the revision affects both current and future periods.
(D) PRINCIPLES OF CONSOLIDATION
Subsidiaries are those companies in which AB InBev, directly or indirectly, has an interest of more than half of the voting rights or, otherwise, has control, directly or indirectly, over the operations so as to govern the financial and operating policies in order to obtain benefits from the companies’ activities. In assessing control, potential voting rights that presently are exercisable are taken into account. Control is presumed to exist where AB InBev owns, directly or indirectly, more than one half of the voting rights (which does not always equate to economic ownership), unless it can be demonstrated that such ownership does not constitute control. The financial statements of subsidiaries are included in the consolidated financial statements from the date that control commences until the date that control ceases. Total comprehensive income of subsidiaries is attributed to the owners of the company and to the non-controlling interests even if this results in the non-controlling interests having a deficit balance.

24
Jointly controlled entities are those entities over whose activities AB InBev has joint control, established by contractual agreement and requiring unanimous consent for strategic financial and operating decisions. Jointly controlled entities are consolidated using the proportionate method of consolidation.
Associates are undertakings in which AB InBev has significant influence over the financial and operating policies, but which it does not control. This is generally evidenced by ownership of between 20% and 50% of the voting rights. In certain instances, the company may hold directly and indirectly an ownership interest of 50% or more in an entity, yet not have effective control. In these instances, such investments are accounted for as associates. Associates are accounted for by the equity method of accounting, from the date that significant influence commences until the date that significant influence ceases. When AB InBev’s share of losses exceeds the carrying amount of the associate, the carrying amount is reduced to nil and recognition of further losses is discontinued except to the extent that AB InBev has incurred obligations in respect of the associate.
The financial statements of the company’s subsidiaries, jointly controlled entities and associates are prepared for the same reporting year as the parent company, using consistent accounting policies. In exceptional cases when the financial statements of a subsidiary, jointly controlled entity or associate are prepared as of a different date from that of AB InBev (e.g. Modelo), adjustments are made for the effects of significant transactions or events that occur between that date and the date of AB InBev's financial statements. In such cases, the difference between the end of the reporting period of these subsidiaries, jointly controlled entities or associates from AB InBev's reporting period is no more than three months. Upon acquisition of Anheuser Busch, their operations in China were reported with one month time lag. During 2009, their reporting has been aligned to AB InBev’s reporting period.
All intercompany transactions, balances and unrealized gains and losses on transactions between group companies have been eliminated. Unrealized gains arising from transactions with associates and jointly controlled entities are eliminated to the extent of AB InBev’s interest in the entity. Unrealized losses are eliminated in the same way as unrealized gains, but only to the extent that there is no evidence of impairment.
A listing of the company’s most important subsidiaries and associates is set out in Note 35 AB InBev companies.
(E) SUMMARY OF CHANGES IN ACCOUNTING POLICIES
The following new standards and amendments to standards are mandatory for the first time for the financial year beginning 1 January 2010.
Revised IFRS 3 Business Combinations (2008)
Revised IFRS 3 Business Combinations (2008) incorporates the following changes that are likely to be relevant to AB InBev’s operations:
• The definition of a business has been broadened, which is likely to result in more acquisitions being treated as business combinations;
• Contingent consideration will be measured at fair value, with subsequent changes therein recognized in profit or loss; • Transaction costs, other than share and debt issue costs, will be expensed as incurred; • Any pre-existing interest in the acquiree will be measured at fair value with the gain or loss recognized in profit or loss; • Any non-controlling (minority) interest will be measured at either fair value, or at its proportionate interest in the
identifiable assets and liabilities of the acquiree, on a transaction-by-transaction basis. The company adopted the revised standard as of 1 January 2010 with no material effect on its financial result or financial position. Please refer to Note 6 Acquisition and disposal of subsidiaries for more details. Amended IAS 27 Consolidated and Separate Financial Statements (2008)
Amended IAS 27 Consolidated and Separate Financial Statements (2008) requires accounting for changes in ownership interests by AB InBev in a subsidiary, while maintaining control, to be recognized as an equity transaction. When AB InBev loses control of a subsidiary, any interest retained in the former subsidiary will be measured at fair value with the gain or loss recognized in profit or loss. The company adopted the amendment as of 1 January 2010. The effect for changes in ownership interests, while maintaining control, is disclosed in Note 23 Changes in equity and earnings per share. The effect from loss of control of a subsidiary and the measurement at fair value of the retained interest is disclosed in Note 6 Acquisition and disposal of subsidiaries. IAS 28 Investments in Associates (2008)
The principle adopted under IAS 27 (2008) (see above) that a loss of control is recognized as a disposal and reacquisition of any retained interest is measured at fair value is extended by consequential amendments to IAS 28. Therefore, when significant influence over an associate is lost, the investment measures any investments retained in the former associate at fair value, with any consequential gain or loss recognized in profit or loss. The company adopted the revised standard as of 1 January 2010 with no material effect on its financial result or financial position. IFRIC 17 Distributions of Non-cash Assets to Owners
IFRIC 17 Distributions of Non-cash Assets to Owners addresses the treatment of distributions in kind to shareholders. A liability has to be recognized when the dividend has been appropriately authorized and is no longer at the discretion of the entity, to be measured at the fair value of the non-cash assets to be distributed. Outside the scope of IFRIC 17 are distributions in which the assets being distributed are ultimately controlled by the same party or parties before and after the distribution (common control transactions).
The company adopted the interpretation as of 1 January 2010 with no material effect on its financial result or financial position.
25
IFRIC 18 Transfers of Assets from Customers
IFRIC 18 Transfers of Assets from Customers addresses the accounting by access providers for property, plant and equipment contributed to them by customers. Recognition of the assets depends on who controls them. When the asset is recognized by the access provider, it is measured at fair value upon initial recognition. The timing of the recognition of the corresponding revenue depends on the facts and circumstances.
The company adopted the interpretation as of 1 January 2010 with no material effect on its financial result or financial position. Amendment to IAS 39 Financial Instruments: Recognition and Measurement – Eligible Hedged Items Amendment to IAS 39 Financial Instruments: Recognition and Measurement – Eligible Hedged Items provides additional guidance concerning specific positions that qualify for hedging (“eligible hedged items”). The company adopted the amendment as of 1 January 2010 with no material effect on its financial result or financial position.
Improvements to IFRSs (2009)
Improvements to IFRSs (2009) is a collection of minor improvements to existing standards.
The company adopted the improvement as of 1 January 2010 with no material effect on its financial result or financial position.
Amendment to IAS 32 Financial Instruments: Presentation – Classification of Rights Issues
Amendment to IAS 32 Financial Instruments: Presentation – Classification of Rights Issues allows rights, options or warrants to acquire a fixed number of the entity’s own equity instruments for a fixed amount of any currency to be classified as equity instruments provided the entity offers the rights, options or warrants pro rata to all of its existing owners of the same class of its own non-derivative equity instruments.
The company adopted the amendment as of 1 January 2010 with no material effect on its financial result or financial position.
IFRIC 19 Extinguishing Financial Liabilities with E quity Instruments
IFRIC 19 Extinguishing Financial Liabilities with Equity Instruments provides guidance on the accounting for debt for equity swaps.
The company adopted the interpretation as of 1 January 2010 with no material effect on its financial result or financial position.
Revised IAS 24 Related Party Disclosures (2009)
Revised IAS 24 Related Party Disclosures amends the definition of a related party and modifies certain related party disclosure requirements for government-related entities.
The company adopted the revised standard as of 1 January 2010 with no material effect on its financial result or financial position.
Amendments to IFRIC 14 IAS 19 The limit on a Defined Benefit Asset, Minimum Funding Requirements and their Interaction
Amendments to IFRIC 14 IAS 19 The limit on a Defined Benefit Asset, Minimum Funding Requirements and their Interaction removes unintended consequences arising from the treatment of prepayments where there is a minimum funding requirement. These amendments result in prepayments of contributions in certain circumstances being recognized as an asset rather than an expense.
The company adopted the amendment as of 1 January 2010 with no material effect on its financial result or financial position.
(F) FOREIGN CURRENCIES
FOREIGN CURRENCY TRANSACTIONS
Foreign currency transactions are accounted for at exchange rates prevailing at the date of the transactions. Monetary assets and liabilities denominated in foreign currencies are translated at the balance sheet date rate. Gains and losses resulting from the settlement of foreign currency transactions and from the translation of monetary assets and liabilities denominated in foreign currencies are recognized in the income statement. Non-monetary assets and liabilities denominated in foreign currencies are translated at the foreign exchange rate prevailing at the date of the transaction. Non-monetary assets and liabilities denominated in foreign currencies that are stated at fair value are translated to US dollar at foreign exchange rates ruling at the dates the fair value was determined.
TRANSLATION OF THE RESULTS AND FINANCIAL POSITION OF FOREIGN OPERATIONS
Assets and liabilities of foreign operations are translated to US dollar at foreign exchange rates prevailing at the balance sheet date. Income statements of foreign operations, excluding foreign entities in hyperinflationary economies, are translated to US dollar at exchange rates for the year approximating the foreign exchange rates prevailing at the dates of the transactions. The components of shareholders’ equity are translated at historical rates. Exchange differences arising from the translation of shareholders’ equity to US dollar at year-end exchange rates are taken to comprehensive income (translation reserves).
In hyperinflationary economies, re-measurement of the local currency denominated non-monetary assets, liabilities, income statement accounts as well as equity accounts is made by applying a general price index. These re-measured accounts are used for

26
conversion into US dollar at the closing exchange rate. As of 30 November 2009 the economy in Venezuela has been assessed to be highly inflationary and AB InBev has applied the price index from Venezuela’s central bank to report its Venezuelan operations from December 2009 until October 2010, when the Venezuelan operations were deconsolidated, following the transaction between AmBev and Cerveceria Regional S.A.. The impact of hyperinflation accounting is not material to the company’s financial results or financial position.
Effective 1 January 2010, one of AB InBev's holding companies changed its functional currency from the euro to the US dollar. As a result of the refinancing of the debt related to the Anheuser-Busch acquisition in late 2009 and beginning 2010, the primary economic environment for this entity became the US dollar. In accordance with IAS 21 The Effects of Changes in Foreign Exchange Rates the change was accounted for prospectively.
EXCHANGE RATES
The most important exchange rates that have been used in preparing the financial statements are:
Closing rate Average rate 1 US dollar equals: 2010 2009 2010 2009 Argentinean peso ................................................ 3.975791 3.796702 3.945504 3.726834 Brazilian real ...................................................... 1.666201 1.741198 1.767915 2.015192 Canadian dollar ................................................... 0.997006 1.050117 1.033045 1.147982 Chinese yuan...................................................... 6.602304 6.826993 6.757342 6.863060 Euro............ ...................................................... 0.748391 0.694155 0.756302 0.721191 Pound sterling..................................................... 0.644177 0.616479 0.647243 0.643458 Russian ruble ...................................................... 30.184359 30.117797 30.144764 31.833634 Ukrainian hryvnia ................................................ 7.912866 7.947278 7.849527 7.743168
(G) INTANGIBLE ASSETS
RESEARCH AND DEVELOPMENT
Expenditure on research activities, undertaken with the prospect of gaining new scientific or technical knowledge and understanding, is recognized in the income statement as an expense as incurred.
Expenditure on development activities, whereby research findings are applied to a plan or design for the production of new or substantially improved products and processes, is capitalized if the product or process is technically and commercially feasible, future economic benefits are probable and the company has sufficient resources to complete development. The expenditure capitalized includes the cost of materials, direct labor and an appropriate proportion of overheads. Other development expenditure is recognized in the income statement as an expense as incurred. Capitalized development expenditure is stated at cost less accumulated amortization (see below) and impairment losses (refer accounting policy P).
Amortization related to research and development intangible assets is included within the cost of sales if production related and in sales and marketing if related to commercial activities.
Borrowing cost directly attributable to the acquisition, construction or production of qualifying assets are capitalized as part of the cost of such assets.
SUPPLY AND DISTRIBUTION RIGHTS
A supply right is the right for AB InBev to supply a customer and the commitment by the customer to purchase from AB InBev. A distribution right is the right to sell specified products in a certain territory.
Acquired customer relationships in a business combination are initially recognized at fair value as supply rights to the extent that they arise from contractual rights. If the IFRS recognition criteria are not met, these relationships are subsumed under goodwill.
Acquired distribution rights are measured initially at cost or fair value when obtained through a business combination.
Amortization related to supply and distribution rights is included within sales and marketing expenses.
BRANDS
If part of the consideration paid in a business combination relates to trademarks, trade names, formulas, recipes or technological expertise these intangible assets are considered as a group of complementary assets that is referred to as a brand for which one fair value is determined. Expenditure on internally generated brands is expensed as incurred.
SOFTWARE
Purchased software is measured at cost less accumulated amortization. Expenditure on internally developed software is capitalized when the expenditure qualifies as development activities; otherwise, it is recognized in the income statement when incurred.
Amortization related to software is included in cost of sales, distribution expenses, sales and marketing expenses or administrative expenses based on the activity the software supports.
OTHER INTANGIBLE ASSETS
Other intangible assets, acquired by the company, are stated at cost less accumulated amortization and impairment losses.
Other intangible assets also include multi-year sponsorship rights acquired by the company. These are stated at present value of the future payments less accumulated amortization and impairment losses.
SUBSEQUENT EXPENDITURE
Subsequent expenditure on capitalized intangible assets is capitalized only when it increases the future economic benefits embodied in the specific asset to which it relates. All other expenditure is expensed as incurred.

27
AMORTIZATION
Intangible assets with a finite life are amortized using the straight-line method over their estimated useful lives. Licenses, brewing, supply and distribution rights are amortized over the period in which the rights exist. Brands are considered to have an indefinite life unless plans exist to discontinue the brand. Discontinuance of a brand can be either through sale or termination of marketing support. When AB InBev purchases distribution rights for its own products the life of these rights is considered indefinite, unless the company has a plan to discontinue the related brand or distribution. Software and capitalized development cost related to technology are amortized over 3 to 5 years.
Brands are deemed intangible assets with indefinite useful lives and, therefore, are not amortized but tested for impairment on an annual basis (refer accounting P).
GAINS AND LOSSES ON SALE
Net gains on sale of intangible assets are presented in the income statement as other operating income. Net losses on sale are included as other operating expenses. Net gains and losses are recognized in the income statement when the significant risks and rewards of ownership have been transferred to the buyer, recovery of the consideration is probable, the associated costs can be estimated reliably, and there is no continuing managerial involvement with the intangible assets.
(H) BUSINESS COMBINATIONS
The company applies the purchase method of accounting to account for acquisitions of businesses. The cost of an acquisition is measured as the aggregate of the fair values at the date of exchange of the assets given, liabilities incurred and equity instruments issued. Identifiable assets, liabilities and contingent liabilities acquired or assumed are measured separately at their fair value as of the acquisition date. The excess of the cost of the acquisition over the company’s interest in the fair value of the identifiable net assets acquired is recorded as goodwill.
The allocation of fair values to the identifiable assets acquired and liabilities assumed is based on various assumptions requiring management judgment.
(I) GOODWILL
Goodwill is determined as the excess of the consideration paid over AB InBev’s interest in the net fair value of the identifiable assets, liabilities and contingent liabilities of the acquired subsidiary, jointly controlled entity or associate recognized at the date of acquisition. All business combinations are accounted for by applying the purchase method. Business combinations entered into before 31 March 2004, were accounted for in accordance with IAS 22 Business Combinations. This means that acquired intangibles such as brands were subsumed under goodwill for those transactions. Effective 1 January 2010, when AB InBev acquires non-controlling interests any difference between the cost of acquisition and the non-controlling interest’s share of net assets acquired is accounted for as an equity transaction in accordance with IAS 27 Consolidated and Separate Financial Statements.
In conformity with IFRS 3 Business Combinations, goodwill is stated at cost and not amortized but tested for impairment on an annual basis and whenever there is an indicator that the cash generating unit to which goodwill has been allocated, may be impaired (refer accounting policy P).
Goodwill is expressed in the currency of the subsidiary or jointly controlled entity to which it relates and is translated to US dollar using the year-end exchange rate.
In respect of associates, the carrying amount of goodwill is included in the carrying amount of the investment in the associate.
If AB InBev’s interest in the net fair value of the identifiable assets, liabilities and contingent liabilities recognized exceeds the cost of the business combination such excess is recognized immediately in the income statement as required by IFRS 3 Business Combinations.
Expenditure on internally generated goodwill is expensed as incurred.
(J) PROPERTY, PLANT AND EQUIPMENT
Property, plant and equipment is measured at cost less accumulated depreciation and impairment losses (refer accounting policy P). Cost includes the purchase price and any costs directly attributable to bringing the asset to the location and condition necessary for it to be capable of operating in the manner intended by management (e.g. non refundable tax and transport cost). The cost of a self-constructed asset is determined using the same principles as for an acquired asset. The depreciation methods, residual value, as well as the useful lives are reassessed and adjusted if appropriate, annually.
Borrowing cost directly attributable to the acquisition, construction or production of qualifying assets are capitalized as part of the cost of such assets.
SUBSEQUENT EXPENDITURE
The company recognizes in the carrying amount of an item of property, plant and equipment the cost of replacing part of such an item when that cost is incurred if it is probable that the future economic benefits embodied with the item will flow to the company and the cost of the item can be measured reliably. All other costs are expensed as incurred.
DEPRECIATION
The depreciable amount is the cost of an asset less its residual value. Residual values, if not insignificant, are reassessed annually. Depreciation is calculated from the date the asset is available for use, using the straight-line method over the estimated useful lives of the assets.
The estimated useful lives are defined in terms of the asset’s expected utility to the company and can vary from one geographical area to another. On average the estimated useful lives are as follows:

28
Industrial buildings – other real estate properties .............................................................................................. 20 - 33 years Production plant and equipment: Production equipment .............................................................................................................................. 10 - 15 years Storage, packaging and handling equipment ............................................................................................... 5 - 7 years Returnable packaging: Kegs ...................................................................................................................................................... 2 - 10 years Crates .................................................................................................................................................... 2 - 10 years Bottles ................................................................................................................................................... 2 - 5 years Point of sale furniture and equipment .............................................................................................................. 5 years Vehicles ....................................................................................................................................................... 5 years Information processing equipment................................................................................................................... 3 - 5 years Where parts of an item of property, plant and equipment have different useful lives, they are accounted for as separate items of property, plant and equipment.
Land is not depreciated as it is deemed to have an indefinite life.
GAINS AND LOSSES ON SALE
Net gains on sale of items of property, plant and equipment are presented in the income statement as other operating income. Net losses on sale are presented as other operating expenses. Net gains and losses are recognized in the income statement when the significant risks and rewards of ownership have been transferred to the buyer, recovery of the consideration is probable, the associated costs can be estimated reliably, and there is no continuing managerial involvement with the property, plant and equipment.
(K) ACCOUNTING FOR LEASES
Leases of property, plant and equipment where the company assumes substantially all the risks and rewards of ownership are classified as finance leases. Finance leases are recognized as assets and liabilities (interest-bearing loans and borrowings) at amounts equal to the lower of the fair value of the leased property and the present value of the minimum lease payments at inception of the lease. Amortization and impairment testing for depreciable leased assets, is the same as for depreciable assets that are owned (refer accounting policies J and P).
Lease payments are apportioned between the outstanding liability and finance charges so as to achieve a constant periodic rate of interest on the remaining balance of the liability.
Leases of assets under which all the risks and rewards of ownership are substantially retained by the lessor are classified as operating leases. Payments made under operating leases are charged to the income statement on a straight-line basis over the term of the lease.
When an operating lease is terminated before the lease period has expired, any payment required to be made to the lessor by way of penalty is recognized as an expense in the period in which termination takes place.
(L) INVESTMENTS
All investments are accounted for at trade date.
INVESTMENTS IN EQUITY SECURITIES
Investments in equity securities are undertakings in which AB InBev does not have significant influence or control. This is generally evidenced by ownership of less than 20% of the voting rights. Such investments are designated as available-for-sale financial assets which are at initial recognition measured at fair value unless the fair value cannot be reliably determined in which case they are measured at cost. Subsequent changes in fair value, except those related to impairment losses which are recognized in the income statement, are recognized directly in other comprehensive income.
On disposal of an investment, the cumulative gain or loss previously recognized directly in equity is recognized in profit or loss.
INVESTMENTS IN DEBT SECURITIES
Investments in debt securities classified as trading or as being available-for-sale are carried at fair value, with any resulting gain or loss respectively recognized in the income statement or directly in other comprehensive income. Fair value of these investments is determined as the quoted bid price at the balance sheet date. Impairment charges and foreign exchange gains and losses are recognized in the income statement.
Investments in debt securities classified as held to maturity are measured at amortized cost.
In general, investments in debt securities with original maturities of more than three months and remaining maturities of less than one year are classified as short-term investments. Investments with maturities beyond one year may be classified as short-term based on their highly liquid nature and because such marketable securities represent the investment of cash that is available for current operations.
OTHER INVESTMENTS
Other investments held by the company are classified as available-for-sale and are carried at fair value, with any resulting gain or loss recognized directly in other comprehensive income. Impairment charges are recognized in the income statement.

29
(M) INVENTORIES
Inventories are valued at the lower of cost and net realizable value. Cost includes expenditure incurred in acquiring the inventories and bringing them to their existing location and condition. The weighted average method is used in assigning the cost of inventories.
The cost of finished products and work in progress comprises raw materials, other production materials, direct labor, other direct cost and an allocation of fixed and variable overhead based on normal operating capacity. Net realizable value is the estimated selling price in the ordinary course of business, less the estimated completion and selling costs.
(N) TRADE AND OTHER RECEIVABLES
Trade and other receivables are carried at amortized cost less impairment losses. An estimate is made for doubtful receivables based on a review of all outstanding amounts at the balance sheet date.
An allowance for impairment of trade and other receivables is established if the collection of a receivable becomes doubtful. Such receivable becomes doubtful when there is objective evidence that the company will not be able to collect all amounts due according to the original terms of the receivables. Significant financial difficulties of the debtor, probability that the debtor will enter into bankruptcy or financial reorganization, and default or delinquency in payments are considered indicators that the receivable is impaired. The amount of the allowance is the difference between the asset’s carrying amount and the present value of the estimated future cash flows. An impairment loss is recognized in the statement of income, as are subsequent recoveries of previous impairments.
(O) CASH AND CASH EQUIVALENTS
Cash and cash equivalents include all cash balances and short-term highly liquid investments with a maturity of three months or less from the date of acquisition that are readily convertible into cash. They are stated at face value, which approximates their fair value. For the purpose of the cash flow statement, cash and cash equivalents are presented net of bank overdrafts.
(P) IMPAIRMENT
The carrying amounts of financial assets, property, plant and equipment, goodwill and intangible assets are reviewed at each balance sheet date to determine whether there is any indication of impairment. If any such indication exists, the asset’s recoverable amount is estimated. In addition, goodwill, intangible assets that are not yet available for use and intangibles with an indefinite useful life are tested for impairment annually. An impairment loss is recognized whenever the carrying amount of an asset or the related cash-generating unit exceeds its recoverable amount. Impairment losses are recognized in the income statement.
CALCULATION OF RECOVERABLE AMOUNT
The recoverable amount of the company’s investments in unquoted debt securities is calculated as the present value of expected future cash flows, discounted at the debt securities’ original effective interest rate. For equity and quoted debt securities the recoverable amount is their fair value.
The recoverable amount of other assets is determined as the higher of their fair value less costs to sell and value in use. For an asset that does not generate largely independent cash inflows, the recoverable amount is determined for the cash-generating unit to which the asset belongs. In assessing value in use, the estimated future cash flows are discounted to their present value using a discount rate that reflects current market assessments of the time value of money and the risks specific to the asset. Impairment losses recognized in respect of cash-generating units are allocated first to reduce the carrying amount of any goodwill allocated to the units and then to reduce the carrying amount of the other assets in the unit on a pro rata basis.
Goodwill and intangible assets with indefinite useful life are tested annually at the business unit level (that is one level below the segments). The recoverable amount of the cash generating units to which the goodwill and the intangible assets with indefinite useful life belong is based on a fair value approach. More specifically, a discounted free cash flow approach, based on current acquisition valuation models, is used. These calculations are corroborated by valuation multiples, quoted share prices for publicly traded subsidiaries or other available fair value indicators.
Whenever there is an indication of impairment, intangible assets with an indefinite useful life are tested on a fair value approach applying multiples that reflect current market transactions to indicators that drive the profitability of the asset or the royalty stream that could be obtained from licensing the intangible asset to another party in an arm’s length transaction.
REVERSAL OF IMPAIRMENT LOSSES
An impairment loss in respect of goodwill or investments in equity securities is not reversed. Impairment losses on other assets are reversed if the subsequent increase in recoverable amount can be related objectively to an event occurring after the impairment loss was recognized. An impairment loss is reversed only to the extent that the asset’s carrying amount does not exceed the carrying amount that would have been determined, net of depreciation or amortization, if no impairment loss had been recognized.
(Q) SHARE CAPITAL
REPURCHASE OF SHARE CAPITAL
When AB InBev buys back its own shares, the amount of the consideration paid, including directly attributable costs, is recognized as a deduction from equity under treasury shares.
DIVIDENDS
Dividends are recognized as a liability in the period in which they are declared.
30
SHARE ISSUANCE COSTS
Incremental costs directly attributable to the issue of new shares or options are shown in equity as a deduction, net of tax, from the proceeds.
(R) PROVISIONS
Provisions are recognized when (i) the company has a present legal or constructive obligation as a result of past events, (ii) it is probable that an outflow of resources embodying economic benefits will be required to settle the obligation, and (iii) a reliable estimate of the amount of the obligation can be made. Provisions are determined by discounting the expected future cash flows at a pre-tax rate that reflects current market assessments of the time value of money and, where appropriate, the risks specific to the liability.
RESTRUCTURING
A provision for restructuring is recognized when the company has approved a detailed and formal restructuring plan, and the restructuring has either commenced or has been announced publicly. Costs relating to the ongoing activities of the company are not provided for. The provision includes the benefit commitments in connection with early retirement and redundancy schemes.
ONEROUS CONTRACTS
A provision for onerous contracts is recognized when the expected benefits to be derived by the company from a contract are lower than the unavoidable cost of meeting its obligations under the contract. Such provision is measured at the present value of the lower of the expected cost of terminating the contract and the expected net cost of continuing with the contract.
DISPUTES AND LITIGATIONS
A provision for disputes and litigation is recognized when it is more likely than not that the company will be required to make future payments as a result of past events, such items may include but are not limited to, several claims, suits and actions both initiated by third parties and initiated by AB InBev relating to antitrust laws, violations of distribution and license agreements, environmental matters, employment related disputes, claims from tax authorities, and alcohol industry litigation matters.
(S) EMPLOYEE BENEFITS
POST-EMPLOYMENT BENEFITS
Post-employment benefits include pensions, post-employment life insurance and post-employment medical benefits. The company operates a number of defined benefit and defined contribution plans throughout the world, the assets of which are generally held in separate trustee-managed funds. The pension plans are generally funded by payments from employees and the company, and, for defined benefit plans taking account of the recommendations of independent actuaries. AB InBev maintains funded and unfunded pension plans.
a) Defined contribution plans
Contributions to defined contribution plans are recognized as an expense in the income statement when incurred. A defined contribution plan is a pension plan under which AB InBev pays fixed contributions into a fund. AB InBev has no legal or constructive obligations to pay further contributions if the fund does not hold sufficient assets to pay all employees the benefits relating to employee service in the current and prior periods.
b) Defined benefit plans
A defined benefit plan is a pension plan that is not a defined contribution plan. Typically defined benefit plans define an amount of pension benefit that an employee will receive on retirement, usually dependent on one or more factors such as age, years of service and compensation. For defined benefit plans, the pension expenses are assessed separately for each plan using the projected unit credit method. The projected unit credit method considers each period of service as giving rise to an additional unit of benefit entitlement. Under this method, the cost of providing pensions is charged to the income statement so as to spread the regular cost over the service lives of employees in accordance with the advice of qualified actuaries who carry out a full valuation of the plans at least every three years. The amounts charged to the income statement include current service cost, interest cost, the expected return on any plan assets, past service costs and the effect of any curtailments or settlements. The pension obligations recognized in the balance sheet are measured at the present value of the estimated future cash outflows using interest rates based on high quality corporate bond yields, which have terms to maturity approximating the terms of the related liability, less any past service costs not yet recognized and the fair value of any plan assets. Past service costs result from the introduction of, or changes to, post-employment benefits. They are recognized as an expense over the average period that the benefits vest. Actuarial gains and losses comprise, for assets and liabilities, the effects of differences between the previous actuarial assumptions and what has actually occurred and the effects of changes in actuarial assumptions on the plans’ liabilities. Actuarial gains and losses are recognized in full in the period in which they occur in the statement of comprehensive income.
Where the calculated amount of a defined benefit liability is negative (an asset), AB InBev recognizes such pension asset to the extent of any cumulative unrecognized past service costs plus any economic benefits available to AB InBev either from refunds or reductions in future contributions.
OTHER POST-EMPLOYMENT OBLIGATIONS
Some AB InBev companies provide post-employment medical benefits to their retirees. The entitlement to these benefits is usually based on the employee remaining in service up to retirement age. The expected costs of these benefits are accrued over the period of employment, using an accounting methodology similar to that for defined benefit pension plans.
TERMINATION BENEFITS
Termination benefits are recognized as an expense when the company is demonstrably committed, without realistic possibility of withdrawal, to a formal detailed plan to terminate employment before the normal retirement date. Termination benefits for

31
voluntary redundancies are recognized if the company has made an offer encouraging voluntary redundancy, it is probable that the offer will be accepted, and the number of acceptances can be estimated reliably.
BONUSES
Bonuses received by company employees and management are based on pre-defined company and individual target achievement. The estimated amount of the bonus is recognized as an expense in the period the bonus is earned. To the extent that bonuses are settled in shares of the company, they are accounted for as share-based payments.
(T) SHARE-BASED PAYMENTS
Different share and share option programs allow company senior management and members of the board to acquire shares of the company and some of its affiliates. AB InBev adopted IFRS 2 Share-based Payment on 1 January 2005 to all awards granted after 7 November 2002 that had not yet vested at 1 January 2005. The fair value of the share options is estimated at grant date, using an option pricing model that is most appropriate for the respective option. Based on the expected number of options that will vest, the fair value of the options granted is expensed over the vesting period. When the options are exercised, equity is increased by the amount of the proceeds received.
(U) INTEREST-BEARING LOANS AND BORROWINGS
Interest-bearing loans and borrowings are recognized initially at fair value, less attributable transaction costs. Subsequent to initial recognition, interest-bearing loans and borrowings are stated at amortized cost with any difference between the initial amount and the maturity amount being recognized in the income statement (in accretion expense) over the expected life of the instrument on an effective interest rate basis.
(V) TRADE AND OTHER PAYABLES
Trade and other payables are stated at amortized cost.
(W) INCOME TAX
Income tax on the profit for the year comprises current and deferred tax. Income tax is recognized in the income statement except to the extent that it relates to items recognized directly in equity, in which case the tax effect is also recognized directly in equity.
Current tax is the expected tax payable on the taxable income for the year, using tax rates enacted, or substantively enacted, at the balance sheet date, and any adjustment to tax payable in respect of previous years.
In accordance with IAS 12 Income Taxes deferred taxes are provided using the so-called balance sheet liability method. This means that, for all taxable and deductible differences between the tax bases of assets and liabilities and their carrying amounts in the balance sheet a deferred tax liability or asset is recognized. Under this method a provision for deferred taxes is also made for differences between the fair values of assets and liabilities acquired in a business combination and their tax base. IAS 12 prescribes that no deferred taxes are recognized i) on initial recognition of goodwill, ii) at the initial recognition of assets or liabilities in a transaction that is not a business combination and affects neither accounting nor taxable profit and iii) on differences relating to investments in subsidiaries to the extent that they will probably not reverse in the foreseeable future. The amount of deferred tax provided is based on the expected manner of realization or settlement of the carrying amount of assets and liabilities, using currently or substantively enacted tax rates.
Deferred tax assets and liabilities are offset if there is a legally enforceable right to offset current tax liabilities and assets, and they relate to income taxes levied by the same tax authority on the same taxable entity, or on different taxable entities which intend either to settle current tax liabilities and assets on a net basis, or to realize the assets and settle the liabilities simultaneously.
The company recognizes deferred tax assets, including assets arising from losses carried forward, to the extent that future probable taxable profit will be available against which the deferred tax asset can be utilized. A deferred tax asset is reduced to the extent that it is no longer probable that the related tax benefit will be realized.
Tax claims are recorded within provisions on the balance sheet (refer accounting policy R).
(X) INCOME RECOGNITION
Income is recognized when it is probable that the economic benefits associated with the transaction will flow to the company and the income can be measured reliably.
GOODS SOLD
In relation to the sale of beverages and packaging, revenue is recognized when the significant risks and rewards of ownership have been transferred to the buyer, and no significant uncertainties remain regarding recovery of the consideration due, associated costs or the possible return of goods, and there is no continuing management involvement with the goods. Revenue from the sale of goods is measured at the fair value of the consideration received or receivable, net of returns and allowances, trade discounts, volume rebates and discounts for cash payments.
RENTAL AND ROYALTY INCOME
Rental income is recognized under other operating income on a straight-line basis over the term of the lease. Royalties arising from the use by others of the company’s resources are recognized in other operating income on an accrual basis in accordance with the substance of the relevant agreement.
GOVERNMENT GRANTS
A government grant is recognized in the balance sheet initially as deferred income when there is reasonable assurance that it will be received and that the company will comply with the conditions attached to it. Grants that compensate the company for expenses

32
incurred are recognized as other operating income on a systematic basis in the same periods in which the expenses are incurred. Grants that compensate the company for the acquisition of an asset are presented by deducting them from the acquisition cost of the related asset in accordance with IAS 20 Accounting for Government Grants and Disclosure of Government Assistance.
FINANCE INCOME
Finance income comprises interest received or receivable on funds invested, dividend income, foreign exchange gains, losses on currency hedging instruments offsetting currency gains, gains on hedging instruments that are not part of a hedge accounting relationship, gains on financial assets classified as trading as well as any gains from hedge ineffectiveness (refer accounting policy Z).
Interest income is recognized as it accrues (taking into account the effective yield on the asset) unless collectability is in doubt. Dividend income is recognized in the income statement on the date that the dividend is declared.
(Y) EXPENSES
FINANCE COSTS
Finance costs comprise interest payable on borrowings, calculated using the effective interest rate method, foreign exchange losses, gains on currency hedging instruments offsetting currency losses, results on interest rate hedging instruments, losses on hedging instruments that are not part of a hedge accounting relationship, losses on financial assets classified as trading, impairment losses on available-for-sale financial assets as well as any losses from hedge ineffectiveness (refer accounting policy Z).
All interest costs incurred in connection with borrowings or financial transactions are expensed as incurred as part of finance costs. Any difference between the initial amount and the maturity amount of interest bearing loans and borrowings, such as transaction costs and fair value adjustments, are being recognized in the income statement (in accretion expense) over the expected life of the instrument on an effective interest rate basis (refer accounting policy U). The interest expense component of finance lease payments is also recognized in the income statement using the effective interest rate method.
RESEARCH AND DEVELOPMENT, ADVERTISING AND PROMOTIONAL COSTS AND SYSTEMS DEVELOPMENT COSTS
Research, advertising and promotional costs are expensed in the year in which these costs are incurred. Development costs and systems development costs are expensed in the year in which these costs are incurred if they do not meet the criteria for capitalization (refer accounting policy G).
PURCHASING, RECEIVING AND WAREHOUSING COSTS
Purchasing and receiving costs are included in the cost of sales, as well as the costs of storing and moving raw materials and packaging materials. The costs of storing finished products at the brewery as well as costs incurred for subsequent storage in distribution centers are included within distribution expenses.
(Z) DERIVATIVE FINANCIAL INSTRUMENTS
AB InBev uses derivative financial instruments to mitigate the transactional impact of foreign currencies, interest rates and commodity prices on the company’s performance. AB InBev’s financial risk management policy prohibits the use of derivative financial instruments for trading purposes and the company does therefore not hold or issue any such instruments for such purposes. Derivative financial instruments that are economic hedges but that do not meet the strict IAS 39 Financial Instruments: Recognition and Measurement hedge accounting rules, however, are accounted for as financial assets or liabilities at fair value through profit or loss.
Derivative financial instruments are recognized initially at fair value. Fair value is the amount for which the asset could be exchanged or the liability settled, between knowledgeable, willing parties in an arm’s length transaction. The fair value of derivative financial instruments is either the quoted market price or is calculated using pricing models taking into account current market rates. These pricing models also take into account the current creditworthiness of the counterparties.
Subsequent to initial recognition, derivative financial instruments are re-measured to their fair value at balance sheet date. Depending on whether cash flow or net investment hedge accounting is applied or not, any gain or loss is either recognized directly in other comprehensive income or in the income statement.
Cash flow, fair value or net investment hedge accounting is applied to all hedges that qualify for hedge accounting when the required hedge documentation is in place and when the hedge relation is determined to be effective.
CASH FLOW HEDGE ACCOUNTING
When a derivative financial instrument hedges the variability in cash flows of a recognized asset or liability, the foreign currency risk of a firm commitment or a highly probable forecasted transaction, the effective part of any resulting gain or loss on the derivative financial instrument is recognized directly in other comprehensive income (hedging reserves). When the firm commitment in foreign currency or the forecasted transaction results in the recognition of a non financial asset or a non financial liability, the cumulative gain or loss is removed from other comprehensive income and included in the initial measurement of the asset or liability. When the hedge relates to financial assets or liabilities, the cumulative gain or loss on the hedging instrument is reclassified from other comprehensive income into the income statement in the same period during which the hedged risk affects the income statement (e.g. when the variable interest expense is recognized). The ineffective part of any gain or loss is recognized immediately in the income statement.
When a hedging instrument or hedge relationship is terminated but the hedged transaction is still expected to occur, the cumulative gain or loss (at that point) remains in equity and is reclassified in accordance with the above policy when the hedged transaction occurs. If the hedged transaction is no longer probable, the cumulative gain or loss recognized in other comprehensive income is reclassified into the income statement immediately.

33
FAIR VALUE HEDGE ACCOUNTING
When a derivative financial instrument hedges the variability in fair value of a recognized asset or liability, any resulting gain or loss on the hedging instrument is recognized in the income statement. The hedged item is also stated at fair value in respect of the risk being hedged, with any gain or loss being recognized in the income statement.
NET INVESTMENT HEDGE ACCOUNTING
When a foreign currency liability hedges a net investment in a foreign operation, exchange differences arising on the translation of the liability to the functional currency are recognized directly in other comprehensive income (translation reserves).
When a derivative financial instrument hedges a net investment in a foreign operation, the portion of the gain or the loss on the hedging instrument that is determined to be an effective hedge is recognized directly in other comprehensive income (translation reserves), while the ineffective portion is reported in the income statement.
Investments in equity instruments or derivatives linked to and to be settled by delivery of an equity instrument are stated at cost when such equity instrument does not have a quoted market price in an active market and for which other methods of reasonably estimating fair value are clearly inappropriate or unworkable.
(AA) SEGMENT REPORTING
Operating segments are components of the company’s business activities about which separate financial information is available that is evaluated regularly by management.
AB InBev’s operating segment reporting format is geographical because the company’s risks and rates of return are affected predominantly by the fact that AB InBev operates in different geographical areas. The company’s management structure and internal reporting system to the board of directors is set up accordingly. A geographical segment is a distinguishable component of the company that is engaged in providing products or services within a particular economic environment, which is subject to risks and returns that are different from those of other segments. In accordance with IFRS 8 Operating segments AB InBev’s reportable geographical segments were determined as North America, Latin America North, Latin America South, Western Europe, Central and Eastern Europe, Asia Pacific and Global Export and Holding Companies. The company’s assets are predominantly located in the same geographical areas as its customers.
Segment results, assets and liabilities include items directly attributable to a segment as well as those that can be allocated on a reasonable basis. Unallocated assets comprise interest bearing loans granted, investment securities, deferred tax assets, income taxes receivable, cash and cash equivalent and derivative assets. Unallocated liabilities comprise equity and non-controlling interest, interest bearing loans, deferred tax liabilities, bank overdrafts, income taxes payable and derivative liabilities.
Segment capital expenditure is the total cost incurred during the period to acquire property, plant and equipment, and intangible assets other than goodwill.
(BB) NON-RECURRING ITEMS
Non-recurring items are those that in management’s judgment need to be disclosed by virtue of their size or incidence. Such items are disclosed on the face of the consolidated income statement or separately disclosed in the notes to the financial statements. Transactions which may give rise to non-recurring items are principally restructuring activities, impairments, gains or losses on disposal of investments and the effect of the accelerated repayment of certain debt facilities.
(CC) DISCONTINUED OPERATIONS AND NON-CURRENT ASSETS HELD FOR SALE
A discontinued operation is a component of the company that either has been disposed of or is classified as held for sale and represents a separate major line of business or geographical area of operations and is part of a single coordinated plan to dispose of or is a subsidiary acquired exclusively with a view to resale.
AB InBev classifies a non-current asset (or disposal group) as held for sale if its carrying amount will be recovered principally through a sale transaction rather than through continuing use if all of the conditions of IFRS 5 are met. A disposal group is defined as a group of assets to be disposed of, by sale or otherwise, together as a group in a single transaction, and liabilities directly associated with those assets that will be transferred. Immediately before classification as held for sale, the company measures the carrying amount of the asset (or all the assets and liabilities in the disposal group) in accordance with applicable IFRS. Then, on initial classification as held for sale, non-current assets and disposal groups are recognized at the lower of carrying amount and fair value less costs to sell. Impairment losses on initial classification as held for sale are included in profit or loss. The same applies to gains and losses on subsequent re-measurement. Non-current assets classified as held for sale are no longer depreciated or amortized.
(DD) RECENTLY ISSUED IFRS
To the extent that new IFRS requirements are expected to be applicable in the future, they have been summarized hereafter. For the year ended 31 December 2010, they have not been applied in preparing these consolidated financial statements.
IFRS 9 Financial Instruments
IFRS 9 Financial Instruments is the standard issued as part of a wider project to replace IAS 39. IFRS 9 retains but simplifies the mixed measurement model and establishes two primary measurement categories for financial assets: amortized cost and fair value. The basis of classification depends on the entity’s business model and the contractual cash flow characteristics of the financial asset. The guidance in IAS 39 on impairment of financial assets and hedge accounting continues to apply.
Prior periods need not be restated if an entity adopts the standard for reporting periods beginning before 1 January 2012. IFRS 9, which becomes mandatory for AB InBev’s 2013 consolidated financial statements, is not expected to have a material impact on AB InBev’s consolidated financial statements.

34
A number of other new standards, amendments to standards, and interpretations are effective for annual periods beginning after 1 January 2010, and have not been applied in preparing these consolidated financial statements. None of them is expected to have a significant effect on AB InBev’s consolidated financial statements.
4. USE OF ESTIMATES AND JUDGMENTS
The preparation of financial statements in conformity with IFRS requires management to make judgments, estimates and assumptions that affect the application of policies and reported amounts of assets and liabilities, income and expenses. The estimates and associated assumptions are based on historical experience and various other factors that are believed to be reasonable under the circumstances, the results of which form the basis of making the judgments about carrying values of assets and liabilities that are not readily apparent from other sources. Actual results may differ from these estimates.
The estimates and underlying assumptions are reviewed on an ongoing basis. Revisions to accounting estimates are recognized in the period in which the estimate is revised if the revision affects only that period or in the period of the revision and future periods if the revision affects both current and future periods.
Although each of its significant accounting policies reflects judgments, assessments or estimates, AB InBev believes that the following accounting policies reflect the most critical judgments, estimates and assumptions that are important to its business operations and the understanding of its results: business combinations, intangible assets, goodwill, impairment, provisions, share-based payments, employee benefits and accounting for current and deferred tax.
The fair values of acquired identifiable intangibles are based on an assessment of future cash flows. Impairment analyses of goodwill and indefinite-lived intangible assets are performed annually and whenever a triggering event has occurred, in order to determine whether the carrying value exceeds the recoverable amount. These calculations are based on estimates of future cash flows.
The company uses its judgment to select a variety of methods including the discounted cash flow method and option valuation models and make assumptions about the fair value of financial instruments that are mainly based on market conditions existing at each balance sheet date.
Actuarial assumptions are established to anticipate future events and are used in calculating pension and other postretirement benefit expense and liability. These factors include assumptions with respect to interest rates, expected investment returns on plan assets, rates of increase in health care costs, rates of future compensation increases, turnover rates, and life expectancy.
During 2010 AB InBev conducted an operational review of the useful lives of certain items of property, plant and equipment in the zone Latin America North, which resulted in changes in the expected usage of some of these assets. See Note 13 Property, plant and equipment.
Judgments made by management in the application of IFRS that have a significant effect on the financial statements and estimates with a significant risk of material adjustment in the next year are further discussed in the relevant notes hereafter.

35
5. SEGMENT REPORTING
Segment information is presented by geographical segments, consistent with the information that is available and evaluated regularly by the chief operating decision maker. AB InBev operates its business through seven zones. Regional and operating company management is responsible for managing performance, underlying risks, and effectiveness of operations. Internally, AB InBev management uses performance indicators such as normalized profit from operations (normalized EBIT) and normalized EBITDA as measures of segment performance and to make decisions regarding allocation of resources. These measures are reconciled to segment profit in the tables presented (figures may not add up due to rounding).
Effective from 1 January 2010 onward, AB InBev has updated its segment reporting for purposes of internal review by senior management. This presentation treats all 2009 divestitures as if they had closed on 1 January 2009. In addition, certain intra–group transactions, which were previously recorded in the zones, are recorded in the Global Export and Holding Companies segment, thus with no impact at the consolidated level. The tables below provide the segment information per zone for 2009 in the format that is used by management as of 2010 to monitor performance. The differences between the 2009 Reference base and the 2009 audited income statement as Reported represent the effect of divestitures.
SEGMENT REPORTING (2009 REFERENCE BASE)
All figures in the table below are stated in million US dollar, except volume (million hls).
North America Latin America North Latin America South Western Europe Central and Eastern
Europe Asia Pacific Global Export and Holding Companies
Effect of divestitures Consolidated
2010
2009 Reference
base 2010
2009 Reference
base 2010
2009 Reference
base 2010
2009 Reference
base 2010
2009 Reference
base 2010
2009 Reference
base 2010
2009 Reference
base 2010
2009 bridge to reported 2010
2009 Reported
Volume .............................. 129 134 120 110 34 33 32 32 27 27 50 49 7 6 - 18 399 409
Revenue ............................15 296 15 380 10 018 7 649 2 182 1 899 3 937 4 221 1 619 1 571 1 767 1 720 1 479 1 423 - 2 896 36 297 36 758
Cost of goods sold ...............(6 946) (7 254) (3 410) (2 488) (842) (736) (1 883) (2 037) (857) (822) (1 008) (947) (1 206) (1 249) - (1 666) (16 151) (17 198) Distribution expenses........... (774) (778) (1 128) (781) (180) (166) (393) (418) (191) (157) (140) (120) (106) (114) - (138) (2 913) (2 671) Sales and marketing expenses ...........................(1 565) (1 691) (1 238) (1 016) (228) (182) (716) (775) (353) (297) (439) (493) (174) (164) - (374) (4 712) (4 992) Administrative expenses....... (526) (633) (518) (551) (75) (73) (291) (389) (109) (126) (148) (132) (292) (324) - (83) (1 960) (2 310) Other operating income/(expenses) .............. 61 232 359 244 (8) (7) 83 87 7
4 47 37 54 53 - 12 604 661
Normalized profit from operations (EBIT) .............5 546 5 255 4 083 3 056 849 735 737 690 117 174 79 65 (245) (375) - 648 11 165 10 248 Depreciation, amortization and impairment ....................... (898) (970) (698) (437) (160) (144) (362) (382) (206) (211) (213) (194) (168) (171) - (280) (2 704) (2 789) Normalized EBITDA...........6 444 6 225 4 780 3 493 1 009 879 1 099 1 072 323 385 292 259 (77) (204) - 928 13 869 13 037
Normalized EBITDA
margin in % ......................42.1% 40.5% 47.7% 45.7% 46.2% 46.3% 27.9% 25.4% 20.0% 24.5% 16.5% 15.0% - - - - 38.2% 35.5%

36
SEGMENT REPORTING (2009 REPORTED)
All figures in the table below are stated in million US dollar, except volume (million hls) and full time equivalents (FTE in units)
North
America Latin
America North Latin
America South Western Europe
Central and Eastern Europe
Asia Pacific
Global export and holding companies Consolidated
2010 2009 2010 2009 2010 2009 2010 2009 2010 2009 2010 2009 2010 2009 2010 2009 Volume........................................ 129 135 120 110 34 33 32 33 27 40 50 53 7 5 399 409
Revenue...................................... 15 296 15 486 10 018 7 649 2 182 1 899 3 937 4 312 1 619 2 492 1 767 1 985 1 479 2 936 36 297 36 758 Cost of goods sold.......................... (6 946) (7 525) (3 410) (2 487) (842) (735) (1 883) (1 962) (857) (1 194) (1 008) (1 052) (1 206) (2 243) (16 151) (17 198) Distribution expenses ..................... (774) (792) (1 128) (781) (180) (166) (393) (457) (191) (241) (140) (142) (106) (93) (2 913) (2 671) Sales and marketing expenses......... (1 565) (1 694) (1 238) (1 016) (228) (182) (716) (798) (353) (485) (439) (542) (174) (275) (4 712) (4 992) Administrative expenses ................. (526) (636) (518) (551) (75) (73) (291) (389) (109) (171) (148) (142) (292) (349) (1 960) (2 310) Other operating income/(expenses) . 61 54 359 243 (8) (12) 83 (107) 7 (121) 47 36 54 568 604 661 Normalized profit from
operations (EBIT) ....................... 5 546 4 894 4 083 3 056 849 731 737 599 117 281 79 144 (245) 543 11 165 10 248 Non-recurring items (refer Note 8) ... (237) 62 (34) 109 (8) (7) (54) (56) 2 (1) 9 (47) 54 1 261 (268) 1 321 Profit from operations (EBIT) ..... 5 309 4 956 4 049 3 165 841 724 683 543 118 279 88 96 (191) 1 805 10 897 11 569
Net finance cost............................. (503) (567) (98) (353) (55) (92) (291) (299) (41) (37) 8 (10) (2 756) (3 061) (3 736) (4 419) Share of result of associates............ 520 514 - - - - 1 (1) - - - - - - 521 513 Profit before tax.......................... 5 326 4 903 3 951 2 811 786 632 393 244 77 243 96 86 (2 947) (1 256) 7 682 7 663
Income tax expense ....................... (1 454) (1 519) (637) (521) (230) (184) (98) (73) (21) (48) (22) (76) 542 636 (1 920) (1 786) Profit........................................... 3 872 3 384 3 314 2 290 556 448 295 171 56 195 74 10 (2 405) (620) 5 762 5 877 Normalized EBITDA ........................ 6 444 5 868 4 780 3 492 1 009 875 1 099 983 323 599 292 349 (77) 870 13 869 13 037 Non-recurring items ....................... (154) 62 (34) 109 (8) (7) (54) (56) 2 (1) 9 (47) 54 1 290 (185) 1 350 Non-recurring impairment ............... (83) - - - - - - - - - - - - (29) (83) (29) Depreciation, amortization and impairment .................................. (898) (974) (697) (437) (160) (144) (362) (384) (206) (319) (213) (206) (168) (326) (2 704) (2 789) Net finance costs ........................... (503) (567) (98) (353) (55) (92) (291) (299) (41) (37) 8 (10) (2 756) (3 061) (3 736) (4 419) Share of results of associates .......... 520 514 - - - - 1 (1) - - - - - - 521 513 Income tax expense ....................... (1 454) (1 519) (637) (521) (230) (184) (98) (73) (21) (48) (22) (76) 542 636 (1 920) (1 786)
Profit........................................... 3 872 3 384 3 313 2 290 556 448 295 171 56 195 74 10 (2 405) (620) 5 762 5 877 Normalized EBITDA margin in %...... 42.1% 37.9% 47.7% 45.7% 46.2% 46.1% 27.9% 22.8% 20.0% 24.1% 16.5% 17.6% - - 38.2% 35.5% Segment assets ............................. 72 412 72 222 17 767 16 221 3 564 3 766 5 436 5 889 2 387 2 484 3 749 3 549 3 608 4 189 108 923 108 320 Intersegment elimination ................ (1 638) (2 089) Non-segmented assets ................... 7 057 6 294 Total assets................................. 114 342 112 525 Segment liabilities.......................... 5 737 5 250 4 619 3 819 685 785 2 593 3 067 609 418 1 403 1 143 3 712 3 134 19 358 17 616 Intersegment elimination ................ (1 638) (2 089) Non-segmented liabilities ................ 96 622 96 998 Total liabilities ............................ 114 342 112 525
Gross capex .................................. 282 342 1 046 499 179 155 322 246 112 175 316 224 87 67 2 344 1 708 Additions to/(reversals of) provisions 167 (24) 28 53 2 3 62 59 (2) - (4) 47 114 69 367 207 FTE .............................................. 18 264 19 597 32 098 28 460 8 040 7 780 7 989 7 551 10 249 10 588 35 475 40 859 2 198 1 654 114 313 116 489

37
Net revenue from the beer business amounted to 32 616m US dollar while the net revenue from the non-beer business (soft drinks and other business) accounted for 3 681m US dollar.
Net revenue from external customers attributable to AB InBev’s country of domicile (Belgium) and non-current assets located in the country of domicile represent 886m US dollar and 1 405m US dollar, respectively.
6. ACQUISITIONS AND DISPOSALS OF SUBSIDIARIES
The table below summarizes the impact of acquisitions on the Statement of financial position of AB InBev for 31 December 2010 and 2009:
Million US dollar
2010
Total Acquisitions 2009
Total Acquisitions Non-current assets Property, plant and equipment ............................................................................. 1 15 Intangible assets ................................................................................................ 15 13 Investment in associates ..................................................................................... - (12) Current assets Inventories ........................................................................................................ 2 4 Trade and other receivables................................................................................. 2 4 Cash and cash equivalents................................................................................... - 6 Non-current liabilities Interest-bearing loans and borrowings .................................................................. - (2) Employee benefits .............................................................................................. - (1) Provisions.......................................................................................................... - (1) Deferred tax liabilities ......................................................................................... - (1) Current liabilities Income tax payable ............................................................................................ - (2) Trade and other payables .................................................................................... (1) (5) Net identifiable assets and liabilities ............................................................... 19 18 Goodwill on acquisition........................................................................................ - 17 Net cash paid on prior year acquisitions ................................................................ 18 579 Consideration paid satisfied in cash ................................................................ 37 614 Cash acquired .................................................................................................... - (6) Net cash outflow ............................................................................................. 37 608
2010 ACQUISITIONS
On 29 October 2010, the company acquired a local distributor in the US for a total cash consideration of 19m US dollar. Costs directly attributable to the acquisition were less than 1m US dollar. As the purchase price was fully allocated to the respective asset categories, no goodwill was recognized.
Net cash paid on prior year acquisitions of 18m US dollar mainly reflects the settlement of outstanding consideration payable to former Anheuser-Busch shareholders who had not yet claimed the proceeds as of 31 December 2009, as well as the settlement of transaction costs.
2009 ACQUISITIONS
In March 2009, the company acquired Corporación Boliviana de Bebidas for a total cash consideration of 27m US dollar. Costs directly attributable to the acquisition were less than 1m US dollar. Goodwill recognized on this transaction amounted to 9m US dollar.
The company also acquired local distributors. As these distributors are immediately integrated in the AB InBev operations, no separate reporting is maintained on their contributions to the AB InBev profit. Goodwill recognized on these transactions amounted to 8m US dollar.
Net cash paid on prior year acquisitions of 579m US dollar mainly reflected the settlement of outstanding consideration payable to former Anheuser-Busch shareholders who had not yet claimed the proceeds as of 31 December 2008, as well as the settlement of transaction costs related to the Anheuser-Busch acquisition.

38
DISPOSALS
The table below summarizes the impact of disposals on the Statement of financial position of AB InBev for 31 December 2010 and 2009:
2010 2009 2009 2009 2009 2009 Million US dollar
Total disposals
Oriental Brewery
Busch Entertainment
Central Europe
Other disposals
Total disposals
Non-current assets Property, plant and equipment ...................... (68) - (1 889) (595) - (2 484) Goodwill ..................................................... - - - (166) - (166) Intangible assets ......................................... - - (470) (39) (1) (510) Investment securities................................... 71 - - (1) - (1) Deferred tax assets...................................... - - - (5) - (5) Trade and other receivables.......................... (1) - (3) (15) (1) (19) Current assets Income tax receivable .................................. - - - (3) - (3) Inventories ................................................. (14) - (33) (75) (1) (109) Trade and other receivables.......................... (10) - (82) (138) 3 (217) Cash and cash equivalents............................ (7) (75) - (334) (7) (416) Assets held for sale...................................... - (1 396) - - (58) (1 454) Non-current liabilities Interest-bearing loans and borrowings ........... - - - 1 - 1 Trade and other payables ............................. - - - 5 - 5 Provisions................................................... - - - 4 - 4 Deferred tax liabilities .................................. - - - 8 - 8 Current liabilities Bank overdrafts........................................... - 43 - 13 - 56 Interest-bearing loans and borrowings ........... 4 - - - 4 4 Income tax payable ..................................... - - - 21 - 21 Trade and other payables ............................. (2) - 195 190 1 386 Provisions .................................................. - - - 5 - 5 Liabilities held for sale.................................. - 159 - - 60 219 Net identifiable assets and liabilities ........ (27) (1 269) (2 282) (1 124) - (4 675)
Loss/(gain) on disposal ................................ 31 (428) - (1 088) (1) (1 517) Net cash received from last years’ disposal ..... (20) - - - - - Consideration received, satisfied in cash.. (16) (1 697) (2 282) (2 212) (1) (6 192)
Cash disposed of ......................................... 7 32 - 322 7 361 Cash to be received ..................................... - 225 - 374 - 599
Net cash inflow......................................... (9) (1 440) (2 282) (1 516) 6 (5 232)
2010 DISPOSALS
On 20 October 2010, AmBev and Cerveceria Regional S.A. closed a transaction pursuant to which they combined their business in Venezuela, with Regional owning a 85% interest and AmBev owning the remaining 15% in the new company, which may be increased to 20% over the next four years. The measurement at fair value of the retained interest, as prescribed by Amended IAS 27 Consolidated and separate financial statements, led to the recognition of an impairment loss of (31)m US dollar.
During 2010, AB InBev collected the deferred consideration related to the disposal of Oriental Brewery. The deferred consideration with a notional amount of 300m US dollar had been reported for a fair value amount of 225m US dollar by year end 2009. The deferred consideration was sold to a third party for a gross proceed of 275m US dollar excluding interest accrued since inception and resulted in a non-recurring gain of 50m US dollar – see Note 8 Non-recurring items. The cash receipt was partially offset by corporate taxes paid on the disposal of Busch Entertainment and other subsidiaries (255m US dollar).
2009 DISPOSALS
On 24 July 2009, AB InBev announced that it completed the sale of Oriental Brewery to Kohlberg Kravis Roberts & Co. L.P. for 1.8 billion US dollar of which 1.5 billion US dollar was cash and 0.3 billion US dollar was received as an unsecured deferred payment. As a result of the sale, AB InBev recorded a capital gain of approximately 428m US dollar.
On 1 December 2009, AB InBev completed the sale of its indirect wholly owned subsidiary of Busch Entertainment Corporation, to an entity established by Blackstone Capital Partners V L.P. for up to 2.7 billion US dollar. The purchase price was comprised of a cash payment of 2.3 billion US dollar and a right to participate in Blackstone Capital Partners’ return on initial investment, which is capped at 400m US dollar. There was no capital gain recorded on this transaction as the selling price equaled the net carrying value at the date of disposal.
On 2 December 2009, the company completed the sale of the Central European operations to CVC Capital Partners for an enterprise value of 2.2 billion US dollar, of which 1.6 billion US dollar was cash, 448m US dollar was received as a unsecured deferred payment obligation with a six-year maturity and 165m US dollar represents the value to non-controlling interest. The company also received additional rights to a future payments estimated up to 800m US dollar contingent on CVC’s return on initial investments. As a result of the sale, AB InBev recorded a capital gain of approximately 1.1 billion US dollar.

39
Other 2009 Disposals
The sale of the company’s integrated distribution network in France (CafeIn) during 2008 was closed by February 2009. The impact of the selling price is reflected in the changes in assets and liabilities above. There was no capital gain recorded on this transaction as the selling price equaled the net carrying value at date of disposal.
The company also disposed of local distributors during the year. Such disposals were not material individually or in the aggregate. The impact on assets and liabilities of these disposals are reflected in the above table.
7. OTHER OPERATING INCOME/(EXPENSES)
Million US dollar 2010 2009 Government grants.......................................................................................... 243 155 License income................................................................................................ 96 84 Net (additions to)/reversals of provisions ........................................................... (4) 159 Net gain on disposal of property, plant and equipment, intangible assets and assets held for sale.................................................................................................... 119 123 Net rental and other operating income ............................................................... 150 140 604 661
Research expenses as incurred.......................................................................... 184 159
The government grants relate primarily to fiscal incentives given by certain Brazilian states based on the company’s operations and investments in those states.
The net (additions to)/reversals of provisions in 2009 contained a curtailment gain of 164m US dollar, following the amendment of post-retirement healthcare in the US.
In 2010, the company expensed 184m US dollar in research, compared to 159m US dollar in 2009. Part of this was expensed in the area of market research, but the majority is related to innovation in the areas of process optimization especially as it pertains to capacity, new product developments and packaging initiatives.
8. NON-RECURRING ITEMS
IAS 1 Presentation of financial statements requires material items of income and expense to be disclosed separately. Non-recurring items are items, which in management’s judgment, need to be disclosed by virtue of their size or incidence in order for the user to obtain a proper understanding of the financial information. The company considers these items to be of significance in nature, and accordingly, management has excluded these from their segment measure of performance as noted in Note 5 Segment Reporting.
The non-recurring items included in the income statement are as follows:
Million US dollar 2010 2009 Restructuring (including impairment losses)........................................................ (252) (153) Fair value adjustments..................................................................................... - (67) Business and asset disposal (including impairment losses).................................... (16) 1 541 Impact on profit from operations ................................................................. (268) 1 321
Non-recurring finance cost................................................................................ (925) (629) Non-recurring taxes ......................................................................................... 153 29 Non-recurring non-controlling interest................................................................ 26 (35) Net impact on profit attributable to equity holders of AB InBev ................... (1 014) 686
The 2010 non-recurring restructuring charges total (252)m US dollar. These charges are primarily related to the Anheuser-Busch integration in North America, organizational alignments and outsourcing activities in Western Europe in order to eliminate overlap or duplicated processes and activities across functions and zones, and the closure of the Hamilton Brewery in Canada. These one time expenses as a result of the series of decisions provide us with a lower cost base besides a stronger focus on AB InBev’s core activities, quicker decision-making and improvements to efficiency, service and quality.
The 2010 business and asset disposals (including impairment losses) resulted in a net loss of (16)m US dollar mainly representing the net impact of the settlement of the deferred collection relating to the 2009 disposal of the Korean subsidiary Oriental Brewery (50m US dollar), the measurement at fair value of the retained interest in the combination in Venezuela between AmBev and Cerveceria Regional S.A ((31)m US dollar), the disposal of non-core assets of Anheuser-Busch ((52)m US dollar, including a (65)m US dollar impairment loss) and a 17m US dollar adjustment of accruals and provisions relating to divestitures of previous years. See also Note 6 Acquisitions and disposals of subsidiaries for more details on business disposals.
The 2009 non-recurring restructuring charges total (153)m US dollar. These charges primarily relate to the Anheuser-Busch integration in North America and Asia Pacific and organizational alignments and outsourcing activities in the Global headquarters and Western Europe.
IFRS fair value adjustments, recognized in 2009 for a total of (67)m US dollar, relate to the non-recurring employee benefit expenses in accordance with IFRS 2, following the change in vesting conditions on certain share-based payment plans.
The 2009 business and asset disposals resulted in a non-recurring income of 1 541m US dollar mainly representing the sale of assets of InBev USA LLC (also doing business under the name Labatt USA) to an affiliate of KPS Capital Partners, L.P. (54m US dollar), the sale of the Korean subsidiary Oriental Brewery to an affiliate of Kohlberg Kravis Roberts & Co. L.P. (428m US dollar) and the sale of the Central European operations to CVC Capital Partners (1 088m US dollar), next to other costs linked to divestitures.

40
The company also incurred non-recurring net finance costs totaling (925)m US dollar for the year ended 31 December 2010 ((629)m US dollar for the year ended 31 December 2009). See Note 11 Finance cost and income.
All the above amounts are before income taxes. The 2010 and 2009 non-recurring items decreased income taxes by 153m US dollar and 29m US dollar, respectively.
Non-controlling interests on the non-recurring items amount to 26m US dollar in 2010 versus (35)m US dollar in 2009.
9. PAYROLL AND RELATED BENEFITS
Million US dollar 2010 2009 Wages and salaries .......................................................................................... (2 912) (3 835) Social security contributions ............................................................................. (512) (587) Other personnel cost........................................................................................ (741) (805) Pension expense for defined benefit plans........................................................... (217) 1 Share-based payment expense ......................................................................... (156) (208) Contributions to defined contribution plans ......................................................... (44) (43) (4 582) (5 477)
Number of full time equivalents (FTE) ................................................................ 114 313 116 489
The number of full time equivalents can be split as follows:
2010 2009 AB InBev NV (parent company)......................................................................... 272 261 Other subsidiaries............................................................................................ 112 020 114 260 Proportionally consolidated entities .................................................................... 2 021 1 968 114 313 116 489
Note 5 Segment reporting contains the split of the FTE by geographical segment.
10. ADDITIONAL INFORMATION ON OPERATING EXPENSES BY NATURE
Depreciation, amortization and impairment charges are included in the following line items of the 2010 income statement:
Million US dollar
Depreciation and impairment of property,
plant and equipment
Amortization and impairment of intangible
assets Impairment of goodwill Cost of sales ....................................................... 1 943 11 - Distribution expenses........................................... 126 1 - Sales and marketing expenses .............................. 261 76 - Administrative expenses....................................... 122 160 - Other operating expenses..................................... 3 2 - Non-recurring items............................................. 83 - - 2 538 250 -
Depreciation, amortization and impairment charges were included in the following line items of the 2009 income statement:
Million US dollar
Depreciation and impairment of property,
plant and equipment
Amortization and impairment of intangible
assets Impairment of goodwill Cost of sales ........................................................ 1 996 16 - Distribution expenses............................................ 111 - - Sales and marketing expenses ............................... 256 63 - Administrative expenses........................................ 145 187 - Other operating expenses...................................... 15 - - Non-recurring items.............................................. 23 6 - 2 546 272 -
The depreciation, amortization and impairment of property, plant and equipment included a full-cost reallocation of (1)m US dollar in 2010 and 7m US dollar in 2009 from the aggregate depreciation, amortization and impairment expense to cost of goods sold.

41
11. FINANCE COST AND INCOME
RECOGNIZED IN PROFIT OR LOSS
FINANCE COSTS Million US dollar 2010 20091 Interest expense ................................................................................................... (3 065) (3 522) Capitalization of borrowing costs ............................................................................. 35 4 Accretion expense ................................................................................................. (159) (381) Net losses on hedging instruments that are not part of a hedge accounting relationship . - (46) Net losses from hedge ineffectiveness...................................................................... - (46) Tax on financial transactions................................................................................... (30) (25) Other financial costs, including bank fees ................................................................. (117) (121) (3 336) (4 137) Non-recurring finance costs .................................................................................... (925) (629) (4 261) (4 766)
Finance costs, excluding non-recurring items, decreased by 801m US dollar from prior year driven by lower interest charges as a result of reduced net debt levels and lower accretion expenses as bank borrowings are being reduced as a percentage of total debt following the refinancing and repayment of the 2008 and 2010 senior facilities - see Note 24 Interest-bearing loans and borrowings.
During 2009 and 2010, AB InBev repaid and refinanced the debt incurred under the 2008 senior facilities arising from the acquisition of Anheuser-Busch (see Note 24 Interest-bearing loans and borrowings). Consequently, interest and accretion expense decreased by 457m US dollar and 222m US dollar respectively, compared to 2009.
As a result of the repayments and refinancing in 2010, AB InBev incurred hedging losses of 733m US dollar (474m US dollar in 2009) on interest rate swaps that became ineffective and incremental accretion expense of 192m US dollar (145m US dollar in 2009). These amounts have been recorded as non-recurring finance cost. See also Note 8 Non-recurring items.
Borrowing costs capitalized relate to the capitalization of interest expenses directly attributable to the acquisition and construction of qualifying assets mainly in Brazil. Interests are capitalized at a borrowing rate ranging between 6% and 12.5%.
Interest expense recognized on unhedged and hedged financial liabilities and the net interest expense from the related hedging derivative instruments can be summarized per type of hedging relationship as follows:
Million US dollar 2010 2009 Financial liabilities measured at amortized cost – not hedged ...................................... (1 992) (1 780) Fair value hedges – hedged items............................................................................ (236) (216) Fair value hedges – hedging instruments.................................................................. (26) (36) Cash flow hedges – hedged items............................................................................ (215) (577) Cash flow hedges – hedging instruments (reclassified from equity) ............................. (501) (580) Net investment hedges - hedging instruments (interest component) ........................... (77) (54) Economic hedges - hedged items not part of a hedge accounting relationship ............... (25) - Economic hedges - hedging instruments not part of a hedge accounting relationship ..... 7 (279) (3 065) (3 522)
Hedging instruments not part of a hedge accounting relationship are mainly related to the pre-hedge of dollar issuance of bonds related to the Anheuser-Busch acquisition and hedging instruments that ceased to qualify for a hedge accounting relationship given the repayment of certain underlying hedged facilities - see Note 24 Interest-bearing loans and borrowings.
For further information on instruments hedging AB InBev’s interest rate risk see 29 Risks arising from financial instruments.
FINANCE INCOME
Million US dollar 2010 20091 Interest income..................................................................................................... 316 151 Dividend income, non-consolidated companies .......................................................... 5 1 Net foreign exchange gains (net of the effect of foreign exchange derivative instruments) ......................................................................................................... 113 160 Net gains on hedging instruments that are not part of a hedge accounting relationship .. 21 - Net gains from hedge ineffectiveness....................................................................... 40 - Other financial income ........................................................................................... 30 35
525 347
The increase in interest income is explained by higher cash and cash equivalent positions and investments in Brazilian real denominated government debt securities in AmBev Brazil and in the holding companies.
1 Reclassified to conform to the 2010 presentation.

42
In 2010, net foreign exchange gains of 113m US dollar are mainly comprised of euro/US dollar currency fluctuations on intra-group transactions. Net foreign exchange gains of 160m US dollar in 2009 are related to hedging activities on bond proceeds that were issued during the same year and unrealized foreign exchange gains on monetary items.
No interest income was recognized on impaired financial assets.
The 2010 interest income stems from the following financial assets:
Million US dollar 2010 2009 Cash and cash equivalents...................................................................................... 165 101 Investment debt securities held for trading............................................................... 118 22 Loans to customers................................................................................................ 6 11 Other loans and receivables .................................................................................... 27 17 316 151
The split between results from foreign currency hedged items and results on the related hedging instruments can be summarized per type of hedging relationship as follows:
Million US dollar 2010 2009 Fair value hedges - hedged items ............................................................................ 40 358 Fair value hedges - hedging instruments .................................................................. (40) (358) Cash flow hedges - hedged items ............................................................................ - (78) Cash flow hedges - hedging instruments (reclassified from equity) .............................. (2) 78 Economic hedges - hedged items not part of a hedge accounting relationship ............... (102) - Economic hedges - hedging instruments not part of a hedge accounting relationship ..... 111 - 7 -
For further information on instruments hedging AB InBev’s foreign exchange risk see Note 29 Risks arising from financial instruments.
RECOGNIZED DIRECTLY IN OTHER COMPREHENSIVE INCOME
Million US dollar 2010 2009 Hedging reserve Effective portion of changes in fair value of cash flow hedges...................................... (120) 729 Net changes in fair value of cash flow hedges reclassified to profit or loss..................... 892 478 Net changes in fair value of cash flow hedges transferred to initial carrying amounts of hedged items ........................................................................................................
- (37)
772 1 170
Translation reserve Effective portion of changes in fair value of net investment hedges.............................. (816) 1 776 Foreign currency translation differences for foreign operations .................................... 1 807 692 991 2 468
The amounts recognized in the hedge reserve, net of related tax effects are mainly related to interest rate swaps entered into in 2008 to cover for the interest rate risk of the 2008 and 2010 senior facilities, as well as certain aluminum hedges. The decrease of the translation reserve is related mainly to the strengthening of the Brazilian real, the Mexican peso, the Canadian dollar and the Chinese yuan. For further information see also Note 29 Risks arising from financial instruments.
12. INCOME TAXES
Income taxes recognized in the income statement can be detailed as follows:
Million US dollar 2010 20091 Current tax expense
Current year ......................................................................................................... (2 272) (1 436) (Underprovided)/overprovided in prior years............................................................. 23 17 (2 249) (1 419)
Deferred tax (expense)/income Origination and reversal of temporary differences...................................................... 419 (168) Utilization of deferred tax assets on tax losses .......................................................... (106) (251) Recognition of previously unrecognized tax losses ..................................................... 16 52 329 (367)
Total income tax expense in the income statement............................................ (1 920) (1 786)
1 Reclassified to conform to the 2010 presentation.

43
The reconciliation of the effective tax rate with the aggregated weighted nominal tax rate can be summarized as follows:
Million US dollar 2010 2009 Profit before tax .................................................................................................... 7 682 7 663 Deduct share of result of associates......................................................................... 521 513 Profit before tax and before share of result of associates .................................. 7 161 7 150
Adjustments on taxable basis
Expenses not deductible for tax purposes ................................................................. 234 2 770 Taxable intercompany dividends.............................................................................. 8 9 Non-taxable financial and other income.................................................................... (736) (1 332) 6 667 8 597
Aggregated weighted nominal tax rate............................................................... 34.7% 31.7% Tax at aggregated weighted nominal tax rate............................................................ (2 313) (2 721) Adjustments on tax expense Utilization of tax losses not previously recognized...................................................... 32 - Recognition of deferred tax assets on previous years’ tax losses.................................. 16 104 Write-down of deferred tax assets on tax losses and current year losses for which no deferred tax asset is recognized ..............................................................................
(73) (193)
(Underprovided)/overprovided in prior years............................................................. 23 17 Tax savings (costs) from tax credits and special tax status ......................................... 667 1 184 Change in tax rate................................................................................................. (1) (1) Withholding taxes.................................................................................................. (137) (100) Other tax adjustments ........................................................................................... (134) (76) (1 920) (1 786)
Effective tax rate ................................................................................................ 26.8% 25.0%
The total income tax expense amounts to 1 920m US dollar with an effective tax rate of 26.8% (versus 25.0% in 2009). The increase in the effective tax rate in 2010 compared to 2009 was primarily due to the effect of the non-deductibility of certain non-recurring charges associated with refinancing and repayment of senior facilities (see Note 24 Interest-bearing loans and borrowings) as well as non-recurring taxable gains on disposals in low tax jurisdictions during 2009. The company continues to benefit at the AmBev level from the impact of interest on equity payments and tax deductible goodwill from the merger between InBev Holding Brazil and AmBev in July 2005 and the acquisition of Quinsa in August 2006.
Expenses non-deductible for tax purposes in 2009 mainly related to a non-taxable intercompany loss that for purposes of this reconciliation has no net impact on AB InBev’s tax expenses as there is a compensating offset from tax savings from special tax status.
Normalized effective tax rate in 2010 is 24.8% (versus 28.1% in 2009). Normalized effective tax rate is not an accounting measure under IFRS accounting and should not be considered as an alternative to the effective tax rate. Normalized effective tax rate method does not have a standard calculation method and AB InBev’s definition of normalized effective rate may not be comparable to other companies.
Income taxes were directly recognized in comprehensive income as follows:
Million US dollar 2010 2009 Income tax (losses)/gains Actuarial gains and losses on pensions ..................................................................... 70 (104) Cash flow hedges .................................................................................................. (21) (6) Net investment hedges .......................................................................................... (20) (29)

44
13. PROPERTY, PLANT AND EQUIPMENT
2010 2009
Million US dollar Land and buildings
Plant and equipment
Fixtures and fittings
Under construction Total Total
Acquisition cost Balance at end of previous year................. 7 855 17 619 3 060 756 29 290 30 892
Effect of movements in foreign exchange ........ (43) (190) (46) 30 (249) 2 069 Effect of hyperinflation .................................. 10 43 3 - 56 - Acquisitions ................................................. 14 341 136 1 681 2 172 1 540 Acquisitions through business combinations ..... - 1 - - 1 15 Disposals..................................................... (87) (350) (179) (2) (618) (885) Disposals through the sale of subsidiaries........ (54) (266) (19) (1) (340) (3 386) Transfer to other asset categories................... (39) 851 315 (1 149) (22) (1 263) Other movements......................................... (1) 6 - 1 6 308 Balance at end of year ............................... 7 655 18 055 3 270 1 316 30 296 29 290
Depreciation and impairment losses Balance at end of previous year................. (2 113) (8 582) (2 134) - (12 829) (11 221)
Effect of movements in foreign exchange ........ 48 185 33 - 266 (1 203) Effect of hyperinflation .................................. (7) (36) (1) - (44) - Disposals..................................................... 46 273 180 - 499 784 Disposals through the sale of subsidiaries........ 37 228 7 - 272 902 Depreciation ................................................ (333) (1 662) (360) - (2 355) (2 411) Impairment losses ........................................ (48) (129) (1) (6) (184) (128) Transfer to other asset categories................... 83 7 (130) 6 (34) 683 Other movements......................................... (2) 5 3 - 6 (235) Balance at end of year ............................... (2 289) (9 711) (2 403) - (14 403) (12 829)
Carrying amount
at 31 December 2009 ................................ 5 742 9 037 926 756 16 461 16 461 at 31 December 2010 ............................... 5 366 8 344 867 1 316 15 893 -
The transfer to other asset categories mainly relates to the separate presentation in the balance sheet of property, plant and equipment held for sale in accordance with IFRS 5 Non-current assets held for sale and discontinued operations.
During 2010 AB InBev conducted an operational review of the useful lives of certain items of property, plant and equipment in the zone Latin America North, which resulted in changes in the expected usage of some of these assets. The effect of these changes on depreciation expense in 2010 amounted to 167m US dollar of which 139m US dollar recognized in cost of sales and 28m US dollar in sales and marketing expenses.
The carrying amount of property, plant and equipment subject to restrictions on title amounts to 158m US dollar.
LEASED ASSETS
The company leases land and buildings as well as equipment under a number of finance lease agreements. The carrying amount of leased land and buildings was 164m US dollar as at 31 December 2010 (98m US dollar as at 31 December 2009) and leased plant and equipment was 18m US dollar as at 31 December 2010 (14m US dollar as at 31 December 2009). For an overview of the operating lease agreements, please refer to Note 30 Operating leases.
14. GOODWILL
Million US dollar 2010 2009 Acquisition cost Balance at end of previous year....................................................................... 52 132 50 251 Effect of movements in foreign exchange .............................................................. 386 2 988 Purchases of non-controlling interests ................................................................... (13) 145 Acquisitions through business combinations ........................................................... - 17 Disposals........................................................................................................... - (304) Disposals through the sale of subsidiaries.............................................................. - (166) Transfer to other asset categories ........................................................................ - (799) Balance at end of year ..................................................................................... 52 505 52 132 Impairment losses
Balance at end of previous year....................................................................... (7) (7) Impairment losses .............................................................................................. - - Balance at end of year ..................................................................................... (7) (7)
Carrying amount at 31 December 2009 ...................................................................................... 52 125 52 125
at 31 December 2010 ..................................................................................... 52 498 -
Goodwill increased from 52 125m US dollar per end of December 2009 to 52 498m US dollar per end of December 2010. 2010 movements represent a 386m US dollar effect of movements in foreign currency exchange rates, and a subsequent fair value adjustment of (13)m US dollar related to a contingent consideration from the purchase of non-controlling interests in prior years.

45
Effective 01 January 2010, AB InBev adopted the amendments to IAS27 Consolidated and Separate Financial Statements, whereby changes in ownership interests while maintaining control are to be recognized as equity transactions. The effects are described in Note 23 Changes in equity and earnings per share. The business combinations that took place in 2009 are the acquisition of several local businesses throughout the world. These transactions resulted in recognition of goodwill of 17m US dollar.
As a result of the asset and business disposals completed in 2009, goodwill was derecognized for a total amount of 1 269m US dollar (including disposals, disposals through the sale of subsidiaries and transfer to other assets categories), mainly represented by the sale of the Korean subsidiary Oriental Brewery to an affiliate of Kohlberg Kravis Roberts & Co. L.P. (799m US dollar), the sale of the Central European operations to CVC Capital Partners (166m US dollar), the sale of four metal can lid manufacturing plants from AB InBev’s US metal packaging subsidiary, Metal Container Corporation, to Ball Corporation (156m US dollar) and the sale of Tennent’s Lager brand and associated trading assets in Scotland, Northern Ireland and the Republic of Ireland to C&C Group plc (148m US dollar). In 2009, changes in ownership interests while maintaining control increased goodwill by 145m US dollar. These mainly included the buy-out of the businesses in Dominican Republic and Peru. In addition, under the exchange of share-ownership program, a number of AmBev shareholders who are part of the senior management of AB InBev exchanged AmBev shares for AB InBev shares which increased AB InBev’s economic interest percentage in AmBev. As the related subsidiaries were already fully consolidated, the purchases did not impact AB InBev’s profit, but reduced non-controlling interests and thus impacted the profit attributable to equity holders of AB InBev. The carrying amount of goodwill was allocated to the different business unit levels as follows:
Million US dollar Business unit 2010 20091 USA .................................................................................................................. 32 617 32 617 Brazil ................................................................................................................ 10 700 10 240 Canada ............................................................................................................. 2 075 1 970 China ................................................................................................................ 1 696 1 640 Germany/Italy/Swiss/Austria ............................................................................... 1 488 1 604 Hispanic Latin America ........................................................................................ 1 440 1 468 Russia/Ukraine................................................................................................... 1 090 1 104 Global Export/Spain ............................................................................................ 707 763 UK/Ireland......................................................................................................... 585 611 Belgium/Netherlands/France/Luxemburg ............................................................... 100 108 52 498 52 125
AB InBev completed its annual impairment test for goodwill and concluded, based on the assumptions described below, that no impairment charge was warranted. The company cannot predict whether an event that triggers impairment will occur, when it will occur or how it will affect the asset values reported. AB InBev believes that all of its estimates are reasonable: they are consistent with the internal reporting and reflect management’s best estimates. However, inherent uncertainties exist that management may not be able to control. While a change in the estimates used could have a material impact on the calculation of the fair values and trigger an impairment charge, the company is not aware of any reasonably possible change in a key assumption used that would cause a business unit’s carrying amount to exceed its recoverable amount.
Goodwill impairment testing relies on a number of critical judgments, estimates and assumptions. Goodwill, which accounted for approximately 46% of AB InBev's total assets as at 31 December 2010, is tested for impairment at the business unit level (that is, one level below the segments) based on a fair-value-less-cost-to-sell approach using a discounted free cash flow approach based on current acquisition valuation models. The key judgments, estimates and assumptions used in the fair-value-less-cost-to-sell calculations are as follows:
• The first year of the model is based on management's best estimate of the free cash flow outlook for the current year;
• In the second to fourth years of the model, free cash flows are based on AB InBev's strategic plan as approved by key management. AB InBev's strategic plan is prepared per country and is based on external sources in respect of macro-economic assumptions, industry, inflation and foreign exchange rates, past experience and identified initiatives in terms of market share, revenue, variable and fixed cost, capital expenditure and working capital assumptions;
• For the subsequent six years of the model, data from the strategic plan is extrapolated generally using simplified assumptions such as constant volumes and variable cost per hectoliter and fixed cost linked to inflation, as obtained from external sources;
• Cash flows after the first ten-year period are extrapolated generally using expected annual long-term consumer price indices, based on external sources, in order to calculate the terminal value;
• Projections are made in the functional currency of the business unit and discounted at the unit's weighted average cost of capital. The latter ranged primarily between 6.3% and 21.6% in US dollar nominal terms for goodwill impairment testing conducted for 2010;
• Cost to sell is assumed to reach 2% of the entity value based on historical precedents.
The above calculations are corroborated by valuation multiples, quoted share prices for publicly-traded subsidiaries or other available fair value indicators.
Although AB InBev believes that its judgments, assumptions and estimates are appropriate, actual results may differ from these estimates under different assumptions or conditions.
1 Reclassified to conform to the 2010 cash generating units.

46
15. INTANGIBLE ASSETS
2010 2009
Million US dollar Brands Commercial intangibles Software Other Total Total
Acquisition cost Balance at end of previous year............................. 21 655 1 449 802 161 24 067 24 330 Effect of movements in foreign exchange .................... (5) (36) (20) 3 (58) 75 Acquisitions through business combinations ................. - 15 - - 15 13 Acquisitions and expenditures .................................... - 368 50 10 428 168 Disposals through the sale of subsidiaries.................... - - - - - (583) Disposals................................................................. - (21) (7) (1) (29) (44) Transfer to/from other asset categories....................... - 11 23 (4) 30 108 Balance at end of year ........................................... 21 650 1 786 848 169 24 453 24 067
Amortization and impairment losses Balance at end of previous year ............................ - (400) (465) (37) (902) (693)
Effect of movements in foreign exchange .................... - 19 10 1 30 (47) Amortization ............................................................ - (101) (135) (12) (248) (266) Disposals through the sale of subsidiaries.................... - - - - - 73 Disposals................................................................. - 17 7 1 25 34 Impairment losses .................................................... - - (2) - (2) (6) Transfer to/from other asset categories....................... - (10) 2 11 3 3 Balance at end of year ........................................... - (475) (583) (36) (1 094) (902)
Carrying value at 31 December 2009 ............................................ 21 655 1 049 337 124 23 165 23 165
at 31 December 2010 ........................................... 21 650 1 311 265 133 23 359 -
AB InBev is the owner of some of the world’s most valuable brands in the beer industry. As a result, certain brands and distribution rights are expected to generate positive cash flows for as long as the company owns the brands and distribution rights. Given AB InBev’s more than 600-year history, certain brands and their distribution rights have been assigned indefinite lives.
Acquisitions and expenditures of commercial intangibles mainly represent supply and distribution rights, exclusive multi-year sponsorship rights and other commercial intangibles.
Intangible assets with indefinite useful lives are comprised primarily of brands and certain distribution rights that AB InBev purchases for its own products, and are tested for impairment during the fourth quarter of the year or whenever a triggering event has occurred. As of 31 December 2010, the carrying amount of the intangible assets amounted to 23 359m US dollar (31 December 2009: 23 165m US dollar) of which 22 296m US dollar was assigned an indefinite useful life (31 December 2009: 22 265m US dollar) and 1 063m US dollar a finite life (31 December 2009: 900m US dollar).
The carrying amount of intangible assets with indefinite useful lives was allocated to the different countries as follows:
Million US dollar Country 2010 2009 USA ............................................................................................................ 21 077 21 036 Argentina .................................................................................................... 354 371 China .......................................................................................................... 239 231 Paraguay..................................................................................................... 189 188 Bolivia......................................................................................................... 169 169 UK.............................................................................................................. 104 109 Uruguay ...................................................................................................... 50 51 Canada ....................................................................................................... 40 38 Russia......................................................................................................... 27 27 Chile ........................................................................................................... 27 25 Germany ..................................................................................................... 20 20 22 296 22 265
Intangible assets with indefinite useful lives have been tested for impairment using the same methodology and assumptions as disclosed in Note 14 Goodwill. Based on the assumptions described in that note, AB InBev concluded that no impairment charge is warranted. While a change in the estimates used could have a material impact on the calculation of the fair values and trigger an impairment charge, the company is not aware of any reasonable possible change in a key assumption used that would cause a business unit’s carrying amount to exceed its recoverable amount.

47
16. INVESTMENT IN ASSOCIATES
Million US dollar 2010 2009
Balance at end of previous year.................................................................. 6 744 6 871
Effect of movements in foreign exchange ......................................................... 420 324 Disposals...................................................................................................... (12) (927) Share of results of associates.......................................................................... 521 513 Dividends ..................................................................................................... (378) (14) Transfer to other asset categories.................................................................... - (23) Balance at end of year ................................................................................ 7 295 6 744
AB InBev holds a 35.12% direct interest in Grupo Modelo, Mexico’s largest brewer, and a 23.25% direct interest in Diblo S.A. de C.V., Grupo Modelo’s operating subsidiary, providing AB InBev with, directly and indirectly, a 50.2% interest in Modelo without however having voting or other control of either Grupo Modelo or Diblo. On a stand alone basis (100%) under IFRS, aggregate amounts of Modelo’s assets and liabilities for 2010 represented 17 392m US dollar and 2 995m US dollar respectively, while the 2010 net revenue amounted to 6 646m US dollar and the profit to 1 023m US dollar.
Disposals in 2009 mainly comprised the divestiture, as part of AB-InBev’s deleveraging program, of the 27% stake in Tsingtao Brewery Company Limited for a consideration of 901m US dollar. There was no capital gain recorded on this transaction as the selling price equaled the net carrying value at the date of the disposal.
17. INVESTMENT SECURITIES
Million US dollar 2010 2009 Non-current investments Investments in quoted companies – available for sale ......................................... 6 7 Investments in unquoted companies – available for sale...................................... 236 144 Debt securities held-to-maturity ....................................................................... 1 126 243 277 Current investments
Financial assets at fair value through profit or loss - held for trading..................... 641 30 Financial assets – available for sale................................................................... - 6 Debt securities - held to maturity ..................................................................... - 19 641 55
As at 31 December 2010, financial assets at fair value through profit or loss held for trading represent investments in Brazilian real denominated government debt securities entered into in order to facilitate liquidity and capital preservation. These investments are of highly liquid nature.
AB InBev’s exposure to equity price risk is disclosed in Note 29 Risks arising from financial instruments. The equity securities available-for-sale consist mainly of investments in unquoted companies and are measured at cost as their fair value can not be reliably determined.
18. DEFERRED TAX ASSETS AND LIABILITIES
The amount of deferred tax assets and liabilities by type of temporary difference can be detailed as follows:
2010 Million US dollar Assets Liabilities Net Property, plant and equipment ........................................................................ 308 (2 718) (2 410) Intangible assets ........................................................................................... 178 (8 480) (8 302) Goodwill ....................................................................................................... 118 (28) 90 Inventories ................................................................................................... 34 (78) (44) Investment in associates ................................................................................ 3 (1 601) (1 598) Trade and other receivables............................................................................ 38 (2) 36 Interest-bearing loans and borrowings ............................................................. 46 (511) (465) Employee benefits ......................................................................................... 1 023 (21) 1 002 Provisions..................................................................................................... 282 (64) 218 Derivatives ................................................................................................... 92 (31) 61 Other items .................................................................................................. 132 (182) (50) Loss carry forwards ....................................................................................... 297 - 297 Gross deferred tax assets/(liabilities)........................................................ 2 551 (13 716) (11 165) Netting by taxable entity ............................................................................ (1 807) 1 807 -
Net deferred tax assets/(liabilities) ........................................................... 744 (11 909) (11 165)

48
2009 Million US dollar Assets Liabilities Net Property, plant and equipment ......................................................................... 86 (4 394) (4 308) Intangible assets ............................................................................................ 208 (8 826) (8 618) Goodwill ........................................................................................................ 126 (9) 117 Inventories .................................................................................................... 24 (321) (297) Investment securities...................................................................................... 4 - 4 Investment in associates ................................................................................. 3 (3 816) (3 813) Trade and other receivables ............................................................................. 16 (407) (391) Interest-bearing loans and borrowings .............................................................. 3 466 (67) 3 399 Employee benefits .......................................................................................... 876 (16) 860 Provisions ...................................................................................................... 295 (196) 99 Derivatives .................................................................................................... 266 - 266 Other items ................................................................................................... 825 (146) 679 Loss carry forwards......................................................................................... 457 - 457 Gross deferred tax assets/(liabilities)......................................................... 6 652 (18 198) (11 546)
Netting by taxable entity ............................................................................. (5 703) 5 703 -
Net deferred tax assets/(liabilities) ............................................................ 949 (12 495) (11 546)
Net deferred tax assets and liabilities decreased slightly from prior year due to timing of temporary differences and the slight improvement of AB InBev’s deferred tax rate expected to be applied when the asset or liability is realized.
Most of the temporary differences are related to the fair value adjustment on intangible assets with indefinite useful lives and property, plant and equipment acquired in a business combination. The realization of such temporary differences is unlikely to revert within 12 months.
On 31 December 2010, a deferred tax liability of 74m US dollar (2009: 139m US dollar) relating to investment in subsidiaries has not been recognized because management believes that this liability will not be incurred in the foreseeable future.
Tax losses carried forward and deductible temporary differences on which no deferred tax asset is recognized amount to 2 101m US dollar (2009: 1 025m US dollar). 809m US dollar of these tax losses and deductible temporary differences do not have an expiration date, 70m US dollar, 74m US dollar and 93m US dollar expire within respectively 1, 2 and 3 years, while 1 055m US dollar have an expiration date of more than 3 years. Deferred tax assets have not been recognized on these items because it is not probable that future taxable profits will be available against which these tax losses and deductible temporary differences can be utilized and the company has no tax planning strategy currently in place to utilize these tax losses and deductible temporary differences.
19. INVENTORIES
Million US dollar
2010 2009
Prepayments.................................................................................................................... 129 61 Raw materials and consumables ......................................................................................... 1 519 1 495 Work in progress .............................................................................................................. 217 256 Finished goods ................................................................................................................. 497 434 Goods purchased for resale................................................................................................ 47 108 2 409 2 354
Inventories other than work in progress Inventories stated at net realizable value ............................................................................ 2 1 Carrying amount of inventories subject to collateral.............................................................. - -
The cost of inventories recognized as an expense in 2010 amounted to 16 151m US dollar, included in cost of sales. Last year, this expense amounted to 17 198m US dollar.
Impairment losses on inventories recognized in 2010 amount to 67m US dollar (2009: 58m US dollar).
20. TRADE AND OTHER RECEIVABLES
NON-CURRENT TRADE AND OTHER RECEIVABLES
Million US dollar
2010
2009
Trade receivables ............................................................................................................. 1 4 Cash deposits for guarantees ............................................................................................. 332 291 Loans to customers........................................................................................................... 69 125 Deferred collection on disposals.......................................................................................... 381 585 Tax receivable, other than income tax................................................................................. 199 137 Derivative financial instruments with positive fair values ....................................................... 585 680 Other receivables ............................................................................................................. 133 119 1 700 1 941

49
For the nature of cash deposits for guarantees see Note 31 Collateral and contractual commitments for the acquisition of property, plant and equipment, loans to customers and other.
On 24 July 2009, AB InBev completed the sale of Oriental Brewery to Kohlberg Kravis Roberts & Co. L.P and on 2 December, AB InBev completed the sale of its Central European operations to CVC Capital Partners. These transactions included deferred considerations for a notional amount of 300m US dollar in the case of Oriental Brewery and 300m euro in the case the Central European operations respectively (see also Note 6 Acquisition and disposal of subsidiaries). During 2010, AB InBev collected the deferred consideration related to the disposal of Oriental Brewery. The deferred consideration was sold to a third party for a gross proceed of 275m US dollar excluding interest accrued since inception and resulted in a non-recurring gain of 50m US dollar (see Note 8 Non-recurring items). The deferred consideration related to the sale of the Central European operations is reported for a fair value amount of 363m US dollar by year end 2010 in deferred collection on disposals.
CURRENT TRADE AND OTHER RECEIVABLES
Million US dollar
2010
2009
Trade receivables ............................................................................................................. 2 604 2 432 Interest receivable............................................................................................................ 98 46 Tax receivable, other than income tax................................................................................. 303 262 Derivative financial instruments with positive fair values ....................................................... 1 059 706 Loans to customers........................................................................................................... 28 42 Prepaid expenses ............................................................................................................. 451 444 Accrued income................................................................................................................ 35 69 Other receivables ............................................................................................................. 60 98 4 638 4 099
The fair value of trade and other receivables, excluding derivatives, equals their carrying amounts as the impact of discounting is not significant.
The aging of the current trade receivables, interest receivable, other receivables and accrued income and of the current and non-current loans to customers can be detailed as follows for 2010 and 2009 respectively:
Of which not impaired as of the reporting date and past due
Net carrying amount as of December 31,
2010
Of which: neither impaired nor past due on
the reporting date
Past due less
than 30 days
Past due between 30 and 59 days
Past due between 60 and 89 days
Past due between 90 and
179 days
Past due between 180 and
359 days
Past due more than 359 days
Trade receivables .............................. 2 604 2 496 58 21 11 8 7 3 Loans to customers............................ 97 91 1 1 - - 1 3 Interest receivable............................. 98 98 - - - - - - Other receivables and accrued income............................................. 95 95 - - - - - - 2 894 2 780 59 22 11 8 8 6
Of which not impaired as of the reporting date and past due
Net carrying amount as of December 31,
2009
Of which: neither impaired nor past due on
the reporting date
Past due less
than 30 days
Past due between 30 and 59 days
Past due between 60 and 89 days
Past due between 90 and
179 days
Past due between 180 and
359 days
Past due more than 359 days
Trade receivables .............................. 2 432 2 377 11 10 8 17 3 6 Loans to customers............................ 167 156 1 1 1 2 2 4 Interest receivable............................. 46 46 - - - - - - Other receivables and accrued income............................................. 167 167 - - - - - - 2 812 2 746 12 11 9 19 5 10
In accordance with the IFRS 7 Financial Instruments: Disclosures the above analysis of the age of financial assets that are past due as at the reporting date but not impaired also includes the non-current part of loans to customers. Past due amounts were not impaired when collection is still considered likely, for instance because the amounts can be recovered from the tax authorities or AB InBev has sufficient collateral. Impairment losses on trade and other receivables recognized in 2010 amount to 56m US dollar.
AB InBev’s exposure to credit, currency and interest rate risks is disclosed in Note 29 Risks arising from financial instruments.

50
21. CASH AND CASH EQUIVALENTS
Million US dollar 2010 2009 Short term bank deposits .................................................................................................. 3 099 2 051 Cash and bank accounts.................................................................................................... 1 412 1 638 Cash and cash equivalents............................................................................................. 4 511 3 689
Bank overdrafts............................................................................................................. (14) (28)
4 497 3 661
As of 31 December 2010 cash and cash equivalents include restricted cash of 42m US dollar of which 32m US dollar reflects the outstanding consideration payable to former Anheuser-Busch shareholders whom did not yet claim the proceeds (the related payable is recognized as a deferred consideration on acquisition) and 10m US dollar relates to restricted cash held on escrow accounts following the disposal of the Central European subsidiaries.
22. ASSETS AND LIABILITIES HELD FOR SALE
Assets Liabilities Million US dollar 2010 2009 2010 2009 Balance at the end of previous year ....................................... 66 51 - -
Effect of movements in foreign exchange ..................................... 1 44 - (6) Disposal through the sale of subsidiaries ...................................... - (1 454) - 289 Disposals.................................................................................. (71) (908) - 37 Impairment loss ........................................................................ (18) 7 - - Transfers from other asset categories .......................................... 54 2 326 - (320) Balance at end of year ............................................................ 32 66 - -
Assets held for sale at 31 December 2010 include land and buildings, mainly in Brazil. The disposal of these assets is expected in 2011. No gain or loss with respect to these assets was recognized in 2010.
2009 assets held for sale included 66m US dollar land and buildings, mainly in Brazil, UK and US. These assets were sold in 2010.
The total amount of other comprehensive income accumulated in equity relating to assets held for sale was immaterial as at 31 December 2010.
In 2009, transfers from other asset categories for an amount of 2 326m US dollar and from other liability categories for an amount of 320m US dollar mainly result from the reclassification of the identifiable assets and liabilities of the Korean subsidiary, of four metal beverage can lid manufacturing plants from AB InBev’s US metal packaging subsidiary and of the Tennent’s Lager brand and associated trading assets in Scotland, Northern Ireland and the Republic or Ireland, in accordance with IFRS 5 Non-current Assets Held for Sale and Discontinued Operations. See also Note 6 Acquisitions and disposals of subsidiaries.
23. CHANGES IN EQUITY AND EARNINGS PER SHARE
STATEMENT OF CAPITAL
The tables below summarize the changes in issued capital and treasury shares during the year:
ISSUED CAPITAL Million US dollar Million shares At the end of the previous year ............................................................................................. 1 732 1 604 Changes during the year ...................................................................................................... 1 1 1 733 1 605
TREASURY SHARES Million US dollar Million shares At the end of the previous year ............................................................................................. 659 13.6 Changes during the year ...................................................................................................... (71) (1.5) 588 12.1
During 2010 AB InBev increased its share capital by 21m US dollar (1m US dollar issued capital, 20m US dollar share premium).
As at 31 December 2010, the total issued capital of 1 733m US dollar is represented by 1 605 183 954 shares without par value, of which 400 761 393 registered shares, 5 083 721 bearer shares and 1 199 338 840 dematerialized shares. For a total amount of capital of 4m US dollar there are still 3 688 128 of subscription rights outstanding corresponding with a maximum of 3 688 128 shares to be issued. The total of authorized, un-issued capital amounts to 49m US dollar (37m euro).
The holders of ordinary shares are entitled to receive dividends as declared from time to time and are entitled to one vote per share at meetings of the company. In respect of the company’s shares that are held by AB InBev, rights are suspended.
The shareholders’ structure based on the notifications made to the company pursuant to the Belgian Law of 02 May 2007 on the disclosure of significant shareholdings in listed companies is included in the Corporate Governance section of AB InBev’s annual report.

51
Capital contributions in subsidiaries, mainly in the zone Latin America North, subscribed by non-controlling interests amounted to 194m US dollar in 2010.
CHANGES IN OWNERSHIP INTERESTS
As of 2010 and in compliance with the revised IAS 27, the acquisition of additional shares in a subsidiary after control was obtained has been accounted for as an equity transaction with owners.
During 2010, AB InBev purchased non-controlling interests in several subsidiaries for a total consideration paid of 28m US dollar. As the related subsidiaries were already fully consolidated, the purchases did not impact AB InBev’s profit, but reduced the non-controlling interests and thus impacted the profit attributable to equity holders of AB InBev.
The impact of the 2010 main purchases of non-controlling interests in the related subsidiaries can be summarized as follows:
Direct ownership interest 31 December 2010 31 December 2009 Quinsa, Argentina........................................................................................... 99.99% 99.83% Harbin Brewing Jiamusi Jiafeng Company Limited, China ..................................... 100.00% 60.00%
REPORT ACCORDING TO ARTICLE 624 OF THE BELGIAN COMPANIES CODE - PURCHASE OF OWN SHARES
During the year 2010, AB InBev did not purchase any AB InBev shares.
During the year 2010, AB InBev proceeded with the following sale transactions:
• 253 734 shares were sold to members of the AmBev senior management who were transferred to AB InBev. The sale occurred according to a share exchange program at a price reduced with 16.66% compared to the market price, in order to encourage management mobility;
• 498 389 shares were granted to executives of the group according to the company’s executive remuneration policy; • 25 755 shares were sold to members of the Anheuser-Busch senior management. The sale occurred according to the
authorization of the annual shareholders meeting of 28 April 2009 at a price reduced with 16.66% compared to the market price, provided these managers remain in service for a period of 5 years;
• 182 489 shares were granted to executives of the company in exchange for unvested options, in order to encourage management mobility, in particular for the benefit of executives moving to the United States. The shares are subject to a lock-up period until 31 December 2018;
• Finally, 612 936 shares were sold, as a result of the exercise of options granted to employees of the group.
At the end of the period, the group owned 12 048 781 own shares of which 11 550 514 were held directly by AB InBev.
The par value of the shares is 0.77 euro. As a consequence, the shares that were sold during the year 2010 represent 1 601 798 US dollar (1 211 443 euro) of the subscribed capital and the shares that the company still owned at the end of 2010 represent 12 396 678 US dollar (9 277 561 euro) of the subscribed capital.
DIVIDENDS
On 2 March 2011, a dividend of 0.80 euro per share or, approximately 1 276m euro, was proposed by the board of directors. In accordance with IAS 10 Events after the balance sheet date, the dividend has not been recorded in the 2010 financial statements.
On 28 April 2010 a dividend of 0.38 euro per share or 605m euro was approved on the shareholders meeting. This dividend was paid out on 3 May 2010.
TRANSLATION RESERVES
The translation reserves comprise all foreign currency exchange differences arising from the translation of the financial statements of foreign operations. The translation reserves also comprise the portion of the gain or loss on the foreign currency liabilities and on the derivative financial instruments determined to be effective net investment hedges in conformity with IAS 39 Financial Instruments: Recognition and Measurement hedge accounting rules.
HEDGING RESERVES
The hedging reserves comprise the effective portion of the cumulative net change in the fair value of cash flow hedges to the extent the hedged risk has not yet impacted profit or loss – see also Note 29 Risks arising from financial instruments.
TRANSFERS FROM SUBSIDIARIES
The amount of dividends payable to AB InBev by its operating subsidiaries is subject to, among other restrictions, general limitations imposed by the corporate laws, capital transfer restrictions and exchange control restrictions of the respective jurisdictions where those subsidiaries are organized and operate. Capital transfer restrictions are also common in certain emerging market countries, and may affect AB InBev’s flexibility in implementing a capital structure it believes to be efficient. Dividends paid to AB InBev by certain of its subsidiaries are also subject to withholding taxes. Withholding tax, if applicable, generally does not exceed 10%.
EARNINGS PER SHARE
The calculation of basic earnings per share is based on the profit attributable to equity holders of AB InBev of 4 037m US dollar (2009: 4 613m US dollar) and a weighted average number of ordinary shares outstanding during the year, calculated as follows:
Million shares 2010 2009 Issued ordinary shares at 1 January, net of treasury shares......................................................... 1 591 1 582 Effect of shares issued/share buyback programs ........................................................................ 1 2 Weighted average number of ordinary shares at 31 December ........................................... 1 592 1 584

52
The calculation of diluted earnings per share is based on the profit attributable to equity holders of AB InBev of 4 037m US dollar (2009: 4 613m US dollar) and a weighted average number of ordinary shares (diluted) outstanding during the year, calculated as follows:
Million shares 2010 2009 Weighted average number of ordinary shares at 31 December ..................................................... 1 592 1 584 Effect of share options and warrants ......................................................................................... 19 9 Weighted average number of ordinary shares (diluted) at 31 December ............................ 1 611 1 593
The calculation of earnings per share before non-recurring items is based on the profit after tax and before non-recurring items, attributable to equity holders of AB InBev. A reconciliation of profit before non-recurring items, attributable to equity holders of AB InBev to profit attributable to equity holders of AB InBev is calculated as follows:
Million US dollar 2010 2009 Profit before non-recurring items, attributable to equity holders of AB InBev.................................. 5 040 3 927 Non-recurring items, after taxes, attributable to equity holders of AB InBev (refer Note 8) ............. (142) 1 288 Non-recurring finance cost, after taxes, attributable to equity holders of AB InBev (refer Note 8) ..... (872) (602) Profit attributable to equity holders of AB InBev................................................................. 4 026 4 613
The table below sets out the EPS calculation:
Million US dollar 2010 2009 Profit attributable to equity holders of AB InBev ......................................................................... 4 026 4 613 Weighted average number of ordinary shares ............................................................................ 1 592 1 584 Basic EPS............................................................................................................................. 2.53 2.91
Profit before non-recurring items, attributable to equity holders of AB InBev.................................. 5 040 3 927 Weighted average number of ordinary shares ............................................................................ 1 592 1 584 EPS before non-recurring items........................................................................................... 3.17 2.48
Profit attributable to equity holders of AB InBev ......................................................................... 4 026 4 613 Weighted average number of ordinary shares (diluted) ............................................................... 1 611 1 593 Diluted EPS.......................................................................................................................... 2.50 2.90 Profit before non-recurring items, attributable to equity holders of AB InBev.................................. 5 040 3 927 Weighted average number of ordinary shares (diluted) ............................................................... 1 611 1 593 Diluted EPS before non-recurring items .............................................................................. 3.13 2.47
The average market value of the company’s shares for purposes of calculating the dilutive effect of share options was based on quoted market prices for the period that the options were outstanding. 11.4m share options were anti-dilutive and not included in the calculation of the dilutive effect.
24. INTEREST-BEARING LOANS AND BORROWINGS
This note provides information about the company’s interest-bearing loans and borrowings. For more information about the company’s exposure to interest rate and foreign currency risk, refer to Note 29 Risks arising from financial instruments.
NON-CURRENT LIABILITIES
Million US dollar 2010 2009 Secured bank loans ................................................................................................................ 105 53 Unsecured bank loans ............................................................................................................. 9 141 18 616 Unsecured bond issues............................................................................................................ 32 562 28 126 Secured other loans ................................................................................................................ 6 6 Unsecured other loans ............................................................................................................ 72 204 Finance lease liabilities............................................................................................................ 75 44 41 961 47 049
CURRENT LIABILITIES Million US dollar 2010 2009 Secured bank loans ................................................................................................................ 32 30 Unsecured bank loans ............................................................................................................. 1 898 1 559 Unsecured bond issues............................................................................................................ 777 387 Secured other loans ................................................................................................................ - 14 Unsecured other loans ............................................................................................................ 172 19 Finance lease liabilities............................................................................................................ 40 6 2 919 2 015
The current and non-current interest-bearing loans and borrowings amount to 44 880m US dollar as of 31 December 2010, compared to 49 064m US dollar as of 31 December 2009.
To finance the acquisition of Anheuser-Busch, AB InBev entered into a 45 billion US dollar senior debt facilities agreement (of which 44 billion US dollar was ultimately drawn) and a 9.8 billion US dollar bridge facility agreement, enabling the company to consummate the acquisition, including the payment of 52.5 billion US dollar to shareholders of Anheuser-Busch, refinancing certain

53
Anheuser-Busch indebtedness, payment of all transaction charges, fees and expenses and accrued but unpaid interest to be paid on Anheuser-Busch’s outstanding indebtedness, which together amounted to approximately 54.8 billion US dollar.
On 18 December 2008, AB InBev repaid the debt it had incurred under the bridge facility with the net proceeds of the rights offering and cash proceeds it received from pre-hedging the foreign exchange rate between the euro and the US dollar in connection with the rights offering.
As of 31 December 2009, the amounts outstanding under AB InBev’s 45 billion US dollar senior debt facilities had been reduced to 17.2 billion US dollar. In 2010, AB InBev fully refinanced the debt incurred under the senior facility with the proceeds of new senior credit facilities and debt capital market offerings as shown below.
• On 26 February 2010, AB InBev obtained 17.2 billion US dollar in long-term bank financing. The new financing consisted of a 13.0 billion US dollar senior credit facilities agreement (“2010 senior facilities”) comprising of a 5.0 billion US dollar term loan maturing in 2013 and a 8.0 billion US dollar multi-currency revolving credit facility maturing in 2015 bearing interest at a floating rate equal to LIBOR (or EURIBOR for euro-denominated loans) plus 1.175% and 0.975%, respectively; and 4.2 billion US dollar in long-term bilateral facilities that was subsequently canceled on 31 March 2010.
• On 24 March 2010, AB InBev issued four series of notes in an aggregate principal amount of 3.25 billion US dollar, consisting of 1.0 billion US dollar aggregate principal of notes due 2013, 0.75 billion US dollar aggregate principal of notes due 2015 and 1.0 billion US dollar aggregate principal of notes due 2020 bearing interest at a rate of 2.5%, 3.625% and 5.0% respectively and a note consisting of 0.5 billion US dollar aggregate principal of notes due 2013 and bearing an interest at a floating rate of 3 month US dollar LIBOR plus 0.73%.
As of 6 April 2010, AB InBev had fully repaid the remaining balance under the 45 billion US dollar senior debt facilities from proceeds from the 2010 senior facilities, proceeds from the March 2010 bond issuance, cash generated from operations, proceeds of disposal activities and from drawdowns from existing loan facilities.
In addition to the above, AB InBev continued to refinance and repay its obligations under the 2010 senior facilities by using cash generated from operations, proceeds of disposal activities, drawdowns from existing loan facilities and by using the proceeds of the following capital market offerings:
• On 26 April 2010, AB InBev issued notes from its European Medium Term Note program in an aggregate principal amount of 750m euro due 2018 bearing interest at a fixed rate of 4.0%.
• On 10 November 2010, AB InBev issued a Brazilian real linked series of notes in an aggregate principal amount of 750m Brazilian real due 2015, bearing a interest at a rate of 9.750%.
• On 8 December 2010, AB InBev issued a series of notes in an aggregate principal amount of 600m Canadian dollar due 2016, bearing an interest at a rate of 3.650%.
As of 31 December 2010, the outstanding balance of the 2010 senior facilities amounted to 4 410 million US dollar. The interest rate on the outstanding 2010 senior facilities have effectively been fixed through a series of hedge arrangements. For further information, please refer to Note 29 Risks arising from financial instruments.
TERMS AND DEBT REPAYMENT
SCHEDULE AT 31 DECEMBER 2010 Million US dollar Total
1 year or less 1-2 years 2-3 years 3-5 years
More than 5 years
Secured bank loans.............................. 137 32 58 29 12 6 Unsecured bank loans .......................... 11 039 1 898 3 993 4 611 525 12 Unsecured bond issues ......................... 33 339 777 3 878 3 311 7 912 17 461 Secured other loans ............................. 6 - - 6 - - Unsecured other loans.......................... 244 171 13 14 23 23 Finance lease liabilities ......................... 115 40 5 1 2 67 44 880 2 918 7 947 7 972 8 474 17 569
TERMS AND DEBT REPAYMENT
SCHEDULE AT 31 DECEMBER 2009
Million US dollar Total 1 year or
less 1-2 years 2-3 years 3-5 years More than 5
years Secured bank loans.............................. 83 30 22 16 15 - Unsecured bank loans .......................... 20 175 1 559 5 648 427 12 416 125 Unsecured bond issues ......................... 28 513 387 819 3 784 6 684 16 839 Secured other loans ............................. 20 14 - - 6 - Unsecured other loans.......................... 223 19 104 14 26 60 Finance lease liabilities ......................... 50 6 4 4 1 35 49 064 2 015 6 597 4 245 19 148 17 059
FINANCE LEASE LIABILITIES
Million US dollar 2010
Payments 2010
Interests 2010
Principal 2009
Payments 2009
Interests 2009
Principal Less than one year............................... 48 8 40 9 3 6 Between one and two years .................. 12 7 5 7 3 4 Between two and three years ................ 7 6 1 6 2 4 Between three and five years ................ 14 12 2 5 4 1 More than 5 years................................ 118 51 67 99 64 35 199 84 115 126 76 50

54
AB InBev’s net debt decreased to 39 704m US dollar as of 31 December 2010, from 45 174m US dollar as of 31 December 2009. Net debt is defined as non-current and current interest-bearing loans and borrowings and bank overdrafts minus debt securities and cash. Net debt is a financial performance indicator that is used by AB InBev’s management to highlight changes in the company’s overall liquidity position. The company believes that net debt is meaningful for investors as it is one of the primary measures AB InBev’s management uses when evaluating its progress towards deleveraging.
The following table provides a reconciliation of AB InBev’s net debt as of the dates indicated:
Million US dollar 2010 2009 Non-current interest bearing loans and borrowings ............................................................... 41 961 47 049 Current interest bearing loans and borrowings ..................................................................... 2 919 2 015 44 880 49 064
Bank overdrafts................................................................................................................ 14 28 Cash and cash equivalents................................................................................................. (4 511) (3 689) Interest bearing loans granted (included within Trade and other receivables)........................... (38) (48) Debt securities (included within Investment securities) ........................................................ (641) (181) Net debt ....................................................................................................................... 39 704 45 174
Apart from operating results net of capital expenditures, the net debt is mainly impacted by dividend payments to shareholders of AB InBev and AmBev (1 924m US dollar); the payment of interest and taxes (4 450m US dollar); and the impact of changes in foreign exchange rates (725m US dollar decrease of net debt).
25. EMPLOYEE BENEFITS
AB InBev sponsors various post-employment benefit plans world-wide. These include pension plans, both defined contribution plans, and defined benefit plans, and other post-employment benefits (OPEB). In accordance with IAS 19 Employee Benefits post-employment benefit plans are classified as either defined contribution plans or defined benefit plans.
DEFINED CONTRIBUTION PLANS
For defined contribution plans, AB InBev pays contributions to publicly or privately administered pension funds or insurance contracts. Once the contributions have been paid, the group has no further payment obligation. The regular contribution expenses constitute an expense for the year in which they are due. For 2010, benefits paid for defined contribution plans for the company amounted to 44m US dollar compared to 43m US dollar for 2009.
DEFINED BENEFIT PLANS
During 2010, the company contributed to 66 defined benefit plans, of which 49 are retirement plans and 17 are medical cost plans. Most plans provide benefits related to pay and years of service. The German, French and Luxemburg plans are unfunded while Belgian, Canadian, UK and US plans are partially funded. The assets of the other plans are held in legally separate funds set up in accordance with applicable legal requirements and common practice in each country. The medical cost plans in Canada, US, Belgium and Brazil provide medical benefits to employees and their families after retirement.
The present value of funded obligations includes a 289m US dollar liability related to two medical plans, for which the benefits are provided through the Fundação Antonio Helena Zerrenner (“FAHZ”). The FAHZ is a legally distinct entity which provides medical, dental, educational and social assistance to current and retired employees of AmBev. On 31 December 2010, the actuarial liabilities related to the benefits provided by the FAHZ are fully offset by an equivalent amount of assets existing in the fund. The net liability recognized in the balance sheet is nil.
The employee benefit net liability amounts to 2 733 m US dollar as of 31 December 2010 compared to 2 601m US dollar as of 31 December 2009. The plan assets value increase of 429m US dollar in 2010 driven by better market performance and plan contributions was primarily offset by 537m US dollar of increase in benefit obligations resulting mainly from changes in actuarial assumptions (unfavorable changes in discount rates and inflation assumptions).
The company’s net liability for post-employment and long-term employee benefit plans comprises the following at 31 December:
Million US dollar
2010 2009
Present value of funded obligations..................................................................................... (6 218) (5 728) Fair value of plan assets.................................................................................................... 5 074 4 645 Present value of net obligations for funded plans.......................................................... (1 144) (1 083)
Present value of unfunded obligations ................................................................................. (1 178) (1 131) Present value of net obligations .................................................................................... (2 322) (2 214)
Unrecognized past service cost........................................................................................... (17) 2 Unrecognized asset........................................................................................................... (378) (371) Net liability.................................................................................................................... (2 717) (2 583)
Other long term employee benefits ..................................................................................... (16) (18) Total employee benefits ................................................................................................ (2 733) (2 601) Employee benefits amounts in the balance sheet: Liabilities......................................................................................................................... (2 746) (2 611) Assets............................................................................................................................. 13 10 Net liability.................................................................................................................... (2 733) (2 601)
55
The changes in the present value of the defined benefit obligations are as follows:
Million US dollar 2010 2009 Defined benefit obligation at 1 January................................................... (6 856) (6 565)
Current service costs .................................................................................. (104) (124) Contribution by plan participants .................................................................. (5) (14) New past service cost ................................................................................. (68) 186 Interest cost .............................................................................................. (428) (416) Actuarial losses .......................................................................................... (378) (126) (Losses)/gains on curtailments..................................................................... (3) 92 Reclassifications from provisions .................................................................. (2) - Settlements ............................................................................................... 15 - Exchange differences .................................................................................. (29) (430) Benefits paid.............................................................................................. 462 541 Defined benefit obligation at 31 December.............................................. (7 396) (6 856)
The changes in the fair value of plan assets are as follows:
Million US dollar 2010 2009 Fair value of plan assets at 1 January...................................................... 4 645 3 873
Expected return ......................................................................................... 369 317 Actuarial gains and (losses) ......................................................................... 117 396 Contributions by AB InBev........................................................................... 358 173 Contributions by plan participants................................................................. 5 14 Exchange differences .................................................................................. 40 416 Other ........................................................................................................ 2 (3) Benefits paid.............................................................................................. (462) (541) Fair value of plan assets at 31 December ................................................ 5 074 4 645
Actual return on plans assets amounted to a gain of 486m US dollar in 2010 compared to a gain of 713m US dollar in 2009. This is mostly driven by investment returns generally in excess of long term expectations particularly in the UK, US, Netherlands and Canada.
The increase in contributions by AB InBev (358m US dollar in 2010 versus 173m US dollar in 2009) is primarily explained by minimum contribution requirements in US plans.
The expense recognized in the income statement with regard to defined benefit plans can be detailed as follows:
Million US dollar 2010 2009 Current service costs .................................................................................. (104) (123) Interest cost .............................................................................................. (428) (416) Expected return on plan assets .................................................................... 369 317 Past service cost ........................................................................................ (68) 133 (Losses)/gains on settlements or curtailments ............................................... 14 120 Asset limitation .......................................................................................... - (30) (217) 1
In 2010, early termination benefits and other plan changes, mainly in the US, increased the amortized past service cost.
In 2009, as part of the Anheuser-Busch integration into AB InBev, a curtailment was recognized following the amendment of certain US pension and post-retirement healthcare benefits. The effect of these changes was recorded through the income statement and led to an additional income amount of 240m US dollar.
The employee benefit expense is included in the following line items of the income statement:
Million US dollar 2010 2009 Cost of sales .............................................................................................. (99) (66) Distribution expenses.................................................................................. (17) (29) Sales and marketing expenses ..................................................................... (12) (30) Administrative expenses.............................................................................. (22) (42) Other operating income/expense.................................................................. - 168 Non-recurring items.................................................................................... (67) - (217) 1
Weighted average assumptions used in computing the benefit obligations at the balance sheet date are as follows:
2010 2009 Discount rate ............................................................. 6.1% 6.5% Price Inflation............................................................. 2.6% 2.6% Future salary increases................................................ 3.0% 2.8% Future pension increases ............................................. 2.8% 2.6% Medical cost trend rate ................................................ 8.1% p.a. reducing to 5.8% 7.9% p.a. reducing to 5.6% Life expectation for a 65 year old male .......................... 83 82 Life expectation for a 65 year old female ....................... 85 84

56
Weighted average assumptions used in computing the net periodic pension cost for the year are as follows:
2010 2009 Discount rate ............................................................. 6.5% 6.5% Expected return on plan assets .................................... 8.1% 8.2% Future salary increases ............................................... 2.8% 3.3% Future pension increases ............................................. 2.6% 2.2% Medical cost trend rate................................................ 7.9% p.a. reducing to 5.6% 8.9% p.a. reducing to 6.6%
Several factors are considered in developing the estimate for the long-term expected rate of return on plan assets. For the defined benefit plans, these include historical rates of return of broad equity and bond indices and projected long-term rates of return from pension investment consultants; taking into account different markets where AB InBev has plan assets.
The expected rates of return on individual categories of plan assets are determined by reference to relevant indices based on advice of external valuation experts. The overall expected rate of return is calculated by weighting the expected rates of return for each asset class in accordance with the anticipated share in the total investment portfolio.
Assumed medical cost trend rates have a significant effect on the amounts recognized in profit or loss. A one percentage point change in the assumed medical cost trend rates would have the following effects (note that a positive amount refers to a decrease in the obligations or cost while a negative amount refers to an increase in the obligations or cost):
Million US dollar 2010 2009
Medical cost trend rate
100 basis points increase
100 basis points decrease
100 basis points increase
100 basis points decrease
Effect on the aggregate of the service cost and interest cost of medical plans ..................................................... (10) 10 (6) 5 Effect on the defined benefit obligation for medical cost .... (74) 73 (77) 70
In line with the IAS 1 Presentation of Financial Statements disclosure requirements on key sources of estimation uncertainty AB InBev has included the results of its sensitivity analysis with regard to the discount rate, the future salary increase and the longevity assumptions.
Million US dollar 2010 2009
Discount rate
50 basis points increase
50 basis points decrease
50 basis points increase
50 basis points decrease
Effect on the aggregate of the service cost and interest cost of defined benefit plans ........................................... 3 (1) 7 (6) Effect on the defined benefit obligation............................ 445 (475) 435 (476)
Million US dollar 2010 2009
Future salary increase
50 basis points increase
50 basis points decrease
50 basis points increase
50 basis points decrease
Effect on the aggregate of the service cost and interest cost of defined benefit plans ........................................... (3) 3 (4) 4 Effect on the defined benefit obligation............................ (30) 28 (46) 45
Million US dollar 2010 2009
Longevity
One year increase
One year decrease
One year increase One year decrease
Effect on the aggregate of the service cost and interest cost of defined benefit plans ........................................... (12) 12 (6) 7 Effect on the defined benefit obligation............................ (195) 197 (105) 108
The above are purely hypothetical changes in individual assumptions holding all other assumptions constant: economic conditions and changes therein will often affect multiple assumptions at the same time and the effects of changes in key assumptions are not linear. Therefore, the above information is not necessarily a reasonable representation of future results.
The fair value of plan assets at 31 December consists of the following:
2010 2009 Government bonds ................................................................................................ 34% 27% Corporate bonds.................................................................................................... 13% 16% Equity instruments ................................................................................................ 49% 53% Property ............................................................................................................... 2% 2% Cash .................................................................................................................... 1% 1% Insurance contracts ............................................................................................... 1% 1% 100% 100%
The change in allocation of the fair value of plan assets in 2010 is mainly due to the increase in the valuation of the US plan assets as well as an increase in the fixed income allocation.
The five year history of the present value of the defined benefit obligations, the fair value of the plan assets and the deficit in the plans is as follows:
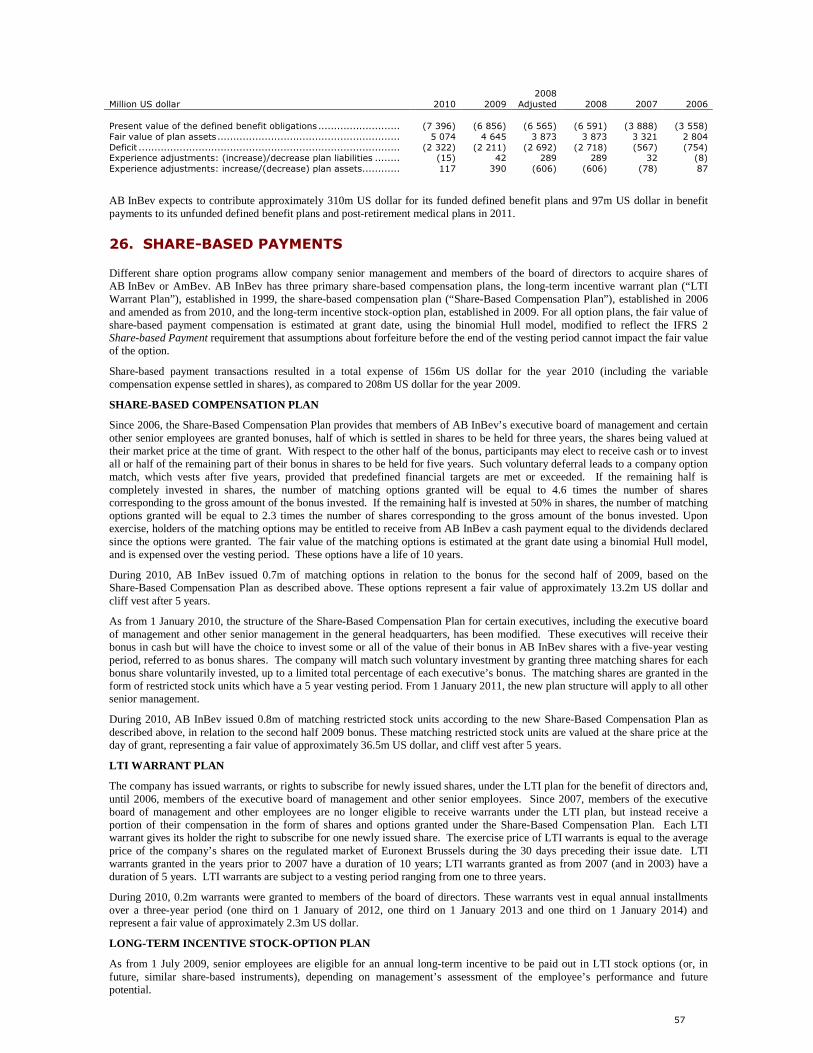
57
Million US dollar 2010 2009
2008 Adjusted 2008 2007 2006
Present value of the defined benefit obligations .......................... (7 396) (6 856) (6 565) (6 591) (3 888) (3 558) Fair value of plan assets.......................................................... 5 074 4 645 3 873 3 873 3 321 2 804 Deficit ................................................................................... (2 322) (2 211) (2 692) (2 718) (567) (754) Experience adjustments: (increase)/decrease plan liabilities ........ (15) 42 289 289 32 (8) Experience adjustments: increase/(decrease) plan assets............ 117 390 (606) (606) (78) 87
AB InBev expects to contribute approximately 310m US dollar for its funded defined benefit plans and 97m US dollar in benefit payments to its unfunded defined benefit plans and post-retirement medical plans in 2011.
26. SHARE-BASED PAYMENTS
Different share option programs allow company senior management and members of the board of directors to acquire shares of AB InBev or AmBev. AB InBev has three primary share-based compensation plans, the long-term incentive warrant plan (“LTI Warrant Plan”), established in 1999, the share-based compensation plan (“Share-Based Compensation Plan”), established in 2006 and amended as from 2010, and the long-term incentive stock-option plan, established in 2009. For all option plans, the fair value of share-based payment compensation is estimated at grant date, using the binomial Hull model, modified to reflect the IFRS 2 Share-based Payment requirement that assumptions about forfeiture before the end of the vesting period cannot impact the fair value of the option.
Share-based payment transactions resulted in a total expense of 156m US dollar for the year 2010 (including the variable compensation expense settled in shares), as compared to 208m US dollar for the year 2009.
SHARE-BASED COMPENSATION PLAN
Since 2006, the Share-Based Compensation Plan provides that members of AB InBev’s executive board of management and certain other senior employees are granted bonuses, half of which is settled in shares to be held for three years, the shares being valued at their market price at the time of grant. With respect to the other half of the bonus, participants may elect to receive cash or to invest all or half of the remaining part of their bonus in shares to be held for five years. Such voluntary deferral leads to a company option match, which vests after five years, provided that predefined financial targets are met or exceeded. If the remaining half is completely invested in shares, the number of matching options granted will be equal to 4.6 times the number of shares corresponding to the gross amount of the bonus invested. If the remaining half is invested at 50% in shares, the number of matching options granted will be equal to 2.3 times the number of shares corresponding to the gross amount of the bonus invested. Upon exercise, holders of the matching options may be entitled to receive from AB InBev a cash payment equal to the dividends declared since the options were granted. The fair value of the matching options is estimated at the grant date using a binomial Hull model, and is expensed over the vesting period. These options have a life of 10 years.
During 2010, AB InBev issued 0.7m of matching options in relation to the bonus for the second half of 2009, based on the Share-Based Compensation Plan as described above. These options represent a fair value of approximately 13.2m US dollar and cliff vest after 5 years.
As from 1 January 2010, the structure of the Share-Based Compensation Plan for certain executives, including the executive board of management and other senior management in the general headquarters, has been modified. These executives will receive their bonus in cash but will have the choice to invest some or all of the value of their bonus in AB InBev shares with a five-year vesting period, referred to as bonus shares. The company will match such voluntary investment by granting three matching shares for each bonus share voluntarily invested, up to a limited total percentage of each executive’s bonus. The matching shares are granted in the form of restricted stock units which have a 5 year vesting period. From 1 January 2011, the new plan structure will apply to all other senior management.
During 2010, AB InBev issued 0.8m of matching restricted stock units according to the new Share-Based Compensation Plan as described above, in relation to the second half 2009 bonus. These matching restricted stock units are valued at the share price at the day of grant, representing a fair value of approximately 36.5m US dollar, and cliff vest after 5 years.
LTI WARRANT PLAN
The company has issued warrants, or rights to subscribe for newly issued shares, under the LTI plan for the benefit of directors and, until 2006, members of the executive board of management and other senior employees. Since 2007, members of the executive board of management and other employees are no longer eligible to receive warrants under the LTI plan, but instead receive a portion of their compensation in the form of shares and options granted under the Share-Based Compensation Plan. Each LTI warrant gives its holder the right to subscribe for one newly issued share. The exercise price of LTI warrants is equal to the average price of the company’s shares on the regulated market of Euronext Brussels during the 30 days preceding their issue date. LTI warrants granted in the years prior to 2007 have a duration of 10 years; LTI warrants granted as from 2007 (and in 2003) have a duration of 5 years. LTI warrants are subject to a vesting period ranging from one to three years.
During 2010, 0.2m warrants were granted to members of the board of directors. These warrants vest in equal annual installments over a three-year period (one third on 1 January of 2012, one third on 1 January 2013 and one third on 1 January 2014) and represent a fair value of approximately 2.3m US dollar.
LONG-TERM INCENTIVE STOCK-OPTION PLAN
As from 1 July 2009, senior employees are eligible for an annual long-term incentive to be paid out in LTI stock options (or, in future, similar share-based instruments), depending on management’s assessment of the employee’s performance and future potential.

58
In December 2009 AB InBev issued 1.6m LTI stock options with an estimated fair value of 21.0m US dollar. In November 2010 AB InBev issued 4.1m LTI stock options with an estimated fair value of 62.4m US dollar, whereby 1.2m options relate to American Depositary Shares (ADS’s) and 2.9m options to AB InBev shares.
In addition to awards granted under the plans described above, the company offered stock options to a small group of senior executives in November 2008 and April 2009. AB InBev believes that the selected executives will help implement a successful integration of Anheuser-Busch Companies, Inc., which will underpin AB InBev’s ability to quickly deleverage. The number of options offered was 28.4m in 2008 and 4.9m in 2009, representing a combined fair value of approximately 383.9m US dollar. One half of the stock options granted in November 2008 have a life of 10 years as from granting and vest on 1 January 2014; the other half has a life of 15 years as from granting and vest on 1 January 2019. The stock options granted in April 2009 have a life of 10 years as from granting and vest on 1 January 2014. Vesting is conditional upon achievement of certain predefined financial targets.
In order to encourage management mobility, in particular for the benefit of executives moving to the United States, an options exchange program was executed in 2009 whereby 4.4m unvested options were exchanged against 2.8m restricted shares that will remain locked-up until 31 December 2018. 47m US dollar cost was reported in the second half of 2009 related to the acceleration of the IFRS 2 cost following this exchange in accordance with IFRS 2. In 2010, a similar options exchange program was executed whereby 0.3m unvested options were exchanged against 0.2m restricted shares that will remain locked-up until 31 December 2018. Furthermore, to encourage management mobility, certain options granted have been modified whereby the dividend protected feature of these options have been cancelled and replaced by the issuance of 5.7m options in 2009 and 0.2m options in 2010 representing the economic value of the dividend protection feature. As there was no change between the fair value of the original award immediately before the modification and the fair value of the modified award immediately after the modification, no additional expense was recorded as a result of the modification.
As from 2010 AB InBev has in place three specific long-term restricted stock unit programs. One program allows for the offer of restricted stock units to certain employees in certain specific circumstances, whereby grants are made at the discretion of the CEO, e.g. to compensate for assignments of expatriates in countries with difficult living conditions. The restricted stock units vest after five years and in case of termination of service before the vesting date, special forfeiture rules apply. In 2010, 0.1m restricted stock units with an estimated fair value of 6.5m US dollar were granted under this program to a selected number of employees. A second program allows for the exceptional offer of restricted stock units to certain employees at the discretion of the Remuneration Committee of AB InBev as a long-term retention incentive for key employees of the company. Employees eligible to receive a grant under this program receive 2 series of restricted stock units, the first half of the restricted stock units vesting after five years, the second half after 10 years. In case of termination of service before the vesting date, special forfeiture rules apply. In December 2010 0.3m restricted stock units with an estimated fair value of 18m US dollar were granted under this program to a selected number of employees. A third program allows certain employees to purchase company shares at a discount aimed as a long-term retention incentive for high-potential employees of the company, who are at a mid-manager level (“People bet share purchase program”). The voluntary investment in company shares leads to the grant of 3 matching shares for each share invested. The discount and matching shares are granted in the form of restricted stock units which vest after 5 years. In case of termination before the vesting date, special forfeiture rules apply. In 2010, there was no grant under this program.
As per the terms of the Anheuser-Busch merger agreement, the company offered 5.9m options with a fair value of 53.6m US dollar following the approval of the AB InBev shareholders meeting of April 2009. Furthermore the company offered in December 2009 3m options with an estimated fair value of 39.2m US dollar.
During 2009, a limited number of Anheuser-Busch shareholders who are part of the senior management of Anheuser-Busch were given the opportunity to purchase AB InBev shares (0.6m) at a discount of 16.7% provided that they stay in service for another five years. The fair value of this transaction amounts to approximately 2.9m US dollar and is expensed over the five year service period.
The weighted average fair value of the options and assumptions used in applying the AB InBev option pricing model for the 2010 grants of awards described above are as follows:
Amounts in US dollar unless otherwise indicated1 2010 2009 20082 Fair value of options and warrants granted ............................................................... 14.59 13.99 38.17 Share price ........................................................................................................... 51.71 29.03 90.58 Exercise price ....................................................................................................... 51.61 21.62 86.62 Expected volatility ................................................................................................. 26% 32% 24% Expected dividends................................................................................................ 2.35% 0.85% 0.16% Risk-free interest rate ............................................................................................ 3.29% 3.49% 4.47%
Since the acceptance period of the options is 2 months, the fair value was determined as the average of the fair values calculated on a weekly basis during the two months offer period.
Expected volatility is based on historical volatility calculated using 1 506 days of historical data. In the determination of the expected volatility, AB InBev is excluding the volatility measured during the period 15 July 2008 until 30 April 2009, in view of the extreme market conditions experienced during that period. The binomial Hull model assumes that all employees would immediately exercise their options if the AB InBev share price is 2.5 times above the exercise price. As a result, no single expected option life applies.
1 Amounts have been converted to US dollar at the closing rate of the respective period. 2 Not adjusted for the NYSE Euronext 'ratio method' as applied after the rights issue of 17 December 2008 (adjustment factor 0.6252).

59
The total number of outstanding options developed as follows:
Million Options and Warrants 2010 2009 20081 Options and warrants outstanding at 1 January ......................................................... 50.8 8.8 6.3 Options and warrants issued during the year ............................................................ 9.8 50.3 1.1 Options and warrants exercised during the year ........................................................ (1.8) (6.6) (1.2) Options and warrants forfeited during the year.......................................................... (2.7) (1.7) (0.4) Additional options and warrants granted as a result of the December 2008 rights issue.. - - 3.0 Options outstanding at end of December............................................................ 56.1 50.8 8.8
As a consequence of the rights issue that took place in November 2008, the exercise price and the number of options were adjusted with the intention of preserving the rights of the existing option holders. The terms and conditions of the new options are the same as those of the existing options to which they relate. For vesting purposes, they are treated as if they have been issued at the same time as the existing options, and are exercisable in the same manner and under the same conditions. The company accounted for the dilutive effect of the rights issuance by applying the ratio method as set out in the NYSE Euronext “Liffe’s Harmonised Corporate Actions Policy” pursuant to which both the number of existing options and the exercise price were adjusted by a ratio of 0.6252. The adjusted exercise price of the options equals the original exercise price multiplied by the adjustment ratio. The adjusted number of options equals the original number of options divided by the adjustment ratio. As a result, during the fourth quarter of 2008, 3m additional options (1.4m and 1.6m options under the Share-based Compensation Plan and the LTI Warrant Plan, respectively) were granted to employees in order to compensate for the dilutive effect of the rights issue. As there was no change between the fair value of the original award immediately before the modification and the fair value of the modified award immediately after the modification, no additional expense was recorded as a result of the modification.
The range of exercise prices of the outstanding options is between 10.32 euro (13.79 US dollar) and 58.31 euro (77.91 US dollar) while the weighted average remaining contractual life is 9.00 years.
Of the 56.1m outstanding options 5.3m options are vested at 31 December 2010.
The weighted average exercise price of the options is as follows:
Amounts in US dollar2 2010 2009 2008 Options and warrants outstanding at 1 January ................................ 27.37 34.42 46.50 Granted during the year ................................................................ 51.86 24.78 76.923 Granted during the year (adjustment factor).................................... - - 32.87 Forfeited during the year ............................................................... 27.76 27.48 56.63 Exercised during the year .............................................................. 25.81 18.94 32.76 Outstanding at the end of December............................................... 29.88 27.37 34.42 Exercisable at the end of December ................................................ 30.71 31.16 23.66
For share options exercised during 2010 the weighted average share price at the date of exercise was 41.41 euro (55.34 US dollar).
AMBEV SHARE-BASED COMPENSATION PLAN Since 2005, AmBev has had a plan which is substantially similar to the Share-Based Compensation Plan under which bonuses granted to company employees and management are partially settled in shares. Under an equivalent 5 year cliff vesting plan, AmBev has issued in 2010, 3.2m options for which the fair value amounts to approximately 38m US dollar. Under the Share-Based Compensation Plan as modified as of 2010, AmBev issued 0.2m restricted stock units with an estimated fair value of 4m US dollar.
As from 2010, senior employees are eligible for an annual long-term incentive to be paid out in AmBev LTI stock options (or, in future, similar share-based instruments), depending on management’s assessment of the employee’s performance and future potential. In 2010 AmBev issued 3.4m LTI stock options with an estimated fair value of 37m US dollar.
The weighted fair value of the options and assumptions used in applying a binomial option pricing model for the 2010 AmBev grant are as follows:
Amounts in US dollar unless otherwise indicated2 2010 20094 20084 Fair value of options granted.......................................................... 11.24 10.40 8.90 Share price .................................................................................. 24.09 15.39 14.30 Exercise price .............................................................................. 24.57 14.94 14.30 Expected volatility ........................................................................ 28% 45% 33% Expected dividends....................................................................... 2.57% 0.00% 0.00% Risk-free interest rate ................................................................... 12.24% 12.64% 12.50%
The total number of outstanding AmBev options developed as follows:
Million options 2010 20094 20084 Options outstanding at 1 January ................................................... 20.6 14.1 11.5 Options issued during the year....................................................... 6.6 8.2 4.0 Options exercised during the year .................................................. (0.5) (0.6) (0.7) Options forfeited during the year .................................................... (0.4) (1.1) (0.7) Options outstanding at end of December................................... 26.3 20.6 14.1
1 Not adjusted for the NYSE Euronext 'ratio method' as applied after the rights issue of 17 December 2008 (adjustment factor 0.6252). 2 Amounts have been converted to US dollar at the closing rate of the respective period. 3 Pre rights issue. 4 Amounts have been adjusted for the AmBev share split of 17 December 2010.

60
Following the decision of the General Meeting of Shareholders of 17 December 2010, each common and preferred share issued by AmBev was split into 5 shares, without any modification to the amount of the capital stock of AmBev. As a consequence of the split of the AmBev shares with a factor 5, the exercise price and the number of options were adjusted with the intention of preserving the rights of the existing option holders.
The range of exercise prices of the outstanding options is between 11.29 Brazilian real (6.77 US dollar) and 46.80 Brazilian real (28.09 US dollar) while the weighted average remaining contractual life is 8.26 years.
Of the 26.3m outstanding options 1.5m options are vested at 31 December 2010.
The weighted average exercise price of the options is as follows:
Amounts in US dollar1 2010 20092 20082 Options outstanding at 1 January ................................................... 12.46 11.20 9.84 Granted during the year ................................................................ 24.57 14.03 11.48 Forfeited during the year ............................................................... 11.59 11.35 6.74 Exercised during the year .............................................................. 7.17 6.59 8.12 Outstanding at the end of December............................................... 14.83 11.92 8.41 Exercisable at the end of December ...................................................... 7.00 6.56 4.72
For share options exercised during 2010 the weighted average share price at the date of exercise was 48.04 Brazilian real (28.83 US dollar).
During the fourth quarter of 2010, a limited number of AmBev shareholders who are part of the senior management of AB InBev were given the opportunity to exchange AmBev shares against a total of 0.3m AB InBev shares (2009: 2.1m - 2008: 0.9m) at a discount of 16.7% provided that they stay in service for another five years. The fair value of this transaction amounts to approximately 2m US dollar (2009: 11m US dollar - 2008: 11m US dollar) and is expensed over the five years service period. The fair values of the AmBev and AB InBev shares were determined based on the market price. In 2009, 20m US dollar of cost was reported related to the acceleration of the vesting of the AmBev share swap for selected employees in accordance with IFRS 2 following the change in vesting conditions.
27. PROVISIONS
Million US dollar Restructuring Disputes Other Total Balance at 1 January 2010 ............................................................... 230 788 256 1 274 Effect of changes in foreign exchange rates ............................................ (10) 6 (7) (11) Provisions made .................................................................................. 169 224 7 400 Provisions used ................................................................................... (142) (74) (64) (280) Provisions reversed.............................................................................. (43) (59) (31) (133) Other movements................................................................................ 37 (16) (121) (100) Balance at 31 December 2010 .......................................................... 241 869 40 1 150
The restructuring provisions are primarily explained by the organizational alignments, as explained in Note 8 Non-recurring items. Provisions for disputes mainly relate to various disputed direct and indirect taxes and to claims from former employees.
The provisions are expected to be settled within the following time windows:
Million US dollar Total < 1 year 1-2 years 2-5 years > 5 years Restructuring Reorganization .......................................................... 241 134 27 66 14
Disputes Income and indirect taxes .......................................... 570 27 425 76 42 Labor ....................................................................... 157 37 25 51 44 Commercial .............................................................. 80 19 42 9 10 Environmental........................................................... 1 1 - - - Other disputes .......................................................... 61 11 22 21 7 869 95 514 157 103
Other contingencies
Onerous contracts ..................................................... 5 1 - - 4 Guarantees given ...................................................... 7 - 2 5 - Other contingencies ................................................... 28 8 15 3 2 40 9 17 8 6
Total provisions 1 150 238 558 231 123
Since 1 January 2005 AB InBev is subject to the greenhouse gas emission allowance trading scheme in force in the European Union. Acquired emission allowances are recognized at cost as intangible assets. To the extent that it is expected that the number of allowances needed to settle the CO2 emissions exceeds the number of emission allowances owned, a provision is recognized. Such a provision is measured at the estimated amount of the expenditure required to settle the obligation. At 31 December 2010, the emission allowances owned fully covered the expected CO2 emissions. As such no provision needed to be recognized.
1 Amounts have been converted to US dollar at the closing rate of the respective period. 2 Amounts have been adjusted for the AmBev share split of 17 December 2010.

61
28. TRADE AND OTHER PAYABLES
NON-CURRENT TRADE AND OTHER PAYABLES
Million US dollar 2010 2009 Indirect taxes payable.................................................................................................... 535 349 Trade payables.............................................................................................................. 395 87 Cash guarantees ........................................................................................................... 12 13 Deferred consideration on acquisitions ............................................................................. 117 90 Derivative financial instruments with negative fair values ................................................... 1 216 1 374 Other payables.............................................................................................................. 20 66 2 295 1 979
CURRENT TRADE AND OTHER PAYABLES
Million US dollar 2010 2009 Trade payables and accrued expenses.............................................................................. 6 704 5 657 Payroll and social security payables ................................................................................. 624 743 Indirect taxes payable.................................................................................................... 1 323 1 350 Interest payable ............................................................................................................ 874 848 Consigned packaging ..................................................................................................... 559 523 Cash guarantees ........................................................................................................... 45 41 Derivative financial instruments with negative fair values ................................................... 1 730 1 956 Dividends payable ......................................................................................................... 116 106 Deferred income............................................................................................................ 18 18 Deferred consideration on acquisitions ............................................................................. 41 59 Other payables.............................................................................................................. 37 76 12 071 11 377
Derivative financial instruments with negative fair values mainly reflect the mark-to-market of the interest rate swaps entered into to hedge the Anheuser-Busch acquisition financing (See also Note 29 Risks arising from financial instruments).
29. RISKS ARISING FROM FINANCIAL INSTRUMENTS
AB InBev’s activities expose it to a variety of financial risks: market risk (including currency risk, fair value interest risk, cash flow interest risk, commodity risk and equity risk), credit risk and liquidity risk. The company analyses each of these risks individually as well as on an interconnected basis, and defines strategies to manage the economic impact on the company’s performance in line with its financial risk management policy.
The risk management committee meets on a frequent basis and is responsible for reviewing the results of the risk assessment, approving recommended risk management strategies, monitoring compliance with the financial risk management policy and reporting to the finance committee of the board of directors.
Some of the company’s risk management strategies include the usage of derivatives. Derivative instruments used by the company mainly include forward exchange contracts, exchange traded foreign currency futures, interest rate swaps, cross currency interest rate swaps (“CCIRS”), forward rate agreements, exchange traded interest rate futures, equity swaps, aluminum swaps and forwards, exchange traded sugar futures and exchange traded wheat futures. AB InBev’s policy prohibits the use of derivatives in the context of speculative trading.

62
The following table provides an overview of the derivative financial instruments outstanding at year-end by maturity bucket. The amounts included in this table are the notional amounts.
2010 2009
Million US dollar < 1 year
1-2 years
2-3 years
3-5 years
> 5 years
< 1 year
1-2 years
2-3 years
3-5 years
> 5 years
Foreign currency Forward exchange contracts 2 206 952 - - - 2 334 410 190 - - Foreign currency futures..... 2 587 18 - - - 1 581 6 - - - Other foreign currency derivatives........................ - - - - - 330 83 - - - Interest rate Interest rate swaps............ 216 70 196 6 153 4 750 180 17 324 212 57 738 7 495 264 Cross currency interest rate swaps .............................. 1 264 982 1 349 1 536 1 536 550 1 971 940 662 1 276 Interest rate futures .......... 117 464 600 121 113 - - - - - Other interest rate derivatives........................ - - - - - - 52 - - - Commodities Aluminum swaps ............... 1 048 53 - - - 738 381 - - - Other commodity derivatives........................ 406 48 - - - 325 78 - - - Credit Credit default swaps .......... - - - - - 86 - - - - Equity Equity instruments ............ 378 412 - - - - 52 - - - To finance the acquisition of Anheuser-Busch, AB InBev entered into a 45 billion US dollar senior facilities agreement, of which 44 billion US dollar was ultimately drawn (the “2008 senior facilities”). At the time of the Anheuser-Busch acquisition, the interest rate for an amount of up to 34.5 billion US dollar had effectively been fixed through a series of hedge arrangements at a weighted average rate of 3.875% per annum (plus applicable fixed spreads) for the period 2009 to 2011 and a portion of the hedging arrangements had been successively extended for an additional two year period. In 2009 the company repaid part of the 2008 senior facilities and in 2010, the 2008 senior facilities were fully refinanced and partially replaced by the 2010 Senior facilities as described in Note 24 Interest-bearing loans and borrowings. Following the repayment and refinancing activities performed throughout 2009 and 2010, the company entered into new interest rate swaps to unwind the ones that became freestanding as a result of these repayments. As of 31 December 2010, the remaining open positions include a series of US dollar LIBOR fixed interest-rate swaps covering the interest exposure on the outstanding balance of the 2010 senior facilities amounting to 4.4 billion US dollar. The interest rate had been fixed at a weighted average rate of 4.038% per annum (plus applicable spreads) for the period 2010 and 2011 and at a weighted average rate of 2.85% per annum (plus applicable spreads) for the period 2012 to 2013.
During 2010, approximately 17.3 billion US dollar interest swap instruments matured.
Forward exchange contracts include derivatives used to hedge the Brazilian real borrowings in Canada. Interest rate futures include derivatives to hedge short-term financial assets held by AmBev Brazil.
A. FOREIGN CURRENCY RISK
AB InBev incurs foreign currency risk on borrowings, investments, (forecasted) sales, (forecasted) purchases, royalties, dividends, licenses, management fees and interest expense/income whenever they are denominated in a currency other than the functional currency of the subsidiary. The main derivative financial instruments used to manage foreign currency risk are forward exchange contracts, exchange traded foreign currency futures and cross currency interest rate swaps.
FOREIGN EXCHANGE RISK ON OPERATING ACTIVITIES
As far as foreign currency risk on firm commitments and forecasted transactions is concerned, AB InBev’s policy is to hedge operational transactions which are reasonably expected to occur (e.g. cost of goods sold and selling, general & administrative expenses) within a maximum of 15 months. Operational transactions that are certain (e.g. capital expenditure) are hedged without any limitation in time.
The table below provides an indication of the company’s main net foreign currency positions as regards firm commitments and forecasted transactions for the most important currency pairs. The open positions are the result of the application of AB InBev’s risk management policy. Positive amounts indicate that the company is long (net future cash inflows) in the first currency of the currency pair while negative amounts indicate that the company is short (net future cash outflows) in the first currency of the currency pair. The second currency of the currency pairs listed is the functional currency of the related subsidiary.

63
31 December 2010 31 December 2009 Total Total Open Total Total Open Million US dollar exposure derivatives position exposure derivatives position Czech koruna/Euro ..................................... (14) 9 (5) - - - Euro/Argentinean peso................................ (7) 7 - - - - Euro/Brazilian real ...................................... (38) 38 - (28) 28 - Euro/Canadian dollar .................................. (35) 35 - - - - Euro/Pound sterling .................................... (179) 172 (7) (116) 77 (39) Euro/Romanian lei ...................................... - - - - 28 28 Euro/Russian ruble ..................................... (154) 109 (45) (97) 95 (2) Euro/Ukrainian hryvnia................................ (101) 51 (50) (117) - (117) Hungarian forint/Euro ................................. (16) 13 (3) - - - Pound sterling/Canadian dollar ..................... (18) 18 - - - - Pound sterling/Euro .................................... (23) 9 (14) 7 (6) 1 US dollar/Argentinean peso ......................... (172) 172 - (238) 238 - US dollar/Bolivian boliviano ......................... 46 (46) - 59 (59) - US dollar/Brazilian real................................ 231 (231) - (156) 156 - US dollar/Canadian dollar ............................ (172) 172 - - - - US dollar/Chilean peso ................................ 39 (39) - 25 (25) - US dollar/Dominican peso............................ (10) 10 - (29) 29 - US dollar/Euro ........................................... 197 (197) - 224 (226) (2) US dollar/Paraguayan guarani ...................... (37) 37 - (25) 25 - US dollar/Peruvian nuevo sol ....................... (76) 76 - (19) 19 - US dollar/Pound sterling.............................. (26) 26 - (22) 19 (3) US dollar/Russian ruble ............................... (85) 73 (12) (105) 105 - US dollar/Ukrainian hryvnia ......................... (31) 18 (13) (19) - (19) US dollar/Uruguayan peso ........................... (27) 27 - (26) 26 - Further analysis on the impact of open currency exposures is performed in the Currency Sensitivity Analysis below.
In conformity with IAS 39 hedge accounting rules, these hedges of firm commitments and highly probable forecasted transactions denominated in foreign currency are designated as cash flow hedges.
FOREIGN EXCHANGE RISK ON INTRAGROUP LOANS
In 2009, a series of foreign exchange derivatives were contracted to hedge the foreign currency risk from intercompany loans transacted between group entities with different functional currencies. Intercompany loans with Russia and UK were hedged against euro for respectively 3 979m Russian ruble and 105m pound sterling. As of 31 December 2010, there are no outstanding derivative contracts linked to foreign exchange risk on intragroup loans.
FOREIGN EXCHANGE RISK ON NET INVESTMENTS IN FOREIGN OPERATIONS
AB InBev enters into hedging activities to mitigate exposures related to its investments in foreign operations. These strategies are designated as net investment hedges and include both derivative and non-derivative financial instruments.
As of 31 December 2010, designated derivative and non-derivative financial instruments in a net investment hedge relationship amount to 6 283m US dollar equivalent in Holding companies and approximately 370m US dollar equivalent at AmBev level. Those derivatives and non-derivatives are used to hedge foreign operations with functional currencies denominated in Brazilian real, Canadian dollar, pound sterling, Russian ruble, euro, and US dollar.
FOREIGN EXCHANGE RISK ON FOREIGN CURRENCY DENOMINATED DEBT
It is AB InBev’s policy to have the debt in the subsidiaries as much as possible in the functional currency of the subsidiary. To the extent this is not the case, hedging is put in place unless the cost to hedge outweighs the benefits. Following the acquisition of Anheuser-Busch, AB InBev adopted a hybrid currency matching model pursuant to which the company may (i) match net debt currency exposure to cash flows in such currency, measured on the basis of normalized EBITDA, by swapping a significant portion of US dollar debt to other currencies, such as Brazilian real (with a higher coupon), although this would negatively impact AB InBev’s profit and earnings due to the higher Brazilian real interest coupon, and (ii) use Anheuser-Busch’s US dollar cash flows to service interest payments under AB InBev’s debt obligations.
A description of the foreign currency risk hedging related to the debt instruments issued in a currency other than the functional currency of the subsidiary is further detailed in the Interest Rate Risk section below.
CURRENCY SENSITIVITY ANALYSIS
Currency translational risk
Around 60% of AB InBev’s revenue is generated by foreign operations of which the activities are conducted in a currency other than the US dollar. A currency translation risk arises when the financial data of these foreign operations are converted in AB InBev’s presentation currency, the US dollar. On the basis of the volatility of these currencies against the US dollar in 2010, AB InBev estimated the reasonably possible change of the exchange rate of these currencies against the US dollar as follows:

64
2010
1 US dollar equals: Closing rate
31 December 2010 Average rate
2010 Possible closing rate volatility1
Possible average rate volatility
Volatility of rates in %
Argentinean peso ................ 3.98 3.95 3.84 - 4.11 3.81 - 4.08 3.49% Bolivian boliviano ................ 7.04 7.09 6.28 - 7.8 6.32 - 7.85 10.84% Brazilian real....................... 1.67 1.77 1.43 - 1.90 1.52 - 2.02 14.28% Canadian dollar ................... 1.00 1.03 0.88 - 1.11 0.92 - 1.15 11.42% Chinese yuan ...................... 6.60 6.76 6.09 - 7.12 6.23 - 7.28 7.77% Paraguayan guarani ............. 4 563 4 787 4 228 – 4 899 4 435 – 5 139 7.35% Pound sterling..................... 0.64 0.65 0.58 - 0.71 0.58 - 0.71 9.96% Russian ruble ...................... 30.18 30.14 27.29 - 33.07 27.26 - 33.03 9.58% Ukrainian hryvnia ................ 7.91 7.85 7.62 - 8.21 7.56 - 8.14 3.70% Euro .................................. 0.75 0.76 0.66 - 0.84 0.67 - 0.85 11.88% 2009
1 US dollar equals: Closing rate
31 December 2009 Average rate
2009 Possible closing rate volatility1
Possible average rate volatility
Possible volatility of rates in %
Argentinean peso ................ 3.80 3.73 3.66 - 3.93 3.60 - 3.86 3.47% Bolivian boliviano ................ 7.07 7.13 6.48 - 7.66 6.54 - 7.73 8.32% Brazilian real....................... 1.74 2.02 1.44 - 2.04 1.67 - 2.36 17.07% Canadian dollar ................... 1.05 1.15 0.90 - 1.2 0.99 - 1.31 14.07% Chinese yuan ...................... 6.83 6.86 6.79 - 6.87 6.82 - 6.90 0.57% Paraguayan guarani ............. 4 597 5 008 4 188 - 5 006 4 562 - 5 453 8.90% Pound sterling..................... 0.62 0.64 0.53 - 0.70 0.56 - 0.73 13.22% Russian ruble ...................... 30.12 31.83 25.95 - 34.28 27.43 - 36.23 13.82% Ukrainian hryvnia ................ 7.95 7.74 5.69 - 10.21 5.54 - 9.94 28.46% Euro .................................. 0.69 0.72 0.61 - 0.78 0.64 - 0.81 11.68% Had the US dollar weakened/strengthened during 2010 by the above estimated possible changes against the above listed currencies with all other variables held constant, the 2010 profit before taxes would have been 756m US dollar (13%) higher/lower while the pre-taxes impact on translation reserves in equity would have been 1 669m US dollar higher/lower. In 2009, AB InBev estimated this impact to be 1 070m US dollar on profit and 3 324m US dollar on the translation reserves.
Currency transactional risk
Most of AB InBev’s non-derivative monetary financial instruments are either denominated in the functional currency of the subsidiary or are converted into the functional currency through the use of derivatives. However, the company can have open positions in Eastern European countries for which hedging can be limited as the illiquidity of the local foreign exchange market prevents us from hedging at a reasonable cost. The transactional foreign currency risk mainly arises from open positions in Ukrainian hryvnia, and Russian ruble against the US dollar and the euro. AB InBev estimated the reasonably possible change of exchange rate, on the basis of the average volatility on the open currency pairs, as follows:
2010
Closing rate
31 December 2010 Possible closing rate
volatility1 Volatility
of rates in % Euro/Russian ruble ........................................... 40.33 36.76 - 43.91 8.86% Euro/Ukrainian hryvnia ..................................... 10.57 9.26 - 11.89 12.46% Pound sterling/Euro .......................................... 1.16 1.06 - 1.27 9.16% US dollar/Russian ruble ..................................... 30.18 27.29 - 33.07 9.58% US dollar/Ukrainian hryvnia .............................. 7.91 7.62 – 8.21 3.70%
2009
Closing rate
31 December 2009 Possible closing rate
volatility1 Possible volatility
of rates in % Euro/Ukrainian hryvnia...................................... 11.45 8.35 - 14.55 27.09% Euro/Romanian lei ............................................ 4.10 3.86 - 4.33 5.62% US dollar/Ukrainian hryvnia ............................... 7.95 5.69 - 10.21 28.46% Had the Ukrainian hryvnia, the Russian ruble and the pound sterling weakened/strengthened during 2010 by the above estimated changes against the euro or the US dollar, with all other variables held constant, the 2010 impact on consolidated profit before taxes would have been approximately 12m US dollar higher/lower.
Additionally, the AB InBev sensitivity analysis1 to the foreign exchange rates on its total derivatives positions as of 31 December 2010, shows a pre-tax impact on equity reserves of 22m US dollar positive/negative.
B. INTEREST RATE RISK
The company applies a dynamic interest rate hedging approach whereby the target mix between fixed and floating rate debt is reviewed periodically. The purpose of AB InBev’s policy is to achieve an optimal balance between cost of funding and volatility of financial results, while taking into account market conditions as well as AB InBev’s overall business strategy.
1 Sensitivity analysis is assessed based on the yearly volatility using daily observable market data during 250 days at 31 December 2010 and at 31 December 2009 respectively.

65
FLOATING INTEREST RATE RISK ON BORROWINGS IN US DOLLAR
The company entered into a 45 billion US dollar senior facilities agreement (of which 44 billion US dollar was ultimately drawn) to acquire Anheuser-Busch and entered into a series of forward starting US dollar interest rate swaps in order to provide a higher predictability of cash flows (see Note 24 Interest-bearing loans and borrowings). As a result, the interest rates for up to an amount of 34.5 billion US dollar, under the 45 billion US dollar senior facility agreement, had effectively been fixed at 3.875% per annum plus applicable spreads, for the period of 2009-2011 and designated as cash flow hedge at inception. From this 34.5 billion US dollar hedging, 25 billion US dollar hedge was designated to the senior facility, 5 billion US dollar was designated to a pre-hedging of the bond issuance in January 2009, 3 billion US dollar was designated to a pre-hedging of the bond issuance in May 2009 and 1 billion US dollar was designated to a pre-hedging of bond issuance in October 2009 (0.5 billion US dollar was derecognized during 2009).
Following the refinancing and the repayment of the 2008 and 2010 senior facilities part of interest rate swaps that were designated for the hedge of the financing of the Anheuser-Busch acquisition became freestanding given the repayment of part of these senior facilities. In order to offset the interest rate risk, the freestanding derivatives were unwound via additional offsetting trades. As of 31 December 2010, the remaining open debt under the 2010 senior facilities amounting to 4.4 billion US dollar remains designated as cash flow hedge and it is hedged via two tranches of US dollar LIBOR fixed interest-rate swaps with a notional amount of 4.4 billion US dollar each. The interest rate for the first tranche had been fixed at a weighted average rate of 4.038% per annum (plus applicable spreads) for the period 2010 and 2011 and the interest rate for the second tranche had been fixed at a weighted average rate of 2.85% per annum (plus applicable spreads) for the period 2012 to 2013.
PRIVATE PLACEMENT HEDGES (FOREIGN CURRENCY RISK + INTEREST RATE RISK ON BORROWINGS IN US DOLLAR)
The company borrowed 850m US dollar through private placement of which 775m US dollar matured during 2009 and 2010, and 75m US dollar are due in 2013.
The company entered into US dollar fixed/euro floating cross currency interest rate swaps for a total amount of 730m US dollar of which 655m US dollar expired during 2009 and 2010 and the remaining will mature in 2013.
In conformity with IAS 39, 75m US dollar hedges are still designated for hedge accounting in fair value hedge relationships by year end 2010.
AMBEV BOND HEDGES (FOREIGN CURRENCY RISK + INTEREST RATE RISK ON BORROWINGS IN US DOLLAR)
In December 2001, AmBev issued 500m US dollar in foreign securities (bond 2011). This bond bears interest at 10.5% and is repayable semi-annually as from July 2002 with final maturity in December 2011. In September 2003 AmBev issued another 500m US dollar in foreign securities (bond 2013). This bond bears interest at 8.75% and is repayable semi-annually since March 2004 with final maturity in September 2013. In July 2007 AmBev issued a Brazilian real bond (bond 2017), which bears interest at 9.5% and is repayable semi-annually with final maturity date in July 2017.
AmBev entered into several US dollar fixed/Brazilian real floating cross currency interest rate swaps to manage and reduce the impact of changes in the US dollar exchange rate and interest rate on these bonds. In addition to this, AmBev entered into a fixed/floating interest rate swap to hedge the interest rate risk on the bond 2017. These derivative instruments have been designated in a fair value hedge accounting relationship.
CANADA DEBENTURE HEDGES (FOREIGN CURRENCY RISK + INTEREST RATE RISK ON BORROWINGS IN BRAZILIAN
REAL)
As of 31 December 2010, the company has outstanding bank loans of 717m Brazilian real and 474m Brazilian real relating to loans issued in 2007 and 2006, respectively. The company has entered into a series of derivative contracts to hedge the foreign exchange and interest rate risk related to the Brazilian real. The maturity dates for the derivative contracts are identical to the maturity dates of the two loans, which mature on June 2011 for the first loan and January 2012 for the second loan. These hedges were designated in a cash flow hedge accounting relationship.
POUND STERLING HEDGES (FOREIGN CURRENCY RISK + INTEREST RATE RISK ON BORROWINGS IN POUND STERLING)
In June 2009, the company issued a pound sterling bond for an equivalent of 750m pound sterling. This bond bears interest at 6.50% with maturity in June 2017.
The company entered into several pound sterling fixed/euro floating cross currency interest rate swaps to manage and reduce the impact of changes in the pound sterling exchange rate and interest rate on this bond.
These derivative instruments have been designated in a fair value hedge accounting relationship.
SWISS FRANC BOND HEDGES (FOREIGN CURRENCY RISK + INTEREST RATE RISK ON BORROWINGS IN SWISS FRANC)
In May 2009, the company issued a Swiss franc bond for an equivalent of 600m Swiss franc. This bond bears interest at 4.51% with maturity in June 2014.
The company entered into a Swiss franc fixed/euro floating cross currency interest rate swap to manage and reduce the impact of changes in the Swiss franc exchange rate and interest rate on this bond.
This derivative instrument was designated in a fair value hedge accounting relationship in 2009. During 2010, although this derivative continues to be considered an economic hedge, hedge accounting designation was discontinued.
NET DEBT CURRENCY EXPOSURE ADJUSTMENT (US DOLLAR AND EURO TO BRAZILIAN REAL)
As of 31 December 2010 the company has outstanding US dollar/Brazilian real and euro/Brazilian real cross currency interest rate swap contracts for an equivalent of approximately 1 344m Brazilian real and 1 292m Brazilian real, respectively.
The purpose of these derivatives is to effectively increase the level of Brazilian real denominated debt in order to achieve a better balance of the company’s net currency exposure.
These derivative instruments are designated in net investment hedge accounting relationship by year end 2010.
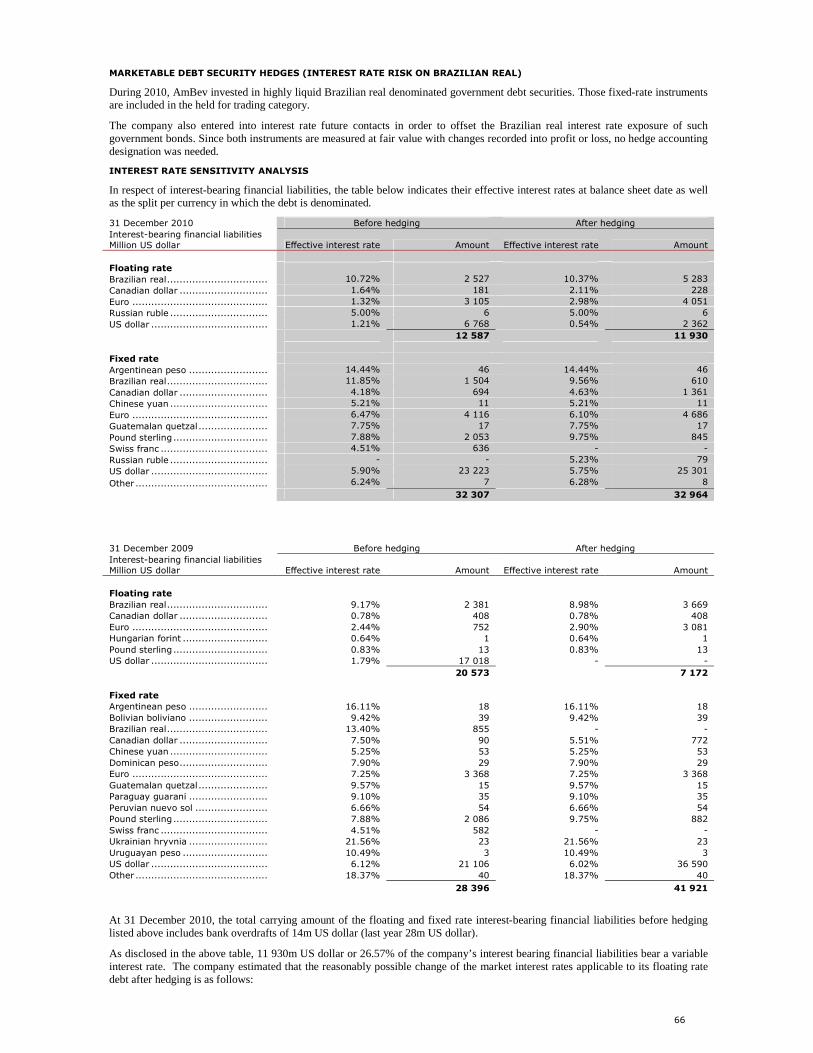
66
MARKETABLE DEBT SECURITY HEDGES (INTEREST RATE RISK ON BRAZILIAN REAL)
During 2010, AmBev invested in highly liquid Brazilian real denominated government debt securities. Those fixed-rate instruments are included in the held for trading category.
The company also entered into interest rate future contacts in order to offset the Brazilian real interest rate exposure of such government bonds. Since both instruments are measured at fair value with changes recorded into profit or loss, no hedge accounting designation was needed.
INTEREST RATE SENSITIVITY ANALYSIS In respect of interest-bearing financial liabilities, the table below indicates their effective interest rates at balance sheet date as well as the split per currency in which the debt is denominated.
31 December 2010 Before hedging After hedging Interest-bearing financial liabilities Million US dollar Effective interest rate Amount Effective interest rate Amount Floating rate Brazilian real................................ 10.72% 2 527 10.37% 5 283 Canadian dollar ............................ 1.64% 181 2.11% 228 Euro ........................................... 1.32% 3 105 2.98% 4 051 Russian ruble ............................... 5.00% 6 5.00% 6 US dollar ..................................... 1.21% 6 768 0.54% 2 362 12 587 11 930
Fixed rate Argentinean peso ......................... 14.44% 46 14.44% 46 Brazilian real................................ 11.85% 1 504 9.56% 610 Canadian dollar ............................ 4.18% 694 4.63% 1 361 Chinese yuan ............................... 5.21% 11 5.21% 11 Euro ........................................... 6.47% 4 116 6.10% 4 686 Guatemalan quetzal...................... 7.75% 17 7.75% 17 Pound sterling.............................. 7.88% 2 053 9.75% 845 Swiss franc .................................. 4.51% 636 - - Russian ruble ............................... - - 5.23% 79 US dollar ..................................... 5.90% 23 223 5.75% 25 301 Other .......................................... 6.24% 7 6.28% 8
32 307 32 964
31 December 2009 Before hedging After hedging Interest-bearing financial liabilities Million US dollar Effective interest rate Amount Effective interest rate Amount Floating rate Brazilian real................................ 9.17% 2 381 8.98% 3 669 Canadian dollar ............................ 0.78% 408 0.78% 408 Euro ........................................... 2.44% 752 2.90% 3 081 Hungarian forint ........................... 0.64% 1 0.64% 1 Pound sterling.............................. 0.83% 13 0.83% 13 US dollar ..................................... 1.79% 17 018 - - 20 573 7 172
Fixed rate Argentinean peso ......................... 16.11% 18 16.11% 18 Bolivian boliviano ......................... 9.42% 39 9.42% 39 Brazilian real................................ 13.40% 855 - - Canadian dollar ............................ 7.50% 90 5.51% 772 Chinese yuan ............................... 5.25% 53 5.25% 53 Dominican peso............................ 7.90% 29 7.90% 29 Euro ........................................... 7.25% 3 368 7.25% 3 368 Guatemalan quetzal...................... 9.57% 15 9.57% 15 Paraguay guarani ......................... 9.10% 35 9.10% 35 Peruvian nuevo sol ....................... 6.66% 54 6.66% 54 Pound sterling.............................. 7.88% 2 086 9.75% 882 Swiss franc .................................. 4.51% 582 - - Ukrainian hryvnia ......................... 21.56% 23 21.56% 23 Uruguayan peso ........................... 10.49% 3 10.49% 3 US dollar ..................................... 6.12% 21 106 6.02% 36 590 Other .......................................... 18.37% 40 18.37% 40 28 396 41 921
At 31 December 2010, the total carrying amount of the floating and fixed rate interest-bearing financial liabilities before hedging listed above includes bank overdrafts of 14m US dollar (last year 28m US dollar).
As disclosed in the above table, 11 930m US dollar or 26.57% of the company’s interest bearing financial liabilities bear a variable interest rate. The company estimated that the reasonably possible change of the market interest rates applicable to its floating rate debt after hedging is as follows:

67
2010
Interest rate
31 December 20101 Possible interest rate
volatility2 Volatility
of rates in % Brazilian real........................................... 10.32% 9.09% - 11.54% 11.90% Canadian dollar ....................................... 1.30% 1.01% - 1.59% 22.67% Euro ...................................................... 1.01% 0.92% - 1.09% 8.08% US dollar ................................................ 0.30% 0.24% - 0.37% 21.66%
2009
Interest rate
31 December 2009 Possible interest rate
volatility2 Volatility
of rates in % Brazilian real........................................... 8.37% 6.73% - 10.01% 19.59% Canadian dollar ....................................... 0.44% 0.28% - 0.61% 37.52% Euro ...................................................... 0.70% 0.63% - 0.77% 9.39% Hungarian forint ...................................... 6.19% 5.24% - 7.14% 15.40% Pound sterling......................................... 0.61% 0.54% - 0.67% 11.25% US dollar ................................................ 0.25% 0.20% - 0.30% 19.81% When AB InBev applies the reasonably possible increase/decrease in the market interest rates mentioned above on its floating rate debt at 31 December 2010, with all other variables held constant, 2010 interest expense would have been 71m US dollar higher/lower. This effect would partly be compensated by 8m US dollar higher/lower interest income on AB InBev’s interest-bearing financial assets. In 2009, AB InBev estimated this impact to be 63m US dollar on profit which was partly compensated by 1m US dollar interest income.
C. COMMODITY RISK
The commodity markets have experienced and are expected to continue to experience price fluctuations. AB InBev therefore uses both fixed price purchasing contracts and commodity derivatives to minimize exposure to commodity price volatility. The company has important exposures to the following commodities: aluminum, corn grits, corn syrup, corrugated, crowns, glass, hops, labels, malt, fuel oil, natural gas, rice and wheat. As of 31 December 2010, the company has the following commodity derivatives outstanding (in notional amounts): aluminum swaps for 1 101m US dollar (last year 1 119m US dollar), natural gas and energy derivatives for 132m US dollar, exchange traded sugar futures for 89m US dollar (last year 81m US dollar), corn swaps for 74m US dollar, exchange traded wheat futures for 128m US dollar (last year 29m US dollar) and rice swaps for 31m US dollar. These hedges are designated in a cash flow hedge accounting relationship.
D. EQUITY PRICE RISK
During 2010, AB InBev entered into a series of derivative contracts to hedge the risk arising from the different share based payment programs. The purpose of these derivatives is to effectively hedge the risk that a price increase in the AB InBev shares will negatively impact future cash flows related to the share based payments. These derivative instruments could not qualify for hedge accounting therefore they have not been designated in any hedge relationships.
When AB InBev applies the reasonably possible increase/decrease in the price of its own shares of 24.21%, with all other variables held constant, 2010 profit before tax would have been approximately 210m US dollar higher/lower.
During 2010, AB InBev has not held any material equity investments classified as available-for-sale. In addition, marketable securities classified as held for trading mainly consist of debt securities not exposed to variation in equity prices or indexes.
E. CREDIT RISK
Credit risk encompasses all forms of counterparty exposure, i.e. where counterparties may default on their obligations to AB InBev in relation to lending, hedging, settlement and other financial activities. The company has a credit policy in place and the exposure to counterparty credit risk is monitored.
AB InBev mitigates its exposure to counterparty credit risk through minimum counterparty credit guidelines, diversification of counterparties, working within agreed counterparty limits and through setting limits on the maturity of financial assets. The company has furthermore master netting agreements with most of the financial institutions that are counterparties to the derivative financial instruments. These agreements allow for the net settlement of assets and liabilities arising from different transactions with the same counterparty. Based on these factors, AB InBev considers the risk of counterparty default per 31 December 2010 to be limited.
AB InBev has established minimum counterparty credit ratings and enters into transactions only with financial institutions of investment grade. The company monitors counterparty credit exposures closely and reviews any downgrade in credit rating immediately. To mitigate pre-settlement risk, minimum counterparty credit standards become more stringent as the duration of the derivative financial instruments increases. To minimize the concentration of counterparty credit risk, the company enters into derivative transactions with a portfolio of financial institutions.
1 Applicable 3-month InterBank Offered Rates as of 31 December 2010. 2 Sensitivity analysis is assessed based on the yearly volatility using daily observable market data during 250 days at 31 December 2010. For the Brazilian real floating rate debt, the estimated market interest rate is composed of the InterBank Deposit Certificate (‘CDI’) and the Long-Term Interest Rate (‘TJLP’). With regard to other market interest rates, our analysis is based on the 3-month InterBank Offered Rates applicable for the currencies concerned (e.g. EURIBOR 3M, LIBOR 3M, BUBOR 3M).

68
EXPOSURE TO CREDIT RISK
The carrying amount of financial assets represents the maximum credit exposure of the Group. The carrying amount is presented net of the impairment losses recognized. The maximum exposure to credit risk at the reporting date was:
2010 2009
Million US dollar Gross Impairment
Net carrying amount Gross Impairment
Net carrying amount
Financial assets at fair value through profit or loss.. 641 - 641 30 - 30 Available-for-sale financial assets ......................... 297 (55) 242 180 (34) 146 Held-to-maturity investments .............................. 2 - 2 145 - 145 Trade receivables ............................................... 2 839 (234) 2 605 2 650 (214) 2 436 Cash deposits for guarantees ............................... 332 - 332 291 - 291 Loans to customers............................................. 215 (118) 97 269 (102) 167 Other receivables ............................................... 1 785 (125) 1 660 1 886 (117) 1 769 Derivative financial assets ................................... 1 644 - 1 644 1 386 - 1 386 Cash and cash equivalents................................... 4 511 - 4 511 3 689 - 3 689 12 266 (532) 11 734 10 526 (467) 10 059
There was no significant concentration of credit risks with any single counterparty per 31 December 2010.
IMPAIRMENT LOSSES
The allowance for impairment recognized during the period per classes of financial assets was as follows:
2010
Million US dollar Available-for-sale financial assets
Trade receivables
Loans to customers
Other receivables Total
Balance at 1 January................................... (34) (214) (102) (117) (467) Impairment losses ...................................... (30) (49) (7) - (86) Derecognition ............................................ 1 27 9 - 37 Currency translation and other ..................... 8 2 (18) (8) (16) Balance at 31 December.......................... (55) (234) (118) (125) (532)
2009
Million US dollar Available-for-sale financial assets
Trade receivables
Loans to customers
Other receivables Total
Balance at 1 January................................... (22) (264) (72) (84) (442) Impairment losses ...................................... (6) (20) (38) (28) (92) Derecognition ............................................ 6 44 10 3 63 Currency translation ................................... (12) 26 (2) (8) 4 Balance at 31 December.......................... (34) (214) (102) (117) (467)
F. LIQUIDITY RISK
AB InBev’s primary sources of cash flow have historically been cash flows from operating activities, the issuance of debt, bank borrowings and the issuance of equity securities. AB InBev’s material cash requirements have included the following:
� Debt service;
� Capital expenditures;
� Investments in companies;
� Increases in ownership of AB InBev’s subsidiaries or companies in which it holds equity investments;
� Share buyback programs; and
� Payments of dividends and interest on shareholders’ equity.
The company believes that cash flows from operating activities, available cash and cash equivalent and short term investments, along with the derivative instruments and access to borrowing facilities, will be sufficient to fund capital expenditures, financial instrument liabilities and dividend payments going forward. It is the intention of the company to continue to reduce its financial indebtedness through a combination of strong operating cash flow generation and continued refinancing.
The following are the contractual maturities of non-derivative financial liabilities including interest payments and derivative financial assets and liabilities:

69
2010
Million US dollar Carrying amount
Contractual cash flows
Less than 1 year 1-2 years 2-3 years 3-5 years
More than 5 years
Non-derivative financial liabilities Secured bank loans ........................... (137) (169) (40) (66) (36) (19) (8) Unsecured bank loans ........................ (11 039) (11 713) (2 119) (4 206) (4 744) (634) (10) Unsecured bond issues....................... (33 339) (54 605) (2 927) (5 967) (5 125) (10 956) (29 630) Secured other loans ........................... (6) (7) (1) (1) (5) - - Unsecured other loans ....................... (244) (288) (180) (16) (15) (25) (52) Finance lease liabilities....................... (115) (199) (48) (12) (7) (14) (118) Bank overdraft .................................. (14) (14) (14) - - - - Trade & other payables ...................... (11 416) (11 418) (10 341) (768) (84) (140) (85)
(56 310) (78 413) (15 670) (11 036) (10 016) (11 788) (29 903)
Derivative financial assets/liabilities Interest rate derivatives ..................... (1 658) (1 661) (984) (546) (108) (42) 19 Foreign exchange derivatives .............. 260 242 133 109 - - - Interest rate and foreign exchange derivatives........................................ (212) (293) (139) (161) (150) 140 17 Commodity derivatives....................... 234 236 221 15 - - - Equity instruments derivatives ............ 74 76 46 30 - - -
(1 302) (1 400) (723) (553) (258) 98 36
Of which: directly related to cash flow hedges............................................. 120 111 193 (12) (37) (33) -
2009
Million US dollar Carrying amount
Contractual cash flows
Less than 1 year 1-2 years 2-3 years 3-5 years
More than 5 years
Non-derivative financial liabilities
Secured bank loans ........................... (83) (105) (37) (28) (21) (19) - Unsecured bank loans ........................ (20 176) (21 561) (1 931) (6 051) (628) (12 823) (128) Unsecured bond issues....................... (28 513) (50 512) (2 257) (2 661) (5 598) (9 795) (30 201) Secured other loans ........................... (20) (21) (15) (1) (1) (6) 2 Unsecured other loans ....................... (222) (241) (27) (108) (16) (29) (61) Finance lease liabilities....................... (50) (126) (9) (7) (6) (5) (99) Bank overdraft .................................. (28) (28) (28) - - - - Trade & other payables ...................... (10 023) (10 023) (9 422) (426) (53) (57) (65)
(59 115) (82 617) (13 726) (9 282) (6 323) (22 734) (30 552)
Derivative financial assets/liabilities Interest rate derivatives ..................... (2 094) (2 064) (960) (796) (363) 54 1 Foreign exchange derivatives .............. 207 162 (93) 180 75 - - Interest rate and foreign exchange derivatives........................................ (374) (622) (230) (217) 38 (119) (94) Commodity derivatives....................... 318 312 239 73 - - -
(1 943) (2 212) (1 044) (760) (250) (65) (93)
Of which: directly related to cash flow hedges............................................. (598) (636) (421) (150) (119) 54 -
G. CAPITAL MANAGEMENT
AB InBev is continuously optimizing its capital structure targeting to maximize shareholder value while keeping the desired financial flexibility to execute the strategic projects. Besides the statutory minimum equity funding requirements that apply to the company’s subsidiaries in the different countries, AB InBev is not subject to any externally imposed capital requirements. When analyzing AB InBev’s capital structure the company uses the same debt/equity classifications as applied in the company’s IFRS reporting.
H. FAIR VALUE
Fair value is the amount for which an asset could be exchanged, or a liability settled, between knowledgeable, willing parties in an arm’s length transaction. In conformity with IAS 39 all derivatives are recognized at fair value in the balance sheet.
The fair value of derivative financial instruments is either the quoted market price or is calculated using pricing models taking into account current market rates.
The fair value of these instruments generally reflects the estimated amount that AB InBev would receive on the settlement of favorable contracts or be required to pay to terminate unfavorable contracts at the balance sheet date, and thereby takes into account any unrealized gains or losses on open contracts.

70
The following table summarizes for each type of derivative the fair values recognized as assets or liabilities in the balance sheet:
Assets Liabilities Net Million US dollar 2010 2009 2010 2009 2010 2009 Foreign currency Forward exchange contracts ........................ 345 322 (76) (122) 269 200 Foreign currency futures.............................. 5 - (14) (15) (9) (15) Other foreign currency derivatives................ - 22 - - - 22 Interest rate Interest rate swaps..................................... 585 420 (2 242) (2 514) (1 657) (2 094) Cross currency interest rate swaps ............... 370 237 (582) (611) (212) (374) Interest rate futures ................................... - - (1) - (1) - Commodities Aluminum swaps ........................................ 126 327 (7) (27) 119 300 Sugar futures............................................. 78 44 - (16) 78 28 Wheat futures ............................................ 17 3 (7) - 10 3 Other commodity derivatives ....................... 40 11 (13) (25) 27 (14) Equity Equity instruments ..................................... 78 - (4) - 74 -
1 644 1 386 (2 946) (3 330) (1 302) (1 944)
During the twelve-month period ended 31 December 2010, the net mark-to-market balance for interest rate swaps decreased by 437m US dollar, mainly driven by payment of interests and the unwinding effect of hedging instruments not part of a hedge relationship. The decrease was partially offset by unfavorable movements on US dollar LIBOR interest rates.
As of 31 December 2010, the net mark-to-market liability of 1 657m US dollar for interest rate swaps includes 976m US dollar of hedging losses that have been recorded as non-recurring items in the income statement in 2009 and 2010 as a result of the repayment and refinancing of the 2008 and 2010 senior facilities and that have not been settled by 31 December 2010 (see Note 24 Interest-bearing loans and borrowings).
The following table compares the carrying amounts of the fixed rate interest-bearing financial liabilities (before hedging) with their fair values at 31 December 2010:
Interest-bearing financial liabilities Million US dollar
2010 Carrying amount
2010 Fair value
2009 Carrying amount
2009 Fair value
Fixed rate Argentinean peso ........................................ (46) (46) (18) (18) Bolivia boliviano .......................................... - - (39) (39) Brazilian real .............................................. (1 504) (1 568) (855) (901) Canadian dollar........................................... (694) (699) (90) (84) Chinese yuan.............................................. (11) (11) (53) (53) Dominican peso .......................................... - - (29) (29) Euro .......................................................... (4 116) (4 650) (3 368) (3 873) Guatemalan quetzal .................................... (17) (17) (15) (15) Peruvian nuevo sol ...................................... (5) (5) (54) (54) Pound sterling ............................................ (2 053) (2 538) (2 086) (2 380) Ukrainian hryvnia........................................ - - (23) (23) US dollar.................................................... (23 223) (27 185) (21 106) (22 625) Paraguay guarani ........................................ - - (35) (35) Swiss franc................................................. (636) (695) (582) (575) Other......................................................... (2) (3) (42) (79)
(32 307) (37 417) (28 395) (30 783)
As required by IFRS 7, the following table provides an analysis of financial instruments that are measured subsequent to initial recognition at fair value, grouped into Levels 1 to 3 based on the degree to which the fair value is observable.
• Level 1 fair value measurements are those derived from quoted prices (unadjusted) in active markets for identical assets or liabilities.
• Level 2 fair value measurements are those derived from inputs other than quoted prices included within Level 1 that are observable for the asset or liability, either directly (i.e. as prices) or indirectly (i.e. derived from prices).
• Level 3 fair value measurements are those derived from valuation techniques that include inputs for the asset or liability that are not based on observable market data (unobservable inputs).
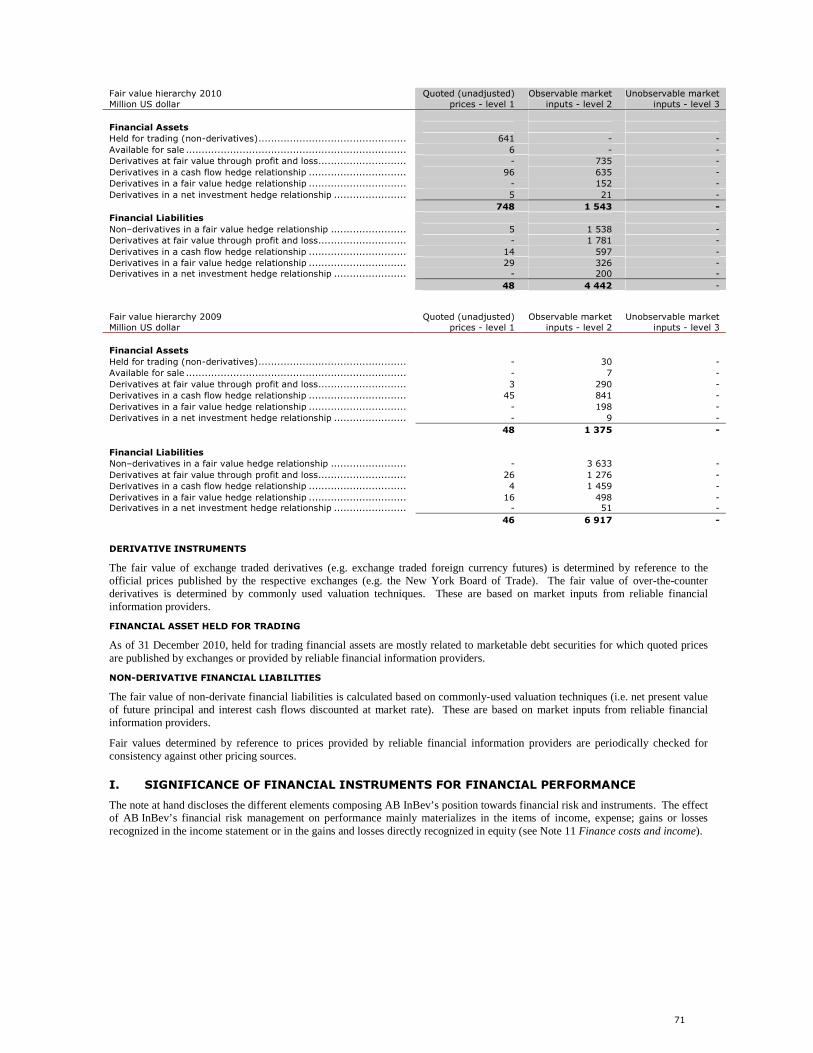
71
Fair value hierarchy 2010 Million US dollar
Quoted (unadjusted) prices - level 1
Observable market inputs - level 2
Unobservable market inputs - level 3
Financial Assets Held for trading (non-derivatives)............................................... 641 - - Available for sale ...................................................................... 6 - - Derivatives at fair value through profit and loss............................ - 735 - Derivatives in a cash flow hedge relationship ............................... 96 635 - Derivatives in a fair value hedge relationship ............................... - 152 - Derivatives in a net investment hedge relationship ....................... 5 21 - 748 1 543 -
Financial Liabilities Non–derivatives in a fair value hedge relationship ........................ 5 1 538 - Derivatives at fair value through profit and loss............................ - 1 781 - Derivatives in a cash flow hedge relationship ............................... 14 597 - Derivatives in a fair value hedge relationship ............................... 29 326 - Derivatives in a net investment hedge relationship ....................... - 200 - 48 4 442 -
Fair value hierarchy 2009 Million US dollar
Quoted (unadjusted) prices - level 1
Observable market inputs - level 2
Unobservable market inputs - level 3
Financial Assets Held for trading (non-derivatives)............................................... - 30 - Available for sale ...................................................................... - 7 - Derivatives at fair value through profit and loss............................ 3 290 - Derivatives in a cash flow hedge relationship ............................... 45 841 - Derivatives in a fair value hedge relationship ............................... - 198 - Derivatives in a net investment hedge relationship ....................... - 9 - 48 1 375 -
Financial Liabilities Non–derivatives in a fair value hedge relationship ........................ - 3 633 - Derivatives at fair value through profit and loss............................ 26 1 276 - Derivatives in a cash flow hedge relationship ............................... 4 1 459 - Derivatives in a fair value hedge relationship ............................... 16 498 - Derivatives in a net investment hedge relationship ....................... - 51 - 46 6 917 -
DERIVATIVE INSTRUMENTS
The fair value of exchange traded derivatives (e.g. exchange traded foreign currency futures) is determined by reference to the official prices published by the respective exchanges (e.g. the New York Board of Trade). The fair value of over-the-counter derivatives is determined by commonly used valuation techniques. These are based on market inputs from reliable financial information providers.
FINANCIAL ASSET HELD FOR TRADING
As of 31 December 2010, held for trading financial assets are mostly related to marketable debt securities for which quoted prices are published by exchanges or provided by reliable financial information providers.
NON-DERIVATIVE FINANCIAL LIABILITIES
The fair value of non-derivate financial liabilities is calculated based on commonly-used valuation techniques (i.e. net present value of future principal and interest cash flows discounted at market rate). These are based on market inputs from reliable financial information providers.
Fair values determined by reference to prices provided by reliable financial information providers are periodically checked for consistency against other pricing sources.
I. SIGNIFICANCE OF FINANCIAL INSTRUMENTS FOR FINANCIAL PERFORMANCE
The note at hand discloses the different elements composing AB InBev’s position towards financial risk and instruments. The effect of AB InBev’s financial risk management on performance mainly materializes in the items of income, expense; gains or losses recognized in the income statement or in the gains and losses directly recognized in equity (see Note 11 Finance costs and income).

72
30. OPERATING LEASES
LEASES AS LESSEE
Non-cancelable operating leases are payable as follows:
Million US dollar 2010 2009 Less than one year ........................................................................................................ 229 249 Between one and two years ............................................................................................ 210 227 Between two and three years.......................................................................................... 190 204 Between three and five years.......................................................................................... 321 349 More than five years ...................................................................................................... 993 1 113 1 943 2 142
At 31 December 2010, 238m US dollar was recognized as an expense in the income statement in respect of operating leases as lessee (2009: 269m US dollar).
Following the sale of Dutch and Belgian pub real estate to Cofinimmo in October 2007, AB InBev entered into lease agreements of 27 years. These operating leases maturing in November 2034 represent a payable of 903m US dollar in the table above.
Furthermore, the company leases a number of warehouses, factory facilities and other commercial buildings under operating leases. The leases typically run for an initial period of five to ten years, with an option to renew the lease after that date. Lease payments are increased annually to reflect market rentals. None of the leases include contingent rentals.
SUBLEASES
AB InBev has sublet some of the leased properties. Non-cancelable operating subleases are receivable as follows:
Million US dollar 2010 2009 Less than one year ........................................................................................................ 130 141 Between one and two years ............................................................................................ 117 124 Between two and three years.......................................................................................... 107 114 Between three and five years.......................................................................................... 187 201 More than five years ...................................................................................................... 223 192 764 772
At 31 December 2010, 149m US dollar was recognized as income in the income statement in respect of subleases (2009: 153m US dollar).
The pubs leased from Cofinimmo as from October 2007 are subleased for an average outstanding period of 6 to 8 years for an amount of 225m US dollar. These leases are subject to renewal after their expiration date. The impact of such renewal is not reported in the table above.
LEASES AS LESSOR
The company leases out part of its property under operating leases. Non-cancelable operating leases are receivable as follows:
Million US dollar 2010 2009 Less than one year ........................................................................................................ 6 9 Between one and two years ............................................................................................ 5 9 Between two and three years.......................................................................................... 4 8 Between three and five years.......................................................................................... 4 12 More than five years ...................................................................................................... 4 10 23 48
At 31 December 2010, 9m US dollar was recognized as income in the income statement in respect of operating leases as lessor (2009: 13m US dollar).
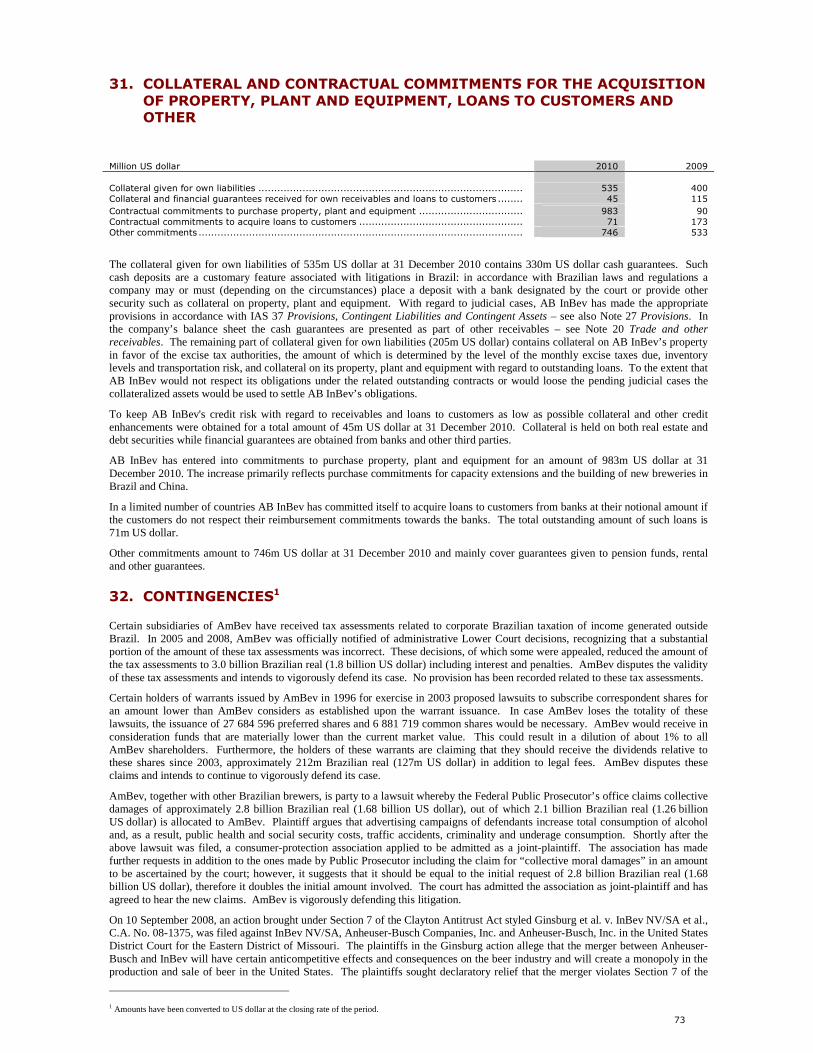
73
31. COLLATERAL AND CONTRACTUAL COMMITMENTS FOR THE ACQUISITION OF PROPERTY, PLANT AND EQUIPMENT, LOANS TO CUSTOMERS AND OTHER
Million US dollar 2010 2009 Collateral given for own liabilities .................................................................................... 535 400 Collateral and financial guarantees received for own receivables and loans to customers ........ 45 115 Contractual commitments to purchase property, plant and equipment ................................. 983 90 Contractual commitments to acquire loans to customers .................................................... 71 173 Other commitments ....................................................................................................... 746 533
The collateral given for own liabilities of 535m US dollar at 31 December 2010 contains 330m US dollar cash guarantees. Such cash deposits are a customary feature associated with litigations in Brazil: in accordance with Brazilian laws and regulations a company may or must (depending on the circumstances) place a deposit with a bank designated by the court or provide other security such as collateral on property, plant and equipment. With regard to judicial cases, AB InBev has made the appropriate provisions in accordance with IAS 37 Provisions, Contingent Liabilities and Contingent Assets – see also Note 27 Provisions. In the company’s balance sheet the cash guarantees are presented as part of other receivables – see Note 20 Trade and other receivables. The remaining part of collateral given for own liabilities (205m US dollar) contains collateral on AB InBev’s property in favor of the excise tax authorities, the amount of which is determined by the level of the monthly excise taxes due, inventory levels and transportation risk, and collateral on its property, plant and equipment with regard to outstanding loans. To the extent that AB InBev would not respect its obligations under the related outstanding contracts or would loose the pending judicial cases the collateralized assets would be used to settle AB InBev’s obligations.
To keep AB InBev's credit risk with regard to receivables and loans to customers as low as possible collateral and other credit enhancements were obtained for a total amount of 45m US dollar at 31 December 2010. Collateral is held on both real estate and debt securities while financial guarantees are obtained from banks and other third parties.
AB InBev has entered into commitments to purchase property, plant and equipment for an amount of 983m US dollar at 31 December 2010. The increase primarily reflects purchase commitments for capacity extensions and the building of new breweries in Brazil and China.
In a limited number of countries AB InBev has committed itself to acquire loans to customers from banks at their notional amount if the customers do not respect their reimbursement commitments towards the banks. The total outstanding amount of such loans is 71m US dollar.
Other commitments amount to 746m US dollar at 31 December 2010 and mainly cover guarantees given to pension funds, rental and other guarantees.
32. CONTINGENCIES1
Certain subsidiaries of AmBev have received tax assessments related to corporate Brazilian taxation of income generated outside Brazil. In 2005 and 2008, AmBev was officially notified of administrative Lower Court decisions, recognizing that a substantial portion of the amount of these tax assessments was incorrect. These decisions, of which some were appealed, reduced the amount of the tax assessments to 3.0 billion Brazilian real (1.8 billion US dollar) including interest and penalties. AmBev disputes the validity of these tax assessments and intends to vigorously defend its case. No provision has been recorded related to these tax assessments.
Certain holders of warrants issued by AmBev in 1996 for exercise in 2003 proposed lawsuits to subscribe correspondent shares for an amount lower than AmBev considers as established upon the warrant issuance. In case AmBev loses the totality of these lawsuits, the issuance of 27 684 596 preferred shares and 6 881 719 common shares would be necessary. AmBev would receive in consideration funds that are materially lower than the current market value. This could result in a dilution of about 1% to all AmBev shareholders. Furthermore, the holders of these warrants are claiming that they should receive the dividends relative to these shares since 2003, approximately 212m Brazilian real (127m US dollar) in addition to legal fees. AmBev disputes these claims and intends to continue to vigorously defend its case.
AmBev, together with other Brazilian brewers, is party to a lawsuit whereby the Federal Public Prosecutor’s office claims collective damages of approximately 2.8 billion Brazilian real (1.68 billion US dollar), out of which 2.1 billion Brazilian real (1.26 billion US dollar) is allocated to AmBev. Plaintiff argues that advertising campaigns of defendants increase total consumption of alcohol and, as a result, public health and social security costs, traffic accidents, criminality and underage consumption. Shortly after the above lawsuit was filed, a consumer-protection association applied to be admitted as a joint-plaintiff. The association has made further requests in addition to the ones made by Public Prosecutor including the claim for “collective moral damages” in an amount to be ascertained by the court; however, it suggests that it should be equal to the initial request of 2.8 billion Brazilian real (1.68 billion US dollar), therefore it doubles the initial amount involved. The court has admitted the association as joint-plaintiff and has agreed to hear the new claims. AmBev is vigorously defending this litigation.
On 10 September 2008, an action brought under Section 7 of the Clayton Antitrust Act styled Ginsburg et al. v. InBev NV/SA et al., C.A. No. 08-1375, was filed against InBev NV/SA, Anheuser-Busch Companies, Inc. and Anheuser-Busch, Inc. in the United States District Court for the Eastern District of Missouri. The plaintiffs in the Ginsburg action allege that the merger between Anheuser-Busch and InBev will have certain anticompetitive effects and consequences on the beer industry and will create a monopoly in the production and sale of beer in the United States. The plaintiffs sought declaratory relief that the merger violates Section 7 of the
1 Amounts have been converted to US dollar at the closing rate of the period.

74
Clayton Antitrust Act, injunctive relief to prevent consummation of the merger and fees and expenses. On 18 November 2008, plaintiffs’ request for injunctive relief was denied. On 3 August 2009, the Court granted defendants Motion to dismiss plaintiffs claims with prejudice. On 4 August 2009, the Court entered judgment in favor of the defendants. On 19 August 2009, plaintiffs filed an appeal of such judgment. A hearing of plaintiffs’ appeal before the Eighth Circuit Court of Appeals occurred on 14 April 2010. On 27 October 2010 plaintiffs’ appeal was denied. Plaintiffs’ subsequent Motions for Rehearing were denied on 3 December 2010. AB InBev will continue to vigorously defend against any remaining appeals of these claims.
On 22 July 2009, CADE, the Brazilian antitrust authority issued its ruling in Administrative Proceeding No. 08012.003805/2004-1. This proceeding was initiated in 2004 as a result of a complaint filed by Schincariol (a South American brewery and beverage maker based in Brazil) and had, as its main purpose, the investigation of AmBev’s conduct in the market, in particular its customer loyalty program known as “Tô Contigo” and which is similar to airline frequent flyer and other mileage programs. During its investigation, the Secretariat of Economic Law of the Ministry of Justice (“SDE”) concluded that the program should be considered anticompetitive unless certain adjustments were made. These adjustments had already been substantially incorporated into the current version of the Program. The SDE opinion did not threaten any fines and recommended that the other accusations be dismissed. After the SDE opinion was issued, the proceeding was sent to CADE, which issued a ruling that, among other things, imposed a fine in the amount of 353m Brazilian real (212m US dollar). AmBev believes that CADE’s decision was without merit and thus has challenged it before the federal courts, which have ordered the suspension of the fine and other parts of the decision upon its posting of a guarantee. AmBev has already rendered a court bond (carta de fiança) for this purpose. According to its advisors’ analysis, a loss is possible (but not probable), and therefore the company has not established a provision in its financial statements. AmBev is also involved in other administrative proceedings before CADE and SDE, relating to the investigation of certain conduct, none of which the company believes contravenes applicable competition rules and regulations.
On 1 December 2009, AB InBev and several of its related companies were sued in Federal Court in the Eastern District of Missouri in a lawsuit styled Richard F. Angevine v. AB InBev, et al. The plaintiff sought to represent a class of certain employees of Busch Entertainment Corporation, which was divested on 1 December 2009, and the four Metal Container Corporation plants which were divested on 1 October 2009. He also sought to represent certain employees of any other Anheuser-Busch Companies, Inc. (ABC) subsidiary that had been divested or may be divested during the 18 November 2008 and 17 November 2011 period. The lawsuit contained claims that the class was entitled to enhanced retirement benefits under sections 4.3 and 19.11(f) of the Anheuser-Busch Companies' Salaried Employees' Pension Plan (the "Plan"). Specifically, plaintiff alleged that the divestitures resulted in his "involuntarily termination" from "ABC and its operating division and subsidiaries" within three years of the 18 November 2008 ABC/InBev merger, which allegedly triggered the enhanced benefits under the Plan. The lawsuit claimed that by failing to provide the class members with these enhanced benefits, AB InBev, et al. breached their fiduciary duties under ERISA. The complaint sought punitive damages and attorneys' fees. On 16 July 2010, the Court ruled that the claims for breach of fiduciary duty and punitive damages were not proper. The Court also found that Angevine did not exhaust his administrative remedies, which he must first do before filing a lawsuit. Angevine filed an appeal of this ruling with the Eighth Circuit Court of Appeals on 9 August 2010, which is currently pending. AB InBev will continue to vigorously defend against the appeal. On 15 September 2010, AB InBev and several of its related companies were sued in Federal Court for the Southern District of Ohio in a lawsuit entitled Rusby Adams et al. v. AB InBev et al. This lawsuit was filed by four employees of Metal Container Corporation’s facilities in Columbus, Ohio, Gainesville, Florida, and Ft. Atkinson, Wisconsin that were divested on 1 October 2009. Similar to the Angevine lawsuit, these plaintiffs seek to represent a class of participants of the Anheuser-Busch Companies’ Inc. Salaried Employees’ Pension Plan (the “Plan”) who had been employed by Anheuser-Busch Companies, Inc. subsidiaries that had been or may be divested during the period of 18 November 2008 and 17 November 2011. The plaintiffs also allege claims similar to the Angevine lawsuit: (1) that they are entitled to benefits under section 19.11(f) of the Plan; (2) that the denial of benefits was a breach of fiduciary duty. AB InBev believes that it has defenses to these claims, and has filed a Motion to Dismiss, which is currently pending. AB InBev intends to vigorously defend against the lawsuit.
33. RELATED PARTIES
TRANSACTIONS WITH DIRECTORS AND EXECUTIVE BOARD MANAGEMENT MEMBERS (KEY
MANAGEMENT PERSONNEL)
In addition to short-term employee benefits (primarily salaries) AB InBev’s executive board management members are entitled to post-employment benefits. More particular, members of the executive board management participate in the pension plan of their respective country – see also Note 25 Employee Benefits. Finally, key management personnel are eligible for the company’s share option, restricted stock unit and/or share swap program (refer Note 26 Share-based Payments). Total directors and executive board management compensation included in the income statement can be detailed as follows:
2010 2009
Million US dollar Directors Executive board
management Directors Executive board
management Short-term employee benefits ................. 4 35 4 54 Post-employment benefits....................... - 2 - 2 Share-based payments ........................... 5 43 4 51 Non-recurring IFRS 2 adjustment ............ - - - 45 9 80 8 152
Directors’ compensation consists mainly of directors’ fees (tantièmes). Key management personnel was not engaged in any transactions with AB InBev and did not have any significant outstanding balances with the company, with the exception of a consultancy agreement entered into between AB InBev and Mr. Busch IV in connection with the merger and which will continue until 31 December 2013. Under the terms of the consultancy agreement Mr. Busch IV received a lump sum cash payment of 10.3m US dollar in 2008. During the consultancy period Mr. Busch IV will be paid a fee of approximately 120 000 US dollar per month and Mr. Busch IV will be provided with an appropriate office in St Louis, Missouri, administrative support and certain employee benefits that are materially similar to those provided to full-time salaried employees of Anheuser-Busch.
75
The decrease in key management remuneration mainly results from higher accruals for variable compensations in 2009 compared to 2010. The non-recurring IFRS 2 adjustment recognized in 2009 for a total of 45m US dollar relates to accelerated share-based payment expenses in accordance with IFRS 2, following the change in vesting conditions on certain share-based payment plans.
JOINTLY CONTROLLED ENTITIES
AB InBev reports its interest in jointly controlled entities using the line-by-line reporting format for proportionate consolidation. Significant interests in joint ventures include two distribution entities in Canada, two entities in Brazil, one in China and in UK. None of these joint ventures are material to the company. Aggregate amounts of AB InBev’s interest are as follows:
Million US dollar 2010 2009 Non-current assets ............................................................................................................... 113 76 Current assets ..................................................................................................................... 69 42 Non-current liabilities............................................................................................................ 99 131 Current liabilities .................................................................................................................. 217 84 Result from operations .......................................................................................................... 11 - Profit attributable to equity holders......................................................................................... 1 -
TRANSACTIONS WITH ASSOCIATES
AB InBev’s transactions with associates were as follows:
Million US dollar 2010 2009 Revenue.............................................................................................................................. 36 45 Non-current assets ............................................................................................................... - - Current assets ..................................................................................................................... 8 9 Current liabilities .................................................................................................................. 11 22
Revenue from associates primarily consists of sales to distributors in which AB InBev has a non-controlling interest.
TRANSACTIONS WITH PENSION PLANS
AB InBev’s transactions with pension plans are mainly comprised of 4m US dollar revenue from pension plans in US and 5m US dollar revenue from pension plans in Brazil.
TRANSACTIONS WITH GOVERNMENT-RELATED ENTITES
AB InBev’s transactions with government-related entities are mainly comprised of 2m US dollar of current liabilities versus local government in China.
34. EVENTS AFTER THE BALANCE SHEET DATE
On 24 January 2011, AB InBev announced that one of its subsidiaries, AB InBev Worldwide Inc, completed the pricing of 1.65 billion US dollar aggregate principal amount of notes, consisting of 650 million US dollar aggregate principal amount of floating rate notes due 2014, 500 million US dollar aggregate principal amount of fixed rate notes due 2016 and 500 million US dollar aggregate principal amount of fixed rate notes due 2021. The notes will bear interest at an annual rate of 55 basis points above three-month LIBOR for the floating rate notes, 2.875% for the 2016 notes, and 4.375% for the 2021 notes. The notes will mature on 27 January 2014 in the case of the floating rate notes, 15 February 2016 in the case of the 2016 notes and 15 February 2021 in the case of the 2021 notes. The issuance closed on 27 January 2011. As a result of this transaction, non-recurring finance costs in the first quarter 2011 will include a one-time accretion expense and negative mark-to-market adjustment estimated at approximately 75m US dollar, as a portion of the interest rates swaps, hedging borrowings under the 2010 senior facilities, will no longer be effective. The cash equivalent of the negative mark-to-market adjustment will be spread from 2011 to 2014.
On 11 February 2011, our subsidiary, Anheuser-Busch InBev Worldwide Inc., launched an exchange offer for up to 8.0 billion US dollar of its outstanding unregistered notes, for freely tradable notes registered under the Securities Act of 1933 with otherwise substantially the same terms and conditions. The unregistered notes were issued during the first half of 2009 before we became an SEC reporting company. The exchange offer will close on 14 March 2011.

76
35. AB INBEV COMPANIES
Listed below are the most important AB InBev companies. A complete list of the company’s investments is available at AB InBev NV, Brouwerijplein 1, B-3000 Leuven, Belgium. The total number of companies consolidated (fully, proportional and equity method) is 353.
LIST OF MOST IMPORTANT FULLY CONSOLIDATED COMPANIES
NAME AND REGISTERED OFFICE OF FULLY CONSOLIDATED COMPANIES
% OF ECONOMIC INTEREST AS AT
31 DECEMBER 2010
ARGENTINA CERVECERIA Y MALTERIA QUILMES SAICA y G - Charcas 5160 - Buenos Aires 61.85 BELGIUM AB INBEV NV – Grote Markt 1 - 1000 - Brussel Consolidating Company BRASSERIE DE L'ABBAYE DE LEFFE S.A. - Place de l'Abbaye 1 - 5500 - Dinant 98.54 BROUWERIJ VAN HOEGAARDEN N.V. - Stoopkensstraat 46 - 3320 - Hoegaarden 100.00 COBREW N.V. - Brouwerijplein 1 - 3000 - Leuven 100.00 INBEV BELGIUM N.V. - Industrielaan 21 - 1070 - Brussel 100.00 BOLIVIA CERVECERIA BOLIVIANA NACIONAL S.A. - Av. Montes 400 and Chuquisaca Street - La Paz 61.85 BRAZIL CIA DE BEBIDAS DAS AMERICAS - AMBEV BRASIL - Rua Dr. Renato Paes de Barros, 1017, 4° Andar (parte), cj. 44 e 42 - Itaim Bibi, Sao Paulo 61.86 CANADA LABATT BREWING COMPANY LIMITED - 207 Queen's Quay West, Suite 299 - M5J 1A7 - Toronto 61.86 CHILE CERVECERIA CHILE S.A. - Av. Presidente Eduado Frei Montalva 9600 - Quilicura 61.85 CHINA BUDWEISER WUHAN INTERNATIONAL BREWING COMPANY LIMITED - Qingduankou Shang Shou - Hanyang District - Wuhan City - Hubei 430051 97.06 HARBIN BREWING COMPANY LIMITED - 20 Youfang Street - Xiangfang District - Harbin, Heilongjiang Province 100.00 INBEV (ZHOUSHAN) BREWERY CO LTD - No.1 Linggang Yi Road, Linggang industrial area, Dinghai District - Zhou Shan 100.00 INBEV BAISHA (HUNAN) BREWERY CO LTD - No. 304 Shao Shan Zhong Lu - Changsha 100.00 INBEV DOUBLE DEER GROUP CO LTD - 419 Wu Tian Street - Wenzhou 55.00 INBEV JINLONGQUAN (HUBEI) BREWERY CO LTD - 89 Chang Ning Street - Jingmen 60.00 INBEV JINLONGQUAN (XIAOGAN) BREWERY CO LTD - No. 198 Chengzhan Street - Xiaogan 60.00 INBEV KK (NINGBO) BREWERY CO LTD - Yiyiang Zhen, 315000 - Ningbo 100.00 INBEV SEDRIN BREWERY Co, Ltd - 660 Gong Ye Road, Putian Hanjiang District - Fujiang 100.00 INBEV SHILIANG (ZHEJIANG) BREWERY CO LTD. - 159, Qi Xia Dong Road - Cheng Guan, Tiantai County 100.00 INBEV ZHEDONG (ZHEHIANG) BREWERY CO. LTD - Yiyiang Zhen, 315000 - Ningbo 100.00 NANJING INBEV JINLING BREWERY CO. LTD - Qi Li Qiao, Yiang Pu District - 211800 100.00 DOMINICAN REPUBLIC COMPAÑIA CERVECERA AMBEV DOMINICANA C. por A - Av. San Martin, 279 - Apartado Postal 723 - Santo Domingo 61.86 ECUADOR COMPAÑIA CERVECERA AMBEV ECUADOR S.A. - Av. Amazonas E4-69 y Av. Patria - Quito 61.86 FRANCE AB - INBEV FRANCE S.A.S. 38 Allée Vauban 59110 La Madeleine 100.00 GERMANY BRAUEREI BECK GmbH & CO. KG - Am Deich 18/19 - 28199 - Bremen 100.00 BRAUEREI DIEBELS GmbH & CO.KG - Brauerei-Diebels-Strasse 1 - 47661 - Issum 100.00 BRAUERGILDE HANNOVER AG - Hildesheimer Strasse 132 - 30173 - Hannover 100.00 HAAKE-BECK BRAUEREI GmbH & Co. KG - Am Deich 18/19 - 28199 - Bremen 99.94 HASSERÖDER BRAUEREI GmbH - Auerhahnring 1 - 38855 - Wernigerode 100.00 INBEV GERMANY HOLDING GmbH - Am Deich 18/19 - 28199 - Bremen 100.00 SPATEN - FRANZISKANER - BRÄU GmbH - Marsstrasse 46 + 48 - 80335 - München 100.00 GRAND DUCHY OF LUXEMBURG BRASSERIE DE LUXEMBOURG MOUSEL - DIEKIRCH - 1, Rue de la Brasserie - L-9214 - Diekirch 95.54 INDIA
CROWN BEERS INDIA LIMITED - #8-2-309/8/6 & 8, Road No. 14 - Banjara Hills, Hyderabad 500034 - Andhra Pradesh 100.00 PARAGUAY CERVECERIA PARAGUAYA S.A. - Ruta Villeta KM 30 - Ypané 61.85 PERU COMPANIA CERVECERA AMBEV PERU SAC - Av. Los Laureles Mz. A Lt. 4 del Centro Poblado Menor Santa Maria de s/n Huachipa - Lurigancho, Chosica City Lima 15 61.86

77
NAME AND REGISTERED OFFICE OF FULLY CONSOLIDATED COMPANIES
% OF ECONOMIC
INTEREST AS AT
31 DECEMBER 2010
RUSSIA OAO SUN INBEV - 28 Moscovskaya Street, Moscow region - 141600 - Klin 99.57 THE NETHERLANDS INBEV NEDERLAND N.V. - Ceresstraat 1 - 4811 CA - Breda 100.00 INTERBREW INTERNATIONAL B.V. - Ceresstraat 1 - 4811 CA - Breda 100.00 UKRAINE
PJSC SUN InBev Ukraine - 30V Fizkultury St - 03680 - Kyiv 99.57 US ANHEUSER-BUSCH COMPANIES, INC. - One Busch Place - St. Louis, MO 63118 100.00 ANHEUSER-BUSCH INTERNATIONAL, INC. - One Busch Place - St. Louis, MO 63118 100.00 ANHEUSER-BUSCH PACKAGING GROUP, INC. - 3636 S. Geyer Road - Sunset Hills, MO 63127 100.00
UNITED KINGDOM BASS BEERS WORLDWIDE LIMITED - Porter Tun House, 500 Capability Green - LU1 3LS - Luton 100.00 INBEV UK LTD - Porter Tun House, 500 Capability Green - LU1 3LS - Luton 100.00 URUGUAY CERVECERIA Y MALTERIA PAYSSANDU S.A. - Rambla Baltasar Brum, 2933 - 11800 - Payssandu 61.85
LIST OF MOST IMPORTANT ASSOCIATED COMPANIES
NAME AND REGISTERED OFFICE OF ASSOCIATES
% OF ECONOMIC
INTEREST AS AT
31 DECEMBER 2010
MEXICO GRUPO MODELO S.A.B. de C.V. - Torre Acuario - Javier Barros Sierra No 555 - Piso 6 - Colonia Zedec Santa Fe - Delagacion Alvaro Obregon - 01210 México, D.F. 50.20

78
Information to our shareholders
EARNINGS, DIVIDENDS, SHARE AND SHARE PRICE
Euro per share unless stated otherwise 2010 2009 2008 2007
restated1 2006
restated1 Cash flow from operating activities (usd per share)............................... 6.22 5.76 5.54 5.69 4.24 Normalized earnings per share (usd per share) .................................... 3.17 2.48 2.51 2.61 1.96 Dividend (euro per share).................................................................. 0.80 0.38 0.28 2.44 0.72 Share price high (euro per share) ....................................................... 46.33 36.80 39.1 43.1 31.2 Share price low (euro per share) ........................................................ 33.50 16.34 10.0 29.8 21.9 Year-end share price (euro per share)................................................. 42.80 36.40 16.6 35.6 31.2 Weighted average number of ordinary shares (million shares)................ 1 592 1 584 999 976 972 Diluted weighted average number of ordinary shares (million shares) ..... 1 611 1 593 1 000 981 980 Volume of shares traded (million shares)............................................. 588 798 825 453 352
AB INBEV SHARE PRICE EVOLUTION COMPARED TO DOW JONES EURO STOXX 50
euro
0
10
20
30
40
50
Dec-00 Dec-01 Dec-02 Dec-03 Dec-04 Dec-05 Dec-06 Dec-07 Dec-08 Dec-09 Dec-10
AB InBev DJ Euro Stoxx 50
1 In accordance with IAS33, historical data per share have been adjusted by an adjustment ratio of 0.6252 following the capital increase in December 2008.
79
INFORMATION ON THE AUDITORS’ ASSIGNMENTS AND RELATED FEES
AB InBev’s Statutory auditor is PricewaterhouseCoopers Bedrijfsrevisoren cvba, represented by Yves Vandenplas, engagement partner.
Base fees for auditing the annual financial statements of AB InBev and its subsidiaries are determined by the general meeting of shareholders after review and approval by the company’s audit committee and board of directors.
Audit and audit related fees for 2010 in relation to services provided by PricewaterhouseCoopers Bedrijfsrevisoren amounted to 2 824k US dollar (20091: 2 840k US dollar), which was composed of audit services for the annual financial statements of 1 745k US dollar (20091: 843k US dollar), tax services of 317k US dollar (20091: 0) and audit related services of 762k US dollar (20091: 1 997k US dollar). Audit related services mainly relate to services incurred in connection with due diligence and the rights and bonds issues, all of which have been pre-approved by the company’s audit committee.
Audit and other fees for 2010 in relation to services provided by other offices in the PricewaterhouseCoopers network amounted to 9 940k US dollar (20091: 8 682k US dollar), which was composed of audit services for the annual financial statements of 5 768k US dollar (20091: 5 624k US dollar), tax services of 4 071k US dollar (20091: 120k US dollar) and audit related services of 101k US dollar (20091: 2 938k US dollar).
FINANCIAL CALENDAR
Publication of 2010 results................................................................................ 3 March 2011
Annual report 2010 available on www.ab-inbev.com ........................................... 3 March 2011
General shareholders meeting........................................................................... 26 April 2011
Dividend: ex-coupon date................................................................................. 27 April 2011
Publication of first quarter results ...................................................................... 4 May 2011
Publication of half year results .......................................................................... 11 August 2011
Publication of third quarter results ..................................................................... 9 November 2011
INVESTOR RELATIONS CONTACT
Media Investors
Marianne Amssoms Graham Staley
Tel: +1-212-573-9281 Tel: +1-212-573-4365
E-mail: [email protected] E-mail: [email protected]
Karen Couck Thelke Gerdes
Tel: +32-16-27-69-65 Tel: +32-16-27-68-88
E-mail: [email protected] E-mail: [email protected]
1 AB InBev’s statutory auditor in 2009 was KPMG Bedrijfsrevisoren cvba and the 2009 fees do not include audit and other fees of the Anheuser-Busch companies which were audited by PricewaterhouseCoopers.

80
Excerpt from the AB InBev NV separate (non-consolidated) financial statements prepared in accordance with Belgian GAAP
The following information is extracted from the separate Belgian GAAP financial statements of AB InBev NV. These separate financial statements, together with the management report of the board of directors to the general assembly of shareholders as well as the auditors’ report, will be filed with the National Bank of Belgium within the legally foreseen time limits. These documents are also available on request from: AB InBev NV, Brouwerijplein 1, 3000 Leuven.
It should be noted that only the consolidated financial statements as set forth above present a true and fair view of the financial position and performance of the AB InBev group.
Since AB InBev NV is essentially a holding company, which recognizes its investments at cost in its non-consolidated financial statements, these separate financial statements present no more than a limited view of the financial position of AB InBev NV. For this reason, the board of directors deemed it appropriate to publish only an abbreviated version of the non-consolidated balance sheet and income statement prepared in accordance with Belgian GAAP as at and for the year ended 31 December 2010.
The statutory auditor’s report is unqualified and certifies that the non-consolidated financial statements of AB InBev NV prepared in accordance with Belgian GAAP for the year ended 31 December 2010 give a true and fair view of the financial position and results of AB InBev NV in accordance with all legal and regulatory dispositions.
ABBREVIATED NON-CONSOLIDATED BALANCE SHEET
Million euro 2010 2009 ASSETS Non-current assets Intangible assets........................................................................................... 142 230 Property, plant and equipment ........................................................................ 64 61 Financial assets............................................................................................. 32 700 33 075
32 906 33 366
Current assets............................................................................................ 831 1 895
Total assets ................................................................................................ 33 737 35 261 EQUITY AND LIABILITIES Equity Issued capital ............................................................................................... 1 236 1 236 Share premium ............................................................................................. 13 123 13 107 Legal reserve................................................................................................ 124 124 Reserves not available for distribution.............................................................. 405 453 Reserves available for distribution ................................................................... 116 68 Profit carried forward ..................................................................................... 5 795 7 018 20 799 22 006
Provisions and deferred taxes .................................................................... 155 39 Non-current liabilities ................................................................................ 8 160 7 925 Current liabilities........................................................................................ 4 623 5 291 Total equity and liabilities .......................................................................... 33 737 35 261
ABBREVIATED NON-CONSOLIDATED INCOME STATEMENT
Million euro 2010 2009 Operating income .......................................................................................... 820 1 208 Operating expenses ....................................................................................... (602) (966) Operating result ......................................................................................... 218 242 Financial result.............................................................................................. (202) 3 012 Extraordinary result....................................................................................... 37 3 124 Result for the year available for appropriation ........................................... 53 6 378
81
Glossary
AGGREGATED WEIGHTED NOMINAL TAX RATE
Calculated by applying the statutory tax rate of each country on the taxable basis of each entity and by dividing the resulting tax charge by that taxable basis.
DILUTED EPS
Profit attributable to equity holders of AB InBev divided by the fully diluted weighted average number of ordinary shares.
DILUTED WEIGHTED AVERAGE NUMBER OF ORDINARY SHARES
Weighted average number of ordinary shares, adjusted by the effect of share options on issue.
EBIT
Profit from operations.
EBITDA
Profit from operations plus depreciation, amortization and impairment.
EPS
Profit attributable to equity holders of AB InBev divided by the weighted average number of ordinary shares.
INVESTED CAPITAL
Includes property, plant and equipment, goodwill and intangible assets, investments in associates and equity securities, working capital, provisions, employee benefits and deferred taxes.
MARKETING EXPENSES
Include all costs relating to the support and promotion of the brands. They include among others operating costs (payroll, office costs, etc.) of the marketing department, advertising costs (agency costs, media costs, etc.), sponsoring and events, and surveys and market research.
NET CAPEX
Acquisitions of property, plant and equipment and of intangible assets, minus proceeds from sale.
NET DEBT
Non-current and current interest-bearing loans and borrowings and bank overdrafts, minus debt securities and cash.
NON-RECURRING ITEMS
Items of income or expense which do not occur regularly as part of the normal activities of the company.
NORMALIZED
The term “normalized” refers to performance measures (EBITDA, EBIT, Profit, EPS) before non-recurring items. Non-recurring items are items of income or expense which do not occur regularly as part of the normal activities of the company and which warrant separate disclosure because they are important for the understanding of the underlying results of the company due to their size or nature. AB InBev believes that the communication and explanation of normalized measures is essential for readers of its financial statements to understand fully the sustainable performance of the company. Normalized measures are additional measures used by management and should not replace the measures determined in accordance with IFRS as an indicator of the company’s performance.
NORMALIZED DILUTED EPS
Diluted EPS adjusted for non-recurring items.
NORMALIZED EBIT
Profit from operations adjusted for non-recurring items.
NORMALIZED EBITDA
Profit from operations adjusted for non-recurring items, plus depreciation, amortization and impairment.
NORMALIZED EFFECTIVE TAX RATE
Effective tax rate adjusted for non-recurring items.
NORMALIZED EPS
EPS adjusted for non-recurring items.
NORMALIZED PROFIT
Profit adjusted for non-recurring items.
NORMALIZED PROFIT FROM OPERATIONS
Profit from operations adjusted for non-recurring items.
PAY OUT RATIO
Gross dividend per share multiplied by the number of outstanding ordinary shares at year-end, divided by normalized profit attributable to equity holders of AB InBev.
REVENUE
Gross revenue less excise taxes and discounts.
SALES EXPENSES
Include all costs relating to the selling of the products. They include among others the operating costs (payroll, office costs, etc.) of the sales department and the sales force.

82
SCOPE
Financials are analyzed eliminating the impact of changes in currencies on translation of foreign operations, and scopes. A scope represents the impact of acquisitions and divestitures other than those eliminated from the Reference Base, the start up or termination of activities or the transfer of activities between segments, curtailment gains and losses and year over year changes in accounting estimates and other assumptions that management does not consider as part of the underlying performance of the business.
WEIGHTED AVERAGE NUMBER OF ORDINARY SHARES
Number of shares outstanding at the beginning of the period, adjusted by the number of shares cancelled, repurchased or issued during the period multiplied by a time-weighing factor.
WORKING CAPITAL
Includes inventories, trade and other receivables and trade and other payables, both current and non-current.