Annual Report 2010 - Astellas Pharma · Contents 01 Profile 02 Message to Stakeholders 04 Financial...
82
Annual Report 2010 For the Year Ended March 31, 2010
Transcript of Annual Report 2010 - Astellas Pharma · Contents 01 Profile 02 Message to Stakeholders 04 Financial...

Annual Report 2010For the Year Ended March 31, 2010

Contents
01 Profile
02 Message to Stakeholders
04 Financial Highlights
06 Interview With the President & CEO
18 R&D Feature
22 Pipeline List (All)
26 Review of Global Operations
26 Japan
28 Americas
30 Europe
32 Asia
34 CSR
36 Corporate Governance
39 Financial Section
76 Principal Subsidiaries and Affiliates
78 Investor Information
06Interview With the President & CEOIn May 2010, Astellas launched a new mid-term management plan (MTP14) covering the period to March 2015 (FY2010–2014). The slogan of MTP14 is “Leveraging our strengths to grow.” In this section, President & CEO Masafumi Nogimori talks about Astellas’ aims and specific strategies to achieve them.
18R&D FeatureAstellas is making steady progress developing its drug pipeline. The R&D feature section looks at global progress with development of new drugs and the oncology pipeline that we are developing as drivers of future growth at Astellas.
26Review of Global OperationsAstellas has a well-balanced global business network covering the four regions of Japan, the Americas, Europe and Asia. Here we review business results in fiscal 2009 and planned developments in each region going forward.
Note about forward-looking statements and forecasts
Statements made in this annual report with respect to current plans, estimates, strategies and beliefs and other statements of Astellas that are not historical facts are forward-looking statements about the future performance of Astellas. These statements are based on management’s current assumptions and beliefs in light of the information currently available to it and involve known and unknown risks and uncertainties. Consequently, undue reliance should not be placed on these statements. Astellas cautions the reader that a number of important factors could cause actual results to differ materially from those discussed in the forward-looking statements. Such factors include, but are not limited to: (i) changes in general economic conditions, and in the Pharmaceu-tical Affairs Law and other laws and regulations relating to markets of Astellas, (ii) currency exchange rate fluctuations, (iii) delays in new product launches, (iv) the inability of Astellas to market existing and new products effectively, (v) the inability of Astellas to continue to effectively research and develop prod-ucts accepted by customers in highly competitive markets and (vi) infringe-ments of intellectual property rights of third parties.
* Market size, market share and product ranking; sourced from IMS Health Information Services.

Astellas Pharma Inc.’s raison d’être is to contribute toward improving the
health of people around the world through the provision of innovative and
reliable pharmaceutical products. Guided by this business philosophy,
Astellas is actively developing its business operations as a research-oriented
global pharmaceutical company.
Through the tireless pursuit of R&D, we are determined to continuously
discover innovative and highly useful new drugs in therapeutic areas where
there is a high degree of unmet medical needs. In delivering these drugs to
the world, our desire is to be a source of strength for each and every patient
battling illness. Our communications slogan, “Changing tomorrow,” was
borne from this desire. This slogan encapsulates the commitment and
resolve of Astellas Group employees worldwide to constantly rise to the
challenge of creating drugs that are really needed. It also reflects our desire
to give courage and hope to patients afflicted by illness.
Looking ahead, Astellas will work to change tomorrow for patients and
their family members with new ethical pharmaceutical products.
Profile
“Leading Light for Life”Superior pharmaceuticals that provide the promise of a healthier and more enriched life to people from all over the world. That is Astellas’ earnest wish. Our challenge, our vision, and our mission are to illuminate the future and constantly seek a better life for all. As a global pharmaceutical company, Astellas is determined to be the “Leading Light for Life.”
This corporate message directly reflects our business philosophy (raison d’être): “Contribute toward improving the health of people around the world through the provision of innovative and reliable pharmaceutical products.”
01Astellas Pharma Inc. Annual Report 2010
Profile

Message to Stakeholders
Masafumi NogimoriPresident & CEO
We will do our utmost from a patient-oriented perspective to
supply patients around the world with innovative medicines that
satisfy unmet medical needs.
02 Astellas Pharma Inc. Annual Report 2010
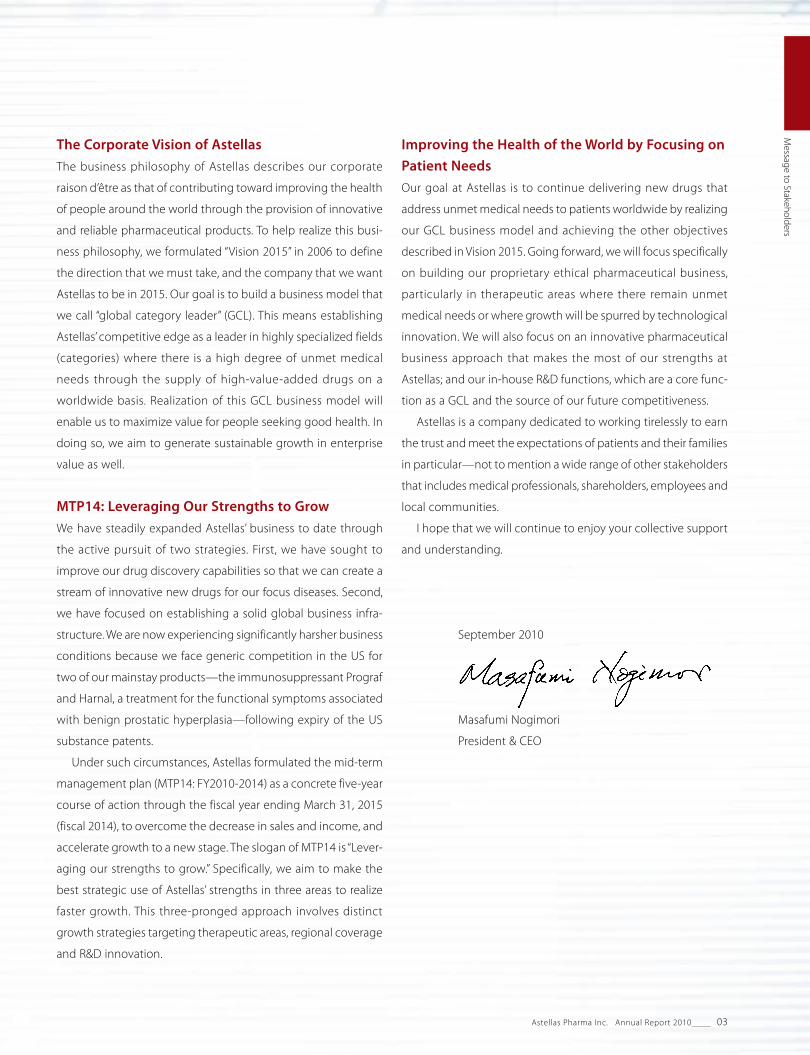
The Corporate Vision of AstellasThe business philosophy of Astellas describes our corporate
raison d’être as that of contributing toward improving the health
of people around the world through the provision of innovative
and reliable pharmaceutical products. To help realize this busi-
ness philosophy, we formulated “Vision 2015” in 2006 to define
the direction that we must take, and the company that we want
Astellas to be in 2015. Our goal is to build a business model that
we call “global category leader” (GCL). This means establishing
Astellas’ competitive edge as a leader in highly specialized fields
(categories) where there is a high degree of unmet medical
needs through the supply of high-value-added drugs on a
worldwide basis. Realization of this GCL business model will
enable us to maximize value for people seeking good health. In
doing so, we aim to generate sustainable growth in enterprise
value as well.
MTP14: Leveraging Our Strengths to Grow We have steadily expanded Astellas’ business to date through
the active pursuit of two strategies. First, we have sought to
improve our drug discovery capabilities so that we can create a
stream of innovative new drugs for our focus diseases. Second,
we have focused on establishing a solid global business infra-
structure. We are now experiencing significantly harsher business
conditions because we face generic competition in the US for
two of our mainstay products—the immunosuppressant Prograf
and Harnal, a treatment for the functional symptoms associated
with benign prostatic hyperplasia—following expiry of the US
substance patents.
Under such circumstances, Astellas formulated the mid-term
management plan (MTP14: FY2010-2014) as a concrete five-year
course of action through the fiscal year ending March 31, 2015
(fiscal 2014), to overcome the decrease in sales and income, and
accelerate growth to a new stage. The slogan of MTP14 is “Lever-
aging our strengths to grow.” Specifically, we aim to make the
best strategic use of Astellas’ strengths in three areas to realize
faster growth. This three-pronged approach involves distinct
growth strategies targeting therapeutic areas, regional coverage
and R&D innovation.
Improving the Health of the World by Focusing on Patient NeedsOur goal at Astellas is to continue delivering new drugs that
address unmet medical needs to patients worldwide by realizing
our GCL business model and achieving the other objectives
described in Vision 2015. Going forward, we will focus specifically
on building our proprietary ethical pharmaceutical business,
particularly in therapeutic areas where there remain unmet
medical needs or where growth will be spurred by technological
innovation. We will also focus on an innovative pharmaceutical
business approach that makes the most of our strengths at
Astellas; and our in-house R&D functions, which are a core func-
tion as a GCL and the source of our future competitiveness.
Astellas is a company dedicated to working tirelessly to earn
the trust and meet the expectations of patients and their families
in particular—not to mention a wide range of other stakeholders
that includes medical professionals, shareholders, employees and
local communities.
I hope that we will continue to enjoy your collective support
and understanding.
September 2010
Masafumi Nogimori
President & CEO
03Astellas Pharma Inc. Annual Report 2010
Message to Stakeholders
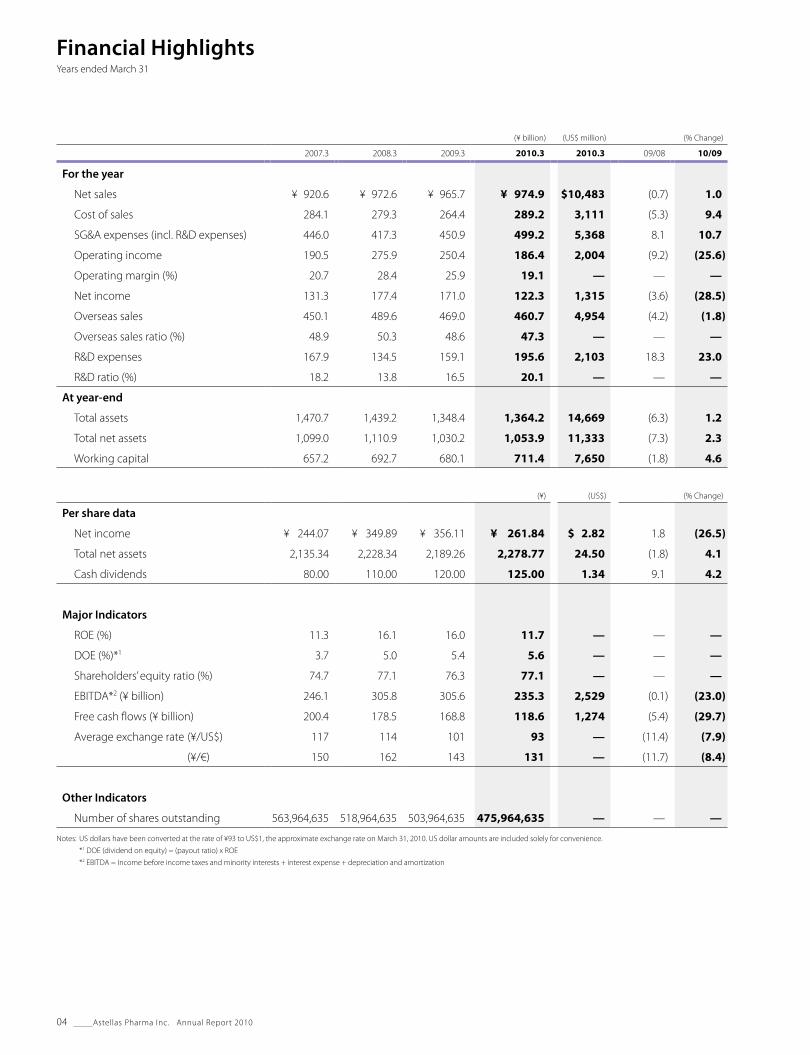
Financial HighlightsYears ended March 31
(¥ billion) (US$ million) (% Change)
2007.3 2008.3 2009.3 2010.3 2010.3 09/08 10/09
For the year
Net sales ¥ 920.6 ¥ 972.6 ¥ 965.7 ¥ 974.9 $10,483 (0.7) 1.0
Cost of sales 284.1 279.3 264.4 289.2 3,111 (5.3) 9.4
SG&A expenses (incl. R&D expenses) 446.0 417.3 450.9 499.2 5,368 8.1 10.7
Operating income 190.5 275.9 250.4 186.4 2,004 (9.2) (25.6)
Operating margin (%) 20.7 28.4 25.9 19.1 — — —
Net income 131.3 177.4 171.0 122.3 1,315 (3.6) (28.5)
Overseas sales 450.1 489.6 469.0 460.7 4,954 (4.2) (1.8)
Overseas sales ratio (%) 48.9 50.3 48.6 47.3 — — —
R&D expenses 167.9 134.5 159.1 195.6 2,103 18.3 23.0
R&D ratio (%) 18.2 13.8 16.5 20.1 — — —
At year-end
Total assets 1,470.7 1,439.2 1,348.4 1,364.2 14,669 (6.3) 1.2
Total net assets 1,099.0 1,110.9 1,030.2 1,053.9 11,333 (7.3) 2.3
Working capital 657.2 692.7 680.1 711.4 7,650 (1.8) 4.6
(¥) (US$) (% Change)
Per share data
Net income ¥ 244.07 ¥ 349.89 ¥ 356.11 ¥ 261.84 $ 2.82 1.8 (26.5)
Total net assets 2,135.34 2,228.34 2,189.26 2,278.77 24.50 (1.8) 4.1
Cash dividends 80.00 110.00 120.00 125.00 1.34 9.1 4.2
Major Indicators
ROE (%) 11.3 16.1 16.0 11.7 — — —
DOE (%)*1 3.7 5.0 5.4 5.6 — — —
Shareholders’ equity ratio (%) 74.7 77.1 76.3 77.1 — — —
EBITDA*2 (¥ billion) 246.1 305.8 305.6 235.3 2,529 (0.1) (23.0)
Free cash flows (¥ billion) 200.4 178.5 168.8 118.6 1,274 (5.4) (29.7)
Average exchange rate (¥/US$) 117 114 101 93 — (11.4) (7.9)
(¥/€) 150 162 143 131 — (11.7) (8.4)
Other Indicators
Number of shares outstanding 563,964,635 518,964,635 503,964,635 475,964,635 — — —
Notes: US dollars have been converted at the rate of ¥93 to US$1, the approximate exchange rate on March 31, 2010. US dollar amounts are included solely for convenience.
*1 DOE (dividend on equity) = (payout ratio) x ROE
*2 EBITDA = Income before income taxes and minority interests + interest expense + depreciation and amortization
04 Astellas Pharma Inc. Annual Report 2010

250
16.2
2006.3
142.1
167.9
18.2134.5
13.8
16.5
195.6
159.1
2007.3 2008.3 2009.3 2010.3
20.1
200
150
100
50
0
30
18
24
12
6
0
1,200
45.3
2006.3
879.4920.6
48.9
972.6
50.3 48.6
974.9965.7
2007.3 2008.3 2009.3 2010.3
47.3900
600
300
0
80
60
40
20
0
8
2006.3
3.33.7
5.05.65.4
2007.3 2008.3 2009.3 2010.3
6
4
2
0
400
2006.3
183.88
244.07
349.89
261.84
356.11
2007.3 2008.3 2009.3 2010.3
300
200
100
0
300
22.0
2006.3
193.0 190.5
20.7
275.9
28.4 25.9
186.4
250.4
2007.3 2008.3 2009.3 2010.3
19.1
240
180
120
60
0
100
60
80
40
20
0
400
2006.3
216.1246.1
305.8
235.3
305.6
2007.3 2008.3 2009.3 2010.3
300
200
100
0
20
2006.3
8.8
11.3
16.1
11.7
16.0
2007.3 2008.3 2009.3 2010.3
15
10
5
0
200
2006.3
103.7
131.3
177.4
122.3
171.0
2007.3 2008.3 2009.3 2010.3
150
100
50
0
250
2006.3
52.5
200.4
178.5
118.6
168.8
2007.3 2008.3 2009.3 2010.3
200
150
100
50
0
R&D Expenses/R&D Ratio
Net Sales/Overseas Sales Ratio
DOE
Net Income per Share
Operating Income/Operating Margin
EBITDA
ROE
Net Income
Free Cash Flows
Net sales Overseas sales ratio Operating income Operating margin
(¥ billion) (%)
(¥ billion) (%)
(%)
(¥)
(¥ billion) (%)
(¥ billion)
(%)
(¥ billion)
(¥ billion)
R&D expenses R&D ratio
05Astellas Pharma Inc. Annual Report 2010
Financial Highlights

Interview With the President & CEO
Under the mid-term management plan MTP14, we will leverage our strengths to achieve accelerated growth in the period from April 2010 to March 2015 to take Astellas to the next stage.
A Currency headwinds, delayed new product launches and worse-than-expected generic competition for our mainstay products meant that we fell short of the numerical perfor-
mance targets in the plan. On the other hand, the past five years saw us quickly reap synergy benefits from the merger to establish a global business platform. We also actively invested to position Astellas for the next stage of growth.
In the five years since Astellas was formed, we have achieved the critical
goal of the previous mid-term management plan to establish foundations
for global growth.
A key achievement during this period was to expand Astellas’ global
franchises in the therapeutic areas of transplantation and urology, based
around the mainstay products Prograf, Harnal and overactive bladder
(OAB) treatment Vesicare. I believe that we substantially reinforced our
position as a global category leader (GCL) in both of these fields.
During these five years, we also established a global management
system. We increased sales and earnings in each of the four geographic
regions of Japan, the Americas, Europe and Asia to create a well-balanced
structure. We also continued building a business platform in the BRICs
nations and other emerging markets as part of strengthening our global
operations.
At the same time we actively reformed our cost structures. We reduced
manufacturing costs without hesitating, optimized the number of produc-
tion bases, and moved quickly to generate merger-related consolidation
and synergy benefits in human resources and other areas. We successfully
squeezed our cost base.
In addition, we reinforced our in-house R&D capabilities and significantly
expanded and enriched the development pipeline through a combination
of in-licensing and strategic alliances. We invested heavily in upgrading our
drug discovery capabilities. This included the integration of Agensys, into
the Astellas Group through which we gained a presence in antibody
technologies. I believe we have successfully developed a range of strengths
that are unique to Astellas through these various initiatives.
In terms of quantitative performance, we did not attain the numerical
targets in the plan due to a combination of significant adverse currency
movements, delays in launching new products and the advent of generic
competition for mainstay products that was greater than we had antici-
pated. On a currency-adjusted basis, our net sales grew at a relatively steady
pace in the five years to March 2010. Operating income also expanded
steadily due to the growth in sales, although the launch of generic versions
of Prograf in the US market did depress profits in the fiscal year ended March
31, 2010 (fiscal 2009) to a certain extent. Our capital efficiency improved
rapidly, with return on equity (ROE) reaching 16% in the third year after the
merger. ROE was in single digits at the time of the merger. We also adopted
a proactive stance toward shareholder returns in this period.
Q It is now five years since the formation of Astellas. Please review the first mid-term management plan to March 2011 that was formulated in 2006.
Masafumi Nogimori
President & CEO
06 Astellas Pharma Inc. Annual Report 2010

190.5
920.6
193.0
879.4
275.9
972.6250.4
965.7186.4
974.9
920
960
1,000
840
880
180
240
300
60
120
0
A Broadly, Astellas has five main strengths. The key issue that we face at the moment is how to recover quickly following the decrease in sales and profits associated with the
expiry of patents for Prograf and Harnal in the US.
Q How do you see Astellas’ current strengths and issues?
In terms of the strengths of Astellas, the first is the leading global position
that we have developed as a GCL in the areas of transplantation and
urology. Second is the well-balanced global sales network that we have
established covering the four regions of Japan, the Americas, Europe and
Asia. Third is our powerful position in the Japanese market, where our
large sales platform enables us to maximize the potential of our diversified
product portfolio. Fourth is our unique pipeline, which includes many
molecules that are either “first-in-class” or “best-in-class.” Fifth, we possess
a range of strong drug discovery research capabilities by virtue of our
wide-ranging expertise spanning low-molecule synthesis, fermentation,
antibody and protein drug technologies.
I believe that these strengths will constitute a major driving force that
will support the future growth of Astellas.
We recognize that a significant issue we face is turning around the
downward trend in sales and earnings caused by the loss of patent
protection in the US for Prograf and Harnal. The other key issues are further
enriching our late-stage clinical development pipeline; establishing
Astellas as a GCL in another therapeutic area to augment transplantation
and urology; and further upgrading our drug discovery research capabili-
ties. I believe that overcoming each of these issues will help us realize
growth over the medium to long term and enhance enterprise value in
a sustained manner. To address these different issues, we have formulated
MTP14 to specify what we plan to do over the next five years to the end
of March 2015 to achieve accelerated growth and reach a new stage. The
strategic theme of MTP14 is “leveraging our strengths to grow.”
FY2005 to FY2009 Performance
(¥ billion) (¥ billion)
Exchange Rate FY2005 FY2006 FY2007 FY2008 FY2009
US$ ¥113 ¥117 ¥114 ¥101 ¥93
EUR C= ¥138 ¥150 ¥162 ¥143 ¥131
ROE 8.8% 11.3% 16.1% 16.0% 11.7%
ROA 3.3% 3.7% 5.0% 5.4% 5.6%
Net Sales Operating Income
07Astellas Pharma Inc. Annual Report 2010
Interview W
ith the President & CEO

MTP14 (FY2010 to FY2014)—Basic Policy and Strategy
Growth strategy
Therapeutic area strategy• Maintain and strengthen GCL position in urology and transplantation• Strengthen oncology franchise to realize third GCL
Regional strategy• Expand well-balanced four-region business base• Invest further in emerging countries with high potential
R&D innovation strategy (Strengthen drug discovery research capabilities)• Actively approach Precision Medicine drug discovery • Prioritize strategic therapeutic areas• Utilize cutting-edge technologies in drug discovery research • Leverage global development framework to bolster pipelines
Efficiency strategy
Improve cost efficiency• Efficiently allocate resources through execution of therapeutic area strategy• Better and more dynamically allocate expenses• Review business processes to achieve cost savings
A MTP14 aims to help us accelerate Astellas to the next stage of growth by leveraging our strengths to the maximum extent. We will promote a three-pronged growth strategy
composed of a therapeutic area strategy, a regional strategy and an R&D innovation strategy, alongside a separate strategy to boost efficiency.
As I mentioned earlier, the strategic goal of MTP14 is to accelerate growth
to a new stage so that we can overcome the declines in sales and profits
caused by the loss of patent protection for Prograf and Harnal in the US.
To do this, we plan to pursue two separate strategies to promote higher
growth and increased efficiency. The growth strategy consists of three
pillars: a therapeutic area strategy, a regional strategy and an R&D innova-
tion strategy. The efficiency strategy focuses on realizing higher cost
efficiencies in three ways: first, through efficient allocation of resources,
linked to the promotion of the therapeutic area strategy; second, through
better and more dynamic expense allocation; and third, by reviewing
business processes to achieve cost savings.
In particular, we plan to implement the following five sets of specific
measures aimed at overcoming the decline in financial performance due
to the expiry of patents for our mainstay products Prograf and Harnal in
the US.
1 Grow and maintain global products in urology and
transplantation areas
Our plan is to maintain the global Prograf and Harnal businesses while at
the same time generating significant growth in the urology franchise with
the OAB treatments Vesicare and mirabegron, which we expect to launch
during the MTP14 period.
2 Expand sales of growth products in each region
The antifungal agent Mycamine is a growth product that we promote
globally. In Japan, our other major growth products are Symbicort, a treat-
ment for adult bronchial asthma, the non-steroidal anti-inflammatory
analgesic agent Celecox, and the anti-hypertensive Micardis. In the Americas,
the main growth products we will be promoting are the pharmacologic
stress agent Lexiscan, Sumavel DosePro, a treatment for migraine that uses
a needle-free delivery system, and the antibiotic VIBATIV. In Europe, we have
the advanced prostate cancer treatment Eligard and Qutenza, a treatment
for peripheral neuropathic pain. We aim to expand the sales of each of these
growth products in their respective regions.
3 Continuously launch new products
We aim to launch a continuous stream of new products through steady
development of our drug pipeline.
4 Actively in-license products and develop alliances
We will continue reinforcing our in-licensing and alliance activities,
targeting drugs that are a good fit with our therapeutic area strategy
and local franchises.
5 Further expand global sales network
We will also continue expanding and upgrading our sales presence in
global markets, including in emerging countries.
Q Please describe the strategic policy framework of MTP14.
08 Astellas Pharma Inc. Annual Report 2010

Financial Targets: Improve Management Indicators
Move back onto a growth trajectory beginning in FY2010
Net salesFY2010
¥940 billionFY2014
¥1,100 billion
Invest substantially in R&D in support of long-term growth
R&D as a percentage of net sales
Around 16% or more
Actively and continuously endeavor to raise cost efficiency
Cost of sales and SG&A expense ratio
Reduction of cost of salesEfficient use of expenses
Raise enterprise value by increasing profits and improving capital efficiency
Operating incomeOperating margin
ROE
FY2010
¥152 billion16%
FY2014
¥240 billion22%
Over 15%
(Note) As of mid-term management plan announcement (May 25, 2010) Assumed exchange rates: 90 yen/USD, 130 yen/EUR
Excludes the impact of acquiring OSI.
I am confident that by steadily implementing these policies we can
address the impact of generic competition affecting our two mainstay
products and move Astellas back onto a solid growth trajectory.
In terms of numerical targets, we are aiming for net sales of ¥1,100
billion in the year ending March 2015. Since our business depends on
discovering innovative new drugs, it is also important that we continue
to invest in R&D to support long-term growth. We will continue to invest
actively in R&D, with related spending of at least 16% of net sales through
fiscal 2014. Our fiscal 2014 target for operating income is ¥240 billion,
which is based on increased sales and cost savings achieved through the
efficiency strategy. We are targeting an operating margin of 22% in fiscal
2014. We also expect to generate ROE in excess of 15%, reflecting gains
in enterprise value due to substantial improvements in both profitability
and capital efficiency.
Payout Policy
Improve capital efficiency
Put highest priority on business investment for future growth
Continuously improve returns to shareholders
Increase enterprise value
Increase dividends continuously through medium- to long-term profit growth
Implement flexible share buybacks
We will strive continuously to increase returns to Astellas shareholders
through a number of measures. While prioritizing business investment for
future growth, we will also seek to increase dividends steadily and continu-
ously based on medium- to long-term growth in profits. Complementing
this policy, we will maintain our stance of flexible share buybacks. Based
on this policy mix, we aim to generate sustained growth in enterprise
value so that we can boost returns to shareholders.
09Astellas Pharma Inc. Annual Report 2010
Interview W
ith the President & CEO

With growth of Vesicare and mirabegron
Target sales of
over ¥170 billion in FY2014
A We have already established Astellas as a GCL in the therapeutic areas of urology and transplantation. We aim to maintain and expand on these positions while also aiming to
establish GCL status in the third area of oncology.
UrologyWe aim to establish an overwhelming presence in urology through the launch of new products such as mirabegron.Within the therapeutic area of urology, Astellas has a global leading
position in the markets of benign prostatic hyperplasia (BPH) and OAB.
We are currently achieving steady global growth in sales of Vesicare in
the OAB market in particular. In June 2010, we filed an application in
Japan for regulatory approval of mirabegron, which we believe has major
sales potential worldwide. Regulatory filings are being prepared in the
US and Europe as well. Leveraging Astellas’ strengths in urology, we will
expand the OAB franchise further, while also seeking to maintain our BPH
franchise. We are looking to generate franchise synergies with prostate
cancer, where we have a number of compounds currently in develop-
ment. In addition, we are actively conducting R&D to discover promising
drugs to treat other urological diseases with market potential.
We have high expectations for mirabegron as a growth driver in
urology. The most commonly prescribed medicines in the OAB market
are anticholinergics (ACs). The introduction of mirabegron will provide a
Q Please describe Astellas’ growth strategy relating to therapeutic areas.
novel treatment option for the many OAB patients who do not respond
to ACs or cannot adhere to an AC therapeutic regimen.
We think that there is huge untapped potential in the OAB market.
Since the launch of Vesicare, we have been trying to develop the OAB
market by actively working to raise patient awareness of diseases. We are
also continuing to maximize product value by collecting scientific evi-
dence from ongoing Phase 3b/Phase 4 clinical studies. This helped us to
achieve high rates of growth and an increased share of the OAB market
in the year ended March 2010, when our OAB sales reached ¥82.3 billion.
We expect to launch mirabegron around 2012. In fiscal 2014, with both
Vesicare and mirabegron on the market, we aim to increase our annual
sales from the OAB franchise to more than ¥170 billion.
We are targeting fiscal 2014 sales of at least ¥230 billion for the urology
therapeutic area as a whole. In addition to sales from the growing OAB
franchise, we aim to maintain our sales of Harnal outside the US and to
launch EC905 (for treating lower urinary tract syndrome associated with
benign prostatic hyperplasia) in Europe.
Maximize Global Sales of the OAB Franchise
(¥ billion)
FY2009FY2008FY2007FY2006FY2005 FY2010 Forecast
FY2014 Target
Asia Europe Americas Japan
Over 170
14.8
36.2
60.171.4
82.3
98.3
(Note) As of mid-term management plan announcement (May 25, 2010)
Develop market by actively raising awareness of conditions
Maximize product value by building scientific evidence (P3b/P4 clinical studies)
10 Astellas Pharma Inc. Annual Report 2010

Marketed Products Pipeline
Prograf Advagraf /Graceptor
ASP0485 (P2: alefacept)ASP015K (P2: Immunosuppressant)ASKP1240 (P2: CD40 antagonistic monoclonal
antibody)Maxy-4 (Preclinical)
TransplantationOur goal is to make a further contribution to the transplant community and to maintain our GCL status within this thera-peutic area.In addition to urology, based on the Prograf business, transplantation is
another therapeutic area where Astellas has established GCL status. While
we do not expect to launch any new products in this area in the MTP14
period, we do have a number of potential successors to Prograf with
unique mechanisms of action currently in Phase 2 or pre-clinical develop-
ment. We believe that Astellas can make a further contribution as a GCL
to the therapeutic area of transplantation since there are still unmet
medical needs, including issues such as chronic rejection and delayed
graft function. Leveraging our strengths, our strategy is to continue
seeking to maintain and maximize the Prograf business so that we can
bolster our GCL status in this area.
In terms of specifics, in addition to the transplantation area, we plan
to continue growing Prograf sales in Japan through contributions from
other non-transplantation autoimmune diseases such as rheumatoid
arthritis. In the US market, although we expect a significant fall in sales of
Prograf in fiscal 2010 due to the impact of generic competition, we project
that sales thereafter will only decline slightly. Our goal is to limit the extent
of sales deceleration to maintain the business. In Europe, we expect the
impact of generic competition to be much less than in the US. Combined
with a sales contribution from the once-daily formulation Advagraf, we
expect to maintain sales in the region from this franchise over the MTP14
period. In Asia, we are targeting high rates of growth with Prograf due to
increasing sales in China and regulatory approvals for additional indica-
tions to treat autoimmune diseases. Based on these different measures,
we aim to generate over ¥170 billion in sales from the Prograf business in
the year ending March 2015.
Maintain and Maximize Prograf Business
(¥ billion)
FY2009 FY2010 Forecast
FY2014 Target
Americas Asia Japan Europe
Over 170186.7
163.6
(Note) As of mid-term management plan announcement (May 25, 2010)
Strengths in Transplantation
• Global leading position• Pipelines with unique mechanisms of action• Existing unmet medical needs
11Astellas Pharma Inc. Annual Report 2010
Interview W
ith the President & CEO

OncologyWith the aim of making oncology into our third GCL area after urology and transplantation, we are working to strengthen our drug pipeline and to establish a business base in this thera-peutic area.One of our strengths is that the acquisition of OSI Pharmaceuticals (OSI)
has enabled us to acquire a fully integrated business platform in the
oncology area. Another major strength is the advanced antibody and
antibody-drug conjugate (ADC) technologies of Agensys, which was
integrated into the Astellas Group in 2007. In addition, we already have a
significant number of first-in-class compounds and antibody drugs in
various stages of research and development. We expect to begin launch-
ing some of these products in the latter half of the MTP14 period.
Besides utilizing OSI’s integrated oncology platform, we will leverage
our strengths by employing novel drug targets and the latest drug dis-
covery technologies to reinforce our oncology pipeline based on an active
research program. At the same time, we will strengthen our global market-
ing and product strategy functions within the oncology area.
Let me explain why we decided to target oncology as Astellas’
third GCL area.
The first point to make is that oncology is a good strategic fit for Astellas
in terms of our GCL business model concept. Since cancer comes in many
different forms, the field of oncology is one where there is still a high level
of unmet medical needs. For example, prostate cancer, breast cancer and
colorectal cancer all have high rates of incidence. There are also many
types of cancer where mortality rates remain high, such as lung cancer,
pancreatic cancer, stomach cancer and leukemia. Oncology is also a good
fit with our GCL concept because it is a highly specialized market and it
is an area based on advanced science that continues to evolve.
Perhaps most significantly, we targeted oncology as our third GCL area
because we see it as an area where we can leverage Astellas’ strengths to
establish a competitive edge. We believe we can prevail in this highly
competitive sector based on a portfolio of first-in-class compounds and
therapeutic antibodies, strong drug discovery engine and cutting-edge
ADC technology that I mentioned earlier.
We have a three-pronged strategic approach to developing first-in-
class and best-in-class products to create a competitive oncology portfolio.
First, we will adopt a “Precision Medicine” approach to develop drugs with
high efficacy in certain patient population segments. Second, we will
select drug targets that are applicable across multiple tumor types. Third,
we will seek to leverage the specialized expertise that we possess in other
therapeutic areas. Our drug pipeline includes first-in-class and best-in-class
compounds and antibody drugs with novel mechanisms of action that
we have developed by applying these approaches.
Oncology Pipeline and Product Launch Schedule
FY2010
FY2014
Launch year
• Expect to launch many new products from current pipeline over medium and long terms
• Strengthen pipeline through acquisition of OSI
OSI-906 P3 (US)(Adrenocortical carcinoma, NSCLC, ovarian cancer)
Tarceva P3 (US)(Adjuvant NSCLC, ovarian cancer, colorectal cancer)
Tarceva (JP/EU/US) NSCLC
YM155 P2 (EU/US)
MDV3100 P3 (EU/US) Prostate cancer
Eligard (EU) Prostate cancer
OSI low-molecule
Antibody
Low-molecule
AGS-1C4D4 P2 (EU/US)
ASP6183 P2 (US)*
AC220 P2 (EU/US) Acute myeloid leukemia
Degarelix P2 (JP) Prostate cancer
ASG-5ME
ASP1707
OSI-930
OSI-027
AGS-16M8F
AGS-16M18
Launch during MTP14
Enrich pipeline further
* Development suspended
12 Astellas Pharma Inc. Annual Report 2010

Early Establishment of Astellas’ Oncology Franchise Through OSI AcquisitionOSI is a firm with unique, highly profitable and fully integrated operations spanning the discovery, development and commercialization of
innovative molecular targeted therapies for the treatment of cancer, diabetes and obesity. The company’s mainstay product, Tarceva, achieved
worldwide sales of US$1.2 billion in 2009.
Through the OSI acquisition, Astellas has gained a fully integrated drug discovery, development and commercialization platform in the US,
an expanded clinical-stage oncology pipeline, and access to a low-molecular compound discovery research platform in oncology. These will
help accelerate the development of our oncology franchise.
OSI’s business platform accelerates Astellas’ oncology business strategy
Discovery & Clinical Development Sales & Marketing
• Acquire fully integrated oncology capabilities in the US including discovery, development and commercialization
• Expand clinical stage oncology pipeline
• Access to low-molecular compound discovery research platform in oncology
Proven low-molecular compound discovery research capabilities in oncology
Experienced sales representatives focused on oncology
Our strategy for entering the oncology market is to build a sales
organization and strengthen product strategy functions ahead of our
anticipated launch of new drugs in this area from the second half of the
MTP14 period. We aim to develop an efficient sales force that will target
specialist physicians according to product and regional characteristics.
Sales force build-up will be timed to coincide with product launches.
We expect to launch three new oncology drugs within the MTP14
period. In Japan, we plan to introduce degarelix, a treatment for advanced
prostate cancer. In Western markets, our lead compounds are AC220, a
treatment for acute myeloid leukemia, and MDV3100 for prostate cancer.
We aim to secure regulatory approval for an additional indication for OSI’s
anticancer drug Tarceva and to complete the development of novel
molecules such as the IGF-1R/IR tyrosine kinase inhibitor OSI-906 to
augment our existing pipeline. The OSI acquisition has augmented the
Astellas oncology pipeline substantially, and it now consists of a total of
nine low-molecules and five antibody drugs. I am confident this pipeline
will be a major driver of future growth.
Oncology: Market Entry Strategy
• Target specialists according to product and regional characteristics (Oncologists, hematologists, urologists, etc.) and build efficient sales
organization to coincide with product launch years.
• Actively use OSI’s established business platform in the US
Build efficient sales organization
Target Specialists
Urologists Oncologists Hematologists
Eligard -EU (Prostate cancer) YM155 (Melanoma, breast cancer)
Degarelix-Japan (Prostate cancer)YM155 (Non-Hodgkin’s lymphoma)
AC220 (Acute myeloid leukemia)
MDV3100 (Prostate cancer/pre-chemotherapy) MDV3100 (Prostate cancer/post-chemotherapy)
13Astellas Pharma Inc. Annual Report 2010
Interview W
ith the President & CEO

A We will make further investments to expand and upgrade our own sales network in emerging markets while continuing to pursue a well-balanced global development
strategy based around the four regions of Japan, the Americas, Europe and Asia.
One of the major strengths of Astellas is that we have developed a well-
balanced global business spanning the four key regions of Japan, the
Americas, Europe and Asia. At the same time, we are continuing to build
a broad-based independent sales network spanning the BRICs countries
and other emerging markets with significant future growth potential. We
now have sales operations through local affiliates in more than 40 coun-
tries worldwide, with a global sales force of approximately 5,500 MRs. We
plan to further reinforce our global business development during the
MTP14 period, based on the operational infrastructure that we have
established within each of these four regions. I am confident that these
efforts will translate into future growth.
In Japan, our aim is to secure the leading market share in the MTP14
period through expanded sales of growth products and a steady stream
Q Please explain Astellas’ regional growth strategy.
of new drug launches. In the Americas, we are aiming to generate fresh
growth to offset the loss of Prograf sales through the OAB franchise with
VESIcare and mirabegron, complemented by growth products and new
product launches, and the expansion of Astellas’ business in Latin America.
In Europe, our goal is to reinforce our current position as the top Japanese
pharmaceutical company in the region based on the growth drivers of
Vesicare and mirabegron, and Advagraf as well as growth products. We
will also look to expand our sales coverage in the region to include new
countries. In Asia, we are targeting dramatic growth, with growth from
the Vesicare and mirabegron, Prograf and Harnal franchises. Business
expansion through reinforcement of our sales organization in the Chinese
market will also spur growth in Asia.
Well-Balanced Business Expansion in 4 Regions
56%
4%
22%
18%
Wide coverage with own sales network including emerging countries such as BRICs
Achieve well-balanced growth in all 4 regions
Group HQ/Regional HQ Sales Affiliate Promotion Base (EUR)
Sales through own affiliates in more than 40 countries5,500 MRs
Net salesFY2010 forecast:
¥940 billion
Russia
China
India
Brazil
Net salesFY2014 target:
¥1,100 billion
Japan Americas Europe Asia
(Note) As of mid-term management
plan announcement
(May 25, 2010)
14 Astellas Pharma Inc. Annual Report 2010

A Besides channeling our research resources into five focus research areas, this strategy involves leveraging the strengths of Astellas through a dual approach to innovative
drug discovery.
Q Please explain the R&D innovation strategy, another key element of the strategy to ensure Astellas’ future growth.
In 2009, we redefined our therapeutic area research strategy to focus on
the five areas of urology, immunology and infectious diseases (including
transplantation), oncology, neuroscience, and diabetes complications
and metabolic diseases. Within these areas of focus, we identify specific
research themes at the level of individual diseases and seek to discover
innovative new drugs by concentrating our research resources. Within
each therapeutic area, we will also seek to establish a GCL model for
Astellas by applying two distinct approaches that we refer to as “Disease
Knowledge” and “Precision Medicine.”
The Disease Knowledge approach seeks to maximize the experience
and knowledge that we have accumulated in disease-related R&D and
marketing. This approach to drug discovery focuses on leveraging the
existing strengths of Astellas.
The Precision Medicine approach to drug discovery is based on precise
molecular targets and mechanisms of action. It refers to offering highly
effective therapeutic options for precisely defined patient populations
based on molecular targeting and accurate diagnosis using tools such as
biomarkers. Until now, many drugs developed by pharmaceutical com-
panies have followed the “Mass Medicine” approach, in which the same
medicine is prescribed for many patients that are diagnosed with the same
disease. While such drugs have been successful in overcoming many
diseases, mass prescription to patients is requiring greater efforts to ensure
safety and demonstrate the long-term benefits of these medicines. As
science advances, we are now beginning to pinpoint the specific causes
of disease and gain an understanding of the biological factors that lead
to differences in efficacy and safety between individual patients. If we are
to create more effective and useful medicines while maintaining safety, I
believe that we need to build on the results of this advanced science so
that we can address areas of unmet clinical demand. At Astellas, we plan
to adopt this Precision Medicine approach actively to discover drugs that
satisfy unmet medical needs.
Five Focus Research Areas
Establish a GCL model in 5 focus research areas with Disease Knowledge and Precision Medicine approaches
Current GCL areas Future GCL candidates
UrologyImmunology & Infectious DiseasesTransplantation
Oncology
Neuroscience
DM Complications & Metabolic Diseases
Disease Knowledge Approach Precision Medicine Approach
15Astellas Pharma Inc. Annual Report 2010
Interview W
ith the President & CEO

Drugs discovered using the Precision Medicine approach are expected
to combine high efficacy with fewer side effects. We can develop these
drugs using clinical trials of smaller scale to target a specific patient
population. There are also some potential pharmacoeconomic advan-
tages because such drugs would only be prescribed to those patients
that would be expected to respond to them. There are already a number
of oncology drugs that have been discovered using the Precision Medi-
cine approach. In the future, we expect these kinds of drugs to provide
an increasing range of therapeutic options. Our aim for Astellas is to
establish a leading position within Precision Medicine by leveraging our
translational science base, including in-house biomarker research.
We plan to use multiple NME (new molecular entity) platforms for drug
discovery across each of Astellas’ focus research areas. The integration of
Agensys and the establishment of the joint venture Perseid Therapeutics
with US-based Maxygen have helped reinforce our technical research
capabilities. In addition to traditional strengths in low-molecule synthesis
and fermentation technologies, we have been able to build a base of
expertise in antibody/protein drug technologies. As a result, we now have
an increased range of drug discovery technologies on which we can draw.
In each area of research focus, we can choose the most appropriate drug
discovery technology for each project, whether this be low-molecule
synthesis, fermentation, antibodies or protein drug technologies. During
the MTP14 period, we plan to invest aggressively in our antibody drug
platform in particular. Specifically, we will be investing in new manufactur-
ing facilities to supply antibody drugs and to gain access to critical new
technologies such as VelocImmune technology for generating fully human
monoclonal antibodies and ADC technology.
Past Future
“One-size fits all” prescription Highly effective drugs for defined patients
Actively Approach Precision Medicine Drug Discovery
Astellas aims to establish a leading position in Precision Medicine by leveraging translational science and biomarker research
Mass Medicine Precision Medicine
Utilize Multiple NME Platforms
Focused AreaNME platform
Low-molecule synthesis Fermentation Antibody/Protein
Oncology
Immunology (transplantation) and Infectious Diseases
DM Complications and Metabolic Diseases
Neuroscience
Urology
16 Astellas Pharma Inc. Annual Report 2010

A We will accelerate growth, targeting the realization of our GCL ambitions based on implementing five policies.
Q What is your message to the company’s stakeholders?
As I have explained, Astellas has numerous strengths and a range of
strategies to generate growth going forward. Specifically, they cover the
numbers one to five. First is the realization of the No. 1 market share in
Japan. Second is the maximization of our existing two GCL areas. Third
is to upgrade oncology into Astellas’ third GCL area. Fourth is well-
balanced globalization across four regions. And fifth is to enrich our
pipeline in five areas of research focus. We will steadily implement all of
these policies so that we can become a GCL. Our aim in financial terms
is to realize accelerated growth in sales and profits, starting in the year
to March 2011.
The communication slogan of Astellas is “Changing tomorrow.” It
expresses our core message that we hope to change tomorrow for
patients and their families by providing a continuous supply of drugs that
satisfy unmet medical needs to patients all around the world. It is our
conviction that maximizing the value added by Astellas for everyone who
seeks better health will ensure that we increase the company’s long-term
enterprise value.
Launch Milestones and Growth Realization
FY2010Forecast
FY2011 FY2012 FY2013 FY2014Target
940
1521,100
240
Continuous growth in both net sales and operating income after FY2010
Net sales (¥ billion) Operating income (¥ billion)
FY2009 New Products
Symbicort (JP)Qutenza (EU)Sumavel DosePro (US)VIBATIV (US)
Launches
ASP8825 (JP)
(Note) As of mid-term management plan announcement (May 25, 2010)
Excludes the impact of acquiring OSI.
Launches
MDV3100 (US, EU)ASP1941 (JP)RSD1235 (US)
AC220 (EU, US)isavuconazole (EU, US)
Launches
mirabegron (JP/US/EU)
Launches
Japan New Product Lineup(Degarelix, YM150VTE,
YM529, YM443, ASP1585)telavancin (EU)
EC905 (EU)
17Astellas Pharma Inc. Annual Report 2010
Interview W
ith the President & CEO

Astellas’ pipeline is growing steadily in various therapeutic areas through global development projects, local development projects, and development projects for additional indications or formulations. All pipeline projects are progressing toward late-phase development.
YM178 (mirabegron), YM150, and ASP1941, as well as the rapidly expanded oncology pipeline in recent years, all have the potential to become future growth drivers for Astellas.
Mirabegron is a beta 3 receptor agonist with a novel mechanism of action. The compound
will be first-in-class for this mechanism of action.
Global development of mirabegron is progressing steadily. In Japan, an NDA filing was
submitted in June 2010 for the indications of urgency, urinary frequency, and urge urinary
incontinence associated with overactive bladder (OAB). In Europe and the US, we have
obtained results from pivotal Phase 3 trials that will allow us to file for NDA approval. We will
prepare NDA filings in the second half of the fiscal year ending March 31, 2011. We are currently
conducting long-term studies and additional thorough QT studies in the US and Europe. In
Asia, we are conducting Phase 3 trials.
Anticholinergics such as Vesicare are currently the most common treatment for OAB. As
mirabegron is a beta 3 receptor agonist with a different mechanism of action, we expect it to
be useful in patients insufficiently responsive to anticholinergics or who discontinue anticho-
linergic therapy due to side effects such as dry mouth.
R&D Feature
Growth Driver—mirabegron
• Indications Treatment of urinary frequency, urinary incontinence or urgency
associated with OAB
• Mechanism of Action Beta 3 receptor agonist (first-in-class)
• Target Product Profile Comparable (better) efficacy to anticholinergics (ACs) in improvement
of OAB symptoms Placebo-level incidence of anticholinergic side effects (dry mouth, etc.) Placebo-level acute urinary retention risk (ACs: use caution in patients
with clinically significant bladder outflow obstruction)
Strengthen No.1 position in global OAB market together with Vesicare
Confirmed clinical benefit of mirabegron in Phase 3 trials in Japan, the US and Europe
Mirabegron Product Profile
Provide a new treatment option with new mechanisms of action to patients who do not respond to ACs or who cannot adhere to ACs
YM178 (mirabegron)
18 Astellas Pharma Inc. Annual Report 2010

11.3
3.3
9.9
25.929.4
25.7
16.3
33.1
18.415.2
2.5
8.7
1.03.9
1.5
YM150 is a factor Xa inhibitor for the prevention of thrombosis. The compound is undergoing
Phase 2 and Phase 3 trials worldwide for the indications of prevention of postoperative venous
thromboembolism (VTE) and thromboembolic complications associated with atrial fibrillation
(AF), and for the indication of acute coronary syndrome (ACS).
In Japan, summary results from two Phase 3 pivotal studies on VTE prevention have con-
firmed positive outcomes. In September 2010, we filed for regulatory approval for the indication
of VTE prevention.
There is fierce competition to develop factor Xa inhibitors. We are developing YM150 globally
and aim to obtain a superior risk-benefit profile compared with competitor compounds.
YM150
Unmet Medical Needs in OAB Treatment
YM150 Development Progress Clinical trial status P2b and P3 are ongoing for VTE, AF and ACS
Reasons for discontinuing anticholinergic drug therapy (female patients, stopped taking drugs within 6 months of beginning treatment)
NDA filing for the indication of VTE prevention in Japan in September 2010. P2b/3 for VTE in EU/US, P2b for AF in EU/JP/Asia and P2b for ACS in EU: Patient recruitment completed.
YM150 development aims for an anticoagulant with the best risk-benefit balance.
Dry mouth, constipation, blurred vision
Other adverse effects
Insufficient efficacy Symptoms eliminated/ improved
Patient’s financial reason
Others
US
Europe/US
Japan/Asia
P1 P2 P3
P2b completed n=681 (YM150: QD/BID, warfarin)
P2b/3 ongoing n=2,000 (YM150: QD/BID, enoxaparin)
P3 1 2 3 4 5 completed 6 ongoing
1 TKR n=366, 2 THR n=609, (YM150: BID, placebo, enoxaparin)
3 Hip fracture surgery, 4 Abdominal surgery, 5 Acute medical illness, 6 History of VTE
P2a completed P2b ongoing n=1,280 (YM150: QD/BID, warfarin)
P2b ongoing n=1,264 (YM150: QD/BID, placebo)
Expected completion in 2010
Results are available
NDA filed (Japan)
VTE prevention
EuropeExpected completion in 1st Half 2011
ACS
(Note) Global market research by TNS/Astellas, 2007
US (n=187) Japan (n=108) EU 5 (n=514)50
40
30
20
10
0
(%)
33.7
28.6
38.9
Europe/Japan/Asia
AFExpected completion in 2010
19Astellas Pharma Inc. Annual Report 2010
R&D Feature

ASP1941 is a sodium-glucose co-transporter 2 (SGLT2) inhibitor to treat type 2 diabetes. SGLT2
inhibitors suppress glucose reabsorption in the renal tubules, providing a novel mechanism
of action for the treatment of type 2 diabetes.
Global development is progressing steadily. ASP1941 is at Phase 3 in Japan and Phase 2b
in Europe and the US.
In Japan, we are conducting two Phase 3 trials on ASP1941 monotherapy and a study on
combination use with metformin. We also plan to start other studies on combination use with
anti-hyperglycemic drugs during the fiscal year ending March 31, 2011.
In spring 2010, we started a Phase 2b trial on monotherapy in the US and a Phase 2b trial
on combination use with metformin in Europe.
We presented positive results of the Japanese Phase 2b study and the US Phase 2a study
at the American Diabetes Association in June 2010.
ASP1941
ASP1941 (SGLT2 Inhibitor) Development Progress
Development status
Japan: Two monotherapy P3 studies are ongoing. Add-on P3 study with metformin initiated. Other add-on studies will be initiated in FY2010.
US/EU: Monotherapy P2b study in the US and add-on P2b study with metformin in Europe are ongoing.
The results of P2b in Japan and P2a in the US were presented at American Diabetes Association (ADA) in June 2010.
Monotherapy (placebo-controlled DBT)
Monotherapy (long-term safety)
Monotherapy dose-finding
Add-on studies with other anti-hyperglycemic drugs
Dose-finding add-on study with metformin
P1 P2 P3Japan
US
Europe
Ongoing (n=120, 16 weeks)
Ongoing (n=150, 52 weeks)
Add-on study with metformin initiated. (n=150, 24 + 28 weeks)Other add-on studies will be initiated in FY2010.
Ongoing (n=380, 12 weeks)
Ongoing (n=320, 12 weeks)
20 Astellas Pharma Inc. Annual Report 2010

We have rapidly expanded our oncology pipeline and now have five low-molecules and five
antibody drugs at the clinical stages of development.
The table below summarizes these projects. Each compound has a unique profile, acts on
a novel target or has a new mechanism of action, and has the potential to become an
important therapeutic option in the treatment of cancer.
Global projects at the late stages of clinical development include MDV3100 in-licensed
from US company Medivation in October 2009 for the treatment of prostate cancer, and AC220
in-licensed from US company Ambit Biosciences Corporation in December 2009 for the
treatment of acute myeloid leukemia. Phase 3 and Phase 2 trials, respectively, are underway
for each product. We are also preparing to file for approval in 2010 for degarelix, a local project
under development in Japan for the treatment of prostate cancer.
Expanded anticancer
pipeline
Oncology Pipeline Expansion
Project·Product name Target cancer Characteristics P1 P2 P3 Launch
Low-molecule
Eligard Prostate cancerGnRH* agonist/Flexible dosing options (1, 3, 6-monthly injections)
MDV3100 Prostate cancer Second-generation AR* antagonist
AC220 Acute myeloid leukemiaPotent and highly selective second-generation FLT3 kinase inhibitor
ASP3550 degarelix
Prostate cancer First GnRH* antagonist in Japan
YM155Breast cancer, Non-Hodgkin’s lymphoma, melanoma
A “First-in-class” survivin suppressant
ASP1707 Prostate cancer, endometriosis
Antibody
AGS-1C4D4 Pancreatic cancerNovel antibody target (Prostate stem cell antigen)
ASP6183 (AGS-8M4)
Ovarian cancerA “First-in-class” antibody binds to human chondrolectin (AGS-8)
AGS-16M18 Novel antibody target
AGS-16M8F Antibody utilizing ADC technology
ASG-5ME Antibody utilizing ADC technology
* GnRH: Gonadotropin-releasing hormone
AR: Androgen Receptor
(EU)
(EU/US)
(EU/US)
(EU/US)
(US)
(Japan)
(EU/US/Japan)
NDA preparation
Development suspended
21Astellas Pharma Inc. Annual Report 2010
R&D Feature

Global Development
Code No. [Generic Name] Classification Therapeutic Target Phase 1 Phase 2 Phase 3 Filed AreaDosage
FormOrigin Remarks
YM617[tamsulosin]
Alpha-1 receptor antagonistLower urinary tract syndrome in male patients
(June 2007)Japan Oral In-house New indication
[telavancin] Lipoglycopeptide antibiotic
Complicated skin and soft tissue infections (cSSTI)
(Oct. 2009)Europe
Injection TheravanceNosocomial pneumonia (NP)(Jan. 2009)
US*
(Oct. 2009)Europe
MRSA infections Japan
YM905[solifenacin]
Muscarine M3 receptor antagonist
Urinary frequency, urinary incontinence or urgency associated with overactive bladder (orally-disintegrating tablet) (Dec. 2009)
Japan Oral In-house New formulation
YM178[mirabegron] Beta 3 receptor agonist
Urinary frequency, urinary incontinence or urgency associated with overactive bladder
(Jun. 2010)Japan
Oral In-houseUS
Europe
YM150 Factor Xa inhibitor
Prevention of venous thromboembolism (VTE) after major orthopedic surgery
(Sep. 2010)Japan/Asia
Oral In-house
Europe
US
Prophylaxis of thromboembolic complications associated with atrial fibrillation (AF)
Europe
Japan/Asia
Acute coronary syndrome (ACS) Europe
[solifenacin][tamsulosin]
Concomitant use of solifenacin/tamsulosin
Lower urinary tract syndrome associated with benign prostatic hyperplasia (BPH)
Europe Oral In-house
MDV3100 Androgen antagonist Prostate cancer
US
Oral Medivation
Europe
ASP1941 SGLT2 inhibitor Type 2 diabetes
Japan
OralIn-house (co-development with Kotobuki)
US
Europe
Pipeline development at Astellas mainly targets therapeutic fields such as transplantation, infectious diseases, urology and cancer where there is a high degree of unmet medical needs and few effective treatments.
Pipeline List (All)(As of August 2010)
22 Astellas Pharma Inc. Annual Report 2010

Code No. [Generic Name] Classification Therapeutic Target Phase 1 Phase 2 Phase 3 Filed AreaDosage
FormOrigin Remarks
[Isavuconazole] Azole antifungal
Invasive aspergillosis US/EuropeInjection/Oral
Basilea
Candidemia/Invasive candidiasis US/Europe
YM155 Survivin suppressantBreast cancer, Non-Hodgkin’s lymphoma, Melanoma
US
Injection In-houseEurope
Japan
AC220 FLT3 kinase inhibitor Acute Myeloid Leukemia
US
Oral Ambit
Europe
ASP2151 Helicase-primase inhibitor Herpes zoster, Genital herpes
Japan**
Oral In-house
US**
ASP0485[alefacept]
ImmunosuppressantProphylaxis of kidney transplant rejection
US
Injection In-house
Europe
ASP9831 PDE4 inhibitor Non-alcoholic steatohepatitis Europe Oral In-house
YM311(FG-2216)
HIF stabilizer Renal anemia
Europe
Oral FibroGen
Japan
ASP1517(FG-4592)
HIF stabilizer Renal anemia
Europe
Oral FibroGen
Japan
YM060[ramosetron]
5-HT3 receptor antagonist Irritable bowel syndrome (IBS) Europe Oral In-house
AGS-1C4D4 Antibody (Prostate stem cell antigen)
Pancreatic cancer US/Europe InjectionIn-house (Agensys)
ASP6183(AGS-8M4)
Antibody binds to human chondrolectin (AGS-8)
Ovarian cancer US** InjectionIn-house (Agensys)
ASP015K ImmunosuppressantSuppression of organ rejection in organ transplant
US
Oral In-house
Japan
ASKP1240 Anti-CD40 antagonistSuppression of organ rejection in organ transplant
US InjectionKyowa Hakko Kirin
(Notes) * Received a Complete Response letter from the FDA in November 2009
** Development suspended
23Astellas Pharma Inc. Annual Report 2010
Pipeline List (All)

Local Development: Japan
Code No. [Generic Name] Classification Therapeutic Target Phase 1 Phase 2 Phase 3 Filed AreaDosage
FormOrigin Remarks
ASP8825(XP13512)
Prodrug of gabapentin Restless legs syndrome(Nov. 2009)
Japan Oral XenoPort
YM529[minodronate]
BisphosphonateOsteoporosis (intermittent administration) (Sep. 2010)
Japan OralIn-house (co-development with Ono)
New formulation
YM443[acotiamide]
Acetylcholine esterase inhibitor
Functional dyspepsia(Sep. 2010)
Japan Oral Zeria
ASP1585(AMG223)
Non-absorbed, polymer-based phosphate binder
Hyperphosphatemia Japan Oral Ilypsa/Amgen
YM177[celecoxib]
Cyclooxygenase-II inhibitor Acute pain Japan Oral Pfizer New indication
YM533[beraprost sodium]
Prostacyclin receptor stimulator
Chronic renal failure (primary, nephrosclerosis)
Japan/Asia Oral TorayNew indicationNew formulation
ASP3550[degarelix]
GnRH receptor antagonist Prostate cancer Japan* Injection Ferring
* Under preparation for NDA filing by using abroad clinical data.
Local Development: US
Code No. [Generic Name] Classification Therapeutic Target Phase 1 Phase 2 Phase 3 Filed AreaDosage
FormOrigin Remarks
RSD1235[vernakalant]
Antiarrhythmic agent Atrial fibrillation (AF)(Dec. 2006)*
US Injection Cardiome
* Received an approvable letter from the FDA in August 2008
Phase-I
Code No. [Generic Name] Therapeutic TargetDosage
FormOrigin
ASP2905 Alzheimer’s disease (Dementia), Schizophrenia
Oral In-house
AGS-16M18 Cancer Injection In-house (Agensys)
AGS-16M8F Cancer (ADC) Injection In-house (Agensys)
ASG-5ME Cancer (ADC) InjectionIn-house (Agensys) [Co-development with Seattle Genetics]
ASP3652 Overactive bladder Oral In-house
ASP7035 Nocturia Oral In-house
ASP0777 Alzheimer’s disease (Dementia) Oral In-house
Code No. [Generic Name] Therapeutic TargetDosage
FormOrigin
ASP3291 Ulcerative colitis Oral In-house
FK949E Major depressive disorder Oral AstraZeneca
ASP4178 Type 2 diabetes Oral In-house
ASP5034 Type 2 diabetes Oral In-house
ASP1707 Prostate cancer, Endometriosis Oral In-house
ASP0306 Lower urinary tract syndrome Oral In-house
ASP4058 Multiple sclerosis Oral In-house
24 Astellas Pharma Inc. Annual Report 2010

Pipeline by Therapeutic Area
Filed Phase 3 Phase 2 Phase 1
Urology
YM617 (LUTs, J)
YM905 (OAB D tablet, J)
YM178 (OAB, J)
YM178 (OAB, E, US)
solifenacin/tamasulosin (E)
ASP3652ASP7035ASP0306
Transplant lmmunology YM177 (Acute Pain, J)
ASP0485 (Transplant, E, US)
ASP9831 (E)
ASP015K (Transplant, US)
ASKP1240 (Transplant, US)
ASP015K (J)ASP3291ASP4058
Anti-lnfectivetelavancin (NP, US)
telavancin (cSSTl/NP, E)lsavuconazole (E, US) ASP2151 (US, J)* telavancin (J)
Diabetes Cardiology Renal
YM150 (VTE, J)
RSD1235 (US)
ASP1941 (J)
ASP1585 (Hyperphosphatemia, J)
YM533 (Chronic renal failure, J, A)
YM150 (VTE, E, US)
YM150 (AF, E, J, A)
YM150 (ACS, E)
ASP1941 (US, E)
YM311 (US) ASP1517 (US)#
YM311 (J) #ASP1517 (J) #ASP4178ASP5034
CNS ASP8825 (Restless legs syndrome, J)ASP2905ASP0777FK949E
Oncology MDV3100 (Prostate cancer, E, US)
ASP3550 (Prostate cancer, J)
AGS-1C4D4 (Pancreatic cancer E, US)
YM155 (E, US)
ASP6183 (AGS-8M4) (Ovarian cancer US)*
AC220 (Acute Myeloid Leukemia E, US)
AGS-16M18AGS-16M8FASG-5MEYM155 (J)ASP1707
OthersYM443 (J)
YM529 (1M, J)YM060 (E)
Local New Indication, New Formulation In-house Global Licensed-in Global
* Development suspended, # Licensed territory: E and J etc.
cSSTI: Complicated Skin and Soft Tissue InfectionsHAP: Hospital-acquired PneumoniaNP: Nosocomial pneumoniaVTE: Venous thromboembolism prophylaxisAF: Atrial fibrillation prophylaxisACS: Acute Coronary Syndrome
Pipeline of OSI (Astellas acquired OSI Pharmaceuticals in June 2010.)
Compounds Classification Indication Phase 1 Phase 2 Phase 3
Tarceva (erlotinib)(Extension)
HER1/EGFR tyrosine kinase inhibitor
Adjuvant NSCLC, Ovarian cancer, Colorectal cancer
Other indications
OSI-906 IGF-1R/IR tyrosine kinase inhibitor
Adrenocortical Carcinoma
Ovarian cancer
OSI-930(Out-licensed to Simcere Pharma in China)
c-kit/VEGFR-2 tyrosine kinase inhibitorSmall cell lung cancer, glioblastoma, Colorectal, renal, head and neck, non-small cell lung cancer, Gastric cancers
OSI-027 mTOR kinase inhibitor Advanced solid tumor, lymphoma
PSN821 GPR119 agonist Type 2 diabetes /obesity
PSN010 (Out-licensed to Eli Lilly)
Glucokinase activator Type 2 diabetes
25Astellas Pharma Inc. Annual Report 2010
Pipeline List (All)

600
478.2 491.5 509.8
2008.3 2009.3 2010.3
500
400
300
200
100
0
* Invoiced prices base
* Yen base
Calculated according to the location of sellers
Review of Global Operations
Fiscal 2009 OverviewNet sales in the Japanese ethical pharmaceuticals market expanded steadily in the year
ended March 2010, growing 3.7% on a year-on-year basis to ¥509.8 billion. Mainstay
products making a positive contribution to growth included long-acting angiotensin II
receptor blocker Micardis (together with the combination drug Micombi), immunosup-
pressant Prograf, hypercholesterolemia treatment Lipitor, overactive bladder (OAB) treat-
ment Vesicare, insomnia treatment Myslee, and schizophrenia treatment Seroquel. New
products included non-steroidal anti-inflammatory analgesic agent Celecox, oral quinolone
antibiotic Geninax, osteoporosis treatment Bonoteo, and Symbicort, a treatment for adult
bronchial asthma. Sales of seasonal vaccines and a vaccine for the prevention of H1N1
influenza also generated growth.
Achieve the No. 1 market share in Japan during MTP14 (fiscal 2010 to fiscal 2014)
Core Objective:Japan
Japan
54.3%
Net Sales (Japanese Market Sales)(¥ billion)
Sales by Geographical Area2010.3
Americas18.4%
Europe24.2%
Asia3.1%
Sales of Major Products(¥ billion)
2009.3 2010.32011.3
(Forecasts)
Rx sales in Japan 491.5 509.8 510.9
Lipitor 95.3 99.9 92.4
Micardis 64.4 71.6 72.7 Micombi — 1.6 —
Gaster 53.0 49.9 41.4
Harnal 35.6 35.0 30.3
Prograf 28.5 33.8 38.8
Myslee 25.7 29.1 32.0
Seroquel 21.0 23.6 25.8
Vesicare 19.0 22.9 26.5
Celecox 10.4 17.8 26.6
Geninax 6.4 8.1 9.4
Irribow 1.6 0.2 1.9
Bonoteo — 1.0 1.6
Symbicort — 1.5 7.1
* Invoiced prices base.
26 Astellas Pharma Inc. Annual Report 2010

510.9
Strategy: Leveraging Our Strengths to GrowThe strength of Astellas in Japan lies in its robust sales and marketing platform.
Astellas boasts a number of key strengths in the domestic Japanese market: one of the
largest teams of quality MRs with high-level detailing skills; a rich lineup of products, both
in terms of therapeutic areas and numbers of products; and solid promotional and support
systems capable of marketing numerous products at the same time.
Astellas can also point to several successful marketing alliances for major products,
including Micardis, Lipitor and Myslee. The latest example of co-promotion is the marketing
of Symbicort with AstraZeneca.
By leveraging such strengths, Astellas aims to grow sales in Japan over the MTP14 period,
to at least ¥550 billion in the year ending March 2015.
The growth drivers in Japan include existing products with growth potential such as the
Micardis family (Micardis, Micombi and Micamlo), Celecox and Geninax; recently launched
products such as Symbicort, Bonoteo and Irribow, a treatment for diarrhea-predominant
irritable bowel syndrome in males; several products that are expected to be launched in the
MTP14 period; OAB treatments Vesicare and mirabegron; and Prograf, which is expected to
generate further growth in Japan.
Relative to projected sales in fiscal 2010, these various growth drivers are expected to
generate an increase in net sales in Japan of over ¥160 billion.
One of the biggest and best teams of MRs: approx. 2,400 Rich product lineup (Therapeutic areas and product
numbers) Solid sales force structure and support system Successful experience in marketing alliances
With growing products (incl. recently launched products)*, new products**, Vesicare, mirabegron and Prograf,
we are aiming for a more than ¥160 billion revenue increase from projected fiscal 2010 sales.
* Growing products (incl. recently launched products):
Micardis family, Celecox, Geninax, Irribow, Bonoteo, Symbicort
** New products: ASP1585, degarelix, YM443, ASP1941, ASP8825, YM150
Growth Drivers in MTP14
Sales Target (Japanese Market Sales)(¥ billion)
Over 550.0
2015.3Target
2011.3Forecast
Growing products + New products Vesicare + mirabegron Prograf Other
Strengths:
(Note) As of mid-term management plan announcement (May 25, 2010)
27Astellas Pharma Inc. Annual Report 2010
Review of G
lobal Operations

2,500
1,7021,878 1,936
2008.3 2009.3 2010.3
2,000
1,500
1,000
500
0
* Local currency base
* Yen base
Calculated according to the location of sellers
Fiscal 2009 OverviewReflecting the impact of a stronger yen and other factors, regional net sales declined 4.8%
in year-on-year terms to ¥179.8 billion in the year ended March 2010. In local currency terms,
however, sales increased 3.1% to US$1,936 million. Sales generated by Prograf were lower
than in fiscal 2008 due to increased competition from generic versions, which first entered
the US market in August 2009. Astellas focused on continuing to strengthen the urology and
hospital franchises to develop a broader portfolio for the future. OAB treatment VESIcare,
pharmacologic stress imaging agent Lexiscan and the antifungal agent Mycamine all gener-
ated steady growth in sales.
Improve and bolster existing business platform for future growth
Americas
Americas
18.4%
Sales by Geographical Area2010.3
Japan54.3%
Europe24.2%
Asia3.1%
Sales of Major Products(US$ million)
2009.3 2010.32011.3
(Forecasts)
Sales in the Americas 1,878 1,936 1,941
Prograf 884 734 479
Scan (Adenoscan and Lexiscan) 390 495 563Lexiscan 93 326 —
AmBisome 61 67 67
Protopic 75 78 96
VESIcare 308 378 467
Mycamine 51 81 93
Vaprisol 7 10 15
Amevive 16 13 13VIBATIV — 4 —
Net Sales(US$ million)
Core Objective:
28 Astellas Pharma Inc. Annual Report 2010

1,941
Sales Target(US$ million)
Over 2,300
2015.3Target
2011.3Forecast
Strategy: Leveraging Our Strengths to GrowIn the Americas, Astellas is focused on improving and bolstering the existing business
platform for future growth.
In the US, Astellas is currently pursuing a business model that is focused on specialty
areas, and has built a slim, efficient organization. Alongside a high-quality MR sales force, the
major strength is that the organization has the flexibility to adapt efficiently to customer
needs and market trends. Astellas has also established a solid sales platform centered on
in-house products in Canada.
In Latin America, Astellas is stepping up activities. Augmenting its current, robust distribu-
tion network, Astellas set up a sales affiliate in Brazil in July 2009.
By leveraging these strengths, Astellas aims to grow regional sales during the MTP14
period to at least US$2,300 million in the year ending March 2015.
In the US, although Prograf sales are declining, OAB treatments VESIcare and mirabegron
are expected to be significant growth drivers. In addition, growing products such as Mycamine,
Lexiscan and Adenoscan; the recently launched product Sumavel DosePro, a treatment for
migraine presented in a novel needle-free delivery system; and new products that are due to
be launched in the MTP14 period are also expected to be growth drivers.
Relative to projected sales in fiscal 2010, these various growth drivers are expected to
generate an increase in net sales of more than US$500 million in local currency terms. Astellas
is also targeting business expansion within the region, including development of its own
sales and marketing capabilities within Latin America.
Strengths
Growing products + New products VESIcare + mirabegron Prograf Other
* Growing products (incl. recently launched products):
Mycamine, Lexiscan, Protopic, Sumavel DosePro, VIBATIV, Vaprisol
** New products: RSD1235, MDV3100, AC220, isavuconazole
With growing products (incl. recently launched products)*, new products**, VESIcare and mirabegron,
we are aiming for a more than $500 million revenue increase from projected fiscal 2010 sales.
Growth Drivers in MTP14
(Note) As of mid-term management plan announcement (May 25, 2010)
US: Business model focused on specialty areas, and slim, efficient and flexible organization
(High-quality sales force, efficient adaptation to customer needs and market trends, abundant experience in strategic alliances)
Canada: Solid sales platform centered on in-house products
Latin America: Sales affiliate in Brazil and business network in Latin America
29Astellas Pharma Inc. Annual Report 2010
Review of G
lobal Operations

2,000
1,514
1,6661,798
2008.3 2009.3 2010.3
1,500
1,000
500
0
* Yen base
Calculated according to the location of sellers
Fiscal 2009 OverviewReflecting the impact of a stronger yen, regional net sales declined 1.4% in year-on-year
terms to ¥235.9 billion in the year ended March 2010. In local currency terms, however, sales
increased 7.9% to €1,798 million.
Sales of Harnal (which is marketed in Europe under the brand names Omnic and Omnic
OCAS) through our own distribution channel as well as bulk sales and royalty income from
licensees were both higher in local currency terms, but declined in yen terms due to currency
appreciation. Prograf sales declined in yen terms due to the yen’s appreciation, but continued
to increase in local currency terms. Following the expiry of the substance patent for Prograf
in major European countries in June 2009, generic versions of the drug received marketing
approval in several European countries during fiscal 2009. Vesicare and the advanced prostate
cancer treatment Eligard recorded steady increases in sales, and Mycamine also contributed
to growth.
Expand and reinforce business further as the leading Japanese pharmaceutical company in the region
Europe
Europe
24.2%
Sales by Geographical Area2010.3
Americas18.4%
Asia3.1%
Sales by Astellas Bulk and royalties Exports to third parties
* Local currency base
Japan54.3%
Sales of Major Products(€ million)
2009.3 2010.32011.3
(Forecasts)
Sales in Europe 1,666 1,798 1,560
Harnal (Omnic, Omnic OCAS, Flomax) 504 533 205
Sales by Astellas (Omnic, Omnic OCAS) 179 185 172Bulk Sales and Royalties 324 348 33
Prograf and Advagraf (Incl. exports to third parties) 502 545 516
Vesicare 143 175 216
Protopic 36 42 49
Mycamine 0 9 23
Eligard 87 107 117
Net Sales(€ million)
Core Objective:
30 Astellas Pharma Inc. Annual Report 2010

1,560
(Note) As of mid-term management plan announcement (May 25, 2010)
*No. 1 in sales among Japanese pharmaceutical companies
Agile and lean organization (Efficient adaptation to customer needs and market trends)
Extensive geographic coverage (Most extensive geographical coverage among Japanese pharmaceutical companies: 20 sales affiliates)
Success in emerging markets (Russia generates the 5th largest sales among European countries; recently established sales affiliate in Turkey, as well as legal entity for promotion in Romania and Bulgaria)
* Copyright 2010 IMS Health. All rights reserved. Source: MIDAS 2010 March MAT Reprinted
with permission
Sales Target(€ million)
Over 1,900
2015.3Target
2011.3Forecast
Strategy: Leveraging Our Strengths to GrowThe solid business platform developed in Europe is one of Astellas’ major strengths. Astellas
is now the leading Japanese pharmaceutical company in the region by sales.
This position is due to the development of a dynamic and efficient sales organization
with extensive geographic coverage. Astellas is the leading Japanese pharmaceutical
company in the region by geographical coverage as well.
Astellas is also enjoying success in emerging markets within the European region. For
instance, Russia is already Astellas’ fifth largest market in Europe by sales due to a growing
presence in that country.
By leveraging these strengths, Astellas aims to grow regional sales during the MTP14
period to at least €1,900 million in the year ending March 2015.
Growth drivers during the MTP14 period include growing products such as Eligard and
Mycamine, the OAB treatments Vesicare and mirabegron, and new products scheduled for
launch in this period such as EC905 (for treating lower urinary tract syndrome associated
with benign prostatic hyperplasia). Relative to projected sales in fiscal 2010, Astellas aims to
generate growth in net sales of more than €300 million in local currency terms from these
various growth drivers.
Astellas also aims to maintain sales of Prograf and other existing products, which still account
for a substantial proportion of regional sales. In addition, royalty revenue relating to anti-cancer
agent bendamustine is expected to contribute to sales expansion in Europe. Further, the
company plans to expand its sales network in other emerging countries in Europe.
Strengths
* Growing products (incl. recently launched products): Eligard, Mycamine,
Protopic and Qutenza
** New products: EC905, telavancin, MDV3100, AC220, isavuconazole
With growing products (incl. recently launched products)*, new products**, Vesicare and mirabegron,
we are aiming for more than €300 million revenue increase from projected fiscal 2010 sales.
Growth Drivers in MTP14
Growing products + New products Vesicare + mirabegron Prograf Other
31Astellas Pharma Inc. Annual Report 2010
Review of G
lobal Operations

40
27.8 27.230.0
2008.3 2009.3 2010.3
30
20
10
0
* Yen base
Calculated according to the location of sellers
Fiscal 2009 OverviewNet sales in Asia advanced 10.0% to ¥30.0 billion compared with the previous year, despite
the impact of yen appreciation. Sales of Prograf grew steadily, and products such as Harnal,
Vesicare and Mycamine also contributed to continued growth.
Strategy: Leveraging Our Strengths to Grow (Asia)Astellas is developing its own sales network that covers most major markets in the Asian
region (China, Hong Kong, Taiwan, South Korea, Indonesia, Thailand, the Philippines and
India). Excluding India, Astellas has the highest aggregate sales in this region of any Japanese
pharmaceutical company.
A high-margin business structure that is centered around in-house products within
the transplantation and urology fields, together with a successful sales strategy tailored
to the market needs of each country, has enabled Astellas to cultivate a strong presence
in the region.
Astellas aims to achieve dramatic growth by leveraging these strengths, increasing
regional sales to at least ¥60 billion in the year ending March 2015. Virtually all products are
expected to see sales growth, with regional net sales increasing by more than ¥30 billion
relative to projected sales in fiscal 2010.
The key focus of regional expansion in Asia remains business in China, where further
market growth is expected. Astellas is also considering expanding its own sales capabilities
in new territories in the region.
Realize dramatic growth by expanding sales in each country in the growing Asian region
Asia
Asia
3.1%
Sales by Geographical Area2010.3
Americas18.4%
Europe24.2%
Japan54.3%
Sales of Major Products(¥ billion)
2009.3 2010.32011.3
(Forecasts)
Sales in Asia 27.2 30.0 35.4
Prograf 11.2 12.8 14.5
Harnal 8.1 8.6 9.2
Vesicare 0.7 1.0 1.7
Mycamine 0.5 1.0 1.9
Protopic 0.5 0.7 1.4
Net Sales(¥ billion)
Core Objective:
32 Astellas Pharma Inc. Annual Report 2010

35.4
China
Aim for sales of more than double projected
fiscal 2010 sales in China in fiscal 2014
Sales Target(¥ billion) Over 60.0
2015.3Target
2011.3Forecast
Leveraging Our Strengths to GrowNet sales in China grew rapidly in fiscal 2009, increasing by about
20% compared with the previous year.
Astellas first entered the Chinese market in 1994 and has estab-
lished a strong track record in the country. The company has rein-
forced the local business platform over the years with the
establishment of a manufacturing facility for product formulation
and multiple sales bases.
Going forward, Astellas expects to maintain high growth by
leveraging these strengths. The goal is to more than double sales
within the MTP14 period relative to projected sales in fiscal 2010.
Many products are expected to act as growth drivers in China,
notably Prograf, Harnal, Vesicare and Mycamine. Astellas also plans to
expand the local MR sales force to boost customer coverage.
35.4
Sales Target(¥ billion) Over 60.0
2015.3Target
2011.3Forecast
China Others
Raise presence as the leading* Japanese pharmaceutical company
(Note) As of mid-term management plan
announcement (May 25, 2010)
* Sourced from IMS Health Information Services data from January through December 2009
Strengths:
Expansion of sales network by own affiliates (*No. 1 sales among Japanese pharmaceutical companies (7 areas except
India), coverage of Asian main market)
Business foundation with high profit structure (In-house products in transplantation and urology as the business core,
marketing strategy that accurately meets market needs in each country)
* Copyright 2010 IMS Health. All rights reserved. Source: MIDAS 2010 March MAT Reprinted
with permission.
Growth Drivers in MTP14
Growing products* + New products** Vesicare + mirabegron Prograf Other
(Note) As of mid-term management plan announcement (May 25, 2010)
* Growing products: Harnal, Mycamine, Protopic, Irribow, Nasea, Dorner
** New products: febuxostat
For Asia as a whole,
we are aiming for a more than ¥30 billion revenue increase from projected fiscal 2010 sales.
Growth Drivers in MTP14
33Astellas Pharma Inc. Annual Report 2010
Review of G
lobal Operations

Astellas Business Ethics Policy ~doing the right thing~Each of us as employees of Astellas will aspire to behave in accordance with the following ethical principles.
integrity We will consistently do what is right.
respectWe will value each other as individuals, recognizing our diverse viewpoints and unique contributions.
responsibilityWe will be accountable for our actions toward each other and the environment, reporting workplace concerns without fear of retribution, and seeking clarification when in doubt.
fairnessWe will conduct our business in an equitable manner and will make business decisions without bias.
transparencyWe will conduct our business in an open and truthful manner with appropriate respect for confidentiality.
Compliance
Economy
Environment
Employees
Society
Primary stakeholdersCustomers, shareholders, business partners, and competitors
• Providing value
• Honest profits
• Shareholder return
• Fair dealings, competition, etc.
Primary stakeholdersEmployees
• Hiring
• Human resources
• Skills development
• Human rights
• Safety and health, etc.
Primary stakeholdersLocal communities, the international community, NGOs
• Partnership
• Social issues
• Contributing to society
• Information disclosure, etc.
Primary stakeholdersToday’s and tomorrow’s generations
• Management system
• Voluntary action
• Reducing environmental load
• Information disclosure, etc.
Compliance is the foundation of CSR-based management
The Five Fields
Technological measures
Policy measures
Economic measures
• Energy conservation
• Green chemistry, etc.
• Emissions trading (purchase of credits)
• Domestic carbon credit system, etc.
• Efficient production, research, and sales activities
Measures for Reducing Greenhouse Gas Emissions Considered by Astellas
CSR
The Five Fields of CSR-Based ManagementCorporate performance is evaluated not only from an economic perspective but also in terms of the company’s environmental and social performance. The determination of a company’s overall rating using this “triple bottom line” has become a commonly accepted practice. At Astellas, we break this down further by making society and employees into separate categories, and add compliance as an additional factor. We call these the five fields of CSR-based management. Compliance is the very foundation of all our corporate activities, and we are strongly committed to fulfilling our social responsibilities in the other four fields as well.
ComplianceIntegrity in Corporate ManagementFor a company to carry out its business activities on a sustainable basis, it is necessary that it and its individual employees act in accor-dance with the expectations of society. As individual employees, we endeavor to uphold the highest level of integrity in our interactions with our stakeholders. Given our high standard of ethics, we must naturally choose to act conscientiously, and with integrity. Accord-ingly, individual employees are required to maintain high ethical standards when acting on their own initiative. This is what enables the company to fulfill its social responsibilities.
Our Ethical PrinciplesThe Astellas Business Ethics Policy is a package of ethical principles that provides a basis for all individuals working at Astellas across the globe in performing their respective duties. It demonstrates important values that we all should share in maintaining the highest standards of ethics. The five ethical principles of integrity, respect, responsibility, fairness and transparency have been determined by identifying common values from different corporate codes of behavior and behavioral criteria in different countries of Group companies. These principles are respected by all those who work at Astellas.
EnvironmentThe global environment has been recognized as the greatest issue of the 21st century, threatening not only the sustainability of the economy, but the existence of humankind. There are many issues that must be resolved to realize a sustainable society. At Astellas, we believe that promoting “corporate activities in harmony with the global environment” is a theme of the highest priority for realizing our business philosophy.
To this end, we have set concrete numerical targets for combating global warming, preserving biodiversity, controlling chemical sub-stances, and managing waste, and we are actively working to reduce our environmental load. We have positioned efforts to combat global warming as an important management theme in our new mid-term management plan. Leading our efforts in this regard is the Global Warming Prevention Committee. This committee plays a key role in formulating medium- and long-term action plans and investment plans for the entire Astellas Group, while our Headquarters leads implementation of strategic measures.
34 Astellas Pharma Inc. Annual Report 2010

Tsukuba Research Center
Poskesdes birth center (overview)Consultation room
Employees assembling a bicycle for donation
Orally disintegrating tablets quickly dissolve in water.The tablet (left photograph) disintegrates after 10–20 seconds (right photograph)
Increasing Active Roles of Women in the Workforce
Diversity among human resources includes differing ethnic groups, nationalities,
genders, and ages. Astellas launched its diverse human resource initiatives by
first considering the active roles of women in the workforce. We must change
our corporate culture and employee awareness to enable women to more
completely utilize their abilities at work. We also have to overcome issues that
make it more difficult for people from diverse backgrounds to demonstrate their
abilities. We believe these initiatives will help Astellas strengthen its overall
competitiveness. To this end, we are working to reform how personnel systems
are structured and operate, to improve business processes and to raise aware-
ness among employees, managers and women themselves.
SocietyCSR-based management is more than a simple matter of taking initia-tive in the fulfillment of a company’s social responsibilities. It is also crucial to ensure accountability for our activities through communica-tion with society, and to recognize any discrepancies between solu-tions to the challenges that society is facing and the initiatives that we are implementing, in order to keep improving our corporate activities. Astellas will continue to faithfully disclose information on the current state of its activities from a CSR perspective, and promote a fruitful dialogue with the greater community.
Cooperation with a Science Lab Tour Program for Children Organized by the Tsukuba Board of EducationAs part of a science lab tour program for children organized by the Tsukuba Board of Education to develop future researchers, we offered a tour of the Tsukuba Research Center. We first gave young visitors an easy-to-understand lecture on drugs, and after the tour we invited them to the labo-ratory where they helped out with protein concentra-tion experiments.
IndonesiaAstellas constructed and donated a birth center and health clinic (Poskesdes) in Pontang Legon village, Indonesia, in cooperation with Peoples Hope Japan (PH-Japan), an NGO working on medical assis-tance programs in developing countries. At Poskesdes, trained midwives are on duty 24 hours a day to provide antenatal and post-maternal healthcare services as well as childbirth assistance.
USOur employees assembled 50 bicycles to contribute to the local community and donated them to children via a local charity orga-nization. Employees also donated various goods to two charity organizations.
EmployeesSeparating the field of employees from that of society, and making it a field of its own is the most distinctive part of Astellas’ CSR-based management philosophy. This embodies the idea that employees, as the driving force of corporate activities, are an important stakeholder group of a company, and one of the company’s objectives is to provide them with benefits and welfare systems. Astellas’ CSR-based manage-ment also incorporates our desire to be a company that deeply values its employees. Based on this stance, we strive to enrich our human resources and work to provide an HR management, training, and welfare and benefits system targeted at raising employee satisfaction. Furthermore, by respecting employees’ individual rights and charac-teristics, we provide a safe, discrimination-free workplace.
EconomyEfforts to Improve Product Convenience and Encourage Proper UseIt goes without saying that drugs must be effective and have a good safety profile, but many patients also want drugs that are easy to take and easy to handle.
Before drugs are prescribed to patients in a clinical setting, the drug name, dosage, administration route and many other points are checked to prevent prescription of wrong drugs and wrong usage. Patients also feel more secure if they can easily confirm the name of the drug and the manufacturer before taking it.
Astellas is applying proprietary technologies to develop tablets that quickly dissolve even in small amount of water. We are also working to make drugs easier to handle, so that we can enhance safety. For example, we make the markings on drug packaging easier to understand and mark product names directly onto tablets.
35Astellas Pharma Inc. Annual Report 2010
CSR

Corporate Governance
Outside Director
Yasuyuki TakaiOutside Director
Kanoko OishiOutside Director
Shiro YasutakeOutside Director
Takao Saruta, MD, Ph. D.
Representative Director, Executive Vice President and Chief Sales & Marketing Officer
Yasuo IshiiSenior Corporate Executives
Iwaki Miyazaki Masao YoshidaKatsuro Yamada Shinichi Tsukamoto Ph. D.Yoshiro Miyokawa Masaru ImahoriYoshihiko Hatanaka Masaharu Asano Ph. D.
Representative Director, President and Chief Executive Officer
Masafumi Nogimori
36 Astellas Pharma Inc. Annual Report 201036 Astellas Pharma Inc. Annual Report 2010

Outside Corporate Auditor
Yukiko KurodaCorporate Auditor
Osamu NagaiCorporate Auditor
Shigeo AoyagiRepresentative Director and Chairman
Toichi Takenaka, Ph. D.
Outside Corporate Auditor
Hideo Yamada Ph. D.
Corporate Executives
Seitaro Mutoh Ph. D.Seigo KashiiHidetoshi ShutoMasaki Doi Ph. D.Kohei Nomoto
Yasumasa MasudaHirofumi SekiShinichiro KatayanagiYoshiaki NakashimaToshihiko Iwata
Yoshihiro MinamiYutaka UnnoMitsunori MatsudaShoji Yokota
Takahisa IizukaYukihiko SatoHaruhisa HirosakiKenji Yasukawa
37Astellas Pharma Inc. Annual Report 2010
Corporate Governance
37Astellas Pharma Inc. Annual Report 2010

Basic Policy on Corporate GovernanceThe company strives to improve its corporate governance system based on the basic policy of maximizing its corporate value, improving business transparency and fulfilling accountability requirements to society.
The Astellas business philosophy has three elements—raison d’être, mis-sion and beliefs. The company’s raison d’être is to contribute toward improv-ing the health of people around the world through the provision of innovative and reliable pharmaceutical products. Our mission is to achieve sustainable enhancement of our enterprise value. And our beliefs—high sense of ethics, customer focus, creativity and competitive focus—underpin our Code of Conduct.
The company has established the “Charter of Corporate Conduct,” which states this business philosophy in concrete terms of specific business con-duct, and the “Astellas Business Ethics Policy” as ethical principles common to the Astellas Group in accordance with which “high ethical views” stated in the business philosophy and Charter of Corporate Conduct are realized. Further-more, the company and Astellas Group companies have established “Our Code of Conduct” relating to the daily operational activities of officers and employees. The company defines the faithful practice of them as “CSR man-agement.” Our goal is to earn the support and trust of all our stakeholders, including customers, shareholders, employees and the general public.
The company has introduced the Corporate Executives System. This system clearly separates the roles of the Directors who have management decision-making and business execution supervisory functions from the roles of the Corporate Executives who are responsible for business execution. The Board of Directors has seven members, four of whom are outside Direc-tors in order to promote decision-making and supervise business execution from a broader viewpoint.
The company has established the Global Management Committee, the Corporate Administration & Finance Committee, and the Human Resources Committee. These committees discuss important issues involving global management, important issues involving finance, accounting and adminis-tration, and important issues involving human resources, respectively, of the company and Group companies.
The Board of Directors has the Nomination Committee and the Compensation Committee as advisory bodies for the purpose of enhancing
the transparency and objectivity of the deliberation process for nomination of Directors, Corporate Executives and Corporate Auditors and of the com-pensation system.
The company also adopted the Corporate Auditors System with the Board of Corporate Auditors that has four members, including two outside Corporate Auditors. The Corporate Auditors audit the performance of duties by the Directors.
Internal ControlThe company has established an internal control system in every part of the Astellas Group and will further establish, develop, and enhance systems, such as the system to improve work efficiency, the risk management system, the system for compliance with laws and other matters, and the internal audit system, as well as promote systems and an environment for ensuring audits by Corporate Auditors are carried out effectively. Through these efforts, the company will endeavor to ensure that the entire Astellas Group’s business is duly executed.
Internal Controls Over Financial ReportingThe company will establish and operate an internal control system for finan-cial reporting in accordance with standards generally accepted to be fair and reasonable in Japan, in order to ensure improved reliability of financial reporting, and will assess effectiveness in an appropriate way.
The company will formulate the “Regulations for Internal Control Assessment of Financial Report” and General Manager of Internal Auditing Department will carry out the internal control assessment for financial reports, under the direction of the President and CEO, who is responsible for assessment for internal control system.
Election/Dismissal Election/Dismissal Election/Dismissal
Execution/Direction/Supervision
Direction/Supervision
Direction/Supervision
Appointment/Removal
Report Report
Report
Report
Report/ Coordination
Report
CoordinationCoordination Report
Audit/Report
Direction
Report
Report
Report
Report
Report
Proposal/Report
Proposal/Report Proposal/Report
Appointment/Removal, Supervision
Appointment/ Removal, Supervision
Proposal/Report
Consultation/Recommendation
Consultation/Recommendation
General Shareholders’ Meeting
Accounting AuditorsAccounting Audits
Internal Auditing Department
Executive Vice President
Board of Corporate Auditors4 Auditors
(Including 2 Outside Auditors)
Nomination Committee
Compensation Committee
Corporate Governance at Astellas
Internal audit
Direction/N
otification
3 Corporate Administration & Finance
Committee
7 Risk Management Committee
Board of Directors7 Directors (including 4 Outside Directors)
President and CEO
1 Global Management Committee
2 Human Resources Committee
4 IR Committee
5 CSR Committee
Direction
Corporate Executives
Department and Group Companies
6 Compliance Committee
Business Execution Committees: 1 Discuss important issues concerning global management 2 Discuss important issues concerning human resources 3 Discuss important issues concerning finance,
accounting and administration 4 Promote investor relations (IR) activities/Discuss issues concerning corporate information disclosure 5 Discuss policies and plans
concerning the environment, safety, etc. 6 Discuss policies and plans, etc., concerning compliance, etc. 7 Discuss policies, measures, etc., for risk management
38 Astellas Pharma Inc. Annual Report 2010

Financial Section
Contents
40 Management’s Discussion and Analysis
52 Consolidated Balance Sheets
54 Consolidated Statements of Income
55 Consolidated Statements of Changes in Net Assets
56 Consolidated Statements of Cash Flows
57 Notes to Consolidated Financial Statements
75 Report of Independent Auditors
39Astellas Pharma Inc. Annual Report 2010
Financial Section
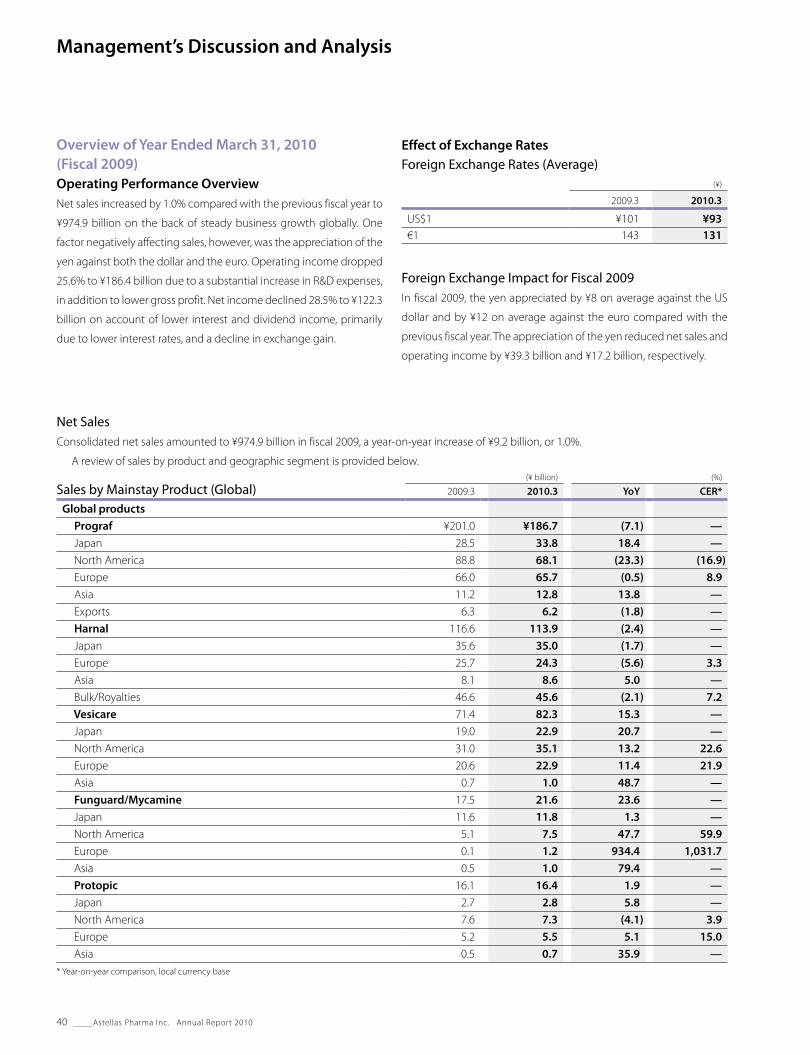
Management’s Discussion and Analysis
Overview of Year Ended March 31, 2010 (Fiscal 2009)Operating Performance OverviewNet sales increased by 1.0% compared with the previous fiscal year to
¥974.9 billion on the back of steady business growth globally. One
factor negatively affecting sales, however, was the appreciation of the
yen against both the dollar and the euro. Operating income dropped
25.6% to ¥186.4 billion due to a substantial increase in R&D expenses,
in addition to lower gross profit. Net income declined 28.5% to ¥122.3
billion on account of lower interest and dividend income, primarily
due to lower interest rates, and a decline in exchange gain.
Effect of Exchange RatesForeign Exchange Rates (Average)
(¥)
2009.3 2010.3
US$1 ¥101 ¥93€1 143 131
Foreign Exchange Impact for Fiscal 2009In fiscal 2009, the yen appreciated by ¥8 on average against the US
dollar and by ¥12 on average against the euro compared with the
previous fiscal year. The appreciation of the yen reduced net sales and
operating income by ¥39.3 billion and ¥17.2 billion, respectively.
Net SalesConsolidated net sales amounted to ¥974.9 billion in fiscal 2009, a year-on-year increase of ¥9.2 billion, or 1.0%.
A review of sales by product and geographic segment is provided below.
Sales by Mainstay Product (Global)(¥ billion) (%)
2009.3 2010.3 YoY CER*
Global products Prograf ¥201.0 ¥186.7 (7.1) — Japan 28.5 33.8 18.4 — North America 88.8 68.1 (23.3) (16.9) Europe 66.0 65.7 (0.5) 8.9 Asia 11.2 12.8 13.8 — Exports 6.3 6.2 (1.8) — Harnal 116.6 113.9 (2.4) — Japan 35.6 35.0 (1.7) — Europe 25.7 24.3 (5.6) 3.3 Asia 8.1 8.6 5.0 — Bulk/Royalties 46.6 45.6 (2.1) 7.2 Vesicare 71.4 82.3 15.3 — Japan 19.0 22.9 20.7 — North America 31.0 35.1 13.2 22.6 Europe 20.6 22.9 11.4 21.9 Asia 0.7 1.0 48.7 — Funguard/Mycamine 17.5 21.6 23.6 — Japan 11.6 11.8 1.3 — North America 5.1 7.5 47.7 59.9 Europe 0.1 1.2 934.4 1,031.7 Asia 0.5 1.0 79.4 — Protopic 16.1 16.4 1.9 — Japan 2.7 2.8 5.8 — North America 7.6 7.3 (4.1) 3.9 Europe 5.2 5.5 5.1 15.0 Asia 0.5 0.7 35.9 —
* Year-on-year comparison, local currency base
40 Astellas Pharma Inc. Annual Report 2010

Sales by Geographical Area (Local)(¥ billion) (%)
2009.3 2010.3 YoY CER*
Japan Lipitor 95.3 99.9 4.8 — Micardis 64.4 71.6 11.2 — Micombi — 1.6 — — Gaster 53.0 49.9 (5.9) — Myslee 25.7 29.1 13.2 — Seroquel 21.0 23.6 12.2 — Celecox 10.4 17.8 70.2 — Geninax 6.4 8.1 26.1 — Irribow 1.6 0.2 (87.1) — Bonoteo — 1.0 — — Symbicort — 1.5 — —North America Scan (Adenoscan and Lexiscan) 39.3 46.0 17.2 26.9 Lexiscan 9.4 30.2 221.1 247.7 AmBisome 6.1 6.2 0.8 9.2 VIBATIV — 0.3 — —Europe Eligard 12.5 14.1 13.0 23.7
* Year-on-year comparison, local currency base
Sales by Product
Prograf (Immunosuppressant)
Sales in Japan increased by ¥5.2 billion to ¥33.8 billion, a gain of 18.4%
compared with the previous year. The steady growth in sales in the
area of transplantation was supplemented by sales contributions from
new indications for autoimmune diseases such as rheumatoid arthritis
(RA), lupus nephritis and myasthenia gravis. The RA indication now
accounts for more than 30% of sales of Prograf in Japan.
In the area of transplantation, the once-daily formulation launched
under the brand name Graceptor in October 2008 became eligible for
long-term prescription in October 2009. Sales of this product continue
to expand steadily. Graceptor offers patients a more convenient dosing
regimen that is expected to enhance compliance, while delivering
similar levels of efficacy and safety as Prograf, which could lead to fur-
ther improvements in long-term transplant outcomes.
Sales in North America fell by ¥20.6 billion, or 23.3%, to ¥68.1 billion.
Besides the impact of a stronger yen, this result reflected fierce com-
petition from generic versions launched in the US in August 2009 after
the expiry of the US substance patent. In local currency terms, sales fell
by US$149 million, or 16.9%, to US$734 million. The share achieved by
Prograf of the calcineurin inhibitor (CNI) market in new organ trans-
plant patients was approximately 82% in liver transplants, 82% in
kidney transplants and 80% in heart transplants, based on data
collected by the United Network for Organ Sharing (UNOS data for
January–March 2010).
Reflecting the impact of yen appreciation, sales in Europe declined
by ¥0.3 billion, or 0.5%, to ¥65.7 billion. In local currency terms, sales
continued growing, rising by €40 million, or 8.9%, to €501 million. The
CNI market share of Prograf in Europe was approximately 50%. The
once-daily formulation Advagraf is currently marketed in 23 countries
in Europe. Advagraf generated about 18% of total Prograf sales in the
region in fiscal 2009, up from approximately 10% in the previous year.
The substance patent on Prograf expired in most major European
markets in June 2009. Generic versions of the drug received regula-
tory approval during fiscal 2009 in several countries.
In Asia, sales increased by ¥1.5 billion, or 13.8%, to ¥12.8 billion.
Sales expanded steadily in markets such as China and South Korea.
Following the launch of Advagraf in South Korea in January 2009,
Prograf was launched in India in March 2010.
Harnal (Treatment for the functional symptoms associated with benign prostatic hyperplasia (BPH))
Sales in Japan declined by ¥0.6 billion, or 1.7%, to ¥35.0 billion. Competition
has intensified following the expiry of the substance patent in February
2005. Harnal had a share of approximately 51% of the BPH market in
Japan in fiscal 2009, maintaining its position as the leading product.
41Astellas Pharma Inc. Annual Report 2010
Managem
ent’s Discussion and Analysis

The drug is marketed under the brand name Omnic in Europe.
Sales dropped by ¥1.4 billion, or 5.6%, to ¥24.3 billion in fiscal 2009,
reflecting the impact of the yen’s appreciation. On a local currency
basis, sales increased by €5 million, or 3.3%, to €185 million. Sales of
the drug have continued to increase in markets such as Spain and
Russia despite the expiry of the substance patent in February 2006.
Sales of the additional formulation, Omnic OCAS, grew 7.5% on a
local currency basis in fiscal 2009 and generated about 66% of
regional sales of Omnic.
Sales in Asia increased ¥0.4 billion, or 5.0%, to ¥8.6 billion. This mainly
reflected steady sales growth in China, South Korea and other markets.
Bulk sales and royalty revenues of Harnal decreased by ¥0.9 billion,
or 2.1%, to ¥45.6 billion, reflecting the impact of the yen’s apprecia-
tion. Strong sales in the US by licensee Boehringer Ingelheim under
the brand name Flomax helped sales increase in local currency terms
by €23 million, or 7.2%, to €348 million. Generic versions were
launched in the US market in early March 2010.
Vesicare (Overactive bladder (OAB) treatment)
Sales in Japan have expanded steadily since Vesicare was launched in
June 2006. Sales grew by ¥3.9 billion, or 20.7%, to ¥22.9 billion in fiscal
2009. Vesicare strengthened its hold on the top spot in this category
by growing its market share to approximately 46%. There remain sig-
nificant unmet medical needs in the market for OAB treatments,
making it a sector with excellent growth potential. Astellas is working
to develop the market for Vesicare further by raising public aware-
ness of this condition.
VESIcare was introduced in North America in January 2005. In fiscal
2009, sales rose by ¥4.1 billion year on year, or 13.2%, to ¥35.1 billion.
In local currency terms, sales increased US$69 million, or 22.6%, to
US$378 million. Co-promotion with US partner GlaxoSmithKline (GSK)
continues to achieve high growth. Market share on a total prescrip-
tion basis was 18% (as of April 2010). VESIcare is the second-ranked
branded drug in its category in the US.
In Europe, Vesicare is marketed in 37 countries and has a market
share of about 35% (in value terms, as of February 2010). It is the lead-
ing treatment for OAB within the European regional market. Sales
increased by ¥2.3 billion, or 11.4%, to ¥22.9 billion in fiscal 2009. On a
local currency basis, sales grew €31 million, or 21.9%, to €175 million.
Vesicare continues to grow at a high rate in Europe.
In Asia outside Japan, sales grew steadily in fiscal 2009, rising
¥0.3 billion, or 48.7%, to ¥1.0 billion. Sales started in China in
December 2009.
Funguard/Mycamine (Candin-type injectable antifungal agent)
Sales in Japan rose ¥0.1 billion, or 1.3%, to ¥11.8 billion. Astellas has
secured a 50% market share in the market for injectable antifungal
agents and is maintaining steady growth.
This injectable antifungal agent is marketed as Mycamine outside
Japan. Sales in North America increased by ¥2.4 billion, or 47.7%, to
¥7.5 billion. On a local currency basis, sales climbed by US$30 million,
or 59.9%, to US$81 million. The regulatory approval gained in January
2008 for the additional three indications of candidemia, acute dis-
seminated candidiasis, and candida peritonitis and abscesses has
also contributed to steady growth in sales volumes and market share
gains. In terms of patient days per month, the share of Mycamine of
the market for injectable candin-type antifungal agents improved
significantly, increasing to approximately 56% in February 2010.
In Europe, sales increased by ¥1.1 billion to ¥1.2 billion. On a local
currency basis, sales grew €8 million to €9 million. Mycamine is now
marketed in 23 countries in Europe following the August 2008 launch
in the UK. The European market for injectable antifungal agents contin-
ues to expand each year. Astellas aims to reinforce its franchise within
the field of infectious diseases through the launch of Mycamine.
In Asia outside of Japan sales expanded steadily in fiscal 2009,
rising by ¥0.4 billion, or 79.4%, to ¥1.0 billion. Mycamine was launched
in India in January 2010 and Astellas has begun co- promoting the
product with GlaxoSmithKline.
Protopic (Treatment for atopic dermatitis)
Sales in North America declined by ¥0.3 billion, or 4.1%, to ¥7.3 billion.
On a local currency basis, sales increased steadily, growing US$2
million, or 3.9%, to US$78 million.
Sales in Europe rose by ¥0.2 billion, or 5.1%, year-on-year to ¥5.5
billion. On a local currency basis, sales grew €5 million, or 15.0%, to
€42 million. Steady growth was recorded due to ongoing activities
targeting dermatologists.
Lipitor (Hypercholesterolemia treatment)
Lipitor sales grew steadily, rising ¥4.6 billion, or 4.8%, to ¥99.9 billion.
In Japan, the market for statins grew 8.0% on an NHI drug price basis
to approximately ¥304.0 billion. Lipitor recorded a 37.1% share of the
market, which represented an approximate 1.2 percentage point
decline from the previous fiscal year. The introduction of new prod-
ucts further increased competition within the statins market. Amid
these conditions, Astellas continues to strengthen co-promotional
42 Astellas Pharma Inc. Annual Report 2010

efforts with Pfizer Japan and take advantage of extensive clinical
evidence of efficacy to maximize value for Lipitor. At the same time,
Astellas is working to raise patient awareness of the importance of
LDL cholesterol reduction therapy as part of broader efforts to edu-
cate patients about hypercholesterolemia.
In December 2009, Astellas launched Caduet Combination Tablets
(generic name: amlodipine besylate and atorvastatin calcium), a
combination drug for the treatment of hypertension and hypercho-
lesterolemia. In Japan, Pfizer Japan is responsible for manufacturing
and sales of Caduet Combination Tablets, and Pfizer Japan and
Astellas are co-promoting this drug.
Micardis (Anti-hypertensive)
Sales of Micardis rose ¥7.2 billion, or 11.2%, to ¥71.6 billion. Amid an
increasingly competitive angiotensin II receptor blocker (ARB) market
in Japan, Astellas successfully expanded aggregate sales of Micardis
and Micombi, a combination formulation with a diuretic that was
launched in June 2009. The Japanese ARB market grew 9.4% in fiscal
2009 to approximately ¥563.0 billion. The market share of Micardis
was on a par with the previous year at 14.0%. Sales of Micardis have
grown steadily within a rapidly expanding ARB market because, in
addition to its powerful antihypertensive effect, the drug possesses
specific properties such as PPAR-gamma activation. Astellas is co-
promoting Micardis in Japan with Nippon Boehringer Ingelheim.
Gaster (Treatment for peptic ulcers and gastritis)
Sales of Gaster (generic name: famotidine) declined ¥3.1 billion, or
5.9%, to ¥49.9 billion. In fiscal 2009, Gaster recorded an 18.3% share of
the overall Japanese market for H2 receptor antagonists and proton
pump inhibitors (PPIs), a decline of 2.6 percentage points in year-on-
year terms.
Japanese authorities continue to introduce various measures to
promote increased use of generics. Rules affecting prescribing were
changed in April 2008 to make generic substitution easier. Since this
change, the share of generics within famotidine products has grown
to about 20% (on a volume basis, excluding direct sales).
Myslee (Insomnia treatment)
Sales of Myslee grew strongly, rising ¥3.3 billion, or 13.2%, to ¥29.1
billion.
The market in Japan for insomnia treatments grew 5.5% in fiscal
2009 to approximately ¥81.0 billion. Myslee solidified its grip on the
top spot in this category with a market share of 40.2%, a year-on-year
gain of 3.5 percentage points. While the Japanese market for
insomnia treatments continues to expand year after year, there
remains considerable latent potential. Astellas aims to continue
strengthening detailing capabilities in qualitative and quantitative
terms in the central nervous system (CNS) field by deploying special-
ist medical representatives (MRs). Astellas is co-promoting Myslee
with Sanofi-aventis in Japan.
Seroquel (Schizophrenia treatment)
Sales of Seroquel grew strongly, rising ¥2.5 billion, or 12.2%, to ¥23.6
billion. The market for anti-schizophrenic agents grew by 11.8% to
approximately ¥154.0 billion in fiscal 2009. Seroquel ranked third in
this market with a share of 17.0%, the same as in fiscal 2008. This
market has shifted away from conventional antipsychotics following
the introduction of atypical antipsychotics, and this trend is driving
the expansion of the overall market. Astellas is working to increase
prescriptions of Seroquel, primarily through the efforts of specialist
CNS medical representatives.
Celecox (Selective COX-2 inhibitor)
Sales of Celecox grew strongly, climbing ¥7.3 billion, or 70.2%, to
¥17.8 billion.
In addition to rheumatoid arthritis (RA) and osteoarthritis (OA), in
June 2009 Astellas gained approval for the additional indication of
lumbago, etc., which helped lift sales sharply. The market for anti-
inflammatory agents grew 4.7% to approximately ¥84.0 billion in
fiscal 2009. Celecox had a market share of 23.3%, up 8.0 percentage
points from the previous fiscal year.
Going forward, through co-promotional efforts with Pfizer Japan,
Astellas will promote the special characteristics of Celecox while
continuing to encourage appropriate product use.
Geninax (Oral quinolone antibiotic)
Sales of Geninax increased ¥1.6 billion, or 26.1%, to ¥8.1 billion. The
category share of Geninax increased by 3.5 percentage points to
14.3%, giving it second spot in the market for oral quinolone antibiot-
ics. Going forward, Astellas plans to penetrate the market further,
through co-promotion with Taisho Toyama Pharmaceutical.
Adenoscan/Lexiscan (Pharmacologic stress agent)
Total sales of Adenoscan and Lexiscan in the US rose by ¥6.7 billion,
or 17.2%, to ¥46.0 billion. On a local currency basis, total sales grew
US$105 million, or 26.9%, to US$495 million. Sales on a local cur-
rency basis of Lexiscan, which was launched in June 2008, increased
sharply by US$232 million from fiscal 2008 to US$326 million.
43Astellas Pharma Inc. Annual Report 2010
Managem
ent’s Discussion and Analysis

Eligard (Advanced prostate cancer treatment)
Sales of Eligard in Europe grew by ¥1.6 billion, or 13.0%, to ¥14.1 billion.
Boosted by a strong performance from the six-month formulation, sales
in local currency terms rose €20 million, or 23.7%, to €107 million.
Several new products also contributed to higher sales. In Japan, sales
of Bonoteo, a treatment for osteoporosis that was launched in April
2009, were ¥1.0 billion, while sales of Symbicort, a treatment for adult
bronchial asthma launched in January 2010, were ¥1.5 billion. Sales of
the antibiotic VIBATIV, which was launched in the US in November
2009, were ¥0.3 billion.
Sales by Geographical Area(¥ billion)
2009.3 2010.3
Consolidated ¥965.7 ¥974.9Japan 510.5 529.2North America 188.9 179.8Europe 239.1 235.9Asia 27.2 30.0
* Calculated according to the location of sellers
• JapanSales in Japan rose 3.7% in fiscal 2009 to ¥529.2 billion.
Sales of ethical pharmaceuticals in the Japanese market grew
steadily, rising 3.7% to ¥509.8 billion.
Sales increased of mainstay products such as Micardis (including
Micombi), Prograf, Lipitor, Vesicare, Myslee and Seroquel. Furthermore,
new products including Celecox, Geninax, Bonoteo, and Symbicort,
as well as vaccines contributed to sales growth. On the other hand,
sales of Gaster and Harnal declined.
• North AmericaSales in North America on a local currency basis rose by 3.1% to
US$1,936 million. However, sales on a yen basis declined 4.8% to
¥179.8 billion as a result of a stronger yen and other factors. VESIcare,
Lexiscan and Mycamine recorded higher sales. Prograf, however, saw
sales decline in the face of intensifying competition from generic ver-
sions, which entered the US market in August 2009.
• EuropeSales in Europe declined by 1.4% to ¥235.9 billion because of a stron-
ger yen. In local currency terms, however, sales increased 7.9% to
€1,798 million.
Sales of Harnal (which is marketed in Europe under the brand
names Omnic and Omnic OCAS) through our own distribution chan-
nels as well as bulk sales and royalty income from licensees were both
higher in local currency terms, but declined in yen terms due to cur-
rency appreciation. Prograf sales declined in yen terms due to the
yen’s appreciation, but continued to increase in local currency terms.
Vesicare and Eligard recorded steady increases in sales, and Mycamine
also contributed to growth.
• AsiaSales in Asia rose 10.0% to ¥30.0 billion.
Sales rose despite the impact of yen appreciation. Sales of Prograf
grew steadily, and products such as Harnal, Vesicare and Mycamine
also contributed to continued growth.
Overseas Sales(¥ billion)
2009.3 2010.3
Consolidated ¥469.0 ¥460.7North America 235.0 224.9Europe 180.4 181.2Asia 35.9 40.5Other 17.7 14.1Overseas sales ratio 48.6% 47.3%
Overseas sales are attributed by location of customers.
The overseas sales ratio declined 1.3 percentage points in fiscal
2009 due to the impact of the yen’s appreciation against the US dollar
and the euro.
44 Astellas Pharma Inc. Annual Report 2010

Cost of Sales(¥ billion)
2009.3 2010.3
Net sales ¥965.7 ¥974.9Cost of sales 264.4 289.2Cost of sales ratio 27.4% 29.7%
Cost of sales increased by ¥24.8 billion, or 9.4%, to ¥289.2 billion.
The cost of sales ratio rose 2.3 percentage points in fiscal 2009 to
29.7% due to the impact of changes in product composition and
other factors.
Selling, General and Administrative (SG&A) Expenses(¥ billion)
2009.3 2010.3
SG&A expenses ¥450.9 ¥499.2SG&A ratio 46.7% 51.2% Personnel expenses 115.1 120.1 Advertising and sales promotional expenses 84.8 87.7 R&D expenses 159.1 195.6 Other 91.9 95.8
* SG&A expenses include R&D expenses.
Including R&D expenses, SG&A expenses increased ¥48.4 billion, or
10.7%, in year-on-year terms to ¥499.2 billion. The ratio of SG&A
expenses to net sales was 51.2%, an increase of 4.5 percentage points.
Personnel expenses rose ¥5.0 billion, or 4.3%, to ¥120.1 billion. The
main reasons for this increase were the launch of new products in
each region, the establishment of a sales affiliate in Brazil, sales area
expansion in Europe, and an increase in personnel such as MRs in line
with the strengthening of sales and marketing capabilities in Asia.
Advertising and sales promotional expenses increased by ¥2.9
billion, or 3.4%, to ¥87.7 billion. These expenses increased by ¥0.8 billion
in Japan due to expenses associated with new product launches. In
Europe and the US, these expenses increased by ¥2.0 billion. Significant
factors pushing up costs included increased payments to
GlaxoSmithKline due to higher sales of VESIcare in the US, and costs
relating to the launches of VIBATIV and Sumavel DosePro in the US and
of Mycamine and Qutenza in Europe.
Other SG&A expenses were ¥4.0 billion, or 4.3%, higher than in the
previous year, at ¥95.8 billion. Within this figure, goodwill amortization
costs relating to the Agensys acquisition increased by ¥2.3 billion.
R&D Expenses(¥ billion)
2009.3 2010.3
R&D expenses ¥159.1 ¥195.6R&D ratio 16.5% 20.1%
R&D expenses increased by ¥36.5 billion, or 23.0%, to ¥195.6 billion.
The ratio of R&D expenses to net sales was 20.1%, an increase of 3.6
percentage points compared with the previous year. The growth in
R&D expenses reflected higher costs associated with progress made
in clinical development projects and increased depreciation expenses
for the new research buildings at the Tsukuba Research Center. One-
time upfront fees linked to in-licensing agreements, including
MDV3100 for the treatment of prostate cancer from Medivation, Inc.,
were also higher than in the previous year.
The Astellas Group aims to generate sustained growth over the
medium and long term through early and ongoing discovery of a
stream of innovative and useful new drugs in therapeutic areas where
effective treatments do not exist currently and there is a high degree
of unmet medical need. To this end, the Astellas Group actively pro-
motes R&D activities as a priority measure.
Drug discovery efforts are selectively targeting the following focus
research areas: urology, immunology and infectious diseases, oncol-
ogy, neuroscience, and diabetes complications and metabolic dis-
eases. Astellas is also actively seeking to reinforce technological
platforms for drug discovery by establishing a presence in therapeu-
tic antibody technology. This approach promises to supplement the
Group’s traditional strengths in low-molecule synthesis and fermen-
tation technology. To further improve the speed and quality of drug
discovery research, Astellas consolidated drug discovery research
functions at its Tsukuba site in April 2009, and in October 2009, reor-
ganized fermentation research functions and created the Bioimaging
Research Labs.
In clinical development, the Group aims to speed up the pace of
development programs by concentrating resources on the highest
priority projects. Furthermore, in order to strengthen global develop-
ment systems further, in April 2009, Astellas introduced a framework
for strengthening the operational base for global clinical develop-
ment, upgrading project management functions, and enhancing the
capabilities of the Group in terms of devising and executing drug
development strategy by therapeutic area. Based on this set-up, fur-
ther progress was made in fiscal 2009 in the development of in-house
compounds such as OAB treatment YM178, antithrombotic YM150
and diabetes treatment ASP1941.
45Astellas Pharma Inc. Annual Report 2010
Managem
ent’s Discussion and Analysis

On the technical development side, work commenced in
September 2009 on building a Fermentation Technology Research
Building at the Toyama Plant of manufacturing subsidiary Astellas
Toyama. The facility will enable stable global supplies of active phar-
maceutical ingredients for candidate compounds derived from the
fermentation of natural substances. The building is due to be com-
pleted in October 2010.
Alongside in-house drug discovery programs, the Group also
actively seeks to expand and improve the drug development pipeline
by utilizing compounds and technologies licensed from alliance part-
ners. In September 2009, Astellas established an R&D joint venture
with Maxygen of the US to focus on protein drugs emerging from
Maxygen’s MAXY-4 program aimed at generating candidates for indi-
cations of organ rejection suppression in transplantation and other
autoimmune therapies, and other protein drugs generated by early-
stage drug discovery research programs. In October 2009, Astellas
concluded an agreement with Medivation of the US granting Astellas
worldwide rights to develop and commercialize the prostate cancer
treatment MDV3100. In November 2009, Astellas concluded an agree-
ment with US-based Ironwood Pharmaceuticals granting Astellas
exclusive rights to develop and market linaclotide (generic name), an
agent for the treatment of irritable bowel syndrome with constipation
and chronic constipation in Japan, Indonesia, Korea, the Philippines,
Taiwan and Thailand. In December 2009, Astellas also entered into a
worldwide agreement with Ambit Biosciences Corporation of the US
for the joint development and commercialization of FLT3 kinase
inhibitors, including AC220, in oncology and non-oncology indica-
tions. In February 2010, Astellas concluded an exclusive licensing
agreement with Basilea Pharmaceutica International of Switzerland
covering the development and marketing in all countries except
Japan for isavuconazole (generic name), an azole antifungal agent. In
other major licensing developments, Astellas affiliate Agensys revised
the terms of its licensing agreement with US-based Seattle Genetics in
November 2009 concerning antibody-drug conjugate (ADC) tech-
nology, which is technology related to Seattle Genetics’ antibody
pharmaceuticals, to expand the scope of the license.
In October 2009, Astellas terminated the development of ASK8007,
an anti-human osteopontin antibody for rheumatoid arthritis that was
under co-development with the Chemo- Sero-Therapeutic Research
Institute of Japan. Astellas also terminated the US development of
functional dyspepsia treatment agent YM443 (Z-338), a compound
that had been in-licensed from Zeria Pharmaceutical. Astellas and Zeria
dissolved the exclusive development and sales agreement for this
compound in the US and Canada in January 2010.
The Group also actively seeks to develop promotional tie-ups with
various partners. In April 2009, the Taiwanese subsidiary of Astellas
concluded an exclusive agreement with Teijin Pharma covering the
sale in Taiwan of TMX-67 for the treatment of hyperuricemia in
patients with gout. In June 2009, the Group’s European subsidiary
Astellas Pharma Europe made an exclusive licensing agreement with
US-based NeurogesX for the commercialization of peripheral neuro-
pathic pain treatment Qutenza covering Europe, the Middle East and
Africa. In July 2009, Astellas concluded an alliance with AstraZeneca,
covering the co-promotion of the adult bronchial asthma treatment
Symbicort in Japan. In August 2009, Astellas Pharma US concluded a
co-promotion agreement covering the US market with US-based
Zogenix for Sumavel DosePro, a treatment for migraine that uses a
needle-free delivery system. And with Pfizer Japan, Astellas con-
cluded a co-promotion agreement in Japan for Caduet Combination
Tablets, a combination drug for the treatment of hypertension and
hypercholesterolemia.
Operating Income(¥ billion)
2009.3 2010.3
Net sales ¥965.7 ¥974.9Operating income 250.4 186.4Operating margin 25.9% 19.1%
Operating income declined ¥64.0 billion, or 25.6%, to ¥186.4 billion.
The operating margin dropped 6.8 percentage points from fiscal
2008 due to a 2.3 point decline in the gross margin and a higher ratio
of R&D expenses to sales.
Other Income and ExpensesInterest and dividend income declined by ¥7.4 billion to ¥3.9 billion.
This mainly reflected a drop in interest income due to lower interest
rates. Astellas recorded an exchange gain of ¥0.2 billion, down con-
siderably from the ¥9.3 billion recorded in fiscal 2008. A gain on sale
of investment securities of ¥2.7 billion was recognized. Astellas also
recorded a loss on impairment of fixed assets of ¥4.1 billion, which
included asset write-downs associated with the relocation of the
Fermentation and Biotechnology Labs.
46 Astellas Pharma Inc. Annual Report 2010

Foreign Exchange Trends (Year-end rate)(¥)
2009.3 2010.3
US$ ¥ 98 ¥ 93€ 130 125
Income Before Income Taxes and Minority Interests, Income Taxes, and Net IncomeIncome before income taxes and minority interests declined by ¥75.9
billion, or 28.9%, to ¥186.8 billion.
Income taxes decreased by ¥27.0 billion, or 30.1%, to ¥62.6 billion.
The tax rate improved by 0.6 percentage points to 33.5%. The main
factor behind the net improvement in the tax rate was a change in
the corporate tax regulations applicable to fiscal 2009, which resulted
in additional tax relief for spending on research and development.
Reflecting the factors outlined above, net income decreased ¥48.7
billion, or 28.5%, to ¥122.3 billion.
Consolidated Forecasts for Year Ending March 31, 2011 (Fiscal 2010) (Announced August 2010)
Consolidated forecasts for fiscal 2010 are as follows.
In June 2010, Astellas purchased all the shares of OSI
Pharmaceuticals (OSI) through a tender offer, making the US-based
pharmaceuticals company a consolidated subsidiary. However, fiscal
2010 forecasts in this annual report do not include the impact on
earnings of the OSI acquisition.
Fiscal 2010 Forecasts(¥ billion)
2010.32011.3
(Forecasts)
Net sales ¥974.9 ¥914.0Operating income 186.4 135.0Net income 122.3 94.0
(¥)
Average foreign exchange rates US$1 ¥ 93 ¥ 91 €1 131 112
Net sales are forecast to decrease by 6.2% to ¥914.0 billion.
Astellas expects sales of the global products Vesicare and
Funguard/Mycamine to continue expanding, but sales of Prograf
and Harnal are expected to fall due to increased generic competi-
tion following the expiry of the respective substance patents in the
US and Europe. In Japan, growth from mainstay products and sales
contributions from a range of new and recently launched products
are expected to offset a negative impact from the NHI drug price
cuts implemented in April 2010.
Astellas expects to report higher ethical pharmaceuticals sales in
the Japanese market in fiscal 2010. The main contributors to growth
are projected to be mainstay products such as Vesicare, Prograf
(including Graceptor), Micardis (including Micombi) and Myslee, as
well as new products such as Geninax, Celecox and Symbicort.
In the Americas, Astellas expects steady growth in sales of
VESIcare, Mycamine and Lexiscan to help counter an anticipated
decline in sales of Prograf due to increased generic competition in
the US. Astellas also expects the US healthcare reform legislation
that was passed in March 2010 to depress regional sales revenues by
around ¥6.0 billion.
In Europe, Astellas expects Vesicare, Mycamine, Eligard and other
products to generate steady growth in sales. However, sales of
Prograf are expected to decline following the launch of generic
versions of the drug. With Harnal, in addition to lower sales of the
product through our own regional sales channels (under the brand
names Omnic and Omnic OCAS), we expect the impact of generic
competition in the US to result in substantially reduced bulk sales
and royalty income from our licensee.
Sales in Asia are expected to grow due to products such as Prograf,
Vesicare and Mycamine.
Operating income is forecast to decline by 27.6% to ¥135.0 billion.
Gross profit is expected to decline due to lower sales, together
with an increase in the cost of sales ratio associated with projected
changes in product composition.
Astellas expects a reduction in overall SG&A expenses in fiscal
2010. R&D spending is projected to decline 1.3% in year-on-year
terms to ¥193.0 billion, equivalent to a ratio of R&D spending to net
sales of 21.1%. One-time payments from in-licensing agreements are
expected to be lower than in fiscal 2009. Excluding R&D spending,
SG&A expenses are projected to rise due to higher sales promotional
expenses associated with launches of new products. The lack of
refunds of marketing expenses by Harnal licensees in the US will be
an additional factor pushing up SG&A expenses.
Net income is projected to decline by 23.1% to ¥94.0 billion.
47Astellas Pharma Inc. Annual Report 2010
Managem
ent’s Discussion and Analysis

Number of EmployeesAs of March 31, 2010, the Astellas Group employed 15,161 people (a
year-on-year increase of 900).
Employee headcount was 7,860 in Japan (up 338 from the previ-
ous year-end). This reflected increases in employee numbers across
sales and marketing and other divisions, together with the transfer of
165 employees from a subcontractor to a domestic Group firm. In the
Americas, regional headcount was 2,375 (up 57) due to increases in
sales and marketing, and R&D personnel, which offset a decline in the
number employed by the manufacturing division. Employee num-
bers in Europe were 3,775 (up 385), reflecting continued recruitment
in the sales and marketing division to strengthen regional sales capa-
bilities and expand into new territories. The Group also recruited
more MRs in China, South Korea, Indonesia and India, which increased
the regional headcount in Asia to 1,151 (up 120).
The total number of MRs employed by the Astellas Group world-
wide was 5,500 at the end of March 2010, a year-on-year increase in
the sales force of 350 people.
Number of Employees by Geographical Area(persons)
2009.3 2010.3
Japan 7,522 7,860Americas 2,318 2,375Europe 3,390 3,775Asia 1,031 1,151Total 14,261 15,161
Number of MRs by Geographical Area(persons)
2009.3 2010.3
Total 5,150 5,500Japan 2,400 2,400Americas 890 980Europe 1,350 1,500Asia 580 670
Financial ConditionAssetsTotal assets as of March 31, 2010 amounted to ¥1,364.2 billion. This
figure was ¥15.7 billion higher than at the end of the previous fiscal
year-end.
Current assets of ¥988.5 billion were ¥24.9 billion higher than a
year earlier. This reflected an increase in cash and cash equivalents of
¥22.1 billion to ¥431.9 billion.
At ¥184.5 billion, net property, plant and equipment, net was ¥3.0
billion higher than a year earlier. Contributory factors included the
commencement of construction work on a new Fermentation
Technology Research Building at Astellas Toyama.
Investments and other assets dropped ¥12.2 billion to ¥191.1
billion. Investment securities declined by ¥19.5 billion to ¥69.8 billion
due mainly to reclassifications to current assets. Goodwill associated
with the Agensys acquisition declined by ¥4.2 billion to ¥22.2 billion.
Goodwill at the end of March 2009 was ¥26.4 billion (US$284 million).
Additions to goodwill in fiscal 2009 totaled ¥7.0 billion (US$75 million)
and reflected the initiation of Phase 2 clinical trials for AGS-8M4 and
milestone payments made following the filing of investigational new
drug (IND) applications for AGS-16M8E and AGS-5ME. Amortization
expense of ¥9.8 billion (US$105 million) was recorded in fiscal 2009. As
a result, the balance at March 31, 2010 was ¥22.2 billion (US$238 million).
Other intangible assets increased by ¥8.6 billion to ¥40.6 billion.
Acquisitions of patents and of sales rights for products such as
Symbicort in Japan and Qutenza in Europe more than offset the
reduction due to amortization of assets.
LiabilitiesTotal liabilities of ¥310.2 billion at March 31, 2010 represented a
decline of ¥8.0 billion, compared with the previous fiscal year-end.
Current liabilities of ¥277.2 billion were ¥6.4 billion lower than a year
earlier. There was an ¥18.5 billion decline in accrued income taxes, which
outweighed an ¥11.0 billion increase in accrued expenses.
Total long-term liabilities of ¥33.1 billion were ¥1.6 billion lower
than a year earlier.
48 Astellas Pharma Inc. Annual Report 2010

Net AssetsNet assets totaled ¥1,053.9 billion at March 31, 2010, an increase of
¥23.7 billion compared with a year earlier.
Total shareholders’ equity amounted to ¥1,120.8 billion at March
31, 2010, an increase of ¥38.9 billion. Major items included net income
of ¥122.3 billion, payments of ¥56.4 billion in cash dividends from
retained earnings, and acquisition of the company’s own shares via
open market purchases totaling ¥27.0 billion.
Valuation, translation adjustments and others became negative
¥68.4 billion. This represented a net increase of ¥15.5 billion from the
previous fiscal year-end. Translation adjustments increased by ¥19.6
billion in year-on-year terms to negative ¥82.5 billion. This was princi-
pally due to the year-end value of the yen appreciating from the end
of March 2009 against both the US dollar and the euro.
Liquidity and FinancingTo strengthen and develop the ethical pharmaceutical business, the
Astellas Group is constantly working to build market share in the
Japanese market, while also developing a global sales and marketing
network to boost Astellas’ presence in overseas markets. Moreover,
the Group continues to reinforce R&D capabilities to maintain a
strong drug discovery capability. In addition, the company is pursu-
ing in-licensing activities globally in order to strengthen its pipeline
as part of pursuing strategic business investment opportunities.
A sufficient level of cash and cash equivalents is maintained to
enable the Group to target such strategic investment opportunities
while also supplying working capital and funding capital expendi-
tures. As of the end of March 2010, the Group’s balance sheet carried
no interest-bearing debt other than lease obligations. After the OSI
acquisition, Astellas secured short-term borrowings of ¥40.0 billion in
the first quarter of 2010 to provide a temporary boost to working
capital for use in Japanese operations.
As outlined in the section on business risks, the Group’s pharma-
ceutical operations face a varied set of risks that are peculiar to the
industry. Going forward, in the event of demand for funding, the
Group’s financial policy is to maintain a healthy balance sheet at all
times so we can raise capital smoothly.
Cash FlowsThe balance of cash and cash equivalents at the end of March 2010
was ¥431.9 billion, an increase of ¥22.1 billion compared with the
previous fiscal year-end.
Cash Flows From Operating ActivitiesNet cash provided by operating activities amounted to ¥150.1 billion,
a decrease of ¥47.7 billion in year-on-year terms. Major factors
included a fall in income before income taxes and minority interests
of ¥75.9 billion to ¥186.8 billion, and a decline in income taxes paid of
¥7.2 billion to ¥79.3 billion.
Cash Flows From Investing ActivitiesNet cash used in investing activities totaled ¥31.6 billion, an increase
in cash outflow of ¥2.6 billion compared with the previous year. Major
factors included an increase in purchases of property, plant and
equipment of ¥2.9 billion to ¥39.5 billion, and an increase in cash
outflows for the acquisition of intangible assets, such as sales rights to
Symbicort in Japan and Qutenza in Europe. In addition, there was a
decrease in investment securities of ¥1.9 billion compared with an
increase of ¥18.0 billion in the previous fiscal year.
Cash Flows From Financing ActivitiesNet cash used in financing activities totaled ¥85.9 billion, a decrease of
¥98.8 billion compared with the previous year. Major factors included
cash outflows due to the purchase of treasury stock, which decreased
¥96.6 billion relative to the previous year to ¥27.0 billion, and a year-on-
year decrease in cash dividends of ¥2.2 billion to ¥56.4 billion.
Capital ExpendituresThe Astellas Group makes capital expenditures on an ongoing basis
with the aim of reinforcing R&D, production, sales and marketing
capabilities and boosting operational efficiency. Capital expenditures
in fiscal 2009 totaled ¥37.8 billion (based on the value of property,
plant and equipment). Construction work commenced on a
Fermentation Technology Research Building at Astellas Toyama to
reinforce production capacity for active pharmaceutical ingredients
for candidate compounds derived from the fermentation of natural
substances. Other capital spending was undertaken to upgrade and
renew various functional capabilities and equipment across produc-
tion and research.
Capital spending is forecast to increase 8.5% to ¥41.0 billion in
fiscal 2010.
49Astellas Pharma Inc. Annual Report 2010
Managem
ent’s Discussion and Analysis

Net Income, Cash Dividends and Net Assets per SharePer Share Data
(¥)
2009.3 20010.3
Net income Basic ¥ 356.11 ¥ 261.84 Diluted 355.90 261.62Cash dividends 120.00 125.00Net assets 2,189.26 2,278.77
Policy on Shareholder ReturnsAstellas is actively working to boost shareholder returns through
sustained growth in enterprise value. While prioritizing the
re- investment of funds in the business to foster growth, Astellas
strives to achieve stable and sustained growth in dividends, based on
medium- to long-term consolidated earnings growth and taking the
dividend-on-equity (DOE) ratio into consideration. Furthermore,
Astellas will flexibly purchase treasury stock if appropriate to improve
capital efficiency and the level of return to shareholders.
Treasury stock acquisitions in fiscal 2009 are summarized below.
Treasury Stock
2009.3 2010.3
Number of shares bought back 28,080 thousand
8,200 thousand
Acquisition cost ¥123.4 billion
¥27.0 billion
Number of shares cancelled 15,000 thousand
28,000 thousand
Amount cancelled ¥72.1 billion
¥128.1 billion
Total Number of Shares Issued(thousands of shares)
2009.3 2010.3
Total number of shares issued 503,965 475,965Shares in treasury 33,948 14,147
ROE and DOE(%)
2009.3 2010.3
ROE 16.0 11.7DOE 5.4 5.6
Return on equity (ROE) was 11.7%, down 4.3 percentage points from
fiscal 2008. The DOE ratio increased 0.2 percentage point to 5.6%.
Business RisksThe main risks that could significantly impact the business results and
financial position of the Astellas Group are outlined below.
• Inherent uncertainties in pharmaceutical R&DIn general, the probability of discovering a promising compound
through drug discovery research is not high. Further, it takes a large
amount of investments and a great deal of time to successfully launch
a new product after discovery of a new compound. However, it may be
necessary to discontinue clinical development if the effectiveness of a
drug is not proven as initially expected, or if safety issues arise. In addi-
tion, pharmaceuticals are subject to legal restrictions in each country,
so that authorization from local regulatory authorities is a prerequisite
for a product launch in each country. It is difficult to accurately foresee
if and when approvals for new products can be obtained.
The Astellas Group’s research and development activities are sub-
ject to these inherent risks.
• Sales-related riskThe pharmaceutical industry operates in a highly competitive envi-
ronment characterized by rapid technological innovation. The
Astellas Group faces fierce competition from drug makers and
generics manufacturers based in Japan or overseas. The launch of
competitive products by rivals could impact the Astellas Group’s
business results significantly.
• Intellectual property (IP) riskThe Astellas Group’s ethical pharmaceuticals business benefits from
the protection of many patents. Although the Astellas Group man-
ages intellectual property rights properly and is vigilant against third-
party violation of such rights, the adverse impact on the Astellas
Group’s business results of actual IP violations may still be substantial.
The Astellas Group’s business results are also subject to the outcome
of litigation undertaken by the Astellas Group to protect patents
where infringement has occurred.
While the Astellas Group strives to ensure that its actions do not
infringe the IP rights of other parties, there is a risk of litigation in the
event of any inadvertent violations. Such litigation could also impact
the Astellas Group’s business results significantly.
50 Astellas Pharma Inc. Annual Report 2010
• Risks relating to product side effects and safetyAny problems arising due to serious side effects or other safety issues
that are caused by the Astellas Group’s products could impact the
Astellas Group’s business results significantly.
• Pharmaceutical regulatory riskThe ethical pharmaceutical business is governed by a wide variety of
regulations in each country. In Japan, for example, the authorities
periodically revise the NHI drug prices. Governments in developed
countries in particular continue to adopt measures aimed at contain-
ing medical expenditures. Any trend toward stricter regulations
governing the development, manufacture or distribution of pharma-
ceuticals is a factor that could impact business results.
• Environment-related risksThe Astellas Group is careful to observe laws and regulations
relating to environmental or health and safety issues, and has insti-
tuted internal standards that aim to exceed most statutory require-
ments. Despite such precautions, the costs involved in the unlikely
event of a business-related incident causing a serious breach of
compliance in this area could impact the Astellas Group’s business
results significantly.
• Foreign exchange rate fluctuationsThe Astellas Group’s business results and financial position are subject
to the impact of exchange rate fluctuations due to the Astellas
Group’s extensive international operations.
In addition to the risks outlined above, the Astellas Group is exposed
to a wide range of business-related risks, including but not limited to
(1) general commercial litigation, (2) delays or suspension of
manufacturing activities due to natural disasters or other factors, and
(3) partial dependence on licensing or sales agreements relating to
pharmaceuticals developed by other companies.
51Astellas Pharma Inc. Annual Report 2010
Managem
ent’s Discussion and Analysis

Consolidated Balance SheetsAstellas Pharma Inc. and SubsidiariesMarch 31, 2010 and 2009
Millions of yen
Millions of U.S. dollars
(Note 4)
Assets 2010 2009 2010
Current assets:
Cash and cash equivalents ¥ 431,920 ¥ 409,827 $ 4,644
Short-term investments (Note 16) 117,354 122,510 1,262
Notes and accounts receivable 256,870 242,053 2,762
Allowance for doubtful receivables (1,651) (1,020) (18)
255,219 241,033 2,744
Inventories (Note 5) 111,054 105,430 1,194
Deferred tax assets (Note 9) 63,316 67,564 681
Other 9,681 17,277 105
Total current assets 988,544 963,641 10,630
Property, plant and equipment, at cost:
Land 30,190 29,115 325
Buildings and structures 233,831 233,952 2,514
Machinery and equipment 218,612 216,929 2,351
Other 3,142 2,977 33
Construction in progress 18,680 13,964 201
Accumulated depreciation (319,965) (315,489) (3,440)
Property, plant and equipment, net 184,490 181,448 1,984
Investments and other assets:
Investment securities (Note 16) 69,772 89,315 750
Investments in and advances to affiliates 1,251 268 13
Goodwill 22,159 26,377 238
Other intangible assets 40,601 31,985 437
Deferred tax assets (Note 9) 46,900 46,223 504
Other 10,460 9,189 113
Total investments and other assets 191,143 203,357 2,055
Total assets ¥1,364,177 ¥1,348,446 $14,669
See accompanying notes to consolidated financial statements.
52 Astellas Pharma Inc. Annual Report 2010

Millions of yen
Millions of U.S. dollars
(Note 4)
Liabilities and net assets 2010 2009 2010
Current liabilities:
Notes and accounts payable:
Trade ¥ 163,968 ¥ 169,615 $ 1,763
Construction 14,021 11,947 151
Accrued expenses 66,050 55,057 710
Accrued income taxes (Note 9) 21,216 39,682 228
Deferred tax liabilities (Note 9) 12 833 0
Other (Note 6) 11,891 6,419 128
Total current liabilities 277,158 283,553 2,980
Long-term liabilities:
Accrued retirement benefits for employees (Note 10) 17,638 15,030 190
Other (Note 6) 15,448 19,642 166
Total long-term liabilities 33,086 34,672 356
Net assets (Note 7):
Shareholders’ equity:
Common stock, without par value:
Authorized: 2,000,000,000 shares;
Issued: 475,964,635 shares in 2010 and 503,964,635 shares in 2009 103,001 103,001 1,108
Capital surplus 176,822 176,822 1,901
Retained earnings 895,101 957,346 9,624
Treasury stock, at cost:
14,146,832 shares in 2010 and 33,948,017 shares in 2009 (54,160) (155,295) (582)
Total shareholders’ equity 1,120,764 1,081,874 12,051
Valuation, translation adjustments and others
Unrealized holding gain on securities 14,154 10,019 152
Translation adjustments (82,543) (62,905) (887)
Total valuation, translation adjustments and others (68,389) (52,886) (735)
Stock subscription rights 1,206 895 13
Minority interests 352 338 4
Total net assets 1,053,933 1,030,221 11,333
Contingent liabilities (Note 13)
Total liabilities and net assets ¥1,364,177 ¥1,348,446 $14,669
53Astellas Pharma Inc. Annual Report 2010
Consolid
ated Balance Sheets

Consolidated Statements of IncomeAstellas Pharma Inc. and SubsidiariesYear ended March 31, 2010, 2009 and 2008
Millions of yen
Millions of U.S. dollars
(Note 4)
2010 2009 2008 2010
Net sales ¥974,878 ¥965,698 ¥972,586 $10,483
Cost of sales 289,241 264,431 279,342 3,111
Gross profit 685,637 701,267 693,244 7,372
Selling, general and administrative expenses (Note 11) 499,230 450,872 417,340 5,368
Operating income 186,407 250,395 275,904 2,004
Other income (expenses):
Interest and dividend income 3,939 11,380 15,026 42
Interest expense — — (53) —
Exchange gain (loss) 225 9,251 (14,869) 2
Equity in earnings (losses) of affiliates 84 (47) 7,994 1
Gain on sale of investment securities 2,700 500 138 29
Loss on impairment of fixed assets (4,082) (1,340) (9,331) (44)
Special retirement benefits — (2,526) (12,979) —
Loss on devaluation of investment securities — (1,976) — —
Compensation for cancellation of contracts — (1,364) — —
Expenses for integration and closure of business bases — — (3,308) —
Other, net (2,471) (1,581) 10,256 (26)
395 12,297 (7,126) 4
Income before income taxes and minority interests 186,802 262,692 268,778 2,008
Income taxes (Note 9):
Current 64,717 86,851 93,999 696
Deferred (2,111) 2,771 (4,812) (23)
62,606 89,622 89,187 673
Income before minority interests 124,196 173,070 179,591 1,335
Minority interests (1,939) (2,084) (2,153) (20)
Net income (Note 14) ¥122,257 ¥170,986 ¥177,438 $ 1,315
See accompanying notes to consolidated financial statements.
54 Astellas Pharma Inc. Annual Report 2010

Consolidated Statements of Changes in Net AssetsAstellas Pharma Inc. and SubsidiariesYear ended March 31, 2010, 2009 and 2008
Millions of yen
Shareholders’ equity Valuation, translation
adjustments and others
Common stock
Capital surplus
Retained earnings
Treasury stock
Total shareholders’
equity
Stock subscription
rightsMinority interests
Total net assets
Balance as of March 31, 2007 ¥ 103,001 ¥ 176,822 ¥1,006,648 ¥(241,920) ¥ 1,044,551 ¥ 53,809 ¥ 284 ¥ 351 ¥ 1,098,995 Cash dividends paid (45,878) (45,878) (45,878) Net income 177,438 177,438 177,438 Purchase of treasury stock (81,914) (81,914) (81,914) Disposal of treasury stock (53) 197 144 144 Cancellation of treasury stock (219,514) 219,514 Other (1,435) (1,435) (1,435) Net change in items other than shareholders’ equity (36,817) 353 (23) (36,487)
Total movements during the year (89,442) 137,797 48,355 (36,817) 353 (23) 11,868
Balance as of March 31, 2008 103,001 176,822 917,206 (104,123) 1,092,906 16,992 637 328 1,110,863 Cash dividends paid (58,625) (58,625) (58,625) Net income 170,986 170,986 170,986 Purchase of treasury stock (123,600) (123,600) (123,600) Disposal of treasury stock (80) 287 207 207 Cancellation of treasury stock (72,141) 72,141 Net change in items other than shareholders’ equity (69,878) 258 10 (69,610)
Total movements during the year 40,140 (51,172) (11,032) (69,878) 258 10 (80,642)
Balance as of March 31, 2009 103,001 176,822 957,346 (155,295) 1,081,874 (52,886) 895 338 1,030,221 Cash dividends paid (56,402) (56,402) (56,402) Net income 122,257 122,257 122,257 Purchase of treasury stock (26,997) (26,997) (26,997) Disposal of treasury stock (17) 49 32 32 Cancellation of treasury stock (128,083) 128,083 Net change in items other than shareholders’ equity (15,503) 311 14 (15,178) Total movements during the year (62,245) 101,135 38,890 (15,503) 311 14 23,712Balance as of March 31, 2010 ¥103,001 ¥176,822 ¥ 895,101 ¥ (54,160) ¥1,120,764 ¥(68,389) ¥1,206 ¥352 ¥1,053,933
Millions of U.S. dollars (Note 4)
Shareholders’ equity Valuation, translation
adjustments and others
Common stock
Capital surplus
Retained earnings
Treasury stock
Total shareholders’
equity
Stock subscription
rightsMinority interests
Total net assets
Balance as of March 31, 2009 $ 1,108 $ 1,901 $10,294 $(1,670) $ 11,633 $ (568) $ 10 $ 4 $ 11,079 Cash dividends paid (607) (607) (607) Net income 1,315 1,315 1,315 Purchase of treasury stock (291) (291) (291) Disposal of treasury stock (0) 1 1 1 Cancellation of treasury stock (1,378) 1,378 Net change in items other than shareholders’ equity (167) 3 0 (164) Total movements during the year (670) 1,088 418 (167) 3 0 254Balance as of March 31, 2010 $1,108 $1,901 $ 9,624 $ (582) $12,051 $(735) $13 $4 $11,333
See accompanying notes to consolidated financial statements.
Number of shares issued 2010 2009 2008
Beginning of year 503,964,635 518,964,635 563,964,635 Cancellation of treasury stock (28,000,000) (15,000,000) (45,000,000)
End of year 475,964,635 503,964,635 518,964,635
55Astellas Pharma Inc. Annual Report 2010
Consolid
ated Statem
ents of Income/C
onsolidated
Statements of C
hanges in N
et Assets

Consolidated Statements of Cash FlowsAstellas Pharma Inc. and SubsidiariesYear ended March 31, 2010, 2009 and 2008
Millions of yen
Millions of U.S. dollars
(Note 4)
2010 2009 2008 2010
Operating activities
Income before income taxes and minority interests ¥186,802 ¥ 262,692 ¥ 268,778 $2,008
Depreciation and amortization 48,466 42,890 36,946 521
Loss on impairment of fixed assets 4,082 1,340 9,331 44
Gain on sale of investment securities (2,700) (500) (138) (29)
Notes and accounts receivable 1,310 (17,487) 4,524 14
Inventories (8,741) (26,569) (5,262) (94)
Notes and accounts payable (2,051) 26,012 (20,745) (22)
Accrued expenses 12,032 (54) (7,046) 129
Accrued retirement benefits for employees 1,547 (93) (835) 17
Other (15,391) (16,107) (26,082) (165)
Subtotal 225,356 272,124 259,471 2,423
Interest and dividends received 4,098 12,196 25,756 44
Interest paid — — (50) —
Income taxes paid (79,323) (86,529) (98,247) (853)
Net cash provided by operating activities 150,131 197,791 186,930 1,614
Investing activities
Purchases of property, plant and equipment (39,525) (36,653) (27,314) (425)
Proceeds from sale of property, plant and equipment 1,014 5,811 17,923 11
Acquisition of subsidiaries’ shares — — (40,407) —
Decrease in short-term investments 28,584 24,454 64,360 307
Decrease (increase) in investment securities 1,940 (18,013) (12,660) 21
Increase in other assets (24,776) (10,902) (12,974) (266)
Other 1,182 6,315 2,656 12
Net cash used in investing activities (31,581) (28,988) (8,416) (340)
Financing activities
Purchases of treasury stock (26,997) (123,600) (81,914) (291)
Cash dividends (56,402) (58,625) (45,878) (607)
Other (2,503) (2,451) (3,630) (26)
Net cash used in financing activities (85,902) (184,676) (131,422) (924)
Effects of exchange rate changes on cash and cash equivalents (10,555) (34,786) (8,037) (113)
Increase (decrease) in cash and cash equivalents 22,093 (50,659) 39,055 237
Decrease in cash and cash equivalents due to decrease in subsidiaries — — (1,082) —
Cash and cash equivalents at beginning of year 409,827 460,486 422,513 4,407
Cash and cash equivalents at end of year ¥431,920 ¥ 409,827 ¥ 460,486 $4,644
See accompanying notes to consolidated financial statements.
56 Astellas Pharma Inc. Annual Report 2010
Notes to Consolidated Financial StatementsAstellas Pharma Inc. and Subsidiaries
Astellas Pharma Inc. (the “Company”) and its domestic subsidiaries
maintain their accounting records and prepare their financial state-
ments in accordance with accounting principles generally accepted
in Japan, and its foreign subsidiaries maintain their books of account
in conformity with International Financial Reporting Standards (IFRS)
or accounting principles generally accepted in the United States.
Effective April 1, 2008, the Company adopted the “Practical Solu-
tion on Unification of Accounting Policies Applied to Foreign Subsid-
iaries for Consolidated Financial Statements (PITF No 18).” In
accordance with PITF No. 18, the accompanying consolidated finan-
cial statements for the years ended March 31, 2010 and 2009 have
been prepared by using, the accounts of foreign consolidated sub-
sidiaries prepared in accordance with either IFRS or accounting
principles generally accepted in the United States as adjusted for
certain items including those for goodwill, actuarial differences and
capitalized development costs. See Note 3(c).
The accompanying consolidated financial statements have been
prepared in accordance with accounting principles generally
accepted in Japan, which are different in certain respects as to the
application and disclosure requirements of IFRS, and are compiled
from the consolidated financial statements prepared by the Com-
pany as required by the Financial Instruments and Exchange Law.
Certain amounts in the prior years’ consolidated financial
statements have been reclassified to conform to the current year
presentation.
2. Summary of Significant Accounting Policies
1. Basis of Presentation
(a) Basis of consolidation and accounting for investments in subsidiaries and affiliates
The accompanying consolidated financial statements include the
accounts of the Company and all subsidiaries. Companies over which
the Company exercises significant influence in terms of their operat-
ing and financial policies are included in the consolidated financial
statements on an equity basis. As of March 31, 2010, the numbers of
consolidated subsidiaries, and subsidiaries and affiliates accounted
for by the equity method were 66 and 3 (64 and 2 in 2009), respec-
tively. All significant intercompany balances and transactions are
eliminated in consolidation.
All subsidiaries close their books of account at March 31 for finan-
cial reporting purposes.
The excess of cost over underlying fair value of net assets at the
date of acquisition is amortized over periods not exceeding 20 years on
a straight-line basis except that when the excess amount is immaterial,
it is fully charged to income in the year of acquisition. Such amortiza-
tion is included in selling, general and administrative expenses.
(b) Foreign currency translationReceivables and payables denominated in foreign currencies are
translated into Japanese yen at the year-end rates, and foreign
exchange gains or losses are charged to current income/expense.
Revenue and expense accounts of the foreign subsidiaries are
translated into yen using the average exchange rates during the year
and, except for the components of net assets excluding minority
interests, the balance sheet accounts are translated into yen at the
exchange rates in effect at the balance sheet date. The components
of net assets excluding minority interests are translated into yen at
their historical exchange rates. Differences arising from the transla-
tion are presented as translation adjustments and minority interests
in the accompanying consolidated financial statements.
(c) Cash equivalentsAll highly liquid investments with a maturity of three months or less
when purchased are considered as cash equivalents.
(d) InventoriesInventories of the Company and its domestic subsidiaries are stated
principally at the lower of cost or market, cost being determined by
the average method. However, inventories of the foreign subsidiaries
are stated principally at the lower of cost or market, cost being deter-
mined by the first-in, first-out method.
(e) Depreciation and amortization (excluding lease assets)Depreciation of property, plant and equipment of the Company and
its domestic subsidiaries is calculated principally by the declining-
balance method at rates based on the estimated useful lives of the
respective assets. However, depreciation of property, plant and
equipment of the foreign subsidiaries is calculated principally by the
straight-line method. The useful lives of property, plant and equip-
ment are summarized as follows:
Buildings and structures 2 to 60 years
Machinery, equipment and vehicles 2 to 20 years
57Astellas Pharma Inc. Annual Report 2010
Consolidated Statements of Cash Flow
s / Notes to Consolidated Financial Statem
ents
Intangible assets are amortized by the straight-line method over
their estimated useful lives.
(f) Allowance for doubtful receivablesFor normal receivables, an allowance for doubtful receivables is pro-
vided using the historical experienced default ratio. For specific
receivables such as bankruptcy/rehabilitation claims, an allowance
for doubtful receivables is provided for the estimated amounts con-
sidered to be uncollectible after reviewing individual collectability.
(g) LeasesNon-cancelable leases are generally classified and accounted for as
either finance or operating leases. Depreciation of finance leases for
which ownership of the leased assets is not transferred to the lessee
is calculated principally by the straight-line method over their useful
life being lease period with residual value being zero.
(h) Short-term investments and investment securitiesSecurities other than equity securities issued by the Company’s sub-
sidiaries and affiliates are classified into held-to-maturity or other
securities. Held-to-maturity securities are carried at amortized cost.
Marketable securities classified as other securities are carried at fair
value with changes in unrealized gain or loss, net of the applicable
income taxes, included directly in net assets. Non-marketable securi-
ties classified as other securities are stated at cost. Cost of securities
sold is determined by the moving average method.
(i) Research and development expensesResearch and development expenses are charged to income as incurred.
(j) Income taxesDeferred tax assets and liabilities are determined based on the differ-
ences between financial reporting and the tax bases of the assets and
liabilities, and are measured using the effective tax rates and laws
which will be in effect when the differences are expected to reverse.
(k) Retirement benefitsAccrued retirement benefits for employees and prepaid pension cost
are recorded mainly at an amount calculated based on the retirement
benefit obligation and the fair value of the pension plan assets at the
balance sheet dates, as adjusted for unrecognized actuarial gain or
loss and unrecognized past service cost.
Actuarial gain and loss are being amortized from the following
year in which the gain or loss is recognized primarily by the straight-
line method over the average remaining years of service of the
employees. Past service cost is being amortized as incurred by the
straight-line method over the average remaining years of service of
the employees.
(l) Derivative financial instrumentsThe Company utilizes various derivatives transactions in order to
manage certain risks arising mainly from adverse fluctuations in for-
eign currency exchange rates and interest rates. Derivative financial
instruments are carried at fair value with any changes in unrealized
gain or loss charged or credited to operations, except for those which
meet the criteria for deferral hedge accounting under which unreal-
ized gain or loss is deferred as a component of net assets.
(a) Effective April 1, 2009, Partial Amendments to Accounting Standard
for Retirement Benefits (Part 3), has been adopted. This change had
no impact on the operating results and financial conditions.
(b) Effective April 1, 2008, the Company and its domestic subsidiaries
adopted a new accounting standard for lease transactions and
related implementation guidance, which requires all finance lease
transactions to be capitalized. Until the year ended March 31,
2008, finance leases in which there was no transfer of ownership
of leased assets upon the expiration of lease periods had been
accounted for as operating leases. This change had no impact on
the operating results and financial conditions.
(c) Effective April 1, 2008, PITF No. 18 has been adopted. This change
had no impact on the operating results and financial conditions.
3. Accounting Changes
58 Astellas Pharma Inc. Annual Report 2010

4. U.S. Dollar AmountsU.S. dollar amounts presented are solely for convenience, as a matter
of arithmetic computation only, translated from yen at ¥93 = US
$1.00, the approximate rate of exchange on March 31, 2010. The
translation should not be construed as a representation that yen has
been, could have been, or could in the future be, converted into U.S.
dollars at the above or any other rates.
5. InventoriesInventories as of March 31, 2010 and 2009 were as follows:
Millions of yenMillions of U.S. dollars
2010 2009 2010
Merchandise and finished goods ¥ 82,750 ¥ 80,755 $ 889Work in process 12,152 12,506 131Raw materials and supplies 16,152 12,169 174Total ¥111,054 ¥105,430 $1,194
(d) Effective April 1, 2007, the Company and its domestic subsidiaries
implemented earlier adoption of a new accounting standard for
measurement of inventories, which requires all the inventories to
be stated at the lower of cost or market. The effect of this change
was to decrease gross profit by ¥99 million and to increase operat-
ing income and income before income taxes and minority inter-
ests by ¥493 million and ¥939 million, respectively, for the year
ended March 31, 2008 compared to the corresponding amounts
which would have been recognized under the previous method.
(e) Effective April 1, 2007, the Company and its domestic subsidiaries
changed the depreciation rates and the salvage value of property,
plant and equipment mainly based on the amendment of Corpo-
rate Tax Law of Japan and the change in the investment strategy.
The effect of these changes was to decrease gross profit by ¥449
million and to decrease operating income and income before
income taxes and minority interests by ¥1,477 million for the year
ended March 31, 2008.
6. Short-Term Borrowings and Long-Term DebtThere were no short-term borrowings or long-term debt except for
lease obligations at March 31, 2010 and 2009. Current portion of lease
obligations of ¥525 million ($6 million) at March 31, 2010 and ¥598
million at March 31, 2009 were included in other current liabilities,
and lease obligations excluding current portion of ¥625 million ($7
million) at March 31, 2010 and ¥911 million at March 31, 2009 were
included in other long-term liabilities.
The aggregate annual maturities of lease obligations for 5 years subsequent to March 31, 2010 are summarized as follows:
Year ending March 31, Millions of yenMillions of U.S. dollars
2011 ¥ 525 $ 62012 273 32013 190 22014 108 12015 and thereafter 54 1Total ¥1,150 $13
59Astellas Pharma Inc. Annual Report 2010
Notes to Consolidated Financial Statem
ents
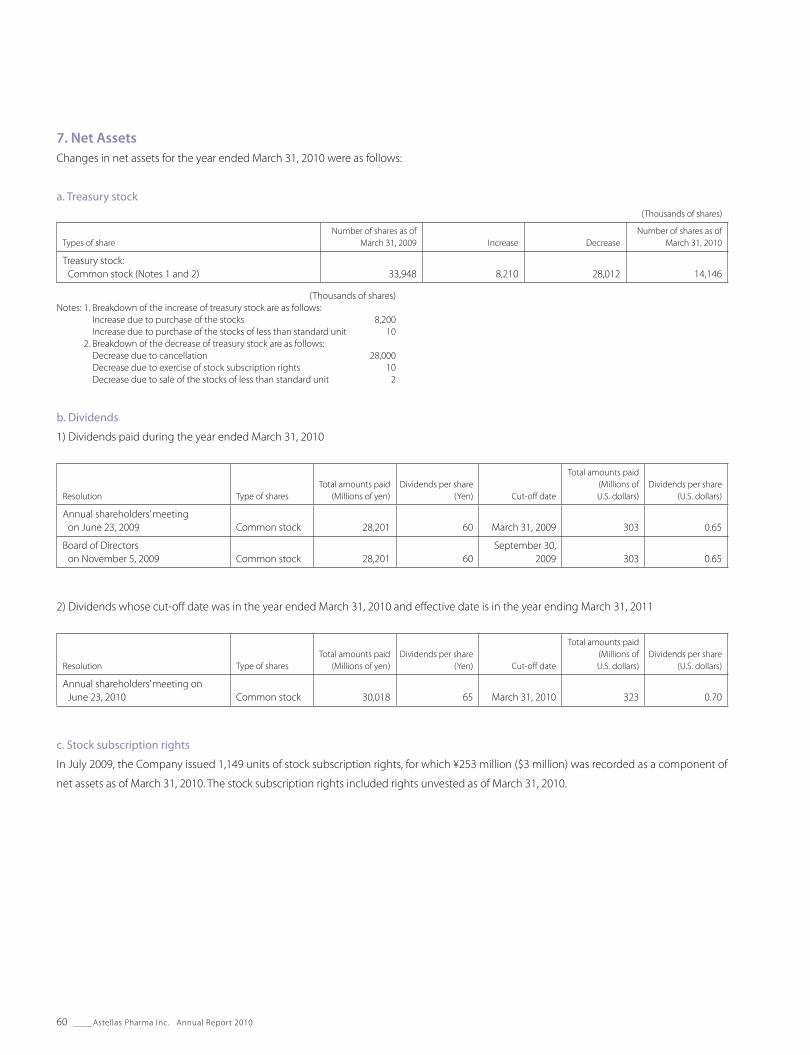
7. Net AssetsChanges in net assets for the year ended March 31, 2010 were as follows:
a. Treasury stock(Thousands of shares)
Types of shareNumber of shares as of
March 31, 2009 Increase DecreaseNumber of shares as of
March 31, 2010
Treasury stock: Common stock (Notes 1 and 2) 33,948 8,210 28,012 14,146
(Thousands of shares)Notes: 1. Breakdown of the increase of treasury stock are as follows: Increase due to purchase of the stocks 8,200 Increase due to purchase of the stocks of less than standard unit 10 2. Breakdown of the decrease of treasury stock are as follows: Decrease due to cancellation 28,000 Decrease due to exercise of stock subscription rights 10 Decrease due to sale of the stocks of less than standard unit 2
b. Dividends
1) Dividends paid during the year ended March 31, 2010
Resolution Type of sharesTotal amounts paid
(Millions of yen)Dividends per share
(Yen) Cut-off date
Total amounts paid (Millions of U.S. dollars)
Dividends per share (U.S. dollars)
Annual shareholders’ meeting on June 23, 2009 Common stock 28,201 60 March 31, 2009 303 0.65
Board of Directors on November 5, 2009 Common stock 28,201 60
September 30, 2009 303 0.65
2) Dividends whose cut-off date was in the year ended March 31, 2010 and effective date is in the year ending March 31, 2011
Resolution Type of sharesTotal amounts paid
(Millions of yen)Dividends per share
(Yen) Cut-off date
Total amounts paid (Millions of U.S. dollars)
Dividends per share (U.S. dollars)
Annual shareholders’ meeting on June 23, 2010 Common stock 30,018 65 March 31, 2010 323 0.70
c. Stock subscription rights
In July 2009, the Company issued 1,149 units of stock subscription rights, for which ¥253 million ($3 million) was recorded as a component of
net assets as of March 31, 2010. The stock subscription rights included rights unvested as of March 31, 2010.
60 Astellas Pharma Inc. Annual Report 2010

8. Stock Option PlanThe Company has implemented a stock option plan under which stock subscription rights were granted to directors, corporate officers and
employees of the Company.
The following table summarizes the Company’s stock option plan:
Stock subscription rights granted as a stock option plan
Granted on July 1, 2003
Granted on July 1, 2004
Granted on August 31, 2005
Individuals covered by the plan Directors of the Company 18 4 6
Corporate officers of the Company — 16 26
Employees of the Company 37 36 —
Total 55 56 32
Type and number of shares to be issued upon the exercise of the stock subscription rights Common stock 141,000 147,000 104,800
Vesting period— —
From July 1, 2005 to June 23, 2006
Exercise period From July 1, 2005 to June 27, 2013
From July 1, 2006 to June 24, 2014
From September 1, 2005 to June 24, 2025
Stock subscription rights granted as a stock option plan
Granted on February 13, 2007
Granted on August 10, 2007
Granted on September 16, 2008
Individuals covered by the plan Directors of the Company 4 4 3
Corporate officers of the Company 27 26 23
Employees of the Company — — —
Total 31 30 26
Type and number of shares to be issued upon the exercise of the stock subscription rights Common stock 75,700 74,000 72,700
Vesting period From July 1, 2006 to June 26, 2007
From July 1, 2007 to June 25, 2008
From July 1, 2008 to June 23, 2009
Exercise period From February 14, 2007 to June 27, 2026
From August 11, 2007 to June 26, 2027
From September 17, 2008 to June 24, 2028
Stock subscription rights granted as a stock option plan
Granted on July 8, 2009
Individuals covered by the plan Directors of the Company 3
Corporate officers of the Company 25
Employees of the Company —
Total 28
Type and number of shares to be issued upon the exercise of the stock subscription rights Common stock 114,900
Vesting period From July 1, 2009 to June 22, 2010
Exercise period From July 9, 2009 to June 23, 2029
61Astellas Pharma Inc. Annual Report 2010
Notes to Consolidated Financial Statem
ents

Conditions for the exercise of stock subscription rights are as follows:
1) For stock options granted in 2003 and 2004, there are no vesting conditions.
2) For stock options granted in 2005 and thereafter, individuals granted stock options are required to meet certain criteria.
The following table summarizes the movements of stock subscriptions rights:
Stock subscription rights granted as a stock option plan
Granted on July 1, 2003
Granted on July 1, 2004
Granted on August 31, 2005
Unvested stock subscription rights (shares)
Outstanding as of March 31, 2009 — — —
Granted — — —
Forfeited — — —
Vested — — —
Outstanding as of March 31, 2010 — — —
Vested stock subscription rights (shares)
Outstanding as of March 31, 2009 17,500 69,100 91,500
Vested — — —
Exercised 3,700 — 3,500
Forfeited — — —
Outstanding as of March 31, 2010 13,800 69,100 88,000
Exercise price (Yen) 3,209 3,690 1
Weighted average exercise price (Yen) 3,389 — 3,323
Weighted average fair value per stock at the granted date (Yen) — — —
Exercise price (U.S. dollars) 34.51 39.68 0.01
Weighted average exercise price (U.S. dollars) 36.44 — 35.73
Weighted average fair value per stock at the granted date (U.S. dollars) — — —
62 Astellas Pharma Inc. Annual Report 2010

Stock subscription rights granted as a stock option plan
Granted on February 13, 2007
Granted on August 10, 2007
Granted on September 16, 2008
Unvested stock subscription rights (shares)
Outstanding as of March 31, 2009 — — 18,175
Granted — — —
Forfeited — — —
Vested — — 18,175
Outstanding as of March 31, 2010 — — —
Vested stock subscription rights (shares)
Outstanding as of March 31, 2009 70,300 70,200 54,525
Vested — — 18,175
Exercised 3,000 — —
Forfeited — — —
Outstanding as of March 31, 2010 67,300 70,200 72,700
Exercise price (Yen) 1 1 1
Weighted average exercise price (Yen) 3,338 — —
Weighted average fair value per stock at the granted date (Yen) 5,009 4,639 3,980
Exercise price (U.S. dollars) 0.01 0.01 0.01
Weighted average exercise price (U.S. dollars) 35.89 — —
Weighted average fair value per stock at the granted date (U.S. dollars) 53.86 49.88 42.80
Stock subscription rights granted as a stock option plan
Granted on July 8, 2009
Unvested stock subscription rights (shares)
Outstanding as of March 31, 2009 —
Granted 114,900
Forfeited —
Vested 86,175
Outstanding as of March 31, 2010 28,725
Vested stock subscription rights (shares)
Outstanding as of March 31, 2009 —
Vested 86,175
Exercised —
Forfeited —
Outstanding as of March 31, 2010 86,175
Exercise price (Yen) 1
Weighted average exercise price (Yen) —
Weighted average fair value per stock at the granted date (Yen) 2,942
Exercise price (U.S. dollars) 0.01
Weighted average exercise price (U.S. dollars) —
Weighted average fair value per stock at the granted date (U.S. dollars) 31.63
63Astellas Pharma Inc. Annual Report 2010
Notes to Consolidated Financial Statem
ents

Stock option expense was included in selling, general and administrative expenses for the year ended March 31, 2010 amounted to ¥326
million ($4 million). The fair value of options granted on July 8, 2009 was estimated using the binomial model with the following weighted
average assumptions.
Stock subscription rights granted on July 8, 2009
as a stock option plan
Expected volatility 30.39%
Expected holding period 4 years
Expected dividend per share 120 yen
Risk-free rate 1.99%
9. Income Taxes
Income taxes applicable to the Company and its domestic subsid-
iaries comprise corporation tax, inhabitants’ taxes and enterprise
tax which, in the aggregate, resulted in statutory tax rate of
approximately 41% for 2010, 2009 and 2008. Income taxes of the
foreign subsidiaries are based generally on the tax rates applicable
in their countries of incorporation.
The effective tax rates reflected in the consolidated statements of income for the years ended March 31, 2010, 2009 and 2008 differ from
the statutory tax rate for the following reasons:
2010 2009 2008
Statutory tax rate 41.0% 41.0% 41.0%Effect of: Tax deductions for research and development expenses (7.0) (4.5) (3.3) Different tax rates applied to income of foreign subsidiaries (6.3) (4.2) (4.0) Expenses not deductible for income tax purposes 3.3 2.2 1.5 Amortization of goodwill 2.1 1.2 0.3 Equity in earnings of affiliates — — (1.2) Other, net 0.4 (1.6) (1.1)
Effective tax rates 33.5% 34.1% 33.2%
64 Astellas Pharma Inc. Annual Report 2010

The significant components of the deferred tax assets and liabilities as of March 31, 2010 and 2009 were as follows:
Millions of yenMillions of U.S. dollars
2010 2009 2010
Deferred tax assets: Loss on devaluation of investment securities ¥ 2,743 ¥ 3,604 $ 29 Accrued retirement benefits 6,945 6,401 75 Depreciation and amortization 39,804 34,396 428 Loss on impairment of fixed assets 4,907 4,663 53 Accrued expenses 22,845 23,129 246 Inventories 20,401 24,797 219 Accrued enterprise and other taxes 1,779 2,916 19 Other 36,899 44,236 397Gross deferred tax assets 136,323 144,142 1,466Valuation allowance (8,581) (14,940) (92) Total deferred tax assets 127,742 129,202 1,374Deferred tax liabilities: Unrealized holding gain on securities 9,071 6,229 98 Depreciation and amortization 564 1,136 6 Other 7,903 8,883 85 Total deferred tax liabilities 17,538 16,248 189Net deferred tax assets ¥110,204 ¥112,954 $1,185
10. Retirement Benefit PlansThe Company and its domestic subsidiaries have defined benefit
plans, corporate pension fund plans and a lump-sum payment plans,
and defined contribution plans.
In addition, certain employees may be entitled to additional
special retirement benefits upon early termination of employment
based on the conditions under which termination occurs. Such ben-
efits are not subject to the actuarial calculation required by the
accounting standard for retirement benefits.
Certain foreign subsidiaries have defined benefit plans and
defined contribution plans.
The following table sets forth the funded and accrued status of the plans, and the amounts recognized in the consolidated balance sheets
as of March 31, 2010 and 2009 for the defined benefit plans:
Millions of yenMillions of U.S. dollars
2010 2009 2010
Retirement benefit obligation ¥(146,961) ¥(145,364) $(1,580)Plan assets at fair value 120,661 106,645 1,297Unfunded retirement benefit obligation (26,300) (38,719) (283)Unrecognized actuarial loss 18,647 33,774 201Unrecognized past service cost (8,192) (9,075) (88)Net retirement benefit obligation (15,845) (14,020) (170)Prepaid pension cost 1,793 1,010 20Accrued retirement benefits ¥ (17,638) ¥ (15,030) $ (190)
65Astellas Pharma Inc. Annual Report 2010
Notes to Consolidated Financial Statem
ents

The components of retirement benefit expenses for the years ended March 31, 2010, 2009 and 2008 are outlined as follows:
Millions of yenMillions of U.S. dollars
2010 2009 2008 2010
Service cost ¥ 4,399 ¥ 4,893 ¥ 5,690 $ 47Interest cost 3,984 4,120 4,323 43Expected return on plan assets (3,778) (4,570) (3,768) (41)Amortization of actuarial loss 4,101 2,451 1,681 44Amortization of past service cost (869) (825) (880) (9)Other 5,792 7,590 16,571 63 Total ¥13,629 ¥13,659 ¥23,617 $147
The assumptions used in accounting for the above plans were as follows:
2010 2009
Discount rates 2.0%–5.2% 2.0%–6.1%Expected rates of return on plan assets 3.0%–4.4% 3.0%–5.0%
11. Research and Development ExpensesResearch and development expenses, all of which were included in selling, general and administrative expenses for the years ended March 31,
2010, 2009 and 2008, totaled ¥195,570 million ($2,103 million), ¥159,059 million and ¥134,464 million, respectively.
12. LeasesFuture minimum lease payments subsequent to March 31, 2010 on non-cancelable operating lease transactions are summarized as follows:
Year ending March 31, Millions of yenMillions of U.S. dollars
2011 ¥ 4,983 $ 542012 and thereafter 16,335 176 Total ¥21,318 $230
See Note 3 (b).
66 Astellas Pharma Inc. Annual Report 2010

13. Contingent LiabilitiesContingent liabilities of the Company and its subsidiaries as of March 31, 2010 and 2009 were as follows:
Millions of yenMillions of U.S. dollars
2010 2010
Contingent liabilities as guarantors of indebtedness of the Company’s employees and affiliates ¥2,545 $27
Millions of yen2009
Contingent liabilities as guarantors of indebtedness of the Company’s employees and affiliates ¥3,025
The Company and its subsidiaries may be involved in various
lawsuits during the normal course of business. The management
believes the lawsuits in which the Company and its subsidiaries are
currently involved would not have material adverse impacts on the
financial conditions and/or operating results.
14. Amounts per ShareYen U.S. dollars
2010 2009 2008 2010
Net income: Basic ¥ 261.84 ¥ 356.11 ¥ 349.89 $ 2.82 Diluted 261.62 355.90 349.71 2.81Cash dividends 125.00 120.00 110.00 1.34Net assets 2,278.77 2,189.26 2,228.34 24.50
Basic net income per share is computed based on net income avail-
able for distribution to shareholders of common stock and the
weighted-average number of shares of common stock outstanding
during the year.
Diluted net income per share is computed based on net income
available for distribution to the shareholders and the weighted-
average number of shares of common stock outstanding during
each year after giving effect to the dilutive potential of shares of
common stock to be issued upon the exercise of stock subscription
rights and the conversion of convertible bonds. There were no
outstanding issues of convertible bonds during the years ended
March 31, 2010 and 2009.
Cash dividends per share represent the annual cash dividends
declared as applicable to the respective years including the interim
cash dividends paid.
Net assets per share are computed based on the amount of net
assets at the year end excluding stock subscription rights and minor-
ity interests, and the number of common stock outstanding at the
year end.
67Astellas Pharma Inc. Annual Report 2010
Notes to Consolidated Financial Statem
ents

15. Supplementary Cash Flow InformationAgensys, Inc. was consolidated as a result of the acquisition of 100% of its stock during the year ended March 31, 2008. The following is a
summary of the assets acquired and liabilities assumed:
Millions of yen
Current assets ¥ 3,305Property, plant and equipment 4,781Goodwill 30,862Current liabilities (345)Long-term liabilities (7)
Acquisition cost of stock of Agensys, Inc. ¥38,596Cash and cash equivalents of Agensys, Inc. (3,171)Effect of exchange rate fluctuation 4,982
Net cash used in the acquisition ¥40,407
16. Financial Instruments
Basic policy to manage financial instruments and related risksThe Company has set its financial investment policy, which aims to
preserve financial assets for strategic investment opportunities, by
putting priority on safety, and mitigating opportunity loss while
keeping sufficient liquidity. In the case that financing is necessary, the
most appropriate measure will be chosen among the various options
including bank loans, bond issuance or stock offering, taking into
account business circumstances and financial market conditions.
Derivative transactions are utilized solely for the purpose of hedging
exposure to adverse fluctuation primarily in foreign currency
exchange rates or interest rates, but the Company does not enter into
such transactions for speculative or trading purposes.
With regard to bank deposits, the Company and its subsidiaries
enter into transactions only with financial institutions with high credit
ratings. Although accounts receivable are exposed to credit risk in
relation to customers, the risk is managed by monitoring business
conditions, creditworthiness and outstanding balances by individual
customer. In addition, monthly collections of accounts receivable are
monitored. With regard to listed stocks that the Company has invested
in, the Company manages the price volatility risk by monthly monitor-
ing of market prices of those stocks. Derivative transactions are exe-
cuted based on internal rules and the balance of derivative transactions
is monitored monthly. To minimize credit risk in the event of nonper-
formance by the counterparties, the Company and its subsidiaries
enter into derivative transactions only with financial institutions with
high credit ratings.
Fair value of financial instrumentsThe following table summarizes carrying values and fair values of financial instruments at March 31, 2010.
Millions of yen Millions of U.S. dollarsCarrying value Fair value Difference Carrying value Fair value Difference
Cash and cash equivalents ¥ 431,920 ¥ 431,920 ¥— $ 4,644 $ 4,644 $—Notes and accounts receivable 256,870 256,870 — 2,762 2,762 —Short-term investments and Investment securities Other securities 172,146 172,146 — 1,851 1,851 —Notes and accounts payable ¥(177,989) ¥(177,989) ¥— $(1,914) $(1,914) $—
Numbers with parenthesis represent liabilities in the above table.
The above table does not include financial instruments for which it is extremely difficult to determine fair value because no quoted market
price nor future cash flow is available.
68 Astellas Pharma Inc. Annual Report 2010

The following methods and assumptions were used in estimat-
ing fair value disclosures for financial instruments:
Cash and cash equivalents, notes and accounts receivable, notes
and accounts payable: The carrying amount approximates fair value
because of the short maturity of the instruments.
Short-term investments and investment securities: The fair value of
stocks is based on quoted market prices. The fair value of debt securi-
ties is based on either quoted market prices or prices provided by the
financial institutions making markets in these securities.
SecuritiesInformation regarding marketable securities classified as held-to-maturity debt securities and other securities as of March 31, 2010 and 2009 is
summarized as follows:
Held-to-maturity debt securities
There were no held-to-maturity debt securities outstanding as of March 31, 2010.
Millions of yen
2009
Carrying valueEstimated fair value
Unrealized gain (loss)
Securities whose fair value exceeds their carrying value: Government/local bonds ¥600 ¥602 ¥ 2 Corporate bonds — — — Other — — —
Total ¥600 ¥602 ¥ 2
Other securitiesMillions of yen Millions of U.S. dollars
2010 2010
Acquisition cost Carrying valueUnrealized gain (loss) Acquisition cost Carrying value
Unrealized gain (loss)
Securities whose carrying value exceeds their acquisition cost: Stock ¥ 20,532 ¥ 45,659 ¥25,127 $ 221 $ 491 $270 Debt securities 76,785 76,854 69 826 827 1 Other 2,000 2,097 97 21 22 1 Subtotal 99,317 124,610 25,293 1,068 1,340 272Securities whose acquisition cost exceeds their carrying value: Stock 467 417 (50) 5 4 (1) Debt securities 41,461 41,330 (131) 445 444 (1) Other 113,513 113,513 — 1,221 1,221 — Subtotal 155,441 155,260 (181) 1,671 1,669 (2) Total ¥254,758 ¥279,870 ¥25,112 $2,739 $3,009 $270
69Astellas Pharma Inc. Annual Report 2010
Notes to Consolidated Financial Statem
ents

Millions of yen
2009
Acquisition cost Carrying valueUnrealized gain (loss)
Securities whose carrying value exceeds their acquisition cost: Stock ¥ 20,448 ¥ 40,391 ¥19,943 Debt securities 52,361 52,540 179 Other — — —
Subtotal 72,809 92,931 20,122
Securities whose acquisition cost exceeds their carrying value: Stock 13,344 11,673 (1,671) Debt securities 125,446 123,243 (2,203) Other 2,050 2,031 (19)
Subtotal 140,840 136,947 (3,893)
Total ¥213,649 ¥229,878 ¥16,229
Proceeds from sales of securities classified as other securities and the related aggregate gains and losses for the years ended March 31,
2010, 2009 and 2008 are summarized as follows:
Millions of yen Millions of U.S. dollars
2010 2010Proceeds Aggregate gain Aggregate loss Proceeds Aggregate gain Aggregate loss
Stock ¥ 3,705 ¥2,700 ¥39 $ 40 $29 $ 0Debt securities 4,613 — 3 50 — 0Other 53,558 — — 576 — — Total ¥61,876 ¥2,700 ¥42 $666 $29 $ 0
Millions of yen
2009 2008Proceeds Aggregate gain Aggregate loss Proceeds Aggregate gain Aggregate loss
¥38,807 ¥508 ¥389 ¥25,996 ¥123 ¥4
The redemption schedule for securities with maturities as of March 31, 2010 is summarized as follows:
Millions of yenDue in
one year or less
Due after one year through
five years
Due after five years through
ten yearsDue after ten years
Government/local bonds ¥ 97,522 ¥ 92 ¥1,995 ¥ 20Corporate bonds 14,044 4,262 — —Other debt securities 40,998 59 — 153Other 9,000 — — — Total ¥161,564 ¥4,413 ¥1,995 ¥173
70 Astellas Pharma Inc. Annual Report 2010

Millions of U.S. dollarsDue in
one year or less
Due after one year through
five years
Due after five years through
ten yearsDue after ten years
Government/local bonds $1,049 $ 1 $21 $ 0Corporate bonds 151 46 — —Other debt securities 441 1 — 2Other 97 — — — Total $1,738 $48 $21 $2
Securities without determinable fair value
Millions of yenMillions of U.S. dollars
2010 2010Carrying value Carrying value
Non marketable stocks ¥15,595 $168 Total ¥15,595 $168
Millions of yen
2009Carrying value
Non marketable stocks ¥ 5,016Senior investment securities 5,000Certificate of deposits 32,000Commercial paper 42,775Money management fund 20,056
Impairment loss on securities
Impairment loss on securities amounting to ¥675 million ($7 million) in the year ended March 31, 2010.
Derivative TransactionsThere were no outstanding derivative transactions as of March 31, 2010.
The notional amounts and the estimated fair value of derivatives outstanding as of March 31, 2009 are summarized as follows:
Millions of yen
2009Notional amount Fair value
Unrealized gain (loss)
Forward foreign exchange contracts Sell: U.S. dollars ¥1,663 ¥1,669 ¥ (6) Euros 3,224 3,374 (150) British pounds 139 140 (1)
Total ¥5,026 ¥5,183 ¥(157)
The notional amounts of the derivatives do not necessarily represent the amounts exchanged by the parties and, therefore, are not a
direct measure of the risk exposure in connection with derivatives.
71Astellas Pharma Inc. Annual Report 2010
Notes to Consolidated Financial Statem
ents

The consolidated statement of income for the year ended March
31, 2008 included the results of operations of Agensys, Inc. from the
date of acquisition. Had the business combination completed at the
beginning of the year, the effect for the year ended March 31, 2008
on net sales would have been immaterial, however, operating income,
and income before income taxes and minority interests would have
been decreased by approximately ¥7,899 million for the year ended
March 31, 2008.
The excess of cost over underlying net assets at fair value at the
date of acquisition was recognized as goodwill in the amount of
¥30,862 million and has been amortized over a period of five years on
a straight-line basis. After the acquisition, five milestones were
achieved and US$125 million had been recognized as goodwill by
the year ended March 31, 2010. Those goodwill has been amortized
over the same period as the goodwill from upfront purchase price.
18. Segment Information
Business segmentsThe Company and its subsidiaries’ businesses are segmented into
“Pharmaceutical” and “Other” based on their similarity in terms of dis-
tribution methods, the nature and type of products sold, and
manufacturing methods. As net sales, operating income and total
assets in the “Pharmaceutical” segment constituted more than 90% of
the consolidated totals, the disclosure of business segment informa-
tion has been omitted.
Millions of yen
Current assets ¥3,305Long-term assets 4,781
Total assets ¥8,086
Current liabilities ¥ 345Long-term liabilities 7
Total liabilities ¥ 352
17. Acquisition of Stock of Agensys, Inc.
On December 18, 2007, Astellas acquired 100% shares of stock of
Agensys, Inc., a biotechnology company specializing in therapeutic
antibody research and development in cancer area. The acquisition
was to reinforce and to accelerate the antibody research and develop-
ment in oncology field, which is one of the important research areas.
All of the upfront purchase price of ¥38,596 million was paid by
cash. In addition, Astellas was to pay up to a maximum of US$150
million if certain predefined milestones are achieved. The acquisition
has been accounted for as a purchase business combination. Under
the purchase method of accounting, the assets acquired and liabili-
ties assumed from Agensys, Inc. were recorded at their respective fair
values as of the date of acquisition. The summarized information of
those fair values were as follows:
Geographical areasGeographical areas, which include the results of the operation attributed by the location of the Company and its subsidiaries, for the years ended
March 31, 2010, 2009, and 2008 are summarized as follows:
Millions of yenYear ended March 31, 2010 Japan North America Europe Asia Total Eliminations Consolidated
Sales to third parties ¥529,243 ¥179,807 ¥235,861 ¥29,967 ¥ 974,878 ¥ — ¥ 974,878Intergroup sales and transfers 106,851 67,496 66,193 28 240,568 (240,568) — Total sales 636,094 247,303 302,054 29,995 1,215,446 (240,568) 974,878Operating expenses 521,563 232,484 258,121 27,694 1,039,862 (251,391) 788,471Operating income ¥114,531 ¥ 14,819 ¥ 43,933 ¥ 2,301 ¥ 175,584 ¥ 10,823 ¥ 186,407
Total assets ¥877,072 ¥202,982 ¥303,872 ¥18,873 ¥1,402,799 ¥ (38,622) ¥1,364,177
72 Astellas Pharma Inc. Annual Report 2010

Millions of U.S. dollarsYear ended March 31, 2010 Japan North America Europe Asia Total Eliminations Consolidated
Sales to third parties $5,692 $1,933 $2,535 $323 $10,483 $ — $10,483Intergroup sales and transfers 1,149 726 712 0 2,587 (2,587) — Total sales 6,841 2,659 3,247 323 13,070 (2,587) 10,483Operating expenses 5,609 2,500 2,775 298 11,182 (2,703) 8,479Operating income $1,232 $ 159 $ 472 $ 25 $ 1,888 $ 116 $ 2,004
Total assets $9,431 $2,183 $3,267 $203 $15,084 $ (415) $14,669
Millions of yenYear ended March 31, 2009 Japan North America Europe Asia Total Eliminations Consolidated
Sales to third parties ¥510,500 ¥188,853 ¥239,114 ¥27,231 ¥ 965,698 ¥ — ¥ 965,698Intergroup sales and transfers 130,153 68,004 54,649 18 252,824 (252,824) —
Total sales 640,653 256,857 293,763 27,249 1,218,522 (252,824) 965,698Operating expenses 465,066 224,013 253,937 23,882 966,898 (251,595) 715,303
Operating income ¥175,587 ¥ 32,844 ¥ 39,826 ¥ 3,367 ¥ 251,624 ¥ (1,229) ¥ 250,395
Total assets ¥909,020 ¥201,035 ¥271,139 ¥16,869 ¥1,398,063 ¥ (49,617) ¥1,348,446
Millions of yenYear ended March 31, 2008 Japan North America Europe Asia Total Eliminations Consolidated
Sales to third parties ¥ 505,596 ¥194,506 ¥244,643 ¥27,841 ¥ 972,586 ¥ — ¥ 972,586Intergroup sales and transfers 111,792 64,497 58,048 10 234,347 (234,347) —
Total sales 617,388 259,003 302,691 27,851 1,206,933 (234,347) 972,586Operating expenses 441,348 202,672 261,657 25,098 930,775 (234,093) 696,682
Operating income ¥ 176,040 ¥ 56,331 ¥ 41,034 ¥ 2,753 ¥ 276,158 ¥ (254) ¥ 275,904
Total assets ¥1,034,390 ¥148,591 ¥278,727 ¥18,221 ¥1,479,929 ¥ (40,777) ¥1,439,152
Overseas salesOverseas sales, which include the sales of attributed by the location of customers, for the years ended March 31, 2010, 2009 and 2008 are
summarized as follows:
Millions of yenYear ended March 31, 2010 North America Europe Asia Other Total
Overseas sales ¥224,865 ¥181,249 ¥40,470 ¥14,128 ¥460,712Consolidated net sales 974,878
Millions of U.S. dollarsYear ended March 31, 2010 North America Europe Asia Other Total
Overseas sales $2,418 $1,949 $435 $152 $ 4,954Consolidated net sales 10,483Overseas sales as a percentage of consolidated net sales 23.1% 18.6% 4.2% 1.4% 47.3%
Millions of yenYear ended March 31, 2009 North America Europe Asia Other Total
Overseas sales ¥235,023 ¥180,393 ¥35,875 ¥17,688 ¥468,979Consolidated net sales 965,698Overseas sales as a percentage of consolidated net sales 24.3% 18.7% 3.7% 1.9% 48.6%
73Astellas Pharma Inc. Annual Report 2010
Notes to Consolidated Financial Statem
ents

Acquisition of OSI Pharmaceuticals, Inc.In June 2010, Astellas acquired OSI Pharmaceuticals, Inc. (OSI), a US-
based biotechnology company through a tender offer, and OSI
became a wholly-owned consolidated subsidiary of the Company.
(1) Objectives of the acquisition
Astellas has set goals of becoming a “Global Category Leader”
(“GCL”) in its “VISION 2015.” In order to realize GCL in the oncol-
ogy field, Astellas has defined that therapeutic field as one of its
prioritized research areas and has been taking initiatives to
quickly establish the oncology platform. This acquisition will
quickly provide a top-tier oncology business in the United
States and further expand its product portfolio and pipeline.
Furthermore, by adding not only OSI’s oncology infrastructure,
but also its discovery platform and talent base to the existing
business, Astellas can strengthen its growth strategies through
maximizing the value of business resources possessed by both
companies. In addition to these contributions to mid- and
long-term growth, this acquisition is expected to contribute
the performance even in shorter-term through the revenue
from Tarceva, an anti-cancer blockbuster product generated
by OSI.
(2) Outline of OSI
– Trade name: OSI Pharmaceuticals, Inc.
– Location: Melville, New York, USA
– Representative: Colin Goddard, Ph. D., CEO
– Major business: Research and development, and
marketing of pharmaceuticals in
oncology and diabetes/obesity field
– Foundation: 1984
– Outstanding shares issued:
61,207,646 (as of May 3, 2010)
– Business performance in the year ended December 31, 2009
Net sales: $428 million
Net income: $76 million
(3) Outline of tender offer
– Tender period: March 2, 2010 to June 7, 2010 (EST)
– Type of shares acquired: Common stocks
– Tender price: $57.50 per share
– Funds to close the tender offer:
approximately $40 billion (fully
diluted basis)
– Financing to close the tender offer:
Cash in hand
20. Subsequent Events
19. Impairment LossThe Company and its subsidiaries base the grouping for assessing
impairment losses on the business segments. However, the Company
and its subsidiaries determine whether an asset is impaired on an
individual asset basis when the asset is deemed idle or if it is sched-
uled to be disposed of. Loss on impairment of fixed assets, which was
recognized by reducing the book value of such assets to their respec-
tive realized value, for the years ended March 31, 2010, 2009 and 2008
amounted to ¥4,082 million ($44 million), ¥1,340 million and ¥9,331
million, respectively. Loss on impairment of fixed assets for the year
ended March 31, 2010 mainly consists of losses on buildings and
structures in the aggregate amount of ¥3,602 million ($39 million).
Loss on impairment of fixed assets for the year ended March 31, 2009
mainly consists of losses on buildings and structures in the aggregate
amount of ¥1,088 million. Loss on impairment of fixes assets for the
year ended March 31, 2008 mainly consists of losses on land in the
aggregate amount of ¥3,389 million and on buildings and structures
in the aggregate amount of ¥3,248 million.
Millions of yenYear ended March 31, 2008 North America Europe Asia Other Total
Overseas sales ¥247,129 ¥195,636 ¥34,399 ¥12,407 ¥489,571Consolidated net sales 972,586Overseas sales as a percentage of consolidated net sales 25.4% 20.1% 3.5% 1.3% 50.3%
74 Astellas Pharma Inc. Annual Report 2010

Report of Independent Auditors
The Board of Directors
Astellas Pharma Inc.
We have audited the accompanying consolidated balance sheets of Astellas Pharma Inc. (the “Company”) and subsidiaries as of March 31, 2010
and 2009, and the related consolidated statements of income, changes in net assets, and cash flows for each of the three years in the period
ended March 31, 2010, all expressed in yen. These financial statements are the responsibility of the Company’s management. Our responsibility
is to express an opinion on these financial statements based on our audits.
We conducted our audits in accordance with auditing standards generally accepted in Japan. Those standards require that we plan and per-
form the audit to obtain reasonable assurance about whether the financial statements are free of material misstatement. An audit includes
examining, on a test basis, evidence supporting the amounts and disclosures in the financial statements. An audit also includes assessing the
accounting principles used and significant estimates made by management, as well as evaluating the overall financial statement presentation.
We believe that our audits provide a reasonable basis for our opinion.
In our opinion, the financial statements referred to above present fairly, in all material respects, the consolidated financial position of Astellas
Pharma Inc. and subsidiaries at March 31, 2010 and 2009, and the consolidated results of their operations and their cash flows for each of the
three years in the period ended March 31, 2010 in conformity with accounting principles generally accepted in Japan.
Supplemental Information
As described in Note 20, “Subsequent Events,” Astellas Pharma Inc. acquired all of the shares of OSI Pharmaceuticals, Inc. (“OSI”) on June 8, 2010,
and OSI became a consolidated subsidiary of the Company.
The U.S. dollar amounts in the accompanying consolidated financial statements with respect to the year ended March 31, 2010 are presented
solely for convenience. Our audit also included the translation of yen amounts into U.S. dollar amounts and, in our opinion, such translation has
been made on the basis described in Note 4.
June 23, 2010
75Astellas Pharma Inc. Annual Report 2010
Report of Independent Auditors

Principal Subsidiaries and Affiliates(as of July 2010)
Americas
Holding company in North America
Astellas US Holding, Inc. Three Parkway North, Deerfield, IL 60015, USTEL: +1-847-317-8800
Headquarters in North America
Astellas US LLC Three Parkway North, Deerfield, IL 60015, US TEL: +1-847-317-8800
Other principal subsidiaries and affiliates in The Americas
Astellas Pharma US, Inc. Three Parkway North, Deerfield, IL 60015, US TEL: +1-847-317-8800
Astellas Pharma Global Development, Inc. Three Parkway North, Deerfield, IL 60015, US TEL: +1-847-317-8800
Astellas Pharma Canada, Inc. 675 Cochrane Drive, Suite 500, Markham, Ontario L3R 0B8, Canada TEL: +1-905-470-7990
Astellas Pharma Technologies, Inc. 3300 Marshall Avenue, Norman, OK 73072, US TEL: +1-405-217-6501
Astellas US Technologies, Inc. Three Parkway North, Deerfield, IL 60015, US TEL: +1-847-317-8800
Agensys, Inc. 2225 Colorado Avenue, Santa Monica, CA 90404, US TEL: +1-310-820-8029
Astellas Research Institute of America LLC P.O. Box 188, Skokie, IL 60076-0188, US
Astellas Venture Management LLC P.O. Box H, Los Altos, CA 94023, US
Urogenix, Inc. P.O. BOX 12035 Durham, NC 27709, US
Astellas Farma Brasil Importação e Distribuição de Medicamentos Ltda.Av. das Nações Unidas 14.171, Rochaverá Corporate Towers, Torre B – Andar 3 – Sala 302, São Paulo SP – CEP: 04794-000TEL: +55-11-8228-3052
OSI Pharmaceuticals, Inc.41 Pinelawn Road Melville, NY 11747, USTEL: +1-631-962-2000
Europe
Holding company in Europe
Astellas B.V. Elisabethhof 19, P.O. Box 108, 2350 AC, Leiderdorp, The NetherlandsTEL: +31-715-455-500
European headquarters
Astellas Pharma Europe Ltd. Lovett House, Lovett Road, Staines, Middlesex, TW18 3AZ, U.K. TEL: +44-1784-4194-00
Other principal subsidiaries and affiliates in Europe
Astellas Pharma Europe B.V. Elisabethhof 19, P.O. Box 108, 2350 AC, Leiderdorp, The NetherlandsTEL: +31-715-455-500
Astellas Ireland Co., Ltd.Damastown Road, Damastown Industrial Park, Mulhuddart, Dublin 15, Republic of Ireland TEL: +353-1-803-0800
• Germany
Astellas Pharma GmbHGeorg-Brauchle-Ring 64-66, 80992, Munich, GermanyTEL: +49-89-45-44-01
• Spain
Astellas Pharma S.A.Parque Empresarial ‘La Finca’, Paseo del Club Deportivo nº1, Bloque 14, 2ª planta, 28223 Pozuelo de Alarcón, Madrid, SpainTEL: +34-91-495-2700
• France
Astellas Pharma S.A.SLe Malesherbes, 114 Rue Victor Hugo, 92686, Levallois Perret, Paris, FranceTEL: +33-1-55-91-75-00
• Italy
Astellas Pharma S.p.A.Via delle Industrie 1, 20061, Carugate, Milan, ItalyTEL: +39-02-92-138-1
• United Kingdom
Astellas Pharma Ltd.Lovett House, Lovett Road, Staines, Middlesex, TW18 3AZ, U.K.TEL: +44-1784-4194-00
• Export
Astellas Pharma International B.V.Elisabethhof 19, P.O. Box 108, 2350 AC, Leiderdorp, The NetherlandsTEL: +31-715-455-500
• Northern Europe
Astellas Pharma A/SNaverland 4, DK - 2600 Glostrup, DenmarkTEL: +45-434-30-355
• Poland
Astellas Pharma Sp.zo.o.Poleczki 21, 02-822, Warsaw, PolandTEL: +48-22-545-11-11
76 Astellas Pharma Inc. Annual Report 2010

• Russia
ZAO Astellas PharmaMarksistskaya Ulitsa 16, 109147, Moscow, RussiaTEL: +709-5737-0755
• Netherlands
Astellas Pharma B.V.Elisabethhof 19, P.O. Box 108, 2350 AC, Leiderdorp, The NetherlandsTEL: +31-715-455-500
• Belgium
Astellas Pharma B.V. (Branch)Erasmus Park, Square Marie Curie 50/1, Building 5, 1070 Brussels,BelgiumTEL: +32-2-558-07-10
• Portugal
Astellas Farma LimitadaEdificio Cinema, Rua José Fontana, nº1-1 andar, 2770-101Paço de Arcos, PortugalTEL: +351-21-440-13-00
• Austria
Astellas Pharma Ges.mbHLinzerstrasse 221/E02, A 1140 Vienna, AustriaTEL: +43-1-877-26-68
• Ireland
Astellas Pharma Co., Limited25 The Courtyard, Kilcarbery Business Park, Clondalkin, Dublin 22,Republic of IrelandTEL: +353-1-467-1555
• Czech Republic
Astellas Pharma s.r.oSokolovská 100/94, 186 00 Prague 8, Czech RepublicTEL: +420-236-080-300
• Greece
Astellas Pharmaceuticals AEBEThoukididou 1, 145 65 Ag. Stefanos, Athens, GreeceTEL: +30-2108-189-911
• Switzerland
Astellas Pharma A.G.Grindelstrasse 6, CH-8304, Wallisellen, SwitzerlandTEL: +41-43-233-60-20
• South Africa
Astellas Pharma (Pty) LimitedGillooly’s View Office Park, Block F, Ground Floor, 5 Osborne Lane,Bedfordview 2007 Johannesburg, South AfricaTEL: +011-615-9433
• Hungary
Astellas Pharma KftKelenhegyi út 43, H 1118 Budapest, HungaryTEL: +36-1-361-4673
• Turkey
Astellas Pharma ilaç Ticaret ve Sanayi A.Ş.Tekstilkent Koza Plaza, A Blok 16.Kat No: 60, 34235 Esenler, Istanbul, TurkeyTEL: +90-212-440-0800
Asia
Astellas Pharma China, Inc. 1901-1904, SK Tower Beijing, No.6 Jia Jianguomenwai Avenue, Chaoyang District, Beijing 100022, People’s Republic of China TEL: +86-10-8567-9911
Astellas Pharma Hong Kong Co., Ltd. Unit 1103, 5-7, Level 11, Tower 1, Grand Century Place, No.193 Prince Edward Road West, Mongkok, Kowloon, Hong KongTEL: +852-2377-9801
Astellas Pharma Taiwan, Inc. 5/F, No.10, Sec 3, Min-Sheng E. Rd., Taipei 104 Taiwan, R.O.C. TEL: +886-2-2507-5799
Astellas Pharma Korea, Inc. 6/F Kumha Bldg. 41-2 Chungdam-Dong Kangnam-Ku, Seoul, 135-766 Korea TEL: +82-2-3448-0504
Astellas Pharma Philippines, Inc. 23/F, Salcedo Towers 169 H.V. del Costa Street Salcedo Village 1227 Makati City, Philippines TEL: +63-2-845-1558
Astellas Pharma (Thailand) Co., Ltd. 10/F, Wave Place, 55 Wireless Road, Lumpini, Patumwan,Bangkok 10330, Thailand TEL: +66-2-655-4050
P.T. Astellas Pharma Indonesia Wisma Kyoei Prince Building 11/F, Jl. Jend. Sudirman Kav. 3,Jakarta 10220, Indonesia TEL: +62-21-572-4344
Astellas Pharma India Private LimitedUnit No. 505 & 506, Meadows Sahar Plaza Complex, Andheri Kurla Road, Andheri East, Mumbai MM-4-00059, IndiaTEL: +91-22-4075-7676
Japan
Manufacturing subsidiaries
Astellas Tokai Co., Ltd.
Astellas Toyama Co., Ltd.
Astellas Pharma Chemicals Co., Ltd.
77Astellas Pharma Inc. Annual Report 2010
Principal Subsidiaries and Affiliates

Investor Information(as of March 31, 2010)
Company NameAstellas Pharma Inc.
Head Office2-3-11, Nihonbashi-Honcho, Chuo-ku, Tokyo 103-8411, Japan
TEL: +81-3-3244-3000
http://www.astellas.com/en/
Common StockAuthorized: 2,000,000,000
Issued: 475,964,635 (including 14,146,832 treasury stock) *On May 31, 2010, Astellas cancelled 8 million shares of common stock held as treasury stock.
Number of shareholders: 51,576
Stock Exchange ListingTokyo, Osaka
(Ticker Code: 4503)
Independent AuditorsErnst & Young ShinNihon LLC
Osaka Kokusai Bldg., 2-3-13, Azuchi-machi,
Chuo-ku, Osaka-shi, Osaka 541-0052, Japan
Transfer Agent for Common Stock in JapanThe Chuo Mitsui Trust and Banking Company, Limited
33-1, Shiba 3-chome, Minato-ku, Tokyo 105-8574, Japan
Jun.May Apr. Mar. Feb. ’10Jan.Dec. Nov. Oct. Sep. Aug. Jul. Jun. May Apr. Mar. Feb.
’09Jan.Dec. Nov. Oct. Sep. Aug. Jul. Jun. May Apr. Mar. Feb.
’08Jan.Dec. Nov. Oct. Sep. Aug. Jul. Jun. May
’07Apr.
6,000
5,000
4,000
3,000
2,000
20,000
16,000
12,000
8,000
4,000
90,000
60,000
30,000
0
Trading volumes(thousand shares)
Stock price Nikkei Stock Average
Trading volumes
Stock price Nikkei Stock Average(Yen) (Yen)
Stock Prices and Trading Volumes on the Tokyo Stock Exchange(highest/lowest in the month; yen)
78 Astellas Pharma Inc. Annual Report 2010

Major Shareholders
NameShares owned
(Thousand shares)
Percentage of total common
shares outstanding (%)
Japan Trustee Services Bank, Ltd. (trust account) 28,727 6.03
Nippon Life Insurance Company 21,749 4.56
The Master Trust Bank of Japan, Ltd. (trust account) 21,542 4.52
State Street Bank and Trust Company 18,465 3.87
JPMorgan Chase Bank 385147 14,265 2.99
The Bank of Tokyo-Mitsubishi UFJ, Ltd. 13,669 2.87
State Street Bank and Trust Company 505225 11,989 2.51
Mellon Bank N.A. as agent for its client Mellon Omnibus U.S. Pension 9,071 1.90
Japan Trustee Services Bank, Ltd. (trust account 9) 8,038 1.68
Northern Trust Co. (AVFC) Sub A/C American Clients 6,928 1.45
Note: Shares owned are rounded down to the nearest thousand shares, while the percentage of total common shares outstanding is rounded down to two decimal places.
The Company owned 14,146 thousand shares of treasury stock as of March 31, 2010, but they are not included in the principal shareholders stated above.
Breakdown of Shareholders
Foreign companies
46.3%
Individuals and others
8.8%
Treasury stock
3.0%
Other companies
4.0%
Securities companies
4.2%
Financial institutions
33.7%
Domestic companies41.9%
Investor Information
79Astellas Pharma Inc. Annual Report 2010

Astellas Pharma Inc.2-3-11, Nihonbashi-Honcho,Chuo-ku, Tokyo 103-8411, Japanhttp://www.astellas.com/en/
Printed in Japan