Annual report 2010 - Zonebourse.com · 8 Who we are 4,300 km of motorways in Italy, Brazil, Chile,...
359
1 Annual Report 2010
Transcript of Annual report 2010 - Zonebourse.com · 8 Who we are 4,300 km of motorways in Italy, Brazil, Chile,...

1
Annual Report 2010

2
(This page intentionally left blank)

3
Contents
1. Introduction ........................................................................................................ 5
Milestones ........................................................................................................................ 6 Who we are ....................................................................................................................... 8 Consolidated financial highlights ............................................................................................ 9 Shareholder structure and share price performance .................................................................... 10 Key market data................................................................................................................. 11 Group structure at 31 December 2010 .................................................................................... 12 Statement to shareholders .................................................................................................... 16 Corporate bodies ............................................................................................................... 19
2. Report on operations ........................................................................................... 23
Consolidated financial review .............................................................................................. 25 Financial review for Atlantia SpA .......................................................................................... 53 Operating review for Group companies .................................................................................. 66 Key performance indicators for the main Group companies .................................................. 66 Operating performance of the Group’s motorway operators .................................................. 68 Operating performance of other subsidiaries ..................................................................... 94 Innovation, research and development ............................................................................. 98 Operating performance of the Group’s main investee companies ........................................... 100 Workforce ...................................................................................................................... 105 Corporate governance ........................................................................................................ 117 Sustainability .................................................................................................................. 120 Significant regulatory aspects .............................................................................................. 133 Related party transactions .................................................................................................. 143 Other information ........................................................................................................... 146 Events after 31 December 2010 ........................................................................................... 148 Outlook and risks or uncertainties ........................................................................................ 151 Proposed resolutions for the Annual General Meeting of Atlantia SpA’s shareholders ....................... 152
3. Atlantia Group’s consolidated financial statements and notes ......................................... 155
4. Atlantia SpA’s separate financial statements and notes ................................................. 277
5. Reports ........................................................................................................... 333
6. Key performance indicators for subsidiaries, associates and joint ventures pursuant to art. 2429,
paragraphs 3 and 4 of the Italian Civil Code ................................................................. 353

4

5
1. Introduction
The Italian government establishesAutostrade-Concessioni e Costruzioni Autostrade SpA in 1950
Autostrade is privatised in 1999 and the place of the Stateis taken by a stable core of shareholders
Autostrade per l’Italia SpA, a wholly owned subsidiaryof Autostrade SpA, is incorporated in 2003, following thedemerger of the motorway concession business
Autostrade SpA becomes Atlantia SpA in 2007
6
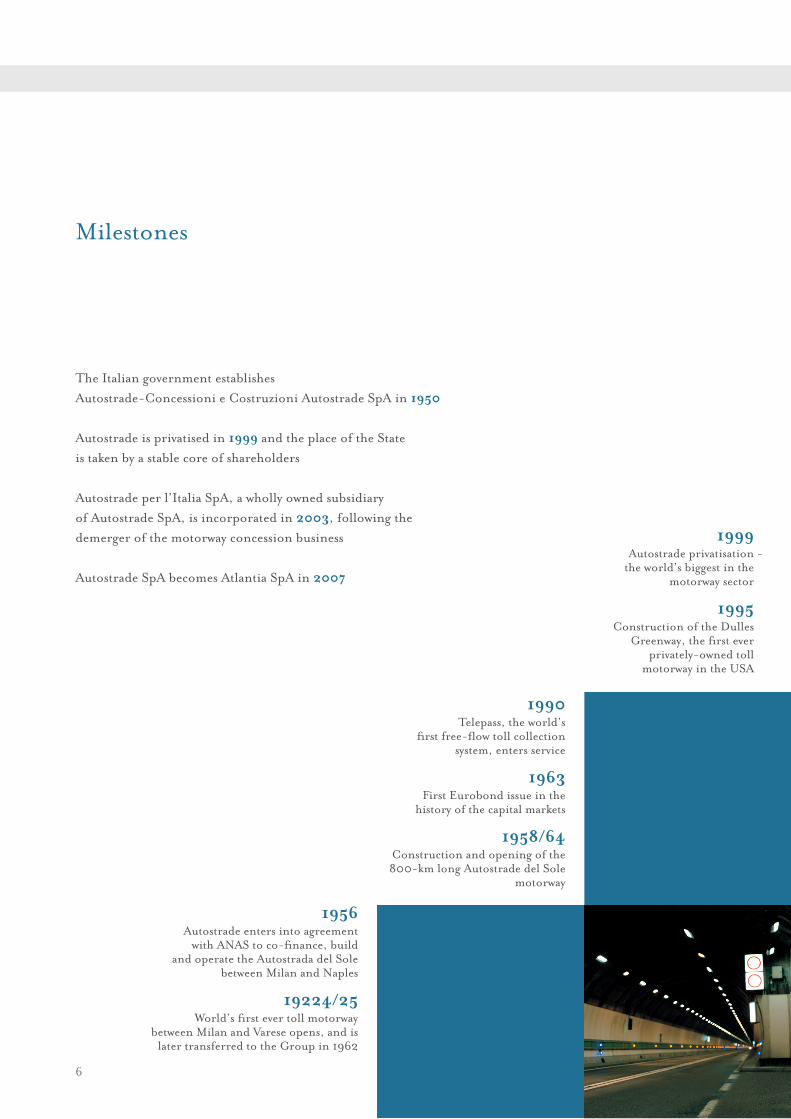
Milestones
1956Autostrade enters into agreement
with ANAS to co-fi nance, buildand operate the Autostrada del Sole
between Milan and Naples
19224/25World’s fi rst ever toll motorway
between Milan and Varese opens, and is later transferred to the Group in 1962
1990Telepass, the world’s
fi rst free-fl ow toll collectionsystem, enters service
1963First Eurobond issue in the
history of the capital markets
1958/64Construction and opening of the800-km long Autostrade del Sole
motorway
1999Autostrade privatisation -
the world’s biggest in the motorway sector
1995Construction of the Dulles
Greenway, the fi rst ever privately-owned toll
motorway in the USA

2011Autostrade per l’Italia is chosen
to implement and operatea satellite-based toll system
for heavy vehicles using France’s 15,000 km road network
2009Acquisition of investments
in motorway operators responsiblefor 700 km of network in
Chile and Brazil
Award of the concession, in partnership with the Tata group, to operate the 110-km motorway
linking Pune and Solapur in India
2006Acquisition of the 61 km
Katowice-Krakow motorway (Poland)
2005 Acquisition of Costanera
Norte (Chile), the operator of 43 km of motorway in
Santiago del Chile
2004World’s fi rst free-fl ow
toll-collection system entersservice on over 2,000 km of motorway network in Austria
2003Opening of the M6 Toll, theUK’s fi rst ever toll motorway

8
Who we are 4,300 km of motorways in Italy, Brazil, Chile, India and Poland More than 5 million customers a day Turnover of €3.7bn, EBITDA of €2.3bn and annual capital expenditure of €1.5bn Market capitalisation of €9bn Europe’s biggest investor, with €20bn currently being invested World number one in free-flow toll systems Leader in motorway design and widening, toll collection, safety and energy saving technologies Excellent credit ratings from S&P: A-, Moody’s: A3, Fitch: A- A member of the Dow Jones Sustainability World Index

9
Consolidated financial highlights
(€m) 2010 2009 (a)(b)
Revenue 3,750 3,488
Toll revenue 3,119 2,845
Contract revenue and other operating income 631 643
Gross operating profit (EBITDA) 2,285 2,139
EBITDA margin 60.9% 61.3%
Operating profit (EBIT) 1,767 1,667
EBIT margin 47.1% 47.8%
Profit/(loss) from continuing operations 708 582
Profit margin from continuing operations 18.8% 16.7%
Profit for the year (including non-controlling interests) 701 562
Profit for the year attributable to owners of the parent 683 563
Operating cash flow (c) 1,428 1,300
Capital expenditure 1,525 1,275Equity (attributable to owners of the parent and non-
controlling interests) (d) 3,587 3,197
Net debt (d) 9,657 9,755
(d) As at 31 December.
(c) Operating cash flow is calculated as profit + amortisation/depreciation + provisions + financial expenses from discounting of provisions +/- impairment losses/reversals of impairment losses on assets +/- share of profit/(loss) of investments accounted for using equity method +/- (losses)/gains on sale of assets +/- other non-cash items +/- portion of deferred tax assets/liabilities recognised in the income statement.Partly due to the impact of application of IFRIC 12, as described below, the composition of the components of operating cash flow has been modified.As a result, the figure for 2009 has also been restated compared with previously published amounts.
(a) Compared with previously published amounts, figures in the consolidated statement of financial position and income statement as at and for the year ended 31 December 2009 have been restated to take account of the impact of adoption of IFRIC 12.
(b) In view of the fact that consolidation of Strada dei Parchi's contribution to the income statement for 2010 was conducted in accordance with IFRS 5, thus recognising the contribution to profit for the year in "Profit/(Loss) from discontinued operations/assets held for sale" , Strada dei Parchi’s contribution to the comparative consolidated income statement for 2009 has also been reclassified. Income statement amounts for 2009 are therefore also different from those published in the annual report as at and for the year ended 31 December 2009 due to this reason, as well as due to the adoption of IFRIC 12.

10
Shareholder structure and share price performance
(*) Prices per share adjusted to take account of bonus issue carried out on 7 June 2010
Jan-10 Feb-10 Mar-10 Apr-10 May-10 Jun-10 Jul-10 Aug-10 Sep-10 Oct-10 Nov-10 Dec-10

11
Key market data
2010 2009 (a)
Issued capital (at 31 December) (€) 600,297,135 (b) 571,711,557
Number of shares (unit par value €1) 600,297,135 (b) 571,711,557
Market capitalisation (€m) (c) 9,167 10,434
Earnings per share (€) 1.16 0.96
Operating cash flow per share (€) 2.43 2.21
Dividend per share (€) 0.746 0.746
Interim 0.355 0.355
Final 0.391 0.391
Payout ratio (%) 31% 34%
Dividend yield (c ) 4.9% 4.1%
Year-end price (€) 15.27 18.25
High (€) 18.10 18.25
Low (€) 13.68 9.35
Share price / Earnings per share (P/E) (c ) 13.2 19.0
Share price / Cash flow per share (c ) 6.3 8.3
Market to book value (c ) 2.6 3.3
Atlantia as % of FTSE Italia All Share index (c ) 2.29% 2.26%
Atlantia as % of FTSE/Mib index (c ) 1.69% 2.68%
Group's ratings
Standard&Poor's A- (negative outlook) A- (stable outlook)
Moody's A3 (stable outlook) A3 (stable outlook)
Fitch Ratings A- (stable outlook) A- (stable outlook)
(c ) The figures have been calculated on the basis of the year-end price.
(a) Compared with previously published amounts, figures in the consolidated statement of financial position and income statement as at and for the year ended 31 December 2009 have been restated to take account of the impact of adoption of IFRIC 12, as described below.
(b) The bonus issue approved by the Shareholders at their Extraordinary General Meeting of 14 April 2010, pursuant to art. 2442 of the Italian Civil Code, was completed on 7 June 2010 via the issue of one new share for every 20 held. Share prices have been adjusted to take account of the bonus issue carried out on 7 June 2010.

12
Group structure at 31 December 2010
Tangenziale di Napoli SpA 100%Autostrada Torino-Savona SpA 99.98%Società Autostrada Tirrenica SpA 94%Strada dei Parchi SpA 60%Autostrade Meridionali SpA 58.98%Società Italiana pA Traforo del Monte Bianco 51%
Raccordo AutostradaleValle d’Aosta SpA 58% (1)
TowerCo SpA 100%Pune Solapur Expressways Private Ltd. 50% (3)Alitalia – Compagnia Aerea Italiana SpA 8.85% (3)
(1) The percentage refers to ordinary shares representing the issued capital.(2) The remaining 3.85% is held by Autostrade Tech SpA.(3) Unconsolidated company.(4) The remaining 25% is held by Autostrade Participations SA.
100.0%
EsseDiEsse Società di Servizi SpA 100%Pavimental SpA 71.67%
Pavimental Polska Sp.zo.o. 100%Spea Ingegneria Europea SpA 100%Ad Moving SpA 75%Port Mobility SpA 70%Newpass SpA 51%Giove Clear Srl 100%Tirreno Clear Srl 100%Autostrade Tech SpA 100%Telepass SpA 96.15% (2)Autostrade Service SpA 100%Infoblu SpA 75% IGLI SpA 33.3% (3)
Impregilo SpA 29.96% (1)(3)
Autostrade Participations SA100% Autostrade International US Holdings Inc. 75% (4)
Autostrade International of Virginia O & M Inc. 100%Electronic Transaction Consultants Co. 45%
Stalexport Autostrady SA 56.24%Biuro Centrum Spzoo 74.38%Stalexport Autostrada Dolnośląska SA 100%Stalexport Autoroute Sarl 100%
Stalexport Autostrada Malopolska SA100%Stalexport Transroute Autostrada SA 55%
Autostrade dell’Atlantico Srl 100%Autostrade Holding do Sur SA 100%
Sociedad Concesionaria de Los Lagos SA100%Autostrade Portugal SA100%
Autostrade Brasil Ltda100%Triangulo do Sol SA 50% (3)
Autostrade Sud America Srl 45.76% (3)Autopista do Pacif ico SA 100% (3)
Costanera Norte SA 100% (3)Sociedad Concesionaria AMB SA 100% (3)
Inversiones Autostrade Chile Limitada 100% (3)Nororiente SA 100% (3)Gestion Vial SA 100% (3)Litoral SA 50% (3)Operalia SA 50% (3)Autostrade Urbane de Chile SA 100% (3)
Vespucio Sur SA 50% (3)Autostrade Indian Inf rastructure Development Private Ltd. 100%
Italian motorway operations Service companies International operations
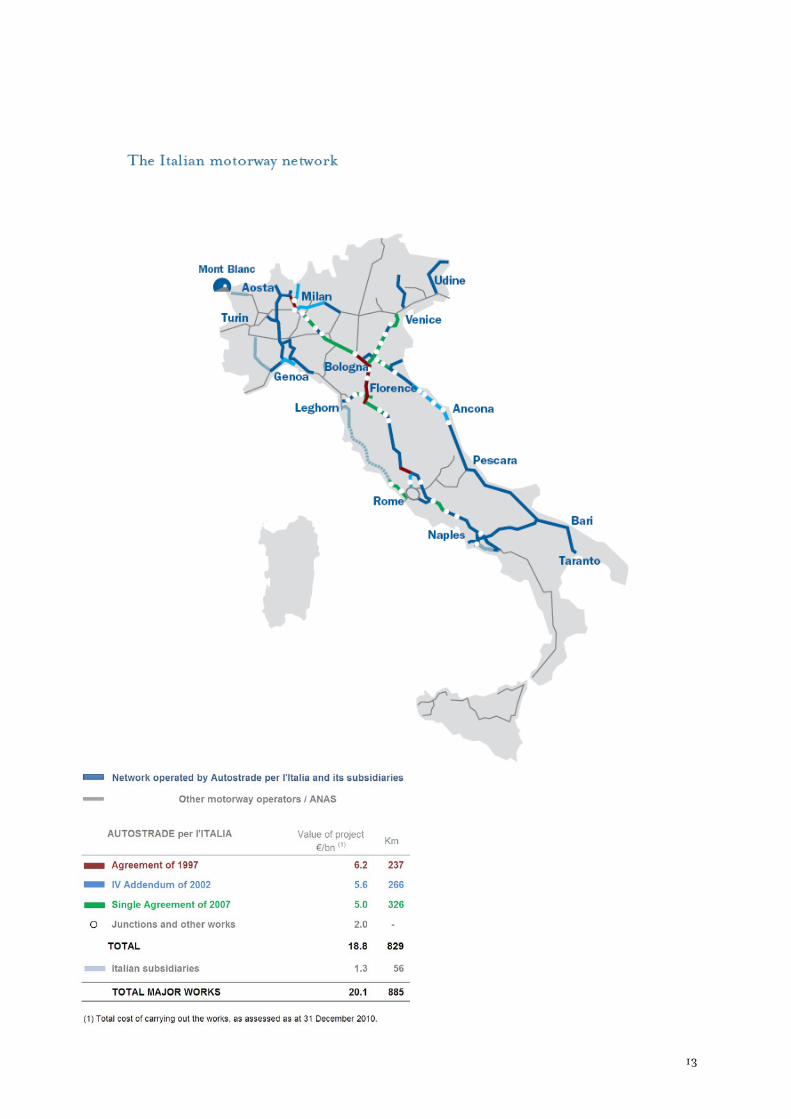
13

Overseas motorway networks
Cartagena
CasablancaAlgarrobo
Rio Bueno
Puerto Montt
Red Vial Litoral CentralLength: 79 kmShareholder: Autostrade del Sud America 50%
Acceso NororienteLength: 22 kmShareholder: Autostrade del Sud America 100%
Acceso Vial AeropuertoLength: 10 kmShareholder: Autostrade del Sud America 100%
Costanera NorteLength: 43 kmShareholder: Autostrade del Sud America 100%
Vespucio SurLength: 24 kmShareholder: Autostrade del Sud America 50%
Los LagosLength: 135 kmShareholder: Autostrade per l’Italia 100%
Chile
14
1. Introduction
Investments held directly or indirectly through subsidiaries.
Poland
Manaus
Belém
Recife
Porto Alegre
Rio de JaneiroSão Paulo
Fortaleza
GoianaSalvador
São Paulo
Cracovia
Katowice
Katowice
Cracovia
Delhi
Chennai
MumbaiGulbarga
Latur
Ahmadnagar
Sangli
Kolhapur
Sholapur
Pune
MumbaiDombivili
Kolkata
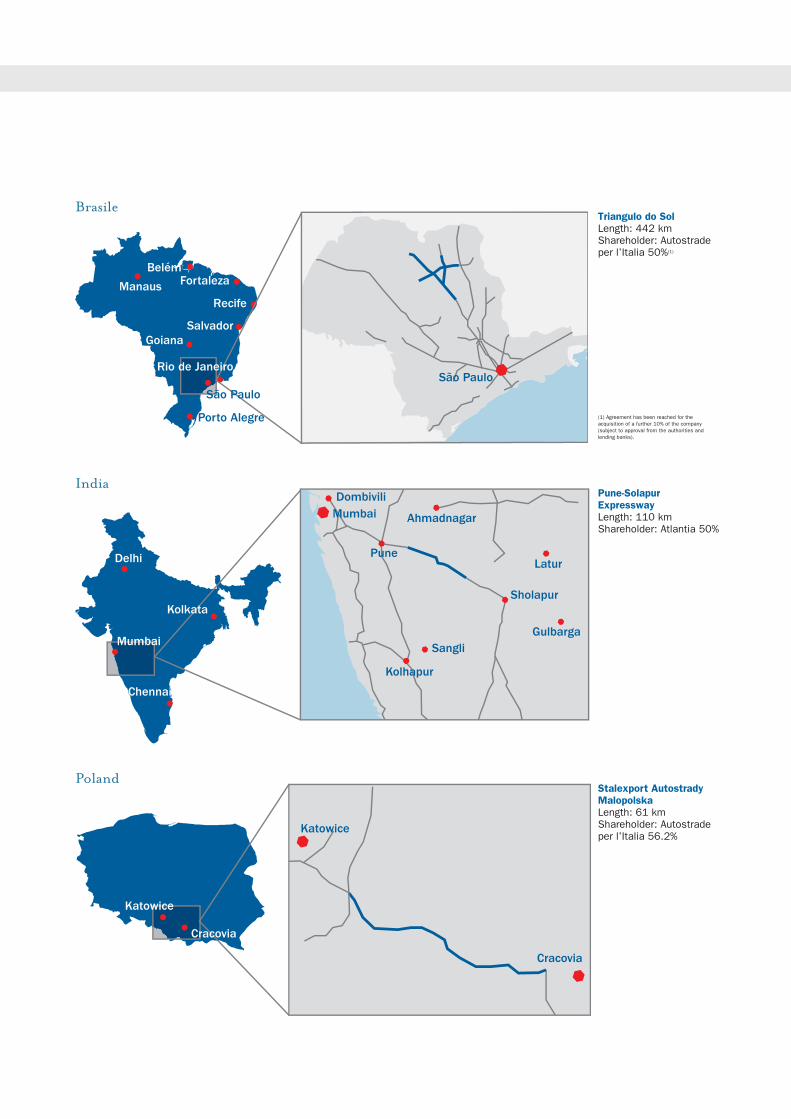
Stalexport AutostradyMalopolskaLength: 61 kmShareholder: Autostrade per l’Italia 56.2%
Triangulo do SolLength: 442 kmShareholder: Autostradeper l’Italia 50%(1)
(1) Agreement has been reached for the acquisition of a further 10% of the company (subject to approval from the authorities and lending banks).
Pune-SolapurExpresswayLength: 110 kmShareholder: Atlantia 50%
Brasile
India
16
Statement to shareholders
Despite lingering uncertainties, the world economy appears to be on the way to recovery, with
growth being driven primarily by the developing economies, thanks in part to the emergence of a
growing and increasingly well-off “middle class” looking to imitate western models of consumption.
Although the macroeconomic environment remains challenging, 2010 saw the Group firmly
committed to pursuing the key objectives in our growth strategy: to implement our investment
programme, improve service quality, optimise the use of resources, strengthen our financial structure,
and expand our global footprint by entering the fastest growing countries.
We are rapidly progressing with implementation of an unprecedented upgrade programme for
Italy’s motorway network, which will see us invest approximately €20 billion over the next ten years,
including works with a value of €6 billion that have already been carried out. This makes Autostrade
per l’Italia the country’s biggest private investor. The programme covers around 900 km of road, used
by almost 45% of all traffic on the network.
The Group’s determination to press ahead with expenditure on upgrading the network saw us
further boost investment in 2010, spending more than €1.5 billion (up 20% on 2009).
Excavation of the Base Tunnel, which has two separate carriageways approximately 8.6 km in
length, was completed at the end of 2010. This tunnel, linking the regions of Emilia Romagna and
Tuscany, is emblematic of the Variante di Valico section of the A1 motorway from Milan to Naples.
Excavation of the Base Tunnel was completed in record time for Italy, despite particularly challenging
geological and geotechnical conditions and severe restrictions regarding the route. The tunnel is one
of the biggest works ever built or being built in Europe, and may be compared to the San Gottardo
Tunnel or the tunnel built for the high-speed railway line between Florence and Bologna.

17
Work on construction of the third lane for the Florence Interchange between Florence North and
Florence South is proceeding to plan and work has begun on widening the Barberino-Florence North
section following the conclusion of the Services Conference. The Services Conference for the Florence
South-Incisa section has, however, yet to be concluded.
Work was speeded up on the addition of a third lane for the A14, on the A9 between Lainate and
Como, on the A1 between Fiano and Settebagni, thanks to the fact that the relevant contracts were
awarded to the Group company, Pavimental. In Genoa, thanks to innovative use of a public
consultation process, we have been able to reach agreement on the route for the bypass with the
surrounding community and local authorities, as well as with the Grantor. Work on the final design is
currently underway.
The Group has obtained further financing to fund the motorway upgrade programme. A total
of approximately €1.8 billion was raised on the international financial markets through the issue of
bonds and the use of alternative sources of funding at competitive rates. In total, the Group currently
has cash reserves of over €6bn to meet its capital expenditure and refinancing needs through to 2014.
The Group has achieved further improvements in its operating performance. In the 10 years
since privatization, the death rate on the motorway network operated under concession has fallen by
more than 70%, the time wasted in traffic queues and due to delays has been halved, draining
pavement now covers Autostrade per l’Italia’s entire network (except where it was not possible to lay it)
and annual investment in the upgrade of the network has more than quadrupled. Over the same period
tolls on Autostrade per l’Italia’s network have risen more or less in line with inflation.
Thanks to our extensive experience and leveraging our use of the most advanced technologies available
to the sector, the Group is today the preferred partner for European countries and emerging nations
in the construction and operation of infrastructure works and in the installation of toll collection
systems. The Group’s emerging country presence now covers approximately 900 km of toll motorway
in: Brazil (442 km of motorway operated in the state of Sao Paolo); Chile (300 km of motorway

18
operated in the Santiago area); India (having been awarded the contract to upgrade and operate a 110-
km section under concession); and Poland (61 km of motorway).
In Brazil we have reached agreement to increase the Group’s stake in the operator, Triangulo
do Sol, acquired in 2009, from 50% to 60%. The transaction is currently awaiting approval by the
local authorities. In Chile, the merger of Autostrade per il Cile into Autostrade Sud America has
brought the activities of the two sub-holding companies, which operate motorways under concession in
the metropolitan area of Santiago through subsidiaries or investee companies, under the control of a
single parent.
Thanks to our leadership and the Group’s world-beating expertise in tolling systems, we have
pulled off a major success in France, where Autostrade per l'Italia was chosen in January 2011 to
implement and operate a satellite-based tolling system for heavy vehicles using France’s 15,000-km
public road network.
In addition, Autostrade per l’Italia has agreed to sell the Group’s 60% interest in Strada dei
Parchi. The transfer of the shares is subject to receipt of the necessary approvals. The transaction will
give Atlantia greater financial flexibility in pursuing its international expansion strategy.
Our ability to meet our objectives makes us confident that, thanks to our continuing
commitment to making the best use of our resources and acceleration of our investment programme,
we will be in a position to create sustainable value for all our stakeholders in future years, contributing
to the country’s economic and social development and expanding our global footprint in the fastest
growing areas of the world.
Fabio Cerchiai Giovanni Castellucci
Chairman Chief Executive Officer

19
Corporate bodies
Board of Directors Chairman Fabio CERCHIAI in office for 2010-2012 Chief Executive Officer Giovanni CASTELLUCCI Directors Gilberto BENETTON Alessandro BERTANI Alberto BOMBASSEI (independent) Stefano CAO Roberto CERA Alberto CLÔ (independent) Antonio FASSONE
Carlo MALINCONICO (independent)
Giuliano MARI (independent) Gianni MION Giuseppe PIAGGIO Antonino TURICCHI
Paolo ZANNONI (independent)
Secretary Andrea GRILLO Internal Control and Chairman Giuseppe PIAGGIO Corporate Governance Committee Members Giuliano MARI (independent) Antonino TURICCHI (independent) Human Resources Committee Chairman Alberto BOMBASSEI (independent) Members Stefano CAO Alberto CLÔ
Giuseppe PIAGGIO (independent)
Paolo ZANNONI
Supervisory Board Chairman Renato GRANATA Members Simone BONTEMPO Pietro FRATTA Board of Statutory Auditors Chairman Marco SPADACINI for three-year period 2009-2011 Auditors Tommaso DI TANNO Raffaello LUPI
Angelo MIGLIETTA
Alessandro TROTTER Alternate Auditors Giuseppe Maria CIPOLLA Giandomenico GENTA Independent Auditors for the period 2006-2011
KPMG SpA

20
(This page intentionally left blank)

21
(This page intentionally left blank)

22
23
2. Report on operations

24
(This page intentionally left blank)

25
Consolidated financial review
Introduction
The financial review contained in this section includes and analyses the reclassified consolidated
income statement, the consolidated statement of comprehensive income, the statement of changes in
consolidated equity and the statement of changes in consolidated net debt for the year ended 31
December 2010, in which amounts are compared with those of the previous year. The review also
includes and analyses the reclassified statement of financial position, compared with comparative
amounts as at 31 December 2009, and the reconciliation of the Parent’s equity and profit for the year
with the corresponding consolidated figures.
These consolidated financial statements have been prepared under the international financial
reporting standards (IFRS) issued by the International Accounting Standard Board, endorsed by the
European Commission, and in force at 31 December 2010.
Compared with the accounting standards applied in preparing the consolidated financial statements as
at and for the year ended 31 December 2009, the Group has adopted the new interpretation IFRIC 12
“Service Concession Arrangements”. The Group has, therefore, calculated the impact of adoption of
the new interpretation with effect from the beginning of the comparative financial year (1 January
2009) and in respect of all comparative amounts included in the financial statements as at and for the
year ended 31 December 2010.
Reference should be made to note 4 “Impact of IFRIC 12 adoption on the Group’s consolidated
financial statements” in the consolidated financial statements as at and for the year ended 31 December
2010 for details of the impact of IFRIC 12 adoption on the consolidated financial statements for prior

26
periods, and for comparisons of amounts in the consolidated financial statements before and after
IFRIC 12 adoption as at 1 January 2009 and 31 December 2009 and for the year ended 31 December
2009.
The basis of consolidation as at 31 December 2010 is the same as the one used in preparing the
consolidated financial statements as at and for the year ended 31 December 2009. However, the
contributions to the income statement and statement of cash flows for the comparative period of the
companies acquired from the Itinere group at the end of June 2009 are limited to just the second half
of 2009, as opposed to the full year in 2010. Where material, the review of the consolidated results of
operations shows the impact of the different period of contribution to changes in amounts in the
financial statements.
Following the start-up of talks that have led to an agreement for the sale of the Group’s 60% interest in
the operator, Strada dei Parchi, this company’s contribution to the consolidated income statement for
the year ended 31 December 2010 is accounted for in “Profit/(Loss) from discontinued
operations/assets held for sale”, as required by IFRS 5 “Non-current Assets Held for Sale and
Discontinued Operations”, rather than included in each component of the consolidated income
statement for continuing operations. As a result, in accordance with IFRS 5, Strada dei Parchi’s
contribution to the comparative consolidated income statement for 2009 has also been reclassified
with respect to the statement published in the annual report as at and for the year ended 31 December
2009.
The consolidated assets and liabilities of Strada dei Parchi as at 31 December 2010 have been
accounted for in the statement of financial position in assets and liabilities included in disposal
groups, again in accordance with IFRS 5. The comparative information as at 31 December 2009
remains unchanged.
The investment in Triangulo do Sol, the Brazilian company in which the Group holds a 50% interest,
has not been consolidated on a line-by-line basis in the annual report as at and for the year ended 31

27
December 2010 as, despite the fact that the Group agreed to acquire a further 10% of the company on
11 June 2010, the transaction has yet to close, as the parties are awaiting approval from the local
authorities.
The Group did not enter into material transactions, either with third or related parties, of a non-
recurring, atypical or unusual nature during 2010.
The reclassified consolidated financial statements have not been independently audited and there are
certain differences with respect to classification compared with the statutory consolidated financial
statements presented in the section “Consolidated financial statements”. Above all:
a) the “Reclassified consolidated income statement” includes “Gross operating profit
(EBITDA)”, which is not reported in the income statement in the consolidated financial
statements. This profit margin is calculated by taking the figure for total revenue reported in
the income statement and deducting all operating costs, with the exception of amortisation,
depreciation, impairment losses on assets and reversals of impairment losses, provisions and
other adjustments. In addition, revenue reported in the reclassified income statement differs
from revenue reported in the income statement, as construction service revenues, recognised
on the basis of the capitalised service costs, personnel expense and financial expenses incurred
in providing the construction services, are presented in the reclassified statement as a
reduction of the respective components of operating costs and financial expenses. As a result,
“Operating profit (EBIT)” in the two statements, resulting from the deduction from EBITDA
of the above components, differs in terms of the component regarding capitalised financial
expenses relating to construction services, which is included in revenue in the income
statement in the consolidated financial statements and in financial income and expenses in the
reclassified income statement. Finally, the two income statements also differ in that the
reclassified consolidated income statement is more condensed;
b) the “Reclassified consolidated statement of financial position” adopts a different classification
of assets and liabilities compared with the statement of financial position in the consolidated

28
financial statements, showing working capital (as the balance of current non-financial assets
and liabilities), net invested capital (as the balance of non-current non-financial assets and the
sum of negative working capital and non-current non-financial liabilities), and, as sources of
funds, equity and net debt (representing the balance of all financial liabilities and assets). In
addition, the reclassified consolidated statement of financial position is a more condensed
version than the statement of financial position in the consolidated financial statements, as it
excludes the sub-items below each main entry and shows assets and liabilities related to
discontinued operations in the various sections of the reclassified statement based on their
nature (financial or non-financial) ;
c) “Consolidated net debt” reported in the reclassified consolidated statement of financial
position takes account of non-current financial assets, unlike the “Analysis of consolidated net
debt” in the notes to the consolidated financial statements that is prepared as required by the
Committee of European Securities Regulators (CESR) recommendation of 10 February 2005,
which does not permit non-current financial assets to be deducted from debt;
d) the “Statement of changes in consolidated net debt” differs from the statement of cash flows in
the consolidated financial statements insofar as it presents the impact of cash flows generated
or used during the year on consolidated net debt, as defined above, rather than on net cash and
cash equivalents. The main differences between the two statements regard:
1) cash flows from/(used in) operating activities, which in the statement of changes in
consolidated net debt include, in the change in working capital presented in the statement
of cash flows, the change in operating capital, consisting of trade-related items directly
linked to the ordinary activities of the business concerned;
2) cash generated from/(used in) investing activities, which in the “Statement of changes in
consolidated net debt” does not include movements in current and non-current financial
assets. Moreover, the statement shows investments in newly consolidated companies and
proceeds from the sale of previously consolidated companies after deducting the net debt
on the books of these companies, whilst in the statement of cash flows in the consolidated

29
financial statements these figures are reported less any net cash on the books of the newly
consolidated or recently sold companies;
3) net equity cash inflows/(outflows) reported in the “Statement of changes in consolidated
net debt” differ from cash generated from/(used in) financing activities in the statement of
cash flows in the consolidated financial statements, as the former do not include
movements in current and non-current financial liabilities. Moreover, the dividends
reported are those approved during the reporting period, whilst the statement of cash
flows reports dividends paid in the reporting period;
4) changes to the fair value of hedging instruments recognised in the statement of
comprehensive income are reported in the “Statement of changes in consolidated net
debt”, whilst they are not reported in the statement of cash flows in the consolidated
financial statements, as they have no impact on net cash.

30
Consolidated results of operations “Total revenue” for 2010 amounts to €3,750.0 million, marking an increase of €261.7 million (7.5%)
on 2009 (€3,488.3 million).
In order to aid the reader’s understanding of certain changes in the operating results, it should be
noted that, following the entry into effect of Law Decree 78/2009, converted into Law 102/2009,
from 5 August 2009 an increase in the concession fee payable to ANAS is included in operating costs
(equal to 3 thousandths of a euro per km for classes A and B and to 9 thousandths of a euro per km for
classes 3, 4 and 5), whilst a matching toll increase is recognised in toll revenue, without having any
impact on the Group’s results. In implementation of Law Decree 78/2010, converted into Law
122/2010, from 1 July 2010 a further toll increase has been applied by Italian motorway operators to
match a further rise in the concession fee payable to ANAS (1 thousandth of a euro per kilometre for
toll classes A and B and 3 thousandths of a euro per kilometre for classes 3, 4 and 5).
The total amount for the above toll increases recognised in revenue for 2010 stands at €227.7 million,
compared with the €79.1 million recognised in revenue for the period 5 August – 31 December 2009.
It should be noted, with regard to toll revenue for 2009, that the annual toll charge increase for that
year was applied from 1 May, unlike 2010 when the annual increase was applied from 1 January. The
difference between the two dates for application of the annual toll increases has boosted toll revenue
for 2010 by approximately €20.4m.
Revenue for 2010 also includes non-recurring income of €4.4 million generated by the handover,
free of charge, of buildings located at a number of service areas. This compares with income of €33.4
million from the same source recognised in 2009.
Based on a like-for-like period of contribution to the Group’s results from the companies acquired
from the Itinere group at the end of June 2009, and after stripping out the above toll increases, the
benefit deriving from the different period of application of the annual toll charge increase and non-
recurring income for the two comparative periods, total like-for-like revenue is up €114.8 million
(3.4%).

31
RECLASSIFIED CONSOLIDATED INCOME STATEMENT
(€m) 2010 2009 TOTAL % 2010 2009
Toll revenue 3,118.9 2,845.2 273.7 9.6 83.2 81.6
Contract revenue 60.8 50.2 10.6 21.1 1.6 1.4
Other operating income 570.3 592.9 -22.6 -3.8 15.2 17.0
Total revenue 3,750.0 3,488.3 261.7 7.5 100.0 100.0
Cost of materials and external services (1) -586.4 -618.4 32.0 -5.2 -15.6 -17.7
Concession fees -309.6 -158.1 -151.5 95.8 -8.3 -4.5
Personnel expense -637.4 -614.2 -23.2 3.8 -17.0 -17.7
Capitalised personnel expense 67.9 41.8 26.1 62.4 1.8 1.2
Total net operating costs -1,465.5 -1,348.9 -116.6 8.6 -39.1 -38.7
Gross operating profit (EBITDA) 2,284.5 2,139.4 145.1 6.8 60.9 61.3
Amortisation, depreciation, impairment losses and reversals of impairment losses -469.3 -431.0 -38.3 8.9 -12.5 -12.4
Provisions and other adjustments -47.9 -41.1 -6.8 16.5 -1.3 -1.1
Operating profit (EBIT) 1,767.3 1,667.3 100.0 6.0 47.1 47.8
Financial income/(expenses) -495.1 -468.2 -26.9 5.7 -13.2 -13.4
Financial expenses from discounting of provisions and for construction services required by contract -176.4 -192.3 15.9 -8.3 -4.7 -5.5
Capitalised financial expenses 14.6 7.0 7.6 - 0.4 0.2
Share of profit/(loss) of associates and joint ventures accounted for using the equity method -2.1 -51.1 49.0 -95.9 -0.1 -1.5
Profit/(Loss) before tax from continuing operations 1,108.3 962.7 145.6 15.1 29.5 27.6
Income tax (expense)/benefit -400.3 -380.7 -19.6 5.1 -10.7 -10.9
Profit/(Loss) from continuing operations 708.0 582.0 126.0 21.6 18.8 16.7
Profit/(Loss) from discontinued operations -7.0 -20.5 13.5 -65.9 -0.2 -0.6
Profit/(Loss) for the year 701.0 561.5 139.5 24.8 18.6 16.1
(Profit)/Loss attributable to non-controlling interests -18.1 1.0 -19.1 - -0.5 -
Profit/(Loss) for the year attributable to owners of the parent 682.9 562.5 120.4 21.4 18.1 16.1
(1) After deducting the margin recognised on construction services provided by the Group's own technical units.
2010 2009
Basic earnings per share (€) 1.16 0.96 0.20 from:continuing operations 1.17 0.99 0.18discontinued operations -0.01 -0.03 0.02
Diluted earnings per share (€) 1.16 0.96 0.20 from:continuing operations 1.17 0.99 0.18discontinued operations -0.01 -0.03 0.02
2010 2009
Operating cash flow (€m) 1,428.1 1,300.1 128.0 from:continuing operations 1,412.0 1,278.8 133.2discontinued operations 16.1 21.3 -5.2
Operating cash flow per share (€) 2.43 2.21 0.22 from:continuing operations 2.40 2.17 0.23discontinued operations 0.03 0.04 -0.01
INCREASE/ (DECREASE)
INCREASE/ (DECREASE)
INCREASE/ (DECREASE) % OF REVENUE

32
“Toll revenue” of €3,118.9 million is up €273.7 million (9.6%) on the figure for 2009 (€2,845.2
million). This performance primarily reflects:
a) the application of annual toll increases by the Group’s Italian operators from 1 January in
2010, rather than from 1 May, as in 2009 (a 3.1% increase);
b) an improved traffic mix thanks to a significant recovery in heavy traffic with 3 or more axles
(up 3.2% on Autostrade per l’Italia’s network), whilst the total volume of traffic was
substantially unchanged, boosting toll revenue by an estimated 0.5%; c) an increase in toll revenue (up €9.0 million) reported by the Polish operator, Stalexport
Autostrada Malopolska, primarily as a result of tariff increases applied from December 2009
(average increases of 17.0%), traffic growth (up 5.0%) and the stronger Polish zloty (up
10.0%), boosting toll revenue by 0.3%;
d) the toll revenue of the Chilean operator, Sociedad Concesionaria de Los Lagos, amounting to
€13.1 million for 2010 (up €7.6 million on 2009, having been consolidated from 1 July
2009), boosting toll revenue by 0.3%;
e) an increase in toll revenue reported by Autostrade Meridionali which, following the signature
of the relevant Single Concession Arrangement, as of its financial statements as at and for the
year ended 31 December 2009 no longer defers a portion of the “X variable” of tariffs,
partially releasing provisions made in previous years (a total benefit of €3.0 million or 0.1%),
and
f) the above-mentioned inclusion in toll revenue, from 5 August 2009, of the toll increase
matching the rise in the concession fee introduced by the above Law 102/2009, and the
increase introduced from 1 July 2010 in implementation of Law 122/2010 (a benefit of
5.2%).
Like-for-like toll revenue is up €98.4 million (3.6%).

33
“Contract revenue” of €60.8 million is up €10.6 million (21.1%) on 2009 (€50.2 million). The
increase is substantially due to an increase in work carried out by Pavimental for external customers
(above all for Raccordo di Montichiari).
“Other operating income” of €570.3 million is down €22.6 million (3.8%) on 2009 (€592.9
million), reflecting:
a) a reduction in non-recurring income deriving from the handover, free of charge, of buildings
located at service areas by sub-operators (€4.4 million in 2010, compared with €33.4 million
in 2009);
b) an increase in income from service areas and payment systems (amounting to €20.8 million),
essentially reflecting increases in service area royalties and in customers (the number of
Telepass devices in circulation is up approximately 447 thousand, whilst subscribers of the
Premium option are up 256 thousand);
c) a reduction in other income (down €14.4m), essentially reflecting a decrease in sales (above all
at Pavimental) and the fact that the figure for 2009 benefitted from the release of provisions
considered excess to requirements.
“Total net operating costs” of €1,465.5 million are up €116.6 million (8.6%) on 2009 (€1,348.9
million). Based on a like-for-like period of contribution to the Group’s results from the companies
acquired from the Itinere group, and after stripping out the rise in the concession fee, like-for-like net
operating costs are down €35.8 million (2.8%).
The “Cost of materials and external services” amounts to €586.4 million, marking a reduction of
€32.0 million on 2009 (€618.4 million). This reflects the greater contribution from activities linked
to construction work carried out by the Group’s own technical units and the optimisation of the road
resurfacing programme, slightly offset by an increase in the external costs incurred on contract work
(above all for Raccordo di Montichiari).

34
“Concession fees”, totalling €309.6 million, are up €151.5 million on 2009 (€158.1 million),
essentially due to the above increases in the concession fees payable by Italian operators from August
2009 and July 2010.
“Personnel expense”, before deducting capitalised expenses, of €637.4 million is up €23.2 million
(3.8%) on 2009 (€614.2 million). The increase reflects the combined impact of an increase in the
average unit cost (up 2.1%), primarily due to salary increases deriving from renewal of the contract
applied by operators (up 2.0%), the presence of an additional two Sundays (up 0.4%), the INPS
national insurance contributions holiday benefitting a number of Group companies (down 0.6%) and
provisions for charges attributable to 2010 regarding the France Project (up 0.3%). The performance
was also influenced by an increase of 158 in the average workforce (up 1.7%), resulting from the greater
volume of construction work carried out by staff employed by Spea and Pavimental on behalf of the
Group’s operators.
“Capitalised personnel expense” is up from €41.8 million to €67.9 million (up €26.1 million),
primarily due to an increase in infrastructure construction work carried out by Spea and Pavimental
personnel.
“Gross operating profit” (EBITDA) of €2,284.5 million is up €145.1 million (6.8%) compared with
2009 (€2,139.4 million).
On a like-for-like basis, the increase in gross operating profit is €150.6 million (up 7.2%).
“Operating profit” (EBIT) of €1,767.3 million is up €100.0 million (6.0%) compared with 2009
(€1,667.3 million).
The improvement in operating profit for 2010 reflects the increase in gross operating profit, despite
increased charges for depreciation and amortisation (up €39.5 million), relating primarily to
concession rights, and greater provisions and impairments (up €6.8 million), including provisions for
repair and replacement obligations and the allowance for impairment. Moreover, based on the
impairment tests conducted, previous impairment losses on the carrying amount of the infrastructure
operated by Raccordo Autostradale Valle d’Aosta have been reversed, with €16.1 million reversed in

35
2010 and €29.0 million in 2009, whilst 2009 included the impairment loss on the carrying amount
of the concession held by Stalexport Autostrada Malopolska (€16.4 million).
“Financial expenses”, after deducting financial income, total €495.1 million and are up €26.9 million
(5.7%) on 2009 (€468.2 million).
The increase reflects the following changes:
a) an increase in interest payable, essentially as a result of the differential (up €21.7 million)
between the cost of borrowing incurred in order to provide the financial resources to be used
to repay the bond issue maturing in 2011 and returns on the investment of liquidity, following
an increase in average liquidity partially invested, offset by an increase in the average return on
its investment;
b) an increase in interest payable and other costs (up €4.0 million), reflecting the Group’s
greater average exposure in 2010;
c) the recognition, in 2009, of non-recurring financial income (€20.5 million) following the
purchase by S.I.A.S. – Società Iniziative Autostradali e Servizi SpA of 50% of Autostrade per il
Cile;
d) the different contribution of the Autostrade dell’Atlantico group in the two comparative
periods (resulting in an increase of €19.1 million, including €10.1 million relating to the first
half of 2010), which include financial income recognised as a result of the guaranteed
minimum toll revenue attributable to the Chilean operator, Sociedad Concesionaria de Los
Lagos.
“Financial expenses from discounting of provisions and of provisions for construction services
required by contract” total €176.4 million, marking a decline of €15.9 million compared with 2009
(down 8.3%). This primarily reflects favourable interest rate trends.
Capitalised financial expenses, amounting to €14.6 million, are up €7.6 million on 2009, reflecting
the progressive increase in accumulated payments made for investments in the Group’s network for
which it will receive additional economic benefits.
36
The “Share of the profit/(loss) of associates and joint ventures accounted for using the equity method”
has resulted in a net loss of €2.1 million for the period, compared with a net loss of €51.1 million for
2009. This item includes the following:
a) the impairment loss on the investment in IGLI of €24.2 million (€67.0 million in 2009), of
which €15.2 million (€67.7 million in 2009) based on a comparison between the carrying
amount of the Impregilo shares held by IGLI and their market value (the stock market price of
the Impregilo shares held);
b) recognition of the Group’s share of the profits, totalling €17.3 million (€12.2 million in
2009), reported by the Autostrade Sud America group, which absorbed Autostrade per il Cile
with effect from 1 January 2010, by Triangulo do Sol, (€3.2 million, compared with €3.8
million in 2009) and the overall profit reported by other associates, amounting to €1.6
million (a loss of €0.1 million in 2009).
“Income tax expense” of €400.3 million is up €19.6 million (5.1%) on 2009 (€380.7 million), which
benefitted from non-recurring income (€13.1 million) in the form of a rebate of IRES as a result of
deductible IRAP. The less than proportional increase in income tax expense in 2010, compared with
the pre-tax profit, is essentially due to reduced impairment losses on investments and other non-
current assets, and to the tax effect linked to the above non-recurring items.
“Profit from continuing operations” thus amounts to €708.0 million, marking an increase of €126.0
million (21.6%) on 2009 (€582.0 million).
“Profit/(Loss) from discontinued operations” essentially regards the operating results for the period of
Strada dei Parchi which, as noted above, are recognised in this item, according to IFRS 5, instead of
being included in each component of the consolidated income statement. As a result, Strada dei
Parchi’s contribution to the comparative consolidated income statement for 2009 has also been
reclassified with respect to the statement published in the annual report as at and for the year ended 31
December 2009. The improvement of €13.5 million substantially reflects the cessation of depreciation
and amortisation of Strada dei Parchi’s non-current assets, after the related taxation, from 30 June
2010, the date on which the investment was reclassified in accordance with IFRS 5.

37
“Profit for the year” for 2010, amounting to €701.0 million, is up €139.5 million (24.8%) on 2009
(€561.5 million). After stripping out the above non-recurring items, the different contribution to the
two periods of consolidation of the companies acquired from the Itinere group, and the above
impairment losses and reversals of impairment losses, after the related taxation, like-for-like profit is
up 14.7%. “Profit for the year attributable to owners of the parent”, amounting to €682.9 million, is
up €120.4 million (+21.4%; +13.2 like for like) on 2009 (€562.5 million), whilst the profit
attributable to non-controlling interests amounts to €18.1 million (a loss of €1.0 million in 2009).
This essentially reflects the cessation of depreciation and amortisation of Strada dei Parchi’s assets in
the second half of 2010 and the above impairment loss on the concession right held by the Polish
company, Stalexport Autostrada Malopolska, in 2009, in addition to the different reversals of
impairment losses on Raccordo Autostradale Valle d’Aosta in the two comparable periods.
“Operating cash flow” for 2010, as defined in the section “Consolidated financial highlights”, to which
reference should be made, amounts to €1,428.1 million, up €128.0 million (9.8%) on 2009. This
amount was primarily used to fund the Group’s capital expenditure during 2010.
38
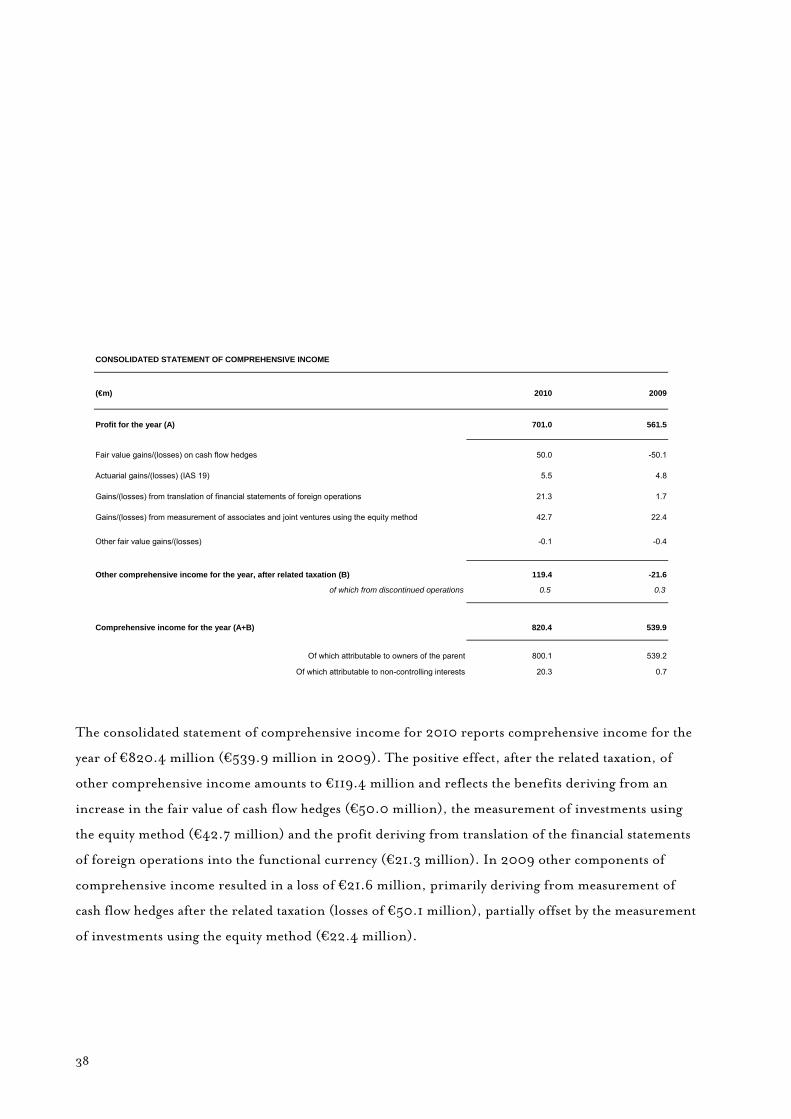
The consolidated statement of comprehensive income for 2010 reports comprehensive income for the
year of €820.4 million (€539.9 million in 2009). The positive effect, after the related taxation, of
other comprehensive income amounts to €119.4 million and reflects the benefits deriving from an
increase in the fair value of cash flow hedges (€50.0 million), the measurement of investments using
the equity method (€42.7 million) and the profit deriving from translation of the financial statements
of foreign operations into the functional currency (€21.3 million). In 2009 other components of
comprehensive income resulted in a loss of €21.6 million, primarily deriving from measurement of
cash flow hedges after the related taxation (losses of €50.1 million), partially offset by the measurement
of investments using the equity method (€22.4 million).
(€m) 2010 2009
Profit for the year (A) 701.0 561.5
Fair value gains/(losses) on cash flow hedges 50.0 -50.1
Actuarial gains/(losses) (IAS 19) 5.5 4.8
Gains/(losses) from translation of financial statements of foreign operations 21.3 1.7
Gains/(losses) from measurement of associates and joint ventures using the equity method 42.7 22.4
Other fair value gains/(losses) -0.1 -0.4
Other comprehensive income for the year, after related taxation (B) 119.4 -21.6
of which from discontinued operations 0.5 0.3
Comprehensive income for the year (A+B) 820.4 539.9
Of which attributable to owners of the parent 800.1 539.2
Of which attributable to non-controlling interests 20.3 0.7
CONSOLIDATED STATEMENT OF COMPREHENSIVE INCOME

39
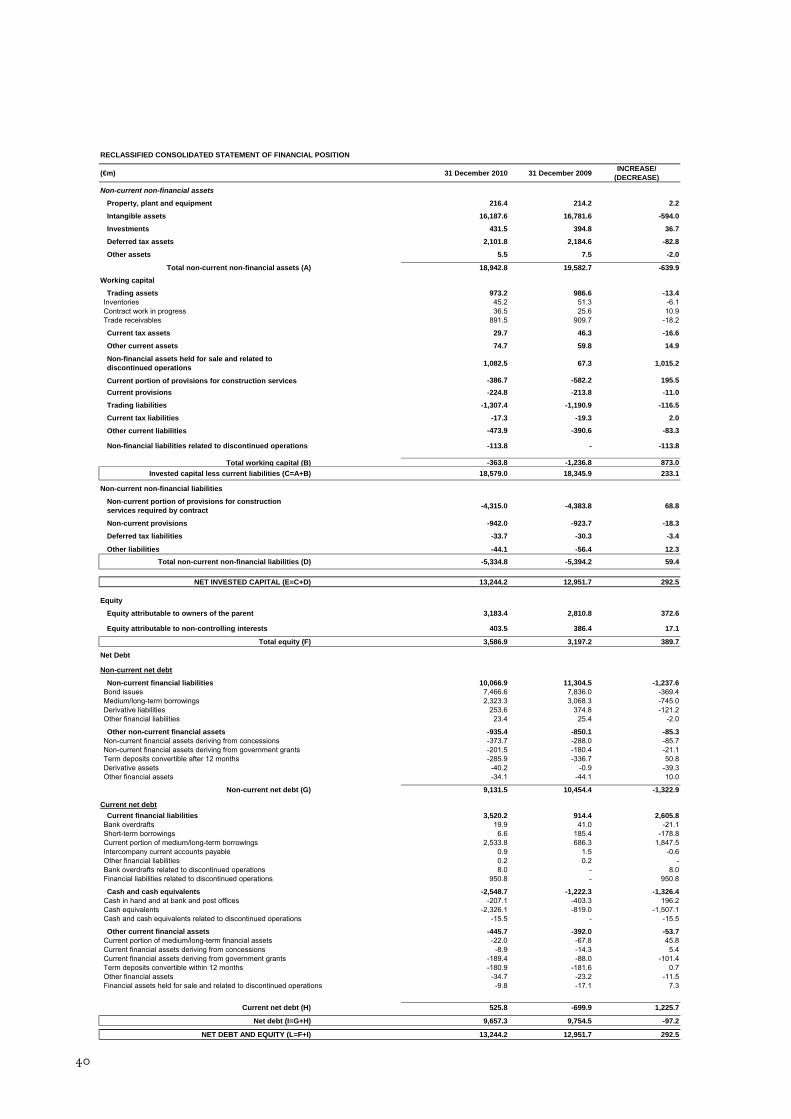
Consolidated financial position As at 31 December 2010 “Non-current non-financial assets” of €18,942.8 million are down €639.9
million on the figure for 31 December 2009 (€19,582.7 million). This essentially reflects the
reclassification of the subsidiary, Strada dei Parchi, whose assets and liabilities as at 31 December 2010
have been classified in current assets and liabilities related to discontinued operations.
“Property, plant and equipment”, amounting to €216.4 million, has not undergone significant
changes during the year.
“Intangible assets” total €16,187.6 million (€16,781.6 million at 31 December 2009). In addition to
the goodwill (€4,382.9 million) recognised at 31 December 2003, following acquisition of the
majority shareholding in the former Autostrade – Concessioni e Costruzioni Autostrade SpA, these
assets include the Group’s concession rights, amounting to €11,752.0 million (€12,345.1 million at 31
December 2009). These rights refer to concession rights accruing from construction services for
which no additional economic benefits are received, totalling €9,257.3 million (€9,380.5 million at
31 December 2009) and construction services for which additional economic benefits are received,
totalling €2,216.9 million (€2,089.0 million at 31 December 2009).
The reduction in intangible assets, amounting to €594.0 million, is essentially due to the
reclassification of €950.5 million in intangible assets attributable to Strada dei Parchi, which have
been reclassified to “Non-financial assets included in disposal groups”, and amortisation for the year
(€455.4 million), partly offset by investment in construction services for which additional economic
benefits are received (an increase of €582.2 million) and the adjustment of the present value on
completion of investments in construction services for which no additional benefits are received (an
increase of €202.5 million).
40
(€m) 31 December 2010 31 December 2009 INCREASE/ (DECREASE)
Non-current non-financial assets
Property, plant and equipment 216.4 214.2 2.2
Intangible assets 16,187.6 16,781.6 -594.0
Investments 431.5 394.8 36.7
Deferred tax assets 2,101.8 2,184.6 -82.8
Other assets 5.5 7.5 -2.0
Total non-current non-financial assets (A) 18,942.8 19,582.7 -639.9
Working capital
Trading assets 973.2 986.6 -13.4Inventories 45.2 51.3 -6.1Contract work in progress 36.5 25.6 10.9Trade receivables 891.5 909.7 -18.2
Current tax assets 29.7 46.3 -16.6
Other current assets 74.7 59.8 14.9
Non-financial assets held for sale and related to discontinued operations 1,082.5 67.3 1,015.2
Current portion of provisions for construction services -386.7 -582.2 195.5Current provisions -224.8 -213.8 -11.0
Trading liabilities -1,307.4 -1,190.9 -116.5
Current tax liabilities -17.3 -19.3 2.0
Other current liabilities -473.9 -390.6 -83.3
Non-financial liabilities related to discontinued operations -113.8 - -113.8
Total working capital (B) -363.8 -1,236.8 873.0Invested capital less current liabilities (C=A+B) 18,579.0 18,345.9 233.1
Non-current non-financial liabilities
Non-current portion of provisions for construction services required by contract -4,315.0 -4,383.8 68.8
Non-current provisions -942.0 -923.7 -18.3
Deferred tax liabilities -33.7 -30.3 -3.4
Other liabilities -44.1 -56.4 12.3Total non-current non-financial liabilities (D) -5,334.8 -5,394.2 59.4
NET INVESTED CAPITAL (E=C+D) 13,244.2 12,951.7 292.5
Equity
Equity attributable to owners of the parent 3,183.4 2,810.8 372.6
Equity attributable to non-controlling interests 403.5 386.4 17.1
Total equity (F) 3,586.9 3,197.2 389.7
Net Debt
Non-current net debt
Non-current financial liabilities 10,066.9 11,304.5 -1,237.6Bond issues 7,466.6 7,836.0 -369.4Medium/long-term borrowings 2,323.3 3,068.3 -745.0Derivative liabilities 253.6 374.8 -121.2Other financial liabilities 23.4 25.4 -2.0
Other non-current financial assets -935.4 -850.1 -85.3Non-current financial assets deriving from concessions -373.7 -288.0 -85.7Non-current financial assets deriving from government grants -201.5 -180.4 -21.1Term deposits convertible after 12 months -285.9 -336.7 50.8Derivative assets -40.2 -0.9 -39.3Other financial assets -34.1 -44.1 10.0
Non-current net debt (G) 9,131.5 10,454.4 -1,322.9
Current net debtCurrent financial liabilities 3,520.2 914.4 2,605.8
Bank overdrafts 19.9 41.0 -21.1Short-term borrowings 6.6 185.4 -178.8Current portion of medium/long-term borrowings 2,533.8 686.3 1,847.5Intercompany current accounts payable 0.9 1.5 -0.6Other financial liabilities 0.2 0.2 -Bank overdrafts related to discontinued operations 8.0 - 8.0Financial liabilities related to discontinued operations 950.8 - 950.8
Cash and cash equivalents -2,548.7 -1,222.3 -1,326.4Cash in hand and at bank and post offices -207.1 -403.3 196.2Cash equivalents -2,326.1 -819.0 -1,507.1Cash and cash equivalents related to discontinued operations -15.5 - -15.5
Other current financial assets -445.7 -392.0 -53.7Current portion of medium/long-term financial assets -22.0 -67.8 45.8Current financial assets deriving from concessions -8.9 -14.3 5.4Current financial assets deriving from government grants -189.4 -88.0 -101.4Term deposits convertible within 12 months -180.9 -181.6 0.7Other financial assets -34.7 -23.2 -11.5Financial assets held for sale and related to discontinued operations -9.8 -17.1 7.3
Current net debt (H) 525.8 -699.9 1,225.7
Net debt (I=G+H) 9,657.3 9,754.5 -97.2
NET DEBT AND EQUITY (L=F+I) 13,244.2 12,951.7 292.5
RECLASSIFIED CONSOLIDATED STATEMENT OF FINANCIAL POSITION

41
As at 31 December 2010 “Investments”, totalling €431.5 million (€394.8 million at 31 December
2009), are up €36.7 million, primarily reflecting:
a) recognition of an increase of €36.3 million in the value of the investment in the Autostrade
Sud America group, which, from 1 January 2010, incorporates Autostrade per il Cile,
following its measurement using the equity method, with €17.3 million recognised in the
income statement and €19.0 million recognised in other comprehensive income;
b) recognition of an increase of €7.2 million in the Group’s investment in the Brazilian operator,
Triangulo do Sol, following measurement using the equity method. The increase consists of
€3.2 million recognised in the income statement and €14.1 million recognised in other
comprehensive income as a result of favourable exchange rate movements, offset by a reduction
of €10.1 million resulting from the receipt of dividends during the year;
c) the impairment loss on the investment in IGLI (down €15.2 million), including a loss of
€24.2 million recognised in the income statement and a gain of €9,0 million recognised in
other comprehensive income. The impairment is linked to the negative performance of the
market value (stock market price) of the Impregilo shares held by IGLI compared with their
carrying amount.
“Deferred tax assets”, after offsetting against deferred tax liabilities, amount to €2,101.8 million
(€2,184.6 million at 31 December 2009), marking a reduction of €82.8 million. This primarily
reflects a combination of the following:
a) the release of deferred tax assets recognised on the intercompany gain arising in 2003 as a
result of the transfer of motorway assets to Autostrade per l’Italia, totalling €105.8 million;
b) the reduction of €63.2 million following the reclassification of deferred tax assets attributable
to Strada dei Parchi to “Non-financial assets held for sale and related to discontinued
operations”;
c) the recognition of net deferred tax assets relating to the expenses and income accounted for in
application of IFRIC 12 by Autostrade per l’Italia, totalling €66.4 million;

42
d) the increase in net deferred tax assets deriving from recognition of deferred tax assets on the
non-deductible portion of provisions (€26.9 million);
e) the decrease in net deferred tax assets deriving from the fair value gain on hedging derivatives
(€23.5 million).
“Other non-current assets” of €5.5 million show a small reduction with respect to the figure for 31
December 2009.
Consolidated working capital reports a negative balance of €363.8 million as at 31 December 2010,
marking a change of €873.0 million compared with the negative balance of €1,236.8 million as at 31
December 2009.
This change primarily reflects the above reclassification to working capital of non-current non-
financial assets and liabilities held for sale and related to discontinued operations attributable to the
subsidiary, Strada dei Parchi, totalling €993.8 million.
The Group’s working capital, after stripping out the reclassification of the above items attributable to
the subsidiary, Strada dei Parchi, amounts to a negative €1,357.6 million, marking a reduction of
€120.8 million on the amount as at 31 December 2009 (€1,236.8 million).
The change reflects the combined effect of the following:
a) an increase of €173.2 million in trade payables due to third parties, essentially reflecting the
greater amount payable to suppliers as a result of increased capital expenditure during the
year, particularly through the subsidiaries, Pavimental (up €97.7 million) and Spea (up €12.0
million). Amounts payable to the operators of interconnecting motorways have also risen (up
25.6 million), primarily due to the toll increases linked to increases in the concession fee;
b) a reduction in the current portion of provisions for construction services required by contract
and other provisions (down €164.3 million), due to the change in provisions for construction
services required by contract (down €195.5 million), reflecting provisions used in relation to
construction services for which no additional economic benefits are received, after
reclassifications to the current portion and accrued government grants. The change in
provisions for construction services required by contract is partially offset by the

43
reclassification to current liabilities of provisions for long-term incentive plans at the
subsidiary, Autostrade per l’Italia (€24.5 million), in view of expected payments in 2011;
c) an increase in other current liabilities, totalling €93.1 million, essentially reflecting an
increase in amounts payable to ANAS and the Ministry of the Economy and Finance (€55.9
million), in addition to increased amounts payable as a result of expropriations (€12.4
million) and an increase in amounts payable to staff and to social security agencies and in
other payables (€20.6 million);
d) the sale of investments previously accounted for in working capital and held through the
subsidiary, Autostrade dell’Atlantico, totalling €27.4 million.
“Non-current non-financial liabilities”, totalling €5,334.8 million, are down €59.4 million on the
figure for 31 December 2009 (€5,394.2 million), primarily due to the reclassification of the current
portion of provisions for construction services required by contract and of Strada dei Parchi’s non-
current non-financial liabilities (€24.3 million) to “Working capital”, offset by the adjustment, based
on current and prospective interest rates, of the present value on completion of investments in
construction services for which no additional benefits are received and to the increase resulting from
discounting to present value.
As a result, “Net invested capital”, totalling €13,244.2 million as at 31 December 2010, is up €292.5
million on the figure for 31 December 2009 (€12,951.7 million).
“Equity attributable to owners of the parent and non-controlling interests” totals €3,586.9 million
(€3,197.2 million as at 31 December 2009). “Equity attributable to owners of the parent” of €3,183.4
million is up €372.6 million, essentially reflecting:
a) profit for the year (€682.9 million);
b) payment of the final dividends for 2009 (€219.1 million) and the interim dividends for 2010
(€208.8 million);

44
c) the direct recognition of net gains of €119.4 million, which include the impact of an increase
in the cash flow hedge reserve (€50.0 million after taxation), gains on the measurement of
associates and joint ventures using the equity method (€42.7 million), and gains from the
translation of the financial statements of foreign operations (€21.3 million).
“Equity attributable to non-controlling interests” of €403.5 million is up €17.1 million on the figure
for 31 December 2009 (€386.4 million), essentially reflecting profit for the year attributable to non-
controlling interests, totalling €18.1 million.
The Group’s net debt as at 31 December 2010 amounts to €9,657.3 million, marking a reduction of
€97.2 million on 31 December 2009 (€9,754.5 million). The decline essentially reflects the positive
impact of marking cash flow hedges to market, resulting in a reduction of €72.3 million in net
financial liabilities.
“Non-current net debt”, amounting to €9,131.5 million (€10,454.5 million at 31 December 2009),
consists of:
a) non-current financial liabilities of €10,066.9 million (€11,304.5 million at 31 December 2009),
consisting of:
1) bond issues totalling €7,466.6 million, marking a reduction of €369.4 million, essentially due
to the reclassification to current liabilities of the bond issue with a par value of €2,000 million
(accounted for in the financial statements at €1,996.1 million) maturing on 9 June 2011,
partially offset by new bond issues totalling €1,000 million (maturing in 2017) and €500
million (maturing in 2025), an increase in foreign currency bond issues (GBP and YEN)
resulting from a strengthening in the value of the two currencies with respect to the euro (up
€51.8 million), and the increase (up €67.8 million) in the value of the bonds with a par value
of €1,500 million issued in May 2009 as a result of interest rate movements. Fair value
hedges, taken out to reduce the exposure to interest rate risk of the above bonds issued in May
2009, were unwound in September. This means that the bonds are again subject to fixed rate

45
exposure, although this is lower than the original exposure due to the benefit of €69.4 million
resulting from the above unwinding, including €58.5 million to be released to the income
statements starting from the derivatives instruments expiration date to May 2016;
2) medium/long-term borrowings of €2,323.3 million, marking a reduction of €745.0 million,
essentially following the reclassification to current liabilities of both Strada dei Parchi SpA’s
borrowings (down €658.8 million) and the portion of borrowings maturing within the next 12
months (down €179.9 million), partially offset by an increase in foreign currency financial
liabilities as a result of translation differences (up €24.7 million) and new borrowings (up
€91.6 million);
3) fair value losses on hedging instruments, amounting to €253.6 million, which is down €121.2
million, essentially following the payment of differentials and interest and exchange rate
movements (down €98.1 million), the unwinding of the fair value hedges (down €11.3 million)
hedging the bonds with a par value of €1,500 million (issued in May 2009) and reclassification
to current liabilities of the fair value (down €26.0 million) of the derivatives hedging the above
bond issue with a par value of €2,000 million (maturing in June 2011);
b) non-current financial assets of €935.4 million, marking an increase of €85.3 million,
substantially due to:
1) an increase of €85.7 million in non-current financial assets deriving from concessions,
essentially reflecting investments in motorway infrastructure by Autostrade Meridionali during
2010;
2) an increase of €21.1 million in financial assets deriving from the non-current portion of
accrued government grants for construction services rendered during the year by the Group’s
motorway operators, after reclassification of the short-term portion;
3) an increase in fair value gains (up €39.3 million) on the derivatives hedging the yen
denominated bond issue, primarily due to the strengthening of the currency in which the
bonds were issued with respect to the euro, as reflected in a change in the hedged liability;
4) a €50.8 million reduction in non-current term deposits, following the reclassification to
current assets of the portion of terms deposits that management believes will be released within

46
twelve months, based on the update of the schedule of certified releases pursuant to laws
662/96, 135/97 and 345/97.
As at 31 December 2010 current net debt amounts to €525.8 million (at 31 December 2009 current
net funds of €699.9 million) and includes:
a) current financial liabilities of €3,520.2 million, marking an increase of €2,605.8 million,
essentially due to the following:
1) reclassifications to current liabilities of the bond issue with a par value of €2,000 million (up
€1,996.1 million) and the fair value of the derivatives (up €26.0 million) hedging the issue, of
the portions of borrowings maturing within the next 12 months (up €181.7 million) and of
Strada dei Parchi SpA’s borrowings, now accounted for in liabilities related to discontinued
operations (up €658.8 million);
2) an increase in accrued interest expense on medium/long-term borrowings (up €17.0 million);
3) a reduction in the current portion of medium/long-term borrowings, following repayments
(down €245.8 million);
4) the reduced use of lines of credit (down €13.1 million);
b) cash and cash equivalents of €2,548.7 million, marking an increase of €1,326.4 million on 31
December 2009, reflecting new bond issues, the collection of €69.4 million following the
unwinding of the derivative hedging the bonds maturing in 2016, and operating cash flow, partially
offset by cash used in investing activities, to pay dividends and to repay medium/long-term
borrowings;
c) other current financial assets of €445.7 million, marking an increase of €53.7 million on 31
December 2009, following the increase in current financial assets deriving from government
grants accruing on the completion of construction services, totalling €101.4 million, partially
offset by the collection of differentials (down €45.8 million) on the derivatives hedging the
interest rate risk exposure of the bond issue with a par value of €1,500 million, which were
unwound in September 2010.
47
The Group’s ordinary operating and financing activities expose it to market risks, primarily regarding
interest rate and currency risks linked to the financial assets acquired and the financial liabilities
assumed, in addition to liquidity and credit risks.
The Group’s financial risk management strategy is consistent with the objectives set by Atlantia’s Board
of Directors. The strategy aims to both manage and control such risks, wherever possible mitigating
interest rate and currency risks and minimising borrowing costs, whilst taking account of the interests
of stakeholders, as defined in the approved Hedging Policy.
The components of the Group’s derivatives portfolio as at 31 December 2010 are classified, in
application of IAS 39, as cash flow hedges.
Based on the positive outcome of tests of effectiveness of cash flow hedges as at 31 December 2010,
changes in fair value have been recognised in full in equity, with no recognition of any ineffective
portion in profit or loss.
The residual weighted average term to maturity of the Group’s interest bearing debt is approximately 7
years, with 96% fixed rate.
9% of the Group’s medium/long-term debt is denominated in currencies other than the euro. Taking
account of foreign exchange hedges and the proportion of debt denominated in the local currency of
the country in which the relevant Group company operates (around 2%), the Group is not exposed to
currency risk on translation into euros.
The average cost of the Group’s medium/long-term borrowings in 2010 was approximately 4.9%.
As at 31 December 2010 the Group has cash reserves of €6,166 million, consisting of:
a) €2,549 million in cash and/or investments maturing no later than the maturity date of the
bond issue with a par value of €2,000 million (9 June 2011);
b) €467 million in term deposits allocated primarily to finance the execution of specific
construction services;
c) €3,150 million in undrawn committed lines of credit. In particular, the Group has obtained
the following lines of credit:

48
1) €500 million under the loan agreement signed in November 2008 by the European
Investment Bank and Autostrade per l’Italia (€1 billion), which may be drawn down until
November 2012 and matures in 2036;
2) €300 million representing the undrawn portion of the loan agreement signed in December
2010 by the European Investment Bank and Autostrade per l’Italia, which may be drawn
down until December 2014 and matures in 2036;
3) €350 million representing the undrawn portion of a loan granted in December 2008 to
Autostrade per l’Italia by Cassa Depositi e Prestiti SpA, totalling €500 million, which may
be drawn down until August 2013 and matures in 2034;
4) €1,000 million representing the undrawn portion of a loan granted in December 2009 by
Cassa Depositi e Prestiti and Sace, which may be drawn down until September 2014 and
matures in 2024;
5) €1,000 million available to Autostrade per l’Italia under a committed Revolving Credit
Facility with Mediocredito acting as Agent Bank, which is undrawn as at 31 December 2010
and matures in June 2015.
The Group’s net debt, as defined according to the CESR recommendation of 10 February 2005
(which does not permit the deduction of non-current financial assets from debt), amounts to
€10,592.7 million as at 31 December 2010, compared with net debt of €10,604.6 million as at 31
December 2009.

49
Issued capital Cash flow hedge reserve
Currency translation reserve
Reserve for companies
accounted for using the equity
method
Other reserves and retained earnings Treasury shares Profit/(Loss) for the
year Total
571.7 54.5 -6.1 -11.2 2,677.8 -215.6 544.4 3,615.5 370.6 3,986.1
Effects of IFRIC 12 adoption as at 1 January 2009 - - 1.4 - -939.1 - - -937.7 -11.3 -949.0
Retained earnings for the previous year - - - - 544.4 - -544.4 - - -
571.7 54.5 -4.7 -11.2 2,283.1 -215.6 - 2,677.8 359.3 3,037.1
- -51.4 1.4 22.4 4.3 - 562.5 539.2 0.7 539.9
Final dividend approved - - - - -207.3 - - -207.3 -2.6 -209.9
Interim dividend - - - - - - -198.9 -198.9 -0.2 -199.1
Change in basis of consolidation, capital contributions and other changes - - - - - - - - 29.2 29.2
571.7 3.1 -3.3 11.2 2,080.1 -215.6 363.6 2,810.8 386.4 3,197.2
- 50.3 19.0 42.7 5.2 - 682.9 800.1 20.3 820.4
Bonus issue 28.6 - - - -28.6 - - - - -
Final dividend approved - - - - - - -219.1 -219.1 -2.6 -221.7
Retained earnings for the previous year - - - - 144.5 - -144.5 - - -
Interim dividend - - - - - - -208.8 -208.8 -0.3 -209.1
Share buyback - - - - - - - - - -
Change in basis of consolidation, capital contributions and other changes
- - - - 0.4 - - 0.4 -0.3 0.1
600.3 53.4 15.7 53.9 2,201.6 -215.6 474.1 3,183.4 403.5 3,586.9 Balance as at 31 December 2010
Balance as at 31 December 2009
Total comprehensive income for the period
Owner transactions and other changes
Balance as at 31 December 2008
Balance as at 1 January 2009 (including effects of first-time adoption of IFRIC 12)
Total comprehensive income for the period
Owner transactions and other changes
STATEMENT OF CHANGES IN CONSOLIDATED EQUITY
Equity attributable to owners of the parent
Equity attributable to non-controlling
interestsTotal equity
(€m)

50
Consolidated cash flow
Net debt decreased by €97.2 million during 2010, compared with an increase of €423.9 million in
2009.
Operating activities generated cash flows of €1,640.8 million in 2010, compared with €1,317.3
million in 2009. The increase in operating cash flow essentially reflects the improved performance of
continuing operations (operating cash flow up €128.0 million, after also taking account of non-cash
items recognised in the two comparative periods), and the positive contribution of working capital (an
inflow of €168.9 million in 2010, compared with an outflow of €54.0 million in 2009). This
essentially reflects an increase in trading liabilities, partly due to higher amounts payable to the
operators of interconnecting motorways and increased trade payables.
(€m) Equity as at31 December 2010 Profit for 2010
6,413.0 509.9
3,314.9 719.7
- (578.8)
(6,850.7) 7.4
4,382.7 -
(4,186.8) -
90.5 9.919.8 14.8
3,183.4 682.9
403.5 18.1
3,586.9 701.0
3,586.9 701.0
Amounts in consolidated financial statements
RECONCILIATION OF EQUITY AS AT 31 DECEMBER 2010 AND PROFIT FOR 2010 OF THE PARENT AND THE CORRESPONDING CONSOLIDATED AMOUNTS
Amounts in financial statements of Atlantia SpA
Recognition of equity and profit/(loss) for the year (IFRS) of consolidated investments less non-controlling interestsElimination of intercompany dividends
Elimination of carrying amount of consolidated investments
Recognition of goodwill less non-controlling interests
Elimination, after the related taxation, of intercompany profits and losses
Measurement of investments using the equity method/at fair value
Other minor adjustments
Amounts in consolidated financial statements (attributable to owners of the parent)
Amounts in consolidated financial statements (attributable to non-controlling interests)

51
Cash used for investments in non-financial assets amounts to €1,199.4 million, marking a reduction
of €94.8 million on the same figure for 2009 (€1,294.2 million). The figure for 2010 reflects an
increase of €189.8 million in investments in motorway infrastructure, net of the related government
grants and the increase in financial assets in the form of takeover rights, and the inflow of €27.4
million from the sale of three investments in Portuguese companies, whilst the figure for 2009
reflected the acquisition of investments (the purchase of investments from the Itinere group, Alitalia,
IGLI and Tangenziali Esterne di Milano), totalling €258.9 million.
The cash outflow resulting from changes in equity amounts to €416.4 million in 2010 (€379.3 million
in 2009), essentially due to dividends paid during the year, totalling €430.8 million (€409.0 million
in 2009).
The overall impact of the above cash flows was to reduce net debt by €25.0 million in 2010, compared
with the increase of €356.2 million registered in 2009.
In addition, in 2010 net debt was also reduced by changes in the fair value of cash flow hedges
recognised in comprehensive income (amounting to €72.2 million), whilst the corresponding effect in
2009 resulted in an increase in net debt of €67.7 million.
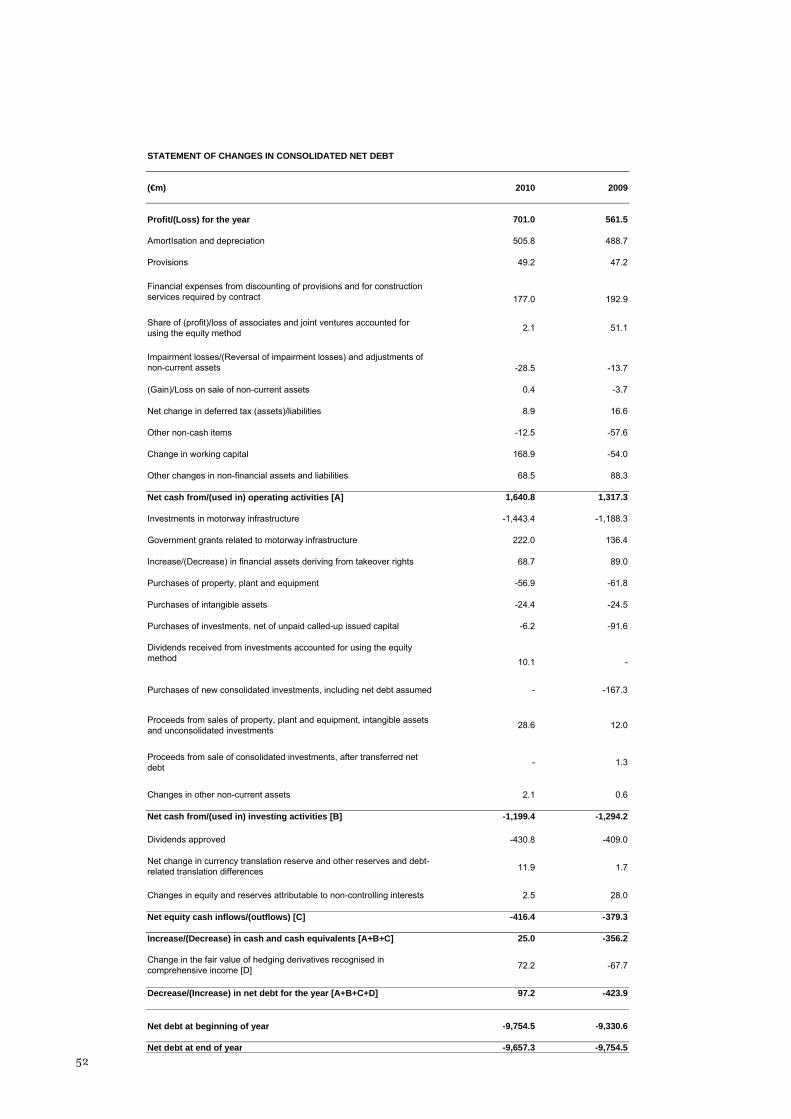
52
(€m) 2010 2009
Profit/(Loss) for the year 701.0 561.5
AmortIsation and depreciation 505.8 488.7
Provisions 49.2 47.2
Financial expenses from discounting of provisions and for construction services required by contract 177.0 192.9
Share of (profit)/loss of associates and joint ventures accounted for using the equity method 2.1 51.1
Impairment losses/(Reversal of impairment losses) and adjustments of non-current assets -28.5 -13.7
(Gain)/Loss on sale of non-current assets 0.4 -3.7
Net change in deferred tax (assets)/liabilities 8.9 16.6
Other non-cash items -12.5 -57.6
Change in working capital 168.9 -54.0
Other changes in non-financial assets and liabilities 68.5 88.3
Net cash from/(used in) operating activities [A] 1,640.8 1,317.3
Investments in motorway infrastructure -1,443.4 -1,188.3
Government grants related to motorway infrastructure 222.0 136.4
Increase/(Decrease) in financial assets deriving from takeover rights 68.7 89.0
Purchases of property, plant and equipment -56.9 -61.8
Purchases of intangible assets -24.4 -24.5
Purchases of investments, net of unpaid called-up issued capital -6.2 -91.6
Dividends received from investments accounted for using the equity method 10.1 -
Purchases of new consolidated investments, including net debt assumed - -167.3
Proceeds from sales of property, plant and equipment, intangible assets and unconsolidated investments 28.6 12.0
Proceeds from sale of consolidated investments, after transferred net debt - 1.3
Changes in other non-current assets 2.1 0.6
Net cash from/(used in) investing activities [B] -1,199.4 -1,294.2
Dividends approved -430.8 -409.0
Net change in currency translation reserve and other reserves and debt-related translation differences 11.9 1.7
Changes in equity and reserves attributable to non-controlling interests 2.5 28.0
Net equity cash inflows/(outflows) [C] -416.4 -379.3
Increase/(Decrease) in cash and cash equivalents [A+B+C] 25.0 -356.2
Change in the fair value of hedging derivatives recognised in comprehensive income [D] 72.2 -67.7
Decrease/(Increase) in net debt for the year [A+B+C+D] 97.2 -423.9
Net debt at beginning of year -9,754.5 -9,330.6
Net debt at end of year -9,657.3 -9,754.5
STATEMENT OF CHANGES IN CONSOLIDATED NET DEBT

53
Financial review for Atlantia SpA
Introduction The financial review for Atlantia SpA includes and analyses the Parent’s reclassified income statement,
statement of comprehensive income, statement of changes in equity and statement of cash flows for the
year ended 31 December 2010, in which amounts are compared with those of the previous year. The
review also includes and analyses the reclassified statement of financial position as at 31 December
2010, compared with comparative amounts as at 31 December 2009.
These separate financial statements have been prepared under the international financial reporting
standards (IFRS) issued by the International Accounting Standard Board, endorsed by the European
Commission, and in force at 31 December 2010. The accounting standards and policies used in
preparing this document are consistent with those applied in the separate financial statements as at and
for the year ended 31 December 2009.
The reclassified financial statements have not been independently audited and there are certain
differences compared with the separate financial statements presented in the section “Financial
statements”. Above all:
a) the “Reclassified separate income statement” includes “Gross operating profit (EBITDA)”, which
is not reported in the income statement in the separate financial statements. This profit margin is
calculated by taking the figure for operating income and deducting all operating costs, with the
exception of amortisation, depreciation, impairment losses on assets and reversals of impairment

54
losses, provisions and other adjustments. Deducting these costs from gross operating profit gives
the “Operating profit (EBIT)” as reported in the income statement in the separate financial
statements. There are no differences between the intermediate components of the two income
statements below operating profit, apart from the fact that the “Reclassified income statement” is
more condensed;
b) the “Reclassified statement of financial position” adopts a different classification of assets and
liabilities compared with the separate statement of financial position, showing working capital (as
the balance of current non-financial assets and liabilities), net invested capital (as the balance of
non-current non-financial assets and the sum of positive working capital and non-current non-
financial liabilities), and, as sources of funds, equity and net debt (representing the balance of all
financial liabilities and assets). In addition, the reclassified statement of financial position is a
more condensed version than the separate statement of financial position, as it excludes the sub-
items below each main entry. “Net debt” reported in the reclassified statement of financial position
takes account of non-current financial assets, unlike the “Analysis of net funds/(debt)” in the notes
to the financial statements that is prepared as required by the Committee of European Securities
Regulators (CESR) recommendation of 10 February 2005, which does not permit the inclusion of
non-current financial assets.
The following key events occurred during the year:
a) at their Extraordinary General Meeting held on 14 April 2010, the Shaholders approved a bonus
issue, which was completed on 7 June 2010 with the issue of 28,585,578 new ordinary shares with
a par value of €1.00, amounting to a total of €28,585,578 and resulting in a corresponding
reduction in the extraordinary reserve;
b) in compliance with the terms and conditions previously approved by the Board of Directors on 8
April 2009, on 15 July 2010 Atlantia’s Board of Directors extended the term for the issue of non-
convertible bonds under the MTN Programme instituted on 7 May 2004 from 31 December 2010
to 31 December 2012, with any decision to issue bonds to be based on market conditions;
55
c) on 16 September 2010 Atlantia SpA carried out two bond issues, one with a value of €1,000
million (a term to maturity of 7 years, maturing in September 2017) and the other with a
value of €500 million (a term to maturity of 15 years, maturing in September 2025). The cash
raised as a result of the issues will, in addition to the Group’s existing cash reserves, be used
for corresponding intercompany loans, designed to meet the funding requirements of
Autostrade per l’Italia SpA in connection with the investment plan envisaged in its concession
arrangement, and to ensure that adequate funds are available in view of the approaching
repayment of bonds maturing in 2011 and 2014. In compliance with the terms of the MTN
Programme, Atlantia received guarantees from the subsidiary, Autostrade per l’Italia, amounting
to 120% of the bonds issued. In return for providing the guarantee, Atlantia pays an annual lump-
sum fee of 0.125% of the guaranteed amount;
d) in September 2010 the Company unwound derivatives entered into with banks and other Group
companies – previously classified as fair value hedges – hedging the exposure to interest rate risk of
the bonds with a par value of €1,500 million, issued on 6 May 2009 and maturing on 6 May
2016, and of the corresponding loan granted to the subsidiary, Autostrade per l’Italia, which
replicates, at intercompany level, the Company’s borrowing in the market. The unwinding of
these derivatives, which did not result in any charge for the Company, means that the bond issue
and the intercompany loan are again subject to fixed rate exposure;
e) on 21 October 2010 the Board of Directors, based on the performance of Atlantia SpA and the
Group during the first half of 2010, decided to pay an interim dividend of €0.355 per share
outstanding at the ex dividend date of 22 November 2010, with payment on 25 November 2010
of a total amount of €208.8 million. The Board of Directors of Autostrade per l’Italia also
decided to pay an interim dividend of €0.46 per share (€0.45 in 2009), amounting to a total of
€286.1 million.

56
Results of operations
“Operating income” in 2010 was €0.8 million, which primarily includes rental income from
subsidiaries. The reduction of €2.8 million compared with 2009 (€3.6 million) essentially reflects
reduced reimbursements from Group companies.
The “Cost of materials and external services” totals €7.6 million, marking a reduction of €3.1 million
on 2009 (€10.7 million). This primarily reflects reductions in professional services and consultants’
fees (down €1.9 million) and in non-deductible VAT (down €0.8 million).
(€m) 2010 2009 TOTAL %
Operating income 0.8 3.6 -2.8 -77.8Total revenue 0.8 3.6 -2.8 -77.8
Cost of materials and external services -7.6 -10.7 3.1 -29.0Personnel expense -3.6 -2.4 -1.2 50.0
Total net operating costs -11.2 -13.1 1.9 -14.5Gross operating loss (EBITDA) -10.4 -9.5 -0.9 9.5
Amortisation, depreciation, impairment losses and reversals of impairment losses -0.4 -0.4 - -
Operating loss (EBIT) -10.8 -9.9 -0.9 9.1Financial income/(expenses) 527.2 498.1 29.1 5.8
Profit before tax from continuing operations 516.4 488.2 28.2 5.8
Income tax (expense)/benefit -6.5 -5.3 -1.2 22.6Profit from continuing operations 509.9 482.9 27.0 5.6
Profit/(loss) from discontinued operations/assets held for sale - - - -
Profit for the year 509.9 482.9 27.0 5.6
(€)2010 2009 INCREASE/
(DECREASE)
Basic earnings per share 0.87 0.82 0.05 from:continuing operations 0.87 0.82 0.05 discontinued operations/assets held for sale - - -
Diluted earnings per share 0.87 0.82 0.05 from:continuing operations 0.87 0.82 0.05 discontinued operations/assets held for sale - - -
INCREASE/ (DECREASE)
RECLASSIFIED INCOME STATEMENT

57
“Personnel expense” of €3.6 million is up €1.2 million on 2009 (€2.4 million) and essentially regards
the remuneration and fees paid to Directors.
The “Gross operating loss” (negative EBITDA) amounts to €10.4 million (€9.5 million in 2009),
whilst the “Operating loss” (negative EBIT) amounts to €10.8 million (€9.9 million in 2009), after
depreciation and amortisation, impairment losses and reversals of impairments losses totalling €0.4
million.
Net “Financial income” of €527.2 million is up €29.1 million on 2009 (€498.1 million), primarily
reflecting an increase in dividends received from subsidiaries (up €28.3 million), above all Autostrade
per l’Italia.
“Income tax expense” of €6.5 million is up €1.2 million on 2009 (€5.3 million), reflecting the
increase in taxable income.
“Profit for the year”, totalling €509.9 million, is thus up €27.0 million on 2009 (€482.9 million).
The statement of comprehensive income reports comprehensive income of €543.0 million (452.6
million in 2009). Compared with the figure for profit for the year, this reflects fair value gains on cash
flow hedges, after the related taxation.
STATEMENT OF COMPREHENSIVE INCOME
(€m) 2010 2009
Profit for the year (A) 509.9 482.9
Fair value gains/(losses) on cash flow hedges 33.0 -30.3Actuarial gains/(losses) (IAS 19) 0.1 -
Other comprehensive income for the year, after related taxation (B) 33.1 -30.3Comprehensive income for the year (A+B) 543.0 452.6

58
Financial position
“Non-current non-financial assets” of €6,097.4 million are up €5.4 million on the figure for 31
December 2009 (€6,092.0 million).
These assets consist almost entirely of “Investments” amounting to €6,089.5 million. The increase of
€5.7 million compared with 2009 (€6,083.8 million) essentially reflects the capital call by Pune
Solapur Expressways Private Limited (€4.8 million) and the capital contribution paid to Autostrade
for Russia GmbH (€0.6 million).
“Working capital” of €1.0 million is down €5.3 million on the figure for 31 December 2009 (€6.3
million), primarily reflecting a reduction in net current tax assets (€2.8 million) and an increase in
other current liabilities (€1.3 million). In addition, provisions for long-term incentives for the
Company’s management were reclassified to current liabilities (€1.6 million), in view of expected
payments in 2011.
“Non-current non-financial liabilities” amount to €26.6 million (€11.0 million as at 31 December
2009) and almost entirely regard deferred tax liabilities (after offsetting against deferred tax assets),
which are recognised primarily as a result of fair value gains on cash flow hedges.
“Net invested capital” of €6,071.8 million is down €15.5 million on the figure for 31 December 2009
(€6,087.3 million).

59
(€m) 31 December 2010 31 December 2009 INCREASE/ (DECREASE)
Non-current non-financial assetsProperty, plant and equipment 7.7 8.0 -0.3
Intangible assets 0.2 0.2 -
Investments 6,089.5 6,083.8 5.7
Total non-current non-financial assets (A) 6,097.4 6,092.0 5.4
Working capitalTrading assets 2.3 2.4 -0.1Current tax assets 19.3 26.3 -7.0Other current assets 2.2 2.4 -0.2Current provisions -1.6 - -1.6Trading liabilities -4.2 -4.9 0.7Current tax liabilities -14.3 -18.5 4.2Other current liabilities -2.7 -1.4 -1.3
Total working capital (B) 1.0 6.3 -5.3
Invested capital less current liabilities (C=A+B) 6,098.4 6,098.3 0.1
Non-current non-financial liabilitiesProvisions -0.3 -0.2 -0.1
Deferred tax liabilities -26.3 -10.8 -15.5
Total non-current non-financial liabilities (D) -26.6 -11.0 -15.6
NET INVESTED CAPITAL (E=C+D) 6,071.8 6,087.3 -15.5
Equity (F) 6,413.0 6,297.6 115.4
Net debt
Non-current net debt
Non-current financial liabilities 7,737.6 8,248.3 -510.7Derivative liabilities 218.0 341.5 -123.5Bond issues 7,519.6 7,906.8 -387.2
Other non-current financial assets -7,869.5 -8,325.5 456.0Derivative assets -164.7 -188.0 23.3Other financial assets -7,704.8 -8,137.5 432.7
Non-current net debt (G) -131.9 -77.2 -54.7
Current net debt Current financial liabilities 2,258.9 265.9 1,993.0
Current portion of medium/long-term borrowings 2,258.8 265.8 1,993.0Other financial liabilities 0.1 0.1 -
Cash and cash equivalents -197.6 -124.2 -73.4 Other current financial assets -2,270.6 -274.8 -1,995.8
Current portion of medium/long-term financial assets -2,267.3 -270.8 -1,996.5Other financial assets -3.3 -4.0 0.7
Current net debt (H) -209.3 -133.1 -76.2
Net debt (I=G+H) -341.2 -210.3 -130.9
NET DEBT AND EQUITY (L=F+I) 6,071.8 6,087.3 -15.5
RECLASSIFIED STATEMENT OF FINANCIAL POSITION

60
“Equity” totals €6,413.0 million (€6,297.6 million at 31 December 2009) and is up €115.4 million
compared with the end of the previous year. This is primarily the result of the following:
a) comprehensive income for the year, amounting to €543.0 million and consisting of profit for the
year (€509.9 million) and the recognition of net gains (€33.1 million) on fair value
measurements, primarily of cash flow hedges, after the related taxation;
b) payment of the final dividend for 2009, amounting to €219.1 million (€0.37 per share), and of
the interim dividend for 2010, totalling €208.8 million (€0.355 per share).
As noted in the introduction, in execution of the resolution passed by the Shareholders at their
Extraordinary General Meeting of 14 April 2010, on 7 June 2010 the Company carried out a bonus
issue with a value of €28,585,587 via the release of a corresponding amount from the extraordinary
reserve. In execution of the resolution, the shares resulting from the bonus issue were allotted to
shareholders on the basis of one new share for every twenty held. The number of treasury shares held
by the Company has thus increased by 573,831 to 12,050,447. As at 31 December 2010 the Company’s
fully subscribed and paid-up issued capital thus consists of 600,297,135 ordinary shares with a par
value of €1.00 each (including 12,050,447 treasury shares with a carrying amount of €215.6 million),
resulting in a total of €600,297,135.
As at 31 December 2010 Atlantia reports “Net funds” of €341.2 million (€210.3 million as at 31
December 2009), comprising a non-current portion of €131.9 million (€77.2 million at 31 December
2009) and a current portion of €209.3 million (€133.1 million at 31 December 2009).
Non-current net funds have increased €54.7 million as a result of the fair value gain on hedging
derivatives due to interest rate trends and the payment of differentials during the year.
As noted in the introduction, on 16 September 2010 Atlantia carried out two bond issues, one with a
value of €1,000 million (paying a fixed rate of 3.375% and maturing in September 2017) and the
other with a value of €500 million (paying a fixed rate of 4.375% and maturing in September 2025).
At the same time, the Company granted intercompany loans of the same amount and term to maturity
to the subsidiary, Autostrade per l’Italia, replicating, at intercompany level, the Company’s borrowing
61
in the market.
In addition, in September 2010 the Company unwound derivatives entered into with banks and other
Group companies – previously classified as fair value hedges – hedging the exposure to interest rate risk
of the bonds with a par value of €1,500 million, issued on 6 May 2009 and maturing on 6 May 2016,
and of the corresponding loan granted to the subsidiary, Autostrade per l’Italia. The unwinding of
these derivatives means that the bond issue and the intercompany loan are again subject to fixed rate
exposure.
Current net funds as at 31 December 2010 amount to €209.3 million (€133.1 million as at 31
December 2009), marking an increase of €76.2 million, primarily due to the fact that the value of
dividends received from investee companies was higher than the value of those paid to shareholders
during the year.
In view of the approaching maturity of the bond issue with a par value of €2,000 million and the loan
to Autostrade per l’Italia of a corresponding amount in June 2011, these financial liabilities and assets
have been reclassified to current debt.
The Company’s ordinary operating and financial activities expose it to market risks, primarily
regarding interest rate and currency risks linked to the financial assets acquired and the financial
liabilities assumed.
Atlantia’s financial risk management strategy is consistent with the business goals set by the Company’s
Board of Directors in the various strategic plans that have been approved over time. The strategy aims
to both manage and control such risks, wherever possible mitigating interest rate and currency risks
and minimising borrowing costs, as defined in the Hedging Policy approved by the Board of Directors.
The medium/long-term loans provided to the subsidiary, Autostrade per l’Italia, were granted on the
same terms as the Company’s borrowings in the market, plus a margin to take account of operating
costs, including those incurred for hedges using derivative financial instruments entered into to
mitigate the exposure to cash flow risk of the underlying instruments as a result of interest rate
movements. Based on the positive outcome of tests of effectiveness, these derivatives are classified as
cash flow hedges. As a result, any change in the cash flows generated by the underlying transaction is
62
offset by a matching change in the cash flows deriving from the derivative instrument.
The fair value of these instruments is based on expected cash flows that are discounted at rates derived
from the market yield curve at the measurement date. Amounts in currencies, other than the euro, are
translated at closing exchange rates provided by the European Central Bank. All hedging derivatives fall
within the category of financial instruments measured at fair value.
The residual average term to maturity of the Company’s debt is approximately 6 years. 100% of the
Company’s debt is fixed rate, partly following the above unwinding of derivatives hedging the bond
issue with a par value of €1,500 million, maturing in 2016.
9% of the Company’s medium/long-term debt is denominated in currencies other than the euro.
Taking account of foreign exchange hedges, the percentage of foreign currency debt exposed to
currency risk on translation into euros is zero.
The average cost of medium/long-term borrowings in 2010 was approximately 4.9%.

63
Shar
e pr
emiu
m
rese
rve
Lega
l re
serv
eEx
trao
rdin
ary
rese
rve
Res
erve
for
purc
hase
of
trea
sury
sh
ares
Res
erve
for
nega
tive
good
will
Cas
h flo
w
hedg
e re
serv
e
Res
erve
for a
ctua
rial
gain
s an
d lo
sses
on
post
-em
ploy
men
t be
nefit
s
Oth
er
rese
rves
Ret
aine
d ea
rnin
gs
571.
70.
226
1.4
4,60
2.5
215.
644
9.0
52.0
-0.4
-
2.
3-2
15.6
312.
26,
250.
9-
-
-
-
-
-
-30.
3-
-
-
-
482.
945
2.6
Fina
l div
iden
d ap
prov
ed-
-
-
-
-
-
-
-
-
-
-
-2
07.2
-207
.2
Prof
it fo
r pre
viou
s ye
ar ta
ken
to e
xtra
ordi
nary
rese
rve
-
-
-
105.
0-
-
-
-
-
-
-
-1
05.0
-
Inte
rim d
ivid
end
-
-
-
-
-
-
-
-
-
-
-
-198
.9-1
98.9
Shar
e op
tion
plan
and
oth
er c
hang
es-
-
-
-
-
-
-
-
0.2
-
-
-
0.2
571.
70.
226
1.4
4,70
7.5
215.
644
9.0
21.7
-0.4
0.2
2.3
-215
.628
4.0
6,29
7.6
-
-
-
-
-
-
33
.00.
1-
-
-
509.
954
3.0
Fina
l div
iden
d ap
prov
ed-
-
-
-
-
-
-
-
-
-
-
-2
19.1
-219
.1
Prof
it fo
r pre
viou
s ye
ar ta
ken
to e
xtra
ordi
nary
rese
rve
-
-
-
65.0
-
-
-
-
-
-
-
-65.
0-
Inte
rim d
ivid
end
-
-
-
-
-
-
-
-
-
-
-
-208
.8-2
08.8
Bonu
s is
sue
28.6
-
-
-2
8.6
-
-
-
-
-
-
-
-
-
Shar
e op
tion
plan
and
oth
er c
hang
es-
-
-
-
-
-
-
-0.
3-
-
-
0.
360
0.3
0.2
261.
44,
743.
921
5.6
449.
054
.7-0
.30.
52.
3-2
15.6
301.
06,
413.
0
Ow
ner t
rans
actio
ns a
nd o
ther
cha
nges
Bal
ance
at 3
1 D
ecem
ber 2
010
Tota
l com
preh
ensi
ve in
com
e
Tota
l com
preh
ensi
ve in
com
e
STA
TEM
ENT
OF
CH
AN
GES
IN E
QU
ITY
(€m
)
Issu
ed
capi
tal
Res
erve
s an
d re
tain
ed e
arni
ngs
Trea
sury
sh
ares
Prof
it fo
r the
ye
arTo
tal e
quity
Bal
ance
at 3
1 D
ecem
ber 2
008
Ow
ner t
rans
actio
ns a
nd o
ther
cha
nges
Bal
ance
at 3
1 D
ecem
ber 2
009
64
Cash flow Cash and cash equivalents increased by €73.4 million in 2010, compared with the increase of €17.6
million reported in 2009.
“Cash from operating activities” amounts to €515.4 million, marking an increase of €32.9 million
compared with the figure for 2009 (€482.5 million). This reflects the improvement in profit for the
year (up €27.0 million).
“Cash used in investing activities”, totalling €1,571.1 million, essentially relates to the disbursement of
two new intercompany loans with par values of €1,000 million and €500 million to the subsidiary,
Autostrade per l’Italia. The figure for 2009 (an outflow of €1,317.8 million) primarily resulted from
disbursement of a loan with a par value of €1,500 million to the subsidiary, Autostrade per l’Italia,
corresponding to the bond issue of 6 May 2009, and the payment of €44.4 million for an equity
interest in Alitalia – Compagnia Aerea Italiana SpA, partly offset by the extinction of intercompany
loans following the transfer of loans totalling €450.0 million from the European Investment Bank
(EIB) to the subsidiary, Autostrade per l’Italia.
“Cash from financing activities” totals €1,129.1 million and essentially consists of the above bond issues
with par values of €1,000 million and €500 million, after the related transaction costs, partly offset by
dividends paid during the year (€427.9 million). Cash generated from financing activities in 2009 (an
inflow of €852.9 million) was also influenced by the bond issue with a par value of €1,500 million on
6 May 2009, partly offset by extinction of the above loan from the European Investment Bank (EIB),
totalling €450 million, and dividends paid (€417.4 million).
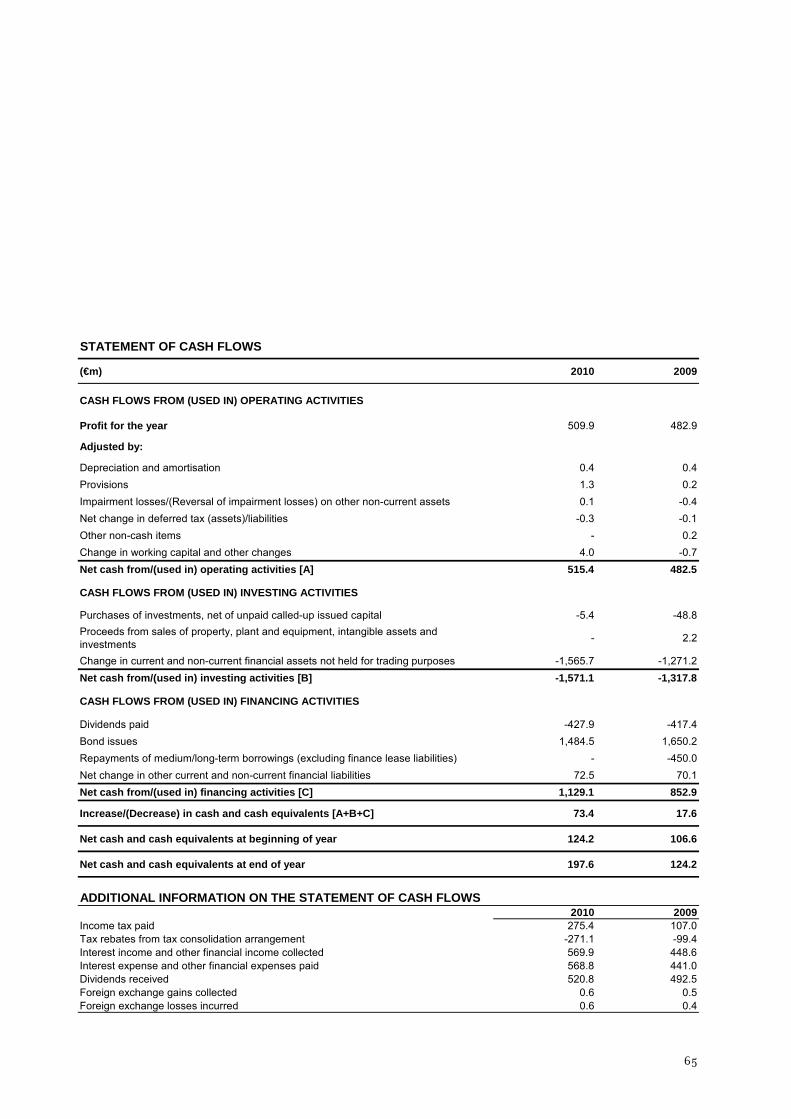
65
(€m) 2010 2009
CASH FLOWS FROM (USED IN) OPERATING ACTIVITIES
Profit for the year 509.9 482.9
Adjusted by:
Depreciation and amortisation 0.4 0.4Provisions 1.3 0.2Impairment losses/(Reversal of impairment losses) on other non-current assets 0.1 -0.4Net change in deferred tax (assets)/liabilities -0.3 -0.1Other non-cash items - 0.2Change in working capital and other changes 4.0 -0.7Net cash from/(used in) operating activities [A] 515.4 482.5
CASH FLOWS FROM (USED IN) INVESTING ACTIVITIES
Purchases of investments, net of unpaid called-up issued capital -5.4 -48.8Proceeds from sales of property, plant and equipment, intangible assets and investments - 2.2
Change in current and non-current financial assets not held for trading purposes -1,565.7 -1,271.2Net cash from/(used in) investing activities [B] -1,571.1 -1,317.8
CASH FLOWS FROM (USED IN) FINANCING ACTIVITIES
Dividends paid -427.9 -417.4Bond issues 1,484.5 1,650.2 Repayments of medium/long-term borrowings (excluding finance lease liabilities) - -450.0Net change in other current and non-current financial liabilities 72.5 70.1Net cash from/(used in) financing activities [C] 1,129.1 852.9
Increase/(Decrease) in cash and cash equivalents [A+B+C] 73.4 17.6
Net cash and cash equivalents at beginning of year 124.2 106.6
Net cash and cash equivalents at end of year 197.6 124.2
2010 2009Income tax paid 275.4 107.0Tax rebates from tax consolidation arrangement -271.1 -99.4Interest income and other financial income collected 569.9 448.6Interest expense and other financial expenses paid 568.8 441.0Dividends received 520.8 492.5Foreign exchange gains collected 0.6 0.5 Foreign exchange losses incurred 0.6 0.4
STATEMENT OF CASH FLOWS
ADDITIONAL INFORMATION ON THE STATEMENT OF CASH FLOWS

66
Operating review for Group companies
Key performance indicators for the main Group companies (*)
(*)Figures calculated under IFRS and, in particular, in compliance with the standards and policies adopted by the Atlantia Group, and extracted from specific reporting packages prepared by each subsidiary for the purpose of preparing the Atlantia Group's consolidated financial statements. (**) Company in the process of being sold.

67
Total % Total %
1,952.1 1,879.8 72.3 3.8% -9,052.5 -8,940.6 -111.9 1.3%
34.9 33.5 1.4 4.2% 26.4 -3.3 29.7 n.s.
2.2 0.8 1.4 175.0% 67.5 72.7 -5.2 -7.2%
30.7 32.5 -1.8 -5.5% 19.2 35.9 -16.7 -46.5%
15.6 14.0 1.6 11.4% -73.8 -55.9 -17.9 32.0%
69.4 70.7 -1.3 -1.8% -947.2 -934.2 -13.0 1.4%
21.2 16.2 5.0 30.9% -53.2 -57.4 4.2 -7.3%
41.8 39.7 2.1 5.3% 163.6 135.7 27.9 20.6%
1.9 1.1 0.8 72.7% -7.6 -3.9 -3.7 94.9%
29.8 10.6 19.2 181.1% -22.1 -28.2 6.1 -21.6%
4.2 4.1 0.1 2.4% 185.4 110.5 74.9 67.8%
15.0 8.5 6.5 76.5% -162.8 -106.5 -56.3 52.9%
50.2 31.9 18.3 57.4% 19.9 4.8 15.1 314.6%
4.4 3.2 1.2 37.5% 13.6 11.8 1.8 15.5%
0.9 0.4 0.5 125.0% 2.9 4.1 -1.2 -29.3%
11.1 10.1 1.0 9.9% 7.6 7.6 0.0 0.0%
0.5 0.1 0.4 n.s. -1.9 -2.4 0.5 -20.8%
0.8 0.7 0.1 14.3% -0.4 -2.4 2.0 -83.3%
65.2 60.3 4.9 8.1% -195.3 -218.3 23.0 -10.5%12.3 0.4 11.9 n.s. 7.5 -0.2 7.7 n.s.
2010 2009
EBITDA
2010 2009
Net funds/(debt)Increase/(Decrease) Increase/(Decrease)

68
Operating performance of the Group’s motorway operators
Traffic
The number of kilometres travelled on the network managed by Autostrade per l’Italia and the Group’s
Italian motorway operators during 2010 amounted to 54,965 million, 43,243 million by light vehicles
(78.7% of the total) and 11,722 million by heavy vehicles (21.3% of the total).
Traffic is down 0.07% compared with 2009 (including Strada dei Parchi, a company in the process of
being sold), with the light component falling 0.4% and heavy vehicles up 1.3%.
Excluding the motorways operated by Strada dei Parchi, traffic using the network operated by
Autostrade per l’Italia and the Group’s other Italian motorway operators was in line with the previous
year, with total traffic down 0.01%, light vehicles down 0.37% and heavy vehicles up 1.32%.
The figure reflects tough comparatives with the previous year, which recorded strong growth in “light“
traffic from the second quarter on.
In contrast, heavy vehicles showed clear signs of recovery in 2010, compensating for the above decline
in light vehicles.
The breakdown by concessionaire shows notable differences in performance. Traffic using Autostrade
per l’Italia’s network was more or less stable (up 0.05%), reflecting a slight decline in light vehicles
(down 0.3%) and moderate growth in heavy traffic (up 1.3%).
The various motorways that make up Autostrade per l’Italia’s network registered differing trends, with
traffic on the A23 Udine-Tarvisio falling 4.5%, despite growth in heavy traffic, and traffic using the
A27 Venice-Belluno up 2.5%, reflecting significant growth in the second half of the year, above all in

69
the heavy component, following the opening to traffic of the section linking the motorway to the A28
at Conegliano.
The A14 Bologna-Taranto also recorded a decline (down 1%), following the opening of alternative
routes, above all around Pescara and Foggia, which affected traffic on both the directly related sections
of motorway and nearby sections.
Traffic using the Mestre Interchange continues to reflect the impact of the entry into service of the
Mestre Bypass on 8 February 2009, with traffic down 13.6%.
There were increases in traffic using the motorway network managed by Raccordo Autostradale Valle
d’Aosta (up 7.6%) the Mont Blanc Tunnel (up 4.0%), where the recovery in heavy traffic was
particularly significant, making up for the sharp decline in 2009.
Traffic growth was also reported by Tangenziale di Napoli (up 0.7%), whilst the Group’s remaining
motorways recorded declines: Autostrada Torino-Savona (down 1,3%), Autostrade Meridionali (down
1.6%), Autostrada Tirrenica (down 1.7%) and Strada dei Parchi (down 1.5%). The falls in traffic
reported by Autostrada Torino-Savona and Autostrada Tirrenica primarily reflect the performance of
light traffic, which was affected by adverse weather conditions, above all in May. The reduction
recorded by Strada dei Parchi reflects a slowdown in reconstruction work, undertaken following the
earthquake of 6 April 2009. Work on rebuilding the motorway had resulted in particularly strong
growth during the previous year.

70
Light vehicles
Heavy vehicles
Total vehicles
% increase/ (decrease)
A1 Milan-Naples 14,076 4,491 18,567 0.41 63,310 A4 Milan-Brescia 2,937 872 3,809 2.41 111,597 A7 Serravalle-Genoa 512 126 638 1.09 34,945 A8/A9 Milan-Lakes 2,073 348 2,421 -0.36 85,338 A8/26 branch 433 74 507 -0.88 57,874 A10 Genoa-Savona 771 160 931 -0.19 56,090 A11 Florence-Coast 1,343 263 1,606 -1.72 53,855 A12 Genoa-Sestri 780 139 919 -0.80 51,704 A12 Rome-Civitavecchia 633 99 732 -1.03 30,673 A13 Bologna-Padua 1,555 537 2,092 2.07 45,023 A14 Bologna-Taranto 8,113 2,597 10,710 -0.99 37,549 A16 Naples-Canosa 1,235 275 1,510 -0.62 24,010 A23 Udine-Tarvisio 424 171 595 -4.53 16,101 A26 Genoa Voltri- Gravellona Toce 1,685 459 2,144 -0.48 23,990 A27 Venice-Belluno 560 106 666 2.49 22,199 A30 Caserta-Salerno 674 189 863 1.29 42,787 Mestre Interchange 32 10 42 -13.63 --TOTAL AUTOSTRADE PER L'ITALIA 37,836 10,916 48,752 0.05 46,790 Turin-Savona 803 169 972 -1.35 20,341 Naples-Pompei-Salerno 1,389 150 1,539 -1.61 81,738 Naples Ring Road 940 85 1,025 0.70 139,089 Mont Blanc Tunnel 8 3 11 3.99 5,097 Livorno-Rosignano 197 43 240 -1.68 17,928 Valle d'Aosta Motorway Link Road 87 29 116 7.59 9,848 Strada dei Parchi 1,983 327 2,310 -1.54 22,995 TOTAL ITALIAN SUBSIDIARIES 5,407 806 6,213 -1.00 30,801
TOTAL 43,243 11,722 54,965 -0.07 44,197
* ATVD = total km travelled/length of section /no. of days in year.
Motorway
Traffic on the network operated under concession in Italy in 2010
Vehicles*km (millions) ATVD * 2010
6,000
5,000
4,000
3,000
2,000
1,000
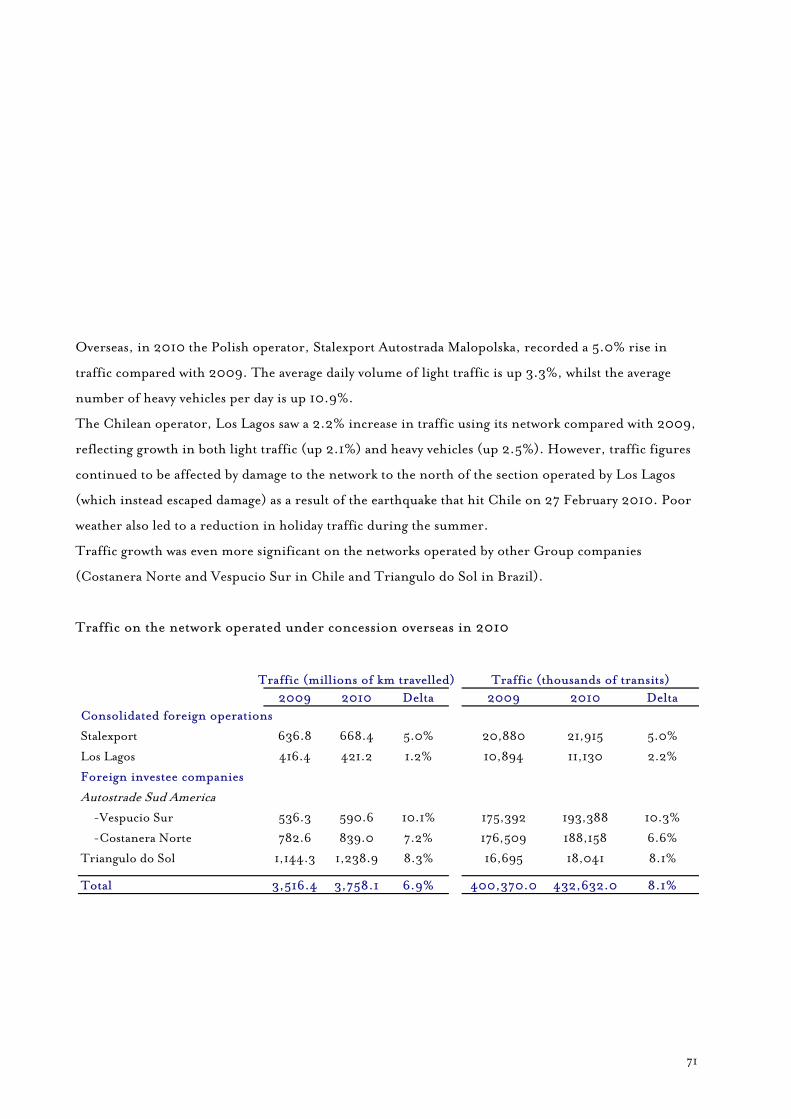
71
Overseas, in 2010 the Polish operator, Stalexport Autostrada Malopolska, recorded a 5.0% rise in
traffic compared with 2009. The average daily volume of light traffic is up 3.3%, whilst the average
number of heavy vehicles per day is up 10.9%.
The Chilean operator, Los Lagos saw a 2.2% increase in traffic using its network compared with 2009,
reflecting growth in both light traffic (up 2.1%) and heavy vehicles (up 2.5%). However, traffic figures
continued to be affected by damage to the network to the north of the section operated by Los Lagos
(which instead escaped damage) as a result of the earthquake that hit Chile on 27 February 2010. Poor
weather also led to a reduction in holiday traffic during the summer.
Traffic growth was even more significant on the networks operated by other Group companies
(Costanera Norte and Vespucio Sur in Chile and Triangulo do Sol in Brazil).
Traffic on the network operated under concession overseas in 2010
Traffic (millions of km travelled) Traffic (thousands of transits)2009 2010 Delta 2009 2010 Delta
Consolidated foreign operations
Stalexport 636.8 668.4 5.0% 20,880 21,915 5.0%
Los Lagos 416.4 421.2 1.2% 10,894 11,130 2.2%
Foreign investee companies
Autostrade Sud America -Vespucio Sur 536.3 590.6 10.1% 175,392 193,388 10.3%
-Costanera Norte 782.6 839.0 7.2% 176,509 188,158 6.6%
Triangulo do Sol 1,144.3 1,238.9 8.3% 16,695 18,041 8.1%
Total 3,516.4 3,758.1 6.9% 400,370.0 432,632.0 8.1%

72
Toll charges
The following annual tariff increases for 2010 were introduced by Autostrade per l’Italia and the
Group’s Italian motorway operators from 1 January 2010.
Toll increases effective 1 January 2010
Italian motorway operator Toll charge increase
Autostrade per l'Italia 2.40%
Raccordo Autostradale Valle D'Aosta 0.94%
Autostrada Torino-Savona 1.47%
Autostrada Tirrenica 2.11%
Strada dei Parchi 4.78%
Tangenziale di Napoli 2.17%
Autostrade Meridionali 1.43%
Società Italiana Traforo del Monte Bianco 5.55%
Raccordo Autostradale Valle d'Aosta, Autostrada Torino-Savona, Autostrada Tirrenica, Tangenziale di
Napoli, Autostrade Meridionali and Strada dei Parchi signed the new single concession arrangements
provided for by Law Decree 262/2006 in 2009. Whilst awaiting the conclusion of the process that will
see the new arrangements come into effect, the above companies have been granted the tariff increases
due under the respective concession arrangements in force, including, in the case of Strada dei Parchi,
the tariff increases not approved for 2007, 2008 and 2009.
In accordance with bilateral agreements between Italy and France, and with the resolution approved by
the Intergovernmental Committee for the Mont Blanc Tunnel on 20 November 2009, from 1 January
2010 Società Italiana Traforo del Monte Bianco has applied a total increase of 5.55%, resulting from
the combination of two elements: i) 2.05% representing the average inflation rate in Italy (2.52%) and

73
France (1.58%) for the period from 1 March 2008 to 31 August 2009; and ii) 3.50% based on the
increase approved by the Intergovernmental Committee on 20 November 2009.
From 1 December 2009 the toll charges applied by Stalexport have been increased for both light
vehicles, which saw a 23% rise, and heavy vehicles weighing below 12 tonnes, where the rise was 8%.
The increases introduced by Stalexport are within the limits provided for in the concession
arrangement. Moreover, from 1 July 2010 the shadow tolls paid by the Grantor to the Operator for
heavy vehicles weighing more than 12 tonnes were increased by 5.4%.
Under the terms of its concession arrangement, the Chilean operator, Los Lagos, introduced a 3.4%
reduction in tolls from 1 January 2010. This reflects the need to keep pace with deflation in the
country of 2.3% (measured between 1 December 2008 and 30 November 2009) and the negative
impact of the “safety factor”, which was 5.0% in 2009 and 3.5% in 2010, partially offset by the
rounding off of tariffs to the nearest 100 pesos (up 0.4%).

74
Capital expenditure Autostrade per l’Italia and the Group’s other motorway operators are in the process of implementing a
programme of investments in major infrastructure projects worth over €13 billion. The purpose of these
investments is to increase the capacity of the existing motorway network on the country’s principal arteries,
in order to improve road safety and service quality.
Autostrade per l’Italia’s investment programme is divided into two parts. The first is included in the
financial plan annexed to the 1997 Agreement with ANAS (Italy’s Highways Agency) and the second is
contained in the IV Addendum to the above Agreement signed in 2002.
The above programmes have been included in Autostrade per l’Italia’s new Single Concession
Arrangement, which was signed on 12 October 2007 and came into effect from 8 June 2008. The new
Arrangement also envisages further investments totalling €7 billion, via:
• extensions to projects already included in the Agreement of 1997, involving new specific network
upgrades worth approximately €2 billion;
• a commitment to develop preliminary designs for the upgrade of certain sections of motorway
operated under concession, totalling around 330 km, at a cost of approximately €5 billion.
Works envisaged by the investment programmes of the Group’s other motorway concessionaires, and
included in their respective financial plans, have the same purpose as those made by Autostrade per l’Italia
and involve the expansion of existing roads. The widening and modernisation of the Naples-Pompeii-
Salerno motorway (SAM) and of the motorways between Rome and Abruzzo (Strada dei Parchi) are of
particular significance. In addition, Autostrada Tirrenica’s Single Concession Arrangement requires the
latter to complete the remaining 200 km of the A12 Livorno-Civitavecchia, subject to approval of the final
design and the related financial plan and definition of the terms for the return on investment.

75
Upgrades and modernisation of the network operated under concession in Italy

76
Investments in the network operated under concession by Autostrade per l’Italia and the Group’s other
Italian motorway operators amounted to €1,443.4 million in 2010, marking an increase of €255.1 million
(21.5%) on 2009.
Investments relating to Autostrade per l’Italia’s Agreement of 1997 are substantially in line with the
figure for 2009. This primarily reflects the completion of work on the Casalecchio-Sasso Marconi
section (down €30.8 million), completion of excavation work for the Base Tunnel (down €36.9
million) and for the tunnels included in Lot 12 (down €61.8 million) and completion of work on Lot
17 of the Variante di Valico (down €4.8 million). These reductions were offset by an increase in work
on the Florence North–Florence South section (up €62.5 million), where excavation of the
Pozzolatico and Melarancio tunnels was completed and the platform of the A1/A11 link road was
opened to traffic in time for the summer holiday season. There was an increase in work on Lots 5-8 of
the Variante di Valico (up €42.5 million), following the start-up of work on Lot 6-7, and on Lot 13,
following settlement of the dispute with the contractor (up €26.4 million).
Investments envisaged under Autostrade per l’Italia’s IV Addendum of 2002 are up €175.2 million on
2009, primarily due to increased work on the addition of a third lane for the A14 (Lots 1A – 1B – 3),
on the A9 between Lainate and Como and on the A1 between Fiano and Settebagni, due to the fact
that the relevant contracts were awarded to Pavimental (up €190.7 million). Work has also started on
Lots 2, 4 and 6B of the A14 between Rimini North and Porto Sant’Elpidio, for which all the contracts
have been awarded (up €23.6 million), whilst work was substantially completed on Lot 6A (down
Capital expenditure by the Atlantia Group
€m 2010 2009 % inc./(dec.)
Autostrade per l'Italia -projects in Agreement of 1997 618.8 617.6 0.2%Autostrade per l'Italia - projects in IV Addendum of 2002 365.3 190.1 92.2%Investments in major works by other subsidiaries 115.7 72.4 59.8%Other investments in the network and capitalised costs (staff, maintenance, other) 343.6 308.2 11.5%Total investments in motorway assets 1,443.4 1,188.3 21.5%
Investments in other intangible assets 24.4 24.5 -
Investments in property, plant and equipment 56.9 61.8 -7.9%
Total capital expenditure by the Group 1,524.7 1,274.6 19.6%
Compared with previously published amounts, figures in the consolidated statement of financial position and income statement as at and for the year ended 31 December 2009 have been restated to take account of the impact of application of IFRIC 12. Details are provided in note 4 in the consolidated financial statements as at and for the year ended 31 December 2010.
77
€44.7 million), which led to the opening to traffic of 33 km of motorway between the Ancona South
junction and the Chienti service area in time for the summer holiday season, and the tender process
for Lot 5 was completed (down €4.7 million). Finally, work began on designing the Genoa Motorway
Bypass (up €5.8 million) and renovation of the Adda and Brembo bridges was substantially completed
(up €4.5 million).
The authorisation process for investment projects Motorway investment projects are subject to a complex authorisation process involving various
relevant ministries and entities, in addition to ANAS. The authorisations, primarily having regard to
environmental and urban planning requirements, are dependent on numerous entities with decision-
making powers. There are, however, significant difficulties in obtaining all necessary permits and the
application processes are long and drawn out. The approval process may be summarised as follows:
a) agreement with the grantor (ANAS) regarding investment plans and the conditions for
financing the works;
b) approval of each project by the relevant entities and institutions. Independently of the required
procedure for each motorway upgrading project, it is necessary to perform an Environmental
Impact Assessment (EIA) at national level (involving the Ministry of the Environment, the
Ministry of Culture and regional authorities) and have the project approved by a Services
Conference. During the above process, the various authorities often request changes to the
original design, making it necessary to obtain new authorisations, including EIAs at regional
level depending on the category of work to be carried out;
c) approval of the final and executive designs by ANAS;
d) award of the related contracts in accordance with the laws in force;
e) execution of the works subject to receipt of secondary authorisations from local authorities. At
this stage, execution of the works and management of the sites is monitored by Environmental
Watchdogs and Technical Oversight Committees, established to monitor compliance with
requirements identified by the EIA, and subject to the supervision of ANAS.
78
In point of fact, despite the best efforts of Autostrade per l’Italia and its subsidiaries, there are
significant hold-ups and delays in carrying out the various works, often due to factors, causes and
situations that are totally beyond the control of operators. Progress in executing the works envisaged in
the operators’ financial plans is held up, at the approval stage, by the complexity of the various
authorisation procedures involved and, during execution, by the policies and requests of local
authorities, that often result in long delays and suspension of work, and sometimes even the need to
start the entire authorisation process over again.
Even when projects have been given approval and agreement has been reached with local communities,
further difficulties for construction companies that were awarded the contract for the works can even
then be created due to the selection criteria imposed on Autostrade per l’Italia by the Concession
Arrangement, which, in accordance with current legislation, essentially require contracts subject to
public tender to be awarded on a lowest cost basis. This requirement, which focuses exclusively on the
cost of the work, often ignores the technical ability and quality of contractors.
Moreover, following enactment of Law 286/06, all motorway operators were required to award
contracts for works solely to external contractors via public tender.
Only recently, with enactment of Law Decree 207 of 30 December 2008, converted with amendments
into Law 14 of 27 February 2009, have new regulations been introduced for motorway operators, who
are now permitted to award contracts to subsidiaries or associates, such as Pavimental, for a portion of
the network upgrade works to be carried out.
This option had already enabled work to be successfully carried out, subject to specific prior
authorisations from the Ministry of Infrastructure and ANAS, on extremely congested, highly
industrialised and urbanised sections of the network ensuring that disruption was kept to a minimum
for both traffic and customers.
During 2009 Autostrade per l’Italia and the Group’s other Italian motorway operators awarded
Pavimental contracts worth over €600 million, whilst contracts with a value of approximately €450
million were awarded to the subsidiary in 2010 and early 2011.
Despite the well-documented difficulties regarding administrative and executive authorisation,
Autostrade per l’Italia has succeeded in progressively speeding up the pace of investment since 2008,

79
with capital expenditure in 2010 being 2% higher than the figure for annual investment in the Single
Arrangement of 2007 and thus reducing the shortfall with respect to the commitments given in the
Arrangement, which was built up primarily in 2008.
Stage of completion of works being carried out by Autostrade per l’Italia and the Group’s other
Italian motorway operators The following table shows all major works for the upgrade of the network operated under concession,
based on the commitments given in the respective concession arrangements.
The estimated value of each project includes the overall cost (before any government grants) of the
works, as assessed at the end of December 2010 and calculated on the basis of the stage of completion
reached at this date, based on:
a) the value of the base bid price of the works, after actual or expected reductions;
b) available funds (for example, for hold-ups, design work, works supervision, etc.);
c) recognised reserves;
d) early completion bonuses;
e) expert appraisals of contract variations.
The resulting amounts are subject to change based on the effective future stage of completion of the
works.
In spite of the Group’s determination to push ahead with design work and organisation of the projects,
the above complications and problems relating to approvals may well continue to delay completion of
works, with the following implications:
a) the impossibility of making a reasonable estimate of the date of completion and entry into service
of the various works, especially those where construction has yet to begin;
b) potential cost overruns due to disputes and eventual changes to designs.
Autostrade per l’Italia’s Board of Directors has set up a body to be known as the “Committee
responsible for the Completion of Projects”, with the role of monitoring:
80
a) the performance of infrastructure investment plans in terms of state of progress of the works, the
related costs and compliance with the commitments given by the Company and its subsidiaries in
the relevant concession arrangements;
b) the process of awarding contracts for execution of the works;
c) the organisational and procedural aspects of execution of the works;
d) the state of contract reserves;
e) the state of the most important legal disputes.
The Committee met 10 times in 2010 in order to monitor the performance of infrastructure
investment programmes and the state of progress of the works, the selection of contractors by tender,
the organisational and procedural aspects of execution of the works, the state of contract reserves and
the charges incurred in re-assessing contract terms and conditions.
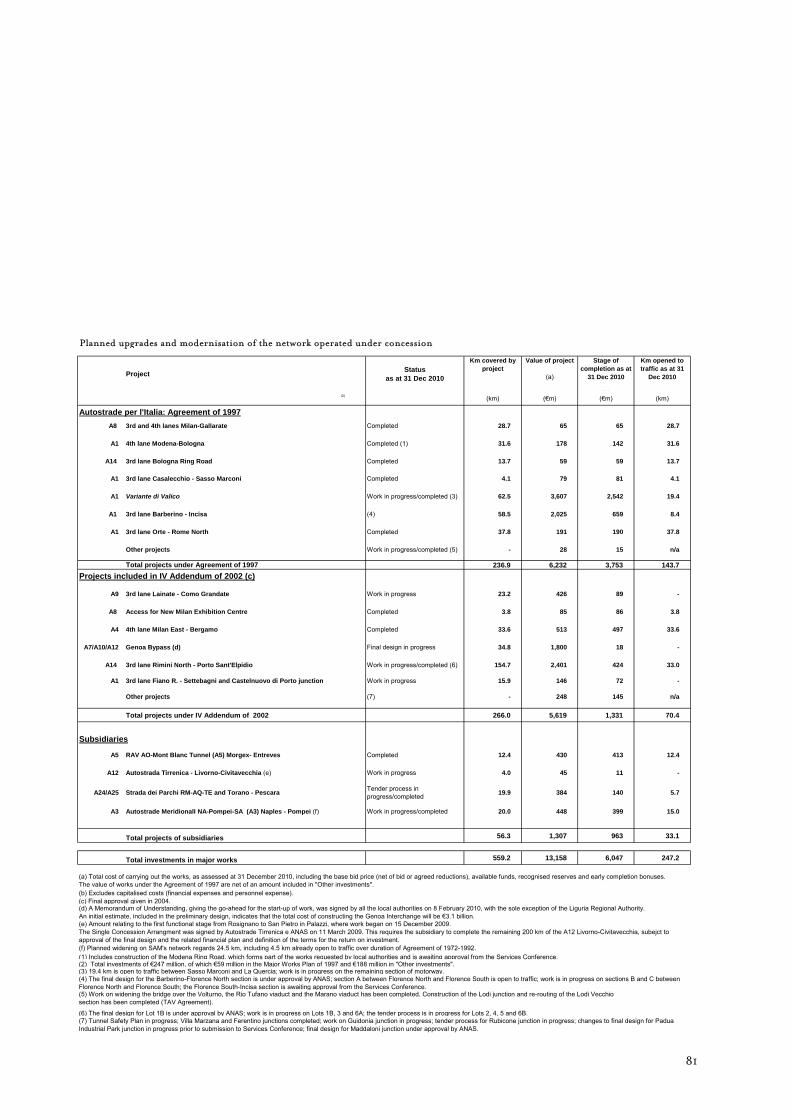
81
Planned upgrades and modernisation of the network operated under concession
Project Status as at 31 Dec 2010
Km covered by project
Value of project
(a)
Stage of completion as at
31 Dec 2010
(b)
Km opened to traffic as at 31
Dec 2010
(km) (€m) (€m) (km)
A8 3rd and 4th lanes Milan-Gallarate Completed 28.7 65 65 28.7
A1 4th lane Modena-Bologna Completed (1) 31.6 178 142 31.6
A14 3rd lane Bologna Ring Road Completed 13.7 59 59 13.7
A1 3rd lane Casalecchio - Sasso Marconi Completed 4.1 79 81 4.1
A1 Variante di Valico Work in progress/completed (3) 62.5 3,607 2,542 19.4
A1 3rd lane Barberino - Incisa (4) 58.5 2,025 659 8.4
A1 3rd lane Orte - Rome North Completed 37.8 191 190 37.8
Other projects Work in progress/completed (5) - 28 15 n/a
Total projects under Agreement of 1997 236.9 6,232 3,753 143.7
A9 3rd lane Lainate - Como Grandate Work in progress 23.2 426 89 -
A8 Access for New Milan Exhibition Centre Completed 3.8 85 86 3.8
A4 4th lane Milan East - Bergamo Completed 33.6 513 497 33.6
A7/A10/A12 Genoa Bypass (d) Final design in progress 34.8 1,800 18 -
A14 3rd lane Rimini North - Porto Sant'Elpidio Work in progress/completed (6) 154.7 2,401 424 33.0
A1 3rd lane Fiano R. - Settebagni and Castelnuovo di Porto junction Work in progress 15.9 146 72 -
Other projects (7) - 248 145 n/a
Total projects under IV Addendum of 2002 266.0 5,619 1,331 70.4
A5 RAV AO-Mont Blanc Tunnel (A5) Morgex- Entreves Completed 12.4 430 413 12.4
A12 Autostrada Tirrenica - Livorno-Civitavecchia (e) Work in progress 4.0 45 11 -
A24/A25 Strada dei Parchi RM-AQ-TE and Torano - Pescara Tender process in progress/completed 19.9 384 140 5.7
A3 Autostrade MeridionalI NA-Pompei-SA (A3) Naples - Pompei (f) Work in progress/completed 20.0 448 399 15.0
Total projects of subsidiaries 56.3 1,307 963 33.1
Total investments in major works 559.2 13,158 6,047 247.2
(b) Excludes capitalised costs (financial expenses and personnel expense).(c) Final approval given in 2004.
(f) Planned widening on SAM's network regards 24.5 km, including 4.5 km already open to traffic over duration of Agreement of 1972-1992.(1) Includes construction of the Modena Ring Road, which forms part of the works requested by local authorities and is awaiting approval from the Services Conference.(2) Total investments of €247 million, of which €59 million in the Major Works Plan of 1997 and €188 million in "Other investments".(3) 19.4 km is open to traffic between Sasso Marconi and La Quercia; work is in progress on the remaining section of motorway.
(6) The final design for Lot 1B is under approval by ANAS; work is in progress on Lots 1B, 3 and 6A; the tender process is in progress for Lots 2, 4, 5 and 6B.
Subsidiaries
(a) Total cost of carrying out the works, as assessed at 31 December 2010, including the base bid price (net of bid or agreed reductions), available funds, recognised reserves and early completion bonuses.The value of works under the Agreement of 1997 are net of an amount included in "Other investments".
(7) Tunnel Safety Plan in progress; Villa Marzana and Ferentino junctions completed; work on Guidonia junction in progress; tender process for Rubicone junction in progress; changes to final design for Padua Industrial Park junction in progress prior to submission to Services Conference; final design for Maddaloni junction under approval by ANAS.
(e) Amount relating to the first functional stage from Rosignano to San Pietro in Palazzi, where work began on 15 December 2009.The Single Concession Arrangment was signed by Autostrade Tirrenica e ANAS on 11 March 2009. This requires the subsidiary to complete the remaining 200 km of the A12 Livorno-Civitavecchia, subejct to approval of the final design and the related financial plan and definition of the terms for the return on investment.
Autostrade per l'Italia: Agreement of 1997
Projects included in IV Addendum of 2002 (c)
(4) The final design for the Barberino-Florence North section is under approval by ANAS; section A between Florence North and Florence South is open to traffic; work is in progress on sections B and C between Florence North and Florence South; the Florence South-Incisa section is awaiting approval from the Services Conference.
(d) A Memorandum of Understanding, giving the go-ahead for the start-up of work, was signed by all the local authorities on 8 February 2010, with the sole exception of the Liguria Regional Authority. An initial estimate, included in the preliminary design, indicates that the total cost of constructing the Genoa Interchange will be €3.1 billion.
(5) Work on widening the bridge over the Volturno, the Rio Tufano viaduct and the Marano viaduct has been completed. Construction of the Lodi junction and re-routing of the Lodi Vecchio section has been completed (TAV Agreement).
(2)
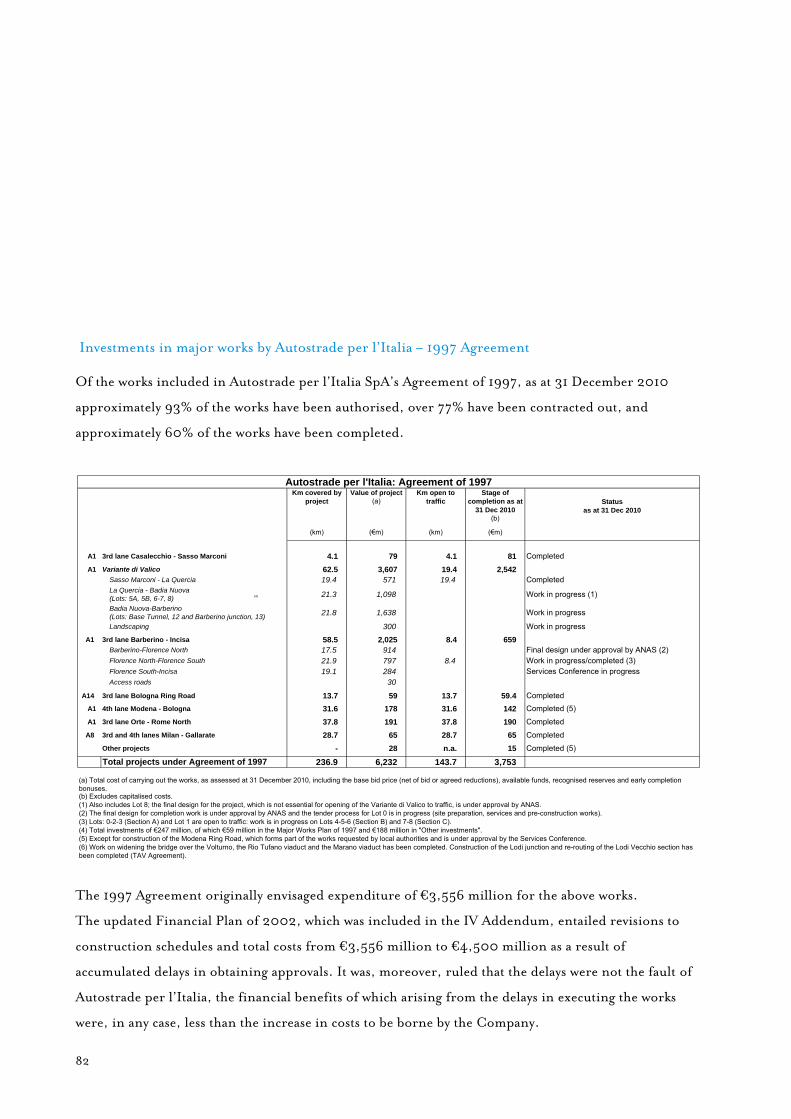
82
Investments in major works by Autostrade per l’Italia – 1997 Agreement Of the works included in Autostrade per l’Italia SpA’s Agreement of 1997, as at 31 December 2010
approximately 93% of the works have been authorised, over 77% have been contracted out, and
approximately 60% of the works have been completed.
The 1997 Agreement originally envisaged expenditure of €3,556 million for the above works.
The updated Financial Plan of 2002, which was included in the IV Addendum, entailed revisions to
construction schedules and total costs from €3,556 million to €4,500 million as a result of
accumulated delays in obtaining approvals. It was, moreover, ruled that the delays were not the fault of
Autostrade per l’Italia, the financial benefits of which arising from the delays in executing the works
were, in any case, less than the increase in costs to be borne by the Company.
Km covered by project
Value of project(a)
Km open to traffic
Stage of completion as at
31 Dec 2010(b)
Status as at 31 Dec 2010
(km) (€m) (km) (€m)
A1 3rd lane Casalecchio - Sasso Marconi 4.1 79 4.1 81 Completed
A1 Variante di Valico 62.5 3,607 19.4 2,542Sasso Marconi - La Quercia 19.4 571 19.4 CompletedLa Quercia - Badia Nuova(Lots: 5A, 5B, 6-7, 8) 21.3 1,098 Work in progress (1)
Badia Nuova-Barberino(Lots: Base Tunnel, 12 and Barberino junction, 13) 21.8 1,638 Work in progress
Landscaping 300 Work in progressA1 3rd lane Barberino - Incisa 58.5 2,025 8.4 659
Barberino-Florence North 17.5 914 Final design under approval by ANAS (2)Florence North-Florence South 21.9 797 8.4 Work in progress/completed (3)Florence South-Incisa 19.1 284 Services Conference in progressAccess roads 30
A14 3rd lane Bologna Ring Road 13.7 59 13.7 59.4 CompletedA1 4th lane Modena - Bologna 31.6 178 31.6 142 Completed (5)
A1 3rd lane Orte - Rome North 37.8 191 37.8 190 Completed
A8 3rd and 4th lanes Milan - Gallarate 28.7 65 28.7 65 Completed
Other projects - 28 n.a. 15 Completed (5)
Total projects under Agreement of 1997 236.9 6,232 143.7 3,753
(b) Excludes capitalised costs.
(4) Total investments of €247 million, of which €59 million in the Major Works Plan of 1997 and €188 million in "Other investments".
Autostrade per l'Italia: Agreement of 1997
(a) Total cost of carrying out the works, as assessed at 31 December 2010, including the base bid price (net of bid or agreed reductions), available funds, recognised reserves and early completion bonuses.
(1) Also includes Lot 8; the final design for the project, which is not essential for opening of the Variante di Valico to traffic, is under approval by ANAS.
(5) Except for construction of the Modena Ring Road, which forms part of the works requested by local authorities and is under approval by the Services Conference.
(2) The final design for completion work is under approval by ANAS and the tender process for Lot 0 is in progress (site preparation, services and pre-construction works).
(6) Work on widening the bridge over the Volturno, the Rio Tufano viaduct and the Marano viaduct has been completed. Construction of the Lodi junction and re-routing of the Lodi Vecchio section has been completed (TAV Agreement).
(3) Lots: 0-2-3 (Section A) and Lot 1 are open to traffic: work is in progress on Lots 4-5-6 (Section B) and 7-8 (Section C).
(4)
83
The increase in the costs above the levels originally set out in the Financial Plan annexed to the
Agreement of 1997, are primarily the result of the above delays that led to price increases and changes
to subsequently issued regulations. Cost increases were also caused by works requested by local
authorities involved in the approval and authorisation process. It is not envisaged that past and future
cost overruns incurred by Autostrade per l'Italia will be made up by rises in toll charges.
When, moreover, construction schedules were revised and agreed during the drafting of the IV
Addendum in mid-2002, the authorisation process for many sections had not yet been completed (for
Casalecchio-Sasso Marconi, lots 5, 6, 7, 8, 13 and 14 of the Variante di Valico, Barberino-Florence
North, lots 4, 5 and 6 of the Florence North-Florence South section, Florence South-Incisa and the
Bologna Ring Road) and it was not possible to estimate when this might occur.
From 2002 to date, all the authorisation procedures have been completed for the upgrade of the A1
between Bologna and Florence and for the other network upgrades, even though much later than
predicted in 2002, with the exception of the Florence South-Incisa section, for which the Services
Conference has yet to be concluded.
The delays in obtaining approvals between 2002 and 2010 have resulted in a reduction in investment
compared with the estimates contained in the plan drawn up in 2002. As at 31 December 2010 these
delays are estimated to amount to approximately €741 million. The accrued financial benefits deriving
from the delays, calculated year by year, amount to an after tax figure of approximately €401 million,
including €352 million that Autostrade per l’Italia has taken to an undistributable equity reserve, as
required by the terms and conditions of the Single Concession Arrangement. The residual €49
million will be the subject of a proposal to be submitted to shareholders at the next Annual General
Meeting, when they will be asked to approve an increase of the same amount in the above
undistributable equity reserve.
At the end of 2010 the final cost of the works (based on contracts in progress and final and executive
designs awaiting authorisation) amounts to €6.2 billion. Of this, works with a value of approximately
84
€3.8 billion have been carried out, a figure that is higher than the original estimate.
Moreover, execution of the works envisaged in the Agreement of 1997 is proving more complex than
expected at the design stage, above all with regard to the Variante di Valico and the Florence North-
Florence South section.
The reason for this is the local geology which, given the width of the sections to be excavated for the
tunnels, has resulted in longer construction times and higher costs. This reflects the need to
guarantee site safety and comply with new environmental protection legislation (in particular
regarding management of the excavated earth and rocks).
Based on the above, it is now estimated that the final cost of the works envisaged in the Agreement of
1997 will reach €6.5 billion, with the section of motorway covered by the Variante di Valico project
scheduled to open to traffic at the end of 2013.
Compared with the initial estimate of €3.5 billion, on the basis of which the Company was privatised,
the additional expense to be borne by the operator amounts to €3.0 billion.
The stage of completion of the main sections on which work is being carried out is as follows:
• Variante di Valico
Work is continuing. This section of motorway is scheduled to open to traffic in 2013, partly thanks to
the use of a mechanised EPB (Earth Pressure Balance) tunnelling machine for the Sparvo tunnel (2.5
km), enabling full mechanisation of both the excavation and tunnel cladding process. This involves
stabilisation of the tunnel face by keeping the excavated spoil under pressure, thereby significantly
speeding up finalising time.

85
Excavation of the Base Tunnel, which has two separate carriageways approximately 8.6 km in length,
was completed on 21 December 2010. This tunnel, linking the regions of Emilia Romagna and
Tuscany, is emblematic of the Variante di Valico section of the A1 motorway from Milan to Naples.
• Florence North - Florence South Work on sections B and C is continuing. Excavation of the Melarancio tunnel (1.1 km) was completed
on 22 June. Lot 1 of the third lane of the Florence North–Florence South section was opened to
traffic on 28 July 2010. This was followed by certain upgrade work and the laying of draining
pavement.
Work on the Pozzolatico tunnel (2.4 km) was completed on 10 December, enabling the southbound
carriageway of the section between Florence Scandicci and Florence South, totalling over 13 km, to be
opened to traffic in time for peak-time traffic during the summer of 2011, thus relieving congestion
on one of the busiest stretches of the A1.
• Barberino - Florence North On 27 April 2010 ANAS approved the final design for Lot 0, including site preparation, service roads
and certain pre-construction works. On 10 June 2010 Autostrade per l’Italia submitted the executive
design to ANAS, which notified its approval on 17 December 2010 and 26 January 2011. The related
contracts have been awarded to the subsidiary, Pavimental. Approval by ANAS of the final design for
the completion works is still pending.
In the meantime, Autostrade per l’Italia has opted to use an EPB (Earth Pressure Balance) tunnelling
machine to build a single tunnel in place of nine tunnels originally to be excavated using the
traditional method. This will significantly cut construction time, provide enhanced safety guarantees
for workers, reduce the environmental impact and result in cost savings.
Following a plenary meeting of the EIA Commission, held at the Ministry of the Environment on 3
December 2010, on 18 January 2011 Autostrade per l’Italia received the final opinion, containing a
number of requirements. This opinion excludes the Environmental Impact Assessment procedure for

86
the Santa Lucia Tunnel. Autostrade per l’Italia is carefully assessing whether or not the requirements
are compatible with construction of the tunnel using mechanised excavation.
• Florence South – Incisa On 1 February 2010 Autostrade per l’Italia submitted the updated final design, taking account of the
requirements agreed on during the first session of the Services Conference held on 5 November 2009
to all the entities involved.
On 7 April 2010 the Ministry of Infrastructure and Transport called a new session of the Services
Conference for 13 May 2010. This was then adjourned until 21 June 2010 in response to requests
from the mayors of Bagno a Ripoli, Rignano and Incisa, who wished to have more time to assess
aspects linked to the routing of the road through urban areas. On this date it was decided to delay
closure of the process in order to complete further examination of the design. In view of the
difficulties involved in starting work, Autostrade per l’Italia is looking at alternative solutions to
present to the Regional Authority and the interested municipalities.
Investments in major works by Autostrade per l’Italia – IV Addendum 2002
Investments envisaged by the IV Addendum are designed to upgrade the network close to a number of
major conurbations (Milan, Genoa, and Rome) and along the Adriatic coast. The authorisation
process for works covered by the IV Addendum, signed by Autostrade per l’Italia in December 2002,
was completed and become effective in June 2004, following a letter from ANAS announcing that the
interministerial decree approving the Addendum had been registered with the Italian Court of
Auditors. Work on the designs relating to the investment programme envisaged by the IV Addendum
could thus only start from this date, after a delay of 21 months with respect to the original programme.
As at 31 December 2010 around 66% of the works have been authorised, over 65% have been
contracted out and more than 23% have been completed.

87
The investments included in the IV Addendum are associated with specific toll increases linked to
validation of the individual works based on the stage of completion.
The stage of completion of the main sections on which work is being carried out is as follows: • A9 Lainate - Como
In the first six months of 2010 the process of handing over all the sites to the subsidiary, Pavimental,
was completed, despite the numerous problems encountered with operators of the various networks
that interfere with the motorway (above all water and gas supply networks) and a number of appeals
brought before the Regional Administrative Court by expropriated parties. Certain problems
regarding interference issues have so far yet to be resolved.
Thanks to award of the contract to the subsidiary, Pavimental, the Group expects to complete the
works around 6 months ahead of schedule.
Km covered by project
Value of project(a)
Km open to traffic
Stage of completion at 31
Dec 2010(b)
Status at 31 Dec 2010
(km) (€m) (km) (€m)
A1 3rd lane Fiano R. - Settebagni and Castelnuovo di Porto junction 15.9 146 - 72 Work in progress
A4 4th lane Milan East - Bergamo 33.6 513 33.6 497 Completed
A9 3rd lane Lainate - Como Grandate 23.2 426 - 89 Work in progress
A14 3rd lane Rimini North - Porto Sant'Elpidio: 154.7 2,401 33.0 424Rimini North-Cattolica - Lot 1A 1.2 81 Work in progressRimini North-Cattolica - Lot 1B 27.8 420 Work in progressCattolica-Fano - Lot 2 28.3 525 Work in progressFano-Senigallia - Lot 3 21.0 353 Work in progressSenigallia - Ancona North and Marina di Monte Marciano junction - Lot 4 18.9 373 Work in progressAncona North-Ancona South - Lot 5 17.2 350 Executive design in progress for integrated tenderAncona South-Porto Sant'Elpidio - Lot 6A 37.0 145 33.0 CompletedAncona South-Porto Sant'Elpidio and Porto Sant'Elpidio junction - Lot 6B 3.3 148 Work in progress
Porto Sant'Elpidio - Pedaso - Lots 7A - 7B 6 Project no longer envisaged in the Single Concession Arrangment of 2007 (16.6 km)
A8 Access for New Milan Exhibition Centre 3.8 85 3.8 86 CompletedA7/A10 Genoa Bypass (c) 34.8 1,800 - 18 Final design in progress
Other projects - 248 n.a. 145 (1)
Total projects under IV Addendum of 2002 266.0 5,619 70.4 1,331
(*) Final approval given in 2004.
Projects included in IV Addendum of 2002 (*)
(a) Total cost of carrying out the works, as assessed at 31 December 2010, including the base bid price (net of bid or agreed reductions), available funds, recognised reserves and early completion bonuses.
(1) Tunnel Safety Plan in progress; Villa Marzana and Ferentino junctions completed; work on Guidonia junction in progress; tender process for Rubicone junction in progress; changes to final design for Padua Industrial Park junction in progress prior to submission to Services Conference; final design for Maddaloni junction under approval by ANAS.
(c) A Memorandum of Understanding, giving the go-ahead for the start-up of work, was signed by all the local authorities on 8 February 2010, with the sole exception of the Liguria Regional Authority. An initial estimate, included in the preliminary design, indicates that the total cost of constructing the Genoa Interchange will be €3.1 billion.
(b) Excludes capitalised costs (financial expenses and personnel expense).

88
• A14 Rimini North – Porto Sant’Elpidio
Work on the 37-km section of Lot 6A between Ancona South and Porto Sant’Elpidio, which began in
March 2007, is nearing completion. The 33-km stretch between the Ancona South junction and the
Chienti Service Area was opened to traffic on 30 July 2010, in readiness for the summer holiday
season.
Widening work is currently underway on the remaining section, with the exception of the 17.2 km
between Ancona North and Ancona South (Lot 5), for which the contract was only awarded on 1
October 2010. The contractor began work on the executive design on 26 November 2010.
Autostrade per l’Italia has agreed with Pavimental that Lots 1A and 3 will open to traffic in November
2012 and July 2011, around 6 months ahead of the contractually agreed completion date. Similarly,
Lot 1B is also expected to open to traffic approximately 6 months ahead of the contractually agreed
completion date.
• Fiano - Settebagni di Roma and the Castelnuovo di Porto Junction
Work is proceeding after the handover of the site to the subsidiary, Pavimental, on 30 April 2009.
The Castelnuovo di Porto junction was opened to traffic on 27 July 2010.
Autostrade per l’Italia has agreed with Pavimental that the section of motorway will open to traffic in
July 2011, around 9 months ahead of the contractually agreed completion date.
• Genoa Bypass
Following conclusion of the public consultation process on 8 February 2010, and after receiving
approval from the various entities involved, the Ministry of Infrastructure and Transport, Genoa
Provincial Authority, the Municipality of Genoa, the Genoa Port Authority, ANAS and Autostrade
per l’Italia signed the new memorandum of understanding, which sets out the new solution agreed
upon and identifies the next steps to be taken in order to proceed with work on the project.

89
Autostrade per l’Italia is currently preparing the final design to be submitted to ANAS for its technical
assessment and to the national Services Conference.
An initial estimate contained in the preliminary design indicates that the total cost of constructing the
Genoa Interchange will be €3.1 billion. This figure will be confirmed in the final and executive
designs.
• Tunnel Safety Plan
Work on tunnel upgrades proceeded in 2010.
As at 31 December 2010 the upgrade of 312 tunnels has been completed, whilst work on a further 236
is underway ; two upgrades have been included in widening projects.
Planned investments in major works by the Group’s other motorway operators
With regard to investments in new works by Autostrade per l’Italia’s subsidiaries (Raccordo
Autostradale Valle d’Aosta, Strada dei Parchi, Autostrade Meridionali and Società Autostrade
Tirrenica), as at 31 December 2010 100% of the works have been authorised, over 80% of the works
are being carried out or the related contracts are being awarded, and 77% have been completed.
Km covered by project
Value of project(a)
Km open to traffic
Stage of completion at 31
Dec 2010(b)
Status at 31 Dec 2010
(km) (€m) (km) (€m)
A5 RAV AO-Mont Blanc Tunnel (A5) Morgex- Entreves 12.4 430 12.4 413 Works completed
A24/A25 Strada dei Parchi RM-AQ-TE and Torano - Pescara 19.9 384 5.7 140 Works subcontracted/completed
A3 Autostrade MeridionalI NA-Pompei-SA (A3) Naples - Pompeii (C) 20.0 448 15.0 399 Works in progress/completed
A12 Autostrada Tirrenica - Livorno-Civitavecchia (D) 4.0 45 - 11 Works in progress
Total subsidiaries capital expenditures 56.3 1,307 33.1 963
(c) Planned widening on SAM's network regards 24.5 km, including 4.5 km already open to traffic over duration of Agreement of 1972-1992.
THE GROUP'S OTHER OTHER ITALIAN MOTORWAY OPERATORS
(a) Total cost of carrying out the works, as assessed at 31 December 2010, including the base bid price (net of bid or agreed reductions), available funds, recognised reserves and early completion bonuses.
(d) Amount relating to the first functional stage from Rosignano to San Pietro in Palazzi, where work began on 15 December 2009.The Single Concession Arrangment was signed by Autostrade Tirrenica e ANAS on 11 March 2009. This requires the subsidiary to complete the remaining 200 km of the A12 Livorno-Civitavecchia, subject to approval of the final design and the related financial plan and definition of the terms for the return on investment.
(b) Excludes capitalised costs (financial expenses and personnel expense).
90
On 21 March 2010 Autostrade Meridionali opened 1.3 km of the third lane close to the Torre
Annunziata and Torre del Greco junctions to traffic, in addition to the 1.6 km section included in
Lots 5-17.
As at 31 December 2010 a total of 15 km of new third lane has been opened to traffic on the A3
Naples-Salerno.
On 29 March 2010 Strada dei Parchi submitted the Executive Design for the upgrade of the section
between Lunghezza (Rome East) and Via Palmiro Togliatti to ANAS for approval, which was granted
on 19 January 2011.
Autostrada Tirrenica holds the concession for the Livorno-Civitavecchia motorway, of which 37 km is
in operation between Livorno and Cecina.
Work on the 4-km section between Rosignano and San Pietro in Palazzi is proceeding after the
handover to Pavimental on 15 December 2009.
Work on the final design for the section from San Pietro in Palazzi to Tarquinia (187 km) was started
and this section is scheduled for completion in early 2011. The final design for the section of motorway
of approximately 15 km between the junction for the Port of Civitavecchia and Tarquinia is in the
process of being approved.
Contract reserves quantified by contractors
As at 31 December 2010 operators have recognised contract reserves quantified by contractors
amounting to €610 million, including €200 million regarding works envisaged in Autostrade per
l’Italia’s Agreement of 1997, the additional cost of which cannot be recovered via toll charges.

91
New motorway initiatives by investee companies
Autostrade per l’Italia is participating in a number of projects relating to expansion of the Italian
motorway network.
Società Infrastrutture Toscane SpA (formerly A.T.I. Prato – Signa 46.0% owned by Autostrade per
l’Italia and 0.6% owned by SPEA).
Società Infrastrutture Toscane is the project company, established on 28 June 2006, that took over the
regional concession to carry out the construction and management of the 10-km toll motorway link
between Prato and Signa, under a project financing initiative, from the previous temporary
consortium.
On 17 July 2006 Società Infrastrutture Toscane signed a Concession Arrangement with the Tuscany
Regional Authority.
The Final Design and the Environmental Impact Assessment were completed and forwarded to the
authorities for their opinions as required by law. The approval process that started on 10 October
2007 is in progress.
Tangenziali Esterne di Milano SpA (Autostrade per l’Italia’s interest: 32%)
On 27 March 2009 the project company, Tangenziale Esterna SpA (TE SpA), and Concessioni
Autostradali Lombarde SpA (CAL) signed a draft agreement covering the design, construction and
operation of Milan’s new outer ring road, planned to be a total of approximately 33 km in length. TE
SpA is 57% owned by Tangenziali Esterne di Milano SpA, in which Autostrade per l’Italia holds a 32%
interest.
The Interministerial Decree approving the Single Concession Arrangement, signed by the Minister of
the Economy and Finance and the Minister of Infrastructure and Transport, was issued on 8 October

92
2010. The approved arrangement has been added to and amended to reflect the requirements
expressed by NARS (the consultative committee that advises the government on service regulation), the
CIPE (the Interministerial Economic Planning Committee), the Ministry of the Economy and Finance
and the relevant parliamentary committees.
The Interministerial Decree was registered with the Italian Court of Auditors on 22 November 2010.
This has rendered the Arrangement effective and marks the start of the period covered by the timetable
included in the arrangement for submitting the Final Design to CAL.
The final design was submitted to CAL on 20 December 2010 with an undertaking to subsequently
present the related cost estimates as soon as they were finalised, in agreement with the Grantor and all
the various local government bodies and institutions involved, and a breakdown of the related works
provided for in the Planning Agreement.
In response to a reduction in the overall investment in order to improve its financial sustainability, the
company has initiated a series of meetings with local government institutions, the Lombardy Regional
Authority and Milan Provincial Authority. In the meantime, on 23 December 2010 CAL announced
its approval of the plans contained in the Final Design submitted by the company, subject to a number
of requirements regarding cost limits and a reduction of the time needed to complete construction of
the Arco TEM (the section of the Outer Ring Road where the Bre.Be.Mi. motorway is to join).
On 7 February 2011 the company published the final design marking the start of the process leading to
the declaration of public utility and application for a certificate of environmental compatibility, with
the subsequent opening of the Services Conference in accordance with the law.
Tangenziali Esterne di Milano SpA has raised further capital partly in order to subscribe new shares to
be issued by the investee company, TE SpA, or in any event to provide the project company with
financing for the activities related to the final design and the start-up of construction.

93
Service areas
There are currently 258 service areas (246 excluding Strada dei Parchi) along the motorway network
operated by Autostrada per l’Italia and the Group’s other operators (including Stalexport Autostrada
Malopolska), 216 of which are on motorways operated by Autostrade per l’Italia.
The planned upgrade of service areas on Autostrada per l’Italia’s network, involving both Autostrade
per l’Italia and its sub-operators, continues. At the end of 2010 approximately 95% of the works
included in the €800 million upgrade programme, covering works to be carried out at service areas by
both Autostrade per l’Italia and sub-operators, had either been started or completed. Work on 188
service areas has already been completed, whilst expansion and renovation work is being carried out by
Autostrade per l’Italia at a further 11 service areas.
All the new fuel and food service concessions came into effect in early 2010, following expiry of the
previous ones in 2009 and award of the new concessions at the end of a competitive tender process,
conducted by an independent external adviser in 2009. Among other features, the new contracts
include price commitments on both a range of food products and the main fuels sold on a self-service
basis.
Royalties received from sub-operators on the network managed by Autostrade per l’Italia and the
Group’s other motorway operators totalled €257.2 million in 2010, marking growth of approximately
6.0% in recurring royalties compared with 2009. Excluding Strada dei Parchi, the company in the
process of being sold, royalties total €251.9 million, representing an increase of 6.1% on 2009.
As a result of the renewal of contracts expiring at the end of 2009, and of the early termination of a
number of other contracts, during 2010 buildings erected by sub-operators on Autostrade per l’Italia’s
land became the property of the company, which has original title as a result of the contractual
obligation for sub-operators to hand over these assets.
The overall value of the properties acquired (as appraised by an independent expert) is €8.6 million.
94
In 2010 the subsidiary, AD Moving SpA, earned revenue of approximately €15.7 million (down €0.4
million on 2009) from the management and marketing of advertising space along the motorway
network (temporary and permanent billboards, the “Infomoving” TV channel and advertising space at
service areas, and road travel information along the motorways) and at other locations (ports and
airports).
Operating performance of other main subsidiaries
Pavimental The company, which has traditionally operated as a motorway maintenance provider, also carries out
road surfacing for Autostrade per l’Italia and for other operators. Since 2004 it has been engaged in
carrying out a number of major infrastructure works for Autostrade per l’Italia.
Revenue for 2010 (€467.1 million) is up €192.6 million (70.2%) on 2009, due to the increased
volume of construction work carried out for Autostrade per l’Italia (up €177.3 million) and Autostrada
Tirrenica (up €9.1 million), in addition to other contracts awarded by Autostrade per l’Italia and by
other customers, partially offset by a reduction in maintenance carried out for Group companies.
EBITDA of €15.0 million for 2010 is up 76.5% on 2009, whilst the EBITDA margin (3.2%) is
substantially in line with the previous year.
Capital expenditure is up 28.7% in 2010 (relating above all to plant and equipment for infrastructure
projects).
Spea - Ingegneria Europea
The company supplies engineering services, primarily to the Group. It offers design, project
management and monitoring services for upgrade and extraordinary maintenance of the network.
Revenue of €149.9 million for 2010 is up 42.7% (€44.9 million) on 2009, primarily due to an
increase design work for infrastructure projects. This includes the final design for the Genoa

95
Interchange for Autostrade per l’Italia and completion of the A12 Livorno-Civitavecchia for
Autostrada Tirrenica. 97% of the company’s revenue was earned on services provided to the Group.
EBITDA for 2010 amounts to €50.2 million, up €18.3 million due to the increase in revenue (up
€44.9 million), partially offset by a rise in personnel expense (up €7.7 million, reflecting an increase
in the average unit cost and an increase of 91 in the average workforce) and greater use of external
consultants (up €17.8 million).
Telepass The company, which commenced operations on 7 October 2008, is responsible for operating
motorway toll collection systems providing an alternative to cash payments: the Viacard direct debit
card and the Telepass and Telepass Family devices.
In 2010 the number of Telepass devices in circulation reached a total of 7.5 million (up 447,200 on
2009), with the number of subscribers of the Premium option totalling 1.2 million (up 256,200 on
2009). Revenue of €124.5 million for 2010 was primarily generated by Viacard subscription fees of
€21.8 million (in line with the previous year), Telepass fees of €84.0 million (up €5.8 million on
2009) and payments for Telepass Premium services of €8.8 million (up €2.3 million on 2009).
The company’s EBITDA of €65.2 million results in an EBITDA margin of 52.4%.
Autostrade Portugal
Autostrade Portugal SA (formerly Somague Itinere SA, a wholly owned subsidiary of the Group
acquired in June 2009 as part of the acquisition of a number of investments in Chilean and
Brazilian operators from the Itinere group) completed the following sales in 2010:
- a 25% stake in Autoestradas do Oeste SA for a total consideration of €26.1 million,
including transferred financial assets;
- a 12% stake in Vialitoral – Concessoes Rodoviarias da Madeira SA for a total consideration of
€7.5 million;

96
- a 19% stake in SMLN – Concessões Rodoviárias de Portugal for a total consideration of €8.7
million, including transferred financial assets.
Autostrade Portugal currently owns 17.21% of Lusoponte - Concessionaria para a Travessia do Tejo
SA, the company that operates two toll bridges that cross the river Tagus in Lisbon; moreover, the
company holds indirectly, by the subsidiary Autostrade Brasil, the 50% of Triangulo do Sol equity.
Triangulo do Sol holds concession of the 442 km toll motorway in the State of Sao Paulo in Brasil,
with expiration date on 2021.
Autostrade International of Virginia O&M
On 26 April 2010 Toll Road Investors Partnership II (TRIP II), which operates the Dulles Greenway
toll motorway in Virginia under concession, informed Autostrade International of Virginia O&M
(AIV) that it had terminated the “Operations & Maintenance” contract with effect from 30 April 2010.
In response, AIV has filed legal action that is still in its initial stages. The action aims to have
termination of the contract declared unlawful and obtain the related damages.
Electronic Transaction Consultants
Electronic Transaction Consultants (ETC) is the leading US provider of systems integration, hardware
and software maintenance, customer services and consultancy in the field of free flow electronic toll
collection systems.
Via its subsidiary, Autostrade International US Holdings, Autostrade per l’Italia holds a 45% stake in
the company, which, as a result of a call option on a further 16% of the company’s shares, is thus
accounted for as a subsidiary under the relevant accounting standards and consolidated in the Group’s
accounts.
ETC generated revenue of €36.9 million in 2010, marking an increase of 14.2% (up 8.6% after
adjusting for exchange rate movements) compared with 2009 (€32.3 million). Gross operating profit
(EBITDA) is €2.4 million, compared with the €1.2 million of 2009.

97
On 26 March 2010 ETC was selected by Georgia State Road and Tollway Authority (SRTA) to
implement and maintain a traffic congestion management system using “High Occupancy Toll (HOT)
lanes” on a section of interstate highway 85. The total value of the contract is approximately US$17
million.
TowerCo
TowerCo is responsible for the construction and management of fully equipped sites located around
the motorway network managed under concession by the Group and on land owned by other parties
(ANAS, municipal authorities and other motorway operators). These sites host antennae and
equipment used by commercial operators (mobile communications companies and TV and radio
broadcasters) and public services (police, Isoradio or traffic monitoring systems).
At the end of December 2010, a total of 272 sites have been built (with 72 providing GSM/UMTS
coverage in motorway tunnels), 5 sites are under construction, and a further 26 sites are being
designed or are at the authorisation stage.
The company reports revenue of €18.7 million for 2010 (€17.9 million in 2009), with gross operating
profit (EBITDA) of €11.1 million, compared with €10.1 million for 2009.
98
Innovation, research and development
The Group’s research and development activities aim to offer innovative solutions designed to:
• boost service quality, in terms of safety and traffic flows, using new technologies for maintenance
and monitoring of the network;
• improve management of the network through the development of dedicated information systems;
• minimise the impact of motorway operations right from the start of the design process, by
managing the infrastructure in an environmentally efficient way.
Group research and development activities, some of which are long-term in nature, are undertaken by
the relevant departments within Autostrade per l’Italia, using the company’s own research laboratories
in partnership with other Group companies, in collaboration with research centres and universities
and, on occasion, in conjunction with other companies.
The following projects entered the application phase during 2010:
• the “Carbon Neutral Building” regarding the entry into service of an automated thermal comfort
management system for the building that houses Autostrade per l’Italia’s Rome headquarters;
• a free-flow multi-lane tolling system based on the Telepass onboard unit and the automated
reading of registration plates;
• new DSRC (Dedicated Short Range Communication) onboard units using state-of-the-art
components capable of reducing the cost and extending the life of the units.
The most important research projects in progress regard:
• the development of an information system for monitoring traffic and accidents to improve traffic
management and the planning of road works;
• adaptation of the existing tolling system in accordance with European Electronic Tolling Service
standards to enhance the interoperability of the systems used by the various networks;

99
• a new onboard unit for toll collection;
• implementation of the control system designed to optimise the management of tunnel systems in
relation to traffic conditions and the behaviour of road users;
• the development of mixes of bitumen conglomerate produced by the “hot” recycling of road
planings.
The Group also takes part in initiatives in collaboration with other Italian and EU bodies and
associations. These projects relate to the establishment of transport-related regulations, such as safety,
the implementation of intelligent transport systems, automated toll collection or the provision of input
for the preparation of European and national research, development and innovation programmes.
Group companies’ total expenditure on innovation, research and development in 2010 amounts to
€8.4 million, and is in line with the European objective of “intelligent growth that promotes research
and innovation”.
100
Operating performance of the Group’s main investee companies
Autostrade Sud America
The merger of Autostrade per il Cile (50% owned by the Group) into Autostrade Sud America (45%
owned by the Group) was completed on 30 August 2010.
As a result of the merger, Autostrade Sud America, in which the Group’s holds a 45.76% stake, holds
(directly and indirectly) all the following controlling interests and investments in companies that
operate sections of motorway under concession in the metropolitan area of Santiago:
• 100% of Costanera Norte SA, which holds the concession (expiring 2033) for 43 km of road
network in the city of Santiago in Chile;
• 50% of Autopista Vespucio Sur SA, the holder of the concession (expiring 2032) for the 23.5-km
southern section of the orbital toll motorway serving the city of Santiago del Chile;
• 50% of Litoral Central SA, the holder of the concession (expiring 2031) for the 79-km toll
motorway serving the cities of Algarrobo, Casablanca and Cartagena in Chile;
• 100% of Autopista Nororiente SA, the holder of the concession (expiring 2044) for the 21.5-km
north-eastern bypass in the city of Santiago del Chile;
• 100% of Accesso Vial Aeropuerto SA, the holder of the concession for the urban motorway linking
the city of Santiago with Arturo Merino Benitez International Airport;
• 100% of Gestion Vial SA, the company responsible for motorway operation, maintenance and
construction services in Chile, including services provided to Autopista Nororiente, Autopista
Vespucio Sur and Litoral Central;
• 50% of Sociedad de Operacion Y Logistica de Infraestructura SA, the company responsible for
certain road maintenance and construction services on the section of motorway operated by
Autopista Vespucio Sur.
Checks and surveys, carried out following the earthquake that hit central Chile on 27 February 2010,
have shown that operators have not incurred major damage and are, in any event, covered by
insurance.

101
Measurement of the investment in Autostrade Sud America as at 31 December 2010 using the equity
method, including the impact of the merger with Autostrade per il Cile, has resulted in recognition of
a profit of €17.3 million in the income statement, and of a gain recognised in other comprehensive income
of €19.0 million (reflecting the favourable performance of the euro/Chilean peso exchange rate during the
period). This has resulted in a total increase of €36.3 million in the carrying amount of the investment in
the consolidated financial statements.
Measurement of Autostrade Sud America using the equity method reflects the company’s share of the
profit/(loss) of its investee companies.
Costanera Norte
During 2010 traffic using the motorway operated under concession by Costanera Norte (a wholly
owned subsidiary of Autostrade Sud America) rose 6.6%, whilst toll revenue recorded growth of 7.9%
compared with the previous year (after adjusting for exchange rate movements). From January 2010
the company has introduced the toll charge increase of 1.1% provided for under the concession
arrangement (the increase is equal to the factorial product of 100% of consumer price deflation of
2.3% in 2009, plus 3.5%).
Revenue of the year, amounting to €53.8 million (including income from supplementary agreement
7), marks growth of 41.6% (23.7% after adjusting for exchange rate movements) compared with 2009
(€38.0 million, including the impact of IFRIC 12 adoption). Gross operating profit (EBITDA) of
€38.2 million is up 50.7% (31.8% after adjusting for exchange rate movements) on 2009 (€25.4
million, including the impact of IFRIC 12 adoption).
Autopista Nororiente During 2010 the motorway operated by the Chilean operator, Nororiente (a wholly owned subsidiary
of Autostrade Sud America, following the merger with Autostrade per il Cile) which holds the
concession for 21.5 km of toll motorway in the city of Santiago, registered an average daily volume of
traffic (including light and heavy vehicles) of 4,946 vehicles, amounting to a total of approximately 39

102
million kilometres travelled. In the previous year, which witnessed the opening to traffic of the entire
motorway in March, the company recorded an average daily volume of traffic (including light and heavy
vehicles) of 3,077 vehicles, amounting to total of 24 million kilometres.
In 2010 Autopista Nororiente recorded revenue of €5.4 million and a gross operating loss (negative
EBITDA) of €0.7 million.
Triangulo do Sol
On 11 June 2010 agreement was reached with Leão & Leão Ltda. for the acquisition of a 10% stake
in Triângulo do Sol, the company that holds the concession for a 442-km toll motorway network
in the state of Sao Paolo in Brazil, expiring in 2021. The Group already holds 50% of Triângulo
do Sol, included in June 2009 as part of the acquisition of a number of investments from the
Itinere group. The 10% interest is being bought at a price of 70 million Brazilian reals (equal to
approximately €32 million).
Completion of the transaction is subject to approval by the competent authorities and investment
banks.
In the event of completion of the acquisition, the company will be consolidated on a line-by-line
basis in the Group’s accounts.
During 2010 Triangulo do Sol recorded an 8.1% increase in traffic using the motorway sections it
operates, compared with the previous year.
Triangulo do Sol reports revenue of €114.3 million for 2010 and gross operating profit (EBITDA) of
€67.5 million.
Measurement of the investment in Triangulo do Sol as at 31 December 2010 using the equity method
has resulted in recognition of a profit of €3.2 million in the income statement, and of a gain recognised
in other comprehensive income of €14.1 million (reflecting the favourable performance of the
euro/Brazilian real exchange rate during the year). The impact of these increases in value was partially
offset by the reduction resulting from the collection of dividends paid during the year (amounting to

103
€10.1 million). This has resulted in an overall increase of €7.2 million in the carrying amount of the
investment.
Pune Solapur Expressways Private Limited
On 17 February 2009 Atlantia, in consortium (50-50) with TRIL Roads Private Limited, a Tata
Group company, was awarded a 21-year concession for the 110-km Pune-Solapur section of motorway
in the Indian state of Maharashtra.
Work on construction and on widening the motorway from two to four lanes is underway, having been
divided into two lots for which contracts were awarded separately to the local companies, Oriental and
IJM. Under the Concession Arrangement, construction work is to last 30 months from 14 November
2009. In reality, the necessary expropriations of land, which is the responsibility of the Grantor, is
behind schedule with respect to the deadline of mid-February 2010. The Operator is putting pressure
on the Grantor to speed up the process.
IGLI
On 12 June 2010 Autostrade per l’Italia, Argo Finanziaria, Immobiliare Fondiaria–SAI and
Immobiliare Milano Assicurazioni (the “Parties”) announced that they had executed an agreement
(also signed by Immobiliare Lombarda SpA, in accordance with its respective role) making limited
changes to and renewing, until 31 July 2012, the previous shareholders’ agreement relating to the
above Parties’ interests in IGLI SpA. This latter company owns 29.96% of the ordinary shares of
Impregilo SpA, a company listed on the Italian Stock Exchange.
The shareholders’ agreement establishes rules for IGLI SpA’s corporate governance and the rights
deriving from IGLI SpA’s shareholding in Impregilo SpA.
Measurement of the investment as at 31 December 2010 using the equity method has resulted in a loss
of €24.2 million in the income statement, and of a gain recognised in other comprehensive income of

104
€9.0 million. This has resulted in a total impairment loss of €15.2 million, due essentially to the
negative performance of the market value (stock market price) of the Impregilo shares held by IGLI.
Alitalia
Atlantia holds an interest of 8.85% in Alitalia – Compagnia Aerea Italiana SpA.
For the year ended 31 December 2010 the Alitalia group reports revenue of €3,225 million, up 14.1%
on 2009 (€2,827 million), and an operating loss of €107 million (an operating loss of €274 million
in 2009).
Alitalia made a loss of €168 million for 2010 (€327 million in 2009).
In terms of the group’s financial position, as at 31 December 2010 net financial debt stands at €839
million (€847 million as at 31 December 2009).

105
Workforce
As at 31 December 2010 the Group employs 9,528 staff on open-ended contracts and 714 on fixed-
term contracts, resulting in a total workforce of 10,242, after excluding Strada dei Parchi. This is
down 1.6% on the 10,413 of 2009, which also included Strada dei Parchi’s workforce. In detail,
compared with 31 December 2009 the number of open-ended contract staff is down 374 and the
number of fixed-term contracts up 203.
The reduction in open-ended contract staff essentially derives from the deconsolidation of Strada dei
Parchi as held for sale (down 521). After stripping out this item, the workforce is up 147, reflecting
trends at the following Group companies:
• Italian operators (down 41, after intercompany transfers), reflecting a reduction, above all at
Autostrade per l’Italia, in toll collectors, partially offset by an increase in maintenance, traffic
management and plant operations personnel and a rise in the staff employed by a number of
technical units at headquarters;
• Pavimental (up 111), primarily linked to an increase in construction work commissioned by
Autostrade per l’Italia;
• Pavimental Polska (down 38), following closure of the Warsaw office;
• Spea (up 84), as a result of an increase in design activities for the Group (above all completion of
the A12 between Livorno and Civitavecchia), and the recruitment of additional staff to work on
project management for construction work being carried out by Autostrade per l’Italia;
• Autostrade International of Virginia (down 57), following termination, from 5 May 2010, by Toll
Road Investors Partnership II, the operator of the Dulles Greenway motorway under concession,
of the Operations & Maintenance contract;
106
• Electronic Transactions Consultants (up 21), following the acquisition of a number of contracts in
Georgia, Florida and Texas;
• Autostrade dell’Atlantico group and Autostrade Indian Infrastructure Development (a total
increase of 67), companies established in the second half of 2009. The increase in open-ended
contract staff at the Autostrade dell’Atlantico group reflects the process of insourcing Operation &
Maintenance activities by the Chilean operator, Los Lagos.
The Group also reports an increase of 203 in fixed-term contracts staff, primarily relating to
Electronic Transactions Consultants Co (up 143) and Spea (up 50) as a result of the above-mentioned
award of new contracts.
The Group’s average workforce has risen from 9,528 in 2009 to 9,686 in 2010, marking an increase
of 158 (up 1.7%).
The main changes in the average workforce, which are linked to the above factors, regarded the
following Group companies:
• Pavimental (up 122 on average);
• SPEA (up 91 on average);
• Electronic Transactions Consultants (up 45);
• Autostrade dell’Atlantico group and Autostrade Indian Infrastructure Development (a total
increase of 36);
• Italian operators (down 70 on average, after intercompany transfers);
• Autostrade International of Virginia (down 38 on average);
• Pavimental Polska (down 23 on average);
• Essediesse (down 15 on average).
Net personnel expense of €569.5 million is down €2.9 million (0.5%) on the €572.4 million of 2009
on a like-for-like basis. Capitalised personnel expense is up from €41.8 million in 2009 to €67.9

107
million in 2010, marking an increase of €26.1 million. This is primarily due to the increased
involvement of Pavimental and SPEA in activities relating to the Group’s construction work.
Personnel expense, before deducting capitalised expenses, amounts to €637.4 million, marking an
increase of €23.2 million (3.8%) on 2009 (€614.2 million).
This is due to:
• an increase in the average unit cost (up 2.1%), primarily due to renewal of the contract applied by
the Group’s Italian operators from the second half of 2009 (up 2.0%);
• the above increase of 158 in the average workforce (up 1.7%).

108
Open-ended contract staff
Absolute %
Senior managers 174 179 (5) -2.8
Middle managers 667 696 (29) -4.2
Administrative staff 3,842 3,811 31 0.8
Manual workers 1,803 1,844 (41) -2.2
Toll collectors 3,042 3,372 (330) -9.8
Total 9,528 9,902 (374) -3.8
Fixed-term contract staff
Absolute %
Senior managers - - -
Middle managers - 2 -2 -
Administrative staff 403 226 177 78.3
Manual workers 83 76 7 9.2
Toll collectors 228 207 21 10.1
Total 714 511 203 39.7
Average workforce
Absolute %
Senior managers 176 175 1 0.6
Middle managers 673 684 (11) -1.6
Administrative staff 3,951 3,766 185 4.9
Manual workers 1,823 1,717 106 6.2
Toll collectors 3,063 3,186 (123) -3.9
Total 9,686 9,528 158 1.7
(*) Excludes Strada dei Parchi
Position
2010 (*) 2009Increase/(Decrease)
31 Dec 2010 (*) 31 Dec 2009Increase/(Decrease)
31 Dec 2010 (*) 31 Dec 2009Increase/(Decrease)

109
Distribution of the Group’s workforce
1.8%7.0%
40.3%32.0%
18.9%
Distribution of open-ended contract staff by category/position
Senior managers
Middle managers
Admin. Staff
Toll collectors
Manual workers
4.7%
34.9%
46.1%
12.6%
1.7%
Distribution of open-ended contract staff by age range
under 31 31 to 45
46 to 55 56 to 60
over 60
16.5%
45.8%
37.7%
Distribution of open-ended contract staff by educational qualification
University graduates
High school graduates
Other
8.4%
18.5%
6.9%
17.1%
38.3%
10.7%
Distribution of open-ended contract staff by length of service
under 1 year
2 to 5 years
6 to 10 years
11 to 20 years
21 to 30 years
over 30 years

110
Staff development and training The Group has an ongoing commitment to developing and improving the prospects of its human
resources, with the aim of:
• motivating the workforce to improve their performance;
• developing professional skills and achieving the targets assigned within the deadlines set;
• providing effective systems and tools to meet the new challenges facing the business.
To more effectively direct investment in staff development and training, the Group identifies and
assesses high-potential staff, using Performance Management systems, systems designed to assess
potential, schemes that assess individual contributions to the achievement of the Group’s objectives
(MBO), and interviews and meetings forming an integral part of human resources management.
For the third consecutive year in 2010 the Group ran a Performance Management scheme for 1,300
middle managers, Professionals and Junior Professionals (young graduates on accelerated development
programmes), segmented by professional role.
The first Performance Management scheme for the Group’s senior management was also introduced.
Development programmes for 2010 involved a total of 160 staff at various levels (middle managers,
Professionals and young graduates).
In 2010 the Group launched its Skills Mapping initiative, involving 100 staff, that aims to assess skills,
work experience, knowledge, capabilities and behavioural characteristics, and the individual “desires”
of the people who take up the opportunity represented by the initiative.
The project was awarded the “Ethics and Business” prize in 2010. This prize is given in recognition of
agreements between social partners that stand out in terms of their participatory and dialogue-based
approach.
111
Approximately 82,000 hours of training were provided by the Group in 2010 (excluding safety
training) at an overall cost of €1.8 million, in addition to the in-house personnel employed directly in
running the courses.
Training involved a total of more than 4,100 staff, equal to 44% of the total workforce.
In line with the plan to progressively insource training, a “Train the Trainer” programme was
implemented in 2010, involving 30 staff. This aims to teach future in-house trainers how to design
and run training courses and about classroom management skills. In-house trainers provided a total of
over 200 days of training, with 10,300 hours of courses provided to more than 1,600 participants.
The other main training initiatives organised by Group companies in 2010 were:
• professional retraining: continuation of the retraining programme for people involved in the
insourcing project, launched following the agreement with the labour unions of July 2009;
• Trainingpass: another two editions of this induction course were run for young new recruits (this
scheme has been running since 2008);
• Widening Project: a training initiative designed to develop managerial skills via the management of
cross-functional teams;
• Workshop on Emergencies;
• Sales techniques for Punto Blu customer care staff;
• Styles of communication for the heads of Traffic Information and Communication at the Section
Departments;
• “SFIDA” project (Integrated Training Solutions for Autostrade), financed via a grant from
Fondimpresa to Autostrade per l'Italia SpA, Telepass SpA and Essediesse SpA, and resulting in
courses covering a wide range of topics and involving around 100 staff.

112
The Group continued to work with a number of leading Italian and European universities and
business schools in 2010, within the framework called “Autostrade per la Conoscenza” (“Autostrade
for Knowledge”), which aims to exploit and enhance the Group’s distinctive expertise.
A Talent Academy focusing on Project Management was created together with MIP–Milan Polytechnic.
The Academy is providing advanced training in integrated project management to approximately 50
Group personnel.
Remuneration system
At their Annual General Meeting held on 23 April 2009, Atlantia’s shareholders approved the
following share-based incentive plans. The plans are compliant with the European Commission’s
Recommendations on the matter.
• 2009 Share Option Plan
On 8 May 2009 and 16 July 2009 Atlantia’s Board of Directors identified the 10 executives and
directors who were to be the beneficiaries of the Plan.
Subsequently, on 15 July 2010, the company’s Board of Directors added a further beneficiary of
the Plan, voting to include the Chairman, Fabio Cerchiai. The Board of Directors also decided to
grant Gian Maria Gros-Pietro, the Company’s former Chairman, the option of maintaining his
right to exercise, according to the same conditions applied to other Share Option Plan
beneficiaries, the options granted to him in 2009.
The terms and conditions of the Share Option Plan provide for the granting of a number of
options to employees and/or directors with specific roles in Atlantia and its subsidiaries, having
regard to the importance of their positions in relation to the creation of value for the Company.
Further details of the Share Option Plan and the conditions governing exercise of the options is
provided in note 7.12 – Equity in the notes to the consolidated financial statements.

113
• 2008-2010 Three-year Incentive Plan (TIP)
On 11 June 2009 Atlantia’s Board of Directors implemented the Three-year Incentive Plan
designed to foster the loyalty of management and reward the achievement of objectives related to
operational and business performance. 91 of the Group’s managers are beneficiaries of the Plan.
The plan involves payment of incentives based on the achievement of objectives linked to specific
indicators, including consolidated profit, investments in major works during the period and
Atlantia’s share price.
The TIP terms and conditions envisage, among other things, suspension of the plan in the event
of a dispute arising between Autostrade per l’Italia and the Grantor, pursuant to art. 7 of Law
241/90.
The bonus issue approved by Atlantia’s shareholders at their Extraordinary General Meeting held on
14 April 2010, pursuant to art. 2442 of the Italian Civil Code, was implemented via the issue of
28,585,578 new ordinary shares with a par value of euro 28,585,578.00, ranking equally in all
respects with the existing issued ordinary shares. As a result, on 15 July 2010 Atlantia’s Board of
Directors made certain technical alterations to the 2009 Share Option Plan and the 2008-2010
Three-year Incentive Plan (TIP) to ensure that there was no change in the substantial terms of the
plans, as provided for in the respective terms and conditions. The Board also voted that further
changes to the Share Option Plan should be submitted for approval by the Company’s shareholders.
The Company has also implemented an MBO incentive scheme, which offers beneficiaries an annual
cash bonus based on the objectives assigned and achieved during the previous year. In 2010 this
involved 155 senior managers and 457 middle managers and administrative staff with roles of
responsibility into the Group.
Organisational model On 1 January 2010, Autostrade per l’Italia transferred the business unit responsible, at national and
international level, for the design and construction of equipment and information systems used in the
114
monitoring and automation of transport, tolling systems, safety and in the management of information
relating to infrastructure for the movement of people and goods to Autostrade Tech.
With effect from 11 March 2010 Autostrade per l’Italia set up joint departments responsible for
Customer Services, Network Development and Technical Services.
A total of 261 internal procedures were either issued or updated in 2010 in response to the regulatory
or organisational changes introduced.
The main updates regarded the following matters:
• the health and safety at work management system, pursuant to art. 30 of legislative Decree 81/2008;
• the Corporate Governance system;
• administrative and accounting procedures adopted in compliance with the Consolidated Finance
Act.
Industrial relations
Details of the Productivity Bonus to be paid in 2010, based on the results achieved in 2009, were
agreed on 4 February 2010.
Talks on renewal of the national collective labour contract (Federreti and the other trade unions),
which expired on 31 December 2009, began in June 2010. As part of the plan to simplify the range of
contracts used, the negotiations aim to draw up a single contract for the sectors that currently apply
contracts used by ANAS and motorway operators.
From 1 July 2010 health insurance cover has been extended to all staff and family members included in
the policy.
115
Health and safety
During 2010 the Health and Safety at Work Management System created in accordance with OHSAS
18001:2007 standards was implemented throughout the organisation. As required by OHSAS
standards, effective implementation of the model was verified through audits conducted by both
internal inspectors and external experts.
In parallel, the process of obtaining OHSAS 18001:2007 certification for all Autostrade per l’Italia’s
activities and places of work was launched. This process involves an initial audit by the certification
body, TUV, which was successfully completed in November 2010, and a second stage that will be
completed by March 2011.
Training in Health and Safety at Work and the Environment continued. A total of 2,000 people took
part in the courses during the year, with approximately 19,500 hours of training provided. Of these,
11,300 hours for 1,270 staff were funded by a grant from Fondimpresa as part of the “Safety on the
Motorway” plan agreed with the trade unions. Multimedia training was also provided to toll collectors,
making it easier to extend health and safety training to all network personnel.
The over 460 Risk Assessment Documents used by Group companies were updated during the year,
adding assessment of the risk of “work-related stress” in compliance with the methodological
recommendations in the relevant regulations.
As provided for in the Group’s Health and Safety Monitoring Plans, climate surveys were again carried
out in 2010 to check that places of work meet the related requirements.
The Group, in collaboration with INAIL (formerly ISPESL), also promoted adoption of the “Learning
by mistakes” programme, which gathers, processes, analyses and publicises information about
accidents, injuries and near misses. The project, which aims to make staff more aware of the issues
surrounding near misses, was promoted by the Occupational Health and Safety Steering Committee
and developed as part of the activities of the Consultative Occupational Health and Safety Committee.
The 6 meetings of the Consultative Occupational Health and Safety Committee, which consists of a
representative from each of the trade unions that signed the National Collective Labour Contract and
116
representatives from the various departments within Autostrade per l’Italia, dealt with a range of health
and safety issues.
With regard to environmental concerns, design of the Environmental Management System began with
gap analysis of activities during the year. In terms of aspects relating to regulatory compliance, the
registration of all Autostrade per l’Italia’s sites with SISTRI, the waste tracking system set up by the
Ministerial Decree of 17 December 2009, was completed and training was provided to staff involved in
ensuring compliance with the regulations.

117
Corporate governance
Atlantia SpA’s Corporate Governance system is based on a collection of rules that are in line with
regulatory guidelines and the very highest market standards.
This system is based on Atlantia SpA’s Corporate Governance Code, which has been drawn up in
accordance with the principles and criteria contained in the Corporate Governance Code published by
Borsa Italiana in March 2006.
In accordance with the current Articles of Association, management of the Company is assigned
exclusively to the Board of Directors, whilst supervisory functions are the responsibility of the Board of
Statutory Auditors and responsibility for auditing the Group’s accounts is assigned to the Independent
Auditors, all of whose appointments are approved by the shareholders at their General Meeting.
Based on the provisions of art. 30 of the Articles of Association, the Chairman and Chief Executive
Officer represent the Company.
Separation of the roles of Chairman and Chief Executive Officer means that it is not necessary to appoint
a Lead Independent Director.
Based on the provisions of the Company’s Corporate Governance Code, the Board of Directors has
established the following board committees: the Human Resources Committee and the Internal Control
and Corporate Governance Committee.
In implementation of the provisions of Legislative Decree 231/2001, Atlantia has adopted the
Management and Control Organisational Model and has set up a Supervisory Board.

118
Lastly, in compliance with the CONSOB requirements contained in the Regulations for Related Party
Transactions (Resolution 17221 of 12 March 2010, as subsequently amended), on 21 October 2010
Atlantia set up a Committee of Independent Directors with responsibility for Related Party Transactions –
consisting of three Independent Directors – and, on 11 November 2010, approved the new Procedure for
Related Party Transactions, which came into effect from 1 January 2011.
In addition to the above Procedure, Atlantia has, among others, adopted the Procedure for Market
Announcements, the Procedure for relations with the Independent Auditors, the Procedure for
Reporting to the Board of Statutory Auditors and the Code of Conduct for internal dealing.
The Company’s Governance system is completed by the regulations contained in the Articles of
Association and in the General Meeting Regulations.
Sintonia SA, via Schemaventotto SpA, is the shareholder that directly and indirectly holds a relative
majority of the issued capital of Atlantia SpA. Sintonia SA, in part through Schemaventotto SpA, is
therefore deemed to hold sufficient voting rights to exercise dominant influence at the ordinary general
meetings of Atlantia SpA’s shareholders, pursuant to art. 2359 of the Italian Civil Code, as referred to by
art. 2497-sexies of the Code.
The fact that Atlantia is deemed not be subject to management and coordination by the parent, Sintonia
SA, was confirmed in a specific joint declaration sent to Atlantia SpA on 12 March 2009 by Sintonia SA
and Schemaventotto SpA.
Given that there have not been any further announcements or changes in circumstances, the basis for
considering Atlantia as not subject to management and coordination by its parents, Sintonia SA and
Schemaventotto SpA, is deemed to be unchanged.
Autostrade per l’Italia, which is a wholly owned subsidiary of Atlantia, is instead subject to management
and coordination by Atlantia. Moreover, following the Group’s reorganisation in 2007, Atlantia has
119
transferred responsibility for management and coordination of the motorway operators and industrial
companies controlled by its subsidiary to Autostrade per l’Italia itself.
The full text of the “Annual report on Corporate Governance and the Ownership Structure”, prepared in
accordance with indications from Assonime and Emittenti Titoli and, where appropriate, the indications
contained in the format for corporate governance reports published by Borsa Italiana (II Edition of
February 2010), is available in the “Corporate Governance” section of the Company’s website at
“www.atlantia.it”.
120
Sustainability
Atlantia heads a group of companies devoted to the design, operation and construction of motorway
networks capable of supporting and driving social and economic development in Italy and in other
countries. The Group’s activities aim to benefit people’s lives, contribute to the development and
wellbeing of the communities in which it operates, achieve ongoing improvements in safety and in the
quality of the services provided to customers, protect the environment, invest in new technologies and
boost energy efficiency. Atlantia’s growing commitment to progressively and continually improving its
sustainability performance, and boosting the efficiency of its operations and processes, was rewarded in
2010 with reconfirmation of the Group’s membership of the prestigious Dow Jones Sustainability World
Index, which ranks the world’s best companies on the basis of economic, environmental and social
criteria. Atlantia ranked as one of the best performers in the transport and infrastructure sector, with
maximum points scores for customer relationship management, its codes of conduct and the fight against
corruption, energy efficiency, staff development, and social and environmental reporting.
This year the has also been included in the Dow Jones Sustainability Europe Index, which ranks the
performances of Europe’s leading companies.
The results of the Group’s commitment to sustainability in 2010, which are reported in brief below based
on the three dimensions of sustainability (economic, social and environmental), are contained in
Autostrade per l’Italia’s Sustainability Report 2010, which is available on the company’s website at
www.autostrade.it/sostenibilità.

121
Economic responsibility
The Group believes that its economic responsibility should combine the traditional commitment to
maximising shareholder value and investor returns with the goal of creating and distributing value for the
various categories of stakeholder. Distribution of the value generated among stakeholders (government,
the business, staff, capital providers and shareholders) is measured in terms of Distributable Integrated
Added Value (DIAV). This indicator represents the wealth (added value) produced by the business and
how it is redistributed among stakeholders in the form of taxation, remuneration, dividends and interest.
The added value to be redistributed is calculated by subtracting operating costs and other expenses from
the gross value of production (including toll revenues, the portion attributable to ANAS and other
operating income).
The DIAV for 2010 has been calculated taking account of the adoption of the new interpretation, IFRIC
12 "Service Concession Arrangements". For the purposes of comparison, the figure for 2009 has also
been restated.
Statement of DIAV (€m)
2009 2010 % inc./(dec.)
09/10 Toll revenue 2,766 2,891 4.5 Portion attributable to third-party entities 183 228 24.2 Other operating income 643 631 -1.9 Gross value of production 3,592 3,750 4.4 Operating costs -765 -884 15.6 Integrated added value 2,828 2,866 1.3 Adjustments -44 64 - Distributable integrated added value 2,784 2,930 5.3
The DIAV of €2,930 million generated in 2010, increase of 5.3% on 2009, are distributed to the
Group’s stakeholders as follows:
• the largest portion, 27% of the total, amounting to €787 million, was kept by the Group and
used to finance its operations;

122
• €672 million (23% of the total) was paid to capital providers as interest on borrowings, after
deducting financial income;
• staff accounted for 17% (€508 million) in salaries, wages, post-employment benefits,
provisions for incentives.
• approximately €532 million (18% of the total) was transferred to the government in the form
of direct and indirect taxation and social security contributions. The government as
stakeholder also received approximately €82 million in 2010 in concession and sub-
concession fees and €227 million in additional concession fees paid from toll revenue
following the new legislation introduced by Law Decree 78/2009, making a total of €309
million;
• finally, €431 million was paid to shareholders in the form of dividends (15%).

123
Social responsibility
Social responsibility is an integral part of the Group’s strategy, leading the Group to focus on how its
activities affect all members of society and engage in dialogue with stakeholders with an interest in and
involved in the Group’s activities.
Workforce
The Group manages its Italian and international workforce in full compliance with the rights established
by law and in labour contracts, and without any limitation or discrimination with regard to race,
nationality, religion or gender. Every member of the workforce is required to be informed of and comply
with Atlantia’s Code of Ethics. Every effort is made to ensure that all the people who work for the Group
have opportunities for professional growth and development throughout their working lives and at all
levels, thanks to training and improvements to working conditions and the working environment.
124
With the aim of improving quality of life for its staff, in addition to the more traditional measures already
taken (such as, for example, flexitime working, health insurance and pension provision, services designed
to help commuters and sustainable transport), the Group has adopted a series of initiatives targeting
employees and their families, in order to help them achieve a better work-life balance and boost the
welfare of the Company’s workforce. More than €0.5 million was spent on such initiatives in 2010, which
primarily regarded health prevention campaigns, summer camps for the children of employees, and the
provision of free advice on legal, tax and pension-related matters.
Customers
The Group is committed to achieving ongoing improvements in service quality for motorway users,
continually raising safety standards and improving traffic flow, assistance and access to the network. This is
done through the upgrade, modernisation and maintenance of the motorway network, by boosting
operating efficiency (including, for example, improved planning of road works and faster removal of
damaged vehicles) and through information and awareness campaigns aimed at road users, with the aim of
promoting safer driving behaviours.
The global accident rate continued to decline in 2010, having decreased to 36.10 from the 36.30 of the
previous year, whilst the fatal accident rate was slightly up from 0.32 in 2009 to 0.33 in 2010. The Total
Delay indicator (the number of hours spent in traffic queues) is up 1.15% on 2009 to 5.399 million
hours in 2010 (down 11% with respect to the three-year period 2008-2010).
The increase is primarily due to major road works, above all on the A1 Milan–Naples around Florence and
on the A14 Bologna–Taranto, and to weather conditions.
In terms of perceived service quality, the results of the customer satisfaction surveys conducted by ASPI in
2010, via telephone interviews of 3,600 customers, are in line with the results in 2008 and 2009 (6.92
on a scale of 1 to 10), confirming that the degree of customer satisfaction is well above satisfactory.

125
Government and the community
Government and community relations account for a large part of the Group’s stakeholder relations and
play a key role in the process of designing and operating large-scale infrastructure.
The nature of this dialogue derives from the varied and numerous entities involved at both national and
local level, guaranteeing the real involvement of all stakeholders.
At government level, the Group’s main counterparties are ministries, ANAS, parliamentary committees,
regulatory and supervisory bodies and, more in general, national and local politicians.
Relations with international institutions are also of great importance, as they establish the principles,
overall objectives and strategies on which EU transport policy is based, as well as issuing specific directives
regarding issues directly and indirectly linked to the motorway business.
Community relations are one of the main tools available to the Group in implementing the sustainability
policies linked to its business: in operating the motorway network in keeping with the characteristics of the
surrounding area, in carrying out infrastructure works and in enhancing the environment, even when not
directly connected to the impact of the motorway network. The Group’s humanitarian, scientific, cultural,
sporting and social initiatives also play an important role, whether implemented independently or in
collaboration with national and international entities and bodies. Over time such initiatives have become
more than a simple question of corporate giving, having increasingly taken the form of projects designed
to culturally enrich the people and communities involved and spread the adoption of sustainable
behaviours. The Group spent around €3.7 million on this type of initiative in 2010.

126
Suppliers The Group’s supply chain consists of businesses that provide goods and services and those involved in the
construction of new infrastructure and maintenance of the existing network.
The Group’s relations with this category of stakeholder go beyond the “commercial” aspect, with precise
supplier selection and management standards having been established in line with its sustainable
approach. A preliminary condition of any contract is that suppliers must familiarise themselves with and
explicitly agree to comply with the standards set out in the Atlantia’s Code of Ethics. In addition, all the
contracts entered into include specific clauses requiring the supplier to meet a series of social obligations
relating, for example, to health and safety at work and protection of the environment, such as the methods
used for disposing of waste and scrap. These requirements are applied to the entire supply chain and may
also be extended to include sub-contractors.

127
Environmental responsibility
The Group is fully aware of the impact of its activities on the environment. Considerations regarding
environmental responsibility form an integral part of all the stages involved in the core business: the
potential effects on ecosystems are examined and assessed during the design stage, and monitored and
managed during the construction and operation of motorways.
In 2010 the Group remained committed to the series of initiatives previously launched in accordance with
Italian and European Community objectives regarding energy and the environment. These aim to boost
production of renewable energy and improve the energy efficiency of its buildings and the infrastructure it
manages.
Use of resources
Optimising the use of the materials employed is a constant concern in managing the Group’s activities.
One of the essential materials used to ensure that motorways are safe and kept open during the winter
months is de-icing salt (sodium chloride and calcium chloride) to prevent ice forming on roads. Annual
salt use depends on climatic conditions, which can vary significantly from year to year. In 2010 Group
companies used a total of 216,449 tonnes of de-icing salt during the winter, marking an increase of
around 16% on the previous year. The increase was due to the increased number and greater intensity of
snow events, above all on the motorway network in north-western Italy and along the Adriatic.
Water consumption totalled approximately 549,240 cubic metres in 2010 (down 7 % on 2009). In 2010
the quantity of bitumen conglomerate used for road surface maintenance and in upgrading the motorway
network totalled 858,003 tonnes (down 10% on 2009). This was produced and used in the activities
carried out by the subsidiary, Pavimental SpA.
In 2010 waste produced by Autostrade per l’Italia amounted to a total of approximately 94,549 tonnes,
marking an increase of 4.8% on the amount produced in 2009. Of this, around 22% was produced by

128
Pavimental and 75% by Autostrade per l’Italia’s Section Departments. 42% of the total waste produced in
2010 was recycled, primarily including mixed waste from construction and demolition work, paper, iron
and steel, excavation soil and rocks, packaging, bitumen conglomerate and obsolete equipment. Moreover,
in order to minimise the need to purchase quarry stone and the dumping of unused excavation materials,
all the motorway designs aim to fully re-use all the soil and rocks produced by excavation, both in
construction of the roads themselves (embankments, landscaping, noise absorbing dunes, etc.) and in
cleaning up disused areas indicated by local communities (e.g. abandoned quarries). In 2010
approximately 3.5 million cubic metres of excavation materials was used on various lots included in the
Variante di Valico project and on the A14, on the Florentine stretch of the A1 and for work being carried
out on the A9 motorway. As at 31 December 2010 a total of around 15 million cubic metres of excavation
materials has been used.
Use of resources 2009 2010 De-icing salt in tonnes 187,348 216,449 Water in m3 588,292 549,240 Consumption of conglomerate in tonnes 948,705 858,003 Waste in tonnes 90,182 94,549 Recycled waste in millions of cubic metres 2.7 3.5
The Group’s energy consumption depends on the organisation’s needs and the amount of energy used in
providing the motorway service: the lighting of tunnels, toll stations, junctions and service areas, power
for plant and equipment, fuel for service vehicles. In 2010 the Group consumed a total of 498,025 MWh,
including electivity, natural gas, LPG, diesel and petrol.
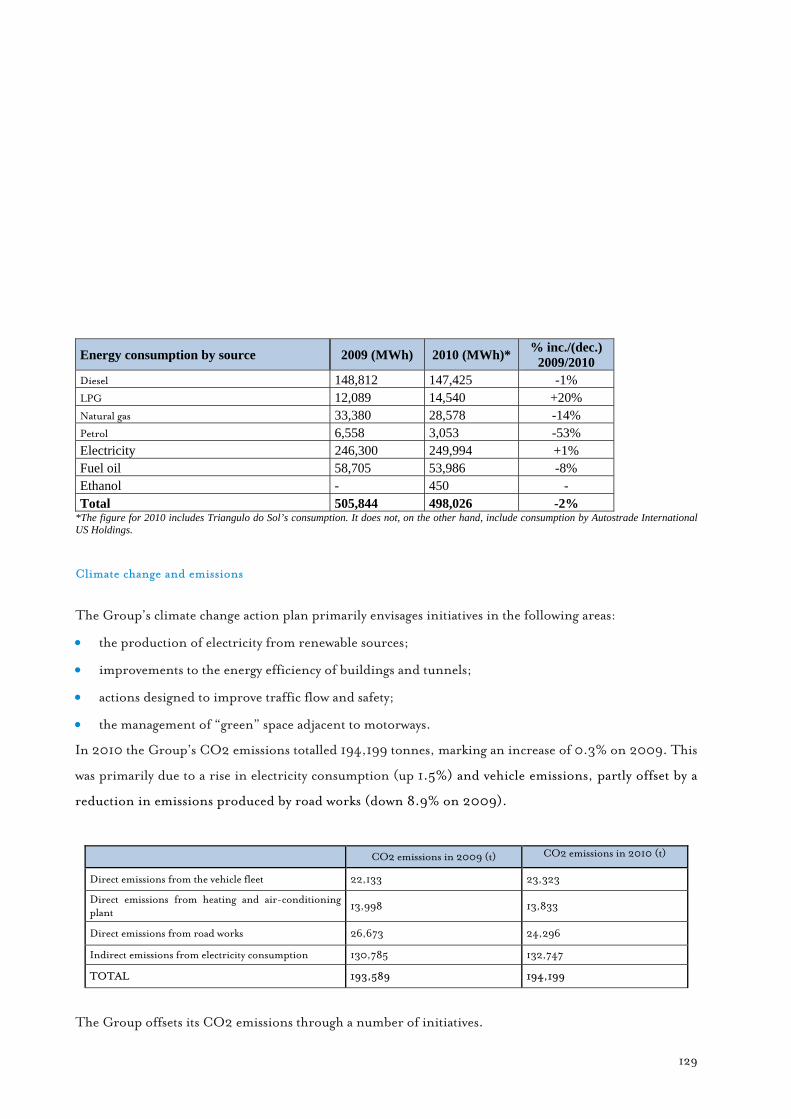
129
Energy consumption by source 2009 (MWh) 2010 (MWh)* % inc./(dec.) 2009/2010
Diesel 148,812 147,425 -1% LPG 12,089 14,540 +20% Natural gas 33,380 28,578 -14% Petrol 6,558 3,053 -53% Electricity 246,300 249,994 +1% Fuel oil 58,705 53,986 -8% Ethanol - 450 - Total 505,844 498,026 -2%
*The figure for 2010 includes Triangulo do Sol’s consumption. It does not, on the other hand, include consumption by Autostrade International US Holdings.
Climate change and emissions
The Group’s climate change action plan primarily envisages initiatives in the following areas:
• the production of electricity from renewable sources;
• improvements to the energy efficiency of buildings and tunnels;
• actions designed to improve traffic flow and safety;
• the management of “green” space adjacent to motorways.
In 2010 the Group’s CO2 emissions totalled 194,199 tonnes, marking an increase of 0.3% on 2009. This
was primarily due to a rise in electricity consumption (up 1.5%) and vehicle emissions, partly offset by a
reduction in emissions produced by road works (down 8.9% on 2009).
CO2 emissions in 2009 (t) CO2 emissions in 2010 (t)
Direct emissions from the vehicle fleet 22,133 23,323
Direct emissions from heating and air-conditioning plant 13,998 13,833
Direct emissions from road works 26,673 24,296
Indirect emissions from electricity consumption 130,785 132,747
TOTAL 193,589 194,199
The Group offsets its CO2 emissions through a number of initiatives.

130
Autostrade per l’Italia’s plan to install solar panels at service areas between 2008 and 2010 was completed
at the end of December 2010. This has involved the installation of solar panel car ports, with the ports
installed at 88 service areas on the company’s motorway network providing installed photovoltaic capacity
of 3.94 MW.
Work on a further 10 solar power plants for the Florence, Fiano Romano, Cassino and Pescara head
offices was also completed in 2010, providing total installed capacity of 2.68 MW. Overall, taking into
account the solar power plants that entered service in previous years, at the end of 2010 the company has
installed a veritable “photovoltaic plant” spread out around the country, providing total installed capacity
of approximately 7 MW and, when fully on stream, reducing CO2 emissions by approximately 4,800
tonnes a year.
As part of its energy saving programme, the Group proceeded with the replacement of the traditional high
pressure sodium lamps used in permanent motorway tunnel lighting systems with LED lamps. A total of
10,179 lamps were replaced in 2010, bringing the total number of new lamps installed to around 17,000
by the end of the year.
The programme for 2011 envisages the installation of a further 10,858 lamps, resulted in an estimated
energy saving of 6,692 MWh a year (3,553 tonnes of CO2 a year).
In terms of initiatives designed to improve traffic flow and safety, since 2009 the Group has included an
estimate of emissions deriving from traffic congestion along the network, resulting in tailbacks, queues
and frequent “stop and go” conditions, thus rendering the Group’s emissions reduction policy more
effective and constructive. These situations are summarised, for Autostrade per l’Italia’s network, by the
“traffic flow rate” or “Total Delay” indicator (TD), representing the total duration of delays for all
vehicles.
Investments in improving levels of service and safety standards have helped to significantly reduce the
Total Delay (down 11% in the three-year period 2008-2010), resulting in a notable reduction in
emissions of CO2 and of other air pollutants caused by motorway traffic. The estimated volume of CO2
emissions saved thanks to the reduction in congestion compared with 2005 is approximately 12,780
tonnes.
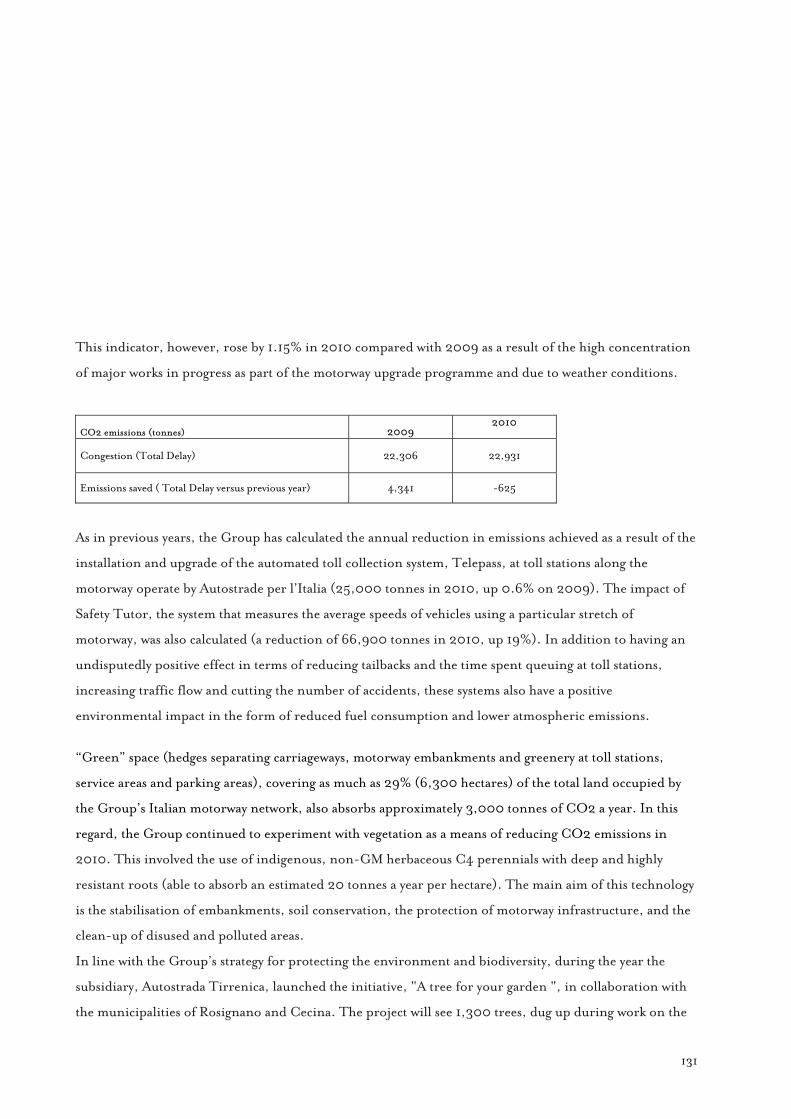
131
This indicator, however, rose by 1.15% in 2010 compared with 2009 as a result of the high concentration
of major works in progress as part of the motorway upgrade programme and due to weather conditions.
CO2 emissions (tonnes) 2009 2010
Congestion (Total Delay) 22,306 22,931
Emissions saved ( Total Delay versus previous year) 4,341 -625
As in previous years, the Group has calculated the annual reduction in emissions achieved as a result of the
installation and upgrade of the automated toll collection system, Telepass, at toll stations along the
motorway operate by Autostrade per l’Italia (25,000 tonnes in 2010, up 0.6% on 2009). The impact of
Safety Tutor, the system that measures the average speeds of vehicles using a particular stretch of
motorway, was also calculated (a reduction of 66,900 tonnes in 2010, up 19%). In addition to having an
undisputedly positive effect in terms of reducing tailbacks and the time spent queuing at toll stations,
increasing traffic flow and cutting the number of accidents, these systems also have a positive
environmental impact in the form of reduced fuel consumption and lower atmospheric emissions.
“Green” space (hedges separating carriageways, motorway embankments and greenery at toll stations,
service areas and parking areas), covering as much as 29% (6,300 hectares) of the total land occupied by
the Group’s Italian motorway network, also absorbs approximately 3,000 tonnes of CO2 a year. In this
regard, the Group continued to experiment with vegetation as a means of reducing CO2 emissions in
2010. This involved the use of indigenous, non-GM herbaceous C4 perennials with deep and highly
resistant roots (able to absorb an estimated 20 tonnes a year per hectare). The main aim of this technology
is the stabilisation of embankments, soil conservation, the protection of motorway infrastructure, and the
clean-up of disused and polluted areas.
In line with the Group’s strategy for protecting the environment and biodiversity, during the year the
subsidiary, Autostrada Tirrenica, launched the initiative, "A tree for your garden ", in collaboration with
the municipalities of Rosignano and Cecina. The project will see 1,300 trees, dug up during work on the

132
motorway section between Rosignano and San Pietro in Palazzi, handed over to the community and
private citizens, who will be able to reserve the tress they want. The initiative has proved a great success,
with applications for the trees far outstripping the number of trees available.

133
Significant regulatory aspects
Single concession arrangements for Italian operators
On 13 May and 22 July 2010, the CIPE (Interministerial Economic Planning Committee) gave
clearance, subject to certain requirements, for the single concession arrangements entered into in
2009 by ANAS and a number of motorway operators, including Autostrada Tirrenica, Strada dei
Parchi, Autostrada Torino-Savona and Raccordo Autostradale Valle d’Aosta, Tangenziale di Napoli
and Autostrade Meridionali, and revised its opinion, again subject to certain requirements, on the
single concession arrangements of Tangenziale di Napoli and Autostrade Meridionali.
The CIPE resolutions containing the requirements applicable to the Group’s single concession
arrangements were published in the Official Journal in October 2010. With the signing of the
document ratifying adoption of the above requirements, the procedure introduced by Law 191 of 2009
has come to an end. As a result, the single concession arrangements provided for by Law Decree 262 of
2006, as subsequently amended and added to, and signed by the Italian motorway operators controlled
by Autostrade per l’Italia in 2009 (with the exception of Società Italiana Traforo del Monte Bianco,
which operates under a different concession regime) are now effective. Raccordo Autostradale Valle
d’Aosta, Autostrada Tirrenica and Tangenziale di Napoli signed the above document on 24 November
2010, Strada dei Parchi and Autostrade Meridionali on 29 November 2010, Autostrada Torino-
Savona on 22 December 2010.

134
Toll increases for 2011
The following annual toll increases have been introduced by Autostrade per l’Italia and the Group’s
Italian motorway operators from 1 January 2011:
Toll increases 2011 (excluding increases pursuant to Law 122/2010)
Operator Increases 2011Autostrade per l'Italia 1.92%Autostrada Torino-Savona 0.63%Raccordo Autostradale Valle d'Aosta 14.15%Autostrada Tirrenica 4.08%Tangenziale di Napoli 3.80%Autostrade Meridionali -6.56%(*)
Strada dei Parchi 8.14%
Società Italiana Traforo del Monte Bianco 4.96%
(*) As a result of rounding, the impact on the final tolls paid by road users is limited to class B.
In accordance with the Single Concession Arrangement signed by ANAS and Autostrade per l'Italia on
12 October 2007, the toll increase of 1.92% for 2011 has been calculated on the basis of two
components:
• 0.63%, equivalent to 70% of the inflation rate in the period from 1 July 2009 to 30 June 2010;
• 1.29%, relating to the X investments component of the tariff formula, designed to cover the
additional capital expenditure inserted into the IV Addendum of 2002.
The inflation-linked component (0.63%) was calculated on the basis of consumer price inflation for
the Italian population as a whole, as calculated by ISTAT (the NIC index), for the period between 1
July 2009 and 30 June 2010, increase 0.90%, compared with the period from 1 July 2008 to 30 June
2009.
The toll component relating to capital expenditure inserted into the IV Addendum (1.29%) is based on
the state of progress of work on the individual projects, as reported in the statement of financial
position as at 30 September 2010.

135
The subsidiaries, Raccordo Autostradale Valle d'Aosta, Autostrada Tirrenica, Tangenziale di Napoli,
Autostrade Meridionali and Strada dei Parchi, whose single concession arrangements, involving the
rebalancing of their respective financial plans, became effective in 2010, have for the first time applied
the new formula for calculating their toll increases. The various factors taken into account include the
target inflation rate, the rebalancing component and the return on investment, in addition to quality.
The increases granted from 1 January 2011 represented the sum of the increases granted in compliance
with the new arrangements for the years 2010 and 2011, after deducting the increase already applied
from 1° January 2010 on the basis of the arrangements in force at that time.
The toll increase for Autostrada Torino-Savona is 0.63%, which was granted on the basis of the
existing single arrangement, following the signature with ANAS of the document ratifying the CIPE
requirements. This increase is equal to 70% of the inflation rate in the period from 1 July 2009 to 30
June 2010.
Società Italiana Traforo del Monte Bianco, which operates under a different concession regime based
on bilateral agreements between Italy and France, applied a total increase of 4.96% from 1 January
2011, in accordance with the resolution approved by the Intergovernmental Committee for the Mont
Blanc Tunnel on 22 October 2010. This increase is based on the combination of two elements:
• 1.46% representing the average inflation rate in France and Italy for the period from 1 September
2009 to 31 August 2010;
• 3.50% in accordance with the agreement between the Italian and French governments dated 24
February 2009, with use of the proceeds still be decided on by the two governments.
Toll increases to be applied and passed on to ANAS
Art. 15.c.4 of Law Decree 78 of 31 May 2010, converted into Law 122/2010, introduced increases to
the concession fee payable by motorway operators to ANAS. The increases amount to: (i) 1 thousandth
of a euro per kilometre for toll classes A and B and 3 thousandths of a euro per kilometre for classes 3,

136
4 and 5 with effect from 1 July 2010; and (ii) 2 thousandths of a euro per kilometre for toll classes A
and B and 6 thousandths of a euro per kilometre for classes 3, 4 and 5 with effect from 1 January 2011.
At the same time, motorway tolls were increased by a corresponding amount.
Toll increases applied on behalf of ANAS
Art. 15.c.2 of Law Decree 78/2010 also authorised ANAS, from 1 July 2010, to provisionally apply
lump-sum toll increases at toll stations interconnecting with motorways and orbital motorways
operated directly by ANAS. These lump-sum increases amount to €1.00 for toll classes A and B and
€2.00 for classes 3, 4 and 5. The Prime Ministerial Decree of 25 June 2010 specified the stations at
which the toll increases. Consequently, Autostrade per l'Italia and the other motorway operators have,
from 1 July 2010, applied the increases introduced by the above legislation.
As a result of the injunctions granted by the Lazio and Piedmont regional administrative courts –
subsequently confirmed by the Council of State – suspending application of the above toll increases,
ANAS issued instructions on 4 August 2010 requesting motorway operators “to suspend, as soon as
technically feasible, application of the toll increases” referred to above. Autostrade per l’Italia has thus
proceeded to suspend application of the toll increases introduced by art. 15.c.2 of Law Decree
78/2010.
On 21 February 2011 Lazio Regional Administrative Court upheld the appeal, annulling the Prime
Ministerial Decree of 25 June 2010.
Snow events in December 2010
On 14 December 2010 ANAS began an investigation with the aim of verifying Autostrade per l’Italia’s
compliance with the required procedures for dealing with snow emergencies, following events on the
A14 Bologna-Bari-Taranto motorway between 14 and 16 December 2010.

137
On 20 December 2010 ANAS launched a similar investigation in relation to snow events in the
Florence area on the A1 Milan-Naples and A11 Florence-Pisa motorways on 17 and 18 December 2010.
As a result of the same events on 17 December 2010, the Antitrust Authority has also launched an
investigation into whether or not Autostrade per l’Italia (i) omitted to provide or provided incomplete
or delayed information to consumers (motorway users) regarding effective conditions on the motorway
sections during the snow emergency, and (ii) had adequate emergency measures in place to enable
users to avoid or reduce the disruption caused by the subsequent road closures.
On 20 December 2010 ANAS initiated a similar investigation with the aim of verifying whether or not
the Group’s operators, Autostrada Tirrenica and Strada dei Parchi, had complied with the required
procedures for dealing with snow emergencies, following events on the A12 Livorno-Rosignano
Marittimo motorway and on the Tivoli-Carsoli section of the A24 Rome-L’Aquila-Teramo motorway
on 17 and 18 December 2010.
The investigations are ongoing and so far have not found evidence of either non-compliance or
omissions.
Autostrade per l’Italia has also received claims from individual users and consumers’ associations in
relation to the same events.
With regard to the snow event of 17 December 2010, the Florence District Attorney’s office has begun
an investigation into whether or not, as a result of the disruption experienced by motorway, road and
rail users, there are grounds for criminal prosecutions. Autostrade per l’Italia has provided the District
Attorney’s office with all the support needed to understand what warnings were received prior to the
event and verify whether or not the company responded to the event in line with the snow plans
approved by the grantor, ANAS.
In response to the above snow event, AVCP (the regulator that oversees public contracts) has launched
an investigation to see if the existing concession arrangement with ANAS was fully complied with by
both the operator and ANAS, which is responsible for supervising implementation of the
arrangement.
At a hearing held by AVCP, representatives from ANAS and Autostrade per l’Italia presented details of
the concession arrangement, focusing above all on the provisions governing the management of events
138
that have an impact on motorway traffic, including serious weather events, such as those that took
place.
The regulator was informed that ANAS, in the form of its Motorway Concession Inspectorate, has, as
noted above, launched an investigation of the event.
Following the above snow event, Autostrade per l’Italia held talks with the “Safety Advisory
Committee”, which includes representatives of the consumers’ associations, ADOC, ADUSBEF,
ADICONSUM, CODACONS and FEDERCONSUMATORI, in order to identify initiatives that could
be taken to show customers that the company acknowledges the disruption caused.
Autostrade per l’Italia has adopted this approach, despite the fact that the company believes that it
cannot be held responsible for the disruption and any inconvenience caused to motorway users, given
that it responded to the event in accordance with the approved snow plans. The resulting agreement
with the consumers’ associations is thus simply intended as a gesture of goodwill towards the users who
were affected by the disruption caused on the motorway sections it directly operates.
A specific form has been prepared on the basis of the agreement with the consumers’ associations,
enabling customers to initiate the conciliation procedure. The form is available on Autostrade per
l'Italia’s websites and on those of the various associations.
The definition of the conciliation procedures have been estimated by Autostrade per l’Italia and
recognised in expenses for 2010.
Dispute over tolls applied by Strada dei Parchi
On 1 March 2010 Codacons (a consumers’ association) filed suit at Lazio Regional Administrative
Court against ANAS, the Ministry of Infrastructure, the Ministry of the Economy and Finance and the
Abruzzo and Lazio regional authorities, contesting the basis for the increase in motorway toll charges
for 2010, applied by Strada dei Parchi from 1 January 2010. Briefly, Codacons contests i) the
violation of CIPE Directive 319 of 20 December 1996, given that the increase for 2010 is alleged not
to be linked to investments carried out; (ii) the alleged failure by ANAS to oversee Strada dei Parchi’s
compliance with its contractual obligations.

139
Following further requests for documents by Codacons, the hearing held on 31 March 2010 did not
discuss the application for an injunction brought by the plaintiff.
Lazio Regional Administrative Court adjourned the hearing on the merits until a later date, which is
still to be set.
The Lazio Regional Administrative Court sentence deposited on 30 March 2010 upheld the appeals
brought in 2006 by the Abruzzo Regional Authority, Teramo Provincial Authority and the Gran Sasso
Mountain Community against ANAS and Strada dei Parchi, annulling the tariff increase introduced in
2006, and the revised toll charge for the Basciano-Teramo section introduced in 2008.
Following this, Strada dei Parchi filed appeal against the above sentences before the Council of State,
requesting a suspension and petitioning for a presidential decree to provide immediate suspension
whilst awaiting the hearing to discuss the application for interim relief.
On 20 April 2010 Lazio Regional Administrative Court upheld Strada dei Parchi’s request,
suspending application of the sentence and scheduling a hearing on the merits for 15 June 2010. This
hearing was further adjourned until 26 October 2010, following a request for revocation submitted by
the Abruzzo Regional Authority.
The Fourth Section of the Council of State, sitting in its judicial capacity, issued a sentence on 9
December 2010, upholding the company’s appeals and, as a result, cancelling the appealed sentences.
The Council found that the toll increase applied was legitimate, as was the revised toll charge for the
Basciano-Teramo section introduced in 2008.
Council of State sentence regarding award of the concession to Pedemontana Veneta
Following the Council of State sentence that upheld the appeal brought by the permanent consortium
led by SIS Scpa, and the ensuing decision by the Veneto Regional Authority to award the concession to the
afore-mentioned company, the temporary consortium that includes Pedemontana Veneta SpA (in

140
which Autostrade per l’Italia holds a direct 28% interest) appealed the above Council of State sentence.
This appeal was turned down. The above award was also challenged before Veneto Regional
Administrative Court.
In addition, the Pedemontana Veneta temporary consortium has filed a request for pre-trail relief
before Lazio Regional Administrative Court, which, on 21 October 2009, granted an injunction
blocking execution of the contract, which had, however, already been signed by the government-
appointed Extraordinary Commissioner, who had in the meantime taken over responsibility for the
infrastructure project from the Veneto Regional Authority, on the same date.
A further appeal was filed before Lazio Regional Administrative Court on 16 December 2009, again
requesting the court, which has jurisdiction over the Commissioner’s actions, to exclude SIS Scpa
from the tender process for failing to meet the necessary requirements for participation in the tender.
This request had, as noted, already been filed with Veneto Regional Administrative Court, although it
was decided to withdraw it whilst awaiting examination of the principal appeal brought before Lazio
Regional Administrative Court.
On 30 July 2010 Veneto Regional Administrative Court issued a sentence acknowledging the plaintiffs’
decision to withdraw their appeal. This sentence was then deposited with Lazio Regional Administrative
Court. The Lazio Regional Administrative Court hearing on the merits has been scheduled for 8 June
2011.
On 28 September 2010 the company asked the Extraordinary Commissioner to grant access to the
documents regarding the final design, following press reports on 20 September 2010 that the related
decree of approval had been signed.
On 4 October 2010 the Extraordinary Commissioner sent Pedemontana Veneta a letter including a copy
of the decree approving the final design, but refused access to the design documents.
Pedemontana Veneta has recently decided to file a legal challenge with Lazio Regional Administrative
Court, contesting the letter refusing access to the documents regarding the final design.
The action challenging the letter refusing access to the documents regarding the final design for the
highway was discussed at a Lazio Regional Administrative Court hearing held on 26 January 2011. The
sentence of the court is pending.

141
Other ongoing litigation Autostrade per l’Italia is the defendant in two actions, which are still pending, brought before Lazio
Regional Administrative Court regarding toll charges. The actions, which have been brought by
Codacons and other consumers’ associations, aim to challenge the toll increases introduced in 1999
and 2003.
With regard to the preliminary design for the “Rosignano Marittima-Civitavecchia” section of the A12
motorway approved by the CIPE resolution of 18 December 2008 (published in the Official Journal of 14
May 2009), Autostrada Tirrenica SpA is party, together with the other public bodies involved, to a
number of legal actions pending before Lazio Regional Administrative Court, and to a number of
extraordinary appeals to the Head of State, contesting the above CIPE resolution of 18 December
2008.
The Antitrust Authority’s appeal to the Council of State requesting annulment of Lazio Regional
Administrative Court sentences 4994/09 and 5005/09 is still pending. These sentences at first
instance partly upheld the appeals brought by ACI GLOBAL SpA and EUROP ASSISTANCE VAI SpA
requesting annulment of Antitrust Authority ruling 19021 of 23 October 2008 regarding emergency
breakdown services. Autostrade per l’Italia is a party to the appeals with file numbers R.G. no. 8813/09
and no. 8814/09.
On 21 October 2010, Varese Provincial Authority filed suit at Lombardy Regional Administrative
Court, requesting cancellation, and an immediate injunction halting application, of Autostrade per
l’Italia’s letter dated 28 September 2010, in which the operator informed the Authority that it was not
possible to satisfy its request to eliminate the toll charge on the Varese-Gallarate section of motorway,
in addition to all arrangements governing tolls on the above motorway section.

142
Autostrade per l’Italia presented its defence on 1 December 2010. The Lombardy Regional
Administrative Court sentence of 2 December 2010 turned down the request for an injunction,
scheduling a hearing on the merits for 26 May 2011.
Finally, Autostrade per l’Italia is the defendant in a number of legal actions regarding expropriations,
tenders and claims for damages deriving from motorway activities.
At the present time, the outcomes of the above litigation proceedings are not expected to result in
significant charges to be incurred by Group companies, in addition to the amounts already provided at
31 December 2010 and reported in the consolidated financial statements.

143
Related party transactions
In implementation of the provisions of art. 2391-bis of the Italian Civil Code, the Regulations adopted
by the Commissione Nazionale per le Società e la Borsa (the CONSOB) in Resolution 17221 of 12
March 2010, as subsequently amended and as interpreted by CONSOB Communication
DEM/10078683 of 24 September 2010, on 11 November Atlantia’s Board of Directors approved the
new Procedure for Related Party Transactions entered into directly by the Company and/or through
subsidiaries. This Procedure sets out the criteria to be used in identifying related parties and the
related reporting requirements.
The principal transactions entered into by the Group and Atlantia SpA with related parties, as
identified in accordance with the criteria defined in the above Procedure, are described below. Related
party transactions are conducted on an arm’s length basis.
Related party transactions do not include transactions of an atypical or unusual nature. The Atlantia
Group did not engage in material transactions with its direct or indirect parents during 2010.
During 2010 fees, non-monetary benefits, bonuses, incentives and other forms of compensation were
paid to the Chairman of Atlantia, Fabio Cerchiai (€0.5 million), and the Chief Executive Officer and
General Manager, Giovanni Castellucci (€1.5 million), in relation to positions held in Atlantia and in
other Group companies. A total of €0.2 million was also paid to the previous Chairman, Gian Maria
Gros-Pietro.

144
Transactions with Schemaventotto
Transactions with the parent, Schemaventotto, regard amounts due to the Group in the form of an
IRES refund resulting from the tax consolidation arrangement in which certain Group companies
participated until 1 January 2008.
Atlantia Group’s related party transactions
In compliance with IAS 24, the Autogrill group, which is under the common control of Edizione Srl,
is treated as a related party. With regard to relations between the Atlantia Group’s motorway operators
and the Autogrill group, it should be noted that, at 31 December 2010, Autogrill holds 140 (134
excluding Strada dei Parchi) food service concessions for service areas along the Group’s motorway
network.
In 2010 the Group earned revenue of approximately €77.8 million on transactions with Autogrill,
including approximately €0.8 million deriving from the handover, free of charge, of buildings located
at service areas (following expiry of the related sub-concessions) and €77.0 million in royalties
deriving from management of service areas. This income is generated by contracts entered into over
various years, of which a large part was awarded as a result of transparent and non-discriminatory
competitive tenders.
Further details of the impact of related party transactions on the results of operations and the financial
position are provided in the table in note 10.4 to the consolidated financial statements.
Atlantia SpA’s related party transactions
The Company primarily engages in transactions with the subsidiary, Autostrade per l’Italia, over which
it exercises management and coordination.

145
As at 31 December 2010 the Company has granted medium/long-term loans with a total par value of
€9,649.2 million to Autostrade per l’Italia on the same terms as those applied to Atlantia’s bank
borrowings, increased by a spread that takes account of the cost of managing the loans. These loans
have increased by €1,500 million compared with 31 December 2009, essentially as a result of the
disbursement of two new medium/long-term loans with par values of €1,000 million and €500
million, respectively. These replicate, at intercompany level, the bonds issued on 16 September 2010.
A portion of these loans is hedged against interest rate risk through the use of specific derivative
financial instruments that have also been entered into with Autostrade per l’Italia. Fair value gains on
these hedges total €150.4 million as at 31 December 2010.
In September 2010 Atlantia and Autostrade per l’Italia unwound a number of hedging transactions –
previously classified as fair value hedges – entered into to hedge the exposure to interest rate risk of
loans with a par value of €1,500 million granted in May 2010 and maturing in May 2016. The
unwinding of these derivatives, which did not result in any charge for the Company, means that the
bond issue and the intercompany loan are again subject to fixed rate exposure.
The Company also has an intercompany current account with Autostrade per l’Italia, which provides
centralised treasury services for the Group. The account has a credit balance of €196.7 million as at 31
December 2010.
Finally, as a result of the tax consolidation arrangement headed by Atlantia, the statement of financial
position as at 31 December 2010 includes current tax assets due from Group companies of €14.4
million, and current tax liabilities payable to Group companies of €6.9 million.
Further details of the impact of related party transactions on the results of operations and the financial
position are provided in the table in note 7.2 to the separate financial statements.
146
Other information
As at 31 December 2010 Atlantia holds 12,050,446 treasury shares (post bonus issue of 7 June 2010),
representing approximately 2.0% of its issued capital. No treasury shares have been purchased or sold
during 2010.
Atlantia SpA does not own, either directly or indirectly through trust companies or proxies, shares or
units issued by parents. No transactions were carried out during the year involving shares or units
issued by parents.
Atlantia does not operate branch offices.
With reference to CONSOB Ruling 2423 of 1993, regarding criminal proceedings or judicial
investigations, the Group is not involved in proceedings, other than those described in the section
“Significant regulatory aspects” in this report on operations, that may result in charges or potential
liabilities with an impact on the consolidated financial statements.
Finally, in accordance with the Data Protection Act (Legislative Decree 196/2003, annex B, point 26),
the Company declares that it has updated its Security Planning Document for 2010.

147
Shareholdings of Directors, Statutory Auditors, General Managers and other key management personnel
NAME AND SURNAME COMPANY
INVESTED IN
NO. OF SHARES HELD AT END
OF 2009
NO. OF SHARES
PURCHASED
NO. OF SHARES SOLD
NO. OF SHARES HELD AT END OF 2010
Gian Maria Gros-Pietro (Chairman) (1) Atlantia SpA ------- ------- ------- -------
Fabio Cerchiai (Chairman) Atlantia SpA 5,000 ------- ------- 5,250(2)
Giovanni Castellucci (Director) and General Manager
Atlantia SpA ------- ------- ------- -------
Gilberto Benetton (Director) Atlantia SpA ------- ------- ------- -------
Alessandro Bertani (Director) Atlantia SpA ------- ------- ------- -------
Alberto Bombassei (Director) Atlantia SpA ------- ------- ------- -------
Stefano Cao (Director) Atlantia SpA 320 ------- ------- 336 (2)
Roberto Cera (Director) Atlantia SpA ------- ------- ------- -------
Alberto Clô (Director) Atlantia SpA ------- ------- ------- -------
Antonio Fassone (Director) Atlantia SpA ------- ------- ------- -------
Carlo Malinconico (Director) Atlantia SpA ------- ------- ------- -------
Giuliano Mari (Director) Atlantia SpA ------- ------- ------- -------
Gianni Mion (Director) Atlantia SpA ------- 3.500 ------- 3,500
Giuseppe Piaggio (Director) Atlantia SpA 3,000 1.000 ------- 4,150(2)
Antonino Turicchi (Director) Atlantia SpA ------- ------- ------- -------
Paolo Zannoni (Director) (1) Atlantia SpA ------- ------- ------- -------
Marco Spadacini (Statutory Auditor) Atlantia SpA 3,700 ------- ------- 3,885 (2)
Tommaso Di Tanno (Statutory Auditor) Atlantia SpA ------- ------- ------- -------
Raffaello Lupi (Statutory Auditor) Atlantia SpA ------- ------- ------- -------
Angelo Miglietta (Statutory Auditor) Atlantia SpA ------- ------- ------- -------
Alessandro Trotter (Statutory Auditor) Atlantia SpA ------- ------- ------- -------
Giuseppe Maria Cipolla (Alternate Auditor) Atlantia SpA ------- ------- ------- -------
Giandomenico Genta (Alternate Auditor) Atlantia SpA ------- ------- ------- -------
(1) Gian Maria Gros-Pietro was Chairman until the Annual General Meeting of 14 April 2010, whilst Paolo Zannoni was co-opted on to the Board
of Directors on 5 March 2010 and was elected at the Annual General Meeting of 14 April 2010.
(2) The increase was due to the bonus issue approved the Extraordinary General Meeting of 14 April 2010 and implemented ex dividend no.14 on 7
June 2010.
148
Events after 31 December 2010
Agreement for the sale of Strada dei Parchi As announced on 3 January 2011, Autostrade per l’Italia SpA has agreed to sell its 60% interest in
Strada dei Parchi SpA to Toto SpA for a total price of €89m. Under the terms of the agreement, Toto
is to buy 58% of the company for €86m, with a first instalment of €60m to be paid on transfer of the
shares and the remaining €26m to be paid within 36 months of the sale. The value of the second
instalment will be revalued at an annual interest rate agreed by the parties and backed by an
independent first demand guarantee provided by a bank. The remaining 2% stake held by Autostrade
per l'Italia is subject to a call/put option (at a price of €3m), execution of which is deferred until the
conditions described in art. 156, paragraph 3 of Legislative Decree 163/2006 have been met (for
example, on certification of the infrastructure).
Execution of the sale agreement is subject to the following conditions, which have already been or are
in the process of being met: the positive outcome of the procedure required by Strada dei Parchi’s
Single Concession Arrangement, which means that ANAS must approve any change in control of the
company; the receipt of antitrust clearance; signature of the project finance loan agreement and
completion of the first drawdown of funds to fund the company’s investment programme.
In this regard, on 25 February 2011 Strada dei Parchi and a syndicate of leading Italian and
international banks entered into a project financing agreement worth €571 million.

149
Eco Taxe Poids Lourds
Following a tender procedure launched in May 2009, on 18 January 2011 France’s Ministry of
Ecology, Sustainable Development, Transport and Housing chose Autostrade per l’Italia as the
preferred bidder in the process to award a contract for the implementation and operation of a satellite-
based toll system for heavy vehicles weighing over 3.5 tonnes using the country’s 15,000-km road
network (Eco Taxe Poids Lourds).
On 8 February 2011 the Ministry notified Autostrade per l’Italia that it had been awarded the contract.
The contract, will have a duration of thirteen years and is worth over €2bn in terms of total expected
revenue. The contract envisages an initial twenty-one month design and construction phase, followed
by operation and maintenance of the system for eleven and a half years.A number of leading French
industrial groups, subcontractor in the project, with Thales, SNCF, SFR and Steria are committed to
acquiring stakes amounting to 30% of the project, following the execution of the contract and
compliant with bid rules.
On March 11, 2011 the Administrative Court of Cergy-Pontoise, following the appeal introduced by
members of a rival consortium, notwithstanding, has canceled the tender process. Advancements are
underway for bringing a legal action at the French Council of State
Tender to provide tolling system for ANAS
Law Decree 125 of 5 August 2010 – containing urgent transport-related and financial measures, and
later converted into Law 163 of 1 October 2010 – brought forward to 30 April 2011 the application of
tolls on the motorway sections and link roads directly operated by ANAS.
On 13 September 2010 ANAS published a call for tenders “for the supply and installation of a free-
flow toll system on the motorways and motorway link roads operated by ANAS and provision of the
related maintenance services, operation of the tolling and toll collection system and provision of on-
the-job training for ANAS personnel to prepare them to take over operation of the system”.

150
Autostrade per l'Italia bid for the contract as the agent for a Temporary Consortium, acting on behalf
of the principals, Autostrade Tech SpA and Sinelec SpA.
On 18 January 2011, having examined the bids submitted by the qualifying bidders, the Evaluation
Committee provisionally awarded the contract to the Consortium for which Autostrade per l’Italia is
acting as agent.

151
Outlook and risks or uncertainties
Despite uncertainty regarding the macroeconomic environment, substantially stable traffic figures,
combined with toll increases and the development of related activities, lead us to expect an improvement
in the Group’s operating performance compared with 2010.
With regard to risks or uncertainties, in addition to the information already provided in the various
sections of this report on operations, it should be noted that the volume of traffic using the Group’s
motorway network is affected by numerous factors. These include the overall economic climate and, more
specifically, industrial output, consumer spending and, albeit to a limited extent on the basis of historical
evidence, fuel prices. Any resulting shift in traffic trends may have an impact on the Group’s operating
results or financial position.

152
Proposed resolutions for the Annual General Meeting of Atlantia SpA’s shareholders
Dear Shareholders,
In conclusion, we invite you:
- to discuss and approve the Board of Directors' report on operations and the statutory financial
statements as at and for the year ended 31 December 2010, which report profit of €509,898,117;
- to appropriate the remaining €301,070,543 in profit for the year, after payment of the interim
dividend of €208,827,574 in 2010, to:
1. pay a final dividend of €0.391 per share for 2010, payable to holders of each of the shares with
a par value €1.00 outstanding at the ex dividend date, excluding treasury shares held in
portfolio at that date. The total value of the final dividend, based on the number of shares
outstanding (588,246,688) and of treasury shares in portfolio (12,050,447), is estimated at
€230,004,455;
2. take the remaining profit for the year, after payment of the final dividend, to the extraordinary
reserve. This amount, based on the number of shares outstanding at the ex dividend date, is
estimated at €71,066,088;
- to establish the dividend payment date as 26 May 2011 and the ex dividend no.16 date as 23 May
2011.
For the Board of Directors
The Chairman

153
(This page intentionally left blank)

154

155
3. Atlantia Group’s consolidated financial statements and notes

156
(This page intentionally left blank)

157
CONSOLIDATED FINANCIAL STATEMENTS
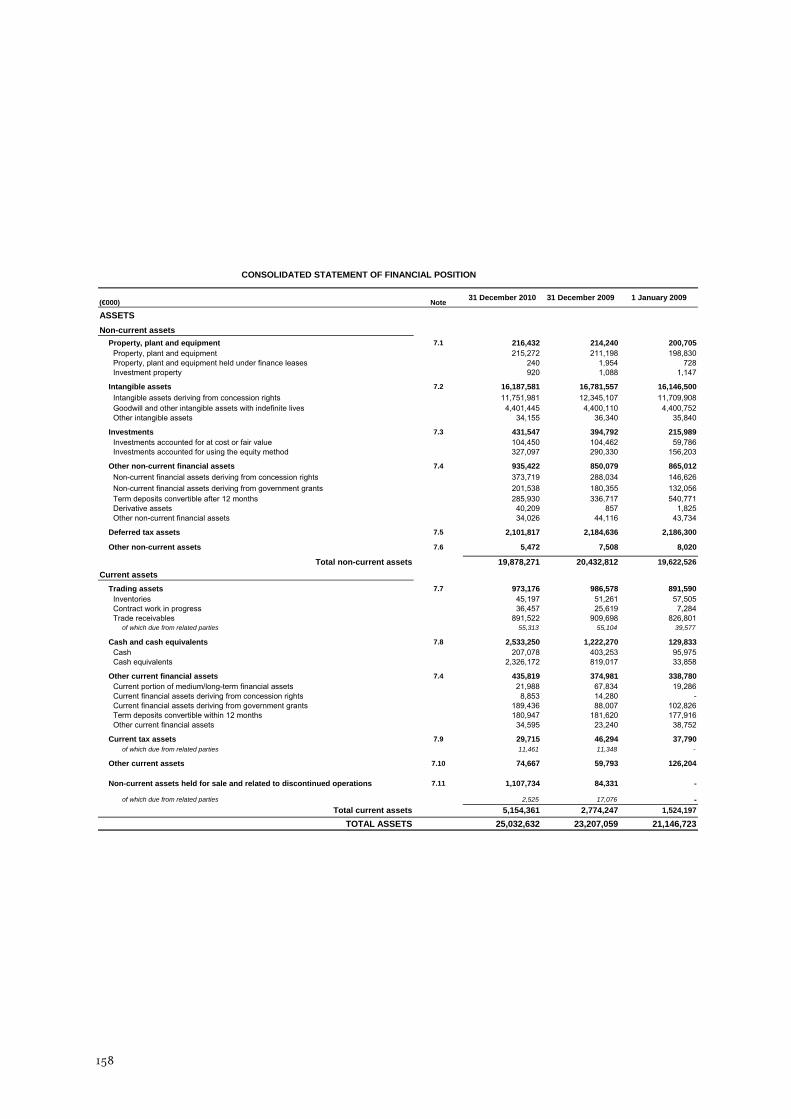
158
(€000) Note
ASSETSNon-current assets
Property, plant and equipment 7.1 216,432 214,240 200,705Property, plant and equipment 215,272 211,198 198,830Property, plant and equipment held under finance leases 240 1,954 728Investment property 920 1,088 1,147
Intangible assets 7.2 16,187,581 16,781,557 16,146,500Intangible assets deriving from concession rights 11,751,981 12,345,107 11,709,908Goodwill and other intangible assets with indefinite lives 4,401,445 4,400,110 4,400,752Other intangible assets 34,155 36,340 35,840
Investments 7.3 431,547 394,792 215,989Investments accounted for at cost or fair value 104,450 104,462 59,786Investments accounted for using the equity method 327,097 290,330 156,203
Other non-current financial assets 7.4 935,422 850,079 865,012Non-current financial assets deriving from concession rights 373,719 288,034 146,626Non-current financial assets deriving from government grants 201,538 180,355 132,056Term deposits convertible after 12 months 285,930 336,717 540,771Derivative assets 40,209 857 1,825Other non-current financial assets 34,026 44,116 43,734
Deferred tax assets 7.5 2,101,817 2,184,636 2,186,300
Other non-current assets 7.6 5,472 7,508 8,020
Total non-current assets 19,878,271 20,432,812 19,622,526Current assets
Trading assets 7.7 973,176 986,578 891,590Inventories 45,197 51,261 57,505Contract work in progress 36,457 25,619 7,284Trade receivables 891,522 909,698 826,801
of which due from related parties 55,313 55,104 39,577
Cash and cash equivalents 7.8 2,533,250 1,222,270 129,833Cash 207,078 403,253 95,975Cash equivalents 2,326,172 819,017 33,858
Other current financial assets 7.4 435,819 374,981 338,780Current portion of medium/long-term financial assets 21,988 67,834 19,286Current financial assets deriving from concession rights 8,853 14,280 -Current financial assets deriving from government grants 189,436 88,007 102,826Term deposits convertible within 12 months 180,947 181,620 177,916Other current financial assets 34,595 23,240 38,752
Current tax assets 7.9 29,715 46,294 37,790of which due from related parties 11,461 11,348 -
Other current assets 7.10 74,667 59,793 126,204
Non-current assets held for sale and related to discontinued operations 7.11 1,107,734 84,331 -
of which due from related parties 2,525 17,076 -Total current assets 5,154,361 2,774,247 1,524,197
TOTAL ASSETS 25,032,632 23,207,059 21,146,723
CONSOLIDATED STATEMENT OF FINANCIAL POSITION
31 December 2010 31 December 2009 1 January 2009

159
(€000) Note
Equity
Equity attributable to owners of the parent 3,183,391 2,810,815 2,677,790Issued capital 600,297 571,712 571,712Reserves and retained earnings 2,324,613 2,091,091 2,321,722Treasury shares -215,644 -215,644 -215,644Profit for the year after payment of interim dividends 474,125 363,656 -
Equity attributable to non-controlling interests 403,510 386,395 359,261Issued capital and reserves 385,706 387,689 359,261Profit/(Loss) for the year after payment of interim dividends 17,804 -1,294 -
Total equity 7.12 3,586,901 3,197,210 3,037,051
Non-current liabilities
Provisions for construction services required by contract 7.13 4,315,051 4,383,829 4,191,013
Non-current provisions 7.14 941,982 923,731 873,971Provisions for employee benefits 130,604 173,782 172,939Provisions for repair and maintenance obligations 790,281 728,122 671,303Other provisions 21,097 21,827 29,729
Non-current financial liabilities 7.15 10,066,909 11,304,537 9,786,217Bond issues 7,466,600 7,836,019 6,144,899Medium/long-term borrowings 2,323,273 3,068,276 3,256,309Derivative liabilities 253,599 374,778 335,295Other non-current financial liabilities 23,437 25,464 49,714
Deferred tax liabilities 7.5 33,666 30,253 6,376
Other non-current liabilities 7.16 44,151 56,479 56,166
Total non-current liabilities 15,401,759 16,698,829 14,913,743
Current liabilities
Current portion of provisions for construction services required by contract 7.13 386,660 582,217 607,929
Current provisions 7.14 224,778 213,783 215,008Provisions for employee benefits 46,615 15,462 17,469Provisions for repair and maintenance obligations 121,341 126,384 116,896Other provisions 56,822 71,937 80,643
Trading liabilities 7.17 1,307,429 1,190,764 1,103,702Contract work in progress - - 45Trade payables 1,307,429 1,190,764 1,103,657
of which due to related parties 27,808 19,055 21,872
Current financial liabilities 7.15 2,561,332 914,316 877,978Bank overdrafts 19,857 40,990 82,959Short-term borrowings 6,574 185,390 199,379Current portion of medium/long-term financial liabilities 2,533,779 686,253 576,751Intercompany current accounts payable 881 1,453 7,284Other current financial liabilities 241 230 11,605
Current tax liabilities 7.9 17,278 19,303 48,563
Other current liabilities 7.18 473,862 390,637 342,749
Liabilities related to discontinued operations 7.11 1,072,633 - -
Total current liabilities 6,043,972 3,311,020 3,195,929
TOTAL LIABILITIES 21,445,731 20,009,849 18,109,672
TOTAL EQUITY AND LIABILITIES 25,032,632 23,207,059 21,146,723
CONSOLIDATED STATEMENT OF FINANCIAL POSITION
1 January 200931 December 2010 31 December 2009
TOTAL EQUITY AND LIABILITIES

160
(€000) Note 2010 2009
REVENUEToll revenue 8.1 3,118,872 2,845,195Revenue from construction services 8.2 782,558 455,362
of which related parties 826 27,371Contract revenue 8.3 60,807 50,225Other operating income 8.4 565,829 559,514
of which related parties 81,294 76,647
TOTAL REVENUE 4,528,066 3,910,296
COSTSRaw and consumable materials 8.5 -325,907 -244,036
Purchases of materials -315,016 -232,131Change in inventories of raw and consumable materials and goods -10,891 -11,905
Service costs 8.6 -1,459,329 -1,373,060Service costs -1,459,329 -1,373,060
of which related parties -45,517 -36,797Gain/(loss) on sale of property, plant and equipment -75 64Net personnel expense 8.7 -636,677 -614,168Other operating costs 8.8 -449,006 -285,578
Concession fees -309,634 -158,138Lease expense -19,412 -17,952Change in provisions for repair and maintenance obligations -27,142 -32,021Other provisions -9,700 -4,100Other operating costs -83,118 -73,367
Use of provisions for construction services required by contract 8.9 605,191 716,610Amortisation and depreciation -482,967 -443,507
Depreciation of property, plant and equipment 7.1 -49,834 -45,580Depreciation of property, plant and equipment held under finance leases 7.1 -66 -220Depreciation of investment property 7.1 -76 -71Amortisation of intangible assets deriving from concession rights 7.2 -409,958 -374,014Amortisation of other intangible assets 7.2 -23,033 -23,622
(Impairment losses)/Reversals of impairment losses 8.10 2,664 7,581
TOTAL COSTS -2,746,106 -2,236,094
OPERATING PROFIT 1,781,960 1,674,202
Financial income 8.11 188,254 145,453Financial income 185,811 144,817Revaluations of financial assets - 196Dividends received from investee companies 2,443 440
Net financial expenses 8.11 -865,191 -805,636Financial expenses from discounting of provisions -176,382 -192,310Other financial expenses after government grants -688,809 -613,399Capitalised financial expenses - 73
Foreign exchange gains/(losses) 8.11 5,378 -246
FINANCIAL INCOME/(EXPENSES) -671,559 -660,429
Share of (profit)/loss of associates and joint ventures accounted for using the equity method 8.12 -2,080 -51,102
PROFIT BEFORE TAX FROM CONTINUING OPERATIONS 1,108,321 962,671
Income tax (expense)/benefit 8.13 -400,300 -380,741Current tax expense -387,915 -372,668Differences on current tax expense for previous years -3,671 13,355Deferred tax income and expense -8,714 -21,428
PROFIT/(LOSS) FROM CONTINUING OPERATIONS 708,021 581,930
Profit/(loss) from discontinued operations 8.14 -6,999 -20,466
PROFIT FOR THE YEAR 701,022 561,464
of which:
Profit attributable to owners of the parent 682,952 562,539 Profit/(loss) attributable to non-controlling interests 18,070 -1,075
(€) 2010 2009
Basic earnings per share attributable to the owners of the parent (€) 8.15 1.16 0.96 of which:from continuing operations 1.17 0.99from discontinued operations -0.01 -0.03
Diluted earnings per share attributable to the owners of the parent (€) 8.15 1.16 0.96 of which:from continuing operations 1.17 0.99from discontinued operations -0.01 -0.03
CONSOLIDATED INCOME STATEMENT

161
(€000) Note 2010 2009
Profit for the year (A) 701,022 561,464
Fair value gains/(losses) on cash flow hedges 50,003 -50,087
Gains/(losses) from actuarial valuations (IAS 19) 5,540 4,815
Translation gains on financial statements with functional currencies other than the euro
21,258 1,686
Gains/(losses) from measurement of associates and joint ventures using the equity method
42,721 22,437
Other fair value gains/(losses) -97 -466
Other comprehensive income for the year after related taxation (B) 7.12 119,425 -21,615
of which: discontinued operations 458 260
Comprehensive income for the year (A+B) 820,447 539,849
of which attributable to owners of the parent 800,120 539,172
of which attributable to non-controlling interests 20,327 677
CONSOLIDATED STATEMENT OF COMPREHENSIVE INCOME
Issued capital
Financial instruments
fair value reserve
Currency translation
reserve
Reserve for investments valued
using the equity method
Other reserves and retained
earnings
Treasury shares Profit for the year Total
571,712 54,489 -6,053 -11,181 2,677,808 -215,644 544,352 3,615,483 370,609 3,986,092
Effect of the adoption of IFRIC 12 as at 1 Jan 2009 - - 1,410 - -939,103 - - -937,693 -11,348 -949,041
Retained earnings for previous year - - - - 544,352 - -544,352 - - -
571,712 54,489 -4,643 -11,181 2,283,057 -215,644 - 2,677,790 359,261 3,037,051
- -51,406 1,360 22,437 4,240 - 562,539 539,170 679 539,849
Final dividend approved - - - - -207,287 - - -207,287 -2,593 -209,880
Interim dividend - - - - - - -198,883 -198,883 -219 -199,102
Changes in the basis of consolidation, capital contributions and other movements
- - - - 25 - - 25 29,269 29,292
571,712 3,083 -3,283 11,256 2,080,035 -215,644 363,656 2,810,815 386,395 3,197,210
- 50,274 19,021 42,721 5,152 - 682,952 800,120 20,327 820,447
Bonus issue of share capital 28,585 - - - -28,585 - - - - -
Final dividend approved - - - - - - -219,054 -219,054 -2,633 -221,687
Retained earnings for previous year - - - - 144,602 - -144,602 - - -
Interim dividend - - - - - - -208,827 -208,827 -266 -209,093
Changes in the basis of consolidation, capital contributions and other movements
- - 44 - 293 - - 337 -313 24
600,297 53,357 15,782 53,977 2,201,497 -215,644 474,125 3,183,391 403,510 3,586,901
STATEMENT OF CHANGES IN CONSOLIDATED EQUITY
Equity attributable to owners of the parent
Equity attributable non-
controlling interests
Total equity attributable to owners of the parent and non-controlling interests(€000)
Comprehensive income for the year
Shareholder transactions and other movements
Balance as at 31 December 2010
Balance as at 31 December 2008
Balance at 1 January 2009 (including the effect of first adoption of IFRIC 12)
Comprehensive income for the year
Shareholder transactions and other movements
Balance as at 31 December 2009

162
(€000) Note 2010 2009
CASH FLOWS FROM (USED IN) OPERATING ACTIVITIESProfit for the period 701,022 561,464Adjusted by:Amortisation and depreciation 505,845 488,656Provisions 49,188 47,259Financial expenses from discounting of provisions 177,000 192,936Share of (profit)/loss of associates and joint ventures accounted for using the 8.12 2,080 51,104Impairment losses/(Reversal of impairment losses) and adjustments of other non- -28,502 -13,748(Gain)/Loss on sale of non-current assets 398 -3,695Net change in deferred tax (assets)/liabilities 8,895 16,573Other non-cash costs (income) -12,498 -57,554Change in working capital and other changes 237,417 34,256Net cash from/(used in) operating activities [a] 9.1 1,640,845 1,317,251CASH FLOWS FROM (USED IN) INVESTING ACTIVITIESInvestments in motorways infrastructure -1,443,370 -1,188,325Government grants related to motorway infrastructure 222,027 136,424Increase in financial assets deriving from takeover rights (related to investments in motorway infrastructure) 68,712 89,049
Purchases of property, plant & equipment 7.1 -56,904 -61,832Purchases of intangible assets 7.2 -24,400 -24,455Purchase of investments, net of unpaid called-up issued capital 7.3 -6,194 -91,576Purchase of new consolidated investments, net of cash acquired - -220,492
Dividends received from investee companies accounted for using the equity method 10,080 -
Proceeds from sales of property, plant and equipment, intangible assets and unconsolidated investments 28,526 12,017
Proceeds form sales of consolidated investments net of cash and cash equivalents - 1,290Net change in other non-current assets 2,036 512Net change in current and non-current financial assets not held for trading -145,824 185,365Net cash from/(used in) investing activities [b] 9.1 -1,345,311 -1,162,023CASH FLOWS FROM (USED IN) FINANCING ACTIVITIESDividends paid -430,751 -420,218Net change in the currency translation reserve and other reserves 17,414 931Net change in issued capital and reserves attributable to non-controlling interests 2,450 28,008Issuance of bonds 1,484,571 1,642,240Increase in medium/long term borrowings (excluding finance lease liabilities) 94,093 8,004Increase in finance lease liabilities 170 1,353Repayments of medium/long term borrowings (excluding finance lease liabilities) 7.15 -245,484 -138,092Payment of finance lease liabilities 7.15 -351 -780Net change in other current and non-current financial liabilities 121,137 -136,859
Net cash from/(used in) financing activities [c] 9.1 1,043,249 984,587Net effect of foreign exchange rate movements on net cash and cash equivalents [d]
1,340 422
Increase/(Decrease) in cash and cash equivalents [a+b+c+d] 9.1 1,340,123 1,140,237
Net cash and cash equivalents at beginning of year 1,179,827 39,590
Net cash and cash equivalents at end of year 2,519,950 1,179,827
ADDITIONAL INFORMATION ON THE STATEMENT OF CASH FLOWS
Note 2010 2009
Income taxes paid 383,729 394,694Interest income and other financial income collected 130,052 51,626Interest expense and other financial expenses paid 596,952 551,390Dividends received 2,443 441Foreign exchange gains collected 8.11 745 878Foreign exchange losses incurred 8.11 681 692
RECONCILIATION OF NET CASH AND CASH EQUIVALENTS
Note 2010 2009
Net cash and cash equivalents at beginning of period 1,179,827 39,590
Cash and cash equivalents 7.8 1,222,270 129,833Bank overdrafts repayable on demand 7.15 -40,990 -82,959Bank account balances payable to unconsolidated Group companies 7.15 -1,453 -7,284
Net cash and cash equivalents at end of period 2,519,950 1,179,827
Cash and cash equivalents 7.8 2,533,250 1,222,270Bank overdrafts repayable on demand 7.15 -19,857 -40,990Bank account balances payable to unconsolidated Group companies 7.15 -881 -1,453Cash and cash equivalents attributable to discontinued operations 7.11 15,494 -Bank overdrafts (discontinued operations/assets held for sale) 7.11 -8,056 -
CONSOLIDATED STATEMENT OF CASH FLOWS

163
NOTES
1. INTRODUCTION
The Atlantia Group’s core business is the operation of motorways under concessions granted by the
relevant Authorities. Under the related concession arrangements, the Group’s operators are
responsible for the construction, management, improvement and upkeep of sections of motorway
in Italy and overseas. Further information on the Group’s concession arrangements is provided in
note 5.
The Parent, Atlantia SpA, listed on the Milan Stock Exchange, operates solely as a holding
company. It is responsible for developing growth and financial strategies in the infrastructure
sector, but does not have a direct operational role. The Company’s registered office is in Rome, at
Via Nibby, 20. The Company does not have branch offices. The duration of the Company is
currently until 31 December 2050.
At the date of preparation of these consolidated financial statements, the shareholder that, via
Schemaventotto SpA, directly and indirectly holds a relative majority of the issued capital of
Atlantia SpA is Sintonia SA.
Sintonia SA, which is in turn a subsidiary of Edizione Srl, does not exercise management and
coordination of Atlantia SpA.
The list of investments annexed to these notes also complies with the disclosure requirements of
art. 126 of CONSOB Regulation 11971/1999 relating to investments of more than 10% of the
issued capital of unlisted companies.
The consolidated financial statements were approved by the Board of Directors of Atlantia SpA at
its meeting of 11 March 2011.
2. BASIS OF PRESENTATION
The consolidated financial statements as at and for the year ended 31 December 2010 are based on
the assumption that consolidated companies are going concerns. They have been prepared in
compliance with articles 2 and 3 of Legislative Decree 38/2005 and International Financial
Reporting Standards (IFRS) issued by the International Accounting Standards Board and endorsed
by the European Commission, as in force at that date. These standards reflect the interpretations
issued by the International Financial Reporting Interpretations Committee (IFRIC), in addition to
previous International Accounting Standards (IAS) and interpretations issued by the Standard

164
Interpretations Committee (SIC) and still in force at the end of the reporting period. For the sake
of simplicity, all the above standards and interpretations are hereinafter referred to as “IFRS”.
Moreover, reference was made to the measures introduced by the CONSOB, in application of
paragraph 3 of article 9 of Legislative Decree 38/2005.
The consolidated financial statements consist of the income statement, statement of comprehensive
income, statement of financial position, statement of changes in equity, statement of cash flows and
these notes, in application of IAS 1 “Presentation of financial statements” and, in general, the
historic cost convention with the exception of those items that are required by IFRS to be
recognised at fair value as explained in the notes to the relevant items. The statement of financial
position is based on the format that separately discloses current and non-current assets and
liabilities. The income statement is classified by nature of expense, whilst the statement of cash
flows has been prepared in application of the indirect method.
IFRS have been applied in accordance with the indications provided in the “Framework for the
Preparation and Presentation of Financial Statements”, and no events have occurred that would
require exemptions pursuant to paragraph 19 of IAS 1.
CONSOB Resolution 15519 of 27 July 2006 requires that, in addition to the specific requirements
of IAS 1 and other IFRS, financial statements must, where material, include separate sub-items
providing (i) disclosure of amounts deriving from related party transactions; and, with regard to
the income statement, (ii) separate disclosure of income and expenses deriving from events and
transactions that are non-recurring in nature, or transactions or events that do not occur on a
frequent basis during the normal course of business. In this regard, it should be noted that no
material non-recurring, atypical or unusual transactions were entered into during 2010, either
with third or related parties.
All amounts are shown in thousands of euros, unless otherwise stated. The euro is both the
Group’s functional currency and its presentation currency.
Each item in the consolidated financial statements is compared with the corresponding amount for
the previous year which, however, has been restated as explained in detail in note 4, below, in
connection with the first-time adoption of IFRIC 12. The application of the interpretation from 1
January 2010 has made it necessary to review the propriety of certain financial statement items and,
consequently, the income statement, statement of financial position and statement of cash flows.
The statement of consolidated financial position balances brought forward at the beginning of the
previous financial year (1 January 2009) have also been restated, as required by paragraph 39 of
IAS 1.
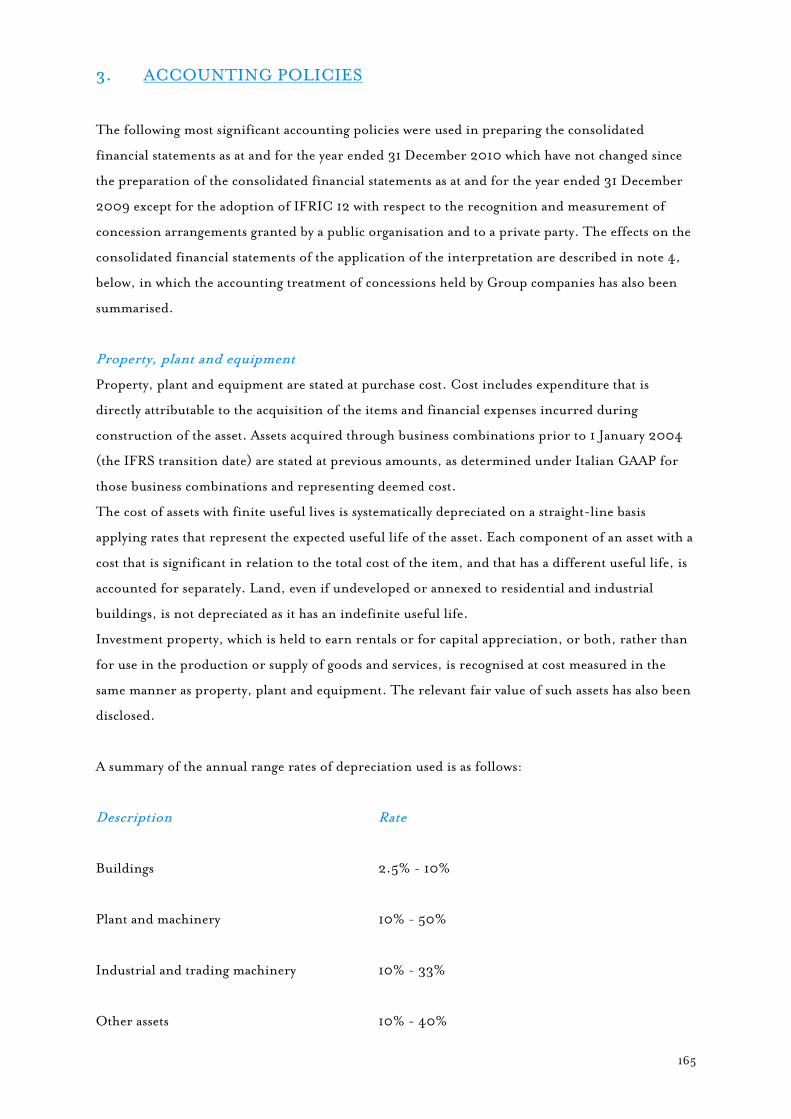
165
3. ACCOUNTING POLICIES
The following most significant accounting policies were used in preparing the consolidated
financial statements as at and for the year ended 31 December 2010 which have not changed since
the preparation of the consolidated financial statements as at and for the year ended 31 December
2009 except for the adoption of IFRIC 12 with respect to the recognition and measurement of
concession arrangements granted by a public organisation and to a private party. The effects on the
consolidated financial statements of the application of the interpretation are described in note 4,
below, in which the accounting treatment of concessions held by Group companies has also been
summarised.
Property, plant and equipment
Property, plant and equipment are stated at purchase cost. Cost includes expenditure that is
directly attributable to the acquisition of the items and financial expenses incurred during
construction of the asset. Assets acquired through business combinations prior to 1 January 2004
(the IFRS transition date) are stated at previous amounts, as determined under Italian GAAP for
those business combinations and representing deemed cost.
The cost of assets with finite useful lives is systematically depreciated on a straight-line basis
applying rates that represent the expected useful life of the asset. Each component of an asset with a
cost that is significant in relation to the total cost of the item, and that has a different useful life, is
accounted for separately. Land, even if undeveloped or annexed to residential and industrial
buildings, is not depreciated as it has an indefinite useful life.
Investment property, which is held to earn rentals or for capital appreciation, or both, rather than
for use in the production or supply of goods and services, is recognised at cost measured in the
same manner as property, plant and equipment. The relevant fair value of such assets has also been
disclosed.
A summary of the annual range rates of depreciation used is as follows:
Description
Rate
Buildings 2.5% - 10%
Plant and machinery
10% - 50%
Industrial and trading machinery
10% - 33%
Other assets
10% - 40%
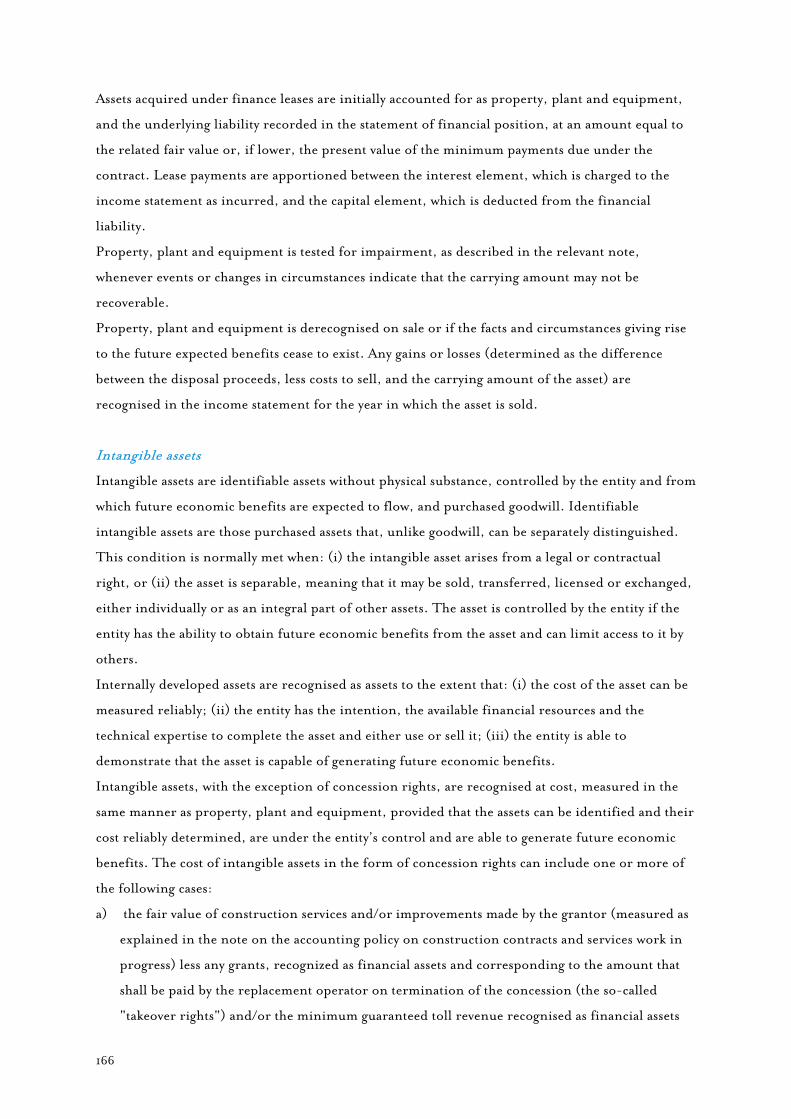
166
Assets acquired under finance leases are initially accounted for as property, plant and equipment,
and the underlying liability recorded in the statement of financial position, at an amount equal to
the related fair value or, if lower, the present value of the minimum payments due under the
contract. Lease payments are apportioned between the interest element, which is charged to the
income statement as incurred, and the capital element, which is deducted from the financial
liability.
Property, plant and equipment is tested for impairment, as described in the relevant note,
whenever events or changes in circumstances indicate that the carrying amount may not be
recoverable.
Property, plant and equipment is derecognised on sale or if the facts and circumstances giving rise
to the future expected benefits cease to exist. Any gains or losses (determined as the difference
between the disposal proceeds, less costs to sell, and the carrying amount of the asset) are
recognised in the income statement for the year in which the asset is sold.
Intangible assets
Intangible assets are identifiable assets without physical substance, controlled by the entity and from
which future economic benefits are expected to flow, and purchased goodwill. Identifiable
intangible assets are those purchased assets that, unlike goodwill, can be separately distinguished.
This condition is normally met when: (i) the intangible asset arises from a legal or contractual
right, or (ii) the asset is separable, meaning that it may be sold, transferred, licensed or exchanged,
either individually or as an integral part of other assets. The asset is controlled by the entity if the
entity has the ability to obtain future economic benefits from the asset and can limit access to it by
others.
Internally developed assets are recognised as assets to the extent that: (i) the cost of the asset can be
measured reliably; (ii) the entity has the intention, the available financial resources and the
technical expertise to complete the asset and either use or sell it; (iii) the entity is able to
demonstrate that the asset is capable of generating future economic benefits.
Intangible assets, with the exception of concession rights, are recognised at cost, measured in the
same manner as property, plant and equipment, provided that the assets can be identified and their
cost reliably determined, are under the entity’s control and are able to generate future economic
benefits. The cost of intangible assets in the form of concession rights can include one or more of
the following cases:
a) the fair value of construction services and/or improvements made by the grantor (measured as
explained in the note on the accounting policy on construction contracts and services work in
progress) less any grants, recognized as financial assets and corresponding to the amount that
shall be paid by the replacement operator on termination of the concession (the so-called
"takeover rights") and/or the minimum guaranteed toll revenue recognised as financial assets

167
and/or the minimum guaranteed by the Granter. Such cost will be recovered through the tolls
paid by users of the infrastructure. Specifically, identified as follow:
1) rights obtained as consideration for specific obligations to provide construction services for
the expansion and modernisation of the infrastructure and for which the operator does not
receive additional economic benefits. These rights are initially recognised at the present
fair value of the construction services to be provided in future (excluding any financial
expenses to be incurred by the operator during the construction period), less any grants,
with a contra entry of an equal amount in “provisions for construction services required by
contract”; in addition to the impact of amortisation, the initial value of the rights changes
over time as a result of periodic reassessment of the present fair value of the part of the
construction services still to be rendered at the end of the reporting period;
2) rights accrued in return for construction services rendered for which the operator receives
additional economic benefits, represented by specific tariff increases and/or extensions of
the infrastructure expected to result in significant increases in the number of users;
3) rights accruing from construction work carried out and paid for by service area operators,
handed over free of charge to the Company.
b) rights obtained from third parties, if costs have been incurred to acquire concessions from the
grantor from third parties (the latter relating to the acquisition of companies that hold a
concession).
Amortisation of intangible assets with finite useful lives begins when the assets are ready for use and
is based on remaining economic benefits to be obtained in relation to their residual useful lives.
Concession rights, on the other hand, are amortised over the concession period, in a pattern that
reflects the estimated flow of economic benefits to the company. The rate of amortisation is,
therefore, determined taking account, among other things, of projected traffic changes, if material,
over the concession period. Concession rights are amortised from the accounting period in which
they commence generating economic benefits.
A summary of the annual range rates of amortisation used for intangible assets with finite useful
lives is as follows:
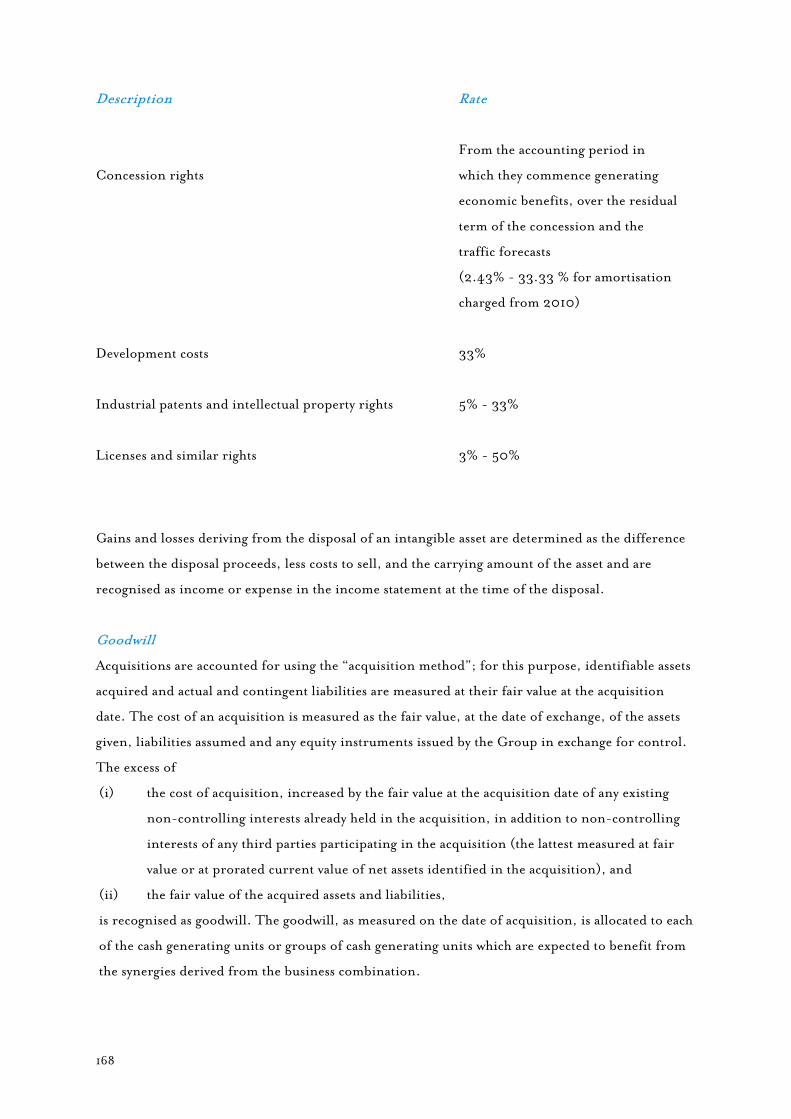
168
Description
Rate
Concession rights
From the accounting period in
which they commence generating
economic benefits, over the residual
term of the concession and the
traffic forecasts (2.43% - 33.33 % for amortisation
charged from 2010)
Development costs
33%
Industrial patents and intellectual property rights
5% - 33%
Licenses and similar rights
3% - 50%
Gains and losses deriving from the disposal of an intangible asset are determined as the difference
between the disposal proceeds, less costs to sell, and the carrying amount of the asset and are
recognised as income or expense in the income statement at the time of the disposal.
Goodwill
Acquisitions are accounted for using the “acquisition method”; for this purpose, identifiable assets
acquired and actual and contingent liabilities are measured at their fair value at the acquisition
date. The cost of an acquisition is measured as the fair value, at the date of exchange, of the assets
given, liabilities assumed and any equity instruments issued by the Group in exchange for control.
The excess of
(i) the cost of acquisition, increased by the fair value at the acquisition date of any existing
non-controlling interests already held in the acquisition, in addition to non-controlling
interests of any third parties participating in the acquisition (the lattest measured at fair
value or at prorated current value of net assets identified in the acquisition), and
(ii) the fair value of the acquired assets and liabilities,
is recognised as goodwill. The goodwill, as measured on the date of acquisition, is allocated to each
of the cash generating units or groups of cash generating units which are expected to benefit from
the synergies derived from the business combination.

169
A negative difference between the cost of the acquisition (increased by the components described
above) and the Group’s share in the fair value of the acquired assets and liabilities is accounted for
as income in the income statement for the year of acquisition.
Goodwill on acquisitions of non-controlling interests is included in the carrying amount of the
relevant investments.
After initial recognition, goodwill is no longer amortised and is carried at cost less any accumulated
impairment losses, determined as described below.
On acquiring control, further acquisitions of the interests of minority shareholders, or sales of
shareholdings to minority shareholders that do not result in a loss of control, are accounted for as
equity transactions. This means that any differences between the change in equity attributable to
non controlling interests and the cash and cash equivalents exchanged are recognised directly as
movements in equity attributable to owners of the parent.
For the purposes of the transition to IFRS and preparation of the opening financial statements (as
at 1 January 2004) under the IFRS adopted by the Parent, IFRS 3 – Business combinations was not
applied retrospectively to acquisitions prior to 1 January 2004. As a result, the carrying amount of
goodwill on these acquisitions is that determined under Italian GAAP, which is the net carrying
amount at the IFRS transition date, subject, however, to impairment testing and the recognition of
any impairment losses.
Investments
Investments in unconsolidated subsidiaries and other companies, which qualify as available-for-
sale financial instruments as defined by IAS 39, are initially accounted for at cost at the settlement
date, in that this represents fair value plus any directly attributable transaction costs.
After initial recognition, these investments are measured at fair value, to the extent reliably
determinable, through the statement of comprehensive income and hence in a specific equity
reserve. On realisation or recognition of an impairment loss, the accumulated gains and losses in
that reserve are taken to the income statement.
Impairment losses, identified as described in the note on “Impairment of assets”, are reversed
through the other comprehensive income if the circumstances that resulted in the loss no longer
exist.
When fair value cannot be reliably determined, investments classified as available-for-sale are
measured at cost less any impairment losses. In this case impairment losses may not be reversed.
Investments in associates and joint ventures are accounted for using the equity method, and the
Group’s share of post-acquisition profits or losses is recognised in the income statement for the
accounting period to which they relate, with the exception of the effects deriving from other
changes in the equity of the investee, when the Group’s share is recognised directly in
comprehensive income attributable to owners of the parent.
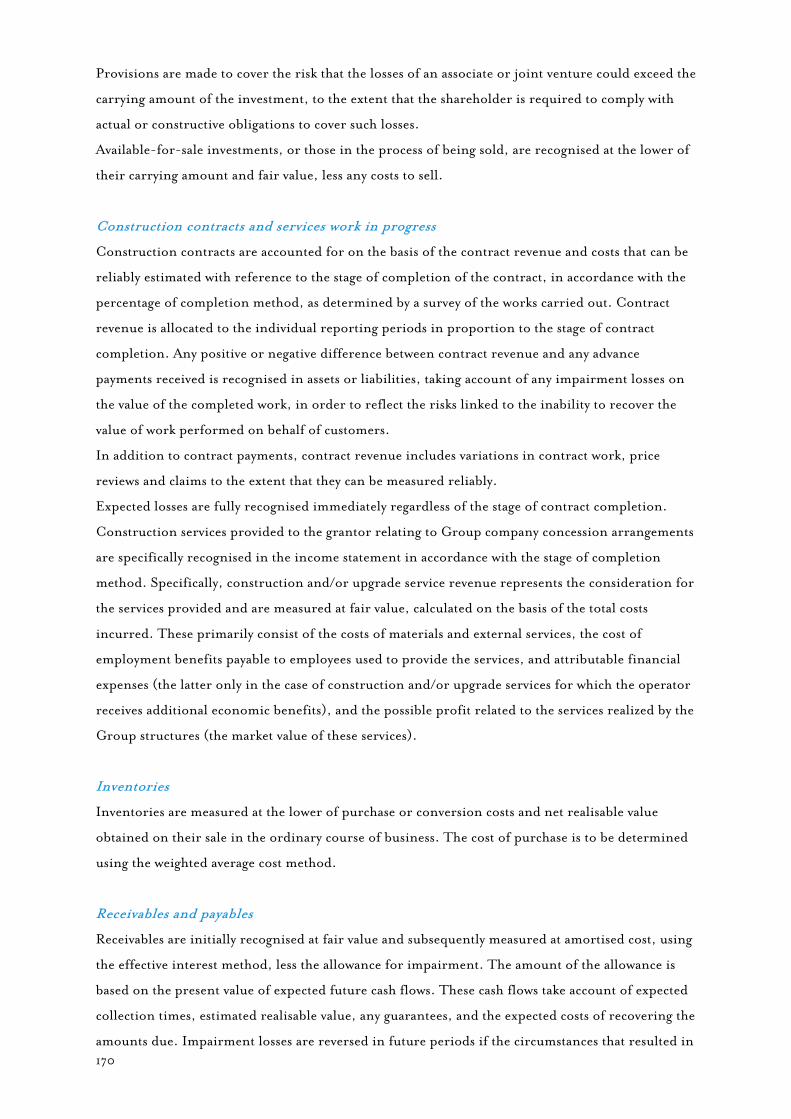
170
Provisions are made to cover the risk that the losses of an associate or joint venture could exceed the
carrying amount of the investment, to the extent that the shareholder is required to comply with
actual or constructive obligations to cover such losses.
Available-for-sale investments, or those in the process of being sold, are recognised at the lower of
their carrying amount and fair value, less any costs to sell.
Construction contracts and services work in progress
Construction contracts are accounted for on the basis of the contract revenue and costs that can be
reliably estimated with reference to the stage of completion of the contract, in accordance with the
percentage of completion method, as determined by a survey of the works carried out. Contract
revenue is allocated to the individual reporting periods in proportion to the stage of contract
completion. Any positive or negative difference between contract revenue and any advance
payments received is recognised in assets or liabilities, taking account of any impairment losses on
the value of the completed work, in order to reflect the risks linked to the inability to recover the
value of work performed on behalf of customers.
In addition to contract payments, contract revenue includes variations in contract work, price
reviews and claims to the extent that they can be measured reliably.
Expected losses are fully recognised immediately regardless of the stage of contract completion.
Construction services provided to the grantor relating to Group company concession arrangements
are specifically recognised in the income statement in accordance with the stage of completion
method. Specifically, construction and/or upgrade service revenue represents the consideration for
the services provided and are measured at fair value, calculated on the basis of the total costs
incurred. These primarily consist of the costs of materials and external services, the cost of
employment benefits payable to employees used to provide the services, and attributable financial
expenses (the latter only in the case of construction and/or upgrade services for which the operator
receives additional economic benefits), and the possible profit related to the services realized by the
Group structures (the market value of these services).
Inventories
Inventories are measured at the lower of purchase or conversion costs and net realisable value
obtained on their sale in the ordinary course of business. The cost of purchase is to be determined
using the weighted average cost method.
Receivables and payables
Receivables are initially recognised at fair value and subsequently measured at amortised cost, using
the effective interest method, less the allowance for impairment. The amount of the allowance is
based on the present value of expected future cash flows. These cash flows take account of expected
collection times, estimated realisable value, any guarantees, and the expected costs of recovering the
amounts due. Impairment losses are reversed in future periods if the circumstances that resulted in

171
the loss no longer exist. In this case, the reversal is accounted for in the income statement and may
not in any event exceed the amortised cost of the receivable had no previous impairment losses
been recognised.
Payables are initially recognised at cost, which corresponds to the fair value of the liability, less any
directly attributable transaction costs. After initial recognition, payables are recognised at
amortised cost, using the original effective interest method.
Trade receivables and payables, which are subject to normal commercial terms and conditions, are
not discounted to present value.
Cash and cash equivalents
Cash and cash equivalents are recognised at par value. They include highly liquid demand deposits
or very short-term instruments of excellent quality, which are subject to an insignificant risk of
changes in value.
Other financial assets and liabilities
Financial assets that Group companies intend and are able to hold to maturity, in accordance with
IAS 39, and financial liabilities are recognised at the fair value of the purchase consideration at the
settlement date, with assets being increased and liabilities being reduced by transaction costs
directly attributable to the purchase of the asset or issuance of a financial liability. After initial
recognition, financial assets and liabilities are measured at amortised cost using the original
effective interest method.
Financial assets and liabilities are derecognised when, following their sale or settlement, the Group
is no longer involved in their management and has transferred all risks and rewards of ownership.
Financial assets held for trading are accounted for and measured at fair value through the income
statement. Other categories of financial assets are classified as available-for-sale financial
instruments, which are accounted for and measured at fair value through the statement of
comprehensive income. The financial instruments included in these categories have, to date, never
been reclassified.
Derivative financial instruments
All derivative financial instruments are recognised at fair value at the end of the reporting period.
As required by IAS 39, derivatives are designated as hedging instruments when the relationship
between the derivative and the hedged item is formally documented and the periodically assessed
effectiveness of the hedge is high and ranges between 80% and 125%.
Changes in the fair value of instruments hedging assets and liabilities (cash flow hedges) are
recognised in the statement of comprehensive income, net of any deferred taxation. The gain or
loss relating to the ineffective portion is recognised in the income statement.

172
The changes in the fair value of instruments hedging the changes in the fair value of assets and
liabilities are recognised in profit or loss for the year. Analogously, the hedged assets and liabilities
are restated at fair value through the income statement.
Changes in the fair value of derivative instruments that do not qualify for hedge accounting under
IAS 39 are recognised in the income statement.
Fair value hierarchy of financial instruments
IFRS 7 "Financial Instruments: Disclosures" requires that financial instruments recognised at fair
value in the statement of financial position be classified with reference to a hierarchy of levels,
based on the source of the inputs used to derive the fair value.
The standard classifies financial instruments recognised at fair value based on the following levels:
a) Level 1 - quoted prices in active markets;
b) Level 2 – inputs other than quoted prices included in level 1 that are observable either
directly (i.e. as prices) or indirectly (i.e. derived from prices);
c) Level 3 - inputs that are not based on observable market data.
There were no transfers among the fair value hierarchy of levels in 2010.
No financial instruments have been classified as level 3.
Provisions and provisions for construction services required by contract
“Provisions” are made when: (i) the Group has a present (actual or constructive) obligation as a
result of a past event; (ii) it is probable that an outflow of resources will be required to settle the
obligation; and (iii) the related amount can be reliably estimated.
Provisions are measured on the basis of management’s best estimate of the expenditure required to
settle the present obligation at the end of the reporting period. If the discount to present value is
material, provisions are determined by discounting future expected cash flows to their present
value using a discount rate that reflects current market assessments of the time value of money and
the specific risks relating to the liability. Subsequent to the computation of present value, the
increase in provisions over time is recognised as a financial expense.
In accordance with the contract obligations reflected in the financial plans annexed to the
concession arrangements in force, “Provisions for the repair and maintenance obligations” reflect
provisions made at the end of the reporting period in order to cover the cost of future maintenance
obligations, designed to ensure the required functionality and safety of motorway infrastructure.
These provisions are calculated on the basis of the usage and wear and tear of motorway
infrastructure, taking into account, if material, the time value of money.
The Provision for construction services required by contract relates to contractual obligations
specifically in connection with the upgrading of motorway infrastructure, for which the Group
obtains no additional economic benefits. Such costs are treated as consideration for concession
arrangements and are initially recognised at the present value of the fair value of construction

173
services to be rendered in the future (ignoring any financial costs) less any grants received. They
are accounted for as a contra item of concession rights without additional benefits. The present
value of the residual liability to be rendered in the future, for the construction services still to be
rendered to date, consequently periodically reassessed and changes to the measurement of the
liabilities (such as, for example, changes to the estimated cash outflows necessary to extinguish the
obligation, a change in the discount rate or a change in the construction period) are recognised as a
matching increase or reduction in the corresponding intangible asset.
Employee benefits
Short-term employee benefits, provided during the period of employment, are accounted for at the
accrued liability at the end of the reporting period.
Liabilities deriving from other medium/long-term employee benefits are recognised in the vesting
period, less any plan assets and advance payments made. They are determined on the basis of
actuarial assumptions, if material, and recognised on an accruals basis in line with the period of
service necessary to obtain the benefit.
Post-employment benefits in the form of defined benefit plans are recognised at the amount
accrued at the end of the reporting period.
Post-employment benefits in the form of defined benefit plans (for Italian companies, primarily
post-employment benefits accrued to 31 December 2006 or, where applicable, until the date the
employee joins a supplementary pension fund) are recognised in the vesting period, less any plan
assets and advance payments made. Such defined benefit plans primarily regard the obligation as
determined on the basis of actuarial assumptions and recognised on an accruals basis in line with
the period of service necessary to obtain the benefit. The obligation is calculated by independent
actuaries. Any resulting actuarial gain and loss is recognised in full in other comprehensive income
in the period to which they relate, net of any deferred taxation.
Non-current assets held for sale and related to discontinued operations
Where the carrying amount of non-current assets held for sale and assets and liabilities related to
discontinued operations is material and is to be recovered primarily through sale rather than
through continued use, these items are presented separately in the statement of financial position.
Immediately prior to being classified as held for sale, the above assets and liabilities are recognised
under the specific IFRS applicable to each asset and liability, and subsequently accounted for at the
lower of the carrying amount and estimated fair value. Any impairment losses are recognised
immediately in the income statement.
With regard to their classification in the income statement, discontinued or discontinuing
operations are assets sold or classified as held for sale that satisfy one of the following requirements:
a) they represent a major line of business or geographical area of operation;
b) they are part of a single coordinated plan to dispose of a separate major line of business or
geographical area of operation;
174
c) they are subsidiaries acquired exclusively with a view to resale.
Gains and losses on such items, after the related taxation, are recognised in a specific item in the
income statement, together with comparative amounts.
Revenue
Revenue is recognised when the fair value can be reliably measured and it is probable that the
economic benefits associated with the transactions will flow to the Group. Depending on the type
of transaction, revenue is recognised on the basis of the following specific criteria:
a) toll revenue, on an accruals basis in the accounting period in which it is earned based on
motorway usage. Due partially to the fact that the Group’s network interconnects with other
networks, and that it is consequently necessary to allocate revenue among the various operators,
a portion of toll revenue, relating to the last part of the accounting period, is determined on
the basis of reasonable estimates;
b) sales of assets, when the significant risks and rewards of ownership of the goods have been
transferred to the buyer;
c) the rendering of services, in proportion to the stage of completion of the transaction based on
the same criteria used for construction contracts. When the amount of the revenue cannot be
reliably determined, revenue is recognised only to the extent of the expenses recognised that
are recoverable;
d) rental income or royalties, on an accruals basis, based on the agreed terms and conditions of
contract.
Interest income and expense is accrued on assets and liabilities based on the effective interest
method.
Dividend income is recognised when the right to receive payment is established.
Government grants
Government grants are accounted for at fair value when: (i) the related amount can be reliably
determined and there is reasonable certainty that (ii) they will be received and that (iii) the
conditions attaching to them will be satisfied.
Grants related to income are accounted for in the income statement for the accounting period in
which they accrue, in line with the corresponding costs.
Grants for investments in motorway infrastructure are recognised as construction services revenue
in accordance with the accounting policy on "Construction contracts and services work in
progress".
Grants related to assets received to fund development projects and activities are accounted for in
liabilities, and are subsequently recognised in operating income in the income statement, in line
with depreciation of the assets to which they refer.

175
Any grants received to fund investments in property, plant and equipment are accounted for as a
reduction in the cost of the asset to which they refer and result in a reduction in depreciation.
Income taxes
Income taxes are recognised on the basis of a realistic estimate of tax expense to be paid, in
compliance with the regulations in force and taking account of any applicable exemptions.
Income tax payables are reported under current tax liabilities in the statement of financial position
less any advance payments of taxes. Any overpayments of IRAP are recognised as current tax assets.
Deferred tax assets and liabilities are taxes expected to be recovered or paid on temporary
differences between the carrying amounts of assets and liabilities in the company's books, calculated
in accordance with the above policies, and the corresponding tax bases, as follows:
a) deferred tax assets are only recognised to the extent that it is probable that future taxable
profits will be available against which the asset can be utilised;
b) deferred tax liabilities are always recognised.
The Parent, Atlantia SpA has once again elected to adopt a tax consolidation arrangement for
2010, in which certain subsidiaries participate.
Share-based payments
The cost of the services rendered by employees and/or directors and paid for in the form of share
options is based on the fair value of the options granted at the grant date. The method of
calculating fair value takes account of all features of the options at the grant date (the option
period, exercise price and vesting conditions, etc.) and the instrument underlying the option. The
cost is recognised in the income statement, with a contra-entry in equity, over the vesting period,
based on a best estimate of the number of options that will vest.
The cost of any services provided by employees and/or directors and remunerated through share-
based payments, but settled in cash, is measured at the fair value of the liability recorded in the
“Provisions for employee benefits”. Fair value is remeasured at the end of the each reporting
period until such time as the liability is settled, with any changes recognised in the income
statement.
Impairment of assets (impairment testing)
At the end of the reporting period, the Group tests property, plant and equipment, intangible
assets, financial assets and investments for impairment.
If there are indications that these assets have been impaired, the recoverable amounts of such assets
are estimated to verify and eventually measure the amount of the impairment loss to recognize.
Irrespective of whether there is an indication of impairment, intangible assets with indefinite lives
and those which are not yet available for use are tested for impairment at least annually, or more

176
frequently, if an event has occurred or there has been a change in circumstances that could cause an
impairment.
If it is not possible to estimate the recoverable amounts of individual assets individually, the
recoverable amount of the cash-generating unit to which a particular asset belongs is estimated.
This entails estimating the recoverable amount of the asset (represented by the higher of the asset's
fair value less costs to sell and its value in use) and comparing it with the carrying amount. If the
recoverable amount of an asset is estimated to be less than its carrying amount, the carrying amount
is reduced to its recoverable amount. In calculating value in use, expected future pre-tax cash flow
is discounted using a pre-tax rate that reflects current market assessments of the cost of capital
which embodies the time value of money and the risks specific to the business.
Impairment losses are recognised in the income statement, and classified according to the nature of
the impaired asset. Losses are reversed if the circumstances that resulted in the loss no longer exist,
provided that the reversal does not exceed the cumulative impairment losses previously recognised,
unless the impairment loss relates to goodwill and equity instruments measured at cost, where the
related fair value cannot be reliably determined.
Estimates and judgements
Preparation of financial statements in compliance with IFRS involves the use of estimates and
judgements, which are reflected in the measurement of the carrying amounts of assets and liabilities
and in the disclosures provided in the notes to the financial statements, including contingent assets
and liabilities at the end of the reporting period. These estimates are especially important in
determining amortisation and depreciation, impairment testing of assets (including the
measurement of receivables), provisions, employee benefits, the fair value of financial assets and
liabilities, and deferred tax assets and liabilities.
The amounts subsequently recognised may, therefore, differ from these estimates. Moreover, these
estimates and judgements are periodically reviewed and updated, and the resulting effects of each
change immediately recognised in the financial statements.
Translation of foreign currency items
The financial statements of each consolidated company are prepared using the functional currency
of the economy in which the company operates. Transactions in currencies other than the
functional currency are recognised by application of the exchange rate at the transaction date.
Assets and liabilities denominated in currencies other than the functional currency are,
subsequently, remeasured by application of the exchange rate at the end of the reporting period.
Any exchange differences on remeasurement are recognised in the income statement. Non-
monetary assets and liabilities denominated in foreign currencies and recognised at historical cost
are translated using the exchange rate at the date of initial recognition.

177
Earnings per share
Basic earnings per share are computed by dividing profit attributable to owners of the parent by the
weighted average number of shares outstanding during the accounting period.
Diluted earnings per share are computed by taking into account, for both profit attributable to
owners of the parent and the above weighted average, the effects deriving from the
subscription/conversion of all potential shares that may be issued as a result of the exercise of any
outstanding share options.
New accounting standards and interpretations, or revisions and modifications of existing
standards, that have either yet to come into effect or yet to be endorsed by the European
Union
There were no new standards or revisions to existing accounting standards and interpretations in
2010 that had a material impact on the consolidated financial statements, with the exception of
interpretation IFRIC 12 on the recognition and measurement of public-to-private service
concession arrangements, with particular regard to the method of accounting for assets to be
handed over, the activities involved in the operation of such assets, and constructions obligations
with respect to their repair and maintenance. The impact of adoption of this interpretation on the
Atlantia Group’s consolidated financial statements is described below in note 4.
As required by IAS 8 “Accounting Policies, Changes in Accounting Estimates and Errors”, this
section describes new accounting standards and interpretations, and revisions of existing standards
and interpretations that are already applicable, but that have either yet to come into effect or yet to
be endorsed by the European Union (EU), and that may in the future be applied in the Group’s
consolidated financial statements.
IFRS 3 – Business Combinations
As part of its Annual Improvements project, the IASB published an amendment to IFRS 3 on 6
May 2010 clarifying the method of measuring non-controlling interests in business combinations.
IFRS 3 provides that non-controlling interests may be measured at fair value or at the non-
controlling interest's proportionate share in net assets of the acquiree. The second alternative is
only available for equity instruments that currently provide non-controlling interests with the
rights of ordinary shareholders specifically with respect to obtaining a prorated share of net assets
in the event of a liquidation. Any other non-controlling interest instruments (such as preference
shares or warrants issued by the acquiree) must be measured at fair value unless otherwise required
under another international financial reporting standard.
The amendment is required to be applied from 2011 and was endorsed by the EU in February 2011.
178
IFRS 9 – Financial Instruments
The IASB issued the first part of IFRS 9 on 12 November 2009 that only revised requirements for
the classification and measurement of financial assets currently regulated by IAS 39. When
completed, IFRS 9 will fully replace IAS 39. The IASB subsequently issued a revised version of
IFRS 9 on 28 October 2010 that also contained requirements with respect to the classification and
measurement of financial liabilities.
IFRS 9 only provides for two categories of financial assets. It also provides for two accounting
methods: amortised cost and fair value.
Classifications should be made with reference to the business model for managing the financial
asset and the characteristics of its contractual cash flows.
Initial recognition and subsequent measurement at amortised cost are subject to both of the
following conditions:
a) the asset is held in conjunction with a business model whose objective is to hold assets in order
to collect contractual cash flows; and,
b) the contractual terms of the financial asset give rise on specified dates to cash flows that are
solely payments of principal and interest on the principal amount outstanding.
If either one of the above two conditions is not satisfied, the financial asset is required to be
initially recognised and subsequently measured at fair value.
All financial assets in the form of shares are to be measured at fair value. Unlike IAS 39, the revised
standard does not admit exception to the general rule. As a result, it is not possible to measure
unlisted shares, for which fair value cannot be reliably determined, at cost.
A financial asset meeting the conditions to be classified and measured at amortised cost may, on
initial recognition, be designated as a financial asset at fair value through profit or loss, to the
extent that this accounting treatment would eliminate or significantly reduce a measurement or
recognition inconsistency (sometimes referred to as an ‘accounting mismatch’) that would
otherwise arise from measuring assets or liabilities or recognising the gains and losses on them on
different bases.
In addition, provides that an entity, with respect to investments in equity instruments, which
consequently may not be carried and measured at amortised cost unless such instruments are shares
that are not held for trading but rather for strategic reasons, the new standard provides may make
an irrevocable election on initial recognition to present changes in the fair value in comprehensive
income.
The accounting requirements relating to financial liabilities as provided by the current IAS 39
have, however, been upheld by the new IFRS 9. Financial liabilities continue to be accounted for at
amortised cost or fair value through profit or loss in specific circumstances.
The changes from current practice under IAS 39 are primarily:
a) changes in the fair value of certain types of financial liabilities, due to the credit risk inherent
in liabilities, are required by IFRS 9 to be recognised in comprehensive income;
179
b) the elimination of the option to measure financial liabilities at amortised cost, which are in the
form of derivatives entailing the delivery of unlisted equity instruments. This revision means
that all derivative instruments must now be measured at fair value.
IFRS 9 is currently being examined by the EU in conjunction with their overall assessment of the
revision and replacement of IAS 39.
IAS 12 – Income Taxes
The IASB approved certain revisions to IAS 12 on 20 December 2010 relating to the recovery of
deferred taxes associated with certain types of assets. The revisions, among other things, set aside
SIC 21.
IAS 12, in contrast to the current presumption that deferred tax assets will be recovered through
use, now presumes that deferred tax assets relating to investment property and property, plant &
equipment carried at fair value will now be recovered and all temporary differences reversed
through the sale of the asset unless there is clear proof that the deferred tax asset can be recovered
through use.
The amendment is to be applied for accounting periods starting on or after 1 January 2012. Earlier
adoption is permitted. The amendment has not yet been endorsed by the EU.
IAS 32 - Financial Instruments: Presentation
The IASB published a revision to IAS 32 on 8 October 2009 that clarified the accounting
treatment of certain rights issues in a currency other than the issuer's functional currency. When
rights are issued on a prorated basis to all shareholders for a fixed amount of currency, they must
be classified as equity instruments even to the extent that their exercise price is denominated in a
currency other than the issuer's functional currency. The previous accounting treatment under IAS
32 was that these instruments should be accounted for as derivative liabilities.
The amendments to the standard were endorsed by the EU on 23 December 2009 and must be
applied to financial statements for accounting periods commencing after 31 December 2010.
Earlier adoption is permitted.
IFRIC 14 and IAS 19—The Limit on a Defined Benefit Asset, Minimum Funding Requirements
and their Interaction
The IASB released amendments to IFRIC 14 and IAS 19 on 26 November 2009 that were required
because the effects of any prepayments of minimum contributions had not been considered. In
certain circumstances, however, the entity making such prepayments would be required to
recognise a charge against income. The amendment to IFRIC 14, however, requires prepayments of
minimum contributions to defined benefit plans to be recognised as assets.
The interpretation was endorsed by the EU in July 2010 and must be applied from 2011.

180
IFRIC 19 – Extinguishing Financial Liabilities with Equity Instruments
IFRIC 19 was published on 26 November 2009. The interpretation determines the mandatory
accounting treatment to be applied by a debtor when, following a renegotiation of the terms of the
liability, the creditor and the debtor agree to a so-called debt for equity swap in full or partial
settlement of a financial liability, through the issuance of equity instruments by the debtor.
IFRIC 19 was endorsed by the EU in 2010 and must be applied for financial statements relating to
accounting periods starting on or after 1 July 2010. Earlier adoption is permitted.
The Atlantia Group is analysing the future impact, if any, of the newly issued standards and
interpretations, and revisions of existing standards and interpretations.
181
4. IMPACT OF IFRIC 12 ADOPTION ON THE GROUP’S CONSOLIDATED FINANCIAL STATEMENTS
4.1 Introduction
This section describes the impact of introduction of Interpretation IFRIC 12 “Service Concession
Arrangements”, issued by the International Accounting Standards Board, regarding the
recognition and measurement of public-to-private service concession arrangements.
IFRIC 12, published by the IASB in November 2006, was endorsed by the European Commission
with EC Regulation 254/2009 dated 25 March 2009. Application is mandatory for IFRS financial
statements for reporting periods beginning after the date of endorsement.
With effect from the interim report as at and for the three months ended 31 March 2010, the
Atlantia Group therefore publishes its accounts applying IFRIC 12, preparing its financial
statements in compliance with the document published by the Italian Accounting Standards Setter
(the OIC), Application 3 “Service Concession Arrangements”.
IFRIC 12 establishes that the operator shall not recognise the public service infrastructure (assets to
be handed over) as property, plant and equipment because the contractual service arrangement
does not convey the right to “control” the infrastructure, but only the right to use it to provide the
public service in accordance with the terms and conditions specified in the contract with the
grantor. This right may be classified as a financial asset or as an intangible asset, depending on
whether there is an unconditional contractual right to receive a consideration regardless of effective
use of the infrastructure or a right to charge users of the public service.
The criteria used for adoption of the interpretation to the concessions held by the Group and the
impact of its first-time adoption are described below.
4.2 Scope of application and Criteria used of the interpretation
4.2.1 Scope of application of the interpretation
IFRIC 12 applies to public-to-private concession arrangements if:
a) the grantor controls or regulates what services the operator must provide with the
infrastructure, to whom it must provide them, and at what price; and
b) the grantor controls – through ownership, beneficial entitlement or otherwise – any
significant residual interest in the infrastructure at the end of the term of the arrangement.
Following analysis of the Group’s existing concessions, the new interpretation was deemed
applicable to all the concession arrangements to which the Atlantia Group’s operators are party,
with particular regard to the motorway concessions awarded to the subsidiaries, Autostrade per
l’Italia SpA, Strada dei Parchi SpA, Società Italiana per azioni per il Traforo del Monte Bianco,
Raccordo Autostradale Valle d’Aosta SpA, Società Autostrada Tirrenica pA, Tangenziale di Napoli
SpA, Autostrade Meridionali SpA, Autostrada Torino - Savona SpA, Stalexport Autostrada
182
Malopolska SA and Sociedad Concesionaria de Los Lagos SA, and the concession for port mobility
services held by the subsidiary Port Mobility SpA.
The interpretation is also applicable to concession arrangements involving the Group’s associates
and joint ventures. The most important of these, with respect to IFRIC 12, regard the concessions
indirectly held by Autostrade Sud America Srl (which merged Autostrade per il Cile on 1 January
2010), sub-holding company owning controlling interests or investments in companies that
operate motorways under concessions in Chile.
4.2.2 First-time adoption of the interpretation
In accordance with IAS 8, on first-time adoption the provisions of IFRIC 12 must be applied
retrospectively, reassessing the effects that adoption would have had as at 1 January 2009 (the
beginning of the reporting period used for comparative purposes) and attributing the effects to
components of equity.
However, should it be impracticable to apply the interpretation retrospectively, paragraph 30 of
IFRIC 12 allows the operator, at the above date of 1 January 2009, to alternatively apply the
interpretation prospectively and:
a) identify and recognise the financial assets and intangible assets that existed at that date;
b) use the previous carrying amounts of those financial and intangible assets (however
previously classified) as their carrying amounts under IFRIC 12 as at that date;
c) test the financial and intangible assets recognised at that date for impairment.
Retrospective application was adopted for the concession arrangements entered into by the
subsidiaries, Autostrade per l’Italia SpA, Società Autostrada Tirrenica pA, Autostrada Torino -
Savona SpA, Stalexport Autostrada Malopolska SA and Sociedad Concesionaria de Los Lagos SA.
Given the significant difficulties in reconstructing the related historical data, due to the peculiar
characteristics of the respective concessions and their development over time, prospective
application was adopted in the case of the subsidiaries, Strada dei Parchi SpA, Società Italiana per
azioni per il Traforo del Monte Bianco, Raccordo Autostradale Valle d’Aosta SpA, Tangenziale di
Napoli SpA, Autostrade Meridionali SpA and Port Mobility SpA.
In the case of Autostrade per l’Italia SpA, Società Autostrada Tirrenica pA and Autostrada Torino -
Savona SpA, retrospective application regarded the period after 28 February 2003, the date of the
business combination that resulted in the Parent 's acquisition of control of the Group companies
and in respect of which, on transition to IFRS, the Group elected to apply the option granted by
IFRS 1 and not restate this transaction in accordance with IFRS 3.
With reference to Stalexport Autostrada Malopolska SA and Sociedad Concesionaria de Los Lagos
SA, and to the investment in associates and joint ventures held through Autostrade Sud America
Srl, retrospective application of IFRIC 12 has involved reassessment of the effects of the business
combinations that resulted in the acquisition of the investments in these companies (dated 30 June
2007 and 30 June 2009, respectively).

183
4.2.3 Presentation of the impact of adoption of the interpretation on the income
statement and statement of financial position
In order to show the impact of IFRIC 12 adoption, this section includes a number of accounting
schedules reconciling statement of financial position and income statement components pre- and
post-application of IFRIC 12. These are:
a) the reconciliation of consolidated equity as at 1 January and 31 December 2009 and
consolidated profit for 2009;
b) the comparative consolidated statements of financial position as at 1 January 2009 and 31
December 2009;
c) the comparative consolidated income statements and statements of cash flows for 2009.
Application of the interpretation required the Group to restate and adapt a number of components
of the (statutory and reclassified) consolidated financial statements and, consequently, the results
of operations, financial position and cash flows presented.
4.2.4 Key elements in the accounting presentation of IFRIC 12 by the Atlantia Group
On the basis of the concession arrangements falling within the scope of application of IFRIC 12,
the operator provides the following services: (i) construction and/or upgrade of the infrastructure
used in supplying the public service; and (ii) management and maintenance of the infrastructure
for a fixed period of time. Due to the fact that the construction and upgrade of infrastructure is
analogous with the operations of a construction company, construction costs and revenue, during
the period of providing these services, are recognised in profit or loss in accordance with IAS 11.
As indicated in IFRIC 12, in return for the construction and/or upgrade services provided by the
operator, the grantor gives the operator a consideration to be recognised at fair value. This
consideration may be rights to:
a) a financial asset (the financial asset model), or
b) an intangible asset (the intangible asset model).
The financial asset model is applied to the extent that the operator has an unconditional
contractual right to receive contractually guaranteed cash payments for the construction services
rendered, regardless of the extent to which the public uses the service.
Under the intangible asset model, on the other hand, in return for the construction and/or
upgrade services provided, the operator receives the right to charge users of the public service.
Therefore, the cash received by the operator is not guaranteed by the grantor, but is contingent on
the extent to which the public uses the service, thus resulting in the operator’s exposure to demand
risk. This is the risk that cash flows generated by the right to charge users of the public service will
not be sufficient to recover the operator’s investment.
If the operator is paid for the construction and upgrade services partly by a financial asset and
partly by an intangible asset, a mixture of the two models is used. In this case, it is necessary to

184
account separately for the financial asset and intangible asset components of the consideration. In
this case, IFRIC 12 requires the operator to first calculate the financial asset component and then
the intangible asset for the remainder (with respect to the value of the construction and/or upgrade
services rendered).
The intangible asset model is applicable to a number of concession arrangements to which Atlantia
Group companies are party, whilst the mixed model (where the financial asset and intangible asset
models apply to the same concession arrangement) is applicable to others.
In cases where the intangible asset model applies, the arrangements include:
a) arrangements involving the construction of infrastructure;
b) arrangements involving the management of existing infrastructure and specific obligations
to extend or upgrade it, in return for which the operator does not receive additional
economic benefits;
c) arrangements involving the management of existing infrastructure and its extension or
upgrade, in return for which the operator receives additional economic benefits.
On the other hand, in cases in which the operator receives the right to a financial asset in return
for the construction and/or upgrade services provided, this asset is represented by:
a) a right to receive a fixed amount in the form of a grant to cover the costs incurred for the
construction of the works, and/or
b) a right to receive a fixed amount in the form of guaranteed minimum toll revenue.
If, however, the grantor awards the operator a “takeover right” at the end of the concession term,
this right qualifies as a financial asset only if payment for this right to the outgoing operator is no
longer subject to demand risk. In other cases, the estimated amount of the “takeover right”
represents the residual value of the intangible asset recognised under IFRIC 12, not subject to
amortisation.
4.2.5 Summary of the main components of the financial statements impacted by IFRIC 12 or presented for the
first time
Based on the above, the main effects of IFRIC 12 adoption on the statement of financial position in
the Atlantia Group’s consolidated financial statements regard:
a) property, plant and equipment: as a result of elimination of assets to be handed over,
previously accounted for in proprietary assets;
b) intangible assets: following recognition of the concession rights accruing from construction
and/or upgrade services, to be recovered via the receipt of payment for use of the public
service, to the extent of the portion not guaranteed by the grantor. These concession rights,
recognised less accumulated amortisation to date, are attributable to the following
categories:

185
1) rights acquired from third parties, if costs have been incurred to acquire concessions
from the grantor or from third parties (the latter relating to the acquisition of
companies that hold a concession);
2) rights accrued in return for the commitment to provide construction services for which
the operator does not receive additional economic benefits. These rights are initially
recognised at the present fair value of the construction services to be provided in future
(excluding any financial expenses incurred during the construction period), with a
contra entry of an equal amount in “provisions for construction services required by
contract”; in addition to the impact of amortisation, the initial value of the rights
changes over time as a result of periodic reassessment of the present fair value of the
part of the construction services still to be rendered to date;
3) rights accrued in return for construction services rendered (measured at fair value,
including any financial expenses incurred during the construction period) for which
the operator receives additional economic benefits, represented by specific tariff
increases and/or significant increases in the number of expected users from realization
of the infrastructure increases;
4) rights accruing from construction work carried out by service area operators,
represented by investments carried out by these entities and to be handed over free of
charge to motorway operators.
In accordance with IAS 38, the above intangible assets are amortised over the related
concession terms, on a basis that reflects the manner in which the economic benefits of the
activity flow to the entity. For this purpose, the rates of amortisation are calculated taking
account of expected changes in traffic over the concession term, if significant. Concession
rights are amortised from the accounting period in which they commence generating
economic benefits;
c) financial assets and liabilities: in terms of financial assets, the following receivables have
been recognised:
1) the “takeover rights” to be unconditionally paid by new operators;
2) the present value of the minimum toll charges guaranteed by the grantor;
3) the amounts payable by public entities as grants related to construction services.
Financial liabilities have been adjusted on the basis of the accounting models described
above, applying certain reclassifications;
d) provisions for construction services required by contract: in arrangements involving the
management of existing infrastructure and specific obligations to extend or upgrade it, in
return for which the operator does not receive additional economic benefits, the obligation
to provide future construction services is deemed to be part of the consideration deriving
from the arrangement. As previously described, in this case the operator initially recognises
a liability equal to the present fair value of the construction services to be rendered in
future, with a contra entry for the concession rights recognised in intangible assets.
186
Measurement of this liability is periodically reassessed and changes to the measurement of
the liabilities for the residual obligation (such as, for example, changes to the estimated
cash outflows necessary to extinguish the obligation, a change in the discount rate or a
change in the construction period) are recognised as a matching increase or reduction in
the corresponding intangible asset;
e) provisions: as a result of the new models used to account for concession arrangements,
provisions for repair and mantainance obligations, representing the contractual obligation
to maintain and replace infrastructure in order to ensure that it is in good working
condition, have been adjusted. This is because operators, under IFRIC 12, are not required
to replace proprietary assets (for which the accounting treatment would have been the
disposal of the asset replaced and recognition of a new asset), but rather have an obligation
to the grantor to maintain infrastructure in good working condition;
f) other liabilities: deferred income relating to the portion of toll revenue collected as a result
of tariff increases applied on the basis of investments not yet completed by Autostrade per
l’Italia (the so-called “X investments”) has been eliminated given that, following IFRIC 12
adoption, these tariff increases are received in connection with the provision of specific
construction services giving rise to additional economic benefits. As mentioned above,
these are recognised as a specific form of concession right, which is amortised from the date
on which the rights begin to produce the related economic benefits.
The most significant effects on components of the Atlantia Group’s consolidated income
statement, in addition to those previously described and regarding the absence of depreciation of
property, plant and equipment to be handed over (no longer recognised), recognition of the
amortisation of concession rights and changes to net provisions regard:
a) toll revenue: i) the minimum guaranteed portion of which receivable from the Grantor and
the financial income accrued on amounts to be received in future accounting periods are
lower than the pre IFRIC accounting model; whereas ii) revenue on toll rate increases
received for construction services and/or the upgrading of works not yet in completed
increased due to their immediate recognition whilst prior to IFRIC 12 they were treated as
deferred income until the works entered service;
b) construction service revenue and costs: the costs incurred in the execution of construction
services for which additional economic benefits are received are recognised in profit or loss
based on the stage of completion. Construction and/or upgrade service revenue represents
the consideration receivable by the operator for the services provided and is measured at
fair value, calculated on the basis of the total construction costs incurred. These primarily
consist of the costs of materials and external services, the cost of internal staff used to
provide the services, and attributable financial expenses (the latter only in the case of
construction and/or upgrade services for which the operator receives additional economic
benefits). These costs are classified in profit or loss by nature. Solely in the case of
187
construction services for which no additional economic benefits are received, the related
costs are, in addition to grants recognised in construction service revenue, also offset by use
of the provisions for construction services required by contract, which is allocated with a
positive balance to a specific component of operating costs;
c) financial income and expenses: compared with the pre-IFRIC 12 accounting model,
financial income and expenses are adjusted for:
1) expenses accruing during the period on the discounting of provisions and for
construction services required by contract;
2) financial expenses relating to construction services for which the operator does not
receive additional economic benefits, which are no longer capitalised under assets;
3) financial income accruing on financial assets recognised on the basis of the present value
of minimum toll revenue guaranteed by the grantor.
In accordance with IAS 12, the tax effects of the impact of first-time adoption of IFRIC 12,
determined applying the above criteria, have been calculated, resulting in recognition of deferred
tax assets and liabilities.

188
4.3 Reconciliation of consolidated equity as at 1 January and 31 December 2009 and consolidated profit for 2009
The following paragraphs present and comment the reconciliations of equity at the beginning and
end of 2009 and the profit/(loss) for 2009 before and after IFRIC 12 adoption, showing the
nature of the adjustments and reclassifications made on adoption of the accounting interpretation.
4.3.1 Impact on the consolidated statement of financial position
a) Property, plant and equipment:
for the reasons described above, the item “assets to be handed over”, included in property,
plant and equipment in the pre-IFRIC 12 statement of financial position, has been
derecognised. The derecognised amounts total €8,971,354 thousand as at 1 January 2009
and €9,845,041 thousand as at 31 December 2009.
(€000)
Amounts attributable to owners of the parent, before IFRIC 12 adoption 3,615,483 3,865,202
Amounts attributable to non-controlling interests, before IFRIC 12 adoption 370,609 390,261
Amounts before IFRIC 12 adoption 3,986,092 4,255,463
IFRIC 12 adjustments, before taxation -1,397,079 -1,563,084
Elimination of property, plant and equipment to be handed over -8,971,354 -9,845,041
Adjustment of intangible assets - Concession rights acquired from third parties 682,884 639,992
Recognition of intangible assets - Concession rights accruing from construction services for which no additional economic benefits are received 8,962,533 9,380,460
Recognition of intangible assets - Concession rights accruing from construction services for which additional economic benefits are received 1,868,783 2,089,042
Recognition of intangible assets - Concession rights accruing from construction services provided by sub-operators 43,946 74,760
Recognition of financial assets - Takeover rights 146,626 235,675
Recognition of financial assets - Guaranteed minimum revenues 0 66,639
Recognition of financial assets - Government grants related to construction services 234,882 268,362
Adjustment of financial liabilities - Government grants related to construction services 37,948 41,442
Recognition of provisions for construction services required by contract - Construction services for which no additional economic benefits are received -4,798,942 -4,966,046
Adjustment of provisions for repair and replacement obligations 277,105 306,461
Elimination of deferred income 45,860 70,591
Adjustment of carrying amounts of investments accounted for using the equity method 28,152 44,432
Other minor adjustments and reclassifications from other components of the financial position 44,498 30,147
Tax effect of IFRIC 12 adjustments 448,038 504,831
Amounts after IFRIC 12 adoption 3,037,051 3,197,210
Amounts attributable to owners of the parent, after IFRIC 12 adoption 2,677,790 2,810,815
Amounts attributable to non-controlling interests, after IFRIC 12 adoption 359,261 386,395
Total difference -949,041 -1,058,253
attributable to owners of the parent -937,693 -1,054,387
attributable to non-controlling interests -11,348 -3,866
% difference -23.8% -24.9%
Equity 1 January 2009
Equity 31 December 2009
189
A part of the assets to be handed over, relating to the motorway infrastructure acquired
from the grantor in previous financial years by the subsidiary, Strada dei Parchi, has been
reclassified to intangible assets, as concession rights acquired from third parties. A smaller
part of assets to be handed over, relating to prepayments made to suppliers for the
construction of motorway infrastructure, has been reclassified to trading assets, in current
assets.
b) Intangible assets:
the restatement and recognition of concession rights, less accumulated amortisation to
date, is attributable to the following categories:
1) concession rights acquired from third parties, the value of which has been adjusted
by €682,884 thousand as at 1 January 2009 and €639,992 thousand as at 31
December 2009, following the above reclassification of the cost of acquiring its
concession incurred by the subsidiary, Strada dei Parchi, in addition to adjustment
of the value of the concession rights held by the Polish operator, Stalexport
Autostrada Malopolska and, solely as at 31 December 2009, by the Chilean
operator, Sociedad Concesionaria de Los Lagos, both included in the consolidated
financial statements following the business combination by which control of the
companies was obtained;
2) rights accruing from construction services for which no additional economic
benefits are received, amounting to €8,962,533 thousand as at 1 January 2009 and
€9,380,460 thousand as at 31 December 2009, essentially regarding Autostrade
per l’Italia’s investment commitments under the Agreement of 1997, as confirmed
in the Single Concession Arrangement of 2007, the most significant of which
regards widening of the Florence – Bologna section. The increase in the figure at
the end of 2009, compared with the figure at the beginning of the year, primarily
reflects adjustment of the present value of investments through to completion (up
€739,949 thousand), partially offset by the recognition of amortisation for the year
(€299,024 thousand);
3) rights accruing from the commitment to provide construction services for which
additional economic benefits are received, amounting to €1,868,783 thousand as at
1 January 2009 and €2,089,042 thousand as at 31 December 2009, the increase in
which primarily derives from investments carried out during the year (€352,291
thousand), less accrued amortisation (€77,239 thousand) and the reclassification of
the investment in works generating additional economic benefits constructed by
Autostrade Meridionali to financial assets: takeover rights;
4) rights accruing from construction services provided by service area operators (sub-
operators), amounting to €43,946 thousand as at 1 January 2009 and €74,760
thousand as at 31 December 2009; the increase of €30,814 thousand derives from
190
recognition of the appraisal value of buildings handed over free of charge in 2009
(€33,396 thousand), less amortisation for the year (€2,582 thousand).
c) Financial assets – takeover rights:
financial assets of €146,626 thousand have been recognised as at 1 January 2009 and
€235,675 thousand as at 31 December 2009, representing the takeover right to be awarded
to the subsidiary, Autostrade Meridionali, at the end of the related concession term.
d) Financial assets – guaranteed minimums:
financial assets of €66,639 thousand as at 31 December 2009 have been recognised in
relation to the right of the Chilean operator, Sociedad Concesionaria de Los Lagos, which
has been consolidated from the second half of 2009, to receive a fixed payment from the
grantor in the form of guaranteed minimum toll revenue.
e) Financial assets and liabilities – government grants related to construction services:
receivables relating to grants payable by grantors or other public entities in relation to
investments carried out to date amount to €234,882 thousand as at 1 January 2009 and
€268,362 thousand as at 31 December 2009.
In application of the new accounting model adopted, a part of the financial debt payable by
Autostrade per l’Italia to ANAS (deriving from the grantor’s repayment of loans obtained
by the operator to finance specific construction work) has been reclassified as a reduction
in financial assets. This has resulted in reductions in these liabilities of €37,948 thousand
as at 1 January 2009 and a €41,442 thousand as at 31 December 2009.
f) Provisions for construction services required by contract:
as previously noted, provisions have been recognised in relation to the obligation to
provide future construction and/or upgrade services for which no additional economic
benefits are received. Measurement of this liability (€4,798,942 thousand as at 1 January
2009 and €4,966,046 thousand as at 31 December 2009) was, in compliance with IAS 37,
based on the best estimate of the present value of the construction services expected to be
provided in the future in order to fulfil the commitments given to grantors to provide
construction and/or upgrade services.
g) Provisions for repair and maintenance obligations:
these provisions are made to cover the obligation to maintain the infrastructure operated
under concession in good working condition and, in accordance with the accounting model
adopted, the provisions for the repair and replacement of assets to be handed over have
been accordingly reassessed, based on the best estimate of the present value of the future
cost of restoring the infrastructure. This has resulted in reductions in provisions of
€277,105 thousand as at 1 January 2009 and €306,461 thousand as at 31 December 2009.
h) Other liabilities:
deferred income relating to the portion of toll revenue collected as a result of tariff
increases applied on the basis of investments not yet completed by Autostrade per l’Italia
(the so-called “X investments”) has been eliminated in full, resulting in reductions in

191
liabilities of €45,860 thousand as at 1 January 2009 and €70,591 thousand as at 31
December 2009.
i) Investments:
the carrying amounts of investments accounted for using the equity method, and to which
IFRIC 12 is applicable, have been adjusted to reflect the accounting effects of application of
IFRIC 12 to the related components of the financial statements. This has resulted in
increases in the value of these investments of €28,152 thousand as at 1 January 2009 and
€44,432 thousand as at 31 December 2009, essentially reflecting increases in the value of
the Group’s investments in the Chilean operators held, in that period, by Autostrade Sud
America and Autostrade per il Cile.
j) Other adjustments and reclassifications of sundry components of the financial position:
this item primarily includes the impact of reclassifications of a number of items referred to
above to other components of asset and liabilities, the most significant of which were
trading assets, prepayments to suppliers for the construction of assets to be handed over.
k) Tax effects:
following the above adjustments, the Group recognised deferred tax assets and liabilities,
resulting in net assets of €448,038 thousand as at 1 January 2009 and €504,831 thousand
as at 31 December 2009.
Finally, the following reclassifications were made due to the first time adoption of IFRIC 12 and
ensure the propriety of the balances affected, without impacts on equity attributable to the owners
of the parent and to non controlling interest:
a) amounts due from and to the operators of interconnected motorway networks have been
reclassified from other current assets and liabilities to trading assets ( €16,545 thousand as
at 1 January 2009 and €18,046 thousand as at 31 December 2009) and trading liabilities
(€371,851 thousand as at 1 January 2009 and €420,433 thousand as at 31 December
2009), respectively, to provide a more accurate presentation of the related amounts;
b) concession fees payable to the grantor have been reclassified from trade liabilities to other
current liabilities (€46,988 thousand as at 1 January 2009 and €60,151 thousand as at 31
December 2009).

192
4.3.2 Impact on the consolidated income statement
The most significant effects of IFRIC 12 adoption on the consolidated income statement for 2009
regard:
a) the increase in toll revenue, due to the derecognition of deferred income relating to tariff
increases applied on the basis of investments not yet completed by Autostrade per l’Italia
(the so-called “X investments”), amounting to €24,731 thousand, partly offset by the
reduction in Sociedad Concesionaria de Los Lagos’s toll revenue, compensated for by the
financial income recognised as a result of the guaranteed minimum (down €4,148
thousand);
b) elimination of depreciation of property, plant and equipment to be handed over,
amounting to €348,734 thousand;
c) the recognition of amortisation of concession rights, totalling €412,828 thousand,
attributable to (i) the adjustment of amortisation of rights acquired from third parties
(€33,983 thousand), and (ii) the recognition of amortisation of rights accruing from
(€000)
Amounts attributable to owners of the parent, before IFRIC 12 adoption 690,672
Amounts attributable to non-controlling interests, before IFRIC 12 adoption -8,285
Amounts before IFRIC 12 adoption 682,387
IFRIC 12 adjustments, before taxation -184,964
Elimination of deferred income 24,731
Adjustment of toll revenues for operators with guaranteed minimum revenues -4,148
Adjustments to other operating income/(costs) -13,875
Elimination of depreciation of property, plant and equipment to be handed over 348,734
Adjustment of amortisation of intangible assets - Concession rights acquired from third parties -33,983
Recognition of amortisation of intangible assets - Concession rights accruing from construction services for which no additional economic benefits are received -299,024
Recognition of amortisation of intangible assets - Concession rights accruing from construction services for which additional economic benefits are received -77,239
Recognition of amortisation of intangible assets - Concession rights accruing from construction services provided by sub-operators -2,582
Adjustment of impairments of intangible assets - Concession rights acquired from third parties 26,136
Adjustment of provisions for repair and replacement obligations 63,296
Adjustment of financial income - Guaranteed minimum revenues and government grants 5,508
Adjustment of financial expenses from discounting to present value of provisions and for construction services required by contract -184,065
Adjustment of capitalised financial expenses -44,063
Adjustment of share of profit/(loss) of investee companies accounted for using the equity method 5,610
Tax effect of IFRIC 12 adjustments 64,041
Amounts after IFRIC 12 adoption 561,464
Amounts attributable to owners of the parent, after IFRIC 12 adoption 562,539
Amounts attributable to non-controlling interests, after IFRIC 12 adoption -1,075
Total difference -120,923
attributable to owners of the parent -128,133
attributable to non-controlling interests 7,210
Percentage change -17.7%
Profit/(Loss) for 2009
193
construction services for which no additional economic benefits are received (€299,024
thousand), rights accruing from construction services for which additional economic
benefits are received (€77,239 thousand), and rights accruing from construction services
provided by service area operators (€2,582 thousand);
d) the reduction (€26,136 thousand) in the impairment loss on the concession right held by
the Polish operator, Stalexport Autostrada Malopolska, recognised at the end of 2009
(amounting to €42,547 thousand) and calculated on the basis of the present value of
expected future cash flows generated through to expiry of the related concession term
(March 2027), in application of impairment testing; the reduction of the impairment
reflects the difference in the carrying amount of the concession right before the
impairment loss as a result of the impact of IFRIC 12 adoption on the financial statements
of Stalexport Autostrada Malopolska;
e) the reduction in provisions for the repair and replacement of assets to be handed over,
totalling, €63,296 thousand;
f) the portion of financial expenses from the discounting of provisions and of provisions for
construction services required by contract, totalling €184,065 thousand;
g) the reduction in capitalised financial expenses (down €44,063 thousand), which may no
longer be recognised in respect of construction services for which no additional economic
benefits are received, essentially referring to Autostrade per l’Italia.
After deferred taxation on the above effects (resulting in the recognition of a €64,041 thousand
increase in net deferred tax assets), profit for 2009 is down €120,923 thousand.
4.3.3 Impact on the consolidated statement of cash flows
The impact of IFRIC 12 on the statement of cash flows for 2009 was a reduction in cash flows from
operating activities of €58,527 thousand, substantially corresponding to a €60,840 thousand
decrease in cash flows for investing activities. This reflects reduced investments in motorway
infrastructure after IFRIC 12 adoption, compared with investments in property, plant and
equipment before IFRIC 12 adoption.
As explained above, the decrease was a result of a lower level of financial expenses capitalised as
non-current assets since they longer generated additional economic benefits, as well as the change
in the accounting treatment of prepayments to suppliers for investments in assets to be handed over
which are now recognised as trading assets and, therefore, no longer relevant to cash flows from
investing activities.

194
4.4 Comparative consolidated statements of financial position as at 1 January 2009 and 31 December 2009 and the consolidated income statement and consolidated statement of cash flows for 2009 before and after IFRIC 12 adoption
The following consolidated schedules show a comparison of consolidated amounts before IFRIC 12
adoption and the corresponding amounts restated in accordance with the interpretation, at the
dates and for the reporting period specified in the above heading.
With regard to amounts shown in the consolidated income statement, it should be noted that,
following the start of talks at the end of the first half of 2010, with a view to selling the Group’s
controlling interest in the operator, Strada dei Parchi, with an agreement having been signed for
the sale of 60% of the company's share capital, this company’s contribution to the 2010
consolidated results is accounted for in “Profit/(Loss) from discontinued operations”, in
accordance with IFRS 5 “Non-current Assets Held for Sale and Discontinued Operations”, instead
of being included in each component of the consolidated income statement referring to continuing
operations. As a result, in accordance with IFRS 5, Strada dei Parchi’s contribution to the
consolidated financial statements as at and for the year ended 31 December 2010 and to the
comparative consolidated income statement for 2009 has also been reclassified with respect to the
statements previously published in the financial statements as at and for the year ended 31
December 2009.
Therefore, the column headed “2009 Before IFRIC 12” in the comparative consolidated income
statement for 2009 also shows different amounts for the individual components of the
consolidated income statement with respect to those previously published in the annual report as at
and for the year ended 31 December 2009, in which Strada dei Parchi’s contribution to the income
statement was classified in continuing operations. Despite this, profit attributable to owners of the
parent and profit attributable to non-controlling interests reported in the comparative
consolidated income statement for 2009 are the same as the previously published amounts.
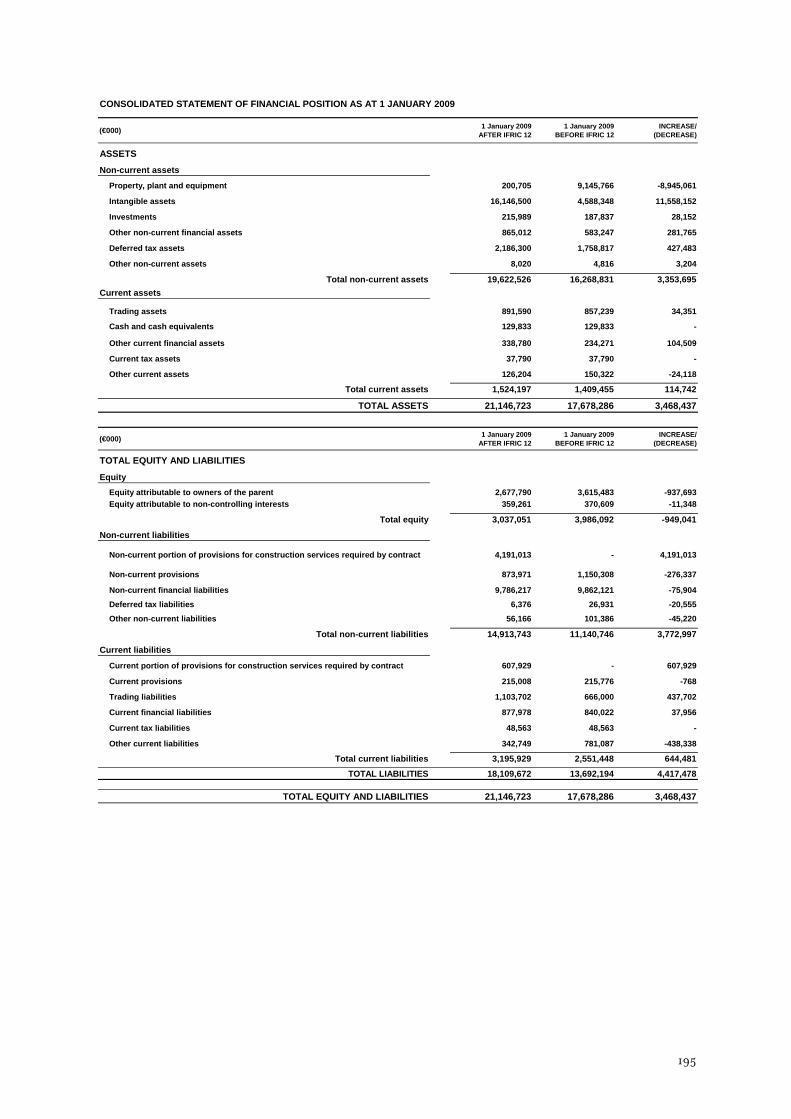
195
(€000) 1 January 2009AFTER IFRIC 12
1 January 2009 BEFORE IFRIC 12
INCREASE/ (DECREASE)
ASSETS
Non-current assets
Property, plant and equipment 200,705 9,145,766 -8,945,061
Intangible assets 16,146,500 4,588,348 11,558,152
Investments 215,989 187,837 28,152
Other non-current financial assets 865,012 583,247 281,765
Deferred tax assets 2,186,300 1,758,817 427,483
Other non-current assets 8,020 4,816 3,204
Total non-current assets 19,622,526 16,268,831 3,353,695Current assets
Trading assets 891,590 857,239 34,351
Cash and cash equivalents 129,833 129,833 -
Other current financial assets 338,780 234,271 104,509
Current tax assets 37,790 37,790 -
Other current assets 126,204 150,322 -24,118
Total current assets 1,524,197 1,409,455 114,742
TOTAL ASSETS 21,146,723 17,678,286 3,468,437
(€000) 1 January 2009AFTER IFRIC 12
1 January 2009 BEFORE IFRIC 12
INCREASE/ (DECREASE)
EquityEquity attributable to owners of the parent 2,677,790 3,615,483 -937,693Equity attributable to non-controlling interests 359,261 370,609 -11,348
Total equity 3,037,051 3,986,092 -949,041
Non-current liabilities
Non-current portion of provisions for construction services required by contract 4,191,013 - 4,191,013
Non-current provisions 873,971 1,150,308 -276,337
Non-current financial liabilities 9,786,217 9,862,121 -75,904
Deferred tax liabilities 6,376 26,931 -20,555
Other non-current liabilities 56,166 101,386 -45,220
Total non-current liabilities 14,913,743 11,140,746 3,772,997
Current liabilities
Current portion of provisions for construction services required by contract 607,929 - 607,929
Current provisions 215,008 215,776 -768
Trading liabilities 1,103,702 666,000 437,702
Current financial liabilities 877,978 840,022 37,956
Current tax liabilities 48,563 48,563 -
Other current liabilities 342,749 781,087 -438,338
Total current liabilities 3,195,929 2,551,448 644,481
TOTAL LIABILITIES 18,109,672 13,692,194 4,417,478
TOTAL EQUITY AND LIABILITIES 21,146,723 17,678,286 3,468,437
CONSOLIDATED STATEMENT OF FINANCIAL POSITION AS AT 1 JANUARY 2009
TOTAL EQUITY AND LIABILITIES
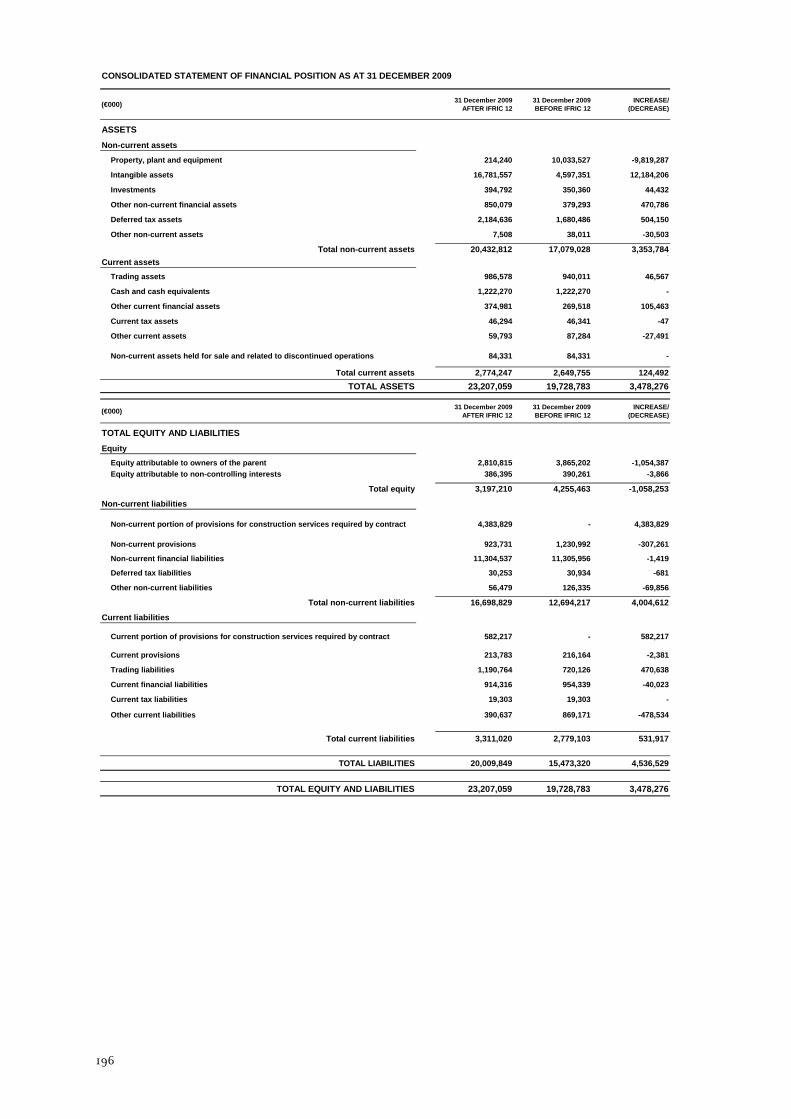
196
(€000) 31 December 2009AFTER IFRIC 12
31 December 2009 BEFORE IFRIC 12
INCREASE/ (DECREASE)
ASSETS
Non-current assets
Property, plant and equipment 214,240 10,033,527 -9,819,287
Intangible assets 16,781,557 4,597,351 12,184,206
Investments 394,792 350,360 44,432
Other non-current financial assets 850,079 379,293 470,786
Deferred tax assets 2,184,636 1,680,486 504,150
Other non-current assets 7,508 38,011 -30,503
Total non-current assets 20,432,812 17,079,028 3,353,784-
Current assetsTrading assets 986,578 940,011 46,567
Cash and cash equivalents 1,222,270 1,222,270 -
Other current financial assets 374,981 269,518 105,463
Current tax assets 46,294 46,341 -47
Other current assets 59,793 87,284 -27,491
Non-current assets held for sale and related to discontinued operations 84,331 84,331 -
Total current assets 2,774,247 2,649,755 124,492-
TOTAL ASSETS 23,207,059 19,728,783 3,478,276
(€000) 31 December 2009AFTER IFRIC 12
31 December 2009 BEFORE IFRIC 12
INCREASE/ (DECREASE)
EquityEquity attributable to owners of the parent 2,810,815 3,865,202 -1,054,387Equity attributable to non-controlling interests 386,395 390,261 -3,866
Total equity 3,197,210 4,255,463 -1,058,253
Non-current liabilities
Non-current portion of provisions for construction services required by contract 4,383,829 - 4,383,829
Non-current provisions 923,731 1,230,992 -307,261
Non-current financial liabilities 11,304,537 11,305,956 -1,419
Deferred tax liabilities 30,253 30,934 -681
Other non-current liabilities 56,479 126,335 -69,856
Total non-current liabilities 16,698,829 12,694,217 4,004,612
Current liabilities
Current portion of provisions for construction services required by contract 582,217 - 582,217
Current provisions 213,783 216,164 -2,381
Trading liabilities 1,190,764 720,126 470,638
Current financial liabilities 914,316 954,339 -40,023
Current tax liabilities 19,303 19,303 -
Other current liabilities 390,637 869,171 -478,534
Total current liabilities 3,311,020 2,779,103 531,917
TOTAL LIABILITIES 20,009,849 15,473,320 4,536,529
TOTAL EQUITY AND LIABILITIES 23,207,059 19,728,783 3,478,276
TOTAL EQUITY AND LIABILITIES
CONSOLIDATED STATEMENT OF FINANCIAL POSITION AS AT 31 DECEMBER 2009

197
(€000) 2009 AFTER IFRIC 12
2009 BEFORE IFRIC 12
INCREASE/ (DECREASE)
REVENUEToll revenue 2,845,195 2,824,612 20,583Revenue from construction services 455,362 - 455,362Contract revenue 50,225 50,225 -Other operating income 559,514 595,214 -35,700
-TOTAL REVENUE 3,910,296 3,470,051 440,245
COSTSRaw and consumable materials -244,036 -133,716 -110,320
Purchases of materials -232,131 -162,556 -69,575Change in inventories of raw and consumable materials and goods -11,905 -11,905 -Capitalised cost of materials - 40,745 -40,745
Service costs -1,373,060 -411,517 -961,543Service costs -1,373,060 -554,154 -818,906Capitalised service costs - 142,637 -142,637
Gain/(loss) on sale of property, plant and equipment 64 331 -267Net personnel expense -614,168 -572,345 -41,823
Net personnel expense -614,168 -614,178 10Capitalised personnel expense - 41,833 -41,833
Other operating costs -285,578 -318,018 32,440Concession fees -158,138 -158,138 -Lease expense -17,952 -17,580 -372Change in provisions for the repair and replacement of assets to be relinquished -32,021 -94,774 62,753Other provisions -4,100 -4,100 -Other operating costs -73,367 -46,234 -27,133Other capitalised operating costs - 2,808 -2,808
Use of provisions for construction services required by contract 716,610 - 716,610Amortisation and depreciation -443,507 -379,413 -64,094
Depreciation of assets to be relinquished - -304,230 304,230Depreciation of property, plant and equipment -45,580 -42,450 -3,130Depreciation of property, plant and equipment held under finance leases -220 -220 -Depreciation of investment property -71 -71 -Amortisation of intangible assets deriving from concession rights -374,014 - -374,014Amortisation of other intangible assets -23,622 -32,442 8,820
(Impairment losses) and reversals of impairment losses 7,581 -18,555 26,136
TOTAL COSTS -2,236,094 -1,833,233 -402,861
OPERATING PROFIT 1,674,202 1,636,818 37,384
Financial income 145,453 139,945 5,508Financial income 144,817 139,309 5,508Revaluations of financial assets 196 196 -Dividends received from investee companies 440 440 -
Net financial expenses -805,636 -571,021 -234,615Financial expenses from discounting of provisions -192,310 -8,390 -183,920Other financial expenses after government grants -613,399 -613,154 -245Capitalised financial expenses 73 50,523 -50,450
Foreign exchange gains/(losses) -246 -997 751
FINANCIAL INCOME/(EXPENSES) -660,429 -432,073 -228,356-
Share of (profit)/loss of associates and joint ventures accounted for using the equity method -51,102 -56,712 5,610
-
PROFIT BEFORE TAX FROM CONTINUING OPERATIONS 962,671 1,148,033 -185,362
Income tax (expense)/benefit -380,741 -444,910 64,169Current tax expense -372,668 -372,629 -39Differences on current tax expense for previous years 13,355 13,355 -Deferred tax income and expense -21,428 -85,636 64,208
PROFIT/(LOSS) FROM CONTINUING OPERATIONS 581,930 703,123 -121,193
Profit/(Loss) from discontinued operations/assets held for sale -20,466 -20,736 270-
PROFIT FOR THE YEAR 561,464 682,387 -120,923of which:
Profit attributable to owners of the parent 562,539 690,672 -128,133 Profit/(loss) attributable to non-controlling interests -1,075 -8,285 7,210
(€) 2009 AFTER IFRIC 12
2009 BEFORE IFRIC 12 INCREASE/ (DECREASE)
Basic earnings per share attributable to the owners of the parent (€) 0.96 1.17 -0.21 of which:from continuing operations 0.99 1.20 -0.21from discontinued operations/assets held for sale -0.03 -0.03 -
Diluted earnings per share attributable to the owners of the parent (€) 0.96 1.17 -0.21 of which:from continuing operations 0.99 1.20 -0.21from discontinued operations/assets held for sale -0.03 -0.03 -
CONSOLIDATED INCOME STATEMENT FOR THE YEAR ENDED 31 DECEMBER 2009

198
CONSOLIDATED STATEMENT OF COMPREHENSIVE INCOME FOR THE YEAR ENDED 31 DECEMBER 2009
(€000) 2009 AFTER IFRIC 12
2009BEFORE IFRIC
12
INCREASE/ (DECREASE)
Profit for the year (A) 561,464 682,387 -120,923
Fair value gains/(losses) on cash flow hedges -50,087 -50,087 -
Gains/(losses) from actuarial valuations (IAS 19) 4,815 4,815 -
Translation gains on financial statements with functional currencies other than the euro 1,686 618 1,068
Gains/(losses) from measurement of associates and joint ventures using the equity method 22,437 11,794 10,643
Other fair value gains/(losses) -466 -466 -
Other comprehensive income for the year after related taxation (B) -21,615 -33,326 11,711
of which: discontinued operations 260 260 -
Comprehensive income for the year (A+B) 539,849 649,061 -109,212
Of which attributable to owners of the parent 539,172 655,866 -116,694
Of which attributable to non-controlling interests 677 -6,805 7,482
(€000) 2009 AFTER IFRIC 12
2009 BEFORE IFRIC 12
INCREASE/ (DECREASE)
CASH FLOWS FROM (USED IN) OPERATING ACTIVITIESProfit for the year 561,464 682,387 -120,923Adjusted by:Amortisation and depreciation 488,656 424,562 64,094Provisions 47,259 97,749 -50,490Financial expenses from discounting of provisions 192,936 8,872 184,064Share of (profit)/loss of associates and joint ventures accounted for using the 51,104 56,712 -5,608Impairment losses/(Reversal of impairment losses) and adjustments of other non-current assets
-13,748 10,386 -24,134
(Gain)/Loss on sale of non-current assets -3,695 -1,138 -2,557Net change in deferred tax (assets)/liabilities 16,573 80,362 -63,789Other non-cash costs (income) -57,554 -32,823 -24,731Change in working capital and other changes 34,256 48,709 -14,453Net cash from/(used in) operating activities [a] 1,317,251 1,375,778 -58,527CASH FLOWS FROM (USED IN) INVESTING ACTIVITIESInvestments in motorways infrastructure -1,188,325 - -1,188,325Government grants related to motorway infrastructure 136,424 - 136,424Increase in financial assets deriving from takeover rights (related to investments in motorway infrastructure)
89,049 - 89,049
Purchases of property, plant & equipment -61,832 -1,313,319 1,251,487Purchases of intangible assets -24,455 -24,455 -Change in government grants relating to property, plant & equipment and other intangible assets
- 241,552 -241,552
Purchase of investments, net of unpaid called-up issued capital -91,576 -91,576 -Purchase of new consolidated investments, net of cash acquired -220,492 -220,492 -Proceeds from sales of property, plant and equipment, intangible assets and unconsolidated investments
12,017 12,017 -
Proceeds form sales of consolidated investments net of cash and cash equivalents 1,290 1,290 -Net change in other non-current assets 512 -4,639 5,151Net change in current and non-current financial assets not held for trading 185,365 176,759 8,606Net cash from/(used in) investing activities [b] -1,162,023 -1,222,863 60,840CASH FLOWS FROM (USED IN) FINANCING ACTIVITIESDividends paid -420,218 -420,218 -Net change in the currency translation reserve and other reserves 931 133 798Net change in issued capital and reserves attributable to non-controlling interests 28,008 28,008 -Issuance of bonds 1,642,240 1,650,195 -7,955Increase in medium/long term borrowings (excluding finance lease liabilities) 8,004 13,771 -5,767Increase in finance lease liabilities 1,353 1,266 87Repayments of medium/long term borrowings (excluding finance lease liabilities) -138,092 -138,092 -Payment of finance lease liabilities -780 -780 -Net change in other current and non-current financial liabilities -136,859 -147,383 10,524Net cash from/(used in) financing activities [c] 984,587 986,900 -2,313Net effect of foreign exchange rate movements on net cash and cash equivalents 422 422 -Increase/(decrease) in cash and cash equivalents [a+b+c+d] 1,140,237 1,140,237 -
Net cash and cash equivalents at beginning of year 39,590 39,590 -
Net cash and cash equivalents at end of year 1,179,827 1,179,827 -
CONSOLIDATED STATEMENT OF CASH FLOWS FOR THE YEAR ENDED 31 DECEMBER 2009

199
5. CONCESSION ARRANGEMENTS The Group’s core business is the operation of motorways under concessions in Italy and overseas,
under which the Group’s operators are responsible for the construction and operation of
motorways. The following key information is provided as required by SIC 29 with respect to
concession arrangements pertinent to consolidated Group companies.
Very briefly, these concessions give the operators, on the one hand, the right to retain tolls
collected from motorway users less, in some cases, a minimum guaranteed value payable by the
grantor, with such tolls being revised annually based on a toll formula contained in the concessions
while, on the other hand, requiring the operators to paid the concession fees, perform works and
to maintain and operate roads under such concessions.
At the end of the concession period, the concessions are not automatically renewed but rather
publicly re-tendered in accordance with law as may be in force from time to time. For that reason,
all motorway construction by the operator during the period (the so-called assets to be handed
over) must be handed over free of charge and in a good state of repair, except for those concessions
requiring payment by the replacement operator of the residual carrying amount of assets handed
over.
Further to the situation reported in the consolidated financial statements for 2009, the process was
completed in 2010 that will render effective the single concession arrangements signed by the
subsidiaries, Autostrada Tirrenica, Autostrade Meridionali, Tangenziale di Napoli, Strada dei
Parchi, Autostrada Torino-Savona and Raccordo Autostradale Valle d’Aosta.
CIPE provided its conditional consent on 13 May with respect to concession arrangements signed
in 2009 by ANAS with certain motorway companies including Società Autostrada Tirrenica, Strada
dei Parchi, Autostrada Torino–Savona and Raccordo Autostradale Valle d’Aosta and also
reformulated its opinion with conditions on the Tangenziale di Napoli and Autostrade Meridionali
single arrangements. CIPE then reformulated its opinion on 22 July 2010 on Società Autostrada
Tirrenica's arrangements requiring the addition of a new finance plan, within three months of the
signature of the ratification, forecasting a replacement value of practically zero.
The CIPE resolutions containing the requirements for the Group's single concession arrangements
were published in the Official Journal in October 2010. The signature of the document ratifying
the CIPE requirements resulted in the effectiveness of the single concessions for the subsidiaries of
Autostrade per l'Italia.
Raccordo Autostradale Valle d’Aosta, Società Autostrada Tirrenica and Tangenziale di Napoli
signed the ratification on 24 November 2010, Strada dei Parchi and Autostrade Meridionali on 29
November 2010 and Autostrada Torino Savona on 22 December 2010.

200
With respect to the concession of the Chilean subsidiary Sociedad Concesionaria de Los Lagos SA,
the Grantor opted to pay the operator the amount owing pursuant to the second addendum to the
Concession. The assumption of a renewal of the concession for a maximum period of ten years in
lieu of payment has now, consequently, been dropped. The term of the concession has now,
therefore, been confirmed as 25 years from 1998 to 2023.
The following table lists the Group’s motorway operators consolidated on a line-by-line basis,
indicating the related sections as at 31 December 2010, as well as the expiry dates of concessions
currently in effect.

201
6. BASIS AND SCOPE OF CONSOLIDATION
The scope of consolidation includes the Parent Autostrade SpA and all entities over which it
exercises direct and indirect control.
Those entities are consolidated which Atlantia SpA controls because of its direct and indirect
holding of the majority of shares eligible to vote at shareholders' meetings or because it is able to
exercise an express dominant influence on the entity's financial and operating decisions and obtain
the relevant benefits independently of its percentage shareholding.
Entities are not included in the line-by-line consolidation if their operations would make them
quantitatively or qualitatively irrelevant (e.g., dormant companies, companies that are nearly
liquidated) to a true and fair view of the Group's financial position and results of operations.
All entities, over which control is exercised, are consolidated from the date on which control is
obtained. Entities are deconsolidated from the date on which the Group loses control.
For the purposes of preparing the IFRS consolidated financial statements, all consolidated
companies have, as in previous years, prepared a special “reporting package”, based on the
previously described IFRS adopted by the Group.
Operator Section of motorway Kilometres in service Expiry
A1 Milan - Naples 803.5A4 Milan – Brescia 93.5A7 Genoa – Serravalle 50A8/9 Milan – lakes 77.7A8 / A26 link road 24A10 Genoa – Savona 45.5A11 Florence – coast 81.7A12 Genoa – Sestri Levante 48.7A12 Rome – Civitavecchia 65.4A13 Bologna – Padua 127.3A14 Bologna – Taranto 781.4A16 Naples – Canosa 172.3A23 Udine – Tarvisio 101.2A26 Genoa – Gravellona Toce 244.9A27 Venice – Belluno 82.2A30 Caserta – Salerno 55.3
2,854.60 31 December 2038
Sociedad Concesionaria de Los Lagos Rio Bueno - Puerto Montt 135.0 20 September 2023
Società Autostrada Tirrenica A12 Livorno – Rosignano 36.6 31 December 2046 (*)
Stalexport Autostrada Malopolska A4 Krakow – Katowice (Poland) 61.0 15 March 2027
A24 Rome – Teramo 166.5
A25 Torano – Pescara 114.9281.4 31 December 2030
(*) The renewal of concession from 2028 to 2046 is subject to approvation by the Grantor of final plan and of the related Financial Plan's Cecina-Civitavecchia motorway with 206 km (in total 242,6 km in concession)
Autostrade per l'Italia
Società Italiana per azioni per il Traforo del Monte Bianco Mont Blanc Tunnel 5.8 31 December 2050
Autostrada Torino-Savona A6 Turin – Savona 130.9 31 December 2038
Strada dei Parchi
Raccordo Autostradale Valle d'Aosta A5 Aosta – Mont Blanc 32.3
Autostrade Meridionali A3 Naples – Salerno 51.6 31 December 2012
Tangenziale di Napoli Tangenziale di Napoli 20.2 31 December 2037
31 December 2032

202
The exchange rates used for the translation of financial statements denominated in functional
currencies other than the euro, as shown below, are those published by the Bank of Italy:
There have been no changes in the scope of consolidation as at 31 December 2010 compared with
31 December 2009. The scope of consolidation at that date included the sub-holding company,
Autostrade dell’Atlantico Srl, and the companies it had acquired or incorporated as part of the
acquisition of a number of assets from the Itinere group (as described in note 6 in the notes to the
consolidated financial statements as at and for the year ended 31 December 2009), These
companies were:
a) Autostrade Holding do Sur SA, a Chilean-registered company (a 99.99% interest);
b) Sociedad Concesionaria de Los Lagos SA, a Chilean-registered motorway operator (a wholly
owned subsidiary);
c) Autostrade Portugal SA (formerly Somague Itinere SA), a Portuguese-registered sub-holding
company (a wholly owned subsidiary of Autostrade dell’Atlantico);
d) Autostrade Concessoes e Partecipasoes Brasil Limitada (previously Itinere Brasil), a Brazilian-
registered sub-holding company (a wholly owned subsidiary of Autostrade Portugal SA).
These companies were consolidated from 30 June 2009, the date that the Group obtained control.
Their corresponding income statement items and cash flows for 2009, therefore, only relate to the
second half of 2009.
Also, note that following the opening of a negotiating process aimed at selling to a third-party
controlling interest in Strada dei Parchi, which led to the signing of an agreement for the sale of a
60% stake in the company, the contribution of the same to the 2010 consolidated financial results
is presented under "Income (loss) from discontinued operations, as required by IFRS 5"Non-
current Assets Held for Sale and Discontinued Operations ", instead of being included in each of
the Consolidated income statement items relating to continuing operations. Consequently, even in
the comparative consolidated income statement for 2009 the contribution of the Strada dei Parchi
has been reclassified, in accordance with IFRS 5, compared to that published in the annual reports
at 31 December 2009.
With reference to the data of the statement of financial position, it is stated that, again in
accordance with IFRS 5, the balances of consolidated assets and liabilities of Strada dei Parchi are
Currency31 December Average exchange
rate for year 31 December Average exchange rate for year
Euro/US Dollar 1.336 1.326 1.441 1.395Euro/Polish Zloty 3.975 3.995 4.105 4.328Euro/Chilean Peso 625.275 675.346 730.744 776.509Euro/Brazilian Real 2.218 2.331 2.511 2.621Euro/Indian Rupee 59.759 60.588 67.040 68.925
2010 2009

203
presented among the assets and liabilities related to discontinued operations, maintaining the
presentation of comparative data as at 31 December 2009 unchanged.
204
7. NOTES TO THE CONSOLIDATED STATEMENT OF FINANCIAL
POSITION
The following notes provide information on items in the consolidated statement of financial
position as at 31 December 2010. Corresponding amounts as at 31 December 2009 are shown in
brackets.
As explained in note 6, above, movements in assets in 2010 include the reclassification of certain
assets and liabilities of Strada dei Parchi as at 31 December 2010 to the specific items related to
discontinued operations. Details of the assets included in those items as at 31 December are
contained in note 7.11.
7.1 Property, plant and equipment • €216,432 thousand (€214,240
thousand)
Property, plant and equipment primarily increased in 2010 due to the combined effect of the
following movements:
a) new investments of €56,904 thousand;
b) depreciation of €50,467 thousand.
Property, plant and equipment attributable to Strada dei Parchi (amounting to €4,575 thousand)
has been reclassified to assets related to discontinued operations.
The following tables show movements in property, plant and equipment during the year, including
amounts at the beginning and end of the year.
There were no material changes during the year in the expected useful lives of these assets.
Property, plant and equipment as at 31 December 2010 are free of mortgages, liens or other
collateral guarantees of a material amount restricting use.

205

206
Investment property refers to land and buildings not used in operations and measured at cost,
amounting to €920 thousand.
The total fair value of those assets are estimated to be approximately €5 million, based on
independent appraisals and information on property markets relevant to these types of investment
properties.
7.2 Intangible assets • €16,187,581 thousand (€16,781,557 thousand)
Intangible assets recorded a net reduction of approximately €593,976 thousand in 2010, due to the
combined effect of the following changes:
a) reclassification of €950,491 thousand in assets, attributable to the subsidiary Strada dei Parchi
and primarily regarding this company’s concession rights, to assets related to discontinued
operations;
b) increases accruing from construction and/or upgrade services for which additional economic
benefits are received, totalling €582,167 thousand, including the takeover financial right
related to construction activities carried out, during the year, by Autostrade Meridionali and
reclassified under financial assets (€68,712 thousand);
c) depreciation of €455,378 thousand;
d) an increase of €202,480 thousand in concession rights accruing from construction and/or
upgrade services for which no additional economic benefits are received, with a corresponding
increase in provisions for construction services required by contract, deriving from the
updated estimate of the present value of the construction services to be provided in the future.
There were no changes during the year in the expected useful lives of intangible assets.
€11,751,981 thousand of intangible assets (€12,345,107 as at 31 December 2009) relates to
intangible concession rights, which have been categorised as follows:
1) rights obtained from third parties in consideration of payments made to the acquire
concessions from the Grantor or third parties (€201,796 thousand);
2) rights accruing from construction services for which no additional economic benefits are
received (€9,257,335 thousand);
3) rights accruing from construction services for which additional economic benefits were
received (€2,216,866 thousand);
4) rights accruing from construction work carried out by service area operators, represented
by investments carried out by these entities and handed over free of charge to Group’s
operators (€75,984 thousand).
The Group, including the company Strada dei Parchi, invested total of €1,443,370 thousand in
motorway infrastructure in 2010 (€1,188,325 thousand in 2009). In application of IFRIC 12, in
the income statement for the year, the Group recognised operating and financial costs, by nature,

207
and the fair value of related construction services provided. The following table shows the
components of investment in infrastructure recognised in return for construction services
provided:
In 2010, moreover, research and development expenditure of approximately €0.7 million was
recognised in the income statement. These activities are carried out in order to improve
infrastructure, the services offered, safety levels and environmental protection.
With regard to investments made by the subsidiaries, Raccordo Autostradale Valle d’Aosta (RAV)
and Stalexport Autostrada Malopolska, which are Cash Generating Units (CGU) as are all the other
operators, at the end of 2009 there was an impairment loss on those companies’ concession rights
of, respectively, €209,949 thousand and €16,363 thousand, before the related deferred taxation
of, respectively, €65,924 thousand and €3,109 thousand. This was the result of the impairment
tests required by IAS 36, and was essentially due to the modest value of the cash flows expected in
future years through to the end of the concession term.
Raccordo Autostradale Valle d’Aosta, in addition to having signed the document with the Grantor
in 2010 ratifying the observations of CIPE on the single concession arrangement that resulted in
the agreement coming into effect, joined the tax consolidation arrangements established by its
direct parent, Società per il Traforo del Monte Bianco, thus enabling Raccordo Autostradale Valle
d’Aosta to improve its cash flows. An impairment test (as described below) was performed as at 31
December 2010, based on the revised business and financial plan appended to the single
concession arrangement. This resulted in a reversal of impairment losses of €16,106 thousand with
respect to concession rights and a consequent release of deferred tax assets of €5,057 thousand
(deferred tax provision of €1,703 thousand with the estimate benefit of joining the tax
consolidation arrangement).
€4,396,851 thousand (€4,395,847 thousand as at 31 December 2009) of "Goodwill and other
assets with indefinite lives" of €4,401,445 thousand relates to goodwill.
Rather than being systematically amortised, goodwill is impairment tested at least once a year.
Goodwill of €4,382,941 thousand (the same as at 31 December 2009) relates to the acquisition of a
majority interest in the former Autostrade – Concessioni e Costruzioni Autostrade SpA in 2003.
The value of this goodwill has been determined under Italian GAAP and is consistent with the net
(€000) 31 December 2010 31 December 2009 Increase/ (Decrease)
Increase in rights acquired 38,817 - 38,817Use of non-current provisions for construction services required by contract 605,191 716,610 -111,419Revenue from government grants for construction services without additional benefits 217,195 119,424 97,771Increase of intangible concession rights relating to works with additional economic benefits 582,167 352,291 229,876
Total investments in motorways infrastructure 1,443,370 1,188,325 255,045

208
carrying amount as at 1 January 2004, the IFRS transition date. It has been allocated entirely to the
CGU represented by the operator, Autostrade per l’Italia.
The remaining goodwill of €18,504 thousand includes €18,443 thousand relating to the excess of
purchase consideration for the controlling interest in ETC at the end of 2007, as determined by
the identification of the fair value of the assets acquired and liabilities assumed.
The recoverability of goodwill, Group companies' concession rights and other intangible assets of
indefinite lives (being the ETC trademark, the value of which as at 31 December 2010 was €4,566
thousand) was impairment tested for those CGU where there were indications of impairment in
addition to any of the other above-mentioned goodwill and other intangible assets with indefinite
lives.
Methodology of impairment tests:
a) as previously explained, each operator is a separate CGU since the cash flows generated by the
motorways operated under concession arrangements are closely related to each other.
Subsidiaries that are not motorway concession operators are also treated as separate CGU;
b) impairment tests for motorway concession operators are performed to confirm the
recoverability of the assets of each CGU (net of any impairment losses recognised in previous
years) by estimating value in use. In detail for the subsidiary Raccordo Autostradale Valle
d’Aosta, the impairment test resulted in a partial reversal of previous years' impairment
losses, as explained above.
Value in use was estimated with reference to long-term plans approved by the relevant Boards
of Directors derived from the business and financial plans annexed to concession
arrangements signed with the Grantor which contain traffic, investment, cost and revenue
projections for the full term of the concession period. The projected after tax cash flows of
Italian motorway concession operators (except for the subsidiary Raccordo Autostradale Valle
d’Aosta) were discounted to present value at 5.6% which is their after tax weighted average
cost of capital (5.9% in 2009), whereas projected cash flows of Raccordo Autostradale Valle
d’Aosta and the Polish company Stalexport Autostrada Malopolska were discounted at the
after tax WACC of those companies, respectively 6.9% and 9.0%. After tax cash flows and
discount rates are used because the results are substantially the same as pre-tax computations;
c) the impairment testing of ETC's CGU confirmed the recoverability of that CGU's assets by
estimating the fair value of the entity based on a valuation performed by an independent
third party.
The following statement shows intangible assets at the beginning and end of the year and
movements in the different categories of intangible asset during 2010.

209

210
7.3 Investments • €431,547 thousand (€394,792 thousand)
The table on the next page shows carrying amounts at the beginning and end of the year, grouped
by category, and changes in investments during 2010. The table shows a net increase of €36,755
thousand.
The increase primarily regards investments accounted for using the equity method, and essentially
reflects the combined effect of the following:
a) a €36,319 thousand increase of the investment in the Autostrade Sud America group (which
includes Autostrade per il Cile from 1 January 2010) as a result of valuing the investment
using the equity method. €17,282 thousand of the increase was recognised in profit or loss
with the remaining €19,037 thousand being recognised in other comprehensive income;
b) a €7,204 thousand increase in the carrying amount of the Brazilian operator, Triangulo do
Sol as a result of measuring the investment using the equity method. €3,166 thousand of the
increase was recognised in profit or loss with the remaining €14,118 thousand being
recognised in other comprehensive income, which, however, was partially offset by dividends
distributed by the company of €10,080 thousand;
c) a €15,170 thousand decrease in the carrying amount of IGLI resulting in the recognition of a
€24,235 thousand charge to income and a €9,065 thousand gain in comprehensive income as
a result of measuring the investment using the equity method and an impairment loss, which is
fully described below;
d) recognition of the Group’s share of the profits or losses for the year reported by associates and
joint ventures, other than those already cited, amounting to a profit of €1,707 thousand, and
of income recognised in other comprehensive income and attributable to these companies,
totalling €501 thousand;
e) further capital contributions for existing investments, the most significant of which was the
capital call by Pune Solapur Expressways Pvt Ltd, totalling €4,709 thousand.
The process of accounting for investments using the equity method was based on the latest available
approved financial statements of associates and joint ventures, supplemented by certain estimates,
based on available information, if the financial statements as at and for the year ended 31 December
2010 were not available and, where necessary, adjusted to be consistent with Group accounting
policies.
Furthermore, the merger of Autostrade per il Cile Srl into Autostrade del Sud America Srl was
completed on 30 August 2010.
Those companies individually and jointly indirectly control certain Chilean motorway operators.

211
On the completion of the merger, Autostrade per l’Italia, which had held 50% of the share capital
of the merged company and 45% of the share capital of the merging company, increased its
shareholding in Autostrade Sud America to 45.765%. The same percentage is held by Società
Iniziative Autostradali e Servizi, with Mediobanca holding the remaining 8.470% of share capital.
The merger, which had no effect on governance, brought the two companies together under a
single parent. In December 2010 this was followed by the merger of the Chilean sub-holdings
owned, in turn, by Autostrade Sud America. The mergers, which simplified the group’s structure,
enhanced the value of the group, which could be important from the viewpoint of a potential stock
market listing.
With specific reference to the investment in IGLI, which is the main shareholder of Impregilo SpA,
measurement of the related value was based on the statement of financial position and income
statement of the Impregilo Group at 30 September 2010, given that the financial statement as at
and for the year ended 31 December 2010 were not yet available. Moreover, as a result of the
existence of evidence of impairment, the investment was tested exclusively with reference to its fair
value (as evidenced by its stock market price) since the estimated value was not considered reliable.
The test resulted in the recognition of an impairment loss of €15,170 thousand.
With regard to developments in 2010 relating to the administrative and criminal investigation
involving Impregilo, previously described in Atlantia's previous consolidated financial statements, a
press release was issued on 18 June 2010 announcing that the Supreme Court of Cassations had
upheld the Impregilo group’s appeal, thereby annulling the preventive seizure of assets with a value
of approximately €266 million belonging to the group, ordered in February 2010 by the Naples
Court of Review in relation to the investigation of the recycling of urban refuse in the Campania
region. In addition, the Supreme Court of Cassations rejected the appeal brought by the Naples
District Attorney and ordered the immediate return of the assets seized.
Reporting on the above litigation in the Impregilo group’s quarterly report as at and for the three
months ended 30 September 2010, the company’s directors stated that, despite the improvement
in the legislative and legal environment, the group continues to report both the impairments losses
on the assets held for sale recognised in previous years, relating to urban refuse projects in
Campania, and provisions of €50 million made at that date in response to the ongoing legal
proceedings.
At the date of preparation of these consolidated financial statements, Impregilo has not announced
any further material developments regarding the above litigation, or any further potential effects
on the Impregilo group’s results of operations, financial position or cash flows.
Since trigger events occurred, represented by the losses recorded by Alitalia – Compagnia Aerea
Italiana SpA, the impairment test has been performed based on the determination of its value in
use. The test is based on the latest projections of cash flows, net of taxes, using a discount rate after

212
tax (representative of the WACC) of 8.75%. The results of the impairment tests have not revealed
the need to record impairment losses on the carrying amount of the investment.
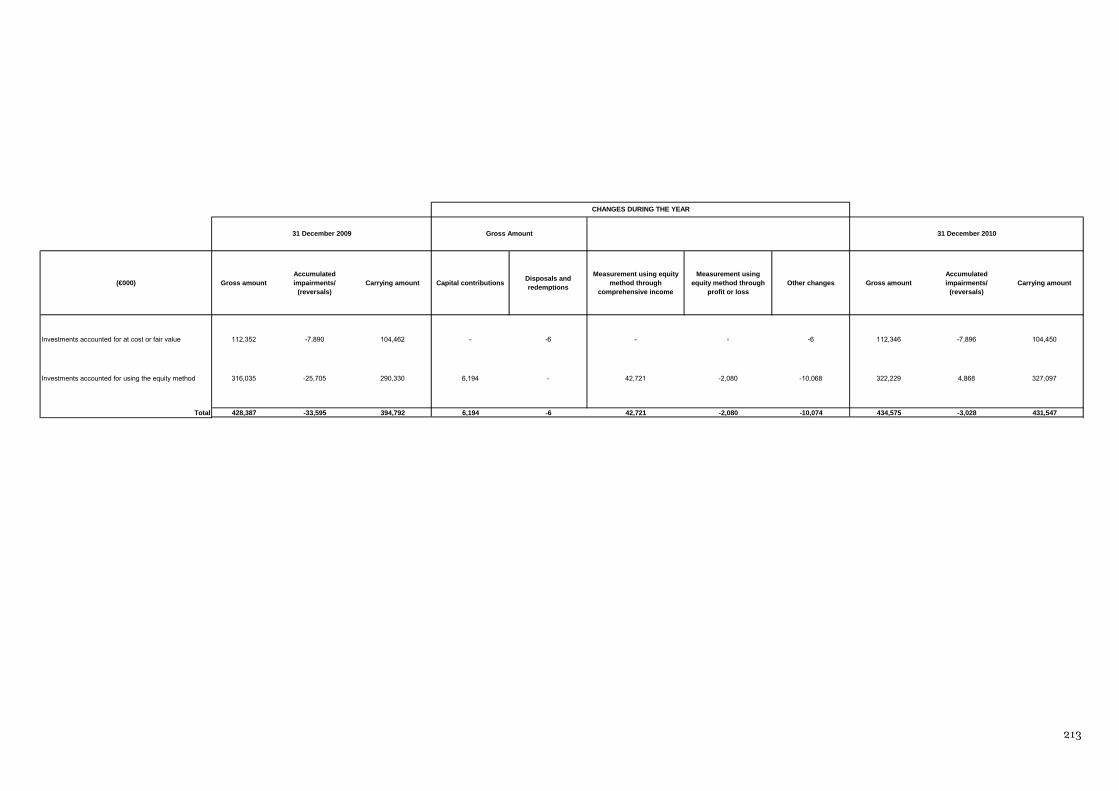
213
(€000) Gross amountAccumulated impairments/
(reversals)Carrying amount Capital contributions Disposals and
redemptions
Measurement using equity method through
comprehensive income
Measurement using equity method through
profit or lossOther changes Gross amount
Accumulated impairments/
(reversals)Carrying amount
Investments accounted for at cost or fair value 112,352 -7,890 104,462 - -6 - - -6 112,346 -7,896 104,450
Investments accounted for using the equity method 316,035 -25,705 290,330 6,194 - 42,721 -2,080 -10,068 322,229 4,868 327,097
Total 428,387 -33,595 394,792 6,194 -6 42,721 -2,080 -10,074 434,575 -3,028 431,547
CHANGES DURING THE YEAR
31 December 2009 Gross Amount 31 December 2010

214
The following table shows an analysis of the Group’s principal investments included in this item in
addition to the Group’s interest, the relevant carrying amount net of unpaid, called-up issued
capital.
Annex 1 contains a list of all the Group’s investments as at 31 December 2010.
(€000)
% interest Carrying amount % interest Carrying
amount
Investments accounted for at cost or fair value
Alitalia - Compagnia Aerea Italiana SpA 8.85% 100,000 8.85% 100,000Firenze Parcheggi SpA 5.36% 2,582 5.36% 2,582Tangenziale Esterna SpA 1.25% 625 1.25% 625Uirnet SpA 1.62% 427 1.70% 427Emittente titoli SpA 6.02% 277 6.02% 277Veneto Strade SpA 5.00% 258 5.00% 258Other smaller companies 281 293
104,450 104,462
Investments accounted for using the equity method
Autostrade Sud America Srl 45.76% 163,037 45.00% 75,502Autostrade per il Cile Srl * - 50.00% 51,216Triangulo do Sol Auto-estradas SA 50.00% 116,535 50.00% 109,331IGLI SpA 33.33% 13,079 33.33% 28,249Tangenziali Esterne di Milano SpA 32.00% 9,509 32.00% 8,341Societa' Infrastrutture Toscane SpA 45.77% 6,345 46.60% 6,613Bologna & Fiera Parking SpA 50.00% 9,161 50.00% 3,785Pune Solapur Expressways Private Limited 32.50% 4,444 32.50% 4,338Arcea Lazio SpA 34.00% 1,920 34.00% 420Pedemontana Veneta SpA 28.00% 1,410 28.00% 1,438Geie del Traforo Del Monte Bianco 50.00% 1,000 50.00% 1,000Other smaller companies 658 98
327,097 290,330
Total 431,547 394,792
(*) Company merged into Autostrade Sud America effective 1 January 2010.
31 December 2010 31 December 2009

215
7.4 Other financial assets (non-current) • €935,422 thousand (€850,079 thousand) (current) • €435,819 thousand (€374,981 thousand)
The following table shows the composition of other financial assets at the beginning and end of the
year:
Financial concession rights include:
a) the takeover rights (€304,387 thousand as at 31 December 2010) to be paid to the subsidiary,
Autostrade Meridionali, at the end of its concession term;
b) the present value of the guaranteed minimum payment to be made by the grantor under the
concession arrangement signed by the Chilean subsidiary, Sociedad Concessionaria de Los
Lagos (€78,185 thousand as at 31 December 2010).
The increase for the year, totalling €80,258 thousand, essentially reflects construction services
provided by Autostrade Meridionali during the year, which are represented by investments in
motorway infrastructure.
Financial assets deriving from government grants include receivables from grantors or other public
bodies paying grants for construction services, accounted for the investments and increased by
€122,612 thousand.
Convertible term deposits relate primarily relate to loans disbursed by Intesa-Sanpaolo and
Crediop as a condition precedent for the grants financing the new construction required by Laws
662/1996, 345/1997 and 135/1997.
Non-current financial assets of €40,209 thousand relating to derivative contracts primarily
represent fair value gains on derivatives hedging the 20,000 million yen bond issue, which
increased in value by €39,352 thousand following the strengthening of the currency in which the
(€000)
Total financial assets Current portion Non-current portion Total financial assets Current portion Non-current portion
Financial assets deriving from concession rights (1) 382,572
8,853 373,719302,314
14,280 288,034
Financial assets deriving from government grants related to construction services (1) 390,974
189,436 201,538268,362
88,007 180,355
Convertible term deposits (2) 466,877 180,947 285,930 518,337 181,620 336,717
Derivative assets (3) 62,073 21,864 40,209 67,826 66,969 857Loans and receivables due from ANAS (1) 10,008 - 10,008 16,499 - 16,499
Staff loans (1) 10,306 97 10,209 8,644 111 8,533Other loans and receivables (2) 6,207 27 6,180 14,629 754 13,875
Non-current prepayments (1) 7,629 - 7,629 5,209 - 5,209Medium/long-term borrowings 96,223 21,988 74,235 112,807 67,834 44,973
Other financial assets (4) 34,595 34,595 - 23,240 23,240 -1,371,241 435,819 935,422 1,225,060 374,981 850,079
1) These assets have been classified as "loans and receivables" under IAS 39.2) These assets have been classified as "available-for-sale" financial instruments and in level 2 of the fair value hierarchy.3) These assets mainly include derivative financial instruments and in level 2 of the fair value hierarchy.4) This item primarily consists of financial instruments classifiable as "available-for-sale" financial instruments and in level 1 of the fair value hierarchy.
31 December 2010 31 December 2009

216
bonds were issued with respect to the euro, as reflected in a change in the hedged liability. The
€45,105 thousand decrease in the current portion is primarily due to the reduction in accrued
income following the payment of differentials during the year. Further details of derivatives
subscribed to by the Group for hedging purposes at the end of the year are contained in note 9.3
“Financial risk management”.
Other current financial assets (totalling €34,595 thousand as at 31 December 2010) essentially
regard the investment of liquidity by the Stalexport Autostrady group, whose assets are managed by
major financial institutions.
There are no indications of impairment losses on any financial assets to be reported.
7.5 Deferred tax assets and liabilities
Deferred tax assets • €2,101,817 thousand (€2,184,636 thousand) Deferred tax liabilities • €33,666 thousand (€30,253 thousand)
The following tables show the amount of deferred tax assets and liabilities both offsetable and not
offsetable in addition to movements on the deferred tax account in 2010 with respect to temporary
timing differences between consolidated carrying amounts and the corresponding tax bases.
(€000) 31 December 2010 31 December 2009
Deferred tax assets 2,206,874 2,294,240Offsettable deferred tax liabilities -105,057 -109,604Net deferred tax assets 2,101,817 2,184,636
Non-offsettable deferred tax liabilities 33,666 30,253

217
As shown in the table, the carrying amount as at 31 December 2010 primarily consists of residual
deferred tax assets that were recognised in connection with the reversal of intercompany gains that
arose in 2003 following the contribution of the portfolio of motorways to Autostrade per l’Italia
(€1,093,725 thousand) and advance taxes recognised on adoption of IFRIC 12 by Autostrade per
l’Italia (€686,139 thousand) as described in detail in note 4.
The carrying amount also includes deferred tax assets of €237,997 thousand relating to the non-
deductible portion of Autostrade per l’Italia's provisions primarily consisting of provisions for
repair and maintenance obligations, and deferred tax assets in connection with accumulated
impairment losses and depreciation of property, plant and equipment (totalling €87,177 thousand)
related principally to Raccordo Autostradale Valle d’Aosta.
Changes during the year include:
a) the release of deferred tax assets amounting to €105,800 thousand, being the deductible
portion of the goodwill in Autostrade per l’Italia that arose in 2003 on the above
contribution of assets;
b) the reclassification to non-current assets and liabilities related to discontinued operations
of the carrying amount of deferred tax assets as at 31 December 2010 attributable to Strada
dei Parchi, amounting to €54,652 thousand;
c) deferred tax assets totalling €66,381 thousand recognised by Autostrade per l'Italia for
additional temporary differences arising in 2010 as a result of the adoption of IFRIC 12;
d) the net increase in deferred tax assets of €26,942 thousand relating to the non-deductible
portion of provisions mainly for expenditure on the repair and replacement of assets held
by Autostrade per l’Italia's under concessions;
(€000) 31 December 2009 Provisions Releases
Deferred tax assets/liabilities on gains and losses
recognised in comprehensive
income
Other changes
Reclassifications to assets/liabilities attributable to
discontinued operations/held for sale
31 December 2010
Deferred tax assets on:
Deductible intercompany goodwill 1,199,525 - -105,800 - - - 1,093,725
Effects deriving from application of IFRIC 12 by Autostrade per l'Italia (*) 612,059 66,381 - - 7,700 - 686,140
Provisions 220,910 59,722 -32,780 - 927 -10,782 237,997
Impairments loss on and depreciation/amortisation of non-current assets 123,476 6,096 -5,714 - 7,612 -44,293 87,177
Measurement of cash flow hedges 58,176 - - -23,546 3 - 34,633
Impairment loss on receivables and write-down of inventories 25,246 2,429 -4,188 - 89 - 23,576
Tax loss carryforwards 7,608 1,625 -188 - -644 -8,059 342
Other temporary differences 47,240 4,751 -5,330 -198 -3,068 -109 43,286
Deferred tax assets 2,294,240 141,004 -154,000 -23,744 12,619 -63,243 2,206,876
Deferred tax liabilities on:
Accelerated depreciation -39,400 -6,133 2,057 - -1,698 - -45,174
Gain subject to deferred taxation -33,922 -755 - - -5,861 - -40,538
Fair value measurement of assets and liabilities deriving from business combinations -18,967 - 1,114 - -615 - -18,468
Measurement of cash flow hedges -10,945 - - 1,243 - - -9,702
Effects of fair value measurement of assets held for sale -9,551 - 3,068 - - - -6,483
Other temporary differences -27,072 -10,130 1,318 -184 9,119 8,591 -18,358
Deferred tax liabilities -139,857 -17,018 7,557 1,059 945 8,591 -138,723
2,154,383 123,986 -146,443 -22,685 13,564 -54,652 2,068,153
CHANGES DURING THE YEAR
(*) The figure does not include the adjustment resulting from application of IFRIC 12 regarding the restatement of provisions for the repair and replacement obligations of Autostrade per l'Italia. The impact on deferred tax assets is accounted for in the item "Provisions".

218
e) the €22,300 thousand net decrease in deferred tax liabilities on the measurement of cash
flow hedge derivative financial instruments.
7.6 Other non-current assets • €5,472 thousand (€7,508 thousand) Other non-current assets consist primarily of amounts due from the tax authorities in the form of
withholding tax paid on provisions for post-employment benefits in 2010.
7.7 Trading assets • €973,176 thousand (€986,578 thousand) Trading assets include inventories (stocks and spare parts used in the maintenance or assembly of
plant), contract work in progress, advance payments of concession-related work, and trade
receivables, which constitute the largest component.
The following tables show the composition of trade receivables at the end of the year, and the
related aging schedule as at 31 December 2010.
Receivables due from customers, after allowance for impairment, are down €6,647 thousand on 31
December 2009, primarily due to the decrease in receivables (down €4,029 thousand) because of
payments received, decreased receivables without recourse (down €4,771 thousand) and unpaid
tolls (down €2,934 thousand). These decreases were partially offset by an increase in tolls
receivable from road users who pay by direct debit (up €8,179 thousand) substantially because of
changes in traffic volumes during the year and the net increase in toll rates including the surcharge
payable to the Grantor.
Overdue receivables regard uncollected and unpaid tolls, in addition to royalties due from service
area operators and sales of other goods and services, such as authorisations to cross motorways, the
sale of services and proprietary assets and the lease of land and buildings. The relevant allowance
for impairment is adequate and has been determined with reference to experience gained with
(€000)
Amounts due from customers
Other trade receivables
Prepayments for construction
services
Other trading assets TOTAL Amounts due
from customersOther trade receivables
Prepayments for construction
services
Other trading assets TOTAL
Direct debit road users and similar: outstanding bills 402,894 394,715Road users for unpaid tolls 48,657 60,748Service area operators 147,064 148,972Receivable from sundry customers and retentions 175,320 184,116Advance payments to suppliersGross trade receivables 773,935 150,239 42,707 13,289 980,170 788,551 184,532 22,129 11,003 1,006,215
Allowance for impairment 76,269 12,379 - - 88,648 84,238 12,279 - - 96,517
Net trade receivables 697,666 137,860 42,707 13,289 891,522 704,313 172,253 22,129 11,003 909,698
31 December 2010 31 December 2009
(€000) Total receivables31/12/2010
Total not yet due and payable
More than 90 days overdue
Between 90 and 365 days overdue
More than one year overdue
Trade receivables 980,170 831,363 12,924 56,657 79,226

219
specific customers and historical data regarding losses on receivables, taking guarantee deposits and
other collateral given by customers into account.
Changes during the year in allowance for impairment are shown in the following table:
The carrying amount of trade receivables approximates to fair value.
Advance payments for concession-related work of €42,707 thousand (€22,129 thousand as at 31
December 2009) increased by €20,578 thousand due to the increase in the volume of work during
the year.
7.8 Cash and cash equivalents • €2,533,250 thousand (€1,222,270 thousand)
This item includes cash balances and investments for terms shorter than the redemption date of the
€2,000 million bond issue (9 June 2011). These balances have increased €1,310,980 thousand
since 31 December 2009 due to the combined effect of:
a) cash flows from operating activities;
b) 2010 bond issues;
c) the receipt on the unwinding of derivatives hedging the bond issue maturing in 2016;
d) cash flows used in investing activities;
e) dividend payments;
f) repayments of medium to long-term loans.
7.9 Current tax assets and liabilities
Current tax assets • €29,715 thousand (€46,294 thousand) Current tax liabilities • €17,278 thousand (€19,303 thousand)
Current tax assets and liabilities at the beginning and end of the year are shown below.
With effect from 1 January 2010 Autostrade Tech SpA and Newpass SpA joined the tax
consolidation arrangement headed by the Parent, Atlantia SpA, on the basis of Legislative Decree
(€000) 31 December 2009 Additions Uses Reclassifications and other changes
Reclassifications to discontinued operations/assets
held for sale31 December 2010
Allowance for impairment 96,517 11,977 20,907 1,380 -319 88,648
(€000)
31 December 2010 31 December 2009 31 December 2010 31 December 2009
IRAP 6,074 22,148 3,989 3,605IRES 12,054 13,738 9,408 10,164Other income taxes 11,587 10,408 3,881 5,534
Total 29,715 46,294 17,278 19,303
Assets Liabilities

220
344/2003. As a result, these companies’ current tax assets and liabilities in connection with IRES
are also consolidated by Atlantia SpA.
The other Group companies that have been participating in the tax consolidation arrangement
since 1 January 2009 for the three-year period 2009 - 2011 are: Autostrade Meridionali SpA,
Tangenziale di Napoli SpA, EsseDiEsse Società di Servizi SpA, TowerCo SpA, Autostrada Torino –
Savona SpA, SPEA – Ingegneria Europea SpA, Infoblu SpA, AD Moving SpA, Autostrade
dell’Atlantico Srl, Pavimental SpA, Port Mobility SpA, Società Autostrada Tirrenica SpA and
Telepass SpA.
Autostrade per l'Italia SpA joined the arrangement in 2008 for the three-year period 2008-2010.
7.10 Other current assets • €74,667 thousand (€59,793 thousand) This item consists of receivables and other current assets that are not eligible for classification as
trading or financial. The composition of this item is shown below.
The increase was essentially due to for increased VAT receivable and because of greater amounts
due from insurance companies in connection with claims, which were recognised in accordance
with the new methods of accounting for the settlement of claims and.
7.11 Non-current assets held for sale and related to discontinued operations • €1,107,734 thousand (€84,331 thousand) Liabilities related to discontinued operations • €1,072,633 thousand ( - )
These amounts included as at 31 December 2010:
a) the value of minority interests (€39,852 thousand) and loans and receivables attributable to
the related companies (€1,643 thousand) acquired in 2009 as part of the transaction with
the Itinere group and held for sale in the short term;
(€000) 31 December 2010 31 December 2009 Increase/ (Decrease)
Receivables due from end users and insurance companies for damages 30,817 26,993 3,824
Other tax assets 21,026 15,528 5,498
Receivable from public entities 4,623 4,829 -206
Other current assets 49,502 42,023 7,479
105,968 89,373 16,595
Allowance for impairment -31,301 -29,580 -1,721
Total 74,667 59,793 14,874

221
b) the carrying amount of the assets and liabilities of the subsidiary, Strada dei Parchi
(amounting respectively to €1,066,239 thousand and €1,072,633 thousand), classified in
these components following the start-up of talks with a view to selling a controlling
shareholding in Strada dei Parchi with an agreement having been signed for the sale of 60%
of the company's share capital. The contribution of the same to the 2010 consolidated
financial results is presented under "Income (loss) from discontinued operations, as
required by IFRS 5"Non-current Assets Held for Sale and Discontinued Operations ",
instead of being included in each of the Consolidated income statement items relating to
continuing operations. Consequently, even in the comparative consolidated income
statement for 2009 the contribution of the Strada dei Parchi has been reclassified, in
accordance with IFRS 5, compared to that published in the annual reports at 31 December
2009.
The following tables show an analysis of non-current assets held for sale and the assets and
liabilities of Strada dei Parchi classified as discontinued operations for the purposes of IFRS 5.
7.12 Equity • €3,586,901 thousand (€3,197,210 thousand) Atlantia’s issued capital is fully subscribed and paid-in and consists of 600,297,135 ordinary shares
(571,711,557 as at 31 December 2009) with a par value of €1 each, amounting to €600,297
thousand. The number of shares increased by 28,585,578 in 2010 as a result of the bonus issue
approved by shareholders at the Extraordinary General Meeting held on 14 April 2010, which
Non-current assets held for sale and related to discontinued operations/Liabilities related to discontinued operations
(€000) 31 December 2010 31 December 2009
Assets related to discontinued operations of Strada dei Parchi 1,066,239 -Other assets held for sale - Investments 39,852 67,255Other assets held for sale – Non-current financial assets 1,643 17,076
Total assets related to discontinued operations 1,107,734 84,331
Liabilities related to discontinued operations of Strada dei Parchi 1,072,633 -
Total liabilities related to discontinued operations 1,072,633 -
Assets and liabilities related to discontinued operations attributable to the subsidiary, Strada dei Parchi
(€000)
ASSETSNon-current assets Non-current liabilitiesProperty, plant and equipment 4,575 Non-current provisions 15,741Intangible assets 950,491 Non-current financial liabilities 658,841Investments 5 Deferred tax liabilities 8,591Non-current financial assets 8,132 Other non-current liabilities -Deferred tax assets 63,243Other non-current assets -
Total non-current assets 1,026,446 Total non-current liabilities 683,173Current assets Current liabilitiesTrading assets 18,710Cash and cash equivalents 15,494 Current provisions 20,208Other current financial assets - Trading liabilities 56,664Current tax assets 3,156 Current financial assets 299,980
of which bank overdrafts 8,056Other current assets 2,433 Current tax liabilities 2,869
Other current liabilities 9,739Total current assets 39,793 Total current liabilities 389,460
TOTAL ASSETS 1,066,239 TOTAL LIABILITIES 1,072,633
LIABILITIES

222
decided to issue 1 new share for every 20 shares in issue. This resulted in an increase in treasury
shares of 573,831, with the total number of treasury shares held rising from 11,476,616 to
12,050,447.
Equity attributable to owners of the parent, totalling €3,183,391 thousand, has increased by
€372,576 thousand compared with 31 December 2009. The main changes during the year regard:
a) net comprehensive income for the year (€820,120 thousand), reflecting profit for the year
(€682,952 thousand) and the recognition of other comprehensive income (total income of
€117,168 thousand), which include primarily the combined effect of a fair value loss on the
cash flow hedge reserve (€50,003 thousand), the recognition of gains on the translation of
the financial statements of foreign operations (€19,021 thousand), and the recognition of
gains on the measurement of associates and joint ventures using the equity method
(€42,721 thousand);
b) payment of the final dividend of €219,054 thousand for 2009 (€0.39 per share) and the
interim dividend of €208,827 thousand for 2010 (€0.35 per share).
Equity attributable to non-controlling interests of €403,510 thousand has increased by €17,115
thousand on 31 December 2009 (€386,395 thousand). This essentially reflects the net
comprehensive income for the year (€20,327 thousand), after deducting the dividends approved
(€2,633 thousand).
Finally, equity as at 1 January 2009 was derived from the consolidated financial statements as at and
for the year ended 31 December 2008 prepared in line with the new interpretation IFRIC 12. To
represent more clearly the impacts of IFRIC 12 adoption on equity at 1 January 2009 in the
consolidated statement of changes in equity, the 2008 profit was appropriated to Other reserves
and retained earnings as at 1 January 2009. The distribution of 2008 dividends as approved by the
shareholders at their meeting of 23 April 2009 resulted in a reduction of Other reserves and
retained earnings.
Atlantia manages its capital in order to create value for shareholders, ensure the Group can
function as a going concern, safeguard the interests of stakeholders, and guarantee efficient access
to external sources of financing to adequately support the growth of its businesses and fulfil the
commitments given in the concession arrangements.
Other comprehensive income
The section “Consolidated financial statements” includes the “Statement of comprehensive
income”, which includes other comprehensive income, after the related taxation.
The following table shows the gross amounts of these other components and the related taxation.

223
Disclosures regarding share-based payments
The Group has put in place a plan to provide incentives for personnel and foster the loyalty of
certain directors and managers of the Atlantia Group, linked to the achievement of pre-established
corporate and individual objectives, and designed to boost their entrepreneurial spirit and creation
of value for shareholders. With effect from 2009, the Group has launched incentive schemes
entailing, on the achievement of certain pre-established objectives for the period 2009-2013, the
granting of rights to shares in Atlantia SpA.
The share option plan (“SOP”) approved at the Annual General Meeting of 23 April 2009
envisages the granting of options to buy up to 850,000 of the Company’s ordinary shares, each of
which gives the right to purchase 1 ordinary Atlantia share held by the Company, at that date at a
price equal to the normal value of the shares at the date on which Atlantia’s Board of Directors
selects the beneficiary and establishes the number of options to be granted. The terms and
conditions of the SOP are detailed in the Information Memorandum prepared pursuant to art. 84-
bis of CONSOB Regulation 11971/1999 and subsequent amendments and additions.
In the following table are shown the options granted to directors and employees of the Group by 31
December 2010 and movements during the year and the vesting and exercise period.
In execution of the rights granted, beneficiaries can purchase Atlantia shares at a their excercise
price. The options will vest only if, at the end of the vesting period, the final value (the market
value of each share, by convention calculated on the basis of the average official price of Atlantia’s
ordinary shares at the end of each trading day in the period from 23 January 2013 to 23 April
2013, plus any dividends paid from the grant date to the end of the vesting period) is equal to or
greater than €15.00. Should the final value be less than €15.00, beneficiaries will definitively lose
their right to exercise the options granted, unless otherwise decided by the Board of Directors.
(€000)
Before tax Tax effect After tax Before tax Tax effect After tax
Fair value gains/(losses) on cash flow hedges 72,306 -22,303 50,003 -67,390 17,303 -50,087Gains/(losses) from actuarial valuations (IAS 19) 5,922 -382 5,540 5,183 -368 4,815Gains/(losses) from translation of financial statements of foreign operations 21,258 - 21,258 1,686 - 1,686Gains/(losses) from measurement of associates and joint ventures using the equity method 42,721 - 42,721 22,437 - 22,437
Other fair value gains/(losses) -97 - -97 -466 - -466
Other comprehensive income for the year 142,110 -22,685 119,425 -38,550 16,935 -21,615
2010 2009
Number of options granted
Maximum number of Atlantia shares under options
Vesting date Exercise dateExercise price
(€)
Options outstanding at 1 January 2010‐ grants with BoD's resolution of 8 May 2009 534,614 534,614 23/04/2013 30/04/2014 12.97‐ grants with BoD's resolution of 16 July 2009 174,987 174,987 23/04/2013 30/04/2014 14.00
709,601 709,601
Options granted in 2010‐ grant with BoD's resolution of 15 July 2010 140,399 140,399 23/04/2013 30/04/2014 15.08
Options outstanding at 31 December 2010 850,000 850,000

224
Should the final value be equal to or greater than €15.00, the number of vested options will be
equal to a percentage of the options granted, based on the final value, as shown in the following
table.
The terms and conditions of the SOP expressly state that any capital gains realised as a result of the
exercise of vested options may under no circumstances exceed twice (three in the case of the Chief
Executive Officer) the beneficiary’s gross annual fixed salary as at 1 January 2009.
The options are under no circumstances transferable inter vivos and their non-transferability only
ceases on the unilateral termination of employment or fair dismissal by the beneficiary within three
years of the date of giving such a commitment.
As a result of the above bonus issue approved by the Shareholders at their General Meeting of 14
April 2010, on 15 July 2010 the Board of Directors of Atlantia approved certain alterations to the
incentive plans to ensure that there is no change in the substantial and financial terms of the
existing plans, the conditions of which would otherwise have deteriorated in respect of the
beneficiaries, given the reduced intrinsic value of each share. These changes, which are to be put to
the vote at the first available Shareholders’ General Meeting, essentially involve (i) reductions in
the exercise prices for the options granted at the Board of Directors’ meeting of 8 May 2009 from
€12.966 to €12.349 and in the exercise price for the options granted at the Board of Directors’
meeting of 16 July 2009 from €13.999 to €13.332; (ii) the granting to beneficiaries of the options
already granted of 1 new option for every 20 options previously granted; (iii) the reduction to
€14,286 (previously €15,00) of the final minimum value for purpose of the vesting of shares
granted and certain changes to the conversion table from vested options to options granted; and,
(iv) the decision to grant Gian Maria Gros-Pietro, the Company’s former Chairman, the option of
maintaining his right to exercise, in accordance with the same conditions applied to other
beneficiaries, the options previously granted to him and (v) in the case of termination of the
Final share price
(€)15 20%16 27%17 35%18 42%19 49%20 56%21 64%22 71%23 78%24 85%25 93%26 100%
over €26
A percentage calculated by the formula:
[(26 - Exercise Price) / (Final Share Price - Exercise Price)] * 100
Percentage of options granted that have vested

225
employee relationship for reasons other than those mentioned above, the possibility to mantain the
rights granted by Board of Directors’ resolution.
At the same meeting, the Board of Directors approved the grant of 140,399 options to the
Chairman, Fabio Cerchiai, with a vesting period of 15 July 2010 - 23 April 2013 and an exercise
period of 24 April 2013 to 30 April 2014 at an exercise price of €15.079. The fair value of each
stock option granted as determined by a specially appointed expert was €1.42. The Monte Carlo
model was used to determine fair value using the following parameters:
- risk free interest rate: 1.62%
- expected expiry: 3.8 years
- expected volatility (equal to historic volatility): 26.7%
- expected dividends: 3.67%
- share price on grant date: €15.17
The weighted average price of an Atlantia ordinary share in 2010 was €15.61 whereas it was €15.56
for the period between 15 July and 31 December 2010. As at 31 December 2010 the price was
€15.27 per share.
As a result of implementation of the plan, as at 31 December 2010 the Group has recognised, in
accordance with the requirements of IFRS 2, an increase in equity reserves of €319 thousand, based
on the accrued fair value of the options granted in the year, with a contra entry in the income
statement in personnel expense.
7.13 Provisions for construction services required by contract (non-current) • €4,315,051 thousand (€4,383,829 thousand) (current) • €386,660 thousand (€582,217 thousand)
The following table shows provisions for construction services for which no additional economic
benefits are received at the beginning and end of the year and changes in 2010, showing the non-
current and current portions.
These provisions represent the present value of motorway infrastructure construction and/or
upgrade services that certain of the Group’s operators and, particularly, Autostrade per l'Italia are
required to provide and for which no additional economic benefits are received, in terms of
specific toll charge increases and/or significant increases in expected traffic.

226
(€000)
Balance non-current current Financial provisions
Additions to revise present value of
contract commitments
Reductions for completed works
Grants accrued on completed
works
Currency translation differences
Balance non-current current
Provisions for construction services required by contract
Provisions construction services required by contract - Upgrade of Florence - Bologna section
2,281,060 1,791,747 489,313 51,224 157,101 -626,752 217,195 - 2,079,828 1,757,220 322,608
Provisions construction services required by contract - Third and fourth lanes
19,585 18,986 599 399 847 344 - - 21,175 19,804 1,371
Provisions construction services required by contract - Other construction services
2,665,401 2,573,096 92,305 82,685 44,532 -195,978 - 4,068 2,600,708 2,538,027 62,681
4,966,046 4,383,829 582,217 134,308 202,480 -822,386 217,195 4,068 4,701,711 4,315,051 386,660
31 December 2009 CHANGES DURING THE YEAR 31 December 2010
227
7.14 Provisions (non-current) • €941,982 thousand (€923,731 thousand) (current) • €224,778 thousand (€213,783 thousand)
The following table shows provisions at the beginning and end of the year, 2010 movements in the
non-current and current portions.
PROVISIONS FOR EMPLOYEE BENEFITS (non-current) • €130,604 thousand (€173,782 thousand) (current) • €46,615 thousand (€15,462 thousand) As at 31 December 2010 this item essentially consists of provisions for post-employment benefits
and for the long-term incentive plan for the Group’s management.
Provisions for post-employment benefits, of €177,219 thousand (including both current and non-
current components), decreased €22,618 thousand. This is essentially the difference between:
a) uses of €13,342 thousand for benefits and advances paid;
b) the reclassification to liabilities related to discontinued operations of vested benefits of Strada
dei Parchi employees (€9,292 thousand).
c) operating and financial provisions, totalling €7,316 thousand;
d) actuarial gains of €5,922 thousand recognised in the statement of comprehensive income;
The main actuarial assumptions applied in estimating provisions for post-employment benefits as
at 31 December 2010 are shown below:
financial assumptions:
- annual discount rate: 4.55%
- annual inflation rate: 2.0%
- annual rate of increase in post-employment benefits 3.00%
- annual reate of increase in real salaries 0.65%
- annual turnover rate: 2.0 - 5.0%
- annual rate of advances paid: 2.0 - 3.5%
demographic assumptions:
- mortality: Government General Accounting Office projections
- disability: INPS tables by age and sex
- retirement age: Mandatory state pension retirement age
Provisions for the 2008-2010 three-year incentive plan for the Group’s management have risen
€10,613 thousand due to provisions to cover the estimated cost for the year
.
228
PROVISIONS FOR REPAIR AND REPLACEMENT OBLIGATIONS (non-current) • €790,281 thousand (€728,122 thousand) (current) • €121,341 thousand (€126,384 thousand) This item regards the present value of provisions for the repair and replacement of assets operated
under concession, in accordance with commitments given by the Group’s operators in their
arrangements with the related grantors.
There was a net increase in total provisions, including current and non-current portions, of
€57,116 thousand being the difference between new operating and financial provisions (totalling
€476,950 thousand) and uses (€412,231 thousand) in connection with repairs and replacements
carried out during 2010.
OTHER PROVISIONS (non-current) • €21,097 thousand (€21,827 thousand) (current) • €56,822 thousand (€71,937 thousand) These provisions essentially regard liabilities expected to be incurred in connection with pending
litigation and disputes, including those with maintenance contractors regarding contract reserves.
The change during the year essentially relates to the reclassification of Strada dei Parchi’s
provisions to liabilities related to discontinued operations (€20,208 thousand).
Group companies are party to a number of disputes with the tax authorities. The related amounts
are not significant.
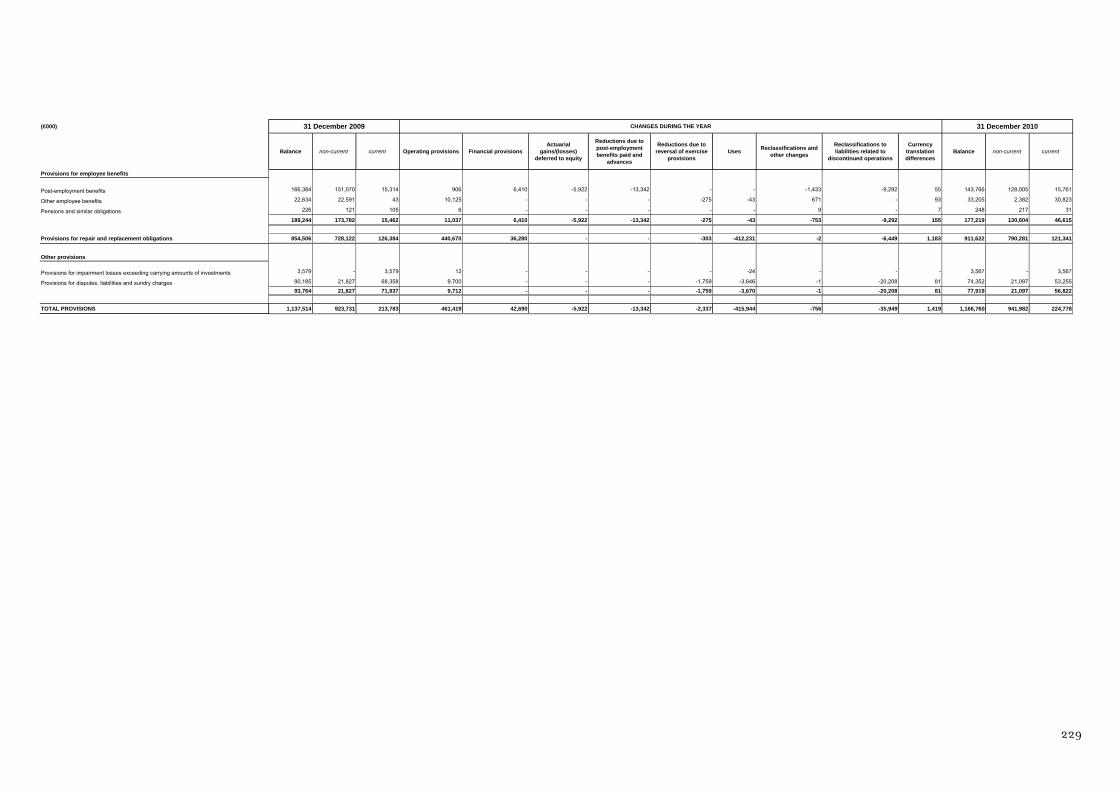
229
(€000)
Balance non-current current Operating provisions Financial provisionsActuarial
gains/(losses) deferred to equity
Reductions due to post-employment benefits paid and
advances
Reductions due to reversal of exercise
provisionsUses Reclassifications and
other changes
Reclassifications to liabilities related to
discontinued operations
Currency translation differences
Balance non-current current
Provisions for employee benefits
Post-employment benefits 166,384 151,070 15,314 906 6,410 -5,922 -13,342 - - -1,433 -9,292 55 143,766 128,005 15,761
Other employee benefits 22,634 22,591 43 10,125 - - - -275 -43 671 - 93 33,205 2,382 30,823
Pensions and similar obligations 226 121 105 6 - - - - - 9 - 7 248 217 31
189,244 173,782 15,462 11,037 6,410 -5,922 -13,342 -275 -43 -753 -9,292 155 177,219 130,604 46,615
Provisions for repair and replacement obligations 854,506 728,122 126,384 440,670 36,280 - - -303 -412,231 -2 -6,449 1,183 911,622 790,281 121,341
Other provisions
Provisions for impairment losses exceeding carrying amounts of investments 3,579 - 3,579 12 - - - - -24 - - - 3,567 - 3,567
Provisions for disputes, liabilities and sundry charges 90,185 21,827 68,358 9,700 - - - -1,759 -3,646 -1 -20,208 81 74,352 21,097 53,255
93,764 21,827 71,937 9,712 - - - -1,759 -3,670 -1 -20,208 81 77,919 21,097 56,822
TOTAL PROVISIONS 1,137,514 923,731 213,783 461,419 42,690 -5,922 -13,342 -2,337 -415,944 -756 -35,949 1,419 1,166,760 941,982 224,778
31 December 2009 31 December 2010CHANGES DURING THE YEAR

230
7.15 Financial liabilities (non-current) • €10,066,909 thousand (€11,304,537 thousand) (current) • €2,561,332 thousand (€914,316 thousand)
The following two tables provide an analysis of financial liabilities.
The first compares carrying amounts as at 31 December 2010 with those as at 31 December 2009 by
term to maturity (current and non-current portions).
The second table compares the aggregate carrying amount (current and non-current portions) of
medium/long-term financial liabilities with relevant par and fair values. This table also summarises
the terms and conditions applied to each material financial liability.
The fair value reported for bond issues was measured on the basis of closing market prices, whilst
the fair value of other financial liabilities was measured by discounting expected future cash flows,
using the yield curve at the end of the year.
Total financial liabilities Current portion Non-current portion Total financial
liabilities Current portion Non-current portion maturing between 13 and 60 months
maturing after 60 months
Bond issuesBond 2004-2011 1,987,211 - 1,987,211 1,996,056 1,996,056 - - - Bond 2004-2014 2,695,077 - 2,695,077 2,706,363 - 2,706,363 2,706,363 - Bond 2004-2022 (GBP) 550,148 - 550,148 568,940 - 568,940 - 568,940 Bond 2004-2024 971,989 - 971,989 973,244 - 973,244 - 973,244 Bond 2009-2016 1,482,041 - 1,482,041 1,549,877 - 1,549,877 - 1,549,877 Bond 2009-2038 (JPY) 149,553 - 149,553 183,444 - 183,444 - 183,444 Bond 2010-2017 - - - 990,510 - 990,510 - 990,510 Bond 2010-2025 - - - 494,222 - 494,222 - 494,222
Total bond issues 7,836,019 - 7,836,019 9,462,656 1,996,056 7,466,600 2,706,363 4,760,237
Medium/long-term borrowingsBank borrowingsTerm Loan Facility 786,087 76,504 709,583 709,580 76,830 632,750 632,750 -EIB 1,039,969 89,338 950,631 950,631 50,176 900,455 173,151 727,304 Cassa Depositi e Prestiti 143,531 - 143,531 143,912 - 143,912 11,953 131,959Other banks 171,540 15,220 156,320 233,080 12,299 220,781 96,452 124,329Total borrowings linked to grants 419,861 38,692 381,169 381,202 40,634 340,568 190,277 106,224
Total bank borrowings 2,560,988 219,754 2,341,234 2,418,405 179,939 2,238,466 1,104,583 1,089,816
Other borrowingsANAS 783,191 142,486 640,705 32,611 32,611 - - - Central Guarantee Fund 56,664 19,810 36,854 56,479 19,953 36,526 2,873 33,653 Other borrowings 53,219 3,736 49,483 52,101 3,820 48,281 10,868 37,413
Total other borrowings 893,074 166,032 727,042 141,191 56,384 84,807 13,741 71,066
Total medium/long-term borrowings 3,454,062 385,786 3,068,276 2,559,596 236,323 2,323,273 1,118,324 1,160,882
Derivative financial instruments liability 374,778 - 374,778 279,593 25,994 253,599 47,683 207,369
Other financial liabilities 49,712 24,248 25,464 47,676 24,239 23,437 6,918 17,497
Accrued expenses on medium/long-term financial liabilities 276,219 276,219 - 251,167 251,167 - - -
Total medium/long-term financial liabilities 11,990,790 686,253 11,304,537 12,600,688 2,533,779 10,066,909 3,879,288 6,145,985
Short-term financial liabilities
Bank overdrafts 40,990 40,990 - 19,857 19,857 - - -
Short-term borrowings 185,390 185,390 - 6,574 6,574 - - -
Current account payables to unconsolidated group companies 1,453 1,453 - 881 881 - - -
Other current financial liabilities 230 230 - 241 241 - - -
Total short-term financial liabilities 228,063 228,063 - 27,553 27,553 - - -
12,218,853 914,316 11,304,537 12,628,241 2,561,332 10,066,909 3,879,288 6,145,985
(€000)
31 December 2009 Non-current maturities as at 31 December 2010
Medium/long-term financial liabilities
31 December 2010

231
Bon
d is
sues
Bon
d 20
04-2
011
2,
000,
000
1,
987,
211
1,99
8,20
0
2,00
0,00
0
1,99
6,05
6 1,
998,
800
3M E
urib
or
1.96
%(2
)0.
45%
9 Ju
ne 2
011
Bon
d 20
04-2
014
2,
750,
000
2,
695,
077
2,92
5,45
0
2,75
0,00
0
2,70
6,36
3 2,
883,
100
5.00
%5.
52%
9 Ju
ne 2
014
Bon
d 20
04-2
022
(GBP
)
75
0,00
0
55
0,14
8 78
5,25
0
75
0,00
0
56
8,94
0 61
5,80
15.
99%
6.47
%(2
) (3)
9 Ju
ne 2
022
Bon
d 20
04-2
024
1,
000,
000
971,
989
1,09
9,70
0
1,00
0,00
0
97
3,24
4 1,
106,
700
5.88
%6.
17%
9 Ju
ne 2
024
Bon
d 20
09-2
016
1,
500,
000
1,
482,
041
1,
632,
150
1,
500,
000
1,
549,
877
1,60
9,65
05.
63%
4.90
%6
May
201
6B
ond
2009
-203
8 (J
PY)
149,
176
149,
553
183,
155
149,
176
183,
444
238,
185
5.30
%5.
48%
(2) (
3)10
Dec
203
8B
ond
2010
-201
7
-
-
-
1,00
0,00
0
99
0,51
0
94
6,33
0 3.
38%
3.54
%18
Sep
t 201
7B
ond
2010
-202
5
-
-
-
500,
000
494,
222
458,
580
4.38
%4.
48%
16 S
ept 2
025
Tota
l bon
d is
sues
(A)
8
,149
,176
7,8
36,0
19
8
,623
,905
9,6
49,1
76
9
,462
,656
9,8
57,1
46
(4)
Med
ium
/long
-term
bor
row
ings
Ban
k bo
rrow
ings
Term
Loa
n Fa
cilit
y
80
0,00
0
78
6,08
7
81
0,15
6
72
0,00
0
70
9,58
0
72
7,59
1 6M
Eur
ibor
2.08
%(2
)0.
33%
30 J
une
2015
EIB
1,
039,
969
1,
039,
969
1,
123,
043
950,
631
950,
631
1,
054,
627
(5)
Cas
sa D
epos
iti e
Pre
stiti
SpA
150,
000
143,
531
170,
492
150,
000
143,
912
170,
979
6M E
urib
or2.
75%
1.23
%19
Dec
203
4O
ther
ban
ks
17
3,39
5
17
1,54
0
17
1,71
0
23
8,40
4
23
3,08
0
23
3,08
0 (2
)To
tal b
orro
win
gs li
nked
to g
rant
s
41
9,90
1
41
9,86
1
41
9,90
1
38
1,20
2
38
1,20
2
38
1,20
2 N
on-in
tere
st b
earin
g
Tota
l ban
k bo
rrow
ings
2,
583,
265
2,
560,
988
2,
695,
302
2,
440,
237
2,
418,
405
2,
567,
479
(4)
Oth
er b
orro
win
gsAN
ASA
utos
trade
per
l’Ita
lia S
pA
11
0,55
3
11
0,55
3
11
0,55
3
3
2,61
1
3
2,61
1
3
2,61
1 N
on-in
tere
st b
earin
g(4
)S
trada
dei
Par
chi S
pA
67
2,63
8
67
2,63
8
79
8,09
6
-
-
-
Cen
tral
Gua
rant
ee F
und
106,
378
56,
664
56,
664
104,
155
56,
479
56,
479
Non
-inte
rest
bea
ring
(7)
Oth
er
5
3,21
9
5
3,21
9
5
3,21
9
5
2,10
1
5
2,10
1
5
2,10
1
Tota
l oth
er b
orro
win
gs
94
2,78
8
89
3,07
4
1,01
8,53
2
18
8,86
7
14
1,19
1
14
1,19
1
Tota
l med
ium
/long
-term
bor
row
ings
(B)
3
,526
,053
3,4
54,0
62
3
,713
,834
2,6
29,1
04
2
,559
,596
2,7
08,6
70
Med
ium
/long
-term
bon
d is
sues
and
bo
rrow
ings
(C)=
(A)+
(B)
1
1,67
5,22
9
11,
290,
081
1
2,33
7,73
9
12,
278,
280
1
2,02
2,25
2
12,
565,
816
(6)
Der
ivat
ive
finan
cial
inst
rum
ents
liab
ility
(D)
374
,778
3
74,7
78
279
,593
2
79,5
93
(8)
Oth
er fi
nanc
ial l
iabi
litie
s(E
)
49,
712
4
7,67
6 (9
)
Acc
rued
exp
ense
s on
med
ium
/long
-term
fina
ncia
l lia
bilit
ies
(F)
276
,219
2
51,1
67
Tota
l med
ium
/long
-term
fina
ncia
l lia
bilit
ies
(G
)=(C
)+(D
)+(E
)+(F
)
11,
990,
790
1
2,60
0,68
8
(1) T
he v
alue
of m
ediu
m/lo
ng-te
rm fi
nanc
ial l
iabi
litie
s sh
own
in th
e ta
ble
incl
udes
bot
h th
e no
n-cu
rrent
and
cur
rent
por
tions
.
(3) T
he p
ar v
alue
incl
udes
the
chan
ge ra
te o
f the
cur
renc
y he
dged
.
Spre
adM
atur
ity
(8) I
nstru
men
t cla
ssifi
ed a
s a
hedg
ing
deriv
ativ
e in
acc
orda
nce
with
IAS
39 a
nd in
leve
l 2 o
f the
fair
valu
e hi
erar
chy.
Fair
valu
e as
at 3
1 D
ec 2
009
Par v
alue
as
at 3
1 D
ec 2
010
(1)
Car
ryin
g am
ount
as
at 3
1 D
ec 2
010
(1)
Fair
valu
e as
at 3
1 D
ec 2
010
Ref
eren
ce in
tere
st
rate
Effe
ctiv
e in
tere
st
rate
(9) I
tem
incl
udes
bor
row
ings
cla
ssifi
ed a
s fin
anci
al li
abilit
ies
mea
sure
d at
fair
valu
e in
acc
orda
nce
with
IAS
39.
Not
e
(2) A
s at
31
Dec
embe
r 201
0 in
tere
st ra
te a
nd fo
reig
n ex
chan
ge h
edge
s w
ith a
not
iona
l am
ount
of €
3,66
7 m
illion
wer
e in
pla
ce th
at w
ere
clas
sifie
d as
cas
h flo
w h
edge
s in
acc
orda
nce
with
IAS
39.
(4) F
inan
cial
inst
rum
ent c
lass
ified
as
a fin
anci
al li
abilit
y m
easu
red
at a
mor
tised
cos
t in
acco
rdan
ce w
ith IA
S 39
.(5
) Loa
ns re
paya
ble
betw
een
2011
and
203
3.(6
) Stra
da d
ei P
arch
i SpA
's m
ediu
m/lo
ng-te
rm b
orro
win
gs a
s at
31
Dec
embe
r 201
0 of
€69
5,32
7 th
ousa
nd h
ave
been
recl
assi
fied
to li
abilit
ies
rela
ted
to d
isco
ntin
ued
oper
atio
ns.
(7) F
inan
cial
inst
rum
ent c
lass
ified
as
a fin
anci
al li
abilit
y m
easu
red
at fa
ir va
lue
in a
ccor
danc
e w
ith IA
S 39
.
(€00
0)Pa
r val
ue a
s at
31
Dec
200
9 (1
)C
arry
ing
amou
nt a
s at
31
Dec
200
9 (1
)

232
The following table shows the par value of medium/long-term financial liabilities by currency as at
31 December 2010 and 31 December 2009, not including accrued borrowing costs at those dates,
and changes during 2010.
The Group uses derivative financial instruments to hedge the risks associated with certain financial
liabilities, including interest rate swaps (IRS) and Cross Currency Swaps (CCS), which under IAS
39 were classified as at 31 December 2010 as cash flow hedges. The market value of the above
hedging instruments as at 31 December 2010 were recognised in Derivative liabilities and assets.
More detailed information on financial risks and the manner in which they are managed in
addition to outstanding financial instruments is contained in note 9.3 “Financial risk
management”.
BOND ISSUES (non-current) • €7,466,600 thousand (€7,836,019 thousand) (current) • €1,996,056 thousand ( - ) This item refers to bonds issued by the Parent as part of its €10 billion Medium Term Note (MTN)
Programme.
The non-current portion as at 31 December 2010 amounts to €7,466,600 thousand, having
decreased by €369,419 thousand. This essentially reflects the combined effect of:
a) the reclassification to current liabilities of the bond issue with a par value of €2,000 million
(carried at €1,996,056 thousand as at 31 December 2010) maturing on 9 June 2011;
Euro 10,558,501 11,088,601GBP 750,000 750,000JPY 149,176 149,176PLN 81,515 140,944CLP 134,083 147,758USD 1,954 1,801
TOTAL 11,675,229 12,278,280
(€000) Par value as at 31 Dec 2009
Par value as at 31 Dec 2010
(€000) Par value as at 31 Dec 2009 Repayments New
borrowings
Currency translation differences
Other changes
Reclassifications to liabilities related to
discontinued operations
Par value as at 31 Dec 2010
Bond issues 8,149,176 - 1,500,000 - - - 9,649,176Bank borrowings 2,583,265 -223,822 57,804 23,217 - -227 2,440,237Other borrowings 942,788 -22,013 36,673 1,805 -75,286 -695,100 188,867
TOTAL 11,675,229 -245,835 1,594,477 25,022 -75,286 -695,327 12,278,280
233
b) new fixed rate bonds issued during the year with par values of €1,000 million maturing in
2017 and of €500 million maturing in 2025;
c) an increase (€67,836 thousand) in the fair value of the bond issue with a par value of
€1,500,000 thousand issued in May 2009 in line with movements in interest rates. Since the
fair value of the bond had been hedged by derivatives it was measured at fair value. In
September 2010 derivatives classified as fair value hedges that had put in place in May 2009 to
cover the interest rate risk of the bond issue, were unwound. The unwinding of the derivatives
meant the bonds were exposed to interest rate risk, which, however, was lower than the original
exposure as a result of the gain of €69,435 thousand on unwinding the derivative, €58,451
thousand of which will gradually be recognised in the income statement starting from the
derivative instruments expiration date to May 2016;
d) an increase of €51,772 thousand in foreign currency bond issues (GBP and YEN) resulting
from a strengthening in the value of the two currencies with respect to the euro.
MEDIUM/LONG-TERM BORROWINGS (non-current) • €2,323,273 thousand (€3,068,276 thousand) (current) • €236,323 thousand (€385,786 thousand) These liabilities, which were detailed in the previous tables, include a non-current portion of
€2,323,273 thousand, which has decreased by €745,003 thousand during the year. The reduction
essentially reflects the combined effect of the reclassification to current liabilities of both Strada dei
Parchi’s borrowings (€658,841 thousand), now accounted for liabilities related to discontinued
operations, and the portion of borrowings that will mature in the next twelve months (€179,918
thousand). These changes were partially offset by an increase in foreign currency liabilities
(€24,703 thousand), reflecting exchange rate movements, and new borrowings of the year
(€91,612 thousand).
The current portion, totalling €236,323 thousand, is down €149,463 thousand compared with 31
December 2009, primarily due to repayments of medium/long-term borrowings during the year
(€245,835 thousand), partially offset by the above reclassifications of current portion of financial
liabilities maturing to medium/long term.
The Term Loan Facility agreement (€709,580 thousand as at 31 December 2010) imposes certain
covenants with which the borrower must comply over the term of the facility and which have always
been complied with.
In particular, the ratios of Funds from Operations (FFO) to other net financial expenses and FFO
to net debt and the borrower’s equity must remain within a certain range. The variables used for
the calculation of the ratios are specifically defined in the agreement.

234
DERIVATIVE LIABILITIES (non-current) €253,599 thousand (€374,778 thousand) (current) • €25,994 thousand ( - ) This item represents fair value losses on outstanding derivatives as at 31 December 2010, classified
as cash flow hedges depending on the hedged risk, as required by IAS 39.
Cash flow hedges include a Cross Currency Interest Rate Swap (CCIRS) entered into by Atlantia to
hedge exposure to currency and interest rate risk associated with the medium/long-term bond issue
with a par value of GBP500,000 (the fair value of €217,990 thousand of which reflects the impact
of the movement in the euro/sterling exchange rate, amounting to €169,110 thousand, thereby
offsetting the movement in the underlying liability), and Interest Rate Swaps entered into by
certain Group companies, hedging interest rate risk on the non-current financial liabilities set out
below:
a) a Senior Secured Long Term Facility (Term Loan Facility) with a par value of €720,000
thousand on the books of Autostrade per l’Italia;
b) Project Financing with a par value of €47,799 thousand on the books of the Stalexport
Autostrady group.
The current portion of €25,994 thousand relates entirely to the fair value of cash flow hedges in
respect of the above bond issue with a par value of €2,000,000 thousand maturing in June 2011.
Further details of derivatives subscribed to by the Group for hedging purposes are contained in
note 9.3 “Financial risk management”.
OTHER MEDIUM TO LONG-TERM FINANCIAL LIABILITIES (non-current) €23,437 thousand (€25,464 thousand) (current) • €24,239 thousand (€24,248 thousand) Other medium to long-term financial liabilities consist predominantly of long-term deferred
income relating to interest rate subsidies in future years related to Società Autostrada Tirrenica e
Tangenziale di Napoli.
SHORT-TERM BORROWINGS• €278,720 thousand (€504,282 thousand) The carrying amount as at 31 December 2010 essentially consists of:
a) current account overdrafts of €19,857 thousand, marking a reduction of €21,133
thousand compared with 31 December 2009;
b) short-term borrowings of €6,574 thousand, which are down €178,816 thousand
primarily due to the reclassification to liabilities related to discontinued operations of
the loan granted to Strada dei Parchi (total carrying amount €181,337 thousand);
c) accrued borrowing costs on medium/long-term borrowings of €251,167 thousand,
down €25,052 thousand, essentially because of the reclassification to liabilities related

235
to discontinued operations of accrued borrowing costs payable to other lenders to
Strada dei Parchi (€40,714 thousand), partially offset by the increase in accrued
interest on medium term borrowings (€15,484 thousand).
7.16 Other non-current liabilities • €44,151 thousand (€56,479 thousand) The €12,328 thousand decrease is essentially due to the release to income statement of a part of the
decrease in accrued expenses because of higher revenue associated with the X variable collected in
previous years by Autostrade Meridionali.
7.17 Trading liabilities • €1,307,428 thousand (€1,190,764 thousand) The increase in trading liabilities essentially derives from the greater exposure to suppliers because
of the increase in investments during the year, particularly those of Pavimental, which recorded an
increase of €97,699 thousand, and Spea where the increase was €12,001 thousand. The balance as
at 31 December 2010 was also affected by the reclassification of Strada dei Parchi trading liabilities
of €56,664 thousand to liabilities related to discontinued operations.
(€000) 13 December 2010 31 December 2009 Increase/ (Decrease)
Trade payables746,702 647,254 99,448
Payable to operators of interconnecting motorways 446,037 420,433 25,604
Tolls in the process of settlement110,367 117,835 -7,468
Deferred costs and other current liabilities4,323 5,243 -920
Total 1,307,429 1,190,765 116,664
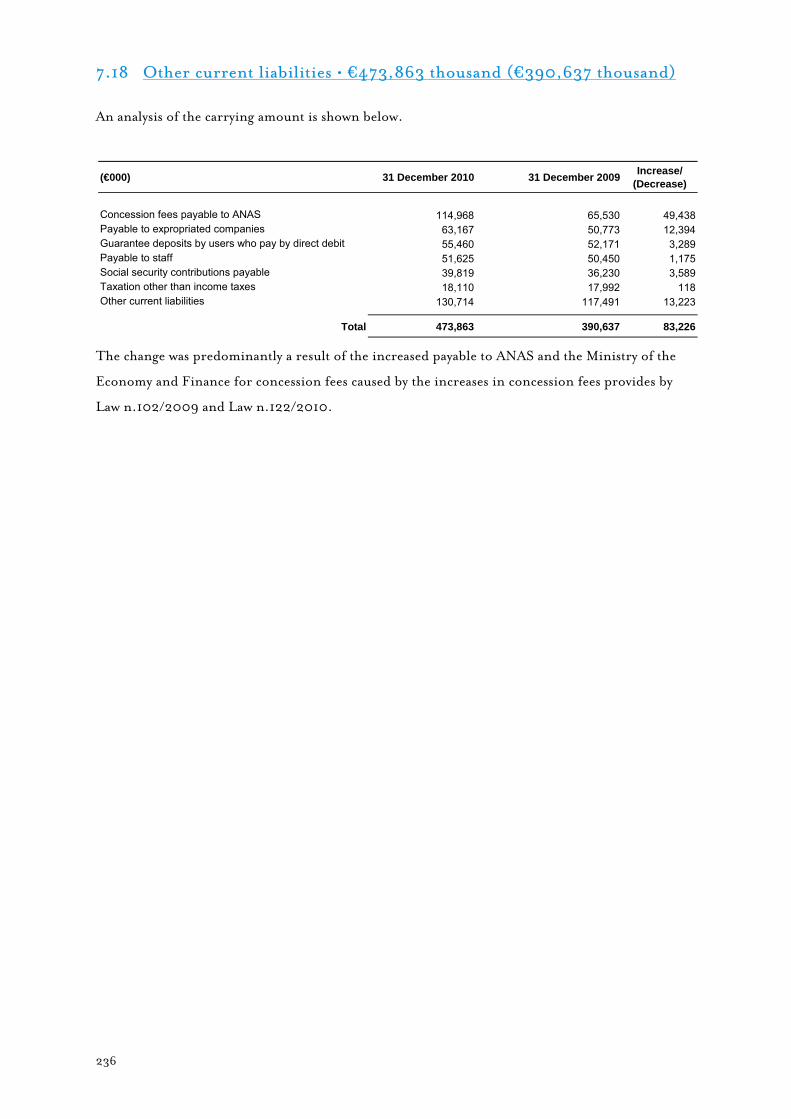
236
7.18 Other current liabilities • €473,863 thousand (€390,637 thousand)
An analysis of the carrying amount is shown below.
The change was predominantly a result of the increased payable to ANAS and the Ministry of the
Economy and Finance for concession fees caused by the increases in concession fees provides by
Law n.102/2009 and Law n.122/2010.
(€000) 31 December 2010 31 December 2009 Increase/ (Decrease)
Concession fees payable to ANAS 114,968 65,530 49,438Payable to expropriated companies 63,167 50,773 12,394Guarantee deposits by users who pay by direct debit 55,460 52,171 3,289Payable to staff 51,625 50,450 1,175Social security contributions payable 39,819 36,230 3,589Taxation other than income taxes 18,110 17,992 118Other current liabilities 130,714 117,491 13,223
Total 473,863 390,637 83,226

237
8. NOTES TO THE CONSOLIDATED INCOME STATEMENT
This section analyses the main income statement items. Amounts for 2009 are shown in brackets.
8.1 Toll revenue • €3,118,872 thousand (€2,845,195 thousand) Toll revenue of €3,118,872 thousand increased by a total of €273,677 thousand (9.6%) on the
figure for 2009 (€2,845,195 thousand), primarily reflecting:
a) toll rate increases for the Group’s Italian operators from 1 January 2010 whereas the 3.1%
toll rate increase in 2009 was only from 1 May;
b) the improvement in the traffic mix caused by the significant increase in volumes three axle
heavy vehicles (3.2% on the network operated by Autostrade per l'Italia), with total
volumes substantially unchanged, thus resulting in an increase in toll revenue estimated to
be 0.5%;
c) an increase in tolls collected by the Polish operator, Stalexport Autostrada Malopolska (up
€8,965 thousand on 2009), primarily as a result of tariff increases applied from
December 2009 (average increases of 17.0%), increased traffic (up 5.0%) and the
stronger Polish zloty (up 10.0%) resulting in an overall increase of 0.3%;
d) toll revenue for the Chilean operator, Sociedad Concesionaria de Los Lagos was up in
2010 to €13,084 thousand, €7,165 thousand above 2009, primarily because the company
had only been consolidated from 1 July 2009, with an overall increase of 0.3%;
e) the increased toll revenue of Autostrade Meridionali (uo €6,141 thousand on 2009),
which, following the signature of the Single Concession Arrangement, is no longer
entitled to the X variable from the year ended 31 December 2009. This resulted in the
reversal of prior year deferrals (+0.1%); and,
f) the increase in tolls from 5 August 2009 caused by the increase in the concession fee
pursuant to Law 102/2009 in addition to the 1 July 2010 increase in application of Law
122/2010 (up €148,600 thousand on 2009) (5.2%).
Further information on toll charge increases applied by the Group’s motorway operators and
traffic trends is provided in the relevant section of the report on operations.
The portion of toll revenue relating to the latter part of the year is calculated on the basis of
reasonable estimates.
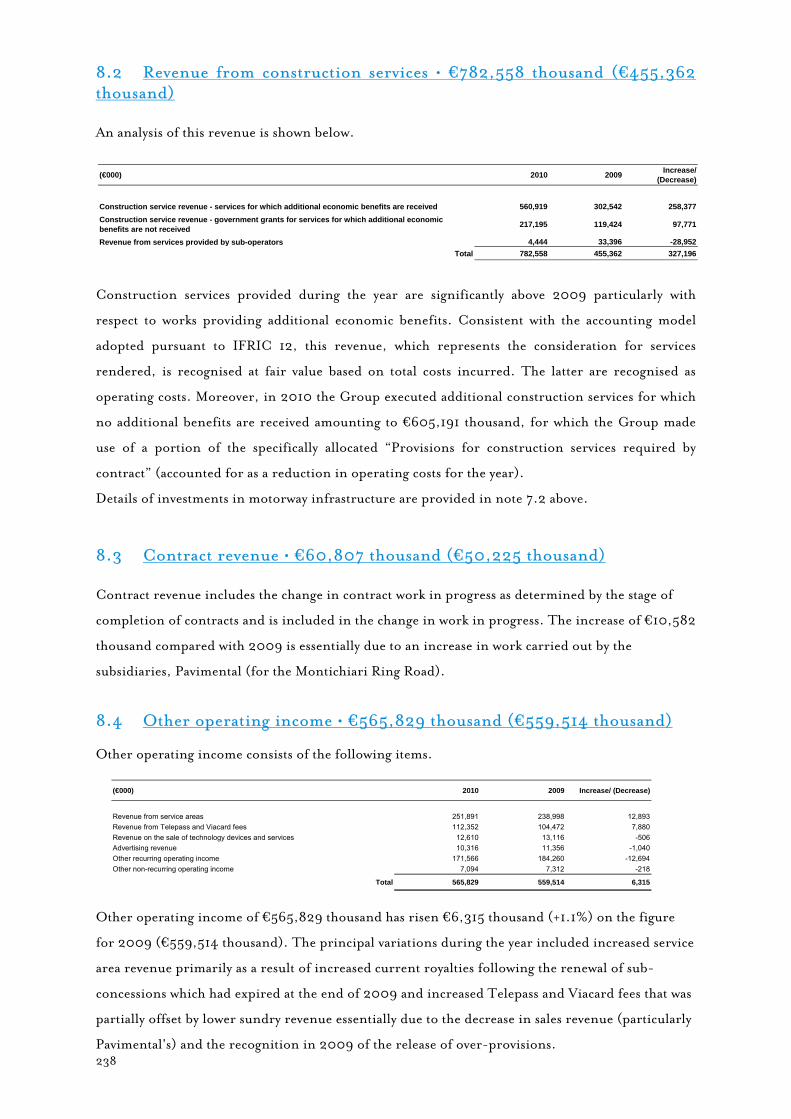
238
8.2 Revenue from construction services • €782,558 thousand (€455,362 thousand) An analysis of this revenue is shown below.
Construction services provided during the year are significantly above 2009 particularly with
respect to works providing additional economic benefits. Consistent with the accounting model
adopted pursuant to IFRIC 12, this revenue, which represents the consideration for services
rendered, is recognised at fair value based on total costs incurred. The latter are recognised as
operating costs. Moreover, in 2010 the Group executed additional construction services for which
no additional benefits are received amounting to €605,191 thousand, for which the Group made
use of a portion of the specifically allocated “Provisions for construction services required by
contract” (accounted for as a reduction in operating costs for the year).
Details of investments in motorway infrastructure are provided in note 7.2 above.
8.3 Contract revenue • €60,807 thousand (€50,225 thousand) Contract revenue includes the change in contract work in progress as determined by the stage of
completion of contracts and is included in the change in work in progress. The increase of €10,582
thousand compared with 2009 is essentially due to an increase in work carried out by the
subsidiaries, Pavimental (for the Montichiari Ring Road).
8.4 Other operating income • €565,829 thousand (€559,514 thousand) Other operating income consists of the following items.
Other operating income of €565,829 thousand has risen €6,315 thousand (+1.1%) on the figure
for 2009 (€559,514 thousand). The principal variations during the year included increased service
area revenue primarily as a result of increased current royalties following the renewal of sub-
concessions which had expired at the end of 2009 and increased Telepass and Viacard fees that was
partially offset by lower sundry revenue essentially due to the decrease in sales revenue (particularly
Pavimental's) and the recognition in 2009 of the release of over-provisions.
(€000) 2010 2009 Increase/ (Decrease)
Construction service revenue - services for which additional economic benefits are received 560,919 302,542 258,377Construction service revenue - government grants for services for which additional economic benefits are not received 217,195 119,424 97,771
Revenue from services provided by sub-operators 4,444 33,396 -28,952Total 782,558 455,362 327,196
(€000) 2010 2009 Increase/ (Decrease)
Revenue from service areas 251,891 238,998 12,893Revenue from Telepass and Viacard fees 112,352 104,472 7,880Revenue on the sale of technology devices and services 12,610 13,116 -506Advertising revenue 10,316 11,356 -1,040Other recurring operating income 171,566 184,260 -12,694Other non-recurring operating income 7,094 7,312 -218
Total 565,829 559,514 6,315
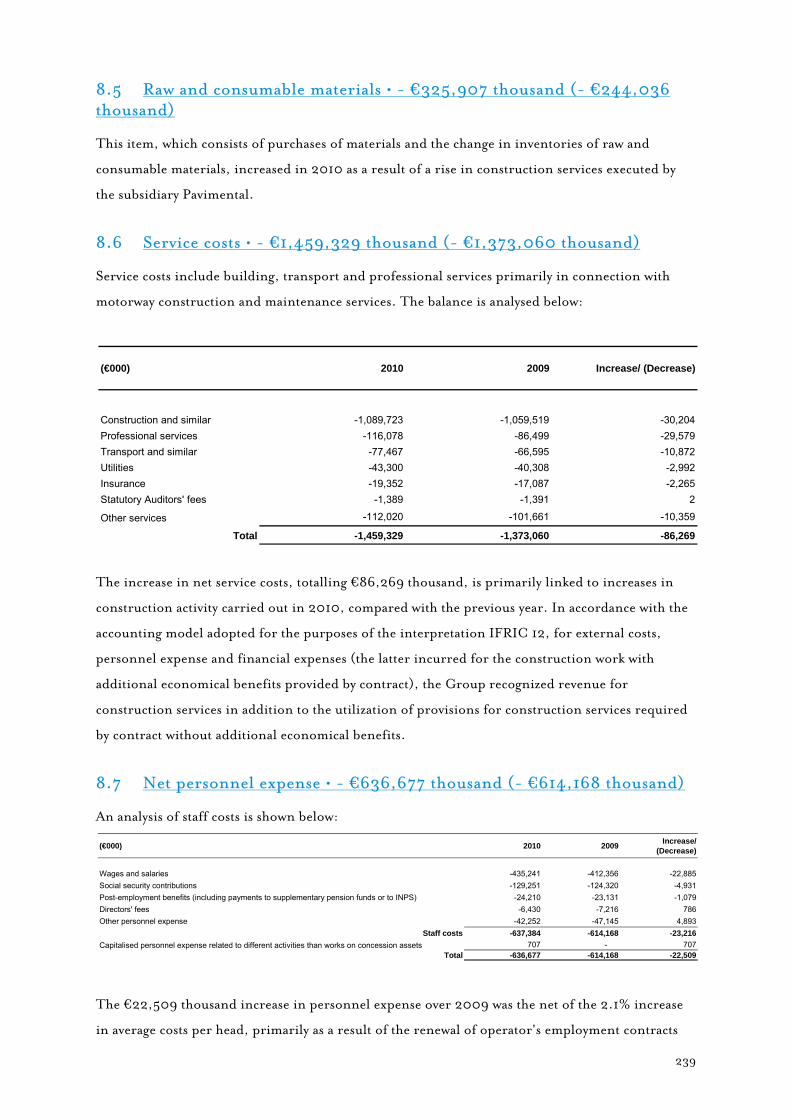
239
8.5 Raw and consumable materials • - €325,907 thousand (- €244,036 thousand) This item, which consists of purchases of materials and the change in inventories of raw and
consumable materials, increased in 2010 as a result of a rise in construction services executed by
the subsidiary Pavimental.
8.6 Service costs • - €1,459,329 thousand (- €1,373,060 thousand) Service costs include building, transport and professional services primarily in connection with
motorway construction and maintenance services. The balance is analysed below:
The increase in net service costs, totalling €86,269 thousand, is primarily linked to increases in
construction activity carried out in 2010, compared with the previous year. In accordance with the
accounting model adopted for the purposes of the interpretation IFRIC 12, for external costs,
personnel expense and financial expenses (the latter incurred for the construction work with
additional economical benefits provided by contract), the Group recognized revenue for
construction services in addition to the utilization of provisions for construction services required
by contract without additional economical benefits.
8.7 Net personnel expense • - €636,677 thousand (- €614,168 thousand) An analysis of staff costs is shown below:
The €22,509 thousand increase in personnel expense over 2009 was the net of the 2.1% increase
in average costs per head, primarily as a result of the renewal of operator's employment contracts
(€000) 2010 2009 Increase/ (Decrease)
Construction and similar -1,089,723 -1,059,519 -30,204Professional services -116,078 -86,499 -29,579Transport and similar -77,467 -66,595 -10,872Utilities -43,300 -40,308 -2,992Insurance -19,352 -17,087 -2,265Statutory Auditors' fees -1,389 -1,391 2
Other services -112,020 -101,661 -10,359
Total -1,459,329 -1,373,060 -86,269
(€000) 2010 2009 Increase/ (Decrease)
Wages and salaries -435,241 -412,356 -22,885Social security contributions -129,251 -124,320 -4,931Post-employment benefits (including payments to supplementary pension funds or to INPS) -24,210 -23,131 -1,079Directors' fees -6,430 -7,216 786Other personnel expense -42,252 -47,145 4,893
Staff costs -637,384 -614,168 -23,216Capitalised personnel expense related to different activities than works on concession assets 707 - 707
Total -636,677 -614,168 -22,509
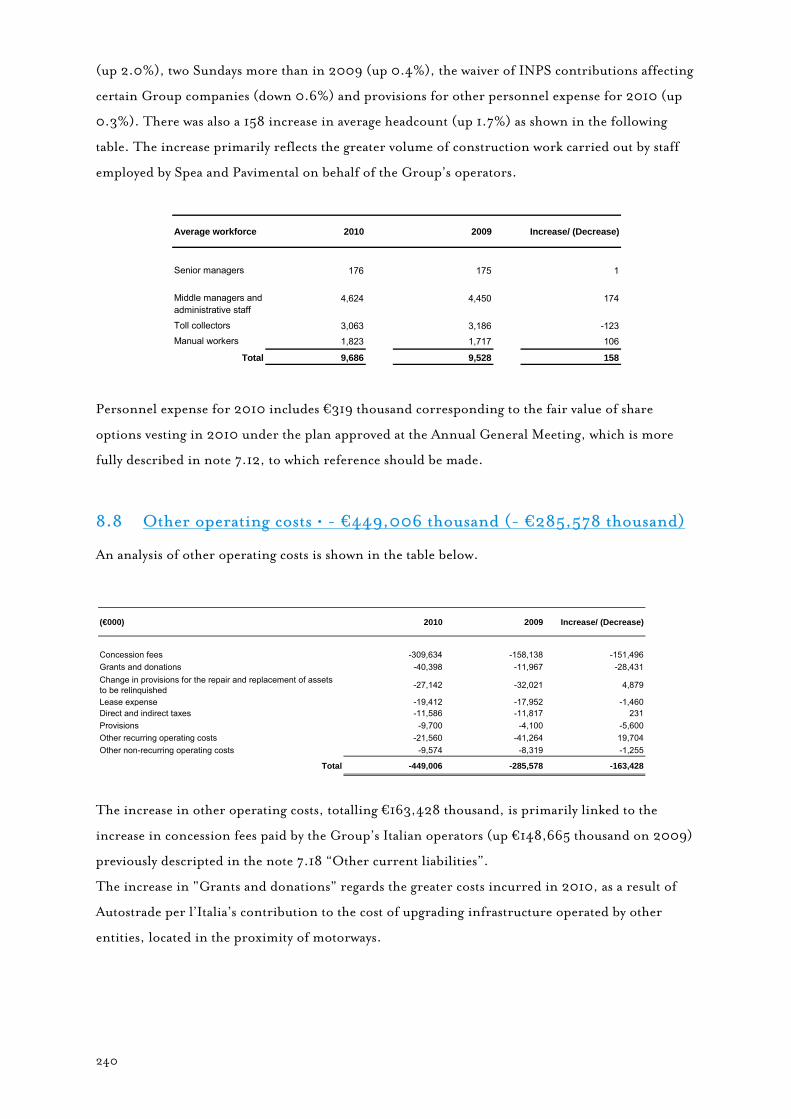
240
(up 2.0%), two Sundays more than in 2009 (up 0.4%), the waiver of INPS contributions affecting
certain Group companies (down 0.6%) and provisions for other personnel expense for 2010 (up
0.3%). There was also a 158 increase in average headcount (up 1.7%) as shown in the following
table. The increase primarily reflects the greater volume of construction work carried out by staff
employed by Spea and Pavimental on behalf of the Group’s operators.
Personnel expense for 2010 includes €319 thousand corresponding to the fair value of share
options vesting in 2010 under the plan approved at the Annual General Meeting, which is more
fully described in note 7.12, to which reference should be made.
8.8 Other operating costs • - €449,006 thousand (- €285,578 thousand) An analysis of other operating costs is shown in the table below.
The increase in other operating costs, totalling €163,428 thousand, is primarily linked to the
increase in concession fees paid by the Group’s Italian operators (up €148,665 thousand on 2009)
previously descripted in the note 7.18 “Other current liabilities”.
The increase in "Grants and donations" regards the greater costs incurred in 2010, as a result of
Autostrade per l’Italia’s contribution to the cost of upgrading infrastructure operated by other
entities, located in the proximity of motorways.
Average workforce 2010 2009 Increase/ (Decrease)
Senior managers 176 175 1
Middle managers and administrative staff
4,624 4,450 174
Toll collectors 3,063 3,186 -123Manual workers 1,823 1,717 106
Total 9,686 9,528 158
(€000) 2010 2009 Increase/ (Decrease)
Concession fees -309,634 -158,138 -151,496Grants and donations -40,398 -11,967 -28,431Change in provisions for the repair and replacement of assets to be relinquished -27,142 -32,021 4,879
Lease expense -19,412 -17,952 -1,460Direct and indirect taxes -11,586 -11,817 231Provisions -9,700 -4,100 -5,600Other recurring operating costs -21,560 -41,264 19,704Other non-recurring operating costs -9,574 -8,319 -1,255
Total -449,006 -285,578 -163,428

241
8.9 Use of provisions for construction services required by contract • €605,191 thousand (€716,610 thousand) This item regards the use, during the year, of provisions for construction services required by
contract in relation to works for which no additional economic benefits are received. The
provisions used, based on the construction services provided during year, are recognised as indirect
adjustments of the relevant categories of cost, classified by nature, incurred in the rendering of
construction services during the year by The Group’s operators.
Further information on construction services and total investments during the year is provided in
notes 7.2 and 8.2.
8.10 (Impairment losses)/Reversal of impairment losses • €2,664 thousand (€7,581 thousand) An analysis of impairment losses and reversal of impairment losses is shown below:
The changes of figure compared to 2009, reflect essentially the impairment losses on trade
receivables accounted for in the previous year, due to evidence that the Group will not be able to
collect all or any of the amount. €16,106 thousand of the impairment loss in Raccordo
Autostradale Valle d’Aosta's infrastructure was reversed in 2010 and €28,961 thousand in 2009.
Whereas an impairment losses on the Polish company Stalexport Autostrada Malopolska's
concession rights of €16,363 thousand was recognised in 2009.
(€000) 2010 2009 Increase/ (Decrease)
Impairment lossestrade receivable accounting in previous year -10,966 -4,934 -6,032concession rights - -16,363 16,363other current assets -2,555 -83 -2,472
-13,521 -21,380 7,859Reversal of impairment lossesconcession rights 16,106 28,961 -12,855material and immaterial assets 79 - 79
16,185 28,961 -12,776
Total 2,664 7,581 -4,917

242
8.11 Financial income/(expenses) - €671,559 thousand (-€660,429 thousand)
Income from financial assets • €188,254 thousand (€145,453 thousand) Net financial expenses • - €865,191 thousand (- €805,636 thousand) Foreign exchange gains/(losses) • €5,378 thousand (- €246 thousand)
An analysis of financial income and expenses is shown below.
Net financial expenses, after deducting financial income, total €671,559 thousand, which is
substantially in line with the figure for 2009 (€660,429 thousand).
The most important variations were:
a) an increase in net financial income resulting from consolidation of the Autostrade
dell’Atlantico group, totalling €19,323 thousand;
b) an approximately €21,658 thousand increase in interest essentially because of the increase
in the differential, between funding costs that increased to obtain sufficient funds to
finance the intercompany repayment in 2011 and the return on cash investments following
the increase in average cash invested, partially offset by an increase in the average return on
those balances;
(€000) 2010 2009 Increase/ (Decrease)
Income from transactions in derivative financial instruments 134,005 84,719 49,286Income from discounting to present value 19,495 8,925 10,570Interest and fees on bank and post office deposits 25,337 15,511 9,826Other financial income 6,974 35,662 -28,688Income from financial assets 185,811 144,817 40,994Revaluations of financial assets - 196 -196Dividends from investments 2,443 440 2,003
Income from financial assets 188,254 145,453 42,801
Financial expenses from discounting of provisions and for construction services required by contract -176,382 -192,310 15,928
Interest on bonds -386,340 -352,274 -34,066Interest on medium/long-term borrowings -79,459 -96,696 17,237Losses on derivative financial instruments -146,931 -155,609 8,678Interest and fees on bank and post office deposits -1,053 -1,311 258Other financial expenses -77,062 -9,549 -67,513Grants for interest 2,036 2,040 -4Other financial expenses -688,809 -613,399 -75,410Capitalised financial expenses - 73 -73
Net financial expenses -865,191 -805,636 -59,555
Unrealised foreign exchange gains 57,760 39,966 17,794Realised foreign exchange gains 745 895 -150Foreign exchange gains 58,505 40,861 17,644
Unrealised foreign exchange losses -52,447 -40,415 -12,032Realised foreign exchange losses -680 -692 12Foreign exchange losses -53,127 -41,107 -12,020
Foreign exchange gains/(losses) 5,378 -246 5,624Total -671,559 -660,429 -11,130

243
c) an approximately €3,993 thousand increase in interest and fees due to the higher average
level of borrowings during the year;
d) the €15,928 thousand reduction for the year of "Financial expenses from the discounting
of provisions and provision for construction services required by contract" principally
because of the favourable effect of interest rates;
e) the recognition in the first half of 2009 of non-recurring income of €20,465 thousand
following the SIAS group’s acquisition of 50% of Autostrade per il Cile, the company set
up by Autostrade per l’Italia at the beginning of 2009 and used as a vehicle for the
acquisition of certain assets from the Itinere group.
The 31 December 2010 balances furthermore reflect the unwinding of derivatives previously
classified as the fair value hedges of the bond issue redeemable in 2016.
Interest rate subsidies refer to non-interest bearing loans granted by the Central Guarantee Fund
that were recognised in accordance with IAS 39.
8.12 Share of profit/(loss) of associates and joint ventures accounted for using the equity method • - €2,080 thousand ( - €51,102 thousand)
This item consists of the effect on the income statement of recognising investments in associated
companies and joint ventures using the equity method (see note 7.3).
The variation in 2010 was essentially due to the €24,235 thousand impairment loss on the
investment in IGLI (€67,045 thousand in 2009), €15,170 thousand (€67,708 thousand) of which
relates to the difference between the carrying amount of IGLI's shareholding in Impregilo and the
market value of the shares (the stock market price of Impregilo's shares), which was only partially
offset by the prorated recognition of the results for the year of:
a) Autostrade Sud America, totalling €17,282 thousand (€12,196 thousand in 2009), which
reflects the positive performance of the subsidiary, Costanera Norte;
b) Triangulo do Sol, totalling €3,166 thousand (€3,763 thousand), in which the Group has a
50% shareholding;
c) other associates accounted for using the equity method, which report an overall profit of
€1,707 thousand (- €18 thousand in 2009).

244
8.13 Income tax (expense)/benefit • - €400,300 thousand (-€380,741 thousand)
A comparison of the tax charges for the two comparative years is shown in the following table.
"Income tax expense" amounted to €400,300 thousand in 2010, a €19,559 increase (5.1%) over
2009 (€380,741 thousand) benefiting from non-recurring income (€13,072 thousand)
recognised in 2009 due to the claim for a deductible IRES and IRAP refund. The increase in the
2010 tax charge, which is less than proportional to pre-tax results, was primarily due to the
incidence of taxation in combination with lower non-deductible impairment losses than in 2009.
It should be noted that in the absence of legislation governing the tax regime, Autostrade per l’Italia
asked the Tax Authorities to confirm the tax treatment used following the adoption of IFRIC 12. It
is evident, however, that a possible different interpretation by the Tax Authorities, would not
produce significant effects on the amount of total taxes, but a possible reclassification between
current and deferred taxes.
The following table shows a reconciliation of the theoretical rate of IRES with the effective charge.
(€000) 2010 2009
IRES -286,849 -275,558IRAP -101,524 -96,831
Other taxes -2,621 -1,534
Current tax benefit of tax loss carry-forwards 3,079 1,255Current taxes -387,915 -372,668
Recovery of previous year's income taxes 1,953 16,221Previous year's income taxes -5,624 -2,866
Differences on current tax expense for previous years -3,671 13,355
Provisions 129,221 146,159Releases -151,387 -156,396Change in estimates for previous years 8,013 -9,338
Deferred tax income -14,153 -19,575
Provisions -9,266 -9,267Releases 6,078 7,295Change in estimates for previous years 8,627 119
Deferred tax expense 5,439 -1,853
Total -400,300 -380,741

245
8.14 Profit/(loss) from discontinued operations • - €6,999 thousand (- €20,466 thousand) “Profit/(loss) from discontinued operations" essentially refers to the operating loss for the year of
Strada dei Parchi which, as noted above, is accounted for as discontinued operations due to the fact
that negotiations have now been finalised for the sale of a controlling shareholding in Strada dei
Parchi with an agreement having been signed for the sale of 60% of the company's share capital.
8.15 Earnings per share The following table shows the calculation of basic and diluted earnings per share with comparative
amounts.
As required by IAS 33, the weighted average number of shares in issue was recomputed to take
account of Atlantia's bonus issue carried out in May 2010, as described in note 7.12 above. An
adjustment was also made to the computation of diluted earnings per share to reflect share option
(€000) Amount Effective tax rate Amount Effective tax
rate
Profit from continuing operations 1,108,321 962,671
Theoretical income tax expense/(credit) 304,788 27.50% 264,735 27.50% Temporary differences deductible in future years 335,838 92,356 8.33% 407,230 111,988 11.63% Temporary differences taxable in future years -9,386 -2,581 -0.23% -29,116 -8,007 -0.83%
Reversal of temporary differences arising in previous years -428,933 -117,957 -10.64% -447,328 -123,015 -12.78% Permanent differences 26,052 7,164 0.65% 104,005 28,601 2.97%
Taxable income for purposes of IRES 1,031,892 997,462
Current IRES charge for the year (after deduction of tax losses) 283,770 25.60% 274,303 28.49%
Current IRAP charge for the year 101,524 9.16% 96,831 9.92%
Other income tax expense for the year payable by non-Italian companies 2,621 0.24% 1,534 0.40%
Current tax expense for the year 387,915 35.00% 372,668 38.82%
2010 2009
Taxable income
TaxationTaxable income
Taxation
(€000) 2010 2009 Increase/ (Decrease)
Operating income 174,294 190,439 -16,145Operating costs -128,649 -165,555 36,906Financial income 374 165 209Financial expenses -51,017 -48,318 -2,699Income tax (expense)/benefit -1,378 1,996 -3,374Loss from discontinued operations (Strada dei Parchi) -6,376 -21,273 14,897
Other net profit/(loss) from discontinued operations -623 807 -1,430
Profit/(Loss) from discontinued operations -6,999 -20,466 13,467

246
plans.
Number of shares outstanding 600,297,135 600,297,135Weighted average of treasury shares in portfolio -12,050,447 -12,050,447Weighted average of shares outstanding for the calculation of basic earnings per share 588,246,688 588,246,688
Weighted average shares held under stock option plans with dilutive effect 101,718 50,224 Weighted average of all shares outstanding for the calculation of diluted earnings per share 588,348,406 588,296,912
Profit for the year attributable to owners of the parent (€000) 682,952 562,539Basic earnings per share (€) 1.16 0.96 Diluted earnings per share 1.16 0.96
Profit from continuing operations attributable owners of the parent (€000) 687,401 574,496Basic earnings per share from continuing operations (€) 1.17 0.99 Diluted earnings per share from continuing operations (€) 1.17 0.99
Profit/(loss) from discontinued operations attributable to owners of the parent (€000) -4,449 -11,957Basic earnings per share from discontinued operations (€) -0.01 -0.03Diluted earnings per share from discontinued operations (€) -0.01 -0.03
2010 2009

247
9. OTHER FINANCIAL INFORMATION
9.1 Notes to the consolidated statement of cash flows
Cash flow in 2010, as reported in the consolidated statement of cash flows, is analysed and
compared with the previous year below.
Cash increased by €1,340.1 million during 2010, compared with an increase of €1,140.2 million
in 2009.
Operating activities generated cash flows of €1,640.8 million in 2010, compared with €1,317.3
million in 2009. The increase in operating cash flow essentially reflects the improved performance
of continuing, and the positive contribution of working capital. This essentially reflects an increase
in trading liabilities, partly due to higher amounts payable to the operators of interconnecting
motorways and increased trade payables.
Cash used in investing activities totalled €1,345.3 million, €183.3 million more than the €1,162.0
million of 2009. The outflow in 2009 reflected the acquisition of investments (Alitalia, IGLI,
Tangenziali Esterne di Milano and companies acquired from the Itinere group), totalling €312.1
million, whilst the figure for 2010 benefited from the sale of two investments in Portuguese
companies. 2010 also witnessed an increase of €189.8 million in investments in motorway
infrastructure, net of the related government grants and the increase in financial assets in the form
of takeover rights. Finally, cash of €145.8 million used in investing activities in 2010 relates to the
increase in current and non-current financial assets compared with 2009 (€185.4 million),
essentially due to the greater releases from term deposits in 2009 relating to prior investments.
Financing activities in 2010 generated net cash flows of €1,043.2 million, primarily as a result of a
bond issue in September 2010. Cash flow generated in 2009 of €984.6 million, on the other
hand, was a result of the May 2009 bond issue.
The following table shows cash flows, as required by IFRS 5, from operating, investing and
financing activities of the subsidiary Strada dei Parchi, the assets and liabilities of which have been
recognised as assets and liabilities related to discontinued operations:
(€000) 2010 2009
Net cash generated from/(used in) operating activities 49,481 6,544Net cash generated from/(used in) investing activities -62,814 -52,326Net cash generated from/(used in) financing activities 54,351 69,986

248
9.2 Notes to the analysis of consolidated net debt
The following statement shows the Group’s net debt broken down into its principal components,
notes on which are set out above in the relevant notes dealing with financial assets and liabilities,
and amounts due to and from related parties, as required by CONSOB Communication
DEM/6064293 of 28 July 2006.
The financial assets and liabilities as at 31 December 2010 relating to Strada dei Parchi, recognised
in "Non-current assets held for sale and related to discontinued operations" and "Liabilities
related to discontinued operations" in the consolidated statement of financial position reported
below by nature in the separate accounts for assets and current liabilities.
(€ m) Increase/ (Decrease)
Non-current financial liabilities 10,066.9 11,304.5 -1,237.6Bond issues 7,466.6 7,836.0 -369.4Medium/long-term borrowings 2,323.3 3,068.3 -745.0Derivative liabilities 253.6 374.8 -121.2Other financial liabilities 23.4 25.4 -2.0
Current financial liabilities 3,520.2 914.4 2,605.8Bank overdrafts 19.9 41.0 -21.1Short-term borrowings 6.6 185.4 -178.8Current portion of medium/long-term borrowings 2,533.8 686.3 1,847.5Bank account payables to unconsolidated group companies 0.9 1.5 -0.6Other financial liabilities 0.2 0.2 0.0Bank overdrafts related to discontinued operations 8.0 - 8.0Financial liabilities related to discontinued operations 950.8 - 950.8
Total financial liabilities 13,587.1 12,218.9 1,368.2
Cash and cash equivalents -2,548.7 -1,222.3 -1,326.4Cash -207.1 -403.3 196.2Cash equivalents -2,326.1 -819.0 -1,507.1Cash and cash equivalents -15.5 - -15.5
Other current financial assets -445.7 -392.0 -53.7Current portion of medium/long-term financial assets -22.0 -67.8 45.8Current financial assets deriving from concession rights -8.9 -14.3 5.4Current financial assets deriving from government grants -189.4 -88.0 -101.4Term deposits convertible within 12 months -180.9 -181.6 0.7Other financial assets -34.7 -23.2 -11.5
of which due from related parties -1.2 -5.6 4.4Financial assets included in disposal groups -9.8 -17.1 7.3
of which due from related parties -1.6 -17.1 15.5
Total current financial assets -2,994.4 -1,614.3 -1,380.1
(Net funds)/Net debt in accordance with CESR recommendation of 10 Feb 2005 10,592.7 10,604.6 -11.9
Non-current financial assets -935.4 -850.1 -85.3Non-current financial assets deriving from concessions -373.7 -288.0 -85.7Non-current financial assets deriving from government grants -201.5 -180.4 -21.1Term deposits convertible after 12 months -285.9 -336.7 50.8Derivative assets -40.2 -0.9 -39.3Other financial assets -34.1 -44.1 10.0
(Net funds) / Net debt 9,657.3 9,754.5 -97.2
CONSOLIDATED (NET FUNDS) / NET DEBT
31 December 2010 31 December 2009

249
9.3 Financial risk management
The Atlantia Group’s financial risk management objectives and policies
In the normal course of business, the Atlantia Group is exposed to:
a) market risk, principally linked to the effect of variations of interest and foreign exchange rates
on financial assets acquired and financial liabilities assumed;
b) liquidity risk, with regard to ensuring the availability of sufficient financial resources to fund
the Group’s operating activities and repayment of the liabilities assumed;
c) credit risk, linked to both ordinary trading relations and the likelihood of defaults by financial
counterparties.
The Atlantia Group’s financial risk management strategy is derived from and consistent with the
business goals set by the Atlantia Board of Directors that are contained in the various strategic plans
approved by the Board. The strategy aims to both manage and control such risks.
Market risk
The adopted strategy for each type of risk aims, wherever possible, to eliminate interest rate and
currency risks and minimise borrowing costs, whilst taking account of stakeholders’ interests, as
defined in the Financial Policy approved by Atlantia’s Board of Directors on 16 September 2010.
Management of these risks is based on prudence and best market practice.
The main objectives set out in this policy are as follows:
a) to protect the scenario forming the basis of the strategic plan from the effect of exposure to
currency and interest rate risks, identifying the best combination of fixed and floating rates;
b) to pursue a potential reduction of the Group’s borrowing costs within the risk limits
determined by the Board of Directors;
c) to manage derivative financial instruments taking account of their potential impact on the
results of operations and financial position in relation to their classification and presentation.
The Group's derivative hedging instruments as at 31 December 2010 are classified as cash flow
hedges in accordance with IAS 39.
The fair value of financial derivative instruments is based on expected discounted cash flows, using
the market yield curve at the measurement date. Amounts in foreign currencies other than the euro
are translated at closing exchange rates communicated by the European Central Bank.
The residual average term to maturity of the Group’s debt is around 7 years.
The average cost of medium/long-term borrowings in 2010 was approximately 4.9%.
Monitoring is, moreover, intended to assess, on a continuing basis, counterparty creditworthiness
and the degree of risk concentration.

250
Interest rate risk
Interest rate risk is linked to uncertainty regarding the performance of interest rates, and takes two
forms:
a) cash flow risk: this is linked to financial assets and liabilities with cash flows indexed to a market
interest rate. In order to reduce floating rate debt, the Group has entered into interest rate
swaps (IRS), classified as cash flow hedges. The hedging instruments and the underlying
financial liabilities have matching terms to maturity and notional amounts. Tests have shown
that the hedges were fully effective during the year. Changes in fair value are recognised in the
statement of comprehensive income, with no recognition of any ineffective portion in the
income statement. Interest income or expense deriving from the hedged instruments is
recognised simultaneously in the income statement;
b) fair value risk: this represents the risk of losses deriving from an unexpected change in the value
of fixed rate financial assets and liabilities following an unfavourable shift in the market
interest rate curve. There were no hedges on the books as at 31 December 2010 that could be
classified as fair value hedges in accordance with IAS 39, partially due to the unwinding of
hedges of the bond issue with a par value of €1,500,000 thousand maturing in May 2016.
As a result of hedging interest rates, 96% of interest bearing debt is fixed rate.
Currency risk
Currency risk can result in the following types of exposure:
a) economic exposure incurred through purchases and sales denominated in currencies other
than the company's functional currency;
b) translation exposure through equity investments in subsidiaries and associates that present
financial statements in a currency other than the euro;
c) transaction exposure incurred by making deposits or obtaining loans in a currency other than
the company's functional currency.
The Group's prime objective of currency risk is to minimise transaction exposure through the
assumption of liabilities in currencies other than the euro. Cross currency swaps (CCIRS) with
notional amounts and maturities matching those of the underlying financial liabilities were entered
into specifically to eliminate the currency risk to which the sterling and yen denominated bonds are
exposed. These swaps also qualify as cash flow hedges and tests have shown that they are fully
effective.
9% of the Group’s medium/long-term debt is denominated in currencies other than the euro.
Taking account of foreign exchange hedges and the proportion of debt denominated in the local
currency of the country in which the relevant Group company operates (around 2%), the Group is
not exposed to currency risk on translation into euros. The translation risk associated with the
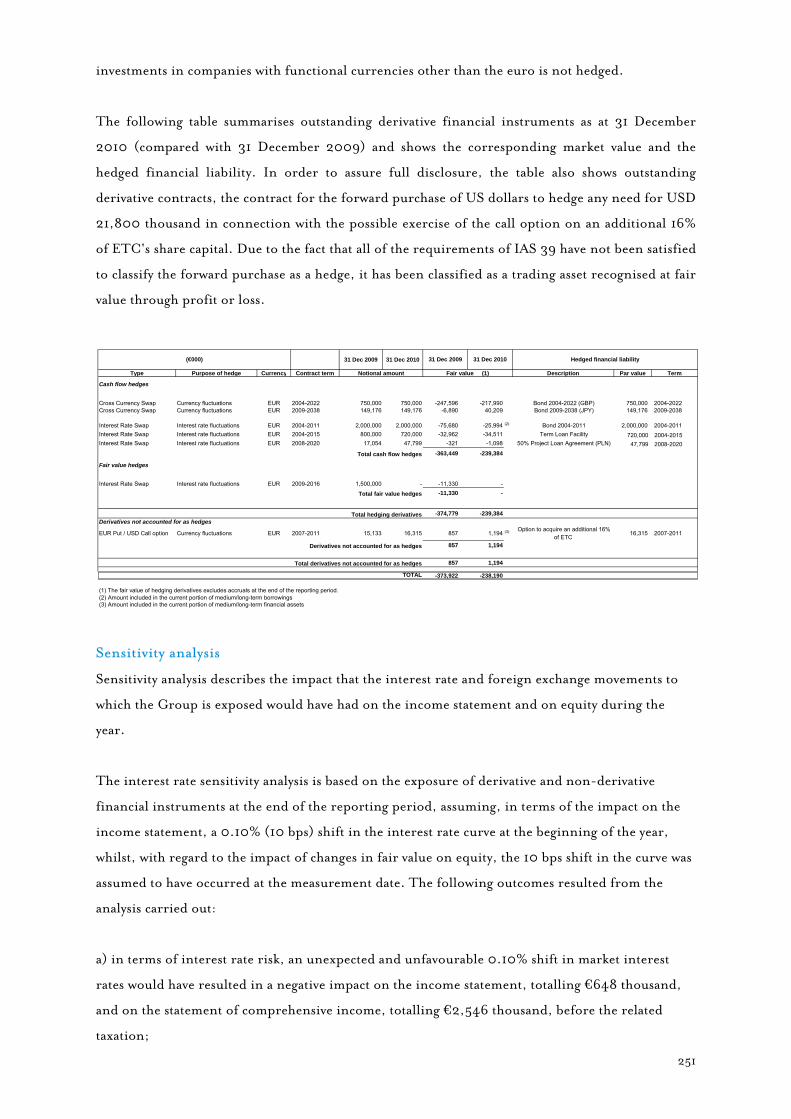
251
investments in companies with functional currencies other than the euro is not hedged.
The following table summarises outstanding derivative financial instruments as at 31 December
2010 (compared with 31 December 2009) and shows the corresponding market value and the
hedged financial liability. In order to assure full disclosure, the table also shows outstanding
derivative contracts, the contract for the forward purchase of US dollars to hedge any need for USD
21,800 thousand in connection with the possible exercise of the call option on an additional 16%
of ETC's share capital. Due to the fact that all of the requirements of IAS 39 have not been satisfied
to classify the forward purchase as a hedge, it has been classified as a trading asset recognised at fair
value through profit or loss.
Sensitivity analysis
Sensitivity analysis describes the impact that the interest rate and foreign exchange movements to
which the Group is exposed would have had on the income statement and on equity during the
year.
The interest rate sensitivity analysis is based on the exposure of derivative and non-derivative
financial instruments at the end of the reporting period, assuming, in terms of the impact on the
income statement, a 0.10% (10 bps) shift in the interest rate curve at the beginning of the year,
whilst, with regard to the impact of changes in fair value on equity, the 10 bps shift in the curve was
assumed to have occurred at the measurement date. The following outcomes resulted from the
analysis carried out:
a) in terms of interest rate risk, an unexpected and unfavourable 0.10% shift in market interest
rates would have resulted in a negative impact on the income statement, totalling €648 thousand,
and on the statement of comprehensive income, totalling €2,546 thousand, before the related
taxation;
31 Dec 2009 31 Dec 2010
Type Purpose of hedge Currency Contract term Description Par value Term
Cross Currency Swap Currency fluctuations EUR 2004-2022 750,000 750,000 -247,596 -217,990 Bond 2004-2022 (GBP) 750,000 2004-2022 Cross Currency Swap Currency fluctuations EUR 2009-2038 149,176 149,176 -6,890 40,209 Bond 2009-2038 (JPY) 149,176 2009-2038
Interest Rate Swap Interest rate fluctuations EUR 2004-2011 2,000,000 2,000,000 -75,680 -25,994 (2) Bond 2004-2011 2,000,000 2004-2011 Interest Rate Swap Interest rate fluctuations EUR 2004-2015 800,000 720,000 -32,962 -34,511 Term Loan Facility 720,000 2004-2015Interest Rate Swap Interest rate fluctuations EUR 2008-2020 17,054 47,799 -321 -1,098 50% Project Loan Agreement (PLN) 47,799 2008-2020
Total cash flow hedges -363,449 -239,384
Interest Rate Swap Interest rate fluctuations EUR 2009-2016 1,500,000 - -11,330 -
Total fair value hedges -11,330 -
Total hedging derivatives -374,779 -239,384
EUR Put / USD Call option Currency fluctuations EUR 2007-2011 15,133 16,315 857 1,194 (3) Option to acquire an additional 16% of ETC
16,315 2007-2011
Derivatives not accounted for as hedges 857 1,194
Total derivatives not accounted for as hedges 857 1,194
TOTAL -373,922 -238,190
(2) Amount included in the current portion of medium/long-term borrowings(3) Amount included in the current portion of medium/long-term financial assets
(€000) 31 Dec 2009 31 Dec 2010 Hedged financial liability
Notional amount Fair value (1)
Cash flow hedges
Fair value hedges
Derivatives not accounted for as hedges
(1) The fair value of hedging derivatives excludes accruals at the end of the reporting period.

252
b) in terms of currency risk, an unexpected and unfavourable 10% shift in the exchange rate would
have resulted in a negative impact on the income statement, totalling approximately €119 thousand,
before the related taxation.
Liquidity risk
Liquidity risk relates to the risk that cash resources may be insufficient to fund the payment of
liabilities as they fall due. The Group believes that its ability to generate cash assures an ample
diversification of funding sources and the availability of committed and uncommitted lines of
credit provides sufficient alternative sources of finance to meet projected financial needs.
As at 31 December 2010 the Group has cash reserves of €6166 million, consisting of:
a) €2,533 million in cash or invested for a period shorter than the redemption date of the par
value €2,000 million bond issue (9 June 2011);
b) €16 million in cash held by Strada dei Parchi and included in assets related to discontinued
operations;
c) €467 million primarily in term deposits allocated to finance the execution of specific
construction services;
d) €3,150 million in undrawn committed lines of credit, details of which are shown in the
following table.
The following tables show the time distributions of financial liabilities by term to maturity as at 31
December 2010 and comparable figures as at 31 December 2009.
Drawdown period Final maturity Available Drawn Undrawn lines
Committed Revolving Credit Facility May 2015 June 2015 1,000 - 1,000 Medium/long-term committed EIB line - Tranche A 30/11/2012 31/12/2036 1,000 500 500 Medium/long-term committed EIB line - Tranche B 31/12/2014 31/12/2036 300 - 300 Medium/long-term committed CDB/EIB line 01/08/2013 19/12/2034 500 150 350 Medium/long-term committed CDB/SACE line 23/09/2014 23/12/2024 1,000 - 1,000
Total lines of credit 3,800 650 3,150
(€m) 31 December 2010

253
(€000)
Non-derivative financial liabilities (1)Bond issues
Bond 2004-2011 -1,996,056 -2,014,954 -2,014,954 - - -Bond 2004-2014 -2,706,363 -3,300,000 -137,500 -137,500 -3,025,000 -Bond 2004-2022 (GBP) -568,940 -1,016,555 -36,306 -36,306 -108,917 -835,028Bond 2004-2024 -973,244 -1,822,500 -58,750 -58,750 -176,250 -1,528,750Bond 2009-2016 -1,549,877 -2,006,250 -84,375 -84,375 -253,125 -1,584,375Bond 2009-2038 (JPY) -183,444 -324,786 -5,025 -5,025 -15,076 -299,659Bond 2010-2017 -990,510 -1,236,250 -33,750 -33,750 -101,250 -1,067,500Bond 2010-2025 -494,222 -828,125 -21,875 -21,875 -65,625 -718,750
Total bond issues (A) -9,462,656 -12,549,421 -2,392,535 -377,581 -3,745,243 -6,034,062
Bank borrowingsTerm Loan Facility -709,580 -756,253 -91,161 -89,976 -575,116 -EIB -950,631 -1,399,494 -92,360 -71,264 -251,890 -983,980Cassa Depositi e Prestiti SpA -143,912 -204,874 -3,768 -3,973 -25,437 -171,696Other banks -233,080 -171,357 -17,480 -20,041 -55,067 -78,769Total borrowings linked to grants -381,202 -381,202 -40,640 -42,680 -181,872 -116,010
Total bank borrowings -2,418,405 -2,913,181 -245,409 -227,935 -1,089,382 -1,350,455
Other borrowingsANAS -32,611 -32,611 -32,611 - - -Central Guarantee Fund -56,479 -104,155 -44,192 -2,484 -8,234 -49,244Other borrowings -52,101 -69,093 -3,860 -3,694 -5,459 -56,080
Total other borrowings -141,191 -205,858 -80,663 -6,178 -13,693 -105,324
Total medium/long-term borrowings (B) -2,559,596 -3,119,039 -326,072 -234,113 -1,103,074 -1,455,780
Total non-derivative financial liabilities (C)=(A)+(B) -12,022,252 -15,707,295 -2,757,442 -611,694 -4,848,317 -7,489,842
Derivatives (2) (3)IRS (4) -61,603 -91,824 -50,544 -15,617 -23,751 -1,912CCS -177,781 -329,648 -12,299 -12,607 -36,514 -268,228TOTAL -239,384 -421,472 -62,843 -28,224 -60,265 -270,140
(3) Expected cash flows are calculated on the basis of exchange rates determined on the measurement date.
(€000)
Non-derivative financial liabilities (1)Bond issues
Bond 2004-2011 -1,987,211 -2,035,464 -23,664 -2,011,800 - -Bond 2004-2014 -2,695,077 -3,437,500 -137,500 -137,500 -3,162,500 -Bond 2004-2022 (GBP) -550,148 -1,020,437 -35,187 -35,187 -105,562 -844,499Bond 2004-2024 -971,989 -1,881,250 -58,750 -58,750 -176,250 -1,587,500Bond 2009-2016 -1,482,041 -2,090,625 -84,375 -84,375 -253,125 -1,668,750Bond 2009-2038 -149,553 -269,105 -4,100 -4,100 -12,301 -248,603
Total bond issues (A) -7,836,019 -10,734,381 -343,577 -2,331,713 -3,709,738 -4,349,353Bank borrowings
Term Loan Facility -786,086 -841,162 -90,521 -89,427 -500,104 -161,110EIB -1,039,969 -1,534,783 -135,288 -92,360 -236,651 -1,070,484Cassa Depositi e Prestiti SpA -143,532 -200,970 -4,244 -3,337 -16,957 -176,432Other banks -171,540 -172,145 -1,735 -11,517 -53,889 -105,004Total borrowings linked to grants -419,861 -801,104 -40,640 -160,991 -179,572 -419,901
Total bank borrowings -2,560,988 -3,550,164 -272,428 -357,632 -987,173 -1,932,931Other borrowings
ANAS -783,191 -1,283,605 -166,413 -55,860 -167,579 -893,753Central Guarantee Fund -56,664 -106,378 -44,062 -2,353 -7,843 -52,120Other borrowings -53,219 -71,071 -3,927 -3,745 -8,856 -54,543
Total other borrowings -893,074 -1,461,054 -214,402 -61,958 -184,278 -1,000,416Total medium/long-term borrowings (B) -3,454,062 -5,011,218 -486,830 -419,590 -1,171,451 -2,933,347Other financial liabilitiesTotal non-derivative financial liabilities (C)=(A)+(B) -11,290,081 -15,745,599 -830,407 -2,751,303 -4,881,189 -7,282,700Derivatives (2) (3)IRS (4) -120,294 41,768 -63,308 -25,627 48,355 82,348CCS -254,486 -435,033 -14,298 -14,342 -42,996 -363,397TOTAL -374,780 -393,265 -77,606 -39,969 5,359 -281,049
(3) Expected cash flows are calculated on the basis of exchange rates determined on the measurement date.(4) Future cash flows deriving from interest rate swap (IRS) differentials are calculated on the basis of the latest established rate and held constant to the maturity of the contract.
(1) Future cash flows relating to floating rate loans have been calculated on the basis of the latest established rate and applied and held constant to final maturity.
(2) Includes derivative instruments hedging the interest rate and currency risks associated with bond issues and loans outstanding as at 31 December 2010.
(4) Future cash flows deriving from interest rate swap (IRS) differentials are calculated on the basis of the latest established rate and held constant to the maturity of the contract.
Financial liabilities
31/12/2009 Carrying amount)
Total contractual
Within 12 months
Between 1 and 2 years
Between 3 and 5 years
After 5 years
(1) Future cash flows relating to floating rate loans have been calculated on the basis of the latest established rate and applied and held constant to final maturity.
(2) Includes derivative instruments hedging the interest rate and currency risks associated with bond issues and loans outstanding as at 31 December 2009.
31 December 2010 Carrying amount)
Total contractual
flows
Within 12 months
Between 1 and 2 years
Between 3 and 5 years After 5 years

254
The amounts in the above tables include interest payments and exclude the impact of any offset
agreements.
The time distribution of terms to maturity is based on the residual contract term or on the earliest
date on which payment may be required, unless a better estimate is available.
The distribution for liabilities with repayment schedules is based on the date on which each
instalment falls due.
The following table shows the time distribution of expected cash flows from cash flow hedges, and
the periods in which they will be recognised in the income statement.
Credit risk
The Group manages credit risk essentially through recourse to counterparties with high credit
ratings and does not report significant credit risk concentrations in accordance with the Financial
Policy.
Credit risk deriving from outstanding derivative financial instruments can also be considered
marginal in that the counterparties involved are major financial institutions.
Allowances for impairment on individually material items are established when there is objective
evidence that the Group will not be able to collect all or any of the amount due. The amount of the
allowances takes account of estimated future cash flows and the date of collection, any future
recovery costs and expenses, and the value of any security and guarantee deposits received from
customers. General provisions, based on the available historical and statistical data, are established
for items for which specific provisions have not been made.
(€000)
Interest rate swapsAssets - - - - - - - - - - - -Liabilities -108,963 -113,216 -81,024 -29,306 -3,112 226 -61,603 -65,633 -46,673 -12,843 -6,078 -39
Cross currency swapsAssets 40,209 40,026 -2,996 -2,830 -7,412 53,264Liabilities -254,486 -260,551 -14,229 -14,088 -40,256 -191,978 -217,990 -223,194 -9,217 -9,413 -25,877 -178,687Total cash flow hedges -363,449 -248,801
Accrued expenses on cash flow hedges -30,308 -30,087Accrued income on cash flow hedges 19,990 20,670
Total cash flow hedge derivative assets/liabilities -373,767 -373,767 -95,253 -43,394 -43,368 -191,752 -248,801 -248,801 -58,886 -25,086 -39,367 -125,462
(€000)
Interest rate swapsIncome on cash flow hedges - - - - - - - - - -Losses on cash flow hedges -108,963 -79,726 -26,799 -2,551 113 -61,603 -42,756 -12,767 -6,040 -41
Cross currency swapsIncome on cash flow hedges 855,473 38,651 37,656 105,719 673,447 960,657 40,555 40,242 114,403 765,457Losses on cash flow hedges -1,109,959 -52,815 -51,767 -145,655 -859,722 -1,138,438 -52,773 -52,116 -147,510 -886,039
Total income (losses) on cash flow hedges -363,449 -93,890 -40,910 -42,487 -186,162 -239,384 -54,974 -24,641 -39,147 -120,623
Expected cash flows (1)
Within 12 months
Between 1 and 2 years
Between 3 and 5 years
After 5 years
After 5 years
Expected cash flows (1)
(1) Expected cash flows from swap differentials are calculated on the basis of market curves at the measurement date.
31/12/2009 31/12/2010
Within 12 months
Between 1 and 2 years
31 December 2009 31 December 2010Between 3
and 5 After 5 years
After 5 years
Carrying amount
Expected cash flows (1)
Within 12 months
Between 1 and 2 years
Between 3 and 5
Between 3 and 5 years
Carrying amount
Expected cash flows (1)
Within 12 months
Between 1 and 2 years

255
10. OTHER INFORMATION
10.1 Analysis by geographical segment
The following table shows an analysis of the Group’s revenue and non-current assets by
geographical segment.
"International" primarily relates to the contributions of companies operating in Poland (the
Stalexport Autostrady group), the United States (the Autostrade International U.S. Holdings
group) and the Chilean operator, Los Lagos.
The contribution of international, which is not significant in terms of the Group's consolidated
financial statements, is not shown in greater detail since the information is not of particular
relevance to the Group.
10.2 Guarantees
The Group has certain guarantees in issue to third parties as at 31 December 2010. With the
exception of guarantees given for liabilities accounted for in the consolidated financial statements,
they are listed by importance:
a) a surety of €120,350 thousand issued in favour of the Chilean holding company, Autopista do
Pacifico (a subsidiary of Autostrade del Sud America), guaranteeing the loan obtained by this
company to finance the acquisition of the motorway operator, Costanera Norte;
b) a guarantee of €69,913 thousand issued by Atlantia in connection with the loan obtained by the
sub-holding Autostrade per il Cile, since merged into Autostrade Sud America;
c) the guarantee of €13,479 thousand issued by Autostrade per l'Italia in favour of Assicurazioni
Generali for the issue of a surety in favour of ANAS on behalf of Strada dei Parchi;
(€000) 2010 2009 31 Dec 2010 31 Dec 2009
Italy 4,430,193 3,829,723 16,370,285 16,955,421
International* 97,873 80,573 473,801 442,676
4,528,066 3,910,296 16,844,086 17,398,097
* Non-current assets do not include financial instruments, deferred tax assets, post-employment benefit and insurance claims.
Revenue Non-current assets*

256
In addition, as at 31 December 2010 the shares held in foreign operators, Strada dei Parchi and
Bologna e Fiera Parking, have been pledged to collateralise loans granted to certain Group
companies and to back up commitments made to certain Grantors.
10.3 Reserves
Group companies had contract reserves of €610 million as at 31 December 2010 a portion of which
is likely to be paid to contractors.
Any amount paid will be recognised as an increase in the cost of intangible concession rights and
subsequently amortised.
In the case of other reserves not related to investing activities (contract work and maintenance), any
future charges are covered by provisions for disputes.
10.4 Related party transactions
In implementation of the provisions of art. 2391-bis of the Italian Civil Code and the Regulation
adopted by the Commissione Nazionale per le Società e la Borsa (the CONSOB) in Resolution
17221 of 12 March 2010, as subsequently amended and as interpreted by CONSOB
Communication DEM/10078683 of 24 September 2010, on 11 November Atlantia’s Board of Directors approved the new Procedure for Related Party Transactions entered into directly by the
Company and/or through subsidiaries. This Procedure sets out the criteria to be used in
identifying related parties and the related reporting requirements.
The principal transactions entered into by the Group and Atlantia SpA with related parties, as
identified in accordance with the criteria defined in the above Procedure, are described below.
Related party transactions are conducted on an arm’s length basis.
Related party transactions do not include transactions of an atypical or unusual nature. The
Atlantia Group did not engage in material transactions with its direct or indirect parents during
2010.
During 2010 fees, non-monetary benefits, bonuses, incentives and other forms of compensation
were paid to the Chairman of Atlantia, Fabio Cerchiai (€0.5 million), and the Chief Executive
Officer and General Manager, Giovanni Castellucci (€1.5 million), in relation to positions held in
Atlantia and in other Group companies. A total of €0.2 million was also paid to the previous
Chairman, Gian Maria Gros-Pietro.

257
Transactions with the parent, Schemaventotto, regard amounts due to the Group in the form of an
IRES refund resulting from the tax consolidation arrangement in which certain Group companies
participated until 1 January 2008.
In compliance with IAS 24, the Autogrill group, which is under the common control of Edizione
Srl, is treated as a related party. With regard to relations between the Atlantia Group’s motorway
operators and the Autogrill group, it should be noted that, at 31 December 2010, Autogrill holds
ParentsSchemaventotto 11.5 - - - 11.2 - - -
Total parents 11.5 - - - 11.2 - - -Associates
GEIE Traforo Monte Bianco 10.4 4.2 0.3 10.5 9.6 4.2 0.3 10.1 Bologna & Fiera Parking SpA 1.1 0.1 0.1 - 1.1 - 2.2 - Società Infrastrutture Toscana 0.1 - 0.1 - 0.1 - 0.1 - Uirnet SpA 1.2 - 1.0 - - - 0.1 - Tangenziali esterne di Milano - - 0.1 - - 0.7 - -
Total associates 12.8 4.3 1.6 10.5 10.8 4.9 2.7 10.1 Joint ventures
Autostrade Sud America Srl - - - - 0.4 - - - Autostrade per il Cile Srl - - - - 0.5 - 0.4 - Pune Solapur Expressways Private Limited - - - - 0.1 - 0.1 - Triangulo do Sol Auto-estradas SA 2.6 - 3.8 - 0.4 - - -
Total joint ventures 2.6 - 3.8 - 1.4 - 0.5 -Total unconsolidated subsidiariesAffiliates
Autogrill SpA 37.4 1.0 77.8 2.9 40.8 0.6 101.8 3.6 Benetton Group - - - 0.1 - - - -
Total affiliates 37.4 1.0 77.8 3.0 40.8 0.6 101.8 3.6 Consortia
CONSORZIO TANGENZIALE ENGINEERING - 0.6 - - - - - - ELMAS SCARL 0.6 1.3 - - 0.6 1.4 0.2 4.3 Vespucci Scarl - - - - 0.1 - 0.1 - PISTA 1 SCARL - - - 0.2 0.3 0.3 - 0.4 Consorzio Trinacria Scarl 0.1 0.3 - 0.8 - 0.1 - 0.2 Consorzio Galileo Scarl 0.6 0.1 - - 0.2 1.1 - - Consorzio Ramonti SCARL 0.1 19.0 0.1 31.5 0.2 9.6 0.4 17.4
Consorzio RFCC (in liquidation) 0.1 - - - 0.1 - - - Quadrante 300 0.9 0.4 0.3 1.3 0.2 1.1 0.2 1.1 Consorzio Italtecnasud - - - - 0.4 - - -
Total Consortia 2.4 21.7 0.4 33.8 2.1 13.6 0.9 23.4 Other related parties
ITC Italcementi SpA - 0.7 - 1.0 - - - - River Spa - - - - 0.2 - - -
Total other related parties - 0.7 - 1.0 0.2 - - -TOTAL 66.7 27.7 83.6 48.3 66.5 19.1 105.9 37.1
AssociatesBeskidzi Dom Maklerski SA - - 0.1 - - - - -Società Infrastrutture Toscana - 0.9 - - - 1.5 - - Lusuponte 1.6 - - - 1.6 - - -SMNL - Concessoes de Portugal SA - - - - 8.7 - - - Auto-estradas do Oeste - - - - 6.7 - - -Vialitoral SA - - - - 0.7 - - -
Total associates 1.6 0.9 0.1 - 17.7 1.5 - -Joint ventures
Autostrade for Russia GMBH - - - - 0.7 - - -Total joint ventures - - - - 0.7 - - -Affiliates
Autogrill SpA - - 1.4 - - - 1.4 -Total affiliates - - 1.4 - - - 1.4 -Consortia
Consorzio Midra 0.1 - - - - - - -Consorzio Trinacria Scarl 0.2 - - - 0.2 - - -ELMAS SCARL 1.0 - - - 1.0 - - -PISTA 1 SCARL - - - - 1.0 - - -
Total Consortia 1.3 - - - 2.2 - - -TOTAL 2.9 0.9 1.5 - 20.6 1.5 1.4 -
2009
Assets Liabilities Income Expenses Assets LiabilitiesName Income Expenses
31 Dec 2010 2010 31 Dec 2009
Related party financial transactions
(€ m)
Income Expenses
Related party trading and other transactions(€ m)
Name31 Dec 2010 2010 31 Dec 2009 2009
Assets Liabilities Income Expenses Assets Liabilities

258
140 (134 excluding Strada dei Parchi) food service concessions for service areas along the Group’s
motorway network.
In 2010 the Group earned revenue of approximately €77.8 million on transactions with Autogrill,
including approximately €0.8 million deriving from the handover, free of charge, of buildings
located at service areas (following expiry of the related sub-concessions) and €77.0 million in
royalties deriving from management of service areas. This income is generated by contracts entered
into over various years, of which a large part was awarded as a result of transparent and non-
discriminatory competitive tenders.
10.5 Significant regulatory aspects
Single concession arrangements for Italian operators
On 13 May and 22 July 2010, the CIPE (Interministerial Economic Planning Committee) gave
clearance, subject to certain requirements, for the single concession arrangements entered into in
2009 by ANAS and a number of motorway operators, including Autostrada Tirrenica, Strada dei
Parchi, Autostrada Torino-Savona and Raccordo Autostradale Valle d’Aosta, Tangenziale di Napoli
and Autostrade Meridionali, and revised its opinion, again subject to certain requirements, on the
single concession arrangements of Tangenziale di Napoli and Autostrade Meridionali.
The CIPE resolutions containing the requirements applicable to the Group’s single concession
arrangements were published in the Official Journal in October 2010. With the signing of the
document ratifying adoption of the above requirements, the procedure introduced by Law 191 of
2009 has come to an end. As a result, the single concession arrangements provided for by Law
Decree 262 of 2006, as subsequently amended and added to, and signed by the Italian motorway
operators controlled by Autostrade per l’Italia in 2009 (with the exception of Società Italiana
Traforo del Monte Bianco, which operates under a different concession regime) are now effective.
Raccordo Autostradale Valle d’Aosta, Autostrada Tirrenica and Tangenziale di Napoli signed the
above document on 24 November 2010, Strada dei Parchi and Autostrade Meridionali on 29
November 2010 and Autostrada Torino-Savona on 22 December 2010.

259
Toll increases for 2011
The following annual toll increases have been introduced by Autostrade per l’Italia and the Group’s
Italian motorway operators from 1 January 2011:
Toll increases 2011 (excluding increases pursuant to Law 122/2010)
Operator Increases 2011Autostrade per l'Italia 1.92%Autostrada Torino-Savona 0.63%Raccordo Autostradale Valle d'Aosta 14.15%Autostrada Tirrenica 4.08%Tangenziale di Napoli 3.80%Autostrade Meridionali -6.56%(*)
Strada dei Parchi 8.14%
Società Traforo del Monte Bianco 4.96%
(*) As a result of rounding, the impact on the final tolls paid by road users is limited to class B.
In accordance with the Single Concession Arrangement signed by ANAS and Autostrade per l'Italia
on 12 October 2007, the toll increase of 1.92% for 2011 has been calculated on the basis of two
components:
• 0.63%, equivalent to 70% of the inflation rate in the period from 1 July 2009 to 30 June
2010;
• 1.29%, relating to the X investments component of the tariff formula, designed to cover the
additional capital expenditure inserted into the IV Addendum of 2002.
The inflation-linked component (0.63%) was calculated on the basis of consumer price inflation
for the Italian population as a whole, as calculated by ISTAT (the NIC index), for the period
between 1 July 2009 and 30 June 2010, equal to 0.90%, compared with the period from 1 July
2008 to 30 June 2009.
The toll component relating to capital expenditure inserted into the IV Addendum (1.29%) is
based on the state of progress of work on the individual projects, as reported in the statement of
financial position as at 30 September 2010.
The subsidiaries, Raccordo Autostradale Valle d'Aosta, Autostrada Tirrenica, Tangenziale di
Napoli, Autostrade Meridionali and Strada dei Parchi, whose single concession arrangements,
involving the rebalancing of their respective financial plans, became effective in 2010, have for the
first time applied the new formula for calculating their toll increases. The various factors taken into
account include the target inflation rate, the rebalancing component and the return on investment,
in addition to quality.
The increases granted from 1 January 2011 represented the sum of the increases granted in
compliance with the new arrangements for the years 2010 and 2011, after deducting the increase
already applied from 1 January 2010 on the basis of the arrangements in force at that time.

260
The toll increase for Autostrada Torino-Savona is 0.63%, which was granted on the basis of the
existing single arrangement, following the signature with ANAS of the document ratifying the
CIPE requirements. This increase is equal to 70% of the inflation rate in the period from 1 July
2009 to 30 June 2010.
Società Traforo del Monte Bianco, which operates under a different concession regime based on
bilateral agreements between Italy and France, applied a total increase of 4.96% from 1 January
2011, in accordance with the resolution approved by the Intergovernmental Committee for the
Mont Blanc Tunnel on 22 October 2010. This increase is based on the combination of two
elements:
• 1.46% representing the average inflation rate in France and Italy for the period from 1
September 2009 to 31 August 2010;
• 3.50% in accordance with the agreement between the Italian and French governments dated
24 February 2009, with use of the proceeds still be decided on by the two governments.
Toll increases to be applied and passed on to ANAS
Art. 15.c.4 of Law Decree 78 of 31 May 2010, converted into Law 122/2010, introduced increases
to the concession fee payable by motorway operators to ANAS. The increases amount to: (i) 1
thousandth of a euro per kilometre for toll classes A and B and 3 thousandths of a euro per
kilometre for classes 3, 4 and 5 with effect from 1 July 2010; and (ii) 2 thousandths of a euro per
kilometre for toll classes A and B and 6 thousandths of a euro per kilometre for classes 3, 4 and 5
with effect from 1 January 2011.
At the same time, motorway tolls were increased by a corresponding amount, thereby matching the
increases in the concession fee introduced by the above legislation.
Toll increases applied on behalf of ANAS
Art. 15.c.2 of Law Decree 78/2010 also authorised ANAS, from 1 July 2010, to provisionally apply
lump-sum toll increases at toll stations interconnecting with motorways and orbital motorways
operated directly by ANAS. These lump-sum increases amount to €1.00 for toll classes A and B
and €2.00 for classes 3, 4 and 5. The Prime Ministerial Decree of 25 June 2010 specified the
stations at which to apply the toll increases from 1 July 2010. Consequently, Autostrade per l'Italia
and the other motorway operators have, from 1 July 2010, applied the increases introduced by the
above legislation, alongside the above increases in the concession fee.
As a result of the injunctions granted by the Lazio and Piedmont regional administrative courts –
subsequently confirmed by the Council of State – suspending application of the above toll increases
introduced by art. 15.c.2 of Law Decree 78/2010, ANAS issued instructions on 4 August 2010
requesting motorway operators “to suspend, as soon as technically feasible, application of the toll
261
increases” referred to above. Autostrade per l’Italia has thus proceeded to suspend application of
the toll increases introduced by art. 15.c.2 of Law Decree 78/2010.
On 21 February 2011 Lazio Regional Administrative Court upheld the appeal, annulling the Prime
Ministerial Decree of 25 June 2010.
Snow events in December 2010
On 14 December 2010 ANAS began an investigation with the aim of verifying Autostrade per
l’Italia’s compliance with the required procedures for dealing with snow emergencies, following
events on the A14 Bologna-Bari-Taranto motorway between 14 and 16 December 2010.
On 20 December 2010 ANAS launched a similar investigation in relation to snow events in the
Florence area on the A1 Milan-Naples and A11 Florence-Pisa motorways on 17 and 18 December
2010. As a result of the same events on 17 December 2010, the Antitrust Authority has also
launched an investigation into whether or not Autostrade per l’Italia (i) omitted to provide or
provided incomplete or delayed information to consumers (motorway users) regarding effective
conditions on the motorway sections during the snow emergency, and (ii) had adequate emergency
measures in place to enable users to avoid or reduce the disruption caused by the subsequent road
closures.
On 20 December 2010 ANAS initiated a similar investigation with the aim of verifying whether or
not the Group’s operators, Autostrada Tirrenica and Strada dei Parchi, had complied with the
required procedures for dealing with snow emergencies, following events on the A12 Livorno-
Rosignano Marittimo motorway and on the Tivoli-Carsoli section of the A24 Rome-L’Aquila-
Teramo motorway on 17 and 18 December 2010.
The investigations are ongoing and so far have not found evidence of either non-compliance or
omissions.
Autostrade per l’Italia has also received claims from individual motorway users and consumers’
associations in relation to the same events.
With regard to the snow event of 17 December 2010, the Florence District Attorney’s office has
begun an investigation into whether or not, as a result of the disruption experienced by motorway,
road and rail users due to the snow event, there are grounds for criminal prosecutions. Autostrade
per l’Italia has provided the District Attorney’s office with all the support needed to understand
what warnings were received prior to the event and verify whether or not the company responded to
the event in line with the snow plans approved by the grantor, ANAS.
In response to the above snow event, AVCP (the regulator that oversees public contracts) has
launched an investigation to see if the existing concession arrangement with ANAS was fully
complied with by both the operator and ANAS, which is responsible for supervising
implementation of the arrangement.
At a hearing held by AVCP, representatives from ANAS and Autostrade per l’Italia presented
details of the concession arrangement, focusing above all on the provisions governing the

262
management of events that have an impact on motorway traffic, including serious weather events,
such as those that took place.
The regulator was informed that ANAS, in the form of its Motorway Concession Inspectorate, has,
as noted above, launched an investigation of the event.
Following the above snow event, Autostrade per l’Italia held talks with the “Safety Advisory
Committee”, which includes representatives of the consumers’ associations, ADOC, ADUSBEF,
ADICONSUM, CODACONS and FEDERCONSUMATORI, in order to identify initiatives that
could be taken to show customers that the company acknowledges the disruption caused.
Autostrade per l’Italia has adopted this approach, despite the fact that the company believes that it
cannot be held responsible for the disruption and any inconvenience caused to motorway users,
given that it responded to the event in accordance with the approved snow plans. The resulting
agreement with the consumers’ associations is thus simply intended as a gesture of goodwill towards
the users who were affected by the disruption caused on the motorway sections it directly operates.
A specific form has been prepared on the basis of the agreement with the consumers’ associations,
enabling customers to initiate the conciliation procedure. The form is available on Autostrade per
l'Italia’s websites and on those of the various associations.
The charges for settling the conciliation procedures have been estimated by Autostrade per l’Italia
and recognised in expenses for 2010.
Dispute over tolls applied by Strada dei Parchi
On 1 March 2010 Codacons (a consumers’ association) filed suit at Lazio Regional Administrative
Court against ANAS, the Ministry of Infrastructure, the Ministry of the Economy and Finance and
the Abruzzo and Lazio regional authorities, contesting the basis for the increase in motorway toll
charges for 2010, applied by Strada dei Parchi from 1 January 2010. Briefly, Codacons contests i)
the violation of CIPE Directive 319 of 20 December 1996, given that the increase for 2010 is
alleged not to be linked to investments carried out; (ii) the alleged failure by ANAS to oversee
Strada dei Parchi’s compliance with its contractual obligations.
Following further requests for documents by Codacons, the hearing held on 31 March 2010 did
not discuss the application for an injunction brought by the plaintiff.
Lazio Regional Administrative Court adjourned the hearing on the merits until a later date, which
is still to be set.
The Lazio Regional Administrative Court sentence deposited on 30 March 2010 upheld the
appeals brought in 2006 by the Abruzzo Regional Authority, Teramo Provincial Authority and the
Gran Sasso Mountain Community against ANAS and Strada dei Parchi, annulling the tariff
increase introduced in 2006, and the revised toll charge for the Basciano-Teramo section
introduced in 2008.
Following this, Strada dei Parchi filed appeal against the above Lazio Regional Administrative
Court sentences before the Council of State, requesting a suspension and petitioning for a

263
presidential decree to provide immediate suspension whilst awaiting the hearing to discuss the
application for interim relief.
On 20 April 2010 Lazio Regional Administrative Court upheld Strada dei Parchi’s request,
suspending application of the sentence and scheduling a hearing on the merits for 15 June 2010.
This hearing was further adjourned until 26 October 2010, following a request for revocation
submitted by the Abruzzo Regional Authority.
The Fourth Section of the Council of State, sitting in its judicial capacity, issued a sentence on 9
December 2010, upholding the company’s appeals and, as a result, cancelling the appealed
sentences. The Council found that the toll increase applied was legitimate, as was the revised toll
charge for the Basciano-Teramo section introduced in 2008.
Council of State sentence regarding award of the concession to Pedemontana Veneta
Following the Council of State sentence that upheld the appeal brought by the permanent
consortium led by SIS Scpa, and the ensuing decision by the Veneto Regional Authority to award the
concession to the afore-mentioned SIS Scpa, the temporary consortium that includes Pedemontana
Veneta SpA (in which Autostrade per l’Italia holds a direct 28% interest) appealed the above
Council of State sentence. This appeal was turned down. The above award to SIS Scpa was also
challenged before Veneto Regional Administrative Court.
In addition, the Pedemontana Veneta temporary consortium has filed a request for pre-trail relief
before Lazio Regional Administrative Court, which, on 21 October 2009, granted an injunction
blocking execution of the contract, which had, however, already been signed by the government-
appointed Extraordinary Commissioner, who had in the meantime taken over responsibility for the
infrastructure project from the Veneto Regional Authority, on the same date.
A further appeal was filed before Lazio Regional Administrative Court on 16 December 2009,
again requesting the court, which has jurisdiction over the Commissioner’s actions, to exclude SIS
Scpa from the tender process for failing to meet the necessary requirements for participation in the
tender. This request had, as noted, already been filed with Veneto Regional Administrative Court,
although it was decided to withdraw it whilst awaiting examination of the principal appeal brought
before Lazio Regional Administrative Court.
On 30 July 2010 Veneto Regional Administrative Court issued a sentence acknowledging the
plaintiffs’ decision to withdraw their appeal. This sentence was then deposited with Lazio Regional
Administrative Court. The Lazio Regional Administrative Court hearing on the merits has been
scheduled for 8 June 2011.
On 28 September 2010 the company asked the Extraordinary Commissioner to grant access to the
documents regarding the final design, following press reports on 20 September 2010 that the related
decree of approval had been signed.

264
On 4 October 2010 the Extraordinary Commissioner sent Pedemontana Veneta a letter including a
copy of the decree approving the final design, but refused access to the design documents.
Pedemontana Veneta has recently decided to file a legal challenge with Lazio Regional Administrative
Court, contesting the letter refusing access to the documents regarding the final design.
The action challenging the letter refusing access to the documents regarding the final design for the
highway was discussed at a Lazio Regional Administrative Court hearing held on 26 January 2011.
The sentence of the court is pending.
Other ongoing litigation Autostrade per l’Italia is the defendant in two actions, which are still pending, brought before Lazio
Regional Administrative Court regarding toll charges. The actions, which have been brought by
Codacons and other consumers’ associations, aim to challenge the toll increases introduced in 1999
and 2003.
With regard to the preliminary design for the “Rosignano Marittima-Civitavecchia” section of the
A12 motorway approved by the CIPE resolution of 18 December 2008 (published in the Official
Journal of 14 May 2009), Autostrada Tirrenica SpA is party, together with the other public bodies
involved, to a number of legal actions pending before Lazio Regional Administrative Court, and to
a number of extraordinary appeals to the Head of State, contesting the above CIPE resolution of 18
December 2008.
The Antitrust Authority’s appeal to the Council of State requesting annulment of Lazio Regional
Administrative Court sentences 4994/09 and 5005/09 is still pending. These sentences at first
instance partly upheld the appeals brought by ACI GLOBAL SpA and EUROP ASSISTANCE VAI
SpA requesting annulment of Antitrust Authority ruling 19021 of 23 October 2008 regarding
emergency breakdown services. Autostrade per l’Italia is a party to the appeals with file numbers
R.G. no. 8813/09 and no. 8814/09.
On 21 October 2010, Varese Provincial Authority filed suit at Lombardy Regional Administrative
Court, requesting cancellation, and an immediate injunction halting application, of Autostrade per
l’Italia’s letter dated 28 September 2010, in which the operator informed the Authority that it was
not possible to satisfy its request to eliminate the toll charge on the Varese-Gallarate section of
motorway, in addition to all arrangements governing tolls on the above motorway section.
Autostrade per l’Italia presented its defence on 1 December 2010. The Lombardy Regional
Administrative Court sentence of 2 December 2010 turned down the request for an injunction,
scheduling a hearing on the merits for 26 May 2011.

265
Finally, Autostrade per l’Italia is the defendant in a number of legal actions regarding
expropriations, tenders and claims for damages deriving from motorway activities.
At the present time, the outcomes of the above litigation proceedings are not expected to result in
significant charges to be incurred by Group companies, in addition to the amounts already
provided at 31 December 2010 and reported in the consolidated financial statements.
10.6 Events after 31 December 2010
Agreement for the sale of Strada dei Parchi As announced on 3 January 2011, Autostrade per l’Italia SpA has agreed to sell its 60% interest in
Strada dei Parchi SpA to Toto SpA for a total price of €89m. Under the terms of the agreement,
Toto is to buy 58% of the company for €86m, with a first instalment of €60m to be paid on
transfer of the shares and the remaining €26m to be paid within 36 months of the sale. The value
of the second instalment will be revalued at an annual interest rate agreed by the parties and backed
by an independent first demand guarantee provided by a bank. The remaining 2% stake held by
Autostrade per l'Italia is subject to a call/put option (at a price of €3m), execution of which is
deferred until the conditions described in art. 156, paragraph 3 of Legislative Decree 163/2006
have been met (for example, on certification of the infrastructure).
Execution of the sale agreement is subject to the following conditions, which have already been or
are in the process of being met: the positive outcome of the procedure required by Strada dei
Parchi’s Single Concession Arrangement, which means that ANAS must approve any change in
control of the company; the receipt of antitrust clearance; signature of the project finance loan
agreement and completion of the first drawdown of funds to fund the company’s investment
programme.
In this regard, on 25 February 2011 Strada dei Parchi and a syndicate of leading Italian and
international banks entered into a project financing agreement worth €571 million.
Eco Taxe Poids Lourds
Following a tender launched in May 2009, on 18 January 2011 France’s Ministry of Ecology,
Sustainable Development, Transport and Housing chose Autostrade per l’Italia as the preferred
bidder in the process to award a contract for the implementation and operation of a satellite-based
toll system for heavy vehicles weighing over 3.5 tonnes using the country’s 15,000-km road
network (Eco Taxe Poids Lourds). Subsequently, on 8 February 2011 Ministry notified
Autostrade per l’Italia that it was awarded the contract.
The contract will have a duration of thirteen years and is worth over €2 billion in terms of total
expected revenue. The contract envisages an initial twenty-one month design and construction
phase, followed by operation and maintenance of the system for eleven and a half years. Some
major French industrial groups, sub-contractors for the project, have pledged to take over shares of
266
the project company, following the signing of the Contract, as allowed by the rules of the tender,
up to a maximum of 30% of capital, and in particular Thales, SNCF, SFR and Steria. On 11 March
2011 the Administrative Court of Cergy-Pontoise, following the appeal lodged by members of a
rival consortium, however, has canceled the tender process. Advancements are underway for
bringing a legal action before the French Council of State.
Tender to provide tolling system for ANAS
Law Decree 125 of 5 August 2010 – containing urgent transport-related and financial measures,
and later converted into Law 163 of 1 October 2010 – brought forward to 30 April 2011 the
application of tolls on the motorway sections and link roads directly operated by ANAS.
On 13 September 2010 ANAS published a call for tenders “for the supply and installation of a free-
flow toll system on the motorways and motorway link roads operated by ANAS and provision of the
related maintenance services, operation of the tolling and toll collection system and provision of
on-the-job training for ANAS personnel to prepare them to take over operation of the system”.
Autostrade per l'Italia bid for the contract as the agent for a Temporary Consortium, acting on
behalf of the principals, Autostrade Tech SpA and Sinelec SpA.
On 18 January 2011, having examined the bids submitted by the qualifying bidders, the Evaluation
Committee provisionally awarded the contract to the Consortium for which Autostrade per l’Italia
is acting as agent.

267
ANNEXES TO THE CONSOLIDATED FINANCIAL STATEMENTS
- ANNEX 1
The Atlantia Group’s scope of
consolidation and investments as at 31
December 2010
- ANNEX 2
Disclosures pursuant to art.149-duodecies
of the CONSOB Regulations for Issuers
11971/1999

268
ANNEX 1 THE ATLANTIA GROUP’S BASIS OF CONSOLIDATION AND INVESTMENTS AS AT 31 DECEMBER 2010
PARENT
ATLANTIA SpA ROME HOLDING COMPANY EURO 600,297,135.00
SUBSIDIARIES CONSOLIDATED ON A LINE-BY-LINE BASIS
AD Moving SpA ROME ADVERTISING SERVICES EURO 1,000,000.00 Autostrade per l’Italia SpA 75.00% 75.00%
AUTOSTRADE CONCESSÕES E PARTICIPAÇÕES BRASIL LIMITADA SAO PAULO, BRAZIL HOLDING COMPANY REAL 70,000,000.00 Autostrade Portugal - Concessoes de
Infrastructuras SA 100% 100%
Autostrade Sud America Srl ROME HOLDING COMPANY EURO 1,000,000.00 Autostrade per l’Italia SpA 100% 100%
AUTOSTRADE HOLDING DO SUR SA SANTIAGO, CHILE HOLDING COMPANY PESO 51,496,771,000.00 Autostrade Sud America Srl 99.99% 99.99%
AUTOSTRADE INDIAN INFRASTRUCTURE DEVELOPMENT PRIVATE LIMITED
MUMBAI, MAHARASHTRA, INDIA RUPEE 500,000.00 100% 100%
Autostrade per l’Italia SpA 99.99%
SPEA Ingegneria Europea SpA 0.01%
AUTOSTRADE INTERNATIONAL OF VIRGINIA O&M INC VIRGINIA, USA MOTORWAY OPERATOR DOLLAR 1.00 Autostrade International US Holdings Inc. 100% 100%
AUTOSTRADE INTERNATIONAL US HOLDINGS INC DELAWARE, USA HOLDING COMPANY DOLLAR 4.00 100% 100%
Autostrade per l’Italia SpA 75.00%
Autostrade Participations SA 25.00% 100%
AUTOSTRADA MAZOWSZE SA Katowice, Poland MOTORWAY OPERATOR ZLOTY 20,000,000.00 100% 86.87%
Atlantia SpA 70.00%
Stalexport Autostrady SA 30.00%
AUTOSTRADE MERIDIONALI SpA NAPLES MOTORWAY CONSTRUCTION AND CONCESSIONS EURO 9,056,250.00 Autostrade per l’Italia SpA 58.98% 58.98% (1)
AUTOSTRADE PARTICIPATIONS SA LUXEMBOURG, LUXEMBOURG
HOLDING COMPANY OF INTERNATIONAL INVESTMENTS EURO 5,000,800.00 100% 100%
Autostrade per l’Italia SpA 99.9996%
SPEA Ingegneria Europea SpA 0.0004%
AUTOSTRADE PER L'ITALIA SpA ROME MOTORWAY CONSTRUCTION AND CONCESSIONS EURO 622,027,000.00 Atlantia SpA 100% 100%
(1) Company listed on Borsa Italiana SpA's Expandi market.
Held by
% interest in share capital/consortium
fundOverall group interest (%) NoteName Registered office Business Currency
Share capital/Consortium
fundat 31 Dec 2010

269
AUTOSTRADE PORTUGAL - CONCESSOES DE INFRASTRUCTURAS SA SINTRA, PORTUGAL HOLDING COMPANY EURO 30,000,000.00 Autostrade Sud America Srl 100% 100%
AUTOSTRADE SERVICE - SERVIZI AL TERRITORIO SpA ROMEMAINTENANCE AND SAFETY IMPROVEMENTS FOR THE ITALIAN MOTORWAY NETWORK
EURO 1,671,000.00 Autostrade per l’Italia SpA 100% 100%
AUTOSTRADE TECH SpA ROME
INFORMATION SYSTEMS AND EQUIPMENT FOR THE CONTROL AND AUTOMATION OF TRAFFIC AND ROAD SAFETY
EURO 1,120,000.00 Autostrade per l’Italia SpA 100% 100%
AUTOSTRADA TORINO - SAVONA SpA TURIN MOTORWAY CONSTRUCTION AND CONCESSIONS EURO 161,720,000.00 Autostrade per l’Italia SpA 99.98% 99.98%
BIURO CENTRUM SP. Z O.O. KATOWICE, POLAND ADMINISTRATIVE SERVICES ZLOTY 80,000.00 Stalexport Autostrady SA 74.38% 41.83%
ELECTRONIC TRANSACTIONS CONSULTANTS CO. RICHARDSON, TEXAS, USA AUTOMATED TOLL COLLECTION SERVICES DOLLAR 3,235.02 Autostrade International US Holdings Inc. 45.00% 45.00%
ESSEDIESSE SOCIETÀ DI SERVIZI SpA ROME GENERAL ADMINISTRATIVE SERVICES EURO 500,000.00 Autostrade per l’Italia SpA 100% 100%
GIOVE CLEAR Srl ROME CLEANING SERVICES EURO 10,000.00 Autostrade per l’Italia SpA 100% 100%
INFOBLU SpA ROME TRAFFIC INFORMATION EURO 5,160,000.00 Autostrade per l’Italia SpA 75% 75%
MIZARD SRL ROME
ACQUISITION, SALE AND MANAGEMENT OF INVESTMENTS IN INFORMATION SERVICES/RADIO AND TELEVISION/TELECOMMUNICATIONS COMPANIES
EURO 10,000.00 Atlantia SpA 100% 100%
NEWPASS SpA VERONATRANSPORT CONTROL AND AUTOMATED INFORMATION SYSTEMS AND EQUIPMENT
EURO 1,747,084.00 Autostrade per l’Italia SpA 51.00% 51.00%
PAVIMENTAL SpA ROMEMOTORWAY AND AIRPORT CONSTRUCTION AND MAINTENANCE
EURO 4,669,131.87 Autostrade per l’Italia SpA 71.67% 71.67%
PAVIMENTAL POLSKA SP.ZO.O. WARSAW, POLANDMOTORWAY AND AIRPORT CONSTRUCTION AND MAINTENANCE
ZLOTY 3,000,000.00 Pavimental SpA 100% 71.67%
PORT MOBILITY SpA CIVITAVECCHIA PORT MOBILITY SERVICES EURO 1,610,000.00 Autostrade per l’Italia SpA 70.00% 70.00%
RACCORDO AUTOSTRADALE VALLE D'AOSTA SpA ROME MOTORWAY CONSTRUCTION AND CONCESSIONS EURO 343,805,000.00 Società Italiana per Azioni per il Traforo del
Monte Bianco 47.97% 24.46% (2)
SOCIEDAD CONCESIONARIA DE LOS LAGOS SA SANTIAGO, CHILE MOTORWAY CONSTRUCTION AND CONCESSIONS PESO 37,433,282,600 100% 99.99%
Autostrade Holding Do Sur SA 99.95%
Autostrade dell'Atlantico 0.05%
Società Autostrada Tirrenica pA ROME MOTORWAY CONSTRUCTION AND CONCESSIONS EURO 24,460,800.00 Autostrade per l’Italia SpA 94.00% 94.00%
SOCIETÀ ITALIANA PER AZIONI PER IL TRAFORO DEL MONTE BIANCO PRE' SAINT DIDIER, AOSTA
MONT BLANC TUNNEL CONCESSIONS AND CONSTRUCTION
EURO 109,084,800.00 Autostrade per l’Italia SpA 51.00% 51.00%
(2) The issued capital is made up of 284,350,000 preference shares. The percentage interest is calculated with reference to all shares in issue whereas the 58.00% of voting rights is calculated with reference to ordinary voting shares.general meetings.
NoteName Registered office Business Currency
Share capital/Consortium
fundat 31 Dec 2010
Held by
% interest in share capital/consortium
fundOverall group interest (%)
(2) The issued capital is made up of 284,350,000 preference shares. The percentage interest is calculated with reference to all shares in issue whereas the 58.00% of voting rights is calculated with reference to ordinary voting shares.general meetings.

270
SPEA INGEGNERIA EUROPEA SpA MILAN INTEGRATED TECHNICAL ENGINEERING SERVICES EURO 5,160,000.00 Autostrade per l’Italia SpA 100% 100%
STALEXPORT AUTOSTRADA DOLNOŚLĄSKA S.A. KATOWICE, POLAND MOTORWAY SERVICES ZLOTY 10,000,000.00 Stalexport Autostrady SA 100% 56.24%
STALEXPORT AUTOSTRADA MAŁOPOLSKA SA KATOWICE, POLAND MOTORWAY CONSTRUCTION AND CONCESSIONS ZLOTY 29,553,000.00 Stalexport Autoroute Sarl 100% 56.24%
STALEXPORT AUTOROUTE SARL LUXEMBOURG, LUXEMBOURG MOTORWAY SERVICES EURO 47,565,000.00 Stalexport Autostrady SA 100% 56.24%
STALEXPORT AUTOSTRADY SA KATOWICE, POLAND POLISH INVESTMENT HOLDING COMPANY ZLOTY 494,524,046.00 Autostrade per l’Italia SpA 56.24% 56.24% (3)
STALEXPORT TRANSROUTE AUTOSTRADA SA KATOWICE, POLAND MOTORWAY SERVICES ZLOTY 500,000.00 Stalexport Autoroute Sarl 55.00% 30.93%
STRADA DEI PARCHI SpA ROME MOTORWAY CONSTRUCTION AND CONCESSIONS EURO 67,764,700.00 Autostrade per l’Italia SpA 60.00% 60.00%
TANGENZIALE DI NAPOLI SpA NAPLES MOTORWAY CONSTRUCTION AND CONCESSIONS EURO 108,077,490.00 Autostrade per l’Italia SpA 100% 100%
TELEPASS SpA ROME AUTOMATED TOLL COLLECTION SERVICES EURO 26,000,000.00 100% 100%
Autostrade per l’Italia SpA 96.15%
Autostrade Tech SpA 3.85%
TIRRENO CLEAR Srl ROME CLEANING SERVICES EURO 10,000.00 Autostrade per l’Italia SpA 100% 100%
TOWERCO SpA ROME TOWER MANAGEMENT SERVICES EURO 20,100,000.00 Atlantia SpA 100% 100%
(3) Company listed on the Warsaw stock exchange.
Held by
% interest in share capital/consortium
fundOverall group interest (%) NoteName Registered office Business Currency
Share capital/Consortium
fundat 31 Dec 2010

271
INVESTMENTS ACCOUNTED FOR USING THE EQUITY METHOD
Associates and joint ventures
ARCEA LAZIO SpA ROMEROAD AND MOTORWAY CONSTRUCTION AND CONCESSIONS IN LAZIO
EURO 1,983,469.00 Autostrade per l’Italia SpA 34.00%
AUTOSTRADE FOR RUSSIA GMBH VIENNA, AUSTRIA INVESTMENT HOLDING COMPANY EURO 60,000.00 Atlantia SpA 51.00% (4)
AUTOSTRADE SUD AMERICA Srl MILAN INVESTMENT HOLDING COMPANY EURO 100,000,000.00 Autostrade per l’Italia SpA 45.77%
BOLOGNA & FIERA PARKING SpA BOLOGNADESIGN, CONSTRUCTIN AND MANAGEMENT OF MULTI-LEVEL PUBLIC CAR PARKS
EURO 13,000,000.00 Autostrade per l’Italia SpA 32.50%
GEIE DEL TRAFORO DEL MONTE BIANCO COURMAYEUR, AOSTA MAINTENANCE AND OPERATION OF MONT BLANC TUNNEL EURO 2,000,000.00 Società Italiana per Azioni per il Traforo del Monte Bianco 50.00%
IGLI SpA MILANINVESTMENT ACQUSITION, SALES AND MANAGEMENT - CONSTRUCTION
EURO 24,120,000.00 Autostrade per l’Italia SpA 33.33%
PEDEMONTANA VENETA SpA VERONA MOTORWAY CONSTRUCTION AND CONCESSIONS EURO 6,000,000.00 Autostrade per l’Italia SpA 28.00%
PUNE SOLAPUR EXPRESSWAYS PRIVATE LIMITED NEW DELHI, INDIA MOTORWAY CONSTRUCTION AND CONCESSIONS RUPEE 100,000,000.00 Atlantia SpA 50.00%
SOCIETA' INFRASTRUTTURE TOSCANE SpA FLORENCEDESIGN, CONSTRUCTIN AND OPERATION OF PRATO TO SIGNA MOTORWAY LINK
EURO 30,000,000.00 46.60%
Autostrade per l’Italia SpA 46.00%
SPEA Ingegneria Europea SpA 0.60%
TANGENZIALI ESTERNE DI MILANO SpA MILAN CONSTRUCTION AND OPERATION OF THE MILAN RING ROAD EURO 27,929,989.50 Autostrade per l’Italia SpA 32.00%
TRIANGULO DO SOL AUTO-ESTRADAS SA MATAO, SP, BRAZIL MOTORWAY CONSTRUCTION AND CONCESSIONS REAL 61,000,000.00 Autostrade Concessões e Participações Brasil 50.00%
(4) This company is jointly controlled with the other shareholder in accordance with agreements regarding the company's corporate governance.
NoteName Registered office Business CurrencyShare capital/
Consortium fundat 31 Dec 2010
Held by % interest in share capital/consortium fund
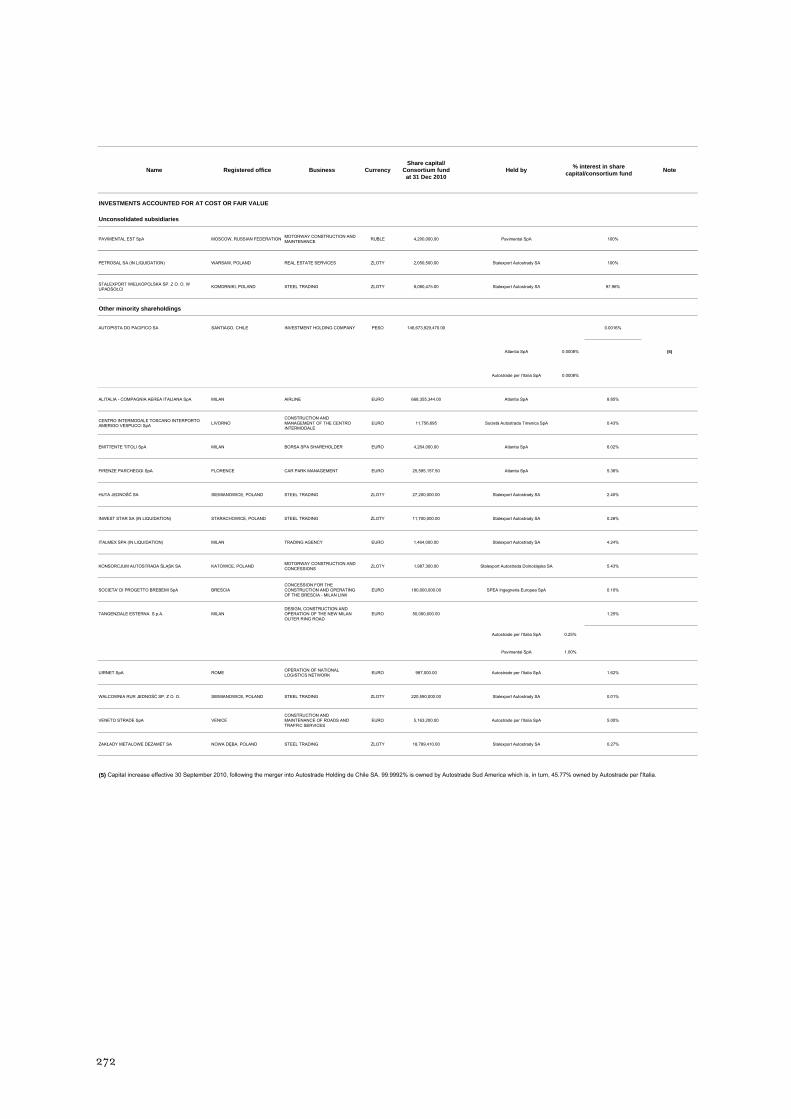
272
Unconsolidated subsidiaries
PAVIMENTAL EST SpA MOSCOW, RUSSIAN FEDERATION MOTORWAY CONSTRUCTION AND MAINTENANCE RUBLE 4,200,000.00 Pavimental SpA 100%
PETROSAL SA (IN LIQUIDATION) WARSAW, POLAND REAL ESTATE SERVICES ZLOTY 2,050,500.00 Stalexport Autostrady SA 100%
STALEXPORT WIELKOPOLSKA SP. Z O. O. W UPADŚOŁCI KOMORNIKI, POLAND STEEL TRADING ZLOTY 8,080,475.00 Stalexport Autostrady SA 97.96%
Other minority shareholdings
AUTOPISTA DO PACIFICO SA SANTIAGO, CHILE INVESTMENT HOLDING COMPANY PESO 146,673,929,470.00 0.0016%
Atlantia SpA 0.0008%
Autostrade per l’Italia SpA 0.0008%
ALITALIA - COMPAGNIA AEREA ITALIANA SpA MILAN AIRLINE EURO 668,355,344.00 Atlantia SpA 8.85%
CENTRO INTERMODALE TOSCANO INTERPORTO AMERIGO VESPUCCI SpA LIVORNO
CONSTRUCTION AND MANAGEMENT OF THE CENTRO INTERMODALE
EURO 11,756,695 Società Autostrada Tirrenica SpA 0.43%
EMITTENTE TITOLI SpA MILAN BORSA SPA SHAREHOLDER EURO 4,264,000.00 Atlantia SpA 6.02%
FIRENZE PARCHEGGI SpA FLORENCE CAR PARK MANAGEMENT EURO 25,595,157.50 Atlantia SpA 5.36%
HUTA JEDNOŚĆ SA SIEMIANOWICE, POLAND STEEL TRADING ZLOTY 27,200,000.00 Stalexport Autostrady SA 2.40%
INWEST STAR SA (IN LIQUIDATION) STARACHOWICE, POLAND STEEL TRADING ZLOTY 11,700,000.00 Stalexport Autostrady SA 0.26%
ITALMEX SPA (IN LIQUIDATION) MILAN TRADING AGENCY EURO 1,464,000.00 Stalexport Autostrady SA 4.24%
KONSORCJUM AUTOSTRADA ŚLĄSK SA KATOWICE, POLAND MOTORWAY CONSTRUCTION AND CONCESSIONS ZLOTY 1,987,300.00 Stalexport Autostrada Dolnośląska SA 5.43%
SOCIETA' DI PROGETTO BREBEMI SpA BRESCIACONCESSION FOR THE CONSTRUCTION AND OPERATING OF THE BRESCIA - MILAN LINK
EURO 180,000,000.00 SPEA Ingegneria Europea SpA 0.10%
TANGENZIALE ESTERNA S.p.A. MILANDESIGN, CONSTRUCTION AND OPERATION OF THE NEW MILAN OUTER RING ROAD
EURO 50,000,000.00 1.25%
Autostrade per l’Italia SpA 0.25%
Pavimental SpA 1.00%
UIRNET SpA ROME OPERATION OF NATIONAL LOGISTICS NETWORK EURO 987,000.00 Autostrade per l’Italia SpA 1.62%
WALCOWNIA RUR JEDNOŚĆ SP. Z O. O. SIEMIANOWICE, POLAND STEEL TRADING ZLOTY 220,590,000.00 Stalexport Autostrady SA 0.01%
VENETO STRADE SpA VENICECONSTRUCTION AND MAINTENANCE OF ROADS AND TRAFFIC SERVICES
EURO 5,163,200.00 Autostrade per l’Italia SpA 5.00%
ZAKŁADY METALOWE DEZAMET SA NOWA DĘBA, POLAND STEEL TRADING ZLOTY 18,789,410.00 Stalexport Autostrady SA 0.27%
(5) Capital increase effective 30 September 2010, following the merger into Autostrade Holding de Chile SA. 99.9992% is owned by Autostrade Sud America which is, in turn, 45.77% owned by Autostrade per l'Italia.
% interest in share capital/consortium fund Note
INVESTMENTS ACCOUNTED FOR AT COST OR FAIR VALUE
(5)
Name Registered office Business CurrencyShare capital/
Consortium fundat 31 Dec 2010
Held by

273
CONSORTIA (6)
CONSORCIO ANHANGUERA NORTE Riberao Preto, Brazil CONSTRUCTION CONSORTIUM REAL - Autostrade Concessões e Participações Brasil 13.13%
CONSORZIO AUTOSTRADE ITALIANE ENERGIA ROME POWER SUPPLIES EURO 107,112.35 41.80%
Autostrade per l’Italia SpA 29.00%
Strada dei Parchi SpA 4.70%
Autostrada Torino-Savona SpA 2.00%
Tangenziale di Napoli SpA 2.00%
Società Italiana per Azioni per il Traforo del Monte Bianco 1.90%
Raccordo Autostradale Valle d'Aosta SpA 1.10%
Autostrade Meridionali SpA 0.90%
Società Autostrada Tirrenica SpA 0.20%
CONSORZIO FASTIGI CIVITAVECCHIA, ROME TUNNEL SAFETY RESEARCH AND STUDIES EURO 40,000.00 Autostrade per l’Italia SpA 12.50%
CONSORZIO GALILEO SCARL TODI, PERUGIA CONSTRUCTION OF AIRPORT TARMACS EURO 10,000.00 Pavimental SpA 40.00%
CONSORZIO ITALTECNASUD (IN LIQUIDATION) ROME CONTROL OF IRPINIA EARTHQUAKE FUNDS EURO 51,645.69 SPEA Ingegneria Europea SpA 20.00%
CONSORZIO MIDRA FLORENCE SCIENTIFIC RESEARCH FOR DEVICE BASE TECHNOLOGIES EURO 73,988.79 Autostrade Tech SpA 33.33%
CONSORZIO MITECO PESCHIERA BORROMEO(MILAN)
OPERATIONS AND WORKS ON BEALF OF TANGENZIALE ESTERNA SPA
EURO 10,000.00 Pavimental SpA 1.30%
CONSORZIO NUOVA ROMEA ENGINEERING LIMENA, PADUA MOTORWAY DESIGNS EURO 60,000.00 SPEA Ingegneria Europea SpA 16.67%
CONSORZIO PEDEMONTANA ENGINEERING VERONA DESIGN OF PEDEMONTANA VENETA MOTORWAY EURO 20,000.00 SPEA Ingegneria Europea SpA 23.30%
CONSORZIO RAMONTI SCARL TORTONA, ALESSANDRIA MOTORWAY CONSTRUCTION EURO 10,000.00 Pavimental SpA 49.00%
CONSORZIO R.F.C.C. (IN LIQUIDATION) TORTONA, ALESSANDRIA CONSTRUCTION OF MOROCCAN ROAD NETWORK EURO 510,000.00 Pavimental SpA 30.00%
CONSORZIO TANGENZIALE ENGINEERING MILANINTEGRATED TECHNICAL ENGINEERING SERVICES - MILAN EXTERNAL RINGROAD EAST
EURO 20,000.00 SPEA Ingegneria Europea SpA 30.00%
CONSORZIO TRINACRIA SCARL LIMENA (PADUA) CONSTRUCTION OF AIRPORT TARMACS EURO 10,000.00 Pavimental SpA 53.00%
CONSORZIO 2050 ROME MOTORWAY DESIGNS EURO 50,000.00 SPEA Ingegneria Europea SpA 0.50%
ELMAS SCARL ROMECONSTRUCTION AND MAINTENANCE OF AIRPORT RUNWAYS AND TARMACS
EURO 10,000.00 Pavimental SpA 60.00%
IDROELETTRICA SCRL CHATILLON, AOSTA POWER SELF GENERATOR EURO 50,000.00 Raccordo Autostradale Valle d'Aosta SpA 0.10%
PISTA 1 SCARL (IN LIQUIDATION) ROMECONSTRUCTION AND MAINTENANCE OF AIRPORT RUNWAYS AND TARMACS
EURO 10,000.00 Pavimental SpA 80.00% (7)
QUADRANTE 300 ROME REPAVING OF AIRPORT TARMACS EURO 10,000.00 Pavimental SpA 40.00%
NoteName Registered office Business CurrencyShare capital/
Consortium fundat 31 Dec 2010
Held by % interest in share capital/consortium fund

274
INVESTMENTS RECOGNISED AS CURRENT ASSETS (8)
DOM MAKLERSKI BDM SA BIELSKO-BIAŁA , POLAND HOLDING COMPANY PLN 21,896,933.00 Stalexport Autostrady SA 2.45%
CENTROZAP SA KATOWICE, POLAND STEEL TRADING PLN 305,000,000.00 3.13%
Stalexport Autostrady SA 2.96%
Biuro Centrum Sp. z o.o. 0.16%
LUSOPONTE - CONCESSIONARIA PARA A TRAVESSIA DO TEJO SA MONTIJO, PORTUGAL MOTORWAY CONCESSIONAIRE EURO 25,000,000.00 Autostrade Portugal - Concessoes de Infraestructuras SA 17.21%
(8) Investments accounted for in current assets are all held for sale.
NoteName Registered office Business CurrencyShare capital/
Consortium fundat 31 Dec 2010
Held by % interest in share capital/consortium fund

275
ANNEX 2 DISCLOSURES PURSUANT TO ART.149-DUODECIES OF THE CONSOB
REGULATIONS FOR ISSUERS 11971/1999
Parent
Type of service Provider of service Note Fees (€000)
Audit KPMG SpA 73 Certification KPMG SpA (1) 45 Tax advisory KPMG SpA - Other services KPMG SpA (2) 310 Total parent 428
Subsidiaries
Type of services (€000) Provider of service Note Fees (€000)
Audit KPMG SpA 1,094 Audit Kpmg SpA Network 205 Certification KPMG SpA (1) 94 Certification Kpmg SpA Network (1) - Tax advisory KPMG SpA - Tax advisory Kpmg SpA Network 37 Other services KPMG SpA (3) 211 Other services Kpmg SpA Network (4) 39 Total Subsidiaries 1,680
Total Atlantia Group 2,108
(1) Opinion on distribution of interim dividends and review of Sustainability Report.(c) Comfort letters on EMTN programme offering circulars, signing of Consolidated Tax Return and Form 770, verification of documentation required by public tenders in India in which the Group participated during the year, agreed upon procedures regarding accounting data and information.(3) Signing of Consolidated Tax Return and Form 770, agreed upon procedures on accounting data and information.(4) Agreed upon procedures on accounting data and information and tax advisory services.

276

277
4. Atlantia SpA’s separate financial statements and notes

278
(This page intentionally left blank)

279
ATLANTIA SPA SEPARATE FINANCIAL STATEMENTS
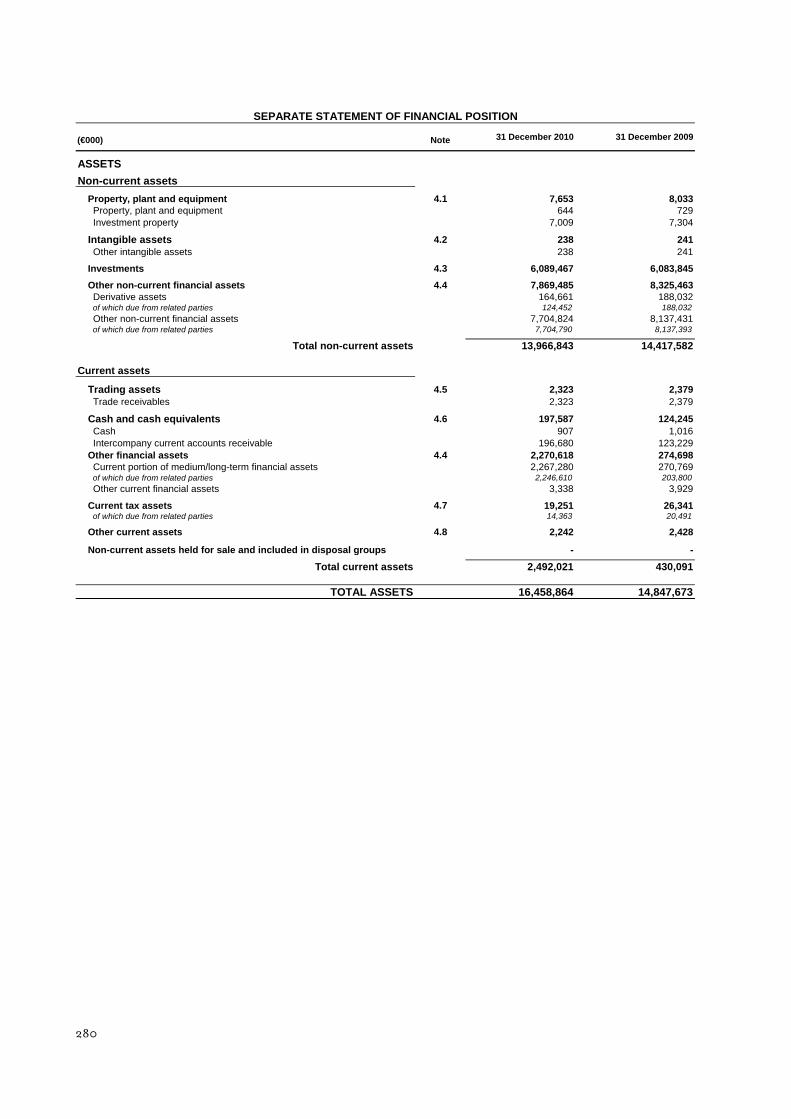
280
(€000) Note
ASSETSNon-current assets
Property, plant and equipment 4.1 7,653 8,033Property, plant and equipment 644 729Investment property 7,009 7,304
Intangible assets 4.2 238 241Other intangible assets 238 241
Investments 4.3 6,089,467 6,083,845Other non-current financial assets 4.4 7,869,485 8,325,463Derivative assets 164,661 188,032of which due from related parties 124,452 188,032Other non-current financial assets 7,704,824 8,137,431of which due from related parties 7,704,790 8,137,393
Total non-current assets 13,966,843 14,417,582
Current assets
Trading assets 4.5 2,323 2,379Trade receivables 2,323 2,379
Cash and cash equivalents 4.6 197,587 124,245Cash 907 1,016Intercompany current accounts receivable 196,680 123,229
Other financial assets 4.4 2,270,618 274,698Current portion of medium/long-term financial assets 2,267,280 270,769of which due from related parties 2,246,610 203,800Other current financial assets 3,338 3,929
Current tax assets 4.7 19,251 26,341of which due from related parties 14,363 20,491
Other current assets 4.8 2,242 2,428
Non-current assets held for sale and included in disposal groups - -
Total current assets 2,492,021 430,091
TOTAL ASSETS 16,458,864 14,847,673
SEPARATE STATEMENT OF FINANCIAL POSITION
31 December 2010 31 December 2009

281
(€000) Note
EQUITY AND LIABILITIESEquity
Equity 6,412,971 6,297,552Issued capital 600,297 571,712Reserves and retained earnings 5,727,248 5,657,447Treasury shares -215,644 -215,644Profit for the year after payment of interim dividend 301,070 284,037
Total equity 4.9 6,412,971 6,297,552Non-current liabilities
Non-current provisions 4.10 274 240Provisions for employee benefits 274 240
Non-current financial liabilities 4.11 7,737,623 8,248,314Bond issues 7,519,633 7,906,818Derivative liabilities 217,990 341,496
Deferred tax liabilities 4.12 26,291 10,827
Total non-current liabilities 7,764,188 8,259,381Current liabilities
Current provisions 4.10 1,568 -Provisions for employee benefits 1,568 -
Trading liabilities 4.13 4,177 4,927Trade payables 4,177 4,927
Current financial liabilities 4.11 2,258,937 265,894Bank overdrafts 1 2Current portion of medium/long-term financial liabilities 2,258,857 265,823 of which due to related parties - 48,695Other current financial liabilities 79 69
Current tax liabilities 4.7 14,342 18,491of which due to related parties 6,852 8,529
Other current liabilities 4.14 2,681 1,428
Liabilities included in disposal groups - -
Total current liabilities 2,281,705 290,740
TOTAL LIABILITIES 10,045,893 8,550,121
TOTAL EQUITY AND LIABILITIES 16,458,864 14,847,673
SEPARATE STATEMENT OF FINANCIAL POSITION
31 December 2010 31 December 2009
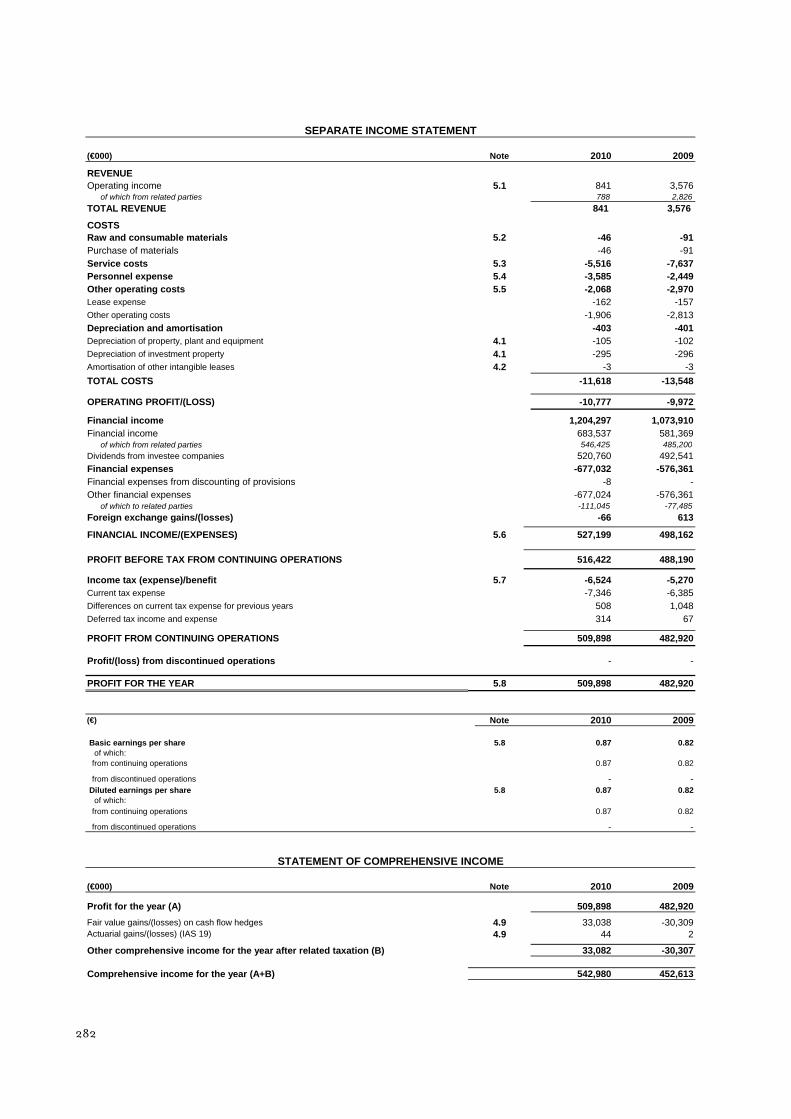
282
(€000) Note 2010 2009
REVENUEOperating income 5.1 841 3,576 of which from related parties 788 2,826TOTAL REVENUE 841 3,576
COSTSRaw and consumable materials 5.2 -46 -91Purchase of materials -46 -91Service costs 5.3 -5,516 -7,637Personnel expense 5.4 -3,585 -2,449Other operating costs 5.5 -2,068 -2,970Lease expense -162 -157Other operating costs -1,906 -2,813Depreciation and amortisation -403 -401Depreciation of property, plant and equipment 4.1 -105 -102Depreciation of investment property 4.1 -295 -296Amortisation of other intangible leases 4.2 -3 -3TOTAL COSTS -11,618 -13,548
OPERATING PROFIT/(LOSS) -10,777 -9,972
Financial income 1,204,297 1,073,910Financial income 683,537 581,369 of which from related parties 546,425 485,200Dividends from investee companies 520,760 492,541Financial expenses -677,032 -576,361Financial expenses from discounting of provisions -8 -Other financial expenses -677,024 -576,361 of which to related parties -111,045 -77,485Foreign exchange gains/(losses) -66 613
FINANCIAL INCOME/(EXPENSES) 5.6 527,199 498,162
PROFIT BEFORE TAX FROM CONTINUING OPERATIONS 516,422 488,190
Income tax (expense)/benefit 5.7 -6,524 -5,270Current tax expense -7,346 -6,385Differences on current tax expense for previous years 508 1,048Deferred tax income and expense 314 67
PROFIT FROM CONTINUING OPERATIONS 509,898 482,920
Profit/(loss) from discontinued operations - -
PROFIT FOR THE YEAR 5.8 509,898 482,920
(€) Note 2010 2009
Basic earnings per share 5.8 0.87 0.82 of which:from continuing operations 0.87 0.82
from discontinued operations - - Diluted earnings per share 5.8 0.87 0.82
of which:from continuing operations 0.87 0.82
from discontinued operations - -
(€000) Note 2010 2009
Profit for the year (A) 509,898 482,920Fair value gains/(losses) on cash flow hedges 4.9 33,038 -30,309Actuarial gains/(losses) (IAS 19) 4.9 44 2
Other comprehensive income for the year after related taxation (B) 33,082 -30,307
Comprehensive income for the year (A+B) 542,980 452,613
SEPARATE INCOME STATEMENT
STATEMENT OF COMPREHENSIVE INCOME

283
STAT
EMEN
T O
F C
HAN
GES
IN E
QU
ITY
Shar
e pr
emiu
m
rese
rve
Lega
l res
erve
Extr
aord
inar
y re
serv
e
Res
erve
for
purc
hase
of
trea
sury
sh
ares
Res
erve
for
nega
tive
good
will
Cas
h flo
w
hedg
e re
serv
e
Res
erve
for a
ctua
rial
gain
s an
d lo
sses
on
post
-em
ploy
men
t be
nefit
s
Oth
er re
serv
esR
etai
ned
earn
ings
571,
712
154
261,
410
4,60
2,47
921
5,64
444
8,99
952
,011
-398
-
2,
325
-215
,644
312,
244
6,25
0,93
6
-
-
-
-
-
-
-3
0,30
92
-
-
-
482,
920
452,
613
Fina
l div
iden
ds a
ppro
ved
-
-
-
-
-
-
-
-
-
-
-
-207
,287
-207
,287
Pro
fit fo
r pre
viou
s ye
ar ta
ken
to e
xtra
ordi
nary
rese
rve
-
-
-
10
4,95
7-
-
-
-
-
-
-
-104
,957
-
Inte
rim d
ivid
ends
-
-
-
-
-
-
-
-
-
-
-
-198
,883
-198
,883
Sha
re o
ptio
n pl
an a
nd o
ther
cha
nges
-
-
-
-
-
-
-
-
173
-
-
-
17
3
571,
712
154
261,
410
4,70
7,43
621
5,64
444
8,99
921
,702
-396
173
2,32
5-2
15,6
4428
4,03
76,
297,
552
-
-
-
-
-
-
33
,038
44
-
-
-
50
9,89
854
2,98
0
Fina
l div
iden
ds a
ppro
ved
-
-
-
-
-
-
-
-
-
-
-
-219
,052
-219
,052
Pro
fit fo
r pre
viou
s ye
ar ta
ken
to e
xtra
ordi
nary
rese
rve
-
-
-
64
,985
-
-
-
-
-
-
-
-6
4,98
5-
Inte
rim d
ivid
ends
-
-
-
-
-
-
-
-
-
-
-
-208
,828
-208
,828
Bon
us is
sue
28,5
85
-
-
-28,
585
-
-
-
-
-
-
-
-
-
Sha
re o
ptio
n pl
an a
nd o
ther
cha
nges
-
-
-
-
-
-
-
2031
3
-1
4-
-
31
9
600,
297
154
261,
410
4,74
3,83
621
5,64
444
8,99
954
,740
-332
486
2,31
1-2
15,6
4430
1,07
06,
412,
971
Ow
ner t
rans
actio
ns a
nd o
ther
cha
nges
Bal
ance
at 3
1 D
ecem
ber 2
010
Prof
it fo
r the
yea
rTo
tal e
quity
Tota
l com
preh
ensi
ve in
com
e
Tota
l com
preh
ensi
ve in
com
e
(€m
)
Issu
ed
capi
tal
Res
erve
s an
d re
tain
ed e
arni
ngs
Trea
sury
sh
ares
Bal
ance
at 3
1 D
ecem
ber 2
008
Ow
ner t
rans
actio
ns a
nd o
ther
cha
nges
Bal
ance
at 3
1 D
ecem
ber 2
009

284
(€000)Note 2010 2009
CASH FLOWS FROM (USED IN) OPERATING ACTIVITIES
Profit for the year 509,898 482,920
Adjusted by:
Depreciation and amortisation 4.1, 4.2 403 401 Provisions 1,331 238 Financial expenses from discounting of provisions 8 - Impairment losses/(Reversal of impairment losses) on other non-current assets 44 -418Net change in deferred tax (assets)/liabilities -314 -67Other non-cash items 34 174 Change in working capital and other changes 3,994 -739Net cash from/(used in) operating activities [A] 6 515,398 482,509
CASH FLOWS FROM (USED IN) INVESTING ACTIVITIES
Purchases of property, plant and equipment -20 - Purchases of investments, net of unpaid called-up issued capital 4.3 -5,381 -48,817Proceeds from sales of property, plant and equipment, intangible assets and investments - 2,240
Change in current and non-current financial assets not held for trading purposes -1,565,745 -1,271,237 of which due from related parties -1,571,836 -1,251,238Net cash from/(used in) investing activities [B] 6 -1,571,146 -1,317,814
CASH FLOWS FROM (USED IN) FINANCING ACTIVITIES
Dividends paid -427,874 -417,430Bond issues 1,484,571 1,650,195Repayments of medium/long-term borrowings (excluding finance lease liabilities) - -450,000Net change in other current and non-current financial liabilities 72,394 70,188Net cash from/(used in) financing activities [C] 6 1,129,091 852,953
Increase/(Decrease) in cash and cash equivalents [A+B+C] 73,343 17,648
Net cash and cash equivalents at beginning of year 124,243 106,595
Net cash and cash equivalents at end of year 197,586 124,243
Note 2010 2009Income tax paid 275,414 107,062Tax rebates from tax consolidation arrangement -271,075 -99,428Interest income and other financial income collected 569,906 448,608Interest expense and other financial expenses paid 568,841 441,011Dividends received 5.6 520,760 492,541Foreign exchange gains collected 5.6 554 549Foreign exchange losses incurred 5.6 576 355
RECONCILIATION OF NET CASH AND CASH EQUIVALENTS
Note 2010 2009
Net cash and cash equivalents at beginning of year 124,243 106,595Cash and cash equivalents 4.6 124,245 106,596Bank overdrafts repayable on demand 4.11 -2 -1
Net cash and cash equivalents at end of year 197,586 124,243Cash and cash equivalents 4.6 197,587 124,245Bank overdrafts repayable on demand 4.11 -1 -2
SEPARATE STATEMENT OF CASH FLOWS
ADDITIONAL INFORMATION ON THE STATEMENT OF CASH FLOWS

285
NOTES
1 INTRODUCTION
Atlantia SpA (also the “Company”) was formed in 2003. The Company’s registered office is in Rome,
at Via Nibby, 20. The Company does not have branch offices.
The Company operates solely as a holding company, and is listed on the Milan Stock Exchange. It is
responsible for developing growth and financial strategies in the infrastructure sector, but does not
have a direct operational role.
The life of the Company expires on 31 December 2050.
As at the date of preparation of these separate financial statements, the shareholder that, via
Schemaventotto SpA, directly and indirectly holds a relative majority of the issued capital of Atlantia
SpA is Sintonia SA. Sintonia SA, which is in turn a subsidiary of Edizione Srl, does not exercise
management and coordination of Atlantia SpA.
These financial statements were approved by the Company’s Board of Directors at its meeting of 11
March 2011. Due to the fact that the Company has significant controlling shareholdings in other
companies, it also prepares Group consolidated financial statements that are presented together with
the Company’s separate financial statements.
2 BASIS OF PRESENTATION
The separate financial statements as at and for the year ended 31 December 2010 have been prepared
on a going concern basis. They have been prepared in compliance with articles 2 and 4 of Legislative
Decree 38/2005 and in accordance with the International Financial Reporting Standards (IFRS)
issued by the International Accounting Standards Board and endorsed by the European Commission,
as in force at that date. These standards reflect the interpretations issued by the International Financial
Reporting Interpretations Committee (IFRIC), in addition to previous International Accounting
Standards (IAS) and interpretations issued by the Standard Interpretations Committee (SIC) and still
in force at the end of the reporting period. For the sake of simplicity, all the above standards and
interpretations are hereinafter referred to as “IFRS”. Moreover, reference was made to the measures
introduced by the CONSOB, in application of paragraph 3 of article 9 of Legislative Decree 38/2005.
The separate financial statements consist of the financial statements of Atlantia SpA (statement of
financial position, income statement, statement of comprehensive income, statement of changes in
equity, the statement of cash flow) and these notes, in application of IAS 1 “Presentation of financial

286
statements” and, in general, the historic cost convention with the exception of those items that are
required by IFRS to be recognised at fair value, as explained in the notes to the relevant items. The
statement of financial position is based on the format that separately discloses current and non-
current assets and liabilities. The income statement is classified by nature of expense, whilst the
statement of cash flows has been prepared in application of the indirect method. IFRS have been applied in accordance with the indications provided in the “Framework for the
Preparation and Presentation of Financial Statements”, and no events have occurred that would
require exemptions pursuant to paragraph 19 of IAS 1.
CONSOB Resolution 15519 of 27 July 2006 requires that, in addition to the specific requirements of
IAS 1 and other IFRS, financial statements must, where material, include separate sub-items providing
(i) disclosure of amounts deriving from related party transactions; and, with regard to the income
statement, (ii) separate disclosure of income and expenses deriving from events and transactions that
are non-recurring in nature, or transactions or events that do not occur on a frequent basis during the
normal course of business. In this regard, it should be noted that no material non-recurring, atypical
or unusual transactions were entered into during 2010, either with third or related parties.
Atlantia SpA's financial statements and the notes are shown in thousands of euros, unless otherwise
indicated. The euro is both the Company’s functional currency and its presentation currency.
Each item in the financial statements is compared with the corresponding amount for the previous
year. These comparative amounts have not been reclassified with respect to amounts previously
presented in the financial statements as at and for the year ended 31 December 2008, as there have
been no events or changes to the accounting standards applied that would require such
reclassifications.
3 ACCOUNTING POLICIES
The following most significant accounting policies were used in preparing the separate financial
statements as at and for the year ended 31 December 2010. They are consistent with those applied in
preparation of the financial statements for the previous year.
Property, plant and equipment
Property, plant and equipment are stated at purchase cost. Cost includes expenditure that is directly
attributable to the acquisition of the items and financial expenses incurred during construction of the
asset. Assets acquired through business combinations prior to 1 January 2004 (the IFRS transition

287
date) are stated at previous amounts, as determined under Italian GAAP for those business
combinations and representing deemed cost.
The cost of assets with finite useful lives is systematically depreciated on a straight-line basis applying
rates that represent the expected useful life of the asset. Each component of an asset with a cost that is
significant in relation to the total cost of the item, and that has a different useful life, is accounted for
separately. Land, whether free of constructions or annexed to civil and industrial buildings, is not
depreciated as it has an indefinite useful life.
Investment property, which is held to earn rentals or for capital appreciation, or both, rather than for
use in the production or supply of goods and services, is recognised at cost measured in the same
manner as property, plant and equipment. The relevant fair value of such assets has also been
disclosed.
A summary of the annual rates of depreciation used is as follows:
Property, plant and equipment is tested for impairment, as described in the relevant note, whenever
events or changes in circumstances indicate that the carrying amount may not be recoverable.
Property, plant and equipment is derecognised following sale or if the facts and circumstances giving
rise to the future expected benefits cease to exist. Any gains or losses (determined as the difference
between the disposal proceeds, less costs to sell, and the carrying amount of the asset) are recognised in
the income statement for the year in which the asset is sold.
Intangible assets
Intangible assets are identifiable assets without physical substance, controlled by the entity and from
which future economic benefits are expected to flow, and purchased goodwill. Identifiable intangible
assets are those purchased assets that, unlike goodwill, can be separately distinguished. This
requirement is generally satisfied when: (i) the intangible asset arises from a legal or contractual right,
or (ii) the asset is separable, meaning that it may be sold, transferred, licensed or exchanged, either
individually or as an integral part of other assets. The asset is controlled by the entity if the entity has
the power to obtain future economic benefits from the asset and can limit access to it by others.
Internally developed assets are recognised as assets to the extent that: (i) the cost of the asset can be
measured reliably; (ii) the entity has the intention, the available financial resources and the technical
Buildings 3% Other assets (furniture and fittings) 12%-20%
DescriptionRate of
depreciation
288
expertise to complete the asset and either use or sell it; (iii) the entity is able to demonstrate that the
asset is capable of generating future economic benefits.
Intangible assets are recognised at cost, measured in the same manner as property, plant and
equipment, provided that the assets can be identified and their cost reliably determined, are under the
entity’s control and are able to generate future economic benefits.
Amortisation of intangible assets with finite useful lives begins when the assets are ready for use and is
based on remaining economic benefits to be obtained in relation to their residual useful lives.
Gains and losses deriving from the disposal of an intangible asset are determined as the difference
between the disposal proceeds, less costs to sell, and the carrying amount of the asset and are
recognised as income or expense in the income statement at the time of the disposal.
Investments
Investments in subsidiaries, associates and joint ventures are accounted for at cost and include any
directly attributable transaction costs.
Investments in other companies, which qualify as available-for-sale financial instruments, as defined
by IAS 39, are initially accounted for at cost at the settlement date, in that this represents fair value,
including any directly attributable transaction costs. After initial recognition, these investments are
measured at fair value, to the extent reliably determinable, through other comprehensive income and
hence in a specific equity reserve. On realisation or recognition of an impairment loss, the
accumulated gains and losses in that reserve are taken to the income statement.
Impairment losses, identified as described in the note on “Impairment of assets”, are reversed in the
other comprehensive income if the circumstances that resulted in the loss no longer exist.
When fair value cannot be reliably determined, investments classified as available-for-sale financial
instruments are measured at cost less any impairment losses. In this case impairment losses may not be
reversed.
Provisions are made to cover the risk that the losses of an investee company could exceed the carrying
amount of the investment, to the extent that the Company is required to comply with actual or
constructive obligations to cover such losses.
Available-for-sale investments, or those in the process of being sold, are recognised at the lower of
their carrying amount and fair value, less any costs to sell.
Receivables and payables
Receivables are initially recognised at fair value and subsequently measured at amortised cost, using the
effective interest method, less the allowance for impairment. The amount of the allowance is based on
the present value of expected future cash flows. These cash flows take account of expected collection
times, estimated realisable value, any guarantees, and the expected costs of recovering the amounts
due. Impairment losses are reversed in future periods if the circumstances that resulted in the loss no

289
longer exist. In this case, the reversal is accounted for in the income statement and may not in any
event exceed the amortised cost of the receivable had no previous impairment losses been recognised.
Payables are initially recognised at cost, which corresponds to the fair value of the liability, less any
directly attributable transaction costs. After initial recognition, payables are recognised at amortised
cost, using the original effective interest method.
Trade receivables and payables, which are subject to normal commercial terms and conditions, are not
discounted to present value.
Cash and cash equivalents
Cash and cash equivalents are recognised at par value. They include highly liquid demand deposits or
very short-term instruments of excellent quality, which are subject to an insignificant risk of changes
in value.
Other financial assets and liabilities
Financial assets that the Company intends and is able to hold to maturity, in accordance with IAS 39,
and financial liabilities are recognised at the fair value of the purchase consideration at the settlement
date, with assets being increased and liabilities being reduced by transaction costs directly attributable
to the purchase of the asset or issuance of a financial liability. After initial recognition, financial assets
and liabilities are measured at amortised cost using the original effective interest method.
Financial assets and liabilities are derecognised when, following their sale or settlement, the Company
is no longer involved in their management and has transferred all risks and rewards of ownership.
Financial assets held for trading are accounted for and measured at fair value through the income
statement. Other categories of financial assets are classified as available-for-sale financial instruments,
which are accounted for and measured at fair value through other comprehensive income. The
financial instruments included in these categories have, to date, never been reclassified.
Derivative financial instruments
All derivative financial instruments are recognised at fair value at the end of the reporting period.
As required by IAS 39, derivatives are designated as hedging instruments when the relationship
between the derivative and the hedged item is formally documented and the periodically assessed
effectiveness of the hedge is high and ranges between 80% and 125%. Changes in the fair value of
derivatives that are designated and qualify as cash flow hedges are recognised in other comprehensive
income, net of any deferred taxation. The gain or loss relating to the ineffective portion is recognised
in the income statement.

290
Changes in the fair value of derivatives serving as fair value hedges are recognised in the income
statement. Analogously, the hedged assets and liabilities are restated at fair value through the income
statement.
Changes in the fair value of derivative instruments that do not qualify for hedge accounting under IAS
39 are recognised in the income statement.
Fair value hierarchy of financial instruments
IFRS 7 "Financial Instruments: Disclosures" requires that financial instruments recognised at fair
value in the statement of financial position be classified with reference to a hierarchy of levels, based
on the source of the inputs used to derive the fair value.
The standard classifies financial instruments recognised at fair value based on the following levels:
a) Level 1 - quoted prices in active markets;
b) Level 2 – inputs other than quoted prices included in level 1 that are observable either directly
(i.e. as prices) or indirectly (i.e. derived from prices);
c) Level 3 - inputs that are not based on observable market data.
There were no transfers among the fair value hierarchy of levels in 2010.
No financial instruments have been classified as level 3.
Provisions
Provisions are made when: (i) the Company has a present (actual or constructive) obligation as a result
of a past event; (ii) it is probable that an outflow of resources will be required to settle the obligation;
and (iii) the related amount has been reliably estimated.
Provisions are measured on the basis of management’s best estimate of the expenditure required to
settle the present obligation at the end of the reporting period. If the discount to present value is
material, provisions are determined by discounting future expected cash flows to their present value
using a discount rate used that reflects current market assessments of the time value of money and the
specific risks relating to the liability. Subsequent to the computation of present value, the increase in
provisions over time is recognised as a financial expense.
Employee benefits
Short-term employee benefits, provided during the period of employment, are accounted for at the
accrued liability at the end of the reporting period.
Liabilities deriving from other medium/long-term employee benefits are recognised in the vesting
period, less any plan assets and advance payments made. They are determined on the basis of actuarial
assumptions, if material, and recognised on an accruals basis in line with the period of service
necessary to obtain the benefit.

291
Post-employment benefits in the form of defined contribution plans are recognised at the amount
accrued at the end of the reporting period.
Post-employment benefits in the form of defined benefit plans (for Italian companies, primarily post-
employment benefits accrued to 31 December 2006 or, where applicable, until the date the employee
joins a supplementary pension fund) are recognised in the vesting period, less any plan assets and
advance payments made. Such defined benefit plans primarily regard the obligation as determined on
the basis of actuarial assumptions and recognised on an accruals basis in line with the period of service
necessary to obtain the benefit. The obligation is calculated by independent actuaries. Any resulting
actuarial gain and loss is recognised in full in other comprehensive income in the period to which they
relate, net of any deferred taxation.
Revenue
Revenue is recognised when the fair value can be reliably measured and it is probable that the
economic benefits associated with the transactions will flow to the Company. Depending on the type of
transaction, revenue is recognised on the basis of the following specific criteria:
a) the sale of goods, when the significant risks and rewards of ownership of the goods have been
transferred to the buyer;
b) the rendering of services, in proportion to the stage of completion of the transaction. When the
amount of the revenue cannot be reliably determined, revenue is recognised only to the extent
of the expenses recognised that are recoverable;
c) rental income or royalties, on an accruals basis, based on the agreed terms and conditions of
the contract.
Interest income and expense is accrued on assets and liabilities based on the effective interest method.
Dividend income is recognised when the Company’s right to receive payment is established.
Income taxes
Income taxes are recognised on the basis of a realistic estimate of tax expense to be paid, in compliance
with the regulations in force and taking account of any applicable exemptions.
Deferred tax assets and liabilities are taxes expected to be recovered or paid on temporary differences
between the carrying amounts of assets and liabilities in the statement of financial position, calculated
in accordance with the above policies, and the corresponding tax bases, as follows:
a) deferred tax assets are only recognised to the extent that it is probable that future taxable profit will
be available against which the asset can be utilised;
b) deferred tax liabilities are always recognised.

292
Atlantia SpA has established a tax consolidation arrangement for the financial years 2008-2010, on
the basis of Legislative Decree 344/2003. The subsidiary, Autostrade per l’Italia SpA, participates in
the arrangement, as do, from 2009, the indirect subsidiaries, Tangenziale di Napoli SpA, EsseDiEsse
Società di Servizi SpA, TowerCo SpA, Autostrada Torino – Savona SpA, SPEA – Ingegneria Europea
SpA, AD Moving SpA, Autostrade Meridionali SpA, Autostrade dell’Atlantico Srl, Pavimental SpA,
Società Autostrada Tirrenica SpA, Port Mobility SpA, Telepass SpA, Infoblu SpA, Autostrade Tech
SpA and Newpass SpA. As a result, these companies’ current tax assets and liabilities for IRES, which
are included in the consolidation, are reported as current tax assets and liabilities, with recognition of
a matching receivable or payable due from or to the subsidiary, in connection with the transfer of
funds to be carried out as a result of the tax consolidation.
Relations between the companies are regulated by a specific contract. This contract establishes that
participation in the tax consolidation arrangement may not, under any circumstances, result in
economic or financial disadvantages for the participating companies compared with the situation that
would have arisen had they not participated in the arrangement. Should such disadvantages arise, they
are to be offset by a corresponding indemnity to be paid to the participating companies concerned.
Share-based payments
The cost of the services rendered by employees and/or directors and paid for in the form of share
options is based on the fair value of the options granted at the grant date. The method of calculating
fair value takes account of all features of the options at the grant date (the option period, exercise price
and vesting conditions, etc.) and the instrument underlying the option. The cost is recognised in the
income statement, with a contra-entry in equity, over the vesting period, based on a best estimate of
the number of options that will vest.
Impairment of assets (impairment testing)
At the end of the reporting period, the Company tests property, plant and equipment, intangible
assets, financial assets and investments for impairment.
If there are indications that these assets have been impaired, the recoverable amounts of such assets are
estimated in order to measure the amount of the eventual impairment loss to accrue. Irrespective of
whether there is an indication of impairment, intangible assets with indefinite lives and those which
are not yet available for use are tested for impairment at least annually, or more frequently, if an event
has occurred or there has been a change in circumstances that could cause an impairment.
If it is not possible to estimate the recoverable amounts of individual assets individually, the
recoverable amount of the cash-generating unit to which a particular asset belongs is estimated.
This entails estimating the recoverable amount of the asset (represented by the higher of the asset's fair
value less costs to sell and its value in use) and comparing it with the carrying amount. If the

293
recoverable amount of an asset is estimated to be less than its carrying amount, the carrying amount is
reduced to its recoverable amount. In calculating value in use, expected future pre-tax cash flow is
discounted using a pre-tax rate that reflects current market assessments of the cost of capital which
embodies the time value of money and the risks specific to the business.
Impairment losses are recognised in the income statement and are classified according to the nature of
the impaired asset. Losses are reversed if the circumstances that resulted in the loss no longer exist,
provided that the reversal does not exceed the cumulative impairment losses previously recognised,
unless the impairment loss relates to goodwill and equity instruments measured at cost, where the
related fair value cannot be reliably determined.
Estimates and judgements
Preparation of financial statements in compliance with IFRS involves the use of estimates and
judgements, which are reflected in the measurement of the carrying amounts of assets and liabilities
and in the disclosures provided in the notes to the financial statements, including contingent assets
and liabilities at the end of the reporting period. These estimates are especially important in
determining amortisation and depreciation, impairment testing of assets (including the measurement
of receivables), provisions, employee benefits, the fair value of financial assets and liabilities, and
deferred tax assets and liabilities.
The amounts subsequently recognised may, therefore, differ from these estimates. Moreover, these
estimates and judgements are periodically reviewed and updated, and the resulting effects of each
change immediately recognised in the financial statements.
Translation of foreign currency items
Transactions in currencies other than the functional currency are recognised by application of the
exchange rate at the transaction date. Assets and liabilities denominated in currencies other than the
functional currency are, subsequently, remeasured by application of the exchange rate at the end of the
reporting period. Any exchange differences on remeasurement are recognised in the income
statement. Non-monetary assets and liabilities denominated in foreign currencies and recognised at
historical cost are translated using the exchange rate at the date of initial recognition.
Earnings per share
Basic earnings per share are computed by dividing profit by the weighted average number of shares
outstanding during the accounting period.
Diluted earnings per share are computed by taking into account, for both profit and the above
weighted average, the effects deriving from the subscription and/or conversion of all potential shares
that may be issued as a result of the exercise of any outstanding share options.

294
New accounting standards and interpretations, or revisions and modifications of existing
standards, that have either yet to come into effect or yet to be endorsed by the European Union
In 2010, no new accounting standards or interpretations were approved or existing accounting
standards or interpretations revised that would have had a material effect on Atlantia’s separate
financial statements.
As required by IAS 8 “Accounting Policies, Changes in Accounting Estimates and Errors”, this section
describes new accounting standards and interpretations, and revisions of existing standards and
interpretations that are already applicable, but that have either yet to come into effect or yet to be
endorsed by the European Union (EU), and that may in the future be applied in the Company’s
financial statements.
IFRS 9 – Financial Instruments
The IASB issued the first part of IFRS 9 on 12 November 2009 that only revised requirements for the
classification and measurement of financial assets currently regulated by IAS 39. When completed,
IFRS 9 will fully replace IAS 39. The IASB subsequently issued a revised version of IFRS 9 on 28
October 2010 that also contained requirements with respect to the classification and measurement of
financial liabilities.
IFRS 9 only provides for two categories of financial assets. It also provides for two accounting
methods: amortised cost and fair value.
Classifications should be made with reference to the business model for managing the financial asset
and the characteristics of its contractual cash flows.
Initial recognition and subsequent measurement at amortised cost are subject to both of the following
conditions:
a) the asset is held in conjunction with a business model whose objective is to hold assets in order to
collect contractual cash flows; and,
b) the contractual terms of the financial asset give rise on specified dates to cash flows that are solely
payments of principal and interest on the principal amount outstanding.
If either one of the above two conditions is not satisfied, the financial asset is required to be initially
recognised and subsequently measured at fair value.
All financial assets in the form of shares are to be measured at fair value. Unlike IAS 39, the revised
standard does not admit exception to the general rule. As a result, it is not possible to measure
unlisted non-controlling interests, for which fair value cannot be reliably determined, at cost.
A financial asset meeting the conditions to be classified and measured at amortised cost may, on initial
recognition, be designated as a financial asset at fair value through profit or loss, to the extent that this
accounting treatment would eliminate or significantly reduce a measurement or recognition

295
inconsistency (sometimes referred to as an ‘accounting mismatch’) that would otherwise arise from
measuring assets or liabilities or recognising the gains and losses on them on different bases.
In addition, the new standard provides that an entity, with respect to investments in equity
instruments, which consequently may not be carried and measured at amortised cost unless such
instruments are shares that are not held for trading but rather for strategic reasons, may make an
irrevocable election on initial recognition to present changes in the fair value in comprehensive
income.
The accounting requirements relating to financial liabilities as provided by the current IAS 39 have,
however, been upheld by the new IFRS 9. Financial liabilities continue to be accounted for at
amortised cost or fair value through profit or loss in specific circumstances.
The changes from current practice under IAS 39 are primarily:
a) changes in the fair value of certain types of financial liabilities, due to the credit risk inherent in
liabilities, are required by IFRS 9 to be recognised in comprehensive income;
b) the elimination of the option to measure financial liabilities at amortised cost, which are in the
form of derivatives entailing the delivery of unlisted equity instruments. This revision means that
all derivative instruments must now be measured at fair value.
IFRS 9 is currently being examined by the EU in conjunction with their overall assessment of the
revision and replacement of IAS 39.
IAS 12 – Income Taxes
The IASB approved certain revisions to IAS 12 on 20 December 2010 relating to the recovery of
deferred taxes associated with certain types of assets. The revisions, among other things, set aside SIC
21.
IAS 12, in contrast to the current presumption that deferred tax assets will be recovered through use,
now presumes that deferred tax assets relating to investment property and property, plant &
equipment carried at fair value will now be recovered and all temporary differences reversed through
the sale of the asset unless there is clear proof that the deferred tax asset can be recovered through use.
The amendment is to be applied for accounting periods starting on or after 1 January 2012. Earlier
adoption is permitted. The amendment has not yet been endorsed by the EU.
IAS 32 - Financial Instruments: Presentation
The IASB published a revision to IAS 32 on 8 October 2009 that clarified the accounting treatment of
certain rights issues in a currency other than the issuer's functional currency. When rights are issued
on a prorated basis to all shareholders for a fixed amount of currency, they must be classified as equity
instruments even to the extent that their exercise price is denominated in a currency other than the
issuer's functional currency. The previous accounting treatment under IAS 32 was that these
instruments should be accounted for as derivative liabilities.
296
The revisions to the standard were endorsed by the EU on 23 December 2009 and must be applied to
accounting periods commencing after 31 December 2010. Earlier adoption is permitted.
IFRIC 14 and IAS 19—The Limit on a Defined Benefit Asset, Minimum Funding Requirements and
their Interaction
The IASB released amendments to IFRIC 14 and IAS 19 on 26 November 2009 that were required
because the effects of any prepayments of minimum contributions had not been considered. In certain
circumstances, however, the entity making such prepayments would be required to recognise a charge
against income. The amendment to IFRIC 14, however, requires prepayments of minimum
contributions to defined benefit plans to be recognised as assets.
The interpretation was endorsed by the EU in July 2010 and must be applied from 2011.
IFRIC 19 – Extinguishing Financial Liabilities with Equity Instruments
IFRIC 19 was published on 26 November 2009. The interpretation determines the mandatory
accounting treatment to be applied by a debtor when, following a renegotiation of the terms of the
liability, the creditor and the debtor agree to a so-called debt for equity swap in full or partial
settlement of a financial liability, through the issuance of equity instruments by the debtor.
IFRIC 19 was endorsed by the EU in 2010 and must be applied for financial statements relating to
accounting periods starting on or after 1 July 2010. Earlier adoption is permitted.
Atlantia is analysing the future impact, if any, of the newly issued standards and interpretations, and
revisions of existing standards and interpretations.

297
4 NOTES TO THE STATEMENT OF FINANCIAL POSITION
The following notes provide information on items in the statement of financial position as at 31
December 2010. Comparative amounts as at 31 December 2009 are shown in brackets.
4.1 Property, plant and equipment � €7,653 thousand (€8,033 thousand)
As at 31 December 2010 property, plant and equipment totals €7,653 thousand, representing a decrease
of €380 thousand compared with 31 December 2009. The reduction is due to depreciation for the year
(€400 thousand), partially offset by capital expenditure (€20 thousand).
There were no changes in the expected useful lives of these assets during 2009.
Property, plant and equipment as at 31 December 2010 is free of mortgages, liens or other collateral
guarantees restricting their use.
The following tables show changes in property, plant and equipment during the year, including amounts
at the beginning and end of the year.
(€000)
Gross amount Accumulated depreciation
Property, plant and equipment:
Land 33 - 33 - - 33 - 33
Buildings 3,017 -2,363 654 - -91 3,017 -2,454 563
Other assets 87 -45 42 20 -14 107 -59 48
Total 3,137 -2,408 729 20 -105 3,157 -2,513 644
Investment property:
Land 1,130 - 1,130 - - 1,130 - 1,130Buildings 9,853 -3,679 6,174 - -295 9,853 -3,974 5,879
Total 10,983 -3,679 7,304 - -295 10,983 -3,974 7,009
Total property, plant and equipment 14,120 -6,087 8,033 20 -400 14,140 -6,487 7,653
31 December 2010
Gross amount Accumulated depreciation Carrying amount
CHANGES DURING THE YEAR
31 December 2009
Accumulated depreciation Carrying amountAdditions Gross amount
Additions due to purchases and capitalisations
Property, plant and equipment of €644 thousand as at 31 December 2010 (€729 thousand as at 31
December 2009) primarily consist of a portion of the buildings located at Via Nibby (€563 thousand)
used for operations and the surrounding land (€33 thousand).
Investment property consists of land and buildings owned by the Company and rented to other Group
companies: Villa Fassini and a portion of the building in Via Nibby, both located in Rome. Investment
property generated rental income of €754 thousand in 2010.
The fair value of these assets is approximately €7.6 million for Villa Fassini and approximately €4.7
million for the building in Via Nibby.

298
4.2 Intangible assets • €238 thousand (€241 thousand)
CHANGES DURING
THE YEAR
(€000)
Accumulated amortisation
Gross amount Accumulated amortisation Carrying amount Additions Gross amount Accumulated
amortisation Carrying amount
Other intangible assets:
Licences2,108 -1,867 241 -3 2,108 -1,870 238
Total 2,108 -1,867 241 -3 2,108 -1,870 238
Total intangible assets 2,108 -1,867 241 -3 2,108 -1,870 238
31 December 201031 December 2009
Intangible assets consist solely of building rights for land owned by the Municipality of Florence, which
are amortised over the term of the rights.
4.3 Investments • €6,089,467 thousand (€6,083,845 thousand)
The following table shows an analysis of investments as at 31 December 2010, together with the
Company’s percentage interest and relevant carrying amount:
Registered office Number of shares/ percentage held Par value Interest
(%) Number of shares Carrying amount (€000)
Investments in subsidiaries - Autostrade per l'Italia SpA Rome 622,027,000 1.00 622,027,000 100% 622,027,000 5,954,522 - TowerCo SpA Rome 20,100,000 1.00 20,100,000 100% 20,100,000 20,100 - Autostrade Mazowsze SA Katowice, Poland 200,000 100.00 (1) 20,000,000 (1) 70% 140,000 2,577 - Mizard Srl Rome 1 10,000.00 10,000 100% 1 10
Total 5,977,209
Investments in associates and joint ventures - Autostrade for Russia Gmbh Vienna (Austria) 60,000 1.00 60,000 51% 30,600 791 - Pune Solapur Expressways Private Ltd. New Delhi (India) 10,000,000 10.00 (2) 100,000,000 (2) 50% 5,000,000 8,606
Total 9,397
Investments in other Group companies
- Firenze Parcheggi SpA Florence 495,550 51.65 25,595,158 5.36% 26,560 2,582 - Emittente Titoli SpA Milan 8,200,000 0.52 4,264,000 6.02% 494,000 277 - Alitalia - Compagnia Aerea Italiana SpA Milan 668,355,344 1.00 668,355,344 8.85% 59,175,680 100,000 - Autopista do Pacifico SA Santiago (Chile) 65,000 146,673,929,470 (3) 0.008% 1 2
Total 102,861
(1) Amount in Polish zlotys(2) Amount in Indian rupees.(3) Amount in Chilean pesos.
Issued capital/ Consortium fund
Capital/Consortium fund
This item consists of the carrying amounts of investments in subsidiaries, associates, joint ventures and
other companies, as determined though application of the accounting policy contained in note 3
“Accounting policies”.
Investments amount to €6,089,467 million (€6,083,845 million as at 31 December 2008) and include
investments in subsidiaries, totalling €5,977,209 thousand, primarily consisting of the investment in

299
Autostrade per l’Italia, investments in associates, totalling €9,397 million, and investments in other
companies, totalling €102,861 thousand.
The investment in Autostrade per l’Italia has been tested for impairment and the recoverability of the
carrying amount, based on its value in use, confirmed. Value in use was determined by using the long-
term business plan approved by the Board of Directors, which was based on the updated financial plans
annexed to the concession arrangement entered into with the Grantor. These contain projections for
traffic, investment, costs and revenues throughout the related concession terms. The company’s estimated
after-tax cash flows were discounted to present value using a discount rate of 5.6%, which is the Group’s
(after-tax) WACC (5.9% in 2009). After-tax cash flows and discount rates were used as this produces
results that are substantially the same as those deriving from the use of pre-tax figures.
Moreover, since a trigger events occurred, represented by the economic losses recorded by Alitalia -
Italian Airline SpA, has been performed the impairment test based on the determination of its value in
use. The test is based on the latest projections of cash flows, net of taxes, using a discount rate after tax
(representative of the WACC) of 8.75%. The results of the impairment tests have not revealed the need to
make writedowns on the value of the investment.
Since trigger events occurred, represented by the losses recorded by Alitalia – Compagnia Aerea Italiana
SpA, the impairment test has been performed based on the determination of its value in use. The test is
based on the latest projections of cash flows, net of taxes, using a discount rate after tax (representative of
the WACC) of 8.75%. The results of the impairment tests have not revealed the need to record
impairment losses on the carrying amount of the investment.
The main changes during 2010 regard:
a) the capital call by Pune Solapur Expressways Private Limited (€4,820 thousand);
b) the capital contribution paid to Autostrade for Russia GmbH (€561 thousand).
The following table shows carrying amounts at the beginning and end of the year and changes in
investments during the year.

300
(€000) Gross amount Carrying amountNew acquisitions and
purchases of additional shares
Increases due to share options
Other increases and payment of called-up
capital
Currency translation differences on
payment of call-up capital
Gross amount Carrying amount
Investments in subsidiaries
Autostrade per l'Italia SpA 5,954,237 5,954,237 - 285 - - 5,954,522 5,954,522TowerCo SpA 20,100 20,100 - - - - 20,100 20,100Autostrade Mazowsze SA 2,621 2,621 - - - -44 2,577 2,577Mizard Srl 10 10 - - - - 10 10
5,976,968 5,976,968 - 285 - -44 5,977,209 5,977,209Investments in associates and joint venturesAutostrade for Russia Gmbh 230 230 561 - - - 791 791Pune Solapur Expressways Private Ltd 3,786 3,786 4,709 - 111 - 8,606 8,606
4,016 4,016 5,270 - 111 - 9,397 9,397
Investments in other Group companies
Firenze Parcheggi SpA 2,582 2,582 - - - - 2,582 2,582Emittente Titoli SpA 277 277 - - - - 277 277Alitalia - Compagnia Aerea Italiana SpA 100,000 100,000 - - - - 100,000 100,000Autopista do Pacifico SA 2 2 - - - - 2 2
102,861 102,861 - - - - 102,861 102,861
Total investments 6,083,845 6,083,845 5,270 285 111 -44 6,089,467 6,089,467
Changes during the year
31 December 2009 Cost 31 December 2010
4.4 Other financial assets
(non-current) • €7,869,485 thousand (€8,325,463 thousand)
(current) • €2,270,618 thousand (€274,698 thousand)
The following table shows the composition of other financial assets as at 31 December 2010:
(€000)
Total financial assets
Current portion
Non-current portion
Total financial assets
Current portion
Non-current portion
Derivative assets (1) 236,283 71,622 164,661 280,459 92,427 188,032Intercompany loans (2) 9,900,448 2,195,658 7,704,790 8,315,735 178,342 8,137,393Other financial assets (2) 3,372 3,338 34 3,967 3,929 38
Total 10,140,103 2,270,618 7,869,485 8,600,161 274,698 8,325,463
31 December 2010 31 December 2009
(1) These assets are classified as hedging derivatives and in level 2 of the fair value hierarchy.(2) Intercompany loans are classified as "loans and receivables" in accordance with IAS 39.
Derivative assets, totalling €236,283 thousand, essentially regard fair value gains as at 31 December 2010
on certain derivative financial instruments entered into with Autostrade per l’Italia and banks to hedge
interest rate and currency risks.
The non-current portion (€164,661 thousand) is represented by the fair value of outstanding derivatives
hedging:
a) the medium/long-term loan of €750,000 thousand granted to the subsidiary (€124,452 thousand);
b) the bond issue with par value of 20 billion yen (€40,209 thousand).
The change compared with 31 December 2009 (down €23,371 thousand) essentially reflects the payment
of differentials during the year and a shift in the interest rate curve at the end of the year, in addition to
the unwinding, on 17 September 2010, of the derivatives hedging the intercompany loan of €1,500,000
thousand, previously classified as fair value hedges.

301
The current portion (€71,622 thousand) includes fair value gains (€25,994 thousand) on the derivatives
hedging the intercompany loan with a parvalue of €2,000,000 thousand maturing on 9 June 2011 and
accrued income in the form of cash flows from the derivatives (€45,628 thousand).
The change compared with 31 December 2009 (down €20,805 thousand) regards a reduction in accrued
income on hedging derivatives, partially offset by reclassification of the above fair value gain on the
derivative hedging the intercompany loan with a par value of €2,000,000 thousand.
Details of derivatives held for hedging purposes and the Company’s hedging strategy are contained in note
6.3, “Financial risk management”.
Intercompany loans relate to medium/long-term loans to the subsidiary, Autostrade per l'Italia
(€9,704,790 thousand), in addition to accrued interest income on non-current loans (€195,658
thousand). The overall increase of €1,584,713 thousand, compared with 31 December 2009, essentially
reflects two new intercompany loans with par values of €1,000 million and €500 million to the
subsidiary, which replicate, at intercompany level, the bonds issued on 16 September 2010, and an
increase (€55,614 thousand) recognised following the above-mentioned unwinding of derivatives
previously classified as fair value hedges. These had been used to hedge the intercompany loan with a par
value of €1,500,000 thousand granted in 2009.
In addition, in view of the approaching maturity of the bond issue with a par value of €2,000,000
thousand and the loan to Autostrade per l’Italia of a corresponding amount in June 2011, these financial
assets and liabilities have been reclassified to the current portion, together with the fair value of the
related derivatives, as noted above.
Other financial assets of €3,372 thousand principally relate to other short-term loans and receivables due
from the subsidiary Autostrade per l’Italia.
The loans granted to Autostrade per l’Italia are on the same terms as those applied to Company’s bank
borrowings, increased by a spread that takes account of the cost of managing the loans.
The following two tables show intercompany medium/long-term financial assets outstanding at year end.
The first presents a comparison of financial assets at 31 December 2010 and 31 December 2009 by
maturity (current and non-current portions).

302
Total financial assets Current portion Non-current
portionTotal financial
assets Current portion Non-current portion
maturing between 13 and
60 months
maturing after 60 months
Intercompany loans
Autostrade per l'Italia SpA loan 2004-2011 2,000,000 - 2,000,000 2,000,000 2,000,000 - - - Autostrade per l'Italia SpA loan 2004-2014 2,750,000 - 2,750,000 2,750,000 - 2,750,000 2,750,000 - Autostrade per l'Italia SpA loan 2004-2022 750,000 - 750,000 750,000 - 750,000 - 750,000 Autostrade per l'Italia SpA loan 2004-2024 1,000,000 - 1,000,000 1,000,000 - 1,000,000 - 1,000,000 Autostrade per l'Italia SpA loan 2009-2016 1,488,217 - 1,488,217 1,555,614 - 1,555,614 - 1,555,614 Autostrade per l'Italia SpA loan 2004-2038 149,176 - 149,176 149,176 - 149,176 149,176 Autostrade per l'Italia SpA loan 2010-2017 - - - 1,000,000 - 1,000,000 - 1,000,000 Autostrade per l'Italia SpA loan 2010-2025 - - - 500,000 - 500,000 - 500,000
Total intercompany loans 8,137,393 - 8,137,393 9,704,790 2,000,000 7,704,790 2,750,000 4,954,790
Derivative assets 188,032 - 188,032 190,655 25,994 164,661 - 164,661
Other financial assets 3,967 3,929 38 3,372 3,338 34 34 -
Accrued income on medium/long-term financial assets 270,769 270,769 - 241,286 241,286 - - -
Total financial assets 8,600,161 274,698 8,325,463 10,140,103 2,270,618 7,869,485 2,750,034 5,119,451
(€000)
31 December 2009 Non-current maturities at 31 Dec 201031 December 2010
The second table compares the aggregate carrying amounts (current and non-current portions) of
medium/long-term financial assets, their par values and fair values at the end of the two years. The second
table also summarises the principal conditions applied to each financial asset.
Fair value is determined by discounting expected cash flows to their present value using discount rates
taken from the year-end market interest rate curve.
The Company’s financial risks and risk management policies are described in note 6.3, “Financial risk
management”.
There are no indications of impairment losses on any financial assets.
Intercompany loans
Autostrade per l'Italia SpA loan 2004-2011 2,000,000 2,000,000 2,023,234 2,000,000 2,000,000 2,009,470 3M Euribor 2.14% (2) 0.73% 9 June 2011Autostrade per l'Italia SpA loan 2004-2014 2,750,000 2,750,000 3,142,562 2,750,000 2,750,000 3,134,189 5.37% 5.37% 9 June 2014Autostrade per l'Italia SpA loan 2004-2022 750,000 750,000 840,317 750,000 750,000 836,355 6M Euribor 2.62% (2) 1.15% 9 June 2022Autostrade per l'Italia SpA loan 2004-2024 1,000,000 1,000,000 1,281,474 1,000,000 1,000,000 1,312,717 6.15% 6.15% 9 June 2024Autostrade per l'Italia SpA loan 2009-2016 1,500,000 1,488,217 1,797,795 1,500,000 1,555,614 1,803,318 5.85% 5.04% 6 May 2016Autostrade per l'Italia SpA loan 2004-2038 149,176 149,176 191,508 149,176 149,176 203,218 5.47% 5.47% 10 Dec 2038Autostrade per l'Italia SpA loan 2010-2017 - - - 1,000,000 1,000,000 1,055,988 3.59% 3.59% 18 Sept 2017Autostrade per l'Italia SpA loan 2010-2025 - - - 500,000 500,000 560,930 4.573% 4.57% 16 Sept 2025
Total intercompany loans 8,149,176 8,137,393 9,276,890 9,649,176 9,704,790 10,916,185 (3)
Derivative assets 188,032 188,032 190,655 190,655 (4)
Other financial assets 3,967 3,372
Accrued income on medium/long-term financial assets 270,769 241,286
Total non-current financial assets 8,600,161 10,140,103
(1) The value of medium/long-term financial assets shown in the table includes both the non-current and current portions.(2) At 31 December 2010 interest rate hedges with a notional amount of €2,750 million were in place. These were classified either as cash flow or fair value hedges depending on the nature of the risk hedged, in accordance with IAS 39.(3) These financial assets are classified as "loans and receivables" in accordance with IAS 39.
Note Spread Maturity
(4) These financial instruments are classified as hedging derivatives and in level 2 of the fair value hierarchy.
(€000) Par value at 31 Dec 2009 (1)
Carrying amount at 31 Dec 2009 (1)
Fair value at 31 Dec 2009
Par value at 31 Dec 2010 (1)
Carrying amount at 31 Dec 2010
(1)
Fair value at 31 Dec 2010
Reference interest rate
Effective interest rate
The following table shows changes in the par value of medium/long-term financial assets during 2010.
(€000)Par value at 31 Dec
2009 (1) Repayments New loans Other changesPar value at 31 Dec 2010
(1)
Total intercompany loans 8,149,176 - 1,500,000 - 9,649,176
(1) The value of medium/long-term financial assets shown in the table includes both the non-current and current portions.

303
4.5 Trading assets • €2,323 thousand (€2,379 thousand)
This item primarily consists of trade receivables of €2,323 thousand as at 31 December 2010, which is
substantially in line with the figure as at 31 December 2009 (€2,379 thousand).
4.6 Cash and cash equivalents • €197,587 thousand (€124,245 thousand)
As at 31 December 2010 cash amounts to €907 thousand, whilst balances receivable on intercompany
current accounts amount to €196,680 thousand (€123,229 thousand as at 31 December 2009). This
essentially reflects Autostrade per l’Italia’s current account balance.
4.7 Current tax assets and liabilities
Current tax assets • €19,251 thousand (€26,341 thousand)
Current tax liabilities • €14,342 thousand (€18,491 thousand)
Current tax assets and liabilities are shown below:
(€000) 31 Dec 2010 31 Dec 2009 31 Dec 2010 31 Dec 2009
IRAP 4,888 5,850 - -IRES - - 7,490 9,962
IRES from tax consolidation (1) 14,363 20,491 6,852 8,529
Total 19,251 26,341 14,342 18,491
Assets Liabilities
(1) Intercompany tax assets and liabilities. With effect from 1 January 2010, the subsidiaries, Autostrade Tech SpA and Newpass SpA have also joined
the tax consolidation arrangement established by the Company on the basis of Legislative Decree
344/2003.
The following Group companies had already been included in the tax consolidation arrangement for the
three-year period 2009-2011 from 1 January 2009: Autostrade Meridionali SpA, Tangenziale di Napoli
SpA, EsseDiEsse Società di Servizi SpA, TowerCo SpA, Autostrada Torino – Savona SpA, SPEA –
Ingegneria Europea SpA, Infoblu SpA, AD Moving SpA, Autostrade dell’Atlantico Srl, Pavimental SpA,
Port Mobility SpA, Società Autostrada Tirrenica SpA and Telepass SpA. Autostrade per l’Italia SpA had,

304
meanwhile, already participated in the tax consolidation arrangement for the three-year period 2008-
2010.
The balance thus includes IRES payable to the tax authorities, totalling €7,490 thousand, and receivables
of €14,363 thousand and payables of €6,852 thousand due from and to participating companies.
4.8 Other current assets • €2,242 thousand (€2,428 thousand)
This item consists of receivables and other current assets that are not eligible for classification as trading
or financial. An analysis of the balance at 31 December 2010, which is substantially in line with the figure
for 31 December 2009, is shown below:
(€000) 31 December 2010 31 December 2009 Increase/ (Decrease)
Social security receivables (INPS) 1,681 1,685 -4Other current assets 561 743 -182
2,242 2,428 -186
4.9 Equity • €6,412,971 thousand (€6,297,552 thousand)
Atlantia’s issued capital is fully subscribed and paid-in and consists of 600,297,135 ordinary shares with a
par value of €1 each, amounting to €600,297 thousand. The number of shares increased by 28,585,578
in 2010 as a result of the bonus issue approved by shareholders at the Extraordinary General Meeting held
on 14 April 2010, which decided to issue 1 new share for every 20 shares in issue. This resulted in an
increase in treasury shares of 573,831, with the total number of treasury shares held rising from
11,476,616 to 12,050,447.
Equity totals €6,412,971 thousand (€6,297,552 thousand as at 31 December 2009) and is up €115,419
thousand compared with the end of the previous year. This is primarily the result of the following:
a) net comprehensive income for the year of €542,980 thousand, consisting of profit for the year
(€509,898 thousand) and the recognition of other comprehensive income (€33,082 thousand),
primarily due to the effect of changes in the fair value of cash flow hedges, after the related taxation;
b) payment of the final dividend for 2009, totalling €219,052 thousand (€0.37 per share), and of the
interim dividends for 2010, totalling €208,828 thousand (€0.355 per share).
Atlantia’s aims to manage its capital in order to create value for shareholders, ensure the Company
remains a going concern, safeguard the interest of stakeholders, and guarantee efficient access to external
sources of funding to adequately support the growth of the Group’s businesses.

305
The tables below show an analysis of issued capital and equity reserves, showing their permitted uses.
To cover losses
Issued capital 600,297 (1) B
ReservesLegal reserve 261,410 (2) A, B 141,351 -Share premium reserve 154 A, B, C 154 -Extraordinary reserve 4,743,836 (3) A, B, C 4,743,836 244,229 (5)Reserve for purchase of treasury shares 215,644Treasury shares in portfolio -215,644Reserve for negative goodwill 448,999 (4) A, B, C 448,999 -Reserve for actuarial gains and losses on post-employment benefits -332 B -
Cash flow hedge reserve 54,740 B -Other reserves and retained earnings 2,797 A, B, C 2,797 -Total reserves 5,511,604
Total capital and reserves 6,111,901 5,337,137 - 244,229of which:Non-distributable - Distributable 5,337,137
* Key:A: capital increasesB: to cover lossesC: shareholder distributions
Notes
(2) The available portion is equal to one-fifth of the issued capital, totalling €141,351 thousand.(3) Including €1,250,000 thousand that may be used to purchase treasury shares, with a corresponding transfer to thereserve for the purchase of treasury shares, as approved by the shareholders at their Annual General Meeting of 14 April 2010.
(1) Including €566,687 thousand relating to the capital increase generated by the merger of Autostrade with and into the former NewCo28 SpA in 2003. With reference to art. 172, paragraph 5 of the Consolidated Income Tax Act, this capital increase is restricted to the following reserves that are taxable on distribution:- revaluation reserve pursuant to Law 72/1982, amounting to €556,960 thousand;- revaluation reserve pursuant to Law 413/1991, amounting to €6,807 thousand;- revaluation reserve pursuant to Law 342/2000, amounting to €2,920 thousand.
(4) With reference to art. 172, paragraph 5 of the Consolidated Income Tax Act, the merger surplus generated by the merger described in note (1) is restricted to and accounted for in the following reserves that are taxable on distribution:- reserve for capital contributions, amounting to €8,113 thousand;- revaluation reserve pursuant to Law 72/1982, amounting to €368,840 thousand;- revaluation reserve pursuant to Law 413/1991, amounting to €50,416 thousand;- revaluation reserve pursuant to Law 342/2000, amounting to €21,630 thousand.(5) To fund the reserve for the purchase of treasury shares in 2008 (€215,644 thousand) and for the bonus issue that took place in the first half of 2010 (€28,585 thousand).
Description Amount as at 31 December 2010 (€000)
Permitted uses (A, B, C)*
Available portion (€000)
Uses during the past three years
For other reasons
Other components of the statement of comprehensive income
The section separate “Financial statements” includes the “Statement of comprehensive income”, which
includes other comprehensive income, after the related taxation.
The following table shows gross amounts for components of other comprehensive income and the related
taxation.
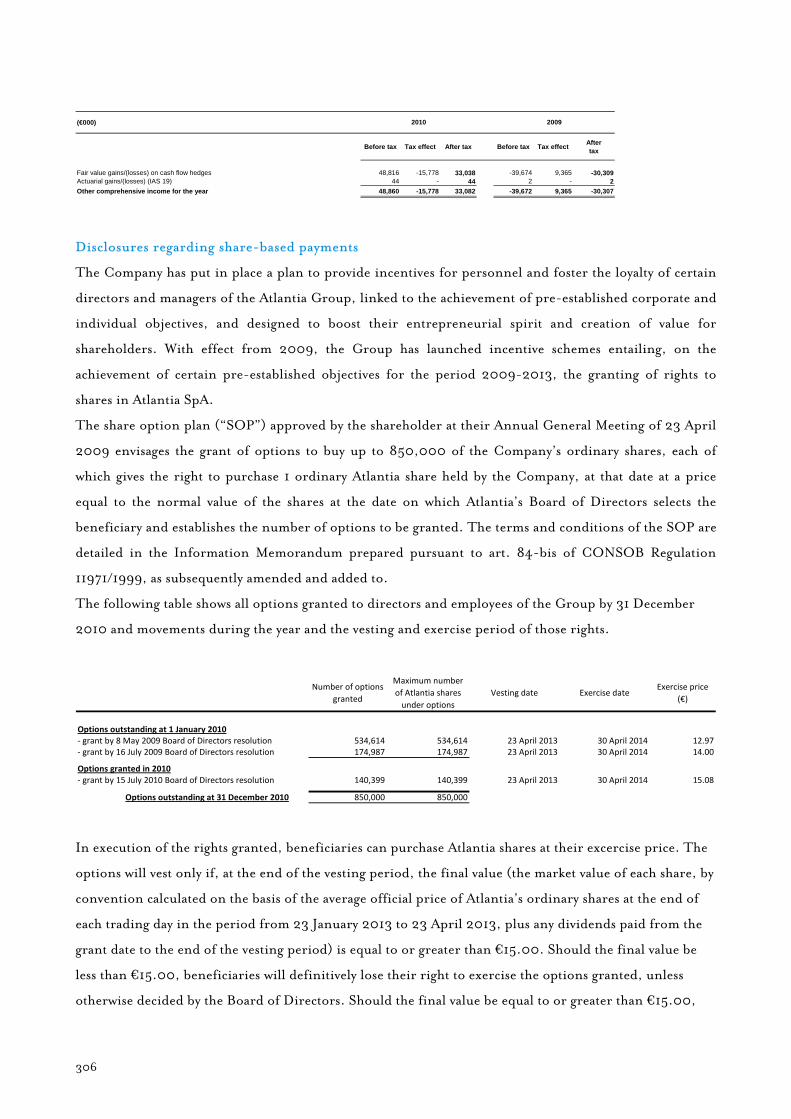
306
(€000)
Before tax Tax effect After tax Before tax Tax effect After tax
Fair value gains/(losses) on cash flow hedges 48,816 -15,778 33,038 -39,674 9,365 -30,309Actuarial gains/(losses) (IAS 19) 44 - 44 2 - 2Other comprehensive income for the year 48,860 -15,778 33,082 -39,672 9,365 -30,307
2010 2009
Disclosures regarding share-based payments
The Company has put in place a plan to provide incentives for personnel and foster the loyalty of certain
directors and managers of the Atlantia Group, linked to the achievement of pre-established corporate and
individual objectives, and designed to boost their entrepreneurial spirit and creation of value for
shareholders. With effect from 2009, the Group has launched incentive schemes entailing, on the
achievement of certain pre-established objectives for the period 2009-2013, the granting of rights to
shares in Atlantia SpA.
The share option plan (“SOP”) approved by the shareholder at their Annual General Meeting of 23 April
2009 envisages the grant of options to buy up to 850,000 of the Company’s ordinary shares, each of
which gives the right to purchase 1 ordinary Atlantia share held by the Company, at that date at a price
equal to the normal value of the shares at the date on which Atlantia’s Board of Directors selects the
beneficiary and establishes the number of options to be granted. The terms and conditions of the SOP are
detailed in the Information Memorandum prepared pursuant to art. 84-bis of CONSOB Regulation
11971/1999, as subsequently amended and added to.
The following table shows all options granted to directors and employees of the Group by 31 December
2010 and movements during the year and the vesting and exercise period of those rights.
Number of options granted
Maximum number of Atlantia shares under options
Vesting date Exercise dateExercise price
(€)
Options outstanding at 1 January 2010‐ grant by 8 May 2009 Board of Directors resolution 534,614 534,614 23 April 2013 30 April 2014 12.97‐ grant by 16 July 2009 Board of Directors resolution 174,987 174,987 23 April 2013 30 April 2014 14.00
Options granted in 2010‐ grant by 15 July 2010 Board of Directors resolution 140,399 140,399 23 April 2013 30 April 2014 15.08
Options outstanding at 31 December 2010 850,000 850,000
In execution of the rights granted, beneficiaries can purchase Atlantia shares at their excercise price. The
options will vest only if, at the end of the vesting period, the final value (the market value of each share, by
convention calculated on the basis of the average official price of Atlantia’s ordinary shares at the end of
each trading day in the period from 23 January 2013 to 23 April 2013, plus any dividends paid from the
grant date to the end of the vesting period) is equal to or greater than €15.00. Should the final value be
less than €15.00, beneficiaries will definitively lose their right to exercise the options granted, unless
otherwise decided by the Board of Directors. Should the final value be equal to or greater than €15.00,

307
the number of vested options will be equal to a percentage of the options granted, based on the final value,
as shown in the following table:
Final share price(€)15 20%16 27%17 35%18 42%19 49%20 56%21 64%22 71%23 78%24 85%25 93%26 100%
above 26A percentage calculated on the basis of the following formula:
[(26 - Exercise Price) / (Closing Value - Exercise Price)] * 100
Percentage of options granted that have vested
The terms and conditions of the SOP expressly state that any capital gains realised as a result of the
exercise of vested options may under no circumstances exceed twice (three in the case of the Chief
Executive Officer) the beneficiary’s gross annual fixed salary as at 1 January 2009.
The options are under no circumstances transferable inter vivos and their non-transferability only ceases
on the unilateral termination of employment or on the fair dismissal by the beneficiary within three years
of the date of giving such a commitment.
As a result of the above bonus issue approved by the Shareholders at their General Meeting of 14 April
2010, on 15 July 2010 the Board of Directors of Atlantia approved certain alterations to the incentive
plans to ensure that there is no change in the substantial and financial terms of the existing plans, the
conditions of which would otherwise have deteriorated in respect of the beneficiaries, given the reduced
intrinsic value of each share. These changes, which are to be put to the vote at the first available
Shareholders’ General Meeting, essentially involve (i) reductions in the exercise prices for the options
granted at the Board of Directors’ meeting of 8 May 2009 from €12.966 to €12.349 and in the exercise
price for the options granted at the Board of Directors’ meeting of 16 July 2009 from €13.999 to
€13.332; (ii) the granting to beneficiaries of the options already granted of 1 new option for every 20
options previously granted; (iii) the reduction to €14,286 (previously €15,00) of the final minimum
value for purpose of the vesting of shares granted and certain changes to the conversion table from vested
options to options granted; and, (iv) the decision to grant Gian Maria Gros-Pietro, the Company’s
former Chairman, the option of maintaining his right to exercise, in accordance with the same conditions
applied to other beneficiaries, the options previously granted to him and (v) in the case of termination of
the employee relationship for reasons other than those mentioned above, the possibility to mantain the
rights granted by Board of Directors’ resolution.
At the same meeting, the Board of Directors approved the grant of 140,399 options to the Chairman,
Fabio Cerchiai, with a vesting period of 15 July 2010 - 23 April 2013 and an exercise period of 24 April
308
2013 to 30 April 2014 at an exercise price of €15.079. The fair value of each stock option granted as
determined by a specially appointed expert was €1.42. The Monte Carlo model was used to determine fair
value using the following parameters:
- risk free interest rate: 1.62%
- expected expiry: 3.8 years
- expected volatility (equal to historic volatility): 26.7%
- expected dividends: 3.67%
- share price on grant date: €15.17
The weighted average price of an Atlantia ordinary share in 2010 was €15.61 whereas it was €15.56 for the
period between 15 July and 31 December 2010. As at 31 December 2010 the price was €15.27 per share.
As a result of implementation of the plan, as at 31 December 2010 the Group has recognised, in
accordance with the requirements of IFRS 2, an increase in equity reserves of €319 thousand, based on
the accrued fair value of the options granted at that date, with a contra entry in the income statement in
personnel expense.
4.10 Provisions
(non-current) • €274 thousand (€240 thousand)
(current) • €1,568 thousand (-)
As at 31 December 2010 this item refers solely to provisions for employee benefits, consisting of post-
employment benefits, totalling €274 thousand, and provisions for the long-term staff incentive plan
(€1,568 thousand). The latter regards the three-year incentive plan (2008-2010) for the Company’s
management.
In view of the expected payment of the incentives in 2011, the related provisions have been classified in
current liabilities.
The main actuarial assumptions applied in estimating provisions for post-employment benefits at 31
December 2010 are shown below:
financial assumptions:
• annual discount rate 4.55%
• annual inflation rate 2.0%
• annual rate of increase in post-employment benefits 3.0%
• annual rate of increase in real salaries 0.65%
• annual turnover rate 3.5%
• annual rate of advances paid 3.0%
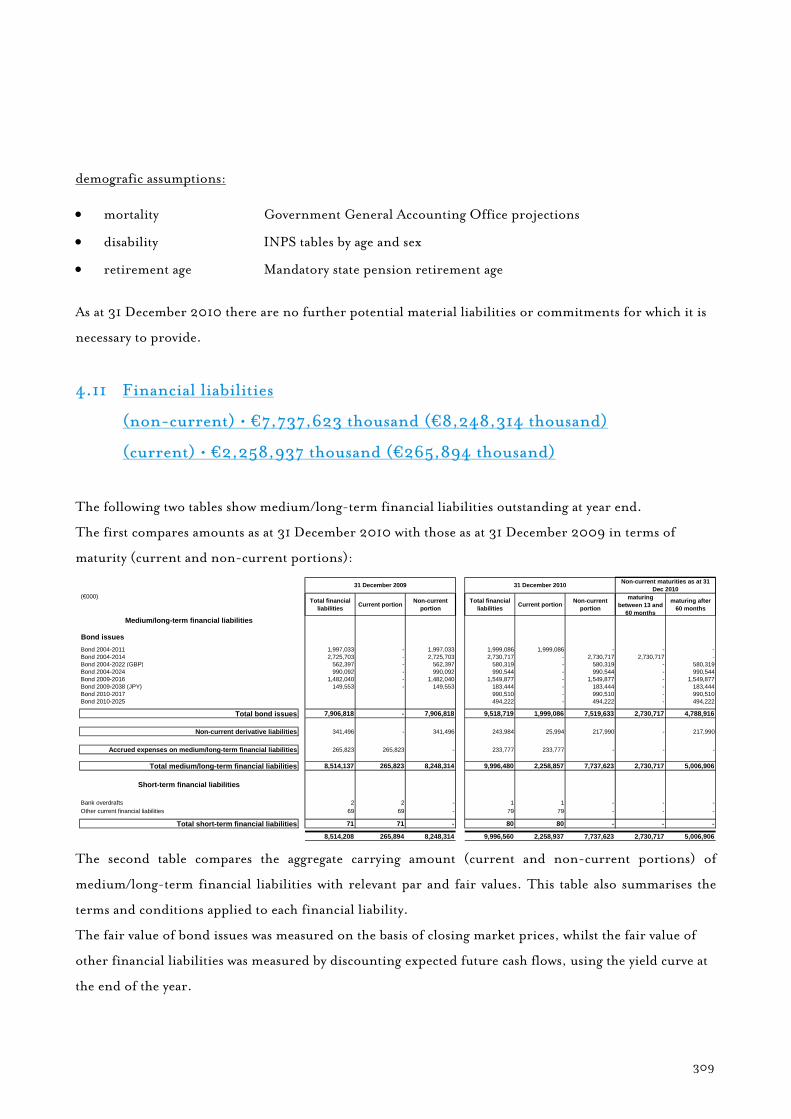
309
demografic assumptions:
• mortality Government General Accounting Office projections
• disability INPS tables by age and sex
• retirement age Mandatory state pension retirement age
As at 31 December 2010 there are no further potential material liabilities or commitments for which it is
necessary to provide.
4.11 Financial liabilities
(non-current) • €7,737,623 thousand (€8,248,314 thousand)
(current) • €2,258,937 thousand (€265,894 thousand)
The following two tables show medium/long-term financial liabilities outstanding at year end.
The first compares amounts as at 31 December 2010 with those as at 31 December 2009 in terms of
maturity (current and non-current portions):
Total financial liabilities Current portion Non-current
portionTotal financial
liabilities Current portion Non-current portion
maturing between 13 and
60 months
maturing after 60 months
Medium/long-term financial liabilities
Bond issuesBond 2004-2011 1,997,033 - 1,997,033 1,999,086 1,999,086 - - -Bond 2004-2014 2,725,703 - 2,725,703 2,730,717 - 2,730,717 2,730,717 -Bond 2004-2022 (GBP) 562,397 - 562,397 580,319 - 580,319 - 580,319Bond 2004-2024 990,092 - 990,092 990,544 - 990,544 - 990,544Bond 2009-2016 1,482,040 - 1,482,040 1,549,877 - 1,549,877 - 1,549,877Bond 2009-2038 (JPY) 149,553 - 149,553 183,444 - 183,444 - 183,444Bond 2010-2017 990,510 - 990,510 - 990,510Bond 2010-2025 494,222 - 494,222 - 494,222
Total bond issues 7,906,818 - 7,906,818 9,518,719 1,999,086 7,519,633 2,730,717 4,788,916
Non-current derivative liabilities 341,496 - 341,496 243,984 25,994 217,990 - 217,990
Accrued expenses on medium/long-term financial liabilities 265,823 265,823 - 233,777 233,777 - - -
Total medium/long-term financial liabilities 8,514,137 265,823 8,248,314 9,996,480 2,258,857 7,737,623 2,730,717 5,006,906
Short-term financial liabilities
Bank overdrafts 2 2 - 1 1 - - -Other current financial liabilities 69 69 - 79 79 - - -
Total short-term financial liabilities 71 71 - 80 80 - - -
8,514,208 265,894 8,248,314 9,996,560 2,258,937 7,737,623 2,730,717 5,006,906
(€000)
Non-current maturities as at 31 Dec 201031 December 2009 31 December 2010
The second table compares the aggregate carrying amount (current and non-current portions) of
medium/long-term financial liabilities with relevant par and fair values. This table also summarises the
terms and conditions applied to each financial liability.
The fair value of bond issues was measured on the basis of closing market prices, whilst the fair value of
other financial liabilities was measured by discounting expected future cash flows, using the yield curve at
the end of the year.

310
Bond issuesBond 2004-2011 2,000,000 1,997,033 1,998,200 2,000,000 1,999,086 1,998,800 3M Euribor 1.61% (2) 0.45% 9 June 2011Bond 2004-2014 2,750,000 2,725,703 2,925,450 2,750,000 2,730,717 2,883,100 5.00% 5.23% 9 June 2014Bond 2004-2022 (GBP) 750,000 562,397 785,250 750,000 580,319 615,801 5.99% 6.25% (2), (3) 9 June 2022Bond 2004-2024 1,000,000 990,092 1,099,700 1,000,000 990,544 1,106,700 5.88% 5.98% 9 June 2024Bond 2009-2016 1,500,000 1,482,040 1,632,150 1,500,000 1,549,877 1,609,650 5.63% 4.90% 6 May 2016Bond 2009-2038 (JPY) 149,176 149,553 183,155 149,176 183,444 238,185 5.30% 5.48% (2), (3) 10 Dec 2038Bond 2010-2017 - - - 1,000,000 990,510 946,330 3.38% 3.54% 18 Sept 2017Bond 2010-2025 - - - 500,000 494,222 458,580 4.38% 4.48% 16 Sept 2025
Total bond issues (A) 8,149,176 7,906,818 8,623,905 9,649,176 9,518,719 9,857,146Non-current derivative liabilities (B) 341,496 341,496 243,984 243,984 (4)
Accrued expenses on medium/long-term financial liabilities (C) 265,823 233,777
Total medium/long-term financial liabilities (A)+(B)+(C) 8,514,137 9,996,480
(1) The value of medium/long-term financial liabilities shown in the table includes both the non-current and current portions.
(4) These financial instruments are classified as hedging derivatives and in level 2 of the fair value hierarchy.
(€000) Par value as at 31 Dec 2009 (1)
Carrying amount as at 31 Dec 2009 (1)
Fair value as at 31 Dec 2009
Par value as at 31 Dec 2010 (1)
Carrying amount as at 31 Dec 2010 (1)
Fair value as at 31 Dec 2010
Reference interest rate
Effective interest
rateNote Spread Maturity
(2) As at 31 December 2010 interest rate and foreign exchange hedges with a notional amount of €2,899 million were in place that were classified as cash flow hedges in accordance with IAS 39.(3) The par value in euro was determined using the exchange rate on the date that the cross currency swap was concluded.
The following table shows the par value of medium/long-term financial liabilities by currency as at 31
December 2010 and 31 December 2009, not including accrued borrowing costs at those dates, and
changes during 2010.
Euro 7,250,000 8,750,000GBP 750,000 750,000JPY 149,176 149,176TOTAL (1) 8,149,176 9,649,176
(€000)Par value as at 31 Dec
2009 Par value as at 31 Dec 2010
(1) Accrued expenses on medium/long-term financial liabilities not included.
(€000)Par value as at 31
Dec 2009 (1) Repayments New borrowingsPar value as at 31
Dec 2010 (1)
Bond issues 8,149,176 - 1,500,000 9,649,176
Total par value of medium/long-term financial liabilities 8,149,176 - 1,500,000 9,649,176
(1) The value of medium/long-term financial liabilities shown in the table includes both the non-current and current portions.
Non-current financial liabilities, net of the related borrowing costs, where incurred, include:
a) bonds totalling €7,519,633 thousand (€7,906,818 thousand as at 31 December 2009), issued by the
Company as part of its €10 billion Medium Term Note (MTN) Programme. The non-current
portion has decreased by €387,185 thousand, essentially due to the reclassification to current
liabilities of the bond issue with a par value of €2,000,000 thousand (accounted for in the financial
statements at 31 December 2010 at €1,999,086 thousand) maturing on 9 June 2011, partially offset by
new bond issues in September 2010, totalling €1,000,000 thousand (maturing in 2017) and
€500.000 thousand (maturing in 2025), an increase of €51,813 thousand in foreign currency bond
issues (GBP and YEN), primarily resulting from a strengthening in the value of the two currencies
with respect to the euro, and the increase (up €67,837 thousand) in the value of the bonds with a par
value of €1,500 million issued in May 2009 as a result of interest rate movements.

311
Fair value hedges, entered into to hedge the above liabilities and the corresponding intercompany
loan to the subsidiary, Autostrade per l’Italia, were unwound in September 2010. As a result, from
this date the above bond issues are no longer measured at fair value, but at amortised cost, based on a
fixed rate of interest;
b) fair value losses on exchange rate hedges, amounting to €217,990 thousand (€341,496 thousand as at
31 December 2009), recognised as a result of a change in value of the sterling denominated bonds.
The reduction of €123,506 thousand compared with 31 December 2009 essentially reflects
movements in interest rates and exchange rates at the end of the year and the reclassification to
current liabilities of fair value losses on the derivative linked to the bond issue maturing in 2011.
Current financial liabilities are up €1,993,043 thousand, primarily due to the reclassification to current
liabilities of the bond issue with a par value of €2,000,000 thousand maturing on 9 June 2011 and of the
fair value of the associated cash flow hedges (up €25,994 thousand), in addition to an increase in accrued
interest expense on bond issues (up €17,030 thousand) following the above-mentioned new issues in
September 2010. These effects are partially offset by the reduction in accrued financial expenses (down
€49,076 thousand), following the payment of differentials on interest and exchange rate hedges.
4.12 Net deferred tax liabilities • €26,291 thousand (€10,827 thousand)
The following tables show deferred tax liabilities, after offsetting against deferred tax assets, and the
related changes in 2010.
(€000) 31 December 2010 31 December 2009
Deferred tax liabilities -49,314 -57,550Deferred tax assets 23,023 46,723Net deferred tax liabilities -26,291 -10,827

312
(€000) 31 December 2009 Provisions Releases
Deferred tax assets/liabilities on gains and losses
recognised in statement of
comprehensive income
Other changes 31 December 2010
Deferred tax liabilities on:
Fair value measurement of cash flow hedges -56,963 - - 8,339 - -48,624
Application of amortised cost -543 - - - - -543
Other temporary differences -44 - 12 - -115 -147
Deferred tax liabilities -57,550 - 12 8,339 -115 -49,314
Deferred tax assets on:
Fair value measurement of cash flow hedges 46,600 - - -24,117 - 22,483
Provisions 65 366 - - - 431
Other temporary differences 58 107 -53 - -3 109
Deferred tax assets 46,723 473 -53 -24,117 -3 23,023
Net deferred tax liabilities -10,827 473 -41 -15,778 -118 -26,291
CHANGES DURING THE YEAR
The increase of €15,464 thousand in net deferred tax liabilities essentially reflects fair value gains on cash
flow hedges.
4.13 Trading liabilities • €4,177 thousand (€4,927 thousand)
Trading liabilities of €4,177 thousand (€4,927 thousand as at 31 December 2009) consist of amounts
payable to suppliers (€3,795 thousand), primarily relating to professional services, and trade payables due
to Group companies (€382 thousand), most of which are payable to Autostrade per l’Italia.
The carrying amount of trade payables approximates their fair value, in that the effect of discounting to
present value is not significant.
4.14 Other current liabilities • €2,681 thousand (€1,428 thousand)
The composition of this item and details of changes during the year are shown in the following table:
(€000) 31 December 2010 31 December 2009 Increase/ (Decrease)
Payable to staff 848 160 688Social security contributions payable 367 112 255Taxation other than income taxes 861 817 44Other current liabilities 605 339 266
Total 2,681 1,428 1,253
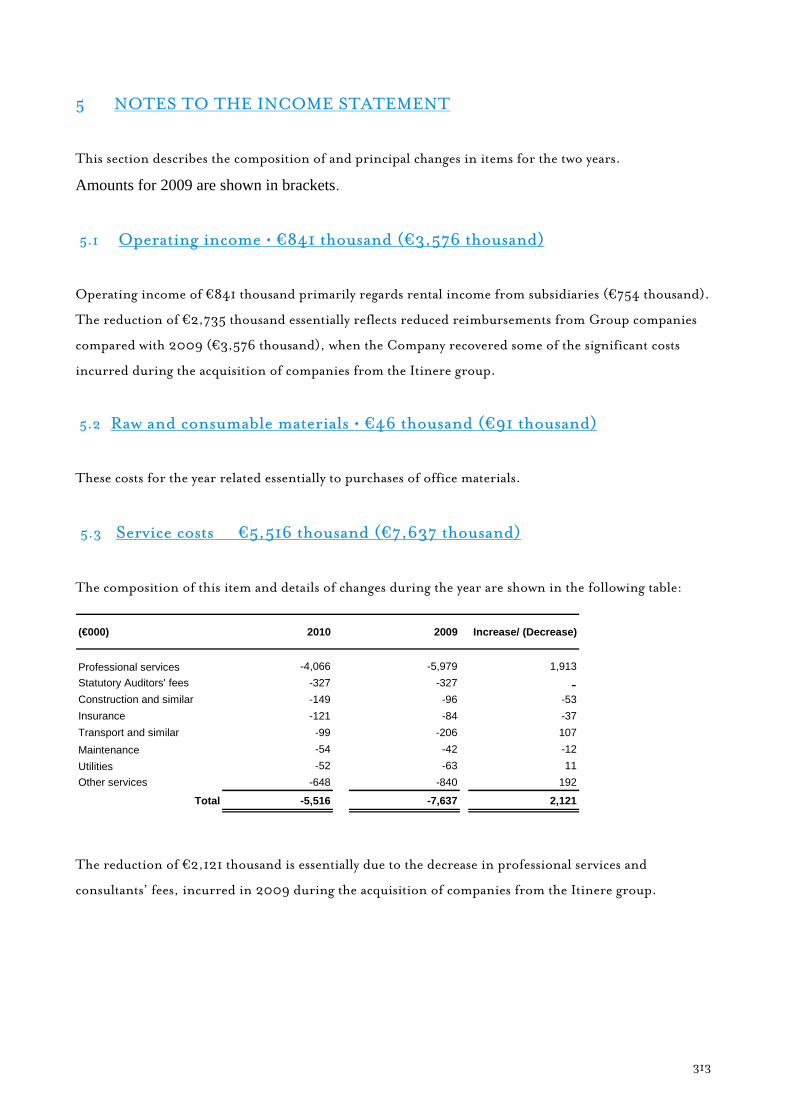
313
5 NOTES TO THE INCOME STATEMENT
This section describes the composition of and principal changes in items for the two years.
Amounts for 2009 are shown in brackets.
5.1 Operating income • €841 thousand (€3,576 thousand)
Operating income of €841 thousand primarily regards rental income from subsidiaries (€754 thousand).
The reduction of €2,735 thousand essentially reflects reduced reimbursements from Group companies
compared with 2009 (€3,576 thousand), when the Company recovered some of the significant costs
incurred during the acquisition of companies from the Itinere group.
5.2 Raw and consumable materials • €46 thousand (€91 thousand)
These costs for the year related essentially to purchases of office materials.
5.3 Service costs � €5,516 thousand (€7,637 thousand)
The composition of this item and details of changes during the year are shown in the following table:
(€000) 2010 2009 Increase/ (Decrease)
Professional services -4,066 -5,979 1,913Statutory Auditors' fees -327 -327 -Construction and similar -149 -96 -53Insurance -121 -84 -37Transport and similar -99 -206 107Maintenance -54 -42 -12Utilities -52 -63 11Other services -648 -840 192
Total -5,516 -7,637 2,121
The reduction of €2,121 thousand is essentially due to the decrease in professional services and
consultants’ fees, incurred in 2009 during the acquisition of companies from the Itinere group.
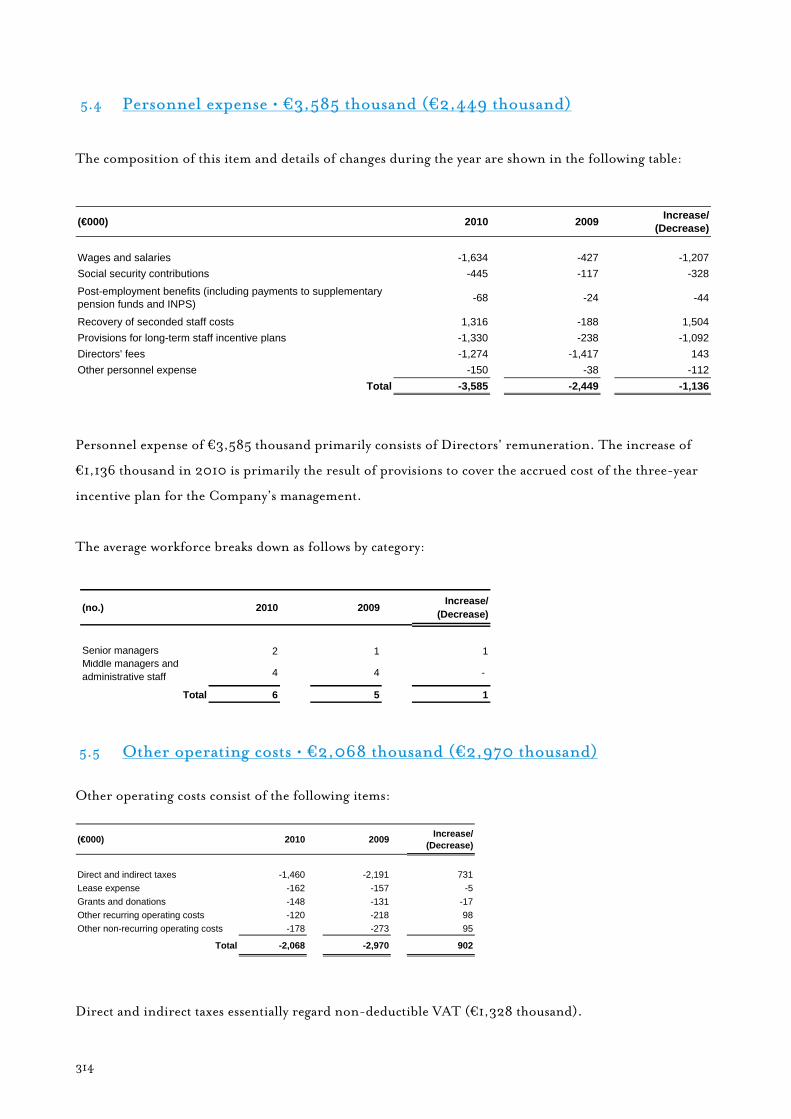
314
5.4 Personnel expense • €3,585 thousand (€2,449 thousand)
The composition of this item and details of changes during the year are shown in the following table:
(€000) 2010 2009 Increase/ (Decrease)
Wages and salaries -1,634 -427 -1,207Social security contributions -445 -117 -328Post-employment benefits (including payments to supplementary pension funds and INPS) -68 -24 -44
Recovery of seconded staff costs 1,316 -188 1,504Provisions for long-term staff incentive plans -1,330 -238 -1,092Directors' fees -1,274 -1,417 143Other personnel expense -150 -38 -112
Total -3,585 -2,449 -1,136
Personnel expense of €3,585 thousand primarily consists of Directors' remuneration. The increase of
€1,136 thousand in 2010 is primarily the result of provisions to cover the accrued cost of the three-year
incentive plan for the Company’s management.
The average workforce breaks down as follows by category:
(no.) 2010 2009 Increase/ (Decrease)
Senior managers 2 1 1Middle managers and administrative staff 4 4 -
Total 6 5 1
5.5 Other operating costs • €2,068 thousand (€2,970 thousand)
Other operating costs consist of the following items:
(€000) 2010 2009 Increase/ (Decrease)
Direct and indirect taxes -1,460 -2,191 731Lease expense -162 -157 -5Grants and donations -148 -131 -17Other recurring operating costs -120 -218 98Other non-recurring operating costs -178 -273 95
Total -2,068 -2,970 902
Direct and indirect taxes essentially regard non-deductible VAT (€1,328 thousand).
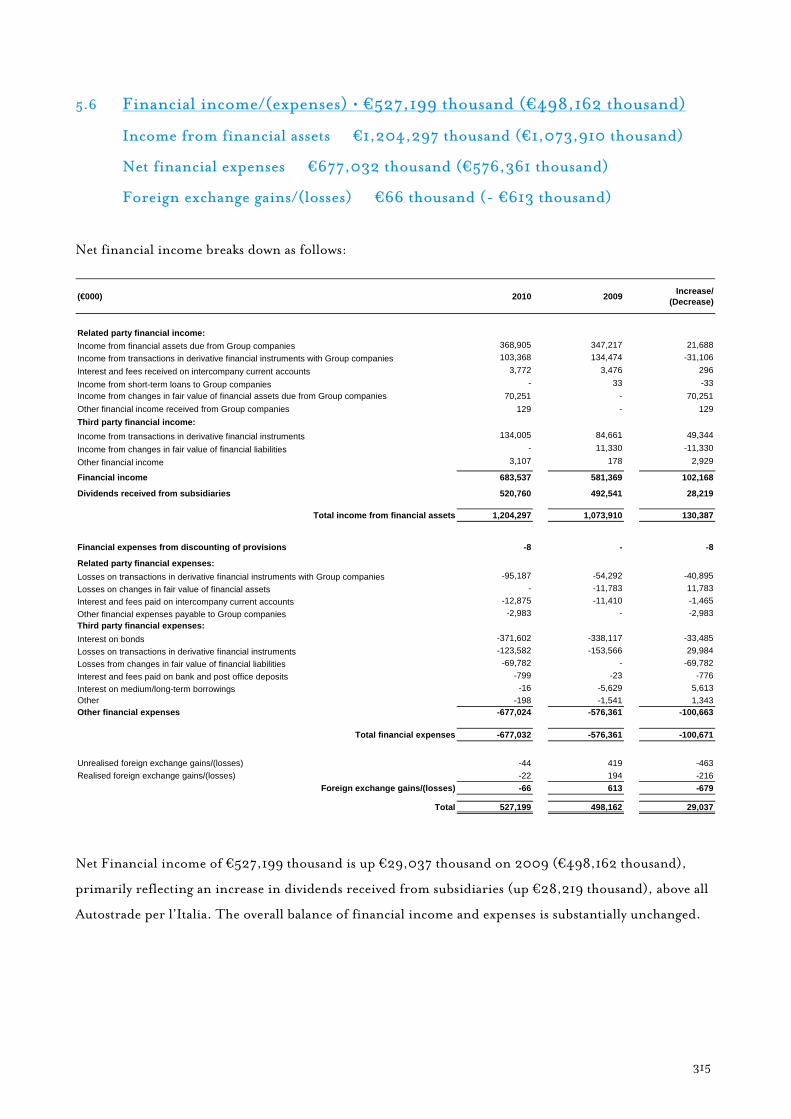
315
5.6 Financial income/(expenses) • €527,199 thousand (€498,162 thousand)
Income from financial assets � €1,204,297 thousand (€1,073,910 thousand)
Net financial expenses � €677,032 thousand (€576,361 thousand)
Foreign exchange gains/(losses) � €66 thousand (- €613 thousand)
Net financial income breaks down as follows:
(€000) 2010 2009 Increase/ (Decrease)
Related party financial income:Income from financial assets due from Group companies 368,905 347,217 21,688Income from transactions in derivative financial instruments with Group companies 103,368 134,474 -31,106Interest and fees received on intercompany current accounts 3,772 3,476 296
Income from short-term loans to Group companies - 33 -33Income from changes in fair value of financial assets due from Group companies 70,251 - 70,251Other financial income received from Group companies 129 - 129Third party financial income:Income from transactions in derivative financial instruments 134,005 84,661 49,344
Income from changes in fair value of financial liabilities - 11,330 -11,330
Other financial income 3,107 178 2,929
Financial income 683,537 581,369 102,168
Dividends received from subsidiaries 520,760 492,541 28,219
Total income from financial assets 1,204,297 1,073,910 130,387
Financial expenses from discounting of provisions -8 - -8
Related party financial expenses:Losses on transactions in derivative financial instruments with Group companies -95,187 -54,292 -40,895Losses on changes in fair value of financial assets - -11,783 11,783Interest and fees paid on intercompany current accounts -12,875 -11,410 -1,465Other financial expenses payable to Group companies -2,983 - -2,983Third party financial expenses:Interest on bonds -371,602 -338,117 -33,485Losses on transactions in derivative financial instruments -123,582 -153,566 29,984Losses from changes in fair value of financial liabilities -69,782 - -69,782Interest and fees paid on bank and post office deposits -799 -23 -776Interest on medium/long-term borrowings -16 -5,629 5,613Other -198 -1,541 1,343Other financial expenses -677,024 -576,361 -100,663
Total financial expenses -677,032 -576,361 -100,671
Unrealised foreign exchange gains/(losses) -44 419 -463Realised foreign exchange gains/(losses) -22 194 -216
Foreign exchange gains/(losses) -66 613 -679
Total 527,199 498,162 29,037
Net Financial income of €527,199 thousand is up €29,037 thousand on 2009 (€498,162 thousand),
primarily reflecting an increase in dividends received from subsidiaries (up €28,219 thousand), above all
Autostrade per l’Italia. The overall balance of financial income and expenses is substantially unchanged.
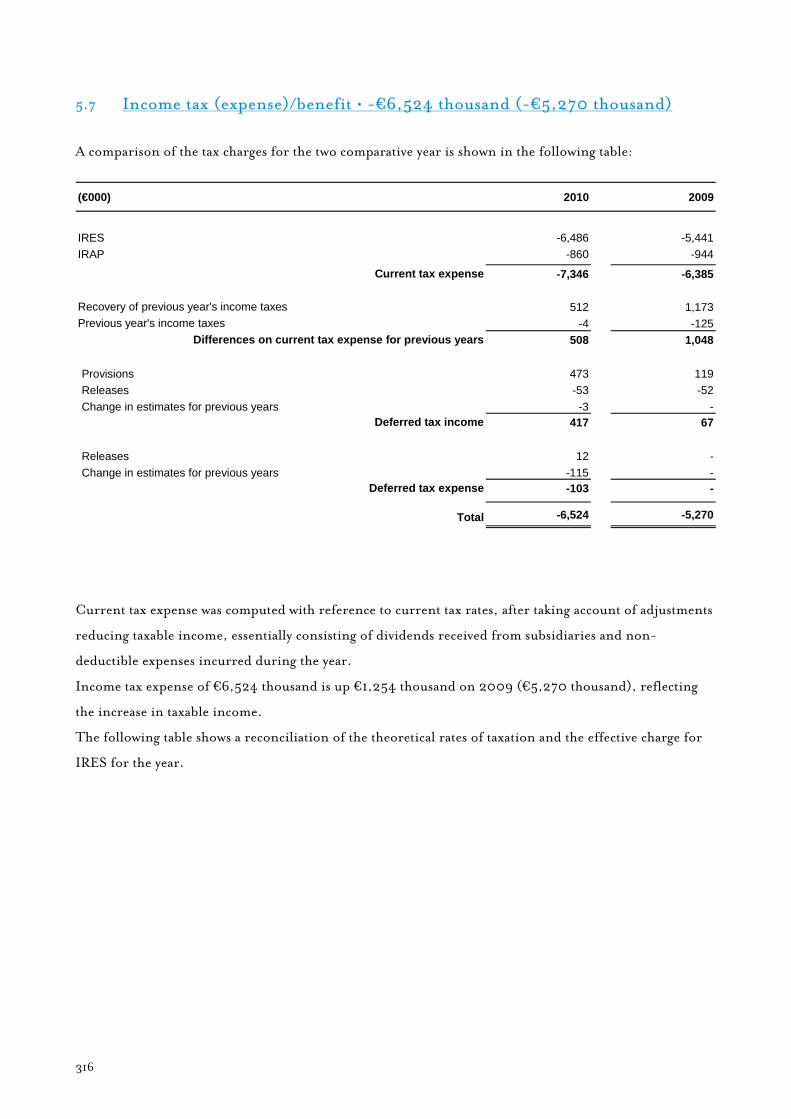
316
5.7 Income tax (expense)/benefit • -€6,524 thousand (-€5,270 thousand)
A comparison of the tax charges for the two comparative year is shown in the following table:
(€000) 2010 2009
IRES -6,486 -5,441IRAP -860 -944
Current tax expense -7,346 -6,385
Recovery of previous year's income taxes 512 1,173Previous year's income taxes -4 -125
Differences on current tax expense for previous years 508 1,048
Provisions 473 119Releases -53 -52Change in estimates for previous years -3 -
Deferred tax income 417 67
Releases 12 -Change in estimates for previous years -115 -
Deferred tax expense -103 -
Total -6,524 -5,270
Current tax expense was computed with reference to current tax rates, after taking account of adjustments
reducing taxable income, essentially consisting of dividends received from subsidiaries and non-
deductible expenses incurred during the year.
Income tax expense of €6,524 thousand is up €1,254 thousand on 2009 (€5,270 thousand), reflecting
the increase in taxable income.
The following table shows a reconciliation of the theoretical rates of taxation and the effective charge for
IRES for the year.
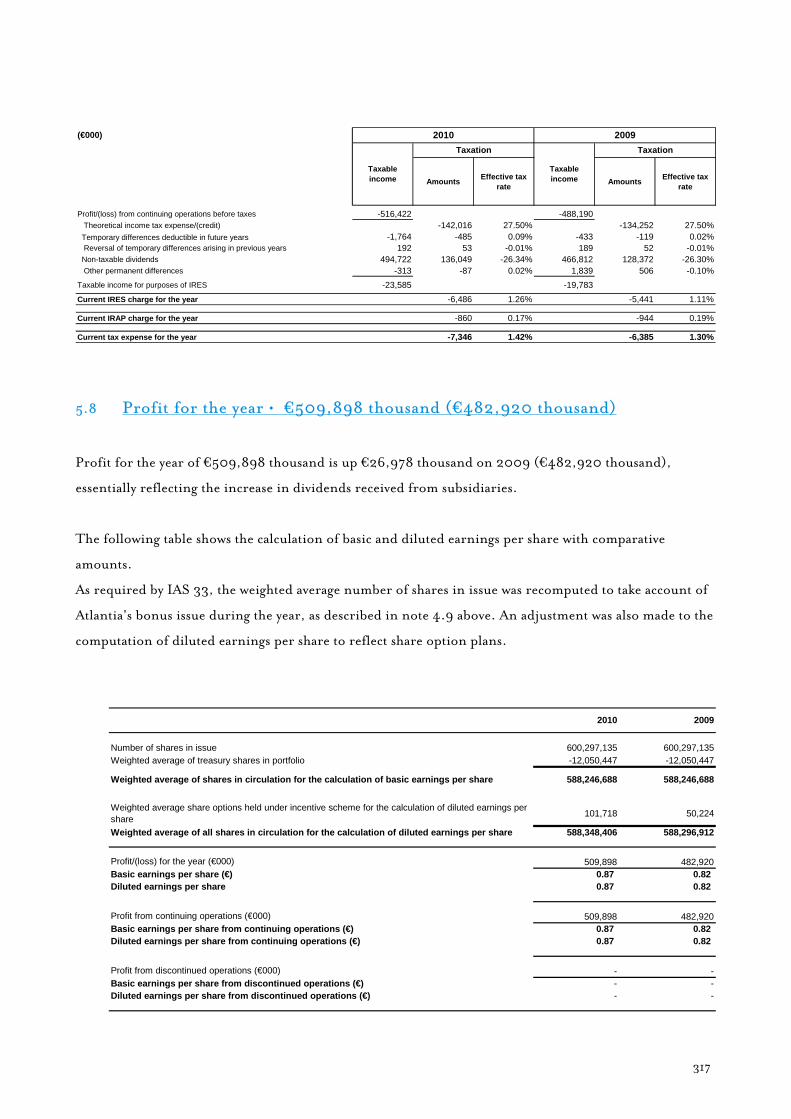
317
Amounts Effective tax rate Amounts Effective tax
rate
Profit/(loss) from continuing operations before taxes -516,422 -488,190 Theoretical income tax expense/(credit) -142,016 27.50% -134,252 27.50% Temporary differences deductible in future years -1,764 -485 0.09% -433 -119 0.02% Reversal of temporary differences arising in previous years 192 53 -0.01% 189 52 -0.01% Non-taxable dividends 494,722 136,049 -26.34% 466,812 128,372 -26.30% Other permanent differences -313 -87 0.02% 1,839 506 -0.10%Taxable income for purposes of IRES -23,585 -19,783Current IRES charge for the year -6,486 1.26% -5,441 1.11%
Current IRAP charge for the year -860 0.17% -944 0.19%
Current tax expense for the year -7,346 1.42% -6,385 1.30%
(€000) 2010 2009
Taxable income
Taxation
Taxable income
Taxation
5.8 Profit for the year • €509,898 thousand (€482,920 thousand)
Profit for the year of €509,898 thousand is up €26,978 thousand on 2009 (€482,920 thousand),
essentially reflecting the increase in dividends received from subsidiaries.
The following table shows the calculation of basic and diluted earnings per share with comparative
amounts.
As required by IAS 33, the weighted average number of shares in issue was recomputed to take account of
Atlantia's bonus issue during the year, as described in note 4.9 above. An adjustment was also made to the
computation of diluted earnings per share to reflect share option plans.
Number of shares in issue 600,297,135 600,297,135Weighted average of treasury shares in portfolio -12,050,447 -12,050,447
Weighted average of shares in circulation for the calculation of basic earnings per share 588,246,688 588,246,688
Weighted average share options held under incentive scheme for the calculation of diluted earnings per share 101,718 50,224
Weighted average of all shares in circulation for the calculation of diluted earnings per share 588,348,406 588,296,912
Profit/(loss) for the year (€000) 509,898 482,920Basic earnings per share (€) 0.87 0.82 Diluted earnings per share 0.87 0.82
Profit from continuing operations (€000) 509,898 482,920Basic earnings per share from continuing operations (€) 0.87 0.82 Diluted earnings per share from continuing operations (€) 0.87 0.82
Profit from discontinued operations (€000) - -Basic earnings per share from discontinued operations (€) - -Diluted earnings per share from discontinued operations (€) - -
2010 2009

318
6 OTHER FINANCIAL INFORMATION
6.1 Notes to the separate statement of cash flows
Cash and cash equivalents increased by €73,343 thousand in 2010, compared with the increase of
€17,648 thousand reported in 2009.
“Net Cash from operating activities” amounts to €515,398 thousand, marking an increase of €32,889
thousand compared with the figure for 2009 (€482,509 thousand). This reflects the improvement in
profit for the year (up €26,978 thousand).
“Net Cash used in investing activities”, totalling €1,571,146 thousand, essentially relates to the
disbursement of two new intercompany loans with face values of €1,000,00 thousand and €500,000
thousand to the subsidiary, Autostrade per l’Italia. The figure for 2009 (an outflow of €1,317,814
thousand) primarily resulted from disbursement of a loan with a par value of €1,500,000 thousand to the
subsidiary, Autostrade per l’Italia, corresponding to the bond issue of 6 May 2009, and the payment of
€44,374 thousand for an equity interest in Alitalia – Compagnia Aerea Italiana SpA, partly offset by the
extinction of intercompany loans following the transfer of loans totalling €450,000 thousand from the
European Investment Bank (EIB) to the subsidiary, Autostrade per l’Italia.
“Net Cash from financing activities” totals €1,129,091 thousand and essentially consists of the above bond
issues with par values of €1,000,000 thousand and €500,000 thousand, after the related transaction
costs, partly offset by dividends paid during the year (€427,874 thousand). Cash generated from
financing activities in 2009 (an inflow of €852,953 thousand) was also influenced by the bond issue with
a par value of €1,500,000 thousand on 6 May 2009, partly offset by extinction of the above loan from the
European Investment Bank (EIB), totalling €450,000 thousand, and dividends paid (€417,430
thousand).

319
6.2 Notes to the analysis of net debt
The following statement shows net debt broken down into its principal components and amounts due to
and from related parties, as required by CONSOB Communication DEM/6064293 of 28 July 2006.
(€000) INCREASE/ (DECREASE)
Non-current financial liabilities -7,737,623 -8,248,314 510,691Bond issues -7,519,633 -7,906,818 387,185Derivative liabilities -217,990 -341,496 123,506
Current financial liabilities -2,258,937 -265,894 -1,993,043Bank overdrafts -1 -2 1Current portion of medium/long-term borrowings -2,258,857 -265,823 -1,993,034
of which due to related parties - -48,695- Autostrade per l'Italia SpA - -48,695
Other financial liabilities -79 -69 -10
Total financial liabilities -9,996,560 -8,514,208 -1,482,352
Cash and cash equivalents 197,587 124,245 73,342Cash and bank and post office deposits 907 1,016 -109Intercompany current accounts receivable 196,680 123,229 73,451
of which due from related parties 196,680 123,229- Autostrade per l'Italia SpA 196,680 123,229
Other current financial assets 2,270,618 274,698 1,995,920Current portion of medium/long-term financial assets 2,267,280 270,769 1,996,511
of which due from related parties 2,246,610 203,800- Autostrade per l'Italia SpA 2,246,610 203,800
Other financial assets 3,338 3,929 -591
Total current financial assets 2,468,205 398,943 2,069,262
Net debt in accordance with CESR recommendation of 10 February 2005 -7,528,355 -8,115,265 586,910
Non-current financial assets 7,869,485 8,325,463 -455,978Derivative assets 164,661 188,032 -23,371
of which due from related parties 124,452 188,032- Autostrade per l'Italia SpA 124,452 188,032
Other financial assets 7,704,824 8,137,431 -432,607of which due from related parties 7,704,790 8,137,393
- Autostrade per l'Italia SpA 7,704,790 8,137,393
Net funds/(Net debt) 341,130 210,198 130,932
31 December 2010 31 December 2009

320
6.3 Financial risk management
Financial risk management objectives and policies
In the normal course of business, the Company is exposed to:
a) market risk, principally linked to the effect of movements in interest and foreign exchange rates on
financial assets acquired and financial liabilities assumed;
b) liquidity risk, with regard to ensuring the availability of sufficient financial resources to fund
operating activities and repayment of the liabilities assumed;
c) credit risk, linked to both ordinary trading relations and the likelihood of defaults by financial
counterparties.
The Company’s financial risk management strategy is derived from and consistent with the business goals
set by the Board of Directors that are contained in the various strategic plans approved by the Board. The
strategy aims to both manage and control such risks.
Market risk
The adopted strategy for each type of risk aims to eliminate interest rate and currency risks and minimise
borrowing costs, as defined in the Financial Policy approved by Atlantia’s Board of Directors on 16
September 2010.
Management of these risks is based on prudence and best market practice.
The main objectives set out in this policy are as follows:
a) to protect the scenario forming the basis of the strategic plan from the effect of exposure to interest
rate and currency risks, identifying the best combination of fixed and floating rates;
b) to pursue a potential reduction of the Group’s borrowing costs within the risk limits determined by
the Board of Directors;
c) to manage derivative financial instruments taking account of their potential impact on the results of
operations and financial position in relation to their classification and presentation.
The Company’s derivative hedging instruments as at 31 December 2010 are classified as cash flow hedges
in accordance with IAS 39.
The fair value of financial derivative instruments is based on expected discounted cash flows, using the
market yield curve at the measurement date. Amounts in foreign currencies other than the euro are
translated at closing exchange rates communicated by the European Central Bank.
The residual average term to maturity of the Company’s debt is around 6 years.
The average cost of medium/long-term borrowings in 2010 was approximately 4.9%.

321
Monitoring is, moreover, intended to assess, on a continuing basis, counterparty creditworthiness and the
degree of risk concentration.
Interest rate risk
Interest rate risk is linked to uncertainty regarding the performance of interest rates, and takes two forms:
a) cash flow risk: this is linked to financial assets and liabilities with cash flows indexed to a market
interest rate. In order to reduce floating rate debt, the Company has entered into interest rate swaps
(IRS), classified as cash flow hedges. The hedging instruments and the underlying financial liabilities
have matching terms to maturity and notional amounts. Tests have shown that the hedges were fully
effective during 2010. Changes in fair value are recognised in other components of comprehensive
income, with no recognition of any ineffective portion in the income statement. Interest income or
expense deriving from the hedged instruments is recognised simultaneously in the income statement;
b) fair value risk: this represents the risk of losses deriving from an unexpected change in the value of a
financial asset or liability following an unfavourable shift in the market interest rate curve. As at 31
December 2010 the Company is not a party to any transactions classifiable as fair value hedges under
IAS 39, in that all such transactions were unwound during the year.
100% of the Company’s debt is fixed rate as at 31 December 2010 (82% as at 31 December 2009).
Currency risk
Currency risk is mainly incurred through the assumption of financial liabilities denominated in a
currency other than the Group's currency of account.
9% of the Company’s medium/long-term debt is nominally denominated in currencies other than the
euro. Taking account of foreign exchange hedges, the percentage of foreign currency debt exposed to
currency risk on translation into euros is zero. Cross currency swaps (CCIRS) with notional amounts and
maturities matching those of the underlying financial liabilities were entered into specifically to eliminate
the currency risk to which the sterling and yen denominated bonds are exposed. These swaps also qualify
as cash flow hedges and tests have shown that they are fully effective.
The following table summarises outstanding derivative financial instruments at 31 December 2010
(compared with 31 December 2009) and shows the corresponding market value.

322
31 Dec 2009 31 Dec 2010 31 Dec 2009 31 Dec 2010
Type Purpose of hedge Currency Contract term Description Par value Term
Cross Currency Swap Exchange rate fluctuations EUR 2004-2022 750,000 750,000 -247,596 -217,990 Bond 2004-2022 (GBP) 750,000 2004-2022 Cross Currency Swap Exchange rate fluctuations EUR 2009-2038 149,176 149,176 -6,890 40,209 Bond 2009-2038 (JPY) 149,176 2009-2038
Interest Rate Swap Interest rate fluctuations EUR 2004-2011 2,000,000 2,000,000 -75,680 -25,994 Bond 2004-2011 2,000,000 2004-2011
Interest Rate Swap (2) Interest rate fluctuations EUR 2004-2022 750,000 750,000 100,569 124,452 Loan to Autostrade per l'Italia 2004-2022 750,000 2004-2022
Interest Rate Swap (2) Interest rate fluctuations EUR 2004-2011 2,000,000 2,000,000 75,680 25,994 Loan to Autostrade per l'Italia 2004-2011 2,000,000 2004-2011
-153,917 -53,329
Fair value hedges
Interest Rate Swap Interest rate fluctuations EUR 2009-2016 1,500,000 - -11,330 -
Interest Rate Swap (2) Interest rate fluctuations EUR 2009-2016 1,500,000 - 11,783 -
453 --153,464 -53,329
Total fair value hedgesTotal hedging derivatives
(1) The fair value of hedging derivatives excludes accruals at the end of the reporting period.(2) The counterparty in these transactions is Autostrade per l'Italia.
(€000) Hedged financial liabilities
Notional amount Fair value (1)
Total cash flow hedges
Cash flow hedges
Sensitivity analysis
Sensitivity analysis describes the impact that the interest rate and foreign exchange movements to which
the Company is exposed would have had on the income statement and on equity during the year.
The interest rate sensitivity analysis is based on the exposure of derivative and non-derivative financial
instruments at the end of the reporting period, assuming, in terms of the impact on the income
statement, a 0.10% (10 bps) shift in the interest rate curve at the beginning of the year, whilst, with regard
to the impact of changes in fair value on other comprehensive income, the 10 bps shift in the curve was
assumed to have occurred at the measurement date. The following outcomes resulted from the analysis
carried out:
a) in terms of interest rate risk, an unexpected and unfavourable 10 bps shift in market interest rates
would have resulted in a negative impact on the income statement, totalling €148 thousand, and on
comprehensive income, totalling €3,023 thousand;
b) in terms of currency risk, an unexpected and unfavourable 10% shift in the exchange rate would have
had no impact on the income statement.
Liquidity risk
Liquidity risk relates to the risk that cash resources may be insufficient to fund the payment of liabilities as
they fall due. The Company believes that its ability to generate cash assures an ample diversification of
funding sources and the availability of uncommitted lines of credit provides sufficient alternative sources
of finance to meet projected financial needs.
The following tables show the time distributions of financial liabilities by term to maturity as at 31
December 2010 and comparable figures as at 31 December 2009.

323
(€000)
Non-derivative financial liabilities (1)Bond 2004-2011 -1,999,086 -2,014,954 -2,014,954 - - -Bond 2004-2014 -2,730,717 -3,300,000 -137,500 -137,500 -3,025,000 -Bond 2004-2022 (GBP) -580,319 -1,016,555 -36,305 -36,305 -108,917 -835,028Bond 2004-2024 -990,544 -1,822,500 -58,750 -58,750 -176,250 -1,528,750Bond 2009-2016 -1,549,877 -2,006,250 -84,375 -84,375 -253,125 -1,584,375Bond 2009-2038 (JPY) -183,444 -324,786 -5,025 -5,025 -15,076 -299,660Bond 2010-2017 -990,510 -1,236,250 -33,750 -33,750 -101,250 -1,067,500Bond 2010-2025 -494,222 -828,125 -21,875 -21,875 -65,625 -718,750Total bond issues -9,518,719 -12,549,420 -2,392,534 -377,580 -3,745,243 -6,034,063Derivative liabilities (2)IRS (2) -25,994 -31,466 -31,466 - - -CCS (3) -177,781 -329,648 -12,299 -12,607 -36,514 -268,228Total derivatives -203,775 -361,114 -43,765 -12,607 -36,514 -268,228
(€000)
Passività finanziarie non derivate (1)Bond 2004-2011 -1,997,033 -2,035,464 -23,664 -2,011,800 - -Bond 2004-2014 -2,725,703 -3,437,500 -137,500 -137,500 -3,162,500 -Bond 2004-2022 (GBP) -562,397 -1,020,435 -35,187 -35,187 -105,562 -844,499Bond 2004-2024 -990,092 -1,881,250 -58,750 -58,750 -176,250 -1,587,500Bond 2009-2016 -1,482,040 -2,090,625 -84,375 -84,375 -253,125 -1,668,750Bond 2009-2038 (JPY) -149,553 -269,104 -4,100 -4,100 -12,301 -248,603Total bond issues -7,906,818 -10,734,378 -343,576 -2,331,712 -3,709,738 -4,349,352Derivative liabilities (2)IRS (2) -87,010 129,765 -40,240 -4,977 88,480 86,502CCS (3) -254,486 -435,033 -14,298 -14,342 -42,996 -363,397Total derivatives -341,496 -305,268 -54,538 -19,319 45,484 -276,895
(4) Future cash flows deriving from cross currency swap (CCS) differentials have been calculated on the basis of the latest established exchange rate at the
Financial liabilities
31 December 2010 Carrying amount Total contractual flows
Within 12 months
Between 1 and 2 years
Between 3 and 5 years
After 5 years
After 5 years
(1) Future cash flows relating to floating rate bond issues have been calculated on the basis of the latest established rate and applied and held constant to finalmaturity.(2) includes interest rates and cross currency hedging derivatives related bond as at December 31, 2009(3) Future cash flows deriving from interest rate swap (IRS) differentials are calculated on the basis of the latest established rate and held constant to thematurity of the contract.
(1) Future cash flows relating to floating rate bond issues have been calculated on the basis of the latest established rate and applied and held constant to finalmaturity.
(3) Future cash flows deriving from interest rate swap (IRS) differentials are calculated on the basis of the latest established rate and held constant to thematurity of the contract.(4) Future cash flows deriving from cross currency swap (CCS) differentials have been calculated on the basis of the latest established exchange rate at themeasurement date.
Financial liabilities
31 December 2009 Carrying amount Total contractual flows
Within 12 months
Between 1 and 2 years
Between 3 and 5 years
(2) includes interest rates and cross currency hedging derivatives related bond as at December 31, 2010
The amounts in the above tables include interest payments and exclude the impact of any offset
agreements.
The time distribution of terms to maturity is based on the residual contract term or on the earliest date on
which payment may be required, unless a better estimate is available.
The distribution for transactions with repayment schedules is based on the date on which each instalment
falls due.
The following table shows the time distribution of expected cash flows from cash flow hedges, and the
periods in which they will be recognised in the income statement.
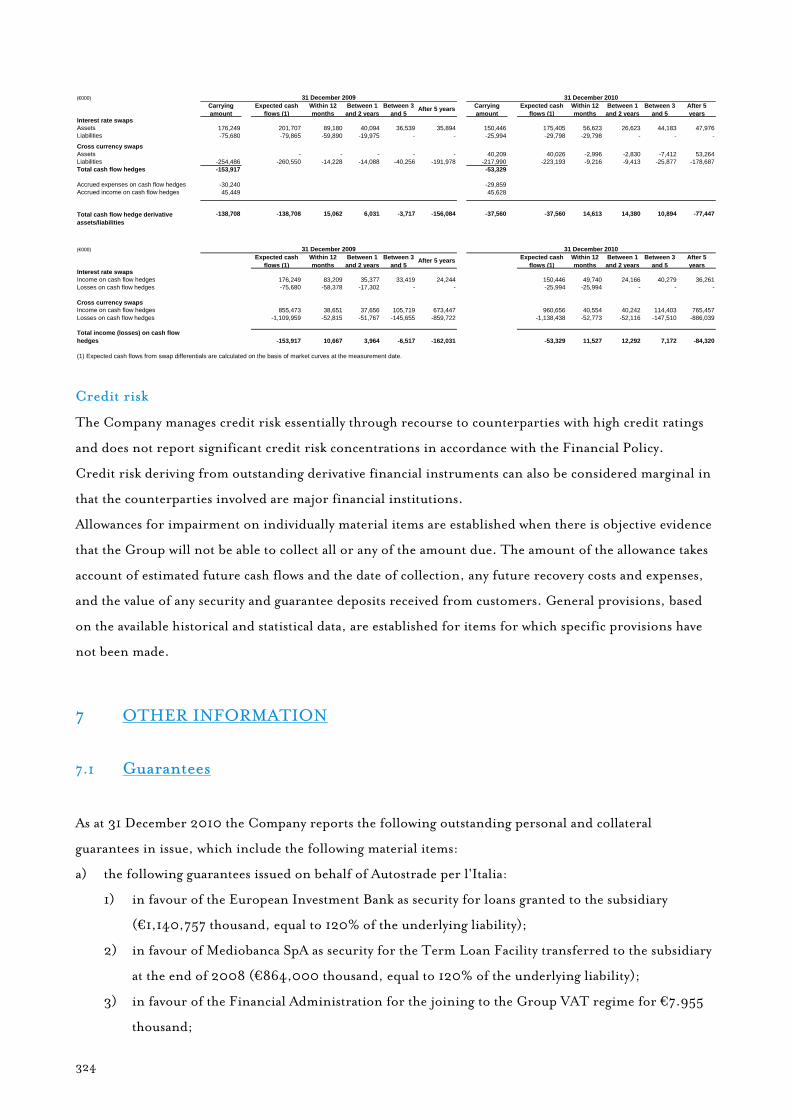
324
(€000)
Interest rate swapsAssets 176,249 201,707 89,180 40,094 36,539 35,894 150,446 175,405 56,623 26,623 44,183 47,976Liabilities -75,680 -79,865 -59,890 -19,975 - - -25,994 -29,798 -29,798 - - -
Cross currency swapsAssets - - - - - 40,209 40,026 -2,996 -2,830 -7,412 53,264Liabilities -254,486 -260,550 -14,228 -14,088 -40,256 -191,978 -217,990 -223,193 -9,216 -9,413 -25,877 -178,687Total cash flow hedges -153,917 -53,329
Accrued expenses on cash flow hedges -30,240 -29,859Accrued income on cash flow hedges 45,449 45,628
Total cash flow hedge derivative assets/liabilities
-138,708 -138,708 15,062 6,031 -3,717 -156,084 -37,560 -37,560 14,613 14,380 10,894 -77,447
(€000)
Interest rate swapsIncome on cash flow hedges 176,249 83,209 35,377 33,419 24,244 150,446 49,740 24,166 40,279 36,261Losses on cash flow hedges -75,680 -58,378 -17,302 - - -25,994 -25,994 - - -
Cross currency swapsIncome on cash flow hedges 855,473 38,651 37,656 105,719 673,447 960,656 40,554 40,242 114,403 765,457Losses on cash flow hedges -1,109,959 -52,815 -51,767 -145,655 -859,722 -1,138,438 -52,773 -52,116 -147,510 -886,039
Total income (losses) on cash flow hedges -153,917 10,667 3,964 -6,517 -162,031 -53,329 11,527 12,292 7,172 -84,320
31 December 2009 31 December 2010Carrying amount
Expected cash flows (1)
Within 12 months
Between 1 and 2 years
Between 3 and 5
After 5 years After 5 years
Carrying amount
Expected cash flows (1)
Within 12 months
Between 1 and 2 years
Between 3 and 5
31 December 2009 31 December 2010Expected cash
flows (1)Within 12 months
Between 1 and 2 years
Between 3 and 5
After 5 years After 5 years
(1) Expected cash flows from swap differentials are calculated on the basis of market curves at the measurement date.
Expected cash flows (1)
Within 12 months
Between 1 and 2 years
Between 3 and 5
Credit risk
The Company manages credit risk essentially through recourse to counterparties with high credit ratings
and does not report significant credit risk concentrations in accordance with the Financial Policy.
Credit risk deriving from outstanding derivative financial instruments can also be considered marginal in
that the counterparties involved are major financial institutions.
Allowances for impairment on individually material items are established when there is objective evidence
that the Group will not be able to collect all or any of the amount due. The amount of the allowance takes
account of estimated future cash flows and the date of collection, any future recovery costs and expenses,
and the value of any security and guarantee deposits received from customers. General provisions, based
on the available historical and statistical data, are established for items for which specific provisions have
not been made.
7 OTHER INFORMATION
7.1 Guarantees
As at 31 December 2010 the Company reports the following outstanding personal and collateral
guarantees in issue, which include the following material items:
a) the following guarantees issued on behalf of Autostrade per l'Italia:
1) in favour of the European Investment Bank as security for loans granted to the subsidiary
(€1,140,757 thousand, equal to 120% of the underlying liability);
2) in favour of Mediobanca SpA as security for the Term Loan Facility transferred to the subsidiary
at the end of 2008 (€864,000 thousand, equal to 120% of the underlying liability);
3) in favour of the Financial Administration for the joining to the Group VAT regime for €7.955
thousand;

325
b) a surety of €120,350 thousand issued in favour of the Chilean holding company, Autopista do
Pacifico (a subsidiary of Autostrade del Sud America), guaranteeing the loan obtained by this
company to finance the acquisition of the motorway concessionaire, Costanera Norte;
c) a guarantee of €69,913 thousand issued by Atlantia in connection with the loan obtained by the sub-
holding Autostrade per il Cile, since merged into Autostrade Sud America;
d) a portion of the Company’s holding of shares in Pune Solapur Expressways Private Ltd. pledged to
credit institutions.
7.2 Related party transactions
In implementation of the provisions of art. 2391-bis of the Italian Civil Code, the Regulations adopted by
the Commissione Nazionale per le Società e la Borsa (the CONSOB) in Resolution 17221 of 12 March
2010, as subsequently amended and as interpreted by CONSOB Communication DEM/10078683 of 24
September 2010, on 11 November Atlantia’s Board of Directors approved the new Procedure for Related
Party Transactions entered into directly by the Company and/or through subsidiaries. This Procedure sets
out the criteria to be used in identifying related parties and the related reporting requirements.
The principal transactions entered into by the Company with related parties, as identified in accordance
with the criteria defined in the above Procedure, are described below. Related party transactions are
conducted on an arm’s length basis.
Related party transactions do not include transactions of an atypical or unusual nature. Atlantia did not
engage in material transactions with its direct or indirect parents during 2010.
Relatied party transactions with subsidiaries
The Company primarily engages in transactions with the subsidiary, Autostrade per l’Italia, over which it
exercises management and coordination.
As at 31 December 2010 the Company has granted medium/long-term loans with a total par value of
€9,649,176 thousand to Autostrade per l’Italia on the same terms as those applied to Atlantia’s bank
borrowings, increased by a spread that takes account of the cost of managing the loans. These loans have
increased by €1,500,000 thousand compared with 31 December 2009, essentially as a result of the
disbursement of two new medium/long-term loans with par values of €1,000,000 thousand and
€500,000 thousand, respectively. These replicate, at intercompany level, the bonds issued on 16
September 2010.
A portion of these loans is hedged against interest rate risk through the use of specific derivative financial
instruments that have also been entered into with Autostrade per l’Italia. Fair value gains on these hedges
total €150,447 thousand as at 31 December 2010.

326
In September 2010 Atlantia and Autostrade per l’Italia unwound a number of hedging transactions –
previously classified as fair value hedges – entered into to hedge the exposure to interest rate risk of loans
with a par value of €1,500,000 thousand granted in May 2010 and maturing in May 2016. The
unwinding of these derivatives, which did not result in any charge for the Company, means that the bond
issue and the intercompany loan are again subject to fixed rate exposure.
The Company also has an intercompany current account with Autostrade per l’Italia, which provides
centralised treasury services for the Group. The account has a credit balance of €196,680 thousand as at
31 December 2010.
Finally, as a result of the tax consolidation arrangement headed by the Company, the statement of
financial position as at 31 December 2010 includes current tax assets due from Group companies of
€14,363 thousand, and current tax liabilities payable to Group companies of €6,852 thousand.
Other related party transactions
During 2010 fees, non-monetary benefits, bonuses, incentives and other forms of compensation were
paid to the Chairman of Atlantia, Fabio Cerchiai (€0.5 million), and the Chief Executive Officer and
General Manager, Giovanni Castellucci (€1.5 million), in relation to positions held in Atlantia and in
other Group companies. A total of €0.2 million was also paid to the previous Chairman, Gian Maria
Gros-Pietro.
The following table summarises the impact of related party transactions on the results of operations for
2010 and the financial position as at 31 December 2010.
(€000)
SubsidiariesSpea - taxes 5,901 - - - 3,261 - - - Autostrade Tech - taxes 3,370 - - - - - - - Tangenziale di Napoli - taxes 2,221 - - - - - - - Telepass - taxes 1,951 - - - 12,903 - - - Autostrade per l'Italia - trade 1,097 344 1,785 1,640 48 1,492 522 1,491 - taxes - 4,752 - - - 4,644 - - Total subsidiaries 14,540 5,096 1,785 1,640 16,212 6,136 522 1,491
TOTAL 14,540 5,096 1,785 1,640 16,212 6,136 522 1,491
(1) Includes reimbursements, accounted for as a reduction of operating costs in the income statement.
Receivables Payables Income (1) Expenses
MATERIAL INTERCOMPANY TRADING TRANSACTIONS
Name31 Dec 2010 2010 31 Dec 2009 2009
Receivables Payables Income (1) Expenses
(€000)
Subsidiaries
Autostrade per l'Italia 10,275,727 - 1,062,440 111,045 8,655,616 48,695 969,972 77,486 TowerCo - - 4,432 - - - 4,898 -
Total subsidiaries 10,275,727 - 1,066,872 111,045 8,655,616 48,695 974,870 77,486
TOTAL 10,275,727 - 1,066,872 111,045 8,655,616 48,695 974,870 77,486
(1) Financial income includes dividends received from subsidiaries.
Assets Liabilities Financial income (1)
Financial expenses
MATERIAL INTERCOMPANY FINANCIAL TRANSACTIONS
Name31 Dec 2010 2010 31 Dec 2009 2009
Assets Liabilities Financial income (1)
Financial expenses
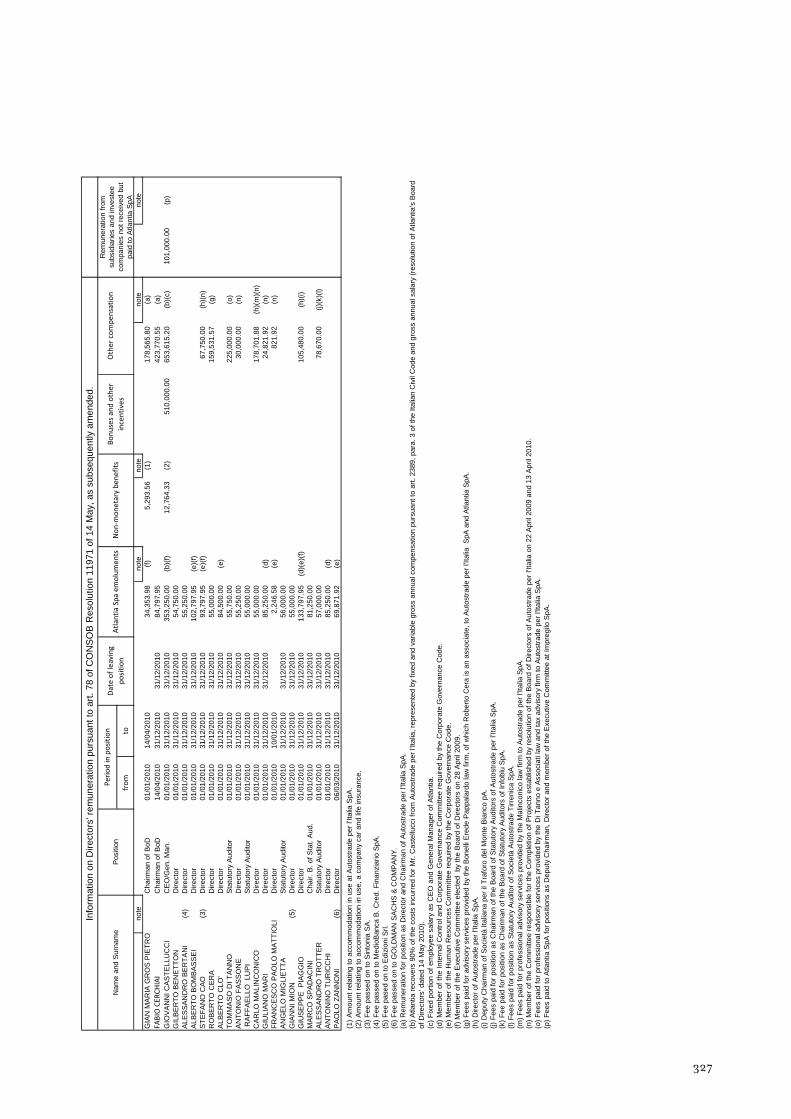
327
from
to
note
note
note
note
note
GIA
N M
ARIA
GR
OS
PIE
TRO
Cha
irman
of B
oD01
/01/
2010
14/0
4/20
1034
,353
.98
(f)
5,29
3.56
(1)
178,
565.
80
(a
)FA
BIO CER
CHIAI
Cha
irman
of B
oD14
/04/
2010
31/1
2/20
1031
/12/
2010
84,7
97.9
5
423,
770.
55
(a
)G
IOV
AN
NI C
AS
TELL
UC
CI
CE
O/G
en. M
an.
01/0
1/20
1031
/12/
2010
31/1
2/20
1035
3,25
0.00
(b)(
f)12
,764
.33
(2
)51
0,00
0.00
653,
615.
20
(b
)(c)
101,
000.
00
(p
)G
ILB
ER
TO B
EN
ETT
ON
D
irect
or01
/01/
2010
31/1
2/20
1031
/12/
2010
54,7
50.0
0
ALES
SAN
DR
O B
ERTA
NI
(4)
Dire
ctor
01/0
1/20
1031
/12/
2010
31/1
2/20
1055
,250
.00
A
LBE
RTO
BO
MB
AS
SE
I D
irect
or01
/01/
2010
31/1
2/20
1031
/12/
2010
102,
797.
95
(e
)(f)
STE
FAN
O C
AO
(3
)D
irect
or01
/01/
2010
31/1
2/20
1031
/12/
2010
93,7
97.9
5
(e)(
f)67
,750
.00
(h)(
n)R
OB
ER
TO C
ER
A
Dire
ctor
01/0
1/20
1031
/12/
2010
31/1
2/20
1055
,000
.00
15
9,53
1.57
(g)
ALB
ER
TO C
LO'
Dire
ctor
01/0
1/20
1031
/12/
2010
31/1
2/20
1084
,500
.00
(e
)TO
MM
AS
O D
I TA
NN
O
Sta
tuto
ry A
udito
r01
/01/
2010
31/1
2/20
1031
/12/
2010
55,7
50.0
0
225,
000.
00
(o
)A
NTO
NIO
FA
SSO
NE
D
irect
or01
/01/
2010
31/1
2/20
1031
/12/
2010
55,2
50.0
0
30,0
00.0
0
(n
) R
AFF
AE
LLO
LU
PI
Sta
tuto
ry A
udito
r01
/01/
2010
31/1
2/20
1031
/12/
2010
55,0
00.0
0
CAR
LO M
ALIN
CO
NIC
O
Dire
ctor
01/0
1/20
1031
/12/
2010
31/1
2/20
1055
,000
.00
17
8,70
1.88
(h)(
m)(
n)G
IULI
ANO
MAR
I D
irect
or01
/01/
2010
31/1
2/20
1031
/12/
2010
85,2
50.0
0
(d)
24,8
21.9
2
(n
)FR
AN
CE
SC
O P
AO
LO M
ATTI
OLI
D
irect
or01
/01/
2010
10/0
1/20
102,
246.
58
(e
)82
1.92
(n)
AN
GE
LO M
IGLI
ETTA
S
tatu
tory
Aud
itor
01/0
1/20
1031
/12/
2010
31/1
2/20
1056
,000
.00
G
IAN
NI M
ION
(5
)D
irect
or01
/01/
2010
31/1
2/20
1031
/12/
2010
55,0
00.0
0
GIU
SEPP
E P
IAG
GIO
D
irect
or01
/01/
2010
31/1
2/20
1031
/12/
2010
133,
797.
95
(d
)(e)
(f)10
5,48
0.00
(h)(
i)M
ARC
O S
PAD
ACIN
I C
hair.
B. o
f Sta
t. A
ud.
01/0
1/20
1031
/12/
2010
31/1
2/20
1081
,250
.00
AL
ESSA
ND
RO
TR
OTT
ER
Stat
utor
y Au
dito
r01
/01/
2010
31/1
2/20
1031
/12/
2010
57,0
00.0
0
78,6
70.0
0
(j)
(k)(
l)A
NTO
NIN
O T
UR
ICC
HI
Dire
ctor
01/0
1/20
1031
/12/
2010
31/1
2/20
1085
,250
.00
(d
)P
AO
LO Z
AN
NO
NI
(6)
Dire
ctor
06/0
3/20
1031
/12/
2010
31/1
2/20
1069
,871
.92
(e
)
(1) A
mou
nt re
latin
g to
acc
omm
odat
ion
in u
se a
t Aut
ostra
de p
er l'
Italia
SpA
.(2
) Am
ount
rela
ting
to a
ccom
mod
atio
n in
use
, a c
ompa
ny c
ar a
nd li
fe in
sura
nce.
(3) F
ee p
asse
d on
to S
into
nia
SA
.(4
) Fee
pas
sed
on to
Med
ioB
anca
B. C
red.
Fin
anzi
ario
SpA
.(5
) Fee
pas
ed o
n to
Edi
zion
i Srl.
(6) F
ee p
asse
d on
to G
OLD
MAN
SA
CH
S &
CO
MP
AN
Y.(a
) Rem
uner
atio
n fo
r pos
ition
as
Dire
ctor
and
Cha
irman
of A
utos
trade
per
l'Ita
lia S
pA.
(c) F
ixed
por
tion
of e
mpl
oyee
sal
ary
as C
EO
and
Gen
eral
Man
ager
of A
tlant
ia.
(d) M
embe
r of t
he In
tern
al C
ontro
l and
Cor
pora
te G
over
nanc
e C
omm
ittee
requ
ired
by th
e C
orpo
rate
Gov
erna
nce
Cod
e.(e
) Mem
ber o
f the
Hum
an R
esou
rces
Com
mitt
ee re
quire
d by
the
Cor
pora
te G
over
nanc
e C
ode.
(f) M
embe
r of t
he E
xecu
tive
Com
mitt
ee e
lect
ed b
y th
e B
oard
of D
irect
ors
on 2
8 A
pril
2009
.(g
) Fee
s pa
id fo
r adv
isor
y se
rvic
es p
rovi
ded
by th
e B
onel
li E
rede
Pap
pala
rdo
law
firm
, of w
hich
Rob
erto
Cer
a is
an
asso
ciat
e, to
Aut
ostra
de p
er l'
Italia
SpA
and
Atla
ntia
SpA
.(h
) Dire
ctor
of A
utos
trade
per
l'Ita
lia S
pA.
(i) D
eput
y C
hairm
an o
f Soc
ietà
Ital
iana
per
il T
rafo
ro d
el M
onte
Bia
nco
pA.
(j) F
ees
paid
for p
ositi
on a
s C
hairm
an o
f the
Boa
rd o
f Sta
tuto
ry A
udito
rs o
f Aut
ostra
de p
er l’
Italia
SpA
.(k
) Fee
pai
d fo
r pos
ition
as
Cha
irman
of t
he B
oard
of S
tatu
tory
Aud
itors
of I
nfob
lu S
pA.
(l) F
ees
paid
for p
ositi
on a
s S
tatu
tory
Aud
itor o
f Soc
ietà
Aut
ostra
de T
irren
ica
SpA
.(m
) Fee
s pa
id fo
r pro
fess
iona
l adv
isor
y se
rvic
es p
rovi
ded
by th
e M
alin
coni
co la
w fi
rm to
Aut
ostra
de p
er l'
Italia
SpA
.(n
) Mem
ber o
f the
Com
mitt
ee re
spon
sibl
e fo
r the
Com
plet
ion
of P
roje
cts
esta
blis
hed
by re
solu
tion
of th
e B
oard
of D
irect
ors
of A
utos
trade
per
l'Ita
lia o
n 22
Apr
il 20
09 a
nd 1
3 A
pril
2010
.(o
) Fee
s pa
id fo
r pro
fess
iona
l adv
isor
y se
rvic
es p
rovi
ded
by th
e D
i Tan
no e
Ass
ocia
ti la
w a
nd ta
x ad
viso
ry fi
rm to
Aut
ostra
de p
er l'
Italia
SpA
.(p
) Fee
s pa
id to
Atla
ntia
SpA
for p
ositi
ons
as D
eput
y C
hairm
an, D
irect
or a
nd m
embe
r of t
he E
xecu
tive
Com
mitt
ee a
t Im
preg
ilo S
pA.
Rem
uner
atio
n fro
m
subs
idia
ries
and
inve
stee
co
mpa
nies
not
rece
ived
but
pa
id to
Atla
ntia
SpA
(b) A
tlant
ia re
cove
rs 9
0% o
f the
cos
ts in
curr
ed fo
r Mr.
Cas
tellu
cci f
rom
Aut
ostra
de p
er l'
Italia
, rep
rese
nted
by
fixed
and
var
iabl
e gr
oss
annu
al c
ompe
nsat
ion
purs
uant
to a
rt. 2
389,
par
a. 3
of t
he It
alia
n C
ivil
Cod
e an
d gr
oss
annu
al s
alar
y (r
esol
utio
n of
Atla
ntia
's B
oard
of
Dire
ctor
s' d
ated
14
May
201
0).In
form
atio
n on
Dire
ctor
s' re
mun
erat
ion
purs
uant
to a
rt. 7
8 of
CO
NSO
B R
esol
utio
n 11
971
of 1
4 M
ay, a
s su
bseq
uent
ly a
men
ded.
Nam
e an
d S
urna
me
Posi
tion
Period
in position
Date of leaving
positio
nAtla
ntia Spa
emolum
ents
Non
‐mon
etary be
nefits
Bonu
ses and othe
r incentives
Other com
pensation

328
7.3 Events after 31 December 2010 There are no material events to report.

329
ANNEXES TO THE SEPARATE FINANCIAL STATEMENTS
- Annex 1: Disclosures pursuant to art.149-
duodecies of the CONSOB Regulations for
Issuers 11971/1999

330
Annex 1
Disclosures pursuant to art.149-duodecies of the CONSOB Regulations for Issuers 11971/1999
Atlantia SpA
Type of service Provider of service Note Fees (€000)
Audit Kpmg SpA 73 Certification Kpmg SpA (1) 45 Other services Kpmg SpA (2) 310 Total Parent Company 428 (1) Opinion on payment of the interim dividends.(2) Comfort letters on EMTN programme offering circulars, Signing of Consolidated Tax Return and Form 770, verification of documentation required by public tenders in India in which the Group participated during the year, agreed upon procedures regarding accounting data and information.

331
(This page intentionally left blank)

332

333
5. Reports

334
(This page intentionally left blank)

335
Attestation of the consolidated financial statements pursuant to art. 81-ter of CONSOB
Regulation 11971 of 14 May 1999 and subsequent amendments and additions
1. We, the undersigned, Giovanni Castellucci and Giancarlo Guenzi, as Chief Executive Officer and
as the manager responsible for Atlantia SpA’s financial reporting, having taken account of the
provisions of art. 154-bis, paragraphs 3 and 4 of Legislative Decree 58 of 24 February 1998, attest
to:
• the adequacy with regard to the nature of the Company and
• the effective application
of the administrative and accounting procedures adopted in preparation of the consolidated
financial statements during 2010.
2. The administrative and accounting procedures adopted in preparation of the consolidated
financial statements as at and for the year ended 31 December 2010 were drawn up, and their
adequacy assessed, on the basis of the regulations and methods drawn up by Atlantia SpA in
accordance with the Internal Control–Integrated Framework model issued by the Committee of
Sponsoring Organizations of the Treadway Commission. This Commission has established a body of
general principles providing a standard for internal control systems that is generally accepted at
international level.
3. We also attest that
3.1 the consolidated financial statements:
a) have been prepared in compliance with international accounting standards approved for
application in the European Community by EC Regulation 1606/2002, passed by the
European Parliament and by the Council on 19 July 2002;
b) are consistent with the underlying accounting books and records;
c) present a true and fair view of the financial position and results of operations of the issuer and
the consolidated companies.
3.2 the report on operations contains a reliable analysis of operating trends and results, in addition
to the state of affairs of the issuer and the consolidated companies, together with a description of the
principle risks and uncertainties to which they are exposed.
11 March 2011 Giovanni Castellucci Giancarlo Guenzi
Chief Executive Officer Manager responsible for financial reporting

336
Attestation of the separate financial statements pursuant to art. 81-ter of CONSOB
Regulation 11971 of 14 May 1999 and subsequent amendments and additions
1. We, the undersigned, Giovanni Castellucci and Giancarlo Guenzi, as Chief Executive Officer and
as the manager responsible for Atlantia SpA’s financial reporting, having taken account of the
provisions of art. 154-bis, paragraphs 3 and 4 of Legislative Decree 58 of 24 February 1998, attest
to:
• the adequacy with regard to the nature of the Company and
• the effective application
of the administrative and accounting procedures adopted in preparation of the separate financial
statements during 2010.
2. The administrative and accounting procedures adopted in preparation of the separate financial
statements as at and for the year ended 31 December 2010 were drawn up, and their adequacy
assessed, on the basis of the regulations and methods drawn up by Atlantia SpA in accordance with
the Internal Control–Integrated Framework model issued by the Committee of Sponsoring
Organizations of the Treadway Commission. This Commission has established a body of general
principles providing a standard for internal control systems that is generally accepted at
international level.
3. We also attest that
3.1 the separate financial statements:
a) have been prepared in compliance with international accounting standards approved for
application in the European Community by EC Regulation 1606/2002, passed by the
European Parliament and by the Council on 19 July 2002;
b) are consistent with the underlying accounting books and records;
c) present a true and fair view of the financial position and results of operations of the issuer.
3.2 the report on operations contains a reliable analysis of operating trends and results, in addition
to the state of affairs of the issuer, together with a description of the principle risks and uncertainties
to which it is exposed.
11 March 2011 Giovanni Castellucci Giancarlo Guenzi
Chief Executive Officer Manager responsible for financial reporting

337
Report of the Board of Statutory Auditors (pursuant to art 153 of Legislative Decree 58/1998 and art. 2429, paragraph 3 of the Italian Civil Code)
During the financial year ended 31 December 2010, we performed the audit procedures required by
law, adopting, inter alia, the Standards recommended by the Italian accounting profession.
As required by the rules established by the CONSOB in Ruling 1025564 of 6 April 2001, as amended,
and by the provision of art. 19 of Legislative Decree 39 of 27 January 2010, with reference to the
internal control and audit committee, whose functions in listed companies are performed by the Board
of Statutory Auditors, we report the following:
• we verified compliance with the law and the articles of association;
• we obtained quarterly reports from the Directors, providing adequate information on the
Company’s activities and on transactions carried out by the Company and its subsidiaries with a
major impact on the Company’s results of operations, financial position and cash flow, ensuring
that the actions decided on and carried out were in compliance with the law and the articles of
association, were not subject to any potential conflict of interest or contrary to the resolutions
adopted by the General Meeting, and were not clearly imprudent or risky or such as to
compromise the value of the Company;
• in accordance with our responsibilities, we obtained information on and checked the adequacy of
the Company’s organisational structure and on observance of the principles of good governance,
by means of direct observation, the gathering of information from the heads of the various
departments and through meetings with the independent auditors with a view to exchanging the
relevant data and information; in this regard we have no special observations to make;
• we verified, pursuant to art. 149, paragraph 1.c–bis of the Consolidated Finance Act (“CFA”) the
actual procedures used in implementing the corporate governance rules contained in Atlantia’s
Corporate Governance Code;
• we verified the adequacy of the guidelines communicated by the Company to its subsidiaries
pursuant to article 114, paragraph 2 of Legislative Decree 58/1998.
• In this regard, it should be noted that the shareholder, Sintonia SA (a subsidiary of Edizione Srl)
directly (with an 8.965% interest) and indirectly, through Schemaventotto SpA (which holds
33.283%), holds a relative majority (42.248%) of the issued capital of Atlantia SpA, holding
sufficient voting rights to exercise dominant influence at the ordinary general meetings of Atlantia
SpA’s shareholders, pursuant to art. 2359 of the Italian Civil Code, as referred to by art. 2497-sexies
of the Code. Nevertheless, as already noted in our report to last year’s Annual General Meeting, and
as stated in the “Annual report on Corporate Governance and the Ownership Structure”, published
on Atlantia’s website, a specific joint declaration sent to Atlantia on 12 March 2009 by Sintonia SA
and Schemaventotto SpA states that the pre-existing circumstances and structure of group relations

338
have not changed. This means that neither Sintonia SA nor Schemaventotto SpA has ever exercised
management and coordination of Atlantia or of the Group of which it is the Parent Company.
Moreover, the declaration confirmed and left unchanged the information and explanations approved
by the Board of Directors of Schemaventotto SpA and communicated to Atlantia in the past, in order
to permit the latter, in its role as a holding company, to independently exercise management and
coordination of its direct and indirect subsidiaries.
Finally, on 20 March 2009 Atlantia’s Board of Directors thus issued an attestation stating that
Atlantia is not subject to the management and coordination of either Sintonia SA or
Schemaventotto SpA.
Therefore, as stated in the “Annual report on Corporate Governance and the Ownership
Structure”, given that there have not been any further announcements or changes in the relevant
facts, the basis for considering Atlantia as not subject to management and coordination by its
parents, Sintonia SA and Schemaventotto SpA, is deemed to be unchanged.
With reference, instead, to relations between Atlantia and its subsidiary, Autostrade per l’Italia, as
noted in our report to last year’s Annual General Meeting, and as stated in the “Annual report on
Corporate Governance and the Ownership Structure”, at its meeting of 14 February 2008,
Atlantia’s Board of Directors acknowledged, based on the evidence, that Autostrade per l’Italia was
subject to the management and coordination of Atlantia. In this regard, as noted in our report to
last year’s Annual General Meeting, and as stated in the “Annual report on Corporate Governance
and the Ownership Structure”, following the Group’s restructuring in 2007, Atlantia as a holding
company responsible for investments and portfolio strategies, capable of supporting growth in the
infrastructure and network management sector, but without having any direct operational role, which has
been assigned to the subsidiary, Autostrade per l’Italia SpA, as an operating parent company in the
motorway sector. At its meeting of 14 December 2007, the Board of Directors, partly as a
consequence of the new Corporate Governance Code, assigned Autostrade per l’Italia SpA
responsibility for management and coordination of the motorway concessionaires and industrial
companies it controls. As a result, Autostrade per l’Italia’s subsidiaries have complied with the
requirements of art. 2497-bis of the Italian Civil Code.
• we assessed and verified the adequacy of the internal control system and the effectiveness of
internal control and risk management systems.
You will recall that, in order to assess the correct functioning of the internal control system, the
Board of Directors makes use of the Internal Control and Corporate Governance Committee, in
addition to one or more staff with responsibility for internal controls, who operate with an
adequate level of independence and are suitably equipped to carry out their role. These members
of staff are the heads of the Internal Audit and Risk Management departments, who report on
their activities to the Chairman, Chief Executive Officer, the Internal Control and Corporate
Governance Committee and the Board of Statutory Auditors.

339
In particular, during our periodic meetings with the heads of the Internal Audit and Risk
Management departments, the Board of Statutory Auditors was kept fully informed regarding
internal auditing activities (with a view to assessing the adequacy and functionality of the internal
control system, and compliance with the law and with internal procedures and regulations), and
the activities of the Risk Management department, which is responsible for overseeing the
management of risk at Group level via correct implementation and development of the COSO
Enterprise Risk Management (ERM), a methodological framework that Atlantia adopted 5 years
ago to identify, measure, manage and monitor the risks inherent in the Company’s current
Business Risk Model (compliance, regulatory and operational risks). The Risk Management
department also provides the necessary support to departments in reviewing the design of the
internal control system and monitoring implementation of the resulting changes.
Moreover, as stated in the “Annual report on Corporate Governance and the Ownership
Structure”, published on Atlantia’s website, pursuant to art. 33 of the Articles of Association,
which is in compliance with the provisions of art. 154-bis of the CFA, in 2010 the new Board of
Directors, subject to the approval of the Board of Statutory Auditors, confirmed the appointment
of the Chief Financial Officer (CFO) as the manager responsible for financial reporting until the
conclusion of the Board of Directors’ term of office.
With reference to the oversight required by art. 19 of Legislative Decree 39/2010, relating to
financial reporting, we verified that the administrative and accounting aspects of the internal
control system, as they relate to the attestations to be issued by the Chief Executive Officer and the
manager responsible for financial reporting, were updated in 2010.
The process entailed Group-level analyses of significant entities and the related significant
processes, through the mapping of activities carried out to verify the existence of controls (at
entity and process level) designed to oversee compliance risk in respect of the law and accounting
regulations and standards relating to periodic financial reporting.
Effective application of the administrative and accounting procedures was verified by the manager
responsible for financial reporting, with the assistance of the relevant internal departments
(including Risk Management and Internal Audit) and a leading firm of specialist consultants,
using a programme designed to monitor the control and governance environment, as well as key
controls at process level of the significant entities and processes.
The results of this process were verified by us during our periodic meetings with the manager
responsible for financial reporting.
On 11 March 2011 the Chief Executive Officer and the manager responsible for financial
reporting issued the attestations of the consolidated and separate financial statements required by
art. 81-ter of the CONSOB Regulations of 14 May 1999, as amended and added to.
As stated in the “Annual report on Corporate Governance and the Ownership Structure”,
published on Atlantia’s website, at its meeting of 18 February 2011 the Board of Directors, having
taken note of the preparatory analysis carried out by the Internal Control and Corporate

340
Governance Committee regarding the in-depth report provided by the various people responsible
for implementing the internal control system (the persons responsible for Internal Control, the
Supervisory Board and the manager responsible for financial reporting), adjudged the internal
control system, taken as a whole, to be adequate, effective and effectively functional.
Finally, compliance of the process used in publishing price sensitive information with the
Company’s procedure for “Market announcements” was also verified;
• we assessed and verified the adequacy of the administrative/accounting system and its ability to
correctly represent operating activities, by gathering information from the respective heads of
department, examining corporate documents and analysing the results of the work carried out by
the independent auditors;
• we held meetings with representatives of the independent auditors, pursuant to art. 150, paragraph
2 of Legislative Decree 58/98, and no significant information that should be included in this
report has come to light;
• with regard to the provisions of art. 19 of Legislative Decree 39/2010, we oversaw the audit of the
annual and consolidated accounts, obtaining detailed information, during meetings with the
independent auditors, on the audit plan for 2010, significant aspects of the consolidated financial
statements for 2010 and the potential impact of the significant risks highlighted in the financial
statements;
• as noted above, we held periodic meetings during the year with the manager responsible for
financial reporting and the persons responsible for Internal Control;
• the Chairman of the Board of Statutory Auditors, or another Statutory Auditor delegated to
attend, participated in the meetings of Internal Control and Corporate Governance Committee.
In addition, 8 joint meetings were organised with the Committee to discuss a number of
important issues relating to: the internal control system, the changes introduced by Legislative
Decree 39/2010, the corporate governance system, and related party transactions;
• with regard to the provisions of art. 3 of Legislative Decree 37 of 6 February 2004, which has
introduced a series of changes to Legislative Decree 58/98, including the provision in the second
paragraph of art. 151, living the Parent Company’s Board of Statutory Auditors the opportunity to
exchange information with the corresponding bodies within its subsidiaries, we have obtained
information from the board of statutory auditors of Autostrade per l’Italia, a subsidiary over
which Atlantia exercises management and coordination, regarding its activities during the year
and the steps taken by the board of statutory auditors of Autostrade per l’Italia to monitor the
activities of the boards of statutory auditors of the subsidiaries over which Autostrade per l’Italia
exercises management and coordination;
• we verified the absence of atypical and/or unusual transactions, including intercompany or related
party transactions;
341
• we assessed the adequacy of the information provided in the management report on operations,
regarding the absence of atypical and/or unusual transactions, including intercompany or related
party transactions;
• as stated in the “Annual report on Corporate Governance and the Ownership Structure”,
published on the Company’s website, in compliance with CONSOB Resolution 17221 of 2010,
and with the prior approval of the Independent Directors on the Related Party Transactions
Committee (established on 21 October 2010), dated 8 November 2010, and the prior approval of
the Internal Control and Corporate Governance Committee, dated 10 November 2010, and
following the Board of Statutory Auditors’ positive assessment of the Procedure’s compliance with
the Standards contained in the CONSOB Resolution, dated 10 November 2010, on 11 November
2010 Atlantia’s Board of Directors approved the new Procedure for Related Party Transactions.
The new procedure, which from 1 January 2011 has replaced the previously adopted standards for
conducting Atlantia’s related party transactions, defines the scope of application of the rules
governing related party transactions (transactions of greater and lesser significance and
transactions within the purview of the general meeting), the related cases of exclusion, and the
procedures for drawing up and updating the list of related parties;
• we verified that related party or intercompany transactions were of an ordinary or recurring
nature, in relation to which we report the following:
- intercompany transactions, whether of a trading or financial nature, between the Parent
Company and its subsidiaries were all conducted on an arm’s length basis, according to
the terms and conditions of contractual agreements. Such transactions are adequately
described in the Annual Report. In particular, the section, “Related party transactions",
in the report on operations provides details of transactions between the Group and
Atlantia and their related parties. Related party transactions did not include atypical
and/or unusual transactions and during 2010 neither the Group nor Atlantia SpA
engaged in material transactions with Atlantia’s direct or indirect parents;
- with reference to the Atlantia Group’s related party transactions, the section, “Related
party transactions", in the report on operations states that in compliance with IAS 24,
the Autogrill group, which is under the common control of Edizione Srl, is classified as a
related party. Moreover, with regard to relations between the Atlantia Group’s motorway
operators and the Autogrill group, it should be noted that, as at 31 December 2009,
Autogrill holds 140 (134 excluding Strada dei Parchi) food service concessions for
service areas along the Group’s motorway network (including 128 granted by Autostrade
per l’Italia SpA, of which 3 operated as part of temporary consortia with other
operators). In 2010 the Group earned revenues of approximately €77.8 million (of
which €73.7 million attributable to Autostrade per l’Italia SpA) on transactions with
Autogrill, including €0.8 million in the form of non-recurring income from the
transfer free of charge of buildings located at service areas (following expiry of the

342
related sub-concessions) and €77.0 million in royalties deriving from management of
service areas (of which €64.6 million attributable to Autostrade per l’Italia). Recurring
income is generated by contracts entered into over the years, of which a large part was
entered into after transparent and non-discriminatory competitive tenders. With regard
to the process of awarding food service concessions, as you have been informed in the
Board of Statutory Auditors’ reports for previous years, it should be noted that Antitrust
Authority Ruling 8009 of 2 March 2000, relating to clearance for the purchase of a
controlling interest in Autostrade (now Atlantia) by Edizione Holding, laid down that
the execution of such activities be entrusted to an external entity which, acting as
“Adviser”, would have the task of independently managing competitive tenders,
including drawing up the requirements for participation, the parameters for awarding
the related contracts and publishing all the relevant information. KPMG was retained as
the Adviser in 2001. Roland Berger Strategy Consultants has performed this role since 1
June 2003;
- with reference to Atlantia’s related party transactions, the section, “Related party
transactions", in the report on operations states that the Company primarily engages in
transactions with its subsidiary, Autostrade dell’Italia, over which it exercises
management and coordination.
As at 31 December 2010 the Company had granted medium/long-term loans with a total
face value of €9,649.2 million to Autostrade per l’Italia (representing an increase of
€1,500.00 million on 2009) on the same terms as those applied to Atlantia’s bank
borrowings, increased by a spread that takes account of the cost of managing the loans. A
portion of these loans is hedged against interest rate risk through the use of specific
derivative financial instruments, which have also been entered into with Autostrade per
l’Italia (as at 31 December 2010 fair value gains on these instruments amounted to
€150.4 million).
Atlantia also has an intercompany current account with Autostrade per l’Italia, which
provides centralised treasury services for the Group. The account has a credit balance of
€196.7 million as at 31 December 2010. Finally, as a result of the tax consolidation
arrangement headed by Atlantia, the statement of financial position as at 31 December
2010 includes current tax assets and liabilities due from and to Group companies of
€14.4 million and €6.9 million.
Details of the impact of related party transactions on the Group’s results of operations
and the financial position as at and for the year ended 31 December 2010 are provided
in note 10.4 to the consolidated financial statements, whilst details of the impact of
related party transactions on Atlantia’s results of operations and financial position as at
and for the year ended 31 December 2010 are provided in note 7.2 to the separate
financial statements;

343
- with regard to Directors, Statutory Auditors and General Managers, a special schedule
covering the type and amounts of remuneration is annexed to the financial statements in
compliance with the Regulations implementing Legislative Decree 58 of 24 February
1998, as adopted by CONSOB Resolution 11971 of 14 May 1999 and subsequent
amendments;
• we note that, as described in the Introduction to the section “Consolidated financial review” in the
report on operations, the Company has presented the reclassified consolidated income statement,
the statement of changes in consolidated equity, the consolidated statement of comprehensive
income and the statement of changes in consolidated net debt for the year ended 31 December
2010, and the reclassified consolidated balance sheet as at 31 December 2010, which include
comparative amounts for the previous year, prepared under the international financial reporting
standards (IFRS) issued by the International Accounting Standards Board, endorsed by the
European Commission, and in force at 31 December 2010.
Compared with the accounting standards applied in preparing the consolidated financial
statements for the previous year, the Group has adopted the new interpretation IFRIC 12 “Service
Concession Arrangements”. The Group has, therefore, calculated the impact of adoption of the
new interpretation with effect from the beginning of the comparative financial year (1 January
2009) and in respect of all comparative amounts included in the financial statements as at and for
the year ended 31 December 2010. Note 4 “Impact of IFRIC 12 adoption on the Group’s
consolidated financial statements” in the consolidated financial statements provides details of the
criteria used by the Group in applying the interpretation and of the impact of IFRIC 12 adoption
on the consolidated financial statements for prior periods used as the basis for comparison, and
includes comparisons of amounts in the consolidated financial statements before and after IFRIC
12 adoption as at 1 January 2009 and 31 December 2009 and for the year ended 31 December
2009. The basis of consolidation is unchanged with respect to the previous year. However, the
contributions to the income statement and statement of cash flows for the comparative period of
the companies acquired from the Itinere group at the end of June 2009 are limited to just the
second half of 2009, as opposed to the full year in 2010. Where material, the review of the
consolidated results of operations shows the impact of the different period of contribution to
changes in amounts in the financial statements.
The reclassified financial statements described in the introduction to the “Consolidated financial
review” have not been independently audited. The above introduction describes the differences
compared with the statutory financial statements presented in the section “Consolidated financial
statements”;
• the accounts have been submitted to the required controls by the independent auditors KPMG
SpA, which, during periodic meetings with the Board, had nothing to report on this matter;
• we checked that no complaints have been lodged under art. 2408 of the Italian Civil Code, and no
petitions of any kind have been presented;

344
• we note that the “Corporate Governance Code” approved by the Company’s Board of Directors on
14 December 2007 (the full text of the Code is available on the Company’s website) substantially
applies the standards and criteria in Borsa Italiana SpA’s Corporate Governance Code of March
2006, with the exception of certain aspects and exemptions described in the Code itself, having
taken account of the changes resulting from the Group’s reorganisation in 2007;
• we note that the “Annual Report on Corporate Governance and the Ownership Structure”, the full
text of which is available on the Company’s website, in compliance with the related legal and
regulatory obligations, contains information on the ownership structure, application of the Codes
of Conduct and fulfilment of the resulting commitments, highlighting the choices made by the
Company in applying corporate governance standards;
• we note that during 2009, Atlantia’s Supervisory Board oversaw a review of the organisational,
management and control model adopted by Atlantia SpA, pursuant to Legislative Decree
231/2001, identifying, with the help of an expert in criminal law, the necessary measures to be
taken as a result of changes in legislation and in the Company’s organisational structure. On 16
December 2010 the Company’s Board of Directors approved the updated version of the
Organisational Model as at 30 November 2010;
• we verified, also with reference to the provisions of art. 19 of Legislative Decree 39/2010, the
independence of the independent auditors, KPMG, checking the nature and entity of any services
other than auditing provided to Atlantia and its subsidiaries by the auditors, and by entities
belonging to its network.
We also verified that, in compliance with the requirements of art. 149-duodecies of CONSOB
Resolution 11971/1999, containing the Regulations for Issuers, that details of the type of services
provided to Atlantia and its subsidiaries by the independent auditors, KPMG, and companies
belonging to the KPMG network, together with the related fees, have been provided in an annex
to the consolidated financial statements.
The following fees were paid by the Atlantia Group to the independent auditors, KPMG, and
companies belonging to the KPMG network:
- audit €1,372 thousand
- audit-related services €660 thousand
- tax advice (to subsidiaries, by the
KPMG network) €76 thousand
making a total of €2,108 thousand.
We therefore deem that the independent auditors, KPMG, meet the requirements for
independence;
• we note that in the section "Other information" of the report on operations it is stated that the
Company, in accordance with the Data Protection Act (Legislative Decree 196/2003, annex B,
point 26), has updated its Security Planning Document for 2010;

345
• with regard to the provisions of art. 149 of the CFA relating to the Board of Statutory Auditors’
supervision “of the methods of actually implementing the corporate governance rules laid down in
the corporate governance codes prepared by stock exchange companies and the related trade
associations, with which the Company has publicly declared it will comply”, taking account of the
fact that art. 15, paragraph 2 of the Corporate Governance Code approved by Atlantia’s Board of
Directors on 14 December 2007, requires that “Statutory Auditors shall be chosen from people
who may be qualified as independent also on the basis of the criteria contained in this Code with
reference to Directors” and that “the Board of Statutory Auditors shall check compliance with the
above criteria after election and every year thereafter, including the outcome of their checks in the
corporate governance report”, at the meeting of 16 September 2010 the Board of Statutory
Auditors checked that all the Statutory Auditors meet the independence requirements;
• we checked, pursuant to art. 15, paragraph 6 of Atlantia’s Corporate Governance Code, the correct
application of the assessment criteria and procedures used by the Board of Directors in assessing
the independence of the Directors, Alberto Bombassei, Alberto Clò, Carlo Malinconico, Giuliano
Mari and Antonino Turicchi, announcing the result of their assessment to the market, via the
relevant department;
• during the year the Board of Statutory Auditors issued its opinion, pursuant to art. 154-bis of the
CFA and art. 33 of the Articles of Association, on the confirmation of the CFO as the manager
responsible for financial reporting on 14 April 2010;
• we examined the financial statements as at and for the year ended 31 December 2010, the
consolidated financial statements and the report on operations, with regard to which we state the
following:
In view of the fact that it is not our responsibility to audit the financial statements, we
checked the overall basis of presentation of the separate and consolidated financial
statements and their general compliance with the laws relating to their preparation and
structure; we have no particular observations to make in this regard.
We verified compliance with the laws governing preparation of the management report on
operations and have no particular observations to make in this regard.
To the best of our knowledge, in preparing the financial statements, the Directors did not
elect to apply any of the exemptions permitted by art. 2433, paragraph 4 of the Italian Civil
Code.
We verified that the financial statements are consistent with the information in our
possession, as a result of carrying out our duties, and have no particular observations to
make in this regard.
We note that the report on operations includes a section “Significant regulatory aspects”, in
which the Directors provide detailed information and their views on certain events in 2010,
including reference to their potential implications for the future. In particular, full and
extensive information is provided on:
346
- Single concession arrangement for Italian operators
- Toll increases for 2011
- Toll increases to be applied and passed on to ANAS
- Toll increases applied on behalf of ANAS
- Snow events in December 2010
- Dispute over tolls applied by Strada dei Parchi
- Council of State sentence regarding award of the concession to Pedemontana Veneta
- Other ongoing litigation.
We note that the report on operations includes a section, “Outlook and risks or
uncertainties”, in which the Directors state that substantially stable traffic figures, combined
with toll increases and the development of related activities, lead them to expect an
improvement in the Group’s operating performance in 2011 compared with the previous
year. The Directors, however, emphasise that the volume of traffic using the Group’s
motorway network is affected by numerous macroeconomic factors, and that any resulting
shift in traffic trends may have an impact on the Group’s operating results or financial
position.
After also considering the report of the independent auditors, we invite the Annual General
Meeting to approve the Annual Report for the year ended 31 December 2010, as prepared
by the Directors.
The above audit procedures were carried out during 15 meetings of the Board, by taking part in 1 2
meetings of the Board of Directors, and through the participation of the Chairman of the Board of
Statutory Auditors, or another Statutory Auditor delegated to attend, in meetings of the Internal
Control and Corporate Governance Committee, which met on 15 occasions.
Finally, as a result of the audit procedures carried out and on the basis of the information obtained
from the independent auditors, we are not aware of any omissions, frauds, irregularities or any other
material events, that would require a report to be made to regulatory bodies.
25 March 2011
Marco Spadacini (Chairman) ____________________________
Tommaso Di Tanno (Auditor) ____________________________
Raffaello Lupi (Auditor) ____________________________
Angelo Miglietta (Auditor) ____________________________
Alessandro Trotter (Auditor) ____________________________
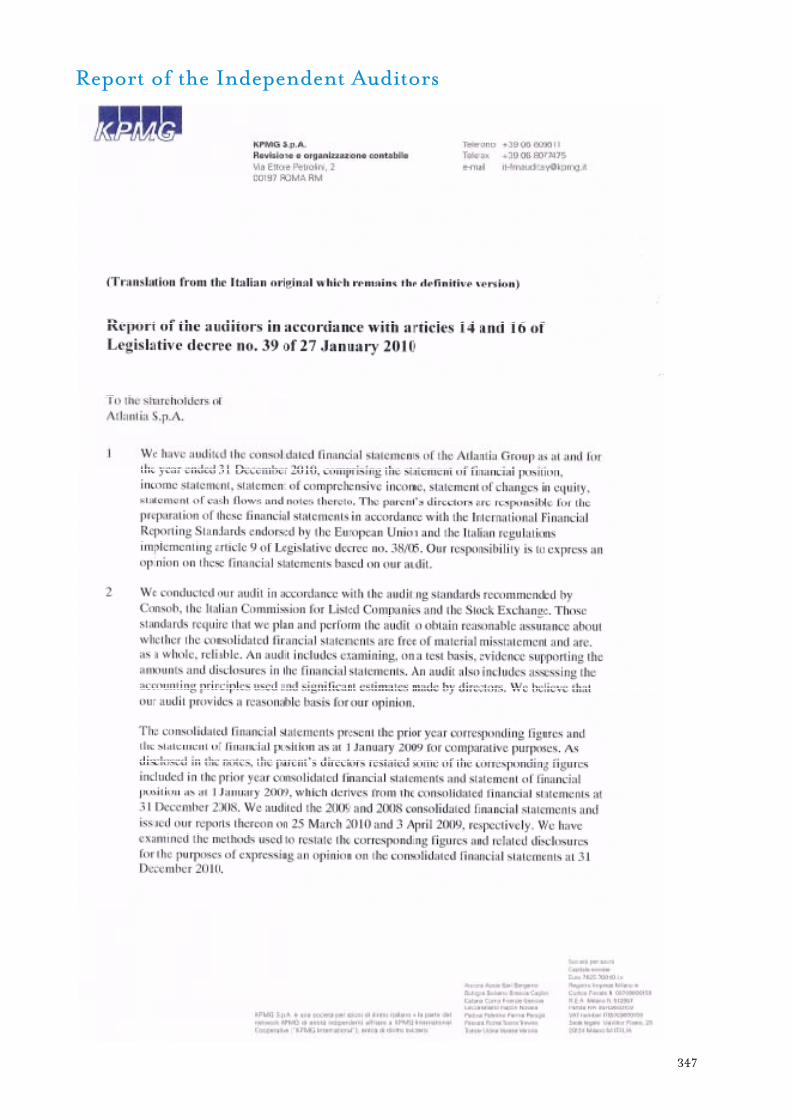
347
Report of the Independent Auditors

348

349

350

351
(This page intentionally left blank)

352

353
6. Key performance indicators for subsidiaries, associates and joint ventures pursuant to art. 2429, paragraphs 3 and 4 of the Italian Civil Code
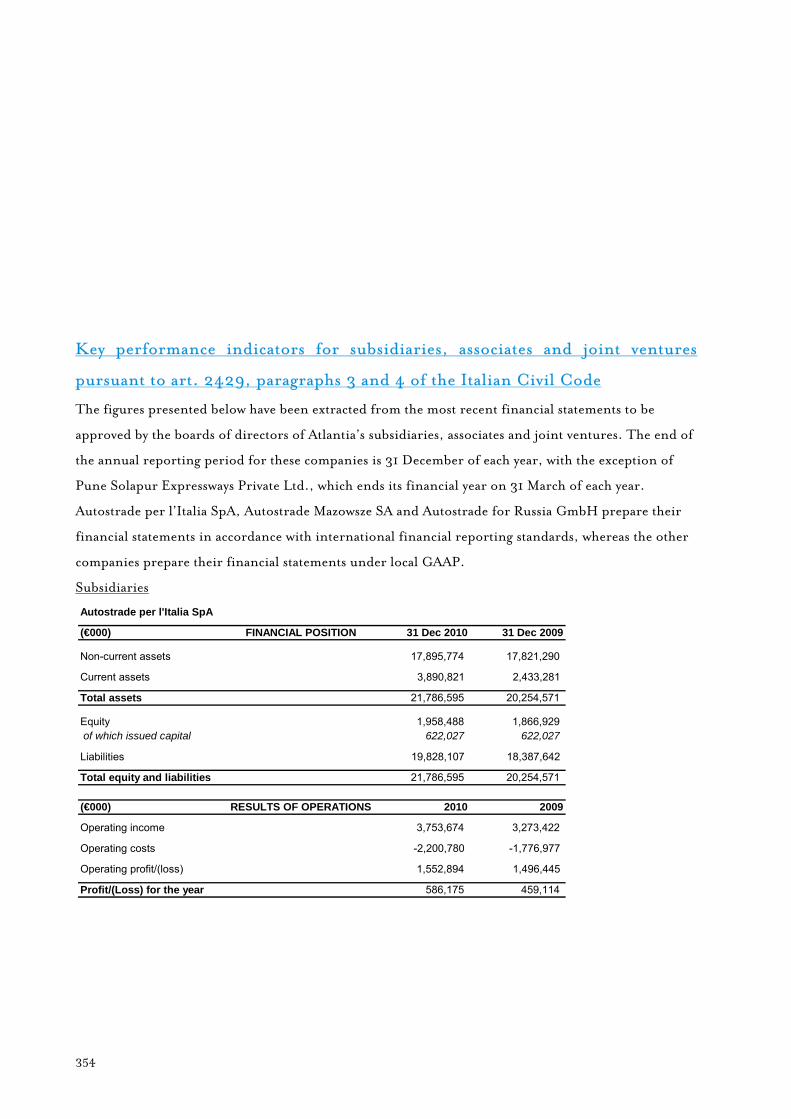
354
Key performance indicators for subsidiaries, associates and joint ventures
pursuant to art. 2429, paragraphs 3 and 4 of the Italian Civil Code
The figures presented below have been extracted from the most recent financial statements to be
approved by the boards of directors of Atlantia’s subsidiaries, associates and joint ventures. The end of
the annual reporting period for these companies is 31 December of each year, with the exception of
Pune Solapur Expressways Private Ltd., which ends its financial year on 31 March of each year.
Autostrade per l’Italia SpA, Autostrade Mazowsze SA and Autostrade for Russia GmbH prepare their
financial statements in accordance with international financial reporting standards, whereas the other
companies prepare their financial statements under local GAAP.
Subsidiaries
Autostrade per l'Italia SpA
(€000) FINANCIAL POSITION 31 Dec 2010 31 Dec 2009
Non-current assets 17,895,774 17,821,290
Current assets 3,890,821 2,433,281
Total assets 21,786,595 20,254,571
Equity 1,958,488 1,866,929 of which issued capital 622,027 622,027
Liabilities 19,828,107 18,387,642
Total equity and liabilities 21,786,595 20,254,571
(€000) RESULTS OF OPERATIONS 2010 2009
Operating income 3,753,674 3,273,422
Operating costs -2,200,780 -1,776,977
Operating profit/(loss) 1,552,894 1,496,445
Profit/(Loss) for the year 586,175 459,114
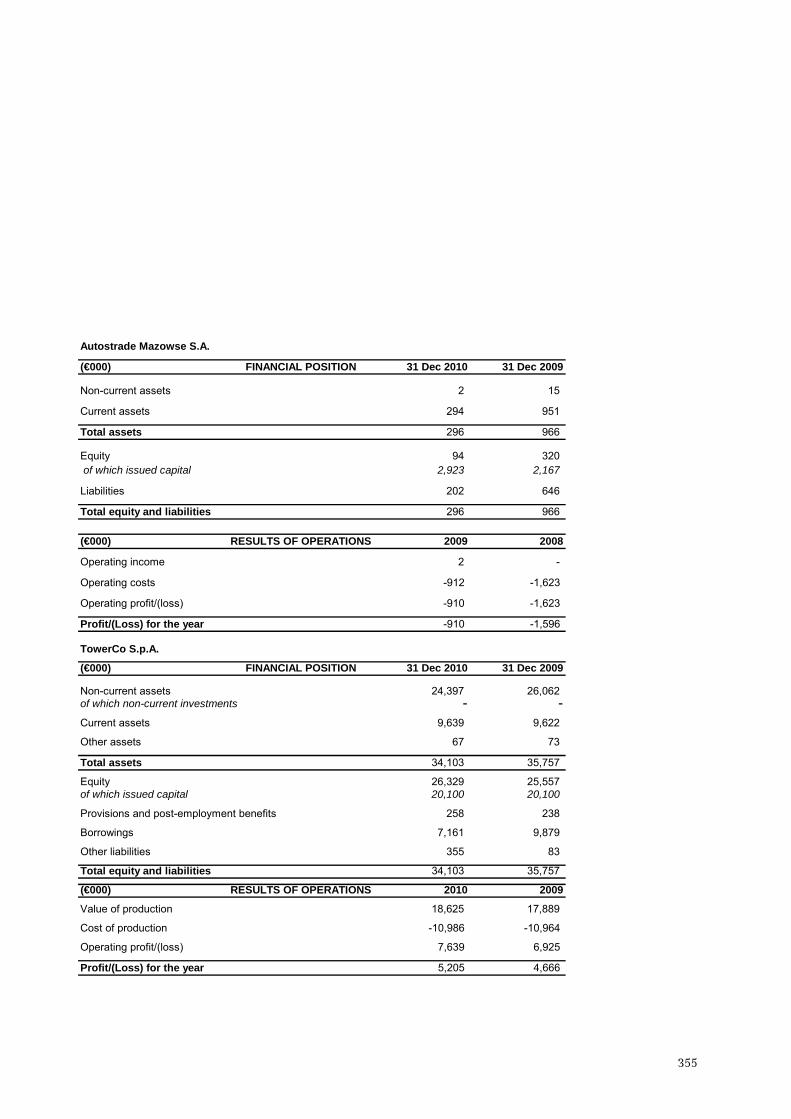
355
Autostrade Mazowse S.A.
(€000) FINANCIAL POSITION 31 Dec 2010 31 Dec 2009
Non-current assets 2 15
Current assets 294 951
Total assets 296 966
Equity 94 320 of which issued capital 2,923 2,167
Liabilities 202 646
Total equity and liabilities 296 966
(€000) RESULTS OF OPERATIONS 2009 2008
Operating income 2 -
Operating costs -912 -1,623
Operating profit/(loss) -910 -1,623
Profit/(Loss) for the year -910 -1,596
TowerCo S.p.A.
(€000) FINANCIAL POSITION 31 Dec 2010 31 Dec 2009
Non-current assets 24,397 26,062 of which non-current investments - -Current assets 9,639 9,622
Other assets 67 73
Total assets 34,103 35,757
Equity 26,329 25,557 of which issued capital 20,100 20,100
Provisions and post-employment benefits 258 238
Borrowings 7,161 9,879
Other liabilities 355 83
Total equity and liabilities 34,103 35,757
(€000) RESULTS OF OPERATIONS 2010 2009
Value of production 18,625 17,889
Cost of production -10,986 -10,964
Operating profit/(loss) 7,639 6,925
Profit/(Loss) for the year 5,205 4,666

356
Joint ventures
Mizard S.r.l.
(€000) FINANCIAL POSITION 31 Dec 2010 31 Dec 2009
Non-current assets - -of which non-current investments - -Current assets 6 8
Other assets - -Total assets 6 8
Equity 6 7 of which issued capital 10 10
Provisions and post-employment benefits - -Borrowings - -Other liabilities - 1
Total equity and liabilities 6 8
(€000) RESULTS OF OPERATIONS 2010 2009
Value of production - -Cost of production -1 -1
Operating profit/(loss) -1 -1
Profit/(Loss) for the year -1 -1
Autostrade for Russia GmbH
(€000) FINANCIAL POSITION 31 Dec 2010 31 Dec 2009
Non-current assets 379 379
Current assets 2,094 930
Total assets 2,473 1,309
Equity 1,547 423 of which issued capital 60 60
Liabilities 926 886
Total equity and liabilities 2,473 1,309
(€000) RESULTS OF OPERATIONS 2009 2008
Operating income - -Operating costs -10 -28
Operating profit/(loss) -10 -28
Profit/(Loss) for the year 20 -11
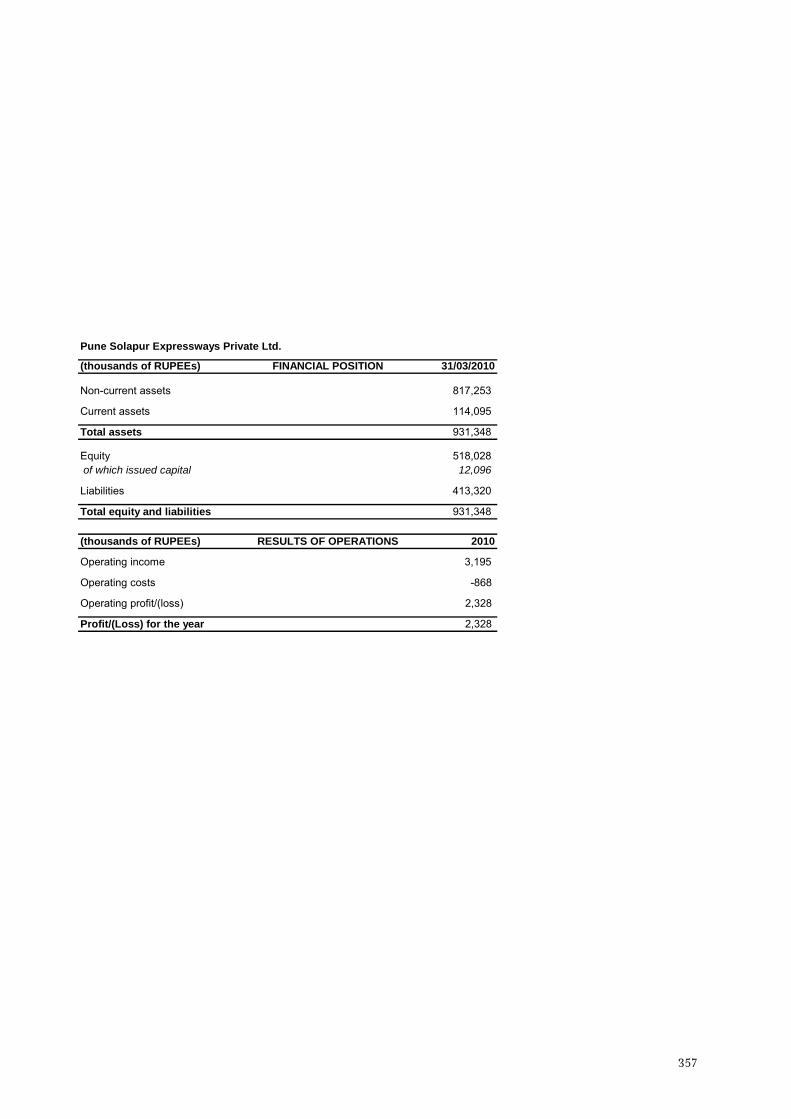
357
Pune Solapur Expressways Private Ltd.
(thousands of RUPEEs) FINANCIAL POSITION 31/03/2010
Non-current assets 817,253
Current assets 114,095
Total assets 931,348
Equity 518,028 of which issued capital 12,096
Liabilities 413,320
Total equity and liabilities 931,348
(thousands of RUPEEs) RESULTS OF OPERATIONS 2010
Operating income 3,195
Operating costs -868
Operating profit/(loss) 2,328
Profit/(Loss) for the year 2,328

358
(This page intentionally left blank)

359
Legal information and contacts
Registered office
Via Antonio Nibby 20 - 00161 Rome
Tel. 06 44172699
Fax 06 44172696
www.atlantia.it
Legal information
Issued capital: €600,297,135.00, fully paid-up.
Tax code, VAT number and Rome Companies’
Register no. 03731380261
REA no. 1023691
Investor Relations
e-mail: [email protected]
Media Relations
e-mail: [email protected]