Annual Report 2006 - option.com - Option confirms Vodafone Germany’s choice of GlobeSurfer i CON...
71
2 Annual Report 2006
Transcript of Annual Report 2006 - option.com - Option confirms Vodafone Germany’s choice of GlobeSurfer i CON...

2
Annual Report 2006

GlobeTrotter HSDPA “7.2 Ready” With its “7.2 Ready” strategy Option continued its successful execution of its HSDPA product road-map. The “7.2 Ready” series is designed to be compatible with mobile operator infrastructure equipment capable of supporting higher data rates of up to 7.2 Mbps while backward compatibility ensures HSDPA connections at lower data rates of 3.6 Mbps and 1.8 Mbps.
1. MISSION
Anywhere, anytime easy access to information.

3
2. REPORT OF ACTIVITIES 6
2.1. Financial Highlights 62.2. Ubiquitous Broadband Data Solutions 82.3. Chairman’s Statement 92.4. Management Discussion – Social Report 11
2.4.1. Workforce 112.4.2. Executive Officers 11
2.5. Corporate Governance 132.6. Corporate Social Responsability 15
3. FINANCIAL REVIEW 18
4. FINANCIAL REPORT - IFRS 22
4.1. Consolidated Financial Statements 224.1.1. Consolidated Income Statement 224.1.2. Consolidated Balance Sheet 234.1.3. Consolidated Cash Flow Statement 244.1.4. Consolidated Statement of Shareholders’ Equity 25
4.2. Notes to the Consolidated Financial Statements 26Note 1: Significant Accounting Policies 27Note 2: Business Segments and Geographical Spread 32Note 3: Additional Information on Operating Expenses by Nature 33Note 4: Payroll and Related Benefits 33Note 5: Finance Costs 34Note 6: Tax Expense 34Note 7: Cash and Cash Equivalents 35Note 8: Trade and Other Receivables 35Note 9: Inventories 36Note 10: Property, Plant and Equipment 36Note 11: Intangible Assets 37Note 12: Deferred Taxes Assets and Liabilities 38Note 13: Trade and Other Payables 38Note 14: Operating Leases 39Note 15: Finance Leases and Credit Facilities 39Note 16: Shareholders’ Equity 40Note 17: Earnings per Share 40Note 18: Share-based Payment Plans 41Note 19: Derivate Financial Instruments 42Note 20: Contingencies 42Note 21: Related Parties Transactions 43Note 22: Events After Balance Sheet Date 43Note 23: Option Companies 45Note 24: Information on The Auditor’s Assignments and Related Fees 45
5. CONSOLIDATED AND STATUTORY REPORT 2006 OF THE BOARD OF DIRECTORS OF OPTION NV 48
6. AUDITOR’S REPORT 56
7. ABBREVIATED STATUTORY ACCOUNTS OF OPTION NV AND EXPLANATORY NOTES 58
7.1. Abbreviated Statutory Balance Sheet (according to Belgian Accounting Standards) 587.2. Abbreviated Statutory Income Statement (according to Belgian Accounting Standards) 597.3. Summary of most Significant Valuation Rules - Abbreviated statutory accounts - Belgian GAAP 607.4. Explanatory Notes - Abbreviated Statutory Accounts - Belgian GAAP 61
8. INVESTOR RELATIONS AND FINANCIAL CALENDAR 64
9. INFORMATION SHEET BY END 2006 66
10. GLOSSARY 70

GTM378 HSDPA 7.2 embedded module for laptops
GTM478 HSDPA 7.2 embedded module in form factor optimized for PDA’s, Portable MultiMedia Players and Smartphone applications

5
2.REPORT OF ACT IV IT IES

66
2.1. FINANCIAL HIGHLIGHTS 1-2
At December 31, (Audited and consolidated) IFRS US GAAP
Thousands EUR, unless stated otherwise 2006 2005 2004 2003 2002
Revenues 279 868 198 615 102 512 56 640 25 626
Gross profit 104 614 84 412 49 502 27 724 10 568
Gross margin 37.4% 42.5% 48.3% 48.9% 41.2%
EBITDA 53 134 46 306 26 991 9 227 (4 550)
EBIT 42 137 38 765 22 346 6 893 (7 747)
EBIT margin 15.1% 19.5% 21.8% 12.2% (30.2)%
Net profit/( loss) 35 316 28 993 17 748 5 580 (7 071)
Balance sheet total 176 489 127 013 70 090 32 782 25 210
Working capital 77 820 56 227 32 243 9 884 205
Net financial debt (35 840) (48 780) (30 193) (6 552) 3 784
Shareholders’ equity 111 634 76 340 46 717 19 150 7 269
Solvency ratio 63.2% 60.1% 66.7% 58.4% 28.8%
Gearing ratio (32.1)% (63.9)% (64.6)% (34.2)% 52.1%
Cash flow from operating activities 4 944 34 844 23 397 7 368 (1 408)
Net capex 33 618 16 775 8 591 3 337 2 568
Weighted average number of ordinary shares
41 249 296 40 648 232 39 122 272 32 887 624 31 837 024
Diluted weighted average number of ordinary shares
41 249 296 41 249 628 40 499 952 38 015 756 37 218 000
Period-end number of ordinary shares 41 249 296 41 249 296 40 421 416 37 140 924 32 875 940
Year-end share price (EUR) 10.30 15.69 6.61 2.14 0.35
Market capitalization (million EUR) 425 647 267 79 11
Book value per share (EUR) 2.71 1.88 1.19 0.58 0.23
Cash flow per share (EUR) 1.12 0.90 0.57 0.25 (0.12)
Basic earnings per share (EUR) 0.86 0.71 0.45 0.17 (0.22)
Diluted earnings per share (EUR) 0.86 0.70 0.44 0.15 (0.22)
Dividends (in EUR) 0 0 0 0 0
1 Adjusted retroactively to take into account the 4-for-1 stock split completed on April 24, 2006.2 Refer to Glossary.
2. REPORT OF ACTIVITIES

77
Report of Activities | Option Annual Report 2006
300 000
250 000
200 000
150 000
100 000
50 000
0
2002 2003 2004 2005 2006
Revenues
50 000
40 000
30 000
20 000
10 000
0
-10 000
2002 2003 2004 2005 2006
EBIT
120 000
100 000
80 000
60 000
40 000
20 000
0
Shareholders’ Equity
2002 2003 2004 2005 2006

8
2.2. UBIQUITOUS WIRELESS BROADBAND DATA SOLUTIONS
In bringing new products to market, expanding its customer base and further reinforcing its organization on a global scale Option further strengthened its market and technology leadership in wireless broadband data solutions, while reinforcing its role as a market-driven innovator in the wireless industry.
JANUARY – DECEMBER 2006
Customer announcements
- GlobeTrotter 3G QUAD data card selected by Smart-Tone (Vodafone Hong Kong)
- GTM351 embedded wireless module selected by Acer- GlobeSurfer 3G selected by TMN- GlobeTrotter GT MAX selected by Cingular Wireless (US)- GlobeTrotter 3G/EDGE “HSDPA Ready” selected by Mobistar - Option confirms Vodafone Germany’s choice of GlobeSurfer i CON and
GlobeTrotter HSDPA - T-Mobile empowers mobile users at CeBIT with Option’s GlobeTrotter
GT MAX- Option to supply Casio with Globe Trotter COMBO data cards for large
project at Deutsche Bahn- TIM selects Option’s 3G/EDGE “HSDPA Ready” Data Card- Bouygues Telecom picks Option’s GlobeTrotter FUSION + “HDSPA
Ready” to offer French mobile road warriors anytime, anywhere access.- Austrian mobile users surf at top speed with GlobeTrotter GT MAX- PTC selects GlobeTrotter GT MAX delivering HDSPA/UMTS/EDGE con-
nectivity to Polish mobile users- T-mobile austria launched the GlobeSurfer i CON as a new “web ‘n’
walk” solution- Option to supply Samsung with embedded wireless module- Proximus selects Option’s GlobeSurfer i CON- Option to supply three HSDPA products to Orange France- Uniwill a leading manufacturer of notebooks, selects Option’s embed-
ded wireless modules- 3 Scandinavia offers HSDPA 3.6 Services with Option’s GlobeTrotter
GT MAX- Australian mobile users to surf at 3.6 Mbps using Option’s Globe Trot-
ter GT MAX “7.2 Ready”- Cingular introduces the newest Option Globe Trotter GT MAX “7.2
READY”- Samsung Electronics and SK Telecom to launch new products with
Option’s HSDPA wireless module inside
Technology leadership
- GlobeTrotter GT MAX, the world’s first tri-band 3G data card and world’s first retractable, Option-patented, antenna design
- GlobeTrotter HSDPA data card (1,8 Mbps)- GlobeSurfer i CON, world’s first USB-based wireless alternative to DSL- GlobeSurfer HSDPA, world’s first HSDPA wireless router- GlobeTrotter FUSION+ HSDPA, world’s first device fusing all cellular
technologies and WLAN in a single data card
- O2 demonstrates GlobeSurfer HSDPA at CeBIT 2006- GlobeTrotter GT MAX “7.2 Ready”- GlobeTrotter EXPRESS 7.2- Cingular Wireless completes live HSDPA 3.6 Mbps data call on com-
mercial network- World’s first retractable – flip out antenna design for 3G bands (Option
patended)- Option to showcase 3.6 Mbps HSDPA Data Card at CTIA Wireless
2006 (Las Vegas, April 5-7)- GTM351E embedded wireless module receives GCF certification- Option achieves industry’s first HSUPA calls using Next Generation
Wireless Data Card- World’s first UMTS900 call made using Option’s HSDPA Data Card
and Elisa’s mobile communication network
Organization
- Option CEO Jan Callewaert named ‘Manager of the Year 2005’- Mr. Laurence Levy, Mr. Jan Loeber and Mr. David Hytha join Option’s
Board of Directors- Selected for membership of the Kempen/SNS Social Responsible
Investment Index- Moving to the new global headquarters to accommodate growth- Celebration 20 Years of Innovative Entrepreneurship and introduction
of new corporate identity- Norbert Metzner strengthens Option’s Executive Management Team as
Vice President Product Marketing
JANUARY – FEBRUARY 2007
Customer announcements
- Option’s new wireless module embedded by Sharp- Wataniya Telecom revolutionizes residential internet service provision-
ing with Option’s HSDPA GlobeSurfer Wireless Router- Option to supply Fujitsu Siemens Computers with HSDPA 3.6Mbps
embedded wireless module- Option wins eMobile business in Japan
Technological leadership
- Option implements HSUPA across its product portfolio at 3GSM World Congress – Barcelona
- Option unveils new ‘Plug ‘n Play’ high performance and sleek de-signed wireless alternative to DSL: GlobeSurfer i CON HSUPA
- Option adds two new HSUPA data cards to market leading wireless portfolio
- Option adds HSUPA to embedded wireless module- Option highlights segmented connectivity software offerings- Option broadband wireless portfolio ready for Windows Vista 32 and
Vista 64
Organization
- Patrick Hofkens strengthens Option’s Executive Management Team as Vice President Strategic Alliances & General Counsel.

99
Report of Activities | Option Annual Report 2006
2.3. CHAIRMAN’S STATEMENT
Dear Shareholders,
Option continued to perform strongly in 2006 delivering revenue growth of 40.9% and record revenues of EUR 279.9 million. Gross profit for the year was EUR 104.6 million, up 23.9% on 2005. In an increasingly competitive market, gross margin was a respectable 37.4% of total 2006 revenues. Full year EBIT also increased, from EUR 38.8 million to EUR 42.1 million, or 15.1% of total revenues. Net profit of EUR 35.3 million, up 21.8% compared with 2005, reflected our continuing commitment to the pursuit of profitable growth. As a result, earnings per share rose to EUR 0.86 per basic share and EUR 0.86 per diluted share compared with EUR 0.71 per basic share and EUR 0.70 per diluted share in 2005. We continue to outperform our peer-group of listed companies that, like Option, are primarily focused on the wireless broadband opportunity. When 2006 results are converted to EUR, taking the relevant exchange rate at the year-end, Option outperformed its nearest rival on revenues by 66 percent, gross profit by very nearly 100 percent, gross margin by a fifth, and diluted EPS by 197 percent. Even though technology delays pushed a substantial volume of fourth quarter data card sales into 2007, we still delivered record shipments of 1.82 million devices in 2006, up 64% on 2005. Option’s market share rose by three points to 35 percent based on ABI Research’s estimated global market of 5.2 million devices for 2006.
Twenty years of “Innovative Entrepreneurship” The solid performance across the business was only one cause for celebration in 2006. In June we celebrated our elevation to membership of the Kempen / SNS Smaller Europe Socially Responsible Investment Index. Membership is restricted to companies with the very highest standards and practice in business ethics, human resources and environmental consciousness. We celebrated our 20th anniversary in September. Since its foundation in 1986, Option has matured into the global leader in the specialist but
growing niche of broadband wireless. Our products are changing lives by allowing users to share in our vision of “anytime, anywhere easy access to information” via mobile networks. Our longevity in an industry dominated by large multinational corpora-tions rests on our commitment for excellence in engineering and our ability to execute, combined with an entrepreneurial enthusiasm and a passion for market-driven innovation - values more commonly associated with start-ups than companies with a 20-year heritage. At the year-end we had 500 employees, major facilities in Belgium, Ireland, Germany and Stockholm, sales and support offices in the US, Japan and Taiwan as well as representation in Hong Kong. We also celebrated the relocation of our global headquarters to new, larger premises that provide a world-class working environment. Our investment in laboratory expansion will reap dividends by enabling product development and production test teams to work side-by-side, improving communication, accelerating development cycles and reducing time to market. We also unveiled a refreshed corporate identity to differentiate our company and products as we enter new geographical markets and penetrate new customer segments. The new logo brings Option to the forefront, reflects passion and the transferring of information and knowledge while maintaining a sense of advanced technology. From our core business in wireless data cards, we have diversified. Embedded modules that provide wireless broadband connectivity for laptop computers, and fixed-wireless convergence devices such as USB wireless modems and wireless routers make up a non-data card business segment that we expect to generate significant growth in the years ahead. To meet the needs of more diverse users, we also offer a segmented portfolio of software solutions. International operators groups, including Vodafone, T-Mobile and Orange, and the major players in some of the world’s fastest growing markets, such as Cingular Wireless in the US and Airtel in India, now offer Option devices. Our list of operator customers grew from 75 at the end of 2005 to more than 90 at the end of 2006. In addition five leading manufactur-ers of personal computers and multimedia devices are working with our embedded modules. A year of change Approaching 150 operators worldwide had launched 3G UMTS by the end of 2006. Of these, more than 140 are committed to taking the HSDPA upgrade path. Nearly 100 have already introduced their initial HSDPA offerings which deliver an alternative to DSL with the convenience and versatility of wireless.
1 Liberating the Laptop: 5-Year Market Outlook on PC Cards & Embedded WWAN-
Connectivity, Strategy Analytics, January 2007

1010
Rapid technological change created challenges as operators shifted network strategies from 1.8 Mbps HSDPA in early 2006 to 3.6 Mbps HSDPA in the second half of the year. Option’s “HSDPA-Ready” strategy, which allowed users to enjoy the benefits of 3G knowing their data card was easily upgradeable when their operator launched HSDPA, placed us in a strong position in early 2006. The market for 3.6 Mbps HSDPA data cards started to develop towards the end of the year when the first operators started upgrading their 1.8 Mbps HSDPA networks. Incorporating Advanced Radio Technology – ART – delivering valuable performance benefits to users and operational benefits to networks, the chipset would also build on the “HSDPA-Ready” precedent: our data cards would be easily upgrade-able when operators are ready to undertake their next network upgrades to deliver 7.2 Mbps HSDPA.
Delays in the commercial availability of the advanced HSDPA chipsets constrained data card sales in the fourth quarter of 2006, although deliveries resumed in early 2007.
Overall, Option announced eight new data cards during 2006 including our first models compatible with the new smaller ExpressCard expansion slots that are now found in the latest laptops. Data card application software was also updated to make compatible with Microsoft’s new Vista operating system.
The slower than expected growth in demand for embedded modules and fixed wireless devices also curbed top-line sales, even though we were ready with an attractive portfolio of products.
Incorporating wide-area wireless capability within their laptops is becoming more and more important for personal computer manufactur-ers. However, a lack of consensus on business models that adequately reward laptop manufacturer, mobile operator and distribution channel hinders take-up.
Less than a year after we opened our office in Tokyo, Option is already actively helping manufacturers in Asia embed wireless into laptops and mobile multimedia devices. Our experience confirms that delivering the required performance from an embedded wireless device is a technical challenge that varies from laptop to laptop. Similarly, securing the necessary regulatory and operator certification requires a dedicated team with expert knowledge and a patient, systematic approach. It was little surprise to us that the Intel-Nokia project to integrate HSDPA within the Centrino architecture was abandoned after less than six months. Accelerating the uplink - HSUPA As 2006 drew to a close, operators started turning their attention to HSUPA - High Speed Uplink Packet Access. This complement to HSDPA initially increases maximum upload speed to 2 Mbps. By raising the
speed at which users can send large data files across the “uplink” to the network, HSUPA will create new business applications, particularly in the media sector, appeal to many consumers and further stimulate demand for embedded modules from laptop manufacturers. Option’s HSUPA development programme progressed strongly through 2006, and a comprehensive portfolio of HSUPA products, which are also HSDPA “7.2 Ready” and incorporate ART, was unveiled at the 3GSM World Congress in Barcelona in February 2007. Managing growth We welcomed Mr. Lawrence Levy, Mr. Jan Loeber and Mr. David Hytha to the Board of Directors at the 2006 Annual General Meeting. Their wealth of experience in the wireless industry will help the executive manage-ment team, itself strengthened with two new appointments, maintain the company’s leadership in product development and engineering, operations, supply chain management, sales and finance.
Business development and sales teams are being augmented to create an even more effective marketing machine to complement the engineering machine on which Option’s success has been founded to-date. Industry analysts agree that there is a significant market opportunity: ABI Research, for example, forecasts cellular modem shipments will experience compound annual growth rates of 53% to reach 68 million units in 2012. With demand continuing to grow, we took early steps to secure manufacturing capacity to meet forecast demand for 2007. In line with a strategy to locate manufacturing close to key markets, a new contract manufacturing partner has been identified in China to meet demand from Asia for our embedded modules. More than a decade ago, we were ahead of our time when we launched the world’s first GSM cellular modem. Our crystal-clear vision, market-driven innovation, solid execution and our talented people have been the drivers of our growth. Today, our data cards are market leaders. Our USB modems, wireless routers and advanced embedded modules define the cutting edge in wireless broadband as we embark upon a new growth path.
Jan CALLEWAERT, Chairman
March 9, 2007

1111
Report of Activities | Option Annual Report 2006
2.4. MANAGEMENT DISCUSSION – SOCIAL REPORT
2.4.1. WORKFORCE
Headcount
On 31st December 2006 there were 497 full time employees in the Option Group supported by an additional 19 contractors. This compares with 341 full time employees and 32 contractors in the previous year.
The gender breakdown is 58% men and 42% women.The average age of female employees is 30 and the average age of male employees is 33.
The average age of all employees is 32, with 89% of the workforce between the age of 20 and 44.
We refer to the note 4: Payroll and related benefits of the financial statements in this annual report for additional informa-tion about the payroll costs.
Health and safety
All personnel within Option NV can be vaccinated against flu free of charge. In 2006, 60 persons on a total of 221 took the opportunity to be vaccinated.
Training and development
The strong focus on technological innovation requires Option to invest continuously in training and personal development. Option individuals or teams receive training from suppliers, partners and other training institutes at different European locations. The trainings needs are discussed as part of the annual employee performance evaluation.
Development through education and training at Option includes on-the-job professional development, technical education, certification programs, and management development courses.
The Option Competence Center (OCC) provides internal trainings to all employees and contributes to the enhancement of the training quality, knowledge sharing, communication and competency development.
In the Belgian Headquarters, foreign employees can benefit from Dutch courses.
2.4.2. EXECUTIVE OFFICERS
Jan Callewaert (50), Founder and CEO. an Callewaert chairs the Executive Management Team. Prior to founding Option in 1986, Jan Callewaert gained IT experience with BULL and Telecom experience with Ericsson where he worked on office automation systems, integrating modems, data networks, fibre optics and videotext. Jan Callewaert is a qualified Commercial and Managerial Engineer in Management Informatics and has a Baccalaureat in Philosophy from the University of Leuven. A regular speaker on mobile computing at industry conferences, Jan Callewaert is a recognized figure in the mobile data communication industry. Jan Callewaert chairs the Executive Management Team.
Frederic Convent (44), Chief Financial Officer. Frederic Convent was Vice President, CFO and Corporate Secre-tary of Xeikon until January 2001 where he was responsible for the accounting and financial departments of the Belgian head-quarters and the five foreign subsidiaries of this manufacturer of digital printing systems. Before joining Option in September 2002, he provided investor relations’ advice to a number of stock market-listed companies. Previously, he acted as Senior
>59
55-59
50-54
45-49
40-44
35-39
30-34
25-29
20-24
18-19
0
0% 5% 10% 15% 20% 25% 30% 35%
Age pyramid Male Female
90%
80%
70%
60%
50%
40%
30%
20%
10%
0%
0-5 6-10 11-15 16-20
Seniority pyramid in % Headcount
Average senoirity in the Group is close to 5 years.

12
Investment Manager at GIMV and as Senior Auditor at Coopers & Lybrand during respectively five and three years. He holds a law degree from the University of Leuven and an MBA from Vlerick University, Ghent. Frederic Convent is a member of the Executive Management Team of Option.
Bart Goedseels (39), Vice President Operations & Sales. Bart Goedseels, graduated from the Law School of the University of Leuven, joined Option in March 2001 to assume the position of Vice President of Operations. Bart Goedseels worked for Leisureplanet (UK) for eight years, and was COO the last two years. He organized and supervised Leisureplanet’s general structure with project-driven and globally spread activities. Bart Goedseels is a member of the Executive Management Team of Option.
Douglas Ros (54), Vice President Business Development. Educated in the UK with a Higher Diploma in Electrical & Mechani-cal Engineering sponsored by the Racal Decca Group, Douglas Ros joined Option in February 2000 from World Telecom Labs where he was Director of Sales and Marketing. Previously, he was Managing Director at Micro-Integration Europe and General Manager of Thorn EMI where he served for over 14 years in a variety of technical, sales, business development and management positions. Douglas Ros is a member of the Executive Management Team of Option.
Bernard Schaballie (47), Vice President Engineering. Bernard Schaballie graduated as a civil electronics engineer at the University of Leuven in 1982. He started his career at the Leuven University as a research assistant specializing in digital signal processing and silicon compilers. During 15 years he was employed by Telindus, where he assumed positions as development engineer, team leader and R&D director, heading a team of 60 researchers. Before joining Option in May 2001, he was responsible for business development of own products in Telindus, initiating alliances with major players in the industry. Bernard Schaballie is a member of the Executive Management Team of Option.
Norbert Metzner (46), Vice President Product Marketing. Dipl.-Ing in Telecommunications, was primarily responsible for product management and the product concepts of mobile devices within the product portfolios of T-Mobile International. Previously, as Head of Terminals at Vodafone Holding – Düsseldorf (Germany), he was responsible for the definition and the successful roll-out of the business model for Vodafone live! Terminals. He can also draw on consumer device, mobile phone and mobile networking experience from a variety of roles during a ten-year career at Siemens – Munich (Germany). He was educated within Germany’s University of the Federal Forces and Air Force Academy. Norbert Metzner is a member of the Executive Management Team of Option
Patrick Hofkens (37),
General Counsel & Vice President Strategic Alliances. Patrick Hofkens holds a Master Degree in Law from the Catholic University of Louvain and a Master Degree in Corporate Law from the Catholic Universities of Brussels and Louvain, was previously Senior Legal Counsel for the Borealis Group, a petrochemi-cal company with interests in Europe, Brazil and in the US and advocate with Loyens & Loeff, a Benelux based international law firm. He returns to Option having previously served as General Counsel to the Company between April 1998 and December 2002. Patrick Hofkens is a member of the Executive Management Team of Option.
Jan Vercruysse (48), Vice President Technology. Jan Vercruysse holds a degree in Civil Engineering from the Univer-sity of Leuven and a degree in Telecommunications Engineering from the University of Leuven. For 6 years as Project and R&D Manager he pioneered the engineering department to become a centre of excel-lence. Jan Vercruysse worked for Sparnex as HDSL Development Engineer and Team Manager. At Telindus he had won his spurs in the design of PCBs and ASICs for data products. Jan Vercruysse joined Option in January 1997.
Andy Kinsella (41), Vice President Manufacturing. Andy Kinsella graduated in Electronic Engineering at Cork Institute of Technology, Ireland, and holds a Diploma in Business Administration form the Irish Management Institute and Henley Management College London. After engagements over the previous 10 years as RF Design Engineer and Project Manager at Maxon and M/A-COM, he joined Option in December 1997 with responsibilities for the manufacturing and logistics operations in Ireland. In the course of 2004, Andy Kinsella became Vice President of the Company.

1313
Report of Activities | Option Annual Report 2006
2.5. CORPORATE GOVERNANCE
The Belgian Corporate Governance Code
On 9 December 2004, the Corporate Governance Committee published the Belgian Corporate Governance Code. The Code known as “Code Lippens” and its nine principles can be found on the website http://www.corporategovernancecommittee.be.
This Code entered into force on 1st January 2005. In line with the Code as from 1st January 2006, Option made public on its website www.option.com (refer to the “invest” section), a Corporate Governance Charter, outlining its corporate governance structure and policies.
The Code has a high degree of built-in flexibility, enabling it to be adapted to each company varying size, activities and culture. It is based on a “comply or explain” system, which allows companies to deviate from the provisions of the Code when their specificities so justify, subject to providing adequate explanation.
Option adopted the “comply or explain” system with regards to the following topics, also described in this annual report:- the combination Chairman – CEO- the Audit Committee membership- the combination Nomination Committee – Remuneration Committee- the proposal to grant stock options plan to the Board of Directors.
Composition of the Board of Directors
The articles of association stipulate that the Board of Directors is composed of a minimum of three and a maximum of nine members, who are appointed by the general shareholders meeting for a maximum period of six years. The Board of Directors has to contain at least three independent Directors.
The Board of Directors is currently composed of seven members, namely :• Jan Callewaert • Arnoud De Meyer, Independent Director • Triakon NV, represented by Lucien De Schamphelaere,
Independent Director• Philip Vermeulen, Independent Director • Lawrence Levy• Jan Loeber, Independent Director• David A. Hytha
At the Shareholders’ meeting, on March 30, 2007, Triakon NV, represented by Mr. Lucien De Schamphelaere, will resign as an independent director. The Group would like to thank Mr. Lucien De Schamphelaere for a decade of commitment, support and guidance.The term of the office of all other Directors will expire immediately after the Annual General Meeting, which will be asked to approve the annual accounts for the year ending in 2008.
Jan Callewaert (50), Founder and Chairman.
Mr. Jan Callewaert is through Pepper NV the most important shareholder of Option. He was appointed CEO of the Company and at the Board meeting of March 31, 2003, the Board of Directors elected Mr. Jan Callewaert as Chairman. As a result, Mr. Jan Callewaert combines the function of Chairman and CEO, a deviation from one of the principles set by the Belgian Corporate Governance Code. The Board of Directors is of the opinion that this combination is in the companies Company ‘best interests as Mr. Jan Callewaert’s vision on the wireless industry combined with his drive and enthusiasm to execute this vision as CEO are key factors to the success of the Company. Furthermore, given the size of the Company and its growing pattern, the split between chairman and CEO would add another layer of complexity in the Company. The Board of Directors is of the opinion that this would not benefit the Company’s ability to react fast to internal and external changes and challenges. Prior to founding Option, Mr. Jan Callewaert gained IT experience with Bull where he was product manager for the Dealer Channel. Then, with Ericsson where he was product-marketing manager for Office Automation products, he worked on the integration of hardware and software combining modems, data networks, fibre optics and videotext. Mr. Jan Callewaert is a qualified Commercial and Managerial Engineer in Management Informatics and has a Baccalaureat in Philosophy from the University of Leuven. He has presented papers on mobile computing to industry conferences, and is a recognized figure in the mobile data com-munications industry. He will continue to promote Option through regular presentations to industry groups.
Arnoud De Meyer (53).
Mr. Arnoud De Meyer is Professor of Management Studies at Cambridge University (UK) and Director of the Judge Business School. He is also a Professorial Fellow of Jesus College. Until August 2006 he was Akzo Nobel Fellow in Strategic Management and Professor of Technology Management at INSEAD, where he also assumed several management positions, including that of Founding Dean of INSEAD’s Asia Campus in Singapore. Professor Arnoud De Meyer’s main interests are in manufac-turing and technology strategy, the implementation of new manufacturing technologies, and the management of R&D and he has published widely in these areas. While being an academic Professor Arnoud De Meyer has also acted as a consultant for a number of medium-sized and large companies throughout Europe and Asia. He is board member of Dassault Systemes S.A. Lucien De Schamphelaere (75).
Mr. Lucien De Schamphelaere is Chairman and CEO of Triakon N.V. Till July 1999 he was Chairman of Xeikon N.V., a company that he formed in 1988. Prior to founding Xeikon he held, during a period of over 35 years, several positions in the field of process control, instrumentation and elec-tronic imaging at Agfa-Gevaert. From 1986 till 1993 he served as CEO of AGIF N.V., Agfa-Gevaert’s venture capital fund. Mr. De Schamphelaere is also a Director of Imec vzw, a Belgium-based semiconductor R&D Institute and of several Belgium-based start-up companies that are active in the high-tech field, such as Melexis N.V.

1414
Philip Vermeulen (50).
Mr. Philip Vermeulen served in various positions with Chase Manhattan Bank S.A. (Belgium), Sidel Computers Centers N.V. and IPPA Bank N.V. (Belgium). He also served as Executive Senior Investment Manager for Venture Capital with GIMV and later at FLV C.V.A. He is an Advisor Direc-tor of various companies active in the information technology business.
Lawrence Levy (68).
Mr. Lawrence Levy has been, and continues as, Senior Counsel at Brown Rudnick Berlack Israels LLP. For more than 30 years before that, Mr. Levy had been a partner at Brown Rudnick, specializing in Corporate and Securities Law. Since 1998, Mr. Levy has divided his time between Brown Rudnick’s Boston and London offices, dealing with cross-border issues and transactions for the firm’s clients. Mr. Levy is also a Director of Hologic, Inc., located in Bedford, Massachu-setts. Mr. Levy received a B.A. from Yale University and a LLB from Harvard Law School.
Jan Loeber (63).
Mr. Jan Loeber is a member of the Board of Directors of Tele2 in Swe-den, the Chairman of the Stichting organization of Interxion, BV in The Netherlands and Chairman of Newfound Comm. Previously Mr. Loeber held leadership positions at a number of companies as the founding Managing Director of GTS Carrier Services in Brussels, Managing Director of Bankers Trust’s Global Telecom Merchant Banking Group, founding Managing Director of Unitel (merged with Mercury one-2-one and acquired by T-Mobile) in London and Group President of Nokia Americas. He has also held other senior management positions at ITT Europe in Brussels and at AT&T (Bell Laboratories) in New Jersey. Mr. Loeber received his B.S. in Physics from Michigan Technologi-cal University and his M.S. in business administration from George Washington University.
David A. Hytha (52).
Mr. David Hytha is a wireless executive and entrepreneur and was most recently Executive Vice President, Terminals for T-Mobile in Europe, responsible for the selection, marketing and development of all handsets for T-Mobile in Europe. His career includes leadership roles in mobile communications handsets, infrastructure, services and systems-on-chip solutions in industry-leading firms and successful new ventures including: Silicon Wave (now RFMD), LGC Wireless (in-building antenna systems), Motorola, McCaw Cellular (now Cingular Wireless), AT&T Network Systems (now Lucent) and AT&T Microelec-tronics (now Agere), including founding the first overseas department of Bell Laboratories. Mr. David Hytha is also a Venture Partner at Sofinnova Partners, one of Europe’s leading venture capital firms. He holds a MBA from Columbia University in New York and a BA from the College of the Holy Cross.
Functioning of Board of Directors
In 2006, the Board of Directors met 13 times, 5 times in person and 8 times via conference call.The average attendance rate amounts to 95%, with the following individual attendance rate figures:
Jan Callewaert 100%Triakon NV 100%Jan Loeber 70%Arnoud De Meyer 100%Philip Vermeulen 100%David Hytha 100%Lawrence Levy 100%
No transaction or any other contractual relationship occurred in 2006 between the Company (including its related companies) and a member of the Board of Directors, that could create a conflict of interest covered by the legal provisions on conflicts of interests (Articles 523 and 524 of the Belgian Company Code).
The policy with regard to transactions between the Company or any of its affiliated companies on the one hand and members of the Board of Directors or the Executive Management Team (or members of their immediate families) on the other hand that could give rise to conflicts of interest (other than the ones defined in the Belgian Companies Act) has been defined in the Corporate Governance Charter. During the past business year, one such transaction has been reported and discussed in the Board of Directors. Since 1997 the Company has a professional relationship with the US based law firm Brown Rudnick Berlack Israels LLP. Mr. Lawrence Levy who joined the Board of Directors of the Company early 2006 is one of the Senior Counsels of this law firm. Going forward, the Company would like to continue to work for certain matters with this law firm whereby it is agreed that Mr. Lawrence Levy will not directly work on Company related matters in his capacity of Senior Counsel of Brown Rudnick Berlack Israels LLP.In order to avoid any ambiguity the Board of Directors decided to report on an annual basis on the fees that were paid to Brown Rudnick during the financial year. We refer to the note 21: Related parties transactions in this annual report for additional information.
Audit Committee
The Audit Committee of the Company is composed of two independent Directors, Mr. Philip Vermeulen and Mr. Arnoud De Meyer, and Mr. Jan Callewaert. Mr. Callewaert is shareholder of Option and CEO. He has a good understanding of the wireless industry and in-depth insight in the dynamics of the Company. This knowledge is important to the Audit Committee as one of its primary roles is to ensure that the financial reports of the Group give a true, fair and clear picture of the situation and the prospects of the Group. As Mr. Callewaert is best suited to make a proper assessment of industry development matters and development projects the Board of Directors is of the opinion that his membership in the audit committee is appropriate. The Audit Committee gives guidance and controls the financial reporting of the Company. It ensures the

1515
Report of Activities | Option Annual Report 2006
presence of sufficient internal control mechanisms and, in co-operation with the statutory auditor of the Company, investigates questions relating to bookkeeping and valuation. The Audit Committee met 4 times during 2006 and reported to the Board of Directors on its activities and findings.
Remuneration Committee
The Remuneration Committee is composed of two independent Directors Mr. Philip Vermeulen, Mr. Arnoud De Meyer and Mr. Lawrence Levy. The Remuneration Committee’s role is to provide for a fair policy of remuneration for the employees and to ensure best international practices are respected when determining the remuneration and incen-tives of Directors and Officers, and the appointment of the latter. Given the size of the Group the Remuneration Committee is also combining the function of a nomination committee. The Remuneration Committee met three times during 2006 and reported to the Board of Directors on its activities and findings.
Strategic Committee
At the meeting of the Board of Directors held in December 2006 it was decided to set up a Strategic Committee. The Strategic Committee is composed of four Directors, Mr. Jan Callewaert, Mr. Arnoud de Meyer, Mr. David Hytha and Mr. Jan Loeber. The Committee’s role is to reflect upon the mid and long term strategy of the Company taking into account the global market evolutions and developments in the telecom sector (and more in general the high tech industry). In addition, the Committee shall review and evaluate major strategic decisions and provide guidance to the Board of Directors.
Remuneration of Directors and Executive Officers
The Remuneration of Directors and Executive Officers is covered in the note 21: Related parties transactions of the financial statements in this annual report.
Auditors’ Remuneration
The annual meeting of shareholders held on 31st March 2004 renewed the mandate of the statutory auditor, Deloitte Bedrijfsrevisoren/Reviseurs d’Entreprises, represented by Mr. Leo Van Steenberge. The mandate expires immediately after the annual shareholder meeting on 30 March 2007 called to approve the annual accounts for the financial year ending on 31 December 2006.
Statutory audit and other fees for 2006 in relation to services provided by Deloitte Bedrijfsrevisoren/Reviseurs d’Entreprises amounted to EUR 201k (2005: EUR 181k), which was composed of audit services for the annual financial statements of EUR 100k (2005: EUR 90k), tax and legal advices services EUR 101k (2005: EUR 57k) and in 2006, no other services (2005: EUR 34k).
Worldwide audit and other fees for 2006 in relation to services provided by Deloitte amounted to EUR 295k (2005: EUR 225k), which was composed of audit services for the annual financial statements of the Company and its subsidiaries of EUR 169k (2005: EUR 111k), tax and legal advices services EUR 124k (2005: EUR 76k) and other services of EUR 2k (2005: EUR 38k).
2.6. CORPORATE SOCIAL RESPONSABILITY
Statement of Business Ethics
Option is mindful of its responsibilities to behave in an ethical manner in the course of pursuing its business goals and therefore makes the following ethical statement.
Option NV, including all its subsidiaries, affiliates and/or consolidated holdings adopts the following practices:
Investment
We will not invest in any of the following areas:• Marketing, development or production of nuclear, chemical or biologi-
cal weapons.• Marketing, development or production of weapons of war or other
armaments.• Marketing, development or production of products involving animal
fur or animal testing.• Production of strategic parts of weapon systems of any kind. • Marketing, development or production of pornography, the sex indus-
try, hard drugs or tobacco.
Employment
We will not engage in any of the following activities:• use of children under the legal age for employment.• use of forced, bonded or compulsory labor.
Discrimination
We will not discriminate against our employees in any of the following areas:• on the grounds of race, color, sex, sexual orientation, religion, political
opinion, age or nationality.• on the grounds of pregnancy or on maternity leave.
Purchasing
We will put into place checks, controls and procedures to ensure all our suppliers and sub-contractors:• have ethical standards that do not compromise any of the above• have checks, controls and procedures that ensure their suppliers or
sub-contractors do not compromise any of the above.
Prevention of Corruption
We will include in our distribution and supply agreements anti-bribery standard clauses. Our employment policies outline measures that can and will be taken in order to prevent corruption. Option, as a public company, respects the Corporate Governance rules, as it is member of the ETHIBEL Sustainability index.
Environemental policy of the production and logistical unit
The scope of operations of Option Wireless Ltd includes: “Source, manufacture and supply of wireless communication products and solutions”.

1616
The organization recognizes its environmental responsibilities to its staff, shareholders, customers and the general public and is committed to the continual improvement of the operating environment of its facilities. To this end it will maintain and document an Environmental Management System which conforms to: ISO 14001: 1996 and will take into account all regulatory and legislative requirements pertinent to it’s sector, local operating environment and customer requirements.
The organization’s objectives include the following:
• Communicating its policies both internally and externally• Commitment to continual improvement in environmental
performance• Using the input of staff, customers, shareholders, government,
local authorities, interested third parties and the general public• Awareness and training on environmental issues• Creating a better environment for all, through the reduction,
recycling and reuse of waste, the optimum usage of resources and the elimination of polluting releases of the environment
• Compliance with all pertinent applicable regulations and legislation• Prevention of pollution• Manufacture and supply of product in a safe environment to
customer specifications and requirements.The above policy is supported by the management of Option Wireless Ltd who shall commit the necessary resources ensuring that the objectives and targets can be achieved. Appropriate pro-grams are set up to achieve our objectives and will be reviewed at the Annual Management Review and Quarterly Objective Review Meetings.
In 2006, Option NV decided to sponsor the Roger Van Overstraeten Society (www.rvo-society.be) to inspire young kids for engineering games and create a technology passion.
Vigeo results
Vigeo, the corporate social responsibility ratings agency, assessed Option ‘corporate responsibility profile, Vigeo concluded that despite its limited size compared with the other companies in the sector, Option shows an overall good level of awareness on corporate social responsibility.
Quality certification
The Certificate of Registration of Quality System to I.S. EN ISO 9001:2000 has been delivered by the National Standards Authority of Ireland to Option Wireless Ltd on 08 February 2006.
The Certificate of Registration of Environmental System to I.S. EN ISO 14001:2004 has been delivered by the National Standards Authority of Ireland to Option Wireless Ltd on 23 June 2006.
The Certificate of Registration of Quality System to I.S. ISO 9001/2000 has been delivered by the National Standards Authority of Ireland to Option Wireless Ltd on 19 August 2006.

1717
Financial Review | Option Annual Report 2006
3 .FINANCIAL REV IEW

1818
On April the 19th, 2006 the Shareholders’ meeting has approved amendments to the by-laws of the Company including a four-for-one split of the Company’s common stock. As a result, the Capital of the Company is represented by 41 249 296 shares. The shares after the split were listed on the exchange ‘Eurolist by Euronext Brussels’ under the code BE0003836534 as of Monday April 24, 2006.
Due to the fact that the Option shares only exist in dematerialized form on a security account, all shareholders did automatically receive four new shares after the split for every outstanding share.
During the remainder of 2006 no further changes occurred so that at December 31, 2006 the common stock shares amounted to 41 249 296.
At year-end 2006, the Company announced the following significant shareholders:
Identity of the person, entity or group of persons or entities (*)
Number basic shares held
Percentage of financial instru-
ments held
Pepper NV (100% Jan Callewaert) 7 054 504 17.10 %
Free float of which: 34 194 792 82.90%
- KBC Asset Management NV (Belgium)
1 885 368 4.57%
- BGL Investment Partners (Luxemburg)
1 530 000 3.70%
- UBS AG (Switzerland) 2 058 512 4.99%
Total shares outstanding 41 249 296 100%
(*) Each class of the voting financial instruments of the Company, for each person, entity or group of persons or entities, known to the company to hold at least 3% or more directly or indirectly is listed.
End of 2006 there were no warrants outstanding. All warrants that have been granted to beneficiaries active in the Option group under the warrant plan ‘T’, which the Board of Directors created in February 2002 and implemented in July 2003, were executed during the course of 2004 and 2005.
DISCUSSION OF THE CONSOLIDATED ANNUAL ACCOUNTS
Unless mentioned explicitly, all numbers are according to IFRSs.
The consolidated accounts include the following subsidiaries:- Option Wireless Ltd, Cork (Ireland)- Option Germany GmbH, Adelsried (Germany)- Option Wireless, Stockholm (Sweden)- Option Japan KK (Japan)- Option Wireless Hong Kong, Limited (China)- Option Wireless Hong Kong Limited Taiwan Branch (Taiwan)
At the end of 2004, an American subsidiary was founded, Option Inc. Given its immaterial size, this subsidiary has not been
included of the consolidation scope in 2006 and 2005.
REVENUES
Revenues for 2006 increased by 40.9% to EUR 279 868k, compared with EUR 198 615k in 2005. The Group generated in 2006 90% of its revenue from equipment sales of PC data cards and wireless routers and 10% through other sales.
GEOGRAPHICAL SPREAD OF SALES
Geographically, Europe accounts for 87% of the sales in 2006, compared with 93% in 2005.
GROSS MARGIN
Gross margin in the full year 2006 was 37.4% on total revenues, compared with gross margin of 42.5% in 2005. Costs of goods sold of EUR 175 254k during 2006 resulted in a gross profit of EUR 104 614k, an increase of 23.9% compared to EUR 84 412k in 2005 equivalent period.
OPERATING EXPENSES
The operating expenses for the full year 2006, including depreciation and amortization charges were EUR 62 477k compared to EUR 45 647k for the previous year.
PROFIT FROM OPERATIONS (EBIT)
During 2006, EBIT increased to EUR 42 137k (or 15.1% on revenues), compared to EUR 38 765k (or 19,5% on revenues) of 2005 representing a growth of 8.7%.
EBITDA
EBITDA amounted to EUR 53 134k (or 19.0% on revenues) for the full year 2006, compared to EUR 46 306k (or 23.3% on revenues) of 2005 representing a growth of 14.7%.
FINANCE RESULT
During 2006, Option obtained a positive financial result of EUR 600k. The total exchange rate gains amounted to EUR 881k mainly thanks to USD rates and Option received EUR 1 112k from risk free investments of the available cash.A total of EUR 1 253k financial discounts were given to custom-ers for cash payments and the other financial costs of EUR 140k were mainly related to financial leases and bank charges.
NET PROFIT AND EARNINGS PER SHARE
On April 24th, 2006, the Company executed a four for one stock split. Applying the transaction retroactively, earnings per share would have been the following:Net profit, for the full year 2006, amounted to EUR 35 316k or EUR 0.86 per basic share (or EUR 0.86 per diluted share). This compares to a net profit of EUR 28 993k or EUR 0.71 per basic share (or 0.70 per diluted share) during 2005. Net profit grew 21.8%.
3. FINANCIAL REVIEW

1919
Financial Review | Option Annual Report 2006
BALANCE SHEET
Total assets amounted to EUR 176 489k compared to EUR 127 013k at the end of the previous year.
Cash and cash equivalents decreased over the year from EUR 49 288k to EUR 36 062k at the end of 2006.
Trade and other receivables increased from EUR 37 050k at the end of 2005 to 54 201k at the end of 2006. This increase was mainly attributable to the trade receivables which increased from EUR 35 703k to EUR 52 400k.The trade receivable portfolio is sound. Most sales in non-OECD countries are covered by letters of credit or by credit insurance, provided by Delcredere. As an autonomous body, guaranteed by the Belgian Government, Delcredere’s role is to promote international economic relations by covering risks relating to exports to, imports from and investments in non-OECD countries.
Inventories have increased from EUR 19 495k at the end of last year to EUR 40 572k at the end of 2006. This increase is explained by an increase of the work in progress stock and components due to a production delay in the fourth quarter and the building of finished goods ready for delivery in the beginning of the first quarter of 2007.52.9% of the inventory at quarter-end was related to compo-nents, 38.7% concerned work in progress whilst the level of finished goods at the quarter-end remained very low, represent-ing only 8.4% of the total inventory. In 2005, these percentages were respectively 51.2% for raw components; 42.5% for work in progress and 6.3% for finished goods.
The net book value of intangible and tangible fixed assets was EUR 42 097k at the end of 2006, compared with EUR 19 446k as at December 31st 2005. During 2006, the total investments in tangible assets, mainly test equipment, amounted to EUR 6 440k and the Group invested EUR 27 410k in intangible assets of which EUR 9 994k for capitalized development projects and EUR 17 416k mainly due to additional licenses.
Total current liabilities increased during the year to EUR 53 125k in 2006, compared with EUR 49 626k in 2005. This increase is mainly related to the increased trade and other payables (+EUR 2 117k) and increased income tax payable (+ EUR 1 594k).The Group generated a deferred tax liability mainly as a result of the capitalization of the commercial development projects under IFRS. In 2006, this deferred tax liability decreased by EUR 569k which was nearly fully related to development projects.
On a balance sheet total of EUR 176 489k, the total shareholders’ equity amounted to EUR 111 634k. Therefore, at the end of 2006, the Group solvency ratio was 63.2%, compared to 60.1% in 2005.
The cash flow generated from operating activities during 2006 amounted to EUR 4 944k compared to EUR 34 844k in the previous year. The decrease is attributable to the combination of a higher net profit in 2006 and a decrease of the cash generated from operations.
APPROPRIATION OF THE NON-CONSOLIDATED RESULT
The statutory accounts of Option NV (Belgian GAAP) reported a net profit for the year 2006 of EUR 22 832k, improving from a net profit of EUR 18 696k in 2005.
The intention in time of dividend distribution will depend of the net non-consolidated results of Option NV, the financial situation of the Company, the establishment of the legal reserves and other elements that the Board of Directors and the Ordinary Sharehold-ers’ Meeting will consider at that moment.
The Board of Directors proposed to add the non-consolidated net profit of EUR 22 832k of 2006 to the profit carried forward from the previous year.
Abridged appropriation account (According to Belgian Accounting Standards)
December 31,in thousands EUR 2006 2005
Profit/( loss) carried forward from previous year
2 345 (15 739)
Profit/( loss) for the period available for appropriation
22 832 18 696
Profit/( loss) to be appropriated 25 177 2 345
Legal reserve - 612
20
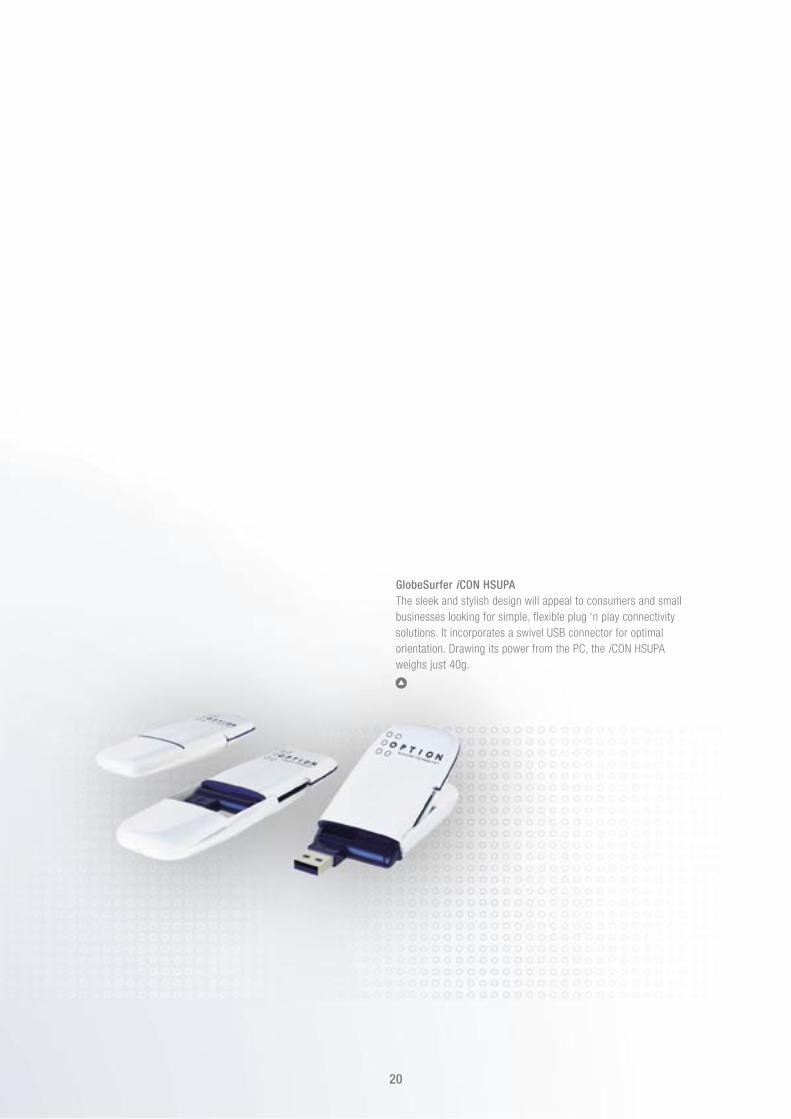
GlobeSurfer i CON HSUPA The sleek and stylish design will appeal to consumers and small businesses looking for simple, flexible plug ‘n play connectivity solutions. It incorporates a swivel USB connector for optimal orientation. Drawing its power from the PC, the i CON HSUPA weighs just 40g.

21
4.FINANCIAL REPORT - I FRS
21

2222
4.1. CONSOLIDATED FINANCIAL STATEMENTS
4.1.1. Consolidated Income Statement
For the year ended 31 DecemberThousands EUR (except per share figures)
Note 2006 20051
Revenues 2 279 868 198 615
Cost of products sold (175 254) (114 203)
Gross profit 104 614 84 412
Research and development expenses 3-4 (18 302) (15 522)
Sales, marketing and royalties expenses 3-4 (32 794) (24 180)
General and administrative expenses 3-4 (11 381) (5 945)
Total operating expenses (62 477) (45 647)
Profit from operations 42 137 38 765
Finance costs 5 (1 790) (3 111)
Finance income 5 2 390 787
Finance costs/income-net 600 (2 324)
Profit before income taxes 42 737 36 441
Tax expense 6 (7 421) (7 448)
Net profit 35 316 28 993
Weighted average number of ordinary shares 41 249 296 40 648 232
Diluted weighted average number of ordinary shares 41 249 296 41 249 628
Basic earnings per share 17 0.86 0.71
Diluted earnings per share 17 0.86 0.70
1 Adjusted retroactively to take into account the 4-for-1 stock split completed on April 24, 2006.
4. FINANCIAL REPORT - IFRS

2323
Financial Report - IFRS | Option Annual Report 2006
4.1.2. Consolidated Balance Sheet
For the year ended 31 DecemberThousands EUR
Note 2006 2005
ASSETS
Cash and cash equivalents 7 36 062 49 288
Trade and other receivables 8 54 201 37 050
Income tax receivable 110 20
Inventories 9 40 572 19 495
Total current assets 130 945 105 853
Property, plant and equipment 10 12 099 8 415
Intangible assets 11 29 998 11 031
Deferred taxes 12 3 303 1 714
Other receivables 8 144 -
Total non-current assets 45 544 21 160
Total Assets 176 489 127 013
LIABILITIES AND SHAREHOLDERS’ EQUITY
Trade and other payables 13 49 137 47 020
Income tax payable 3 914 2 320
Current portion of long-term debt 15 74 286
Total current liabilities 53 125 49 626
Trade and other payables 13 11 326 -
Non-current portion of long-term debt 15 148 222
Deferred taxes 12 256 825
Total non-current liabilities 11 730 1 047
Issued capital 16 6 116 6 116
Share premium 16 43 865 43 865
Reserves 16 335 357
Retained earnings 16 61 318 26 002
Total shareholders’ equity 111 634 76 340
Total liabilities and shareholders’ equity 176 489 127 013

2424
4.1.3. Consolidated Cash Flow Statement
For the year ended 31 December Thousands EUR
2006 2005
OPERATING ACTIVITIES
Net profit (A) 35 316 28 993
Depreciation and amortization 10 987 7 540
Impairment loss 10 2
Write-offs on inventories 145 636
Write-offs on trade debtors 200 1
Unrealized foreign exchange losses/(gains) (202) (4)
Interest ( income) (1 112) (786)
Interest expense 97 157
Loss/(gains) on sale of property, plant and equipment (5) -
Equity-settled share-based payment expense - 115
Tax expense 7 421 7 209
Total (B) 17 541 14 870
CASH FLOW FROM OPERATING ACTIVITIES BEFORE CHANGES IN WORKING CAPITAL (C) = (A)+(B)
52 857 43 863
Decrease/(increase) in trade receivables and other receivables (16 996) (21 007)
Decrease/(increase) in inventories (21 077) (13 935)
Increase/(decrease) in trade and other payables (2 296) 26 935
Total change in working capital (D) (40 369) (8 007)
Cash generated from operations (E) = (C)+(D) 12 488 35 856
Interests (paid) (F) (21) (18)
Interests received (G) 377 344
Income tax (paid)/received (H) (7 900) (1 338)
CASH FLOW FROM OPERATING ACTIVITIES ( I ) = (E)+(F)+(G)+(H) 4 944 34 844
INVESTING ACTIVITIES
Proceeds from sale of property, plant and equipment 5 -
Proceeds from sale of intangible assets 227 -
Acquisition of property, plant and equipment (6 440) (7 597)
Acquisition of property, plant and equipment through business combinations - (106)
Acquisition of intangible fixed assets (1 660) (1 108)
Acquisition of intangible fixed assets through business combinations - (1 894)
Expenditures on product development (10 011) (6 070)
CASH FLOW USED IN INVESTING ACTIVITIES (J) (17 879) (16 775)
FINANCING ACTIVITIES
Net proceeds from capital increase - 518
Payment of finance lease liabilities (286) (911)
CASH FLOW PROVIDED BY FINANCING ACTIVITIES (K) (286) (393)
Net increase/(decrease) in cash and cash equivalents = (I)+(J)+(K) (13 221) 17 676
Cash and cash equivalents at beginning of year 49 288 31 612
Effect of exchange rate fluctuations (5) -
Cash and cash equivalents at end of year 36 062 49 288
Difference (13 221) 17 676

2525
Financial Report - IFRS | Option Annual Report 2006
4.1.4. Consolidated Statement of Shareholders’ Equity
Thousands EUR
Issued capital
Share premium
Share- based payment reserve
Translation reserves
Retained earnings Total
As per 1 January 2005 5 994 43 469 245 - (2 991) 46 717
Net profit - - - - 28 993 28 993
Translation adjustment - - - (3) - (3)
Capital increase 122 396 - - - 518
Share-based payments - - 115 - - 115
As per 31 December 2005 6 116 43 865 360 (3) 26 002 76 340
Net profit - - - - 35 316 35 316
Translation adjustment - - - (22) - (22)
As per 31 December 2006 6 116 43 865 360 (25) 61 318 111 634

2626
4.2. NOTES TO THE CONSOLIDATED FINANCIAL STATEMENTS
Note 1: Significant Accounting Policies 27Note 2: Business Segments and Geographical Spread 32Note 3: Additional Information on Operating Expenses by Nature 33Note 4: Payroll and Related Benefits 33Note 5: Finance Costs 34Note 6: Tax Expense 34Note 7: Cash and Cash Equivalents 35Note 8: Trade and Other Receivables 35Note 9: Inventories 36Note 10: Property, Plant and Equipment 36Note 11: Intangible Assets 37Note 12: Deferred Taxes Assets and Liabilities 38Note 13: Trade and Other Payables 38Note 14: Operating Leases 39Note 15: Finance Leases and Credit Facilities 39Note 16: Shareholders’ Equity 40Note 17: Earnings per Share 40Note 18: Share-based Payment Plans 41Note 19: Derivate Financial Instruments 42Note 20: Contingencies 42Note 21: Related Parties Transactions 43Note 22: Events After Balance Sheet Date 43Note 23: Option Companies 45Note 24: Information on The Auditor’s Assignments and Related Fees 45

2727
Financial Report - IFRS | Option Annual Report 2006
NOTE 1: SIGNIFICANT ACCOUNTING POLICIES
• BUSINESS DESCRIPTION AND ORGANIZATION
Option NV (hereafter the Company) is active in the telecom sector, specialized in the design, development, manufacture and sale of wireless data communication devices such as data cards, USB dongles, wireless routers and (embedded) modules. The Company was incorporated on 3 July 1986 and has been publicly listed since November 1997, first on the European stock exchange (“Easdaq” later “Nasdaq Europe”) and since 2003 on the Eurolist of Euronext Brussels (Ticker: OPTI).
Option NV has the legal form of a limited company (Naamloze Vennootschap (NV)), making or having made a public appeal on savings, incorporated under Belgian law. Its headquarters are located in Belgium (Gaston Geenslaan 14, 3001 Leuven). Option NV is present in different continents around the world. The main companies are the headquarters located in Leuven and the manufacturing and supply chain site in Cork (Ireland). A complete list of all the subsidiaries of the Company can be found at the end of this annual report (see note 23 Option companies).
The consolidated financial statements of the Company for the year ended 31 December 2006 comprise the Company and its subsidiaries (hereinafter jointly referred to as “Option” or the “Group”). The financial statements were authorized for issue by the Board of Directors on March 9, 2007 and signed on its behalf by Jan Callewaert.
• STATEMENT OF COMPLIANCE
These financial statements have been prepared in accordance with International Financial Reporting Standards (IFRSs) as issued by the International Accounting Standards Board (IASB) and adopted by the European Union.
• BASIS OF PREPARATION
The financial statements are presented in euro, rounded to the nearest thousands.
The consolidated financial statements are prepared for the
period ending 31 December 2006.
The financial statements have been prepared on the historical costs basis, except for certain items for which IFRSs require another measurement principle. Such deviation from historical cost is explained in the summary of significant accounting policies below.
At the date of authorization of these financial statements, the following Standards and interpretations were in issue but not yet effective:- IFRS 7 Financial Instruments: Disclosures (applicable for
accounting years beginning on or after 1 January 2007)- IFRS 8 Operating Segments (applicable for accounting years
beginning on or after 1 January 2009)- IAS 1 Presentation of Financial Statements -Amendment-
Capital Disclosures (applicable for accounting years begin-ning on or after 1 January 2007)
- IFRIC 7 Applying the Restatement Approach under IAS 29 Fi-nancial Reporting in Hyperinflationary Economies (applicable for accounting years beginning on or after 1 March 2006)
- IFRIC 8 Scope of IFRS 2 (applicable for accounting years beginning on or after 1 May, 2006)
- IFRIC 9 Reassessment of Embedded Derivatives (applicable for accounting years beginning on or after 1 June 2006)
- IFRIC 10 Interim Financial Reporting and Impairment (appli-cable for accounting years beginning on or after 1 November 2006)
- IFRIC 11 IFRS 2 Group and Treasury share Transactions (ap-plicable for accounting years beginning on or after 1 March 2007)
- IFRIC 12 Service Concession Arrangements (applicable for accounting years beginning on or after 1 January 2008)
The Group anticipates that the adoption of these Standards and Interpretations in future periods will have no material impact on the financial statements of the Group in the period of initial application, except for additional disclosures on capital when the relevant standard comes into effect for periods commencing on or after 1 January 2007.
• USE OF ESTIMATES
The preparation of these financial statements requires management to make estimates and assumptions that affect the amounts reported in the financial statements and accompanying notes, particularly the recoverability of fixed assets, deferred income taxes, intangible assets, warranty accruals and other probable liabilities at the date of the financial statements and the reported amount of revenues and expenses during the reporting period. The Group uses estimates in its normal course of business to evaluate warranty, excess and obsolete inventory and other reserves. Actual results could differ from these estimates.
The estimates and underlying assumptions are reviewed on an ongoing basis. Revisions to accounting estimates are recognized in the period in which the estimate is revised if the revision affects only that period or in the period of the revision and future periods if the revision affects both current and future periods.
Judgments made by management in the application of IFRS that have significant effect on the financial statements and estimates with a significant risk of material adjustment in the next year are discussed in the relevant notes hereafter.

2828
• PRINCIPLES OF CONSOLIDATION
The consolidated financial statements include the financial statements of all the subsidiaries controlled by the Group. Control exists when the Group has the power to govern the financial and operating policies and obtains the benefits from the entities’ activities. Control is presumed to exist when the Group owns, directly or indirectly, more than 50% of an entity’s voting rights of the share capital. The existence and effect of potential voting rights that are currently exercisable or convertible are considered when assessing whether the Group controls another entity.
Subsidiaries are fully consolidated from the date on which control is transferred to the Group. They are de-consolidated from the date that control ceases.
Inter-company transactions, balances and unrealized gains on transactions between Group companies are eliminated in preparing the consolidated financial statements. Unrealized losses are also eliminated in the same way as unrealized gains unless the transaction provides evidence of an impairment of the asset transferred. Accounting policies of subsidiaries have been changed where necessary to ensure consistency with the policies adopted by the Group.
At the end of 2004, an American subsidiary was founded, Option Inc. Given its immaterial size, this subsidiary has not been included in the consolidation scope of 2006 and 2005.
• THE SIGNIFICANT ACCOUNTING POLICIES CAN BE SUMMARIZED AS FOLLOWS:
1) FOREIGN CURRENCIES
- Functional and presentation currency The financial statements of each of the Group’s entities are presented in the local currency (‘functional currency’). The consolidated financial statements are presented in euro, which is the Company’s functional and presentation currency. All companies within the Group have the euro as their functional currency, except for:
- the Swedish subsidiary for which its functional currency is the Swedish Krona;
- the Japanese subsidiary for which its functional currency is the Japanese Yen; and
- the Hong Kong and Taiwanese subsidiary for which the functional currency is respectively the Hong Kong dollar and New Taiwan dollar.
- Foreign currency transactions Transactions in currencies other than euro are recorded at the rates of exchange prevailing on the dates of the transactions. Monetary assets and liabilities denomi-
nated in foreign currencies are translated at the balance sheet date rate. Non-monetary assets and liabilities carried at fair value that are denominated in foreign currencies are translated at the foreign exchange rate prevailing at the date of the transaction. Gains and losses resulting from the settlement of foreign currency transactions and from the translation of monetary assets and liabilities denominated in foreign currencies are recognized in the income statement of the period.
- Translation of the results and financial position of foreign operations On consolidation, assets and liabilities of the Group’s foreign operations are translated to euro at foreign exchange rates prevailing at the balance sheet date. Income and expense items are translated at the average exchange rates for the period unless exchange rates fluctuate significantly. The components of shareholders’ equity are translated at historical rates. Exchange differences arising from the translation of shareholders’ equity to euro at year-end exchange rates are taken to “Translation reserves” in Equity.
2) REVENUE RECOGNITION
The Group generates revenues primarily from the sales of its products and technology, as well as the licensing of its technology. These sales are recognized as revenues when1) there is persuasive evidence of an agreement with the
customer;2) the title has passed;3) the amount due from the customer is fixed and
determinable;4) the collectibility is reasonably assured at the moment
of shipment;5) the Group has no significant future performance
obligation or in case of significant future performance obligations, revenue is spread over the expected remaining contractual lifetime. For multiple element sales, the total revenue is allocated to the fair value of the individual performances, each of which are then recognized in accordance with the accounting principle, applicable to that element. Where the fair value of one or more of the elements cannot be determined, the revenue is spread over the expected remaining contractual lifetime.
At the time of the transaction, the Group assesses whether the amount due from the customer is fixed and determina-ble and collecting of the resulting receivable is reasonably assured. The Group assesses whether the amount due from the customer is fixed and determinable based on the terms of the agreement with the customer, including, but not limited to, the payment terms associated with the transaction. The collection is assessed based on a number

2929
Financial Report - IFRS | Option Annual Report 2006
of factors, including past transaction history with the customer and credit-worthiness of the customer. If the Group determines that collection of an amount due is not reasonably assured, recognition is deferred until collection becomes reasonably assured.
Customers include Value added Resellers, Original Equipment Manufacturers, Wireless Service Providers, Global Operators and End-Users. Deferred revenue is recorded when cash in advance is received before the above revenue recognition criteria are met.
Any cash discount given on top of the market rate is netted against revenue.
3) ROYALTIES BASED ON THE SALE OF PRODUCTS
Under license agreements, the Group is committed to make royalty payments for the use of certain essential patented technologies in wireless data communication. The Group recognizes royalty obligations as determinable in accordance with agreement terms with those patent holders. Where agreements with patent holders are not finalized, management recognizes its current best estimate of the obligation. When the agreements are finalized, the estimate is revised accordingly. Royalty obligations are recorded in Sales, Marketing and royalties’ expenses.
4) INCOME TAXES
Income tax charge on the profit or loss for the year comprises current and deferred taxation. Income tax is recognized in the income statement except to the extent that it relates to items recognized directly in equity, in which case it is recognized in equity.
Current tax is the expected tax payable on the taxable income for the year. Taxable income differs from net income as reported in the income statement because it excludes items of income or expense that are taxable or deductible in other years and it further excludes items that are never taxable or deductible. The Group’s liability for current tax is calculated using tax rates enacted, or substantively enacted, at the balance sheet date, and any adjustment to tax payable in respect of previous years.
Deferred income tax is provided in full, using the balance sheet liability method, for all temporary differences arising between the tax bases of assets and liabilities and their carrying values for financial reporting purposes. Enacted or substantially enacted tax rates are used to determine deferred income tax.
Deferred tax liabilities are generally recognized for all taxable temporary differences. Deferred tax assets are recognized only to the extent that it is probable for
management that future taxable profits will be available against which the asset can be utilized. A deferred tax asset is reduced to the extent that it is no longer probable that the related tax benefit will be realized.
5) INVENTORIES
Raw materials (mainly electronic components) and work in progress are stated at the lower of cost or net realizable value. Cost is determined on a first-in, first-out basis.
Finished goods inventories are stated at the lower of cost and net realizable value. Cost comprises direct materials and where applicable, direct labor costs and those overheads that have been incurred in bringing the inventories to their present location and condition. Cost is calculated using the weighted average method.
Net realizable value is the estimated selling price less the estimated costs of completion and the estimated costs necessary to make the sale.
The Group recognizes consignment stock in its balance sheet unless there has been a substantial transfer of the risks and rewards of ownership to the consignee.
The Group reviews inventories of slow-moving or obsolete items on an ongoing basis and creates allowances if needed.
6) PROPERTY PLANT AND EQUIPMENT
The Group’s property and equipment, including dedicated production equipment, is recorded at historical cost less accumulated depreciation and impairment. Subsequent costs are included in the asset’s carrying amount or recognized as a separate asset as appropriate only when it is probable that future economic benefits associated with the item will flow to the Group and the cost of the item can be measured reliably. All other repair and maintenance costs are charged to the income statement as incurred. The cost of assets retired or otherwise disposed of and the related accumulated depreciation are recognized in the income statement as part of the gain or loss on disposal in the year of disposal. Gains and losses on disposals of property, plant and equipment are included in other income or expense.
Depreciation is computed using the straight-line method over the estimated useful lives of the assets, which are as follows:
Machinery and computer equipment 2 to 10 years Furniture and Vehicles 5 years Leasehold improvements 3 to 9 years
Assets under construction represent are stated at cost. This includes cost of construction, plant and equipment and other direct costs. Assets under construction are not

3030
depreciated until such time as the relevant assets are available for their intended use, at which stage the assets are also reclassified towards the relevant category within property, plant and equipment.
7) ACCOUNTING FOR LEASES
Lease operations can be divided into two types of lease:- Finance lease Leases under which the Group assumes substantially all
the risks and rewards of ownership are classified as finance leases. They are measured at the lower of fair value and the present value of the minimum lease payments at the inception of the lease, less accumu-lated depreciation and impairment losses.
Each lease payment is apportioned between reduction of the lease obligation and finance charges so as to achieve a constant periodic rate of interest on the remaining balance of the liability. The corresponding rental obligations, net of finance charges, are included in short and long-term payables. The interest element is charged to the income statement over the lease period. Assets under finance lease are depreciated over the useful life of the assets according to the rules set out by the Group. In case where it is not certain that the Group will acquire the ownership of the asset at the end of the lease term, depreciation is spread over the shorter of the lease term and the useful life of the asset.
- Operating lease Leases under which a substantial part of risks and rewards
of ownership are effectively retained by the lessor are classified as operating leases. Payments made under operating lease are charged to the income statement on a straight-line basis over the term of the lease.
8) INTANGIBLES
A. Research and development costs and related government
research funding
Research expenditure is recognized as an expense as incurred.
The Group follows the cost reduction method of accounting for government research funding whereby the benefit of the funding is recognized as a reduction in the cost of the related expenditure when certain criteria stipulated under the terms of those funding agreements have been met, and there is reasonable assurance the grants will be received.
Costs incurred on development projects (relating to the design and testing of new or improved products) are recognized as intangible assets pursuant IAS 38 Intangible Assets if following criteria of compliance are met and the Group can demonstrate:- the technical feasibility of completing the intangible
asset so that it will be available for use or sale;- its intention to complete the intangible asset and
use or sell it;- its ability to use or sell the intangible asset;- how the intangible asset will generate probable future
economic benefits (e.g. existence of a market or, if it is to be used internally, the usefulness of the intangible asset);
- the availability of adequate technical, financial and other resource to complete the development and to use or sell the intangible asset;
- its ability to measure reliably the expenditure attributable to the intangible asset during its development.
These intangible assets are amortized on a straight-line basis over their estimated useful life, which is currently assessed to be 2 years.The amortization of capitalized development costs is recognized in the income statement under the caption “Research and Development costs”.
Other development expenditures are recognized as an expense as incurred. Research and Development costs recognized in the previous accounting year as an expense cannot be recognized as an asset in a subsequent period. Development costs that have a finite useful life that have been capitalized are amortized from the commencement of the commercial shipment of the certified product on a straight-line basis over the period of its expected benefit, not exceeding two years.
Capitalization of development costs as detailed above creates a taxable temporary difference. Accordingly, a deferred tax liability is accounted for in this respect.
B. Other intangibles assets
The Group’s other intangible assets include licenses, recorded at purchase price, which are acquired for the integration into its products or as a means for exploita-tion and software for Material Requirements Planning (MRP) and consolidation purposes. Amortization is computed using the straight-line method over the estimated useful lives of the assets, which are as follows: 1,5 to 5 years.
9) IMPAIRMENT
The carrying amounts of financial assets, property, plant and equipment and intangible assets are reviewed whenever events or changes in circumstances occur to determine whether there is any indication of impairment. If any such indication exists, the asset’s recoverable amount is estimated in order to determine the extent of the impairment loss (if any). Where the asset does not

3131
Financial Report - IFRS | Option Annual Report 2006
generate cash flows that are independent from other assets, the Group estimates the recoverable amount of the cash-generating unit to which the asset belongs.
For intangible assets initially recognized that do not meet the criteria described here above (refer accounting policy 8 A), an impairment loss is recognized.
Impairment losses are recognized in the income statement. An impairment loss is reversed if there has been a change
in the estimates used to determine the recoverable amount. An impairment loss is reversed only to the extent that the asset’s carrying amount does not exceed the carrying amount that would have been determined, net of depreciation or amortization, if no impairment loss had been recognized. A reversal of an impairment loss is recognized as income immediately, unless the relevant asset is carried at a revalued amount, in which case the reversal of the impairment loss is treated as a revaluation increase.
10) WARRANTY
The Group provides warranty coverage on its products from date of shipment and/or date of sale to the end customer. The warranty period is in line with the concerned legislation and ranges from 12 to 24 months, determined by the location of the customer. The Group’s policy is to accrue the estimated cost of warranty coverage at the time the sale is recorded. Warranty on sales from the e-shop of the Group and sales outside European Union are limited to not more than one year
11) EMPLOYEE BENEFIT PLANS
Pension obligations
The Group operates a number of defined contribution retirement benefit plans, the assets of which are held in separate trustee-administered funds or group insurances. Payments to defined contribution benefit plans are charged as an expense as they fall due.
Share-Based compensation
The Group operates equity-settled, share-based compen-sation plans through which it grants share options (here after referred to as ‘warrants’) to employees, contractors and directors. The fair value of the employee services received in exchange for the grant of the warrants is recognized as an expense with a corresponding increase in equity.
The total amount to be expensed over the vesting period is determined by reference to the fair value of the warrants granted, measured using the Black Scholes model, taking into account the term and conditions upon which the warrants were granted. At each balance sheet date, the
entity revises its estimates of the number of warrants that are expected to become exercisable except where forfeiture is only due to shares not achieving the threshold for vesting. It recognizes the impact of the revision of original estimates, if any, in the income statement, and a corresponding adjustment to equity over the remaining vesting period. The proceeds received net of any directly attributable transaction costs are credited to share capital (nominal value) and share premium when the warrants are exercised.
12) SEGMENT REPORTING
A segment is a distinguishable component of the Group that is engaged either in providing products or services (business segment), or in providing products or services within a particular economic environment (geographical segment), which is subject to risks and rewards that are different from those of other segments.
Segment results include revenue and expenses directly attributable to a segment and the relevant portion of revenue and expenses that can be allocated on a reasonable basis to a segment.
Segment assets and liabilities comprise those operating assets and liabilities that are directly attributable to the segment or can be allocated to the segment on a reasonable basis. Segment assets and liabilities do not include income tax items.
13) FINANCIAL INSTRUMENTS
Financial assets and financial liabilities are recognized on the Group’s balance sheet when the Group becomes a party to the contractual provisions of the instrument.
Trade receivables and other receivables
Trade debtors and other amounts receivable are shown on the balance sheet at nominal value (in general, the original amount invoiced) less an allowance for doubtful debts.
Such an allowance is recorded in the income statement when it is probable that Option will not be able to collect all amounts due.
Option grants credit to customers in the normal course of business. Generally, the Group does not require collateral or any other security to support amounts due. Manage-ment performs ongoing credit evaluations of its customers. All receivables are fully collectible except those doubtful accounts for which a 100% allowance is accounted for.
Even if one particular brand or a global mobile operator would represent a substantial percentage of the Group’s trade receivables, the Group is dealing with the individual affiliated operator who is free to negotiate and manage its

3232
own contracts and placement of purchase orders. All these affiliated operators have different credit risk profiles and benefit from different terms and conditions.
Cash and cash equivalents
Cash includes cash and term deposits. Highly liquid investments with maturity of three months or less at date of purchase are considered cash equivalents. Cash equivalents consist primarily of term deposits with a number of commercial banks with high credit ratings.
Trade payables and other payables
Trade payables and other payables are stated at amortized cost.
Equity instruments
Equity instruments issued by the Group are recorded at the proceeds received, net of direct issue costs.
Derivative financial instruments
The Group only enters into derivative financial instruments in order to hedge underlying exposures. Derivative financial instruments are initially recognized at fair value on the date a derivative contract is entered into and are subsequently re-measured at their fair value.
The Group does not engage in speculative transactions nor does it issue or hold financial instruments for trading purposes.
14) EARNINGS PER SHARE
Basic net earnings per share is computed based on the weighted average number of ordinary shares outstanding during the period.
Diluted net earnings per share is computed based on the weighted average number of ordinary shares outstanding including the dilutive effect of warrants.
NOTE 2: BUSINESS SEGMENTS AND GEOGRAPHICAL SPREAD
Segment information is presented in respect of the Group’s business and geographical segments. The Group is following up on its activities on a project-by-project basis, whereby each project includes one of more products with similar technologies.
As from 2004, Option evolved to a Group with only one remaining business segment, namely equipment sales. Although Option has an extended product range, the Group believes that they can be looked at as belonging to a single operating segment as the products have similar economic characteristics and they are similar in each of the following categories:
- the nature of the products- the nature of the production processes- the type or class of customer for these products- the methods used to distribute the products- the nature of the regulatory environment for these products.
The Group generated in 2006 90% of its revenue from equipment sales of PC data cards and wireless routers and 10% through other sales.
In 2006, new business segments (modules and USB devices) arose next to the existing segment PC data cards and these will most likely exceed the threshold for segment reporting disclosure in the course of 2007.
Origination of sales December 31, 2006 2005
Data cards and wireless routers 90% 100%
Other 10% 0%
Most of the equipment sales occur under global or international mobile brands and are invoiced to their local, national and partnership network operators, resulting in a spread risk of a vast portfolio of sound and different accounts receivable.
87% of the Group’s revenues in 2006 are obtained within Europe compared with 93% in 2005. Given the limited number of customers, the Group is following up on its sales efforts on a global basis, rather than one regional basis.
Revenues 2006 2005
Europe 87% 93%
Other 13% 7%

3333
Financial Report - IFRS | Option Annual Report 2006
NOTE 3: ADDITIONAL INFORMATION ON OPERATING EXPENSES BY NATURE
Depreciation, amortization and impairment loss are included in the following line items in the income statement:
Thousands EURDepreciation on property and
equipmentAmortization and impairment
loss on intangible assets Total
2006 2005 2006 2005 2006 2005
Cost of products sold 236 308 - - 236 308
Research and development expenses 2 121 1 960 7 600 4 945 9 721 6 905
Sales, marketing and royalties expenses 30 25 441 18 471 43
General and administrative expenses 456 185 113 101 569 286
Total 2 843 2 478 8 154 5 064 10 997 7 542
The Research expenses as incurred amounted to EUR 346k (2005: EUR 332k).
Payroll and related benefits are included in the following line items in the income statement:
Thousands EUR 2006 2005
Cost of products sold 3 853 1 814
Research and development expenses 2 970 3 621
Sales, marketing and royalties expenses 3 349 2 010
General and administrative expenses 3 765 2 627
Total 13 937 10 072
We refer to note 4: Payroll and related benefits of the financial statements in this annual report for further information.
The operating result doesn’t include any grant received by the Flemish Innovation Institute I.W.T. (2005: EUR 35k).
NOTE 4: PAYROLL AND RELATED BENEFITS
Thousands EUR
2006 2005
Wages and salaries 10 294 7 097
Compulsory social security contributions 3 126 2 106
Other personnel expenses 25 709
Contributions to pension plan 492 160
Total 13 937 10 072
a) Total number of people registered at year-end 497 341
b) Average number of people registered in full time equivalent 486 326
- Direct and indirect labor 190 138
- Employees 287 181
- Management 9 7
As from 2003, Option NV and two of its subsidiaries contribute to local pension funds, which are managed by high rated insurance companies. It concerns defined contribution schemes and the contribution can be partially fixed and partially related to the operating profit. The contributions to the pension funds amounted to EUR 492k (2005: EUR 160k).

3434
NOTE 5: FINANCE COSTS
Thousands EUR
2006 2005
Interest income 1 112 786
Interest expense (97) (157)
Net foreign exchange gains/(losses) 881 (2 243)
Other, including cash discounts to customers and bank charges (1 296) (710)
600 (2 324)
The net foreign exchange result amounted to EUR 881k or 0.31% of total revenues of 2006 mainly due to open purchase invoices in USD. The cash discounts granted to customers amounted to EUR 1 253k (2005: EUR 713k).
NOTE 6: TAX EXPENSE
Thousands EUR
2006 2005
Profit before tax 42 737 36 441
Current tax (expense) (9 390) (3 568)
Deferred tax (expense) 1 969 (3 880)
Total tax expense (7 421) (7 448)
Average effective tax rate 17.4% 20.4%
RECONCILIATION OF EFFECTIVE TAX RATE
Profit before tax 42 737 36 441
Adjustments on taxable basis
Non-deductible amortization of intangibles - 45
Expenses not deductible for tax purposes (433) (276)
Non taxable income 12 259 (544)
54 563 36 754
Aggregated weighted tax rate 21.0% 22.7%
Tax at aggregated weighted tax rate (11 441) (8 329)
Over/(under) provided in prior years - 790
Double tax treaty on dividends received 3 229 -
Notional interests 601 -
Deductions for development 337 185
Other tax adjustments (147) (94)
Total tax expense (7 421) (7 448)
The aggregated weighted tax rate is calculated by applying the statutory tax rate of each country (mainly Belgium and Ireland and to a lesser extent Germany and Sweden) on the profit before tax of each entity and by dividing the resulting tax charge by the total profit before tax of the Group.

3535
Financial Report - IFRS | Option Annual Report 2006
NOTE 7: CASH AND CASH EQUIVALENTS
Thousands EUR
2006 2005
Bank accounts 36 047 49 276
Cash 15 12
36 062 49 288
NOTE 8: TRADE AND OTHER RECEIVABLES
CURRENT TRADE AND OTHER RECEIVABLES
Thousands EUR
2006 2005
Trade receivables 52 611 35 802
Allowance for doubtful accounts (211) (99)
Subtotal 52 400 35 703
Recoverable VAT 745 548
Other receivables 1 056 799
Subtotal 1 801 1 347
54 201 37 050
The other receivables consist mainly of prepaid expenses and accrued income.
NON-CURRENT TRADE AND OTHER RECEIVABLES
Thousands EUR
2006 2005
Cash guarantees 144 -
144 -
The cash guarantees are mainly related to rent guarantees in the major facilities.

3636
NOTE 9: INVENTORIES
Thousands EUR
2006 % 2005 %
Raw materials 21 455 52.9% 9 976 51.2%
Work in progress 15 692 38.7% 8 295 42.5%
Finished goods 3 425 8.4% 1 224 6.3%
40 572 19 495
Raw materials consist on chipsets and components. Work in progress concern assembled printed circuit boards and finished goods are the goods ready to be shipped to customers.Inventories increased from EUR 19 495k to EUR 40 572k at the end of 2006. This increase is explained by an increase of the work in progress and components due to a production delay in the fourth quarter and the building of finished goods ready for delivery in the beginning of the first quarter of 2007.
The write-downs on inventories amount to EUR 1 347k (2005: EUR 1 361k). There are no inventories pledged for security.
NOTE 10: PROPERTY, PLANT AND EQUIPMENT
Thousands EUR
Machinery and computer equipment
Furniture and Vehicles
Leasehold improvements
Under Construction Total 2006 Total 2005
ACQUISITION COST
Balance at end of previous year 17 663 615 320 - 18 598 10 927
Effect of movements in foreign exchange
5 (2) - - 3 -
Additions 2 267 976 495 2 702 6 440 7 597
Additions through business combinations
- - - - - 106
Disposals and cancellation (41) (24) - - (65) (32)
Balance at end of year 19 894 1 565 815 2 702 24 976 18 598
DEPRECIATION
Balance at end of previous year (9 553) (354) (276) - (10 183) (7 737)
Depreciation (2 559) (185) (99) - (2 843) (2 478)
Disposals and cancellation 41 24 - - 65 32
Transfer to other asset categories 107 (26) - - 81 -
Other movements - 3 - - 3 -
Balance at end of year (11 964) (538) (375) - (12 877) (10 183)
Carrying amount
at 1 January 8 110 261 44 - 8 415 3 190
at 31 December 7 930 1 027 440 2 702 12 099 8 415

3737
Financial Report - IFRS | Option Annual Report 2006
Leased assets
Assets recorded under a number of financial lease agreements consist of the following:
Thousands EUR
2006 2005
Machinery and equipment 3 145 3 145
Accumulated depreciation (3 145) (2 843)
Net carrying amount 0 302
The lease agreements mainly relate to test equipment for which the purchase option has been exercised and which are still in use.
NOTE 11: INTANGIBLE ASSETS
Thousands EUR
Capitalized development
Concessions, patents, licenses Software Total 2006 Total 2005
ACQUISITION COST
Balance at end of previous year 16 697 4 125 1 328 22 150 13 102
Effect of movements in foreign exchange 21 - - 21 -
Additions 18 17 104 294 17 416 1 108
Additions through business combinations
- - - - 1 894
Expenditures on product development 9 994 - - 9 994 6 070
Disposals and cancellation - - (260) (260) (24)
Transfer to other asset categories (260) - 260 0 -
Other movements 91 - - 91 -
Balance at end of year 26 561 21 229 1 622 49 412 22 150
AMORTIZATION AND IMPAIRMENT LOSS
Balance at end of previous year (8 941) (1 203) (975) (11 119) (6 079)
Effect of movements in foreign exchange (2) - - (2) -
Amortization (11) (1 451) (295) (1 757) (997)
Amortization for expenditures on product development
(6 387) - - (6 387) (4 065)
Impairment loss (10) - - (10) (2)
Disposals and cancellation - - 32 32 24
Transfer to other asset categories 32 (71) (42) (81) -
Other movements (90) - - (90) -
Balance at end of year (15 409) ( 2 725) (1 280) (19 414) (11 119)
Carrying value
at 1 January 7 756 2 922 353 11 031 7 023
at 31 December 11 152 18 504 342 29 998 11 031
The impairment loss on capitalized development projects amounted to EUR 10k (2005: EUR 2k).

3838
The Group secured in 2006 a license to certain intellectual property rights. At the end of 2006, changes in the market occured which may have an impact on the terms and conditions of this license for the Group or on the financial impact of this license on the companies’ balance sheet. The Group is currently investigating this and will report on potential future changes when and if they occur, at which time these will also be reflected in the financial statements.
NOTE 12: DEFERRED TAXES ASSETS AND LIABILITIES
RECOGNIZED DEFERRED TAX ASSETS AND LIABILITIES
Thousands EUR
Assets Liabilities Net
2006 2005 2006 2005 2006 2005
Property, plant and equipment 138 93 - - 138 93
Intangible assets - - (136) (756) (136) (756)
Inventories - - (75) (24) (75) (24)
Other items 3 165 1 621 (45) (45) 3 120 1 576
Tax value of loss carry forwards - - - - - -
Gross tax assets/(liabilities) 3 303 1 714 (256) (825) 3 047 889
Netting by taxable entity - - - - - -
Net deferred tax assets/(liabilities) 3 303 1 714 (256) (825) 3 047 889
At the end of 2006 the total tax losses carried forward of the individual group companies amounted to EUR 330k (2005: EUR 0k) following start-up costs.
NOTE 13: TRADE AND OTHER PAYABLES
CURRENT TRADE AND OTHER PAYABLES
Thousands EUR
2006 2005
Trade payables 41 288 43 728
Salaries, tax and payroll related liabilities 1 591 2 170
Other payables and accrued expenses and deferred income 6 258 1 122
49 137 47 020
In 2006, the accrual for warranty, which is recorded under the caption “Accrued expenses and deferred income”, amounted to EUR 110k (2005: EUR 282k).

3939
Financial Report - IFRS | Option Annual Report 2006
NON-CURRENT TRADE AND OTHER PAYABLES
Thousands EUR
2006 2005
Other payables 11 326 -
11 326 -
The increase in current and non-current other payables is explained by the corresponding liability related to the license secured by the Group to certain intellectual property rights.
NOTE 14: OPERATING LEASES
Leases as lessee
Non-cancelable operating lease rentals are payable as follows:
Thousands EUR
2006 2005
Less than one year 2 030 955
Between one and five years 4 986 3 547
More than five years - -
7 016 4 502
The Group leases a number of office locations, car rentals and office equipment under operating leases. The leases typically run for an initial period of five to ten years, with an option to renew the lease after that date. Lease payments are increased annually to reflect market rentals. None of the leases include contingent rentals.
In 2006, EUR 1 646k was recognized as an expense in the income statement in respect of operating leases (2005: EUR 823k).
Leases as lessorThe Group leases out part of its property under operating leases. Non-cancelable operating lease rentals are receivable as follows:
Thousands EUR
2006 2005
Less than one year 77 77
Between one and five years 84 161
More than five years - -
161 238
In 2006, EUR 77k (2005: EUR 77k) was recognized as rental income in the income statement.
NOTE 15: FINANCE LEASES AND CREDIT FACILITIES
Non-current liabilities
Non-current portion of long-term debt consisted of the following:
Thousands EUR
2006 2005
Subordinate loan 147 222
In 2003, the Company obtained from the Flemish Innovation Institute I.W.T. a subordinated loan of EUR 222k to support Option’s innovative efforts in the Wireless LAN area and seamless transition to the GPRS PC data cards. This loan is reimbursable in 12 quarterly installments of EUR 18.5k as from March 2007 and the interest rate is 7.95%.
Term and debt repayment schedule
2007 2008 2009 2010+
IWT loan-base amount 74 74 74 0
IWT loan-interests 34 29 23 0
IWT loan-total 108 103 97 0
Current liabilities
Current portion of long-term debt consisted of the following:
Thousands EUR
2006 2005
Current portion of ITW loan 74 0
Current portion of financial leases 0 286
The financial leases debt has been repaid in 2006.
Pledges on the Company’s business in favor of a financial institute for past credits consist of the following:
Thousands EUR
2006 2005
Pledge expires on November 14th, 2010 1 977 1 977
Pledge expired on May 20th, 2006 - 682

4040
NOTE 16: SHAREHOLDERS’ EQUITY
We refer to the section ‘Consolidated statement of shareholders’ equity’ of these financial statements regarding the detail of the equity components.
Capital structure
Shares Warrants ‘T’
January 1st, 2005 40 421 416 828 680
September 23rd, 2005 827 880 (827 880)
Forfeited - (800)
December 31st, 2005 41 249 296 -
December 31st, 2006 41 249 296 -
The authorized share capital comprises 41 249 296 ordinary shares, for an amount of EUR 6 116k. The shares have no par value and have been issued and fully paid. All shares held in the Company carry the same rights.
On April the 19th, 2006 the Shareholders’ meeting has approved amendments to the by-laws of the Company including a four-for-one split of the Company’s common stock. All share and per-share information included in these consolidated financial statements have been adjusted to retroactively reflect the stock split for all periods presentend.
Translation reserves
The translation reserve comprise all foreign exchange differences arising from the translation of the financial statements of foreign operations.
NOTE 17: EARNINGS PER SHARE
The following is reconciliation from basic earnings per share to diluted earnings per share for each of the last two years:
Earnings per common share
2006 2005 1
Net profit ( in Thousands EUR) 35 316 28 993
Weighted average shares of common stock outstanding:
Basic 41 249 296 40 648 232
Effect of warrants - 601 396
Diluted 41 249 296 41 249 628
Per Share (in EUR)
Basic earnings per share 0.86 0.71
Diluted earnings per share 0.86 0.70
1 Adjusted retroactively to take into account the 4-for-1 stock split completed on April 24, 2006.
On September the 23rd 2005, 827 880 new shares were issued. As a result the capital and the share premium increased respectively by EUR 122k and EUR 396k.
On April the 19th, 2006 the Shareholders’ meeting has approved amendments to the by-laws of the Company including a four-for-one split of the Company’s common stock. Following this split, the Capital of the company is represented by 41 249 296 shares.

4141
Financial Report - IFRS | Option Annual Report 2006
NOTE 18: SHARE-BASED PAYMENT PLANS
The Board is of the opinion that it is important to create a financial climate whereby the employees are motivated and stimulated to be part of the growth of the Group and to co-operate to the improvement of the financial results of the Group. The Board wants to obtain this goal by giving the employees the possibility to participate in the capital of the Company.
Share-based payment reserve
In conformity with IFRS 2, the Group applied the new share-based payment accounting requirements to all warrants granted after 7 November 2002 which had not yet vested at 1 January 2005.
Equity-settled share option plan
Warrants ‘T’: On February 6th, 2002, the Board authorized the creation of 1 760 000 1 Warrants ‘T’.
In its meeting of July 3rd, 2003, the Board of Directors granted 1 583 000 warrants to beneficiaries active in the Option Group under the warrant plan ‘T’. 1 543 800 warrants were accepted. For 1 423 800 warrants, the execution price was fixed at EUR 0.55 per share. For the remaining 120 000 warrants granted to and accepted by Mondo NV, the management company owned by the CEO, the execution price was fixed at EUR 1.08 per share.
Each warrant entitles the holder to one share. 50% of the warrants were executable one year after they were granted. The remaining 50% were executable one year later. On Termination of Employment for any other reasons than decease and permanent disablement, the execution of the warrant was subject to following regime: after the first anniversary of the offer date but before the second anniversary of the offer date: 20 percent of the warrants held by the warrant holder lapsed automatically and 80 percent of the Warrants were executable for a period of 6 months calculated from the termination date. Warrants not exercised lapsed automatically.
On December 31, 2005, after the second execution in September 2005 of the warrants granted to the Group’s employees and management, no more warrants ‘T’ were outstanding.
Warranty activity for the plan T during the past years was as follows:
Warrants Employees Warrants MondoTotal
Warrants TExecution Price
Warrants EmployeesExecution Price Warrants Mondo
Weighted Average Exercise Price
January 1st, 2005 708 680 120 000 828 680 0.55 1.08 0.63
Executed (707 880) (120 000) (827 880) 0.55 1.08 0.63
Forfeited (800) (800)
December 31st, 2005 - - - - - -
The inputs into the Black-Scholes model at grant date were as follows:
Expected volatility 39.09%
Expected life 5
Expected dividends 0.00%
Risk free rate 2.12%
In 2006, there were no expenses related to equity-settled share-based payment transactions (2005: EUR 115k).
1 Adjusted retroactively to take into account the 4-for-1 stock split completed on April 24, 2006.

4242
NOTE 19: DERIVATIVE FINANCIAL INSTRUMENTS
Derivative financial instruments are used to reduce the exposure to fluctuations in foreign exchange rates and interest rates. These instruments are subject to the risk of market rates changing subsequent to acquisition. These changes are generally offset by opposite effects on the item being hedged.
Credit risk on accounts receivable
Credit evaluations are performed on all customers requiring credit over a certain amount. The credit risk is monitored on a continuous basis.
Only one customer represents 11.3% of the total trade receivables of the Group in 2006. Other customers with open receivables represent less than 10% of the total trade receivables of the Group at year-end. In 2005, one customer represented 15 % of the total receivables of the Group, another 11.4% and others represented less than 10% of the trade receivables of the Group. The same analysis can be made in terms of revenue generated over the year.
Interest risk
The Group is not subject to material interest risk.
Currency risk
The Group is subject to material currency risk, as the larger part of its purchase transactions are in US dollars. The Group aims to match foreign currency cash inflows with foreign cash outflows.
In 2006, the Group entered into a derivative financial instrument to manage its exposure on the US dollar cash flows. The result of the foreign exchange forward contracts has been recognized as exchange rate gains in the income statement.
NOTE 20: CONTINGENCIES
The Group is not involved in any material, legal or arbitration proceedings. Under license agreements, the Group is committed to royalty payments using certain essential patents - intellectual property rights (IPR) - to be used in 2.5G and 3G wireless products. The Group has progressively entered into license agreements with the basic patent holders, which brought down the uncertainty associated with such unasserted claims significantly. As in the prior fiscal year, the Group has continued to recognize its current best estimate of the obligations. The Group believes it has adequately accrued for those essential patents at December 31, 2006. In the opinion of the management, the amount of any ultimate liability with respect to these actions will not materially affect the Group’s consolidated financial position.

4343
Financial Report - IFRS | Option Annual Report 2006
NOTE 21: RELATED PARTIES TRANSACTIONS
Since 1997 the Company has a professional relationship with the US based law firm Brown Rudnick Berlack Israels LLP. Mr. Lawrence Levy who joined the Board of Directors of the Company early 2006 is one of the Senior Counsels of this law firm. Going forward, the Company will continue to work for certain matters with this law firm. It’s being understood that Mr. Lawrence Levy will not directly work on Company related matters in his capacity of Senior Counsel of Brown Rudnick Berlack Israels LLP. In 2006, the fees paid to Brown Rudnick amount to EUR 26k.In the course of normal operations, related party transactions entered into by the Group have been contracted on an arms-length basis.
Board of Directors compensation
In 2006, the compensation for the Board of Directors amounted to EUR 266.8k.
Name
Board meetings attended
Audit Committees attended 1
Remuneration committee attended 1
Total remuneration In thousands EUR
Physical attendance calls
Jan Callewaert 5/5 8/8 4/4 N/A 39.6 2
Arnoud De Meyer 5/5 8/8 4/4 3/3 39.6
Triakon represented by Lucien De Schamphelaere
5/5 8/8 N/A N/A 39.6
Philip Vermeulen 5/5 8/8 4/4 3/3 39.6
Lawrence Levy 5/5 8/8 N/A 1/3 39.6
Jan Loeber 5/5 4/8 N/A N/A 38.6
David Hytha 4/4 7/7 N/A N/A 30.21 Till 2005, Audit Committees attendance were not separately remunerated2 Excluding remuneration amount of EUR 248k to his management company regarding management services to the Group
In addition, one non-executive Board member perceived an amount of EUR 8k in his capacity of member of the Board in Ireland.
Executive Officers compensation
The CEO of the Group is the owner of a management company that is performing management services for the Group. The remunera-tion for these management services of EUR 248k per annum is unchanged compared to 2005.
The outstanding receivable towards Pepper NV (100% Jan Callewaert) amounted to EUR 51k in 2006 and remained unchanged compared to 2005. Mr. Jan Callewaert holds through Pepper NV 17.10% of the shares of the Company.
For the year 2006, an aggregate gross amount of EUR 788k (2005: EUR 687k) was attributed to the eight Vice Presidents (2005: six Vice Presidents). Of this amount, EUR 16k (2005: EUR 13k) was accrued as variable pay relating to 2006 performance. For the eight members of the Executive Committee, benefits include an extra-legal pension scheme, the cost of which amounted to EUR 67k (2005: EUR 64k). No expense was incurred during 2006 as share-based compensation to the Vice Presidents and to the CEO (2005: EUR 64k).
NOTE 22: EVENTS AFTER BALANCE SHEET DATE
In February 2007 the Board of Directors has called an extraordinary meeting of Shareholders to decide upon the issue of a new stock option plan (hereinafter “Warrant Plan U”). At the extraordinary Shareholders meeting of March 1st, 2007 the attendance quorum was not reached and thus a new extraordinary meeting of shareholders is called to take place on Friday 30th of March 2007. At this meeting the shareholders will be able to decide on the “Warrant Plan U” even if the attendance quorum would not be reached.
The details of the proposed “Warrant Plan U” can be found in the reports of the Board of Directors drafted pursuant to article 583 and article 596 juncto 598 of the Belgian Company Code. These reports were made available on the website of the Company as from the 13th of February 2007.

4444
Some of the most important elements of the proposed Warrant Plan U can be summarized as follows:- a maximum of 2.200.000 warrants would be issued, representing a maximum dilution for the shareholders of 5,06%- exercise price: either the average share price over the 30 day period prior to grant of the warrants or the closing price on the
business day prior to the grant of the warrants, provided however that for Board members and contractors the exercise price of the warrants cannot be lower than the average share price over 30 day period prior to the issue of the warrants by the General Shareholders’ meeting
- exercise period: the warrants have to be exercised within a period of 5 years after they have been granted- beneficiaries: the warrants would be granted to Board members, employees and contractors of the company. For Board members
and contractors a list is added to the above mentioned reports and in the agenda for the extraordinary meeting indicating the potential beneficiaries by name and the maximum number of warrants they each can receive. Furthermore, for future Board members and contractors hired before 31st of December 2007 it is suggested to determine that the maximum number of warrants they can receive is 50.000. Finally, for the employees it is suggested that the Board of Directors is granted the power to determine the number of warrants granted.
- term of the “Warrant Plan U”: 5 years, the warrants not granted within the term of the “Warrant Plan U” will lapse automatically- vesting schedule:
- 25% of the warrants will vest one year after they have been granted; - 50% of the warrants will vest two years after they have been granted; - 75% of the warrants will vest three years after they have been granted; - 100% of the warrants will vest four years after they have been granted.
In case the beneficiaries stop the contract that binds them to the Company then the non vested warrants will lapse. In case the contract is stopped because of fault of the beneficiary all warrants will lapse. Upon decision of the Board of Directors the vesting scheme can be accelerated in case of a change of control over the Company.
Further information on the dilution effect and the rules of the suggested Warrant Plan U can be found in the reports of the Board of Directors mentioned above.
Although, the Code Lippens stipulates that it is not recommended to grant performance-related remuneration such as stock related long-term incentive schemes to the Non-Executive Directors, the Board of Directors proposes a stock option plan whereby warrants are granted to all Directors of the Company. The Board of Directors is of the opinion that granting warrants to Directors allows the Company to appoint Directors of the highest international standing and allows the Company to ensure the continued involvement of the Directors whilst at the same time limiting the financial burden upon the Company. The Board of Directors is convinced that the integrity and experience of the Directors is the best guarantee of good judgment and decision-making. Finally the stock option plan is spread out over a period of 5 years thereby limiting the risk of short term driven decisions.
The grant of warrants to the Directors is at no real cost to the Company, and the grant to and exercise by the Directors of the warrants can only result in a very small dilution of 0.84%. In addition, the grant of the warrants is in line with common practice in the interna-tional and highly competitive high-tech and telecom sector.

4545
Financial Report - IFRS | Option Annual Report 2006
NOTE 23: OPTION COMPANIES
LIST OF COMPANIES, ACCOUNTED BY THE FULL CONSOLIDATION METHOD
NAME OF THE SUBSIDIARY REGISTERED OFFICE % OF SHAREHOLDING
BELGIUMOPTION NV Gaston Geenslaan 14, 3001 Leuven, Belgium Consolidating company
IRELANDOPTION WIRELESS Ltd, Cork Kilbarry Industrial Park, Dublin Hill, Cork, Ireland 100 %
GERMANYOPTION GERMANY GmbH Streitheimer Strasse 22, D-86477 Adelsried, Germany 100 %
SWEDENOPTION WIRELESS SWEDEN AB Sturegatan 2, 172 31 Sundbyberg Stockholm, Sweden 100 %
JAPANOPTION WIRELESS JAPAN KK
5-1, Shinbashi 5-chome Minato-ku, Tokyo 105-0004, Japan 100 %
CHINAOPTION WIRELESS HONG KONG LIMITED
77/F, Two International Finance Centre 8 Finance Street, Central, Hong Kong, China 100 %
OPTION WIRELESS HONG KONG LIMITED TAIWAN BRANCH
4F Theta Building 10,Lane 360, Ne-Hu Road, Sec 1, Taipei City, Taiwan 100 %
NON-CONSOLIDATED COMPANY
NAME OF THE SUBSIDIARY REGISTERED OFFICE
U.S.A
OPTION Inc. 1209 Orange Street Wilmington, DE 19801, US
NOTE 24: INFORMATION ON THE AUDITOR’S ASSIGNMENT AND RELATED FEES
The following auditor’s fees were recognized as an expense in the reporting period:
Thousands EUR
2006 2005
Statutory audit services for the annual financial statements (Option NV) 100 90
Worldwide tax and legal services 124 76
Other worldwide services 2 38
226 204

46
Consolidated and Statutory Report 2006 of the Board of Directors of Option NV | Option Annual Report 2006
GlobeTrotter GT MAX HSUPA This data card has 3 unique features: the patented integrated
flip-out “butterfly” antenna, Advanced Radio Technology (ART) bringing the benefit of Receive Diversity and Receive Equalization into the product design, and the Zero-CD installation technology making the product a truly unique Plug ‘n Play solution.

4747
Consolidated and Statutory Report 2006 of the Board of Directors of Option NV | Option Annual Report 2006
5 .CONSOLIDATED AND STATUTORY REPORT 2006
OF THE BOARD OF D IRECTORS OF OPTION NV

48
Consolidated and Statutory Report 2006 of the Board of Directors of Option NV | Option Annual Report 2006
48
Consolidated and Statutory Report 2006 of the Board of Directors of Option NV | Option Annual Report 2006
5. CONSOLIDATED AND STATUTORY REPORT 2006 OF THE BOARD OF DIRECTORS OF OPTION NV
Ladies and gentlemen,Dear shareholders,
We hereby have the pleasure of presenting to you our report relating to the consolidated & statutory results of Option NV (the “Company”) for the financial year that ended on December 31, 2006.
The consolidated results include the financial statements of the parent company Option NV and all its subsidiaries made up to the end of the financial period. Intra-group trading has been eliminated upon consolidation (Option Wireless Ltd. - Cork, Ireland, Option Germany GmbH – Adelsried, Germany and Option Wireless, Sweden AB (Stockholm), Option Wireless Hong Kong Limited (China) and Option Wireless Hong Kong Limited Taiwan Branch (Taiwan)) (jointly “Option” or the “Group”).
OVERVIEW OF RESULTS AND ALLOCATION OF RESULTS OF THE COMPANY
STATUTORY RESULTS
Full year statutory revenues were EUR 54.2 million (based on mainly EUR 6.5 million turnover, EUR 6.8 million capitalized development costs and EUR 40.9 million other operating intercompany income) a year-on-year increase of 16.0% compared with 2005 revenues of EUR 46.8 million (based on mainly EUR 4.4 million turnover, 4 million capitalized development costs and EUR 37.8 million other operating intercompany income).
The operating charges grew from EUR 26.1 million to EUR 36.4 million resulting in an operational result or EBIT of EUR 17.9 million compared to an EBIT of EUR 20.6 million of 2005 representing a decrease of 13.4%.
The profit on ordinary activities before taxes grew from EUR 21 million to EUR 28.2 million and the net profit grew from EUR 18.7 million to EUR 22.8 million, an increase of 22.1%.
The intangible assets grew with EUR 5.4 million to EUR 9.9 million, mainly explained by the activated development costs and furthermore by the investment in some licenses.
The tangible assets grew with EUR 8 million to EUR 11.6 million mainly due to investment of EUR 6 million mainly related to test and measurement equipment.
The inventories grew from EUR 2.1 million to EUR 2.4 million, an increase mainly explained by EUR 0.3 million in components.
The trade and other receivables increased from EUR 4 million to EUR 44.1 million, mainly explained by intercompany receivables with Option Wireless Ltd Cork.
Cash and cash equivalents decreased over the year from EUR 39.3 million to EUR 28.8 million at the end of 2006.
The amounts payable after more within one year moved from EUR 7.2 million to EUR 22.5 million mainly explained by increases of EUR 6.8 million accounts payable and EUR 9.0 million for other debts which are related to intercompany transactions.
On a balance sheet total of EUR 100.0 million, the total equity amounted to EUR 76.8 million. At the end of 2006, therefore the Company’s solvency ratio was 76.7%.
On 31st December 2006 there were 190 full time employees in the Company. This compares with 134 full time employees in the previous year.
ALLOCATION OF THE STATUTORY RESULT
The statutory accounts of Option NV (Belgian GAAP) reported a net profit for the year 2006 of EUR 22.8 million, improving from a net profit of EUR 18.7 million in 2005.
The intention in time of dividend distribution will depend on the net non-consolidated results of Option NV, the financial situation of the Company, the establishment of the legal reserves and other elements that the Board of Directors and the Ordinary Sharehold-ers Meeting will consider at that moment.
The Board of Directors proposes to add the non-consolidated net profit of EUR 22.8 million of 2006 to the profit carried forward from the previous year.
ABRIDGED ALLOCATION ACCOUNT
(ACCORDING TO BELGIAN ACCOUNTING STANDARDS)
December 31, Thousands EUR
2006 2005
Profit/( loss) carried forward from previous year
2 345 (15 739)
Profit/( loss) for the period available for appropriation
22 832 18 696
Profit/( loss) to be appropriated 25 177 2 345
Legal reserve - 612
CONSOLIDATED RESULTS
For a detailed report on the Consolidated Income Statement and Balance Sheet, including IFRS disclosures notes, we refer to the financial report of this brochure.
The highlights of the consolidated results include the following:

49
Consolidated and Statutory Report 2006 of the Board of Directors of Option NV | Option Annual Report 2006
49
Consolidated and Statutory Report 2006 of the Board of Directors of Option NV | Option Annual Report 2006
Revenues for 2006 were EUR 279.9 million, 40.9 percent higher than the EUR 198.6 million reported in fiscal 2005.
Gross margin in the full year 2006 was 37.4% on total revenues, compared with gross margin of 42.5% in 2005. Costs of products sold of EUR 175.3 million during 2006 resulted in a gross profit of EUR 104.6 million, an increase of 23.9% compared to EUR 84.4 million in 2005 equivalent period.
Net profit grew 21.8 percent from EUR 29.0 million in 2005 to EUR 35.3 million in 2006.Earnings per basic share were EUR 0.86, an increase of 21.8 percent compared with EUR 0.71 in 2005. Earnings per diluted share rose from EUR 0.70 in 2005 to EUR 0.86 in 2006.
Option generated EUR 4.9 million cash from operating activities during the full year, up from EUR 34.8 million in the previous year.
Option’s global market share improved to 35% from 32% last year based on ABI Research’s global market estimate of 5.2 million devices.
On 31st December 2006 there were 497 full time employees in the Option Group supported by an additional 19 contractors. This compared with 341 full time employees and 32 contractors in the previous year.
OVERVIEW OF THE ACTIVITIES, ACTIVITIES IN THE FIELD OF RESEARCH AND DEVELOPMENT AND POSITION OF THE COMPANY AND GROUP
MARKET OVERVIEW
The wireless broadband sector experienced another step change in 2006 as 3G UMTS mobile operators worldwide started to upgrade their networks to offer High Speed Downlink Packet Access (HSDPA). This technology increases the maximum speed at which users can download documents, spreadsheets, images or multimedia files over a 3G network and it enables wireless operators to offer performance that competes with DSL fixed broadband. In the course of 2006, the overall majority of the operators adopted HSDPA and shifted their network during the year from the initial 1.8 Mbps HSDPA to 3.6 Mbps HSDPA in the second half of the year.
Towards the end of 2006 operators increased their focus on the uplink and the speeds at which users can upload files from laptop to the mobile network. HSUPA, High Speed Uplink Packet Access, complements HSDPA and, initially, promises upload speeds of up to 2 Mbps. Increasing the speed at which users can send large data files across the “uplink” to the network, HSUPA will greatly benefit a wide variety of business applications, particularly in the media sector, and will also appeal to many consumer uses. The
first wave of commercial HSUPA launches are expected in 2007.
Two other developments that had an impact on the market in 2006, and will become more significant in the years ahead, were the ongoing introduction of laptop computers with the narrower expansion slot for the new ExpressCard form-factor and the commercial uptake of USB devices with wireless broadband capabilities.
Personal computer manufacturers recognize the growing acceptance of wireless broadband: incorporating wide-area wireless capability within their laptops is becoming more and more important.
However, delivering the required performance from a radio device embedded within a laptop, and then securing the necessary regulatory and operator certification is technically challenging and requires close and sustained collaboration between laptop manufacturers and wireless experts. An indication of the specialist nature of this challenge was provided by the cancella-tion, after less than six months, of the Intel-Nokia project to integrate HSDPA within certain Centrino products.
While some wireless-enabled laptops have been launched, current business models for embedded PC modules have yet to achieve the market breakthrough desired or expected by laptop manufacturers or their mobile carrier partners.
OPTION’S POSITION
Against this market background, Option delivered a 40,9% increase in revenues to EUR 279,9 million, and generated net earnings of EUR 35.3 million. In 2006, the Group shipped a record 1.82 million devices.
In bringing eight new products to market in 2006, Option maintained its market and technological leadership in wireless data cards while reinforcing its role as innovator in USB devices, wireless routers and embedded wireless modules. The product portfolio was expanded with the introduction of the GlobeTrotter EXPRESS. Furthermore, Option created the market for the wireless broadband USB devices with the launch early 2006 of the GlobeSurfer iCON. Going forward the USB device market is believed to be very important as demand from business users, the traditional market for wireless broadband solutions, is being augmented by an important and largely untapped consumer segment.
As the vast majority of Option’s products are sold through a distribution channel of various operators, Option continued enlarging this channel in Europe, the US, the Middle East and Asia. By the end of the year more than 90 companies worldwide offer Option devices to their customers. These companies include

50
Consolidated and Statutory Report 2006 of the Board of Directors of Option NV | Option Annual Report 2006
50
Consolidated and Statutory Report 2006 of the Board of Directors of Option NV | Option Annual Report 2006
the Vodafone Group of Companies, T-Mobile Group, Orange Group, Cingular Wireless in the US, and Airtel in India. In addition to increasing penetration within our heartland - two or more operators are now served in all majority of European markets - the decision to invest in sales and support offices in the USA, Japan and Taiwan is now beginning to generate returns.
Cingular Wireless has become an increasingly important customer for Option’s products as this leading US operator is rolling-out its Broadband Connect network across America’s major metropolitan areas. In Asia, our data cards and embedded modules play a central role in the launch of data devices by eMobile Japan whilst Uniwill, Taiwan’s leading manufacturer of ultra-portable notebooks, is developing new products incorporating Option’s embedded wireless devices.
In 2006, the market for embedded PC modules has grown although there has been no real breakthrough yet as desired or expected by laptop manufacturers or their mobile carrier partners. In order to prepare for the growth potential of this market, Option continued its development efforts and did make some significant progress in this sector during 2006.
In April, the Group achieved the world’s first GCF certification for an HSDPA wireless module, the GTM351E. GCF, the Global Certifica-tion Forum, is a partnership between network operators and terminal manufacturers that provides an independent program to ensure global interoperability of 2.5G and 3G HSDPA/UMTS mobile wireless terminals. Obtaining GCF certification is a prerequisite to doing business with multi-national operator groups.
In the second half of the year, development effort was focused on ensuring Option’s embedded module capability included HSUPA.
Embedded devices are also moving beyond the laptop. Working with Sharp, the Japanese consumer electronics manufacturer, Option has developed a module with board-to-board connector for incorporation in a new category of compact wireless-enabled, always-on multimedia device that provide an alternative to the laptop.
The most important technological evolutions and development focus of the Group are briefly highlighted hereunder.
WIRELESS BROADBAND TECHNOLOGIES
• HSDPA Option’s unveiled its “HSDPA Ready” strategy in September
2005. Allowing users to enjoy the benefits of 3G safe in the knowledge that their data card could be upgraded simply when HSDPA became available from their operator, “HSDPA Ready” ensured Option entered 2006 with a portfolio of HSDPA devices.
The initial “HSDPA Ready” products were based on wireless
broadband chipsets that could support data rates of up to 1.8 Mbps. In moving to higher transfer speeds (3.6 Mbps), Option committed an enhanced technology called “Receive Diversity”. This technology requires a specific chipset that was not commercially available at the time other 3.6 Mbps chipsets were. While sales were constrained in the short term, the issues have been resolved and the longer term prospects are positive as the merits of this technology are recognized by the operators.
• HSUPA In October 2006, Option participated in the industry’s first
demonstration of live HSUPA. Working alongside Qualcomm at Nortel’s research campus in Chateaufort in France, Option’s prototype HSUPA data cards achieved a wireless uplink trans-mission rate of 1.3 Mbps and a wireless downlink of 2.7 Mbps at the application level.
The success of the development effort during 2006 has made HSUPA a central feature of Option’s portfolio for 2007 and beyond.
• UMTS 900 3G UMTS 900 is another development that could have a
significant impact on the overall size of the wireless broadband opportunity. This initiative is focused on making 3G UMTS avail-able in the 900 MHz frequency band currently used by hundreds of GSM operators around the world. Adoption of this lower frequency – most 3G UMTS spectrum is currently in the 2100 MHz band – would greatly extend the reach of 3G networks, especially in rural areas and improve indoor coverage in towns. HSDPA and HSUPA would inevitably be offered across the 3G UMTS 900 infrastructure.
Option is already accumulating experience in this new field hav-ing provided 900 MHz data cards to the Finnish operator Elisa which completed the first UMTS 900 trials in November 2006.
ORGANIZATION
Option celebrated “20 years of Innovative Entrepreneurship” in September 2006. Since its incorporation in 1986, the Company has grown from a start-up into a Group with global presence employing almost 500 employees spread across facilities in Belgium, Ireland, Germany and Stockholm, Tokyo, Atlanta in the USA and Taipei, Taiwan. Option’s headcount increased by 156 during the year, mostly in technical and engineering grades working within product development.
In June, the company relocated its global headquarters to larger premises in the new Arenberg Science Park on the outskirts of Leuven in Belgium just 20 minutes from the European capital in Brussels and its international airport.
Accommodating corporate, finance, legal, HR, marketing, business development, operations & sales, technology and

51
Consolidated and Statutory Report 2006 of the Board of Directors of Option NV | Option Annual Report 2006
51
Consolidated and Statutory Report 2006 of the Board of Directors of Option NV | Option Annual Report 2006
engineering functions, the new facility reflects Option’s continuing growth and the company’s commitment to scaling appropriately in line with market demand. The headquarters also accommo-dates an expanded certification team that is being assembled to reduce the certification burden taken on by operators, and so reduce their time to market. Option’s recruitment policies are now actively seeking to ensure that the company mirrors the cultures of the markets it sells into.
One appointment to the executive management team is representative of Option’s efforts to better align the Group with the expanding market opportunities. Norbert Metzner, most recently Vice President Terminal Management at T-Mobile International joined as Vice President Product Marketing.
The board has also been strengthened with the election of Mr. David Hytha, Mr. Jan Loeber and Mr. Lawrence Levy at the Annual General Shareholders Meeting in 2006.
OPERATIONS New customers and new geographical markets helped production volumes increase by 63% to a record 1.82 million units shipped during 2006.
Achieving on-time delivery, cost reduction, product quality, a smooth customization process and transparency of communication with customers remain the principal objectives of the operations department.
Further investments have been made in the SAP information systems to monitor and manage work-flows across all Option and manufacturing partner sites. These systems provide improved visibility of order status to customers.With market analysts forecasting a further expansion of the wireless broadband market Option has spent considerable effort to secure the production capacity and to adjust the supply chain to meet anticipated higher volumes in 2007.
Jabil in Bergamo, Italy remains Option’s primary contract manufacturing partner with Celestica in Klatno, Czech Republic, providing additional capacity in Europe.
With demand growing outside Europe, Option is executing a strategy of locating production as close as possible to its markets consistent with protecting economies of scale. The growing importance of Taiwan and Japan as centres for laptops and multimedia device manufacture has prompted Option to secure embedded module manufacturing capacity at a Jabil facility in Wuxi, PR China.
SIGNIFICANT EVENTS THAT TOOK PLACE AFTER THE END OF THE FINANCIAL YEAR
On Group level, a number of significant events took place and were communicated via the Companies’ website. We provide an overview of the different press releases that were issued during the first two months of the financial year 2007:
Customer announcements- Option’s new wireless module embedded by Sharp- Wataniya Telecom revolutionizes residential internet service
provisioning with Option’s HSDPA GlobeSurfer Wireless Router- Option to supply Fujitsu Siemens Computers with HSDPA
3.6Mbps embedded wireless module- Option wins eMobile business in Japan
Technological leadership- Option implements HSUPA across its product portfolio at 3GSM
World Congress – Barcelona- Option unveils new ‘Plug ‘n Play’ high performance and sleek
designed wireless alternative to DSL: GlobeSurfer i CON HSUPA- Option adds two new HSUPA data cards to market leading wire-
less portfolio- Option adds HSUPA to embedded wireless module- Option highlights segmented connectivity software offerings- Option broadband wireless portfolio ready for Windows Vista 32
and Vista 64
Organization- Vice President Strategic Alliances & General Counsel Strength-
ens Option’s Executive Management Team
Capital and shareholding- Calling of an Extraordinary General Meeting of shareholders’
to decide upon the creation of a new stock option plan and the issue of maximum 2.200.000 warrants.
The meeting took place on the 1st of March 2007. As the attend-ance quorum was not reached at that meeting, a new Extraor-dinary General Meeting of shareholders’ was called to meet on the 30th of March 2007. For further details of the contemplated stock option plan we refer to Note 22 of the IFRS statements.
EVENTS THAT COULD INFLUENCE THE DEVELOPMENT OF THE COMPANY: OVERVIEW OF RISKS AND UNCERTAINTIES
In accordance with Article 96 of the Belgian Company Code, the annual report must describe the main risks and uncertainties that Option is confronted with. Whilst most of such risks and uncertain-ties are related to the evolution of the market in which the Group is active as further outlined in the Review of Operations we would like to specifically mention the following risks and uncertainties:

52
Consolidated and Statutory Report 2006 of the Board of Directors of Option NV | Option Annual Report 2006
52
Consolidated and Statutory Report 2006 of the Board of Directors of Option NV | Option Annual Report 2006
(1) Option depends on third parties to offer wireless data com-munications services. If these services are not deployed as anticipated, consumers would be unable to use Option innovative products and revenues could decline.
(2) Option is outsourcing manufacturing of its products to third parties and can be dependent upon the development and deployment of these third parties’ manufacturing abilities and the overall quality of their work. The inability of any supplier or manufacturer to fulfill the Option’s supply requirement could impact future results. Option has short term supply commitments to its outsource manufacturers based on its estimation of customer and market demand. Where actual results vary from those estimates, whether due to execution on Option’s parts or market conditions, Option could be at commercial risk.
(3) The 2006 revenues could be spread over two global groups of companies of respectively 34% and 20% whilst in 2005, the two groups of companies represented respectively 51% and 16%.
The Group deals with the individual affiliated companies who are free to negotiate and manage their own contracts and placement of purchase orders. All these affiliated companies have different credit risk profiles and benefit from different terms and conditions.
(4) Competition from bigger more established companies with greater resources may prevent the Group from increasing or maintaining its market share and could result in price reduc-tions and reduced revenues.
The wireless data industry is intensely competitive and subject to rapid technological change. Competition might further intensify. More established and larger companies with greater financial, technical and marketing resources can start selling products that might compete with Company products. Existing or future competitors may be able to respond more quickly to technological developments and changes or may independently develop and patent technologies and products that are superior to those of the Group or achieve greater acceptance due to factors such as more favorable pricing or more efficient sales channels. If the Group would be unable to compete effectively with competitors’ pricing strategies, technological advances and other initiatives, its market share and revenues may be reduced.
(5) Option may have difficulty managing its growth, which may damage its ability to retain key personnel and to compete effectively. Furthermore, growth outside Europe is becom-ing increasingly important (Japan, US) and therefore Option becomes exposed to local market instability and impact of exchange difference.
(6) The market is evolving rapidly and the product life cycles are becoming shorter every year. In the event Option would be unable to design and develop new innovative products that gain sufficient commercial acceptance, the Group may be un-able to recover its research and development expenses and Option may not be able to maintain its market share and the revenues could decline.
Furthermore, because of the short product life cycles Option’s future growth is increasingly depending upon designing and developing new products that may not have been commer-cially tested. The ability to design and develop new products depends on a number of factors, including, but not limited to the following;
- the ability of the Group to attract and retain skilled technical employees;
- the availability of critical components from third parties; - the ability of the Group to successfully complete the
development of products in a timely manner; - the ability of the Group to manufacture products at an
acceptable price and quality. A failure by Option or its suppliers in any of these areas, or
a failure of these products to obtain commercial acceptance, could result in Option being unable to recover its research and development expenses and could result in a decrease in market share and its revenues.
FINANCIAL INSTRUMENTS AND RISKS
Derivative financial instruments are used to reduce the exposure to fluctuations in foreign exchange rates and interest rates. These instruments are subject to the risk of market rates changing subsequent to acquisition. These changes are generally offset by opposite effects on the item being hedged.
Credit evaluations are performed on all customers requiring credit over a certain amount. The credit risk is monitored on a continuous basis.
The Group is not subject to material interest risk.
The Group is subject to material currency risk, as the larger part of its purchase transactions are in US dollars. The Group aims to match foreign currency cash inflows with foreign cash outflows. In 2006, the Group entered into a derivative financial instrument to manage its exposure on the US dollar cash flows. The result of the foreign exchange forward contracts has been recognized as exchange rate gains in the income statement.
As indicated above, the wireless data industry is increasingly competitive and subject to rapid technological change. The arrival of more established and larger companies, as well as the rapid technological change may create price erosion and affect Option’s margins and profitability.

53
Consolidated and Statutory Report 2006 of the Board of Directors of Option NV | Option Annual Report 2006
53
Consolidated and Statutory Report 2006 of the Board of Directors of Option NV | Option Annual Report 2006
The Group has no major outstanding credit facilities or loans. Option expects that its currents cash position will provide sufficient financial means to support Option’s growth in the near future.
CONFLICTS OF INTERESTS
No conflicts of interests as meant in article 523 and 524 of the Belgian Company Code occurred in 2006. For an overview of the transactions with related parties we refer to Note 21 of the Financial Report.
AUDITORS’ REMUNERATION
The annual meeting of shareholders held on 31st March 2004 renewed the mandate of the statutory auditor, Deloitte Bedrijfs-revisoren/Reviseurs d’Entreprises, represented by Mr. Leo Van Steenberge. The mandate expires immediately after the annual shareholder meeting on 30 March 2007 called to approve the annual accounts for the financial year ending on 31 December 2006.
Statutory audit and other fees for 2006 in relation to services provided by Deloitte Bedrijfsrevisoren/Reviseurs d’Entreprises amounted to EUR 201k, which was composed of audit services for the annual financial statements of EUR 100k, tax and legal advices services EUR 101k and in 2006, no other services have been performed by the auditors. Worldwide audit and other fees for 2006 in relation to services provided by Deloitte amounted to EUR 295k, which was composed of audit services for the annual financial statements of the Company and its subsidiaries of EUR 169k, tax and legal advices services EUR 124k and other services of EUR 2k.
Leuven, March 9, 2007
The Board of Directors

54
GlobeTrotter FUSION+ HSDPA The world’s first combo product integrating HSDPA/UMTS/
EDGE/Wi-Fi technologies on a single data card.

5555
Auditor’s Report | Option Annual Report 2006
6 .AUDITOR’S REPORT

5656
Statutory Auditor’s Report to the Shareholders Meeting on the Consolidated Financial Statements for the Year Ended 31 December 2006
To the shareholders
As required by law and the company’s articles of association, we are pleased to report to you on the audit assignment which you have entrusted to us. This report includes our opinion on the consolidated financial statements together with the required additional comment.
Unqualified audit opinion on the consolidated financial statementsWe have audited the accompanying consolidated financial statements of OPTION NV (“the company”) and its subsidiaries (jointly “the group”), prepared in accordance with International Financial Reporting Standards as adopted by the European Union and with the legal and regulatory requirements applicable in Belgium. Those consolidated financial statements comprise the consolidated balance sheet as at 31 December 2006, the consolidated income statement, the consolidated statement of changes in equity and the consolidated cash flow statement for the year then ended, as well as the summary of significant accounting policies and other explanatory notes. The consolidated balance sheet shows total assets of 176.489 (000) EUR and a consolidated profit for the year then ended of 35.316 (000) EUR.
The board of directors of the company is responsible for the preparation of the consolidated financial statements. This responsibility includes among other things: designing, implementing and maintaining internal control relevant to the preparation and fair presentation of consolidated financial statements that are free from material misstatement, whether due to fraud or error, selecting and applying appropriate accounting policies, and making accounting estimates that are reasonable in the circumstances.
Our responsibility is to express an opinion on these consolidated financial statements based on our audit. We conducted our audit in accordance with legal requirements and auditing standards applicable in Belgium, as issued by the “Institut des Reviseurs d’Entreprises/Instituut der Bedrijfsrevisoren”. Those standards require that we plan and perform the audit to obtain reasonable assurance whether the consolidated financial statements are free from material misstatement.
In accordance with these standards, we have performed procedures to obtain audit evidence about the amounts and disclosures in the consolidated financial statements. The procedures selected depend on our judgment, including the assessment of the risks of material misstatement of the consolidated financial statements, whether due to fraud or error. In making those risk assessments, we have considered internal control relevant to the group’s preparation and fair presentation of the consolidated financial statements in order to design audit procedures that are appropriate in the circumstances but not for the purpose of expressing an opinion on the effectiveness of the group’s internal control. We have assessed the basis of the accounting policies used, the reasonableness of accounting estimates made by the company and the presentation of the consolidated financial statements, taken as a whole. Finally, the board of directors and responsible officers of the company have replied to all our requests for explanations and information. We believe that the audit evidence we have obtained provides a reasonable basis for our opinion.
In our opinion, the consolidated financial statements give a true and fair view of the group’s financial position as of 31 December 2006, and of its results and its cash flows for the year then ended, in accordance with International Financial Reporting Standards as adopted by the EU and with the legal and regulatory requirements applicable in Belgium.
Additional commentThe preparation and the assessment of the information that should be included in the directors’ report on the consolidated financial state-ments are the responsibility of the board of directors.
Our responsibility is to include in our report the following additional comment which does not change the scope of our audit opinion on the consolidated financial statements:
• The directors’ report on the consolidated financial statements includes the information required by law and is in agreement with the consolidated financial statements. However, we are unable to express an opinion on the description of the principal risks and uncertainties confronting the group, or on the status, future evolution, or significant influence of certain factors on its future development. We can, never-theless, confirm that the information given is not in obvious contradiction with any information obtained in the context of our appointment.
Diegem, 12 March 2007
The statutory auditor
DELOITTE Bedrijfsrevisoren / Reviseurs d’EntreprisesBV o.v.v.e. CVBA / SC s.f.d. SCRLRepresented by Leo Van Steenberge
6. AUDITOR’S REPORT

5757
Abbreviated Statutory Accounts of Option NV and Explanatory Notes | Option Annual Report 2006
7 .ABBREVIATED STATUTORY ACCOUNTS
OF OPTION NV AND EXPLANATORY NOTES

5858
The following documents are extracts of the statutory annual accounts of Option NV prepared under Belgian GAAP in accordance with article 105 of the Company Code.
Only the consolidated annual financial statements as set forth in the preceding pages present a true and fair view of the financial position and performance of the Option Group.
The statutory auditor’s report is unqualified and certifies that the non consolidated financial statements of Option NV for the year ended 31 December 2006 give a true and fair view of the financial position and results of Option NV in accordance with all legal and regulatory dispositions.
7.1. ABBREVIATED STATUTORY BALANCE SHEET (ACCORDING TO BELGIAN ACCOUNTING STANDARDS)
ASSETS
Thousands EUR
2006 2005
Fixed assets 24 132 16 072
Intangible assets 9 869 5 438
Tangible assets 11 632 8 031
Financial assets 2 631 2 603
Current Assets 75 898 45 747
Stocks and contracts in progress 2 419 2 091
Accounts receivable within one year 44 059 4 006
Cash & cash investments 28 849 39 285
Deferred charges and accrued income 571 365
Total Assets 100 030 61 819
LIABILITIES
Thousands EUR
2006 2005
Capital and reserves 76 752 53 920
Capital 6 116 6 116
Share premium 44 847 44 847
Legal reserve 612 612
Profit/( loss) carried forward 25 177 2 345
Creditors 23 278 7 899
Subordinated loan 148 222
Amounts payable after more than one year 0 0
Amounts payable after more within one year 22 454 7 237
Accrued charges and deferred income 676 440
Total liabilities 100 030 61 819
7. ABBREVIATED STATUTORY ACCOUNTS OF OPTION NV AND EXPLANATORY NOTES

5959
Abbreviated Statutory Accounts of Option NV and Explanatory Notes | Option Annual Report 2006
7.2. ABBREVIATED STATUTORY INCOME STATEMENT (ACCORDING TO BELGIAN ACCOUNTING STANDARDS)
ABBREVIATED PROFIT AND LOSS ACCOUNT
Thousands EUR
2006 2005
I. Revenues 54 287 46 783
Turnover 6 504 4 360
Increase (decrease) in stocks in finished goods, work and contracts in progress
(8) 579
Capitalized development costs 6 843 4 028
Other operating income (mainly intercompanies transactions) 40 948 37 816
II. Operating charges (36 416) (26 137)
Raw materials, consumables and goods for resale 4 727 4 910
Services and other goods 15 531 9 453
Remuneration, social security costs and pensions 10 445 7 900
Depreciation of and other amounts written off formation expenses, intangible and tangible fixed assets
5 530 3 682
Increase, decrease in amounts written off stocks, contracts 145 159
Contracts in progress and trade debtors
Provision for contingencies 0 0
Other operating charges 38 33
III. Operating profit/(loss) 17 871 20 646
IV. Financial income 11 076 682
V. Financial charges (774) (340)
VI. Profit/(loss) on ordinary activities before taxes 28 173 20 988
X. Income tax expense (5 341) (2 292)
IX. Profit/(loss) for the period before taxes 22 832 18 696
XIII. Profit/(loss) for the period available for appropriation 22 832 18 696
ABBREVIATED APPROPRIATION ACCOUNT (ACCORDING TO BELGIAN ACCOUNTING STANDARDS)
Thousands EUR
2006 2005
Profit/( loss) to be appropriated 25 177 2 345
Profit/( loss) for the period available for appropriation 22 832 18 696
Profit/( loss) carried forward from previous year 2 345 (15 739)
Legal reserve 0 (612)

6060
7.3. SUMMARY OF MOST SIGNIFICANT VALUATION RULES - ABBREVIATED STATUTORY ACCOUNTS - BELGIAN GAAP
Formation expensesFormation expenses are charged against income except for costs capitalized.
Intangible assetsPatents, licenses and software are linearly depreciated at rates of 20% to 50%.
Machinery and equipmentLab equipment, test equipment and computer equipment are linearly depreciated at rates of 20% to 50%. Test equipment (under lease) is linearly depreciated at a rate between 10% and 50%.
Research and development As from January 1st 2005:Research expenditure is recognized as an expense as incurred. Costs incurred on development projects (relating to the design and testing of new or improved products) are recognized as intangible assets only if all of the following conditions are met:- An asset is developed that can be identified;- It is probable that the asset developed will generate future economic benefits; and- The development costs of the asset can be measured reliably.Other development expenditures are recognized as an expense as incurred. Development costs previously recognized as an expense are not recognized as an asset in a subsequent period. Development costs that have a finite useful life that have been capitalized are amortized from the commencement of the commercial production of the product on a straight-line basis over the period of its expected benefit, not exceeding two years.
VehiclesVehicles are linearly depreciated at rate of 20%.
Office FurnitureOffice furniture and equipment are linearly depreciated at rates of 10% to 33.3%. Leased office equipment is linearly depreciated at rates between 20% and 50%.
Financial assetsDuring the financial period investments are not revalued.
StocksStocks (raw materials, consumables, work in progress, finished goods and goods for resale) are valued at acquisition cost determined according to the FIFO-method or by the lower market value.
ProductsThe products are valued at costs that only directly attribute.
Contracts in progressContracts in progress are valued at production cost.
DebtsLiabilities do not include long-term debts, bearing no interests at an unusual low interest.
Foreign currenciesDebts, liabilities and commitments denominated in foreign currencies are translated using the exchange rate of December 31, 2006. Transactions are converted at the daily exchange rate.Exchange differences have been disclosed in the annual accounts as follows: - Positive exchange results in caption IV. Financial income of the profit and loss account;- Negative exchange results in caption V. Financial charges of the profit and loss account.

6161
Abbreviated Statutory Accounts of Option NV and Explanatory Notes | Option Annual Report 2006
7.4. EXPLANATORY NOTES - ABBREVIATED STATUTORY ACCOUNTS - BELGIAN GAAP
Participating interestsThe following participations in subsidiaries are retained with mention of the number of registered rights and percentage of ownership:
December 31Shares held by company
(by number) % held by company % held by subsidiaries
Option Germany – Adelsried (Germany) 1 100% 0%
Option Wireless– Cork ( Ireland) 2 000 000 100% 0%
Option Wireless Hong Kong Limited – (China) 10 000 100% 0%
Statement of Capital
Statement of Capital Amounts (in EUR) Number of shares1
Issued capitalDecember 31,
At the end of the preceding period 6 116 067 41 249 296
At the end of the period 6 116 067 41 249 296
Structure of the capitalDecember 31,
Different categories of shares
• Registered shares and bearer shares 41 249 296
• Registered -
• Bearer 41 249 296
Authorized capitalDecember 31,
On December 31,2006 the authorized (but non-issued) capital amounted to EUR 6 116k
1 Adjusted retroactively to take into account the 4-for-1 stock split completed on April 24, 2006

62
GlobeSurfer i CON 7.2This product is the successor to the company’s first pioneering and popular fixed-substitution USB device – the GlobeSurfer i CON. The i CON 7.2, supporting HSDPA at 7.2Mbps, is the simplest and most convenient broadband internet connection device available.

6363
Investor Relations And Financial Calendar | Option Annual Report 2006
8 .INVESTOR RELAT IONS AND F INANCIAL CALENDAR

6464
8.1. THE OPTION SHARE ON EURONEXT
Option’s ordinary shares were originally listed in USD on NASDAQ Europe (ex EASDAQ) following the Initial Public Offering of November 26, 1997. Option’s shares started to be listed in EUR on the First Market of Euronext Brussels as from August 5th, 2003. Option NV’s shares are quoted on the continuous trading market under the trading symbol “OPTI”.
In September 2003, the OPTION stock became part of the NextEconomy quality index. Before Option was already part of the CSR Ethibel quality label.
The graph here below shows the value of share price evolution in 2003 to 2006 on Euronext.
With a view to increasing the liquidity of the Option shares and their visibility to the US investors, Option has decided to implement a Level I American Depositary Receipts (“ADR”) Program. An F-6 registration statement has been filed with The Securities and Exchange Commission.
This Level I ADR Program has the following characteristics:• ADRs are U.S. securities issued by a depositary bank repre-
senting shares of a non-US company. In this case, The Bank of New York has been selected as depositary bank;
• An ADR gives, investors a voting right and future dividend rights according to the terms and conditions of the deposit agreement entered into between The Bank of New York, Option and future ADR holders;
• An ADR gives US investors access to the Option shares through the over-the-counter market on which ADRs are freely negoti-able in the US. The ADR ticker is OPNVY.
OPTION SHARE PRICE EVOLUTION 2003 - 2006 ON EURONEXT
8.2. SHARE HISTORY IN 2003-2006 ON EURONEXT
2006 20051
Number of shares outstanding
41 249 296 41 249 296
Year-end share price 10.30 15.69
Market capitalization (million)
425 647
Share price High 24.33 (February 23rd, 2006)
15.71 (December 30th, 2005)
Share price Low 9.09 (October 6th, 2006)
5.60 (January 24th, 2005)
Free float 82.90 % 81.79 %1 Adjusted retroactively to take into account the 4-for-1 stock split completed on
April 24, 2006.
During 2006, a total of 104 125 689 shares were traded on Euronext on 255 trading days, meaning an average for the year of nearly 408 336 shares per day.
8.3. FINANCIAL CALENDAR
Option intends to release its quarterly financial information in 2007 on the following dates – before market hours:
1Q Results Thursday April 26, 20072Q Results Thursday July 26, 20073Q Results Thursday October 25, 2007
General Meeting of Shareholders 2007 Friday March 30, 2007 at 10 AM
General Meeting of Shareholders 2008 Monday March 31, 2008 at 10 AM
For clarification concerning the information contained in this annual report or for information about Option NV and about transparency filings regarding declaration of interests of shares, please contact:
Frederic ConventChief Financial Officer Gaston Geenslaan 14B-3001 Leuven, BelgiumPhone: +32 (0)16 31 74 11Fax: +32 (0)16 31 74 90e-mail: [email protected]
8. INVESTOR RELATIONS AND FINANCIAL CALENDAR
Share price evolution adjusted retroactively to take into account the
4-for-1 stock split completed on April 24, 2006.
30
20
10
02003 2004 2005 2006

6565
Information Sheet by End 2006 | Option Annual Report 2006
9 .INFORMATION SHEET BY END 2006

6666
Name Option NV
Form Limited Company as per Belgian Law
Address Gaston Geenslaan 14, B-3001 Heverlee LEUVEN
Phone +32(0)16 31 74 11
Fax +32(0)16 31 74 90
E-mail [email protected]
Website www.option.com
Enterprise No. 0 429 375 448
V.A.T. BE 429 375 448
Establishment Date July 3rd, 1986
Duration Indefinite duration
Auditor Deloitte-Auditors represented by Leo Van Steenberge
Financial Year Closing December 31st
Capital 6 116 067,21 EUR
Number of shares 41 249 296
Annual Meeting Last business day of March
Listing Euronext-continumarkt-ticker OPTI
Deposit Bank Fortis
Member of index Next Economy
Next 150
Bel Mid
VLAM 21
Other Labels Ethibel
Europe 500
SRI Kempen
9. INFORMATION SHEET BY END 2006

6767
Information Sheet by End 2006 | Option Annual Report 2006
LANGUAGE OF THIS ANNUAL REPORTPursuant to Belgian Law, Option is required to prepare its Annual Report in Dutch. Option has also made an English language translation of this Annual Report. In case of differences in interpretation between the English and Dutch versions of the Annual Report, the original Dutch version shall prevail.
AVAILABILITY OF THE ANNUAL REPORTThe Annual Report is available to the public free of charge upon request to:
Option N.V.Attention Investor RelationsGaston Geenslaan 143001 Leuven, BelgiumPhone: +32(0)16 31 74 11Fax: +32(0)16 31 74 90e-mail: [email protected]
An electronic version of the Annual Report is also available, for information purposes only, via the internet on the website of Option (address: www.option.com). Only the printed Annual Report, published in Belgium in accordance with the applicable rules and legislation is legally valid, and Option takes no responsibility for the accuracy or correctness of the Annual Report available via the Internet. Other information on the website of Option or on any other website does not form part of this Annual Report.
FORWARD-LOOKING STATEMENTSThis Annual Report contains forward-looking statements, including, without limitation, statements containing the words “believes”, “anticipates”, “expects”, “intends”, “plans”, “seeks”, “estimates”, “may”, “will”, and “continue” and similar expressions. Such forward-looking statements involve known and unknown risks, uncertainties, and other factors witch might cause the actual results, financial condition, performance or achievements of Option, or industry results, to be materially different from any future results, performance, or achievements expressed or implied by such forward-looking statements. Given these uncertainties, the public is cautioned not to place any undue reliance on such forward-looking statements. These forward-looking statements are made only as of the date of this Annual Report. Option expressly disclaims any obligation to update any such forward-looking statements in this Annual Report to reflect any change in its expectations with regard thereto or any change in events, conditions, or circumstances on witch any such statement is based, unless such statement is required pursuant to applicable laws and regulations.

GlobeTrotterMOBILITYMANAGER
GlobeTrotter �������������������������������
Option’s software philosophy is built on offering solutions that deliver tangible benefits to users and operators. For users, clear and intuitive interfaces eliminate network and technological complexity enabling easy access to informa-tion. Customisable user-interfaces, languages, profiles and service features empower operators to offer differentiated products and services.

10.GLOSSARY

7070
BOOK VALUE PER SHARE Total Shareholders’ equity divided by the number of weighted average number of ordinary shares.
CASH FLOW PER SHARE Net profit plus non-cash charges such as depreciation and impairment loss divided by weighted average number of ordinary shares.
EBIT Earnings Before Interest and Taxes. Profit from operations.
EBITDA Profit from operations plus depreciation and amortization.
EPS Earnings Per Share. Net profit divided by the weighted average number of ordinary shares.
GEARING RATIO Net debt divided by shareholders’ equity.
NET CAPEX Acquisitions of property and equipment and of intangible assets, minus proceeds from sale.
NET FINANCIAL DEBT Non-current and current debts minus cash.
SOLVENCY RATIO Shareholder’s equity divided by total assets.
WEIGHTED AVERAGE NUMBER OF ORDINARY SHARES
Number of shares outstanding at the beginning of the period, adjusted by the number of shares cancelled, repurchased or issued during the period multiplied by a time-weighting factor.
WORKING CAPITAL Current assets less current liabilities.
10. GLOSSARY

Option NV - Gaston Geenslaan 14 - B-3001 Leuven - Belgium - T +32 16 317 411 - F +32 16 207 164 - www.option.com72