Annual Report 2006 - Loblaw Companies Limited 2006 marked the beginning of a period of significant...
112
2006 Annual Summary Simplify, Innovate, Grow
-
Upload
hoangxuyen -
Category
Documents
-
view
217 -
download
1
Transcript of Annual Report 2006 - Loblaw Companies Limited 2006 marked the beginning of a period of significant...

2006 Annual Summary
Simplify, Innovate,Grow

2006 Annual Summary Loblaw Companies Limited
Loblaw Companies Limited (“Loblaw” or the “Company”) is Canada’s largest food distributor
and a leading provider of general merchandise products, drugstore and financial products
and services. Through its various operating banners, Loblaw is committed to providing
Canadians with a one-stop destination in meeting their food and household needs. This goal
is pursued through a portfolio of store formats across the country. Loblaw is known for the
quality, innovation and value of its food offering. It also offers Canada’s strongest control label
program, including the unique President’s Choice, no name and Joe Fresh Style brands.
Food is at the heart of its offering. Loblaw stores provide a wide, growing and successful
range of products and services to meet the everyday household demands of Canadian consumers.
In addition, President’s Choice Financial services offer core banking, a popular MasterCard®,
PC Financial auto, home, travel and pet insurance, PC Mobile phone services as well as the
PC points loyalty program.
Loblaw is committed to a strategy developed under three core themes: Simplify, Innovate
and Grow. The Company strives to be consumer focused, cost effective and agile, with the
goal of achieving long term growth for its many stakeholders. Loblaw believes that a strong
balance sheet is critical to achieving its potential. It is highly selective in its consideration
of acquisitions and other business opportunities. The Company maintains an active product
development program to support its control label program. It works to ensure that its technology
and systems logistics enhance the efficiency of its operations.
Over 139,000 full-time and part-time employees execute its business strategy in more than
1,000 corporate and franchised stores from coast to coast. This makes Loblaw one of Canada’s
largest private sector employers. It strives to contribute to the communities it serves and to
be proactive in corporate citizenship.
Contents2006 Annual Summary 2 Tracking Our Progress4 Financial Highlights5 Report of Operations
12 Our Stores14 Community Support15 Corporate Social Responsibility16 Summary of Corporate Governance Practices18 Operational Directory and Officers19 Board of Directors20 Shareholder and Corporate Information
As part of our fresh thinking we are now introducingadditional information on our websites at:
www.loblaw.ca
www.pc.ca
www.joe.ca
Forward-Looking StatementsThis Annual Report, which consists of the Annual Summary and the Financial Report, contains forward-looking statements which reflect management’sexpectations and are contained in discussions regarding the Company’s objectives, plans, goals, aspirations, strategies, potential future growth, results ofoperations, performance and business prospects and opportunities. Forward-looking statements are typically, though not always, identified by words orphrases such as “anticipates”, “expects”, “believes”, “estimates”, “intends” and other similar expressions.
These forward-looking statements are not guarantees, but only predictions. Although the Company believes that these statements are based on information and assumptions which are current, reasonable and complete, these statements are necessarily subject to a number of factors that could cause actual resultsto vary significantly from the estimates, projections and intentions. Such differences may be caused by factors which include, but are not limited to, changes in consumer spending and preferences, heightened competition including new competitors and expansion of current competitors, changes in the Company’s orits competitors’ pricing strategies, the ability to realize anticipated cost savings and efficiencies, including those resulting from restructuring, inventoryliquidation and other cost reduction and simplification initiatives, the ability to execute restructuring plans, implement strategies and introduce innovativeproducts successfully and in a timely manner, changes in the markets for the inventory intended for liquidation and changes in the expected realizable value and costs associated with the liquidation, unanticipated, increased or decreased costs associated with the announced initiatives, including those relatedto compensation costs, the Company’s relationship with its employees, results of labour negotiations including the terms of future collective bargainingagreements, changes to the regulatory environment in which the Company operates now or in the future, changes in the Company’s tax liabilities, either throughchanges in tax laws or future assessments, performance of third-party service providers, public health events, the ability of the Company to attract and retainkey executives and supply and quality control issues with vendors. The calculation of the goodwill impairment charge described in this Annual Report involvesthe estimation of several variables, including but not limited to market multiples, projected future sales, earnings, capital investment, discount rates, terminalgrowth rates and the fair values of those assets and liabilities being valued. The Company cautions that this list of factors is not exhaustive.
The assumptions applied in making the forward-looking statements contained in this Annual Report include the following: economic conditions do notmaterially change from those expected, patterns of consumer spending are reasonably consistent with historical trends, no new significant competitors enterour markets nor does any existing competitor unexpectedly significantly increase its presence, neither the Company’s nor its competitors’ pricing strategieschange materially, the Company successfully offers new and innovative products and executes its strategies as planned, anticipated cost savings andefficiencies are realized as planned, continuing future restructuring activities are effectively executed in a timely manner, costs associated with the liquidationof inventory are not higher or lower than expected, the Company’s assumptions regarding average compensation costs and average years of service foremployees affected by the simplification initiatives are materially correct, the Company does not significantly change its approach to its current restructuringactivities, there is no material amount of excess inventory in the Company’s supply chain, there are no material work stoppages and the performance of third-party service providers is in accordance with expectations.
These estimates and assumptions may change in the future due to uncertain competitive and economic market conditions or changes in business strategies.This list of factors and other risks and uncertainties are discussed in the Company’s materials filed with the Canadian securities regulatory authorities from time to time, including the Risks and Risk management section of the Financial Report.
Potential investors and other readers are urged to consider these factors carefully in evaluating these forward-looking statements and are cautioned not to place undue reliance on them. The forward-looking statements included in this Annual Report, are made only as of the filing date of this Annual Report andthe Company disclaims any obligation or intention to publicly update these forward-looking statements to reflect new information, future events or otherwise.In light of these risks, uncertainties and assumptions, the forward-looking events contained in these forward-looking statements may or may not occur. The Company cannot assure that projected results or events will be achieved.
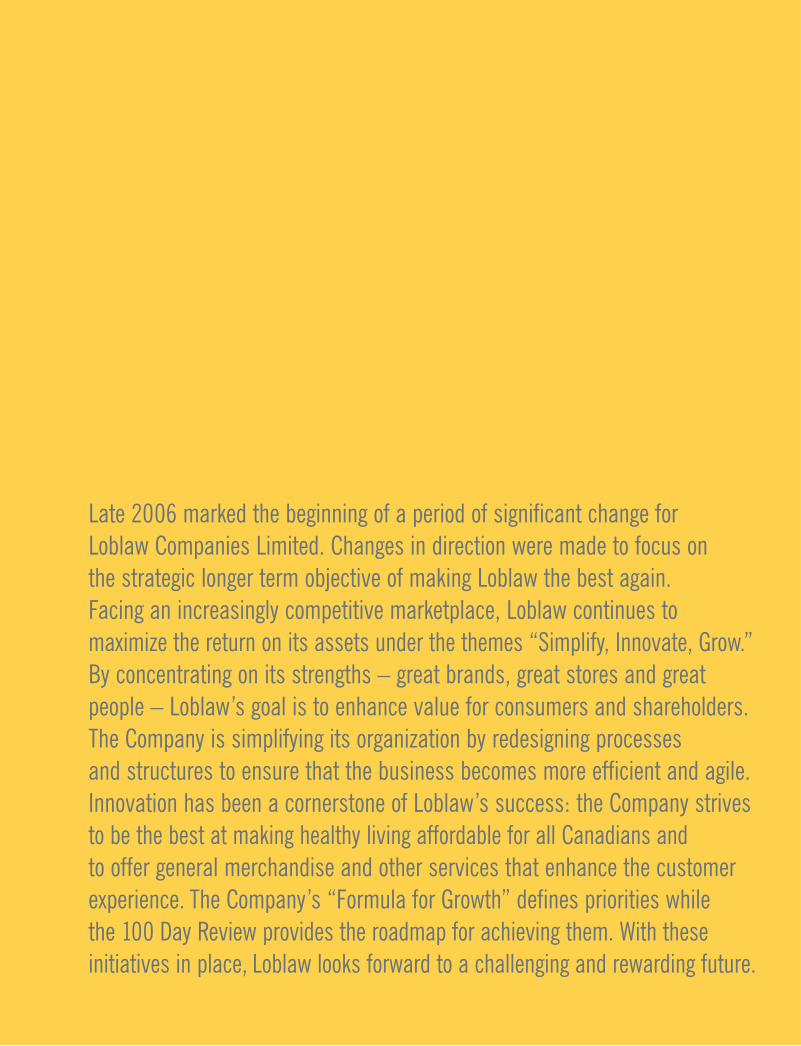
Late 2006 marked the beginning of a period of significant change for Loblaw Companies Limited. Changes in direction were made to focus on the strategic longer term objective of making Loblaw the best again. Facing an increasingly competitive marketplace, Loblaw continues tomaximize the return on its assets under the themes “Simplify, Innovate, Grow.” By concentrating on its strengths – great brands, great stores and greatpeople – Loblaw’s goal is to enhance value for consumers and shareholders.The Company is simplifying its organization by redesigning processes and structures to ensure that the business becomes more efficient and agile.Innovation has been a cornerstone of Loblaw’s success: the Company strivesto be the best at making healthy living affordable for all Canadians andto offer general merchandise and other services that enhance the customerexperience. The Company’s “Formula for Growth” defines priorities while the 100 Day Review provides the roadmap for achieving them. With theseinitiatives in place, Loblaw looks forward to a challenging and rewarding future.

Tracking Our

www.loblaw.ca
For more information about our offerings,visit our website at:
27 MillionKilogramsof fresh producedelivered every week

0
10,000
20,000
30,000
40,000
Corporate StoresSquare Footage(thousands of sq. ft.)
> 60,000 sq. ft.40,000–60,000 sq. ft.< 40,000 sq. ft.
2003 2006200520042002
Progress
InitiativesPr
ogre
ss R
epor
t
Each and every week
12 MillionCanadians choose to shop with us
510
535
560
585
$610
Corporate Stores Sales per Average Square Foot
20062005200420032002
Corporate Stores Salesper Average Square Foot($)
(1)
(1) 2003 was a 53 week year.
SimplifyThe Company is simplifying itsorganization by more clearly definingaccountabilities and establishingconsistent, simple and efficientprocesses. Internal resources have been
dedicated to assessing and, whereappropriate, redesigning processes aswell as developing a short list of keyperformance indicators focused oncustomers and store operations.
InnovateInnovation is one of the many strengthsof Loblaw, most clearly exhibited by its exciting control label offerings.Through ongoing innovation, theCompany concentrates on being the bestat making healthy living affordable to
2006 Progress• Continued efforts to restructure
the supply chain, which proved to be more complex and costly thanoriginally anticipated. By year end, the supply chain stabilized anddelivered improved service levels
• Planned and developed organizationaltransition, focused on redesignedprocesses and a leaner administrativestructure
• Established key performanceindicators beginning with the work ofthe Positive Action Groups, describedunder Grow
2007 Expectations• Continue remaining phases of national
supply chain restructuring, whiledelivering consistent and improvedservice and in-stock availability to our customers
• Approve and implement organizationaltransition and put redesigned processes into practice
• Enhance four distinctive formats –Superstore, Great Food, Hard Discountand Wholesale – to meet the needs of diverse markets across the country
2006 Progress• Launched Joe Fresh Style in
April 2006 with positive consumerresponse, including selling over200,000 basic T-shirts since launch
• Developed and distributed a record six issues of the Insider’s Reportto keep customers informed aboutexciting new products and services.
• Over ten million homes in Canadareceived the Insider’s Report this year
• Over 2,000 new control label products launched
0
15,000
30,000
45,000
60,000
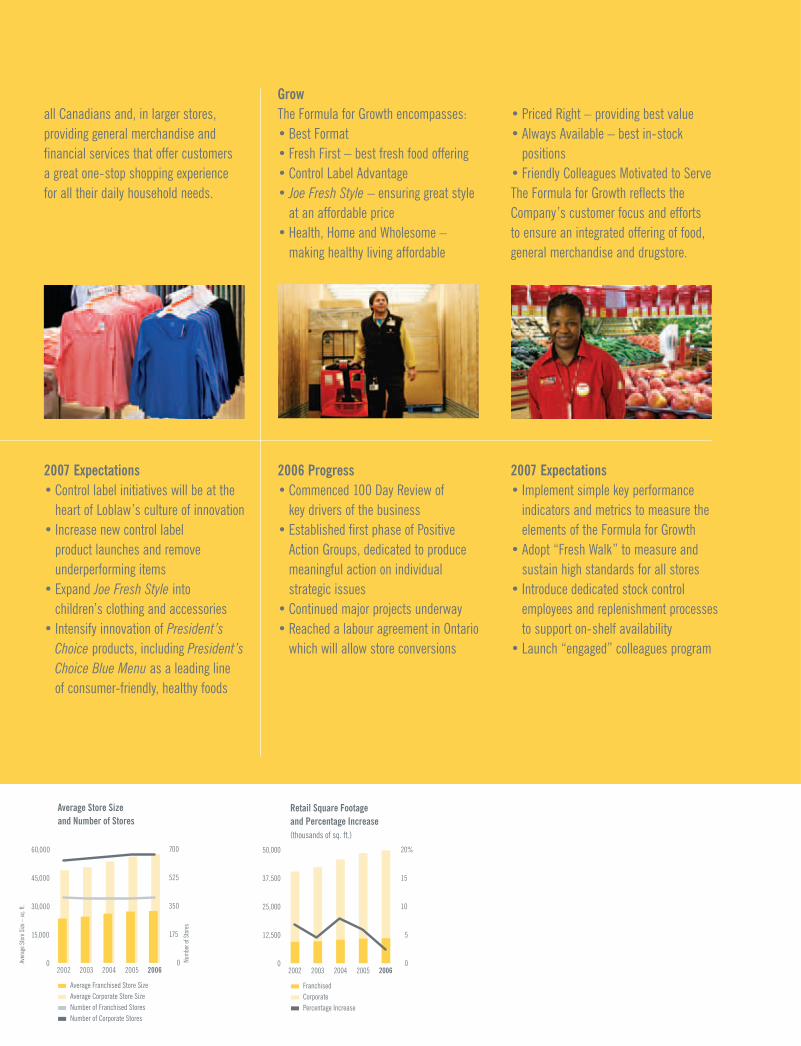
Average Store Size and Number of Stores
Average Franchised Store Size Average Corporate Store Size Number of Franchised Stores Number of Corporate Stores
Aver
age S
tore
Size
– sq
. ft.
0
175
350
525
700
Num
ber o
f Sto
res
200620052004200320020
12,500
25,000
37,500
50,000
0
5
10
15
20%
FranchisedCorporatePercentage Increase
20062005200420032002
Retail Square Footageand Percentage Increase(thousands of sq. ft.)
all Canadians and, in larger stores,providing general merchandise andfinancial services that offer customers a great one-stop shopping experience for all their daily household needs.
GrowThe Formula for Growth encompasses: • Best Format• Fresh First – best fresh food offering• Control Label Advantage • Joe Fresh Style – ensuring great style
at an affordable price• Health, Home and Wholesome –
making healthy living affordable
• Priced Right – providing best value • Always Available – best in-stock
positions • Friendly Colleagues Motivated to ServeThe Formula for Growth reflects theCompany’s customer focus and efforts to ensure an integrated offering of food,general merchandise and drugstore.
2007 Expectations• Control label initiatives will be at the
heart of Loblaw’s culture of innovation• Increase new control label
product launches and removeunderperforming items
• Expand Joe Fresh Style into children’s clothing and accessories
• Intensify innovation of President’sChoice products, including President’sChoice Blue Menu as a leading line of consumer-friendly, healthy foods
2006 Progress• Commenced 100 Day Review of
key drivers of the business• Established first phase of Positive
Action Groups, dedicated to producemeaningful action on individualstrategic issues
• Continued major projects underway• Reached a labour agreement in Ontario
which will allow store conversions
2007 Expectations• Implement simple key performance
indicators and metrics to measure theelements of the Formula for Growth
• Adopt “Fresh Walk” to measure andsustain high standards for all stores
• Introduce dedicated stock controlemployees and replenishment processesto support on-shelf availability
• Launch “engaged” colleagues program

Number of Stores52 Atlantic SaveEasy53 Atlantic Superstore 14 Dominion*
(in Newfoundland and Labrador)106 Extra Foods20 Fortinos 91 Loblaws 96 Maxi 16 Maxi & Cie
134 No Frills105 Provigo
97 The Real Canadian Superstore37 The Real Canadian Wholesale Club23 SuperValu 68 Valu-mart51 Your Independent Grocer50 Zehrs
515 Cash & Carry and other banners
50 Millionsquare feet of retail space from coast to coast
*Trademark used under license.

Progress

4 2006 Annual Summary Loblaw Companies Limited
Financial Highlights
For the years ended December 30, 2006 and December 31, 2005 2006 2005($ millions except where otherwise indicated) (52 weeks) (52 weeks)
Operating ResultsSales(3) $ 28,640 $ 27,627Sales excluding the impact of VIEs (2) (3) 28,257 27,212Adjusted EBITDA(2) 1,892 2,132Operating income 289 1,401Adjusted operating income(2) 1,326 1,600Interest expense 259 252Net (loss) earnings (219) 746
Cash FlowCash flows from operating activities 1,180 1,489Free cash flow (2) 70 103Capital investment 937 1,156
Per Common Share ($)
Basic net (loss) earnings (.80) 2.72Adjusted basic net earnings (2) 2.72 3.35Dividend rate at year end .84 .84Cash flows from operating activities 4.31 5.43Book value 19.85 21.48Market price at year end 48.79 56.37
Financial RatiosAdjusted EBITDA margin (2) 6.7% 7.8%Operating margin 1.0% 5.1%Adjusted operating margin (2) 4.7% 5.9%Return on average total assets (2) 2.3% 11.2%Return on average shareholders’ equity (3.9%) 13.2%Interest coverage 1.0:1 5.1:1Net debt (2) to equity .72:1 .66:1
Operating StatisticsRetail square footage (in millions) 49.7 48.5Average corporate store size (square feet) 57,400 56,100Corporate stores sales per average square foot ($) 585 579Same-store sales growth .8% .2%Number of corporate stores 672 670Number of franchised stores 405 402
(1) For financial definitions and ratios refer to the Glossary of Terms on page 80 in the Financial Report.(2) See Non-GAAP Financial Measures on page 40 in the Financial Report.(3) During 2006, the Company implemented Emerging Issues Committee Abstract 156, “Accounting by a Vendor for Consideration
Given to a Customer (Including a Reseller of the Vendor’s Products)” on a retroactive basis. Accordingly certain sales incentives paid to independent franchisees, associates and independent accounts for the prior year have been reclassified between sales and cost of sales, selling and administrative expenses. For a further discussion, see the Accounting Standards Implemented in 2006 section in the Management’s Discussion and Analysis in the Financial Report contained in this Annual Report.
(4)
2
8
14
20%
Return on AverageShareholders’ Equity
Return on AverageShareholders’ EquityFive Year Average Return
20062005200420032002
50
0
100
150
$200
Loblaw Companies LimitedTSX Food and Staples Retailing Sub IndexS&P/TSX Composite Index
Total Return on $100 Investment(includes dividend reinvestment)($)
200620052004200320022001
(.80)
.30
1.40
2.50
$3.60
Dividend Rate per Common Share at Year EndBasic Net (Loss) Earnings per Common ShareAdjusted Basic Net Earnings per Common Share(1)
20062005200420032002
(1) See Non-GAAP Financial Measures on page 40 of the 2006 Financial Report.(2) 2003 was a 53 week year.
Basic Net (Loss) Earnings, Adjusted Basic Net Earnings(1) andDividend Rate per Common Share($)
(2)

2006 Annual Summary Loblaw Companies Limited 5
2006 was a challenging year for Loblaw Companies Limited
(“Loblaw” or the “Company”). We faced significant hurdles,
took stock of obstacles to profitability and growth, and assessed
the considerable strengths that have made us Canada’s
pre-eminent food retailer.
We enter 2007 with a new leadership team, a resolve to
restore Loblaw to strong profitability and growth, and a game
plan for doing it.
Our plan is built on three pillars: “Simplify, Innovate, Grow”.
And it has one goal: To Make Loblaw the Best Again.
This Annual Report addresses, in detail, our Company’s
performance in 2006. Many of the difficulties we faced were the
culmination of two important factors. First, there have been
significant changes in how food retailers compete and how
consumers shop in Canada.
The second is Loblaw’s own structure, with its history of
mergers and acquisitions. The organization is more complex and
less responsive than it should have been. These two trends
collided in 2006. Loblaw lacked the structural agility and vigour
to address its changing environment.
Sales for the year were $28.6 billion compared to $27.6 billion
in 2005, which represented a 3.7% improvement over last year.
The Company earned $1.3 billion of adjusted operating income(2)
in 2006, compared to $1.6 billion in 2005. Including a non-cash
goodwill impairment charge and other significant non-routine
costs, basic net loss per common share for the year was $0.80
compared to basic net earnings per common share of $2.72
last year. This was the Company’s first annual loss in nineteen
years. Adjusted basic net earnings per common share(2) for
the year declined to $2.72 in 2006 from $3.35 in the prior year.
Excluding the impact of necessary short term costs associated
with one of the largest transformations in the Company’s
history, Loblaw still earned $1.9 billion in Adjusted EBITDA(2).
Report of Operations(1)
Mark Foote President and Chief Merchandising Officer and Galen G. Weston Executive Chairman
2006 was a year of evolution as Loblaw Companies Limited continued to transform into a company that will be truly competitiveover the long term.
(1) See Forward-Looking Statements on the inside front cover.(2) See Non-GAAP Financial Measures on page 40 in the Financial Report.

6 2006 Annual Summary Loblaw Companies Limited
Our 100 Day Review
Last October, we initiated a 100 Day Review. This Review
included visits with every store manager and “total immersion”
sessions with every key function, where we took the temperature
of the organization and heard from our frontline colleagues
what they thought. This gave us an insight into the challenges
we faced and the depth of talent that we had in the organization.
We also put each key driver of our business under intense
scrutiny. Much of this work was conducted by Positive Action
Groups (“PAGs”) made up of some of our most talented
employees from across the organization. The mandate of the
PAGs was to report back within 40 days on critical issues and
how to resolve them. In particular, the PAGs were asked:
• Where do we stand on customer satisfaction – availability,
value-for-money, assortment and our store environments?
• How do we perform on retailing basics – store operations,
supply chain and information technology?
• How can we make our organization more agile and more
focused on stores and customers?
The findings of the PAGs gave us the fact-base from which senior
management could make informed decisions to move forward.
Core Strengths: We have a large number of strengths on which to
build – and many of these are unrivalled.
We start with the number one food market share in every region
and in Canada as a whole. Our control label brands, and
particularly President’s Choice, no name and Joe Fresh Style,
are among the best control label brands in Canada.
The sites from which we operate our stores are well positioned
within their markets. Our stores are more modern, on
average, than our competitors’ stores, and Loblaw owns more
of the stores from which we operate than any other publicly
traded retailer in Canada. Our strong balance sheet in
combination with Adjusted EBITDA(1) of $1.9 billion for 2006
gives us the potential to expand and refurbish our retail space,
increase price competitiveness and invest in infrastructure.
Report of Operations
We knew we had to change, but we also needed to ensure that the evolution of our business would be well-received and strategic over the long term.
Over
2,000new control labelproducts introduced in 2006
(1) See Non-GAAP Financial Measures on page 40 in the Financial Report.

2006 Annual Summary Loblaw Companies Limited 7
Finally, we have over 139,000 colleagues in stores, distribution
centres and store support centres who are eager for Loblaw
to succeed.
A number of key actions taken in 2006 will make an important
contribution to getting Loblaw back on track:
• Labour Relations – Loblaw was able to reach a new four-year
collective agreement with members of Ontario locals of the
United Food and Commercial Workers union in 2006, ensuring
stability and providing increased operating efficiencies on
a store by store basis.
• Store Closures – As part of a review of store operations,
management approved a plan to close underperforming stores.
• Inventory Liquidation – The Company managed inventory levels
down to more desirable levels in store backrooms, outside
storage as well as in distribution centres. Some success was
realized in late 2006 from focused clearance pricing as
well as the initiation of a liquidation process for selected
general merchandise inventory.
Our plan to Simplify, Innovate, Grow will begin to hit its stride
from mid-2007 onwards.
Simplify
Operating a less complicated business is the first crucial step
on our journey and it requires a new structure.
Following a thorough review of retail and merchandising functions
and processes across the Company, Loblaw took the difficult but
necessary decision in January 2007, to eliminate 800 to 1,000
positions in the National Head Office and Store Support Centre
and regional offices – but without affecting staffing at store level.
We have started to simplify Loblaw by defining roles more clearly,
making individual managers more accountable for performance,
and eliminating duplication between the national store support
centre and the regions. We are centralizing where centralization
counts, such as in purchasing, so that we leverage our national
scale advantage. Project Simplify entails centralizing the
merchandising and marketing functions, implementing agile,
execution-focused store operation functions and creating and
designing new business processes to support the new structure.
We have grown control labels in Canada, including President’s Choice, no name and Joe Fresh Style, so that they are now independently strong brands – and growing.
Over
1 Millionpackages of ChocolateChunk Brownie cookiessold upon launch

8 2006 Annual Summary Loblaw Companies Limited
Report of Operations
Canada has many regional differences and as part of the new
structure, we have created a new “Format Captain” role to
ensure that each of Loblaw’s retail formats is more nationally
consistent with each other, yet is responsive to varying
consumer needs across our regions.
We are fixing the retailing basics through the introduction
of more consistent supply chain and store processes.
The Loblaw supply chain is now operating as a single national
function instead of being regionally fragmented. The focus
is on end-to-end supply chain effectiveness and improving
availability, including forecasting, store-friendly deliveries
from distribution centres, and receiving and replenishment
processes in stores. A national information technology platform
continues to be carefully implemented with a focus on
simple, proven solutions designed to provide management
with the information it needs to run the business every day.
The resulting leaner organization will measure its progress
against specific, focused key performance indicators and will
reflect the elements of the Company’s “Formula for Growth”,
described under “Grow”.
Innovate
Innovation has been a cornerstone of Loblaw’s success. We will
reemphasize innovation as a source of competitive advantage.
Control label brands will be at the heart of that strategy.
Our flagship President’s Choice (“PC”), one of the most trusted
brands in Canada, will play a pivotal role. We will accelerate
the development of new PC products while revitalizing
the President’s Choice Insider’s Report, President’s Choice
Blue Menu, a leading healthy food line in Canada, and
PC Home. Our other important control label brands, from
no name to Joe Fresh Style, will be carefully expanded so that
we enhance Loblaw’s reputation for excitement and for offering
the latest in food and general merchandise. We will continue
to leverage the PC brand to drive growth in our financial services
and mobile phone services.
Loblaw intends to re-establish its position as one of the world’s
most innovative fresh food retailers. Our new store at Maple Leaf
Gardens in Toronto will be our national flagship for fresh food.
Innovation at Loblaw is not limited to products, but also extends to the unique environments that we have created in our leading retail formats.
www.loblaw.ca
For more information about our offerings,visit our websites at:
360o
design is great forlefties and righties!
www.pc.ca www.joe.ca

reviewers gaveour President’s Choice brand
9/10
Launched
700,000 square feet of Joe Fresh Style across Canada since April 2006
Canada’s
1stinfant formula made fromcertified organic food sources
Over
10 Million issues of the Insider’s Report delivered to households nationally

10 2006 Annual Summary Loblaw Companies Limited
Grow
Loblaw’s Formula for Growth, which focuses on what matters
to customers – from our unique products to making sure
that we are always in-stock, will guide our growth strategies
and tactics. For instance, one issue is that our store formats
are no longer distinctive enough. We believe that we can
significantly reduce our cost base so that we can reinvest
in stores and provide better customer service – while at
the same time creating more value for shareholders. Our growth
aspirations are that each of our three retail formats –
Superstore (like the Real Canadian Superstore), Great Food
(like Loblaws) and Hard Discount (like no frills) – will have
format-leading comparable store growth and that Loblaw
as a whole will grow market share in every region of Canada.
“Best Format”: The Real Canadian Superstore (“RCSS”) will
be the key platform for growth. We will continue to redesign
and refit these stores to appeal to all customer segments, with
our first redesigned RCSS in Ontario to open in the fall of 2007.
At the same time, our Great Food stores will focus on customers
who simply want outstanding food, while our Hard Discount
format will continue to serve customers who desire convenience
and great value. We will strive to ensure that the store format
is the best one for each site.
“Fresh First”: Fresh First continues to be a strategic
imperative for Loblaw. A “Fresh Walk” process is being introduced
to measure and sustain high standards across all of our
formats. Loblaw is committed to raising presentation and
quality standards, while minimizing waste, to match the
best in North America.
“Control Label Advantage”: Our control label brands, including
President’s Choice, no name and Joe Fresh Style, will be
at the centre of our culture of innovation. In the next three to
five years, we seek to achieve 30% of total sales from our
control label products.
Formula for Growth
Report of Operations
Our goals are to exceed industry averages and to reach a 98% “Always Available” target in food and 95% “Always Available” target in general merchandise.
45kids on our panel taste every President’sChoice Mini Chefsproduct
Friendly Colleagues Motivated
to Serve
Best Format
Always Available
Priced Right
Health, Home and Wholesome
10% Joe
Control LabelAdvantage
Fresh First
2006 Annual Summary Loblaw Companies Limited 11
“10% Joe”: The Joe Fresh Style label is Loblaw’s original
apparel brand, with significant growth potential. We will extend
this brand into accessories and children’s clothing, while
increasing the retail square footage of Joe Fresh Style in our
larger store formats. Our overall goal is to build Joe into a
$1 billion sales brand.
“Health, Home and Wholesome”: Loblaw aims to make healthy
living affordable for all Canadians with product lines such
as President’s Choice Organics, President’s Choice Blue Menu
and EXACT, and by bringing together our community spaces,
pharmacies, dietitians and fitness clubs in a way we believe that
no competitor can duplicate.
“Priced Right”: We will improve the way we invest in price
and the way we communicate in-store to ensure we get credit
for the value we offer.
“Always Available”: Through new forecasting and replenishment
tools, our goal is to have consistent availability in both food and
general merchandise in all of our stores.
“Friendly Colleagues Motivated to Serve”: At the centre of our
growth strategy are our employees. Across our organization, there
are 139,000 employees who will execute this strategy. We will
provide our team with the training they need to meet customer
needs. In 2007, we will introduce a new share ownership program
to help align employee goals with Company strategies.
By effectively implementing the Formula for Growth, management
aspires to achieve, on average, 5% sales growth, 10% adjusted
net earnings(1) growth and $250 million free cash flow (1).
Simplify, Innovate, Grow is an ambitious plan. It is a plan that
has been carefully considered and is achievable and already well
underway. It is a plan that is conceived and deeply committed
to by the new team of senior executives that I have the privilege
to lead. And it is one endorsed and embraced by our most
important asset – our Loblaw colleagues across Canada. Indeed,
it is a plan that once complete, will give our employees the
tools they need to do what they do best – serve millions
of customers in virtually every community in this great country.
At key moments in its history, Loblaw has been faced with
difficult challenges. Each time, it rose to those challenges –
transforming itself and Canadian retailing by setting standards
admired worldwide. It is that same spirit and determination
that inspires the women and men of our Company today to
Make Loblaw the Best Again.
Galen G. WestonExecutive Chairman
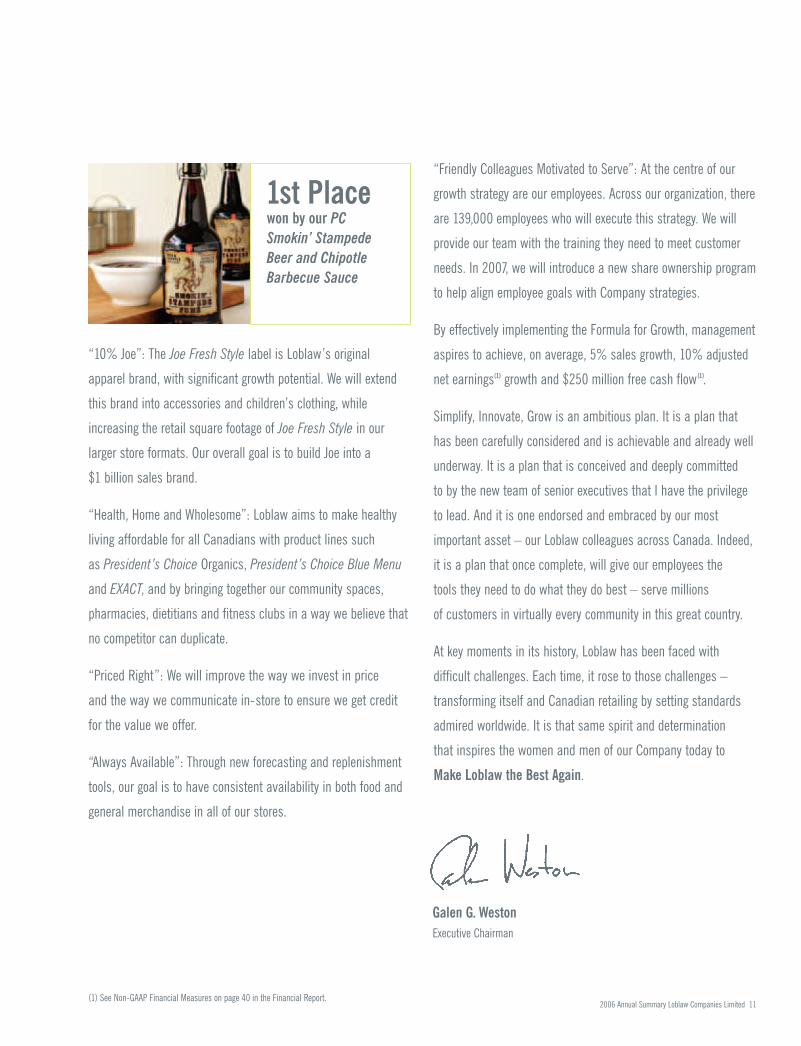
1st Placewon by our PC Smokin’ Stampede Beer and ChipotleBarbecue Sauce
(1) See Non-GAAP Financial Measures on page 40 in the Financial Report.
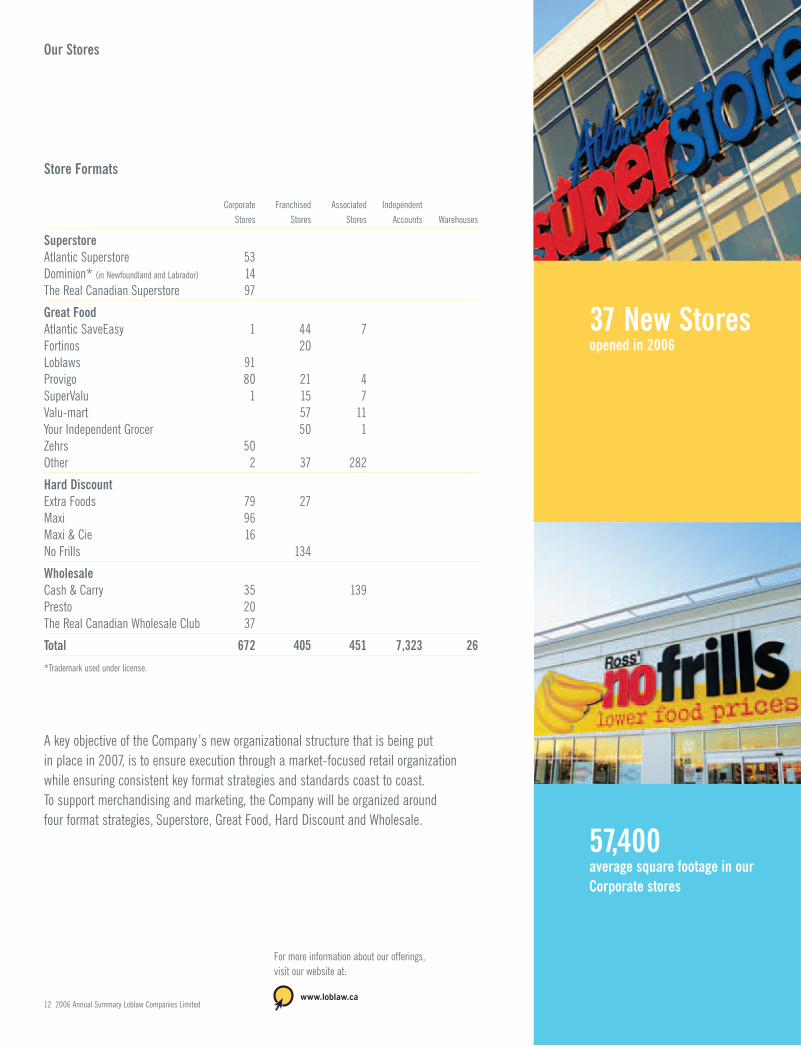
Corporate Franchised Associated Independent Stores Stores Stores Accounts Warehouses
SuperstoreAtlantic Superstore 53 Dominion* (in Newfoundland and Labrador) 14 The Real Canadian Superstore 97
Great Food Atlantic SaveEasy 1 44 7 Fortinos 20 Loblaws 91 Provigo 80 21 4 SuperValu 1 15 7 Valu-mart 57 11 Your Independent Grocer 50 1 Zehrs 50 Other 2 37 282
Hard Discount Extra Foods 79 27 Maxi 96 Maxi & Cie 16No Frills 134
WholesaleCash & Carry 35 139 Presto 20 The Real Canadian Wholesale Club 37
Total 672 405 451 7,323 26
*Trademark used under license.
Store Formats
12 2006 Annual Summary Loblaw Companies Limited
Our Stores
A key objective of the Company’s new organizational structure that is being put in place in 2007, is to ensure execution through a market-focused retail organization while ensuring consistent key format strategies and standards coast to coast.To support merchandising and marketing, the Company will be organized around four format strategies, Superstore, Great Food, Hard Discount and Wholesale.
www.loblaw.ca
For more information about our offerings,visit our website at:
37 New Storesopened in 2006
57,400 average square footage in ourCorporate stores

1,077 Corporate and Franchised storesacross Canada

14 2006 Annual Summary Loblaw Companies Limited
A message from Peggy Hornell, Director, Fundraising andAdministration, President’s Choice Children’s Charity:
President’s Choice Children’s Charity is dedicated to helpingchildren who are physically or developmentally challenged.
President’s Choice Children’s Charity had an outstanding year in 2006.Through the President’s Choice Decadent cookie and Jaden Charity Bearpromotions, and other national and regional fundraising activities, thePresident’s Choice Children’s Charity raised $9.4 million. This money will be directed towards helping more than 765 families across Canada.
This year, we launched our Charity Bear program with Jaden, named after one of the 15,000 children helped by PCCC across Canada. Jaden is 10 yearsold, has cerebral palsy and uses a wheelchair. President’s Choice Children’sCharity gave Jaden and his family the help to buy a new wheelchair accessible van.
Thanks to the support of Loblaw, its employees and customers, President’sChoice Children’s Charity will continue to make difficult lives a little easier.
Community Support
Acting with its employees, the Company supports and contributes to local organizations through its various operating divisions bysponsoring numerous charitable fundraising activities and initiating work experience programs for the physically and developmentallychallenged. The following are examples of our community involvement in 2006:
Cambridge Memorial Hospital FoundationSupports the hospital in raising funds for medical equipment, infrastructure and education of healthcare professionalsin order to meet the healthcare needs of the community.
Food Banks (across Canada)Supporting non-profit organizations that procure, warehouse and distribute foodto member social service agencies.
Grocery Industry Foundation... Together(G.I.F.T.)Provides funding to various Ontario charities dedicated to assisting childrenfacing physical, intellectual or economic challenges.
Heart and Stroke Foundation of CanadaDedicated to improving the health of Canadians by preventing and reducingdisability and death from heart disease and stroke through research, healthpromotion and advocacy.
ROM FoundationContributions fund galleries, curatorialresearch, and programs for children and ensure long term stability of the Royal Ontario Museum.
United Way – Centraide (across Canada)Committed to improving lives and building community by engaging individualsand mobilizing collective action.
The W. Garfield Weston Foundation is a private Canadian charitable
foundation associated with the Company. Its grants are directed
primarily to specific organizations in the fields of education and
environment. These include the Canadian Merit Scholarship
Foundation, the Children First: School Choice Trust, the Royal Ontario
Museum and the Weston Family Innovation Centre at the Ontario
Science Centre. From coast to coast, the Foundation also works with
the Nature Conservancy of Canada to protect critical habitat.
More than
765families helped in 2006 by thePresident’s ChoiceChildren’s Charities
Loblaw Companies Limited is an active participant in the variouscommunities which it serves and supports the philanthropic goals of the “IMAGINE” campaign.

2006 Annual Summary Loblaw Companies Limited 15
Corporate Social Responsibility
These commitments are instilled throughout the organization and are overseen by the Environmental, Health and Safety Committee of the Board of Directors (the “Board”) of the Company, and by the full Board itself. The Board reviews and monitors policies,procedures, practices and compliance in these fields. Initiatives in these areas are undertaken through any combination of fourapproaches: by the Company itself, in conjunction with other industry members, as part of industry-government partnerships, and in direct cooperation with governments.
Respecting the Environment in a Sustainable WayThe commitment to the environment isdemonstrated through measures in such areas as environmental awareness and management, energy efficiency, waste management and packaging.
Environmental Awareness ManagementMeasures in this area are driven by anEnvironmental Management System designed to achieve the structured integration ofenvironmental programs into the Company’soperations. This system also focuses onensuring the control of high-risk activities, themanagement of hazardous wastes, and thecontrol and reduction of ozone-depletingsubstances. Environmental risk assessmentsand audits of ongoing and newly acquired orestablished operations are conducted on aregular basis by in-house environmental staffas well as by external parties. In addition,employees receive education and training thatenable them to recognize and minimizeenvironmental risks and to respond to anyincidents that might occur.
Energy EfficiencyOngoing efforts are directed towards improvingenergy efficiency throughout Loblaw, includingcooperating with federal and provincialagencies. The areas in which these efficienciesare pursued include the lighting used inside and outside stores, energy-efficientrefrigeration, the use of energy in corporatefacilities, and the fuels used in the Company’stransportation and other operations. InSeptember 2005, Loblaw opened its new,energy-efficient National Head Office and StoreSupport Centre in Brampton, Ontario.
Furthermore, Loblaw has establishedpartnerships and commitments with federaland provincial agencies to achieve energyconservation at the retail store level in arealistic and focused manner, including the useof innovative refrigeration system technology.
Waste Management and PackagingWaste management programs follow a three-stage process – source reduction,diversion to re-use or recycling and, finally,disposal. Loblaw is a long-standing supporterof, and financial contributor to, such industry-sponsored programs as CorporationsSupporting Recycling and the CompostingCouncil of Canada. This commitment is evidentthroughout the Company’s operations. In-store photo labs recycle disposable cameras,processing fluids and even film cuttings. Post-consumer recycled material is used inprivate label packaging to the greatest extentpossible without compromising the safety or quality of the product. Packaging of controllabel products is labelled as appropriate with the symbols that help customers identifymaterials that can be recycled through localmunicipal programs. As well, customers areoffered a choice in grocery checkout packaging,including conventional plastic shopping bags, re-usable plastic bags, recyclablecorrugated containers and re-usable bins.Also, this commitment extends to theadministration, support and corporate officesof the Company, where waste minimization and recycling activities are actively employed.These programs promote the diversion ofplastics, metals, paper, corrugate and organicsfrom landfill.
Promoting Health and Food SafetyThe commitment to health promotion and food safety is reflected in the Company’sparticipation in standard-setting initiatives, in its operations, in its dealings with suppliers,and in the information provided to customers.
The Company supports national food initiativesdesigned to promote health and food safety. Itworks to ensure that products meet or exceedthe food safety requirements of the CanadianFood Inspection Agency. It also participates innational joint industry-government initiatives inthe development of food safety programs for different parts of the food supply system.Suppliers are informed of the standards towhich they must adhere and are expected toobserve them. Manufacturing and foodhandling procedures, employee education andtraining programs, compliance systems andindependent audits are among the measuresused to promote food safety within theCompany’s stores and other operations.Through packaging and labelling of controllabel products, customers are informed ofingredients and whether certain products mayhave come in contact with one or moreallergens. This allows consumers to makemore fully informed purchasing decisions.
Offering Products that Provide Meaningful ChoicesThe Company provides a wide range of productofferings to meet an equally wide range of consumer preferences. This includes theprovision of alternative food products thatprovide customers with meaningful choices.
The environmentally responsible collection of President’s Choice GREEN products and the hundreds of President’s ChoiceOrganics products have been developed tosatisfy customers’ environmental or healthpreferences. The organic products are third-party certified as organic, are inpackages containing recycled materials, andare priced to be competitive with similarnational brands. The Natural Value departmentin many stores is a one-stop source for healthfood needs, offering a selection of healthy and nutritious alternative foods, vitamins andherbal products.
The focus on healthy and nutritious foodproducts is further demonstrated by thecontinued expansion of product offerings underthe President’s Choice Mini Chefs and thePresident’s Choice Blue Menu programs. The line of PC Mini Chefs products has beendesigned to fit into a healthy eating plan for young children consistent with the federalgovernment’s “Nutrition Recommendations for Canadians.” These products have beenapproved by a team consisting of prominentnutrition researchers and registered dieticians.The PC Blue Menu products, now numberingover 250 products, offers adults a variety ofalternatives lower in fat, calories and sodium,and higher in fibre.
For more information, visit our website at:
Loblaw Companies Limited and its subsidiaries are committed toresponsible corporate citizenship. This includes providing a safeworkplace for employees, contributing to its local communities,respecting the environment, and promoting health and food safety, while offering products that provide meaningful choices to consumers.
www.loblaw.ca

16 2006 Annual Summary Loblaw Companies Limited
Summary of Corporate Governance Practices
The Board of Directors (the “Board”) and management of LoblawCompanies Limited (the “Company”) believe that sound corporategovernance practices will contribute to effective management.
The Company seeks to attain high standards of corporate governance andwhen appropriate adopts “best practices” in developing its approach tocorporate governance. The Company’s approach to corporate governance isconsistent with National Policy 58-201 – Corporate Governance Guidelines(the “Guidelines”). The Governance, Employee Development, Nominating and Compensation Committee (“Governance Committee”) regularly reviews its corporate governance practices and considers any changes necessary to maintain the Company’s high standards of corporate governance.
Director IndependenceThe Board is comprised of a majority of independent directors. TheGovernance Committee has reviewed each director’s factual circumstancesand relationships with the Company to determine whether he or she isindependent within the meaning of the Guidelines. The Guidelines provide thata director is independent if he or she has no material relationship with theCompany or its affiliates that would reasonably be expected to interfere withthe director’s independent judgment.
Board LeadershipMr. Galen G. Weston is Executive Chairman of the Company and Mr. Allan L.Leighton is Deputy Chairman. Mr. Weston has a significant common interest with other shareholders with respect to value creation, the well-beingof the Company, and the performance of its publicly listed securities.The Board has established a position description for each of the ExecutiveChairman and the Deputy Chairman. The Board has also appointed anindependent director, Anthony S. Fell, to serve as lead director. The leaddirector provides leadership to the Board and particularly to the independentdirectors. He ensures that the Board operates independently of managementand that directors have an independent leadership contact. As part of hisresponsibilities, the lead director meets periodically with the other directors to obtain insight as to areas where the Board and its Committees can operate more effectively and to ensure the Board is able to discharge its responsibilities independently of management. The Board has developed a position description for the lead director.
Board Responsibilities and DutiesThe Board, directly and through its Committees, supervises the managementof the business and affairs of the Company with the goal of enhancing long term shareholder value. The Board reviews the Company’s direction,assigns responsibility to management for achievement of that direction,develops and approves major policy decisions, delegates to management theauthority and responsibility in day-to-day affairs and reviews management’sperformance and effectiveness. The Board’s expectations of management arecommunicated to management directly and through Committees of the Board.
The Board approves the Company’s corporate goals and objectives, operatingbudgets and strategies, which take into account the opportunities and risks ofthe business. Members of the Board attend an annual all-day strategy sessionwith management to discuss and review the Company’s strategic plans and opportunities. In addition, management’s strengths and weaknesses arediscussed. Through the Audit Committee, the Board oversees the Company’srisk management framework and assesses and evaluates the integrity of the Company’s internal controls and management information systems.Through the Governance Committee, the Board oversees succession planningand compensation for senior management as well as Board nominees.
Individual directors may, with the approval of the lead director, retain anoutside advisor at the expense of the Company.
The Board requires that management seek directors’ review and approval of: • strategic corporate direction and corporate performance objectives; • multi-year and annual business, capital and operating plans and budgets; • material capital expenditures, acquisitions, divestitures and restructurings; and • investment outside of the ordinary course of business.
These matters are in addition to those matters which are required by law to receive Board consideration and approval.
The Board regularly receives reports on the operating results of the Company,as well as timely reports on various matters, including insurance, pensions,corporate governance, health and safety and treasury matters.
Ethical Business ConductThe Company’s Code of Business Conduct (the “Code”), sets out theCompany’s long-standing commitment of requiring adherence to highstandards of ethical conduct and business practices. The Code is reviewedannually to ensure it is current and reflects best practices in the area ofethical business conduct. Directors, officers and employees of the Companyare required to comply with the Code and must acknowledge theircommitment to abide by the Code on a periodic basis. The Code is availableon the Company’s website, www.loblaw.ca.
The Code also deals with conflicts of interest. Should an officer, director oremployee have a conflict of interest with respect to any matter, that individualis required to bring the conflict to the attention of the Ethics and ConductCommittee and, if a director has a conflict with respect to any matter, he or she may not participate in any discussion or vote on the conflict matter. The Code also addresses such issues as the protection of confidentialinformation and the protection and proper use of the Company’s assets.

2006 Annual Summary Loblaw Companies Limited 17
The Company has established an Ethics and Conduct Committee whichreviews all material breaches of the Code. The Ethics and Conduct Committeealso oversees implementation of the Code, educating employees regarding the Code and reviews the Code annually to determine if it requires revision.
The Company encourages the reporting of unethical behaviour and hasestablished an Ethics Response Line, a toll-free number that any employee or director may use to report conduct which he or she feels violates the Code or otherwise constitutes fraud or unethical conduct. A fraud reportingprotocol has also been implemented to ensure that fraud is reported to senior management in a timely manner. In addition, the Audit Committee has endorsed procedures for the receipt, retention and handling of complaintsregarding accounting, internal control or auditing matters. These proceduresare available at www.loblaw.ca.
The Company has adopted a Vendor Code of Conduct that sets out the Company’sexpectations of its vendor community with respect to ethical conduct and socialresponsibilities. The Vendor Code deals with such matters as labour practices,respect for the environment and compliance with various laws.
Board CommitteesThere are five committees of the Board: Audit; Governance, EmployeeDevelopment, Nominating and Compensation; Pension and Benefits;Environmental, Health and Safety and Executive.
The Audit Committee is comprised solely of independent directors. AllCommittees are comprised solely of non-management directors, in each case,with a majority of members being independent directors except for theExecutive Committee. The Board believes that the composition of its committeesother than the Executive Committee allows them to operate independentlyfrom management such that shareholders’ interests are protected.
Each Committee has a formal mandate and a position description for the Chair established by the Board. Both the mandate and position description arereviewed annually. Copies of the Committees’ mandates are available on theCompany’s website, www.loblaw.ca. The following is a brief summary of someof the responsibilities of each Committee.
Audit CommitteeAll members of the Audit Committee must be independent and financially literate as required underapplicable rules. The Audit Committee is also responsible for supporting the Board in overseeing the integrity of the Company’s financial reporting and internal controls over financial reporting,disclosure controls, internal audit function and its compliance with legal and regulatory requirements.The Audit Committee’s responsibilities include: • recommending the appointment of the external auditor; • reviewing the arrangements for and scope of the audit by the external auditor; • reviewing the independence of the external auditor; • reviewing and approving the Company’s hiring policies regarding partners and professional
employees of the present and former external auditor of the Company; • considering and evaluating with management the adequacy and effectiveness of internal controls
over financial reporting and disclosure controls and procedures and reviewing any proposedcorrective actions;
• reviewing and monitoring the Company’s policies relating to ethics and conflicts of interest; • overseeing procedures for the receipt, retention and follow-up of complaints regarding the
Company’s accounting, internal controls and auditing matters and the confidential anonymoussubmission by employees of concerns regarding such matters;
• reviewing and monitoring the internal audit function of the Company; • reviewing the integrity of the Company’s management and information systems; • reviewing and approving the audit fees paid to the external auditor and pre-approval of non-audit
related fees to the external auditor; • discussing and reviewing with management and the external auditor the Company’s annual and
interim consolidated financial statements, key reporting matters and Management’s Discussionand Analysis and Annual Information Form;
• reviewing disclosure containing financial information based on the Company’s financialstatements; and
• reviewing with management the principal risks of the Company’s business and the systems andprocesses implemented to manage these risks.
Governance, Employee Development, Nominating and Compensation CommitteeThe Governance Committee is responsible for overseeing the compensation of directors and executiveofficers. The Governance Committee is also responsible for developing and maintaining governancepractices consistent with high standards of corporate governance. As part of its mandate, the
Governance Committee identifies and recommends candidates for nomination to the Board asdirectors, monitors the orientation program for new directors and maintains a process for assessingthe performance of the Board and its Committees as well as the performance of individual directorsand discharging the Board’s responsibilities relating to compensation and succession planning for the Company’s senior employees. The Governance Committee’s specific responsibilities include: • identifying candidates for membership on the Board and evaluating the independence of
the directors; • assisting in directors’ orientation and assessing their performance on an ongoing basis; • shaping the Company’s approach to corporate governance and recommending to the Board
corporate governance principles to be followed by the Company; • discharging the Board’s responsibilities relating to compensation and succession planning for the
Company’s senior employees; and• determining the process for the compensation of directors and executive officers.
The Board appointed the Chairman of the Governance Committee, who is an independent director, to serve as lead director.
Pension and Benefits CommitteeThe Pension and Benefits Committee is responsible for: • reviewing the performance of the Company’s and its subsidiaries’ pension plans and pension funds; • reviewing and recommending managers for the fund’s portfolio; • reviewing the performance of pension fund managers; • reviewing and approving the assumptions used, the funded status and amendments to the
Company’s and its subsidiaries’ pension plans; and • receiving reports regarding level, types and costs of the Company’s employee benefit plans.
Environmental, Health and Safety CommitteeThe Environmental, Health and Safety Committee is responsible for reviewing and monitoring environ-mental, food safety and workplace health and safety policies, procedures, practices and compliance.
Executive CommitteeThe Executive Committee possesses all of the powers of the Board except the power to declarecommon dividends and certain other powers specifically reserved by applicable law to the Board. The Executive Committee acts only when it is not practicable for the full Board to meet.
Other Corporate Governance MattersDisclosure Policy The Board has reviewed and adopted a corporate Disclosure Policy to deal with the timely dissemination of all material information. A copy of the Disclosure Policy is available on the Company’s website, www.loblaw.ca. The Disclosure Policy, which is reviewed annually,establishes consistent guidance for determining what information is material and how it is to be disclosed to avoid selective disclosure and to ensure wide dissemination. The Board, directly and through its Committees, reviews and approves the contents of major disclosure documents,including unaudited interim and audited annual consolidated financial statements, Management’sDiscussion and Analysis, the Annual Information Form, and the Proxy Circular. The Company seeks to communicate to its shareholders through these documents as well as by means of newsreleases, its website and investor relations meetings.
Disclosure Committee A Disclosure Committee comprised of senior management of the Company oversees the Company’s disclosure process as outlined in the Disclosure Policy. The Disclosure Committee’s mandate includes ensuring that effective disclosure controls andprocedures are in place to allow the Company to satisfy all of its continuous disclosure obligationsincluding certification requirements. The Disclosure Committee is also responsible for ensuring that the policies and procedures contained in the Company’s Disclosure Policy are in compliance with regulatory requirements.

18 2006 Annual Summary Loblaw Companies Limited
Operational Directory(age and years of service)
Galen G. Weston (34 and 9 years)
Executive Chairman
Allan L. Leighton (53 and 1 year)
Deputy Chairman
Mark Foote (45 and 1 year)
President and Chief Merchandising Officer
Dalton Philips (38 and January 2007)
Chief Operating Officer
William M. Wells (46 and effective April 2007)
Chief Financial Officer
Robert A. Balcom (45 and 13 years)
Senior Vice President, Secretary and General Counsel
Karen Hanna (49 and 1 year)
Senior Vice President, Human Resources
Peter McMahon (51 and 1 year)
Executive Vice President, Supply Chain and Information Technology
Pietro Satriano (44 and 5 years)
Executive Vice President, Food
Galen G. Weston (34 and 9 years)
Executive Chairman
Allan L. Leighton (53 and 1 year)
Deputy Chairman
Mark Foote (45 and 1 year)
President and Chief Merchandising Officer
Dalton Philips (38 and January 2007)
Chief Operating Officer
William M. Wells (46 and effective April 2007)
Chief Financial Officer
David K. Bragg (58 and 23 years)
Executive Vice President
Barry K. Columb (42 and 1 year)
President, President’s ChoiceFinancial
Joseph Jackman (47 and 2 years)
Executive Vice President, Marketing
Richard P. Mavrinac (54 and 24 years)
Executive Vice President
Peter McMahon (51 and 1 year)
Executive Vice President, Supply Chain and Information Technology
Frank Rocchetti (46 and 1 year)
Executive Vice President, General Merchandise
Pietro Satriano (44 and 5 years)
Executive Vice President, Food
Robert A. Balcom (45 and 13 years)
Senior Vice President, Secretary and General Counsel
Roy R. Conliffe (56 and 25 years)
Senior Vice President, Labour Relations
Karen Hanna (49 and 1 year)
Senior Vice President, Human Resources
Louise M. Lacchin (49 and 23 years)
Senior Vice President, Finance
Ann Weir (44 and 13 years)
Senior Vice President, Internal Audit and Internal Control Compliance
Joseph J. Wilke (38 and 13 years)
Senior Vice President, Financial Reporting and Control
Geoffrey H. Wilson (51 and 20 years)
Senior Vice President, FinancialServices and Investor Relations
Manny DiFilippo (47 and 15 years)
Vice President, Risk Management and Strategic Initiatives
David G. Gore (36 and 5 years)
Vice President, Legal Counsel,Compliance, Privacy and Ethics Officer
J. Bradley Holland (43 and 13 years)
Vice President, Taxation
Michael N. Kimber (51 and 22 years)
Vice President, Legal Counsel
Joyce C. Lee (35 and 10 years)
Vice President, Financial Reporting
Lucy J. Paglione (47 and 23 years)
Vice President, Pension and Benefits
George D. Seslija (51 and 27 years)
Vice President, Real EstateDevelopment
Lisa R. Swartzman (36 and 13 years)
Vice President, Treasurer
Laurel MacKay-Lee (36 and 7 years)
Controller, Financial Projects
Irene Pinheiro (39 and 14 years)
Controller, Financial Analysis
Marian M. Burrows (52 and 28 years)
Assistant Secretary
Swavek A. Czapinski (32 and 8 years)
Assistant Treasurer
M. Darryl Hanstead (32 and 8 years)
Assistant Treasurer
Walter H. Kraus (44 and 18 years)
Senior Director, Environmental Affairs
Officers(age and years of service)

2006 Annual Summary Loblaw Companies Limited 19
Board of Directors
Galen G. Weston, B.A., M.B.A.1
Executive Chairman, LoblawCompanies Limited; Former SeniorVice President, Loblaw CompaniesLimited; Director, WittingtonInvestments, Limited; FormerDirector, George Weston Limited.
Allan L. Leighton1
Deputy Chairman, LoblawCompanies Limited, George WestonLimited, Selfridges & Co. Ltd.;Chairman, Royal Mail Group; Former President and ChiefExecutive Officer, Wal-Mart Europe;Director, BHS Ltd., Brown ThomasGroup Limited, BskyB plc, Holt, Renfrew & Co. Limited.
Paul M. Beeston, C.M., B.A., F.C.A.2,5
Chairman, Centre for Addiction andMental Health; Former Presidentand Chief Executive Officer, MajorLeague Baseball; Former President, Toronto Blue Jays Baseball Team;Director, President’s Choice Bank,Newport Partners Income Fund.
Gordon A.M. Currie, B.A., LL.B.4
Executive Vice President, Secretary and General Counsel,George Weston Limited; Former Senior Vice President andGeneral Counsel, Centrica NorthAmerica; Former Partner, Blake,Cassels & Graydon LLP.
Camilla H. Dalglish, B.A.5
Director, The W. Garfield WestonFoundation, The Garfield WestonFoundation (UK); Former President, The Civic Garden Centre; FormerDirector, The Nature Conservancy ofCanada, Royal Botanical Gardens.
Anthony S. Fell, O.C.3*,4*
Chairman, RBC Capital Markets Inc.;Former Chairman and ChiefExecutive Officer, RBC DominionSecurities; Former DeputyChairman, Royal Bank of Canada;Chairman, Munich ReinsuranceGroup of Companies; Director, BCEInc., CAE Inc., The Toronto CentralLocal Health Integration Network.
Anthony R. Graham1,3,4
President and Director, WittingtonInvestments, Limited; President and Chief Executive Officer,Sumarria Inc.; Former ViceChairman, National Bank Financial;Chairman and Director, President’sChoice Bank, Graymont Limited;Director, George Weston Limited,Brown Thomas Group Limited, Holt, Renfrew & Co., Limited, Power Corporation of Canada, Power Financial Corporation, Provigo Inc., Selfridges & Co. Ltd.
Nancy H.O. Lockhart, O.Ont.3,5*
Chief Administrative Officer, Frum Development Group; Former Vice President, Shoppers Drug Mart Corporation;Former Chair, Canadian Film Centre,Ontario Science Centre; Former President, Canadian Club of Toronto; Director, The Toronto Community Foundation,The Stratford Chef’s School.
Pierre Michaud, C.M.5
Founder, Réno-Dépôt Inc.; Chairman and Director, Provigo Inc.;Vice Chairman, Laurentian Bank of Canada; Director, BombardierRecreational Products Inc., Capital GVR Inc., Gaz Métro Inc.
Thomas C. O’Neill, B. COMM., F.C.A.2*
Retired Chairman,PricewaterhouseCoopers Consulting;Former Chief Executive Officer,PricewaterhouseCoopers LLP; Vice Chair, Board of Governors,Queen’s University; Director,President’s Choice Bank, Adecco S.A., BCE Inc., Nexen Inc.,Ontario Teachers’ Pension Plan, St. Michael’s Hospital.
G. Joseph Reddington, B.A., J.D.3
Retired Chairman, Director andChief Executive Officer, BreunersHome Furnishings Corporation;Former Chairman and ChiefExecutive Officer, The SignatureGroup; Former President and ChiefExecutive Officer, Sears Canada;Director, Ansett Worldwide.
John D. Wetmore B.Math.2,4
Former President and ChiefExecutive Officer, IBM Canada;Retired Vice President, ContactCentre Development, IBM Americas;Director, Research in Motion Limited,Sunnybrook Foundation, Universityof Waterloo; Trustee, ResolveBusiness Outsourcing Income Fund.
Joseph H. Wright, B.A.2,3,4
Managing Partner, BarnagainCapital; Former President and Chief Executive Officer, Swiss BankCorporation (Canada); Chairmanand Trustee, BFI Canada IncomeFund; Director, President’s ChoiceBank, OutdoorPartner MediaCorporation, ROC Pref Corp.
1. Executive Committee2. Audit Committee3. Governance, Employee Development,
Nominating and Compensation Committee4. Pension and Benefits Committee5. Environmental, Health and Safety Committee* Chairman of the Committee

TrademarksLoblaw Companies Limited and its subsidiaries own a number oftrademarks. Several subsidiariesare licensees of additionaltrademarks. These trademarks arethe exclusive property of LoblawCompanies Limited or the licensorand where used in this report are in italics.
National Head Office and Store Support CentreLoblaw Companies Limited1 President’s Choice CircleBrampton, CanadaL6Y 5S5Tel: (905) 459-2500Fax: (905) 861-2206Internet: www.loblaw.ca
Stock Exchange Listing and SymbolThe Company’s common shares arelisted on the Toronto Stock Exchangeand trade under the symbol “L”.
Common Shares63% of the Company’s common shares are owned beneficially by W. Galen Weston and George Weston Limited.
At year end 2006 there were274,173,564 common shares issuedand outstanding, 5,696 registered common shareholders and 100,744,229 common shares available for public trading.
The average daily trading volume of the Company’s common sharesfor 2006 was 382,410.
Investor RelationsShareholders, security analysts andinvestment professionals shoulddirect their requests to Mr. GeoffreyH. Wilson, Senior Vice President,Financial Services and InvestorRelations at the Company’s NationalHead Office or by e-mail [email protected]
Common Dividend PolicyIt is the Company’s policy tomaintain a dividend payment equalto approximately 20% to 25% of the prior year’s adjusted basicnet earnings per common share.(1)
Common Dividend DatesThe declaration and payment of quarterly dividends are made subject to approval by the Board of Directors. The anticipated recordand payment dates for 2006 are:
Record Date Payment Date
March 15 April 1June 15 July 1Sept. 15 Oct. 1Dec. 15 Dec. 30
Normal Course Issuer BidThe Company has a Normal Course Issuer Bid on the Toronto Stock Exchange.
Additional financial information hasbeen filed electronically with varioussecurities regulators in Canadathrough the System for ElectronicDocument Analysis and Retrieval(SEDAR) and with the Office of theSuperintendent of FinancialInstitutions (OSFI) as the primaryregulator for the Company’ssubsidiary, President’s Choice Bank. The Company holds an analyst callshortly following the release of itsquarterly results. These calls arearchived in the Investor Zonesection of the Company’s website.
Value of Common SharesFor capital gains purposes, thevaluation day (December 22, 1971)cost base for the Company is $0.958per common share. The value onFebruary 22, 1994 was $7.67 percommon share.
Registrar and Transfer AgentComputershare Investor Services Inc.100 University AvenueToronto, CanadaM5J 2Y1Tel: (416) 263-9200Toll free: 1-800-663-9097Fax: (416) 263-9394Toll free fax: 1-888-453-0330
To change your address, eliminate multiple mailings, or for othershareholder account inquiries, please contact ComputershareInvestor Services Inc.
Ce rapport est disponible enfrançais.
This Annual Summary was printed inCanada on Cougar Opaque, manufacturedtotally chlorine-free with 10% post-consumer fibre, at a mill independentlycertified as meeting the procurementprovisions of the Sustainable ForestryInitiative® (SFI) standard.
Independent AuditorsKPMG LLP
Chartered AccountantsToronto, Canada
Annual and Special MeetingLoblaw Companies Limited Annualand Special Meeting of Shareholderswill be held on Tuesday, May 1, 2007 at 11:00 a.m. at Maple Leaf Gardens, 60 Carlton Street, Toronto, Canada.
Shareholder and Corporate Information
Desig
n an
d Co
ordin
ation
: Ove
Des
ign &
Com
mun
icatio
ns L
td. w
ww.ov
edes
ign.co
mTy
pese
tting
: Mov
eable
Inc.
www.
mov
eable
.com
Prin
ting:
Tran
scon
tinen
tal P
rintin
g G.
P.
20 2006 Annual Summary Loblaw Companies Limited
(1) See Non-GAAP Financial Measures on page 40 of the 2006 Financial Report.

Loblaw Companies Limited1 President’s Choice CircleBrampton, CanadaL6Y 5S5
Tel: (905) 459-2500Fax: (905) 861-2206
For more information about our offerings,visit our websites at:
www.loblaw.ca
www.pc.ca
www.joe.ca

For more information, visit our website at www.loblaw.ca

2006 Financial Report
Simplify, Innovate,Grow

Financial Highlights
Contents2006 Financial Report
1 Management’s Discussion and Analysis44 Financial Results80 Glossary of Terms
As part of our fresh thinking, we are now introducing additional information on our website loblaw.ca.
The Annual Report consists of the 2006 Annual Summary and the 2006 Financial Report.
For the years ended December 30, 2006 and December 31, 2005 2006 2005($ millions except where otherwise indicated) (52 weeks) (52 weeks)
Operating ResultsSales(3) $ 28,640 $ 27,627Sales excluding the impact of VIEs (2) (3) 28,257 27,212Adjusted EBITDA(2) 1,892 2,132Operating income 289 1,401Adjusted operating income(2) 1,326 1,600Interest expense 259 252Net (loss) earnings (219) 746
Cash FlowCash flows from operating activities 1,180 1,489Free cash flow (2) 70 103Capital investment 937 1,156
Per Common Share ($)
Basic net (loss) earnings (.80) 2.72Adjusted basic net earnings (2) 2.72 3.35Dividend rate at year end .84 .84Cash flows from operating activities 4.31 5.43Book value 19.85 21.48Market price at year end 48.79 56.37
Financial RatiosAdjusted EBITDA margin (2) 6.7% 7.8%Operating margin 1.0% 5.1%Adjusted operating margin (2) 4.7% 5.9%Return on average total assets (2) 2.3% 11.2%Return on average shareholders’ equity (3.9%) 13.2%Interest coverage 1.0:1 5.1:1Net debt (2) to equity .72:1 .66:1
Operating StatisticsRetail square footage (in millions) 49.7 48.5Average corporate store size (square feet) 57,400 56,100Corporate stores sales per average square foot ($) 585 579Same-store sales growth .8% .2%Number of corporate stores 672 670Number of franchised stores 405 402
(1) For financial definitions and ratios refer to the Glossary of Terms on page 80.(2) See Non-GAAP Financial Measures on page 40.(3) During 2006, the Company implemented Emerging Issues Committee Abstract 156, “Accounting by a Vendor for Consideration
Given to a Customer (Including a Reseller of the Vendor’s Products)” on a retroactive basis. Accordingly certain sales incentives paid to independent franchisees, associates and independent accounts for the prior year have been reclassified between sales and cost of sales, selling and administrative expenses. For a further discussion, see the Accounting Standards Implemented in 2006 section in the Management’s Discussion and Analysis of this Financial Report.

2006 Financial Report Loblaw Companies Limited 1
Management’s Discussion and Analysis
2 1. Forward-Looking Statements
3 2. Overview
4 3. Vision and Strategies
5 4. Key Performance Indicators
6 5. Financial Performance8 5.1 Results of Operations
SalesOperating IncomeInterest ExpenseIncome TaxesNet Earnings
13 5.2 Financial ConditionFinancial RatiosCommon Share DividendsOutstanding Share Capital
14 6. Liquidity and Capital Resources14 6.1 Cash Flows
Cash Flows from Operating ActivitiesCash Flows used in Investing ActivitiesCash Flows used in Financing Activities
16 6.2 Sources of Liquidity18 6.3 Contractual Obligations18 6.4 Off-Balance Sheet Arrangements
GuaranteesSecuritization of Credit Card ReceivablesIndependent Funding TrustFinancial Derivative Instruments
20 7. Selected Consolidated Annual Information
22 8. Quarterly Results of Operations22 8.1 Results by Quarter24 8.2 Fourth Quarter Results
26 9. Management’s Certification of Disclosure Controls and Procedures
27 10. Risks and Risk Management27 10.1 Operating Risks and Risk Management
Industry and Competitive EnvironmentChange ManagementFood Safety and Public HealthInformation TechnologyLabourEmployee Future Benefit ContributionsMulti-Employer Pension PlansThird-Party Service ProvidersReal EstateSeasonalityExcess InventoryEmployee Development and RetentionUtility and Fuel PricesInsuranceEnvironmental, Health and SafetyEthical Business ConductLegal, Taxation and AccountingHolding Company Structure
32 10.2 Financial Risks and Risk ManagementFinancial Derivative InstrumentsForeign Currency Exchange RateInterest RateCommon Share Market PriceCounterpartyCredit
34 11. Related Party Transactions
34 12. Critical Accounting Estimates35 12.1 Inventories35 12.2 Employee Future Benefits36 12.3 Goodwill36 12.4 Income Taxes37 12.5 Goods and Services Tax and Provincial Sales Taxes37 12.6 Fixed Assets
37 13. Accounting Standards37 13.1 Accounting Standards Implemented in 200638 13.2 Future Accounting Standards
40 14. Outlook
40 15. Non-GAAP Financial Measures
43 16. Additional Information
Management’s Discussion and Analysis
2 2006 Financial Report Loblaw Companies Limited
The following Management’s Discussion and Analysis (“MD&A”) for Loblaw Companies Limited and its subsidiaries (collectively, the“Company” or “Loblaw”) should be read in conjunction with the consolidated financial statements and the accompanying notes on pages 45to 77 of this Financial Report. The consolidated financial statements and the accompanying notes have been prepared in accordance withCanadian generally accepted accounting principles (“GAAP”) and are reported in Canadian dollars. The consolidated financial statementsinclude the accounts of the Company and its subsidiaries and variable interest entities (“VIEs”) that the Company is required to consolidatein accordance with Accounting Guideline 15, “Consolidation of Variable Interest Entities”, (“AcG 15”). A glossary of terms used throughoutthis Financial Report can be found on page 80. The information in this MD&A is current to March 13, 2007, unless otherwise noted.
1. Forward-Looking Statements
This Annual Report, including the Annual Summary and this MD&A, contains forward-looking statements which reflect management’sexpectations and are contained in discussions regarding the Company’s objectives, plans, goals, aspirations, strategies, potential futuregrowth, results of operations, performance and business prospects and opportunities. Forward-looking statements are typically, though not always, identified by words or phrases such as “anticipates”, “expects”, “believes”, “estimates”, “intends” and other similar expressions.
These forward-looking statements are not guarantees, but only predictions. Although the Company believes that these statements are basedon information and assumptions which are current, reasonable and complete, these statements are necessarily subject to a number offactors that could cause actual results to vary significantly from the estimates, projections and intentions. Such differences may be causedby factors which include, but are not limited to, changes in consumer spending and preferences, heightened competition including newcompetitors and expansion of current competitors, changes in the Company’s or its competitors’ pricing strategies, the ability to realizeanticipated cost savings and efficiencies, including those resulting from restructuring, inventory liquidation and other cost reduction andsimplification initiatives, the ability to execute restructuring plans, implement strategies and introduce innovative products successfully and in a timely manner, changes in the markets for the inventory intended for liquidation and changes in the expected realizable value andcosts associated with the liquidation, unanticipated, increased or decreased costs associated with the announced initiatives, including thoserelated to compensation costs, the Company’s relationship with its employees, results of labour negotiations including the terms of futurecollective bargaining agreements, changes to the regulatory environment in which the Company operates now or in the future, changes in the Company’s tax liabilities, either through changes in tax laws or future assessments, performance of third-party service providers, public health events, the ability of the Company to attract and retain key executives and supply and quality control issues with vendors. The calculation of the goodwill impairment charge described in this MD&A involves the estimation of several variables, including but not limited to market multiples, projected future sales and earnings, capital investment, discount rates, terminal growth rates and the fair values of those assets and liabilities being valued. The Company cautions that this list of factors is not exhaustive.
The assumptions applied in making the forward-looking statements contained in this Annual Report, including this MD&A include the following: economic conditions do not materially change from those expected, patterns of consumer spending are reasonably consistent with historical trends, no new significant competitors enter our market nor does any existing competitor unexpectedly significantly increase its presence, neither the Company’s nor its competitors’ pricing strategies change materially, the Company successfully offers new and innovative products and executes its strategies as planned, anticipated cost savings and efficiencies are realized as planned,continuing future restructuring activities are effectively executed in a timely manner, costs associated with the liquidation of inventory arenot higher or lower than expected, the Company’s assumptions regarding average compensation costs and average years of service foremployees affected by the simplification initiatives are materially correct, the Company does not significantly change its approach to itscurrent restructuring activities, there is no material amount of excess inventory in the Company’s supply chain, there are no material work stoppages and the performance of third-party service providers is in accordance with expectations.

2006 Financial Report Loblaw Companies Limited 3
These estimates and assumptions may change in the future due to uncertain competitive and economic market conditions or changes in business strategies. This list of factors and other risks and uncertainties are discussed in the Company’s materials filed with theCanadian securities regulatory authorities from time to time, including the Risks and Risk Management section of this MD&A.
Potential investors and other readers are urged to consider these factors carefully in evaluating these forward-looking statements and are cautioned not to place undue reliance on them. The forward-looking statements included in this Annual Report, including this MD&Aare made only as of the filing date of this Annual Report and the Company disclaims any obligation or intention to publicly update theseforward-looking statements to reflect new information, future events or otherwise. In light of these risks, uncertainties and assumptions, the forward-looking events contained in these forward-looking statements may or may not occur. The Company cannot assure that projectedresults or events will be achieved.
2. Overview
Loblaw, a subsidiary of George Weston Limited, is Canada’s largest food distributor and a leading provider of general merchandise, drugstoreand financial products and services. Through its various operating banners, including 672 corporate stores and 405 franchised stores,Loblaw is committed to providing Canadians across the country with a one-stop destination in meeting their food and everyday householdneeds. For 50 years, the Company has supplied the Canadian market with innovative products and services through a portfolio of storeformats across Canada.
Corporate owned store banners include Atlantic Superstore, Dominion (in Newfoundland and Labrador), Extra Foods, Loblaws, Maxi, Maxi & Cie, Provigo, the Real Canadian Superstore and Zehrs and wholesale outlets operating as Cash & Carry, Presto and The Real Canadian Wholesale Club. The Company’s franchised and associated stores operate under the trade names Atlantic SaveEasy,Fortinos, no frills, SuperValu, Valu-mart and Your Independent Grocer. The store network is supported by 26 Company-operated and 2 third-party warehouse facilities located across Canada as well as temporary storage facilities when required.
The Company offers a strong control label program, including the President’s Choice, no name and Joe Fresh Style brands. In addition, the Company makes available to consumers President’s Choice Financial services and products, including the President’s ChoiceFinancial MasterCard®, and PC Financial auto, home, travel and pet insurance, PC Mobile phone service, as well as a loyalty programknown as PC points.
The Company competes in the retail industry in Canada, which is a changing and competitive market. Consumer needs drive industry changes,which are impacted by changing demographic and economic trends such as changes in disposable income, ethnic diversity, nutritionalawareness and time availability. Over the past several years, consumers have demanded more choice, value and convenience. Customersatisfaction is central to the success of the Company’s business.
The Company competes with non-traditional competitors as well as traditional supermarkets. Recent industry changes have seen theexpansion of non-traditional competitors, such as mass merchandisers, warehouse clubs, drugstores, limited assortment stores, discountstores, convenience stores and specialty stores, all of which continue to increase their offerings of products typically associated withtraditional supermarkets. Over the past several years, there has been an increase in the number of retail outlets that traditionally exclusivelyfeatured food, general merchandise or drugstore items that now offer a selection of these items, resulting in what is commonly referred to in the industry as “channel blurring”. This evolution of the retail landscape presents a number of issues for traditional grocers: the need toreposition conventional supermarkets to either expand or, conversely, better focus their offerings; the reality of lower prices offered by discountretailers; and the need to reduce operating and labour costs in order to maintain earnings in light of lower prices and increased competition.

Management’s Discussion and Analysis
4 2006 Financial Report Loblaw Companies Limited
Since the beginning of 2005 and throughout 2006, the financial performance of the Company has been uncharacteristically poor. 2006 was a year of challenge and change for the Company as it evolves through its continued transformation into a company that will be trulycompetitive over the long term. The past year saw a number of significant changes in the operations of the Company, including the change in senior leadership. Galen G. Weston was appointed Executive Chairman of the Company’s Board of Directors (the “Board”), Mark Footebecame President and Chief Merchandising Officer and Allan L. Leighton joined the Board as Deputy Chairman. Early in 2007, Dalton Philipsjoined the Company as Chief Operating Officer and William M. Wells will be joining the Company as Chief Financial Officer, effective April 2007. A 100 Day Review of the Company commenced in the latter half of 2006 which focused on key drivers of the business such asfresh food presentation, maximizing employee engagement, the performance of retailing basics and customer satisfaction. The results of this review provided key inputs into management’s future business priorities and vision for the organization.
3. Vision and Strategies
VisionLoblaw’s vision is to maximize the return on its assets under the three main principles of, “Simplify, Innovate, Grow” in addition to its “Formula for Growth”. The Company strives to be consumer focused, cost effective and agile. While accepting prudent operating risks,Loblaw seeks long term, stable growth supported by a strong balance sheet, with the goal of providing sustainable superior returns to its shareholders through a combination of common share price appreciation and dividends.
StrategiesUnder the principles of Simplify, Innovate, Grow, the Company employs various operating and financial strategies which guide the Companyover the long term and represent a philosophy for the way in which it conducts its business.
Loblaw is simplifying the organization by more clearly defining accountabilities, eliminating duplication and establishing consistent, simpleand efficient processes. A less complex organizational structure and a short list of key performance indicators are expected to lead to more focus on customers and store operations.
Innovation is one of the many strengths of Loblaw, most clearly exhibited by its control label offerings. The Company supports innovationbased on the belief that providing consumers with new products and convenient services at competitive prices and stimulating shoppingenvironments is critical to its success.
The new management team developed its Formula for Growth to define priorities for a three year renewal plan. In order to provide anintegrated offering of food, general merchandise and drugstore, the Company’s Formula for Growth focuses on the following:• best format: truly distinctive formats meeting customers’ different needs;• fresh first: best fresh food offering;• control label advantage: leading in the development of unique, high quality control label products and services;• Joe Fresh Style: ensuring great style at an affordable price;• health, home and wholesome: making healthy living affordable;• priced right: providing best value;• always available: best in-stock positions; and• friendly colleagues motivated to serve.
The Company’s long term operating strategies are consistent with its Formula for Growth and continue to be as follows: • using the cash flow generated in the business to invest in its future; • owning its real estate, where possible, to maximize flexibility for product and business opportunities in the future; • using a multi-format approach to maximize market share over the longer term; • focusing on food but serving the consumer’s everyday household needs;

2006 Financial Report Loblaw Companies Limited 5
• creating customer loyalty and enhancing price competitiveness through a superior control label program; • implementing and executing plans and programs flawlessly; and • constantly striving to improve the Company’s value proposition.
The Company’s long term financial strategies are as follows: • maintaining a strong balance sheet; • minimizing the risks and costs of its operating and financing activities; and • maintaining liquidity and access to capital markets.
The table below summarizes the Company’s strategic imperatives and the activities undertaken in 2006 to progress these imperatives.
Strategic Imperative Progress in 2006
Simplify • Continued efforts to restructure the supply chain which proved to be more complex and costly than originallyanticipated. By year end, the supply chain stabilized and delivered improved service levels.
• Planned and developed organizational transition, focused on redesigned processes and a leaner administrative structure.
• Identified key performance indicators to be further developed and implemented in 2007.
Innovate • Launched Joe Fresh Style apparel for adults in April 2006 with positive consumer response.• Developed and distributed a record six issues of the Insider’s Report to a total of over ten million homes
in Canada, keeping customers informed about exciting new products and services.• Over 2,000 new control label products launched.
Grow • Commenced the 100 Day Review of key drivers of the business.• Established the first phase of Positive Action Groups, teams made up of employees from every functional area
across the business, dedicated to producing meaningful action on individual strategic issues includingoptimization of the Real Canadian Superstore, fresh perception measurement, groundwork for Maple LeafGardens great food store, Credit For Value, on-shelf availability measurement, and an employee survey tool.
• Continued major product development, to be refined as needed.• Reached a labour agreement in Ontario which will allow store conversions.
Board CommitmentThe Company’s Board and senior management meet annually to review the strategic imperatives. These strategic imperatives, whichgenerally span a three to five year timeframe, target specific issues in response to the Company’s performance and changes in consumerneeds and the competitive retail landscape.
4. Key Performance Indicators
As a result of the priorities established under the new management’s Formula for Growth and following the 100 Day Review, the Company has identified and is developing specific key performance indicators to measure the progress of short and long term strategies. These keyperformance indicators will measure format same-store sales, fresh perception, penetration of control label sales, Joe Fresh Style percentageshare of total general merchandise sales; specific comparative sales for Health and Beauty, Natural Value and President’s Choice Organics,index pricing targets, targeted on-shelf availability and employee satisfaction. In 2007, targets will be implemented across the Company thatwill enable management to assess progress made on each imperative as well as the effectiveness of implementation of the Company’sstrategy. The Company believes that if it successfully implements and executes its various strategic imperatives in support of its long termoperating and financial strategies, it will be well positioned to pursue its vision of providing sustainable superior returns to its shareholders.

Management’s Discussion and Analysis
6 2006 Financial Report Loblaw Companies Limited
Additional key financial performance indicators are set out below:
Key Financial Performance Indicators
2006 2005(2)
(52 weeks) (52 weeks)
Sales growth 3.7% 6.1%Sales growth excluding the impact of VIEs(1) 3.8% 4.5%Basic net earnings per common share decline (129.4%) (22.9%)Adjusted basic net earnings per common share(1) decline (18.8%) (3.7%)Net debt(1) to equity ratio .72:1 .66:1Free cash flow(1) ($ millions) $ 70 $ 103Return on average shareholders’ equity (3.9%) 13.2%
(1) See Non-GAAP Financial Measures on page 40.(2) During 2006, the Company implemented Emerging Issues Committee Abstract 156, “Accounting by a Vendor for Consideration Given to a Customer (Including a Reseller of the Vendor’s
Products)” on a retroactive basis. Accordingly certain sales incentives paid to independent franchisees, associates and independent accounts for the prior years have been reclassifiedbetween sales and cost of sales, selling and administrative expenses. For a further discussion, see the Accounting Standards Implemented in 2006 section included in this MD&A.
By effectively implementing the Formula for Growth, management aspires to achieve on average 5% sales growth, 10% adjusted netearnings(1) growth and $250 million of free cash flow(1).
5. Financial Performance
Basic net loss per common share for 2006 was $0.80, a decrease of $3.52 when compared to basic net earnings per common share of$2.72 last year. Basic net loss per common share was impacted in 2006 by the following: • a charge of $2.92 per common share related to non-cash goodwill impairment;• a charge of 20 cents per common share related to the Ontario collective labour agreement;• a charge of 16 cents per common share related to inventory liquidation;• a charge of 17 cents per common share for the net effect of stock-based compensation and the associated equity forwards;• a charge of 11 cents per common share related to restructuring and other charges; • a charge of 3 cents per common share related to a departure entitlement payment; • income of 6 cents per common share related to the adjustment to future income tax balances resulting from changes in the Canadian
federal and certain provincial statutory income tax rates; and• income of 1 cent per common share related to the consolidation of VIEs.
After adjusting for the above-noted items, adjusted basic net earnings per common share(1) were $2.72 for 2006 compared to $3.35 in 2005,a decline of 18.8%, which for 2005 excluded the impact of the following:• a charge of 22 cents per common share for the net effect of stock-based compensation and the associated equity forwards;• a charge of 20 cents per common share related to restructuring and other charges;• a charge of 10 cents per common share for Goods and Services Tax (“GST”) and provincial sales taxes (“PST”); • a charge of 7 cents per common share for direct costs associated with supply chain disruptions;
(1) See Non-GAAP Financial Measures on page 40.

2006 Financial Report Loblaw Companies Limited 7
• a charge of 1 cent per common share related to the adjustment to future income tax balances resulting from changes in statutoryincome tax rates; and
• a charge of 3 cents per common share related to the consolidation of VIEs.
Results for 2006 were affected by the short term costs associated with one of the largest transformations in the Company’s history. Theneed for this transformative process was driven by the Company’s recent uncharacteristically poor financial performance, its assessmentof a fast-changing retail environment and a strategic review of processes, structure and key drivers of its operations.
This strategic review highlighted both core strengths and issues to be addressed. The core strengths include a strong market share, controllabel products and a strong store network. A number of issues facing the business included unacceptable levels of on-shelf availability, the need to strengthen price positioning, insufficiently distinctive formats, a complex organizational structure with inconsistent proceduresand standards which lacked clear accountabilities and insufficient focus on the customer. In response to these findings, the Companyembarked on planning and developing an organizational transition which focuses on redesigning processes, a leaner administrative structureand a comprehensive strategy designed to fortify its competitive position and maintain its leadership role in meeting the food and everyday household needs of Canadian consumers. In pursuit of this strategy, the Company is refocusing the business around the threeprinciples of Simplify, Innovate, Grow and took decisive action in 2006 to initiate tangible change. Additional steps taken in 2006 includethe negotiation of a new four-year collective agreement with members of certain Ontario locals of the United Food and Commercial Workersunion (“UFCW”), the liquidation of certain general merchandise inventory and the closure of certain underperforming stores.
Changes in 2005 included the restructuring of its supply chain network, the reorganizations involving its merchandising, procurement andoperations groups, the establishment of a new National Head Office and Store Support Centre in Brampton, Ontario, which opened in 2005,and the relocation of general merchandise operations from Calgary, Alberta to the new National Head Office.
During 2005, the Company encountered challenges during the execution of planned changes to its systems, supply chain and generalmerchandise areas, including certain supply chain systems conversions which were initiated as part of the creation of a nationalinformation technology platform and the start-up of a new third-party owned and operated general merchandise warehouse anddistribution centre for eastern Canada which handles general merchandise and certain drugstore products, primarily health and beautycare products. These challenges disrupted the flow of inventory to the Company’s stores and caused the Company to incur additionaloperating costs and reduced overall sales as product availability impacted consumers at the store level.
During 2006, the Company continued to feel the effects from these changes. However, progress continued to be made in reducing the impact of the supply chain disruptions as follows:• the third-party owned and operated general merchandise warehouse and distribution centre for eastern Canada posted slight
productivity improvements and achieved improved service levels;• six additional systems conversions were completed during the year with minimal disruption to continuing operations as part of
the move to a national systems platform;• food service levels continued at expected levels during 2006 and service levels for drugstore improved; and• service levels for general merchandise showed signs of stability and improvement, and while slower than anticipated, progress
has been made.

Management’s Discussion and Analysis
8 2006 Financial Report Loblaw Companies Limited
5.1 Results of Operations
Sales and Sales Growth Excluding the Impact of VIEs(1)
2006 2005(2)
($ millions except where otherwise indicated) (52 weeks) (52 weeks)
Total sales $ 28,640 $ 27,627Less: Sales attributable to the consolidation of VIEs 383 415
Sales excluding the impact of VIEs(1) $ 28,257 $ 27,212
Total sales growth 3.7% 6.1%Less: Impact on sales growth attributable to the consolidation of VIEs (.1%) 1.6%
Sales growth excluding the impact of VIEs(1) 3.8% 4.5%
(1) See Non-GAAP Financial Measures on page 40.(2) During 2006, the Company implemented Emerging Issues Committee Abstract 156, “Accounting by a Vendor for Consideration Given to a Customer (Including a Reseller of the Vendor’s
Products)” on a retroactive basis. Accordingly certain sales incentives paid to independent franchisees, associates and independent accounts for the prior years have been reclassifiedbetween sales and cost of sales, selling and administrative expenses. For a further discussion, see the Accounting Standards Implemented in 2006 section included in this MD&A.
SalesFull year sales in 2006 increased 3.7% to $28.6 billion from $27.6 billion last year, including a decrease of 0.1% or $32 million in salesrelating to the consolidation of certain independent franchisees as required by AcG 15. In 2006, sales excluding the impact of VIEs(1),increased by $1 billion or 3.8% over last year.
The following factors further explain the major components in the change in sales over the prior year: • food, general merchandise and drugstore sales posted gains over the prior year across all regions of the country;• significant sales growth from the Real Canadian Superstore program in Ontario; • same-store sales growth of approximately 0.8% compared to 0.2% in 2005; • a decline in tobacco sales negatively impacted sales and same-store sales by approximately 1.2%;
Sales Sales Growth Sales Growth Excluding Impact of VIEs (1)
(1) See Non-GAAP Financial Measures on page 40.(2) 2003 was a 53 week year.
0
7,500
15,000
22,500
$30,000
Sales and Sales Growth ($ millions)
2003 20062005200420020
5
10
15
20%
(2)0
1.5
3.0
4.5
6.0%
Same-Store Sales Growth
Same-Store Sales Growth
20062005200420032002
(1) 2003 was a 53 week year.
(1)
(1) See Non-GAAP Financial Measures on page 40.

2006 Financial Report Loblaw Companies Limited 9
• national food price inflation as measured by “The Consumer Price Index for Food Purchased from Stores” (“CPI”) was approximately2.3% for the year compared to approximately 2.0% for 2005, with variances by region; the Company’s calculation of food price inflation,which considers Company-specific product mix and pricing strategy, was reasonably consistent with that of CPI;
• an increase in net retail square footage of 1.2 million square feet or 2.5% due to the net effect of the opening of 37 new corporate andfranchised stores and the closure of 33 stores inclusive of stores which underwent conversions and major expansions;
• sales per corporate store increased to $33 million in 2006 from $32 million in 2005 reflecting the introduction of larger stores which areexpected to become ultimately more productive; and
• sales per average square foot of corporate stores of $585 in 2006 increased from $579 in 2005 as a result of an increase in sales whichoutpaced the increase in net retail square footage.
Sales of control label products for 2006 amounted to $6.2 billion compared to $5.9 billion in 2005. Control label penetration, which is measured as control label retail sales as a percentage of total retail sales, was 22.9% for 2006, compared to 22.4% for 2005. The Company introduced over 2,000 new control label products in 2006, including 1,400 new general merchandise products. The Company’s control label program, which includes President’s Choice, PC, President’s Choice Organics, President’s Choice Blue Menu,President’s Choice Mini Chefs, no name, Joe Fresh Style, Club Pack, President’s Choice GREEN, EXACT, Teddy’s Choice and Life@Home,provides additional sales growth potential.
Loblaw expects that the following initiatives, coupled with continued focus on value-for-money, promotions and advertising whereappropriate, will generate continued sales growth over the next few years: • focus on on-shelf availability of product through an enhancement of customer focus and supply chain, and stronger store processes; • restoring innovation as a competitive advantage both for control label products as well as unique environments in each retail format;• refining three distinctive retail formats: Superstore, Great Food and Hard Discount, and making the Real Canadian Superstore the key
platform for growth;• increasing the number of stores carrying the Joe Fresh Style apparel offering;• emphasizing a fresh first focus by raising presentation and quality standards; and• training of employees to ensure they are focused on meeting customer needs.
Operating Income, Adjusted Operating Income(1), Adjusted EBITDA(1) and Margins(1)
2006 2005($ millions except where otherwise indicated) (52 weeks) (52 weeks) Change
Operating income $ 289 $ 1,401 (79%)Adjusted operating income(1) $ 1,326 $ 1,600 (17%)Adjusted EBITDA(1) $ 1,892 $ 2,132 (11%)Operating margin 1.0% 5.1%Adjusted operating margin(1) 4.7% 5.9%Adjusted EBITDA margin(1) 6.7% 7.8%
(1) See Non-GAAP Financial Measures on page 40.
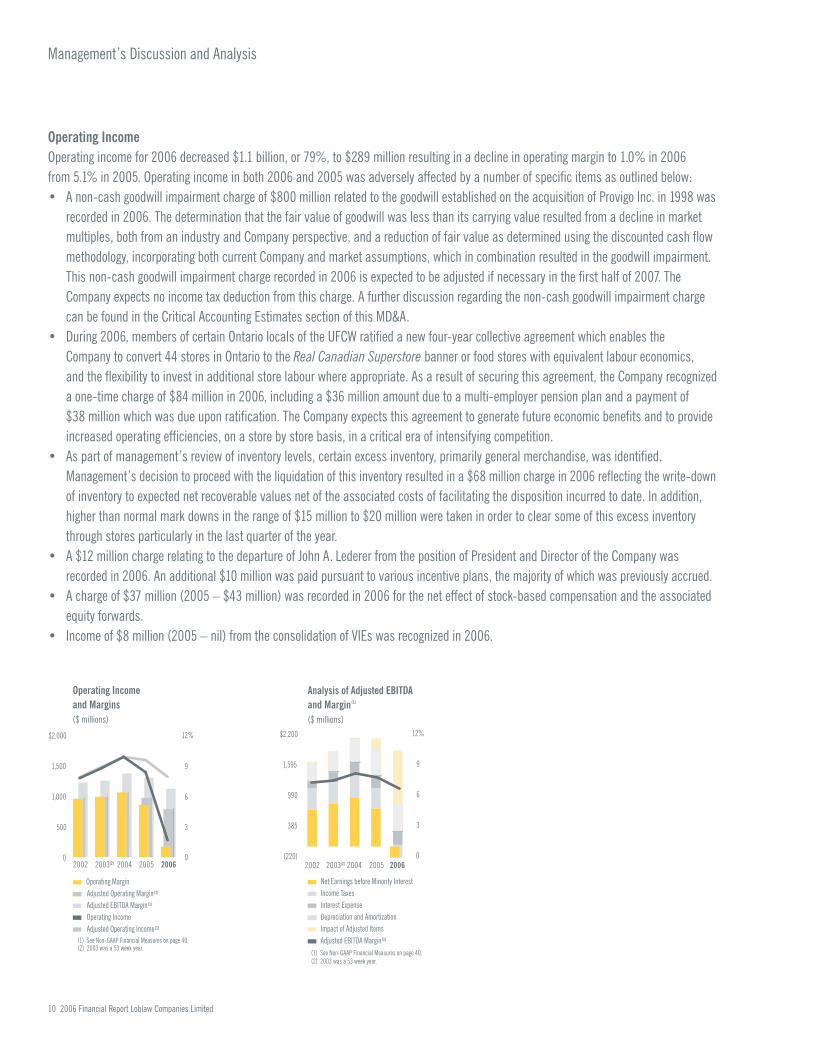
Management’s Discussion and Analysis
10 2006 Financial Report Loblaw Companies Limited
Operating IncomeOperating income for 2006 decreased $1.1 billion, or 79%, to $289 million resulting in a decline in operating margin to 1.0% in 2006 from 5.1% in 2005. Operating income in both 2006 and 2005 was adversely affected by a number of specific items as outlined below:• A non-cash goodwill impairment charge of $800 million related to the goodwill established on the acquisition of Provigo Inc. in 1998 was
recorded in 2006. The determination that the fair value of goodwill was less than its carrying value resulted from a decline in marketmultiples, both from an industry and Company perspective, and a reduction of fair value as determined using the discounted cash flowmethodology, incorporating both current Company and market assumptions, which in combination resulted in the goodwill impairment.This non-cash goodwill impairment charge recorded in 2006 is expected to be adjusted if necessary in the first half of 2007. TheCompany expects no income tax deduction from this charge. A further discussion regarding the non-cash goodwill impairment chargecan be found in the Critical Accounting Estimates section of this MD&A.
• During 2006, members of certain Ontario locals of the UFCW ratified a new four-year collective agreement which enables the Company to convert 44 stores in Ontario to the Real Canadian Superstore banner or food stores with equivalent labour economics, and the flexibility to invest in additional store labour where appropriate. As a result of securing this agreement, the Company recognizeda one-time charge of $84 million in 2006, including a $36 million amount due to a multi-employer pension plan and a payment of $38 million which was due upon ratification. The Company expects this agreement to generate future economic benefits and to provideincreased operating efficiencies, on a store by store basis, in a critical era of intensifying competition.
• As part of management’s review of inventory levels, certain excess inventory, primarily general merchandise, was identified.Management’s decision to proceed with the liquidation of this inventory resulted in a $68 million charge in 2006 reflecting the write-downof inventory to expected net recoverable values net of the associated costs of facilitating the disposition incurred to date. In addition,higher than normal mark downs in the range of $15 million to $20 million were taken in order to clear some of this excess inventorythrough stores particularly in the last quarter of the year.
• A $12 million charge relating to the departure of John A. Lederer from the position of President and Director of the Company wasrecorded in 2006. An additional $10 million was paid pursuant to various incentive plans, the majority of which was previously accrued.
• A charge of $37 million (2005 – $43 million) was recorded in 2006 for the net effect of stock-based compensation and the associatedequity forwards.
• Income of $8 million (2005 – nil) from the consolidation of VIEs was recognized in 2006.
0
500
1,000
1,500
$2,000
0
3
6
9
Operating Income and Margins ($ millions)
Operating MarginAdjusted Operating Margin (1)
Adjusted EBITDA Margin (1)
Operating IncomeAdjusted Operating Income (1)
20062005200420032002
12%
(1) See Non-GAAP Financial Measures on page 40.(2) 2003 was a 53 week year.
(2)(220)
385
990
1,595
$2,200
0
3
6
9
12%
Analysis of Adjusted EBITDA and Margin($ millions)
Net Earnings before Minority InterestIncome TaxesInterest ExpenseDepreciation and AmortizationImpact of Adjusted ItemsAdjusted EBITDA Margin (1)
20062005200420032002
(1) See Non-GAAP Financial Measures on page 40.(2) 2003 was a 53 week year.
(1)
(2)

2006 Financial Report Loblaw Companies Limited 11(1) See Non-GAAP Financial Measures on page 40.
Included in restructuring and other charges of $44 million (2005 – $86 million) within operating income were the following:• As part of its assessment of store operations, management of the Company approved and communicated a plan in 2006 to close
19 underperforming Quebec stores, mainly within the Provigo banner, and 8 stores in the Atlantic region. This resulted in a charge in 2006 of $29 million for fixed asset impairment and other costs arising from these store closures and employee termination costs. In addition, as a result of the loss of tobacco sales following the decision by a major tobacco supplier to sell directly to certain customers of the Company, a review of the impact on the Cash & Carry and wholesale club network was undertaken. In 2006, managementapproved and communicated a formal plan to close 24 wholesale outlets which were impacted most significantly by this change. This initiative resulted in a charge of $6 million in 2006 for fixed asset impairment and other costs arising from these closures andemployee termination costs. These closures are expected to be completed during 2007.
• A charge of $8 million (2005 – $62 million) was recorded in 2006 relating to the plan approved in 2005 concerning the restructuring of thesupply chain operations, including the closure of six distribution centres and the relocation of certain activities to new distribution centres.
• A charge of $1 million (2005 – $24 million) related to the reorganization of the merchandising, procurement and operations groups, the establishment of a National Head Office and Store Support Centre and the relocation of the general merchandise operations fromCalgary, Alberta to Brampton, Ontario, was recorded in 2006, all of which were approved in 2005.
A summary of restructuring and other charges is included in the table below:
Costs Recognized Costs Recognized Total Total2006 2005 Expected Expected Costs
($ millions) (52 weeks) (52 weeks) Costs Remaining
Store operations $ 35 $ – $ 54 $ 19Supply chain network 8 62 90 20Office move and reorganization of
the operation support functions 1 24 25 –
Total restructuring and other charges $ 44 $ 86 $ 169 $ 39
Details regarding the nature of the above charges are described in Note 4 to the consolidated financial statements.
Additional items specific to 2005 included in operating income in that year are:• A charge of $40 million related to potential liabilities for GST and PST which was not appropriately charged and remitted; and• Approximately $30 million of direct costs associated with the supply chain disruptions experienced during the last two quarters of 2005.
After adjusting for the above noted items, adjusted operating income(1) was $1.3 billion in 2006 compared to $1.6 billion in 2005. Adjusted operating margin(1) was 4.7% in 2006 compared to 5.9% in 2005. Adjusted EBITDA margin(1) decreased to 6.7% from 7.8% in 2005.The $274 million decline in adjusted operating income(1) and the significant decline in adjusted operating margin(1) for 2006 over 2005 wasdue to a variety of factors as discussed below.
Early in 2006, operating income was adversely impacted by the effects of product supply issues, resulting from the implementation challengesarising from the 2005 conversions, and delays in program activities resulted in foregone sales and lost cost leverage on fixed components ofoperating and administrative expenses. The Company’s supply chain performance in the areas of general merchandise and drugstore was notat acceptable levels. Therefore, management early in the year was focused on improving service levels and ensuring product availability at the store level to support merchandising programs. By the end of 2006, the supply chain had stabilized and delivered improved service levels.

Management’s Discussion and Analysis
12 2006 Financial Report Loblaw Companies Limited
Throughout 2006, the continued investments in lower food prices to drive sales growth had a negative impact on operating income. Aggregategross margin percentage softened as a result of this pricing investment, higher general merchandise mark downs, primarily in the fourth quarter,and higher inventory shrink, partially offset by improvements in buying synergies and improved mix of food, general merchandise and drugstore.Higher information technology investments in addition to store and distribution centre operational costs, principally labour, were incurred in orderto stabilize the flow of product to the stores. Short term costs of additional third-party locations for storage of inventory were also absorbed.
A fixed asset impairment charge of $27 million was recorded in 2006 due in part to a decision to suspend plans for a number of sitesscheduled for future development.
As mentioned previously, the new management team is refocusing the business through three principles: Simplify, Innovate, Grow, and has developed a Formula for Growth as a framework for a three year renewal plan. Business priorities for 2007 to return the Company to higher profitability include the following:• simplifying the organization by more clearly defining accountabilities, eliminating duplication and establishing consistent, simple and
efficient processes;• restoring innovation as a competitive advantage; and• focusing on retailing basics in the areas of store operations, supply chain and information technology including on-shelf availability and
major investments in price to obtain maximum Credit For Value.
Early in 2007, the Company approved and announced the restructuring of its merchandising and store operations into more streamlinedfunctions. Costs of this restructuring including severance, retention and other costs are expected to be in the range of $150 million to $200 million, the substantial portion to be recorded in the first half of 2007. The Company is also assessing the loss of drugstore-relatedoperating income in 2007 arising from recently enacted legislative changes late in 2006 by the Ontario government, as more fully explained in the Operating Risks and Risk Management section of this MD&A.
Interest ExpenseInterest expense consists primarily of interest on short and long term debt, the amortization of deferred financing costs, interest on financialderivative instruments net of interest income earned on short term investments and interest capitalized to fixed assets. In 2006, totalinterest expense increased $7 million, or 2.8%, to $259 million from $252 million in 2005.
Interest on long term debt was $284 million compared to $290 million in 2005. The 2006 weighted average fixed interest rate on long termdebt (excluding capital lease obligations) was 6.7% (2005 – 6.7%) and the weighted average term to maturity was 17 years (2005 – 17 years).
0
.2
.4
.6
.8
0
2.5
5.0
7.5
10.0
Net Debt(1) to Equity and Interest Coverage
Net Debt(1) to Equity
Interest Coverage
Net D
ebt t
o Equ
ity
Inte
rest
Cov
erag
e – Ti
mes
20062005200420032002
(1) See Non-GAAP Financial Measures on page 40.
0
3,500
7,000
10,500
$14,000
0
4
8
12
16%
Total Assets and Return on Average Total Assets(1)
($ millions)
Total Assets
Return on Average Total Assets (1)
20062005200420032002
(1) See Non-GAAP Financial Measures on page 40. (2) 2003 was a 53 week year.
(2)
(1) See Non-GAAP Financial Measures on page 40.
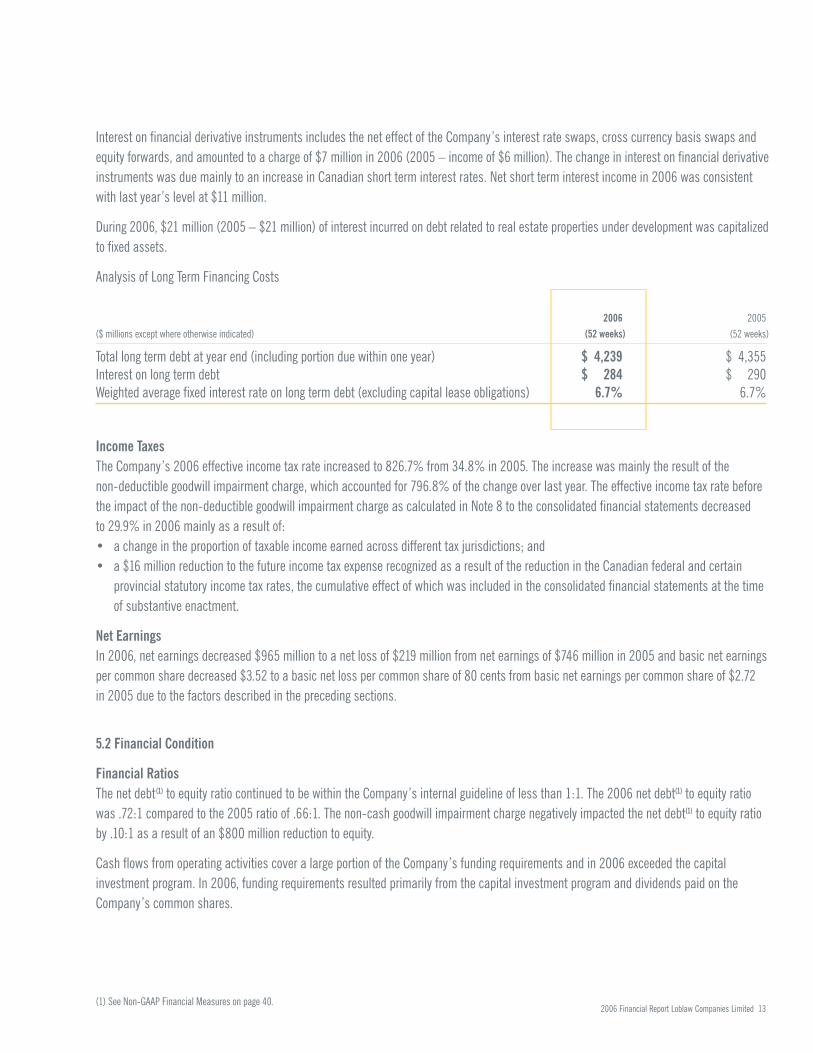
2006 Financial Report Loblaw Companies Limited 13
Interest on financial derivative instruments includes the net effect of the Company’s interest rate swaps, cross currency basis swaps andequity forwards, and amounted to a charge of $7 million in 2006 (2005 – income of $6 million). The change in interest on financial derivativeinstruments was due mainly to an increase in Canadian short term interest rates. Net short term interest income in 2006 was consistentwith last year’s level at $11 million.
During 2006, $21 million (2005 – $21 million) of interest incurred on debt related to real estate properties under development was capitalizedto fixed assets.
Analysis of Long Term Financing Costs
2006 2005($ millions except where otherwise indicated) (52 weeks) (52 weeks)
Total long term debt at year end (including portion due within one year) $ 4,239 $ 4,355Interest on long term debt $ 284 $ 290Weighted average fixed interest rate on long term debt (excluding capital lease obligations) 6.7% 6.7%
Income TaxesThe Company’s 2006 effective income tax rate increased to 826.7% from 34.8% in 2005. The increase was mainly the result of the non-deductible goodwill impairment charge, which accounted for 796.8% of the change over last year. The effective income tax rate beforethe impact of the non-deductible goodwill impairment charge as calculated in Note 8 to the consolidated financial statements decreased to 29.9% in 2006 mainly as a result of:• a change in the proportion of taxable income earned across different tax jurisdictions; and• a $16 million reduction to the future income tax expense recognized as a result of the reduction in the Canadian federal and certain
provincial statutory income tax rates, the cumulative effect of which was included in the consolidated financial statements at the time of substantive enactment.
Net EarningsIn 2006, net earnings decreased $965 million to a net loss of $219 million from net earnings of $746 million in 2005 and basic net earningsper common share decreased $3.52 to a basic net loss per common share of 80 cents from basic net earnings per common share of $2.72 in 2005 due to the factors described in the preceding sections.
5.2 Financial Condition
Financial RatiosThe net debt (1) to equity ratio continued to be within the Company’s internal guideline of less than 1:1. The 2006 net debt(1) to equity ratiowas .72:1 compared to the 2005 ratio of .66:1. The non-cash goodwill impairment charge negatively impacted the net debt(1) to equity ratioby .10:1 as a result of an $800 million reduction to equity.
Cash flows from operating activities cover a large portion of the Company’s funding requirements and in 2006 exceeded the capitalinvestment program. In 2006, funding requirements resulted primarily from the capital investment program and dividends paid on theCompany’s common shares.
(1) See Non-GAAP Financial Measures on page 40.

Management’s Discussion and Analysis
14 2006 Financial Report Loblaw Companies Limited
In 2006, shareholders’ equity decreased $445 million, or 7.6%, to $5.4 billion. The significant decline in operating income resulted in aninterest coverage ratio of 1.0 times in 2006 compared to 5.1 times in 2005. The goodwill impairment charge is a significant non-cash item in operating income, which adversely impacted the interest coverage ratio by approximately 3.1 times.
At year end, the working capital position increased over the prior year. The 2006 return on average total assets(1) was 2.3% compared to 11.2% in 2005. The 2006 return on average shareholders’ equity was (3.9)% compared to the 2005 return of 13.2%. Both 2006 returnswere negatively impacted by the incremental costs and charges incurred in 2006 as outlined previously. The five year average return onshareholders’ equity was 12.5% (2005 – 17.3%).
Common Share DividendsThe declaration and payment of dividends are at the discretion of the Board. The Company’s dividend policy is to maintain a dividendpayment equal to approximately 20% to 25% of the prior year’s adjusted basic net earnings per common share(1), giving consideration to the year end cash position, future cash flow requirements and investment opportunities. Currently, there is no restriction that wouldprevent the Company from paying dividends at historical levels. The Company intends to maintain the current dividend level in 2007 puttingannualized dividends above the historical range. During 2006, the Board declared quarterly dividends of 21 cents per common share. The annualized dividend per common share of 84 cents is equal to 25.1% of the 2005 adjusted basic net earnings per common share(1),which is consistent with the Company’s dividend policy. Subsequent to year end, the Board declared a quarterly dividend of 21 cents per common share, payable April 1, 2007.
Outstanding Share CapitalThe Company’s outstanding share capital is comprised of common shares. An unlimited number of common shares is authorized and274,173,564 common shares were issued and outstanding at year end. Further information on the Company’s outstanding share capital is provided in Note 18 to the consolidated financial statements.
At year end, a total of 4,084,646 stock options were outstanding and represented 1.5% of the Company’s issued and outstanding commonshares, which was within the Company’s guideline of 5%. Further information on the Company’s stock-based compensation is provided inNote 19 to the consolidated financial statements.
6. Liquidity and Capital Resources
6.1 Cash Flows
Major Cash Flow Components
2006 2005($ millions) (52 weeks) (52 weeks) Change
Cash flows from (used in):Operating activities $ 1,180 $ 1,489 $ (309)Investing activities $ (1,308) $ (903) $ (405)Financing activities $ (120) $ (208) $ 88
(1) See Non-GAAP Financial Measures on page 40.

2006 Financial Report Loblaw Companies Limited 15
Cash Flows from Operating Activities2006 cash flows from operating activities decreased to $1.2 billion compared to $1.5 billion in 2005. The change in cash flows fromoperating activities for the year is mainly due to the decrease in operating income.
Cash Flows used in Investing Activities2006 cash flows used in investing activities were $1.3 billion compared to $0.9 billion in 2005. During 2005, proceeds were received from the sale of a portfolio of third-party long term loans receivable as described in the Related Party Transactions section of this MD&A. In addition, capital expenditures declined $219 million and the longer term to maturity profile of the Company’s short term investmentsportfolio resulted in a shift to short term investments from cash and cash equivalents.
Capital investment amounted to $0.9 billion (2005 – $1.2 billion) for the year as the Company continued to maintain and renew its assetbase and invest for growth. Approximately 79% (2005 – 82%) of the capital investment was for new stores, renovations or expansions. The continued capital investment activity benefited all regions in varying degrees and strengthened the existing store base. Some of the new,larger stores replaced older, smaller, less efficient stores that did not offer the broad range of products and services demanded by today’sconsumer. The remaining 21% (2005 – 18%) of the capital investment was for the warehouse and distribution network, informationsystems and other infrastructure required to support store growth. Levels of capital investment in 2007 are expected to be lower than in previous years as a result of the Company’s desire to fully prove store format economics before building new stores.
The 2006 corporate and franchised store capital investment program, which includes the impact of store openings and closures, resulted in an increase in net retail square footage of 2.5% over 2005. During 2006, 37 (2005 – 69) new corporate and franchised stores wereopened and 147 (2005 – 77) underwent renovation or minor expansion. The 37 new stores, net of 33 (2005 – 57) store closures, added 1.2 million square feet of retail space (2005 – 2.8 million). The 2006 average corporate store size increased 2.3% to 57,400 square feet(2005 – 56,100) and the average franchised store size increased 1.1% to 27,400 square feet (2005 – 27,100).
At year end 2006, the Company had committed approximately $153 million (2005 – $264 million) with respect to capital investment projectssuch as the construction, expansion and renovation of buildings and the purchase of real property.
During 2006, the Company also generated $99 million (2005 – $109 million) from fixed asset sales.
0
375
750
1,125
$1,500
Cash Flows from Operating Activities and Capital Investment ($ millions)
Cash Flows from Operating ActivitiesCapital Investment
20062005200420032002
(1) 2003 was a 53 week year.
(1)

Management’s Discussion and Analysis
16 2006 Financial Report Loblaw Companies Limited
Capital Investment and Store Activity
2006 2005(52 weeks) (52 weeks) Change
Capital investment ($ millions) $ 937 $ 1,156 $ (219)Retail square footage (in millions) 49.7 48.5 2.5%Average store size (sq. ft.)
Corporate 57,400 56,100 2.3%Franchised 27,400 27,100 1.1%
Cash Flows used in Financing ActivitiesCash flows used in financing activities decreased to $120 million in 2006 compared to $208 million in 2005 mainly due to the 2006 fourthquarter dividend payment occurring after year end.
During the second quarter of 2006, the Company repaid its $125 million of 8.70% Series 1996 Provigo Inc. Debenture as it matured.
During 2005, the Company’s 2003 Base Shelf Prospectus expired and a new Base Shelf Prospectus was filed allowing for the issue of up to $1.0 billion of aggregate Medium Term Notes (“MTN”), all of which remains available.
The Company intends to renew its Normal Course Issuer Bid (“NCIB”) to purchase on the Toronto Stock Exchange or enter into equityderivatives to purchase up to 5% of its common shares outstanding. No shares were purchased for cancellation in 2006 under the NCIB(2005 – 226,100).
6.2 Sources of Liquidity
The Company can obtain its short term financing through a combination of cash generated from operating activities, cash, cash equivalents,short term investments, bank indebtedness and its commercial paper program. The Company’s cash, cash equivalents and short terminvestments, as well as $845 million in uncommitted operating lines of credit extended by several banks, support its $1.2 billion commercialpaper program. The Company’s commercial paper borrowings generally mature less than three months from the date of issuance althoughthe terms can be up to 364 days.
Securitization of credit card receivables provides President’s Choice Bank (“PC Bank”), a wholly owned subsidiary of the Company, with an additional source of funds for the operation of its business. Under PC Bank’s securitization program, a portion of the total interest in the credit card receivables is sold to independent trusts. In 2006, PC Bank restructured its credit card securitization program and Eagle Credit Card Trust (“Eagle”), a previously established independent trust, issued $500 million of five year senior notes and subordinatednotes due 2011 at a weighted average rate of 4.5%. The restructuring of the portfolio yielded a nominal net loss. PC Bank securitized an aggregate $240 million of credit card receivables during 2006 (2005 – $225 million). Information on PC Bank’s credit card receivablesand securitization is provided in Notes 1 and 11 to the consolidated financial statements and in the Off-Balance Sheet Arrangements section of this MD&A.
The Company obtains its long term financing through its MTN program. The Company plans to refinance existing long term debt as it matures.

2006 Financial Report Loblaw Companies Limited 17
In the normal course of business, the Company establishes standby letters of credit used in connection with certain obligations related to thefinancing program for its independent franchisees, securitization of PC Bank’s credit card receivables, real estate transactions and benefitprograms. At year end, the aggregate gross potential liability related to the Company’s standby letters of credit was approximately $333 million(2005 – $276 million) against which the Company had $371 million (2005 – $316 million) in credit facilities available to draw on.
It is the intention of the Company to enter into a committed credit facility expected to be extended by several banks in the amount of $500 million for general corporate purposes and to support the Company’s commercial paper program.
The Company has the following sources from which it can fund its 2007 cash requirements:• cash flows generated from operating activities;• cash, cash equivalents, and short term investments;• commercial paper program;• MTN program; and• additional credit card receivable securitizations from future growth in the PC Bank credit card operations.
During the third quarter of 2006, the Company’s MTN and debentures were downgraded by Dominion Bond Rating Service (“DBRS”) to “A” from “A (high)” and the commercial paper rating was confirmed at “R-1 (low)”. In both cases, the trend was changed to “stable” from“negative”. During the fourth quarter of 2006, the Company’s long term corporate credit and commercial paper ratings were downgraded by Standard & Poor’s (“S&P”) to “A-” from “A” and to “A-1 (low)” from “A-1 (mid)”, respectively. The Company was removed fromCreditWatch with negative implications and the outlook was changed to “stable”.
Subsequent to year end, DBRS placed the Company’s MTN and debentures Under Review with Negative Implications and at the same time, confirmed the Company’s commercial paper rating at its current level with a “stable” trend; and S&P placed the Company’s long termcorporate credit and commercial paper ratings on CreditWatch with negative implications. Although a further rating decline will increaseborrowing costs, the Company anticipates no difficulty in obtaining external financing based on past experience and the expectation of stablemarket conditions.
The Company’s current credit ratings are outlined in the table below:
Credit Ratings (Canadian Standards)
Dominion Bond StandardRating Service & Poor’s
Commercial paper R-1 (low) A-1 (low)Medium term notes A A-Other notes and debentures A A-
The rating organizations listed above base their credit ratings on quantitative and qualitative considerations. These credit ratings areintended to give an indication of the risk that the Company will not fulfill its obligations in a timely manner.
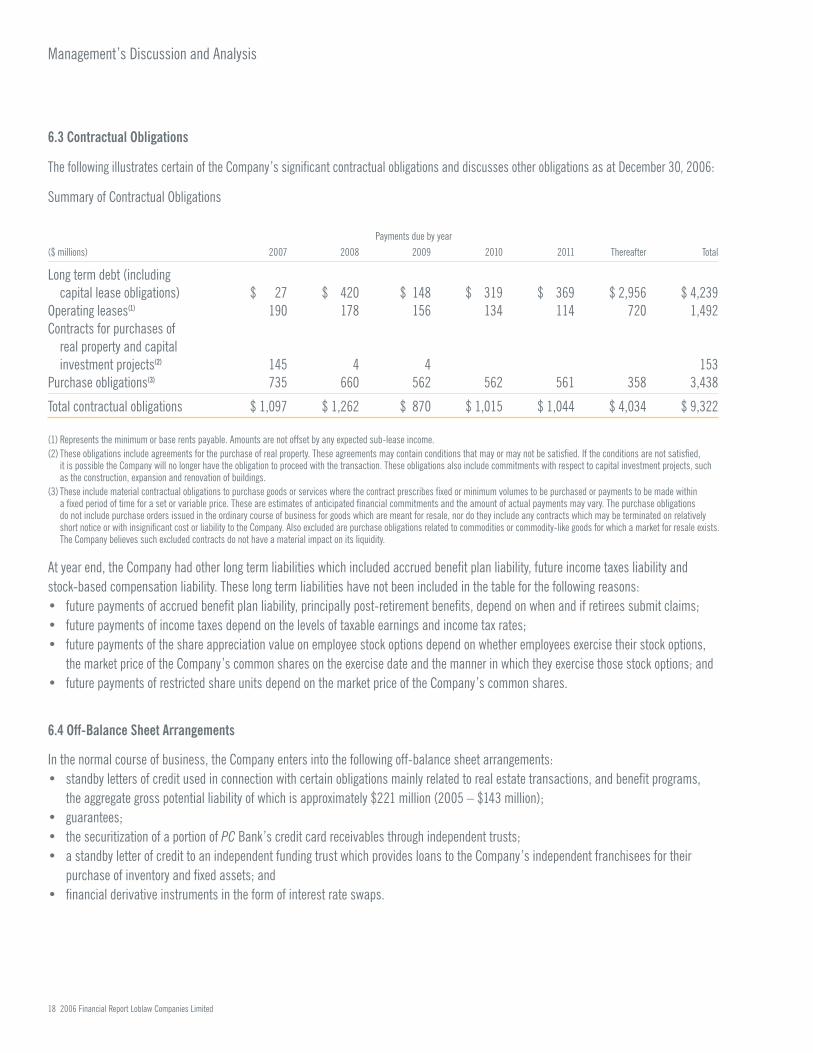
Management’s Discussion and Analysis
18 2006 Financial Report Loblaw Companies Limited
6.3 Contractual Obligations
The following illustrates certain of the Company’s significant contractual obligations and discusses other obligations as at December 30, 2006:
Summary of Contractual Obligations
Payments due by year($ millions) 2007 2008 2009 2010 2011 Thereafter Total
Long term debt (including capital lease obligations) $ 27 $ 420 $ 148 $ 319 $ 369 $ 2,956 $ 4,239
Operating leases(1) 190 178 156 134 114 720 1,492Contracts for purchases of
real property and capital investment projects(2) 145 4 4 153
Purchase obligations(3) 735 660 562 562 561 358 3,438
Total contractual obligations $ 1,097 $ 1,262 $ 870 $ 1,015 $ 1,044 $ 4,034 $ 9,322
(1) Represents the minimum or base rents payable. Amounts are not offset by any expected sub-lease income. (2) These obligations include agreements for the purchase of real property. These agreements may contain conditions that may or may not be satisfied. If the conditions are not satisfied,
it is possible the Company will no longer have the obligation to proceed with the transaction. These obligations also include commitments with respect to capital investment projects, such as the construction, expansion and renovation of buildings.
(3) These include material contractual obligations to purchase goods or services where the contract prescribes fixed or minimum volumes to be purchased or payments to be made within a fixed period of time for a set or variable price. These are estimates of anticipated financial commitments and the amount of actual payments may vary. The purchase obligations do not include purchase orders issued in the ordinary course of business for goods which are meant for resale, nor do they include any contracts which may be terminated on relatively short notice or with insignificant cost or liability to the Company. Also excluded are purchase obligations related to commodities or commodity-like goods for which a market for resale exists.The Company believes such excluded contracts do not have a material impact on its liquidity.
At year end, the Company had other long term liabilities which included accrued benefit plan liability, future income taxes liability and stock-based compensation liability. These long term liabilities have not been included in the table for the following reasons: • future payments of accrued benefit plan liability, principally post-retirement benefits, depend on when and if retirees submit claims; • future payments of income taxes depend on the levels of taxable earnings and income tax rates; • future payments of the share appreciation value on employee stock options depend on whether employees exercise their stock options,
the market price of the Company’s common shares on the exercise date and the manner in which they exercise those stock options; and• future payments of restricted share units depend on the market price of the Company’s common shares.
6.4 Off-Balance Sheet Arrangements
In the normal course of business, the Company enters into the following off-balance sheet arrangements: • standby letters of credit used in connection with certain obligations mainly related to real estate transactions, and benefit programs,
the aggregate gross potential liability of which is approximately $221 million (2005 – $143 million); • guarantees; • the securitization of a portion of PC Bank’s credit card receivables through independent trusts;• a standby letter of credit to an independent funding trust which provides loans to the Company’s independent franchisees for their
purchase of inventory and fixed assets; and • financial derivative instruments in the form of interest rate swaps.
2006 Financial Report Loblaw Companies Limited 19
GuaranteesThe Company has entered into various guarantee agreements including standby letters of credit in relation to the securitization of PC Bank’scredit card receivables and in relation to third-party financing made available to the Company’s independent franchisees and obligations to indemnify third parties in connection with leases, business dispositions and other transactions in the normal course of the Company’sbusiness. For a detailed description of the Company’s guarantees, see Note 21 to the consolidated financial statements.
Securitization of Credit Card ReceivablesThe Company, through its wholly owned subsidiary PC Bank, securitizes credit card receivables through an independent trust administeredby a major Canadian chartered bank and through Eagle, also an independent trust. In these securitizations, PC Bank sells a portion of its credit card receivables to the trusts in exchange for cash. The trusts fund these purchases by issuing debt securities in the form of asset-backed commercial paper (“ABCP”) and asset-backed term notes respectively, to third-party investors. The securitizations are accounted for as asset sales only when PC Bank transfers control of the transferred assets and receives consideration other thanbeneficial interests in the transferred assets. All transactions between the trusts and PC Bank have been, and are expected to continue to be, accounted for as sales as contemplated by Canadian GAAP, specifically Accounting Guideline (“AcG”) 12, “Transfers of Receivables”.As PC Bank does not control or exercise any measure of influence over the trusts, the financial results of the trusts have not been included in the Company’s consolidated financial statements.
When PC Bank sells credit card receivables to the trusts, it no longer has access to the receivables but continues to maintain credit cardcustomer account relationships and servicing obligations. PC Bank does not receive a servicing fee from the trusts for its servicing obligationsand accordingly, a servicing obligation is recorded. When a sale occurs, PC Bank retains rights to future cash flows after obligations to theinvestors in the trusts have been met, which is considered to be a retained interest. The ABCP issuing trust’s recourse to PC Bank’s assets is limited to PC Bank’s retained interests and is further supported through a standby letter of credit provided by a major Canadian charteredbank for 9% (2005 – 9%) of the securitized amount. This standby letter of credit could be drawn upon in the event of a major decline in the income flow from or in the value of the securitized credit card receivables. The Company has agreed to reimburse the issuing bank for any amount drawn on the standby letter of credit. The Company believes that the likelihood of this occurrence is remote. The subordinatednotes issued by Eagle provide credit support to those notes which are more senior. The carrying value of the retained interests is periodicallyreviewed and when a decline in value is identified that is other than temporary, the carrying value is written down to fair value.
As at December 30, 2006, the total amount of securitized credit card receivables outstanding which PC Bank continues to service was $1.25 billion (2005 – $1.01 billion) and the associated retained interests amounted to $5 million (2005 – $5 million). The standby letter ofcredit supporting a portion of these securitized receivables amounted to approximately $68 million (2005 – $91 million). During 2006, PC Bankreceived income of $116 million (2005 – $106 million) in securitization revenue from the independent trusts relating to the securitized credit card receivables. In the absence of securitization, the Company would be required to raise alternative financing by issuing debt orequity instruments. Further disclosure regarding this arrangement is provided in Notes 11 and 21 to the consolidated financial statements.
Independent Funding TrustIndependent franchisees of the Company may obtain financing through a structure involving independent trusts which were created to provide loans to the independent franchisees to facilitate their purchase of inventory and fixed assets, consisting mainly of fixturing and equipment. These trusts are administered by a major Canadian chartered bank. The independent funding trust within the structurefinances its activities through the issuance of ABCP to third-party investors. The total amount of loans issued to the Company’s independentfranchisees outstanding as of December 30, 2006 was $419 million (2005 – $420 million) including $124 million (2005 – $126 million) of loans payable of VIEs consolidated by the Company in 2006. Based on a formula, the Company has agreed to provide credit enhancement in the form of a standby letter of credit for the benefit of the independent funding trust equal to approximately 10% of the principal amount of the loans outstanding at any point in time, $44 million (2005 – $42 million) as of December 30, 2006. This credit enhancement allows the independent funding trust to provide favourable financing terms to the Company’s independent franchisees. In the event that

Management’s Discussion and Analysis
20 2006 Financial Report Loblaw Companies Limited
an independent franchisee defaults on its loan and the Company has not, within a specified time period, assumed the loan or the default is not otherwise remedied, the independent funding trust may assign the loan to the Company and draw upon this standby letter of credit.The Company has agreed to reimburse the issuing bank for any amount drawn on the standby letter of credit. No amount has ever beendrawn on the standby letter of credit. The Company believes it would be able to fully recover from the independent franchisee any amounts it had reimbursed to the issuing bank. Neither the independent funding trust nor the Company can voluntarily terminate the agreement prior to December 2009, and following that date only upon six months’ prior notice. Automatic termination of the agreement can only occur if specific, predetermined events occur and are not remedied within the time periods required including a credit rating downgrade of theCompany below a long term credit rating of A (low) issued by DBRS. If the arrangement is terminated, the independent franchisees would be required to replace the loans provided by the independent funding trust with alternative financing. The Company is under no contractualobligation to provide funding to independent franchisees under such circumstances. In accordance with Canadian GAAP, the financialstatements of the independent funding trust are not consolidated with those of the Company.
Financial Derivative InstrumentsThe Company uses off-balance sheet financial derivative instruments to manage its exposure to changes in interest rates. For a detaileddescription of the Company’s off-balance sheet financial derivative instruments and the related accounting policies, see Notes 1 and 20 tothe consolidated financial statements.
7. Selected Consolidated Annual Information
The following is a summary of selected consolidated annual information extracted from the Company’s audited consolidated financialstatements. This information was prepared in accordance with Canadian GAAP and is reported in Canadian dollars. The analysis of the datacontained in the table focuses on the trends affecting the financial condition and results of operations over the latest two year period.
Selected Consolidated Annual Information
2006 2005(2) 2004(2)
($ millions except where otherwise indicated) (52 weeks) (52 weeks) (52 weeks)
Sales $ 28,640 $ 27,627 $ 26,030Sales excluding the impact of VIEs(1) 28,257 27,212 26,030Net (loss) earnings (219) 746 968
Net (loss) earnings per common share ($)
Basic (.80) 2.72 3.53Adjusted basic(1) 2.72 3.35 3.48Diluted (.80) 2.71 3.51
Total assets 13,486 13,761 12,949Long term debt (excluding amount due within one year) 4,212 4,194 3,935
Dividends declared per common share ($) .84 .84 .76
(1) See Non-GAAP financial measures on page 40. (2) During 2006, the Company implemented Emerging Issues Committee Abstract 156, “Accounting by a Vendor for Consideration Given to a Customer (Including a Reseller of the Vendor’s
Products)” on a retroactive basis. Accordingly certain sales incentives paid to independent franchisees, associates and independent accounts for the prior years have been reclassifiedbetween sales and cost of sales, selling and administrative expenses. For a further discussion, see the Accounting Standards Implemented in 2006 section included in this MD&A.
2006 Financial Report Loblaw Companies Limited 21
The Company has been undergoing a significant amount of change over the past two years. As discussed previously, a number of significantchanges in the operations of the Company occurred in 2006, including the change in senior leadership. The new management teamcommenced a review of the Company in the latter half of 2006 which focused on key drivers of the business such as fresh food presentation,the value propositions of the Company’s banners, maximizing employee engagement, the performance of retailing basics and customersatisfaction. The Company also continued to feel the effects in 2006 of certain of its 2005 initiatives which included restructuring of the supply chain operations, supply chain systems conversions which were initiated as part of the creation of a national informationtechnology platform, the reorganization of its merchandising, procurement and operations groups and the move of personnel to the StoreSupport Centre in Brampton, Ontario.
Sales in 2006 increased 3.7% to $28.6 billion from $27.6 billion in 2005. Excluding the impact of VIEs, sales were $28.3 billion or 3.8%higher than 2005. Same-store sales increased 0.8% in 2006 and 0.2% in 2005. National food price inflation as measured by CPI wasapproximately 2.3% for 2006 compared to approximately 2.0% for 2005. The Company’s calculation of food price inflation, which considersCompany-specific product mix and pricing strategy, was reasonably consistent with that of CPI. Sales and same-store sales in 2006 wereadversely impacted by a decrease in tobacco sales caused by a general market decline and the loss of tobacco sales through its wholesaleclub network due to the decision of a major tobacco supplier to sell directly to certain customers of the Company. In 2005, and to a lesserextent 2006, sales and same-store sales were also adversely impacted as the flow of inventory to the Company’s stores was disrupted bythe effects of systems conversions and the start-up of a third-party warehouse.
Sales were also influenced by a number of other factors, including changes in net retail square footage, expansion into new services and/or departments and the activities of competitors. Over the past two years, an average of $1.0 billion annually in capital was invested,resulting in an increase in net retail square footage of approximately 4.0 million square feet or 8.8%.
Corporate store sales per average square foot decreased from $592 in 2004 to $585 in 2006.
The amount of new net retail square footage and the timing of the store openings and closures within any given year may vary. The increasein weighted average net retail square footage was 4.5% in 2006 and 7.5% in 2005.
In pursuit of improving its value proposition, Loblaw has invested in pricing in specific markets by adopting everyday low pricing strategies.Consistent with its strategy of focusing on food but serving the consumer’s everyday household needs, the Company has expanded itsgeneral merchandise and drugstore offerings over this period and the retail sales growth realized in those categories continued to surpassretail sales growth of food. Competitor activity varied by market. During the past two years, unprecedented levels of retail square footage,mainly associated with food offerings, have been introduced into certain markets, resulting in pressure on prices and customer retention.
Full year 2006 net earnings decreased $965 million to a net loss of $219 million and basic net earnings per common share decreased $3.52 to a basic net loss per common share of 80 cents. This decline included a decrease of 79.4% in operating income and a 2.8%increase in interest expense. The effective income tax rate increased to 826.7% in 2006 from 34.8% in 2005.
In 2005, net earnings decreased $222 million or 22.9% and basic net earnings per common share decreased 81 cents or 22.9% from 2004. The decrease was due to a decrease in operating income of 15.2% over 2004 and a 5.4% increase in interest expense. The effectiveincome tax rate increased to 34.8% in 2005 from 31.5% in 2004.
Management’s Discussion and Analysis
22 2006 Financial Report Loblaw Companies Limited
Operating income for the full year 2006 was lower than in 2005 as a result of recording a non-cash goodwill impairment charge. The ongoingtransformative changes and certain other charges outlined previously in the Results of Operations section of this MD&A have resulted inlower operating income for the year for both 2006 and 2005 when compared to the prior year. Over the two year period, net interest expenseincreased, primarily due to the increase in Canadian short term borrowing rates and the decrease in net interest income due to the maturityof interest rate swaps during this period. The 2006 increase in the effective income tax rate was mainly the result of the non-deductiblegoodwill impairment charge.
Adjusted basic net earnings per common share(1) decreased 18.8% to $2.72 in 2006 from $3.35 in 2005 and decreased 3.7% to $3.35 in2005 from $3.48 in 2004.
Total assets of the Company decreased in 2006 as a result of the non-cash goodwill impairment charge. Fixed assets have grown as a result of the capital investment program. Inventory at the end of 2006 remained relatively flat to 2005 but was still greater than that oftwo years ago due to an investment in general merchandise. Inventory turns of general merchandise categories are lower than those of foodcategories, resulting in higher aggregate levels of investment in general merchandise inventory as that business developed. A substantialportion of credit card receivables is sold to independent trusts and the unsecuritized balance net of the allowance for credit losses increasedby $156 million since 2004. Cash flows from operating activities have covered a large portion of the funding requirements for the Company.While the Company issued long term debt net of amounts retired in 2005, long term debt was repaid in 2006. In addition, long term debtincreased in 2005 as a result of consolidating the long term debt of VIEs pursuant to AcG 15.
Dividends declared per common share have been consistent with the Company’s policy of maintaining a dividend payment equal toapproximately 20% to 25% of the prior year’s adjusted basic net earnings per common share(1), although dividends in 2006 were slightly in excess of that range.
During the two year period ended December 30, 2006, the Company implemented several new accounting standards issued by the Canadian Institute of Chartered Accountants (“CICA”). The new accounting standards implemented in 2006 and the resulting impact on the financial position and results of operations are outlined in the Accounting Standards Implemented in 2006 section of this MD&A. The following standards were implemented in 2005:• AcG 15, “Consolidation of Variable Interest Entities”;• EIC Abstract 150, “Determining Whether an Arrangement Contains a Lease”; and• EIC Abstract 154, “Accounting for Pre-Existing Relationships Between the Parties of a Business Combination”.
8. Quarterly Results of Operations
8.1 Results by Quarter
The 52 week reporting cycle followed by the Company is divided into four quarters of 12 weeks each except for the third quarter which is 16 weeks in duration. The following is a summary of selected consolidated financial information derived from the Company’s unauditedinterim consolidated financial statements for each of the eight most recently completed quarters. This information was prepared inaccordance with Canadian GAAP and is reported in Canadian dollars.
(1) See Non-GAAP Financial Measures on page 40.

2006 Financial Report Loblaw Companies Limited 23
Summary of Quarterly Results(unaudited)
2006 2005First Second Third Fourth Total First Second Third Fourth Total
($ millions except where otherwise indicated) Quarter Quarter Quarter Quarter (audited) Quarter Quarter Quarter Quarter (audited)
Sales(1) $6,147 $6,699 $9,010 $6,784 $28,640 $6,060 $6,405 $8,610 $6,552 $27,627Net (loss) earnings 140 194 203 (756) (219) 142 211 192 201 746
Net (loss) earnings per common share
Basic ($) $ .51 $ .71 $ .74 $ (2.76) $ (.80) $ .52 $ .77 $ .70 $ .73 $ 2.72Diluted ($) $ .51 $ .71 $ .74 $ (2.76) $ (.80) $ .52 $ .76 $ .70 $ .73 $ 2.71
(1) During 2006, the Company implemented Emerging Issues Committee Abstract 156, “Accounting by a Vendor for Consideration Given to a Customer (Including a Reseller of the Vendor’s Products)” on a retroactive basis. Accordingly certain sales incentives paid to independent franchisees, associates and independent accounts for the prior year have been reclassified between sales and cost of sales, selling and administrative expenses. For a further discussion, see the Accounting Standards Implemented in 2006 section included in this MD&A.
Sales growth in 2006 was impacted by various factors. Sales growth during the last two quarters of 2006 continued to be negativelyimpacted by the loss in tobacco sales as discussed previously. Sales and same-store sales in the fourth quarter were higher byapproximately 2.0% excluding the loss in tobacco sales. Tobacco sales are not a large earnings contributor. Quarterly same-store salesgrowth for 2006 improved during the year from a decline of 2.5% in the first quarter to an increase of approximately 1.3% in the fourthquarter. Overall national food price inflation, as measured by CPI, during 2006 was approximately 2.3%. The adverse effects of the 2005 systems conversions and the start-up of the third-party warehouse continued into 2006. Early in 2006, service levels for generalmerchandise were below expected running rates but improved throughout 2006 with increasing stability. Net retail square footage increased by 1.2 million square feet in 2006 and was more heavily weighted over the last two quarters.
Fluctuations in quarterly net earnings in 2006 reflect the impact of a number of specific charges outlined previously resulting from the ongoing transformative changes. Softening sales in the first quarter of 2006, from continued product supply issues and deliberate delays in program activities, resulted in lost leverage on the fixed components in administrative and operating expenses. In the second, third and fourth quarters, higher store and distribution centre operational costs were incurred to stabilize the flow of product to the stores andadditional storage costs were absorbed to quicken the supply chain stabilization process. Fourth quarter performance reflects the adverseimpact on operating income of the following:• Higher inventory shrink of approximately $35 million and higher store labour costs of approximately $20 million;• An investment of approximately 0.5% in food pricing, resulting in an impact of approximately $30 million;• Higher general merchandise mark downs in the range of $15 million to $20 million to clear inventory through retail stores;• A fixed asset impairment charge of $24 million due in part to a decision to suspend plans for a number of sites scheduled for future
development; and• Incremental supply chain costs and information technology investments of approximately $15 million.
Investments in the form of lower food prices continue to be made in specific markets in support of the Company’s business strategy to grow sales levels.

Management’s Discussion and Analysis
24 2006 Financial Report Loblaw Companies Limited
Interest expense, relative to 2005, increased marginally in the first half of 2006, but was reasonably consistent with 2005 in the second half of 2006.
The change in the effective income tax rate for 2006 over 2005 was primarily due to the non-cash goodwill impairment charge which is not deductible for income tax, the change in the proportion of taxable income earned across different tax jurisdictions, and a reduction to future income tax expense resulting from a reduction in statutory income tax rates.
During 2006, the Company did not purchase common shares for cancellation pursuant to its NCIB (2005 – 226,100).
8.2 Fourth Quarter Results
The following is a summary of selected consolidated information for the fourth quarter of 2006. This information was prepared in accordancewith Canadian GAAP and is reported in Canadian dollars. The analysis of the data contained in the table focuses on the results of operationsand changes in the financial condition and cash flows in the fourth quarter.
Selected Consolidated Information for the Fourth Quarter(unaudited)
2006 2005($ millions except where otherwise indicated) (12 weeks) (12 weeks)
Sales(2) $ 6,784 $ 6,552Sales excluding the impact of VIEs(1)(2) 6,692 6,454Operating (loss) income (695) 394Adjusted operating income(1) 286 441Interest expense 60 61Income taxes 2 132Net (loss) earnings (756) 201
Net (loss) earnings per common share ($)
Basic (2.76) .73Adjusted basic(1) .58 .94Diluted (2.76) .73
Cash flows from (used in):Operating activities 777 830Investing activities (409) (456)Financing activities (267) (333)
Dividends declared per common share ($) .21 .21
(1) See Non-GAAP Financial Measures on page 40.(2) During 2006, the Company implemented Emerging Issues Committee Abstract 156, “Accounting by a Vendor for Consideration Given to a Customer (Including a Reseller of the Vendor’s
Products)” on a retroactive basis. Accordingly certain sales incentives paid to independent franchisees, associates and independent accounts for the prior year have been reclassifiedbetween sales and cost of sales, selling and administrative expenses. For a further discussion, see the Accounting Standards Implemented in 2006 section included in this MD&A.
Sales for the fourth quarter of 2006 increased 3.5% or $232 million to $6.8 billion from $6.6 billion reported in the fourth quarter of 2005,including a decrease of 0.2% related to the consolidation of certain independent franchisees.

2006 Financial Report Loblaw Companies Limited 25
Sales and Sales Growth Excluding the Impact of VIEs(1)
2006 2005(2)
($ millions except where otherwise indicated) (12 weeks) (12 weeks)
Total sales $ 6,784 $ 6,552Less: Sales attributable to the consolidation of VIEs 92 98
Sales excluding the impact of VIEs $ 6,692 $ 6,454
Total sales growth 3.5% 4.3%Less: Impact on sales growth attributable to the consolidation of VIEs (.2%) 1.6%
Sales growth excluding the impact of VIEs(1) 3.7% 2.7%
(1) See Non-GAAP Financial Measures on page 40.(2) During 2006, the Company implemented Emerging Issues Committee Abstract 156, “Accounting by a Vendor for Consideration Given to a Customer (Including a Reseller of the Vendor’s
Products)” on a retroactive basis. Accordingly certain sales incentives paid to independent franchisees, associates and independent accounts for the prior years have been reclassifiedbetween sales and cost of sales, selling and administrative expenses. For a further discussion, see the Accounting Standards Implemented in 2006 section included in this MD&A.
Sales increases were realized across all regions of the country and in all areas of food, general merchandise and drugstore. Fourth quarter same-store sales increased approximately 1.3% when compared to the same period last year. The growth in sales andsame-store sales in the quarter is higher by approximately 2.0% excluding the loss in tobacco sales. During the fourth quarter of 2006, 8 new corporate and franchised stores were opened and 4 stores were closed, resulting in a net increase of 0.3 million square feet or 0.6%. The Company’s calculation of food price inflation was consistent with the national food price inflation as measured by CPI ofapproximately 1.5% for the quarter.
During the fourth quarter of 2006, the business focused on on-shelf availability, targeted pricing investments and incremental marketing. The Company experienced some positive sales momentum particularly when the decrease in tobacco sales is excluded. A successful Holiday Insider’s Report contributed to this improved sales performance.
Operating income for the fourth quarter of 2006 decreased $1.1 billion from the fourth quarter of 2005 to an operating loss of $695 millionand operating margin declined to (10.2)% from 6.0% in the comparable period of 2005 due to the effects of the charges described below, all of which have been previously detailed in the Results of Operations section of this MD&A:• A non-cash goodwill impairment charge of $800 million related to the goodwill established on the acquisition of Provigo Inc. in 1998;• A one-time charge of $84 million in the fourth quarter related to the ratification of a new four-year collective agreement with members
of certain Ontario locals of the UFCW;• A charge of $68 million in connection with the liquidation process for selected general merchandise inventory reflecting the expected
inventory value through liquidation as well as the associated costs of facilitating the disposition incurred to date; and • A charge of $35 million recorded upon management’s approval and announcement of its plans to close 19 underperforming stores
in Quebec, mainly within the Provigo banner, 8 stores in the Atlantic region, and 24 wholesale outlets. These closures are expected to result in total costs of $54 million.
(1) See Non-GAAP Financial Measures on page 40.

Management’s Discussion and Analysis
26 2006 Financial Report Loblaw Companies Limited
Adjusted operating income(1) in the fourth quarter of 2006 was $286 million compared to $441 million in 2005, resulting in adjusted operatingmargins(1) of 4.3% and 6.8% respectively. During the fourth quarter of 2006, the Company continued to incur higher than anticipated store and distribution centre operational costs, particularly in higher inventory shrinkage and labour of approximately $35 million and approximately$20 million, respectively. Investments in lower food prices continued into the fourth quarter with an approximate 0.5% investment in foodpricing, which resulted in an adverse impact to operating income of approximately $30 million when compared to the same period last year. As the Company continued to manage its inventory levels down to more desirable levels in store backrooms, outside storage and distributioncentres, some success was realized in the fourth quarter from the focused clearance pricing of certain categories resulting in higher generalmerchandise mark downs in the range of $15 million to $20 million from the clearance of inventory through retail stores. Incremental supplychain costs and information technology investments of approximately $15 million were also absorbed in the fourth quarter.
Adjusted EBITDA(1) and EBITDA margin(1) for the fourth quarter were $414 million and 6.2%, respectively. For the comparable period of 2005, adjusted EBITDA(1) and EBITDA margin(1) were $573 million and 8.9%, respectively.
Total interest expense for the fourth quarter was flat compared to that of last year for the same period.
The effective income tax rate for the fourth quarter of 2006 was negative 0.3% compared to 39.6% in 2005. This significant change in the effective income tax rate was due to the non-cash goodwill impairment recorded in the quarter which is not subject to income tax. In addition, the effective income tax rate was impacted by a change in the proportion of taxable income earned across different tax jurisdictions.
Net loss for the quarter was $756 million, a decrease of $957 million from the same period last year. Basic net loss per common share was $2.76, a decrease of $3.49 from a basic net earnings per common share of 73 cents in 2005. Adjusted basic net earnings per commonshare(1) decreased 36 cents or 38.3% to 58 cents in 2006 from 94 cents in 2005.
Fourth quarter cash flows from operating activities were $777 million in 2006 compared to $830 million in 2005. The decrease was mainlya result of lower net earnings before minority interest. Fourth quarter cash flows used in investing activities were $409 million in 2006compared to $456 million in 2005. Capital investment for the fourth quarter amounted to $261 million (2005 – $335 million). Fourth quartercash flows used in financing activities were $267 million in 2006 compared to $333 million in 2005.
9. Management’s Certification of Disclosure Controls and Procedures
Management is responsible for designing disclosure controls and procedures to provide reasonable assurance that all material informationrelating to the Company and its subsidiaries, is gathered and reported to senior management on a timely basis so that appropriate decisions can be made regarding public disclosure. As required by Multilateral Instrument 52-109 (Certification of Disclosure in Issuers’Annual and Interim Filings) of the Canadian Securities Administrators, the Executive Chairman as chief executive officer and the ExecutiveVice President as chief financial officer have evaluated the effectiveness of such disclosure controls and procedures and have concludedthat the Company’s disclosure controls and procedures are effective as at December 30, 2006.
(1) See Non-GAAP Financial Measures on page 40.

2006 Financial Report Loblaw Companies Limited 27
10. Risks and Risk Management
10.1 Operating Risks and Risk Management
Each year, the Company performs an Enterprise Risk Assessment (“ERA”) which identifies the key risks facing the Company and evaluates the risk management effectiveness for each of these risks. The assessment is primarily carried out through interviews with senior management,who assess the potential impact of risks and the likelihood that a negative impact will occur. The results of the ERA are used to prioritize riskmanagement activities, allocate resources effectively and inform overall business direction. The Audit Committee receives a report on the ERA.
A description of the risks and risk management strategies identified by the ERA is included in the operational risks discussed below, any of which has the potential to negatively affect financial performance. The Company has operating and risk management strategies and insurance programs which help to mitigate the potential financial impact of these operating risks.
Industry and Competitive EnvironmentThe retail industry in Canada is a changing and competitive market. Consumer needs drive industry changes, which are impacted bychanging demographic and economic trends such as changes in disposable income, ethnic diversity, nutritional awareness and timeavailability. Customer satisfaction is central to the Company’s business. Over the past several years, consumers have demanded morechoice, value and convenience. If the Company is ineffective in responding to these demands or ineffective in executing its strategies, its financial performance could be negatively impacted.
The Company monitors its market share and the markets in which it operates, and will adjust its operating strategies, which include, but are not limited to, closing underperforming stores, relocating stores or reformatting them under a different banner, reviewing pricing andadjusting product offerings and marketing programs. The Company’s control label program represents a significant competitive advantagebecause it enhances customer loyalty by offering superior value and provides some protection against national brand pricing strategies.
The Company faces increasing competition from many types of non-traditional competitors, such as mass merchandisers, warehouse clubs, drugstores, limited assortment stores, discount stores, convenience stores and specialty stores, all of which continue to increase their offerings of products typically associated with traditional supermarkets. The Company is also subject to competitive pressures fromnew entrants into the marketplace and from the expansion of existing competitors, particularly those expanding into the grocery market.These competitors may have extensive resources which will allow them to compete effectively with the Company in the long term. Increasedcompetition could adversely affect the Company’s ability to achieve its objectives. The Company’s inability to compete effectively with its current or any future competitors could result in, among other things, lessening of market share and lower pricing in response to its competitors’ pricing activities. Accordingly, the Company’s competitive position and financial performance could be negatively impacted. The Company may not always achieve the expected cost savings and other benefits of its initiatives, which could negatively impact theCompany’s financial performance.
Change Management2006 was a year of significant change for the Company. The change in senior management will be followed by changes to the Company’sstructures and business processes. While these changes are expected to bring benefits to the Company in the form of a more agile andconsumer-focused business, success is dependent on management effectively implementing these changes. Ineffective change managementmay result in disruptions to the operations of the business or affect the ability of the Company to implement and achieve its strategicobjectives, due to a lack of clear accountabilities, or cause employees to act in a manner which is inconsistent with Company objectives.Any of these events could negatively impact the Company’s performance.

Management’s Discussion and Analysis
28 2006 Financial Report Loblaw Companies Limited
Food Safety and Public HealthThe Company is subject to potential liabilities connected with its business operations, including potential exposures associated with productdefects, food safety and product handling. Such liabilities may arise in relation to the storage, distribution and display of products and, with respect to the Company’s control label products, in relation to the production, packaging and design of products.
A majority of the Company’s sales are generated from food products and the Company could be vulnerable in the event of a significantoutbreak of food-borne illness or increased public health concerns in connection with certain food products. Such an event could negativelyaffect the Company’s financial performance. Procedures are in place to manage such events, should they occur. These procedures identify risks, provide clear communication to employees and consumers and are aimed at ensuring that potentially harmful products areexpeditiously removed from inventory. The ability of these procedures to address such events is dependent on their successful execution.Food safety related liability exposures are insured by the Company’s insurance program. In addition, the Company has food safetyprocedures and programs which address safe food handling and preparation standards. The Company endeavours to employ best practicesfor the storage and distribution of food products and also actively supports consumer awareness of safe food handling and consumption.
The Company strives to ensure its control label products have informative nutritional labelling so that today’s health conscious consumercan make informed choices.
Information TechnologyIn order to support the current and future requirements of the business in an efficient, cost effective and well-controlled manner, theCompany is reliant on information technology systems. These have been assessed by management to need significant upgrading in order to act as an enabler for the business to achieve its operating objectives. These systems are essential in providing management with theappropriate information for decision making, including its key performance indicators. Change management risk and other associated riskswill arise from the various information technology projects which will be undertaken to upgrade existing systems and introduce new systems to effectively manage the business going forward. Failure by the Company to appropriately invest in information technology or failure toimplement information technology infrastructure in a timely or effective manner may negatively impact the Company’s financial performance.
LabourA significant majority of the Company’s store level and distribution centre workforce is unionized. Renegotiating collective agreements mightresult in work stoppages or slowdowns, which could negatively affect the Company’s financial performance, depending on their nature andduration. The Company is willing to accept the short term costs of labour disruption in order to negotiate competitive labour costs andoperating conditions for the longer term. Significant labour negotiations took place across the Company in 2006 as 87 collective agreementsexpired and 64 collective agreements were successfully negotiated which represented a combination of agreements expiring in 2006, thosecarried over from prior years, and those negotiated early. In 2007, 77 collective agreements affecting approximately 20,000 employees willexpire, with the single largest agreement covering approximately 8,600 employees. The Company will also continue to negotiate the 57 collective agreements carried over from 2004, 2005 and 2006. The Company has good relations with its employees and unions and,although it is possible, does not anticipate any unusual difficulties in renegotiating these agreements.
Several of the Company’s competitors operate in a non-union environment. These competitors may benefit from lower labour costs andmore favourable operating efficiencies, making it more difficult for the Company to compete.
Employee Future Benefit ContributionsWhile the Company’s registered funded defined benefit pension plans are currently adequately funded and returns on pension plan assetsare in line with expectations, there is no assurance that this will continue. An extended period of depressed capital markets and low interestrates could require the Company to make contributions to its registered funded defined benefit pension plans in excess of those currentlycontemplated, which in turn could have a negative effect on its financial performance.

2006 Financial Report Loblaw Companies Limited 29
During 2006, the Company contributed $88 million (2005 – $59 million) to its registered funded defined benefit pension plans. During 2007,the Company expects to contribute approximately $75 million to these plans. This estimate may vary subject to actuarial valuations beingcompleted, market performance and regulatory requirements. The Company also expects to make contributions in 2007 to definedcontribution pension plans and multi-employer pension plans, as well as benefit payments to the beneficiaries of the unfunded definedbenefit pension and other benefit plans.
Multi-Employer Pension PlansIn addition to the Company-sponsored pension plans, the Company participates in various multi-employer pension plans, providing pension benefits in which approximately 41% (2005 – 40%) of employees of the Company and of its independent franchisees participate.The administration of these plans and the investment of their assets are legally controlled by a board of independent trustees generallyconsisting of an equal number of union and employer representatives. In some circumstances, Loblaw may have a representative on theboard of trustees of these multi-employer pension plans. The Company’s responsibility to make contributions to these plans is limited by the amounts established pursuant to its collective agreements. Pension cost for these plans is recognized as contributions are due.
Subsequent to year end, the Company was served with an action brought by certain beneficiaries of a multi-employer pension plan in theSuperior Court of Ontario. In their claim against the employers and the trustees of the multi-employer pension plan, the plaintiffs claim thatassets of the multi-employer pension plan have been mismanaged. The Company is one of the employers affected by the action. One billiondollars of damages are claimed in the action against a total of 17 defendants. In addition, the plaintiffs are seeking to have a representativedefendant appointed for the employers of all the members of the multi-employer pension plan. The action is framed as a representativeaction on behalf of all of the beneficiaries of the multi-employer pension plan. The action is at a very early stage and the Company intends to vigorously defend it. Statements of Defence have not yet been filed.
During 2006, the trustees of a multi-employer pension plan (including an employee who was appointed by the Company) were chargedunder the Pension Benefits Act (Ontario) by the Superintendent of Financial Services with failure to administer various investments made bythe trustees in a manner consistent with the legislation. It is not anticipated that the trial relating to these charges will be scheduled beforeFebruary, 2008.
Third-Party Service ProvidersCertain aspects of the Company’s business are significantly affected by third parties. While appropriate contractual arrangements are put in place with these third parties, the Company has no direct influence over how such third parties are managed. It is possible that negativeevents affecting these third parties could in turn negatively impact the Company’s operations and its financial performance.
A large portion of the Company’s case-ready meat products are produced by a third party which operates facilities dedicated to Loblaw. The Company’s control label products, which are among the most recognized brands in Canada, are manufactured under contract by third-party vendors. In order to preserve the brands’ equity, these vendors are held to high standards of quality. The Company also usesthird-party logistic services including those in connection with a dedicated warehouse and distribution centre in Pickering, Ontario and third-party common carriers. Any disruption in these services could interrupt the delivery of merchandise to the stores and therefore couldnegatively impact sales.
President’s Choice Financial banking services are provided by a major Canadian chartered bank. PC Bank uses third-party serviceproviders to process credit card transactions, operate call centres and monitor credit and fraud for the President’s Choice FinancialMasterCard®. In order to minimize operating risk, PC Bank and the Company actively manage and monitor their relationships with all third-party service providers. PC Bank has developed a vendor management policy, approved by its Board of Directors, and has establisheda vendor management team that provides its Board with regular reports on vendor management and risk assessment. PC Financial homeand auto insurance products are provided by companies within the Aviva Canada group, the Canadian subsidiary of a major internationalproperty and casualty insurance provider.
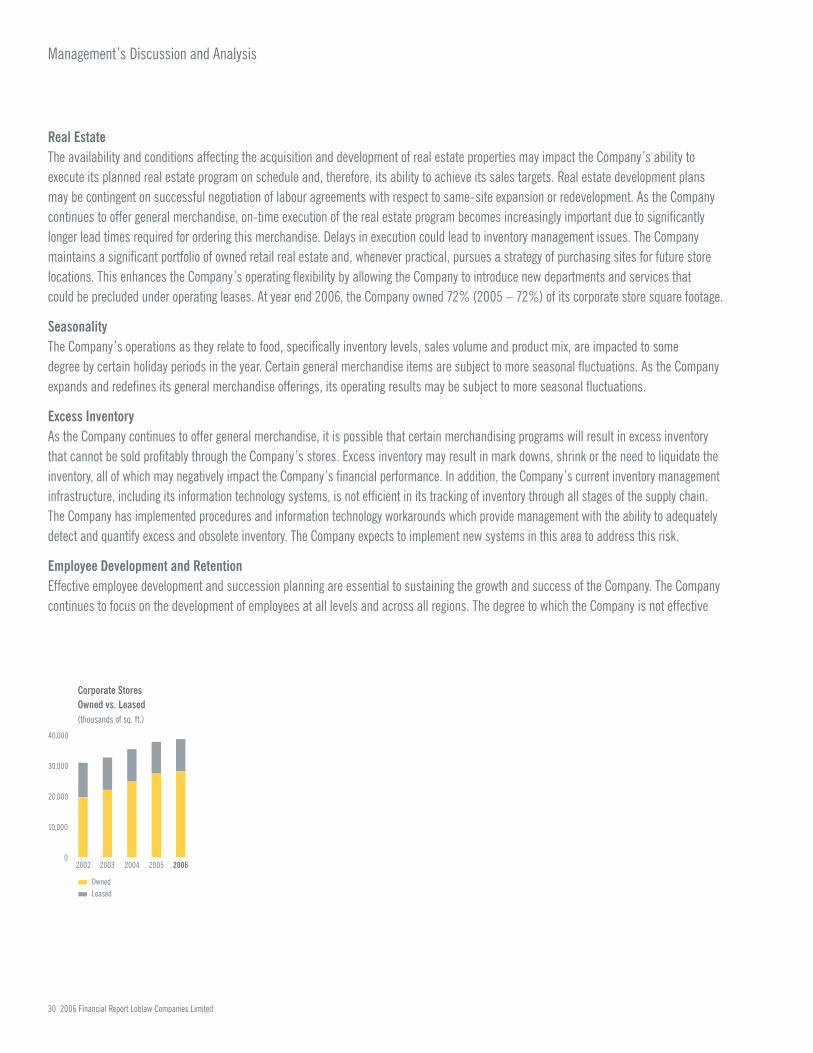
Management’s Discussion and Analysis
30 2006 Financial Report Loblaw Companies Limited
Real Estate The availability and conditions affecting the acquisition and development of real estate properties may impact the Company’s ability toexecute its planned real estate program on schedule and, therefore, its ability to achieve its sales targets. Real estate development plansmay be contingent on successful negotiation of labour agreements with respect to same-site expansion or redevelopment. As the Companycontinues to offer general merchandise, on-time execution of the real estate program becomes increasingly important due to significantlylonger lead times required for ordering this merchandise. Delays in execution could lead to inventory management issues. The Companymaintains a significant portfolio of owned retail real estate and, whenever practical, pursues a strategy of purchasing sites for future storelocations. This enhances the Company’s operating flexibility by allowing the Company to introduce new departments and services that could be precluded under operating leases. At year end 2006, the Company owned 72% (2005 – 72%) of its corporate store square footage.
SeasonalityThe Company’s operations as they relate to food, specifically inventory levels, sales volume and product mix, are impacted to some degree by certain holiday periods in the year. Certain general merchandise items are subject to more seasonal fluctuations. As the Companyexpands and redefines its general merchandise offerings, its operating results may be subject to more seasonal fluctuations.
Excess InventoryAs the Company continues to offer general merchandise, it is possible that certain merchandising programs will result in excess inventory that cannot be sold profitably through the Company’s stores. Excess inventory may result in mark downs, shrink or the need to liquidate theinventory, all of which may negatively impact the Company’s financial performance. In addition, the Company’s current inventory managementinfrastructure, including its information technology systems, is not efficient in its tracking of inventory through all stages of the supply chain.The Company has implemented procedures and information technology workarounds which provide management with the ability to adequatelydetect and quantify excess and obsolete inventory. The Company expects to implement new systems in this area to address this risk.
Employee Development and RetentionEffective employee development and succession planning are essential to sustaining the growth and success of the Company. The Companycontinues to focus on the development of employees at all levels and across all regions. The degree to which the Company is not effective
0
10,000
20,000
30,000
40,000
Corporate Stores Owned vs. Leased(thousands of sq. ft.)
Owned Leased
2003 2006200520042002

2006 Financial Report Loblaw Companies Limited 31
in developing its employees and establishing appropriate succession planning processes could lead to a lack of requisite knowledge, skills and experience which could, in turn, affect its ability to execute its strategies, efficiently run its operations and meet its goals forfinancial performance.
The tight labour market in Western Canada has created unique challenges to effectively operate stores and distribution centres, therebyaffecting the Company’s ability to meet its business objectives. The Company has implemented targeted programs to attract the appropriatecalibre of employee in a very competitive environment.
The Company has announced a reorganization of some of its functions and an associated reduction of between 800 and 1,000 store supportand regional office employees. These actions, if not properly executed, will impact the Company’s ability to execute its strategies goingforward. These actions will require the Company to address employee engagement in the process and ensure that key employees remainempowered to effectively execute the Company’s strategies.
Utility and Fuel PricesThe Company is a significant consumer of electricity, other utilities and fuel. Unanticipated cost increases in these items could negativelyaffect the Company’s financial performance. The Company has entered into contracts with suppliers to fix the price of a portion of its future variable costs associated with electricity and natural gas, and financial contracts to fix a portion of variable costs associated withheating oil requirements for 2007.
InsuranceThe Company limits its exposure to risk through a combination of appropriate levels of self-insurance and the purchase of various insurancecoverages, including an integrated insurance program. The Company’s insurance program is based on various lines and limits of coveragewhich provides the appropriate level of retained and insured risks. Insurance is arranged on a multi-year basis with reliable, financiallystable insurance companies as rated by A.M. Best Company, Inc. The Company combines comprehensive risk management programs andthe active management of claims handling and litigation processes by using internal professionals and external technical expertise tomanage the risk it retains.
Environmental, Health and SafetyThe Company has environmental, health and workplace safety programs in place and has established policies and procedures aimed atensuring compliance with applicable legislative requirements. To this end, the Company employs environmental risk assessments and audits using internal and external resources together with employee awareness programs throughout its operating locations. The Companyendeavours to be socially and environmentally responsible, and recognizes that the competitive pressures for economic growth and costefficiency must be integrated with sound environmental stewardship and ecological considerations. Environmental protection requirementsdo not and are not expected to have a material effect on the Company’s financial performance.
The Environmental, Health and Safety Committee of the Board receives regular reporting from management, addressing current and potentialfuture issues, identifying new regulatory concerns and related communication efforts. The Company’s dedicated Environmental Affairs staff work closely with the operations to help ensure that corporate requirements are met.
Ethical Business ConductAny failure of the Company to adhere to its policies, the law or ethical business practices could significantly affect its reputation and brandsand could, therefore, negatively impact the Company’s financial performance. The Company has adopted a Code of Business Conduct which employees and directors of the Company are required to acknowledge and agree to on a regular basis. The Company has in place an Ethics and Business Conduct Committee which monitors compliance with the Code of Business Conduct and determines how theCompany can best ensure it is conducting its business in an ethical manner. The Company has also adopted a Vendor Code of Conductwhich outlines its ethical expectations to its vendor community in a number of areas, including social responsibility.

Management’s Discussion and Analysis
32 2006 Financial Report Loblaw Companies Limited
Legal, Taxation and AccountingChanges to any of the laws, rules, regulations or policies related to the Company’s business including the production, processing,preparation, distribution, packaging and labelling of its products could have an adverse impact on its financial and operational performance.In the course of complying with such changes, the Company may incur significant costs. Failure by the Company to fully comply withapplicable laws, rules, regulations and policies may subject it to civil or regulatory actions or proceedings, including fines, assessments,injunctions, recalls or seizures, which may have an adverse effect on the Company’s financial results.
During 2006, the Government of Ontario passed a new law which prohibits the receipt of rebates paid by manufacturers to pharmacies in respect of interchangeable products and products listed in Ontario’s Formulary. Pharmacies are permitted to accept only limited defined professional allowances to be used in compliance with a new Code of Conduct. As a result of this recently enacted legislation,drugstore-related operating income could decrease although the Company is attempting to mitigate some of the impact of these changes. It is possible that similar legislation could be implemented in other provinces which could have a further negative impact.
There can be no assurance that the tax laws and regulations in the jurisdictions affecting the Company will not be changed in a mannerwhich could adversely affect the Company. New accounting pronouncements introduced by appropriate authoritative bodies may also impactthe Company’s financial results.
Holding Company StructureLoblaw Companies Limited is a holding company. As such, it does not carry on business directly but does so through its subsidiaries. It has no major source of income or assets of its own, other than the interests it has in its subsidiaries, which are all separate legal entities.Loblaw Companies Limited is therefore financially dependent on dividends and other distributions it receives from its subsidiaries.
10.2 Financial Risks and Risk Management
In the normal course of business, the Company is exposed to financial risks that have the potential to negatively affect its financialperformance including financial risks related to changes in foreign currency exchange rates, interest rates and the market price of theCompany’s common shares. These risks and the actions taken to minimize them are discussed below. The Company is also exposed tocredit risk on certain of its financial instruments.
Financial Derivative InstrumentsThe Company uses over-the-counter financial derivative instruments, specifically cross currency basis swaps, interest rate swaps and equity forwards, to minimize the risks and costs associated with its financing activities and its stock-based compensation plans. The Company maintains treasury centres that operate under policies and guidelines approved by the Board covering funding, investing,equity, foreign currency exchange and interest rate management. The Company’s policies and guidelines prevent it from using any financial derivative instrument for trading or speculative purposes. See Notes 1 and 20 to the consolidated financial statements foradditional information on the Company’s financial derivative instruments.
Foreign Currency Exchange RateThe Company enters into cross currency basis swaps to manage its current and anticipated exposure to fluctuations in foreign currencyexchange rates. The Company’s cross currency basis swaps are transactions in which floating interest payments and principal in UnitedStates dollars are exchanged against the receipt of floating interest payments and principal in Canadian dollars. These cross currency basisswaps limit the Company’s exposure against foreign currency exchange rate fluctuations on a portion of its United States dollar denominatedassets, principally cash, cash equivalents and short term investments.

2006 Financial Report Loblaw Companies Limited 33
Interest RateThe Company enters into interest rate swaps to manage its current and anticipated exposure to fluctuations in interest rates and marketliquidity. Interest rate swaps are transactions in which the Company exchanges interest flows with a counterparty on a specified notionalamount for a predetermined period based on agreed upon fixed and floating interest rates. Notional amounts are not exchanged. The Companymonitors market conditions and the impact of interest rate fluctuations on its fixed and floating interest rate exposure mix on an ongoing basis.
Common Share Market PriceThe Company enters into equity forwards to manage its exposure to fluctuations in its stock-based compensation cost as a result of changesin the market price of its common shares. These equity forwards change in value as the market price of the underlying common shareschanges, which results in a partial offset to fluctuations in the Company’s stock-based compensation costs. The partial offset between the Company’s stock-based compensation costs and the equity forwards exists as long as the market price of the Company’s commonshares exceeds the exercise price of employee stock options. As at year end 2006, 4,068,646 stock options had exercise prices which weregreater than the market price of the Company’s common shares at year end.
CounterpartyOver-the-counter financial derivative instruments are subject to counterparty risk. Counterparty risk arises from the possibility that market changes may affect a counterparty’s position unfavourably and that the counterparty defaults on its obligations to the Company. The Company has sought to minimize potential counterparty risk and losses by conducting transactions for its derivative agreements with counterparties that have at minimum a long term “A” credit rating from a recognized credit rating agency and by placing risk adjustedlimits on its exposure to any single counterparty for its financial derivative agreements. The Company has internal policies, controls and reporting processes, which require ongoing assessment and corrective action, if necessary, with respect to its derivative transactions. In addition, principal amounts on cross currency basis swaps and equity forwards are each netted by agreement and there is no exposure to loss of the original notional principal amounts on the interest rate swaps and equity forwards.
CreditThe Company’s exposure to credit risk relates to the Company’s cash equivalents and short term investments, PC Bank’s credit cardreceivables and accounts receivable from independent franchisees, associates and independent accounts.
Credit risk associated with the Company’s cash equivalents and short term investments results from the possibility that a counterparty may default on the repayment of a security. This risk is mitigated by the established policies and guidelines that require issuers of permissibleinvestments to have at minimum a long term “A” credit rating from a recognized credit rating agency and that specify minimum andmaximum exposures to specific issuers.
PC Bank manages the President’s Choice Financial MasterCard®. PC Bank grants credit to its customers on President’s Choice FinancialMasterCard® with the intention of increasing the loyalty of those customers and the Company’s profitability. Credit risk results from thepotential for loss due to those customers defaulting on their payment obligations. In order to minimize the associated credit risk, PC Bankemploys stringent credit scoring techniques, actively monitors the credit card portfolio and reviews techniques and technology that canimprove the effectiveness of its collection process. In addition, these receivables are dispersed among a large, diversified group of creditcard customers.
The Company also has accounts receivable from its independent franchisees, associates and independent accounts, mainly as a result of sales to these customers. The Company actively monitors the balances on an ongoing basis and collects funds from its independentfranchisees on a frequent basis in accordance with terms specified in the applicable agreements.

Management’s Discussion and Analysis
34 2006 Financial Report Loblaw Companies Limited
11. Related Party Transactions
The Company’s majority shareholder, George Weston Limited and its affiliates (“Weston”), other than the Company, are related parties. It is the Company’s policy to conduct all transactions and settle all balances with related parties on market terms and conditions. Related party transactions include:
Inventory Purchases Purchases of inventory from related parties for resale in the distribution network represented approximately 3%(2005 – 3%) of the cost of sales, selling and administrative expenses.
Cost Sharing Agreements Weston has entered into certain contracts with third parties for administrative and corporate services, includingtelecommunication services and information technology related matters on behalf of the Company. Through cost sharing agreements thathave been established between the Company and Weston concerning these costs, the Company has agreed to be responsible to Weston forits proportionate share of the costs incurred on its behalf. Payments by the Company pursuant to these cost sharing agreements wereapproximately $25 million (2005 – $22 million).
Real Estate Matters The Company leases certain properties from an affiliate of Weston, namely office space for approximately $4 million(2005 – $4 million). During 2006, the Company purchased from an affiliate of Weston a property designated for future development forconsideration of $8 million, which was prepaid in accordance with a former ground lease between the parties.
Borrowings/Lendings The Company, from time to time, may borrow from or may lend to Weston on a short term basis at commercial paperrates. There were no such amounts outstanding as at year end.
Income Tax Matters From time to time, the Company and Weston and its affiliates may make elections that are permitted or required under applicable income tax legislation with respect to affiliated corporations and, as a result, may enter into agreements in that regard.These elections and accompanying agreements did not have any material impact on the Company.
Management Agreements The Company, through Glenhuron Bank Limited (“Glenhuron”), a wholly owned subsidiary of the Company,manages certain United States cash, cash equivalents and short term investments for wholly owned non-Canadian subsidiaries of Weston.Management fees are based on market rates and included in interest expense.
Sale of Loan Portfolio During 2005, Glenhuron sold a portfolio of third-party long term loans receivable to a wholly owned subsidiary ofWeston. The loans in this portfolio were originally acquired from third-party financial institutions in 2001. This transaction was undertakenby Glenhuron as part of its overall ongoing management of its investment portfolio.
The amount of the cash consideration of U.S.$106 million was based on a fair market value of the loan portfolio and was approximatelyequal to carrying value. An independent review of the valuation analysis has been obtained by the Company to ensure that Glenhuron’smethodology used in arriving at fair market value was reasonable. As at the date of sale, the current portion of this loan portfolio of U.S.$13 million was included in accounts receivable and the long term portion of U.S.$93 million was included in other assets.
Glenhuron has entered into an agreement with a subsidiary of Weston for the administration of the loan portfolio.
12. Critical Accounting Estimates
The preparation of financial statements in accordance with Canadian GAAP requires management to make estimates and assumptions thataffect the reported amounts and disclosures made in the consolidated financial statements and accompanying notes.
Management continually evaluates the estimates and assumptions it uses. These estimates and assumptions are based on management’shistorical experience, best knowledge of current events and conditions and activities that the Company may undertake in the future. Actual results could differ from these estimates.

2006 Financial Report Loblaw Companies Limited 35
The estimates and assumptions described in this section depend upon subjective or complex judgments about matters that may beuncertain and changes in these estimates and assumptions could materially impact the consolidated financial statements.
12.1 Inventories
Certain retail store inventories are stated at the lower of cost and estimated net realizable value less normal gross profit margin. Significantestimation or judgment is required in the determination of (i) discount factors used to convert inventory to cost after a physical count atretail has been completed and (ii) estimated inventory losses, or shrinkage, occurring between the last physical inventory count and thebalance sheet date.
Inventories counted at retail are converted to cost by applying a discount factor to retail selling prices. This discount factor is determined at a category or department level, is calculated in relation to historical gross margins and is reviewed on a regular basis for reasonableness.Inventory shrinkage, which is calculated as a percentage of sales, is evaluated throughout the year and provides for estimated inventoryshortages from the last physical count to the balance sheet date. To the extent that actual losses experienced vary from those estimated,both inventories and operating income may be impacted.
During 2006, the Company decided to proceed with the liquidation of certain inventory, consisting primarily of general merchandise. A charge of $68 million was recorded in 2006 in connection with this liquidation process. Significant estimation or judgment was required in the determination of what is considered excess inventory, estimated recovery values and discounted cost of retail store inventories.
Changes or differences in these estimates may result in changes to inventories on the consolidated balance sheet and a charge or credit to operating income in the consolidated statement of earnings.
12.2 Employee Future Benefits
The cost and accrued benefit plan obligations of the Company’s defined benefit pension plans and other benefit plans are accrued based on actuarial valuations which are dependent on assumptions determined by management. These assumptions include the discount rate, the expected long term rate of return on plan assets, the expected growth rate of health care costs, the rate of compensation increase,retirement ages and mortality rates. These assumptions are reviewed annually by management and the Company’s actuaries.
The discount rate, the expected long term rate of return on plan assets and the expected growth rate in health care costs are the three mostsignificant assumptions.
The discount rates are based on market interest rates, as at the Company’s measurement date of September 30 on a portfolio of CorporateAA bonds with terms to maturity that, on average, match the terms of the accrued benefit plan obligations. The discount rates used todetermine the 2006 net cost for defined benefit pension and other benefit plans were 5.25% and 5.2%, respectively, on a weighted averagebasis, compared to 6.25% and 6.1%, respectively, in 2005. The discount rates used to determine the net 2007 defined benefit pension andother benefit plans costs decreased to 5.0% and 5.0%, respectively and as a result, the Company expects an increase in these costs in 2007.
The expected long term rate of return on plan assets is based on current market conditions, the asset mix, the active management of definedbenefit pension plan assets and on historical returns. The Company’s defined benefit pension plan assets had a 10 year annualized return of 9.0% as at the 2006 measurement date. The actual annual returns within this 10 year period varied with market conditions. The Companyhas assumed a 7.75% expected long term rate of return on plan assets in calculating its defined benefit pension plans cost for 2007.
The expected growth rate in health care costs for 2006 was based on external data and the Company’s historical trends for health carecosts, and in 2007 initial growth rates will be relatively consistent with that of 2006.

Management’s Discussion and Analysis
36 2006 Financial Report Loblaw Companies Limited
Since the three key assumptions discussed above are forward-looking and long term in nature, they are subject to uncertainty and actualresults may differ. In accordance with Canadian GAAP, differences between actual experience and the assumptions, as well as the impact ofchanges in the assumptions, are accumulated as unamortized net actuarial gains or losses and amortized over future periods, affecting therecognized cost of defined benefit pension plans and other benefit plans and the accrued benefit plan obligation in future periods. While the Company believes that its assumptions are appropriate, significant differences in actual experience or significant changes in the Company’sassumptions may materially affect its defined benefit pension plans and other benefit plans accrued benefit plan obligations and future cost.
Additional information regarding the Company’s pension and other benefit plans, including a sensitivity analysis for changes in keyassumptions, is provided in Note 15 to the consolidated financial statements and in the Employee Future Benefit Contributions discussion in the Operating Risks and Risk Management section of this MD&A.
12.3 Goodwill
Goodwill is not amortized and is assessed for impairment at the reporting unit level at least annually. Any potential goodwill impairment isidentified by comparing the fair value of a reporting unit to its carrying value. If the fair value of the reporting unit exceeds its carrying value,goodwill is considered not to be impaired. If the carrying value of the reporting unit exceeds its fair value, a more detailed goodwillimpairment assessment must be undertaken. A goodwill impairment charge is recognized to the extent that, at the reporting unit level, the carrying value of goodwill exceeds the implied fair value.
The Company determines the fair value using a discounted cash flow model corroborated by other valuation techniques such as marketmultiples. The process of determining these fair values requires management to make estimates and assumptions including, but not limitedto projected future sales, earnings and capital investment, discount rates and terminal growth rates. Projected future sales, earnings andcapital investment are consistent with strategic plans presented to the Company’s Board. Discount rates are based on an industry weightedaverage cost of capital. These estimates and assumptions are subject to change in the future due to uncertain competitive and economicmarket conditions or changes in business strategies.
In 2006, the Company performed the annual goodwill impairment test and it was determined that the carrying value of the goodwillestablished on the acquisition of Provigo Inc. in 1998 exceeded its respective fair value. As a result, the Company recorded in operatingincome a non-cash goodwill impairment charge of $800 million relating to this goodwill, which was within its previously disclosed range of $600 million to $900 million. The Company expects no income tax deduction from this non-cash goodwill impairment charge. The determination that the fair value of goodwill was less than its carrying value resulted from a decline in market multiples, both from anindustry and Company perspective, and a reduction of fair value as determined using the discounted cash flow methodology, incorporatingboth current Company and market assumptions, which in combination resulted in the goodwill impairment. This non-cash goodwillimpairment charge is expected to be adjusted if necessary in the first half of 2007 and may result in a charge or credit to operating income in the consolidated statement of earnings and in the carrying value of goodwill on the balance sheet.
12.4 Income Taxes
Future income tax assets and liabilities are recognized for the future income tax consequences attributable to temporary differences betweenthe financial statement carrying values of assets and liabilities and their respective income tax bases. Future income tax assets or liabilitiesare measured using enacted or substantively enacted income tax rates expected to apply to taxable income in the years in which thosetemporary differences are expected to be recovered or settled. The calculation of current and future income taxes requires management tomake estimates and assumptions and to exercise judgment regarding the financial statement carrying values of assets and liabilities whichare subject to accounting estimates inherent in those balances, the interpretation of income tax legislation across various jurisdictions,expectations about future operating results and the timing of reversal of temporary differences and possible audits of tax filings by the

2006 Financial Report Loblaw Companies Limited 37
regulatory authorities. Management believes it has adequately provided for income taxes based on current available information. Changes or differences in these estimates or assumptions may result in changes to the current or future income taxes on the consolidated balancesheet, a charge or credit to income tax expense in the consolidated statement of earnings and may result in cash payments or receipts.
12.5 Goods and Services Tax and Provincial Sales Taxes
During 2005, the Company recorded a charge relating to an audit and proposed assessment by the Canada Revenue Agency relating to GST on certain products sold on which GST was not appropriately charged and remitted. In light of this proposed assessment, the Companyassessed and estimated the potential liabilities for GST and PST in other areas of its operations for various periods. Accordingly, a charge of $40 million was recorded in operating income in 2005. Approximately $1 million was paid in 2006 (2005 – $15 million) and approximately$24 million remains accrued as at December 30, 2006. The ultimate remaining amount paid will depend on the outcome of audits performed by or settlements reached with the various tax authorities, and therefore may differ from this estimate. Management will continueto assess the remaining accrual as progress towards resolution with the various tax authorities is made and will adjust the remainingaccrual accordingly. Changes in this accrual may result in a charge or credit to operating income in the consolidated statement of earnings.
12.6 Fixed Assets
Fixed assets to be held and used are reviewed for impairment annually and when events or circumstances indicate that their carrying valueexceeds the sum of the undiscounted cash flows expected from their use and eventual disposition. An impairment loss is measured as the amount by which the fixed assets carrying value exceeds the fair value. As discussed in notes 4 and 13 to the consolidated financialstatements, the Company recorded fixed asset impairment and accelerated depreciation charges of $32 million (2005 – $7 million) and an additional $27 million (2005 – $14 million) was recorded in restructuring and other charges.
Factors that most significantly influence the impairment assessments and calculations are estimates of future cash flows. The Companyuses its internal plans in estimating future cash flows. These plans reflect the Company’s current best estimate of future cash flows but may change due to uncertain competitive and economic market conditions or changes in business strategies. Changes or differences in these estimates may result in changes to fixed assets on the consolidated balance sheet and a charge to operating income on theconsolidated statement of earnings.
13. Accounting Standards
13.1 Accounting Standards Implemented in 2006
During the year, the Company implemented the following accounting standards issued by the CICA:• Section 3831, “Non-Monetary Transactions”, issued in June 2005, replaces Section 3830 of the same name. The revised standard
addresses the measurement and disclosure of non-monetary transactions and defines when an exchange of assets is measured at fairvalue and when it is measured at the carrying amount. The criterion for the measurement of a non-monetary transaction at fair value is based on whether the non-monetary transaction has commercial substance rather than the culmination of the earnings process underSection 3830. The revised standard is applied to non-monetary transactions initiated in periods beginning after January 1, 2006. The adoption of these new recommendations, on a prospective basis, did not have a material impact on the Company’s consolidatedfinancial statements.
• EIC Abstract 156, “Accounting by a Vendor for Consideration Given to a Customer (Including a Reseller of the Vendor’s Products)”, (“EIC 156”) issued in September 2005, addresses cash consideration, including sales incentives, given by a vendor to a customer. This consideration is presumed to be a reduction of the selling price of the vendor’s products and should therefore be classified as a reduction of sales in the vendor’s statement of earnings.

Management’s Discussion and Analysis
38 2006 Financial Report Loblaw Companies Limited
Prior to the implementation of EIC 156, the Company recorded certain sales incentives paid to independent franchisees, associates andindependent accounts in cost of sales, selling and administrative expenses on the statement of earnings.
Accordingly, the implementation of EIC 156, on a retroactive basis, resulted in a reduction in both sales and cost of sales, selling andadministrative expenses as follows:
First Quarter Second Quarter Third Quarter Fourth Quarter Total(12 weeks) (12 weeks) (16 weeks) (12 weeks) (52 weeks)
2005 2004 2005 2004 2005 2004 2005 2004 2005 2004
Sales as previously reported $ 6,124 $ 5,677 $ 6,436 $ 6,069 $ 8,653 $ 8,134 $ 6,588 $ 6,329 $27,801 $26,209Sales after reclassification $ 6,060 $ 5,622 $ 6,405 $ 6,036 $ 8,610 $ 8,089 $ 6,552 $ 6,283 $27,627 $26,030
Reclassification between sales and cost of sales, selling and administrative expenses $ 64 $ 55 $ 31 $ 33 $ 43 $ 45 $ 36 $ 46 $ 174 $ 179
As reclassifications, these changes did not impact net earnings. Operating margins, adjusted operating margins(1) and adjusted EBITDAmargins(1) for 2005 have also been recalculated and updated, if applicable, as a result of the change in sales.• EIC Abstract 157, “Implicit Variable Interest under AcG-15”, issued in October 2005, provides new guidance and clarification to the
recommendations in AcG-15, with respect to all implicit variable interests held by an enterprise or its related parties. The guidanceaddresses how implicit variable interests should be included in the assessment as to whether the entity is the primary beneficiary of the VIE. An implicit variable interest is an interest that indirectly absorbs or receives the variability of the entity. The adoption of theserecommendations in the first quarter of 2006 did not have a material impact on the Company’s consolidated financial statements.
• EIC Abstract 159, “Conditional Asset Retirement Obligations”, issued in December 2005, provides guidance on the recognition andmeasurement of a conditional asset retirement obligation and further clarifies the requirements under Section 3110, “Asset RequirementObligations” such that a conditional asset retirement obligation should be recognized at fair value when the obligation to perform theasset retirement activity is unconditional even though uncertainty exists about the timing and/or method of settlement. Theserecommendations were adopted retroactively for the second quarter of 2006 and did not have a material impact on the Company’sconsolidated financial statements.
• EIC Abstract 162, “Stock-Based Compensation for Employees eligible to retire before the Vesting date”, issued in July 2006, requires that stock-based compensation granted to employees eligible to retire should be expensed at the time of grant. The Company’sstock-based compensation plans do not continue to vest after retirement, and therefore the adoption of this abstract did not have an impact on the Company’s consolidated financial statements.
13.2 Future Accounting Standards
The Company closely monitors new accounting standards to assess the impact, if any, on its consolidated financial statements. In 2007, the Company will be reviewing the implications of the following standards and implementing the recommendations as required: • The Accounting Standards Board continues to work towards the transition from Canadian GAAP to International Financial Reporting
Standards over a five-year period. After this transitional period, Canadian GAAP will cease to exist as a separate, distinct basis offinancial reporting. The Company continues to closely monitor the changes resulting from this transition in preparation for the convergence.
Section 3855, “Financial Instruments – Recognition and Measurement”, Section 3865, “Hedges”, Section 1530, “Comprehensive Income”, Section 3861, “Financial Instruments – Disclosures and Presentation”, and Section 3251, “Equity”, issued in April 2005:• Section 3855, “Financial Instruments – Recognition and Measurement”, establishes guidance for recognizing and measuring financial
assets, financial liabilities and non-financial derivatives. The standard requires that financial instruments within scope, includingderivatives, be included on the Company’s balance sheet and measured, either at fair value or, in limited circumstances, at cost or
(1) See Non-GAAP Financial Measures on page 40.

2006 Financial Report Loblaw Companies Limited 39
amortized cost. All financial instruments must be classified into a defined category, namely, held-to-maturity investments, held-for-trading financial assets or financial liabilities, loans and receivables, available-for-sale financial assets, and other financialliabilities. This classification will determine how each instrument is measured and how gains and losses are recognized. Held-for-tradingfinancial assets and financial liabilities are measured at fair value with gains and losses recognized in net income. Financial assetsheld-to-maturity, loans and receivables and financial liabilities, other than those held-for-trading, are measured at amortized cost usingthe effective interest method of amortization. Available-for-sale financial assets are measured at fair value, with unrealized gains andlosses, including changes in foreign exchange rates, being recognized in other comprehensive income, a new section of shareholders’equity. Investments in equity instruments classified as available-for-sale that do not have a quoted market price in an active market canbe measured at cost. The recommendations further define derivatives to include non-financial derivatives and embedded derivativeswhich meet certain criteria. All derivatives must be classified as held-for-trading unless they are designated in a hedging relationship.
• Section 3865, “Hedges”, replaces AcG 13, “Hedging Relationships” and the guidance formerly in Section 1650, “Foreign CurrencyTranslation” will be replaced by Section 1651 of the same name, such that foreign exchange gains or losses on available-for-salefinancial assets be accounted for in other comprehensive income instead of net earnings. The requirements for identification, designationand documentation of hedging relationships remain unchanged. The new guidance addresses the accounting treatment of qualifyinghedging relationships and the necessary disclosures. The standard defines three specific hedging relationships, namely, fair valuehedges, cash flow hedges, and hedges of a net investment in self-sustaining foreign operations, and defines how the accounting shouldbe performed. Changes in the fair value of hedging derivatives in a fair value hedge are offset in the consolidated statement of earningsagainst the change in fair value of the asset, liability or cash flow being hedged. In cash flow hedges, the changes in fair value arerecorded in other comprehensive income, a new section of shareholders’ equity. To the extent the change in fair value of the derivative is not completely offset by the change in fair value of the item it is hedging, the ineffective portion of the hedging relationship is recordedimmediately in the consolidated statement of earnings.
• Section 1530, “Comprehensive Income” introduces a statement of comprehensive income which will be included in interim and annual financial statements. Comprehensive income is comprised of net income and other comprehensive income, and represents the change in equity during a period from transactions and other events with non-owner sources. Other comprehensive income will include unrealized gains and losses on financial assets that are classified as available-for-sale and changes in fair value of the effective portion of cash flow hedges.
• Section 3861, “Financial Instruments – Disclosure and Presentation”, replaces Section 3860 of the same name, and addresses thepresentation and disclosure of financial instruments and non-financial derivatives. The main features of these new recommendationsrevise the requirements to provide accounting policy disclosures and provide new requirements for disclosure on fair value.
• Section 3251, “Equity”, replaces Section 3250, “Surplus” and establishes standards for the presentation of equity and changes in equityduring the reporting period and requires that an enterprise present separately equity components and changes in equity arising from i) net income; ii) other comprehensive income; iii) other changes in retained earnings; iv) changes in contributed surplus; v) changes in share capital; and vi) changes in reserves.
These standards are effective for interim and annual financial statements for fiscal years beginning on or after October 1, 2006.Consequently, the Company will implement them in the first quarter of 2007. The transitional adjustments resulting from these standardswill be recognized in the opening balances of retained earnings and other comprehensive income as appropriate. The impact on theconsolidated balance sheet will include the recording of the fair value of the interest rate swaps designated in a cash flow hedge. We aredetermining the impact of these changes based on the transitional guidance within these sections. Prior periods will not be restated.
• Section 1506, “Accounting Changes”, issued in July 2006 revises current standards on changes in accounting policy, estimates orerrors. An entity is permitted to change an accounting policy only when it results in financial statements that provide reliable and morerelevant information or results from a requirement under a primary source of Canadian GAAP. The guidance also addresses how toaccount for a change in accounting policy, estimate or corrections of errors, and establishes enhanced disclosures about their effects

Management’s Discussion and Analysis
40 2006 Financial Report Loblaw Companies Limited
on the financial statements. These recommendations are effective for fiscal years beginning on or after January 1, 2007. The Companywill implement these recommendations as required on a prospective basis.
• Section 3862, “Financial Instruments Disclosure” and Section 3863, “Financial Instruments Presentation”, both issued in December 2006,revise the current standards on financial instrument disclosure and presentation, and place an increased emphasis on disclosures regarding the risks associated with both recognized and unrecognized financial instruments and how these risks are managed. Section 3863establishes standards for presentation of financial instruments and non-financial derivatives and provides additional guidance forclassification of financial instruments, from the perspective of the issuer, between liabilities and equity. These recommendations areeffective for fiscal years beginning on or after October 1, 2007 and therefore the Company will implement them in the first quarter of 2008.
• Section 1535, “Capital Disclosures”, issued in December 2006, establishes guidelines for the disclosure of information regarding a company’s capital and how it is managed. Enhanced disclosure with respect to the objectives, policies and processes for managingcapital and quantitative disclosures about what a company regards as capital are required. These recommendations are effective for fiscal years beginning on or after October 1, 2007 and therefore the Company will implement them in the first quarter of 2008.
• EIC Abstract 163, “Determining the variability to be considered in applying AcG-15”, issued in September 2006, addresses how to assess whether arrangements should be treated as variable interests or considered as creators of variability by a reporting enterprisein applying AcG-15. This abstract is effective for fiscal years beginning on or after January 1, 2007. The Company will implement theserecommendations as required on a prospective basis. The Company does not expect the adoption of this abstract to have a materialimpact on the consolidated financial statements.
14. Outlook
Loblaw has a number of strengths at its core – strong market share and control label products and a strong store network under variousstore formats with the potential to meet the needs of all Canadians. But as the Company looks forward, it must transition this enterprise into a lean company that is ready and able to compete on all fronts. 2006 marked the beginning of this transition. The Company’s mainfocus going forward is on simplifying its organizational structure, on retailing basics such as on-shelf availability and customer focus, on innovation as a competitive advantage and on executing the Company’s growth strategy.
15. Non-GAAP Financial Measures
The Company reports its financial results in accordance with Canadian GAAP. However, the Company has included certain non-GAAPfinancial measures and ratios which it believes provide useful information to both management and readers of this Annual Report, includingthis Financial Report, in measuring the financial performance and financial condition of the Company for the reasons set out below. These measures do not have a standardized meaning prescribed by Canadian GAAP and, therefore, may not be comparable to similarly titled measures presented by other publicly traded companies, nor should they be construed as an alternative to other financial measuresdetermined in accordance with Canadian GAAP. For the following tables, the annual non-GAAP financial measures for the years 2006through to 2002, are for the 52 or 53 weeks ended or as at December 30, 2006; December 31, 2005; January 1, 2005; January 3, 2004; and December 28, 2002, respectively.
Sales and Sales Growth Excluding the Impact of VIEsThese financial measures exclude the impact on sales from the consolidation by the Company of certain independent franchisees whichresulted from the implementation of AcG 15 retroactively without restatement effective January 2, 2005. This impact on sales is excludedbecause the Company believes this allows for a more effective analysis of the operating performance of the Company. Both the current and comparative measures reflect the retroactive implementation of EIC 156. A reconciliation of the financial measures to the CanadianGAAP financial measures is included in the table “Sales and Sales Growth Excluding the Impact of VIEs” on pages 8 and 25 of this MD&A.

2006 Financial Report Loblaw Companies Limited 41
Adjusted Operating Income and Margin The following table reconciles adjusted operating income to Canadian GAAP operating income reported in the consolidated statements of earnings for the twelve week periods ended December 30, 2006 and December 31, 2005 and the years ended as previously indicated.Items listed in the reconciliation below are excluded because the Company believes this allows for a more effective analysis of the operatingperformance of the Company. In addition, they affect the comparability of the financial results and could potentially distort the analysis oftrends. The exclusion of these items does not imply they are non-recurring. Adjusted operating income and margin are useful to managementin assessing the Company’s performance and in making decisions regarding the ongoing operations of its business.
2006 2005 2006 2005 2004 2003 2002($ millions) (12 weeks) (12 weeks) (52 weeks) (52 weeks) (52 weeks) (53 weeks) (52 weeks)
Operating (loss) income $ (695) $ 394 $ 289 $ 1,401 $ 1,652 $ 1,467 $ 1,303Add (deduct) impact of the following:
Goodwill impairment charge 800 800Ontario collective labour agreement 84 84Inventory liquidation 68 68Net effect of stock-based compensation and
the associated equity forwards (6) 27 37 43 (4) 14Restructuring and other charges 35 6 44 86Departure entitlement charge 12Goods and Services Tax and provincial sales taxes 40Direct costs associated with
supply chain disruptions 10 30VIEs 4 (8)The Real Canadian Superstore labour arrangement 25
Adjusted operating income $ 286 $ 441 $ 1,326 $ 1,600 $ 1,652 $ 1,488 $ 1,317
Adjusted operating margin is calculated as adjusted operating income divided by sales excluding the impact of VIEs.
Adjusted EBITDA and MarginThe following table reconciles adjusted earnings before interest, income taxes, depreciation and amortization (“EBITDA”) to adjustedoperating income which is reconciled to Canadian GAAP operating income reported in the consolidated statements of earnings, in the tableabove, for the twelve week periods ended December 30, 2006 and December 31, 2005 and the years ended as previously indicated. AdjustedEBITDA is useful to management in assessing the Company’s performance of its ongoing operations and its ability to generate cash flows to fund its cash requirements, including the Company’s capital investment program.
2006 2005 2006 2005 2004 2003 2002($ millions) (12 weeks) (12 weeks) (52 weeks) (52 weeks) (52 weeks) (53 weeks) (52 weeks)
Adjusting operating income $ 286 $ 441 $ 1,326 $ 1,600 $ 1,652 $ 1,488 $ 1,317Add (deduct) impact of the following:
Depreciation and amortization 133 140 590 558 473 393 354VIE depreciation and amortization (5) (8) (24) (26)
Adjusted EBITDA $ 414 $ 573 $ 1,892 $ 2,132 $ 2,125 $ 1,881 $ 1,671

Management’s Discussion and Analysis
42 2006 Financial Report Loblaw Companies Limited
Adjusted EBITDA margin is calculated as adjusted EBITDA divided by sales excluding the impact of VIEs.
Adjusted Net EarningsAdjusted net earnings can be reconciled to Canadian GAAP net earnings reported in the consolidated statements of earnings by excluding the net earnings impact associated with the items included in the adjusted basic net earnings per common share table below. Adjusted netearnings is useful to management in assessing the Company’s performance and in making decisions regarding the ongoing operations of its business. Certain items are excluded from the comparable GAAP measure because the Company believes this allows for a moreeffective analysis of the operating performance of the Company. In addition, they affect the comparability of the financial results and couldpotentially distort the analysis of trends. The exclusion of these items does not imply they are non-recurring.
Adjusted Basic Net Earnings per Common ShareThe following table reconciles adjusted basic net earnings per common share to Canadian GAAP basic net earnings per common sharemeasures reported in the consolidated statements of earnings for the twelve week periods ended December 30, 2006 and December 31, 2005and the years ended as previously indicated. Items listed in the reconciliation below are excluded because the Company believes this allows for a more effective analysis of the operating performance of the Company. In addition, they affect the comparability of the financialresults and could potentially distort the analysis of trends. The exclusion of these items does not imply they are non-recurring. Adjustedbasic net earnings per common share is useful to management in assessing the Company’s performance and in making decisions regardingthe ongoing operations of its business.
2006 2005 2006 2005 2004 2003 2002(12 weeks) (12 weeks) (52 weeks) (52 weeks) (52 weeks) (53 weeks) (52 weeks)
Basic net (loss) earnings per common share $ (2.76) $ .73 $ (.80) $ 2.72 $ 3.53 $ 3.07 $ 2.64Add (deduct) impact of the following:
Goodwill impairment charge 2.92 2.92Ontario collective labour agreement .20 .20Inventory liquidation .16 .16Net effect of stock-based compensation and
the associated equity forwards (.02) .15 .17 .22 (.06) .04Restructuring and other charges .09 .01 .11 .20Departure entitlement charge .03Changes in statutory income tax rates .01 (.06) .01 .03Goods and Services Tax and provincial sales taxes .10Direct costs associated with supply chain disruptions .02 .07VIEs (.01) .02 (.01) .03Resolution of certain income tax matters (.05)The Real Canadian Superstore labour arrangement .06
Adjusted basic net earnings per common share $ 0.58 $ .94 $ 2.72 $ 3.35 $ 3.48 $ 3.10 $ 2.68
Net DebtThe following table reconciles net debt used in the net debt to equity ratio to Canadian GAAP measures reported in the consolidated balancesheets as at the years ended as previously indicated. The Company calculates net debt as the sum of long term debt and short term debtless cash, cash equivalents and short term investments. The net debt to equity ratio is useful in assessing the amount of leverage employed.

($ millions) 2006 2005 2004 2003 2002
Bank indebtedness $ 1 $ 30 $ 28 $ 38 $ –Commercial paper 647 436 473 603 533Long term debt due within one year 27 161 216 106 106Long term debt 4,212 4,194 3,935 3,956 3,420Less: Cash and cash equivalents 669 916 549 618 823
Short term investments 327 4 275 378 304
Net debt $3,891 $ 3,901 $ 3,828 $ 3,707 $ 2,932
Free Cash FlowThe following table reconciles free cash flow to Canadian GAAP measures reported in the consolidated cash flow statements as at the yearsended as previously indicated. The Company calculates free cash flow as cash flows from operating activities less fixed asset purchases anddividends. The Company believes free cash flow is a useful measure of the Company’s cash available for additional funding requirements.
($ millions) 2006 2005 2004 2003 2002
Cash flows from operating activities $ 1,180 $ 1,489 $ 1,443 $ 1,032 $ 998Less: Fixed asset purchases 937 1,156 1,258 1,271 1,079
Dividends 173 230 209 198 127
Free cash flow $ 70 $ 103 $ (24) $ (437) $ (208)
Total AssetsThe following table reconciles total assets used in the return on average total assets to Canadian GAAP measures reported in theconsolidated balance sheets as at the years ended as previously indicated. The Company believes the return on average total assets ratio isuseful in assessing the performance of its operating assets and therefore excludes cash, cash equivalents and short term investments fromthe total assets used in the ratio.
($ millions) 2006 2005 2004 2003 2002
Total assets $ 13,486 $13,761 $12,949 $12,113 $11,047Less: Cash and cash equivalents 669 916 549 618 823
Short term investments 327 4 275 378 304
Total assets $ 12,490 $12,841 $12,125 $11,117 $ 9,920
16. Additional Information
Additional information about the Company, including its Annual Information Form and other disclosure documents, has been filedelectronically with various securities regulators in Canada through the System for Electronic Document Analysis and Retrieval (SEDAR) andis available online at www.sedar.com and with the Office of the Superintendent of Financial Institutions (OSFI) as the primary regulator forthe Company’s subsidiary, President’s Choice Bank.
March 13, 2007Toronto, Canada
2006 Financial Report Loblaw Companies Limited 43

Financial Results
45 Management’s Statement of Responsibility for Financial Reporting
45 Independent Auditors’ Report
46 Consolidated Statements of Earnings
46 Consolidated Statements of Retained Earnings
47 Consolidated Balance Sheets
48 Consolidated Cash Flow Statements
49 Notes to the Consolidated Financial Statements49 Note 1. Summary of Significant Accounting Policies53 Note 2. Implementation of New Accounting Standards 55 Note 3. Goodwill 56 Note 4. Restructuring and Other Charges57 Note 5. Goods and Services Tax and Provincial Sales Taxes58 Note 6. Collective Agreement58 Note 7. Interest Expense58 Note 8. Income Taxes59 Note 9. Basic and Diluted Net (Loss) Earnings per Common Share60 Note 10. Cash, Cash Equivalents and Short Term Investments60 Note 11. Credit Card Receivables61 Note 12. Inventory Liquidation62 Note 13. Fixed Assets62 Note 14. Other Assets63 Note 15. Employee Future Benefits69 Note 16. Long Term Debt70 Note 17. Other Liabilities70 Note 18. Common Share Capital71 Note 19. Stock-Based Compensation73 Note 20. Financial Instruments74 Note 21. Contingencies, Commitments and Guarantees76 Note 22. Related Party Transactions77 Note 23. Subsequent Event77 Note 24. Other Information
78 Five Year Summary
80 Glossary of Terms
44 2006 Financial Report Loblaw Companies Limited

Management’s Statement of Responsibility for Financial Reporting
The management of Loblaw Companies Limited is responsible for the preparation, presentation and integrity of the accompanyingconsolidated financial statements, Management’s Discussion and Analysis and all other information in the Annual Report. This responsibilityincludes the selection and consistent application of appropriate accounting principles and methods in addition to making the judgments and estimates necessary to prepare the consolidated financial statements in accordance with Canadian generally accepted accountingprinciples. It also includes ensuring that the financial information presented elsewhere in the Annual Report is consistent with that in theconsolidated financial statements.
To provide reasonable assurance that assets are safeguarded and that relevant and reliable financial information is produced, management is required to design a system of internal controls and certify as to the design effectiveness of internal controls over financial reporting. Internal auditors, who are employees of the Company, review and evaluate internal controls on management’s behalf. KPMG LLP, whose reportfollows, were appointed as independent auditors by a vote of the Company’s shareholders to audit the consolidated financial statements.
The Board of Directors, acting through an Audit Committee comprised solely of directors who are independent of the Company, is responsiblefor determining that management fulfills its responsibilities in the preparation of the consolidated financial statements and the financialcontrol of operations. The Audit Committee recommends the independent auditors for appointment by the shareholders. The Audit Committeemeets regularly with senior and financial management, internal auditors and the independent auditors to discuss internal controls, auditing activities and financial reporting matters. The independent auditors and internal auditors have unrestricted access to the AuditCommittee. These consolidated financial statements and Management’s Discussion and Analysis have been approved by the Board of Directors for inclusion in the Annual Report based on the review and recommendation of the Audit Committee.
Toronto, CanadaMarch 13, 2007
Galen G. Weston Mark Foote Richard P. MavrinacExecutive Chairman President and Chief Merchandising Officer Executive Vice President
Independent Auditors’ Report
To the Shareholders of Loblaw Companies Limited: We have audited the consolidated balance sheets of Loblaw Companies Limited as at December 30, 2006 and December 31, 2005 and the consolidated statements of earnings, retained earnings and cash flow for the 52 week years then ended. These consolidated financialstatements are the responsibility of the Company’s management. Our responsibility is to express an opinion on these consolidated financial statements based on our audits.
We conducted our audits in accordance with Canadian generally accepted auditing standards. Those standards require that we plan and perform an audit to obtain reasonable assurance whether the consolidated financial statements are free of material misstatement. An audit includes examining, on a test basis, evidence supporting the amounts and disclosures in the consolidated financial statements. An audit also includes assessing the accounting principles used and significant estimates made by management, as well as evaluating the overall consolidated financial statement presentation.
In our opinion, these consolidated financial statements present fairly, in all material respects, the financial position of the Company as at December 30, 2006 and December 31, 2005 and the results of its operations and its cash flow for the years then ended in accordancewith Canadian generally accepted accounting principles.
Toronto, Canada March 13, 2007 Chartered Accountants
2006 Financial Report Loblaw Companies Limited 45
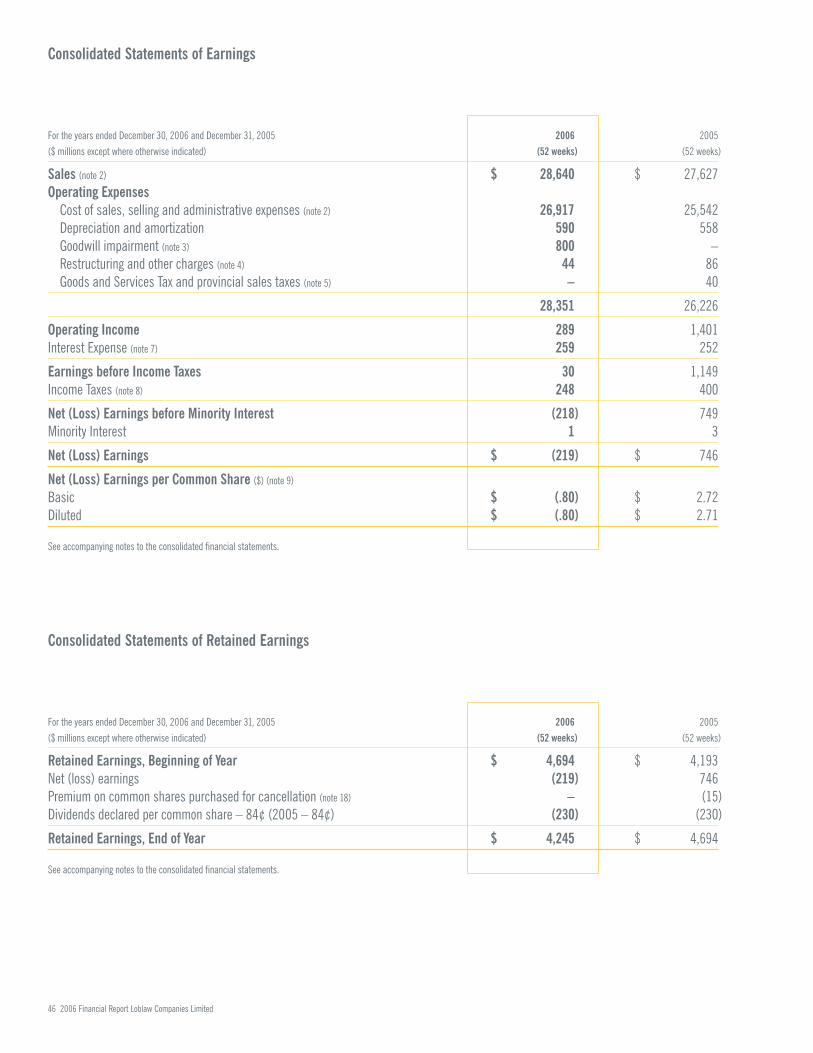
Consolidated Statements of Earnings
For the years ended December 30, 2006 and December 31, 2005 2006 2005($ millions except where otherwise indicated) (52 weeks) (52 weeks)
Sales (note 2) $ 28,640 $ 27,627Operating Expenses
Cost of sales, selling and administrative expenses (note 2) 26,917 25,542Depreciation and amortization 590 558Goodwill impairment (note 3) 800 –Restructuring and other charges (note 4) 44 86Goods and Services Tax and provincial sales taxes (note 5) – 40
28,351 26,226
Operating Income 289 1,401Interest Expense (note 7) 259 252
Earnings before Income Taxes 30 1,149Income Taxes (note 8) 248 400
Net (Loss) Earnings before Minority Interest (218) 749Minority Interest 1 3
Net (Loss) Earnings $ (219) $ 746
Net (Loss) Earnings per Common Share ($) (note 9)
Basic $ (.80) $ 2.72Diluted $ (.80) $ 2.71
See accompanying notes to the consolidated financial statements.
Consolidated Statements of Retained Earnings
For the years ended December 30, 2006 and December 31, 2005 2006 2005($ millions except where otherwise indicated) (52 weeks) (52 weeks)
Retained Earnings, Beginning of Year $ 4,694 $ 4,193Net (loss) earnings (219) 746Premium on common shares purchased for cancellation (note 18) – (15)Dividends declared per common share – 84¢ (2005 – 84¢) (230) (230)
Retained Earnings, End of Year $ 4,245 $ 4,694
See accompanying notes to the consolidated financial statements.
46 2006 Financial Report Loblaw Companies Limited

Consolidated Balance Sheets
As at December 30, 2006 and December 31, 2005($ millions) 2006 2005
AssetsCurrent Assets
Cash and cash equivalents (note 10) $ 669 $ 916Short term investments (note 10) 327 4Accounts receivable (note 11) 728 656Inventories (note 12) 2,037 2,020Income taxes 63 3Future income taxes (note 8) 85 72Prepaid expenses and other assets 39 30
Total Current Assets 3,948 3,701Fixed Assets (note 13) 8,055 7,785Goodwill (note 3) 794 1,587Other Assets (note 14) 689 688
Total Assets $ 13,486 $ 13,761
LiabilitiesCurrent Liabilities
Bank indebtedness $ 1 $ 30Commercial paper 647 436Accounts payable and accrued liabilities 2,598 2,535Long term debt due within one year (note 16) 27 161
Total Current Liabilities 3,273 3,162Long Term Debt (note 16) 4,212 4,194Future Income Taxes (note 8) 234 237Other Liabilities (note 17) 314 271Minority Interest 12 11
Total Liabilities 8,045 7,875
Shareholders’ EquityCommon Share Capital (note 18) 1,196 1,192Retained Earnings 4,245 4,694
Total Shareholders’ Equity 5,441 5,886
Total Liabilities and Shareholders’ Equity $ 13,486 $ 13,761
See accompanying notes to the consolidated financial statements.
Approved on Behalf of the Board
Galen G. Weston Thomas C. O’NeillDirector Director
2006 Financial Report Loblaw Companies Limited 47

Consolidated Cash Flow Statements
For the years ended December 30, 2006 and December 31, 2005 2006 2005($ millions) (52 weeks) (52 weeks)
Operating ActivitiesNet (loss) earnings before minority interest $ (218) $ 749Depreciation and amortization 590 558Goodwill impairment (note 3) 800 –Restructuring and other charges (note 4) 44 86Goods and Services Tax and provincial sales taxes (note 5) – 40Future income taxes (18) 90Change in non-cash working capital (69) (51)Other 51 17
Cash Flows from Operating Activities 1,180 1,489
Investing ActivitiesFixed asset purchases (937) (1,156)Short term investments (323) 271Proceeds from fixed asset sales 99 109Credit card receivables, after securitization (note 11) (82) (84)Franchise investments and other receivables (18) 53Other (47) (96)
Cash Flows used in Investing Activities (1,308) (903)
Financing ActivitiesBank indebtedness (29) (17)Commercial paper 211 (37)Long term debt (note 16)
Issued 29 333Retired (162) (240)
Common share capitalIssued (notes 18 and 19) 4 1Retired (note 18) – (16)
Dividends (173) (230)Other – (2)
Cash Flows used in Financing Activities (120) (208)
Effect of foreign currency exchange rate changeson cash and cash equivalents (note 10) 1 (31)
Initial impact of variable interest entities (note 2) – 20
Change in Cash and Cash Equivalents (247) 367 Cash and Cash Equivalents, Beginning of Year 916 549
Cash and Cash Equivalents, End of Year $ 669 $ 916
See accompanying notes to the consolidated financial statements.
48 2006 Financial Report Loblaw Companies Limited
Notes to the Consolidated Financial Statements
For the years ended December 30, 2006 and December 31, 2005($ millions except where otherwise indicated)
Note 1. Summary of Significant Accounting Policies
The consolidated financial statements were prepared in accordance with Canadian generally accepted accounting principles (“GAAP”) and are reported in Canadian dollars.
Basis of Consolidation The consolidated financial statements include the accounts of Loblaw Companies Limited and its subsidiaries,collectively referred to as the “Company” or “Loblaw”. The Company’s interest in the voting share capital of its subsidiaries is 100%. The Company also consolidates variable interest entities (“VIEs”) that are subject to control on a basis other than through ownership of a majority of voting interest (see Note 2).
Fiscal Year The fiscal year of the Company ends on the Saturday closest to December 31. As a result, the Company’s fiscal year is usually52 weeks in duration but includes a 53rd week every 5 to 6 years. The years ended December 30, 2006 and December 31, 2005 eachcontained 52 weeks.
Revenue Recognition Sales include revenues, net of estimated returns, from customers through corporate stores operated by the Company and independent franchisee stores that are consolidated by the Company pursuant to Accounting Guideline 15, “Consolidation ofVariable Interest Entities”, (“AcG 15”). In addition, sales include sales to and service fees from associated stores and independent accountcustomers and franchised stores excluding VIE stores. The Company recognizes revenue at the time the sale is made to its customers.
(Loss) Earnings per Share (“EPS”) Basic EPS is calculated by dividing the net (loss) earnings available to common shareholders by the weighted average number of common shares outstanding during the year. Diluted EPS is calculated using the treasury stock method,which assumes that all outstanding stock options with an exercise price below the average market price during the year are exercised and the assumed proceeds are used to purchase the Company’s common shares at the average market price during the year.
Cash, Cash Equivalents and Bank Indebtedness Cash balances which the Company has the ability and intent to offset are used to reduce reported bank indebtedness. Cash equivalents are highly liquid investments with a maturity of 90 days or less.
Short Term Investments Short term investments are carried at the lower of cost or quoted market value and consist primarily of UnitedStates government securities, commercial paper and bank deposits.
Credit Card Receivables The Company, through President’s Choice Bank (“PC Bank”), a wholly owned subsidiary of the Company, has creditcard receivables that are stated net of an allowance for credit losses. Credit card receivables, if contractually past due, are not classified as impaired but are fully written off on the earlier of when payments are contractually 180 days in arrears or when the likelihood of collectionis considered remote. Interest income on credit card receivables is recorded on an accrual basis and is recognized in operating income.
Allowance for Credit Losses PC Bank maintains an allowance for probable credit losses on aggregate exposures for which losses cannot be determined on an item-by-item basis. The allowance is based upon a statistical analysis of past performance, the level of allowancealready in place and management’s judgment. The allowance for credit losses is deducted from the credit card receivables balance. The net credit loss experience for the year is recognized in operating income.
Securitization PC Bank securitizes credit card receivables through the sale of a portion of the total interest in these receivables to independent trusts and does not exercise any control over the trusts’ management, administration or assets. The credit card receivables are removed from the consolidated balance sheet when PC Bank has surrendered control and are considered sold for accounting purposes pursuant to Accounting Guideline 12, “Transfers of Receivables”. When PC Bank sells credit card receivables in a securitizationtransaction, it has a retained interest in the securitized receivables represented by the rights to future cash flows after obligations to
2006 Financial Report Loblaw Companies Limited 49

investors have been met. Although PC Bank remains responsible for servicing all credit card receivables, it does not receive additionalcompensation for servicing those credit card receivables sold to the trusts and accordingly a service liability is recorded. Gains or losses onthe sale of these receivables depends, in part, on the previous carrying amount of receivables involved in the securitization, allocatedbetween the receivables sold and the retained interest, based on their relative fair values at the date of securitization. When quoted marketvalues are not available, the fair values are determined using management’s best estimate of the net present value of expected future cash flows using key assumptions for monthly payment rates, weighted average life, expected annual credit losses and discount rates. Any gain or loss on a sale is recognized in operating income at the time of the securitization. The carrying value of retained interests is periodically reviewed and when a decline in value is identified that is other than temporary, the carrying value is written down to fair value.
Vendor Allowances The Company receives allowances from certain of its vendors whose products it purchases for resale. Theseallowances are received for a variety of buying and/or merchandising activities, including vendor programs such as volume purchaseallowances, purchase discounts, listing fees and exclusivity allowances. Consideration received from a vendor is a reduction in the cost of the vendor’s products or services and is recognized as a reduction in the cost of sales, selling and administrative expenses and the related inventory when recognized in the consolidated statement of earnings and the consolidated balance sheet. Certain exceptionsapply if the consideration is a payment for assets or services delivered to the vendor or for reimbursement of selling costs incurred topromote the vendor’s products, provided that certain conditions are met.
Inventories Retail store inventories are stated at the lower of cost and estimated net realizable value less normal gross profit margin.Distribution centre inventories and seasonal general merchandise inventories are stated at the lower of cost and estimated net realizablevalue. Cost is determined substantially using the first-in, first-out method.
Fixed Assets Fixed assets are recorded at cost including capitalized interest. Depreciation commences when the assets are put into use and is recognized on a straight-line basis to depreciate the cost of these assets over their estimated useful lives. Estimated useful livesrange from 20 to 40 years for buildings, 10 years for building improvements and from 3 to 10 years for equipment and fixtures. Leaseholdimprovements are depreciated over their estimated useful lives and may include renewal options when an improvement is made afterinception of the lease to a maximum of 25 years, which approximates economic life. Equipment under capital leases is depreciated over the term of the lease.
Fixed assets are reviewed for impairment when events or changes in circumstances indicate that the carrying value exceeds the sum of the undiscounted future cash flows expected from use and eventual disposal. These events or changes in circumstances include acommitment to close a store or distribution centre or to relocate or convert a store. Fixed assets are also reviewed for impairment annually. For purposes of annually reviewing store assets for impairment, asset groups are reviewed at their lowest level for which identifiable cashflows are largely independent of cash flows of other assets and liabilities. Therefore, store net cash flows are grouped together by primarymarket areas, where cash flows are largely dependent on each other. Primary markets are regional areas where a number of store formatsoperate within close proximity to one another. If an indicator of impairment exists, such as sustained negative operating cash flows of therespective asset group, then an estimate of undiscounted future cash flows of each such store within this group is prepared and comparedto its carrying value. For purposes of annually reviewing distribution centre assets for impairment, distribution centre net cash flows aregrouped with the respective net cash flows of the stores they service. An impairment in the store network serviced by the distribution centrewould indicate an impairment in the distribution centre assets as well. If these assets are determined to be impaired, the impairment loss is measured as the excess of the carrying value over fair value. In addition, the carrying value of fixed assets is evaluated wheneverevents or changes in circumstances indicate that the carrying value of fixed assets may not be recoverable. These events or changes in circumstances include a commitment to close a store or distribution centre or to relocate or convert a store where the carrying value of its assets is greater than the expected undiscounted future cash flows.
50 2006 Financial Report Loblaw Companies Limited
Notes to the Consolidated Financial Statements
Deferred Charges Debt issue costs associated with long term debt are deferred and amortized on a straight-line basis over the term of the respective debt issues. Other deferred charges are amortized over the related assets’ estimated useful lives, to a maximum of 15 years.
Goodwill Goodwill represents the excess of the purchase price of a business acquired over the fair value of the underlying net assets acquired at the date of acquisition. Goodwill is not amortized and its carrying value is tested at least annually for impairment. Any impairment in the carrying value of goodwill is recognized in operating income. Additional disclosure regarding the results of the 2006 annual goodwill impairment test is provided in Note 3.
Financial Derivative Instruments The Company uses financial derivative agreements in the form of cross currency basis swaps, interest rate swaps and equity forwards to manage its current and anticipated exposure to fluctuations in foreign currency exchange rates,interest rates and the market price of the Company’s common shares. The Company does not enter into financial derivative agreements for trading or speculative purposes.
The Company formally identifies, designates and documents the relationships between hedging instruments and hedged items includingcross currency basis swaps and interest rate swaps as cash flow hedges against its exposure to fluctuations in the foreign currencyexchange rate and variable interest rates on a portion of its United States dollar denominated assets, principally cash equivalents and shortterm investments; and interest rate swaps as a cash flow hedge of the variable interest rate exposure on commercial paper. Effectivenesstests are performed to evaluate hedge effectiveness at inception and on an ongoing basis, both retrospectively and prospectively.
Realized and unrealized foreign currency exchange rate adjustments on cross currency basis swaps are offset by realized and unrealized foreign currency exchange rate adjustments on a portion of the Company’s United States dollar denominated assets and arerecognized in operating income. The cumulative unrealized foreign currency exchange rate receivable or payable is recorded in other assets or other liabilities, respectively. The exchange of interest payments on the cross currency basis swaps and interest rate swaps is recognized on an accrual basis in interest expense. Unrealized gains or losses on the interest rate swaps designated within an effectivehedging relationship are not recognized.
Financial derivative instruments not designated within an effective hedging relationship are measured at fair value with changes in fairvalue recorded in interest expense.
Equity forwards are used to manage exposure to fluctuations in the Company’s stock-based compensation cost because they change invalue as the market price of the underlying common shares changes. The market price adjustments on the equity forwards are recognized in operating income as gains or losses and the cumulative unrealized gains or losses are recorded in other assets or other liabilities,respectively. Interest on the equity forwards is recognized on an accrual basis in interest expense.
Foreign Currency Translation Assets and liabilities denominated in foreign currencies are translated into Canadian dollars at the foreign currency exchange rate in effect at the balance sheet date. Exchange gains or losses arising from the translation of these balancesdenominated in foreign currencies are recognized in operating income. Revenues and expenses denominated in foreign currencies aretranslated into Canadian dollars at the average foreign currency exchange rate for the year.
Income Taxes The asset and liability method of accounting is used for income taxes. Under the asset and liability method, future income tax assets and liabilities are recognized for the future income tax consequences attributable to temporary differences between the financialstatement carrying values of existing assets and liabilities and their respective income tax bases. Future income tax assets and liabilities are measured using enacted or substantively enacted income tax rates expected to apply to taxable income in the years in which thosetemporary differences are expected to be recovered or settled. The effect on future income tax assets and liabilities of a change in income taxrates is recognized in income tax expense when enacted or substantively enacted. Future income tax assets are evaluated and a valuationallowance, if required, is recorded against any future income tax asset if it is more likely than not that the asset will not be realized.
2006 Financial Report Loblaw Companies Limited 51

Employee Future Benefits The Company sponsors a number of pension plans including registered funded defined benefit pension plans,defined contribution pension plans and supplemental unfunded arrangements providing pension benefits in excess of statutory limits. The Company also offers certain employee post-retirement and post-employment benefit plans and a long term disability benefit plan. Post-retirement and post-employment benefit plans are not funded, are mainly non-contributory and include health care, life insurance and dental benefits. The Company also contributes to various multi-employer pension plans which provide pension benefits.
Defined Benefit Plans The cost and accrued benefit plan obligations of the Company’s defined benefit pension plans and other benefit plans, including post-retirement, post-employment and long term disability benefits, are accrued based on actuarial valuations. The actuarial valuations are determined using the projected benefit method prorated on service and management’s best estimate of the expected long term rate of return on plan assets, rate of compensation increase, retirement ages of employees and expected growth rate of health care costs. Actuarial valuations are performed using a September 30 measurement date for accounting purposes. Market valuesused to value benefit plan assets are as at the measurement date. The discount rate used to value the accrued benefit plan obligation is based on market interest rates as at the measurement date, assuming a portfolio of Corporate AA bonds with terms to maturity that, on average, match the terms of the accrued benefit plan obligation.
Past service costs arising from plan amendments are amortized over the expected average remaining service period of the active employees.The unamortized net actuarial gain or loss that exceeds 10% of the greater of the accrued benefit plan obligation or the fair value of the benefit plan assets at the beginning of the year is amortized over the expected average remaining service period of the active employeesfor defined benefit pension and post-retirement benefit plans. The unamortized net actuarial gain or loss for post-employment and long term disability benefits is amortized over periods not exceeding three years. The expected average remaining service period of the active employees covered by the defined benefit pension plans ranges from 6 to 17 years, with a weighted average of 13 years. The expectedaverage remaining service period of the employees covered by the post-retirement benefit plans ranges from 6 to 22 years, with a weighted average of 18 years.
The accrued benefit plan asset or liability represents the cumulative difference between the cost and the funding contributions and isrecorded in other assets and other liabilities.
Defined Contribution and Multi-Employer Pension Plans The costs of pension benefits for defined contribution pension plans and multi-employer pension plans are expensed as contributions are due.
Stock Option Plan The Company recognizes a compensation cost in operating income and a liability related to employee stock options that allow for settlement in shares or in the share appreciation value in cash at the option of the employee, using the intrinsic value method.Under the intrinsic value method, the stock-based compensation liability is the amount by which the market price of the common sharesexceeds the exercise price of the stock options. A year-over-year change in the stock-based compensation liability is recognized in operatingincome on a prescribed vesting basis.
The Company accounts for stock options issued prior to December 30, 2001 that will be settled by issuing common shares as capitaltransactions. Consideration paid by employees on the exercise of this type of stock option is credited to common share capital. This type of option was last issued in 2001 and represents approximately 1.0% of all options outstanding at year end.
Restricted Share Unit (“RSU”) Plan The Company recognizes a compensation cost in operating income for each RSU granted equal to the market value of a Loblaw common share at the date on which RSUs are awarded to each participant prorated over the performanceperiod and adjusts for changes in the market value until the end of the performance date. The cumulative effect of the change in marketvalue is recognized in operating income in the period of change.
52 2006 Financial Report Loblaw Companies Limited
Notes to the Consolidated Financial Statements

Employee Share Ownership Plan The Company maintains an Employee Share Ownership Plan which allows employees to acquire the Company’s common shares through regular payroll deductions of up to 5% of their gross regular earnings. The Company contributes an additional 25% of each employee’s contribution to the plan, which is recognized in operating income as a compensation cost when the contribution is made.
Deferred Share Units Members of the Company’s Board of Directors may elect annually to receive all or a portion of their annual retainer(s)and fees in the form of deferred share units, which are accounted for using the intrinsic value method. Under the intrinsic value method, the deferred share unit compensation liability is the amount by which the market price of the common shares exceeds the initial value of thedeferred share unit. The year-over-year change in the deferred share unit compensation liability is recognized in operating income.
Use of Estimates and Assumptions The preparation of the consolidated financial statements requires management to make estimates and assumptions that affect the reported amounts and disclosures made in the consolidated financial statements and accompanying notes.These estimates and assumptions are based on management’s historical experience, best knowledge of current events and conditions and activities that may be undertaken in the future. Actual results could differ from these estimates.
Certain estimates, such as those related to valuation of inventories, goodwill, income taxes, Goods and Services Tax and provincial salestaxes, fixed assets and employee future benefits, depend upon subjective or complex judgments about matters that may be uncertain, andchanges in those estimates could materially impact the consolidated financial statements.
Comparative Information Certain prior year’s information was reclassified to conform with current year’s presentation.
Note 2. Implementation of New Accounting Standards
Accounting Standards Implemented in 2006Effective January 1, 2006, the Company implemented Emerging Issues Committee Abstract 156, “Accounting by a Vendor for ConsiderationGiven to a Customer (Including a Reseller of the Vendor’s Products)”, (“EIC 156”) issued by the Canadian Institute of Chartered Accountantsin September 2005. EIC 156 addresses cash consideration, including sales incentives, given by a vendor to a customer. This consideration is presumed to be a reduction of the selling price of the vendor’s products and should therefore be classified as a reduction of sales in thevendor’s statement of earnings.
Prior to the implementation of EIC 156, the Company recorded certain sales incentives paid to independent franchisees, associates and independent accounts in cost of sales, selling and administrative expenses on the consolidated statements of earnings. Accordingly, the implementation of EIC 156, on a retroactive basis, resulted in a reduction in both sales and cost of sales, selling and administrativeexpenses of $174 for 2005. As reclassifications, these changes did not impact net earnings.
Accounting Standards Implemented in 2005Effective January 2, 2005, the Company implemented AcG 15, retroactively without restatement of prior periods and as a result, theCompany consolidates entities in which it has control through ownership of a majority of the voting interests as well as all VIEs for which it is the primary beneficiary.
AcG 15 defines a variable interest entity as an entity that either does not have sufficient equity at risk to finance its activities withoutsubordinated financial support or where the holders of the equity at risk lack the characteristics of a controlling financial interest. AcG 15requires the primary beneficiary to consolidate VIEs and considers an entity to be the primary beneficiary of a VIE if it holds variable intereststhat expose it to a majority of the VIE’s expected losses or that entitle it to receive a majority of the VIE’s expected residual returns or both.
2006 Financial Report Loblaw Companies Limited 53

Upon implementation of AcG 15, the Company identified the following significant VIEs:
Independent Franchisees The Company enters into various forms of franchise agreements that generally require the independentfranchisee to purchase inventory from the Company and pay certain fees in exchange for services provided by the Company and for the right to use certain trademarks and licences owned by the Company. Independent franchisees generally lease the land and building from the Company, and when eligible, may obtain financing through a structure involving independent trusts to facilitate the purchase of the majority of their inventory and fixed assets, consisting mainly of fixturing and equipment. These trusts are administered by a majorCanadian chartered bank. Under the terms of certain franchise agreements, the Company may also lease equipment to independentfranchisees. Independent franchisees may also obtain financing through operating lines of credit with traditional financial institutions or through issuing preferred shares or notes payable to the Company. The Company monitors the financial condition of its independentfranchisees and provides for estimated losses or write-downs on its accounts and notes receivable or investments when appropriate. Upon implementation of AcG 15, the Company determined that 121 of its independent franchise stores met the criteria for VIEs that requireconsolidation by the Company pursuant to AcG 15.
As at year end 2006, 123 (2005 – 123) of the Company’s independent franchise stores met the criteria for a VIE and were consolidatedpursuant to AcG 15.
Warehouse and Distribution Agreement The Company has entered into a warehouse and distribution agreement with a third party to provide to the Company distribution and warehousing services from a dedicated facility. The Company has no equity interest in this thirdparty; however, the terms of the agreement with the third party are such that the Company has determined that the third party meets the criteria for a VIE that requires consolidation by the Company. As a result of the fee structure agreed to with this third party, the impact of the consolidation of the warehouse and distribution entity was not material.
Accordingly, the Company has included the results of these independent franchisees and this third-party entity that provides distribution and warehousing services in its consolidated financial statements effective January 2, 2005.
An after-tax, one-time charge of $29 (net of income taxes of $12) was recorded upon implementation and resulted mainly from delaying the recognition of vendor monies to when the related inventories of the independent franchisees are sold to their customers, the excess of the independent franchisees’ accumulated losses over the allowance for doubtful accounts previously recorded by the Company and the reversal of initial franchise fees initially recognized upon the sale of franchises to third parties.
Independent Trust The Company has also identified that it holds a variable interest, by way of a standby letter of credit, in an independenttrust which is used to securitize credit card receivables for PC Bank. In these securitizations, PC Bank sells a portion of its credit cardreceivables to the independent trust in exchange for cash. Although this independent trust has been identified as a VIE, it was determinedthat the Company is not the primary beneficiary and therefore this VIE is not subject to consolidation by the Company. The Company’smaximum exposure to loss as a result of its involvement with this independent trust is disclosed in Notes 11 and 21.
The consolidation of these VIEs by the Company does not result in any change to its tax, legal or credit risks, nor does it result in theCompany assuming any obligations of these third parties.
54 2006 Financial Report Loblaw Companies Limited
Notes to the Consolidated Financial Statements

2006 Financial Report Loblaw Companies Limited 55
Note 3. Goodwill
Goodwill is assessed for impairment at the reporting unit level at least annually. Any potential goodwill impairment is identified by comparingthe fair value of a reporting unit to its carrying value. If the fair value of the reporting unit exceeds its carrying value, goodwill is considered not to be impaired. If the carrying value of the reporting unit exceeds its fair value, a more detailed goodwill impairment assessment must be undertaken. A goodwill impairment charge is recognized to the extent that, at the reporting unit level, the carrying value of goodwill exceedsthe implied fair value.
The Company determines the fair value using a discounted cash flow model corroborated by other valuation techniques such as marketmultiples. The process of determining these fair values requires management to make estimates and assumptions including, but not limitedto projected future sales, earnings and capital investment, discount rates and terminal growth rates. Projected future sales, earnings andcapital investment are consistent with strategic plans presented to the Company’s Board of Directors. Discount rates are based on anindustry weighted average cost of capital. These estimates and assumptions are subject to change in the future due to uncertain competitiveand economic market conditions or changes in business strategies.
In 2006, the Company performed the annual goodwill impairment test and it was determined that the carrying value of the goodwill establishedon the acquisition of Provigo Inc. in 1998 exceeded its respective fair value. As a result, the Company recorded in operating income a non-cashgoodwill impairment charge of $800 relating to this goodwill. The Company expects no income tax deduction from this non-cash goodwillimpairment charge. The determination that the fair value of goodwill was less than its carrying value resulted from a decline in market multiples,both from an industry and Company perspective, and a reduction of fair value as determined using the discounted cash flow methodology,incorporating both current Company and market assumptions, which in combination resulted in the goodwill impairment. This non-cash goodwillimpairment charge is expected to be adjusted if necessary in the first half of 2007 and may result in a charge or credit to operating income in the consolidated statement of earnings and in the carrying value of goodwill on the balance sheet.
In the normal course of business, the Company may acquire from time to time franchisee stores and convert them to corporate stores. In 2006,the Company acquired 7 franchisee businesses (2005 – 7 franchisee businesses). The acquisitions were accounted for using the purchasemethod of accounting with the results of the business acquired included in the consolidated financial statements from the date of acquisition.The fair value of the net assets acquired consisted of fixed assets of $2 (2005 – nominal), other assets principally inventory of $2 (2005 – $3)and goodwill of $7 (2005 – $3) for cash consideration of $9 (2005 – $5), net of accounts receivable due from the franchisees of $2 (2005 – $1).
The consolidated balance sheet as at year end 2006 includes $4 (2005 – $4) of goodwill of independent franchisees that were consolidatedby the Company pursuant to the requirements of AcG 15.
During 2005, the Company reduced goodwill by $41 due to the resolution of certain income tax matters previously accrued for as part of the Provigo Inc. purchase equation.
The following table discloses the changes in goodwill over 2006 and 2005.
2006 2005
Balance, beginning of year $ 1,587 $ 1,621Goodwill acquired 7 7Goodwill impairment (800) –Other adjustments – (41)
Balance, end of year $ 794 $ 1,587
Note 4. Restructuring and Other Charges
Store OperationsDuring 2006, the Company completed assessments of its store operations, and approved and communicated plans to restructure certain of its store operations. The total restructuring cost under these plans is estimated to be approximately $54. Of the $54 total estimated costs,approximately $10 is attributable to employee termination benefits which include severance resulting from the termination of employees,$25 to fixed asset impairment and accelerated depreciation of assets relating to these restructuring activities and $19 to site closing andother costs including lease obligations. In 2006, the Company recognized $35 of these restructuring costs, which are composed of $9 foremployee termination benefits, $25 for fixed asset impairment and accelerated depreciation and $1 for other costs directly associated withthose initiatives. The components of the store operations restructuring plan are described below.
As part of a review of the Quebec store operations, the Company approved and communicated a plan in 2006 to close 19 underperformingstores, mainly within the Provigo banner. This initiative is expected to be completed during 2007 and the total restructuring cost under this initiative is estimated to be approximately $40, of which $28 was recognized in 2006.
Based on the Company’s review of the impact on the Cash & Carry and wholesale club network of the loss in tobacco sales following the decision by a major tobacco supplier to sell directly to certain customers of the Company, the Company approved and communicated aplan in 2006 to close 24 wholesale outlets which were impacted most significantly by this change. This initiative is expected to be completedduring 2007 and the total restructuring cost under this initiative is estimated to be approximately $10, of which $6 was recognized in 2006.
As part of a review of the Atlantic store operations, the Company approved and communicated a plan in 2006 to close 8 stores in the Atlantic region. This initiative is expected to be completed during 2007 and the total restructuring cost under this initiative is estimatedto be approximately $4, of which $1 was recognized in 2006.
Supply Chain NetworkDuring 2005, the Company approved a comprehensive plan to restructure its supply chain operations nationally. The restructuring plan isnow expected to be completed by the first quarter of 2009 and the total restructuring cost under this plan is estimated to be approximately$90. Of the $90 total estimated cost, approximately $57 is attributable to employee termination benefits which include severance andadditional pension costs resulting from the termination of employees, $13 to fixed asset impairment and accelerated depreciation of assetsrelating to this restructuring activity and $20 to site closing and other costs directly attributable to the restructuring plan. In 2006, theCompany recognized $8 (2005 – $62) of restructuring costs resulting from this plan which is composed of $4 (2005 – $45) for employeetermination benefits resulting from planned involuntary terminations, $2 (2005 – $11) for fixed asset impairment and accelerateddepreciation and $2 (2005 – $6) for other costs directly associated with those initiatives.
Office Move and Reorganization of the Operation Support FunctionsDuring 2005, the Company consolidated several administrative and operating offices from across southern Ontario into a new National Head Office and Store Support Centre in Brampton, Ontario and reorganized the merchandising, procurement and operations groups whichincluded the transfer of the general merchandise operations from Calgary, Alberta to the new office. Of the expected $25 of costs related to these initiatives, $24 were recognized in 2005 and $1 was recognized in 2006.
56 2006 Financial Report Loblaw Companies Limited
Notes to the Consolidated Financial Statements

The following table provides a summary of the costs recognized and cash payments made, as well as the corresponding net liability as atDecember 30, 2006 and December 31, 2005:
Site Fixed AssetEmployee Closing Total Impairment and
Termination Costs and Net Accelerated 2006 2005Benefits Other Liability Depreciation Total Total
Net liability, beginning of year $ 41 $ – $ 41 $ – $ – $ –
Costs recognized:Store operations 9 1 10 25 35 – Supply chain network 4 2 6 2 8 62Office move and reorganization of
the operation support functions – 1 1 – 1 24
$ 13 $ 4 $ 17 $ 27 $ 44 $ 86
Cash payments: Store operations $ – $ 1 $ 1 $ 1 $ –Supply chain network 4 2 6 6 13Office move and reorganization of
the operation support functions 1 1 2 2 18
$ 5 $ 4 $ 9 $ 9 $ 31
Charges against other assets (1) $ 9 $ – $ 9 $ 9 $ –
Net liability, end of year $ 40 $ – $ 40 $ 40 $ 41
Recorded in the consolidatedbalance sheet as follows:
Other assets (1) (note 15) $ – $ – $ – $ 9Accounts payable and
accrued liabilities 19 19 19 7Other liabilities (note 17) 21 21 21 25
Net liability, end of year $ 40 $ 40 $ 40 $ 41
(1) Represents defined benefit pension plan cost applied to other assets. Charges against other assets relates to the contractual termination benefits cost recognized in 2005 which reduced the accrued benefit plan asset.
Note 5. Goods and Services Tax (“GST”) and Provincial Sales Taxes (“PST”)
During 2005, the Company recorded a charge relating to an audit and proposed assessment by the Canada Revenue Agency relating to GST on certain products sold on which GST was not appropriately charged and remitted. In light of this proposed assessment, the Companyassessed and estimated the potential liabilities for GST and PST in other areas of its operations for various periods. Accordingly, a charge of $40 was recorded in operating income in 2005. Approximately $1 was paid in 2006 (2005 – $15) and approximately $24 remains accruedas at December 30, 2006. The ultimate remaining amount to be paid will depend on the outcome of audits performed by, or settlementsreached with the various tax authorities and therefore may differ from this estimate. Management will continue to assess the remainingaccrual as progress towards resolution with the various tax authorities is made and will adjust the remaining accrual accordingly.
2006 Financial Report Loblaw Companies Limited 57

Note 6. Collective Agreement
During 2006, members of certain Ontario locals of the United Food and Commercial Workers union ratified a new four-year collective agreement.The new agreement enables the Company to convert 44 stores in Ontario to the Real Canadian Superstore banner or food stores withequivalent labour economics, and the flexibility to invest in additional store labour where appropriate. As a result of securing this agreement,the Company recognized a one-time charge of $84 in operating income, including a $36 amount due to a multi-employer pension plan and a payment of $38 which was due upon ratification.
Note 7. Interest Expense
2006 2005
Interest on long term debt $ 284 $ 290Interest expense (income) on financial derivative instruments 7 (6)Net short term interest (11) (11)Capitalized to fixed assets (21) (21)
Interest expense $ 259 $ 252
Net interest paid in 2006 was $278 (2005 – $263).
Note 8. Income Taxes
The effective income tax rate in the consolidated statements of earnings is reported at a rate different than the weighted average basicCanadian federal and provincial statutory income tax rate for the following reasons:
2006 2005
Weighted average basic Canadian federal and provincial statutory income tax rate 33.7% 34.4%Net (decrease) increase resulting from:
Earnings in jurisdictions taxed at rates differentfrom the Canadian statutory income tax rates (0.6) 0.5
Non-taxable amounts (1.1) (0.7)Large corporation tax – 0.5Statutory income tax rate changes on future income tax balances (2.1) 0.3Successful resolution of certain income tax matters from a previous year and other – (0.2)
Effective income tax rate before impact of non-deductible goodwill impairment charge 29.9% 34.8%Non-deductible goodwill impairment charge 796.8 –
Effective income tax rate 826.7% 34.8%
58 2006 Financial Report Loblaw Companies Limited
Notes to the Consolidated Financial Statements

Net income taxes paid in 2006 were $325 (2005 – $387).
The cumulative effects of changes in Canadian federal and certain provincial statutory income tax rates on future income tax assets andliabilities are included in the consolidated financial statements at the time of substantive enactment. Accordingly, in 2006 a $16 reduction tofuture income tax expense was recognized as a result of the reduction in the Canadian federal and certain provincial statutory income tax rates,compared to a $3 charge to future income tax expense in 2005 as a result of statutory income tax rate changes in certain provinces.
The income tax effects of temporary differences that gave rise to significant portions of the future income tax assets (liabilities) were as follows:
2006 2005
Accounts payable and accrued liabilities $ 55 $ 55Other liabilities 117 86Fixed assets (278) (278)Other assets (103) (64)Losses carried forward (expiring 2026) 20 6Other 40 30
Net future income tax liabilities $ (149) $ (165)
2006 2005
Recorded in the consolidated balance sheets as follows: Current future income tax assets $ 85 $ 72Non-current future income tax liabilities (234) (237)
Net future income tax liabilities $ (149) $ (165)
Note 9. Basic and Diluted Net (Loss) Earnings per Common Share ($, except where otherwise indicated)
2006 2005
Net (loss) earnings ($ millions) $ (219) $ 746
Weighted average common shares outstanding (in millions) 274.1 274.2Dilutive effect of stock-based compensation (in millions) .2 .8
Diluted weighted average common shares outstanding (in millions) 274.3 275.0
Basic net (loss) earnings per common share $ (.80) $ 2.72Dilutive effect of stock-based compensation per common share – (.01)
Diluted net (loss) earnings per common share $ (.80) $ 2.71
Stock options outstanding with an exercise price greater than the market price of the Company’s common shares at December 30, 2006were not recognized in the computation of diluted net (loss) earnings per common share. Accordingly, for 2006, 4,027,406 (2005 – 2,254,639)stock options, with a weighted average exercise price of $61.55 (2005 – $69.58) per common share, were excluded from the computation of diluted net (loss) earnings per common share.
2006 Financial Report Loblaw Companies Limited 59

Note 10. Cash, Cash Equivalents and Short Term Investments
At year end, the Company had $864 (2005 – $837) in cash, cash equivalents and short term investments held by Glenhuron Bank Limited(“Glenhuron”), a wholly owned subsidiary of the Company in Barbados. The $40 (2005 – $27) of income from cash, cash equivalents and short term investments was recognized in net short term interest.
The Company recognized an unrealized foreign currency exchange gain of $2 (2005 – $31 loss) as a result of translating its United Statesdollar denominated cash, cash equivalents and short term investments, of which $1 income (2005 – $31 loss) related to cash and cashequivalents. The resulting gain or loss on cash, cash equivalents and short term investments is offset in operating income by the unrealizedforeign currency exchange gain on the cross currency basis swaps. A cumulative unrealized foreign currency exchange receivable of $165 (2005 – $168) relating to these swaps is recorded in other assets on the balance sheet.
Note 11. Credit Card Receivables
The Company, through PC Bank, securitizes credit card receivables through the sale of a portion of the total interest in these receivables to independent trusts and does not exercise any control over the trusts’ management, administration or assets. When PC Bank sells creditcard receivables in a securitization transaction, it has a retained interest in the securitized receivables represented by the right to futurecash flows after obligations to investors have been met. Although PC Bank remains responsible for servicing all credit card receivables, it does not receive additional compensation for servicing those credit card receivables sold to the trusts.
During 2006, $240 (2005 – $225) of credit card receivables were securitized through the sale of a portion of the total interest in thesereceivables to independent trusts, yielding a nominal net loss (2005 – nominal net loss) on the initial sale inclusive of nil (2005 – $1)servicing liability. Servicing liabilities expensed during the year were $14 (2005 – $13) and the fair value at year end of recognized servicing liabilities was $8 (2005 – $8). The trusts’ recourse to PC Bank’s assets is limited to PC Bank’s retained interests and is furthersupported by the Company through a standby letter of credit for 9% (2005 – 9%) on a portion of the securitized amount.
2006 2005
Credit card receivables $ 1,571 $ 1,257Amount securitized (1,250) (1,010)
Net credit card receivables $ 321 $ 247
Net credit loss experience $ 9 $ 5
The net credit loss experience of $9 (2005 – $5) includes $45 (2005 – $33) of credit losses on the total portfolio of credit card receivables netof credit losses of $36 (2005 – $28) relating to securitized credit card receivables. The following table displays the sensitivity of the currentfair value of retained interests to an immediate 10% and 20% adverse change in the 2006 key economic assumptions. The sensitivityanalysis provided in the table is hypothetical and should be used with caution. The sensitivities of each key assumption have been calculatedindependently of any changes in other key assumptions. Actual experience may result in changes in a number of key assumptionssimultaneously. Changes in one factor may result in changes in another, which could amplify or reduce the impact of such assumptions.
60 2006 Financial Report Loblaw Companies Limited
Notes to the Consolidated Financial Statements

Change in Assumptions2006 10% 20%
Carrying value of retained interests $ 5Payment rate (monthly) 44.0%Weighted average life (years) .7Expected credit losses (annual) 3.14% $ (.7) $ (1.4)Discount rate applied to
residual cash flows (annual) 14.83% $ (2.4) $ (4.9)
The details on the cash flows from securitization are as follows:
2006 2005
Proceeds from new securitizations $ 240 $ 225Net cash flows received on retained interests $ 116 $ 106
In 2006, PC Bank restructured its credit card securitization program. Eagle Credit Card Trust (“Eagle”), a previously established independenttrust, issued $500 of five year senior notes and subordinated notes due 2011 at a weighted average rate of 4.5% to finance the purchase of credit card receivables previously securitized by PC Bank through an independent trust. The subordinated notes provide credit support to those notes which are more senior. PC Bank will continue to service the credit card receivables on behalf of Eagle, but will not receive any fee for its servicing obligations and has a retained interest in the securitized receivables represented by the right to future cash flowsafter obligations to investors have been met. In accordance with Canadian GAAP, the financial statements of Eagle are not consolidated with those of the Company. The restructuring of the portfolio yielded a nominal net loss.
Note 12. Inventory Liquidation
As part of the Company’s review of inventory levels, certain excess inventory, primarily general merchandise, was identified. The Company recognized a charge of $68 in operating income as a result of its decision to proceed with the liquidation of this inventory,reflecting the write-down of inventory to recovery values and the associated costs of facilitating the disposition incurred to date. Additionalcosts are to be recognized as appropriate criteria are met.
2006 Financial Report Loblaw Companies Limited 61

Note 13. Fixed Assets
2006 2005
Accumulated Net Book Accumulated Net BookCost Depreciation Value Cost Depreciation Value
Properties held for development $ 500 $ 500 $ 442 $ 442Properties under development 226 226 231 231Land 1,699 1,699 1,629 1,629Buildings 4,955 $ 1,012 3,943 4,579 $ 835 3,744Equipment and fixtures 3,788 2,475 1,313 3,589 2,207 1,382Building and leasehold
improvements 611 269 342 647 290 357
11,779 3,756 8,023 11,117 3,332 7,785
Capital leases – buildingsand equipment 129 97 32 95 95 –
$ 11,908 $ 3,853 $ 8,055 $ 11,212 $ 3,427 $ 7,785
Fixed asset impairment and accelerated depreciation charges of $32 (2005 – $7) were recognized in operating income. An additional $27 (2005 – $14) was recognized in restructuring and other charges in 2006 (see Note 4). The fair values were determined using quotedmarket prices where available, independent offers to purchase where available or prices for similar assets.
Note 14. Other Assets
2006 2005
Franchise investments and other receivables $ 195 $ 194Accrued benefit plan asset (note 15) 182 139Unrealized equity forwards receivable (note 20) – 30Unrealized cross currency basis swaps receivable (notes 10 and 20) 165 168Deferred charges and other 147 157
$ 689 $ 688
62 2006 Financial Report Loblaw Companies Limited
Notes to the Consolidated Financial Statements

Note 15. Employee Future Benefits
Pension and Other Benefit PlansThe Company sponsors a number of pension plans, including registered funded defined benefit pension plans, defined contribution pension plans and supplemental unfunded arrangements providing pension benefits in excess of statutory limits. Certain obligations of the Company to these supplemental pension arrangements are secured by a standby letter of credit issued by a major Canadian charteredbank. The Company’s defined benefit pension plans are predominantly non-contributory and these benefits are, in general, based on career average earnings.
A new national defined contribution pension plan for salaried employees was introduced by the Company during 2006. All eligible salariedemployees were given the option to join this new plan and convert their past accrued pension benefits or to remain in their existing definedbenefit pension plans. All new salaried employees will participate only in the new national defined contribution pension plan.
The Company also offers certain employee post-retirement and post-employment benefit plans and a long term disability benefit plan. Post-retirement and post-employment benefit plans are not funded, are mainly non-contributory and include health care, life insurance anddental benefits. Employees eligible for post-retirement benefits are those who retire at certain retirement ages and employees eligible forpost-employment benefits are those on long term disability leave. The majority of post-retirement health care plans for current and futureretirees include a limit on the total benefits payable by the Company.
The Company also contributes to various multi-employer pension plans that provide pension benefits.
The accrued benefit plan obligations and the fair value of the benefit plan assets were determined using a September 30 measurement date for accounting purposes.
Funding of Pension and Other Benefit PlansThe most recent actuarial valuations of the defined benefit pension plans for funding purposes (“funding valuations”) are to be performed as at December 31, 2006 for all plans, except two plans which were as at December 31, 2004. The Company is required to file fundingvaluations at least every three years; accordingly, the next required funding valuations for the above mentioned plans will be performed no later than December 31, 2009 and 2007, respectively.
Total cash payments made by the Company during 2006, consisting of contributions to funded defined benefit pension plans, definedcontribution pension plans, multi-employer pension plans, long term disability benefit plan and benefits paid directly to beneficiaries of the unfunded defined benefit pension plans and unfunded other benefit plans, were $166 (2005 – $134). The Company has accrued $36 relating to a one-time contribution to a multi-employer pension plan (see Note 6).
During 2007, the Company expects to contribute approximately $75 to its registered funded defined benefit pension plans. This estimate may vary subject to the completion of actuarial valuations, market performance and regulatory requirements. The Company also expects to make contributions in 2007 to defined contribution pension plans and multi-employer pension plans as well as benefit payments directly to beneficiaries of the unfunded defined benefit pension plans and unfunded other benefit plans.
2006 Financial Report Loblaw Companies Limited 63

Pension and Other Benefit Plans StatusInformation on the Company’s defined benefit pension plans and other benefit plans, in aggregate, was as follows:
2006 2005
Pension Other Pension OtherBenefit Plans Benefit Plans(1) Total Benefit Plans Benefit Plans(1) Total
Benefit Plan Assets Fair value, beginning of year $ 944 $ 42 $ 986 $ 838 $ 35 $ 873
Actual return (loss) on plan assets 74 (1) 73 98 2 100Employer contributions 90 21 111 61 22 83Employee contributions 2 – 2 2 – 2Benefits paid (58) (18) (76) (53) (17) (70)Other – – – (2) – (2)
Fair value, end of year $ 1,052 $ 44 $ 1,096 $ 944 $ 42 $ 986
Accrued Benefit PlanObligations
Balance, beginning of year $ 1,155 $ 243 $ 1,398 $ 937 $ 181 $ 1,118Current service cost 50 9 59 37 4 41Interest cost 62 13 75 60 11 71Benefits paid (58) (18) (76) (53) (17) (70)Actuarial loss 55 61 116 173 64 237Past service costs – – – – 2 2Contractual termination benefits(2) – – – 9 – 9Curtailment gain(3) – – – (6) (2) (8)Other (2) – (2) (2) – (2)
Balance, end of year $ 1,262 $ 308 $ 1,570 $ 1,155 $ 243 $ 1,398
Deficit of Plan AssetsVersus Plan Obligations $ (210) $ (264) $ (474) $ (211) $ (201) $ (412)
Unamortized past service costs 5 (7) (2) 6 (7) (1)Unamortized net actuarial loss 313 172 485 271 128 399
Net accrued benefit planasset (liability) $ 108 $ (99) $ 9 $ 66 $ (80) $ (14)
Recorded in the consolidatedbalance sheets as follows:
Other assets (note 14) $ 145 $ 37 $ 182 $ 102 $ 37 $ 139Other liabilities (note 17) (37) (136) (173) (36) (117) (153)
Net accrued benefit planasset (liability) $ 108 $ (99) $ 9 $ 66 $ (80) $ (14)
(1) Other benefit plans include post-retirement, post-employment and long term disability benefit plans. (2) Contractual termination benefits resulted from the 2005 plan to restructure the supply chain operations nationally and were recorded in restructuring and other charges in 2005 (see Note 4).(3) Certain defined benefit pension plans and other benefit plans affected by the 2005 plan to restructure the supply chain operations nationally were remeasured as at March 31, 2005 and
costs subsequent to April 1, 2005 were determined using a discount rate of 5.75%. This resulted in a nominal impact to 2005 net earnings and curtailment gains which were offset againstunamortized net actuarial losses for those plans.
64 2006 Financial Report Loblaw Companies Limited
Notes to the Consolidated Financial Statements
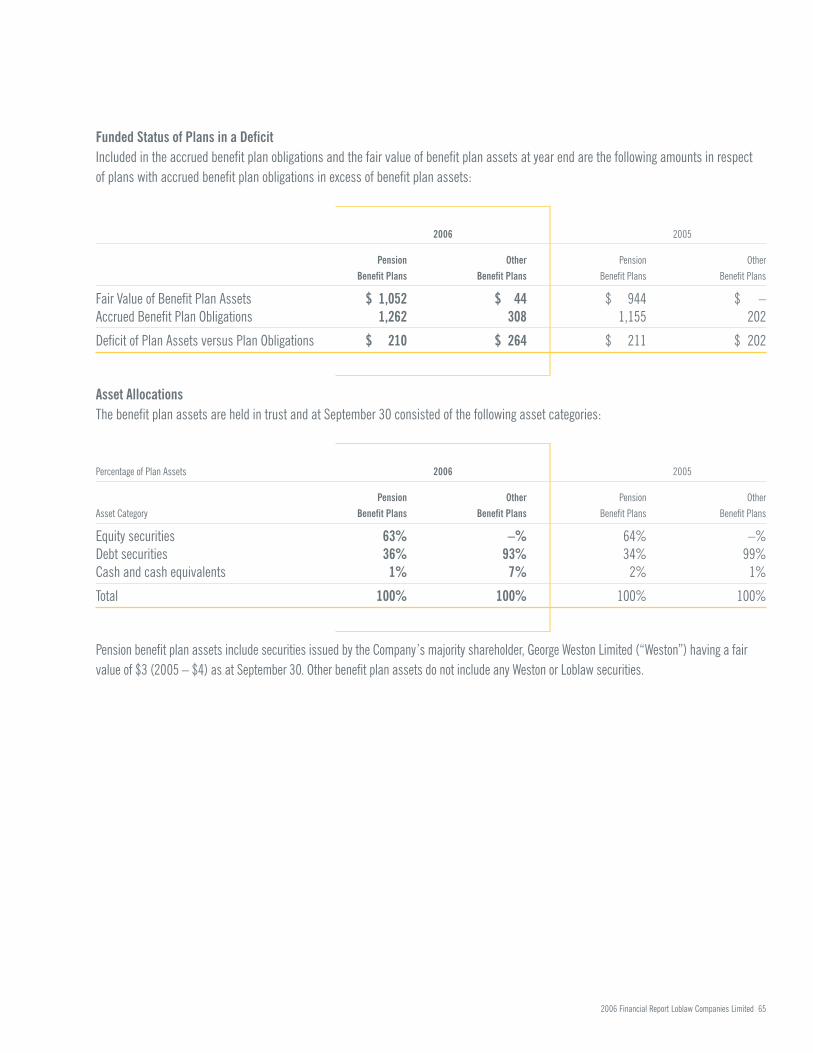
Funded Status of Plans in a DeficitIncluded in the accrued benefit plan obligations and the fair value of benefit plan assets at year end are the following amounts in respect of plans with accrued benefit plan obligations in excess of benefit plan assets:
2006 2005
Pension Other Pension OtherBenefit Plans Benefit Plans Benefit Plans Benefit Plans
Fair Value of Benefit Plan Assets $ 1,052 $ 44 $ 944 $ –Accrued Benefit Plan Obligations 1,262 308 1,155 202
Deficit of Plan Assets versus Plan Obligations $ 210 $ 264 $ 211 $ 202
Asset AllocationsThe benefit plan assets are held in trust and at September 30 consisted of the following asset categories:
Percentage of Plan Assets 2006 2005
Pension Other Pension OtherAsset Category Benefit Plans Benefit Plans Benefit Plans Benefit Plans
Equity securities 63% –% 64% –%Debt securities 36% 93% 34% 99%Cash and cash equivalents 1% 7% 2% 1%
Total 100% 100% 100% 100%
Pension benefit plan assets include securities issued by the Company’s majority shareholder, George Weston Limited (“Weston”) having a fairvalue of $3 (2005 – $4) as at September 30. Other benefit plan assets do not include any Weston or Loblaw securities.
2006 Financial Report Loblaw Companies Limited 65
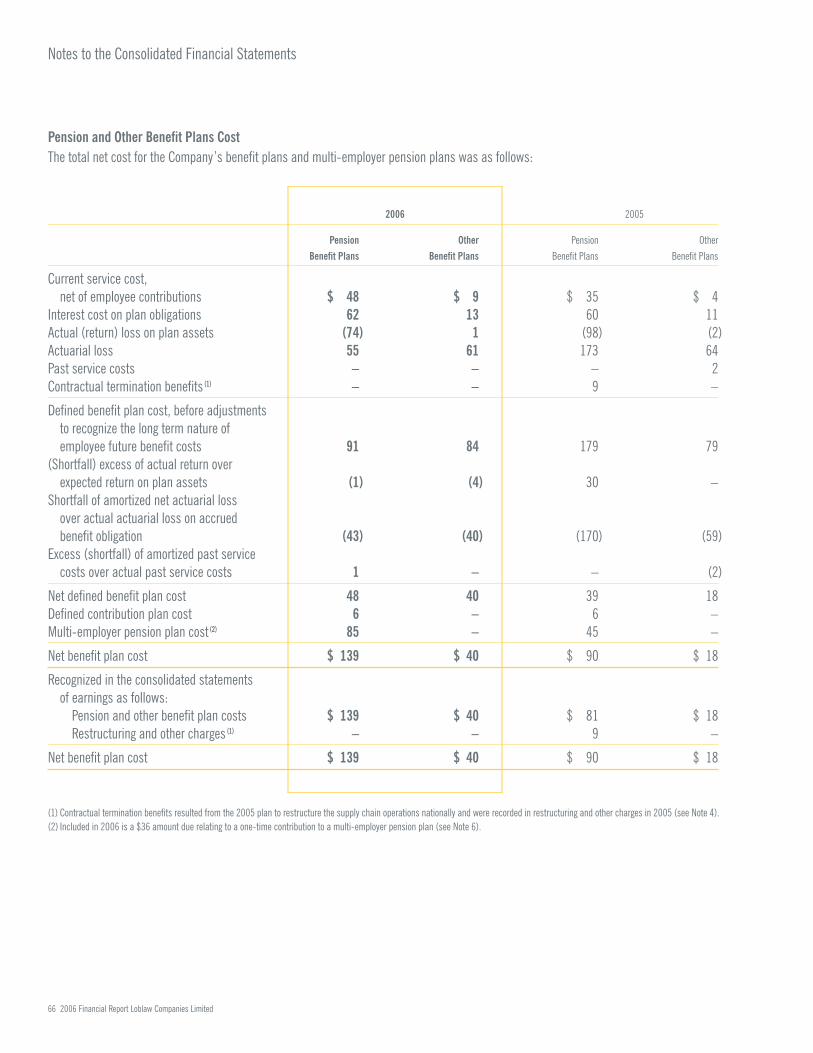
Pension and Other Benefit Plans CostThe total net cost for the Company’s benefit plans and multi-employer pension plans was as follows:
2006 2005
Pension Other Pension OtherBenefit Plans Benefit Plans Benefit Plans Benefit Plans
Current service cost,net of employee contributions $ 48 $ 9 $ 35 $ 4
Interest cost on plan obligations 62 13 60 11Actual (return) loss on plan assets (74) 1 (98) (2)Actuarial loss 55 61 173 64Past service costs – – – 2Contractual termination benefits (1) – – 9 –
Defined benefit plan cost, before adjustments to recognize the long term nature of employee future benefit costs 91 84 179 79
(Shortfall) excess of actual return over expected return on plan assets (1) (4) 30 –
Shortfall of amortized net actuarial loss over actual actuarial loss on accrued benefit obligation (43) (40) (170) (59)
Excess (shortfall) of amortized past service costs over actual past service costs 1 – – (2)
Net defined benefit plan cost 48 40 39 18Defined contribution plan cost 6 – 6 –Multi-employer pension plan cost (2) 85 – 45 –
Net benefit plan cost $ 139 $ 40 $ 90 $ 18
Recognized in the consolidated statementsof earnings as follows:
Pension and other benefit plan costs $ 139 $ 40 $ 81 $ 18Restructuring and other charges (1) – – 9 –
Net benefit plan cost $ 139 $ 40 $ 90 $ 18
(1) Contractual termination benefits resulted from the 2005 plan to restructure the supply chain operations nationally and were recorded in restructuring and other charges in 2005 (see Note 4). (2) Included in 2006 is a $36 amount due relating to a one-time contribution to a multi-employer pension plan (see Note 6).
66 2006 Financial Report Loblaw Companies Limited
Notes to the Consolidated Financial Statements

Plan AssumptionsThe significant annual weighted average actuarial assumptions used in calculating the Company’s accrued benefit plan obligations as at the measurement date of September 30 and the net defined benefit plan cost for the year were as follows:
2006 2005
Pension Other Pension OtherBenefit Plans Benefit Plans Benefit Plans Benefit Plans
Accrued Benefit Plan ObligationsDiscount rate 5.0% 5.0% 5.25% 5.2%Rate of compensation increase 3.5% 3.5%
Net Defined Benefit Plan CostDiscount rate (1) 5.25% 5.2% 6.25% 6.1%Expected long term rate of
return on plan assets 8.0% 5.0% 8.0% 5.5%Rate of compensation increase 3.5% 3.5%
(1) Certain defined benefit pension plans and other benefit plans affected by the 2005 plan to restructure the supply chain operations nationally were remeasured as at March 31, 2005 and costs subsequent to April 1, 2005 were determined using a discount rate of 5.75%. This resulted in a nominal impact to 2005 net earnings and curtailment gains which were offset against unamortized net actuarial losses for those plans.
The growth rate of health care costs, primarily drug and other medical costs for other benefit plans, was estimated at 10.0% (2005 – 10.0%)and is assumed to gradually decrease to 5.0% by 2014 (2005 – 5.0% by 2013), remaining at that level thereafter.
2006 Financial Report Loblaw Companies Limited 67
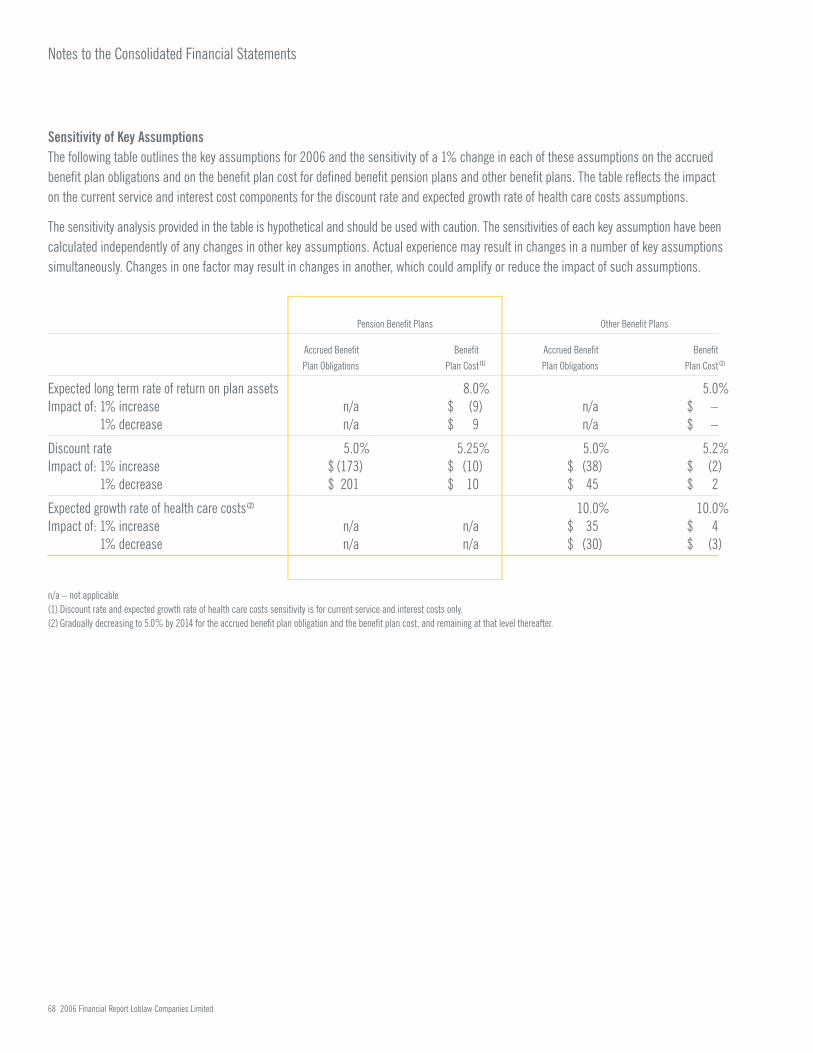
Sensitivity of Key AssumptionsThe following table outlines the key assumptions for 2006 and the sensitivity of a 1% change in each of these assumptions on the accruedbenefit plan obligations and on the benefit plan cost for defined benefit pension plans and other benefit plans. The table reflects the impacton the current service and interest cost components for the discount rate and expected growth rate of health care costs assumptions.
The sensitivity analysis provided in the table is hypothetical and should be used with caution. The sensitivities of each key assumption have beencalculated independently of any changes in other key assumptions. Actual experience may result in changes in a number of key assumptionssimultaneously. Changes in one factor may result in changes in another, which could amplify or reduce the impact of such assumptions.
Pension Benefit Plans Other Benefit Plans
Accrued Benefit Benefit Accrued Benefit BenefitPlan Obligations Plan Cost (1) Plan Obligations Plan Cost (1)
Expected long term rate of return on plan assets 8.0% 5.0%Impact of: 1% increase n/a $ (9) n/a $ –
1% decrease n/a $ 9 n/a $ –
Discount rate 5.0% 5.25% 5.0% 5.2%Impact of: 1% increase $ (173) $ (10) $ (38) $ (2)
1% decrease $ 201 $ 10 $ 45 $ 2
Expected growth rate of health care costs (2) 10.0% 10.0%Impact of: 1% increase n/a n/a $ 35 $ 4
1% decrease n/a n/a $ (30) $ (3)
n/a – not applicable (1) Discount rate and expected growth rate of health care costs sensitivity is for current service and interest costs only. (2) Gradually decreasing to 5.0% by 2014 for the accrued benefit plan obligation and the benefit plan cost, and remaining at that level thereafter.
68 2006 Financial Report Loblaw Companies Limited
Notes to the Consolidated Financial Statements

Note 16. Long Term Debt
2006 2005
Provigo Inc. Debentures Series 1996, 8.70%, due 2006 (i) $ – $ 125Other – 1
Loblaw Companies Limited Notes6.00%, due 2008 390 3905.75%, due 2009 125 1257.10%, due 2010 300 3006.50%, due 2011 350 3505.40%, due 2013 200 2006.00%, due 2014 100 1007.10%, due 2016 300 3006.65%, due 2027 100 1006.45%, due 2028 200 2006.50%, due 2029 175 17511.40%, due 2031
– principal 151 151– effect of coupon repurchase (34) (26)
6.85%, due 2032 200 2006.54%, due 2033 200 2008.75%, due 2033 200 2006.05%, due 2034 200 2006.15%, due 2035 200 2005.90%, due 2036 (i) 300 3006.45%, due 2039 200 2007.00%, due 2040 150 1505.86%, due 2043 55 55
Other at a weighted average interest rate of 8.69%, due 2007 to 2043 21 33VIE loans payable and capital leases (ii) 156 126
Total long term debt 4,239 4,355Less amount due within one year 27 161
$ 4,212 $ 4,194
The five year schedule of repayment of long term debt, inclusive of VIE and other debt, based on maturity is as follows: 2007 – $27; 2008 – $420; 2009 – $148; 2010 – $319; 2011 – $369.
(i) During 2006, the Company repaid its $125 of 8.70% Series 1996 Provigo Inc. Debenture as it matured. During 2005, the Companyissued $300 of 5.90% Medium Term Notes (“MTN”) due 2036 and $200 of 6.95% MTN matured and was repaid.
(ii) Pursuant to the requirements of AcG 15, the consolidated balance sheet as at December 30, 2006 includes $156 (2005 – $126) of loanspayable and capital lease obligations of VIEs consolidated by the Company, $23 (2005 – $23) of which is due within one year.
2006 Financial Report Loblaw Companies Limited 69

The loans payable of $124 (2005 – $126) represent financing obtained by eligible independent franchisees through a structure involvingindependent trusts to facilitate the purchase of the majority of their inventory and fixed assets, consisting mainly of fixturing andequipment. The loans payable, which have an average term to maturity of 8 years (2005 – 7 years), are due and payable on demandunder certain predetermined circumstances and are secured through a general security agreement made by the independent franchiseesin favour of the independent funding trust. Interest is charged on a floating rate basis and prepayment of the loans may be made without penalty. The independent funding trust within the structure finances its activities through the issuance of short term asset-backed notes to third-party investors. As disclosed in Note 21, a standby letter of credit has been provided by a major Canadian chartered bank for the benefit of the independent funding trust equal to approximately 10% of the total principal amount of the loans outstanding at any point in time. The Company has agreed to reimburse the issuing bank for any amount drawn on the standby letter of credit.In the event of a default by an independent franchisee the independent funding trust may assign the loan to the Company and draw
upon the standby letter of credit. No amount has ever been drawn on the standby letter of credit.
Capital lease obligations of $32 (2005 – nil) are included in the consolidated balance sheet as at year end. The capital lease obligationsare related to equipment of the third-party VIE that provides distribution and warehousing services. The amount due within one year is $4 (2005 – nil).
Note 17. Other Liabilities
2006 2005
Accrued benefit plan liability (note 15) $ 173 $ 153Stock-based compensation (note 19) 17 13Unrealized equity forwards payable (note 20) 13 –Restructuring and other charges (note 4) 21 25Goods and Services Tax and provincial sales tax (note 5) 14 16Other 76 64
$ 314 $ 271
Note 18. Common Share Capital (authorized – unlimited)
The changes in the common shares issued and outstanding during the year were as follows:
2006 2005
Number of Common Number of CommonCommon Share Common Share
Shares Capital Shares Capital
Issued and outstanding, beginning of year 274,054,814 $ 1,192 274,255,914 $ 1,192Issued for stock options exercised (note 19) 118,750 4 25,000 1Purchased for cancellation – – (226,100) (1)
Issued and outstanding, end of year 274,173,564 $ 1,196 274,054,814 $ 1,192
Weighted average outstanding 274,066,885 274,183,823
70 2006 Financial Report Loblaw Companies Limited
Notes to the Consolidated Financial Statements

Normal Course Issuer Bids (“NCIB”) During 2006, the Company purchased for cancellation nil of its common shares (2005 – 226,100 for $16).
The Company intends to renew its NCIB to purchase on the Toronto Stock Exchange or enter into equity forwards to purchase up to 5% of its common shares outstanding. The Company, in accordance with the rules and by-laws of the Toronto Stock Exchange, may purchase its shares at the then market price of such shares.
Note 19. Stock-Based Compensation ($, except where otherwise indicated)
The Company maintains various types of stock-based compensation plans, which are described below.
The Company’s net stock-based compensation cost recognized in operating income related to its stock option plan and the associated equityforwards and the restricted share unit plan was as follows:
($ millions) 2006 2005
Stock option plan income $ (11) $ (35)Equity forwards loss (note 20) 32 71Restricted share unit plan expense 16 7
Net stock-based compensation cost $ 37 $ 43
Stock Option Plan The Company maintains a stock option plan for certain employees. Under this plan, the Company may grant options for up to 20.4 million common shares; however, the Company has set a guideline which limits the number of stock option grants to amaximum of 5% of outstanding common shares at any time. Stock options have up to a seven-year term, vest 20% cumulatively on eachanniversary date of the grant and are exercisable at the designated common share price, which is 100% of the market price of the Company’scommon shares on the last trading day prior to the effective date of the grant. Each stock option is exercisable into one common share of the Company at the price specified in the terms of the option, or option holders may elect to receive in cash the share appreciation valueequal to the excess of the market price at the date of exercise over the specified option price.
During 2006, the Company granted 189,354 (2005 – 2,247,627) stock options with a weighted average exercise price of $55.30 (2005 –$69.73) per common share under its existing stock option plan, which allows for settlement in shares or in the share appreciation value in cash at the option of the employee.
In 2006, the share appreciation value of $11 million (2005 – $41 million) was paid on the exercise of 815,403 (2005 – 1,135,221) stockoptions. The Company issued 118,750 (2005 – 25,000) common shares on the exercise of stock options and received cash consideration of $4 million (2005 – $0.9 million) for which it had recorded a stock-based compensation liability of $0.1 million (2005 – $1 million).
At year end, a total of 4,084,646 (2005 – 5,305,422) stock options were outstanding, and represented approximately 1.5% (2005 – 1.9%) of the Company’s issued and outstanding common shares, which was within the Company’s guideline of 5%. Of the 4,084,646 (2005 – 5,305,422) outstanding options, 4,043,406 (2005 – 5,151,682) relate to stock option grants that allow for settlement in shares or in the share appreciation value in cash at the option of the employee and 41,240 (2005 – 153,740) relate to stock option grants, issued prior to December 30, 2001 that will be settled by issuing common shares.
2006 Financial Report Loblaw Companies Limited 71

A summary of the status of the Company’s stock option plan and activity was as follows:
2006 2005
Options Weighted Options Weighted(number of Average Exercise (number of Average Exercise
shares) Price/Share shares) Price/Share
Outstanding options, beginning of year 5,305,422 $ 56.98 4,365,958 $ 45.04Granted 189,354 $ 55.30 2,247,627 $ 69.73Exercised (934,153) $ 35.18 (1,160,221) $ 36.41Forfeited/cancelled (475,977) $ 61.56 (147,942) $ 59.49
Outstanding options, end of year 4,084,646 $ 61.36 5,305,422 $ 56.98
Options exercisable, end of year 1,544,232 $ 57.37 1,701,050 $ 43.25
2006 Outstanding Options 2006 Exercisable Options
WeightedNumber of Average Remaining Weighted Number of Weighted
Options Contractual Average Exercise Exercisable Average ExerciseRange of Exercise Prices Outstanding Life (years) Price/Share Options Price/Share
$ 43.80 – $ 49.05 157,240 1 $ 48.67 157,240 $ 48.67$ 53.60 – $ 55.50 1,928,006 3 $ 53.83 976,113 $ 53.70$ 61.95 – $ 72.95 1,999,400 5 $ 69.61 410,879 $ 69.41
Restricted Share Unit (“RSU”) Plan The Company has adopted a RSU plan for certain senior employees. The RSUs entitle employees to a cash payment after the end of each performance period, of up to 3 years, following the date of award. The RSU payment will be an amountequal to the weighted average price of a Loblaw common share on the last three trading days preceding the end of the performance periodfor the RSUs multiplied by the number of RSUs held by the employee.
During 2006, the Company granted 691,001 (2005 – 393,335) RSUs to 238 (2005 – 236) employees, 211,526 (2005 – 10,151) RSUs werecancelled and 112,707 (2005 – nil) were paid out. At year end, a total of 749,952 (2005 – 383,184) RSUs were outstanding.
Employee Share Ownership Plan (“ESOP”) The Company maintains an ESOP which allows employees to acquire the Company’s common shares through regular payroll deductions of up to 5% of their gross regular earnings. The Company contributes an additional 25%(2005 – 25%) of each employee’s contribution to the plan. The ESOP is administered through a trust which purchases the Company’scommon shares on the open market on behalf of employees. A compensation cost of $6 million (2005 – $5 million) related to this plan wasrecognized in operating income.
Deferred Share Units (“DSUs”) Plan Members of the Company’s Board of Directors may elect annually to receive all or a portion of theirannual retainer(s) and fees in the form of DSUs, the value of which is determined by the market price of the Company’s common shares at the time the director’s annual retainer(s) or fees are earned. Upon termination of Board service, the common shares due to the director,as represented by the DSUs, will be purchased on the open market on the director’s behalf. At year end, 44,397 (2005 – 36,666) DSUs were outstanding. The year-over-year change in the deferred share units liability was minimal and was recognized in operating income.
72 2006 Financial Report Loblaw Companies Limited
Notes to the Consolidated Financial Statements

Note 20. Financial Instruments
A summary of the Company’s outstanding financial derivative instruments is as follows:
Notional Amounts Maturing 2006 2005
2007 2008 2009 2010 2011 Thereafter Total Total
Cross currency basis swaps $ 76 $ 140 $ 31 $ 174 $ 95 $ 544 $ 1,060 $ 1,036Interest rate swaps (receive)/pay $ 240 $ 140 $ 50 $ 200 $ (150) $ 480 $ 437Equity forwards $ 120 $ 34 $ 93 $ 247 $ 240
Cross Currency Basis Swaps The Company enters into cross currency basis swaps to hedge its exposure to fluctuations in the foreign currencyexchange rate on a portion of its United States dollar denominated assets, principally cash, cash equivalents and short term investments.
The Company entered into cross currency basis swaps to exchange United States dollars for $1.1 billion (2005 – $1.0 billion) Canadiandollars, which mature by 2016. Currency adjustments receivable or payable arising from these swaps are settled in cash on maturity. At year end, a cumulative unrealized foreign currency exchange rate receivable of $165 (2005 – $168) was recorded in other assets.
Interest Rate Swaps The Company enters into interest rate swaps to hedge a portion of its exposure to fluctuations in interest rates. The Company’s interest rate swaps convert a net notional $480 (2005 – $437) of its floating rate investments to average fixed rateinvestments at 4.73% (2005 – 4.76%), which mature by 2013.
Equity Forwards ($) The Company enters into equity forwards to manage its exposure to fluctuations in its stock-based compensation cost as a result of changes in the market price of its common shares. At year end 2006, the Company had cumulative equity forwards to buy 4.8 million (2005 – 4.8 million) of its common shares at a cumulative average forward price of $51.43 (2005 – $50.02) including $6.56 (2005 – $5.15) per common share of interest expense net of dividends that has been recognized in net earnings and will be paid at termination. The equity forwards allow for settlement in cash, common shares or net settlement. The Company has included a cumulativeunrealized market loss of $13 million (2005 – gain of $30 million) in other liabilities (2005 – other assets) relating to these equity forwards.
Fair Value of Financial Instruments The fair value of a financial instrument is the estimated amount that the Company would receive or pay to terminate the instrument agreement at the reporting date. The following methods and assumptions were used to estimate the fairvalue of each type of financial instrument by reference to various market value data and other valuation techniques as appropriate.
The fair values of cash, cash equivalents, short term investments, accounts receivable, bank indebtedness, commercial paper, accountspayable and accrued liabilities approximated their carrying values given their short term maturities.
The fair value of the cross currency basis swaps was estimated based on the market spot exchange rates and forward interest rates andapproximated their carrying value.
The fair value of long term debt issues was estimated based on the discounted cash flows of the debt at the Company’s estimatedincremental borrowing rates for debt of the same remaining maturities.
The fair value of the interest rate swaps was estimated by discounting net cash flows of the swaps at market and forward interest rates for swaps of the same remaining maturities.
2006 Financial Report Loblaw Companies Limited 73

The fair value of the equity forwards, which approximated carrying value, was estimated by multiplying the number of the Company’scommon shares outstanding under the equity forwards by the difference between the market price of its common shares and the averageforward price of the outstanding forwards at year end.
2006 2005
Carrying Estimated Carrying EstimatedValue Fair Value Value Fair Value
Long term debt liability $ 4,239 $ 4,798 $ 4,355 $ 5,027Interest rate swaps net liability $ – $ (15) $ – $ (11)
Counterparty Risk The Company may be exposed to losses should any counterparty to its financial derivative agreements fail to fulfill its obligations. The Company has sought to minimize potential counterparty risk and losses by conducting transactions for its derivativeagreements with counterparties that have at minimum a long term A credit rating from a recognized credit agency and by placing riskadjusted limits on its exposure to any single counterparty for its financial derivative agreements. The Company has internal policies, controlsand reporting processes which require ongoing assessment and corrective action, if necessary, with respect to its derivative transactions. In addition, principal amounts on cross currency basis swaps and equity forwards are each netted by agreement and there is no exposure to loss of the original notional principal amounts on the interest rate swaps and equity forwards.
Credit Risk The Company’s exposure to credit risk relates to the Company’s cash equivalents and short term investments, PC Bank’scredit card receivables and accounts receivable from franchisees, associates and independent accounts.
Credit risk associated with the Company’s cash equivalents and short term investments results from the possibility that a counterparty may default on the repayment of a security. This risk is mitigated by established policies and guidelines that require issuers of permissibleinvestments to have at minimum a long term A credit rating from a recognized credit rating agency and that specify minimum and maximum exposures to specific issuers.
Credit risk from PC Bank’s credit card receivables and receivables from franchisees, associates and independents results from thepossibility that customers may default on their payment obligation. PC Bank manages the credit card receivable risk by employing stringentcredit scoring techniques and actively monitoring the credit card portfolio and reviewing techniques and technology that can improve the effectiveness of the collection process. In addition, these receivables are dispersed among a large, diversified group of credit cardcustomers. Accounts receivable from franchisees, associates and independent accounts are actively monitored on an ongoing basis and settled on a frequent basis in accordance with the terms specified in the applicable agreements.
Note 21. Contingencies, Commitments and Guarantees
The Company is involved in and potentially subject to various claims by third parties arising out of the normal course and conduct of its business including, but not limited to, product liability, labour and employment, regulatory and environmental claims. In addition, the Company is involved in and potentially subject to regular audits from federal and provincial tax authorities relating to income, capital and commodity taxes and as a result of these audits may receive assessments and reassessments.
Although such matters cannot be predicted with certainty, management currently considers the Company’s exposure to such claims and litigation, to the extent not covered by the Company’s insurance policies or otherwise provided for, not to be material to theseconsolidated financial statements.
74 2006 Financial Report Loblaw Companies Limited
Notes to the Consolidated Financial Statements

There are various operating leases that have been committed to. Future minimum lease payments relating to these operating leases are as follows:
Payments due by year
Thereafter 2006 20052007 2008 2009 2010 2011 to 2049 Total Total
Operating lease payments $ 190 $ 178 $ 156 $ 134 $ 114 $ 720 $ 1,492 $ 1,637Expected sub-lease income (40) (34) (30) (24) (17) (43) (188) (203)
Net operating lease payments $ 150 $ 144 $ 126 $ 110 $ 97 $ 677 $ 1,304 $ 1,434
At year end, the Company has committed approximately $153 (2005 – $264) with respect to capital investment projects such as theconstruction, expansion and renovation of buildings and the purchase of real property.
The Company establishes standby letters of credit used in connection with certain obligations mainly related to real estate transactions and benefit programs. The aggregate gross potential liability related to these standby letters of credit is approximately $221 (2005 – $143).Other standby letters of credit related to the financing program for the Company’s independent franchisees and securitization of PC Bank’scredit card receivables have been identified as guarantees and are discussed further in the Guarantees section below.
Guarantees The Company has provided to third parties the following significant guarantees as defined pursuant to Accounting Guideline 14,“Disclosure of Guarantees”:
Standby Letters of Credit A standby letter of credit for the benefit of an independent trust with respect to the credit card receivablessecuritization program of PC Bank has been issued by a major Canadian chartered bank. This standby letter of credit could be drawn upon in the event of a major decline in the income flow from or in the value of the securitized credit card receivables. The Company has agreed to reimburse the issuing bank for any amount drawn on the standby letter of credit. The Company believes that the likelihood of thisoccurrence is remote. The aggregate gross potential liability under this arrangement, which represents 9% (2005 – 9%) on a portion of the securitized credit card receivables amount, is approximately $68 (2005 – $91) (see Note 11).
A standby letter of credit has been issued by a major Canadian chartered bank in the amount of $44 (2005 – $42) for the benefit of an independent funding trust which provides loans to the Company’s franchisees for their purchase of inventory and fixed assets, mainlyfixturing and equipment. The amount of the standby letter of credit is equal to approximately 10% of the principal amount of the loansoutstanding at any point in time. In the event that an independent franchisee defaults on its loan and the Company has not, within a specified time period, assumed the loan or the default is not otherwise remedied, the independent funding trust may assign the loan to the Company and draw upon this standby letter of credit. The Company has agreed to reimburse the issuing bank for any amount drawn on the standby letter of credit.
Lease Obligations In connection with historical dispositions of certain of its assets, the Company has assigned leases to third parties. The Company remains contingently liable for these lease obligations in the event any of the assignees are in default of their lease obligations.The estimated amount for minimum rent, which does not include other lease related expenses such as property tax and common areamaintenance charges, is $111 (2005 – $138).
2006 Financial Report Loblaw Companies Limited 75

Indemnification Provisions The Company from time to time enters into agreements in the normal course of its business, such as service and outsourcing arrangements and leases, in connection with business or asset acquisitions or dispositions. These agreements by their nature may provide for indemnification of counterparties. These indemnification provisions may be in connection with breaches of representation and warranty or with future claims for certain liabilities, including liabilities related to tax and environmental matters. The terms of these indemnification provisions vary in duration and may extend for an unlimited period of time. Given the nature of such indemnification provisions, the Company is unable to reasonably estimate its total maximum potential liability as certainindemnification provisions do not provide for a maximum potential amount and the amounts are dependent on the outcome of futurecontingent events, the nature and likelihood of which cannot be determined at this time. Historically, the Company has not made any significant payments in connection with these indemnification provisions.
Legal Proceedings Subsequent to year end, the Company was served with an action brought by certain beneficiaries of a multi-employerpension plan in the Superior Court of Ontario. In their claim against the employers and the trustees of the multi-employer pension plan,the plaintiffs claim that assets of the multi-employer pension plan have been mismanaged. The Company is one of the employers affected
by the action. One billion dollars of damages are claimed in the action against a total of 17 defendants. In addition, the plaintiffs are seeking to have a representative defendant appointed for the employers of all the members of the multi-employer pension plan. The action is framed as a representative action on behalf of all the beneficiaries of the multi-employer pension plan. The action is at a very early stage and the Company intends to vigorously defend it. Statements of Defence have not yet been filed.
Note 22. Related Party Transactions
The Company’s majority shareholder, George Weston Limited and its affiliates (“Weston”), other than the Company, are related parties. It is the Company’s policy to conduct all transactions and settle all balances with related parties on market terms and conditions. Relatedparty transactions include:
Inventory Purchases Purchases of inventory from related parties for resale in the distribution network represented approximately 3%(2005 – 3%) of the cost of sales, selling and administrative expenses. The intercompany payable relating to this inventory, outstanding atyear end, is recorded in accounts payable and accrued liabilities.
Cost Sharing Agreements Weston has entered into certain contracts with third parties for administrative and corporate services, includingtelecommunication services and information technology related matters on behalf of the Company. Through cost sharing agreements thathave been established between the Company and Weston concerning these costs, the Company has agreed to be responsible to Weston forits proportionate share of the costs incurred on its behalf. Payments by the Company pursuant to these cost sharing agreements wereapproximately $25 (2005 – $22).
Real Estate Matters The Company leases certain properties from an affiliate of Weston, namely office space for approximately $4 (2005 – $4). During 2006, the Company purchased from an affiliate of Weston a property designated for future development forconsideration of $8, which was prepaid in accordance with a former ground lease between the parties.
Borrowings/Lendings The Company, from time to time, may borrow from or may lend to Weston on a short term basis at commercial paperrates. There were no such amounts outstanding as at year end.
Income Tax Matters From time to time, the Company and Weston and its affiliates may make elections that are permitted or required under applicable income tax legislation with respect to affiliated corporations and, as a result, may enter into agreements in that regard.These elections and accompanying agreements did not have any material impact on the Company.
76 2006 Financial Report Loblaw Companies Limited
Notes to the Consolidated Financial Statements

Management Agreements The Company, through Glenhuron, manages certain United States cash, cash equivalents and short terminvestments for wholly owned non-Canadian subsidiaries of Weston. Management fees are based on market rates and included in interest expense.
Sale of Loan Portfolio During 2005, Glenhuron sold a portfolio of third-party long term loans receivable to a wholly owned subsidiary of Weston. The loans in this portfolio were originally acquired from third-party financial institutions in 2001. This transaction was undertakenby Glenhuron as part of its overall ongoing management of its investment portfolio.
The amount of the cash consideration of U.S. $106 was based on a fair market value of the loan portfolio and was approximately equal tocarrying value. An independent review of the valuation analysis has been obtained by the Company to ensure that Glenhuron’s methodologyused in arriving at fair market value was reasonable. As at the date of sale, the current portion of this loan portfolio of U.S. $13 was included in accounts receivable and the long term portion of U.S. $93 was included in other assets.
Glenhuron has entered into an agreement with a subsidiary of Weston for the administration of the loan portfolio.
Note 23. Subsequent Event
Subsequent to year end, the Company approved and announced the restructuring of its merchandising and store operations into morestreamlined functions. Costs of this restructuring including severance, retention and other costs are expected to be in the range of $150 to $200, the substantial portion to be recorded in the first half of 2007.
Note 24. Other Information
Segment Information The only reportable operating segment is merchandising, which includes primarily food as well as generalmerchandise and drugstore products and services. All sales to external parties were generated in Canada and all fixed assets and goodwillwere attributable to Canadian operations.
2006 Financial Report Loblaw Companies Limited 77
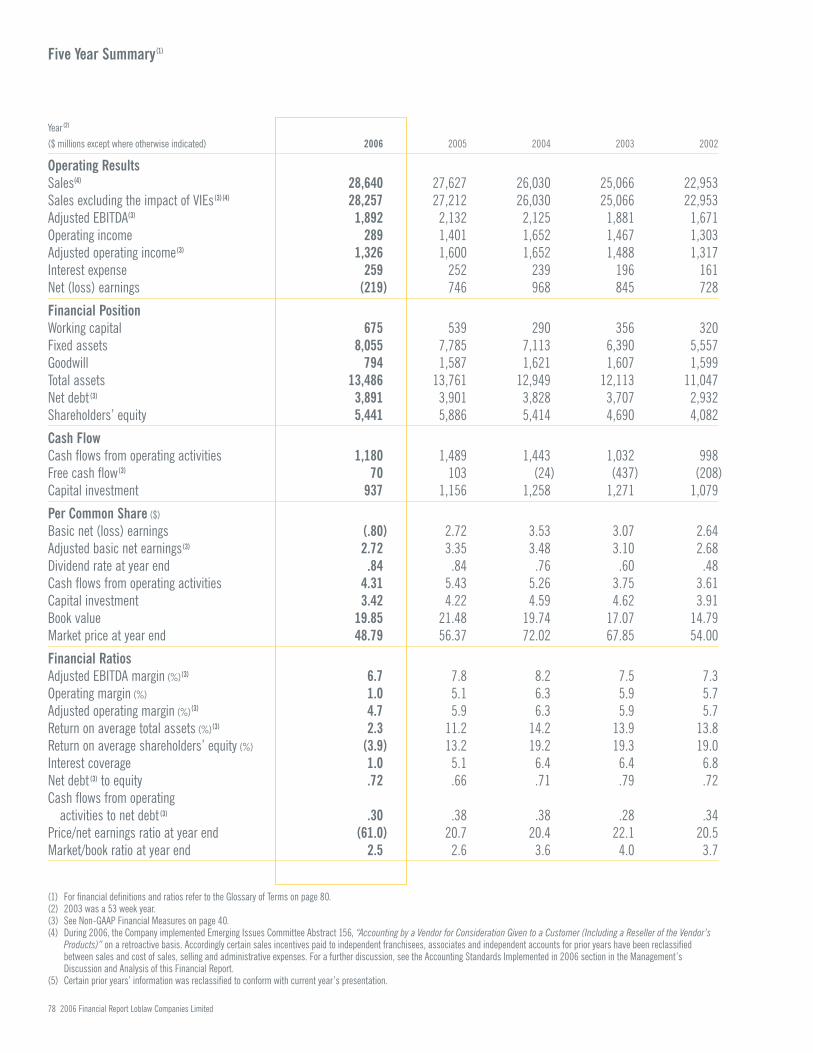
78 2006 Financial Report Loblaw Companies Limited
Year (2)
($ millions except where otherwise indicated) 2006 2005 2004 2003 2002
Operating ResultsSales(4) 28,640 27,627 26,030 25,066 22,953Sales excluding the impact of VIEs (3)(4) 28,257 27,212 26,030 25,066 22,953 Adjusted EBITDA(3) 1,892 2,132 2,125 1,881 1,671Operating income 289 1,401 1,652 1,467 1,303Adjusted operating income (3) 1,326 1,600 1,652 1,488 1,317Interest expense 259 252 239 196 161Net (loss) earnings (219) 746 968 845 728
Financial PositionWorking capital 675 539 290 356 320Fixed assets 8,055 7,785 7,113 6,390 5,557Goodwill 794 1,587 1,621 1,607 1,599Total assets 13,486 13,761 12,949 12,113 11,047Net debt (3) 3,891 3,901 3,828 3,707 2,932Shareholders’ equity 5,441 5,886 5,414 4,690 4,082
Cash FlowCash flows from operating activities 1,180 1,489 1,443 1,032 998Free cash flow(3) 70 103 (24) (437) (208)Capital investment 937 1,156 1,258 1,271 1,079
Per Common Share ($)
Basic net (loss) earnings (.80) 2.72 3.53 3.07 2.64Adjusted basic net earnings (3) 2.72 3.35 3.48 3.10 2.68Dividend rate at year end .84 .84 .76 .60 .48Cash flows from operating activities 4.31 5.43 5.26 3.75 3.61Capital investment 3.42 4.22 4.59 4.62 3.91Book value 19.85 21.48 19.74 17.07 14.79Market price at year end 48.79 56.37 72.02 67.85 54.00
Financial RatiosAdjusted EBITDA margin (%)(3) 6.7 7.8 8.2 7.5 7.3Operating margin (%) 1.0 5.1 6.3 5.9 5.7Adjusted operating margin (%)(3) 4.7 5.9 6.3 5.9 5.7Return on average total assets (%)(3) 2.3 11.2 14.2 13.9 13.8Return on average shareholders’ equity (%) (3.9) 13.2 19.2 19.3 19.0Interest coverage 1.0 5.1 6.4 6.4 6.8Net debt (3) to equity .72 .66 .71 .79 .72Cash flows from operating
activities to net debt (3) .30 .38 .38 .28 .34Price/net earnings ratio at year end (61.0) 20.7 20.4 22.1 20.5Market/book ratio at year end 2.5 2.6 3.6 4.0 3.7
(1) For financial definitions and ratios refer to the Glossary of Terms on page 80.(2) 2003 was a 53 week year.(3) See Non-GAAP Financial Measures on page 40.(4) During 2006, the Company implemented Emerging Issues Committee Abstract 156, “Accounting by a Vendor for Consideration Given to a Customer (Including a Reseller of the Vendor’s
Products)” on a retroactive basis. Accordingly certain sales incentives paid to independent franchisees, associates and independent accounts for prior years have been reclassifiedbetween sales and cost of sales, selling and administrative expenses. For a further discussion, see the Accounting Standards Implemented in 2006 section in the Management’sDiscussion and Analysis of this Financial Report.
(5) Certain prior years’ information was reclassified to conform with current year’s presentation.
Five Year Summary(1)

2006 Financial Report Loblaw Companies Limited 79
0
1,500
3,000
4,500
$6,000
Shareholders’ Equity and Net Debt(3)
($ millions)
Shareholders’ EquityNet Debt (3)
20062005200420032002 (2)0
375
750
1,125
$1,500
Cash Flows from Operating Activities and Capital Investment ($ millions)
Cash Flows from Operating ActivitiesCapital Investment
20062005200420032002 (2)
Basic Net (Loss) Earnings and Adjusted Basic Net Earnings per Common Share(3)
($)
(.80)
.30
1.40
2.50
Basic Net (Loss) Earnings per Common ShareAdjusted Basic Net Earnings per Common Share(3)
2002 2003 2004 2005 2006
$3.60
(2)
Common Share Market Price Range ($)
Common Share Market Price Range
2002 2003 2004 2005 20060
21
42
63
$84
(2)

80 2006 Financial Report Loblaw Companies Limited
Term Definition
Adjusted basic Basic net earnings per common share adjusted for net earnings items that affect the comparability of the financial per common share results and are not a result of ongoing operations
(see Non-GAAP Financial Measures on page 40). Adjusted EBITDA Adjusted operating income before depreciation
and amortization (see Non-GAAP Financial Measureson page 40).
Adjusted EBITDA margin Adjusted EBITDA divided by sales excluding the impact of VIEs (see Non-GAAP Financial Measures on page 40).
Adjusted net earnings Net earnings adjusted for items that affect thecomparability of the financial results and are not aresult of ongoing operations (see Non-GAAP FinancialMeasures on page 40).
Adjusted operating Operating income adjusted for items that affect income the comparability of the financial results and are
not a result of ongoing operations (see Non-GAAPFinancial Measures on page 40).
Adjusted operating Adjusted operating income divided by sales margin excluding the impact of VIEs (see Non-GAAP
Financial Measures on page 40). Annual Report For 2006, the Annual Report consists of the Annual
Summary and the Financial Report.Basic net (loss) earnings Net (loss) earnings available to common shareholdersper common share divided by the weighted average number of common
shares outstanding during the year.Book value per Shareholders’ equity divided by the number of common share common shares outstanding at year end.Capital investment Fixed asset purchases.Capital investment Capital investment divided by the weighted average per common share number of common shares outstanding during the year.Cash flows from Cash flows from operating activities divided by operating activities the weighted average number of common shares per common share outstanding during the year.Cash flows from Cash flows from operating activities divided by operating activities net debt.to net debtControl label A brand and associated trademark that is owned
by the Company for use in connection with its own products and services.
Conversion A store that changes from one Company banner toanother Company banner.
Corporate stores sales Sales by corporate stores divided by the average per average square foot corporate stores’ square footage at year end.Diluted net (loss) Net (loss) earnings available to common shareholders earnings per divided by the weighted average number of common common share shares outstanding during the period minus the dilutive
impact of outstanding stock option grants at period end.Dividend rate per Dividend per common share declared in the common share at fourth quarter multiplied by four.year endFree cash flow Cash flows from operating activities less fixed asset
purchases and dividends (see Non-GAAP FinancialMeasures on page 40).
Gross margin Sales less cost of sales and inventory shrinkagedivided by sales.
Interest coverage Operating income divided by interest expense addingback interest capitalized to fixed assets.
Term Definition
Major expansion Expansion of a store that results in an increase in square footage that is greater than 25% of thesquare footage of the store prior to the expansion.
Market/book ratio Market price per common share at year end divided at year end by book value per common share at year end.Minor expansion Expansion of a store that results in an increase in
square footage that is less than or equal to 25% of thesquare footage of the store prior to the expansion.
Net debt Bank indebtedness, commercial paper, long termdebt due within one year, long term debt and debt equivalents less cash, cash equivalents andshort term investments (see Non-GAAP FinancialMeasures on page 40).
Net debt to equity Net debt divided by total shareholders’ equity.New store A newly constructed store, conversion or
major expansion.Operating income Earnings before interest expense and
income taxes.Operating margin Operating income divided by sales.Price/net (loss) Market price per common share at year end divided earnings ratio by basic net (loss) earnings per common share at year end for the year.Renovation A capital investment in a store resulting in no change
to the store square footage.Retail sales Combined sales of stores owned by the
Company and those owned by the Company’sindependent franchisees.
Retail square footage Retail square footage includes corporate andindependent franchised stores.
Return on average Operating income divided by average total total assets assets excluding cash, cash equivalents
and short term investments (see Non-GAAP FinancialMeasures on page 40).
Return on average Net (loss) earnings available to common shareholders shareholders’ equity divided by average total common shareholders’ equity. Sales excluding Total sales less sales attributable to the consolidationthe impact of VIEs of VIEs pursuant to AcG 15 (see Non-GAAP
Financial Measures on page 40).Same-store sales Retail sales from the same physical location
for stores in operation in that location in both periodsbeing compared but excluding sales from a store thathas undergone a conversion or major expansion inthe period.
Variable interest An entity that either does not have sufficient equity entity (“VIE”) at risk to finance its activities without subordinated
financial support or where the holders of the equity atrisk lack the characteristics of a controlling financialinterest (see Note 2 to the consolidated financial statements).
Weighted average The number of common shares outstanding common shares determined by relating the portion of time within outstanding the year the common shares were outstanding
to the total time in that year.Working capital Total current assets less total current liabilities.Year A fiscal year ends on the Saturday closest to
December 31, usually 52 weeks in duration, butincludes 53 weeks every 5 to 6 years. The year ended January 3, 2004 contained 53 weeks.
Glossary of Terms

Desig
n an
d Co
ordin
ation
: Ove
Des
ign &
Com
mun
icatio
ns L
td. w
ww.ov
edes
ign.co
m
Type
setti
ng: M
ovea
ble In
c. ww
w.m
ovea
ble.co
m
ing:
Tran
scon
tinen
tal P
rintin
g G.
P.
National Head Office and Store Support CentreLoblaw Companies Limited1 President’s Choice CircleBrampton, CanadaL6Y 5S5Tel: (905) 459-2500Fax: (905) 861-2206Internet: www.loblaw.ca
Stock Exchange Listing and SymbolThe Company’s common shares arelisted on the Toronto Stock Exchangeand trade under the symbol “L”.
Common Shares63% of the Company’s commonshares are owned beneficially by W. Galen Weston and George Weston Limited.
At year end 2006 there were274,173,564 common shares issuedand outstanding, 5,696 registeredcommon shareholders and100,744,229 common shares available for public trading.
The average daily trading volume of the Company’s common shares for 2006 was 382,410.
Common Dividend PolicyIt is the Company’s policy to maintain a dividend payment equal to approximately 20% to 25% of the prior year’s adjusted basic netearnings per common share.(1)
Common Dividend DatesThe declaration and payment ofquarterly dividends are made subjectto approval by the Board of Directors.The anticipated record and paymentdates for 2007 are:
Record Date Payment Date
March 15 April 1June 15 July 1Sept. 15 Oct. 1Dec. 15 Dec. 30
Normal Course Issuer BidThe Company has a Normal Course Issuer Bid on the Toronto Stock Exchange.
Value of Common SharesFor capital gains purposes, thevaluation day (December 22, 1971)cost base for the Company is $0.958 per common share. The value on February 22, 1994 was $7.67 per common share.
Registrar and Transfer AgentComputershare Investor Services Inc.100 University AvenueToronto, CanadaM5J 2Y1Tel: (416) 263-9200Toll free: 1-800-663-9097Fax: (416) 263-9394Toll free fax: 1-888-453-0330
To change your address, eliminatemultiple mailings, or for othershareholder account inquiries, please contact Computershare Investor Services Inc.
Independent AuditorsKPMG LLP
Chartered AccountantsToronto, Canada
Annual and Special MeetingLoblaw Companies Limited Annual and Special Meeting of Shareholderswill be held on Tuesday, May 1, 2007at 11:00 a.m. at Maple Leaf Gardens,60 Carlton Street, Toronto, Canada.
TrademarksLoblaw Companies Limited and its subsidiaries own a number of trademarks. Several subsidiariesare licensees of additional trademarks. These trademarks are the exclusive property of LoblawCompanies Limited or the licensor and where used in this report are in italics.
Investor RelationsShareholders, security analysts andinvestment professionals should direct their requests to Mr. Geoffrey H. Wilson, Senior Vice President, Financial Services and InvestorRelations at the Company’s NationalHead Office or by e-mail at [email protected]
Additional financial information has been filed electronically with various securities regulators in Canada through the System for Electronic Document Analysis and Retrieval (SEDAR) and with the Office of the Superintendent ofFinancial Institutions (OSFI) as theprimary regulator for the Company’ssubsidiary, President’s Choice Bank.The Company holds an analyst call shortly following the release of its quarterly results. These calls are archived in the Investor Zonesection of the Company’s website.
Ce rapport est disponible en français.
This Financial Report was printed in Canada on Husky Offset,manufactured elemental chlorine-free, at a mill independently certified as meeting the procurement provisions of the Sustainable Forestry Initiative®
(SFI) standard.
(1) See Non-GAAP Financial Measures on page 40.
Shareholder and Corporate Information

For more information, visit our website at www.loblaw.ca