Annual Report 2004 - Assa Abloy · cards. The products are sold under well-known brand names such...
90
Security, safety and convenience Annual Report 2004
Transcript of Annual Report 2004 - Assa Abloy · cards. The products are sold under well-known brand names such...

Security, safety and convenience
Annual Report 2004

2004 in brief
Contents
■ Sales increased to SEK 25,526 M (24,080) with organic growth of
5 percent. Exchange-rate effects had a negative impact of SEK 982 M.
■ Operating income before goodwill amortization (EBITA) amounted to
SEK 3,748 M (3,352) – an increase of 12 percent.
■ Earnings per share after tax and full conversion amounted to SEK 4.05
(3.31) – an increase of 22 percent.
■ Operating cash flow increased to SEK 3,439 M (3,265).
■ The two-year Leverage & Growth action program is progressing well,
with a long series of specific activities. Annual savings are expected to
reach SEK 450 M during the second half of 2005.
■ During 2004 ASSA ABLOY reviewed the Group’s strategies, which can
be summarized in three main themes: increasing growth in the current
core business, expanding into new markets and new segments, and
reducing the cost base.
Financials in brief . . . . . . . . . . . . . . . . . . . . . . . . . . . . . . . 1
CEO’s statement . . . . . . . . . . . . . . . . . . . . . . . . . . . . . . . 2
Vision, Business Concept and strategy . . . . . . . . . . . . . . . 6
Leverage & Growth . . . . . . . . . . . . . . . . . . . . . . . . . . . . . . 9
The market . . . . . . . . . . . . . . . . . . . . . . . . . . . . . . . . . . . 12
ASSA ABLOY’s products . . . . . . . . . . . . . . . . . . . . . . . . 16
Sustainable development . . . . . . . . . . . . . . . . . . . . . . . . 20
Division EMEA . . . . . . . . . . . . . . . . . . . . . . . . . . . . . . . . . 24
Division Americas . . . . . . . . . . . . . . . . . . . . . . . . . . . . . . 28
Division Asia Pacific . . . . . . . . . . . . . . . . . . . . . . . . . . . . 32
Division Global Technologies . . . . . . . . . . . . . . . . . . . . . . 36
Report of the Board of Directors for 2004 . . . . . . . . . . . . . 42
Corporate governance . . . . . . . . . . . . . . . . . . . . . . . . . . 45
Sales and earnings . . . . . . . . . . . . . . . . . . . . . . . . . . . . . 48
Income statements . . . . . . . . . . . . . . . . . . . . . . . . . . . . . 49
Results by division . . . . . . . . . . . . . . . . . . . . . . . . . . . . . 50
Financial position . . . . . . . . . . . . . . . . . . . . . . . . . . . . . . 52
Balance sheets . . . . . . . . . . . . . . . . . . . . . . . . . . . . . . . . 53
Cash flow . . . . . . . . . . . . . . . . . . . . . . . . . . . . . . . . . . . . 54
Cash flow analysis . . . . . . . . . . . . . . . . . . . . . . . . . . . . . 55
Changes in shareholders’ equity . . . . . . . . . . . . . . . . . . . 56
Financial risk management . . . . . . . . . . . . . . . . . . . . . . . 57
Notes . . . . . . . . . . . . . . . . . . . . . . . . . . . . . . . . . . . . . . . 60
Proposed disposition of earnings . . . . . . . . . . . . . . . . . . . 72
Audit report . . . . . . . . . . . . . . . . . . . . . . . . . . . . . . . . . . 73
Comments on ‘Five years in summary’ . . . . . . . . . . . . . . 74
Five years in summary . . . . . . . . . . . . . . . . . . . . . . . . . . 75
Quarterly information . . . . . . . . . . . . . . . . . . . . . . . . . . . . 76
Definitions . . . . . . . . . . . . . . . . . . . . . . . . . . . . . . . . . . . 77
The ASSA ABLOY share . . . . . . . . . . . . . . . . . . . . . . . . . 78
Information for shareholders . . . . . . . . . . . . . . . . . . . . . . 81
Board of Directors . . . . . . . . . . . . . . . . . . . . . . . . . . . . . . 82
Executive Team . . . . . . . . . . . . . . . . . . . . . . . . . . . . . . . . 84
ASSA ABLOY in brief
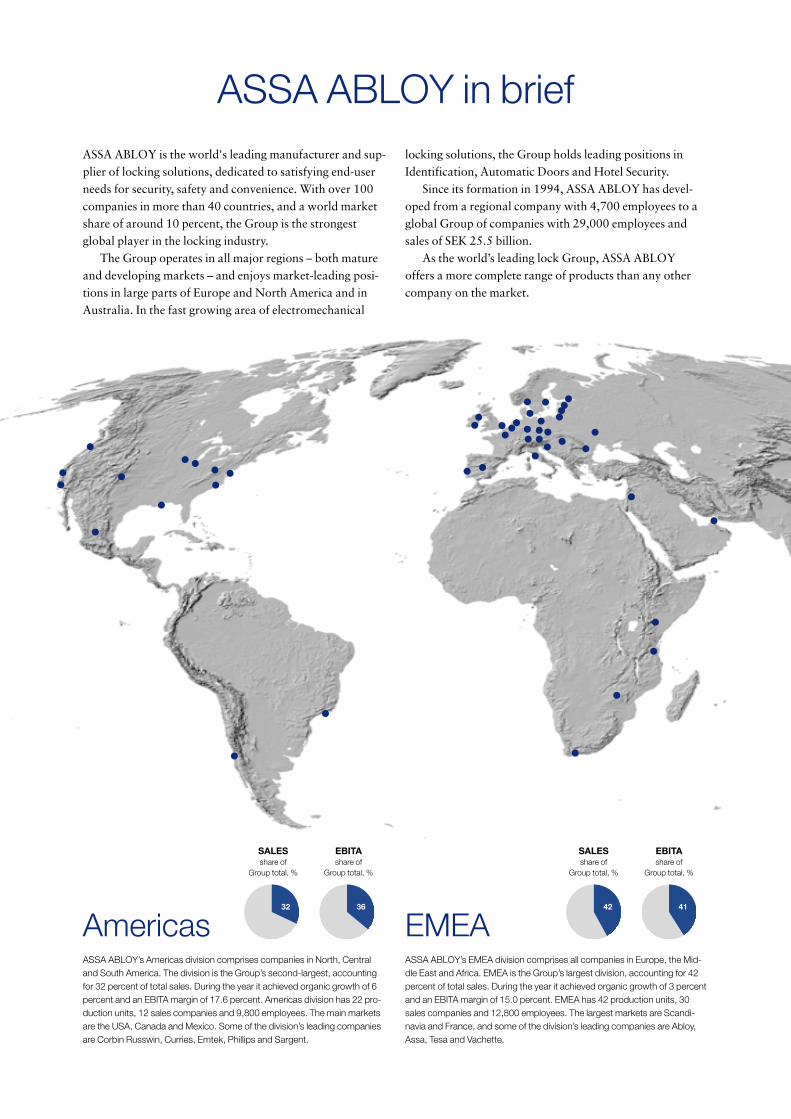
AmericasASSA ABLOY’s Americas division comprises companies in North, Centraland South America. The division is the Group’s second-largest, accountingfor 32 percent of total sales. During the year it achieved organic growth of 6percent and an EBITA margin of 17.6 percent. Americas division has 22 pro-duction units, 12 sales companies and 9,800 employees. The main marketsare the USA, Canada and Mexico. Some of the division’s leading companiesare Corbin Russwin, Curries, Emtek, Phillips and Sargent.
EMEAASSA ABLOY’s EMEA division comprises all companies in Europe, the Mid-dle East and Africa. EMEA is the Group’s largest division, accounting for 42percent of total sales. During the year it achieved organic growth of 3 percentand an EBITA margin of 15.0 percent. EMEA has 42 production units, 30sales companies and 12,800 employees. The largest markets are Scandi-navia and France, and some of the division’s leading companies are Abloy,Assa, Tesa and Vachette.
ASSA ABLOY is the world's leading manufacturer and sup-plier of locking solutions, dedicated to satisfying end-userneeds for security, safety and convenience. With over 100companies in more than 40 countries, and a world marketshare of around 10 percent, the Group is the strongestglobal player in the locking industry.
The Group operates in all major regions – both matureand developing markets – and enjoys market-leading posi-tions in large parts of Europe and North America and inAustralia. In the fast growing area of electromechanical
locking solutions, the Group holds leading positions inIdentification, Automatic Doors and Hotel Security.
Since its formation in 1994, ASSA ABLOY has devel-oped from a regional company with 4,700 employees to aglobal Group of companies with 29,000 employees andsales of SEK 25.5 billion.
As the world’s leading lock Group, ASSA ABLOY offers a more complete range of products than any othercompany on the market.
32 36 42 41
SALESshare of
Group total, %
EBITAshare of
Group total, %
SALESshare of
Group total, %
EBITAshare of
Group total, %

0
6,500
13,000
19,500
26,000
040302010099989796950
1,000
2,000
3,000
4,000
Sales, SEK M EBITA, SEK M
SEK M SEK M
GROUP SALES AND EBITA
Asia PacificASSA ABLOY’s Asia Pacific division comprises companies in Australia, NewZealand, China and elsewhere in Asia. Asia Pacific accounts for 7 percent ofthe Group’s total sales and has 5 production units, 7 sales companies and3,600 employees. During the year it achieved organic growth of 7 percentand an EBITA margin of 15.1 percent. The division’s largest markets areAustralia, New Zealand and China. The largest companies in the divisionare Lockwood in Australia, Interlock in New Zealand and Guli in China.
7 7
SALESshare of
Group total, %
EBITAshare of
Group total, %
Global TechnologiesASSA ABLOY’s Global Technologies division is the Group’s worldwide organizationdedicated to high-technology products and services. The division accounts for19 percent of the Group’s sales and has 2,900 employees. During the year itachieved organic growth of 5 percent and an EBITA margin of 13.0 percent. GlobalTechnologies comprises three business areas:– The Identification Technology Group (ITG), which accounts for 42 percent ofGlobal Technologies’ sales. ITG’s products consist of various types of identificationtechnology for access control, Radio Frequency Identification (RFID) and smartcards. The products are sold under well-known brand names such as HID, Indala,Sokymat and ACG.– Automatic Doors, which accounts for 40 percent of Global Technologies’ sales.This business area consists of Besam, which is the world’s leading supplier ofautomatic door solutions.– ASSA ABLOY Hospitality, which accounts for 18 percent of Global Technolo-gies’ sales. This business area produces hotel locks and security systems and sellschiefly to hotels and cruise ships. Its two leading companies and brands are Ving-Card and Elsafe.
1619
SALESshare of
Group total, %
EBITAshare of
Group total, %
Edgar Velardo, Emtek, USA Kerstin Pipo, Ikon, Germany Camille Smith, Sargent, USA

Financials in brief2004 2003 Change, %
Sales, SEK M 25,526 24,080 6
of which: Organic growth 5
Acquired growth 5
Foreign exchange effects, SEK M –982 –4
Operating income before goodwill amortization (EBITA), SEK M 3,748 3,3522 12
Operating margin before goodwill amortization (EBITA), % 14.7 13.92
Income before tax, SEK M 2,294 1,9032 21
of which, Foreign exchange effects, SEK M –78 –4
Operating cash flow, SEK M 3,4393 3,265 5
Return on capital employed, % 11.8 9.62
Return on capital employed before goodwill amortization, % 16.0 13.32
Data per share (SEK/share) 2004 2003 Change, %
Earnings after tax and full conversion (EPS) 4.05 3.312 22
Earnings after tax and full conversion excluding goodwill 6.66 5.892 13
Cash earnings after tax and full conversion (CEPS) 9.06 8.612 5
Shareholders’ equity after full conversion 32.66 31.23 5
Dividend 2.601 1.25 108
Number of shares after full conversion (1,000s) 378,717 370,9351 Proposed dividend.2 Excluding non-recurring items.3 Excluding restructuring payments.
1
0
5,000
10,000
15,000
20,000
25,000
30,000
040302010099989796950
5
10
15
20
25
30
Capital employed, SEK M
Return on capital employed, %
Return on capital employedbefore goodwill amortization, %
SEK M %
0
500
1,000
1,500
2,000
2,500
3,000
3,500
4,000
04030201009998979695
Income before tax, SEK M
Operating cash flow, SEK M
SEK M
0
1
2
3
4
5
6
7
04030201009998979695
Earnings per share, SEK
Earnings per share excluding goodwill, SEK
SEK
CAPITAL EMPLOYED /RETURN ON CAPITAL EMPLOYED 4
INCOME BEFORE TAX /OPERATING CASH FLOW 4 EARNINGS PER SHARE 4
4 Data for 2001 and 2003 excludes non-recurring items.

How many keys do you have on your keyring? The factthat we nearly always carry keys and access cards aroundwith us demonstrates our daily need for security. And thefact that we have so many different keys on our keyringshows how fragmented the lock industry still is.
It is neither particularly secure nor convenient to carry afull keyring around. There is clearly a need for some inno-vative new solutions. And to be able to create and launchinnovative solutions calls not just for good ideas, but alsofor worldwide resources in development, marketing, logis-tics and manufacturing.
ASSA ABLOY is the only truly global player in ourindustry. In the past ten years we have acquired many of thelock industry’s strongest companies and built a lock Groupthat is world-leading in both size and vigor. But the factthat you are still carrying all those keys around on yourring shows that, despite our success, we have yet to achieveour biggest victories. We have restructured a whole indus-try and are now ready to take the next step, which is tochange our industry – to change how companies, institu-tions and private individuals relate to security and to locks.
Our task now is to exploit our size, our market positionand our worldwide presence to become the leader both instrength of innovation and in cost management. That, inessence, is what we are saying in the new strategy andvision that we defined and presented during 2004.
2004 was, above all, a good business year for ASSAABLOY. We are back to good organic growth of 5 percent.The Group’s operating margin has improved markedly andwe are continuing to deliver strong cash flow. During theyear work under our Leverage & Growth action programcontinued. We set out to solve a number of specific struc-tural issues, turn round a handful of underperforming com-panies and work towards a long-term improvement in ourorganic growth. As a result of our restructuring measuresefficiency has improved. We have sold two companies, andwe are now expecting profitability from the companies that
CEO’s statement
A clear strategyfor better security
2

were not performing to the required level before. Duringthe year we also worked hard to develop our marketing andsales operations and we are continuing with that.
A refined business strategyIn 2004 we decided to take the next step in developing ourindustry. We have therefore clarified and simplified our busi-ness strategies, which we have condensed into three mainthemes. The first theme is to increase growth in our corebusiness by strengthening cooperation with architects, doormanufacturers, suppliers of security systems and distributorsall over the world. In short, to become even better at what weare already good at. The second theme is concerned withexpanding in markets and in segments with higher growth.This covers three principal markets: the consumer market,where customers actively choose their own security solu-tions; the market for electronic access-control; and the fast-growing Chinese market, where we need to increase ourpresence. The third theme is to try to gain more benefit fromour advantages of scale and thereby radically lower ourcosts. This requires greater specialization of our factories,better utilization of production capacity in low-cost coun-tries, and continuing coordination of our purchasing.
People make the company We are now investing more resources – both centrally andin the divisions – to develop the expertise that our employ-ees possess. We are therefore launching a comprehensiveskills development program in Human Resources, while incommunications we are working to strengthen our com-pany culture and our common values. In just ten years wehave built a remarkable Group – and we must now invest infurther development of our own employees, with the over-all purpose of achieving our business goals and our Vision.
Our future is directed towards developing and sellingsecurity solutions – solutions that reduce the number ofkeys on our keyrings and that, above all, improve the security of everything that is important in our lives.
Stockholm, February 2005
Bo Dankis
President and CEO
3

Secure access – safe andconvenient for teachers and students
4

Colleges and universities Many college and
university sites have a mixture of open and closed areas, in
which students, teachers and other staff must all feel safe.
An electronic card system allows everyone to be securely
identified and given authorized access to the places they
need to go.
With their high data storage capacity, fast data transfer
and ability to use encryption and biometric information,
cards can also be used to log on to computer networks and
to make payments, for example in university cafeterias.
And it is quick and easy to invalidate lost cards or restore
security after a break-in.
5
Over the last ten years ASSA ABLOY has built a world-leading lock Group and changed the structure of the lockingindustry. This has been achieved through acquisitions andthrough improving the performance of the acquired compa-nies. The Group was formed in 1994 when Securitas andWärtsilä merged their lock businesses. Over the last ten yearsASSA ABLOY has increased its sales from SEK 3 billion toSEK 25.5 billion. At the same time the number of companieshas increased to more than 100, with operations in over 40countries.
In the light of the Group's rapid development – withacquisitions that have led to involvement in new markets andtechnologies – ASSA ABLOY has carried out a full, fact-based review of the Group’s strategies for existing and poten-tial markets, and of expected future developments. The workhas resulted in a refined business strategy whose goal is tofurther strengthen the Group’s position by driving organicgrowth and improving efficiency. ASSA ABLOY’s new busi-ness strategy is more precise than before, and the Group’sVision and Business Concept have been updated in line withthe strategy.
Vision“ASSA ABLOY will be the most successful and innovativecompany in our markets by placing locks at the heart ofsecurity and providing safe and secure solutions that givetrue added value to our customers. Our solutions makepeople around the world feel safer and more secure, creatingmore freedom in their lives.”
Business Concept“ASSA ABLOY provides safe and secure solutions that arewell-designed, convenient and cost-efficient. Throughcustomer relevance and innovation, our solutions createsuperior value for businesses and for people at work, athome and at leisure.”
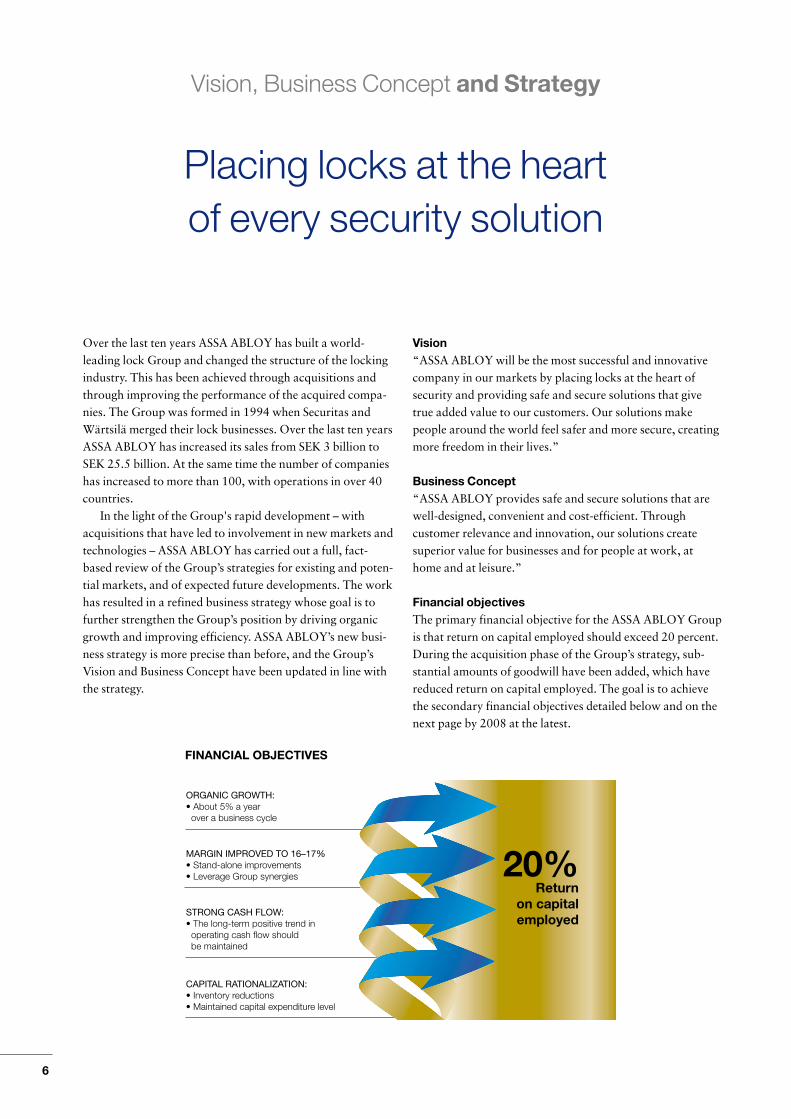
Financial objectivesThe primary financial objective for the ASSA ABLOY Groupis that return on capital employed should exceed 20 percent.During the acquisition phase of the Group’s strategy, sub-stantial amounts of goodwill have been added, which havereduced return on capital employed. The goal is to achievethe secondary financial objectives detailed below and on thenext page by 2008 at the latest.
Vision, Business Concept and Strategy
Placing locks at the heart of every security solution
6
ORGANIC GROWTH: • About 5% a year over a business cycle
MARGIN IMPROVED TO 16–17%• Stand-alone improvements• Leverage Group synergies
STRONG CASH FLOW:• The long-term positive trend in operating cash flow should be maintained
CAPITAL RATIONALIZATION:• Inventory reductions• Maintained capital expenditure level
FINANCIAL OBJECTIVES
20%Return
on capitalemployed

Secondary financial objectives:• Sales should, on average, grow organically at about 5
percent a year over a business cycle.• The EBITA margin should be improved to 16–17 per-
cent. This should be achieved mainly by exploiting syner-gies within the Group.
• The long-term positive trend in ASSA ABLOY’s opera-ting cash flow should be maintained.
• Capital employed should be maintained at the presentabsolute level in spite of organic growth. Measures tomake production more specialized will reduce capitaltied up in inventory. Given the potential to increase uti-lization of current production capacity, capital expendi-ture can be maintained at today’s level – below currentdepreciation.
StrategyFor a number of years ASSA ABLOY has followed a strat-egy model based on three phases of development:1. Global platform. Build a worldwide presence and add
new areas of expertise.2. Leverage synergies and develop the Group’s strength.3. Customer value. Accelerate organic growth by creating
value for customers.ASSA ABLOY has accomplished the main objectives in thethe first phase and created a global platform, althoughthere are still areas of expertise that can be added. As
regards exploiting the Group’s size and advantages of scale,a major step towards correcting some structural imperfec-tions was taken last year with the launch of the Leverage &Growth action program.
The locking industry todayThe world of locks and locking solutions is changing. Newplayers are entering the arena, both from emerging marketsand from other industries. The rapid development of newtechnologies is impacting all parts of the industry. ASSAABLOY’s present competitors are improving their prod-ucts, their quality and their sales strategies. The way peoplebuy locks is changing and so are the various channelsthrough which ASSA ABLOY’s products are distributed. Inseveral market segments there are trends towards providingholistic safety and security solutions rather than offeringindividual products. Customers are similarly shifting focusfrom traditional products to a comprehensive notion ofsafety and security.
At the same time customers’ preferences are polarizing.While some are willing to pay a higher price for well-known, innovative brand names, others are satisfied withfinding a low-price alternative that will meet basic securityrequirements. ASSA ABLOY is now well positioned tomeet these market changes.
A refined business strategyASSA ABLOY’s new strategies aim to realize the Group’sVision, fulfill the Group’s Business Concept and achieve theGroup’s financial objectives. The refined strategy is basedon three overriding themes subdivided into seven mainactivities, as detailed overleaf:
7
Americas division’s new manufacturing plant in Guadalajara, Mexico.

Theme 1. Grow our core business1. Lead the specification markets
Architects and security consultants play an important role in choosing security solutions for new construction. ASSAABLOY’s goal is to strengthen the Group’s resources and ability to market high-security solutions in the specificationsegment.
2. Develop channels to market
A clear majority of ASSA ABLOY’s sales goes through frag-mented local distribution. The Group’s goal is to developexisting and new channels and to influence end-users ofASSA ABLOY’s products more effectively.
3. Develop the door and window OEM markets
In many geographical markets ASSA ABLOY has a lowmarket share of the important door and window OEMmarkets. The Group’s goal is to improve ASSA ABLOY’sability to adapt to large customers’ specific requirements.
Theme 2. Expand into new markets and segments4. Capture and develop consumer opportunities
Customers are demanding security solutions, but the con-sumer market is currently fragmented. ASSA ABLOY’s goalis to increase the Group’s presence in the consumer segmentthrough all channels and to offer integrated solutions thatmeet customers’ needs for safety and security.
5. Grow electromechanical door solutions
The electromechanical door solutions segment is showingrapid growth. ASSA ABLOY’s goal is to increase marketshares and lower costs by developing Standards, adaptingwireless and similar technologies for use with locks, andleveraging the Group’s worldwide strength. Efforts willalso be made to use sales channels such as electric installersto reach a larger market.
6. Develop the Asian potential
Asia in general and China in particular provide a potentialmarket for growth. ASSA ABLOY’s goal is to develop theGroup’s presence on domestic Asian markets and to benefitfrom low-cost manufacturing.
Theme 3. Radically reduce our break-even cost7. Capture purchasing and production synergies and adopt
Lean methods
Because of its many acquisitions, the Group has a complexand fragmented production capacity. ASSA ABLOY’s goalis to use the Group’s size to realize purchasing synergies, to benefit from economies of scale in production, and toadopt Lean methods to achieve even more cost-efficientproduction throughout the Group. Some production willbe moved to low-cost countries.
Vision, Business Concept and Strategy
8
BUSINESS STRATEGY
7. Capture purchasing and production synergies and adopt Lean methods
Radically reduce our break-even cost
3. Develop the door and window OEM markets
1. Lead the specification markets
2. Develop channels to market
Grow our core business
4. Capture and develop consumer opportunities
5. Grow electromechanical door solutions
6. Develop the Asian potential
Expand into new markets and segments
Inno
vatio
n
Customer relevance
Cost efficiency
9
The two-year Leverage & Growth action program waslaunched towards the end of 2003 to leverage the Group’sstrength and create a basis for sustainable growth. Under-performing companies should be turned round by the end of 2004, or else divested. The cost of the programamounted to SEK 1,320 M and it would involve a reduc-tion of 1,400 in the number of people employed.
The largest part of the program affects EMEA divisionand is directed towards raising productivity, which is beingachieved primarily by reductions in the workforce. Americasdivision’s part of the program, which was completed duringthe year, mainly concerned underperforming units. AsiaPacific division’s part of the program is concentrating onconsolidation of production, while Global Technologies divi-sion is focusing on realizing synergies in the Identificationbusiness in Europe and on strengthening its competitivenessin Hospitality.
Work under the action program is proceeding well, witha long list of specific activities. Two underperforming unitsin Americas division have been divested during the year,while other underperforming units have been improved.No further divestments under the action program areplanned.
In 2004, payments made under the action programamounted to SEK 321 M of the planned total of SEK935 M, and 750 of the 1,400 employees affected left theGroup. Negotiations concerning 1,150 of the 1,400 redun-dancies have been completed.
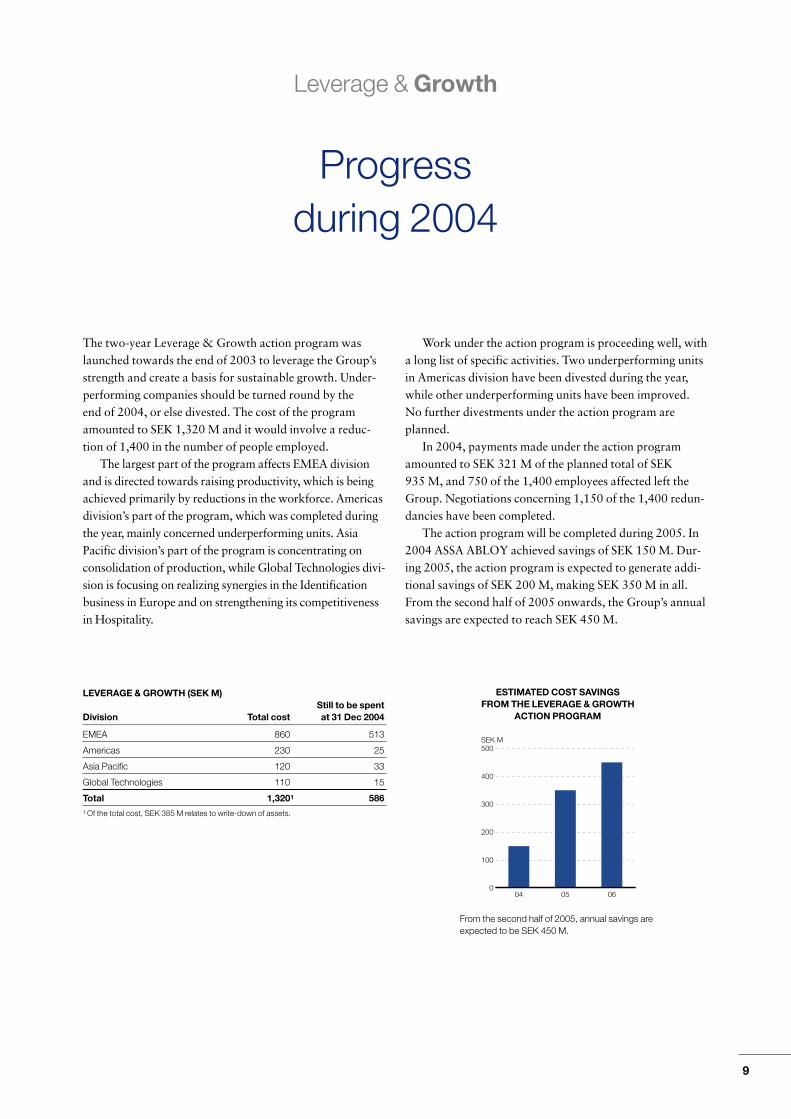
The action program will be completed during 2005. In2004 ASSA ABLOY achieved savings of SEK 150 M. Dur-ing 2005, the action program is expected to generate addi-tional savings of SEK 200 M, making SEK 350 M in all.From the second half of 2005 onwards, the Group’s annualsavings are expected to reach SEK 450 M.
Leverage & Growth
LEVERAGE & GROWTH (SEK M)Still to be spent
Division Total cost at 31 Dec 2004
EMEA 860 513
Americas 230 25
Asia Pacific 120 33
Global Technologies 110 15
Total 1,3201 5861 Of the total cost, SEK 385 M relates to write-down of assets.
0
100
200
300
400
500
060504
SEK M
ESTIMATED COST SAVINGSFROM THE LEVERAGE & GROWTH
ACTION PROGRAM
From the second half of 2005, annual savings areexpected to be SEK 450 M.
Progressduring 2004

Besam doors – efficient entrancesfor millions of people all over theworld
10

Shopping centers and offices 50 million
people a day pass through our doors in stores, shopping
centers, hospitals and office buildings. Automatic doors
provide convenience for everyone, including parents with
baby carriages and people in wheelchairs.
Shops must seem welcoming but must deter shoplifting.
Offices must admit staff and visitors while protecting com-
mercial data worth far more than any security system. In
fire or emergency, rapid escape is vital. The balance of secu-
rity, safety and access control can best be met by sophisti-
cated systems incorporating locks, door controls and per-
sonal identification.
11

Today ASSA ABLOY is the world’s leading lock Group. As theGroup has grown, its product range too has expanded to includea number of product groups, in addition to locks, that are crucialto security. Hence when assessing ASSA ABLOY’s market it hasbecome relevant not just to consider the lock market but to widenthe perspective to the security market in general.
ASSA ABLOY estimates the total security market at around200 billion Euro. The market can be divided into two sections,Security Services and Electronic Security Products, andMechanical Security Products.
Security Services and Electronic Security ProductsElectronic Security Products include electronic cylinders, auto-matic doors and products for access control, which form partof ASSA ABLOY’s product portfolio. The annual growth in the market for Electronic Security Products in which ASSAABLOY is mainly active is around 10 percent.
The development of Security Services and Electronic Secu-rity Products is driven mainly by the general trend towards
higher security. Increased threats in the world around us, in theform of crime, violence and terrorism, create insecurity, whichin turn increases security awareness. This drives the develop-ment of more advanced security solutions and upgrades ofexisting lock solutions to obtain increased protection.
However, this section also contains product groups whereASSA ABLOY has no manufacturing. These include, for ex-ample, fire protection, X-ray scanners and CCTV surveillancecameras, and also Security Services, which mainly compriseguards and surveillance.
Mechanical Security ProductsAs well as locks themselves, Mechanical Security Products alsoinclude products such as handles, strikes, hinges, door closers,exit devices and door and window fittings.
The development of Mechanical Security Products is drivenmainly by new construction, which means that this section ofthe market is expected to grow at about the same rate as GDP.However, a substantial aftermarket creates stability and makes
The market
The security market – two worlds in one
12
0
20
40
60
80
100
120EUR billion
Security guards
Other
Logical authorization control
Automatic doors
Access control
Surveillance cameras (CCTV)
Fire alarms
X-ray inspection systems
Intrusion protection
Other IT security
Alarm centers
Interior hardware
The main product areas where ASSA ABLOY is active are shown in boldface.
Door and window hardware
Locks, exit hardware and door closers
Doors and windows
SECURITY SERVICES AND ELECTRONIC SECURITY PRODUCTS
MECHANICAL SECURITY PRODUCTS
The product groups that ASSA ABLOY manufactures today mean that the Group is active in about 15 percent of the total security market. ASSAABLOY’s market can therefore be estimated at around 30 billion Euro, which in turn gives the Group a market share of around 10 percent. Threequarters of this business is in Mechanical Security Products and the remaining one quarter in Electronic Security Products. ASSA ABLOY’sgrowth target is based on the expected growth in these two markets.

the market less sensitive to changes in the economic climate, asdoes the fact that ASSA ABLOY’s operations are geographi-cally distributed over a large number of countries with differenteconomic cycles.
Distribution channels for security productsA characteristic of today’s security market is that security prod-uct manufacturers such as ASSA ABLOY are usually isolatedfrom end-users behind at least one layer of distributors.
Locksmiths and similar firms are among the most impor-tant distributors of Mechanical Security Products, but otherplayers have a significant role too. Many manufacturers ofdoors and windows integrate lock cases and other securityitems into their products before delivery to customers. Whole-salers of building materials and locks play important parts indelivering the solutions specified by manufacturers for differentconstruction projects. Retailers such building material super-markets and ironmongers serve the consumer market. In thecase of Electronic Security Products, products flow from manu-facturers to end-users mainly via security installers and special-ized distributors. But the products are also sold through inte-grators who often offer turnkey solutions for the installation ofperimeter security, access control and IT security.
TrendsOne of the most obvious trends in the security market is theincreased demand for electronic products. Another clear trendis increased technical standardization, which makes it easier tointegrate the different components of security solutions withone another. This means that, to remain competitive, manufac-turers will be forced to specialize and focus on specific productsegments.
Distribution is changing too. A number of door and win-dow manufacturers, DIY chains and other players are gainingstrength by consolidation. The role of some locksmiths is mov-ing towards increased use of electronics; conversely, IT integra-tors are starting to offer physical security solutions to an evergreater extent.
Another clear trend is that manufacturers in low-cost coun-tries in Asia and elsewhere are increasing their market shares inthe low-price segments of the western world. In some Europeancountries this type of import has increased by nearly 50 percenta year over the last five years. A change can also be seen in thedemand for different levels of security solution. In the past the greatest potential was in the middle segment, but now cus-tomers increasingly choose either a high-security solution or alow-priced alternative.
Major differences between marketsThere are substantial differences between markets. Americansspend more than twice as much on exit devices as Europeans.Conversely, northern Europeans spend three to four times morethan Americans on high-security locks for their homes. Auto-matic doors are also significantly more common in Europe than
13
Intruder alarms
Distributors
Primarily commercial end-users
Integrators.dealers,installers
WholesalersDoor/
window OEM
CCTV Accesscontrol
Locksmiths Distributors Retail
Buildingcontractors
Commercial and residential end-users
Locks Exit hardware
Door/window hardware
ELECTRONIC SECURITY PRODUCTS
Manufacturing
MECHANICAL SECURITY PRODUCTS Manufacturing
Route to market
Route to market
the USA. Electromechanical products are now far more widelyused in the commercial segment than in private homes. In thelong term these differences are likely to disappear. Assumingthat all security and safety solutions could be used equallywidely in Europe and in the USA, a rough estimation indicatesthat the total value of the market could be doubled. Informingand developing the market to reduce the international differ-ences in these market segments is a major challenge for ASSAABLOY.
Americas divisionIn the USA the commercial segment, including schools, hospi-tals and companies, is ASSA ABLOY’s most important market.Interest in security has risen significantly. Product developmentis carried out in close collaboration with insurance companies,police and fire services, customer organizations and other lead-ers of opinion.
In general the residential segment in the USA has lower lockStandards than in Europe. Instead, alarms play a major role insecurity awareness. However, the media are giving more andmore coverage to the fact that better locks are a proactive measure while alarms are a reactive measure when damage has already been done. The residential segment is growing also as a result of rising housing construction.
South AmericaMuch of South America is a fragmented market and there arefew established security Standards. However, the region has amajor need for security solutions and is a future growth market.
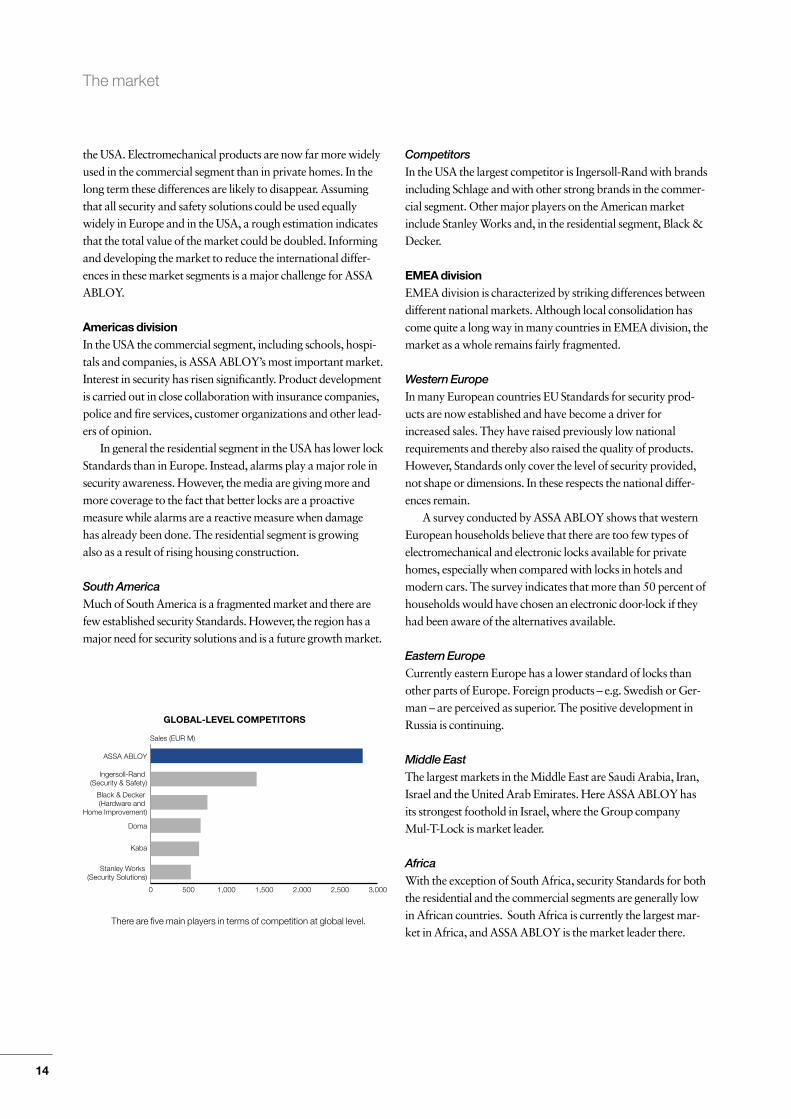
CompetitorsIn the USA the largest competitor is Ingersoll-Rand with brandsincluding Schlage and with other strong brands in the commer-cial segment. Other major players on the American marketinclude Stanley Works and, in the residential segment, Black &Decker.
EMEA divisionEMEA division is characterized by striking differences betweendifferent national markets. Although local consolidation hascome quite a long way in many countries in EMEA division, themarket as a whole remains fairly fragmented.
Western EuropeIn many European countries EU Standards for security prod-ucts are now established and have become a driver forincreased sales. They have raised previously low nationalrequirements and thereby also raised the quality of products.However, Standards only cover the level of security provided,not shape or dimensions. In these respects the national differ-ences remain.
A survey conducted by ASSA ABLOY shows that westernEuropean households believe that there are too few types ofelectromechanical and electronic locks available for privatehomes, especially when compared with locks in hotels andmodern cars. The survey indicates that more than 50 percent ofhouseholds would have chosen an electronic door-lock if theyhad been aware of the alternatives available.
Eastern EuropeCurrently eastern Europe has a lower standard of locks thanother parts of Europe. Foreign products – e.g. Swedish or Ger-man – are perceived as superior. The positive development inRussia is continuing.
Middle EastThe largest markets in the Middle East are Saudi Arabia, Iran,Israel and the United Arab Emirates. Here ASSA ABLOY hasits strongest foothold in Israel, where the Group company Mul-T-Lock is market leader.
AfricaWith the exception of South Africa, security Standards for boththe residential and the commercial segments are generally lowin African countries. South Africa is currently the largest mar-ket in Africa, and ASSA ABLOY is the market leader there.
The market
14
0 500 1,000 1,500 2,000 2,500 3,000
Stanley Works (Security Solutions)
Kaba
Doma
Black & Decker (Hardware and
Home Improvement)
Ingersoll-Rand (Security & Safety)
ASSA ABLOY
Sales (EUR M)
GLOBAL-LEVEL COMPETITORS
There are five main players in terms of competition at global level.
The market
CompetitorsThe largest competitor in the EMEA division is the Swiss com-pany Kaba, which focuses primarily on high-security solutions.
Other major players include Dorma and Abus in Germany,Sécuridev in France and Evva in Austria.
Asia Pacific divisionAustralia and New ZealandThe lock markets in Australia and New Zealand are relativelyconsolidated. ASSA ABLOY’s companies, headed by Lock-wood in Australia and Interlock in New Zealand, are the clearmarket leaders. Growth remains healthy in both residential andcommercial segments.
ChinaChina is the fastest-growing market in Asia, with a majormovement of population from country to town. Today themarket is undeveloped in terms of security Standards and pro-duces an abundance of low-quality products that are mostlyexported. ASSA ABLOY has established its own manufactur-ing plants in China and now faces a major challenge in educat-ing and developing the distribution chain towards productsoffering higher security.
Rest of AsiaIn other parts of Asia, ASSA ABLOY is represented by salesoffices. During the year ASSA ABLOY acquired BEST Met-aline, one of the largest players on the Korean market. Japanand India are other important markets with potential forexpansion.
CompetitorsIn Australia and New Zealand competition comes largely fromimports from low-cost countries, as well as some global compe-tition. In China the lock market is still very fragmented, andeven the largest companies have low market shares. Tri-Circle,whose business is strongly focused on padlocks, is the largestlock manufacturer in China. More than half of Tri-Circle’s salesare exports. In Japan the market leader is Miwa.
Global Technologies divisionIdentification Technology Group (ITG)Because the technological differences between markets aresmall, cards and card readers for both smart cards – based onradio-frequency identification (RFID) – and traditional con-tact-based methods of access control form a worldwide product segment. Demand for products of this type continuesto increase and growth was strong in 2004. The marketremains fairly fragmented and the strongest competition comesfrom the global players and from security integrators such asTyco, Honeywell and GE Infrastructure.
Automatic DoorsThere are a great many local differences between different partsof the world in what they ask of automatic door solutions.Nonetheless, the requirements of the largest customer segments– airports, hospitals, hotels, restaurants and stores – are so simi-lar everywhere that the product segment is best marketed glob-ally. The market is growing and margins improving, especiallyin Europe but also in the USA where competition is fiercest.Consolidation is ongoing, and the strongest competitors, inaddition to the global players Dorma and Stanley Works,include Agta Record from Switzerland, Boon Edam from theNetherlands and Horton Automatics in the USA.
ASSA ABLOY HospitalityThe primary target group for ASSA ABLOY Hospitalityincludes large international hotel and restaurant chains, whichmakes it desirable to organize this business on a global basis.Continuing low demand in the travel industry accounts for thepresent weakness of the hospitality market. Terrorism, politicaldisturbances and natural catastrophes can all be viewed ascauses. At the same time there are contrary trends, for exampleprice pressure in the aviation industry which is likely to lead tomore traveling in the future. The largest competitors are Onityand Saflok.
15

ASSA ABLOY has a world-leading position not just insales, but also in the form of a strong and highly variedrange of products. The development of ASSA ABLOY’sproducts starts from the differing needs of customers. Acontinuous flow of innovative new products is the singlemost important source of organic growth. Focused productdevelopment is thus a critical success factor.
ASSA ABLOY works all the time to develop its productsin ways that will satisfy the end-user’s requirements forsecurity, safety, convenience and design. To meet these cus-tomer requirements more comprehensively, the Groupfocuses on developing total security solutions. Together
with a complete mechanical or electromechanical product,these total solutions include installation and after-salesservice as well.
Design growing in importanceDesign is becoming an ever more important factor in sellingASSA ABLOY’s products. Customers appreciate beinggiven greater choice regarding shape, color and finish, andthis adds value to the product. During the year the Grouphas launched a number of products where design hasplayed a major role in the development process. Sales ofthese ‘designed’ products are rising faster than sales of
ASSA ABLOY’s products
Increased demand for total security solutions
16
Brighthandle – Design is becoming more important for lock products.

standard products. A good example of a designed productis Brighthandle.
Modular platformsMany of ASSA ABLOY’s products, and especially mechani-cal locks, contain similar components. This creates a power-ful opportunity to exploit economies of scale among theGroup’s many companies. Product development and pro-duction are focused on a number of efficient modular plat-forms which can then be used by all companies. Likewise,many different ASSA ABLOY companies can utilize compo-nents produced in a single plant. ASSA ABLOY also worksconstantly to coordinate its purchasing and to limit thenumber of suppliers to the Group so as to improve its procurement performance.
New electromechanical productsASSA ABLOY’s fastest growing product segment is electro-mechanical products for doors and windows. The develop-ment of improved technologies has opened up new opportu-nities to incorporate better components in tailored solutions.These new electromechanical components provide greaterconvenience, for example by automating doors and locks.
17
Mechanicalproducts, 53%
Electromechanical products, 27%
Security doors, 20%
ASSA ABLOY’s SALES BY PRODUCT GROUP
Simpler use with electronic authentication. The iClass card combines RFID and a smart card.
Mechanical productsMechanical locks and accessories continue to form the coreof the ASSA ABLOY product range, accounting for overhalf the Group’s worldwide sales. Mechanical locks pro-vide the two primary functions of any security device: iden-tification (the key) and mechanical strength (the lock).
There is a clear trend towards higher levels of security.In many developing countries, rising standards of livingmean that more people feel the need for greater security.Simpler locks are being replaced by modern high-securitylocks. In developed markets there is a similar demand forthe peace of mind that higher security provides. TheGroup’s huge installed base of locks in these markets cre-ates a solid foundation for new installations and upgrades –and the products are continually being improved.
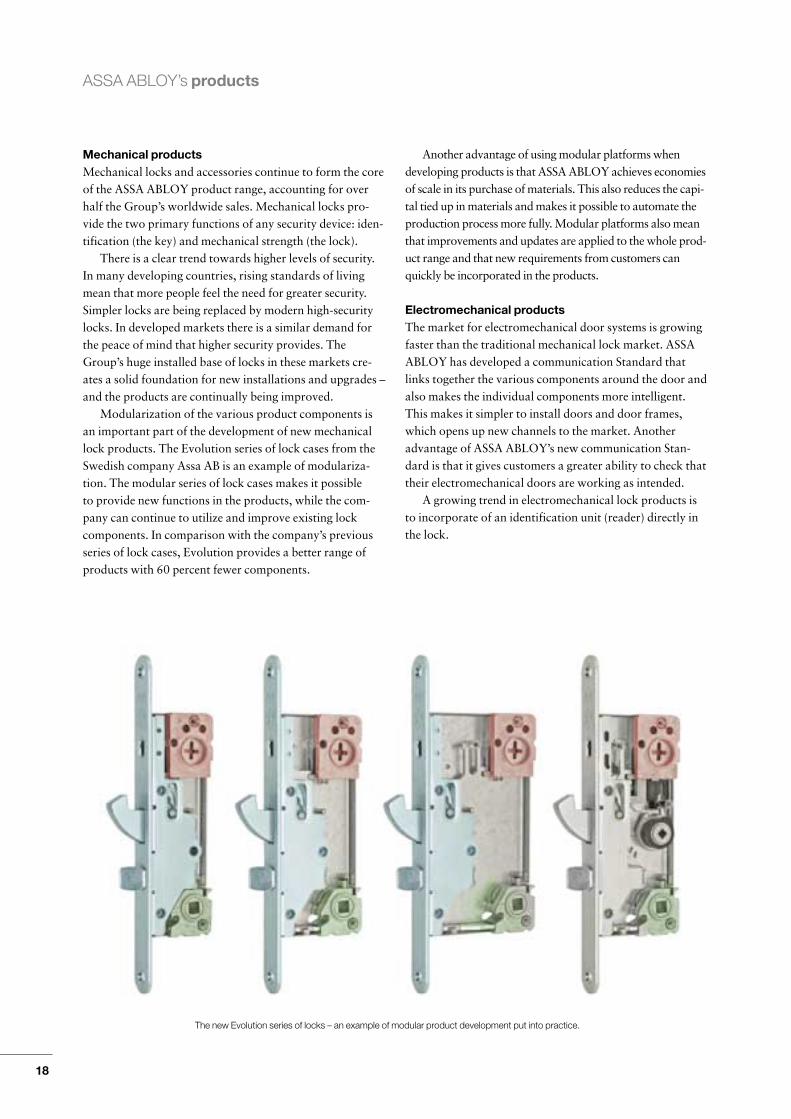
Modularization of the various product components isan important part of the development of new mechanicallock products. The Evolution series of lock cases from theSwedish company Assa AB is an example of modulariza-tion. The modular series of lock cases makes it possibleto provide new functions in the products, while the com-pany can continue to utilize and improve existing lockcomponents. In comparison with the company’s previousseries of lock cases, Evolution provides a better range ofproducts with 60 percent fewer components.
Another advantage of using modular platforms whendeveloping products is that ASSA ABLOY achieves economiesof scale in its purchase of materials. This also reduces the capi-tal tied up in materials and makes it possible to automate theproduction process more fully. Modular platforms also meanthat improvements and updates are applied to the whole prod-uct range and that new requirements from customers canquickly be incorporated in the products.
Electromechanical productsThe market for electromechanical door systems is growingfaster than the traditional mechanical lock market. ASSAABLOY has developed a communication Standard thatlinks together the various components around the door andalso makes the individual components more intelligent.This makes it simpler to install doors and door frames,which opens up new channels to the market. Anotheradvantage of ASSA ABLOY’s new communication Stan-dard is that it gives customers a greater ability to check thattheir electromechanical doors are working as intended.
A growing trend in electromechanical lock products isto incorporate of an identification unit (reader) directly inthe lock.
ASSA ABLOY’s products
18
The new Evolution series of locks – an example of modular product development put into practice.
ASSA ABLOY’s products
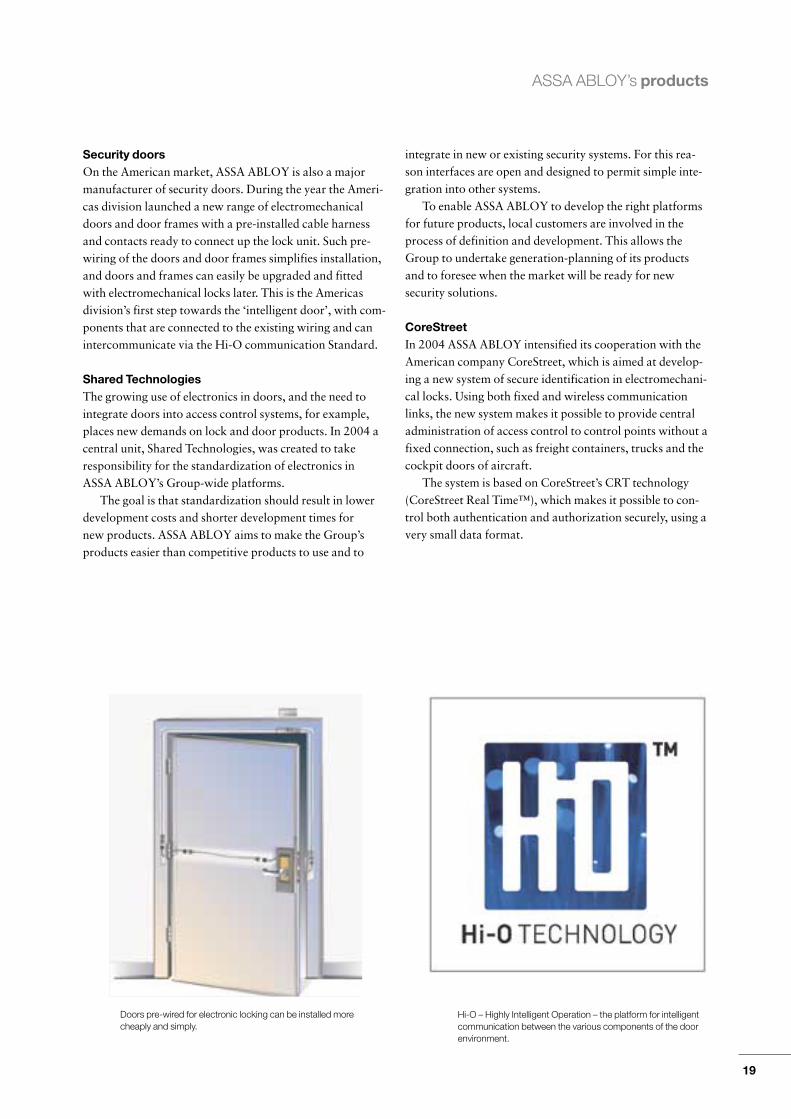
Security doorsOn the American market, ASSA ABLOY is also a majormanufacturer of security doors. During the year the Ameri-cas division launched a new range of electromechanicaldoors and door frames with a pre-installed cable harnessand contacts ready to connect up the lock unit. Such pre-wiring of the doors and door frames simplifies installation,and doors and frames can easily be upgraded and fittedwith electromechanical locks later. This is the Americasdivision’s first step towards the ‘intelligent door’, with com-ponents that are connected to the existing wiring and canintercommunicate via the Hi-O communication Standard.
Shared TechnologiesThe growing use of electronics in doors, and the need tointegrate doors into access control systems, for example,places new demands on lock and door products. In 2004 acentral unit, Shared Technologies, was created to takeresponsibility for the standardization of electronics inASSA ABLOY’s Group-wide platforms.
The goal is that standardization should result in lowerdevelopment costs and shorter development times for new products. ASSA ABLOY aims to make the Group’sproducts easier than competitive products to use and to
integrate in new or existing security systems. For this rea-son interfaces are open and designed to permit simple inte-gration into other systems.
To enable ASSA ABLOY to develop the right platformsfor future products, local customers are involved in theprocess of definition and development. This allows theGroup to undertake generation-planning of its productsand to foresee when the market will be ready for newsecurity solutions.
CoreStreetIn 2004 ASSA ABLOY intensified its cooperation with theAmerican company CoreStreet, which is aimed at develop-ing a new system of secure identification in electromechani-cal locks. Using both fixed and wireless communicationlinks, the new system makes it possible to provide centraladministration of access control to control points without afixed connection, such as freight containers, trucks and thecockpit doors of aircraft.
The system is based on CoreStreet’s CRT technology(CoreStreet Real Time™), which makes it possible to con-trol both authentication and authorization securely, using avery small data format.
19
Hi-O – Highly Intelligent Operation – the platform for intelligentcommunication between the various components of the doorenvironment.
Doors pre-wired for electronic locking can be installed morecheaply and simply.

ASSA ABLOY’s work towards sustainable development isfounded on the four Cornerstones of Vision, Realism, Ethicsand Courage laid down when the Group was formed in 1994.The primary strategy for achieving sustainable development isconstantly to integrate all measures concerned into the Group’sday-to-day work.
ASSA ABLOY has identified the areas where such measuresare desirable, relevant and advantageous for the Group. Themain areas are environmental responsibility, business ethicsand social responsibility. Within these primary classifications alarge number of issues have to be addressed.
A comprehensive analysis of the Group’s risks and opportuni-ties in the field of sustainable development was initiated in 2002,together with an audit of the current position. The analysis, cover-ing all the main elements of the value-chain, was completed in2003 and showed that the industry as a whole – as well as ASSAABLOY specifically – belongs to a medium-risk rather than ahigh-risk segment. ASSA ABLOY has defined the issues that needto be addressed and analyzed how important they are to sustain-able development and what opportunities ASSA ABLOY has toinfluence each individual link in the value-chain.
For example, ASSA ABLOY’s most important raw materialsare metals. Mining and extraction operations often carry risks of major environmental damage and also problems in defendingthe human rights of workers. However, ASSA ABLOY has littleability to influence the mining industry. This is partly becausetrading in metals takes place on commodity exchanges where the
producer is often unknown, and partly because ASSA ABLOY is asmall player on this market and a long way down the value-chain.
The use of lock products is, in a broad view, uncontrover-sial, but there remains much for the Group to do. ASSAABLOY concentrates on taking action in areas where theGroup’s impact is greatest.
Risks and opportunitiesASSA ABLOY has identified risks in the following areas:• Risks related to operations in, and suppliers from, countries
of low production costs. These include environmental, ethi-cal and social issues.
• Problems of business ethics, such as bribery and conflictsof interest, arise in many markets where ASSA ABLOY isactive. ASSA ABLOY has therefore established a zero-tolerance policy regarding bribes, for example.
• Environmental problems of historical origin arising in pro-duction operations. Many plants now forming part of theGroup have occupied the same site for a long time, in somecases more than a century. Instances of soil pollution requir-ing clean-up are arising. ASSA ABLOY is already undertak-ing remedial measures, and is investigating where there arerisks of environmental damage. The costs of these cleaningoperations are relatively small.
• There are still production operations today that give rise to envi-ronmental impact – for example, the use of organic solvents.
Sustainable development
Improved documentation and supervision
20
Courage
Vision
EthicsRealism
Collaboration
People make the difference
Vision• The world leader in safe and secure
lock solutions.• Leading in size and thought.
Realism• Develop the core business.• Know your business.
Ethics• High ethical standards.• Trust and respect other people.
Courage• Lead and embrace change.• Innovate.

The list of potential risk could be extended, especially at a timewhen some business operations are being moved to low-costcountries. However, there are many opportunities too, whichcontribute to the economic argument for ASSA ABLOY tointensify its involvement in sustainable development.
Directives and organization
ASSA ABLOY has produced a number of directives that applyto the whole Group. These are documented and in many casestranslated into several languages. The documents are availableto everyone on the website www.assaabloy.com.
Ultimately it is the Board of Directors that takes responsi-bility for these directives, and ASSA ABLOY’s President andCEO reports to the Board on relevant activities. The CEO alsohas operational responsibility and heads the control groupdealing with such issues. There is an executive with primaryresponsibility for sustainable development in the Parent Com-pany and at least one person with similar responsibility in eachdivision. In each subsidiary, the Managing Director and/or theHuman Resources Director is responsible for ethical and socialissues and the Environmental Director for environmentalissues.
Management systems
Group Management has decided that ASSA ABLOY shouldimplement certifiable environmental management systemsmeeting ISO 14001 in all Group production plants that gener-ate significant environmental impact.
A Code of Conduct has been produced detailing the valuesand guidelines that apply in ASSA ABLOY.
All Group companies should ensure that the guidelinesare followed locally. An overriding system for managing andfollowing up sustainability issues is in course of preparationin the Parent Company.
To ensure that the Group’s suppliers act correctly, a specialquestionnaire has been put to many of them since 2002. Thequestionnaire currently covers quality and environmentalissues and is being expanded to include human rights andworking conditions. The Code of Conduct provides furtherrules of behavior for suppliers.
Ethics and social responsibility
ASSA ABLOY adopted its Code of Conduct in October 2004.The Code is based on a series of internationally accepted con-ventions ratified in most countries. It can naturally not replacelocal laws, which in many cases are more specific, but itexpresses the values and guidelines that should apply within theGroup.ASSA ABLOY is a Group active throughout the world,and major cultural differences inevitably exist between employ-ees in different countries. It is nevertheless valuable from theGroup point of view that employees should share the same val-ues on many issues.An action that constitutes acceptablebehavior in one part of the world may create problems for otheremployees within the Group. Our Code of Conduct covers thefollowing subjects, among others:
• Business ethics– Fair competition and antitrust legislation
– Bribery– Records and reports– Government investigations– Conflict of interest• Workers’ rights, human rights, consumer interests and com-
munity outreach– Child labor– Forced or bonded labor– Freedom of association and collective bargaining– Working hours, overtime and overtime compensation– Discrimination, harassment, equal opportunities, gender
balance and diversity– Employee privacy– Alcohol and/or drug abuse– Human rights under special circumstances– Consumer interests– Community outreach
• Environment, health & safety issues– Environment– Health & safety
Responsibility for the environment
ASSA ABLOY has carried out an analysis of all links in the value-chain and identified the most significant environmental impacts.The analysis revealed major differences between companies inthe impact they have on the environment.Thus manufacturingcompanies have greater impact than those that just sell products.From the Group point of view it is important to concentrate com-mon efforts on production in the first instance.A survey is also inhand to assess historical environmental impacts on soil andground water at all plants with a relevant risk pattern.Thisshould be complete before 2007.
Another goal is to eliminate all use of chlorinated solventsand hexavalent chromium.
In 2004 ASSA ABLOY listed all its planned environmentalmeasures in an Environmental and Stakeholder Integrity Pro-gram together with time schedules for carrying out all Group-wide and local projects. In addition, ASSA ABLOY intends toimplement relevant parts of the EU’s directives on Waste Elec-trical and Electronic Equipment (WEEE) and the Restriction ofHazardous Substances (RoHS) in electrical and electronicequipment within firm time frames.
External auditing
Since March 2004 ASSA ABLOY has been included in theFTSE4Good series of indexes, which judges companies ontheir work on environmental and social issues with a view toencouraging socially responsible investment. Rating institutesand unit trusts also actively follow ASSA ABLOY’s progress insustainable development.
Ongoing developments
ASSA ABLOY continually monitors the evolution of the lawsand conventions governing issues in the field of sustainabledevelopment. However, probably the most important factor isthe common platform of values concerning such issues that isbeing built up in the Group.
21
karin
Placerad bild

Yale – keeping safe what we valuemost, for more than a century
22

Safe houses Many of our customers today are look-
ing for secure protection for their homes and holiday
houses. As the world’s leading lock Group, ASSA ABLOY
can offer customers everything from individual products to
convenient integrated solutions for their home security.
ASSA ABLOY’s goal is clear: by placing its locks at the
heart of every security solution, the Group can provide
solutions that will make people around the world feel safer
and more secure and able to live their lives more freely.
23

IntroductionThe EMEA division comprises companies in Europe, theMiddle East and Africa. EMEA is the Group’s largest divi-sion and accounts for 42 percent of total sales. During theyear the division achieved an organic growth of 3 percentand an EBITA margin of 15.0 percent. The EMEA divisionhas 42 production units, 30 sales companies and 12,800employees. The division is organized into eleven geographi-cal market regions, each with its own management groupwhich is responsible for the region’s marketing strategy,finances and business development. EMEA’s divisional man-agement is based in Stockholm, Sweden. ASSA ABLOY’slargest markets in the division are Scandinavia and France,and the leading companies are Abloy, Assa, Tesa andVachette.
A strongly diversified marketThe EMEA division companies operate in a strongly diver-sified market with significant local differences. Differenttraditions in the markets of northern Europe, southern
Europe, the Middle East and Africa, reinforced by differentBuilding Standards and different climates, mean that thereare many different needs to be met. ASSA ABLOY’sstrength is that its companies have excellent knowledge ofcustomers’ requirements in each local market, which winsthem high levels of repeat business and provides a strongbasis for their operations. ASSA ABLOY also has stronglinks with distributors and good knowledge of local lockStandards. The aftermarket accounts for a significant frac-tion of the division’s sales, which means that local brandsserve an important function.
No clear boundary between the residential and commercial segmentsIn Europe there is no clearly defined boundary betweenproducts for the residential segment and products for thecommercial segment. Many products currently sell to cus-tomers in both segments. An interior door lock for an officewill serve equally well in a home. In this respect the Europeanmarket contrasts with, for example, the American market.
Division EMEA
Focus on the Leverage & Growth program
24
The division operates in a strongly diversified marketwith significant local differences.
Many and varied companies with good knowledge oftheir own markets’ requirements.
No clearly defined boundary between the residentialand commercial segments.
CHARACTERISTICS OF THE EMEA DIVISION
Bo Dankis, President and CEO of ASSA ABLOY and head of EMEA division.

Report on the year2004 saw good demand for ASSA ABLOY’s products.Growth was strongest in the residential segment in Scandi-navia and the Benelux countries. There was also gooddemand in the Do-It-Yourself segment, but growth in thecommercial segment was rather lower this year. The weakUS dollar and rising material prices had a negative effect onsome of the division’s regions during the year. However,ASSA ABLOY was able to compensate for the higher mat-erial prices by means of higher prices for its own products.
ScandinaviaIn Scandinavia, the residential segment made strongadvances in 2004 after a weak 2003. Intensified marketingand increased discussion in the media about how best toprotect the home contributed to rising sales. Developmentin the commercial market was less strong, but increasedfocus on higher security meant that sales still showed somegrowth. There was also growing demand from door andwindow manufacturers for ASSA ABLOY’s products. Toshorten lead-times in delivering to customers, the Grouphas expanded its assembly capacity in Denmark while mov-ing component manufacture to Sweden.
FinlandIn Finland, growth took off in the latter part of 2004 andthe business also improved its margins. Abloy invested inthe aftermarket, which gave stability to its operations.Abloy also increased its export share, especially in the high-security segment, thanks in past to the launch of the newAbloy PROTEC lock cylinder.
25
0
100
200
300
400
Q4Q3Q2Q1Q4Q3Q2Q10
25
50
75
100
Sales, EUR M
EBITA, EUR M
2003 2004
EUR M EUR M
SALES / EBITA
0
200
400
600
800
1,000
1,200
Q4Q3Q2Q1Q4Q3Q2Q10
5
10
15
20
25
30
Capital employed, EUR M
Return on capital employed, %Return on capital employed before goodwill amortization, %
2003 2004
EUR M %
CAPITAL EMPLOYED /RETURN ON CAPITAL EMPLOYED
0
10
20
30
40
50
60
70
Q4Q3Q2Q1Q4Q3Q2Q1
EBITA, EUR MCash flow, EUR M
2003 2004
EUR M
EBITA / CASH FLOW
Division EMEA, Key figures
2004 2003 2004 2003Income statement SEK M SEK M EUR M EUR M
Sales, external 10,747 9,858 1,179 1,081
Sales, internal 284 318 31 35
Sales 11,031 10,176 1,210 1,116
Organic growth 3% –1% 3% –1%
Operating income beforegoodwill amortization (EBITA)1 1,650 1,359 181 149
Operating margin beforegoodwill amortization (EBITA)1 15.0% 13.4% 15.0% 13.4%
Goodwill amortization –358 –338 –39 –37
Operating income (EBIT)1 1,292 1,021 142 112
Operating margin (EBIT)1 11.7% 10.1% 11.7% 10.1%
Capital employed
Capital employed 9,204 8,519 1,020 939
– of which goodwill 4,748 4,728 526 521
Return on capital employed 1 13.5% 10.6% 13.5% 10.6%
Return on capital employedbefore goodwill amortization1 17.2% 14.2% 17.2% 14.2%
Cash flow
Operating income beforegoodwill amortization (EBITA)1 1,650 1,359 181 149
Depreciation (excluding goodwill amortization) 500 505 55 55
Net capital expenditure –340 –357 –37 –39
Change in working capital 16 66 2 7
Cash flow 2 1,826 1,573 201 172
Average number of employees 12,774 12,481 12,774 12,4811 Excluding non-recurring items.2 Excluding restructuring payments.
FranceFrance achieved good growth during the year. Residentialnew construction increased. Electromechanical solutionsare beginning to take market share from the traditionalmechanical lock market.
Germany and SwitzerlandThe German and Swiss markets are showing signs of newgrowth after several years of weakness. As part of theLeverage & Growth program, ASSA ABLOY carried out a major reorganization in Germany during the year. Thenumber of units was reduced from seven to two. The re-organization has improved ASSA ABLOY’s positioning on the market.
United KingdomMost of the Group’s business in the United Kingdom lies inrelatively simple lock products – a segment with many play-ers and price pressure. This business lost some market shareduring the year, and some production was moved to coun-tries with lower production costs, resulting in redundanciesin Britain. The Group also reorganized the companies serv-ing the residential segment and invested resources in moreefficient product development. ASSA ABLOY’s business inthe high-security segment showed good development in2004.
ItalyASSA ABLOY’s companies in Italy showed weak sales andpoor profitability. The profitability of export sales – tradi-tionally important – was hurt by worsening exchange rates.The Italian operations have embarked on a major reorgani-zation involving specialization of units and the movementof some production to low-cost countries. New investmentshave been made, and the Group acquired Corbin in Italy at the start of the year. ASSA ABLOY is working towards
specific goals designed to build up its organization in Italyso as to achieve a critical mass.
BeneluxIn Benelux, integration between companies acquired earlieris progressing well, and synergies between the companies arebecoming apparent. To strengthen ASSA ABLOY’s customeroffering on the market and specifically to boost its position inthe OEM segment for door and window manufacturers,Nemef in the Netherlands was acquired during 2004.
SpainSales on the Spanish market rose in 2004 despite reducedexports. As part of ASSA ABLOY’s strategy to get closer tothe customer, the companies developed specially tailoredsecurity solutions. ASSA ABLOY consolidated its produc-tion companies and sales companies in Spain in 2004 andalso focused on initiatives in the specification segment.
Eastern EuropeASSA ABLOY’s companies in eastern Europe showedstrong growth during the year. The Group is investing inmanufacturing units in the low-cost countries of easternEurope such as Romania and the Czech Republic, both forproduction itself and for the development of new products.Ongoing investment in skills development has resulted inASSA ABLOY now having some 70 locally employedgraduate engineers in Romania. The availability of a well-qualified workforce and high levels of efficiency mean thatthe east European plants have good future expansioncapacity.
Middle EastAfter two years of reduced demand, Mul-T-Lock hasincreased its market shares on the Israeli market and haslaunched a number of new products.
Division EMEA
26
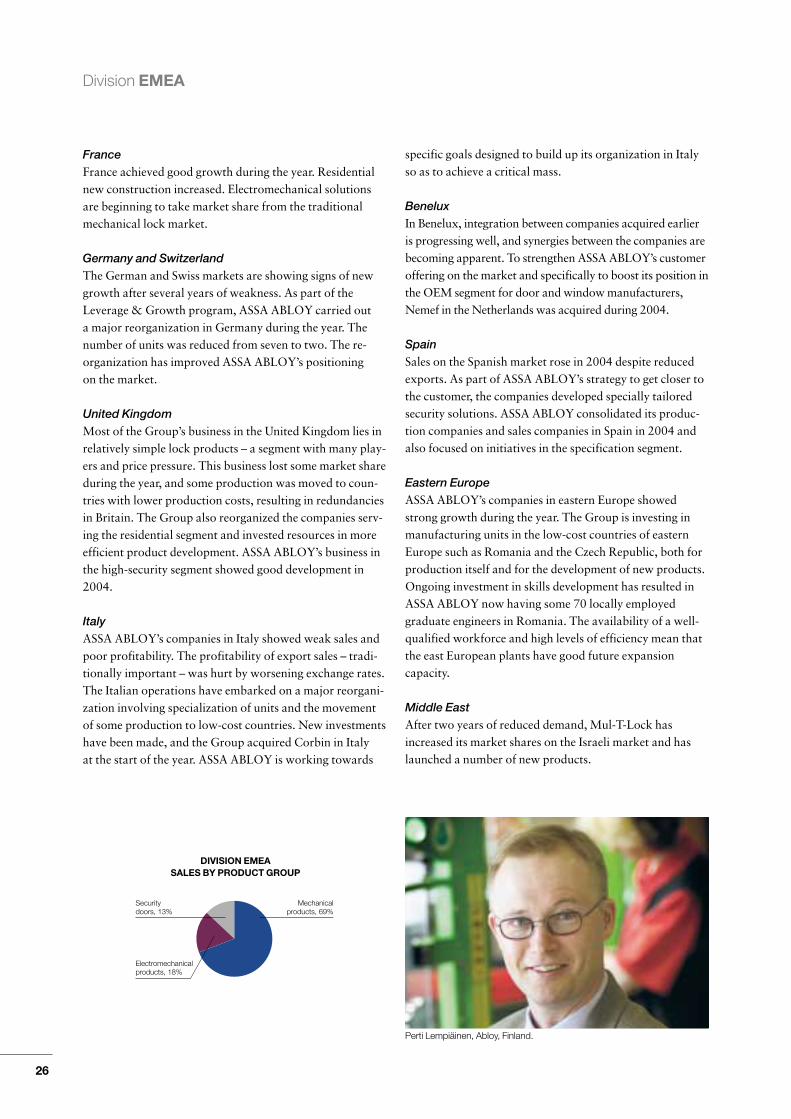
Mechanical products, 69%
Electromechanical products, 18%
Security doors, 13%
DIVISION EMEASALES BY PRODUCT GROUP
Perti Lempiäinen, Abloy, Finland.
Division EMEA
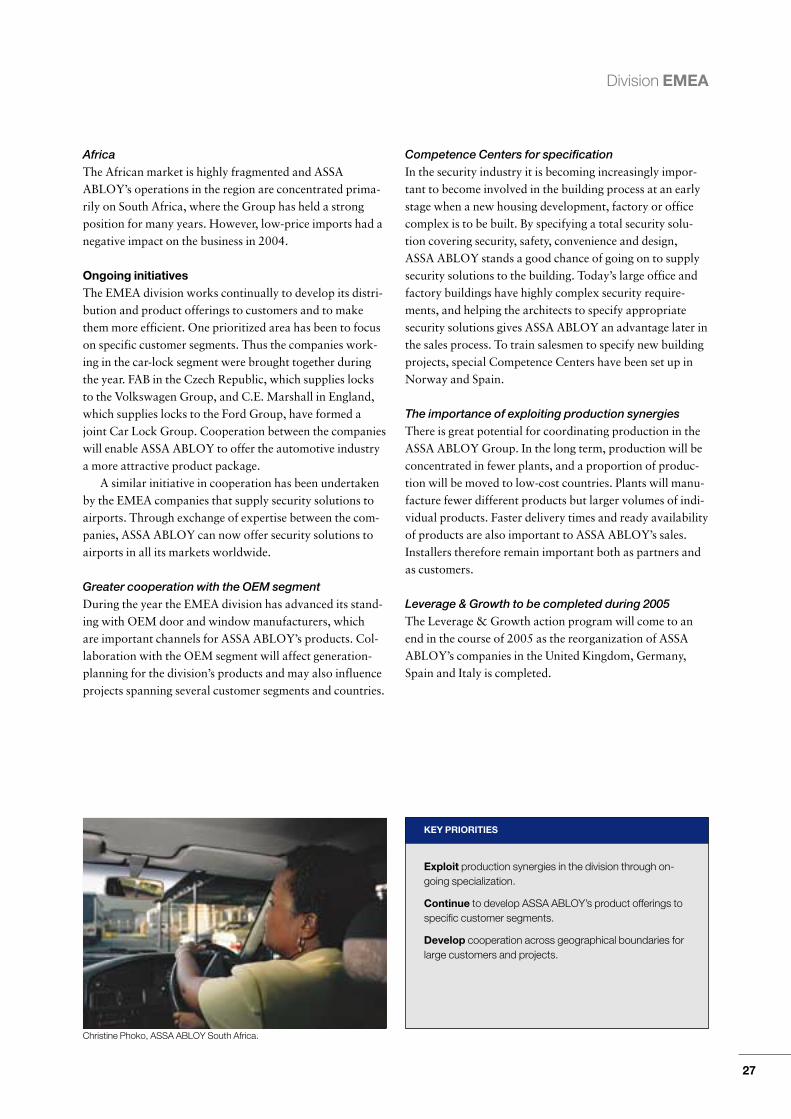
AfricaThe African market is highly fragmented and ASSAABLOY’s operations in the region are concentrated prima-rily on South Africa, where the Group has held a strongposition for many years. However, low-price imports had anegative impact on the business in 2004.
Ongoing initiativesThe EMEA division works continually to develop its distri-bution and product offerings to customers and to makethem more efficient. One prioritized area has been to focuson specific customer segments. Thus the companies work-ing in the car-lock segment were brought together duringthe year. FAB in the Czech Republic, which supplies locksto the Volkswagen Group, and C.E. Marshall in England,which supplies locks to the Ford Group, have formed ajoint Car Lock Group. Cooperation between the companieswill enable ASSA ABLOY to offer the automotive industrya more attractive product package.
A similar initiative in cooperation has been undertakenby the EMEA companies that supply security solutions toairports. Through exchange of expertise between the com-panies, ASSA ABLOY can now offer security solutions toairports in all its markets worldwide.
Greater cooperation with the OEM segmentDuring the year the EMEA division has advanced its stand-ing with OEM door and window manufacturers, which are important channels for ASSA ABLOY’s products. Col-laboration with the OEM segment will affect generation-planning for the division’s products and may also influenceprojects spanning several customer segments and countries.
Competence Centers for specificationIn the security industry it is becoming increasingly impor-tant to become involved in the building process at an earlystage when a new housing development, factory or officecomplex is to be built. By specifying a total security solu-tion covering security, safety, convenience and design,ASSA ABLOY stands a good chance of going on to supplysecurity solutions to the building. Today’s large office andfactory buildings have highly complex security require-ments, and helping the architects to specify appropriatesecurity solutions gives ASSA ABLOY an advantage later inthe sales process. To train salesmen to specify new buildingprojects, special Competence Centers have been set up inNorway and Spain.
The importance of exploiting production synergiesThere is great potential for coordinating production in theASSA ABLOY Group. In the long term, production will beconcentrated in fewer plants, and a proportion of produc-tion will be moved to low-cost countries. Plants will manu-facture fewer different products but larger volumes of indi-vidual products. Faster delivery times and ready availabilityof products are also important to ASSA ABLOY’s sales.Installers therefore remain important both as partners andas customers.
Leverage & Growth to be completed during 2005The Leverage & Growth action program will come to anend in the course of 2005 as the reorganization of ASSAABLOY’s companies in the United Kingdom, Germany,Spain and Italy is completed.
27
Exploit production synergies in the division through on-going specialization.
Continue to develop ASSA ABLOY’s product offerings tospecific customer segments.
Develop cooperation across geographical boundaries forlarge customers and projects.
KEY PRIORITIES
Christine Phoko, ASSA ABLOY South Africa.

The Americas division comprises companies in North,Central and South America. Americas is ASSA ABLOY’ssecond-largest division and accounts for 32 percent of totalsales. During the year the division had an organic growth of6 percent and an EBITA margin of 17.6 percent. The divi-sion is subdivided into product and channel focused groupsin the USA and into geographical regions elsewhere. Itshead office is in New Haven, Connecticut, USA. Americasdivision has 22 production units, 12 sales companies andabout 9,800 employees. Among the major companies in thedivision are Corbin Russwin, Curries, Emtek, Phillips and Sargent.
Report on the yearThe economic climate in the division’s markets was gener-ally more favorable in 2004 than in 2003, resulting in goodgrowth in both non-residential and residential segments.The Door Group and the Residential Group reportedimproved sales during the year, and the Door Group hascontinued to develop positively despite higher material
costs. The Architectural Hardware Group has alsoimproved its margins through continuing focus on imple-menting Lean operations. The division’s EBITA margin roseby 110 basis points during the year as a consequence ofcontinuous improvement efforts, the Leverage & Growthaction program and better market conditions. Significantincreases in material prices, primarily due to the global steelmarket situation, had some negative effect, but the divisionwas able to offset the impact through operational efficien-cies and price increases to the market.
Clear distinction between market segmentsThe North American market differs from the Europeanmarket in having a clear distinction between productsintended for the non-residential segment and productsintended for the residential segment. The commercial seg-ment accounts for a very large percentage of the division’ssales. Due to the segment and channel distinctions, only afew of the division’s products are suitable for both officeand home applications.
Division Americas
Growing with increased margins
28
A clear majority of the division’s sales comes from thenon-residential segment.
There is a significant differentiation between products andchannels for the institutional and commercial segment andproducts for the residential segment.
Doors and door frames are major components of solu-tions offered to the non-residential segment in the USA.
CHARACTERISTICS OF THE AMERICAS DIVISION
Thanasis Molokotos, Executive Vice President of ASSA ABLOY and head of Americas division.

The non-residential segmentThe non-residential segment consists primarily of publicbuildings, offices, schools and hospitals. Security and safetyStandards for these environments are much more demand-ing than for typical residential applications; consequently,product functionality, quality and prices are all significantlyhigher. Growth in the commercial segment recovered thisyear after being weak for a number of years.
Products sold to the non-residential segment includedoors and door frames from the Door Group; door fittings,handles, locks etc. from the Architectural Hardware Groupand the Electromechanical Group; and high-security prod-ucts from the High Security and Aftermarket Group.
Emtek continues the positive trendIn the residential segment, Emtek continued to show stronggrowth and rising margins. The company, based in Califor-nia, focuses on high-end residential products.
Actions under the Leverage & Growth programThe division’s operations have been rationalized by thedivestment of its two companies specializing in the deten-tion segment – Folger Adam Security and Trussbilt. Theirproducts did not fit ASSA ABLOY’s core business, and thecompanies were underperforming on sales and margins.Other companies included under the Leverage & Growthaction program have improved their sales and margins.
29
0
50
100
150
200
250
300
Q4Q3Q2Q1Q4Q3Q2Q10
10
20
30
40
50
60
2003 2004
Sales, USD M
USD M USD M
EBITA, USD M
SALES / EBITA
0
250
500
750
1,000
1,250
Q4Q3Q2Q1Q4Q3Q2Q10
10
20
30
40
50
2003 2004
Capital employed, USD M
Return on capital employed, %Return on capital employed before goodwill amortization, %
USD M %
CAPITAL EMPLOYED /RETURN ON CAPITAL EMPLOYED
0
10
20
30
40
50
60
70
Q4Q3Q2Q1Q4Q3Q2Q1
2003 2004
EBITA, USD MCash flow, USD M
USD M
EBITA / CASH FLOW
Division Americas, Key figures
2004 2003 2004 2003Income statement SEK M SEK M USD M USD M
Sales, external 8,242 8,625 1,125 1,069
Sales, internal 28 32 4 4
Sales 8,270 8,657 1,129 1,073
Organic growth 6% –2% 6% –2%
Operating income beforegoodwill amortization (EBITA)1 1,452 1,428 198 176
Operating margin beforegoodwill amortization (EBITA)1 17.6% 16.5% 17.6% 16.5%
Goodwill amortization –314 –331 –43 –41
Operating income (EBIT)1 1,138 1,097 155 135
Operating margin (EBIT)1 13.8% 12.6% 13.8% 12.6%
Capital employed
Capital employed 7,049 7,528 1,066 1,046
– of which goodwill 4,332 5,010 655 696
Return on capital employed 1 14.6% 12.4% 14.6% 12.4%
Return on capital employedbefore goodwill amortization 1 18.7% 16.2% 18.7% 16.2%
Cash flow
Operating income beforegoodwill amortization (EBITA)1 1,452 1,428 198 176
Depreciation (excluding goodwillamortization) 227 250 31 31
Net capital expenditure –195 –212 –27 –26
Change in working capital –72 61 –10 8
Cash flow2 1,412 1,527 192 189
Average number of employees 9,767 10,091 9,767 10,0911 Excluding non-recurring items.2 Excluding restructuring payments.

MexicoContinued efforts have been made by ASSA ABLOY’s com-panies in Mexico to improve the division’s market position.Implementation of Lean manufacturing principles, cross-learning with other companies and participation in Groupprocurement practices have helped to improve overall per-formance.
Tesa Mexico has built a new plant in Guadalajara,which started production in September 2004. The plant has significantly increased manufacturing capacity and efficiency. Production was previously split among eight different buildings but has now been concentrated in onebuilding laid out for one-piece-flow Lean operations.
The plant supplies products to both the domestic and export markets. Among its exports are Yale-brandedproducts for the US residential market and products andcomponents for other Group companies in the USA, wherestrategically beneficial.
CanadaASSA ABLOY’s Canadian operations have achievedgrowth during the year despite low non-residential growthin the marketplace. All but one, Fleming Door, are sales and service companies. The sales companies have been neg-atively impacted by the weak US dollar.
South AmericaASSA ABLOY’s companies in South America have grownwith increased margins during 2004. The Brazilian market,which accounts for a relatively small percentage of the divi-sion’s sales, has undergone significant improvements. LaFonte has been restructured, with a new management, new organization, cost reductions and more efficientadministrative functions. Its success is also due in part tosubstantial collaboration with many companies across theAmericas division. By working together on the develop-ment of new products, the companies offer more attractivesecurity solutions on their own local markets.
Ongoing initiativesSpecification skills increasingly importantThe division is expanding its knowledge of the various cus-tomer categories. Different types of buildings require differ-ent solutions. The development of specification skills is animportant initiative in the Americas division. Modernsafety and security Standards are complex, and new build-ing regulations constantly appear. Helping architects tosolve their safety and security requirements during thedesign and planning phases of a building project can oftenlead on directly to good sales.
Division Americas
30
Mechanical products, 51%
Electromechanical products, 9%
Securitydoors, 40%
DIVISION AMERICASSALES BY PRODUCT GROUP
Joaquim Chaves, La Fonte, Brazil.

Division Americas
Education of ASSA ABLOY’s distributorsDistributors are an essential part of the Americas division’smarketing strategy. Educational support to ASSA ABLOY’sdistributors as well as end-users will help bring the impor-tance of integrated solutions to the forefront.
Implementation of Lean business principles and profit centersIn the USA the Door Group and the Architectural Hard-ware Group have accelerated the implementation in allmajor companies of new, more cost-efficient productionmethods (Lean operations) and a profit-center organiza-tion. These efforts focus on improved production-line effi-ciency to create a better product flow; lower administrativecosts; clearer accountability; and streamlined decision-making – all of which result in greater speed to market andpromote effective innovation. Each profit center focuses onone line of products or one market segment, which againproduces a clearer division of responsibilities and moreeffective interaction with the market and the sales force.
Purchasing Council teamAnother important objective for the Americas division is tofurther leverage the Group’s procurement synergies. A Pur-chasing Council team coordinates pricing negotiations withsuppliers to the division. In 2004 this proved extremelyimportant in finding an efficient way to handle increasedmaterial prices.
Offering complete solutionsThe division is working towards offering customers morecomplete solutions to their safety and security problemsand hence providing greater added value. Achieving thiscalls for precise knowledge of the true needs of both theinstaller and the end-user. ElectroLynx™ – a new system of pre-wiring doors and frames to simplify installation ofelectromechanical locks and other hardware – is one suchsolution. Another is the LiteGuide™ system, which assistsemergency evacuation of buildings by clearly illuminatingthe egress door opening by means of illuminated doorframes and door and hardware components.
31
Implement Lean operations in all units.
Collaborate more closely with distribution channels andend-users to invest further in coordinated marketing initiatives that will sell products and solutions.
Innovate end-user-specific integrated solutions.
Educate the marketplace on the importance of high-security and life-safety solutions.
KEY PRIORITIES
Sylvia Romero, Emtek, USA.
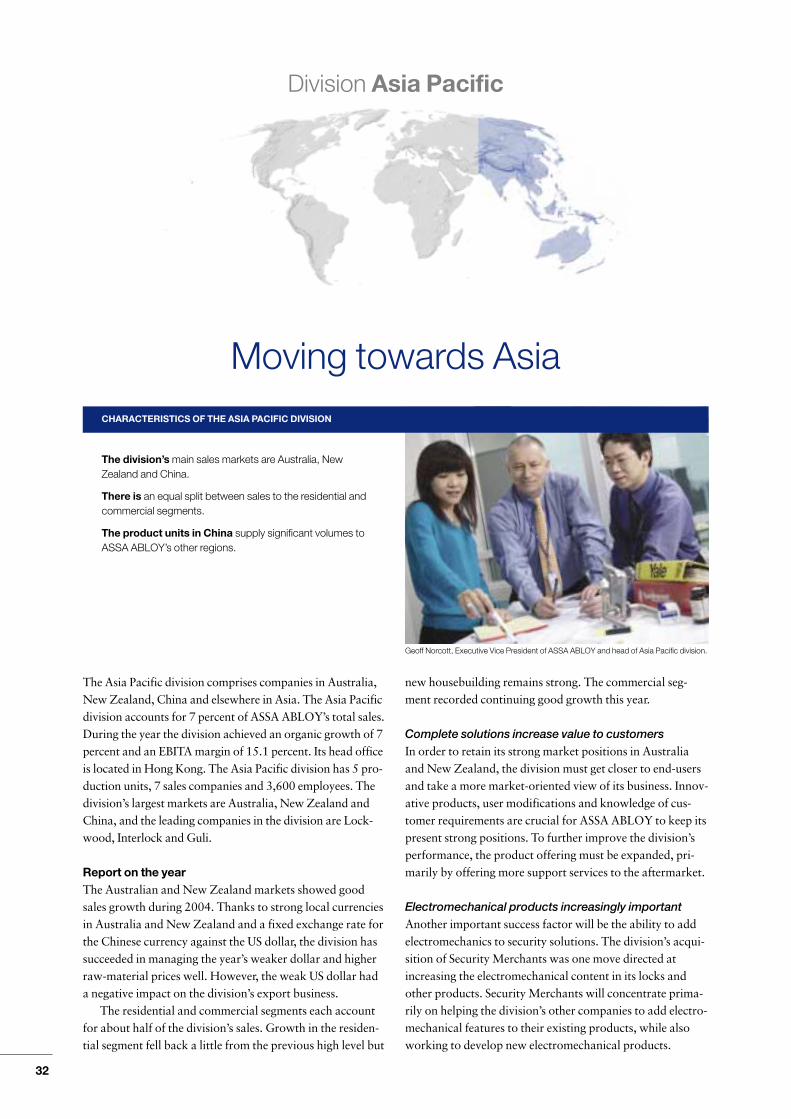
The Asia Pacific division comprises companies in Australia,New Zealand, China and elsewhere in Asia. The Asia Pacificdivision accounts for 7 percent of ASSA ABLOY’s total sales.During the year the division achieved an organic growth of 7percent and an EBITA margin of 15.1 percent. Its head officeis located in Hong Kong. The Asia Pacific division has 5 pro-duction units, 7 sales companies and 3,600 employees. Thedivision’s largest markets are Australia, New Zealand andChina, and the leading companies in the division are Lock-wood, Interlock and Guli.
Report on the yearThe Australian and New Zealand markets showed goodsales growth during 2004. Thanks to strong local currenciesin Australia and New Zealand and a fixed exchange rate forthe Chinese currency against the US dollar, the division hassucceeded in managing the year’s weaker dollar and higherraw-material prices well. However, the weak US dollar hada negative impact on the division’s export business.
The residential and commercial segments each accountfor about half of the division’s sales. Growth in the residen-tial segment fell back a little from the previous high level but
new housebuilding remains strong. The commercial seg-ment recorded continuing good growth this year.
Complete solutions increase value to customersIn order to retain its strong market positions in Australiaand New Zealand, the division must get closer to end-usersand take a more market-oriented view of its business. Innov-ative products, user modifications and knowledge of cus-tomer requirements are crucial for ASSA ABLOY to keep itspresent strong positions. To further improve the division’sperformance, the product offering must be expanded, pri-marily by offering more support services to the aftermarket.
Electromechanical products increasingly importantAnother important success factor will be the ability to addelectromechanics to security solutions. The division’s acqui-sition of Security Merchants was one move directed atincreasing the electromechanical content in its locks andother products. Security Merchants will concentrate prima-rily on helping the division’s other companies to add electro-mechanical features to their existing products, while alsoworking to develop new electromechanical products.
Division Asia Pacific
Moving towards Asia
32
The division’s main sales markets are Australia, NewZealand and China.
There is an equal split between sales to the residential andcommercial segments.
The product units in China supply significant volumes toASSA ABLOY’s other regions.
CHARACTERISTICS OF THE ASIA PACIFIC DIVISION
Geoff Norcott, Executive Vice President of ASSA ABLOY and head of Asia Pacific division.

A significant new product developed for the matureAustralian and New Zealand markets is Nexion. This is aremote-control security system that allows householders toopen the door of the house with a remote device. Later itwill be possible to link it into the home’s alarm system. Nex-ion has just been launched on the Australian market and hasbeen very well received by both customers and distributors.
Increased sales to the OEM segmentInterlock in New Zealand produces security fittings for resi-dential doors and windows. Most of Interlock’s business iswith Original Equipment Manufacturers (OEMs), and thisbusiness in particular was impacted by the weak US dollarin 2004. In order to serve this market better and to reducetransport costs, production will be relocated to China andthe USA in 2005.
Correct specification leads to higher salesThe specification market is growing, and it is essential thatthe Asia Pacific division increases its efforts to train capablespecifiers in accordance with ASSA ABLOY’s overall strat-egy. The ability to support architects by specifying a build-ing with the relevant security standards can very often leaddirectly to successful sales. Lockwood in Australia has ahigh level of specification expertise which is being used totrain more specifiers in the division. One current specifica-tion project is ASSA ABLOY’s support for the organizers ofthe 2008 Beijing Olympics to ensure world-class securitystandards for the buildings there.
33
0
25
50
75
100
Q4Q3Q2Q1Q4Q3Q2Q10
5
10
15
20
2003 2004
Sales, AUD M
AUD M AUD M
EBITA, AUD M
SALES / EBITA
0
100
200
300
400
Q4Q3Q2Q1Q4Q3Q2Q10
10
20
30
40
2003 2004
Capital employed, AUD M
Return on capital employed, %Return on capital employed before goodwill amortization, %
AUD M %
CAPITAL EMPLOYED /RETURN ON CAPITAL EMPLOYED
0
5
10
15
20
Q4Q3Q2Q1Q4Q3Q2Q1
2003 2004
EBITA, AUD MCash flow, AUD M
AUD M
EBITA / CASH FLOW
Division Asia Pacific, Key figures
2004 2003 2004 2003Income statement SEK M SEK M AUD M AUD M
Sales, external 1,726 1,506 320 288
Sales, internal 121 109 23 21
Sales 1,847 1,615 343 309
Organic growth 7% 5% 7% 5%
Operating income beforegoodwill amortization (EBITA)1 278 240 52 46
Operating margin beforegoodwill amortization (EBITA)1 15.1% 14.9% 15.1% 14.9%
Goodwill amortization –57 –52 –11 –10
Operating income (EBIT)1 221 188 41 36
Operating margin (EBIT)1 11.9% 11.8% 11.9% 11.8%
Capital employed
Capital employed 1,620 1,513 314 280
– of which goodwill 864 839 168 155
Return on capital employed 1 12.3% 11.8% 12.3% 11.8%
Return on capital employedbefore goodwill amortization 1 15.5% 15.1% 15.5% 15.1%
Cash flow
Operating income beforegoodwill amortization (EBITA)1 278 240 52 46
Depreciation (excluding goodwillamortization) 62 56 12 11
Net capital expenditure –29 –53 –5 –10
Change in working capital –43 –28 –8 –5
Cash flow 2 268 215 51 42
Average number of employees 3,629 3,507 3,629 3,5071 Excluding non-recurring items.2 Excluding restructuring payments.

ChinaThe Chinese market has generated strong growth for severalyears, but today accounts for a relatively small proportionof the Asia Pacific division’s total sales. In 2004 the pace ofgrowth slowed in response to the efforts of China’s politicalleaders to temper overheating of the economy. Despite thisslowing, the residential segment grew by some 15 percentand the commercial segment by some 10 percent during theyear.
Concentrate on the mass-market segmentThe segment for high-end products is still relatively small inChina, and the division does not therefore envisage makingmajor marketing efforts in this segment at present. ASSAABLOY will concentrate primarily on products for themass-market segment, although some of the Group’s spe-cialized companies aim to develop the high-end segment.The Group’s largest company in China is Guli, which is nowfocusing primarily on producing goods for ASSA ABLOY’sother markets and supplying products to Group companiesthroughout the world.
New plant near ShanghaiTogether with Global Technologies division, Asia Pacificdivision is building a plant in Suzhou, west of Shanghai. Theplant will manufacture automatic-door products for Besaminternationally while also supplying electromechanicalproducts for the Asia Pacific division’s local markets. Theplant will start deliveries early in 2005.
Other Asian marketsASSA ABLOY’s companies in Asian markets other thanChina achieved higher earnings in 2004 than in 2003. TheAsia Pacific division has mainly sales companies in thesecountries. These businesses are showing growth and will bedeveloped in future years. Market shares in Asian marketsoutside China are still generally small. One major projectduring the year was the sale of a comprehensive securitysolution to the newly opened Hong Kong Disneyland.
Actions under the Leverage & Growth programThe aim of the Leverage & Growth action program in theAsia Pacific division has been to consolidate production andto transfer parts of manufacturing to low-cost countries.The division contained one underperforming company thatwas affected by the action program and has been reorgan-ized; it is now showing higher sales and better margins.
Acquisition in South KoreaIn February 2005 ASSA ABLOY completed the acquisitionof BEST Metaline in South Korea. The company specializesin lock and door fittings and automatic doors, and also hasa strong position in specifying customized hardware toarchitects and construction companies. The acquisition ofBEST Metaline strengthens ASSA ABLOY’s position innorth east Asia.
Division Asia Pacific
34
Mechanical products, 64%
Electromechanical products, 10%
Securitydoors, 26%
DIVISION ASIA PACIFICSALES BY PRODUCT GROUP
Wiek Cuppen, Lockwood, Australia.

Division Asia Pacific
Ongoing initiativesTransfer of production to low-cost countriesIn 2005 the division will transfer parts of ASSA ABLOY’sproduction units from Australia and New Zealand toChina. Assembly and completion of products and customermodifications will remain in Australia and New Zealand, aswill manufacture of newly developed products such as Nex-ion. As production gradually moves away from the divi-sion’s largest markets, the companies in Australia and NewZealand will concentrate on sales and marketing of Groupproducts. Active promotion of ASSA ABLOY’s brands willbe crucial to success in these mature markets.
Developing solutions for the end-userThe companies within the Asia Pacific division sell most oftheir products to distributors, and ASSA ABLOY has greatlyincreased the development of complete security solutions tothe end-user. Innovation and continuing product develop-ment are essential if ASSA ABLOY is to maintain an appeal-ing product range.
Electromechanical security products are becoming evermore important. The Asia Pacific division’s product port-folio will be expanded to include more electromechanicalproducts, and electromechanical functionality will be addedto many existing products.
Developing distribution on the Chinese marketThe Asia Pacific division’s highest priority is to develop dis-tribution on the Chinese market. The division’s strategy is to
acquire companies with an established distribution chainand network of contacts that it can build on. In some casesthe local managements and employees will own minorityshareholdings in the companies. This is a departure fromASSA ABLOY’s usual strategy of having wholly ownedGroup companies, but part-ownership and local stakehold-ing are important parts of Chinese business and will help thecompanies to succeed.
Recruitment vital to success Recruitment of competent people for its expansion in Chinais one of the greatest challenges the Asia Pacific divisionfaces. The division is currently training people in its estab-lished Australian and New Zealand markets who will then work in China on project management and companydevelopment.
Sales to Asia’s dynamic markets must increaseIn the longer term the balance between the different marketsserved by the Asia Pacific division will change. At present aclear majority of the division’s sales are to Australia andNew Zealand and considerably less are to Asia. Ultimately,more than half of all sales should be to Asia. Growth in thedivision will come both organically and through acquisi-tions, and most of the division’s acquisitions in future yearswill therefore be in Asia.
35
Innovate in product segments, electromechanicalsolutions and business processes.
Develop and capture benefits from low-cost productionunits.
Complete the restructuring process.
Develop a cross-cultural management team to handleAsian acquisitions.
Increase manufacture of low-cost products for otherdivisions.
KEY PRIORITIES
Stasia Dye, ASSA ABLOY Asia Pacific, New Zealand.

Global Technologies division is the Group’s worldwideorganization dedicated to high-technology products andservices. Global Technologies accounts for 19 percent ofASSA ABLOY’s total sales. During the year the divisionachieved an organic growth of 5 percent and an EBITAmargin of 13.0 percent. Its head office is located in Provi-dence, Rhode Island, USA. Global Technologies divisionhas 10 production units, 41 sales companies and about2,900 employees.
Global Technologies divisionconsists of three business areas:– The Identification Technology Group (ITG), which
accounts for 42 percent of the division’s sales. ITG’s prod-ucts comprise various types of identification technologyfor access control as well as Radio Frequency Identifica-tion (RFID) and smart cards. These are sold under well-known brand names such as HID, Indala, Sokymat andACG.
– Automatic Doors, which accounts for 40 percent of thedivision’s sales. This business area consists of Besam,
which is the world’s leading supplier of automatic doorsolutions.
– ASSA ABLOY Hospitality, which accounts for 18 percentof the division’s sales. This business area consists of hotellocking systems and safes, and serves the hotel, cruise-ship and other lodging markets with leading brands suchas VingCard and Elsafe.
Report on the yearIdentification Technology Group (ITG)During 2004 ITG recorded rising demand and strong salesgrowth in all its product areas. The companies acquired in2003, mainly in Europe, have given ITG a more balancedbusiness than it had before, and a priority in 2004 was tointegrate these earlier acquisitions. Today 40 percent ofITG’s sales are in North America, 40 percent in Europe and20 percent in Asia, Australia and New Zealand. The mar-gins for ITG have improved during the year. The acquiredcompanies, which specialize in Radio-Frequency Identifica-tion (RFID) and smart cards, have been well integrated intothe Group.
Division Global Technologies
Rising demand forIdentification and Automatic Doors
36
The division’s products are sold entirely to the non-residential segment.
The division’s largest markets are North America andEurope.
Three separate business areas: Identification TechnologyGroup (ITG), Automatic Doors and ASSA ABLOYHospitality.
CHARACTERISTICS OF THE GLOBAL TECHNOLOGIES DIVISION
Joseph J. Grillo, Executive Vice President of ASSA ABLOY and head of Global Technologies division.

Demand for ITG products from the access-control mar-ket has been good all year. Growth was especially strong inNorth America.
Strong growth for HIDHID is the world’s largest manufacturer of access-controlreaders and cards for the security market. The company isalso a pioneer of Radio-Frequency Identification (RFID)for authenticating access. HID achieved strong growth onall markets in 2004. The company’s products, such as themulti-application iClass card, combine a variety of tech-nologies with RFID, including magnetic stripes, barcodesand modules with smart chips.
Holograms or ultraviolet inks can be supplied for usersrequiring higher security. HID’s long experience in cardtechnology has also given the company a strong position inthe development of contactless cards, which are now usedfor applications such as secure access, IT signatures anddigital cash. For even greater security such cards can alsostore users’ biometric templates based on fingerprints, irisscans etc.
Product launches during 2004During the year ITG launched its first access control prod-ucts under HID’s new VertX brand. VertX CS is a new classof access control panels specifically designed to manageaccess control from a remote central station. Offering full‘plug and play’ card access-control functionality in anopen-architecture platform, VertX CS is fully scalable fromtwo-door retail installations to large corporate campuses.
The future of electronic passportsSeveral ITG companies are active in the market for elec-tronic passports. The intention is to introduce a moresecure passport than today’s and to improve the authenti-
cating process. The ASSA ABLOY companies in this fieldare already offering a product range that includes both thetransponders and readers for electronic passports. The firstpurchases of these systems are expected in 2005 with signif-icant growth in coming years.
37
0
300
600
900
1,200
1,500
Q4Q3Q2Q1Q4Q3Q2Q10
30
60
90
120
150
180
2003 2004
Sales, SEK M
SEK M SEK M
EBITA, SEK M
SALES / EBITA
0
2,000
4,000
6,000
Q4Q3Q2Q1Q4Q3Q2Q10
10
20
30
2003 2004
Capital employed, SEK M
Return on capital employed, %Return on capital employed before goodwill amortization, %
SEK M %
CAPITAL EMPLOYED /RETURN ON CAPITAL EMPLOYED
0
50
100
150
200
250
300
Q4Q3Q2Q1Q4Q3Q2Q1
2003 2004
EBITA, SEK MCash flow, SEK M
SEK M
EBITA / CASH FLOW
Division Global Technologies, Key figures
2004 2003Income statement SEK M SEK M
Sales, external 4,811 4,093
Sales, internal 100 84
Sales 4,911 4,177
Organic growth 5% 6%
Operating income beforegoodwill amortization (EBITA)1 637 542
Operating margin beforegoodwill amortization (EBITA)1 13.0% 13.0%
Goodwill amortization –249 –238
Operating income (EBIT)1 388 304
Operating margin (EBIT)1 7.9% 7.3%
Capital employed
Capital employed 5,077 5,288
– of which goodwill 4,068 4,189
Return on capital employed 1 7.4% 5.6%
Return on capital employedbefore goodwill amortization 1 12.2% 9.9%
Cash flow
Operating income beforegoodwill amortization (EBITA)1 637 542
Depreciation (excluding goodwillamortization) 95 81
Net capital expenditure –78 –64
Change in working capital –2 –10
Cash flow2 652 549
Average number of employees 2,925 2,5741 Excluding non-recurring items.2 Excluding restructuring payments.

Automatic DoorsBesam constitutes the entire Automatic Doors business ofthe Global Technologies division. In 2004 the companyachieved good growth with further improved margins. Thegrowth of service business was particularly strong in allgeographic markets. Europe is Besam’s largest market andaccounts for some 70 percent of sales. Other markets arethe USA, accounting for 25 percent of sales, and Asia, Australia and New Zealand, which represent 5 percent.
Reorganization on the US marketBesam’s business in the USA has been reorganized, withmanufacturing relocated to the Yale plant at Charlotte inNorth Carolina. This move is now complete and in 2004the production unit achieved major improvements in effi-ciency. As a result of this reorganization, and backed byactive marketing and sales efforts, Besam succeeded duringthe year in reversing the negative trend on the Americanmarket. Against stiff competition, Besam has been success-ful in winning a number of important contracts.
Good growth in EuropeBesam has shown strong growth on a number of its Europeanmarkets especially in the United Kingdom, Spain and centraland eastern Europe. Market growth was driven primarily bypublic investments, the implementation of the Disability Dis-crimination Act in Britain, and expansion programs led bythe international retail chains. Besam was successful insecuring several major contracts, particularly in the retailsegment.
The Swedish production plant in Landskrona accountsfor a major part of the output of Besam’s more complexproducts. The factory was reorganized in 2004 with theaim of reworking production flows so as to improve
efficiency and reduce administration costs. The reorganiza-tion of manufacturing has been a success and the plant isnow achieving more efficient production.
Positive development in Asia PacificAlthough Asian, Australian and New Zealand markets rep-resent a small fraction of Besam’s sales, they achieved satis-factory growth in 2004. To meet expected future demandand benefit from lower production costs, Besam and theAsia Pacific division are building a new production plant inSuzhou, China. This will supply both local and export mar-kets with Besam’s products mainly intended for the lowerend of the market.
Launch of a new brand, EntreMaticEntreMatic is a new brand in the Automatic Doors businessarea. Products carrying this name will build on Besam’sestablished technology and know-how, but will be offeredthrough an indirect channel. EntreMatic will act as a com-plementary brand to reach smaller customers not suited toa direct sales approach.
ASSA ABLOY HospitalityThe weak demand that still prevails in the hotel and travelindustry had a negative effect on ASSA ABLOY Hospital-ity, the division’s business area directed at the hotel andcruise-ship markets. For this reason ASSA ABLOY Hospi-tality was reorganized in 2004, and a new managementteam has been put in place.
VingCard in Norway reorganizedVingCard in Norway was reorganized during 2004 withthe aims of raising efficiency and lowering productioncosts. Employee numbers were cut back because of plant
Division Global Technologies
38
Mechanical products, 11%
Electromechanical products, 88%
Security doors, 1%
DIVISION GLOBAL TECHNOLOGIESSALES BY PRODUCT GROUP
Berrit Laursen, Besam, Sweden.

Division Global Technologies
overcapacity. In addition, parts of VingCard’s productionwill be relocated to low-cost countries. Overall, the restruc-turing of the Hospitality business area will continue in2005 with increased emphasis being placed on the strongVingCard and Elsafe brands.
Acquisition in ChinaASSA ABLOY Hospitality has acquired Kingsgate inChina, which manufactures hotel safes. Kingsgate showedmodest growth for the year with positive margins, and itsacquisition will strengthen the position of the Hospitalitybusiness area on Asian markets.
Ongoing initiativesVast potential for ITGWithin a timeframe of a few years, ITG has the potential toshow strong growth in all segments. This will be achievedin part through organic growth but also through acquisi-tions. In its core area of electronic access control, ITG willsee significant growth from sales of the next generation ofproducts using contactless smart card technology. For HID,VertX and other products based on an open architecturerepresent a major growth opportunity.
Elsewhere, ITG will focus on replicating its success inselling RFID technology for access control by applying thesame fundamental technology to other rapidly growingmarket segments. These include industrial applications andnational identity cards / electronic passports, where RFIDmay be combined with biometrics.
Expanding Automatic Doors byacquisitions and product launchesIn the Automatic Doors business area, Besam will extendits product portfolio through selective acquisitions, either
to expand geographically or to diversify the range of solu-tions offered to its commercial and retail customer base.Besam will also expand its EntreMatic business into newgeographic markets in order to reach smaller customers.New products are being developed to address markets oflow penetration or high growth such as eastern Europeand Asia. Besam will also continue to focus on the higher-margin service business, using key-account management toattract major retail, industrial and commercial customers.
Acquisition in the UKIn February 2005 ASSA ABLOY signed an agreement toacquire Doorman Services. The company supplies, installsand services manual and automatic doors and roller shut-ters throughout the UK and has a strong presence in theretail segment. The acquisition strengthens ASSA ABLOY’sAutomatic Doors business area.
Focus on strong brands in the Hospitality groupThe Hospitality group will focus on its strongest and best-known brands, VingCard and Elsafe. Ongoing restructur-ing will be directed at reducing the costs of manufacturinglocking systems and safes, reducing the overhead structuresof the business, and streamlining logistics and the supplychain. Development in such areas as card activation, RFID-based locks and wireless ‘on-line’ locks will continue, sothat hotel chains and other customers can be offered thelatest technical innovations. Other major initiatives willemphasize key-account management and increasing servicerevenue.
39
Establish a presence in growing RFID markets bydeveloping new products.
Improve efficiency and lower production costs.
Increase service and maintenance business in ASSAABLOY Hospitality and Besam.
Coordinate strategy for key-account management withthe Group’s other divisions to increase sales of all GlobalTechnologies products.
KEY PRIORITIES
David Sullivan, HID EMEA, United Kingdom.
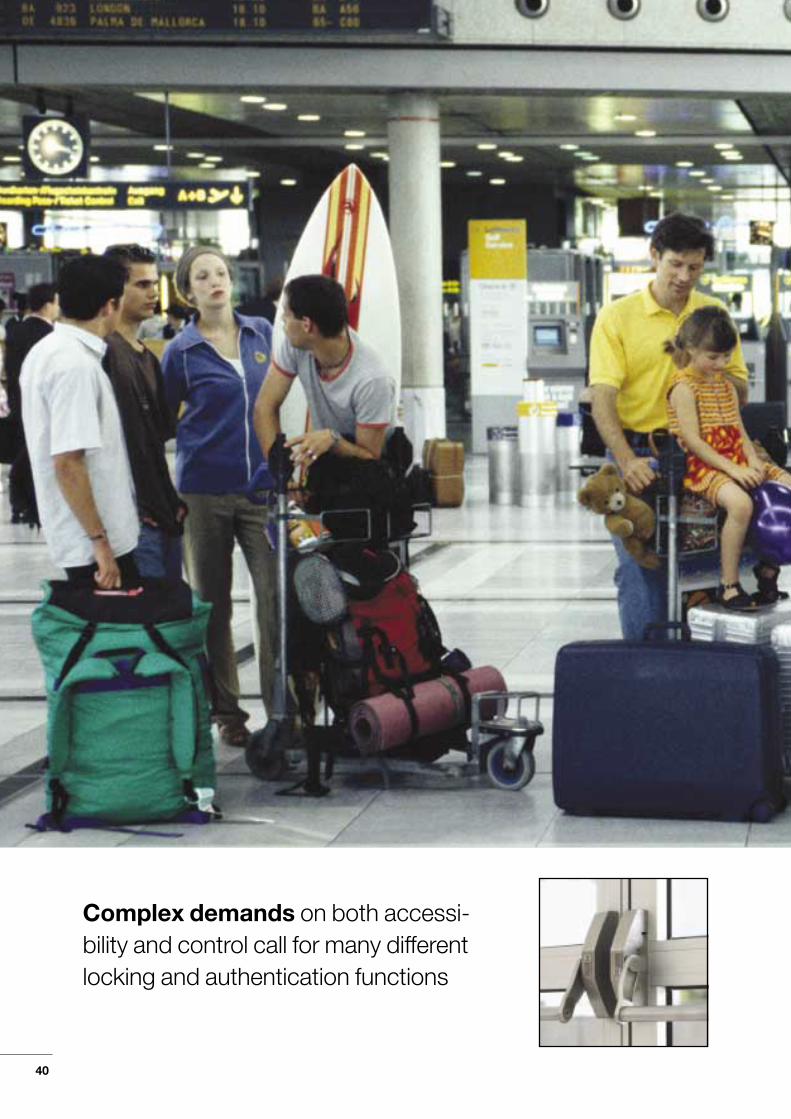
Complex demands on both accessi-bility and control call for many differentlocking and authentication functions
40

Airports Modern airports are divided into multiple
security zones with complex security needs. There are often
thousands of staff with different access authority deter-
mined by their duties. An electronic card system allows
everyone to go just to areas where their job requires.
Airports also have public areas with open access. With
so many people in one place and most unfamiliar with the
site layout, a critical consideration is safety in a security
alert or other emergency. Clearly signed emergency exits
guiding people through just a few doors allow quick, safe
evacuation.
41
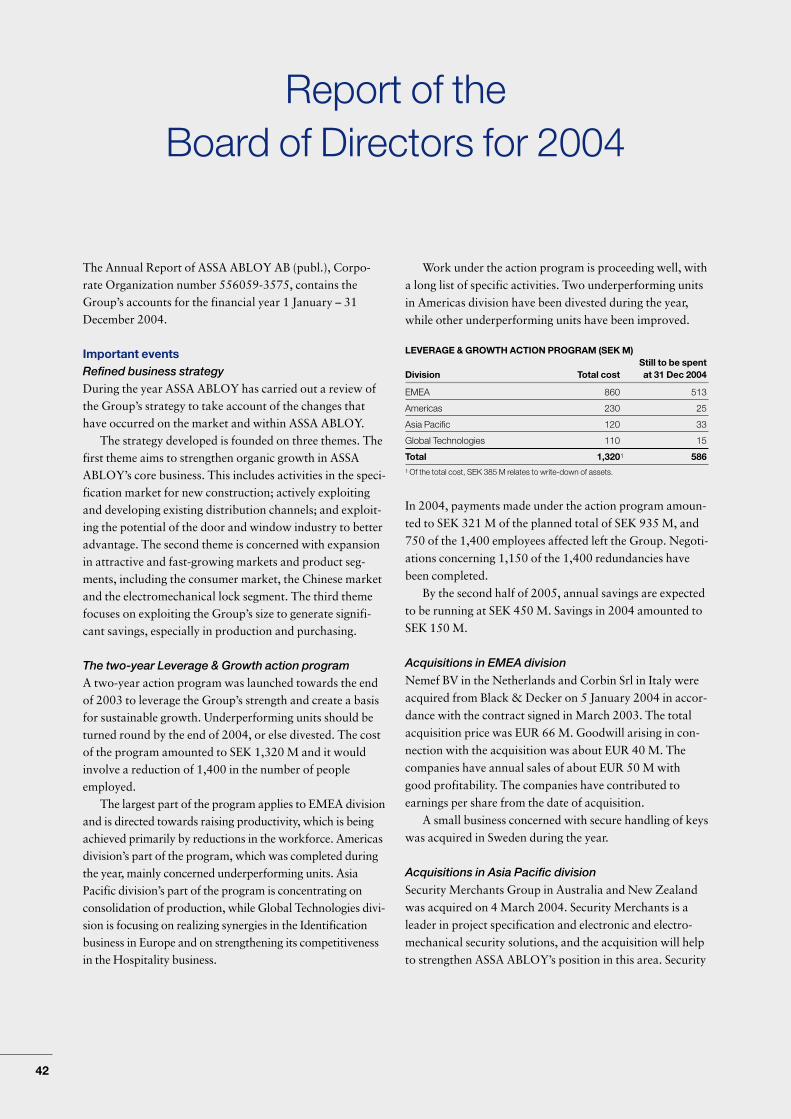
The Annual Report of ASSA ABLOY AB (publ.), Corpo-rate Organization number 556059-3575, contains theGroup’s accounts for the financial year 1 January – 31December 2004.
Important eventsRefined business strategyDuring the year ASSA ABLOY has carried out a review ofthe Group’s strategy to take account of the changes thathave occurred on the market and within ASSA ABLOY.
The strategy developed is founded on three themes. Thefirst theme aims to strengthen organic growth in ASSAABLOY’s core business. This includes activities in the speci-fication market for new construction; actively exploitingand developing existing distribution channels; and exploit-ing the potential of the door and window industry to betteradvantage. The second theme is concerned with expansionin attractive and fast-growing markets and product seg-ments, including the consumer market, the Chinese marketand the electromechanical lock segment. The third themefocuses on exploiting the Group’s size to generate signifi-cant savings, especially in production and purchasing.
The two-year Leverage & Growth action programA two-year action program was launched towards the endof 2003 to leverage the Group’s strength and create a basisfor sustainable growth. Underperforming units should beturned round by the end of 2004, or else divested. The costof the program amounted to SEK 1,320 M and it wouldinvolve a reduction of 1,400 in the number of peopleemployed.
The largest part of the program applies to EMEA divisionand is directed towards raising productivity, which is beingachieved primarily by reductions in the workforce. Americasdivision’s part of the program, which was completed duringthe year, mainly concerned underperforming units. AsiaPacific division’s part of the program is concentrating onconsolidation of production, while Global Technologies divi-sion is focusing on realizing synergies in the Identificationbusiness in Europe and on strengthening its competitivenessin the Hospitality business.
Work under the action program is proceeding well, witha long list of specific activities. Two underperforming unitsin Americas division have been divested during the year,while other underperforming units have been improved.
LEVERAGE & GROWTH ACTION PROGRAM (SEK M)Still to be spent
Division Total cost at 31 Dec 2004
EMEA 860 513
Americas 230 25
Asia Pacific 120 33
Global Technologies 110 15
Total 1,3201 5861 Of the total cost, SEK 385 M relates to write-down of assets.
In 2004, payments made under the action program amoun-ted to SEK 321 M of the planned total of SEK 935 M, and750 of the 1,400 employees affected left the Group. Negoti-ations concerning 1,150 of the 1,400 redundancies havebeen completed.
By the second half of 2005, annual savings are expectedto be running at SEK 450 M. Savings in 2004 amounted toSEK 150 M.
Acquisitions in EMEA division
Nemef BV in the Netherlands and Corbin Srl in Italy wereacquired from Black & Decker on 5 January 2004 in accor-dance with the contract signed in March 2003. The totalacquisition price was EUR 66 M. Goodwill arising in con-nection with the acquisition was about EUR 40 M. Thecompanies have annual sales of about EUR 50 M withgood profitability. The companies have contributed toearnings per share from the date of acquisition.
A small business concerned with secure handling of keyswas acquired in Sweden during the year.
Acquisitions in Asia Pacific division
Security Merchants Group in Australia and New Zealandwas acquired on 4 March 2004. Security Merchants is aleader in project specification and electronic and electro-mechanical security solutions, and the acquisition will helpto strengthen ASSA ABLOY’s position in this area. Security
Report of the Board of Directors for 2004
42

Report of the Board of Directors for 2004
Merchants has annual sales of about AUD 30 M. The com-pany has contributed to earnings per share from the date ofacquisition.
On 13 December 2004 a contract was signed for theacquisition of BEST Metaline, one of South Korea’s leadingcompanies in lock and door fittings. BEST Metaline will addnew products to ASSA ABLOY’s security offering and willstrengthen ASSA ABLOY’s market position in north eastAsia. BEST Metaline’s sales in 2004 totaled around SEK65 M and the company is expected to make a positive con-tribution to earnings per share from the date of acquisition.
Acquisitions by Global Technologies divisionTwo small businesses were acquired during the year. Panijain England works in identification, while Kingsgate inChina manufactures hotel safes.
On 31 January 2005 a contract was signed for theacquisition of Doorman Services, one of the UK’s leadingdoor service companies. The acquisition will broaden ASSAABLOY’s offering in automatic doors. Doorman Services’sales in 2004 totaled around GBP 11 M and the company isexpected to make a positive contribution to earnings pershare from the date of acquisition.
Divestments in Americas divisionOn 24 August 2004 ASSA ABLOY completed the sale ofthe principal operating assets of Folger Adam SecurityDetention to Phelps-Tointon. Folger Adam was part of theacquisition of Intruder Security Group from Williams inAugust 2000. On 20 September 2004 the principal operat-ing assets of Trussbilt Detention were sold to a group ofprivate investors. Trussbilt was part of the acquisition ofUnited Door products in June 2001. Both Folger AdamSecurity Detention and Trussbilt Detention are active inlocks for prisons. The divested businesses have annual salesof about SEK 200 M, and the transactions will have a posi-tive effect on ASSA ABLOY’s operating margin from therespective dates of sale.
Cooperation agreementsDuring the year ASSA ABLOY invested in the Swedishcompany Brighthandle, which develops innovative doorhandles. Collaboration with the American developmentcompany CoreStreet, which is involved in identificationand access control, was also intensified.
Incentive 2004During the year an international incentive program, Incen-tive 2004, was launched, which offers the Group’s employ-ees the opportunity to benefit from growth in the value ofthe ASSA ABLOY share. This is expected to lead to greaterinterest in the Group’s financial performance and tostrengthen employees’ sense of involvement in the Group.Almost 2,000 employees in some 15 countries took part inthe program, which amounts to EUR 100 M and will rununtil June 2009.
FinancingDuring the year ASSA ABLOY renegotiated the conditionsof the company’s back-up facility. The facility amounts toEUR 1,000 M and runs for an initial period of five years.The conditions include no financial covenants and are inde-pendent of ratings. ASSA ABLOY has also repurchasedEMTN loans worth EUR 300 M, out of a total of EUR600 M, with a redemption date of December 2006. Thepurpose is to improve the maturity structure and therebyreduce risk and adjust the loan portfolio to the Group’scurrent requirements.
New dividend policyASSA ABLOY’s Board of Directors decided in 2004 toadopt a new dividend policy under which, in the long term,33–50 percent of earnings after standard tax of 28 percentwill be distributed, but always taking into account ASSAABLOY’s long-term financial requirements. The change toIFRS accounting from 2005 means that the income state-ment will no longer be burdened with amortization ofgoodwill. This permits a significant increase in the dividendpaid.
43

Environmental impactFour of the ASSA ABLOY Group’s subsidiaries in Swedencarry out licensable business activities in accordance withSwedish environmental regulations. The Group’s activitiesliable to license and registration affect the external environ-ment chiefly through the subsidiaries Assa AB, Assa IndustriAB, AB FAS Låsfabrik and FIX AB. The companies operatemachine shops and foundries and associated surface-coatingplants, which have an impact on the external environmentthrough the discharge of water, air and solid waste.
The subsidiaries Assa AB, Assa Industri AB, AB FAS Lås-fabrik and FIX AB are actively addressing environmentalissues, and are certified in accordance with ISO 14001.Most units outside Sweden carry out licensable businessactivities and hold comparable licenses under local legisla-tion.
Legal disputesASSA ABLOY is involved in a number of disputes, butthese require no further disclosure considering the size ofthe disputed amounts, applicable insurance cover, etc.
Accounting principlesFrom 2004 ASSA ABLOY is adopting the Swedish Finan-cial Accounting Standards Council’s Standard RR 29
‘Employee benefits’ in the Group’s accounting. The rulesare based on IAS 19. Pensions and other remuneration afterretirement have previously been reported in accordancewith each country’s local rules. The move to RR 29 had anegative effect of some SEK 815 M on the Group’s share-holders’ equity after deduction for deferred tax. In accor-dance with RR 29, this effect is reported as a correction tothe opening shareholders’ equity on 1 January 2004. Themove itself will have no effect on income or cash flow. Norwill there be any change to the ASSA ABLOY Group’s obli-gations to its employees. In other respects, accounting prin-ciples are unchanged from previous years. The effects of thechange to IFRS in 2005 are described in Note 1.
OutlookOrganic sales growth is expected to continue at a good rate.The operating margin (EBITA) is expected to rise, mainlydue to savings resulting from the restructuring program.Excluding restructuring payments, the strong cash genera-tion is expected to continue. Long term, ASSA ABLOYexpects an increase in security-driven demand. Focus onend-user value and innovation as well as leverage on ASSAABLOY’s strong positions will accelerate growth andincrease profitability.
Report of the Board of Directors for 2004
44

Corporate Governance
ASSA ABLOY’s objective is that its activities should gener-ate good long-term returns for its shareholders and otherstakeholders. An effective scheme of corporate governancefor ASSA ABLOY comprises a number of interacting com-ponents, which are described below.
Ownership ASSA ABLOY’s principal shareholders are Investment ABLatour and SäkI (9.8 percent of the capital and 29.8 percentof the votes) and Melker Schörling and companies (4.0 per-cent of the capital and 11.6 percent of the votes). The num-ber of shareholders at year-end was 30,191. ASSA ABLOY’sshare capital at year-end amounted to SEK 366 M, distrib-uted among 19,175,323 Series A shares and 346,742,711Series B shares. All shares give the holders equal rights to thecompany's assets and earnings. Each Series A share carries10 votes and each Series B share one vote.
Annual General MeetingThe Annual General Meeting must be held within sixmonths of the end of the company’s financial year. Share-holders who are recorded in the share register on the nomi-nated day and who have notified their intention to attendmay take part in the Meeting.
Board of DirectorsThe Board consists of nine members, two employee represen-tatives and two deputy employee representatives. The Boardmeets on not less than four occasions a year, at least one ofwhich is a meeting combined with a visit and an in-depthreview of a country in which the company has operations.During 2004, seven Board meetings were held. The Boarddecides on the Group’s overall strategy and the acquisition ofcompanies and real estate. In addition, the Board is responsi-ble for the organization and administration of the Group inaccordance with the Swedish Companies Act. Working pro-cedures for the Board and instructions for the CEO havebeen set down in written form and are reviewed annually.
The Board has a Remuneration Committee consisting of three people. There is also an Audit Committee, which
consists of four people. The purpose of these committees isto assist the Board in giving deeper and more efficient con-sideration to these matters. The Audit Committee holdsthree meetings a year, one of which forms the annual year-end meeting, held in conjunction with the ordinary Boardmeeting. The Committee’s duties include review of finan-cial policy and control of the company’s financial report-ing, internal reporting and control systems, and legal risks.There is an ongoing dialog with the appointed auditor, whoparticipates in the Audit Committee’s meetings.
The Audit Committee consists of Melker Schörling(Chairman), Gustaf Douglas, Per-Olof Eriksson and LottaLundén. There is also a Nomination Committee with theduties – before each General Meeting – of preparing for theselection of Directors, the setting of Directors’ remunera-tion and associated issues. The Nomination Committeeconsists of Gustaf Douglas (Chairman), Georg Ehrnroothand Melker Schörling, plus two representatives of themajor institutional shareholders. In November 2004Marianne Nilsson of Robur and Staffan Grefbäck ofAlecta were appointed as members of the NominationCommittee prior to the 2005 Annual General Meeting.
Remuneration of Board and ManagementRemuneration of the Board is in accordance with decisionstaken at the Annual General Meeting. There are no separatefees for committee work. The Chairman of the Board and theDirectors receive fees that are decided by the Board withinthe framework of a total sum decided by the Annual GeneralMeeting, which is currently SEK 3.6 M (3.6). The Chairmanand other Directors have no pension benefits or severancepay agreements. The CEO and the employee representativesdo not receive a Director’s fee. Remuneration of the CEOand the Executive Team is determined by the RemunerationCommittee and approved by the Board. The RemunerationCommittee consists of Georg Ehrnrooth (Chairman), MelkerSchörling and Sven-Christer Nilsson. The RemunerationCommittee held three meetings in 2004.
Remuneration of the Executive Team consists of basicsalary, variable salary, other benefits, and pensions. Vari-able salary is based primarily on improvement in operatingincome compared with the previous year in the recipient’sarea of responsibility. Variable salary may also be based onorganic growth. Such variable salary is capped at a maxi-mum of two-thirds of basic salary. The Executive Team alsohas the opportunity to receive variable salary based onimprovement in earnings per share. The maximum pay-ment of SEK 2 M per person applies if earnings per shareincrease by 25 percent compared with the previous year.Half of such variable salary is paid the following year, whilethe other half is retained for four years and grows at thesame rate as the Group’s return on capital employed. Thissecond half is paid only if, at the end of the period, the
45
FIN
ANC
IAL
REPO
RTIN
G
DECENTRALIZED ORGANIZATION
EXTERNAL AU
DITIN
G
OwnersAnnual General
MeetingNomination Committee
Board of DirectorsAudit Committee
Remuneration Committee
Executive ManagementManagement philosophy • Policies and guidelines
Internal control and risk management

person concerned has neither left his job on his own initiativenor been dismissed for breach of contract.
Basic pension arrangements for the CEO and others in theExecutive Team are through participation in the ITP plan orequivalent. In addition, the CEO and certain other senior exec-utives have the right to retire with a pension at the earliest onreaching the age of 60. ASSA ABLOY pays a premium on pen-sions amounting to about 60 percent of basic salary. Assumingservice of at least 15 years, this means that pensions willamount to 70 percent of basic salary at the time of retiring forthose between the ages of 60 and 65, and 50 percent of thissalary after the age of 65 for the remainder of life. The CEO hasa severance payment agreement providing 100 percent of hisbasic salary for 24 months. The payment is made only wherethe company terminates the contract. The CEO is also entitledto reimbursement for any losses resulting from relocation. Oth-ers in the Executive Team are entitled to six months’ notice andreceive a severance payment of 100 percent of their basic salaryfor a maximum of 12 months, which is reduced by any incomefrom employment that may arise.
REMUNERATION AND OTHER BENEFITS PAID TO SENIOR OFFICE-HOLDERS
Salary/ Variable Pension Other SocialSEK M Fee salary costs benefits costs Total
Chairman 1 – – – 0 1
Other Board members 3 – – – 1 4
CEO 6 5 4 0 5 20
Other senior executives (5 people) 15 16 5 0 5 41
Total 25 21 9 0 11 66
Executive Team shareholdings in ASSA ABLOYMembers of the Executive Team hold Series B shares, andhave taken part in the convertible debenture loans 2001/06Series 1-4 and 2004/09 Series 1-4 through purchase of sharesin ASSA ABLOY Incentive 2001 Holding S.A. and ASSAABLOY Incentive 2004 Holding S.A., as detailed in the tablebelow. The shares were purchased at market value in line withthe offers made to employees in 2001 and 2004.
EXECUTIVE TEAM SHAREHOLDINGS IN ASSA ABLOY AT 31 DECEMBER
Incentive Series B shares programs1
2004 2003 2004 2003
Bo Dankis 86,000 86,000 267,550 10,750
Göran Jansson 230,000 351,784 231,200 60,000
Geoff Norcott – – 161,200 60,000
Thanasis Molokotos 25,000 25,000 86,100 55,000
Joseph J. Grillo – – 164,800 32,500
Åke Sund 135,000 175,000 153,400 60,0001 Equivalent number of Series B shares at conversion prices EUR 10.20 – 25.30.
Incentive programsASSA ABLOY is constantly striving to strengthen the moti-vation of its personnel and their involvement in the Group’scontinuing development. Since 1995 there have been severalIncentive programs, which also aim to increase employees’shareholdings in ASSA ABLOY. Over 4,000 employees inmore than 15 countries are taking part in the current Incen-tive programs.
Executive ManagementASSA ABLOY’s business operations are divided into fourdivisions. The Executive Team (Group Management) con-sists of the CEO, the heads of the Group’s divisions, theDeputy CEO (who is also CFO) and an Executive Vice Presi-dent responsible for market and business development. Thecomposition of this group gives a geographical and strategicspread of responsibility designed to ensure short decision-making paths.
Management philosophyASSA ABLOY’s firm conviction is that people make the com-pany. The Group’s management philosophy is based on trust,positive thinking, and respect for local conditions and values.
The four cornerstones of Vision, Realism, Ethics andCourage play a central role in the Group.
Policies and guidelinesThe Group’s most important policies and guidelines concernethics and social responsibility, environmental issues, finan-cial control, the Group’s brands, and communication issues.In 2004 ASSA ABLOY adopted a Code of Conduct thatapplies to the whole Group. The Code, which is based on aset of internationally accepted conventions, defines the val-ues and guidelines that should govern the Group in matterssuch as business ethics, rights and privileges and socialresponsibility.
The environmental policy provides guidance for theGroup’s environmental work and is based on internationalStandards in this field, such as ISO 14001, the UN GlobalCompact and the OECD’s Guidelines.
Common financial, reporting and investment policies setthe frameworks for financial control and monitoring.
Guidelines concerning brands aim to protect and developthe major assets that the Group’s brands represent. TheASSA ABLOY brand is used as an endorsement brandstanding behind the local brands.
ASSA ABLOY’s communication policy aims to treat allinterested parties in the same way; to present importantinformation at the right time and in the right way; to meetlegal requirements and observe relevant stock market rules;and to maintain a high level of ethics.
Corporate Governance
46

Corporate Governance
Internal control and risk managementThe Board has overriding responsibility for an efficient sys-tem of internal control and risk management, while theCEO is responsible for executing internal control and riskmanagement. Risk management includes continually iden-tifying, quantifying and assessing the business risks that thecompany is exposed to.
In the annual budget process, the Executive Team estab-lishes business frameworks while also laying the basis for ahigh degree of decentralization of the Group’s operations.
Internal financial reporting is based on the Group’s vari-ous benchmarking units. Results are monitored againstbudgets and against previous years’ performance. Continu-ous benchmarking among all the Group’s units forms animportant part of the control and monitoring of operations.
For information about financial risks see the section‘Financial risk management’ on page 59.
Decentralized organizationThe Group tries to achieve a simple, ‘flat’ organization inwhich all its businesses are divided into benchmarking unitsincluded in the Group’s four operating divisions. A bench-marking unit may be either a factory or a sales company.The Group currently has more than 70 factories and morethan 80 sales companies.
The local management group for a benchmarking unithas operational responsibility for its earnings, and as a rulereports direct to the management of its division. Thismakes for a ‘flat’ organization with short decision-makingpaths. Examples of central functions are Operations,Shared Technologies and Supply Management – areaswhere there are obvious economies of scale.
The Group’s multinational management is important inensuring understanding of, and sensitivity to, local needs,business procedures and distribution requirements. Theseare vital in achieving success because of the very localnature of the lock industry.
External auditThe Annual General Meeting has appointed Pricewater-houseCoopers as auditors for the period up to the 2006Annual General Meeting. PricewaterhouseCoopers under-
takes the audit of ASSA ABLOY AB, the Group and a sub-stantial majority of its subsidiaries round the world. Theaudit of ASSA ABLOY AB also covers the administrationby the Board of Directors and the CEO.
The audit is carried out in accordance with good audit-ing practice in Sweden. The auditing of annual financialstatements for legal entities outside Sweden is in accor-dance with legal requirements and other applicable regula-tions in the countries concerned and with good auditingpractice as defined by the International Federation ofAccountants (IFAC) for the issue of audit reports for thelegal entities. For remuneration of auditors, see Note 4.
The Group’s accounting and valuation principles com-ply with Sweden’s Annual Accounts Act and the standardsand pronouncements of the Swedish Financial AccountingStandards Council, in accordance with the listing contractof the Stockholm Stock Exchange.
Financial reportingExternal financial information is provided at regular inter-vals via Quarterly Reports issued as press releases, and viathe Annual Report. News and other important informationthat could affect the share price are issued via pressreleases. Coinciding with press releases and the presenta-tion of quarterly and year-end results, telephone confer-ences and meetings with analysts and investors are held. AllReports and press releases are simultaneously published onASSA ABLOY’s website, www.assaabloy.com.
The Swedish Code of Corporate GovernanceThe Swedish Code of Corporate Governance was publishedon 16 December 2004. The Code, which is based on self-regu-lation using the ‘comply or explain’ principle, deals mainlywith the organization and methods of working of a company’sannual general meeting, board of directors and management,and the interaction between the three. The subjects coveredinclude rules for the appointment of the board and auditor, theboard’s responsibility for internal control, processes for settingthe remuneration of the company management, and informa-tion about corporate governance. ASSA ABLOY intends toadopt the Code from 1 July 2005, when the Code is expectedto become part of the rules of the Stockholm Stock Exchange.
47
Executive team
GlobalTechnologies
EMEA Americas Asia Pacific
Benchmarking units
ORGANIZATIONAL STRUCTURE
• Organic growth for comparable units was 5 percent (0). • Operating margin before amortization of goodwill and
excluding non-recurring items (EBITA) was 14.7 percent(13.9).
• Earnings per share excluding non-recurring itemsamounted to SEK 4.05 (3.31).
SalesThe Group’s sales rose in 2004 to SEK 25,526 M (24,080).Exchange-rate effects affected sales negatively by SEK 982 Mcompared with 2003. In local currencies, sales increased by10 percent. Of this, organic growth by comparable unitsaccounted for 5 percent (0), while acquired units made apositive contribution of 5 percent.
CHANGES IN SALES% 2004 2003
Acquired growth 5 5
Organic growth 5 0
Currency effects –4 –10
Total 6 –5
Mechanical locks, lock systems and accessories accountedfor 53 percent (57) of sales. Sales of electromechanical andelectronic locks rose to 27 percent (24). Sales of securitydoors and fittings also increased to 20 percent (19).
SALES BY PRODUCT GROUP% 2004 2003
Mechanical locks, lock systems and accessories 53 57
Electromechanical and electronic locks 27 24
Security doors and fittings 20 19
Cost structureTotal remuneration costs including social costs and pensioncosts amounted to SEK 8,526 M (8,351), which represents33 percent (35) of sales. The average number of employeeswas 29,160 (28,708).
The average number of employees in the Parent Com-pany was 52 (43).
The Group’s material costs totaled SEK 7,213 M(6,527), which represents 28 percent (27) of sales.
Other purchasing costs totaled SEK 5,146 M (4,951),which represents 20 percent (21) of sales.
Depreciation of tangible fixed assets amounted to SEK860 M (861), which represents 3 percent (4) of sales.
Operating incomeOperating income (EBIT) amounted to SEK 2,770 M(1,073). The operating margin was 10.9 percent (4.5).
Depreciation and amortization for the year totaled SEK1,872 M (1,856), of which SEK 978 M (959) representedgoodwill.
Operating income before depreciation and amortization(EBITDA), adjusted for non-recurring items, amounted toSEK 4,642 M (4,249). The corresponding margin was 18.2percent (17.6).
Consolidated operating income before goodwill amorti-zation (EBITA) amounted to SEK 3,748 M (3,352) and wasaffected negatively by exchange-rate effects totaling SEK146 M.
The operating margin before goodwill amortization was14.7 percent (13.9).
Income before taxIncome before tax and non-recurring items totaled SEK2,294 M (1,903). This represents an increase of 21 percentcompared with the previous year, with negative currencyeffects of SEK 78 M. Financial items amounted to SEK–484 M (–497). The improvement is due to reduced netdebt. Profit margin – defined as income before tax and non-recurring items in relation to sales – amounted to 9.0 per-cent (7.9).
The Parent Company’s income before tax amounted toSEK 3,876 M (-439).
TaxThe Group’s tax charge totaled SEK 792 M (556), whichcorresponds to an effective tax rate of 34.5 percent (35.5)after adjusting for non-recurring items and tax pertainingto them.
Earnings per shareEarnings per share excluding non-recurring itemsamounted to SEK 4.05 (3.31). Earnings per share excludinggoodwill and non-recurring items amounted to SEK 6.66(5.89).
Sales and earnings
48

Income statements
GROUP PARENT COMPANY
EUR M1 SEK M SEK M EUR M1 SEK M SEK MNote 2004 2004 2003 2004 2004 2003
Sales 2 2,799 25,526 24,080 – – –
Cost of goods sold –1,661 –15,148 –14,613 – – –
Gross income 1,138 10,378 9,467 – – –
Selling expenses –468 –4,272 –3,957 – – –
Administrative expenses 4 –206 –1,883 –1,679 –36 –331 –234
R&D costs –55 –500 –447 – – –
Other operating income 19 181 180 63 580 202
Other operating expenses –17 –157 –212 – – –
Goodwill amortization 5 –107 –978 –959 – – –
Non-recurring items 7 – – –1,320 – – –
Operating income 3, 6 304 2,770 1,073 27 249 –32
Income from shares and shareholdings in subsidiaries 8 – – – 444 4,044 33
Interest income and similar income items 9 20 186 224 55 506 481
Interest expenses and similar expense items 9 –73 –670 –721 –101 –923 –921
Shares of earnings in associated companies 1 8 7 – – –
Income before tax 252 2,294 583 425 3,876 –439
Tax 10 –87 –792 –556 –1 –7 –
Minority interests –1 –7 –18 – – –
Net income 164 1,495 9 424 3,869 –439
Earnings per share 16
after tax and before conversion, SEK 4.09 0.06
after tax and before conversion, SEK 3.302
after tax and full conversion, SEK 4.05 0.07
after tax and full conversion, SEK 3.312
after tax and full conversion but excluding goodwill, SEK 6.66 5.892
1 Average EUR/SEK rate: 9.12.2 Excluding non-recurring items after tax.
49
ASSA ABLOY is organized into three geographical divi-sions and one product division. The geographical divisions,EMEA (Europe, Middle East and Africa), Americas (Northand South America) and Asia Pacific (Asia, Australia andNew Zealand), consist of a number of local lock companieswhich are active mainly on a local market. The productdivision, Global Technologies, covers Identification, Auto-matic Doors and Hospitality, which all serve a global mar-ket. The column headed ‘Other’ in the table includes com-mon Group functions.
EMEASales totaled EUR 1,210 M (1,116), with organic growth.of 3 percent. Operating income before goodwill amortiza-tion and excluding non-recurring items amounted to EUR181 M (149), with an operating margin (EBITA) of 15.0percent (13.4). Return on capital employed before goodwillamortization amounted to 17.2 percent (14.2). Operatingcash flow before interest paid amounted to EUR 201 M(172).
EMEA made excellent progress this year, which wasmainly due to the two largest market areas, Scandinaviaand France, and in part to improved market conditions.
Eastern Europe and Israel showed strong organicgrowth during the year, while Italy and the United King-dom lost sales volumes, which had a negative impact onresults. The structural changes in the division affectedresults positively. The acquisition of Nemef strengthenedthe division’s position in the Benelux area.
AmericasSales totaled USD 1,129 M (1,073), with organic growth of6 percent. Operating income before goodwill amortizationand excluding non-recurring items amounted to USD 198 M(176), with an operating margin (EBITA) of 17.6 percent(16.5). Return on capital employed before goodwill amorti-zation amounted to 18.7 percent (16.2). Operating cashflow before interest paid amounted to USD 192 M (189).
Good progress in Americas was due in part to improveddemand in the USA, specifically in the important commer-cial segment. Profitability was also improved by the struc-tural measures undertaken and by the divestment of theDetention Group. The Architectural Hardware Group,which represents about 40 percent of Americas’ sales,continued to improve its profitability despite relatively
stable volumes. The Door Group showed strong growth,due in part to a rise in new construction and in part to pricerises resulting from the increased cost of steel. The Residen-tial Group showed strong growth and profitability. SouthAmerica and Mexico also developed well.
Asia PacificSales totaled AUD 343 M (309), with organic growth of 7percent. Operating income before goodwill amortizationand excluding non-recurring items amounted to AUD 52 M(46), with an operating margin (EBITA) of 15.1 percent(14.9). Return on capital employed before goodwill amorti-zation amounted to 15.5 percent (15.1). Operating cashflow before interest paid amounted to AUD 51 M (42).
Australia showed weak positive growth of both vol-umes and margins during the year, while sales volumes inNew Zealand grew strongly. The division’s exports were hitby changes in exchange rates. Development in China andSouth East Asia was strong. The acquisition of SecurityMerchants strengthens the division’s position, chiefly inAustralia and New Zealand.
Global TechnologiesSales totaled SEK 4,911 M (4,177), with organic growth of5 percent. Operating income before goodwill amortizationand excluding non-recurring items amounted to SEK 637 M(542), with an operating margin (EBITA) of 13.0 percent(13.0). Return on capital employed before goodwill amorti-zation amounted to 12.2 percent (9.9). Operating cash flowbefore interest paid amounted to SEK 652 M (549).
Global Technologies is making good progress, withgood development of sales and margins after allowing forthe dilution effects of acquisitions. The Identification busi-ness area developed positively, especially in North America,with strong growth and improved margins. The acquiredunits in Europe developed well.
Automatic Doors achieved gradually increasing salesgrowth during the year in terms of both new sales andservice. Europe and Asia are showing strong advanceswhile North America improved after restructuring meas-ures were implemented. The market for Hospitality fellback this year. Profitability continued to be weak as partsof the business were restructured and a number of manage-ment changes were made.
Comments by Division
50

GlobalEMEA1 Americas2 Asia Pacific3 Technologies4 Other TotalEUR M USD M AUD M SEK M SEK M SEK M
2004 2003 2004 2003 2004 2003 2004 2003 2004 2003 2004 2003
Sales, external 1,179 1,081 1,125 1,069 320 288 4,811 4,093 25,526 24,080
Sales, internal 31 35 4 4 23 21 100 84 –533 –544
Sales 1,210 1,116 1,129 1,073 343 309 4,911 4,177 –533 –544 25,526 24,080
Organic growth 3% –1% 6% –2% 7% 5% 5% 6% 5% 0%
EBITA 5 181 149 198 176 52 46 637 542 –269 –217 3,748 3,352
EBITA / Sales 15.0% 13.4% 17.6% 16.5% 15.1% 14.9% 13.0% 13.0% 14.7% 13.9%
Goodwill amortization –39 –37 –43 –41 –11 –10 –249 –238 –978 –959
Non-recurring items – –94 – –29 – –23 – –110 – –1,320
Operating income (EBIT) 142 18 155 106 41 13 388 194 –269 –217 2,770 1,073
Operating margin (EBIT) 5 11.7% 10.1% 13.8% 12.6% 11.9% 11.8% 7.9% 7.3% 10.9% 9.9%
Capital employed 1,020 939 1,066 1,046 314 280 5,077 5,288 –268 136 22,683 22,984
– of which, goodwill 526 521 655 696 168 155 4,068 4,189 14,012 14,766
Return on capital employed 5 13.5% 10.6% 14.6% 12.4% 12.3% 11.8% 7.4% 5.6% 11.8% 9.6%
Return on capital employed before goodwill amortization 5 17.2% 14.2% 18.7% 16.2% 15.5% 15.1% 12.2% 9.9% 16.0% 13.3%
Assets 1,398 1,295 1,225 1,252 376 345 6,186 6,446 475 758 29,322 29,827
Liabilities 378 356 160 206 62 65 1,109 1,158 12,977 12,928 18,874 19,149
EBITA 5 181 149 198 176 52 46 637 542 –269 –217 3,748 3,352
Depreciation (excluding goodwill) 55 55 31 31 12 11 95 81 10 5 894 897
Investments – acquisitions –49 –50 –36 –42 –13 –11 –104 –87 –24 –9 –894 –952
Investments – disposals 12 11 9 16 8 1 26 23 16 1 244 258
Change in working capital 2 7 –10 8 –8 –5 –2 –10 53 79 –48 168
Cash flow 6 201 172 192 189 51 42 652 549 3,944 3,723
Items not affecting cash flow –16 62 –16 62
Interest paid and received –489 –520 –489 –520
Operating cash flow 6 3,439 3,265
Acquisitions of shares in companies –78 –14 – –78 –18 –13 –62 –267 –13 –37 –917 –1,133
Disposals of shares in companies – – 8 – – – – – – – 62 –
Average number of employees 12,774 12,481 9,767 10,091 3,629 3,507 2,925 2,574 65 55 29,160 28,708
GlobalSEK M EMEA1 Americas2 Asia Pacific3 Technologies4 Other Total
2004 2003 2004 2003 2004 2003 2004 2003 2004 2003 2004 2003
Sales, external 10,747 9,858 8,242 8,625 1,726 1,506 4,811 4,093 25,526 24,080
Sales, internal 284 318 28 32 121 109 100 84 –533 –544
Sales 11,031 10,176 8,270 8,657 1,847 1,615 4,911 4,177 –533 –544 25,526 24,080
Organic growth 3% –1% 6% –2% 7% 5% 5% 6% 5% 0%
EBITA 5 1,650 1,359 1,452 1,428 278 240 637 542 –269 –217 3,748 3,352
EBITA / Sales 15.0% 13.4% 17.6% 16.5% 15.1% 14.9% 13.0% 13.0% 14.7% 13.9%
Goodwill amortization –358 –338 –314 –331 –57 –52 –249 –238 –978 –959
Non-recurring items – –860 – –230 – –120 – –110 – –1,320
Operating income (EBIT) 1,292 161 1,138 867 221 68 388 194 –269 –217 2,770 1,073
Operating margin (EBIT) 5 11.7% 10.1% 13.8% 12.6% 11.9% 11.8% 7.9% 7.3% 10.9% 9.9%
Capital employed 9,204 8,519 7,049 7,528 1,620 1,513 5,077 5,288 –268 136 22,683 22,984
– of which, goodwill 4,748 4,728 4,332 5,010 864 839 4,068 4,189 14,012 14,766
Return on capital employed 5 13.5% 10.6% 14.6% 12.4% 12.3% 11.8% 7.4% 5.6% 11.8% 9.6%
Return on capital employed before goodwill amortization 5 17.2% 14.2% 18.7% 16.2% 15.5% 15.1% 12.2% 9.9% 16.0% 13.3%
Assets 12,616 11,748 8,105 9,010 1,940 1,865 6,186 6,446 475 758 29,322 29,827
Liabilities 3,410 3,230 1,058 1,482 320 351 1,109 1,158 12,977 12,928 18,874 19,149
EBITA 5 1,650 1,359 1,452 1,428 278 240 637 542 –269 –217 3,748 3,352
Depreciation (excluding goodwill) 500 505 227 250 62 56 95 81 10 5 894 897
Investments – acquisitions –436 –458 –263 –341 –67 –57 –104 –87 –24 –9 –894 –952
Investments – disposals 96 101 68 129 38 4 26 23 16 1 244 258
Change in working capital 16 66 –72 61 –43 –28 –2 –10 53 79 –48 168
Cash flow 6 1,826 1,573 1,412 1,527 268 215 652 549 3,944 3,723
Items not affecting cash flow –16 62 –16 62
Interest paid and received –489 –520 –489 –520
Operating cash flow 6 3,439 3,265
Acquisitions of shares in companies –707 –127 – –632 –135 –70 –62 –267 –13 –37 –917 –1,133
Disposals of shares in companies – – 62 – – – – – – – 62 –
Average number of employees 12,774 12,481 9,767 10,091 3,629 3,507 2,925 2,574 65 55 29,160 28,708
1 Europe, Middle East and Africa. 3 Asia, Australia and New Zealand. 5 2003 excluding non-recurring items.2 North and South America. 4 Automatic Doors, Hospitality and Identification. 6 Excluding restructuring payments. 51
• Capital employed amounts to SEK 22,683 M (22,984).• Net debt was reduced to SEK 12,208 M (12,290).• Net debt / equity ratio was 1.17 (1.15).
SEK M 2004 2003
Capital employed 22,683 22,984
– of which, goodwill 14,012 14,766
Net debt 12,208 12,290
Minority interests 27 16
Shareholders’ equity 10,448 10,678
Capital employedCapital employed in the Group – defined as total assets lessinterest-bearing assets and non-interest-bearing liabilitiesincluding deferred tax liabilities – amounted to SEK 22,683M (22,984). The return on capital employed, excludinggoodwill amortization and non-recurring items, was 16.0percent (13.3).
Intangible assets amounted to SEK 14,154 M (14,933).The change is explained mainly by amortization. Duringthe year goodwill of SEK 671 M arose from acquisitions.A valuation model based on discounted future cash flow isused for regular impairment testing of goodwill. No write-down took place this year.
Tangible fixed assets amounted to SEK 5,163 M(5,329). Investments in tangible fixed assets, less sales oftangible fixed assets, totaled SEK 650 M (694). Deprecia-tion according to plan amounted to SEK 860 M (861).
Deferred tax receivables amounted to SEK 793 M(507). The increase is due principally to the increased pen-sion liability arising in connection with the move to RR 29.
Accounts receivable totaled SEK 4,146 M (4,131) andinventories totaled SEK 3,135 M (3,030). The average collec-tion period for accounts receivable was 55 days (56). Mater-ial throughput time averaged 105 days (108), the improve-ment being due to the systematic efforts being undertaken bythe Group to reduce capital tied up in inventory.
Net debtNet debt amounted to SEK 12,208 M (12.290), of whichpension liabilities accounted for SEK 1,677 M (723). Net
debt was reduced by the strong operational cash flow butincreased to a comparable extent by company acquisitionsand the changed accounting principles applying toemployee benefits and the dividend paid.
External financingThe Group’s long-term loan financing consists mainly of anEMTN program for a maximum of EUR 1,500 M (1,500),a global Commercial Paper program for a maximum ofUSD 1,000 M (1,000), a Nordic MTN program for EUR300 M (300) and a Swedish Commercial Paper program forSEK 5,000 M (5,000).
At year-end the EMTN program was being utilized forSEK 2,706 M, the global Commercial Paper program forSEK 4,128 M, the Nordic MTN program for SEK 902 Mand the Swedish Commercial Paper program for SEK 549M. During the year the Group’s financing options wereincreased by an Incentive Program of EUR 100 M, equiva-lent to SEK 902 M. There is also a Multi-Currency Revolv-ing Credit (MCRF) agreement for a maximum of EUR1,000 M (820), which at year-end was not being utilized atall. The interest coverage ratio, defined as income beforetax, plus net interest, divided by net interest, amounted to5.7 (4.7).
Periods for fixed-interest-rate borrowings are generallyshort, averaging less than one year. This is partly becauseGroup revenues largely follow the trends in each country,and partly due to the strong cash flow.
Cash and cash equivalents amounted to SEK 1,017 M(880). Cash and cash equivalents are invested in banks withhigh credit ratings.
Shareholders’ equityShareholders’ equity in the Group totaled SEK 10,448 M(10,678) at year-end. The return on capital employedamounted to 13.2 percent (9.9). The equity ratio was 35.6percent (35.9). The net debt / equity ratio, defined as netdebt divided by shareholders’ equity, was 1.17 (1.15).
Financial position
52
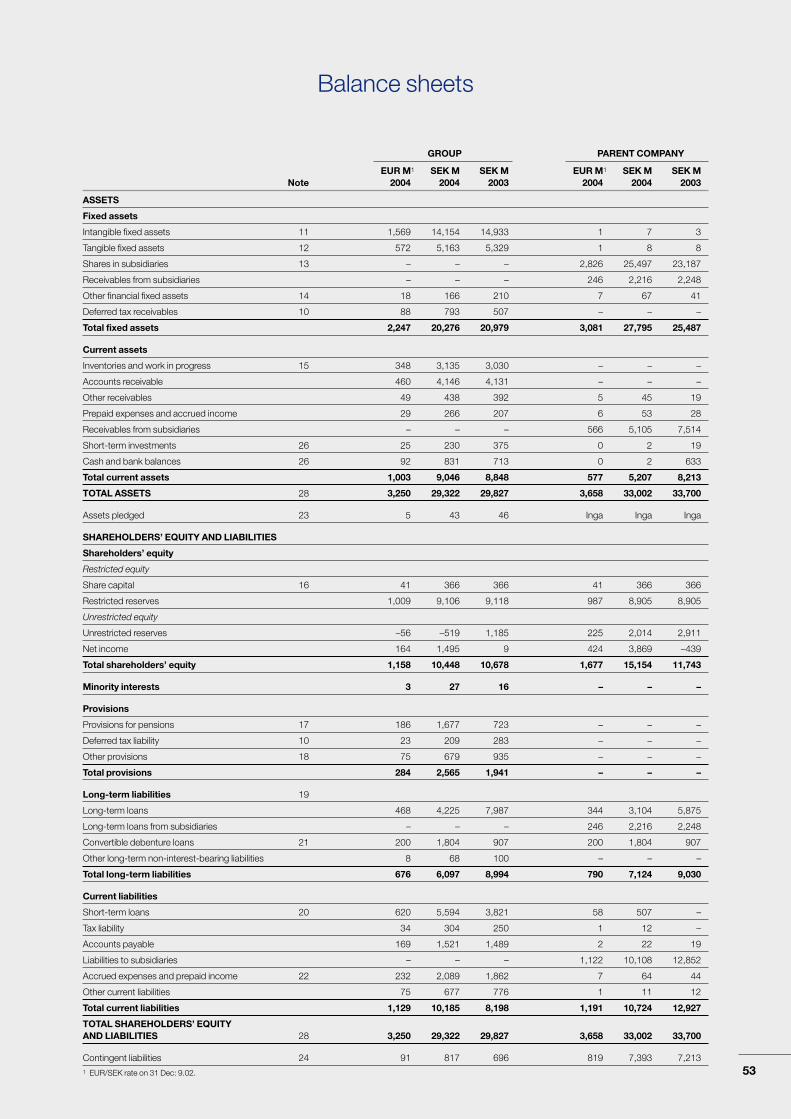
Balance sheets
GROUP PARENT COMPANY
EUR M1 SEK M SEK M EUR M1 SEK M SEK MNote 2004 2004 2003 2004 2004 2003
ASSETS
Fixed assets
Intangible fixed assets 11 1,569 14,154 14,933 1 7 3
Tangible fixed assets 12 572 5,163 5,329 1 8 8
Shares in subsidiaries 13 – – – 2,826 25,497 23,187
Receivables from subsidiaries – – – 246 2,216 2,248
Other financial fixed assets 14 18 166 210 7 67 41
Deferred tax receivables 10 88 793 507 – – –
Total fixed assets 2,247 20,276 20,979 3,081 27,795 25,487
Current assets
Inventories and work in progress 15 348 3,135 3,030 – – –
Accounts receivable 460 4,146 4,131 – – –
Other receivables 49 438 392 5 45 19
Prepaid expenses and accrued income 29 266 207 6 53 28
Receivables from subsidiaries – – – 566 5,105 7,514
Short-term investments 26 25 230 375 0 2 19
Cash and bank balances 26 92 831 713 0 2 633
Total current assets 1,003 9,046 8,848 577 5,207 8,213
TOTAL ASSETS 28 3,250 29,322 29,827 3,658 33,002 33,700
Assets pledged 23 5 43 46 Inga Inga Inga
SHAREHOLDERS’ EQUITY AND LIABILITIES
Shareholders’ equity
Restricted equity
Share capital 16 41 366 366 41 366 366
Restricted reserves 1,009 9,106 9,118 987 8,905 8,905
Unrestricted equity
Unrestricted reserves –56 –519 1,185 225 2,014 2,911
Net income 164 1,495 9 424 3,869 –439
Total shareholders’ equity 1,158 10,448 10,678 1,677 15,154 11,743
Minority interests 3 27 16 – – –
Provisions
Provisions for pensions 17 186 1,677 723 – – –
Deferred tax liability 10 23 209 283 – – –
Other provisions 18 75 679 935 – – –
Total provisions 284 2,565 1,941 – – –
Long-term liabilities 19
Long-term loans 468 4,225 7,987 344 3,104 5,875
Long-term loans from subsidiaries – – – 246 2,216 2,248
Convertible debenture loans 21 200 1,804 907 200 1,804 907
Other long-term non-interest-bearing liabilities 8 68 100 – – –
Total long-term liabilities 676 6,097 8,994 790 7,124 9,030
Current liabilities
Short-term loans 20 620 5,594 3,821 58 507 –
Tax liability 34 304 250 1 12 –
Accounts payable 169 1,521 1,489 2 22 19
Liabilities to subsidiaries – – – 1,122 10,108 12,852
Accrued expenses and prepaid income 22 232 2,089 1,862 7 64 44
Other current liabilities 75 677 776 1 11 12
Total current liabilities 1,129 10,185 8,198 1,191 10,724 12,927
TOTAL SHAREHOLDERS’ EQUITY AND LIABILITIES 28 3,250 29,322 29,827 3,658 33,002 33,700
Contingent liabilities 24 91 817 696 819 7,393 7,2131 EUR/SEK rate on 31 Dec: 9.02. 53
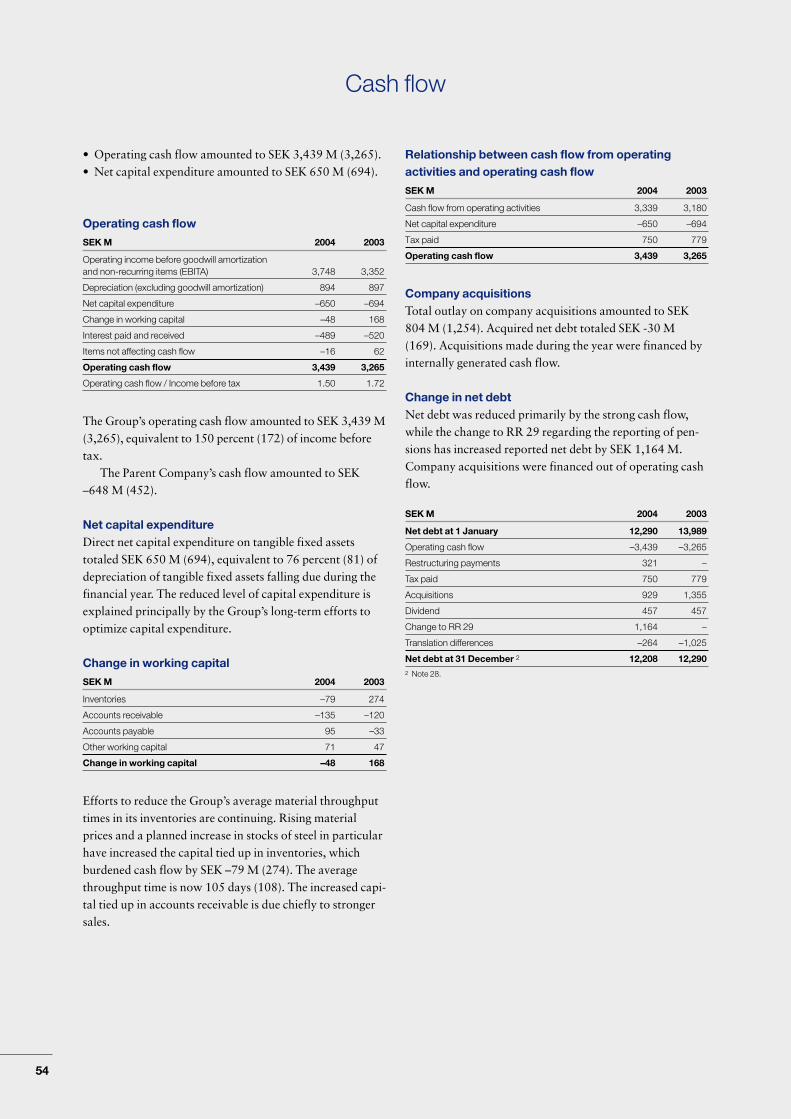
• Operating cash flow amounted to SEK 3,439 M (3,265).• Net capital expenditure amounted to SEK 650 M (694).
Operating cash flow
SEK M 2004 2003
Operating income before goodwill amortization and non-recurring items (EBITA) 3,748 3,352
Depreciation (excluding goodwill amortization) 894 897
Net capital expenditure –650 –694
Change in working capital –48 168
Interest paid and received –489 –520
Items not affecting cash flow –16 62
Operating cash flow 3,439 3,265
Operating cash flow / Income before tax 1.50 1.72
The Group’s operating cash flow amounted to SEK 3,439 M(3,265), equivalent to 150 percent (172) of income beforetax.
The Parent Company’s cash flow amounted to SEK–648 M (452).
Net capital expenditureDirect net capital expenditure on tangible fixed assetstotaled SEK 650 M (694), equivalent to 76 percent (81) ofdepreciation of tangible fixed assets falling due during thefinancial year. The reduced level of capital expenditure isexplained principally by the Group’s long-term efforts tooptimize capital expenditure.
Change in working capital
SEK M 2004 2003
Inventories –79 274
Accounts receivable –135 –120
Accounts payable 95 –33
Other working capital 71 47
Change in working capital –48 168
Efforts to reduce the Group’s average material throughputtimes in its inventories are continuing. Rising materialprices and a planned increase in stocks of steel in particularhave increased the capital tied up in inventories, whichburdened cash flow by SEK –79 M (274). The averagethroughput time is now 105 days (108). The increased capi-tal tied up in accounts receivable is due chiefly to strongersales.
Relationship between cash flow from operatingactivities and operating cash flow
SEK M 2004 2003
Cash flow from operating activities 3,339 3,180
Net capital expenditure –650 –694
Tax paid 750 779
Operating cash flow 3,439 3,265
Company acquisitionsTotal outlay on company acquisitions amounted to SEK804 M (1,254). Acquired net debt totaled SEK -30 M(169). Acquisitions made during the year were financed byinternally generated cash flow.
Change in net debtNet debt was reduced primarily by the strong cash flow,while the change to RR 29 regarding the reporting of pen-sions has increased reported net debt by SEK 1,164 M.Company acquisitions were financed out of operating cashflow.
SEK M 2004 2003
Net debt at 1 January 12,290 13,989
Operating cash flow –3,439 –3,265
Restructuring payments 321 –
Tax paid 750 779
Acquisitions 929 1,355
Dividend 457 457
Change to RR 29 1,164 –
Translation differences –264 –1,025
Net debt at 31 December 2 12,208 12,2902 Note 28.
Cash flow
54

Cash flow analysis
GROUP PARENT COMPANY
EUR M1 SEK M SEK M EUR M1 SEK M SEK MNote 2004 2004 2003 2004 2004 2003
OPERATING ACTIVITIES
Operating income 304 2,770 1,073 27 249 –32
Depreciation and amortization 5 205 1,872 1,856 0 3 3
Adjustment for non-recurring items – – 1,320 – – –
Adjustment for items not included in cash flow 27 –2 –16 62 – – –
Cash flow before interest and tax 507 4,626 4,311 28 252 –29
Interest paid and received 27 –54 –489 –520 –21 –187 –367
Dividends received – – – 364 3,322 296
Tax paid on income –82 –750 –779 – – –
Cash flow before changes in working capital 371 3,387 3,012 371 3,387 –100
Changes in working capital 27 –5 –48 168 10 91 294
Cash flow from operating activities 366 3,339 3,180 381 3,478 194
INVESTING ACTIVITIES
Net capital expenditure 27 –72 –650 –694 –1 –7 –8
Investments in subsidiaries 27 –99 –904 –1,096 –1,584 –14,456 –912
Reduction of shareholders’ equity in subsidiaries – – – 915 8,348 –
Sales of shares in subsidiaries 7 62 – 548 4,996 –
Investments in associated companies 27 – – 8 – – –
Other investments 27 –1 –13 –45 –1 –5 –
Cash flow from investing activities –165 –1,505 –1,827 –123 –1,124 –920
FINANCING ACTIVITIES
Dividends paid –50 –457 –457 –50 –457 –457
Net cash effect of changes in borrowings –140 –1,277 –1,315 –279 –2,545 1,635
Cash flow from financing activities –190 –1,734 –1,772 –329 –3,002 1,178
CASH FLOW 11 100 –419 –71 –648 452
CASH AND CASH EQUIVALENTS 2
Cash and cash equivalents at 1 January 97 880 1,408 71 652 200
Cash flow 11 100 –419 –71 –648 452
Effect of translation differences 5 37 –109 – – –
Cash and cash equivalents at 31 December 26 113 1,017 880 0 4 652
1 Average EUR/SEK rate: 9.12.2 EUR/SEK rate on 31 Dec: 9.02.
55

GROUP Share Restricted UnrestrictedSEK M capital reserves reserves Total
Closing balance 31 December 2002 366 10,343 1,672 12,381
Translation differences for the year –1,255 –1,255
Transfers between unrestricted and restricted reserves –1,225 1,225 0
Net income 9 9
Dividend –457 –457
Closing balance 31 December 2003 366 9,118 1,194 10,678
Change to RR 29 –815 –815
Translation differences for the year –435 –435
Transfers between unrestricted and restricted reserves –12 12 0
Transaction costs connected with convertible bond issue –18 –18
Net income 1,495 1,495
Dividend –457 –457
Closing balance 31 December 2004 366 9,106 976 10,448
The accumulated translation difference since 1 January 1999 amounts to SEK –2,433 M (–1,998).
PARENT COMPANY Share Premium Reserve Unappropriated SEK M capital reserve fund earnings Total
Closing balance 31 December 2002 366 8,260 645 3,368 12,639
Net income –439 –439
Dividend –457 –457
Closing balance 31 December 2003 366 8,260 645 2,472 11,743
Net income 3,869 3,869
Dividend –457 –457
Closing balance 31 December 2004 366 8,260 645 5,883 15,154
Changes in shareholders’ equity
56
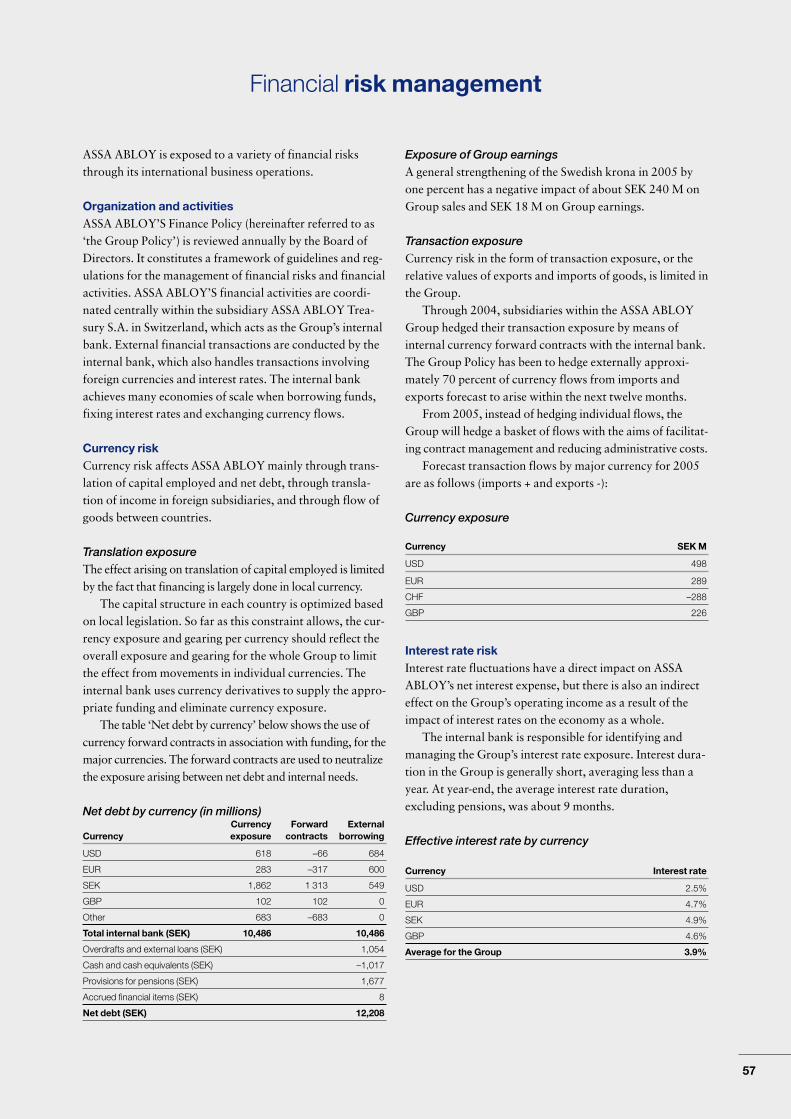
Financial risk management
ASSA ABLOY is exposed to a variety of financial risksthrough its international business operations.
Organization and activitiesASSA ABLOY’S Finance Policy (hereinafter referred to as‘the Group Policy’) is reviewed annually by the Board ofDirectors. It constitutes a framework of guidelines and reg-ulations for the management of financial risks and financialactivities. ASSA ABLOY’S financial activities are coordi-nated centrally within the subsidiary ASSA ABLOY Trea-sury S.A. in Switzerland, which acts as the Group’s internalbank. External financial transactions are conducted by theinternal bank, which also handles transactions involvingforeign currencies and interest rates. The internal bankachieves many economies of scale when borrowing funds,fixing interest rates and exchanging currency flows.
Currency riskCurrency risk affects ASSA ABLOY mainly through trans-lation of capital employed and net debt, through transla-tion of income in foreign subsidiaries, and through flow ofgoods between countries.
Translation exposureThe effect arising on translation of capital employed is limitedby the fact that financing is largely done in local currency.
The capital structure in each country is optimized basedon local legislation. So far as this constraint allows, the cur-rency exposure and gearing per currency should reflect theoverall exposure and gearing for the whole Group to limitthe effect from movements in individual currencies. Theinternal bank uses currency derivatives to supply the appro-priate funding and eliminate currency exposure.
The table ‘Net debt by currency’ below shows the use ofcurrency forward contracts in association with funding, for themajor currencies. The forward contracts are used to neutralizethe exposure arising between net debt and internal needs.
Net debt by currency (in millions)Currency Forward External
Currency exposure contracts borrowing
USD 618 –66 684
EUR 283 –317 600
SEK 1,862 1 313 549
GBP 102 102 0
Other 683 –683 0
Total internal bank (SEK) 10,486 10,486
Overdrafts and external loans (SEK) 1,054
Cash and cash equivalents (SEK) –1,017
Provisions for pensions (SEK) 1,677
Accrued financial items (SEK) 8
Net debt (SEK) 12,208
Exposure of Group earningsA general strengthening of the Swedish krona in 2005 byone percent has a negative impact of about SEK 240 M onGroup sales and SEK 18 M on Group earnings.
Transaction exposureCurrency risk in the form of transaction exposure, or therelative values of exports and imports of goods, is limited inthe Group.
Through 2004, subsidiaries within the ASSA ABLOYGroup hedged their transaction exposure by means ofinternal currency forward contracts with the internal bank.The Group Policy has been to hedge externally approxi-mately 70 percent of currency flows from imports andexports forecast to arise within the next twelve months.
From 2005, instead of hedging individual flows, theGroup will hedge a basket of flows with the aims of facilitat-ing contract management and reducing administrative costs.
Forecast transaction flows by major currency for 2005are as follows (imports + and exports -):
Currency exposure
Currency SEK M
USD 498
EUR 289
CHF –288
GBP 226
Interest rate riskInterest rate fluctuations have a direct impact on ASSAABLOY’s net interest expense, but there is also an indirecteffect on the Group’s operating income as a result of theimpact of interest rates on the economy as a whole.
The internal bank is responsible for identifying andmanaging the Group’s interest rate exposure. Interest dura-tion in the Group is generally short, averaging less than ayear. At year-end, the average interest rate duration,excluding pensions, was about 9 months.
Effective interest rate by currency
Currency Interest rate
USD 2.5%
EUR 4.7%
SEK 4.9%
GBP 4.6%
Average for the Group 3.9%
57
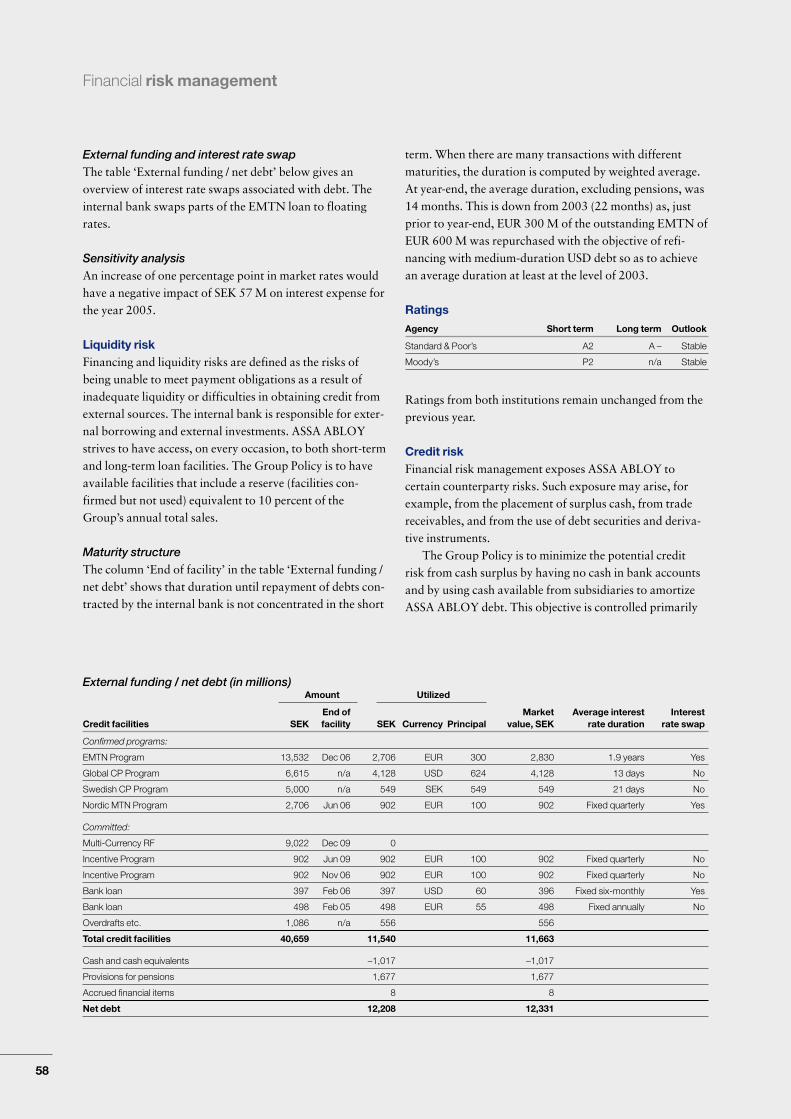
External funding and interest rate swapThe table ‘External funding / net debt’ below gives anoverview of interest rate swaps associated with debt. Theinternal bank swaps parts of the EMTN loan to floatingrates.
Sensitivity analysisAn increase of one percentage point in market rates wouldhave a negative impact of SEK 57 M on interest expense forthe year 2005.
Liquidity riskFinancing and liquidity risks are defined as the risks ofbeing unable to meet payment obligations as a result ofinadequate liquidity or difficulties in obtaining credit fromexternal sources. The internal bank is responsible for exter-nal borrowing and external investments. ASSA ABLOYstrives to have access, on every occasion, to both short-termand long-term loan facilities. The Group Policy is to haveavailable facilities that include a reserve (facilities con-firmed but not used) equivalent to 10 percent of theGroup’s annual total sales.
Maturity structureThe column ‘End of facility’ in the table ‘External funding /net debt’ shows that duration until repayment of debts con-tracted by the internal bank is not concentrated in the short
term. When there are many transactions with differentmaturities, the duration is computed by weighted average.At year-end, the average duration, excluding pensions, was14 months. This is down from 2003 (22 months) as, justprior to year-end, EUR 300 M of the outstanding EMTN ofEUR 600 M was repurchased with the objective of refi-nancing with medium-duration USD debt so as to achievean average duration at least at the level of 2003.
Ratings
Agency Short term Long term Outlook
Standard & Poor’s A2 A – Stable
Moody’s P2 n/a Stable
Ratings from both institutions remain unchanged from theprevious year.
Credit riskFinancial risk management exposes ASSA ABLOY to certain counterparty risks. Such exposure may arise, for example, from the placement of surplus cash, from tradereceivables, and from the use of debt securities and deriva-tive instruments.
The Group Policy is to minimize the potential creditrisk from cash surplus by having no cash in bank accountsand by using cash available from subsidiaries to amortizeASSA ABLOY debt. This objective is controlled primarily
Financial risk management
58
External funding / net debt (in millions)Amount Utilized
End of Market Average interest InterestCredit facilities SEK facility SEK Currency Principal value, SEK rate duration rate swap
Confirmed programs:
EMTN Program 13,532 Dec 06 2,706 EUR 300 2,830 1.9 years Yes
Global CP Program 6,615 n/a 4,128 USD 624 4,128 13 days No
Swedish CP Program 5,000 n/a 549 SEK 549 549 21 days No
Nordic MTN Program 2,706 Jun 06 902 EUR 100 902 Fixed quarterly Yes
Committed:
Multi-Currency RF 9,022 Dec 09 0
Incentive Program 902 Jun 09 902 EUR 100 902 Fixed quarterly No
Incentive Program 902 Nov 06 902 EUR 100 902 Fixed quarterly No
Bank loan 397 Feb 06 397 USD 60 396 Fixed six-monthly Yes
Bank loan 498 Feb 05 498 EUR 55 498 Fixed annually No
Overdrafts etc. 1,086 n/a 556 556
Total credit facilities 40,659 11,540 11,663
Cash and cash equivalents –1,017 –1,017
Provisions for pensions 1,677 1,677
Accrued financial items 8 8
Net debt 12,208 12,331

Financial risk management
through the cash pool network put in place by the internalbank. Approximately 80 percent of commercial sales weresettled through cash pools in 2004. The Group may never-theless deposit surplus funds on a short-term basis withbanks in order to match debt maturities.
Derivative instruments are allocated to banks accordingto risk factors set in the Group Policy to limit counterpartyrisk.
The internal bank enters into derivative contracts ex-clusively with banks participating in the syndicated creditsystem or with banks rated AAA and AA. An ISDA (fullnetting of transactions in case of default by one counter-party) is agreed in the case of interest derivatives.
Trade receivables are spread over a large number ofindividual customers, thus minimizing credit risk.
Commodity riskThe Group is exposed to price risk related to purchases ofcertain commodities (primarily metals) used as raw materi-als in its business. To date, the Group has engaged in verylimited hedging of materials traded on world marketsthrough commodity forward contracts.
Financial instruments and accounting treatmentFinancial derivative instruments such as currency andinterest-rate forwards are used to the extent necessary.The use of derivative instruments is solely to reduce ex-posure to financial risks. Financial derivative instrumentsare not used with speculative intent.
Currency-derivative hedging of fundingAll contracts used to hedge funding activity will maturewithin 12 months. Interest spreads are amortized into inter-est expense and income over the life of the contracts. Theremaining spot portions of the contracts are revalued at year-end spot market rates and charged to the income statement.
Currency-derivative hedging of transaction exposureSubsidiaries do not revalue their forward contracts on anongoing basis. Currency effects from forward contracts arerecorded when the underlying transactions are realized.Interest spreads are amortized into interest expense andincome over the life of the contracts. The positions whichmay from time to time exist between internal contracts andtheir external hedge with banks are revalued at year-endspot market rates and charged to the income statement.
Interest rate derivativesInterest income and expense are recorded on an accrualbasis. The fair value of interest rate derivatives is not recog-nized in the balance sheet.
Outstanding derivative instruments at 31 December 2004 (SEK M)
Positive Negativemarket market Nominal
Instrument value value value
Foreign exchange forwards – funding 63 –19 7,032
Foreign exchange forwards – transaction 7 –26 452
Currency basket option – – 504
Interest rate swaps 8 –88 4,823
Total 78 –133 12,811
59

NOTE 1 Accounting and valuation principlesThe Group’s accounting and valuation principles comply withSweden’s Annual Accounts Act and the standards of theSwedish Financial Accounting Standards Council.
The new standard of the Financial Accounting StandardsCouncil, RR 29 ‘Employee benefits’, was adopted from1 January 2004. Pensions and other remuneration afterretirement were previously reported according to eachcountry’s local rules. In the consolidated financial state-ments, reporting is now in accordance with RR 29. Theintroduction of RR 29 has meant a reduction of SEK 815 Min the Group’s shareholders’ equity, but has not requiredany adjustment of figures for previously reported periods.Apart from the adoption of RR 29, accounting principlesare unchanged from previous years.
Consolidated accountsThe consolidated financial statements include the ParentCompany and companies in which the Parent Companyheld more than 50 percent of the votes at year-end, as wellas companies in which the Parent Company exercises con-trol by some other means. The consolidated income state-ment includes income from companies acquired during theyear as from the date of acquisition. Income from compa-nies sold during the year is included in the consolidatedincome statement for the period up to the date of disposal.The consolidated financial statements are prepared inaccordance with the purchase method, which means thatthe acquisition value of shares in subsidiaries is eliminatedagainst their shareholders’ equity at the time of acquisition.In this context, shareholders’ equity in subsidiaries is deter-mined on the basis of the fair value of assets, liabilities andprovisions at the date of acquisition. If the acquisition valueof shares in a subsidiary exceeds the acquired shareholders’equity as computed above, the difference is reported asgoodwill, which is amortized according to plan. If theacquisition value of shares in subsidiaries is less than theacquired shareholders’ equity, a provision for negativegoodwill is made, which is dissolved in accordance with adefined plan.
Minority interestsMinority interests in the year’s income statement and share-holders’ equity are based on subsidiaries’ accounts pre-pared in accordance with the Group’s accounting princi-ples. Minority participations in subsidiaries’ equity areshown as a separate item in the consolidated balance sheet.
Associated companiesAssociated companies are defined as companies which arenot subsidiaries but are companies in which the ParentCompany has shareholdings which, directly or indirectly,represent at least 20 percent of all participations and/or isconsidered to have a significant influence. Participations inassociated companies are reported in accordance with theequity method. The consolidated income statementincludes shares in the income before tax of associated com-panies. In cases in which the acquisition value of shares inassociated companies was higher than the shareholders’equity in the acquired company at the acquisition date, thedifference is amortized on the same basis as consolidatedgoodwill, following an analysis of the character of the sur-plus value, and is charged against share in earnings of asso-ciated companies. Participation in tax on associated com-panies’ income is included in the Group’s tax expense. Inthe consolidated balance sheet, shareholdings in associatedcompanies are reported at the acquisition value, adjustedfor dividends and participation in income after the date ofacquisition. In determining the equity share, untaxedreserves are attributed to shareholders’ equity after deduc-tion for estimated tax.
Translation of foreign subsidiariesThe Group applies the so-called current method for trans-lating the accounts of all foreign subsidiaries that are con-sidered to operate with a high degree of independence. Thecurrent method means that all balance sheet items exceptnet income are translated at the closing-day rate. Netincome is translated at the average rate and the differencearising thereby is taken directly to unrestricted reserves.Subsidiaries’ income statements are translated at the aver-age rate for the financial year. Subsidiaries operating inhigh-inflation countries are translated using the monetarymethod.
The Group hedges to a limited extent its investments inforeign net assets. Hedging is implemented through loansand forward exchange contracts. These are valued at theexchange rate at year-end. Exchange rate differences onhedging operations are eliminated from the income state-ment and, like differences that arise when foreign net assetsare translated, are carried directly to shareholders’ equity in the balance sheet. Interest differentials on forward con-tracts are annualized and reported in the income statement.
Notes
60

Notes
Exchange ratesThe rates for currencies used in the Group were as follows(weighted average for the year, and rate at year-end):
Average rate Year-end rate
Argentina ARS 2.49 2.22
Australia AUD 5.39 5.15
Bermuda BMD 7.34 6.68
Brazil BRL 2.51 2.49
Canada CAD 5.65 5.50
Switzerland CHF 5.90 5.85
Chile CLP 0.012 0.012
China CNY 0.88 0.80
Czech Republic CZK 0.29 0.30
Denmark DKK 1.23 1.21
Estonia EEK 0.58 0.58
Euroland EUR 9.12 9.02
United Kingdom GBP 13.38 12.74
Hong Kong HKD 0.94 0.85
Hungary HUF 0.036 0.037
Indonesia IDR 0.00082 0.00071
Israel ILS 1.64 1.53
Japan JPY 0.068 0.064
Kenya KES 0.093 0.08
Lithuania LTL 2.64 2.61
Mauritius MUR 0.27 0.23
Mexico MXN 0.65 0.59
Malaysia MYR 1.93 1.74
Nigeria NGN 0.055 0.050
Norway NOK 1.09 1.09
New Zealand NZD 4.85 4.75
Poland PLN 2.02 2.21
Romania ROL 0.00022 0.00023
Russia RUR 0.25 0.24
Singapore SGD 4.34 4.05
Slovenia SIT 0.038 0.038
Slovakia SKK 0.23 0.23
Thailand THB 0.18 0.17
USA USD 7.33 6.62
Uruguay UYU 0.26 0.25
South Africa ZAR 1.15 1.17
Zimbabwe ZWD 0.0026 0.0012
Reporting by segmentThe Group’s business operations are divided organization-ally among four divisions: EMEA, Americas, Asia Pacificand Global Technologies. The divisions form the Group’ssegments. There are no secondary segments.
Revenue recognitionRevenue from sales of the Group’s products is recognizedwhen significant risks and rewards associated with owner-ship are transferred to the purchaser in accordance withapplicable conditions of sale, which is normally the time of delivery. If the product requires installation on the
customer’s premises, revenue is recognized when installa-tion is completed. All sales are reported less VAT, discounts,returns and freight. Intra-Group sales are eliminated fromthe consolidated income statement.
Intra-Group sales
Transfer pricing between companies in the Group is carriedout at arm’s length and thus at market prices. Internal prof-its arising from intra-Group sales have been eliminated intheir entirety.
Government grants
Grants from governments, public authorities etc arereported when there is reasonable assurance that the com-pany will comply with the conditions attaching to the grantand that the grant will be received. Grants related to assetsare handled by reducing the carrying amount of the asset bythe amount of the grant.
Leasing
Only operational leasing of limited scope occurs in theGroup, and the leasing payments are expensed at a con-stant rate over the period of the contract.
Research and development
Research costs are expensed as they are incurred. The costsof development work are included in the balance sheet onlyto the extent that they are expected to generate future eco-nomic benefits. Such costs for development work are depre-ciated on a straight-line basis. Other development costs areexpensed as they are incurred.
Depreciation according to plan
Depreciation according to plan is based on the historicalcost of assets, with due consideration of the estimated use-ful life of the asset. A depreciation period of five years isapplied for intangible rights. Group goodwill is amortizedover 10-20 years, depending on the type of companyacquired. Goodwill in well-established companies withindependent and well-known brands is amortized over 10years. Goodwill in companies that, in addition, constitute astrategic acquisition in terms of products or markets isamortized over 20 years. The depreciation period for officebuildings is 50 years, and for industrial buildings 25 years.A depreciation period of 7-10 years is applied to machineryand other technical facilities. Equipment and tools aredepreciated over 3-6 years.
Borrowing costs
Borrowing costs are recognized as expenses in the period inwhich they are incurred.
61

Tax on incomeThe income statement includes all tax that is to be paid orreceived for the current year, adjustments relating to tax duefor previous years, and changes in deferred tax. Tax sumshave been calculated as nominal amounts in accordancewith the tax regulations in each country and in accordancewith tax rates that have either been decided or have beennotified and can confidently be expected to be confirmed.For items reported in the income statement, associated taxeffects are also reported in the income statement. The taxeffects of items reported directly against shareholders’equity are themselves reported against shareholders’ equity.
Deferred tax is accounted for under the balance sheetliability method. This means that deferred tax is accountedfor on all temporary differences between the book values ofassets and liabilities and their taxable values. Deferred taxreceivables relating to tax losses carried forward or otherfuture tax allowances are reported to the extent that it isprobable that the allowance can be set against taxableincome in future taxation. Deferred tax liabilities relatingto temporary differences resulting from investments in sub-sidiaries are not reported in ASSA ABLOY’s consolidatedaccounts since the Parent Company can always control thetime at which the temporary differences are canceled and itis not considered likely that such cancellation will occur inthe foreseeable future. In the Parent Company, because ofthe relationship between accounting and taxation, deferredtax liabilities on untaxed reserves are shown in the ParentCompany’s accounts as part of untaxed reserves.
Cash flow statementThe cash flow statement has been prepared according tothe indirect method. The reported cash flow includes onlytransactions involving cash payments.
As well as cash and bank balances, cash and cash equiva-lents are taken to include short-term investments that (a) areexposed to only small risks of change in value and (b) aretraded on an open market for known sums and have a matu-rity date less than three months from the date of acquisition.
Intangible and tangible fixed assetsIntangible and tangible fixed assets are reported at cost lessaccumulated depreciation. Expenditure on improvementsthat raise an asset’s performance above its original levelincreases the carrying amount of the asset. Expenditure onrepairs and maintenance is shown as a cost. Tangible andintangible fixed assets are depreciated systematically over theasset’s expected useful life. If the carrying value of an assetexceeds its estimated recoverable amount, the asset is imme-diately written down to the recoverable amount. A valuationmodel based on discounted future cash flow is used for regu-lar impairment testing of goodwill.
InventoriesInventories are valued in accordance with the FIFO (First in,first out) principle at the lower of acquisition value and netrealizable value at year-end. Deductions are made for internalprofits arising from deliveries between Group companies.Work in progress and finished goods include both direct costsincurred and an allocation of indirect manufacturing costs.
ReceivablesReceivables are valued in the amounts that after individualassessment are expected to be received.
Foreign currenciesReceivables and liabilities are valued at the year-end rate.The forward rate has been used when exchange rates havebeen hedged by means of forward contracts. Transactions inforeign currencies are translated at the rate current on thetransaction date. When the currency effects of future budgeted flows are hedged, the hedging instrument is not revalued forthe changed exchange rates. The full effect of changes inexchange rates is shown in the income statement at the timethat the hedging instrument falls due for payment.
ProvisionsProvisions have been made for all obligations attributableto the financial year or prior financial years which, on theclosing date, were likely to be incurred, but which wereuncertain as to amount or date of payment.
PensionsBoth defined-contribution and defined-benefit pensionplans exist in the Group. Comprehensive defined-benefitplans are found chiefly in the USA and the UK. In the USApost-retirement medical benefits are also available, whichare reported in the same way as defined-benefit pensionplans. Assessments related to defined-benefit pension plansare made by independent actuaries and are based on vari-ous actuarial assumptions concerning discount rate, futureinflation, salary increases etc. Obligations are valued on the closing day at the current value of expected future pay-ments. For funded plans, obligations are reduced by the fairvalue of the plan assets. Funded plans with a positive valuein the form of net assets are reported as financial fixedassets. In principle, pension costs for defined-benefit plansare spread over the employee’s service period. Actuarialprofits and losses lying outside the so-called ten-percentcorridor are spread over the expected average remainingservice period. The Group’s payments related to defined-contribution pension plans are reported as a cost in theperiod to which they refer, based on the services performedby the employee. The part of the interest component in thepension cost that relates to the deficit in pension plans isreported as a financial expense.
Notes
62

Notes
Transition to IFRS in 2005Summary
ASSA ABLOY will report its Group accounting accordingto International Financial Reporting Standards (IFRS) from2005. The transition has effect from 1 January 2004 andcomparative figures for 2004 will be adjusted in accor-dance with IFRS. In accordance with IFRS 1, ASSAABLOY has chosen not to make adjustments for acquisi-tions made before 1 January 2004. The information givenhere provides a preliminary overview of the impact of thenew accounting rules on the Group’s accounting.In summary, these are the expected effects of the change:• Amortization of goodwill will cease, and amortization of
goodwill charged as a cost during 2004 will be canceled.• Deferred tax receivables will be considered in relation to
tax-deductible goodwill from 1 January 2004.• Intangible rights pertaining to 2004 acquisitions will be
differentiated from goodwill and written off over theirestimated useful life.
• Some provisions for acquisition-related restructuringthat do not meet the requirements of IFRS will becharged as costs.
• Financial instruments will be reported in the balancesheet at their fair value.
Expected effect on the Group’s income statement for2004
SEK billion 2004 Adjustment Under IFRS
Sales 25.5 – 25.5
Operating income 2.8 + 0.9 3.7
Net income 1.5 + 0.8 2.3
Expected effect on the Group’s balance sheet for 2004
SEK billion 2004 Adjustment Under IFRS
Capital employed 22.7 + 0.8 23.5
Net debt 12.2 + 0.1 12.3
Shareholders’ equity 10.5 + 0.7 11.2
General comments on the change to IFRSIn recent years Swedish accounting, through the standardsof the Swedish Financial Accounting Standards council, hasmoved steadily towards IFRS. Nonetheless, a number ofdifferences remain, mainly concerning dates of adoptionand transition rules, but also related to the changes in IFRSmade through the Improvement Project of the InternationalAccounting Standard Board (IASB). From ASSA ABLOY’sperspective, the Swedish accounting rules are in line in allimportant respects with the changes introduced in theEuropean Union on 1 January 2005.
The change to IFRS for ASSA ABLOYASSA ABLOY is adopting IFRS from the financial year thatbegan on 1 January 2005. The Interim Report for the first
quarter of 2005, to be published in April 2005, will be thefirst prepared according to IFRS.
The opening balance for 2004 and quarterly informa-tion for 2004 will be adjusted in line with IFRS. Earlierfinancial years will not be adjusted, which is in accordancewith the changeover rules in IFRS 1.
In 2003 a project group headed by the Chief FinancialOfficer was established to evaluate the effects of the transi-tion to IFRS and to make practical preparations for, andcarry through, the change in 2005. Continual contact wasmaintained between the project group and the Company’sauditors, and the progress of the project was reported backregularly to the Executive Team, the Audit Committee andthe Board of Directors. The most important effects relate toaccounting for acquisitions, including accounting for good-will, and accounting for and valuation of financial instru-ments.
Acquisitions and mergersIFRS 3, ‘Business Combinations’, deals with company acqui-sitions and mergers. ASSA ABLOY does not intend to adjustany acquisitions made before the date of transition (1 Janu-ary 2004). Adjustments relating to allocation of the purchaseprice are being made for acquisitions made after this date.Adjustments will also be made for restructuring reserves thatdo not meet the requirements of IFRS. Under IFRS 3, allamortization of goodwill ceases, and the amortization ofgoodwill set against income in 2004 will be canceled in linewith IFRS when 2004 comparatives are restated. To theextent that amortization of goodwill is tax-deductible,deferred tax receivables will be accounted for and expensedwhen the tax deduction is utilized.
Amortization of goodwill will be replaced by an impair-ment test that will be carried out every quarter for all Cash-Generating Units (CGUs). Goodwill and acquisition-relatedintangible assets will be tested for impairment at the samelevel as monthly performance is reviewed within the Group.Accounting for acquisitions will be changed under IFRS 3,mainly as regards purchase price allocation. To a greaterextent than before, the purchase price will be allocated toidentifiable intangible assets, which will be amortized overtheir estimated useful life. The adoption of IFRS 3 will affectaccounting for acquisitions but not the Group’s acquisitionstrategy.
Financial instrumentsIAS 39, ‘Financial Instruments’, will be adopted from 1January 2005 without adjustment of comparison figures.The accumulated effects of revaluation of financial instru-ments in accordance with IAS 39 will be reported as anadjustment of shareholders’ equity. The reporting of theseeffects, which represents a change in accounting principles,will be made as a reduction of unrestricted reserves, after a
63

deduction for tax. Reporting of financial instruments underIAS 39 will give rise to increased volatility in both theincome statement and the balance sheet. ASSA ABLOYbelieves that these fluctuations should be limited. ASSAABLOY has used financial instruments chiefly to hedgetransaction exposure and in Treasury operations. From2005 this type of hedging operation will use different methods, which are expected to limit fluctuation effectsresulting from the adoption of IAS 39.
Effects on key figuresThe adoption of IFRS will have a positive effect on ASSAABLOY’s key figures. For example, Return on capitalemployed, Return on shareholders’ equity, Earnings pershare and Net debt / Equity ratio will all be improved,mainly because goodwill will no longer be amortized.
Note 2 Sales by country 1
SEK M 2004 2003
USA 8,414 8,686
France 2,260 2,108
United Kingdom 1,675 1,585
Germany 1,380 1,261
Sweden 1,180 1,089
Australia 1,056 914
Netherlands 1,036 650
Spain 961 852
Finland 739 709
Canada 728 691
Mexico 649 731
Norway 576 545
Denmark 503 455
Italy 454 390
Asia (excluding China) 394 358
Belgium 356 311
New Zealand 319 234
China 286 244
Middle East 273 255
Czech Republic 263 240
Switzerland 244 260
South America 238 195
South Africa 222 197
Austria 179 139
Central America (excluding Mexico) 129 128
Portugal 122 110
Russia 118 124
Poland 103 69
Baltic countries 92 79
Romania 48 42
Other countries 529 429
Total 25,526 24,0801 Sales to customers in each country.
Note 3 Salaries, wages, other remuneration and social costs
Salaries, wages and other remuneration (of which, performance-related salary paid to managing directors)
Group
SEK M 2004 2003
Sweden 475 (9) 403 (3)
Finland 285 (1) 278 (1)
Norway 242 (1) 243 (1)
Denmark 116 (0) 123 (0)
Germany 491 (1) 480 (1)
United Kingdom 471 (2) 467 (2)
Belgium 69 (0) 57 (0)
France 583 (2) 576 (2)
Netherlands 220 (1) 120 (0)
Czech Republic 58 (0) 47 (0)
Canada 215 (0) 93 (0)
Australia 227 (0) 212 (1)
New Zealand 125 (–) 115 (–)
USA 1,866 (11) 2,143 (13)
China 67 (0) 74 (1)
Romania 23 (–) 17 (–)
Israel 58 (0) 62 (1)
Italy 129 (–) 107 (0)
South Africa 61 (–) 58 (–)
Mexico 168 (0) 215 (1)
Spain 270 (–) 267 (1)
Switzerland 207 (0) 149 (0)
South America 42 (–) 41 (0)
Other countries 108 (2) 79 (2)
Total 6,576 (30) 6,426 (30)
Parent company
Sweden 62 (5) 46 (0)
Other countries 4 (–) –
Total 66 (5) 46 (0)
Social costs (of which, pensions)
Group
SEK M 2004 2003
Total 1,950 (433)1,925 (384)
Parent company
Total 36 (17) 25 (12)
Absence for illness
Parent company
% 2004 20031
Total absence for illness: 1.1 1.0
– long-term – –
– men 0.2 0.2
– women 2.1 1.7
– aged 29 or younger 0.6 0.4
– aged 30–49 1.5 1.3
– aged 50 or older 0.5 0.31 During the period 1 July – 31 December 2003.
Notes
64

Notes
Note 4 Auditors’ fees
Group Parent company
SEK M 2004 2003 2004 2003
Audit
PricewaterhouseCoopers 22 24 2 2
Other 4 4 – –
Assignments other than audit
PricewaterhouseCoopers 12 7 2 3
Other 7 3 4 1
Total 45 38 8 6
Note 5 Depreciation and amortization
Group Parent company
SEK M 2004 2003 2004 2003
Goodwill 978 959 – –
Intangible rights 34 35 1 1
Machinery 493 491 – –
Equipment 245 255 2 2
Buildings 121 115 – –
Land and land improvements 1 1 – –
Total 1,872 1,856 3 3
Note 6 Operational leasing agreements
Group Parent company
SEK M 2004 2004
Leasing fees paid during the year 144 9
Group Parent company
SEK M 2004 2004
Nominal value of agreed future leasing fees
Due for payment in 2005 121 9
Due for payment in 2006 92 9
Due for payment in 2007 65 9
Due for payment in 2008 41 9
Due for payment in 2009 40 9
Due for payment in 2010 or later 34 9
Total 393 54
Note 7 Non-recurring items
Group
SEK M 2004 2003
Provision for restructuring – 935
Write-downs of fixed assets and inventories – 385
Total – 1,320
Note 8 Income from participations in Group companies
Parent company
SEK M 2004 2003
Dividends 2,845 733
Write-downs of shares in subsidiaries –177 –700
Income from disposal of shares in subsidiaries 1,376 –
Total 4,044 33
Write-downs of shares in subsidiaries includes SEK 177 M (700) arising fromdividends received from subsidiaries.
Note 9 Financial items
Group Parent company
SEK M 2004 2003 2004 2003
Dividends 0 0 – –
Interest income and similar income items 164 176 0 3
Interest income from Group companies – – 506 478
Exchange-rate differences 22 48 – –
Total 186 224 506 481
Interest expenses and similar expense items –670 –721 –518 –363
Interest expenses from Group companies – – –385 –531
Exchange-rate differences – – –20 –27
Total –670 –721 –923 –921
Net financial items –484 –497 –417 –440
Note 10 Tax
Group Parent company
SEK M 2004 2003 2004 2003
Current tax paid –707 –572 – –
Tax attributable to prior years –77 –92 –7 –
Deferred tax –8 109 – –
Totalt –792 –556 –7 –
Explanation for the difference between nominal Swedish tax rateand effective tax rate according to the income statement:
Group
Percent 2004 2003
Swedish rate of tax on income 28.0 28.0
Non-recurring items – 59.9
Effect of foreign tax rates –2.0 –3.5
Non-deductible goodwill amortization 7.0 7.4
Other non-deductible expenses 4.5 5.4
Other –3.0 –1.8
Effective tax rate according tothe income statement 34.5 95.4
Deferred tax liabilities and deferred tax receivables are made up as follows:
Group
2004 2003
Deferred tax liabilities
Fixed assets 121 188
Inventories 69 75
Short-term receivables and liabilities 19 20
209 283
Deferred tax receivables
Fixed assets 78 95
Inventories 85 82
Short-term receivables and liabilities 20 5
Provisions 462 179
Tax-deductible losses 148 146
793 507
The Group has additional tax losses carried forward of some SEK 500 Mwhich have not been accounted for as deferred tax receivables because it isnot probable that the tax losses can be realized.
65
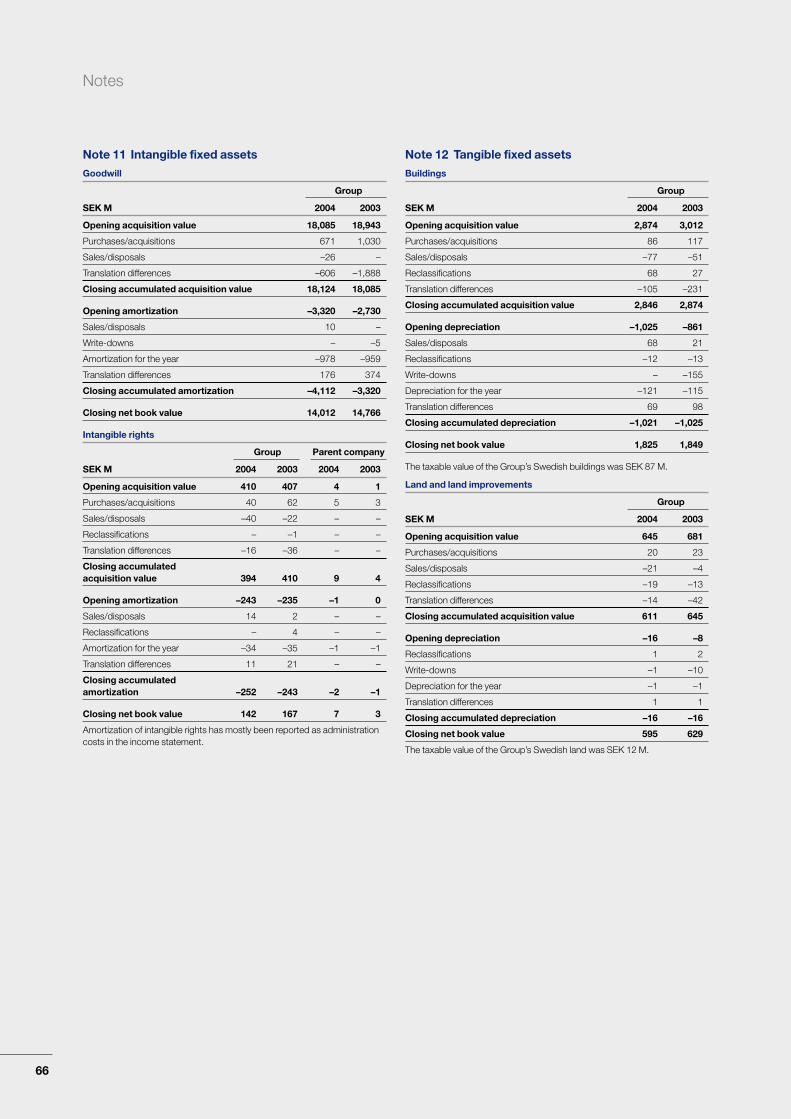
Note 11 Intangible fixed assets
Goodwill
Group
SEK M 2004 2003
Opening acquisition value 18,085 18,943
Purchases/acquisitions 671 1,030
Sales/disposals –26 –
Translation differences –606 –1,888
Closing accumulated acquisition value 18,124 18,085
Opening amortization –3,320 –2,730
Sales/disposals 10 –
Write-downs – –5
Amortization for the year –978 –959
Translation differences 176 374
Closing accumulated amortization –4,112 –3,320
Closing net book value 14,012 14,766
Intangible rights
Group Parent company
SEK M 2004 2003 2004 2003
Opening acquisition value 410 407 4 1
Purchases/acquisitions 40 62 5 3
Sales/disposals –40 –22 – –
Reclassifications – –1 – –
Translation differences –16 –36 – –
Closing accumulated acquisition value 394 410 9 4
Opening amortization –243 –235 –1 0
Sales/disposals 14 2 – –
Reclassifications – 4 – –
Amortization for the year –34 –35 –1 –1
Translation differences 11 21 – –
Closing accumulated amortization –252 –243 –2 –1
Closing net book value 142 167 7 3
Amortization of intangible rights has mostly been reported as administrationcosts in the income statement.
Note 12 Tangible fixed assets
Buildings
Group
SEK M 2004 2003
Opening acquisition value 2,874 3,012
Purchases/acquisitions 86 117
Sales/disposals –77 –51
Reclassifications 68 27
Translation differences –105 –231
Closing accumulated acquisition value 2,846 2,874
Opening depreciation –1,025 –861
Sales/disposals 68 21
Reclassifications –12 –13
Write-downs – –155
Depreciation for the year –121 –115
Translation differences 69 98
Closing accumulated depreciation –1,021 –1,025
Closing net book value 1,825 1,849
The taxable value of the Group’s Swedish buildings was SEK 87 M.
Land and land improvements
Group
SEK M 2004 2003
Opening acquisition value 645 681
Purchases/acquisitions 20 23
Sales/disposals –21 –4
Reclassifications –19 –13
Translation differences –14 –42
Closing accumulated acquisition value 611 645
Opening depreciation –16 –8
Reclassifications 1 2
Write-downs –1 –10
Depreciation for the year –1 –1
Translation differences 1 1
Closing accumulated depreciation –16 –16
Closing net book value 595 629
The taxable value of the Group’s Swedish land was SEK 12 M.
Notes
66
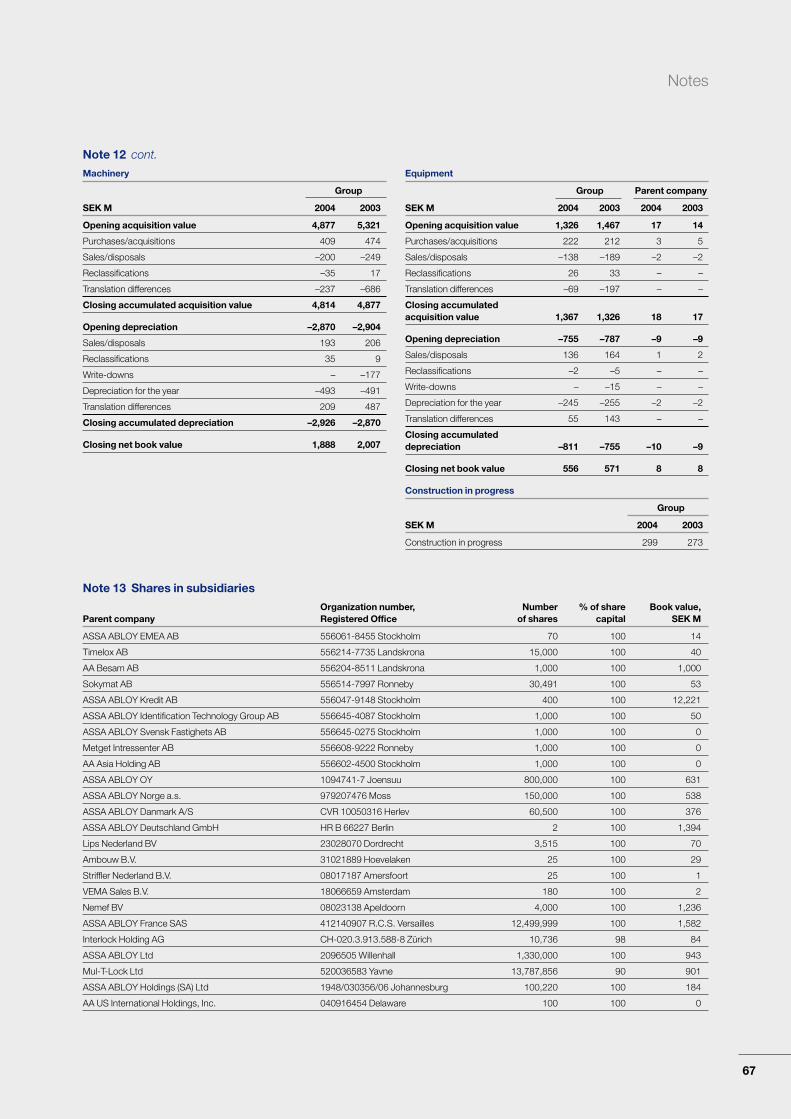
Notes
Note 12 cont.
Machinery
Group
SEK M 2004 2003
Opening acquisition value 4,877 5,321
Purchases/acquisitions 409 474
Sales/disposals –200 –249
Reclassifications –35 17
Translation differences –237 –686
Closing accumulated acquisition value 4,814 4,877
Opening depreciation –2,870 –2,904
Sales/disposals 193 206
Reclassifications 35 9
Write-downs – –177
Depreciation for the year –493 –491
Translation differences 209 487
Closing accumulated depreciation –2,926 –2,870
Closing net book value 1,888 2,007
Equipment
Group Parent company
SEK M 2004 2003 2004 2003
Opening acquisition value 1,326 1,467 17 14
Purchases/acquisitions 222 212 3 5
Sales/disposals –138 –189 –2 –2
Reclassifications 26 33 – –
Translation differences –69 –197 – –
Closing accumulated acquisition value 1,367 1,326 18 17
Opening depreciation –755 –787 –9 –9
Sales/disposals 136 164 1 2
Reclassifications –2 –5 – –
Write-downs – –15 – –
Depreciation for the year –245 –255 –2 –2
Translation differences 55 143 – –
Closing accumulated depreciation –811 –755 –10 –9
Closing net book value 556 571 8 8
Construction in progress
Group
SEK M 2004 2003
Construction in progress 299 273
67
Note 13 Shares in subsidiaries
Organization number, Number % of share Book value,Parent company Registered Office of shares capital SEK M
ASSA ABLOY EMEA AB 556061-8455 Stockholm 70 100 14
Timelox AB 556214-7735 Landskrona 15,000 100 40
AA Besam AB 556204-8511 Landskrona 1,000 100 1,000
Sokymat AB 556514-7997 Ronneby 30,491 100 53
ASSA ABLOY Kredit AB 556047-9148 Stockholm 400 100 12,221
ASSA ABLOY Identification Technology Group AB 556645-4087 Stockholm 1,000 100 50
ASSA ABLOY Svensk Fastighets AB 556645-0275 Stockholm 1,000 100 0
Metget Intressenter AB 556608-9222 Ronneby 1,000 100 0
AA Asia Holding AB 556602-4500 Stockholm 1,000 100 0
ASSA ABLOY OY 1094741-7 Joensuu 800,000 100 631
ASSA ABLOY Norge a.s. 979207476 Moss 150,000 100 538
ASSA ABLOY Danmark A/S CVR 10050316 Herlev 60,500 100 376
ASSA ABLOY Deutschland GmbH HR B 66227 Berlin 2 100 1,394
Lips Nederland BV 23028070 Dordrecht 3,515 100 70
Ambouw B.V. 31021889 Hoevelaken 25 100 29
Striffler Nederland B.V. 08017187 Amersfoort 25 100 1
VEMA Sales B.V. 18066659 Amsterdam 180 100 2
Nemef BV 08023138 Apeldoorn 4,000 100 1,236
ASSA ABLOY France SAS 412140907 R.C.S. Versailles 12,499,999 100 1,582
Interlock Holding AG CH-020.3.913.588-8 Zürich 10,736 98 84
ASSA ABLOY Ltd 2096505 Willenhall 1,330,000 100 943
Mul-T-Lock Ltd 520036583 Yavne 13,787,856 90 901
ASSA ABLOY Holdings (SA) Ltd 1948/030356/06 Johannesburg 100,220 100 184
AA US International Holdings, Inc. 040916454 Delaware 100 100 0
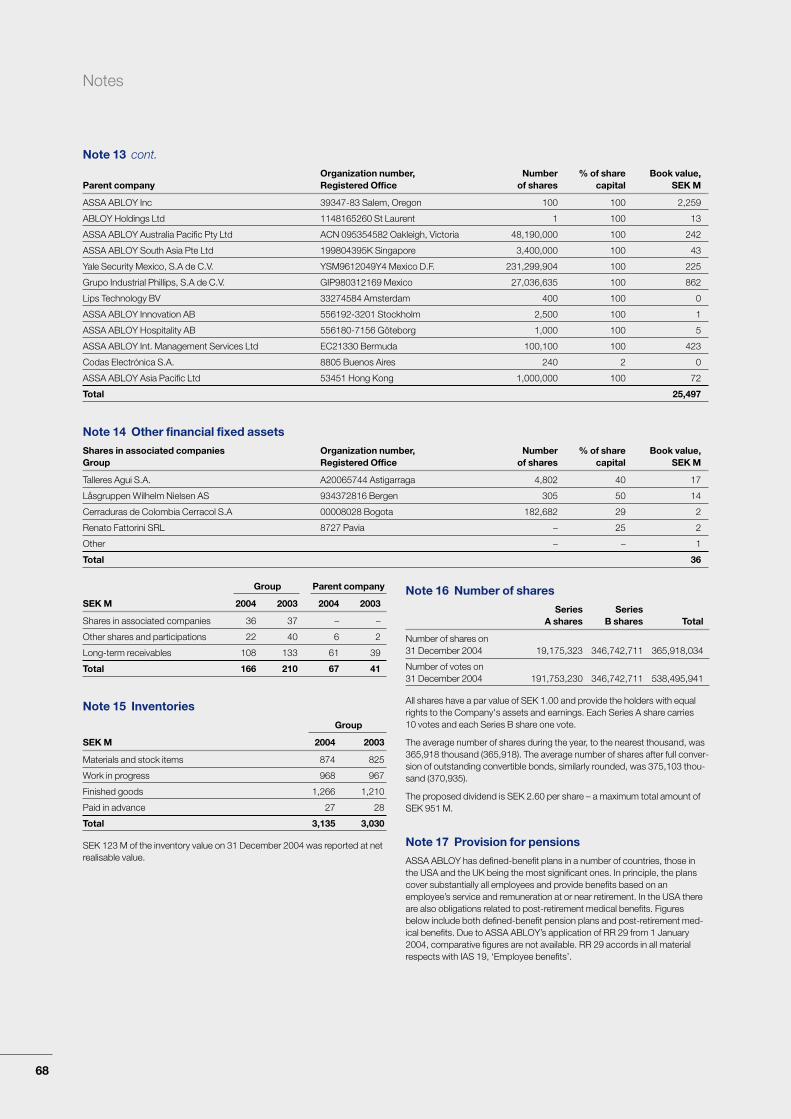
Note 13 cont.
Organization number, Number % of share Book value,Parent company Registered Office of shares capital SEK M
ASSA ABLOY Inc 39347-83 Salem, Oregon 100 100 2,259
ABLOY Holdings Ltd 1148165260 St Laurent 1 100 13
ASSA ABLOY Australia Pacific Pty Ltd ACN 095354582 Oakleigh, Victoria 48,190,000 100 242
ASSA ABLOY South Asia Pte Ltd 199804395K Singapore 3,400,000 100 43
Yale Security Mexico, S.A de C.V. YSM9612049Y4 Mexico D.F. 231,299,904 100 225
Grupo Industrial Phillips, S.A de C.V. GIP980312169 Mexico 27,036,635 100 862
Lips Technology BV 33274584 Amsterdam 400 100 0
ASSA ABLOY Innovation AB 556192-3201 Stockholm 2,500 100 1
ASSA ABLOY Hospitality AB 556180-7156 Göteborg 1,000 100 5
ASSA ABLOY Int. Management Services Ltd EC21330 Bermuda 100,100 100 423
Codas Electrónica S.A. 8805 Buenos Aires 240 2 0
ASSA ABLOY Asia Pacific Ltd 53451 Hong Kong 1,000,000 100 72
Total 25,497
Note 14 Other financial fixed assets
Shares in associated companies Organization number, Number % of share Book value,Group Registered Office of shares capital SEK M
Talleres Agui S.A. A20065744 Astigarraga 4,802 40 17
Låsgruppen Wilhelm Nielsen AS 934372816 Bergen 305 50 14
Cerraduras de Colombia Cerracol S.A 00008028 Bogota 182,682 29 2
Renato Fattorini SRL 8727 Pavia – 25 2
Other – – 1
Total 36
Notes
68
Group Parent company
SEK M 2004 2003 2004 2003
Shares in associated companies 36 37 – –
Other shares and participations 22 40 6 2
Long-term receivables 108 133 61 39
Total 166 210 67 41
Note 16 Number of shares
Series SeriesA shares B shares Total
Number of shares on 31 December 2004 19,175,323 346,742,711 365,918,034
Number of votes on 31 December 2004 191,753,230 346,742,711 538,495,941
All shares have a par value of SEK 1.00 and provide the holders with equalrights to the Company's assets and earnings. Each Series A share carries10 votes and each Series B share one vote.
The average number of shares during the year, to the nearest thousand, was365,918 thousand (365,918). The average number of shares after full conver-sion of outstanding convertible bonds, similarly rounded, was 375,103 thou-sand (370,935).
The proposed dividend is SEK 2.60 per share – a maximum total amount ofSEK 951 M.
Note 17 Provision for pensions
ASSA ABLOY has defined-benefit plans in a number of countries, those inthe USA and the UK being the most significant ones. In principle, the planscover substantially all employees and provide benefits based on anemployee’s service and remuneration at or near retirement. In the USA thereare also obligations related to post-retirement medical benefits. Figuresbelow include both defined-benefit pension plans and post-retirement med-ical benefits. Due to ASSA ABLOY’s application of RR 29 from 1 January2004, comparative figures are not available. RR 29 accords in all materialrespects with IAS 19, ‘Employee benefits’.
Note 15 Inventories
Group
SEK M 2004 2003
Materials and stock items 874 825
Work in progress 968 967
Finished goods 1,266 1,210
Paid in advance 27 28
Total 3,135 3,030
SEK 123 M of the inventory value on 31 December 2004 was reported at netrealisable value.

Notes
Note 17 cont.
The amounts recognized in the income statement are as follows:
Pension cost (SEK M) 2004
Current service costs 119
Interest cost 208
Expected return on plan assets –154
Net actuarial losses (gains) recognized –
Past service costs –5
Losses (gains) on curtailments/settlements –7
Total pension cost 161
of which recorded as:
Operating income 116
Financial items 45
Cost of defined-contribution plans was SEK 272 M. The actual return on planassets regarding defined-benefit plans was SEK 148 M in 2004.
Actuarial gains/losses, resulting from changes in the actuarial assumptionsfor defined-benefit plans, are recognized to the extent that their accumulatedamount exceeds the 10 percent corridor, i.e. 10 percent of the higher of theobligation’s present value or the fair value of plan assets. The surplus/deficitoutside the 10 percent corridor is recognized as income/expense over theexpected average remaining service period. Amortization of actuarialgains/losses that arose in 2004 will start in 2005.
The amounts recognized in the balance sheet are as follows:
Pension obligations (SEK M) 2004
Provisions for defined-benefit plans 1,609
Provisions for defined-contribution plans 68
Provisions for pensions, total 1,677
Assets regarding defined-contribution plans –22
Pension obligations, net 1,655
There are no defined-benefit plans with surpluses within the Group. Partlyfunded or unfunded pension plans are reported as provision for pensions.Out of pension obligations for defined-benefit plans, SEK 382 M relates topost-retirement medical benefits.
Specification of pension obligations (SEK M) 2004
Present value of funded defined-benefit obligations 3,294
Fair value of plan assets –2,243
Funded status 1,051
Present value of unfunded defined-benefit obligations 666
Unrecognized actuarial gains (losses), net –111
Unrecognized past service cost 3
Provision for pensions, net 1,609
Specification of movements in provision for pensions (SEK M) 2004
Net provision on 31 December 2003 723
Adoption of RR 29, 1 January 2004 1,164
Net provision on 1 January 2004 1,887
Pension cost, defined-benefit plans 161
Contributions –384
Effect from acquisitions/disposals, net –1
Curtailments –47
Currency translation differences –7
Provision for pensions, net 1,609
Key actuarial assumptions (weighted average) 1 1 Jan 2004 31 Dec 2004
Discount rate 5.6% 5.2%
Expected return on plan assets 7.1% 6.9%
Future salary increases 1.9% 2.1%
Future pension increases 1.2% 1.5%
Future medical-benefit increases 9.0% 8.0%
Expected inflation 2.4% 2.5%1 The actuarial assumptions have been used in calculating the defined-benefit pension
obligations.
Pensions with AlectaCommitments for old-age pensions and family pensions for salaried employ-ees in Sweden are guaranteed in part through insurance with Alecta. Accord-ing to statement URA 42 from the Swedish Financial Accounting StandardsCouncil’s Emerging Issues Taskforce, this is a defined-benefit plan that cov-ers many employers. For the 2004 financial year the company has not hadaccess to information making it possible to report this plan as a defined-benefit plan. Pension plans in accordance with ITP that are guaranteedthrough insurance with Alecta are therefore reported as defined-contributionplans. The year’s contributions that are contracted to Alecta amount to SEK9 M. Alecta’s surplus may be distributed to the policy-holders and/or the per-sons insured. At the end of 2004 Alecta’s surplus expressed as collectiveconsolidation level amounted to 128.0 percent (119.9). Collective consolida-tion level consists of the market value of Alecta’s assets as a percentage of itsinsurance commitments calculated according to Alecta’s actuarial calculationassumptions, which do not comply with RR 29.
Note 18 Other provisions
Group
SEK M 2004 2003
Restructuring 586 935
Other 93 –
Total 679 935
Note 19 Long-term liabilities due for payment laterthan five years after the financial year-end
Group
SEK M 2004 2003
Liabilities to credit institutions 46 44
Other liabilities – 1
Total 46 45
Note 20 Corporate credit line
Overdrafts granted to the Group totaled SEK 1,024 M (903), of whichSEK 204 M (264) was utilized.
Note 21 Convertible debenture bonds
Group
SEK M 2004 2003
Incentive 2001 902 907
Incentive 2004 902 –
Total 1,804 907
69

Note 21 cont.
INCENTIVE 2001 has a variable interest rate equivalent to 0.9*EURIBOR + 54basis points. Convertible debenture loans within INCENTIVE 2001 can beconverted from October 2006. Full conversion at a conversion rate of EUR15.80 for Bond 1, of EUR 19.00 for Bond 2, of EUR 22.10 for Bond 3 and ofEUR 25.30 for Bond 4 will add 5,017,432 shares. The dilution effects with fullconversion will amount to 1.4 percent of share capital and 0.9 percent of thetotal number of votes.
INCENTIVE 2004 has a variable interest rate equivalent to 0.9*EURIBOR + 47basis points. Convertible debenture loans within INCENTIVE 2004 can beconverted from March 2009. Full conversion at a conversion rate of EUR10.20 for Bond 1, of EUR 12.20 for Bond 2, of EUR 14.30 for Bond 3 and ofEUR 16.30 for Bond 4 will add 7,782,155 shares. The dilution effects with fullconversion will amount to 2.1 percent of share capital and 1.4 percent of thetotal number of votes.
Full conversion of both programs will add a total of 12,799,587 shares andresult in dilution effects amounting to 3.4 percent of share capital and 2.3percent of the total number of votes. Each program has a total value of EUR100 M.
Note 22 Accrued expenses and prepaid income
Group Parent company
SEK M 2004 2003 2004 2003
Personnel-related expenses 964 747 29 13
Customer-related expenses 295 175 – –
Interest expenses 58 87 – –
Prepaid income 54 43 28 24
Other 718 810 7 7
Total 2,089 1,862 64 44
Note 23 Assets pledged
Group
SEK M 2004 2003
Relating to long-term liabilities to credit institutions:
Real-estate mortgages 43 46
Chattel mortgages 0 0
Total 43 46
Note 24 Contingent liabilities
Group Parent company
SEK M 2004 2003 2004 2003
Guarantees 119 120 118 109
Guarantees on behalf of subsidiaries 692 567 7,275 7,104
Other 6 9 – –
Total 817 696 7,393 7,213
Notes
70
Note 25 Average number of employees by country and by gender
Women Men Total
Group 2004 2003 2004 2003 2004 2003
USA 1,880 1,919 4,389 4,505 6,269 6,424
Mexico 1,992 2,113 1,235 1,282 3,227 3,395
France 918 926 1,444 1,491 2,362 2,417
China 1,082 1,035 1,084 1,008 2,166 2,043
United Kingdom 780 813 927 946 1,707 1,759
Sweden 552 492 836 790 1,388 1,282
Germany 472 471 788 790 1,260 1,261
Finland 424 420 680 687 1,104 1,107
Australia 396 392 630 589 1,026 981
Romania 385 351 553 470 938 821
Spain 297 310 636 667 933 977
Czech Republic 475 460 376 362 851 822
South Africa 360 324 389 345 749 669
Norway 202 219 461 468 663 687
Netherlands 106 100 551 320 657 420
South America 141 156 508 546 649 702
Italy 242 253 278 285 520 538
New Zealand 165 145 328 362 493 507
Switzerland 198 122 250 184 448 306
Israel 104 67 265 273 369 340
Canada 64 60 292 256 356 316
Denmark 126 118 152 154 278 272
Belgium 69 64 132 117 201 181
Other countries 192 175 354 306 546 481
Total 11,622 11,505 17,538 17,203 29,160 28,708
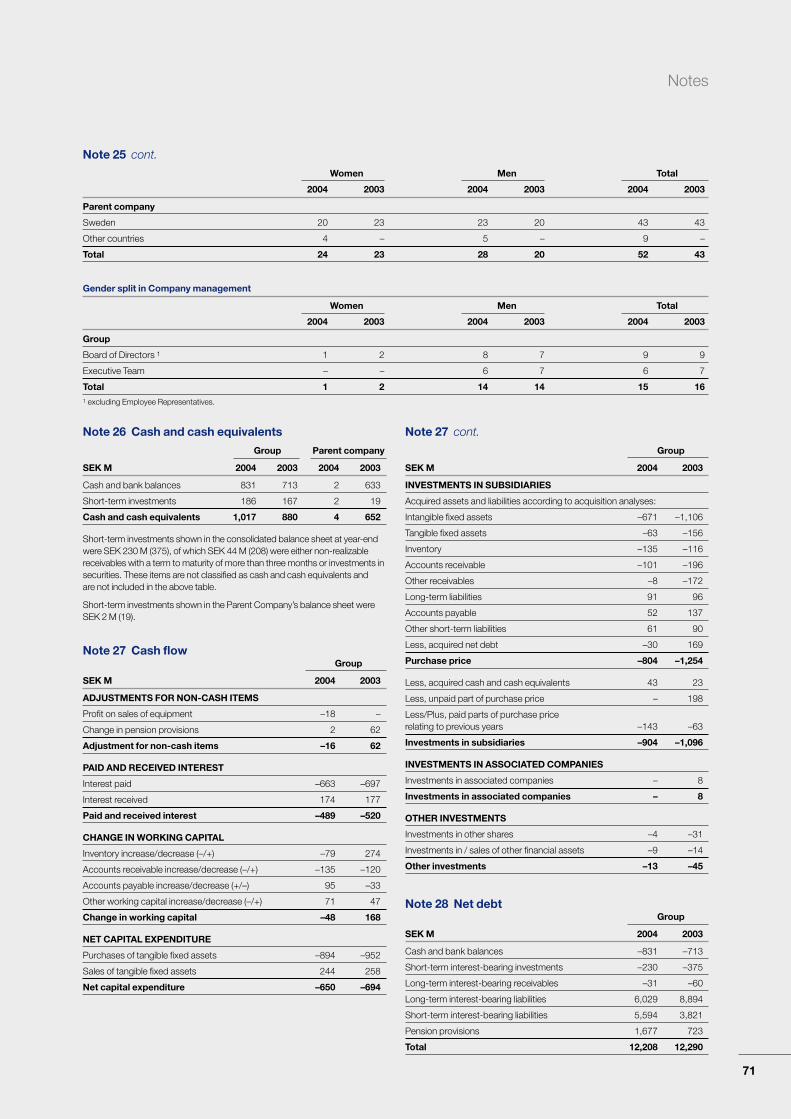
Notes
Note 25 cont.
Women Men Total
2004 2003 2004 2003 2004 2003
Parent company
Sweden 20 23 23 20 43 43
Other countries 4 – 5 – 9 –
Total 24 23 28 20 52 43
Gender split in Company management
Women Men Total
2004 2003 2004 2003 2004 2003
Group
Board of Directors 1 1 2 8 7 9 9
Executive Team – – 6 7 6 7
Total 1 2 14 14 15 161 excluding Employee Representatives.
71
Note 26 Cash and cash equivalents
Group Parent company
SEK M 2004 2003 2004 2003
Cash and bank balances 831 713 2 633
Short-term investments 186 167 2 19
Cash and cash equivalents 1,017 880 4 652
Short-term investments shown in the consolidated balance sheet at year-endwere SEK 230 M (375), of which SEK 44 M (208) were either non-realizablereceivables with a term to maturity of more than three months or investments insecurities. These items are not classified as cash and cash equivalents andare not included in the above table.
Short-term investments shown in the Parent Company’s balance sheet wereSEK 2 M (19).
Note 27 Cash flow Group
SEK M 2004 2003
ADJUSTMENTS FOR NON-CASH ITEMS
Profit on sales of equipment –18 –
Change in pension provisions 2 62
Adjustment for non-cash items –16 62
PAID AND RECEIVED INTEREST
Interest paid –663 –697
Interest received 174 177
Paid and received interest –489 –520
CHANGE IN WORKING CAPITAL
Inventory increase/decrease (–/+) –79 274
Accounts receivable increase/decrease (–/+) –135 –120
Accounts payable increase/decrease (+/–) 95 –33
Other working capital increase/decrease (–/+) 71 47
Change in working capital –48 168
NET CAPITAL EXPENDITURE
Purchases of tangible fixed assets –894 –952
Sales of tangible fixed assets 244 258
Net capital expenditure –650 –694
Note 27 cont.
Group
SEK M 2004 2003
INVESTMENTS IN SUBSIDIARIES
Acquired assets and liabilities according to acquisition analyses:
Intangible fixed assets –671 –1,106
Tangible fixed assets –63 –156
Inventory –135 –116
Accounts receivable –101 –196
Other receivables –8 –172
Long-term liabilities 91 96
Accounts payable 52 137
Other short-term liabilities 61 90
Less, acquired net debt –30 169
Purchase price –804 –1,254
Less, acquired cash and cash equivalents 43 23
Less, unpaid part of purchase price – 198
Less/Plus, paid parts of purchase price relating to previous years –143 –63
Investments in subsidiaries –904 –1,096
INVESTMENTS IN ASSOCIATED COMPANIES
Investments in associated companies – 8
Investments in associated companies – 8
OTHER INVESTMENTS
Investments in other shares –4 –31
Investments in / sales of other financial assets –9 –14
Other investments –13 –45
Note 28 Net debtGroup
SEK M 2004 2003
Cash and bank balances –831 –713
Short-term interest-bearing investments –230 –375
Long-term interest-bearing receivables –31 –60
Long-term interest-bearing liabilities 6,029 8,894
Short-term interest-bearing liabilities 5,594 3,821
Pension provisions 1,677 723
Total 12,208 12,290

As shown in the consolidated balance sheet, the Group’s unrestricted equity amounts to SEK 976 M (1,194). No transfer to the Group’s restricted equity is required.
The following unappropriated earnings are available for disposition by the shareholders at the Annual General Meeting:
Net income for the year: SEK 3,869 MUnappropriated earnings brought forward: SEK 2,014 M
Total: SEK 5,883 M
The Board of Directors and the President and CEO propose that a dividend of SEK 2.60 per share, a maximum total of SEK 951 M, be distributed to shareholders and that the remainder, SEK 4,932 M, be carried forward
to the new financial year.
Stockholm, 16 February 2005
Georg Ehrnrooth Melker Schörling Carl-Henric SvanbergChairman Vice Chairman Vice Chairman
Bo Dankis Carl Douglas Gustaf Douglas President and CEO
Per-Olof Eriksson Lotta Lundén Sven-Christer Nilsson
Seppo Liimatainen Mats PerssonEmployee representative Employee representative
Our audit report was issued on 16 February 2005
PricewaterhouseCoopers AB
Anders LundinAuthorized Public Accountant
Proposed disposition of earnings
72

Audit report
To the General Meeting of the shareholders of ASSA ABLOY ABCorporate Organization number 556059-3575
We have audited the annual accounts, the consolidated accounts, the accounting records and the administration of theBoard of Directors and the President of ASSA ABLOY AB for the year 2004. The Board of Directors and the President areresponsible for accounting and administration and for ensuring that the annual accounts and consolidated accounts com-ply with the Annual Accounts Act. Our responsibility is to express an opinion on the annual accounts, the consolidatedaccounts and the administration, based on our audit.
We conducted our audit in accordance with generally accepted auditing standards in Sweden. Those standards requirethat we plan and perform the audit to obtain reasonable assurance that the annual accounts and the consolidated accountsare free of material misstatement. An audit includes examining, on a test basis, evidence supporting the amounts and dis-closures in the accounts. An audit also includes assessing the accounting principles used and their application by the Boardof Directors and the President, judging the significant estimates made by the Board of Directors and the President in draw-ing up the annual accounts and the consolidated accounts, and evaluating the overall presentation of information in theannual accounts and the consolidated accounts. As a basis for our opinion concerning discharge from liability, we exam-ined significant decisions, actions taken and circumstances of the Company in order to be able to determine the liability, ifany, to the Company of any Board member or the President. We also examined whether any Board member or the Presi-dent has, in any other way, acted in contravention of the Companies Act, the Annual Accounts Act or the Articles of Asso-ciation. We believe that our audit provides a reasonable basis for our opinion set out below.
The annual accounts and the consolidated accounts have been prepared in accordance with the Annual Accounts Actand give thereby a true and fair view of the Company’s and the Group’s financial position and results of operations inaccordance with generally accepted accounting principles in Sweden. The Directors’ Report is consistent with the rest ofthe annual accounts and the consolidated accounts.
We recommend to the General Meeting of shareholders that the income statements and balance sheets of the ParentCompany and the Group be adopted, that the profit for the Parent Company be dealt with in accordance with the proposalin the administration report and that the members of the Board of Directors and the President be discharged from liabilityfor the financial year.
Stockholm, 16 February 2005
PricewaterhouseCoopers AB
Anders LundinAuthorized Public Accountant
73
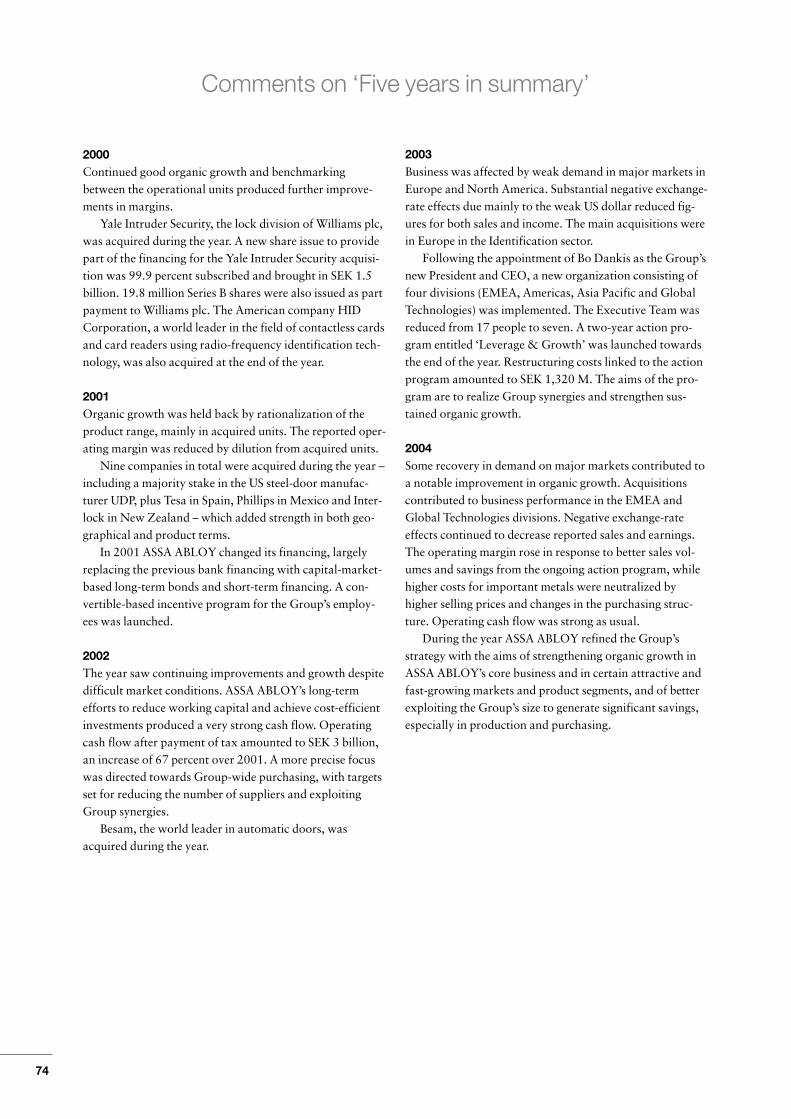
2000Continued good organic growth and benchmarkingbetween the operational units produced further improve-ments in margins.
Yale Intruder Security, the lock division of Williams plc,was acquired during the year. A new share issue to providepart of the financing for the Yale Intruder Security acquisi-tion was 99.9 percent subscribed and brought in SEK 1.5billion. 19.8 million Series B shares were also issued as partpayment to Williams plc. The American company HIDCorporation, a world leader in the field of contactless cardsand card readers using radio-frequency identification tech-nology, was also acquired at the end of the year.
2001Organic growth was held back by rationalization of theproduct range, mainly in acquired units. The reported oper-ating margin was reduced by dilution from acquired units.
Nine companies in total were acquired during the year –including a majority stake in the US steel-door manufac-turer UDP, plus Tesa in Spain, Phillips in Mexico and Inter-lock in New Zealand – which added strength in both geo-graphical and product terms.
In 2001 ASSA ABLOY changed its financing, largelyreplacing the previous bank financing with capital-market-based long-term bonds and short-term financing. A con-vertible-based incentive program for the Group’s employ-ees was launched.
2002The year saw continuing improvements and growth despitedifficult market conditions. ASSA ABLOY’s long-termefforts to reduce working capital and achieve cost-efficientinvestments produced a very strong cash flow. Operatingcash flow after payment of tax amounted to SEK 3 billion,an increase of 67 percent over 2001. A more precise focuswas directed towards Group-wide purchasing, with targetsset for reducing the number of suppliers and exploitingGroup synergies.
Besam, the world leader in automatic doors, wasacquired during the year.
2003Business was affected by weak demand in major markets inEurope and North America. Substantial negative exchange-rate effects due mainly to the weak US dollar reduced fig-ures for both sales and income. The main acquisitions werein Europe in the Identification sector.
Following the appointment of Bo Dankis as the Group’snew President and CEO, a new organization consisting offour divisions (EMEA, Americas, Asia Pacific and GlobalTechnologies) was implemented. The Executive Team wasreduced from 17 people to seven. A two-year action pro-gram entitled ‘Leverage & Growth’ was launched towardsthe end of the year. Restructuring costs linked to the actionprogram amounted to SEK 1,320 M. The aims of the pro-gram are to realize Group synergies and strengthen sus-tained organic growth.
2004Some recovery in demand on major markets contributed toa notable improvement in organic growth. Acquisitionscontributed to business performance in the EMEA andGlobal Technologies divisions. Negative exchange-rateeffects continued to decrease reported sales and earnings.The operating margin rose in response to better sales vol-umes and savings from the ongoing action program, whilehigher costs for important metals were neutralized byhigher selling prices and changes in the purchasing struc-ture. Operating cash flow was strong as usual.
During the year ASSA ABLOY refined the Group’sstrategy with the aims of strengthening organic growth inASSA ABLOY’s core business and in certain attractive andfast-growing markets and product segments, and of betterexploiting the Group’s size to generate significant savings,especially in production and purchasing.
Comments on ‘Five years in summary’
74

Five years in summary
(Amounts in SEK M unless stated otherwise) 2000 1 2001 2002 2003 2004
Sales and income
Sales 14,394 22,510 25,397 24,080 25,526
Organic growth, % 5 3 2 0 5
Acquired growth, % 32 44 15 5 5
Operating income before depreciation and amortization (EBITDA) 2,705 4,020 4,545 4,249 4,642
Depreciation and amortization 985 1,721 1,907 1,856 1,872
Operating income before goodwill amortization (EBITA) 2,107 3,159 3,595 3,352 3,748
Operating income (EBIT) 1,720 2,133 2,638 1,073 2,770
Income before tax (EBT) 1,402 1,476 2,015 583 2,294
Net income 915 949 1,270 9 1,495
Cash flow
Cash flow from operating activities 1,799 2,631 3,847 3,180 3,339
Cash flow from investing activities –5,189 –7,112 –4,268 –1,827 –1,505
Cash flow from financing activities 4,609 4,259 568 –1,772 –1,734
Cash flow 1,219 –222 146 –419 100
Operating cash flow 1,756 2,338 3,525 3,265 3,439
Capital employed and financing
Capital employed 19,779 27,861 26,701 22,984 22,683
– of which, goodwill 12,078 16,371 16,213 14,766 14,012
Net debt 8,560 15,534 13,989 12,290 12,208
Minority interests 560 481 331 16 27
Shareholders’ equity 10,659 11,846 12,381 10,678 10,448
Data per share, SEK
Earnings per share after tax and before conversion 2.76 2.99 2 3.53 3.30 2 4.09
Earnings per share after tax and full conversion (EPS) 2.73 2.98 2 3.53 3.31 2 4.05
Earnings per share after tax and full conversion excluding goodwill 3.88 5.39 2 6.13 5.89 2 6.66
Cash earnings per share after tax and full conversion (CEPS) 5.81 8.07 2 9.08 8.61 2 9.06
Shareholders’ equity per share after full conversion 30.58 35.80 35.85 31.23 32.66
Dividend per share (for 2004, as proposed by the Board) 0.90 1.00 1.25 1.25 2.60
Price of Series B share at year-end 184.50 151.00 99.50 85.50 113.50
Key data
Gross margin (EBITDA), % 18.8 17.9 17.9 17.6 18.2
Operating margin before goodwill amortization (EBITA), % 14.6 14.0 14.2 13.9 14.7
Operating margin (EBIT), % 12.0 10.2 2 10.4 9.9 2 10.9
Profit margin (EBT), % 9.7 7.3 2 7.9 7.9 2 9.0
Return on capital employed, % 13.7 9.7 2 9.9 9.6 2 11.8
Return on capital employed before goodwill amortization, % 16.7 13.3 2 13.4 13.3 2 16.0
Return on shareholders’ equity, % 13.3 8.9 2 9.9 9.9 2 13.2
Equity ratio, % 43.1 35.6 38.2 35.9 35.6
Net debt / Equity ratio, times 0.80 1.31 1.13 1.15 1.17
Interest coverage ratio, times 5.5 3.5 3.9 4.7 5.7
Interest on convertible debenture loan after tax, SEK M 8.5 9.0 27.2 17.8 24.0
Number of shares, thousands 352,453 353,751 365,918 365,918 365,918
Number of shares after full conversion, thousands 356,712 361,730 370,935 370,935 378,717
Average number of employees 16,881 24,211 28,754 28,708 29,160
1 Key data for 1999 and 2000 have been adjusted for changes in accounting principles.2 Excluding non-recurring items.
75

THE GROUP IN SUMMARY Full FullQ1 Q2 Q3 Q4 year Q1 Q2 Q3 Q4 year
SEK M 2003 2003 2003 2003 2003 2004 2004 2004 2004 2004
Sales 6,124 5,930 5,930 6,096 24,080 6,283 6,533 6,447 6,263 25,526
Organic growth1 0% –2% 0% 2% 0% 3% 7% 6% 4% 5%
Gross income 2,390 2,299 2,333 2,445 9,467 2,509 2,688 2,633 2,568 10,378
Gross income / sales 39.0% 38.8% 39.3% 40.1% 39.3% 39.9% 40.8% 40.8% 41.0% 40.7%
Operating income before depreciation (EBITDA) 1,078 993 1,044 1,135 4,249 1,120 1,168 1,196 1,158 4,642
Gross margin (EBITDA) 17.6% 16.7% 17.6% 18.6% 17.6% 17.8% 17.9% 18.6% 18.5% 18.2%
Depreciation –232 –223 –219 –223 –897 –230 –232 –220 –212 –894
Operating income before goodwill amortization (EBITA) 846 770 824 912 3,352 890 936 976 946 3,748
Operating margin before goodwill amortization (EBITA) 13.8% 13.0% 13.9% 15.0% 13.9% 14.2% 14.3% 15.1% 15.1% 14.7%
Goodwill amortization –244 –237 –238 –240 –959 –243 –247 –245 –243 –978
Non-recurring items – – – –1,320 –1,320 – – – – –
Operating income (EBIT) 602 533 586 –648 1,073 647 689 731 703 2,770
Operating margin (EBIT) 9.8% 9.0% 9.9% 11.0%3 9.9%3 10.3% 10.6% 11.3% 11.2% 10.9%
Financial items –135 –129 –120 –113 –497 –118 –121 –127 –118 –484
Income before tax (EBT) 468 407 467 –758 583 530 571 605 588 2,294
Profit margin (EBT) 7.6% 6.9% 7.9% 9.2%3 7.9%3 8.4% 8.7% 9.4% 9.4% 9.0%
Tax –165 –143 –165 –83 –556 –183 –197 –208 –204 –792
Minority interests –4 –7 –4 –4 –18 –2 –2 –2 –1 –7
Net income 299 257 299 –845 9 345 372 395 383 1,495
Full FullQ1 Q2 Q3 Q4 year Q1 Q2 Q3 Q4 year
OPERATING CASH FLOW 2003 2003 2003 2003 2003 2004 2004 2004 2004 2004
Operating income before goodwill amortization (EBITA) 846 770 824 912 3,352 890 936 976 946 3,748
Depreciation (excluding goodwill amortization) 232 223 219 223 897 230 232 220 212 894
Net operating capital expenditure –157 –184 –163 –190 –694 –123 –166 –146 –215 –650
Change in working capital –298 –83 291 258 168 –362 –187 135 366 –48
Paid and received interest –88 –169 –107 –156 –520 –45 –144 –67 –233 –489
Non-cash items 29 21 –11 22 62 25 –19 –36 14 –16
Operating cash flow 564 578 1,054 1,069 3,265 6152 6522 1,0822 1,0902 3,4392
Operating cash flow / Income before tax 1.21 1.42 2.26 1.903 1.723 1.16 1.14 1.79 1.85 1.50
Full FullQ1 Q2 Q3 Q4 year Q1 Q2 Q3 Q4 year
CHANGE IN NET DEBT 2003 2003 2003 2003 2003 2004 2004 2004 2004 2004
Net debt at start of period 13,989 13,702 13,405 12,829 13,989 12,290 14,425 14,514 13,331 12,290
Operating cash flow –564 –578 –1,054 –1,069 –3,265 –615 –652 –1,082 –1,090 –3,439
Restructuring payments – – – – – 35 45 112 129 321
Tax paid 333 97 151 198 779 164 322 103 161 750
Acquisitions 106 39 675 535 1,355 830 23 –27 103 929
Dividend – 457 – – 457 – 457 – – 457
Change to RR 29 – – – – – 1,108 – – 56 1,164
Translation differences –162 –312 –348 –203 –1,025 613 –106 –289 –482 –264
Net debt at end of period 13,702 13,405 12,829 12,290 12,290 14,425 14,514 13,331 12,208 12,208
Net debt / Equity ratio 1.10 1.12 1.09 1.15 1.15 1.37 1.40 1.26 1.17 1.17
1 Organic growth relates to comparable units after adjusting for acquisitions and changes in exchange rates.2 Excluding restructuring payments.3 Excluding non-recurring items.
Quarterly information
76

Definitions
Q1 Q2 Q3 Q4 Q1 Q2 Q3 Q4CAPITAL EMPLOYED AND FINANCING 2003 2003 2003 2003 2004 2004 2004 2004
Capital employed 26,452 25,683 24,743 22,984 24,966 24,934 23,949 22,683
– of which, goodwill 15,755 15,137 14,910 14,766 15,432 15,210 14,699 14,012
Net debt 13,702 13,405 12,829 12,290 14,425 14,514 13,331 12,208
Minority interests 315 295 143 16 17 20 20 27
Shareholders’ equity 12,435 11,983 11,772 10,678 10,523 10,400 10,598 10,448
DATA PER SHARE Full FullQ1 Q2 Q3 Q4 year Q1 Q2 Q3 Q4 year
SEK 2003 2003 2003 2003 2003 2004 2004 2004 2004 2004
Earnings per share after tax and before conversion 0.82 0.70 0.82 0.961 3.301 0.94 1.02 1.08 1.05 4.09
Earnings per share after tax and full conversion 0.82 0.71 0.81 0.971 3.311 0.94 1.01 1.07 1.03 4.05
Earnings per share after tax and full conversion excluding goodwill 1.48 1.34 1.46 1.611 5.891 1.60 1.67 1.71 1.68 6.66
Cash earnings per share after tax and full conversion 2.13 2.10 2.09 2.291 8.611 2.18 2.28 2.29 2.31 9.06
Shareholders’ equity per share after full conversion 36.01 34.77 34.14 31.23 31.23 30.87 32.91 33.19 32.66 32.66
Mar Jun Sep Dec Mar Jun Sep DecNUMBER OF SHARES 2003 2003 2003 2003 2004 2004 2004 2004
Number of shares before conversion, thousands2 365,918 365,918 365,918 365,918 365,918 365,918 365,918 365,918
Number of shares after full conversion, thousands2 370,935 370,935 370,935 370,935 370,935 371,449 373,889 375,103
1 Excluding non-recurring items.2 Accumulated weighted average.
Organic growth:Change in sales for comparable units after adjust-ments for acquisitions and exchange-rate effects.
Gross margin (EBITDA):Operating income before depreciation andamortization as a percentage of sales.
Operating margin before goodwill amortization (EBITA):Operating income before goodwill amortization asa percentage of sales.
Operating margin (EBIT):Operating income as a percentage of sales.
Profit margin (EBT):Income before tax as a percentage of sales.
Operating cash flow:See consolidated cash flow statement.
Net capital expenditure:Investments in tangible fixed assets less dispos-als of tangible fixed assets.
Depreciation:Depreciation/amortization of intangible andtangible fixed assets.
Net debt:Interest-bearing liabilities less interest-bearinginvestments.
Capital employed:Total assets less interest-bearing assets and non-interest-bearing liabilities including deferred taxliability.
Equity ratio:Shareholders‘ equity including minority interestsas a percentage of total assets.
Interest coverage ratio:Income before tax plus net interest divided by netinterest.
Return on shareholders‘ equity:Net income plus interest expenses after tax forconvertible debenture loans as a percentage ofaverage shareholders‘ equity after full conversion.
Return on capital employed before goodwill amortization:Income before tax plus net interest and goodwillamortization as a percentage of average capitalemployed.
Return on capital employed:Income before tax plus net interest as a percent-age of average capital employed.
Earnings per share after tax and full conversion:Net income plus interest expenses after tax forconvertible debenture loans divided by weightedaverage number of shares after full conversion.
Earnings per share after tax and full conversion excluding goodwill:Net income excluding goodwill amortization plusinterest expenses after tax for convertible deben-ture loans divided by weighted average number ofshares after full conversion.
Cash earnings per share after tax and full conversion:Net income plus interest expenses after tax forconvertible debenture loans, plus depreciationand amortization, plus profit share from minorityinterests, less profit share from associated com-panies and adjustments for changes in deferredtax, divided by weighted average number ofshares after full conversion.
Shareholders’ equity per share after full conversion:Shareholders‘ equity plus convertible debentureloans divided by numbers of shares after full con-version.
77
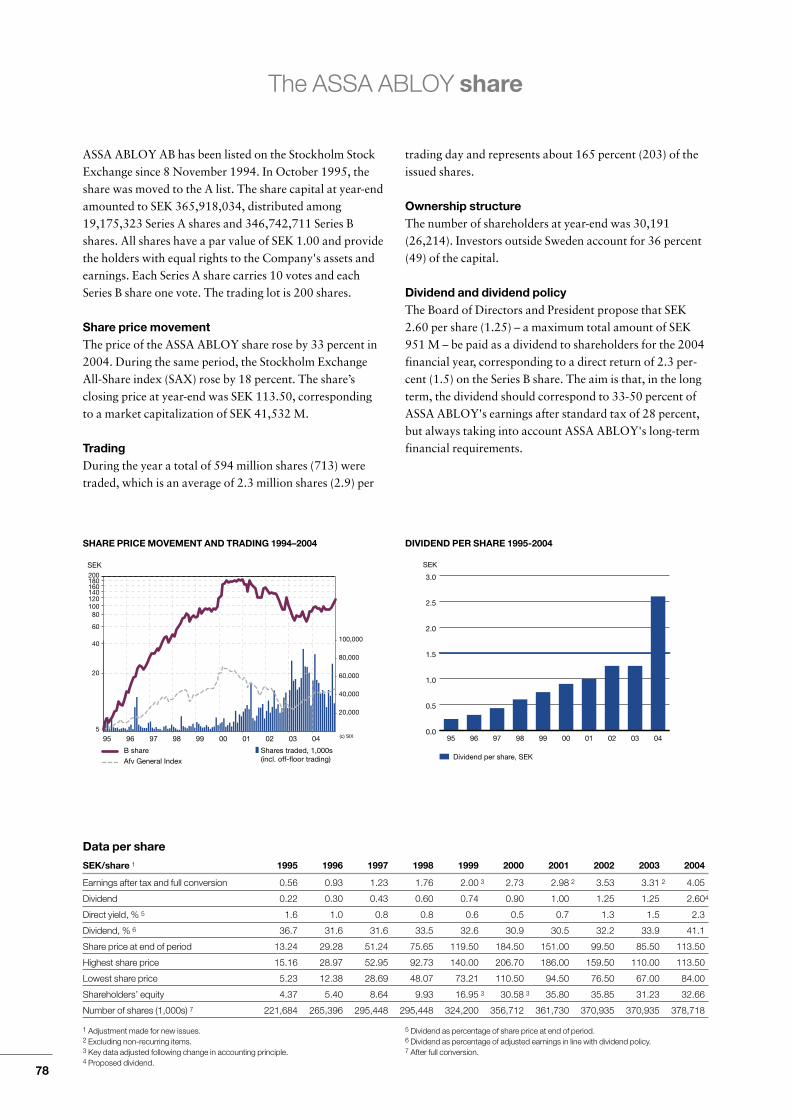
ASSA ABLOY AB has been listed on the Stockholm StockExchange since 8 November 1994. In October 1995, theshare was moved to the A list. The share capital at year-endamounted to SEK 365,918,034, distributed among19,175,323 Series A shares and 346,742,711 Series Bshares. All shares have a par value of SEK 1.00 and providethe holders with equal rights to the Company's assets andearnings. Each Series A share carries 10 votes and eachSeries B share one vote. The trading lot is 200 shares.
Share price movementThe price of the ASSA ABLOY share rose by 33 percent in2004. During the same period, the Stockholm ExchangeAll-Share index (SAX) rose by 18 percent. The share’sclosing price at year-end was SEK 113.50, correspondingto a market capitalization of SEK 41,532 M.
TradingDuring the year a total of 594 million shares (713) weretraded, which is an average of 2.3 million shares (2.9) per
trading day and represents about 165 percent (203) of theissued shares.
Ownership structureThe number of shareholders at year-end was 30,191(26,214). Investors outside Sweden account for 36 percent(49) of the capital.
Dividend and dividend policyThe Board of Directors and President propose that SEK2.60 per share (1.25) – a maximum total amount of SEK951 M – be paid as a dividend to shareholders for the 2004financial year, corresponding to a direct return of 2.3 per-cent (1.5) on the Series B share. The aim is that, in the longterm, the dividend should correspond to 33-50 percent ofASSA ABLOY's earnings after standard tax of 28 percent,but always taking into account ASSA ABLOY's long-termfinancial requirements.
Data per share
SEK/share 1 1995 1996 1997 1998 1999 2000 2001 2002 2003 2004
Earnings after tax and full conversion 0.56 0.93 1.23 1.76 2.00 3 2.73 2.98 2 3.53 3.31 2 4.05
Dividend 0.22 0.30 0.43 0.60 0.74 0.90 1.00 1.25 1.25 2.604
Direct yield, % 5 1.6 1.0 0.8 0.8 0.6 0.5 0.7 1.3 1.5 2.3
Dividend, % 6 36.7 31.6 31.6 33.5 32.6 30.9 30.5 32.2 33.9 41.1
Share price at end of period 13.24 29.28 51.24 75.65 119.50 184.50 151.00 99.50 85.50 113.50
Highest share price 15.16 28.97 52.95 92.73 140.00 206.70 186.00 159.50 110.00 113.50
Lowest share price 5.23 12.38 28.69 48.07 73.21 110.50 94.50 76.50 67.00 84.00
Shareholders’ equity 4.37 5.40 8.64 9.93 16.95 3 30.58 3 35.80 35.85 31.23 32.66
Number of shares (1,000s) 7 221,684 265,396 295,448 295,448 324,200 356,712 361,730 370,935 370,935 378,718
1 Adjustment made for new issues. 2 Excluding non-recurring items.3 Key data adjusted following change in accounting principle. 4 Proposed dividend.
5 Dividend as percentage of share price at end of period. 6 Dividend as percentage of adjusted earnings in line with dividend policy.7 After full conversion.
The ASSA ABLOY share
78
B share
Afv General Index
Shares traded, 1,000s (incl. off-floor trading)
(c) SIX
SEK
20,000
40,000
60,000
80,000
100,000
20
40
60
80 100 120 140 160 180 200
95 96 97 98 99 00 01 02 03 045 0.0
0.5
1.0
1.5
2.0
2.5
3.0
04030201009998979695
Dividend per share, SEK
SEK
SHARE PRICE MOVEMENT AND TRADING 1994–2004 DIVIDEND PER SHARE 1995-2004

The ASSA ABLOY share
Share capital
Year Transaction A shares C shares B shares Share capital, SEK1
1989 20,000 2,000,000
1994 100:1 split 2,000,000 2,000,000
1994 Bonus issue
1994 Non-cash issue 1,746,005 1,428,550 50,417,555 53,592,110
1996 New share issue 2,095,206 1,714,260 60,501,066 64,310,532
1996 Conversion of C shares into A shares 3,809,466 60,501,066 64,310,532
1997 New share issue 4,190,412 66,541,706 70,732,118
1998 Converted debentures 4,190,412 66,885,571 71,075,983
1999 Converted debentures before split 4,190,412 67,179,562 71,369,974
1999 Bonus issue
1999 4:1 split 16,761,648 268,718,248 285,479,896
1999 New share issue 18,437,812 295,564,487 314,002,299
1999 Converted debentures after split and new issues 18,437,812 295,970,830 314,408,642
2000 Converted debentures 18,437,812 301,598,383 320,036,195
2000 New share issue 19,175,323 313,512,880 332,688,203
2000 Non-cash issue 19,175,323 333,277,912 352,453,235
2001 Converted debentures 19,175,323 334,576,089 353,751,412
2002 New share issue 19,175,323 344,576,089 363,751,412
2002 Converted debentures 19,175,323 346,742,711 365,918,034
Number of shares after full conversion 19,175,323 359,542,298 378,717,621
1 SEK 1 per share – number of shares at end of period.
ASSA ABLOY’s 10 largest shareholdersBased on the share register at 31 December 2004.
Owner A shares B shares Capital, % Voting rights, %
Investment AB Latour 6,746,425 20,000,000 7.3 16.2
SäkI 7,118,818 2,000,000 2.5 13.6
Melker Schörling and companies 5,310,080 9,296,636 4.0 11.6
Robur unit trusts 19,485,973 5.3 3.6
Wärtsilä Corporation 17,270,350 4.7 3.2
SEB 11,114,000 3.0 2.1
AMF pension 10,680,600 2.9 2.0
Nordea unit trusts 9,891,738 2.7 1.8
The third National Swedish Pension fund 9,567,179 2.6 1.8
Alecta 8,402,200 2.3 1.6
Other shareholders 229,034,035 62.6 42.5
Total number 19,175,323 346,742,711 100.0 100.0
Source: SIS Ägarservice AB and VPC AB.
Ownership structure at 31 December 2004
No. of Shareholding No. of shareholders Percent shares Capital, % Voting rights, %
1–1,000 24,563 81.4 7,508,540 2.1 1.4
1,001–5,000 4,105 13.6 9,462,600 2.6 1.8
5,001–20,000 907 3.0 9,256,964 2.5 1.7
20,001–50,000 237 0.8 7,634,909 2.1 1.4
50,001–500,000 267 0.9 41,679,781 11.4 7.7
500,000– 112 0.4 290,375,240 79.4 86.0
Total 30,191 100.0 365,918,034 100.0 100.0
Source: SIS Ägarservice AB.
79
Convertible debentures for personnelThe ASSA ABLOY Group has issued several convertibledebentures to employees in the Group. The first debenturewas issued in 1995 and about 400 employees participatedin the issue. The debenture amounted to about SEK 75 Mand ran from 29 June 1995 to 30 June 2000. The seconddebenture was issued in 1997. A total of 1,400 employeesparticipated in this issue. This debenture amounted to SEK250 M and ran from 8 December 1997 to 2 December2002.
In 2001 a convertible debenture, Incentive 2001, wasissued, based on four series of convertible bonds each witha value of EUR 25 M. The only difference between theseries of bonds is the conversion price. On full conversion,at a conversion price for Series 1 of EUR 15.80, Series 2 ofEUR 19.00, Series 3 of EUR 22.10 and Series 4 of EUR
25.30, an additional 5,017,432 shares would be created.The convertible bonds can be converted in October/November 2006.
In 2004 a further convertible debenture, Incentive 2004,was issued. Like Incentive 2001, this is based on four seriesof convertible bonds each with a value of EUR 25 M. Theonly difference between the series of bonds is the conver-sion price. On full conversion, at a conversion price forSeries 1 of EUR 10.20, Series 2 of EUR 12.20, Series 3 ofEUR 14.30 and Series 4 of EUR 16.30, an additional7,782,155 shares would be created. The convertible bondscan be converted from March 2009.
Over 4,000 employees in more than 15 countries areparticipating in the two current Incentive programs, Incentive 2001 and Incentive 2004.
Financial analysts who follow ASSA ABLOY
Company Name Telephone number E-mail
ABG Sundal Collier Anders Jegers +44 207 9055 631 [email protected]
Alfred Berg ABN AMRO Henrik Fröjd +46 8 572 358 33 [email protected]
CAI Cheuvreux Sasu Ristimäki +44 207 621 5173 [email protected]
Carnegie Anders Idborg +46 8 676 86 88 [email protected]
Cazenove Ilan Chaitowitz +44 207 155 8207 [email protected]
CSFB Patrick Marshall +44 207 888 0289 [email protected]
Dresdner Kleinwort Wasserstein Colin Grant +44 207 475 9161 [email protected]
Enskilda Securities Julian Beer +46 8 522 296 52 [email protected]
Goldman Sachs James Moore +44 207 774 1515 [email protected]
Hagströmer & Qviberg Patric Lindqvist +46 8 696 20 84 [email protected]
Handelsbanken Henrik Saläng +46 8 701 12 51 [email protected]
JP Morgan Nick Paton +44 207 325 5044 [email protected]
Kaupthing Bank Sverige AB Peder Frölén +46 8 791 47 86 [email protected]
Lehman Brothers Brian Hall +44 207 102 4726 [email protected]
Merrill Lynch Raymond Greaves +44 207 996 4783 [email protected]
Morgan Stanley Daniel Cunliffe +44 207 425 2057 [email protected]
Swedbank Anders Bruzelius +46 8 585 912 88 [email protected]
UBS Anders Fagerlund +46 8 453 73 30 [email protected]
Öhman J:or Fondkommission AB Johan Gahm +46 8 402 52 68 [email protected]
The ASSA ABLOY share
80
Information for shareholders
Annual General MeetingThe Annual General Meeting of ASSA ABLOY will be held in the Great Hall of the Royal Academy of Music,Nybrokajen 11, Stockholm at 15.30 on Wednesday 27April 2005. Shareholders wishing to attend the AnnualGeneral Meeting should:– be registered in the share register kept by VPC AB no later
than Friday 15 April 2005;– notify ASSA ABLOY AB of their intention to attend by
16.00 on Thursday 21 April 2005.
Registration in the share registerASSA ABLOY’s share register is kept by VPC. Only hold-ings registered by a shareholder are recorded under theshareholder’s own name in the register. Shareholders withnominee-registered shares can attend the Annual GeneralMeeting only if they register their holdings under their ownnames. Shares must be registered to the shareholder byFriday 15 April 2005 at the latest.
Notification of intention to attendShareholders must notify ASSA ABLOY of their intentionto attend the Annual General Meeting no later than 16.00on Thursday 21 April via:– Website www.assaabloy.com– E-mail [email protected]– Post ASSA ABLOY AB, ‘Bolagsstämma’,
Box 70340, SE-107 23 Stockholm, Sweden– Telephone +46 8 506 485 00– Fax +46 8 506 485 85
The notification should state:– Name– Personal identity number or Corporate Organization
number– Address and daytime telephone number– Number of shares held
Shareholders who are to be represented by a proxy shouldsend a form of appointment with their notification. Thosewho represent corporate bodies should present a copy oftheir proof of registration or similar document confirmingtheir due authority.
Nomination CommitteeThe duty of the Nomination Committee is, before eachAnnual General Meeting, to consider in advance the choiceof Board members, the remuneration of the Board andassociated matters. The Committee is appointed at theAnnual General Meeting. The current members of theNomination Committee before the 2005 Annual GeneralMeeting are Gustaf Douglas (Chairman), Georg Ehrnroothand Melker Schörling, plus two representatives of themajor institutional shareholders, Marianne Nilsson ofRobur and Staffan Grefbäck of Alecta.
Entitlement to dividendMonday 2 May 2005 has been set as the qualification dayfor dividends. If the Annual General Meeting decides to fol-low the recommendation of the Board of Directors, divi-dends are expected to be distributed through VPC AB onFriday 6 May 2005.
Reports can be ordered fromASSA ABLOY AB:– Website www.assaabloy.com– Telephone +46 8 506 485 00– Fax +46 8 506 485 85– Post ASSA ABLOY AB
Box 70340SE-107 23 StockholmSweden
Future financial reportsInterim reports:
First quarter: 27 April 2005Second quarter: 17 August 2005Third quarter: 8 November 2005
Fourth quarter and Year-end Report: February 2006
2005 Annual Report: March 2006
81
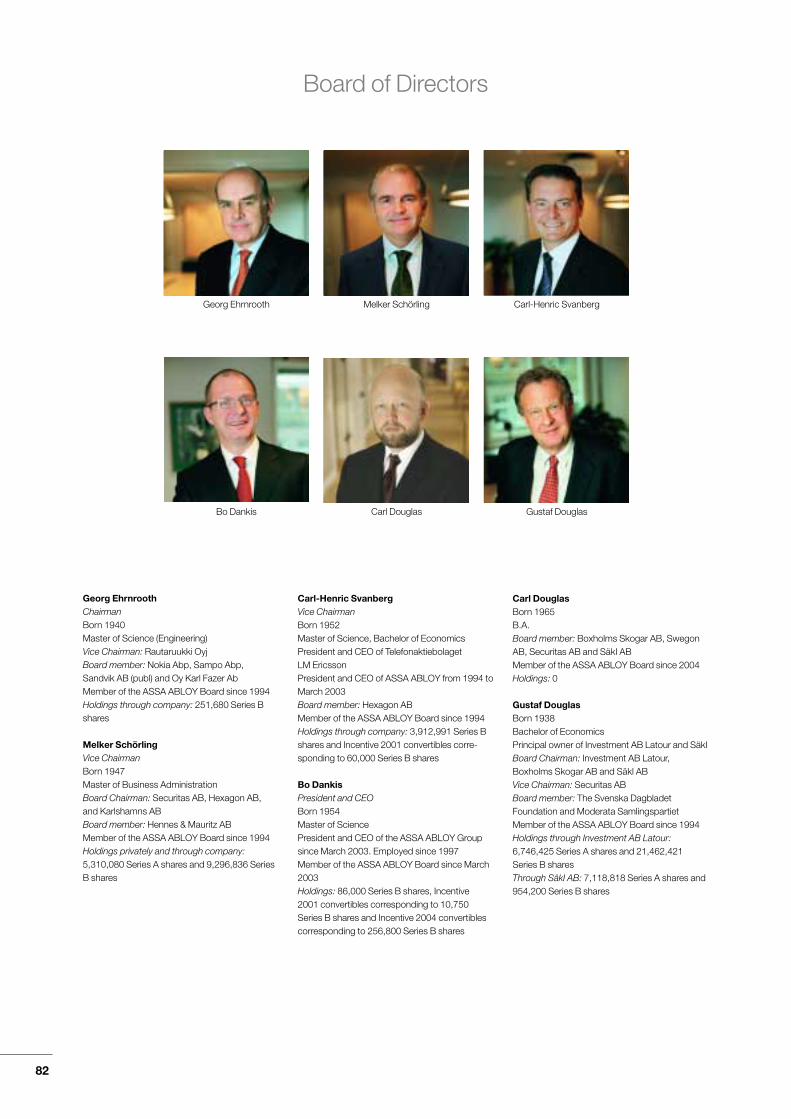
Georg EhrnroothChairmanBorn 1940Master of Science (Engineering)Vice Chairman: Rautaruukki OyjBoard member: Nokia Abp, Sampo Abp,Sandvik AB (publ) and Oy Karl Fazer AbMember of the ASSA ABLOY Board since 1994Holdings through company: 251,680 Series Bshares
Melker SchörlingVice ChairmanBorn 1947Master of Business AdministrationBoard Chairman: Securitas AB, Hexagon AB,and Karlshamns ABBoard member: Hennes & Mauritz ABMember of the ASSA ABLOY Board since 1994Holdings privately and through company:5,310,080 Series A shares and 9,296,836 SeriesB shares
Carl-Henric SvanbergVice ChairmanBorn 1952Master of Science, Bachelor of EconomicsPresident and CEO of TelefonaktiebolagetLM EricssonPresident and CEO of ASSA ABLOY from 1994 toMarch 2003Board member: Hexagon ABMember of the ASSA ABLOY Board since 1994Holdings through company: 3,912,991 Series Bshares and Incentive 2001 convertibles corre-sponding to 60,000 Series B shares
Bo DankisPresident and CEOBorn 1954Master of SciencePresident and CEO of the ASSA ABLOY Groupsince March 2003. Employed since 1997Member of the ASSA ABLOY Board since March2003Holdings: 86,000 Series B shares, Incentive2001 convertibles corresponding to 10,750Series B shares and Incentive 2004 convertibles corresponding to 256,800 Series B shares
Carl DouglasBorn 1965B.A.Board member: Boxholms Skogar AB, SwegonAB, Securitas AB and SäkI ABMember of the ASSA ABLOY Board since 2004Holdings: 0
Gustaf DouglasBorn 1938Bachelor of EconomicsPrincipal owner of Investment AB Latour and SäkIBoard Chairman: Investment AB Latour,Boxholms Skogar AB and Säkl ABVice Chairman: Securitas ABBoard member: The Svenska DagbladetFoundation and Moderata SamlingspartietMember of the ASSA ABLOY Board since 1994Holdings through Investment AB Latour:6,746,425 Series A shares and 21,462,421Series B sharesThrough SäkI AB: 7,118,818 Series A shares and954,200 Series B shares
Board of Directors
82
Georg Ehrnrooth Melker Schörling Carl-Henric Svanberg
Bo Dankis Carl Douglas Gustaf Douglas

Per-Olof ErikssonBorn 1938Master of Engineering, Doctor of Technology h.c.Board Chairman: Callans Trä AB,Odlander,Fredriksson & Co. and Consolis OyBoard member: Senea AB, SSAB Svenskt StålAB, AB Volvo, Investmentbolaget Öresund andElkem ASA. Member of the Royal Swedish Acad-emy of Engineering SciencesMember of the ASSA ABLOY Board since 1995Holdings: 10,000 Series B shares
Lotta LundénBorn 1957Bachelor of EconomicsBoard member: J C, Bergendahlsgruppen,Exportrådet and Glitter. Partner in Koncept-verkstanMember of the ASSA ABLOY Board since 2003Holdings: 0
Sven-Christer NilssonBorn 1944Bachelor of Science (Computer Science)Partner in Startupfactory, a venture capitalcompanyBoard Chairman: The National Swedish PublicService Broadcasting Foundation and Xelerated,Inc. (USA)Board member: TeliaSonera AB, CEVA, Inc.(USA) and Startupfactory B.V. (The Netherlands)Member of the ASSA ABLOY Board since 2001Holdings: 0
Seppo LiimatainenBorn 1950Employee representative, Federation of SalariedEmployees in Industry and ServicesMember of the ASSA ABLOY Board since 2003Holdings: 2,600 Series B shares and Incentive2001 convertibles corresponding to 125 Series B shares
Mats PerssonBorn 1955Employee representative, Swedish Metal WorkersUnionMember of the ASSA ABLOY Board since 1994Holdings: 0
Deputy Members
Joakim JärrebringBorn 1976Employee representativeMember of the ASSA ABLOY Board since 2003Holdings: 0
Per-Edvin NyströmBorn 1955Employee representative, Swedish Metal Workers UnionMember of the ASSA ABLOY Board since 1994Holdings: 7,727 Series B shares, Incentive2001 convertibles corresponding to 125Series B shares and Incentive 2004 convertibles corresponding to 7,800 Series B shares
Auditor
PricewaterhouseCoopers ABAuditor in chargeAnders LundinBorn 1956Authorized Public Accountant
83
Per-Olof Eriksson Lotta Lundén Sven-Christer Nilsson
Seppo Liimatainen Mats Persson Joakim Järrebring Per-Edvin Nyström

Executive Team
84
Bo DankisBorn 1954Master of SciencePresident and Chief Executive OfficerHead of EMEA divisionEmployed since 1997Holdings: 86,000 Series B shares, Incentive2001 convertibles corresponding to 10,750Series B shares and Incentive 2004 convertibles corresponding to 256,800 Series B shares
Göran JanssonBorn 1958Graduate Diploma in Business AdministrationDeputy CEO and Chief Financial OfficerEmployed since 1997Holdings: 230,000 Series B shares, Incentive2001 convertibles corresponding to 60,000Series B shares and Incentive 2004 convertibles corresponding to 171,000 Series B shares
Joseph J. GrilloBorn 1957Bachelor of Finance and EconomicsExecutive Vice President of ASSA ABLOYHead of Global Technologies divisionEmployed since 2001Holdings: Incentive 2001 convertibles corresponding to 32,500 Series B shares andIncentive 2004 convertibles corresponding to132,300 Series B shares
Thanasis MolokotosBorn 1958Master of ScienceExecutive Vice President of ASSA ABLOYHead of Americas divisionEmployed since 1996Holdings: 25,000 Series B shares, Incentive2001 convertibles corresponding to 55,000Series B shares and Incentive 2004 convertibles corresponding to 31,100 Series B shares
Geoff NorcottBorn 1947Bachelor of Engineering Hons. (Industrial),1st classExecutive Vice President of ASSA ABLOYHead of Asia Pacific divisionEmployed since August 2000Holdings: Incentive 2001 convertiblescorresponding to 60,000 Series B shares and Incentive 2004 convertibles corresponding to 101,200 Series B shares
Åke SundBorn 1957Graduate Diploma in MarketingExecutive Vice President of ASSA ABLOYHead of Market and Business DevelopmentEmployed since the Group was formedHoldings: 135,000 Series B shares, Incentive2001 convertibles corresponding to 60,000 Series B shares and Incentive 2004 convertibles corresponding to 93,400 Series B shares
ASSA ABLOY’s Executive Team: Geoff Norcott, Thanasis Molokotos, Åke Sund, Joseph J. Grillo, Göran Jansson and Bo Dankis.

Production: n3prenörEnglish editing: Marcom International
Photographs: Ulf Huett, gettyimages and othersPrinting: Ljungbergs tryckeri AB, Klippan
We are the world’s largest lock Group and
the only global player in our industry. We will draw
benefit from our size to become true leaders in
innovation, cost-efficiency and creating
added value for our customers.
Bo DankisPresident and CEO
ASSA ABLOY AB (publ)P.O. Box 70340, SE-107 23 Stockholm, Sweden · Visiting address: Klarabergsviadukten 90
Tel: +46 8 506 485 00 · Fax: +46 8 506 485 85Corporate Organization no.: 556059-3575
www.assaabloy.com