Annual Report 06 WorleyParsons Annual Report 2006 $2,464.4m REVENUE 2006 The result was earned on...
76
Annual Report 2006
Transcript of Annual Report 06 WorleyParsons Annual Report 2006 $2,464.4m REVENUE 2006 The result was earned on...

Annual Report 2006
2 WorleyParsons Annual Report 2006
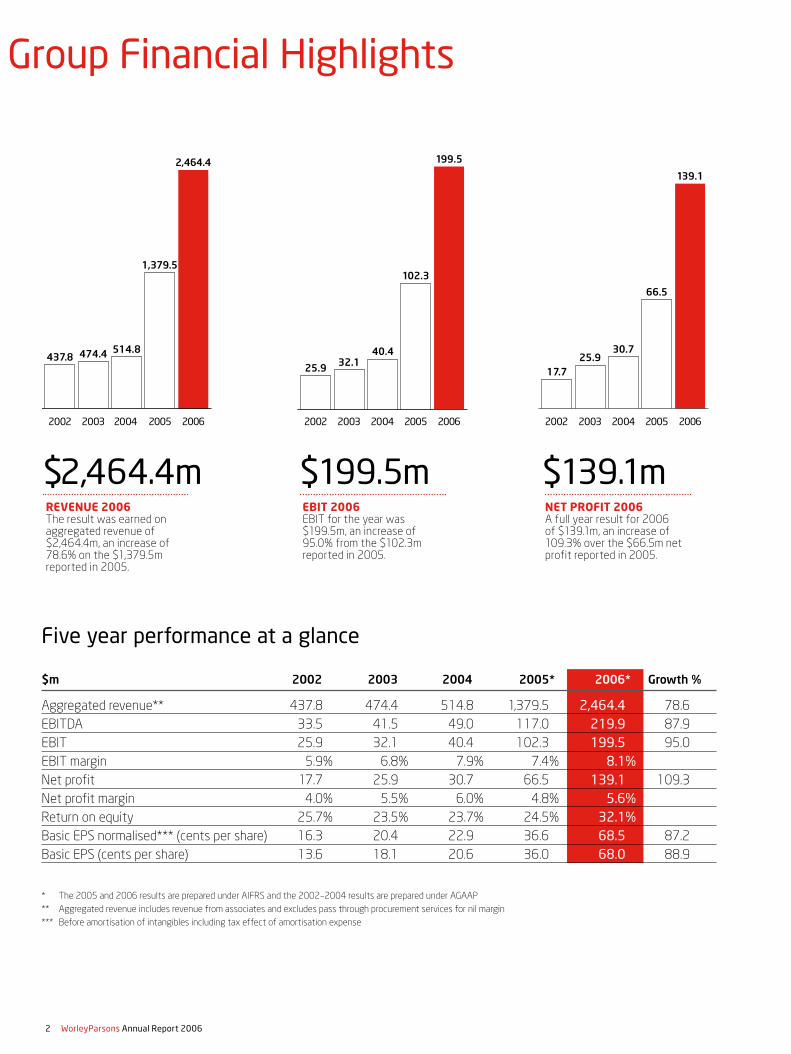
$2,464.4mREVENUE 2006The result was earned on aggregated revenue of $2,464.4m, an increase of 78.6% on the $1,379.5m reported in 2005.
$199.5mEBIT 2006EBIT for the year was $199.5m, an increase of 95.0% from the $102.3m reported in 2005.
$139.1mNET PROFIT 2006A full year result for 2006 of $139.1m, an increase of 109.3% over the $66.5m net profit reported in 2005.
Group Financial Highlights
Five year performance at a glance $m 2002 2003 2004 20 2005* 2006* Growth %
Aggregated revenue** 437.8 474.4 514.8 1,379.5 2,464.4 78.6
EBITDA 33.5 41.5 49.0 117.0 219.9 87.9
EBIT 25.9 32.1 40.4 102.3 199.5 95.0
EBIT margin 5.9% 6.8% 7.9% 7.4% 8.1%
Net profit 17.7 25.9 30.7 66.5 139.1 109.3
Net profit margin 4.0% 5.5% 6.0% 4.8% 5.6%
Return on equity 25.7% 23.5% 23.7% 24.5% 32.1%
Basic EPS normalised*** (cents per share) 16.3 20.4 22.9 36.6 68.5 87.2
Basic EPS (cents per share) 13.6 18.1 20.6 36.0 68.0 88.9
* The 2005 and 2006 results are prepared under AIFRS and the 2002–2004 results are prepared under AGAAP
** Aggregated revenue includes revenue from associates and excludes pass through procurement services for nil margin
*** Before amortisation of intangibles including tax effect of amortisation expense
514.8
1,379.5
437.8 474.4
2004 20052002 2003 20062004 20052002 2003 2006 2004 20052002 2003 2006
2,464.4 199.5
32.140.4
25.9
102.3
30.7
66.5
25.917.7
139.1
WorleyParsons Annual Report 2006 3
ContentsGroup Financial Highlights 2
Chairman’s Letter 5
Chief Executive Officer’s Report 6
Board of Directors 10
Corporate Governance Statement 12
Directors’ Report 18
Financial Statements 32
Shareholder Information 72
Corporate Information 74
The Annual General Meeting will be held as follows
Place: The Observatory Hotel89-113 Kent StreetSydney NSW 2000
Date: Friday 25 October 2006
Time: 2.00 pm
WorleyParsons is a leading provider of professional services to the energy, resource and complex process industries.In these industries, our services cover the full asset spectrum both in size and lifecycle, from the creation of new assets, to services that sustain and enhance the value of operating assets.
AGM
Annual Report 2006

4 WorleyParsons Annual Report 2006
Right: John Grill Chief Executive Officer
Left: Ron McNeilly Chairman and Non-Executive Director
“I believe WorleyParsons has now earned its place in the top tier of professional services firms globally, servicing the ever-growing demand for more effective use of our scarce natural resources.”Ron McNeilly
Chairman
WorleyParsons Annual Report 2006 5
Chairman’s LetterThis year, the WorleyParsons Group again rewarded investors with an outstanding performance, driven by strong contributions from all the sectors we service worldwide. The FY2006 result includes the first full year of contributions from the Parsons E&C business following its merger with Worley in 2004, highlighting the synergies achieved by bringing together two leading players with complementary skills and experience. The merger has delivered more than the sum of its parts, placing us in the top tier of our peer group internationally and providing unparalleled opportunities for us going forward.
While the Group remains headquartered in Australia, WorleyParsons’ globalisation continues apace. An increasing proportion of our total revenue and profit in FY2006 was generated in international markets. The percentage of earnings before tax derived from our international operations now stands at 64%, and can be expected to continue to grow in coming years.
The Year in Review report which accompanies this Annual Report will give you an insight into the experience and the commitment that WorleyParsons’ people bring to our projects around the globe. Our challenge is to continue to grow our people and our skills, and to continue to find new ways to do what we do better.
SAFETYThe safety of our people remains our highest priority. Each year we identify and introduce new ways to improve our safety performance across the whole Group.
Our goal is clear and unequivocal: a perfect result, with no incidents. This goal is embodied in the Groups’ comprehensive Zero Harm safety program.
Although our people are frequently placed in extremely challenging situations, both in terms of geographic location and also the types of sectors we service, I am pleased to report that WorleyParsons’ safety performance compares favourably with international best practice within our industry sectors.
PEOPLEWorleyParsons’ major resource, and indeed its strength, is its people, led by an accomplished and committed senior management team.
This FY2006 result is testament to their dedication and expertise. While the scale of the business provides many opportunities for our people, the work we undertake is often extremely challenging. Despite this, our employees continue to produce exceptional results. On behalf of the Board, I would like to extend our special thanks to all members of the WorleyParsons team worldwide for their efforts this year.
Our extensive operational footprint—we now have 14,310 people based in 94 offices globally—means that we can grow the business across all of the main markets we service, and at the same time, continue to deliver superior results for our clients.
Each office is embedded in its local market, fulfilling the requirements of its clients in a specific area. Our global service delivery model integrates this local on-ground capability with specialist resources, ensuring we are flexible and responsive to each client’s needs and preferences. It also enables us to allocate work effectively within our network providing important flexibility in the current context where skilled workers are highly sought after.
FINANCIAL PERFORMANCEThe directors have declared a final dividend of 22.5 cents per share, of which 7.65 cents per share will be franked, bringing the full year dividend to 41.0 cents per share. The dividend will be paid on 29 September 2006 and represents an increase of 105% on the dividend paid for the year to June 2005.
The Group’s financial performance was again outstanding, setting another profit benchmark with growth in all key financial indicators. The result was underpinned by a stronger than ever operating performance across all business groups, driven by a continuation of the buoyant market conditions experienced in resources markets over the last few years.
This year’s result was the first full year result under the Australian equivalent to International Financial Reporting Standards. The FY2006 result was earned on aggregated revenue of $2,464 million, an increase of 79% on the $1,380 million achieved in FY2005. Basic earnings per share increased 89% to 68 cents per share and net profit after tax rose to $139 million for the full year to 30 June 2006, up 109% on the previous corresponding period.
The Company finished the year with a strong balance sheet, providing potential for pursuit of future growth opportunities.
BUSINESS DEVELOPMENTSWorleyParsons has a strategy of growth through joint venture relationships as well as selective acquisitions that strengthen our existing capabilities. In FY2006 we opened 20 new offices as a result of either organic growth or acquisition.
CORPORATE GOVERNANCEDuring the year there were no changes to the Board or senior management of the Company. The Board remains committed to ensuring WorleyParsons operates to the highest standards of corporate governance.
I believe WorleyParsons has now earned its place in the top tier of professional services firms globally, servicing the ever-growing demand for more effective use of our scarce natural resources. We are confident that we have the best resources both people and technical that will ensure we continue to capitalize on these opportunities, for the benefit of our clients and shareholders.
Ron McNeilly Chairman
6 WorleyParsons Annual Report 2006
Chief Executive Officer’s ReportWorleyParsons’ team again generated an exceptional result during the year, achieving another record financial performance. The year was characterised by the continuation of strong markets, coupled with a very strong operational performance from all areas of the Group, divisional and geographic, as well as improvements in safety performance.
The integration of the Worley and Parsons E&C businesses is now complete and the benefits of the merger are clear across the Group. WorleyParsons continues to be awarded projects across the world that would have been out of the reach of either company acting alone prior to the merger.
The Company’s aim is to be the preferred global provider of technical, project and operational support services to our customers and I am pleased to report we have made significant advances towards achieving this goal.
HEALTH, SAFETY AND ENVIRONMENTThe safety of people remains our first priority and we continue to work towards our objective of zero harm in health, safety and environment. In aiming for continuous improvement in these areas the Company acknowledges that the nature of the industries we service and the geographies in which many of our clients operate frequently places our people in very challenging situations.
We are committed to continually improving our HSE performance across every region and sector. We are jointly pioneering a significant program to this end: working with TAFE and Transfield Services, we have established induction centres in Australia and New Zealand. The aim of the induction centres is to eliminate injuries and harm through more effective awareness training, and at the same time, to provide an enduring safety network across the major industries in these countries. The centres will also enhance current induction processes. Work is ongoing at the centres and progress to date has been encouraging. Planning for new centres in other countries is progressing.
WorleyParsons now has offices in 30 countries, with varying requirements for classification and reporting safety performance. We believe the most appropriate system for classification and reporting consolidated safety performance for the Group is the use of the US OSHA (Occupational Safety and Health Act) reporting requirements.
The Company’s safety performance as reported under OSHA showed a total injury case rate of 0.16 for the 2006 financial year and compares favourably with international safety best practice performance within our industry sectors.
The challenge for the business going forward will be to further improve our safety results while the size and scope of our operating activities increase.
PEOPLEWe recognise that our people are our greatest resource and strength: as a result, the business is 100% committed to recruiting and retaining the best people everywhere we operate.
A key outcome of the merger of Worley and Parsons E&C has been the extra demand created by the leveraging of complementary skill sets and sector positions. To meet this demand the Company has increased its total personnel from 12,000 in 2005 to 14,310 in 2006.
WorleyParsons, like all other operators in our markets, faces the challenge of increased competition for resources. We continue to take advantage of the flexibility our global network of offices and project teams provides when undertaking projects.
WorleyParsons also has an active graduate recruitment program, an example of which is in Nigeria, where graduates were employed at a rate of over twenty new trainees a month for a number of months.
We are committed to providing opportunities for personal development and growth for all of our people. We continue to introduce extensive training programs in all of the regions we operate in; including our most recent programs in Saudi Arabia and Nigeria.
FINANCIAL PERFORMANCEThe record result achieved for the 2006 financial year included a net profit of $139 million up 109% and revenue up 79% to $2,464 million
reflecting the continuation of buoyant trading conditions across the Group and a strong operational performance, in particular from the former Parsons E&C businesses in North America.
Hydrocarbons has again performed ahead of expectations with a historically high level of activity across WorleyParsons’ global hydrocarbons operations.
During the year the Company has grown its global capability in Power, Minerals & Metals and Infrastructure complementing the existing strength in Hydrocarbons.
OPERATIONAL REVIEWThe expected synergies from the Parsons E&C acquisition are contributing to business growth as evidenced by the strong operating
We are committed to providing opportunities for personal development and growth for all of our people. We continue to introduce extensive training programs in all of the regions we operate in; including our most recent programs in Saudi Arabia and Nigeria.

WorleyParsons Annual Report 2006 7
result as well as the size and scope of projects that WorleyParsons has been awarded throughout the year.
Our enhanced capabilities and technical expertise mean the Company is exceptionally well positioned to take advantage of an increasing demand for projects with environmental criteria, such as greenhouse gas reduction. As government legislation in this area changes and becomes more defined, our clients must develop effective and optimal responses. Consequently, WorleyParsons has been able to secure an increasing role in these projects, in particular those where technologies for cleaner emissions are required.
A significant development during the year was the acquisition of Canadian environmental services company Komex Environmental for $35 million. Komex is recognised as one of the world’s leading groundwater consultants. The acquisition further expands WorleyParsons’ ability to support both the initial development and the ongoing operation of major resources projects around the globe.
In addition, the Ohio Air Quality Development Authority approved a grant to WorleyParsons to assist the state in determining site(s) for the FutureGen project, a US$1 billion power plant proposed by the US Department of Energy. FutureGen will be the first near-zero-pollution power plant in the US.
Nuclear power is a major component within the energy markets around the world. The fact that we have been in a position to secure new work in eastern Europe has reinforced WorleyParsons’ global capability in this sector. The Company has also experienced an increased demand for services in some of the emerging renewable energy industries, such as biodiesel.
Our contracted revenue profile in asset services and for major projects, a key performance indicator for the Group, continues to lengthen. Acquisitions made during the year are contributing ahead of expectations, and we are confident that this will continue.
HYDROCARBONSHydrocarbons continues to be the largest contributor to the WorleyParsons business generating 72% of the Group’s revenue in the 2006 financial year.
Revenue for the year was $1,778 million, a 80% increase on the previous year underpinned by the strong performance of the business in North America. Segment EBIT was $159 million with a reported net margin of 8.9%.
Operational highlights include significant improvement in operational performance in the Middle East, a strong performance in the second half from the US operations and a continuation of historically high levels of activity across the Company’s global hydrocarbons operations.
A number of material contracts were announced during the year. In the Australasian region, these included the award by Woodside Energy of an A$700 million engineering and maintenance services contract to the Transfield Worley joint venture. Following the conclusion of the front end study for Woodside Energy’s Angel gas development, WorleyParsons joint venture with KBR, Eos, was subsequently awarded the EPCM contract for this development.
In February 2006 WorleyParsons announced it had won a US$69 million contract to provide services to Al-Khafji Joint Operations oil and gas production facilities in Saudi Arabia and Kuwait. This was followed in April 2006 with the award of a US$35 million contract for professional services for the FEED activities for the world scale NCP petrochemicals complex in Jubail Saudi Arabia. Kuwait Oil Company also awarded WorleyParsons a US$222 million contract to provide EPCM services for its gas oil pipeline project.
In June 2006 Abu Dhabi Gas Industries Limited and Abu Dhabi Gas Liquefaction Company Limited awarded Parsons Energy and Chemicals Group Limited (a wholly owned subsidiary of WorleyParsons) three contracts with a total estimated value of approximately US$36 million.
The hydrocarbons business in the Americas and Europe continued to perform strongly. In April 2006 WorleyParsons won a three-year contract to provide professional services to ExxonMobil Chemical Company in Beaumont, Texas, and the Company opened a new office in the area to service this contract.
The Company also acquired the remaining 50 per cent of Canadian joint venture company WorleyParsons MEG Limited during the year.
The Parsons Iraq joint venture, a joint venture of WorleyParsons and Parsons Corporation–the entity executing the contract to restore Iraqi oil infrastructure–continues to be a material contributor to the Group’s results notwithstanding the many operational challenges we face there.
OutlookThe outlook for the Hydrocarbons business remains positive. Historically high oil prices, increasing demand for gas, the upturn in downstream refining and petrochemical activity together with the expected continued development of major FEED and EPCM projects and the ongoing capital expenditure associated with maintaining and upgrading major hydrocarbon facilities provide a strong basis for future growth. WorleyParsons’ geographic coverage, together with its established client relationships and partnering strategies position it well for this market sector.
The safety of people remains our first priority and we continue to work towards our objective of zero harm in health, safety and environment.
8 WorleyParsons Annual Report 2006
CEO’s Report continued
POWERThe Power business continues to deliver strong growth, and in terms of its contribution to earnings is the second largest business unit after hydrocarbons. Aggregated revenue for the Power business was $368 million, up 113% from 2005 with a contribution to EBIT of $48 million compared to $22 million in the previous corresponding period. Reported margin was 13.0% (2005 12.7%).
Major activity in the power sector included significant project wins in Bulgaria, high levels of activity in the domestic US market, particularly for flue gas desulphurisation projects, support of the Tennessee Valley Authority contract and feasibility and siting studies for new coal and nuclear facilities.
The Singapore power business acquired in 2004 continues to develop its operations in Singapore and across the region including support for a supercritical coal plant study in China.
OutlookThe outlook for the Power business in 2007 remains positive. Continued demand for new coal and nuclear facilities, greenfield gas plants, air quality control systems on existing coal plants and an increase in demand for power delivery services provides a solid base for continued growth in 2007.
MINERALS & METALSThe Minerals & Metals group performed ahead of expectations with aggregated revenue of $202 million, an increase of 26% compared to 2005 ($160 million). Contribution to EBIT was $28 million with a recorded margin of 13.7% (2005 14.2%).
Major project activity included work for the BHPB Worsley facility, projects for BeMax and the Yarwun facility in Orica.
Two acquisitions were made during the year. In November 2005 WorleyParsons agreed to purchase Canadian minerals and metals company HG Engineering Limited (HGE) for A$16.2 million. HGE brings significant expertise and experience in mineral and metal processing in the base and ferrous metal industries. HGE continues to perform well and will assist in the international expansion of the Minerals & Metals business.
The Company also completed the purchase of the remaining 49% of shares in specialist aluminium services provider Jones & Jones Engineering Design Pty Limited which was an important step in the development of the Minerals & Metals business.
Material contracts awarded during the year to Minerals & Metals include a US$133 million program management services contract from Saudi Arabian mining company Ma’aden.
In May 2006 WorleyParsons was awarded an A$160 million contract by The Pilbara Infrastructure Pty Limited, a 100% subsidiary of Fortescue Metals Group Limited for its Pilbara Iron Ore and Infrastructure project.
OutlookThe outlook for the Minerals & Metals sector remains positive with the continued pressure and competition for resources being the major constraining factor in the sector.The focus for 2007 will be on the transition of current feasibility studies to project sanction, continued development of WorleyParsons’ EPCM contracting capability, expansion of project alliances and the development of the Company’s international operations.
INFRASTRUCTUREThe Infrastructure business reported aggregated revenue of $127 million, increasing by 114% on the previous year. Segment EBIT was $10 million (2005 $7 million) and EBIT margin was 7.7% (2005 11.4%).
In addition to providing services to private and public infrastructure projects, the Infrastructure business continues to support other parts of the WorleyParsons’ operations by undertaking the siting and feasibility studies for the infrastructure component of resource and energy developments.
OutlookUnderlying demand in the Infrastructure market remains strong in most markets in which the Company operates. The increased size and capability of the Infrastructure group positions the company well to respond to this demand.
We expect the markets for WorleyParsons’ services will continue to be strong. Our key markets and sectors are experiencing positive conditions and we are well positioned to respond to these opportunities. Subject to conditions remaining favourable in these markets we expect to achieve increased earnings in 2007.
WorleyParsons Annual Report 2006 9
DEVELOPMENTSThe Company continued the expansion of its development activities in 2006. The operating results on the Esperance Energy Project were in line with expectations with the project now in its second year of operation.
Commissioning of the Exmouth project is underway with commercial operations expected to commence in September 2006.
The Company has also entered into a relationship with United Utilities Australia Pty for the pursuit of development projects in the industrial water market in Australia. The Company has also further developed its ability to service the municipal solid waste market in Australia.
SUBSEQUENT EVENTSince the end of the financial year the Power business has been awarded a US$64 million professional services contract for Santee Cooper’s 600-megawatt coal-fired generation facility in South Carolina. The power facility is due to be operational in early 2012 and the project has a total estimated constructed cost of US$998 million.
STRATEGIC FOCUSWe continually review and update the differentiators of our business. In combination, we believe these factors define WorleyParsons and make our offering unique. In particular we have introduced a new differentiator reflecting the importance of our people to the business.
Our six differentiators are:
• Committed, empowered and technically capable people• Industry leadership in health, safety and environmental performance• Outstanding operational and corporate performance• Focus on long-term contracts and asset services• Success in project delivery – large and small• Comprehensive geographic presence and industry capability
Further details on our differentiators are outlined in the Year in Review report which accompanies the Annual Report.
OUTLOOKWe expect the markets for WorleyParsons’ services will continue to be strong. Our key markets and sectors are experiencing positive conditions and we are well positioned to respond to these opportunities. Subject to conditions remaining favourable in these markets we expect to achieve increased earnings in 2007.
The Company continues to evaluate opportunities for new business growth that will add to our existing capabilities and provide value for our shareholders.
John GrillChief Executive Officer
We continually review and update the differentiators of our business. In combination, we believe these factors define WorleyParsons and make our offering unique. In particular we have introduced a new differentiator reflecting the importance of our people to the business.
10 WorleyParsons Annual Report 2006
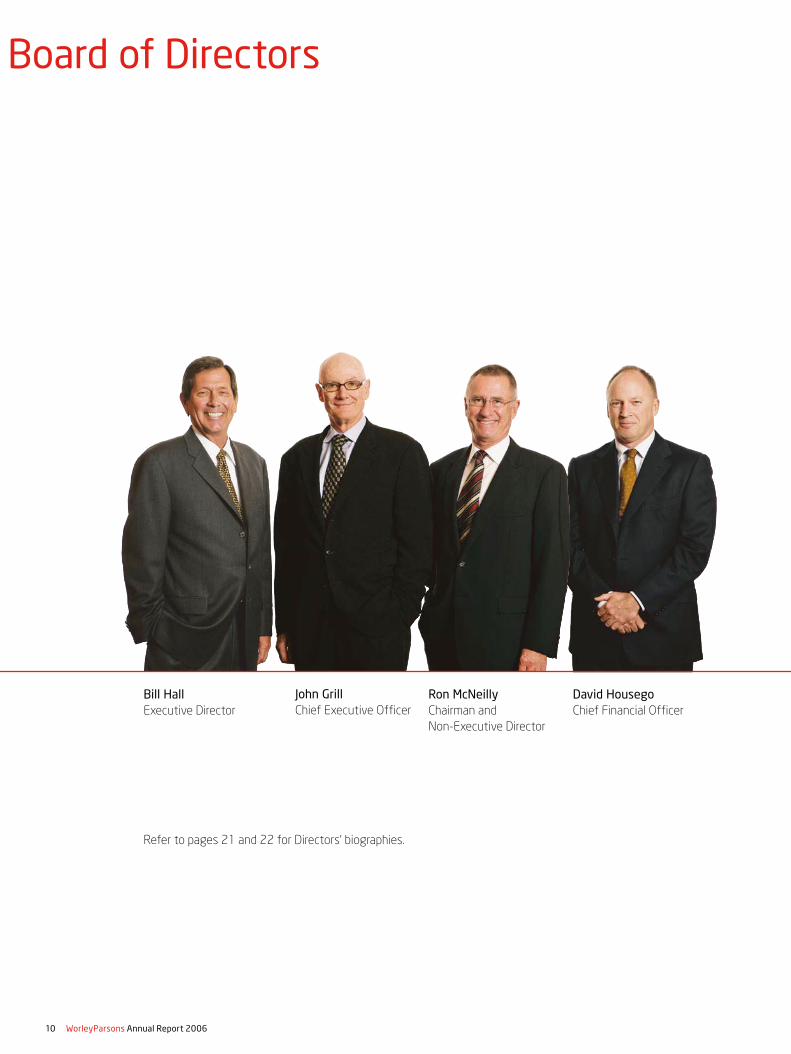
Board of Directors
Bill HallExecutive Director
David Housego Chief Financial Officer
John Grill Chief Executive Officer
Ron McNeilly Chairman and Non-Executive Director
Refer to pages 21 and 22 for Directors’ biographies.
WorleyParsons Annual Report 2006 11
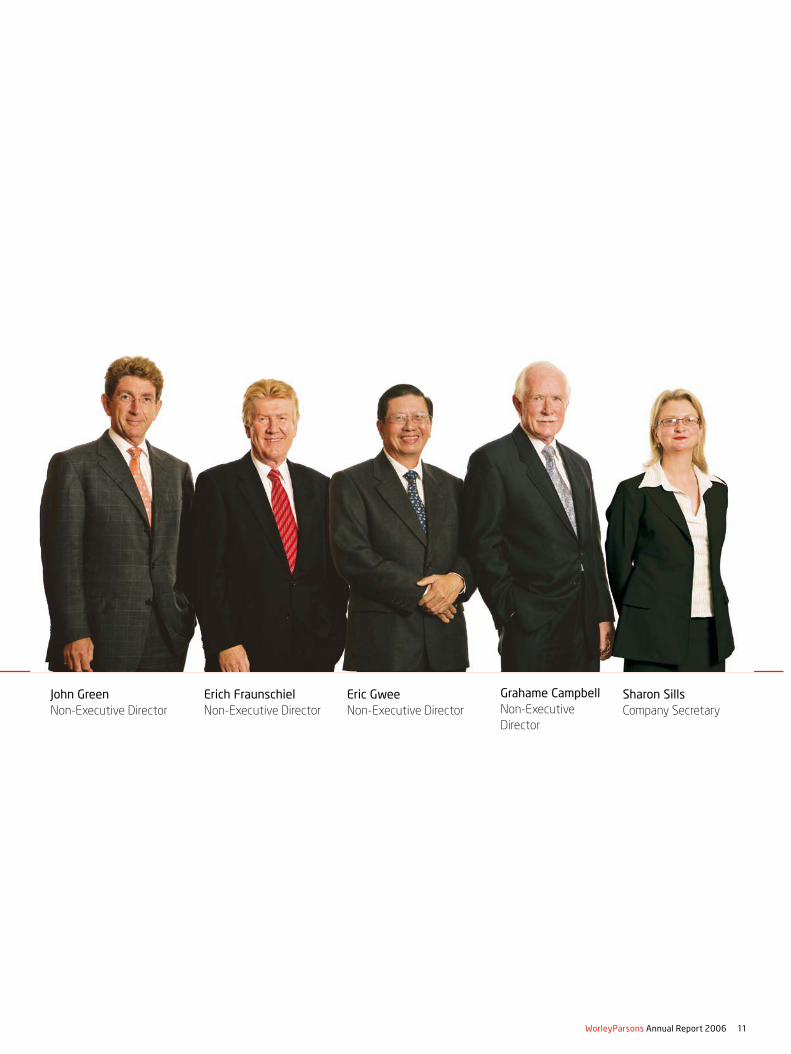
Grahame Campbell Non-Executive Director
Sharon Sills Company Secretary
John Green Non-Executive Director
Erich Fraunschiel Non-Executive Director
Eric Gwee Non-Executive Director
Corporate Governance Statement
The Board of Directors of WorleyParsons strives to ensure that the Companymeets high standards of safety, performance and governance across its globaloperations. The Company recognises that this is an on-going commitment,requiring continual review, modification and enhancement of governancesystems over time. The Board is committed to the highest level of businessethics. During the year, the Code of Conduct was comprehensively reviewedand reinforced across the Company’s global operations.
The directors of WorleyParsons recognise the Company’s responsibilitiesto its customers, employees and suppliers as well as to the welfare of thecommunities in which it operates. The Board regards corporate governanceas a performance enhancement opportunity for WorleyParsons.
In accordance with the ASX Principles of Corporate Governance and recentdevelopments in governance practice in Australia and internationally,WorleyParsons has adopted various policies and codes, including a CorporateGovernance Code and Board Charter. Many of WorleyParsons’ policies andcodes were implemented by WorleyParsons prior to the ASX Principles beingreleased. These codes and policies have been reviewed to take accountof recent changes in law as well as the increased geographic spread ofpersonnel and operations. The review process continues in respect of anumber of key codes.
This statement outlines WorleyParsons’ approach to corporate governance.The statement addresses each of the 10 Principles of good corporategovernance listed in the ASX Principles.
The Investor section of the Company’s website (www.worleyparsons.com)publishes information relating to WorleyParsons’ corporate governanceapproach, including committee charters, the Corporate Governance Codeand Board Charter, the Code of Conduct and other policies and codes.
PRINCIPLE 1: LAY SOLID FOUNDATIONS FOR MANAGEMENT ANDOVERSIGHT BY THE BOARD
The Board’s responsibilities are encompassed in the Corporate GovernanceCode and Board Charter.
The Board is responsible for approving the strategic direction ofWorleyParsons. It monitors all aspects of WorleyParsons’ performance.The Board works with senior management to formulate strategic direction,set goals, budgets, plans and policies and to identify and mitigate risk.
The deliberations of the directors in the Board meetings and the applicationof WorleyParsons’ policies are aimed at allowing the Board to critically andobjectively review management’s performance and to ensure that seniormanagement’s activities are aligned with the expectations of shareholders.
In carrying out its duties, the Board meets formally at least six times a year,with additional meetings held as required. Details of the Board and Committeemeetings held and attendances at those meetings are set out in the Directors’Report on page 21. The non-executive directors meet at least twice a year, inthe absence of the executive directors and management, to discuss theCompany and its affairs.
Members of senior management are invited to attend Board meetings ona regular basis, even if they are not members of the Board. This provides adirect line of communication between the directors and management.
To ensure the Board is well equipped to discharge its responsibilities andto assist the Board in carrying out its responsibilities, it has established twostanding committees, the Audit and Risk Committee and the Nominations andRemuneration Committee.
The Chairman of the Board is an independent director. Each Committee hasa non-executive director as Chairman and only non-executive directors canbe members of the Committees. Each Committee has a Charter, which isreviewed annually by the relevant Committee and the Board and is availableon the Company’s investor website. Members of senior management mayattend Committee meetings upon invitation from the relevant Chairman.Both Committees meet every four months or coincident upon every secondBoard meeting.
The Company has formal letters of appointment with each director whichoutline the key terms and conditions relative to each appointment.
MANAGEMENT COMMITTEESThe Board has delegated certain of its powers relating to the management ofthe Company’s operations to the Chief Executive Officer with the mandate todrive the Company’s strategic direction and meet the goals determined bythe Board.
The Chief Executive Officer is ably supported in his role by a number ofmanagement committees.
The CEO’s Committee comprises the most senior executives of the Company.The CEO’s Committee Charter is to support the Chief Executive Officer byformulating and reviewing Group policies and initiatives in relation to HealthSafety and Environment, addressing matters which affect the global business,monitoring major projects, identifying and managing risk, implementing Groupstrategy and identifying opportunities for the Company. The CEO’s Committeealso reviews items that are to be escalated to the Board for approval. TheCEO’s Committee membership was reviewed at the end of the year to ensurerepresentation by the heads of each region, each customer sector group andkey support groups.
The AAME (Australia/New Zealand, Asia and Middle East) ExecutiveCommittee has an operational focus and is responsible for managing theeastern hemisphere business of WorleyParsons. Its charter is to support itschairman in this pursuit. It has many of the functions of the CEO’s Committee,but its scope covers Australia, New Zealand, Asia and Middle East.
The AE (Americas and Europe) Executive Committee is responsible formanaging the western hemisphere business of WorleyParsons. Its charteris similar in terms to the AAME Committee Charter, its scope covering theAmericas and Europe.
These executive committees were reviewed at the end of the year andreorganised into more specific regional committees. From 1 July 2006, thereare five Regional Management Committees: Australia/New Zealand,Asia/Middle East/Africa, USA, Canada and Latin America, and Europe/UnitedKingdom.
The membership of the regional management committees comprises regionalcustomer sector group leaders, business development leaders, as well asrepresentation from important support functions such as human resources,risk management, information, communications and technology and finance.
12 WorleyParsons Annual Report 2006
Annual Report 2006 WorleyParsons 13
PRINCIPLE 2: STRUCTURE THE BOARD TO ADD VALUE
The Board comprises eight directors in office at the date of this Statement,five of whom, including the Chairman, are independent, non-executivedirectors.
The directors in office at the date of this Statement are:
NAME POSITION
Ron McNeilly Chairman
Grahame Campbell Non-Executive Director
Erich Fraunschiel Non-Executive Director
John Green Non-Executive Director
Eric Gwee Non-Executive Director
John Grill Chief Executive Officer
David Housego Chief Financial Officer
William Hall Executive Director
Profiles of each of these directors are included on pages 21 and 22 of theDirectors’ Report.
The composition of the Board is determined in accordance with the followingprinciples:
• the Board should comprise at least three members, and maintain amajority of non-executive directors;
• the positions of Chairman and Chief Executive Officer must be held byseparate persons;
• the office of Chairman is always to be filled by a non-executive director;
• the Board comprises directors with an appropriate range and mix ofqualifications and expertise which enhance the Board’s performance;
• the Board annually conducts a review of its own performance and fromtime to time engages external consultants to undertake an independentreview of the Board’s and individual director’s performance andeffectiveness;
• all directors (except the Chief Executive Officer) are required to submitthemselves for re-election at regular intervals and at least every threeyears; and
• directors serve a maximum of three terms unless their tenure is extendedby the Board.
In the opinion of the Board, the present composition provides the range ofskills, knowledge and experience necessary to govern the Company with thediscipline, rigour and expertise necessary to deliver results for shareholders.
The Nominations and Remuneration Committee sets and reviews the criteriafor appointment of new directors having regard to the overall composition ofthe Board. The Committee can retain and supervise appropriate search firmsto assist in the recruitment of new directors.
DIRECTOR INDEPENDENCEIn settling its Board Charter, the Board has had reference to the definitionof director independence proposed by the ASX Principles, Australiancorporations’ law and current corporate governance practice. In this context,the Board Charter sets materiality considerations for the definition of“director independence”. In determining independence, the Board considers“materiality” on an on-going basis, having regard to the need to continuallyre-assess corporate governance practices and requirements in light of thechanging circumstances of the Company. As such, the Board does not take aprescriptive approach to independence, but considers the true independenceof each director on a case-by-case basis.
The Board has considered the various positions and relationships of eachof the five non-executive directors and has formed the view that all fivenon-executive directors are independent. The Board is of the opinion thateach non-executive director is independent of WorleyParsons’ managementand is free of any business or other relationship that could interfere withthe exercise of their free and unfettered judgement, to the detriment of theCompany, its shareholders or other stakeholders.
Mr Erich Fraunschiel, the Chairman of the Company’s Audit and RiskCommittee, is a director of Woodside Petroleum Limited which is a materialcustomer of WorleyParsons in Australia. Mr Eric Gwee is a director ofSingapore Power, which is a material customer of one of the Company’sSingaporean subsidiaries, WorleyParsons (DRPL) Pte Limited. BothMr Fraunschiel and Mr Gwee are considered by the Board to be independentafter application of the principles stated above. In the opinion of the Board,the judgement of Messrs Fraunschiel and Gwee has not been impaired orconflicted by virtue of their directorships of these other entities.
The Company’s established process for dealing with potential conflicts ofinterest is outlined under Principle 3, below.
Both Mr John Green and Mr Grahame Campbell served on WorleyParsons’Advisory Board in earlier years, when the Company was an unlisted publiccompany. The purpose of the Advisory Board was to provide the unlistedWorleyParsons group with the rigour of independent oversight and review.WorleyParsons benefits from the continuation of these individuals asnon-executive directors. The Board is of the opinion that both of theseindividuals retain independence of character and judgement and have madeoutstanding contributions to the work of the Board.
The Board recognises that the tenure of each director is important to anassessment of independence. Directors may serve a maximum of three termsof three years, with the potential for their tenure to be extended by theBoard. Tenure limits bring fresh ideas to the Board but this must be balancedagainst the loss of directors who, over time, have developed a specialisedinsight into WorleyParsons’ operations. The period of office of each directoris set out in the Directors’ Report at pages 21 and 22. The Board believes thatthe current composition of the Board balances tenure issues for the benefit ofWorleyParsons’ shareholders.
PRINCIPLE 3: PROMOTE ETHICAL AND RESPONSIBLE DECISIONMAKING
The Board has published various policies and codes to promoteWorleyParsons’ approach to ethical and responsible decision making.
The Board recently revised the Code of Conduct which guides allWorleyParsons personnel as to the standards of behaviour expected of alldirectors, executives, management, employees, contractors and agents ofthe Company. During the year, the new code was well received in itscomprehensive roll out across the Company’s global operations. A copy of thenew Code of Conduct is available on the Company’s website.
While the Code of Conduct seeks to prescribe standards of behaviour for allpersonnel to observe, the code does not, and understandably cannot identifyevery ethical issue that a director or employee might face. The objective ofthe code is to provide a benchmark for professional behaviour throughoutthe Company, to support WorleyParsons’ reputation and make directors,employees and others aware of the consequences if they breach the code.
The Code of Conduct deals with many ethical issues, including:
• WorleyParsons’ commitment to a safe and harassment-free workplace;
• good corporate citizenship and compliance with laws;
• acting with professional integrity; and
• protecting WorleyParsons’ reputation, assets, resources, informationand records.
As required by law, the Board Charter and as a matter of Board process, thedirectors notify the Chairman of their material personal interests in othercompanies and contracts, etc., including their directorships and officeholdingsin other companies. In the event of a real or potential conflict, the Board actsappropriately and minutes its actions accordingly. The Board Charter detailsthe process that WorleyParsons applies in the event that a conflict arisesfor one or more of its directors. In particular, a director who has a materialpersonal interest will not, without the Chairman’s approval, receive relevantBoard papers and/or be present during any discussion or vote on the matter.
PRINCIPLE 4: SAFEGUARD INTEGRITY IN FINANCIAL REPORTING
To safeguard WorleyParsons’ integrity in financial reporting, the ChiefExecutive Officer and Chief Financial Officer provide written undertakings tothe Board assuring that the Company’s financial reports represent a true andfair view of the Company’s financial condition and operational results andcomply with the relevant accounting standards.
The Board established an Audit and Risk Committee to assist the Boardin its oversight of the integrity of financial reporting, the Company’s riskmanagement framework and internal controls. The Committee has animportant role in supervising and monitoring the progress of the internal auditand risk management function and it manages the relationship with theexternal auditor including the appointment, removal and evaluation of theauditor and approval of the auditor’s contract, fees and audit plan.
The Audit and Risk Committee also reviews and makes recommendationson the strategic direction, objectives and effectiveness of the Company’sfinancial and operational risk management policies. This includes ensuringcompliance with the law and reviewing the effectiveness of its riskmanagement, internal compliance and control systems.
The Committee, on behalf of the Board, ensures the integrity of the externalaudit function by not permitting:
1. the partner managing the audit for the external auditor to serve for morethan five consecutive years; and/or
2. the external auditor to be retained for non-audit work where suchretainer may detract, or be perceived to detract, from the auditor’sindependence or impartiality.
The external auditor, who served for five years at the end of the 2006financial year, has now been replaced.
Fees paid to the external auditor for non-audit work are disclosed in theaccounts.
The following non-executive directors were members of the Audit and RiskCommittee throughout the year:
NAME POSITION DURATION
Erich Fraunschiel Chairman Whole year
Grahame Campbell Non-Executive Director Whole year
John Green Non-Executive Director Whole year
Members of the Audit and Risk Committee are selected by the Board fortheir financial literacy and for their knowledge of the industries in whichthe Company operates. Details of the qualifications of the Audit and RiskCommittee members are included in the profiles of directors on page 21of the Directors’ Report.
Corporate Governance Statement
14 WorleyParsons Annual Report 2006
PRINCIPLE 5: MAKE TIMELY AND BALANCED DISCLOSURE
The Board of Directors is committed to WorleyParsons complying with itscontinuous disclosure obligations and has approved a Continuous DisclosurePolicy that applies to all WorleyParsons’ personnel. The Board seeks topromote investor confidence by ensuring that trade in WorleyParsons’ sharestakes place in an informed and competitive market. The Continuous DisclosurePolicy provides for a Disclosure Committee to meet to consider issues whichmay be of interest to shareholders and the market in general. The role of theDisclosure Committee is essentially to ensure ongoing compliance with theCompany’s obligations under the Corporations Act and ASX Listing Rules andin the interests of keeping shareholders appropriately informed.
The policy is designed to ensure that all WorleyParsons personnel areaware of WorleyParsons’ obligations and to ensure accountability at a seniormanagement level for timely disclosure of material information. This meansthat shareholders and the market in general are kept properly informed ofmaterial price sensitive information affecting the Company, on a timely basis.
WorleyParsons discharges this obligation by releasing material price sensitiveinformation to the ASX in the form of an ASX release or disclosure in otherdocuments distributed to shareholders, such as the annual or half-year report.
PRINCIPLE 6: RESPECT THE RIGHTS OF SHAREHOLDERS
The Board of Directors aims to ensure that the shareholders are fully informedof all material information relating to WorleyParsons by communicating toshareholders through:
• continuous disclosure reporting to the ASX;
• the annual report;
• the half-yearly report; and
• media releases and other investor relations publications on theCompany’s website.
The comprehensive Continuous Disclosure Policy outlines the proceduresfor disclosure of relevant information to the market (refer Principle 5) andincorporates the Company’s communications policy.
In addition, the Board encourages the full participation of shareholders atthe Annual General Meeting to ensure a high level of accountability anddiscussion of the Company’s performance and goals. The Chairman encouragesquestions and comments from shareholders and seeks to ensure thatshareholders are given ample opportunity to participate. The Chief ExecutiveOfficer and/or the Chief Financial Officer occasionally meet with analysts andinvestors. Any presentations made to these groups are published on the ASXwebsite and on the investor section of the Company’s own website.
The Company invites the external auditor to attend the Annual GeneralMeeting and be available to answer shareholder questions about the conductof the audit and the preparation and content of the auditor’s report.
PRINCIPLE 7: RECOGNISE AND MANAGE RISK
WorleyParsons recognises the need to manage the risks associated with itsoperational sites and domestic and international locations. WorleyParsons hasadopted an enterprise-wide risk management approach based on StandardAustralia’s AS/NZS 4360.1999 (Risk Management). This approach adopts bestpractice in risk management so far as it relates to WorleyParsons’ requirements.
The Audit and Risk Committee provides guidance and direction in managingrisk and overseeing the internal audit and risk management function.The internal audit and risk management function is independent frommanagement. It provides assurance that WorleyParsons’ main business risksare being managed and that its internal control framework is operatingeffectively. In addition to its ongoing audit reports, internal audit and riskmanagement provides to the Audit and Risk Committee an annual assessmentof the adequacy and effectiveness of WorleyParsons’ control processes andrisk management procedures in light of the nature, function and size of theCompany’s operations.
In relation to environmental risk, WorleyParsons generally assist its clientswith the management of their environmental responsibilities, rather thanholding those responsibilities directly. In this context, WorleyParsonshas environmental responsibilities in terms of compliance with environmentalcontrols and in exercising reasonable care and skill in its design, constructionmanagement and supervision activities. The risks associated withenvironmental issues are managed through WorleyParsons’ risk managementand quality assurance systems. To the extent that WorleyParsons hasownership interests in pipeline and power station projects, the appropriateenvironmental approvals are held by the ownership entity. Compliance withthese approvals is managed via the various systems (operational, riskmanagement and quality assurance) which control and monitor the operationand maintenance of these assets.
WorleyParsons has implemented processes to assess the effectiveness ofthe Company’s risk management control systems. These processes are thenreported to the Audit and Risk Committee and the Board, with a writtenassurance from the Chief Executive Officer and the Chief Financial Officer inrelation to the efficacy of the risk and control processes in place across theWorleyParsons group.
Annual Report 2006 WorleyParsons 15
PRINCIPLE 8: ENCOURAGE ENHANCED PERFORMANCE
WorleyParsons encourages excellence from all its personnel and the directorsrecognise that the performance of all personnel, including directors, isenhanced by a structured performance review process.
The Board conducts a formal review of its own performance, policies andpractice every 12 months.
The review includes:
1. comparing Board performance against agreed criteria;
2. examining the effectiveness and composition of the Board;
3. a review of the Company’s strategic direction and objectives;
4. assessing whether corporate governance principles are appropriate andreflect “best practice”; and
5. assessing whether the various expectations of shareholders havebeen met.
Informal reviews are conducted as necessary and any director may suggestthat the Board conduct an additional formal review earlier than the regularannual review.
From time to time the Board engages external consultants to undertake anindependent review of the Board and individual director’s performance andeffectiveness.
The Board establishes performance criteria for the Chief Executive Officerand conducts a performance review of the Chief Executive Officer at leastannually. In turn, the Chief Executive Officer conducts performance reviewsof senior management and reports on their performance to the Nominationsand Remuneration Committee.
The Nominations and Remuneration Committee is responsible for designinginduction and ongoing training and education programs for the Board.Directors are encouraged and are given the opportunity to broaden theirknowledge of the Company’s business and to keep abreast of developmentsimpacting the business by visiting offices in different locations.
PRINCIPLE 9: REMUNERATE FAIRLY AND RESPONSIBLY
The role of the Nominations and Remuneration Committee is to assist andadvise the Board on matters relating to the appointment and remunerationof the directors, the Chief Executive Officer and other senior executives andemployees of WorleyParsons. The Committee reviews, assesses and advisesthe Board in relation to the necessary and desirable competencies of theBoard and the Committee. It oversees the selection and appointmentpractices for non-executive directors and senior management and assiststhe Board in determining appropriate remuneration strategies.
The following non-executive directors were members of the Nominations andRemuneration Committee throughout the year:
NAME POSITION DURATION
Ron McNeilly Chairman To August 2005
Non-Executive Director From August 2005
John Green Non-Executive Director Whole year
Grahame Campbell Chairman From August 2005
Eric Gwee Non-Executive Director Whole year
Mr Gwee was appointed Chairman of the Committee with effect from July 2006.
WorleyParsons seeks to attract and retain executives and directors withthe appropriate expertise and the ability to create value for shareholders.Remuneration of executives is covered by an Executive Remuneration Policy.Details of the remuneration policies and practices of the Company and theremuneration paid to directors and senior executives are set out in theRemuneration Report on pages 22 to 30. Shareholders will be invited toconsider the Remuneration Report at the 2006 Annual General Meeting.
PRINCIPLE 10: RECOGNISE THE LEGITIMATE INTERESTS OFSTAKEHOLDERS
The Board recognises the best way to advance the legitimate interests of allWorleyParsons’ stakeholders is to encourage all WorleyParsons’ personnelto act honestly and with integrity. Through WorleyParsons’ adoption of theCorporate Governance Code and Board Charter, Code of Conduct and otherpolicies referred to above, the Board demonstrates its ongoing commitment toimplementing best corporate governance practice and the highest standardsof ethical conduct throughout WorleyParsons. These codes and policies arepublished on the Company’s website.
Corporate Governance Statement
16 WorleyParsons Annual Report 2006

Directors’ Report 18
Income Statement 32
Balance Sheet 33
Statement of Changes in Equity 34
Cash Flow Statement 35
Notes to the Financial Statements 36
Directors’ Declaration 69
Independent Audit Report to Members of WorleyParsons Limited 70
Shareholder Information 72
Corporate Information 74
WORLEYPARSONS LIMITEDACN 096 090 158
Annual Report 2006 WorleyParsons 17
Financial ReportFinancial Year Ended 30 June 2006
Financial Contents
The directors present their report on the consolidated entity consisting ofWorleyParsons Limited (“WorleyParsons”, “parent entity” or ”Company”) andthe entities it controlled (“consolidated entity” or “Group”) at the end of, orduring, the financial year ended 30 June 2006.
DIRECTORS
The following persons were directors of WorleyParsons Limited during thefinancial year and until the date of this report:
Ron McNeilly (Chairman)
Grahame Campbell
Erich Fraunschiel
John Green
John Grill (Chief Executive Officer)
Eric Gwee
William Hall
David Housego
PRINCIPAL ACTIVITIES
During the financial year, the principal activities of the consolidated entityconsisted of:
(a) provision of engineering design and project services to the followingsectors:
• Hydrocarbons
• Power
• Minerals & Metals
• Infrastructure;
(b) provision of maintenance and reliability support services to these sectors;and
(c) infrastructure developments.
DIVIDENDS – WORLEYPARSONS LIMITED
Details of dividends in respect of the financial year are as follows:
12 MONTHS TO 12 MONTHS TO
30 JUNE 2006 30 JUNE 2005
$’000 $’000
Final ordinary dividend for the financial year ended
30 June 2004 of 6.5 cents per ordinary share paid on
30 September 2004* – 9,708
Interim ordinary dividend for the financial year ended
30 June 2005 of 7.5 cents per ordinary share paid on
6 April 2005* – 15,372
Final ordinary dividend for the financial year ended
30 June 2005 of 12.5 cents per ordinary share paid on
30 September 2005* 25,619 –
Interim ordinary dividend for the financial year ended
30 June 2006 of 18.5 cents per ordinary share paid on
7 April 2006# 37,916 –
Total dividends paid 63,535 25,080
* Fully franked dividend.
# Partly franked dividend.
Since the end of the financial year, the directors have declared a finaldividend of 22.5 cents per fully paid ordinary share, partly franked basedon tax paid at 30%. In accordance with Accounting Standard AASB 137“Provisions, Contingent Liabilities and Contingent Assets”, the aggregateamount of the proposed final dividend of $46.1 million is not recognised asa liability as at 30 June 2006.
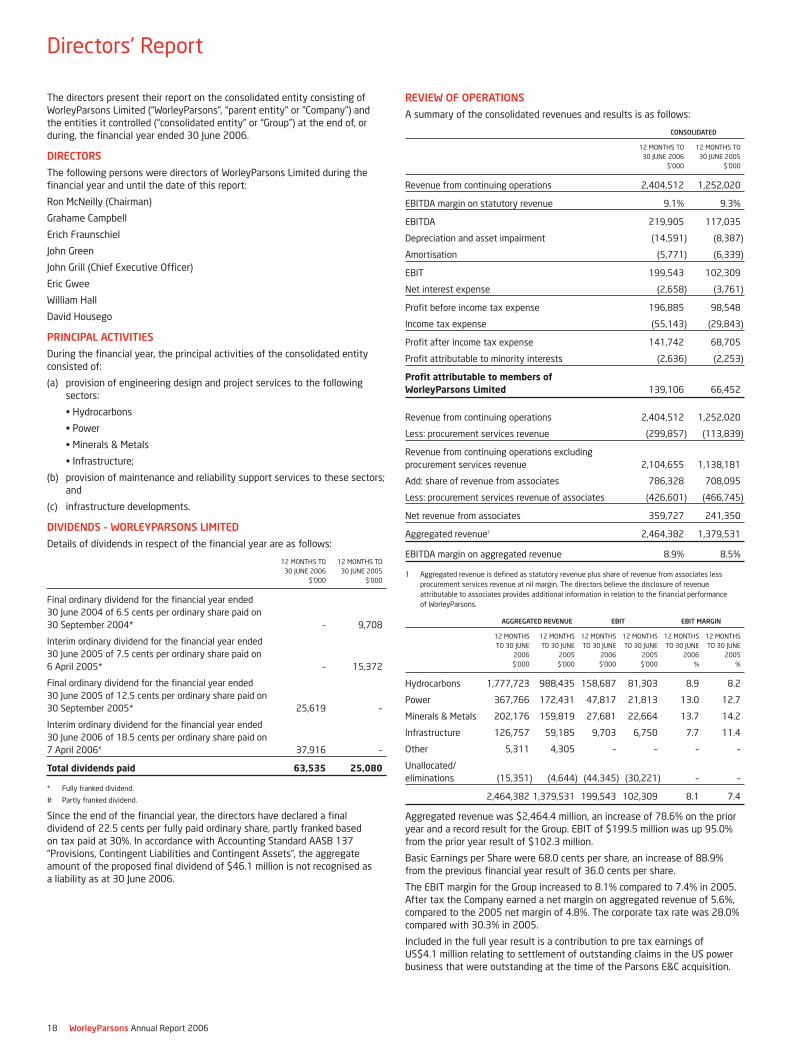
REVIEW OF OPERATIONS
A summary of the consolidated revenues and results is as follows:
CONSOLIDATED
12 MONTHS TO 12 MONTHS TO
30 JUNE 2006 30 JUNE 2005
$’000 $’000
Revenue from continuing operations 2,404,512 1,252,020
EBITDA margin on statutory revenue 9.1% 9.3%
EBITDA 219,905 117,035
Depreciation and asset impairment (14,591) (8,387)
Amortisation (5,771) (6,339)
EBIT 199,543 102,309
Net interest expense (2,658) (3,761)
Profit before income tax expense 196,885 98,548
Income tax expense (55,143) (29,843)
Profit after income tax expense 141,742 68,705
Profit attributable to minority interests (2,636) (2,253)
Profit attributable to members of WorleyParsons Limited 139,106 66,452
Revenue from continuing operations 2,404,512 1,252,020
Less: procurement services revenue (299,857) (113,839)
Revenue from continuing operations excluding
procurement services revenue 2,104,655 1,138,181
Add: share of revenue from associates 786,328 708,095
Less: procurement services revenue of associates (426,601) (466,745)
Net revenue from associates 359,727 241,350
Aggregated revenue1 2,464,382 1,379,531
EBITDA margin on aggregated revenue 8.9% 8.5%
1 Aggregated revenue is defined as statutory revenue plus share of revenue from associates less
procurement services revenue at nil margin. The directors believe the disclosure of revenue
attributable to associates provides additional information in relation to the financial performance
of WorleyParsons.
AGGREGATED REVENUE EBIT EBIT MARGIN
12 MONTHS 12 MONTHS 12 MONTHS 12 MONTHS 12 MONTHS 12 MONTHS
TO 30 JUNE TO 30 JUNE TO 30 JUNE TO 30 JUNE TO 30 JUNE TO 30 JUNE
2006 2005 2006 2005 2006 2005
$’000 $’000 $’000 $’000 % %
Hydrocarbons 1,777,723 988,435 158,687 81,303 8.9 8.2
Power 367,766 172,431 47,817 21,813 13.0 12.7
Minerals & Metals 202,176 159,819 27,681 22,664 13.7 14.2
Infrastructure 126,757 59,185 9,703 6,750 7.7 11.4
Other 5,311 4,305 – – – –
Unallocated/
eliminations (15,351) (4,644) (44,345) (30,221) – –
2,464,382 1,379,531 199,543 102,309 8.1 7.4
Aggregated revenue was $2,464.4 million, an increase of 78.6% on the prioryear and a record result for the Group. EBIT of $199.5 million was up 95.0%from the prior year result of $102.3 million.
Basic Earnings per Share were 68.0 cents per share, an increase of 88.9%from the previous financial year result of 36.0 cents per share.
The EBIT margin for the Group increased to 8.1% compared to 7.4% in 2005.After tax the Company earned a net margin on aggregated revenue of 5.6%,compared to the 2005 net margin of 4.8%. The corporate tax rate was 28.0%compared with 30.3% in 2005.
Included in the full year result is a contribution to pre tax earnings ofUS$4.1 million relating to settlement of outstanding claims in the US powerbusiness that were outstanding at the time of the Parsons E&C acquisition.
Directors’ Report
18 WorleyParsons Annual Report 2006

The Company retains a strong cash position and low level of gearing with Netdebt to Net debt plus Equity at year end of 10.2%. Cash as at 30 June 2006was $78.2 million. EBITDA interest cover for 2006 was 27.6 times.
Operating cash flow for the period was $115.7 million, compared to$91.1 million in 2005. During the year the first tranche of the Company’sLong Term Incentive plan vested. The performance rights exercisable underthe plan were purchased on market by the Company at a cost of $7.6 million,which is included in operating cash flow.
Cash outflow from investing activities was $102.4 million. This includes$35.2 million paid for the acquisition of Komex Environmental and$26.3 million paid for the acquisition of the remaining 50% of WorleyParsonsMEG Ltd, the remaining 49% of Jones & Jones, 100% of HGE Limitedand others.
The Company also committed $20.9 million in 2006 on the development ofthe Exmouth Energy project in Western Australia as part of its infrastructuredevelopment strategy.
HYDROCARBONSAggregated revenue for the Hydrocarbons group in the year was$1,777.7 million representing approximately 72% of WorleyParsons revenueand an increase of 79.9% from the prior year. Segment EBIT was$158.7 million with a reported segment margin of 8.9% (2005: EBIT$81.3 million margin 8.2%).
Operational highlights include significant improvement in operationalperformance in the Middle East, a strong performance in the second half fromthe US operations and a continuation of historically high level of activityacross WorleyParsons’ global hydrocarbons operations.
Major activities in the period for the Australasian region included thesuccessful conclusion of the front end study for Woodside Energy’s Angelgas development and subsequent award of the EPCM contract to Eos, a jointventure of WorleyParsons and KBR. Eos also completed the front end designfor the PNG Gas project (PNG facilities and pipeline) during the year.
Other major projects include the commencement of the design and projectservices for the new LNG V train for the North West Shelf venture beingundertaken by a joint venture between WorleyParsons and Foster Wheeler(FWWP) and the award by Woodside Energy of a $700 million integratedservices contract to the Transfield Worley joint venture.
Highlights in the Asian operations of WorleyParsons include strongperformance in Indonesia on a series of projects for ConocoPhillips, theretention of the contract to support operations for Brunei Shell Petroleumand the expansion of the Company’s operations in Thailand to service thedownsteam market. WorleyParsons’ Malaysian venture, Ranhill WorleyParsons,performed projects for a range of regional clients including Petronas, SarawakShell, BG India, BP Vietnam, and NIOC/Petropars.
The Middle East region has delivered its strongest operating performancewith improved results across the region, particularly in Oman and Saudi Arabia.Work has commenced on the Al-Khafji joint operations engineering servicescontract. Activity levels in Saudi Arabia are at their highest level in recentyears. The growth of the Abu Dhabi hub continues with several Engineeringand PMC projects being awarded in the period by the ADNOC group ofcompanies.
The Company was also awarded an EPCM contract for the Kuwait Oil companyfor a pipeline project at the Al Ahmadi refinery.
The African operations continue to grow with a focus on supporting localoperations in Nigeria and the recent opening of an office in Angola to providein country project and asset support to the hydrocarbons industry.
Activity levels in the Americas remain high with a strong second halfperformance from the US operations. The US operations executed majorprojects for ExxonMobil in Venezuela, for ExxonMobil and ChevronTexaco inNigeria and for Unocal in Bangladesh.
The downstream market in the United States continues to expand withWorleyParsons’ operations awarded a major FEED contract for the clean fuelsupgrade for the New Zealand Refining Company (NZRC), a three year servicescontract for ExxonMobil Chemical Company at Beaumont, Texas, and the FEEDfor the NCP petrochemical complex in Saudi Arabia.
The Canadian operating result has benefited from the continuing high levelof activity in the development of oil sands projects. The Company is currentlyexecuting projects for ConocoPhillips, Canadian Natural Resources Limited,
North American Oil Sands, Nexen, Husky and others while providingenvironmental services and asset services support to the existing facilitiesfor Suncor, Imperial Oil (ExxonMobil), Shell and Petro-Canada.
A substantial effort is being undertaken in the integration of the Canadianoperations to ensure that the benefits from the Company’s acquisition ofKomex Environmental, the remaining 50% of WorleyParsons MEG and HGELimited are realised so that the Canadian operations can service all ofWorleyParsons customer segments.
An early indication of the opportunities available in the Canadian marketcan be seen in the recent award by Shell’s Albian oil sands operation whichinvolves WorleyParsons Komex providing environmental services, HGEproviding materials handling and primary material process expertise andWorleyParsons MEG providing oil process and facilities support services.
The European operations continue to support major project activity inKazakhstan and Russia. Progress was made in the year in the development oflocal operations in Kazakhstan, enhancing WorleyParsons’ ability to performadditional services in country. In addition, the London office is providing majorproject support in conjunction with other WorleyParsons offices to projects inthe Middle East and Africa and is developing a regional asset servicescapability to provide asset support for global and regional customers.
POWERWorleyParsons Power business experienced strong growth in 2006.Aggregated revenue grew 113.3% to $367.8 million. Segment EBIT was$47.8 million with a reported segment margin of 13.0% (2005: EBIT$21.8 million margin 12.7%).
Included in the Power result is a contribution to pre tax earnings ofUS$4.1 million relating to settlement of outstanding claims in the US powerbusiness that were outstanding at the time of the Parsons E&C acquisition.
Major activity in the Power sector in the year included significant projectactivity in Bulgaria on the Belene nuclear facility and the Maritza coal station.The United States market saw a continuation of high levels of activityparticularly for flue gas desulphurisation projects, support of the TennesseeValley Authority contract and feasibility and siting studies for new coal andnuclear facilities.
Subsequent to year end the Company was awarded a services contract forSantee Cooper’s 600 megawatt coal-fired generation facility near Kingsburgin Florence County, South Carolina. This power facility is scheduled to beoperational in early 2012. The project has a total estimated constructedcost of US$998 million and continues the successful relationship betweenWorleyParsons and Santee Cooper, South Carolina’s state-owned electric andwater utility.
The expansion of the Singapore power business acquired in 2004 continuesto develop its operations in Singapore and across the region including supportfor a supercritical coal study in China.
MINERALS & METALSThe Minerals & Metals group performed ahead of expectations withaggregated revenue for the year of $202.2 million, an increase of 26.5% fromthe $159.8 million reported in 2005. EBIT for the year was $27.7 million witha margin of 13.7% (2005: EBIT $22.7 million margin 14.2%).
Major project activity in the period included work for the BHP Billiton Worsleyfacility, projects for BeMax and the Yarwun facility for Orica. The recentlyacquired HGE Limited continues to perform well and will assist in theinternational expansion of the Minerals & Metals business.
In 2006 the Company was awarded a contract to provide programmanagement services for the Ma’aden Phosphate project in Saudi Arabia.When completed the phosphate project will be the largest integratedfertiliser plant in the world and represents the largest contract secured byWorleyParsons in its Minerals & Metals and Infrastructure businesses to date.
Zinifex awarded WorleyParsons a three year Projects Alliance to managesustaining capital projects for the Port Pirie Smelter. This award furtherextended the already broad base of project alliances that the Minerals &Metals group have in the industry.
Reflecting the increasing depth and breadth of technical capability withinthe Minerals & Metals business, feasibility studies are being performed forclients in the alumina, aluminium and base metals sectors including the recentaward by BHP Billiton to a WorleyParsons and SNC Lavalin joint venture forinvolvement in studies for the expansion of the Olympic Dam facility.
Annual Report 2006 WorleyParsons 19

INFRASTRUCTUREThe Infrastructure business reported aggregated revenue of $126.8 million,an increase of 114.2% on the prior year. EBIT of $9.7 million was 43.7%ahead of the 2005 result of $6.8 million. Margins in Infrastructure in 2006were 7.7%, lower than the 11.4% margin achieved in 2005 reflectingadditional costs in developing the international operations and costsassociated with the exit of an underperforming business unit.
In addition to providing services to private and public infrastructureprojects, the Infrastructure business continues to support other parts of theWorleyParsons’ operations by undertaking the siting and feasibility studiesfor the infrastructure component of resource and energy developments.
2006 has seen the Group commence work on two world scale resourceinfrastructure projects; the Ma’aden Phosphate project and the PilbaraInfrastructure project.
The acquisition of the Calgary based Komex Environmental business inJanuary 2006 has provided a significant increase in the scale and capabilityof the infrastructure business and good progress has been made in a limitedtime in the integration of the Komex operations.
DEVELOPMENTSThe second development project the Company is undertaking, the$31.4 million Exmouth Energy project, has been affected by cost overrunsresulting in an impairment charge of $1.9 million being recorded against thecarrying value of the project. It is expected that the project will be operationalin the first quarter of the 2007 financial year with the Company contributingapproximately $6.3 million in equity to the project with the balance beingproject financed.
EARNINGS PER SHARE2006 2005
CENTS CENTS
Basic earnings per share 68.0 36.0
Diluted earnings per share 67.9 35.9
SIGNIFICANT CHANGES IN THE STATE OF AFFAIRS
Effective 1 August 2005, a wholly owned subsidiary of WorleyParsonsLimited, acquired the remaining 50% interest of WorleyParsons MEG Limited(“MEG”) for a total consideration of $17.8 million and gained effective controlat that date. From the date of acquisition to 30 June 2006, the incrementalnet profit after tax to the Group resulting from the increase in ownershippercentage was $1.6 million. The deferred consideration of $7.7 million ispayable in two equal cash instalments due on the first and secondanniversaries of the acquisition.
Effective 1 September 2005, wholly owned subsidiaries of WorleyParsonsLimited, acquired 100% of Canadian minerals and metals company HGEngineering Limited (“HGE”) for a total consideration of $16.2 million. HGEis an engineering and project management business with operations inToronto, Canada and Dallas, Texas. HGE reported revenues of approximately$15.1 million in the previous year and has around 140 employees. From thedate of acquisition to 30 June 2006, HGE contributed $2.3 million to the netprofit after tax of the Group. The deferred consideration of $6.1 million ispayable in two equal cash instalments due on the first and secondanniversaries of the acquisition.
On 1 January 2006, WorleyParsons (Canada) Limited, a wholly ownedsubsidiary of WorleyParsons Limited, acquired 100% of Komex EnvironmentalLimited (“Komex”) for a total consideration of $35.2 million. Komex is aCalgary based group that provides a range of services including waterresource engineering and specialist geotechnical and environmentalconsulting and engineering to the resources and energy sector. From thedate of acquisition to 30 June 2006, Komex has contributed $2.7 million tothe net profit after tax of the Group. Komex employs approximately 420 staffand has operations in Canada, the USA and Europe.
MATTERS SUBSEQUENT TO THE END OF THE FINANCIAL YEAR
On 1 July 2006, WorleyParsons Infrastructure Holdings Pty Limited,a wholly owned subsidiary of WorleyParsons Limited acquired 100% ofTMG International Holdings Pty Limited (“TMG”) for $3.6 million. TMG isan Australian based company that provides specialist consulting andtechnological solutions to the rail and associated industries. TMG had
estimated revenue of $5.5 million for the year ended 30 June 2006 andemploys around 35 staff.
Subsequent to 30 June 2006, WorleyParsons Financial Services Pty Limitedhas agreed to provide financial support to Burns & Roe Worley Pty Limited,an associate entity in which the consolidated entity has a 50.0% beneficialinterest. It is not expected that the provision of this financial support willresult in a material impact to the profit attributable to members ofWorleyParsons Limited.
No other matter or circumstance has arisen since 30 June 2006 that hassignificantly affected, or may significantly affect:
(a) the consolidated entity’s operations in future financial years; or
(b) the results of those operations in future financial years; or
(c) the consolidated entity’s state of affairs in future financial years.
LIKELY DEVELOPMENTS AND EXPECTED RESULTS OF OPERATIONS
We expect the market for WorleyParsons’ services will continue to be strong.Our key markets and sectors continue to experience positive conditions,in particular Hydrocarbons and Power. We are well positioned throughoutthe business to respond to these opportunities.
Further information on likely developments in the operations of theconsolidated entity and the expected results of the operations have not beenincluded in this report because the directors believe it would be likely to resultin unreasonable prejudice to the consolidated entity.
ENVIRONMENTAL REGULATION
In the majority of WorleyParsons’ business situations, WorleyParsons is notthe owner or operator of plant and equipment requiring environmentalapprovals. WorleyParsons would typically be assisting its customers withthe management of their environmental responsibilities, rather than holdingthose responsibilities directly. However, WorleyParsons has environmentalresponsibilities in terms of compliance with environmental controls and inexercising reasonable care and skill in its design, construction managementand supervision activities. The risks associated with environmental issues aremanaged through WorleyParsons’ risk management and quality assurancesystems.
During the year, WorleyParsons acquired Komex Environmental Limited(“WorleyParsons Komex”), an international environmental and water resourcesconsulting and engineering company. WorleyParsons Komex providesenvironmental consulting and monitoring services to industrial clients.WorleyParsons Komex is also involved in remediation of contaminated sitesfor its clients and in the past acquired and remediated its own brownfieldssites. WorleyParsons Komex still owns one remediated property.
WorleyParsons has ownership interests in pipeline and power station assetsprojects that hold appropriate environmental approvals. Compliance withthese approvals is managed through the operational systems which controland monitor the operation and maintenance of these assets.
The Company is not aware of any breaches by a WorleyParsons controlledentity of any environmental rule or regulation.
NON-AUDIT SERVICES
Non-audit services provided by the external auditor (Ernst & Young) duringthe financial year to the Company and entities in its consolidated group areset out below.
Independent Accountant’s Report and Financial Information $61,964
Tax services $121,477
Group treasury review $21,000
Other acquisition related assurance services $85,000
Total non-audit services provided by the external auditor $289,441
The Board has considered the position and, in accordance with the advicereceived from the Audit and Risk Committee is satisfied that the provisionof the non-audit services is compatible with the general standard ofindependence for auditors imposed by the Corporations Act 2001. Thedirectors are satisfied that the provision of non-audit services by the auditor,as set out above, did not compromise the auditor independence requirementsof the Corporations Act 2001 for the following reasons:
Directors’ Report
20 WorleyParsons Annual Report 2006

• all non-audit services have been reviewed by the Audit and RiskCommittee to ensure they do not impact the integrity and objectivity ofthe auditor; and
• none of the services undermine the general principles relating toauditor independence as set out in professional statement F1, includingreviewing and auditing the auditor’s own work, acting in a managementor decision making capacity for the Company, acting as advocate for theCompany or jointly sharing economic risk and rewards.
MEETINGS OF DIRECTORS
The number of meetings of directors (including meetings of committees ofdirectors) held during the financial year and the number of meetings attendedby each director was as follows:
NOMINATIONS AND AUDIT AND REMUNERATION
BOARD MEETINGS RISK COMMITTEE COMMITTEE
MEETINGS MEETINGS MEETINGS
HELD HELD HELD
WHILE A NUMBER WHILE A NUMBER WHILE A NUMBER
DIRECTOR DIRECTOR ATTENDED MEMBER ATTENDED MEMBER ATTENDED
Ron McNeilly 8 8 – – 6 6
Grahame Campbell 8 8 6 6 6 6
Erich Fraunschiel 8 8 6 6 – –
John Green 8 8 6 6 6 5
John Grill 8 8 – – – –
Eric Gwee 8 8 – – 6 6
William Hall 8 8 – – – –
David Housego 8 8 – – – –
INFORMATION ON DIRECTORS
RON McNEILLY
CHAIRMAN AND NON-EXECUTIVE DIRECTORRon is Chairman of the Board and a member of the Nominations andRemuneration Committee. Ron is currently the Deputy Chairman of BlueScopeSteel Limited (previously BHP Steel) and has over 30 years’ experience in thesteel industry. Ron joined BHP in 1962 and has held positions with BHPBilliton including Executive Director and President BHP Minerals, ChiefOperating Officer, Executive General Manager and Chief Executive Officer BHPSteel, General Manager Transport, General Manager Long Products Divisionand General Manager Whyalla Works. Ron is the Chairman of the MelbourneBusiness School Limited and a director of Alumina Limited. He is a formerChairman of Ausmelt Limited and a former director of GH Michell Holdings PtyLimited, QCT Resources and Tubemakers of Australia.
Australian listed company directorships
NATURE OF
LISTED COMPANY NAME DIRECTORSHIP DATE OF COMMENCEMENT DATE OF CESSATION
Alumina Limited Non-executive 11 December 2002 n/a
director
BlueScope Deputy Chairman 10 May 2002 n/a
Steel Limited
Ausmelt Limited Chairman 21 October 2002 19 November 2004
GRAHAME CAMPBELL
NON-EXECUTIVE DIRECTORGrahame is a member of the Audit and Risk Committee and the Nominationsand Remuneration Committee. Grahame was Managing Director of CMPS&Ffrom 1987 to 1995, at the time one of the largest engineering and projectmanagement groups in Australia. Grahame has over 30 years’ experience inthe management of major Australian and offshore infrastructure projectsincluding oil, gas, road, rail, mining and minerals projects. Grahame is currentlya director of Iluka Resources Limited and the Macro Engineering Council(University of Sydney). Grahame is a past President of the Association ofConsulting Engineers Australia and the Australian Pipeline IndustryAssociation. Prior to his appointment as non-executive director of theCompany on listing in 2002, Grahame was a member of the advisory boardfor four years.
Australian listed company directorships
NATURE OF
LISTED COMPANY NAME DIRECTORSHIP DATE OF COMMENCEMENT DATE OF CESSATION
Iluka Resources Non-executive 17 December 1998 n/a
Limited director
ERICH FRAUNSCHIEL
NON-EXECUTIVE DIRECTORErich is the Chairman of the Audit and Risk Committee. Erich is a director ofWoodside Petroleum Limited, West Australian Newspapers Holdings Limited,Rabobank Australia Limited, the WCM Group Limited and the West AustraliaOpera Inc. He is Chairman of Wesfarmers Federation Insurance Limited andLumley General Insurance Limited. Erich’s early business career was in thepetroleum marketing and management consulting industries. In 1981, hejoined the Australian Industry Development Corporation where he wasinvolved in project lending, investment banking and venture capitalinvestment. In 1984, he joined Wesfarmers Limited to start the company’sprojects and business development function. In 1988, he became GeneralManager of the group’s commercial division and from 1992 until hisretirement in July 2002 was an executive director and Chief Financial Officerof the group.
Australian listed company directorships
NATURE OF
LISTED COMPANY NAME DIRECTORSHIP DATE OF COMMENCEMENT DATE OF CESSATION
West Australian Non-executive 2 May 2002 n/a
Newspapers director
Holdings Limited
Woodside Non-executive 1 December 2002 n/a
Petroleum Limited director
Foodland Non-executive 2 October 2002 8 December 2004
Associated Limited director
JOHN GREEN
NON-EXECUTIVE DIRECTORJohn is a member of the Audit and Risk Committee and the Nominations andRemuneration Committee. John is a company director, investor and writer.Until August 2006, he was an investment banker at Macquarie Bank, wherehe was an executive director for 13 years. His professional career beforeinvestment banking was 17 years in law, including as a partner in law firmsFreehills and Dawson Waldron. John is director of three not-for-profits:Macquarie Bank Foundation, the General Sir John Monash Foundation andThe Centre for Independent Studies. In past years, he was a member of theASX National Listings Committee and held a number of posts in the SecuritiesInstitute of Australia (now Finsia). Prior to his appointment as a non-executivedirector of the Company on listing in 2002, John was a member of theadvisory board for nine years, including a period as its Chairman.
JOHN GRILL
CHIEF EXECUTIVE OFFICERJohn joined ESSO Australia in 1968 and in 1971 became Chief Executive ofthe entity that ultimately became WorleyParsons Limited, Wholohan Grill andPartners. This specialised consulting practice acquired the business of WorleyEngineering Pty Limited in Australia in 1987. Following group restructuring, in2002 Worley Group Limited listed on the Australian Stock Exchange. In 2004,Worley Group Limited acquired Parsons E&C Corporation, a US based globalproject services company, and changed its name to WorleyParsons Limited.John has personal expertise in every aspect of project delivery for projects inthe resources and energy industries. He has been directly involved with mostof WorleyParsons’ major clients and remains closely involved at Board levelwith WorleyParsons’ joint ventures.
Annual Report 2006 WorleyParsons 21
ERIC GWEE
NON-EXECUTIVE DIRECTOREric joined the Board in February 2005 and is the Chairman of theNominations and Remuneration Committee. Eric is a Singaporean nationalwith extensive international experience in the hydrocarbons and powerindustries, including a career spanning more than 31 years with theExxonMobil group. Eric is currently a non-executive director of SingaporePower Limited and Chairman of SP Services Limited, he is a non-executivedirector of SP Australia (Distribution) Limited, SP Australia (Transmission)Limited and SP Australia Networks (RE) Limited. Eric is a director of theMelbourne Business School Limited. Previously, he was the Chairman ofCPG Corporation Pte Limited and was a director of ExxonMobil SingaporePte Limited.
Australian listed company directorships
NATURE OF
LISTED COMPANY NAME DIRECTORSHIP DATE OF COMMENCEMENT DATE OF CESSATION
SP Australia Director 31 May 2005 n/a
Networks
(Distribution) Ltd
SP Australia Director 26 October 2005 n/a
Networks
(Transmission) Ltd
WILLIAM HALL
EXECUTIVE DIRECTORWilliam (Bill) joined the Board in 2004 following the Company’s acquisition ofParsons E&C Corporation. Bill was with the Parsons Group for 25 years. Hebecame Chairman and CEO of Parsons Energy & Chemicals Group Inc in 2002.Prior to this position he served as President of Parsons Energy & ChemicalsGroup Inc (1997-2001), President of The Ralph M Parsons Company(1992-1995), and Senior Vice President and Manager of the Petroleum &Chemical (P&C) Division with the company (1989-1991). Bill has 39 years’experience in the global engineering field, holding a number of key projectand other US and international management positions with Parsons. Bill hasbachelor and masters degrees in Chemical Engineering at Virginia PolytechnicInstitute and has completed the Executive Program at Stanford University.He is also on the Board of Directors of the US-Saudi Arabian Business Council.
DAVID HOUSEGO
CHIEF FINANCIAL OFFICERDavid joined the Company in July 1999. He led the corporate reorganisationand subsequent Initial Public Offering and listing on the ASX of Worley GroupLimited (now WorleyParsons Limited) in 2002 and the acquisition of ParsonsE&C. He also represents WorleyParsons on a number of its joint venturecompanies. David’s finance experience covers business development,corporate strategic planning, investment evaluation, investor relations andmanagement accounting systems development. Prior to joining the Group,David held senior finance roles with Coca-Cola Amatil. Previously, he workedfor a number of firms in the UK and held a variety of accounting positionswith AAP Reuters and IBM Australia.
SHARON SILLS
COMPANY SECRETARY AND GROUP TAX MANAGERSharon Sills is a member of the Institute of Chartered Accountants ofAustralia, the Institute of Chartered Secretaries and Administrators, CharteredSecretaries Australia Ltd and the Taxation Institute of Australia. In 2004Sharon completed the Graduate Diploma in Company Secretarial Practice andis currently enrolled in the Master of Laws program at the University ofSydney. Sharon’s background is in taxation, both in the profession and incommerce. Sharon joined WorleyParsons in May 2000 as Group TaxationManager and was appointed Company Secretary in 2003. Special projectsinclude group restructuring pre- and post-IPO, the listing of the Company in2002 and the acquisition of Parsons E&C Corporation in 2004.
INSURANCE OF OFFICERS
During the financial year WorleyParsons Limited paid insurance premiums toinsure the directors, secretaries and executive officers of the Company and itssubsidiary companies. The contracts of insurance prohibit the disclosure of theamounts of premiums paid.
The liabilities insured are legal costs that may be incurred in defending civil orcriminal proceedings that may be brought against the directors and officersin their capacity as directors and officers of WorleyParsons Limited and itssubsidiary companies, and any other payments arising from liabilities incurredby the officers in connection with such proceedings, other than where suchliabilities arise out of conduct involving a wilful breach of duty by the officersor the improper use by the officers of their position or of information to gainadvantage for themselves or someone else or to cause detriment to theCompany. It is not possible to apportion the premium between amountsrelating to the insurance against legal costs and those relating to otherliabilities.
ROUNDING OF AMOUNTS
The Company is of a kind referred to in Class Order 98/0100 issued by theAustralian Securities and Investments Commission, relating to the “roundingoff” of amounts in the Directors’ Report and financial statements. Amountshave been rounded off to the nearest thousand dollars in accordance withthat Class Order.
REMUNERATION REPORT
The directors present the Remuneration Report for the Company and theconsolidated entity prepared in accordance with section 300A of theCorporations Act 2001 for the financial year ended 30 June 2006.This Remuneration Report forms part of the Directors’ Report.
COMPANY PERFORMANCEWorleyParsons listed on the Australian Stock Exchange (“ASX”) in November2002. The graphs below illustrate the performance of the Company’s sharesand its key ratios since it began trading as a listed Company and as such coverthe previous three financial years and the current year.
The Company has experienced strong growth in earnings of approximately67% per annum compound growth over the period since it became a listedcompany, resulting in:
• a 1,118% increase in the Company’s share price;
• Earnings per Share growth (“EPS”) of approximately 43% on anannualised basis;
• Total Shareholder Return (“TSR”) of approximately 1,133%.
The EPS and TSR measures are discussed in more detail on pages 25 to 26.
Since listing in November 2002, the Company has paid/declared the followingdividends:
Final dividend 2003 5.0 cps
Interim dividend 2004 5.5 cps
Final dividend 2004 6.5 cps
Interim dividend 2005 7.5 cps
Final dividend 2005 12.5 cps
Interim dividend 2006 18.5 cps*
Final dividend 2006 (declared) 22.5 cps*
* Partly franked dividend.
The following graphs and tables illustrate the impact of the Company’sperformance on shareholder wealth.
The first graph below shows WorleyParsons’ share price performance againstthe ASX 200 and ASX 100 indices since the Initial Public Offer (“IPO”). Thesecond graph shows WorleyParsons’ full year profit from continuing operationsbefore income tax.
Directors’ Report
22 WorleyParsons Annual Report 2006

Earnings per share before trade name and goodwill amortisation is calculatedby taking the profit attributable to members of WorleyParsons after incometax excluding the amortisation of goodwill and trade name, divided by theweighted average number of shares in the financial year.
The two graphs above show the Company’s EPS before trade name andgoodwill amortisation and TSR results over the same period.
As explained in greater detail below, the fixed component of an executive’sremuneration is set with reference to market data and is not related to theCompany’s financial performance per se. However, the Short Term IncentivePlan is related in part to WorleyParsons’ financial results. The Long TermIncentive Plan is also related to financial performance, in particular to thosedrivers which the Board believes will underpin sustainable long-term growthin shareholder value.
NOMINATIONS AND REMUNERATION COMMITTEE
The Nominations and Remuneration Committee (“Committee”) wasestablished as a sub-committee of the Board in December 2002, shortly afterthe Company listed. Information regarding the objectives and role of theCommittee is set out in its Charter, which is available in the Investor Relationssection of the Company’s website www.worleyparsons.com.
The Committee met six times during the financial year. Attendance at thosemeetings is detailed in this Directors’ Report. The following directors weremembers of the Committee during the year:
NAME POSITION DURATION
Grahame Campbell Chairman From August 2005
Ron McNeilly Chairman To August 2005
Member From August 2005
John Green Member Whole year
Eric Gwee Member Whole year
Mr Eric Gwee has been appointed the Chairman of the Committee with effectfrom 1 July 2006.
The Chief Executive Officer, the Managing Director Americas and Europe andthe Chief Financial Officer attend Committee meetings by invitation. TheExecutive Director Human Resources is the secretary of the Committee.
WOR ASX100 ASX200
TSR to ASX100 & ASX200
0%
200%
400%
600%
800%
1000%
1200%
1400%
Nov-02 May-03 Nov-03 May-04 Nov-04 May-05 Nov-05 May-06
EPS Before Trade Name & Goodwill Amortisation
20.4
22.9
36.6
68.5
10.00.0 20.0 30.0 40.0 50.0 60.0 70.0 80.0
2003
2004
2005
2006
Cents per share
EBIT & Profit after tax
50
0
100
150
200
250
2003 2004 2005 2006
$Mil
EBIT PAT
WOR ASX100 ASX200
WorleyParsons share price vs ASX100 & ASX200
$0
$5
$10
$15
$20
$25
Dec-02 Jun-03 Dec-03 Jun-04 Dec-04 Jun-05 Dec-05 Jun-06
Annual Report 2006 WorleyParsons 23
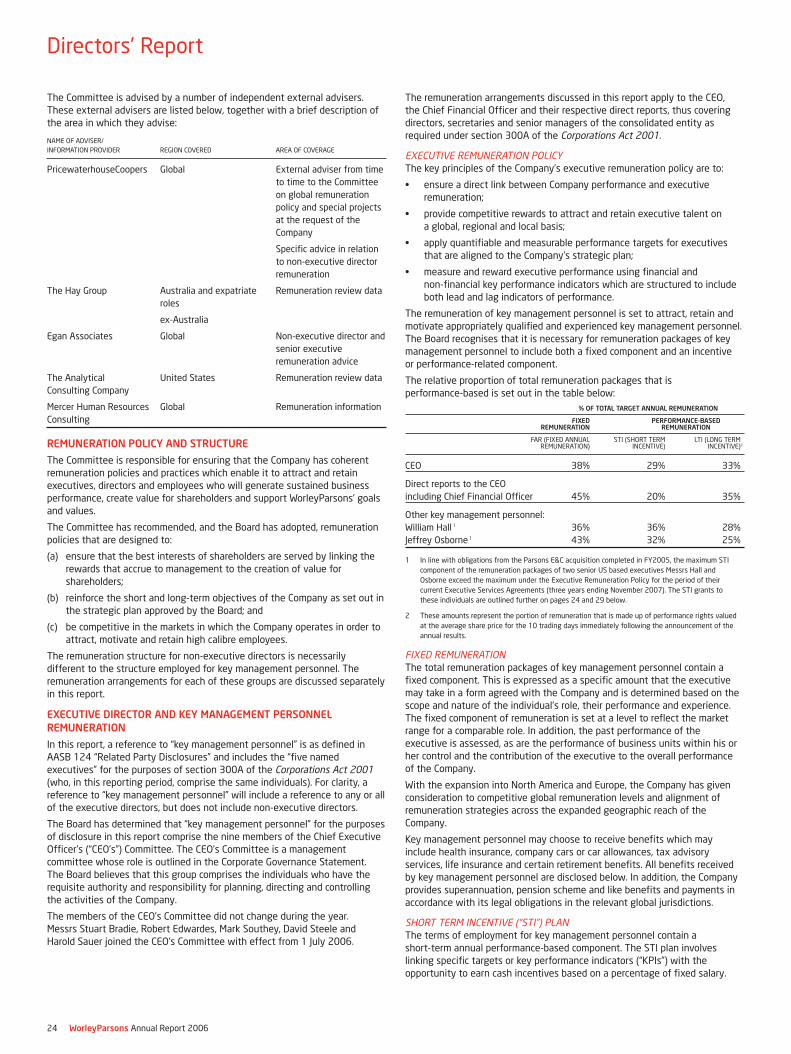
The Committee is advised by a number of independent external advisers.These external advisers are listed below, together with a brief description ofthe area in which they advise:
NAME OF ADVISER/
INFORMATION PROVIDER REGION COVERED AREA OF COVERAGE
PricewaterhouseCoopers Global External adviser from time
to time to the Committee
on global remuneration
policy and special projects
at the request of the
Company
Specific advice in relation
to non-executive director
remuneration
The Hay Group Australia and expatriate Remuneration review data
roles
ex-Australia
Egan Associates Global Non-executive director and
senior executive
remuneration advice
The Analytical United States Remuneration review data
Consulting Company
Mercer Human Resources Global Remuneration information
Consulting
REMUNERATION POLICY AND STRUCTURE
The Committee is responsible for ensuring that the Company has coherentremuneration policies and practices which enable it to attract and retainexecutives, directors and employees who will generate sustained businessperformance, create value for shareholders and support WorleyParsons’ goalsand values.
The Committee has recommended, and the Board has adopted, remunerationpolicies that are designed to:
(a) ensure that the best interests of shareholders are served by linking therewards that accrue to management to the creation of value forshareholders;
(b) reinforce the short and long-term objectives of the Company as set out inthe strategic plan approved by the Board; and
(c) be competitive in the markets in which the Company operates in order toattract, motivate and retain high calibre employees.
The remuneration structure for non-executive directors is necessarilydifferent to the structure employed for key management personnel. Theremuneration arrangements for each of these groups are discussed separatelyin this report.
EXECUTIVE DIRECTOR AND KEY MANAGEMENT PERSONNELREMUNERATION
In this report, a reference to “key management personnel” is as defined inAASB 124 “Related Party Disclosures” and includes the “five namedexecutives” for the purposes of section 300A of the Corporations Act 2001(who, in this reporting period, comprise the same individuals). For clarity, areference to “key management personnel” will include a reference to any or allof the executive directors, but does not include non-executive directors.
The Board has determined that “key management personnel” for the purposesof disclosure in this report comprise the nine members of the Chief ExecutiveOfficer’s (“CEO’s”) Committee. The CEO’s Committee is a managementcommittee whose role is outlined in the Corporate Governance Statement.The Board believes that this group comprises the individuals who have therequisite authority and responsibility for planning, directing and controllingthe activities of the Company.
The members of the CEO’s Committee did not change during the year.Messrs Stuart Bradie, Robert Edwardes, Mark Southey, David Steele andHarold Sauer joined the CEO’s Committee with effect from 1 July 2006.
The remuneration arrangements discussed in this report apply to the CEO,the Chief Financial Officer and their respective direct reports, thus coveringdirectors, secretaries and senior managers of the consolidated entity asrequired under section 300A of the Corporations Act 2001.
EXECUTIVE REMUNERATION POLICYThe key principles of the Company’s executive remuneration policy are to:
• ensure a direct link between Company performance and executiveremuneration;
• provide competitive rewards to attract and retain executive talent ona global, regional and local basis;
• apply quantifiable and measurable performance targets for executivesthat are aligned to the Company’s strategic plan;
• measure and reward executive performance using financial andnon-financial key performance indicators which are structured to includeboth lead and lag indicators of performance.
The remuneration of key management personnel is set to attract, retain andmotivate appropriately qualified and experienced key management personnel.The Board recognises that it is necessary for remuneration packages of keymanagement personnel to include both a fixed component and an incentiveor performance-related component.
The relative proportion of total remuneration packages that isperformance-based is set out in the table below:
% OF TOTAL TARGET ANNUAL REMUNERATION
FIXED PERFORMANCE-BASEDREMUNERATION REMUNERATION
FAR (FIXED ANNUAL STI (SHORT TERM LTI (LONG TERMREMUNERATION) INCENTIVE) INCENTIVE)2
CEO 38% 29% 33%
Direct reports to the CEO
including Chief Financial Officer 45% 20% 35%
Other key management personnel:
William Hall 1 36% 36% 28%
Jeffrey Osborne 1 43% 32% 25%
1 In line with obligations from the Parsons E&C acquisition completed in FY2005, the maximum STI
component of the remuneration packages of two senior US based executives Messrs Hall and
Osborne exceed the maximum under the Executive Remuneration Policy for the period of their
current Executive Services Agreements (three years ending November 2007). The STI grants to
these individuals are outlined further on pages 24 and 29 below.
2 These amounts represent the portion of remuneration that is made up of performance rights valued
at the average share price for the 10 trading days immediately following the announcement of the
annual results.
FIXED REMUNERATIONThe total remuneration packages of key management personnel contain afixed component. This is expressed as a specific amount that the executivemay take in a form agreed with the Company and is determined based on thescope and nature of the individual’s role, their performance and experience.The fixed component of remuneration is set at a level to reflect the marketrange for a comparable role. In addition, the past performance of theexecutive is assessed, as are the performance of business units within his orher control and the contribution of the executive to the overall performanceof the Company.
With the expansion into North America and Europe, the Company has givenconsideration to competitive global remuneration levels and alignment ofremuneration strategies across the expanded geographic reach of theCompany.
Key management personnel may choose to receive benefits which mayinclude health insurance, company cars or car allowances, tax advisoryservices, life insurance and certain retirement benefits. All benefits receivedby key management personnel are disclosed below. In addition, the Companyprovides superannuation, pension scheme and like benefits and payments inaccordance with its legal obligations in the relevant global jurisdictions.
SHORT TERM INCENTIVE (“STI”) PLANThe terms of employment for key management personnel contain ashort-term annual performance-based component. The STI plan involveslinking specific targets or key performance indicators (“KPIs”) with theopportunity to earn cash incentives based on a percentage of fixed salary.
Directors’ Report
24 WorleyParsons Annual Report 2006
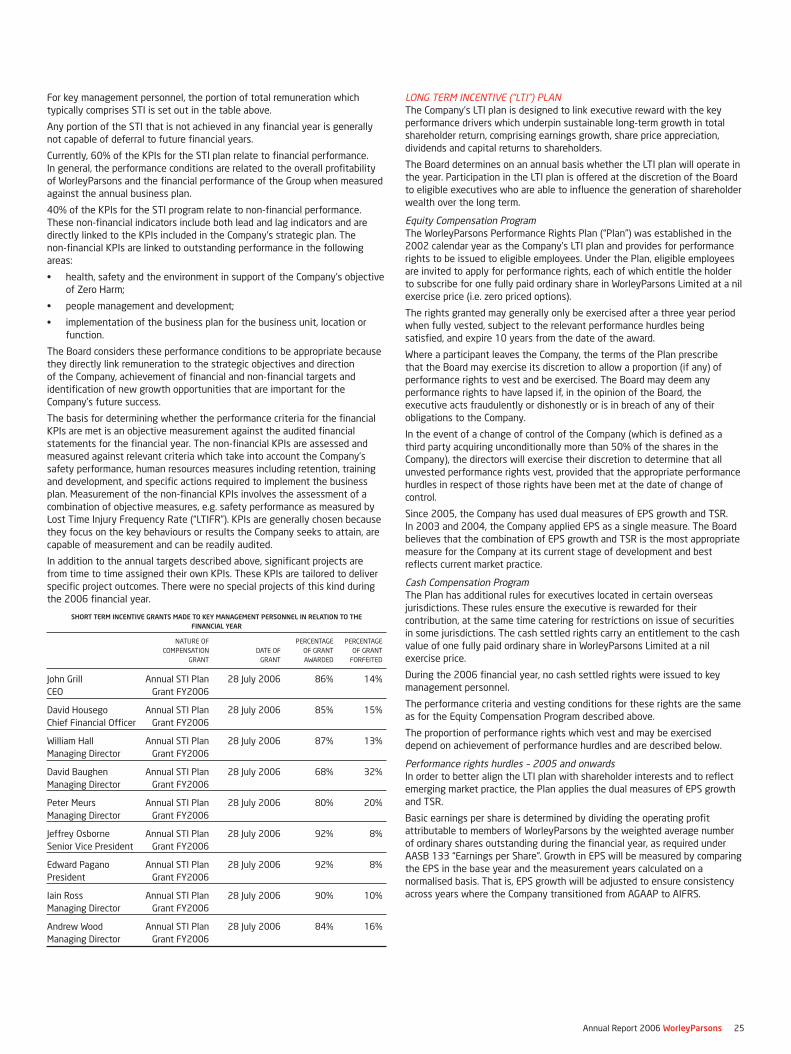
For key management personnel, the portion of total remuneration whichtypically comprises STI is set out in the table above.
Any portion of the STI that is not achieved in any financial year is generallynot capable of deferral to future financial years.
Currently, 60% of the KPIs for the STI plan relate to financial performance.In general, the performance conditions are related to the overall profitabilityof WorleyParsons and the financial performance of the Group when measuredagainst the annual business plan.
40% of the KPIs for the STI program relate to non-financial performance.These non-financial indicators include both lead and lag indicators and aredirectly linked to the KPIs included in the Company’s strategic plan. Thenon-financial KPIs are linked to outstanding performance in the followingareas:
• health, safety and the environment in support of the Company’s objectiveof Zero Harm;
• people management and development;
• implementation of the business plan for the business unit, location orfunction.
The Board considers these performance conditions to be appropriate becausethey directly link remuneration to the strategic objectives and directionof the Company, achievement of financial and non-financial targets andidentification of new growth opportunities that are important for theCompany’s future success.
The basis for determining whether the performance criteria for the financialKPIs are met is an objective measurement against the audited financialstatements for the financial year. The non-financial KPIs are assessed andmeasured against relevant criteria which take into account the Company’ssafety performance, human resources measures including retention, trainingand development, and specific actions required to implement the businessplan. Measurement of the non-financial KPIs involves the assessment of acombination of objective measures, e.g. safety performance as measured byLost Time Injury Frequency Rate (“LTIFR”). KPIs are generally chosen becausethey focus on the key behaviours or results the Company seeks to attain, arecapable of measurement and can be readily audited.
In addition to the annual targets described above, significant projects arefrom time to time assigned their own KPIs. These KPIs are tailored to deliverspecific project outcomes. There were no special projects of this kind duringthe 2006 financial year.
SHORT TERM INCENTIVE GRANTS MADE TO KEY MANAGEMENT PERSONNEL IN RELATION TO THEFINANCIAL YEAR
NATURE OF PERCENTAGE PERCENTAGE
COMPENSATION DATE OF OF GRANT OF GRANT
GRANT GRANT AWARDED FORFEITED
John Grill Annual STI Plan 28 July 2006 86% 14%
CEO Grant FY2006
David Housego Annual STI Plan 28 July 2006 85% 15%
Chief Financial Officer Grant FY2006
William Hall Annual STI Plan 28 July 2006 87% 13%
Managing Director Grant FY2006
David Baughen Annual STI Plan 28 July 2006 68% 32%
Managing Director Grant FY2006
Peter Meurs Annual STI Plan 28 July 2006 80% 20%
Managing Director Grant FY2006
Jeffrey Osborne Annual STI Plan 28 July 2006 92% 8%
Senior Vice President Grant FY2006
Edward Pagano Annual STI Plan 28 July 2006 92% 8%
President Grant FY2006
Iain Ross Annual STI Plan 28 July 2006 90% 10%
Managing Director Grant FY2006
Andrew Wood Annual STI Plan 28 July 2006 84% 16%
Managing Director Grant FY2006
LONG TERM INCENTIVE (“LTI”) PLANThe Company’s LTI plan is designed to link executive reward with the keyperformance drivers which underpin sustainable long-term growth in totalshareholder return, comprising earnings growth, share price appreciation,dividends and capital returns to shareholders.
The Board determines on an annual basis whether the LTI plan will operate inthe year. Participation in the LTI plan is offered at the discretion of the Boardto eligible executives who are able to influence the generation of shareholderwealth over the long term.
Equity Compensation ProgramThe WorleyParsons Performance Rights Plan (“Plan”) was established in the2002 calendar year as the Company’s LTI plan and provides for performancerights to be issued to eligible employees. Under the Plan, eligible employeesare invited to apply for performance rights, each of which entitle the holderto subscribe for one fully paid ordinary share in WorleyParsons Limited at a nilexercise price (i.e. zero priced options).
The rights granted may generally only be exercised after a three year periodwhen fully vested, subject to the relevant performance hurdles beingsatisfied, and expire 10 years from the date of the award.
Where a participant leaves the Company, the terms of the Plan prescribethat the Board may exercise its discretion to allow a proportion (if any) ofperformance rights to vest and be exercised. The Board may deem anyperformance rights to have lapsed if, in the opinion of the Board, theexecutive acts fraudulently or dishonestly or is in breach of any of theirobligations to the Company.
In the event of a change of control of the Company (which is defined as athird party acquiring unconditionally more than 50% of the shares in theCompany), the directors will exercise their discretion to determine that allunvested performance rights vest, provided that the appropriate performancehurdles in respect of those rights have been met at the date of change ofcontrol.
Since 2005, the Company has used dual measures of EPS growth and TSR.In 2003 and 2004, the Company applied EPS as a single measure. The Boardbelieves that the combination of EPS growth and TSR is the most appropriatemeasure for the Company at its current stage of development and bestreflects current market practice.
Cash Compensation ProgramThe Plan has additional rules for executives located in certain overseasjurisdictions. These rules ensure the executive is rewarded for theircontribution, at the same time catering for restrictions on issue of securitiesin some jurisdictions. The cash settled rights carry an entitlement to the cashvalue of one fully paid ordinary share in WorleyParsons Limited at a nilexercise price.
During the 2006 financial year, no cash settled rights were issued to keymanagement personnel.
The performance criteria and vesting conditions for these rights are the sameas for the Equity Compensation Program described above.
The proportion of performance rights which vest and may be exerciseddepend on achievement of performance hurdles and are described below.
Performance rights hurdles – 2005 and onwardsIn order to better align the LTI plan with shareholder interests and to reflectemerging market practice, the Plan applies the dual measures of EPS growthand TSR.
Basic earnings per share is determined by dividing the operating profitattributable to members of WorleyParsons by the weighted average numberof ordinary shares outstanding during the financial year, as required underAASB 133 “Earnings per Share”. Growth in EPS will be measured by comparingthe EPS in the base year and the measurement years calculated on anormalised basis. That is, EPS growth will be adjusted to ensure consistencyacross years where the Company transitioned from AGAAP to AIFRS.
Annual Report 2006 WorleyParsons 25
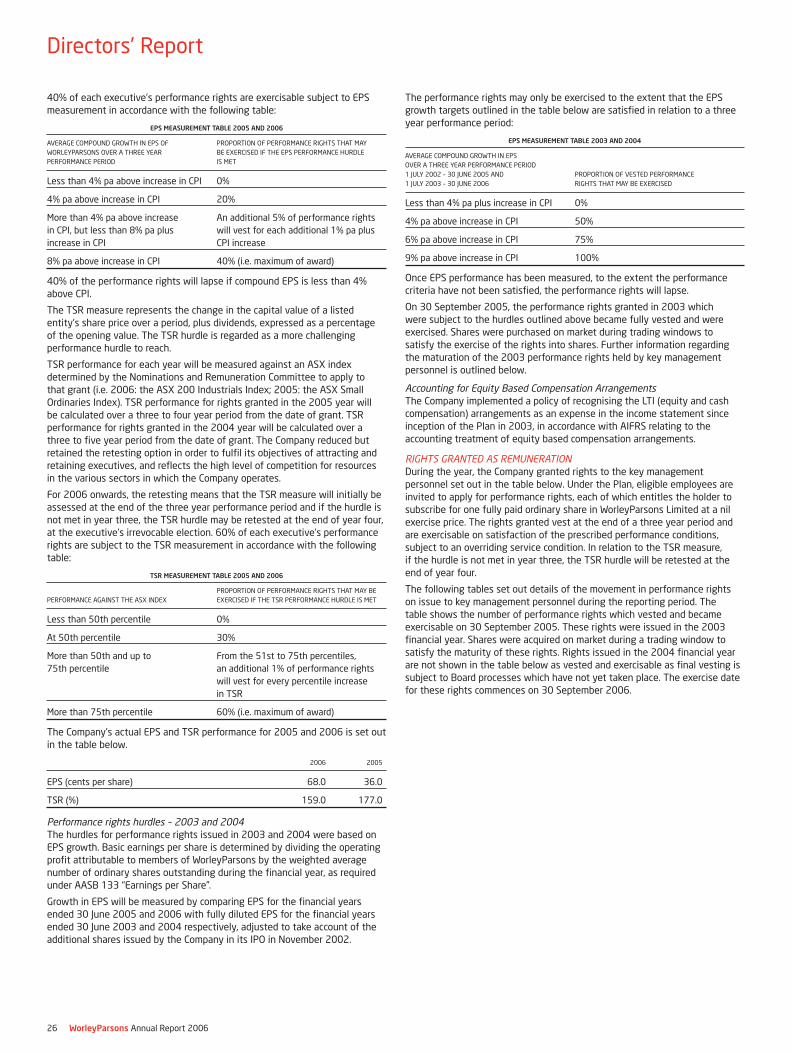
40% of each executive’s performance rights are exercisable subject to EPSmeasurement in accordance with the following table:
EPS MEASUREMENT TABLE 2005 AND 2006
AVERAGE COMPOUND GROWTH IN EPS OF PROPORTION OF PERFORMANCE RIGHTS THAT MAY
WORLEYPARSONS OVER A THREE YEAR BE EXERCISED IF THE EPS PERFORMANCE HURDLE
PERFORMANCE PERIOD IS MET
Less than 4% pa above increase in CPI 0%
4% pa above increase in CPI 20%
More than 4% pa above increase An additional 5% of performance rights
in CPI, but less than 8% pa plus will vest for each additional 1% pa plus
increase in CPI CPI increase
8% pa above increase in CPI 40% (i.e. maximum of award)
40% of the performance rights will lapse if compound EPS is less than 4%above CPI.
The TSR measure represents the change in the capital value of a listedentity’s share price over a period, plus dividends, expressed as a percentageof the opening value. The TSR hurdle is regarded as a more challengingperformance hurdle to reach.
TSR performance for each year will be measured against an ASX indexdetermined by the Nominations and Remuneration Committee to apply tothat grant (i.e. 2006: the ASX 200 Industrials Index; 2005: the ASX SmallOrdinaries Index). TSR performance for rights granted in the 2005 year willbe calculated over a three to four year period from the date of grant. TSRperformance for rights granted in the 2004 year will be calculated over athree to five year period from the date of grant. The Company reduced butretained the retesting option in order to fulfil its objectives of attracting andretaining executives, and reflects the high level of competition for resourcesin the various sectors in which the Company operates.
For 2006 onwards, the retesting means that the TSR measure will initially beassessed at the end of the three year performance period and if the hurdle isnot met in year three, the TSR hurdle may be retested at the end of year four,at the executive’s irrevocable election. 60% of each executive’s performancerights are subject to the TSR measurement in accordance with the followingtable:
TSR MEASUREMENT TABLE 2005 AND 2006
PROPORTION OF PERFORMANCE RIGHTS THAT MAY BE
PERFORMANCE AGAINST THE ASX INDEX EXERCISED IF THE TSR PERFORMANCE HURDLE IS MET
Less than 50th percentile 0%
At 50th percentile 30%
More than 50th and up to From the 51st to 75th percentiles,
75th percentile an additional 1% of performance rights
will vest for every percentile increase
in TSR
More than 75th percentile 60% (i.e. maximum of award)
The Company’s actual EPS and TSR performance for 2005 and 2006 is set outin the table below.
2006 2005
EPS (cents per share) 68.0 36.0
TSR (%) 159.0 177.0
Performance rights hurdles – 2003 and 2004The hurdles for performance rights issued in 2003 and 2004 were based onEPS growth. Basic earnings per share is determined by dividing the operatingprofit attributable to members of WorleyParsons by the weighted averagenumber of ordinary shares outstanding during the financial year, as requiredunder AASB 133 “Earnings per Share”.
Growth in EPS will be measured by comparing EPS for the financial yearsended 30 June 2005 and 2006 with fully diluted EPS for the financial yearsended 30 June 2003 and 2004 respectively, adjusted to take account of theadditional shares issued by the Company in its IPO in November 2002.
The performance rights may only be exercised to the extent that the EPSgrowth targets outlined in the table below are satisfied in relation to a threeyear performance period:
EPS MEASUREMENT TABLE 2003 AND 2004
AVERAGE COMPOUND GROWTH IN EPS
OVER A THREE YEAR PERFORMANCE PERIOD
1 JULY 2002 – 30 JUNE 2005 AND PROPORTION OF VESTED PERFORMANCE
1 JULY 2003 – 30 JUNE 2006 RIGHTS THAT MAY BE EXERCISED
Less than 4% pa plus increase in CPI 0%
4% pa above increase in CPI 50%
6% pa above increase in CPI 75%
9% pa above increase in CPI 100%
Once EPS performance has been measured, to the extent the performancecriteria have not been satisfied, the performance rights will lapse.
On 30 September 2005, the performance rights granted in 2003 whichwere subject to the hurdles outlined above became fully vested and wereexercised. Shares were purchased on market during trading windows tosatisfy the exercise of the rights into shares. Further information regardingthe maturation of the 2003 performance rights held by key managementpersonnel is outlined below.
Accounting for Equity Based Compensation ArrangementsThe Company implemented a policy of recognising the LTI (equity and cashcompensation) arrangements as an expense in the income statement sinceinception of the Plan in 2003, in accordance with AIFRS relating to theaccounting treatment of equity based compensation arrangements.
RIGHTS GRANTED AS REMUNERATIONDuring the year, the Company granted rights to the key managementpersonnel set out in the table below. Under the Plan, eligible employees areinvited to apply for performance rights, each of which entitles the holder tosubscribe for one fully paid ordinary share in WorleyParsons Limited at a nilexercise price. The rights granted vest at the end of a three year period andare exercisable on satisfaction of the prescribed performance conditions,subject to an overriding service condition. In relation to the TSR measure,if the hurdle is not met in year three, the TSR hurdle will be retested at theend of year four.
The following tables set out details of the movement in performance rightson issue to key management personnel during the reporting period. Thetable shows the number of performance rights which vested and becameexercisable on 30 September 2005. These rights were issued in the 2003financial year. Shares were acquired on market during a trading window tosatisfy the maturity of these rights. Rights issued in the 2004 financial yearare not shown in the table below as vested and exercisable as final vesting issubject to Board processes which have not yet taken place. The exercise datefor these rights commences on 30 September 2006.
Directors’ Report
26 WorleyParsons Annual Report 2006
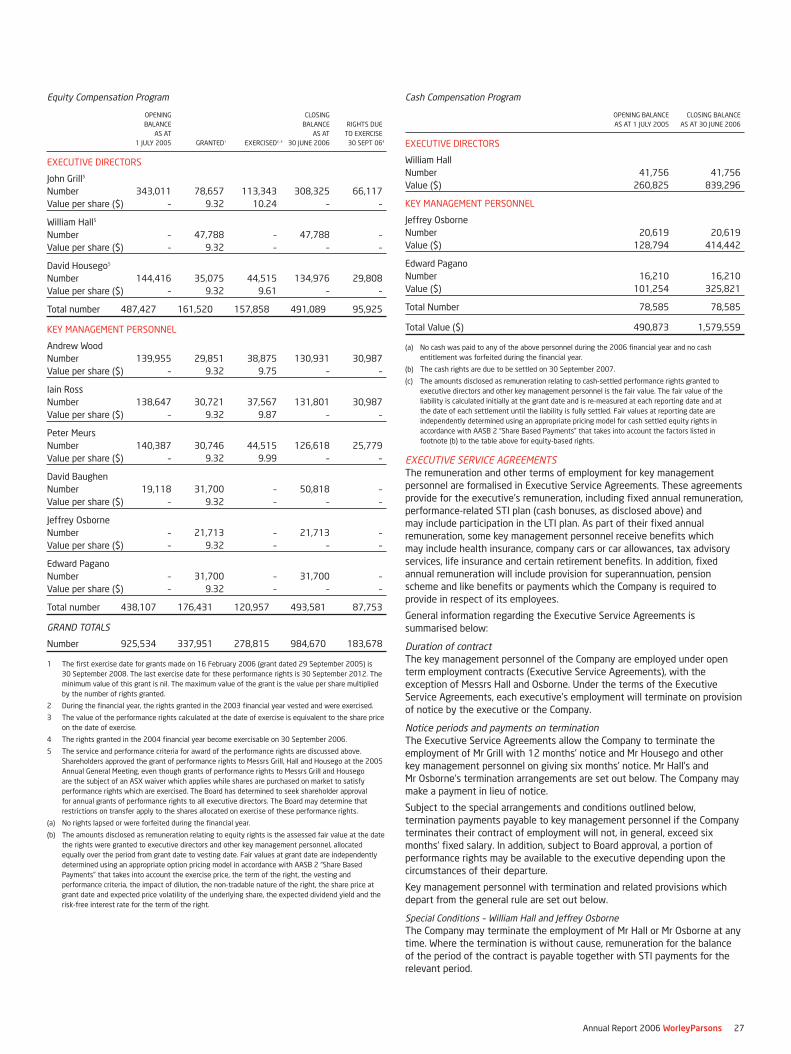
Equity Compensation Program
OPENING CLOSING
BALANCE BALANCE RIGHTS DUE
AS AT AS AT TO EXERCISE
1 JULY 2005 GRANTED1 EXERCISED2, 3 30 JUNE 2006 30 SEPT 064
EXECUTIVE DIRECTORS
John Grill5
Number 343,011 78,657 113,343 308,325 66,117
Value per share ($) – 9.32 10.24 – –
William Hall5
Number – 47,788 – 47,788 –
Value per share ($) – 9.32 – – –
David Housego5
Number 144,416 35,075 44,515 134,976 29,808
Value per share ($) – 9.32 9.61 – –
Total number 487,427 161,520 157,858 491,089 95,925
KEY MANAGEMENT PERSONNEL
Andrew Wood
Number 139,955 29,851 38,875 130,931 30,987
Value per share ($) – 9.32 9.75 – –
Iain Ross
Number 138,647 30,721 37,567 131,801 30,987
Value per share ($) – 9.32 9.87 – –
Peter Meurs
Number 140,387 30,746 44,515 126,618 25,779
Value per share ($) – 9.32 9.99 – –
David Baughen
Number 19,118 31,700 – 50,818 –
Value per share ($) – 9.32 – – –
Jeffrey Osborne
Number – 21,713 – 21,713 –
Value per share ($) – 9.32 – – –
Edward Pagano
Number – 31,700 – 31,700 –
Value per share ($) – 9.32 – – –
Total number 438,107 176,431 120,957 493,581 87,753
GRAND TOTALS
Number 925,534 337,951 278,815 984,670 183,678
1 The first exercise date for grants made on 16 February 2006 (grant dated 29 September 2005) is
30 September 2008. The last exercise date for these performance rights is 30 September 2012. The
minimum value of this grant is nil. The maximum value of the grant is the value per share multiplied
by the number of rights granted.
2 During the financial year, the rights granted in the 2003 financial year vested and were exercised.
3 The value of the performance rights calculated at the date of exercise is equivalent to the share price
on the date of exercise.
4 The rights granted in the 2004 financial year become exercisable on 30 September 2006.
5 The service and performance criteria for award of the performance rights are discussed above.
Shareholders approved the grant of performance rights to Messrs Grill, Hall and Housego at the 2005
Annual General Meeting, even though grants of performance rights to Messrs Grill and Housego
are the subject of an ASX waiver which applies while shares are purchased on market to satisfy
performance rights which are exercised. The Board has determined to seek shareholder approval
for annual grants of performance rights to all executive directors. The Board may determine that
restrictions on transfer apply to the shares allocated on exercise of these performance rights.
(a) No rights lapsed or were forfeited during the financial year.
(b) The amounts disclosed as remuneration relating to equity rights is the assessed fair value at the date
the rights were granted to executive directors and other key management personnel, allocated
equally over the period from grant date to vesting date. Fair values at grant date are independently
determined using an appropriate option pricing model in accordance with AASB 2 “Share Based
Payments” that takes into account the exercise price, the term of the right, the vesting and
performance criteria, the impact of dilution, the non-tradable nature of the right, the share price at
grant date and expected price volatility of the underlying share, the expected dividend yield and the
risk-free interest rate for the term of the right.
Cash Compensation Program
OPENING BALANCE CLOSING BALANCE
AS AT 1 JULY 2005 AS AT 30 JUNE 2006
EXECUTIVE DIRECTORS
William Hall
Number 41,756 41,756
Value ($) 260,825 839,296
KEY MANAGEMENT PERSONNEL
Jeffrey Osborne
Number 20,619 20,619
Value ($) 128,794 414,442
Edward Pagano
Number 16,210 16,210
Value ($) 101,254 325,821
Total Number 78,585 78,585
Total Value ($) 490,873 1,579,559
(a) No cash was paid to any of the above personnel during the 2006 financial year and no cash
entitlement was forfeited during the financial year.
(b) The cash rights are due to be settled on 30 September 2007.
(c) The amounts disclosed as remuneration relating to cash-settled performance rights granted to
executive directors and other key management personnel is the fair value. The fair value of the
liability is calculated initially at the grant date and is re-measured at each reporting date and at
the date of each settlement until the liability is fully settled. Fair values at reporting date are
independently determined using an appropriate pricing model for cash settled equity rights in
accordance with AASB 2 “Share Based Payments” that takes into account the factors listed in
footnote (b) to the table above for equity-based rights.
EXECUTIVE SERVICE AGREEMENTSThe remuneration and other terms of employment for key managementpersonnel are formalised in Executive Service Agreements. These agreementsprovide for the executive’s remuneration, including fixed annual remuneration,performance-related STI plan (cash bonuses, as disclosed above) andmay include participation in the LTI plan. As part of their fixed annualremuneration, some key management personnel receive benefits whichmay include health insurance, company cars or car allowances, tax advisoryservices, life insurance and certain retirement benefits. In addition, fixedannual remuneration will include provision for superannuation, pensionscheme and like benefits or payments which the Company is required toprovide in respect of its employees.
General information regarding the Executive Service Agreements issummarised below:
Duration of contractThe key management personnel of the Company are employed under openterm employment contracts (Executive Service Agreements), with theexception of Messrs Hall and Osborne. Under the terms of the ExecutiveService Agreements, each executive’s employment will terminate on provisionof notice by the executive or the Company.
Notice periods and payments on terminationThe Executive Service Agreements allow the Company to terminate theemployment of Mr Grill with 12 months’ notice and Mr Housego and otherkey management personnel on giving six months’ notice. Mr Hall’s andMr Osborne’s termination arrangements are set out below. The Company maymake a payment in lieu of notice.
Subject to the special arrangements and conditions outlined below,termination payments payable to key management personnel if the Companyterminates their contract of employment will not, in general, exceed sixmonths’ fixed salary. In addition, subject to Board approval, a portion ofperformance rights may be available to the executive depending upon thecircumstances of their departure.
Key management personnel with termination and related provisions whichdepart from the general rule are set out below.
Special Conditions – William Hall and Jeffrey OsborneThe Company may terminate the employment of Mr Hall or Mr Osborne at anytime. Where the termination is without cause, remuneration for the balanceof the period of the contract is payable together with STI payments for therelevant period.
Annual Report 2006 WorleyParsons 27
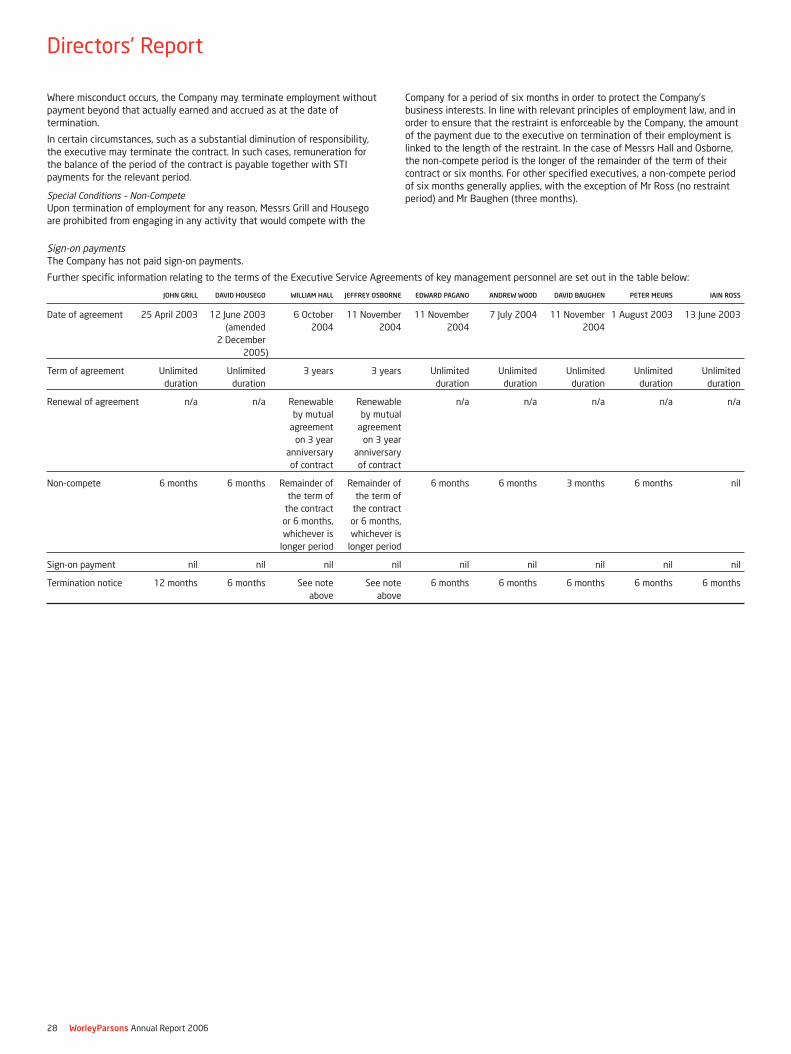
Where misconduct occurs, the Company may terminate employment withoutpayment beyond that actually earned and accrued as at the date oftermination.
In certain circumstances, such as a substantial diminution of responsibility,the executive may terminate the contract. In such cases, remuneration forthe balance of the period of the contract is payable together with STIpayments for the relevant period.
Special Conditions – Non-CompeteUpon termination of employment for any reason, Messrs Grill and Housegoare prohibited from engaging in any activity that would compete with the
Company for a period of six months in order to protect the Company’sbusiness interests. In line with relevant principles of employment law, and inorder to ensure that the restraint is enforceable by the Company, the amountof the payment due to the executive on termination of their employment islinked to the length of the restraint. In the case of Messrs Hall and Osborne,the non-compete period is the longer of the remainder of the term of theircontract or six months. For other specified executives, a non-compete periodof six months generally applies, with the exception of Mr Ross (no restraintperiod) and Mr Baughen (three months).
Sign-on paymentsThe Company has not paid sign-on payments.
Further specific information relating to the terms of the Executive Service Agreements of key management personnel are set out in the table below:
JOHN GRILL DAVID HOUSEGO WILLIAM HALL JEFFREY OSBORNE EDWARD PAGANO ANDREW WOOD DAVID BAUGHEN PETER MEURS IAIN ROSS
Date of agreement 25 April 2003 12 June 2003 6 October 11 November 11 November 7 July 2004 11 November 1 August 2003 13 June 2003
(amended 2004 2004 2004 2004
2 December
2005)
Term of agreement Unlimited Unlimited 3 years 3 years Unlimited Unlimited Unlimited Unlimited Unlimited
duration duration duration duration duration duration duration
Renewal of agreement n/a n/a Renewable Renewable n/a n/a n/a n/a n/a
by mutual by mutual
agreement agreement
on 3 year on 3 year
anniversary anniversary
of contract of contract
Non-compete 6 months 6 months Remainder of Remainder of 6 months 6 months 3 months 6 months nil
the term of the term of
the contract the contract
or 6 months, or 6 months,
whichever is whichever is
longer period longer period
Sign-on payment nil nil nil nil nil nil nil nil nil
Termination notice 12 months 6 months See note See note 6 months 6 months 6 months 6 months 6 months
above above
Directors’ Report
28 WorleyParsons Annual Report 2006
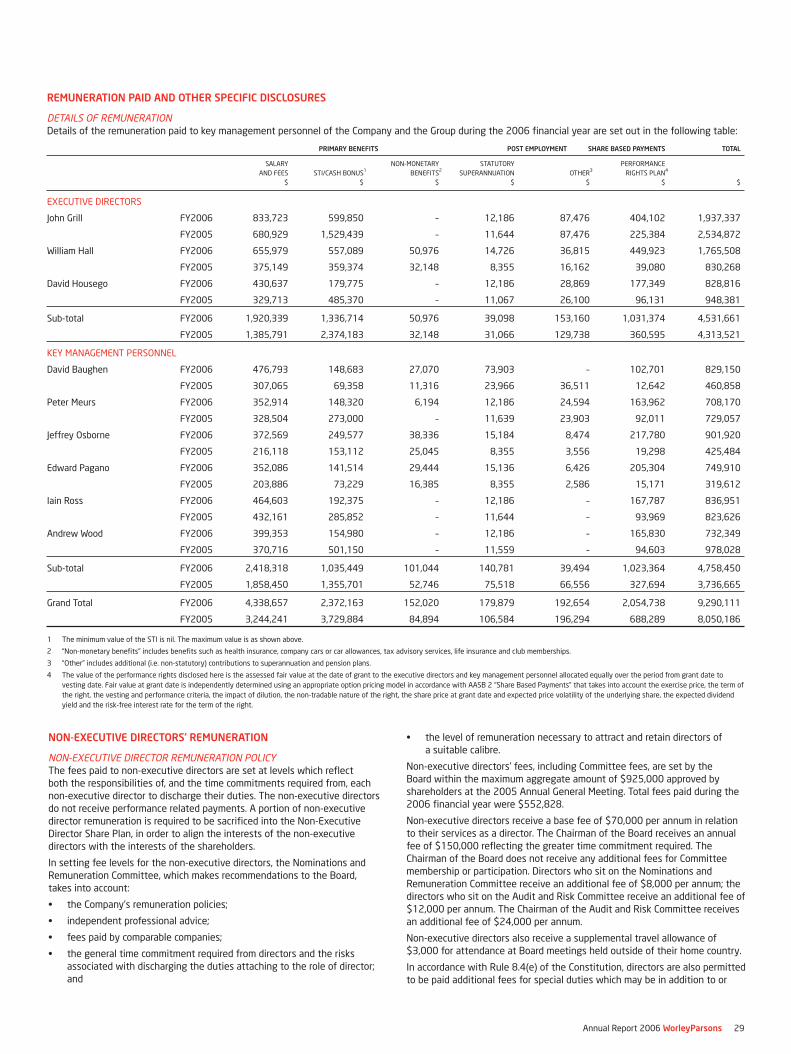
REMUNERATION PAID AND OTHER SPECIFIC DISCLOSURES
DETAILS OF REMUNERATIONDetails of the remuneration paid to key management personnel of the Company and the Group during the 2006 financial year are set out in the following table:
PRIMARY BENEFITS POST EMPLOYMENT SHARE BASED PAYMENTS TOTAL
SALARY NON-MONETARY STATUTORY PERFORMANCE
AND FEES STI/CASH BONUS1 BENEFITS2 SUPERANNUATION OTHER3 RIGHTS PLAN4
$ $ $ $ $ $ $
EXECUTIVE DIRECTORS
John Grill FY2006 833,723 599,850 – 12,186 87,476 404,102 1,937,337
FY2005 680,929 1,529,439 – 11,644 87,476 225,384 2,534,872
William Hall FY2006 655,979 557,089 50,976 14,726 36,815 449,923 1,765,508
FY2005 375,149 359,374 32,148 8,355 16,162 39,080 830,268
David Housego FY2006 430,637 179,775 – 12,186 28,869 177,349 828,816
FY2005 329,713 485,370 – 11,067 26,100 96,131 948,381
Sub-total FY2006 1,920,339 1,336,714 50,976 39,098 153,160 1,031,374 4,531,661
FY2005 1,385,791 2,374,183 32,148 31,066 129,738 360,595 4,313,521
KEY MANAGEMENT PERSONNEL
David Baughen FY2006 476,793 148,683 27,070 73,903 – 102,701 829,150
FY2005 307,065 69,358 11,316 23,966 36,511 12,642 460,858
Peter Meurs FY2006 352,914 148,320 6,194 12,186 24,594 163,962 708,170
FY2005 328,504 273,000 – 11,639 23,903 92,011 729,057
Jeffrey Osborne FY2006 372,569 249,577 38,336 15,184 8,474 217,780 901,920
FY2005 216,118 153,112 25,045 8,355 3,556 19,298 425,484
Edward Pagano FY2006 352,086 141,514 29,444 15,136 6,426 205,304 749,910
FY2005 203,886 73,229 16,385 8,355 2,586 15,171 319,612
Iain Ross FY2006 464,603 192,375 – 12,186 – 167,787 836,951
FY2005 432,161 285,852 – 11,644 – 93,969 823,626
Andrew Wood FY2006 399,353 154,980 – 12,186 – 165,830 732,349
FY2005 370,716 501,150 – 11,559 – 94,603 978,028
Sub-total FY2006 2,418,318 1,035,449 101,044 140,781 39,494 1,023,364 4,758,450
FY2005 1,858,450 1,355,701 52,746 75,518 66,556 327,694 3,736,665
Grand Total FY2006 4,338,657 2,372,163 152,020 179,879 192,654 2,054,738 9,290,111
FY2005 3,244,241 3,729,884 84,894 106,584 196,294 688,289 8,050,186
1 The minimum value of the STI is nil. The maximum value is as shown above.
2 “Non-monetary benefits” includes benefits such as health insurance, company cars or car allowances, tax advisory services, life insurance and club memberships.
3 “Other” includes additional (i.e. non-statutory) contributions to superannuation and pension plans.
4 The value of the performance rights disclosed here is the assessed fair value at the date of grant to the executive directors and key management personnel allocated equally over the period from grant date to
vesting date. Fair value at grant date is independently determined using an appropriate option pricing model in accordance with AASB 2 “Share Based Payments” that takes into account the exercise price, the term of
the right, the vesting and performance criteria, the impact of dilution, the non-tradable nature of the right, the share price at grant date and expected price volatility of the underlying share, the expected dividend
yield and the risk-free interest rate for the term of the right.
Annual Report 2006 WorleyParsons 29
NON-EXECUTIVE DIRECTORS’ REMUNERATION
NON-EXECUTIVE DIRECTOR REMUNERATION POLICYThe fees paid to non-executive directors are set at levels which reflectboth the responsibilities of, and the time commitments required from, eachnon-executive director to discharge their duties. The non-executive directorsdo not receive performance related payments. A portion of non-executivedirector remuneration is required to be sacrificed into the Non-ExecutiveDirector Share Plan, in order to align the interests of the non-executivedirectors with the interests of the shareholders.
In setting fee levels for the non-executive directors, the Nominations andRemuneration Committee, which makes recommendations to the Board,takes into account:
• the Company’s remuneration policies;
• independent professional advice;
• fees paid by comparable companies;
• the general time commitment required from directors and the risksassociated with discharging the duties attaching to the role of director;and
• the level of remuneration necessary to attract and retain directors ofa suitable calibre.
Non-executive directors’ fees, including Committee fees, are set by theBoard within the maximum aggregate amount of $925,000 approved byshareholders at the 2005 Annual General Meeting. Total fees paid during the2006 financial year were $552,828.
Non-executive directors receive a base fee of $70,000 per annum in relationto their services as a director. The Chairman of the Board receives an annualfee of $150,000 reflecting the greater time commitment required. TheChairman of the Board does not receive any additional fees for Committeemembership or participation. Directors who sit on the Nominations andRemuneration Committee receive an additional fee of $8,000 per annum; thedirectors who sit on the Audit and Risk Committee receive an additional fee of$12,000 per annum. The Chairman of the Audit and Risk Committee receivesan additional fee of $24,000 per annum.
Non-executive directors also receive a supplemental travel allowance of$3,000 for attendance at Board meetings held outside of their home country.
In accordance with Rule 8.4(e) of the Constitution, directors are also permittedto be paid additional fees for special duties which may be in addition to or

in substitution of fees otherwise paid to directors, within the aggregateremuneration cap approved by shareholders. No such fees were paid duringthe 2006 financial year.
Directors are also entitled to be reimbursed for all business related expenses,including travel on Company business, as may be incurred in the discharge oftheir duties.
Superannuation contributions are made on behalf of the non-executivedirectors in accordance with the Company’s statutory superannuationobligations.
The Board, with the assistance of the Nominations and RemunerationCommittee, continues to review its approach to non-executive directorremuneration to ensure it remains in line with general industry practice andbest practice principles of corporate governance.
The non-executive director fee arrangements were reviewed during the 2006financial year to ensure that they adequately reflect the increased size andcomplexity of the Company and the consequent enhanced responsibilitiesassociated with membership of the Committees of the Board, as well as theincreased travel requirements of members of the Board. In reviewing thenon-executive director fee arrangements, the Company was assisted byexternal advisers in relation to the quantum and structure of theremuneration.
The revised annual fee arrangements which will apply from 1 July 2006 aredescribed below. Committee fees are in addition to the base non-executivedirector fee. The Chairman will not receive any additional fee for Committeemembership or participation.
Chairman $236,000
Non-executive director $90,000
Chairman of Audit and Risk Committee $35,000
Member of Audit and Risk Committee $17,500
Chairman of Nominations and Remuneration Committee $18,000
Member of Nominations and Remuneration Committee $12,000
Travel allowance for meetings outside home country $3,000
NON-EXECUTIVE DIRECTOR SHARE PLANIn recognising that ownership of Company shares aligns directors’ interestswith those of shareholders, the Company adopted the Non-Executive DirectorShare Plan in the financial year 2003.
Under the terms of the Non-Executive Director Share Plan, non-executivedirectors are required to sacrifice a minimum of 25% of their gross annualfees and may elect to sacrifice up to a maximum 60% of their fees. In return,the Company will procure the acquisition of an equivalent value of shares atthe prevailing market price. These shares are subject to a restriction ondealing which expires on the earliest of 10 years from the grant of shares,the director ceases to hold office or the Board determines in its discretionthat any restrictions cease. The shares are held by the trustee of theWorleyParsons Limited Plans Trust (“Trust”) during this restriction period.
During the financial year, shares were allocated to non-executive directorsunder the Non-Executive Director Share Plan out of a parcel of shares whichcomprised general trust property. When shares are purchased on market, thepurchases take place within a share trading window as required under theterms of the Company’s Guideline on Securities Dealing.
The Non-Executive Director Share Plan is not a performance based share plan.Nor is it intended as an incentive component of non-executive directorremuneration. Non-executive directors are not eligible to participate in any ofthe Company’s incentive arrangements.
Details of securities acquired on behalf of non-executive directors under theNon-Executive Director Share Plan during the financial year are set out in theremuneration summary below.
RETIREMENT BENEFITSThe Company does not pay non-executive director retirement benefits otherthan statutorily prescribed superannuation contributions. Superannuationcontributions are made on behalf of the non-executive directors in accordancewith the Company’s statutory superannuation obligations.
REMUNERATIONDetails of non-executive directors’ remuneration for the financial years ended 30 June 2006 and 2005 are set out in the following table:
PRIMARY BENEFITS POST EMPLOYMENT SHARE BASED PAYMENTS TOTAL
STATUTORY NON-EXEC. DIRECTOR
SALARY AND FEES1 SUPERANNUATION2 OTHER3 SHARE PLAN
$ $ $ $ $
Ron McNeilly FY2006 115,500 10,128 – 37,500 163,128
FY2005 84,375 7,595 – 28,125 120,095
Grahame Campbell FY2006 70,500 6,078 – 22,500 99,078
FY2005 81,898 7,372 – 18,125 107,395
Erich Fraunschiel FY2006 73,500 – – 23,502 97,002
FY2005 61,500 – – 20,500 82,000
John Green FY2006 21,000 1,620 33,750 38,250 94,620
FY2005 29,000 2,610 – 43,500 75,110
Eric Gwee FY2006 79,500 – – 19,500 99,000
FY2005 19,500 – – 6,500 26,000
Total FY2006 360,000 17,826 33,750 141,252 552,828
FY2005 276,273 17,577 – 116,750 410,600
1 Includes travel and similar allowances.
2 Superannuation contributions are made on behalf of the non-executive directors in accordance with the Company’s statutory superannuation obligations.
3 “Other” includes additional (i.e. non-statutory) contributions to superannuation and pension plans.
DIRECTORS’ SHAREHOLDINGS
Particulars of directors’ beneficial interests in shares of WorleyParsons Limited as at the date of this report are set out in note 37 of the financial statements.
Directors’ Report
30 WorleyParsons Annual Report 2006
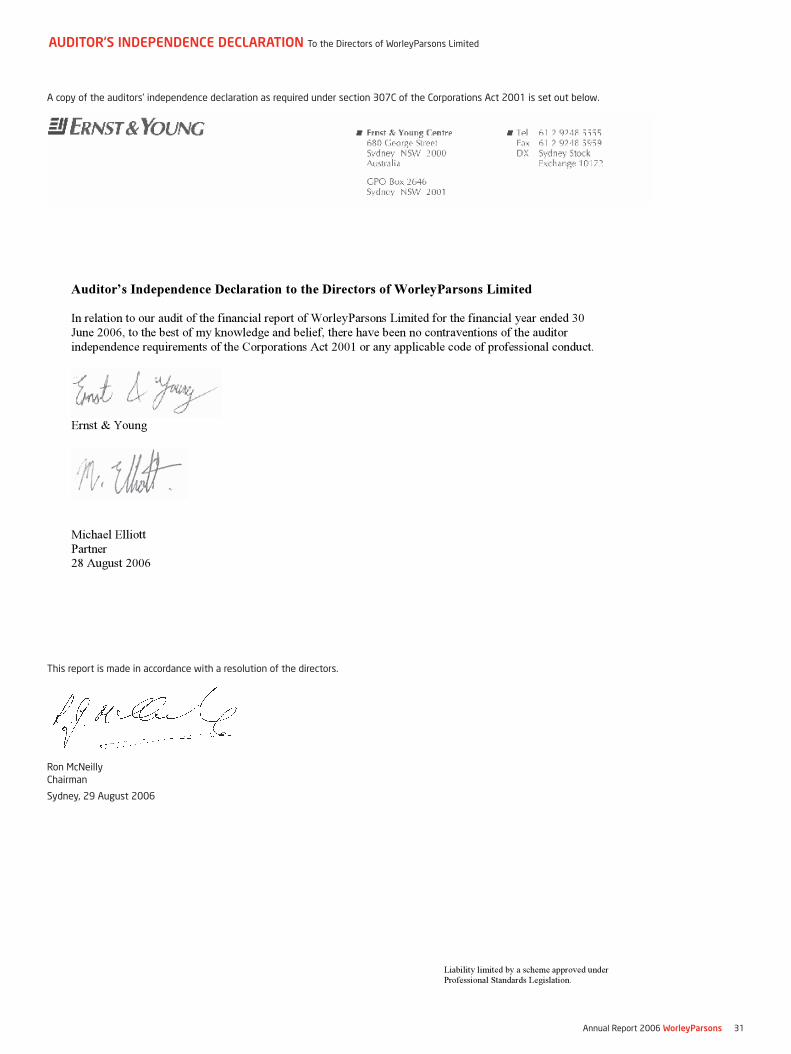
Annual Report 2006 WorleyParsons 31
Liability limited by a scheme approved underProfessional Standards Legislation.
Auditor’s Independence Declaration to the Directors of WorleyParsons Limited
In relation to our audit of the financial report of WorleyParsons Limited for the financial year ended 30 June 2006, to the best of my knowledge and belief, there have been no contraventions of the auditor independence requirements of the Corporations Act 2001 or any applicable code of professional conduct.
Ernst & Young
Michael ElliottPartner 28 August 2006
AUDITOR’S INDEPENDENCE DECLARATION To the Directors of WorleyParsons Limited
A copy of the auditors’ independence declaration as required under section 307C of the Corporations Act 2001 is set out below.
This report is made in accordance with a resolution of the directors.
Ron McNeillyChairman
Sydney, 29 August 2006
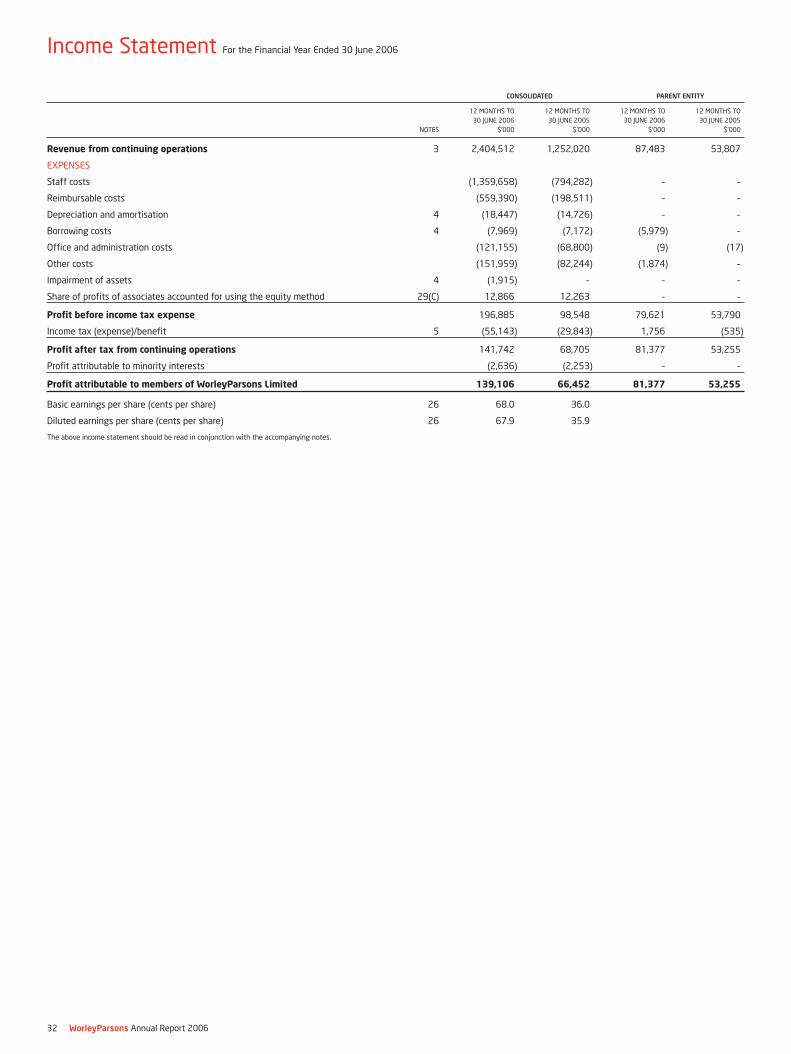
CONSOLIDATED PARENT ENTITY
12 MONTHS TO 12 MONTHS TO 12 MONTHS TO 12 MONTHS TO
30 JUNE 2006 30 JUNE 2005 30 JUNE 2006 30 JUNE 2005
NOTES $’000 $’000 $’000 $’000
Revenue from continuing operations 3 2,404,512 1,252,020 87,483 53,807
EXPENSES
Staff costs (1,359,658) (794,282) – –
Reimbursable costs (559,390) (198,511) – –
Depreciation and amortisation 4 (18,447) (14,726) – –
Borrowing costs 4 (7,969) (7,172) (5,979) –
Office and administration costs (121,155) (68,800) (9) (17)
Other costs (151,959) (82,244) (1,874) –
Impairment of assets 4 (1,915) – – –
Share of profits of associates accounted for using the equity method 29(C) 12,866 12,263 – –
Profit before income tax expense 196,885 98,548 79,621 53,790
Income tax (expense)/benefit 5 (55,143) (29,843) 1,756 (535)
Profit after tax from continuing operations 141,742 68,705 81,377 53,255
Profit attributable to minority interests (2,636) (2,253) – –
Profit attributable to members of WorleyParsons Limited 139,106 66,452 81,377 53,255
Basic earnings per share (cents per share) 26 68.0 36.0
Diluted earnings per share (cents per share) 26 67.9 35.9
The above income statement should be read in conjunction with the accompanying notes.
Income Statement For the Financial Year Ended 30 June 2006
32 WorleyParsons Annual Report 2006
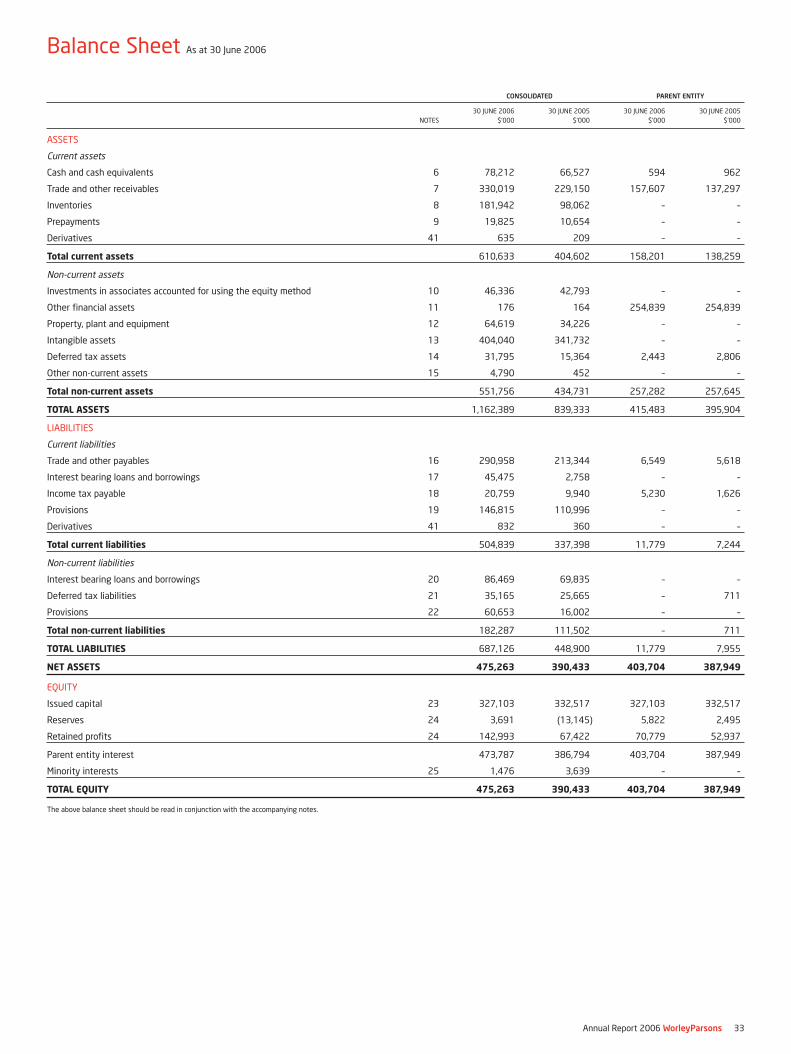
Balance Sheet As at 30 June 2006
Annual Report 2006 WorleyParsons 33
CONSOLIDATED PARENT ENTITY
30 JUNE 2006 30 JUNE 2005 30 JUNE 2006 30 JUNE 2005
NOTES $’000 $’000 $’000 $’000
ASSETS
Current assets
Cash and cash equivalents 6 78,212 66,527 594 962
Trade and other receivables 7 330,019 229,150 157,607 137,297
Inventories 8 181,942 98,062 – –
Prepayments 9 19,825 10,654 – –
Derivatives 41 635 209 – –
Total current assets 610,633 404,602 158,201 138,259
Non-current assets
Investments in associates accounted for using the equity method 10 46,336 42,793 – –
Other financial assets 11 176 164 254,839 254,839
Property, plant and equipment 12 64,619 34,226 – –
Intangible assets 13 404,040 341,732 – –
Deferred tax assets 14 31,795 15,364 2,443 2,806
Other non-current assets 15 4,790 452 – –
Total non-current assets 551,756 434,731 257,282 257,645
TOTAL ASSETS 1,162,389 839,333 415,483 395,904
LIABILITIES
Current liabilities
Trade and other payables 16 290,958 213,344 6,549 5,618
Interest bearing loans and borrowings 17 45,475 2,758 – –
Income tax payable 18 20,759 9,940 5,230 1,626
Provisions 19 146,815 110,996 – –
Derivatives 41 832 360 – –
Total current liabilities 504,839 337,398 11,779 7,244
Non-current liabilities
Interest bearing loans and borrowings 20 86,469 69,835 – –
Deferred tax liabilities 21 35,165 25,665 – 711
Provisions 22 60,653 16,002 – –
Total non-current liabilities 182,287 111,502 – 711
TOTAL LIABILITIES 687,126 448,900 11,779 7,955
NET ASSETS 475,263 390,433 403,704 387,949
EQUITY
Issued capital 23 327,103 332,517 327,103 332,517
Reserves 24 3,691 (13,145) 5,822 2,495
Retained profits 24 142,993 67,422 70,779 52,937
Parent entity interest 473,787 386,794 403,704 387,949
Minority interests 25 1,476 3,639 – –
TOTAL EQUITY 475,263 390,433 403,704 387,949
The above balance sheet should be read in conjunction with the accompanying notes.
CONSOLIDATED PARENT ENTITY
12 MONTHS TO 12 MONTHS TO 12 MONTHS TO 12 MONTHS TO
30 JUNE 2006 30 JUNE 2005 30 JUNE 2006 30 JUNE 2005
NOTES $’000 $’000 $’000 $’000
Total equity at the beginning of the financial year 390,433 133,223 387,949 136,389
Capitalised acquisition costs recognised directly in equity 23 – (9,270) – (9,270)
Tax effect of capitalised acquisition costs recognised directly in equity 23 – 2,914 – 2,914
Cash flow hedges, net of tax 24(B) 723 (151) – –
Performance rights expense 24(C) 4,304 1,806 4,304 1,806
Exchange differences on translation of foreign operations 24(A) 12,786 (9,410) – –
Net income recognised directly in equity 17,813 (14,111) 4,304 (4,550)
Profit after tax from continuing operations 141,742 68,705 81,377 53,255
Total recognised income and expense for the financial year 159,555 54,594 85,681 48,705
Transactions with equity holders in their capacity as equity holders:
Contributions of equity 23 – 227,935 – 227,935
Dividends paid 27 (63,535) (25,080) (63,535) (25,080)
(63,535) 202,855 (63,535) 202,855
Purchase of shares to satisfy performance rights 23 (7,622) – (7,622) –
Tax effect of purchase of shares to satisfy
performance rights 23 1,231 – 1,231 –
Minority interest movement (4,799) (239) – –
(11,190) (239) (6,391) –
Total equity at the end of the financial year 475,263 390,433 403,704 387,949
Total recognised income and expense for the financial year is attributable to:
Members of WorleyParsons Limited 161,718 52,580 85,681 48,705
Minority interests (2,163) 2,014 – –
The above statement of changes in equity should be read in conjunction with the accompanying notes.
Statement of Changes in Equity For the Financial Year Ended 30 June 2006
34 WorleyParsons Annual Report 2006
CONSOLIDATED PARENT ENTITY
12 MONTHS TO 12 MONTHS TO 12 MONTHS TO 12 MONTHS TO
30 JUNE 2006 30 JUNE 2005 30 JUNE 2006 30 JUNE 2005
NOTES $’000 $’000 $’000 $’000
CASH FLOWS FROM OPERATING ACTIVITIES
Receipts from customers (inclusive of goods and services tax) 2,351,536 1,224,701 – –
Payments to suppliers and employees (inclusive of goods and services tax) (2,176,709) (1,105,609) (63) (23)
174,827 119,092 (63) (23)
Dividends received 29(B) 3,210 6,455 85,000 51,068
Purchase of shares to satisfy performance rights 23 (7,622) – (7,622) –
Interest received 5,311 3,411 2,483 369
Borrowing costs paid (7,923) (7,139) (7,807) –
Income taxes paid (52,146) (30,691) (4,020) (10,253)
Net cash inflow from operating activities 33 115,657 91,128 67,971 41,161
CASH FLOWS FROM INVESTING ACTIVITIES
Payments for purchase of equity and other investments, net of return of capital (328) (9,853) – (160,179)
Proceeds from disposal of controlled activities 200 – – –
Payments for acquisition of controlled entities 28(C) (61,491) (348,218) – –
Payments for incidental costs of acquisition – (5,315) – –
Payments of liabilities on acquisition – (34,860) – –
Payments for purchase of property, plant and equipment (20,316) (17,610) – –
Payments for assets under construction (20,916) – – –
Proceeds from sale of property, plant and equipment 418 1,381 – –
Net cash outflow from investing activities (102,433) (414,475) – (160,179)
CASH FLOWS FROM FINANCING ACTIVITIES
Proceeds from issue of ordinary shares – 227,935 – 227,935
Payment of share issue transaction costs – (9,270) – (9,270)
Repayment of borrowings (113,029) (136,485) – –
Proceeds from borrowings 162,678 201,582 – –
Lease payments (307) (142) – –
Loans to controlled entities – – (110,195) (381,335)
Loans from controlled entities repaid – – 105,391 307,044
Loans to related parties (7,653) (281) – –
Loans from related parties repaid 8,155 2,861 – –
Dividends paid to the Company’s shareholders 27 (63,535) (25,080) (63,535) (25,080)
Dividends paid to minority interests (2,793) (1,458) – –
Net cash (outflow)/inflow from financing activities (16,484) 259,662 (68,339) 119,294
NET (DECREASE)/INCREASE IN CASH (3,260) (63,685) (368) 276
Cash at the beginning of the financial year 63,976 16,950 962 686
Cash balances in controlled entities acquired, net of overdraft 8,110 102,830 – –
Effects of exchange rate changes on cash 1,457 7,881 – –
CASH AND CASH EQUIVALENTS AT THE END OF THE FINANCIAL YEAR 6 70,283 63,976 594 962
The above cash flow statement should be read in conjunction with the accompanying notes.
Cash Flow Statement For the Financial Year Ended 30 June 2006
Annual Report 2006 WorleyParsons 35

Notes to the Financial Statements For the Financial Year Ended 30 June 2006
36 WorleyParsons Annual Report 2006
1 CORPORATE INFORMATION
The financial report of WorleyParsons Limited for the financial year ended30 June 2006 was authorised for issue in accordance with a resolution of thedirectors on 29 August 2006.
WorleyParsons Limited is a company limited by shares incorporated inAustralia whose shares are publicly traded on the Australian Stock Exchange(ASX: WOR).
The nature of the operations and principal activities of the Group aredescribed in note 40.
2 SUMMARY OF SIGNIFICANT ACCOUNTING POLICIES
(A) BASIS OF ACCOUNTINGThis general purpose financial report has been prepared inaccordance with Australian Accounting Standards, other authoritativepronouncements of the Australian Accounting Standards Board, UrgentIssues Group Interpretations and the Corporations Act 2001.
The financial report has been prepared on a historical costs basis, exceptfor derivative financial instruments and available-for-sale financial assetsthat have been measured at fair value. The carrying values of recognisedassets and liabilities that are hedged with fair value hedges are adjustedto record changes in the fair values attributable to the risks that arebeing hedged.
The Company is of a kind referred to in Class Order 98/0100 issued bythe Australian Securities and Investments Commission, relating tothe “rounding off” of amounts in the Directors’ Report and financialstatements. Amounts have been rounded off to the nearest thousanddollars in accordance with that Class Order.
(B) STATEMENT OF COMPLIANCEThe financial report complies with Australian Accounting Standards,which include Australian Equivalents to International Financial ReportingStandards (“AIFRS”). Compliance with AIFRS ensures that the financialreport, comprising the financial statements and notes thereto, complieswith the International Financial Reporting Standards.
This is the first financial report prepared based on AIFRS andcomparatives for the financial year ended 30 June 2005 have beenrestated accordingly. A summary of the significant accounting policiesof the Group under AIFRS is disclosed below.
In the application of AIFRS, management is required to make judgements,estimates, and assumptions about carrying values of assets and liabilitiesthat are not readily apparent from other sources. The estimates andassociated assumptions are based on historical experience and variousother factors that are believed to be reasonable under the circumstances,the results of which form the basis of making judgements. Actual resultsmay differ from estimate.
The estimates and underlying assumptions are reviewed on an ongoingbasis. Revisions to accounting estimates are recognised in the period inwhich the estimate is revised if the revision affects only that period or inthe period of the revision and future periods if the revision affects bothcurrent and future periods.
Judgements made by management in the application of AIFRS that havesignificant effects on the financial statements and estimates with asignificant risk of material adjustments in the next year are disclosed,where applicable in the relevant notes to the financial statements.
Certain standards and amendments for early adoption have not beenapplied by the consolidated entity in these financial statements. Theimpact is minor as they largely relate to disclosure. The more significantof these are:
(i) AASB 7 “Financial Instruments: Disclosure” (August 2005) replacingthe presentation requirements of AASB 132 “Financial Instruments:Disclosures and Presentation”. AASB 7 is applicable for annualreporting periods beginning on or after 1 January 2007;
(ii) AASB 2005-9 “Amendments to Australian Accounting Standards(September 2005)” requires that liabilities arising from the issue offinancial guarantee contracts are recognised in the balance sheet.AASB 2005-9 is applicable for annual reporting periods on or after1 January 2006.
(iii) AASB 2005-10 “Amendments to Australian Accounting Standards(September 2005)” makes consequential amendments to AASB 132“Financial Instruments: Disclosures and Presentation”, AASB 101“Presentation of Financial Statements”, AASB 114 “SegmentReporting”, AASB 117 “Leases”, AASB 133 “Earnings per Share”,AASB 139 “Financial Instruments: Recognition and Measurement”,AASB 1 “First-time Adoption of Australian Equivalents toInternational Financial Reporting Standards”, AASB 4 “InsuranceContracts”, AASB 1023 “General Insurance Contracts” and AASB 1038“Life Insurance Contracts”, arising from the release of AASB 7.AASB 2005-10 is applicable for annual reporting periods beginningon or after 1 January 2007.
The consolidated entity plans to adopt AASB 7 and AASB 2005-10in the 2008 financial year. The initial application of AASB 7 andAASB 2005-10 is not expected to have an impact on the financialresults of the Company and the consolidated entity as the standardand amendment are concerned only with disclosures.
The initial application of AASB 2005-9 could have an impact on thefinancial results of the Company and the consolidated entity as theamendment could result in liabilities being recognised for financialguarantee contracts that have been provided by the Company andconsolidated entity. However the quantification of the financialimpact is not known or cannot be reasonably estimated in the currentfinancial year as an exercise to quantify the financial impact hasnot been undertaken by the Company and the consolidated entityto date.
(C) PRINCIPLES OF CONSOLIDATIONThe consolidated financial statements incorporate assets and liabilities ofall entities controlled by WorleyParsons Limited as at 30 June 2006 andthe results of all controlled entities for the financial year then ended.WorleyParsons Limited and its controlled entities together are referredto in this financial report as the “consolidated entity” or the “Group”.
The effects of all transactions between entities in the consolidatedentity are eliminated in full. Minority interests in the results and equityof controlled entities are shown separately in the consolidated incomestatement and consolidated balance sheet respectively.
Where control of an entity is obtained during a financial year, its resultsare included in the consolidated income statement from the date onwhich control commences. Where control of an entity ceases during afinancial year, its results are included for that part of the year duringwhich control existed.
(D) EMPLOYEE BENEFITSProvision is made for employee benefits accumulated as a result ofemployees rendering services up to the reporting date. These benefitsinclude wages and salaries, annual leave, sick leave and long serviceleave.
Liabilities arising in respect of wages and salaries, annual leave, sickleave and any other employee benefits expected to be settled within12 months of the reporting date are measured at their nominal amountsbased on remuneration rates which are expected to be paid when theliability is settled. All other employee benefits liabilities are measured atthe present value of the estimated future cash outflows to be made inrespect of services provided by the employees up to the reporting date.In determining the present value of future cash outflows, the marketyield as at the reporting date on national government bonds, which haveterms to maturity approximating the terms of the related liability, is used.
Employee benefits expenses and revenues arising in respect of wagesand salaries, non-monetary benefits, leave entitlements and other typesof entitlements are charged against profits on a net basis in theirrespective categories.
Equity based compensation scheme – performance rightsPerformance rights (“rights”) over the ordinary shares of WorleyParsonsLimited are granted to executive directors and other executives of theconsolidated entity for nil consideration in accordance with performanceguidelines approved by the Board. The fair values of the rights are beingamortised on a straight line basis over their three year vesting period.For share settled rights, the fair values of the rights are the share priceat grant date adjusted for the impact of performance hurdles and other
vesting or exercise criteria attached to the right. For cash settled rights,the fair values of the rights are recalculated at the end of each reportingperiod and amortised on a straight line basis over their three yearvesting period.
(E) TAXES
(i) Income taxThe income tax expense or revenue for the period is the tax payableon the current period’s taxable income based on the income tax ratefor each jurisdiction adjusted by changes in deferred tax assets andliabilities attributable to temporary differences between the taxbases of assets and liabilities and their carrying amounts in thefinancial statement, and to unused tax losses.
Deferred tax assets and liabilities are recognised for temporarydifferences at the tax rates expected to apply when the assets arerecovered or liabilities are settled, based on those tax rates which areenacted or substantially enacted for each jurisdiction. The relevanttax rates are applied to the cumulative amounts of deductible andtaxable temporary differences to measure the deferred tax asset orliability. An exception is made for certain temporary differencesarising from the initial recognition of an asset or a liability. Nodeferred tax asset or liability is recognised in relation to thesetemporary differences if they arose in a transaction, other thana business combination, that at the time did not affect eitheraccounting profit or taxable profit or loss.
Deferred tax assets are recognised for deductible temporarydifferences and unused tax losses only if it is probable that futuretaxable amounts will be available to utilise those temporarydifferences.
Deferred tax liabilities and assets are not recognised for temporarydifferences between the carrying amount and tax bases ofinvestments in controlled entities where the parent entity is able tocontrol the timing of the reversal of the temporary differences and itis probable that the differences will not reverse in the foreseeablefuture.
Current and deferred tax balances relating to items recogniseddirectly in equity are also recognised in equity and not in the incomestatement.
(ii) Goods and services tax (“GST”)Revenues, expenses and assets are recognised net of the amount ofGST except:
(a) where the GST incurred on a purchase of goods and services isnot recoverable from the taxation authority, in which case theGST is recognised as part of the cost of acquisition of the assetor as part of the expense item as applicable; and
(b) receivables and payables are stated with the amount of GSTincluded.
The net amount of GST recoverable from, or payable to, the taxationauthority is included as part of receivables or payables in the balancesheet.
Cash flows are included in the cash flow statement on a gross basisand the GST component of cash flows arising from investingactivities, which is recoverable from, or payable to, the taxationauthority are classified as operating cash flows.
Commitments and contingencies are disclosed net of the amount ofGST recoverable from, or payable to, the taxation authority.
(F) FOREIGN CURRENCY TRANSLATION
(i) Functional and presentation currencyItems included in the financial statements of each of the Group’sentities are measured using the currency of the primary economicenvironment in which the entity operates (“functional currency”).The consolidated financial statements are presented in Australiandollars, which is WorleyParsons functional and presentation currency.
(ii) Translation of foreign currency transactionsTransactions denominated in a foreign currency are converted atthe exchange rate at the date of the transaction. Foreign currencyreceivables and payables at balance date are translated at exchange
rates at balance date. Exchange gains and losses are brought toaccount in determining the profit and loss for the financial year.
(iii) Specific hedgesHedging is undertaken to avoid or minimise potential adversefinancial effects of movements in foreign currency exchange rates.Gains or costs arising upon entry into a hedging transaction intendedto hedge the purchase or sale of goods or services, together withsubsequent exchange gains or losses resulting from thosetransactions, are deferred up to the date of the purchase or sale andincluded in the measurement of the purchase or sale. The accountingpolicy note 2 (AC) provides specific details on the calculation of thesegains or costs.
(G) ACQUISITION OF ASSETSThe purchase method of accounting is used for all acquisitions of assetsregardless of whether equity instruments or other assets are acquired.Cost is measured as the fair value of the assets given up, shares issuedor liabilities undertaken at the date of acquisition plus incidental costsdirectly attributable to the acquisition.
Where equity instruments are issued in an acquisition, the value of theinstruments is their market price as determined by market valuation atthe acquisition date. Transaction costs arising on the issue of equityinstruments are recognised directly in equity.
(H) REVENUE RECOGNITIONAmounts disclosed as revenue are net of returns, trade allowances, dutiesand taxes paid. Revenue is recognised to the extent that it is probablethat the economic benefits will flow to the entity and the revenue can bereliably measured. The following specific recognition criteria must be metbefore revenue is recognised:
(i) Engineering design and project servicesContract revenue and expenses are recognised in accordance withthe percentage of completion method unless the outcome of thecontract cannot be reliably estimated. Where it is probable that a losswill arise from a construction contract, the excess of total costs overrevenue is recognised as an expense.
Where the outcome of a contract cannot be reliably estimated,contract costs are recognised as an expense as incurred, and where itis probable that the costs will be recovered, revenue is recognised tothe extent of costs incurred. Incentive payments on contracts arerecognised as part of total contract revenue where it is probablethat specified performance standards are met or exceeded and theamount of the incentive payment can be reliably measured.
For fixed price contracts, the stage of completion is measured byreference to labour hours incurred to date as a percentage ofestimated total labour hours for each contract.
Revenue from cost plus contracts is recognised by reference tothe recoverable costs incurred during the reporting period plus thepercentage of fees earned.
(ii) Sale of goodsRevenue is recognised when the significant risks and rewards ofownership of the goods have passed to the buyer and the costsincurred or to be incurred in respect of the transaction can bemeasured reliably. Risks and rewards of ownership are consideredpassed to the buyer at the time of delivery of the goods to thecustomer.
(iii) InterestInterest income is recognised as it accrues.
(iv) DividendsControl of a right to receive consideration for the investment inassets is attained, usually evidenced by approval of the dividend.
(I) TRADE AND OTHER RECEIVABLESAll trade receivables are recognised at the original amounts less anallowance for any uncollectible debts. An allowance for doubtful debts ismade when there is objective evidence that the Group will not be able tocollect debts. The recoverable amount of trade receivables is reviewed onan ongoing basis.
Annual Report 2006 WorleyParsons 37

Accrued receivables are stated at the aggregate of contract costs incurredto date plus recognised profits less recognised losses and progressbillings. Contract costs include all costs directly related to specificcontracts, costs that are specifically chargeable to the customer under theterms of the contract and an allocation of overhead expenses incurred inconnection with the consolidated entity’s activities in general.
(J) INVENTORIES
(i) Raw materials and finished goodsRaw materials and finished goods are stated at the lower of cost andnet realisable value. Cost comprises direct materials, direct labour andan appropriate proportion of variable and fixed overhead expenditure,the latter being allocated on the basis of normal operating capacity.Costs are assigned to individual items of inventory on the first-in,first-out basis. Net realisable value is the estimated selling pricein the ordinary course of business less the estimated costs ofcompletion and the estimated costs necessary to make the sale.
(ii) Consumables and storesConsumables and stores are stated at the lower of cost and netrealisable value and charged to specific contracts when used.
(iii) Work in progressWork in progress is valued at the lower of cost and net realisablevalue. Cost comprises staff salary costs and direct expenses togetherwith an appropriate proportion of overheads. Net realisable value isbased on estimated selling prices less further costs expected to beincurred to completion.
(K) RECOVERABLE AMOUNTWhere the carrying amount of a non-current asset is greater than itsrecoverable amount, the asset is written down to its recoverable amount.In determining the recoverable amount, the expected cash flows havebeen discounted to their present value using a market determined riskadjusted discount rate.
(L) PROPERTY, PLANT AND EQUIPMENTProperty, plant and equipment are stated at cost less accumulateddepreciation and impairment, if any. Depreciation is calculated on astraight line basis to write off the net cost or revalued amount of eachitem of property, plant and equipment (excluding land) over its expecteduseful life to the consolidated entity. The expected useful lives for plantand equipment range from three to 10 years. The estimated useful lives,residual values and depreciation method are reviewed at the end of eachannual reporting period.
(M) IMPAIRMENT OF ASSETSAssets that have an indefinite useful life are not subject to amortisationand are tested annually for impairment. Assets that are subject toamortisation are reviewed for impairment whenever events or changes incircumstances indicate that the carrying amount exceeds its recoverableamount. The recoverable amount is the higher of an asset’s fair value lesscosts to sell, and value in use. For the purposes of assessing impairment,assets are grouped at the lowest levels for which there are separatelyidentifiable cash flows (“cash generating units”).
(N) LEASEHOLD IMPROVEMENTSThe cost of improvements to or on leasehold properties is amortisedover the unexpired period of the lease or the estimated useful life of theimprovement to the consolidated entity, whichever is the shorter.
(O) LEASES
(i) Finance leasesWhere property, plant and equipment are acquired by means offinance leases, the present value of the minimum lease paymentsis recognised as an asset at the beginning of the lease term andamortised on a straight line basis over the expected useful life of theleased asset. A corresponding liability is also established and eachlease payment is allocated between the liability and finance charge.
(ii) Operating leasesThe minimum lease payments of operating leases, where the lessoreffectively retains substantially all of the risks and benefits ofownership of the leased item, are recognised as an expense ona straight line basis.
(P) INTANGIBLES
(i) GoodwillGoodwill represents the excess of the purchase consideration overthe fair value of identifiable net assets acquired at the time ofacquisition of a business or shares in a controlled entity or anassociate. Goodwill on acquisition of subsidiaries is included inintangible assets and goodwill on acquisitions of associates isincluded in investments in associates. Gains and losses on thedisposal of an entity include the carrying amount of goodwillrelating to the entity sold.
Goodwill is not amortised, instead it is tested annually for anyimpairment in the carrying amount or more frequently if events orchanges in circumstances indicate that it might be impaired. Goodwillis carried at cost less accumulated impairment losses. Goodwill isallocated to cash generating units for the purpose of impairmenttesting. Where the recoverable amount of the cash generating unitis less than the carrying amount, an impairment loss is recognised.
(ii) Trade nameThe WorleyParsons trade name in Australia is recognised at its costof acquisition and amortised over its expected useful life being20 years. The estimated useful life and amortisation method arereviewed at the end of each annual reporting period.
(Q) TRADE AND OTHER PAYABLESLiabilities for trade payables and other amounts are carried at cost whichis the fair value of the consideration to be paid in the future for goodsand services received, whether or not billed to the Company.
Payables to related parties are carried at principal amount. Interest, whencharged by the lender, is recognised as an expense on an accrual basis.
(R) INTEREST BEARING LOANS AND BORROWINGSLoans and debentures are initially recognised at fair value, net oftransaction costs incurred. Loans and debentures are subsequentlymeasured at amortised cost. Any difference between the proceeds(net of transaction costs) and the redemption amount is recognised inthe income statement over the period of the loan and debenture usingthe effective interest method.
(S) PROVISIONSProvisions are recognised when the consolidated entity has a legal,equitable or constructive obligation to make a future sacrifice ofeconomic benefits to other entities as a result of past transactions orother past events, it is probable that a future sacrifice of economicbenefits will be required and a reliable estimate can be made of theamount of the obligation.
(i) Dividends payableProvision is made for the amount of any dividends declared,determined or publicly recommended by the directors at or beforethe end of the financial year but not distributed at balance date.
(ii) Insurance provisionProvision for insurance liabilities is recognised in line with actuarialcalculations of unsettled professional indemnity claims, net ofinsurance recoveries. The provision is based on the aggregateamount of individual claims incurred but not reported that are lowerin value than the insurance deductible of the consolidated entity.It is based on the ultimate cost of settling claims and consideration isgiven to the ultimate claim size, future inflation as well as the levelsof compensation awarded through the courts.
(iii) Warranty provisionProvision is made for the estimated liability on all products andservices still under warranty at balance date. This provision isestimated having regard to prior service warranty experience. Incalculating the liability at balance date, amounts were not discountedto their present value as the effect of discounting was not material.
(iv) Insurance claim on acquisitionProvision for insurance claims on acquisition are recognised based onthe estimated liability at the date of acquisition.
NOTES TO THE FINANCIAL STATEMENTS For the Financial Year Ended 30 June 2006
38 WorleyParsons Annual Report 2006
(T) JOINT VENTURES
(i) Jointly controlled operations and assetsThe proportionate interests in the assets, liabilities and expensesof unincorporated joint ventures and jointly controlled assets havebeen incorporated in the financial statements under the appropriateheadings. Details of the joint ventures have been set out in note 30.
(ii) Jointly controlled entitiesThe interest in jointly controlled entities is carried at the lower ofthe equity accounted amount and the recoverable amount in theconsolidated financial statements. The share of profits or losses ofthe entities is recognised in the consolidated income statement, andthe share of movements in reserves is recognised in the consolidatedbalance sheet.
Profits or losses on transactions establishing joint venturepartnerships and transactions with the joint ventures are eliminatedto the extent of the consolidated entity’s ownership interest untilsuch time as they are realised by the joint venture entities onconsumption or sale.
(U) REPAIRS AND MAINTENANCERepairs, minor renewals and improvements, and the purchase of minoritems of tools and equipment are charged to expense as incurred. Majorrenewals and improvements are capitalised to the respective asset anddepreciated.
(V) BORROWING COSTSBorrowing costs are recognised as expenses in the period in which theyare incurred, except when they are included in the costs of qualifyingassets. Borrowing costs include:
(i) interest on bank overdrafts, short-term and long-term borrowings;
(ii) amortisation of discounts or premiums relating to borrowings; and
(iii) finance lease charges.
(W) CASH AND CASH EQUIVALENTSFor the purposes of the cash flow statement, cash includes deposits atcall which are readily convertible to cash on hand and are subject to aninsignificant risk of changes in value, net of outstanding bank overdrafts.Bank overdrafts are carried at their principal amount.
(X) INVESTMENTSInvestments in associates are accounted for in the consolidated financialstatements using the equity method of accounting. Under this method,the consolidated entity’s share of the post acquisition profits or lossesof associates is recognised in the consolidated income statement, andits share of post acquisition movements in reserves is recognised inconsolidated reserves. The cumulative post acquisition movements areadjusted against the cost of the investment. Associates are those entitiesover which the consolidated entity exercises significant influence, butnot control.
All other non-current investments are carried at the lower of cost orrecoverable amount.
(Y) ISSUED CAPITALIssued and paid up capital is recognised at the fair value of theconsideration received by the Company. Any transactions costs arisingon the issue of ordinary shares are recognised directly in equity as areduction of the share proceeds received.
(Z) EARNINGS PER SHARE
(i) Basic earnings per shareBasic earnings per share is determined by dividing the profitattributable to members of WorleyParsons Limited by the weightedaverage number of ordinary shares outstanding during the financialyear.
(ii) Diluted earnings per shareDiluted earnings per share are calculated as profit attributable tomembers of WorleyParsons Limited adjusted for:
(a) costs of servicing equity (other than dividends);
(b) the after tax effect of dividends and interest associated withdilutive potential ordinary shares that have been recognised asexpenses; and
(c) other non-discretionary changes in revenues or expensesduring the period that would result from the dilution of potentialordinary shares divided by the weighted average number ofordinary shares and dilutive potential ordinary shares, adjustedfor any bonus element.
(AA) RESTRUCTURING PROVISIONSProvisions for restructurings are recognised when the consolidated entityhas developed a detailed formal plan for the restructuring and has raiseda valid expectation in those affected that it will carry out therestructuring by:
(i) starting to implement the plan; or
(ii) announcing its main features to those affected by it.
(AB) SEGMENT REPORTINGA business segment is a group of assets and operations engaged inproviding products or services that are subject to risks and returnsthat are different to those of other business segments. A geographicalsegment is engaged in providing products or services within a particulareconomic environment and is subject to risks and returns that aredifferent from those of segments operating in other economicenvironments.
(AC) DERIVATIVE FINANCIAL INSTRUMENTSThe Group uses derivative financial instruments such as forwardexchange contracts where it agrees to buy or sell specified amounts offoreign currencies in the future at a predetermined exchange rate. Theobjective is to match the contract with anticipated future cash flows fromsales and purchases in foreign currencies, to protect the consolidatedentity against the possibility of loss from future exchange ratefluctuations. Such derivative financial instruments are stated at fair value.
For the purposes of hedge accounting, hedges are classified as either fairvalue hedges when they hedge the exposure to changes in the fair valueof a recognised asset or liability, or cash flow hedges where they hedgeexposure to variability in cash flows that is either attributable to aparticular risk associated with a recognised asset or liability or aforecasted transaction.
For derivatives that do not qualify for hedge accounting, any gains orlosses arising from changes in fair value are taken directly to theincome statement. Hedge accounting is discontinued when the hedginginstrument expires or is sold, terminated or exercised, or no longerqualifies for hedge accounting. At that point in time, any cumulative gainor loss on the hedging instrument recognised in equity is kept in equityuntil the forecasted transaction occurs.
If a hedged transaction is no longer expected to occur, the net cumulativegain or loss recognised in equity is transferred to the income statement.
(i) Forward exchange contractsForward exchange contracts are recognised at the date the contractis entered into. Exchange gains or losses on forward exchangecontracts are recognised in the income statement except thoserelating to hedges of specific commitments that are deferred andincluded in the measurement of the sale or purchase.
The fair value of forward exchange contracts is calculated byreference to current forward exchange rates for contracts with similarmaturity profiles. The fair value for interest rate swaps contracts isdetermined by reference to market values for similar instruments.
(ii) Fair value hedgesIn relation to fair value hedges which meet the conditions for specialhedge accounting, any gain or loss from remeasuring the hedginginstrument at fair value is recognised immediately in the incomestatement.
Any gain or loss attributable to the hedged risk on remeasurementof the hedged item is adjusted against the carrying amount of thehedged item and recognised in the income statement. Where theadjustment is to the carrying amount of a hedged interest bearing
Annual Report 2006 WorleyParsons 39
financial instrument, the adjustment is amortised to the incomestatement such that it is fully amortised by maturity.
(iii) Cash flow hedgesIn relation to cash flow hedges to hedge firm commitments whichmeet the conditions for special hedge accounting, the portion of thegain or loss on the hedging instrument that is determined to be aneffective hedge is recognised directly in equity and the ineffectiveportion is recognised in the income statement.
When the hedged firm commitment results in the recognition ofan asset or a liability, then, at the time the asset or liability isrecognised, the associated gains or losses that had previously beenrecognised in equity are included in the initial measurement of theacquisition cost or other carrying amount of the asset or liability.
For all other cash flow hedges, the gains or losses that arerecognised in equity are transferred to the income statement atbalance date in which the hedged firm commitment affects the profitattributable to members of WorleyParsons Limited (e.g. when thefuture sale actually occurs).
(AD) AASB 1 TRANSITIONAL EXEMPTIONSThe Group has made its election in relation to the transitional exemptionsallowed by AASB 1 “First-time Adoption of Australian Equivalents toInternational Reporting Standards” as follows:
(i) Business combinationsAASB 3 “Business Combinations” was not applied retrospectively topast business combinations (i.e. business combinations that occurredbefore the date of transition to AIFRS);
(ii) Designation of previously recognised financial instrumentsFinancial instruments were designated as financial assets orliabilities at fair value through profit or loss or as available-for-saleat the date of transition to AIFRS;
(iii) Share Based payment transactionsAASB 2 “Share Based Payment” is applied only to equity instrumentsgranted after 7 November 2002 that had not vested on or before1 January 2005; and
(iv) Exemption from the requirement to restate comparative informationfor AASB 132 and AASB 139The Group has not elected to adopt this exemption and has appliedAASB 132 “Financial Instruments: Presentation and Disclosure” andAASB 139 “Financial Instruments: Recognition and Measurement”to its comparative information.
NOTES TO THE FINANCIAL STATEMENTS For the Financial Year Ended 30 June 2006
40 WorleyParsons Annual Report 2006
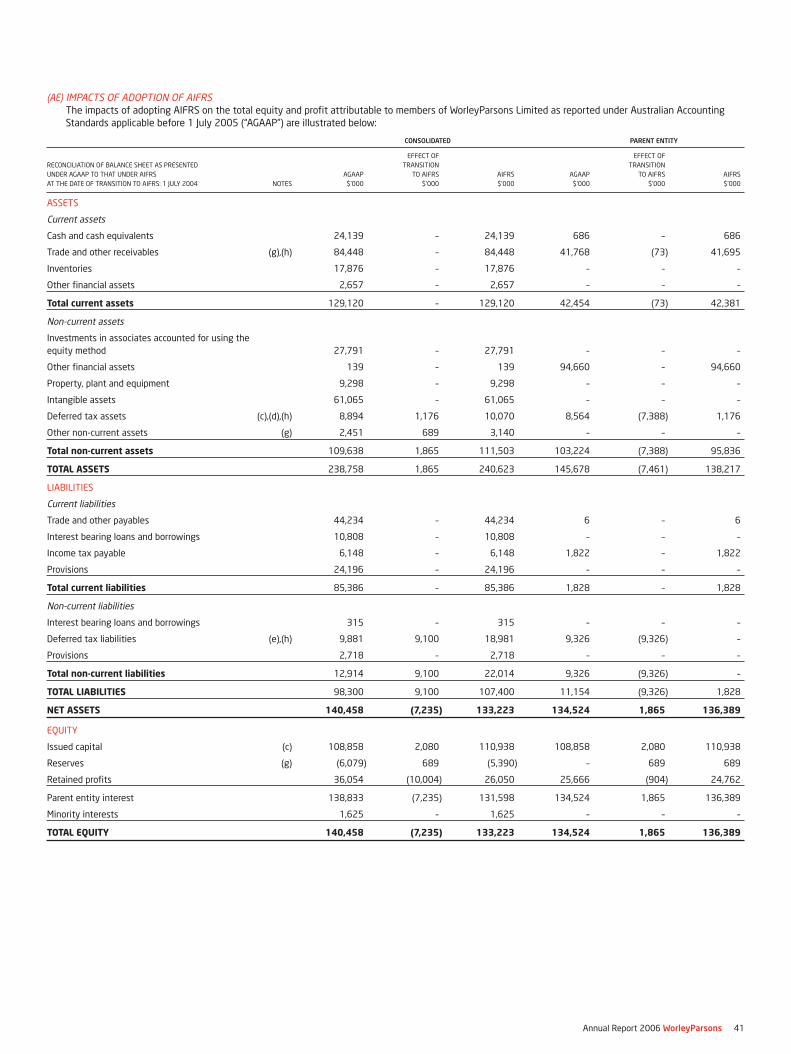
(AE) IMPACTS OF ADOPTION OF AIFRSThe impacts of adopting AIFRS on the total equity and profit attributable to members of WorleyParsons Limited as reported under Australian AccountingStandards applicable before 1 July 2005 (“AGAAP”) are illustrated below:
CONSOLIDATED PARENT ENTITY
EFFECT OF EFFECT OF
RECONCILIATION OF BALANCE SHEET AS PRESENTED TRANSITION TRANSITION
UNDER AGAAP TO THAT UNDER AIFRS AGAAP TO AIFRS AIFRS AGAAP TO AIFRS AIFRS
AT THE DATE OF TRANSITION TO AIFRS: 1 JULY 2004 NOTES $’000 $’000 $’000 $’000 $’000 $’000
ASSETS
Current assets
Cash and cash equivalents 24,139 – 24,139 686 – 686
Trade and other receivables (g),(h) 84,448 – 84,448 41,768 (73) 41,695
Inventories 17,876 – 17,876 – – –
Other financial assets 2,657 – 2,657 – – –
Total current assets 129,120 – 129,120 42,454 (73) 42,381
Non-current assets
Investments in associates accounted for using the
equity method 27,791 – 27,791 – – –
Other financial assets 139 – 139 94,660 – 94,660
Property, plant and equipment 9,298 – 9,298 – – –
Intangible assets 61,065 – 61,065 – – –
Deferred tax assets (c),(d),(h) 8,894 1,176 10,070 8,564 (7,388) 1,176
Other non-current assets (g) 2,451 689 3,140 – – –
Total non-current assets 109,638 1,865 111,503 103,224 (7,388) 95,836
TOTAL ASSETS 238,758 1,865 240,623 145,678 (7,461) 138,217
LIABILITIES
Current liabilities
Trade and other payables 44,234 – 44,234 6 – 6
Interest bearing loans and borrowings 10,808 – 10,808 – – –
Income tax payable 6,148 – 6,148 1,822 – 1,822
Provisions 24,196 – 24,196 – – –
Total current liabilities 85,386 – 85,386 1,828 – 1,828
Non-current liabilities
Interest bearing loans and borrowings 315 – 315 – – –
Deferred tax liabilities (e),(h) 9,881 9,100 18,981 9,326 (9,326) –
Provisions 2,718 – 2,718 – – –
Total non-current liabilities 12,914 9,100 22,014 9,326 (9,326) –
TOTAL LIABILITIES 98,300 9,100 107,400 11,154 (9,326) 1,828
NET ASSETS 140,458 (7,235) 133,223 134,524 1,865 136,389
EQUITY
Issued capital (c) 108,858 2,080 110,938 108,858 2,080 110,938
Reserves (g) (6,079) 689 (5,390) – 689 689
Retained profits 36,054 (10,004) 26,050 25,666 (904) 24,762
Parent entity interest 138,833 (7,235) 131,598 134,524 1,865 136,389
Minority interests 1,625 – 1,625 – – –
TOTAL EQUITY 140,458 (7,235) 133,223 134,524 1,865 136,389
Annual Report 2006 WorleyParsons 41

CONSOLIDATED PARENT ENTITY
RECONCILIATION OF BALANCE SHEET AS PRESENTED EFFECT OF EFFECT OF
UNDER AGAAP TO THAT UNDER AIFRS TRANSITION TRANSITION
AT THE END OF THE LAST REPORTING PERIOD UNDER AGAAP: 30 JUNE 2005 AGAAP TO AIFRS AIFRS AGAAP TO AIFRS AIFRS
NOTES $’000 $’000 $’000 $’000 $’000 $’000
ASSETS
Current assets
Cash and cash equivalents 66,527 – 66,527 962 – 962
Trade and other receivables (g),(h) 229,150 – 229,150 133,910 3,387 137,297
Inventories 98,062 – 98,062 – – –
Prepayments 10,654 – 10,654 – – –
Derivatives (f) – 209 209 – – –
Total current assets 404,393 209 404,602 134,872 3,387 138,259
Non-current assets
Investments in associates accounted for using
the equity method (a) 41,883 910 42,793 – – –
Other financial assets 164 – 164 254,839 – 254,839
Property, plant and equipment 34,226 – 34,226 – – –
Intangible assets (a) 329,519 12,213 341,732 – – –
Deferred tax assets (c),(d),(h) 12,558 2,806 15,364 7,739 (4,933) 2,806
Other non-current assets (g) 5,259 (4,807) 452 – – –
Total non-current assets 423,609 11,122 434,731 262,578 (4,933) 257,645
TOTAL ASSETS 828,002 11,331 839,333 397,450 (1,546) 395,904
LIABILITIES
Current liabilities
Trade and other payables (g) 218,962 (5,618) 213,344 – 5,618 5,618
Interest bearing loans and borrowings 2,758 – 2,758 – – –
Income tax payable 9,940 – 9,940 1,626 – 1,626
Provisions 110,996 – 110,996 – – –
Derivatives (f) – 360 360 – – –
Total current liabilities 342,656 (5,258) 337,398 1,626 5,618 7,244
Non-current liabilities
Interest bearing loans and borrowings 71,519 (1,684) 69,835 – – –
Deferred tax liabilities (b),(e),(h) 13,571 12,094 25,665 13,175 (12,464) 711
Provisions 16,002 – 16,002 – – –
Total non-current liabilities 101,092 10,410 111,502 13,175 (12,464) 711
TOTAL LIABILITIES 443,748 5,152 448,900 14,801 (6,846) 7,955
NET ASSETS 384,254 6,179 390,433 382,649 5,300 387,949
EQUITY
Issued capital (d) 327,523 4,994 332,517 327,523 4,994 332,517
Reserves (d),(f) (15,540) 2,395 (13,145) – 2,495 2,495
Retained profits 68,632 (1,210) 67,422 55,126 (2,189) 52,937
Parent entity interest 380,615 6,179 386,794 382,649 5,300 387,949
Minority interests 3,639 – 3,639 – – –
TOTAL EQUITY 384,254 6,179 390,433 382,649 5,300 387,949
NOTES TO THE FINANCIAL STATEMENTS For the Financial Year Ended 30 June 2006
42 WorleyParsons Annual Report 2006
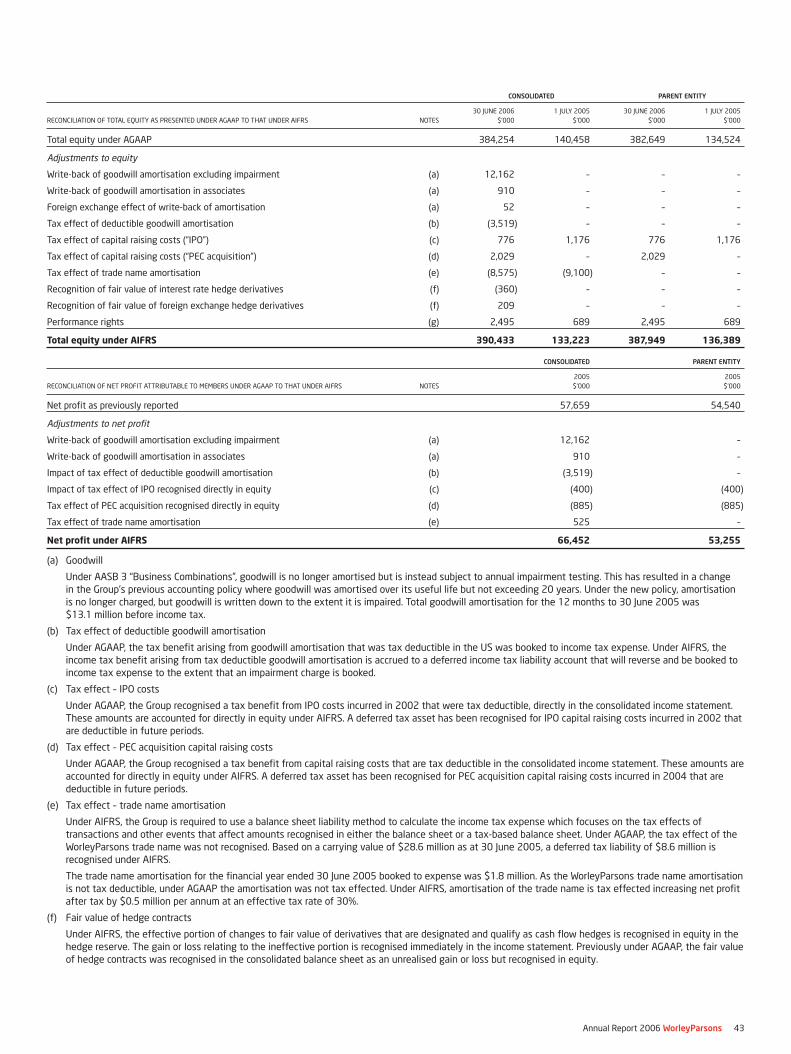
CONSOLIDATED PARENT ENTITY
30 JUNE 2006 1 JULY 2005 30 JUNE 2006 1 JULY 2005
RECONCILIATION OF TOTAL EQUITY AS PRESENTED UNDER AGAAP TO THAT UNDER AIFRS NOTES $’000 $’000 $’000 $’000
Total equity under AGAAP 384,254 140,458 382,649 134,524
Adjustments to equity
Write-back of goodwill amortisation excluding impairment (a) 12,162 – – –
Write-back of goodwill amortisation in associates (a) 910 – – –
Foreign exchange effect of write-back of amortisation (a) 52 – – –
Tax effect of deductible goodwill amortisation (b) (3,519) – – –
Tax effect of capital raising costs (“IPO”) (c) 776 1,176 776 1,176
Tax effect of capital raising costs (“PEC acquisition”) (d) 2,029 – 2,029 –
Tax effect of trade name amortisation (e) (8,575) (9,100) – –
Recognition of fair value of interest rate hedge derivatives (f) (360) – – –
Recognition of fair value of foreign exchange hedge derivatives (f) 209 – – –
Performance rights (g) 2,495 689 2,495 689
Total equity under AIFRS 390,433 133,223 387,949 136,389
CONSOLIDATED PARENT ENTITY
2005 2005
RECONCILIATION OF NET PROFIT ATTRIBUTABLE TO MEMBERS UNDER AGAAP TO THAT UNDER AIFRS NOTES $’000 $’000
Net profit as previously reported 57,659 54,540
Adjustments to net profit
Write-back of goodwill amortisation excluding impairment (a) 12,162 –
Write-back of goodwill amortisation in associates (a) 910 –
Impact of tax effect of deductible goodwill amortisation (b) (3,519) –
Impact of tax effect of IPO recognised directly in equity (c) (400) (400)
Tax effect of PEC acquisition recognised directly in equity (d) (885) (885)
Tax effect of trade name amortisation (e) 525 –
Net profit under AIFRS 66,452 53,255
(a) Goodwill
Under AASB 3 “Business Combinations”, goodwill is no longer amortised but is instead subject to annual impairment testing. This has resulted in a changein the Group’s previous accounting policy where goodwill was amortised over its useful life but not exceeding 20 years. Under the new policy, amortisationis no longer charged, but goodwill is written down to the extent it is impaired. Total goodwill amortisation for the 12 months to 30 June 2005 was$13.1 million before income tax.
(b) Tax effect of deductible goodwill amortisation
Under AGAAP, the tax benefit arising from goodwill amortisation that was tax deductible in the US was booked to income tax expense. Under AIFRS, theincome tax benefit arising from tax deductible goodwill amortisation is accrued to a deferred income tax liability account that will reverse and be booked toincome tax expense to the extent that an impairment charge is booked.
(c) Tax effect – IPO costs
Under AGAAP, the Group recognised a tax benefit from IPO costs incurred in 2002 that were tax deductible, directly in the consolidated income statement.These amounts are accounted for directly in equity under AIFRS. A deferred tax asset has been recognised for IPO capital raising costs incurred in 2002 thatare deductible in future periods.
(d) Tax effect – PEC acquisition capital raising costs
Under AGAAP, the Group recognised a tax benefit from capital raising costs that are tax deductible in the consolidated income statement. These amounts areaccounted for directly in equity under AIFRS. A deferred tax asset has been recognised for PEC acquisition capital raising costs incurred in 2004 that aredeductible in future periods.
(e) Tax effect – trade name amortisation
Under AIFRS, the Group is required to use a balance sheet liability method to calculate the income tax expense which focuses on the tax effects oftransactions and other events that affect amounts recognised in either the balance sheet or a tax-based balance sheet. Under AGAAP, the tax effect of theWorleyParsons trade name was not recognised. Based on a carrying value of $28.6 million as at 30 June 2005, a deferred tax liability of $8.6 million isrecognised under AIFRS.
The trade name amortisation for the financial year ended 30 June 2005 booked to expense was $1.8 million. As the WorleyParsons trade name amortisationis not tax deductible, under AGAAP the amortisation was not tax effected. Under AIFRS, amortisation of the trade name is tax effected increasing net profitafter tax by $0.5 million per annum at an effective tax rate of 30%.
(f) Fair value of hedge contracts
Under AIFRS, the effective portion of changes to fair value of derivatives that are designated and qualify as cash flow hedges is recognised in equity in thehedge reserve. The gain or loss relating to the ineffective portion is recognised immediately in the income statement. Previously under AGAAP, the fair valueof hedge contracts was recognised in the consolidated balance sheet as an unrealised gain or loss but recognised in equity.
Annual Report 2006 WorleyParsons 43
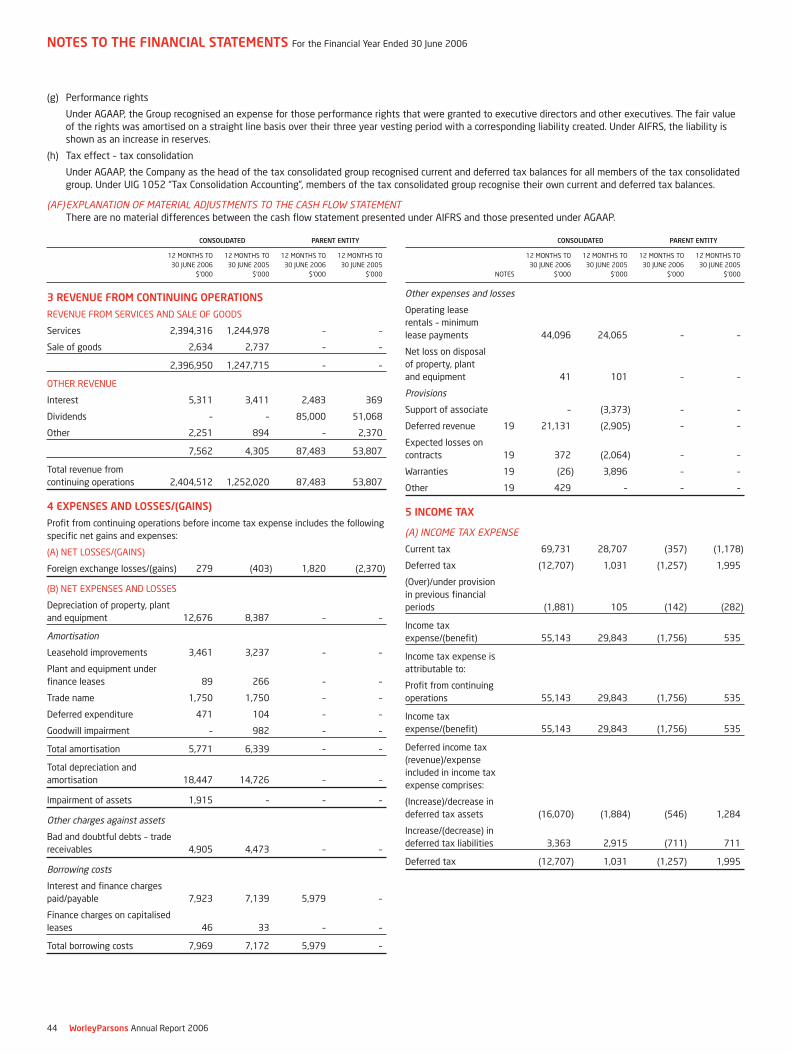
CONSOLIDATED PARENT ENTITY
12 MONTHS TO 12 MONTHS TO 12 MONTHS TO 12 MONTHS TO
30 JUNE 2006 30 JUNE 2005 30 JUNE 2006 30 JUNE 2005
$’000 $’000 $’000 $’000
3 REVENUE FROM CONTINUING OPERATIONS
REVENUE FROM SERVICES AND SALE OF GOODS
Services 2,394,316 1,244,978 – –
Sale of goods 2,634 2,737 – –
2,396,950 1,247,715 – –
OTHER REVENUE
Interest 5,311 3,411 2,483 369
Dividends – – 85,000 51,068
Other 2,251 894 – 2,370
7,562 4,305 87,483 53,807
Total revenue from
continuing operations 2,404,512 1,252,020 87,483 53,807
4 EXPENSES AND LOSSES/(GAINS)
Profit from continuing operations before income tax expense includes the following
specific net gains and expenses:
(A) NET LOSSES/(GAINS)
Foreign exchange losses/(gains) 279 (403) 1,820 (2,370)
(B) NET EXPENSES AND LOSSES
Depreciation of property, plant
and equipment 12,676 8,387 – –
Amortisation
Leasehold improvements 3,461 3,237 – –
Plant and equipment under
finance leases 89 266 – –
Trade name 1,750 1,750 – –
Deferred expenditure 471 104 – –
Goodwill impairment – 982 – –
Total amortisation 5,771 6,339 – –
Total depreciation and
amortisation 18,447 14,726 – –
Impairment of assets 1,915 – – –
Other charges against assets
Bad and doubtful debts – trade
receivables 4,905 4,473 – –
Borrowing costs
Interest and finance charges
paid/payable 7,923 7,139 5,979 –
Finance charges on capitalised
leases 46 33 – –
Total borrowing costs 7,969 7,172 5,979 –
CONSOLIDATED PARENT ENTITY
12 MONTHS TO 12 MONTHS TO 12 MONTHS TO 12 MONTHS TO
30 JUNE 2006 30 JUNE 2005 30 JUNE 2006 30 JUNE 2005
NOTES $’000 $’000 $’000 $’000
Other expenses and losses
Operating lease
rentals – minimum
lease payments 44,096 24,065 – –
Net loss on disposal
of property, plant
and equipment 41 101 – –
Provisions
Support of associate – (3,373) – –
Deferred revenue 19 21,131 (2,905) – –
Expected losses on
contracts 19 372 (2,064) – –
Warranties 19 (26) 3,896 – –
Other 19 429 – – –
5 INCOME TAX
(A) INCOME TAX EXPENSE
Current tax 69,731 28,707 (357) (1,178)
Deferred tax (12,707) 1,031 (1,257) 1,995
(Over)/under provision
in previous financial
periods (1,881) 105 (142) (282)
Income tax
expense/(benefit) 55,143 29,843 (1,756) 535
Income tax expense is
attributable to:
Profit from continuing
operations 55,143 29,843 (1,756) 535
Income tax
expense/(benefit) 55,143 29,843 (1,756) 535
Deferred income tax
(revenue)/expense
included in income tax
expense comprises:
(Increase)/decrease in
deferred tax assets (16,070) (1,884) (546) 1,284
Increase/(decrease) in
deferred tax liabilities 3,363 2,915 (711) 711
Deferred tax (12,707) 1,031 (1,257) 1,995
NOTES TO THE FINANCIAL STATEMENTS For the Financial Year Ended 30 June 2006
44 WorleyParsons Annual Report 2006
(g) Performance rights
Under AGAAP, the Group recognised an expense for those performance rights that were granted to executive directors and other executives. The fair valueof the rights was amortised on a straight line basis over their three year vesting period with a corresponding liability created. Under AIFRS, the liability isshown as an increase in reserves.
(h) Tax effect – tax consolidation
Under AGAAP, the Company as the head of the tax consolidated group recognised current and deferred tax balances for all members of the tax consolidatedgroup. Under UIG 1052 “Tax Consolidation Accounting”, members of the tax consolidated group recognise their own current and deferred tax balances.
(AF)EXPLANATION OF MATERIAL ADJUSTMENTS TO THE CASH FLOW STATEMENTThere are no material differences between the cash flow statement presented under AIFRS and those presented under AGAAP.
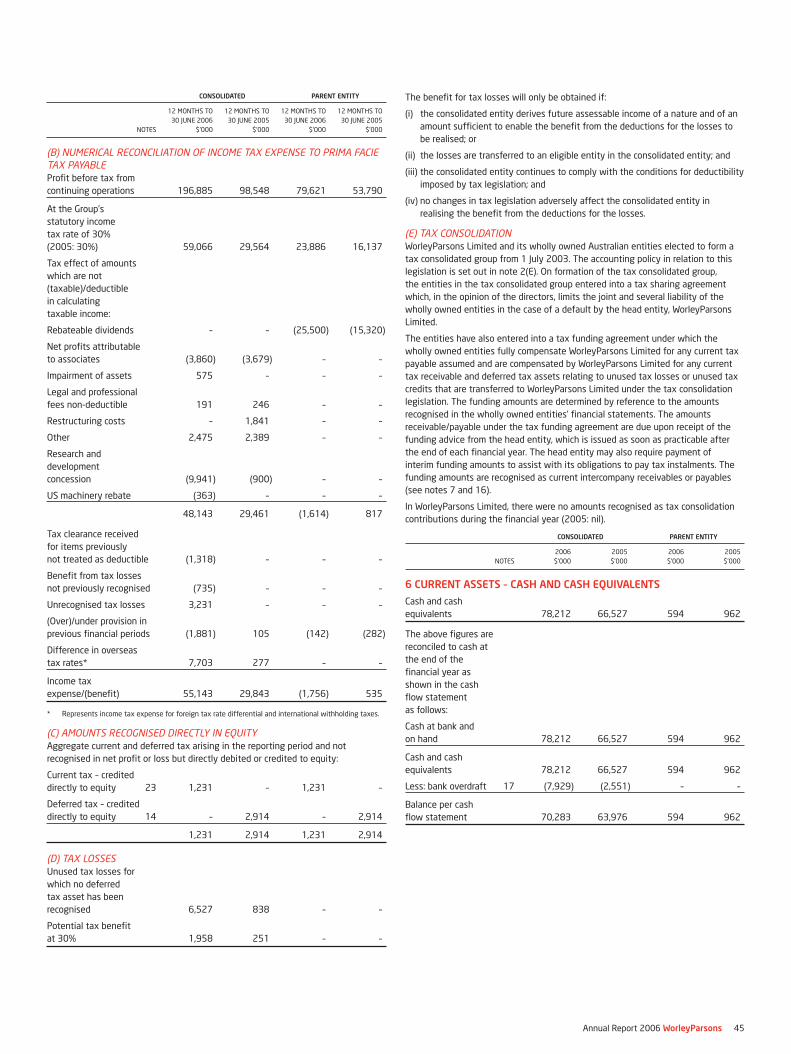
CONSOLIDATED PARENT ENTITY
12 MONTHS TO 12 MONTHS TO 12 MONTHS TO 12 MONTHS TO
30 JUNE 2006 30 JUNE 2005 30 JUNE 2006 30 JUNE 2005
NOTES $’000 $’000 $’000 $’000
(B) NUMERICAL RECONCILIATION OF INCOME TAX EXPENSE TO PRIMA FACIETAX PAYABLEProfit before tax from
continuing operations 196,885 98,548 79,621 53,790
At the Group’s
statutory income
tax rate of 30%
(2005: 30%) 59,066 29,564 23,886 16,137
Tax effect of amounts
which are not
(taxable)/deductible
in calculating
taxable income:
Rebateable dividends – – (25,500) (15,320)
Net profits attributable
to associates (3,860) (3,679) – –
Impairment of assets 575 – – –
Legal and professional
fees non-deductible 191 246 – –
Restructuring costs – 1,841 – –
Other 2,475 2,389 – –
Research and
development
concession (9,941) (900) – –
US machinery rebate (363) – – –
48,143 29,461 (1,614) 817
Tax clearance received
for items previously
not treated as deductible (1,318) – – –
Benefit from tax losses
not previously recognised (735) – – –
Unrecognised tax losses 3,231 – – –
(Over)/under provision in
previous financial periods (1,881) 105 (142) (282)
Difference in overseas
tax rates* 7,703 277 – –
Income tax
expense/(benefit) 55,143 29,843 (1,756) 535
* Represents income tax expense for foreign tax rate differential and international withholding taxes.
(C) AMOUNTS RECOGNISED DIRECTLY IN EQUITYAggregate current and deferred tax arising in the reporting period and not
recognised in net profit or loss but directly debited or credited to equity:
Current tax – credited
directly to equity 23 1,231 – 1,231 –
Deferred tax – credited
directly to equity 14 – 2,914 – 2,914
1,231 2,914 1,231 2,914
(D) TAX LOSSESUnused tax losses for
which no deferred
tax asset has been
recognised 6,527 838 – –
Potential tax benefit
at 30% 1,958 251 – –
The benefit for tax losses will only be obtained if:
(i) the consolidated entity derives future assessable income of a nature and of an
amount sufficient to enable the benefit from the deductions for the losses to
be realised; or
(ii) the losses are transferred to an eligible entity in the consolidated entity; and
(iii) the consolidated entity continues to comply with the conditions for deductibility
imposed by tax legislation; and
(iv) no changes in tax legislation adversely affect the consolidated entity in
realising the benefit from the deductions for the losses.
(E) TAX CONSOLIDATIONWorleyParsons Limited and its wholly owned Australian entities elected to form a
tax consolidated group from 1 July 2003. The accounting policy in relation to this
legislation is set out in note 2(E). On formation of the tax consolidated group,
the entities in the tax consolidated group entered into a tax sharing agreement
which, in the opinion of the directors, limits the joint and several liability of the
wholly owned entities in the case of a default by the head entity, WorleyParsons
Limited.
The entities have also entered into a tax funding agreement under which the
wholly owned entities fully compensate WorleyParsons Limited for any current tax
payable assumed and are compensated by WorleyParsons Limited for any current
tax receivable and deferred tax assets relating to unused tax losses or unused tax
credits that are transferred to WorleyParsons Limited under the tax consolidation
legislation. The funding amounts are determined by reference to the amounts
recognised in the wholly owned entities’ financial statements. The amounts
receivable/payable under the tax funding agreement are due upon receipt of the
funding advice from the head entity, which is issued as soon as practicable after
the end of each financial year. The head entity may also require payment of
interim funding amounts to assist with its obligations to pay tax instalments. The
funding amounts are recognised as current intercompany receivables or payables
(see notes 7 and 16).
In WorleyParsons Limited, there were no amounts recognised as tax consolidation
contributions during the financial year (2005: nil).
CONSOLIDATED PARENT ENTITY
2006 2005 2006 2005
NOTES $’000 $’000 $’000 $’000
6 CURRENT ASSETS – CASH AND CASH EQUIVALENTS
Cash and cash
equivalents 78,212 66,527 594 962
The above figures are
reconciled to cash at
the end of the
financial year as
shown in the cash
flow statement
as follows:
Cash at bank and
on hand 78,212 66,527 594 962
Cash and cash
equivalents 78,212 66,527 594 962
Less: bank overdraft 17 (7,929) (2,551) – –
Balance per cash
flow statement 70,283 63,976 594 962
Annual Report 2006 WorleyParsons 45
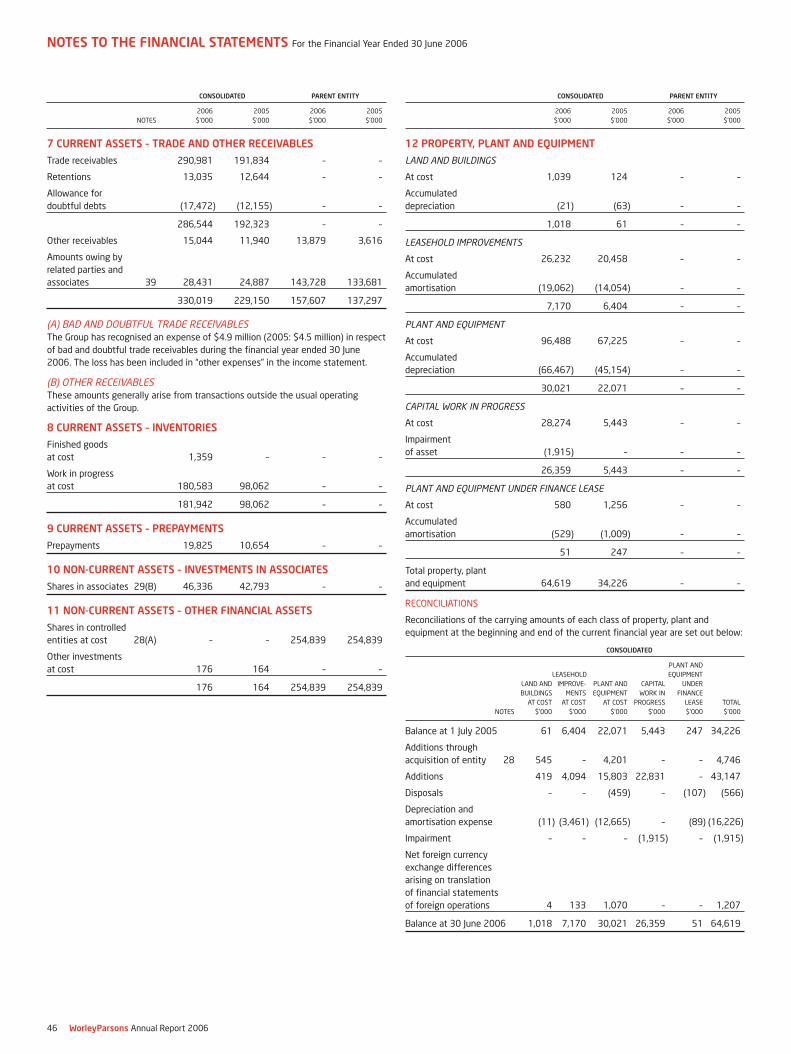
CONSOLIDATED PARENT ENTITY
2006 2005 2006 2005
NOTES $’000 $’000 $’000 $’000
7 CURRENT ASSETS – TRADE AND OTHER RECEIVABLES
Trade receivables 290,981 191,834 – –
Retentions 13,035 12,644 – –
Allowance for
doubtful debts (17,472) (12,155) – –
286,544 192,323 – –
Other receivables 15,044 11,940 13,879 3,616
Amounts owing by
related parties and
associates 39 28,431 24,887 143,728 133,681
330,019 229,150 157,607 137,297
(A) BAD AND DOUBTFUL TRADE RECEIVABLESThe Group has recognised an expense of $4.9 million (2005: $4.5 million) in respect
of bad and doubtful trade receivables during the financial year ended 30 June
2006. The loss has been included in “other expenses” in the income statement.
(B) OTHER RECEIVABLESThese amounts generally arise from transactions outside the usual operating
activities of the Group.
8 CURRENT ASSETS – INVENTORIES
Finished goods
at cost 1,359 – – –
Work in progress
at cost 180,583 98,062 – –
181,942 98,062 – –
9 CURRENT ASSETS – PREPAYMENTS
Prepayments 19,825 10,654 – –
10 NON-CURRENT ASSETS – INVESTMENTS IN ASSOCIATES
Shares in associates 29(B) 46,336 42,793 – –
11 NON-CURRENT ASSETS – OTHER FINANCIAL ASSETS
Shares in controlled
entities at cost 28(A) – – 254,839 254,839
Other investments
at cost 176 164 – –
176 164 254,839 254,839
CONSOLIDATED PARENT ENTITY
2006 2005 2006 2005
$’000 $’000 $’000 $’000
12 PROPERTY, PLANT AND EQUIPMENT
LAND AND BUILDINGS
At cost 1,039 124 – –
Accumulated
depreciation (21) (63) – –
1,018 61 – –
LEASEHOLD IMPROVEMENTS
At cost 26,232 20,458 – –
Accumulated
amortisation (19,062) (14,054) – –
7,170 6,404 – –
PLANT AND EQUIPMENT
At cost 96,488 67,225 – –
Accumulated
depreciation (66,467) (45,154) – –
30,021 22,071 – –
CAPITAL WORK IN PROGRESS
At cost 28,274 5,443 – –
Impairment
of asset (1,915) – – –
26,359 5,443 – –
PLANT AND EQUIPMENT UNDER FINANCE LEASE
At cost 580 1,256 – –
Accumulated
amortisation (529) (1,009) – –
51 247 – –
Total property, plant
and equipment 64,619 34,226 – –
RECONCILIATIONS
Reconciliations of the carrying amounts of each class of property, plant and
equipment at the beginning and end of the current financial year are set out below:
CONSOLIDATED
PLANT AND
LEASEHOLD EQUIPMENT
LAND AND IMPROVE- PLANT AND CAPITAL UNDER
BUILDINGS MENTS EQUIPMENT WORK IN FINANCE
AT COST AT COST AT COST PROGRESS LEASE TOTAL
NOTES $’000 $’000 $’000 $’000 $’000 $’000
Balance at 1 July 2005 61 6,404 22,071 5,443 247 34,226
Additions through
acquisition of entity 28 545 – 4,201 – – 4,746
Additions 419 4,094 15,803 22,831 – 43,147
Disposals – – (459) – (107) (566)
Depreciation and
amortisation expense (11) (3,461) (12,665) – (89) (16,226)
Impairment – – – (1,915) – (1,915)
Net foreign currency
exchange differences
arising on translation
of financial statements
of foreign operations 4 133 1,070 – – 1,207
Balance at 30 June 2006 1,018 7,170 30,021 26,359 51 64,619
NOTES TO THE FINANCIAL STATEMENTS For the Financial Year Ended 30 June 2006
46 WorleyParsons Annual Report 2006

CONSOLIDATED PARENT ENTITY
GOODWILL TRADE NAME GOODWILL TRADE NAME
$’000 $’000 $’000 $’000
13 NON-CURRENT ASSETS – INTANGIBLE ASSETS
Balance at 1 July 2004
Deemed cost 30,733 35,000 – –
Accumulated amortisation and
impairment – (4,667) – –
Net book amount 30,733 30,333 – –
Year ended 30 June 2005
Opening net book amount 30,733 30,333 – –
Additions 299,340 – – –
Amortisation and impairment* (982) (1,750) – –
Foreign currency translation
reserve (15,942) – – –
Closing net book amount 313,149 28,583 – –
Balance at 30 June 2005
Deemed cost 314,131 35,000 – –
Accumulated amortisation and
impairment (982) (6,417) – –
Net book amount 313,149 28,583 – –
Year ended 30 June 2006
Opening net book amount 313,149 28,583 – –
Additions 55,388 – – –
Disposal (199) – – –
Foreign currency translation
reserve 11,230 – – –
Adjustment to pre acquisition
provisions (2,361) – – –
Amortisation charge* – (1,750) – –
Closing net book amount 377,207 26,833 – –
At 30 June 2006
Deemed cost 378,189 35,000 – –
Accumulated amortisation and
impairment (982) (8,167) – –
Net book amount 377,207 26,833 – –
* Amortisation of $1.8 million (2005: $1.8 million) is included in amortisation expense in the income
statement.
The carrying amount of intangible assets is tested for impairment annually at the
balance date and whenever there is an indication that the asset may be impaired.
If an intangible asset is impaired, the asset is written down to its recoverable
amount. The recoverable amount is based on a value in use calculation. These
calculations use cash flow projections based on financial forecasts of how the
business is expected to operate based on current performance and the business
environment but taking into account expected future changes.
Key assumptions used for impairment testing for the financial year ended 30 June
2006 include pre-tax discount rates (13.9% to 18.9%), expected future profits
and future nominal growth rates (5% to 10%) without re-investment. Sensitivity
analysis is used to determine whether the carrying value is supported under
different assumptions.
Goodwill is not impaired at reporting date. The business segments form the basis of
the cash generating units. Goodwill at net book amount is disclosed by segment in
note 40.
Following the Parsons E&C acquisition in October 2004, the Group restructured its
operations in the Middle East region which resulted in goodwill impairment of
$982,000 for the financial year ended 30 June 2005.
CONSOLIDATED PARENT ENTITY
2006 2005 2006 2005
$’000 $’000 $’000 $’000
14 NON-CURRENT ASSETS – DEFERRED TAX ASSETS
The balance comprises
temporary differences
attributable to:
Amounts recognised
in the income
statement:
Provision for doubtful
debts 4,487 1,973 – –
Employee benefits 9,859 3,877 – –
General and sundry
accruals 1,853 1,001 – –
Provision for
self-insurance 639 936 – –
Performance rights 2,511 808 – –
Warranty provisions 2,656 – – –
Project provisions 1,761 2,423 – –
Lease incentives 1,167 1,233 – –
Interests in
partnerships 1,011 – – –
Subsidiary earnings
not distributed 825 476 – –
Foreign exchange 1,698 (470) 546 –
Other 161 301 – –
28,628 12,558 546 –
Amounts recognised
directly in equity:
Costs associated with
the IPO 375 777 375 777
Costs associated with
the PEC acquisition 1,522 2,029 1,522 2,029
Cash flow hedges 232 – – –
Foreign currency
translation reserve 1,038 – – –
3,167 2,806 1,897 2,806
Net deferred tax assets 31,795 15,364 2,443 2,806
Balance at the beginning
of the financial year 15,364 10,070 2,806 1,176
Foreign currency
exchange movements – (17) – –
Credited/(charged) to
the income statement 16,070 1,884 546 (1,284)
Credited/(charged) to
equity 361 2,914 (909) 2,914
Acquisition of subsidiary – 513 – –
Balance at the end of
the financial year 31,795 15,364 2,443 2,806
Annual Report 2006 WorleyParsons 47
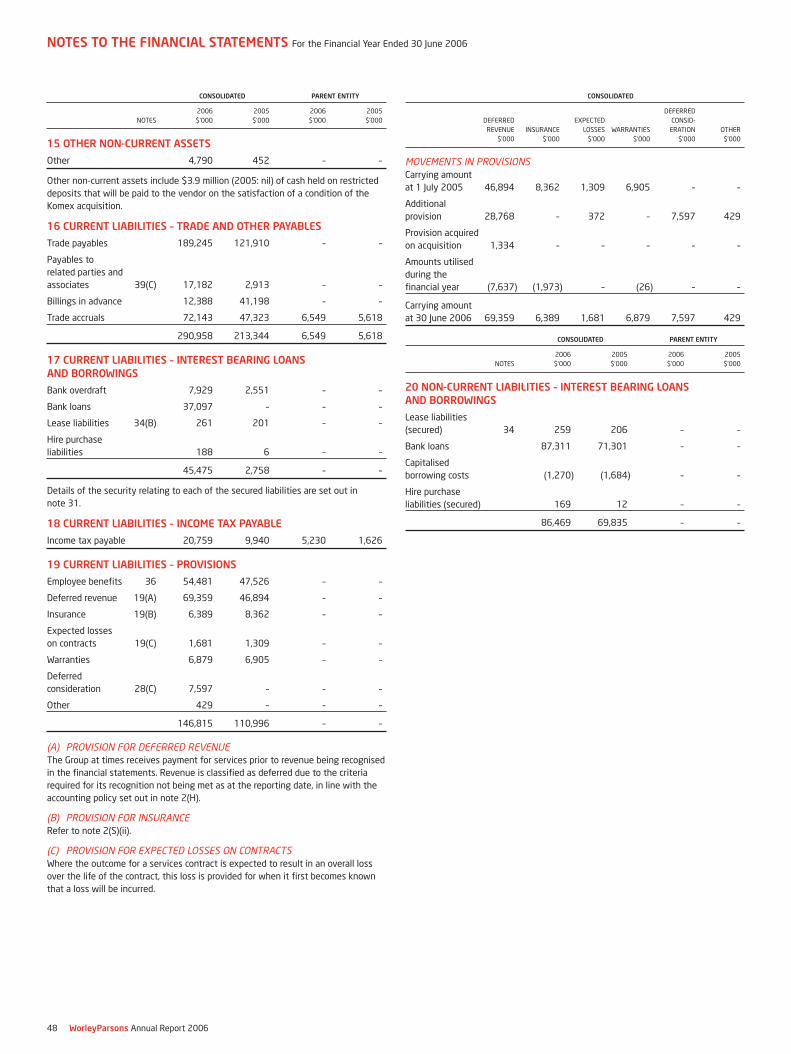
CONSOLIDATED PARENT ENTITY
2006 2005 2006 2005
NOTES $’000 $’000 $’000 $’000
15 OTHER NON-CURRENT ASSETS
Other 4,790 452 – –
Other non-current assets include $3.9 million (2005: nil) of cash held on restricted
deposits that will be paid to the vendor on the satisfaction of a condition of the
Komex acquisition.
16 CURRENT LIABILITIES – TRADE AND OTHER PAYABLES
Trade payables 189,245 121,910 – –
Payables to
related parties and
associates 39(C) 17,182 2,913 – –
Billings in advance 12,388 41,198 – –
Trade accruals 72,143 47,323 6,549 5,618
290,958 213,344 6,549 5,618
17 CURRENT LIABILITIES – INTEREST BEARING LOANSAND BORROWINGS
Bank overdraft 7,929 2,551 – –
Bank loans 37,097 – – –
Lease liabilities 34(B) 261 201 – –
Hire purchase
liabilities 188 6 – –
45,475 2,758 – –
Details of the security relating to each of the secured liabilities are set out in
note 31.
18 CURRENT LIABILITIES – INCOME TAX PAYABLE
Income tax payable 20,759 9,940 5,230 1,626
19 CURRENT LIABILITIES – PROVISIONS
Employee benefits 36 54,481 47,526 – –
Deferred revenue 19(A) 69,359 46,894 – –
Insurance 19(B) 6,389 8,362 – –
Expected losses
on contracts 19(C) 1,681 1,309 – –
Warranties 6,879 6,905 – –
Deferred
consideration 28(C) 7,597 – – –
Other 429 – – –
146,815 110,996 – –
(A) PROVISION FOR DEFERRED REVENUEThe Group at times receives payment for services prior to revenue being recognised
in the financial statements. Revenue is classified as deferred due to the criteria
required for its recognition not being met as at the reporting date, in line with the
accounting policy set out in note 2(H).
(B) PROVISION FOR INSURANCERefer to note 2(S)(ii).
(C) PROVISION FOR EXPECTED LOSSES ON CONTRACTSWhere the outcome for a services contract is expected to result in an overall loss
over the life of the contract, this loss is provided for when it first becomes known
that a loss will be incurred.
CONSOLIDATED
DEFERRED
DEFERRED EXPECTED CONSID-
REVENUE INSURANCE LOSSES WARRANTIES ERATION OTHER
$’000 $’000 $’000 $’000 $’000 $’000
MOVEMENTS IN PROVISIONSCarrying amount
at 1 July 2005 46,894 8,362 1,309 6,905 – –
Additional
provision 28,768 – 372 – 7,597 429
Provision acquired
on acquisition 1,334 – – – – –
Amounts utilised
during the
financial year (7,637) (1,973) – (26) – –
Carrying amount
at 30 June 2006 69,359 6,389 1,681 6,879 7,597 429
CONSOLIDATED PARENT ENTITY
2006 2005 2006 2005
NOTES $’000 $’000 $’000 $’000
20 NON-CURRENT LIABILITIES – INTEREST BEARING LOANSAND BORROWINGS
Lease liabilities
(secured) 34 259 206 – –
Bank loans 87,311 71,301 – –
Capitalised
borrowing costs (1,270) (1,684) – –
Hire purchase
liabilities (secured) 169 12 – –
86,469 69,835 – –
NOTES TO THE FINANCIAL STATEMENTS For the Financial Year Ended 30 June 2006
48 WorleyParsons Annual Report 2006
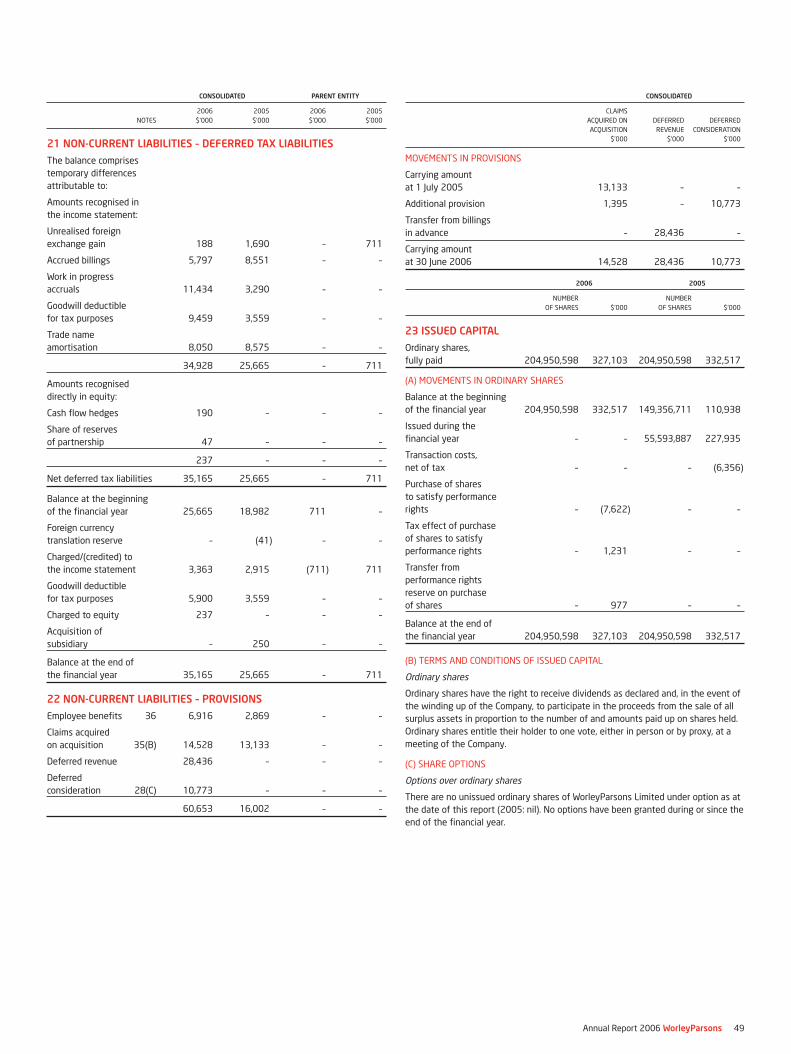
CONSOLIDATED PARENT ENTITY
2006 2005 2006 2005
NOTES $’000 $’000 $’000 $’000
21 NON-CURRENT LIABILITIES – DEFERRED TAX LIABILITIES
The balance comprises
temporary differences
attributable to:
Amounts recognised in
the income statement:
Unrealised foreign
exchange gain 188 1,690 – 711
Accrued billings 5,797 8,551 – –
Work in progress
accruals 11,434 3,290 – –
Goodwill deductible
for tax purposes 9,459 3,559 – –
Trade name
amortisation 8,050 8,575 – –
34,928 25,665 – 711
Amounts recognised
directly in equity:
Cash flow hedges 190 – – –
Share of reserves
of partnership 47 – – –
237 – – –
Net deferred tax liabilities 35,165 25,665 – 711
Balance at the beginning
of the financial year 25,665 18,982 711 –
Foreign currency
translation reserve – (41) – –
Charged/(credited) to
the income statement 3,363 2,915 (711) 711
Goodwill deductible
for tax purposes 5,900 3,559 – –
Charged to equity 237 – – –
Acquisition of
subsidiary – 250 – –
Balance at the end of
the financial year 35,165 25,665 – 711
22 NON-CURRENT LIABILITIES – PROVISIONS
Employee benefits 36 6,916 2,869 – –
Claims acquired
on acquisition 35(B) 14,528 13,133 – –
Deferred revenue 28,436 – – –
Deferred
consideration 28(C) 10,773 – – –
60,653 16,002 – –
CONSOLIDATED
CLAIMS
ACQUIRED ON DEFERRED DEFERRED
ACQUISITION REVENUE CONSIDERATION
$’000 $’000 $’000
MOVEMENTS IN PROVISIONS
Carrying amount
at 1 July 2005 13,133 – –
Additional provision 1,395 – 10,773
Transfer from billings
in advance – 28,436 –
Carrying amount
at 30 June 2006 14,528 28,436 10,773
2006 2005
NUMBER NUMBER
OF SHARES $’000 OF SHARES $’000
23 ISSUED CAPITAL
Ordinary shares,
fully paid 204,950,598 327,103 204,950,598 332,517
(A) MOVEMENTS IN ORDINARY SHARES
Balance at the beginning
of the financial year 204,950,598 332,517 149,356,711 110,938
Issued during the
financial year – – 55,593,887 227,935
Transaction costs,
net of tax – – – (6,356)
Purchase of shares
to satisfy performance
rights – (7,622) – –
Tax effect of purchase
of shares to satisfy
performance rights – 1,231 – –
Transfer from
performance rights
reserve on purchase
of shares – 977 – –
Balance at the end of
the financial year 204,950,598 327,103 204,950,598 332,517
(B) TERMS AND CONDITIONS OF ISSUED CAPITAL
Ordinary shares
Ordinary shares have the right to receive dividends as declared and, in the event of
the winding up of the Company, to participate in the proceeds from the sale of all
surplus assets in proportion to the number of and amounts paid up on shares held.
Ordinary shares entitle their holder to one vote, either in person or by proxy, at a
meeting of the Company.
(C) SHARE OPTIONS
Options over ordinary shares
There are no unissued ordinary shares of WorleyParsons Limited under option as at
the date of this report (2005: nil). No options have been granted during or since the
end of the financial year.
Annual Report 2006 WorleyParsons 49

CONSOLIDATED PARENT ENTITY
2006 2005 2006 2005
$’000 $’000 $’000 $’000
24 RESERVES AND RETAINED PROFITS
Foreign currency
translation reserve (2,703) (15,489) – –
Hedge reserve 572 (151) – –
Performance
rights reserve 5,822 2,495 5,822 2,495
Reserves 3,691 (13,145) 5,822 2,495
Retained profits 142,993 67,422 70,779 52,937
146,684 54,277 76,601 55,432
(A) FOREIGN CURRENCY TRANSLATION RESERVE
The foreign currency translation reserve is used to record exchange differences
arising from the translation of the financial statements of foreign operations.
Balance at the
beginning of the
financial year (15,489) (6,079) – –
Gain/(loss) on
translation of foreign
controlled entities
and associates 12,786 (9,410) – –
Balance at the end
of the financial year (2,703) (15,489) – –
(B) HEDGE RESERVE
The hedge reserve is used to record gains or losses on hedging instruments in the
cash flow hedges that are recognised directly in equity, as described in note 2(AC).
Amounts are recognised in profit and loss when the associated hedged transaction
affects profit and loss.
Balance at the
beginning of the
financial year (151) – – –
(Loss)/gain on
foreign exchange
hedges net of tax (758) 209 – –
Gain/(loss) on
interest rate hedges,
net of tax 753 (360) – –
Share of interest rate
hedges recognised
in associates 728 – – –
Balance at the
end of the
financial year 572 (151) – –
(C) PERFORMANCE RIGHTS RESERVE
The rights reserve is used to recognise the fair value of performance rights issued
but not satisfied.
Balance at the
beginning of the
financial year 2,495 689 2,495 689
Performance
rights expense 4,304 1,806 4,304 1,806
Transfer to issued
capital on purchase
of shares to satisfy
performance rights (977) – (977) –
Balance at the
end of the
financial year 5,822 2,495 5,822 2,495
CONSOLIDATED PARENT ENTITY
2006 2005 2006 2005
NOTES $’000 $’000 $’000 $’000
(D) RETAINED PROFITS
Balance at the
beginning of the
financial year 67,422 26,050 52,937 24,762
Profit attributable
to members of
WorleyParsons Limited 139,106 66,452 81,377 53,255
Dividends paid 27 (63,535) (25,080) (63,535) (25,080)
Balance at the
end of the
financial year 142,993 67,422 70,779 52,937
CONSOLIDATED
2006 2005
$’000 $’000
25 MINORITY INTERESTS IN CONTROLLED ENTITIES
MINORITY INTERESTS IN CONTROLLED ENTITIES COMPRISE:
Interest in:
Issued capital 405 943
Reserves – (164)
Retained profits 1,071 2,860
1,476 3,639
CONSOLIDATED
12 MONTHS TO 12 MONTHS TO
30 JUNE 2006 30 JUNE 2005
$’000 $’000
26 EARNINGS PER SHARE
Basic earnings per share (cents per share) 68.0 36.0
Net profit used as the numerator in calculating
basic earnings per share ($’000) 139,106 66,452
Weighted average number of ordinary shares used
as the denominator in calculating basic earnings
per share 204,558,651 184,492,081
Diluted earnings per share (cents per share) 67.9 35.9
Net profit used as the numerator in calculating
diluted earnings per share ($’000) 139,106 66,452
Weighted average number of ordinary shares used
as the denominator in calculating diluted earnings
per share 204,950,598 184,884,058
NOTES TO THE FINANCIAL STATEMENTS For the Financial Year Ended 30 June 2006
50 WorleyParsons Annual Report 2006
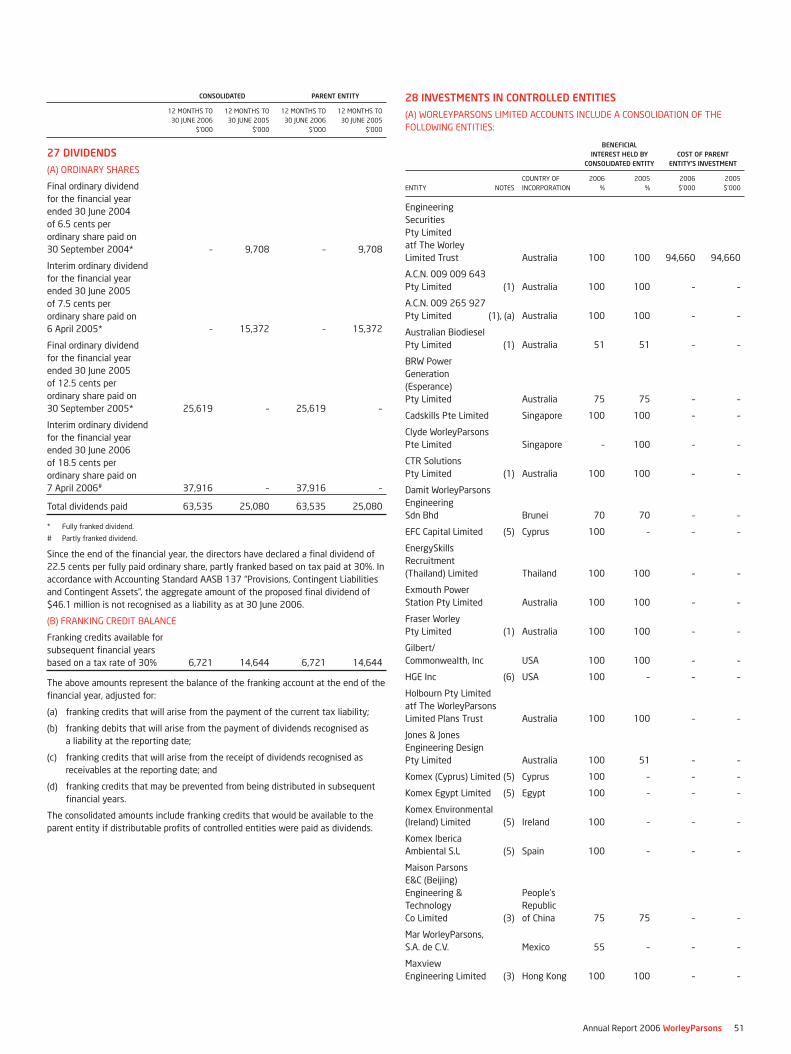
CONSOLIDATED PARENT ENTITY
12 MONTHS TO 12 MONTHS TO 12 MONTHS TO 12 MONTHS TO
30 JUNE 2006 30 JUNE 2005 30 JUNE 2006 30 JUNE 2005
$’000 $’000 $’000 $’000
27 DIVIDENDS
(A) ORDINARY SHARES
Final ordinary dividend
for the financial year
ended 30 June 2004
of 6.5 cents per
ordinary share paid on
30 September 2004* – 9,708 – 9,708
Interim ordinary dividend
for the financial year
ended 30 June 2005
of 7.5 cents per
ordinary share paid on
6 April 2005* – 15,372 – 15,372
Final ordinary dividend
for the financial year
ended 30 June 2005
of 12.5 cents per
ordinary share paid on
30 September 2005* 25,619 – 25,619 –
Interim ordinary dividend
for the financial year
ended 30 June 2006
of 18.5 cents per
ordinary share paid on
7 April 2006# 37,916 – 37,916 –
Total dividends paid 63,535 25,080 63,535 25,080
* Fully franked dividend.
# Partly franked dividend.
Since the end of the financial year, the directors have declared a final dividend of
22.5 cents per fully paid ordinary share, partly franked based on tax paid at 30%. In
accordance with Accounting Standard AASB 137 “Provisions, Contingent Liabilities
and Contingent Assets”, the aggregate amount of the proposed final dividend of
$46.1 million is not recognised as a liability as at 30 June 2006.
(B) FRANKING CREDIT BALANCE
Franking credits available for
subsequent financial years
based on a tax rate of 30% 6,721 14,644 6,721 14,644
The above amounts represent the balance of the franking account at the end of the
financial year, adjusted for:
(a) franking credits that will arise from the payment of the current tax liability;
(b) franking debits that will arise from the payment of dividends recognised as
a liability at the reporting date;
(c) franking credits that will arise from the receipt of dividends recognised as
receivables at the reporting date; and
(d) franking credits that may be prevented from being distributed in subsequent
financial years.
The consolidated amounts include franking credits that would be available to the
parent entity if distributable profits of controlled entities were paid as dividends.
28 INVESTMENTS IN CONTROLLED ENTITIES
(A) WORLEYPARSONS LIMITED ACCOUNTS INCLUDE A CONSOLIDATION OF THE
FOLLOWING ENTITIES:
BENEFICIAL INTEREST HELD BY COST OF PARENT
CONSOLIDATED ENTITY ENTITY’S INVESTMENT
COUNTRY OF 2006 2005 2006 2005
ENTITY NOTES INCORPORATION % % $’000 $’000
Engineering
Securities
Pty Limited
atf The Worley
Limited Trust Australia 100 100 94,660 94,660
A.C.N. 009 009 643
Pty Limited (1) Australia 100 100 – –
A.C.N. 009 265 927
Pty Limited (1), (a) Australia 100 100 – –
Australian Biodiesel
Pty Limited (1) Australia 51 51 – –
BRW Power
Generation
(Esperance)
Pty Limited Australia 75 75 – –
Cadskills Pte Limited Singapore 100 100 – –
Clyde WorleyParsons
Pte Limited Singapore – 100 – –
CTR Solutions
Pty Limited (1) Australia 100 100 – –
Damit WorleyParsons
Engineering
Sdn Bhd Brunei 70 70 – –
EFC Capital Limited (5) Cyprus 100 – – –
EnergySkills
Recruitment
(Thailand) Limited Thailand 100 100 – –
Exmouth Power
Station Pty Limited Australia 100 100 – –
Fraser Worley
Pty Limited (1) Australia 100 100 – –
Gilbert/
Commonwealth, Inc USA 100 100 – –
HGE Inc (6) USA 100 – – –
Holbourn Pty Limited
atf The WorleyParsons
Limited Plans Trust Australia 100 100 – –
Jones & Jones
Engineering Design
Pty Limited Australia 100 51 – –
Komex (Cyprus) Limited (5) Cyprus 100 – – –
Komex Egypt Limited (5) Egypt 100 – – –
Komex Environmental
(Ireland) Limited (5) Ireland 100 – – –
Komex Iberica
Ambiental S.L (5) Spain 100 – – –
Maison Parsons
E&C (Beijing)
Engineering & People’s
Technology Republic
Co Limited (3) of China 75 75 – –
Mar WorleyParsons,
S.A. de C.V. Mexico 55 – – –
Maxview
Engineering Limited (3) Hong Kong 100 100 – –
Annual Report 2006 WorleyParsons 51
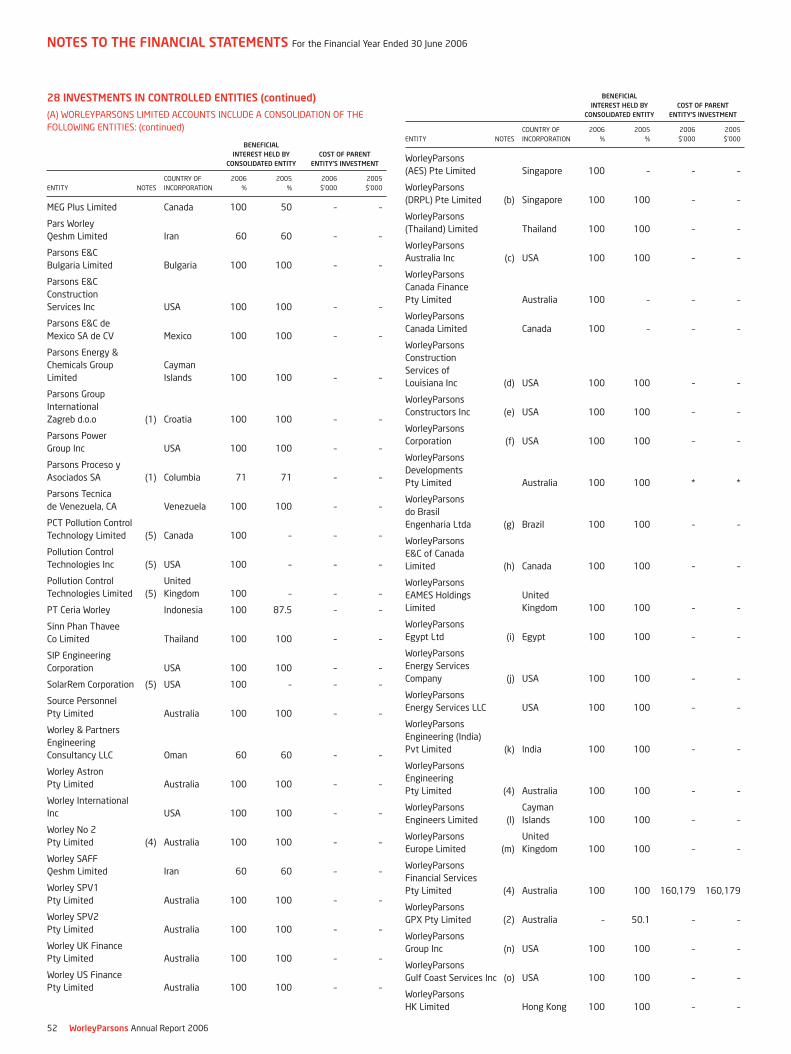
28 INVESTMENTS IN CONTROLLED ENTITIES (continued)
(A) WORLEYPARSONS LIMITED ACCOUNTS INCLUDE A CONSOLIDATION OF THE
FOLLOWING ENTITIES: (continued)
BENEFICIAL INTEREST HELD BY COST OF PARENT
CONSOLIDATED ENTITY ENTITY’S INVESTMENT
COUNTRY OF 2006 2005 2006 2005
ENTITY NOTES INCORPORATION % % $’000 $’000
MEG Plus Limited Canada 100 50 – –
Pars Worley
Qeshm Limited Iran 60 60 – –
Parsons E&C
Bulgaria Limited Bulgaria 100 100 – –
Parsons E&C
Construction
Services Inc USA 100 100 – –
Parsons E&C de
Mexico SA de CV Mexico 100 100 – –
Parsons Energy &
Chemicals Group Cayman
Limited Islands 100 100 – –
Parsons Group
International
Zagreb d.o.o (1) Croatia 100 100 – –
Parsons Power
Group Inc USA 100 100 – –
Parsons Proceso y
Asociados SA (1) Columbia 71 71 – –
Parsons Tecnica
de Venezuela, CA Venezuela 100 100 – –
PCT Pollution Control
Technology Limited (5) Canada 100 – – –
Pollution Control
Technologies Inc (5) USA 100 – – –
Pollution Control United
Technologies Limited (5) Kingdom 100 – – –
PT Ceria Worley Indonesia 100 87.5 – –
Sinn Phan Thavee
Co Limited Thailand 100 100 – –
SIP Engineering
Corporation USA 100 100 – –
SolarRem Corporation (5) USA 100 – – –
Source Personnel
Pty Limited Australia 100 100 – –
Worley & Partners
Engineering
Consultancy LLC Oman 60 60 – –
Worley Astron
Pty Limited Australia 100 100 – –
Worley International
Inc USA 100 100 – –
Worley No 2
Pty Limited (4) Australia 100 100 – –
Worley SAFF
Qeshm Limited Iran 60 60 – –
Worley SPV1
Pty Limited Australia 100 100 – –
Worley SPV2
Pty Limited Australia 100 100 – –
Worley UK Finance
Pty Limited Australia 100 100 – –
Worley US Finance
Pty Limited Australia 100 100 – –
BENEFICIAL INTEREST HELD BY COST OF PARENT
CONSOLIDATED ENTITY ENTITY’S INVESTMENT
COUNTRY OF 2006 2005 2006 2005
ENTITY NOTES INCORPORATION % % $’000 $’000
WorleyParsons
(AES) Pte Limited Singapore 100 – – –
WorleyParsons
(DRPL) Pte Limited (b) Singapore 100 100 – –
WorleyParsons
(Thailand) Limited Thailand 100 100 – –
WorleyParsons
Australia Inc (c) USA 100 100 – –
WorleyParsons
Canada Finance
Pty Limited Australia 100 – – –
WorleyParsons
Canada Limited Canada 100 – – –
WorleyParsons
Construction
Services of
Louisiana Inc (d) USA 100 100 – –
WorleyParsons
Constructors Inc (e) USA 100 100 – –
WorleyParsons
Corporation (f) USA 100 100 – –
WorleyParsons
Developments
Pty Limited Australia 100 100 * *
WorleyParsons
do Brasil
Engenharia Ltda (g) Brazil 100 100 – –
WorleyParsons
E&C of Canada
Limited (h) Canada 100 100 – –
WorleyParsons
EAMES Holdings United
Limited Kingdom 100 100 – –
WorleyParsons
Egypt Ltd (i) Egypt 100 100 – –
WorleyParsons
Energy Services
Company (j) USA 100 100 – –
WorleyParsons
Energy Services LLC USA 100 100 – –
WorleyParsons
Engineering (India)
Pvt Limited (k) India 100 100 – –
WorleyParsons
Engineering
Pty Limited (4) Australia 100 100 – –
WorleyParsons Cayman
Engineers Limited (l) Islands 100 100 – –
WorleyParsons United
Europe Limited (m) Kingdom 100 100 – –
WorleyParsons
Financial Services
Pty Limited (4) Australia 100 100 160,179 160,179
WorleyParsons
GPX Pty Limited (2) Australia – 50.1 – –
WorleyParsons
Group Inc (n) USA 100 100 – –
WorleyParsons
Gulf Coast Services Inc (o) USA 100 100 – –
WorleyParsons
HK Limited Hong Kong 100 100 – –
NOTES TO THE FINANCIAL STATEMENTS For the Financial Year Ended 30 June 2006
52 WorleyParsons Annual Report 2006
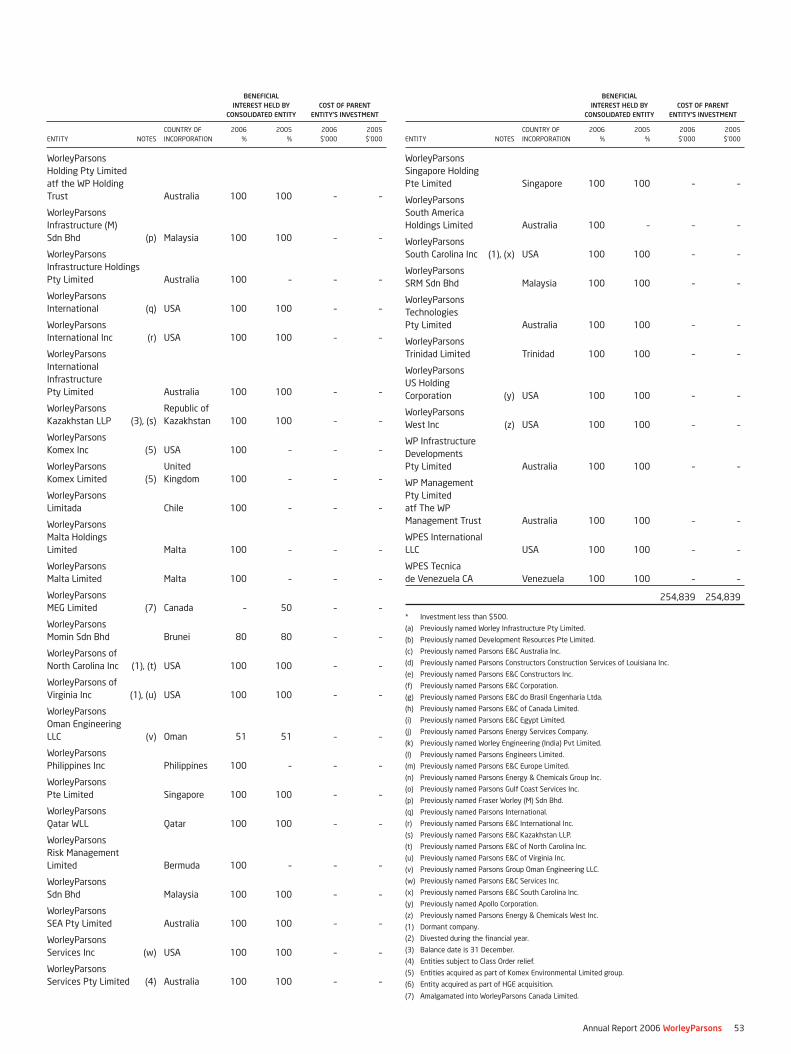
BENEFICIAL INTEREST HELD BY COST OF PARENT
CONSOLIDATED ENTITY ENTITY’S INVESTMENT
COUNTRY OF 2006 2005 2006 2005
ENTITY NOTES INCORPORATION % % $’000 $’000
WorleyParsons
Holding Pty Limited
atf the WP Holding
Trust Australia 100 100 – –
WorleyParsons
Infrastructure (M)
Sdn Bhd (p) Malaysia 100 100 – –
WorleyParsons
Infrastructure Holdings
Pty Limited Australia 100 – – –
WorleyParsons
International (q) USA 100 100 – –
WorleyParsons
International Inc (r) USA 100 100 – –
WorleyParsons
International
Infrastructure
Pty Limited Australia 100 100 – –
WorleyParsons Republic of
Kazakhstan LLP (3), (s) Kazakhstan 100 100 – –
WorleyParsons
Komex Inc (5) USA 100 – – –
WorleyParsons United
Komex Limited (5) Kingdom 100 – – –
WorleyParsons
Limitada Chile 100 – – –
WorleyParsons
Malta Holdings
Limited Malta 100 – – –
WorleyParsons
Malta Limited Malta 100 – – –
WorleyParsons
MEG Limited (7) Canada – 50 – –
WorleyParsons
Momin Sdn Bhd Brunei 80 80 – –
WorleyParsons of
North Carolina Inc (1), (t) USA 100 100 – –
WorleyParsons of
Virginia Inc (1), (u) USA 100 100 – –
WorleyParsons
Oman Engineering
LLC (v) Oman 51 51 – –
WorleyParsons
Philippines Inc Philippines 100 – – –
WorleyParsons
Pte Limited Singapore 100 100 – –
WorleyParsons
Qatar WLL Qatar 100 100 – –
WorleyParsons
Risk Management
Limited Bermuda 100 – – –
WorleyParsons
Sdn Bhd Malaysia 100 100 – –
WorleyParsons
SEA Pty Limited Australia 100 100 – –
WorleyParsons
Services Inc (w) USA 100 100 – –
WorleyParsons
Services Pty Limited (4) Australia 100 100 – –
BENEFICIAL INTEREST HELD BY COST OF PARENT
CONSOLIDATED ENTITY ENTITY’S INVESTMENT
COUNTRY OF 2006 2005 2006 2005
ENTITY NOTES INCORPORATION % % $’000 $’000
WorleyParsons
Singapore Holding
Pte Limited Singapore 100 100 – –
WorleyParsons
South America
Holdings Limited Australia 100 – – –
WorleyParsons
South Carolina Inc (1), (x) USA 100 100 – –
WorleyParsons
SRM Sdn Bhd Malaysia 100 100 – –
WorleyParsons
Technologies
Pty Limited Australia 100 100 – –
WorleyParsons
Trinidad Limited Trinidad 100 100 – –
WorleyParsons
US Holding
Corporation (y) USA 100 100 – –
WorleyParsons
West Inc (z) USA 100 100 – –
WP Infrastructure
Developments
Pty Limited Australia 100 100 – –
WP Management
Pty Limited
atf The WP
Management Trust Australia 100 100 – –
WPES International
LLC USA 100 100 – –
WPES Tecnica
de Venezuela CA Venezuela 100 100 – –
254,839 254,839
* Investment less than $500.
(a) Previously named Worley Infrastructure Pty Limited.
(b) Previously named Development Resources Pte Limited.
(c) Previously named Parsons E&C Australia Inc.
(d) Previously named Parsons Constructors Construction Services of Louisiana Inc.
(e) Previously named Parsons E&C Constructors Inc.
(f) Previously named Parsons E&C Corporation.
(g) Previously named Parsons E&C do Brasil Engenharia Ltda.
(h) Previously named Parsons E&C of Canada Limited.
(i) Previously named Parsons E&C Egypt Limited.
(j) Previously named Parsons Energy Services Company.
(k) Previously named Worley Engineering (India) Pvt Limited.
(l) Previously named Parsons Engineers Limited.
(m) Previously named Parsons E&C Europe Limited.
(n) Previously named Parsons Energy & Chemicals Group Inc.
(o) Previously named Parsons Gulf Coast Services Inc.
(p) Previously named Fraser Worley (M) Sdn Bhd.
(q) Previously named Parsons International.
(r) Previously named Parsons E&C International Inc.
(s) Previously named Parsons E&C Kazakhstan LLP.
(t) Previously named Parsons E&C of North Carolina Inc.
(u) Previously named Parsons E&C of Virginia Inc.
(v) Previously named Parsons Group Oman Engineering LLC.
(w) Previously named Parsons E&C Services Inc.
(x) Previously named Parsons E&C South Carolina Inc.
(y) Previously named Apollo Corporation.
(z) Previously named Parsons Energy & Chemicals West Inc.
(1) Dormant company.
(2) Divested during the financial year.
(3) Balance date is 31 December.
(4) Entities subject to Class Order relief.
(5) Entities acquired as part of Komex Environmental Limited group.
(6) Entity acquired as part of HGE acquisition.
(7) Amalgamated into WorleyParsons Canada Limited.
Annual Report 2006 WorleyParsons 53
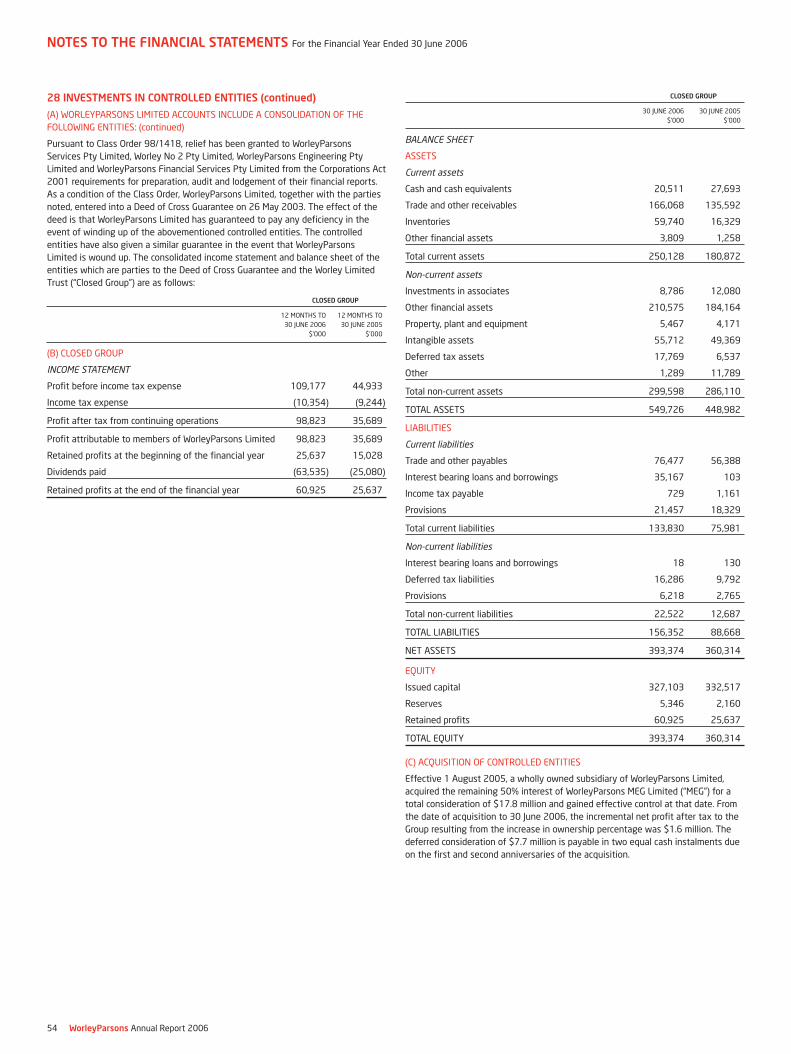
28 INVESTMENTS IN CONTROLLED ENTITIES (continued)
(A) WORLEYPARSONS LIMITED ACCOUNTS INCLUDE A CONSOLIDATION OF THE
FOLLOWING ENTITIES: (continued)
Pursuant to Class Order 98/1418, relief has been granted to WorleyParsons
Services Pty Limited, Worley No 2 Pty Limited, WorleyParsons Engineering Pty
Limited and WorleyParsons Financial Services Pty Limited from the Corporations Act
2001 requirements for preparation, audit and lodgement of their financial reports.
As a condition of the Class Order, WorleyParsons Limited, together with the parties
noted, entered into a Deed of Cross Guarantee on 26 May 2003. The effect of the
deed is that WorleyParsons Limited has guaranteed to pay any deficiency in the
event of winding up of the abovementioned controlled entities. The controlled
entities have also given a similar guarantee in the event that WorleyParsons
Limited is wound up. The consolidated income statement and balance sheet of the
entities which are parties to the Deed of Cross Guarantee and the Worley Limited
Trust (“Closed Group”) are as follows:
CLOSED GROUP
12 MONTHS TO 12 MONTHS TO
30 JUNE 2006 30 JUNE 2005
$’000 $’000
(B) CLOSED GROUP
INCOME STATEMENT
Profit before income tax expense 109,177 44,933
Income tax expense (10,354) (9,244)
Profit after tax from continuing operations 98,823 35,689
Profit attributable to members of WorleyParsons Limited 98,823 35,689
Retained profits at the beginning of the financial year 25,637 15,028
Dividends paid (63,535) (25,080)
Retained profits at the end of the financial year 60,925 25,637
CLOSED GROUP
30 JUNE 2006 30 JUNE 2005
$’000 $’000
BALANCE SHEET
ASSETS
Current assets
Cash and cash equivalents 20,511 27,693
Trade and other receivables 166,068 135,592
Inventories 59,740 16,329
Other financial assets 3,809 1,258
Total current assets 250,128 180,872
Non-current assets
Investments in associates 8,786 12,080
Other financial assets 210,575 184,164
Property, plant and equipment 5,467 4,171
Intangible assets 55,712 49,369
Deferred tax assets 17,769 6,537
Other 1,289 11,789
Total non-current assets 299,598 286,110
TOTAL ASSETS 549,726 448,982
LIABILITIES
Current liabilities
Trade and other payables 76,477 56,388
Interest bearing loans and borrowings 35,167 103
Income tax payable 729 1,161
Provisions 21,457 18,329
Total current liabilities 133,830 75,981
Non-current liabilities
Interest bearing loans and borrowings 18 130
Deferred tax liabilities 16,286 9,792
Provisions 6,218 2,765
Total non-current liabilities 22,522 12,687
TOTAL LIABILITIES 156,352 88,668
NET ASSETS 393,374 360,314
EQUITY
Issued capital 327,103 332,517
Reserves 5,346 2,160
Retained profits 60,925 25,637
TOTAL EQUITY 393,374 360,314
(C) ACQUISITION OF CONTROLLED ENTITIES
Effective 1 August 2005, a wholly owned subsidiary of WorleyParsons Limited,
acquired the remaining 50% interest of WorleyParsons MEG Limited (“MEG”) for a
total consideration of $17.8 million and gained effective control at that date. From
the date of acquisition to 30 June 2006, the incremental net profit after tax to the
Group resulting from the increase in ownership percentage was $1.6 million. The
deferred consideration of $7.7 million is payable in two equal cash instalments due
on the first and second anniversaries of the acquisition.
NOTES TO THE FINANCIAL STATEMENTS For the Financial Year Ended 30 June 2006
54 WorleyParsons Annual Report 2006
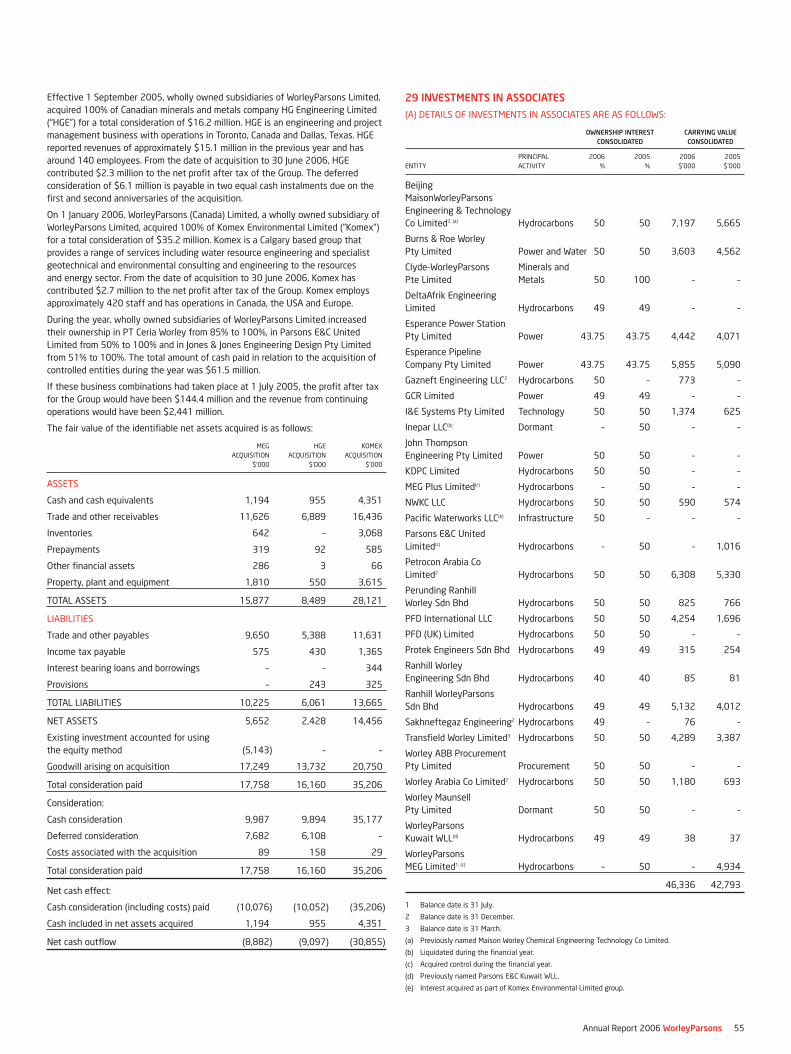
Effective 1 September 2005, wholly owned subsidiaries of WorleyParsons Limited,
acquired 100% of Canadian minerals and metals company HG Engineering Limited
(“HGE”) for a total consideration of $16.2 million. HGE is an engineering and project
management business with operations in Toronto, Canada and Dallas, Texas. HGE
reported revenues of approximately $15.1 million in the previous year and has
around 140 employees. From the date of acquisition to 30 June 2006, HGE
contributed $2.3 million to the net profit after tax of the Group. The deferred
consideration of $6.1 million is payable in two equal cash instalments due on the
first and second anniversaries of the acquisition.
On 1 January 2006, WorleyParsons (Canada) Limited, a wholly owned subsidiary of
WorleyParsons Limited, acquired 100% of Komex Environmental Limited (“Komex”)
for a total consideration of $35.2 million. Komex is a Calgary based group that
provides a range of services including water resource engineering and specialist
geotechnical and environmental consulting and engineering to the resources
and energy sector. From the date of acquisition to 30 June 2006, Komex has
contributed $2.7 million to the net profit after tax of the Group. Komex employs
approximately 420 staff and has operations in Canada, the USA and Europe.
During the year, wholly owned subsidiaries of WorleyParsons Limited increased
their ownership in PT Ceria Worley from 85% to 100%, in Parsons E&C United
Limited from 50% to 100% and in Jones & Jones Engineering Design Pty Limited
from 51% to 100%. The total amount of cash paid in relation to the acquisition of
controlled entities during the year was $61.5 million.
If these business combinations had taken place at 1 July 2005, the profit after tax
for the Group would have been $144.4 million and the revenue from continuing
operations would have been $2,441 million.
The fair value of the identifiable net assets acquired is as follows:
MEG HGE KOMEX
ACQUISITION ACQUISITION ACQUISITION
$’000 $’000 $’000
ASSETS
Cash and cash equivalents 1,194 955 4,351
Trade and other receivables 11,626 6,889 16,436
Inventories 642 – 3,068
Prepayments 319 92 585
Other financial assets 286 3 66
Property, plant and equipment 1,810 550 3,615
TOTAL ASSETS 15,877 8,489 28,121
LIABILITIES
Trade and other payables 9,650 5,388 11,631
Income tax payable 575 430 1,365
Interest bearing loans and borrowings – – 344
Provisions – 243 325
TOTAL LIABILITIES 10,225 6,061 13,665
NET ASSETS 5,652 2,428 14,456
Existing investment accounted for using
the equity method (5,143) – –
Goodwill arising on acquisition 17,249 13,732 20,750
Total consideration paid 17,758 16,160 35,206
Consideration:
Cash consideration 9,987 9,894 35,177
Deferred consideration 7,682 6,108 –
Costs associated with the acquisition 89 158 29
Total consideration paid 17,758 16,160 35,206
Net cash effect:
Cash consideration (including costs) paid (10,076) (10,052) (35,206)
Cash included in net assets acquired 1,194 955 4,351
Net cash outflow (8,882) (9,097) (30,855)
29 INVESTMENTS IN ASSOCIATES
(A) DETAILS OF INVESTMENTS IN ASSOCIATES ARE AS FOLLOWS:
OWNERSHIP INTEREST CARRYING VALUE CONSOLIDATED CONSOLIDATED
PRINCIPAL 2006 2005 2006 2005
ENTITY ACTIVITY % % $’000 $’000
Beijing
MaisonWorleyParsons
Engineering & Technology
Co Limited2, (a) Hydrocarbons 50 50 7,197 5,665
Burns & Roe Worley
Pty Limited Power and Water 50 50 3,603 4,562
Clyde-WorleyParsons Minerals and
Pte Limited Metals 50 100 – –
DeltaAfrik Engineering
Limited Hydrocarbons 49 49 – –
Esperance Power Station
Pty Limited Power 43.75 43.75 4,442 4,071
Esperance Pipeline
Company Pty Limited Power 43.75 43.75 5,855 5,090
Gazneft Engineering LLC2 Hydrocarbons 50 – 773 –
GCR Limited Power 49 49 – –
I&E Systems Pty Limited Technology 50 50 1,374 625
Inepar LLC(b) Dormant – 50 – –
John Thompson
Engineering Pty Limited Power 50 50 – –
KDPC Limited Hydrocarbons 50 50 – –
MEG Plus Limited(c) Hydrocarbons – 50 – –
NWKC LLC Hydrocarbons 50 50 590 574
Pacific Waterworks LLC(e) Infrastructure 50 – – –
Parsons E&C United
Limited(c) Hydrocarbons – 50 – 1,016
Petrocon Arabia Co
Limited2 Hydrocarbons 50 50 6,308 5,330
Perunding Ranhill
Worley Sdn Bhd Hydrocarbons 50 50 825 766
PFD International LLC Hydrocarbons 50 50 4,254 1,696
PFD (UK) Limited Hydrocarbons 50 50 – –
Protek Engineers Sdn Bhd Hydrocarbons 49 49 315 254
Ranhill Worley
Engineering Sdn Bhd Hydrocarbons 40 40 85 81
Ranhill WorleyParsons
Sdn Bhd Hydrocarbons 49 49 5,132 4,012
Sakhneftegaz Engineering2 Hydrocarbons 49 – 76 –
Transfield Worley Limited3 Hydrocarbons 50 50 4,289 3,387
Worley ABB Procurement
Pty Limited Procurement 50 50 – –
Worley Arabia Co Limited2 Hydrocarbons 50 50 1,180 693
Worley Maunsell
Pty Limited Dormant 50 50 – –
WorleyParsons
Kuwait WLL(d) Hydrocarbons 49 49 38 37
WorleyParsons
MEG Limited1, (c) Hydrocarbons – 50 – 4,934
46,336 42,793
1 Balance date is 31 July.
2 Balance date is 31 December.
3 Balance date is 31 March.
(a) Previously named Maison Worley Chemical Engineering Technology Co Limited.
(b) Liquidated during the financial year.
(c) Acquired control during the financial year.
(d) Previously named Parsons E&C Kuwait WLL.
(e) Interest acquired as part of Komex Environmental Limited group.
Annual Report 2006 WorleyParsons 55
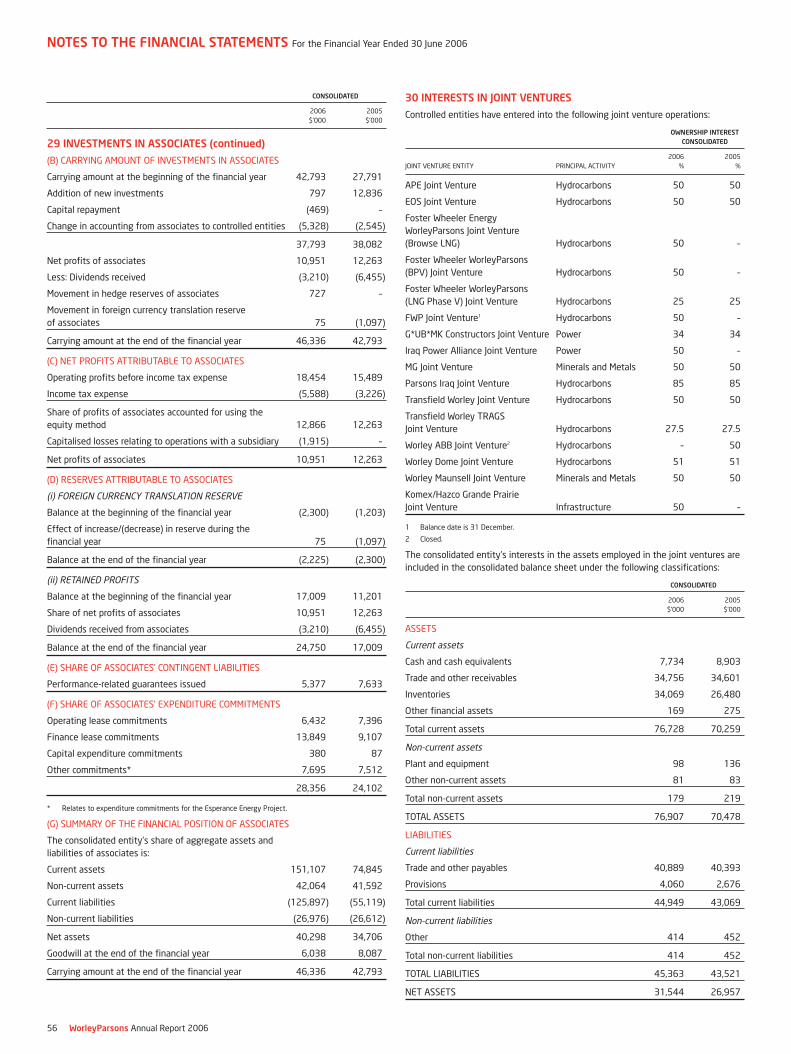
CONSOLIDATED
2006 2005
$’000 $’000
29 INVESTMENTS IN ASSOCIATES (continued)
(B) CARRYING AMOUNT OF INVESTMENTS IN ASSOCIATES
Carrying amount at the beginning of the financial year 42,793 27,791
Addition of new investments 797 12,836
Capital repayment (469) –
Change in accounting from associates to controlled entities (5,328) (2,545)
37,793 38,082
Net profits of associates 10,951 12,263
Less: Dividends received (3,210) (6,455)
Movement in hedge reserves of associates 727 –
Movement in foreign currency translation reserve
of associates 75 (1,097)
Carrying amount at the end of the financial year 46,336 42,793
(C) NET PROFITS ATTRIBUTABLE TO ASSOCIATES
Operating profits before income tax expense 18,454 15,489
Income tax expense (5,588) (3,226)
Share of profits of associates accounted for using the
equity method 12,866 12,263
Capitalised losses relating to operations with a subsidiary (1,915) –
Net profits of associates 10,951 12,263
(D) RESERVES ATTRIBUTABLE TO ASSOCIATES
(i) FOREIGN CURRENCY TRANSLATION RESERVE
Balance at the beginning of the financial year (2,300) (1,203)
Effect of increase/(decrease) in reserve during the
financial year 75 (1,097)
Balance at the end of the financial year (2,225) (2,300)
(ii) RETAINED PROFITS
Balance at the beginning of the financial year 17,009 11,201
Share of net profits of associates 10,951 12,263
Dividends received from associates (3,210) (6,455)
Balance at the end of the financial year 24,750 17,009
(E) SHARE OF ASSOCIATES’ CONTINGENT LIABILITIES
Performance-related guarantees issued 5,377 7,633
(F) SHARE OF ASSOCIATES’ EXPENDITURE COMMITMENTS
Operating lease commitments 6,432 7,396
Finance lease commitments 13,849 9,107
Capital expenditure commitments 380 87
Other commitments* 7,695 7,512
28,356 24,102
* Relates to expenditure commitments for the Esperance Energy Project.
(G) SUMMARY OF THE FINANCIAL POSITION OF ASSOCIATES
The consolidated entity’s share of aggregate assets and
liabilities of associates is:
Current assets 151,107 74,845
Non-current assets 42,064 41,592
Current liabilities (125,897) (55,119)
Non-current liabilities (26,976) (26,612)
Net assets 40,298 34,706
Goodwill at the end of the financial year 6,038 8,087
Carrying amount at the end of the financial year 46,336 42,793
30 INTERESTS IN JOINT VENTURES
Controlled entities have entered into the following joint venture operations:
OWNERSHIP INTEREST CONSOLIDATED
2006 2005
JOINT VENTURE ENTITY PRINCIPAL ACTIVITY % %
APE Joint Venture Hydrocarbons 50 50
EOS Joint Venture Hydrocarbons 50 50
Foster Wheeler Energy
WorleyParsons Joint Venture
(Browse LNG) Hydrocarbons 50 –
Foster Wheeler WorleyParsons
(BPV) Joint Venture Hydrocarbons 50 –
Foster Wheeler WorleyParsons
(LNG Phase V) Joint Venture Hydrocarbons 25 25
FWP Joint Venture1 Hydrocarbons 50 –
G*UB*MK Constructors Joint Venture Power 34 34
Iraq Power Alliance Joint Venture Power 50 –
MG Joint Venture Minerals and Metals 50 50
Parsons Iraq Joint Venture Hydrocarbons 85 85
Transfield Worley Joint Venture Hydrocarbons 50 50
Transfield Worley TRAGS
Joint Venture Hydrocarbons 27.5 27.5
Worley ABB Joint Venture2 Hydrocarbons – 50
Worley Dome Joint Venture Hydrocarbons 51 51
Worley Maunsell Joint Venture Minerals and Metals 50 50
Komex/Hazco Grande Prairie
Joint Venture Infrastructure 50 –
1 Balance date is 31 December.
2 Closed.
The consolidated entity’s interests in the assets employed in the joint ventures are
included in the consolidated balance sheet under the following classifications:
CONSOLIDATED
2006 2005
$’000 $’000
ASSETS
Current assets
Cash and cash equivalents 7,734 8,903
Trade and other receivables 34,756 34,601
Inventories 34,069 26,480
Other financial assets 169 275
Total current assets 76,728 70,259
Non-current assets
Plant and equipment 98 136
Other non-current assets 81 83
Total non-current assets 179 219
TOTAL ASSETS 76,907 70,478
LIABILITIES
Current liabilities
Trade and other payables 40,889 40,393
Provisions 4,060 2,676
Total current liabilities 44,949 43,069
Non-current liabilities
Other 414 452
Total non-current liabilities 414 452
TOTAL LIABILITIES 45,363 43,521
NET ASSETS 31,544 26,957
NOTES TO THE FINANCIAL STATEMENTS For the Financial Year Ended 30 June 2006
56 WorleyParsons Annual Report 2006
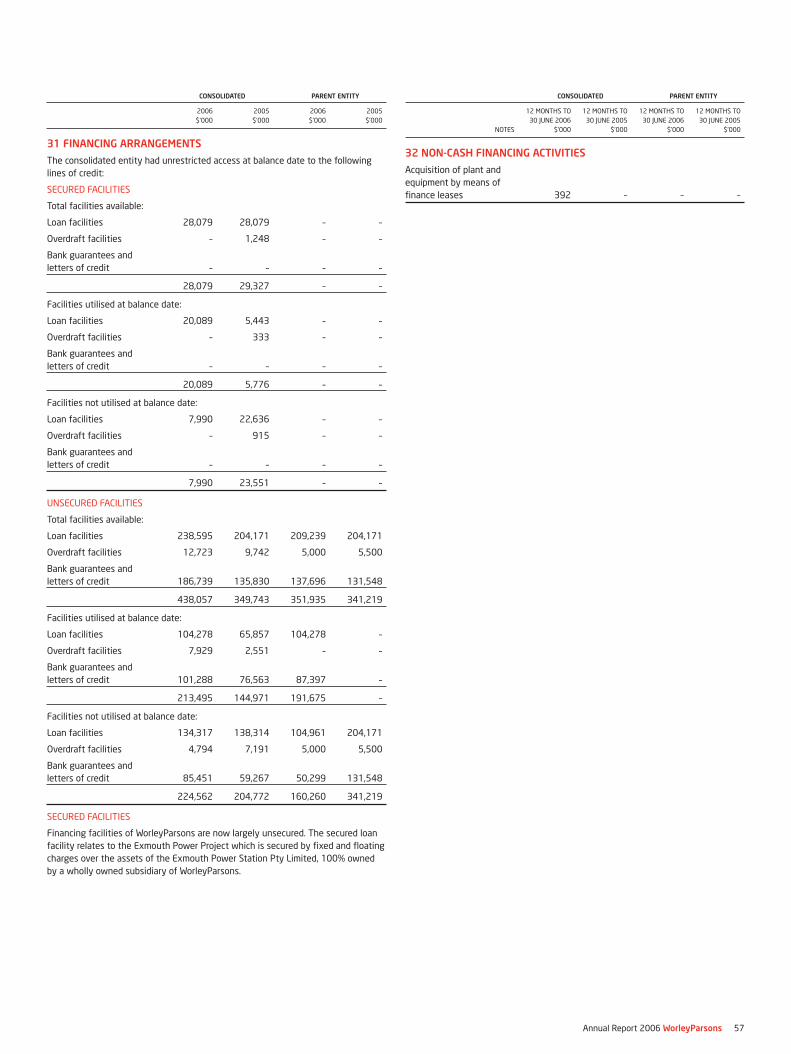
CONSOLIDATED PARENT ENTITY
2006 2005 2006 2005
$’000 $’000 $’000 $’000
31 FINANCING ARRANGEMENTS
The consolidated entity had unrestricted access at balance date to the following
lines of credit:
SECURED FACILITIES
Total facilities available:
Loan facilities 28,079 28,079 – –
Overdraft facilities – 1,248 – –
Bank guarantees and
letters of credit – – – –
28,079 29,327 – –
Facilities utilised at balance date:
Loan facilities 20,089 5,443 – –
Overdraft facilities – 333 – –
Bank guarantees and
letters of credit – – – –
20,089 5,776 – –
Facilities not utilised at balance date:
Loan facilities 7,990 22,636 – –
Overdraft facilities – 915 – –
Bank guarantees and
letters of credit – – – –
7,990 23,551 – –
UNSECURED FACILITIES
Total facilities available:
Loan facilities 238,595 204,171 209,239 204,171
Overdraft facilities 12,723 9,742 5,000 5,500
Bank guarantees and
letters of credit 186,739 135,830 137,696 131,548
438,057 349,743 351,935 341,219
Facilities utilised at balance date:
Loan facilities 104,278 65,857 104,278 –
Overdraft facilities 7,929 2,551 – –
Bank guarantees and
letters of credit 101,288 76,563 87,397 –
213,495 144,971 191,675 –
Facilities not utilised at balance date:
Loan facilities 134,317 138,314 104,961 204,171
Overdraft facilities 4,794 7,191 5,000 5,500
Bank guarantees and
letters of credit 85,451 59,267 50,299 131,548
224,562 204,772 160,260 341,219
SECURED FACILITIES
Financing facilities of WorleyParsons are now largely unsecured. The secured loan
facility relates to the Exmouth Power Project which is secured by fixed and floating
charges over the assets of the Exmouth Power Station Pty Limited, 100% owned
by a wholly owned subsidiary of WorleyParsons.
CONSOLIDATED PARENT ENTITY
12 MONTHS TO 12 MONTHS TO 12 MONTHS TO 12 MONTHS TO
30 JUNE 2006 30 JUNE 2005 30 JUNE 2006 30 JUNE 2005
NOTES $’000 $’000 $’000 $’000
32 NON-CASH FINANCING ACTIVITIES
Acquisition of plant and
equipment by means of
finance leases 392 – – –
Annual Report 2006 WorleyParsons 57
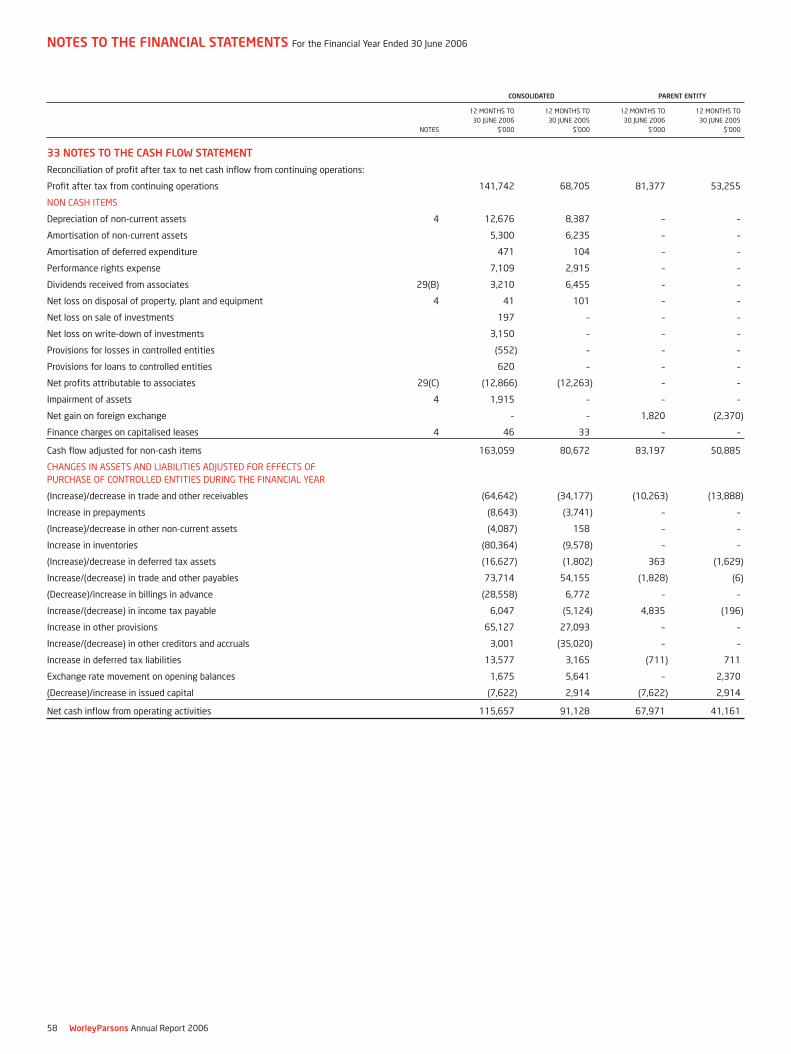
CONSOLIDATED PARENT ENTITY
12 MONTHS TO 12 MONTHS TO 12 MONTHS TO 12 MONTHS TO
30 JUNE 2006 30 JUNE 2005 30 JUNE 2006 30 JUNE 2005
NOTES $’000 $’000 $’000 $’000
33 NOTES TO THE CASH FLOW STATEMENT
Reconciliation of profit after tax to net cash inflow from continuing operations:
Profit after tax from continuing operations 141,742 68,705 81,377 53,255
NON CASH ITEMS
Depreciation of non-current assets 4 12,676 8,387 – –
Amortisation of non-current assets 5,300 6,235 – –
Amortisation of deferred expenditure 471 104 – –
Performance rights expense 7,109 2,915 – –
Dividends received from associates 29(B) 3,210 6,455 – –
Net loss on disposal of property, plant and equipment 4 41 101 – –
Net loss on sale of investments 197 – – –
Net loss on write-down of investments 3,150 – – –
Provisions for losses in controlled entities (552) – – –
Provisions for loans to controlled entities 620 – – –
Net profits attributable to associates 29(C) (12,866) (12,263) – –
Impairment of assets 4 1,915 – – –
Net gain on foreign exchange – – 1,820 (2,370)
Finance charges on capitalised leases 4 46 33 – –
Cash flow adjusted for non-cash items 163,059 80,672 83,197 50,885
CHANGES IN ASSETS AND LIABILITIES ADJUSTED FOR EFFECTS OF
PURCHASE OF CONTROLLED ENTITIES DURING THE FINANCIAL YEAR
(Increase)/decrease in trade and other receivables (64,642) (34,177) (10,263) (13,888)
Increase in prepayments (8,643) (3,741) – –
(Increase)/decrease in other non-current assets (4,087) 158 – –
Increase in inventories (80,364) (9,578) – –
(Increase)/decrease in deferred tax assets (16,627) (1,802) 363 (1,629)
Increase/(decrease) in trade and other payables 73,714 54,155 (1,828) (6)
(Decrease)/increase in billings in advance (28,558) 6,772 – –
Increase/(decrease) in income tax payable 6,047 (5,124) 4,835 (196)
Increase in other provisions 65,127 27,093 – –
Increase/(decrease) in other creditors and accruals 3,001 (35,020) – –
Increase in deferred tax liabilities 13,577 3,165 (711) 711
Exchange rate movement on opening balances 1,675 5,641 – 2,370
(Decrease)/increase in issued capital (7,622) 2,914 (7,622) 2,914
Net cash inflow from operating activities 115,657 91,128 67,971 41,161
NOTES TO THE FINANCIAL STATEMENTS For the Financial Year Ended 30 June 2006
58 WorleyParsons Annual Report 2006
CONSOLIDATED PARENT ENTITY
2006 2005 2006 2005
NOTES $’000 $’000 $’000 $’000
34 COMMITMENTS FOR EXPENDITURE
(A) OPERATING LEASES
Commitments for
minimum lease
payments in relation
to non-cancellable
operating leases are
payable as follows:
Within one year 49,127 38,678 – –
Later than one year
and not later than
five years 134,834 86,309 – –
Later than five years 41,611 21,755 – –
Commitments not
recognised in the
financial statements 225,572 146,742 – –
(B) FINANCE LEASES
Commitments in
relation to finance
leases are payable
as follows:
Within one year 279 213 – –
Later than one year
and not later than
five years 276 218 – –
Minimum lease
payments 555 431 – –
Less: future finance
charges (35) (24) – –
Total lease liabilities 520 407 – –
Representing lease liabilities:
Current 17 261 201 – –
Non-current 20 259 206 – –
Total lease liabilities 520 407 – –
(C) CAPITAL EXPENDITURE COMMITMENTS
Estimated capital
expenditure contracted
for at reporting date
but not provided for
payable as follows:
Within one year 68 18,065 – –
Later than one year
and not later than
five years – 161 – –
68 18,226 – –
CONSOLIDATED PARENT ENTITY
2006 2005 2006 2005
$’000 $’000 $’000 $’000
35 CONTINGENT LIABILITIES
(A) GUARANTEES
The consolidated entity is, in the normal course of business, required to provide
guarantees and letters of credit on behalf of controlled entities, associates and
related parties in respect of their contractual performance-related obligations.
These guarantees and indemnities only give rise to a liability where the entity
concerned fails to perform its contractual obligations.
Bank guarantees
outstanding at balance
date in respect of
financing facilities 1,600 5,349 – –
Bank guarantees
outstanding at balance
date in respect of
contractual performance 99,688 71,214 – –
101,288 76,563 – –
The consolidated entity is subject to various actual and pending claims arising in
the normal course of business. The directors are of the view that the consolidated
entity is adequately provided in respect of these claims.
(B) ASBESTOS
Certain members of Parsons E&C Group and other subsidiaries of Parsons
Corporation, have been, and continue to be, the subject of litigation relating to the
handling of, or exposure to, asbestos.
Based on its due diligence investigations during the acquisition of Parsons E&C
Corporation from Parsons Corporation, including an analysis of available insurance
coverage, and in light of the continuation and extension of the existing indemnity
and asbestos claims administration arrangements between Parsons Corporation and
Parsons E&C Corporation, WorleyParsons is not aware of any circumstance that is
likely to lead to a material residual contingent exposure for WorleyParsons in
respect of asbestos liabilities.
CONSOLIDATED PARENT ENTITY
2006 2005 2006 2005
NOTES $’000 $’000 $’000 $’000
36 EMPLOYEE BENEFITS AND SUPERANNUATION COMMITMENTS
EMPLOYEE BENEFITS
The aggregate employee
benefits liability,
including on-costs is
comprised of:
Provisions (current) 19 54,481 47,526 – –
Provisions
(non-current) 22 6,916 2,869 – –
61,397 50,395 – –
EMPLOYEE NUMBERS
Number of employees
as at 30 June 14,310 12,000 – –
SUPERANNUATION COMMITMENTSThe consolidated entity does not operate a superannuation fund. The consolidated
entity contributes to various superannuation funds at the statutory superannuation
guarantee rate.
EXECUTIVE PERFORMANCE RIGHTSOn 30 November 2005, a total of 1,139,483 performance rights with a fair value of
$10.6 million were granted to employees of the consolidated entity with annual
vesting periods over three years. In line with the vesting periods, the fair value of
the performance rights at inception is being amortised over three years on a
straight line basis. The fair value of the rights issued has been determined using an
appropriate pricing model that takes into account the vesting and performance
criteria of the performance right. 653,552 rights were exercised during the
financial year ended 30 June 2006 and 64,732 rights lapsed. No performance rights
were eligible for exercise during the financial year ended 30 June 2005.
Annual Report 2006 WorleyParsons 59
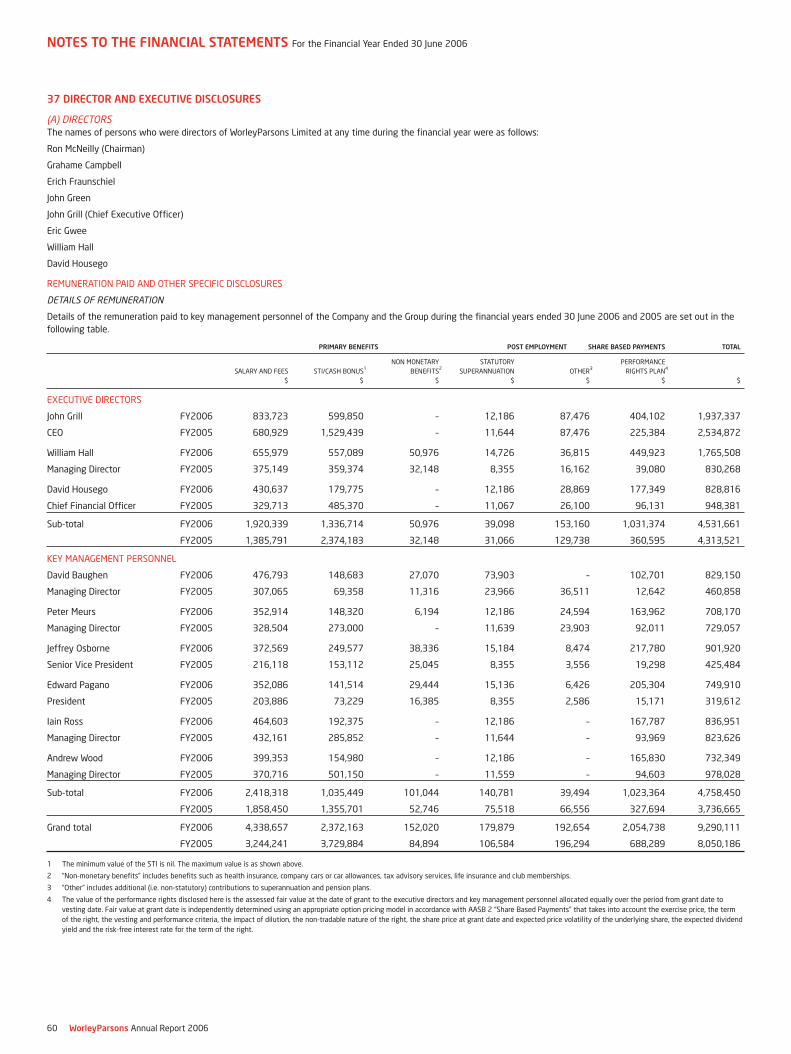
NOTES TO THE FINANCIAL STATEMENTS For the Financial Year Ended 30 June 2006
60 WorleyParsons Annual Report 2006
37 DIRECTOR AND EXECUTIVE DISCLOSURES
(A) DIRECTORSThe names of persons who were directors of WorleyParsons Limited at any time during the financial year were as follows:
Ron McNeilly (Chairman)
Grahame Campbell
Erich Fraunschiel
John Green
John Grill (Chief Executive Officer)
Eric Gwee
William Hall
David Housego
REMUNERATION PAID AND OTHER SPECIFIC DISCLOSURES
DETAILS OF REMUNERATION
Details of the remuneration paid to key management personnel of the Company and the Group during the financial years ended 30 June 2006 and 2005 are set out in the
following table.
PRIMARY BENEFITS POST EMPLOYMENT SHARE BASED PAYMENTS TOTAL
NON MONETARY STATUTORY PERFORMANCE
SALARY AND FEES STI/CASH BONUS1 BENEFITS2 SUPERANNUATION OTHER3 RIGHTS PLAN4
$ $ $ $ $ $ $
EXECUTIVE DIRECTORS
John Grill FY2006 833,723 599,850 – 12,186 87,476 404,102 1,937,337
CEO FY2005 680,929 1,529,439 – 11,644 87,476 225,384 2,534,872
William Hall FY2006 655,979 557,089 50,976 14,726 36,815 449,923 1,765,508
Managing Director FY2005 375,149 359,374 32,148 8,355 16,162 39,080 830,268
David Housego FY2006 430,637 179,775 – 12,186 28,869 177,349 828,816
Chief Financial Officer FY2005 329,713 485,370 – 11,067 26,100 96,131 948,381
Sub-total FY2006 1,920,339 1,336,714 50,976 39,098 153,160 1,031,374 4,531,661
FY2005 1,385,791 2,374,183 32,148 31,066 129,738 360,595 4,313,521
KEY MANAGEMENT PERSONNEL
David Baughen FY2006 476,793 148,683 27,070 73,903 – 102,701 829,150
Managing Director FY2005 307,065 69,358 11,316 23,966 36,511 12,642 460,858
Peter Meurs FY2006 352,914 148,320 6,194 12,186 24,594 163,962 708,170
Managing Director FY2005 328,504 273,000 – 11,639 23,903 92,011 729,057
Jeffrey Osborne FY2006 372,569 249,577 38,336 15,184 8,474 217,780 901,920
Senior Vice President FY2005 216,118 153,112 25,045 8,355 3,556 19,298 425,484
Edward Pagano FY2006 352,086 141,514 29,444 15,136 6,426 205,304 749,910
President FY2005 203,886 73,229 16,385 8,355 2,586 15,171 319,612
Iain Ross FY2006 464,603 192,375 – 12,186 – 167,787 836,951
Managing Director FY2005 432,161 285,852 – 11,644 – 93,969 823,626
Andrew Wood FY2006 399,353 154,980 – 12,186 – 165,830 732,349
Managing Director FY2005 370,716 501,150 – 11,559 – 94,603 978,028
Sub-total FY2006 2,418,318 1,035,449 101,044 140,781 39,494 1,023,364 4,758,450
FY2005 1,858,450 1,355,701 52,746 75,518 66,556 327,694 3,736,665
Grand total FY2006 4,338,657 2,372,163 152,020 179,879 192,654 2,054,738 9,290,111
FY2005 3,244,241 3,729,884 84,894 106,584 196,294 688,289 8,050,186
1 The minimum value of the STI is nil. The maximum value is as shown above.
2 “Non-monetary benefits” includes benefits such as health insurance, company cars or car allowances, tax advisory services, life insurance and club memberships.
3 “Other” includes additional (i.e. non-statutory) contributions to superannuation and pension plans.
4 The value of the performance rights disclosed here is the assessed fair value at the date of grant to the executive directors and key management personnel allocated equally over the period from grant date to
vesting date. Fair value at grant date is independently determined using an appropriate option pricing model in accordance with AASB 2 “Share Based Payments” that takes into account the exercise price, the term
of the right, the vesting and performance criteria, the impact of dilution, the non-tradable nature of the right, the share price at grant date and expected price volatility of the underlying share, the expected dividend
yield and the risk-free interest rate for the term of the right.

Details of non-executive directors’ remuneration for the financial years ended 30 June 2006 and 2005 are set out in the following table:
PRIMARY BENEFITS POST EMPLOYMENT SHARE BASED PAYMENTS TOTAL
STATUTORY NON-EXEC. DIRECTOR
SALARY AND FEES1 SUPERANNUATION2 OTHER3 SHARE PLAN
$ $ $ $ $
Ron McNeilly FY2006 115,500 10,128 – 37,500 163,128
FY2005 84,375 7,595 – 28,125 120,095
Grahame Campbell FY2006 70,500 6,078 – 22,500 99,078
FY2005 81,898 7,372 – 18,125 107,395
Erich Fraunschiel FY2006 73,500 – – 23,502 97,002
FY2005 61,500 – – 20,500 82,000
John Green FY2006 21,000 1,620 33,750 38,250 94,620
FY2005 29,000 2,610 – 43,500 75,110
Eric Gwee FY2006 79,500 – – 19,500 99,000
FY2005 19,500 – – 6,500 26,000
Total FY2006 360,000 17,826 33,750 141,252 552,828
FY2005 276,273 17,577 – 116,750 410,600
1 Includes travel and similar allowances.
2 Superannuation contributions are made on behalf of the non-executive directors in accordance with the Company’s statutory superannuation obligations.
3 “Other” includes additional (i.e. non-statutory) contributions to superannuation and pension plans.
(B) EQUITY COMPENSATION PROGRAMParticulars of the holdings of directors’ and other key management personnel in the
WorleyParsons Performance Rights Plan are as follows:
OPENING CLOSING
BALANCE BALANCE RIGHTS DUE
AS AT AS AT TO EXERCISE
1 JULY 2005 GRANTED1 EXERCISED2, 3 30 JUNE 2006 30 SEPT 064
EXECUTIVE DIRECTORS
John Grill5
Number 343,011 78,657 113,343 308,325 66,117
Value per share ($) – 9.32 10.24 – –
William Hall5
Number – 47,788 – 47,788 –
Value per share ($) – 9.32 – – –
David Housego5
Number 144,416 35,075 44,515 134,976 29,808
Value per share ($) – 9.32 9.61 – –
Total number 487,427 161,520 157,858 491,089 95,925
KEY MANAGEMENT PERSONNEL
Andrew Wood
Number 139,955 29,851 38,875 130,931 30,987
Value per share ($) – 9.32 9.75 – –
Iain Ross
Number 138,647 30,721 37,567 131,801 30,987
Value per share ($) – 9.32 9.87 – –
Peter Meurs
Number 140,387 30,746 44,515 126,618 25,779
Value per share ($) – 9.32 9.99 – –
David Baughen
Number 19,118 31,700 – 50,818 –
Value per share ($) – 9.32 – – –
OPENING CLOSING
BALANCE BALANCE RIGHTS DUE
AS AT AS AT TO EXERCISE
1 JULY 2005 GRANTED1 EXERCISED2, 3 30 JUNE 2006 30 SEPT 064
Jeffrey Osborne
Number – 21,713 – 21,713 –
Value per share ($) – 9.32 – – –
Edward Pagano
Number – 31,700 – 31,700 –
Value per share ($) – 9.32 – – –
Total number 438,107 176,431 120,957 493,581 87,753
GRAND TOTAL
Number 925,534 337,951 278,815 984,670 183,678
1 The first exercise date for grants made on 16 February 2006 (grant dated 29 September 2005) is
30 September 2008. The last exercise date for these performance rights is 30 September 2012.
The minimum value of this grant is nil. The maximum value of the grant is the value per share
multiplied by the number of rights granted.
2 During the financial year, the rights granted in the 2003 financial year vested and were exercised.
3 The value of the performance rights calculated at the date of exercise is equivalent to the share price
on the date of exercise.
4 The rights granted in the 2004 financial year become exercisable on 30 September 2006.
5 The service and performance criteria for award of the performance rights are discussed above.
Shareholders approved the grant of performance rights to Messrs Grill, Hall and Housego at the 2005
Annual General Meeting, even though grants of performance rights to Messrs Grill and Housego are
the subject of an ASX waiver which applies while shares are purchased on market to satisfy
performance rights which are exercised. The Board has determined to seek shareholder approval for
annual grants of performance rights to all executive directors. The Board may determine that
restrictions on transfer apply to the shares allocated on exercise of these performance rights.
(a) No rights lapsed or were forfeited during the financial year.
(b) The amounts disclosed as remuneration relating to equity rights is the assessed fair value at the date
the rights were granted to executive directors and other key management personnel, allocated
equally over the period from grant date to vesting date. Fair values at grant date are independently
determined using an appropriate option pricing model in accordance with AASB 2 “Share Based
Payments” that takes into account the exercise price, the term of the right, the vesting and
performance criteria, the impact of dilution, the non-tradable nature of the right, the share price at
grant date and expected price volatility of the underlying share, the expected dividend yield and the
risk-free interest rate for the term of the right.
Annual Report 2006 WorleyParsons 61
OPENING BALANCE CLOSING BALANCE
AS AT 1 JULY 2005 AS AT 30 JUNE 2006
37 DIRECTOR AND EXECUTIVE DISCLOSURES (continued)
(C) CASH COMPENSATION PROGRAM
EXECUTIVE DIRECTORS
William Hall
Number 41,756 41,756
Value ($) 260,825 839,296
OTHER KEY MANAGEMENT PERSONNEL
Jeffrey Osborne
Number 20,619 20,619
Value ($) 128,794 414,442
Edward Pagano
Number 16,210 16,210
Value ($) 101,254 325,821
Total Number 78,585 78,585
Total Value ($) 490,873 1,579,559
(a) No cash was paid to any of the above personnel during the 2006 financial year and no cash
entitlement was forfeited during the financial year.
(b) The cash rights are due to be settled on 30 September 2007.
(c) The amounts disclosed as remuneration relating to cash-settled performance rights granted to
executive directors and other key management personnel is the fair value. The fair value of the
liability is calculated initially at the grant date and is remeasured at each reporting date and at the
date of each settlement until the liability is fully settled. Fair values at reporting date are
independently determined using an appropriate pricing model for cash settled equity rights in
accordance with AASB 2 “Share Based Payments” that takes into account the factors listed in
footnote (b) to the table above for equity-based rights.
(D) PARTICULARS OF DIRECTORS’ INTERESTS IN SHARESParticulars of directors’ and specified executives’ beneficial interests in shares of
WorleyParsons Limited as at the date of this report are as follows:
NUMBER OF SHARES HELD IN WORLEYPARSONS LIMITED
BALANCE AT GRANTED AS ON EXERCISE SHARES BALANCE AT
1 JULY 2005 REMUNERATION1 OF RIGHTS SOLD 30 JUNE 2006
DIRECTORS
Ron McNeilly 349,721 3,051 – – 352,772
Grahame Campbell 451,807 1,831 – – 453,638
Erich Fraunschiel 145,950 1,913 – – 147,863
John Green 887,522 3,453 – – 890,975
John Grill 32,424,222 – 113,343 (22,501) 32,515,064
Eric Gwee 968 1,587 – – 2,555
William Hall 68,524 – – – 68,524
David Housego 366,667 – 44,515 (166,667) 244,515
Sub-total 34,695,381 11,835 157,858 (189,168) 34,675,906
KEY MANAGEMENT PERSONNEL
Peter Meurs 13,897,456 – 44,515 (519,509) 13,422,462
Jeffrey Osborne 16,951 – – – 16,951
Edward Pagano 3,741 – – – 3,741
Iain Ross 398,223 – 37,567 – 435,790
Andrew Wood 708,376 – 38,875 – 747,251
Sub-total 15,024,747 – 120,957 (519,509) 14,626,195
Grand total 49,720,128 11,835 278,815 (708,677) 49,302,101
1 Shares granted as remuneration during the financial year.
CONSOLIDATED PARENT ENTITY
2006 2005 2006 2005
$ $ $ $
38 REMUNERATION OF AUDITORS
Remuneration for audit
or review of the financial
reports of the parent entity
or any entity in the
consolidated entity:
Auditor of the parent entity 1,664,125 1,349,225 – –
Other auditors of
controlled entities 33,450 8,134 – –
1,697,575 1,357,359 – –
Amounts received for
other services:
Services provided in relation
to the acquisition of
Parsons E&C Corporation 61,964 1,540,310 – –
Tax related services 121,477 295,814 – –
Group treasury review 21,000 – – –
Other acquisition related
assurance services 85,000 – – –
289,441 1,836,124 – –
1,987,016 3,193,483 – –
39 RELATED PARTIES
(A) DIRECTORSThe names of persons who were directors of WorleyParsons Limited at any time
during the financial year were as follows:
Ron McNeilly (Chairman)
Grahame Campbell
Erich Fraunschiel
John Green
John Grill (Chief Executive Officer)
Eric Gwee
William Hall
David Housego
(B) WHOLLY OWNED GROUP TRANSACTIONSThe wholly owned Group consists of WorleyParsons Limited and its wholly owned
entities listed at note 28.
Aggregate amounts included in the determination of operating profit before income
tax that resulted from transactions with entities in the wholly owned Group:
CONSOLIDATED PARENT ENTITY
12 MONTHS TO 12 MONTHS TO 12 MONTHS TO 12 MONTHS TO
30 JUNE 2006 30 JUNE 2005 30 JUNE 2006 30 JUNE 2005
$’000 $’000 $’000 $’000
Dividend revenue – – 85,000 51,068
NOTES TO THE FINANCIAL STATEMENTS For the Financial Year Ended 30 June 2006
62 WorleyParsons Annual Report 2006
CONSOLIDATED PARENT ENTITY
12 MONTHS TO 12 MONTHS TO 12 MONTHS TO 12 MONTHS TO
30 JUNE 2006 30 JUNE 2005 30 JUNE 2006 30 JUNE 2005
$’000 $’000 $’000 $’000
(C) OTHER RELATED PARTIESAggregate amounts included
in the determination of
operating profit before
income tax that resulted
from transactions with each
class of other related parties:
Dividend revenue
Controlled entities – – 85,000 51,068
Associates and related parties 3,210 6,455 – –
Other revenue
Associates and related parties 1,346 800 – –
Aggregate amounts brought
to account in relation to
other transactions with each
class of other related parties:
Loans advanced to
Controlled entities – – 110,195 381,335
Associates and related parties 7,653 281 – –
Loan repayments from
Controlled entities – – 105,391 307,044
Associates and related parties 8,155 2,861 – –
Aggregate amounts receivable
from, and payable to, each
class of other related parties
at balance date:
Current receivables
Controlled entities – – 143,728 133,681
Associates and related parties 28,431 24,887 – –
Current payables
Associates and related parties 17,182 2,913 – –
Related entities provide specific advisory services to controlled entities in the
normal course of business. These transactions are made on normal terms and
conditions and at market rates.
(D) CONTROLLING ENTITIESWorleyParsons Limited is the ultimate Australian parent company.
Annual Report 2006 WorleyParsons 63
40 SEGMENT INFORMATION
The Group operates in four primary business segments: Hydrocarbons, Power, Minerals & Metals and Infrastructure. The Hydrocarbons segment incorporates theOil and Gas, and Refining, Petrochemicals and Chemicals business units.
HYDROCARBONS POWER MINERALS & METALS INFRASTRUCTURE OTHER ELIMINATIONS CONSOLIDATED
12 MONTHS TO 30 JUNE 2006 $’000 $’000 $’000 $’000 $’000 $’000 $’000
PRIMARY REPORTING – BUSINESS SEGMENTS
Sales to external customers 1,302,046 320,518 184,655 101,461 – (4,607) 1,904,073
Procurement services revenue 490,694 – – 2,183 – – 492,877
Inter-segment sales 4,113 – 1,387 5,244 – (10,744) –
Total sales revenue 1,796,853 320,518 186,042 108,888 – (15,351) 2,396,950
Other revenue – – 141 2,110 5,311 – 7,562
Total segment revenue 1,796,853 320,518 186,183 110,998 5,311 (15,351) 2,404,512
Segment result 149,048 46,080 26,362 9,532 – – 231,022
Share of net profit of associates 9,639 1,737 1,319 171 – – 12,866
Amortisation expense (1,750)
Unallocated corporate expenses (45,253)
Profit from continuing operations before
income tax expense 158,687 47,817 27,681 9,703 196,885
Income tax expense (55,143)
Profit from continuing operations after income tax expense 141,742
Segment assets 356,843 93,729 49,305 55,870 8,451 – 564,198
Goodwill and trade name 240,907 90,300 23,300 22,700 26,833 – 404,040
Unallocated corporate assets 194,151
Consolidated total assets 1,162,389
Segment liabilities 296,311 80,926 27,844 26,516 36,262 – 467,859
Unallocated corporate liabilities 219,267
Consolidated total liabilities 687,126
Investments in associates included
in segment assets 32,436 13,900 – – – – 46,336
Acquisition of property, plant and
equipment, intangible and other
non-current assets 12,321 24,306 1,563 2,535 507 – 41,232
Depreciation and amortisation expense 11,727 1,782 1,161 1,550 477 – 16,697
Unallocated depreciation and
amortisation expense 1,750
Total depreciation and amortisation 18,447
Non-cash expenses other than
depreciation and amortisation – – – – – – –
Total segment revenue 1,796,853 320,518 186,183 110,998 5,311 (15,351) 2,404,512
Share of associates’ revenue 705,145 47,248 15,993 17,942 – – 786,328
Procurement revenue – controlled (297,674) – – (2,183) – – (299,857)
Procurement revenue – associates (426,601) – – – – – (426,601)
Aggregated revenue 1,777,723 367,766 202,176 126,757 5,311 (15,351) 2,464,382
NOTES TO THE FINANCIAL STATEMENTS For the Financial Year Ended 30 June 2006
64 WorleyParsons Annual Report 2006
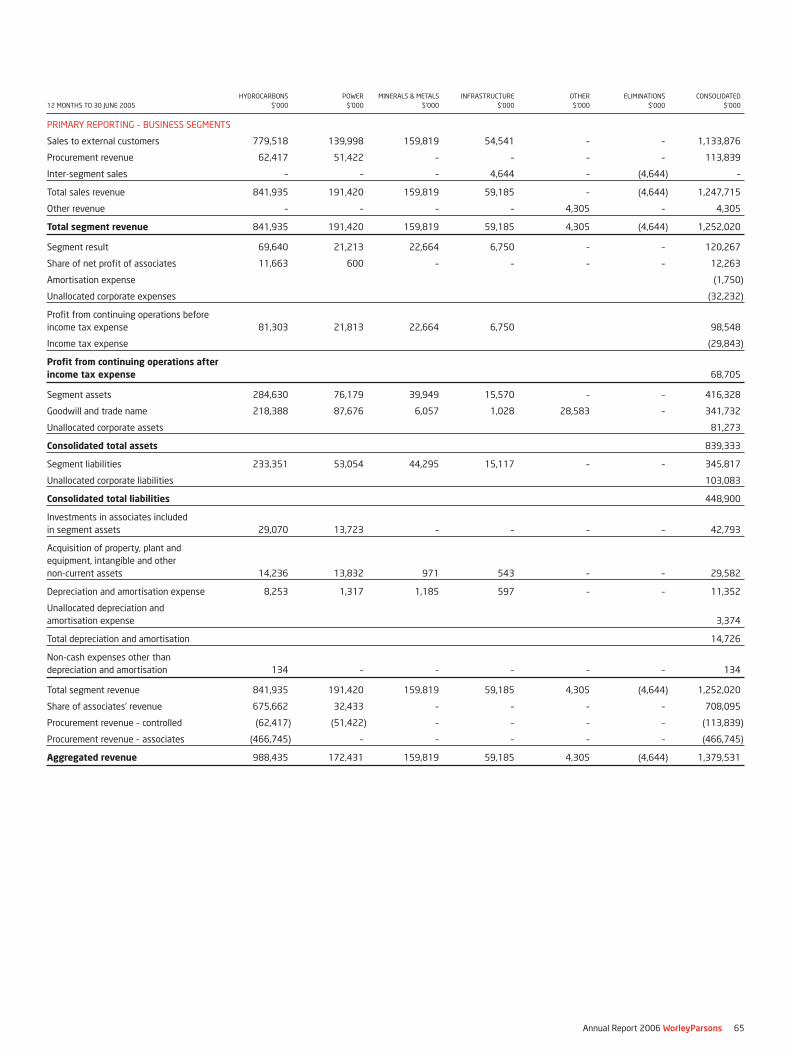
HYDROCARBONS POWER MINERALS & METALS INFRASTRUCTURE OTHER ELIMINATIONS CONSOLIDATED
12 MONTHS TO 30 JUNE 2005 $’000 $’000 $’000 $’000 $’000 $’000 $’000
PRIMARY REPORTING – BUSINESS SEGMENTS
Sales to external customers 779,518 139,998 159,819 54,541 – – 1,133,876
Procurement revenue 62,417 51,422 – – – – 113,839
Inter-segment sales – – – 4,644 – (4,644) –
Total sales revenue 841,935 191,420 159,819 59,185 – (4,644) 1,247,715
Other revenue – – – – 4,305 – 4,305
Total segment revenue 841,935 191,420 159,819 59,185 4,305 (4,644) 1,252,020
Segment result 69,640 21,213 22,664 6,750 – – 120,267
Share of net profit of associates 11,663 600 – – – – 12,263
Amortisation expense (1,750)
Unallocated corporate expenses (32,232)
Profit from continuing operations before
income tax expense 81,303 21,813 22,664 6,750 98,548
Income tax expense (29,843)
Profit from continuing operations after income tax expense 68,705
Segment assets 284,630 76,179 39,949 15,570 – – 416,328
Goodwill and trade name 218,388 87,676 6,057 1,028 28,583 – 341,732
Unallocated corporate assets 81,273
Consolidated total assets 839,333
Segment liabilities 233,351 53,054 44,295 15,117 – – 345,817
Unallocated corporate liabilities 103,083
Consolidated total liabilities 448,900
Investments in associates included
in segment assets 29,070 13,723 – – – – 42,793
Acquisition of property, plant and
equipment, intangible and other
non-current assets 14,236 13,832 971 543 – – 29,582
Depreciation and amortisation expense 8,253 1,317 1,185 597 – – 11,352
Unallocated depreciation and
amortisation expense 3,374
Total depreciation and amortisation 14,726
Non-cash expenses other than
depreciation and amortisation 134 – – – – – 134
Total segment revenue 841,935 191,420 159,819 59,185 4,305 (4,644) 1,252,020
Share of associates’ revenue 675,662 32,433 – – – – 708,095
Procurement revenue – controlled (62,417) (51,422) – – – – (113,839)
Procurement revenue – associates (466,745) – – – – – (466,745)
Aggregated revenue 988,435 172,431 159,819 59,185 4,305 (4,644) 1,379,531
Annual Report 2006 WorleyParsons 65

NOTES TO THE FINANCIAL STATEMENTS For the Financial Year Ended 30 June 2006
66 WorleyParsons Annual Report 2006
40 SEGMENT INFORMATION (continued)
SECONDARY REPORTING – GEOGRAPHICAL SEGMENTS
AUSTRALIA
AND ASIA AND
EUROPE NEW ZEALAND MIDDLE EAST AMERICAS TOTAL
12 MONTHS TO 30 JUNE 2006 $’000 $’000 $’000 $’000 $’000
Sales to external
customers 367,985 582,032 467,181 979,752 2,396,950
Aggregated revenue 447,381 655,783 534,920 826,298 2,464,382
Segment assets 160,252 303,979 146,305 551,853 1,162,389
AUSTRALIA
AND ASIA AND
EUROPE NEW ZEALAND MIDDLE EAST AMERICAS TOTAL
12 MONTHS TO 30 JUNE 2005 $’000 $’000 $’000 $’000 $’000
Sales to external
customers 240,715 392,447 220,682 393,871 1,247,715
Aggregated revenue 262,350 477,308 226,457 413,416 1,379,531
Segment assets 106,975 310,352 43,595 378,411 839,333
The 2006 segment results include the allocation of overhead that can be directlyattributable to an individual business segment. Those expenses that cannot beattributed to a business segment are recorded as unallocated corporate expenses.The 2005 comparatives have been prepared on a similar basis.
The consolidated entity provides engineering design, project services, andmaintenance and reliability support services to a number of markets. Theconsolidated entity’s activities also include infrastructure developments withinthe Power sector.
The consolidated entity’s operations are organised and managed separatelyaccording to the nature of the services they provide, with each segment servingdifferent markets.
Geographically, the consolidated entity operates in four predominant segments,Australia and New Zealand, Asia and the Middle East, Americas and Europe. Outsideof Australia, activities are predominantly in the Hydrocarbons and Power segments.
SEGMENT ACCOUNTING POLICIES
Segment accounting policies are the same as the consolidated entity’s policiesdescribed in note 2. During the financial year, there were no changes in segmentaccounting policies that had a material effect on the segment information.
Segment revenues, expenses, assets and liabilities are those that are directlyattributable to a segment and the relevant portion that can be allocated to thesegment on a reasonable basis. Segment assets include all assets used by asegment and consist primarily of receivables and plant and equipment.
Segment revenues, expenses and results include transactions between segmentsincurred in the ordinary course of business. These transactions are priced on anarm’s length basis and are eliminated on consolidation.
41 FINANCIAL INSTRUMENTS
(A) DERIVATIVE INSTRUMENTS
FORWARD EXCHANGE CONTRACTSThe consolidated entity is exposed to exchange rate transaction risk on foreigncurrency sales, purchases and loans to related entities. The most significantexchange rate risk is US dollar receipts by Australian entities. When required,hedging is undertaken through transactions entered into in the foreign exchangemarkets. Forward exchange contracts have been used for hedging purposes.Forward exchange contracts are accounted for as cash flow hedges.
At balance date, the details of outstanding contracts are:
BUY AUSTRALIAN AVERAGE DOLLARS EXCHANGE RATE
2006 2005 2006 2005
$’000 $’000
SELL US DOLLARS
0 – 6 months 7,780 6,090 0.76 0.73
6 – 12 months 6,601 – 0.76 –
12 – 18 months 5,295 – 0.76 –
Total sell US dollars 19,676 6,090 0.76 0.73
SELL UK POUND STERLING
0 – 6 months 4,988 – 0.40 –
BUY US AVERAGE DOLLARS EXCHANGE RATE
2006 2005 2006 2005
$’000 $’000
SELL AUSTRALIAN DOLLARS
0 – 6 months 5,144 4,500 0.73 0.76
SELL EUROS
0 – 6 months 3,768 2,574 1.26 1.29
6 – 12 months – 1,294 – 1.29
Total sell Euros 3,768 3,868 1.26 1.29
BUY UK POUND AVERAGESTERLING EXCHANGE RATE
2006 2005 2006 2005
$’000 $’000
SELL US DOLLARS
6 – 12 months 3,729 – 1.88 –
BUY CANADIAN AVERAGE DOLLARS EXCHANGE RATE
2006 2005 2006 2005
$’000 $’000
SELL EUROS
0 – 6 months 830 – 1.38 –
6 – 12 months 380 – 1.38 –
12 – 18 months 190 – 1.39 –
Total sell Euros 1,400 – 1.38 –
As these contracts are hedging anticipated future receipts and sales, any unrealised
gains and losses on the contracts, together with the cost of the contracts, are
deferred and will be recognised in the measurement of the underlying transaction
provided the underlying transaction is still expected to occur as originally
designated. Included in the amounts deferred are any gains and losses on hedging
contracts terminated prior to maturity where the related hedged transaction is still
expected to occur as designated.
The following gains and losses have been deferred at balance date:
2006 2005
$’000 $’000
Unrealised gains 47 220
Less: unrealised losses (879) (11)
Net unrealised (losses)/gains (832) 209
INTEREST RATE SWAP CONTRACTSExmouth Power Station Pty Limited, 100% owned by a wholly owned subsidiary
of WorleyParsons is contracted to build the Exmouth Power Station and has drawn
down on a loan facility which currently bears an average variable interest rate of
5.66% per annum. It is policy to protect part of the loan from exposure to
increasing interest rates. Accordingly, the consolidated entity has entered into
interest rate swap contracts under which it is obliged to receive interest at variable
rates and to pay interest at fixed rates. The contracts are settled on a net basis and
the net amount receivable or payable at the reporting date is included in other
debtors or other creditors.
The contracts require settlement of net interest receivable or payable monthly
and six monthly. The settlement dates coincide with the dates on which interest
is payable on the underlying debt.
Swaps currently in place cover approximately 100% (2005: 100%) of the loan
principal outstanding and are timed to expire as each loan repayment falls due.
The fixed interest rates range between 5.89% and 6.82% per annum (2005: 5.89%
and 6.82%) and the variable rates are between 0.0% and 1.1% above the 90 day
bank bill rate which at balance date was 5.66% per annum.
At 30 June 2006, the notional principal amounts and periods of expiry of the
interest rate swap contracts are as follows:
2006 2005
$’000 $’000
Less than one year 28,542 5,779
Later than one year but not later than five years 4,367 3,044
Later than five years 19,670 21,456
52,579 30,279
As these contracts are hedging anticipated future receipts and sales, any unrealised
gains and losses on the contracts, together with the cost of the contracts, are
deferred and will be recognised in the measurement of the underlying transaction
provided the underlying transaction is still expected to occur as originally
designated. Included in the amounts deferred are any gains and losses on hedging
contracts terminated prior to maturity where the related hedged transaction is still
expected to occur as designated. These contracts have been accounted for as cash
flow hedges.
The following gains have been deferred at balance date:
2006 2005
$’000 $’000
Unrealised gains/(losses) 635 (360)
(B) CREDIT RISK EXPOSURESThe credit risk on financial assets of the consolidated entity which have been
recognised on the balance sheet is generally the carrying amount, net of any
provisions for doubtful debts.
(C) INTEREST RATE RISK EXPOSURESThe consolidated entity’s exposure to interest rate risk and the effective weighted average interest rate by maturity periods is set out in the following table:
FIXED INTEREST MATURING IN:WEIGHTED AVERAGE FLOATING MORE THAN NON–INTEREST
INTEREST RATE INTEREST RATE 1 YEAR OR LESS 1 TO 2 YEARS 2 TO 3 YEARS 3 TO 4 YEARS 4 TO 5 YEARS 5 YEARS BEARING TOTAL
AS AT 30 JUNE 2006 PA (%) $’000 $’000 $’000 $’000 $’000 $’000 $’000 $’000 $’000
FINANCIAL ASSETS
Cash and deposits* 3.80 78,212 – – – – – – – 78,212
Trade and other receivables – – – – – – – 330,019 330,019
Prepayments – – – – – – – 19,825 19,825
Derivatives – – – – – – – 635 635
Total financial assets 78,212 – – – – – – 350,479 428,691
FINANCIAL LIABILITIES
Bank overdrafts 9.25 7,929 – – – – – – – 7,929
Bank loans 6.49 124,408 – – – – – – – 124,408
Other interest bearing liabilities
and loans – 449 396 32 – – – – 877
Trade and other payables – – – – – – – 290,958 290,958
Derivatives – – – – – – – 832 832
Interest rate swap (52,579) 28,542 977 1,050 1,128 1,212 19,670 – –
Total financial liabilities 79,758 28,991 1,373 1,082 1,128 1,212 19,670 291,790 425,004
Net financial assets 3,687
* Includes cash and deposits held in overseas subsidiary bank accounts at lower than Australian interest rates.
AS AT 30 JUNE 2005
FINANCIAL ASSETS
Cash and deposits* 3.68 66,527 – – – – – – – 66,527
Trade and other receivables – – – – – – – 229,150 229,150
Prepayments – – – – – – – 10,654 10,654
Derivatives – – – – – – – 209 209
Total financial assets 66,527 – – – – – – 240,013 306,540
FINANCIAL LIABILITIES
Bank overdrafts 8.90 2,551 – – – – – – – 2,551
Bank loans 4.51 71,301 – – – – – – – 71,301
Other interest bearing liabilities
and loans 6.23 – 207 218 – – – – – 425
Trade and other payables – – – – – – – 213,344 213,344
Derivatives – – – – – – – 360 360
Interest rate swap (30,279) 5,779 463 977 1,050 1,128 20,882 – –
Total financial liabilities 43,573 5,986 681 977 1,050 1,128 20,882 213,704 287,981
Net financial assets 18,559
* Includes cash and deposits held in overseas subsidiary bank accounts at lower than Australian interest rates.
Annual Report 2006 WorleyParsons 67
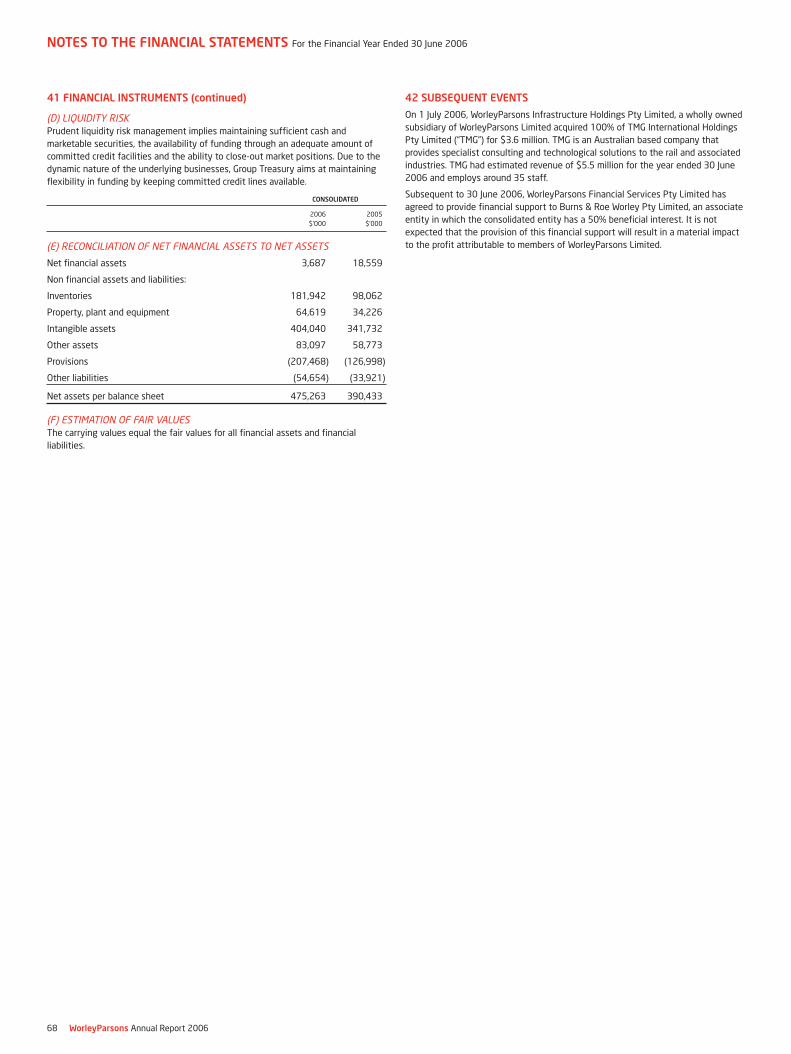
41 FINANCIAL INSTRUMENTS (continued)
(D) LIQUIDITY RISKPrudent liquidity risk management implies maintaining sufficient cash and
marketable securities, the availability of funding through an adequate amount of
committed credit facilities and the ability to close-out market positions. Due to the
dynamic nature of the underlying businesses, Group Treasury aims at maintaining
flexibility in funding by keeping committed credit lines available.
CONSOLIDATED
2006 2005
$’000 $’000
(E) RECONCILIATION OF NET FINANCIAL ASSETS TO NET ASSETS
Net financial assets 3,687 18,559
Non financial assets and liabilities:
Inventories 181,942 98,062
Property, plant and equipment 64,619 34,226
Intangible assets 404,040 341,732
Other assets 83,097 58,773
Provisions (207,468) (126,998)
Other liabilities (54,654) (33,921)
Net assets per balance sheet 475,263 390,433
(F) ESTIMATION OF FAIR VALUESThe carrying values equal the fair values for all financial assets and financial
liabilities.
42 SUBSEQUENT EVENTS
On 1 July 2006, WorleyParsons Infrastructure Holdings Pty Limited, a wholly owned
subsidiary of WorleyParsons Limited acquired 100% of TMG International Holdings
Pty Limited (“TMG”) for $3.6 million. TMG is an Australian based company that
provides specialist consulting and technological solutions to the rail and associated
industries. TMG had estimated revenue of $5.5 million for the year ended 30 June
2006 and employs around 35 staff.
Subsequent to 30 June 2006, WorleyParsons Financial Services Pty Limited has
agreed to provide financial support to Burns & Roe Worley Pty Limited, an associate
entity in which the consolidated entity has a 50% beneficial interest. It is not
expected that the provision of this financial support will result in a material impact
to the profit attributable to members of WorleyParsons Limited.
NOTES TO THE FINANCIAL STATEMENTS For the Financial Year Ended 30 June 2006
68 WorleyParsons Annual Report 2006
DIRECTORS’ DECLARATION
Annual Report 2006 WorleyParsons 69
In accordance with a resolution of the directors of WorleyParsons Limited, we state that:
(1) In the opinion of the directors:
(a) the financial report and the additional disclosures included in the Directors’ Report designated as audited, of the Company and of the consolidatedentity are in accordance with the Corporations Act 2001, including:
(i) giving a true and fair view of the Company’s and consolidated entity’s financial position as at 30 June 2006 and of their performance for thefinancial year ended on that date; and
(ii) complying with Accounting Standards and Corporations Regulations 2001; and
(b) there are reasonable grounds to believe that the Company will be able to pay its debts as and when they become due and payable.
(2) This declaration has been made after receiving the declarations required to be made to the directors in accordance with section 295A of the CorporationsAct 2001 for the financial year 30 June 2006.
(3) In the opinion of the directors, as at the date of this declaration, there are reasonable grounds to believe that the members of the Closed Group in note 28will be able to meet any obligations or liabilities to which they are or may become subject, by virtue of the Deed of Cross Guarantee.
On behalf of the Board
Ron McNeillyChairman
Sydney, 29 August 2006
Liability limited by a scheme approved underProfessional Standards Legislation.
Independent audit report to members of WorleyParsons Limited
Scope
The financial report, remuneration disclosures and directors’ responsibility
The financial report comprises the balance sheet, income statement, statement of changes in equity,statement of cash flows, accompanying notes to the financial statements, and the directors’ declaration forWorleyParsons Limited (the company) and the consolidated entity, for the year ended 30 June 2006. Theconsolidated entity comprises both the company and the entities it controlled during that year.
The company has disclosed information about the remuneration of directors and executives (“remunerationdisclosures”), as required by Accounting Standard AASB 124 Related Party Disclosures, under the heading“remuneration report” in the directors’ report, as permitted by the Corporations Regulation 2M.6.04. Theseremuneration disclosures are identified in the directors’ report as being subject to audit. The remunerationreport also contains information not subject to audit, which has been identified as such.
The directors of the company are responsible for preparing a financial report that gives a true and fair viewof the financial position and performance of the company and the consolidated entity, and that complies withAccounting Standards in Australia, in accordance with the Corporations Act 2001. This includesresponsibility for the maintenance of adequate accounting records and internal controls that are designed toprevent and detect fraud and error, and for the accounting policies and accounting estimates inherent in thefinancial report. The directors are also responsible for the remuneration disclosures contained in thedirectors’ report.
Audit approach
We conducted an independent audit of the financial report in order to express an opinion to the members ofthe company. Our audit was conducted in accordance with Australian Auditing Standards and InternationalStandards on Auditing, in order to provide reasonable assurance as to whether the financial report is free ofmaterial misstatement and the remuneration disclosures comply with Accounting Standard AASB 124Related Party Disclosures. The nature of an audit is influenced by factors such as the use of professionaljudgement, selective testing, the inherent limitations of internal control, and the availability of persuasiverather than conclusive evidence. Therefore, an audit cannot guarantee that all material misstatements havebeen detected.
We performed procedures to assess whether in all material respects the financial report presents fairly, inaccordance with the Corporations Act 2001, including compliance with Accounting Standards in Australia,and other mandatory financial reporting requirements in Australia, a view which is consistent with ourunderstanding of the company’s and the consolidated entity’s financial position, and of their performance asrepresented by the results of their operations and cash flows and whether the remuneration disclosurescomply with Accounting Standard AASB 124 Related Party Disclosures.
We formed our audit opinion on the basis of these procedures, which included:examining, on a test basis, information to provide evidence supporting the amounts and disclosuresin the financial report and the remuneration disclosures; andassessing the appropriateness of the accounting policies and disclosures used and the reasonablenessof significant accounting estimates made by the directors.
70 WorleyParsons Annual Report 2006

2
While we considered the effectiveness of management’s internal controls over financial reporting whendetermining the nature and extent of our procedures, our audit was not designed to provide assurance oninternal controls.
We performed procedures to assess whether the substance of business transactions was accurately reflectedin the financial report and the remuneration disclosures. These and our other procedures did not includeconsideration or judgement of the appropriateness or reasonableness of the business plans or strategiesadopted by the directors and management of the company.
IndependenceWe are independent of the company and the consolidated entity and have met the independence requirementsof Australian professional ethical pronouncements and the Corporations Act 2001. We have given to thedirectors of the company a written Auditor’s Independence Declaration a copy of which is included in theDirectors’ Report. The Auditors’ Independence Declaration would have been expressed in the same terms ifit had been given to the directors at the date this audit report was signed. In addition to our audit of thefinancial report and the remuneration disclosures, we were engaged to undertake the services disclosed in thenotes to the financial statements. The provision of these services has not impaired our independence.
Audit opinion
In our opinion:
1. the financial report of WorleyParsons Limited is in accordance with:(a) the Corporations Act 2001, including:
(i) giving a true and fair view of the financial position of WorleyParsons Limited and theconsolidated entity at 30 June 2006 and of their performance for the year ended on that date;and
(ii) complying with Accounting Standards in Australia and the Corporations Regulations 2001;and
(b) other mandatory financial reporting requirements in Australia.
2. the remuneration disclosures, that are contained in the directors’ report and identified as beingsubject to audit, comply with Accounting Standard AASB 124 Related Party Disclosures.
Ernst & Young
Michael ElliottPartnerSydney29 August 2006
WorleyParsons Annual Report 2006 71
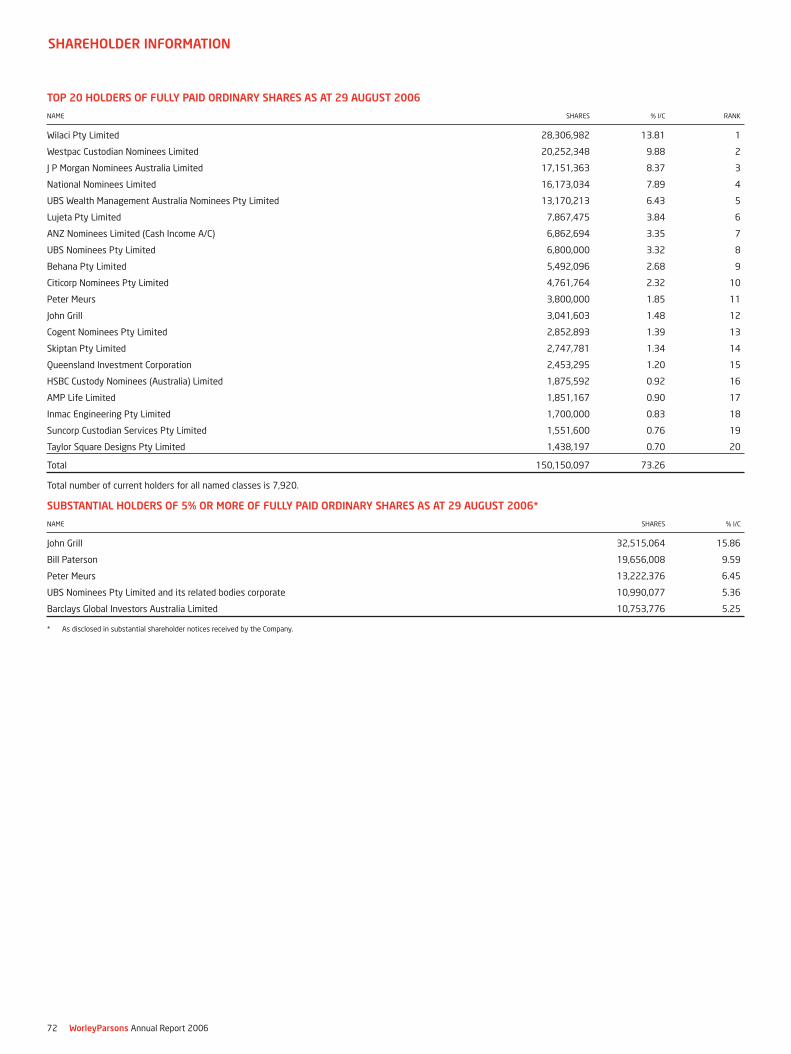
TOP 20 HOLDERS OF FULLY PAID ORDINARY SHARES AS AT 29 AUGUST 2006
NAME SHARES % I/C RANK
Wilaci Pty Limited 28,306,982 13.81 1
Westpac Custodian Nominees Limited 20,252,348 9.88 2
J P Morgan Nominees Australia Limited 17,151,363 8.37 3
National Nominees Limited 16,173,034 7.89 4
UBS Wealth Management Australia Nominees Pty Limited 13,170,213 6.43 5
Lujeta Pty Limited 7,867,475 3.84 6
ANZ Nominees Limited (Cash Income A/C) 6,862,694 3.35 7
UBS Nominees Pty Limited 6,800,000 3.32 8
Behana Pty Limited 5,492,096 2.68 9
Citicorp Nominees Pty Limited 4,761,764 2.32 10
Peter Meurs 3,800,000 1.85 11
John Grill 3,041,603 1.48 12
Cogent Nominees Pty Limited 2,852,893 1.39 13
Skiptan Pty Limited 2,747,781 1.34 14
Queensland Investment Corporation 2,453,295 1.20 15
HSBC Custody Nominees (Australia) Limited 1,875,592 0.92 16
AMP Life Limited 1,851,167 0.90 17
Inmac Engineering Pty Limited 1,700,000 0.83 18
Suncorp Custodian Services Pty Limited 1,551,600 0.76 19
Taylor Square Designs Pty Limited 1,438,197 0.70 20
Total 150,150,097 73.26
Total number of current holders for all named classes is 7,920.
SUBSTANTIAL HOLDERS OF 5% OR MORE OF FULLY PAID ORDINARY SHARES AS AT 29 AUGUST 2006*
NAME SHARES % I/C
John Grill 32,515,064 15.86
Bill Paterson 19,656,008 9.59
Peter Meurs 13,222,376 6.45
UBS Nominees Pty Limited and its related bodies corporate 10,990,077 5.36
Barclays Global Investors Australia Limited 10,753,776 5.25
* As disclosed in substantial shareholder notices received by the Company.
72 WorleyParsons Annual Report 2006
SHAREHOLDER INFORMATION
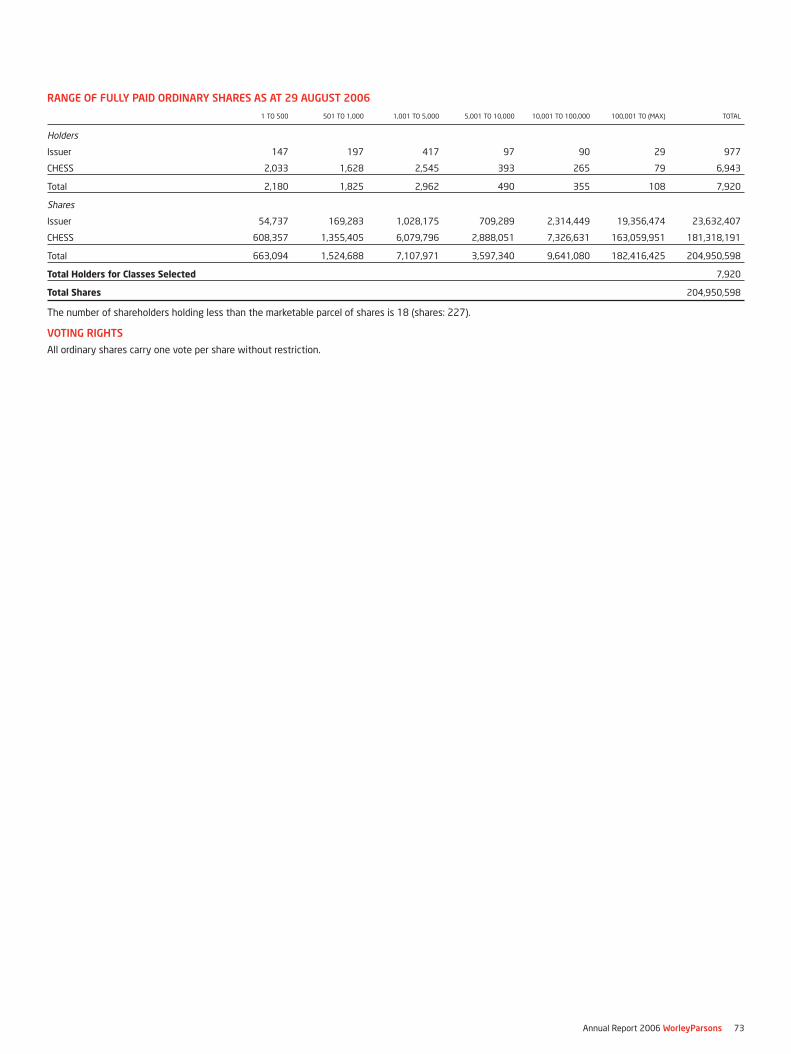
Annual Report 2006 WorleyParsons 73
RANGE OF FULLY PAID ORDINARY SHARES AS AT 29 AUGUST 2006
1 TO 500 501 TO 1,000 1,001 TO 5,000 5,001 TO 10,000 10,001 TO 100,000 100,001 TO (MAX) TOTAL
Holders
Issuer 147 197 417 97 90 29 977
CHESS 2,033 1,628 2,545 393 265 79 6,943
Total 2,180 1,825 2,962 490 355 108 7,920
Shares
Issuer 54,737 169,283 1,028,175 709,289 2,314,449 19,356,474 23,632,407
CHESS 608,357 1,355,405 6,079,796 2,888,051 7,326,631 163,059,951 181,318,191
Total 663,094 1,524,688 7,107,971 3,597,340 9,641,080 182,416,425 204,950,598
Total Holders for Classes Selected 7,920
Total Shares 204,950,598
The number of shareholders holding less than the marketable parcel of shares is 18 (shares: 227).
VOTING RIGHTS
All ordinary shares carry one vote per share without restriction.

74 WorleyParsons Annual Report 2006
WorleyParsons Limited
ACN 096 090 158
DIRECTORS
Ron McNeilly (Chairman)
Grahame Campbell
Erich Fraunschiel
John Green
John Grill (Chief Executive Officer)
Eric Gwee
William Hall
David Housego
COMPANY SECRETARY
Sharon Sills
REGISTERED OFFICE
Level 7
116 Miller Street
North Sydney NSW 2060
AUDITORS
Ernst & Young
BANKERS
HSBC
The Royal Bank of Scotland
Westpac Banking Corporation
JPMorgan Chase
LAWYERS
Freehills
Baker & McKenzie
SHARE REGISTRY
Computershare Investor Services Pty Limited
Level 3, 60 Carrington Street
Sydney NSW 2000
Australia
Ph: 1300 855 080
CORPORATE INFORMATION

By buying products with the FSC label youare supporting the growth of responsibleforest management worldwide.
This report is printed on Monza Satin, an FSC certified mixed source paper.
© 1996 Forest Stewardship Council A.C.
Designed & Produced by walterwakefield.com.au
SCS-COC-00858