
Annual Renewable Energy Constraint and Curtailment Report … · Annual Renewable Energy Constraint...
28
Annual Renewable Energy Constraint and Curtailment Report 2015 14/06/2016
Transcript of Annual Renewable Energy Constraint and Curtailment Report … · Annual Renewable Energy Constraint...

Annual Renewable Energy Constraint and Curtailment
Report 2015 14/06/2016
Annual Renewable Energy Constraint and Curtailment Report 2015
Page 2
Contents Executive Summary ................................................................................................................................................................. 3
1. Introduction ...................................................................................................................................................................... 5
1.1 Context ...................................................................................................................................................................... 5
1.2 Reasons for Dispatch-Down ............................................................................................................................. 5
1.3 Data Gathering ....................................................................................................................................................... 5
2. Level of Dispatch-Down Energy in 2015 ......................................................................................................... 6
2.1 All Island ................................................................................................................................................................... 6
2.2 Northern Ireland ................................................................................................................................................... 7
2.3 Ireland ....................................................................................................................................................................... 7
3 Contributory Factors for Dispatch-Down of Wind ........................................................................................... 8
3.1 Changes to Operational Dispatch Policy...................................................................................................... 8
3.2 Level of Wind .......................................................................................................................................................... 8
3.3 Demand Level ...................................................................................................................................................... 10
3.4 Breakdown of Wind Dispatch-down – Curtailment vs. Constraint .............................................. 10
3.5 Curtailment........................................................................................................................................................... 11
3.6 Constraints ........................................................................................................................................................... 12
3.7 Wind Dispatch Down by Region .................................................................................................................. 14
4 Mitigation Measures ................................................................................................................................................... 16
4.1 Network Reinforcements: .............................................................................................................................. 16
4.2 Operational Policy and the DS3 Programme .......................................................................................... 16
4.3 Operational Policy – Interconnection ........................................................................................................ 16
4.4 Controllability of Wind Generators ............................................................................................................ 17
Appendix A – Detailed Results ......................................................................................................................................... 18
All-Island: ........................................................................................................................................................................ 18
Ireland: ............................................................................................................................................................................. 19
Northern Ireland: ........................................................................................................................................................ 20
Individual dispatch-down of VPTG windfarms 2015: .................................................................................. 21
Appendix B – Calculation Methodologies .................................................................................................................... 23
Ireland ................................................................................................................................................................................... 23
Northern Ireland .............................................................................................................................................................. 25
Appendix C – Summary Results ...................................................................................................................................... 27
Appendix D – Abbreviations ............................................................................................................................................. 28

Annual Renewable Energy Constraint and Curtailment Report 2015
Page 3
Executive Summary EirGrid and SONI have prepared this report for the Regulatory Authorities to outline the levels of dispatch-down of renewable energy in 2015, as required under European1 and Member State2 legislation. The EU Renewable Energy Directive (2009/28/EC) sets a target for Ireland to meet 16% of the country’s total energy consumption from renewable energy sources by 2020. In order to achieve this target, the Government set a 10% renewable transport target, a 12% renewable heat target and a 40% renewable electricity target. Similarly in Northern Ireland, the Department of Enterprise, Trade and Investment (DETI) published the Strategic Energy Framework (SEF) in September 2010 that set out a 40% renewable electricity target to be reached by 2020. The Transmission System Operators (TSOs) for Ireland and Northern Ireland, EirGrid and SONI respectively, are actively working towards facilitating the governments’ renewable electricity targets. The Renewable Energy Directive requires the TSOs to prioritise renewable energy generation. Sometimes measures are taken to turn-off or dispatch-down renewable energy for system security reasons. In these circumstances TSOs must report this to the regulatory authorities. They must also indicate which corrective measures they intend to take in order to prevent inappropriate dispatching-down. Reducing the level of renewable dispatch down helps bring both environmental and economic benefits to consumers in Ireland and Northern Ireland. In Ireland and Northern Ireland renewable energy is predominately sourced from wind. Other sources include hydroelectricity, solar photovoltaic, biomass and waste. These latter sources of energy are generally maximised in dispatch. Due to their small overall contribution to renewable energy these are excluded from the report. Dispatch-down of wind energy refers to the amount of wind energy that is available but cannot be produced. This is because of power system limitations, known as curtailment, or network limitations, known as constraints. In 2015, the total wind energy generated in Ireland and Northern Ireland was 8,233 GWh, while an estimated 442 GWh of wind energy was dispatched-down. This represents 5.1% of the total available wind energy in 2015, and is an increase of about 165 GWh on the 2014 figure.
1 Article 16. C of the 2009 renewables directive (2009/28/EC) states: If significant measures are taken to curtail the renewable energy sources in order to guarantee the security of the national electricity system and security of energy supply, Members States shall ensure that the responsible system operators report to the competent regulatory authority on those measures and indicate which corrective measures they intend to take in order to prevent inappropriate curtailments. 2 Article 4.4 of Statutory Instrument 147 of 2011 states: If significant measures are taken to curtail the renewable energy sources in order to guarantee the security of the electricity system and security of energy supply, the transmission system operator shall report to CER on those measures and indicate which corrective measures it is intended to take in order to prevent inappropriate curtailments.

Annual Renewable Energy Constraint and Curtailment Report 2015
Page 4
In Ireland, the dispatch-down energy from wind resources was 348 GWh: this is equivalent to 5.1% of the total available wind energy. The dispatch-down energy from variable price-taking generation (VPTG) was 275 GWh, and from autonomous generation was 73 GWh. In Northern Ireland, the dispatch-down energy from wind resources was 95 GWh. This is equivalent to 5.3% of the total available wind energy. The dispatch-down energy from variable price-taking generation (VPTG) was 58 GWh, and from autonomous generation was 37 GWh. A high level summary of the above for the last four years can be found in Appendix C. The level of dispatch-down is affected by a number of factors which vary from year to year. The amount of wind installed on the system and the capacity factor of the wind generation will have an impact on the levels of dispatch-down. The total capacity of wind generation rose by 203 MW in 2015 while the average capacity factor was 32.3%. In 2014 the average capacity factor was 28.5%. The level of demand is another important factor which can vary from year to year. Average demand in Ireland in 2015 was 2.9% higher than in 2014 and in Northern Ireland it was just 0.1% lower than in 2014. The principal benefits of the Moyle and East West interconnectors are:
reducing the price of electricity in Single Electricity Market ;
improving security of supply.
However, they can also facilitate the reduction of wind curtailment. This is done through the use of System Operator trades directly with National Grid Electricity Transmission or through the TSOs’ trading partner in Great Britain. The fundamental issues which give rise to curtailment are being addressed by EirGrid’s DS3 programme (Delivering a Secure, Sustainable Electricity System). This programme has been specifically designed to cater for the increased levels of renewable generation which the system now needs to accommodate. This is necessary to ensure that the power system can be operated securely and efficiently and also to address other system wide limitations. This programme of work is based on the published Facilitation of Renewables studies. During 2015 the System Non-Synchronous Penetration (SNSP) level, which is an indication of the maximum level of non-synchronous generation (wind and interconnection) which will be allowed on the system increased from 50% to 55%, as a trial, from 16/10/2015. In order to address the network limitations which give rise to constraint of wind energy, the Draft Grid Development strategy was developed in Ireland and a similar programme is under development in Northern Ireland. The reinforcement of the network will increase the capacity of wind generation which can be accommodated. However, it should be noted that temporary outages of transmission equipment can be required for:
network improvement works;
Connections of new wind-farms to the network.
These works can lead to reduced network capacity and consequentially increased levels of dispatch-down in the short-term.

Annual Renewable Energy Constraint and Curtailment Report 2015
Page 5
1. Introduction
1.1 Context
The 2009 European Renewable Directive (2009/28/EC) requires that the TSOs report to the Regulatory Authorities, CER and URegNI. This report must detail why renewable energy was dispatched down and what measures are being taken to prevent inappropriate curtailment. This Directive was transposed into law in Ireland as S.I. No. 147 of 2011 and in Northern Ireland through the Electricity (Priority Dispatch) Regulations No. 385 of 2012. The Single Electricity Market (SEM) Committee, in its scheduling and dispatch decision paper SEM-11-062, requires that the TSOs report on this as appropriate to CER and URegNI, respectively. This report represents EirGrid and SONI’s response to the obligations required through National Law and through the SEM Committee requirement.
1.2 Reasons for Dispatch-Down
Renewable generation has priority dispatch. However, there will be times when it is not possible to accommodate all priority dispatch generation while maintaining the safe, secure operation of the power system. Security-based limits have to be imposed, due to both local network and system-wide security issues. It is therefore necessary to reduce the output of renewable generators below their maximum available level on occasions when these security limits are reached. This reduction is referred to in this report as “dispatch-down” of renewable generation and is consistent with the principle of priority dispatch. There are two reasons for the dispatch-down of wind energy, curtailment and constraint. Curtailment refers to the dispatch-down of wind for system-wide reasons (where the reduction of any or all wind generators would alleviate the problem). Constraint refers to the dispatch-down of wind generation for more localised network reasons (where only a subset of wind generators can contribute to alleviating the problem). The SEM Committee approved in SEM-13-011 the difference between constraint and curtailment.
1.3 Data Gathering
The SEM is the preferred source of data due to the reliability and accessibility of the data by all stakeholders. This adds to the transparency of the calculations as they can be readily verified. However, this source is only available for windfarms that are registered in the market as Variable Price Taking Generators (VPTGs). There is no appropriate SEM data to calculate dispatch-down of autonomous generation. This had to be estimated manually using aggregate SCADA data (which is less accurate than the data for VPTGs). It was estimated that the dispatch-down energy from autonomous windfarms in Ireland and Northern Ireland was approximately 110 GWh for 2015. Furthermore, due to the differences in the IT systems used in Ireland and Northern Ireland, it was not possible to log all of the categories for the reasons for constraint or curtailment of wind energy in both jurisdictions. This capability has become available in the new All-Island Wind Dispatch Tool which went live in Quarter 2, 2014 in Ireland and Quarter 3, 2014 in Northern Ireland. The TSOs have been engaging with Industry on the new

Annual Renewable Energy Constraint and Curtailment Report 2015
Page 6
reporting templates and calculation methodology and these new reports will be issued for Q1 2016 in May 2016 and a month following each quarter thereafter. In the meantime the TSOs intend to provide information based on estimates from the data available.
2. Level of Dispatch-Down Energy in 2015
The following provides a summary of the dispatch-down of wind energy in 2015 for Ireland and Northern Ireland. More details and figures are provided in Appendix A.
2.1 All Island
In the calendar year 2015, the share of centrally dispatched generation3 from renewable sources in Ireland and Northern Ireland was 25%. This is broken down as follows: 22% provided by wind, 2% by hydro and 1% by other renewable energy sources. The total wind energy generated was 8,233 GWh in Ireland and Northern Ireland. There was an estimated total of 442 GWh of dispatch-down energy of windfarms, which is an increase of approximately 165 GWh compared to 2014. The level of dispatch-down of wind represents 5.1% of total available energy from wind resources in Ireland and Northern Ireland. Details of the calculation methodology are provided in Appendix B.
Figure 1: Monthly Variations in Wind Dispatch-Down Levels in 2015
3 Note that since the percentage figures are presented for centrally dispatched generation (based on SCADA data), they do not account for non-dispatchable embedded renewable generation, which includes biomass, land-fill gas and small-scale hydro.
0.0%
1.0%
2.0%
3.0%
4.0%
5.0%
6.0%
7.0%
8.0%
9.0%
10.0%
-
10,000
20,000
30,000
40,000
50,000
60,000
70,000
80,000
90,000
Per
cen
tage
Vo
lum
e (
MW
h)

Annual Renewable Energy Constraint and Curtailment Report 2015
Page 7
2.2 Northern Ireland
In 2015 the total dispatch-down energy from wind generation in Northern Ireland was 95 GWh; this is equivalent to 5.3% of total available wind energy in that jurisdiction. This is a total overall increase of approximately 54 GWh in dispatch-down energy from wind generation compared to 2014. This dispatch-down was spread across variable price taking wind generation (VPTG) and autonomous generation. The dispatch-down energy from VPTG was 58 GWh in Northern Ireland. This represents 4.2% of the available energy from these generators in this period. In addition, there was an estimated 37 GWh of dispatch-down from other controllable wind generation. At end of 2015, VPTGs constituted approximately 76% of all wind capacity in Northern Ireland. The dispatch-down of VPTGs occurred across 18 windfarms which had a total registered capacity of approximately 479 MW by the end of 2015.
2.3 Ireland
In 2015, the total dispatch-down energy from wind generation in Ireland was 348 GWh; this is equivalent to 5.1% of total available wind energy in Ireland. This is a total overall increase of approximately 112 GWh in dispatch-down energy from wind generation compared to 2014. This dispatch-down was spread across variable price taking wind generation (VPTG) and autonomous generation. The dispatch-down energy from VPTG was 275 GWh in Ireland. This represents 5.7% of the available energy from these generators in this period. In addition, there was an estimated 73 GWh of dispatch-down from other controllable wind generation. At end of 2015, VPTGs constituted approximately 65% of all wind capacity in Ireland. The dispatch-down of VPTGs occurred across 50 windfarms which had a total registered capacity of approximately 1,540 MW by the end of 2015. It is difficult to assign dispatch-down to local network (“constraint”) and system-wide (“curtailment”) reasons distinctly and unequivocally. However two major constraint areas are identifiable: the north-west and the south-west of Ireland. In addition, curtailment is seen to arise mainly during the night time hours (between 11pm and 9am) due to the low overall system demand.

Annual Renewable Energy Constraint and Curtailment Report 2015
Page 8
3 Contributory Factors for Dispatch-Down of Wind
3.1 Changes to Operational Dispatch Policy
Prior to the SEM-11-062 decision paper, the operational policy in use was to dispatch-down variable price-taking generation4 before autonomous5 units. This policy was implemented in 2008. The purpose of it is twofold:
- to provide clarity on operational practice, and
- reflect the more onerous commercial implications of dispatch-down that existed for
autonomous units.
Since the introduction of SEM-11-062, there is a requirement to dispatch wind generators down based on their controllability. This is defined under Grid Code and is verified through performance monitoring and testing. The implementation of this is described in an operational policy document entitled “Policy for Implementing Scheduling and Dispatch Decisions SEM-11-062”6 and the associated addendum. To meet the controllability definition, the operational policy7 requires a wind farm to achieve Operational Certificate status 12 months after energisation. This process was implemented in December 2014 and a number of windfarms were moved to category (i) for this reason. If a wind farm is in category (i) it means that it will be dispatched down ahead of other wind farms. As a result of this SEM-11-062 decision paper, this report accounts for the dispatch-down of both variable price taking wind generation (VPTG) and autonomous wind generation. In the SEM, VPTG units have availability values that are distinct from dispatch quantities and actual output. This allows the dispatch-down of these units to be calculated. In contrast, autonomous units have their dispatch and availability quantities set to the metered outputs. There is no mechanism from SEM data to calculate the dispatch-down of these windfarms. Some estimation for Ireland generators has been provided in this report. The TSOs are introducing new wind dispatch reports in 2016 which will quantify the volume of curtailment and constraint for each controllable windfarm in Ireland and Northern Ireland.
3.2 Level of Wind
As explained in section 1.2, it is necessary, at times, to limit the maximum level of wind generation on the system for security or safety reasons. The impact of these limits on the level of dispatch-down will depend on two factors. These are the amount of wind generation installed and the capacity factor of the wind generation. At the beginning of January 2015, the total installed capacity of wind generation on the island was 2787 MW. By year-end, the figure had risen to 2990 MW (2363 MW in Ireland and 627 MW in Northern Ireland). Figure 2 shows the end of year wind capacities on the
4 Variable Price Taker Generators (VPTGs) which are:
o When not constrained/curtailed are scheduled and paid based on their actual output
o When constrained/curtailed are scheduled based on their actual availability
5 Autonomous Price Taker Generators (APTGs) which are paid based on their actual output at all times as outlined in Table 5.1 of the Trading & Settlement Code 6 http://www.eirgridgroup.com/library/index.xml 7 Wind Farm Controllability Categorisation Policy; 5th March 2012

Annual Renewable Energy Constraint and Curtailment Report 2015
Page 9
island from 2000 to 2015. Of this total capacity, almost 2,019 MW was registered in the SEM as Variable Price Taker Generators (VPTG). Over the year the capacity factors8 of windfarms was 32.3%. For comparison the annual capacity factor in 2014 was 28.5% and in 2013 it was 30.6%. The seasonal variation in the capacity factor is evident in figure 3.
Figure 2: Wind Capacities on the island from 2000 to 2015
8 The capacity factor is the amount of energy produced (MW output) relative to the theoretical maximum that could have been produced if the wind generation operated at full capacity. It therefore represents the average output of the wind generation. This capacity factor is based on SCADA data.
Year End
Northern
Ireland
(MW)
Ireland
(MW)
All-Island
(MW)
2000 36.8 119.4 156
2001 36.8 125.8 163
2002 36.8 138.5 175
2003 76.0 214.0 290
2004 89.1 341.6 431
2005 108.6 517.2 626
2006 131.6 749.0 881
2007 214.0 797.6 1,012
2008 230.7 1,030.4 1,261
2009 301.1 1,265.5 1,567
2010 340.9 1,373.8 1,715
2011 405.1 1,631.0 2,036
2012 488.5 1,763.5 2,252
2013 554.3 1,896.2 2,451
2014 614.0 2,173.0 2,787
2015 627.0 2,363.0 2,990
Annual Renewable Energy Constraint and Curtailment Report 2015
Page 10
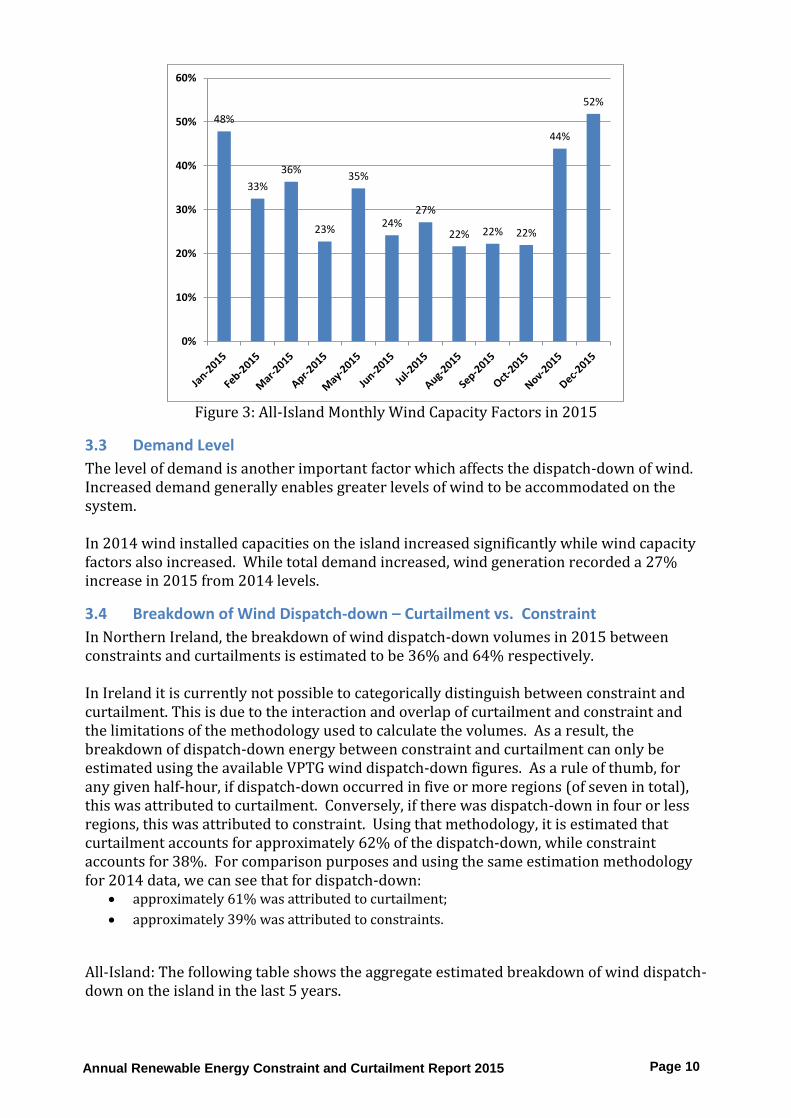
Figure 3: All-Island Monthly Wind Capacity Factors in 2015
3.3 Demand Level
The level of demand is another important factor which affects the dispatch-down of wind. Increased demand generally enables greater levels of wind to be accommodated on the system. In 2014 wind installed capacities on the island increased significantly while wind capacity factors also increased. While total demand increased, wind generation recorded a 27% increase in 2015 from 2014 levels.
3.4 Breakdown of Wind Dispatch-down – Curtailment vs. Constraint
In Northern Ireland, the breakdown of wind dispatch-down volumes in 2015 between constraints and curtailments is estimated to be 36% and 64% respectively. In Ireland it is currently not possible to categorically distinguish between constraint and curtailment. This is due to the interaction and overlap of curtailment and constraint and the limitations of the methodology used to calculate the volumes. As a result, the breakdown of dispatch-down energy between constraint and curtailment can only be estimated using the available VPTG wind dispatch-down figures. As a rule of thumb, for any given half-hour, if dispatch-down occurred in five or more regions (of seven in total), this was attributed to curtailment. Conversely, if there was dispatch-down in four or less regions, this was attributed to constraint. Using that methodology, it is estimated that curtailment accounts for approximately 62% of the dispatch-down, while constraint accounts for 38%. For comparison purposes and using the same estimation methodology for 2014 data, we can see that for dispatch-down:
approximately 61% was attributed to curtailment;
approximately 39% was attributed to constraints.
All-Island: The following table shows the aggregate estimated breakdown of wind dispatch-down on the island in the last 5 years.
48%
33%
36%
23%
35%
24%27%
22% 22% 22%
44%
52%
0%
10%
20%
30%
40%
50%
60%

Annual Renewable Energy Constraint and Curtailment Report 2015
Page 11
Estimated Breakdown of Dispatch-down of Wind on the Island
2011 2012 2013 2014
2015
Constraints 20% 38% 28% 35% 36%
Curtailments 80% 62% 72% 65% 64%
Table 1: Yearly Breakdown of Dispatch-down Energy into Constraints and Curtailments
3.5 Curtailment
Curtailment refers to the dispatch-down of wind for system-wide reasons. There are five types of system security limits that necessitate curtailment: i) System stability requirements (synchronous inertia, dynamic and transient stability)
ii) Operating reserve requirements, including negative reserve
iii) Voltage control requirements
iv) Morning load rise requirements
v) System Non-Synchronous Penetration (SNSP9) limit (50% limit was increased to 55% as a trial
from 16/10/2015)
The first four of these limits tend to impose minimum generation requirements on the conventional (synchronous) generation portfolio. This in turn can limit the “room” for wind generation, particularly overnight during the lower demand hours. The current implementation of these security limits are described in the Operational Constraints Update paper. This paper superseded the Transmission Constraint Groups document. Both documents are published10 on the EirGrid website. SNSP is a system security metric that has been established from the results of the Facilitation of Renewables studies. These studies initially identified 50% as the maximum permissible level. Due to works undertaken by the TSOs under the DS3 programme the SNSP level was reassessed and this was increased to 55% as a trial from 16/10/2015. In 2015 there were some instances of curtailment to ensure these limits were not breached. However, the SNSP limit is often superseded by the other minimum generation limits described above. This is most likely during low demand periods with high wind. The impact of curtailment can be seen in figure 4, which shows the total annual all-island dispatch-down energy by hour of day. The predominance of curtailment in the night hours 23:00 – 09:00 over local constraints (which arise throughout the day) is evident.
9 SNSP is the ratio of non-synchronous generation (wind and HVDC imports) to demand plus HVDC exports 10 http://www.eirgridgroup.com/library/index.xml

Annual Renewable Energy Constraint and Curtailment Report 2015
Page 12
Figure 4: Estimated Breakdown of VPTG Dispatch-down Volumes on the Island in 2015
3.6 Constraints
The dispatch-down of wind for network reasons is referred to as a constraint. Constraint of wind can occur for intact network conditions. This can be for two main reasons:
more wind generation than the localised carrying capacity of the network; or
during outages which can be for maintenance, upgrade works or due to faults.
The draft grid development strategy, Your Grid, Your Views, Your Tomorrow, and associated programmes directly address these issues in Ireland. The strategy allows for strengthening the network in critical/constrained areas. Similar programmes are being envisioned in Northern Ireland which will address the limitations in that jurisdiction. The major capital works associated with these types of projects may reduce the capacity of the network for the duration of the work. In the short term, this leads to a rise in the levels of constraint in these areas. However, in the long term, this reinforcement of the network increases its capacity. This enables the accommodation of more generation in that area. Several circuits were upgraded during 2015 allowing more wind generation to be exported from the region and thus reducing wind constraints. From a network perspective, the west, north-west and south-west of the Irish system have the greatest level of restrictions for the export of wind. See “VPTG Wind Dispatch-Down by Region in 2015” Chart in Appendix A. Previously there were often restrictions in Donegal, even when there was a fully intact network. This resulted in high levels of constraint of wind in this area in the past. However, a new circuit was energised in 2014 to help reduce the level of wind constraints in this region.
0
5,000
10,000
15,000
20,000
25,000
30,000
00:0
0
01:0
0
02:0
0
03:0
0
04:0
0
05:0
0
06:0
0
07:0
0
08:0
0
09:0
0
10:0
0
11:0
0
12:0
0
13:0
0
14:0
0
15:0
0
16:0
0
17:0
0
18:0
0
19:0
0
20:0
0
21:0
0
22:0
0
23:0
0
2015
Dis
pat
ch D
ow
n (
MW
h)
Dispatch-Down - Curtailment
Dispatch-Down - Constraint

Annual Renewable Energy Constraint and Curtailment Report 2015
Page 13
There is also evidence that other areas on the system have at times seen restrictions but these are generally associated with transmission outages.
The proportion of dispatch-down attributable to constraints (rather than curtailment) is
estimated to be 36% in 2015. This is due partly to an increase in installed wind generation
but more significantly to the transmission outages in 2015. Many of these outages were to
facilitate the upgrading and uprating of the transmission system. Some of the transmission
outages that resulted in significant constraint of wind generation are described below.
North West: The SEM-13-011 decision paper defined the Donegal region as a defined constraint group. High constraints on wind farms north of Srananagh 220 kV station can largely be attributed to outages that were required. These outages resulted in windfarms in this region being constrained down to avoid overloading transmission circuits in this region.
South West: During 2015 there were significant capital works undertaken to upgrade the transmission system in order to allow more wind generation be exported from the region. The Clashavoon-Tarbert 220 kV transmission line and the Tarbert-Tralee-2 (two) 110 kV line were on outage for the majority of the year to allow the connection and commissioning of two new 220/110 kV stations in Kilpaddoge and Ballyvouskill. Unfortunately technical difficulties were identified with the equipment during energisation of the new Kilpaddoge 220 kV station. This then had knock-on delays to the Ballyvouskill 220 kV station. The new Ballyvouskill 220 kV station was energised in November 2015 and Kilpaddoge was temporarily bypassed in order to address network resilience requirements over the winter period. During the outages of these lines the export capability from the South West region was reduced which in turn would have led to large volumes of wind constraints at times. Furthermore a large windfarm was connected to the South West region in 2015. As this windfarm was in the commissioning phase it is placed in category (iii), per SEM-11-062, meaning that this windfarm is subject to dispatch down after category (i) and category (ii) windfarms in the region.
During 2015 there was also a forced outage of the Clahane – Trien 110 kV circuit from mid-February to early March. This led to increased wind constraints at times in order to avoid overloading transmission circuits in this region.

Annual Renewable Energy Constraint and Curtailment Report 2015
Page 14
Figure 5: Transmission System Map
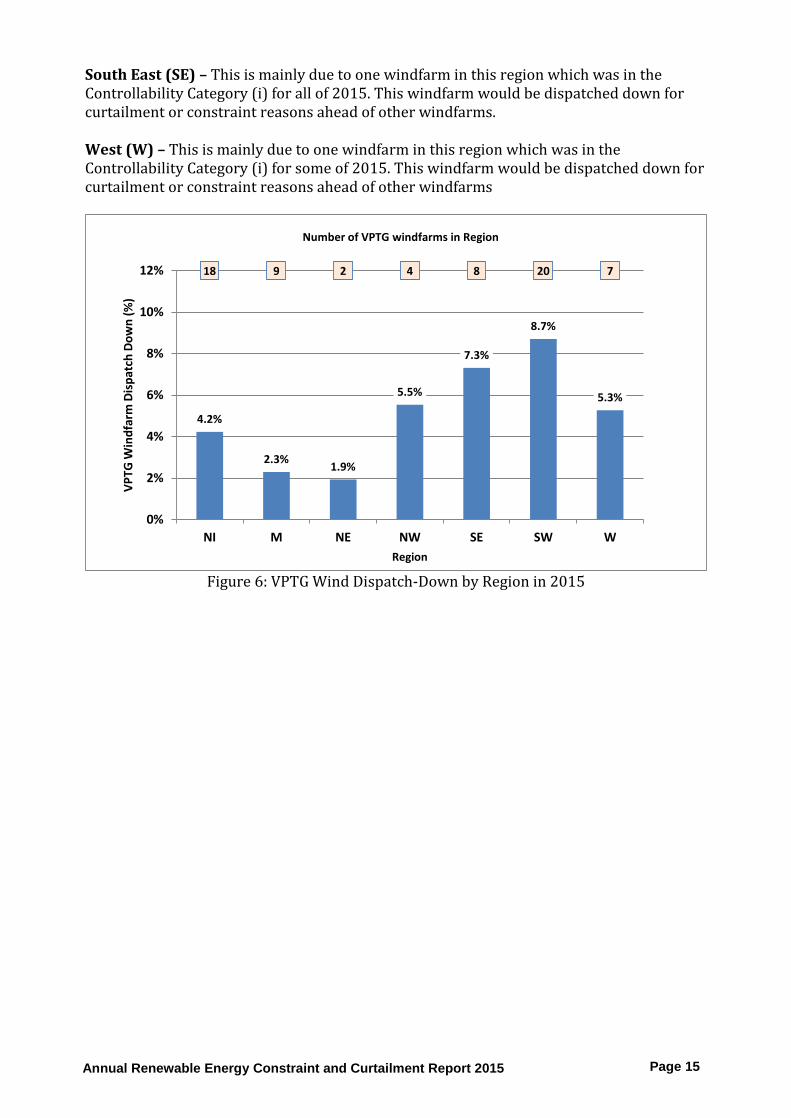
3.7 Wind Dispatch Down by Region
The greatest percentage of wind dispatch down was observed in the SW, SE, NW and W as shown in Figure 5. The following are the main drivers for higher than average wind dispatch down in these regions: South West (SW) – The dispatch down of wind in the region is predominately due to transmission constraints associated with capital works as described in Section 3.6. North West (NW) – The dispatch down of wind in the region is predominately due to transmission constraints as described in Section 3.6.
Annual Renewable Energy Constraint and Curtailment Report 2015
Page 15
South East (SE) – This is mainly due to one windfarm in this region which was in the Controllability Category (i) for all of 2015. This windfarm would be dispatched down for curtailment or constraint reasons ahead of other windfarms. West (W) – This is mainly due to one windfarm in this region which was in the Controllability Category (i) for some of 2015. This windfarm would be dispatched down for curtailment or constraint reasons ahead of other windfarms
Figure 6: VPTG Wind Dispatch-Down by Region in 2015
4.2%
2.3%1.9%
5.5%
7.3%
8.7%
5.3%
18 9 2 4 8 20 7
-1E+09
-8E+08
-6E+08
-4E+08
-2E+08
0
0%
2%
4%
6%
8%
10%
12%
NI M NE NW SE SW W
Region
VP
TG
Win
dfa
rm D
isp
atch
Do
wn
(%
)
Number of VPTG windfarms in Region

Annual Renewable Energy Constraint and Curtailment Report 2015
Page 16
4 Mitigation Measures
4.1 Network Reinforcements:
The draft grid development strategy as well as the programmes being developed in Northern Ireland are the primary methods of addressing network capacity issues in the coming years. The outages necessary to deliver the network upgrades may result in additional constraints in the short term. However, in the long run constraints on wind generation will be reduced. In addition, consideration will be given to the use and deployment of new technologies including dynamic line rating and special protection schemes.
4.2 Operational Policy and the DS3 Programme
The fundamental issues that give rise to curtailment have been identified in section 2.5 above. These issues will be addressed by EirGrid and SONI’s Delivering a Secure Sustainable Electricity System (DS3) programme11. This is a multi-stakeholder, multi-year programme of work designed specifically to securely and efficiently increase the capability of the power system. It will cover operation from a maximum of 50% System Non-Synchronous Penetration (SNSP) level to a maximum of 75% and also address the other limits identified in section 2.5. The DS3 programme was formally launched in August 2011 and is designed to reduce curtailment. However, the success of the programme is dependent on appropriate and positive engagement from all industry stakeholders. This includes conventional and renewable generators, the Regulatory Authorities, Transmission System Operators and Distribution System Operators. As part of the DS3 programme of work there are studies underway to investigate the optimisation of operational policy and to minimise curtailment. The System Services procurement project is also underway which is also aiming to help minimise curtailment.
4.3 Operational Policy – Interconnection
Interconnector Status Updates
The East West Interconnector (EWIC) went into partial commercial operation in December 2012 and full commercial operation in May 2013. The Moyle Interconnector was operating at 250 MW of its 500 MW capacity during 2015.
11 http://www.eirgridgroup.com/how-the-grid-works/ds3-programme/

Annual Renewable Energy Constraint and Curtailment Report 2015
Page 17
System Operator Interconnector Countertrading12
Following gate closure in the SEM, the TSOs may seek to initiate changes to the interconnector flows. The reasons for this would be for system security or to facilitate priority dispatch generation (as directed in SEM Committee Decision paper SEM-11-062). These changes would be through countertrading13 between SOs or through a third party in the wholesale electricity market in Great Britain.
Countertrading is carried out in accordance with: commercial parameters approved by
the Regulatory Authorities; any relevant system limitations; and the availability of a
counter party to give effect to any potential trade.
Countertrading arrangements were used on a regular basis throughout the year to alleviate curtailment of priority dispatch generation and also for reserve co-optimisation. This countertrading is predominately carried out using the services of a third party trading partner. As the tool used by the TSOs optimises the generation schedule based on numerous variables it is not possible to differentiate whether the countertrading was for priority dispatch or for economic reasons.
4.4 Controllability of Wind Generators
Windfarm controllability is the ability of the TSO control centres to dispatch a windfarm’s output to a specific level. Uncontrollable windfarms are dispatched directly by opening circuit breakers. This results in full disconnection rather than a gradual dispatch-down. Controllability enables fairness of dispatch-down between windfarms on a pro-rata basis. To ensure increasing and appropriate levels of controllability, EirGrid and SONI have sought, where possible, to standardise testing procedures and rigorously enforce controllability requirements on all windfarms.
12 http://www.eirgridgroup.com/site-files/library/EirGrid/InformationNoteExtensionofTSOcounter-tradingfacilitiesforDBCmanagement.pdf 13 Once the SEM market has closed the TSOs may initiate changes to the interconnector schedules via SO countertrading for reasons of system security or to facilitate priority dispatch generation (as directed in SEM Committee Decision paper SEM-11-062).

Annual Renewable Energy Constraint and Curtailment Report 2015
Page 18
Appendix A – Detailed Results
The following tables provide a detailed summary of the dispatch-down of wind (in MWh and in terms of percentage of available energy). The data is provided for Northern Ireland and Ireland individually and in aggregate.
All-Island:
Table 2: Details of Monthly Dispatch-down Energy on the Island
Figure 7: All-Island Wind Dispatch-Down Monthly Volumes and Percentages in 2015
Month
All Wind
Generation
(MWh)
All Wind Dispatch
Down Vol
(MWh)
All Wind
Dispatch Down
(%)
VPTG Dispatch-
Down Vol
(MWh)
Non-VPTG Dispatch-
Down Vol
(MWh)
Jan-2015 1,005,856 45,310 4.3% 32,197 13,114
Feb-2015 618,828 26,968 4.2% 17,566 9,402
Mar-2015 772,090 74,069 8.8% 50,972 23,097
Apr-2015 470,324 9,376 2.0% 6,976 2,399
May-2015 747,116 33,807 4.3% 22,240 11,567
Jun-2015 509,156 25,575 4.8% 18,576 6,999
Jul-2015 594,526 22,621 3.7% 16,864 5,757
Aug-2015 473,159 28,113 5.6% 20,059 8,053
Sep-2015 476,679 12,021 2.5% 7,019 5,003
Oct-2015 482,332 19,399 3.9% 14,661 4,738
Nov-2015 936,461 68,435 6.9% 65,652 2,783
Dec-2015 1,146,070 76,686 6.3% 59,935 16,751
2015 Total 8,232,598 442,380 5.1% 332,717 109,663
0.0%
1.0%
2.0%
3.0%
4.0%
5.0%
6.0%
7.0%
8.0%
9.0%
10.0%
-
10,000
20,000
30,000
40,000
50,000
60,000
70,000
80,000
90,000
Per
cen
tage
Vo
lum
e (
MW
h)

Annual Renewable Energy Constraint and Curtailment Report 2015
Page 19
Ireland:
Table 3: Details of Monthly Dispatch-down Energy in Ireland
Figure 8: Ireland Wind Dispatch-Down Monthly Volumes and Percentages in 2015
Month
All Wind
Generation
(MWh)
All Wind Dispatch
Down Vol
(MWh)
All Wind
Dispatch Down
(%)
VPTG Dispatch-
Down Vol
(MWh)
Non-VPTG
Dispatch-Down Vol
(MWh)
Jan-2015 790,696 35,558 4.3% 26,451 9,108
Feb-2015 487,989 20,667 4.1% 14,834 5,833
Mar-2015 600,095 51,941 8.0% 38,234 13,706
Apr-2015 379,443 6,766 1.8% 5,223 1,544
May-2015 586,663 27,540 4.5% 18,854 8,686
Jun-2015 394,382 20,540 5.0% 15,981 4,559
Jul-2015 487,725 19,510 3.8% 15,347 4,164
Aug-2015 372,971 22,835 5.8% 16,933 5,902
Sep-2015 379,026 10,583 2.7% 6,183 4,401
Oct-2015 381,637 15,018 3.8% 12,045 2,973
Nov-2015 754,347 54,956 6.8% 54,956 -
Dec-2015 921,235 61,756 6.3% 50,123 11,633
2015 Total 6,536,210 347,671 5.1% 275,162 72,509
0.0%
1.0%
2.0%
3.0%
4.0%
5.0%
6.0%
7.0%
8.0%
9.0%
-
10,000
20,000
30,000
40,000
50,000
60,000
70,000
Per
cen
tage
Vo
lum
e (
MW
h)
Annual Renewable Energy Constraint and Curtailment Report 2015
Page 20
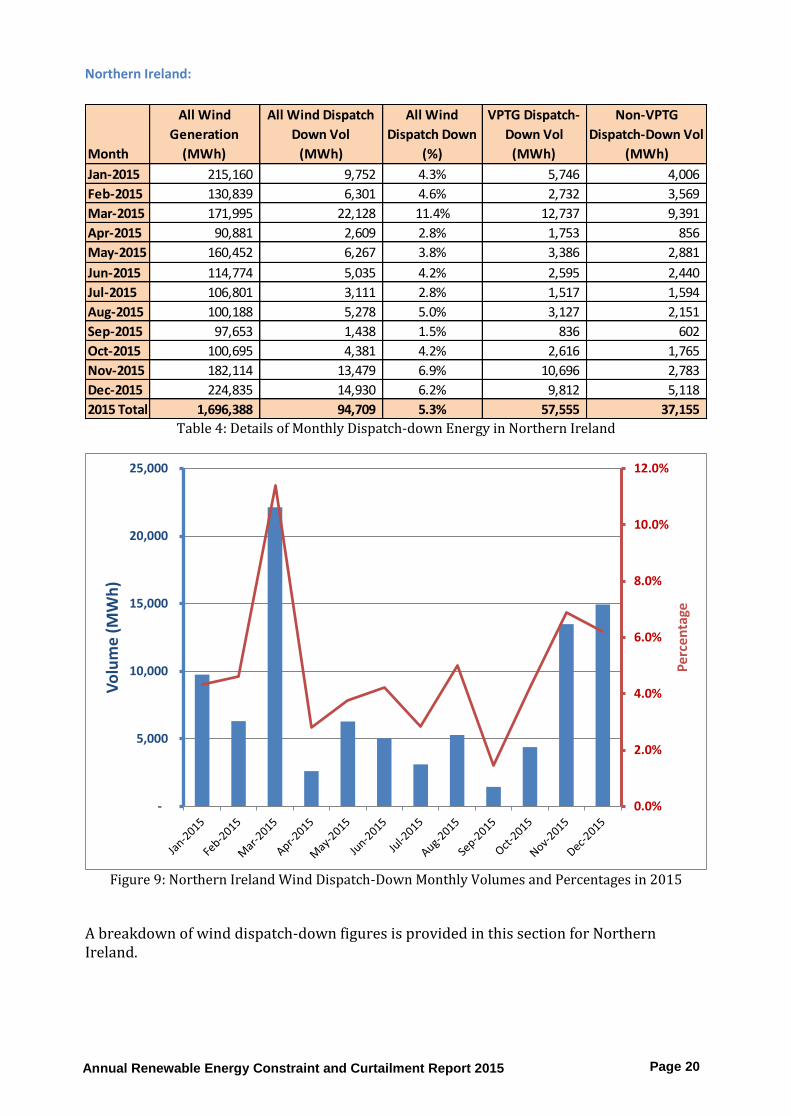
Northern Ireland:
Table 4: Details of Monthly Dispatch-down Energy in Northern Ireland
Figure 9: Northern Ireland Wind Dispatch-Down Monthly Volumes and Percentages in 2015
A breakdown of wind dispatch-down figures is provided in this section for Northern Ireland.
Month
All Wind
Generation
(MWh)
All Wind Dispatch
Down Vol
(MWh)
All Wind
Dispatch Down
(%)
VPTG Dispatch-
Down Vol
(MWh)
Non-VPTG
Dispatch-Down Vol
(MWh)
Jan-2015 215,160 9,752 4.3% 5,746 4,006
Feb-2015 130,839 6,301 4.6% 2,732 3,569
Mar-2015 171,995 22,128 11.4% 12,737 9,391
Apr-2015 90,881 2,609 2.8% 1,753 856
May-2015 160,452 6,267 3.8% 3,386 2,881
Jun-2015 114,774 5,035 4.2% 2,595 2,440
Jul-2015 106,801 3,111 2.8% 1,517 1,594
Aug-2015 100,188 5,278 5.0% 3,127 2,151
Sep-2015 97,653 1,438 1.5% 836 602
Oct-2015 100,695 4,381 4.2% 2,616 1,765
Nov-2015 182,114 13,479 6.9% 10,696 2,783
Dec-2015 224,835 14,930 6.2% 9,812 5,118
2015 Total 1,696,388 94,709 5.3% 57,555 37,155
0.0%
2.0%
4.0%
6.0%
8.0%
10.0%
12.0%
-
5,000
10,000
15,000
20,000
25,000
Per
cen
tage
Vo
lum
e (
MW
h)

Annual Renewable Energy Constraint and Curtailment Report 2015
Page 21
Due to the differences in the systems used to record the data, it was not possible in the past to log all of the categories for the reasons for constraint or curtailment of wind energy in Ireland. This capability became available in the new All-Island Wind Dispatch Tool which went live in Quarter 2, 2014 in Ireland and Quarter 3, 2014 in Northern Ireland. The TSOs have been engaging with Industry on the new reporting templates and calculation methodology and these new reports will be issued for Q1 2016 in May 2016 and a month following each quarter thereafter. In the meantime the TSOs intend to provide information based on estimates from the data available.
Individual dispatch-down of VPTG windfarms 2015:
Year Jurisdiction Unit ID Unit NameCapacity
(MW)
Dispatch
Down Vol
(MWh)
Available
Energy
(MWh)
Dispatch
Down %
VPTG Start
Date
2015 NI ALT2 Altahullion 2 11.7 1,047 29,957 3.5%
2015 NI CarnHill CarnHill 13.8 1,867 40,493 4.6%
2015 NI Carrickatane Carrickatane 20.7 1,853 65,496 2.8%
2015 NI Churchill Churchill 18.4 2,811 49,683 5.7%
2015 NI Crighshane Crighshane 32.2 5,098 79,443 6.4%
2015 NI Crockagarron Crockagarron 17.5 1,254 54,170 2.3%
2015 NI Curryfree Curryfree 15 1,375 51,360 2.7%
2015 NI Dunmore Dunmore NI 21 4,477 61,753 7.2%
2015 NI GAR Garves 15 1,946 46,297 4.2%
2015 NI GRU Gruig 25 3,252 66,685 4.9%
2015 NI HUN Hunters Hill 20 2,674 50,149 5.3%
2015 NI Screggagh Screggagh 20 2,243 40,016 5.6%
2015 NI SD1 Slieve Divena 1 30 3,780 70,492 5.4%
2015 NI SLI2 Slieve Rushen 2 54 4,689 185,880 2.5%
2015 NI Slieve Kirk Slieve Kirk 74 8,501 218,543 3.9%
2015 NI TAP Tappaghan 28.5 3,292 80,804 4.1%
2015 NI Thornog Thornog 20 3,209 50,568 6.3% 12/02/2015
2015 NI Dunbeg Dunbeg 42 4,188 119,810 3.5% 26/03/2015
2015 NI 478.8 57,555 1,361,599 4.2%

Annual Renewable Energy Constraint and Curtailment Report 2015
Page 22
Table 6: Dispatch-down Figures for Each VPTG Windfarm in 2015
Note: VPTG start dates are displayed only for windfarms that became VPTG during 2015.
Year Jurisdiction Unit ID Unit NameCapacity
(MW)
Dispatch
Down Vol
(MWh)
Available
Energy
(MWh)
Dispatch
Down %VPTG Start Date
2015 IRE GE1 Gortahile 20 1,383 69,259 2.0%
2015 IRE GM1 Garracummer 1 36.9 2,833 136,574 2.1%
2015 IRE GU1 Glenough 32.5 1,590 122,960 1.3%
2015 IRE LS1 Lisheen 1 36 3,609 112,047 3.2%
2015 IRE LS2 Lisheen 1a 19 2,167 75,605 2.9%
2015 IRE MO1 Mount Lucas 79.2 6,464 241,274 2.7% 17/02/2015
2015 IRE BU1 Bruckana 39.6 2,780 121,116 2.3% 10/03/2015
2015 IRE KH1 Kill Hill 36 2,111 91,697 2.3% 28/04/2015
2015 IRE MH1 Monaincha 36 495 51,397 1.0% 17/11/2015
2015 IRE BD1 Bindoo 48 2,488 125,868 2.0%
2015 IRE ML1 Mountain Lodge 1 31.5 1,732 92,632 1.9%
2015 IRE BM1 Beam Hill 1 14 3,280 43,658 7.5%
2015 IRE MCT Meentycat 84.96 12,975 255,188 5.1%
2015 IRE SN1 Sornehill 38.9 7,605 106,844 7.1%
2015 IRE SP1 Spaddan 17.5 146 27,768 0.5% 01/12/2015
2015 IRE BW1 Ballywater 42 22,455 97,652 23.0%
2015 IRE BX1 Ballymartin 1 6 530 19,877 2.7%
2015 IRE BX2 Ballymartin 2 8 1,003 28,747 3.5%
2015 IRE BY1 Ballycadden 1 14.45 1,727 44,432 3.9%
2015 IRE BY2 Ballycadden 2 11.5 1,048 29,886 3.5%
2015 IRE CK1 Castledockrell 41.4 3,949 117,676 3.4%
2015 IRE RF1 Richfield 27 1,940 80,702 2.4%
2015 IRE WS1 Woodhouse 20 149 29,693 0.5% 15/12/2015
2015 IRE AH1 Athea 1 34.35 13,360 105,099 12.7%
2015 IRE BA1 Ballybane 1 29.9 3,137 78,477 4.0%
2015 IRE BCW Ballincollig Hill 13.3 5,132 41,063 12.5%
2015 IRE BG1 Boggeragh 57 6,219 179,075 3.5%
2015 IRE BR1 Bawnmore 24 1,949 78,223 2.5%
2015 IRE CG1 Coomagearlahy 1 42.5 17,554 124,469 14.1%
2015 IRE CG2 Coomagearlahy 2 8.5 2,510 26,952 9.3%
2015 IRE CG3 Coomagearlahy 3 32.5 8,560 96,638 8.9%
2015 IRE CJ1 Clahane 37.8 13,138 116,835 11.2%
2015 IRE CZ1 Coomacheo 59.225 36,586 171,293 21.4%
2015 IRE DR1 Dromada 28.5 9,976 88,508 11.3%
2015 IRE DV1 Dromdeeveen 27 2,350 93,966 2.5%
2015 IRE GLC Glanlee 29.8 11,669 90,811 12.8%
2015 IRE GW1 Grouse Lodge 15 1,200 50,306 2.4%
2015 IRE KW1 Knockawarriga 22.5 7,586 69,369 10.9%
2015 IRE RC1 Rathcahill West 12.5 550 40,341 1.4%
2015 IRE TN2 Tournafulla 17.2 8,476 54,870 15.4%
2015 IRE TR1 Taurbeg 25.3 2,385 72,430 3.3%
2015 IRE KC1 Knockacummer 87 10,312 269,699 3.8% 13/01/2015
2015 IRE BA2 Ballybane 2 11.5 602 26,466 2.3% 21/07/2015
2015 IRE BT1 Booltiagh 1 19.45 3,009 43,568 6.9%
2015 IRE BT2 Booltiagh 2 12 1,029 40,092 2.6%
2015 IRE DY1 Derrybrien 59.5 12,086 136,932 8.8%
2015 IRE GH1 Garvagh 1 26 3,908 94,340 4.1%
2015 IRE GH2 Garvagh 2 22 3,457 67,625 5.1%
2015 IRE KG2 Kingsmountain 2 11.05 1,571 32,437 4.8%
2015 IRE XR1 Carrowleagh 34.15 2,391 105,796 2.3% 14/04/2015
2015 Ireland 1,539.9 275,162 4,518,232 6.1%
Annual Renewable Energy Constraint and Curtailment Report 2015
Page 23
Appendix B – Calculation Methodologies This appendix outlines the methodologies used to calculate wind dispatch-down in Ireland and Northern Ireland. The methodologies are different due to the different systems used in both jurisdictions in 2014. The new wind dispatch tool went live in quarter 2 of 2014. This will allow the use of the same calculation methodologies in both jurisdictions in the future.
Ireland
Data Used
The following figures were obtained (for VPTG windfarms) from the Single Energy Market
settlement system:
DQ (Dispatch Quantities in MW)
AO (Actual Output in MW)
AP (Profiled Availabilities in MW)
TPD (Market Trading Period Duration = 0.5 hr)
Data from other sources (for all windfarms):
Total wind generation: EirGrid & SONI Operations
Total half hourly wind availabilities and generation from SCADA (Ireland only)
Calculation Methodology
Dispatch-down of wind energy is calculated individually for generators that are registered in the SEM as VPTGs. Prior to the SEM-11-062 decision the majority of units dispatched down were VPTGs. Since SEM-11-062 this has changed to the dispatch-down of controllable windfarms, which includes some autonomous generation. Due to the market rules for autonomous generators (APTGs) it is not possible to use validated SEM data to calculate the dispatch-down of APTGs; instead, this is estimated on an aggregate basis using SCADA data. The calculation steps for dispatch-down of wind are as follows:
Step 1: Dispatch-Down Calculation for VPTG Wind using SEM Data
a) Dispatch-down volume V (MWh) in each trading period:
IF AP = DQ
THEN V = 0
ELSE V = TPD * Max[0, AP-Max(AO,DQ)]
Total dispatch-down volume R = ∑rpV
Where rp is the reporting period – the year 2015 in this case.

Annual Renewable Energy Constraint and Curtailment Report 2015
Page 24
b) Dispatch-down level (%): The dispatch-down levels for a VPTG wind generator are calculated based on the dispatch-down volume R from part (a) above and the wind generator’s maximum possible energy generation PE (MWh): PE = ∑rp[Max(AO,AP)] * TPD
(Only during those trading periods where the wind generator is registered as VPTG in SEM)
VPTG dispatch-down level (%) = 100 * R / PE
Step 2: Dispatch-Down Calculation for Autonomous (Non-VPTG) Wind
SCADA data is used to estimate autonomous wind dispatch-down in Ireland only.
a) Estimating all wind dispatch-down in Ireland from SCADA:
The difference between total wind availabilities (Avail) and total wind output (WO) is used as an indicator of the dispatch-down volume of all wind in Ireland. However, the accuracy of SCADA data is not high. To improve the accuracy, this difference (Avail – WO) is used only during the trading periods where there was a dispatch-down in the market in Ireland (VI ≠ 0). Market dispatch-down volumes in Ireland (VI) can give us a better indication of when there was active dispatching down of wind taking place in Ireland. Total Dispatch-Down Volume in Ireland DD (MWh) = ΣMax[VI, (Avail-WO)*TPD] (Note: DD will be zero when VI is zero, i.e. during periods where there was no dispatching down of VPTG wind in Ireland.) All wind Dispatch-Down % in Ireland = 100 * DD / ( DD + Σ(WOI*TPD) )
All wind Dispatch-Down % in Northern Ireland = 100 * RNI / ( RNI + Σ(WONI*TPD) )
Where R is the dispatch-down volume calculated for Northern Ireland in Step 1.
Actual total wind output is used for Northern Ireland (WO).
b) Estimating autonomous dispatch-down of wind in Ireland:
It is calculated by getting the difference between the estimated total wind dispatch-down volume in Ireland and the VPTG dispatch-down in Ireland = DD – RI

Annual Renewable Energy Constraint and Curtailment Report 2015
Page 25
Northern Ireland
Data Used
The figures used in these calculations are obtained from the SONI Energy Management System (EMS) in conjunction with dispatch data recorded in EDIL, the control centre tool for dispatching generating plant.
DIs (Dispatch Instructions in MW from EDIL)
MW Availability (Minute SCADA MW Availability Data from EMS)
MW Generation (Minute SCADA MW Generation data from EMS)
Wind Farm Capacity (MW)
TP (Time Period, 1 minute)
Calculation Methodology
Dispatch-down of wind energy is calculated individually for each wind farm in Northern Ireland. This is calculated based on Dispatch Instructions logged by SONI Control Engineers in EDIL (date in dd-mm-yy and time in hh:mm) and MW Generation / MW Availability data in the SONI EMS. The resolution of the data used from the EMS is 1 minute.
Where a wind farm’s output is reduced by SONI, instructions are logged as a way of determining why a wind farms output has been reduced and as a way of sending instructions to SEMO for market settlement.
Wind Farm Dispatch Instructions recorded in EDIL are classified using the following EDIL reason codes:
LOCL Local Transmission Constraint
CURL All Island Curtailment
LOCL T Local Distribution Constraint
MWOF MW of Fuel
Step 1: Dispatch-Down Calculation for VPTG Wind using SEM Data
See Ireland calculation methodology section above.
Step 2: Dispatch-down Calculation
1-minute MW Availability and MW Generation SCADA data is downloaded daily from the EMS. This is downloaded for each wind farm installed in Northern Ireland.
Where a wind farm has been dispatched down, the time logged in EDIL is used to calculate the dispatch-down volume for each 1-minute time period. A value in MWhrs and time (hrs) is recorded.
Total Dispatch-down Volume (V) in MWhrs is calculated, using minute SCADA data, in the following way;
IF DI < Wind Farm Capacity
THEN V = (MAX(MW Availability, MW Generation) – DI, 0)
Where V >= 0 MW

Annual Renewable Energy Constraint and Curtailment Report 2015
Page 26
Total Dispatch-down time (t) in hrs is calculated, using minute SCADA data, in the following way;
IF DI < Wind Farm Capacity
THEN t = COUNT(TP(DI < Wind Farm Capacity))
Notes
These calculations are applied daily to all wind farms in Northern Ireland. The accuracy of the Dispatch-down Volumes (V) is dependent on the accuracy of MW Availability and MW Generation SCADA data.
The accuracy of the Dispatch-down time (t) is dependent on the accuracy of the instructions entered into EDIL. These are checked daily by SONI staff.

Annual Renewable Energy Constraint and Curtailment Report 2015
Page 27
Appendix C – Summary Results
Year Wind Dispatch-Down (%)
Northern Ireland Ireland All Island
2011 1.3% 2.4% 2.2%
2012 0.7% 2.5% 2.1%
2013 1.9% 3.5% 3.2%
2014 2.8% 4.4% 4.1%
2015 5.3% 5.1% 5.1%
Year Wind Dispatch-Down Volume (GWh)
Northern Ireland Ireland All Island
2011 13 106 119
2012 7 103 110
2013 24 171 196
2014 41 236 277
2015 95 348 442
Year Wind Capacity (MW) at Year End
Northern Ireland Ireland All Island
2011 405 1,631 2,036
2012 488 1,763 2,252
2013 554 1,896 2,450
2014 614 2,173 2,787
2015 627 2,363 2,990
Year All Island Estimated Wind Dispatch Breakdown
Constraints Curtailment
2011 20% 80%
2012 38% 62%
2013 28% 72%
2014 35% 65%
2015 36% 66%

Annual Renewable Energy Constraint and Curtailment Report 2015
Page 28
Appendix D – Abbreviations
CER Commission for Energy Regulation
DETI Department of Enterprise, Trade and Investment
E East
EWIC East West Interconnector
GW Gigawatt
GWh Gigawatt-hour
HVDC High Voltage Direct Current
IRE Ireland
IT Information Technology
km Kilometre
kV kilovolt
MW Megawatt
MWh Megawatt-hour
NE North East
NI Northern Ireland
NW North West
S South
S.I Statutory Instrument
SCADA Supervisory Control And Data Acquisition
SE South East
SEF Strategic Energy Framework
SEM Single Electricity Market
SNSP System Non-Synchronous Penetration
SONI System Operator Northern Ireland
SW South West
TSO Transmission System Operator
URegNI Utility Regulator Northern Ireland
VPTG Variable Price Taking Generator
W West


![Policy Paper [PP/04/2019] - Low Carbon Ukraine · Policy Paper [PP/04/2019] Curtailment of renewable electricity as a flexibility option Dr. Frank Meissner ... Our optimal dispatch](https://static.fdocuments.in/doc/165x107/60d207bc64830873a21d225e/policy-paper-pp042019-low-carbon-ukraine-policy-paper-pp042019-curtailment.jpg)

