
Annual Radiation Protection Report 1 JULY 2008 - … · Olympic Dam BHP Billiton Limited ... Annual...
52
Annual Radiation Protection Report 1 JULY 2008 - 30 JUNE 2009 Uranium Olympic Dam
Transcript of Annual Radiation Protection Report 1 JULY 2008 - … · Olympic Dam BHP Billiton Limited ... Annual...

Annual Radiation Protection Report 1 JULY 2008 - 30 JUNE 2009
Uranium Olympic Dam
Olympic Dam
BHP Billiton Limited
Uranium
ABN 99 007 835 761
A member of the BHP Billiton Olympic Dam Corporation Pty Ltd, which is headquartered in Australia
Registered Office: Rialto Towers Level 29, 525 Collins St, Melbourne, Victoria 3000, Australia
ABN 99 007 835 761

OLYMPIC DAM
Annual Radiation Protection Report
1 JULY 2008 - 30 JUNE 2009
DISTRIBUTION
ENVIRONMENT PROTECTION AUTHORITY (SA)
Director, Radiation Section (2 copies)
DEPARTMENT FOR ADMINISTRATIVE AND INFORMATION SERVICES
SafeWork SA
DEPARTMENT OF PRIMARY INDUSTRIES AND RESOURCES, SOUTH AUSTRALIA
Chief Inspector of Mines (2 copies)
BHP BILLITON URANIUM
Manager – Corporate Affairs
BHP BILLITON OLYMPIC DAM President Uranium
Vice President, Surface
Vice President, Services
Vice President, Mining
Vice President, HS
Manager, Mine Production
Manager, Mine Development
Manager, Fixed Plant and Infrastructure
Manager, Mine Technical Services
Manager, Concentrator & Hydromet
Manager, Smelter and Refinery Production
Manager, Surface Technology
Manager, Maintenance Processing
Manager, Smelter and Refinery Maintenance
Manager, Environment and Radiation
Superintendent Radiation and Occupational Hygiene
Radiation Safety Officer – Process
Senior Radiation Safety Officer - Mine
Ventilation Superintendent
Occupational Hygienist
Occupational Physician
Records Centre
This Report has been reviewed by:
Radiation Safety Officer – Process David Kruss
Senior Radiation Safety Officer – Mine Cameron Lawrence
Superintendent Radiation & Occ Hygiene Kathryn Taylor
Manager - Environment and Radiation Frank Harris

1 JULY 2008 - 30 JUNE 2009 BHP BILLITON OLYMPIC DAM Annual Radiation Protection Report
INTRODUCTION Page 5
Table of Contents
1 INTRODUCTION ......................................................................................9
2 EMPLOYEE DOSE ASSESSMENT METHOD ......................................10
2.1 Exposure Calculation Methodology...................................................................10 2.2 Exposure to Dose Calculations .........................................................................11
3 Employee Doses...................................................................................13
3.1 Doses to Mine Employees.................................................................................13 3.2 Doses to Metallurgical Plant Employees ...........................................................34 3.3 Annual Dose Trends..........................................................................................48 3.4 Doses to Members of the Public........................................................................49 3.5 Radiation Management Plan (RMP)..................................................................50
4 CONCLUSION .......................................................................................51
5 APPENDIX A..........................................................................................52
BHP BILLITON OLYMPIC DAM 1 JULY 2008 - 30 JUNE 2009 Annual Radiation Protection Report
Page 6 INTRODUCTION
List of Figures
Figure 3-1: Annual Dose Distribution 2008/2009 for All Designated Employees - Mine .......................................................................................................13
Figure 3-2: Doses, showing components, for Full Time Designated Mine Employees .............................................................................................16
Figure 3-3: Annual Dose Trends for the Backfill Workgroup ....................................17 Figure 3-4: Annual Dose Trends for the Core Farm Workgroup ..............................18 Figure 3-5: Annual Dose Distribution for the Development Workgroup....................19 Figure 3-6: Annual Dose Trends for the Development Workgroup ..........................19 Figure 3-7: Annual Dose Distribution for the Diamond Drilling Workgroup ..............20 Figure 3-8: Annual Dose Trends for the Diamond Drilling Workgroup .....................20 Figure 3-9: Annual Dose Distribution for the Electrician Workgroup ........................21 Figure 3-10: Annual Dose Trends for the Electrician Workgroup ...............................21 Figure 3-11: Annual Dose Distribution for the Fitter Workgroup.................................22 Figure 3-12: Annual Dose Trends for the Fitter Workgroup .......................................22 Figure 3-13: Annual Dose Distribution for the Surface Workers Workgroup ..............23 Figure 3-14: Annual Dose Trends for the Surface Workers Workgroup.....................23 Figure 3-15: Annual Dose Distribution for the Ore Handling Workgroup....................24 Figure 3-16: Annual Dose Trends for the Ore Handling Workgroup ..........................24 Figure 3-17: Annual Dose Distribution for the Production Charger Workgroup..........25 Figure 3-18: Annual Dose Trends for the Production Charger Workgroup ................25 Figure 3-19: Annual Dose Distribution for the Production Driller Workgroup .............26 Figure 3-20: Annual Dose Trends for the Production Driller Workgroup ....................26 Figure 3-21: Annual Dose Distribution for the Raise Driller Workgroup .....................27 Figure 3-22: Annual Dose Trends for the Raise Driller Workgroup ............................27 Figure 3-23: Annual Dose Distribution for the Underground Services Workgroup .....28 Figure 3-24: Annual Dose Trends for the Underground Services Workgroup............28 Figure 3-25: Annual Dose Distribution for Non-Designated mine end employees .....31 Figure 3-26: Average Dose Trends for Non-Designated Employees .........................32 Figure 3-27: Annual Doses for Non-Designated employees, by source and by
Occupation .............................................................................................32 Figure 3-28: Five Year Cumulative Dose Distribution Mine........................................33 Figure 3-29: Annual Dose Distribution for all Metallurgical Plant employees .............35 Figure 3-30: Annual dose components by workgroup ................................................36 Figure 3-31: Annual Dose Distribution for the Concentrator Workgroup ....................37 Figure 3-32: Dose Trends for the Concentrator Workgroup .......................................37 Figure 3-33: Annual Dose Distribution for the Hydromet Workgroup .........................38 Figure 3-34: Dose Trends for the Hydromet Workgroup ............................................38 Figure 3-35: Annual Dose Distribution for the Smelter Workgroup ............................39 Figure 3-36: Dose Trends for the Smelter Workgroup ...............................................39 Figure 3-37: Annual Dose Distribution for the Refinery Workgroup ...........................40 Figure 3-38: Dose Trends for the Refinery Workgroup ..............................................40
1 JULY 2008 - 30 JUNE 2009 BHP BILLITON OLYMPIC DAM Annual Radiation Protection Report
INTRODUCTION Page 7
Figure 3-39: Annual Dose Distribution for the Maintenance/Services Workgroup .....41 Figure 3-40: Dose Trends for the Maintenance/Services Workgroup ........................41 Figure 3-41: Annual Dose Distribution for the Smelter Slag Handling Workgroup.....42 Figure 3-42: Dose Trends for the Smelter Slag Handling Workgroup........................42 Figure 3-43: Simplified dust recycle path ...................................................................44 Figure 3-44: Average Dose to Non-designated Metallurgical Plant Employees.........45 Figure 3-45: Annual Dose Distribution for Non-designated process plant
employees..............................................................................................46 Figure 3-46: Non Designated Process plant dose break-up, by workgroup...............47 Figure 3-47: 5 Year Cumulative Dose Distribution for Process Plant Employees......48 Figure 3-48: Mine Annual dose trend.........................................................................49 Figure 3-49: Plant Annual Dose Trend.......................................................................49 Figure 3-50: Total Dose Trend for Olympic Dam Village and Roxby Downs .............50

BHP BILLITON OLYMPIC DAM 1 JULY 2008 - 30 JUNE 2009 Annual Radiation Protection Report
Page 8 INTRODUCTION
List of Tables
Table 3-1: Statistics for designated employees, mine.............................................14 Table 3-2: Statistics for Full Time Designated Mine Employees .............................15 Table 3-3: Non Designated Mine Employee Statistics ............................................31 Table 3-4: Five Year Stats.......................................................................................34 Table 3-5: Statistics for designated employees, Metallurgical Plant .......................34 Table 3-6: Annual Dose Statistics by Work Areas, Full-Time Designated
Metallurgical Plant Employees ...............................................................36 Table 3-7: Non-Designated Employees Metallurgical plant, Dose Statistics...........45 Table 3-8: Dose Statistics For non-designated Plant employees............................46 Table 3-9: Five Year Dose Statistics .......................................................................48 Table 3-10: Public Doses ..........................................................................................49 Table 5-1: Dust Dose Conversion Factors ..............................................................52

1 JULY 2008 - 30 JUNE 2009 BHP BILLITON OLYMPIC DAM Annual Radiation Protection Report
INTRODUCTION Page 9
1 INTRODUCTION
This document is the annual report on radiation protection for BHP Billiton Olympic Dam Corporation Pty Ltd and includes the following:
In accordance of clause 2.10.1, 3.8.1 and 3.10.1 of the Code of Practice and Safety Guide on Radiation Protection and Radioactive Waste Management in Mining and Processing 2005, employee dose assessments, dose calculation methodologies, dose parameters and dose conversion factors for the period 1st July 2008 to 30th June 2009 are presented. Individual personal doses and dose components for the period 1st July 2008 to 30th June 2009 are forwarded with this document on electronic media.

BHP BILLITON OLYMPIC DAM 1 JULY 2008 - 30 JUNE 2009 Annual Radiation Protection Report
Page 10 EMPLOYEE DOSE ASSESSMENT METHOD
2 EMPLOYEE DOSE ASSESSMENT METHOD
2.1 Exposure Calculation Methodology
2.1.1 Exposure Calculation at the Mine The main exposure pathways for Mine workers are inhalation of Radon Decay Products (RDP), irradiation by gamma radiation and inhalation of radioactive dust. Assessment of exposure from dust and RDP are based on employee time sheet/card information and measurements from the approved monitoring program.
Employee and contractor time card information is entered into one of the three time tracking databases [IRIS, SAP, Production Tracking Normal Time (Prodtrak_Normtime)] for either daily or monthly work periods. The site security database (CARDAX) is also used to determine the monthly average hours for individuals whose timesheets have not been logged into any of the other databases mentioned above. The information from CARDAX is converted into tables that can be easily imported into the IRIS database for dose calculation. Each database records employee name, employee number, occupation, date, work location and hours in location information.
Locations within the Mine are grouped into areas of ‘like air’ known as airways. The Senior Ventilation Engineer or their nominee, who is familiar with the underground environment, maintains the locations within the airways. Airways are segregated into weekly periods and new locations are mapped into their relevant airway this results in there being 13 weekly groupings each quarter covering the history of ventilation throughout the Mine.
The RDP concentration is then determined for each airway for each week using measurements from the approved monitoring program, which covers monitoring of most active work areas. For work airways not sampled in that week, an average is calculated. This average is calculated from all readings for that particular airway over the quarter.
Employee exposure to radioactive dust is calculated using quarterly occupation-based averages. The averages are obtained from monitoring performed under the approved monitoring program. An occupation-based dust concentration level is then allocated to each occupation.
The occupation-based dust concentration information and location-based RDP concentration information is then combined with the employee time card information to derive individual exposure data. Dust exposure is measured in units of Becquerel-hours per cubic metre (Bq.hr/m3) and RDP concentration is measured in units of micro Joule-hours per cubic metre (µJ.hr/m3). Exposure details are combined to give quarterly personal exposures.
The entire procedure is processed using a software program known as the Integrated Radiation Information System (IRIS). The system is designed such that the Radiation Safety Officer is required to perform checks in each step of the process. This is in addition to a built-in auditing system within the program.
Respiratory protection in the form of airstream helmets are available for all employees and are worn when tasks are identified as requiring them. They are typically worn by some workgroups such as Ore Handling Beltrunners and Services Ventilation Crew. Airstream helmets are also mandatory for identified specific tasks or in certain conditions. Routine and non-routine use of airstream helmets is monitored and logged.

1 JULY 2008 - 30 JUNE 2009 BHP BILLITON OLYMPIC DAM Annual Radiation Protection Report
EMPLOYEE DOSE ASSESSMENT METHOD Page 11
No respiratory protection factors are used in these exposure calculations, and therefore actual individual exposures will be lower than reported.
Exposure to gamma radiation is assessed using Thermo Luminescent Dosimeters (TLD’s) badges from the Australian Radiation Protection and Nuclear Safety Agency (ARPANSA) Personal Monitoring Service. TLD badges are worn for a period of three months; non-badge wearers are allocated an occupation-based average exposure.
2.1.2 Exposure calculation in the Metallurgical Plant The main exposure pathways for Metallurgical Plant workers are inhalation of radioactive dust and fumes, and irradiation by gamma radiation. Assessment of exposure from dust and fumes is based on employee time sheet/card information and measurements from the approved monitoring program. Dust exposure in the Metallurgical Plant may involve exposure to different types of dust. These dusts will differ in particle size and radionuclide composition, which will produce different dust Dose Conversion Factors (DCF's). The table of DCF’s is given in Appendix A.
Information from employee and contractor time cards or employee activity sheets is entered into IRIS via one of the three databases [IRIS (Manual), SAP, Prodtrak_Normtime] containing daily or monthly information, depending on work area and occupation. From these databases a file of unique locations/occupations is obtained. Locations of the same section or similar exposure are grouped into exposure groups. A quarterly mean of dust activity is determined for each of the exposure groups based on the results of the monitoring program.
CARDAX is used to extract time sheet information for all personnel where it is not possible to get this information from the three main databases commonly used at Olympic Dam for timesheet logging (IRIS, Prodtrak and SAP).
Quarterly location/occupation dust averages are combined with time information to produce a dust exposure for each employee and each different dust type.
Exposure to gamma radiation is assessed using TLD badges from the Personal Monitoring Service of ARPANSA. TLD badges are worn for a period of three months. They are issued to all occupation groups with designated employees. The balance of employees receive the average exposure for their occupation group. TLD badges are issued to different employees every monitoring period. Employees from occupation groups which are likely to receive elevated gamma dose are issued a TLD badge each monitoring period (eg. Slag Crushers, Mill Technician, Product Packer, Slag Handling Technician, TRS Technician, Instrumentation Technician working with radiation gauges). Spare TLD badges are also kept on hand to be issued to employees upon request.
Although the exposure to RDP within the Metallurgical Plant is much less than other pathways, it is assessed in the same way as for Mine employees. The same time information used for calculation of dust exposure is used for calculating RDP exposure. All surface locations/occupations are grouped into one surface airway. A weekly average is calculated from all surface RDP measurements and is assigned to this airway. Location-based RDP concentration information is then combined with the employee time card information to derive individual weekly exposure data (µJ.hr/m3).
2.2 Exposure to Dose Calculations Conversion of dust exposure to committed effective dose is achieved by the use of dose conversion factors, which are derived using the methodologies in ICRP68/72. The parameters physically measured to determine the factors are; particle size and radionuclide content. These measurements are undertaken in a number of areas of the Mine and Metallurgical Plant.
BHP BILLITON OLYMPIC DAM 1 JULY 2008 - 30 JUNE 2009 Annual Radiation Protection Report
Page 12 EMPLOYEE DOSE ASSESSMENT METHOD
Analysis of the samples used to determine the radionuclide content was carried out by the Olympic Dam Analytical Laboratory. These results were used to determine dose conversion factors, which remain unchanged from last year. A summary of the dose conversion factors used for 2008/2009 is given in Appendix A. Dose conversion factors have been carried over from the previous reporting year.
To calculate committed dose for airborne dust exposure, the airborne dust exposure is multiplied by the appropriate dose conversion factor. The committed doses for the different dusts are then added to give a total airborne dust dose.
Dose equivalent from RDP are calculated by multiplying the RDP exposure by the default dose conversion factor recommended by ICRP65 of 1.41 mSv.m3/mJ.hr (5 mSv/WLM).

1 JULY 2008 - 30 JUNE 2009 BHP BILLITON OLYMPIC DAM Annual Radiation Protection Report
Employee Doses Page 13
3 Employee Doses
3.1 Doses to Mine Employees
3.1.1 Descriptive Statistics A total of 738 full-time designated Mine worker’s doses were calculated for the period 1st July 2008 to 30th June 2009. This included all BHP Billiton Olympic Dam Mine employees and associated contractors. The distribution of doses for these work classifications is given in Figure 3-1.
0
50
100
150
200
250
300
1 2 3 4 5 6 7 8 9 10 11 12 13 14 15 16 17 18 19 20 >20
Dose (mSv)
No
. o
f W
ork
ers
0
0.1
0.2
0.3
0.4
0.5
0.6
0.7
0.8
0.9
1
Per
cen
tag
e o
f w
ork
ers
abo
ve d
ose
Part-time
Ful-Time
%over Ann
ual R
epor
ting
lev
Figure 3-1: Annual Dose Distribution 2008/2009 for All Designated Employees - Mine
The selection criteria for determining whether employees are categorised as ‘full- time’ or ‘part-time’ is as follows:
A ‘full-time’ Mine employee is an employee whose dose has been assessed for a total of three or more quarters in the Mine. A ‘part-time’ employee therefore has dose assessment for less than three quarters. This eliminates any unintentional biasing of the analysis of data due to short exposure periods.
The mean dose to all designated mine employees was 3.4 mSv in 2008/2009, a decrease from the 2007/2008 value of 3.6 mSv.
The mean dose for full-time designated mine workers was 3.5 mSv in 2008/2009, a decrease from the 2007/2008 value of 3.7 mSv.
The mean dose for part-time designated mine workers was 3.0 mSv in 2008/2009, an increase from the 2007/2008 value of 2.9 mSv.
The average exposure to radon decay products (RDP) in the underground mine for 2008/2009 was 5% lower than in 2007/2008. Table 3-1 consolidates the results.
BHP BILLITON OLYMPIC DAM 1 JULY 2008 - 30 JUNE 2009 Annual Radiation Protection Report
Page 14 Employee Doses
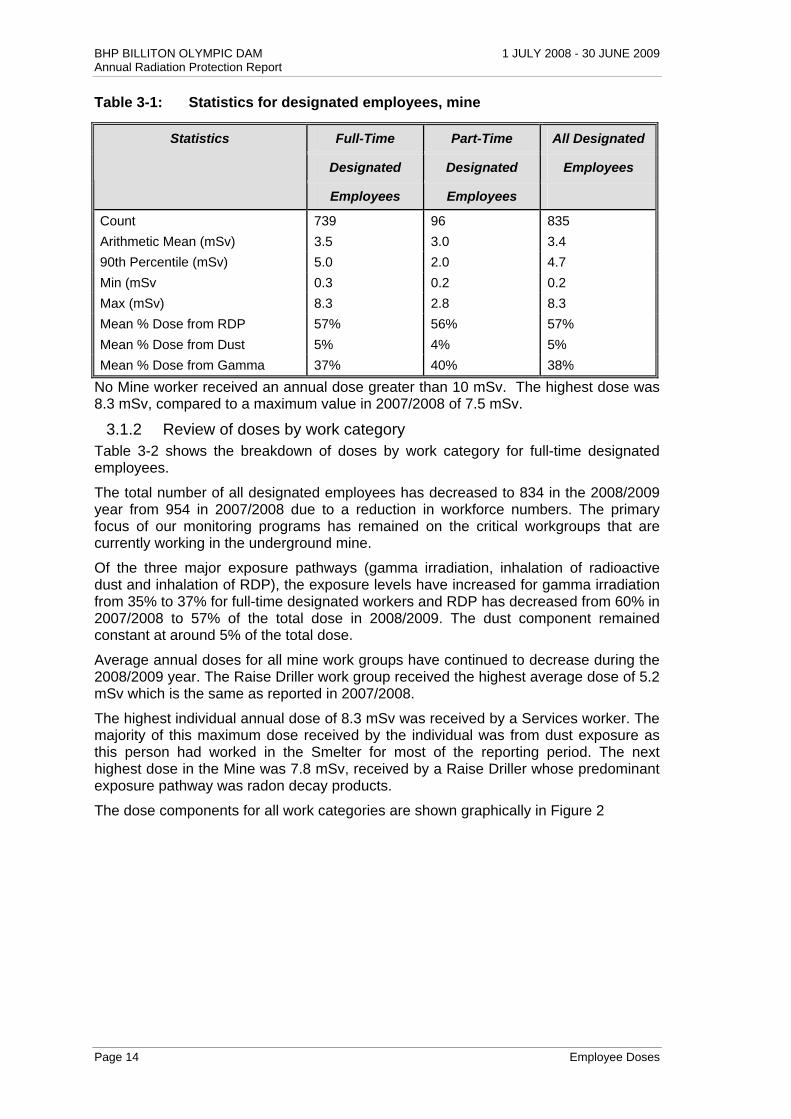
Table 3-1: Statistics for designated employees, mine
Full-Time Part-Time All Designated
Designated Designated Employees
Statistics
Employees Employees
Count 739 96 835
Arithmetic Mean (mSv) 3.5 3.0 3.4
90th Percentile (mSv) 5.0 2.0 4.7
Min (mSv 0.3 0.2 0.2
Max (mSv) 8.3 2.8 8.3
Mean % Dose from RDP 57% 56% 57%
Mean % Dose from Dust 5% 4% 5%
Mean % Dose from Gamma 37% 40% 38%
No Mine worker received an annual dose greater than 10 mSv. The highest dose was 8.3 mSv, compared to a maximum value in 2007/2008 of 7.5 mSv.
3.1.2 Review of doses by work category Table 3-2 shows the breakdown of doses by work category for full-time designated employees.
The total number of all designated employees has decreased to 834 in the 2008/2009 year from 954 in 2007/2008 due to a reduction in workforce numbers. The primary focus of our monitoring programs has remained on the critical workgroups that are currently working in the underground mine.
Of the three major exposure pathways (gamma irradiation, inhalation of radioactive dust and inhalation of RDP), the exposure levels have increased for gamma irradiation from 35% to 37% for full-time designated workers and RDP has decreased from 60% in 2007/2008 to 57% of the total dose in 2008/2009. The dust component remained constant at around 5% of the total dose.
Average annual doses for all mine work groups have continued to decrease during the 2008/2009 year. The Raise Driller work group received the highest average dose of 5.2 mSv which is the same as reported in 2007/2008.
The highest individual annual dose of 8.3 mSv was received by a Services worker. The majority of this maximum dose received by the individual was from dust exposure as this person had worked in the Smelter for most of the reporting period. The next highest dose in the Mine was 7.8 mSv, received by a Raise Driller whose predominant exposure pathway was radon decay products.
The dose components for all work categories are shown graphically in Figure 2

1 JULY 2008 - 30 JUNE 2009 BHP BILLITON OLYMPIC DAM Annual Radiation Protection Report
Employee Doses Page 15
Table 3-2: Statistics for Full Time Designated Mine Employees
No. Mean Minimum Maximum 90th
of (mSv) (mSv) (mSv) Percentile
WORK CATEGORY
Emp. (mSv)
Backfill 3 1.7 1.6 1.9 1.8
Core Farm 8 0.4 0.3 0.5 0.5
Development 145 3.9 1.0 6.3 5.2
Diamond Driller 35 3.3 0.6 4.9 4.4
Electrician 21 2.6 1.3 4.6 4.1
Fitter 35 2.0 0.7 3.7 2.7
Mine Surface 26 1.8 0.5 4.4 3.0
Ore Handling 155 3.8 1.0 6.9 4.7
Production Charger 16 4.7 3.2 5.4 5.3
Production Drilling 43 3.8 1.7 6.3 4.8
Raise Driller 18 5.2 2.4 7.8 7.1
Services 234 3.3 0.5 8.3 5.1
RDP. RDP. % Gamma Gamma %
Dust Dust %
Average of Total Average of total Average of Total
WORK CATEGORY
(mSv) Dose (mSv) Dose (mSv) Dose
Backfill 1.0 60% 0.6 36% 0.1 4%
Core Farm 0.1 20% 0.2 43% 0.1 37%
Development 2.2 56% 1.5 39% 0.2 5%
Diamond Driller 2.0 61% 1.2 36% 0.1 3%
Electrician 1.2 46% 1.2 47% 0.2 7%
Fitter 1.1 55% 0.7 35% 0.2 10%
Mine Surface 1.1 60% 0.6 35% 0.1 5%
Ore Handling 2.4 62% 1.3 34% 0.2 4%
Production Charger 2.3 49% 2.2 47% 0.2 4%
Production Drilling 2.1 55% 1.6 42% 0.1 2%
Raise Driller 3.0 58% 2.0 39% 0.2 3%
Services 1.9 56% 1.2 37% 0.2 7%

BHP BILLITON OLYMPIC DAM 1 JULY 2008 - 30 JUNE 2009 Annual Radiation Protection Report
Page 16 Employee Doses
0.0
1.0
2.0
3.0
4.0
5.0
6.0
Backf
ill
Core F
arm
Develo
pmen
t
Diamond
Drill
er
Electri
cian
Fitter
Mine
Sur
face
Ore H
andli
ng
Produc
tion
Charge
r
Produc
tion
Drilling
Raise D
riller
Servic
es
Work Group
Do
se (
mS
v)
Dust Average (mSv) RDP. Average (mSv) Gamma Average (mSv)
Figure 3-2: Doses, showing components, for Full Time Designated Mine Employees
The average and maximum effective dose for the critical Mine underground workgroups and dose component trends for selected workgroups are given in Figure 3-3 to Figure 3-24.

1 JULY 2008 - 30 JUNE 2009 BHP BILLITON OLYMPIC DAM Annual Radiation Protection Report
Employee Doses Page 17
Back Fill The average and maximum dose to the Backfill workgroup has decreased from 2.4 mSv and 4.5 mSv to 1.7 mSv and 1.9 mSv respectively. The Backfill workgroup required a correction during the 2007/2008 reporting period as employees who worked underground and reported to Services were being mapped to the surface Backfill workgroup since they were employed by the same contractor company. This issue has been resolved but was not backdated for dose assessment and accounts for the peak seen in exposures in 2006/2007. The dose distribution histogram has been removed for Backfill due to the small size of the workgroup.
0.0
2.0
4.0
6.0
8.0
10.0
12.0
14.0
16.0
18.0
20.0
Jul04-Jun05 Jul05-Jun06 Jul06-Jun07 Jul07-Jun08 Jul08-Jun09
Period
Do
se (
mS
v)
Dust RDP Gamma MAX Total Dose(mSv)
Figure 3-3: Annual Dose Trends for the Backfill Workgroup

BHP BILLITON OLYMPIC DAM 1 JULY 2008 - 30 JUNE 2009 Annual Radiation Protection Report
Page 18 Employee Doses
Core Processing The average and maximum dose to Core Processing employees have remained at low levels of under 1mSv per year, 0.4 mSv and 0.5 mSv respectively. Dust exposure to this workgroup is in the process of review for occupational hygiene purposes. The dose distribution histogram has been removed for the Core Processing workgroup as all doses are below 1 mSv.
0.0
2.0
4.0
6.0
8.0
10.0
12.0
14.0
16.0
18.0
20.0
Jul04-Jun05 Jul05-Jun06 Jul06-Jun07 Jul07-Jun08 Jul08-Jun09
Period
Do
se (
mS
v)
Dust RDP Gamma MAX Total Dose(mSv)
Figure 3-4: Annual Dose Trends for the Core Farm Workgroup

1 JULY 2008 - 30 JUNE 2009 BHP BILLITON OLYMPIC DAM Annual Radiation Protection Report
Employee Doses Page 19
Development The average and maximum dose to the Development workgroup has decreased from 4.3 mSv and 7.4 mSv to 3.9 mSv and 6.3 mSv respectively. This is primarily a result of reduced exposure to radon decay products with a minor reduction in gamma.
0
10
20
30
40
50
60
1 2 3 4 5 6 7 8 9 10 11 12 13 14 15 16 17 18 19 20 >20
Annual Dose (mSv)
No
. o
f P
eop
le
Part-Time
Full-Time
Figure 3-5: Annual Dose Distribution for the Development Workgroup
0.0
2.0
4.0
6.0
8.0
10.0
12.0
14.0
16.0
18.0
20.0
Jul04-Jun05 Jul05-Jun06 Jul06-Jun07 Jul07-Jun08 Jul08-Jun09
Period
Do
se (
mS
v)
Dust RDP Gamma MAX Total Dose(mSv)
Figure 3-6: Annual Dose Trends for the Development Workgroup

BHP BILLITON OLYMPIC DAM 1 JULY 2008 - 30 JUNE 2009 Annual Radiation Protection Report
Page 20 Employee Doses
Diamond Drilling The average and maximum dose to the Diamond Drilling workgroup has decreased from 3.7 mSv and 5.8 mSv to 3.3 mSv and 4.9 mSv respectively. The large reduction observed since 2007/2008 is primarily a result of decreased gamma exposures with improved site set up. Radon decay product exposures to the workgroup have also reduced in the current reporting period and continue to be a focus for the workgroup.
0
2
4
6
8
10
12
14
16
18
1 2 3 4 5 6 7 8 9 10 11 12 13 14 15 16 17 18 19 20 >20
Annual Dose (mSv)
No
. o
f P
eop
le
Part-Time
Full-Time
Figure 3-7: Annual Dose Distribution for the Diamond Drilling Workgroup
0.0
2.0
4.0
6.0
8.0
10.0
12.0
14.0
16.0
18.0
20.0
Jul04-Jun05 Jul05-Jun06 Jul06-Jun07 Jul07-Jun08 Jul08-Jun09
Period
Do
se (
mS
v)
Dust RDP Gamma MAX Total Dose(mSv)
Figure 3-8: Annual Dose Trends for the Diamond Drilling Workgroup

1 JULY 2008 - 30 JUNE 2009 BHP BILLITON OLYMPIC DAM Annual Radiation Protection Report
Employee Doses Page 21
Electrician The average dose to electricians has remained constant at 2.6 mSv and the maximum has increased from 4.4 mSv to 4.6 mSv.
0
2
4
6
8
10
12
14
1 2 3 4 5 6 7 8 9 10 11 12 13 14 15 16 17 18 19 20 >20
Annual Dose (mSv)
No
. o
f P
eop
le
Part-Time
Full-Time
Figure 3-9: Annual Dose Distribution for the Electrician Workgroup
0.0
2.0
4.0
6.0
8.0
10.0
12.0
14.0
16.0
18.0
20.0
Jul04-Jun05 Jul05-Jun06 Jul06-Jun07 Jul07-Jun08 Jul08-Jun09
Period
Do
se (
mS
v)
Dust RDP Gamma MAX Total Dose(mSv)
Figure 3-10: Annual Dose Trends for the Electrician Workgroup
BHP BILLITON OLYMPIC DAM 1 JULY 2008 - 30 JUNE 2009 Annual Radiation Protection Report
Page 22 Employee Doses
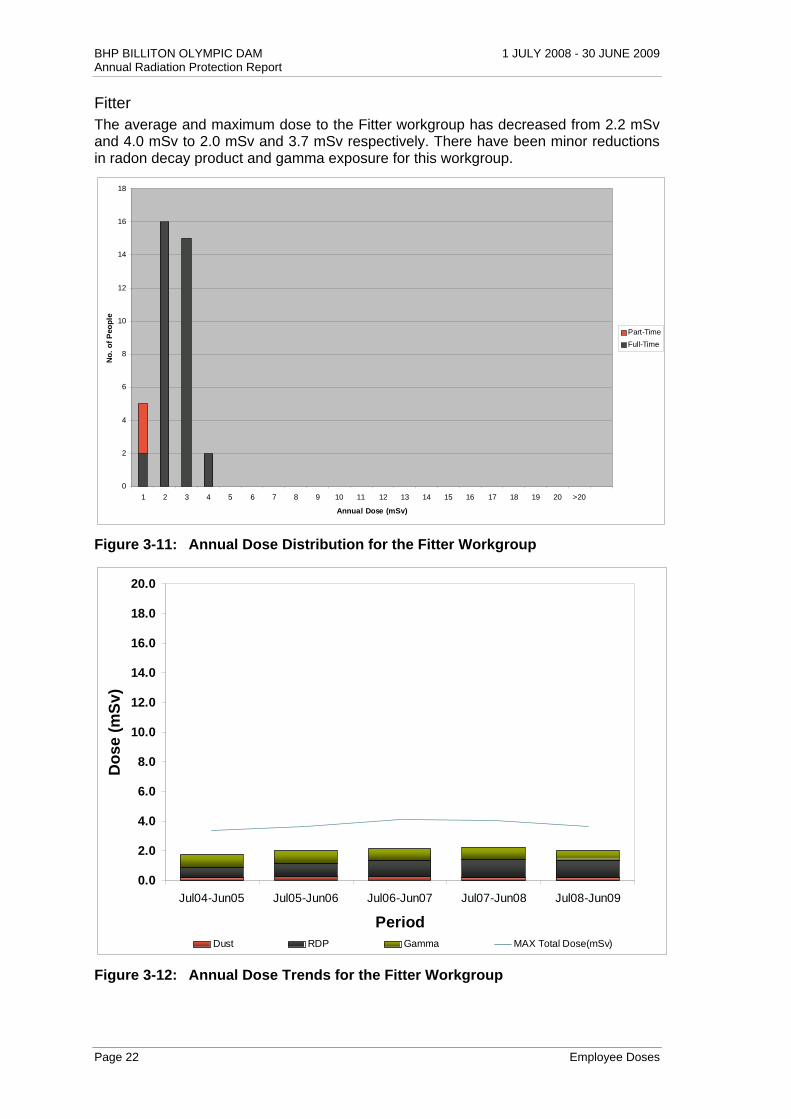
Fitter The average and maximum dose to the Fitter workgroup has decreased from 2.2 mSv and 4.0 mSv to 2.0 mSv and 3.7 mSv respectively. There have been minor reductions in radon decay product and gamma exposure for this workgroup.
0
2
4
6
8
10
12
14
16
18
1 2 3 4 5 6 7 8 9 10 11 12 13 14 15 16 17 18 19 20 >20
Annual Dose (mSv)
No
. o
f P
eop
le
Part-Time
Full-Time
Figure 3-11: Annual Dose Distribution for the Fitter Workgroup
0.0
2.0
4.0
6.0
8.0
10.0
12.0
14.0
16.0
18.0
20.0
Jul04-Jun05 Jul05-Jun06 Jul06-Jun07 Jul07-Jun08 Jul08-Jun09
Period
Do
se (
mS
v)
Dust RDP Gamma MAX Total Dose(mSv)
Figure 3-12: Annual Dose Trends for the Fitter Workgroup

1 JULY 2008 - 30 JUNE 2009 BHP BILLITON OLYMPIC DAM Annual Radiation Protection Report
Employee Doses Page 23
Surface Workers The average dose has increased from 1.7 mSv to 1.8 mSv and the maximum dose has reduced from 5.5 mSv to 4.4 mSv. There was a minor increase in the average exposure to radon decay products.
0
2
4
6
8
10
12
14
1 2 3 4 5 6 7 8 9 10 11 12 13 14 15 16 17 18 19 20 >20
Annual Dose (mSv)
No
. o
f P
eop
le
Part-Time
Full-Time
Figure 3-13: Annual Dose Distribution for the Surface Workers Workgroup
0.0
2.0
4.0
6.0
8.0
10.0
12.0
14.0
16.0
18.0
20.0
Jul04-Jun05 Jul05-Jun06 Jul06-Jun07 Jul07-Jun08 Jul08-Jun09
Period
Do
se
(m
Sv
)
Dust RDP Gamma MAX Total Dose(mSv)
Figure 3-14: Annual Dose Trends for the Surface Workers Workgroup

BHP BILLITON OLYMPIC DAM 1 JULY 2008 - 30 JUNE 2009 Annual Radiation Protection Report
Page 24 Employee Doses
Ore Handling The average dose has decreased from 4.1 mSv to 3.8 mSv while the maximum dose has increased from 6.1 mSv to 6.9 mSv. The decrease in the average dose is a result of minor decreases in radon decay product and gamma exposure. Average and maximum doses for the workgroup are still within historical levels.
0
10
20
30
40
50
60
70
80
90
100
1 2 3 4 5 6 7 8 9 10 11 12 13 14 15 16 17 18 19 20 >20
Annual Dose (mSv)
No
. o
f P
eop
le
Part-Time
Full-Time
Figure 3-15: Annual Dose Distribution for the Ore Handling Workgroup
0.0
2.0
4.0
6.0
8.0
10.0
12.0
14.0
16.0
18.0
20.0
Jul04-Jun05 Jul05-Jun06 Jul06-Jun07 Jul07-Jun08 Jul08-Jun09
Period
Do
se
(m
Sv
)
Dust RDP Gamma MAX Total Dose(mSv)
Figure 3-16: Annual Dose Trends for the Ore Handling Workgroup

1 JULY 2008 - 30 JUNE 2009 BHP BILLITON OLYMPIC DAM Annual Radiation Protection Report
Employee Doses Page 25
Production Charger The average and maximum dose for Production Chargers have decreased from 4.8 mSv and 6.1 mSv to 4.7 mSv and 5.4 mSv respectively. The reduction is a result of a decrease in radon decay product exposure with a minor increase in gamma exposure. Exposures remain within historical variations.
0
1
2
3
4
5
6
7
8
9
10
1 2 3 4 5 6 7 8 9 10 11 12 13 14 15 16 17 18 19 20 >20
Annual Dose (mSv)
No
. o
f P
eop
le
Part-Time
Full-Time
Figure 3-17: Annual Dose Distribution for the Production Charger Workgroup
0.0
2.0
4.0
6.0
8.0
10.0
12.0
14.0
16.0
18.0
20.0
Jul04-Jun05 Jul05-Jun06 Jul06-Jun07 Jul07-Jun08 Jul08-Jun09
Period
Do
se
(m
Sv
)
Dust RDP Gamma MAX Total Dose(mSv)
Figure 3-18: Annual Dose Trends for the Production Charger Workgroup

BHP BILLITON OLYMPIC DAM 1 JULY 2008 - 30 JUNE 2009 Annual Radiation Protection Report
Page 26 Employee Doses
Production Driller The average dose for the production drillers has decreased from 4.1 mSv to 3.8 mSv and maximum dose increased from 5.9 mSv to 6.3 mSv. The reduction in the average exposure is due to a decrease in the radon decay product exposures. Exposures remain within the range of those experienced historically.
0
2
4
6
8
10
12
14
16
18
20
1 2 3 4 5 6 7 8 9 10 11 12 13 14 15 16 17 18 19 20 >20
Annual Dose (mSv)
No
. o
f P
eop
le
Part-Time
Full-Time
Figure 3-19: Annual Dose Distribution for the Production Driller Workgroup
0.0
2.0
4.0
6.0
8.0
10.0
12.0
14.0
16.0
18.0
20.0
Jul04-Jun05 Jul05-Jun06 Jul06-Jun07 Jul07-Jun08 Jul08-Jun09
Period
Do
se
(m
Sv
)
Dust RDP Gamma MAX Total Dose(mSv)
Figure 3-20: Annual Dose Trends for the Production Driller Workgroup

1 JULY 2008 - 30 JUNE 2009 BHP BILLITON OLYMPIC DAM Annual Radiation Protection Report
Employee Doses Page 27
Raise Driller The average dose has decreased from 5.3 mSv to 5.2 mSv and the maximum dose has increased from 7.5 mSv to 7.8 mSv. This workgroup has seen a reduction in exposure to radon decay product exposure and a minor 0.2 mSv increase in gamma exposure. Focus on radon decay product exposure continues to be the main priority for radiation exposure to this workgroup.
0
1
2
3
4
5
6
1 2 3 4 5 6 7 8 9 10 11 12 13 14 15 16 17 18 19 20 >20
Annual Dose (mSv)
No
. o
f P
eop
le
Part-Time
Full-Time
Figure 3-21: Annual Dose Distribution for the Raise Driller Workgroup
0.0
2.0
4.0
6.0
8.0
10.0
12.0
14.0
16.0
18.0
20.0
Jul04-Jun05 Jul05-Jun06 Jul06-Jun07 Jul07-Jun08 Jul08-Jun09
Period
Do
se
(m
Sv
)
Dust RDP Gamma MAX Total Dose(mSv)
Figure 3-22: Annual Dose Trends for the Raise Driller Workgroup
BHP BILLITON OLYMPIC DAM 1 JULY 2008 - 30 JUNE 2009 Annual Radiation Protection Report
Page 28 Employee Doses
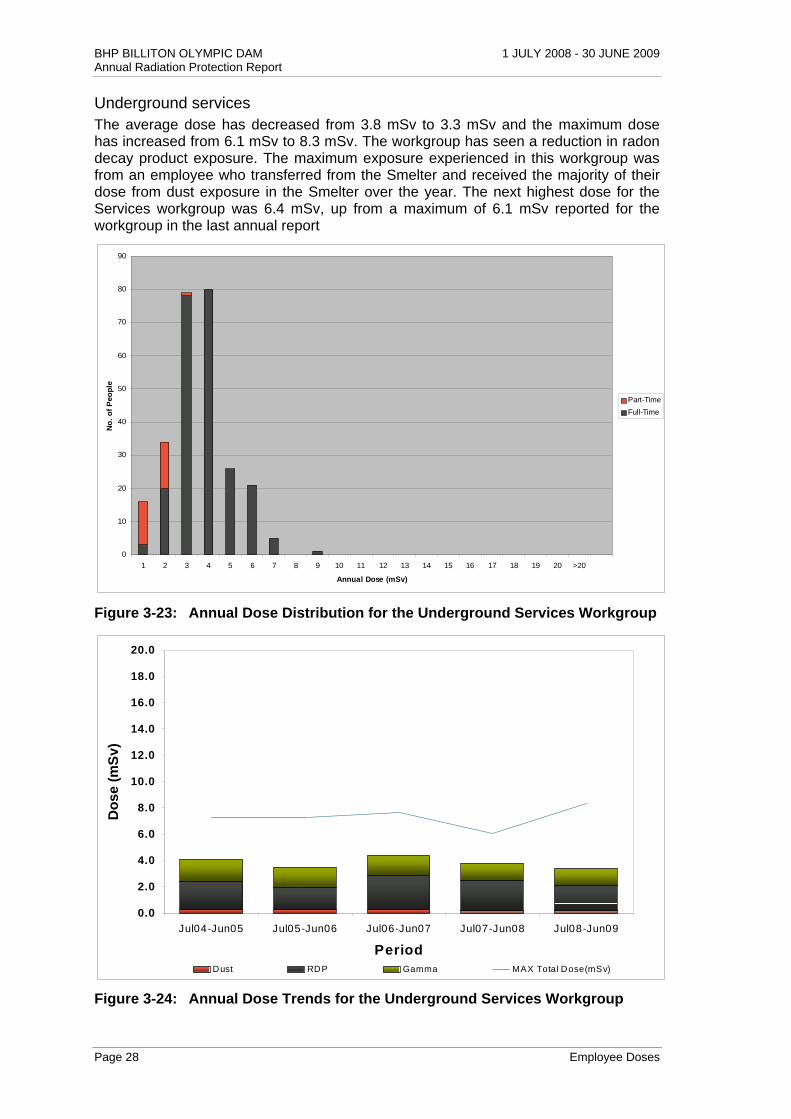
Underground services The average dose has decreased from 3.8 mSv to 3.3 mSv and the maximum dose has increased from 6.1 mSv to 8.3 mSv. The workgroup has seen a reduction in radon decay product exposure. The maximum exposure experienced in this workgroup was from an employee who transferred from the Smelter and received the majority of their dose from dust exposure in the Smelter over the year. The next highest dose for the Services workgroup was 6.4 mSv, up from a maximum of 6.1 mSv reported for the workgroup in the last annual report
0
10
20
30
40
50
60
70
80
90
1 2 3 4 5 6 7 8 9 10 11 12 13 14 15 16 17 18 19 20 >20
Annual Dose (mSv)
No
. o
f P
eop
le
Part-Time
Full-Time
Figure 3-23: Annual Dose Distribution for the Underground Services Workgroup
0.0
2.0
4.0
6.0
8.0
10.0
12.0
14.0
16.0
18.0
20.0
Jul04-Jun05 Jul05-Jun06 Jul06-Jun07 Jul07-Jun08 Jul08-Jun09
Period
Do
se
(m
Sv
)
Dust RDP Gamma MAX Total Dose(mSv)
Figure 3-24: Annual Dose Trends for the Underground Services Workgroup

1 JULY 2008 - 30 JUNE 2009 BHP BILLITON OLYMPIC DAM Annual Radiation Protection Report
Employee Doses Page 29
3.1.3 Strategies for Dose Reduction There is a continuous focus on reducing dose to employees at the mine and some of these measures include;
Development of a new Radiation Management Plan
Implementation of continuous radon decay product monitoring equipment
Increasing the electronic gamma dosimeter monitoring program and a trial of new instrumentation
Extensions to the existing ventilation system
Focused radiation monitoring for the higher exposed work groups
The mine ventilation department have continued to focus on ensuring that exposure to radon decay products are minimised. This has been achieved through the following;
Continued control over interactions in the mine through improvements in the 8 day and 3 month schedules
Commencement of RB33 for the Cyan’s and Rail level in FY09
Plans for RB34 as an exhaust for the southern rail, CC and DSE sections of the mine in FY10.
RB31 intake to be extended down to the rail to cater for exhausting of RB34 in FY10
The Bladewerx instruments require further analysis to be undertaken on their suitability prior to approval being granted for their use by underground shifts in accessing areas of the Mine. A reduction in departmental resources this year has resulted in this project being put on hold temporarily, however it is intended to be followed up in FY10.
The Mine Radiation Team has focused on real time electronic gamma monitoring as well as general improvements to their operating systems over the last 12 months. The following year will see an increased implementation of electronic gamma monitoring and further push for the implementation of real time radon decay product monitors underground.
3.1.4 Case Study – Electronic Gamma Monitoring Two different types of electronic gamma dosimeters are being used to assess and control exposure to gamma rays present in the underground operations. Canberra Dosicards are being used as part of a program that replaced the use of monthly issued Thermoluminescent Dosimeter (TLD) badges with quarterly issue for some workgroups. Two types of Polimaster gamma watches have also been introduced to specific workgroups to assist with the determination of sites that may require remedial controls for gamma radiation exposure. To date both programs have been successfully integrated into the radiation monitoring program for the underground operation and have provided dramatic improvements in our ability to quickly determine sources of elevated gamma radiation in the underground environment and subsequently introduce controls.
To date the major problem experienced with the dosicard instruments has been their durability and for the first 6 months of the monitoring program there was a high attrition rate of the instruments due to the way they were being worn on employee cap lamp leads. Damage has ranged from the cards being crushed in vehicle doors to immersion in water. Attaching the cards to the external side of employees cap lamp batteries has improved the instrument survival rates dramatically. On-site studies showed that any shielding afforded by the battery was minimal in comparison to the manufacturer’s published variations.
Results from the Canberra Dosicard program have been incorporated into the quarterly Radiation and Occupational Hygiene Monitoring reports. A daily dose action limit of 30
BHP BILLITON OLYMPIC DAM 1 JULY 2008 - 30 JUNE 2009 Annual Radiation Protection Report
Page 30 Employee Doses
uSv has been selected as the level where further investigation is required. Since the sites where the dosicards are used have already been part of the normal gamma survey schedule prior to employees entering the area, the cards have found their main advantage in ensuring good housekeeping measures are employed at the sites or determining whether further remedial action is required.
Since their implementation in early 2008 the dosicards have been successful in identifying a diamond drill rig site with poor housekeeping. The site had cuttings in a drain causing some medium term occupancy zones to be above the site gamma radiation action limit. Follow-up gamma surveys, concreting the drainage channel and ensuring that hosing away the cuttings was performed each shift ensured that the gamma radiation exposure was not only reduced below the action limit but minimised. Other monitoring that has produced results above the action limit has been investigated and identified some sites that have required remedial action in the form of additional shotcrete.
Primarily the electronic dosimeter program has been used to successfully replace the requirement for Raise Drillers, Diamond Drillers and Production Drill and Blast to wear monthly TLD badges. These workgroups now wear quarterly TLD badges that are used for dose assessment and the dosicard program assists with the swift identification and determination of any significant increase in exposures. Costs and resources associated with the analysis, distribution and collection of monthly badges have been put to better use providing more opportunity for other proactive radiation safety and occupation hygiene measures to be put in place.
In conjunction with the normal underground gamma survey program and quarterly TLD badge monitoring the use of the Canberra Dosicards has been a welcome improvement for the control of gamma radiation in the underground operations at Olympic Dam.
Of greater interest to the employees is the trial of the Polimaster gamma watches. These have been issued to development employees who are typically the first people to enter new areas of the mine. As the underground operations continue to develop, increased gamma surveys of new development headings are required to be undertaken. By issuing these watches to the relevant employees we ensure that the headings are surveyed in a timely manner and that information on where the watch has alarmed is passed back to the radiation safety department so that detailed follow up surveys can be performed. The watches have also been trialled with the shotcreters who visit the development headings in order to perform shotcreting for ground support, and this has again resulted in timely data collection and implementation of controls if required.
To date the watches have helped to identify several sites of interest for remedial action where gamma levels have been above the site action limit. In one particular case where the watches were given to shotcreters they were able to perform remedial action while they were at the site after being shown how to perform a basic gamma survey using the watch. The trial of the gamma watches also helped to identify another recent development site with gamma levels above the site action limit. In this case the site was restricted until remedial action in the form of shotcreting was applied. Trial of the watches continues and other sites have been identified as requiring follow-up surveys.
The trial of the watches has shown them to be more robust than the dosicards but as they are not designed to determine personal doses they have only been implemented for use as an additional survey tool. It is expected that due to their greater durability that more Polimaster 1603A watches will be purchased and issued to underground employees in the development workgroup. The primary focus of this program is to help identify areas of elevated gamma radiation that might then provide higher exposures to employees who would spend longer periods of time at the site. By identifying these
1 JULY 2008 - 30 JUNE 2009 BHP BILLITON OLYMPIC DAM Annual Radiation Protection Report
Employee Doses Page 31
sites during the development process and performing remedial action at this step it reduces the exposure to any personnel who might access the area. It also improves efficiency for the operation, in that shotcreting is a development process, and ensures that all sites are identified at the earliest stage of the mining process reducing exposures to employees further down the production chain.
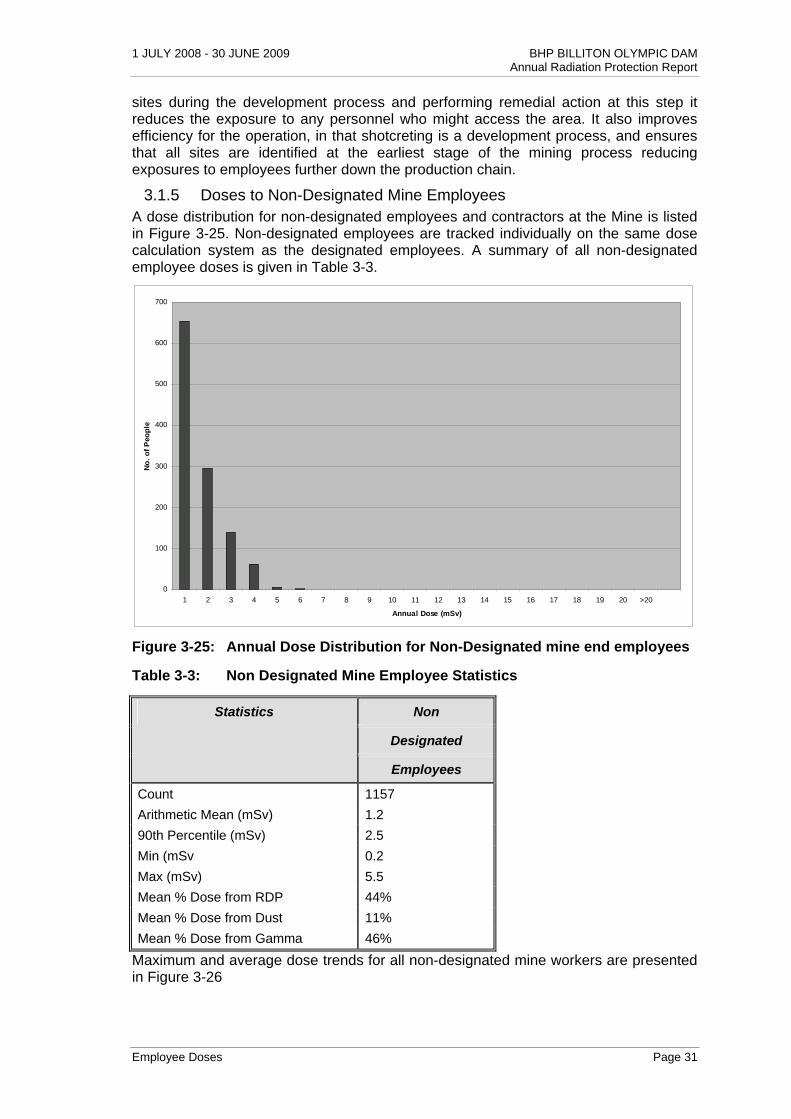
3.1.5 Doses to Non-Designated Mine Employees A dose distribution for non-designated employees and contractors at the Mine is listed in Figure 3-25. Non-designated employees are tracked individually on the same dose calculation system as the designated employees. A summary of all non-designated employee doses is given in Table 3-3.
0
100
200
300
400
500
600
700
1 2 3 4 5 6 7 8 9 10 11 12 13 14 15 16 17 18 19 20 >20
Annual Dose (mSv)
No
. o
f P
eop
le
Figure 3-25: Annual Dose Distribution for Non-Designated mine end employees
Table 3-3: Non Designated Mine Employee Statistics
Non
Designated
Statistics
Employees
Count 1157
Arithmetic Mean (mSv) 1.2
90th Percentile (mSv) 2.5
Min (mSv 0.2
Max (mSv) 5.5
Mean % Dose from RDP 44%
Mean % Dose from Dust 11%
Mean % Dose from Gamma 46%
Maximum and average dose trends for all non-designated mine workers are presented in Figure 3-26

BHP BILLITON OLYMPIC DAM 1 JULY 2008 - 30 JUNE 2009 Annual Radiation Protection Report
Page 32 Employee Doses
0.0
1.0
2.0
3.0
4.0
5.0
6.0
7.0
8.0
9.0
10.0
2004/2005 2005/2006 2006/2007 2007/2008 2008/2009
Period
Do
se
(mS
v)
0
200
400
600
800
1000
1200
1400
1600
1800
No
. of
Em
plo
ye
es
Avg Max Dose Number of workers
Figure 3-26: Average Dose Trends for Non-Designated Employees
Airborne dust doses and radon decay product doses have been calculated using average airborne dust measurements, average radon decay product measurements, dose conversion factors and either an estimation of the hours worked based on a typical working roster, or actual hours. Gamma doses have been estimated based on direct personal monitoring and averages resulting from this monitoring.
0.0
0.5
1.0
1.5
2.0
2.5
3.0
3.5
Backfill Core Farm Development DiamondDriller
Electrician Fitter MineSurface
Ore Handling ProductionDrilling
Raise Driller ServicesWork Group
Do
se (
mS
v)
Dust Average (mSv) RDP. Average (mSv) Gamma Average (mSv)
Figure 3-27: Annual Doses for Non-Designated employees, by source and by Occupation

1 JULY 2008 - 30 JUNE 2009 BHP BILLITON OLYMPIC DAM Annual Radiation Protection Report
Employee Doses Page 33
Figure 3-26 shows maximum and average dose trends for all non-designated Mine workers from 1 July 2003 to 30 June 2009.
The total number of non-designated employees has increased from 997 in 2007/2008 to 1157 in 2008/2009. The average dose has increased from 1.1 mSv to 1.2 mSv. Seventy mine employees received a dose above 3 mSv, with the highest being 5.5 mSv. Fifty six of these workers were issued with TLD badges including the worker with the highest dose. These employees have not been designated because they were recently engaged workers, have recently changed jobs or previously assessed as not needing to be designated.
Employee’s designation status is reviewed quarterly. It is also important to note that designation status is lost when a worker is terminated which means that terminated employees will be included in non-designated statistics, as is the case with the diamond driller who received 5.5 mSv.
3.1.6 Cumulative Five Year Dose As outlined in ICRP 60, the total dose of any individual radiation worker should not exceed 100 mSv in any five year period. To this end, a five year total dose has been determined for all full-time currently designated Mine workers who were employed at Olympic Dam for the previous five years. The calculation of cumulative five year effective dose includes employees who have worked for more than 18 quarters.
There were a total of 393 designated Mine workers who worked continuously at the Mine during the period 1st July 2004 to 30th June 2009. This number has increased from the 340 workers reported for the period 1st July 2003 to 30th June 2008. The maximum dose for a Mine worker is 35.4 mSv for the five year period ending 30 June 2008, as compared with 37.5 mSv for the 2003/2004 to 2008/2009 five year dose period. The arithmetic mean for the group was 16.6 mSv, a slight decrease from 16.7mSv for the five year dose period 2003/2004 to 2007/2008.
The number of employees who have continuously worked for five years at the Mine has continued to increase due to an increase in staffing in general over the last few years. The distribution of doses for the cumulative five year dose is shown in Figure 3-28.
0
20
40
60
80
100
120
140
160
180
200
10 20 30 40 50 60 70 80 90 100 >100
5 Year Dose (mSv)
No
. o
f P
eop
le
Figure 3-28: Five Year Cumulative Dose Distribution Mine

BHP BILLITON OLYMPIC DAM 1 JULY 2008 - 30 JUNE 2009 Annual Radiation Protection Report
Page 34 Employee Doses
A summary of the cumulative five year dose is given in Table 3-4.
Table 3-4: Five Year Stats
Cumulative 5 year Doses Equivalent Average yearly Dose
For Continuously Employed
Statistics
Designated Mine Employees
Count 393 393
Arithmetic Mean (mSv) 16.6 3.3
90th Percentile (mSv) 24.3 4.9
Min (mSv 2.7 0.5
Max (mSv) 35.4 7.1
Mean % Dose from RDP 54%
Mean % Dose from Dust 13%
Mean % Dose from Gamma 39%
3.2 Doses to Metallurgical Plant Employees
3.2.1 Descriptive Statistics A total of 208 full-time designated Metallurgical Plant worker’s doses were calculated for the period 1st July 2008 to 30th June 2009. This included most BHP Billiton Olympic Dam Metallurgical Plant employees and associated contractors who work full time in the plant.
The mean dose to all designated plant employees was 2.7 mSv in 2008/2009, a decrease from the 2007/2008 value of 2.8 mSv.
The mean dose for full-time designated plant workers was 3.0 mSv in 2008/2009, an increase from the 2007/2008 value of 2.9 mSv.
The mean dose for part-time designated plant workers was 0.9 mSv in 2008/2009, a decrease from the 2007/2008 value of 1.5 mSv.
For this period the distribution of doses is shown in Figure 3-29, and the statistics are given in Table 3-5.
Table 3-5: Statistics for designated employees, Metallurgical Plant
Full-Time Part-Time All Designated
Designated Designated Employees
Statistics
Employees Employees
Count 208 19 227
Arithmetic Mean (mSv) 3.0 0.9 2.7
90th Percentile (mSv) 8.5 1.9 7.8
Min (mSv 0.3 0.0 0.0
Max (mSv) 13.1 3.5 13.1
Mean % Dose from RDP 4% 5% 4%
Mean % Dose from Dust 79% 64% 77%
Mean % Dose from Gamma 17% 31% 19%

1 JULY 2008 - 30 JUNE 2009 BHP BILLITON OLYMPIC DAM Annual Radiation Protection Report
Employee Doses Page 35
0
10
20
30
40
50
60
70
80
90
1 2 3 4 5 6 7 8 9 10 11 12 13 14 15 16 17 18 19 20 >20
Dose (mSv)
No
. o
f W
ork
ers
0.00%
10.00%
20.00%
30.00%
40.00%
50.00%
60.00%
70.00%
80.00%
90.00%
100.00%
Per
cen
tag
e o
f w
ork
ers
abo
ve d
ose
Part-time
Ful-Time
%over Ann
ual R
epor
ting
lev
Figure 3-29: Annual Dose Distribution for all Metallurgical Plant employees
3.2.2 Review of Doses by Work Areas The analysis of doses by work area is presented in Table 3-6. The dose statistics for the 2008/2009 year from the Metallurgical Plant areas show decrease in mean dose for Concentrator and Services workgroups from the 2007/2008 year. Hydromet and Smelter mean remained constant and the mean from Refinery and Smelter Slag Handling increased. Maximum doses from the Concentrator and Services decreased while the Refinery maximum dose remained constant. Maximum doses in the Hydromet, Smelter and Slag Handling increased from the previous year.
Individual Work Areas The highest levels were recorded in the Smelter workgroup and their exposure has predominantly been impacted by the recycling of dust to the Flash Furnace. This is discussed in further detail in a case study below. The number of full-time designated employees in the Metallurgical Plant has decreased from 226 in 2007/2008 to 208 in 2008/2009.
Annual dose components for each work area can be seen in Figure 3-29.
Annual total dose distributions and dose trends for each work area along with dose component profiles for selected workgroups can be seen in Figure 3-31 to Figure 3-40.
BHP BILLITON OLYMPIC DAM 1 JULY 2008 - 30 JUNE 2009 Annual Radiation Protection Report
Page 36 Employee Doses
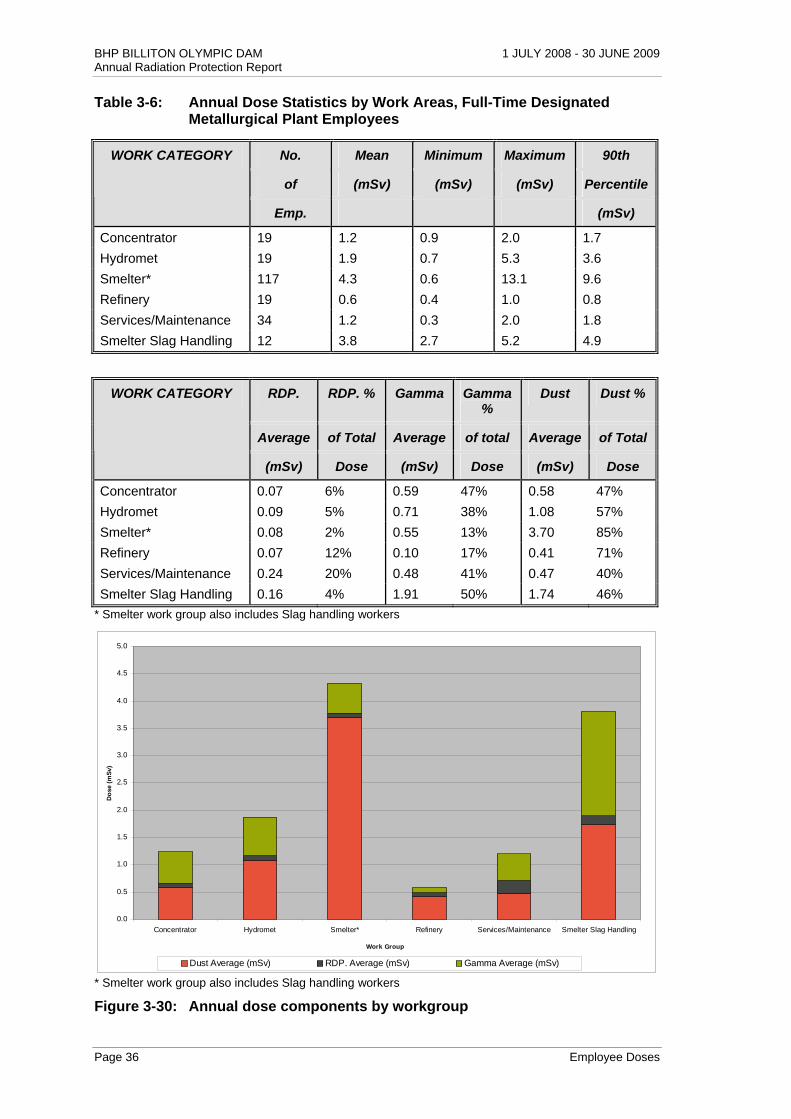
Table 3-6: Annual Dose Statistics by Work Areas, Full-Time Designated Metallurgical Plant Employees
No. Mean Minimum Maximum 90th
of (mSv) (mSv) (mSv) Percentile
WORK CATEGORY
Emp. (mSv)
Concentrator 19 1.2 0.9 2.0 1.7
Hydromet 19 1.9 0.7 5.3 3.6
Smelter* 117 4.3 0.6 13.1 9.6
Refinery 19 0.6 0.4 1.0 0.8
Services/Maintenance 34 1.2 0.3 2.0 1.8
Smelter Slag Handling 12 3.8 2.7 5.2 4.9
RDP. RDP. % Gamma Gamma %
Dust Dust %
Average of Total Average of total Average of Total
WORK CATEGORY
(mSv) Dose (mSv) Dose (mSv) Dose
Concentrator 0.07 6% 0.59 47% 0.58 47%
Hydromet 0.09 5% 0.71 38% 1.08 57%
Smelter* 0.08 2% 0.55 13% 3.70 85%
Refinery 0.07 12% 0.10 17% 0.41 71%
Services/Maintenance 0.24 20% 0.48 41% 0.47 40%
Smelter Slag Handling 0.16 4% 1.91 50% 1.74 46%
* Smelter work group also includes Slag handling workers
0.0
0.5
1.0
1.5
2.0
2.5
3.0
3.5
4.0
4.5
5.0
Concentrator Hydromet Smelter* Refinery Services/Maintenance Smelter Slag Handling
Work Group
Do
se (
mS
v)
Dust Average (mSv) RDP. Average (mSv) Gamma Average (mSv)
* Smelter work group also includes Slag handling workers
Figure 3-30: Annual dose components by workgroup

1 JULY 2008 - 30 JUNE 2009 BHP BILLITON OLYMPIC DAM Annual Radiation Protection Report
Employee Doses Page 37
Concentrator Concentrator doses decreased slightly from previous reporting year primarily due to decrease in recorded dose from gamma radiation following the changes which moved TLD storage to the change rooms ensuring that gamma radiation was not being recorded on the badge during non-wearing periods due to incorrect storage.
0
2
4
6
8
10
12
14
16
1 2 3 4 5 6 7 8 9 10 11 12 13 14 15 16 17 18 19 20 >20
Annual Dose (mSv)
No
. o
f P
eop
le
Part-Time
Full-Time
Figure 3-31: Annual Dose Distribution for the Concentrator Workgroup
0.0
2.0
4.0
6.0
8.0
10.0
12.0
14.0
16.0
18.0
20.0
Jul04-Jun05 Jul05-Jun06 Jul06-Jun07 Jul07-Jun08 Jul08-Jun09
Period
Do
se
(m
Sv
)
Dust RDP Gamma MAX Total Dose(mSv)
Figure 3-32: Dose Trends for the Concentrator Workgroup

BHP BILLITON OLYMPIC DAM 1 JULY 2008 - 30 JUNE 2009 Annual Radiation Protection Report
Page 38 Employee Doses
Hydromet The average dose for Hydromet workers remained steady in this reporting period. The dust proportion of dose has in fact increased, however this was offset by a decrease in gamma exposure following changes to TLD storage. The increase in the dust component was potentially due to poor performance of the uranium packing booth dust extraction system. Its filters were changed out in February 2009 which has resulted in improved performance and a subsequent decrease in radioactivity measured in the monitoring program for this area.
0
1
2
3
4
5
6
7
8
9
1 2 3 4 5 6 7 8 9 10 11 12 13 14 15 16 17 18 19 20 >20
Annual Dose (mSv)
No
. o
f P
eop
le
Part-Time
Full-Time
Figure 3-33: Annual Dose Distribution for the Hydromet Workgroup
0.0
2.0
4.0
6.0
8.0
10.0
12.0
14.0
16.0
18.0
20.0
Jul04-Jun05 Jul05-Jun06 Jul06-Jun07 Jul07-Jun08 Jul08-Jun09
Period
Do
se
(m
Sv
)
Dust RDP Gamma MAX Total Dose(mSv)
Figure 3-34: Dose Trends for the Hydromet Workgroup
1 JULY 2008 - 30 JUNE 2009 BHP BILLITON OLYMPIC DAM Annual Radiation Protection Report
Employee Doses Page 39
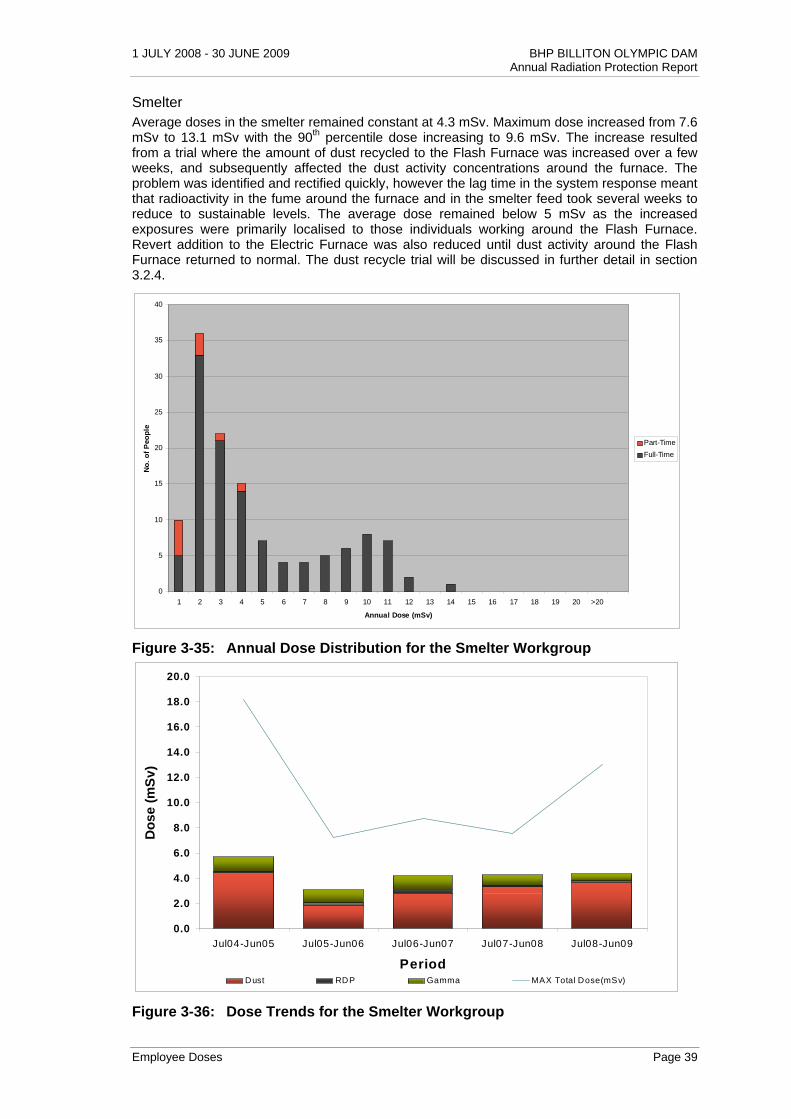
Smelter Average doses in the smelter remained constant at 4.3 mSv. Maximum dose increased from 7.6 mSv to 13.1 mSv with the 90th percentile dose increasing to 9.6 mSv. The increase resulted from a trial where the amount of dust recycled to the Flash Furnace was increased over a few weeks, and subsequently affected the dust activity concentrations around the furnace. The problem was identified and rectified quickly, however the lag time in the system response meant that radioactivity in the fume around the furnace and in the smelter feed took several weeks to reduce to sustainable levels. The average dose remained below 5 mSv as the increased exposures were primarily localised to those individuals working around the Flash Furnace. Revert addition to the Electric Furnace was also reduced until dust activity around the Flash Furnace returned to normal. The dust recycle trial will be discussed in further detail in section 3.2.4.
0
5
10
15
20
25
30
35
40
1 2 3 4 5 6 7 8 9 10 11 12 13 14 15 16 17 18 19 20 >20
Annual Dose (mSv)
No
. o
f P
eop
le
Part-Time
Full-Time
Figure 3-35: Annual Dose Distribution for the Smelter Workgroup
0.0
2.0
4.0
6.0
8.0
10.0
12.0
14.0
16.0
18.0
20.0
Jul04-Jun05 Jul05-Jun06 Jul06-Jun07 Jul07-Jun08 Jul08-Jun09
Period
Do
se
(m
Sv
)
Dust RDP Gamma MAX Total Dose(mSv)
Figure 3-36: Dose Trends for the Smelter Workgroup
BHP BILLITON OLYMPIC DAM 1 JULY 2008 - 30 JUNE 2009 Annual Radiation Protection Report
Page 40 Employee Doses
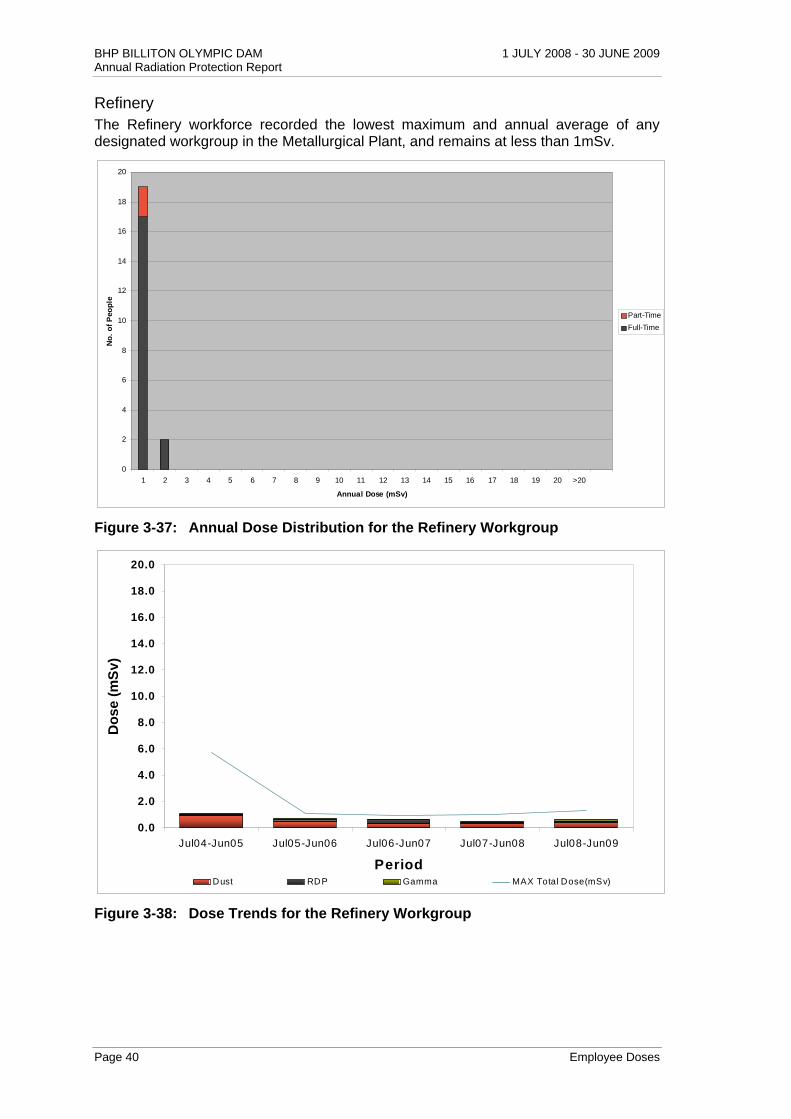
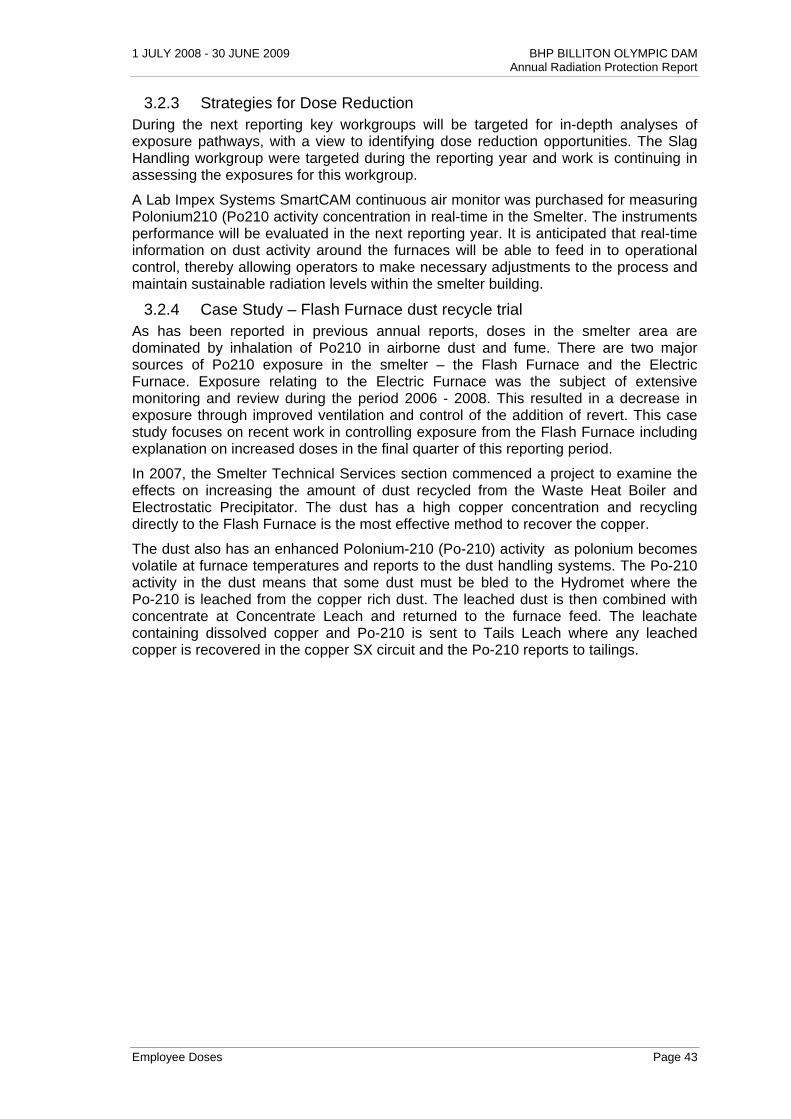
Refinery The Refinery workforce recorded the lowest maximum and annual average of any designated workgroup in the Metallurgical Plant, and remains at less than 1mSv.
0
2
4
6
8
10
12
14
16
18
20
1 2 3 4 5 6 7 8 9 10 11 12 13 14 15 16 17 18 19 20 >20
Annual Dose (mSv)
No
. o
f P
eop
le
Part-Time
Full-Time
Figure 3-37: Annual Dose Distribution for the Refinery Workgroup
0.0
2.0
4.0
6.0
8.0
10.0
12.0
14.0
16.0
18.0
20.0
Jul04-Jun05 Jul05-Jun06 Jul06-Jun07 Jul07-Jun08 Jul08-Jun09
Period
Do
se
(m
Sv
)
Dust RDP Gamma MAX Total Dose(mSv)
Figure 3-38: Dose Trends for the Refinery Workgroup

1 JULY 2008 - 30 JUNE 2009 BHP BILLITON OLYMPIC DAM Annual Radiation Protection Report
Employee Doses Page 41
Maintenance/ Services The variable nature of the maximum dose is due to the fact that some of these personnel are spending time both underground and in the smelter building. The annual average dose decreased to 1.3 mSv from 1.5 mSv in 2007/2008.
0
5
10
15
20
25
1 2 3 4 5 6 7 8 9 10 11 12 13 14 15 16 17 18 19 20 >20
Annual Dose (mSv)
No
. o
f P
eop
le
Part-Time
Full-Time
Figure 3-39: Annual Dose Distribution for the Maintenance/Services Workgroup
0.0
2.0
4.0
6.0
8.0
10.0
12.0
14.0
16.0
18.0
20.0
Jul04-Jun05 Jul05-Jun06 Jul06-Jun07 Jul07-Jun08 Jul08-Jun09
Period
Do
se
(m
Sv
)
Dust RDP Gamma MAX Total Dose(mSv)
Figure 3-40: Dose Trends for the Maintenance/Services Workgroup

BHP BILLITON OLYMPIC DAM 1 JULY 2008 - 30 JUNE 2009 Annual Radiation Protection Report
Page 42 Employee Doses
Slag Handling The average and maximum dose to the Slag Handling workgroup has increased this reporting period with the dust and gamma components of dose being higher than last year. During the year some operators were issued with electronic dosimeters and a complete gamma survey of the slag area was completed. It showed that the operators receive the highest exposure during slag breaking operations. The process plant radiation safety officer is working closely with area owners to determine the best way to reduce exposure in this workgroup. Dose to this workgroup is dominated by exposure to gamma radiation and dust.
0
1
2
3
4
5
6
1 2 3 4 5 6 7 8 9 10 11 12 13 14 15 16 17 18 19 20 >20
Annual Dose (mSv)
No
. o
f P
eop
le
Part-Time
Full-Time
Figure 3-41: Annual Dose Distribution for the Smelter Slag Handling Workgroup
0.0
2.0
4.0
6.0
8.0
10.0
12.0
14.0
16.0
18.0
20.0
Jul04-Jun05 Jul05-Jun06 Jul06-Jun07 Jul07-Jun08 Jul08-Jun09
Period
Do
se
(m
Sv
)
Dust RDP Gamma MAX Total Dose(mSv)
Figure 3-42: Dose Trends for the Smelter Slag Handling Workgroup
1 JULY 2008 - 30 JUNE 2009 BHP BILLITON OLYMPIC DAM Annual Radiation Protection Report
Employee Doses Page 43
3.2.3 Strategies for Dose Reduction During the next reporting key workgroups will be targeted for in-depth analyses of exposure pathways, with a view to identifying dose reduction opportunities. The Slag Handling workgroup were targeted during the reporting year and work is continuing in assessing the exposures for this workgroup.
A Lab Impex Systems SmartCAM continuous air monitor was purchased for measuring Polonium210 (Po210 activity concentration in real-time in the Smelter. The instruments performance will be evaluated in the next reporting year. It is anticipated that real-time information on dust activity around the furnaces will be able to feed in to operational control, thereby allowing operators to make necessary adjustments to the process and maintain sustainable radiation levels within the smelter building.
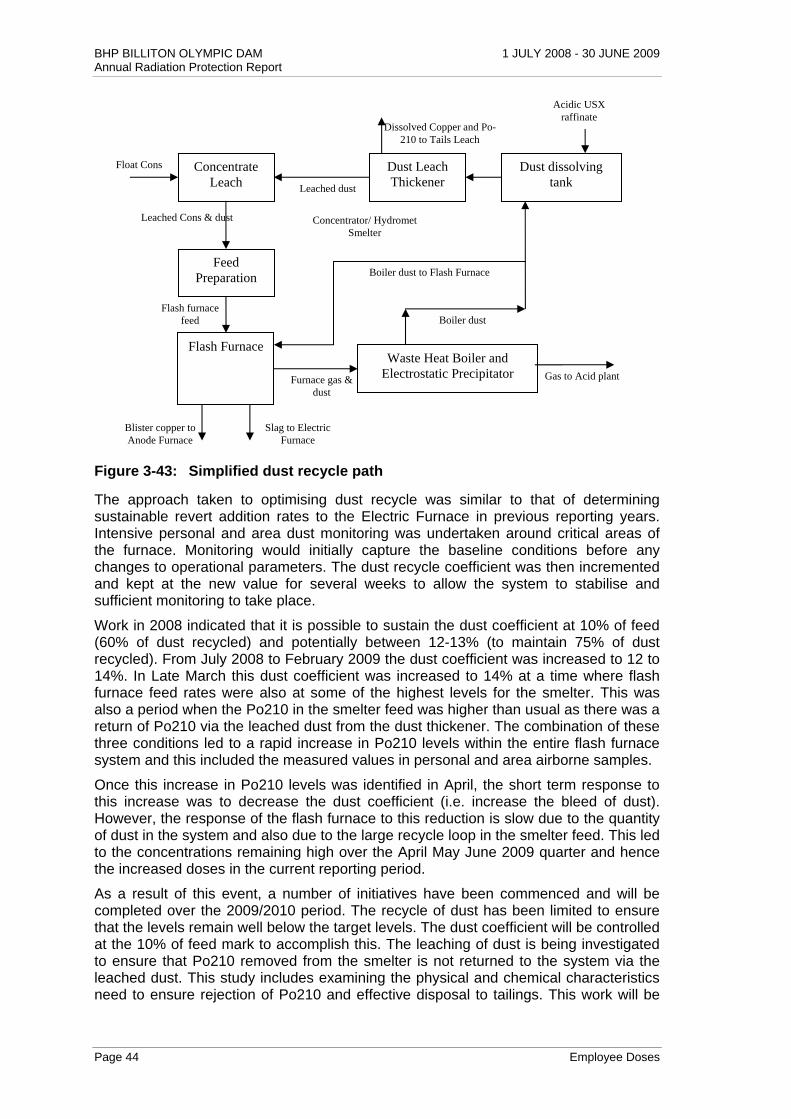
3.2.4 Case Study – Flash Furnace dust recycle trial As has been reported in previous annual reports, doses in the smelter area are dominated by inhalation of Po210 in airborne dust and fume. There are two major sources of Po210 exposure in the smelter – the Flash Furnace and the Electric Furnace. Exposure relating to the Electric Furnace was the subject of extensive monitoring and review during the period 2006 - 2008. This resulted in a decrease in exposure through improved ventilation and control of the addition of revert. This case study focuses on recent work in controlling exposure from the Flash Furnace including explanation on increased doses in the final quarter of this reporting period.
In 2007, the Smelter Technical Services section commenced a project to examine the effects on increasing the amount of dust recycled from the Waste Heat Boiler and Electrostatic Precipitator. The dust has a high copper concentration and recycling directly to the Flash Furnace is the most effective method to recover the copper.
The dust also has an enhanced Polonium-210 (Po-210) activity as polonium becomes volatile at furnace temperatures and reports to the dust handling systems. The Po-210 activity in the dust means that some dust must be bled to the Hydromet where the Po-210 is leached from the copper rich dust. The leached dust is then combined with concentrate at Concentrate Leach and returned to the furnace feed. The leachate containing dissolved copper and Po-210 is sent to Tails Leach where any leached copper is recovered in the copper SX circuit and the Po-210 reports to tailings.
BHP BILLITON OLYMPIC DAM 1 JULY 2008 - 30 JUNE 2009 Annual Radiation Protection Report
Page 44 Employee Doses
Figure 3-43: Simplified dust recycle path
The approach taken to optimising dust recycle was similar to that of determining sustainable revert addition rates to the Electric Furnace in previous reporting years. Intensive personal and area dust monitoring was undertaken around critical areas of the furnace. Monitoring would initially capture the baseline conditions before any changes to operational parameters. The dust recycle coefficient was then incremented and kept at the new value for several weeks to allow the system to stabilise and sufficient monitoring to take place.
Work in 2008 indicated that it is possible to sustain the dust coefficient at 10% of feed (60% of dust recycled) and potentially between 12-13% (to maintain 75% of dust recycled). From July 2008 to February 2009 the dust coefficient was increased to 12 to 14%. In Late March this dust coefficient was increased to 14% at a time where flash furnace feed rates were also at some of the highest levels for the smelter. This was also a period when the Po210 in the smelter feed was higher than usual as there was a return of Po210 via the leached dust from the dust thickener. The combination of these three conditions led to a rapid increase in Po210 levels within the entire flash furnace system and this included the measured values in personal and area airborne samples.
Once this increase in Po210 levels was identified in April, the short term response to this increase was to decrease the dust coefficient (i.e. increase the bleed of dust). However, the response of the flash furnace to this reduction is slow due to the quantity of dust in the system and also due to the large recycle loop in the smelter feed. This led to the concentrations remaining high over the April May June 2009 quarter and hence the increased doses in the current reporting period.
As a result of this event, a number of initiatives have been commenced and will be completed over the 2009/2010 period. The recycle of dust has been limited to ensure that the levels remain well below the target levels. The dust coefficient will be controlled at the 10% of feed mark to accomplish this. The leaching of dust is being investigated to ensure that Po210 removed from the smelter is not returned to the system via the leached dust. This study includes examining the physical and chemical characteristics need to ensure rejection of Po210 and effective disposal to tailings. This work will be
Flash Furnace Waste Heat Boiler and
Electrostatic Precipitator
Dust dissolving tank
Dust Leach Thickener
Concentrate Leach
Feed Preparation
Float Cons
Leached Cons & dust
Slag to Electric Furnace
Blister copper to Anode Furnace
Furnace gas & dust
Boiler dust
Boiler dust to Flash Furnace
Flash furnace feed
Acidic USX raffinate
Leached dust
Dissolved Copper and Po-210 to Tails Leach
Concentrator/ Hydromet Smelter
Gas to Acid plant

1 JULY 2008 - 30 JUNE 2009 BHP BILLITON OLYMPIC DAM Annual Radiation Protection Report
Employee Doses Page 45
conducted in parallel with ongoing work to improve hygiene and ventilation systems within the smelter.
3.2.5 Doses to Non-Designated Employees Doses to the most exposed non-designated Metallurgical Plant employees have been assessed. The current time/location system collects information from the majority of BHP Billiton Olympic Dam employees and contractors on site. Only a small fraction of these workers are designated. The rest are classified as non-designated workers, however, their doses are assessed using the same dose calculation system as for designated employees. A summary of dose statistics is given in Table 3-7.
Table 3-7: Non-Designated Employees Metallurgical plant, Dose Statistics
Non
Designated
Statistics
Employees
Count 2489
Arithmetic Mean (mSv) 0.8
90th Percentile (mSv) 1.5
Min (mSv 0.0
Max (mSv) 4.3
Mean % Dose from RDP. 9%
Mean % Dose from Dust 48%
Mean % Dose from Gamma 43%
The total number of non-designated employees increased from 2049 in the 2007/2008 year to 2489 in the 2008/2009 year.
0.0
2.0
4.0
6.0
8.0
10.0
12.0
14.0
16.0
18.0
20.0
2004/2005 2005/2006 2006/2007 2007/2008 2008/2009
Period
Do
se (
mS
v)
0
500
1000
1500
2000
2500
3000
3500
No
. o
f E
mp
loy
ees
Avg Max Dose Number of workers
Figure 3-44: Average Dose to Non-designated Metallurgical Plant Employees
BHP BILLITON OLYMPIC DAM 1 JULY 2008 - 30 JUNE 2009 Annual Radiation Protection Report
Page 46 Employee Doses
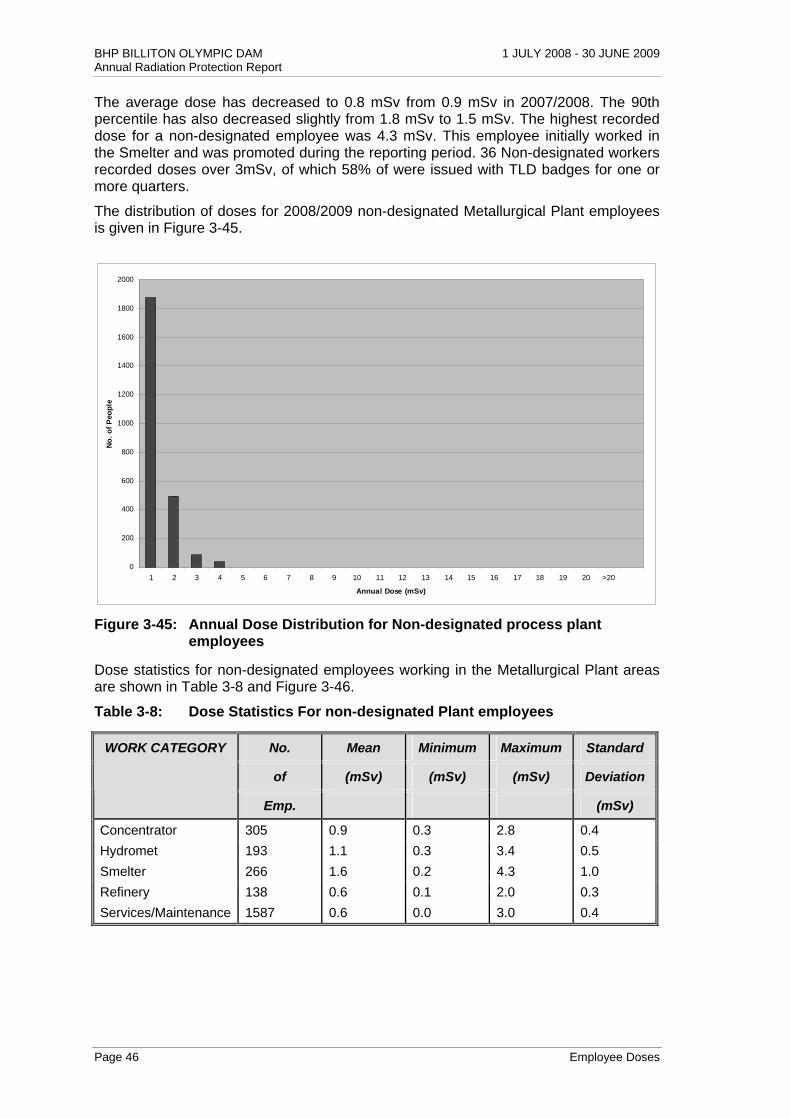
The average dose has decreased to 0.8 mSv from 0.9 mSv in 2007/2008. The 90th percentile has also decreased slightly from 1.8 mSv to 1.5 mSv. The highest recorded dose for a non-designated employee was 4.3 mSv. This employee initially worked in the Smelter and was promoted during the reporting period. 36 Non-designated workers recorded doses over 3mSv, of which 58% of were issued with TLD badges for one or more quarters.
The distribution of doses for 2008/2009 non-designated Metallurgical Plant employees is given in Figure 3-45.
0
200
400
600
800
1000
1200
1400
1600
1800
2000
1 2 3 4 5 6 7 8 9 10 11 12 13 14 15 16 17 18 19 20 >20
Annual Dose (mSv)
No
. o
f P
eop
le
Figure 3-45: Annual Dose Distribution for Non-designated process plant employees
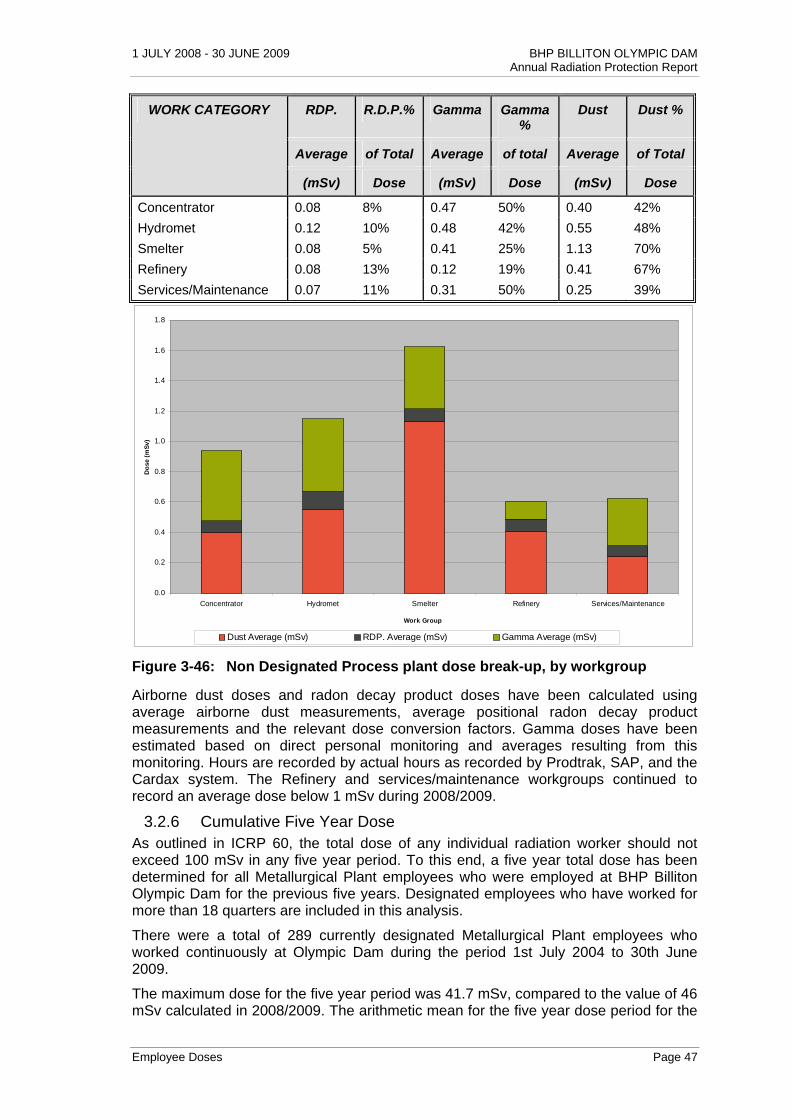
Dose statistics for non-designated employees working in the Metallurgical Plant areas are shown in Table 3-8 and Figure 3-46.
Table 3-8: Dose Statistics For non-designated Plant employees
No. Mean Minimum Maximum Standard
of (mSv) (mSv) (mSv) Deviation
WORK CATEGORY
Emp. (mSv)
Concentrator 305 0.9 0.3 2.8 0.4
Hydromet 193 1.1 0.3 3.4 0.5
Smelter 266 1.6 0.2 4.3 1.0
Refinery 138 0.6 0.1 2.0 0.3
Services/Maintenance 1587 0.6 0.0 3.0 0.4
1 JULY 2008 - 30 JUNE 2009 BHP BILLITON OLYMPIC DAM Annual Radiation Protection Report
Employee Doses Page 47
RDP. R.D.P.% Gamma Gamma %
Dust Dust %
Average of Total Average of total Average of Total
WORK CATEGORY
(mSv) Dose (mSv) Dose (mSv) Dose
Concentrator 0.08 8% 0.47 50% 0.40 42%
Hydromet 0.12 10% 0.48 42% 0.55 48%
Smelter 0.08 5% 0.41 25% 1.13 70%
Refinery 0.08 13% 0.12 19% 0.41 67%
Services/Maintenance 0.07 11% 0.31 50% 0.25 39%
0.0
0.2
0.4
0.6
0.8
1.0
1.2
1.4
1.6
1.8
Concentrator Hydromet Smelter Refinery Services/Maintenance
Work Group
Do
se (
mS
v)
Dust Average (mSv) RDP. Average (mSv) Gamma Average (mSv)
Figure 3-46: Non Designated Process plant dose break-up, by workgroup
Airborne dust doses and radon decay product doses have been calculated using average airborne dust measurements, average positional radon decay product measurements and the relevant dose conversion factors. Gamma doses have been estimated based on direct personal monitoring and averages resulting from this monitoring. Hours are recorded by actual hours as recorded by Prodtrak, SAP, and the Cardax system. The Refinery and services/maintenance workgroups continued to record an average dose below 1 mSv during 2008/2009.
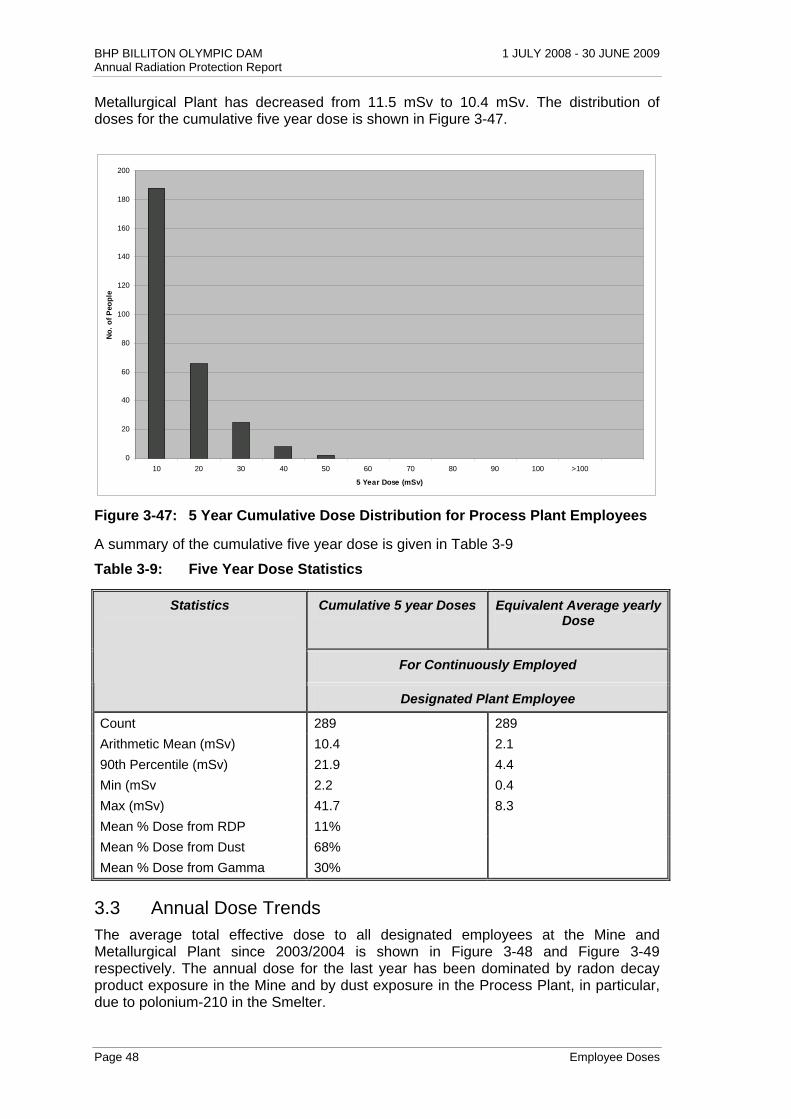
3.2.6 Cumulative Five Year Dose As outlined in ICRP 60, the total dose of any individual radiation worker should not exceed 100 mSv in any five year period. To this end, a five year total dose has been determined for all Metallurgical Plant employees who were employed at BHP Billiton Olympic Dam for the previous five years. Designated employees who have worked for more than 18 quarters are included in this analysis.
There were a total of 289 currently designated Metallurgical Plant employees who worked continuously at Olympic Dam during the period 1st July 2004 to 30th June 2009.
The maximum dose for the five year period was 41.7 mSv, compared to the value of 46 mSv calculated in 2008/2009. The arithmetic mean for the five year dose period for the
BHP BILLITON OLYMPIC DAM 1 JULY 2008 - 30 JUNE 2009 Annual Radiation Protection Report
Page 48 Employee Doses
Metallurgical Plant has decreased from 11.5 mSv to 10.4 mSv. The distribution of doses for the cumulative five year dose is shown in Figure 3-47.
0
20
40
60
80
100
120
140
160
180
200
10 20 30 40 50 60 70 80 90 100 >100
5 Year Dose (mSv)
No
. o
f P
eop
le
Figure 3-47: 5 Year Cumulative Dose Distribution for Process Plant Employees
A summary of the cumulative five year dose is given in Table 3-9
Table 3-9: Five Year Dose Statistics
Cumulative 5 year Doses Equivalent Average yearly Dose
For Continuously Employed
Statistics
Designated Plant Employee
Count 289 289
Arithmetic Mean (mSv) 10.4 2.1
90th Percentile (mSv) 21.9 4.4
Min (mSv 2.2 0.4
Max (mSv) 41.7 8.3
Mean % Dose from RDP 11%
Mean % Dose from Dust 68%
Mean % Dose from Gamma 30%
3.3 Annual Dose Trends The average total effective dose to all designated employees at the Mine and Metallurgical Plant since 2003/2004 is shown in Figure 3-48 and Figure 3-49 respectively. The annual dose for the last year has been dominated by radon decay product exposure in the Mine and by dust exposure in the Process Plant, in particular, due to polonium-210 in the Smelter.

1 JULY 2008 - 30 JUNE 2009 BHP BILLITON OLYMPIC DAM Annual Radiation Protection Report
Employee Doses Page 49
0
2
4
6
8
10
12
14
16
18
20
2004/2005 2005/2006 2006/2007 2007/2008 2008/2009
Period
Do
se
(m
Sv
)
Dust Average (mSv) RDP. Average (mSv) Gamma Average (mSv) MAX. Total Dose
Figure 3-48: Mine Annual dose trend
0
2
4
6
8
10
12
14
16
18
20
2004/2005 2005/2006 2006/2007 2007/2008 2008/2009
Period
Do
se (
mS
v)
Dust Average (mSv) RDP. Average (mSv) Gamma Average (mSv) MAX. Total Dose
Figure 3-49: Plant Annual Dose Trend
3.4 Doses to Members of the Public The full assessment of doses to members of the public will be presented separately in the Environmental Management and Monitoring Report.
For all members of the public, the effective dose from the operation, for the period July 2008 to June 2009 was well below the statutory limit of 1 mSv per annum. Estimated maximum operational related doses are shown in Table 3-10.
Table 3-10: Public Doses
2007/2008 dose to Members of the Dose
Public living at (mSv) Dose Limit (mSv)
Roxby Downs 0.021 1
Olympic Dam Village 0.021 1

BHP BILLITON OLYMPIC DAM 1 JULY 2008 - 30 JUNE 2009 Annual Radiation Protection Report
Page 50 Employee Doses
0.00
0.10
0.20
0.30
0.40
0.50
0.60
0.70
0.80
0.90
1.00
1.10
1991 1992 1993 1994 1995 1996 1997 1998 1999 2000 2001 2002 2003 2004 FY05 FY06 FY07 FY08 FY09
Do
se
eq
uiv
ale
nt
(mS
v/y
r)
Roxby Downs Olympic Dam Village Detection Limit Legislative Limit
Figure 3-50: Total Dose Trend for Olympic Dam Village and Roxby Downs
Shown in Figure 3-50 are the public dose trends for Olympic Dam Village and Roxby Downs since 1991. It is clear from the above graph that dose to the members of the public has not increased above the minimum detection limit of 0.048 mSv in all the monitoring periods.
3.5 Radiation Management Plan (RMP) During the 2008/2009 reporting period the radiological protection practices have been under review to determine where there is potential to improve current systems. This included having external evaluation of our current systems and comparison against international best practice in radiation protection. The Radiation Management Plan is in the process of being revised to take on key aspects of this review. Upon completion the revised RMP will be submitted to the Environment Protection Authority (EPA) for approval. BHP Billiton Olympic Dam already have a robust Quality Control System which incorporates the annual review of controlled documents and radiation protection documents are continually assessed as part of this. Information relating to radiation protection procedures that has been provided to government previously, including the approved RMP currently in use, are still valid.
1 JULY 2008 - 30 JUNE 2009 BHP BILLITON OLYMPIC DAM Annual Radiation Protection Report
CONCLUSION Page 51
4 CONCLUSION
An extensive program of radiation monitoring and dose assessment is in place at Olympic Dam. The knowledge gained during the dust recycle project at the Smelter has shown the importance of combining radiation monitoring results with operational parameters to ensure the operation remains within its dose constraints. With the new knowledge we can optimise production in a sustainable manner whilst remaining well within dose constraints.
Assessment of employees’ doses for the period 1st July 2008 to 30th June 2009 has shown that, out of a total of 1062 designated employees, no employee received a dose greater than the annual dose limit of 20 mSv. The average dose to all designated employees was 3.3 mSv, with a maximum dose of 13.1 mSv.
The average dose to the 3646 non-designated employees was 0.9 mSv, with a maximum dose of 5.5 mSv.

BHP BILLITON OLYMPIC DAM 1 JULY 2008 - 30 JUNE 2009 Annual Radiation Protection Report
Page 52 APPENDIX A
5 APPENDIX A
Dose Conversion Factors 2008/2009
A summary of the airborne dust dose conversion factors for specific work areas can be viewed in the following table.
Table 5-1: Dust Dose Conversion Factors
DCF Location
(µSv.m3/Bq.hr)
Smelter 7.5
Refinery / STP 5.4
SX / Precipitation / Calciners 4.5
Other* 4.1
*All other areas of Mine, Concentrator, Slag Concentrator, Hydromet and Services (Laboratories and Metallurgical Workshop)
The default RDP dose conversion factor used was 1.41 mSv.m3/mJ.hr (5 mSv/WLM).