ANNUAL PERFORMANCE REPORT 2012–13
98
ANNUAL PERFORMANCE REPORT 2012–13 WORKING FOR OUR COMMUNITIES
Transcript of ANNUAL PERFORMANCE REPORT 2012–13

ANNUAL PERFORMANCE REPORT 2012–13WORKING FOR OUR COMMUNITIES

About this report
This report provides a candid account of Endeavour Energy’s performance during the financial year 2012-13. It notes successes, areas for improvement and our future direction and challenges.
Endeavour Energy has a proud tradition of dedicated service to our communities. The theme for this year’s report – working for our communities – reflects our commitment to improve efficiency and productivity to control future increases in electricity prices for our customers while delivering a reliable and sustainable network for our communities.
The contents of this report are guided by the requirements of the Annual Report Statutory Bodies Act 1984, the State Owned Corporations Act 1989 and the principles of the Global Reporting Initiative.
Statutory accounts and financial information are verified by the NSW Auditor General.
This annual report can be found on our website at www.endeavourenergy.com.au. It was produced at a cost of $11,360 (GST inclusive).
© Endeavour Energy 2013
This work is copyright. Material contained in this document may be reproduced for personal, in-house or non-commercial use without formal permission or charge provided there is due acknowledgement of Endeavour Energy as the source.
Requests and enquiries concerning reproduction and rights for a purpose other than personal, in-house or non-commercial use should be addressed to the Manager Corporate Affairs, Endeavour Energy, PO Box 811, Seven Hills NSW 1730.
ISSN 1834-0733
Cover image: Part of the team responsible for the construction of the award winning Casula Zone substation Troy Kidd (Civil Project Manager) and Manju Puthan Veetil (Senior Engineer, Subs Civil Design). Casula Zone Substation won the Master Builders Association annual Regional Building Award for the Best Commercial New Building $3-$5 million category.
Project management Corporate Affairs, Endeavour Energy
Design Impress Design
1Endeavour Energy Annual Performance Report 2012–13
Letter to Shareholding Ministers
31 October 2013
The Hon. Mike Baird MP Treasurer Level 36, Governor Macquarie Tower 1 Farrer Place SYDNEY NSW 2000
The Hon. Andrew Constance MP Minister for Finance and Services Level 34, Governor Macquarie Tower 1 Farrer Place SYDNEY NSW 2000
Dear Ministers
REPORT ON PERFORMANCE FOR THE YEAR ENDED 30 JUNE 2013
We are pleased to submit Endeavour Energy’s annual report detailing performance, operations and financial results for the year ended 30 June 2013.
The report has been prepared in accordance with the Annual Reports (Statutory Bodies) Act 1984 and is submitted for tabling in Parliament.
Copies are being sent to the Premier of NSW, the Auditor-General, the Minister for Resources and Energy, and other key stakeholders.
The report is available on our website: www.endeavourenergy.com.au.
Sincerely
Roger Massy-Greene Chairman
Vince Graham Chief Executive Officer
CONTENTS
Our organisation 2
Year at a glance 3
The year in review 4
Our plans and priorities 6
Our performance 8
Improve safety performance 8
Deliver the network plan 9
Improve customer value 10
Leverage technology 11
Manage business risk 12
Deliver performance through people 13
Network 14
People 22
Community 24
Environment 26
Governance 28
Management discussion and analysis 32
Financial statements 34
Appendices 77

2
Endeavour Energy is a New South Wales state-owned energy corporation serving some of Australia’s largest and fastest growing regional economies. Endeavour Energy manages a $5.31 billion electricity distribution network for 907,996 customers, or 2.2 million people, in households and businesses across a network area spanning 24,500 square kilometres in Sydney’s Greater West, the Illawarra and South Coast, the Blue Mountains, the Southern Highlands and Shoalhaven.
Endeavour Energy is incorporated under the Energy Services Corporations Act 1995 and operates within the terms of the Electricity Supply Act 1995 on behalf of our shareholder, the New South Wales Government.
The focus of our 2,635 people is to deliver a safe, reliable and efficient electricity supply to our residential and business customers while delivering strong financial results to our shareholder. We are committed to making a serious and sincere effort to deliver better value for customers by reducing our operating costs without compromising safety or services.
Our business purposeTo be of service to our communities by efficiently distributing electricity to our customers in a way that is safe, reliable and sustainable.
Our valuesThese five values form the basis for everything we do.
Safety excellence
• put safety as your number one priority
• do not participate in unsafe acts, and challenge unsafe behaviours
• think before you act • lead by example • take responsibility for the health and
safety of yourself and others.
Respect for people
• treat all people with respect, dignity, fairness and equity
• demonstrate co-operation, trust and support in the workplace
• practise open, two-way communication.
Customer and community focus
• deliver value and reliable service to our customers and communities
• use resources responsibly and efficiently
• be environmentally and socially responsible.
Continuous improvement
• look for safer and better ways to do your job
• improve our financial performance • support innovation to add value
to our business.
Act with integrity
• act honestly and ethically in everything you do
• be accountable and own your actions
• follow the rules and speak up.
1 Refers to Endeavour Energy’s Regulatory Asset Base.
1OUR ORGANISATION

3Endeavour Energy Annual Performance Report 2012–13
OUR ORGANISATION 1
Year at a glance
ITEMS 2011–12 2012–13 % CHANGE
OUR SHAREHOLDER
EBITDA $m 755.7 821.0 8.6
Operating profit after tax $m 265.5 306.5 15.4
Returns to NSW Government $m 302.3 340.9 12.7
Dividend $m 186.6 209.5 12.3
Income tax equivalents $m 115.7 131.4 13.5
Net assets $m 1,450.7 1,586.2 9.3
Return on assets % 10.6 10.3 (2.3)
Return on equity % 19.8 20.2 2.0
OUR OPERATIONS
Reliability (unplanned interruptions to supply) Min/lost/cust 81.8 88.0 (7.6)
Capital expenditure $m 634.3 577.7 (8.9)
Output (GWh) GWh 16,506 16,001 (3.1)
Sales revenuea $m 1,225.0 1,299.2 6.1
OUR CUSTOMERS
Total network customer connections 883,658 907,996 2.8
Customer Satisfaction Indicator % 76 75 (1.3)
ENVIRONMENT
Transformer oil recycledb litres 253,254 342,092 35.1
Greenhouse gas emissions – direct emissionsc t CO2e 637,702 633,106 0.7
Reportable environmental incidents No. 5 2 60.0
OUR PEOPLE
Total employeesd 2,824 2,635 (6.7)
Lost time injury frequency rate (LTIFR)e 3.6 2.6 27.8
To ensure consistency on an annual basis, prior year statistics may have changed in line with amendments to comparative financial statement disclosures and amended definitions.
a. Sales revenue includes total network use of system income only.
b. The increase in recycled oil is the result of an increase in transformer refurbishments, replacements and transformers being decommissioned in 2012–13.
c. We have reported our emissions using the National Greenhouse and Energy Reporting Scheme Determination where available, or if unavailable, using methods consistent with the emission estimates published by the Department of Climate Change and Energy Efficiency in the National Greenhouse Accounts, or relevant environmental key performance indicators developed by the Energy Network Association of Australia. Includes all scope 1 and 2 emissions minus offsets purchased.
d. Full time equivalent employees as at 30 June 2013.
e. The LTIFR indicates how frequently lost time injuries have occurred per million hours worked. It is calculated by taking the number of LTIs reported in the previous 12 months (multiplied by 1,000,000) and then dividing by the average number of employees for the previous 12 months (multiplied by 2,000 hours worked per FTE).
Jason Perkins (Project Manager Civil) and Brett Hooper (Project Manager Subs) at the new $32 million Claremont Meadows Zone Substation. This new zone substation was constructed to supply significant residential development in the Claremont Meadows area and provide support to the rapid increase in load on the adjoining Kingswood and St Marys Zone Substations.

4
THE YEAR IN REVIEW
To be of service to our communities by efficiently distributing electricity to our customers in a way that is safe, reliable and sustainable
Our purpose statement
Industry reformThe NSW Government introduced a reform program for state owned electricity networks on 1 July 2012, including a shared group management model called Networks NSW.
Along with Endeavour Energy, the group includes Ausgrid and Essential Energy. Each business continues to operate as a separate legal entity managed by a joint Board of Directors and a common Chief Executive Officer.
A key objective of the Government’s reform program is to deliver more than $400 million in cost and efficiency savings over four years to assist electricity customers, particularly those receiving Low Income Household and Family Energy rebates. These savings are being delivered across the three businesses through more streamlined corporate and support services, reducing duplication, more efficient capital spending and strategic procurement initiatives.
The industry reforms also aim to deliver a more efficient, lower cost electricity distribution service to customers while maintaining the financial sustainability and reliability of the network in a way that is safe for its employees and the public.
Keeping our pricing promiseThese reforms build on Endeavour Energy’s efficiency and productivity programs – Projects Challenge and Compete. These programs began two years ago with a promise to our customers to do everything we could to keep network prices at or below the rate of inflation without compromising safety or reliability. We delivered on this promise this year, when our average distribution network price increase of 0.01% from 1 July 2013 fell below CPI for the first time in a decade.
This achievement is a direct result of our collective efforts to realise efficiencies totalling over $99 million over the past three years. It also reflects our success in delivering on our voluntary commitment to the Australian Energy Regulator (AER) to reduce operating costs by 2% a year from 2009.
Safety performance improvesSafety excellence is Endeavour Energy’s number one priority and the responsibility of every employee. Our goal is to keep our workers and the public safe. In the past year, the number of lost time injuries fell significantly – from 22 in 2011–12 to 14. While this result had a favourable impact on our lost time injury frequency rate of 2.6, being our best result, we did not meet our target of 2.2.
We encouraged greater reporting of incidents, continued to use incident investigation to identify improvements and renewed our focus on leadership and personal accountability for safety.
We also started training workers about random alcohol and drug testing, due to start in October 2013. This forms part of our Lifeguard program, designed to minimise the risk of a worker affected by alcohol, drugs or fatigue causing injury or death.
Delivering a more resilient networkTo meet the electricity needs of 2.2 million people located in some of the fastest growing regions in NSW, we invested $780 million in our network during the year, delivering a capital program of around $578 million and an operating program of almost $240 million.
We worked on 49 major projects and over 4,900 distribution projects. This investment program and targeted reliability improvement projects have made our network more resilient, as its performance during 45 degree plus days in Western Sydney in January 2013 testified.
Our network endured temperature extremes last year with snow and high winds in the upper Blue Mountains interrupting power to 31,000 customers on 12 October, while a mini tornado savaged the coastal town of Kiama on the 23–24 February, again testing crews as they worked in dangerous conditions to safely restore power to more than 44,000 customers.
Because of the large number of weather events, we did not meet our reliability performance target in 2012–13 although our underlying reliability remains consistently strong.
Financial performanceEndeavour Energy met our financial targets contributing to our continued sustainability and ability to contain future electricity price increases for customers.
Endeavour Energy’s profit after tax was $306.5 million and earnings before interest, tax, depreciation and amortisation was $821.0 million.
Revenue was down compared to budget due to declining demand, a trend which is expected to continue. Energy use across our network has fallen 8.2% since July 2009. This is due to mild summers and winters; prevailing economic conditions; the high Australian dollar; reduced electricity use in response to high prices; and the rapid uptake of solar across the network.
Origin Energy transition a great successAfter nearly two years of operating a Transition Services Agreement (TSA), Endeavour Energy successfully transitioned its retail customer data for 477,000 sites and all retail functions across to Origin Energy following the sale of our retail business in March 2011. We now operate as a ‘network only’ business.
New rules for engaging customersFollowing recent changes to the National Electricity Rules and to guide the development of our investment plans, the AER requires electricity distributors like Endeavour Energy to increase engagement with customers.
5Endeavour Energy Annual Performance Report 2012–13
OUR ORGANISATION 1Leading Hand Technologist Graeme Sydenham with Third Year Apprentice, Michael Baiada at Penrith Transmission Substation. $38.7 million has been invested in the construction of a new 132/33kV indoor transmission substation to meet the electricity needs of approximately 40,000 customers across the Penrith region.
The AER’s determination is critical for our business as it sets the revenues we will receive over the five-year period from 2014–15 to 2018–19. The key focus of the determination is to continue to deliver safe, reliable electricity while taking account of community concerns about affordability. In addition we must ensure long-term sustainability of investment to deliver predictable outcomes for customers on an ongoing basis.
During the year we worked with Networks NSW to develop key themes and principles to guide the development of Endeavour Energy’s AER submission.
New customer framework requires changesIn preparation for the implementation of the National Energy Customer Framework (NECF) on 1 July 2013, we completed extensive work to ensure our business processes and systems meet the requirements of the new framework, which aims to streamline the regulation of energy distribution and retail functions.
The framework has required us to make changes to our contractual relationship with customers, to the process for connecting them to our network, to the management of supply interruptions, interactions with customers and electricity retailers, and reporting and compliance responsibilities.
Endeavour Energy plans further improvements to our customer service systems and processes to enable our networks customers to receive efficient service and adequate protections.
Our peopleCapable, skilled people are critical to the success of our strategy. We continued to build our leadership capability through development programs attended by 100 managers focused on culture, change management, business acumen and safety leadership.
We also negotiated a new two-year Enterprise Agreement to help us deliver our business objectives and provide rewarding and sustainable jobs for our employees. For the first time, Endeavour Energy used interest-based bargaining principles under the Australian Fair Work Act to negotiate a two year Agreement effective from 24 December 2012. The 2.7% per annum wage increase met our key objectives of improving safety, providing fair and responsible wage outcomes for our people and delivering value to our customers.
Plans for 2013–14Improving our safety performance will remain our top priority in 2013–14. In addition, we plan to improve our asset management efficiency through initiatives including better management of our road fleet, revising our network investment plans and developing a common logistics and supply chain plan.
Submitting a robust, prudent network investment proposal to the AER for the five-year period commencing July 2014 represents a considerable challenge. The AER’s determination will set our revenue and drive customers’ electricity prices for that period.
Thanks to allOur ambition is to continue to keep price increases low for our customers without compromising safety, reliability or the sustainability of our network. Our plans to achieve this ambition present challenges and changes for us all. Notwithstanding these challenges, we have continued to make real progress this year – improving safety, running a more efficient business, delivering our capital plan and our pricing promise. Against this backdrop, we gratefully acknowledge the combined efforts of Endeavour Energy’s people for their dedicated commitment to our customers and communities.
It is entirely due to their dedication that millions of Australians have access to a safe and reliable electricity supply, every day.
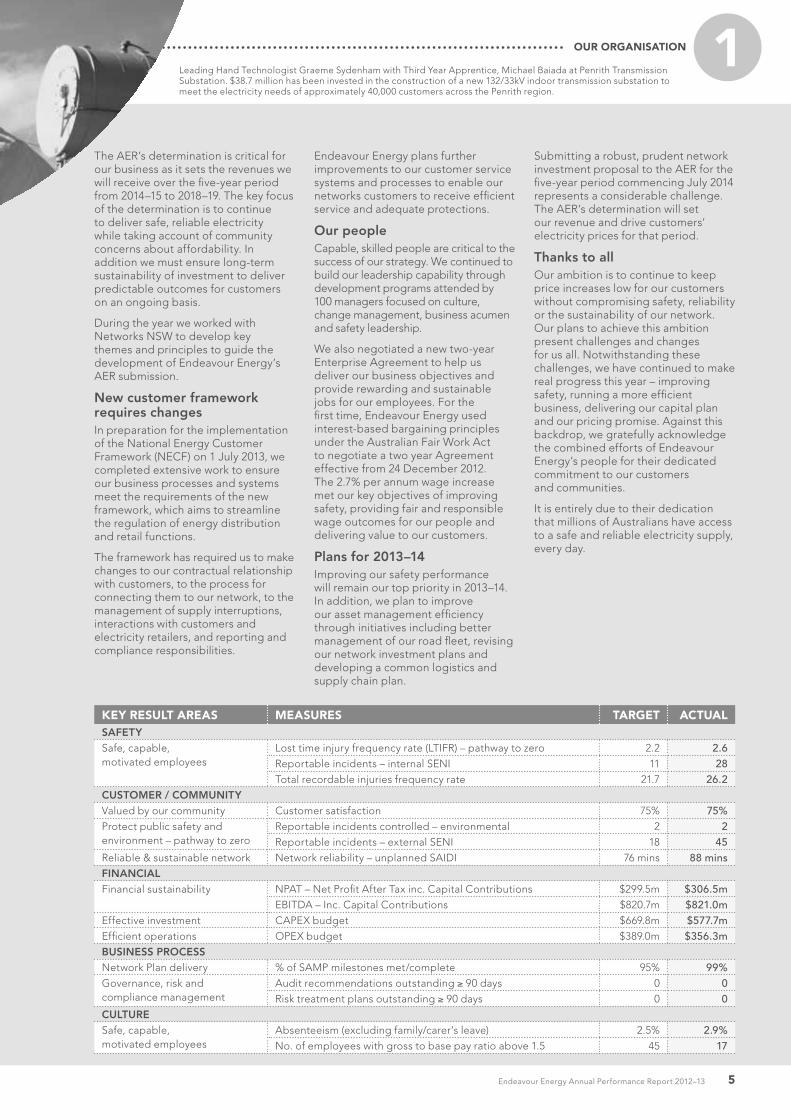
KEY RESULT AREAS MEASURES TARGET ACTUALSAFETYSafe, capable, motivated employees
Lost time injury frequency rate (LTIFR) – pathway to zero 2.2 2.6Reportable incidents – internal SENI 11 28Total recordable injuries frequency rate 21.7 26.2
CUSTOMER / COMMUNITYValued by our community Customer satisfaction 75% 75%Protect public safety and environment – pathway to zero
Reportable incidents controlled – environmental 2 2Reportable incidents – external SENI 18 45
Reliable & sustainable network Network reliability – unplanned SAIDI 76 mins 88 minsFINANCIALFinancial sustainability NPAT – Net Profit After Tax inc. Capital Contributions $299.5m $306.5m
EBITDA – Inc. Capital Contributions $820.7m $821.0mEffective investment CAPEX budget $669.8m $577.7mEfficient operations OPEX budget $389.0m $356.3mBUSINESS PROCESSNetwork Plan delivery % of SAMP milestones met/complete 95% 99%Governance, risk and compliance management
Audit recommendations outstanding ≥ 90 days 0 0Risk treatment plans outstanding ≥ 90 days 0 0
CULTURESafe, capable, motivated employees
Absenteeism (excluding family/carer’s leave) 2.5% 2.9%No. of employees with gross to base pay ratio above 1.5 45 17

6
1
Endeavour Energy’s six strategic objectives identify those areas that will lead to significant transformational changes in our business in the areas of safety, customer service and efficiency.
Our plans and priorities for 2012–13
1IMPROVE SAFETY
PERFORMANCE
2DELIVER
THE NETWORK PLAN
3IMPROVE
CUSTOMER VALUE
Why?• To reduce the risk and
occurrence of incidents and injuries so that all workers and the public go home safely and we achieve a best practice result of zero harm and injuries.
Why?• To continue to deliver safe
and reliable electricity while at the same time taking account of the community’s concerns about affordability.
Why?• To keep network price increases close to CPI
over the next five years without affecting the safety, reliability and sustainability of our network
• To fund NSW Government’s Low Income Household Rebate and Family Energy Rebate schemes.
Target for 2012–13• LTIFR of < 2.0 on a pathway
to zero by 2015.
Target for 2012–13• Invest $669.8 million in capital
expenditure to replace ageing assets and meet future growth
• Deliver our next Australian Energy Regulator submission by May 2013.
Target for 2012–13• Reducing corporate and administration costs
by $22m pa by June 2014
• Reducing the real cost of operation our regional and network operations by $26m pa by June 2014
• Support delivery of the Network Electricity Reform Program over four years from July 2012.
Result• LTIFR result was 2.6, against
our target of 2.2. While we did not meet our target, it was a significant improvement from our 3.6 LTIFR result in 2011–12. This decrease is attributed to number of reported lost time injuries which declined from 22 in 2011–12 to 14 in 2012–13.
• Actively encouraged the reporting of all incidents and near misses.
Result• Delivered $577.7 million in
capital expenditure, which includes work on 60 major construction projects
• As a result of changes to the National Electricity Rules, the deadline for submission to the AER has been deferred to 2013–14.
Result• Savings for Project Challenge to date is
$26.4m OPEX and $0.3m CAPEX
• Savings for Project Compete to date is $4.4m OPEX and $2.6m CAPEX
• A part of Reform Program, Endeavour Energy:
– implemented new Level 3 and 4 Management structures
– delivered OPEX and CAPEX savings of over $8 million
– implemented the governance requirements to improve fraud control, compliance and risk frameworks.
Focus for 2013–14• Implement our Safety Strategic
Plan to reduce the risk of incidents and injuries to our employees, contractors and the public.
Focus for 2013–14• Develop our Network Reliability
Plan by December 2013 to maintain reliability for customers to meet service standards.
Focus for 2013–14• Deliver our Customer Value Improvement Plan
during 2013–14 to 2018–19 to improve electricity affordability for our customers
• Develop our Network Reliability Plan by December 2013 to maintain reliability for customers to meet service standards
• Develop and deliver our submission to the Australian Energy Regulator on time to deliver a safe, reliable and affordable network throughout 2014 to 2019.
7Endeavour Energy Annual Performance Report 2012–13
OUR ORGANISATION 1These strategic objectives and related actions are outlined in our 2012–13 Corporate Plan. Over the past year, we made excellent progress against these objectives, which has led to improvements in safety; placed the organisation in a strong position to respond to ongoing electricity affordability concerns in
the community; and delivered the successful transition of our retail customer data to Origin Energy.
Our focus for 2013–14 is to deliver three key outcomes designed to promote the long-term interests of our customers, employees and shareholders:
1. Continuously improving safety performance
2. Maintaining the reliability and sustainability of the network
3. Containing average distribution network tariff increases to CPI for our customers.
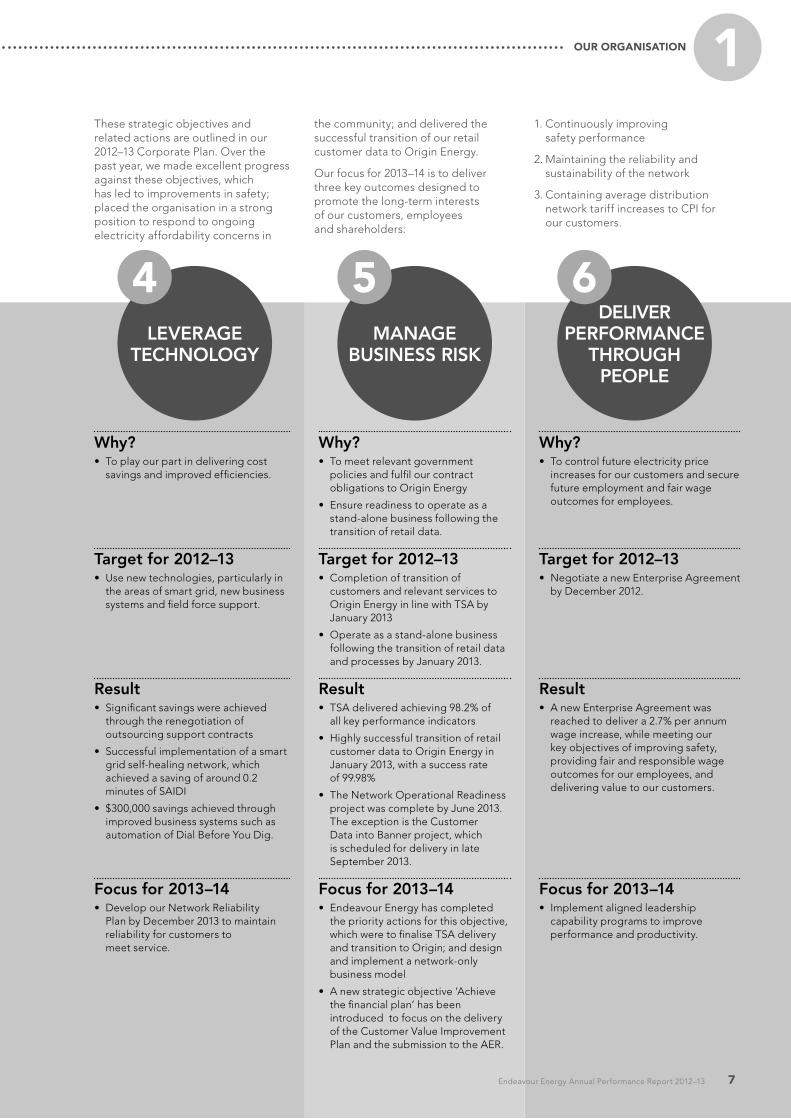
4LEVERAGE
TECHNOLOGY
5MANAGE
BUSINESS RISK
6DELIVER
PERFORMANCE THROUGH
PEOPLE
Why?• To play our part in delivering cost
savings and improved efficiencies.
Why?• To meet relevant government
policies and fulfil our contract obligations to Origin Energy
• Ensure readiness to operate as a stand-alone business following the transition of retail data.
Why?• To control future electricity price
increases for our customers and secure future employment and fair wage outcomes for employees.
Target for 2012–13• Use new technologies, particularly in
the areas of smart grid, new business systems and field force support.
Target for 2012–13• Completion of transition of
customers and relevant services to Origin Energy in line with TSA by January 2013
• Operate as a stand-alone business following the transition of retail data and processes by January 2013.
Target for 2012–13• Negotiate a new Enterprise Agreement
by December 2012.
Result• Significant savings were achieved
through the renegotiation of outsourcing support contracts
• Successful implementation of a smart grid self-healing network, which achieved a saving of around 0.2 minutes of SAIDI
• $300,000 savings achieved through improved business systems such as automation of Dial Before You Dig.
Result• TSA delivered achieving 98.2% of
all key performance indicators
• Highly successful transition of retail customer data to Origin Energy in January 2013, with a success rate of 99.98%
• The Network Operational Readiness project was complete by June 2013. The exception is the Customer Data into Banner project, which is scheduled for delivery in late September 2013.
Result• A new Enterprise Agreement was
reached to deliver a 2.7% per annum wage increase, while meeting our key objectives of improving safety, providing fair and responsible wage outcomes for our employees, and delivering value to our customers.
Focus for 2013–14• Develop our Network Reliability
Plan by December 2013 to maintain reliability for customers to meet service.
Focus for 2013–14• Endeavour Energy has completed
the priority actions for this objective, which were to finalise TSA delivery and transition to Origin; and design and implement a network-only business model
• A new strategic objective ‘Achieve the financial plan’ has been introduced to focus on the delivery of the Customer Value Improvement Plan and the submission to the AER.
Focus for 2013–14• Implement aligned leadership
capability programs to improve performance and productivity.

8
2OUR PERFORMANCE
1. Improve safety performanceSafety is our number one priority and the responsibility of every employee. We seek to encourage a culture where no employee knowingly participates in an unsafe act. One of the ways we’ll measure our success is by reducing our Lost Time Injury Frequency Rate (LTIFR) to below 2.2 by June 2014 on a pathway to zero.
Endeavour Energy’s LTIFR performance of 2.6 for 2012–13 represents a significant improvement in comparison to the previous year. This is largely the result of the decline in the number of lost time injuries reported from 22 in 2011–12 to 14.
In March 2013, an employee working on our overhead electricity network in Merrylands received an electric shock. First aid-trained Endeavour Energy employees immediately commenced CPR, and he was treated in hospital for a third-degree burn to his thumb and a minor burn to his abdomen. He was discharged from hospital next day and has returned to work.
We provided the employee and his family with all the assistance and support they needed for his recovery. Subsequently we reviewed our risk controls for work undertaken on an energised overheard network, and issued three safety alerts to employees to reinforce safe work practices.
Safety managementThe Incident Cause Analysis Method (ICAM) methodology is used to investigate incidents so we can learn from them and take corrective action.
In 2012–13, we reviewed and made improvements to our compliance program and audit reporting information to demonstrate that our Health, Safety and Environmental Management Systems have been effectively implemented.
We also updated our Workers Compensation and Injury Management procedures to comply with the requirements of the amended Workers Compensation Legislation Amendment Act 2012, and communicated these changes to employees who are directly impacted.
Asbestos managementDuring the year we improved our asbestos management system. We worked closely with employees, Ausgrid, Essential Energy, unions and WorkCover NSW to develop and deliver a program of work to ensure safe management of asbestos in our assets – for our workforce and the community. These efforts included additional training for front line staff, independent assessment of work practices and disposal of hazardous materials by specialists.
Lifeguard ProgramOur Lifeguard Program is one way to ensure employees on duty are fit for work and free of the effects of drugs, alcohol or fatigue.
Random alcohol testing will be introduced from October 2013.
During 2012–13, we continued our consultation with stakeholders on the parameters that were set by Fair Work Australia on breath alcohol concentration (BAC) levels for alcohol testing.
We now have an agreed method and have applied this for determining BAC levels across Endeavour’s 1,400 role classifications.
Our Fatigue Management procedure has been developed in accordance with the Work Health and Safety Regulations 2011 and relevant code. Consultation on this procedure is continuing with employees and unions.
LTIFR
2008
–09
2009
–10
2010
–11
2011
–12
2012
–13
Go
od
TRIFR
3.93.1
3.64.5
28.323.723.422.5
2.6
26.2
As at 30 June 2013.
LTIFR indicates how frequently lost time injuries have occurred – LTIs per million hours worked.
TRIFR is the total number of injuries or illnesses certified by workers compensation medical certificate per million hours worked. This includes measures such as medical treatment, restricted work and LTIs.
PERFORMANCE INDICATORLost time incident frequency rate and total recordable injuries
9Endeavour Energy Annual Performance Report 2012–13
OUR PERFORMANCE 2
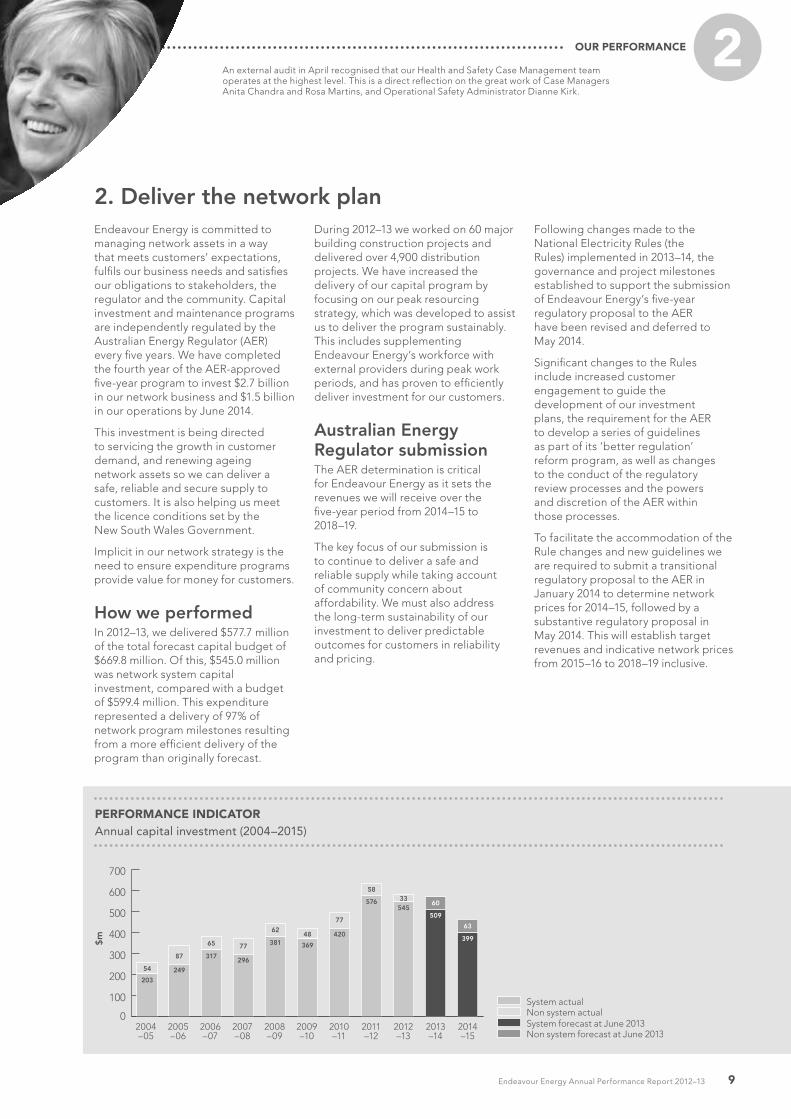
2. Deliver the network planEndeavour Energy is committed to managing network assets in a way that meets customers’ expectations, fulfils our business needs and satisfies our obligations to stakeholders, the regulator and the community. Capital investment and maintenance programs are independently regulated by the Australian Energy Regulator (AER) every five years. We have completed the fourth year of the AER-approved five-year program to invest $2.7 billion in our network business and $1.5 billion in our operations by June 2014.
This investment is being directed to servicing the growth in customer demand, and renewing ageing network assets so we can deliver a safe, reliable and secure supply to customers. It is also helping us meet the licence conditions set by the New South Wales Government.
Implicit in our network strategy is the need to ensure expenditure programs provide value for money for customers.
How we performedIn 2012–13, we delivered $577.7 million of the total forecast capital budget of $669.8 million. Of this, $545.0 million was network system capital investment, compared with a budget of $599.4 million. This expenditure represented a delivery of 97% of network program milestones resulting from a more efficient delivery of the program than originally forecast.
During 2012–13 we worked on 60 major building construction projects and delivered over 4,900 distribution projects. We have increased the delivery of our capital program by focusing on our peak resourcing strategy, which was developed to assist us to deliver the program sustainably. This includes supplementing Endeavour Energy’s workforce with external providers during peak work periods, and has proven to efficiently deliver investment for our customers.
Australian Energy Regulator submissionThe AER determination is critical for Endeavour Energy as it sets the revenues we will receive over the five-year period from 2014–15 to 2018–19.
The key focus of our submission is to continue to deliver a safe and reliable supply while taking account of community concern about affordability. We must also address the long-term sustainability of our investment to deliver predictable outcomes for customers in reliability and pricing.
Following changes made to the National Electricity Rules (the Rules) implemented in 2013–14, the governance and project milestones established to support the submission of Endeavour Energy’s five-year regulatory proposal to the AER have been revised and deferred to May 2014.
Significant changes to the Rules include increased customer engagement to guide the development of our investment plans, the requirement for the AER to develop a series of guidelines as part of its ‘better regulation’ reform program, as well as changes to the conduct of the regulatory review processes and the powers and discretion of the AER within those processes.
To facilitate the accommodation of the Rule changes and new guidelines we are required to submit a transitional regulatory proposal to the AER in January 2014 to determine network prices for 2014–15, followed by a substantive regulatory proposal in May 2014. This will establish target revenues and indicative network prices from 2015–16 to 2018–19 inclusive.
PERFORMANCE INDICATORAnnual capital investment (2004–2015)
2004–05
2005–06
2006–07
2007–08
2008–09
2009–10
2010–11
2011–12
2012–13
2013–14
2014–15
0
100
200
300
400
500
600
700
System actualNon system actual
$m
System forecast at June 2013Non system forecast at June 2013
203
249
317296
381 369
420
545509
399
54
87
65 77
6248
77
576
5833
60
63
An external audit in April recognised that our Health and Safety Case Management team operates at the highest level. This is a direct reflection on the great work of Case Managers Anita Chandra and Rosa Martins, and Operational Safety Administrator Dianne Kirk.

10
23. Improve customer value
In 2009, Endeavour Energy committed to reducing the cost of running the business by 10% over five years in a plan designed to keep electricity affordable for customers.
Through our two efficiency programs, Projects Challenge and Compete, we aim to contain electricity price increases close to the Consumer Price Index (CPI) for customers by reducing corporate and administration costs and the cost of operating our regional and network operations, while delivering a reliable and sustainable network for our communities.
Project Challenge focuses on corporate support and network services. This work includes optimising processes in corporate governance, finance, health and safety, human resources, information technology,
property and logistics and other business services.
Renegotiating with existing suppliers and market testing of specific services are among the ways we achieve the required savings. The finalisation of the transition of our retail business has also enabled us to simplify some corporate support functions and allow us to focus more closely on ‘network only’ operations.
Project Compete looks at regional and network operations. Its work includes a review of our workforce delivery model, improving scheduling processes, standardising work practices, better overtime control strategies, and reviewing our maintenance standards and defect management strategies. These initiatives in combination have helped
Actual Distribution Network Prices Increases
Future Distribution Network Prices Constrained to no more than CPI
End
eavo
ur E
nerg
y’s
Dis
trib
utio
n N
etw
ork
Pri
ce In
crea
se (N
om
inal
%)
July10
July09
July11
July12
July13
July14
July15
July16
July17
July18
02468
101214161820
17.48
15.0616.22
3.55
0.012.5 2.5 2.5 2.5 2.5
PERFORMANCE INDICATOROur pricing promise to customers (2009–2018)
Note: Distribution network prices do not include costs outside of Endeavour Energy’s control, such as, transmission costs and contributions to the NSW Government’s Climate Change Fund.
Go
od
8979
7282
88
2008
–09
2009
–10
2010
–11
2011
–12
2012
–13
PERFORMANCE INDICATORSupply reliability – normalised unplanned SAIDI (minutes)
drive a prudent cost control culture across the organisation, delivering $33.7 million in annualised savings.
We plan to pursue further savings by delivering the Network Reform Program. This includes streamlining of corporate and support services, implementing policy changes and capital programs that deliver better practice across the industry, and streamlining sourcing processes for products and services.
Thanks to our collective efforts to contain costs and boost productivity, the average distribution network price increase of 0.01% from 1 July 2013 fell below CPI for the first time in a decade. Customers in our network now benefit from the lowest regulated electricity prices in New South Wales.
We aim to maintain downward pressure on prices by controlling costs and keep average distribution network price increases to CPI (or below) for the next five years.
Reliability improvementWe monitor the reliability of our network with the System Average Interruption Duration Index (SAIDI). This measures the number of unplanned minutes customers, on average, are without electricity each year, excluding the impact of significant storms.
Our SAIDI improved from 126 minutes in 2003–04 to 88 minutes by the end of June 2013. However due to the large number of weather events, we did not meet our target of 76 minutes this year. The cumulative contribution of major weather events added 28 minutes SAIDI. Changes to reporting systems also resulted in 760 interruptions being included in SAIDI that would not have been reported in previous years. This added a further 1.9 minutes to SAIDI.
Events that significantly impacted our reliability result included 38 interruptions to the sub-transmission network, 2,267 interruptions to the distribution network, and 1,862 interruptions to the low voltage network, mainly due to adverse weather. Four big weather events, in particular, and a major sub-transmission outage caused significant disruption.
Nevertheless Endeavour Energy customers continued to benefit from one of the most reliable electricity networks in Australia.

11Endeavour Energy Annual Performance Report 2012–13
OUR PERFORMANCE 24. Leverage technologyEndeavour Energy is using technology to support delivery of Projects Challenge and Compete (see page 10), particularly in the areas of field force support, smart grid and new business systems.
During the year we made excellent progress on a number of important initiatives, delivering significant benefits to the organisation in savings and productivity improvements. They include:
MySafeWe contributed to improvements in safety through MySafe, a new system for reporting and tracking incidents relating to health and safety, environment, security, network shocks, network fires and vehicles. Once fully implemented, MySafe will be a valuable source of information for analysing safety issues.
iSafeWe continued with the rollout of iSafe, with installation completed in 90% of our vehicles. This system enables field employees to notify the office in an emergency and be located through GPS (global positioning system) technology.
Field force automationField force automation initiatives included the introduction in the field of tablet computers and applications for the Service Wire Replacement Program and live line crews. These applications enable data to be loaded in the field directly into systems, and accessed from anywhere for job dispatch, to calculate conductor loading on poles, and provide access to the live line manual and safety documentation. Projects are also underway to deliver solutions to reduce back office manual data entry for meter changes, streetlight maintenance and other inspection types.
Feeder automationWe continued to implement technology to help maintain network reliability. Our feeder automation system in the Springwood area successfully detected and isolated faults, automatically restoring supply from adjacent feeders and ensuring customers were not inconvenienced by blackouts. In six months of operation this scheme has prevented 465 customers from experiencing outages – totalling 4.7 hours saved in lost supply.
Controlled meteringThrough the use of controlled metering and management of air conditioning, along with more traditional commercial demand management, we completed the final year of the Rooty Hill demand management program. It achieved more than 5 MVA peak reduction, helping defer the need for a new substation in Glendenning.
Dial before you digTo boost efficiency further, we developed a new dial-before-you-dig (DBYD) application which automatically collects data from the GIS and eDocs systems and provides information to customers on underground assets. The DBYD response rate has enabled over half of our 7,000 monthly requests to be automated, saving $300,000 a year. Before we implemented this solution, 85% of enquiries were responded to within 48 hours, supported by eight full-time employees. The new application means 99.2% of enquiries are now answered within 48 hours by two employees.
Geographic Information System/Computer Aided DesignOur new GIS/CAD system allows faster capture of, and access to, electrical drawings for regional employees and accredited service providers in the field. It provides a more up-to-date view of our network assets and helps boost the Asset Information Team’s productivity.
Keith Irwin, Project Officer – South (Springhill) demonstrates how easy it is to record a safety observation in MySafe. MySafe empowers our people to respond to a wide range of incidents, hazards, near misses and safety observations with the most up-to-date information.

12
25. Manage business riskOur priority actions included management of two key business risks in 2012–13, discussed below.
Transition to OriginThe former Integral Energy Retail business was sold to Origin Energy with effect from 1 March 2011, and a two-year Transition Services Agreement (TSA) then commenced. In this period Endeavour Energy delivered retail services on behalf of Origin Energy, issuing almost five million retail bills and answering more than two million customer phone calls.
Transitioning 477,000 customer accounts involved enormous effort from employees across several business units, and close communication and a strong working relationship with Origin Energy. The organisations’ shared objective of prioritising service delivery throughout the TSA ensured there was no adverse impact on customers.
Network readinessThe aim of the Network Operational Readiness Project was to put in place systems and process changes necessary to ensure Endeavour Energy could continue to operate as a network-only organisation following the completion of the TSA. A program of 17 separate work packets was developed and their progress was monitored by an Executive Steering Committee. The committee also provided oversight of the day-to-day TSA activities.
Risk managementIn 2012–13, Endeavour Energy, together with Ausgrid and Essential Energy, implemented a revised common risk management framework that enables us to identify and manage risks that could affect customers, the community, environment, our people, assets and financial resources.
This year we reviewed major risks to our strategic objectives and developed and implemented action plans to help manage them.
Our management of business risk is based on three key behaviours:
• We are aware of our activities, operations and objectives.
• We consider what can go wrong and the consequences.
• We take action to prevent what can go wrong.
We also implemented initiatives outlined in the risk management strategy to strengthen risk management practices across the company.
Both the risk management strategy and risk management plan are reviewed by the Audit and Risk Committee of the Board throughout the year. ‘Risk owners’ provide regular reports to management and to the Audit and Risk Committee on the results of ongoing monitoring and review of risks, and on action plans to manage them. Risks to achievement of our corporate plan are continually identified and assessed across nine categories, as shown in this table:
Incident management and business continuity Endeavour Energy is committed to maintaining continuity of supply and business systems during network and other events. An important function of our incident management plan therefore is to enable us to mobilise resources, communicate with stakeholders and quickly recover key business processes.
Our incident management plan provides a framework to guide us through major disruptive events. This is supported by our business continuity and disaster recovery plans for critical processes and systems. All plans are regularly reviewed and tested. The incident management plan was activated several times during the year, on one occasion during a major simulation exercise in early 2013.
BUSINESS RISK CATEGORY RISK DESCRIPTION
Safety Fatality/serious injury of employee or member of public
Network Significant customer impact related to the network
Finance Significant unbudgeted financial loss
Compliance Liability associated with a dispute or material breach of legislation or licence
Reputation Sustained public criticism of Endeavour Energy
Environment Significant environmental incident
People Failure to deliver performance through people
Strategy Strategic objectives are not delivered and business opportunities are lost
ICT Significant information communications technology (ICT) &/or organisational technology service failure

13Endeavour Energy Annual Performance Report 2012–13
OUR PERFORMANCE 26. Deliver performance through people
A new Enterprise AgreementEndeavour Energy commenced the negotiation process for the 2012 Enterprise Agreement in July 2012. Under the Australian Fair Work Act 2009, for the first time Endeavour Energy used interest-based bargaining principles to negotiate. This requires parties to focus on their respective interests and work on generating options to address them.
Our three key objectives included: to improve safety outcomes for employees, contractors and the public; provide fair and responsible wage outcomes and deliver sustainable jobs for employees; and demonstrate value to customers by improving our productivity and containing future network tariff increases to CPI.
Following ten months of negotiations, on 21 May 2013, the Fair Work Commission certified the new Endeavour Energy Enterprise Agreement 2012 following a secret ballot held in accordance with the requirements of the Fair Work Act 2009. Employees voted 79% in favour of the agreement.
The agreement is for a two-year term and provides a wage increase of 2.7% per annum. Wage-related allowances (excluding the Electrical Safety Rules Allowance) were also increased in accordance with the Fair Work Commission’s recommendations following the previous agreement.
Employer contribution to accumulation superannuation payments will remain at 15% for the life of the agreement, regardless of changes in the Commonwealth Government’s Superannuation Guarantee Contribution.
The new agreement also contains new clauses relating to consultation, dispute resolution and work practice change. In addition to these, a new domestic violence clause has been added to reflect growing community concern about this important issue.
Overall, the 2.7% per annum wage increase met our three key objectives.
Developing our leadership capabilities and cultureDuring 2012–13, we continued to build our leadership capability and aligned leadership development programs to our purpose and desired culture.
Our leadership development programs this year focused on developing Strategic Leaders and Active Leaders. These programs aim to develop leadership capability in mobilising change, develop other employees, communicate and influence and enable managers to hold others to account. During 2012–13 over 90 leaders participated in the programs.
The frontline leaders program was successfully piloted with 15 Operations Managers in 2012–13. It delivered greater understanding of leader accountabilities and developed practical skills and tools that leaders need to be effective.
Chief Executive Officer Vince Graham talks to field staff as part of a program to develop future Leading Hands. The program focuses on three primary areas – safety, operations and leadership – with participants becoming preferred candidates ready to act as Leading Hands in the future.

14
3NETWORK
Our Network StrategyDuring the current regulatory period (2009–14), total expenditure on the network of $2.7 billion was approved by the Australian Energy Regulator (AER). We are now in the final year of this five-year plan, with a capital program of $509 million to deliver in 2013–14.
This investment aims to address three significant challenges:
1. Servicing growth in demand across our network area. New network infrastructure must be built to support the continued development of Sydney’s northwest and southwest residential growth centres. While we have seen reductions in demand from industrial customers in the last two years, our network is forecast to grow at a rate of 2.1% per year over the next 10 years, mainly due to greenfield development.
2. Meeting customers’ reliability needs. Our recent capital investment program has helped us ensure our network has a high degree of resistance to environmental impacts. The focus is now to improve operational effectiveness and reliability and reduce costs.
3. Managing the network efficiently and sustainably. A sustainable network is one in which we can maintain consistent levels of safety and reliability over long asset lives, while minimising volatility in costs.
In developing our network strategy, we took a range of regional, climatic, asset, customer and licence requirement issues into account. Some of these are:
• Our network contains some of Australia’s fastest growing communities. Under the NSW Government’s draft Metropolitan Strategy for Sydney, Endeavour Energy’s network area is forecast to accommodate 180,000 new dwellings and 171,000 new jobs by 2031.
• While customers expect secure and reliable supply, they have become increasingly concerned about the price of electricity. Network investment must be prudent and efficient to minimise upward pressure on prices.
• Peak temperatures across the network are typically higher and stay high for longer than those of central Sydney and other coastal areas.
• Eighty-one percent of households in Greater Western Sydney now have air conditioning units, compared with 59% in the Illawarra and 40% in the Blue Mountains. This has resulted in a ‘peakier’ load pattern in hot weather requiring more assets to service demand that only exists for a short time each year.
• Increasing penetration of rooftop photovoltaic systems is contributing to reduced energy usage and increased network management issues.
Major projects approved 2012–13To replace ageing assets, cater for future growth and ensure the security and reliability of electricity supply to customers, two major projects were approved this year valued at $28.6 million. They included $19.9 million for the establishment of Marsden Park Zone Substation and $8.7 million to replace the 132kV transmission cable between Union Street Switching Station and Camellia Transmission Substation. Construction on these will commence in coming years.
Apprentice Zoe Osborne in a pole dressing challenge at the 2012 Electricity Supply Industry Field Days. Endeavour Energy crews demonstrated a high standard of safety excellence claiming four first places, four second places and four third places, out of the 14 events entered.

15Endeavour Energy Annual Performance Report 2012–13
OUR NETWORK OPERATIONS 3
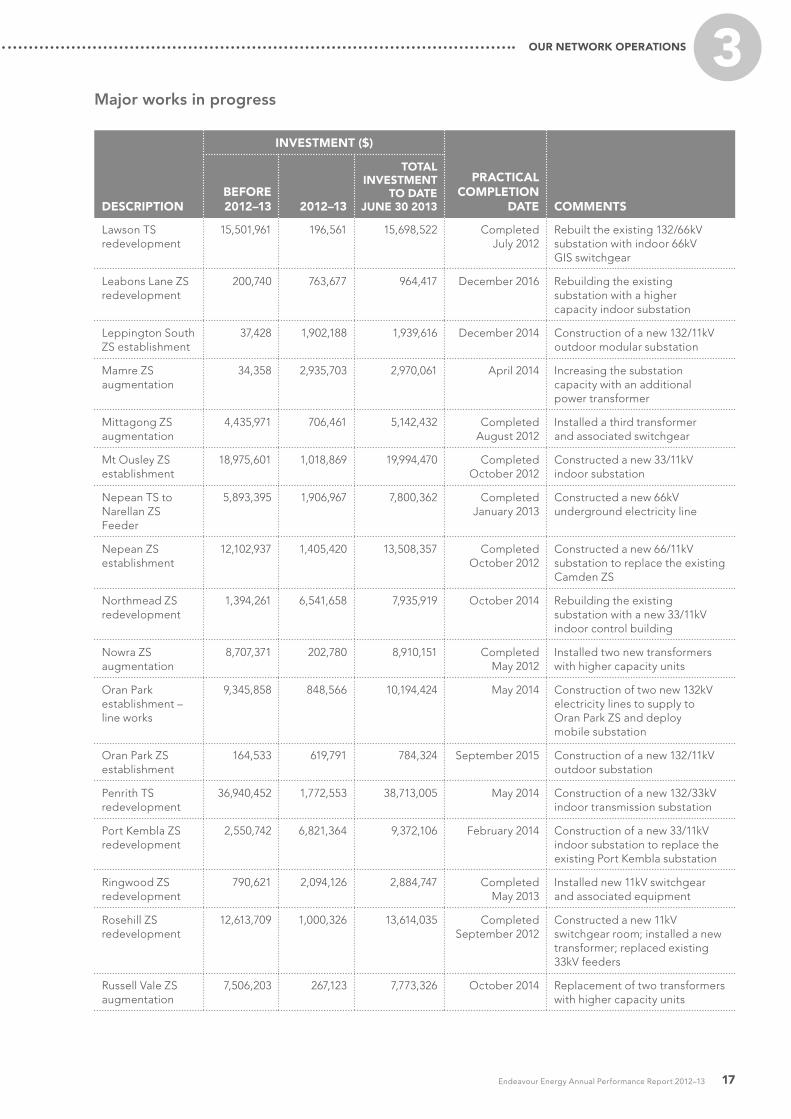
Major works in progress
DESCRIPTION
INVESTMENT ($)
PRACTICAL COMPLETION
DATE COMMENTSBEFORE 2012–13 2012–13
TOTAL INVESTMENT
TO DATE JUNE 30 2013
Abbotsbury ZS establishment
3,264,697 7,231,160 10,495,857 July 2014 Construct a new 132/11kV indoor zone substation (ZS). Includes related transmission mains and distribution line works
Baulkham Hills ZS establishment
8,807,201 429,585 9,236,786 Completed October 2012
Constructed a new 132/11kV substation within an existing transmission substation (TS)
Blackheath ZS redevelopment
5,481,255 1,183,294 6,664,549 Completed June 2012
Rebuilt the existing 66/11kV substation
Bomaderry ZS redevelopment
6,291,310 1,723,553 8,014,863 Completed May 2013
Replaced three transformers, installed bus-section circuit breakers and augmented 33KV feeder
Bulli ZS redevelopment
2,800,927 4,949,924 7,750,851 May 2014 Construction of a new 33/11kV indoor substation
Canley Vale ZS redevelopment
9,541,373 2,936,276 12,477,649 September 2013 Constructed a 33/11kV indoor zone substation
Castle Hill ZS redevelopment
2,685,642 2,587,864 5,273,506 July 2017 Rebuilding an existing 66/11kV substation with indoor switchgear
Casula ZS establishment
7,156,374 9,772,410 16,928,784 Completed July 2013
Constructed a new 33/11kV indoor zone substation
Cattai ZS feeders 443 and 458
619,595 8,253,417 8,873,012 July 2014 Replacement of 33kV outdoor switchgear with indoor and augmentation of 33kV feeders
Cawdor ZS establishment
15,797,739 3,138,094 18,935,833 Completed November 2012
Constructed a new 33/11kV substation
Cheriton Ave ZS establishment
42,135,377 3,440,859 45,576,236 Completed October 2012
Constructed a new 132/11kV indoor substation
Chipping Norton ZS establishment
2,640,408 8,070,101 10,710,509 November 2013 Construction of a new 33/11 kV zone substation
Claremont Meadows ZS establishment
21,538,642 8,672,501 30,211,143 Completed February 2013
Constructed a new 33/11kV indoor substation
Connection works for the establishment of Macarthur BSP
15,146,759 3,274,133 18,420,892 June 2014 Connection works associated with the new TransGrid Macarthur Bulk Supply Point
Steve Jones Project Manager (Civil) at the $11m East Parramatta switching station. Endeavour Energy is investing $300 million in essential electricity infrastructure for Parramatta and surrounding areas over the next 15 years to meet the future electricity demand of one of Australia’s major business centres now and in the future.
a The practical completion date typically refers to the energisation of electrical assets within a project. After practical completion, expenditure may still be undertaken on complementary distribution works, network reconfiguration, defect rectification, landscaping and road restoration.
a

16
3Major works in progress
DESCRIPTION
INVESTMENT ($)
PRACTICAL COMPLETION
DATE COMMENTSBEFORE 2012–13 2012–13
TOTAL INVESTMENT
TO DATE JUNE 30 2013
Corrimal ZS redevelopment
6,933,527 3,645,264 10,578,791 December 2013 Construction of a new control building to house new switchgear and electrical equipment. Installation of two new transformers
Culburra ZS augmentation
415,517 4,796,494 5,212,011 August 2014 Installation of indoor 33KV switchgear; construction of a new 33KV feeder
Doonside ZS establishment
32,298,466 9,917,074 42,215,540 May 2014 Rebuilding an existing substation with a new higher capacity 132/11kV indoor substation
East Liverpool TS establishment
24,992,609 807,678 25,800,287 Completed September 2012
Constructed a new 132/33kV indoor substation
East Parramatta SS & West Parramatta ZS establishment
37,409,081 37,759,302 75,168,383 October 2013 Construction of a new 132/11kV indoor substation and a new 132kV indoor switching station
East Richmond ZS establishment
12,269,019 8,979,133 21,248,152 October 2013 Construction of a new 33/11kV indoor substation to replace the existing Richmond ZS
Figtree ZS establishment
9,146,255 6,370,531 15,516,786 Completed February 2012
Construct a new 33/11kV zone substation. Rebuild existing 33kV feeder to a higher rating
Gerringong ZS augmentation
7,647,770 701,616 8,349,386 Completed July 2012
Replaced 11KV switchgear; augmented the 33KV feeder
Glenorie ZS establishment
3,396,900 6,258,617 9,655,517 September 2013 Construction of a new 33/11kV modular substation
Granville ZS establishment
39,993,458 2,858,030 42,851,488 Completed May 2012
Constructed a new 132/11kV indoor substation to replace the existing substation
Guildford TS redevelopment
29,082,247 12,938,189 42,020,436 December 2013 Construction of a new control building and installation of 132kV and 33KV GIS switchgear and three new transformers
Holroyd ZS redevelopment
10,931,472 2,173,312 13,104,784 August 2013 Replaced 33 KV and 11KV switchgear with new indoor switchgear
Homepride ZS establishment
9,694 434,908 444,602 July 2014 Augmentation of the 33kV sub transmission electricity network
Huntingwood ZS establishment
5,669,908 11,137,303 16,807,211 December 2013 Construction of a new 132/11kV outdoor substation
Jordan Springs ZS establishment
1,297,714 9,154,573 10,452,287 December 2015 Construction of a new 33/11kV indoor substation (initially deploy mobile substation)
Kemps Creek ZS redevelopment
6,555,000 357,431 6,912,431 Completed October 2012
Extended the control room to accommodate new 11kV switchboard
17Endeavour Energy Annual Performance Report 2012–13
OUR NETWORK OPERATIONS 3
DESCRIPTION
INVESTMENT ($)
PRACTICAL COMPLETION
DATE COMMENTSBEFORE 2012–13 2012–13
TOTAL INVESTMENT
TO DATE JUNE 30 2013
Lawson TS redevelopment
15,501,961 196,561 15,698,522 Completed July 2012
Rebuilt the existing 132/66kV substation with indoor 66kV GIS switchgear
Leabons Lane ZS redevelopment
200,740 763,677 964,417 December 2016 Rebuilding the existing substation with a higher capacity indoor substation
Leppington South ZS establishment
37,428 1,902,188 1,939,616 December 2014 Construction of a new 132/11kV outdoor modular substation
Mamre ZS augmentation
34,358 2,935,703 2,970,061 April 2014 Increasing the substation capacity with an additional power transformer
Mittagong ZS augmentation
4,435,971 706,461 5,142,432 Completed August 2012
Installed a third transformer and associated switchgear
Mt Ousley ZS establishment
18,975,601 1,018,869 19,994,470 Completed October 2012
Constructed a new 33/11kV indoor substation
Nepean TS to Narellan ZS Feeder
5,893,395 1,906,967 7,800,362 Completed January 2013
Constructed a new 66kV underground electricity line
Nepean ZS establishment
12,102,937 1,405,420 13,508,357 Completed October 2012
Constructed a new 66/11kV substation to replace the existing Camden ZS
Northmead ZS redevelopment
1,394,261 6,541,658 7,935,919 October 2014 Rebuilding the existing substation with a new 33/11kV indoor control building
Nowra ZS augmentation
8,707,371 202,780 8,910,151 Completed May 2012
Installed two new transformers with higher capacity units
Oran Park establishment – line works
9,345,858 848,566 10,194,424 May 2014 Construction of two new 132kV electricity lines to supply to Oran Park ZS and deploy mobile substation
Oran Park ZS establishment
164,533 619,791 784,324 September 2015 Construction of a new 132/11kV outdoor substation
Penrith TS redevelopment
36,940,452 1,772,553 38,713,005 May 2014 Construction of a new 132/33kV indoor transmission substation
Port Kembla ZS redevelopment
2,550,742 6,821,364 9,372,106 February 2014 Construction of a new 33/11kV indoor substation to replace the existing Port Kembla substation
Ringwood ZS redevelopment
790,621 2,094,126 2,884,747 Completed May 2013
Installed new 11kV switchgear and associated equipment
Rosehill ZS redevelopment
12,613,709 1,000,326 13,614,035 Completed September 2012
Constructed a new 11kV switchgear room; installed a new transformer; replaced existing 33kV feeders
Russell Vale ZS augmentation
7,506,203 267,123 7,773,326 October 2014 Replacement of two transformers with higher capacity units
Major works in progress

18
3
DESCRIPTION
INVESTMENT ($)
PRACTICAL COMPLETION
DATE COMMENTSBEFORE 2012–13 2012–13
TOTAL INVESTMENT
TO DATE JUNE 30 2013
Rydalmere ZS redevelopment
8,814,101 7,652,171 16,466,272 October 2015 Rebuilding the existing 66/11kV substation with indoor 66kV GIS switchgear
Schofields ZS establishment
30,373,860 2,153,159 32,527,019 Completed October 2012
Constructed a new 132/11kV indoor substation
South Granville ZS redevelopment
9,047,604 3,230,932 12,278,536 July 2013 Constructed a new 33/11kV indoor substation
South Nowra ZS redevelopment
5,912,111 353,743 6,265,854 Completed September 2012
Constructed a new control building; replaced Transformer No.2 and augment 33kV Feeder 7507
South Windsor ZS redevelopment
1,129,893 1,522,946 2,652,839 Completed December 2012
Rebuilt the fire damaged 11kV switchroom
St Marys ZS redevelopment
234,145 1,360,594 1,594,739 July 2016 Rebuilding the existing substation with a higher capacity indoor substation
The Oaks ZS 3,198,782 3,442,289 6,641,071 Completed March 2013
Constructed a new 33/11kV modular substation
Tomerong ZS establishment
4,455,477 9,926,338 14,381,815 March 2014 Construction of a new 33/11kV indoor substation
West Liverpool ZS establishment
15,807,360 1,450,698 17,258,058 Completed November 2012
Constructed a new 33/11kV indoor substation to replace Hoxton Park ZS
West Tomerong TS establishment
8,856,267 15,371,924 24,228,191 December 2013 Construction of a new 132/33kV substation
Westmead ZS redevelopment
44,692 889,649 934,341 May 2014 Rebuilding the existing 33/11kV indoor substation
Wilton Park ZS establishment
20,277,617 3,998,788 24,276,405 Completed May 2013
Constructed a new 66/11kV substation
Windsor ZS augmentation
10,755,239 2,616,713 13,371,952 August 2013 Rebuilding the existing substation with a higher capacity indoor substation
Total 628,059,225 268,926,703 896,985,928
Major works in progress 2012–13
Graduating apprentices Shimeon Sumner, Shane Worthington and Shawn Craig won best in their category at regional NSW Training Awards in Wollongong and Western Sydney.

19Endeavour Energy Annual Performance Report 2012–13
OUR NETWORK OPERATIONS 3Network maintenance Our Strategic Network Maintenance Plan, which is part of our Strategic Asset Management Plan, analyses maintenance needs against business objectives and outlines the strategies we need to adopt to maintain our network.
This work includes vegetation management, asset inspections and pre-summer bushfire inspections of our overhead electricity lines in bushfire-prone areas. The plan is reviewed and updated annually to identify what network maintenance we will need to undertake over the ensuing 12 months.
In 2012–13, Endeavour Energy delivered its maintenance program at a cost of $240.4 million, in compliance with our maintenance targets.
Maintenance work and expenditure included:
• $24.4 million on vegetation management to maintain safety clearances, reduce outages, improve reliability and manage bushfire risk
• $11.6 million on metering, work which included reading of meters and providing information for billing
• $16.9 million for fault and emergency work following weather-related events and third-party incidents
• $32.1 million on preventative maintenance and inspections of the transmission and distribution network
• $31.1 million on condition-based maintenance
• $10.2 million for expenses related to contestable customer connection works, including transformers and switchgear paid by customers
• $11.5 million for the overhead line and pole inspection program, involving the inspection of 104,858 poles
• $6.1 million on street lighting, including replacing 62,228 lamps
• $96.5 million on network operating management and other maintenance activities.
Vegetation managementEndeavour Energy is committed to best practice asset inspection and vegetation management to ensure our network can operate safely and reliably. A key component of this strategy is to minimise the risk of bushfires and risk to our assets and customer reliability resulting from trees coming in contact with our network. We are now employing LiDAR (light detection and ranging) technology for pre-summer bushfire inspections.
We have also introduced new, innovative vegetation maintenance contracts. For the first time we have an auditable management system which details the type and location of vegetation close to our overhead mains. This information will be used to identify ways we can reduce costs in controlling vegetation.
StreetlightingEndeavour Energy owns and maintains over 195,000 streetlights on behalf of 29 public lighting customers, which include 23 local councils. During the year we replaced 62,228 lamps as part of the bulk change maintenance program. Since 1 January 2011, defective streetlight lamps have been replaced with fluorescent lamps that consume less energy.
We are also undertaking trials in Blacktown, Penrith and The Ponds to assess the performance of more efficient light emitting diode (LED) lights and Ceramic Arc Metal Halide lamps for street illumination. They are more efficient and reliable than other technologies available to date. To facilitate LED technology being available as an option for public lighting customers, in addition to running field trials Endeavour Energy has developed pricing for approval by the AER.
The NSW Public Lighting Code requires us to repair faulty streetlights reported to us by a customer within eight working days of receiving the fault report. In 2012–13, our average response time to repair such faults was 4.3 days.
In 2012–13 adverse weather events had a greater impact of the reliability of supply to customers than in the three years prior. In response to storms and high winds, Endeavour Energy emergency crews are ready to immediately respond to make safe fallen powerlines and restore supply to customers.

20
3Demand managementOne way of reducing the cost of network management is to investigate demand management alternatives (also known as non-network options) to network upgrades for capital expenditure projects.
Where feasible, we investigate and implement projects that modify demand as an alternative to spending money to upgrade the network. Projects may include negotiating with high-use customers to move electricity consumption away from the network at peak times, or implementing projects to reduce overall usage in those times.
We recognise there is an imperative to ensure electricity is delivered reliably and in an energy efficient and environmentally responsible manner, which is why we evaluate demand-side as well as construction options in the network planning process.
The National Electricity Rules (NER) require distribution network service providers to investigate demand management options when planning major network upgrades by engaging in a thorough consultation process. This gives all interested parties the opportunity to submit ideas, and allows for cost-effective demand management and other system support options.
The NER calls for a ‘screening test’ for all capital projects above $5 million to determine if a non-network option is credible and should be investigated
further. We perform these tests and summarise the results in our annual Demand Management Plan (DM Plan).
If a non-network option is deemed to be feasible, a request for proposals (RFP) is issued or an inhouse demand management investigation is conducted. The RFP is a public process in which Endeavour Energy invites interested stakeholders to make submissions for system support options, which are evaluated against network options.
The table below outlines our Network Demand Management Plan projects for investigation in 2012–13.
Residential demand management programsThe CoolSaver and PeakSaver residential DM programs were implemented in the Rooty Hill Zone Substation supply area and were the first operational residential DM programs that Endeavour Energy implemented. Trials into air conditioning cycling and dynamic peak pricing were conducted previously, and their findings were used to implement effective residential DM programs.
The CoolSaver program used air conditioners that were built to the new Australian Standard to control energy consumption. The PeakSaver program allows customers to manage their own consumption, and be financially rewarded depending on how much energy they save.
The three-year program period concluded at the end of summer. It revealed that customers are happy to participate at 88% satisfaction and that the demand reduction recorded was as high as 35% for PeakSaver (1.7 kVA per customer) and 30% for CoolSaver (1.5 kVA per customer). We now seek to expand the programs.
Dial Before You Dig (DBYD)Since the exposure of some high-profile ‘dig-ins’ and the associated legislative response in 2009 to prevent damage to electricity assets, we have seen a 120% increase in the number of enquiries per day through our DBYD service. We currently receive 350 enquiries daily on average, with peaks of around 450.
Metering servicesEndeavour Energy undertook 6,561,614 routine meter reads in 2012-13. In addition we supplied about 191,000 out-of-cycle meter reads to facilitate requests for reconnections, disconnections and special reads.
AREA DESCRIPTION
TARGET DEMAND REDUCTION (KVA)
CAPITAL EXPENDITURE DEFERRED RESULTS OF INVESTIGATION
Warilla ZS Commercial, residential areas
1,500 $5 million Firm rating exceeded in 2014. Licence condition limits exceeded in 2028 DM not warranted at this stage
Kingswood ZS Commercial, residential areas & major customer
4,000 $23 million Firm rating exceeded in 2014. Licence condition limits exceeded in 2030 DM not warranted at this stage
Sherwood ZS Commercial, residential areas
1,500 $10 million Firm rating exceeded in 2013. Licence condition limits exceeded in 2030 DM not warranted at this stage

21Endeavour Energy Annual Performance Report 2012–13
OUR NETWORK OPERATIONS 3Exceptional customer serviceDuring 2012–13, our Customer Interaction Centres (CICs) in Huntingwood and Coniston received 622,361 retail calls on behalf of Origin Energy under the Transitional Services Agreement (TSA), which expired on 25 January 2013. The average answering time for retail calls was 36 seconds.
The CICs also received 202,223 calls relating to emergencies and outages on our network. The average speed of answer for network calls was 29 seconds. Our outage management interactive voice response satisfied 172,356 customers.
We received 3,689 complaints in 2012–13 compared with 4,461 the previous year. The main complaints related to planned and unplanned outages, property access issues and vegetation management.
The CIC also launched a new ‘Network General Enquiries’ contact number (133 718) in May 2013, to differentiate emergency and outage enquiries. This followed the transition of the former ‘Retail Account Enquiries’ phone number to Origin Energy.
National Energy Customer Framework The National Energy Customer Framework (NECF) legislative package commenced in NSW on 1 July 2013. Endeavour Energy invested much time and effort to ensure we were prepared to operate within this new regulatory framework.
The NECF harmonises the jurisdiction-based regulatory frameworks in relation to the sale and supply of energy, and Endeavour Energy supports its intent to improve customer protection measures.
Changes introduced include
• New contractual arrangements for customers connecting to the network
• Priority management of life support customers to ensure supply
• Increased lead times for notifying customers of planned outages
• Acting on connect or disconnect requests from retailers within given time frames
• Improved communication between retailers and distributors.
Network connectionsEndeavour Energy developed and certificated 788 contestable designs for proposed changes to the network and 798 contestable construction projects representing approximately $75 million of non-cash capital contributions in 2012–13. Overall there were approximately 13,279 new connections to the network. However activity remained weak across all major development categories, including residential and commercial/industrial subdivisions. We have been working closely with developers, particularly UrbanGrowth (formerly Landcom), in support of the NSW Government’s aim to increase residential land supply.
We have also been involved in negotiating supply arrangements for a number of government infrastructure projects, such as the South West and North West rail lines, as well as upgrading of supply to the Western line at Toongabbie and numerous asset relocation projects for the ARTC freight rail expansion of the Southern line.
In the coal mining sector a number of mines have upgraded their supply arrangements in preparation for increasing production.
The development of new data centres requiring substantial supply capabilities has continued, despite the reduction in activity of many other commercial development types.
Major network eventsOn 23 and 24 February 2013, our network was hit with strong winds and heavy rain. The Kiama region was one the worst affected areas with parts of the township devastated by a coastal tornado.
Heavy rain in the area had softened ground which meant large trees were brought down over mains and service lines. Trees across roads and dangers associated with wind gusts limited employees’ access to many of the hardest-hit areas.
Our crews worked throughout the day and into the night to restore power to over 44,000 customers. Another 300 customers had their power restored on 25 February. The cost to replace the assets damaged by the windstorm was almost $600,000.
Our response to the incident was completed with no harm or injury to any of our people or the public.
The Kiama region was hit by a coastal tornado which devastated a narrow, 200 metre-wide corridor. Extraordinary winds and heavy rain tested our crews as they worked to restore power to more than 44,000 customers across our network franchise. The intensity and ferocity of the tornado resulted in homes with roofs missing, walls blown out and many trees being brought to the ground.

22
4PEOPLE
Endeavour Energy employeesEndeavour Energy understands that to achieve our business goals and deliver better value to our customers, we need an engaged and capable workforce who reflect our values and culture.
During 2012–13, we continued to focus on implementing initiatives to improve productivity, to provide the most efficient service possible for customers. These improvements, along with the NSW Government’s recruitment freeze, meant that our workforce decreased to 2,635 full-time equivalent employees in 2012–13. This represents a decrease of 6.7% over the previous year.
RecruitmentWith the ongoing changing needs of the business, our focus during the year was to support more internal recruitment across the organisation. This work included the successful Mix and Match program.
The development of a new agency supplier panel for temporary resources and the centralisation of the management of temporary employees to the recruitment team were among major changes introduced to our recruitment processes. The new panel and centralised management will bring more transparency, efficiency and visibility in relation to our temporary labour recruiting. In addition, it will result in significant cost savings, with more competitive margins offered by our new suppliers.
Employee Mobility TeamThe Employee Mobility Team continues to support employees whose positions have been impacted by organisational change. A significant focus and achievement for the team this year was the successful redeployment of employees affected by the sale of the retail business. Through Mix and Match we enabled 49 employees to be permanently appointed in the network-only business, and provided proactive career transition support.
ApprenticesIn early 2013, we employed 28 new apprentices, including one existing employee and one woman. They will complete a Distribution Electricity Supply Industry trade qualification.
Meanwhile 71 apprentices completed their qualification during the year, with most accepting permanent employment in the organisation. We now employ 200 people in development programs, including 187 apprentices.
It was a successful year for Endeavour Energy apprentices at the 2013 NSW Training Awards, with four being nominated for awards. In the South Western Sydney Region, Shane Worthington and Shawn Craig were finalists for Apprentice of the Year, and in the Illawarra and South East NSW Region, Joel Ward was given an Industry Excellence Award in the Supply Industry – Distribution category. Shimeon Sumner was awarded Certificate of Excellence – Apprentice of the Year for the Supply Industry category.
It was a successful year for Endeavour Energy apprentices at the 2013 NSW Training Awards, with four being nominated for awards.
2,871
4.0%
2,888
0.6%2,925
1.3%
2,824
-3.5%
2,635
-6.7%
2008
–09
2009
–10
2010
–11
2011
–12
2012
–13
PERFORMANCE INDICATOREmployee numbers 2008–2013 (based on full time equivalents)

23Endeavour Energy Annual Performance Report 2012–13
OUR PEOPLE 4
DiversityDiversity at Endeavour Energy continues to focus on three themes: equality, multiculturalism and ability (disability awareness and action) within our Diversity Framework.
Our Diversity workgroup has developed a five-year plan to embed our diversity principles and continue working towards government-set EEO group targets, which are detailed on page 79–80.
We continued to work towards strengthening our indigenous employment connections, developing our ability awareness and improving our flexible working arrangements.
Recognising long‑serving employeesAt our annual Service Awards in August 2012, we recognised the contribution of 41 employees who had collectively contributed 1,185 years of service to meeting the energy needs of our community. A special presentation celebrated the achievement of our longest-serving employee, who had been with us for over 49 years, and three, five and 32 employees who had served for 45, 40 and 25 years respectively.
Our Diversity workgroup has developed a five-year plan to embed our diversity principles
Endeavour Energy’s success depends upon attracting and retaining high calibre employees to deliver our business strategy and meet the needs and expectations of our customers. In 2012, we congratulated Ann Smith, Electrical Fitter Mechanic from our Springhill Field Service Centre, on 25 years of continuous service. In 1987, Ann was the first female electrical apprentice of one of our predecessor organisations Illawarra County Council. Ann is pictured here receiving her award from Chief Operating Officer Rod Howard (left) and General Manager Network Operations Scott Ryan (right).
Endeavour Energy employed 28 new apprentices in 2012-13. Amongst these new apprentices were (front row) Andrew Eisenhuth, Shane Hearne, Matthew Emerson, Karyn Downs, Jackson Dwyer, Jack Cromer, Thomas Hill and (back row) Ryan Dalley, Jaymee Dillon, Ryan Harwood, Reece Crofts, Brendan Mc Kay, Brett Gibbs (Trainer).
Carmen Depares, Charline Coombes, Cherrie Sharpe and Ian Cambourne have changed careers as part of our innovative Mix and Match Program.

24
5COMMUNITY
Public safetyThrough our Public Electrical Safety Awareness Plan we have targeted community groups most at risk from electrical hazards.
Work associated with the plan has involved engaging emergency services and the construction industry to embed specially developed training resources into their training programs, upgrading our community safety website and running well-received information evenings with the Master Builders’ Association. Once again we helped to educate primary school students about electricity safety through the Electricity Safety Week program. This was taken up by 91% of schools in our franchise area.
We used radio messages to raise awareness about electricity hazards in relation to vegetation around power lines and preparing for the bushfire season, ‘tingles’ in the home, DIY and staying away from power lines and underground cables.
‘Black spot’ pole programOur black spot pole program aims to reduce vehicle impacts into power poles by identifying sites were fatalities and serious accidents have occurred. Poles are then relocated to improve public safety. In 2012–13 four sites were completed and a further three sites were in construction at the end of the financial year at a cost of $703,090.
Overhead power line ‘Plan ahead. Keep your distance’ campaignThe need for construction industry workers to plan ahead and manage electricity hazards before starting work was the focus of the campaign to prevent overhead power line strike. The campaign used local media and billboards on major roads.
Graffiti Endeavour Energy has been actively involved in graffiti management activities across the network franchise area in 2012–13. Information is gathered through our graffiti email address, local council contacts and customer complaints phone service. A total of 1,800 reports have been received and attended to by the company’s graffiti management contractor, costing the organisation just over $215,000.
There has been a 10% decrease in costs associated with this work compared to the previous three years, thanks to initiatives with Penrith and Parramatta City Councils, supplying paint to community groups, and allowing murals to be painted on some of our assets. We seek to further reduce these costs and are trialling anti-graffiti coatings on our Securemax fencing around substations.
Copper theft Theft of cable remains an important issue for Endeavour Energy – financially and, more importantly, as a safety concern. In July 2012 a person suspected of attempting to steal cable from a work site at Liverpool was severely injured when he cut into energised electricity cables.
During 2012–2013 30 incidents of copper theft were reported, with losses costed at $72,351. This is a substantial decrease in incidents over the previous year, when 121 incidents were reported, costing $158,150.
We have placed advertisements in local media and organised radio announcements to warn the public of the dangers of stealing copper and to remind them to contact Crime Stoppers if they are aware of any cable theft. Our security systems are constantly upgraded at field
service centres and substations to increase electronic monitoring to detect attempted site breaches. Security patrols have been valuable in identifying illegal entry attempts.
Community engagementOur communities expect us to deliver a safe and reliable electricity supply to homes, businesses and regional centres – every day. Living up to this expectation requires careful planning, and heeding community views are an important part of the process. We plan community engagement to ensure there is minimal impact on people’s day-to-day activities when we undertake major works.
In 2012–13, major projects on which we engaged with local communities included the upgrades of our:
• Existing Leabons Lane Zone Substation in Seven Hills, originally built in 1964
• Existing transmission lines that supply Cattai Zone Substation and the new Jordan Springs Zone Substation currently under construction.
As part of the Australian Energy Regulator’s (AER) ‘Better Reform’ program, a consumer engagement guideline has been developed to encourage network businesses to engage in genuine and ongoing consultation with customers.
Endeavour Energy has developed a significant program to improve our engagement with customers over time. Preliminary research conducted in early 2013 indicated that customers value price stability, safety and reliability. Our proposal to the AER – to be submitted in May 2014 – will be prepared on the basis of these customer priorities.

25Endeavour Energy Annual Performance Report 2012–13
OUR COMMUNITY 5
Customer consultative committeeWe have run our Customer Consultative Committee successfully for over 20 years.
In late 2012 we refreshed membership of the committee to align its operations with a network-only business.
In 2012–13, the committee met twice to discuss Endeavour Energy’s strategic priorities, our 2013–14 network prices, the National Energy Customer Framework and delivery of our network investment program.
Community partnershipsDuring 2012–13 a new Networks NSW Community Partnership Policy introduced set out the key criteria under which community partnerships
at Ausgrid, Endeavour Energy and Essential Energy need to be assessed.
During 2012–13, we provided $41,000 to our community partners, which included support for Australia Day, Electric Energy Society of Australia and the Western Sydney and Illawarra TAFE Student Excellence Awards.
University of Wollongong Power Quality and Reliability CentreEndeavour Energy has been a partner of the Power Quality and Reliability Centre since it was established at the University of Wollongong in 1996. Key areas of research include power quality issues that can affect the performance of the network and equipment, reliability of the distribution network, and integration of renewable energy into existing networks.
In July 2013, we made a commitment to continue the partnership for another three years from 1 July 2013.
Investment in the communitySince its launch in July 2004, our workplace giving program I care! has donated almost $1.7 million to 11 employee-selected charities. Employees can make pre-tax donations to the program and their donations are matched dollar-for-dollar by Endeavour Energy, up to $150,000 per year. Currently, 8.5% of employees participate in I care!
Multicultural policies and services programEndeavour Energy’s corporate values commit the organisation to acknowledging and valuing cultural diversity across our stakeholder base. This commitment is evident in our delivery of customer services, management of employees and interactions with suppliers, communities and other stakeholder groups.
CustomersWe strive to ensure that appropriate services are offered to our multicultural customers and that customers are not disadvantaged because of their cultural backgrounds.
Data collected from the 2010 Census indicates that 31% of people living in our franchise area – Sydney’s Greater West, the Blue Mountains, Southern Highlands, the Illawarra and Shoalhaven – were born outside Australia. To ensure we offer the same level of service to everyone, we provide an interpreter service that allows customers to speak their own language.
As part of our efforts to improve access to information for customers from non-English-speaking backgrounds, based on a benchmarking study conducted in 2011–12, we now include the interpreter information on all significant customer communication materials we produce and have it prominently displayed on our ‘Contact us’ page on our website.
EmployeesWe are committed to fostering an environment in which diversity in the workplace is respected and valued as a source of new ideas and perspectives. This commitment includes encouraging diversity across all areas of employment such as recruitment, remuneration, training, development and career progression and accommodating the needs of employees in their observance of religious duties and cultural obligations while at work.
Please see page 23 for more information on Endeavour Energy’s diversity policy.
Focus for 2013–14• Action Endeavour Energy Diversity Plan to further
embed our diversity principles and work towards government-set EEO group targets.
• Continue to raise awareness of the interpreter service and availability of translated safety information for targeted areas of our franchise area.
• Develop new electricity safety signage with translated information.
The proactive action of our Bowenfels Field Support Centre Health and Safety Committee members Lee Wiggins, Neil Charlton, Brendan Quince and Nathanael Hunter inspired a new public safety campaign highlighting the risks of tampering with power lines. Two billboards with the campaign message ‘Electricity Can Kill’ are highly visible on the Great Western Highway in the Blue Mountains and Lithgow.

26
6ENVIRONMENT
Strategy In line with our Environment Policy, Endeavour Energy established a three-year Environment Strategy in 2011–12.
The strategy aims to create value for the organisation through the efficient use of resources, reduction of risk and engagement with stakeholders. Implementation continued in 2012–13, with the following significant achievements:
• We established an integrated training and communications plan. To reinforce key messages, training and communication initiatives are now aligned under a common theme each quarter. As a result environmental awareness has improved among field employees.
• The Environmental Impact Assessment process for minor works was revised to strengthen key controls and continue to meet our obligations under the Environmental Planning and Assessment Act 1979.
• We developed and implemented a risk-based program of environmental performance audits in 2012-13. The program was closely aligned with the training and communications plan.
Environmental performanceEnvironmental complianceWe again faced no fines or prosecutions in 2012–13. Our strategic focus on risk reduction resulted in a significant decrease in the number of incidents reported to the regulator under the Protection of the Environment Operations Act 1997. In 2012–13, two incidents were defined as ‘notifiable’ under the legislation compared with five the previous year. Each has been investigated and corrective actions implemented.
The Environment Protection Authority (EPA) is currently investigating one of the ‘notifiable’ incidents related to the disposal and transport of drilling mud by an Endeavour Energy subcontractor. We are cooperating with the EPA and have taken steps to mitigate this risk.
In addition to the two reportable incidents, a further 66 minor incidents were reported internally. Environmental incidents decreased by 18% compared to 2011–12.
We continue to report illegal dumping activities to align our efforts with the NSW Government’s 10-year strategic business plan, NSW 2021: A plan to make NSW number one. During the year we worked in partnership with Regional Illegal Dumping Squads established by the EPA and local councils. Incidents were jointly investigated and actions taken to prevent future illegal dumping.
Greenhouse We met our commitments to state-based and national environmental schemes again in 2012–13. The schemes aim to reduce greenhouse gas emissions or promote energy efficiency among businesses and consumers.
In addition we complied with the Australian Government’s Large Scale Renewable Energy Target and Small-scale Renewable Energy Scheme, the Queensland Government’s 15% Gas Scheme and the NSW Energy Savings Scheme.
Following the closure on 1 July 2012 of the NSW & ACT Greenhouse Gas Reduction Schedule, we completed the final surrender of certificates and Benchmark Statement in September 2012. Endeavour Energy’s commitments under GreenPower were similarly completed in 2011–12.
Carbon policyEndeavour Energy’s Carbon Management Policy aims to eliminate 20,000 tonnes of carbon from our operations by 2016. In 2012–13, the business continued to identify and assess opportunities to reduce emissions.
The detailed design and tender for the Springhill Field Service Centre redevelopment was completed. Designed to achieve a 4.5 star NABERS1 rating when constructed, it will commence in 2013–14 and be completed the following year.
1 NABERS is a national program managed by the NSW Office of Environment and Heritage. NABERS tools measure the environmental impact of a building on a rating scale from 1 to 6 stars.
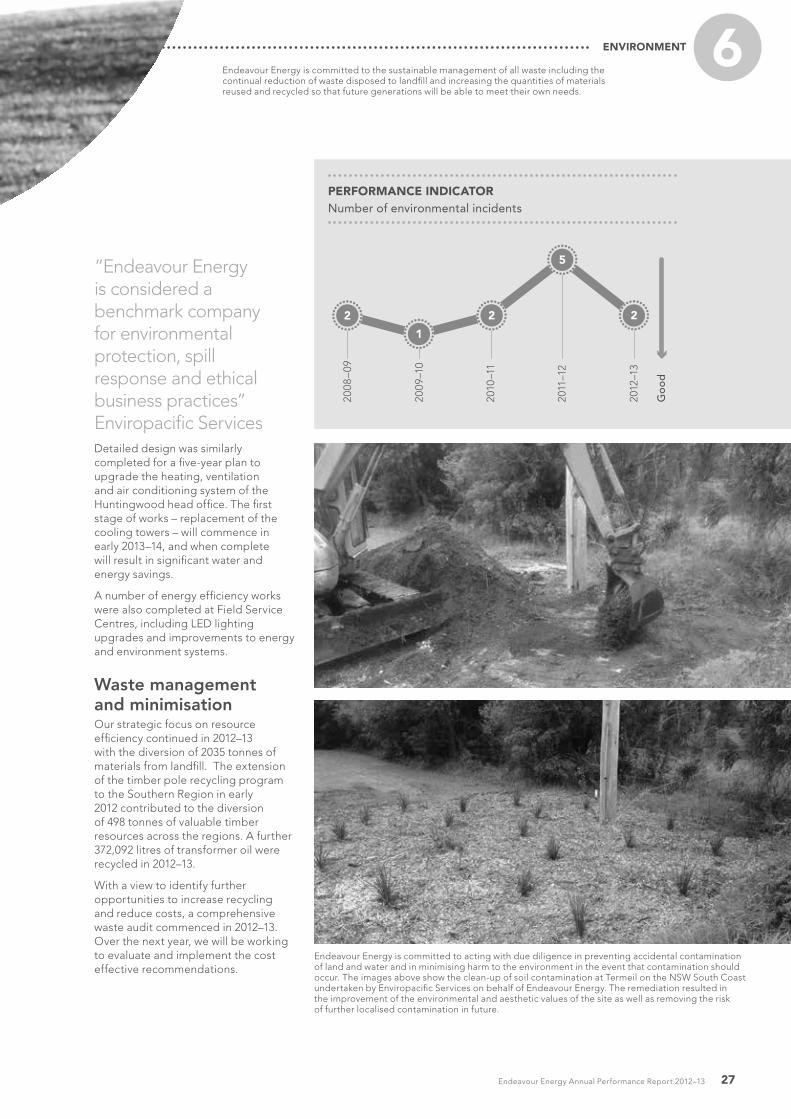
27Endeavour Energy Annual Performance Report 2012–13
ENVIRONMENT 6
PERFORMANCE INDICATORNumber of environmental incidents
Go
od
2
1
2
5
2
2008
–09
2009
–10
2010
–11
2011
–12
2012
–13
Detailed design was similarly completed for a five-year plan to upgrade the heating, ventilation and air conditioning system of the Huntingwood head office. The first stage of works – replacement of the cooling towers – will commence in early 2013–14, and when complete will result in significant water and energy savings.
A number of energy efficiency works were also completed at Field Service Centres, including LED lighting upgrades and improvements to energy and environment systems.
Waste management and minimisationOur strategic focus on resource efficiency continued in 2012–13 with the diversion of 2035 tonnes of materials from landfill. The extension of the timber pole recycling program to the Southern Region in early 2012 contributed to the diversion of 498 tonnes of valuable timber resources across the regions. A further 372,092 litres of transformer oil were recycled in 2012–13.
With a view to identify further opportunities to increase recycling and reduce costs, a comprehensive waste audit commenced in 2012–13. Over the next year, we will be working to evaluate and implement the cost effective recommendations.
Endeavour Energy is committed to acting with due diligence in preventing accidental contamination of land and water and in minimising harm to the environment in the event that contamination should occur. The images above show the clean-up of soil contamination at Termeil on the NSW South Coast undertaken by Enviropacific Services on behalf of Endeavour Energy. The remediation resulted in the improvement of the environmental and aesthetic values of the site as well as removing the risk of further localised contamination in future.
“Endeavour Energy is considered a benchmark company for environmental protection, spill response and ethical business practices” Enviropacific Services
Endeavour Energy is committed to the sustainable management of all waste including the continual reduction of waste disposed to landfill and increasing the quantities of materials reused and recycled so that future generations will be able to meet their own needs.

28
7GOVERNANCE
Endeavour Energy is a State Owned Corporation subject to a number of statutory and legislative requirements. Our Board has overall responsibility for corporate governance at Endeavour Energy.
Changes to governance and management structureIn 2012 the NSW Government announced plans to reform the three NSW electricity network companies – Endeavour Energy, Ausgrid and Essential Energy – to generate $400 million in efficiencies over four years to fund its energy rebate scheme for low income households and families.
Endeavour Energy, Ausgrid and Essential Energy continue to operate as separate legal entities but are managed by a joint Board of Directors
and common Chief Executive Officer (CEO). The three network companies operate under a shared Group management model known as Networks NSW. Each business remains focused on the objectives of the State Owned Corporations Act, including:
• operating a safe, reliable and sustainable network
• operating at least as efficiently as any comparable privately owned business
• maximising the value of the company to the State
• balancing commercial, social, environmental and customer expectations.
Networks NSW consists of a shared Group management structure. The Executive Leadership Group (ELG)
includes the CEO, Group Executive Managers, the Chief Operating Officer from each network company and the Board Secretary.
The CEO reports to the joint Board, which in turn is accountable to the two voting shareholders, the NSW Treasurer and the NSW Minister for Finance, who each hold one share in each of the three businesses for and on behalf of the NSW Government. The Portfolio Minister of each of the network companies is the NSW Minister for Energy.
The joint Board is responsible for setting the overall strategic direction and performance targets, and monitoring the implementation of the strategy by the three organisations. The CEO leads the ELG in delivering the approved strategy and achieving the performance targets set by the joint Board.
Endeavour Energy’s governance and organisational structure (as at 30 June 2013)
Integrated suite of ethical principles
EXECUTIVE LEADERSHIP GROUP
Chief Engineer
Jim Battersby• Primary systems• Secondary systems• Asset & network planning• Network data and performance• Electrical safety & authorisations
General ManagerNetwork Development
Ty Christopher• Portfolio management• Project development• Major projects• Capital programs• Maintenance & vegetation
General ManagerNetwork Operations
Scott Ryan• Regional operations• System control• Operational performance management• Network connections
General ManagerHealth, Safety & Environment
David Neville• Operational safety• Public safety program• Safety management• Health & wellbeing• Environment
General ManagerFinance & Compliance
Michael Ghattas• Finance• Governance & business risk• Network regulation• Legal• Strategy & compliance
Code of Conduct Statement of Business EthicsOutlines Endeavour Energy’s expectations of private sector service providers in conducting business with Endeavour Energy
Sets out the principles and values by which the Board and employees of Endeavour Energy are expected to act
General ManagerInformation, Communication and TechnologyIan Robinson• Strategy, architecture & governance • Infrasture & operations• Business systems• Vendor management
General ManagerPeople & Service
Bruce Rowley• Human resources• Corporate affairs• Customer service• Procurement & logistics• Property & fleet• Internal audit
Group Chief Financial Officer
Group Executive Network Strategy
Group Executive People & Services
ESSENTIAL ENERGY
AUSGRID
Chief Operating OfficerRod Howard
Board Secretary
Board of Directors
Chief Executive OfficerVince Graham

29Endeavour Energy Annual Performance Report 2012–13
7GOVERNANCE
Board of Directors (during 2012–13)
The project team responsible for building the new $33 million Schofields Zone Substation included Christian Abran (Project Manager (Subs)), Steve Semmens (Project Manager (Civil)), Ben Maude (Project Supervisor (Contractor)) and Satnam Johal (Techologist – Protection). The new substation provides a safe, reliable and sustainable electricity supply for families and businesses in Schofields, Riverstone and Quakers Hill. Part of the North West Growth Centre, the Schofields Zone Substation will meet the increased capacity required by 6,300 new homes, two new schools and commercial development planned for the Alex Avenue precinct in coming years.
Roger Massy‑Greene BSc BE (Hons) MBA, FAICD
Chairman
Term: 1 July 2012 to 30 June 2015
Chairman of the Board from 1 July 2012
Chairman, Nominations Committee
Member, Audit and Risk Committee
Member, Safety, Human Resources and Environment Committee
Other Directorships:
• Ausgrid, Chairman• Essential Energy, Chairman• Eureka Capital Partners Pty Ltd,
Chairman• Salvation Army’s Red Shield Appeal
Committee Sydney, Chairman• Eureka Benevolent Foundation,
Chairman• OneVentures Pty Ltd, Director• The Hunger Project Australia,
Director
Peter Dodd PhD, MSc MCom, BCom, Dip Ed
Non‑Executive Director
Term: 1 July 2012 to 31 December 2013
Chair, Audit and Risk Committee
Member, Nominations Committee
Other Directorships:
• Ausgrid, Director• Essential Energy, Director• The Centre for Independent
Studies Ltd, Director• Peter Dodd Pty Ltd, Director• Collgar Wind Farm Pty Ltd, Director• CWF Holding Pty Ltd, Director• Energy Industries Superannuation
Scheme, Director• Investa Listed Funds
Management Limited, Director• Macquarie University Group
of companies, Director
Philip Garling BBuild, FAIB, FAICD, FIE (Aust)
Non‑Executive Director
Term: 1 January 2013 to 31 December 2015
Chair, Safety, Human Resources and Environment Committee (from 25 March 2013)
Other Directorships:
• Ausgrid, Director,• Essential Energy, Director• Australian Renewable Fuels Limited,
Chairman• Downer EDI Limited, Director• Water Polo Australia Limited, Director• Biofuel Producers Limited, Director• Charter Hall Limited, Director• Charter Hall Funds Management
Limited, Director
Penny Le Couteur BSc (Hons), MAICD
Non‑Executive Director
Term: 1 July 2012 to 30 June 2013
Chair, Safety, Human Resources and Environment Committee (from 1 July 2012 to 25 March 2013)
Member, Audit and Risk Committee
Member, Nominations Committee
Note: Term expired on 30 June 2013 – Did not seek re-appointment
Other Directorships:
• Ausgrid, Director• Essential Energy, Director• Aurora New Music Inc, Director• Bennelong Forty Two Pty Ltd,
Director• The Song Company, Director• WorkCover Tasmania, Director
Laura Reed BBus, MBA, FCPA
Non‑Executive Director
Term: 1 January 2013 to 31 December 2015
Member, Audit and Risk Committee
Other Directorships:
• Ausgrid, Director• Essential Energy, Director• ATCO Australia Pty Limited, Director• ATCO Gas Australia GP Pty Limited,
Director• MAPS Group, Director
Vince Graham BE (Civil), Grad Dip Mgmt, FAICD
Chief Executive Officer and Executive Director
Term: Initial appointment as Chief Executive Officer 1 July 2012 to 31 December 2012. Following a recruitment process, appointed as Chief Executive Officer December 2012
Ex-officio member Audit and Risk Committee and Safety, Human Resources and Environment Committee
Other Directorships:
• Ausgrid, CEO & Executive Director• Essential Energy, CEO &
Executive Director• Graham Management Services Pty
Limited, Director (inactive)
Barbara Ward BEc, MPol Econ MAICD
Non‑Executive Director
Term: 1 July 2012 to 31 December 2012
Note: Term expired on 31 December 2012 – Did not seek reappointment
Board and Board Committee meetings held in 2012–13
MEETINGSHELD
BOARD OF DIRECTORS’
MEETINGAUDIT & RISK COMMITTEE
SAFETY, HUMAN RESOURCES &
ENVIRONMENT NOMINATIONSA B A B A B A B
R Massy-Greene 16 16 6 6 2 2 3 3P Dodd 16 16 6 6 – – 3 3P Garling 6 5 – #1 2 2 – –P Le Couteur 16 15 3 3 2 2 3 3L Reed 6 6 3 3 – – – –B Ward 10 10 3 3 – – – 3V Graham 15 14 *6 6 *2 2 – –
A Indicates number of meetings held during the period the Director was entitled to attendB Indicates the number of meetings attended by the Director during the period* the CEO is an ex-officio member of the Audit & Risk and Safety, Human Resources and Environment Committees# Attended meetings while not a member of the Committee

30
7Board of directorsThe Energy Services Corporations Act 1995 (NSW), the State Owned Corporations Act 1989 (NSW), and the Constitution of Endeavour Energy address the membership of the Board of Endeavour Energy.
All members of the Board of Directors, with the exception of the CEO, are appointed by the voting shareholders for terms of up to five years. Appointments may be renewed by the voting shareholders. The voting shareholders may appoint the other directors at their discretion.
Each non-executive director’s remuneration is determined by the voting shareholders and is paid out of Endeavour Energy’s funds. The Chief Executive Officer is not entitled to additional remuneration for being an executive director.
Role and responsibilitiesThe Board is responsible for the corporate governance of Endeavour Energy. The Board’s accountabilities include setting the strategic direction, establishing performance targets as set out in the Statement of Corporate Intent, and monitoring the achievement of those targets. In carrying out its responsibilities, the Board undertakes to serve the interests of voting shareholders, as well as employees, suppliers and customers and the broader community, honestly, fairly, diligently and in accordance with applicable laws.
The Board of Directors operates at all times in accordance with its Charter which is designed to complement the Constitution of Endeavour Energy, the Directors’ Legal Duties and Obligations Manual, and the Company’s Code of Conduct.
Board committeesThe role of the Board is to provide strategic guidance for the corporation and effective oversight of its management. In undertaking this role, the Board has established the following committees:
Audit and Risk CommitteeThe Audit and Risk Committee meets five times per year and ensures that audit and business risk matters, including compliance, are dealt with in an independent manner. The committee’s responsibilities cover matters relating to the financial affairs and business risks of Endeavour Energy, internal and external audits, risk management, compliance and fraud prevention. In addition, the committee examines any other matters referred to it by the Board.
Safety, Human Resources and Environment CommitteeThe Safety, Human Resources and Environment Committee meets four times per year and assists the Board in fulfilling its responsibilities with regard to work health and safety and environmental practices, and to discharge the Board’s responsibilities of oversight and corporate governance in relation to human resources and environment matters. In addition, the Committee examines any other matters referred to it by the Board.
Nominations CommitteeThe Nominations Committee meets as required and assists the Board in fulfilling its responsibilities with regard to Director appointments and reappointments. The Nominations Committee consists of the Chairman of the Board and two non-executive directors. Membership is subject to rotation so that non-executive directors do not participate in the review of their own reappointment.
Board of Directors A new governance and management structure commenced on 1 July 2012 with a common Chairman, Directors and CEO replacing the three Chairs, Directors and CEOs at Ausgrid, Endeavour Energy and Essential Energy. As a result, the term of the former non-executive directors concluded on 30 June 2012. Ms Penny Le Couteur was reappointed to serve a further term until 30 June 2013.
Director indemnity and insuranceUnder the State Owned Corporations Act 1989 and the Company’s Constitution, Endeavour Energy may, with the approval of its Shareholder Ministers, indemnify its Directors against certain liabilities incurred in the course of their duties. This indemnity does not cover the Director if the liability arises out of conduct involving lack of good faith. Endeavour Energy’s non-executive Directors have been granted indemnity in accordance with Shareholder approval and the NSW Treasury State Owned Corporation Indemnity Policy. Endeavour Energy also has in place a Directors’ and Officers’ liability and professional indemnity insurance policy.
Ethics and conduct Endeavour Energy’s Code of Conduct states the corporate values and behaviours expected of employees. Supporting the code is the Statement of Business Ethics which sets out the business principles for our dealings with suppliers. Both documents are available on our website.
On 27 February 2013, the Board approved the revised Code of Conduct.
A key initiative supporting our ethical culture is the five-year Ethics Communication and Engagement Strategy developed to make our corporate values meaningful to employees in their everyday work, encourage a culture of personal accountability for behaviour, and provide tools to apply in ethical dilemmas.
The Year 4 Program (2012–13) of the strategy included the training of 159 leaders to deliver ethics awareness sessions to employees. One hundred percent of available employees received the training, which focused on our value of safety excellence and our anti-corruption initiatives.
Endeavour Energy’s Code of Conduct is available at www.endeavourenergy.com.au.
31Endeavour Energy Annual Performance Report 2012–13
7GOVERNANCE
Fraud risk register Endeavour Energy’s Fraud Risk Register is reviewed and updated throughout the year as the business environment changes. An independent review of the Fraud Risk Register was conducted in July 2012. The revised register formed the basis of the company-wide Fraud Risk Assessment conducted between December 2012 and February 2013.
Key initiatives in our Fraud and Corruption Control Plan (FCCP) 2012–2014 (approved by the Audit and Risk Board Committee in May 2012) drive the continuous update of the register.
Conflicts of interest To ensure their independent status, all directors of Endeavour Energy are subject to the statutory duties and prohibitions in relation to conflicts of interest. We rely on the integrity of the Board to identify and disclose issues which may give rise to any conflict of interest. The Board Secretary maintains the Register of Disclosures which is reviewed, as a minimum, every six months.
Insurance Endeavour Energy reviews the adequacy of insurance policy coverage and limits during each annual insurance renewal process and ensures all participating markets meet acceptable insurer security requirements.
Compliance Our Strategic Compliance Plan 2011–13 is structured around the four key focus areas of commitment, implementation, monitoring and measurement and continual improvement from Australian Standard AS 3806-2006: Compliance Programs. The plan’s status was regularly reported to the Audit & Risk Committee throughout the year and a new plan for the 2013–15 reporting period commenced.
Internal audit The Board and Executive Leadership Team are committed to the operation of an objective and independent internal audit function. Internal Audit assists management to achieve our statutory and business objectives by adopting a disciplined approach to evaluating and improving risk management, controls and governance processes. During the year we completed 28 internal audits across the organisation, with no serious issues identified.
External auditThe Auditor-General of New South Wales provides independent external audit services through the Audit Office of New South Wales. It does not provide other services to Endeavour Energy. The Audit and Business Risk Committee reviews the NSW Audit Office Client Service Plan, issues raised in the Annual Management Letter and the results of the annual audit of financial statements.

32
78MANAGEMENT DISCUSSION & ANALYSIS
PerformanceEndeavour Energy is required to submit a Statement of Corporate Intent (SCI) to NSW Treasury. The SCI is an agreement with the NSW Government which documents the objectives, strategies and obligations by which the organisation is expected to operate. The SCI sets financial targets and sets clear limits on the scope of activities the organisation may undertake.
In 2012–13 Endeavour Energy maintained strong performance, achieved through continued focus on business fundamentals, financial discipline and corporate governance.
Profit resultsEndeavour Energy’s profit before tax result was $437.9 million, exceeding the 2012–13 SCI target of $427.9 million by $10.0 million, despite lower than budget Network revenue driven by reduced energy consumption.
The better than expected profit result was primarily due to:
• lower operating expenditure with the benefits of savings resulting from continued focus on targeted programs to reduce costs and improve efficiencies. In addition, employee benefit actuarial assessment outcomes resulted in a decrease in employee entitlements, primarily driven by an increase in the discount rate.
• lower borrowing costs resulting from reduced borrowings (in line with reduced capital expenditure purchases) and lower funding costs; and
• higher capital contributions
• partially offset by an unfavourable Gross Margin.
Balance sheetEndeavour Energy’s total assets increased by $464.3 million compared to the prior year. The major contributing factor was an increase in property, plant and equipment in the amount of $499.8 million resulting from increased capital expenditure.
Return on assets, calculated as EBIT divided by the average asset base, decreased marginally from 10.6% in 2011–12 to 10.3% at 30 June 2013.
Total liabilities increased by $328.8 million compared to previous year driven by an increase in borrowings (inclusive of discounts / premiums) of $355.7 million, primarily due to the need to fund the capital expenditure program, and increased deferred tax liability outcomes totalling $54.1 million. Partly offsetting this were decreases in provisions totalling $45.8 million driven by EISS defined benefit superannuation and employee entitlement actuarial assessment outcomes (driven by an increase in the discount rate), and reduced balances for derivative financial liabilities totalling $17.4 million.
FINANCIAL RESULTS2011–12 RESULT
2012–13 SCI
2012–13 RESULT
VARIATION TO SCI
Earnings before interest, tax, depreciation & amortisation (EBITDA) ($m)
755.7 820.7 821.0 0.3
Earnings before interest and tax (EBIT) ($m) 585.9 638.3 636.6 -1.7
Operating profit before tax ($m) 381.3 427.9 437.9 10.0
Operating profit after tax ($m) 265.5 299.5 306.5 7.0
Dividend ($m) 186.6 209.7 209.5 -0.2
Total Distribution (Dividend + Income Tax Expense) ($m) 302.3 338.0 340.9 2.9
Return on assets (%) 10.6 10.2 10.3 0.1
Return on equity (%) 19.8 20.1 20.2 0.1
Capital Expenditure ($m) 634.3 669.8 577.7 -92.1

33Endeavour Energy Annual Performance Report 2012–13
8MANAGEMENT DISCUSSION AND ANALYSIS
Return on equity, calculated as profit after tax divided by average equity, was 20.2% at 30 June 2013. This result increased from the 2011–12 outcome of 19.8%, with a 15.4% increase in profit after tax compared to an increase of 13.2% in average equity.
Cash flowsCash and cash equivalents at the end of the financial year increased by $1.5 million compared to the prior year. Net cash flows from operating activities for the year were $415.4 million, an increase of $31.8 million compared to 2011–12.
Net cash outflows from investing activities for the year were $576.7 million, compared to $607.2 million in the prior year, driven by lower payments for property, plant and equipment.
Net cash flows from financing activities for the year were $162.8 million, compared to $219.2 million in the prior year, driven by less proceeds from borrowings with reduced capital expenditure payments and higher cash inflows from operating activities.
DebtBalance sheet debt increased by $354.6 million compared to the prior year, primarily due to the requirement to fund the capital expenditure program. The gearing ratio, calculated as debt divided by debt plus equity, increased marginally from 67.4% at 30 June 2012 to 67.9% at 30 June 2013. This result was driven by a slightly lower percentage increase in debt plus equity compared to the percentage increase in debt.
Shareholder returnThe directors declared a final dividend of $209.5 million, determined based on the Government’s dividend cap policy for the energy sector of the State Owned Corporations and negotiations between NSW Treasury on behalf of the shareholders and Endeavour energy prior to 30 June 2013.
The dividend is in line with the 2012–13 SCI target, and represents an increase of $22.9 million compared to the prior year.
Capital expenditureCapital expenditure for the 2012–13 financial year was $577.7 million, $92.1 million below the 2012–13 SCI target and a decrease of $56.6 million compared to the prior year. The capital program is underpinned by Endeavour Energy’s Strategic Asset Management Plan (SAMP). The SAMP
is updated annually and reflects plans and strategies which: are aligned to customer and technical drivers; improve long-term network asset values; and produce optimal returns to shareholders. The plan sets priorities and summarises the investment in the network required to maintain ongoing network capability, consistent with a ‘best in class’ network asset manager. In 2012–13, Endeavour Energy’s network capital expenditure achieved 97% of network program milestones through a more efficient delivery of the program than originally forecast.
Endeavour Energy’s Demand Management/Network Utilisation Manger Frank Bucca and Plumpton Marketplace Operations Manager Barry Thompson working at saving electricity and money as part of the Rooty Hill demand management program. The success of this program, which included Plumpton Marketplace’s significant demand reductions, has enabled Endeavour Energy to defer indefinitely the construction of the $23 million North Glendenning Zone Substation.
Contract Inspector Chris Jarett was recently nominated for an award by Electricity Safety Inspector Grant Gillard for his ability to coordinate the fast track replacement of two live feeder cables that where exposed and damaged.

34
FINANCIAL STATEMENTS
9FOR THE YEAR ENDED 30 JUNE 2013
Independent Auditor’s Report 35
Statement of Comprehensive Income 36
Statement of Financial Position 37
Statement of Changes in Equity 38
Statement of Cash Flows 39
Notes to the Financial Statements 40
Statement by Directors 76

35Endeavour Energy Annual Performance Report 2012–13
FINANCIAL STATEMENTS 9INDEPENDENT AUDITOR’S REPORTFOR THE YEAR ENDED 30 JUNE 2013

36
9STATEMENT OF COMPREHENSIVE INCOMEFOR THE YEAR ENDED 30 JUNE 2013
Note 2013
$m2012
$m
Revenue 2 1,492.8 1,476.9
Expenses excluding finance costs 3(a) (856.2) (891.1)
Interest and finance charges paid/payable 3(b) (198.7) (204.6)
Profit before income tax 437.9 381.2
Income tax expense 4 (131.4) (115.7)
Profit for the year 306.5 265.5
Other comprehensive income
Items that will not be reclassified subsequently to profit or loss
Superannuation defined benefits actuarial gains/(losses) 23(b) 37.8 (97.1)
System asset revaluation 9 – 267.3
Revaluation of land and buildings 9 16.1 32.4
Income tax relating to items that will not be reclassified 4 (16.1) (60.8)
37.8 141.8
Items that will be reclassified subsequently to profit or loss
Effective portion of changes in fair value of cash flow hedges 1.0 (4.5)
Income tax relating to items that will be reclassified 4 (0.3) 1.4
0.7 (3.1)
Total comprehensive income for the year 345.0 404.2
The above Statement of Comprehensive Income should be read in conjunction with the accompanying notes

37Endeavour Energy Annual Performance Report 2012–13
FINANCIAL STATEMENTS 9STATEMENT OF FINANCIAL POSITIONAS AT 30 JUNE 2013
Note 2013
$m2012
$m
ASSETS
Current assets
Cash and cash equivalents 6 0.4 –
Trade and other receivables 7 240.1 264.5
Inventories 26.6 24.6
Derivative financial instruments 8,15(g) 0.6 13.0
267.7 302.1
Assets classified as held for sale 4.8 4.8
Total current assets 272.5 306.9
Non-current assets
Derivative financial instruments 8,15(g) 0.3 0.7
Property, plant and equipment 9 6,055.8 5,556.0
Intangible assets 10 72.2 72.9
Total non-current assets 6,128.3 5,629.6
Total assets 6,400.8 5,936.5
LIABILITIES
Current liabilities
Bank overdraft 6 – 1.1
Trade and other payables 11 201.2 209.3
Borrowings 12 513.5 457.3
Derivative financial instruments 8,15(g) 0.4 16.7
Current tax liabilities 47.1 54.8
Provisions 13 386.5 354.2
Other current liabilities 14 11.9 12.8
Total current liabilities 1,160.6 1,106.2
Non-current liabilities
Borrowings 12 2,844.9 2,545.4
Deferred tax liabilities 5 592.3 538.2
Provisions 13 211.7 289.8
Derivative financial instruments 8,15(g) 5.1 6.2
Total non-current liabilities 3,654.0 3,379.6
Total liabilities 4,814.6 4,485.8
Net assets 1,586.2 1,450.7
EQUITY
Contributed equity 335.0 335.0
Reserves 24 928.3 916.6
Retained earnings 322.9 199.1
Total equity 1,586.2 1,450.7
The above Statement of Financial Position should be read in conjunction with the accompanying notes
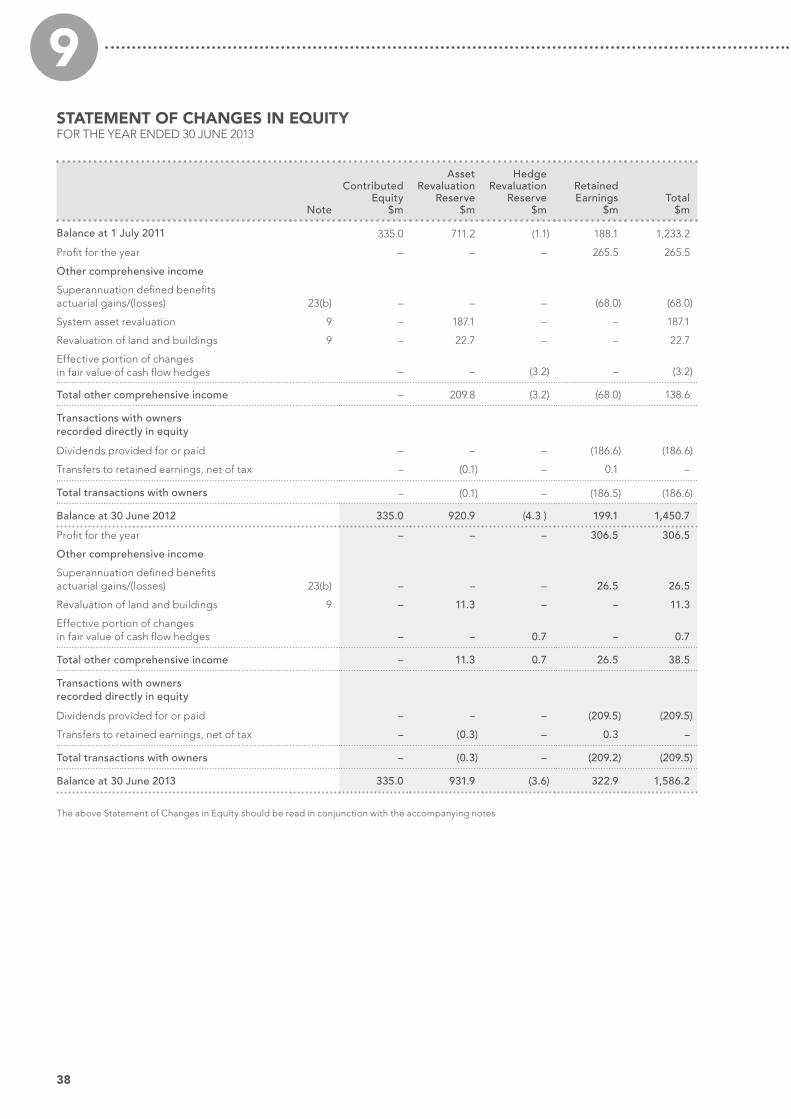
38
9STATEMENT OF CHANGES IN EQUITYFOR THE YEAR ENDED 30 JUNE 2013
Note
Contributed Equity
$m
Asset Revaluation
Reserve $m
Hedge Revaluation
Reserve $m
Retained Earnings
$mTotal
$m
Balance at 1 July 2011 335.0 711.2 (1.1) 188.1 1,233.2
Profit for the year – – – 265.5 265.5
Other comprehensive income
Superannuation defined benefits actuarial gains/(losses) 23(b) – – – (68.0) (68.0)
System asset revaluation 9 – 187.1 – – 187.1
Revaluation of land and buildings 9 – 22.7 – – 22.7
Effective portion of changes in fair value of cash flow hedges – – (3.2) – (3.2)
Total other comprehensive income – 209.8 (3.2) (68.0) 138.6
Transactions with owners recorded directly in equity
Dividends provided for or paid – – – (186.6) (186.6)
Transfers to retained earnings, net of tax – (0.1) – 0.1 –
Total transactions with owners – (0.1) – (186.5) (186.6)
Balance at 30 June 2012 335.0 920.9 (4.3 ) 199.1 1,450.7
Profit for the year – – – 306.5 306.5
Other comprehensive income
Superannuation defined benefits actuarial gains/(losses) 23(b) – – – 26.5 26.5
Revaluation of land and buildings 9 – 11.3 – – 11.3
Effective portion of changes in fair value of cash flow hedges – – 0.7 – 0.7
Total other comprehensive income – 11.3 0.7 26.5 38.5
Transactions with owners recorded directly in equity
Dividends provided for or paid – – – (209.5) (209.5)
Transfers to retained earnings, net of tax – (0.3) – 0.3 –
Total transactions with owners – (0.3) – (209.2) (209.5)
Balance at 30 June 2013 335.0 931.9 (3.6) 322.9 1,586.2
The above Statement of Changes in Equity should be read in conjunction with the accompanying notes
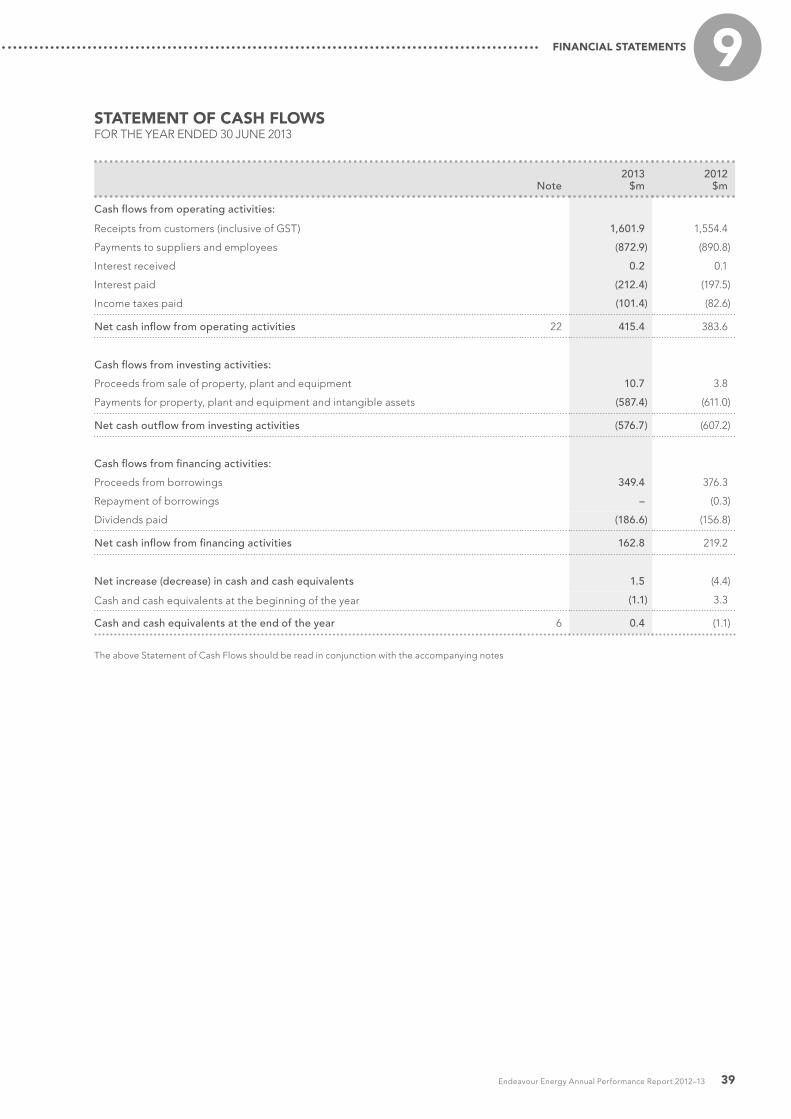
39Endeavour Energy Annual Performance Report 2012–13
FINANCIAL STATEMENTS 9STATEMENT OF CASH FLOWSFOR THE YEAR ENDED 30 JUNE 2013
Note 2013
$m2012
$m
Cash flows from operating activities:
Receipts from customers (inclusive of GST) 1,601.9 1,554.4
Payments to suppliers and employees (872.9) (890.8)
Interest received 0.2 0.1
Interest paid (212.4) (197.5)
Income taxes paid (101.4) (82.6)
Net cash inflow from operating activities 22 415.4 383.6
Cash flows from investing activities:
Proceeds from sale of property, plant and equipment 10.7 3.8
Payments for property, plant and equipment and intangible assets (587.4) (611.0)
Net cash outflow from investing activities (576.7) (607.2)
Cash flows from financing activities:
Proceeds from borrowings 349.4 376.3
Repayment of borrowings – (0.3)
Dividends paid (186.6) (156.8)
Net cash inflow from financing activities 162.8 219.2
Net increase (decrease) in cash and cash equivalents 1.5 (4.4)
Cash and cash equivalents at the beginning of the year (1.1) 3.3
Cash and cash equivalents at the end of the year 6 0.4 (1.1)
The above Statement of Cash Flows should be read in conjunction with the accompanying notes

40
9NOTES TO THE FINANCIAL STATEMENTSFOR THE YEAR ENDED 30 JUNE 2013
1 Significant Accounting Policies
(a) Reporting entityEndeavour Energy is a New South Wales statutory State Owned Corporation (for profit) established under the Energy Services Corporations Act 1995.
The financial statements were authorised for issue by the Directors on 13 September 2013.
(b) Statement of complianceThe financial statements comprise a general purpose financial report which has been prepared in accordance with Australian Accounting Standards (AASBs) (including the Australian Accounting Interpretations) adopted by the Australian Accounting Standards Board, the requirements of the Public Finance and Audit Act 1983, the Public Finance and Audit Regulation 2010, and the State Owned Corporations Act 1989. The financial statements of the Corporation also comply with International Financial Reporting Standards (IFRSs) and interpretations adopted by the International Accounting Standards Board.
(c) Basis of preparation
(i) Basis of measurementThe financial statements are prepared on the historical cost basis except that the following assets and liabilities are stated at their fair value: derivative financial instruments, provisions and property, plant and equipment.
(ii) Comparative figuresWhen the presentation or classification of items in the financial statements is amended in respect of changes in the current year, comparative amounts are reclassified to enhance comparability unless the reclassification is impracticable. No material amounts have been reclassified during the current or prior period.
(iii) Functional and presentation currency
The financial statements are presented in Australian dollars. The amounts shown in the accounts have been rounded to the nearest tenth of a million dollars, unless otherwise stated. The Corporation is exempt from Part 2 paragraph 5 of the Public Finance and Audit Regulation 2010.
(d) Use of estimates and judgements
The preparation of financial statements require management to make judgements, estimates and assumptions that affect the application of policies and reported amounts of assets and liabilities, income and expenses. The estimates and associated assumptions are based on historical experience and various other factors that are believed to be reasonable under the circumstances, the results of which form the basis of making the judgements about carrying values of assets and liabilities that are not readily apparent from other sources. Actual results may differ from these estimates.
The estimates and underlying assumptions are reviewed on an ongoing basis. Revisions to accounting estimates are recognised in the period in which the estimate is revised if the revision affects only that period or in the period of the revision and future periods if the revision affects both current and future periods.
Judgements made by management in the application of AASBs that have significant effect on the financial statements and estimates with a significant risk of material adjustment in the next year are included in the following notes:
Note 1(f)(iv) – Unread meters
Note 5 – Deferred tax assets/liabilities
Note 1(k)(i), 9 – Property, plant and equipment
Note 13 – Provisions
Note 15 – Financial instruments
Note 19 – Contingent liabilities and contingent assets
Note 23(d) – Superannuation defined benefits plan - valuation method and principal actuarial assumptions.
In relation to employee benefit related provisions, a 3.5% expected increase rate has been assumed for the purposes of actuarial valuations, however the NSW Government Wages Policy requires that any salary increase above 2.5% be offset by appropriate productivity savings made by the Corporation.
(e) Income taxEndeavour Energy is exempt from federal income tax under the Income Tax Assessment Acts. However, Endeavour Energy is subject to the National Tax Equivalent Regime which is based on the Income Tax Assessment Acts. Tax equivalents are payable to the Office of State Revenue.
Income tax on the profit or loss for the year comprises current and deferred tax. Income tax is recognised in the profit or loss except to the extent that it relates to items recognised directly in equity.
Current tax is the expected tax payable on the taxable income for the year, using tax rates enacted or substantively enacted at the statement of financial position date, and any adjustment to tax payable in respect of previous years.
Deferred tax is provided using the statement of financial position liability method, providing for temporary differences between the carrying amounts of assets and liabilities for financial reporting purposes and the amounts used for taxation purposes. The following temporary differences are not provided for: initial recognition of goodwill and initial recognition of assets or liabilities that affect neither accounting nor taxable profit. The amount of deferred tax provided is based on the expected manner of realisation or settlement of the carrying amount of assets and liabilities, using tax rates enacted or substantively enacted at the statement of financial position date.
A deferred tax asset is recognised only to the extent that it is probable that future taxable profits will be available against which the asset can be utilised. Deferred tax assets are reduced to the extent that it is no longer probable that the related tax benefit will be realised.

41Endeavour Energy Annual Performance Report 2012–13
FINANCIAL STATEMENTS 9
1 Significant Accounting Policies continued
Additional income taxes that arise from the distribution of dividends and other payments are recognised at the same time as the liability to pay the related dividend or payment.
(f) RevenueRevenue is recognised when the significant risks and rewards of ownership have been transferred to the buyer, the amount of revenue can be reliably measured, and it is probable that the future economic benefits will flow to the entity.
(i) Network use of system revenueEndeavour Energy recognises revenue involving the rendering of electricity supply services in the Statement of Comprehensive Income when the goods are provided or when the fee in respect of services provided is receivable. Network use of system income is recognised on an accrual basis as revenue is accrued for consumption which is not invoiced at month end. No revenue is recognised if there are significant uncertainties regarding recovery of the consideration due, or if the costs incurred or to be incurred can not be measured reliably.
(ii) Rental incomeRental income from properties leased under property leases is recognised in the Statement of Comprehensive Income on a straight line basis over the term of the lease. Lease incentives granted are recognised as an integral part of the total rental income.
(iii) Contributions for capital worksThis represents sums contributed by customers and developers, mainly towards the capital cost of electricity connections. Cash and non-cash capital contributions have been reported in order to comply with Australian Accounting Interpretation 18 Transfers of Assets from Customers.
Contributions of non-current assets are recognised as revenue and an asset when Endeavour Energy gains control of the asset. The fair value of contributed assets is recognised at the date at which control is gained.
(iv) Unread metersAt reporting date, Endeavour Energy accrues an estimate of the network use of system charges associated with electricity consumed where the meter has not been read. The accounting estimating methodology for calculating the unread revenue accrual calculates unread revenue volume where energy imports relating to basic meters are phased over the current month and future months in order to estimate the likely billing pattern relating to consumption. This calculation is accounted for as revenue from unread meters in profit or loss.
(v) Other revenueOther revenue is recognised on an accrual basis and in accordance with the substance of the agreement covering such transactions.
(g) Cash and cash equivalentsCash and cash equivalents in the Statement of Financial Position comprise cash balances and call deposits. For the purposes of the Statement of Cash Flows, cash includes cash assets net of bank overdraft.
(h) Trade and other receivables
Trade and other receivables are financial assets recognised initially at fair value plus any directly attributable transaction costs and subsequently measured at amortised cost using the effective interest rate method, less any impairment losses.
Collectability of trade receivables is reviewed on an ongoing basis in accordance with AASB 139 Financial Instruments. Individual debts that are known to be uncollectible are written off when identified. An impairment provision is recognised when there is objective evidence that the entity will not be able to collect the receivables, such as evidence of financial difficulties of the debtor, and default payments.
(i) InventoriesInventories are stated at the lower of cost and net realisable value. Cost is determined using the average purchase price of each item. In the case of manufactured stock for internal use, costs include direct labour, materials and a portion of variable overhead which comprises the cost of bringing the inventories to their appropriate location and condition. Net realisable value is the estimated selling price in the ordinary course of business, less the estimated costs of completion and selling expenses.
(j) Assets classified as held for sale
Non-current assets and disposal groups are classified as held for sale and measured at the lower of their carrying amount and fair value less costs to sell, if their carrying amount will be recovered principally through a sale transaction as opposed to use. Once classified as held for sale, depreciation and amortisation ceases. For an asset or disposal group to be classified as held for sale, it must be available for immediate sale in its present condition and its sale must be highly probable.
Non-current assets held for sale for Endeavour Energy relate to vacant non-infrastructure land & buildings.
(k) Property, plant and equipment
(i) Recognition and measurementItems of property, plant and equipment are initially recognised at cost. Cost includes expenditure that is directly attributable to the acquisition of the asset.
After initial recognition as an asset, items of property, plant and equipment are measured at fair value. Fair value is determined in accordance with NSW Treasury Accounting Policy TPP 07-1 Valuation of Physical Non-current Assets at Fair Value and AASB 116 Property, Plant and Equipment, and reviewed annually for impairment in accordance with AASB136 Impairment of Assets.

42
9NOTES TO THE FINANCIAL STATEMENTSFOR THE YEAR ENDED 30 JUNE 2013
1 Significant Accounting Policies continued
System assets
System assets are stated at fair value less accumulated depreciation and impairment losses. Fair value is best represented as current market price, however where this cannot be observed, an asset’s fair value is measured at either depreciated replacement cost or an income approach in accordance with AASB 116 Property, Plant and Equipment.
Treasury Circular NSW TC12/05 Fair Value of Specialised Physical Assets also allows the option in AASB 116 Property, Plant and Equipment to measure specialised assets using either depreciated replacement cost or an income approach. The income approach methodology reflects a discounted cash flow methodology to value Endeavour Energy’s assets, and a calculation to subtract the value of other business assets and liabilities to arrive at a value for Endeavour Energy’s network assets.
The income approach is based on a discounted cash flow model using the following methods and assumptions:
• Use of an estimate of future cash flows to be derived based on financial forecasts;
• Expectations about possible variations in the amount/timing of future cash flows to reflect the most likely outcome;
• The time value of money, represented by the current market risk free rate and the price for bearing the uncertainty inherent in the asset, as encapsulated in the Weighted Average Cost of Capital (WACC);
• Other factors such as liquidity that should be reflected in pricing future cash flows; and
• The regulated asset base (RAB) used as a proxy for the terminal value.
System assets are revalued at least every five years in accordance with TPP07-1. However, an assessment is made at each reporting date to ensure the net carrying value of system assets does not differ materially from its fair value, which is calculated on a ‘cash generating unit’ (CGU) basis using the
discounted cash flow. The net carrying amount of system assets did not differ materially to the discounted cash flow.
Land and non‑system buildings
Land and non-system buildings are valued at fair value of the asset.
Following initial recognition at cost, land and non-system building assets are carried at fair value less accumulated depreciation and impairment losses, in accordance with NSW Treasury Accounting Policy TPP07-1 Valuation of Physical Non-current Assets at Fair Value. Land and non-system buildings are subject to independent valuation on a cyclical basis over a three year period.
The carrying amount of land and non-system building assets is reviewed between independent valuations, to ensure the carrying amount does not differ materially from fair value. A revaluation of land and non-system buildings was undertaken by an independent valuer and recognised as at 30 June 2013. The valuations were based on market-based evidence in accordance with AASB 116 Property, Plant and Equipment.
Other property, plant and equipment
Other property, plant and equipment assets comprise non-specialised assets with short useful lives. These assets are stated at fair value which is equivalent to their depreciated historical costs (deemed to be fair value in accordance with NSW Treasury Accounting Policy Valuation of Physical Non-Current Assets at Fair Value [TPP07-1] as any difference is unlikely to be material).
(ii) RevaluationsRevaluation increments are credited directly to the asset revaluation reserve, except that, to the extent that an increment reverses a revaluation decrement in respect of that asset previously recognised as an expense in net profit or loss, the increment is recognised immediately as revenue in net profit or loss. Revaluation decrements are recognised immediately as expenses in net profit or loss, except that, to the extent that a credit balance exists in the asset revaluation reserve in respect of the same asset, they are debited directly to the asset revaluation reserve.
Gains and losses on disposal of revalued assets are included in the Statement of Comprehensive Income for the year. Any related revaluation increments in the asset revaluation reserve upon disposal are transferred to Retained Earnings.
(iii) Capitalisation policyNon-system assets purchased below $1,000 are expensed as acquired. All costs of assets constructed by Endeavour Energy are capitalised. This includes the cost of materials, direct labour, the initial estimate, where relevant, of the costs of dismantling and removing the items and restoring the site on which they are located, a proportion of overhead allocated on the basis of labour hours, other costs directly attributable to bringing the asset to a working condition for intended use and capitalised borrowing costs.
(iv) Subsequent costsThe entity recognises in the carrying amount of an item of property, plant and equipment the cost of replacing part of such an item when that cost is incurred if it is probable that the future economic benefits embodied with the item will flow to the entity and the cost of the item can be measured reliably. All other costs are recognised in the Statement of Comprehensive Income as an expense as incurred.
(v) DepreciationWhere parts of an item of property, plant and equipment have different useful lives, they are accounted for as separate components of property, plant and equipment.
Depreciation is charged to the Statement of Comprehensive Income on a straight-line basis over the estimated useful lives of each part of an item of property, plant and equipment. Land is not depreciated. The estimated useful lives in the current and comparative periods are as follows:
Years
buildings 40
system assets 7 – 60
plant and equipment 4 – 10
The residual value, if significant, is reassessed annually.

43Endeavour Energy Annual Performance Report 2012–13
FINANCIAL STATEMENTS 9
1 Significant Accounting Policies continued
(l) Intangible assetsIntangible assets that are acquired externally or internally generated by the entity are stated at cost less accumulated amortisation and impairment losses (see Note 1(m)(ii)).
Subsequent expenditure on capitalised intangible assets is capitalised only when it increases the future economic benefits embodied in the specific asset to which it relates. All other expenditure is expensed as incurred.
Easements, which are interests in land allowing access to network assets, are not amortised as they are granted for an unlimited time.
Amortisation is charged to the Statement of Comprehensive Income on a straight-line basis over the estimated useful lives of intangible assets unless such lives are indefinite. Intangible assets with an indefinite useful life are systematically tested for impairment at each statement of financial position date. Other intangible assets are amortised from the date they are available for use.
The estimated useful lives in the current and comparative periods are as follows:
Years
computer software 4 – 9
(m) Impairment
(i) Financial assets (including receivables)
A financial asset not carried at fair value through profit or loss is assessed at each reporting date to determine whether there is objective evidence that it is impaired. A financial asset is impaired if objective evidence indicates that a loss event has occurred after the initial recognition of the asset, and that the loss event had a negative effect on the estimated future cash flows of that asset that can be estimated reliably.
An impairment loss in respect of a financial asset measured at amortised cost is calculated as the difference between its carrying amount and the present value of the estimated future cash flows discounted at the asset’s original effective interest rate. Losses are recognised in profit or loss and reflected in an allowance account against receivables. Interest on the impaired asset continues to be recognised through the unwinding of discount. When a subsequent event causes the amount of impairment loss to decrease, the decrease in impairment loss is reversed through profit or loss to the extent that the carrying amount reversed does not exceed what the amortised cost would have been had the impairment not been recognised.
Significant receivables are individually assessed for impairment. Non-significant receivables are collectively assessed instead, by placing them in portfolios of similar risk profiles, based on objective evidence from historical experience adjusted for any effects of economic and credit conditions existing at each balance date.
(ii) Non‑financial assetsThe carrying amounts of non-financial assets, other than inventories, derivatives and deferred tax assets are reviewed at each reporting date to determine whether there is any indication of impairment. If any such indication exists, the asset’s recoverable amount is estimated.
For assets that have an indefinite useful life and intangible assets that are not yet available for use, the recoverable amount is estimated annually irrespective of any indication of impairment. The recoverable amount of an asset or cash generating unit (CGU) is the greater of their fair value less costs to sell and value in use. In assessing value in use, the estimated future cash flows are discounted to their present value using a pre-tax discount rate that reflects current market assessments of the time value of money and the risks specific to the asset. For an asset that does not generate largely independent cash inflows, the recoverable amount is determined for the CGU to which the asset belongs.
An impairment loss is recognised whenever the carrying amount of an asset or its CGU exceeds its recoverable amount. Impairment losses are recognised in the Statement of Comprehensive Income, unless an asset has previously been revalued, in which case the impairment loss is recognised as a reversal to the extent of that previous revaluation with any excess recognised through profit or loss.
Impairment losses recognised in respect of CGU are allocated first to reduce the carrying amount of any goodwill (if any) allocated to CGU and then, to reduce the carrying amount of the other assets in the unit on a pro-rata basis.
An impairment loss is reversed if there has been a change in the estimates used to determine the recoverable amount. An impairment loss is reversed only to the extent that the asset’s carrying amount does not exceed the carrying amount that would have been determined, net of depreciation and amortisation, if no impairment loss has been recognised for the asset in prior years.
(n) Trade and other payablesTrade and other payables represent liabilities for goods and services provided to Endeavour Energy prior to the end of the financial year where there is an obligation to make future payment. The amounts are unsecured and usually paid within 30 days of recognition.
Subsequent to initial recognition of these liabilities at fair value, they are measured at amortised cost using the effective interest rate method. This measurement is equivalent to the original invoice amount.

44
9NOTES TO THE FINANCIAL STATEMENTSFOR THE YEAR ENDED 30 JUNE 2013
1 Significant Accounting Policies continued
(o) Loans and borrowings Loans and borrowings are initially recognised at fair value, net of transaction costs incurred. After initial recognition, borrowings are subsequently measured at amortised cost using the effective interest method. This includes capital indexed bonds whose carrying amount is restated at each reporting date by way of an indexation adjustment based on the Consumer Price Index (CPI) in Australia.
Amortised cost is calculated by taking into account any issue costs, and any discount or premium on settlement. The difference between the face value and the capital value of these debt securities is amortised over the life of the specific instrument. Interest associated with these instruments is brought to account on an accrual basis. Indexation adjustments on CPI indexed bonds are also recognised as part of finance costs in profit or loss.
Gains and losses are recognised in the Statement of Comprehensive Income when the liabilities are derecognised as well as through the amortisation process.
Loan debt shown as a current liability is nominally due for repayment within twelve months. However due to the availability of roll-over facilities and the liquidity of the underlying debt instruments, Endeavour Energy may not necessarily need to repay these loans within twelve months.
(p) Financial instruments
(i) Foreign exchange contractsEndeavour Energy enters into foreign exchange contracts for anticipated purchase commitments for the supply of parts and equipment which are denominated in foreign currencies. Where the instruments are not designated to hedging relationships, movements in the fair value of these instruments are recognised in the Statement of Comprehensive Income.
(ii) Non‑novated energy derivatives
Where energy derivative contracts were not novated to Origin Energy in the Retail sale during 2010/11, a back to back arrangement is created for each contract. Derivative assets and liabilities for non-novated contracts are recognised in the Statement of Financial Position, with an offsetting asset and liability.
(iii) Derecognition of financial instruments
Endeavour Energy derecognises a financial asset only when the contractual rights to the cash flows from the asset expire, or when it transfers the financial asset and substantially all the risks and rewards of ownership of the asset to another entity. Endeavour Energy derecognises a financial liability when, and only when, Endeavour Energy’s obligation specified in the contract is discharged, cancelled or expired.
(q) Employee benefitsAll liabilities for employee benefits that are expected to be paid for services provided by employees to balance date represent present obligations that are fully provided for in the financial statements.
Liabilities for employee benefits for wages, salaries, maturing allowance, annual leave, pre 93 sick leave and long service leave that are expected to be settled within twelve months of the reporting date, represent present obligations resulting from employees’ services provided to reporting date, are calculated at undiscounted amounts based on remuneration wage and salary rates that the entity expects to pay as at reporting date including related on-costs, such as workers compensation, insurance and payroll tax.
Long service leave, pre 93 sick leave and maturing allowance provisions have been based on an actuarial assessment undertaken by Cumpston Sarjeant Pty Limited as at March 2011 and the associated formulae provided for intervening periods between assessments. Actuarial assessments are performed, as a minimum, every three years.
Cumpston Sarjeant Pty Limited has based their assessment on the following assumptions:
(a) 10 year Commonwealth Government bond rate used as the gross discount rate; and
(b) Rate of general salary increase generally in line with prior year.
Liability for employee benefits (long service leave, pre 93 sick leave and maturing allowance) which are not expected to be settled within twelve months are discounted at 3.76% per annum, based on 10 year Government bond rates as at 30 June 2013. All other provisions have been calculated at nominal amounts based on expected settlement rates.
(r) Superannuation
Defined contribution planA defined contribution plan is a post employment benefit under which an entity pays fixed contributions into a separate entity and will have no legal or constructive obligation to pay further amounts. Obligations for contributions to defined contribution plans are recognised as an employee benefit expense in profit or loss in the periods during which services are rendered by employees.
Defined benefit planA defined benefit plan is a post- employment benefit plan other than a defined contribution plan. The net obligation in respect of defined benefit plans is calculated separately for each plan by estimating the amount of future benefit that employees have earned in return for their service in the current and prior periods; that benefit is discounted to determine its present value, and the fair value of any plan assets is deducted.
The discount rate is the yield at the statement of financial position date on government bonds that have maturity dates approximating to the terms of the entity’s obligations. The calculation is performed by a qualified actuary using the projected unit credit method.
All actuarial gains and losses arising from defined benefit plans are recognised in other comprehensive income in the year in which they occur.

45Endeavour Energy Annual Performance Report 2012–13
FINANCIAL STATEMENTS 9
1 Significant Accounting Policies continued
Where the calculation results in a benefit to the entity, the recognised asset is limited to the net total of any unrecognised actuarial losses and past service costs and the present value of any future refunds from the plan or reductions in future contributions to the plan.
Past service cost is the increase in the present value of the defined benefit obligation for employee services in prior periods, resulting in the current period from the introduction of, or changes to, post-employment benefits or other long-term employee benefits. Past service costs may either be positive (where benefits are introduced or improved) or negative (where existing benefits are reduced).
Endeavour Energy has classified the defined benefits schemes wholly as a non-current liability to reflect the appropriate timing of the obligation.
(s) ProvisionsA provision is recognised in the Statement of Financial Position when the entity has a present legal or constructive obligation as a result of a past event, and it is probable that an outflow of economic benefits will be required to settle the obligation. If the effect is material, provisions are determined by discounting the expected future cash flows at a pre-tax rate that reflects current market assessments of the time value of money and, where appropriate, the risks specific to the liability.
(t) Other liabilities
Deferred revenueDeferred revenue is recognised for customer prepayments for external, recoverable and contestable works carried out by Endeavour Energy at reporting date. The revenue is deferred pending completion of the works and services.
DepositsDeposits represent liabilities for contractors’ deposits which can be refunded at any time after the end of the financial year and unclaimed monies which are held up to 6 years before being transferred to the Office of State Revenue. The amount which can be refunded in the succeeding financial year and at any time is shown as current and the remainder of the liability as non-current.
(u) Share capitalEndeavour Energy is incorporated under the State Owned Corporations Act 1989 with issued capital of two fully paid $1 ordinary shares.
Current shareholders are the Treasurer and the Minister for Finance on behalf of the NSW Government. The holders of ordinary shares are entitled to receive dividends as declared from time to time and are entitled to one vote per share at meetings of the Corporation. The $2 share capital is included in Contributed Equity in the Statement of Financial Position.
(v) Reserve
Asset revaluation reserveThe revaluation reserve relates to fair value movements in property, plant and equipment.
Hedging reserve The hedging reserve is used to record unrealised gains or losses of effective cash flow hedges. The unrealised gains or losses of all other derivatives are recognised in profit and loss.
(w) Finance costsFinance costs are recognised as expenses in the Statement of Comprehensive Income in the period in which they are incurred and include:
• interest expenses calculated using the effective interest method as described in AASB 139 Financial Instruments: Recognition and Measurement e.g. interest on overdrafts and short-term and long-term borrowings, including amounts paid or received on interest rate swaps, amortisation of discounts or premiums relating to borrowings, and indexation adjustments on CPI indexed bonds;
• discount expense applied to provisions and amortised assets;
• amortisation of ancillary costs incurred in connection with the arrangement of borrowings; and
• a government loan guarantee fee assessed by NSW Treasury.
The amount excludes finance costs relating to qualifying assets, in which case they are capitalised as part of the cost of those assets in accordance with AASB 123 Borrowing Costs. Qualifying assets are assets that take a substantial period of time to get ready for their intended use. The Corporation considers this to be 12 months or more.
Capitalisation of borrowing costs is undertaken where a direct relationship can be established between the borrowings and the relevant projects giving rise to qualifying assets. Typically, these are projects whose expected total project expenditure is approximately $10 million or greater.
The amount of borrowing costs capitalised during the year was $31.4 million (2012: $14.4 million), and the capitalisation rate used to determine this amount was at a weighted average interest rate of 7.1% (2012: 7.6%).

46
9NOTES TO THE FINANCIAL STATEMENTSFOR THE YEAR ENDED 30 JUNE 2013
1 Significant Accounting Policies continued
(x) Leases
As lesseePayments made under operating leases are recognised in the Statement of Comprehensive Income on a straight-line basis over the term of the lease. Lease incentives received are recognised in the Statement of Comprehensive Income as an integral part of the total lease expense and spread over the lease term.
Endeavour Energy has not entered into any finance leases as at reporting date. Leases in terms of which the entity assumes substantially all the risks and rewards of ownership are classified as finance leases.
As lessorEndeavour Energy leases out its properties, including premises, land and communications towers, under operating lease agreements at market rentals, predominantly on a fixed term basis.
Rentals received from the tenants during the year are recognised as income in the Statement of Comprehensive Income and the costs of repairs and maintenance incurred on these properties for the year are recognised as an expense in the Statement of Comprehensive Income.
(y) Greenhouse legislationUnder various legislation described below, the Corporation surrendered certificates in 2012/13 to acquit obligations as at 31 December 2012 placed on it by the various Commonwealth and New South Wales greenhouse schemes. The obligations relate to one retail customer that was not transferred as part of the electricity sales transaction on 1 March 2011. For the period commencing 1 July 2012, the following schemes apply:
CommonwealthThe RET scheme, from 1 January 2011, is split into Small-scale Renewable Energy Scheme (SRES) and Large-scale Renewable Energy Target (LRET) requiring the surrender respectively of Small-scale Technology Certificates (STCs) and Large-scale Generation Certificates (LGCs). The Act also imposes an annual liability statement to the Office of the Renewable Energy Regulator (ORER) in discharge of Endeavour Energy’s renewable energy obligations under the RET Scheme.
New South WalesThe Electricity Supply Act 1995 No.94 imposed an obligation on electricity retailers in NSW to comply with the Energy Savings Scheme. These obligations require Endeavour Energy to acquire and surrender sufficient Energy Savings certificates (ESCs), and to lodge an annual statement with the Independent Pricing and Regulatory Tribunal (IPART) in discharge of Endeavour Energy’s greenhouse gas emission reduction obligations.
(z) Goods and services taxRevenues, expenses and assets are recognised net of the amount of Goods and Services Tax (GST), except where the amount of GST incurred is not recoverable from the taxation authority. In these circumstances, the GST is recognised as part of the cost of acquisition of the asset or as part of the expense.
Receivables and payables are stated with the amount of GST included. The net amount of GST recoverable from, or payable to, the taxation authority is included as a current asset or liability in the Statement of Financial Position.
Cash flows are included in the Statement of Cash Flows on a gross basis. The GST components of cash flows arising from investing and financing activities which are recoverable from, or payable to, the taxation authority are classified as operating cash flows.
(aa) Foreign currency Foreign currency transactions are converted to Australian currency at the exchange rates at the date of the transaction, with resulting exchange differences recognised as income or expense in profit or loss.
At each balance sheet date, monetary items denominated in foreign currencies are translated at the rates prevailing on the balance sheet date, with resulting exchange differences classified as equity and transferred to the foreign currency translation reserve.

47Endeavour Energy Annual Performance Report 2012–13
FINANCIAL STATEMENTS 9
1 Significant Accounting Policies continued
(bb) New and revised accounting standards and Australian Accounting Interpretations
Accounting standards and Interpretations issued but not yet effectiveVarious new and revised accounting standards and Australian Accounting Interpretations have been published that are not mandatory for the 30 June 2013 reporting period.
Endeavour Energy’s assessment of the impact of new standards and interpretations which may have an impact and have not been early adopted is set out below. The main impact of these standards and interpretations will be on presentation and disclosure, except for AASB 119 Employee Benefits which becomes mandatory for the entity’s 2014 financial statements and will have an impact on the classification between interest expense and other comprehensive income for defined benefit schemes. Amendments to AASB 119 require retrospective application. Based on initial estimates, when the entity applies the amendments for the first time for the year ending 30 June 2014, profit after tax for the comparative period year ended 30 June 2013 will reduce by $7.6 million and other comprehensive income after income tax for the said year will increase by $7.6 million.
AASB 9 Financial Instruments, AASB 2010-7 Amendments to Australian Accounting Standards arising from AASB 9 (December 2010) [AASBs 1, 3, 4, 5, 7, 101, 102, 108, 112, 118, 120, 121, 127, 128, 131, 132, 136, 137, 139, 1023 & 1038 and Interpretations 2, 5, 10, 12, 19 & 127] and AASB 2012-6 Amendments to Australian Accounting Standards – Mandatory Effective Date of AASB 9 and Transition Disclosures [AASB 9, AASB 2010-7].
AASB 9 (Revised), AASB 2010-7 and AASB 2012-6 are applicable to annual reporting periods beginning on or after 1 January 2015. Endeavour Energy has not elected to adopt this standard early. The entity will apply these standards in the 2015/16 financial statements.
AASB 13 Fair Value Measurement and AASB 2011-8 Amendments to Australian Accounting Standards arising from AASB 13 [AASB 1, 2, 3, 4, 5, 7, 9, 2009-11, 2010-7, 101, 102, 108, 110, 116, 117, 118, 119, 120, 121, 128, 131, 132, 133, 134, 136, 138, 139, 140, 141, 1004, 1023 & 1038 and Interpretations 2, 4, 12, 13, 14, 17, 19, 131 & 132].
AASB 13 and AASB 2011- 8 are applicable to annual reporting periods beginning on or after 1 January 2013. Endeavour Energy has not elected to adopt this standard early. The entity will apply these standards in the 2013/14 financial statements.
AASB 119 Employee Benefits, AASB 2011-10 Amendments to Australian Accounting Standards arising from AASB 119 (September 2011) [AASB 1, AASB 8, AASB 101, AASB 124, AASB 134, AASB 1049 & AASB 2011-8 and Interpretation 14] and AASB 2011-11 Amendments to AASB 119 (September 2011) arising from Reduced Disclosure Requirements.
AASB 119, AASB 2011-10 and AASB 2011-11 are applicable to annual reporting periods beginning on or after 1 January 2013. Endeavour Energy has not elected to adopt these standards early. The entity will apply these standards in the 2013/14 financial statements.
AASB 2012-2 Amendments to Australian Accounting Standards – Disclosures – Offsetting Financial Assets and Financial Liabilities [AASB 7 & AASB 132] and AASB 2012-3 Amendments to Australian Accounting Standards – Offsetting Financial Assets and Financial Liabilities [AASB 132].
AASB 2012-2 and AASB 2012-3 are applicable to annual reporting periods beginning on or after 1 January 2013 and 1 January 2014 respectively. Endeavour Energy has not elected to adopt these standards early. The entity will apply these standards in the 2013/14 (AASB 2012-2) and 2014/15 (AASB 2012-3) financial statements.
All other new standards and interpretations have no impact on Endeavour Energy and will not affect Endeavour Energy’s financial statements.
(cc) Joint ventureA joint venture is a joint arrangement whereby the parties that have joint control of the arrangement have rights to the net assets of the arrangement. Ausgrid, Endeavour Energy and Essential Energy have entered into a joint venture agreement. A legal entity Networks NSW Pty Limited has been used as the vehicle for this joint venture. Networks NSW Pty Limited is incorporated in Australia (refer to Note 17 for details).

48
9NOTES TO THE FINANCIAL STATEMENTSFOR THE YEAR ENDED 30 JUNE 2013
2 Revenue
2013 $m
2012 $m
Revenue
Network use of system income 1,299.2 1,225.0
Capital Contributions 74.7 72.3
Solar Bonus Rebate Scheme Recovery 25.6 69.9
Interest income 0.2 0.1
Gain on disposal of assets 0.8 –
Other revenue 92.3 109.6
Total operating revenue 1,492.8 1,476.9
3 Expenses
(a) Expenses excluding finance costs
2013 $m
2012 $m
Expenses relating to operating activities
Distribution of energy and other services 426.5 378.4
Employee benefits expense 191.8 286.8
Bad debts and impairment of trade receivables (1.1) 1.9
Operating lease rentals 4.7 2.7
External consultants 0.5 2.1
Superannuation (defined benefit plan) recognised in profit for the year 5.8 7.1
Superannuation expense (defined contribution plan) 43.6 38.6
Loss on disposal of assets – 3.7
Total expenses relating to operating activities 671.8 721.3
Depreciation of property, plant and equipment
Buildings 4.2 3.6
System assets 142.3 130.0
Plant and equipment 21.2 20.5
Total depreciation 167.7 154.1
Amortisation of intangible assets
Computer software 16.7 15.7
Total amortisation 16.7 15.7
Total expenses excluding finance costs 856.2 891.1
(b) Finance costs
2013 $m
2012 $m
Interest and finance charges paid/payable 198.7 204.6
Finance costs recognised in the Statement of Comprehensive Income 198.7 204.6

49Endeavour Energy Annual Performance Report 2012–13
FINANCIAL STATEMENTS 9
3 Expenses continued
(c) Maintenance expenses
2013 $m
2012 $m
Employee benefits expense 65.0 71.1
Contracted labour and other (non-employee related) expenses 56.0 47.0
Total maintenance expenses 121.0 118.1
4 Income tax expense(a) Income tax expense recognised in the Statement of Comprehensive Income
2013 $m
2012 $m
Current tax expense
Current year 94.0 88.9
Adjustments for prior years (0.3) 5.5
93.7 94.4
Deferred tax expense
Origination and reversal of temporary differences 37.4 26.3
Under/(over) provided in prior years 0.3 (5.0)
37.7 21.3
Total income tax expense in Statement of Comprehensive Income 131.4 115.7
(b) Numerical reconciliation between income tax expense and prima facie tax payable
2013 $m
2012 $m
Profit before tax 437.9 381.2
Income tax using the domestic corporation tax rate of 30% (2012: 30%) 131.4 114.4
Increase (decrease) in income tax expense due to:
Tax concessions/non-deductible expenses – 0.8
Under/(over) provided in prior years – 0.5
Income tax expense on pre-tax net profit 131.4 115.7
(c) Income tax recognised in Other Comprehensive Income
2013 $m
2012 $m
Items not to be reclassified subsequently to profit or loss
Actuarial gains or losses on defined benefits superannuation 11.3 (29.1)
Revaluation of property, plant and equipment 4.8 89.9
16.1 60.8
Items to be reclassified subsequently to profit or loss
Revaluation of hedge derivatives 0.3 (1.4)
0.3 (1.4)
Income tax charged directly to Other Comprehensive Income 16.4 59.4

50
9NOTES TO THE FINANCIAL STATEMENTSFOR THE YEAR ENDED 30 JUNE 2013
5 Deferred tax assets/liabilities
Recognised deferred tax assets and liabilities
2013 $m
2012 $m
Assets subject to depreciation/amortisation/capital allowances 677.1 643.8
Assets held for sale 1.1 1.1
Deferred income and interest 0.6 0.3
Defined benefits superannuation (33.5) (47.2)
Unread meters 31.5 33.1
Provisions and accruals (83.2) (90.5)
Emission rights and deductible prepayments 0.2 0.2
Derivatives (1.5) (2.6)
Deferred tax (assets)/liabilities 592.3 538.2
The deductible temporary differences and tax losses do not expire under current tax legislation.
Opening balance
$m
Recognised in profit or loss
$m
Recognised in Other
Comprehensive Income
$m
Closing balance
$m
Movement in temporary differences during 2013
Assets subject to depreciation/amortisation/ capital allowances 643.8 28.5 4.8 677.1
Assets held for sale 1.1 – – 1.1
Deferred income and interest 0.3 0.3 – 0.6
Defined benefits superannuation (47.2) 2.4 11.3 (33.5)
Unread meters 33.1 (1.6) – 31.5
Provisions and accruals (90.5) 7.3 – (83.2)
Emission rights and deductible prepayments 0.2 – – 0.2
Derivatives (2.6) 0.8 0.3 (1.5)
Total deferred tax (assets)/liabilities 538.2 37.7 16.4 592.3
Movement in temporary differences during 2012
Assets subject to depreciation/amortisation/ capital allowances 521.7 32.2 89.9 643.8
Assets held for sale 1.1 – – 1.1
Deferred income and interest (0.2) 0.5 – 0.3
Defined Benefits superannuation (19.5) 1.4 (29.1) (47.2)
Unread meters 27.4 5.7 – 33.1
Provisions and accruals (74.5) (16.0) – (90.5)
Emission rights and deductible prepayments 2.5 (2.3) – 0.2
Derivatives (1.1) (0.1) (1.4) (2.6)
Total deferred tax (assets)/liabilities 457.4 21.4 59.4 538.2
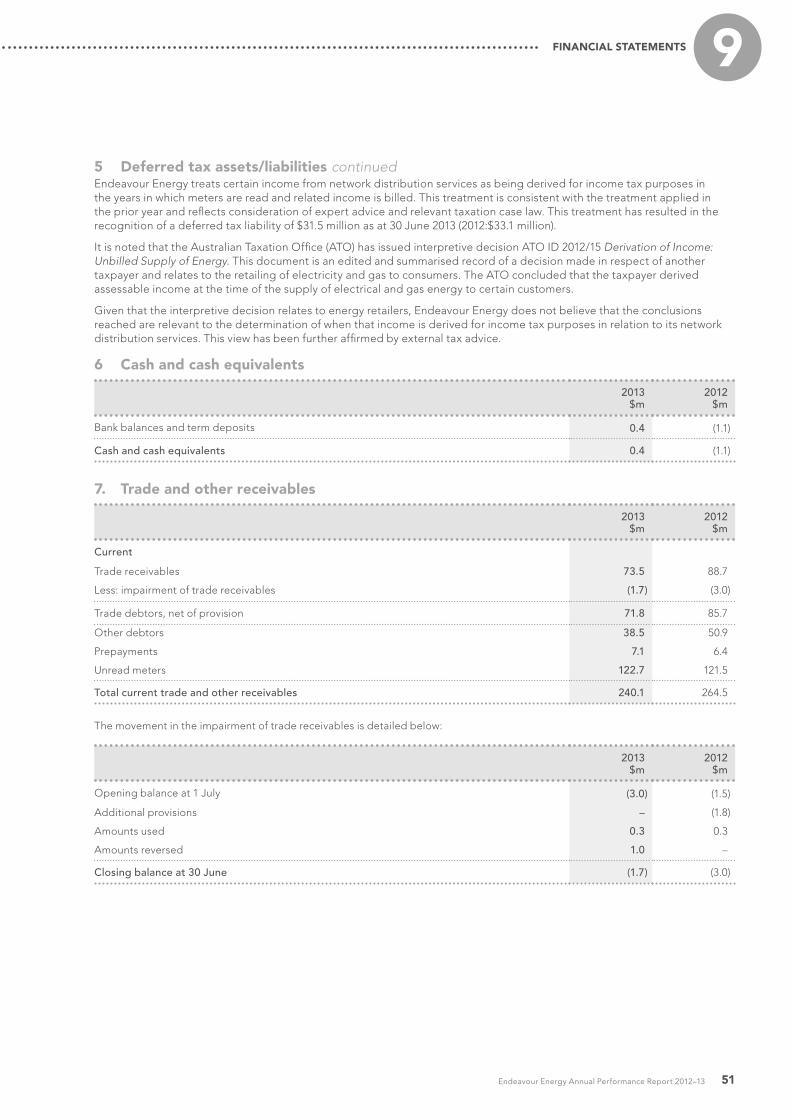
51Endeavour Energy Annual Performance Report 2012–13
FINANCIAL STATEMENTS 9
5 Deferred tax assets/liabilities continuedEndeavour Energy treats certain income from network distribution services as being derived for income tax purposes in the years in which meters are read and related income is billed. This treatment is consistent with the treatment applied in the prior year and reflects consideration of expert advice and relevant taxation case law. This treatment has resulted in the recognition of a deferred tax liability of $31.5 million as at 30 June 2013 (2012:$33.1 million).
It is noted that the Australian Taxation Office (ATO) has issued interpretive decision ATO ID 2012/15 Derivation of Income: Unbilled Supply of Energy. This document is an edited and summarised record of a decision made in respect of another taxpayer and relates to the retailing of electricity and gas to consumers. The ATO concluded that the taxpayer derived assessable income at the time of the supply of electrical and gas energy to certain customers.
Given that the interpretive decision relates to energy retailers, Endeavour Energy does not believe that the conclusions reached are relevant to the determination of when that income is derived for income tax purposes in relation to its network distribution services. This view has been further affirmed by external tax advice.
6 Cash and cash equivalents
2013 $m
2012 $m
Bank balances and term deposits 0.4 (1.1)
Cash and cash equivalents 0.4 (1.1)
7. Trade and other receivables
2013 $m
2012 $m
Current
Trade receivables 73.5 88.7
Less: impairment of trade receivables (1.7) (3.0)
Trade debtors, net of provision 71.8 85.7
Other debtors 38.5 50.9
Prepayments 7.1 6.4
Unread meters 122.7 121.5
Total current trade and other receivables 240.1 264.5
The movement in the impairment of trade receivables is detailed below:
2013 $m
2012 $m
Opening balance at 1 July (3.0) (1.5)
Additional provisions – (1.8)
Amounts used 0.3 0.3
Amounts reversed 1.0 –
Closing balance at 30 June (1.7) (3.0)

52
9NOTES TO THE FINANCIAL STATEMENTSFOR THE YEAR ENDED 30 JUNE 2013
8 Derivative financial instruments
2013 $m
2012 $m
Derivative financial assets – current
Energy derivatives 0.4 12.7
Treasury derivatives 0.2 0.3
Total derivative current assets 0.6 13.0
Derivative financial assets – non‑current
Energy derivatives – 0.1
Treasury derivatives 0.3 0.6
Total derivative non-current assets 0.3 0.7
Derivative financial liabilities – current
Energy derivatives 0.4 12.8
Forward exchange and commodity hedge contracts – 3.9
Total derivative current liabilities 0.4 16.7
Derivative financial liabilities – non-current
Energy derivatives – 0.1
Treasury derivatives 5.1 6.1
Total derivative non-current liabilities 5.1 6.2
Endeavour Energy’s exposure to credit, currency and interest rate risk related to derivatives is disclosed in note 15.

53Endeavour Energy Annual Performance Report 2012–13
FINANCIAL STATEMENTS 9
9 Property, plant and equipment
NoteSystem assets
$m
Land and buildings
$m
Plant and equipment
$mTotal
$m
At 1 July 2012 – fair value
Gross carrying amount 14,313.3 447.2 294.6 15,055.1
Accumulated depreciation and impairment (9,336.1) (0.5) (162.5) (9,499.1)
Net carrying amount 4,977.2 446.7 132.1 5,556.0
At 30 June 2013 – fair value
Gross carrying amount 14,934.0 460.3 303.1 15,697.4
Accumulated depreciation and impairment (9,469.4) (3.0) (169.2) (9,641.6)
Net carrying amount 5,464.6 457.3 133.9 6,055.8
Year ended 30 June 2013
Net carrying amount at start of year 4,977.2 446.7 132.1 5,556.0
Additions 635.1 6.4 26.6 668.1
Disposals (5.4) (0.5) (3.6) (9.5)
Revaluation – 8.9 – 8.9
Depreciation expense 3(a) (142.3) (4.2) (21.2) (167.7)
Net carrying amount at end of year 5,464.6 457.3 133.9 6,055.8
At 1 July 2011 – fair value
Gross carrying amount 13,398.5 403.0 276.6 14,078.1
Accumulated depreciation and impairment (9,213.0) (2.7) (150.4) (9,366.1)
Net carrying amount 4,185.5 400.3 126.2 4,712.0
At 30 June 2012 – fair value
Gross carrying amount 14,313.3 447.2 294.6 15,055.1
Accumulated depreciation and impairment (9,336.1) (0.5) (162.5) (9,499.1)
Net carrying amount 4,977.2 446.7 132.1 5,556.0
Year ended 30 June 2012
Net carrying amount at start of year 4,185.5 400.3 126.2 4,712.0
Additions 659.1 15.7 28.8 703.6
Disposals (4.7) (0.1) (2.4) (7.2)
Revaluation 267.3 34.4 – 301.7
Depreciation expense 3(a) (130.0) (3.6) (20.5) (154.1)
Net carrying amount at end of year 4,977.2 446.7 132.1 5,556.0

54
9NOTES TO THE FINANCIAL STATEMENTSFOR THE YEAR ENDED 30 JUNE 2013
9 Property, plant and equipment continued
Assets under construction
During the year ended 30 June 2013, the entity continued with its Network capital program. At the Statement of Financial Position date, construction in progress totalled:
Land and buildings $2.3 million (2012: $16.2 million)
System assets $869.0 million (2012: $803.6 million)
Plant and equipment $10.7 million (2012: $32.1 million)
Historical cost of revalued assets
The carrying amount of assets had they been carried under the cost model is:
Land and buildings $291.1 million (2012: $289.0 million)
System assets $4,333.9 million (2012: $3,846.4 million)
Plant and equipment $133.8 million (2012: $132.0 million)
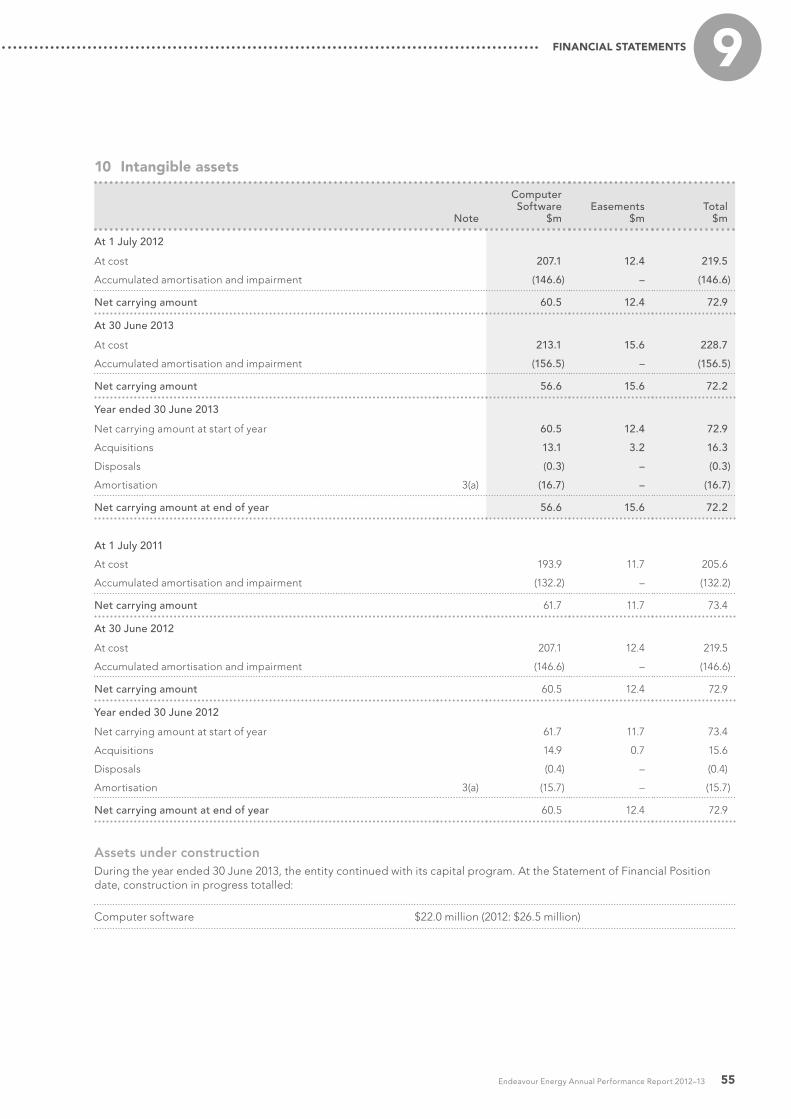
55Endeavour Energy Annual Performance Report 2012–13
FINANCIAL STATEMENTS 9
10 Intangible assets
Note
Computer Software
$mEasements
$mTotal
$m
At 1 July 2012
At cost 207.1 12.4 219.5
Accumulated amortisation and impairment (146.6) – (146.6)
Net carrying amount 60.5 12.4 72.9
At 30 June 2013
At cost 213.1 15.6 228.7
Accumulated amortisation and impairment (156.5) – (156.5)
Net carrying amount 56.6 15.6 72.2
Year ended 30 June 2013
Net carrying amount at start of year 60.5 12.4 72.9
Acquisitions 13.1 3.2 16.3
Disposals (0.3) – (0.3)
Amortisation 3(a) (16.7) – (16.7)
Net carrying amount at end of year 56.6 15.6 72.2
At 1 July 2011
At cost 193.9 11.7 205.6
Accumulated amortisation and impairment (132.2) – (132.2)
Net carrying amount 61.7 11.7 73.4
At 30 June 2012
At cost 207.1 12.4 219.5
Accumulated amortisation and impairment (146.6) – (146.6)
Net carrying amount 60.5 12.4 72.9
Year ended 30 June 2012
Net carrying amount at start of year 61.7 11.7 73.4
Acquisitions 14.9 0.7 15.6
Disposals (0.4) – (0.4)
Amortisation 3(a) (15.7) – (15.7)
Net carrying amount at end of year 60.5 12.4 72.9
Assets under constructionDuring the year ended 30 June 2013, the entity continued with its capital program. At the Statement of Financial Position date, construction in progress totalled:
Computer software $22.0 million (2012: $26.5 million)

56
9NOTES TO THE FINANCIAL STATEMENTSFOR THE YEAR ENDED 30 JUNE 2013
11 Trade and other payables
2013 $m
2012 $m
Current
Trade payables 30.6 31.7
Accruals 161.9 168.8
Other payables 8.7 8.8
Total current trade and other payables 201.2 209.3
12 BorrowingsThis note provides information about the contractual terms of the entity’s interest bearing loans and borrowings. For more information about the entity’s exposure to interest rate and foreign currency risks, see Note 15.
2013 $m
2012 $m
Current liabilities
Current portion of loans 513.5 457.3
Non-current liabilities
Non-current portion of loans 2,844.9 2,545.4
Loans are unsecured and repayable in full on various maturity dates. Interest rates are based on weighted average effective rates on the entire debt, excluding the impact of the Government Guarantee fee.

57Endeavour Energy Annual Performance Report 2012–13
FINANCIAL STATEMENTS 9
12 Borrowings continued
The Corporation has access to the following lines of credit:
2013 $m
2012 $m
Financing facilities
Total facilities available
Bank overdraft (1) 2.0 2.0
TCorp short term accommodation 100.0 100.0
TCorp loans 3,611.0 3,166.0
Total facilities available 3,713.0 3,268.0
Facilities utilised at reporting date
Bank overdraft (2), (3) – 1.1
TCorp short term accommodation (3) 21.5 5.3
TCorp loans (3) 3,336.9 2,997.4
Total facilities utilised 3,358.4 3,003.8
Facilities not utilised at reporting date
Bank overdraft 2.0 0.9
TCorp short term accommodation 78.5 94.7
TCorp loans 274.1 168.6
Total facilities not utilised 354.6 264.2
(1) Reflects the net balance of accounts held which are subject to a Set-Off Arrangement and which must not exceed the Net Facility Limit of $2.0m.
(2) The bank balance at reporting date was $0.4 million credit (2012: $1.1 million debit).
(3) Effective interest rates:
% %
Bank overdraft 9.59 10.24
TCorp short term accommodation 2.90 3.65
TCorp loans – AUD floating rate 3.32 3.99
TCorp loans – AUD fixed rate 5.73 5.91
TCorp loans – AUD inflation indexed 4.07 3.93
In addition, Endeavour Energy has working capital facilities totalling $75.5 million.

58
9NOTES TO THE FINANCIAL STATEMENTSFOR THE YEAR ENDED 30 JUNE 2013
12 Borrowings continued
Financing arrangements
Bank overdraftsInterest on bank overdraft is charged at commercial bank market rates on any balance. Additional market interest is charged on any balance in excess of the approved overdraft on Endeavour Energy’s Limit Facility of $2 million.
The bank overdraft is unsecured. Bank overdrafts are payable on demand and subject to annual review.
TCorp short term accommodationEndeavour Energy has approval under the Public Authorities (Financial Arrangements) Act 1987 (“PAFA Act”) to obtain a $100 million short term accommodation (Come-and-Go facility) from TCorp.
Interest on TCorp short term accommodation is charged at prevailing market rates.
TCorp loansEndeavour Energy has approval under the Public Authorities (Financial Arrangements) Act 1987 to obtain $3,611 million (2012: $3,166 million) loan funds from TCorp.
The loans amount in current liabilities includes the portion of the entity’s TCorp loans payable within one year of $492 million (2012: $452 million).
The non-current TCorp loans are payable on or before 1 April 2041, with maturity dates ranging between 1 and 28 years from reporting date.
All TCorp debt is fully payable on maturity with the majority being fixed rate loans.
13 Provisions
Insurance $m
Dividends $m
Employee benefits
$mOther
$mTotal
$m
Opening balance at 1 July 2012 8.7 186.6 441.9 6.8 644.0
Additional provisions 0.8 209.5 198.3 10.0 418.6
Amounts used (2.6) (186.6) (269.2) (6.0) (464.4)
Closing balance at 30 June 2013 6.9 209.5 371.0 10.8 598.2
Current 1.3 209.5 164.9 10.8 386.5
Non-current 5.6 – 206.1 – 211.7
6.9 209.5 371.0 10.8 598.2
The current provision for employee benefits includes accrued annual leave, vesting sick leave and long service leave. For long service leave it covers all unconditional entitlements where employees have completed the required period of service and also those where employees are entitled to pro-rata payments in certain circumstances. The entire amount of the provision of $164.9 million (2012: $159.5 million) is presented as current, since the group does not have an unconditional right to defer settlement for any of these obligations. However, based on past experience, the entity does not expect all employees to take the full amount of accrued leave or require payment within the next 12 months.
The following amounts reflect leave that is not to be expected to be taken or paid within the next 12 months.
2013 $m
2012 $m
Current leave obligations expected to be settled after 12 months 121.1 117.3
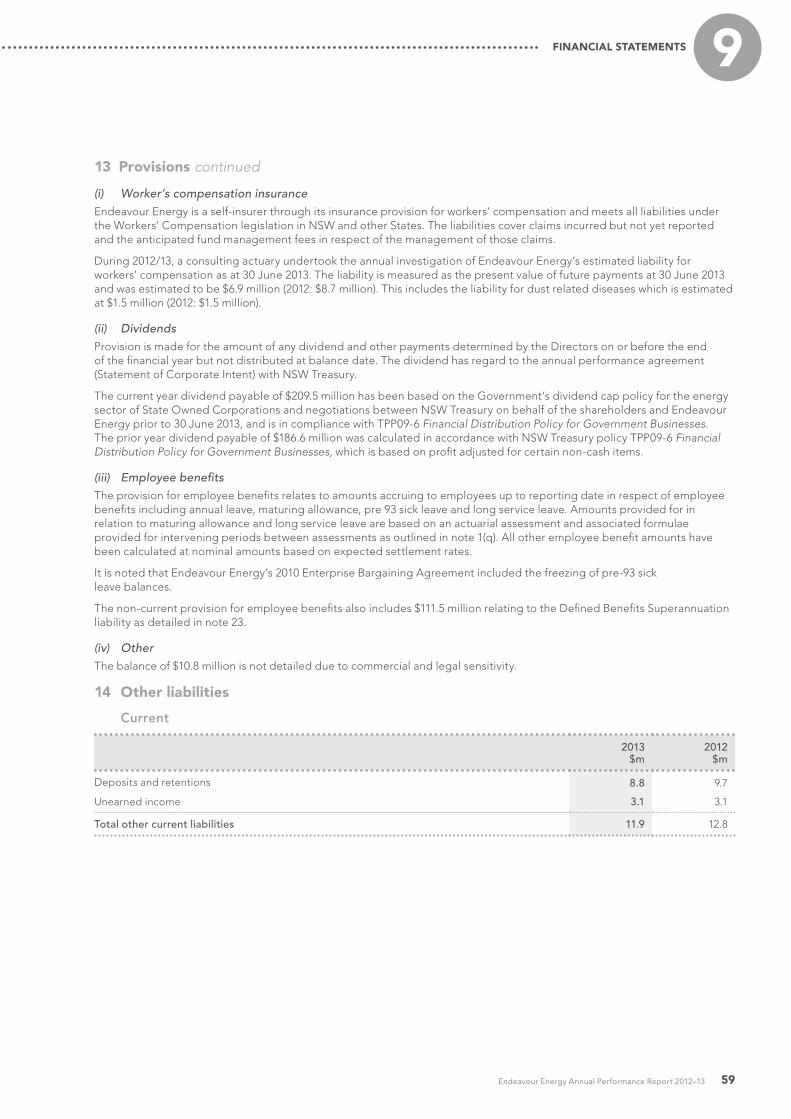
59Endeavour Energy Annual Performance Report 2012–13
FINANCIAL STATEMENTS 9
13 Provisions continued
(i) Worker’s compensation insuranceEndeavour Energy is a self-insurer through its insurance provision for workers’ compensation and meets all liabilities under the Workers’ Compensation legislation in NSW and other States. The liabilities cover claims incurred but not yet reported and the anticipated fund management fees in respect of the management of those claims.
During 2012/13, a consulting actuary undertook the annual investigation of Endeavour Energy’s estimated liability for workers’ compensation as at 30 June 2013. The liability is measured as the present value of future payments at 30 June 2013 and was estimated to be $6.9 million (2012: $8.7 million). This includes the liability for dust related diseases which is estimated at $1.5 million (2012: $1.5 million).
(ii) DividendsProvision is made for the amount of any dividend and other payments determined by the Directors on or before the end of the financial year but not distributed at balance date. The dividend has regard to the annual performance agreement (Statement of Corporate Intent) with NSW Treasury.
The current year dividend payable of $209.5 million has been based on the Government’s dividend cap policy for the energy sector of State Owned Corporations and negotiations between NSW Treasury on behalf of the shareholders and Endeavour Energy prior to 30 June 2013, and is in compliance with TPP09-6 Financial Distribution Policy for Government Businesses. The prior year dividend payable of $186.6 million was calculated in accordance with NSW Treasury policy TPP09-6 Financial Distribution Policy for Government Businesses, which is based on profit adjusted for certain non-cash items.
(iii) Employee benefitsThe provision for employee benefits relates to amounts accruing to employees up to reporting date in respect of employee benefits including annual leave, maturing allowance, pre 93 sick leave and long service leave. Amounts provided for in relation to maturing allowance and long service leave are based on an actuarial assessment and associated formulae provided for intervening periods between assessments as outlined in note 1(q). All other employee benefit amounts have been calculated at nominal amounts based on expected settlement rates.
It is noted that Endeavour Energy’s 2010 Enterprise Bargaining Agreement included the freezing of pre-93 sick leave balances.
The non-current provision for employee benefits also includes $111.5 million relating to the Defined Benefits Superannuation liability as detailed in note 23.
(iv) OtherThe balance of $10.8 million is not detailed due to commercial and legal sensitivity.
14 Other liabilities
Current
2013 $m
2012 $m
Deposits and retentions 8.8 9.7
Unearned income 3.1 3.1
Total other current liabilities 11.9 12.8
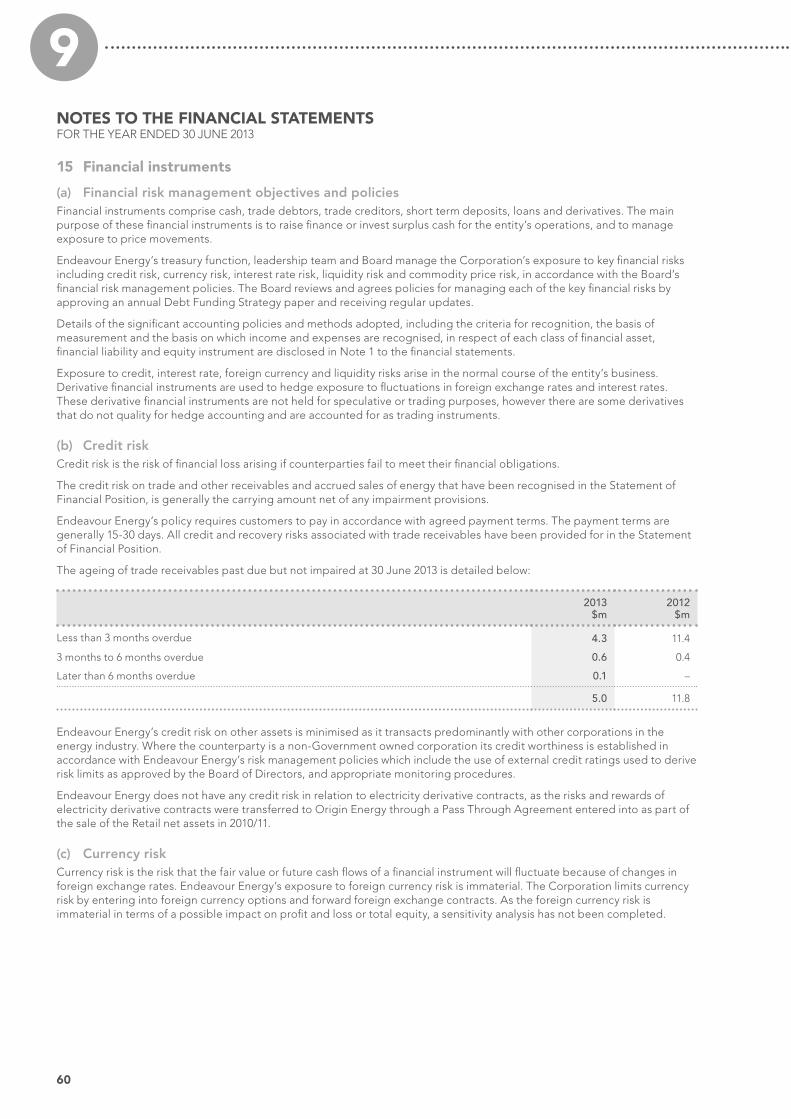
60
9NOTES TO THE FINANCIAL STATEMENTSFOR THE YEAR ENDED 30 JUNE 2013
15 Financial instruments
(a) Financial risk management objectives and policiesFinancial instruments comprise cash, trade debtors, trade creditors, short term deposits, loans and derivatives. The main purpose of these financial instruments is to raise finance or invest surplus cash for the entity’s operations, and to manage exposure to price movements.
Endeavour Energy’s treasury function, leadership team and Board manage the Corporation’s exposure to key financial risks including credit risk, currency risk, interest rate risk, liquidity risk and commodity price risk, in accordance with the Board’s financial risk management policies. The Board reviews and agrees policies for managing each of the key financial risks by approving an annual Debt Funding Strategy paper and receiving regular updates.
Details of the significant accounting policies and methods adopted, including the criteria for recognition, the basis of measurement and the basis on which income and expenses are recognised, in respect of each class of financial asset, financial liability and equity instrument are disclosed in Note 1 to the financial statements.
Exposure to credit, interest rate, foreign currency and liquidity risks arise in the normal course of the entity’s business. Derivative financial instruments are used to hedge exposure to fluctuations in foreign exchange rates and interest rates. These derivative financial instruments are not held for speculative or trading purposes, however there are some derivatives that do not quality for hedge accounting and are accounted for as trading instruments.
(b) Credit riskCredit risk is the risk of financial loss arising if counterparties fail to meet their financial obligations.
The credit risk on trade and other receivables and accrued sales of energy that have been recognised in the Statement of Financial Position, is generally the carrying amount net of any impairment provisions.
Endeavour Energy’s policy requires customers to pay in accordance with agreed payment terms. The payment terms are generally 15-30 days. All credit and recovery risks associated with trade receivables have been provided for in the Statement of Financial Position.
The ageing of trade receivables past due but not impaired at 30 June 2013 is detailed below:
2013 $m
2012 $m
Less than 3 months overdue 4.3 11.4
3 months to 6 months overdue 0.6 0.4
Later than 6 months overdue 0.1 –
5.0 11.8
Endeavour Energy’s credit risk on other assets is minimised as it transacts predominantly with other corporations in the energy industry. Where the counterparty is a non-Government owned corporation its credit worthiness is established in accordance with Endeavour Energy’s risk management policies which include the use of external credit ratings used to derive risk limits as approved by the Board of Directors, and appropriate monitoring procedures.
Endeavour Energy does not have any credit risk in relation to electricity derivative contracts, as the risks and rewards of electricity derivative contracts were transferred to Origin Energy through a Pass Through Agreement entered into as part of the sale of the Retail net assets in 2010/11.
(c) Currency riskCurrency risk is the risk that the fair value or future cash flows of a financial instrument will fluctuate because of changes in foreign exchange rates. Endeavour Energy’s exposure to foreign currency risk is immaterial. The Corporation limits currency risk by entering into foreign currency options and forward foreign exchange contracts. As the foreign currency risk is immaterial in terms of a possible impact on profit and loss or total equity, a sensitivity analysis has not been completed.
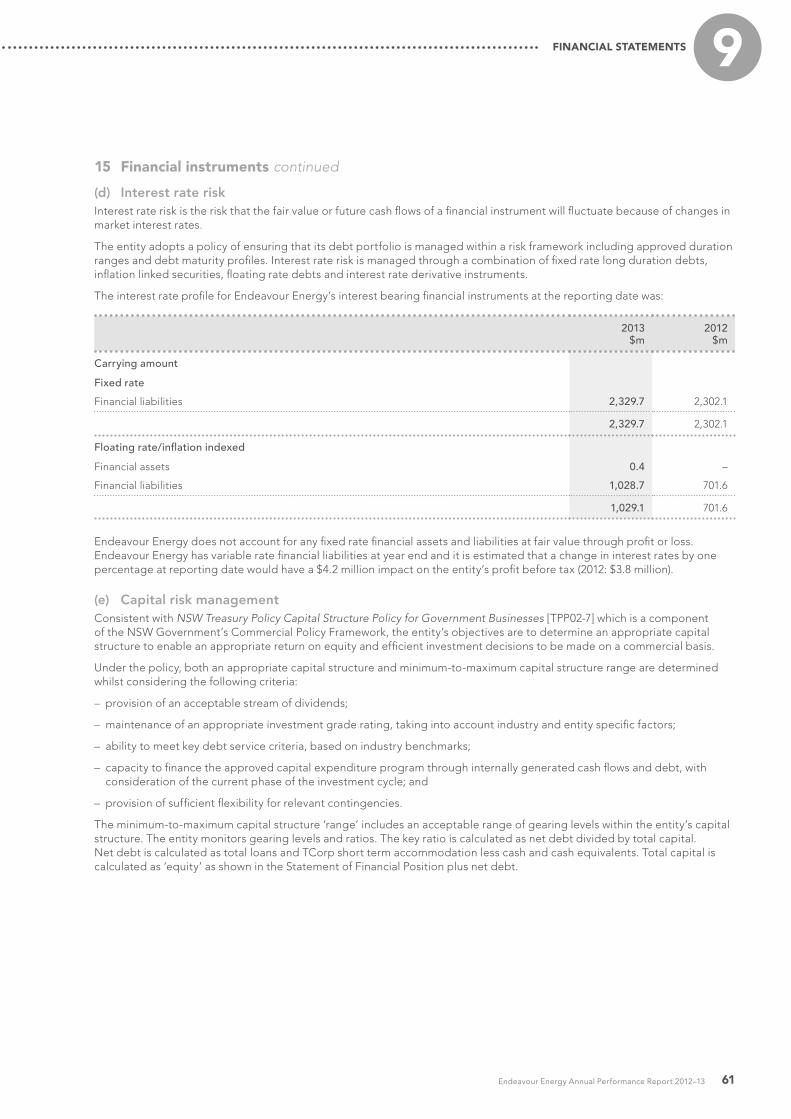
61Endeavour Energy Annual Performance Report 2012–13
FINANCIAL STATEMENTS 9
15 Financial instruments continued
(d) Interest rate riskInterest rate risk is the risk that the fair value or future cash flows of a financial instrument will fluctuate because of changes in market interest rates.
The entity adopts a policy of ensuring that its debt portfolio is managed within a risk framework including approved duration ranges and debt maturity profiles. Interest rate risk is managed through a combination of fixed rate long duration debts, inflation linked securities, floating rate debts and interest rate derivative instruments.
The interest rate profile for Endeavour Energy’s interest bearing financial instruments at the reporting date was:
2013 $m
2012 $m
Carrying amount
Fixed rate
Financial liabilities 2,329.7 2,302.1
2,329.7 2,302.1
Floating rate/inflation indexed
Financial assets 0.4 –
Financial liabilities 1,028.7 701.6
1,029.1 701.6
Endeavour Energy does not account for any fixed rate financial assets and liabilities at fair value through profit or loss. Endeavour Energy has variable rate financial liabilities at year end and it is estimated that a change in interest rates by one percentage at reporting date would have a $4.2 million impact on the entity’s profit before tax (2012: $3.8 million).
(e) Capital risk managementConsistent with NSW Treasury Policy Capital Structure Policy for Government Businesses [TPP02-7] which is a component of the NSW Government’s Commercial Policy Framework, the entity’s objectives are to determine an appropriate capital structure to enable an appropriate return on equity and efficient investment decisions to be made on a commercial basis.
Under the policy, both an appropriate capital structure and minimum-to-maximum capital structure range are determined whilst considering the following criteria:
– provision of an acceptable stream of dividends;
– maintenance of an appropriate investment grade rating, taking into account industry and entity specific factors;
– ability to meet key debt service criteria, based on industry benchmarks;
– capacity to finance the approved capital expenditure program through internally generated cash flows and debt, with consideration of the current phase of the investment cycle; and
– provision of sufficient flexibility for relevant contingencies.
The minimum-to-maximum capital structure ‘range’ includes an acceptable range of gearing levels within the entity’s capital structure. The entity monitors gearing levels and ratios. The key ratio is calculated as net debt divided by total capital. Net debt is calculated as total loans and TCorp short term accommodation less cash and cash equivalents. Total capital is calculated as ‘equity’ as shown in the Statement of Financial Position plus net debt.

62
9NOTES TO THE FINANCIAL STATEMENTSFOR THE YEAR ENDED 30 JUNE 2013
15 Financial instruments continued
2013 $m
2012 $m
Total loans 3,358.4 3,002.7
Add/(less): cash and cash equivalents/bank overdraft (0.4) 1.1
Net debt 3,358.0 3,003.8
Total equity 1,586.2 1,450.7
Total capital 4,944.2 4,454.5
Gearing ratio 67.9% 67.4%
The entity’s agreed capital structure and range is reviewed every year as part of the Statement of Corporate Intent process. The purpose of such a review is to confirm whether or not the current capital structure and range continue to be appropriate and, if not, to negotiate revised arrangements between the Board and Shareholders.
(f) Energy price riskEnergy price risk is the risk that Endeavour Energy’s cash flow will be adversely affected by movements in wholesale market electricity price. As part of the retail sale transaction on 1 March 2011, the Corporation transferred its open energy trading contract to the purchaser, Origin Energy. A number of energy trading contracts were unable to be novated to Origin Energy and are recorded in the Statement of Financial Position as at 30 June 2013. Non-novated contracts held in Endeavour Energy’s name are matched to an equal and opposite position with Origin Energy. Endeavour Energy does not derive any benefit associated with cash flow but still bears residual legal and credit risks until the contract is novated or expired.
(g) Fair values
(i) Valuation techniques and assumptions applied for the purposes of measuring fair valueThe fair value of financial assets and financial liabilities are determined as follows:
The fair value of financial assets and financial liabilities with standard terms and conditions and traded on active liquid markets are determined with reference to quoted market prices. In the absence of quoted market prices, the price of the most recent transaction provides evidence of the current fair value.
The fair values of other financial assets and financial liabilities (excluding energy derivatives) are determined in accordance with generally accepted pricing models based on discounted cash flow analysis using maximum observable market input data which includes prices from observable current market transactions and dealer quotes for similar instruments.
Non‑novated energy derivatives
Fair value of electricity derivatives was calculated either using readily observed market sources or internally adjusted market prices.
The forward curve against which electricity derivatives are revalued is constructed from readily observed market sources. The inputs for this curve are sourced from a combination of available independent broker quotes as well as closing Sydney Future Exchange prices.
For electricity derivatives where directly appropriate market price valuations were not available, the net fair value for such contracts has been calculated based on internally adjusted market price estimates for similar products or reasonable extrapolation of the last observed relative reference prices. Estimated future cashflows resulting from the valuation exercise were discounted to derive the relative net fair values as at balance date. The discount rates used were sourced from a zero coupon yield curve constructed by an independent content provider.
Interest‑bearing loans and borrowings
Fair value is calculated based on discounted expected future principal and interest cash flows.
Trade and other receivables/payables
For receivables/payables with a remaining life of less than one year, the notional amount is deemed to reflect the fair value.
Foreign exchange contracts
The net fair value of foreign exchange contracts is calculated by reference to the current spot and forward market currency exchange rates.
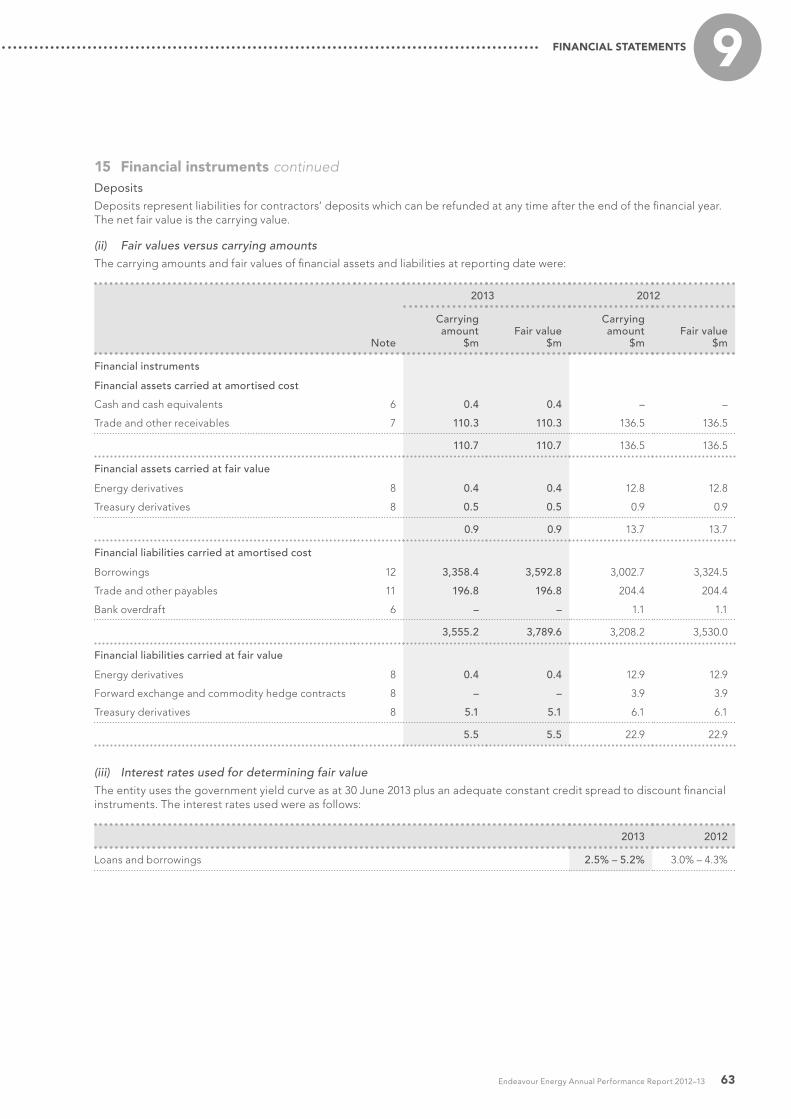
63Endeavour Energy Annual Performance Report 2012–13
FINANCIAL STATEMENTS 9
15 Financial instruments continuedDeposits
Deposits represent liabilities for contractors’ deposits which can be refunded at any time after the end of the financial year. The net fair value is the carrying value.
(ii) Fair values versus carrying amountsThe carrying amounts and fair values of financial assets and liabilities at reporting date were:
Note
2013 2012
Carrying amount
$mFair value
$m
Carrying amount
$mFair value
$m
Financial instruments
Financial assets carried at amortised cost
Cash and cash equivalents 6 0.4 0.4 – –
Trade and other receivables 7 110.3 110.3 136.5 136.5
110.7 110.7 136.5 136.5
Financial assets carried at fair value
Energy derivatives 8 0.4 0.4 12.8 12.8
Treasury derivatives 8 0.5 0.5 0.9 0.9
0.9 0.9 13.7 13.7
Financial liabilities carried at amortised cost
Borrowings 12 3,358.4 3,592.8 3,002.7 3,324.5
Trade and other payables 11 196.8 196.8 204.4 204.4
Bank overdraft 6 – – 1.1 1.1
3,555.2 3,789.6 3,208.2 3,530.0
Financial liabilities carried at fair value
Energy derivatives 8 0.4 0.4 12.9 12.9
Forward exchange and commodity hedge contracts 8 – – 3.9 3.9
Treasury derivatives 8 5.1 5.1 6.1 6.1
5.5 5.5 22.9 22.9
(iii) Interest rates used for determining fair valueThe entity uses the government yield curve as at 30 June 2013 plus an adequate constant credit spread to discount financial instruments. The interest rates used were as follows:
2013 2012
Loans and borrowings 2.5% – 5.2% 3.0% – 4.3%

64
9NOTES TO THE FINANCIAL STATEMENTSFOR THE YEAR ENDED 30 JUNE 2013
15 Financial instruments continued(iv) Fair value hierarchyThe following table provides an analysis of financial instruments that are measured subsequent to initial recognition at fair value, grouped into Levels 1 to 3 based on the degree to which the fair value is observable.
• Level 1 – Quoted prices (unadjusted) in active markets for identical assets or liabilities.
• Level 2 – Inputs other than quoted prices included within Level 1 that are observable for the asset or liability, either directly (i.e. as prices) or indirectly (i.e. derived from prices).
• Level 3 – Valuation techniques that include inputs for the asset or liability that are not based on observable market data (unobservable input).
Level 1 $m
Level 2 $m
Level 3 $m
Total $m
2013
Financial assets at fair value through profit or loss
Treasury derivatives – 0.5 – 0.5
Energy derivatives – 0.4 – 0.4
– 0.9 – 0.9
Financial liabilities at fair value through profit or loss
Treasury derivatives 5.1 – – 5.1
5.1 – – 5.1
2012
Financial assets at fair value through profit or loss
Treasury derivatives – 0.9 – 0.9
Energy derivatives – 2.1 – 2.1
– 3.0 – 3.0
Financial liabilities at fair value through profit or loss
Treasury derivatives 6.1 – – 6.1
Energy derivatives – 10.7 – 10.7
Forward exchange and commodity hedge contracts 3.9 – – 3.9
10.0 10.7 – 20.7
(h) Liquidity riskLiquidity risk is the risk of difficulty in ensuring the availability of sufficient funds to meet obligations associated with financial liabilities that are settled by delivering cash or another financial asset. Endeavour Energy’s liquidity risks are managed with the availability of readily accessible standby facilities and other funding arrangements and by investing surplus funds in marketable securities and deposits (see Notes 1(g), 1(o), 6 and 12).
The Corporation has obtained approval under the Public Authorities (Financial Arrangement) Act 1987 for a TCorp core debt borrowing limit of $3,611.0 million (2012: $3,166.0 million) of which $274.1 million was unused as at 30 June 2013 (2012: $168.6 million). There are also approvals for a TCorp Come and Go Facility limit of $100.0 million (2012: $100.0 million) and a bank overdraft facility limit of $2.0 million (2012: $2.0 million) to fund working capital. Planned future capital expenditure will be funded through TCorp borrowings. Future committed expenditure is disclosed in Note 20.
While current liabilities are greater than current assets as at 30 June 2013, the Corporation continues to trade as a going concern. It is noted that the Corporation derives revenue from non-current assets. The TCorp Come and Go Facility had $78.5 million (2012: $94.7 million) unused and the bank overdraft facility limit had $2.0 million (2012: $0.9 million) unused as at 30 June 2013.
During the current and prior years there were no defaults or breaches on any loans payable. No assets have been pledged as collateral. The Corporation’s exposure to liquidity risk is deemed insignificant based on prior periods data and current assessment of risk.
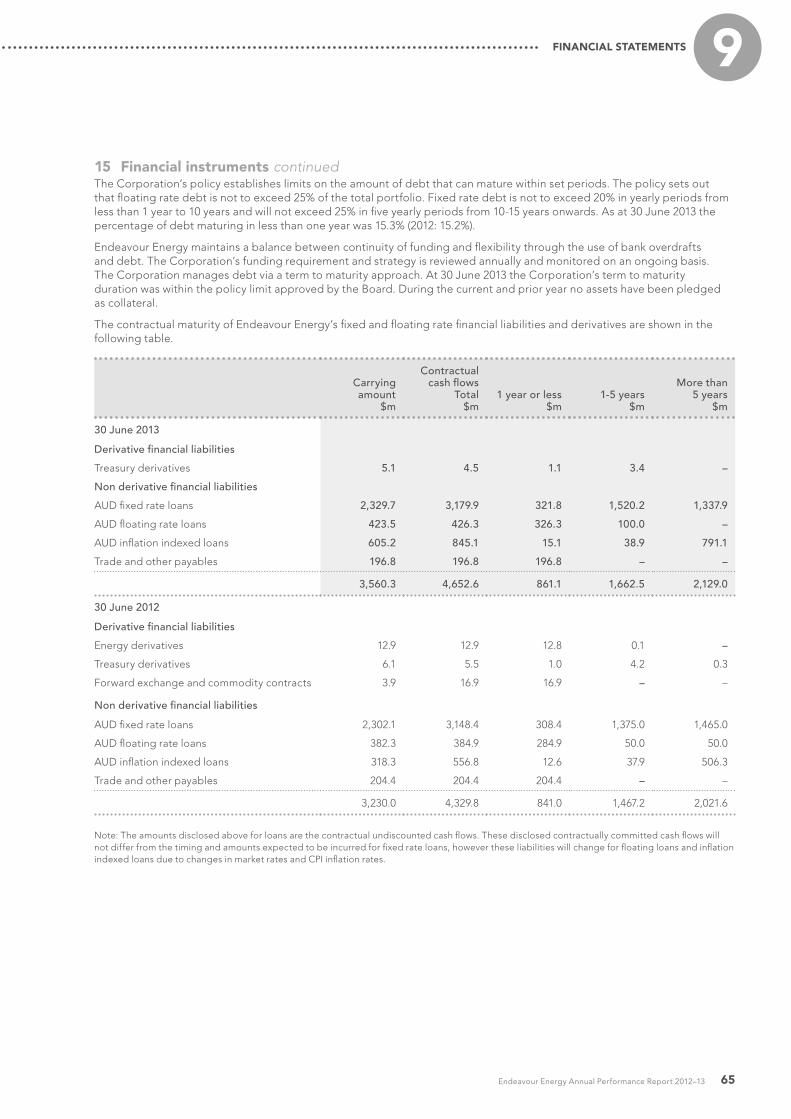
65Endeavour Energy Annual Performance Report 2012–13
FINANCIAL STATEMENTS 9
15 Financial instruments continuedThe Corporation’s policy establishes limits on the amount of debt that can mature within set periods. The policy sets out that floating rate debt is not to exceed 25% of the total portfolio. Fixed rate debt is not to exceed 20% in yearly periods from less than 1 year to 10 years and will not exceed 25% in five yearly periods from 10-15 years onwards. As at 30 June 2013 the percentage of debt maturing in less than one year was 15.3% (2012: 15.2%).
Endeavour Energy maintains a balance between continuity of funding and flexibility through the use of bank overdrafts and debt. The Corporation’s funding requirement and strategy is reviewed annually and monitored on an ongoing basis. The Corporation manages debt via a term to maturity approach. At 30 June 2013 the Corporation’s term to maturity duration was within the policy limit approved by the Board. During the current and prior year no assets have been pledged as collateral.
The contractual maturity of Endeavour Energy’s fixed and floating rate financial liabilities and derivatives are shown in the following table.
Carrying amount
$m
Contractual cash flows
Total $m
1 year or less $m
1-5 years $m
More than 5 years
$m
30 June 2013
Derivative financial liabilities
Treasury derivatives 5.1 4.5 1.1 3.4 –
Non derivative financial liabilities
AUD fixed rate loans 2,329.7 3,179.9 321.8 1,520.2 1,337.9
AUD floating rate loans 423.5 426.3 326.3 100.0 –
AUD inflation indexed loans 605.2 845.1 15.1 38.9 791.1
Trade and other payables 196.8 196.8 196.8 – –
3,560.3 4,652.6 861.1 1,662.5 2,129.0
30 June 2012
Derivative financial liabilities
Energy derivatives 12.9 12.9 12.8 0.1 –
Treasury derivatives 6.1 5.5 1.0 4.2 0.3
Forward exchange and commodity contracts 3.9 16.9 16.9 – –
Non derivative financial liabilities
AUD fixed rate loans 2,302.1 3,148.4 308.4 1,375.0 1,465.0
AUD floating rate loans 382.3 384.9 284.9 50.0 50.0
AUD inflation indexed loans 318.3 556.8 12.6 37.9 506.3
Trade and other payables 204.4 204.4 204.4 – –
3,230.0 4,329.8 841.0 1,467.2 2,021.6
Note: The amounts disclosed above for loans are the contractual undiscounted cash flows. These disclosed contractually committed cash flows will not differ from the timing and amounts expected to be incurred for fixed rate loans, however these liabilities will change for floating loans and inflation indexed loans due to changes in market rates and CPI inflation rates.

66
9NOTES TO THE FINANCIAL STATEMENTSFOR THE YEAR ENDED 30 JUNE 2013
15 Financial instruments continuedThe following table separately discloses the undiscounted contractual net cash inflows and outflows on derivative liabilities that settle on a net basis. When the amount payable or receivable is not fixed, the amount disclosed has been determined by reference to projected prices as illustrated by forward curves at the end of each reporting period. Energy derivatives are subject to pass through provisions in the Purchase and Sale Agreement with Origin Energy, and consequently all cashflows are offset either against contra cashflows with either the original counterparty or Origin Energy.
Carrying amount
$m
Total contractual
cashflows $m
1 year or less $m
1-5 years $m
More than 5 years
$m
Derivative financial liabilities
Net settled:
– Treasury derivatives 5.1 4.5 1.1 3.4 –
5.1 4.5 1.1 3.4 –
30 June 2012
Derivative financial liabilities
Net settled:
– Energy derivatives 12.9 12.9 12.8 0.1 –
– Cashflows offset^ (12.9) (12.9) (12.8) (0.1) –
– Treasury derivatives 10.0 22.5 18.0 4.2 0.3
10.0 22.5 18.0 4.2 0.3
^ Cashflows available under offset arrangements with Origin Energy.
Cash flow hedgesThe following table indicates the periods in which the cash flows associated with derivatives that are cash flow hedges are expected to occur and the profit and loss impact.
Carrying amount
$m
Expected cash flows and
profit & loss impact
$m1 year or less
$m1-5 years
$m
More than 5 years
$m
30 June 2012
Forward foreign exchange and commodity hedge contracts
– Liabilities 3.9 16.9 16.9 – –
Liabilities 3.9 16.9 16.9 – –

67Endeavour Energy Annual Performance Report 2012–13
FINANCIAL STATEMENTS 9
16 Key management personnelKey management personnel comprise members of the Board of Directors, Networks NSW (NNSW) executive management team and the Corporation’s leadership management team.
The following were key management personnel of the entity at any time during the reporting period, and unless otherwise indicated were key management personnel for the entire period.
DirectorsMr Roger Massy-Greene (Chairman) [appointed 1 July 2012]
Dr Peter Dodd [appointed from 1 July 2012]
Ms Penny Le Couteur [reappointed 1 July 2012 – 30 June 2013] – term expired and did not seek a further term
Ms Barbara Ward [appointed 1 July 2012 – 31 December 2012] – term expired and did not seek a further term
Ms Laura Reed [appointed 1 January 2013]
Mr Philip Garling [appointed 1 January 2013]
Mr Vince Graham (Chief Executive Officer) [appointed 1 July 2012]
Key management personnel remunerationIn addition to their salaries, the entity also provides post employment benefits to key management personnel (see Notes 1(q) and 1(r)).
The allocation of NNSW executive management team remuneration to Endeavour Energy is based on the proportion of customer numbers to the total customer numbers of Ausgrid, Endeavour Energy and Essential Energy combined.
The key management personnel compensation included in “employee benefits expense” (see Note 3) are as follows:
2013 $m
2012 $m
Short-term employee benefits 3.4 3.4
Long-term benefits 0.6 0.3
Post-employment benefits 0.2 0.2
Total 4.2 3.9

68
9NOTES TO THE FINANCIAL STATEMENTSFOR THE YEAR ENDED 30 JUNE 2013
17 Related parties transactions
(i) Networks NSW structureOn 1 July 2012, the Networks NSW (NNSW) operating model commenced with Ausgrid, Endeavour Energy and Essential Energy (DNSPs) having separate Boards with common Directors, a common Chairman and common Chief Executive Officer (CEO). A Group Management structure is being implemented to assist the Board and the CEO in undertaking reform of the industry consistent with the objectives of NSW Government policy and in line with the Umbrella Cooperation Agreement (UCA).
NNSW is not a legal entity and the personnel and associated costs of the group management have been captured by the individual DNSPs and equitably shared between the three DNSPs. The Umbrella Cooperation Agreement facilitates the management and cooperation of NNSW and each of the DNSPs. It enables the DNSPs to identify and implement reform measures and realise and share the initiatives through acting collectively and co-operatively.
Subsequent to 30 June 2013 the Energy Services Corporations Amendment (Distributor Efficiency) Legislation was passed. The amendment legislation provides for the appointment of a single Board of Directors that is to be the Board of each of the energy distributors (Ausgrid, Endeavour Energy and Essential Energy) to act in the best interest of energy distributors as if they formed part of a combined operation. The legislation was proclaimed on 27 August 2013.
(ii) Joint ventureFurther to the Umbrella Cooperation Agreement, the DNSPs have entered into a joint venture agreement for the purpose of realising cost savings through joint procurement and service provision activities. A legal entity Networks NSW Pty Limited has been used as the vehicle for this joint venture. Networks NSW Pty Limited will not incur any costs in its own right or enter into any sourcing agreements. Endeavour Energy has a one-third ownership interest in Networks NSW Pty Limited.
(iii) DirectorsSome Directors of Endeavour Energy are also Directors of other companies or have an interest in other companies or entities that may have had transactions with Endeavour Energy during the financial year. A Register of Directors’ interests is maintained by the Board Secretary and updated as required during the year. In accordance with the Board Charter and company Code of Conduct, Directors’ have declared any potential conflicts of interest in matters discussed at the meetings.
18 Remuneration of auditor
2013 $m
2012 $m
Amounts paid and payable to the Audit Office of New South Wales 0.3 0.3

69Endeavour Energy Annual Performance Report 2012–13
FINANCIAL STATEMENTS 9
19 Contingent liabilities and contingent assets
Contingent liabilities
2013 $m
2012 $m
Self insurance 0.4 1.6
Sundry general claims 9.5 5.0
9.9 6.6
The contingent liabilities relate to injury claims (self insurance) and sundry general claims. The Directors do not expect the outcomes of any actions associated with the above contingent liabilities to have a material effect on the Corporation’s financial position.
The Directors are of the opinion that provisions are not required in respect of these matters, as it is not probable that a future sacrifice of economic benefits will be required or the amount is not capable of reliable measurement.
Contingent assets
2013 $m
2012 $m
Sundry general claims 7.3 8.2
7.3 8.2
The contingent asset relates to a contractual dispute and insurance claims.
20 Commitments
2013 $m
2012 $m
Capital commitments
Commitments for the acquisition of assets, plant and equipment contracted for at the reporting date but not recognised as liabilities payable (including GST) 196.0 203.2
GST credits 17.8 18.5
In addition, Endeavour Energy has two Power Purchase Agreements where Endeavour Energy remains the counterparty. However, through an on-sale agreement as part of the Retail sale, energy transferred to Endeavour Energy is automatically transferred to Origin Energy. Energy purchase commitments to be transferred through the on-sale agreement as at 30 June 2013 total $1,315.6 million (2012: $1,506.9 million).
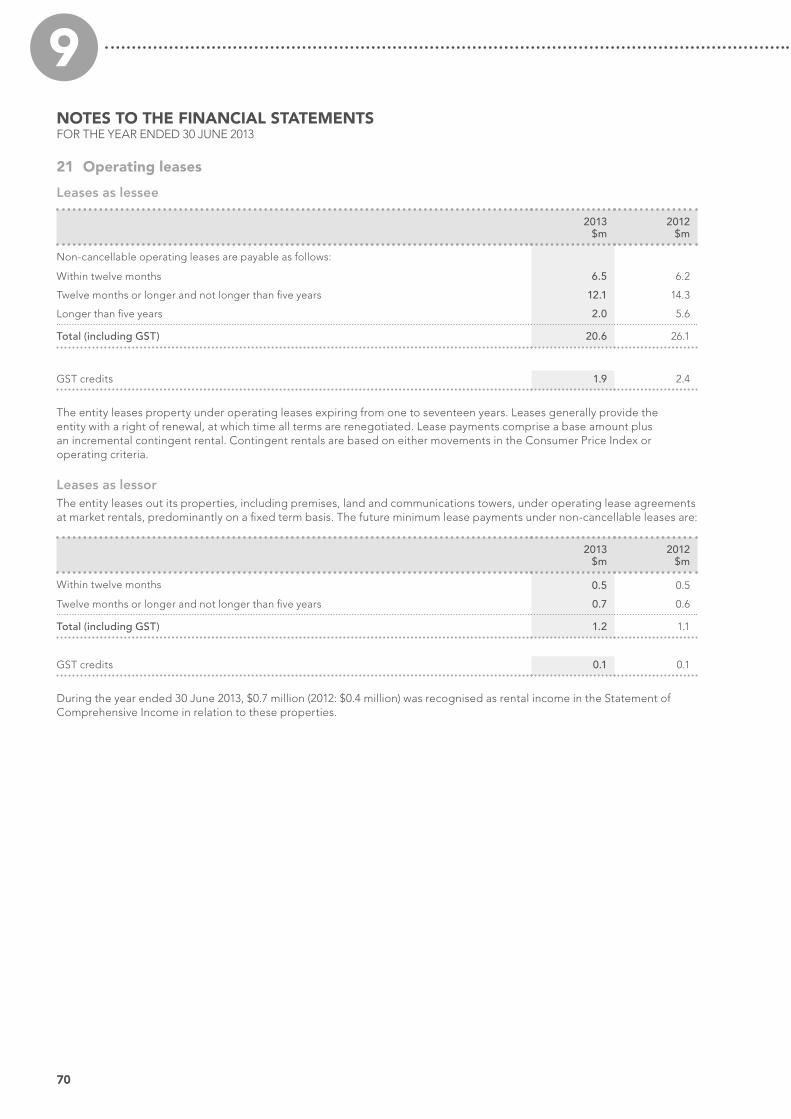
70
9NOTES TO THE FINANCIAL STATEMENTSFOR THE YEAR ENDED 30 JUNE 2013
21 Operating leases
Leases as lessee
2013 $m
2012 $m
Non-cancellable operating leases are payable as follows:
Within twelve months 6.5 6.2
Twelve months or longer and not longer than five years 12.1 14.3
Longer than five years 2.0 5.6
Total (including GST) 20.6 26.1
GST credits 1.9 2.4
The entity leases property under operating leases expiring from one to seventeen years. Leases generally provide the entity with a right of renewal, at which time all terms are renegotiated. Lease payments comprise a base amount plus an incremental contingent rental. Contingent rentals are based on either movements in the Consumer Price Index or operating criteria.
Leases as lessorThe entity leases out its properties, including premises, land and communications towers, under operating lease agreements at market rentals, predominantly on a fixed term basis. The future minimum lease payments under non-cancellable leases are:
2013 $m
2012 $m
Within twelve months 0.5 0.5
Twelve months or longer and not longer than five years 0.7 0.6
Total (including GST) 1.2 1.1
GST credits 0.1 0.1
During the year ended 30 June 2013, $0.7 million (2012: $0.4 million) was recognised as rental income in the Statement of Comprehensive Income in relation to these properties.

71Endeavour Energy Annual Performance Report 2012–13
FINANCIAL STATEMENTS 9
22 Reconciliation of cashflows from operating activities
2013 $m
2012 $m
Profit for the year 306.5 265.5
Add/(less) non-cash items
Depreciation non-current assets 167.7 154.1
Amortisation non-current assets 16.7 15.7
Amortisation of discounts/premiums 6.3 9.1
Non cash additions including capital contributions (74.6) (95.7)
Net (profit)/loss on disposal of property, plant and equipment (0.8) 3.7
Reserve movements 38.4 (161.0)
Changes in assets and liabilities
(Increase)/decrease in trade and other receivables 25.6 84.3
(Increase)/decrease in unread meters (1.1) (73.0)
(Increase)/decrease in derivative financial assets 12.8 41.3
(Increase)/decrease in inventories (2.0) 2.7
(Increase)/decrease in other assets – 7.7
Increase/(decrease) in trade and other payables (39.7) (74.5)
Increase/(decrease) in provisions (68.7) 148.6
Increase/(decrease) in current tax balances (7.7) 11.7
Increase/(decrease) in deferred tax liabilities 54.2 80.8
Increase/(decrease) in derivative financial liabilities (17.4) (35.6)
Increase/(decrease) in other liabilities (0.8) (1.8)
Net cash from operating activities 415.4 383.6
23 Superannuation – Defined benefits planEndeavour Energy has a defined benefit superannuation plan covering a significant number of employees, which requires contributions to be made to a separately administered fund.
(a) General description of the type of planThe Energy Industries Superannuation Scheme:
Division B
Division C
Division D
These Divisions are all defined benefit schemes – at least a component of the final benefit is derived from a multiple of member salary and years of membership.
All the Divisions are closed to new members.

72
9NOTES TO THE FINANCIAL STATEMENTSFOR THE YEAR ENDED 30 JUNE 2013
23 Superannuation – Defined benefits plan continued
(b) Summary of financial informationThe following tables summarise the components of net benefit expense recognised in the profit or loss, actuarial gains and losses recognised in other comprehensive income, and funded status and amounts recognised in the Statement of Financial Position.
Reconciliation of the assets and liabilities recognised in the Statement of Financial Position
2013 $m
2012 $m
Present value of the defined benefit obligation at end of the year (420.0) (434.2)
Fair value of fund assets at end of the year 308.5 276.7
Net asset/(liability) recognised in the Statement of Financial Position at end of the year (111.5) (157.5)
Reconciliation of the present value of the defined benefit obligation
2013 $m
2012 $m
Present value of defined benefit obligation at 1 July 434.2 354.8
Current service cost 11.0 9.8
Interest cost 16.9 20.5
Contributions by fund participants 3.8 4.0
Actuarial (gains)/losses in other comprehensive income (19.2) 71.0
Benefits paid (26.7) (25.9)
Present value of defined benefit obligations at 30 June 420.0 434.2
Reconciliation of the fair value of fund assets
2013 $m
2012 $m
Fair value of fund assets at 1 July 276.7 289.6
Expected return on fund assets 22.1 23.2
Actuarial gains/(losses) in other comprehensive income 18.6 (26.1)
Employer contributions 14.0 11.9
Contributions by fund participants 3.8 4.0
Benefits paid (26.7) (25.9)
Fair value of fund assets at 30 June 308.5 276.7
Expense recognised in profit or loss
2013 $m
2012 $m
Current service cost 11.0 9.8
Interest cost 16.9 20.5
Expected return on fund assets (net of expenses) (22.1) (23.2)
Expense/(income) recognised in profit or loss 5.8 7.1
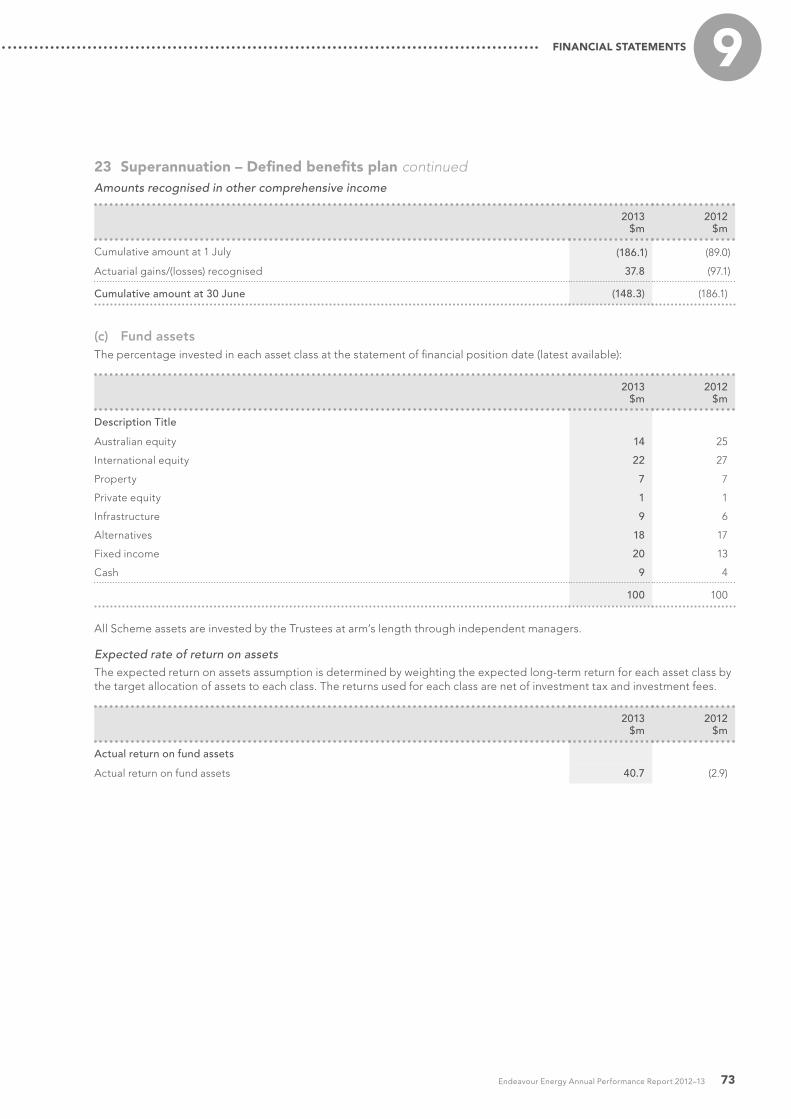
73Endeavour Energy Annual Performance Report 2012–13
FINANCIAL STATEMENTS 9
23 Superannuation – Defined benefits plan continuedAmounts recognised in other comprehensive income
2013 $m
2012 $m
Cumulative amount at 1 July (186.1) (89.0)
Actuarial gains/(losses) recognised 37.8 (97.1)
Cumulative amount at 30 June (148.3) (186.1)
(c) Fund assetsThe percentage invested in each asset class at the statement of financial position date (latest available):
2013 $m
2012 $m
Description Title
Australian equity 14 25
International equity 22 27
Property 7 7
Private equity 1 1
Infrastructure 9 6
Alternatives 18 17
Fixed income 20 13
Cash 9 4
100 100
All Scheme assets are invested by the Trustees at arm’s length through independent managers.
Expected rate of return on assetsThe expected return on assets assumption is determined by weighting the expected long-term return for each asset class by the target allocation of assets to each class. The returns used for each class are net of investment tax and investment fees.
2013 $m
2012 $m
Actual return on fund assets
Actual return on fund assets 40.7 (2.9)

74
9NOTES TO THE FINANCIAL STATEMENTSFOR THE YEAR ENDED 30 JUNE 2013
23 Superannuation – Defined benefits plan continued
(d) Valuation method and principal actuarial assumptions
(i) Valuation methodThe Projected Unit Credit (PUC) valuation method was used to determine the present value of the defined benefit obligations and the related current service costs. This method sees each period of service as giving rise to an additional unit of benefit entitlement and measures each unit separately to build up the final obligation.
(ii) Economic assumptions
2013 $m
2012 $m
Salary increase rate (excluding promotional increases)* 3.50 3.50
Rate of CPI increase 2.50 2.50
Expected rate of return on assets 8.10 8.10
Discount rate 3.80 3.06
* Expected salary increase rates (excluding promotional increases) are 2.7% pa until 30 June 2014, followed by 3.5% thereafter.
(e) Historical information
2013 $m
2012 $m
2011 $m
2010 $m
2009 $m
Present value of defined benefit obligation (420.0) (434.2) (354.7) (329.8) (294.6)
Fair value of fund assets 308.5 276.7 289.6 268.1 233.1
(Deficit)/surplus in fund (111.5) (157.5) (65.1) (61.7) (61.5)
Experience adjustments – fund liabilities (19.2) 71.0 13.0 12.1 3.5
Experience adjustments – fund assets (18.6) 26.1 (7.5) (8.6) (74.4)
(f) Employer contributions
2013 $m
2012 $m
Expected employer contributions to be paid in the next reporting period 11.8 12.4
(g) Funding arrangements for employer contributionsThe following is a summary of the 30 June 2013 financial position of the fund calculated in accordance with AAS 25 Financial Reporting by Superannuation Plans.
(i) Surplus/deficit
2013 $m
2012 $m
Accrued benefits 311.0 296.3
Net market value of fund assets (308.5) (276.6)
Net (surplus)/deficit 2.5 19.7
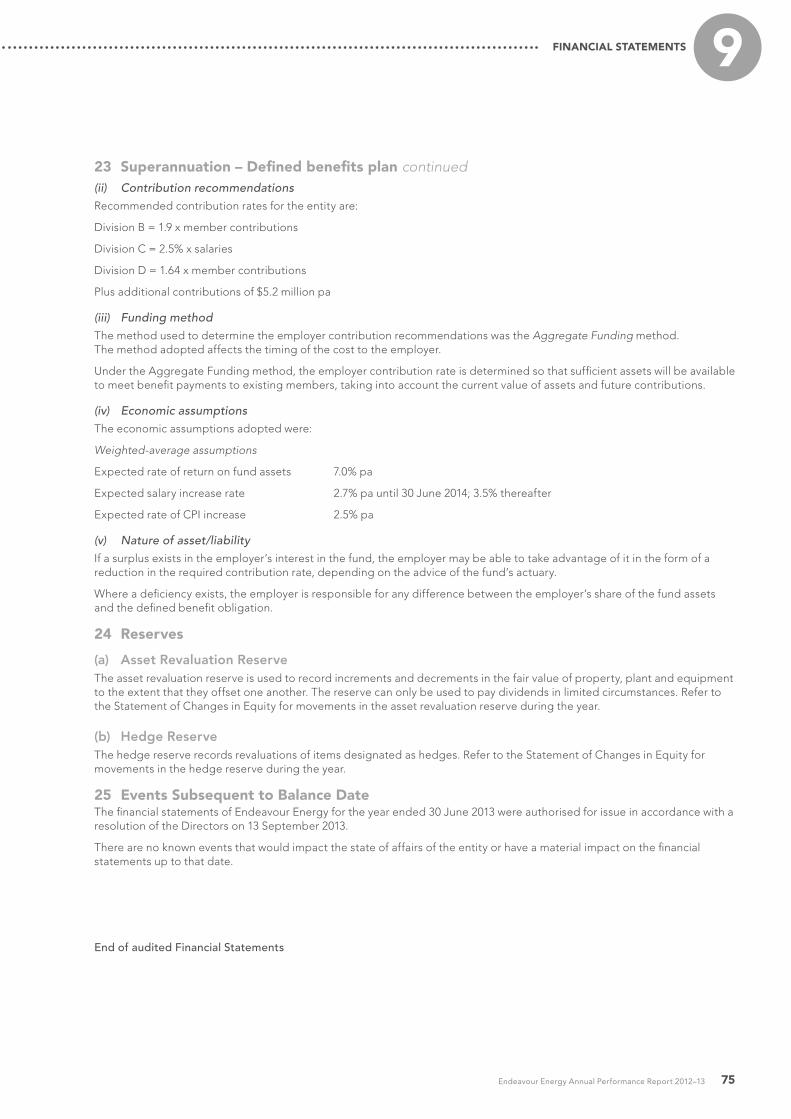
75Endeavour Energy Annual Performance Report 2012–13
FINANCIAL STATEMENTS 9
23 Superannuation – Defined benefits plan continued(ii) Contribution recommendationsRecommended contribution rates for the entity are:
Division B = 1.9 x member contributions
Division C = 2.5% x salaries
Division D = 1.64 x member contributions
Plus additional contributions of $5.2 million pa
(iii) Funding methodThe method used to determine the employer contribution recommendations was the Aggregate Funding method. The method adopted affects the timing of the cost to the employer.
Under the Aggregate Funding method, the employer contribution rate is determined so that sufficient assets will be available to meet benefit payments to existing members, taking into account the current value of assets and future contributions.
(iv) Economic assumptionsThe economic assumptions adopted were:
Weighted-average assumptions
Expected rate of return on fund assets 7.0% pa
Expected salary increase rate 2.7% pa until 30 June 2014; 3.5% thereafter
Expected rate of CPI increase 2.5% pa
(v) Nature of asset/liabilityIf a surplus exists in the employer’s interest in the fund, the employer may be able to take advantage of it in the form of a reduction in the required contribution rate, depending on the advice of the fund’s actuary.
Where a deficiency exists, the employer is responsible for any difference between the employer’s share of the fund assets and the defined benefit obligation.
24 Reserves
(a) Asset Revaluation ReserveThe asset revaluation reserve is used to record increments and decrements in the fair value of property, plant and equipment to the extent that they offset one another. The reserve can only be used to pay dividends in limited circumstances. Refer to the Statement of Changes in Equity for movements in the asset revaluation reserve during the year.
(b) Hedge ReserveThe hedge reserve records revaluations of items designated as hedges. Refer to the Statement of Changes in Equity for movements in the hedge reserve during the year.
25 Events Subsequent to Balance DateThe financial statements of Endeavour Energy for the year ended 30 June 2013 were authorised for issue in accordance with a resolution of the Directors on 13 September 2013.
There are no known events that would impact the state of affairs of the entity or have a material impact on the financial statements up to that date.
End of audited Financial Statements

76
9STATEMENT BY DIRECTORSFOR THE YEAR ENDED 30 JUNE 2013
Pursuant to Section 41C of the Public Finance and Audit Act 1983, we state that in the opinion of the Directors of Endeavour Energy:
(a) The accompanying financial statements and notes are a general purpose financial report which has been prepared in accordance with Australian Accounting Standards, the State Owned Corporations Act 1989, the Public Finance and Audit Act 1983, the Public Finance and Audit Regulation 2010 and Accounting Interpretations, and give a true and fair view of the financial position of Endeavour Energy as at 30 June 2013 and its financial performance for the year ended on that date;
(b) At the date of this statement, there are reasonable grounds to believe that Endeavour Energy will be able to pay its debts as and when they become due and payable; and
(c) We are not aware of any circumstances at the date of this statement that would render any particulars included in the financial report to be misleading or inaccurate.
This declaration is made in accordance with a resolution of the Board of Directors.
Vince Graham Roger Massy-Greene Director Chairman
Sydney 13 September 2013 13 September 2013
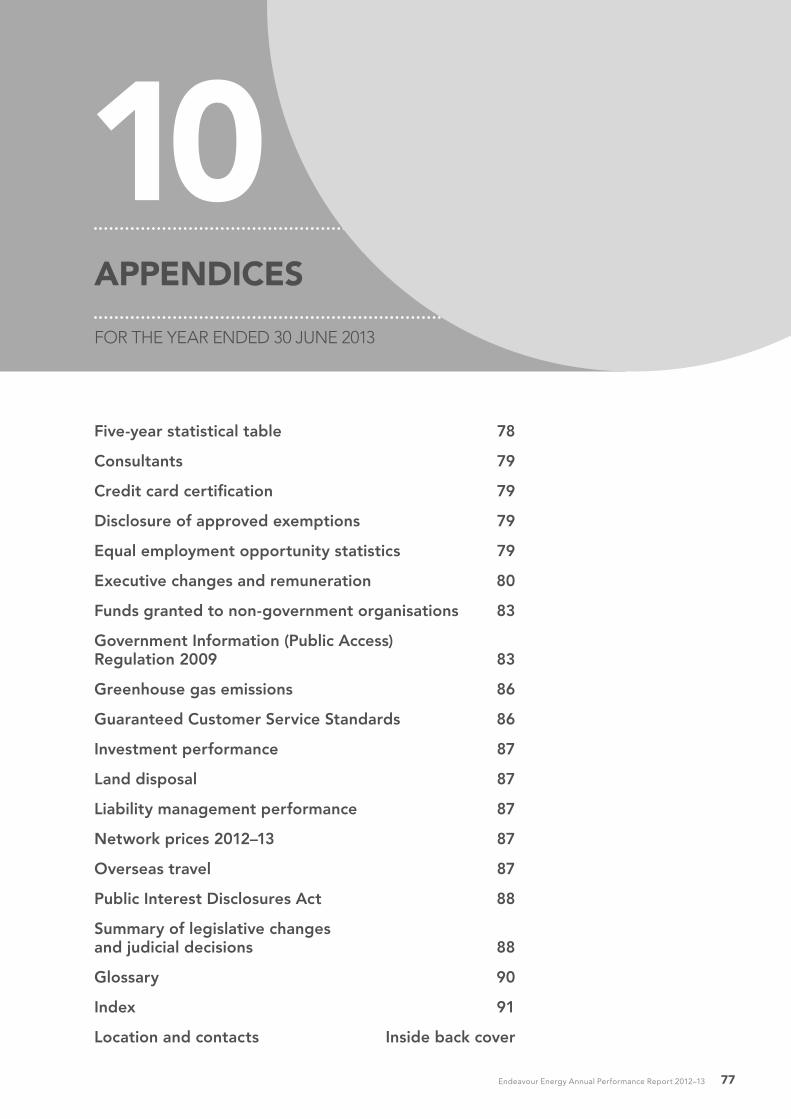
77Endeavour Energy Annual Performance Report 2012–13
APPENDICES
10Five-year statistical table 78
Consultants 79
Credit card certification 79
Disclosure of approved exemptions 79
Equal employment opportunity statistics 79
Executive changes and remuneration 80
Funds granted to non-government organisations 83
Government Information (Public Access) Regulation 2009 83
Greenhouse gas emissions 86
Guaranteed Customer Service Standards 86
Investment performance 87
Land disposal 87
Liability management performance 87
Network prices 2012–13 87
Overseas travel 87
Public Interest Disclosures Act 88
Summary of legislative changes and judicial decisions 88
Glossary 90
Index 91
Location and contacts Inside back cover
FOR THE YEAR ENDED 30 JUNE 2013
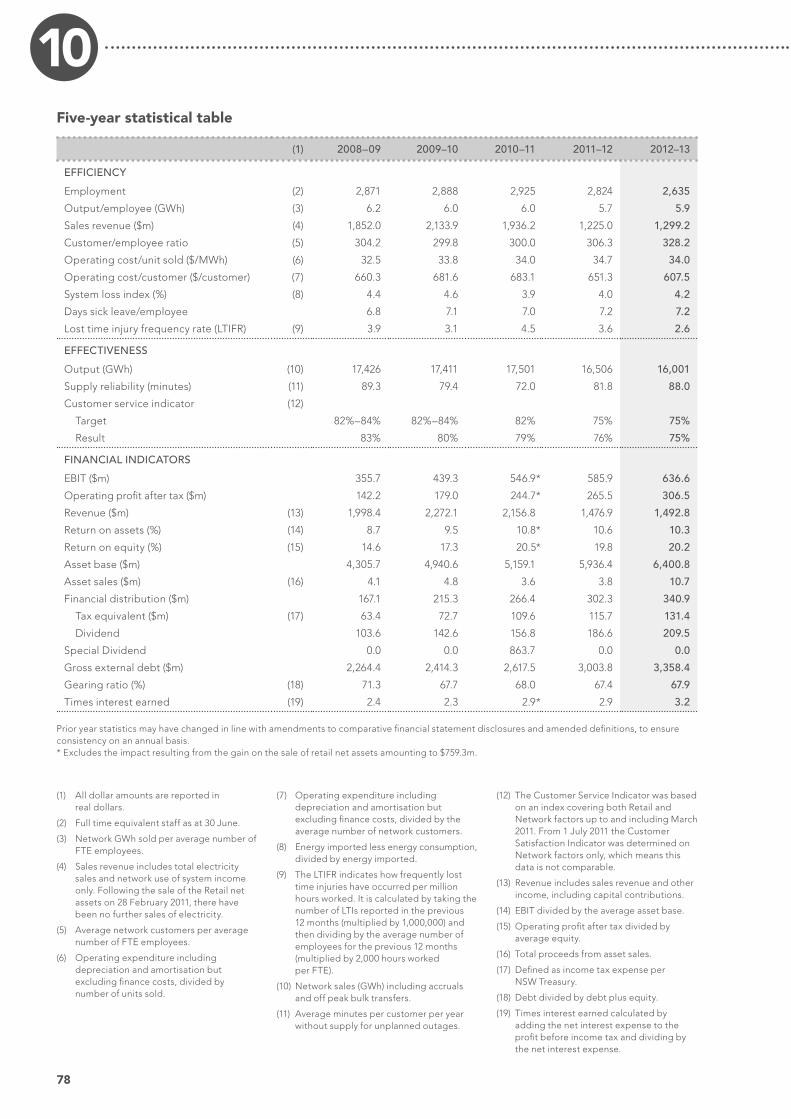
78
10Five-year statistical table
(1) 2008–09 2009–10 2010–11 2011–12 2012–13
EFFICIENCY
Employment (2) 2,871 2,888 2,925 2,824 2,635
Output/employee (GWh) (3) 6.2 6.0 6.0 5.7 5.9
Sales revenue ($m) (4) 1,852.0 2,133.9 1,936.2 1,225.0 1,299.2
Customer/employee ratio (5) 304.2 299.8 300.0 306.3 328.2
Operating cost/unit sold ($/MWh) (6) 32.5 33.8 34.0 34.7 34.0
Operating cost/customer ($/customer) (7) 660.3 681.6 683.1 651.3 607.5
System loss index (%) (8) 4.4 4.6 3.9 4.0 4.2
Days sick leave/employee 6.8 7.1 7.0 7.2 7.2
Lost time injury frequency rate (LTIFR) (9) 3.9 3.1 4.5 3.6 2.6
EFFECTIVENESS
Output (GWh) (10) 17,426 17,411 17,501 16,506 16,001
Supply reliability (minutes) (11) 89.3 79.4 72.0 81.8 88.0
Customer service indicator (12)
Target 82%–84% 82%–84% 82% 75% 75%
Result 83% 80% 79% 76% 75%
FINANCIAL INDICATORS
EBIT ($m) 355.7 439.3 546.9* 585.9 636.6
Operating profit after tax ($m) 142.2 179.0 244.7* 265.5 306.5
Revenue ($m) (13) 1,998.4 2,272.1 2,156.8 1,476.9 1,492.8
Return on assets (%) (14) 8.7 9.5 10.8* 10.6 10.3
Return on equity (%) (15) 14.6 17.3 20.5* 19.8 20.2
Asset base ($m) 4,305.7 4,940.6 5,159.1 5,936.4 6,400.8
Asset sales ($m) (16) 4.1 4.8 3.6 3.8 10.7
Financial distribution ($m) 167.1 215.3 266.4 302.3 340.9
Tax equivalent ($m) (17) 63.4 72.7 109.6 115.7 131.4
Dividend 103.6 142.6 156.8 186.6 209.5
Special Dividend 0.0 0.0 863.7 0.0 0.0
Gross external debt ($m) 2,264.4 2,414.3 2,617.5 3,003.8 3,358.4
Gearing ratio (%) (18) 71.3 67.7 68.0 67.4 67.9
Times interest earned (19) 2.4 2.3 2.9* 2.9 3.2
Prior year statistics may have changed in line with amendments to comparative financial statement disclosures and amended definitions, to ensure consistency on an annual basis. * Excludes the impact resulting from the gain on the sale of retail net assets amounting to $759.3m.
(1) All dollar amounts are reported in real dollars.
(2) Full time equivalent staff as at 30 June.
(3) Network GWh sold per average number of FTE employees.
(4) Sales revenue includes total electricity sales and network use of system income only. Following the sale of the Retail net assets on 28 February 2011, there have been no further sales of electricity.
(5) Average network customers per average number of FTE employees.
(6) Operating expenditure including depreciation and amortisation but excluding finance costs, divided by number of units sold.
(7) Operating expenditure including depreciation and amortisation but excluding finance costs, divided by the average number of network customers.
(8) Energy imported less energy consumption, divided by energy imported.
(9) The LTIFR indicates how frequently lost time injuries have occurred per million hours worked. It is calculated by taking the number of LTIs reported in the previous 12 months (multiplied by 1,000,000) and then dividing by the average number of employees for the previous 12 months (multiplied by 2,000 hours worked per FTE).
(10) Network sales (GWh) including accruals and off peak bulk transfers.
(11) Average minutes per customer per year without supply for unplanned outages.
(12) The Customer Service Indicator was based on an index covering both Retail and Network factors up to and including March 2011. From 1 July 2011 the Customer Satisfaction Indicator was determined on Network factors only, which means this data is not comparable.
(13) Revenue includes sales revenue and other income, including capital contributions.
(14) EBIT divided by the average asset base.
(15) Operating profit after tax divided by average equity.
(16) Total proceeds from asset sales.
(17) Defined as income tax expense per NSW Treasury.
(18) Debt divided by debt plus equity.
(19) Times interest earned calculated by adding the net interest expense to the profit before income tax and dividing by the net interest expense.

79Endeavour Energy Annual Performance Report 2012–13
APPENDICES 10ConsultantsIn 2012–13 Endeavour Energy engaged three consultants for projects (equal to or greater than $50,000) totalling $0.43million, as detailed below:
Consultant Purpose Cost $m
Ernst & Young To provide technical advice in relation to National Energy Customer Framework (NECF), AER Regulatory Submissions and Retailer Engagement Strategy.
0.29
Frontier Economics To provide technical advice in relation to review of the methodology used in AER submissions, and review of energy forecasting processes.
0.09
National Institute of Economic & Industry Research Pty Ltd
To provide technical consulting in relation to modelling of energy demand forecasts.
0.05
Total 0.43
Endeavour Energy also engaged one consultant less than $50,000 during 2012–13 for a cost of $18,676 for provision of managerial and operational advice.
Credit card certificationEndeavour Energy’s corporate and purchasing card program is governed by approved policies and procedures that were developed having regard to the Treasury Circular 05/06 Credit Card Use – Best Practice Guide published in August 2005 (originally published in 1999), Treasurer directions and Premier’s memoranda.
Disclosure of approved exemptions
Reference Comment
s. 41B(c) PF&AAa Financial statements
Exemption from preparing manufacturing, trading, and profit and loss statements. Endeavour Energy is required to prepare a summarised Operating Statement, summarising major categories of revenues and expenses.
Schedule 1 ARSBR Payment of accounts
Statutory SOCs are not subject to the payment of accounts provision in c13 of the Public Finance and Audit Regulation 2010.
Schedule 1 ARSBR Time for Payment of Accounts
As above.
s. 7(1)(a)(ia) ARSBA Financial Statement of Controlled Entities
Exemption from preparing manufacturing and trading statements. Endeavour Energy is required to prepare a summarised Operating Statement (i.e. summarising major categories of revenues and expenses).
a Public Finance and Audit Act 1983; b Annual Reports (Statutory Bodies) Act 1984; c Annual Reports (Statutory Bodies) Regulation 2005
EEO statistics
Trends in the representation of equal employment opportunity groups (% of total employees, excluding casual employees)
EEO Group
Benchmark or Target
(a) 2008–09 2009–10 2010–11 2011–12 2012–13
Women 50% 20.7% 20.7% 20.0% 19.7% 17.3%
Aboriginal People and Torres Strait Islanders 2.6% 0.9% 1.0% 1.0% 1.1% 1.2%
People whose first language spoken as a child was not English 19.0% 7.7% 8.1% 8.8% 9.6% 9.9%
People with a disability N/A 3.9% 3.7% 3.6% 3.9% 4.2%
People with a disability requiring work‑related adjustment 1.5% 0.3% 0.2% 0.2% 0.3% 0.3%
(a) as set by the NSW Government
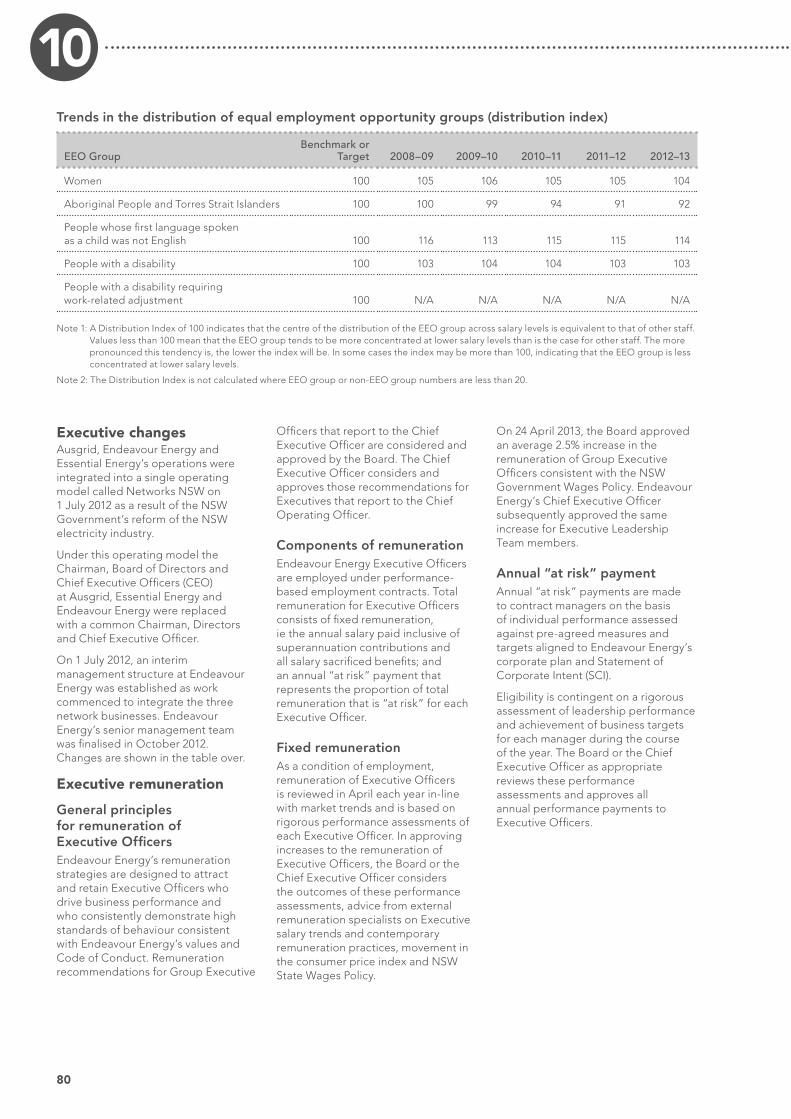
80
10
Executive changes Ausgrid, Endeavour Energy and Essential Energy’s operations were integrated into a single operating model called Networks NSW on 1 July 2012 as a result of the NSW Government’s reform of the NSW electricity industry.
Under this operating model the Chairman, Board of Directors and Chief Executive Officers (CEO) at Ausgrid, Essential Energy and Endeavour Energy were replaced with a common Chairman, Directors and Chief Executive Officer.
On 1 July 2012, an interim management structure at Endeavour Energy was established as work commenced to integrate the three network businesses. Endeavour Energy’s senior management team was finalised in October 2012. Changes are shown in the table over.
Executive remuneration
General principles for remuneration of Executive OfficersEndeavour Energy’s remuneration strategies are designed to attract and retain Executive Officers who drive business performance and who consistently demonstrate high standards of behaviour consistent with Endeavour Energy’s values and Code of Conduct. Remuneration recommendations for Group Executive
Officers that report to the Chief Executive Officer are considered and approved by the Board. The Chief Executive Officer considers and approves those recommendations for Executives that report to the Chief Operating Officer.
Components of remunerationEndeavour Energy Executive Officers are employed under performance‑based employment contracts. Total remuneration for Executive Officers consists of fixed remuneration, ie the annual salary paid inclusive of superannuation contributions and all salary sacrificed benefits; and an annual “at risk” payment that represents the proportion of total remuneration that is “at risk” for each Executive Officer.
Fixed remunerationAs a condition of employment, remuneration of Executive Officers is reviewed in April each year in‑line with market trends and is based on rigorous performance assessments of each Executive Officer. In approving increases to the remuneration of Executive Officers, the Board or the Chief Executive Officer considers the outcomes of these performance assessments, advice from external remuneration specialists on Executive salary trends and contemporary remuneration practices, movement in the consumer price index and NSW State Wages Policy.
On 24 April 2013, the Board approved an average 2.5% increase in the remuneration of Group Executive Officers consistent with the NSW Government Wages Policy. Endeavour Energy’s Chief Executive Officer subsequently approved the same increase for Executive Leadership Team members.
Annual “at risk” payment Annual “at risk” payments are made to contract managers on the basis of individual performance assessed against pre‑agreed measures and targets aligned to Endeavour Energy’s corporate plan and Statement of Corporate Intent (SCI).
Eligibility is contingent on a rigorous assessment of leadership performance and achievement of business targets for each manager during the course of the year. The Board or the Chief Executive Officer as appropriate reviews these performance assessments and approves all annual performance payments to Executive Officers.
Trends in the distribution of equal employment opportunity groups (distribution index)
EEO GroupBenchmark or
Target 2008–09 2009–10 2010–11 2011–12 2012–13
Women 100 105 106 105 105 104
Aboriginal People and Torres Strait Islanders 100 100 99 94 91 92
People whose first language spoken as a child was not English 100 116 113 115 115 114
People with a disability 100 103 104 104 103 103
People with a disability requiring work‑related adjustment 100 N/A N/A N/A N/A N/A
Note 1: A Distribution Index of 100 indicates that the centre of the distribution of the EEO group across salary levels is equivalent to that of other staff. Values less than 100 mean that the EEO group tends to be more concentrated at lower salary levels than is the case for other staff. The more pronounced this tendency is, the lower the index will be. In some cases the index may be more than 100, indicating that the EEO group is less concentrated at lower salary levels.
Note 2: The Distribution Index is not calculated where EEO group or non‑EEO group numbers are less than 20.

81Endeavour Energy Annual Performance Report 2012–13
APPENDICES 10Group Executive employed by Endeavour Energy An eight member Executive Leadership Group (ELG) was established to drive industry reform in October 2012. Each Group Executive is paid by a nominated business. Endeavour Energy is responsible for contractual payments to the following executives and these costs are then shared by the three network businesses.
NamePosition at 30 June 2013 Remuneration a
“At risk” payment b 2012–13 Performance criteria
V. Graham c CEO Ausgrid, Endeavour Energy and Essential Energy
$749,998 $84,375 for period
1/7/12 to 31/12/12c
$87,750 for the period
1/1/13 to 30/6/13c
Led the development of a consistent Safety Management System and safety culture across the three network businesses.
Drove the ambitious network reform program across the three network businesses resulting in no real network price increases for customers on 1 July 2013.
Exceeded the NSW Government targets for efficiencies and savings to fund support program for families and low income electricity customers.
Maintained organisational focus on network reliability and sustainability during a period of significant change.
Delivered common management structure and consistent strategies for the three electricity distribution networks.
D. Lucas d Group Executive People and Services
$425,195 $55,000 Drove the processes to establish the Networks NSW business structures and recruitment to new roles.
Led the establishment of a common Code of Conduct, Risk Management Plan and Fraud and Ethics Program across the three network businesses.
Responsible for achieving savings through the common procurement process and programs.
a excludes “at risk’ payment and legislated employer contributions to superannuation.
b “at risk” payments are based on 2012–13 performance against key criteria, approved by the Board in September 2013.
c Vince Graham was Endeavour Energy’s CEO prior to his appointment as interim CEO for Ausgrid, Endeavour Energy and Essential Energy from 1 July to 31 December 2012. Following a competitive selection process he was appointed Chief Executive Officer on 1 January 2013 for all three NNSW businesses: Endeavour Energy, Ausgrid and Essential Energy.
d Daniel Lucas was Endeavour Energy’s Deputy CEO Corporate. Following a competitive selection process he was appointed Group Executive People and Services Networks NSW from 15 October 2012.
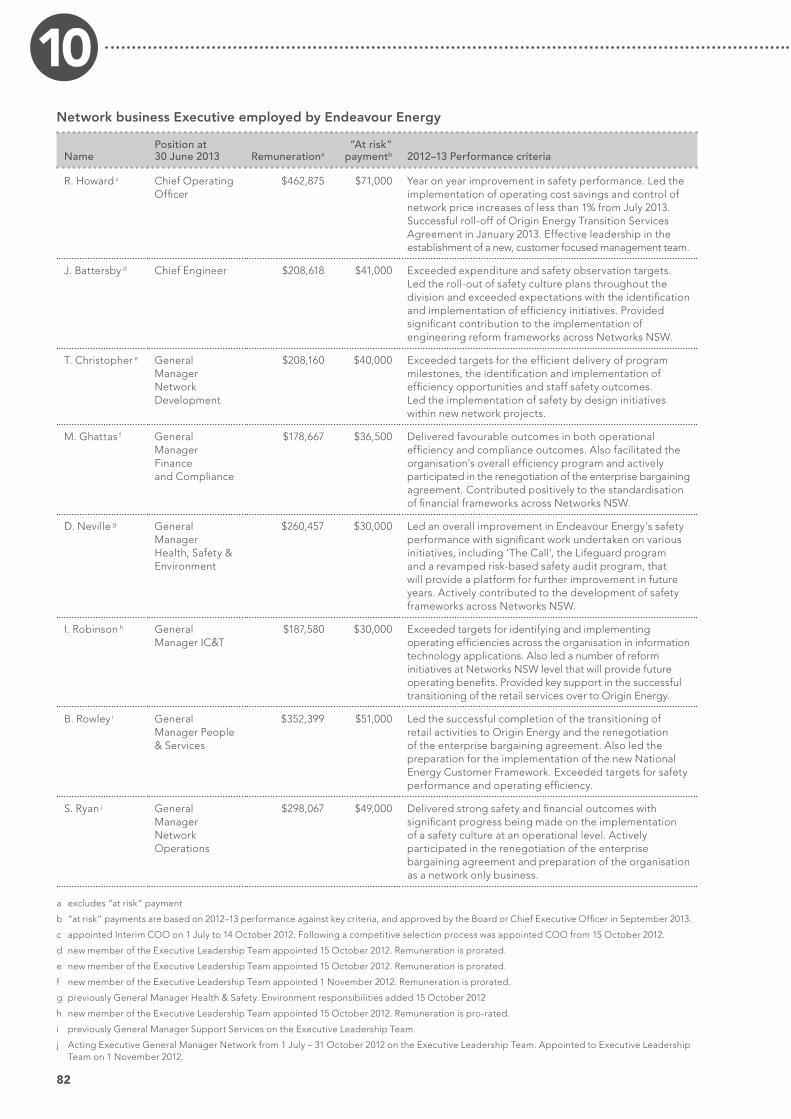
82
10Network business Executive employed by Endeavour Energy
NamePosition at 30 June 2013 Remunerationa
“At risk” paymentb 2012–13 Performance criteria
R. Howard c Chief Operating Officer
$462,875 $71,000 Year on year improvement in safety performance. Led the implementation of operating cost savings and control of network price increases of less than 1% from July 2013. Successful roll‑off of Origin Energy Transition Services Agreement in January 2013. Effective leadership in the establishment of a new, customer focused management team.
J. Battersby d Chief Engineer $208,618 $41,000 Exceeded expenditure and safety observation targets. Led the roll‑out of safety culture plans throughout the division and exceeded expectations with the identification and implementation of efficiency initiatives. Provided significant contribution to the implementation of engineering reform frameworks across Networks NSW.
T. Christopher e General Manager Network Development
$208,160 $40,000 Exceeded targets for the efficient delivery of program milestones, the identification and implementation of efficiency opportunities and staff safety outcomes. Led the implementation of safety by design initiatives within new network projects.
M. Ghattas f General Manager Finance and Compliance
$178,667 $36,500 Delivered favourable outcomes in both operational efficiency and compliance outcomes. Also facilitated the organisation’s overall efficiency program and actively participated in the renegotiation of the enterprise bargaining agreement. Contributed positively to the standardisation of financial frameworks across Networks NSW.
D. Neville g General Manager Health, Safety & Environment
$260,457 $30,000 Led an overall improvement in Endeavour Energy’s safety performance with significant work undertaken on various initiatives, including ‘The Call’, the Lifeguard program and a revamped risk‑based safety audit program, that will provide a platform for further improvement in future years. Actively contributed to the development of safety frameworks across Networks NSW.
I. Robinson h General Manager IC&T
$187,580 $30,000 Exceeded targets for identifying and implementing operating efficiencies across the organisation in information technology applications. Also led a number of reform initiatives at Networks NSW level that will provide future operating benefits. Provided key support in the successful transitioning of the retail services over to Origin Energy.
B. Rowley i General Manager People & Services
$352,399 $51,000 Led the successful completion of the transitioning of retail activities to Origin Energy and the renegotiation of the enterprise bargaining agreement. Also led the preparation for the implementation of the new National Energy Customer Framework. Exceeded targets for safety performance and operating efficiency.
S. Ryan j General Manager Network Operations
$298,067 $49,000 Delivered strong safety and financial outcomes with significant progress being made on the implementation of a safety culture at an operational level. Actively participated in the renegotiation of the enterprise bargaining agreement and preparation of the organisation as a network only business.
a excludes “at risk” payment
b “at risk” payments are based on 2012–13 performance against key criteria, and approved by the Board or Chief Executive Officer in September 2013.
c appointed Interim COO on 1 July to 14 October 2012. Following a competitive selection process was appointed COO from 15 October 2012.
d new member of the Executive Leadership Team appointed 15 October 2012. Remuneration is prorated.
e new member of the Executive Leadership Team appointed 15 October 2012. Remuneration is prorated.
f new member of the Executive Leadership Team appointed 1 November 2012. Remuneration is prorated.
g previously General Manager Health & Safety. Environment responsibilities added 15 October 2012
h new member of the Executive Leadership Team appointed 15 October 2012. Remuneration is pro‑rated.
i previously General Manager Support Services on the Executive Leadership Team.
j Acting Executive General Manager Network from 1 July – 31 October 2012 on the Executive Leadership Team. Appointed to Executive Leadership Team on 1 November 2012.

83Endeavour Energy Annual Performance Report 2012–13
APPENDICES 10Other changes to Endeavour Energy’s Executive Leadership Team during 2012–13Joseph Pizzinga, Chief Financial Officer was seconded to the Network NSW Reform Program from 1 May 2012. He resigned from Endeavour Energy on 15 September 2012 due to his appointment as the General Manager Finance and Compliance at Ausgrid on 17 September 2012.
Irina White resigned as Endeavour Energy’s Company Secretary and was appointed Group Manager Corporate Governance Networks NSW on 1 November 2012. Remuneration paid until 1 November was $107,209.
Funds granted to non-government organisationsEndeavour Energy lends support to selected community organisations that reflect its obligations as a state‑owned corporation and align to its Corporate Plan.
Government Information (Public Access) Act 2009The Government Information (Public Access) Act 2009 (NSW) (GIPA Act) replaced the Freedom of Information Act 1989 (NSW) on 1 July 2010. The GIPA Act has established a comprehensive system for public access to government information. Endeavour Energy is subject to the GIPA Act and is committed to complying with the GIPA Act in a fair and objective manner when dealing with external requests for access to
company information and supports the proactive release of information where it is in the public interest to do so.
Review of program for release of informationDuring 2012–13 Endeavour Energy’s review of its program for release of information, which was undertaken as required by section 7(3) of the GIPA Act, included the review of its policies and procedures regarding processing requests for access to government Information; review and publication of its information guide; the training of staff in GIPA Act compliance; publication of contractual information into a centralised database; a review of its website and publication of relevant information regarding corporate governance and the network business. In addition, Endeavour Energy received positive feedback from an independent review of the company’s existing systems and processes for compliance with the GIPA Act and implemented enhancements to GIPA templates.
Total number of access applications received during the yearIn 2012–13 Endeavour Energy received 15 new formal access applications for information pursuant to the GIPA Act. As at 30 June 2013, two access applications were ongoing. The formal access applications were received from members of the public, media, private sector businesses, lawyers and investigators.
In response to the formal access applications that were finalised in 2012–13 (including one application from 2011–12), full access was provided on nine occasions. With respect to the remaining access applications, one was granted in part and three received refunds due to the requested information not being held. A variety of public interest considerations were taken into account in dealing with these applications and these are set out in Table E. In the course of determining access applications during the financial year Endeavour Energy did not rely on any of the conclusive presumptions of overriding public interest against disclosure (as set out in Schedule 1 of the GIPA Act).
Statistical information about access applicationsAs required by section 7 and schedule 2 of the Government Information (Public Access) Regulation 2009 (NSW), the following tables provide a summary of the responses to requests made pursuant to the GIPA Act in 2012–13.
Table A: Number of applications by type of applicant and outcome
Access granted
in full
Access granted
in part
Access refused
in fullInformation
not held
Information already
available
Refuse to deal with
application
Refuse to confirm/deny
whether information
is heldApplication withdrawn
Media 3 – – – – – – –
Members of Parliament – – – – – – – –
Private sector business 4 – – 1 – – – 1
Not for profit organisations or community groups – – – – – – – –
Members of the public (application by legal representative) 2 1 – 1 – – – –
Members of the public (other) – – – 1 – – – 1
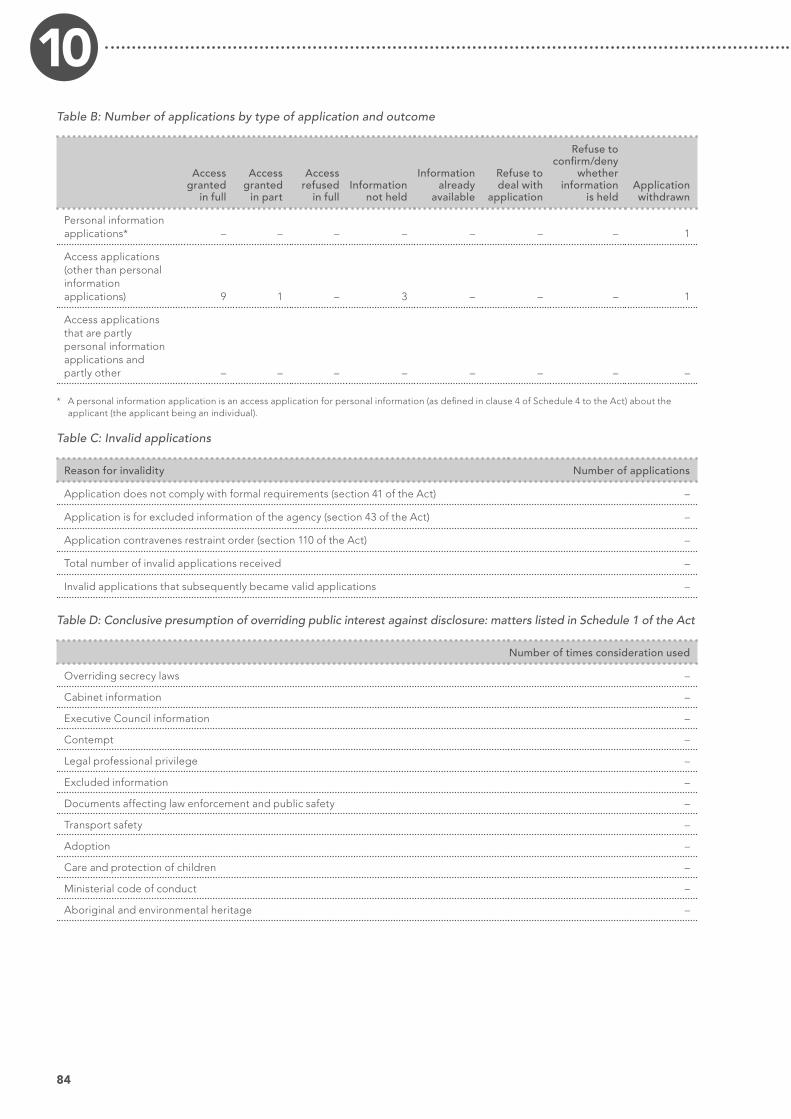
84
10Table B: Number of applications by type of application and outcome
Access granted
in full
Access granted
in part
Access refused
in fullInformation
not held
Information already
available
Refuse to deal with
application
Refuse to confirm/deny
whether information
is heldApplication withdrawn
Personal information applications* – – – – – – – 1
Access applications (other than personal information applications) 9 1 – 3 – – – 1
Access applications that are partly personal information applications and partly other – – – – – – – –
* A personal information application is an access application for personal information (as defined in clause 4 of Schedule 4 to the Act) about the applicant (the applicant being an individual).
Table C: Invalid applications
Reason for invalidity Number of applications
Application does not comply with formal requirements (section 41 of the Act) –
Application is for excluded information of the agency (section 43 of the Act) –
Application contravenes restraint order (section 110 of the Act) –
Total number of invalid applications received –
Invalid applications that subsequently became valid applications –
Table D: Conclusive presumption of overriding public interest against disclosure: matters listed in Schedule 1 of the Act
Number of times consideration used
Overriding secrecy laws –
Cabinet information –
Executive Council information –
Contempt –
Legal professional privilege –
Excluded information –
Documents affecting law enforcement and public safety –
Transport safety –
Adoption –
Care and protection of children –
Ministerial code of conduct –
Aboriginal and environmental heritage –

85Endeavour Energy Annual Performance Report 2012–13
APPENDICES 10Table E: Other public interest considerations against disclosure: matters listed in table to section 14 of Act
Number of occasions when application not successful
Responsible and effective government –
Law enforcement and security –
Individual rights, judicial processes and natural justice –
Business interests of agencies and other persons 1
Environment, culture, economy and general matters –
Secrecy provisions –
Exempt documents under interstate Freedom of Information legislation –
Table F: Timeliness
Number of applications
Decided within the statutory timeframe (20 days plus any extensions) 13
Decided after 35 days (by agreement with applicant) –
Not decided within time (deemed refusal) –
Total 13
Table G: Number of applications reviewed under Part 5 of the Act (by type of review and outcome)
Decision varied
Decision upheld Total
Internal review – – –
Review by Information Commissioner* – – –
Internal review following recommendation under section 93 of Act* – – –
Review by ADT – – –
Total – – –
* The Information Commissioner does not have the authority to vary decisions, but can make recommendation to the original decision‑maker. The data in this table indicates that a recommendation to vary or uphold the original decision has been made. The two internal reviews relate to matters that were with the Information Commissioner at 1 July 2011 and were concluded in 2011–12.
Table H: Applications for review under Part 5 of the Act (by type of applicant)
Number of applications
Applications by access applicants –
Applications by persons to whom information the subject of access application relates (see section 54 of the Act) –
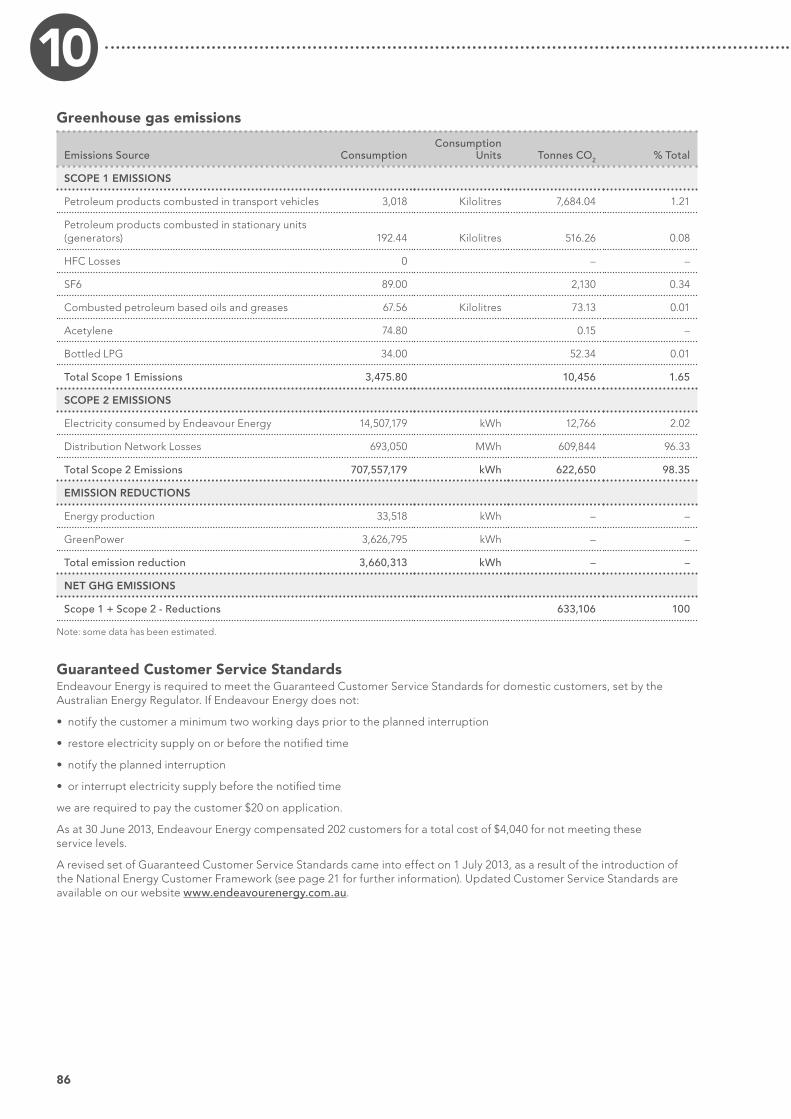
86
10Greenhouse gas emissions
Emissions Source ConsumptionConsumption
Units Tonnes CO2 % Total
SCOPE 1 EMISSIONS
Petroleum products combusted in transport vehicles 3,018 Kilolitres 7,684.04 1.21
Petroleum products combusted in stationary units (generators) 192.44 Kilolitres 516.26 0.08
HFC Losses 0 – –
SF6 89.00 2,130 0.34
Combusted petroleum based oils and greases 67.56 Kilolitres 73.13 0.01
Acetylene 74.80 0.15 –
Bottled LPG 34.00 52.34 0.01
Total Scope 1 Emissions 3,475.80 10,456 1.65
SCOPE 2 EMISSIONS
Electricity consumed by Endeavour Energy 14,507,179 kWh 12,766 2.02
Distribution Network Losses 693,050 MWh 609,844 96.33
Total Scope 2 Emissions 707,557,179 kWh 622,650 98.35
EMISSION REDUCTIONS
Energy production 33,518 kWh – –
GreenPower 3,626,795 kWh – –
Total emission reduction 3,660,313 kWh – –
NET GHG EMISSIONS
Scope 1 + Scope 2 - Reductions 633,106 100
Note: some data has been estimated.
Guaranteed Customer Service Standards Endeavour Energy is required to meet the Guaranteed Customer Service Standards for domestic customers, set by the Australian Energy Regulator. If Endeavour Energy does not:
• notify the customer a minimum two working days prior to the planned interruption
• restore electricity supply on or before the notified time
• notify the planned interruption
• or interrupt electricity supply before the notified time
we are required to pay the customer $20 on application.
As at 30 June 2013, Endeavour Energy compensated 202 customers for a total cost of $4,040 for not meeting these service levels.
A revised set of Guaranteed Customer Service Standards came into effect on 1 July 2013, as a result of the introduction of the National Energy Customer Framework (see page 21 for further information). Updated Customer Service Standards are available on our website www.endeavourenergy.com.au.

87Endeavour Energy Annual Performance Report 2012–13
APPENDICES 10Investment performance Endeavour Energy is a net borrower in the marketplace and has disclosed interest income of $155,000 in the audited Financial Statements Note 2 page 48. This income is derived from interest on our bank account being in funds and the investment of average surplus funds of approximately $2.5 million over the reporting period.
Land disposal Endeavour Energy did not dispose of any land worth more than $5 million during the reporting year.
Access to documents concerning the details of properties disposed of during the reporting year may be made in accordance with the Government Information (Public Access) Act 2009.
Liability management performanceInformation on Endeavour Energy’s weighted average interest rate of various debt as at 30 June 2013 is detailed in the audited Financial Statements Note 12 pages 56–58. Information on Endeavour Energy’s finance costs are disclosed in Note 3 of the audited Financial Statements on page 48.
Network prices 2013–14Each June the Australian Energy Regulator (AER) is required to approve Endeavour Energy’s proposed network prices for the upcoming financial year. On 31 May 2013 the AER advised that Endeavour Energy’s pricing proposal was compliant with Part I of the National Electricity Rules and the AER’s 2009 distribution determination and that all forecasts associated with the proposal are reasonable. The AER approved 2013–14 network prices effective 1 July 2013.
Endeavour Energy’s network tariff strategy aims to move toward prices that better reflect the underlying costs of supplying network capacity while constraining average distribution price increases to no more than the rate of inflation.
Consistent with the tariff strategy, Endeavour Energy’s network prices are designed to:
• Constrain average distribution price increases to no more than the rate of inflation for (at least) the next six years;
• Reflect the role of networks in providing capacity;
• Align the largely fixed costs of the network and revenues;
• Provide outcomes that recognise the impacts that pricing decisions have on our customers;
• Pass through the full cost of TransGrid’s transmission services and preserve transmission price signals where possible; and
• Explore tariff based demand management opportunities, including voluntary time of use tariffs, and tariffs that target network constraints on a locational basis.
Overseas travel
Date from Date to Name Destination Purpose
23 July 2012 25 July 2012 Peter Norrie Vietnam Inspection of power transformers (supplier: ABB)
4 August 2012 11 August 2012 Alex Pianca Vietnam Factory Acceptance Testing of power transformers (supplier: ABB)
7 November 2012 11 November 2012 Alex Pianca Taiwan Inspection of power transformers (supplier: Fortune)
27 November 2012 6 December 2012 Peter Norrie Indonesia Inspection of power transformers (supplier: PTCG)
16 December 2012 24 December 2012 Dejan Bajic Taiwan Factory Acceptance Testing of power transformers (supplier: Fortune)
7 April 2013 12 April 2013 Dejan Bajic China Inspection and testing of 11kV Auxiliary switchgear due to persistent quality issues (supplier: Schneider)
10 May 2013 17 May 2013 Peter Norrie Indonesia Inspection and Factory Acceptance Testing of power transformers (supplier: PTCG)
30 June 2013 8 July 2013 Brian Bailie Indonesia Factory Acceptance Testing of power transformers (supplier: PTCG)

88
10Public Interest Disclosures ActIn compliance with the Public Interest Disclosures Act 1994 (PID Act), Endeavour Energy has a policy for receiving, assessing and dealing with public interest disclosures. Through the publication and distribution of the Code of Conduct booklet and in the roll out of ethics discussion sessions, employees have been informed of the contents of the policy and the protections available under the PID Act.
During the financial year, Endeavour Energy dealt with ten public interest disclosures received from ten public officials. Nine of the matters received were in relation to allegations of corrupt conduct and the other one was related to allegation of maladministration. There were no public interest disclosures received in relation to serious and substantial waste or government information contravention. As at 30 June 2013, ten public interest disclosures have been finalised.
Summary of legislative changes and judicial decisions for 1 July 2012 to 30 June 2013
Material changes to Commonwealth legislation
National Electricity RulesThe AEMC has published a number of final rule changes, including the following:
a. Changes to normal voltage – effective 7 March 2013, the Australian Energy Market Operator (AEMO) is required to publish a notice notifying registered participants that it has received a request to change the normal voltage level at a connection point and a further notice notifying registered participants of the nature and reasons for the change in the normal voltage level.
b. Economic regulation of network service providers – effective 29 November 2012, the AEMC changed the rules governing:
(i) rate of return;
(ii) capital expenditure incentives;
(iii) capital expenditure and operating expenditure allowances; and
(iv) regulatory process.
c. Distribution network planning and expansion framework – effective 1 January 2013, the rule implements an annual planning and reporting process and a distribution project assessment process. The key components are:
(i) a distribution annual planning review;
(ii) a distribution annual planning report;
(iii) demand side engagement obligations on distribution businesses;
(iv) joint planning arrangements;
(v) the regulatory investment test for distribution (RIT‑D); and
(vi) a dispute resolution process for the RIT‑D.
d. Distribution losses in expenditure forecasts – effective 1 January 2013, distribution network service providers are required to provide an explanation of how they take the cost of distribution losses into account as part of the reporting requirements under the new Distribution Annual Planning Report.
e. Cost pass through arrangements for distribution service providers – effective 2 August 2012, network businesses may nominate additional pass through events and may recover their efficient costs if a cost pass through event occurs in the final year of a regulatory control period.
Privacy Act 1988 (Cth)Significant amendments made to this Act via the Privacy Amendment (Enhancing Privacy Protection) Act 2012 (Cth) will commence in March 2014. Following are some of the matters of note arising from the amendments:
• Organisations will need to have a compliance policy that demonstrates compliance with the legislation.
• Each organisation must have documented procedures for complying with the legislation.
• There is a new accountability regime for personal information that is held offshore.
• The implementation of procedures for dealing with complaints.
• There are restrictions on the collection and use of personal information for direct marketing.
• The powers of the Privacy Commissioner have been clarified and expanded.
Material changes to New South Wales legislation
Energy Services Corporations Act 1995 (NSW)This Act was amended by the Energy Services Corporations Amendment (Distributor Efficiency) Act 2013, assented to on 3 June 2013. The amended Act commenced on 27 August 2013. The amendment formally provides for a single board of directors as the joint board of each of the energy distributors. The board must act in the best interests of all of the energy distributors as if the individual businesses were a combined operation.
The amendment also addresses the cost of compliance with Ministerial directions. As a result of the amendment, a single distributor is not entitled to be reimbursed for compliance costs if the Ministerial direction is in the commercial interests of all three distributors combined, i.e. there is an overall net benefit for the distributors as a whole. Also, if a direction is not in the combined commercial interests of the energy distributors, any amount that a single distributor will be entitled to be reimbursed in connection with compliance is to be reduced by the amount of the net benefit accruing to any of the other distributors as a result of compliance.

89Endeavour Energy Annual Performance Report 2012–13
APPENDICES 10Environmental Planning and Assessment Act 1979 (NSW)Effective 1 March 2013, this Act was amended by the Environmental Planning and Assessment Amendment Act 2012 to clarify the purpose, status and content of development control plans and how they are to be taken into account during the development assessment process for achieving environmental objectives, to give more weight to development control instruments over development control plans, to require written contracts for certification work and to extend indemnification against possible copyright breaches of documents submitted by persons who do not have copyright where the documents are publicly notified or made use of under the Act.
Independent Commission Against Corruption Act 1988 (NSW) Effective 19 April 2013, this Act was amended by the Independent Commission Against Corruption Amendment (Disciplinary Proceedings) Act 2013 to enable employers to take disciplinary proceedings against public official employees on the basis of a formal finding of corruption by ICAC without the need for further investigation. It makes admissible in disciplinary proceedings evidence that may be self‑incriminating. The public official must be given an opportunity to make a submission in relation to any proposed action following the determination of the disciplinary proceedings.
State Owned Corporations Act 1989 (NSW)Effective 3 June 2013, amendments through the State Owned Corporations Legislation Amendment (Staff Directors) Act 2013 have removed the mandatory requirement for staff directors to be appointed (including a union nominated director). Instead, merit‑based appointments will be made as roles become vacant.
Work Health & Safety Act 2011 (NSW) Throughout the reporting period, the Work Health and Safety Act 2011 (WHS Act) and the related regulation were amended to:
a. clarify that WorkCover must be notified of notifiable incidents, even if the incidents have also been notified under the Workplace Injury Management and Workers Compensation Act 1998;
b. update the criteria relating to prohibited and restricted carcinogens and hazardous chemicals; and
c. allow WorkCover to share information it obtains under the WHS Act with other persons to enable the administration of a range of other safety, criminal and environmental Acts.
Summary of significant judicial decisions, new codes of practice and compliance exemptions
During the financial year, there were no judicial decisions significantly affecting the operations of Endeavour Energy or the users of its services.

90
10Glossary AASB Australian Accounting
Standards Board
AER Australian Energy Regulator
ARSBA Annual Reports (Statutory Bodies) Act 1984
ARSBR Annual Reports (Statutory Bodies) Regulation 1995
BSP bulk supply point
CAPEX capital expenditure
CPI consumer price index
CEO Chief Executive Officer
DM demand management
EBIT earnings before interest and tax
EBITDA earnings before interest, tax, depreciation and amortisation
EEO equal employment opportunity
ELT Executive Leadership Team
EPA Environment Protection Authority
FBT fringe benefit tax
FTE full‑time equivalent
FWA Fair Work Australia
GRI Global Reporting Initiative
GWh gigawatt hour
GST goods and services tax
ICAC Independent Commission Against Corruption
ICAM incident cause analysis method
I care! Endeavour Energy’s workplace giving program
IPART Independent Pricing and Regulatory Tribunal
ISO International Organization for Standardization
IT Information technology
kV kilovolt
kVA kilovolt ampere
kWh kilowatt hour
LED light‑emitting diode
LTI lost‑time injury
LTIFR lost‑time injury frequency rate
NPAT net profit after tax including capital contributions
NSW New South Wales
NTER National Taxation Equivalent Regime
ODRC optimised depreciated replacement cost
OHS occupational health and safety
OPEX operating expenditure
PCBU person conducting business or undertaking
PESAP Public Electrical Awareness Safety Plan
PID Act Public Interest Disclosures Act 1994 NSW
PUC projected unit credit
RFP request for proposals
SAIDI system average interruption duration index
SAMP Strategic Asset Management Plan
SCI Statement of Corporate Intent
SCADA Supervisory Control and Data Acquisition
SENI serious electrical network incident
SF6 sulphur hexafluoride
SNMP Strategic Network Maintenance Plan
SOC State Owned Corporation
TRI total recordable injuries
TS transmission substation
TSA Transition Services Agreement
TUOS transmission use of system
WACC weighted average cost of capital
ZS zone substation

91Endeavour Energy Annual Performance Report 2012–13
APPENDICES 10IndexAair conditioning 11, 14, 19, 27Annual Reports (Statutory Bodies) Act 1984 (NSW) 1Apprentice of the Year awards 22approved exemptions 79asbestos management system 8assets 32 inspections 11, 19 management 5 net 3, 78 network 11 see also financial statementsAudit and Risk Committee 12, 29, 30, 31Auditor‑General 31, 35Ausgrid 4, 8, 12, 28, 30, 80Australia Day 25Australian Energy Market Commission 88Australian Energy Market Operator 88Australian Energy Regulator (AER) 4–5, 9, 86, 87 ‘Better reform’ program 9, 24 network price approval 87 transitional regulatory proposal 9 2014 submission to 5, 6, 7, 9Australian Fair Work Act 2009 5, 13
BBlack spot program 24Blacktown 19Blue Mountains 14, 25 extreme weather conditions 4Board Committees 29, 30 meetings 29Board of Directors 28, 29 appointment, term and
committee memberships 29 conflicts of interest 31 indemnity against
certain liabilities 30 new governance structure 28, 30 role and responsibilities 30 budget 4, 5, 9 see also financial statementsbushfire risk 19, 24business continuity 12business model, network‑only 4, 7, 10, 25
Ccapital expenditure 3, 4, 6, 9, 14, 33 deferred 20 carbon policy 26Ceramic Arc Metal Halide lamps 19Chief Executive Officer 1, 2, 4, 28, 30, 81climate changesee environment; greenhouse gas emissions; weather conditionsClimate Change Fund, NSW Government 10coal mining sector 21Code of Conduct 28, 30, 88 community consultation/engagement 24 partnerships 25complaints 21Compliance Plan, Strategic 31
construction projects 4, 9 building 9 distribution 9 peak resourcing strategy 9 major works approved 14 major works in progress 15–18consultants 70Consumer Price Index (CPI) 4, 6, 10, 13, 87consumption see electricity demandcontact details inside back covercontractors 13, 24, 26controlled metering 11CoolSaver 20copper theft 24corporate plan 12, 80, 83 strategic objectives 6, 7corruption 89, 91 anti‑corruption initiatives 30cost savings 7, 10, 22credit card certification 79Crime Stoppers 24customer connection works 19Customer Consultative Committee 25Customer Data into Banner project 7Customer Interaction Centres (CICs) 21customer satisfaction 3, 5 Customer Satisfaction Indicator 3customer service 21 Guaranteed Customer
Service Standards 86 National Energy Customer
Framework (NECF) 5, 21, 86Customer Value Improvement Plan 7 customers compensation paid to 86 connections 3, 19 engagement strategy 4–5, 9 high‑use 20 multicultural policies and services 25 number of 2 rebates and assistance 4, 6 see also electricity demand
Ddemand management 20, 87Demand Management Plan 20 projects for investigation 2012–13 20Department of Climate Change and Energy Efficiency 3Dial Before You Dig 7, 11, 20 number of enquiries per day 20Directors see Board of Directorsdisability reporting 79disaster recovery plans 12Distribution Electricity Supply Industry qualification 22distribution network planning 88distribution projects 4, 9dividend 3, 32, 33drug and alcohol testing 4, 8
Eeducation, community 24efficiency programs 4, 5, 10Electric Energy Society of Australia 25
electricity demand growth 14 industrial 14 management 20 peak 11, 14, 20, 87 reduced 4, 14, 32electricity distribution network 2 reliability 5 value 2electricity drawings 11Electricity Supply Act 1995 (NSW) 2 emergency response work 4, 19, 21energy efficient lamps, streetlighting 19energy rebate schemes 4, 6, 28Energy Services Corporations Act 1995 (NSW) 2, 30, 88Enterprise Agreement 5, 7, 13Environment Protection Authority 26environment 3, 26–7, 89 carbon policy 26 compliance 26 energy efficiency 27 greenhouse gas emissions 3, 26, 86 illegal dumping 26 landfill diversion 27 minor incidents 26 performance 26 renewable energy 25, 26 reportable incidents 3, 26 soil remediation 27 staff training 26 strategy 26 timber pole recycling 27 transformer oil recycling 27 waste management 27 water savings 27Environmental Impact Assessment process 26Environmental Planning and Assessment Act 1979 (NSW) amendment 89Essential Energy 4, 8, 12, 28, 30, 80ethical standards 28, 30, 88Ethics Communication and Engagement Strategy 30Executive changes following reforms 80Executive Leadership Team 28, 81external audit 35
FFair Work Australia 8Fair Work Commission 13Family Energy Rebate scheme 4, 6feeder automation 11field force automation 11finance assets and liabilities 32 debt 32, 33, 87 dividend 3, 32, 33 investment performance 87 maintenance expenditure 19 major works approved 14 major works in progress 15–18 profit results 3, 4, 32, 33 sales revenue 3, 4 summary 3financial statements 34–76fraud control 6, 30, 31freedom of information 83future plans 5, 6–7, 10, 25

92
10GGIS/CAD system 11glossary 90governance 28–31 joint Board of Directors
and common CEO 4, 28, 30, 80 new arrangements 28, 30, 80–1Government Information (Public Access) Act 2009 (NSW) 83–5, 87 access applications 83–5GPS technology 11graffiti 24grants 83Greater Western Sydney 14, 25greenfield development 14greenhouse gas emissions 86GreenPower 26
Hhealth and safety 8 fatigue management 8 Incident Cause Analysis
Method (ICAM) 8 injuries to staff 8 Lost Time Injury Frequency
Rate (LTIFR) 3, 4, 5, 6, 8, 78 random alcohol and drug testing 4, 8 reportable incidents 5 staff training 4 strategic objective 6 use of technology 11 see also public safetyHuntingwood head office 27
II care! 25Illawarra 14, 25independent auditor’s report 31, 35Independent Commission Against Corruption Act 1988 (NSW) 89Independent Pricing and Regulatory Tribunal (IPART) 46industrial demand 14, 21 infrastructure projects, government 21Injury Management 8inspections 11, 19insurance 31 liability and professional indemnity 30Integral Energy 12internal audit 31interpreter service 25interruptions to power supply 10 Guaranteed Customer
Service Standards 86investment 5, 6, 9, 14, 33, 87 see also capital expenditure; networkiSafe 11
Jjudicial decisions 89
Kkey result areas 5Kiama mini tornado 4, 21
Lland disposal 87land remediation 27Landcom 21Large Scale Renewable Energy Target 26LED lighting 19, 27
legislative changes 88–9letter of transmittal 1LiDAR technology 19Lifeguard program 4, 8live line crews 11Low Income Household Rebate, 4, 6, 28
Mmaintenance 19management structure 28Marsden park Zone Substation 14Master Builders’ Association 24metering work 19, 20Metropolitan Strategy for Sydney, draft 14Ministerial directions 88multicultural policies 25MySafe 11
NNational Electricity Rules 4, 6, 9, 20, 87, 88 ‘screening test’ for projects
over $5million 20National Energy Customer Framework (NECF) 5, 21, 25, 79, 86National Greenhouse and Energy Reporting Scheme Determination 3network businesses amalgamation, NSW Government 4, 80, 81Network Electricity Reform Program 6, 7Network General Enquiries, new telephone number 21Network Operational Readiness project 7, 12Network Reform Program 4, 10, 81Network Reliability Plan 6network ageing 14 connections 3, 21 expenditure 14 maintenance 19 major projects 15–18 new connections 21 plan delivery 5 prices 4, 5, 6, 7, 9, 10, 14, 24, 25, 87 reform program 10 reliability 3, 5 strategy 14–21Networks NSW 4, 5, 28, 80 Community Partnership 4, 5, 25 shared management structure 28Nominations Committee 29, 30NSW & ACT Greenhouse Gas Reduction Schedule 26NSW 2021: A plan to make NSW number one 26NSW Energy Savings Scheme 26NSW Public Lighting Code 19NSW Training Awards 22NSW Treasury 32
Ooperating costs 3, 4, 78 see also financial statementsorganisational structure 28Origin Energy 7, 21 Transition Services Agreement 4, 7, 21outage management 10, 11, 19, 21outcomes, future key 7outsourcing 7
overhead lines campaign to prevent line strike 24 inspections 19
PParramatta City Council 24PeakSaver 20Penrith 19 City Council 24performance payments 80performance 8–13 indicators 8, 10, 22 investment 87 summary 3, 4pilot projects/programs 19pole ‘black spot’ program 24 inspections 19Power Quality and Reliability Centre 25power supply 2, 5, 14, 24 Guaranteed Customer Service Standards 86 prices 4, 5, 6, 7, 9, 10, 14, 24, 25, 87primary school students 24Privacy Commissioner 88Privacy Act 1988 (Cth) 88 amendment 88profitability 3, 4, 5, 32 see also financial statementsProject Challenge 4, 6, 10, 11Project Compete 4, 6, 10, 11Protection of the Environment Operations Act 1997 (NSW) 26Public Electrical Safety Awareness Plan 24public safety 8, 24–5 education 24 signage 25purpose statement 2
QQueensland Government 15% Gas Scheme 26
Rrail projects 21rebates and assistance to customers 4, 6, 28recycling 27reform program, state‑owned networks 4 see also Networks NSWregional employees 11Regional Illegal Dumping Squads 26regulation of energy distribution, new framework 5reliability 3, 4, 5, 6, 10, 14 technology assistance 11remuneration 80renewable energy 25, 26residential demand management programs 20residential growth 3, 14residential land 21retail transition to Origin Energy 4, 7, 10, 12, 21, 22revenue 3, 4, 5, 9, 32, 78, 87 see also financial statements

93Endeavour Energy Annual Performance Report 2012–13
APPENDICES 10risk management 5, 6, 7, 12, 30 incident management plan 12 risk categories 12 risk management plan 12role and function, Board of Directors 28rooftop photovoltaic systems 14Rooty Hill demand management program 11, 20
Ssafety see health and safety; public safetySafety, Human Resources and Environment Committee 29, 30Safety Strategic Plan 6security 11 electricity supply 14 field service centres
and substations 24 see also reliabilityService Awards 23Service Wire Replacement Program 11shareholders 1, 2Shareholder Ministers 1, 30Shoalhaven 25Small‑scale Renewable Energy Scheme 26smart grid 7, 11solar energy 4 South Coast 2, 27Southern Highlands 25Springhill Field Service Centre 26Springwood 11staff 22–3 absenteeism 5 apprentices 22 awards 22, 23 consultation 8 diversity 23, 25 drug and alcohol testing 4, 8 education and training 22, 26, 30, 83 employee mobility team 22 employment conditions 5, 7, 13
equal employment opportunity 79–80
Executive remuneration 80 Indigenous 23, 79 leadership development 5, 7, 13 long‑serving 23 Mix and Match program 22 recruitment 22 superannuation 13 temporary 9, 22 total number 2, 3, 22 see also Enterprise Agreement;
health and safetyState Owned Corporations Act 1989 (NSW) 28, 30, 89 amendment 89Statement of Corporate Intent (SCI) 30, 32, 33, 80statistics, five‑year table 78Strategic Asset Management Plan (SAMP) 33Strategic Compliance Plan 31Strategic Network Maintenance Plan (SNMP) 19streetlighting 19substations 3, 5, 11, 14, 20, 24, 29, 33 major projects approved 14 major projects in progress 15–18summary of year activities 3System Average Interruption Duration Index (SAIDI) 5, 7, 10
Ttariff strategy 87technology 7, 11The Ponds 19training programs, emergency services and construction industry 24TransGrid 15, 87transmission and distribution network 19travel, overseas 87
UUniversity of Wollongong 25UrbanGrowth 21
Vvalue for customers 2, 9, 10values 2vegetation management 14vehicle tracking 11
Wwaste management 27weather conditions 10, 19 Blue Mountains 4 extreme events 4, 19, 21 Kiama 4 temperature extremes 4, 14website 83 address inside back coverWestern Sydney and Illawarra TAFE Student Excellence Awards 25windstorms 4, 19, 21Work Health & Safety Act 2011 (NSW) 89Work Health and Safety (WHS) regulations 2011 8WorkCover NSW 8, 89Workers Compensation Amendment Act 2012 8Workers Compensation 8workforce 8, 9, 10, 22 see also staffworkplace giving program 25workplace relations 8

Notes

LOCATIONS AND CONTACTS
Kings ParkParramatta
Kings ParkParramatta
Hoxton ParkNarellan
Picton
Moss Vale
Ulladulla
Nowra
Shellharbour
SpringhillConiston
Katoomba
Bowenfels
Kandos
Glendenning
Windsor
PenrithHuntingwood
Ausgrid
EssentialEnergy
PacificOcean
Location, addresses, phone numbers and hours of operationEmergencies, streetlights out, hot water hotlinePhone: 131 003 (24 hours)
Customer enquiriesGeneral enquires phone: 133 718
Head Office Phone: 131 081 or (02) 9853 6666 (8.00am - 5.30pm Monday to Friday)
Interpreter servicesPhone: 131 450
Fax(02) 9853 6000
Websitewww.endeavourenergy.com.au
Ethics hotline1800 ETHICS (384 427)
Main office51 Huntingwood Drive Huntingwood NSW 2148 PO Box 811, Seven Hills NSW 1730
Bowenfels Field Service Centre 9-13 Cooerwull Road Bowenfels NSW 2790
Coniston Office Corner of Bridge Street and Old Springhill Road Coniston NSW 2500
Glendenning Central Logistics Facility 49 Glendenning Road Glendenning NSW 2761
Glendenning Civil Works Centre 15 Belfast Place Glendenning NSW 2761
Glendenning Field Service Centre 43 Glendenning Road Glendenning NSW 2761
Hoxton Park Field Service Centre 490 Hoxton Park Road Hoxton Park NSW 2171
Hoxton Park Technical Training Centre109 Jedda Road Prestons NSW 2170
Kandos Field Service Centre 16 White Crescent Kandos NSW 2848
Katoomba Field Service Centre 27-29 Whitton Street Katoomba NSW 2780
Kings Park Field Service Centre 10 Tasha Place Kings Park NSW 2148
Moss Vale Field Service Centre 8-10 Old Dairy Close Moss Vale NSW 2577
Narellan Field Service Centre 17 McPherson Road Smeaton Grange NSW 2567
Network Project Management OfficeLevels 5 & 9 Westpoint Tower 17 Patrick Street Blacktown NSW 2148
Nowra Field Service Centre
20 Depot Road West Nowra NSW 2541
Parramatta Field Service Centre 84-86 Macarthur Street Parramatta NSW 2150
Penrith Field Service Centre96-120 Blaikie Road Jamisontown NSW 2750
Picton Field Service Centre94 Bridge Street Picton NSW 2571
Shellharbour Field Service Centre Buckleys Road Shell Cove NSW 2529
South Windsor Field Service Centre Corner Ham Street and Fairey Street South Windsor NSW 2756
Springhill Field Service Centre 191-195 Five Island Road Unanderra NSW 2526
Ulladulla Field Service Centre18 Deering Street Ulladulla NSW 2539