Annual Performance Report: 2007-2008 State Assessment Data
226
1 Annual Performance Report: 2007-2008 State Assessment Data Summary Prepared by: Jason Altman, Martha Thurlow, Mai Vang National Center on Educational Outcomes (NCEO) August, 2010 The information in this summary is based on data submitted in states’ Annual Performance Reports to the U.S. Department of Education, as well as their Section 618 Table 6 data. Corrections or updates to the APR reports that were submitted by April, 2009 to the U.S. Department of Education are reflected in this summary, as are corrections to Section 618 data submitted by July 3, 2009.
Transcript of Annual Performance Report: 2007-2008 State Assessment Data

1
Annual Performance Report: 2007-2008 State Assessment Data
Summary Prepared by:
Jason Altman, Martha Thurlow, Mai Vang National Center on Educational Outcomes (NCEO)
August, 2010
The information in this summary is based on data submitted in states’ Annual Performance Reports to the U.S. Department of Education, as well as their Section 618 Table 6 data. Corrections or updates to the APR reports that were submitted by April, 2009 to the U.S. Department of Education are reflected in this summary, as are corrections to Section 618 data submitted by July 3, 2009.
2
Overview
States and other educational entities receiving Part B funding under the Individuals with Disabilities Education Act (IDEA) submitted
their Annual Performance Reports (APRs) and Section 618 Table 6 data together to the U.S. Secretary of Education on or before
February 1, 2009. These reports may have been modified during the following few months, and so the National Center on Educational
Outcomes (NCEO) waited until June to pull final data from these sources. These reports contained information on a variety of
indicators, including large-scale assessment participation and performance data for the 2007-2008 school year. This document is a
summary of the assessment data contained in those reports.
States have been required by the Elementary and Secondary Education Act (ESEA) to test students at least once at the elementary,
middle, and high school levels since 2001-2002. Beginning in 2005-2006, states were required to test all students on reading and
mathematics in grades 3-8, as well as once in high school. Participation in science assessment in elementary, middle, and high school
was required starting in 2007-2008.
The information that states provided in their 2007-2008 APRs sometimes did not completely match the data submitted in Table 6 of
Section 618; most often this was because states aggregated and summarized data in their APRs. For example, states sometimes
summarized data across grades rather than presenting data for each grade. Occasionally, they reported slightly different data in the
APR and in Table 6. Because data contained in the 2007-2008 APRs sometimes were not disaggregated by content area and grade
level or contained only percentages, or contained inconsistencies, NCEO replaced APR data with raw numbers obtained from Table 6
when necessary. In other words, when APR data did not match Section 618 Table 6 data, we used the Table 6 data.
It is important to recognize that the information submitted in a state’s APR and Section 618 Table 6 data may or may not be publicly
reported by the state. Data publicly reported on state Web sites or sent to stakeholders by local education agencies may come from a
different source. NCEO regularly analyzes assessment information that is publicly reported by states (see Albus, Thurlow, & Bremer,
2009; Klein, Thurlow, & Wiley, 2006; Thurlow, Quenemoen, Altman, & Cuthbert, 2007; Thurlow & Wiley, 2004; Thurlow, Wiley, &
Bielinski, 2003; VanGetson & Thurlow, 2007; Wiley, Thurlow, & Klein, 2005). NCEO also analyzed states’ Biennial Performance
Reports that included assessment data for the 2000-2001 year (Thurlow, Wiley, & Bielinski, 2002), states’ Annual Performance
Reports that included assessment data for the 2002-2003 school year (Thurlow, Moen, & Wiley, 2005), 2003-2004 school year
(Thurlow, Moen, & Altman, 2006), 2004-2005 school year (Thurlow, Altman, Cuthbert, & Moen, 2007), 2005-2006 school year
(Thurlow, Altman, Cormier, & Moen, 2008), and 2006-2007 school year (Thurlow, Altman, & Vang, 2009).
For some tables and figures included in this report, data from 2007-2008 are compared to data from earlier years. The data from the
2006-2007, 2005-2006, 2003-2004, and 2002-2003 school years are available in our online reference tool, the NCEO Data Viewer

3
(http://data.nceo.info/). Users of this tool can create customizable reports of state participation and accommodation policies, and
participation and performance assessment data.
The assessment information included in the Annual Performance Reports of regular states (n=50) and unique states subject to IDEA
requirements (n=10; see box below for a list of unique states) is summarized in two sections in this report:
Participation in 2007-2008 State Assessments (see page 6)
Performance on 2007-2008 State Assessments (see page 39)
The information in this report is supported by individual state data available in five appendices. Appendices A and B provide the
participation and performance data used to create the tables and figures in this document. Appendices C and D include a summary of
all of the raw participation and raw performance data that states submitted in their 2007-2008 annual performance reports of state
assessment data. Appendix E provides raw performance data by specific assessment, content area, and grade level for each state.
Unique States: American Samoa (AS), Bureau of Indian Education (BIE), Commonwealth of the Northern Mariana Islands (CNMI),
Washington DC (DC), Federated States of Micronesia (FSM), Guam (GU), Palau, Puerto Rico (PR), Republic of the Marshall Islands
(RMI), Virgin Islands (VI)

4
Table of Contents Text
Page
Relevant
Tables/Figures
Figure
Page
Overview 2
Participation in 2007-2008 State Assessments 6
States with Participation Data for All Three School Levels 6 Table 1 14
Amount of Participation Data Reported for Regular Assessment 6 Fig 1 15
Amount of Participation Data Reported for the Alternate Assessment Based on
Alternate Academic Achievement Standards 6
Fig 2 16
Reading Assessment Participation Rates 7 Fig 3-5 17-19
Mathematics Assessment Participation Rates 7 Fig 6-8 20-22
Reading Assessment Accommodation Rates 8 Fig 9-11 23-25
Mathematics Assessment Accommodation Rates 9 Fig 12-14 26-28
Percent of Students with IEPs Participating in the Regular Assessment with
Accommodations 9
Table 2 29
Percentage of Students with IEPs Participating in an Alternate Assessment Based on
Grade Level Achievement Standards 10 Table 3 30
Percentage of Students with IEPs Participating in an Alternate Assessment Based on
Modified Achievement Standards 10 Table 4 31
Percentage of Students with IEPs Participating in an Out-of-level Assessment 11 Table 5 32
Percentage of Invalid Scores (where >5% of Students with IEPs Took Assessments
with Invalidating Practices) 11 Table 6 32
Reading Assessment Based on Alternate Academic Achievement Standards
Participation Rates 12
Fig 15-17 33-35
Mathematics Assessment Based on Alternate Academic Achievement Standards
Participation Rates 12 Fig 18-20 36-38
Performance in 2007-2008 State Assessments 39
States with Performance Data for All Three School Levels 39 Table 7 44
Amount of Performance Data Reported for Regular Assessment 39 Fig 21 45
Amount of Data Reported for the Alternate Assessment Based on Alternate Academic
Achievement Standards 39
Fig 22 46
Reading Assessment Proficiency Rates 40 Fig 23-25 47-49

5
Mathematics Assessment Proficiency Rates 41 Fig 26-28 50-52
Percentage of All Students Proficient on Alternate Assessments Based on Alternate
Achievement Standards 41 Table 8 53
Percentage of Students with IEPs Proficient on an Alternate Assessment Based on
Grade Level Achievement Standards 42 Table 9 54
Percentage of Students with IEPs Proficient on an Alternate Assessment Based on
Modified Achievement Standards 42 Table 10 55
Reading Assessment Proficiency Rate Change 42 Fig 29-31 56-58
Mathematics Assessment Proficiency Rate Change 43 Fig 32-34 59-61
References 62-63
Appendices 64
Appendix A – State-by-State Participation Summary Data 67 Tables A1-A6 67-84
Appendix B – State-by-State Proficiency Summary Data 85 Tables B1-B6 85-106
Appendix C – State-by-State Participation Raw Data 107 Tables C1-C6 107-136
Appendix D – State-by-State Performance Raw Data 137 Tables D1-D6 137-167
Appendix E – State-by-State Performance Raw Data by Specific Assessment 168 Tables E1-E6 168-226

6
Participation in 2007-2008 State Assessments
Five tables and twenty figures are included in this section. A brief description of overall findings is provided for each table and figure.
In addition, decisions made about the data included in the tables and figures are clarified.
Table 1. States with Participation Data for All Three School Levels (Elementary, Middle, and High School) and Both Reading
and Math (Regular and Alternate Assessment)
Finding: This table shows that all regular states presented participation data for both reading and mathematics
at all three school levels for their 2007-2008 regular and alternate assessments. The number of regular states
providing these data has increased in recent years. Seven unique states reported assessment participation for
their regular assessment and alternate assessments administered during 2007-2008.
Explanation: The numbers in this table represent states that provided participation data in both reading and mathematics for
elementary, middle, and high school levels. To be included in this table, states needed to provide at minimum the number of students
assessed, and the enrollment counts for both students with IEPs and all students.
Figure 1. Amount of Participation Data Reported for the Regular Assessment
Finding: All 50 regular states and 7 unique states provided participation data in reading and math at the
elementary, middle, and high school level for their regular assessment. Two unique states provided data for both
content areas, but did not report data for all school levels. One unique state did not report any data.
Explanation: This figure shows which data were missing for states that lacked some regular assessment participation data in reading
or math at the elementary, middle, or high school level.
Figure 2. Amount of Participation Data Reported for the Alternate Assessment Based on Alternate Academic Achievement
Standards
Finding: All 50 regular states and 7 unique states provided participation data in reading and math at the
elementary, middle, and high school level for their alternate assessment. Two unique states provided data for
both content areas, but did not report data for all school levels. One unique state did not report any data.

7
Explanation: This figure shows which data were missing for states that lacked some participation data in reading or math at the
elementary, middle, or high school level for the alternate assessment based on alternate academic achievement standards.
Figures 3-5. Reading Assessment Participation Rates in Elementary, Middle, and High School: Percent Participation of IEP
Enrollment (Includes Regular and Alternate Assessments)
Finding: The percentage of students tested on reading assessments (regular and alternate) is shown in these figures for those states for which a rate could be calculated. At the elementary level, all 50 regular states and 5 unique states had participation rates of 95% or more. At the middle school level, all 50 regular states and 6 unique states had participation rates of 95% or more. At the high school level, 32 regular states and 3 unique state had participation rates of 95% or more. At this level, 18 regular states and 5 unique states did not assess at least 95% of students, while 2 unique states did not report any data. At the elementary level one state had a participation rate that exceeded 105%.
Explanation: Participation rates were calculated by dividing the number of students assessed in reading by the IEP enrollment. This
produces a rate that is the percentage of students with IEPs who were tested on the regular assessment and the alternate assessments
(those based on alternate academic achievement standards, modified achievement standards, and grade level achievement standards).
Rates in the range of 95%-105% are desired. Percentages that are slightly larger than 100% can be explained by factors such as
counting IEP enrollment at a different time of year from when the assessments were administered. When the participation percentage
is larger than 105%, the most likely explanation is that students were reported as participating in more than one of the two types of
assessment in a single content area (regular and alternate). Such reporting redundancy prevents accurate calculation of participation or
performance percentages.
Figures 6-8. Mathematics Assessment Participation Rates in Elementary, Middle, and High School: Percent Participation of
IEP Enrollment (Includes Regular and Alternate Assessments)
Finding: The percentage of students tested on the mathematics assessment is shown in these figures for those states for which a rate could be calculated. At the elementary level, all 50 regular states and 6 unique states had participation rates of 95% or more. At the middle school level, 48 regular states and 6 unique states had participation rates of 95% or more. At the high school level, 29 regular states and 4 unique states had participation rates of 95% or more. For the 21 regular states with rates less than 95%, 15 were 90% or above; the 4 unique states with rates less than 95% had widely variable rates. Mathematics assessment participation

8
rates were less than those shown for reading. Lower participation rates were evident at the high school level for both reading and mathematics. No states had participation rates in mathematics that exceeded 105%.
Explanation: Data for these figures were calculated in the same way as for Figures 3-5.
Figures 9-11. Reading Assessment Accommodation Rates in Elementary, Middle, and High School: Percentage of Students
with IEPs Taking the Regular Reading Assessment with Accommodations
Finding: The percentage of students using accommodations on the regular reading assessment at each of the school levels is shown for those states for which a rate could be calculated. At the elementary level, 7 regular states and 1 unique state reported 75% or more of their students with IEPs using accommodations on the regular reading assessment, and 24 regular states and 5 unique states had between 50% and 74% of their students with disabilities using accommodations on the regular reading assessment. At the middle school level, 6 regular states and 2 unique states had 75% or more of their students with IEPs using accommodations, and 26 regular states and 4 unique states showed between 50% and 74% of their students with disabilities taking the regular reading assessment with accommodations. At the high school level, 3 regular states and 2 unique states had 75% or more of their students with disabilities using accommodations on the regular high school reading assessment, and 23 regular states and 3 unique states had between 50% and 74% of their students with disabilities using accommodations on the regular reading assessment. The rates reported in 2007-2008 were generally similar to those reported in 2006-2007.
Explanation: Accommodation rates were calculated by dividing the number of students who used accommodations on the regular
reading assessment by the IEP enrollment. Note that this percentage is different from the one that would be obtained if the
denominator was the number of students with IEPs who were assessed on the regular reading assessment. It is important to note that
state accommodations policies, which vary greatly from state to state, are an important driving factor behind the accommodation rates
seen in these figures. For information on these policies, see NCEO’s publication 2007 State Policies on Assessment Participation and
Accommodations for Students with Disabilities available at http://www.nceo.info/OnlinePubs/Synthesis72 or see NCEO’s research
tool “NCEO Data Viewer” at http://data.nceo.info/nceo-pa-data-about.asp.

9
Figures 12-14. Mathematics Assessment Accommodation Rates in Elementary, Middle, and High School: Percentage of
Students with IEPs Taking the Regular Mathematics Assessment with Accommodations
Finding: The percentage of students using accommodations on the regular mathematics assessment is shown for those states for which a rate could be calculated. At the elementary level, 6 regular states and 1 unique state showed 75% or more of their students with IEPs using accommodations on the regular mathematics assessment, and 32 regular states and 5 unique states had between 50% and 74% of their students with disabilities using accommodations on the regular mathematics assessment. At the middle school level, 7 regular states and 2 unique states had 75% or more of their students with IEPs using accommodations; 27 regular states and 4 unique states showed between 50% and 74% of their students with disabilities taking the regular mathematics assessment with accommodations. At the high school level, 4 regular states and 2 unique states had 75% or more of their students with IEPs using accommodations during the assessment, and 20 regular states and 3 unique states showed between 50% and 74% of their students with IEPs taking the regular mathematics assessment with accommodations. More states tested students with accommodations at a rate of 50% or more in mathematics, especially at the elementary level. The highest number of states with accommodation rates greater than 50% were seen at the elementary level for mathematics and the middle school level for reading.
Explanation: Data for these figures were calculated in the same way as for Figures 9-11.
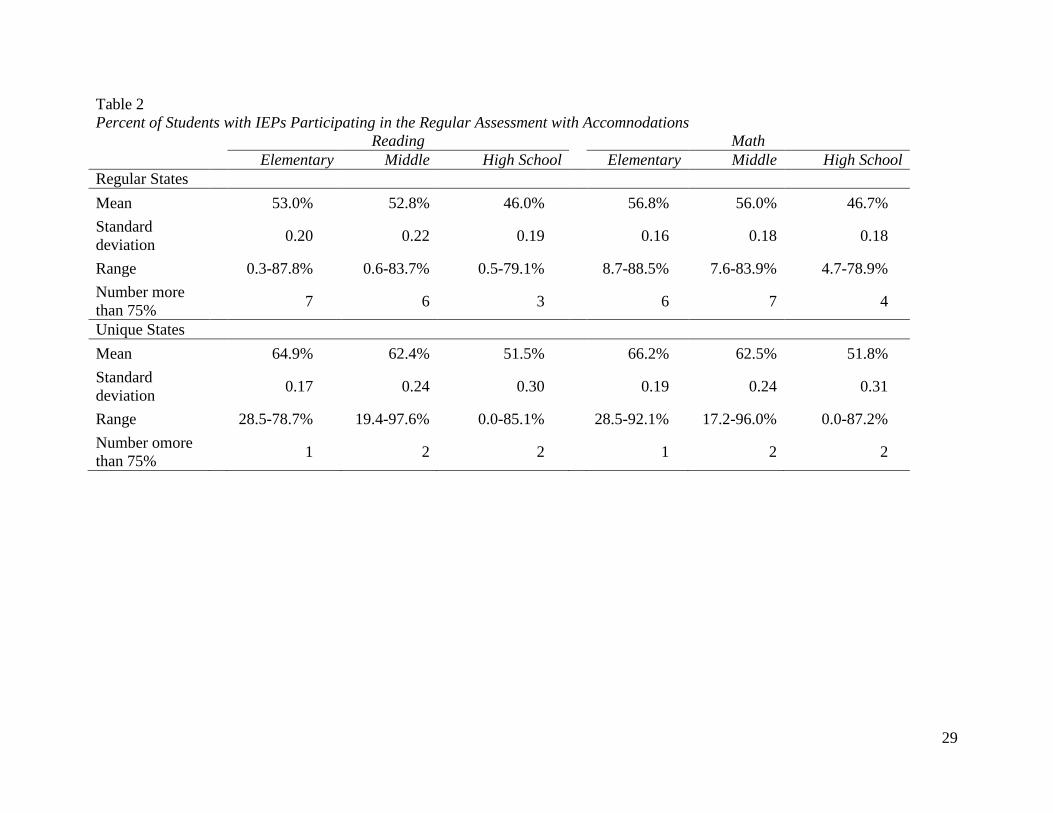
Table 2. Percent of Students with IEPs Participating in the Regular Assessment with Accommodations
Finding: The mean percentage of students with IEPs participating in the regular assessment with accommodations across regular states ranged from 53.0% in elementary to 46.0% in high school for reading, and 56.8% for elementary and 46.7% for mathematics. Means for middle school fell within the range for both content areas. The range of state rates varied widely as there were states that did not report even 1% as a rate, and others that reported rates as high as 88.5%. As few as 3 and as many as 7 of the 50 states reported greater than 75% accommodations rates for students with IEPs. Results were similar for unique states, as means for each content area were highest at the elementary level, and lowest at the high school level with a wide variation among unique states.
Explanation: Accommodation rates were calculated in a manner identical for figures 9-14.

10
Table 3. Percentage of Students with IEPs Participating in an Alternate Assessment Based on Grade Level Achievement
Standards (AA-GLAS)
Finding: Three regular states offered to students with IEPs an alternate assessment based on grade level achievement standards (AA-GLAS); in these states, between 0% and 20% of students with IEPs participated in this assessment depending on school level and content area. Two states had less than 1% of their IEP students in this type of assessment, while one typically tested more than 10% using this assessment though this state did not use this assessment at the high school level.
Explanation: The percentage of students with IEPs participating in an alternate assessment based on grade level achievement
standards (AA-GLAS) was calculated by dividing the number of students participating in this assessment by the number of students
with IEPs. Only those states that also had data for an alternate assessment based on alternate achievement standards (AA-AAS) were
included in this table. Raw data for all alternate assessments are available in Appendix C. AA-GLAS data are provided in footnotes to
Appendices A and B tables, but are available in Appendices D and E.
Table 4. Percentage of Students with IEPs Participating in an Alternate Assessment Based on Modified Achievement
Standards (AA-MAS)
Finding: Nine regular states and one unique state reported data for the AA-MAS in 2007-2008, the first year that a space was provided on forms to report information on this assessment. Participation rates were highly variable across states, and many states did not test at all school levels, or for both content areas. The Bureau of Indian Education (BIE) reported the lowest rates at all grade levels; this may be due to the fact that BIE students participate in assessments in many states, and only those residing in states with an AA-MAS could potentially participate in the AA-MAS. For the regular states, reading participation rates ranged from 10% to 40% of all students with IEPs at the elementary level, from 16% to 39% at the middle school level, and 7% to 40% at the high school level. One state tested only at the elementary level, another only at the high school level, and one state did not test at all for this content area. Participation rates for mathematics ranged from 5% to 36% of all students with IEPs at the elementary level, from 8% to 43% at the middle school level, and 6% to 48% at the high school level. One state tested only at the elementary level, another only at the high school level, and one state tested only for this content area.
Explanation: The percentage of students with IEPs participating in an alternate assessment based on modified achievement standards
was calculated by dividing the number of students participating in the AA-MAS by the number of students with IEPs. Only those
states that also had data for an alternate assessment based on alternate achievement standards were included in this table. This was the

11
first year that reporting tables provided a row for states to report this information. It is suspected that the states with data on an
alternate assessment based on modified achievement standards previously reported data for the AA-GLAS, or merged these data with
AA-AAS data. Raw data for all alternate assessments are available in Appendix C. AA-MAS data are also shown in Appendix A, B,
D, and E.
Table 5. Percentage of Students with IEPs Participating in an Out-of-level Assessment
Finding: A small number of states (n=5) had a small percentage of students with IEPs take out-of-level
assessments. All of these students were counted as non-participants for participation rates. Of the elementary,
middle, and high school reading and math assessments (six possible assessments), out-of-level assessments were
given at all levels and both content areas by just one state. In general, out-of-level tests were given to fewer than
10 students with IEPs at a specific grade and content area.
Explanation: The percentage of out-of-level assessments taken by students with IEPs was calculated by dividing the number of out-
of-level assessments by the number of students with IEPs in a given grade.
Table 6. Percentage of Invalid Scores (where >5% of Students with IEPs Received Invalid Scores)
Finding: A small number of states (n=6) had more than 5% of students with IEPs take regular assessments in a
way that produced invalid scores. The rates for these six states ranged from 5% to 9% for reading, and from 5%
to 10% for mathematics. Five of the six states reported more than 5% invalid scores for both reading and
mathematics at the high school level. These percentages are in contrast to those in 2006-2007, when more than
5% of students with invalid scores were reported at all school levels; in 2007-2008 these occurrences appeared
only at the high school level.
Explanation: The percentage of assessments taken by students with IEPs resulting in invalid scores (as defined by OSEP) was
calculated by dividing the number of invalid practices reported on the regular or alternate assessments by the number of students with
IEPs. Those above 5% were included in the table. A common reason for an invalid score may be that the student received an
accommodation that state policy defined as a modification (e.g., read aloud on a reading test). Students who receive invalid scores are
no longer counted as participants.

12
Figures 15-17. Reading Assessment Based on Alternate Academic Achievement Standards (AA-AAS) Participation Rates in
Elementary, Middle, and High School: Percent Participation of IEP Enrollment
Finding: At the elementary level, 43 regular states and 5 unique states assessed 9% or fewer of students with
IEPs in the reading AA-AAS. Seven regular states and two unique states assessed more than 9% of their students
with IEPs through an alternate assessment based on alternate academic achievement standards; some of these
percentages were close to 10%, some were as high as 20%. At the middle school level, 38 regular states and 6
unique states assessed 9% or fewer of students with IEPs in the alternate assessment based on alternate
academic achievement standards;12 regular states and 3 unique states tested more than 9%; most of these were
close to 10% while one neared 20%. At the high school level, 35 regular states and 5 unique states assessed 9%
or fewer of students with IEPs in the alternate assessment based on alternate academic achievement standards;
15 regular states and 3 unique states assessed more than 9%, again with most states near 10% but one state
with just less than 20% (one unique state reported 50% with a very small “n” size). It appears that students are
more likely to receive an AA-AAS at higher grade levels. The highest rates were much lower than in 2006-2007.
Explanation: The percentage of students with IEPs assessed through a reading alternate assessment based on alternate
achievement standards was calculated by dividing the number of students participating in these assessments by the
number of students with IEPs. Alternate assessments based on grade-level or modified academic achievement standards
were not included here. The 9% threshold when multiplied by the national average for percentage of students with IEPs,
roughly 12%, is approximately equal to the NCLB regulation of a 1% cap on the percentage of the total student
population that can be counted as proficient on these types of assessments. Not all students who are assessed with an
alternate assessment based on alternate academic achievement standards score as proficient; these figures highlight
states that had the potential to exceed the 1% cap. Participation rates based on total student enrollment are provided in
Appendix A.
Figures 18-20. Mathematics Assessment Based on Alternate Academic Achievement Standards (AA-AAS) Participation Rates
in Elementary, Middle, and High School: Percent Participation of IEP Enrollment
Finding: At the elementary level, 45 regular states and 5 unique states assessed 9% or fewer of students with IEPs in the math
AA-AAS. Five regular states and two unique states assessed more than 9% of their students with IEPs through an alternate
assessment based on alternate academic achievement standards; most were near 10%, and one at 18% (one unique state
reported 21% with a very small “n” size). At the middle school level, 37 regular states and 6 unique states assessed 9% or
fewer of students with IEPs in the alternate assessment based on alternate academic achievement standards;13 regular states

13
and 3 unique states tested more than 9%, with a range between 10% and 19% with most near 10%. At the high school level,
34 regular states and 6 unique states assessed 9% or fewer of students with IEPs in the alternate assessment based on
alternate academic achievement standards; 16 regular states and 2 unique states assessed more than 9%, with a range
between 10% and 40% (one unique state reported 50% with a very small “n” size). In general, the percentages for the
mathematics alternate assessment based on alternate academic achievement standards were similar to the percentages for the
reading alternate assessment based on alternate academic achievement standards, except that high school students in
mathematics are much more likely to be tested using the AA-MAS.
Explanation: Data for these figures were calculated in the same way as for Figures 15-17.

14
Table 1
States with Participation Data for All Three School Levels (Elementary, Middle, and High School) and Both Reading and Math
Regular Assessment
Alternate Assessment Based on Alternate
academic achievement standards
Year
Regular States
Unique States
Regular States
Unique States
2007-2008 50 7 50 7
2006-2007 47 7 47 7
2005-2006 45 8 45 6
2003-2004 46 5 45 5
2002-2003 45 7 45 5
Note. See map in Figures 1 and 2 for specific states.

15

16

17

18

19

20

21

22

23

24

25

26

27

28
29
Table 2
Percent of Students with IEPs Participating in the Regular Assessment with Accomnodations
Reading Math
Elementary Middle High School Elementary Middle High School
Regular States
Mean 53.0% 52.8% 46.0% 56.8% 56.0% 46.7%
Standard
deviation
0.20 0.22 0.19 0.16 0.18 0.18
Range 0.3-87.8% 0.6-83.7% 0.5-79.1% 8.7-88.5% 7.6-83.9% 4.7-78.9%
Number more
than 75%
7 6 3 6 7 4
Unique States
Mean 64.9% 62.4% 51.5% 66.2% 62.5% 51.8%
Standard
deviation
0.17 0.24 0.30 0.19 0.24 0.31
Range 28.5-78.7% 19.4-97.6% 0.0-85.1% 28.5-92.1% 17.2-96.0% 0.0-87.2%
Number omore
than 75%
1 2 2 1 2 2

30
Table 3
Percentage of Students with IEPs Participating in Alternate Assessments Based on Grade Level Achievement Standards
Reading Math
Elementary Middle High School Elementary Middle High School
Massachusettsa 0%
a 0%
a 0%
a 0%
a 0%
a 0%
a
North Carolina
0% a 0%
a 0%
a 0%
a 0%
a 0%
a
Virginia 16% 17% --- 11% 20% --- aA small percentage (< 0.5) participated in this type of assessment in the grade levels and content areas represented as 0%.
Four states reported data for this assessment in 2006-2007 but not in 2007-2008: Kansas, Louisiana, Oklahoma, and Texas. It is of
note that all of these states reported assessing students with an AA-MAS during 2007-2008

31
Table 4
Percentage of Students with IEPs Participating in Alternate Assessments Based on Modified Achievement Standards*
Reading Math
Elementary Middle High School Elementary Middle High School
California 24.1% --- --- 20.2% --- ---
Kansas 21.5% 22.4% 21.0% 16.7% 22.2% 27.5%
Louisiana 9.9% 20.3% 12.4% 9.9% 20.2% 12.1%
Maryland --- --- 6.5% --- --- 5.5%
Nebraska --- --- --- 5.3% 7.5% 6.6%
North Carolina 20.1% 20.7% 19.6% 16.7% 19.0% 13.1%
North Dakota 15.2% 16.0% 18.8% 10.8% 16.9% 17.6%
Oklahoma 40.3% 39.0% 39.6% 36.2% 43.4% 48.4%
Texas 32.7% 28.9% 29.8% 29.3% 32.6% 34.5%
Bureau of Indian
Education
2.9% 4.1% 4.6% 2.2% 3.9% 4.8%
*This was the first school year in which OSEP allowed for reporting on the AA-MAS, though it is thought that many of these states
used this assessment in past years and reported under one of the other alternate assessment options (such as AA-GLAS) or aggregated
scores with those of the regular assessment.

32
Table 5
Percentage of Students with IEPs Participating in an Out-of-Level Assessment
Reading Math
Elementary Middle High School Elementary Middle High School
Kansas --- --- 0.1% --- --- ---
New Mexico 0.0%a --- 0.0%
a 0.0%
a --- 0.0%
a
Tennessee --- 0.1% 0.1% --- 0.1% 0.5%
Utah 0.1% 0.3% 0.4% 0.1% 3.2% 7.8%
Washington --- 0.1% --- 0.0%a 0.1% 0.0%
a
a A small number of students (n = < 3) participated in an out-of-level assessment
Table 6
Percentage of Invalid Scores (Where >5% of Students with IEPs Received Invalid Scores)
Reading Math
Elementary Middle High School Elementary Middle High School
Colorado
--- --- 5.4% --- --- ---
Illinois
--- --- 6.1% --- --- 5.9%
Indiana
--- --- 8.0% --- --- 8.0%
Montana
--- --- 5.9% --- --- 5.1%
Vermont
--- --- 7.3% --- --- 8.3%
Washington
--- --- 9.0% --- --- 10.0%

33

34

35

36

37

38

39
Performance on 2007-2008 State Assessments
Four tables and fourteen figures are included in this section. A brief description of overall findings is provided for each table and
figure. In addition, decisions made about the data included in the tables and figures are clarified here.
Table 7. States with Performance Data for All Three School Levels (Elementary, Middle, and High School) for Both Reading
and Math
Finding: This table shows that all 50 regular states, and 7 unique states presented performance data for both
reading and mathematics at all three school levels for their regular and alternate assessments based on
alternate academic achievement standards in 2007-2008. The data here match data for participation, meaning
all of the states that reported provided the same level of reporting for both participation and performance.
Explanation: The numbers in this table represent states that provided performance data in both reading and mathematics for
elementary, middle, and high school levels. To be counted, states needed to provide the number of students proficient on the regular
assessment and alternate assessment based on alternate achievement standards and the enrollment counts for both students with
disabilities and all students.
Figure 21. Amount of Performance Data Reported for the Regular Assessment
Finding: All 50 regular states and 7 unique states provided performance data in reading and math at the
elementary, middle, and high school level for their regular assessment. Two unique states did not provide
performance data for at least one school level but provided data for both content areas. One unique state did
not report data.
Explanation: States are identified in this figure using the same criteria that were used for Table 6.
Figure 22. Amount of Performance Data Reported for the Alternate Assessment based on Alternate Academic Achievement
Standards (AA-AAS)
Finding: Identical to data reported on the regular assessment, all 50 regular states and 7 unique states
provided performance data in reading and math at the elementary, middle, and high school level for their AA-
AAS. Two unique states did not provide performance data for at least one school level but provided data for

40
both content areas. One unique state did not report data. This is the first year that the amount of data reported
on alternate assessments based on alternate achievement standards matched the amount reported for the
regular assessment.
Explanation: States are identified in this figure using the same criteria that were used for Table 6.
Figures 23-25. Reading Assessment Proficiency Rates in Elementary, Middle, and High School: Percent Proficient of IEP
Enrollment (Includes Regular and Alternate Assessments)
Finding: For the states for which rates of student proficiency could be calculated for the reading assessment,
generally more than 30% of students with IEPs performed at a level considered proficient. The number of states
with 30% or more students with IEPs proficient was 39 regular states and 1 unique state at the elementary
school level, 29 regular states and 1 unique state at the middle school level, and 26 regular states and 1 unique
state at the high school level. Compared to data from 2006-2007, these numbers are identical at the elementary
level, up two states at the middle school level, and up one state at the high school level.
Explanation: The percentage of students scoring as proficient on state assessments was calculated by dividing the number of students
who were proficient and above according to each state’s criteria on either the regular or alternate assessments by the number of
students with IEPs in the state (i.e., IEP Enrollment). These figures add together the percentage of students proficient on the regular
assessment plus the percentage of students proficient on the alternate assessments –those based on grade-level, modified or alternate
academic achievement standards– thus providing the total number of students with IEPs who were proficient in the state assessment
program in 2007-2008.
A caution is indicated for proficiency percents reported in the figures. Percentages must be viewed with caution when the alternate
assessment based on alternate academic achievement standards proficiency rate for the same content and school level was
greater than 1% of the total student population (approximately 10% of IEP enrollment), or the alternate assessment based on
modified academic achievement standards proficiency rate for the same content and school level was greater than 2% of the
total student population (approximately 20% of IEP enrollment). These are indicated by a bullet (●) for the AA-AAS or square
marker (■) for the AA-MAS. The U.S. Department of Education's directions to states indicated that scores from the these assessments
should be placed within the lowest proficiency level if they accounted for more than the allowed percentage of the total population of
students, but not all states did so.

41
Figures 26-28. Mathematics Assessment Proficiency Rates in Elementary, Middle, and High School: Percent Proficient of IEP
Enrollment (Includes Regular and Alternate Assessments)
Finding: For those states for which rates of student proficiency could be calculated for the math assessment,
generally about 30% of students with IEPs performed at a level considered proficient. The number of regular
states with 30% or more students with IEPs proficient was 43 at the elementary school level, 25 at the middle
school level and 22 at the high school level. No unique states reported this level of proficiency at the elementary
level, two at the middle school level and one at the high school level. Five more states at the middle school
reported more than 30% of students with IEPs scoring as proficient than a year ago. There was no change at the
elementary or high school level. In 2006-2007 students with IEPs appeared to be having more success in
scoring as proficient on reading assessments compared to mathematics assessments at the middle and high
school levels with the opposite being true at the elementary level. This was not the case in 2007-2008 when
proficiency rates were similar for the two content areas.
Explanation: The percentage of students scoring as proficient on math assessments was calculated in the same way as for the reading
assessments. The same explanations for the data summary and the same cautions apply.
Table 8. Percentage of All Students Proficient on Alternate Assessments Based on Alternate Achievement Standards
Finding: For at least one grade level and content area 17 (up from 10 in 2003-2004, 13 in 2005-2006, and 15 in 2006-2007)
states and 2 unique states counted more than 1% of total student enrollment as proficient on an alternate assessment based on
alternate academic achievement standards. Seven regular states counted more than 1% of total student enrollment as
proficient for only one grade level and content area. Ten regular states counted more than 1% proficient at the high school
level in mathematics. At the elementary level states were more likely to report such a count on a reading assessment (n=7)
than on a math assessment (n=6). Four states counted more than 1% of total enrollment as proficient for every grade level
and both content areas, meaning it is likely that the aggregated total in these states would surpass the 1% of all students
allowed.
Explanation: The percentage of students with IEPs scoring as proficient on an alternate assessment based on alternate achievement
standards was calculated by dividing the number of students who were proficient on a reading or mathematics AA-AAS by the total
student enrollment for the grade level. Only those states with more than 1% for any school level or content area are included in this
table

42
Table 9. Percentage of Students with IEPs Proficient on an Alternate Assessment Based on Grade Level Achievement
Standards (AA-GLAS)
Finding: Three states reported students proficient on an AA-GLAS in 2007-2008. One state had no participants score as
proficient on this assessment. The numbers were small and rounded to 0% in another of the states for all three school levels
and across both content areas. One state reported a range of 10% to 17% of students with IEPs as proficient on an AA-GLAS;
no data were reported for this test at the high school level.
Explanation: Participation rates were calculated by dividing the number of students assessed with a reading or mathematics alternate
assessment based on grade level achievement standards by total student enrollment for the grade level. It is likely that some of the
students reported in this section in the past were assessed using an alternate assessment based on modified achievement standards due
to the lack of a place for states to record performance for this assessment. Those students are now shown in Table 9.
Table 10. Percentage of Students with IEPs Proficient on an Alternate Assessment Based on Modified Achievement Standards
Finding: Eight regular states and one unique state reported students proficient on an AA-MAS in 2007-2008, while an
additional regular state did not report proficiency data for this test but did report participation data. As with participation
data, proficiency rates reported varied widely among the states using the assessment for that content area and at that school
level. For regular states reporting for the AA-MAS in reading, ranges were 1% to 27% of the enrollment of students with IEPs
for elementary, 4% to 26% for middle school, and 1% to 26% for high school. For those using the AA-MAS in math, ranges
reported were 2% to 24% for elementary, 2% to 23% for middle school, and 0% to 35% for high school. One unique state
reported between 1% and 2% of its students as proficient for each school level and both content areas.
Explanation: Participation rates were calculated by dividing the number of students assessed with a reading or mathematics alternate
assessment based on modified achievement standards by total student enrollment for the grade level. It is likely that some of the
students reported here were previously reported as using an alternate assessment based on grade level achievement standards due to
the lack of a place for states to record performance for this assessment prior to this school year.
Figures 29-31. Reading Assessment Proficiency Rate Change in Elementary, Middle, and High School (Regular and Alternate
Assessments)
Finding: For those states for which proficiency rate change between 2006-2007 and 2007-2008 could be calculated for the reading assessments, improvement was noted in 21 regular states at the elementary level (of

43
50 with data for both years), 32 regular states at the middle school level (of 50 with data), and 22 regular states at the high school level (of 48 with data). For unique states, three of five at the elementary level, one of six at the middle school level, and three of six at the high school level saw increases in student proficiency. For regular states, one less state reported an increase overall across all the school levels with an increase in the number of states reporting increases at the middle school level and a decrease in the number of states reporting increases at the elementary and high school level. One more unique state reported an increase in school level performance, across the three levels.
Explanation: The calculated percentage of students scoring as proficient on state assessments in 2006-2007 was subtracted from the
calculated percentage of students scoring as proficient on state assessments in 2007-2008, leaving the percent change in proficiency
percentage. A “+” indicates improvement, and a “-” indicates a decline in proficiency rate. A “0” indicates no change.
Figures 32-34. Mathematics Assessment Proficiency Rate Change in Elementary, Middle, and High School (Regular and
Alternate Assessments)
Finding: For those states for which proficiency rate change between 2006-2007 and 2007-2008 could be
calculated for the mathematics assessments, improvement was noted in 27 regular states at the elementary level
(of 50 with data for both years), 35 regular states at the middle school level (of 50 with data), and 28 regular
states at the high school level (of 47 with data). For unique states, two of five at the elementary level, four of six
at the middle school level, and four of six at the high school level showed increases in student proficiency.
Fourteen fewer regular states reported increases in mathematics proficiency for each school level summed
across all the levels, and there were fewer regular states reporting increases at each school level, especially the
elementary level (8 fewer). This was not true for unique states, with three more unique states reporting increases
in proficiency at a school level across all levels.
Explanation: The proficiency rate improvement on mathematics assessments was calculated in the same way as for the reading
assessments. The same explanations for the data summary apply.

44
Table 7
States with Performance Data for All Three School Levels (Elementary, Middle, and High School) and Both Reading and Math
Regular Assessment
Alternate Assessment Based on Alternate
Academic Achievement Standards
Year
Regular States
Unique States
Regular States
Unique States
2007-2008 50 7 50 7
2006-2007 47 6 47 6
2005-2006 46 8 45 7
2003-2004 47 4 42 4
2002-2003 46 5 42 5
Note. See map in Figures 21 and 22 for specific states.

45

46

47

48

49

50

51

52

53
Table 8
Percentage of All Students Proficient on Alternate Assessments Based on Alternate Achievement Standards
Reading Math
Elementary Middle High School Elementary Middle High School
Arkansas --- --- 1.43% --- --- 1.94%
Delaware --- --- 1.38% --- --- 1.33%
Kansas --- --- 1.11% --- --- ---
Georgia --- --- --- --- --- 1.02%
Maryland --- 1.07% 1.25% --- 1.06% 1.29%
Michigan 1.33% 1.14% 1.23% 1.30% 1.51% 1.74%
Minnesota 1.19% 1.23% 1.06% 1.16% 1.06% 1.11%
New York --- 1.01% --- --- --- ---
North Dakota 1.11% 1.10% 1.08% 1.11% 1.16% 1.20%
Ohio 1.86% 1.86% 1.56% 1.86% 1.84% 1.56%
Oklahoma --- --- --- 1.01% --- ---
Oregon 1.38% --- --- --- --- ---
Tennessee --- 1.11% --- --- 1.10% 2.15%
Utah --- --- --- --- --- 2.00%
Virginia 1.10% 1.11% --- 1.06% 1.09% ---
West Virginia --- 1.09% --- --- 1.02% ---
Wisconsin 1.05% --- --- --- --- ---
District of Columbia 1.44% 1.24% --- 1.33% --- ---
Virgin Islands --- --- --- --- --- 1.25

54
Table 9
Percentage of Students with IEPs Proficient on an Alternate Assessment Based on Grade Level Achievement Standards
Reading Math
Elementary Middle High School Elementary Middle High School
Massachusetts* 0% 0% 0% 0% 0% 0%
North Carolina 0% a 0%
a 0%
a 0%
a 0%
a 0%
a
Virginia 13.8% 14.4% --- 10.0% 17.3% --- *Massachusetts did not report any students as being proficient on the AA-GLAS, though it did report students as participants.
aA small percentage (< 0.5) participated in this type of assessment in the grade levels and content areas represented as 0%.

55
Table 10
Percentage of Students with IEPs Proficient on Alternate Assessments Based on Modified Achievement Standards*
Reading Math
Elementary Middle High School Elementary Middle High School
California 6.8% --- --- 6.4% --- ---
Kansas 18.0% 19.1% 18.9% 13.6% 15.2% 17.8%
Louisiana 1.3% 3.5% 1.2% 1.7% 1.9% 0.3%
Maryland --- --- 1.3% --- --- 1.0%
Nebraska --- --- --- N/A N/A N/A
North Carolina 3.5% 4.8% 3.3% 4.8% 8.3% 6.5%
North Dakota 13.3% 13.0% 14.3% 9.3% 13.9% 11.1%
Oklahoma 26.8% 25.7% 25.9% 24.5% 23.3% 35.2%
Texas 20.0% 17.9% 18.7% 18.1% 14.8% 12.7%
Bureau of Indian
Education
1.5% 1.7% 1.7% 0.9% 1.6% 1.8%
*This was the first school year in which OSEP allowed for reporting on the AA-MAS, though it is thought that many of these states
used this assessment in past years and reported under one of the other alternate assessment options (such as AA-GLAS) or aggregated
scores with those of the regular assessment.
N/A: Nebraska did not report performance information for the students reported as participants on the AA-MAS

56

57

58

59

60

61

62
References
Albus, D. A., Thurlow, M. L., & Bremer, C. (2009). Achieving transparency in the public reporting of 2007-2008 assessment results
(Technical Report 53). Minneapolis, MN: University of Minnesota, National Center on Educational Outcomes.
Klein, J. A., Wiley, H. I., & Thurlow, M. L. (2006). Uneven transparency: NCLB tests take precedence in public assessment reporting
for students with disabilities (Technical Report 43). Minneapolis, MN: University of Minnesota, National Center on
Educational Outcomes. Available at www.nceo.info/OnlinePubs/Technical43.html
Thurlow, M. L., Altman, J. R., Cormier, D., & Moen, R. (2008). Annual performance reports: 2005-2006 state assessment data.
Minneapolis, MN: University of Minnesota, National Center on Educational Outcomes. Available at
www.nceo.info/OnlinePubs/APRreport2005-2006.pdf
Thurlow, M. L., Altman, J. R., Cuthbert, M., & Moen, R. (2007). State performance plans: 2004-2005 state assessment data.
Minneapolis, MN: University of Minnesota, National Center on Educational Outcomes. Available at
www.nceo.info/OnlinePubs/SPP2004-05.pdf
Thurlow, M. L., Moen, R., & Altman, J. R. (2006). Annual performance reports: 2003-2004 state assessment data. Minneapolis, MN:
University of Minnesota, National Center on Educational Outcomes. Available at www.nceo.info/OnlinePubs/APR2003-
04.pdf
Thurlow, M. L., Moen, R., & Wiley, H. I. (2005). Annual performance reports: 2002-2003 state assessment data. Minneapolis, MN:
University of Minnesota, National Center on Educational Outcomes. Available at
www.nceo.info/OnlinePubs/APRsummary2006.pdf
Thurlow, M., Quenemoen, R., Altman, J., & Cuthbert, M. (2007). Trends in the participation and performance of students with
disabilities (Technical Report 50). Minneapolis, MN: University of Minnesota, National Center on Educational Outcomes.
Available at www.nceo.info/OnlinePubs/Tech50/default.htm
Thurlow, M. L., & Wiley, H. I. (2004). Almost there in public reporting of assessment results for students with disabilities (Technical
Report 39). Minneapolis, MN: University of Minnesota, National Center on Educational Outcomes. Available at
www.nceo.info/OnlinePubs/Technical39.htm

63
Thurlow, M. L., Wiley, H. I., & Bielinski, J. (2002). Biennial performance reports: 2000-2001 state assessment data. Available at
www.nceo.info/OnlinePubs/BPRsummary.12.29.02.pdf
Thurlow, M. L., Wiley, H. I., & Bielinski, J. (2003). Going public: What 2000-2001 reports tell us about the performance of students
with disabilities (Technical Report 35). Minneapolis, MN: University of Minnesota, National Center on Educational
Outcomes. Available at www.nceo.info/OnlinePubs/Technical35.htm
VanGetson, G. R., & Thurlow, M.L. (2007). Nearing the target in disaggregated subgroup reporting to the public on 2004-2005
assessment results (Technical Report 46). Minneapolis, MN: University of Minnesota, National Center on Educational
Outcomes. Available at www.nceo.info/OnlinePubs/Tech46/TechReport46.pdf
Wiley, H. I., Thurlow, M. L., & Klein, J. (2005). Steady progress: State public reporting practices for students with disabilities after
the first year of NCLB (2002-2003) (Technical Report 40). Minneapolis, MN: University of Minnesota, National Center on
Educational Outcomes. Available at www.nceo.info/OnlinePubs/Technical40.htm

64
Appendix A
State-by-State Participation Data
This Appendix presents the state-by-state numbers that were used to generate the participation tables and figures in this document.
There are six tables in this Appendix (Tables A1-A6). The two content areas of Reading and Math are shown for each of three grade
levels—Elementary School, Middle School, and High School. The grades reflected in these three levels are grades 4, 8, and one grade
in high school (often this grade was not specified and in many states the test was given as an end of course exam not specific to one
grade level). The specific grade used for each state at each level is shown in Appendix C, along with participation data for all of the
grades on which a state reported.
Each row in Tables A1-A6 shows numbers for one state at one grade within the content area and school level. The third column shows
state-reported special education enrollment, that is, the number of students with an individualized education program (IEP). Following
that is the number of all students enrolled in the grade. It is important to remember that these two counts are often entered by states
either before or after the testing cycle is completed. Next are the numbers and percentages of students reported as taking each of three
kinds of assessments: Regular Assessment, Alternate Assessment based on Modified Achievement Standards (AA-MAS), and
Alternate Assessments based on Alternate Achievement Standards (AA-AAS). Students assessed using an Alternate Assessment based
on Grade Level Achievement Standards are footnoted at the bottom of each table. Note that these data do not include students who
were assessed on out-of-level assessments; these students were considered non-participants. Data for these students are available in
Appendix C.
Any scores that were invalid either because of problems in the testing process or due to changes in testing materials or procedures that
produced invalid results also are not included in these participation data. Consequently, participation counts shown by states in public
reports may be higher than those shown here. Information about invalid scores is shown in Appendix C. Alongside each participation
count in this Appendix, a percentage is shown that was calculated by dividing the number of participants by the number of students
with IEPs. The last count in each row shows a total count of participants. This was calculated by summing the counts reported as
participating in each type of assessment. The associated total participation percentage was calculated by dividing this summed count
of participants by the number of students with IEPs. This number is 100% if all or virtually all enrolled students with IEPs participated
in an assessment. Percentages that deviate substantially from 100% could be due to testing practices such as failing to include all

65
students, testing students out-of-grade level, invalid results, or issues in data management or other factors such as determining
enrollment numbers at a different time of the year from test administration, or to data tabulation or reporting errors.
The data in these tables were obtained directly from Table 6 of Section 618 reports posted to the RRFC website with the 2007-08
Annual Performance Reports whenever possible. For some states data were only available through the Data Accountability Center,
which analyzed state data submitted through the EdFacts system. These states were not required to attach Table 6 with their Annual
Performance Reports. All information is from the 2007-08 school year.
National data are presented in two ways. First, the “Population Average” participation percentages were calculated by summing data
across states and dividing by the total number of students with IEPs enrolled at the grade level. This produces data that reflect the
average value based on the number of students with disabilities across all states. Second, the “State Average” shows the average value
across the 50 states. This row gives equal weight to the data from each state. Similar calculations were conducted for the unique states.
Fifty regular states and seven unique states provided data that could be analyzed to fully complete the participation tables for the
regular assessment. Fifty regular states and seven unique states provided data that could be analyzed to fully complete the participation
tables for the alternate assessment.
In the paragraphs to follow, all information discussed refers to state averages unless specified otherwise.
Regular States
At the elementary school level, for the regular states, the average participation rate as a percentage of special education enrollment for
reading was 87.9% on the regular assessment, 3.3% on the alternate assessment based on modified achievement standards, 7.4% on
the alternate assessment based on alternate achievement standards; overall participation was 98.9%. For math at the elementary level,
average participation rates were 88.7% on the regular assessment, 2.9% on the alternate assessment based on modified achievement
standards, 7.1% on the alternate assessment based on alternate achievement standards; overall participation was 99.0%. Data show
that students with IEPs are slightly more likely to participate in one of the alternate assessments for reading than for math.
At the middle school level, for the regular states, the average participation rate as a percentage of special education enrollment for
reading was 86.5% on the regular assessment, 2.9% on the alternate assessment based on modified achievement standards, 7.9% on
the alternate assessment based on alternate achievement standards; overall participation was 97.7%. For math at the middle school
level, average participation rates were 86.1% on the regular assessment, 3.2% on the alternate assessment based on modified
achievement standards, 7.9% on the alternate assessment based on alternate achievement standards; overall participation was 97.6%.
Middle school data revealed little difference between reading and math assessment participation.

66
At the high school level, for the regular states, the average participation rate as a percentage of special education enrollment for
reading was 83.1% on the regular assessment, 3.0% on the alternate assessment based on modified achievement standards, 8.5% on
the alternate assessment based on alternate achievement standards; overall participation was 94.6%. For math at the high school level,
average participation rates were 81.7% on the regular assessment, 3.3% on the alternate assessment based on modified achievement
standards, 9.7% on the alternate assessment based on alternate achievement standards; overall participation was 94.6%. Data show
that there is lower participation at this school level than at others. Students were more likely to participate in one of the alternate
assessments in the subject area of math than in reading.
For population averages, for reading in the regular states, participation rates were 98.9% at the elementary level, 97.6% at the middle
school level, and 93.6% at the high school level. For population averages for math in the regular states, participation rates were 99.0%
at the elementary level, 97.4% at the middle school level, and 94.9% at the high school level.
Unique States
For the unique states, it is important to keep in mind the small numbers of states. Due to the inclusion of different numbers of unique
states at the elementary, middle school, and high school levels the numbers on which averages are calculated tend to fluctuate greatly.
At the elementary school level, for the unique states in which a participation rate could be calculated, the average participation rate as
a percentage of special education enrollment for reading was 85.3% on the regular assessment, 0.5% on the alternate assessment based
on modified achievement standards, 9.4% on the alternate assessment based on alternate achievement standards; overall participation
was 95.0%. For math at the elementary level, average participation rates were 86.9% on the regular assessment, 0.3% on the alternate
assessment based on modified achievement standards, 9.5% on the alternate assessment based on alternate achievement standards;
overall participation was 96.7%.
At the middle school level, among the unique states in which a participation rate could be calculated, the average participation rate as
a percentage of special education enrollment for reading was 76.5% on the regular assessment, 0.5% on the alternate assessment based
on modified achievement standards, 6.8% on the alternate assessment based on alternate achievement standards; overall participation
was 83.7%. For math at the middle school level, average participation rates were 79.7% on the regular assessment, 0.4% on the
alternate assessment based on modified achievement standards, 6.9% on the alternate assessment based on alternate achievement
standards; overall participation was 87.1%.

67
At the high school level, among the unique states in which a participation rate could be calculated, the average participation rate as a
percentage of special education enrollment for reading was 64.1% on the regular assessment, 0.6% on the alternate assessment based
on modified achievement standards, 13.0% on the alternate assessment based on alternate achievement standards; overall participation
was 77.7%. For math at the high school level, average participation rates were 67.3% on the regular assessment, 0.6% on the alternate
assessment based on modified achievement standards, 13.0% on the alternate assessment based on alternate achievement standards;
overall participation was 80.9%.
For population averages, for reading in the unique states, participation rates were 96.6% at the elementary level, 92.9% at the middle
school level, and 88.0% at the high school level. For population averages for math in the unique states, participation rates were 97.2%
at the elementary level, 94.0% at the middle school level, and 89.7% at the high school level.
Table A1
Elementary Reading Participation
Regular Assessment
Alternate Assessment on Modified
Standards
Alternate Assessment on
Academic Achievement Standards Total Assessed
State Grade
IEP
Enrollment
Total
Enrollment Number
Percent of
IEP Number Percent of IEP Number Percent of IEP Number
Percent of
IEP
AK 4 1482 9347 1387 93.6% 67 4.5% 1454 98.11%
AL 4 6923 57803 6414 92.6% 442 6.4% 6856 99.03%
AR 4 4424 35698 3915 88.5% 474 10.7% 4389 99.21%
AZ 4 11335 82731 10417 91.9% 731 6.4% 11148 98.35%
CA 4 57596 464652 38195 66.3% 13897 24.1% 4493 7.8% 56585 98.24%
CO 4 6675 59065 5945 89.1% 630 9.4% 6575 98.50%
CT 4 5231 42613 4639 88.7% 491 9.4% 5130 98.07%
DE 4 1375 9115 1267 92.1% 94 6.8% 1361 98.98%
FL 4 31810 196023 29102 91.5% 2229 7.0% 31331 98.49%
GA 4 16700 124319 15693 94.0% 936 5.6% 16629 99.57%
HI 4 1389 13605 1281 92.2% 56 4.0% 1337 96.26%
IA 4 4761 34295 4531 95.2% 219 4.6% 4750 99.77%
ID 4 2130 20675 1941 91.1% 173 8.1% 2114 99.25%
IL 4 22745 153606 20652 90.8% 1714 7.5% 22366 98.33%
IN 4 13132 78204 13270 101.1% 599 4.6% 13869 105.61%
KS 4 5437 33931 3880 71.4% 1167 21.5% 367 6.8% 5414 99.58%
KY 4 6896 49112 6436 93.3% 460 6.7% 6896 100.00%
LA 4 8764 56234 7448 85.0% 868 9.9% 432 4.9% 8748 99.82%
MAa 4 13299 72004 11896 89.5% 1219 9.2% 13134 98.76%

68
Regular Assessment
Alternate Assessment on Modified
Standards
Alternate Assessment on
Academic Achievement Standards Total Assessed
State Grade
IEP
Enrollment
Total
Enrollment Number
Percent of
IEP Number Percent of IEP Number Percent of IEP Number
Percent of
IEP
MD 4 7767 60439 7183 92.5% 536 6.9% 7719 99.38%
ME 4 2523 14206 2378 94.3% 126 5.0% 2504 99.25%
MI 4 17089 118963 13454 78.7% 3426 20.0% 16880 98.78%
MN 4 8861 59326 7879 88.9% 856 9.7% 8735 98.58%
MO 4 10460 67630 9717 92.9% 726 6.9% 10443 99.84%
MS 4 4047 38964 3507 86.7% 433 10.7% 3940 97.36%
MT 4 1376 10522 1270 92.3% 91 6.6% 1361 98.91%
NCa 4 15814 111944 11654 73.7% 3181 20.1% 880 5.6% 15761 99.66%
ND 4 1091 6957 821 75.3% 166 15.2% 86 7.9% 1073 98.35%
NE 4 3799 23492 3558 93.7% 199 5.2% 3757 98.89%
NH 4 2309 15089 2144 92.9% 142 6.1% 2286 99.00%
NJ 4 17142 103218 15664 91.4% 1069 6.2% 16733 97.61%
NM 4 3099 24364 2876 92.8% 167 5.4% 3043 98.19%
NV 4 3905 33577 3638 93.2% 249 6.4% 3887 99.54%
NY 4 35015 201918 31965 91.3% 2201 6.3% 34166 97.58%
OH 4 20727 132512 18021 86.9% 2571 12.4% 20592 99.35%
OK 4 7842 46852 3878 49.5% 3163 40.3% 528 6.7% 7569 96.52%
OR 4 6554 42765 5527 84.3% 942 14.4% 6469 98.70%
PA 4 22386 130008 20526 91.7% 1649 7.4% 22175 99.06%
RI 4 1997 11129 1899 95.1% 72 3.6% 1971 98.70%
SC 4 7714 52695 7260 94.1% 401 5.2% 7661 99.31%
SD 4 1245 8790 1158 93.0% 84 6.7% 1242 99.76%
TN 4 8950 73848 8263 92.3% 636 7.1% 8899 99.43%
TX 4 37551 348654 22529 60.0% 12274 32.7% 2398 6.4% 37201 99.07%
UT 4 6718 42558 6251 93.0% 448 6.7% 6699 99.72%
VAa 4 12485 89838 9479 75.9% 1028 8.2% 12443 99.66%
VT 4 755 6454 675 89.4% 65 8.6% 740 98.01%
WA 4 10549 76827 9533 90.4% 729 6.9% 10262 97.28%
WI 4 8614 60081 7565 87.8% 893 10.4% 8458 98.19%
WV 4 3436 20213 3124 90.9% 269 7.8% 3393 98.75%
WY 4 1079 6504 995 92.2% 64 5.9% 1059 98.15%
Population Mean 515003 3633369 432700 84.0% 34716 6.7% 39790 7.7% 509207 98.87%
State Average 87.9% 3.3% 7.4% 98.89%
AS 4 89 991 70 78.7% 5 5.6% 75 84.27%
BIE 4 591 3490 539 91.2% 17 2.9% 32 5.4% 588 99.49%

69
Regular Assessment
Alternate Assessment on Modified
Standards
Alternate Assessment on
Academic Achievement Standards Total Assessed
State Grade
IEP
Enrollment
Total
Enrollment Number
Percent of
IEP Number Percent of IEP Number Percent of IEP Number
Percent of
IEP
CNMI 4 77 847 62 80.5% 15 19.5% 77 100.00%
DC 4 965 4731 849 88.0% 85 8.8% 934 96.79%
FSM 4
GU 4 125 2475 102 81.6% 8 6.4% 110 88.00%
Palau 4 15 223 13 86.7% 2 13.3% 15 100.00%
PR 4
RMI 4
VI 4 123 1188 111 90.2% 8 6.5% 119 96.75%
Population
Average 1985 13945 1746 88.0% 17 0.9% 155 7.8% 1918 96.62%
Unique State
Average 85.3% 0.5% 9.4% 95.04% aThe following states also reported assessing students using an Alternate Assessment based on Grade-level Achievement Standards, MA(19), NC (46), and VA
(1936)

70
Table A2
Middle School Reading Participation
Regular Assessment
Alternate Assessment on
Modified Standards
Alternate Assessment on
Academic Achievement
Standards Total Assessed
State Grade
IEP
Enrollment
Total
Enrollment Number
Percent
of IEP Number Percent of IEP Number Percent of IEP Number
Percent of
IEP
AK 8 1199 9737 1110 92.6% 65 5.4% 1175 98.00%
AL 8 7098 57990 6469 91.1% 501 7.1% 6970 98.20%
AR 8 4431 35467 3932 88.7% 447 10.1% 4379 98.83%
AZ 8 9943 81850 8807 88.6% 794 8.0% 9601 96.56%
CA 8 51454 487914 45248 87.9% 4711 9.2% 49959 97.09%
CO 8 5768 57731 5074 88.0% 506 8.8% 5580 96.74%
CT 8 5484 43930 4863 88.7% 420 7.7% 5283 96.33%
DE 8 1569 10324 1404 89.5% 117 7.5% 1521 96.94%
FL 8 25009 193817 21523 86.1% 2447 9.8% 23970 95.85%
GA 8 14801 122071 13256 89.6% 1429 9.7% 14685 99.22%
HI 8 1580 13361 1475 93.4% 63 4.0% 1538 97.34%
IA 8 5273 35685 5054 95.8% 210 4.0% 5264 99.83%
ID 8 1843 20407 1647 89.4% 177 9.6% 1824 98.97%
IL 8 23412 161119 21151 90.3% 1889 8.1% 23040 98.41%
IN 8 12116 80850 11069 91.4% 807 6.7% 11876 98.02%
KS 8 4961 34346 3504 70.6% 1112 22.4% 306 6.2% 4922 99.21%
KY 8 6032 49469 5417 89.8% 615 10.2% 6032 100.00%
LA 8 6306 51363 4409 69.9% 1277 20.3% 567 9.0% 6253 99.16%
MAa 8 13425 74464 12055 89.8% 961 7.2% 13027 97.04%
MD 8 7996 65438 6999 87.5% 789 9.9% 7788 97.40%
ME 8 2508 15274 2269 90.5% 177 7.1% 2446 97.53%
MI 8 17480 126545 13825 79.1% 3371 19.3% 17196 98.38%
MN 8 8473 63102 7448 87.9% 873 10.3% 8321 98.21%
MO 8 9061 68073 8364 92.3% 642 7.1% 9006 99.39%
MS 8 4245 40069 3571 84.1% 420 9.9% 3991 94.02%
MT 8 1428 11151 1299 91.0% 78 5.5% 1377 96.43%
NCa 8 13670 111321 9730 71.2% 2829 20.7% 896 6.6% 13498 98.74%
ND 8 1048 7423 750 71.6% 168 16.0% 89 8.5% 1007 96.09%
NE 8 2991 23826 2687 89.8% 221 7.4% 2908 97.23%
NH 8 2727 16371 2531 92.8% 143 5.2% 2674 97.95%
NJ 8 18188 106445 16830 92.5% 915 5.0% 17745 97.56%

71
Regular Assessment
Alternate Assessment on
Modified Standards
Alternate Assessment on
Academic Achievement
Standards Total Assessed
State Grade
IEP
Enrollment
Total
Enrollment Number
Percent
of IEP Number Percent of IEP Number Percent of IEP Number
Percent of
IEP
NM 8 3212 24576 2907 90.5% 235 7.3% 3142 97.82%
NV 8 3570 33569 3274 91.7% 261 7.3% 3535 99.02%
NY 8 36530 216523 32349 88.6% 2455 6.7% 34804 95.28%
OH 8 21546 139283 18568 86.2% 2661 12.4% 21229 98.53%
OK 8 7533 45963 3535 46.9% 2937 39.0% 437 5.8% 6909 91.72%
OR 8 5494 42660 4897 89.1% 451 8.2% 5348 97.34%
PA 8 24362 143489 21720 89.2% 2058 8.4% 23778 97.60%
RI 8 2362 12120 2196 93.0% 94 4.0% 2290 96.95%
SC 8 6926 52907 6606 95.4% 221 3.2% 6827 98.57%
SD 8 936 9334 837 89.4% 96 10.3% 933 99.68%
TN 8 8487 72422 7558 89.1% 818 9.6% 8376 98.69%
TX 8 40569 334480 25875 63.8% 11732 28.9% 2509 6.2% 40116 98.88%
UT 8 4616 39316 4165 90.2% 410 8.9% 4575 99.11%
VAa 8 14014 93951 10301 73.5% 1107 7.9% 13824 98.64%
VT 8 1021 7087 923 90.4% 70 6.9% 993 97.26%
WA 8 8693 78095 7620 87.7% 638 7.3% 8258 95.00%
WI 8 9323 64154 8271 88.7% 881 9.4% 9152 98.17%
WV 8 3210 21198 2832 88.2% 276 8.6% 3108 96.82%
WY 8 892 6577 810 90.8% 59 6.6% 869 97.42%
Population
Average 494815 3714637 419014 84.7% 20081 4.1% 41535 8.4% 482922 97.60%
State Average 86.5% 2.9% 7.9% 97.66%
AS 8 125 1119 122 97.6% 3 2.4% 125 100.00%
BIE 8 630 3582 576 91.4% 26 4.1% 18 2.9% 620 98.41%
CNMI 8 85 795 73 85.9% 10 11.8% 83 97.65%
DC 8 1391 5176 1225 88.1% 96 6.9% 1321 94.97%
FSM 8 93 1569 20 21.5% 2 2.2% 22 23.66%
GU 8 189 2352 160 84.7% 4 2.1% 164 86.77%
Palau 8 14 254 12 85.7% 2 14.3% 14 100.00%
PR 8
RMI 8 27 1107 12 44.4% 2 7.4% 14 51.85%
VI 8 137 1227 122 89.1% 15 10.9% 137 100.00%
Population
Average 2691 17181 2322 86.3% 26 1.0% 152 5.6% 2500 92.90%

72
Regular Assessment
Alternate Assessment on
Modified Standards
Alternate Assessment on
Academic Achievement
Standards Total Assessed
State Grade
IEP
Enrollment
Total
Enrollment Number
Percent
of IEP Number Percent of IEP Number Percent of IEP Number
Percent of
IEP
Unique State
Average 76.5% 0.5% 6.8% 83.70% aThe following states also reported assessing students using an Alternate Assessment based on Grade-level Achievement Standards: MA(11), NC (43), and VA
(2416)

73
Table A3
High School Reading Participation
Regular Assessment
Alternate Assessment on Modified
Standards
Alternate Assessment on Academic
Achievement Standards Total Assessed
State Grade
IEP
Enrollment
Total
Enrollment Number Percent of IEP Number Percent of IEP Number Percent of IEP Number
Percent of
IEP
AK H 1066 9990 919 86.2% 89 8.3% 1008 94.56%
AL H 4835 47977 4283 88.6% 448 9.3% 4731 97.85%
AR H 3941 31087 3310 84.0% 553 14.0% 3863 98.02%
AZ H 8096 77634 7044 87.0% 716 8.8% 7760 95.85%
CA H 43333 471683 37913 87.5% 1441 3.3% 39354 90.82%
CO H 5717 61045 4845 84.7% 566 9.9% 5411 94.65%
CT H 4898 42859 4041 82.5% 442 9.0% 4483 91.53%
DE H 1174 9067 978 83.3% 136 11.6% 1114 94.89%
FL H 27211 204527 21550 79.2% 2935 10.8% 24485 89.98%
GA H 8804 93575 7321 83.2% 1172 13.3% 8493 96.47%
HI H 1673 12982 1497 89.5% 49 2.9% 1546 92.41%
IA H 4703 36341 4475 95.2% 200 4.3% 4675 99.40%
ID H 1662 19997 1474 88.7% 152 9.1% 1626 97.83%
IL H 17740 140263 14520 81.8% 1666 9.4% 16186 91.24%
IN H 12234 81967 10019 81.9% 830 6.8% 10849 88.68%
KS H 3218 24567 2186 67.9% 677 21.0% 296 9.2% 3159 98.17%
KY H 5289 49266 4701 88.9% 588 11.1% 5289 100.00%
LA H 3321 42947 2413 72.7% 411 12.4% 434 13.1% 3258 98.10%
MAa H 12125 73540 10567 87.2% 859 7.1% 11433 94.29%
MD H 5609 55714 4391 78.3% 362 6.5% 825 14.7% 5578 99.45%
ME H 2213 15604 1825 82.5% 209 9.4% 2034 91.91%
MI H 14506 123816 10354 71.4% 2774 19.1% 13128 90.50%
MN H 8235 67503 7122 86.5% 832 10.1% 7954 96.59%
MO H 7705 63218 7039 91.4% 581 7.5% 7620 98.90%
MS H 2148 33048 1920 89.4% 0 0.0% 1920 89.39%
MT H 1346 11449 1114 82.8% 124 9.2% 1238 91.98%
NCa H 10128 96847 7141 70.5% 1984 19.6% 604 6.0% 9776 96.52%
ND H 935 7671 620 66.3% 176 18.8% 100 10.7% 896 95.83%
NE H 2590 24180 2317 89.5% 183 7.1% 2500 96.53%
NH H 2640 16467 2317 87.8% 111 4.2% 2428 93.18%
NJ H 16037 100202 14458 90.2% 1045 6.5% 15503 96.67%
NM H 2704 20363 2389 88.4% 189 7.0% 2578 95.34%

74
Regular Assessment
Alternate Assessment on Modified
Standards
Alternate Assessment on Academic
Achievement Standards Total Assessed
State Grade
IEP
Enrollment
Total
Enrollment Number Percent of IEP Number Percent of IEP Number Percent of IEP Number
Percent of
IEP
NV H 3008 31869 2641 87.8% 205 6.8% 2846 94.61%
NY H 24601 195534 19288 78.4% 1333 5.4% 20621 83.82%
OH H 21711 145409 18744 86.3% 2320 10.7% 21064 97.02%
OK H 6410 44652 2909 45.4% 2539 39.6% 476 7.4% 5924 92.42%
OR H 5048 44269 4261 84.4% 415 8.2% 4676 92.63%
PA H 21035 140507 18379 87.4% 1793 8.5% 20172 95.90%
RI H 2012 11427 1804 89.7% 60 3.0% 1864 92.64%
SC H 6657 52436 6066 91.1% 323 4.9% 6389 95.97%
SD H 714 8253 623 87.3% 87 12.2% 710 99.44%
TN H 6161 67876 5382 87.4% 667 10.8% 6049 98.18%
TX H 34179 318610 20933 61.2% 10183 29.8% 2028 5.9% 33144 96.97%
UT H 3888 41172 3388 87.1% 433 11.1% 3821 98.28%
VAa H 10036 90882 8947 89.1% 888 8.8% 9835 98.00%
VT H 993 7404 831 83.7% 60 6.0% 891 89.73%
WA H 8411 83725 6135 72.9% 618 7.3% 6753 80.29%
WI H 9536 70185 8367 87.7% 788 8.3% 9155 96.00%
WV H 2894 20002 2516 86.9% 236 8.2% 2752 95.09%
WY H 603 6043 531 88.1% 55 9.1% 586 97.18%
Population
Average 415733 3547651 338808 81.5% 16332 3.9% 33934 8.2% 389128 93.60%
State Average 83.1% 3.0% 8.5% 94.63%
AS H 94 1060 80 85.1% 4 4.3% 84 89.36%
BIE H 524 12591 447 85.3% 24 4.6% 28 5.3% 499 95.23%
CNMI H 26 608 23 88.5% 3 11.5% 26 100.00%
DC H 675 4118 556 82.4% 55 8.1% 611 90.52%
FSM H 88 1444 0 0.0% 3 3.4% 3 3.41%
GU H 179 3139 165 92.2% 1 0.6% 166 92.74%
Palau H 4 169 0 0.0% 2 50.0% 2 50.00%
PR H
RMI H
VI H 67 1040 53 79.1% 14 20.9% 67 100.00%
Population
Average 1657 24169 1324 79.9% 24 1.4% 110 6.6% 1458 87.99%
Unique State
Average 64.1% 0.6% 13.0% 77.66%

75
aThe following states also reported assessing students using an Alternate Assessment based on Grade-level Achievement Standards: MA(7), and NC (47)

76
Table A4
Elementary Mathematics Participation
Regular Assessment
Alternate Assessment on
Modified Standards
Alternate Assessment on
Academic Achievement
Standards Total Assessed
State Grade
IEP
Enrollment
Total
Enrollment Number Percent of IEP Number Percent of IEP Number Percent of IEP Number
Percent of
IEP
AK 4 1482 9347 1395 94.1% 67 4.5% 1462 98.65%
AL 4 6796 57804 6292 92.6% 442 6.5% 6734 99.09%
AR 4 4424 35698 3910 88.4% 474 10.7% 4384 99.10%
AZ 4 11353 82731 10411 91.7% 731 6.4% 11142 98.14%
CA 4 57581 464513 40408 70.2% 11616 20.2% 4389 7.6% 56413 97.97%
CO 4 6687 59069 5972 89.3% 584 8.7% 6556 98.04%
CT 4 5231 42613 4691 89.7% 491 9.4% 5182 99.06%
DE 4 1375 9115 1271 92.4% 94 6.8% 1365 99.27%
FL 4 31810 196023 29123 91.6% 2219 7.0% 31342 98.53%
GA 4 16699 124312 15676 93.9% 940 5.6% 16616 99.50%
HI 4 1389 13605 1282 92.3% 56 4.0% 1338 96.33%
IA 4 4761 34264 4524 95.0% 218 4.6% 4742 99.60%
ID 4 2129 20675 1939 91.1% 169 7.9% 2108 99.01%
IL 4 22745 153606 20630 90.7% 1714 7.5% 22344 98.24%
IN 4 13132 78204 13201 100.5% 599 4.6% 13800 105.09%
KS 4 5432 33919 4127 76.0% 917 16.9% 356 6.6% 5400 99.41%
KY 4 6896 49112 6436 93.3% 460 6.7% 6896 100.00%
LA 4 8764 56232 7447 85.0% 866 9.9% 432 4.9% 8745 99.78%
MAa 4 13309 72112 11975 90.0% 1226 9.2% 13214 99.29%
MD 4 7771 60460 7181 92.4% 537 6.9% 7718 99.32%
ME 4 2523 14206 2372 94.0% 126 5.0% 2498 99.01%
MI 4 17089 118963 13880 81.2% 3049 17.8% 16929 99.06%
MN 4 8858 59353 7963 89.9% 801 9.0% 8764 98.94%
MO 4 10461 67703 9718 92.9% 725 6.9% 10443 99.83%
MS 4 4047 38964 3508 86.7% 431 10.6% 3939 97.33%
MT 4 1376 10522 1272 92.4% 91 6.6% 1363 99.06%
NCa 4 16378 111948 12645 77.2% 2743 16.7% 884 5.4% 16318 99.63%
ND 4 1091 6957 881 80.8% 118 10.8% 84 7.7% 1083 99.27%
NE 4 3796 23492 3557 93.7% 202 5.3% 14 0.4% 3773 99.03%
NH 4 2309 15089 2142 92.8% 142 6.1% 2284 98.92%
NJ 4 17142 103218 15749 91.9% 1033 6.0% 16782 97.90%

77
Regular Assessment
Alternate Assessment on
Modified Standards
Alternate Assessment on
Academic Achievement
Standards Total Assessed
State Grade
IEP
Enrollment
Total
Enrollment Number Percent of IEP Number Percent of IEP Number Percent of IEP Number
Percent of
IEP
NM 4 3101 24367 2894 93.3% 157 5.1% 3051 98.39%
NV 4 3905 33577 3632 93.0% 249 6.4% 3881 99.39%
NY 4 35000 202067 31964 91.3% 2204 6.9% 34618 97.62%
OH 4 20552 132656 17875 87.0% 2576 12.5% 20451 99.51%
OK 4 7661 46643 4263 55.6% 2770 36.2% 528 6.9% 7561 98.69%
OR 4 6553 42765 5676 86.6% 781 11.9% 6457 98.54%
PA 4 22401 130271 20584 91.9% 1649 7.4% 22233 99.25%
RI 4 1991 11129 1895 95.2% 71 3.6% 1966 98.74%
SC 4 7714 52694 7286 94.5% 400 5.2% 7686 99.64%
SD 4 1245 8790 1158 93.0% 84 6.7% 1242 99.76%
TN 4 8950 73848 8257 92.3% 636 7.1% 8893 99.36%
TX 4 37486 348048 23832 63.6% 10986 29.3% 2400 6.4% 37218 99.29%
UT 4 6146 44936 5681 92.4% 447 7.3% 6128 99.71%
VAa 4 12500 90245 10034 80.3% 1029 8.2% 12459 99.67%
VT 4 754 6463 676 89.7% 64 8.5% 740 98.14%
WA 4 10549 76827 9549 90.5% 717 6.8% 10266 97.32%
WI 4 8614 60081 7744 89.9% 756 8.8% 8500 98.68%
WV 4 3436 20213 3125 90.9% 267 7.8% 3392 98.72%
WY 4 1079 6515 999 92.6% 64 5.9% 1063 98.52%
Population
Average 514473 3635964 438702 85.3% 30218 5.9% 38657 7.5% 509482 99.03%
State Average 88.7% 2.9% 7.1% 99.01%
AS 4 89 991 82 92.1% 5 5.6% 87 97.75%
BIE 4 556 3490 514 92.4% 12 2.2% 27 4.9% 553 99.46%
CNMI 3 72 848 54 75.0% 15 20.8% 69 95.83%
DC 4 965 4731 849 88.0% 85 8.8% 934 96.79%
FSM 4
GU 4 125 2475 105 84.0% 8 6.4% 113 90.40%
Palau 4 15 222 13 86.7% 2 13.3% 15 100.00%
PR 4
RMI 4
VI 4 123 1188 111 90.2% 8 6.5% 119 96.75%
Population
Average 1945 13945 1728 88.8% 12 0.6% 150 7.7% 1890 97.17%

78
Regular Assessment
Alternate Assessment on
Modified Standards
Alternate Assessment on
Academic Achievement
Standards Total Assessed
State Grade
IEP
Enrollment
Total
Enrollment Number Percent of IEP Number Percent of IEP Number Percent of IEP Number
Percent of
IEP
Unique State
Average 86.9% 0.3% 9.5% 96.71% aThe following states also reported assessing students using an Alternate Assessment based on Grade-level Achievement Standards, MA(13), NC (46), and VA
(1396)

79
Table A5
Middle School Mathematics Participation
Regular Assessment
Alternate Assessment on Modified
Standards
Alternate Assessment on
Academic Achievement
Standards Total Assessed
State Grade
IEP
Enrollment
Total
Enrollment Number
Percent
of IEP Number Percent of IEP Number Percent of IEP Number
Percent of
IEP
AK 8 1199 9737 1110 92.6% 65 5.4% 1175 98.00%
AL 8 7005 57990 6362 90.8% 499 7.1% 6861 97.94%
AR 8 4431 35467 3926 88.6% 447 10.1% 4373 98.69%
AZ 8 10327 81850 8801 85.2% 794 7.7% 9595 92.91%
CA 8 51433 487776 44897 87.3% 4643 9.0% 49540 96.32%
CO 8 5765 57743 5099 88.4% 511 8.9% 5610 97.31%
CT 8 5484 43930 4894 89.2% 420 7.7% 5314 96.90%
DE 8 1569 10324 1412 90.0% 117 7.5% 1529 97.45%
FL 8 25009 193817 21415 85.6% 2442 9.8% 23857 95.39%
GA 8 14800 122065 13260 89.6% 1417 9.6% 14677 99.17%
HI 8 1580 13361 1469 93.0% 63 4.0% 1532 96.96%
IA 8 5273 35663 5007 95.0% 205 3.9% 5212 98.84%
ID 8 1843 20407 1637 88.8% 182 9.9% 1819 98.70%
IL 8 23412 161119 21128 90.2% 1888 8.1% 23016 98.31%
IN 8 12116 80850 11041 91.1% 807 6.7% 11848 97.79%
KS 8 4955 34320 3493 70.5% 1099 22.2% 310 6.3% 4902 98.93%
KY 8 6032 49469 5417 89.8% 615 10.2% 6032 100.00%
LA 8 6300 51348 4402 69.9% 1275 20.2% 565 9.0% 6242 99.08%
MAa
8 13435 74540 11993 89.3% 1026 7.6% 13047 97.11%
MD 8 8003 65451 6999 87.5% 789 9.9% 7788 97.31%
ME 8 2508 15274 2265 90.3% 176 7.0% 2441 97.33%
MI 8 17480 126545 13958 79.9% 3309 18.9% 17267 98.78%
MN 8 8470 63126 7421 87.6% 873 10.3% 8294 97.92%
MO 8 9057 68128 8360 92.3% 642 7.1% 9002 99.39%
MS 8 4245 40069 3573 84.2% 418 9.8% 3991 94.02%
MT 8 1428 11151 1279 89.6% 78 5.5% 1357 95.03%
NCa 8 14706 111346 10799 73.4% 2789 19.0% 903 6.1% 14538 98.86%
ND 8 1048 7671 757 72.2% 177 16.9% 95 9.1% 1029 98.19%
NE 8 2982 23826 2612 87.6% 223 7.5% 91 3.1% 2926 95.07%
NH 8 2727 16371 2526 92.6% 143 5.2% 2669 97.87%
NJ 8 18188 106445 16732 92.0% 934 5.1% 17666 97.13%

80
Regular Assessment
Alternate Assessment on Modified
Standards
Alternate Assessment on
Academic Achievement
Standards Total Assessed
State Grade
IEP
Enrollment
Total
Enrollment Number
Percent
of IEP Number Percent of IEP Number Percent of IEP Number
Percent of
IEP
NM 8 3214 24579 2918 90.8% 227 7.1% 3145 97.85%
NV 8 3570 33569 3270 91.6% 260 7.3% 3530 98.88%
NY 8 36446 216546 32124 88.1% 2441 6.7% 34565 94.84%
OH 8 21410 139432 18426 86.1% 2660 12.4% 21086 98.49%
OK 8 6994 44740 3378 48.3% 3035 43.4% 437 6.2% 6850 97.94%
OR 8 5495 42660 4903 89.2% 453 8.2% 5356 97.47%
PA 8 24370 143679 21799 89.5% 2058 8.4% 23857 97.89%
RI 8 2357 12120 2193 93.0% 106 4.5% 2299 97.54%
SC 8 6925 52904 6614 95.5% 221 3.2% 6835 98.70%
SD 8 936 9334 837 89.4% 96 10.3% 933 99.68%
TN 8 8496 72422 7570 89.1% 818 9.6% 8388 98.73%
TX 8 40447 333958 24289 60.1% 13182 32.6% 2522 6.2% 39993 98.88%
UT 8 3707 41736 3144 84.8% 411 11.1% 3555 95.90%
VAa 8 14609 93163 10358 70.9% 1114 7.6% 14363 98.32%
VT 8 1023 7093 924 90.3% 69 6.7% 993 97.07%
WA 8 8693 78095 7587 87.3% 657 7.6% 8244 94.83%
WI 8 9323 64154 8272 88.7% 872 9.4% 9144 98.08%
WV 8 3210 21198 2837 88.4% 275 8.6% 3112 96.95%
WY 8 892 6579 813 91.1% 60 6.7% 873 97.87%
Population
Average 494927 3715140 416300 84.1% 21780 4.4% 41224 8.3% 482270 97.44%
State Average 86.1% 3.2% 7.9% 97.57%
AS 8 125 1119 120 96.0% 3 2.4% 123 98.40%
BIE 8 609 3582 556 91.3% 24 3.9% 18 3.0% 598 98.19%
CNMI 8 86 795 73 84.9% 10 11.6% 83 96.51%
DC 8 1391 5176 1225 88.1% 96 6.9% 1321 94.97%
FSM 8 93 1569 47 50.5% 3 3.2% 50 53.76%
GU 8 189 2352 165 87.3% 5 2.6% 170 89.95%
Palau 8 14 265 12 85.7% 2 14.3% 14 100.00%
PR 8
RMI 8 27 1107 12 44.4% 2 7.4% 14 51.85%
VI 8 137 1227 122 89.1% 15 10.9% 137 100.00%
Population
Average 2671 17192 2332 87.3% 24 0.9% 154 5.8% 2510 93.97%

81
Regular Assessment
Alternate Assessment on Modified
Standards
Alternate Assessment on
Academic Achievement
Standards Total Assessed
State Grade
IEP
Enrollment
Total
Enrollment Number
Percent
of IEP Number Percent of IEP Number Percent of IEP Number
Percent of
IEP
Unique State
Average 79.7% 0.4% 6.9% 87.07% aThe following states also reported assessing students using an Alternate Assessment based on Grade-level Achievement Standards: MA(28), NC (47), and VA
(2891)

82
Table A6
High School Mathematics Participation
Regular Assessment
Alternate Assessment on
Modified Standards
Alternate Assessment on
Academic Achievement Standards Total Assessed
State Grade
IEP
Enrollment
Total
Enrollment Number Percent of IEP Number Percent of IEP Number Percent of IEP Number
Percent of
IEP
AK H 1066 9990 911 85.5% 89 8.3% 1000 93.81%
AL H 4826 47977 4271 88.5% 448 9.3% 4719 97.78%
AR H 7181 71973 4770 66.4% 2188 30.5% 6958 96.89%
AZ H 8096 76701 6866 84.8% 716 8.8% 7582 93.65%
CA H 43298 472019 39897 92.1% 4615 10.7% 44512 102.80%
CO H 5723 61078 4911 85.8% 563 9.8% 5474 95.65%
CT H 4898 42859 4002 81.7% 442 9.0% 4444 90.73%
DE H 1175 9067 977 83.1% 137 11.7% 1114 94.81%
FL H 27211 204527 21116 77.6% 2936 10.8% 24052 88.39%
GA H 8919 94017 7434 83.4% 1176 13.2% 8610 96.54%
HI H 1673 12982 1489 89.0% 49 2.9% 1538 91.93%
IA H 4703 36332 4464 94.9% 201 4.3% 4665 99.19%
ID H 1662 19997 1471 88.5% 156 9.4% 1627 97.89%
IL H 17740 140263 14557 82.1% 1664 9.4% 16221 91.44%
IN H 12234 81967 9872 80.7% 830 6.8% 10702 87.48%
KS H 1836 10052 1198 65.3% 504 27.5% 80 4.4% 1782 97.06%
KY H 4376 44438 3816 87.2% 560 12.8% 4376 100.00%
LA H 3329 42950 2420 72.7% 404 12.1% 433 13.0% 3257 97.84%
MAa H 12080 73391 10473 86.7% 855 7.1% 11341 93.88%
MD H 5694 55067 4522 79.4% 316 5.5% 825 14.5% 5663 99.46%
ME H 2213 15604 1898 85.8% 209 9.4% 2107 95.21%
MI H 14506 123816 10543 72.7% 2768 19.1% 13311 91.76%
MN H 7561 65818 6249 82.6% 879 11.6% 7128 94.27%
MO H 9043 69783 8241 91.1% 692 7.7% 8933 98.78%
MS H 1923 33608 1689 87.8% 0 0.0% 1689 87.83%
MT H 1346 11449 1129 83.9% 124 9.2% 1253 93.09%
NCa H 10812 93874 7880 72.9% 1416 13.1% 605 5.6% 9924 91.79%
ND H 935 7718 625 66.8% 165 17.6% 105 11.2% 895 95.72%
NE H 2514 24180 2112 84.0% 166 6.6% 156 6.2% 2434 91.49%
NH H 2640 16467 2303 87.2% 111 4.2% 2414 91.44%
NJ H 16037 100202 14421 89.9% 987 6.2% 15408 96.08%
NM H 2706 20365 2389 88.3% 191 7.1% 2580 95.34%

83
Regular Assessment
Alternate Assessment on
Modified Standards
Alternate Assessment on
Academic Achievement Standards Total Assessed
State Grade
IEP
Enrollment
Total
Enrollment Number Percent of IEP Number Percent of IEP Number Percent of IEP Number
Percent of
IEP
NV H 3008 31869 2700 89.8% 205 6.8% 2905 96.58%
NY H 24601 195534 20324 82.6% 1301 5.3% 21625 87.90%
OH H 21665 145540 18712 86.4% 2322 10.7% 21034 97.09%
OK H 6455 43950 2964 45.9% 3125 48.4% 504 7.8% 6593 102.14%
OR H 5047 44269 4182 82.9% 420 8.3% 4602 91.18%
PA H 21035 140593 18407 87.5% 1793 8.5% 20200 96.03%
RI H 2004 11427 1795 89.6% 63 3.1% 1858 92.71%
SC H 6656 52430 6047 90.9% 321 4.8% 6368 95.67%
SD H 714 8253 622 87.1% 87 12.2% 709 99.30%
TN H 2115 38385 1206 57.0% 851 40.2% 2057 97.26%
TX H 33331 314399 18894 56.7% 11508 34.5% 2025 6.1% 32427 97.29%
UT H 4832 44023 3285 68.0% 1096 22.7% 4381 90.67%
VAa H 21698 263054 20400 94.0% 890 4.1% 21290 98.12%
VT H 983 7392 811 82.5% 60 6.1% 871 88.61%
WA H 8411 83725 6193 73.6% 616 7.3% 6809 80.95%
WI H 9536 70185 8378 87.9% 773 8.1% 9151 95.96%
WV H 2894 20002 2517 87.0% 237 8.2% 2754 95.16%
WY H 603 6048 529 87.7% 55 9.1% 584 96.85%
Population
Average 425544 3711609 346882 81.5% 17604 4.1% 39409 9.3% 403931 94.92%
Average 81.7% 3.3% 9.7% 94.59%
AS H 94 1060 82 87.2% 4 4.3% 86 91.49%
BIE H 499 12591 425 85.2% 24 4.8% 27 5.4% 476 95.39%
CNMI H 26 608 23 88.5% 2 7.7% 25 96.15%
DC H 675 4118 556 82.4% 55 8.1% 611 90.52%
FSM H 88 1444 17 19.3% 6 6.8% 23 26.14%
GU H 179 3139 173 96.6% 1 0.6% 174 97.21%
Palau H 4 168 0 0.0% 2 50.0% 2 50.00%
PR H
RMI H
VI H 67 1040 53 79.1% 14 20.9% 67 100.00%
Population
Average 1632 24168 1329 81.4% 24 1.5% 111 6.8% 1464 89.71%
Unique State
Average 67.3% 0.6% 13.0% 80.86%

84
aThe following states also reported assessing students using an Alternate Assessment based on Grade-level Achievement Standards, MA(13), and NC (23)

85
Appendix B
State-by-State Performance Data
This Appendix presents the state-by-state numbers that were used to generate the proficiency tables and figures in this document.
There are six tables in this Appendix (Tables B1-B6). The two content areas of Reading and Math are shown for each of three grade
levels—Elementary School, Middle School, and High School. The grades reflected in these three levels are grades 4, 8, and one grade
in high school (often this grade was not specified and in many states the test was given as an end of course exam not specific to one
grade level). The specific grade used for each state at each level is shown in Appendix D, along with proficiency data for all of the
grades on which a state reported. Data for all grade levels, content areas, and specific tests is available in Appendix E.
Each row in the Tables B1-B6 shows numbers for one state at one grade within the content area and school level. The third column
shows state-reported special education enrollment, that is, the number of students with an individualized education program (IEP).
Following that is the number of all students enrolled in the grade. It is important to remember that these two counts are often entered
by states either before or after the testing cycle is completed. Next are the numbers and percentages of students reported proficient in
each of three kinds of assessments: Regular Assessment, Alternate Assessment based on Modified Academic Achievement Standards
(AA-MAS), and Alternate Assessment based on Alternate Academic Achievement Standards (AA-AAS). Students proficient on an
Alternate Assessment based on Grade Level Achievement Standards are footnoted at the bottom of each table. Note that these data do
not include students who were assessed on out-of-level assessments; these students were considered non-participants. Data for these
students are available in Appendix C.
Alongside each performance number, a percentage is shown that was calculated by dividing the number of proficient students by the
number of students with IEPs. An additional percentage shown for the alternate assessments was calculated by dividing the number of
proficient students by the total number of students enrolled in a grade. This is shown because the data reporting instructions stipulated
that states were to limit the number of students reported as proficient on these assessments to no more than two percent of the total
enrollment for the AA-MAS and one percent for the AA-AAS. The last number in each row shows the total number of proficient
students. This was calculated by summing the numbers reported as proficient in each type of assessment, including those in the
alternate assessment based on grade-level achievement standards if available in the state. Total proficiency was calculated by dividing
this summed proficiency numbers by the number of students with IEPs.

86
Note that in addition to any of the factors mentioned in Appendices A and C that may alter participation rates (e.g., taking childcount
at a time other than testing or invalid scores), proficiency rate calculations may be affected by a loss of student data due to other
reasons states may have failed to report achievement results for students who were counted as participating in an assessment (such as
exceeding the 1% or 2% cap). The calculations used in this document provide the most conservative values for proficiency rates given
the data that states supplied.
The data in these tables were obtained directly from Table 6 of Section 618 reports posted to the RRFC website with the 2007-08
Annual Performance Reports. For some states data were only available through the Data Accountability Center, which analyzed data
submitted through the EdFacts system. All information is from the 2007-2008 school year.
National data are presented in two ways. First, the “Population Average” performance percentages were calculated by summing data
across states and dividing by the total number of students with IEPs enrolled at the grade level. This produces data that reflect the
average value based on the number of students with disabilities across all states. Second, the “State Average” shows the average value
across the 50 states. This row gives equal weight to the data from each state. Similar calculations were conducted for the unique states.
Fifty regular states and seven unique states provided data that could be analyzed to fully complete the performance tables for the
regular assessment. Fifty regular states and seven unique states provided data that could be analyzed to fully complete the performance
tables for the alternate assessment.Two additional unique states provided partial information included in analysis.
Regular States
At the elementary school level, for the regular states, the average proficiency rate as a percentage of special education enrollment for
reading was 38.6% on the regular assessment, 12.8% on the alternate assessment based on modified achievement standards, 4.9% on
the alternate assessment based on alternate achievement standards; overall proficiency was 45.5%. For math at the elementary level,
average proficiency rates were 41.0% on the regular assessment, 11.2% on the alternate assessment based on modified achievement
standards, 4.8% on the alternate assessment based on alternate achievement standards; overall proficiency was 47.5%. Data show that
students with IEPs are slightly more likely to be proficient in math at this school level, especially on the regular assessment. This
matches the trend seen in 2006-07 data (Thurlow et al., 2009).
At the middle school level, for the regular states, the average proficiency rate as a percentage of special education enrollment for
reading was 29.4% on the regular assessment, 14.0% on the alternate assessment based on modified achievement standards, 5.2% on
the alternate assessment based on alternate achievement standards; overall proficiency was 36.6%. For math at the middle school
level, average proficiency rates were 24.3% on the regular assessment, 12.9% on the alternate assessment based on modified

87
achievement standards, 5.1% on the alternate assessment based on alternate achievement standards; overall proficiency was 31.3%.
Data show that students with IEPs are more likely to be proficient in reading at this school level, especially on the regular assessment.
At the high school level, for the regular states, the average proficiency rate as a percentage of special education enrollment for reading
was 27.0% on the regular assessment, 11.9% on the alternate assessment based on modified achievement standards, 5.7% on the
alternate assessment based on alternate achievement standards; overall proficiency was 34.4%. For math at the high school level,
average proficiency rates were 20.7% on the regular assessment, 12.1% on the alternate assessment based on modified achievement
standards, 6.4% on the alternate assessment based on alternate achievement standards; overall proficiency was 28.8%. Data show that
students with IEPs are more likely to be proficient in reading at this school level, especially on the regular assessment. This mirrors
results from one year ago (Thurlow et al., 2009). Overall student proficiency was down a bit from one year ago. Factors that might
have influenced this drop in the average proficiency rates included the fact that this year’s analysis included all states while last year’s
analysis included 48 states for reading, and 47 for math. Second, states were allowed to report proficiency data on the AA-MAS for
the first time in 2007-08; it is unclear how this assessment may have affected proficiency overall.
For the AA-MAS, for the elementary level, proficiency rates were 1.9% of all students in reading, and 1.6% of all students in math. At
the middle school level, proficiency rates were 2.0% of all students in reading, and 2.0% of all students in math. At the high school,
proficiency rates were 1.5% of all students in reading, and 1.7% of all students in math. It appears that overall states reported an
acceptable number of students as proficient on this test.
For the AA-AAS, for the elementary level, proficiency rates were 0.7% of all students in reading, and 0.7% of all students in math. At
the middle school level, proficiency rates were 0.7% of all students in reading, and 0.7% of all students in math. At the high school
level, proficiency rates were 0.7% of all students in reading and 0.7% of all students in math.
For population averages, for the elementary level, proficiency rates were 46.1% for reading and 49.8% for math. At the middle school
level, proficiency rates were 38.0% for reading, and 33.8% for math. At the high school level, proficiency rates were 35.8% for
reading and 32.5% for math. Data show fewer students proficient at the high schools level when compared to the elementary level,
especially for math.
Unique States
For the unique states, it is important to keep in mind the small numbers of states. Due to the inclusion of different numbers of unique
states at the elementary, middle school, and high school levels the numbers on which averages are calculated fluctuate.
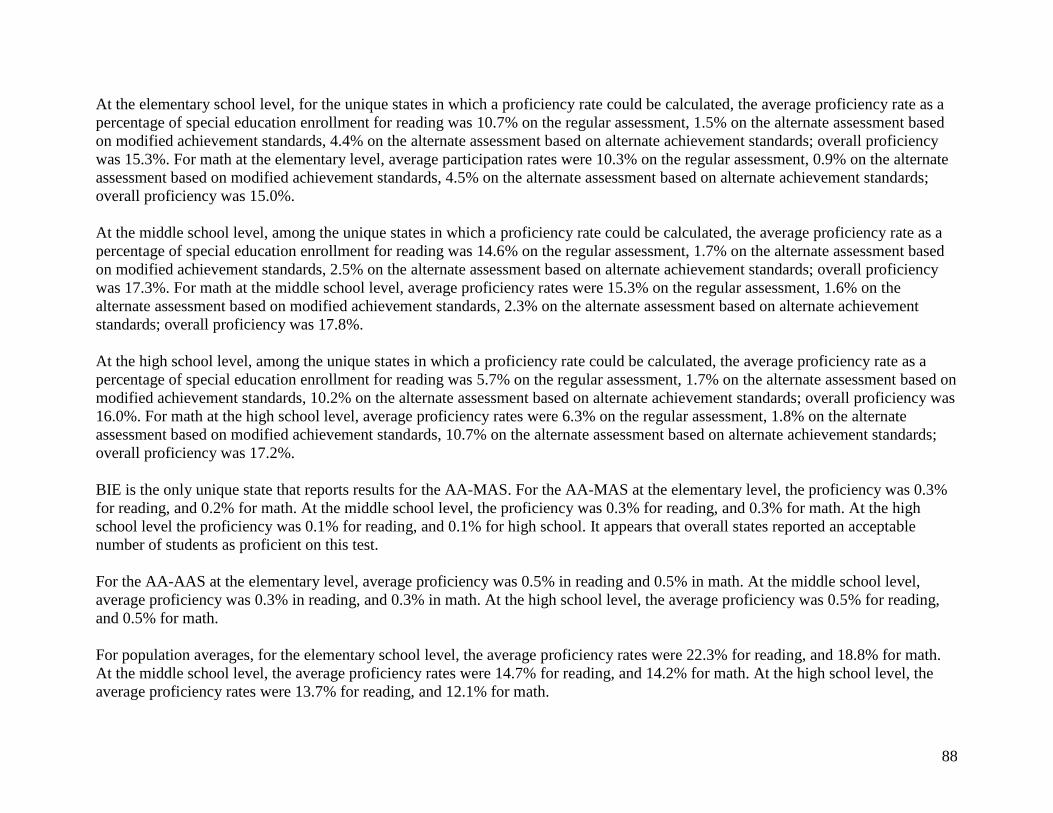
88
At the elementary school level, for the unique states in which a proficiency rate could be calculated, the average proficiency rate as a
percentage of special education enrollment for reading was 10.7% on the regular assessment, 1.5% on the alternate assessment based
on modified achievement standards, 4.4% on the alternate assessment based on alternate achievement standards; overall proficiency
was 15.3%. For math at the elementary level, average participation rates were 10.3% on the regular assessment, 0.9% on the alternate
assessment based on modified achievement standards, 4.5% on the alternate assessment based on alternate achievement standards;
overall proficiency was 15.0%.
At the middle school level, among the unique states in which a proficiency rate could be calculated, the average proficiency rate as a
percentage of special education enrollment for reading was 14.6% on the regular assessment, 1.7% on the alternate assessment based
on modified achievement standards, 2.5% on the alternate assessment based on alternate achievement standards; overall proficiency
was 17.3%. For math at the middle school level, average proficiency rates were 15.3% on the regular assessment, 1.6% on the
alternate assessment based on modified achievement standards, 2.3% on the alternate assessment based on alternate achievement
standards; overall proficiency was 17.8%.
At the high school level, among the unique states in which a proficiency rate could be calculated, the average proficiency rate as a
percentage of special education enrollment for reading was 5.7% on the regular assessment, 1.7% on the alternate assessment based on
modified achievement standards, 10.2% on the alternate assessment based on alternate achievement standards; overall proficiency was
16.0%. For math at the high school level, average proficiency rates were 6.3% on the regular assessment, 1.8% on the alternate
assessment based on modified achievement standards, 10.7% on the alternate assessment based on alternate achievement standards;
overall proficiency was 17.2%.
BIE is the only unique state that reports results for the AA-MAS. For the AA-MAS at the elementary level, the proficiency was 0.3%
for reading, and 0.2% for math. At the middle school level, the proficiency was 0.3% for reading, and 0.3% for math. At the high
school level the proficiency was 0.1% for reading, and 0.1% for high school. It appears that overall states reported an acceptable
number of students as proficient on this test.
For the AA-AAS at the elementary level, average proficiency was 0.5% in reading and 0.5% in math. At the middle school level,
average proficiency was 0.3% in reading, and 0.3% in math. At the high school level, the average proficiency was 0.5% for reading,
and 0.5% for math.
For population averages, for the elementary school level, the average proficiency rates were 22.3% for reading, and 18.8% for math.
At the middle school level, the average proficiency rates were 14.7% for reading, and 14.2% for math. At the high school level, the
average proficiency rates were 13.7% for reading, and 12.1% for math.
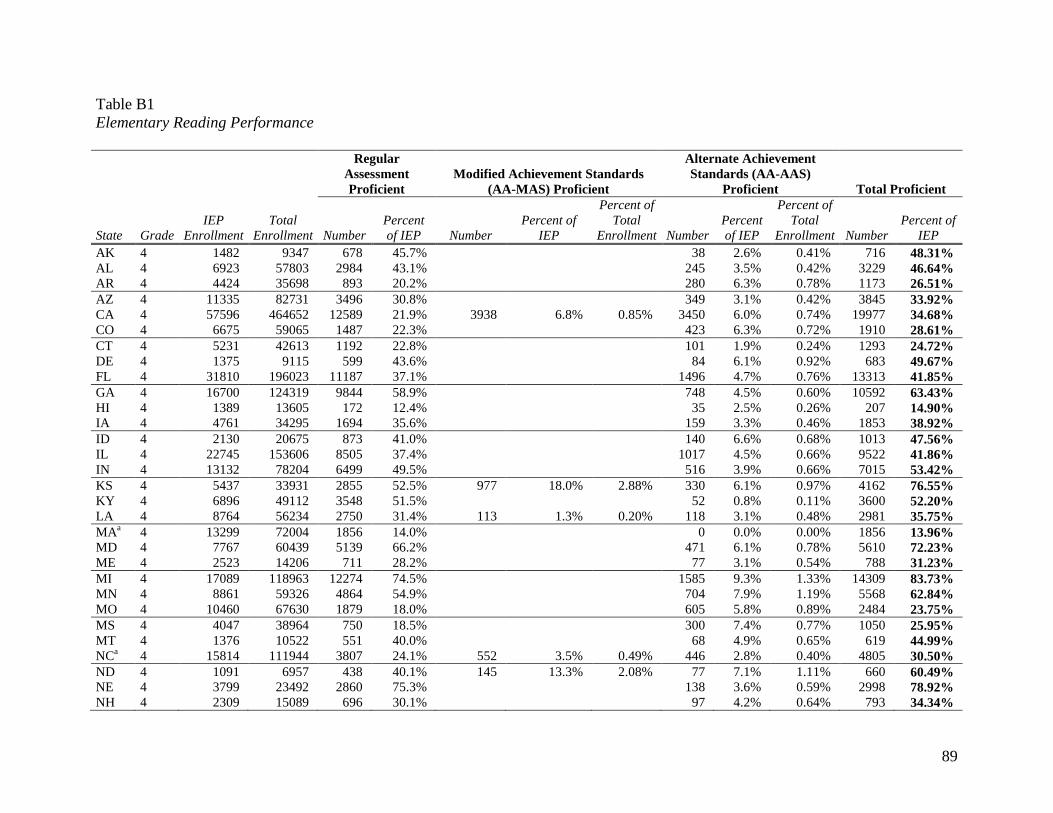
89
Table B1
Elementary Reading Performance
Regular
Assessment
Proficient
Modified Achievement Standards
(AA-MAS) Proficient
Alternate Achievement
Standards (AA-AAS)
Proficient Total Proficient
State Grade
IEP
Enrollment
Total
Enrollment Number
Percent
of IEP Number
Percent of
IEP
Percent of
Total
Enrollment Number
Percent
of IEP
Percent of
Total
Enrollment Number
Percent of
IEP
AK 4 1482 9347 678 45.7% 38 2.6% 0.41% 716 48.31%
AL 4 6923 57803 2984 43.1% 245 3.5% 0.42% 3229 46.64%
AR 4 4424 35698 893 20.2% 280 6.3% 0.78% 1173 26.51%
AZ 4 11335 82731 3496 30.8% 349 3.1% 0.42% 3845 33.92%
CA 4 57596 464652 12589 21.9% 3938 6.8% 0.85% 3450 6.0% 0.74% 19977 34.68%
CO 4 6675 59065 1487 22.3% 423 6.3% 0.72% 1910 28.61%
CT 4 5231 42613 1192 22.8% 101 1.9% 0.24% 1293 24.72%
DE 4 1375 9115 599 43.6% 84 6.1% 0.92% 683 49.67%
FL 4 31810 196023 11187 37.1% 1496 4.7% 0.76% 13313 41.85%
GA 4 16700 124319 9844 58.9% 748 4.5% 0.60% 10592 63.43%
HI 4 1389 13605 172 12.4% 35 2.5% 0.26% 207 14.90%
IA 4 4761 34295 1694 35.6% 159 3.3% 0.46% 1853 38.92%
ID 4 2130 20675 873 41.0% 140 6.6% 0.68% 1013 47.56%
IL 4 22745 153606 8505 37.4% 1017 4.5% 0.66% 9522 41.86%
IN 4 13132 78204 6499 49.5% 516 3.9% 0.66% 7015 53.42%
KS 4 5437 33931 2855 52.5% 977 18.0% 2.88% 330 6.1% 0.97% 4162 76.55%
KY 4 6896 49112 3548 51.5% 52 0.8% 0.11% 3600 52.20%
LA 4 8764 56234 2750 31.4% 113 1.3% 0.20% 118 3.1% 0.48% 2981 35.75%
MAa 4 13299 72004 1856 14.0% 0 0.0% 0.00% 1856 13.96%
MD 4 7767 60439 5139 66.2% 471 6.1% 0.78% 5610 72.23%
ME 4 2523 14206 711 28.2% 77 3.1% 0.54% 788 31.23%
MI 4 17089 118963 12274 74.5% 1585 9.3% 1.33% 14309 83.73%
MN 4 8861 59326 4864 54.9% 704 7.9% 1.19% 5568 62.84%
MO 4 10460 67630 1879 18.0% 605 5.8% 0.89% 2484 23.75%
MS 4 4047 38964 750 18.5% 300 7.4% 0.77% 1050 25.95%
MT 4 1376 10522 551 40.0% 68 4.9% 0.65% 619 44.99%
NCa 4 15814 111944 3807 24.1% 552 3.5% 0.49% 446 2.8% 0.40% 4805 30.50%
ND 4 1091 6957 438 40.1% 145 13.3% 2.08% 77 7.1% 1.11% 660 60.49%
NE 4 3799 23492 2860 75.3% 138 3.6% 0.59% 2998 78.92%
NH 4 2309 15089 696 30.1% 97 4.2% 0.64% 793 34.34%

90
Regular
Assessment
Proficient
Modified Achievement Standards
(AA-MAS) Proficient
Alternate Achievement
Standards (AA-AAS)
Proficient Total Proficient
State Grade
IEP
Enrollment
Total
Enrollment Number
Percent
of IEP Number
Percent of
IEP
Percent of
Total
Enrollment Number
Percent
of IEP
Percent of
Total
Enrollment Number
Percent of
IEP
NJ 4 17142 103218 8607 50.2% 796 4.6% 0.77% 9403 54.85%
NM 4 3099 24364 485 15.7% 92 3.0% 0.38% 577 18.62%
NV 4 3905 33577 851 21.8% 246 6.3% 0.73% 1097 28.09%
NY 4 35015 201918 9652 27.6% 1695 4.8% 0.84% 11347 32.41%
OH 4 20727 132512 9759 47.1% 2463 11.9% 1.86% 12222 58.97%
OK 4 7842 46852 2909 37.1% 2105 26.8% 4.49% 470 6.0% 1.00% 5484 69.93%
OR 4 6554 42765 3242 49.5% 591 9.0% 1.38% 3833 58.48%
PA 4 22386 130008 7261 32.4% 844 3.8% 0.65% 8105 36.21%
RI 4 1997 11129 532 26.6% 44 2.2% 0.40% 576 28.84%
SC 4 7714 52695 3959 51.3% 376 4.9% 0.71% 4335 56.20%
SD 4 1245 8790 810 65.1% 51 4.1% 0.58% 861 69.16%
TN 4 8950 73848 6142 68.6% 622 6.9% 0.84% 6764 75.58%
TX 4 37551 348654 11924 31.8% 7498 20.0% 2.15% 2123 5.7% 0.61% 21545 57.38%
UT 4 6718 42558 2748 40.9% 402 6.0% 0.94% 3150 46.89%
VAa 4 12485 89838 6449 51.7% 988 7.9% 1.10% 9166 73.42%
VT 4 755 6454 136 18.0% 6 0.8% 0.09% 142 18.81%
WA 4 10549 76827 3087 29.3% 425 4.0% 0.55% 3512 33.29%
WI 4 8614 60081 3692 42.9% 632 7.3% 1.05% 4324 50.20%
WV 4 3436 20213 1469 42.8% 184 5.4% 0.91% 1653 48.11%
WY 4 1079 6504 390 36.1% 32 3.0% 0.49% 422 39.11%
Population
Average 515003 3633369 191774 37.2% 15328 3.0% 0.42% 27231 5.3% 1.03% 237142 46.05%
Regular States Average 38.6% 12.8% 1.88% 4.9% 0.70% 45.54%
AS 4 89 991 4 4.5% 0 0.0% 0.00% 4 4.49%
BIE 4 591 3490 83 14.0% 9 1.5% 0.26% 20 3.4% 0.57% 112 18.95%
CNMI 4 77 847 19 24.7% 1 1.3% 0.12% 20 25.97%
DC 4 965 4731 219 22.7% 68 7.0% 1.44% 287 29.74%
FSM 4
GU 4 125 2475 3 2.4% 1 0.8% 0.04% 4 3.20%
Palau 4 15 223 0 0.0% 2 13.3% 0.90% 2 13.33%
PR 4
RMI 4
VI 4 123 1188 8 6.5% 6 4.9% 0.51% 14 11.38%

91
Regular
Assessment
Proficient
Modified Achievement Standards
(AA-MAS) Proficient
Alternate Achievement
Standards (AA-AAS)
Proficient Total Proficient
State Grade
IEP
Enrollment
Total
Enrollment Number
Percent
of IEP Number
Percent of
IEP
Percent of
Total
Enrollment Number
Percent
of IEP
Percent of
Total
Enrollment Number
Percent of
IEP
Population
Average 1985 13945 336 16.9% 9 0.5% 0.06% 98 4.9% 0.70% 443 22.32%
Unique States Average 10.7% 1.5% 0.26% 4.4% 0.51% 15.29% aThe following states also reported assessing students proficient on an Alternate Assessment based on Grade-level Achievement Standards: MA(0), NC (18) and
VA (1729)

92
Table B2
Middle School Reading Performance
Regular
Assessment
Proficient
Modified Achievement Standards
(AA-MAS) Proficient
Alternate Academic
Achievement Standards (AA-
AAS) Proficient Total Proficient
State Grade
IEP
Enrollment
Total
Enrollment Number
Percent
of IEP Number
Percent of
IEP
Percent of
Total
Enrollment Number
Percent
of IEP
Percent of
Total
Enrollment Number
Percent of
IEP
AK 8 1199 9737 520 43.4% 23 1.9% 0.24% 543 45.29%
AL 8 7098 57990 1539 21.7% 314 4.4% 0.54% 1853 26.11%
AR 8 4431 35467 527 11.9% 198 4.5% 0.56% 725 16.36%
AZ 8 9943 81850 1913 19.2% 397 4.0% 0.49% 2310 23.23%
CA 8 51454 487914 5448 10.6% 3348 6.5% 0.69% 8796 17.09%
CO 8 5768 57731 1064 18.4% 289 5.0% 0.50% 1353 23.46%
CT 8 5484 43930 1682 30.7% 85 1.5% 0.19% 1767 32.22%
DE 8 1569 10324 476 30.3% 99 6.3% 0.96% 575 36.65%
FL 8 25009 193817 4290 17.2% 1612 6.4% 0.83% 5902 23.60%
GA 8 14801 122071 8775 59.3% 1168 7.9% 0.96% 9943 67.18%
HI 8 1580 13361 230 14.6% 50 3.2% 0.37% 280 17.72%
IA 8 5273 35685 1195 22.7% 129 2.4% 0.36% 1324 25.11%
ID 8 1843 20407 732 39.7% 155 8.4% 0.76% 887 48.13%
IL 8 23412 161119 8958 38.3% 1312 5.6% 0.81% 10270 43.87%
IN 8 12116 80850 3053 25.2% 652 5.4% 0.81% 3705 30.58%
KS 8 4961 34346 1984 40.0% 949 19.1% 2.76% 278 5.6% 0.81% 3211 64.72%
KY 8 6032 49469 1794 29.7% 72 1.2% 0.15% 1866 30.94%
LA 8 6306 51363 669 10.6% 221 3.5% 0.43% 174 6.2% 0.77% 1064 20.35%
MAa 8 13425 74464 4730 35.2% 0 0.0% 0.00% 4730 35.23%
MD 8 7996 65438 2401 30.0% 702 8.8% 1.07% 3103 38.81%
ME 8 2508 15274 600 23.9% 104 4.1% 0.68% 704 28.07%
MI 8 17480 126545 13537 77.4% 1446 8.3% 1.14% 14983 85.72%
MN 8 8473 63102 3624 42.8% 774 9.1% 1.23% 4398 51.91%
MO 8 9061 68073 885 9.8% 396 4.4% 0.58% 1281 14.14%
MS 8 4245 40069 262 6.2% 257 6.1% 0.64% 519 12.23%
MT 8 1428 11151 486 34.0% 59 4.1% 0.53% 545 38.17%
NCa 8 13670 111321 2124 15.5% 655 4.8% 0.59% 483 3.5% 0.43% 3262 24.03%
ND 8 1048 7423 276 26.3% 136 13.0% 1.83% 82 7.8% 1.10% 494 47.14%
NE 8 2991 23826 2173 72.7% 167 5.6% 0.70% 2340 78.23%
NH 8 2727 16371 601 22.0% 92 3.4% 0.56% 693 25.41%

93
Regular
Assessment
Proficient
Modified Achievement Standards
(AA-MAS) Proficient
Alternate Academic
Achievement Standards (AA-
AAS) Proficient Total Proficient
State Grade
IEP
Enrollment
Total
Enrollment Number
Percent
of IEP Number
Percent of
IEP
Percent of
Total
Enrollment Number
Percent
of IEP
Percent of
Total
Enrollment Number
Percent of
IEP
NJ 8 18188 106445 7431 40.9% 564 3.1% 0.53% 7995 43.96%
NM 8 3212 24576 531 16.5% 173 5.4% 0.70% 704 21.92%
NV 8 3570 33569 434 12.2% 252 7.1% 0.75% 686 19.22%
NY 8 36530 216523 4423 12.1% 2178 6.0% 1.01% 6601 18.07%
OH 8 21546 139283 7242 33.6% 2585 12.0% 1.86% 9827 45.61%
OK 8 7533 45963 1798 23.9% 1938 25.7% 4.22% 373 5.0% 0.81% 4109 54.55%
OR 8 5494 42660 1240 22.6% 179 3.3% 0.42% 1419 25.83%
PA 8 24362 143489 7812 32.1% 912 3.7% 0.64% 8724 35.81%
RI 8 2362 12120 376 15.9% 69 2.9% 0.57% 445 18.84%
SC 8 6926 52907 2106 30.4% 202 2.9% 0.38% 2308 33.32%
SD 8 936 9334 343 36.6% 71 7.6% 0.76% 414 44.23%
TN 8 8487 72422 5829 68.7% 802 9.4% 1.11% 6631 78.13%
TX 8 40569 334480 18005 44.4% 7278 17.9% 2.18% 2167 5.3% 0.65% 27450 67.66%
UT 8 4616 39316 1525 33.0% 362 7.8% 0.92% 1887 40.88%
VAa 8 14014 93951 4964 35.4% 1039 7.4% 1.11% 8022 57.24%
VT 8 1021 7087 190 18.6% 11 1.1% 0.16% 201 19.69%
WA 8 8693 78095 1299 14.9% 129 1.5% 0.17% 1428 16.43%
WI 8 9323 64154 3843 41.2% 536 5.7% 0.84% 4379 46.97%
WV 8 3210 21198 940 29.3% 231 7.2% 1.09% 1171 36.48%
WY 8 892 6577 239 26.8% 32 3.6% 0.49% 271 30.38%
Population
Average 494815 3714637 147118 29.7% 11177 2.3% 0.30% 27784 5.6% 1.03% 188098 38.01%
Regular States Average 29.4% 14.0% 2.00% 5.2% 0.69% 36.54%
AS 8 125 1119 8 6.4% 0 0.0% 0.00% 8 6.40%
BIE 8 630 3582 55 8.7% 11 1.7% 0.31% 7 1.1% 0.20% 73 11.59%
CNMI 8 85 795 7 8.2% 0 0.0% 0.00% 7 8.24%
DC 8 1391 5176 152 10.9% 64 4.6% 1.24% 216 15.53%
FSM 8 93 1569 65 69.9% 1 1.1% 0.06% 66 70.97%
GU 8 189 2352 3 1.6% 1 0.5% 0.04% 4 2.12%
Palau 8 14 254 2 14.3% 1 7.1% 0.39% 3 21.43%
PR 8
RMI 8 27 1107 2 7.4% 0 0.0% 0.00% 2 7.41%
VI 8 137 1227 5 3.6% 11 8.0% 0.90% 16 11.68%

94
Regular
Assessment
Proficient
Modified Achievement Standards
(AA-MAS) Proficient
Alternate Academic
Achievement Standards (AA-
AAS) Proficient Total Proficient
State Grade
IEP
Enrollment
Total
Enrollment Number
Percent
of IEP Number
Percent of
IEP
Percent of
Total
Enrollment Number
Percent
of IEP
Percent of
Total
Enrollment Number
Percent of
IEP
Population
Average 2691 17181 299 11.1% 11 0.4% 0.06% 85 3.2% 0.49% 395 14.68%
Unique States Average 14.6% 1.7% 0.31% 2.5% 0.31% 17.26% aThe following states also reported assessing students proficient on an Alternate Assessment based on Grade-level Achievement Standards: MA(0), NC (23) and
VA (2019)

95
Table B3
High School Reading Performance
Regular
Assessment
Proficient
Modified Achievement Standards
(AA-MAS) Proficient
Alternate Academic
Achievement Standards (AA-
AAS) Proficient Total Proficient
State Grade
IEP
Enrollment
Total
Enrollment Number
Percent
of IEP Number
Percent of
IEP
Percent of
Total
Enrollment Number
Percent
of IEP
Percent of
Total
Enrollment Number
Percent of
IEP
AK H 1066 9990 358 33.6% 33 3.1% 0.33% 391 36.68%
AL H 4835 47977 1095 22.6% 289 6.0% 0.60% 1384 28.62%
AR H 3941 31087 147 3.7% 445 11.3% 1.43% 592 15.02%
AZ H 8096 77634 2055 25.4% 434 5.4% 0.56% 2489 30.74%
CA H 43333 471683 4805 11.1% 997 2.3% 0.21% 5802 13.39%
CO H 5717 61045 969 16.9% 358 6.3% 0.59% 1327 23.21%
CT H 4898 42859 1950 39.8% 79 1.6% 0.18% 2029 41.43%
DE H 1174 9067 195 16.6% 125 10.6% 1.38% 320 27.26%
FL H 27211 204527 2353 8.6% 1995 7.3% 0.98% 4348 15.98%
GA H 8804 93575 4037 45.9% 932 10.6% 1.00% 4969 56.44%
HI H 1673 12982 269 16.1% 29 1.7% 0.22% 298 17.81%
IA H 4703 36341 1402 29.8% 112 2.4% 0.31% 1514 32.19%
ID H 1662 19997 587 35.3% 134 8.1% 0.67% 721 43.38%
IL H 17740 140263 2728 15.4% 1201 6.8% 0.86% 3929 22.15%
IN H 12234 81967 2221 18.2% 646 5.3% 0.79% 2867 23.43%
KS H 3218 24567 996 31.0% 608 18.9% 2.47% 273 8.5% 1.11% 1877 58.33%
KY H 5289 49266 853 16.1% 71 1.3% 0.14% 924 17.47%
LA H 3321 42947 355 10.7% 39 1.2% 0.09% 119 8.3% 0.64% 513 20.11%
MAa H 12125 73540 3925 32.4% 0 0.0% 0.00% 3925 32.37%
MD H 5609 55714 1804 32.2% 72 1.3% 0.13% 699 12.5% 1.25% 2575 45.91%
ME H 2213 15604 194 8.8% 136 6.1% 0.87% 330 14.91%
MI H 14506 123816 10333 71.2% 1517 10.5% 1.23% 11850 81.69%
MN H 8235 67503 4106 49.9% 715 8.7% 1.06% 4821 58.54%
MO H 7705 63218 371 4.8% 293 3.8% 0.46% 664 8.62%
MS H 2148 33048 201 9.4% 0 0.0% 0.00% 201 9.36%
MT H 1346 11449 406 30.2% 108 8.0% 0.94% 514 38.19%
NCa H 10128 96847 1873 18.5% 332 3.3% 0.34% 238 2.3% 0.25% 2443 24.42%
ND H 935 7671 146 15.6% 134 14.3% 1.75% 83 8.9% 1.08% 363 38.82%
NE H 2590 24180 1714 66.2% 121 4.7% 0.50% 1835 70.85%
NH H 2640 16467 593 22.5% 54 2.0% 0.33% 647 24.51%

96
Regular
Assessment
Proficient
Modified Achievement Standards
(AA-MAS) Proficient
Alternate Academic
Achievement Standards (AA-
AAS) Proficient Total Proficient
State Grade
IEP
Enrollment
Total
Enrollment Number
Percent
of IEP Number
Percent of
IEP
Percent of
Total
Enrollment Number
Percent
of IEP
Percent of
Total
Enrollment Number
Percent of
IEP
NJ H 16037 100202 6251 39.0% 675 4.2% 0.67% 6926 43.19%
NM H 2704 20363 236 8.7% 123 4.5% 0.60% 359 13.28%
NV H 3008 31869 892 29.7% 203 6.7% 0.64% 1095 36.40%
NY H 24601 195534 10402 42.3% 1249 5.1% 0.64% 11651 47.36%
OH H 21711 145409 8438 38.9% 2272 10.5% 1.56% 10710 49.33%
OK H 6410 44652 1000 15.6% 1662 25.9% 3.72% 396 6.2% 0.89% 3058 47.71%
OR H 5048 44269 980 19.4% 187 3.7% 0.42% 1167 23.12%
PA H 21035 140507 3436 16.3% 856 4.1% 0.61% 4292 20.40%
RI H 2012 11427 291 14.5% 24 1.2% 0.21% 315 15.66%
SC H 6657 52436 3621 54.4% 297 4.5% 0.57% 3918 58.86%
SD H 714 8253 86 12.0% 51 7.1% 0.62% 137 19.19%
TN H 6161 67876 4651 75.5% 641 10.4% 0.94% 5292 85.90%
TX H 34179 318610 9616 28.1% 6404 18.7% 2.01% 1702 5.0% 0.53% 17722 51.85%
UT H 3888 41172 1091 28.1% 372 9.6% 0.90% 1463 37.63%
VAa H 10036 90882 6735 67.1% 811 8.1% 0.89% 7546 75.19%
VT H 993 7404 127 12.8% 8 0.8% 0.11% 135 13.60%
WA H 8411 83725 2307 27.4% 204 2.4% 0.24% 2511 29.85%
WI H 9536 70185 2551 26.8% 483 5.1% 0.69% 3034 31.82%
WV H 2894 20002 542 18.7% 185 6.4% 0.92% 727 25.12%
WY H 603 6043 100 16.6% 34 5.6% 0.56% 134 22.22%
Population
Average 415733 3547651 116394 28.0% 9251 2.2% 0.26% 23009 5.5% 1.03% 148654 35.76%
Regular States Average 27.0% 11.9% 1.50% 5.7% 0.66% 34.39%
AS H 94 1060 3 3.2% 1 1.1% 0.09% 4 4.26%
BIE H 524 12591 53 10.1% 9 1.7% 0.07% 13 2.5% 0.10% 75 14.31%
CNMI H 26 608 0 0.0% 0 0.0% 0.00% 0 0.00%
DC H 675 4118 78 11.6% 33 4.9% 0.80% 111 16.44%
FSM H 88 1444 16 18.2% 3 3.4% 0.21% 19 21.59%
GU H 179 3139 1 0.6% 0 0.0% 0.00% 1 0.56%
Palau H 4 169 0 0.0% 2 50.0% 1.18% 2 50.00%
PR H
RMI H
VI H 67 1040 1 1.5% 13 19.4% 1.25% 14 20.90%

97
Regular
Assessment
Proficient
Modified Achievement Standards
(AA-MAS) Proficient
Alternate Academic
Achievement Standards (AA-
AAS) Proficient Total Proficient
State Grade
IEP
Enrollment
Total
Enrollment Number
Percent
of IEP Number
Percent of
IEP
Percent of
Total
Enrollment Number
Percent
of IEP
Percent of
Total
Enrollment Number
Percent of
IEP
Population
Average 1657 24169 152 9.2% 9 0.5% 0.04% 65 3.9% 0.27% 226 13.64%
Unique States Average 5.7% 1.7% 0.07% 10.2% 0.45% 16.01% aThe following states also reported assessing students proficient on an Alternate Assessment based on Grade-level Achievement Standards, MA(0), and NC (30)

98
Table B4
Elementary Mathematics Performance
Regular
Assessment
Proficient
Modified Achievement Standards
(AA-MAS) Proficient
Alternate Academic
Achievement Standards (AA-
AAS) Proficient Total Proficient
State Grade
IEP
Enrollment
Total
Enrollment Number
Percent
of IEP Number
Percent of
IEP
Percent of
Total
Enrollment Number
Percent
of IEP
Percent of
Total
Enrollment Number
Percent of
IEP
AK 4 1482 9347 602 40.6% 46 3.1% 0.49% 648 43.72%
AL 4 6796 57804 2562 37.7% 211 3.1% 0.37% 2773 40.80%
AR 4 4424 35698 1457 32.9% 279 6.3% 0.78% 1736 39.24%
AZ 4 11353 82731 4343 38.3% 394 3.5% 0.48% 4737 41.72%
CA 4 57581 464513 15959 27.7% 3690 6.4% 0.79% 2668 4.6% 0.57% 22317 38.76%
CO 4 6687 59069 1891 28.3% 426 6.4% 0.72% 2317 34.65%
CT 4 5231 42613 2135 40.8% 153 2.9% 0.36% 2288 43.74%
DE 4 1375 9115 536 39.0% 81 5.9% 0.89% 617 44.87%
FL 4 31810 196023 14346 42.2% 1438 4.5% 0.73% 14874 46.76%
GA 4 16699 124312 6596 39.5% 768 4.6% 0.62% 7364 44.10%
HI 4 1389 13605 139 10.0% 37 2.7% 0.27% 176 12.67%
IA 4 4761 34264 2156 45.3% 150 3.2% 0.44% 2306 48.44%
ID 4 2129 20675 985 46.3% 129 6.1% 0.62% 1114 52.33%
IL 4 22745 153606 10966 48.2% 1143 5.0% 0.74% 12109 53.24%
IN 4 13132 78204 7625 58.1% 514 3.9% 0.66% 8139 61.98%
KS 4 5432 33919 3064 56.4% 739 13.6% 2.18% 310 5.7% 0.91% 4113 75.72%
KY 4 6896 49112 3166 45.9% 52 0.8% 0.11% 3218 46.66%
LA 4 8764 56232 3177 36.3% 145 1.7% 0.26% 276 3.1% 0.49% 3598 41.05%
MAa 4 13309 72112 2351 17.7% 0 0.0% 0.00% 2351 17.66%
MD 4 7771 60460 4724 60.8% 471 6.1% 0.78% 5195 66.85%
ME 4 2523 14206 806 31.9% 100 4.0% 0.70% 906 35.91%
MI 4 17089 118963 4839 64.9% 607 9.1% 1.30% 12639 73.96%
MN 4 8858 59353 5453 61.6% 687 7.8% 1.16% 6140 69.32%
MO 4 10461 67703 2310 22.1% 588 5.6% 0.87% 2898 27.70%
MS 4 4047 38964 1042 25.7% 263 6.5% 0.67% 1305 32.25%
MT 4 1376 10522 435 31.6% 63 4.6% 0.60% 498 36.19%
NCa 4 16378 111948 6518 39.8% 793 4.8% 0.71% 444 2.7% 0.40% 7755 47.54%
ND 4 1091 6957 523 47.9% 102 9.3% 1.47% 77 7.1% 1.11% 702 64.34%
NE 4 3796 23492 3052 80.4% 140 3.7% 0.60% 3192 84.09%
NH 4 2309 15089 730 31.6% 100 4.3% 0.66% 830 35.95%

99
Regular
Assessment
Proficient
Modified Achievement Standards
(AA-MAS) Proficient
Alternate Academic
Achievement Standards (AA-
AAS) Proficient Total Proficient
State Grade
IEP
Enrollment
Total
Enrollment Number
Percent
of IEP Number
Percent of
IEP
Percent of
Total
Enrollment Number
Percent
of IEP
Percent of
Total
Enrollment Number
Percent of
IEP
NJ 4 17142 103218 10314 60.2% 803 4.7% 0.78% 11117 64.85%
NM 4 3101 24367 473 15.3% 52 1.7% 0.21% 525 16.93%
NV 4 3905 33577 1327 34.0% 244 6.2% 0.73% 1571 40.23%
NY 4 35000 202067 17245 49.3% 1746 5.0% 0.86% 18991 54.26%
OH 4 20552 132656 7667 37.3% 2468 12.0% 1.86% 10135 49.31%
OK 4 7661 46643 2758 36.0% 1874 24.5% 4.02% 472 6.2% 1.01% 5104 66.62%
OR 4 6553 42765 3115 47.5% 413 6.3% 0.97% 3528 53.84%
PA 4 22401 130271 10579 47.2% 733 3.3% 0.56% 11312 50.50%
RI 4 1991 11129 486 24.4% 45 2.3% 0.40% 531 26.67%
SC 4 7714 52694 4036 52.3% 376 4.9% 0.71% 4412 57.19%
SD 4 1245 8790 613 49.2% 42 3.4% 0.48% 655 52.61%
TN 4 8950 73848 5397 60.3% 619 6.9% 0.84% 6016 67.22%
TX 4 37486 348048 13518 36.1% 6768 18.1% 1.94% 2112 5.6% 0.61% 22398 59.75%
UT 4 6146 44936 2654 43.2% 376 6.1% 0.84% 3030 49.30%
VAa 4 12500 90245 6464 51.7% 956 7.6% 1.06% 8673 69.38%
VT 4 754 6463 133 17.6% 6 0.8% 0.09% 139 18.44%
WA 4 10549 76827 1964 18.6% 495 4.7% 0.64% 2459 23.31%
WI 4 8614 60081 3907 45.4% 548 6.4% 0.91% 4455 51.72%
WV 4 3436 20213 1504 43.8% 202 5.9% 1.00% 1706 49.65%
WY 4 1079 6515 529 49.0% 37 3.4% 0.57% 566 52.46%
Population
Average 514473 3635964 206270 40.1% 14111 2.7% 0.39% 28682 5.6% 1.03% 256014 49.76%
Regular States Average 41.0% 11.2% 1.62% 4.8% 0.68% 47.53%
AS 4 89 991 2 2.2% 0.0% 0.00% 2 2.25%
BIE 4 556 3490 77 13.8% 5 0.9% 0.14% 15 2.7% 0.43% 97 17.45%
CNMI 3 72 848 8 11.1% 2 2.8% 0.24% 10 13.89%
DC 4 965 4731 164 17.0% 63 6.5% 1.33% 227 23.52%
FSM 4
GU 4 125 2475 2 1.6% 1 0.8% 0.04% 3 2.40%
Palau 4 15 222 2 13.3% 2 13.3% 0.90% 4 26.67%
PR 4
RMI 4
VI 4 123 1188 16 13.0% 7 5.7% 0.59% 23 18.70%

100
Regular
Assessment
Proficient
Modified Achievement Standards
(AA-MAS) Proficient
Alternate Academic
Achievement Standards (AA-
AAS) Proficient Total Proficient
State Grade
IEP
Enrollment
Total
Enrollment Number
Percent
of IEP Number
Percent of
IEP
Percent of
Total
Enrollment Number
Percent
of IEP
Percent of
Total
Enrollment Number
Percent of
IEP
Population
Average 1945 13945 271 13.9% 5 0.3% 0.04% 90 4.6% 0.65% 366 18.82%
Unique States Average 10.3% 0.9% 0.14% 4.5% 0.50% 14.98% aThe following states also reported assessing students proficient on an Alternate Assessment based on Grade-level Achievement Standards: MA(0), NC (31) and
VA (1253)

101
Table B5
Middle School Mathematics Performance
Regular
Assessment
Proficient
Modified Achievement Standards
(AA-MAS) Proficient
Alternate Academic
Achievement Standards (AA-
AAS) Proficient Total Proficient
State Grade
IEP
Enrollment
Total
Enrollment Number
Percent
of IEP Number
Percent of
IEP
Percent of
Total
Enrollment Number
Percent
of IEP
Percent of
Total
Enrollment Number
Percent of
IEP
AK 8 1199 9737 288 24.0% 23 1.9% 0.24% 311 25.94%
AL 8 7005 57990 1503 21.5% 343 4.9% 0.59% 1846 26.35%
AR 8 4431 35467 467 10.5% 176 4.0% 0.50% 643 14.51%
AZ 8 10327 81850 1552 15.0% 289 2.8% 0.35% 1841 17.83%
CA 8 51433 487776 5454 10.6% 2416 4.7% 0.50% 7870 15.30%
CO 8 5765 57743 570 9.9% 316 5.5% 0.55% 886 15.37%
CT 8 5484 43930 1965 35.8% 93 1.7% 0.21% 2058 37.53%
DE 8 1569 10324 320 20.4% 102 6.5% 0.99% 422 26.90%
FL 8 25009 193817 6496 26.0% 1548 6.2% 0.80% 8044 32.16%
GA 8 14800 122065 5580 37.7% 1145 7.7% 0.94% 6725 45.44%
HI 8 1580 13361 52 3.3% 41 2.6% 0.31% 93 5.89%
IA 8 5273 35663 1473 27.9% 106 2.0% 0.30% 1579 29.95%
ID 8 1843 20407 440 23.9% 148 8.0% 0.73% 588 31.90%
IL 8 23412 161119 9128 39.0% 1286 5.5% 0.80% 10414 44.48%
IN 8 12116 80850 4190 34.6% 668 5.5% 0.83% 4858 40.10%
KS 8 4955 34320 1629 32.9% 755 15.2% 2.20% 266 5.4% 0.78% 2650 53.48%
KY 8 6032 49469 1236 20.5% 86 1.4% 0.17% 1322 21.92%
LA 8 6300 51348 1085 17.2% 121 1.9% 0.24% 322 5.1% 0.63% 1528 24.25%
MAa 8 13435 74540 1509 11.2% 0 0.0% 0.00% 1509 11.23%
MD 8 8003 65451 1668 20.8% 694 8.7% 1.06% 2362 29.51%
ME 8 2508 15274 351 14.0% 105 4.2% 0.69% 456 18.18%
MI 8 17480 126545 2521 71.6% 1906 10.9% 1.51% 14427 82.53%
MN 8 8470 63126 2633 31.1% 668 7.9% 1.06% 3301 38.97%
MO 8 9057 68128 973 10.7% 468 5.2% 0.69% 1441 15.91%
MS 8 4245 40069 368 8.7% 216 5.1% 0.54% 584 13.76%
MT 8 1428 11151 197 13.8% 54 3.8% 0.48% 251 17.58%
NCa 8 14706 111346 4235 28.8% 1227 8.3% 1.10% 452 3.1% 0.41% 5914 40.47%
ND 8 1048 7671 221 21.1% 146 13.9% 1.90% 89 8.5% 1.16% 456 43.51%
NE 8 2982 23826 1962 65.8% 151 5.1% 0.63% 2113 70.86%
NH 8 2727 16371 414 15.2% 84 3.1% 0.51% 498 18.26%

102
Regular
Assessment
Proficient
Modified Achievement Standards
(AA-MAS) Proficient
Alternate Academic
Achievement Standards (AA-
AAS) Proficient Total Proficient
State Grade
IEP
Enrollment
Total
Enrollment Number
Percent
of IEP Number
Percent of
IEP
Percent of
Total
Enrollment Number
Percent
of IEP
Percent of
Total
Enrollment Number
Percent of
IEP
NJ 8 18188 106445 4506 24.8% 507 2.8% 0.48% 5013 27.56%
NM 8 3214 24579 194 6.0% 129 4.0% 0.52% 323 10.05%
NV 8 3570 33569 427 12.0% 255 7.1% 0.76% 682 19.10%
NY 8 36446 216546 10143 27.8% 1956 5.4% 0.90% 12099 33.20%
OH 8 21410 139432 5664 26.5% 2568 12.0% 1.84% 8232 38.45%
OK 8 6994 44740 1797 25.7% 1631 23.3% 3.65% 389 5.6% 0.87% 3817 54.58%
OR 8 5495 42660 1398 25.4% 158 2.9% 0.37% 1556 28.32%
PA 8 24370 143679 5957 24.4% 877 3.6% 0.61% 6834 28.04%
RI 8 2357 12120 301 12.8% 73 3.1% 0.60% 374 15.87%
SC 8 6925 52904 2626 37.9% 201 2.9% 0.38% 2827 40.82%
SD 8 936 9334 264 28.2% 66 7.1% 0.71% 330 35.26%
TN 8 8496 72422 4391 51.7% 798 9.4% 1.10% 5189 61.08%
TX 8 40447 333958 9322 23.0% 6004 14.8% 1.80% 2181 5.4% 0.65% 17507 43.28%
UT 8 3707 41736 1261 34.0% 350 9.4% 0.84% 1611 43.46%
VAa 8 14609 93163 4869 33.3% 1015 6.9% 1.09% 8412 57.58%
VT 8 1023 7093 124 12.1% 7 0.7% 0.10% 131 12.81%
WA 8 8693 78095 633 7.3% 164 1.9% 0.21% 797 9.17%
WI 8 9323 64154 2846 30.5% 578 6.2% 0.90% 3424 36.73%
WV 8 3210 21198 760 23.7% 216 6.7% 1.02% 976 30.40%
WY 8 892 6579 229 25.7% 33 3.7% 0.50% 262 29.37%
Population
Average 494927 3715140 118192 23.9% 9884 2.0% 0.27% 26782 5.4% 1.03% 167386 33.82%
Regular States Average 24.3% 12.9% 1.82% 5.1% 0.67% 31.30%
AS 8 125 1119 8 6.4% 0 0.0% 0.00% 8 6.40%
BIE 8 609 3582 45 7.4% 10 1.6% 0.28% 8 1.3% 0.22% 63 10.34%
CNMI 8 86 795 11 12.8% 0 0.0% 0.00% 11 12.79%
DC 8 1391 5176 164 11.8% 52 3.7% 1.00% 216 15.53%
FSM 8 93 1569 44 47.3% 1 1.1% 0.06% 45 48.39%
GU 8 189 2352 1 0.5% 1 0.5% 0.04% 2 1.06%
Palau 8 14 265 5 35.7% 1 7.1% 0.38% 6 42.86%
PR 8
RMI 8 27 1107 1 3.7% 0 0.0% 0.00% 1 3.70%
VI 8 137 1227 17 12.4% 9 6.6% 0.73% 26 18.98%

103
Regular
Assessment
Proficient
Modified Achievement Standards
(AA-MAS) Proficient
Alternate Academic
Achievement Standards (AA-
AAS) Proficient Total Proficient
State Grade
IEP
Enrollment
Total
Enrollment Number
Percent
of IEP Number
Percent of
IEP
Percent of
Total
Enrollment Number
Percent
of IEP
Percent of
Total
Enrollment Number
Percent of
IEP
Population
Average 2671 17192 296 11.1% 10 0.4% 0.06% 72 2.7% 0.42% 378 14.15%
Unique States Average 15.3% 1.6% 0.28% 2.3% 0.27% 17.78% aThe following states also reported assessing students proficient on an Alternate Assessment based on Grade-level Achievement Standards: MA(0), NC (38) and
VA (2528)

104
Table B6
High School Mathematics Performance
Regular
Assessment
Proficient
Modified Achievement Standards
(AA-MAS) Proficient
Alternate Academic
Achievement Standards (AA-
AAS) Proficient Total Proficient
State Grade
IEP
Enrollment
Total
Enrollment Number
Percent
of IEP Number
Percent of
IEP
Percent of
Total
Enrollment Number
Percent
of IEP
Percent of
Total
Enrollment Number
Percent of
IEP
AK H 1066 9990 176 16.5% 37 3.5% 0.37% 213 19.98%
AL H 4826 47977 1333 27.6% 281 5.8% 0.59% 1614 33.44%
AR H 7181 71973 1082 15.1% 1399 19.5% 1.94% 2481 34.55%
AZ H 8096 76701 1400 17.3% 301 3.7% 0.39% 1701 21.01%
CA H 43298 472019 5100 11.8% 3001 6.9% 0.64% 8101 18.71%
CO H 5723 61078 364 6.4% 336 5.9% 0.55% 700 12.23%
CT H 4898 42859 1770 36.1% 54 1.1% 0.13% 1824 37.24%
DE H 1175 9067 152 12.9% 121 10.3% 1.33% 273 23.23%
FL H 27211 204527 6126 22.5% 2031 7.5% 0.99% 8157 29.98%
GA H 8919 94017 2286 25.6% 963 10.8% 1.02% 3249 36.43%
HI H 1673 12982 43 2.6% 15 0.9% 0.12% 58 3.47%
IA H 4703 36332 1371 29.2% 124 2.6% 0.34% 1495 31.79%
ID H 1662 19997 391 23.5% 124 7.5% 0.62% 515 30.99%
IL H 17740 140263 1938 10.9% 1194 6.7% 0.85% 3132 17.66%
IN H 12234 81967 2765 22.6% 670 5.5% 0.82% 3435 28.08%
KS H 1836 10052 435 23.7% 326 17.8% 3.24% 78 4.2% 0.78% 839 45.70%
KY H 4376 44438 353 8.1% 148 3.4% 0.33% 501 11.45%
LA H 3329 42950 622 18.7% 9 0.3% 0.02% 213 6.4% 0.50% 844 25.35%
MAa H 12080 73391 3717 30.8% 0 0.0% 0.00% 3717 30.77%
MD H 5694 55067 2075 36.4% 56 1.0% 0.10% 713 12.5% 1.29% 2844 49.95%
ME H 2213 15604 150 6.8% 121 5.5% 0.78% 271 12.25%
MI H 14506 123816 10445 72.0% 2150 14.8% 1.74% 12595 86.83%
MN H 7561 65818 688 9.1% 733 9.7% 1.11% 1421 18.79%
MO H 9043 69783 808 8.9% 513 5.7% 0.74% 1321 14.61%
MS H 1923 33608 384 20.0% 0 0.0% 0.00% 384 19.97%
MT H 1346 11449 116 8.6% 80 5.9% 0.70% 196 14.56%
NCa H 10812 93874 3201 29.6% 699 6.5% 0.74% 279 2.6% 0.30% 4179 38.82%
ND H 935 7718 87 9.3% 104 11.1% 1.35% 93 9.9% 1.20% 284 30.37%
NE H 2514 24180 1391 55.3% 122 4.9% 0.50% 1513 60.18%
NH H 2640 16467 90 3.4% 46 1.7% 0.28% 136 5.15%

105
Regular
Assessment
Proficient
Modified Achievement Standards
(AA-MAS) Proficient
Alternate Academic
Achievement Standards (AA-
AAS) Proficient Total Proficient
State Grade
IEP
Enrollment
Total
Enrollment Number
Percent
of IEP Number
Percent of
IEP
Percent of
Total
Enrollment Number
Percent
of IEP
Percent of
Total
Enrollment Number
Percent of
IEP
NJ H 16037 100202 4583 28.6% 432 2.7% 0.43% 5015 31.27%
NM H 2706 20365 123 4.5% 103 3.8% 0.51% 226 8.35%
NV H 3008 31869 287 9.5% 196 6.5% 0.62% 483 16.06%
NY H 24601 195534 10859 44.1% 1181 4.8% 0.60% 12040 48.94%
OH H 21665 145540 6752 31.2% 2275 10.5% 1.56% 9027 41.67%
OK H 6455 43950 1207 18.7% 2270 35.2% 5.16% 395 6.1% 0.90% 3872 59.98%
OR H 5047 44269 573 11.4% 191 3.8% 0.43% 764 15.14%
PA H 21035 140593 2520 12.0% 706 3.4% 0.50% 3226 15.34%
RI H 2004 11427 53 2.6% 19 0.9% 0.17% 72 3.59%
SC H 6656 52430 3089 46.4% 289 4.3% 0.55% 3378 50.75%
SD H 714 8253 74 10.4% 43 6.0% 0.52% 117 16.39%
TN H 2115 38385 789 37.3% 826 39.1% 2.15% 1615 76.36%
TX H 33331 314399 3136 9.4% 4238 12.7% 1.35% 1692 5.1% 0.54% 9066 27.20%
UT H 4832 44023 858 17.8% 882 18.3% 2.00% 1740 36.01%
VAa H 21698 263054 14900 68.7% 792 3.7% 0.30% 15692 72.32%
VT H 983 7392 20 2.0% 10 1.0% 0.14% 30 3.05%
WA H 8411 83725 427 5.1% 173 2.1% 0.21% 600 7.13%
WI H 9536 70185 1990 20.9% 469 4.9% 0.67% 2459 25.79%
WV H 2894 20002 444 15.3% 170 5.9% 0.85% 614 21.22%
WY H 1066 9990 176 16.5% 37 3.5% 0.37% 213 19.98%
Population
Average 426007 3715551 103719 24.3% 7702 1.8% 0.21% 26821 6.3% 1.03% 138242 32.45%
Regular States Average 20.7% 12.1% 1.71% 6.4% 0.70% 28.80%
AS H 94 1060 2 2.1% 0 0.0% 0.00% 2 2.13%
BIE H 499 12591 30 6.0% 9 1.8% 0.07% 18 3.6% 0.14% 57 11.42%
CNMI H 26 608 3 11.5% 1 3.8% 0.16% 4 15.38%
DC H 675 4118 62 9.2% 36 5.3% 0.87% 98 14.52%
FSM H 88 1444 16 18.2% 3 3.4% 0.21% 19 21.59%
GU H 179 3139 0 0.0% 0 0.0% 0.00% 0 0.00%
Palau H 4 168 0 0.0% 2 50.0% 1.19% 2 50.00%
PR H
RMI H
VI H 67 1040 2 3.0% 13 19.4% 1.25% 15 22.39%

106
Regular
Assessment
Proficient
Modified Achievement Standards
(AA-MAS) Proficient
Alternate Academic
Achievement Standards (AA-
AAS) Proficient Total Proficient
State Grade
IEP
Enrollment
Total
Enrollment Number
Percent
of IEP Number
Percent of
IEP
Percent of
Total
Enrollment Number
Percent
of IEP
Percent of
Total
Enrollment Number
Percent of
IEP
Population
Average 1632 24168 115 7.0% 9 0.6% 0.04% 73 4.5% 0.30% 197 12.07%
Unique States Average 6.3% 1.8% 0.07% 10.7% 0.48% 17.18% aThe following states also reported assessing students proficient on an Alternate Assessment based on Grade-level Achievement Standards: MA(0), and NC (18)
107
Appendix C
State-by-State Participation Raw Data
This Appendix presents the state-by-state raw data that were the source of summary data for Tables A1-A6 of Appendix A, which in
turn were used to generate the participation tables and figures in the main body of this document. There are six tables in this
Appendix. Each table shows either reading or math participation counts for all grades within a school level for each state. The specific
grades that were used in Appendix A and in the main document are indicated by an asterisk next to the grade level for the elementary
and middle school tables. All high school data included in this Appendix were used in Appendix A and in the main document.
Each row in the six tables shows numbers for one state on one content area in one grade. The first count shows state reported special
education enrollment, that is, the number of students with an individualized education program (IEP). Following that is the number of
all students enrolled in the grade. Next are two sections of the table that show numbers of students reported as taking each of two
kinds of assessments: Regular Assessment and Alternate Assessment. For the Regular Assessment, the first column shows the total
number of students who took that assessment. This total is the number used in Appendix A for reporting participation. Next to that is
the number of students who took the regular assessment with accommodations. The next column lists the count of students who did
not take a reading assessment in English due to LEP status with less than 12 months as a resident of the U. S. (this does not apply for
math).
The first column for Alternate Assessment shows the total number of students who participated in an alternate assessment. The next
column for Alternate Assessment shows the number of students whose assessment was scored against grade level achievement
standards. The second column for Alternate Assessment shows the number of students whose assessment was scored against modified
achievement standards. The next column for Alternate Assessment shows the number of students whose assessment was scored
against alternate achievement standards. For our purposes, a state needed to first populate the alternate academic achievement
standards column in order to claim participants on the alternate assessment based on grade level achievement standards.
The next section in these tables shows five columns for reporting on students who did not take any assessment. These students do not
count as participants, nor are they included in performance counts. The first column is a count of those students whose test results
were invalidated because of changes in testing materials or practices such as nonstandard accommodations or modifications. Also
included in this column is the count of students whose results were invalid because of problems in the testing process such as students
failing to fill out an answer sheet correctly. Next is a count of “out-of-level” assessments—students who took an assessment at a grade
lower than that of their enrollment. This was the second year these students were counted as non-participants. The columns labeled

108
“Parental Exemption” and “Absent” are self-explanatory. The remaining column, labeled “Other Reasons,” shows counts of students
who were not assessed for reasons other than parental exemption or absence. In cases where states did not distinguish Parental
Exemption and Absent from other reasons for not assessing students, the Other Reasons column shows all of the students reported as
not assessed.
The final column in these tables is “Row Total.” The number in this column is equal to the sum of the number of students tested on
any assessment plus those reported as not tested. “Row total” does not always equal the number of students with IEPs because this
count may not have been completed during the time of testing.
The data in these tables were obtained directly from Section 618, Table 6 included with each state’s 2007-08 Annual Performance
Reports or from the EdFacts data management system as retrieved by the Data Accountability Center when applicable. Differences in
how states completed Table 6, and differences between Table 6 and the EdFacts system, complicate the interpretation of some data.
All information is from the 2007-08 school year.

109
Table C1
Elementary Reading Participation
Enrollment Regular Assessment Alternate Assessment Students Who Took No Assessment
1 2 3 3A 3B 4 4A 4B 4C 5 6 7 8 9
State Gr
Stdnts
with
IEPs
All
Stdnts Total Accom
LEP <
12
months Total
Grade
Level
Mod.
Stand
Alt.
Stand Invalid
Out-of-
Level
Parent
Exemp Absnt
Other
Reasons
Row
Totala
AK 3 1552 9647 1465 1042 1 54 54 18
0 15 0 1552
AK 4* 1482 9347 1387 1045
67 67 10
0 18 0 1482
AK 5 1365 9371 1276 1005
65 65 6
0 18 0 1365
AL 3 6878 58352 6371 1330 141 439 439 1
0 67 0 6878
AL 4* 6923 57803 6414 1518 127 442 442 0
0 67 0 6923
AL 5 6672 57003 6110 1606 131 503 503 0
0 59 0 6672
AR 3 4358 36252 3916 2239
408 408 1
0 30 3 4358
AR 4* 4424 35698 3915 2457
474 474 0
0 33 2 4424
AR 5 4390 35546 3904 2716
457 457 0
0 25 4 4390
AZ 3 11209 84494 10233 4656 746 746 46
0 184 0 11209
AZ 4* 11335 82731 10417 5569 731 731 44
0 161 0 11353
AZ 5 11266 82340 10349 5840 679 679 52
0 186 0 11266
CA 3 52860 461331 36452 2835 15533 11030 4503 624
331 289 0 53229
CA 4* 57596 464652 38195 4581 18390 13897 4493 702
170 263 0 57720
CA 5 58475 468411 39731 4419 14606 13290 4316 724
334 224 0 55619
CO 3 6543 60090 5789 3765
642 642 112
0 0 0 6543
CO 4* 6675 59065 5945 4127
630 630 100
0 0 0 6675
CO 5 6460 57834 5801 3911
568 568 91
0 0 0 6460
CT 3 4822 42095 4230 3249
484 484 73
0 34 1 4822
CT 4* 5231 42613 4639 3735
491 491 74
0 26 1 5231
CT 5 5265 42278 4742 3804
444 444 53
0 23 3 5265
DE 3 1330 9503 1232 118
78 78 0
0 5 15 1330
DE 4* 1375 9115 1267 1207
94 94 0
0 3 11 1375
DE 5 1476 9015 1371 1304
91 91 0
0 3 11 1476
FL 3 34384 207542 31636 20405
2191 2191 80
0 0 477 34384
FL 4* 31810 196023 29102 20670
2229 2229 80
0 0 399 31810
FL 5 31322 198893 28554 21280
2328 2328 90
0 0 350 31322
GA 3 17030 127374 16008 8927
934 934 23
0 65 0 17030
GA 4* 16700 124319 15693 9977
936 936 15
0 56 0 16700
GA 5 16373 122228 15162 10787
1135 1135 18
0 58 0 16373
HI 3 1329 13754 1227 928
68 68 0
2 31 1 1329

110
Enrollment Regular Assessment Alternate Assessment Students Who Took No Assessment
1 2 3 3A 3B 4 4A 4B 4C 5 6 7 8 9
State Gr
Stdnts
with
IEPs
All
Stdnts Total Accom
LEP <
12
months Total
Grade
Level
Mod.
Stand
Alt.
Stand Invalid
Out-of-
Level
Parent
Exemp Absnt
Other
Reasons
Row
Totala
HI 4* 1389 13605 1281 914
56 56 0
8 42 2 1389
HI 5 1497 13451 1392 1030
66 66 0
10 28 1 1497
IA 3 4264 34503 4030 2904
218 218 0
0 16 0 4264
IA 4* 4761 34295 4531 3536
219 219 0
0 11 0 4761
IA 5 5061 34211 4832 3963
220 220 0
0 9 0 5061
ID 3 2086 21268 1874 2
193 193 2
0 0 17 2086
ID 4* 2130 20675 1941 6
173 173 4
0 0 12 2130
ID 5 2060 20338 1897 4
142 142 4
0 2 15 2060
IL 3 21812 155487 19898 11051
1729 1729 162
0 23 0 21812
IL 4* 22745 153606 20652 13247
1714 1714 205
0 174 0 22745
IL 5 22451 153730 20559 14446
1674 1674 181
0 37 0 22451
IN 3 13393 78739 12692 4965 116 484 484 427
0 0 0 13603
IN 4* 13132 78204 13270 6413 105 599 599 282
0 0 0 14151
IN 5 12729 78709 12840 7497 126 648 648 231
0 0 0 13719
KS 3 4914 34205 3495 1685
1393 1015 378 2
2 18 27 4937
KS 4* 5437 33931 3880 1819
1534 1167 367 0
2 7 22 5445
KS 5 5410 33007 3976 1782 1 1417 1095 322 0
1 10 14 5418
KY 3 7004 49678 6537 4344 466 466 0
0 0 30 7033
KY 4* 6896 49112 6436 4881 460 460 0
0 0 38 6934
KY 5 6593 48242 6091 4968 502 502 0
0 0 35 6628
LA 3 6850 52100 6460 5455
367 0 367 0
0 21 2 6850
LA 4* 8764 56234 7448 6712 1 1300 868 432 0
0 13 3 8764
LA 5 5211 45299 4017 3572
1172 706 466 0
0 18 4 5211
MA 3 12282 71057 11016 9202 1092 15 1077 0
0 123 51 12282
MA 4* 13299 72004 11896 10584 1238 19 1219 0
0 89 76 13299
MA 5 13525 71404 12219 10905 1184 20 1164 0
0 65 57 13525
MD 3 7067 58939 6537 4895
467 467 0
0 0 63 7067
MD 4* 7767 60439 7183 5688
536 536 0
0 0 48 7767
MD 5 7942 61333 7236 5976
642 642 0
0 0 64 7942
ME 3 2358 13803 2210 1735
123 123 0
0 25 0 2358
ME 4* 2523 14206 2378 2013
126 126 0
0 19 0 2523
ME 5 2555 14240 2392 1996
136 136 0
0 27 0 2555
MI 3 15736 118468 12463 3341 8 3138 3138 96
0 0 0 15697
MI 4* 17089 118963 13454 4227 7 3426 3426 101
0 0 0 16981

111
Enrollment Regular Assessment Alternate Assessment Students Who Took No Assessment
1 2 3 3A 3B 4 4A 4B 4C 5 6 7 8 9
State Gr
Stdnts
with
IEPs
All
Stdnts Total Accom
LEP <
12
months Total
Grade
Level
Mod.
Stand
Alt.
Stand Invalid
Out-of-
Level
Parent
Exemp Absnt
Other
Reasons
Row
Totala
MI 5 17477 119222 13849 4934 10 3492 3492 154
0 0 0 17495
MN 3 8613 59684 7646 468
846 846 102
11 8 0 8613
MN 4* 8861 59326 7879 615
856 856 102
15 9 0 8861
MN 5 8832 59761 7886 584
863 863 60
10 13 0 8832
MO 3 10518 66954 9752 4946
751 751 7
8 0 0 10518
MO 4* 10460 67630 9717 5933
726 726 6
11 0 0 10460
MO 5 9898 66260 9191 6318
695 695 4
8 0 0 9898
MS 3 4344 39902 3813 1482
385 385 0
0 146 0 4344
MS 4* 4047 38964 3507 1773
433 433 0
0 107 0 4047
MS 5 3918 38324 3441 2054
366 366 0
0 111 0 3918
MT 3 1346 10506 1192 681
95 95 45
0 14 0 1346
MT 4* 1376 10522 1270 829
91 91 1
0 14 0 1376
MT 5 1355 10492 1181 828
108 108 51
0 16 0 1356
NC 3 16361 115372 12554 7595
3748 40 2789 919 0
0 59 0 16361
NC 4* 15814 111944 11654 8118
4107 46 3181 880 0
0 53 0 15814
NC 5 15073 110257 10797 8207
4225 45 3383 797 0
0 51 0 15073
ND 3 1080 6811 843 425
225 151 74 0
0 0 12 1080
ND 4* 1091 6957 821 517
252 166 86 0
0 0 18 1091
ND 5 1024 6996 735 508
277 182 95 0
0 0 12 1024
NE 3 3772 23748 3535 1035
164 164 50
0 21 2 3772
NE 4* 3799 23492 3558 1451
199 199 18
0 22 2 3799
NE 5 3493 23344 3235 1542
192 192 42
0 23 1 3493
NH 3 2043 14686 1867 1525
151 151 0
0 16 9 2043
NH 4* 2309 15089 2144 1777
142 142 0
0 23 0 2309
NH 5 2609 15295 2401 1907
172 172 0
0 22 14 2609
NJ 3 15976 103521 14589 11031
995 995 321
0 71 0 15976
NJ 4* 17142 103218 15664 12808
1069 1069 332
0 77 0 17142
NJ 5 17118 103339 15838 13651
1000 1000 230
0 50 0 17118
NM 3 3154 24878 2907 1282
189 189 51 0 7 0 0 3154
NM 4* 3099 24364 2876 1338
167 167 47 1 8 0 0 3099
NM 5 3112 24274 2865 1317
189 189 49 1 8 0 0 3112
NV 3 3762 33931 3503 1727
246 246 5
0 5 3 3762
NV 4* 3905 33577 3638 1945
249 249 2
0 3 13 3905
NV 5 3831 32857 3554 2086
256 256 8
0 7 6 3831

112
Enrollment Regular Assessment Alternate Assessment Students Who Took No Assessment
1 2 3 3A 3B 4 4A 4B 4C 5 6 7 8 9
State Gr
Stdnts
with
IEPs
All
Stdnts Total Accom
LEP <
12
months Total
Grade
Level
Mod.
Stand
Alt.
Stand Invalid
Out-of-
Level
Parent
Exemp Absnt
Other
Reasons
Row
Totala
NY 3 32723 200479 29844 23944 56 1997 1997 36
0 830 16 32723
NY 4* 35015 201918 31965 27578 48 2201 2201 54
0 778 17 35015
NY 5 35209 202712 32326 28478 50 2049 2049 33
0 778 23 35209
OH 3 20171 137697 17618 8501 129 2482 2482 3
7 6 55 20171
OH 4* 20727 132512 18021 10332 149 2571 2571 31
5 13 86 20727
OH 5 20416 131093 17683 10757 122 2584 2584 21
6 12 110 20416
OK 3 7617 47329 3801 1416 20 3507 2992 515 4
0 9 1 7322
OK 4* 7842 46852 3878 1709 38 3691 3163 528 0
0 27 3 7599
OK 5 7626 45462 3873 2038 15 3375 2914 461 5
0 30 2 7285
OR 3 6064 42798 5021 1693 20 959 959 1
2 81 0 6064
OR 4* 6554 42765 5527 1994 14 942 942 2
4 77 2 6554
OR 5 6496 42364 5645 2116 12 786 786 2
0 63 0 6496
PA 3 21306 130332 19398 11016 1741 1741 60
15 62 30 21306
PA 4* 22386 130008 20526 12749 1649 1649 84
20 62 45 22386
PA 5 22608 130942 20701 13533 1706 1706 75
14 79 33 22608
RI 3 1812 9817 1703 859 1 78 78 0
0 27 4 1812
RI 4* 1997 11129 1899 1118 5 72 72 0
0 21 5 1997
RI 5 2130 10975 2036 1351 2 68 68 0
0 18 8 2130
SC 3 7964 53641 7439 3794
452 452 0
0 0 73 7964
SC 4* 7714 52695 7260 4348 1 401 401 0
0 0 53 7714
SC 5 7224 51658 6721 4316
454 454 0
0 0 49 7224
SD 3 1437 8855 1325 513
105 105 0
7 0 0 1437
SD 4* 1245 8790 1158 625
84 84 0
3 0 0 1245
SD 5 1100 8921 1004 633
88 88 0
8 0 0 1100
TN 3 8964 75193 8285 5939
645 645 7
0 24 3 8964
TN 4* 8950 73848 8263 6325 1 636 636 5
0 41 5 8950
TN 5 8592 71892 7896 6282
656 656 7
0 26 7 8592
TX 3 35359 359355 22305 12503 15 12798 10195 2603 81
0 98 77 35359
TX 4* 37551 348654 22529 14925 18 14672 12274 2398 88
0 150 112 37551
TX 5 39647 349131 23900 17238 18 15497 13200 2297 62
0 97 91 39647
UT 3 6915 44525 6472 3137 577 434 434 0 3 1 4 1 6915
UT 4* 6718 42558 6251 3306 577 448 448 0 6 4 6 3 6718
UT 5 6152 41380 5688 3318 488 450 450 0 7 3 2 2 6152
VA 3 12366 89934 9550 4786
2775 1650 1125 11
11 18 1 12366

113
Enrollment Regular Assessment Alternate Assessment Students Who Took No Assessment
1 2 3 3A 3B 4 4A 4B 4C 5 6 7 8 9
State Gr
Stdnts
with
IEPs
All
Stdnts Total Accom
LEP <
12
months Total
Grade
Level
Mod.
Stand
Alt.
Stand Invalid
Out-of-
Level
Parent
Exemp Absnt
Other
Reasons
Row
Totala
VA 4* 12485 89838 9479 5138
2964 1936 1028 14
9 18 1 12485
VA 5 12385 88348 9315 5189
3020 1982 1038 11
12 27 0 12385
VT 3 664 6343 587 404
46 46 24
0 4 3 664
VT 4* 755 6454 675 478
65 65 9
0 2 4 755
VT 5 926 6515 837 592
70 70 8
0 7 4 926
WA 3 10654 77015 9508 4784
778 778 271 2 0 30 65 10654
WA 4* 10549 76827 9533 5019
729 729 190 1 0 28 68 10549
WA 5 10110 76609 9193 5230
668 668 158 5 0 28 58 10110
WI 3 8416 59996 7362 4033
911 911 0
1 0 142 8416
WI 4* 8614 60081 7565 4803
893 893 0
10 0 146 8614
WI 5 8512 59619 7544 5091
867 867 0
1 0 100 8512
WV 3 3663 20090 3363 1213
257 257 0
2 16 25 3663
WV 4* 3436 20213 3124 1443
269 269 1
3 20 19 3436
WV 5 3027 20033 2710 1396
254 254 0
3 29 31 3027
WY 3 1029 6467 968 490
41 41 0
0 19 1 1029
WY 4* 1079 6504 995 591
64 64 0
0 18 2 1079
WY 5 948 6385 867 536
68 68 0
0 11 2 948
AS 3 67 908 55 55 6 6 0 0 6 0 67
AS 4* 89 991 70 70 5 5 0 0 14 0 89
AS 5 96 1124 91 91 0 0 0 0 5 0 96
BIE 3 519 3661 478 315 33 10 23 3 0 2 3 519
BIE 4* 591 3490 539 395 49 17 32 0 0 1 2 591
BIE 5 571 3451 524 402 39 16 23 3 1 1 3 571 CNMI 3 72 848 54 47 15 15 0 0 3 0 72 CNMI 4* 77 847 62 56 15 15 0 0 0 0 77 CNMI 5 75 851 59 55 12 12 0 0 4 0 75
DC 3 841 4804 740 542 69 69 29 3 0 841
DC 4* 965 4731 849 706 85 85 26 5 0 965
DC 5 1050 4730 949 766 70 70 24 7 0 1050
FSM 3
FSM 4*
FSM 5 0 0 97 0 0 0 0 0 0 0 97
GU 3 104 2528 92 77 2 2 4 0 6 0 104
GU 4* 125 2475 102 85 8 8 5 0 10 0 125

114
Enrollment Regular Assessment Alternate Assessment Students Who Took No Assessment
1 2 3 3A 3B 4 4A 4B 4C 5 6 7 8 9
State Gr
Stdnts
with
IEPs
All
Stdnts Total Accom
LEP <
12
months Total
Grade
Level
Mod.
Stand
Alt.
Stand Invalid
Out-of-
Level
Parent
Exemp Absnt
Other
Reasons
Row
Totala
GU 5 132 2440 107 87 5 5 6 0 14 0 132
PW 3
PW 4* 15 223 13 10 2 2 0 0 0 0 15
PW 5
PR 3
PR 4*
PR 5
RMI 3
RMI 4*
RMI 5
VI 3 84 1114 67 25 14 14 0 0 3 0 84
VI 4* 123 1188 111 35 8 8 0 0 4 0 123
VI 5 91 1265 81 37 7 7 0 0 3 0 91
* Grades that were used in Appendix A and in the body of this document are indicated by an asterisk next to the grade level.

115
Table C2
Middle School Reading Participation
Enrollment Regular Assessment Alternate Assessment Students Who Took No Assessment
1 2 3 3A 3B 4 4A 4B 4C 5 6 7 8 9
State Gr
Stdnts
with
IEPs
All
Stdnts Total Accom
LEP <
12
months Total
Grade
Level
Mod.
Stand
Alt.
Stand Invalid
Out-of-
Level
Parent
Exemp Absnt
Other
Reasons
Row
Totala
AK 6 1268 9389 1181 976
59 59 7
0 20 1 1268
AK 7 1216 9595 1118 957
72 72 5
0 21 0 1216
AK 8* 1199 9737 1110 961 1 65 65 6
0 18 0 1199
AL 6 6667 56554 6113 1290 119 490 490 0
0 64 0 6667
AL 7 6942 58156 6342 1403 101 494 494 0
0 106 0 6942
AL 8* 7098 57990 6469 1346 94 501 501 0
0 128 0 7098
AR 6 4210 35018 3728 2711
447 447 2
0 31 2 4210
AR 7 4219 35217 3746 2604
441 441 1
0 30 1 4219
AR 8* 4431 35467 3932 2546
447 447 0
0 47 5 4431
AZ 6 10798 82788 9820 5283
702 702 51
0 225 0 10798
AZ 7 10798 82105 9272 4507
721 721 56
0 278 0 10327
AZ 8* 9943 81850 8807 4184
794 794 53
0 289 0 9943
CA 6 55648 474309 49322 4782
4579 4579 1292
279 299 0 55771
CA 7 53106 482829 47363 4274
4577 4577 1062
117 202 0 53321
CA 8* 51454 487914 45248 3151
4711 4711 855
236 561 0 51611
CO 6 6326 57768 5626 3685
551 551 149
0 0 0 6326
CO 7 6133 57760 5433 3021
526 526 174
0 0 0 6133
CO 8* 5768 57731 5074 2583
506 506 188
0 0 0 5768
CT 6 5422 43062 4864 3831
452 452 60
0 46 0 5422
CT 7 5383 43241 4786 3458
439 439 69
0 88 1 5383
CT 8* 5484 43930 4863 3487
420 420 101
0 99 1 5484
DE 6 1413 9231 1303 1221
89 89 0
0 6 15 1413
DE 7 1520 9531 1375 1250
111 111 0
0 17 17 1520
DE 8* 1569 10324 1404 1297
117 117 0
0 26 22 1569
FL 6 30248 198739 27250 18041
2229 2229 212
0 0 557 30248
FL 7 30367 203265 26976 17427
2435 2435 260
0 0 696 30367
FL 8* 25009 193817 21523 13881
2447 2447 159
0 0 880 25009
GA 6 15537 121193 14295 11015
1137 1137 23
0 82 0 15537
GA 7 14771 120909 13420 10434
1224 1224 31
0 96 0 14771
GA 8* 14801 122071 13256 10337
1429 1429 25
0 91 0 14801
HI 6 1460 13414 1335 885
72 72 0
6 47 0 1460

116
Enrollment Regular Assessment Alternate Assessment Students Who Took No Assessment
1 2 3 3A 3B 4 4A 4B 4C 5 6 7 8 9
State Gr
Stdnts
with
IEPs
All
Stdnts Total Accom
LEP <
12
months Total
Grade
Level
Mod.
Stand
Alt.
Stand Invalid
Out-of-
Level
Parent
Exemp Absnt
Other
Reasons
Row
Totala
HI 7 1522 13003 1400 809
61 61 0
3 58 0 1522
HI 8* 1580 13361 1475 703
63 63 0
0 39 3 1580
IA 6 5003 34307 4801 4067
187 187 0
2 13 0 5003
IA 7 5068 34882 4830 4150
221 221 0
0 17 0 5068
IA 8* 5273 35685 5054 4373
210 210 0
0 9 0 5273
ID 6 1975 20725 1781 2
180 180 2
0 0 12 1975
ID 7 1839 20348 1652 5
173 173 1
1 0 12 1839
ID 8* 1843 20407 1647 11
177 177 1
0 0 18 1843
IL 6 22460 156811 20431 15245
1811 1811 196
0 22 0 22460
IL 7 22827 159896 20692 15964
1848 1848 242
0 45 0 22827
IL 8* 23412 161119 21151 16269
1889 1889 307
0 65 0 23412
IN 6 11976 80122 12010 7999 98 685 685 276
0 0 0 12971
IN 7 11978 81099 11320 8540 127 768 768 355
0 0 0 12443
IN 8* 12116 80850 11069 8906 108 807 807 390
0 0 0 12266
KS 6 5464 33434 3894 1620 2 1546 1214 332 4
0 13 18 5475
KS 7 5241 33970 3805 1713 1 1403 1067 336 3
0 17 24 5252
KS 8* 4961 34346 3504 1693
1418 1112 306 0
1 39 23 4985
KY 6 6205 48740 5686 4635
518 518 0
0 0 42 6246
KY 7 6054 49447 5502 4642
550 550 0
0 0 53 6105
KY 8* 6032 49469 5417 4404
615 615 0
0 0 59 6091
LA 6 6989 51401 5690 5161
1251 812 439 0
0 29 19 6989
LA 7 6286 50746 4972 4528
1283 812 471 0
0 14 17 6286
LA 8* 6306 51363 4409 4117
1844 1277 567 0
0 26 27 6306
MA 6 13629 72378 12227 10782
1217 12 1205 0
0 110 75 13629
MA 7 13903 74025 12447 11102
1097 10 1087 0
0 271 88 13903
MA 8* 13425 74464 12055 10490
972 11 961 0
0 333 65 13425
MD 6 7644 61990 6965 5915
590 590 0
0 0 89 7644
MD 7 8034 63788 7237 6115
644 644 0
0 0 153 8034
MD 8* 7996 65438 6999 5944
789 789 0
0 0 208 7996
ME 6 2518 14365 2282 1909
197 197 0
0 39 0 2518
ME 7 2555 14818 2330 1912
178 178 0
0 47 0 2555
ME 8* 2508 15274 2269 1832
177 177 0
0 62 0 2508
MI 6 16912 121072 13201 4259 10 3327 3327 263
0 0 0 16791
MI 7 17473 125515 13734 3695 4 3451 3451 145
0 0 0 17330

117
Enrollment Regular Assessment Alternate Assessment Students Who Took No Assessment
1 2 3 3A 3B 4 4A 4B 4C 5 6 7 8 9
State Gr
Stdnts
with
IEPs
All
Stdnts Total Accom
LEP <
12
months Total
Grade
Level
Mod.
Stand
Alt.
Stand Invalid
Out-of-
Level
Parent
Exemp Absnt
Other
Reasons
Row
Totala
MI 8* 17480 126545 13825 3709 8 3371 3371 132
0 0 0 17328
MN 6 8288 59850 7315 480
873 873 74
12 14 0 8288
MN 7 8439 61884 7359 316
954 954 89
12 25 0 8439
MN 8* 8473 63102 7448 340
873 873 90
15 47 0 8473
MO 6 9473 66381 8787 6250
653 653 12
21 0 0 9473
MO 7 9310 67421 8619 6274
669 669 6
16 0 0 9310
MO 8* 9061 68073 8364 5947
642 642 12
43 0 0 9061
MS 6 4161 38561 3608 2138
414 414 0
0 139 0 4161
MS 7 4341 40704 3665 2260
494 494 0
0 182 0 4341
MS 8* 4245 40069 3571 2155
420 420 0
0 254 0 4245
MT 6 1318 10776 1195 842
78 78 34
0 12 0 1319
MT 7 1348 10858 1191 844
100 100 27
0 33 0 1351
MT 8* 1428 11151 1299 891
78 78 46
0 12 0 1435
NC 6 13830 108456 9690 7818
4027 41 3195 791 0
0 113 0 13830
NC 7 13738 109874 9824 8074
3784 63 3022 699 0
0 130 0 13738
NC 8* 13670 111321 9730 8005
3768 43 2829 896 0
0 172 0 13670
ND 6 1033 7028 740 546
262 174 88 0
0 0 31 1033
ND 7 1001 7244 681 534
291 204 87 0
0 0 29 1001
ND 8* 1048 7423 750 600
257 168 89 0
0 0 41 1048
NE 6 3302 23490 2982 1282
218 218 74
0 25 3 3302
NE 7 3142 23746 2792 1234
242 242 78
0 30 0 3142
NE 8* 2991 23826 2687 1132
221 221 47
0 35 1 2991
NH 6 2662 15439 2480 1966
168 168 0
0 14 0 2662
NH 7 2747 15922 2581 1977
140 140 0
0 25 1 2747
NH 8* 2727 16371 2531 1836
140 143 0
0 51 2 2724
NJ 6 17296 104075 15970 14365
1020 1020 233
0 73 0 17296
NJ 7 17861 106040 16485 14972
1021 1021 259
0 96 0 17861
NJ 8* 18188 106445 16830 15228
915 915 301
0 142 0 18188
NM 6 3029 23666 2792 1346
182 182 53 1 1 0 0 3029
NM 7 3129 23964 2860 1181
207 207 56 0 6 0 0 3129
NM 8* 3212 24576 2907 1116
235 235 67 0 3 0 0 3212
NV 6 3728 33450 3415 2165
285 285 4
0 8 16 3728
NV 7 3701 34234 3437 2257
228 228 5
0 13 18 3701
NV 8* 3570 33569 3274 2079
261 261 3
0 14 18 3570

118
Enrollment Regular Assessment Alternate Assessment Students Who Took No Assessment
1 2 3 3A 3B 4 4A 4B 4C 5 6 7 8 9
State Gr
Stdnts
with
IEPs
All
Stdnts Total Accom
LEP <
12
months Total
Grade
Level
Mod.
Stand
Alt.
Stand Invalid
Out-of-
Level
Parent
Exemp Absnt
Other
Reasons
Row
Totala
NY 6 36021 205999 32729 28368 33 2222 2222 42
0 990 38 36021
NY 7 36170 213291 32616 28035 42 2289 2289 36
0 1193 36 36170
NY 8* 36530 216523 32349 28081 20 2455 2455 42
0 1642 42 36530
OH 6 20767 132490 18088 11374 116 2499 2499 30
5 16 129 20767
OH 7 21170 137179 18422 11848 117 2507 2507 19
5 42 175 21170
OH 8* 21546 139283 18568 11712 124 2661 2661 14
10 78 215 21546
OK 6 7237 44764 3436 1700 13 3528 3012 516 1
0 38 1 7004
OK 7 7248 44853 3471 1633 10 3433 2979 454 1
0 71 2 6978
OK 8* 7533 45963 3535 1023 8 3374 2937 437 12
0 86 2 7009
OR 6 6210 42730 5518 1943 12 602 602 0
5 85 0 6210
OR 7 5834 42939 5199 1836 7 518 518 3
6 106 2 5834
OR 8* 5494 42660 4897 1582 6 451 451 2
9 135 0 5494
PA 6 22828 134727 20789 12876 1766 1766 87
17 125 44 22828
PA 7 23456 140060 21258 11852 1814 1814 149
22 168 45 23456
PA 8* 24362 143489 21720 12722 2058 2058 220
29 250 85 24362
RI 6 2185 11312 2067 1338 3 79 79 0
0 29 10 2185
RI 7 2300 11575 2196 1351 3 70 70 0
0 26 8 2300
RI 8* 2362 12120 2196 1316
94 94 0
0 68 4 2362
SC 6 6859 51679 6455 4336
363 363 0
0 0 41 6859
SC 7 7155 52833 6795 4273 2 305 305 0
0 0 55 7155
SC 8* 6926 52907 6606 4064
221 221 0
0 0 99 6926
SD 6 1037 9071 935 601
99 99 0
3 0 2 1039
SD 7 982 9180 891 587
85 85 0
6 0 0 982
SD 8* 936 9334 837 562
96 96 0
3 0 0 936
TN 6 8336 71224 7538 6226
726 726 3 10 0 51 8 8336
TN 7 8498 72804 7712 6227 3 709 709 1 12 0 60 4 8498
TN 8* 8487 72422 7558 5921
818 818 0 9 0 91 11 8487
TX 6 39150 337671 23971 17979 14 14755 12384 2371 79
0 227 118 39150
TX 7 40257 340649 25251 18333 19 14419 12205 2214 92
0 355 140 40257
TX 8* 40569 334480 25875 18628 11 14241 11732 2509 85
0 243 125 40569
UT 6 5578 41024 5141 3182 431 424 424 0 2 7 4 0 5578
UT 7 4919 40217 4464 2167 377 434 434 0 0 4 15 2 4919
UT 8* 4616 39316 4165 1896 383 410 410 0 13 4 23 1 4616
VA 6 12233 89754 8987 3694
3141 2095 1046 11
16 75 3 12233

119
Enrollment Regular Assessment Alternate Assessment Students Who Took No Assessment
1 2 3 3A 3B 4 4A 4B 4C 5 6 7 8 9
State Gr
Stdnts
with
IEPs
All
Stdnts Total Accom
LEP <
12
months Total
Grade
Level
Mod.
Stand
Alt.
Stand Invalid
Out-of-
Level
Parent
Exemp Absnt
Other
Reasons
Row
Totala
VA 7 12688 91502 9155 2466
3384 2305 1079 20
19 108 2 12688
VA 8* 14014 93951 10301 2504
3523 2416 1107 18
38 134 0 14014
VT 6 916 6538 828 555
72 72 8
0 3 5 916
VT 7 1012 6773 930 642
65 65 8
0 1 8 1012
VT 8* 1021 7087 923 612
70 70 15
0 6 7 1021
WA 6 9284 75846 8356 4610
686 686 141 2 0 36 63 9284
WA 7 8851 77768 7909 4247
604 604 194 6 0 53 85 8851
WA 8* 8693 78095 7620 3903
638 638 256 8 0 70 101 8693
WI 6 8656 60906 7678 5694
864 864 0
2 0 112 8656
WI 7 8631 62041 7665 5754
841 841 0
1 0 124 8631
WI 8* 9323 64154 8271 6176
881 881 0
9 0 162 9323
WV 6 3046 20276 2700 1446
263 263 0
3 59 21 3046
WV 7 3121 21122 2785 1379
244 244 1
2 70 19 3121
WV 8* 3210 21198 2832 1256
276 276 0
2 75 25 3210
WY 6 957 6414 876 561
62 62 0
0 16 3 957
WY 7 839 6269 762 513
62 62 0
0 10 5 839
WY 8* 892 6577 810 573
59 59 0
0 21 2 892
AS 6
AS 7 119 1053 114 114 0 0 0 0 5 0 119
AS 8* 125 1119 122 122 3 3 0 0 0 0 125
BIE 6 538 3420 492 386 34 9 25 6 2 1 3 538
BIE 7 586 3409 529 416 53 22 31 2 0 2 0 586
BIE 8* 630 3582 576 420 44 26 18 7 1 2 0 630 CNMI 6 58 847 48 45 9 9 0 0 1 0 58 CNMI 7 CNMI 8* 85 795 73 70 10 10 0 0 3 0 86
DC 6 1181 4808 1070 866 79 79 27 5 0 1181
DC 7 1205 4792 1058 837 81 81 56 10 0 1205
DC 8* 1391 5176 1225 1027 96 96 69 1 0 1391
FSM 6 108 1540 0 39 1 1 0 0 10 0 11
FSM 7 0 0 68 0 0 0 0 0 0 0 68
FSM 8* 93 1569 20 18 2 2 0 0 10 13 45
GU 6 132 2210 113 101 2 2 8 0 9 0 132
GU 7 184 2332 151 126 6 6 8 0 19 0 184

120
Enrollment Regular Assessment Alternate Assessment Students Who Took No Assessment
1 2 3 3A 3B 4 4A 4B 4C 5 6 7 8 9
State Gr
Stdnts
with
IEPs
All
Stdnts Total Accom
LEP <
12
months Total
Grade
Level
Mod.
Stand
Alt.
Stand Invalid
Out-of-
Level
Parent
Exemp Absnt
Other
Reasons
Row
Totala
GU 8* 189 2352 160 125 4 4 9 0 16 0 189
PW 6 13 246 7 5 4 4 0 0 2 0 13
PW 7
PW 8* 14 254 12 10 2 2 0 0 0 0 14
PR 6
PR 7
PR 8*
RMI 6
RMI 7
RMI 8* 27 1107 12 12 2 2 14
VI 6 103 1161 87 54 13 13 0 0 3 0 103
VI 7 153 1463 129 49 14 14 0 0 10 0 153
VI 8* 137 1227 122 55 15 15 0 0 0 0 137 * Grades that were used in Appendix A and in the body of this document are indicated by an asterisk next to the grade level.

121
Table C3
High School Reading Participation
Enrollment Regular Assessment Alternate Assessment Students Who Took No Assessment
1 2 3 3A 3B 4 4A 4B 4C 5 6 7 8 9
State Gr
Stdnts
with
IEPs
All
Stdnts Total Accom
LEP <
12
months Total
Grade
Level
Mod.
Stand
Alt.
Stand Invalid
Out-of-
Level
Parent
Exemp Absnt
Other
Reasons
Row
Totala
AK H 1066 9990 919 752 1 89 89 12
0 46 0 1066
AL H 4835 47977 4283 2396 26 448 448 0
0 104 0 4835
AR H 3941 31087 3310 1919
553 553 0
0 71 7 3941
AZ H 8096 77634 7044 3616
716 716 128
0 415 0 8303
CA H 43333 471683 37913 3142
1441 1441 1524
0 7107 0 47985
CO H 5717 61045 4845 2153
566 566 306
0 0 0 5717
CT H 4898 42859 4041 3003
442 442 231
0 180 4 4898
DE H 1174 9067 978 872
136 136 0
0 42 18 1174
FL H 27211 204527 21550 11875
2935 2935 226
0 0 2500 27211
GA H 8804 93575 7321 5589
1172 1172 70
0 241 0 8804
HI H 1673 12982 1497 517
49 49 0
0 126 1 1673
IA H 4703 36341 4475 3721
200 200 0
0 28 0 4703
ID H 1662 19997 1474 8
152 152 2
0 2 32 1662
IL H 17740 140263 14520 11700
1666 1666 1086
0 468 0 17740
IN H 12234 81967 10019 8458 99 830 830 975
0 0 0 11824
KS H 3218 24567 2186 824
973 677 296 2 3 1 46 20 3231
KY H 5289 49266 4701 3627
588 588 0
0 0 44 5333
LA H 3321 42947 2413 2172
845 411 434 0
0 28 35 3321
MA H 12125 73540 10567 9484
866 7 859 0
0 621 71 12125
MD H 5609 55714 4391 2587
1187 362 825 0
0 0 31 5609
ME H 2213 15604 1825 1108
209 209 0
0 179 0 2213
MI H 14506 123816 10354 8065
2774 2774 732
0 0 0 13860
MN H 8235 67503 7122 404
832 832 179
23 79 0 8235
MO H 7705 63218 7039 4433 581 581 9
76 0 0 7705
MS H 2148 33048 1920 1221
0 0 0
0 228 0 2148
MT H 1346 11449 1114 562
124 124 79
0 34 0 1351
NC H 10128 96847 7141 5402
2635 47 1984 604 0
0 352 0 10128
ND H 935 7671 620 463
276 176 100 0
0 0 39 935
NE H 2590 24180 2317 1005
183 183 47
0 41 0 2588
NH H 2640 16467 2317 1337
143 111 0
0 169 43 2672
NJ H 16037 100202 14458 12513
1045 1045 244
0 290 0 16037

122
Enrollment Regular Assessment Alternate Assessment Students Who Took No Assessment
1 2 3 3A 3B 4 4A 4B 4C 5 6 7 8 9
State Gr
Stdnts
with
IEPs
All
Stdnts Total Accom
LEP <
12
months Total
Grade
Level
Mod.
Stand
Alt.
Stand Invalid
Out-of-
Level
Parent
Exemp Absnt
Other
Reasons
Row
Totala
NM H 2704 20363 2389 744
189 189 120 1 5 0 0 2704
NV H 3008 31869 2641 1672
205 205 0
0 42 120 3008
NY H 24601 195534 19288 2725
1333 1333 0
0 3980 0 24601
OH H 21711 145409 18744 11993 32 2320 2320 9
6 238 394 21711
OK H 6410 44652 2909 1510 11 3015 2539 476 7
0 93 2 6026
OR H 5048 44269 4261 1232 2 415 415 3
7 362 0 5048
PA H 21035 140507 18379 8986 1793 1793 265
29 411 158 21035
RI H 2012 11427 1804 856
60 60 2
0 135 11 2012
SC H 6657 52436 6066 3688 1 323 323 0
0 0 268 6657
SD H 714 8253 623 375
87 87 0
4 0 2 716
TN H 6161 67876 5382 3396
667 667 13 9 0 83 7 6161
TX H 34179 318610 20933 13285 2 12211 10183 2028 73
0 790 172 34179
UT H 3888 41172 3388 937 471 433 433 0 14 3 44 0 3882
VA H 10036 90882 8947 1431
888 888 38
11 152 0 10036
VT H 993 7404 831 496
60 60 72
0 8 22 993
WA H 8411 83725 6135 2951
618 618 760
0 458 440 8411
WI H 9536 70185 8367 5113
788 788 0
22 0 359 9536
WV H 2894 20002 2516 976
236 236 0
5 116 21 2894
WY H 603 6043 531 231
55 55 0
0 16 1 603
AS H 94 1060 80 80
4
4 0
0 10 0 94
BIE H 524 12591 447 258
52
24 28 3
1 11 10 524 CNMI H 26 608 23 14
3
3 0
0 0 0 26
DC H 675 4118 556 430
55
55 33
0 31 0 675
FSM H 88 1444 0 12
3
3 0
0 8 57 68
GU H 179 3139 165 137 1
1 9
0 4 0 179
PW H 4 169 0 0
2
2 0
0 2 0 4
PR H
RMI H
VI H 67 1040 53 47
14
14 0
0 0 0 67

123
Table C4
Elementary Mathematics Participation
Enrollment Regular Assessment Alternate Assessment Students Who Took No Assessment
1 2 3 3A 3B 4 4A 4B 4C 5 6 7 8 9
State Gr
Stdnts
with
IEPs
All
Stdnts Total Accom
LEP <
12
months Total
Grade
Level
Mod.
Stand
Alt.
Stand Invalid
Out-of-
Level
Parent
Exemp Absnt
Other
Reasons
Row
Totala
AK 3 1552 9647 1475 1046
54 54 7
0 16 0 1552
AK 4* 1482 9347 1395 1037
67 67 2
0 18 0 1482
AK 5 1365 9371 1274 1001
66 66 8
0 17 0 1365
AL 3 6760 58355 6261 1336
437 437 1
0 61 0 6760
AL 4* 6796 57804 6292 1522
442 442 0
0 62 0 6796
AL 5 6544 57002 5974 1608
502 502 1
0 67 0 6544
AR 3 4358 36252 3914 2239
408 408 3
0 30 3 4358
AR 4* 4424 35698 3910 2457
474 474 5
0 33 2 4424
AR 5 4390 35546 3904 2716
457 457 0
0 25 4 4390
AZ 3 11209 84494 10235 4659
746 746 44
0 184 0 11209
AZ 4* 11353 82731 10411 5570
731 731 50
0 161 0 11353
AZ 5 11266 82340 10339 5844
679 679 62
0 186 0 11266
CA 3 52853 461208 38558 4069
13159 8774 4385 214
333 200 0 52464
CA 4* 57581 464513 40408 4990
16005 11616 4389 282
324 248 0 57267
CA 5 58466 468306 41110 5452
16217 11990 4227 285
339 208 0 58159
CO 3 6550 60084 5840 3879
580 580 130
0 0 0 6550
CO 4* 6687 59069 5972 4107
584 584 131
0 0 0 6687
CO 5 6476 57850 5844 4055
530 530 102
0 0 0 6476
CT 3 4822 42095 4301 3318 484 484 25
0 11 1 4822
CT 4* 5231 42613 4691 3785 491 491 32
0 16 1 5231
CT 5 5265 42278 4768 3843 444 444 25
0 25 3 5265
DE 3 1330 9503 1234 1159
78 78 0
0 5 13 1330
DE 4* 1375 9115 1271 1217
94 94 0
0 2 8 1375
DE 5 1476 9015 1372 1319
91 91 0
0 3 10 1476
FL 3 34384 207542 31629 20064
2173 2173 69
0 0 513 34384
FL 4* 31810 196023 29123 20387
2219 2219 53
0 0 415 31810
FL 5 31322 198893 28599 21757
2307 2307 79
0 0 337 31322
GA 3 17029 127371 16006 8934
933 933 24
0 66 0 17029
GA 4* 16699 124312 15676 9988
940 940 31
0 52 0 16699
GA 5 16372 122225 15157 7525
1132 1132 20
0 63 0 16372
HI 3 1329 13754 1225 901
68 68 0
2 33 1 1329

124
Enrollment Regular Assessment Alternate Assessment Students Who Took No Assessment
1 2 3 3A 3B 4 4A 4B 4C 5 6 7 8 9
State Gr
Stdnts
with
IEPs
All
Stdnts Total Accom
LEP <
12
months Total
Grade
Level
Mod.
Stand
Alt.
Stand Invalid
Out-of-
Level
Parent
Exemp Absnt
Other
Reasons
Row
Totala
HI 4* 1389 13605 1282 914
56 56 0
8 41 2 1389
HI 5 1497 13451 1391 1011
66 66 0
10 29 1 1497
IA 3 4264 34477 4024 2903
217 217 0
0 23 0 4264
IA 4* 4761 34264 4524 3533
218 218 0
0 19 0 4761
IA 5 5061 34201 4813 3942
216 216 0
0 32 0 5061
ID 3 2084 21268 1881 1147
183 183 2
0 0 18 2084
ID 4* 2129 20675 1939 1270
169 169 5
1 0 15 2129
ID 5 2060 20338 1894 1228
143 143 6
0 2 15 2060
IL 3 21812 155487 19880 11034
1725 1725 184
0 23 0 21812
IL 4* 22745 153606 20630 13229
1714 1714 227
0 174 0 22745
IL 5 22451 153730 20553 14443
1675 1675 186
0 37 0 22451
IN 3 13393 78739 12608 4899
484 484 383
0 0 0 13475
IN 4* 13132 78204 13201 6337
599 599 247
0 0 0 14047
IN 5 12729 78709 12757 7439
648 648 197
0 0 0 13602
KS 3 4908 34223 3716 1747
1161 806 355 3
0 19 27 4926
KS 4* 5432 33919 4127 1934
1273 917 356 1
2 17 24 5444
KS 5 5405 33016 4137 1865
1237 921 316 1
1 20 18 5414
KY 3 7004 49678 6537 4344
466 466 0
0 0 30 7033
KY 4* 6896 49112 6436 4881
460 460 0
0 0 38 6934
KY 5 6593 48242 6091 4968
502 502 0
0 0 35 6628
LA 3 6849 52100 6460 5455 432
367 0
0 21 1 6914
LA 4* 8764 56232 7447 6712 1332 866 432 1
0 15 3 8798
LA 5 5209 45300 4014 3569 1073 706 466 0
0 17 6 5110
MA 3 12284 71140 11053 9194
1079 20 1059 0
0 105 47 12284
MA 4* 13309 72112 11975 10491
1239 13 1226 0
0 45 50 13309
MA 5 13528 71493 12156 10790
1238 28 1210 0
0 63 71 13528
MD 3 7067 58941 6538 4847
467 467 0
0 0 62 7067
MD 4* 7771 60460 7181 5650
537 537 0
0 0 53 7771
MD 5 7941 61333 7229 5951
642 642 0
0 0 70 7941
ME 3 2358 13803 2208 1729 121 121 0
0 29 0 2358
ME 4* 2523 14206 2372 1998 126 126 0
0 25 0 2523
ME 5 2555 14240 2390 1986 136 136 0
0 29 0 2555
MI 3 15736 118468 12848 4751
2787 2787 35
0 0 0 15670
MI 4* 17089 118963 13880 6021
3049 3049 42
0 0 0 16971

125
Enrollment Regular Assessment Alternate Assessment Students Who Took No Assessment
1 2 3 3A 3B 4 4A 4B 4C 5 6 7 8 9
State Gr
Stdnts
with
IEPs
All
Stdnts Total Accom
LEP <
12
months Total
Grade
Level
Mod.
Stand
Alt.
Stand Invalid
Out-of-
Level
Parent
Exemp Absnt
Other
Reasons
Row
Totala
MI 5 17477 119222 14345 7262
3102 3102 35
0 0 0 17482
MN 3 8607 59704 7733 2402
794 794 58
10 12 0 8607
MN 4* 8858 59353 7963 2721
801 801 73
13 8 0 8858
MN 5 8831 59782 7917 2855
829 829 54
9 22 0 8831
MO 3 10519 67041 9749 4941
749 749 8
13 0 0 10519
MO 4* 10461 67703 9718 5992
725 725 7
11 0 0 10461
MO 5 9903 66370 9190 6358
695 695 4
14 0 0 9903
MS 3 4344 39902 3818 1585
373 373 0
0 153 0 4344
MS 4* 4047 38964 3508 1925
431 431 0
0 108 0 4047
MS 5 3918 38324 3437 2230
365 365 0
0 116 0 3918
MT 3 1346 10506 1211 684
95 95 25
0 15 0 1346
MT 4* 1376 10522 1272 848
91 91 0
0 13 0 1376
MT 5 1355 10492 1205 855
108 108 27
0 16 0 1356
NC 3 16906 115379 13481 8239
3354 34 2396 924 0
0 71 0 16906
NC 4* 16378 111948 12645 8798
3673 46 2743 884 0
0 60 0 16378
NC 5 16009 110259 12051 8820
3908 36 3073 799 0
0 50 0 16009
ND 3 1080 6811 901 485
174 99 75 0
0 0 5 1080
ND 4* 1091 6957 881 578
202 118 84 0
0 0 8 1091
ND 5 1024 7028 802 573
220 124 96 0
0 0 2 1024
NE 3 3776 23748 3544 114
167 167 46 0
0 18 1 3730
NE 4* 3796 23492 3557 1492
202 202 14 0
0 20 3 3782
NE 5 3499 23344 3234 1463
191 191 44 0
0 29 1 3455
NH 3 2045 14686 1867 1541
151 151 0
0 18 9 2045
NH 4* 2309 15089 2142 1818
142 142 0
0 25 0 2309
NH 5 2609 15295 2399 1933
172 172 0
0 22 16 2609
NJ 3 15976 103521 14703 11134
111 990 201
0 82 0 15097
NJ 4* 17142 103218 15749 12885
1033 1033 282
0 78 0 17142
NJ 5 17118 103339 15864 13670
1008 1008 195
0 51 0 17118
NM 3 3154 24878 2921 1736
182 182 44 0 7 0 0 3154
NM 4* 3101 24367 2894 1874
157 157 41 1 8 0 0 3101
NM 5 3112 24274 2867 1948
187 187 49 1 8 0 0 3112
NV 3 3762 33931 3499 1890
245 245 8
0 4 6 3762
NV 4* 3905 33577 3632 2155
249 249 9
0 3 12 3905
NV 5 3831 32857 3550 2268
255 255 13
0 6 7 3831
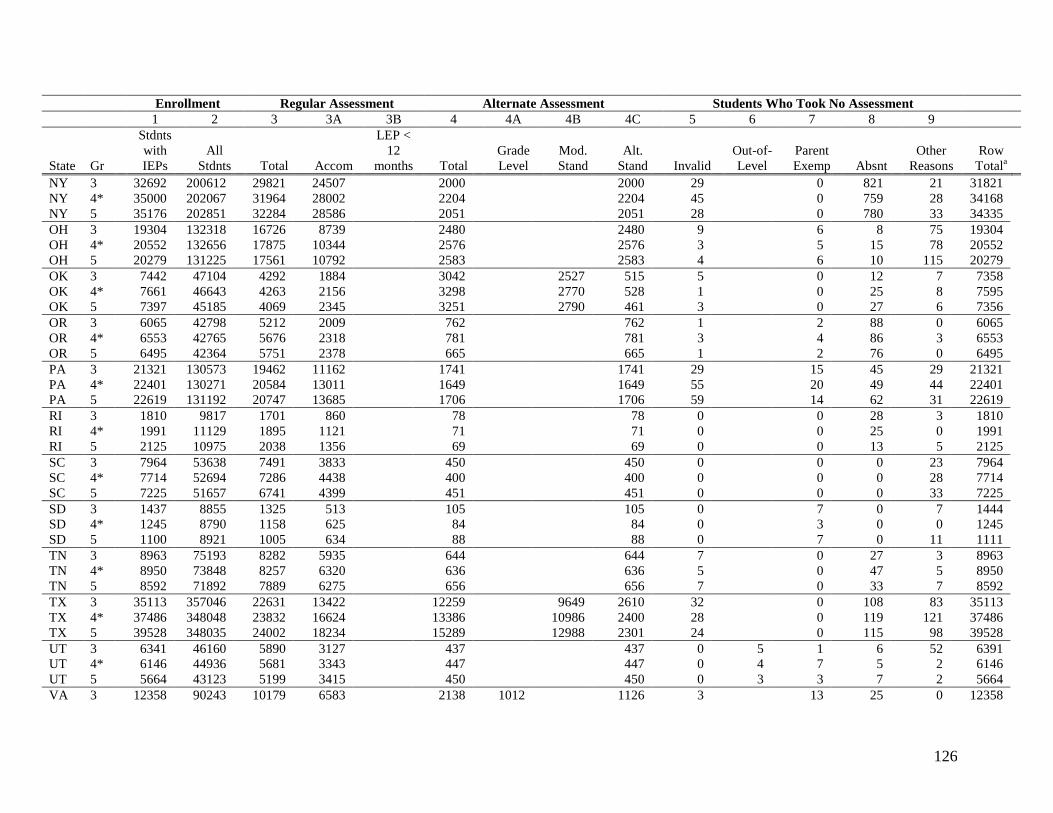
126
Enrollment Regular Assessment Alternate Assessment Students Who Took No Assessment
1 2 3 3A 3B 4 4A 4B 4C 5 6 7 8 9
State Gr
Stdnts
with
IEPs
All
Stdnts Total Accom
LEP <
12
months Total
Grade
Level
Mod.
Stand
Alt.
Stand Invalid
Out-of-
Level
Parent
Exemp Absnt
Other
Reasons
Row
Totala
NY 3 32692 200612 29821 24507
2000 2000 29
0 821 21 31821
NY 4* 35000 202067 31964 28002
2204 2204 45
0 759 28 34168
NY 5 35176 202851 32284 28586
2051 2051 28
0 780 33 34335
OH 3 19304 132318 16726 8739 2480 2480 9
6 8 75 19304
OH 4* 20552 132656 17875 10344 2576 2576 3
5 15 78 20552
OH 5 20279 131225 17561 10792 2583 2583 4
6 10 115 20279
OK 3 7442 47104 4292 1884
3042 2527 515 5
0 12 7 7358
OK 4* 7661 46643 4263 2156
3298 2770 528 1
0 25 8 7595
OK 5 7397 45185 4069 2345
3251 2790 461 3
0 27 6 7356
OR 3 6065 42798 5212 2009
762 762 1
2 88 0 6065
OR 4* 6553 42765 5676 2318
781 781 3
4 86 3 6553
OR 5 6495 42364 5751 2378
665 665 1
2 76 0 6495
PA 3 21321 130573 19462 11162
1741 1741 29
15 45 29 21321
PA 4* 22401 130271 20584 13011
1649 1649 55
20 49 44 22401
PA 5 22619 131192 20747 13685
1706 1706 59
14 62 31 22619
RI 3 1810 9817 1701 860
78 78 0
0 28 3 1810
RI 4* 1991 11129 1895 1121
71 71 0
0 25 0 1991
RI 5 2125 10975 2038 1356
69 69 0
0 13 5 2125
SC 3 7964 53638 7491 3833
450 450 0
0 0 23 7964
SC 4* 7714 52694 7286 4438
400 400 0
0 0 28 7714
SC 5 7225 51657 6741 4399
451 451 0
0 0 33 7225
SD 3 1437 8855 1325 513
105 105 0
7 0 7 1444
SD 4* 1245 8790 1158 625
84 84 0
3 0 0 1245
SD 5 1100 8921 1005 634
88 88 0
7 0 11 1111
TN 3 8963 75193 8282 5935
644 644 7
0 27 3 8963
TN 4* 8950 73848 8257 6320
636 636 5
0 47 5 8950
TN 5 8592 71892 7889 6275
656 656 7
0 33 7 8592
TX 3 35113 357046 22631 13422
12259 9649 2610 32
0 108 83 35113
TX 4* 37486 348048 23832 16624
13386 10986 2400 28
0 119 121 37486
TX 5 39528 348035 24002 18234
15289 12988 2301 24
0 115 98 39528
UT 3 6341 46160 5890 3127
437 437 0 5 1 6 52 6391
UT 4* 6146 44936 5681 3343
447 447 0 4 7 5 2 6146
UT 5 5664 43123 5199 3415
450 450 0 3 3 7 2 5664
VA 3 12358 90243 10179 6583
2138 1012 1126 3
13 25 0 12358

127
Enrollment Regular Assessment Alternate Assessment Students Who Took No Assessment
1 2 3 3A 3B 4 4A 4B 4C 5 6 7 8 9
State Gr
Stdnts
with
IEPs
All
Stdnts Total Accom
LEP <
12
months Total
Grade
Level
Mod.
Stand
Alt.
Stand Invalid
Out-of-
Level
Parent
Exemp Absnt
Other
Reasons
Row
Totala
VA 4* 12500 90245 10034 7161
2425 1396 1029 1
11 29 0 12500
VA 5 12258 85368 9394 7154
2815 1779 1036 7
11 31 0 12258
VT 3 664 6357 597 420
46 46 15
0 3 3 664
VT 4* 754 6463 676 498
64 64 8
0 2 4 754
VT 5 924 6515 836 619
69 69 7
0 8 4 924
WA 3 10654 77015 9617 5329
755 755 194 2 0 21 65 10654
WA 4* 10549 76827 9549 5630
717 717 182 2 0 30 69 10549
WA 5 10110 76609 9211 5926
652 652 152 6 0 28 61 10110
WI 3 8416 59996 7541 4189
803 803 0
1 0 71 8416
WI 4* 8614 60081 7744 4977
756 756 0
10 0 104 8614
WI 5 8512 59619 7647 5193
777 777 0
1 0 87 8512
WV 3 3663 20090 3363 1538
257 257 0
2 16 25 3663
WV 4* 3436 20213 3125 1842
267 267 0
3 22 19 3436
WV 5 3027 20033 2713 1903
256 256 0
3 24 31 3027
WY 3 1029 6475 967 484
41 41 0
0 20 1 1029
WY 4* 1079 6515 999 597
64 64 0
0 14 2 1079
WY 5 948 6395 867 550
68 68 0
0 11 2 948
AS 3 67 908 58 58 6 6 0 0 3 0 67
AS 4* 89 991 82 82 5 5 0 0 2 0 89
AS 5 96 1124 93 93 0 0 0 0 3 0 96
BIE 3 504 3661 470 328 28 8 20 2 0 2 2 504
BIE 4* 556 3490 514 389 39 12 27 0 0 1 2 556
BIE 5 554 3451 520 410 31 9 22 1 1 1 0 554 CNMI 3* 72 848 54 47 15 15 0 0 3 0 72 CNMI 4 CNMI 5 75 851 59 55 12 12 0 0 4 0 75
DC 3 841 4804 740 542 69 69 29 0 3 0 841
DC 4* 965 4731 849 706 85 85 26 0 5 0 965
DC 5 1050 4730 950 766 70 70 24 0 6 0 1050
FSM 3 0 0 0 118 0 0 0 0 0 0 0
FSM 4*
FSM 5
GU 3 104 2528 92 77 5 5 4 0 3 0 104
GU 4* 125 2475 105 85 8 8 5 0 7 0 125

128
Enrollment Regular Assessment Alternate Assessment Students Who Took No Assessment
1 2 3 3A 3B 4 4A 4B 4C 5 6 7 8 9
State Gr
Stdnts
with
IEPs
All
Stdnts Total Accom
LEP <
12
months Total
Grade
Level
Mod.
Stand
Alt.
Stand Invalid
Out-of-
Level
Parent
Exemp Absnt
Other
Reasons
Row
Totala
GU 5 132 2440 110 89 8 8 4 0 10 0 132
PW 3
PW 4* 15 222 13 10 2 2 0 0 0 0 15
PW 5
PR 3
PR 4*
PR 5
RMI 3
RMI 4*
RMI 5
VI 3 84 1114 67 25 14 14 0 0 3 0 84
VI 4* 123 1188 111 35 8 8 0 0 4 0 123
VI 5 91 1265 81 37 7 7 0 0 3 0 91 * Grades that were used in Appendix A and in the body of this document are indicated by an asterisk next to the grade level.

129
Table C5
Middle School Mathematics Participation
Enrollment Regular Assessment Alternate Assessment Students Who Took No Assessment
1 2 3 3A 3B 4 4A 4B 4C 5 6 7 8 9
State Gr
Stdnts
with
IEPs
All
Stdnts Total Accom
LEP <
12
months Total
Grade
Level
Mod.
Stand
Alt.
Stand Invalid
Out-of-
Level
Parent
Exemp Absnt
Other
Reasons
Row
Totala
AK 6 1268 9389 1186 976
59 59 2
0 21 0 1268
AK 7 1216 9595 1115 952
72 72 5
0 24 0 1216
AK 8* 1199 9737 1110 962
65 65 6
0 17 1 1199
AL 6 6547 56554 5974 1282
490 490 0
0 83 0 6547
AL 7 6843 58157 6224 1397
493 493 1
0 125 0 6843
AL 8* 7005 57990 6362 1343
499 499 1
0 143 0 7005
AR 6 4210 35018 3721 2711
447 447 9
0 31 2 4210
AR 7 4219 35217 3745 2604
441 441 2
0 30 1 4219
AR 8* 4431 35467 3926 2546
447 447 6
0 47 5 4431
AZ 6 10798 82788 9805 5275
702 702 66
0 225 0 10798
AZ 7 10327 82105 9272 4517
721 721 56
0 278 0 10327
AZ 8* 10327 81850 8801 4191
794 794 59
0 289 0 9943
CA 6 55631 474185 49609 6359
4482 4482 528
294 263 0 55176
CA 7 53075 482653 47241 4151
4478 4478 693
228 201 0 52841
CA 8* 51433 487776 44897 3914
4643 4643 939
251 479 0 51209
CO 6 6321 57780 5676 3777
525 525 120
0 0 0 6321
CO 7 6124 57760 5469 3184
519 519 136
0 0 0 6124
CO 8* 5765 57743 5099 2728
511 511 155
0 0 0 5765
CT 6 5422 43062 4892 3874 452 452 37
0 41 0 5422
CT 7 5383 43241 4824 3523 439 439 49
0 70 1 5383
CT 8* 5484 43930 4894 3547 420 420 84
0 85 1 5484
DE 6 1413 9231 1308 1234
89 89 0
0 4 12 1413
DE 7 1520 9531 1372 1253
111 111 0
0 19 18 1520
DE 8* 1569 10324 1412 1316
117 117 0
0 21 19 1569
FL 6 30248 198739 27200 17519
2233 2233 256
0 0 559 30248
FL 7 30367 203265 26916 16616
2424 2424 318
0 0 709 30367
FL 8* 25009 193817 21415 14046
2442 2442 191
0 0 961 25009
GA 6 15537 121187 14297 11114
1135 1135 21
0 84 0 15537
GA 7 14771 120906 13415 10528
1224 1224 35
0 97 0 14771
GA 8* 14800 122065 13260 7975
1417 1417 20
0 103 0 14800
HI 6 1460 13414 1335 877
71 71 0
6 48 0 1460

130
Enrollment Regular Assessment Alternate Assessment Students Who Took No Assessment
1 2 3 3A 3B 4 4A 4B 4C 5 6 7 8 9
State Gr
Stdnts
with
IEPs
All
Stdnts Total Accom
LEP <
12
months Total
Grade
Level
Mod.
Stand
Alt.
Stand Invalid
Out-of-
Level
Parent
Exemp Absnt
Other
Reasons
Row
Totala
HI 7 1522 13003 1398 804
61 61 0
3 60 0 1522
HI 8* 1580 13361 1469 712
63 63 0
0 45 3 1580
IA 6 5003 34294 4790 4055
188 188 0
2 23 0 5003
IA 7 5068 34872 4823 4146
220 220 0
0 25 0 5068
IA 8* 5273 35663 5007 4331
205 205 0
0 61 0 5273
ID 6 1975 20725 1780 1152
177 177 2
0 2 14 1975
ID 7 1838 20348 1648 1061
170 170 2
1 1 16 1838
ID 8* 1843 20407 1637 994
182 182 4
0 2 18 1843
IL 6 22460 156811 20399 15207
1812 1812 227
0 22 0 22460
IL 7 22827 159896 20689 15965
1844 1844 249
0 45 0 22827
IL 8* 23412 161119 21128 16249
1888 1888 331
0 65 0 23412
IN 6 11976 80122 11956 7952
685 685 231
0 0 0 12872
IN 7 11978 81099 11285 8572
768 768 266
0 0 0 12319
IN 8* 12116 80850 11041 8911
807 807 295
0 0 0 12143
KS 6 5453 33403 4005 1695
1413 1085 328 1
0 26 20 5465
KS 7 5239 33965 3859 1713
1342 997 345 1
1 24 26 5253
KS 8* 4955 34320 3493 1615
1409 1099 310 0
2 50 25 4979
KY 6 6205 48740 5686 4635
518 518 0
0 0 42 6246
KY 7 6054 49447 5502 4642
550 550 0
0 0 53 6105
KY 8* 6032 49469 5417 4404
615 615 0
0 0 59 6091
LA 6 6985 51399 5683 5154 1245 807 438 0
0 29 28 6985
LA 7 6284 50756 4970 4525 1279 809 470 0
0 15 20 6284
LA 8* 6300 51348 4402 4113 1840 1275 565 0
0 26 32 6300
MA 6 13614 72433 12164 10620
1274 30 1244 0
0 111 65 13614
MA 7 13932 74179 12517 10965
1152 15 1137 0
0 177 86 13932
MA 8* 13435 74540 11993 10282
1054 28 1026 0
0 319 69 13435
MD 6 7653 62003 6969 6003
590 590 0
0 0 94 7653
MD 7 8038 63786 7244 6274
644 644 0
0 0 150 8038
MD 8* 8003 65451 6999 6095
789 789 0
0 0 215 8003
ME 6 2518 14365 2283 1910 196 196 0
0 39 0 2518
ME 7 2555 14818 2321 1900 176 176 0
0 58 0 2555
ME 8* 2508 15274 2265 1844 176 176 0
0 67 0 2508
MI 6 16912 121072 13547 6714
3149 3149 77
0 0 0 16773
MI 7 17473 125515 13895 5993
3352 3352 49
0 0 0 17296

131
Enrollment Regular Assessment Alternate Assessment Students Who Took No Assessment
1 2 3 3A 3B 4 4A 4B 4C 5 6 7 8 9
State Gr
Stdnts
with
IEPs
All
Stdnts Total Accom
LEP <
12
months Total
Grade
Level
Mod.
Stand
Alt.
Stand Invalid
Out-of-
Level
Parent
Exemp Absnt
Other
Reasons
Row
Totala
MI 8* 17480 126545 13958 6092
3309 3309 55
0 0 0 17322
MN 6 8292 59871 7327 2809
853 853 82
13 17 0 8292
MN 7 8439 61911 7355 2730
934 934 97
12 41 0 8439
MN 8* 8470 63126 7421 2450
873 873 98
18 60 0 8470
MO 6 9468 66433 8777 6332
654 654 11
26 0 0 9468
MO 7 9303 67442 8601 6379
669 669 6
27 0 0 9303
MO 8* 9057 68128 8360 6135
642 642 12
43 0 0 9057
MS 6 4161 38561 3612 2412
405 405 0
0 144 0 4161
MS 7 4341 40704 3664 2526
491 491 0
0 186 0 4341
MS 8* 4245 40069 3573 2512
418 418 0
0 254 0 4245
MT 6 1318 10776 1187 858
78 78 41
0 13 0 1319
MT 7 1348 10858 1181 835
100 100 36
0 34 0 1351
MT 8* 1428 11151 1279 877
78 78 64
0 14 0 1435
NC 6 14781 108474 10826 8215
3821 37 2993 791 0
0 134 0 14781
NC 7 14833 109893 11077 8424
3608 61 2849 698 0
0 148 0 14833
NC 8* 14706 111346 10799 8261
3739 47 2789 903 0
0 168 0 14706
ND 6 1033 7244 797 605
221 134 87 0
0 0 15 1033
ND 7 1001 7423 732 586
256 168 88 0
0 0 13 1001
ND 8* 1048 7671 757 611
272 177 95 0
0 0 19 1048
NE 6 3296 23490 2969 1304
221 221 71 0
0 32 3 3225
NE 7 3132 23746 2746 1231
244 244 99 0
0 39 4 3033
NE 8* 2982 23826 2612 1184
223 223 91 0
0 54 2 2891
NH 6 2662 15439 2474 1967
168 168 0
0 20 0 2662
NH 7 2747 15922 2577 1959
140 140 0
0 29 1 2747
NH 8* 2727 16371 2526 1844
143 143 0
0 56 2 2727
NJ 6 17296 104075 15991 14386
1004 1004 208
0 93 0 17296
NJ 7 17861 106040 16490 14977
1003 1003 258
0 110 0 17861
NJ 8* 18188 106445 16732 15143
934 934 303
0 219 0 18188
NM 6 3028 23666 2796 1914
184 184 46 1 1 0 0 3028
NM 7 3129 23964 2865 1716
205 205 53 0 6 0 0 3129
NM 8* 3214 24579 2918 1574
227 227 65 0 4 0 0 3214
NV 6 3728 33450 3421 2209
285 285 0
0 9 13 3728
NV 7 3701 34234 3443 2272
227 227 1
0 14 16 3701
NV 8* 3570 33569 3270 2098
260 260 2
0 16 22 3570

132
Enrollment Regular Assessment Alternate Assessment Students Who Took No Assessment
1 2 3 3A 3B 4 4A 4B 4C 5 6 7 8 9
State Gr
Stdnts
with
IEPs
All
Stdnts Total Accom
LEP <
12
months Total
Grade
Level
Mod.
Stand
Alt.
Stand Invalid
Out-of-
Level
Parent
Exemp Absnt
Other
Reasons
Row
Totala
NY 6 35946 206108 32607 27938
2228 2228 51
0 1019 41 34835
NY 7 36068 213255 32500 28170
2292 2292 31
0 1196 49 34792
NY 8* 36446 216546 32124 27814
2441 2441 72
0 1753 56 34565
OH 6 20625 132497 17969 11384 2501 2501 5
5 22 123 20625
OH 7 21037 137231 18297 11851 2505 2505 7
6 45 177 21037
OH 8* 21410 139432 18426 11754 2660 2660 6
10 90 218 21410
OK 6 7094 44467 3794 2178
3204 2688 516 3
0 41 4 7046
OK 7 7080 44484 3602 1920
3361 2907 454 4
0 68 13 7048
OK 8* 6994 44740 3378 1187
3472 3035 437 5
0 84 4 6943
OR 6 6210 42730 5545 2064
555 555 1
4 105 0 6210
OR 7 5835 42939 5200 1920
511 511 3
5 114 2 5835
OR 8* 5495 42660 4903 1634
453 453 2
8 129 0 5495
PA 6 22837 134937 20844 13095
1766 1766 64
17 102 44 22837
PA 7 23466 140260 21318 12135
1814 1814 112
22 156 44 23466
PA 8* 24370 143679 21799 12801
2058 2058 172
29 227 85 24370
RI 6 2179 11312 2060 1334
79 79 0
0 33 7 2179
RI 7 2296 11575 2194 1349
71 71 0
0 26 5 2296
RI 8* 2357 12120 2193 1316
106 106 0
0 56 2 2357
SC 6 6857 51677 6460 4470
364 364 0
0 0 33 6857
SC 7 7155 52831 6796 4353
304 304 0
0 0 55 7155
SC 8* 6925 52904 6614 4347
221 221 0
0 0 90 6925
SD 6 1037 9071 936 602
99 99 0
2 0 20 1057
SD 7 982 9180 891 587
85 85 0
6 0 39 1021
SD 8* 936 9334 837 562
96 96 0
3 0 3 939
TN 6 8346 71224 7540 6222
726 726 3 10 0 59 8 8346
TN 7 8510 72804 7723 6233
710 710 0 12 0 61 4 8510
TN 8* 8496 72422 7570 5925
818 818 0 9 0 88 11 8496
TX 6 39085 337180 24649 19313
14106 11732 2374 13
0 218 99 39085
TX 7 40180 340126 25005 19353
14640 12419 2221 19
0 316 200 40180
TX 8* 40447 333958 24289 18967
15704 13182 2522 25
0 313 116 40447
UT 6 5149 41997 4703 3084
426 426 0 5 8 7 0 5149
UT 7 4336 42131 3872 2088
431 431 0 5 4 23 3 4338
UT 8* 3707 41736 3144 1493
411 411 0 118 2 28 4 3707
VA 6 12057 82122 8782 6413
3189 2139 1050 3
15 68 0 12057

133
Enrollment Regular Assessment Alternate Assessment Students Who Took No Assessment
1 2 3 3A 3B 4 4A 4B 4C 5 6 7 8 9
State Gr
Stdnts
with
IEPs
All
Stdnts Total Accom
LEP <
12
months Total
Grade
Level
Mod.
Stand
Alt.
Stand Invalid
Out-of-
Level
Parent
Exemp Absnt
Other
Reasons
Row
Totala
VA 7 11916 75420 7945 5153
3815 2733 1082 4
15 137 0 11916
VA 8* 14609 93163 10358 5628
4005 2891 1114 29
42 175 0 14609
VT 6 919 6546 826 574
72 72 11
0 4 6 919
VT 7 1012 6770 927 652
65 65 9
0 5 6 1012
VT 8* 1023 7093 924 623
69 69 16
0 7 7 1023
WA 6 9284 75846 8354 5078
689 689 133 3 0 40 65 9284
WA 7 8851 77768 7902 4541
613 613 186 7 0 62 81 8851
WA 8* 8693 78095 7587 4073
657 657 258 7 0 79 105 8693
WI 6 8656 60906 7757 5771
786 786 0
2 0 111 8656
WI 7 8631 62041 7699 5785
809 809 0
1 0 122 8631
WI 8* 9323 64154 8272 6181
872 872 0
9 0 170 9323
WV 6 3046 20276 2704 2003
263 263 0
3 55 21 3046
WV 7 3121 21122 2790 2010
244 244 0
2 66 19 3121
WV 8* 3210 21198 2837 1987
275 275 0
2 71 25 3210
WY 6 957 6420 880 594
60 60 0
0 14 3 957
WY 7 839 6282 762 530
62 62 0
0 10 5 839
WY 8* 892 6579 813 576
60 60 0
0 17 2 892
AS 6
AS 7 119 1053 114 114 0 0 0 0 5 0 119
AS 8* 125 1119 120 120 3 3 0 0 2 0 125
BIE 6 528 3420 484 384 35 8 27 2 2 1 4 528
BIE 7 574 3409 523 426 47 16 31 2 0 2 0 574
BIE 8* 609 3582 556 426 42 24 18 0 1 2 6 607 CNMI 6 58 847 48 45 9 9 0 0 1 0 58 CNMI 7 65 781 53 53 9 9 0 0 3 0 65 CNMI 8* 86 795 73 70 10 10 0 0 3 0 86
DC 6 1181 4808 1070 866 79 79 27 0 5 0 1181
DC 7 1205 4791 1058 837 81 81 56 0 10 0 1205
DC 8* 1391 5176 1225 1027 96 96 69 0 1 0 1391
FSM 6 108 1540 83 39 2 2 0 0 6 17 108
FSM 7
FSM 8* 93 1569 47 16 3 3 0 0 10 33 93
GU 6 132 2210 118 101 6 6 4 0 4 0 132
GU 7 184 2332 149 123 10 10 3 0 22 0 184

134
Enrollment Regular Assessment Alternate Assessment Students Who Took No Assessment
1 2 3 3A 3B 4 4A 4B 4C 5 6 7 8 9
State Gr
Stdnts
with
IEPs
All
Stdnts Total Accom
LEP <
12
months Total
Grade
Level
Mod.
Stand
Alt.
Stand Invalid
Out-of-
Level
Parent
Exemp Absnt
Other
Reasons
Row
Totala
GU 8* 189 2352 165 129 5 5 6 0 13 0 189
PW 6 13 242 7 5 4 4 0 0 2 0 13
PW 7
PW 8* 14 265 12 10 2 2 0 0 0 0 14
PR 6
PR 7
PR 8*
RMI 6
RMI 7
RMI 8* 27 1107 12 12 2 2 0 0 13 0 27
VI 6 103 1161 87 54 13 13 0 0 3 0 103
VI 7 153 1463 129 49 14 14 0 0 10 0 153
VI 8* 137 1227 122 55 15 15 0 0 0 0 137 * Grades that were used in Appendix A and in the body of this document are indicated by an asterisk next to the grade level.

135
Table C6.
High School Mathematics Participation
Enrollment Regular Assessment Alternate Assessment Students Who Took No Assessment
1 2 3 3A 3B 4 4A 4B 4C 5 6 7 8 9
State Gr
Stdnts
with
IEPs
All
Stdnts Total Accom
LEP <
12
months Total
Grade
Level
Mod.
Stand
Alt.
Stand Invalid
Out-of-
Level
Parent
Exemp Absnt
Other
Reasons
Row
Totala
AK H 1066 9990 911 758 89 89 8
0 58 0 1066
AL H 4826 47977 4271 2403 448 448 0
0 107 0 4826
AR H 7181 71973 4770 2476 2188 2188 0
0 193 30 7181
AZ H 8096 76701 6866 3301 716 716 47
0 467 0 8096
CA H 43298 472019 39897 6503 4615 4615 154
0 1882 0 46548
CO H 5723 61078 4911 2339 563 563 249
0 0 0 5723
CT H 4898 42859 4002 2927 442 442 243
0 206 5 4898
DE H 1175 9067 977 889 137 137 0
0 40 21 1175
FL H 27211 204527 21116 11423 2936 2936 286
0 0 2873 27211
GA H 8919 94017 7434 5647 1176 1176 65
0 244 0 8919
HI H 1673 12982 1489 517 49 49 0
0 134 1 1673
IA H 4703 36332 4464 3709
201 201 0
0 38 0 4703
ID H 1662 19997 1471 798 156 156 4
0 1 30 1662
IL H 17740 140263 14557 11729
1664 1664 1051
0 468 0 17740
IN H 12234 81967 9872 8359 830 830 978
0 0 0 11680
KS H 1836 10052 1198 427 584 504 80 0
0 28 12 1822
KY H 4376 44438 3816 3004 560 560 0
0 0 34 4410
LA H 3329 42950 2420 2177 837 404 433 0
0 31 41 3329
MA H 12080 73391 10473 9303 868 13 855 0
0 665 74 12080
MD H 5694 55067 4522 2706 1141 316 825 0
0 0 31 5694
ME H 2213 15604 1898 1110 209 209 0
0 106 0 2213
MI H 14506 123816 10543 8172 2768 2768 533
0 0 0 13844
MN H 7561 65818 6249 1011 879 879 242
28 163 0 7561
MO H 9043 69783 8241 5369 692 692 18
92 0 0 9043
MS H 1923 33608 1689 992 0 0 0
0 234 0 1923
MT H 1346 11449 1129 569 124 124 68
0 30 0 1351
NC H 10812 93874 7880 4381 2044 23 1416 605 0
0 888 0 10812
ND H 935 7718 625 474 270 165 105 0
0 0 40 935
NE H 2514 24180 2112 856 188 166 156 0
0 56 0 2356
NH H 2640 16467 2303 1349 111 111 0
0 169 57 2640
NJ H 16037 100202 14421 12478 987 987 263
0 366 0 16037

136
Enrollment Regular Assessment Alternate Assessment Students Who Took No Assessment
1 2 3 3A 3B 4 4A 4B 4C 5 6 7 8 9
State Gr
Stdnts
with
IEPs
All
Stdnts Total Accom
LEP <
12
months Total
Grade
Level
Mod.
Stand
Alt.
Stand Invalid
Out-of-
Level
Parent
Exemp Absnt
Other
Reasons
Row
Totala
NM H 2706 20365 2389 1006 191 191 120 1 5 0 0 2706
NV H 3008 31869 2700 1899 205 205 1
0 36 66 3008
NY H 24601 195534 20324 1159
1301 1301 0
0 2976 0 21625
OH H 21665 145540 18712 12040 2322 2322 2
7 237 385 21665
OK H 6455 43950 2964 1709 3629 3125 504 1
0 71 16 6681
OR H 5047 44269 4182 1228 420 420 2
8 435 0 5047
PA H 21035 140593 18407 9068 1793 1793 247
29 400 159 21035
RI H 2004 11427 1795 856 63 63 0
0 132 14 2004
SC H 6656 52430 6047 3307 321 321 0
0 0 288 6656
SD H 714 8253 622 375 87 87 0
5 0 11 725
TN H 2115 38385 1206 468 851 851 26 10 0 15 7 2115
TX H 33331 314399 18894 13381 13533 11508 2025 21
0 755 128 33331
UT H 4832 44023 3285 958
1096 1096 0 376 6 60 9 4832
VA H 21698 263054 20400 5060 890 890 37
34 337 0 21698
VT H 983 7392 811 479 60 60 82
0 7 23 983
WA H 8411 83725 6193 3237 616 616 843 2 0 474 283 8411
WI H 9536 70185 8378 5132 773 773 0
22 0 363 9536
WV H 2894 20002 2517 1584 237 237 0
5 114 21 2894
WY H 603 6048 529 249 55 55 0
0 18 1 603
AS H 94 1060 82 82 4
0 4 0
0 8 0 94
BIE H 499 12591 425 241 51 24 27 1
4 12 15 508 CNMI H 26 608 23 14 2
2 0
0 1 0 26
DC H 675 4118 556 430
55
55 33
0 31 0 675
FSM H 88 1444 17 10 6
6 0
0 8 57 88
GU H 179 3139 173 143 1
1 4
0 1 0 179
PW H 4 168 0 0
2
2 0
0 2 0 4
PR H
RMI H
VI H 67 1040 53 47 14
14 0
0 0 0 67

137
Appendix D
State-by-State Performance Raw Data
This Appendix presents the state-by-state raw data that were the source of summary data for Tables B1-B6 of Appendix B, which in
turn were used to generate the performance tables and figures in the main body of this document. There are six tables in this
Appendix. Each table shows either reading or math performance counts for all grades within a school level for each state. The specific
grades that were used in Appendix B and in the main document are indicated by an asterisk next to the grade level. These data were
drawn from the raw data by achievement level presented in Appendix E.
Each row in the six tables shows numbers for one state on one content area in one grade. The first count shows state-reported special
education enrollment, that is, the number of students with an individualized education program (IEP). Following that is the number of
all students enrolled in the grade. Next are four sections of the table that show numbers of students reported as proficient on each of
four assessments: the regular assessment (with and without accommodations), the alternate assessment based on grade level
achievement standards, the alternate assessment based on modified achievement standards, and the alternate assessment based on
alternate academic achievement standards. Note that these data do not include students who were assessed on out-of-level assessments
or students whose test results were deemed invalid as all of these students were considered non-participants.
Two columns are presented for each assessment. First is the number of students who did not score as proficient. These students were
placed in an achievement level lower than that which the states considered to be proficient. The second is the number of students who
scored as proficient. These students earned an achievement level equal to or above that which is considered to be proficient.
The data in these tables were obtained directly from Section 618, Table 6, included with each state’s 2007-08 Annual Performance
Reports or from the EdFacts data management system as retrieved by the Data Accountability Center when applicable. Differences in
how states completed Table 6, and differences between Table 6 and the EdFacts system, complicate the interpretation of some data.
All information is from the 2007-08 school year.

138
Table D1.
Elementary Reading Performance
Enrollment
Proficient on Regular
Assessment
Proficient on Alternate
Assessment on Grade
Level Achievement
Standards
Proficient on Alternate
Assessment on Modified
Achievement Standards
Proficient on Alternate
Assessment Based on
Alternate Achievement
Standards
1 2 9A-1 9A-2 9B-1 9B-2 9C-1 9C-2 9D-1 9D-2
State Grade
Students
with
IEPs
All
Students
Not
Proficient Proficient
Not
Proficient Proficient
Not
Proficient Proficient
Not
Proficient Proficient
AK 3 1552 9647 777 687 29 25
AK 4* 1482 9347 709 678 29 38
AK 5 1365 9371 629 647 34 31
AL 3 6878 58352 3225 3005 229 210
AL 4* 6923 57803 3303 2984 197 245
AL 5 6672 57003 3478 2501 258 245
AR 3 4358 36252 2947 969 135 257
AR 4* 4424 35698 3022 893 176 280
AR 5 4390 35546 3259 645 201 243
AZ 3 11209 84494 6733 3500 490 256
AZ 4* 11335 82731 6921 3496 382 349
AZ 5 11266 82340 7349 3000 350 329
CA 3 52860 461331 28495 7957 8038 2992 918 3585
CA 4* 57596 464652 25606 12589 9959 3938 1043 3450
CA 5 58475 468411 29940 9791 9604 3686 933 3383
CO 3 6543 60090 3948 1840 215 427
CO 4* 6675 59065 4458 1487 207 423
CO 5 6460 57834 4203 1597 189 379
CT 3 4822 42095 3151 1079 361 123
CT 4* 5231 42613 3447 1192 390 101
CT 5 5265 42278 3288 1454 335 109
DE 3 1330 9503 523 709 12 66
DE 4* 1375 9115 668 599 10 84
DE 5 1476 9015 651 720 8 83
FL 3 34384 207542 16882 14754 688 1503
FL 4* 31810 196023 17285 11817 733 1496
FL 5 31322 198893 18016 10538 748 1580

139
Enrollment
Proficient on Regular
Assessment
Proficient on Alternate
Assessment on Grade
Level Achievement
Standards
Proficient on Alternate
Assessment on Modified
Achievement Standards
Proficient on Alternate
Assessment Based on
Alternate Achievement
Standards
1 2 9A-1 9A-2 9B-1 9B-2 9C-1 9C-2 9D-1 9D-2
State Grade
Students
with
IEPs
All
Students
Not
Proficient Proficient
Not
Proficient Proficient
Not
Proficient Proficient
Not
Proficient Proficient
GA 3 17030 127374 4375 11633 170 764
GA 4* 16700 124319 5849 9844 188 748
GA 5 16373 122228 4790 10372 214 921
HI 3 1329 13754 1064 163 35 33
HI 4* 1389 13605 1109 172 21 35
HI 5 1497 13451 1215 177 24 42
IA 3 4264 34503 2619 1373 44 174
IA 4* 4761 34295 2813 1694 60 159
IA 5 5061 34211 3051 1763 62 158
ID 3 2086 21268 1001 872 30 163
ID 4* 2130 20675 1067 873 33 140
ID 5 2060 20338 1020 877 21 121
IL 3 21812 155487 11381 8515 744 985
IL 4* 22745 153606 12147 8505 697 1017
IL 5 22451 153730 12640 7919 692 982
IN 3 13393 78739 5802 6774 68 416
IN 4* 13132 78204 6666 6499 83 516
IN 5 12729 78709 7008 5706 89 559
KS 3 4914 34205 1112 2383 179 836 33 345
KS 4* 5437 33931 1025 2855 190 977 37 330
KS 5 5410 33007 1241 2734 157 938 22 300
KY 3 7004 49678 2761 3776 430 36
KY 4* 6896 49112 2888 3548 408 52
KY 5 6593 48242 3106 2985 458 44
LA 3 8764 56234 4697 2750 755 113 162 270
LA 4* 5211 45299 2677 1340 584 122 210 256
LA 5 6850 52100 4024 2436 164 203
MA 3 12282 71057 8306 2710 15 0 1077 0
MA 4* 13299 72004 10040 1856 19 0 1219 0
MA 5 13525 71404 9118 3101 20 0 1164 0
MD 3 7067 58939 2483 4054 49 418
MD 4* 7767 60439 2044 5139 65 471

140
Enrollment
Proficient on Regular
Assessment
Proficient on Alternate
Assessment on Grade
Level Achievement
Standards
Proficient on Alternate
Assessment on Modified
Achievement Standards
Proficient on Alternate
Assessment Based on
Alternate Achievement
Standards
1 2 9A-1 9A-2 9B-1 9B-2 9C-1 9C-2 9D-1 9D-2
State Grade
Students
with
IEPs
All
Students
Not
Proficient Proficient
Not
Proficient Proficient
Not
Proficient Proficient
Not
Proficient Proficient
MD 5 7942 61333 2441 4795 75 567
ME 3 2358 13803 1505 705 42 81
ME 4* 2523 14206 1667 711 49 77
ME 5 2555 14240 1751 641 54 82
MI 3 15736 118468 957 11498 1758 1380
MI 4* 17089 118963 723 12724 1841 1585
MI 5 17477 119222 861 12978 2088 1404
MN 3 8613 59684 2729 4917 157 689
MN 4* 8861 59326 3015 4864 152 704
MN 5 8832 59761 2955 4931 184 679
MO 3 10518 66954 7665 2087 131 620
MO 4* 10460 67630 7838 1879 121 605
MO 5 9898 66260 7447 1744 132 563
MS 3 4344 39902 2716 1097 155 230
MS 4* 4047 38964 2757 750 133 300
MS 5 3918 38324 2863 578 126 240
MT 3 1346 10506 549 643 25 70
MT 4* 1376 10522 719 551 23 68
MT 5 1355 10492 668 513 25 83
NC 3 16361 115372 8657 3897 26 14 2358 431 428 491
NC 4* 15814 111944 7847 3807 28 18 2629 552 434 446
NC 5 15073 110257 7900 2897 22 23 2628 755 406 391
ND 3 1080 6811 373 467 31 120 7 67
ND 4* 1091 6957 382 438 21 145 9 77
ND 5 1024 6996 453 281 32 150 6 89
NE 3 3772 23748 804 2731 34 130
NE 4* 3799 23492 698 2860 61 138
NE 5 3493 23344 797 2438 45 147
NH 3 2043 14686 1177 690 39 112
NH 4* 2309 15089 1448 696 45 97
NH 5 2609 15295 1654 747 49 123

141
Enrollment
Proficient on Regular
Assessment
Proficient on Alternate
Assessment on Grade
Level Achievement
Standards
Proficient on Alternate
Assessment on Modified
Achievement Standards
Proficient on Alternate
Assessment Based on
Alternate Achievement
Standards
1 2 9A-1 9A-2 9B-1 9B-2 9C-1 9C-2 9D-1 9D-2
State Grade
Students
with
IEPs
All
Students
Not
Proficient Proficient
Not
Proficient Proficient
Not
Proficient Proficient
Not
Proficient Proficient
NJ 3 15976 103521 5624 8965 221 774
NJ 4* 17142 103218 7057 8607 273 796
NJ 5 17118 103339 11966 3872 290 710
NM 3 3154 24878 2163 744 77 112
NM 4* 3099 24364 2391 485 75 92
NM 5 3112 24274 2383 482 59 130
NV 3 3762 33931 2580 923 7 239
NV 4* 3905 33577 2787 851 3 246
NV 5 3831 32857 3076 478 6 250
NY 3 32723 200479 20552 9236 421 1576
NY 4* 35015 201918 22265 9652 506 1695
NY 5 35209 202712 18938 13338 325 1724
OH 3 20171 137697 8519 8970 98 2384
OH 4* 20727 132512 8113 9759 108 2463
OH 5 20416 131093 11076 6485 65 2519
OK 3 7617 47329 1243 2538 1375 1617 50 465
OK 4* 7842 46852 931 2909 1058 2105 58 470
OK 5 7626 45462 1712 2146 1354 1560 70 391
OR 3 6064 42798 1912 3089 315 644
OR 4* 6554 42765 2271 3242 351 591
OR 5 6496 42364 3101 2532 347 439
PA 3 21306 130332 10804 8594 1092 649
PA 4* 22386 130008 13265 7261 805 844
PA 5 22608 130942 15699 5002 1008 698
RI 3 1812 9817 1061 641 32 46
RI 4* 1997 11129 1362 532 28 44
RI 5 2130 10975 1513 521 31 37
SC 3 7964 53641 2448 4991 38 414
SC 4* 7714 52695 3300 3959 25 376
SC 5 7224 51658 3655 3066 44 410
SD 3 1437 8855 390 935 30 75
SD 4* 1245 8790 348 810 33 51

142
Enrollment
Proficient on Regular
Assessment
Proficient on Alternate
Assessment on Grade
Level Achievement
Standards
Proficient on Alternate
Assessment on Modified
Achievement Standards
Proficient on Alternate
Assessment Based on
Alternate Achievement
Standards
1 2 9A-1 9A-2 9B-1 9B-2 9C-1 9C-2 9D-1 9D-2
State Grade
Students
with
IEPs
All
Students
Not
Proficient Proficient
Not
Proficient Proficient
Not
Proficient Proficient
Not
Proficient Proficient
SD 5 1100 8921 386 618 32 56
TN 3 8964 75193 1753 6532 10 635
TN 4* 8950 73848 2120 6142 14 622
TN 5 8592 71892 1309 6587 6 650
TX 3 35359 359355 5529 16761 3361 6834 306 2297
TX 4* 37551 348654 10587 11924 4776 7498 275 2123
TX 5 39647 349131 8971 14911 5159 8041 301 1996
UT 3 6915 44525 3066 2829 47 387
UT 4* 6718 42558 2926 2748 46 402
UT 5 6152 41380 3147 2053 40 410
VA 3 12366 89934 3654 5896 224 1426 51 1074
VA 4* 12485 89838 3030 6449 207 1729 40 988
VA 5 12385 88348 2943 6372 194 1788 54 984
VT 3 664 6343 416 171 42 4
VT 4* 755 6454 539 136 59 6
VT 5 926 6515 673 164 64 6
WA 3 10654 77015 6278 3230 278 500
WA 4* 10549 76827 6446 3087 304 425
WA 5 10110 76609 6235 2958 452 216
WI 3 8416 59996 3674 3688 267 644
WI 4* 8614 60081 3873 3692 261 632
WI 5 8512 59619 3689 3855 245 622
WV 3 3663 20090 1687 1676 72 185
WV 4* 3436 20213 1655 1469 85 184
WV 5 3027 20033 1671 1039 61 193
WY 3 1029 6467 667 301 21 20
WY 4* 1079 6504 605 390 32 32
WY 5 948 6385 609 258 36 32
AS 3 67 908 44 11 6 0
AS 4* 89 991 66 4 5 0
AS 5 96 1124 87 4 0 0

143
Enrollment
Proficient on Regular
Assessment
Proficient on Alternate
Assessment on Grade
Level Achievement
Standards
Proficient on Alternate
Assessment on Modified
Achievement Standards
Proficient on Alternate
Assessment Based on
Alternate Achievement
Standards
1 2 9A-1 9A-2 9B-1 9B-2 9C-1 9C-2 9D-1 9D-2
State Grade
Students
with
IEPs
All
Students
Not
Proficient Proficient
Not
Proficient Proficient
Not
Proficient Proficient
Not
Proficient Proficient
BIE 3 519 3661 395 83 4 6 10 13
BIE 4* 591 3490 456 83 8 9 12 20
BIE 5 571 3451 449 75 10 6 12 11
CNMI 3 72 848 53 1 13 2
CNMI 4* 77 847 43 19 14 1
CNMI 5 75 851 58 1 7 5
DC 3 841 4804 563 177 18 51
DC 4* 965 4731 630 219 17 68
DC 5 1050 4730 848 192 20 50
FSM 3
FSM 4*
FSM 5
GU 3 104 2528 90 2 2 0
GU 4* 125 2475 99 3 7 1
GU 5 132 2440 106 1 3 2
Palau 3
Palau 4* 15 223 13 0 0 2
Palau 5
PR 3
PR 4*
PR 5
RMI 3
RMI 4*
RMI 5
VI 3 84 1114 59 8 6 8
VI 4* 123 1188 103 8 2 6
VI 5 91 1265 72 9 5 2 * Grades that were used in Appendix B and in the body of this document are indicated by an asterisk next to the grade level.

144
Table D2.
Middle School Reading Performance
Enrollment
Proficient on Regular
Assessment
Proficient on Alternate
Assessment on Grade
Level Achievement
Standards
Proficient on Alternate
Assessment on Modified
Achievement Standards
Proficient on Alternate
Assessment Based on
Alternate Achievement
Standards
1 2 9A-1 9A-2 9B-1 9B-2 9C-1 9C-2 9D-1 9D-2
State Grade
Students
with
IEPs
All
Students
Not
Proficient Proficient
Not
Proficient Proficient
Not
Proficient Proficient
Not
Proficient Proficient
AK 6 1268 9389 685 496 37 22
AK 7 1216 9595 646 472 46 26
AK 8* 1199 9737 589 520 42 23
AL 6 6667 56554 3372 2622 193 297
AL 7 6942 58156 4420 1821 220 274
AL 8* 7098 57990 4836 1539 187 314
AR 6 4210 35018 3239 489 139 288
AR 7 4219 35217 3401 345 156 255
AR 8* 4431 35467 3405 527 230 198
AZ 6 10798 82788 7182 2638 435 267
AZ 7 10798 82105 6852 2420 405 316
AZ 8* 9943 81850 6894 1913 397 397
CA 6 55648 474309 41345 7977 1480 3099
CA 7 53106 482829 40643 6720 1375 3202
CA 8* 51454 487914 39800 5448 1363 3348
CO 6 6326 57768 4182 1444 177 374
CO 7 6133 57760 4253 1180 202 324
CO 8* 5768 57731 4010 1064 217 289
CT 6 5422 43062 3098 1766 352 100
CT 7 5383 43241 2977 1809 341 98
CT 8* 5484 43930 3181 1682 335 85
DE 6 1413 9231 777 526 6 83
DE 7 1520 9531 777 598 6 105
DE 8* 1569 10324 928 476 18 99
FL 6 30248 198739 19027 8223 736 1493
FL 7 30367 203265 18476 8500 755 1680
FL 8* 25009 193817 17233 4290 835 1612
GA 6 15537 121193 5235 9060 225 912

145
Enrollment
Proficient on Regular
Assessment
Proficient on Alternate
Assessment on Grade
Level Achievement
Standards
Proficient on Alternate
Assessment on Modified
Achievement Standards
Proficient on Alternate
Assessment Based on
Alternate Achievement
Standards
1 2 9A-1 9A-2 9B-1 9B-2 9C-1 9C-2 9D-1 9D-2
State Grade
Students
with
IEPs
All
Students
Not
Proficient Proficient
Not
Proficient Proficient
Not
Proficient Proficient
Not
Proficient Proficient
GA 7 14771 120909 5224 8196 217 1007
GA 8* 14801 122071 4481 8775 261 1168
HI 6 1460 13414 1186 149 20 52
HI 7 1522 13003 1177 223 21 40
HI 8* 1580 13361 1245 230 13 50
IA 6 5003 34307 3615 1175 49 138
IA 7 5068 34882 3700 1101 78 143
IA 8* 5273 35685 3846 1195 81 129
ID 6 1975 20725 1125 656 34 146
ID 7 1839 20348 1147 504 26 147
ID 8* 1843 20407 915 732 22 155
IL 6 22460 156811 11652 8779 647 1164
IL 7 22827 159896 12821 7871 721 1127
IL 8* 23412 161119 12193 8958 577 1312
IN 6 11976 80122 7544 4368 180 505
IN 7 11978 81099 7901 3292 176 592
IN 8* 12116 80850 7908 3053 155 652
KS 6 5464 33434 1243 2649 161 1053 22 310
KS 7 5241 33970 1305 2499 111 956 34 302
KS 8* 4961 34346 1520 1984 163 949 28 278
KY 6 6205 48740 3460 2226 471 47
KY 7 6054 49447 3614 1888 480 70
KY 8* 6032 49469 3623 1794 543 72
LA 6 6989 51401 4217 1473 682 130 178 261
LA 7 6286 50746 3874 1098 620 192 160 311
LA 8* 6306 51363 3740 669 1056 221 174 393
MA 6 13629 72378 8588 3639 12 0 1205 0
MA 7 13903 74025 8719 3728 10 0 1087 0
MA 8* 13425 74464 7325 4730 11 0 961 0
MD 6 7644 61990 3566 3399 72 518
MD 7 8034 63788 3823 3414 83 561

146
Enrollment
Proficient on Regular
Assessment
Proficient on Alternate
Assessment on Grade
Level Achievement
Standards
Proficient on Alternate
Assessment on Modified
Achievement Standards
Proficient on Alternate
Assessment Based on
Alternate Achievement
Standards
1 2 9A-1 9A-2 9B-1 9B-2 9C-1 9C-2 9D-1 9D-2
State Grade
Students
with
IEPs
All
Students
Not
Proficient Proficient
Not
Proficient Proficient
Not
Proficient Proficient
Not
Proficient Proficient
MD 8* 7996 65438 4598 2401 87 702
ME 6 2518 14365 1570 712 73 124
ME 7 2555 14818 1582 748 64 114
ME 8* 2508 15274 1669 600 73 104
MI 6 16912 121072 309 12882 2335 992
MI 7 17473 125515 299 13431 2135 1316
MI 8* 17480 126545 280 13537 1925 1446
MN 6 8288 59850 3440 3875 155 718
MN 7 8439 61884 3837 3522 136 818
MN 8* 8473 63102 3824 3624 99 774
MO 6 9473 66381 7497 1290 250 403
MO 7 9310 67421 7568 1051 240 429
MO 8* 9061 68073 7479 885 246 396
MS 6 4161 38561 3239 369 157 257
MS 7 4341 40704 3355 310 181 313
MS 8* 4245 40069 3309 262 163 257
MT 6 1318 10776 678 517 9 69
MT 7 1348 10858 706 485 16 84
MT 8* 1428 11151 813 486 19 59
NC 6 13830 108456 7136 2554 28 13 2377 818 385 406
NC 7 13738 109874 7895 1929 37 26 2302 720 343 356
NC 8* 13670 111321 7606 2124 20 23 2174 655 413 483
ND 6 1033 7028 429 309 43 131 11 77
ND 7 1001 7244 364 315 42 162 8 79
ND 8* 1048 7423 472 276 32 136 7 82
NE 6 3302 23490 776 2206 65 151
NE 7 3142 23746 796 1996 70 172
NE 8* 2991 23826 514 2173 54 167
NH 6 2662 15439 1691 789 43 125
NH 7 2747 15922 1738 843 60 80
NH 8* 2727 16371 1930 601 51 92
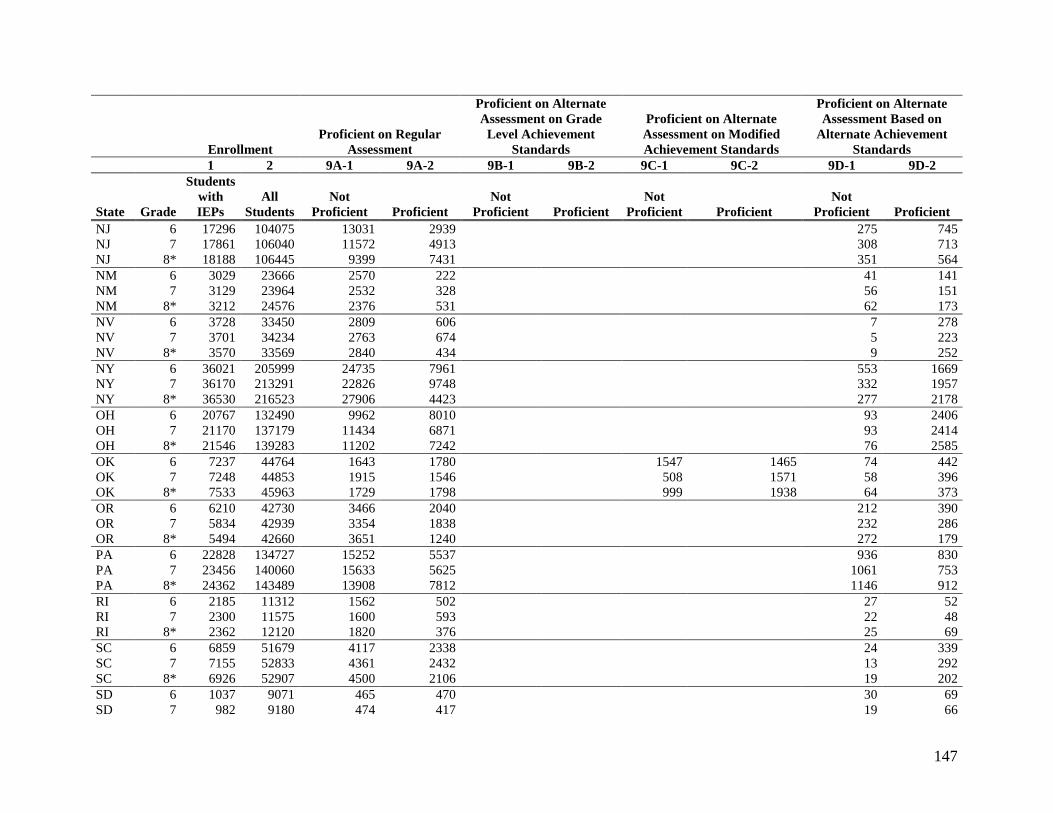
147
Enrollment
Proficient on Regular
Assessment
Proficient on Alternate
Assessment on Grade
Level Achievement
Standards
Proficient on Alternate
Assessment on Modified
Achievement Standards
Proficient on Alternate
Assessment Based on
Alternate Achievement
Standards
1 2 9A-1 9A-2 9B-1 9B-2 9C-1 9C-2 9D-1 9D-2
State Grade
Students
with
IEPs
All
Students
Not
Proficient Proficient
Not
Proficient Proficient
Not
Proficient Proficient
Not
Proficient Proficient
NJ 6 17296 104075 13031 2939 275 745
NJ 7 17861 106040 11572 4913 308 713
NJ 8* 18188 106445 9399 7431 351 564
NM 6 3029 23666 2570 222 41 141
NM 7 3129 23964 2532 328 56 151
NM 8* 3212 24576 2376 531 62 173
NV 6 3728 33450 2809 606 7 278
NV 7 3701 34234 2763 674 5 223
NV 8* 3570 33569 2840 434 9 252
NY 6 36021 205999 24735 7961 553 1669
NY 7 36170 213291 22826 9748 332 1957
NY 8* 36530 216523 27906 4423 277 2178
OH 6 20767 132490 9962 8010 93 2406
OH 7 21170 137179 11434 6871 93 2414
OH 8* 21546 139283 11202 7242 76 2585
OK 6 7237 44764 1643 1780 1547 1465 74 442
OK 7 7248 44853 1915 1546 508 1571 58 396
OK 8* 7533 45963 1729 1798 999 1938 64 373
OR 6 6210 42730 3466 2040 212 390
OR 7 5834 42939 3354 1838 232 286
OR 8* 5494 42660 3651 1240 272 179
PA 6 22828 134727 15252 5537 936 830
PA 7 23456 140060 15633 5625 1061 753
PA 8* 24362 143489 13908 7812 1146 912
RI 6 2185 11312 1562 502 27 52
RI 7 2300 11575 1600 593 22 48
RI 8* 2362 12120 1820 376 25 69
SC 6 6859 51679 4117 2338 24 339
SC 7 7155 52833 4361 2432 13 292
SC 8* 6926 52907 4500 2106 19 202
SD 6 1037 9071 465 470 30 69
SD 7 982 9180 474 417 19 66

148
Enrollment
Proficient on Regular
Assessment
Proficient on Alternate
Assessment on Grade
Level Achievement
Standards
Proficient on Alternate
Assessment on Modified
Achievement Standards
Proficient on Alternate
Assessment Based on
Alternate Achievement
Standards
1 2 9A-1 9A-2 9B-1 9B-2 9C-1 9C-2 9D-1 9D-2
State Grade
Students
with
IEPs
All
Students
Not
Proficient Proficient
Not
Proficient Proficient
Not
Proficient Proficient
Not
Proficient Proficient
SD 8* 936 9334 494 343 25 71
TN 6 8336 71224 1782 5756 16 710
TN 7 8498 72804 2308 5401 14 695
TN 8* 8487 72422 1729 5829 16 802
TX 6 39150 337671 9877 14080 4856 7528 304 2067
TX 7 40257 340649 14010 11222 4386 7819 304 1910
TX 8* 40569 334480 7859 18005 4454 7278 342 2167
UT 6 5578 41024 2859 1851 54 370
UT 7 4919 40217 2677 1410 49 385
UT 8* 4616 39316 2257 1525 48 362
VA 6 12233 89754 3928 5059 299 1796 77 969
VA 7 12688 91502 3901 5254 448 1857 92 987
VA 8* 14014 93951 5337 4964 397 2019 68 1039
VT 6 916 6538 672 156 62 10
VT 7 1012 6773 762 168 54 11
VT 8* 1021 7087 733 190 59 11
WA 6 9284 75846 6603 1753 564 122
WA 7 8851 77768 6724 1185 416 188
WA 8* 8693 78095 6321 1299 509 129
WI 6 8656 60906 3852 3826 280 584
WI 7 8631 62041 3924 3741 307 534
WI 8* 9323 64154 4428 3843 345 536
WV 6 3046 20276 1666 1034 83 180
WV 7 3121 21122 1707 1078 57 187
WV 8* 3210 21198 1892 940 45 231
WY 6 957 6414 619 257 30 32
WY 7 839 6269 578 184 32 30
WY 8* 892 6577 571 239 27 32
AS 6
AS 7 119 1053 110 4 0 0
AS 8* 125 1119 114 8 3 0
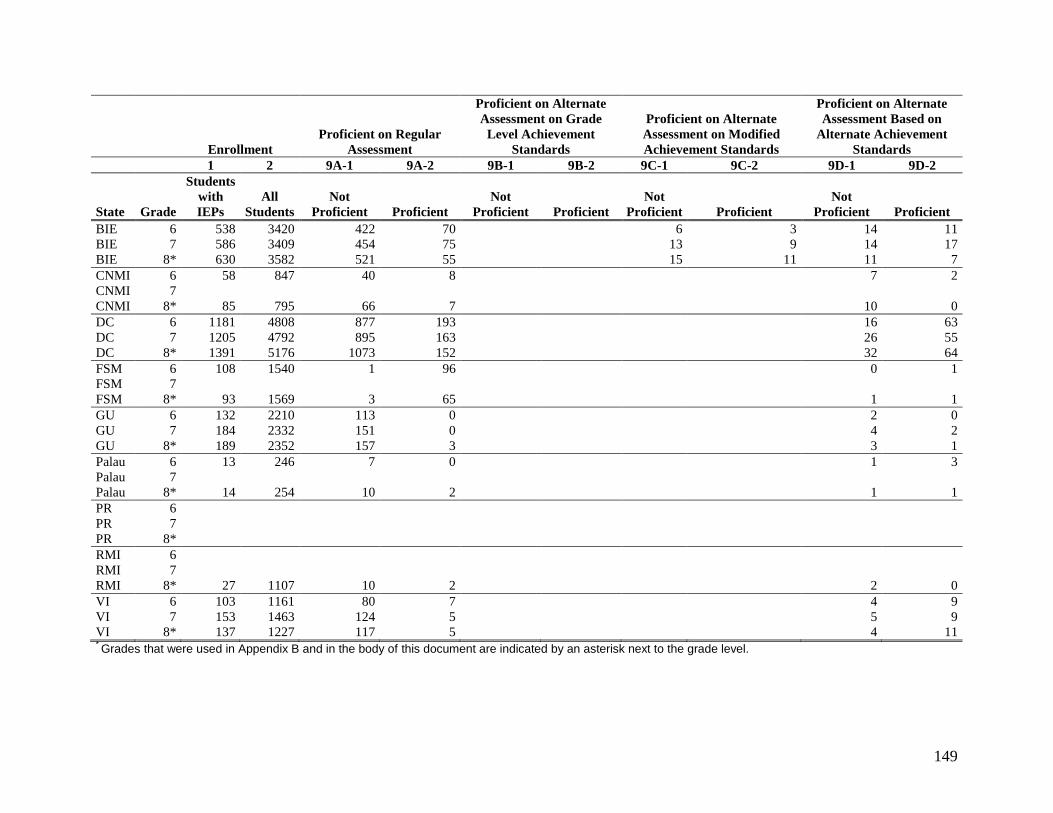
149
Enrollment
Proficient on Regular
Assessment
Proficient on Alternate
Assessment on Grade
Level Achievement
Standards
Proficient on Alternate
Assessment on Modified
Achievement Standards
Proficient on Alternate
Assessment Based on
Alternate Achievement
Standards
1 2 9A-1 9A-2 9B-1 9B-2 9C-1 9C-2 9D-1 9D-2
State Grade
Students
with
IEPs
All
Students
Not
Proficient Proficient
Not
Proficient Proficient
Not
Proficient Proficient
Not
Proficient Proficient
BIE 6 538 3420 422 70 6 3 14 11
BIE 7 586 3409 454 75 13 9 14 17
BIE 8* 630 3582 521 55 15 11 11 7
CNMI 6 58 847 40 8 7 2
CNMI 7
CNMI 8* 85 795 66 7 10 0
DC 6 1181 4808 877 193 16 63
DC 7 1205 4792 895 163 26 55
DC 8* 1391 5176 1073 152 32 64
FSM 6 108 1540 1 96 0 1
FSM 7
FSM 8* 93 1569 3 65 1 1
GU 6 132 2210 113 0 2 0
GU 7 184 2332 151 0 4 2
GU 8* 189 2352 157 3 3 1
Palau 6 13 246 7 0 1 3
Palau 7
Palau 8* 14 254 10 2 1 1
PR 6
PR 7
PR 8*
RMI 6
RMI 7
RMI 8* 27 1107 10 2 2 0
VI 6 103 1161 80 7 4 9
VI 7 153 1463 124 5 5 9
VI 8* 137 1227 117 5 4 11 * Grades that were used in Appendix B and in the body of this document are indicated by an asterisk next to the grade level.

150
Table D3.
High School Reading Performance
Enrollment
Proficient on Regular
Assessment
Proficient on Alternate
Assessment on Grade
Level Achievement
Standards
Proficient on Alternate
Assessment on Modified
Achievement Standards
Proficient on Alternate
Assessment Based on
Alternate Achievement
Standards
1 2 9A-1 9A-2 9B-1 9B-2 9C-1 9C-2 9D-1 9D-2
State Grade
Students
with
IEPs
All
Students
Not
Proficient Proficient
Not
Proficient Proficient
Not
Proficient Proficient
Not
Proficient Proficient
AK H 1066 9990 560 358 56 33
AL H 4835 47977 3162 1095 159 289
AR H 3941 31087 3163 147 30 445
AZ H 8096 77634 4989 2055 282 434
CA H 43333 471683 33108 4805 444 997
CO H 5717 61045 3875 969 208 358
CT H 4898 42859 2091 1950 363 79
DE H 1174 9067 783 195 11 125
FL H 27211 204527 19197 2353 940 1995
GA H 8804 93575 3284 4037 240 932
HI H 1673 12982 1228 269 20 29
IA H 4703 36341 3058 1402 88 112
ID H 1662 19997 887 587 18 134
IL H 17740 140263 11792 2728 465 1201
IN H 12234 81967 7699 2221 184 646
KS H 3218 24567 1190 996 69 608 23 273
KY H 5289 49266 3848 853 517 71
LA H 3321 42947 2058 355 372 39 160 274
MA H 12125 73540 6642 3925 7 0 859 0
MD H 5609 55714 2587 1804 290 72 126 699
ME H 2213 15604 1631 194 73 136
MI H 14506 123816 21 10333 1257 1517
MN H 8235 67503 3016 4106 117 715
MO H 7705 63218 6668 371 288 293
MS H 2148 33048 1719 201 0 0
MT H 1346 11449 708 406 16 108
NC H 10128 96847 5268 1873 17 30 1652 332 366 238
ND H 935 7671 474 146 42 134 17 83

151
Enrollment
Proficient on Regular
Assessment
Proficient on Alternate
Assessment on Grade
Level Achievement
Standards
Proficient on Alternate
Assessment on Modified
Achievement Standards
Proficient on Alternate
Assessment Based on
Alternate Achievement
Standards
1 2 9A-1 9A-2 9B-1 9B-2 9C-1 9C-2 9D-1 9D-2
State Grade
Students
with
IEPs
All
Students
Not
Proficient Proficient
Not
Proficient Proficient
Not
Proficient Proficient
Not
Proficient Proficient
NE H 2590 24180 603 1714 62 121
NH H 2640 16467 1724 593 57 54
NJ H 16037 100202 8207 6251 370 675
NM H 2704 20363 2153 236 66 123
NV H 3008 31869 1749 892 2 203
NY H 24601 195534 8886 10402 84 1249
OH H 21711 145409 10274 8438 48 2272
OK H 6410 44652 1898 1000 877 1662 80 396
OR H 5048 44269 3279 980 228 187
PA H 21035 140507 14943 3436 937 856
RI H 2012 11427 1513 291 36 24
SC H 6657 52436 2444 3621 26 297
SD H 714 8253 537 86 36 51
TN H 6161 67876 731 4651 26 641
TX H 34179 318610 11315 9616 3779 6404 326 1702
UT H 3888 41172 1826 1091 61 372
VA H 10036 90882 2212 6735 0 0 77 811
VT H 993 7404 704 127 52 8
WA H 8411 83725 3828 2307 414 204
WI H 9536 70185 5816 2551 305 483
WV H 2894 20002 1974 542 51 185
WY H 603 6043 431 100 21 34
AS H 94 1060 77 3 3 1
BIE H 524 12591 394 53 15 9 15 13
CNMI H 26 608 23 0 3 0
DC H 675 4118 478 78 22 33
FSM H 88 1444 4 16 0 3
GU H 179 3139 164 1 1 0
Palau H 4 169 0 0 0 2
PR H
RMI H

152
Enrollment
Proficient on Regular
Assessment
Proficient on Alternate
Assessment on Grade
Level Achievement
Standards
Proficient on Alternate
Assessment on Modified
Achievement Standards
Proficient on Alternate
Assessment Based on
Alternate Achievement
Standards
1 2 9A-1 9A-2 9B-1 9B-2 9C-1 9C-2 9D-1 9D-2
State Grade
Students
with
IEPs
All
Students
Not
Proficient Proficient
Not
Proficient Proficient
Not
Proficient Proficient
Not
Proficient Proficient
VI H 67 1040 52 1 1 13 * Grades that were used in Appendix B and in the body of this document are indicated by an asterisk next to the grade level.
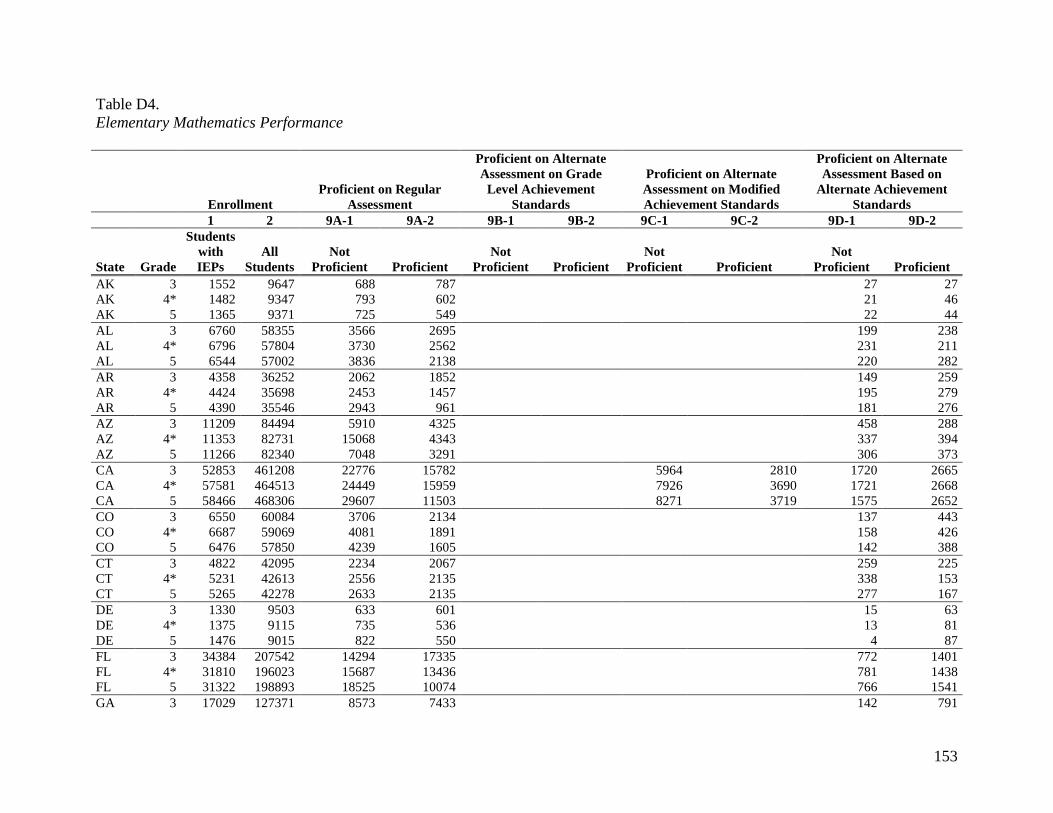
153
Table D4.
Elementary Mathematics Performance
Enrollment
Proficient on Regular
Assessment
Proficient on Alternate
Assessment on Grade
Level Achievement
Standards
Proficient on Alternate
Assessment on Modified
Achievement Standards
Proficient on Alternate
Assessment Based on
Alternate Achievement
Standards
1 2 9A-1 9A-2 9B-1 9B-2 9C-1 9C-2 9D-1 9D-2
State Grade
Students
with
IEPs
All
Students
Not
Proficient Proficient
Not
Proficient Proficient
Not
Proficient Proficient
Not
Proficient Proficient
AK 3 1552 9647 688 787 27 27
AK 4* 1482 9347 793 602 21 46
AK 5 1365 9371 725 549 22 44
AL 3 6760 58355 3566 2695 199 238
AL 4* 6796 57804 3730 2562 231 211
AL 5 6544 57002 3836 2138 220 282
AR 3 4358 36252 2062 1852 149 259
AR 4* 4424 35698 2453 1457 195 279
AR 5 4390 35546 2943 961 181 276
AZ 3 11209 84494 5910 4325 458 288
AZ 4* 11353 82731 15068 4343 337 394
AZ 5 11266 82340 7048 3291 306 373
CA 3 52853 461208 22776 15782 5964 2810 1720 2665
CA 4* 57581 464513 24449 15959 7926 3690 1721 2668
CA 5 58466 468306 29607 11503 8271 3719 1575 2652
CO 3 6550 60084 3706 2134 137 443
CO 4* 6687 59069 4081 1891 158 426
CO 5 6476 57850 4239 1605 142 388
CT 3 4822 42095 2234 2067 259 225
CT 4* 5231 42613 2556 2135 338 153
CT 5 5265 42278 2633 2135 277 167
DE 3 1330 9503 633 601 15 63
DE 4* 1375 9115 735 536 13 81
DE 5 1476 9015 822 550 4 87
FL 3 34384 207542 14294 17335 772 1401
FL 4* 31810 196023 15687 13436 781 1438
FL 5 31322 198893 18525 10074 766 1541
GA 3 17029 127371 8573 7433 142 791

154
Enrollment
Proficient on Regular
Assessment
Proficient on Alternate
Assessment on Grade
Level Achievement
Standards
Proficient on Alternate
Assessment on Modified
Achievement Standards
Proficient on Alternate
Assessment Based on
Alternate Achievement
Standards
1 2 9A-1 9A-2 9B-1 9B-2 9C-1 9C-2 9D-1 9D-2
State Grade
Students
with
IEPs
All
Students
Not
Proficient Proficient
Not
Proficient Proficient
Not
Proficient Proficient
Not
Proficient Proficient
GA 4* 16699 124312 9080 6596 172 768
GA 5 16372 122225 7168 7989 211 921
HI 3 1329 13754 1080 145 26 42
HI 4* 1389 13605 1143 139 19 37
HI 5 1497 13451 1292 99 31 35
IA 3 4264 34477 2254 1770 72 145
IA 4* 4761 34264 2368 2156 68 150
IA 5 5061 34201 2619 2194 83 133
ID 3 2084 21268 780 1101 42 141
ID 4* 2129 20675 954 985 40 129
ID 5 2060 20338 1209 685 29 114
IL 3 21812 155487 6396 13484 658 1067
IL 4* 22745 153606 9664 10966 571 1143
IL 5 22451 153730 9351 11202 590 1085
IN 3 13393 78739 6025 6583 69 415
IN 4* 13132 78204 5576 7625 85 514
IN 5 12729 78709 5538 7219 91 557
KS 3 4908 34223 993 2723 158 648 45 310
KS 4* 5432 33919 1063 3064 178 739 46 310
KS 5 5405 33016 1064 3073 226 695 39 277
KY 3 7004 49678 3231 3306 423 43
KY 4* 6896 49112 3270 3166 408 52
KY 5 6593 48242 3748 2343 443 59
LA 3 6849 52100 3824 2636 174 193
LA 4* 8764 56232 4270 3177 721 145 156 276
LA 5 5209 45300 2299 1715 591 115 190 276
MA 3 12284 71140 7582 3471 20 0 1059 0
MA 4* 13309 72112 9624 2351 13 0 1226 0
MA 5 13528 71493 9803 2353 28 0 1210 0
MD 3 7067 58941 2685 3853 61 406
MD 4* 7771 60460 2457 4724 66 471

155
Enrollment
Proficient on Regular
Assessment
Proficient on Alternate
Assessment on Grade
Level Achievement
Standards
Proficient on Alternate
Assessment on Modified
Achievement Standards
Proficient on Alternate
Assessment Based on
Alternate Achievement
Standards
1 2 9A-1 9A-2 9B-1 9B-2 9C-1 9C-2 9D-1 9D-2
State Grade
Students
with
IEPs
All
Students
Not
Proficient Proficient
Not
Proficient Proficient
Not
Proficient Proficient
Not
Proficient Proficient
MD 5 7941 61333 3616 3613 84 558
ME 3 2358 13803 1286 922 24 97
ME 4* 2523 14206 1566 806 26 100
ME 5 2555 14240 1647 743 36 100
MI 3 15736 118468 3589 9259 1313 1474
MI 4* 17089 118963 2788 11092 1502 1547
MI 5 17477 119222 2135 12210 1354 1748
MN 3 8607 59704 1527 6206 147 647
MN 4* 8858 59353 2510 5453 114 687
MN 5 8831 59782 3592 4325 97 732
MO 3 10519 67041 7187 2562 135 614
MO 4* 10461 67703 7408 2310 137 588
MO 5 9903 66370 7360 1830 152 543
MS 3 4344 39902 2360 1458 184 189
MS 4* 4047 38964 2466 1042 168 263
MS 5 3918 38324 2706 731 149 216
MT 3 1346 10506 784 427 37 58
MT 4* 1376 10522 837 435 28 63
MT 5 1355 10492 837 368 43 65
NC 3 16906 115379 5988 7493 16 18 1707 689 438 486
NC 4* 16378 111948 6127 6518 15 31 1950 793 440 444
NC 5 16009 110259 6393 5658 9 27 1972 1101 360 439
ND 3 1080 6811 284 617 14 85 5 70
ND 4* 1091 6957 358 523 16 102 7 77
ND 5 1024 7028 343 459 15 109 7 89
NE 3 3776 23748 571 2973 37 130
NE 4* 3796 23492 505 3052 62 140
NE 5 3499 23344 761 2473 74 117
NH 3 2045 14686 1074 793 39 112
NH 4* 2309 15089 1412 730 42 100
NH 5 2609 15295 1593 806 55 117

156
Enrollment
Proficient on Regular
Assessment
Proficient on Alternate
Assessment on Grade
Level Achievement
Standards
Proficient on Alternate
Assessment on Modified
Achievement Standards
Proficient on Alternate
Assessment Based on
Alternate Achievement
Standards
1 2 9A-1 9A-2 9B-1 9B-2 9C-1 9C-2 9D-1 9D-2
State Grade
Students
with
IEPs
All
Students
Not
Proficient Proficient
Not
Proficient Proficient
Not
Proficient Proficient
Not
Proficient Proficient
NJ 3 15976 103521 4040 10663 172 818
NJ 4* 17142 103218 5435 10314 230 803
NJ 5 17118 103339 8172 7692 271 737
NM 3 3154 24878 2288 633 129 53
NM 4* 3101 24367 2421 473 105 52
NM 5 3112 24274 2492 375 108 79
NV 3 3762 33931 2350 1149 6 239
NV 4* 3905 33577 2305 1327 5 244
NV 5 3831 32857 2630 920 3 252
NY 3 32692 200612 9816 20005 270 1730
NY 4* 35000 202067 14719 17245 458 1746
NY 5 35176 202851 15052 17232 285 1766
OH 3 19304 132318 7866 8860 99 2381
OH 4* 20552 132656 10208 7667 108 2468
OH 5 20279 131225 12676 4885 68 2515
OK 3 7442 47104 1626 2666 749 1778 47 468
OK 4* 7661 46643 1505 2758 896 1874 56 472
OK 5 7397 45185 1349 2720 830 1960 40 421
OR 3 6065 42798 2272 2940 311 451
OR 4* 6553 42765 2561 3115 368 413
OR 5 6495 42364 2937 2814 333 332
PA 3 21321 130573 8846 10616 937 804
PA 4* 22401 130271 10005 10579 916 733
PA 5 22619 131192 12786 7961 841 865
RI 3 1810 9817 1071 630 31 47
RI 4* 1991 11129 1409 486 26 45
RI 5 2125 10975 1501 537 31 38
SC 3 7964 53638 3410 4081 37 413
SC 4* 7714 52694 3250 4036 24 376
SC 5 7225 51657 3161 3580 41 410
SD 3 1437 8855 511 814 40 65
SD 4* 1245 8790 545 613 42 42

157
Enrollment
Proficient on Regular
Assessment
Proficient on Alternate
Assessment on Grade
Level Achievement
Standards
Proficient on Alternate
Assessment on Modified
Achievement Standards
Proficient on Alternate
Assessment Based on
Alternate Achievement
Standards
1 2 9A-1 9A-2 9B-1 9B-2 9C-1 9C-2 9D-1 9D-2
State Grade
Students
with
IEPs
All
Students
Not
Proficient Proficient
Not
Proficient Proficient
Not
Proficient Proficient
Not
Proficient Proficient
SD 5 1100 8921 522 483 33 55
TN 3 8963 75193 2870 5412 11 633
TN 4* 8950 73848 2860 5397 17 619
TN 5 8592 71892 2094 5795 13 643
TX 3 35113 357046 8578 14053 3296 6353 342 2268
TX 4* 37486 348048 10314 13518 4218 6768 288 2112
TX 5 39528 348035 9106 14896 5735 7253 303 1998
UT 3 6341 46160 2914 2976 71 366
UT 4* 6146 44936 3027 2654 71 376
UT 5 5664 43123 3023 2176 77 373
VA 3 12358 90243 2858 7321 187 825 84 1042
VA 4* 12500 90245 3570 6464 143 1253 73 956
VA 5 12258 85368 2962 6432 203 1576 83 953
VT 3 664 6357 431 166 42 4
VT 4* 754 6463 543 133 58 6
VT 5 924 6515 667 169 62 7
WA 3 10654 77015 6045 3572 192 563
WA 4* 10549 76827 7585 1964 222 495
WA 5 10110 76609 7334 1877 302 350
WI 3 8416 59996 3584 3957 224 579
WI 4* 8614 60081 3837 3907 208 548
WI 5 8512 59619 4225 3422 227 550
WV 3 3663 20090 1528 1835 71 186
WV 4* 3436 20213 1621 1504 65 202
WV 5 3027 20033 1408 1305 43 213
WY 3 1029 6475 332 635 17 24
WY 4* 1079 6515 470 529 27 37
WY 5 948 6395 520 347 32 36
AS 3 67 908 50 8 6 0
AS 4* 89 991 80 2 5 0
AS 5 96 1124 88 5 0 0

158
Enrollment
Proficient on Regular
Assessment
Proficient on Alternate
Assessment on Grade
Level Achievement
Standards
Proficient on Alternate
Assessment on Modified
Achievement Standards
Proficient on Alternate
Assessment Based on
Alternate Achievement
Standards
1 2 9A-1 9A-2 9B-1 9B-2 9C-1 9C-2 9D-1 9D-2
State Grade
Students
with
IEPs
All
Students
Not
Proficient Proficient
Not
Proficient Proficient
Not
Proficient Proficient
Not
Proficient Proficient
BIE 3 504 3661 375 95 4 4 9 11
BIE 4* 556 3490 437 77 7 5 12 15
BIE 5 554 3451 447 73 5 4 15 7
CNMI 3* 72 848 46 8 13 2
CNMI 4
CNMI 5 75 851 52 7 9 3
DC 3 841 4804 624 116 22 47
DC 4* 965 4731 685 164 22 63
DC 5 1050 4730 810 140 26 44
FSM 3
FSM 4*
FSM 5
GU 3 104 2528 90 2 5 0
GU 4* 125 2475 103 2 7 1
GU 5 132 2440 108 2 4 4
Palau 3
Palau 4* 15 222 11 2 0 2
Palau 5
PR 3
PR 4*
PR 5
RMI 3
RMI 4*
RMI 5
VI 3 84 1114 55 12 5 9
VI 4* 123 1188 95 16 1 7
VI 5 91 1265 64 17 4 3 * Grades that were used in Appendix B and in the body of this document are indicated by an asterisk next to the grade level.

159
Table D5.
Middle School Mathematics Performance
Enrollment
Proficient on Regular
Assessment
Proficient on Alternate
Assessment on Grade
Level Achievement
Standards
Proficient on Alternate
Assessment on Modified
Achievement Standards
Proficient on Alternate
Assessment Based on
Alternate Achievement
Standards
1 2 9A-1 9A-2 9B-1 9B-2 9C-1 9C-2 9D-1 9D-2
State Grade
Students
with
IEPs
All
Students
Not
Proficient Proficient
Not
Proficient Proficient
Not
Proficient Proficient
Not
Proficient Proficient
AK 6 1268 9389 768 418 15 44
AK 7 1216 9595 792 323 45 27
AK 8* 1199 9737 822 288 42 23
AL 6 6547 56554 4474 1500 214 276
AL 7 6843 58157 5298 926 172 321
AL 8* 7005 57990 4859 1503 156 343
AR 6 4210 35018 2778 943 177 270
AR 7 4219 35217 3180 565 178 263
AR 8* 4431 35467 3459 467 271 176
AZ 6 10798 82788 7283 2522 503 199
AZ 7 10327 82105 6837 2435 479 242
AZ 8* 10327 81850 7249 1552 505 289
CA 6 55631 474185 42088 7721 2511 1971
CA 7 53075 482653 41173 6068 2274 2204
CA 8* 51433 487776 39443 5454 2227 2416
CO 6 6321 57780 4537 1139 153 372
CO 7 6124 57760 4840 629 185 334
CO 8* 5765 57743 4529 570 195 316
CT 6 5422 43062 2601 2291 342 110
CT 7 5383 43241 2839 1985 335 104
CT 8* 5484 43930 2929 1965 327 93
DE 6 1413 9231 861 447 6 83
DE 7 1520 9531 1002 370 12 99
DE 8* 1569 10324 1092 320 15 102
FL 6 30248 198739 21359 5841 714 1519
FL 7 30367 203265 19611 7305 874 1550
FL 8* 25009 193817 14919 6496 894 1548

160
Enrollment
Proficient on Regular
Assessment
Proficient on Alternate
Assessment on Grade
Level Achievement
Standards
Proficient on Alternate
Assessment on Modified
Achievement Standards
Proficient on Alternate
Assessment Based on
Alternate Achievement
Standards
1 2 9A-1 9A-2 9B-1 9B-2 9C-1 9C-2 9D-1 9D-2
State Grade
Students
with
IEPs
All
Students
Not
Proficient Proficient
Not
Proficient Proficient
Not
Proficient Proficient
Not
Proficient Proficient
GA 6 15537 121187 9347 4950 193 942
GA 7 14771 120906 7343 6072 215 1009
GA 8* 14800 122065 7680 5580 272 1145
HI 6 1460 13414 1257 78 20 51
HI 7 1522 13003 1321 77 28 33
HI 8* 1580 13361 1417 52 22 41
IA 6 5003 34294 3088 1702 67 121
IA 7 5068 34872 3295 1528 80 140
IA 8* 5273 35663 3534 1473 99 106
ID 6 1975 20725 1207 573 42 135
ID 7 1838 20348 1232 416 39 131
ID 8* 1843 20407 1197 440 34 148
IL 6 22460 156811 9785 10614 543 1269
IL 7 22827 159896 11345 9344 581 1263
IL 8* 23412 161119 12000 9128 602 1286
IN 6 11976 80122 5756 6200 163 522
IN 7 11978 81099 6167 5118 171 597
IN 8* 12116 80850 6851 4190 139 668
KS 6 5453 33403 1497 2508 301 784 35 293
KS 7 5239 33965 1730 2129 378 619 32 313
KS 8* 4955 34320 1864 1629 344 755 44 266
KY 6 6205 48740 3740 1946 432 86
KY 7 6054 49447 3781 1721 459 91
KY 8* 6032 49469 4181 1236 529 86
LA 6 6985 51399 3950 1733 690 117 161 277
LA 7 6284 50756 3776 1194 653 156 196 274
LA 8* 6300 51348 3317 1085 1154 121 243 322
MA 6 13614 72433 9773 2391 30 0 1244 0
MA 7 13932 74179 10909 1608 15 0 1137 0
MA 8* 13435 74540 10484 1509 28 0 1026 0
MD 6 7653 62003 4084 2885 69 521
MD 7 8038 63786 4968 2276 88 556

161
Enrollment
Proficient on Regular
Assessment
Proficient on Alternate
Assessment on Grade
Level Achievement
Standards
Proficient on Alternate
Assessment on Modified
Achievement Standards
Proficient on Alternate
Assessment Based on
Alternate Achievement
Standards
1 2 9A-1 9A-2 9B-1 9B-2 9C-1 9C-2 9D-1 9D-2
State Grade
Students
with
IEPs
All
Students
Not
Proficient Proficient
Not
Proficient Proficient
Not
Proficient Proficient
Not
Proficient Proficient
MD 8* 8003 65451 5331 1668 95 694
ME 6 2518 14365 1837 446 65 131
ME 7 2555 14818 1888 433 71 105
ME 8* 2508 15274 1914 351 71 105
MI 6 16912 121072 1763 11784 1497 1652
MI 7 17473 125515 1379 12516 1510 1842
MI 8* 17480 126545 1437 12521 1403 1906
MN 6 8292 59871 3549 3778 102 751
MN 7 8439 61911 4016 3339 194 740
MN 8* 8470 63126 4788 2633 205 668
MO 6 9468 66433 7093 1684 163 491
MO 7 9303 67442 7183 1418 184 485
MO 8* 9057 68128 7387 973 174 468
MS 6 4161 38561 3101 511 181 224
MS 7 4341 40704 3201 463 210 281
MS 8* 4245 40069 3205 368 202 216
MT 6 1318 10776 937 250 30 48
MT 7 1348 10858 920 261 26 74
MT 8* 1428 11151 1082 197 24 54
NC 6 14781 108474 6386 4440 15 22 1618 1375 328 463
NC 7 14833 109893 6752 4325 21 40 1599 1250 290 408
NC 8* 14706 111346 6564 4235 9 38 1562 1227 451 452
ND 6 1033 7244 364 433 12 122 9 78
ND 7 1001 7423 414 318 16 152 4 84
ND 8* 1048 7671 536 221 31 146 6 89
NE 6 3296 23490 761 2208 76 145
NE 7 3132 23746 724 2021 84 160
NE 8* 2982 23826 650 1962 72 151
NH 6 2662 15439 1795 679 52 116
NH 7 2747 15922 1983 594 57 83
NH 8* 2727 16371 2112 414 59 84

162
Enrollment
Proficient on Regular
Assessment
Proficient on Alternate
Assessment on Grade
Level Achievement
Standards
Proficient on Alternate
Assessment on Modified
Achievement Standards
Proficient on Alternate
Assessment Based on
Alternate Achievement
Standards
1 2 9A-1 9A-2 9B-1 9B-2 9C-1 9C-2 9D-1 9D-2
State Grade
Students
with
IEPs
All
Students
Not
Proficient Proficient
Not
Proficient Proficient
Not
Proficient Proficient
Not
Proficient Proficient
NJ 6 17296 104075 10146 5845 285 719
NJ 7 17861 106040 12265 4225 355 648
NJ 8* 18188 106445 12226 4506 427 507
NM 6 3028 23666 2631 165 78 106
NM 7 3129 23964 2711 154 89 116
NM 8* 3214 24579 2724 194 98 129
NV 6 3728 33450 2688 733 11 274
NV 7 3701 34234 2852 591 6 221
NV 8* 3570 33569 2843 427 5 255
NY 6 35946 206108 18584 14023 286 1942
NY 7 36068 213255 18393 14107 443 1849
NY 8* 36446 216546 21981 10143 485 1956
OH 6 20625 132497 10797 7172 96 2405
OH 7 21037 137231 12989 5308 103 2402
OH 8* 21410 139432 12762 5664 92 2568
OK 6 7094 44467 1830 1964 837 1851 58 458
OK 7 7080 44484 1848 1754 1165 1542 52 402
OK 8* 6994 44740 681 1797 1404 1631 48 389
OR 6 6210 42730 3526 2019 254 301
OR 7 5835 42939 3286 1914 278 233
OR 8* 5495 42660 3505 1398 295 158
PA 6 22837 134937 13827 7017 798 968
PA 7 23466 140260 14997 6321 1120 694
PA 8* 24370 143679 15842 5957 1181 877
RI 6 2179 11312 1697 363 34 45
RI 7 2296 11575 1861 333 28 43
RI 8* 2357 12120 1892 301 33 73
SC 6 6857 51677 3806 2654 31 333
SC 7 7155 52831 3348 3448 17 287
SC 8* 6925 52904 3988 2626 20 201
SD 6 1037 9071 573 363 39 60
SD 7 982 9180 616 275 38 47

163
Enrollment
Proficient on Regular
Assessment
Proficient on Alternate
Assessment on Grade
Level Achievement
Standards
Proficient on Alternate
Assessment on Modified
Achievement Standards
Proficient on Alternate
Assessment Based on
Alternate Achievement
Standards
1 2 9A-1 9A-2 9B-1 9B-2 9C-1 9C-2 9D-1 9D-2
State Grade
Students
with
IEPs
All
Students
Not
Proficient Proficient
Not
Proficient Proficient
Not
Proficient Proficient
Not
Proficient Proficient
SD 8* 936 9334 573 264 30 66
TN 6 8346 71224 2548 4992 16 710
TN 7 8510 72804 3034 4689 18 692
TN 8* 8496 72422 3179 4391 20 798
TX 6 39085 337180 15146 9503 5328 6404 299 2075
TX 7 40180 340126 17051 7954 6054 6365 302 1919
TX 8* 40447 333958 14967 9322 7178 6004 341 2181
UT 6 5149 41997 2941 1762 73 353
UT 7 4336 42131 1946 1926 91 340
UT 8* 3707 41736 1883 1261 61 350
VA 6 12057 82122 5634 3148 324 1815 91 959
VA 7 11916 75420 5406 2539 344 2389 100 982
VA 8* 14609 93163 5489 4869 363 2528 99 1015
VT 6 919 6546 679 147 58 14
VT 7 1012 6770 803 124 61 4
VT 8* 1023 7093 800 124 62 7
WA 6 9284 75846 7493 861 493 196
WA 7 8851 77768 7212 690 330 283
WA 8* 8693 78095 6954 633 493 164
WI 6 8656 60906 4755 3002 233 553
WI 7 8631 62041 4791 2908 211 598
WI 8* 9323 64154 5426 2846 294 578
WV 6 3046 20276 1702 1002 73 190
WV 7 3121 21122 1830 960 84 160
WV 8* 3210 21198 2077 760 59 216
WY 6 957 6420 499 381 26 34
WY 7 839 6282 491 271 25 37
WY 8* 892 6579 584 229 27 33
AS 6
AS 7 119 1053 114 0 0 0
AS 8* 125 1119 112 8 3 0

164
Enrollment
Proficient on Regular
Assessment
Proficient on Alternate
Assessment on Grade
Level Achievement
Standards
Proficient on Alternate
Assessment on Modified
Achievement Standards
Proficient on Alternate
Assessment Based on
Alternate Achievement
Standards
1 2 9A-1 9A-2 9B-1 9B-2 9C-1 9C-2 9D-1 9D-2
State Grade
Students
with
IEPs
All
Students
Not
Proficient Proficient
Not
Proficient Proficient
Not
Proficient Proficient
Not
Proficient Proficient
BIE 6 528 3420 425 59 4 4 12 15
BIE 7 574 3409 461 62 8 8 13 18
BIE 8* 609 3582 511 45 14 10 10 8
CNMI 6 58 847 37 11 7 2
CNMI 7 65 781 52 1 9 0
CNMI 8* 86 795 62 11 10 0
DC 6 1181 4808 964 106 21 58
DC 7 1205 4791 937 127 32 49
DC 8* 1391 5176 1061 164 44 52
FSM 6 108 1540 1 82 1 1
FSM 7
FSM 8* 93 1569 3 44 2 1
GU 6 132 2210 118 0 6 0
GU 7 184 2332 149 0 9 1
GU 8* 189 2352 164 1 4 1
Palau 6 13 242 5 2 1 3
Palau 7
Palau 8* 14 265 7 5 1 1
PR 6
PR 7
PR 8*
RMI 6
RMI 7
RMI 8* 27 1107 11 1 0 0
VI 6 103 1161 76 11 6 7
VI 7 153 1463 104 25 4 10
VI 8* 137 1227 105 17 6 9 * Grades that were used in Appendix B and in the body of this document are indicated by an asterisk next to the grade level.

165
Table D6.
High School Mathematics Performance
Enrollment
Proficient on Regular
Assessment
Proficient on Alternate
Assessment on Grade
Level Achievement
Standards
Proficient on Alternate
Assessment on Modified
Achievement Standards
Proficient on Alternate
Assessment Based on
Alternate Achievement
Standards
1 2 9A-1 9A-2 9B-1 9B-2 9C-1 9C-2 9D-1 9D-2
State Grade
Students
with
IEPs
All
Students
Not
Proficient Proficient
Not
Proficient Proficient
Not
Proficient Proficient
Not
Proficient Proficient
AK H 1066 9990 735 176 52 37
AL H 4826 47977 2938 1333 167 281
AR H 7181 71973 3688 1082 789 1399
AZ H 8096 76701 5466 1400 415 301
CA H 43298 472019 34797 5100 1614 3001
CO H 5723 61078 4547 364 227 336
CT H 4898 42859 2232 1770 388 54
DE H 1175 9067 825 152 16 121
FL H 27211 204527 14990 6126 905 2031
GA H 8919 94017 5148 2286 213 963
HI H 1673 12982 1446 43 34 15
IA H 4703 36332 3093 1371 77 124
ID H 1662 19997 1080 391 32 124
IL H 17740 140263 12619 1938 470 1194
IN H 12234 81967 7107 2765 160 670
KS H 1836 10052 763 435 178 326 2 78
KY H 4376 44438 3463 353 412 148
LA H 3329 42950 1798 622 395 9 220 213
MA H 12080 73391 6756 3717 13 0 855 0
MD H 5694 55067 2447 2075 260 56 112 713
ME H 2213 15604 1748 150 88 121
MI H 14506 123816 98 10445 618 2150
MN H 7561 65818 5561 688 146 733
MO H 9043 69783 7433 808 179 513
MS H 1923 33608 1305 384 0 0
MT H 1346 11449 1013 116 44 80
NC H 10812 93874 4679 3201 5 18 717 699 326 279
ND H 935 7718 538 87 61 104 12 93

166
Enrollment
Proficient on Regular
Assessment
Proficient on Alternate
Assessment on Grade
Level Achievement
Standards
Proficient on Alternate
Assessment on Modified
Achievement Standards
Proficient on Alternate
Assessment Based on
Alternate Achievement
Standards
1 2 9A-1 9A-2 9B-1 9B-2 9C-1 9C-2 9D-1 9D-2
State Grade
Students
with
IEPs
All
Students
Not
Proficient Proficient
Not
Proficient Proficient
Not
Proficient Proficient
Not
Proficient Proficient
NE H 2514 24180 721 1391 66 122
NH H 2640 16467 2213 90 65 46
NJ H 16037 100202 9838 4583 555 432
NM H 2706 20365 2266 123 88 103
NV H 3008 31869 2413 287 9 196
NY H 24601 195534 9465 10859 120 1181
OH H 21665 145540 11960 6752 47 2275
OK H 6455 43950 1757 1207 855 2270 109 395
OR H 5047 44269 3609 573 229 191
PA H 21035 140593 15887 2520 1087 706
RI H 2004 11427 1742 53 44 19
SC H 6656 52430 2958 3089 32 289
SD H 714 8253 548 74 44 43
TN H 2115 38385 417 789 25 826
TX H 33331 314399 15758 3136 7270 4238 333 1692
UT H 4832 44023 2427 858 214 882
VA H 21698 263054 5500 14900 98 792
VT H 983 7392 791 20 50 10
WA H 8411 83725 5766 427 443 173
WI H 9536 70185 6388 1990 304 469
WV H 2894 20002 2073 444 67 170
WY H 603 6048 446 83 28 27
AS H 94 1060 80 2 4 0
BIE H 499 12591 395 30 15 9 9 18
CNMI H 26 608 20 3 1 1
DC H 675 4118 494 62 19 36
FSM H 88 1444 1 16 3 3
GU H 179 3139 173 0 1 0
Palau H 4 168 0 0 0 2
PR H
RMI H

167
Enrollment
Proficient on Regular
Assessment
Proficient on Alternate
Assessment on Grade
Level Achievement
Standards
Proficient on Alternate
Assessment on Modified
Achievement Standards
Proficient on Alternate
Assessment Based on
Alternate Achievement
Standards
1 2 9A-1 9A-2 9B-1 9B-2 9C-1 9C-2 9D-1 9D-2
State Grade
Students
with
IEPs
All
Students
Not
Proficient Proficient
Not
Proficient Proficient
Not
Proficient Proficient
Not
Proficient Proficient
VI H 67 1040 51 2 1 13 * Grades that were used in Appendix B and in the body of this document are indicated by an asterisk next to the grade level.

168
Appendix E
State-by-State Performance Raw Data by Specific Assessment
This Appendix presents the state-by-state raw data that were the source of summary data for Tables D1-D6 of Appendix D, which are
the presentation of the raw data that drive Tables B1-B6 of Appendix B. Appendix B was used to generate the performance tables and
figures in the main body of this document. There are eight tables in this Appendix. Each table shows either reading or math
performance counts for all grades within one content area for one assessment for each state. The tables in Appendix E do match up
with the table numbers in the other appendices because the data in this Appendix are organized by type of assessment (e.g., regular
assessment—reading, regular assessment—math, etc.) rather than by school level and content.
In each table in this Appendix, the first column shows the assessment name reported by the state on its Section 618, Table 6 document
(when available). The next six columns show the total number of students who scored in each achievement level listed in the heading,
which are presented from left to right in increasing levels of proficiency. Following these proficiency level data is the total number of
students assessed. Next is a column listing the lowest proficiency level considered proficient.
The data in these tables were obtained directly from Section 618, Table 6 included with each state’s 2007-08 Annual Performance
Reports or from the EdFacts data management system as retrieved by the Data Accountability Center when applicable. Differences in
how states completed Table 6, and differences between Table 6 and the EdFacts system complicate the interpretation of some data. All
information is from the 2007-08 school year.

169
Table E1.
Regular Assessment Reading Performance
Achievement Levels Attained
State Grade Assessment Name
Level
1
Level
2
Level
3
Level
4
Level
5
Level
6
Total Students
Assessed
Minimum
Proficiency
Level
AK 3 AK Standards Based 377 400 513 174 1464 3
AK 4 AK Standards Based 375 334 532 146 1387 3
AK 5 AK Standards Based 224 405 568 79 1276 3
AK 6 AK Standards Based 168 517 402 94 1181 3
AK 7 AK Standards Based 234 412 414 58 1118 3
AK 8 AK Standards Based 197 392 458 62 1109 3
AK H AK Standards Based 181 379 324 34 918 3
AL 3 ARMT 515 2710 1912 1093 6230 3
AL 4 ARMT 122 3181 1966 1018 6287 3
AL 5 ARMT 416 3062 1730 771 5979 3
AL 6 ARMT 271 3101 1750 872 5994 3
AL 7 ARMT 483 3937 1462 359 6241 3
AL 8 ARMT 635 4201 1309 230 6375 3
AL H ARMT 1767 1395 1027 68 4257 3
AR 3 ACTAAP 2079 868 601 368 3916 3
AR 4 ACTAAP 1487 1535 663 230 3915 3
AR 5 ACTAAP 1957 1302 510 135 3904 3
AR 6 ACTAAP 1962 1277 369 120 3728 3
AR 7 ACTAAP 1713 1688 311 34 3746 3
AR 8 ACTAAP 1952 1453 484 43 3932 3
AR H ACTAAP 1598 1565 147 3310 3
AZ 3 AIMS DPA 3023 3710 3015 485 10233 3
AZ 4 AIMS DPA 3664 3257 3197 299 10417 3
AZ 5 AIMS DPA 3764 3585 2777 223 10349 3
AZ 6 AIMS DPA 3880 3302 2498 140 9820 3
AZ 7 AIMS DPA 3503 3349 2324 96 9272 3
AZ 8 AIMS DPA 3837 3057 1854 59 8807 3
AZ H AIMS DPA 1858 3131 2009 46 7044 3
CA 3 CST 18383 10112 5678 2279 36452 3
CA 4 CST 14719 10887 6838 5751 38195 3
CA 5 CST 17834 12106 6618 3173 39731 3

170
Achievement Levels Attained
State Grade Assessment Name
Level
1
Level
2
Level
3
Level
4
Level
5
Level
6
Total Students
Assessed
Minimum
Proficiency
Level
CA 6 CST 28608 12737 5281 2696 49322 3
CA 7 CST 30767 9876 4688 2032 47363 3
CA 8 CST 29974 9826 3864 1584 45248 3
CA H CAHSEE 24246 8862 4367 438 37913 3
CO 3 CSAP 2416 1533 1760 80 5789 3
CO 4 CSAP 2484 1974 1457 30 5945 3
CO 5 CSAP 2687 1516 1531 66 5800 3
CO 6 CSAP 2313 1869 1370 74 5626 3
CO 7 CSAP 2638 1615 1134 46 5433 3
CO 8 CSAP 2415 1595 1021 43 5074 3
CO H CSAP 1910 1965 945 24 4844 3
CT 3 CMT 2618 533 511 486 82 4230 3
CT 4 CMT 2978 469 468 624 100 4639 3
CT 5 CMT 2798 490 499 844 111 4742 3
CT 6 CMT 2496 602 612 995 159 4864 3
CT 7 CMT 2468 509 496 1125 188 4786 3
CT 8 CMT 2567 614 650 912 120 4863 3
CT H CAPT 1215 876 1474 369 107 4041 3
DE 3 DSTP 256 267 593 68 48 1232 3
DE 4 DSTP 315 353 491 75 33 1267 3
DE 5 DSTP 309 342 608 97 15 1371 3
DE 6 DSTP 351 426 475 49 2 1303 3
DE 7 DSTP 391 386 564 31 3 1375 3
DE 8 DSTP 483 445 461 13 2 1404 3
DE H DSTP 468 315 190 3 2 978 3
FL 3 FCAT 16882 8953 5801 31636 2
FL 4 FCAT 17285 7077 4740 29102 2
FL 5 FCAT 18016 7116 3422 28554 2
FL 6 FCAT 19027 5762 2461 27250 2
FL 7 FCAT 18476 6374 2126 26976 2
FL 8 FCAT 17233 3517 773 21523 2
FL H FCAT 19197 1449 904 21550 2
GA 3 CRCT 4375 9336 2297 16008 2
GA 4 CRCT 5849 8042 1802 15693 2

171
Achievement Levels Attained
State Grade Assessment Name
Level
1
Level
2
Level
3
Level
4
Level
5
Level
6
Total Students
Assessed
Minimum
Proficiency
Level
GA 5 CRCT 4790 9162 1210 15162 2
GA 6 CRCT 5235 8095 965 14295 2
GA 7 CRCT 5224 7642 554 13420 2
GA 8 CRCT 4481 8035 740 13256 2
GA H GA HS Graduation Test 3284 2817 1220 7321 2
HI 3 Hawaii State Assessment 824 240 157 6 1227 3
HI 4 Hawaii State Assessment 883 226 158 14 1281 3
HI 5 Hawaii State Assessment 1041 174 162 15 1392 3
HI 6 Hawaii State Assessment 972 214 135 14 1335 3
HI 7 Hawaii State Assessment 1000 177 208 15 1400 3
HI 8 Hawaii State Assessment 1008 237 208 22 1475 3
HI H Hawaii State Assessment 1052 176 234 35 1497 3
IA 3 ITBS 2619 1252 121 3992 2
IA 4 ITBS 2813 1541 153 4507 2
IA 5 ITBS 3051 1631 132 4814 2
IA 6 ITBS 3615 1087 88 4790 2
IA 7 ITBS 3700 1052 49 4801 2
IA 8 ITBS 3846 1137 58 5041 2
IA H ITBS 3058 1346 56 4460 2
ID 3 ISAT 667 334 621 251 1873 3
ID 4 ISAT 627 440 701 172 1940 3
ID 5 ISAT 520 500 711 166 1897 3
ID 6 ISAT 584 541 551 105 1781 3
ID 7 ISAT 598 549 406 98 1651 3
ID 8 ISAT 339 576 589 143 1647 3
ID H ISAT 377 510 539 48 1474 3
IL 3 ISAT 4475 608 6518 1997 13598 3
IL 4 ISAT 1591 10556 6517 1988 20652 3
IL 5 ISAT 579 12061 6280 1639 20559 3
IL 6 ISAT 336 11316 7564 1215 20431 3
IL 7 ISAT 573 12248 7218 653 20692 3
IL 8 ISAT 414 11779 8759 199 21151 3
IL H PSAE 5517 6275 2428 300 14520 3
IN 3 ISTEP+ 5802 6023 751 12576 2

172
Achievement Levels Attained
State Grade Assessment Name
Level
1
Level
2
Level
3
Level
4
Level
5
Level
6
Total Students
Assessed
Minimum
Proficiency
Level
IN 4 ISTEP+ 6666 5994 505 13165 2
IN 5 ISTEP+ 7008 5359 347 12714 2
IN 6 ISTEP+ 7544 4178 190 11912 2
IN 7 ISTEP+ 7901 3131 161 11193 2
IN 8 ISTEP+ 7908 2964 89 10961 2
IN H ISTEP+ 7699 2205 16 9920 2
KS 3 Regular Assessment 465 647 1072 793 518 3495 3
KS 4 Regular Assessment 520 505 1250 893 712 3880 3
KS 5 Regular Assessment 530 711 1104 843 787 3975 3
KS 6 Regular Assessment 670 573 1234 892 523 3892 3
KS 7 Regular Assessment 577 728 1173 888 438 3804 3
KS 8 Regular Assessment 723 797 1054 619 311 3504 3
KS H Regular Assessment 651 539 638 244 114 2186 3
KY 3 CATS 761 2000 3153 623 6537 3
KY 4 CATS 897 1991 3021 527 6436 3
KY 5 CATS 905 2201 2625 360 6091 3
KY 6 CATS 1265 2195 1968 258 5686 3
KY 7 CATS 1175 2439 1711 177 5502 3
KY 8 CATS 1028 2595 1700 94 5417 3
KY H CATS 1246 2602 815 38 4701 3
LA 3 iLEAP 2308 1716 1941 414 81 6460 3
LA 4 LEAP 2687 2010 2179 511 60 7447 3
LA 5 iLEAP 1543 1134 1108 200 32 4017 3
LA 6 iLEAP 2328 1889 1289 160 24 5690 3
LA 7 iLEAP 1997 1877 950 112 36 4972 3
LA 8 LEAP 1957 1783 601 64 4 4409 3
LA H GEE 1530 528 332 21 2 2413 3
MA 3 MCAS 3216 5090 2362 348 11016 3
MA 4 MCAS 4228 5812 1742 114 11896 3
MA 5 MCAS 2871 6247 2863 238 12219 3
MA 6 MCAS 2905 5683 3431 208 12227 3
MA 7 MCAS 2847 5872 3556 172 12447 3
MA 8 MCAS 2579 4746 4597 133 12055 3
MA H MCAS 1380 5262 3622 303 10567 3

173
Achievement Levels Attained
State Grade Assessment Name
Level
1
Level
2
Level
3
Level
4
Level
5
Level
6
Total Students
Assessed
Minimum
Proficiency
Level
MD 3 MSA 2483 3667 387 6537 2
MD 4 MSA 2044 4572 567 7183 2
MD 5 MSA 2441 3192 1603 7236 2
MD 6 MSA 3566 2603 796 6965 2
MD 7 MSA 3823 2567 847 7237 2
MD 8 MSA 4598 1863 538 6999 2
MD H MSA+H.S.A. 2587 1530 274 4391 2
ME 3 MEA 443 1062 697 8 2210 3
ME 4 MEA 611 1056 701 10 2378 3
ME 5 MEA 735 1016 632 9 2392 3
ME 6 MEA 614 956 670 42 2282 3
ME 7 MEA 753 829 708 40 2330 3
ME 8 MEA 951 718 543 57 2269 3
ME H SAT 1196 435 171 23 1825 3
MI 3 MEAP 957 5589 4567 1342 12455 2
MI 4 MEAP 723 5079 6036 1609 13447 2
MI 5 MEAP 861 4919 5075 2984 13839 2
MI 6 MEAP 309 5073 6667 1142 13191 2
MI 7 MEAP 299 4139 5373 3919 13730 2
MI 8 MEAP 280 4432 5275 3830 13817 2
MI H MME 21 1088 3714 5531 10354 2
MN 3 MCA 2729 1139 1842 1936 7646 2
MN 4 MCA 3015 1705 1839 1320 7879 2
MN 5 MCA 2955 1949 2051 931 7886 2
MN 6 MCA 3440 1674 1420 781 7315 2
MN 7 MCA 3837 1755 1079 688 7359 2
MN 8 MCA 3824 1876 1240 508 7448 2
MN H MCA 3016 2262 1434 410 7122 2
MO 3 MAP 2620 5045 1462 625 9752 3
MO 4 MAP 2783 5055 1483 396 9717 3
MO 5 MAP 2361 5086 1314 430 9191 3
MO 6 MAP 3149 4348 1055 235 8787 3
MO 7 MAP 3475 4093 908 143 8619 3
MO 8 MAP 2289 5190 759 126 8364 3

174
Achievement Levels Attained
State Grade Assessment Name
Level
1
Level
2
Level
3
Level
4
Level
5
Level
6
Total Students
Assessed
Minimum
Proficiency
Level
MO H MAP 3870 2798 302 69 7039 3
MS 3 MCT2 1242 1474 870 227 3813 3
MS 4 MCT2 1484 1273 591 159 3507 3
MS 5 MCT2 1701 1162 527 51 3441 3
MS 6 MCT2 1876 1363 347 22 3608 3
MS 7 MCT2 1992 1363 301 9 3665 3
MS 8 MCT2 2184 1125 258 4 3571 3
MS H End-of-course 1215 504 185 16 1920 3
MT 3 CRT 224 325 444 199 1192 3
MT 4 CRT 262 457 395 156 1270 3
MT 5 CRT 347 321 334 179 1181 3
MT 6 CRT 328 350 399 118 1195 3
MT 7 CRT 381 325 383 102 1191 3
MT 8 CRT 495 318 386 100 1299 3
MT H CRT 402 306 350 56 1114 3
NC 3 EOG 6333 2324 2788 1109 12554 3
NC 4 EOG 4622 3225 2763 1044 11654 3
NC 5 EOG 4805 3095 2447 450 10797 3
NC 6 EOG 5000 2136 2132 422 9690 3
NC 7 EOG 5111 2784 1314 615 9824 3
NC 8 EOG 4637 2969 1917 207 9730 3
NC H End-of-course 0 5268 1873 7141 3
ND 3 NDSA 54 319 416 51 840 3
ND 4 NDSA 153 229 354 84 820 3
ND 5 NDSA 183 270 265 16 734 3
ND 6 NDSA 154 275 281 28 738 3
ND 7 NDSA 147 217 283 32 679 3
ND 8 NDSA 200 272 255 21 748 3
ND H NDSA 269 205 140 6 620 3
NE 3 STARS 151 653 1545 1186 3535 3
NE 4 STARS 168 530 1712 1148 3558 3
NE 5 STARS 225 572 1574 864 3235 3
NE 6 STARS 193 583 1518 688 2982 3
NE 7 STARS 151 645 1459 537 2792 3

175
Achievement Levels Attained
State Grade Assessment Name
Level
1
Level
2
Level
3
Level
4
Level
5
Level
6
Total Students
Assessed
Minimum
Proficiency
Level
NE 8 STARS 96 418 1737 436 2687 3
NE H STARS 109 494 1474 240 2317 3
NH 3 NECAP 681 496 647 43 1867 3
NH 4 NECAP 799 649 642 54 2144 3
NH 5 NECAP 752 902 680 67 2401 3
NH 6 NECAP 787 904 757 32 2480 3
NH 7 NECAP 809 99 812 31 1751 3
NH 8 NECAP 962 968 571 30 2531 3
NH H NECAP 855 869 560 33 2317 3
NJ 3 NJASK 5624 8800 165 14589 2
NJ 4 NJASK 7057 8496 111 15664 2
NJ 5 NJASK 11966 3786 86 15838 2
NJ 6 NJASK 13031 2923 16 15970 2
NJ 7 NJASK 11572 4679 234 16485 2
NJ 8 GEPA 9399 7270 161 16830 2
NJ H HSPA 8207 6071 180 14458 2
NM 3 SBA 1310 853 674 70 2907 3
NM 4 SBA 1414 977 457 28 2876 3
NM 5 SBA 1058 1325 447 35 2865 3
NM 6 SBA 1253 1317 211 11 2792 3
NM 7 SBA 1380 1152 315 13 2860 3
NM 8 SBA 984 1392 527 4 2907 3
NM H SBA 1149 1004 227 9 2389 3
NV 3 CRT 812 1768 574 349 3503 3
NV 4 CRT 1482 1305 665 186 3638 3
NV 5 CRT 1613 1463 420 58 3554 3
NV 6 CRT 1556 1253 525 81 3415 3
NV 7 CRT 1358 1405 644 30 3437 3
NV 8 CRT 1115 1725 403 31 3274 3
NV H HS Prof. Exam 700 1049 673 219 2641 3
NY 3 NYSTP 7758 12794 8582 654 29788 3
NY 4 NYSTP 9869 12396 9474 178 31917 3
NY 5 NYSTP 2776 16162 13148 190 32276 3
NY 6 NYSTP 2630 22105 7905 56 32696 3

176
Achievement Levels Attained
State Grade Assessment Name
Level
1
Level
2
Level
3
Level
4
Level
5
Level
6
Total Students
Assessed
Minimum
Proficiency
Level
NY 7 NYSTP 2747 20079 9701 47 32574 3
NY 8 NYSTP 7162 20744 4343 80 32329 3
NY H NYSTP 3262 5624 9437 965 19288 3
OH 3 Ohio Achievement Test 4560 3959 3589 3660 1721 17489 3
OH 4 Ohio Achievement Test 4417 3696 7844 1723 192 17872 3
OH 5 Ohio Achievement Test 7952 3124 5693 643 149 17561 3
OH 6 Ohio Achievement Test 4018 5944 6608 1180 222 17972 3
OH 7 Ohio Achievement Test 6657 4777 5657 979 235 18305 3
OH 8 Ohio Achievement Test 5066 6136 5251 1678 313 18444 3
OH H Ohio Graduation Test 5842 4432 6488 1656 294 18712 3
OK 3 OCCT 289 954 2462 76 3781 3
OK 4 OCCT 265 666 2837 72 3840 3
OK 5 OCCT 571 1141 2037 109 3858 3
OK 6 OCCT 805 838 1706 74 3423 3
OK 7 OCCT 674 1241 1439 107 3461 3
OK 8 OCCT 586 1143 1746 52 3527 3
OK H OCCT 1066 832 602 398 2898 3
OR 3 Regular Assessment 1912 2208 881 5001 2
OR 4 Regular Assessment 2271 2177 1065 5513 2
OR 5 Regular Assessment 3101 2038 494 5633 2
OR 6 Regular Assessment 3466 1638 402 5506 2
OR 7 Regular Assessment 3354 1523 315 5192 2
OR 8 Regular Assessment 3651 1028 212 4891 2
OR H Regular Assessment 3279 892 88 4259 2
PA 3 PSSA 7574 3230 7218 1376 19398 3
PA 4 PSSA 8588 4677 4825 2436 20526 3
PA 5 PSSA 11412 4287 3753 1249 20701 3
PA 6 PSSA 10267 4985 4162 1375 20789 3
PA 7 PSSA 10255 5378 4171 1454 21258 3
PA 8 PSSA 9754 4154 4780 3032 21720 3
PA H PSSA 11483 3460 2657 779 18379 3
RI 3 NECAP 657 404 580 61 1702 3
RI 4 NECAP 821 541 461 71 1894 3
RI 5 NECAP 865 648 430 91 2034 3

177
Achievement Levels Attained
State Grade Assessment Name
Level
1
Level
2
Level
3
Level
4
Level
5
Level
6
Total Students
Assessed
Minimum
Proficiency
Level
RI 6 NECAP 898 664 484 18 2064 3
RI 7 NECAP 864 736 558 35 2193 3
RI 8 NECAP 1036 784 357 19 2196 3
RI H NECAP 739 774 272 19 1804 3
SC 3 PACT 2448 2681 1977 333 7439 2
SC 4 PACT 3300 2669 1187 103 7259 2
SC 5 PACT 3655 2396 645 25 6721 2
SC 6 PACT 4117 1903 394 41 6455 2
SC 7 PACT 4361 2134 286 12 6793 2
SC 8 PACT 4500 1837 251 18 6606 2
SC H HSAP 2444 2277 1093 251 6065 2
SD 3 Dstep 0 390 791 144 1325 3
SD 4 Dstep 0 348 686 124 1158 3
SD 5 Dstep 0 386 531 87 1004 3
SD 6 Dstep 2 463 411 59 935 3
SD 7 Dstep 0 474 376 41 891 3
SD 8 Dstep 0 494 331 12 837 3
SD H Dstep 2 535 81 5 623 3
TN 3 TCAP Achievement 1753 5199 1333 8285 2
TN 4 TCAP Achievement 2120 4947 1195 8262 2
TN 5 TCAP Achievement 1309 5467 1120 7896 2
TN 6 TCAP Achievement 1782 4998 758 7538 2
TN 7 TCAP Achievement 2308 4858 543 7709 2
TN 8 TCAP Achievement 1729 4919 910 7558 2
TN H Gateway 731 2643 2008 5382 2
TX 3 TAKS 5529 12533 4228 22290 2
TX 4 TAKS 10587 9719 2205 22511 2
TX 5 TAKS 8971 12693 2218 23882 2
TX 6 TAKS 9877 11005 3075 23957 2
TX 7 TAKS 14010 9830 1392 25232 2
TX 8 TAKS 7859 14690 3315 25864 2
TX H TAKS 11315 9331 285 20931 2
UT 3 Criterion-Referenced 1393 1673 1673 1156 5895 3
UT 4 Criterion-Referenced 1369 1557 1655 1093 5674 3

178
Achievement Levels Attained
State Grade Assessment Name
Level
1
Level
2
Level
3
Level
4
Level
5
Level
6
Total Students
Assessed
Minimum
Proficiency
Level
UT 5 Criterion-Referenced 1519 1628 1442 611 5200 3
UT 6 Criterion-Referenced 1406 1453 1295 556 4710 3
UT 7 Criterion-Referenced 1671 1006 966 444 4087 3
UT 8 Criterion-Referenced 1331 926 1005 520 3782 3
UT H Criterion-Referenced 1007 819 877 214 2917 3
VA 3 SOL 752 2902 0 4168 1728 9550 4
VA 4 SOL 638 2392 0 4419 2030 9479 4
VA 5 SOL 729 2214 0 4872 1500 9315 4
VA 6 SOL 1007 2921 0 3981 1078 8987 4
VA 7 SOL 1167 2734 0 4178 1076 9155 4
VA 8 SOL 1548 3654 135 4029 935 10301 4
VA H SOL 0 0 2212 5381 1354 8947 4
VT 3 NECAP 279 137 158 13 587 3
VT 4 NECAP 345 194 125 11 675 3
VT 5 NECAP 408 265 149 15 837 3
VT 6 NECAP 391 281 154 2 828 3
VT 7 NECAP 442 320 165 3 930 3
VT 8 NECAP 407 326 174 16 923 3
VT H NECAP 431 273 117 10 831 3
WA 3 WASL 4074 2204 2028 1202 9508 3
WA 4 WASL 2819 3627 2164 923 9533 3
WA 5 WASL 3236 2999 1917 1041 9193 3
WA 6 WASL 3187 3416 1501 252 8356 3
WA 7 WASL 3695 3029 841 344 7909 3
WA 8 WASL 3544 2777 1002 297 7620 3
WA H WASL 1951 1877 1613 694 6135 3
WI 3 WKCE-CRT 1381 2293 2391 1297 7362 3
WI 4 WKCE-CRT 1541 2332 2564 1128 7565 3
WI 5 WKCE-CRT 1350 2339 2877 978 7544 3
WI 6 WKCE-CRT 1773 2079 2991 835 7678 3
WI 7 WKCE-CRT 1882 2042 2794 947 7665 3
WI 8 WKCE-CRT 2311 2117 3095 748 8271 3
WI H WKCE-CRT 3086 2730 1870 681 8367 3
WV 3 WESTEST 618 1069 1126 472 78 3363 3

179
Achievement Levels Attained
State Grade Assessment Name
Level
1
Level
2
Level
3
Level
4
Level
5
Level
6
Total Students
Assessed
Minimum
Proficiency
Level
WV 4 WESTEST 683 972 1150 281 38 3124 3
WV 5 WESTEST 580 1091 866 160 13 2710 3
WV 6 WESTEST 545 1121 884 117 33 2700 3
WV 7 WESTEST 467 1240 932 128 18 2785 3
WV 8 WESTEST 386 1506 813 111 16 2832 3
WV H WESTEST 679 1295 460 69 13 2516 3
WY 3 PAWS 306 361 262 39 968 3
WY 4 PAWS 153 452 314 76 995 3
WY 5 PAWS 258 351 242 16 867 3
WY 6 PAWS 251 368 220 37 876 3
WY 7 PAWS 263 315 181 3 762 3
WY 8 PAWS 212 359 228 11 810 3
WY H PAWS 246 185 96 4 531 3
AS 3 SBA 31 13 6 5 55 3
AS 4 SBA 49 17 4 0 70 3
AS 5 SBA 65 22 4 0 91 3
AS 6
AS 7 SBA 71 39 4 0 114 3
AS 8 SBA 54 60 8 0 122 3
AS H SBA 55 22 3 0 80 3
BIE 3 N/A* 395 78 5 478 1
BIE 4 N/A* 456 78 5 539 1
BIE 5 N/A* 449 72 3 524 1
BIE 6 N/A* 422 67 3 492 1
BIE 7 N/A* 454 74 1 529 1
BIE 8 N/A* 521 52 3 576 1
BIE H N/A* 394 52 1 447 1
CNMI 3 SAT 10 47 6 1 0 54 3
CNMI 4 Standards Based Assess. 16 27 18 1 62 3
CNMI 5 SAT 10 48 10 1 0 59 3
CNMI 6 SAT 10 33 7 6 2 48 3
CNMI 7
CNMI 8 Standards Based Assess. 48 18 7 0 73 3
CNMI H Standards Based Assess. 16 7 0 0 23 3

180
Achievement Levels Attained
State Grade Assessment Name
Level
1
Level
2
Level
3
Level
4
Level
5
Level
6
Total Students
Assessed
Minimum
Proficiency
Level
DC 3 DCCAS 194 369 170 7 740 3
DC 4 DCCAS 209 421 208 11 849 3
DC 5 DCCAS 303 545 187 5 1040 3
DC 6 DCCAS 392 485 187 6 1070 3
DC 7 DCCAS 362 533 152 11 1058 3
DC 8 DCCAS 480 593 149 3 1225 3
DC H DCCAS 208 270 74 4 556 3
FSM 3
FSM 4
FSM 5
FSM 6 FSM NST 0 1 0 96 97 3
FSM 7
FSM 8 FSM NST 0 3 0 65 68 3
FSM H FSM NST 0 4 0 16 20 3
GU 3 SAT 10 76 14 2 92 3
GU 4 SAT 10 85 14 3 102 3
GU 5 SAT 10 91 15 1 107 3
GU 6 SAT 10 104 9 0 113 3
GU 7 SAT 10 135 16 0 151 3
GU 8 SAT 10 142 15 3 160 3
GU H SAT 10 152 12 1 165 3
Palau 3
Palau 4 *PAT 0 13 0 0 13 3
Palau 5
Palau 6 *PAT 0 7 0 0 7 3
Palau 7
Palau 8 *PAT 0 10 0 2 12 3
Palau H *PAT
PR 3 PPAA
PR 4 PPAA
PR 5 PPAA
PR 6 PPAA
PR 7 PPAA
PR 8 PPAA

181
Achievement Levels Attained
State Grade Assessment Name
Level
1
Level
2
Level
3
Level
4
Level
5
Level
6
Total Students
Assessed
Minimum
Proficiency
Level
PR H PPAA
RMI 3
RMI 4
RMI 5
RMI 6
RMI 7
RMI 8 5 5 2 0 12 3
RMI H
VI 3 VITAL 30 29 6 2 67 3
VI 4 VITAL 51 52 6 2 111 3
VI 5 VITAL 23 49 9 0 81 3
VI 6 VITAL 53 27 4 3 87 3
VI 7 VITAL 45 79 5 0 129 3
VI 8 VITAL 64 53 4 1 122 3
VI H VITAL 34 18 1 0 53 3
* Students in BIE schools are administered the large-scale assessment that is given for NCLB purposes by the state in which the BIE
school is located. For example, students at BIE schools in Wisconsin are administered the WKCE or the WAA

182
Table E2.
Regular Assessment Mathematics Performance
Achievement Levels Attained
State Grade Assessment Name
Level
1
Level
2
Level
3
Level
4
Level
5
Level
6
Total Students
Assessed
Minimum
Proficiency
Level
AK 3 AK Standards Based 423 265 575 212 1475 3
AK 4 AK Standards Based 497 296 453 149 1395 3
AK 5 AK Standards Based 358 367 378 171 1274 3
AK 6 AK Standards Based 438 330 307 111 1186 3
AK 7 AK Standards Based 421 371 259 64 1115 3
AK 8 AK Standards Based 561 261 232 56 1110 3
AK H AK Standards Based 496 239 159 17 911 3
AL 3 ARMT 1705 1861 1503 1192 6261 3
AL 4 ARMT 752 2978 1471 1091 6292 3
AL 5 ARMT 351 3485 1497 641 5974 3
AL 6 ARMT 81 4393 1212 288 5974 3
AL 7 ARMT 17 5281 776 150 6224 3
AL 8 ARMT 2 4857 1368 135 6362 3
AL H ARMT 1360 1578 1247 86 4271 3
AR 3 ACTAAP 953 1109 989 863 3914 3
AR 4 ACTAAP 1657 796 798 659 3910 3
AR 5 ACTAAP 2032 911 748 213 3904 3
AR 6 ACTAAP 1687 1091 643 300 3721 3
AR 7 ACTAAP 2489 691 435 130 3745 3
AR 8 ACTAAP 3021 438 386 81 3926 3
AR H ACTAAP 1560 2128 942 140 4770 3
AZ 3 AIMS DPA 3178 2732 3315 1010 10235 3
AZ 4 AIMS DPA 3624 2444 3431 912 10411 3
AZ 5 AIMS DPA 4420 2628 2722 569 10339 3
AZ 6 AIMS DPA 5384 1899 2125 397 9805 3
AZ 7 AIMS DPA 4508 2329 2216 219 9272 3
AZ 8 AIMS DPA 5681 1568 1420 132 8801 3
AZ H AIMS DPA 4586 880 1328 72 6866 3
CA 3 CST 11419 8357 8112 7670 35558 3
CA 4 CST 14233 10216 8669 7290 40408 3
CA 5 CST 20432 9175 7299 4204 41110 3

183
Achievement Levels Attained
State Grade Assessment Name
Level
1
Level
2
Level
3
Level
4
Level
5
Level
6
Total Students
Assessed
Minimum
Proficiency
Level
CA 6 CST 31877 10211 5144 2577 49809 3
CA 7 CST 32401 8772 4498 1570 47241 3
CA 8 CST 31585 7858 4344 1110 44897 3
CA H CAHSEE 26211 8586 4111 989 39897 3
CO 3 CSAP 1646 2060 1599 535 5840 3
CO 4 CSAP 2037 2044 1498 393 5972 3
CO 5 CSAP 2024 2215 1220 385 5844 3
CO 6 CSAP 2757 1780 896 243 5676 3
CO 7 CSAP 3240 1600 469 160 5469 3
CO 8 CSAP 3400 1129 421 149 5099 3
CO H CSAP 3688 859 279 85 4911 3
CT 3 CMT 1585 649 953 844 270 4301 3
CT 4 CMT 1784 772 1103 787 245 4691 3
CT 5 CMT 1733 900 952 900 283 4768 3
CT 6 CMT 1625 976 1072 974 245 4892 3
CT 7 CMT 1786 1053 1016 784 185 4824 3
CT 8 CMT 1871 1058 1064 726 175 4894 3
CT H CAPT 1257 975 1161 483 126 4002 3
DE 3 DSTP 392 241 468 123 10 1234 3
DE 4 DSTP 461 274 433 71 32 1271 3
DE 5 DSTP 556 266 496 28 26 1372 3
DE 6 DSTP 674 187 406 26 15 1308 3
DE 7 DSTP 858 144 301 51 18 1372 3
DE 8 DSTP 860 232 264 44 12 1412 3
DE H DSTP 634 191 123 19 10 977 3
FL 3 FCAT 14294 9660 7675 31629 2
FL 4 FCAT 15687 8701 4735 29123 2
FL 5 FCAT 18525 5857 4217 28599 2
FL 6 FCAT 21359 4046 1795 27200 2
FL 7 FCAT 19611 5308 1997 26916 2
FL 8 FCAT 14919 4664 1832 21415 2
FL H FCAT 14990 3875 2251 21116 2
GA 3 CRCT 8573 4739 2694 16006 2
GA 4 CRCT 9080 5176 1420 15676 2

184
Achievement Levels Attained
State Grade Assessment Name
Level
1
Level
2
Level
3
Level
4
Level
5
Level
6
Total Students
Assessed
Minimum
Proficiency
Level
GA 5 CRCT 7168 6567 1422 15157 2
GA 6 CRCT 9347 4554 396 14297 2
GA 7 CRCT 7343 5252 820 13415 2
GA 8 CRCT 7680 5134 446 13260 2
GA H GA HS Graduation Test 5148 890 1396 7434 2
HI 3 Hawaii State Assessment 613 467 87 58 1225 3
HI 4 Hawaii State Assessment 862 281 100 39 1282 3
HI 5 Hawaii State Assessment 1145 147 65 34 1391 3
HI 6 Hawaii State Assessment 1119 138 60 18 1335 3
HI 7 Hawaii State Assessment 1198 123 61 16 1398 3
HI 8 Hawaii State Assessment 1287 130 43 9 1469 3
HI H Hawaii State Assessment 1337 109 35 8 1489 3
IA 3 ITBS 2254 1580 190 4024 2
IA 4 ITBS 2368 1896 260 4524 2
IA 5 ITBS 2619 1973 221 4813 2
IA 6 ITBS 3088 1564 138 4790 2
IA 7 ITBS 3299 1420 108 4827 2
IA 8 ITBS 3534 1380 93 5007 2
IA H ITBS 3093 1308 63 4464 2
ID 3 ISAT 307 473 642 459 1881 3
ID 4 ISAT 425 529 745 240 1939 3
ID 5 ISAT 525 684 542 143 1894 3
ID 6 ISAT 619 588 439 134 1780 3
ID 7 ISAT 757 475 340 76 1648 3
ID 8 ISAT 650 547 380 60 1637 3
ID H ISAT 674 406 316 75 1471 3
IL 3 ISAT 2025 4371 8855 4629 19880 3
IL 4 ISAT 753 6711 10722 244 18430 3
IL 5 ISAT 543 8808 10135 1067 20553 3
IL 6 ISAT 629 9156 9643 971 20399 3
IL 7 ISAT 1830 9515 8228 1116 20689 3
IL 8 ISAT 1604 10396 8167 961 21128 3
IL H PSAE 6167 6452 1747 191 14557 3
IN 3 ISTEP+ 6025 5728 855 12608 2

185
Achievement Levels Attained
State Grade Assessment Name
Level
1
Level
2
Level
3
Level
4
Level
5
Level
6
Total Students
Assessed
Minimum
Proficiency
Level
IN 4 ISTEP+ 5576 6328 1297 13201 2
IN 5 ISTEP+ 5538 6084 1135 12757 2
IN 6 ISTEP+ 5756 5250 950 11956 2
IN 7 ISTEP+ 6167 4610 508 11285 2
IN 8 ISTEP+ 6851 3764 426 11041 2
IN H ISTEP+ 7107 2592 173 9872 2
KS 3 Regular Assessment 532 461 1120 922 681 3716 3
KS 4 Regular Assessment 544 519 1445 902 717 4127 3
KS 5 Regular Assessment 555 509 1412 913 748 4137 3
KS 6 Regular Assessment 851 646 1134 818 556 4005 3
KS 7 Regular Assessment 842 888 1159 617 353 3859 3
KS 8 Regular Assessment 1086 778 878 542 209 3493 3
KS H Regular Assessment 513 250 341 81 13 1198 3
KY 3 CATS 1501 1730 2036 1270 6537 3
KY 4 CATS 1562 1708 2000 1166 6436 3
KY 5 CATS 2022 1726 1600 743 6091 3
KY 6 CATS 2135 1605 1328 618 5686 3
KY 7 CATS 2136 1645 1265 456 5502 3
KY 8 CATS 2687 1494 999 237 5417 3
KY H CATS 2697 766 309 44 3816 3
LA 3 iLEAP 2355 1469 1965 485 186 6460 3
LA 4 LEAP 2499 1771 2464 604 109 7447 3
LA 5 iLEAP 1488 811 1388 229 98 4014 3
LA 6 iLEAP 2695 1255 1521 150 62 5683 3
LA 7 iLEAP 2454 1322 1090 81 23 4970 3
LA 8 LEAP 2084 1233 1044 27 14 4402 3
LA H GEE 1336 462 521 73 28 2420 3
MA 3 MCAS 3889 3693 2662 809 11053 3
MA 4 MCAS 3854 5770 1808 543 11975 3
MA 5 MCAS 5323 4480 1839 514 12156 3
MA 6 MCAS 5824 3949 1897 494 12164 3
MA 7 MCAS 7364 3545 1356 252 12517 3
MA 8 MCAS 7157 3327 1271 238 11993 3
MA H MCAS 2812 3944 2689 1028 10473 3

186
Achievement Levels Attained
State Grade Assessment Name
Level
1
Level
2
Level
3
Level
4
Level
5
Level
6
Total Students
Assessed
Minimum
Proficiency
Level
MD 3 MSA 2447 1745 330 4522 2
MD 4 MSA 2685 3194 659 6538 2
MD 5 MSA 2457 3587 1137 7181 2
MD 6 MSA 3616 3183 430 7229 2
MD 7 MSA 4084 2385 500 6969 2
MD 8 MSA 4968 1984 292 7244 2
MD H MSA+H.S.A. 5331 1274 394 6999 2
ME 3 MEA 471 815 782 140 2208 3
ME 4 MEA 721 845 745 61 2372 3
ME 5 MEA 842 805 689 54 2390 3
ME 6 MEA 1123 714 400 46 2283 3
ME 7 MEA 1278 610 376 57 2321 3
ME 8 MEA 1413 501 324 27 2265 3
ME H SAT 1336 412 148 2 1898 3
MI 3 MEAP 3589 6333 2870 56 12848 2
MI 4 MEAP 2788 6253 3674 1165 13880 2
MI 5 MEAP 2135 4228 5879 2103 14345 2
MI 6 MEAP 1763 2931 4960 3893 13547 2
MI 7 MEAP 1379 3014 7310 2192 13895 2
MI 8 MEAP 1437 2967 4861 4693 13958 2
MI H MME 98 790 863 8792 10543 2
MN 3 MCA 1527 1992 3009 1205 7733 2
MN 4 MCA 2510 2137 2294 1022 7963 2
MN 5 MCA 3592 1783 1875 667 7917 2
MN 6 MCA 3549 1843 1544 391 7327 2
MN 7 MCA 4016 1791 1220 328 7355 2
MN 8 MCA 4788 1331 1005 297 7421 2
MN H MCA 5561 398 207 83 6249 2
MO 3 MAP 1663 5524 2111 451 9749 3
MO 4 MAP 2206 5202 1942 368 9718 3
MO 5 MAP 2283 5077 1479 351 9190 3
MO 6 MAP 2818 4275 1411 273 8777 3
MO 7 MAP 3892 3291 1220 198 8601 3
MO 8 MAP 4448 2939 785 188 8360 3

187
Achievement Levels Attained
State Grade Assessment Name
Level
1
Level
2
Level
3
Level
4
Level
5
Level
6
Total Students
Assessed
Minimum
Proficiency
Level
MO H MAP 5293 2140 727 81 8241 3
MS 3 MCT2 1183 1177 1257 201 3818 3
MS 4 MCT2 1522 944 930 112 3508 3
MS 5 MCT2 1696 1010 648 83 3437 3
MS 6 MCT2 2283 818 472 39 3612 3
MS 7 MCT2 2455 746 428 35 3664 3
MS 8 MCT2 2538 667 353 15 3573 3
MS H End-of-course 835 470 316 68 1689 3
MT 3 CRT 530 254 295 132 1211 3
MT 4 CRT 538 299 313 122 1272 3
MT 5 CRT 523 314 289 79 1205 3
MT 6 CRT 661 276 199 51 1187 3
MT 7 CRT 588 332 211 50 1181 3
MT 8 CRT 687 395 160 37 1279 3
MT H CRT 497 516 100 16 1129 3
NC 3 EOG 2011 3977 5664 1829 13481 3
NC 4 EOG 2163 3964 5005 1513 12645 3
NC 5 EOG 2076 4317 4536 1122 12051 3
NC 6 EOG 2017 1369 3513 927 7826 3
NC 7 EOG 2890 3862 3490 835 11077 3
NC 8 EOG 2892 3672 3389 846 10799 3
NC H End-of-course 0 4679 3201 7880 3
ND 3 NDSA 94 190 555 62 901 3
ND 4 NDSA 118 240 450 73 881 3
ND 5 NDSA 140 203 382 77 802 3
ND 6 NDSA 129 235 369 64 797 3
ND 7 NDSA 142 272 244 74 732 3
ND 8 NDSA 240 296 180 41 757 3
ND H NDSA 315 223 83 4 625 3
NE 3 STARS 111 460 1787 1186 3544 3
NE 4 STARS 96 409 1757 1295 3557 3
NE 5 STARS 205 556 1635 838 3234 3
NE 6 STARS 209 552 1537 671 2969 3
NE 7 STARS 167 558 1554 467 2746 3

188
Achievement Levels Attained
State Grade Assessment Name
Level
1
Level
2
Level
3
Level
4
Level
5
Level
6
Total Students
Assessed
Minimum
Proficiency
Level
NE 8 STARS 149 501 1557 405 2612 3
NE H STARS 134 587 1151 240 2112 3
NH 3 NECAP 614 460 668 125 1867 3
NH 4 NECAP 767 645 634 96 2142 3
NH 5 NECAP 1061 532 691 115 2399 3
NH 6 NECAP 1189 606 602 77 2474 3
NH 7 NECAP 1328 655 519 75 2577 3
NH 8 NECAP 1471 641 373 41 2526 3
NH H NECAP 1929 284 86 4 2303 3
NJ 3 NJASK 4040 7885 2778 14703 2
NJ 4 NJASK 5435 7016 3298 15749 2
NJ 5 NJASK 8172 6241 1451 15864 2
NJ 6 NJASK 10146 5156 689 15991 2
NJ 7 NJASK 12265 3689 536 16490 2
NJ 8 GEPA 12226 3761 745 16732 2
NJ H HSPA 9838 4187 396 14421 2
NM 3 SBA 599 1689 577 56 2921 3
NM 4 SBA 666 1755 430 43 2894 3
NM 5 SBA 969 1523 336 39 2867 3
NM 6 SBA 1191 1440 150 15 2796 3
NM 7 SBA 1523 1188 143 11 2865 3
NM 8 SBA 1393 1331 179 15 2918 3
NM H SBA 1641 625 106 17 2389 3
NV 3 CRT 905 1445 765 384 3499 3
NV 4 CRT 1089 1216 928 399 3632 3
NV 5 CRT 842 1788 800 120 3550 3
NV 6 CRT 1512 1176 597 136 3421 3
NV 7 CRT 1675 1177 492 99 3443 3
NV 8 CRT 1750 1093 399 28 3270 3
NV H HS Prof. Exam 1317 1096 252 35 2700 3
NY 3 NYSTP 3138 6678 17816 2189 29821 3
NY 4 NYSTP 6288 8431 15004 2241 31964 3
NY 5 NYSTP 5127 9925 15289 1943 32284 3
NY 6 NYSTP 7616 10968 12648 1375 32607 3

189
Achievement Levels Attained
State Grade Assessment Name
Level
1
Level
2
Level
3
Level
4
Level
5
Level
6
Total Students
Assessed
Minimum
Proficiency
Level
NY 7 NYSTP 5502 12891 12715 1392 32500 3
NY 8 NYSTP 6264 12717 9613 530 29124 3
NY H NYSTP 2973 6492 9406 1453 20324 3
OH 3 Ohio Achievement Test 4106 3760 5677 2120 1063 16726 3
OH 4 Ohio Achievement Test 5914 4294 5552 1439 676 17875 3
OH 5 Ohio Achievement Test 9061 3615 3165 799 921 17561 3
OH 6 Ohio Achievement Test 6072 4725 4537 1617 1018 17969 3
OH 7 Ohio Achievement Test 5139 7850 4445 596 267 18297 3
OH 8 Ohio Achievement Test 5490 7272 4584 900 180 18426 3
OH H Ohio Graduation Test 8041 3919 4244 1553 955 18712 3
OK 3 OCCT 235 1391 2297 369 4292 3
OK 4 OCCT 285 1220 2320 438 4263 3
OK 5 OCCT 305 1044 2282 438 4069 3
OK 6 OCCT 809 1021 1546 418 3794 3
OK 7 OCCT 882 966 1482 272 3602 3
OK 8 OCCT 560 121 1568 229 2478 3
OK H OCCT 875 882 944 263 2964 3
OR 3 Regular Assessment 2272 2179 761 5212 2
OR 4 Regular Assessment 2561 2497 618 5676 2
OR 5 Regular Assessment 2937 2209 605 5751 2
OR 6 Regular Assessment 3526 1530 489 5545 2
OR 7 Regular Assessment 3286 1574 340 5200 2
OR 8 Regular Assessment 3505 1138 260 4903 2
OR H Regular Assessment 3609 495 78 4182 2
PA 3 PSSA 4030 4816 6744 3872 19462 3
PA 4 PSSA 7199 2806 5828 4751 20584 3
PA 5 PSSA 7310 5476 4532 3429 20747 3
PA 6 PSSA 9649 4178 4103 2914 20844 3
PA 7 PSSA 10544 4453 3985 2336 21318 3
PA 8 PSSA 11683 4159 3946 2011 21799 3
PA H PSSA 13394 2493 1964 556 18407 3
RI 3 NECAP 711 360 507 123 1701 3
RI 4 NECAP 911 498 414 72 1895 3
RI 5 NECAP 1117 384 455 82 2038 3

190
Achievement Levels Attained
State Grade Assessment Name
Level
1
Level
2
Level
3
Level
4
Level
5
Level
6
Total Students
Assessed
Minimum
Proficiency
Level
RI 6 NECAP 1274 423 317 46 2060 3
RI 7 NECAP 1391 470 293 40 2194 3
RI 8 NECAP 1428 464 270 31 2193 3
RI H NECAP 1561 181 52 1 1795 3
SC 3 PACT 3410 2501 923 657 7491 2
SC 4 PACT 3250 2441 887 708 7286 2
SC 5 PACT 3161 2569 696 315 6741 2
SC 6 PACT 3806 1874 534 246 6460 2
SC 7 PACT 3348 2749 443 256 6796 2
SC 8 PACT 3988 2382 203 41 6614 2
SC H HSAP 2958 1812 1016 261 6047 2
SD 3 Dstep 7 504 671 143 1325 3
SD 4 Dstep 0 545 549 64 1158 3
SD 5 Dstep 11 511 433 50 1005 3
SD 6 Dstep 20 553 341 22 936 3
SD 7 Dstep 39 577 253 22 891 3
SD 8 Dstep 3 570 252 12 837 3
SD H Dstep 11 537 71 3 622 3
TN 3 TCAP Achievement 2870 3955 1457 8282 2
TN 4 TCAP Achievement 2860 4384 1013 8257 2
TN 5 TCAP Achievement 2094 4638 1157 7889 2
TN 6 TCAP Achievement 2548 4356 636 7540 2
TN 7 TCAP Achievement 3034 4002 687 7723 2
TN 8 TCAP Achievement 3179 3928 463 7570 2
TN H Gateway 417 461 328 1206 2
TX 3 TAKS 8578 10423 3630 22631 2
TX 4 TAKS 10314 10423 3095 23832 2
TX 5 TAKS 9106 11535 3361 24002 2
TX 6 TAKS 15146 7226 2277 24649 2
TX 7 TAKS 17051 7286 668 25005 2
TX 8 TAKS 14967 8577 745 24289 2
TX H TAKS 15758 2875 261 18894 2
UT 3 Criterion-Referenced 1554 1360 1207 1769 5890 3
UT 4 Criterion-Referenced 1654 1373 860 1794 5681 3

191
Achievement Levels Attained
State Grade Assessment Name
Level
1
Level
2
Level
3
Level
4
Level
5
Level
6
Total Students
Assessed
Minimum
Proficiency
Level
UT 5 Criterion-Referenced 1494 1529 868 1308 5199 3
UT 6 Criterion-Referenced 1349 1592 704 1058 4703 3
UT 7 Criterion-Referenced 1202 744 717 1209 3872 3
UT 8 Criterion-Referenced 1259 624 698 563 3144 3
UT H Criterion-Referenced 1661 766 678 180 3285 3
VA 3 SOL 433 2425 0 4531 2790 10179 4
VA 4 SOL 319 3251 0 4435 2029 10034 4
VA 5 SOL 649 2313 0 4056 2376 9394 4
VA 6 SOL 2468 3166 0 2426 722 8782 4
VA 7 SOL 2277 3129 0 2029 510 7945 4
VA 8 SOL 1630 3691 168 3252 1617 10358 4
VA H SOL 0 0 5500 13489 1411 20400 4
VT 3 NECAP 275 156 147 19 597 3
VT 4 NECAP 363 180 119 14 676 3
VT 5 NECAP 509 158 152 17 836 3
VT 6 NECAP 505 174 130 17 826 3
VT 7 NECAP 606 197 111 13 927 3
VT 8 NECAP 599 201 115 9 924 3
VT H NECAP 731 60 19 1 811 3
WA 3 WASL 4003 2042 2640 932 9617 3
WA 4 WASL 5711 1874 1076 888 9549 3
WA 5 WASL 5122 2212 1212 665 9211 3
WA 6 WASL 5989 1504 684 177 8354 3
WA 7 WASL 6347 865 483 207 7902 3
WA 8 WASL 5801 1153 473 160 7587 3
WA H WASL 5106 660 328 99 6193 3
WI 3 WKCE-CRT 2561 1023 2726 1231 7541 3
WI 4 WKCE-CRT 2793 1044 2721 1186 7744 3
WI 5 WKCE-CRT 3132 1093 2239 1183 7647 3
WI 6 WKCE-CRT 3361 1394 2225 777 7757 3
WI 7 WKCE-CRT 3057 1734 2427 481 7699 3
WI 8 WKCE-CRT 3361 2065 2490 356 8272 3
WI H WKCE-CRT 4696 1692 1774 216 8378 3
WV 3 WESTEST 479 1049 1285 440 110 3363 3

192
Achievement Levels Attained
State Grade Assessment Name
Level
1
Level
2
Level
3
Level
4
Level
5
Level
6
Total Students
Assessed
Minimum
Proficiency
Level
WV 4 WESTEST 462 1159 1009 362 133 3125 3
WV 5 WESTEST 358 1050 997 246 62 2713 3
WV 6 WESTEST 723 979 839 138 25 2704 3
WV 7 WESTEST 748 1082 855 87 18 2790 3
WV 8 WESTEST 736 1341 664 85 11 2837 3
WV H WESTEST 1157 916 416 22 6 2517 3
WY 3 PAWS 118 214 530 105 967 3
WY 4 PAWS 251 219 447 82 999 3
WY 5 PAWS 244 276 284 63 867 3
WY 6 PAWS 276 223 332 49 880 3
WY 7 PAWS 288 203 234 37 762 3
WY 8 PAWS 402 182 207 22 813 3
WY H PAWS 191 255 79 4 529 3
AS 3 SBA 43 7 8 58 3
AS 4 SBA 67 13 2 82 3
AS 5 SBA 75 13 5 93 3
AS 6
AS 7 SBA 90 24 0 114 3
AS 8 SBA 59 53 8 120 3
AS H SBA 72 8 2 82 3
BIE 3 N/A* 375 86 9 470 1
BIE 4 N/A* 437 64 13 514 1
BIE 5 N/A* 447 68 5 520 1
BIE 6 N/A* 425 56 3 484 1
BIE 7 N/A* 461 58 4 523 1
BIE 8 N/A* 511 40 5 556 1
BIE H N/A* 395 30 0 425 1
CNMI 3 SAT 10 36 10 6 2 54 3
CNMI 4 Standards Based Assess.
CNMI 5 SAT 10 42 10 6 1 59 3
CNMI 6 SAT 10 27 10 5 6 48 3
CNMI 7 49 3 1 0 53 3
CNMI 8 Standards Based Assess. 19 43 4 7 73 3
CNMI H Standards Based Assess. 13 7 3 0 23 3

193
Achievement Levels Attained
State Grade Assessment Name
Level
1
Level
2
Level
3
Level
4
Level
5
Level
6
Total Students
Assessed
Minimum
Proficiency
Level
DC 3 DCCAS 335 289 96 20 740 3
DC 4 DCCAS 356 329 144 20 849 3
DC 5 DCCAS 469 341 127 13 950 3
DC 6 DCCAS 567 397 98 8 1070 3
DC 7 DCCAS 578 359 123 4 1064 3
DC 8 DCCAS 616 445 157 7 1225 3
DC H DCCAS 290 204 53 9 556 3
FSM 3
FSM 4
FSM 5
FSM 6 FSM NST 0 1 0 82 83 3
FSM 7
FSM 8 FSM NST 0 3 0 44 47 3
FSM H FSM NST 0 1 0 16 17 3
GU 3 SAT 10 78 12 2 0 92 3
GU 4 SAT 10 92 11 2 0 105 3
GU 5 SAT 10 104 4 1 1 110 3
GU 6 SAT 10 115 3 0 0 118 3
GU 7 SAT 10 147 2 0 0 149 3
GU 8 SAT 10 163 1 1 0 165 3
GU H SAT 10 169 4 0 0 173 3
Palau 3
Palau 4 *PAT 0 11 2 0 13 3
Palau 5
Palau 6 *PAT 0 5 1 1 7 3
Palau 7
Palau 8 *PAT 0 7 1 1 12 3
Palau H *PAT
PR 3 PPAA
PR 4 PPAA
PR 5 PPAA
PR 6 PPAA
PR 7 PPAA
PR 8 PPAA

194
Achievement Levels Attained
State Grade Assessment Name
Level
1
Level
2
Level
3
Level
4
Level
5
Level
6
Total Students
Assessed
Minimum
Proficiency
Level
PR H PPAA 0
RMI 3
RMI 4
RMI 5
RMI 6
RMI 7
RMI 8 5 6 1 0 12 3
RMI H
VI 3 VITAL 20 35 11 1 67 3
VI 4 VITAL 26 69 12 4 111 3
VI 5 VITAL 21 43 13 4 81 3
VI 6 VITAL 20 56 10 1 87 3
VI 7 VITAL 7 97 24 1 129 3
VI 8 VITAL 24 81 17 0 122 3
VI H VITAL 4 47 2 0 53 3
* Students in BIE schools are administered the large-scale assessment that is given for NCLB purposes by the state in which the BIE
school is located. For example, students at BIE schools in Wisconsin are administered the WKCE or the WAA

195
Table E3.
Alternate Assessment on Grade Level Achievement Standards Reading Performance
Achievement Levels Attained
State Grade Assessment Name
Level
1
Level
2
Level
3
Level
4
Level
5
Level
6
Total Students
Assessed
Minimum
Proficiency
Level
MA 3 MCAS 15 0 0 0 15 3
MA 4 MCAS 19 0 0 0 19 3
MA 5 MCAS 20 0 0 0 20 3
MA 6 MCAS 12 0 0 0 12 3
MA 7 MCAS 10 0 0 0 10 3
MA 8 MCAS 11 0 0 0 11 3
MA H MCAS 7 0 0 0 7 3
NC 3 NCCLAS 13 13 14 0 40 3
NC 4 NCCLAS 10 18 18 0 46 3
NC 5 NCCLAS 8 14 22 1 45 3
NC 6 NCCLAS 11 17 11 2 41 3
NC 7 NCCLAS 11 26 26 0 63 3
NC 8 NCCLAS 6 14 23 0 43 3
NC H NCCLAS 0 17 30 0 47 3
VA 3 VGLA 56 168 0 578 848 1650 4
VA 4 VGLA 44 163 0 498 1231 1936 4
VA 5 VGLA 48 146 0 749 1039 1982 4
VA 6 VGLA 66 233 0 630 1166 2095 4
VA 7 VGLA 127 321 0 1025 832 2305 4
VA 8 VGLA 82 315 0 865 1154 2416 4
VA H

196
Table E4.
Alternate Assessment on Grade Level Achievement Standards Mathematics Performance
Achievement Levels Attained
State Grade Assessment Name
Level
1
Level
2
Level
3
Level
4
Level
5
Level
6
Total Students
Assessed
Minimum
Proficiency
Level
MA 3 MCAS 20 0 0 0 20 3
MA 4 MCAS 13 0 0 0 13 3
MA 5 MCAS 28 0 0 0 28 3
MA 6 MCAS 30 0 0 0 30 3
MA 7 MCAS 15 0 0 0 15 3
MA 8 MCAS 28 0 0 0 28 3
MA H MCAS 13 0 0 0 13 3
NC 3 NCCLAS 11 5 17 1 34 3
NC 4 NCCLAS 6 9 29 2 46 3
NC 5 NCCLAS 6 3 26 1 36 3
NC 6 NCCLAS 10 5 22 0 37 3
NC 7 NCCLAS 10 11 39 1 61 3
NC 8 NCCLAS 5 4 38 0 47 3
NC H NCCLAS 0 5 18 0 23 3
VA 3 VGLA 74 113 0 486 339 1012 4
VA 4 VGLA 48 95 0 670 583 1396 4
VA 5 VGLA 44 159 0 555 1021 1779 4
VA 6 VGLA 81 243 0 891 924 2139 4
VA 7 VGLA 94 250 0 949 1440 2733 4
VA 8 VGLA 89 274 0 1303 1225 2891 4
VA H

197
Table E5.
Alternate Assessment on Modified Achievement Standards Reading Performance
Achievement Levels Attained
State Grade Assessment Name
Level
1
Level
2
Level
3
Level
4
Level
5
Level
6
Total Students
Assessed
Minimum
Proficiency
Level
CA 3 CMA 5346 2692 1830 1162 11030 3
CA 4 CMA 6737 3222 2405 1533 13897 3
CA 5 CMA 6157 3447 2319 1367 13290 3
CA 6
CA 7
CA 8
CA H
KS 3 KAMM 28 151 498 202 136 1015 3
KS 4 KAMM 49 141 649 136 192 1167 3
KS 5 KAMM 38 119 592 176 170 1095 3
KS 6 KAMM 60 101 604 226 223 1214 3
KS 7 KAMM 50 61 545 227 184 1067 3
KS 8 KAMM 47 116 585 240 124 1112 3
KS H KAMM 22 47 357 101 150 677 3
LA 3
LA 4 LAA 2 600 155 87 26 868 3
LA 5 LAA 2 472 112 88 34 706 3
LA 6 LAA 2 538 144 79 51 812 3
LA 7 LAA 2 450 170 128 64 812 3
LA 8 LAA 2 756 300 159 62 1277 3
LA H LAA 2 297 75 26 13 411 3
MD 3
MD 4
MD 5
MD 6
MD 7
MD 8
MD H MOD HAS 290 71 1 362 2
NC 3 NCEXTEND 2 1149 1209 346 85 2789 3
NC 4 NCEXTEND 2 1216 1413 468 84 3181 3
NC 5 NCEXTEND 2 1091 1537 589 166 3383 3

198
Achievement Levels Attained
State Grade Assessment Name
Level
1
Level
2
Level
3
Level
4
Level
5
Level
6
Total Students
Assessed
Minimum
Proficiency
Level
NC 6 NCEXTEND 2 777 1600 673 145 3195 3
NC 7 NCEXTEND 2 672 1630 605 115 3022 3
NC 8 NCEXTEND 2 701 1473 612 43 2829 3
NC H NCEXTEND 2 0 1652 332 0 1984 3
ND 3 NDAA 2 3 28 90 30 151 3
ND 4 NDAA 2 8 13 130 15 166 3
ND 5 NDAA 2 8 24 135 15 182 3
ND 6 NDAA 2 6 37 112 19 174 3
ND 7 NDAA 2 7 35 127 35 204 3
ND 8 NDAA 2 2 30 97 39 168 3
ND H NDAA 2 1 41 113 21 176 3
OK 3 OMAAP 536 839 883 734 2992 3
OK 4 OMAAP 363 695 972 1133 3163 3
OK 5 OMAAP 263 1091 1049 511 2914 3
OK 6 OMAAP 319 1,228 641 824 3012 3
OK 7 OMAAP 376 132 1020 551 2079 3
OK 8 OMAAP 443 556 1,567 371 2937 3
OK H OMAAP 321 556 900 762 2539 3
TX 3 TAKS MODIFIED 3361 5657 1177 10195 2
TX 4 TAKS MODIFIED 4776 6460 1038 12274 2
TX 5 TAKS MODIFIED 5159 6647 1394 13200 2
TX 6 TAKS MODIFIED 4856 6779 749 12384 2
TX 7 TAKS MODIFIED 4386 6876 943 12205 2
TX 8 TAKS MODIFIED 4454 6259 1019 11732 2
TX H TAKS MODIFIED 3779 5207 1197 10183 2
BIE 3 N/A* 4 5 1 10 2
BIE 4 N/A* 8 7 2 17 2
BIE 5 N/A* 10 6 0 16 2
BIE 6 N/A* 6 3 0 9 2
BIE 7 N/A* 13 8 1 22 2
BIE 8 N/A* 15 7 4 26 2
BIE H N/A* 15 5 4 24 2
* Students in BIE schools are administered the large-scale assessment that is given for NCLB purposes by the state in which the BIE
school is located. For example, students at BIE schools in Wisconsin are administered the WKCE or the WAA

199
Table E6.
Alternate Assessment on Modified Achievement Standards Math Performance
Achievement Levels Attained
State Grade Assessment Name
Level
1
Level
2
Level
3
Level
4
Level
5
Level
6
Total Students
Assessed
Minimum
Proficiency
Level
CA 3 CMA 3840 2124 2103 707 8774 3
CA 4 CMA 5063 2863 2739 951 11616 3
CA 5 CMA 5287 2984 2680 1039 11990 3
CA 6
CA 7
CA 8
CA H
KS 3 KAMM 14 144 347 217 84 806 3
KS 4 KAMM 17 161 521 183 35 917 3
KS 5 KAMM 14 212 471 169 55 921 3
KS 6 KAMM 46 255 553 188 43 1085 3
KS 7 KAMM 47 331 426 144 49 997 3
KS 8 KAMM 70 274 547 135 73 1099 3
KS H KAMM 19 159 263 44 19 504 3
LA 3
LA 4 LAA 2 530 191 94 51 866 3
LA 5 LAA 2 444 147 75 40 706 3
LA 6 LAA 2 540 150 58 59 807 3
LA 7 LAA 2 502 151 98 58 809 3
LA 8 LAA 2 827 327 91 30 1275 3
LA H LAA 2 337 58 6 3 404 3
MD 3
MD 4
MD 5
MD 6
MD 7
MD 8
MD H MOD HAS 260 56 316 2
NC 3 NCEXTEND 2 821 886 656 33 2396 3
NC 4 NCEXTEND 2 795 1155 767 26 2743 3
NC 5 NCEXTEND 2 648 1324 1004 97 3073 3

200
Achievement Levels Attained
State Grade Assessment Name
Level
1
Level
2
Level
3
Level
4
Level
5
Level
6
Total Students
Assessed
Minimum
Proficiency
Level
NC 6 NCEXTEND 2 480 1138 1314 61 2993 3
NC 7 NCEXTEND 2 491 1108 1183 67 2849 3
NC 8 NCEXTEND 2 519 1043 1071 156 2789 3
NC H NCEXTEND 2 0 717 699 0 1416 3
ND 3 NDAA 2 3 11 52 33 99 3
ND 4 NDAA 2 5 11 73 29 118 3
ND 5 NDAA 2 1 14 87 22 124 3
ND 6 NDAA 2 0 12 101 21 134 3
ND 7 NDAA 2 0 16 98 54 168 3
ND 8 NDAA 2 5 26 116 30 177 3
ND H NDAA 2 3 58 68 36 165 3
OK 3 OMAAP 272 477 875 903 2527 3
OK 4 OMAAP 249 647 1396 478 2770 3
OK 5 OMAAP 369 461 1481 479 2790 3
OK 6 OMAAP 250 587 1664 187 2688 3
OK 7 OMAAP 455 710 1374 168 2707 3
OK 8 OMAAP 339 1065 1370 261 3035 3
OK H OMAAP 222 633 1699 571 3125 3
TX 3 TAKS MODIFIED 3296 5152 1201 9649 2
TX 4 TAKS MODIFIED 4218 5828 940 10986 2
TX 5 TAKS MODIFIED 5735 5794 1459 12988 2
TX 6 TAKS MODIFIED 5328 5845 559 11732 2
TX 7 TAKS MODIFIED 6054 5696 669 12419 2
TX 8 TAKS MODIFIED 7178 5453 551 13182 2
TX H TAKS MODIFIED 7270 4126 112 11508 2
BIE 3 N/A* 4 3 1 8 2
BIE 4 N/A* 7 4 1 12 2
BIE 5 N/A* 5 2 2 9 2
BIE 6 N/A* 4 4 0 8 2
BIE 7 N/A* 8 6 2 16 2
BIE 8 N/A* 14 8 2 24 2
BIE H N/A* 15 5 4 24 2
* Students in BIE schools are administered the large-scale assessment that is given for NCLB purposes by the state in which the BIE
school is located. For example, students at BIE schools in Wisconsin are administered the WKCE or the WAA

201
Table E7.
Alternate Assessment on Alternate Achievement Standards Reading Performance
Achievement Levels Attained
State Grade Assessment Name
Level
1
Level
2
Level
3
Level
4
Level
5
Level
6
Total Students
Assessed
Minimum
Proficiency
Level
AK 3 AK Alternate Assessment 19 10 18 7 54 3
AK 4 AK Alternate Assessment 19 10 20 18 67 3
AK 5 AK Alternate Assessment 22 12 28 3 65 3
AK 6 AK Alternate Assessment 15 22 20 2 59 3
AK 7 AK Alternate Assessment 29 17 26 72 3
AK 8 AK Alternate Assessment 30 12 22 1 65 3
AK H AK Alternate Assessment 35 21 21 12 89 3
AL 3 AAA 29 200 180 30 439 3
AL 4 AAA 60 137 211 34 442 3
AL 5 AAA 59 199 201 44 503 3
AL 6 AAA 35 158 261 36 490 3
AL 7 AAA 70 150 221 53 494 3
AL 8 AAA 69 118 268 46 501 3
AL H AAA 55 104 214 75 448 3
AR 3 Portfolio 55 29 67 195 62 408 4
AR 4 Portfolio 65 40 89 153 127 474 4
AR 5 Portfolio 68 42 104 138 105 457 4
AR 6 Portfolio 42 28 89 83 205 447 4
AR 7 Portfolio 27 50 109 62 193 441 4
AR 8 Portfolio 27 95 127 47 151 447 4
AR H Portfolio 22 39 47 33 412 553 4
AZ 3 AIMS-A 143 347 253 3 746 3
AZ 4 AIMS-A 106 276 346 3 731 3
AZ 5 AIMS-A 116 234 326 3 679 3
AZ 6 AIMS-A 123 312 263 4 702 3
AZ 7 AIMS-A 86 319 313 3 721 3
AZ 8 AIMS-A 97 300 390 7 794 3
AZ H AIMS-A 88 194 394 40 716 3
CA 3 CAPA 296 622 1510 2075 4503 3
CA 4 CAPA 386 657 1670 1780 4493 3
CA 5 CAPA 364 569 1477 1906 4316 3

202
Achievement Levels Attained
State Grade Assessment Name
Level
1
Level
2
Level
3
Level
4
Level
5
Level
6
Total Students
Assessed
Minimum
Proficiency
Level
CA 6 CAPA 620 860 1768 1331 4579 3
CA 7 CAPA 574 801 1614 1588 4577 3
CA 8 CAPA 593 770 1643 1705 4711 3
CA H CAPA 200 244 446 551 1441 3
CO 3 CSAPA 85 130 243 155 29 642 3
CO 4 CSAPA 84 123 224 136 63 630 3
CO 5 CSAPA 71 118 133 171 75 568 3
CO 6 CSAPA 63 114 152 181 41 551 3
CO 7 CSAPA 72 130 136 154 34 526 3
CO 8 CSAPA 85 132 115 131 43 506 3
CO H CSAPA 79 129 160 144 54 566 3
CT 3 Skills Checklist 0 361 90 33 484 3
CT 4 Skills Checklist 0 390 77 24 491 3
CT 5 Skills Checklist 0 335 83 26 444 3
CT 6 Skills Checklist 0 352 65 35 452 3
CT 7 Skills Checklist 0 341 70 28 439 3
CT 8 Skills Checklist 0 335 60 25 420 3
CT H Skills Checklist 0 363 44 35 442 3
DE 3 DAPA 8 4 9 13 44 78 3
DE 4 DAPA 6 4 10 22 52 94 3
DE 5 DAPA 4 4 10 29 44 91 3
DE 6 DAPA 5 1 11 17 55 89 3
DE 7 DAPA 3 3 14 16 75 111 3
DE 8 DAPA 9 9 15 15 69 117 3
DE H DAPA 6 5 24 42 59 136 3
FL 3 FL Alternate Assessment 688 781 722 2191 2
FL 4 FL Alternate Assessment 733 815 681 2229 2
FL 5 FL Alternate Assessment 748 890 690 2328 2
FL 6 FL Alternate Assessment 736 754 739 2229 2
FL 7 FL Alternate Assessment 755 857 823 2435 2
FL 8 FL Alternate Assessment 835 809 803 2447 2
FL H FL Alternate Assessment 940 1069 926 2935 2
GA 3 GA Alternate Assessment 170 380 384 934 2
GA 4 GA Alternate Assessment 188 338 410 936 2

203
Achievement Levels Attained
State Grade Assessment Name
Level
1
Level
2
Level
3
Level
4
Level
5
Level
6
Total Students
Assessed
Minimum
Proficiency
Level
GA 5 GA Alternate Assessment 214 418 503 1135 2
GA 6 GA Alternate Assessment 225 431 481 1137 2
GA 7 GA Alternate Assessment 217 436 571 1224 2
GA 8 GA Alternate Assessment 261 560 608 1429 2
GA H GA Alternate Assessment 240 427 505 1172 2
HI 3 HSAA 13 22 32 1 68 3
HI 4 HSAA 6 15 28 7 56 3
HI 5 HSAA 13 11 27 15 66 3
HI 6 HSAA 13 7 33 19 72 3
HI 7 HSAA 14 7 27 13 61 3
HI 8 HSAA 10 3 23 27 63 3
HI H HSAA 16 4 22 7 49 3
IA 3 IA Alternate Assessment 44 70 104 218 2
IA 4 IA Alternate Assessment 60 39 120 219 2
IA 5 IA Alternate Assessment 62 29 129 220 2
IA 6 IA Alternate Assessment 49 80 58 187 2
IA 7 IA Alternate Assessment 78 87 56 221 2
IA 8 IA Alternate Assessment 81 87 42 210 2
IA H IA Alternate Assessment 88 68 44 200 2
ID 3 Alt Assessment 5 25 57 106 193 3
ID 4 Alt Assessment 4 29 66 74 173 3
ID 5 Alt Assessment 7 14 43 78 142 3
ID 6 Alt Assessment 3 31 65 81 180 3
ID 7 Alt Assessment 5 21 74 73 173 3
ID 8 Alt Assessment 5 17 56 99 177 3
ID H Alt Assessment 4 14 43 91 152 3
IL 3 IAA 344 400 530 455 1729 3
IL 4 IAA 354 343 641 376 1714 3
IL 5 IAA 390 302 411 571 1674 3
IL 6 IAA 276 371 596 568 1811 3
IL 7 IAA 286 435 623 504 1848 3
IL 8 IAA 339 238 769 543 1889 3
IL H IAA 197 268 439 762 1666 3
IN 3 ISTAR 68 416 484 2

204
Achievement Levels Attained
State Grade Assessment Name
Level
1
Level
2
Level
3
Level
4
Level
5
Level
6
Total Students
Assessed
Minimum
Proficiency
Level
IN 4 ISTAR 83 516 599 2
IN 5 ISTAR 89 559 648 2
IN 6 ISTAR 180 505 685 2
IN 7 ISTAR 176 592 768 2
IN 8 ISTAR 155 652 807 2
IN H ISTAR 184 646 830 2
KS 3 AA-AAS 3 30 60 154 131 378 3
KS 4 AA-AAS 8 29 57 141 132 367 3
KS 5 AA-AAS 2 20 65 115 120 322 3
KS 6 AA-AAS 2 20 62 130 118 332 3
KS 7 AA-AAS 3 31 45 135 122 336 3
KS 8 AA-AAS 4 24 44 118 116 306 3
KS H AA-AAS 5 18 37 110 126 296 3
KY 3 CATS Alt Assess 132 298 36 0 466 3
KY 4 CATS Alt Assess 107 301 49 3 460 3
KY 5 CATS Alt Assess 115 343 42 2 502 3
KY 6 CATS Alt Assess 175 296 45 2 518 3
KY 7 CATS Alt Assess 149 331 67 3 550 3
KY 8 CATS Alt Assess 206 337 69 3 615 3
KY H CATS Alt Assess 169 348 67 4 588 3
LA 3 LAA1 164 128 75 367 2
LA 4 LAA1 162 152 118 432 2
LA 5 LAA1 210 133 123 466 2
LA 6 LAA1 178 127 134 439 2
LA 7 LAA1 160 166 145 471 2
LA 8 LAA1 174 219 174 567 2
LA H LAA1 160 155 119 434 2
MA 3 MCAS 1075 2 0 1077 3
MA 4 MCAS 1217 2 0 1219 3
MA 5 MCAS 1164 0 1164 3
MA 6 MCAS 1202 3 0 1205 3
MA 7 MCAS 1086 1 0 1087 3
MA 8 MCAS 961 0 961 3
MA H MCAS 859 0 859 3

205
Achievement Levels Attained
State Grade Assessment Name
Level
1
Level
2
Level
3
Level
4
Level
5
Level
6
Total Students
Assessed
Minimum
Proficiency
Level
MD 3 Alt MSA 49 77 341 467 2
MD 4 Alt MSA 65 101 370 536 2
MD 5 Alt MSA 75 117 450 642 2
MD 6 Alt MSA 72 125 393 590 2
MD 7 Alt MSA 83 126 435 644 2
MD 8 Alt MSA 87 175 527 789 2
MD H Alt H.S.A. 126 174 525 825 2
ME 3 PAAP 12 30 45 36 123 3
ME 4 PAAP 10 39 40 37 126 3
ME 5 PAAP 14 40 41 41 136 3
ME 6 PAAP 19 54 89 35 197 3
ME 7 PAAP 19 45 91 23 178 3
ME 8 PAAP 15 58 77 27 177 3
ME H PAAP 22 51 120 16 209 3
MI 3 MI-Access 1758 784 596 3138 2
MI 4 MI-Access 1841 923 662 3426 2
MI 5 MI-Access 2088 688 716 3492 2
MI 6 MI-Access 2035 499 493 3027 2
MI 7 MI-Access 2135 704 612 3451 2
MI 8 MI-Access 1925 921 525 3371 2
MI H MI-Access 1257 1028 489 2774 2
MN 3 MTAS 157 78 249 362 846 2
MN 4 MTAS 152 102 231 371 856 2
MN 5 MTAS 184 101 167 411 863 2
MN 6 MTAS 155 114 140 464 873 2
MN 7 MTAS 136 114 138 566 954 2
MN 8 MTAS 99 70 183 521 873 2
MN H MTAS 117 50 373 292 832 2
MO 3 MAP-A 34 97 272 348 751 3
MO 4 MAP-A 36 85 298 307 726 3
MO 5 MAP-A 43 89 268 295 695 3
MO 6 MAP-A 77 173 196 207 653 3
MO 7 MAP-A 78 162 253 176 669 3
MO 8 MAP-A 87 159 216 180 642 3

206
Achievement Levels Attained
State Grade Assessment Name
Level
1
Level
2
Level
3
Level
4
Level
5
Level
6
Total Students
Assessed
Minimum
Proficiency
Level
MO H MAP-A 89 199 115 178 581 3
MS 3 MAAECF 57 98 110 120 385 3
MS 4 MAAECF 72 61 132 168 433 3
MS 5 MAAECF 57 69 106 134 366 3
MS 6 MAAECF 80 77 152 105 414 3
MS 7 MAAECF 84 97 183 130 494 3
MS 8 MAAECF 81 82 149 108 420 3
MS H N/A 0 3
MT 3 CRT-Alt 8 17 44 26 95 3
MT 4 CRT-Alt 15 8 29 39 91 3
MT 5 CRT-Alt 9 16 39 44 108 3
MT 6 CRT-Alt 5 4 37 32 78 3
MT 7 CRT-Alt 7 9 31 53 100 3
MT 8 CRT-Alt 8 11 15 44 78 3
MT H CRT-Alt 12 4 34 74 124 3
NC 3 NCEXTEND1 142 286 385 106 919 3
NC 4 NCEXTEND1 143 291 327 119 880 3
NC 5 NCEXTEND1 128 278 268 123 797 3
NC 6 NCEXTEND1 110 275 303 103 791 3
NC 7 NCEXTEND1 105 238 225 131 699 3
NC 8 NCEXTEND1 106 307 305 178 896 3
NC H NCEXTEND1 0 366 238 604 3
ND 3 NDAA 3 4 37 30 74 3
ND 4 NDAA 3 6 40 37 86 3
ND 5 NDAA 2 4 51 38 95 3
ND 6 NDAA 3 8 38 39 88 3
ND 7 NDAA 1 7 50 29 87 3
ND 8 NDAA 1 6 43 39 89 3
ND H NDAA 3 14 37 46 100 3
NE 3 STARS Alternate 11 23 66 64 164 3
NE 4 STARS Alternate 23 38 66 72 199 3
NE 5 STARS Alternate 12 33 82 65 192 3
NE 6 STARS Alternate 38 29 109 42 218 3
NE 7 STARS Alternate 33 37 117 55 242 3

207
Achievement Levels Attained
State Grade Assessment Name
Level
1
Level
2
Level
3
Level
4
Level
5
Level
6
Total Students
Assessed
Minimum
Proficiency
Level
NE 8 STARS Alternate 22 32 102 65 221 3
NE H STARS Alternate 23 39 70 51 183 3
NH 3 NECAP ALT 17 22 68 44 151 3
NH 4 NECAP ALT 14 31 59 38 142 3
NH 5 NECAP ALT 10 39 85 38 172 3
NH 6 NECAP ALT 12 31 89 36 168 3
NH 7 NECAP ALT 24 36 52 28 140 3
NH 8 NECAP ALT 14 37 69 23 143 3
NH H NECAP ALT 17 40 45 9 111 3
NJ 3 NJASK 221 485 289 995 2
NJ 4 NJASK 273 519 277 1069 2
NJ 5 NJASK 290 465 245 1000 2
NJ 6 NJASK 275 494 251 1020 2
NJ 7 NJASK 308 432 281 1021 2
NJ 8 GEPA 351 365 199 915 2
NJ H HSPA 370 481 194 1045 2
NM 3 NMAPA 25 52 31 81 189 3
NM 4 NMAPA 13 62 22 70 167 3
NM 5 NMAPA 22 37 27 103 189 3
NM 6 NMAPA 14 27 23 118 182 3
NM 7 NMAPA 22 34 23 128 207 3
NM 8 NMAPA 39 23 32 141 235 3
NM H NMAPA 29 37 8 115 189 3
NV 3 NASAA 4 3 6 233 246 3
NV 4 NASAA 2 1 9 237 249 3
NV 5 NASAA 2 4 7 243 256 3
NV 6 NASAA 4 3 12 266 285 3
NV 7 NASAA 2 3 13 210 228 3
NV 8 NASAA 6 3 7 245 261 3
NV H NASAA 1 1 10 193 205 3
NY 3 NYSAA 183 238 371 1205 1997 3
NY 4 NYSAA 181 325 494 1201 2201 3
NY 5 NYSAA 111 214 724 1000 2049 3
NY 6 NYSAA 108 445 522 1147 2222 3

208
Achievement Levels Attained
State Grade Assessment Name
Level
1
Level
2
Level
3
Level
4
Level
5
Level
6
Total Students
Assessed
Minimum
Proficiency
Level
NY 7 NYSAA 36 296 396 1561 2289 3
NY 8 NYSAA 48 229 538 1640 2455 3
NY H NYSAA 15 69 197 1052 1333 3
OH 3 Ohio Achievement Test 97 1 146 1059 1179 2482 3
OH 4 Ohio Achievement Test 108 0 196 1238 1029 2571 3
OH 5 Ohio Achievement Test 64 1 77 1293 1149 2584 3
OH 6 Ohio Achievement Test 91 2 211 1236 959 2499 3
OH 7 Ohio Achievement Test 91 2 59 835 1520 2507 3
OH 8 Ohio Achievement Test 71 5 101 1299 1185 2661 3
OH H Ohio Graduation Test 46 2 44 967 1261 2320 3
OK 3 OAAP 18 32 441 24 515 3
OK 4 OAAP 14 44 443 27 528 3
OK 5 OAAP 21 49 367 24 461 3
OK 6 OAAP 24 50 418 24 516 3
OK 7 OAAP 18 40 387 9 454 3
OK 8 OAAP 21 43 359 14 437 3
OK H OAAP 27 53 375 21 476 3
OR 3 315 350 294 959 2
OR 4 351 311 280 942 2
OR 5 347 228 211 786 2
OR 6 212 223 167 602 2
OR 7 232 152 134 518 2
OR 8 272 106 73 451 2
OR H 228 107 80 415 2
PA 3 PASA 366 726 537 112 1741 3
PA 4 PASA 377 428 690 154 1649 3
PA 5 PASA 313 695 597 101 1706 3
PA 6 PASA 333 603 663 167 1766 3
PA 7 PASA 375 686 668 85 1814 3
PA 8 PASA 388 758 781 131 2058 3
PA H PASA 452 485 768 88 1793 3
RI 3 RI Alt Assessment 14 18 26 20 78 3
RI 4 RI Alt Assessment 10 18 16 28 72 3
RI 5 RI Alt Assessment 22 9 20 17 68 3

209
Achievement Levels Attained
State Grade Assessment Name
Level
1
Level
2
Level
3
Level
4
Level
5
Level
6
Total Students
Assessed
Minimum
Proficiency
Level
RI 6 RI Alt Assessment 18 9 18 34 79 3
RI 7 RI Alt Assessment 14 8 22 26 70 3
RI 8 RI Alt Assessment 11 14 32 37 94 3
RI H RI Alt Assessment 25 11 21 3 60 3
SC 3 SC_ALT 38 71 94 249 452 2
SC 4 SC_ALT 25 69 65 242 401 2
SC 5 SC_ALT 44 77 68 265 454 2
SC 6 SC_ALT 24 63 60 216 363 2
SC 7 SC_ALT 13 50 38 204 305 2
SC 8 SC_ALT 19 39 27 136 221 2
SC H SC_ALT 26 39 45 213 323 2
SD 3 DStepA 8 22 36 39 105 3
SD 4 DStepA 13 20 31 20 84 3
SD 5 DStepA 16 16 33 23 88 3
SD 6 DStepA 9 21 30 39 99 3
SD 7 DStepA 7 12 31 35 85 3
SD 8 DStepA 6 19 27 44 96 3
SD H DStepA 14 22 27 24 87 3
TN 3 TCAP-Alt PA 10 141 494 645 2
TN 4 TCAP-Alt PA 14 122 500 636 2
TN 5 TCAP-Alt PA 6 120 530 656 2
TN 6 TCAP-Alt PA 16 101 609 726 2
TN 7 TCAP-Alt PA 14 100 595 709 2
TN 8 TCAP-Alt PA 16 112 690 818 2
TN H TCAP-Alt PA 26 142 499 667 2
TX 3 TAKS ALTERNATE 306 1242 1055 2603 2
TX 4 TAKS ALTERNATE 275 1120 1003 2398 2
TX 5 TAKS ALTERNATE 301 1104 892 2297 2
TX 6 TAKS ALTERNATE 304 1065 1002 2371 2
TX 7 TAKS ALTERNATE 304 1023 887 2214 2
TX 8 TAKS ALTERNATE 342 1157 1010 2509 2
TX H TAKS ALTERNATE 326 965 737 2028 2
UT 3 UAA 22 25 69 318 434 3
UT 4 UAA 24 22 81 321 448 3

210
Achievement Levels Attained
State Grade Assessment Name
Level
1
Level
2
Level
3
Level
4
Level
5
Level
6
Total Students
Assessed
Minimum
Proficiency
Level
UT 5 UAA 16 24 82 328 450 3
UT 6 UAA 26 28 64 306 424 3
UT 7 UAA 17 32 70 315 434 3
UT 8 UAA 25 23 93 269 410 3
UT H UAA 24 37 70 302 433 3
VA 3 VAAP 0 0 51 133 941 1125 4
VA 4 VAAP 0 0 40 98 890 1028 4
VA 5 VAAP 0 0 54 110 874 1038 4
VA 6 VAAP 0 0 77 117 852 1046 4
VA 7 VAAP 0 0 92 118 869 1079 4
VA 8 VAAP 0 0 68 139 900 1107 4
VA H VAAP 0 0 77 127 684 888 4
VT 3 PAAGE 28 14 4 46 3
VT 4 PAAGE 50 9 6 65 3
VT 5 PAAGE 44 20 6 70 3
VT 6 PAAGE 43 19 10 72 3
VT 7 PAAGE 40 14 11 65 3
VT 8 PAAGE 44 15 11 70 3
VT H 34 18 8 60 3
WA 3 WAAS PORTFOLIO 191 87 132 368 778 3
WA 4 WAAS PORTFOLIO 216 88 157 268 729 3
WA 5 WAAS PORTFOLIO 263 189 54 162 668 3
WA 6 WAAS PORTFOLIO 425 139 51 71 686 3
WA 7 WAAS PORTFOLIO 255 161 53 135 604 3
WA 8 WAAS PORTFOLIO 384 125 27 102 638 3
WA H WAAS PORTFOLIO 333 81 112 92 618 3
WI 3 WAA 135 132 267 377 911 3
WI 4 WAA 104 157 251 381 893 3
WI 5 WAA 112 133 230 392 867 3
WI 6 WAA 102 178 224 360 864 3
WI 7 WAA 110 197 139 395 841 3
WI 8 WAA 133 212 211 325 881 3
WI H WAA 129 176 192 291 788 3
WV 3 APTA 4 68 81 104 257 3

211
Achievement Levels Attained
State Grade Assessment Name
Level
1
Level
2
Level
3
Level
4
Level
5
Level
6
Total Students
Assessed
Minimum
Proficiency
Level
WV 4 APTA 12 73 100 84 269 3
WV 5 APTA 16 45 74 119 254 3
WV 6 APTA 11 72 58 122 263 3
WV 7 APTA 1 56 54 133 244 3
WV 8 APTA 8 37 85 146 276 3
WV H APTA 6 45 70 115 236 3
WY 3 PAWS ALT 5 16 16 4 41 3
WY 4 PAWS ALT 9 23 27 5 64 3
WY 5 PAWS ALT 13 23 28 4 68 3
WY 6 PAWS ALT 11 19 27 5 62 3
WY 7 PAWS ALT 15 17 26 4 62 3
WY 8 PAWS ALT 9 18 28 4 59 3
WY H PAWS ALT 5 16 30 4 55 3
AS 3 AA-AAS 6 0 0 0 6 3
AS 4 AA-AAS 5 0 0 0 5 3
AS 5 AA-AAS
AS 6
AS 7 AA-AAS
AS 8 AA-AAS 3 0 0 0 3 3
AS H AA-AAS 2 1 1 0 4 3
BIE 3 N/A* 10 9 4 0 23 1
BIE 4 N/A* 12 16 4 0 32 1
BIE 5 N/A* 12 7 4 0 23 1
BIE 6 N/A* 14 9 2 0 25 1
BIE 7 N/A* 14 13 4 0 31 1
BIE 8 N/A* 11 5 2 0 18 1
BIE H N/A* 15 8 5 0 28 1
CNMI 3 MAAECF 11 2 2 0 15 3
CNMI 4 MAAECF 10 4 1 0 15 3
CNMI 5 MAAECF 6 1 1 4 12 3
CNMI 6 MAAECF 4 3 1 1 9 3
CNMI 7 MAAECF
CNMI 8 MAAECF 6 4 0 0 10 3
CNMI H MAAECF 3 0 0 0 3 3

212
Achievement Levels Attained
State Grade Assessment Name
Level
1
Level
2
Level
3
Level
4
Level
5
Level
6
Total Students
Assessed
Minimum
Proficiency
Level
DC 3 DCCAS alternate 12 6 13 38 69 3
DC 4 DCCAS alternate 14 3 14 54 85 3
DC 5 DCCAS alternate 15 5 16 34 70 3
DC 6 DCCAS alternate 8 8 23 40 79 3
DC 7 DCCAS alternate 15 11 16 39 81 3
DC 8 DCCAS alternate 22 10 33 31 96 3
DC H DCCAS alternate 14 8 12 21 55 3
FSM 3
FSM 4
FSM 5
FSM 6 FSM NST-AA-AAS 0 0 0 1 1 3
FSM 7
FSM 8 FSM NST-AA-AAS 0 1 0 1 2 3
FSM H 0 0 0 3 3 3
GU 3 SAT 10 2 0 0 0 2 3
GU 4 SAT 10 7 0 1 0 8 3
GU 5 SAT 10 3 0 2 0 5 3
GU 6 SAT 10 2 0 0 0 2 3
GU 7 SAT 10 3 1 2 0 6 3
GU 8 SAT 10 1 2 1 0 4 3
GU H SAT 10 0 1 0 0 1 3
Palau 3
Palau 4 *AA-AAS 0 0 2 0 2 3
Palau 5
Palau 6 *AA-AAS 1 0 2 1 4 3
Palau 7
Palau 8 *AA-AAS 1 0 1 0 2 3
Palau H *AA-AAS 0 0 2 0 2 3
PR 3 PPEA
PR 4 PPEA
PR 5 PPEA
PR 6 PPEA
PR 7 PPEA
PR 8 PPEA

213
Achievement Levels Attained
State Grade Assessment Name
Level
1
Level
2
Level
3
Level
4
Level
5
Level
6
Total Students
Assessed
Minimum
Proficiency
Level
PR H PPEA
RMI 3
RMI 4
RMI 5
RMI 6
RMI 7
RMI 8 2 0 0 0 2 3
RMI H
VI 3 0 6 5 3 14 3
VI 4 0 2 3 3 8 3
VI 5 2 3 0 2 7 3
VI 6 0 4 6 3 13 3
VI 7 0 5 7 2 14 3
VI 8 0 4 5 6 15 3
VI H 0 1 8 5 14 3
* Students in BIE schools are administered the large-scale assessment that is given for NCLB purposes by the state in which the BIE
school is located. For example, students at BIE schools in Wisconsin are administered the WKCE or the WAA

214
Table E8.
Alternate Assessment on Alternate Achievement Standards Mathematics Performance
Achievement Levels Attained
State Grade Assessment Name
Level
1
Level
2
Level
3
Level
4
Level
5
Level
6
Total Students
Assessed
Minimum
Proficiency
Level
AK 3 AK Alternate Assessment 17 10 6 21 54 3
AK 4 AK Alternate Assessment 16 5 12 34 67 3
AK 5 AK Alternate Assessment 19 3 18 26 66 3
AK 6 AK Alternate Assessment 8 7 20 24 59 3
AK 7 AK Alternate Assessment 30 15 21 6 72 3
AK 8 AK Alternate Assessment 31 11 11 12 65 3
AK H AK Alternate Assessment 27 25 19 18 89 3
AL 3 AAA 36 163 177 61 437 3
AL 4 AAA 34 197 173 38 442 3
AL 5 AAA 77 143 217 65 502 3
AL 6 AAA 39 175 213 63 490 3
AL 7 AAA 54 118 256 65 493 3
AL 8 AAA 53 103 273 70 499 3
AL H AAA 37 130 230 51 448 3
AR 3 Portfolio 59 68 22 92 167 408 4
AR 4 Portfolio 75 99 21 58 221 474 4
AR 5 Portfolio 76 76 29 97 179 457 4
AR 6 Portfolio 67 67 43 74 196 447 4
AR 7 Portfolio 68 73 37 68 195 441 4
AR 8 Portfolio 132 93 46 22 154 447 4
AR H Portfolio 155 190 444 224 1175 2188 4
AZ 3 AIMS-A 131 327 280 8 746 3
AZ 4 AIMS-A 102 235 382 12 731 3
AZ 5 AIMS-A 115 191 357 16 679 3
AZ 6 AIMS-A 120 383 197 2 702 3
AZ 7 AIMS-A 83 396 240 2 721 3
AZ 8 AIMS-A 99 406 288 1 794 3
AZ H AIMS-A 98 317 297 4 716 3
CA 3 CAPA 908 812 1331 1334 4385 3
CA 4 CAPA 634 1087 1471 1197 4389 3
CA 5 CAPA 567 1008 1371 1281 4227 3

215
Achievement Levels Attained
State Grade Assessment Name
Level
1
Level
2
Level
3
Level
4
Level
5
Level
6
Total Students
Assessed
Minimum
Proficiency
Level
CA 6 CAPA 1259 1252 1155 816 4482 3
CA 7 CAPA 1064 1210 1158 1046 4478 3
CA 8 CAPA 1076 1151 1240 1176 4643 3
CA H CAPA 939 675 1323 1678 4615 3
CO 3 CSAPA 49 88 148 143 152 580 3
CO 4 CSAPA 37 121 152 207 67 584 3
CO 5 CSAPA 77 65 128 201 59 530 3
CO 6 CSAPA 83 70 109 122 141 525 3
CO 7 CSAPA 87 98 130 105 99 519 3
CO 8 CSAPA 62 133 126 147 43 511 3
CO H CSAPA 76 151 172 100 64 563 3
CT 3 Skills Checklist 0 259 121 104 484 3
CT 4 Skills Checklist 0 338 116 37 491 3
CT 5 Skills Checklist 0 277 112 55 444 3
CT 6 Skills Checklist 0 342 78 32 452 3
CT 7 Skills Checklist 0 335 80 24 439 3
CT 8 Skills Checklist 0 327 59 34 420 3
CT H Skills Checklist 0 388 44 10 442 3
DE 3 DAPA 10 5 12 13 38 78 3
DE 4 DAPA 9 4 10 18 53 94 3
DE 5 DAPA 2 2 16 34 37 91 3
DE 6 DAPA 6 0 7 20 56 89 3
DE 7 DAPA 4 8 11 27 61 111 3
DE 8 DAPA 9 6 15 24 63 117 3
DE H DAPA 6 10 21 34 66 137 3
FL 3 FL Alternate Assessment 772 633 768 2173 2
FL 4 FL Alternate Assessment 781 715 723 2219 2
FL 5 FL Alternate Assessment 766 724 817 2307 2
FL 6 FL Alternate Assessment 714 806 713 2233 2
FL 7 FL Alternate Assessment 874 761 789 2424 2
FL 8 FL Alternate Assessment 894 900 648 2442 2
FL H FL Alternate Assessment 905 1306 725 2936 2
GA 3 GA Alternate Assessment 142 363 428 933 2
GA 4 GA Alternate Assessment 172 351 417 940 2

216
Achievement Levels Attained
State Grade Assessment Name
Level
1
Level
2
Level
3
Level
4
Level
5
Level
6
Total Students
Assessed
Minimum
Proficiency
Level
GA 5 GA Alternate Assessment 211 416 505 1132 2
GA 6 GA Alternate Assessment 193 431 511 1135 2
GA 7 GA Alternate Assessment 215 427 582 1224 2
GA 8 GA Alternate Assessment 272 537 608 1417 2
GA H GA Alternate Assessment 213 431 532 1176 2
HI 3 HSAA 13 13 28 14 68 3
HI 4 HSAA 6 13 13 24 56 3
HI 5 HSAA 16 15 9 26 66 3
HI 6 HSAA 12 8 25 26 71 3
HI 7 HSAA 17 11 12 21 61 3
HI 8 HSAA 12 10 14 27 63 3
HI H HSAA 22 12 9 6 49 3
IA 3 IA Alternate Assessment 72 84 61 217 2
IA 4 IA Alternate Assessment 68 95 55 218 2
IA 5 IA Alternate Assessment 83 85 48 216 2
IA 6 IA Alternate Assessment 67 73 48 188 2
IA 7 IA Alternate Assessment 80 93 47 220 2
IA 8 IA Alternate Assessment 99 83 23 205 2
IA H IA Alternate Assessment 77 68 56 201 2
ID 3 Alt Assessment 17 25 68 73 183 3
ID 4 Alt Assessment 15 25 76 53 169 3
ID 5 Alt Assessment 14 15 52 62 143 3
ID 6 Alt Assessment 13 29 59 76 177 3
ID 7 Alt Assessment 12 27 41 90 170 3
ID 8 Alt Assessment 12 22 67 81 182 3
ID H Alt Assessment 9 23 49 75 156 3
IL 3 IAA 385 273 598 469 1725 3
IL 4 IAA 287 284 609 534 1714 3
IL 5 IAA 265 325 644 441 1675 3
IL 6 IAA 241 302 630 639 1812 3
IL 7 IAA 295 286 707 556 1844 3
IL 8 IAA 234 368 724 562 1888 3
IL H IAA 240 230 675 519 1664 3
IN 3 ISTAR 69 415 484 2

217
Achievement Levels Attained
State Grade Assessment Name
Level
1
Level
2
Level
3
Level
4
Level
5
Level
6
Total Students
Assessed
Minimum
Proficiency
Level
IN 4 ISTAR 85 514 599 2
IN 5 ISTAR 91 557 648 2
IN 6 ISTAR 163 522 685 2
IN 7 ISTAR 171 597 768 2
IN 8 ISTAR 139 668 807 2
IN H ISTAR 160 670 830 2
KS 3 AA-AAS 8 37 63 132 115 355 3
KS 4 AA-AAS 9 37 62 126 122 356 3
KS 5 AA-AAS 7 32 53 137 87 316 3
KS 6 AA-AAS 7 28 45 124 124 328 3
KS 7 AA-AAS 9 23 62 126 125 345 3
KS 8 AA-AAS 14 30 33 111 122 310 3
KS H AA-AAS 0 2 16 39 23 80 3
KY 3 CATS Alt Assess 133 290 43 0 466 3
KY 4 CATS Alt Assess 100 308 51 1 460 3
KY 5 CATS Alt Assess 95 348 58 1 502 3
KY 6 CATS Alt Assess 106 326 81 5 518 3
KY 7 CATS Alt Assess 115 344 87 4 550 3
KY 8 CATS Alt Assess 160 369 80 6 615 3
KY H CATS Alt Assess 122 290 145 3 560 3
LA 3 LAA1 174 125 68 367 2
LA 4 LAA1 156 164 112 432 2
LA 5 LAA1 190 164 112 466 2
LA 6 LAA1 161 144 133 438 2
LA 7 LAA1 196 162 112 470 2
LA 8 LAA1 243 170 152 565 2
LA H LAA1 220 115 98 433 2
MA 3 MCAS 1058 1 0 1059 3
MA 4 MCAS 1221 5 0 1226 3
MA 5 MCAS 1209 1 0 1210 3
MA 6 MCAS 1240 4 0 1244 3
MA 7 MCAS 1136 1 0 1137 3
MA 8 MCAS 1024 2 0 1026 3
MA H MCAS 854 1 0 855 3

218
Achievement Levels Attained
State Grade Assessment Name
Level
1
Level
2
Level
3
Level
4
Level
5
Level
6
Total Students
Assessed
Minimum
Proficiency
Level
MD 3 Alt MSA 61 106 300 467 2
MD 4 Alt MSA 66 112 359 537 2
MD 5 Alt MSA 84 130 428 642 2
MD 6 Alt MSA 69 132 389 590 2
MD 7 Alt MSA 88 124 432 644 2
MD 8 Alt MSA 95 175 519 789 2
MD H Alt H.S.A. 112 209 504 825 2
ME 3 PAAP 12 12 57 40 121 3
ME 4 PAAP 8 18 63 37 126 3
ME 5 PAAP 15 21 59 41 136 3
ME 6 PAAP 22 43 67 64 196 3
ME 7 PAAP 15 56 55 50 176 3
ME 8 PAAP 16 55 52 53 176 3
ME H PAAP 15 73 57 64 209 3
MI 3 MI-Access 1313 852 622 2787 2
MI 4 MI-Access 1502 940 607 3049 2
MI 5 MI-Access 1354 937 811 3102 2
MI 6 MI-Access 1497 1006 646 3149 2
MI 7 MI-Access 1510 857 985 3352 2
MI 8 MI-Access 1403 1191 715 3309 2
MI H MI-Access 618 1299 851 2768 2
MN 3 MTAS 147 179 255 213 794 2
MN 4 MTAS 114 186 380 121 801 2
MN 5 MTAS 97 152 375 205 829 2
MN 6 MTAS 102 226 343 182 853 2
MN 7 MTAS 194 197 344 199 934 2
MN 8 MTAS 205 235 266 167 873 2
MN H MTAS 146 402 164 167 879 2
MO 3 MAP-A 46 89 287 327 749 3
MO 4 MAP-A 39 98 270 318 725 3
MO 5 MAP-A 47 105 260 283 695 3
MO 6 MAP-A 77 86 278 213 654 3
MO 7 MAP-A 109 75 284 201 669 3
MO 8 MAP-A 84 90 285 183 642 3

219
Achievement Levels Attained
State Grade Assessment Name
Level
1
Level
2
Level
3
Level
4
Level
5
Level
6
Total Students
Assessed
Minimum
Proficiency
Level
MO H MAP-A 62 117 274 239 692 3
MS 3 MAAECF 66 118 117 72 373 3
MS 4 MAAECF 80 88 149 114 431 3
MS 5 MAAECF 77 72 124 92 365 3
MS 6 MAAECF 95 86 149 75 405 3
MS 7 MAAECF 106 104 187 94 491 3
MS 8 MAAECF 93 109 140 76 418 3
MS H N/A 0 3
MT 3 CRT-Alt 27 10 44 14 95 3
MT 4 CRT-Alt 22 6 49 14 91 3
MT 5 CRT-Alt 31 12 43 22 108 3
MT 6 CRT-Alt 15 15 26 22 78 3
MT 7 CRT-Alt 13 13 49 25 100 3
MT 8 CRT-Alt 15 9 21 33 78 3
MT H CRT-Alt 20 24 33 47 124 3
NC 3 NCEXTEND1 141 297 352 134 924 3
NC 4 NCEXTEND1 130 310 340 104 884 3
NC 5 NCEXTEND1 100 260 342 97 799 3
NC 6 NCEXTEND1 99 229 355 108 791 3
NC 7 NCEXTEND1 72 218 259 149 698 3
NC 8 NCEXTEND1 99 352 347 105 903 3
NC H NCEXTEND1 0 326 279 605 3
ND 3 NDAA 3 2 36 34 75 3
ND 4 NDAA 4 3 38 39 84 3
ND 5 NDAA 2 5 41 48 96 3
ND 6 NDAA 3 6 35 43 87 3
ND 7 NDAA 1 3 49 35 88 3
ND 8 NDAA 2 4 47 42 95 3
ND H NDAA 4 8 41 52 105 3
NE 3 STARS Alternate 17 20 44 86 167 3
NE 4 STARS Alternate 28 34 49 91 202 3
NE 5 STARS Alternate 28 46 62 55 191 3
NE 6 STARS Alternate 34 42 106 39 221 3
NE 7 STARS Alternate 35 49 101 59 244 3

220
Achievement Levels Attained
State Grade Assessment Name
Level
1
Level
2
Level
3
Level
4
Level
5
Level
6
Total Students
Assessed
Minimum
Proficiency
Level
NE 8 STARS Alternate 36 36 99 52 223 3
NE H STARS Alternate 26 40 71 51 188 3
NH 3 NECAP ALT 19 20 75 37 151 3
NH 4 NECAP ALT 13 29 69 31 142 3
NH 5 NECAP ALT 18 37 73 44 172 3
NH 6 NECAP ALT 19 33 83 33 168 3
NH 7 NECAP ALT 26 31 53 30 140 3
NH 8 NECAP ALT 20 39 63 21 143 3
NH H NECAP ALT 20 45 39 7 111 3
NJ 3 NJASK 172 517 301 990 2
NJ 4 NJASK 230 485 318 1033 2
NJ 5 NJASK 271 468 269 1008 2
NJ 6 NJASK 285 455 264 1004 2
NJ 7 NJASK 355 388 260 1003 2
NJ 8 GEPA 427 319 188 934 2
NJ H HSPA 555 296 136 987 2
NM 3 NMAPA 22 107 18 35 182 3
NM 4 NMAPA 11 94 14 38 157 3
NM 5 NMAPA 24 84 44 35 187 3
NM 6 NMAPA 16 62 46 60 184 3
NM 7 NMAPA 22 67 29 87 205 3
NM 8 NMAPA 33 65 36 93 227 3
NM H NMAPA 40 48 27 76 191 3
NV 3 NASAA 3 3 13 226 245 3
NV 4 NASAA 3 2 10 234 249 3
NV 5 NASAA 1 2 13 239 255 3
NV 6 NASAA 4 7 8 266 285 3
NV 7 NASAA 2 4 10 211 227 3
NV 8 NASAA 4 1 12 243 260 3
NV H NASAA 4 5 17 179 205 3
NY 3 NYSAA 55 215 698 1032 2000 3
NY 4 NYSAA 69 389 747 999 2204 3
NY 5 NYSAA 101 184 721 1045 2051 3
NY 6 NYSAA 31 255 598 1344 2228 3

221
Achievement Levels Attained
State Grade Assessment Name
Level
1
Level
2
Level
3
Level
4
Level
5
Level
6
Total Students
Assessed
Minimum
Proficiency
Level
NY 7 NYSAA 236 207 777 1072 2292 3
NY 8 NYSAA 267 218 811 1145 2441 3
NY H NYSAA 18 102 237 944 1301 3
OH 3 Ohio Achievement Test 97 2 53 843 1485 2480 3
OH 4 Ohio Achievement Test 107 1 64 1053 1351 2576 3
OH 5 Ohio Achievement Test 66 2 67 1388 1060 2583 3
OH 6 Ohio Achievement Test 94 2 79 839 1487 2501 3
OH 7 Ohio Achievement Test 101 2 79 1040 1283 2505 3
OH 8 Ohio Achievement Test 80 12 80 1249 1239 2660 3
OH H Ohio Graduation Test 46 1 59 1285 931 2322 3
OK 3 OAAP 11 36 446 22 515 3
OK 4 OAAP 16 40 445 27 528 3
OK 5 OAAP 11 29 395 26 461 3
OK 6 OAAP 14 44 422 36 516 3
OK 7 OAAP 10 42 396 6 454 3
OK 8 OAAP 22 26 375 14 437 3
OK H OAAP 29 80 375 20 504 3
OR 3 311 223 228 762 2
OR 4 368 119 294 781 2
OR 5 333 199 133 665 2
OR 6 254 175 126 555 2
OR 7 278 106 127 511 2
OR 8 295 85 73 453 2
OR H 229 132 59 420 2
PA 3 PASA 458 479 734 70 1741 3
PA 4 PASA 309 607 534 199 1649 3
PA 5 PASA 379 462 684 181 1706 3
PA 6 PASA 396 402 724 244 1766 3
PA 7 PASA 498 622 600 94 1814 3
PA 8 PASA 506 675 743 134 2058 3
PA H PASA 637 450 634 72 1793 3
RI 3 RI Alt Assessment 17 14 28 19 78 3
RI 4 RI Alt Assessment 17 9 26 19 71 3
RI 5 RI Alt Assessment 23 8 25 13 69 3

222
Achievement Levels Attained
State Grade Assessment Name
Level
1
Level
2
Level
3
Level
4
Level
5
Level
6
Total Students
Assessed
Minimum
Proficiency
Level
RI 6 RI Alt Assessment 20 14 17 28 79 3
RI 7 RI Alt Assessment 20 8 19 24 71 3
RI 8 RI Alt Assessment 14 19 46 27 106 3
RI H RI Alt Assessment 19 25 18 1 63 3
SC 3 SC_ALT 37 112 150 151 450 2
SC 4 SC_ALT 24 96 114 166 400 2
SC 5 SC_ALT 41 109 129 172 451 2
SC 6 SC_ALT 31 95 80 158 364 2
SC 7 SC_ALT 17 60 80 147 304 2
SC 8 SC_ALT 20 42 68 91 221 2
SC H SC_ALT 32 58 93 138 321 2
SD 3 DStepA 9 31 35 30 105 3
SD 4 DStepA 13 29 29 13 84 3
SD 5 DStepA 20 13 22 33 88 3
SD 6 DStepA 10 29 31 29 99 3
SD 7 DStepA 7 31 22 25 85 3
SD 8 DStepA 8 22 31 35 96 3
SD H DStepA 13 31 26 17 87 3
TN 3 TCAP-Alt PA 11 144 489 644 2
TN 4 TCAP-Alt PA 17 124 495 636 2
TN 5 TCAP-Alt PA 13 130 513 656 2
TN 6 TCAP-Alt PA 16 122 588 726 2
TN 7 TCAP-Alt PA 18 122 570 710 2
TN 8 TCAP-Alt PA 20 126 672 818 2
TN H TCAP-Alt PA 25 186 640 851 2
TX 3 TAKS ALTERNATE 342 1294 974 2610 2
TX 4 TAKS ALTERNATE 288 1167 945 2400 2
TX 5 TAKS ALTERNATE 303 1122 876 2301 2
TX 6 TAKS ALTERNATE 299 1094 981 2374 2
TX 7 TAKS ALTERNATE 302 1049 870 2221 2
TX 8 TAKS ALTERNATE 341 1212 969 2522 2
TX H TAKS ALTERNATE 333 983 709 2025 2
UT 3 UAA 42 29 77 289 437 3
UT 4 UAA 37 34 64 312 447 3

223
Achievement Levels Attained
State Grade Assessment Name
Level
1
Level
2
Level
3
Level
4
Level
5
Level
6
Total Students
Assessed
Minimum
Proficiency
Level
UT 5 UAA 46 31 79 294 450 3
UT 6 UAA 33 40 60 293 426 3
UT 7 UAA 52 39 77 263 431 3
UT 8 UAA 27 34 63 287 411 3
UT H UAA 122 92 238 644 1096 3
VA 3 VAAP 0 0 84 110 932 1126 4
VA 4 VAAP 0 0 73 108 848 1029 4
VA 5 VAAP 0 0 83 101 852 1036 4
VA 6 VAAP 0 0 91 156 803 1050 4
VA 7 VAAP 0 0 100 135 847 1082 4
VA 8 VAAP 0 0 99 131 884 1114 4
VA H VAAP 0 0 98 173 619 890 4
VT 3 PAAGE 30 12 4 46 3
VT 4 PAAGE 49 9 6 64 3
VT 5 PAAGE 42 20 7 69 3
VT 6 PAAGE 44 14 14 72 3
VT 7 PAAGE 45 16 4 65 3
VT 8 PAAGE 47 15 7 69 3
VT H 40 10 10 60 3
WA 3 WAAS PORTFOLIO 110 82 142 421 755 3
WA 4 WAAS PORTFOLIO 123 99 144 351 717 3
WA 5 WAAS PORTFOLIO 186 116 131 219 652 3
WA 6 WAAS PORTFOLIO 341 152 97 99 689 3
WA 7 WAAS PORTFOLIO 236 94 153 130 613 3
WA 8 WAAS PORTFOLIO 405 88 100 64 657 3
WA H WAAS PORTFOLIO 334 109 114 59 616 3
WI 3 WAA 110 114 249 330 803 3
WI 4 WAA 96 112 203 345 756 3
WI 5 WAA 115 112 200 350 777 3
WI 6 WAA 110 123 232 321 786 3
WI 7 WAA 100 111 223 375 809 3
WI 8 WAA 136 158 213 365 872 3
WI H WAA 129 175 213 256 773 3
WV 3 APTA 3 68 67 119 257 3

224
Achievement Levels Attained
State Grade Assessment Name
Level
1
Level
2
Level
3
Level
4
Level
5
Level
6
Total Students
Assessed
Minimum
Proficiency
Level
WV 4 APTA 5 60 60 142 267 3
WV 5 APTA 2 41 31 182 256 3
WV 6 APTA 5 68 90 100 263 3
WV 7 APTA 5 79 87 73 244 3
WV 8 APTA 8 51 105 111 275 3
WV H APTA 12 55 110 60 237 3
WY 3 PAWS ALT 5 12 20 4 41 3
WY 4 PAWS ALT 14 13 29 8 64 3
WY 5 PAWS ALT 20 12 28 8 68 3
WY 6 PAWS ALT 13 13 26 8 60 3
WY 7 PAWS ALT 14 11 30 7 62 3
WY 8 PAWS ALT 14 13 27 6 60 3
WY H PAWS ALT 10 18 20 7 55 3
AS 3 AA-AAS 5 1 0 0 6 3
AS 4 AA-AAS 5 0 0 0 5 3
AS 5 AA-AAS
AS 6
AS 7 AA-AAS
AS 8 AA-AAS 3 0 0 0 3 3
AS H AA-AAS 0 4 0 0 4 3
BIE 3 N/A* 9 9 2 20 1
BIE 4 N/A* 12 12 3 27 1
BIE 5 N/A* 15 4 3 22 1
BIE 6 N/A* 12 14 1 27 1
BIE 7 N/A* 13 11 7 31 1
BIE 8 N/A* 10 7 1 18 1
BIE H N/A* 9 13 5 27 1
CNMI 3 MAAECF 13 0 1 1 15 3
CNMI 4 MAAECF
CNMI 5 MAAECF 7 2 2 1 12 3
CNMI 6 MAAECF 5 2 0 2 9 3
CNMI 7 MAAECF 6 3 0 0 9 3
CNMI 8 MAAECF 7 3 0 0 10 3
CNMI H MAAECF 1 0 0 1 2 3

225
Achievement Levels Attained
State Grade Assessment Name
Level
1
Level
2
Level
3
Level
4
Level
5
Level
6
Total Students
Assessed
Minimum
Proficiency
Level
DC 3 DCCAS alternate 15 7 12 35 69 3
DC 4 DCCAS alternate 16 6 10 53 85 3
DC 5 DCCAS alternate 16 10 8 36 70 3
DC 6 DCCAS alternate 14 7 20 38 79 3
DC 7 DCCAS alternate 18 14 12 37 81 3
DC 8 DCCAS alternate 28 16 25 27 96 3
DC H DCCAS alternate 12 7 15 21 55 3
FSM 3
FSM 4
FSM 5
FSM 6 FSM NST-AA-AAS 0 1 0 1 2 3
FSM 7
FSM 8 FSM NST-AA-AAS 0 2 0 1 3 3
FSM H 0 3 0 3 6 3
GU 3 SAT 10 5 0 0 0 5 3
GU 4 SAT 10 5 2 1 0 8 3
GU 5 SAT 10 4 0 2 2 8 3
GU 6 SAT 10 6 0 0 0 6 3
GU 7 SAT 10 7 2 0 1 10 3
GU 8 SAT 10 2 2 0 1 5 3
GU H SAT 10 1 0 0 0 1 3
Palau 3
Palau 4 *AA-AAS 0 0 2 0 2 3
Palau 5
Palau 6 *AA-AAS 1 0 2 1 4 3
Palau 7
Palau 8 *AA-AAS 1 0 1 0 2 3
Palau H *AA-AAS 0 0 2 0 2 3
PR 3 PPEA
PR 4 PPEA
PR 5 PPEA
PR 6 PPEA
PR 7 PPEA
PR 8 PPEA

226
Achievement Levels Attained
State Grade Assessment Name
Level
1
Level
2
Level
3
Level
4
Level
5
Level
6
Total Students
Assessed
Minimum
Proficiency
Level
PR H PPEA
RMI 3
RMI 4
RMI 5
RMI 6
RMI 7
RMI 8
RMI H
VI 3 0 5 8 1 14 3
VI 4 0 1 5 2 8 3
VI 5 1 3 1 2 7 3
VI 6 0 6 3 4 13 3
VI 7 0 4 7 3 14 3
VI 8 0 6 5 4 15 3
VI H 0 1 8 5 14 3
* Students in BIE schools are administered the large-scale assessment that is given for NCLB purposes by the state in which the BIE
school is located. For example, students at BIE schools in Wisconsin are administered the WKCE or the WAA