Annual Housing Report for 2017 - Federal Housing Finance ... · Annual Housing Report 2017 ......
43
Annual Housing Report 2017 Division of Housing Mission & Goals ANNUAL HOUSING REPORT 2017 October 2017
-
Upload
truongkien -
Category
Documents
-
view
213 -
download
0
Transcript of Annual Housing Report for 2017 - Federal Housing Finance ... · Annual Housing Report 2017 ......

1 | P a g e
A n n u a l H o u s i n g R e p o r t 2 0 1 7
Division of Housing Mission & Goals
ANNUAL HOUSING REPORT 2017
October 2017
i
A n n u a l H o u s i n g R e p o r t 2 0 1 7
Table of Contents
Table of Contents i
Introduction 1
Housing Goals 4
I. Housing Goals – Introduction 4
II. Enterprises’ 2015 Housing Goals Performance 5
III. 2016 Housing Goals Performance 6
Enterprise Data Compared to Market Data 10
Subprime and Nontraditional Loans 17
Higher-Priced Mortgage Loans 17
Duty to Serve Underserved Markets 18
Affordable Housing Allocations 20
Monthly Survey of Mortgage Markets (National Mortgage Database) 21
Public Access to Mortgage Information 22
Appendix A: Preliminary Determination Letters: Enterprise 2016 Housing Goals Performance 24
Appendix B: Subprime and Nontraditional Loans 28
I. Overview of Single-Family Mortgages Acquired by the Enterprises 28
II. Nontraditional Mortgages 30
III. Mortgages with Lower Credit Scores 30
Appendix C: Higher-Priced Mortgage Loans 32
I. Purchase Price 33
II. Combined Loan-to-Value Ratio 33
ii
A n n u a l H o u s i n g R e p o r t 2 0 1 7
III. Product Type 35
IV. Term at Origination 35
V. Interest Rate at Origination 36
VI. Credit Score 37
VII. Borrower Income Ratio 38
VIII. Tract Income Ratio 38
IX. 2010 Census Tract/Percent Minority 39
X. Purpose of Loan 40
XI. Federal Guarantee 40

1
A n n u a l H o u s i n g R e p o r t 2 0 1 7
Introduction
The Federal Housing Finance Agency (FHFA) was established by the Housing and Economic Recovery Act of 2008 (HERA) and is responsible for the effective supervision, regulation, and housing mission oversight of the Federal National Mortgage Association (Fannie Mae), the Federal Home Loan Mortgage Corporation (Freddie Mac), and the Federal Home Loan Bank (Bank or FHLBank) System, which includes 11 FHLBanks and the Office of Finance. FHFA’s mission is to ensure that the regulated entities operate in a safe and sound manner so that they serve as a reliable source of liquidity and funding for housing finance and community investment. Since 2008, FHFA has also served as conservator of Fannie Mae and Freddie Mac (the Enterprises).
The Enterprises, as required under their charters, perform an important role in providing a stable source of housing finance that supports access to mortgage credit for low- and moderate-income families, as well as those in underserved areas.1 FHFA, in its role as conservator over the last nine years, has required the Enterprises to engage in numerous initiatives that identify obstacles to accessing mortgage credit, analyze potential solutions, and develop strategies to improve and maintain credit availability in the housing market in a safe and sound manner.
FHFA outlined its expectations as conservator through its Strategic Plan for the Conservatorships of Fannie Mae and Freddie Mac as well as the annual conservatorship scorecards.2 Since 2013, FHFA has issued an annual conservatorship scorecard that sets forth expectations for activities the Enterprises must undertake to further FHFA’s strategic goals as conservator. For example, FHFA established specific objectives in the 2016 Scorecard for Fannie Mae, Freddie Mac, and Common Securitization Solutions (2016 Scorecard).3 Several of the objectives required the Enterprises to research strategies for improving access to mortgage credit. FHFA continues to work with the Enterprises to ensure that their research builds on past efforts and leads to new pilot programs and initiatives for improving credit availability for low- and moderate-income families.
1 See Federal National Mortgage Association Charter Act, 12 U.S.C. § 1716, and Federal Home Loan Mortgage Corporation Act, 12 U.S.C. § 1451 Note. 2 See https://www.fhfa.gov/AboutUs/Reports/Pages/2014-Conservatorships-Strategic-Plan.aspx. 3 See https://www.fhfa.gov/AboutUs/Reports/ReportDocuments/2016-Scorecard.pdf. See also https://www.fhfa.gov/AboutUs/Reports/ReportDocuments/2017-Scorecard-for-Fannie-Mae-Freddie-Mac-and-CSS.pdf for the 2017 annual conservatorship scorecard.

2
A n n u a l H o u s i n g R e p o r t 2 0 1 7
Both Fannie Mae and Freddie Mac engaged in an initiative to improve access to mortgage credit by revising and clarifying the Representations and Warranties Framework under which lenders and the Enterprises operate. This initiative worked to address a significant obstacle to accessing credit – uncertainty on the part of mortgage originators about who will bear the credit risk from delinquent loans. The initiative resulted in an enhanced Representations and Warranties Framework that provides more clarity and transparency to lenders who do business with the Enterprises by helping lenders understand how to identify and correct origination defects, and the circumstances under which they would need to repurchase a loan from the Enterprises. The revised Representations and Warranties Framework provides the necessary assurances that allow Fannie Mae and Freddie Mac to purchase loans in an efficient and responsible manner. It also provides the Enterprises with remedies to address situations where lender obligations to meet the Enterprises’ purchase guidelines have not been fully met. In conjunction with this effort, the Enterprises conducted industry outreach on how to further improve loan quality and facilitate a more efficient loan origination process.
The Enterprises have also taken steps to improve access to credit by implementing new lending guidelines that incorporate compensating factors and risk mitigants. For example, the Enterprises implemented guidelines enabling creditworthy borrowers who can afford a mortgage, but lack a substantial down payment plus closing costs, to obtain a mortgage with a 3 percent down payment. Their lending guidelines also allow the Enterprises to purchase loans made to eligible, creditworthy borrowers who have a debt-to-income ratio up to 50 percent. In an effort to address the needs of creditworthy borrowers with a limited traditional credit history, the Enterprises allow the purchase of loans for some borrowers who do not have credit scores through manual underwriting or through their automated underwriting systems. This allows the lender to use a borrower’s repayment history on nontraditional forms of credit, such as rent or utility payments. These new or revised underwriting guidelines all incorporate compensating factors that prioritize sustainable access to credit.
FHFA also oversees the Enterprises’ annual housing goals requirements and Duty to Serve obligations. The Safety and Soundness Act requires that FHFA establish several annual housing goals for both single-family and multifamily mortgages purchased by Fannie Mae and Freddie Mac. As required, FHFA issued a final rule establishing Enterprise housing goals for 2015 through 2017.4 The housing goals include separate affordable housing categories for both
4 See 80 Fed. Reg. 53392 (Sept. 3, 2015), codified at 12 CFR part 1282.

3
A n n u a l H o u s i n g R e p o r t 2 0 1 7
single-family and multifamily mortgages. FHFA’s assessment of the Enterprises’ performance against the 2016 single-family goals involves a two-step process: (1) an evaluation of each Enterprise’s actual performance against benchmark levels; and (2) a subsequent evaluation of actual performance against public loan data submitted under the Home Mortgage Disclosure Act (HMDA). FHFA’s assessment of the Enterprises’ performance against the 2016 multifamily goals involves an evaluation of actual performance against benchmark levels.
After issuing a final Duty to Serve regulation in December 2016, FHFA and the Enterprises have worked during 2017 to implement the Enterprises’ obligation to serve three underserved markets: manufactured housing, affordable housing preservation, and rural housing. The Enterprises have published proposed Plans earlier in 2017, and FHFA expects the Enterprises will have final Plans that are ready to implement by January 1, 2018.
This Annual Housing Report (Report) describes the affordable housing activities of the Enterprises during 2016 and meets the reporting requirements of the Federal Housing Enterprises Financial Safety and Soundness Act of 1992, as amended (Safety and Soundness Act).5 The Report begins by describing FHFA’s preliminary review of the Enterprises’ 2016 housing goals performance.
The Report also includes information about the distribution of single-family loans by race/ethnicity, gender, and census tract median income. In addition, the Report includes a breakdown of the single-family mortgage product-types purchased by each Enterprise, as well as information on mortgage payment type (e.g., fixed-rate or adjustable-rate mortgage), loan-to-value ratios, and credit scores for 2016.
The Report describes the status of several other activities related to affordable housing, including FHFA’s Duty to Serve rule.6 The Report also describes the affordable housing allocations made by each Enterprise, as well as FHFA’s efforts to survey the mortgage markets and release loan-level data submitted by the Enterprises to the public. Finally, the Report discusses subprime, nontraditional, and higher-priced mortgage loans.
5 See 12 U.S.C. § 4544. For more information about the Enterprises’ efforts on access to credit that involve scorecard objectives, see 2016 Scorecard Progress Report https://www.fhfa.gov/AboutUs/Reports/ReportDocuments/2016-Scorecard-Progress-Report.pdf. 6 See 81 Fed. Reg. 96242 (Dec. 29, 2016), codified at 12 CFR part 1282.

4
A n n u a l H o u s i n g R e p o r t 2 0 1 7
Housing Goals
I. Housing Goals – Introduction
The Safety and Soundness Act requires FHFA to establish annual housing goals for both single-family and multifamily mortgages purchased by Fannie Mae and Freddie Mac.7 The housing goals are one measure of the extent to which the Enterprises are meeting their public purposes, which include “an affirmative obligation to facilitate the financing of affordable housing for low- and moderate-income families in a manner consistent with their overall public purposes, while maintaining a strong financial condition and a reasonable economic return.”8
Although the Enterprises remain in conservatorship, they continue to support a stable and liquid national market for residential mortgage financing. FHFA continues to establish annual housing goals for the Enterprises and assesses their performance against the housing goals each year.9 FHFA established housing goals for the Enterprises for 2015 through 2017 in a final rule published in the Federal Register on September 3, 2015.10 FHFA established the following goals and subgoals for mortgages on single-family, owner-occupied housing and mortgages on multifamily housing:
Single-family Goals and Subgoal
1. A low-income home purchase goal for home purchase mortgages to families withincomes no greater than 80 percent of area median income (AMI);
2. A very low-income home purchase goal for home purchase mortgages to families withincomes no greater than 50 percent of AMI;
3. A low-income areas home purchase subgoal for home purchase mortgages to familiesliving in census tracts with tract incomes no greater than 80 percent of AMI, or familieswith incomes no greater than 100 percent of AMI who live in census tracts with aminority population of 30 percent or more and a tract median income of less than 100percent of AMI;
7 See 12 U.S.C. § 4561(a). 8 See 12 U.S.C. § 4501(7). 9 Under 12 U.S.C. § 4544(b)(1)(A)(i), FHFA is required to discuss in the annual housing report whether and how each Enterprise is achieving the annual housing goals. 10 See 80 Fed. Reg. 53392 (Sept. 3, 2015), codified at 12 CFR part 1282.

5
A n n u a l H o u s i n g R e p o r t 2 0 1 7
4. A low-income areas home purchase goal for mortgages that meet the criteria under thelow-income areas home purchase subgoal described above, as well as home purchasemortgages to families with incomes no greater than 100 percent of AMI who live in afederally-declared disaster area; and
5. A low-income refinance goal for refinance mortgages to families with incomes nogreater than 80 percent of AMI.
Multifamily Goal and Subgoals
1. A low-income multifamily goal for rental units in multifamily properties affordable tofamilies with incomes no greater than 80 percent of AMI;
2. A very low-income multifamily subgoal for rental units in multifamily propertiesaffordable to families with incomes no greater than 50 percent of AMI; and
3. A small multifamily low-income subgoal for rental units in multifamily properties with5-50 units affordable to families with incomes no greater than 80 percent of AMI.
II. Enterprises’ 2015 Housing Goals Performance
FHFA made its final determinations on the performance of the Enterprises under the 2015 housing goals after FHFA submitted last year’s Annual Housing Report to Congress. FHFA found that Fannie Mae, which had achieved all of the housing goals for 2014, did not meet the low-income and very low-income home purchase goals for 2015, albeit by small margins. Fannie Mae achieved the other single-family and multifamily goals and subgoals. FHFA also found that, as in 2014, Freddie Mac achieved the multifamily goals and three of the single-family goals, but like Fannie Mae, fell short on the low-income and very low-income home purchase goals, although by smaller margins than in 2014. FHFA determined that achievement of the goals each Enterprise failed to attain in 2015 was feasible.
In December 2015, FHFA required Freddie Mac to submit a housing plan based on its performance on the housing goals in 2014, outlining the steps it would take to achieve the unmet goals in 2016 and 2017. In December 2016, as part of the response to the Enterprise’s continued shortfalls in 2015, FHFA required Freddie Mac to extend the duration of its housing plan through

6
A n n u a l H o u s i n g R e p o r t 2 0 1 7
2018.11 Freddie Mac delivered a revised housing plan as required, and FHFA approved the plan on April 3, 2017.12 FHFA is closely monitoring Freddie Mac’s performance on these goals and meets with the Enterprise on a monthly basis to discuss the steps being taken to improve performance on the goals.
Because Fannie Mae met all of its goals in 2014 and fell short by small amounts on two of the goals in 2015, FHFA did not require Fannie Mae to submit a housing plan. However, in a letter dated December 19, 2016, FHFA informed Fannie Mae that it expects Fannie Mae to make improvements in serving these markets, and that FHFA would closely monitor and evaluate Fannie Mae’s housing goals performance in 2017.13
III. 2016 Housing Goals Performance
FHFA notified the Enterprises of its preliminary determinations of their performance under the Enterprise housing goals for 2016 on October 10, 2017, and those letters are included as Appendix A.14 To reach these preliminary determinations, FHFA analyzed the loan-level data submitted with the Enterprises’ annual housing activities reports for 2016. FHFA also calculated the goal-qualifying market shares based on 2016 HMDA data released by the Federal Financial Institutions Examination Council (FFIEC) on September 28, 2017. Each Enterprise has 30 days to submit any documentation it wishes FHFA to consider in making a final determination about the Enterprise’s compliance with the housing goals for 2016.15
11 See https://www.fhfa.gov/PolicyProgramsResearch/Programs/AffordableHousing/Documents/Fred_M_Goals/2016/12-19-16%20_FRE-2015-Housing-Goals-Perf-Final-Determination-ltr.pdf. 12 See https://www.fhfa.gov/PolicyProgramsResearch/Programs/AffordableHousing/Documents/Fred_M_Goals/2017/4-3-17_FRE_Affordable_Hsg_Plan_for_2017-18.pdf. 13 See https://www.fhfa.gov/PolicyProgramsResearch/Programs/AffordableHousing/Documents/Fan_M_Goals/2016/12-19-16_FNM-2015-Housing-Goals-Perf-Final-Determination-ltr.pdf.14 Appendix A of the 2016 Annual Housing Report contained the preliminary goal performance determination lettersfor 2015. Appendix A of this Report contains the corresponding letters for 2016. The final determination lettersregarding goal performance in 2015 were sent to the Enterprises on December 19, 2016, and are available onFHFA’s Web site.15 See 12 U.S.C. § 4566(b)(2).
7
A n n u a l H o u s i n g R e p o r t 2 0 1 7
A. 2016 Housing Goals Performance – Single-Family
The single-family housing goal levels for 2015 through 2017 are expressed as percentages of each Enterprise’s purchases of mortgages on single-family owner-occupied properties. FHFA established the home purchase and refinance goals separately.
For the single-family housing goals for 2015 through 2017, an Enterprise achieves a goal if its performance meets or exceeds at least one of the following:
• The specific benchmark levels established in FHFA’s September 3, 2015, final rule; or
• The share of the conventional, conforming primary mortgage market that qualified for the goal based on FHFA’s analysis of HMDA data.
FHFA analyzes the single-family mortgage market by calculating the share of home purchase or refinance mortgages originated in the primary mortgage market that qualified for the goal in that year. The market level figures are defined as HMDA-reported conventional loans on owner-occupied properties with principal balances less than or equal to the Enterprises’ conforming loan limits. Therefore, the market level figures16 exclude loans insured or guaranteed by the federal government, such as the Federal Housing Administration (FHA), U.S. Department of Veterans Affairs (VA), and U.S. Department of Agriculture Rural Housing Service (RHS). FHFA based these calculations on its analysis of HMDA data submitted to the FFIEC by primary market mortgage originators.
For the 2016 performance year, as in 2010 through 2015, FHFA counted Enterprise loans modified in accordance with the Home Affordable Modification Program (HAMP) as purchases of refinance mortgages for purposes of the low-income refinance goal. Loan modifications resulted in improved performance on the low-income refinance goal by each Enterprise in 2016, though by smaller amounts than in previous years. The HAMP program expired at the end of 2016. There will be some HAMP modifications that will count toward the Enterprise housing goals in 2017 as applications initiated before the end of the program are converted to permanent modifications.
16 FHFA defines the market level figures to include the same kinds of loans that are counted in determining the Enterprise performance on the housing goals.

8
A n n u a l H o u s i n g R e p o r t 2 0 1 7
Fannie Mae – Single-Family Table 1: Fannie Mae Single-Family Housing Goals and Performance Results 2016
Benchmark Level
Market Level
FHFA Preliminary Determination of
Fannie Mae’s 2016 Performance
Low-Income Home Purchase Goal 24.0% 22.9%17 22.9%18
Very Low-Income Home Purchase Goal 6.0% 5.4% 5.2%
Low-Income Areas Home Purchase Goal 17.0% 19.7% 20.2%
Low-Income Areas Home Purchase Subgoal 14.0% 15.9% 16.2%
Low-Income Refinance Goal19 21.0% 19.8% 19.5%
17 The market performance for the low-income home purchase goal in 2016 was 22.87 percent. 18 FHFA preliminarily determined that Fannie Mae exceeded the 2016 market level for the low-income home purchase goal with its performance of 22.92 percent. 19 Fannie Mae’s performance on the low-income refinance goal exclusive of loan modifications in 2016 was 19.4 percent. Fannie Mae modified 3,800 goal-eligible loans under HAMP in 2016, of which 2,127 (56 percent) were for low-income families. FHFA has preliminarily determined that Fannie Mae’s performance on this goal in 2016 was 19.5 percent, thus HAMP modifications added 0.1 percentage point to its performance. The impact was larger in previous years, when HAMP volume was higher.
Based on the above information, FHFA has preliminarily determined that Fannie Mae achieved the single-family low-income home purchase goal and the low-income areas home purchase goal and subgoal for 2016, but failed to meet the very low-income home purchase goal and the low-income refinance goal for 2016.
9
A n n u a l H o u s i n g R e p o r t 2 0 1 7
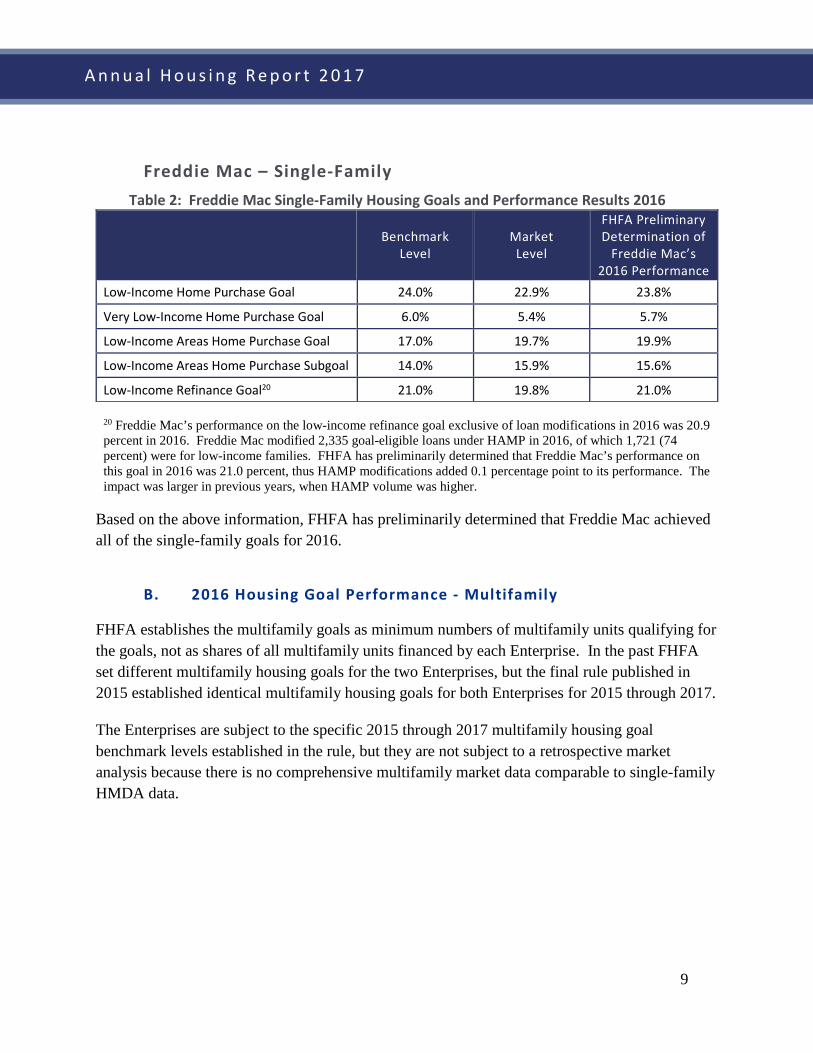
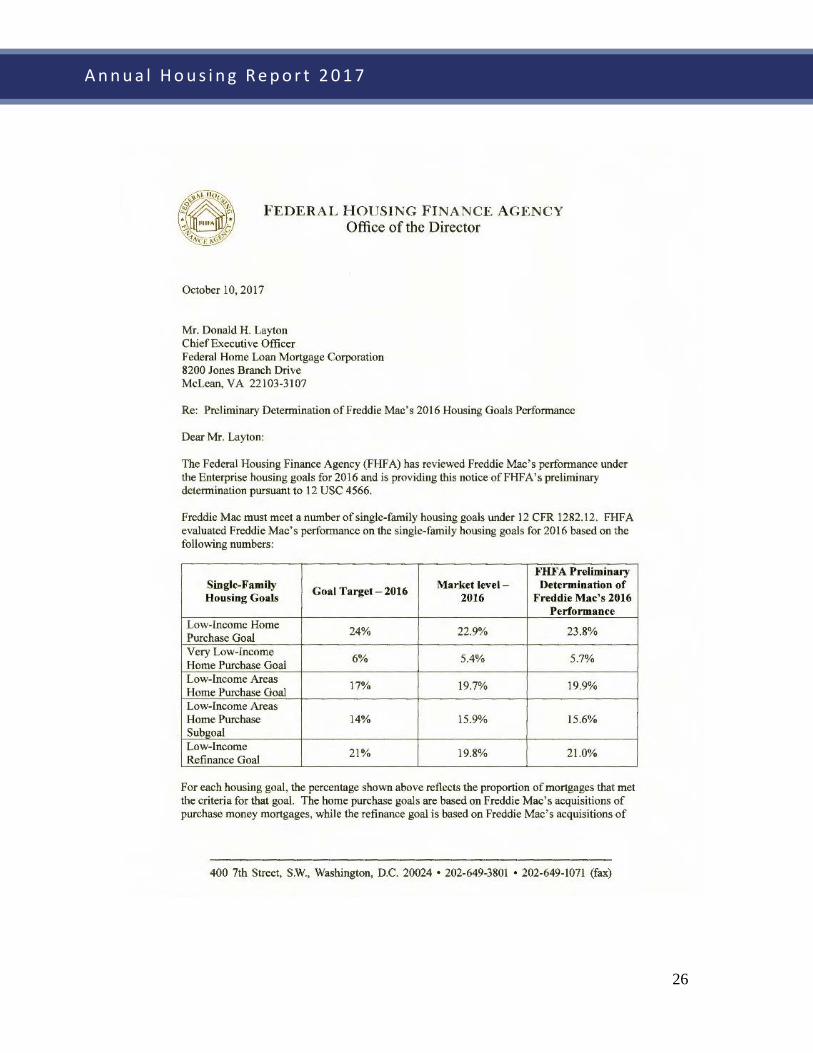
Freddie Mac – Single-Family Table 2: Freddie Mac Single-Family Housing Goals and Performance Results 2016
Benchmark Level
Market Level
FHFA Preliminary Determination of
Freddie Mac’s 2016 Performance
Low-Income Home Purchase Goal 24.0% 22.9% 23.8%
Very Low-Income Home Purchase Goal 6.0% 5.4% 5.7%
Low-Income Areas Home Purchase Goal 17.0% 19.7% 19.9%
Low-Income Areas Home Purchase Subgoal 14.0% 15.9% 15.6%
Low-Income Refinance Goal20 21.0% 19.8% 21.0%
20 Freddie Mac’s performance on the low-income refinance goal exclusive of loan modifications in 2016 was 20.9 percent in 2016. Freddie Mac modified 2,335 goal-eligible loans under HAMP in 2016, of which 1,721 (74 percent) were for low-income families. FHFA has preliminarily determined that Freddie Mac’s performance on this goal in 2016 was 21.0 percent, thus HAMP modifications added 0.1 percentage point to its performance. The impact was larger in previous years, when HAMP volume was higher.
Based on the above information, FHFA has preliminarily determined that Freddie Mac achieved all of the single-family goals for 2016.
B. 2016 Housing Goal Performance - Multifamily
FHFA establishes the multifamily goals as minimum numbers of multifamily units qualifying for the goals, not as shares of all multifamily units financed by each Enterprise. In the past FHFA set different multifamily housing goals for the two Enterprises, but the final rule published in 2015 established identical multifamily housing goals for both Enterprises for 2015 through 2017.
The Enterprises are subject to the specific 2015 through 2017 multifamily housing goal benchmark levels established in the rule, but they are not subject to a retrospective market analysis because there is no comprehensive multifamily market data comparable to single-family HMDA data.

10
A n n u a l H o u s i n g R e p o r t 2 0 1 7
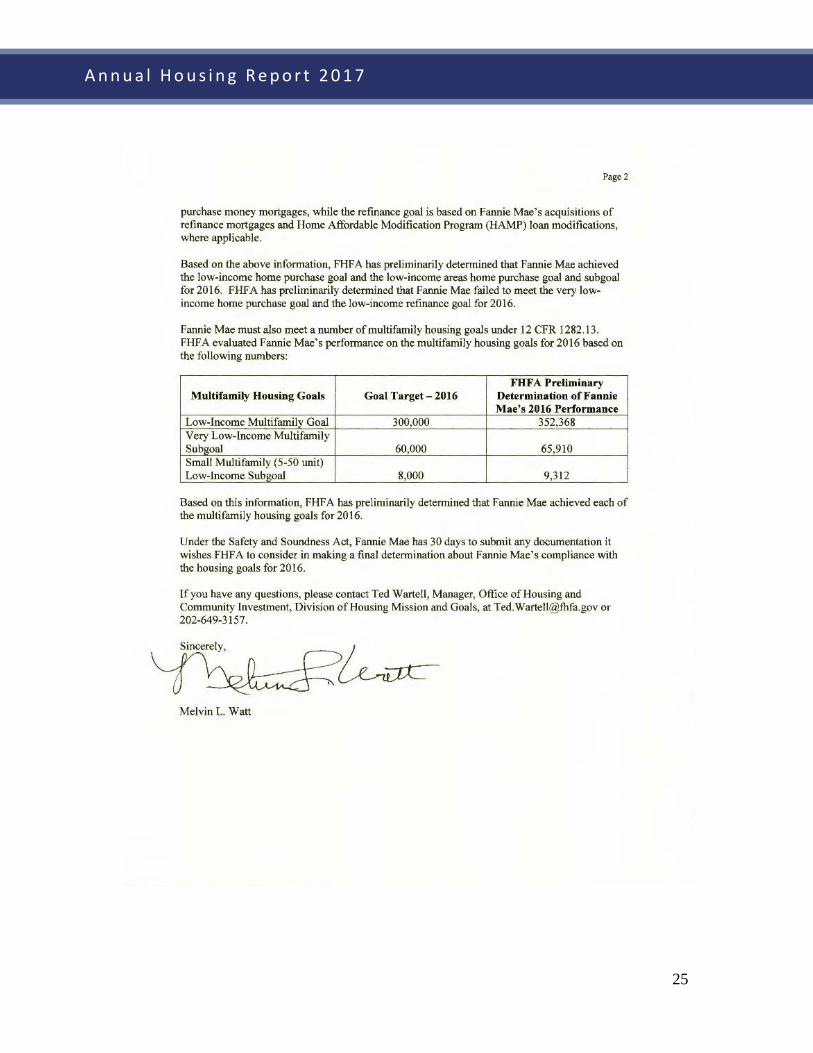
Fannie Mae – Multifamily Table 3: Fannie Mae Multifamily Housing Goals and Performance Results 2016
Benchmark Level FHFA Preliminary
Determination of Fannie Mae’s 2016 Performance
Low-Income Multifamily Goal 300,000 352,368
Very Low-Income Multifamily Subgoal 60,000 65,910
Small Multifamily Low-Income Subgoal 8,000 9,312
Based on the above information, FHFA has preliminarily determined that Fannie Mae achieved all of the multifamily goals for 2016.
Freddie Mac – Multifamily Table 4: Freddie Mac Multifamily Housing Goals and Performance Results 2016
Benchmark Level FHFA Preliminary
Determination of Freddie Mac’s 2016 Performance
Low-Income Multifamily Goal 300,000 406,958
Very Low-Income Multifamily Subgoal 60,000 73,030
Small Multifamily Low-Income Subgoal 8,000 22,101
Based on the above information, FHFA has preliminarily determined that Freddie Mac achieved all of the multifamily goals for 2016.
Enterprise Data Compared to Market Data
In 2016, Fannie Mae acquired $547.8 billion of loans on single-family, owner-occupied housing, and Freddie Mac acquired $362.1 billion of such loans. Tables 5 through 9 show various characteristics of the mortgages purchased by Fannie Mae and Freddie Mac in 2016 and the
11
A n n u a l H o u s i n g R e p o r t 2 0 1 7
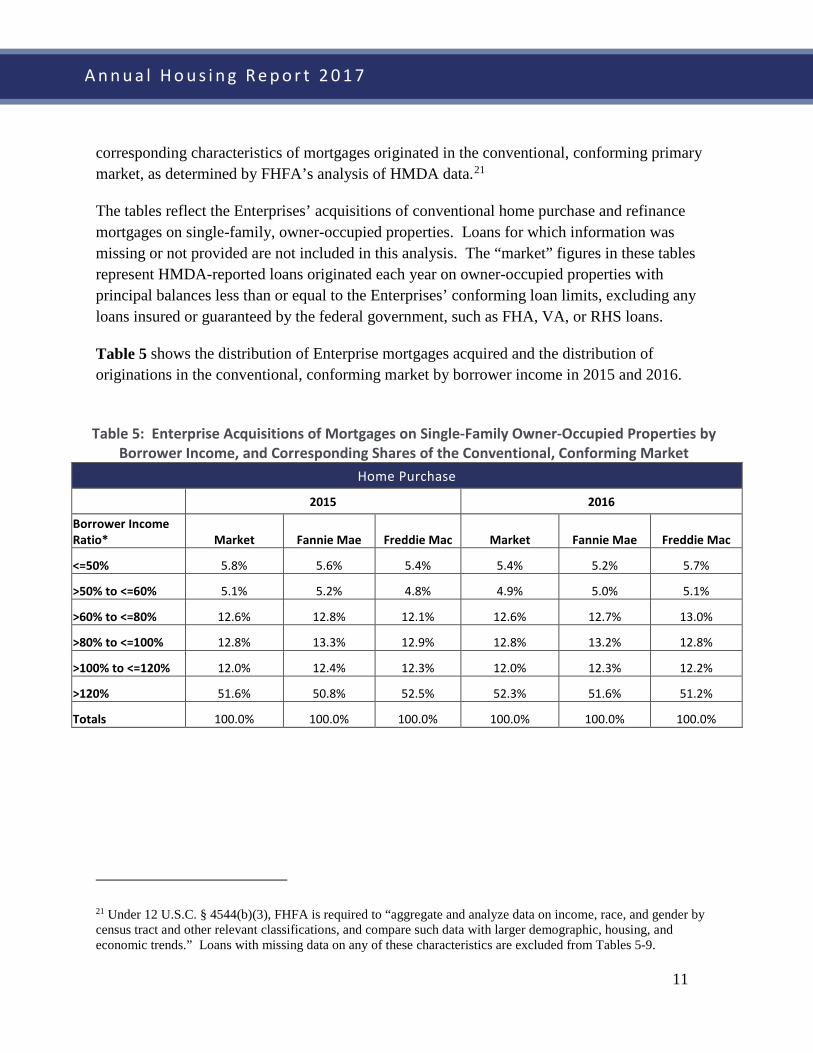
corresponding characteristics of mortgages originated in the conventional, conforming primary market, as determined by FHFA’s analysis of HMDA data.21
The tables reflect the Enterprises’ acquisitions of conventional home purchase and refinance mortgages on single-family, owner-occupied properties. Loans for which information was missing or not provided are not included in this analysis. The “market” figures in these tables represent HMDA-reported loans originated each year on owner-occupied properties with principal balances less than or equal to the Enterprises’ conforming loan limits, excluding any loans insured or guaranteed by the federal government, such as FHA, VA, or RHS loans.
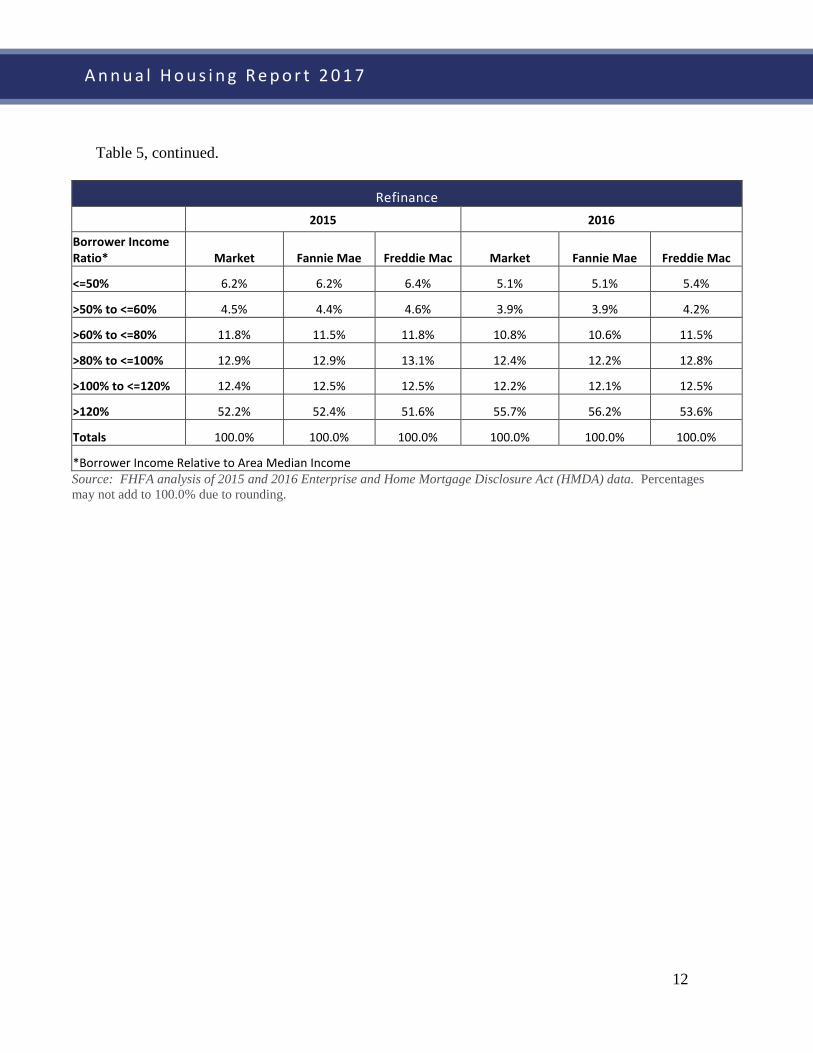
Table 5 shows the distribution of Enterprise mortgages acquired and the distribution of originations in the conventional, conforming market by borrower income in 2015 and 2016.
Table 5: Enterprise Acquisitions of Mortgages on Single-Family Owner-Occupied Properties by
Borrower Income, and Corresponding Shares of the Conventional, Conforming Market Home Purchase
2015 2016
Borrower Income Ratio* Market Fannie Mae Freddie Mac Market Fannie Mae Freddie Mac
<=50% 5.8% 5.6% 5.4% 5.4% 5.2% 5.7%
>50% to <=60% 5.1% 5.2% 4.8% 4.9% 5.0% 5.1%
>60% to <=80% 12.6% 12.8% 12.1% 12.6% 12.7% 13.0%
>80% to <=100% 12.8% 13.3% 12.9% 12.8% 13.2% 12.8%
>100% to <=120% 12.0% 12.4% 12.3% 12.0% 12.3% 12.2%
>120% 51.6% 50.8% 52.5% 52.3% 51.6% 51.2%
Totals 100.0% 100.0% 100.0% 100.0% 100.0% 100.0%
21 Under 12 U.S.C. § 4544(b)(3), FHFA is required to “aggregate and analyze data on income, race, and gender by census tract and other relevant classifications, and compare such data with larger demographic, housing, and economic trends.” Loans with missing data on any of these characteristics are excluded from Tables 5-9.
12
A n n u a l H o u s i n g R e p o r t 2 0 1 7
Table 5, continued.
Refinance 2015 2016
Borrower Income Ratio* Market Fannie Mae Freddie Mac Market Fannie Mae Freddie Mac
<=50% 6.2% 6.2% 6.4% 5.1% 5.1% 5.4%
>50% to <=60% 4.5% 4.4% 4.6% 3.9% 3.9% 4.2%
>60% to <=80% 11.8% 11.5% 11.8% 10.8% 10.6% 11.5%
>80% to <=100% 12.9% 12.9% 13.1% 12.4% 12.2% 12.8%
>100% to <=120% 12.4% 12.5% 12.5% 12.2% 12.1% 12.5%
>120% 52.2% 52.4% 51.6% 55.7% 56.2% 53.6%
Totals 100.0% 100.0% 100.0% 100.0% 100.0% 100.0%
*Borrower Income Relative to Area Median Income Source: FHFA analysis of 2015 and 2016 Enterprise and Home Mortgage Disclosure Act (HMDA) data. Percentages may not add to 100.0% due to rounding.

13
A n n u a l H o u s i n g R e p o r t 2 0 1 7
Table 6 shows the distribution of Enterprise mortgages acquired and the originations distribution in the conventional, conforming market by race/ethnicity of the borrower(s) in 2015 and 2016.
Table 6: Enterprise Acquisitions of Mortgages on Single-Family Owner-Occupied Properties by Borrower Race/Ethnicity, and Corresponding Shares of the Conventional,
Conforming Market Home Purchase
2015 2016
Race/Ethnicity of Borrower(s) Market Fannie
Mae Freddie
Mac Market Fannie Mae
Freddie Mac
Hispanic or Latino 6.8% 7.8% 6.6% 7.6% 8.4% 7.6% American Indian/Alaskan Native 0.3% 0.5% 0.3% 0.3% 0.2% 0.2%
Asian 7.6% 7.4% 8.1% 7.8% 7.7% 7.9%
African American 3.0% 3.0% 2.4% 3.4% 3.3% 2.8%
Native Hawaiian/Pacific Islander 0.2% 0.3% 0.2% 0.2% 0.3% 0.2%
Non-Hispanic White Alone 81.6% 80.7% 80.6% 80.1% 79.7% 79.3%
Two or More Races 0.4% 0.3% 0.0% 0.5% 0.4% 2.0%
Totals 100.0% 100.0% 100.0% 100.0% 100.0% 100.0%
Refinance
2015 2016
Race/Ethnicity of Borrower(s) Market Fannie Mae
Freddie Mac Market Fannie
Mae Freddie
Mac Hispanic or Latino 8.3% 9.3% 8.6% 8.6% 9.2% 8.9% American Indian/Alaskan Native 0.3% 0.5% 0.3% 0.3% 0.3% 0.2%
Asian 6.4% 6.8% 6.7% 7.5% 8.1% 7.0%
African American 3.8% 4.0% 3.6% 3.7% 3.7% 3.4% Native Hawaiian/Pacific Islander 0.3% 0.4% 0.3% 0.4% 0.4% 0.3%
Non-Hispanic White Alone 80.4% 78.6% 78.5% 79.1% 77.9% 78.1%
Two or More Races 0.4% 0.4% 2.0% 0.4% 0.4% 2.1%
Totals 100.0% 100.0% 100.0% 100.0% 100.0% 100.0% Source: FHFA analysis of 2015 and 2016 Enterprise and Home Mortgage Disclosure Act (HMDA) data. Percentages may not add to 100.0% due to rounding.

14
A n n u a l H o u s i n g R e p o r t 2 0 1 7
Table 7 shows the distribution of Enterprise mortgages acquired and the originations distribution in the conventional, conforming market by gender of borrower in 2015 and 2016.
Table 7: Enterprise Acquisitions of Mortgages on Single-Family Owner-Occupied Properties by Borrower Gender, and Corresponding Shares of the Conventional,
Conforming Market Home Purchase
2015 2016
Gender of Borrower(s) Market Fannie Mae
Freddie Mac Market Fannie
Mae Freddie
Mac One Borrower (Male) 30.6 31.3 30.4 31.1 31.3 31.5 One Borrower (Female) 21.8 22.4 20.9 22.3 22.7 22.2 Co-Borrowers (All Male) 1.2 0.9 1.9 1.3 1.3 1.7 Co-Borrowers (All Female) 1.0 0.9 1.4 1.1 1.2 1.4 Co-Borrowers (Male and Female) 45.4 44.5 45.5 44.1 43.5 43.2 Totals 100.0 100.0 100.0 100.0 100.0 100.0
Refinance 2015 2016
Gender of Borrower(s) Market Fannie Mae
Freddie Mac Market Fannie
Mae Freddie
Mac One Borrower (Male) 27.4 28.0 27.3 28.3 28.7 28.9 One Borrower (Female) 20.9 21.1 20.6 20.6 20.7 21.0 Co-Borrowers (All Male) 0.8 0.7 1.0 0.8 0.8 0.9 Co-Borrowers (All Female) 0.8 0.8 0.9 0.8 0.8 0.9 Co-Borrowers (Male and Female) 50.1 49.4 50.2 49.5 49.0 48.3 Totals 100.0 100.0 100.0 100.0 100.0 100.0
Source: FHFA analysis of 2015 and 2016 Enterprise and Home Mortgage Disclosure Act (HMDA) data. Percentages may not add to 100.0% due to rounding.
15
A n n u a l H o u s i n g R e p o r t 2 0 1 7
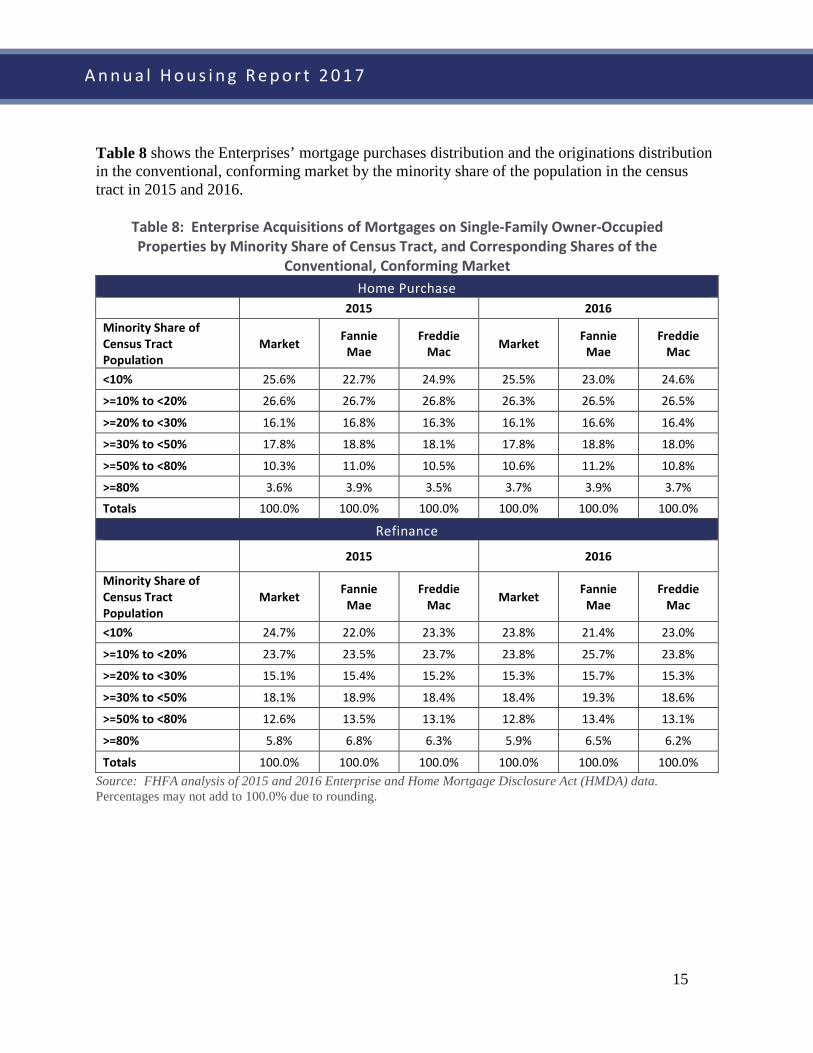
Table 8 shows the Enterprises’ mortgage purchases distribution and the originations distribution in the conventional, conforming market by the minority share of the population in the census tract in 2015 and 2016.
Table 8: Enterprise Acquisitions of Mortgages on Single-Family Owner-Occupied Properties by Minority Share of Census Tract, and Corresponding Shares of the
Conventional, Conforming Market Home Purchase
2015 2016
Minority Share of Census Tract Population
Market Fannie Mae
Freddie Mac Market Fannie
Mae Freddie
Mac
<10% 25.6% 22.7% 24.9% 25.5% 23.0% 24.6%
>=10% to <20% 26.6% 26.7% 26.8% 26.3% 26.5% 26.5%
>=20% to <30% 16.1% 16.8% 16.3% 16.1% 16.6% 16.4%
>=30% to <50% 17.8% 18.8% 18.1% 17.8% 18.8% 18.0%
>=50% to <80% 10.3% 11.0% 10.5% 10.6% 11.2% 10.8%
>=80% 3.6% 3.9% 3.5% 3.7% 3.9% 3.7%
Totals 100.0% 100.0% 100.0% 100.0% 100.0% 100.0%
Refinance
2015 2016
Minority Share of Census Tract Population
Market Fannie Mae
Freddie Mac Market Fannie
Mae Freddie
Mac
<10% 24.7% 22.0% 23.3% 23.8% 21.4% 23.0%
>=10% to <20% 23.7% 23.5% 23.7% 23.8% 25.7% 23.8%
>=20% to <30% 15.1% 15.4% 15.2% 15.3% 15.7% 15.3%
>=30% to <50% 18.1% 18.9% 18.4% 18.4% 19.3% 18.6%
>=50% to <80% 12.6% 13.5% 13.1% 12.8% 13.4% 13.1%
>=80% 5.8% 6.8% 6.3% 5.9% 6.5% 6.2%
Totals 100.0% 100.0% 100.0% 100.0% 100.0% 100.0% Source: FHFA analysis of 2015 and 2016 Enterprise and Home Mortgage Disclosure Act (HMDA) data. Percentages may not add to 100.0% due to rounding.

16
A n n u a l H o u s i n g R e p o r t 2 0 1 7
Table 9 shows the Enterprises’ mortgage purchases distribution and the originations distribution in the conventional, conforming market by the median income level of the population in the census tract in 2015 and 2016.
Table 9: Enterprise Acquisitions of Mortgages on Single-Family Owner-Occupied Properties by Census Tract Median Income Relative to Area Median Income, and Corresponding Shares
of the Conventional, Conforming Market
Home Purchase
2015 2016
Census Tract Income Ratio* Market Fannie
Mae Freddie
Mac Market Fannie Mae
Freddie Mac
<=60% 3.6% 3.6% 3.3% 3.9% 3.8% 3.7%
>60% to <=80% 8.5% 8.8% 8.3% 8.9% 9.2% 8.9%
>80% to <=100% 18.9% 18.2% 17.8% 19.5% 18.9% 18.7%
>100% to <=120% 23.3% 23.3% 23.3% 23.5% 23.1% 22.3%
>120% 45.7% 46.0% 47.2% 44.2% 45.0% 45.5%
Totals 100.0% 100.0% 100.0% 100.0% 100.0% 100.0%
Refinance
2015 2016
Census Tract Income Ratio* Market Fannie
Mae Freddie
Mac Market Fannie Mae
Freddie Mac
<=60% 3.5% 3.6% 3.5% 3.5% 3.5% 3.5%
>60% to <=80% 9.0% 9.0% 8.8% 8.7% 8.8% 8.9%
>80% to <=100% 19.6% 18.9% 18.7% 19.0% 18.7% 18.7%
>100% to <=120% 23.6% 23.2% 23.3% 23.3% 22.8% 23.2%
>120% 44.3% 45.3% 45.7% 45.6% 46.8% 45.7%
Totals 100.0% 100.0% 100.0% 100.0% 100.0% 100.0%
*Median income of the census tract relative to Area Median Income (AMI). Source: FHFA analysis of 2015 and 2016 Enterprise and Home Mortgage Disclosure Act (HMDA) data. Percentages may not add to 100.0% due to rounding.
17
A n n u a l H o u s i n g R e p o r t 2 0 1 7
Subprime and Nontraditional Loans
The Safety and Soundness Act requires FHFA to “identify the extent to which each [E]nterprise is involved in mortgage purchases and secondary market activities involving subprime and nontraditional loans”22 and to “compare the characteristics of subprime and nontraditional loans both purchased and securitized by each [E]nterprise to other loans purchased and securitized by each [E]nterprise.”23 On May 6, 2013, FHFA directed Fannie Mae and Freddie Mac not to purchase interest-only loans, negative amortization loans, loans with terms longer than 30 years, or loans with points and fees exceeding the thresholds established by the Consumer Financial Protection Bureau’s (CFPB) Qualified Mortgage rule. This directive became effective on January 10, 2014.24
Appendix B of this Report provides a breakdown of the characteristics of mortgage products purchased by the Enterprises in 2015 and 2016, as well as information on mortgage payment types, loan-to-value ratios, and credit scores.
Higher-Priced Mortgage Loans
The Safety and Soundness Act requires FHFA to “compare the characteristics of high-cost loans purchased and securitized [by each Enterprise], where such securities are not held on portfolio to loans purchased and securitized, where such securities are either retained on portfolio or repurchased by the [E]nterprise, including such characteristics as (A) the purchase price of the property that secures the mortgage; (B) the loan-to-value ratio of the mortgage, which shall reflect any secondary liens on the relevant property; (C) the terms of the mortgage; (D) the creditworthiness of the borrower; and (E) any other relevant data, as determined by the Director.”25 The Safety and Soundness Act also requires that FHFA release the high-cost loan characteristics data to the public.26 However, the Safety and Soundness Act does not define the term “high-cost loan,” nor does any legislative history state the intent of this provision. After considering various options, FHFA decided to define “high-cost loan” in this context as a loan with a HMDA-reportable “rate spread” that is 150 basis points or more above the Average Prime
22 See 12 U.S.C. § 4544(b)(4). 23 See 12 U.S.C. § 4544(b)(5). 24 See http://www.fhfa.gov/Media/PublicAffairs/Pages/FHFA-Limiting-Fannie-Mae-and-Freddie-MacLoan-Purchases-to-Qualified-Mortgages.aspx. 25 See 12 U.S.C. § 4544(b)(6). 26 See 12 U.S.C. § 4546(d)(2).

18
A n n u a l H o u s i n g R e p o r t 2 0 1 7
Offer Rate (APOR).27 In other contexts, FHFA refers to loans exceeding this rate-spread threshold as “higher-priced mortgage loans.”28 To ensure consistency, the Report uses the “higher-priced” terminology when referring to “high-cost loans.” In 2016, 1.6 percent of all single-family loans purchased by the Enterprises were higher-priced mortgage loans.
For Enterprise mortgage purchases in 2016, the tables in Appendix C show the number of higher-priced mortgage loans in securities compared to the number of higher-priced mortgage loans retained in portfolio at year-end by each Enterprise.29 The tables identify this information according to the following loan characteristics: purchase price, loan-to-value ratio, product type, term at origination, interest rate at origination, credit score, borrower income ratio, tract income ratio, census tract demographics, purpose of the loan, and federal guarantee status.30
Duty to Serve Underserved Markets
The Safety and Soundness Act establishes a duty for the Enterprises to serve very low-, low-, and moderate-income families in three underserved markets – manufactured housing, affordable housing preservation, and rural housing – with the objective of increasing liquidity of mortgage investments and improving the distribution of investment capital available for mortgage financing in each of these markets.31 On December 13, 2016, FHFA issued a final rule implementing the Duty to Serve requirements.32 The final rule specifies the scope of Enterprise activities that are eligible to receive Duty to Serve credit and provides a framework for FHFA’s
27 See 76 Fed. Reg. 60031 (Sept. 28, 2011) (defining “high-cost loan” for purposes of 12 U.S.C. §§ 4544(b)(6) and 4546(d)(2)). 28 CFPB has defined “higher-priced mortgage loan” in the same way for most mortgages, although the CFPB definition sets higher rate spread cut-offs for jumbo mortgages (250 basis points or more above the APOR) and for subordinate lien mortgages (350 basis points or more above the APOR). See 12 CFR § 1026.35(a). In amending the Truth in Lending Act, the Home Ownership and Equity Protection Act (HOEPA), 15 U.S.C. § 1602(bb), established a separate category of loans designated as “high-cost mortgages.” Mortgages on primary residences that exceed the applicable mortgage interest rate and total point and fee thresholds established under HOEPA are not eligible for sale to the Enterprises. 29 Loans identified as “retained in the portfolio” are generally loans that the Enterprises hold as assets in their mortgage portfolios. Examples of these loans would be loans that are not eligible for securitization, defaulted loans purchased out of mortgage-backed securities, and loans that the Enterprises purchase directly either to hold in portfolio and/or to aggregate for securitization at a future date. Loans identified as “not held in the portfolio” are generally loans that the Enterprises have pooled into mortgage-backed securities and sold to investors. 30 These loan characteristics are further described in FHFA’s September 28, 2011, Notice of Order. See 76 Fed. Reg. 60031. 31 See 12 U.S.C. § 4565. 32 See also 81 Fed. Reg. 96242 (Dec. 29, 2016).
19
A n n u a l H o u s i n g R e p o r t 2 0 1 7
method for evaluating and rating the Enterprises’ compliance with their duty to serve these underserved markets, as required by the Safety and Soundness Act.
Under the final rule, the Enterprises may receive Duty to Serve credit for engaging in the following activities:
• In the manufactured housing market – Eligible Enterprise activities are those related to manufactured homes financed as personal property or chattel (initially as a pilot) and manufactured homes financed as real property. Duty to Serve credit is also available for certain categories of blanket loans to finance manufactured housing communities.
• In the affordable housing preservation market – Eligible Enterprise activities are those related to preserving the affordability of housing for renters and homebuyers, including activities under the multifamily rental housing programs specified in the Safety and Soundness Act. Duty to Serve credit is also available for activities related to financing for: energy efficiency improvements on both single-family properties with first liens and multifamily rental properties; small multifamily rental properties; purchase or rehabilitation of distressed single-family properties; shared equity homeownership programs; and the U.S. Department of Housing and Urban Development’s Choice Neighborhoods Initiative and Rental Assistance Demonstration program.
• In the rural housing market – Eligible Enterprise activities are those related to the financing of housing in rural areas, including activities serving the following high-needs rural regions and populations: Middle Appalachia, the Lower Mississippi Delta, colonias, rural census tracts in persistent poverty counties, members of a federally-recognized Native American tribe located in a Native American area, and agricultural workers. Duty to Serve credit is also available for activities that support financing by small financial institutions of housing in rural areas, and activities that support financing of small multifamily rental properties in rural areas.
The final rule requires each Enterprise to adopt a three-year Underserved Markets Plan (Plan) describing the activities and objectives the Enterprise will undertake for Duty to Serve credit. FHFA posted the Enterprises’ proposed 2018-2020 Plans for public input on May 8, 2017, and the public input period on these draft plans closed on July 10, 2017. The Enterprises are working to finalize their proposed Plans, with input from FHFA, and FHFA expects these plans will go into effect on January 1, 2018.
On January 13, 2017, FHFA also posted for public input proposed Evaluation Guidance that describes the procedures the Enterprises would be required to follow in preparing their Plans. The proposed Evaluation Guidance also sets forth the process by which FHFA would evaluate the Plans annually to produce a rating for each Enterprise’s implementation of its Plan and
20
A n n u a l H o u s i n g R e p o r t 2 0 1 7
impact on each underserved market. The public input period on the proposed Evaluation Guidance closed on June 7, 2017. FHFA plans to post the final Evaluation Guidance once it is completed.
Affordable Housing Allocations
The Safety and Soundness Act requires each Enterprise to set aside in each fiscal year an amount equal to 4.2 basis points for each dollar of the unpaid principal balance of its total new business purchases and transfer 65 percent of that amount to the Secretary of the Department of Housing and Urban Development (HUD) to fund the Housing Trust Fund and 35 percent to the Secretary of the Treasury Department to fund the Capital Magnet Fund.33 The Housing Trust Fund assists states in meeting the housing needs of the lowest income families. The Capital Magnet Fund is a special account within the Community Development Financial Institutions (CDFI) Fund designed to increase investment in affordable housing, economic development and community development facilities in low-income or underserved rural areas.34
Prior to 2015, the Enterprises did not set aside these amounts because of a November 2008 directive from FHFA requiring them to suspend the allocations until further notice. On December 11, 2014, FHFA directed each Enterprise to set aside and allocate amounts commencing with the Enterprise’s 2015 fiscal (calendar) year. FHFA also directed each Enterprise to transfer allocated amounts to HUD or the Treasury Department, as appropriate, within 60 days after the end of the Enterprise’s fiscal year, unless during that fiscal year the Enterprise had made, or the transfer would cause the Enterprise to make, a draw on the Treasury Department under the terms of the Senior Preferred Stock Purchase Agreements (PSPA).35
33 See 12 U.S.C § 4567(a). 34 Id.; See also 12 U.S.C. §§ 4568 and 4569. 35 See http://www.fhfa.gov/Media/PublicAffairs/Pages/FHFA-Statement-on-the-Housing-Trust-Fund-and-Capital-Magnet-Fund.aspx.

21
A n n u a l H o u s i n g R e p o r t 2 0 1 7
Fannie Mae’s total business volume in 2016 was $637.4 billion and, as a result, the total affordable housing allocation transferred was $268 million.36 Freddie Mac’s total business volume in 2016 was $445.7 billion and the total affordable housing allocation transferred was $187.1 million.37
Monthly Survey of Mortgage Markets (National Mortgage Database)
The Safety and Soundness Act requires FHFA to conduct a monthly survey of mortgage markets to collect information on the characteristics of individual mortgages, both those eligible and those ineligible for Enterprise purchase.38 The statute requires that FHFA collect the following information for each loan: (1) the price of the house securing the mortgage; (2) the loan-to-value ratio of the mortgage (including secondary financing); (3) the terms of the mortgage; (4) the creditworthiness of the borrower or borrowers; and (5) whether the mortgage (if eligible) was purchased by an Enterprise. The statute also requires FHFA to collect information on the loan and borrower characteristics of subprime mortgages and nontraditional mortgages eligible for purchase by the Enterprises, including the creditworthiness of borrowers and other information needed to determine whether these borrowers could have qualified for prime loans.
At the time Congress enacted HERA, there was no single data source containing all of the items required to comply with the Safety and Soundness Act. As a result, FHFA initiated the development of the National Mortgage Database (NMDB) to comply with these requirements. FHFA announced a partnership with CFPB to develop the NMDB in November 2012. The NMDB is still under development, and consequently, FHFA did not publish monthly mortgage surveys during 2010 through 2016.
When completed, the NMDB will provide comprehensive information about the U.S. mortgage market based upon a 5 percent nationally representative sample of single-family, first lien mortgages outstanding as of 1998. The NMDB will also include data, based on a subset of this 5 percent sample, from a series of borrower surveys about the borrower experience throughout the mortgage life cycle. These surveys currently include the National Survey of Mortgage Originations (NSMO) and the American Survey of Mortgage Borrowers.
36 Fannie Mae’s Form 10-K for 2016, 2/17/17, pp. 24, 186, F-10. 37 Freddie Mac’s Form 10-K for 2016, 2/16/17, pp. 171-72. 38 See 12 U.S.C. § 4544(c).

22
A n n u a l H o u s i n g R e p o r t 2 0 1 7
Although FHFA continues to determine what data fields are necessary for the NMDB and to exclude those that are not, FHFA has consistently maintained the position that the data included in the NMDB will not identify particular borrowers. FHFA has established strong information security systems and protocols and continues to review and evaluate every aspect of these systems and protocols.
FHFA published or updated the following four reports based on the NMDB since issuing the last Annual Housing Report:
• The National Mortgage Database Technical Report 1.1, updated on December 22, 2016, which provides users of the NMDB data background on the development of the database, as well as an assessment of the quality of the data;39
• The National Survey of Mortgage Originations Technical Report 2.1, also updated on December 22, 2016, which provides background details on how the NSMO was developed;
• A Profile of 2013 Mortgage Borrowers: Statistics from the National Survey of Mortgage Originations Technical Report 3.1, updated on March 21, 2017, which provides information about the first (2013) set of responses to NSMO, which is jointly administered by FHFA and the CFPB; and
• A Profile of 2014 Mortgage Borrowers: Statistics from the National Survey of Mortgage Originations Technical Report 4.0, released on March 21, 2017, which provides information about the 2014 set of responses to NSMO.
Public Access to Mortgage Information
The Safety and Soundness Act requires FHFA to make loan-level data submitted by the Enterprises available to the public, except for certain proprietary information and personally identifiable information.40 The Safety and Soundness Act also requires FHFA to make Enterprise data elements reported under HMDA (at the census tract level) available to the public. Finally, the Safety and Soundness Act requires FHFA to make certain high-cost securitized Enterprise loan data it collects available to the public to compare the characteristics of high-cost loans the Enterprises purchase and securitize.41 As noted earlier in this Report, because the
39 See https://www.fhfa.gov/PolicyProgramsResearch/Programs/Pages/National-Mortgage-Database.aspx. 40 See 12 U.S.C. §§ 4543, 4546. 41 See 12 U.S.C. §§ 4544(b)(6), 4546(d). See also Appendix C for the analysis of the higher-priced securitized loan
23
A n n u a l H o u s i n g R e p o r t 2 0 1 7
Safety and Soundness Act does not define the term “high-cost loan,” FHFA determined it would define “high-cost loan” by whether its HMDA rate spread is 150 basis points or more above the APOR. The Safety and Soundness Act requires FHFA to release the data by September 30 of the year following the year the Enterprises acquired the mortgages. On September 25, 2017, FHFA released this data to the public for 2016 through its Public Use Database (PUDB), which is available on FHFA’s website.42
data for 2015. 42 See http://www.fhfa.gov/DataTools/Downloads/Pages/Public-Use-Databases.aspx.

24
A n n u a l H o u s i n g R e p o r t 2 0 1 7
Appendix A: Preliminary Determination Letters: Enterprise 2016 Housing Goals Performance
25
A n n u a l H o u s i n g R e p o r t 2 0 1 7
26
A n n u a l H o u s i n g R e p o r t 2 0 1 7

27
A n n u a l H o u s i n g R e p o r t 2 0 1 7
28
A n n u a l H o u s i n g R e p o r t 2 0 1 7
Appendix B: Subprime and Nontraditional Loans
I. Overview of Single-Family Mortgages Acquired by the Enterprises
Excluding second liens and reverse mortgages, Fannie Mae and Freddie Mac acquired $976.4 billion of single-family loans in 2016 (see Table B1), an increase of 18.27 percent from the $825.6 billion in single-family loans the Enterprises acquired in 2015. These totals include loans that collateralize mortgage-backed securities guaranteed by either Enterprise and loans purchased for cash. While Tables 1 through 9 only include information about owner-occupied single-family purchases, this Appendix reports on both owner-occupied and investor-owned single-family purchases.
Fully amortizing mortgages comprised 100 percent of the single-family loans acquired by the Enterprises in 2016, per conservatorship guidance. Fully amortizing fixed-rate mortgages accounted for 98.40 percent of combined acquisitions, an increase from 94.60 percent in 2015 (see Table B1). Fully amortizing hybrid adjustable-rate mortgages accounted for 1.57 percent of 2016 acquisitions, a decrease from 2.78 percent in 2015. The Enterprises did not acquire any interest-only or negatively amortizing mortgages in 2016, as was the case in 2015.

29
A n n u a l H o u s i n g R e p o r t 2 0 1 7
Table B1. Single-Family Mortgages Acquired by Fannie Mae and Freddie Mac in 2015 and 2016 by Payment and Product Type ($ in millions and percent)43
2015 2016 Product Fully Amortizing Fully Amortizing Fully Amortizing Fully Amortizing
Type UPB Percent44 UPB Percent Fixed-Rate Mortgages $780,984.40 94.60% $960,769.60 98.40% ARMS – Traditional $19.30 0.00% $85.20 0.01% ARMS – Hybrid $22,923.50 2.78% $15,373.40 1.57% Balloon Mortgages $0.00 0.00% $0.00 0.00% Other Mortgages45 $21,672.50 2.63% $189.60 0.02% Totals $825,599.70 100.00% $976,417.80 100.00% 43 Includes mortgages purchased for cash and financed with guaranteed mortgage-backed securities. Excludes second liens and reverse mortgages. 44 Percentages may be zero due to rounding. 45 Other and unidentified product types. Includes Fixed-Rate Other and Other ARM. Fixed-Rate Other is fixed-rate mortgages with a term other than 40, 30, 20, or 15 years. Other ARM is ARMs with a structure other than 3/1, 5/1, 7/1, or 10/1. Source: Federal Housing Finance Agency based on information from Fannie Mae and Freddie Mac.
30
A n n u a l H o u s i n g R e p o r t 2 0 1 7
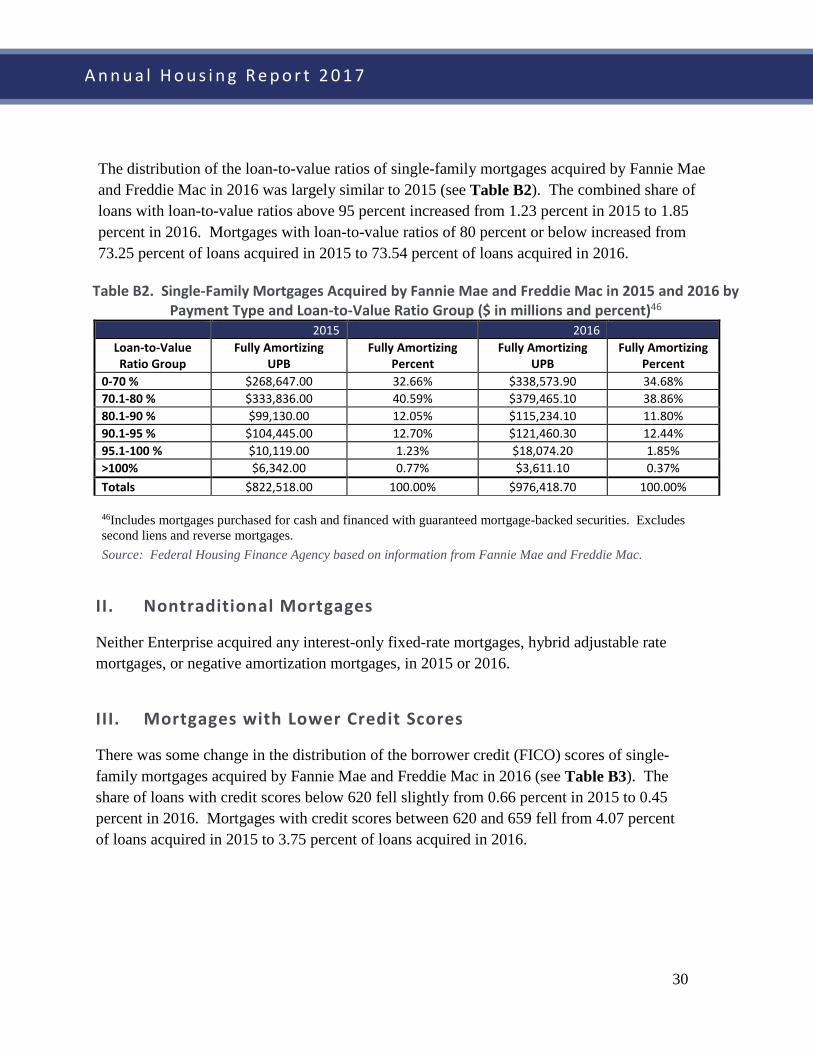
The distribution of the loan-to-value ratios of single-family mortgages acquired by Fannie Mae and Freddie Mac in 2016 was largely similar to 2015 (see Table B2). The combined share of loans with loan-to-value ratios above 95 percent increased from 1.23 percent in 2015 to 1.85 percent in 2016. Mortgages with loan-to-value ratios of 80 percent or below increased from 73.25 percent of loans acquired in 2015 to 73.54 percent of loans acquired in 2016.
Table B2. Single-Family Mortgages Acquired by Fannie Mae and Freddie Mac in 2015 and 2016 by Payment Type and Loan-to-Value Ratio Group ($ in millions and percent)46
2015 2016 Loan-to-Value Ratio Group
Fully Amortizing UPB
Fully Amortizing Percent
Fully Amortizing UPB
Fully Amortizing Percent
0-70 % $268,647.00 32.66% $338,573.90 34.68% 70.1-80 % $333,836.00 40.59% $379,465.10 38.86% 80.1-90 % $99,130.00 12.05% $115,234.10 11.80% 90.1-95 % $104,445.00 12.70% $121,460.30 12.44% 95.1-100 % $10,119.00 1.23% $18,074.20 1.85% >100% $6,342.00 0.77% $3,611.10 0.37% Totals $822,518.00 100.00% $976,418.70 100.00% 46Includes mortgages purchased for cash and financed with guaranteed mortgage-backed securities. Excludes second liens and reverse mortgages.
Source: Federal Housing Finance Agency based on information from Fannie Mae and Freddie Mac.
II. Nontraditional Mortgages
Neither Enterprise acquired any interest-only fixed-rate mortgages, hybrid adjustable rate mortgages, or negative amortization mortgages, in 2015 or 2016.
III. Mortgages with Lower Credit Scores
There was some change in the distribution of the borrower credit (FICO) scores of single-family mortgages acquired by Fannie Mae and Freddie Mac in 2016 (see Table B3). The share of loans with credit scores below 620 fell slightly from 0.66 percent in 2015 to 0.45 percent in 2016. Mortgages with credit scores between 620 and 659 fell from 4.07 percent of loans acquired in 2015 to 3.75 percent of loans acquired in 2016.

31
A n n u a l H o u s i n g R e p o r t 2 0 1 7
Table B3: Single-Family Mortgages Acquired by Fannie Mae and Freddie Mac in 2015 and 2016 by Payment Type and FICO Score Group ($ in millions and percent)47
2015 2016 FICO Score
Group Fully Amortizing
UPB Fully Amortizing
Percent48 Fully Amortizing
UPB Fully Amortizing
Percent 0-619 $5,384.50 0.66% $4,433.80 0.45% 620-659 $33,444.90 4.07% $36,561.60 3.75% 660-719 $173,327.40 21.10% $206,039.50 21.11% 720-749 $143,973.90 17.53% $173,293.90 17.75% 750+ $465,149.50 56.64% $555,767.20 56.94% Totals $821,280.20 100.00% $976,096.00 100.00%
47 Includes mortgages purchased for cash and financed with guaranteed mortgage-backed securities. Excludes second liens and reverse mortgages. Totals in this table do not equal the totals in Table B1a because some loans acquired by the Enterprises do not have FICO Score Group information. 48 Percentages may be zero due to rounding. Source: Federal Housing Finance Agency based on information from Fannie Mae and Freddie Mac.

32
A n n u a l H o u s i n g R e p o r t 2 0 1 7
Appendix C: Higher-Priced Mortgage Loans
As discussed in the “Higher-Priced Mortgage Loans” section of this Report, because the Safety and Soundness Act does not define the term “high-cost loan,” FHFA determined that it would define “high-cost loan” by whether its HMDA-reportable “rate spread” is 150 basis points or more above the APOR. In other contexts, FHFA refers to such loans as “higher-priced mortgage loans.”
In 2016, 1.6 percent of all single-family loans purchased by the Enterprises were higher-priced mortgage loans. The tables below show the number of higher-priced mortgage loans in Enterprise securities compared to the number of higher-priced mortgage loans retained on portfolio at year-end by each Enterprise for 2016.
The Safety and Soundness Act requires FHFA to compare the characteristics of high-cost loans purchased and securitized by each Enterprise “where such securities are not held on portfolio to loans purchased and securitized, where such securities are either retained on portfolio or repurchased by the [E]nterprise.” The comparisons should include “such characteristics as- (A) the purchase price of the property that secures the mortgage; (B) the loan-to-value ratio of the mortgage, which shall reflect any secondary liens on the relevant property; (C) the terms of the mortgage; (D) the creditworthiness of the borrower; and (E) any other relevant data, as determined by the Director.”49 Terms of a mortgage include product type, whether a fixed-rate mortgage (FRM) or an adjustable-rate mortgage (ARM), term (or length) of the mortgage at origination, amortization term, and interest rate at origination. Other relevant data included for comparative analysis are borrower income ratio, census tract income ratio, 2010 Census tract/percent minority, purpose of loan, and whether the loan has a federal guarantee.
49 See 12 U.S.C. § 4544(b)(6).

33
A n n u a l H o u s i n g R e p o r t 2 0 1 7
I. Purchase Price
Table C1 shows the comparison of the higher-priced securitized loans based on purchase price.
Table C1: Purchase Price
Purchase Price
Fannie Mae Freddie Mac
In Portfolio at Year-End?
Totals
In Portfolio at Year-End?
Totals Not Held Retained Not Held Retained
Loans Percent Loans Percent Loans Percent Loans Percent Loans Percent Loans Percent <= $417,000 39,459 93.3 1,794 91.0 41,253 93.2 13,173 93.0 4,795 97.7 17,968 94.2 > $417,000, <= $625,500 2,174 5.1 118 6.0 2,292 5.2 760 5.4 84 1.7 844 4.4 > $625,500, <= $729,750 315 0.7 23 1.2 338 0.8 100 0.7 6 0.1 106 0.6 > $729,750 325 0.8 37 1.9 362 0.8 132 0.9 23 0.5 155 0.8 Totals 42,273 100.0 1,972 100.0 44,245 100.0 14,165 100.0 4,908 100.0 19,073 100.0
II. Combined Loan-to-Value Ratio Table C2 shows the comparison of the higher-priced securitized loans based on the combined loan-to-value ratio of the mortgages, including secondary liens.
Table C2: Combined LTV (or LTV if missing)
Combined LTV (or LTV if missing)
Fannie Mae Freddie Mac In Portfolio at Year-End?
Totals In Portfolio at Year-End?
Totals Not Held Retained Not Held Retained Loans Percent Loans Percent Loans Percent Loans Percent Loans Percent Loans Percent
0% < LTV <= 60% 3,224 7.6 161 8.2 3,385 7.7 1,025 7.2 443 9.0 1,468 7.7 60% < LTV <= 80% 14,401 34.1 820 41.6 15,221 34.4 5,539 39.1 2,492 50.8 8,031 42.1 80% < LTV <= 90% 4,861 11.5 216 11.0 5,077 11.5 951 6.7 366 7.5 1,317 6.9 90% < LTV <= 95% 12,789 30.3 476 24.1 13,265 30.0 5,322 37.6 1,324 27.0 6,646 34.8 LTV > 95% 6,998 16.6 299 15.2 7,297 16.5 1,322 9.3 280 5.7 1,602 8.4 Missing 0 0.0 0 0.0 0 0.0 6 0.0 3 0.1 9 0.0 Totals 42,273 100.0 1,972 100.0 44,245 100.0 14,165 100.0 4,908 100.0 19,073 100.0

34
A n n u a l H o u s i n g R e p o r t 2 0 1 7
Table C2a shows the distribution based on combined loan-to-value ratio for securitized fixed-rate mortgages.
Table C2a: Combined LTV (or LTV if missing) of Fixed-Rate Mortgages
Combined LTV (or LTV if missing)
Fannie Mae Freddie Mac
In Portfolio at Year-End?
Totals
In Portfolio at Year-End?
Totals Not Held Retained Not Held Retained
Loans Percent Loans Percent Loans Percent Loans Percent Loans Percent Loans Percent 0% < LTV <= 60% 3,219 7.6 161 8.2 3,380 7.6 1,025 7.2 442 9.0 1,467 7.7 60% < LTV <= 80% 14,390 34.1 820 41.6 15,210 34.4 5,537 39.1 2,491 50.8 8,028 42.1 80% < LTV <= 90% 4,860 11.5 216 11.0 5,076 11.5 950 6.7 366 7.5 1,316 6.9 90% < LTV <= 95% 12,789 30.3 476 24.1 13,265 30.0 5,319 37.6 1,324 27.0 6,643 34.8 LTV > 95% 6,997 16.6 299 15.2 7,296 16.5 1,322 9.3 280 5.7 1,602 8.4 Missing 0 0.0 0 0.0 0 0.0 6 0.0 3 0.1 9 0.0 Totals 42,255 100.0 1,972 100.0 44,227 100.0 14,159 100.0 4,906 100.0 19,065 100.0
35
A n n u a l H o u s i n g R e p o r t 2 0 1 7
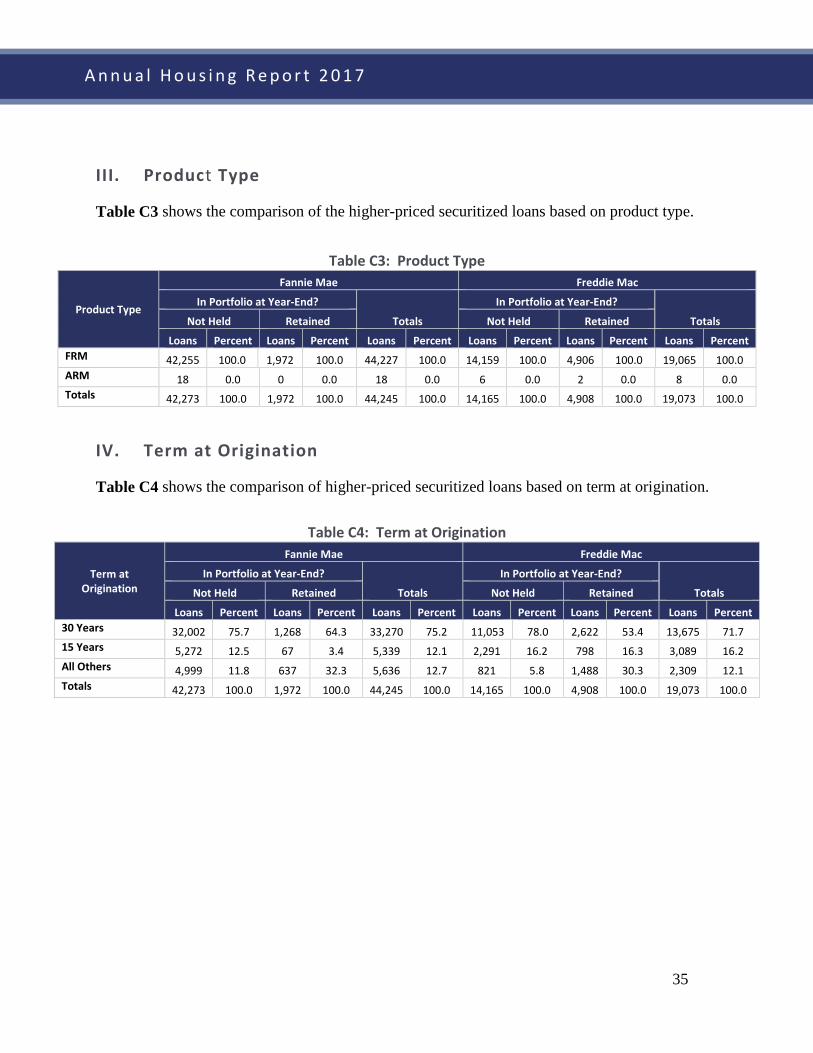
III. Product Type
Table C3 shows the comparison of the higher-priced securitized loans based on product type.
Table C3: Product Type
Product Type
Fannie Mae Freddie Mac
In Portfolio at Year-End?
Totals
In Portfolio at Year-End?
Totals Not Held Retained Not Held Retained
Loans Percent Loans Percent Loans Percent Loans Percent Loans Percent Loans Percent FRM 42,255 100.0 1,972 100.0 44,227 100.0 14,159 100.0 4,906 100.0 19,065 100.0 ARM 18 0.0 0 0.0 18 0.0 6 0.0 2 0.0 8 0.0 Totals 42,273 100.0 1,972 100.0 44,245 100.0 14,165 100.0 4,908 100.0 19,073 100.0
IV. Term at Origination
Table C4 shows the comparison of higher-priced securitized loans based on term at origination.
Table C4: Term at Origination
Term at Origination
Fannie Mae Freddie Mac
In Portfolio at Year-End?
Totals
In Portfolio at Year-End?
Totals Not Held Retained Not Held Retained
Loans Percent Loans Percent Loans Percent Loans Percent Loans Percent Loans Percent 30 Years 32,002 75.7 1,268 64.3 33,270 75.2 11,053 78.0 2,622 53.4 13,675 71.7 15 Years 5,272 12.5 67 3.4 5,339 12.1 2,291 16.2 798 16.3 3,089 16.2 All Others 4,999 11.8 637 32.3 5,636 12.7 821 5.8 1,488 30.3 2,309 12.1 Totals 42,273 100.0 1,972 100.0 44,245 100.0 14,165 100.0 4,908 100.0 19,073 100.0
36
A n n u a l H o u s i n g R e p o r t 2 0 1 7
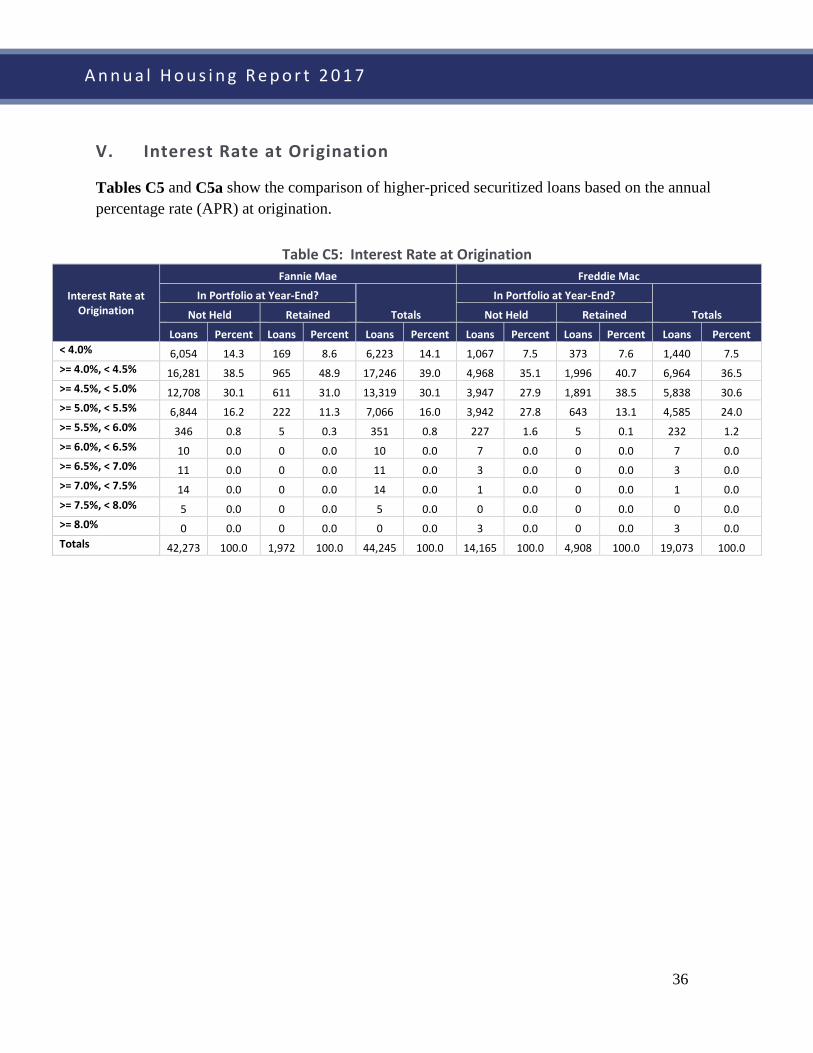
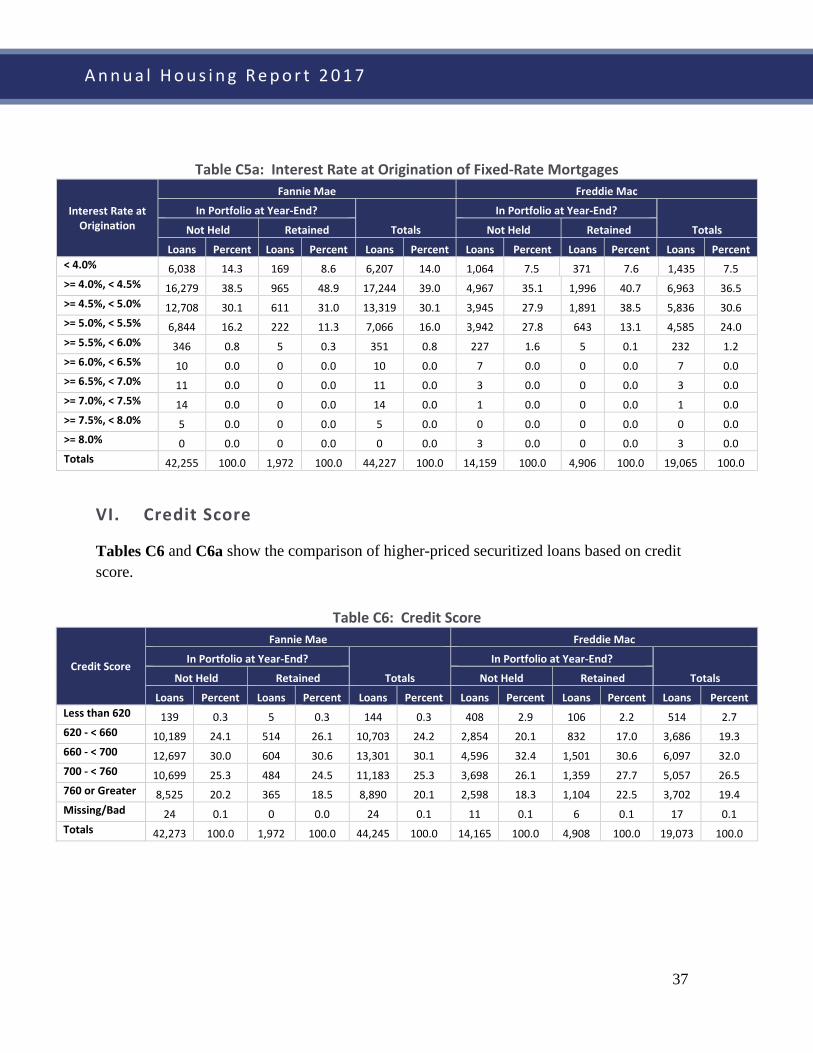
V. Interest Rate at Origination
Tables C5 and C5a show the comparison of higher-priced securitized loans based on the annual percentage rate (APR) at origination.
Table C5: Interest Rate at Origination
Interest Rate at Origination
Fannie Mae Freddie Mac
In Portfolio at Year-End?
Totals
In Portfolio at Year-End?
Totals Not Held Retained Not Held Retained
Loans Percent Loans Percent Loans Percent Loans Percent Loans Percent Loans Percent < 4.0% 6,054 14.3 169 8.6 6,223 14.1 1,067 7.5 373 7.6 1,440 7.5 >= 4.0%, < 4.5% 16,281 38.5 965 48.9 17,246 39.0 4,968 35.1 1,996 40.7 6,964 36.5 >= 4.5%, < 5.0% 12,708 30.1 611 31.0 13,319 30.1 3,947 27.9 1,891 38.5 5,838 30.6 >= 5.0%, < 5.5% 6,844 16.2 222 11.3 7,066 16.0 3,942 27.8 643 13.1 4,585 24.0 >= 5.5%, < 6.0% 346 0.8 5 0.3 351 0.8 227 1.6 5 0.1 232 1.2 >= 6.0%, < 6.5% 10 0.0 0 0.0 10 0.0 7 0.0 0 0.0 7 0.0 >= 6.5%, < 7.0% 11 0.0 0 0.0 11 0.0 3 0.0 0 0.0 3 0.0 >= 7.0%, < 7.5% 14 0.0 0 0.0 14 0.0 1 0.0 0 0.0 1 0.0 >= 7.5%, < 8.0% 5 0.0 0 0.0 5 0.0 0 0.0 0 0.0 0 0.0 >= 8.0% 0 0.0 0 0.0 0 0.0 3 0.0 0 0.0 3 0.0 Totals 42,273 100.0 1,972 100.0 44,245 100.0 14,165 100.0 4,908 100.0 19,073 100.0
37
A n n u a l H o u s i n g R e p o r t 2 0 1 7
Table C5a: Interest Rate at Origination of Fixed-Rate Mortgages
Interest Rate at Origination
Fannie Mae Freddie Mac
In Portfolio at Year-End?
Totals
In Portfolio at Year-End?
Totals Not Held Retained Not Held Retained
Loans Percent Loans Percent Loans Percent Loans Percent Loans Percent Loans Percent < 4.0% 6,038 14.3 169 8.6 6,207 14.0 1,064 7.5 371 7.6 1,435 7.5 >= 4.0%, < 4.5% 16,279 38.5 965 48.9 17,244 39.0 4,967 35.1 1,996 40.7 6,963 36.5 >= 4.5%, < 5.0% 12,708 30.1 611 31.0 13,319 30.1 3,945 27.9 1,891 38.5 5,836 30.6 >= 5.0%, < 5.5% 6,844 16.2 222 11.3 7,066 16.0 3,942 27.8 643 13.1 4,585 24.0 >= 5.5%, < 6.0% 346 0.8 5 0.3 351 0.8 227 1.6 5 0.1 232 1.2 >= 6.0%, < 6.5% 10 0.0 0 0.0 10 0.0 7 0.0 0 0.0 7 0.0 >= 6.5%, < 7.0% 11 0.0 0 0.0 11 0.0 3 0.0 0 0.0 3 0.0 >= 7.0%, < 7.5% 14 0.0 0 0.0 14 0.0 1 0.0 0 0.0 1 0.0 >= 7.5%, < 8.0% 5 0.0 0 0.0 5 0.0 0 0.0 0 0.0 0 0.0 >= 8.0% 0 0.0 0 0.0 0 0.0 3 0.0 0 0.0 3 0.0 Totals 42,255 100.0 1,972 100.0 44,227 100.0 14,159 100.0 4,906 100.0 19,065 100.0
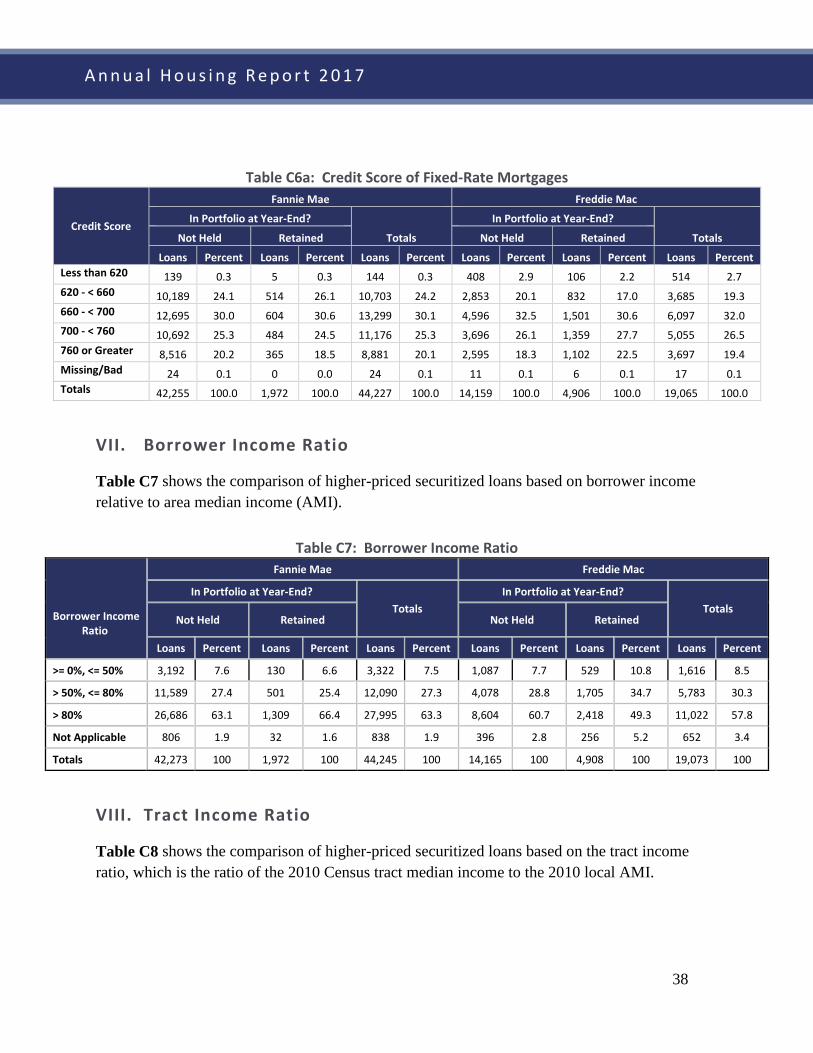
VI. Credit Score
Tables C6 and C6a show the comparison of higher-priced securitized loans based on credit score.
Table C6: Credit Score
Credit Score
Fannie Mae Freddie Mac
In Portfolio at Year-End?
Totals
In Portfolio at Year-End?
Totals Not Held Retained Not Held Retained
Loans Percent Loans Percent Loans Percent Loans Percent Loans Percent Loans Percent Less than 620 139 0.3 5 0.3 144 0.3 408 2.9 106 2.2 514 2.7 620 - < 660 10,189 24.1 514 26.1 10,703 24.2 2,854 20.1 832 17.0 3,686 19.3 660 - < 700 12,697 30.0 604 30.6 13,301 30.1 4,596 32.4 1,501 30.6 6,097 32.0 700 - < 760 10,699 25.3 484 24.5 11,183 25.3 3,698 26.1 1,359 27.7 5,057 26.5 760 or Greater 8,525 20.2 365 18.5 8,890 20.1 2,598 18.3 1,104 22.5 3,702 19.4 Missing/Bad 24 0.1 0 0.0 24 0.1 11 0.1 6 0.1 17 0.1 Totals 42,273 100.0 1,972 100.0 44,245 100.0 14,165 100.0 4,908 100.0 19,073 100.0
38
A n n u a l H o u s i n g R e p o r t 2 0 1 7
Table C6a: Credit Score of Fixed-Rate Mortgages
Credit Score
Fannie Mae Freddie Mac
In Portfolio at Year-End?
Totals
In Portfolio at Year-End?
Totals Not Held Retained Not Held Retained
Loans Percent Loans Percent Loans Percent Loans Percent Loans Percent Loans Percent Less than 620 139 0.3 5 0.3 144 0.3 408 2.9 106 2.2 514 2.7 620 - < 660 10,189 24.1 514 26.1 10,703 24.2 2,853 20.1 832 17.0 3,685 19.3 660 - < 700 12,695 30.0 604 30.6 13,299 30.1 4,596 32.5 1,501 30.6 6,097 32.0 700 - < 760 10,692 25.3 484 24.5 11,176 25.3 3,696 26.1 1,359 27.7 5,055 26.5 760 or Greater 8,516 20.2 365 18.5 8,881 20.1 2,595 18.3 1,102 22.5 3,697 19.4 Missing/Bad 24 0.1 0 0.0 24 0.1 11 0.1 6 0.1 17 0.1 Totals 42,255 100.0 1,972 100.0 44,227 100.0 14,159 100.0 4,906 100.0 19,065 100.0
VII. Borrower Income Ratio
Table C7 shows the comparison of higher-priced securitized loans based on borrower income relative to area median income (AMI).
Table C7: Borrower Income Ratio
Borrower Income Ratio
Fannie Mae Freddie Mac
In Portfolio at Year-End? Totals
In Portfolio at Year-End? Totals
Not Held Retained Not Held Retained
Loans Percent Loans Percent Loans Percent Loans Percent Loans Percent Loans Percent
>= 0%, <= 50% 3,192 7.6 130 6.6 3,322 7.5 1,087 7.7 529 10.8 1,616 8.5
> 50%, <= 80% 11,589 27.4 501 25.4 12,090 27.3 4,078 28.8 1,705 34.7 5,783 30.3
> 80% 26,686 63.1 1,309 66.4 27,995 63.3 8,604 60.7 2,418 49.3 11,022 57.8
Not Applicable 806 1.9 32 1.6 838 1.9 396 2.8 256 5.2 652 3.4
Totals 42,273 100 1,972 100 44,245 100 14,165 100 4,908 100 19,073 100
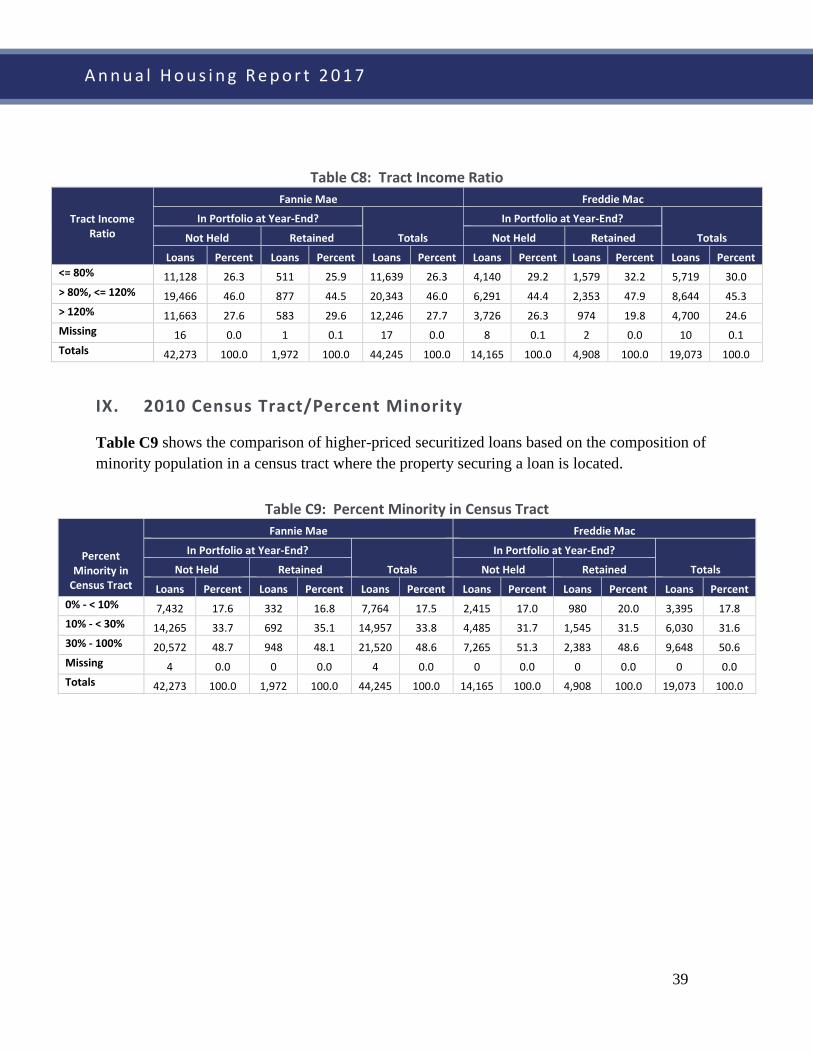
VIII. Tract Income Ratio
Table C8 shows the comparison of higher-priced securitized loans based on the tract income ratio, which is the ratio of the 2010 Census tract median income to the 2010 local AMI.
39
A n n u a l H o u s i n g R e p o r t 2 0 1 7
Table C8: Tract Income Ratio
Tract Income Ratio
Fannie Mae Freddie Mac
In Portfolio at Year-End?
Totals
In Portfolio at Year-End?
Totals Not Held Retained Not Held Retained
Loans Percent Loans Percent Loans Percent Loans Percent Loans Percent Loans Percent <= 80% 11,128 26.3 511 25.9 11,639 26.3 4,140 29.2 1,579 32.2 5,719 30.0 > 80%, <= 120% 19,466 46.0 877 44.5 20,343 46.0 6,291 44.4 2,353 47.9 8,644 45.3 > 120% 11,663 27.6 583 29.6 12,246 27.7 3,726 26.3 974 19.8 4,700 24.6 Missing 16 0.0 1 0.1 17 0.0 8 0.1 2 0.0 10 0.1 Totals 42,273 100.0 1,972 100.0 44,245 100.0 14,165 100.0 4,908 100.0 19,073 100.0
IX. 2010 Census Tract/Percent Minority
Table C9 shows the comparison of higher-priced securitized loans based on the composition of minority population in a census tract where the property securing a loan is located.
Table C9: Percent Minority in Census Tract
Percent Minority in
Census Tract
Fannie Mae Freddie Mac
In Portfolio at Year-End?
Totals
In Portfolio at Year-End?
Totals Not Held Retained Not Held Retained
Loans Percent Loans Percent Loans Percent Loans Percent Loans Percent Loans Percent 0% - < 10% 7,432 17.6 332 16.8 7,764 17.5 2,415 17.0 980 20.0 3,395 17.8 10% - < 30% 14,265 33.7 692 35.1 14,957 33.8 4,485 31.7 1,545 31.5 6,030 31.6 30% - 100% 20,572 48.7 948 48.1 21,520 48.6 7,265 51.3 2,383 48.6 9,648 50.6 Missing 4 0.0 0 0.0 4 0.0 0 0.0 0 0.0 0 0.0 Totals 42,273 100.0 1,972 100.0 44,245 100.0 14,165 100.0 4,908 100.0 19,073 100.0

40
A n n u a l H o u s i n g R e p o r t 2 0 1 7
X. Purpose of Loan
Table C10 shows the comparison of higher-priced securitized loans based on the purpose of the loan, whether for home purchase, refinancing of an existing loan, or other.
Table C10: Loan Purpose
Loan Purpose
Fannie Mae Freddie Mac
In Portfolio at Year-End?
Totals
In Portfolio at Year-End?
Totals Not Held Retained Not Held Retained
Loans Percent Loans Percent Loans Percent Loans Percent Loans Percent Loans Percent Purchase 28,618 67.7 1,135 57.6 29,753 67.2 9,072 64.0 2,570 52.4 11,642 61.0 Refinance/Other 13,655 32.3 837 42.4 14,492 32.8 5,093 36.0 2,338 47.6 7,431 39.0 Totals 42,273 100.0 1,972 100.0 44,245 100.0 14,165 100.0 4,908 100.0 19,073 100.0
XI. Federal Guarantee
Table C11 shows the comparison of higher-priced securitized loans based on whether the loan is federally guaranteed or insured, for example by FHA, VA, or RHS.
Table C11: Federal Guarantee
Federal Guarantee
Fannie Mae Freddie Mac
In Portfolio at Year-End?
Totals
In Portfolio at Year-End?
Totals Not Held Retained Not Held Retained
Loans Percent Loans Percent Loans Percent Loans Percent Loans Percent Loans Percent No 42,266 100.0 1,972 100.0 44,238 100.0 14,143 99.8 4,862 99.1 19,005 99.6 Yes 7 0.0 0 0.0 7 0.0 22 0.2 46 0.9 68 0.4 Totals 42,273 100.0 1,972 100.0 44,245 100.0 14,165 100.0 4,908 100.0 19,073 100.0