Annual Groundwater Monitoring Report - aep.com€¦ · Annual Groundwater Monitoring Report...
31
Annual Groundwater Monitoring Report Appalachian Power Company Mountaineer Plant Bottom Ash Pond CCR Management Unit Letart, WV January 2018 Prepared by: American Electric Power Service Corporation 1 Riverside Plaza Columbus, Ohio 43215
Transcript of Annual Groundwater Monitoring Report - aep.com€¦ · Annual Groundwater Monitoring Report...
Annual Groundwater Monitoring Report
Appalachian Power Company
Mountaineer Plant
Bottom Ash Pond CCR Management Unit
Letart, WV
January 2018
Prepared by:
American Electric Power Service Corporation
1 Riverside Plaza
Columbus, Ohio 43215
i
Page
Table of Contents I. Overview .......................................................................................................................................... 1
II. Groundwater Monitoring Well Locations and Identification Numbers ........................................... 3
III. Monitoring Wells Installed or Decommissioned ............................................................................. 4
IV. Groundwater Quality Data and Static Water Elevation Data and With Flow Rate and Flow
Directions ......................................................................................................................................... 4
V. Discussion About Transition Between Monitoring Requirements or Alternate Monitoring
Frequency ......................................................................................................................................... 4
VI. Other Information Required ............................................................................................................. 4
VII. Description of Any Problems Encountered in 2017 and Actions Taken ......................................... 5
VIII. A Projection of Key Activities for the Upcoming Year ................................................................... 5
Appendix I
1
I. Overview
This Annual Groundwater Monitoring and Corrective Action Report (Report) has been prepared
to report the status of activities for the preceding year for the bottom ash pond CCR unit at
Appalachian Power Company’s, a wholly-owned subsidiary of American Electric Power
Company (AEP), Mountaineer Power Plant. The USEPA’s CCR rules require that the Annual
Groundwater Monitoring and Corrective Action Report be posted to the operating record for the
preceding year no later than January 31, 2018.
In general, the following activities were completed:
Monitoring wells were installed and developed to establish a certified groundwater
monitoring system around each CCR unit, in accordance with the requirements of 40
CFR 257.91 pursuant AEP’s Groundwater Monitoring Network Evaluation;
Groundwater samples were collected and analyzed for Appendix III and Appendix IV
constituents, as specified in 40 CFR 257.94 et seq. and AEP’s Groundwater Sampling
and Analysis Plan;
Groundwater data underwent various validation tests, including tests for completeness,
valid values, transcription errors, and consistent units;
Background values for each Appendix III and Appendix IV constituent were established
Detection Monitoring sampling was initiated
A statistical process in accordance with 40 CFR 257.93 to evaluate groundwater data was
prepared, certified, and posted to AEP’s CCR website in April 2017. AEP’s Statistical
Analysis Plan (AEP 2017). The statistical process was guided by USEPA’s Statistical
Analysis of Groundwater Monitoring Data at RCRA Facilities, Unified Guidance
(“Unified Guidance”, USEPA, 2009). Data evaluation is underway.
The major components of this annual report, to the extent applicable at this time, are presented in
sections that follow:
A map, aerial photograph or a drawing showing the CCR management unit(s), all
groundwater monitoring wells and monitoring well identification numbers.
Identification of any monitoring wells that were installed or decommissioned during the
preceding year, along with a statement as to why that happened.
All of the monitoring data collected, including the rate and direction of groundwater
flow, plus a summary showing the number of samples collected per monitoring well, the
dates the samples were collected and whether the sample was collected as part of
detection monitoring or assessment monitoring programs (Attached as Appendix I).
2
A summary of any transition between monitoring programs or an alternate monitoring
frequency, for example the date and circumstances for transitioning from detection
monitoring to assessment monitoring, in addition to identifying the constituents detected
at a statistically significant increase over background concentrations.
Other information required to be included in the annual report such as alternate source
demonstration or assessment of corrective measures, if applicable
In addition, this report summarizes key actions completed, and where applicable, describes any
problems encountered and actions taken to resolve those problems. The report includes a
projection of key activities for the upcoming year.
3
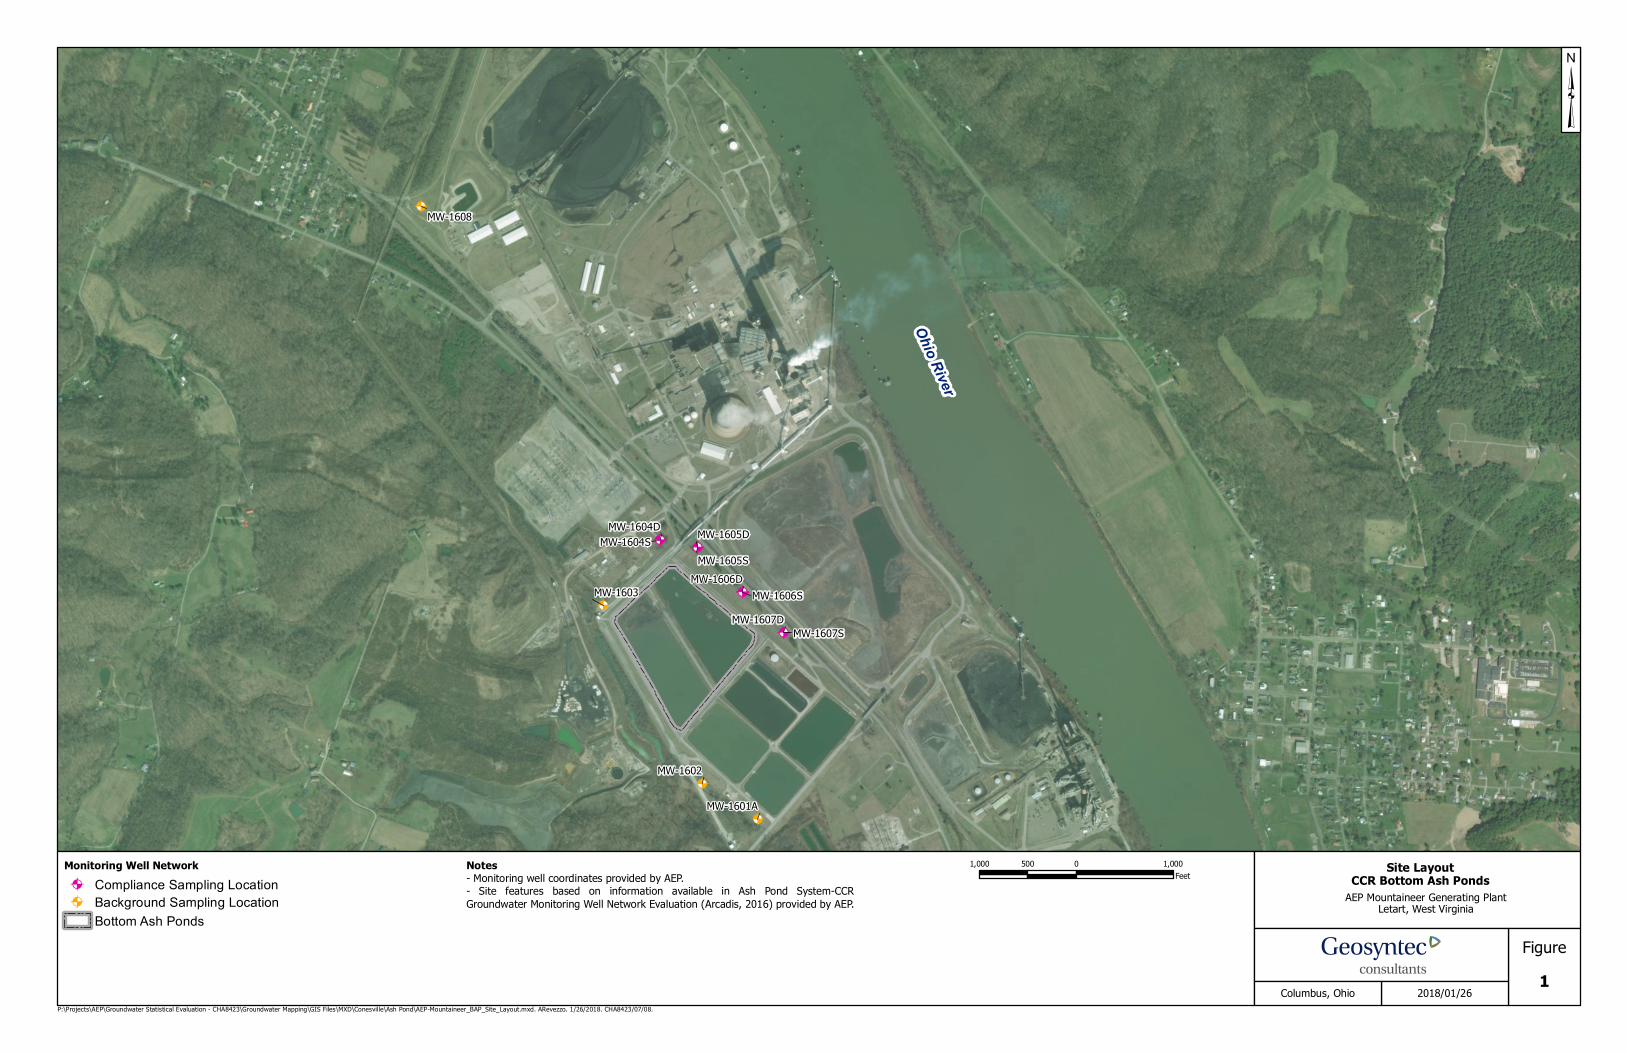
II. Groundwater Monitoring Well Locations and Identification Numbers
The figure that follows depicts the PE-certified groundwater monitoring network, the monitoring
well locations and their corresponding identification numbers. The total groundwater monitoring
network includes 4 up-gradient wells and 8 down-gradient wells. The monitoring well
distribution adequately cover down-gradient and up-gradient areas as detailed in the Ground
Water Monitoring Well Network Evaluation report that was placed in the American Electric
Power CCR public internet site on March 9, 2017.
!A
!A
!A
!A!A!A!A
!A!A
!A!A
!A
MW-1601A
MW-1602
MW-1603
MW-1604SMW-1604D
MW-1605SMW-1605D
MW-1606SMW-1606D
MW-1607SMW-1607D
MW-1608
P:\Projects\AEP\Groundwater Statistical Evaluation - CHA8423\Groundwater Mapping\GIS Files\MXD\Conesville\Ash Pond\AEP-Mountaineer_BAP_Site_Layout.mxd. ARevezzo. 1/26/2018. CHA8423/07/08.
AEP Mountaineer Generating PlantLetart, West Virginia
Site LayoutCCR Bottom Ash Ponds
³
Figure1Columbus, Ohio 2018/01/26
Monitoring Well Network!A Compliance Sampling Location!A Background Sampling Location
Bottom Ash Ponds
Notes- Monitoring well coordinates provided by AEP.- Site features based on information available in Ash Pond System-CCRGroundwater Monitoring Well Network Evaluation (Arcadis, 2016) provided by AEP.
1,000 0 1,000500Feet
Ohio River
4
III. Monitoring Wells Installed or Decommissioned
There were no monitoring wells installed or decommissioned in 2017. The network design, as
summarized in the Groundwater Monitoring Network Design Report (March 9, 2017) and as
posted at the CCR web site for Mountaineer Plant, did not change. That design report, viewable
on the AEP CCR web site, discusses the facility location, the hydrogeological setting, the
hydrostratigraphic units, the uppermost aquifer, downgradient monitoring well locations and the
upgradient monitoring well locations.
IV. Groundwater Quality Data and Static Water Elevation Data and Flow Rate
Appendix I contains tables showing the groundwater quality data collected during the
establishment of background quality. Static water elevation data from each monitoring event
also are shown in Appendix I, along with the groundwater velocity calculations, groundwater
flow direction and potentiometric maps developed after each sampling event.
V. Discussion About Transition Between Monitoring Requirements or Alternate
Monitoring Frequency
As of this first annual groundwater report date there has been no transition between detection
monitoring and assessment monitoring. Detection monitoring will continue in 2018. The
sampling frequency of twice per year will be maintained for the Appendix III parameters (boron,
calcium, chloride, fluoride, pH, sulfate and total dissolved solids).
Regarding defining an alternate monitoring frequency, the groundwater velocity and monitoring
well production is high enough at this facility that no modification of the twice-per-year
detection monitoring effort is needed.
VI. Other Information Required
At the appropriate time the geochemical analyses, coupled with the statistical analyses of the
groundwater quality data, will determine whether an alternate source or alternate sources are
affecting groundwater chemistry. In those cases where an alternative source(s) demonstration is
made, those analyses and supporting information will be presented as well.
5
VII. Description of Any Problems Encountered in 2017 and Actions Taken
No significant problems were encountered. The low flow sampling effort went smoothly and the
schedule was met to support this first annual groundwater report preparation.
VIII. A Projection of Key Activities for the Upcoming Year
Key activities for 2018 include:
Detection monitoring on a twice per year schedule
Evaluation of the first detection monitoring results from a statistical analysis viewpoint,
looking for any statistically significant increases, or decreases when pH is considered.
Responding to any new data received in light of what the CCR rule requires
Preparation of the second annual groundwater report
6
APPENDIX I
Tables follow, showing the groundwater monitoring data collected, the rate and direction of
groundwater flow, and a summary showing the number of samples collected per monitoring
well. The dates that the samples were collected also is shown. Since this is the first annual
groundwater report, which summarizes only the 2017 activities, there is no need to state whether
each sample was collected as part of a detection monitoring or an assessment monitoring
program.

Table 1: Groundwater Data SummaryMountaineer Plant - Bottom Ash Pond
9/28/2016 11/1/2016 12/19/2016 2/20/2017 3/27/2017 4/18/2017 5/15/2017 6/12/2017 10/30/2017Detection
Antimony µg/L 0.0500 0.0500 J 0.0500 J 0.0300 J 0.0300 J 0.0300 J 0.0400 J 0.0400 J -Arsenic µg/L 0.620 0.610 0.650 0.550 0.490 0.590 0.790 0.610 -Barium µg/L 46.6 45.2 47.0 41.4 40.2 47.5 56.9 49.0 -
Beryllium µg/L <0.005 U <0.005 U <0.005 U <0.005 U <0.005 U <0.004 U <0.004 U <0.004 U -Boron mg/L 0.211 0.170 0.196 0.253 0.515 0.259 0.224 0.285 0.224
Cadmium µg/L 0.0100 J 0.0200 J 0.0200 J 0.0200 J 0.0100 J 0.0100 J 0.0200 J 0.0200 J -Calcium mg/L 141 122 130 117 119 130 159 138 137Chloride mg/L 21.8 17.3 20.4 31.0 42.1 55.3 74.4 57.7 49.4
Chromium µg/L 0.300 1.30 0.806 0.198 0.225 0.170 0.166 0.152 -Cobalt µg/L 0.116 0.0860 0.282 0.132 0.0970 0.0930 0.154 0.0980 -
Combined Radium pCi/L 0.438 2.01 1.54 0.313 0.495 0.814 1.28 0.599 -Fluoride mg/L 0.170 0.190 0.180 0.200 0.190 0.190 0.180 0.180 0.190
Lead µg/L 0.132 0.108 0.383 0.139 0.0690 0.0520 0.141 0.0630 -Lithium mg/L 0.00200 0.00100 <0.0002 U 0.00500 0.00600 0.00700 <0.0002 U 0.00400 -Mercury µg/L <0.002 U <0.002 U <0.002 U <0.002 U <0.002 U 0.00300 J <0.002 U <0.002 U -
Molybdenum µg/L 2.61 2.36 0.930 1.42 2.85 1.53 2.04 1.13 -Selenium µg/L 1.30 1.10 1.10 1.40 1.00 1.50 1.30 1.50 -
Total Dissolved Solids mg/L 538 534 544 568 530 580 676 586 564Sulfate mg/L 130 136 141 135 148 169 197 170 169
Thallium µg/L 0.0530 0.0580 0.0400 J 0.0700 0.0300 J 0.0400 J 0.0400 J 0.0400 J -pH SU 7.55 7.22 7.20 7.16 7.06 7.13 7.71 6.91 7.06
Notes:µg/L: micrograms per litermg/L: milligrams per literpCi/L: picocuries per literSU: standard unitU: Non-detect value. Parameters which were not detected are shown as less than the method detection limit (MDL).J: Estimated value. Parameter was detected in concentrations below the reporting limit.-: Not sampledFor statistical analysis, parameters which were not detected were replaced with the reporting limit.
MW-1601A
BackgroundParameter Unit
Page 1 of 12

Table 1: Groundwater Data SummaryMountaineer Plant - Bottom Ash Pond
Antimony µg/LArsenic µg/LBarium µg/L
Beryllium µg/LBoron mg/L
Cadmium µg/LCalcium mg/LChloride mg/L
Chromium µg/LCobalt µg/L
Combined Radium pCi/LFluoride mg/L
Lead µg/LLithium mg/LMercury µg/L
Molybdenum µg/LSelenium µg/L
Total Dissolved Solids mg/LSulfate mg/L
Thallium µg/LpH SU
Parameter Unit 9/28/2016 11/1/2016 12/19/2016 2/20/2017 3/27/2017 4/17/2017 5/15/2017 6/12/2017 10/30/2017Detection
0.0200 J 0.0200 J 0.0200 J <0.01 U 0.0100 J 0.0200 J 0.0200 J 0.0300 J -0.400 0.350 0.430 0.350 0.340 0.360 0.420 0.360 -27.1 28.7 28.9 26.9 29.9 32.1 33.2 33.1 -
<0.005 U <0.005 U <0.005 U <0.005 U <0.005 U <0.004 U <0.004 U <0.004 U -0.141 0.115 0.120 0.0930 0.240 0.107 0.115 0.153 0.0930
0.0200 J 0.0200 J 0.0100 J 0.0100 J 0.0200 J 0.0100 J 0.0200 J 0.0100 J -74.9 71.1 74.7 69.6 86.6 91.1 105 94.0 78.17.95 8.70 9.91 9.76 12.0 12.1 12.6 11.8 8.41
0.200 0.600 1.65 0.194 0.456 0.240 0.136 0.408 -0.217 0.108 0.225 0.0520 0.0590 0.0490 0.0720 0.0660 -0.275 2.09 0.705 0.750 0.679 0.337 1.91 0.290 -0.170 0.180 0.180 0.190 0.190 0.200 0.190 0.200 0.2300.255 0.0700 0.272 0.0520 0.0630 0.0870 0.0780 0.0610 -
0.0130 0.0140 0.00800 0.0130 0.0190 0.0170 0.00900 0.0180 -<0.002 U <0.002 U <0.002 U <0.002 U <0.002 U 0.00200 J <0.002 U <0.002 U -
0.900 1.48 0.560 0.630 1.49 0.660 1.28 0.530 -0.0800 J 0.100 0.0800 J 0.100 0.200 0.100 0.100 0.100 -
412 424 470 494 504 520 598 588 468167 178 188 193 231 248 273 269 184
0.0920 0.116 0.0200 J 0.0200 J 0.0100 J 0.0100 J 0.0400 J 0.0200 J -7.26 6.59 6.93 6.53 6.28 6.66 7.04 6.75 6.67
Notes:µg/L: micrograms per litermg/L: milligrams per literpCi/L: picocuries per literSU: standard unitU: Non-detect value. Parameters which were not detected are shown as less than the method detection limit (MDL).J: Estimated value. Parameter was detected in concentrations below the reporting limit.-: Not sampledFor statistical analysis, parameters which were not detected were replaced with the reporting limit.
MW-1602
Background
Page 2 of 12

Table 1: Groundwater Data SummaryMountaineer Plant - Bottom Ash Pond
Antimony µg/LArsenic µg/LBarium µg/L
Beryllium µg/LBoron mg/L
Cadmium µg/LCalcium mg/LChloride mg/L
Chromium µg/LCobalt µg/L
Combined Radium pCi/LFluoride mg/L
Lead µg/LLithium mg/LMercury µg/L
Molybdenum µg/LSelenium µg/L
Total Dissolved Solids mg/LSulfate mg/L
Thallium µg/LpH SU
Parameter Unit 9/28/2016 11/2/2016 12/19/2016 2/20/2017 3/28/2017 4/17/2017 5/15/2017 6/12/2017 10/30/2017Detection
0.0200 J 0.0200 J 0.0300 J 0.0100 J 0.0200 J 0.0300 J 0.0300 J 0.0300 J -0.360 0.360 0.400 0.370 0.360 0.520 0.430 0.350 -29.5 34.1 33.1 31.7 32.9 33.7 33.0 32.0 -
<0.005 U <0.005 U <0.005 U <0.005 U <0.005 U 0.00500 J <0.004 U <0.004 U -0.327 0.334 0.495 0.543 0.781 0.519 0.546 0.535 0.360
0.0200 J 0.0100 J 0.0100 J 0.0100 J 0.0100 J 0.0100 J 0.0100 J 0.0100 J -124 146 164 169 181 170 187 176 17115.7 22.8 30.1 27.4 25.2 22.9 24.7 20.5 13.1
0.300 0.400 2.37 0.229 0.545 0.304 0.415 0.963 -0.317 0.166 0.134 0.105 0.0930 0.377 0.101 0.0850 -
0.0927 2.59 0.966 0.384 0.207 0.615 1.61 0.776 -0.0700 J 0.0800 J 0.100 J 0.100 J 0.100 J 0.100 J 0.100 J 0.100 J 0.100 J
0.253 0.131 0.0840 0.0770 0.0800 0.308 0.0790 0.0590 -0.0210 0.0220 0.0100 0.0120 0.0200 0.0180 0.0120 0.0210 -
<0.002 U <0.002 U <0.002 U <0.002 U <0.002 U 0.00300 J <0.002 U <0.002 U -1.21 2.47 0.360 0.370 0.720 0.270 0.710 0.290 -
0.100 0.400 0.300 0.400 0.200 0.200 0.100 0.100 -618 814 908 962 918 910 910 878 872388 483 504 485 476 474 470 482 553
0.0200 J 0.0400 J 0.0630 0.0200 J <0.01 U 0.0100 J 0.0200 J 0.0100 J -7.27 6.56 7.41 6.78 6.60 6.93 7.38 6.95 6.58
Notes:µg/L: micrograms per litermg/L: milligrams per literpCi/L: picocuries per literSU: standard unitU: Non-detect value. Parameters which were not detected are shown as less than the method detection limit (MDL).J: Estimated value. Parameter was detected in concentrations below the reporting limit.-: Not sampledFor statistical analysis, parameters which were not detected were replaced with the reporting limit.
MW-1603
Background
Page 3 of 12
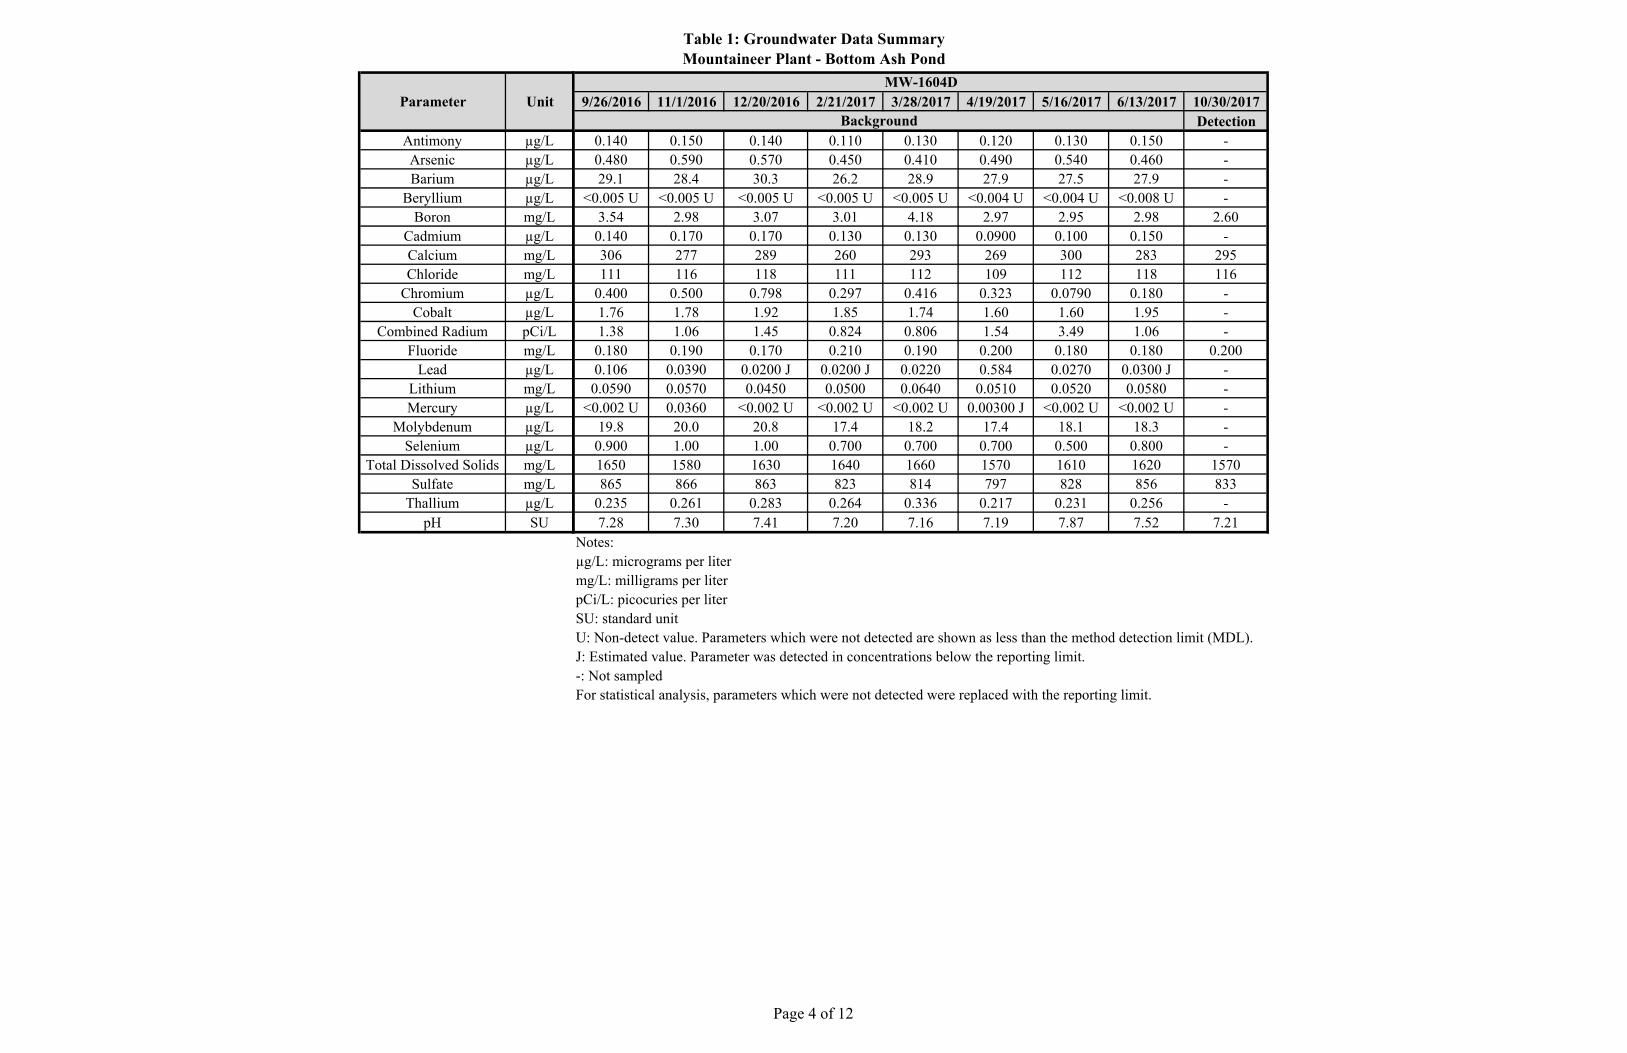
Table 1: Groundwater Data SummaryMountaineer Plant - Bottom Ash Pond
Antimony µg/LArsenic µg/LBarium µg/L
Beryllium µg/LBoron mg/L
Cadmium µg/LCalcium mg/LChloride mg/L
Chromium µg/LCobalt µg/L
Combined Radium pCi/LFluoride mg/L
Lead µg/LLithium mg/LMercury µg/L
Molybdenum µg/LSelenium µg/L
Total Dissolved Solids mg/LSulfate mg/L
Thallium µg/LpH SU
Parameter Unit 9/26/2016 11/1/2016 12/20/2016 2/21/2017 3/28/2017 4/19/2017 5/16/2017 6/13/2017 10/30/2017Detection
0.140 0.150 0.140 0.110 0.130 0.120 0.130 0.150 -0.480 0.590 0.570 0.450 0.410 0.490 0.540 0.460 -29.1 28.4 30.3 26.2 28.9 27.9 27.5 27.9 -
<0.005 U <0.005 U <0.005 U <0.005 U <0.005 U <0.004 U <0.004 U <0.008 U -3.54 2.98 3.07 3.01 4.18 2.97 2.95 2.98 2.60
0.140 0.170 0.170 0.130 0.130 0.0900 0.100 0.150 -306 277 289 260 293 269 300 283 295111 116 118 111 112 109 112 118 116
0.400 0.500 0.798 0.297 0.416 0.323 0.0790 0.180 -1.76 1.78 1.92 1.85 1.74 1.60 1.60 1.95 -1.38 1.06 1.45 0.824 0.806 1.54 3.49 1.06 -
0.180 0.190 0.170 0.210 0.190 0.200 0.180 0.180 0.2000.106 0.0390 0.0200 J 0.0200 J 0.0220 0.584 0.0270 0.0300 J -
0.0590 0.0570 0.0450 0.0500 0.0640 0.0510 0.0520 0.0580 -<0.002 U 0.0360 <0.002 U <0.002 U <0.002 U 0.00300 J <0.002 U <0.002 U -
19.8 20.0 20.8 17.4 18.2 17.4 18.1 18.3 -0.900 1.00 1.00 0.700 0.700 0.700 0.500 0.800 -1650 1580 1630 1640 1660 1570 1610 1620 1570865 866 863 823 814 797 828 856 833
0.235 0.261 0.283 0.264 0.336 0.217 0.231 0.256 -7.28 7.30 7.41 7.20 7.16 7.19 7.87 7.52 7.21
Notes:µg/L: micrograms per litermg/L: milligrams per literpCi/L: picocuries per literSU: standard unitU: Non-detect value. Parameters which were not detected are shown as less than the method detection limit (MDL).J: Estimated value. Parameter was detected in concentrations below the reporting limit.-: Not sampledFor statistical analysis, parameters which were not detected were replaced with the reporting limit.
MW-1604D
Background
Page 4 of 12

Table 1: Groundwater Data SummaryMountaineer Plant - Bottom Ash Pond
Antimony µg/LArsenic µg/LBarium µg/L
Beryllium µg/LBoron mg/L
Cadmium µg/LCalcium mg/LChloride mg/L
Chromium µg/LCobalt µg/L
Combined Radium pCi/LFluoride mg/L
Lead µg/LLithium mg/LMercury µg/L
Molybdenum µg/LSelenium µg/L
Total Dissolved Solids mg/LSulfate mg/L
Thallium µg/LpH SU
Parameter Unit 9/26/2016 11/1/2016 12/20/2016 2/21/2017 3/28/2017 4/19/2017 5/16/2017 6/13/2017 10/30/2017Detection
0.0400 J 0.0400 J 0.0400 J 0.0300 J 0.0300 J 0.0300 J 0.0400 J 0.0300 J -0.390 0.460 0.420 0.420 0.370 0.440 0.510 0.410 -29.4 27.2 26.6 26.7 31.6 28.9 32.2 28.7 -
<0.005 U <0.005 U <0.005 U <0.005 U <0.005 U <0.004 U <0.004 U <0.004 U -2.12 1.90 2.35 3.08 4.04 3.68 3.63 3.48 2.17
0.0300 0.0400 0.0400 0.0400 0.0300 0.0400 0.0400 0.0400 -178 167 165 168 180 191 202 182 16783.9 99.4 99.9 112 116 130 122 112 85.3
0.200 0.300 1.97 0.379 0.692 0.158 0.0980 0.149 -0.358 0.307 0.390 0.501 0.308 0.317 0.317 0.308 -0.136 0.769 0.526 0.920 0.585 0.722 2.58 0.598 -0.200 0.210 0.190 0.210 0.200 0.210 0.190 0.200 0.2100.114 0.0650 0.0930 0.140 0.0550 0.0510 0.100 0.0330 -
0.0340 0.0350 0.0230 0.0330 0.0420 0.0410 0.0330 0.0380 -<0.002 U <0.002 U <0.002 U <0.002 U <0.002 U 0.00300 J <0.002 U <0.002 U -
3.20 2.47 2.71 2.52 2.53 2.53 2.54 2.41 -3.10 2.50 2.70 2.20 2.20 1.70 2.00 2.50 -1280 1310 1300 1430 1420 1500 1510 1400 1150602 626 618 634 663 716 708 685 544
0.0300 J 0.0200 J 0.0300 J 0.0300 J 0.119 0.0200 J 0.0400 J 0.0200 J -7.04 7.10 7.19 7.04 6.94 7.01 7.67 7.53 7.09
Notes:µg/L: micrograms per litermg/L: milligrams per literpCi/L: picocuries per literSU: standard unitU: Non-detect value. Parameters which were not detected are shown as less than the method detection limit (MDL).J: Estimated value. Parameter was detected in concentrations below the reporting limit.-: Not sampledFor statistical analysis, parameters which were not detected were replaced with the reporting limit.
MW-1604S
Background
Page 5 of 12

Table 1: Groundwater Data SummaryMountaineer Plant - Bottom Ash Pond
Antimony µg/LArsenic µg/LBarium µg/L
Beryllium µg/LBoron mg/L
Cadmium µg/LCalcium mg/LChloride mg/L
Chromium µg/LCobalt µg/L
Combined Radium pCi/LFluoride mg/L
Lead µg/LLithium mg/LMercury µg/L
Molybdenum µg/LSelenium µg/L
Total Dissolved Solids mg/LSulfate mg/L
Thallium µg/LpH SU
Parameter Unit 9/27/2016 11/2/2016 12/20/2016 2/21/2017 3/28/2017 4/18/2017 5/16/2017 6/13/2017 10/31/2017Detection
0.0300 J 0.0300 J 0.0300 J 0.0400 J 0.0400 J 0.0300 J 0.0300 J 0.0400 J -2.29 2.48 2.26 2.23 2.01 2.25 2.45 1.99 -31.5 30.6 28.2 25.9 27.9 25.8 26.3 27.2 -
<0.01 U <0.01 U <0.01 U <0.005 U <0.005 U <0.008 U <0.004 U <0.008 U -12.2 9.96 9.35 9.16 11.6 9.06 8.77 9.09 7.83
0.0400 0.0400 0.0400 J 0.0300 0.0300 0.0200 J 0.0200 J 0.0400 -462 381 341 318 344 360 374 351 324195 195 168 163 169 172 187 196 198
0.100 0.200 2.29 0.282 0.556 0.127 0.0990 0.120 -1.91 1.79 1.75 1.84 1.69 1.69 1.63 1.86 -1.06 1.93 2.66 1.03 0.578 0.821 3.43 0.668 -
0.180 0.190 0.180 0.200 0.200 0.200 0.200 0.170 0.2100.0800 0.0440 0.0300 J 0.0210 0.0200 J 0.0200 J 0.0100 J 0.0200 J -0.0850 0.0780 0.0630 0.0710 0.0860 0.0770 0.0750 0.0810 -
<0.002 U <0.002 U <0.002 U <0.002 U <0.002 U 0.00200 J <0.002 U <0.002 U -54.6 52.4 54.7 46.8 44.6 43.2 48.1 45.5 -
0.200 0.200 0.300 0.200 0.200 0.200 J 0.200 0.400 -2650 2510 2300 2290 2350 2280 2240 2260 21701480 1500 1290 1190 1200 1180 1130 1190 1170
0.0600 J 0.0500 J 0.0500 J 0.138 0.0900 0.0400 J 0.0400 J 0.0500 J -7.60 7.37 7.37 7.31 7.16 7.48 7.90 - 7.32
Notes:µg/L: micrograms per litermg/L: milligrams per literpCi/L: picocuries per literSU: standard unitU: Non-detect value. Parameters which were not detected are shown as less than the method detection limit (MDL).J: Estimated value. Parameter was detected in concentrations below the reporting limit.-: Not sampledFor statistical analysis, parameters which were not detected were replaced with the reporting limit.
MW-1605D
Background
Page 6 of 12

Table 1: Groundwater Data SummaryMountaineer Plant - Bottom Ash Pond
Antimony µg/LArsenic µg/LBarium µg/L
Beryllium µg/LBoron mg/L
Cadmium µg/LCalcium mg/LChloride mg/L
Chromium µg/LCobalt µg/L
Combined Radium pCi/LFluoride mg/L
Lead µg/LLithium mg/LMercury µg/L
Molybdenum µg/LSelenium µg/L
Total Dissolved Solids mg/LSulfate mg/L
Thallium µg/LpH SU
Parameter Unit 9/27/2016 11/1/2016 12/20/2016 2/21/2017 3/28/2017 4/18/2017 5/16/2017 6/13/2017 10/31/2017Detection
0.160 0.0700 0.0700 J 0.0400 J 0.0300 J 0.0600 J 0.0600 J 0.0500 J -1.38 0.930 0.880 0.860 0.630 0.740 0.880 0.750 -49.6 38.2 37.0 36.0 32.5 31.9 33.3 30.8 -
0.0200 J 0.00900 J <0.01 U 0.00700 J <0.005 U <0.008 U <0.008 U <0.008 U -8.30 6.55 7.30 9.04 10.8 8.69 8.75 8.80 5.88
0.130 0.0800 0.0800 0.0800 0.0600 0.0800 0.0800 0.0800 -224 220 279 249 261 244 251 218 212150 159 173 179 212 180 217 191 222
0.600 0.700 2.85 0.390 0.349 0.245 0.585 0.387 -3.16 1.26 0.861 1.10 0.448 0.715 0.647 0.708 -
0.777 2.69 0.337 0.785 0.466 0.827 2.73 0.611 -0.240 0.250 0.220 0.250 0.250 0.230 0.260 0.240 0.2502.18 0.793 0.410 0.636 0.181 0.285 0.382 0.541 -
0.0860 0.0840 0.0760 0.0680 0.0760 0.0670 0.0760 0.0710 -<0.002 U <0.002 U <0.002 U <0.002 U <0.002 U 0.00300 J <0.002 U <0.002 U -
25.8 23.9 22.9 17.5 15.4 20.8 18.6 17.8 -1.10 0.900 0.700 1.10 1.00 3.00 1.70 1.70 -1910 1930 2160 2220 2250 2120 2160 1980 2000965 1010 1180 1110 1110 1100 1060 1000 1040
0.174 0.0550 0.0500 J 0.0550 0.102 0.0400 J 0.0600 J 0.0500 J -7.45 7.34 7.35 7.19 7.05 7.36 7.74 7.77 7.18
Notes:µg/L: micrograms per litermg/L: milligrams per literpCi/L: picocuries per literSU: standard unitU: Non-detect value. Parameters which were not detected are shown as less than the method detection limit (MDL).J: Estimated value. Parameter was detected in concentrations below the reporting limit.-: Not sampledFor statistical analysis, parameters which were not detected were replaced with the reporting limit.
MW-1605S
Background
Page 7 of 12

Table 1: Groundwater Data SummaryMountaineer Plant - Bottom Ash Pond
Antimony µg/LArsenic µg/LBarium µg/L
Beryllium µg/LBoron mg/L
Cadmium µg/LCalcium mg/LChloride mg/L
Chromium µg/LCobalt µg/L
Combined Radium pCi/LFluoride mg/L
Lead µg/LLithium mg/LMercury µg/L
Molybdenum µg/LSelenium µg/L
Total Dissolved Solids mg/LSulfate mg/L
Thallium µg/LpH SU
Parameter Unit 9/27/2016 11/2/2016 12/20/2016 2/21/2017 3/28/2017 4/18/2017 5/16/2017 6/13/2017 10/31/2017Detection
0.190 0.190 0.160 0.160 0.150 0.250 0.190 0.160 -0.710 0.840 0.630 0.510 0.440 1.38 0.630 0.520 -64.0 62.6 58.4 52.6 53.6 64.2 56.7 52.0 -
0.00500 J <0.005 U <0.005 U <0.005 U <0.005 U 0.0100 J 0.0310 <0.008 U -4.29 3.97 4.96 5.48 6.90 5.46 5.26 5.90 7.03
0.0700 0.0700 0.0600 0.0700 0.0500 0.0800 0.0700 0.0800 -278 252 260 242 247 274 278 262 287190 201 206 190 187 104 218 219 213
0.300 0.900 0.736 0.300 0.541 0.853 0.163 0.153 -2.20 1.92 1.52 1.33 1.17 4.26 1.39 1.46 -8.46 3.66 1.18 1.71 1.46 1.21 3.18 1.03 -
0.250 0.280 0.240 0.260 0.260 0.260 0.260 0.240 0.2400.522 0.491 0.164 0.0820 0.0870 2.04 0.162 0.0840 -0.129 0.120 0.110 0.109 0.130 0.119 0.124 0.132 -
<0.002 U <0.002 U <0.002 U <0.002 U <0.002 U 0.00400 J <0.002 U <0.002 U -81.4 81.2 83.2 76.6 73.3 71.5 79.1 77.8 -1.80 4.70 3.60 4.10 3.60 4.10 5.90 8.10 -1710 1720 1690 1670 1700 1690 1730 1680 1590813 796 796 759 739 385 764 752 770
0.123 0.0920 0.0940 0.119 0.113 0.0970 0.0950 0.0900 J -7.16 7.43 7.54 7.33 7.22 7.42 8.00 7.47 7.34
Notes:µg/L: micrograms per litermg/L: milligrams per literpCi/L: picocuries per literSU: standard unitU: Non-detect value. Parameters which were not detected are shown as less than the method detection limit (MDL).J: Estimated value. Parameter was detected in concentrations below the reporting limit.-: Not sampledFor statistical analysis, parameters which were not detected were replaced with the reporting limit.
MW-1606D
Background
Page 8 of 12
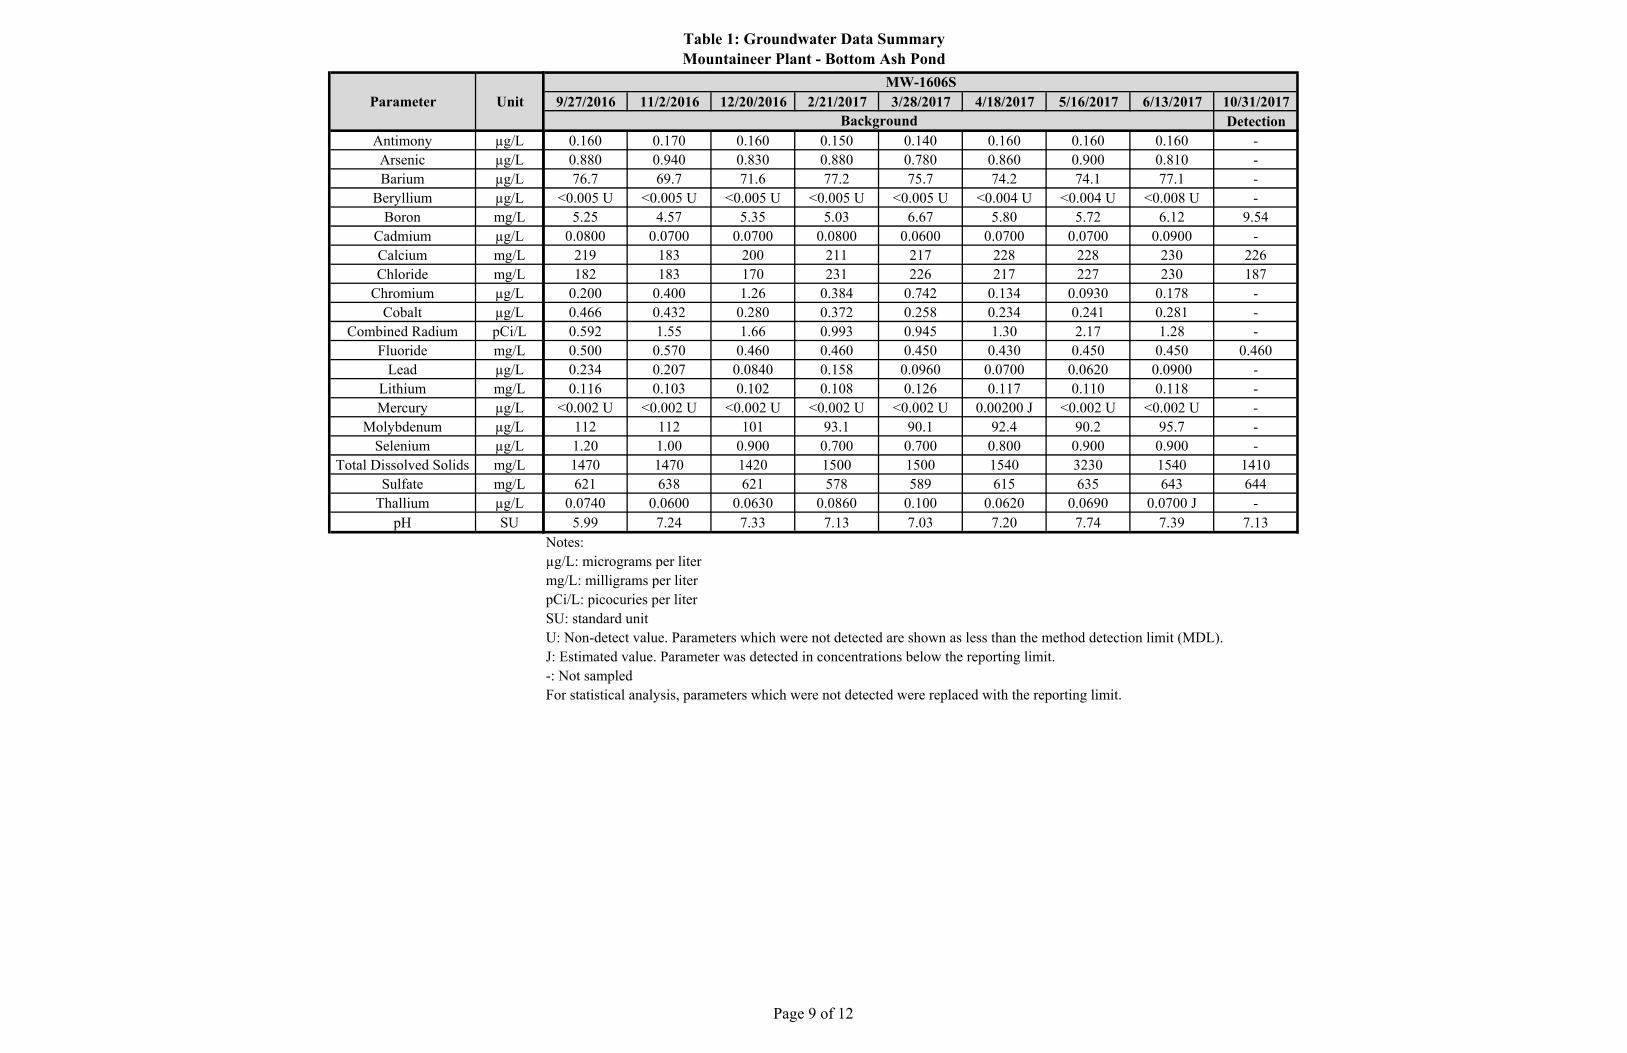
Table 1: Groundwater Data SummaryMountaineer Plant - Bottom Ash Pond
Antimony µg/LArsenic µg/LBarium µg/L
Beryllium µg/LBoron mg/L
Cadmium µg/LCalcium mg/LChloride mg/L
Chromium µg/LCobalt µg/L
Combined Radium pCi/LFluoride mg/L
Lead µg/LLithium mg/LMercury µg/L
Molybdenum µg/LSelenium µg/L
Total Dissolved Solids mg/LSulfate mg/L
Thallium µg/LpH SU
Parameter Unit 9/27/2016 11/2/2016 12/20/2016 2/21/2017 3/28/2017 4/18/2017 5/16/2017 6/13/2017 10/31/2017Detection
0.160 0.170 0.160 0.150 0.140 0.160 0.160 0.160 -0.880 0.940 0.830 0.880 0.780 0.860 0.900 0.810 -76.7 69.7 71.6 77.2 75.7 74.2 74.1 77.1 -
<0.005 U <0.005 U <0.005 U <0.005 U <0.005 U <0.004 U <0.004 U <0.008 U -5.25 4.57 5.35 5.03 6.67 5.80 5.72 6.12 9.54
0.0800 0.0700 0.0700 0.0800 0.0600 0.0700 0.0700 0.0900 -219 183 200 211 217 228 228 230 226182 183 170 231 226 217 227 230 187
0.200 0.400 1.26 0.384 0.742 0.134 0.0930 0.178 -0.466 0.432 0.280 0.372 0.258 0.234 0.241 0.281 -0.592 1.55 1.66 0.993 0.945 1.30 2.17 1.28 -0.500 0.570 0.460 0.460 0.450 0.430 0.450 0.450 0.4600.234 0.207 0.0840 0.158 0.0960 0.0700 0.0620 0.0900 -0.116 0.103 0.102 0.108 0.126 0.117 0.110 0.118 -
<0.002 U <0.002 U <0.002 U <0.002 U <0.002 U 0.00200 J <0.002 U <0.002 U -112 112 101 93.1 90.1 92.4 90.2 95.7 -1.20 1.00 0.900 0.700 0.700 0.800 0.900 0.900 -1470 1470 1420 1500 1500 1540 3230 1540 1410621 638 621 578 589 615 635 643 644
0.0740 0.0600 0.0630 0.0860 0.100 0.0620 0.0690 0.0700 J -5.99 7.24 7.33 7.13 7.03 7.20 7.74 7.39 7.13
Notes:µg/L: micrograms per litermg/L: milligrams per literpCi/L: picocuries per literSU: standard unitU: Non-detect value. Parameters which were not detected are shown as less than the method detection limit (MDL).J: Estimated value. Parameter was detected in concentrations below the reporting limit.-: Not sampledFor statistical analysis, parameters which were not detected were replaced with the reporting limit.
MW-1606S
Background
Page 9 of 12
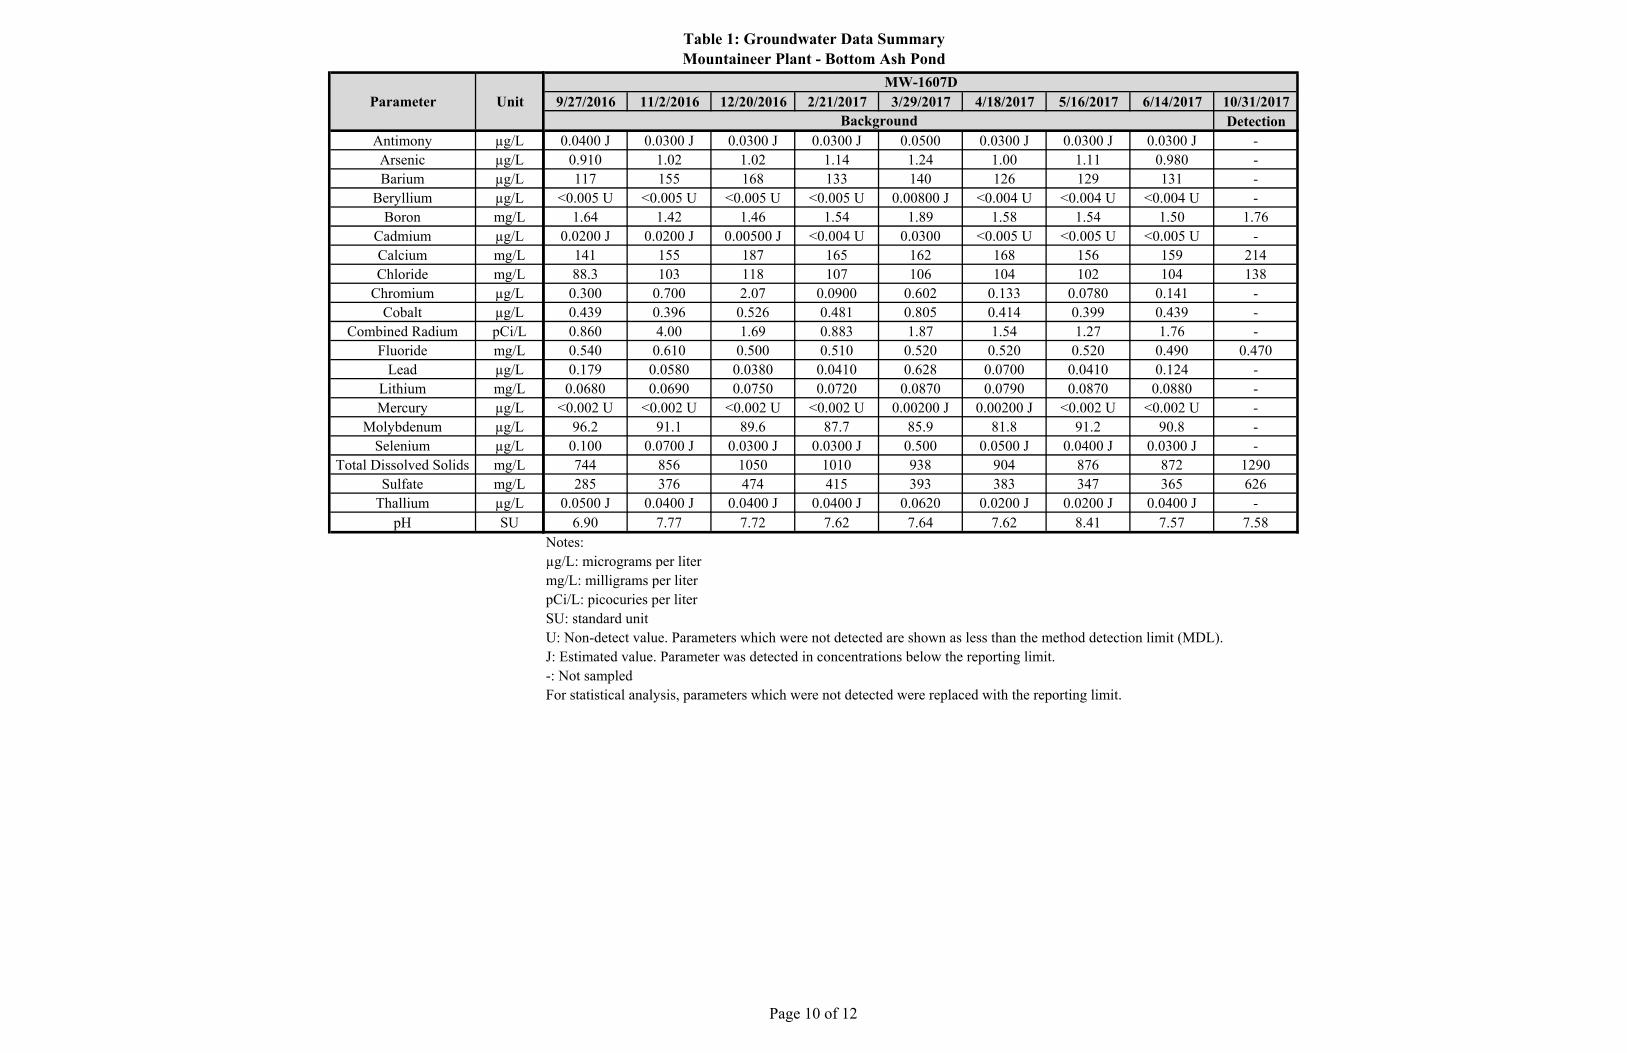
Table 1: Groundwater Data SummaryMountaineer Plant - Bottom Ash Pond
Antimony µg/LArsenic µg/LBarium µg/L
Beryllium µg/LBoron mg/L
Cadmium µg/LCalcium mg/LChloride mg/L
Chromium µg/LCobalt µg/L
Combined Radium pCi/LFluoride mg/L
Lead µg/LLithium mg/LMercury µg/L
Molybdenum µg/LSelenium µg/L
Total Dissolved Solids mg/LSulfate mg/L
Thallium µg/LpH SU
Parameter Unit 9/27/2016 11/2/2016 12/20/2016 2/21/2017 3/29/2017 4/18/2017 5/16/2017 6/14/2017 10/31/2017Detection
0.0400 J 0.0300 J 0.0300 J 0.0300 J 0.0500 0.0300 J 0.0300 J 0.0300 J -0.910 1.02 1.02 1.14 1.24 1.00 1.11 0.980 -117 155 168 133 140 126 129 131 -
<0.005 U <0.005 U <0.005 U <0.005 U 0.00800 J <0.004 U <0.004 U <0.004 U -1.64 1.42 1.46 1.54 1.89 1.58 1.54 1.50 1.76
0.0200 J 0.0200 J 0.00500 J <0.004 U 0.0300 <0.005 U <0.005 U <0.005 U -141 155 187 165 162 168 156 159 21488.3 103 118 107 106 104 102 104 138
0.300 0.700 2.07 0.0900 0.602 0.133 0.0780 0.141 -0.439 0.396 0.526 0.481 0.805 0.414 0.399 0.439 -0.860 4.00 1.69 0.883 1.87 1.54 1.27 1.76 -0.540 0.610 0.500 0.510 0.520 0.520 0.520 0.490 0.4700.179 0.0580 0.0380 0.0410 0.628 0.0700 0.0410 0.124 -
0.0680 0.0690 0.0750 0.0720 0.0870 0.0790 0.0870 0.0880 -<0.002 U <0.002 U <0.002 U <0.002 U 0.00200 J 0.00200 J <0.002 U <0.002 U -
96.2 91.1 89.6 87.7 85.9 81.8 91.2 90.8 -0.100 0.0700 J 0.0300 J 0.0300 J 0.500 0.0500 J 0.0400 J 0.0300 J -744 856 1050 1010 938 904 876 872 1290285 376 474 415 393 383 347 365 626
0.0500 J 0.0400 J 0.0400 J 0.0400 J 0.0620 0.0200 J 0.0200 J 0.0400 J -6.90 7.77 7.72 7.62 7.64 7.62 8.41 7.57 7.58
Notes:µg/L: micrograms per litermg/L: milligrams per literpCi/L: picocuries per literSU: standard unitU: Non-detect value. Parameters which were not detected are shown as less than the method detection limit (MDL).J: Estimated value. Parameter was detected in concentrations below the reporting limit.-: Not sampledFor statistical analysis, parameters which were not detected were replaced with the reporting limit.
MW-1607D
Background
Page 10 of 12
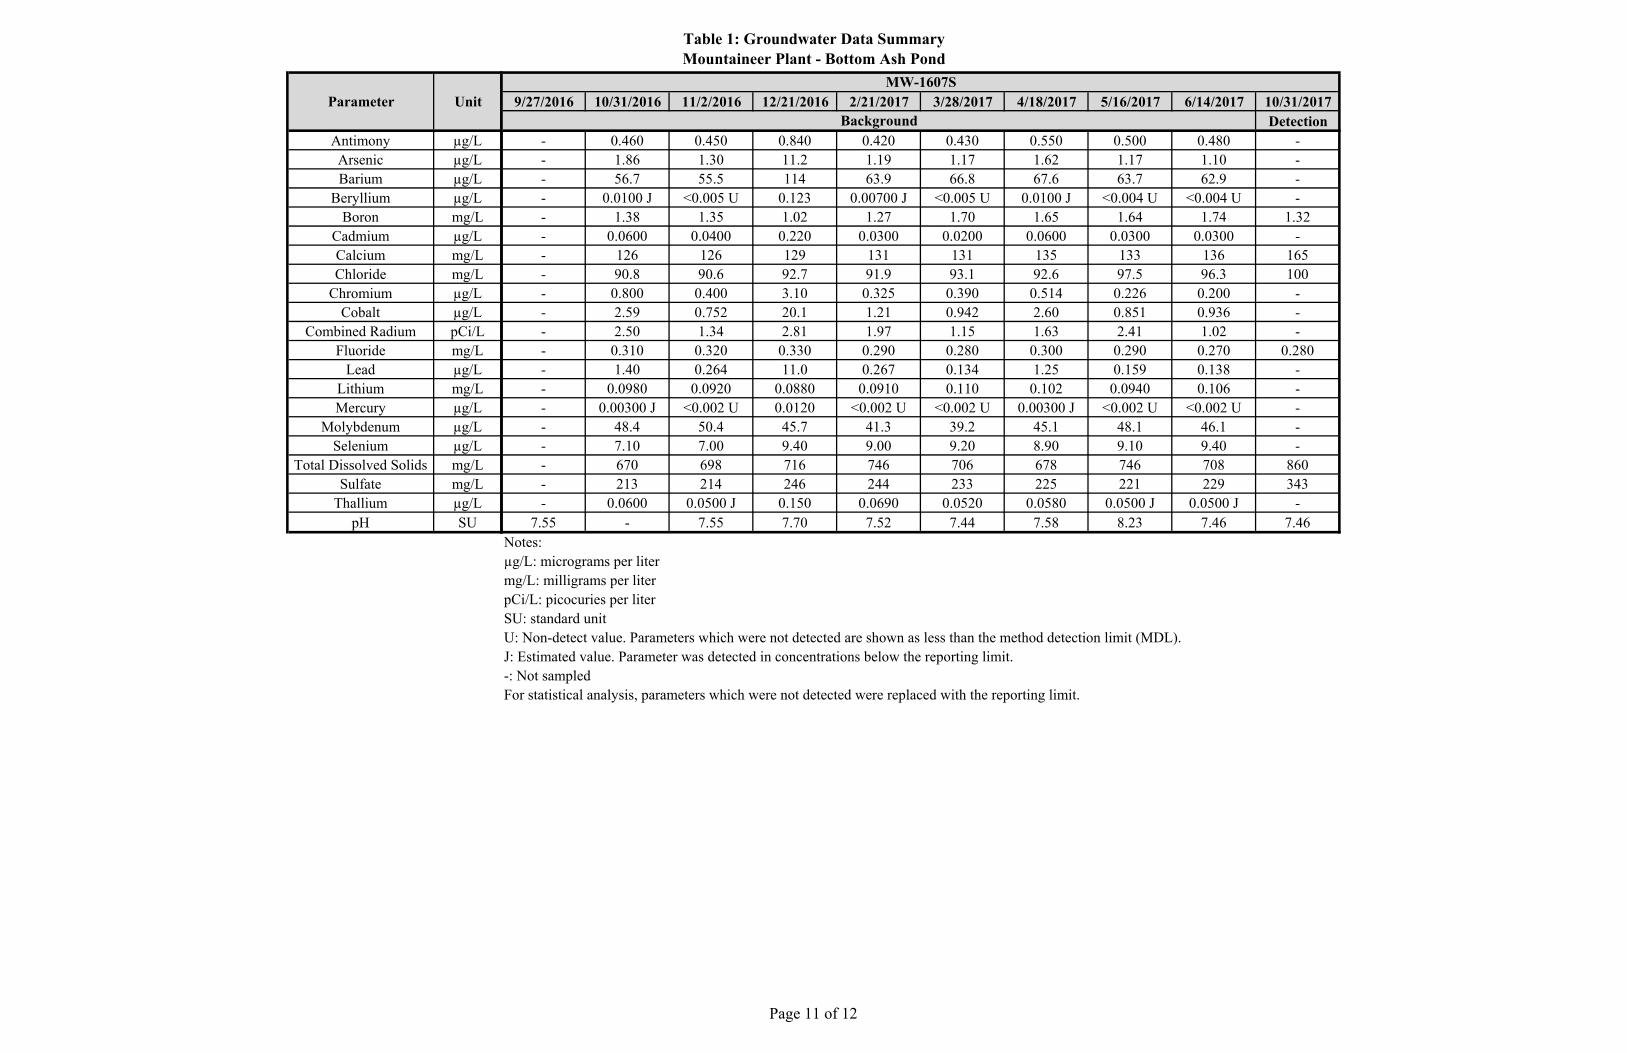
Table 1: Groundwater Data SummaryMountaineer Plant - Bottom Ash Pond
Antimony µg/LArsenic µg/LBarium µg/L
Beryllium µg/LBoron mg/L
Cadmium µg/LCalcium mg/LChloride mg/L
Chromium µg/LCobalt µg/L
Combined Radium pCi/LFluoride mg/L
Lead µg/LLithium mg/LMercury µg/L
Molybdenum µg/LSelenium µg/L
Total Dissolved Solids mg/LSulfate mg/L
Thallium µg/LpH SU
Parameter Unit 9/27/2016 10/31/2016 11/2/2016 12/21/2016 2/21/2017 3/28/2017 4/18/2017 5/16/2017 6/14/2017 10/31/2017Detection
- 0.460 0.450 0.840 0.420 0.430 0.550 0.500 0.480 -- 1.86 1.30 11.2 1.19 1.17 1.62 1.17 1.10 -- 56.7 55.5 114 63.9 66.8 67.6 63.7 62.9 -- 0.0100 J <0.005 U 0.123 0.00700 J <0.005 U 0.0100 J <0.004 U <0.004 U -- 1.38 1.35 1.02 1.27 1.70 1.65 1.64 1.74 1.32- 0.0600 0.0400 0.220 0.0300 0.0200 0.0600 0.0300 0.0300 -- 126 126 129 131 131 135 133 136 165- 90.8 90.6 92.7 91.9 93.1 92.6 97.5 96.3 100- 0.800 0.400 3.10 0.325 0.390 0.514 0.226 0.200 -- 2.59 0.752 20.1 1.21 0.942 2.60 0.851 0.936 -- 2.50 1.34 2.81 1.97 1.15 1.63 2.41 1.02 -- 0.310 0.320 0.330 0.290 0.280 0.300 0.290 0.270 0.280- 1.40 0.264 11.0 0.267 0.134 1.25 0.159 0.138 -- 0.0980 0.0920 0.0880 0.0910 0.110 0.102 0.0940 0.106 -- 0.00300 J <0.002 U 0.0120 <0.002 U <0.002 U 0.00300 J <0.002 U <0.002 U -- 48.4 50.4 45.7 41.3 39.2 45.1 48.1 46.1 -- 7.10 7.00 9.40 9.00 9.20 8.90 9.10 9.40 -- 670 698 716 746 706 678 746 708 860- 213 214 246 244 233 225 221 229 343- 0.0600 0.0500 J 0.150 0.0690 0.0520 0.0580 0.0500 J 0.0500 J -
7.55 - 7.55 7.70 7.52 7.44 7.58 8.23 7.46 7.46Notes:µg/L: micrograms per litermg/L: milligrams per literpCi/L: picocuries per literSU: standard unitU: Non-detect value. Parameters which were not detected are shown as less than the method detection limit (MDL).J: Estimated value. Parameter was detected in concentrations below the reporting limit.-: Not sampledFor statistical analysis, parameters which were not detected were replaced with the reporting limit.
MW-1607S
Background
Page 11 of 12
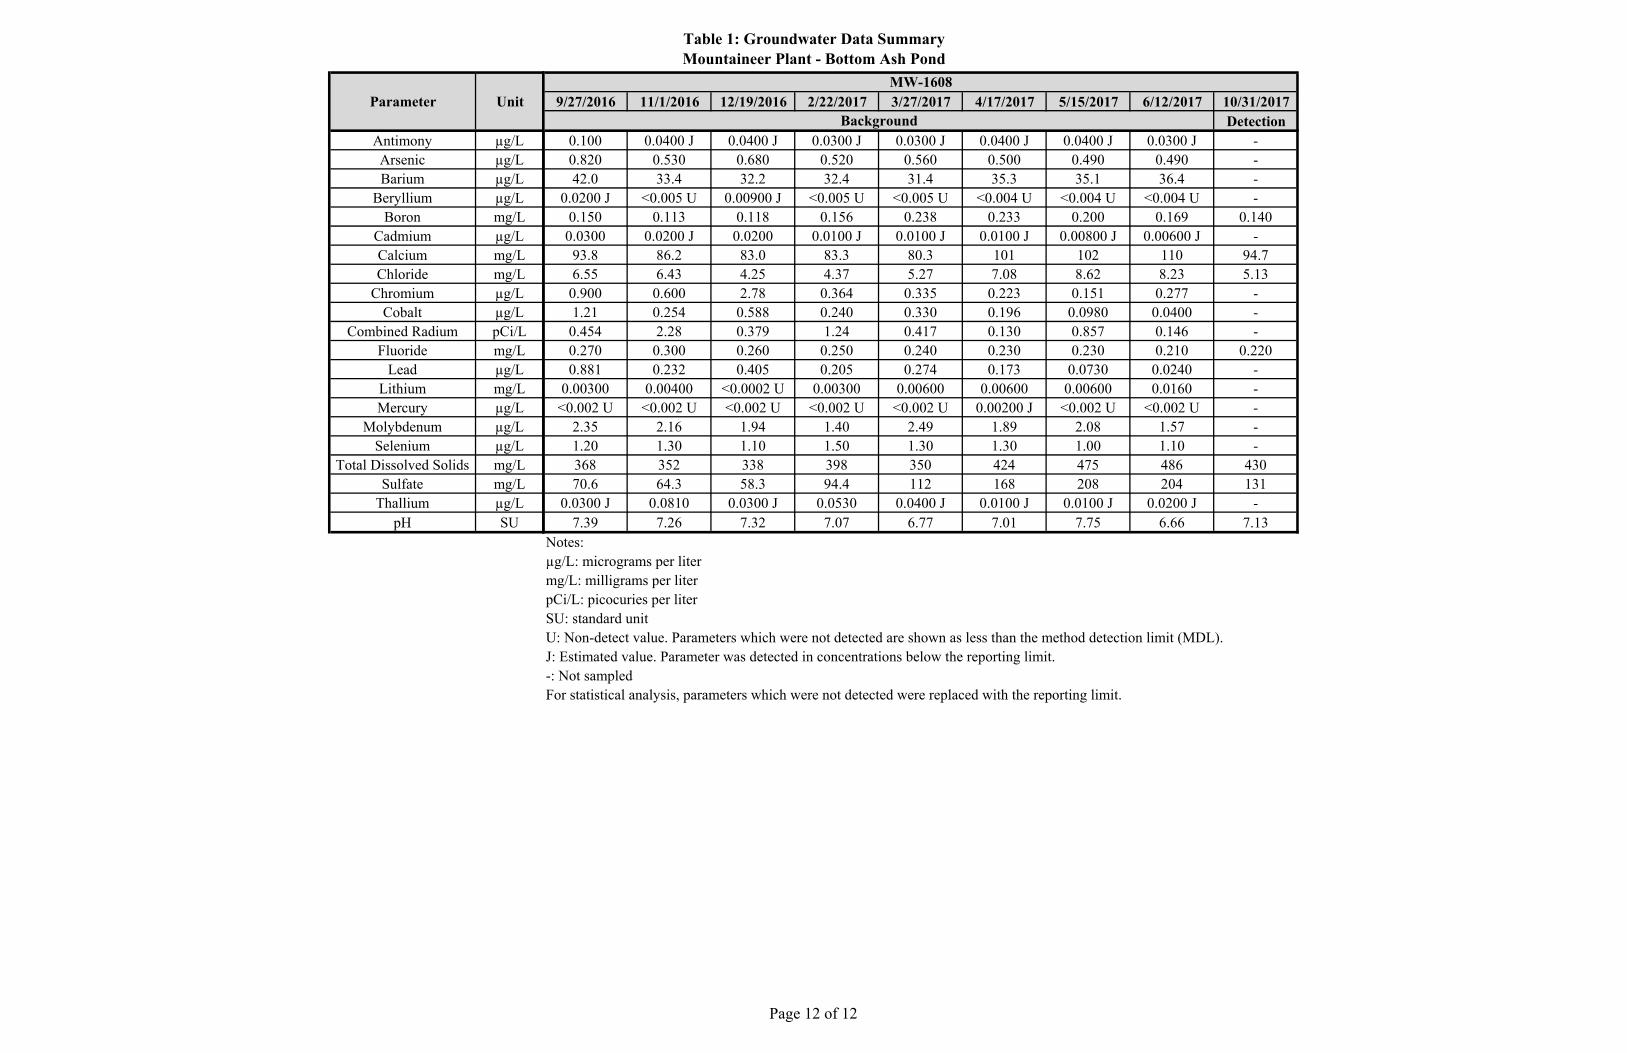
Table 1: Groundwater Data SummaryMountaineer Plant - Bottom Ash Pond
Antimony µg/LArsenic µg/LBarium µg/L
Beryllium µg/LBoron mg/L
Cadmium µg/LCalcium mg/LChloride mg/L
Chromium µg/LCobalt µg/L
Combined Radium pCi/LFluoride mg/L
Lead µg/LLithium mg/LMercury µg/L
Molybdenum µg/LSelenium µg/L
Total Dissolved Solids mg/LSulfate mg/L
Thallium µg/LpH SU
Parameter Unit 9/27/2016 11/1/2016 12/19/2016 2/22/2017 3/27/2017 4/17/2017 5/15/2017 6/12/2017 10/31/2017Detection
0.100 0.0400 J 0.0400 J 0.0300 J 0.0300 J 0.0400 J 0.0400 J 0.0300 J -0.820 0.530 0.680 0.520 0.560 0.500 0.490 0.490 -42.0 33.4 32.2 32.4 31.4 35.3 35.1 36.4 -
0.0200 J <0.005 U 0.00900 J <0.005 U <0.005 U <0.004 U <0.004 U <0.004 U -0.150 0.113 0.118 0.156 0.238 0.233 0.200 0.169 0.140
0.0300 0.0200 J 0.0200 0.0100 J 0.0100 J 0.0100 J 0.00800 J 0.00600 J -93.8 86.2 83.0 83.3 80.3 101 102 110 94.76.55 6.43 4.25 4.37 5.27 7.08 8.62 8.23 5.13
0.900 0.600 2.78 0.364 0.335 0.223 0.151 0.277 -1.21 0.254 0.588 0.240 0.330 0.196 0.0980 0.0400 -
0.454 2.28 0.379 1.24 0.417 0.130 0.857 0.146 -0.270 0.300 0.260 0.250 0.240 0.230 0.230 0.210 0.2200.881 0.232 0.405 0.205 0.274 0.173 0.0730 0.0240 -
0.00300 0.00400 <0.0002 U 0.00300 0.00600 0.00600 0.00600 0.0160 -<0.002 U <0.002 U <0.002 U <0.002 U <0.002 U 0.00200 J <0.002 U <0.002 U -
2.35 2.16 1.94 1.40 2.49 1.89 2.08 1.57 -1.20 1.30 1.10 1.50 1.30 1.30 1.00 1.10 -368 352 338 398 350 424 475 486 43070.6 64.3 58.3 94.4 112 168 208 204 131
0.0300 J 0.0810 0.0300 J 0.0530 0.0400 J 0.0100 J 0.0100 J 0.0200 J -7.39 7.26 7.32 7.07 6.77 7.01 7.75 6.66 7.13
Notes:µg/L: micrograms per litermg/L: milligrams per literpCi/L: picocuries per literSU: standard unitU: Non-detect value. Parameters which were not detected are shown as less than the method detection limit (MDL).J: Estimated value. Parameter was detected in concentrations below the reporting limit.-: Not sampledFor statistical analysis, parameters which were not detected were replaced with the reporting limit.
MW-1608
Background
Page 12 of 12
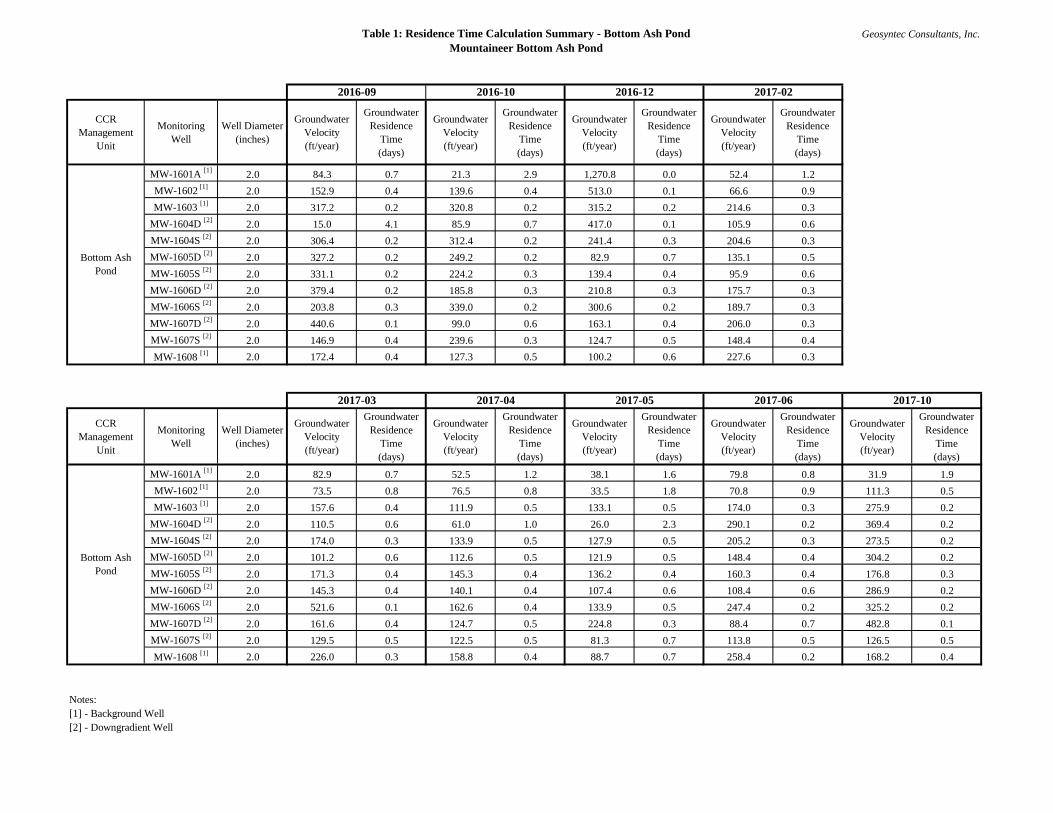
Table 1: Residence Time Calculation Summary - Bottom Ash PondMountaineer Bottom Ash Pond
Geosyntec Consultants, Inc.
CCRManagement
Unit
MonitoringWell
Well Diameter (inches)
Groundwater Velocity (ft/year)
Groundwater Residence
Time (days)
Groundwater Velocity (ft/year)
Groundwater Residence
Time (days)
Groundwater Velocity (ft/year)
Groundwater Residence
Time (days)
Groundwater Velocity (ft/year)
Groundwater Residence
Time (days)
MW-1601A [1] 2.0 84.3 0.7 21.3 2.9 1,270.8 0.0 52.4 1.2MW-1602 [1] 2.0 152.9 0.4 139.6 0.4 513.0 0.1 66.6 0.9MW-1603 [1] 2.0 317.2 0.2 320.8 0.2 315.2 0.2 214.6 0.3
MW-1604D [2] 2.0 15.0 4.1 85.9 0.7 417.0 0.1 105.9 0.6MW-1604S [2] 2.0 306.4 0.2 312.4 0.2 241.4 0.3 204.6 0.3MW-1605D [2] 2.0 327.2 0.2 249.2 0.2 82.9 0.7 135.1 0.5MW-1605S [2] 2.0 331.1 0.2 224.2 0.3 139.4 0.4 95.9 0.6MW-1606D [2] 2.0 379.4 0.2 185.8 0.3 210.8 0.3 175.7 0.3MW-1606S [2] 2.0 203.8 0.3 339.0 0.2 300.6 0.2 189.7 0.3MW-1607D [2] 2.0 440.6 0.1 99.0 0.6 163.1 0.4 206.0 0.3MW-1607S [2] 2.0 146.9 0.4 239.6 0.3 124.7 0.5 148.4 0.4MW-1608 [1] 2.0 172.4 0.4 127.3 0.5 100.2 0.6 227.6 0.3
CCRManagement
Unit
MonitoringWell
Well Diameter (inches)
Groundwater Velocity (ft/year)
Groundwater Residence
Time (days)
Groundwater Velocity (ft/year)
Groundwater Residence
Time (days)
Groundwater Velocity (ft/year)
Groundwater Residence
Time (days)
Groundwater Velocity (ft/year)
Groundwater Residence
Time (days)
Groundwater Velocity (ft/year)
Groundwater Residence
Time (days)
MW-1601A [1] 2.0 82.9 0.7 52.5 1.2 38.1 1.6 79.8 0.8 31.9 1.9MW-1602 [1] 2.0 73.5 0.8 76.5 0.8 33.5 1.8 70.8 0.9 111.3 0.5MW-1603 [1] 2.0 157.6 0.4 111.9 0.5 133.1 0.5 174.0 0.3 275.9 0.2
MW-1604D [2] 2.0 110.5 0.6 61.0 1.0 26.0 2.3 290.1 0.2 369.4 0.2MW-1604S [2] 2.0 174.0 0.3 133.9 0.5 127.9 0.5 205.2 0.3 273.5 0.2MW-1605D [2] 2.0 101.2 0.6 112.6 0.5 121.9 0.5 148.4 0.4 304.2 0.2MW-1605S [2] 2.0 171.3 0.4 145.3 0.4 136.2 0.4 160.3 0.4 176.8 0.3MW-1606D [2] 2.0 145.3 0.4 140.1 0.4 107.4 0.6 108.4 0.6 286.9 0.2MW-1606S [2] 2.0 521.6 0.1 162.6 0.4 133.9 0.5 247.4 0.2 325.2 0.2MW-1607D [2] 2.0 161.6 0.4 124.7 0.5 224.8 0.3 88.4 0.7 482.8 0.1MW-1607S [2] 2.0 129.5 0.5 122.5 0.5 81.3 0.7 113.8 0.5 126.5 0.5MW-1608 [1] 2.0 226.0 0.3 158.8 0.4 88.7 0.7 258.4 0.2 168.2 0.4
Notes:[1] - Background Well[2] - Downgradient Well
2017-10
Bottom AshPond
Bottom AshPond
2016-09
2017-05 2017-06
2016-10 2016-12 2017-02
2017-03 2017-04
@A
@A@A
@A
@A
@A@A
!A!A
!A
@A
@A
@A
@A@A@A@A
@A@A
@A@A
@A
MW-001539.25
MW-002539.95
MW-004540.15
MW-005
MW-016541.3
JTMN-1539.4 JTMN-2
539.24
PZ-09-03
PZ-09-04
PZ-09-05
MW-1601A544.58
MW-1602544.76
MW-1603543.67
MW-1604S542.54
MW-1604D542.74
MW-1605S542.51
MW-1605D542.52
MW-1606S543.19MW-1606D543.15
MW-1607S 543.52MW-1607D543.56
MW-1608541.35
544.5
544.25
544
543.75
543542.75542.5
542.25
542
541.75
541.5
541.25
541
540.75
540.5
540.25
540
539.75
539.5539.25
543.5543.25
539.5
P:\Projects\AEP\Groundwater Statistical Evaluation - CHA8423\Groundwater Mapping\GIS Files\MXD\Mountaineer\AEP-Mountaineer_BAP_GW_2016-09.mxd. CGregory. 12/28/2017. CHA8423/07/08.
AEP Mountaineer Generating Plant - Bottom Ash PondsLetart, West Virginia
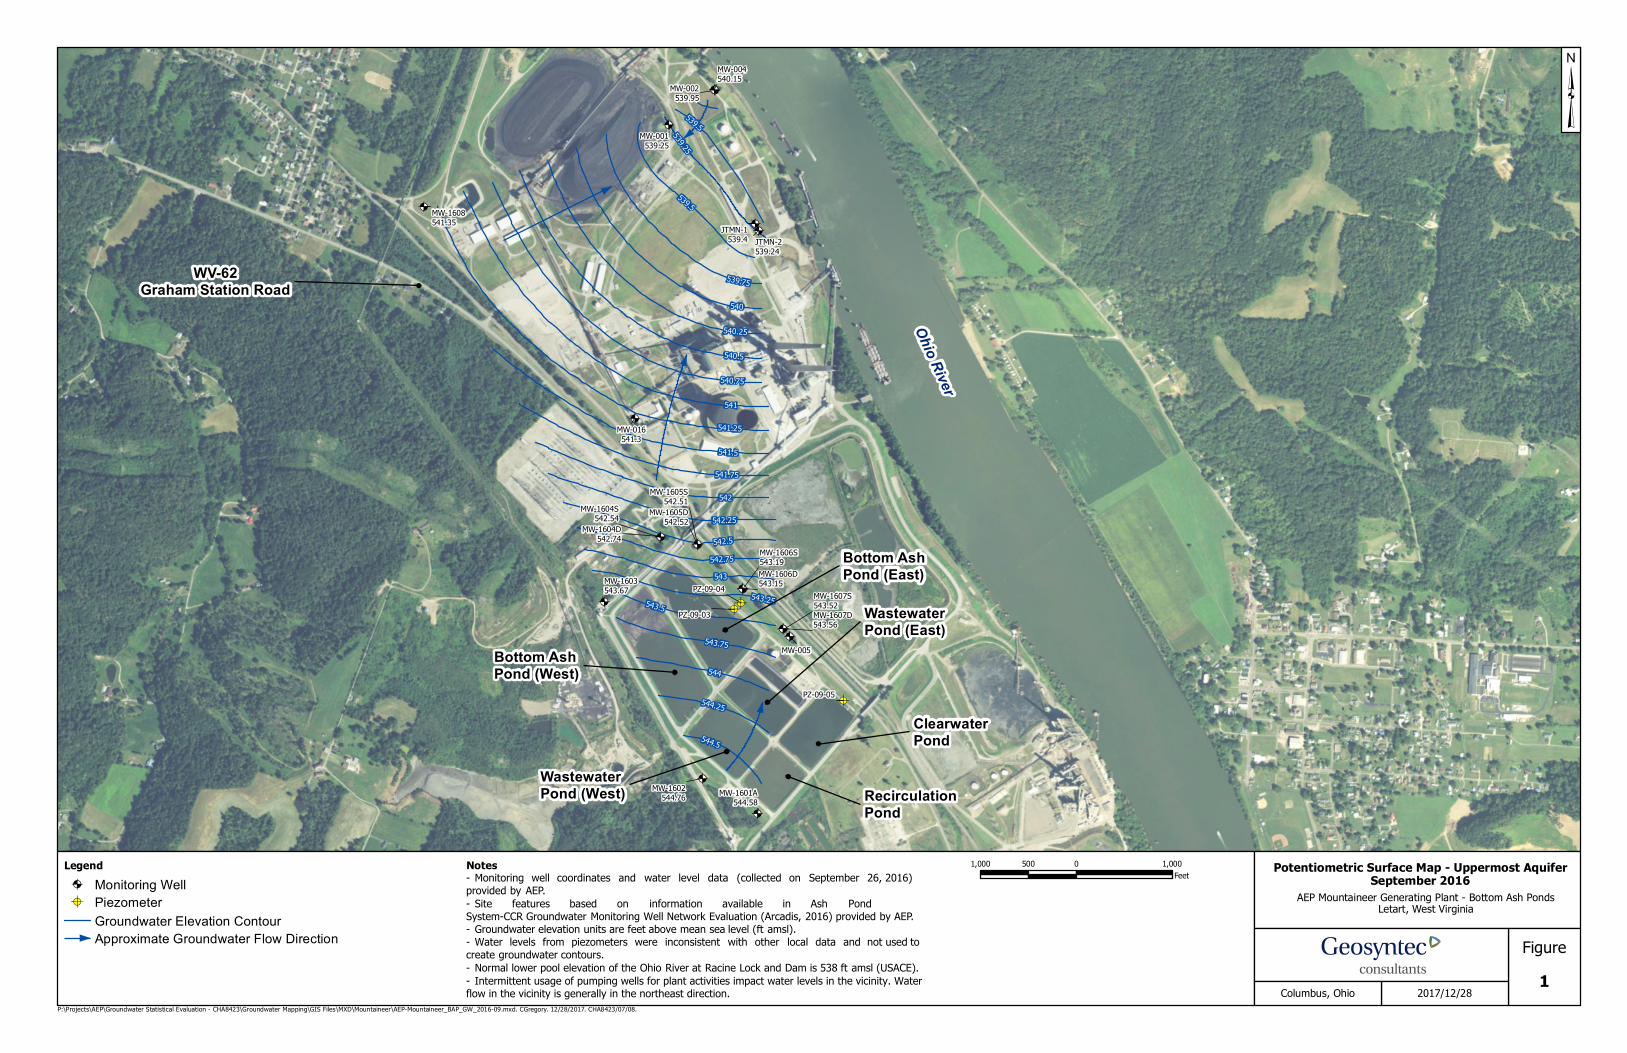
Potentiometric Surface Map - Uppermost AquiferSeptember 2016
³
Figure1Columbus, Ohio 2017/12/28
Bottom AshPond (East)
Legend@A Monitoring Well!A Piezometer
Groundwater Elevation ContourApproximate Groundwater Flow Direction
Notes- Monitoring well coordinates and water level data (collected on September 26, 2016) provided by AEP.- Site features based on information available in Ash Pond System-CCR Groundwater Monitoring Well Network Evaluation (Arcadis, 2016) provided by AEP.- Groundwater elevation units are feet above mean sea level (ft amsl).- Water levels from piezometers were inconsistent with other local data and not used to create groundwater contours.- Normal lower pool elevation of the Ohio River at Racine Lock and Dam is 538 ft amsl (USACE).- Intermittent usage of pumping wells for plant activities impact water levels in the vicinity. Water flow in the vicinity is generally in the northeast direction.
1,000 0 1,000500Feet
Ohio River
WV-62Graham Station Road
WastewaterPond (East)
ClearwaterPond
RecirculationPond
WastewaterPond (West)
Bottom AshPond (West)
@A
@A@A
@A
@A
@A@A
!A!A
!A
@A
@A
@A
@A@A@A@A
@A@A
@A@A
@A
MW-001539.72
MW-002540.48
MW-004540.66
MW-005543.8
MW-016540.82
JTMN-1539.85 JTMN-2
539.64
PZ-09-03PZ-09-04
PZ-09-05
MW-1601A544.26
MW-1602544.38
MW-1603543.21
MW-1604S542.11
MW-1604D542.21
MW-1605S542.13MW-1605D542.15
MW-1606S542.89MW-1606D542.83
MW-1607S 543.23MW-1607D543.26
MW-1608541.08
544
543.75
543.5
543.25
543542.75
542.5
542.25
542
541.75
541.5
541.25
541
540.75
540.5
540.25
540
539.75
540
P:\Projects\AEP\Groundwater Statistical Evaluation - CHA8423\Groundwater Mapping\GIS Files\MXD\Mountaineer\AEP-Mountaineer_BAP_GW_2016-10.mxd. CGregory. 12/28/2017. CHA8423/07/08.
AEP Mountaineer Generating Plant - Bottom Ash PondsLetart, West Virginia
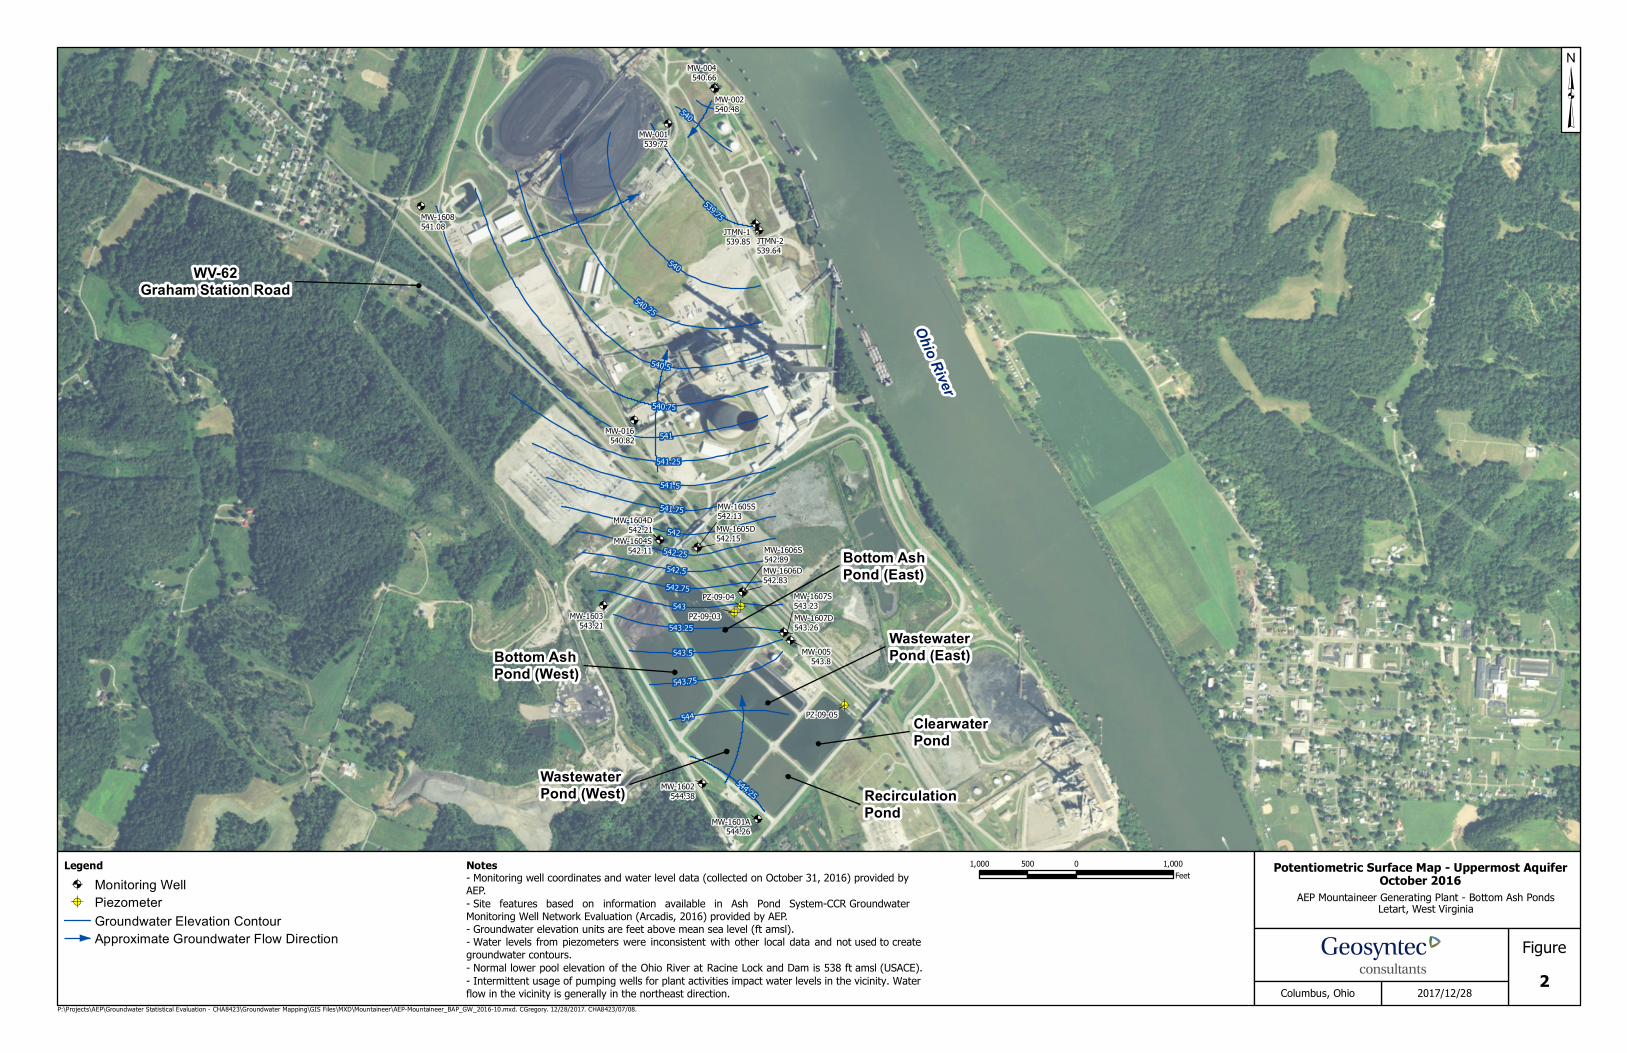
Potentiometric Surface Map - Uppermost AquiferOctober 2016
³
Figure2Columbus, Ohio 2017/12/28
Bottom AshPond (East)
Legend@A Monitoring Well!A Piezometer
Groundwater Elevation ContourApproximate Groundwater Flow Direction
Notes- Monitoring well coordinates and water level data (collected on October 31, 2016) provided by AEP.- Site features based on information available in Ash Pond System-CCR Groundwater Monitoring Well Network Evaluation (Arcadis, 2016) provided by AEP.- Groundwater elevation units are feet above mean sea level (ft amsl).- Water levels from piezometers were inconsistent with other local data and not used to create groundwater contours.- Normal lower pool elevation of the Ohio River at Racine Lock and Dam is 538 ft amsl (USACE).- Intermittent usage of pumping wells for plant activities impact water levels in the vicinity. Water flow in the vicinity is generally in the northeast direction.
1,000 0 1,000500Feet
Ohio River
WV-62Graham Station Road
WastewaterPond (East)
ClearwaterPond
RecirculationPond
WastewaterPond (West)
Bottom AshPond (West)
544.25

@A
@A@A
@A
@A
@A@A
!A!A
!A
@A
@A
@A
@A@A@A@A
@A@A
@A@A
@A
MW-004542.35
MW-1604D541.74
MW-1605S 541.65MW-1605D541.69
MW-1606D542.3
MW-1607D542.71
MW-001540.43
MW-002 542.16
MW-005543.76
MW-016540.59
JTMN-1542.57JTMN-2542.49
PZ-09-03PZ-09-04
PZ-09-05
MW-1601A541.69
MW-1602543.66
MW-1603542.59
MW-1604S 541.61
MW-1606S 542.32
MW-1607S 542.66
MW-1608540.92
543
542.75
542.5
542.25
542
541.75
541.5
541.25
541
540.75
540.5
542.5542
541.75541.554
1.25
541
540.7
5
543.5
543.25
543543
.5
543.25
542.25
P:\Projects\AEP\Groundwater Statistical Evaluation - CHA8423\Groundwater Mapping\GIS Files\MXD\Mountaineer\AEP-Mountaineer_BAP_GW_2016-12.mxd. CGregory. 8/4/2017. CHA8423/07/08.
AEP Mountaineer Generating Plant - Bottom Ash PondsLetart, West Virginia
Potentiometric Surface Map - Uppermost AquiferDecember 2016
³
Figure3Columbus, Ohio 2017/08/04
Bottom AshPond (East)
Legend@A Monitoring Well!A Piezometer
Groundwater Elevation ContourApproximate Groundwater Flow Direction
Notes- Monitoring well coordinates and water level data (collected on December 19, 2016) providedby AEP.- Site features based on information available in Ash Pond System-CCR GroundwaterMonitoring Well Network Evaluation (Arcadis, 2016) provided by AEP.- Groundwater elevation units are feet above mean sea level (ft amsl).- Water levels from piezometers were inconsistent with other local data and not used to creategroundwater contours.- Normal lower pool elevation of the Ohio River at Racine Lock and Dam is 538 ft amsl (USACE).- Intermittent usage of pumping wells for plant activities impact water levels in the vicinity. Waterflow in the vicinity is generally in the northeast direction.
1,000 0 1,000500Feet
Ohio River
WV-62Graham Station Road
WastewaterPond (East)
ClearwaterPond
RecirculationPond
WastewaterPond (West)
Bottom AshPond (West)

@A
@A@A
@A
@A
@A@A
!A!A
!A
@A
@A
@A
@A@A@A@A
@A@A
@A@A
@A
MW-001542.43
MW-002543.08
MW-004543.28
MW-005543.66
MW-016541.46
JTMN-1541.91 JTMN-2
541.64
PZ-09-03PZ-09-04
PZ-09-05
MW-1601A543.8
MW-1602543.62
MW-1603542.73
MW-1604S541.92
MW-1604D542.04
MW-1605S541.94MW-1605D542.02
MW-1606S542.54MW-1606D542.52
MW-1607S542.9MW-1607D542.96
MW-1608543.61
543.25
543
542.75
542.5
542.25
542
543.75
543.5
543
542.7
5
542.5
542.25
541.75
543.25
542.75
P:\Projects\AEP\Groundwater Statistical Evaluation - CHA8423\Groundwater Mapping\GIS Files\MXD\Mountaineer\AEP-Mountaineer_BAP_GW_2017-02.mxd. CGregory. 12/28/2017. CHA8423/07/08.
AEP Mountaineer Generating Plant - Bottom Ash PondsLetart, West Virginia
Potentiometric Surface Map - Uppermost AquiferFebruary 2017
³
Figure4Columbus, Ohio 2017/12/28
Bottom AshPond (East)
Legend@A Monitoring Well!A Piezometer
Groundwater Elevation ContourApproximate Groundwater Flow Direction
Notes- Monitoring well coordinates and water level data (collected on February 20, 2017) providedby AEP.- Site features based on information available in Ash Pond System-CCR GroundwaterMonitoring Well Network Evaluation (Arcadis, 2016) provided by AEP.- Groundwater elevation units are feet above mean sea level.- Water levels from piezometers were inconsistent with other local data and not used to creategroundwater contours.- Normal lower pool elevation of the Ohio River at Racine Lock and Dam is 538 ft amsl (USACE).- Intermittent usage of pumping wells for plant activities impact water levels in the vicinity. Waterflow in the vicinity is generally in the northeast direction.
1,000 0 1,000500Feet
Ohio River
WV-62Graham Station Road
WastewaterPond (East)
ClearwaterPond
RecirculationPond
WastewaterPond (West)
Bottom AshPond (West)
542
541.75
@A
@A@A
@A
@A
@A@A
!A!A
!A
@A
@A
@A
@A@A@A@A
@A@A
@A@A
@A
MW-001541.49
MW-002542.09
MW-004542.34
MW-005543.6
MW-016542.22
JTMN-1541.43
JTMN-2541.33
PZ-09-03
PZ-09-04
PZ-09-05
MW-1601A543.99
MW-1602543.75
MW-1603543.02
MW-1604S542.38
MW-1604D542.52
MW-1605S542.43MW-1605D
542.46
MW-1606S542.91
MW-1606D542.87
MW-1607S 543.19
MW-1607D543.24
MW-1608543.89 54
3.5
543.2
5
543
542.75
542.5
542.25
542
541.75
541.5
543.5
543.25
543
542.75
542541.75
543.75
P:\Projects\AEP\Groundwater Statistical Evaluation - CHA8423\Groundwater Mapping\GIS Files\MXD\Mountaineer\AEP-Mountaineer_BAP_GW_2017-03.mxd. CGregory. 12/28/2017. CHA8423/07/08.
AEP Mountaineer Generating Plant - Bottom Ash PondsLetart, West Virginia
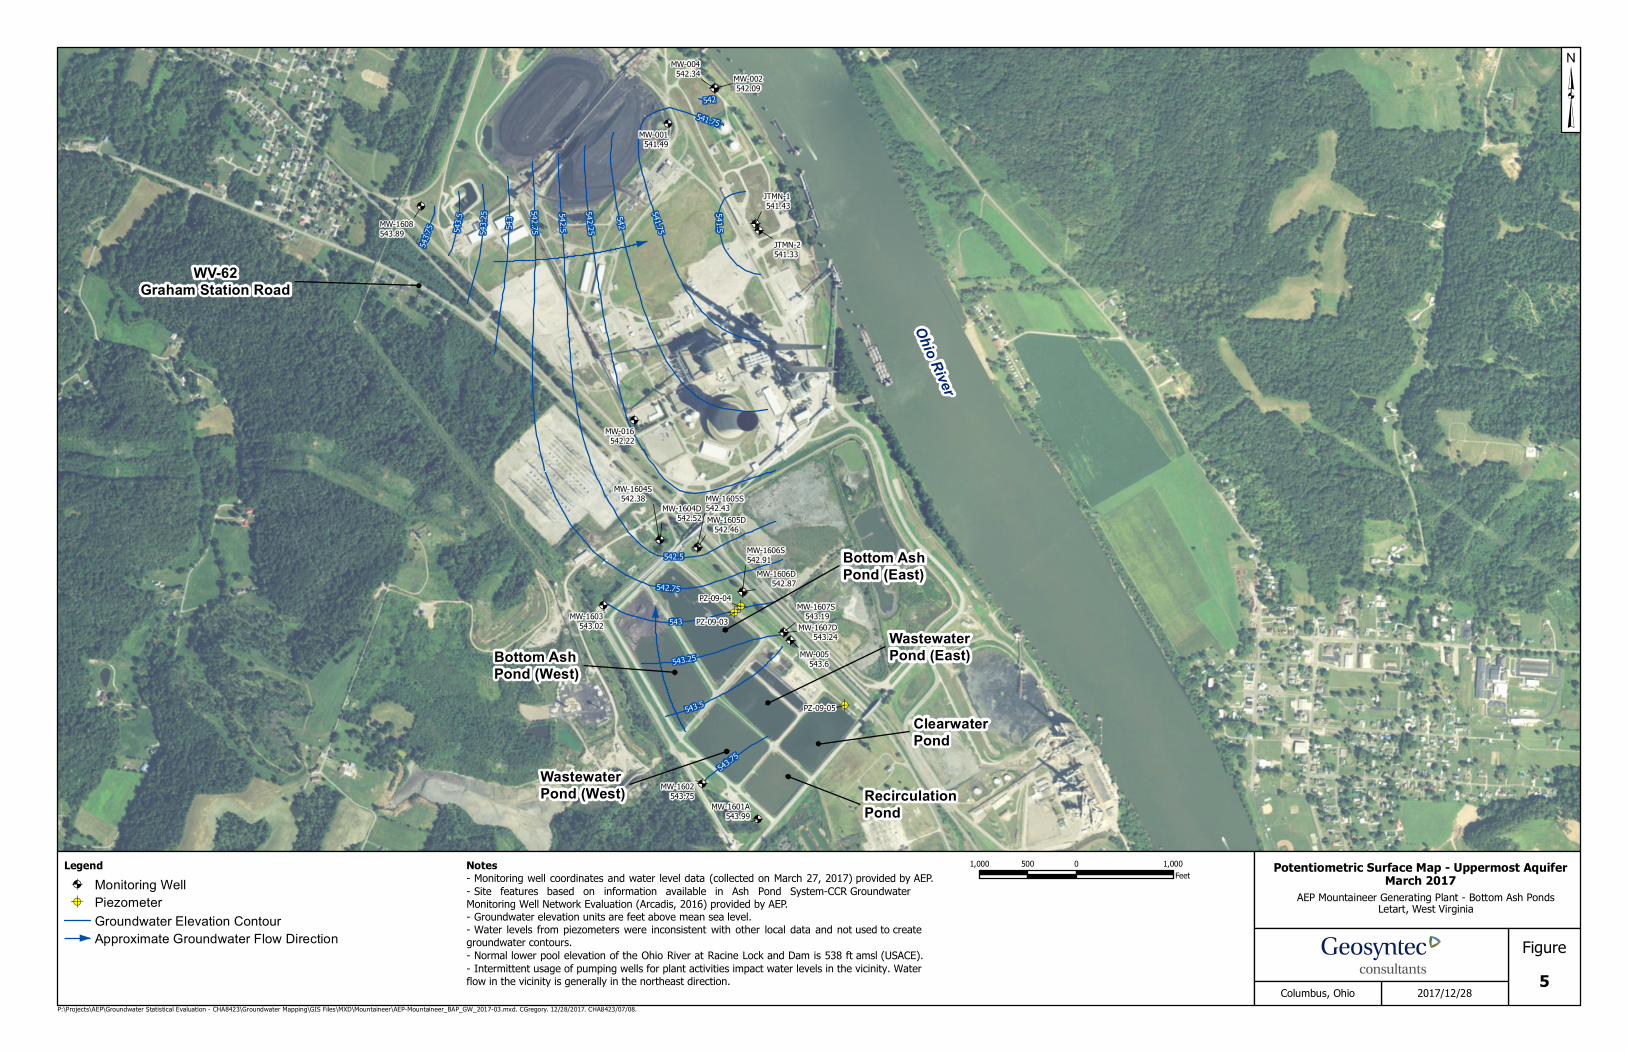
Potentiometric Surface Map - Uppermost AquiferMarch 2017
³
Figure5Columbus, Ohio 2017/12/28
Bottom AshPond (East)
Legend@A Monitoring Well!A Piezometer
Groundwater Elevation ContourApproximate Groundwater Flow Direction
Notes- Monitoring well coordinates and water level data (collected on March 27, 2017) provided by AEP.- Site features based on information available in Ash Pond System-CCR GroundwaterMonitoring Well Network Evaluation (Arcadis, 2016) provided by AEP.- Groundwater elevation units are feet above mean sea level.- Water levels from piezometers were inconsistent with other local data and not used to creategroundwater contours.- Normal lower pool elevation of the Ohio River at Racine Lock and Dam is 538 ft amsl (USACE).- Intermittent usage of pumping wells for plant activities impact water levels in the vicinity. Waterflow in the vicinity is generally in the northeast direction.
1,000 0 1,000500Feet
Ohio River
WV-62Graham Station Road
WastewaterPond (East)
ClearwaterPond
RecirculationPond
WastewaterPond (West)
Bottom AshPond (West)
543.7
5
542.5
@A
@A@A
@A
@A
@A@A
!A!A
!A
@A
@A
@A
@A@A@A@A
@A@A
@A@A
@A
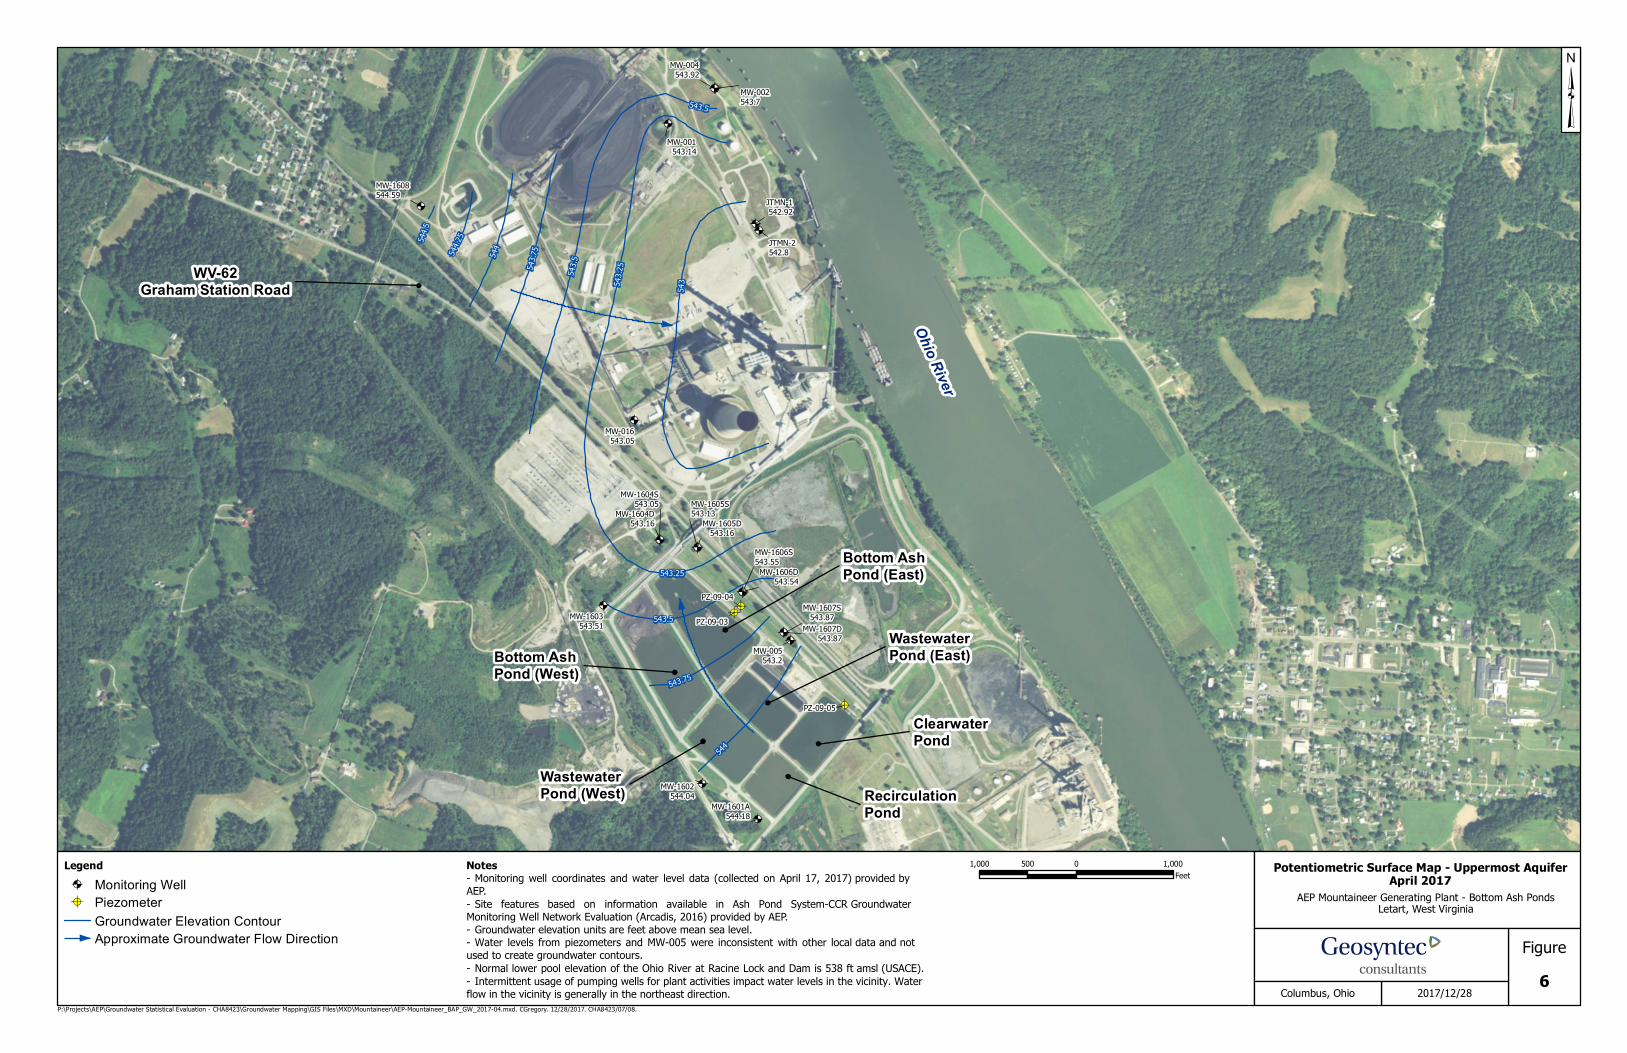
MW-001543.14
MW-002543.7
MW-004543.92
MW-005543.2
MW-016543.05
JTMN-1542.92
JTMN-2542.8
PZ-09-03
PZ-09-04
PZ-09-05
MW-1601A544.18
MW-1602544.04
MW-1603543.51
MW-1604S543.05
MW-1604D543.16
MW-1605S543.13
MW-1605D543.16
MW-1606S543.55MW-1606D
543.54
MW-1607S543.87
MW-1607D543.87
MW-1608544.59
544.25
544
543.7
5
543.5
543.2
5
543
544
543.75
543.5
543.5
P:\Projects\AEP\Groundwater Statistical Evaluation - CHA8423\Groundwater Mapping\GIS Files\MXD\Mountaineer\AEP-Mountaineer_BAP_GW_2017-04.mxd. CGregory. 12/28/2017. CHA8423/07/08.
AEP Mountaineer Generating Plant - Bottom Ash PondsLetart, West Virginia
Potentiometric Surface Map - Uppermost AquiferApril 2017
³
Figure6Columbus, Ohio 2017/12/28
Bottom AshPond (East)
Legend@A Monitoring Well!A Piezometer
Groundwater Elevation ContourApproximate Groundwater Flow Direction
Notes- Monitoring well coordinates and water level data (collected on April 17, 2017) provided byAEP.- Site features based on information available in Ash Pond System-CCR GroundwaterMonitoring Well Network Evaluation (Arcadis, 2016) provided by AEP.- Groundwater elevation units are feet above mean sea level.- Water levels from piezometers and MW-005 were inconsistent with other local data and notused to create groundwater contours.- Normal lower pool elevation of the Ohio River at Racine Lock and Dam is 538 ft amsl (USACE).- Intermittent usage of pumping wells for plant activities impact water levels in the vicinity. Waterflow in the vicinity is generally in the northeast direction.
1,000 0 1,000500Feet
Ohio River
WV-62Graham Station Road
WastewaterPond (East)
ClearwaterPond
RecirculationPond
WastewaterPond (West)
Bottom AshPond (West)
544.5
543.25
@A
@A@A
@A
@A
@A@A
!A!A
!A
@A
@A
@A
@A@A@A@A
@A@A
@A@A
@A
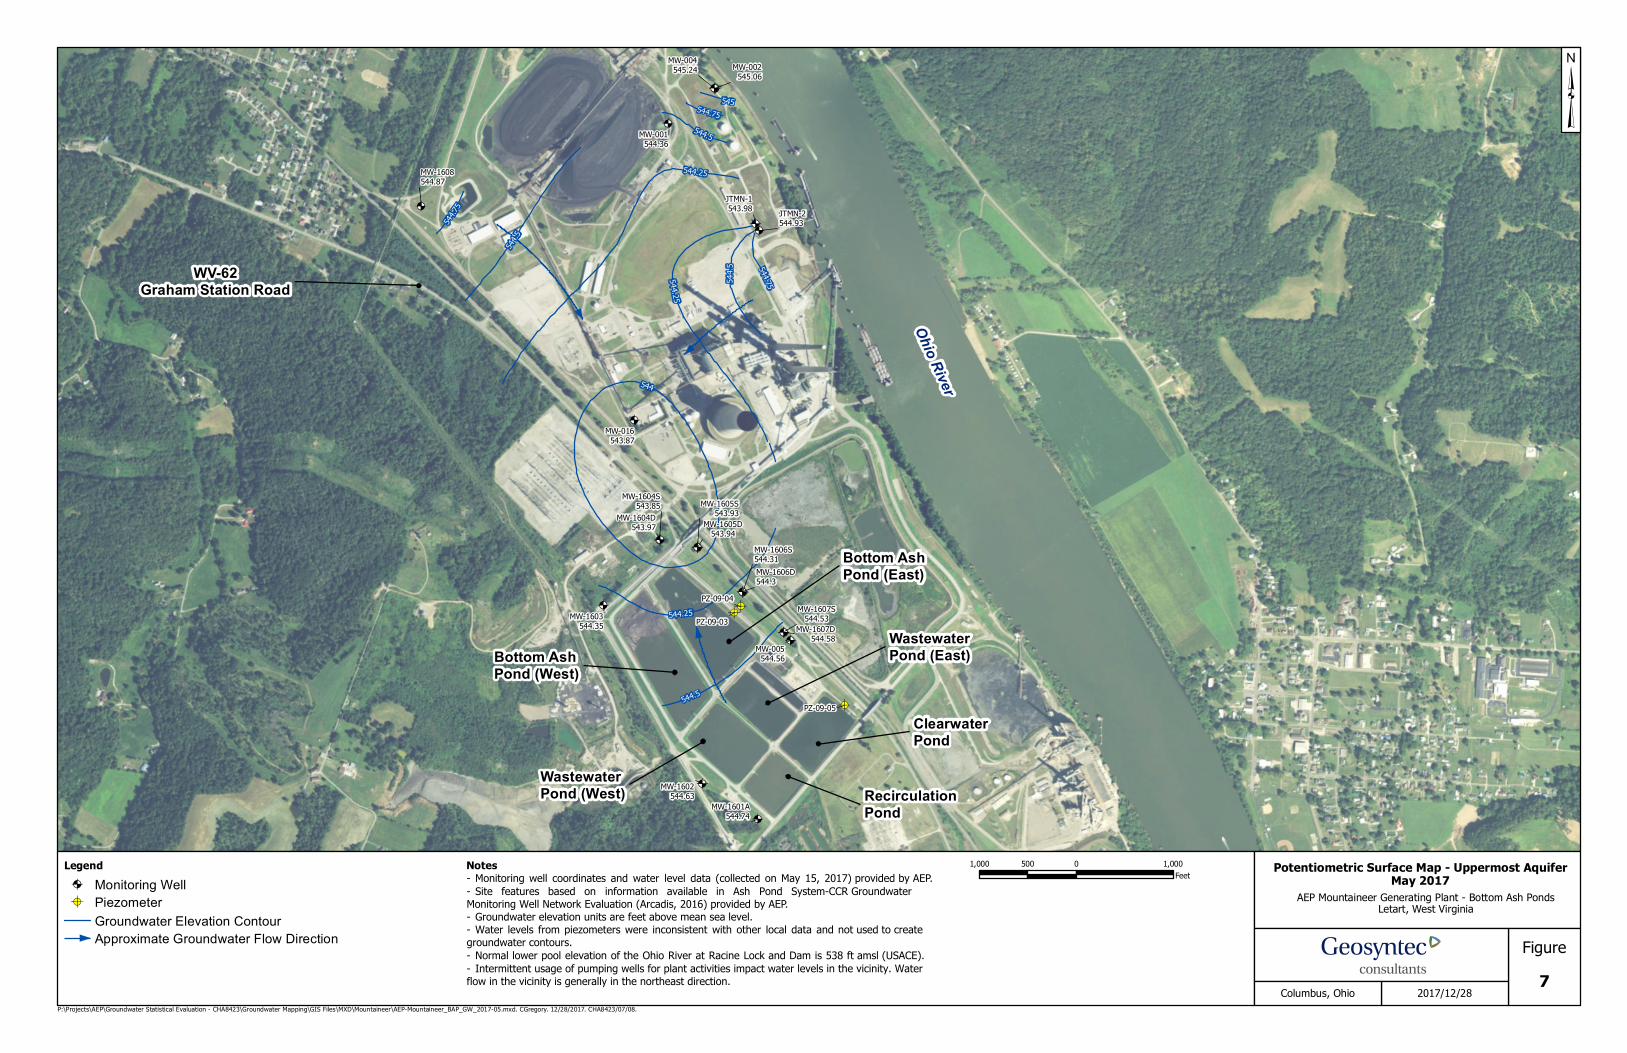
MW-001544.36
MW-002545.06
MW-004545.24
MW-005544.56
MW-016543.87
JTMN-1543.98 JTMN-2
544.93
PZ-09-03
PZ-09-04
PZ-09-05
MW-1601A544.74
MW-1602544.63
MW-1603544.35
MW-1604S543.85
MW-1604D543.97
MW-1605S543.93
MW-1605D543.94
MW-1606S544.31MW-1606D544.3
MW-1607S544.53
MW-1607D544.58
MW-1608544.87
544.75544.5
544.25
544
544.75
544.5
544.5544.25
544.5
544.25
P:\Projects\AEP\Groundwater Statistical Evaluation - CHA8423\Groundwater Mapping\GIS Files\MXD\Mountaineer\AEP-Mountaineer_BAP_GW_2017-05.mxd. CGregory. 12/28/2017. CHA8423/07/08.
AEP Mountaineer Generating Plant - Bottom Ash PondsLetart, West Virginia
Potentiometric Surface Map - Uppermost AquiferMay 2017
³
Figure7Columbus, Ohio 2017/12/28
Bottom AshPond (East)
Legend@A Monitoring Well!A Piezometer
Groundwater Elevation ContourApproximate Groundwater Flow Direction
Notes- Monitoring well coordinates and water level data (collected on May 15, 2017) provided by AEP.- Site features based on information available in Ash Pond System-CCR GroundwaterMonitoring Well Network Evaluation (Arcadis, 2016) provided by AEP.- Groundwater elevation units are feet above mean sea level.- Water levels from piezometers were inconsistent with other local data and not used to creategroundwater contours.- Normal lower pool elevation of the Ohio River at Racine Lock and Dam is 538 ft amsl (USACE).- Intermittent usage of pumping wells for plant activities impact water levels in the vicinity. Waterflow in the vicinity is generally in the northeast direction.
1,000 0 1,000500Feet
Ohio River
WV-62Graham Station Road
WastewaterPond (East)
ClearwaterPond
RecirculationPond
WastewaterPond (West)
Bottom AshPond (West)
544.75
545
@A
@A@A
@A
@A
@A@A
!A!A
!A
@A
@A
@A
@A@A@A@A
@A@A
@A@A
@A
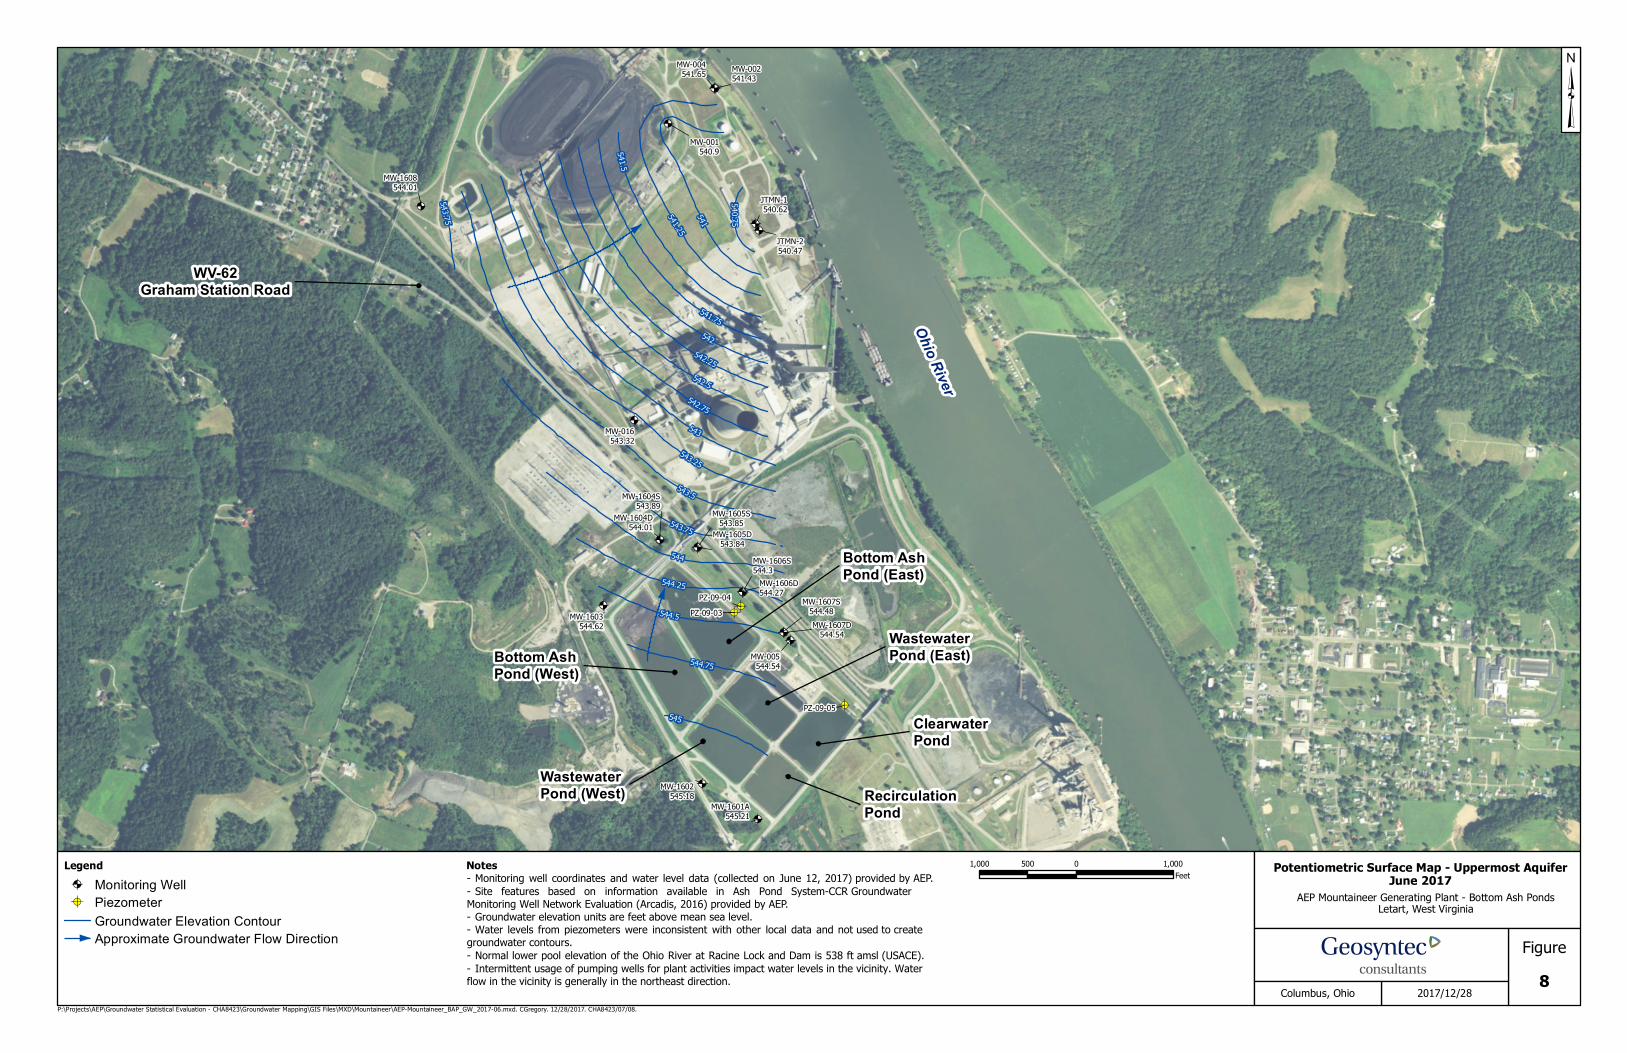
MW-001540.9
MW-002541.43
MW-004541.65
MW-005544.54
MW-016543.32
JTMN-1540.62
JTMN-2540.47
PZ-09-03PZ-09-04
PZ-09-05
MW-1601A545.21
MW-1602545.18
MW-1603544.62
MW-1604S543.89
MW-1604D544.01
MW-1605S543.85
MW-1605D543.84
MW-1606S544.3
MW-1606D544.27
MW-1607S544.48MW-1607D
544.54
MW-1608544.01
544.5
544.25
544
543.75
543.5
543.25
543
542.75
542.5
542.25
542
541.75
545
544.75
541.25541
540.75
541.5
543.75
P:\Projects\AEP\Groundwater Statistical Evaluation - CHA8423\Groundwater Mapping\GIS Files\MXD\Mountaineer\AEP-Mountaineer_BAP_GW_2017-06.mxd. CGregory. 12/28/2017. CHA8423/07/08.
AEP Mountaineer Generating Plant - Bottom Ash PondsLetart, West Virginia
Potentiometric Surface Map - Uppermost AquiferJune 2017
³
Figure8Columbus, Ohio 2017/12/28
Bottom AshPond (East)
Legend@A Monitoring Well!A Piezometer
Groundwater Elevation ContourApproximate Groundwater Flow Direction
Notes- Monitoring well coordinates and water level data (collected on June 12, 2017) provided by AEP.- Site features based on information available in Ash Pond System-CCR GroundwaterMonitoring Well Network Evaluation (Arcadis, 2016) provided by AEP.- Groundwater elevation units are feet above mean sea level.- Water levels from piezometers were inconsistent with other local data and not used to creategroundwater contours.- Normal lower pool elevation of the Ohio River at Racine Lock and Dam is 538 ft amsl (USACE).- Intermittent usage of pumping wells for plant activities impact water levels in the vicinity. Waterflow in the vicinity is generally in the northeast direction.
1,000 0 1,000500Feet
Ohio River
WV-62Graham Station Road
WastewaterPond (East)
ClearwaterPond
RecirculationPond
WastewaterPond (West)
Bottom AshPond (West)
@A
@A@A
@A
@A
@A@A
!A!A
!A
@A
@A
@A
@A@A@A@A
@A@A
@A@A
@A
539.75
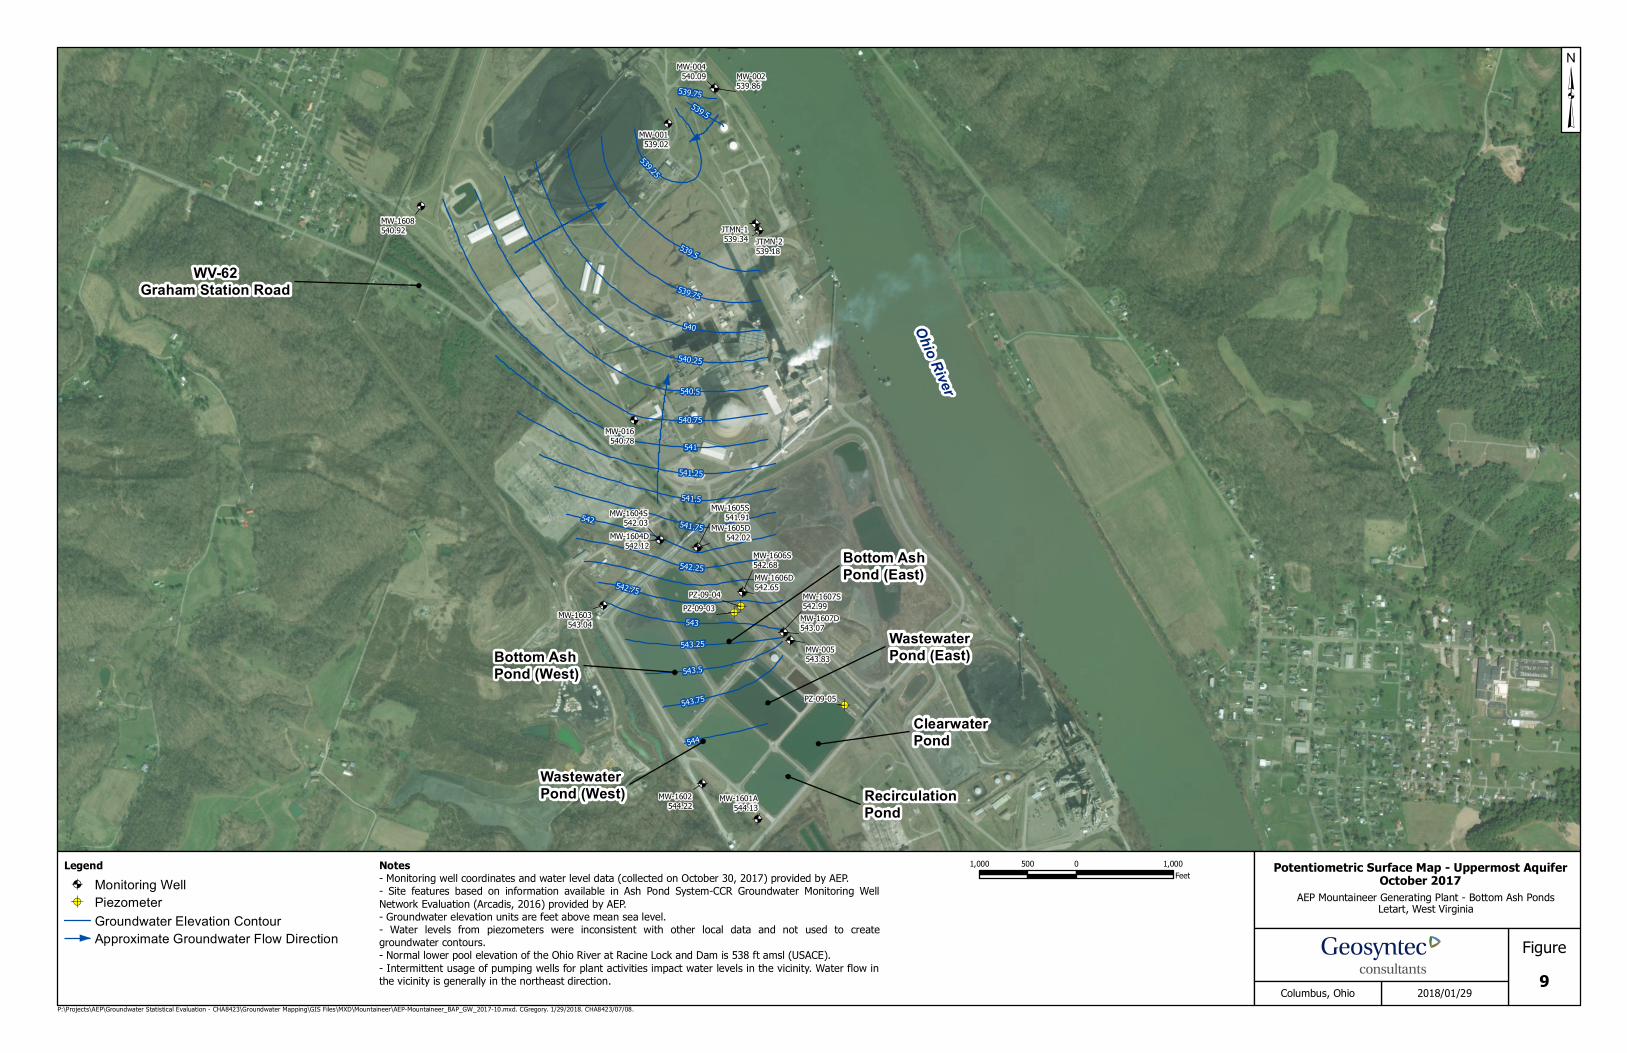
MW-001539.02
MW-002539.86
MW-004540.09
MW-005543.83
MW-016540.78
JTMN-1539.34 JTMN-2
539.18
PZ-09-03PZ-09-04
PZ-09-05
MW-1601A544.13
MW-1602544.22
MW-1603543.04
MW-1604S542.03
MW-1604D542.12
MW-1605S541.91
MW-1605D542.02
MW-1606S542.68MW-1606D542.65
MW-1607S 542.99
MW-1607D543.07
MW-1608540.92
544
543.75
543.5
543.25
543
542.25
541.75
541.5
541.25
541
540.75
540.5
540.25
540
539.75
539.5
542.75
542
539.25
539.5
P:\Projects\AEP\Groundwater Statistical Evaluation - CHA8423\Groundwater Mapping\GIS Files\MXD\Mountaineer\AEP-Mountaineer_BAP_GW_2017-10.mxd. CGregory. 1/29/2018. CHA8423/07/08.
AEP Mountaineer Generating Plant - Bottom Ash PondsLetart, West Virginia
Potentiometric Surface Map - Uppermost AquiferOctober 2017
³
Figure9Columbus, Ohio 2018/01/29
Bottom AshPond (East)
Legend@A Monitoring Well!A Piezometer
Groundwater Elevation ContourApproximate Groundwater Flow Direction
Notes- Monitoring well coordinates and water level data (collected on October 30, 2017) provided by AEP.- Site features based on information available in Ash Pond System-CCR Groundwater Monitoring WellNetwork Evaluation (Arcadis, 2016) provided by AEP.- Groundwater elevation units are feet above mean sea level.- Water levels from piezometers were inconsistent with other local data and not used to creategroundwater contours.- Normal lower pool elevation of the Ohio River at Racine Lock and Dam is 538 ft amsl (USACE).- Intermittent usage of pumping wells for plant activities impact water levels in the vicinity. Water flow inthe vicinity is generally in the northeast direction.
1,000 0 1,000500Feet
Ohio River
WV-62Graham Station Road
WastewaterPond (East)
ClearwaterPond
RecirculationPond
WastewaterPond (West)
Bottom AshPond (West)