ANNUAL FINANCIAL REPORT - … Financial... · leader in the Australian market, ... Tower Group Pty...
102
ANNUAL FINANCIAL REPORT 30 JUNE 2016 INVESTA OFFICE FUND
Transcript of ANNUAL FINANCIAL REPORT - … Financial... · leader in the Australian market, ... Tower Group Pty...

A N N UA L F I N A N C I A L R E P O RT 30 JUNE 2016
INVESTA OFFICE FUND
Investa Office Fund (ASX:IOF) is one of Australia’s leading owners of investment grade office buildings. IOF has total assets under management of $3.6 billion with 22 investments located in core CBD markets throughout Australia. As an externally managed Australian Real Estate Investment Trust, IOF is governed by Investa Listed Funds Management Limited (consisting of majority of Independent Directors) as Responsible Entity and managed by Investa Office (Investa), one of Australia’s largest office owners and managers.
This Annual Financial Report is one of three documents that form IOF's FY16 reporting suite, which also includes the IOF FY16 Annual Review and the IOF FY16 Property Portfolio. For more information or to download any of these documents visit www.investa.com.au/iof
ANNUAL FINANCIAL REPORT
02 Letter from the Chairman
04 Corporate Governance
08 GRI Index
21 Financial Report
92 Investor Relations
94 Substantial Holdings
96 Glossary
98 Corporate Directory
Contents

IOF's strategy is to deliver attractive risk-adjusted returns by investing in high quality Australian CBD assets and leveraging the capabilities of the Investa Management Platform to proactively add value. As an office-only specialist and leader in the Australian market, Investa’s expertise in asset, portfolio and capital management positions IOF strongly in a competitive marketplace, providing the capability to lease-up and renew tenants ahead of market expectations, reposition assets through the market cycle, and maximise returns by managing the debt and equity base of the Fund.
Fund strategy “The 2016 results
are testament to our proactive approach to asset management,
driving $313 million in valuation increases across the portfolio
and again highlighting how our leasing outcomes are
creating value.”
Penny Ransom, Fund Manager, IOF
3.4% 16.9% 1.8%FUNDS FROM OPERATIONS
NET TANGIBLE ASSETS
DISTRIBUTIONS
TO 28.6 CENTS PER UNIT
TO $4.23 PER UNIT
TO 19.60 CENTS PER UNIT
30 JUN
E 2016 IN
VE
STA
OFFIC
E FU
ND
AN
NU
AL F
INA
NC
IAL R
EP
OR
T
1

ANNUAL FINANCIAL REPORT
Letter from the Chairman
2
30 JUN
E 2016 IN
VE
STA
OFFIC
E FU
ND
AN
NU
AL F
INA
NC
IAL R
EP
OR
T

A review has been undertaken by the Honourable James Spigelman AC QC, former Chief Justice of the Supreme Court of NSW, of the governance arrangements in place to deal with conflicts with IOM management roles should these arise. The findings of the review are referred to under corporate governance later in this Report and will be discussed with IOM and other interested parties.
On 12 August 2016, IOF received a certificate of valuation confirming the gross value of the commercial office assets of IOF was greater than $3.5 billion. As a result, IOF has the opportunity to acquire 50% of the Investa Management Platform for $45 million plus agreed working capital and other agreed reimbursement adjustments. The Board will review and consider this potential acquisition and will keep IOF unitholders informed of any material developments as they occur.
I would like to thank the IOF management team and the employees of the now stabilised Investa Management Platform for their continued commitment and performance. Their achievements and the high quality characteristics of the portfolio have underpinned another successful year for IOF. In a low-growth economic environment, the Fund is well positioned moving into financial year 2017.
Finally, I look forward to meeting with unitholders at the Annual General Meeting on 20 October 2016
Yours sincerely,
Richard Longes Chairman, Investa Listed Funds Management Limited
Dear Unitholder,
My name is Richard Longes and together with John Fast, Geoff Kleeman and Bob Seidler AM we were appointed independent non-executive directors of ILFML to replace the previous independent non-executive directors on the Board who resigned following the unitholders’ meeting in April 2016.
In accordance with the constitution of ILFML and with agreement from IOM, we will stand for election at the coming Annual General Meeting. The experience and background of each Director is set out later in this Report.
The Board is committed to ensure that the interests of IOF unitholders remain paramount. Part of this is to work with the Investa team to continue to realise the IOF portfolio’s objectives and maximise the long term returns.
The Fund has appointed Penny Ransom as fund manager. Penny is a highly respected and qualified property executive who brings a lot of experience to this role. I would also like to thank Jason Leong who was acting fund manager from April 2016 until Penny took over her role.
Results from the last financial year have provided strong returns to unitholders.
Funds From Operations (FFO), our preferred measure of operational performance, was up 3.4% to $175.6 million and the distribution to unitholders up 1.8% to 19.60 cents per unit. IOF’s net tangible assets per unit increased by 16.9%, from $3.62 to $4.23, after $313 million of valuation uplifts.
We consider IOF’s $3.6 billion Australian-only office portfolio as being one of the best in the country. By leveraging the skills and expertise of the Investa Management Platform, we have continued to generate attractive and stable risk-adjusted returns through the cycle, for our unitholders.
Our strategic focus on quality office buildings in Australia’s major office markets, particularly the largest and most diversified CBDs of Sydney and Melbourne, is proving advantageous. Both markets have strong underlying fundamentals and continued investment demand, which is providing both income and capital growth. As a result of this and our strong leasing results, the overall portfolio value increased by an impressive 9% following revaluations during the year.
Nationally, the Investa team has achieved significant leasing success. In Brisbane, Investa’s ability to understand the needs and drivers of our tenants delivered over 31,000sqm of value accretive leasing. Occupancy in the Brisbane portfolio increased from 78% to 90%, well above current market occupancy of 83%. Occupancy by income for the portfolio as a whole increased from 93% to 96%. In addition, post 30 June 2016, the Investa team renewed Telstra’s occupancy of over 63,000sqm at 242 Exhibition Street, Melbourne to 2031. This is a major achievement which de-risked the Melbourne portfolio.
Construction of 567 Collins Street, Melbourne was completed in July 2015, bringing a new premium grade asset into the IOF portfolio. The re-development of 151 Clarence Street, Sydney is well underway and due for completion in late 2018, which is opportune timing, given we are forecasting Sydney office vacancy at that point to be less than 5%, well below long term averages.
The unlevered portfolio return for the year was robust at 16.2%. Given the continuing low interest rate environment and improving fundamentals in most markets, particularly Sydney, coupled with the ongoing performance of the Investa management team, we are confident in IOF’s ability to continue delivering attractive risk–adjusted returns.
“Your Board is committed to maintaining market leading standards in corporate governance and maximising value for unitholders”
Richard Longes ILFML Chairman
Left to right: John Fast – Independent Non-Executive Director, Richard Longes – Chairman and Independent Non-Executive Director, Bob Seidler AM – Independent Non-Executive Director, and Geoff Kleemann – Independent Non-Executive Director
30 JUN
E 2016 IN
VE
STA
OFFIC
E FU
ND
AN
NU
AL F
INA
NC
IAL R
EP
OR
T
3

Investa is committed to the highest standards of corporate governance and ethical conduct, recognising both as essential components of Investa’s responsibility to investors. Through its commitment to transparency, Investa has developed a robust framework to ensure its governance objectives are met, risk is monitored and assessed and performance is optimised.
Corporate governance
ANNUAL FINANCIAL REPORT
During the year ended 30 June 2016, the corporate governance framework of IOF was consistent with the third edition of the ASX Corporate Governance Council’s Corporate Governance Principles and Recommendations.
IOF publishes its corporate governance statement on the Investa website rather than in its Annual Financial Report. The Fund’s corporate governance statement, as well as the policies referred to in the corporate governance statement, are available in the governance section of the Investa website at: www.investa.com.au/funds/investa-office-fund-iof/about-iof/governance/
THE RESPONSIBLE ENTITY OF INVESTA OFFICE FUND
The Fund is comprised of the Armstrong Jones Office Fund (AJO Fund) and the Prime Credit Property Trust (PCP Trust), two managed investment schemes registered with the Australian Securities and Investments Commission (ASIC).
The Fund is listed on the Australian Securities Exchange (ASX) and the securities in the AJO Fund and the PCP Trust are stapled together and trade as one stapled security.
Investa Listed Funds Management Limited (ILFML), an Investa entity, is the Responsible Entity of each of the AJO Fund and the PCP Trust. ILFML has acted in this role since 8 July 2011.
30 JUN
E 2016 IN
VE
STA
OFFIC
E FU
ND
AN
NU
AL F
INA
NC
IAL R
EP
OR
T
4

Board of DirectorsBoard of Directors
RICHARD LONGES – CHAIRMAN AND INDEPENDENT NON-EXECUTIVE DIRECTOR
Richard Longes is an Independent Director and Non-Executive Chairman of the Responsible Entity.
Richard Longes is the Chairman of Liberty Financial Pty Limited, Terrace Tower Group Pty Limited and Investec Australia Limited. He was previously Chairman of GPT and Deputy Chairman of Lend Lease, as well as a Director of a number of public companies.
JOHN FAST – INDEPENDENT NON-EXECUTIVE DIRECTOR
John Fast is an Independent Director of the Responsible Entity.
John Fast is founder and Joint Managing Director of international specialist advisory firm Dragoman Pty Limited. John Fast is also Chairman of NIEF Limited, Deputy Chairman of the Norman Beischer Medical Research Foundation, Non-Executive Director of the Australian Brandenburg Orchestra and Chairman of the Advisory Board of the Rotary Aboriginal and Torres Strait Islanders Tertiary Scholarship.
John Fast’s previous executive roles include Chief Legal Counsel and Head of External Affairs at BHP Billiton Limited and BHP Billiton Plc respectively.
GEOFF KLEEMANN – INDEPENDENT NON-EXECUTIVE DIRECTOR
Geoff Kleemann is an Independent Director of the Responsible Entity and Non-Executive Chairman of the Audit and Compliance Committee of the Responsible Entity.
Geoff Kleemann’s former directorships include being an independent and Non-Executive Director of Asciano Limited and a Non-Executive Director of Broadspectrum Limited. Geoff Kleemann was also previously CFO at a number of major Australian companies including Crown Limited, Publishing & Broadcasting Limited and Woolworths Limited.
BOB SEIDLER AM – INDEPENDENT NON-EXECUTIVE DIRECTOR
Bob Seidler AM is an Independent Director of the Responsible Entity. Bob Seidler AM is also a Director of Investa Office Management Pty Limited, which is the parent company of the Responsible Entity and the manager of IOF.
Bob Seidler AM is Chairman of Hunter Phillip Japan Limited and a member of CIMIC Group Limited’s board. Previous board memberships include Valad Property Group, Australian Prime Property Fund, Chairman of Leighton Asia India and Offshore and Leighton Properties Pty Limited.
JONATHAN CALLAGHAN – EXECUTIVE DIRECTOR AND CEO, INVESTA
Jonathan Callaghan is the CEO of Investa and an Executive Director of the Responsible Entity and Investa Wholesale Funds Management Limited.
Jonathan Callaghan is responsible for the strategic direction of Investa, across both the office and funds businesses, including responsibility for financial strategy, treasury, debt and risk management, taxation and internal and external reporting.
Jonathan Callaghan has been with Investa for over 10 years where he has held a number of roles, including Group General Counsel and more recently, Joint Managing Director and Finance Director.
Jonathan Callaghan is a member of the NSW Division Council of the Property Council of Australia and a founding member of the Property Male Champions of Change.
Jonathan Callaghan holds a Bachelor of Science (Hons), a Bachelor of Laws (Hons) and a Masters of Applied Finance.
As at the date of this Report, ILFML has five Directors, four of whom are Independent Directors. An overview of the experience, qualifications and memberships of each Director is set out below.
30 JUN
E 2016 IN
VE
STA
OFFIC
E FU
ND
AN
NU
AL F
INA
NC
IAL R
EP
OR
T
5

VISIONIOF aims to be Australia’s best performing office fund, by combining efficient, sustainable building operations, active portfolio management and proactive capital management. IOF leverages Investa’s integrated Environmental, Social and Governance (ESG) framework and strong track record in sustainable ownership and management of office buildings to deliver outperformance. IOF’s annual Sustainability Action Plan is developed in alignment with Investa’s ESG approach, which is focused on the four key areas outlined below.
ESG AND SUSTAINABILITY APPROACHInvesta sets out to improve the operational performance and subsequent investment returns of the properties it acquires and manages. Its sustainability platform provides a framework for focusing upon and enhancing good business practices, which contribute to enhanced asset income and values and improved social and environmental outcomes. Sustainability is embedded in the management of the Fund via four key principles:
1. Harnessing human capital and meeting tenant needs Tenants are becoming more focused on the environmental performance of their tenancy as a route to more productive, engaged employees. Investa offers sustainability initiatives and tenant and occupant engagement activities designed to create healthier workplaces and better indoor and external environments.
2. Leadership in governance Through external benchmarks, accreditations and membership of sustainability and responsible investment bodies, Investa offers excellence in ESG and investor alignment. Investa’s Sustainable Responsible Investment Guidelines ensure proactive management of risks for investors. An ongoing commitment to transparency of results through Investa’s regular online reporting holds the Fund accountable and drives continuous improvement.
3. Optimising value by improving environmental performance Through experience and technical expertise, the environmental performance of IOF buildings is actively managed, to ensure they operate at an optimal level. Investa’s real estate service teams actively engage with tenants on a range of factors including best practice water and energy usage and waste practices in their tenancies, coupled with strategic capital investment in the base building to better future proof its long term performance, including fine tuning or improving Building Management and Control Systems (BMCS), plant and equipment and lighting.
4. Adding value through research and innovation Investa’s in-house research team analyses the macro and micro-economic drivers of office markets to provide up-to-date and relevant insights to management. Investa also participates in both academic and applied action research for sustainability and facilities management in the built environment, with the aim of understanding and improving the operational and environmental performance of buildings using new technologies and operating data.
BOARD MEETINGS
The Board meets regularly in scheduled Board meetings. In addition to scheduled Board meetings, any Director may convene a Board meeting where the Director considers a meeting is necessary or convenient to the proper discharge of the functions of the Board or in the interests of IOF or ILFML. Attendance at Board meetings over the financial year is shown in the table below:
CURRENT DIRECTORS
GOVERNANCE REVIEW
The Honourable James Spigelman AC QC, former Chief Justice of the Supreme Court of NSW, was appointed in March 2016 to review the corporate governance arrangements for IOM.
The review was undertaken with the aim of identifying any enhancements to Investa’s commitment to best practice governance arrangements to the management of conflicts, with the key imperative that as far as possible each client of IOM has available to it the benefit of the full range of skills and expertise that IOM offers.
The review found that the Investa policy appropriately identifies the potential conflicts which can arise between the interests of different external funds as well as between the interests of Investa as owner of IOM and one of the external funds but does recommend some enhancements which reflect potential additional conflicts which might arise because IOM is indirectly wholly owned by one of the funds.
The Board of ILFML is considering the review and will discuss those recommendations that are relevant to IOF with the Board and management of IOM.
PAST DIRECTORS
DIRECTOR NUMBER OF MEETINGS HELD
WHILE THE INDIVIDUAL WAS
A DIRECTOR
NUMBER OF MEETINGS ATTENDED
BY THE DIRECTOR
Richard Longes 3 3
John Fast 3 3
Geoff Kleemann 3 3
Bob Seidler AM 3 3
Jonathan Callaghan1 12 12
DIRECTOR NUMBER OF MEETINGS HELD
WHILE THE INDIVIDUAL WAS
A DIRECTOR
NUMBER OF MEETINGS ATTENDED
BY THE DIRECTOR
Deborah Page AM 15 15
Peter Rowe 15 15
Peter Dodd 15 15
Scott MacDonald 5 Nil
Campbell Hanan2 5 4
ANNUAL FINANCIAL REPORTCORPORATE GOVERNANCE
1. Resigned 28 January 2016 and re-instated 15 April 2016.2. As an alternate for Scott MacDonald.
30 JUN
E 2016 IN
VE
STA
OFFIC
E FU
ND
AN
NU
AL F
INA
NC
IAL R
EP
OR
T
6

232 Adelaide Street, Brisbane
30 JUN
E 2016 IN
VE
STA
OFFIC
E FU
ND
AN
NU
AL F
INA
NC
IAL R
EP
OR
T
7

GRI Index
GRI INDICATOR GRI DESCRIPTION IOF 2016 ANNUAL FINANCIAL REPORT AND ANNUAL REVIEW
STRATEGY AND ANALYSIS
G4-1 Chairman and CEO’s Statement
Letter from the Chairman (pp.2-3), IOF 2016 Annual Financial Report
Letter from the Chairman (pp.6-7), IOF 2016 Annual Review
G4-2 Key impacts, risks and opportunities
Significant impacts, risks and opportunities for sustainability at IOF are reported in:
Five Year Performance Summary (pp.4-5), Our Approach (pp.10-13), Governance & Management (pp. 14-17), of the IOF 2016 Annual Review.
Our Strategy (pp20-21), IOM 2016 Sustainability Report
ORGANISATIONAL PROFILE
G4-3 Name of the organisation Investa Office Fund (“IOF” or “the Fund”) is an ASX-listed real estate investment trust (“A-REIT”).
Investa Listed Funds Management Limited (ILFML, “the Responsible Entity”), became the Responsible Entity of IOF in July 2011.
Investa Office (“Investa” or “the Manager”) is part of Investa Property Group and is the responsible manager for the funds under management, the property management of many of the Fund’s Australian assets, and employs the management staff.
G4-4 Primary brands, products, and/or services
The Fund is a leading owner of investment grade office buildings and receives rental income from a tenant register comprising predominantly Government and blue chip tenants.
Portfolio Overview (pp.24-31), IOF 2016 Annual Review, and the IOF 2016 Property Portfolio book outline all key assets under management and commercial office leases are supplied to market.
G4-5 Location of headquarters Sydney, Australia.
G4-6 Countries of operation Australia only.
G4-7 Nature of ownership and legal form
Investa Office Fund is an ASX-listed real estate investment trust.
Investa Listed Funds Management Limited, became the Responsible Entity of IOF in July 2011.
Investa Office is part of Investa Property Group and is the responsible manager for the funds under management, the property management of many of the Fund’s Australian assets, and employs the management staff.
G4-8 Markets served IOF has investment assets located in core CBD markets throughout Australia, in the cities of: Sydney, North Sydney, Melbourne, Brisbane, Canberra and Perth.
G4-9 Scale of the reporting organisation
IOF has total assets under management of A$3.6 billion.
Investa Office employs the management staff of the Fund.
The IOM 2016 Sustainability Report (pp.16-17) contains information about employment of management staff, including the number of employees.
Financial Information (pp. 21-89) The IOF 2016 Annual Financial Report details the financial reporting of the Fund.
G4-10 Employee demographics Investa Office employs the management staff of the Fund.
The IOM 2016 Sustainability Report (pp.16-17) contains information about employment of management staff, including the number of employees.
G4-11 Collective bargaining agreements
Investa Office employs the management staff of the Fund.
The IOM 2016 Sustainability Report 2016 (pp.16-17) contains information about employment of management staff, including the number of employees.
ANNUAL FINANCIAL REPORT
30 JUN
E 2016 IN
VE
STA
OFFIC
E FU
ND
AN
NU
AL F
INA
NC
IAL R
EP
OR
T
8

GRI INDICATOR GRI DESCRIPTION IOF 2016 ANNUAL FINANCIAL REPORT AND ANNUAL REVIEW
G4-12 Supply chain The Manager has management policies, practices and reporting of supply chains, these are detailed in the IOM 2016 Sustainability Report 2016. In 2016 a new Supply Chain Management System was developed, highlighted by a Supplier Code of Conduct covering expectations regarding environment, social and governance issues.
Additionally, Investa co-authored a paper with KPMG Banarra detailing ESG Risks in the Property Supply Chain.
G4-13 Significant changes during the reporting period
Four new Directors were appointed to the board of IOF – Richard Longes (Chairman), John Fast, Geoff Kleemann and Bob Seidler AM – with Jonathan Callaghan, the CEO of Investa, re-instated as Executive Director. Penny Ransom was appointed Group Executive and Fund Manager of IOF.
Profiles of the new Directors can be found on (pp.14 -15), IOF 2016 Annual Review and Penny Ransom’s profile can be found on (pp. 17) of the IOF 2016 Annual Review.
COMMITMENTS TO EXTERNAL INITIATIVES
G4-14 Whether and how a precautionary approach is addressed
Governance & Management (pp.14-17), IOF 2016 Annual Financial Report.
And online at www.investa.com.au/funds/investa-office-fund-iof/about-iof/governance/
Additionally, in committing to set a science based emissions reduction target in line with climate science, IOF is incorporating the precautionary principle into the Fund’s response to climate change.
G4-15 Charters to which we subscribe
The Fund, through the Manager, subscribes and is committed to a range of corporate governance and responsibility charters and has external associations and accreditations available online at www.investa.com.au/funds/investa-office-fund-iof/about-iof/governance/
G4-16 Memberships in associations/advocacy organisations
The manager was a member or participant in the following associations and advocacy organisations during financial year 2016:
ANREV – Asian Association for Investors: www.anrev.org
ABRT – Australian Business Roundtable for Disaster Resilience and Safer Communities: australianbusinessroundtable.com.au
API – Australian Property Institute: www.api.org.au
Australian Marketing Institute: www.ami.org.au
Australasian Investor Relations Associations: aira.org.au
CDP – Carbon Disclosure Project: www.cdp.net
GBCA – Green Building Council of Australia: new.gbca.org.au
GRESB – Global Real Estate Sustainability Benchmark (GRESB): www.gresb.com
PCA – Property Council of Australia: www.propertyoz.com.au
PIF – Property Industry Foundation: www.pif.com.au
UDIA – Urban Development Institute of Australia: www.udia.com.au
ULI – Urban Land Institute: uli.org
UNPRI – United Nations Principles for Responsible Investment: www.unpri.org
30 JUN
E 2016 IN
VE
STA
OFFIC
E FU
ND
AN
NU
AL F
INA
NC
IAL R
EP
OR
T
9

GRI INDICATOR GRI DESCRIPTION IOF 2016 ANNUAL FINANCIAL REPORT AND ANNUAL REVIEW
IDENTIFIED MATERIAL ASPECTS AND BOUNDARIES
G4-17 Consolidated financial statements
The Consolidated Financial Statements of IOF incorporate the assets, liabilities and results of Armstrong Jones Office Fund and its subsidiaries and Prime Credit Property Trust and its subsidiaries as at, and for the year ended 30 June 2016.
G4-18 Defining reporting content The Fund reports on 12 month cycles covering performance during the Financial Year. The current suite of documents represents performance during the 2016 Financial Year (FY16).
G4-19 Material aspects Economic aspects are contained in IOF 2016 Annual Financial Report. Financial Performance (pp.23-91), IOF 2016 Financial Review.
Five Year Performance Summary (pp.4-5), IOF 2016 Annual Review, and Optimising Operational Performance (pp. 28-35) IOM 2016 Sustainability Report.
G4-20-21 Aspect boundaries Materiality is confined to the reporting period of FY16 for assets as described in the IOF 2016 Property Portfolio.
G4-22 Restatements Nil.
G4-23 Changes Nil.
G4-24 Stakeholder groups Key stakeholders identified include investors, tenants (customers), the environment, suppliers, employees and the communities the Fund works in, and Australian society at large. Risk and Sustainability (pp.12-13), IOF 2016 Annual Review.
G4-25 Basis for identification and selection of stakeholders
Stakeholders are identified as those individuals, organisations, sectors and communities where the Fund and manager operations have some influence or impact on those people, groups and other externalities. Stakeholders are identified in Our Approach (pp.10-13) IOF 2016 Annual Review.
G4-26 Approaches to stakeholder engagement
Investor Relations (pp.32-33), and Our Approach (pp. 10-13), IOF 2016 Annual Review.
G4-27 Concerns raised through stakeholder engagement
Concerns raised through Investa’s tenant helpdesk, tenant surveys and employee surveys are acknowledged and responded to through a formal process and internal procedure. The Fund’s Investor Relations Representative responds directly to investor feedback.
Investor Relations (pp.32-33), IOF 2016 Annual Review.
REPORT PROFILE
G4-28 Reporting period The IOF 2016 Annual Financial Report, IOF 2016 Annual Review and IOF 2016 Property Portfolio report on Australian Financial Year 2016, for the period 1st July 2016 – 30 June 2016.
Environmental performance data is provided for the reporting year ended 31 March 2016 to allow time to capture billing data for timely reporting.
G4-29 Date of the most recent previous report
IOF 2015 Annual ReportIOF 2015 Annual ReviewIOF 2015 Property PortfolioPublished in June 2015.
G4-30 Reporting cycle Half-year and annual Fund reports are provided each year, and environmental performance data is included.
G4-31 Contact point Corporate Directory (p.98), IOF 2016 Annual Financial Report
G4-32-33 Assurance Independent Auditors report to the stapled security holders of Investa Office Fund and the unitholders of Prime Credit Property Trust, j (pp.90-91), IOF 2016 Annual Financial Report.
Sustainability Assurance and Reporting Rules (p.38), IOM 2016 Sustainability Report.
ANNUAL FINANCIAL REPORT GRI INDEX
30 JUN
E 2016 IN
VE
STA
OFFIC
E FU
ND
AN
NU
AL F
INA
NC
IAL R
EP
OR
T
10

GRI INDICATOR GRI DESCRIPTION IOF 2016 ANNUAL FINANCIAL REPORT AND ANNUAL REVIEW
GOVERNANCE
G4-34 Governance structure Governance & Management (pp.14-17), IOF 2016 Annual Financial Report and online at www.investa.com.au/funds/investa-office-fund-iof/about-iof/governance/
Investa Office has a Risk and Sustainability Committee – Safety, Health, Environment & Audit, reporting to the Board of Investa Office Management Holdings Pty Ltd and its Charter extends to all activities of IOMH, including oversight on behalf of Investa Office Fund and ILFML. This is an independently chaired management committee that assists the Boards with all financial, audit, governance and WH&S issues faced by Investa Office; and guides the implementation, operation and effectiveness of Investa Office’s Sustainability, Safety, Health & Environment policies.
G4-35 Delegating authority General Managers of Sustainability, Environment and Safety report regularly to the Risk and Sustainability Committee. ILMFML Director Geoff Kleemann sits on the Committee.
G4-36 Highest governance body Investa Listed Funds Management Limited (ILFML, “the Responsible Entity”), became the Responsible Entity of IOF in July 2011.
Governance & Management (pp.14-17), IOF 2016 Annual Financial Report.
G4-37 Highest governance body General Managers of Sustainability, Environment and Safety report regularly to the Risk and Sustainability Committee. IOF Director Geoff Kleemann sits on the Committee.
Governance & Management (pp.14-17), IOF 2016 Annual Financial Report.
G4-38 Highest governance body Governance & Management (pp.14-17), IOF 2016 Annual Financial Report
G4-39 Chair of the highest governance body
Richard Longes is the Independent Director and Non-Executive Chairman of ILFML.
G4-40 Nomination and selection process for the highest governance body
Governance & Management (pp.14-17), IOF 2016 Annual Financial Report.
Available online at www.investa.com.au/funds/investa-office-fund-iof/about-iof/governance/
G4-41 Conflicts of interest Governance & Management (pp.14-17), IOF 2016 Annual Financial Report.
Available online at www.investa.com.au/funds/investa-office-fund-iof/about-iof/governance/
G4-42 Organisation’s purpose and mission statement
Governance & Management (pp.14-17), IOF 2016 Annual Financial Report and Our Approach (pp. 10-13), IOF 2016 Annual Review.
G4-43-48 Expertise and roles of governance bodies
These standard disclosures describe whether the highest governance body is accountable for the risk management process and its overall effectiveness. The highest governance bodies’ and senior executives’ consideration of longer term and broader-reaching risk elements and their integration into strategic planning are important governance disclosures.
Additionally, these standard disclosures show the extent of the highest governance bodies’ involvement in developing and approving the organization’s sustainability disclosures, and the degree by which it may be aligned with processes around financial reporting.
Governance & Management (pp.14-17), IOF 2016 Annual Financial Report.
Available online at www.investa.com.au/funds/investa-office-fund-iof/about-iof/governance/
30 JUN
E 2016 IN
VE
STA
OFFIC
E FU
ND
AN
NU
AL F
INA
NC
IAL R
EP
OR
T
11

GRI INDICATOR GRI DESCRIPTION IOF 2016 ANNUAL FINANCIAL REPORT AND ANNUAL REVIEW
G4-49-50 Mechanisms to provide recommendations or direction to the highest governance body
Governance & Management (pp.14-17), IOF 2016 Annual Financial Report.
Available online at www.investa.com.au/funds/investa-office-fund-iof/about-iof/governance/
G4-51-55 Compensation and performance
These standard disclosures focus on the remuneration policies established to ensure that remuneration arrangements support the strategic aims of the organization, align with the interests of stakeholders, and enable the recruitment, motivation and retention of members of the highest governance body, senior executives, and employees.
Governance & Management (pp.14-17), IOF 2016 Annual Financial Report.
Available online at http://www.investa.com.au/funds/investa-office-fund-iof/about-iof/governance/
ETHICS AND INTEGRITY
G4-56-58 Ethics and integrity IOF’s values, principles, standards and norms of behavior such as codes of conduct and codes of ethics pertaining to both employees and the wider environment are detailed online, and are available at http://www.investa.com.au/funds/investa-office-fund-iof/about-iof/governance/ and http://www.investa.com.au/funds/investa-office-fund-iof/sustainability/
STAKEHOLDER ENGAGEMENT
Economic Performance
G4-EC1 Direct economic value generated and distributed
Financial Information (pp.21-89), IOF 2016 Annual Financial Report.
Five Year Performance Summary (pp. 4-5), IOF 2016 Annual Review.
G4-EC2 Financial implications and other risks and opportunities for the organisation’s activities due to climate change
The Fund’s 2014 and 2015 responses to CDP (formally Carbon Disclosure Project) are available via CDP online where detailed annual responses are provided to these issues. See www.cdp.net
The Fund was recognised on CDP’s Global Climate Performance A List in 2016 – one of only two Australian ASX companies.
G4-EC3 Coverage of the organisation’s defined benefit plan obligations
Superannuation contributions are made by the Manager to employees, in accordance with Australian Government legislative requirements.
G4-EC4 Financial assistance received from government
No significant financial assistance was received from government in financial year 2016.
Market Presence
G4-EC5 Ratios of standard entry level wage by gender compared to local minimum wage at significant locations of operation
Following the receipt of the Gender Pay Equity analysis report commissioned and delivered in January 2015, the manager continues to monitor movements to ensure the equity reported was maintained and further enhanced across the Group.
Investa is a founding member of the Property Council of Australia’s Property Male Champions of Change and actively supports its commitment to drive greater gender equality in the property industry and increase the number of women in leadership roles.
G4-EC6 Local hiring procedures Investa Office advertises new roles externally in the local markets in Australia in which the business operates.
G4-EC7-EC8 Development and impact of infrastructure investments
The Fund does not directly invest in infrastructure investments and associated services.
G4-EC9 Proportion of spending on local suppliers at significant locations of operation.
The Manager has management policies, practices and reporting of supply chains, these are detailed in the IOM 2016 Sustainability Report 2016. In 2016 a new Supply Chain Management System was developed, highlighted by a Supplier Code of Conduct covering expectations regarding environment, social and governance issues.
Additionally, Investa co-authored a paper with KPMG Banarra detailing ESG Risks in the Property Supply Chain.
ANNUAL FINANCIAL REPORT GRI INDEX
30 JUN
E 2016 IN
VE
STA
OFFIC
E FU
ND
AN
NU
AL F
INA
NC
IAL R
EP
OR
T
12

GRI INDICATOR GRI DESCRIPTION IOF 2016 ANNUAL FINANCIAL REPORT AND ANNUAL REVIEW
Materials
G4-EN1 Materials used by weight or volume
The Manager has procurement processes in place for the purchasing of materials, and these are reported in the IOM 2016 Sustainability Report.
G4-EN2 Percentage of materials used that are recycled and reused input materials
Five Year Performance Summary (pp.4-5), IOF 2016 Annual Review, and Optimising Operational Performance (pp. 28-35) IOM 2016 Sustainability Report.
Energy
G4-EN3 Direct energy consumption by primary energy source
Five Year Performance Summary (pp.4-5), IOF 2016 Annual Review, and Optimising Operational Performance (pp. 28-35) IOM 2016 Sustainability Report.
G4-EN4 Indirect energy consumption by primary source (outside of the organization)
Five Year Performance Summary (pp.4-5), IOF 2016 Annual Review, and Optimising Operational Performance (pp. 28-35) IOM 2016 Sustainability Report.
G4-EN5 Energy intensity. Five Year Performance Summary (pp.4-5), IOF 2016 Annual Review, and Optimising Operational Performance (pp. 28-35) IOM 2016 Sustainability Report.
G4-EN6 Energy saved due to conservation and efficiency improvements.
Five Year Performance Summary (pp.4-5), IOF 2016 Annual Review, and Optimising Operational Performance (pp. 28-35) IOM 2016 Sustainability Report.
G4-EN7 Initiatives to provide energy-efficient or renewable energy based products and services, and reductions results.
Five Year Performance Summary (pp.4-5), IOF 2016 Annual Review, and Optimising Operational Performance (pp. 28-35) IOM 2016 Sustainability Report.
Water
G4-EN9 Water sources significantly affected by withdrawal of water
Water to IOF properties is supplied directly from municipal water supplies.
G4-EN10 Percentage and total volume of water recycled and reused.
Water is recycled and reused at a number of IOF properties in Australia; however this use is not currently metered.
Biodiversity
G4-EN11 Operational sites The Fund does not have investments in Australia in, or adjacent to, areas of high biodiversity value.
G4-EN12 Significant impacts No direct impacts.
G4-EN13 Habitats protected or restored. No direct interactions.
G4-EN14 IUCN Red and National Conservation Listed species with habitats in affected areas
The Fund does not have investments in Australia in, or adjacent to, areas of high biodiversity value.
Emissions
G4-EN15 Direct GHG emissions (Scope 1)
Five Year Performance Summary (pp.4-5), IOF 2016 Annual Review, and Optimising Operational Performance (pp. 28-35) IOM 2016 Sustainability Report.
G4-EN16 Indirect GHG emissions (Scope 2)
Five Year Performance Summary (pp.4-5), IOF 2016 Annual Review, and Optimising Operational Performance (pp. 28-35) IOM 2016 Sustainability Report.
G4-EN17 Indirect GHG emissions (Scope 3)
Five Year Performance Summary (pp.4-5), IOF 2016 Annual Review, and Optimising Operational Performance (pp. 28-35) IOM 2016 Sustainability Report.
G4-EN18 Indirect GHG emissions (Scope 2)
Five Year Performance Summary (pp.4-5), IOF 2016 Annual Review, and Optimising Operational Performance (pp. 28-35) IOM 2016 Sustainability Report.
30 JUN
E 2016 IN
VE
STA
OFFIC
E FU
ND
AN
NU
AL F
INA
NC
IAL R
EP
OR
T
13

GRI INDICATOR GRI DESCRIPTION IOF 2016 ANNUAL FINANCIAL REPORT AND ANNUAL REVIEW
G4-EN19 Initiatives to reduce greenhouse gas emissions and reductions achieved.
Five Year Performance Summary (pp.4-5), IOF 2016 Annual Review, and Optimising Operational Performance (pp. 28-35) IOM 2016 Sustainability Report.
G4-EN20 Emissions of ozone-depleting substances by weight.
Five Year Performance Summary (pp.4-5), IOF 2016 Annual Review, and Optimising Operational Performance (pp. 28-35) IOM 2016 Sustainability Report.
G4-EN21 NO, SO and other significant air emissions
Not monitored by the Fund.
Effluents and Waste
G4-EN22 Total water discharge Storm water and sewerage discharges are made only into regulated municipal systems for treatment. Total volume is not monitored.
G4-EN23 Total weight of waste by type and disposal method.
Five Year Performance Summary (pp.4-5), IOF 2016 Annual Review, and Optimising Operational Performance (pp. 28-35) IOM 2016 Sustainability Report.
G4-EN24 Total number and volume of significant spills.
Nil.
G4-EN25 Weight of hazardous waste. The Fund and Manager’s activities do not generate waste classified as “hazardous”.
G4-EN26 Discharges of water and runoff.
Storm water and sewerage discharges are made only into regulated municipal systems for treatment.
G4-EN27 Environmental impacts Five Year Performance Summary (pp.4-5), IOF 2016 Annual Review, and Optimising Operational Performance (pp. 28-35) IOM 2016 Sustainability Report.
G4-EN28 Consumer products The Fund and the Manager do not manufacture consumer products.
Compliance
G4-EN29 Significant fines and non-monetary sanctions for non-compliance with environmental laws and regulations.
Nil.
Transport
G4-EN30 Environmental impacts The Manager monitors these impacts, however these are not significant against overall impacts of operating commercial office buildings.
Overall
G4-EN31 Total environmental protection expenditures and investments by type
The Fund and the Manager do not at this time specifically quantify the total expenditure on or investment in environmental protection. The Manager aims to deliver environmental performance improvements as a responsible business. The Fund abides by internal Sustainability Responsible Investment Guidelines. See: www.investa.com.au/sustainability/approach/policy/
Supplier Environmental Assessment
G4-EN32 New suppliers The Manager has management policies, practices and reporting of supply chains, these are detailed in the IOM 2016 Sustainability Report. In 2016 a new Supply Chain Management System was developed, highlighted by a Supplier Code of Conduct covering expectations regarding environment, social and governance issues. All new suppliers are required to comply with the code.
Additionally, Investa co-authored a paper with KPMG Banarra detailing ESG Risks in the Property Supply Chain.
ANNUAL FINANCIAL REPORT GRI INDEX
30 JUN
E 2016 IN
VE
STA
OFFIC
E FU
ND
AN
NU
AL F
INA
NC
IAL R
EP
OR
T
14

GRI INDICATOR GRI DESCRIPTION IOF 2016 ANNUAL FINANCIAL REPORT AND ANNUAL REVIEW
G4-EN33 Negative environmental impacts in the supply chain
The manager adheres to the following process:
a) Report the number of suppliers subject to environmental impact assessments.
b) Report the number of suppliers identified as having significant actual and potential negative environmental impacts.
c) Report the significant actual and potential negative environmental impacts identified in the supply chain.
d) Report the percentage of suppliers identified as having significant actual and potential negative environmental impacts with which improvements were agreed upon as a result of assessment.
e) Report the percentage of suppliers identified as having significant actual and potential negative environmental impacts with which relationships were terminated as a result of assessment and outline why.
G4-EN34 Environmental grievance mechanisms
None.
SOCIAL
Employment
G4-LA1 Total workforce by employment type, employment contract, and region.
Investa Office employs the management staff of the Fund.
The IOM 2016 Sustainability Report (pp.16-17) contains information about employment of management staff, including the number of employees.
G4-LA2 Benefits provided to full-time employees that are not provided to temporary or part-time employees.
Investa Office employs the management staff of the Fund.
The IOM 2016 Sustainability Report (pp.16-17) contains information about employment of management staff, including the number of employees.
G4-LA3 Parental leave The manager tracks related information as follows:
a) Report the total number of employees that were entitled to parental leave, by gender.
b) Report the total number of employees that took parental leave, by gender.
c) Report the total number of employees who returned to work after parental leave ended, by gender.
d) Report the total number of employees who returned to work after parental leave ended who were still employed twelve months after their return to work, by gender.
e) Report the return to work and retention rates of employees who took parental leave, by gender.
Labour/Management Relations
G4-LA4 Operational changes Investa Office employs the management staff of the Fund.
The IOM 2016 Sustainability Report (pp.16-17) contains information about employment of management staff, including the number of employees.
Occupational Health and Safety
G4-LA5 Percentage of total workforce represented in formal joint management-worker health and safety committees.
Investa Office employs the management staff of the Fund.
The IOM 2016 Sustainability Report (pp.16-17) contains information about employment of management staff, including the number of employees.
30 JUN
E 2016 IN
VE
STA
OFFIC
E FU
ND
AN
NU
AL F
INA
NC
IAL R
EP
OR
T
15

GRI INDICATOR GRI DESCRIPTION IOF 2016 ANNUAL FINANCIAL REPORT AND ANNUAL REVIEW
G4-LA6 Types and rates of injury, occupational diseases, lost days, and absenteeism, and number of work-related fatalities by region.
Investa Office employs the management staff of the Fund.
The IOM 2016 Sustainability Report (pp.16-17) contains information about employment of management staff, including the number of employees.
G4-LA7 Workers with high incidence or high risk of disease related to their occupation.
Investa Office employs the management staff of the Fund.
The IOM 2016 Sustainability Report (pp.16-17) contains information about employment of management staff, including the number of employees.
G4-LA8 Health and safety topics covered in formal agreements with trade unions.
Investa Office employs the management staff of the Fund.
The IOM 2016 Sustainability Report (pp.16-17) contains information about employment of management staff, including the number of employees.
Training and Education
G4-LA9 Average hours of training per year per employee by gender and by employee category.
Investa Office employs the management staff of the Fund.
The IOM 2016 Sustainability Report (pp.16-17) contains information about employment of management staff, including the number of employees.
G4-LA10 Programs for skills management and lifelong learning that support employability.
Investa Office employs the management staff of the Fund.
The IOM 2016 Sustainability Report (pp.16-17) contains information about employment of management staff, including the number of employees.
G4-LA11 Percentage of employees receiving regular performance and career development reviews.
Investa Office employs the management staff of the Fund.
The IOM 2016 Sustainability Report (pp.16-17) contains information about employment of management staff, including the number of employees.
Diversity and Equal Opportunity
G4-LA12 Composition of governance bodies and indicators of diversity.
Investa Office employs the management staff of the Fund.
The IOM 2016 Sustainability Report (pp.16-17) contains information about employment of management staff, including the number of employees.
Equal remuneration for women and men
G4-LA13 Ratio of basic salary of men to women by employee category.
Investa Office employs the management staff of the Fund.
The IOM 2016 Sustainability Report (pp.16-17) contains information about employment of management staff, including the number of employees.
G4-LA14-LA15 Percentage of new suppliers that were screened using labour practices criteria
Investa Office employs the management staff of the Fund.
The IOM 2016 Sustainability Report (pp.16-17) contains information about employment of management staff, including the number of employees.
Additionally, Investa co-authored a paper with KPMG Banarra detailing ESG Risks in the Property Supply Chain.
G4-LA16 Labor practices grievance mechanisms
None.
ANNUAL FINANCIAL REPORT GRI INDEX
30 JUN
E 2016 IN
VE
STA
OFFIC
E FU
ND
AN
NU
AL F
INA
NC
IAL R
EP
OR
T
16

GRI INDICATOR GRI DESCRIPTION IOF 2016 ANNUAL FINANCIAL REPORT AND ANNUAL REVIEW
HUMAN RIGHTS
Investment and Procurement Practices
G4-HR1 Significant investment agreements that screen for human rights.
The Fund operates in Australia where legislation is in place regarding issues relating to human rights. The Manager is a signatory to the UNPRI and there are internal Sustainable Responsible Investment Guidelines.
G4-HR2 Total hours of employee training concerning human rights, and percentage trained.
Investa Office employs the management staff of the Fund.
The IOM 2016 Sustainability Report 2016 contains information about employment of management staff.
Non-Discrimination
G4-HR3 Incidents of discrimination. No incidents.
Freedom of Association and Collective Bargaining
G4-HR4 Support and protection of rights to exercise freedom of association and collective bargaining.
Investa Office employs the management staff of the Fund.
The IOM 2016 Sustainability Report contains information about employment of management staff.
Child Labour
G4-HR5 Significant risks for operational incidents of child labour and preventative measures.
The Fund operates in Australia where legislation is in place regarding child labour.
Forced and Compulsory Labour
G4-HR6 Operations identified at risk of incidents of forced or compulsory labour.
The Fund operates in Australia where legislation is in place regarding issues relating to human rights.
Security practices
G4-HR7 Operations identified at risk of incidents of forced or compulsory labour.
Investa Office employs the management staff of the Fund.
The IOM 2016 Sustainability Report contains information about employment of management staff.
Indigenous Rights
G4-HR8 Total number of incidents of violations involving rights of indigenous people and actions taken
Nil.
30 JUN
E 2016 IN
VE
STA
OFFIC
E FU
ND
AN
NU
AL F
INA
NC
IAL R
EP
OR
T
17

GRI INDICATOR GRI DESCRIPTION IOF 2016 ANNUAL FINANCIAL REPORT AND ANNUAL REVIEW
Assessment
G4-HR9 Percentage of suppliers, contractors and other business partners that have been subject to human rights reviews or impact assessments.
The Fund operates in Australia where legislation is in place regarding issues relating to human rights.
G4-HR10-11 Human rights and the supply chain
The Manager has management policies, practices and reporting of supply chains. These are detailed in the IOM 2016 Sustainability Report. In 2016 a new Supply Chain Management System was developed, highlighted by a Supplier Code of Conduct covering expectations regarding environment, social and governance issues. All new suppliers are required to comply with the code which includes criteria concerning human rights.
Additionally, Investa co-authored a paper with KPMG Banarra detailing ESG Risks in the Property Supply Chain.
Human Rights Grievance Mechanisms
G4-HR12 Number of grievances related to human rights through formal mechanisms.
Nil.
SOCIETY
Community
G4-SO1 & SO2 Impacts of operations on communities, including the nature, scope, and effectiveness.
Nil
Anti-Corruption
G4-SO3 Business units analysed for risks related to corruption.
All people employed by the Manager and supplying services to the Fund are subject to an internal Code of Conduct policy, including issues relating to corruption.
Governance & Management (pp.14-17), IOF 2016 Annual Financial Report.
G4-SO4 Employees trained in anti-corruption policies and procedures.
All people employed by the Manager and supplying services to the Fund are subject to an internal Code of Conduct policy, including issues relating to corruption.
Corporate Governance (pp.4-6), IOF 2016 Annual Financial Report.
G4-SO5 Actions taken in response to incidents of corruption.
Nil incidents.
Public Policy
G4-SO6 Public policy positions and participation in public policy development and lobbying.
The Fund and the Manager are not directly involved in public policy though The Manager makes formal submissions to government consultations on matters of interest or when invited to do so.
One such example of the above is the manager’s work as part of the
ANNUAL FINANCIAL REPORT GRI INDEX
30 JUN
E 2016 IN
VE
STA
OFFIC
E FU
ND
AN
NU
AL F
INA
NC
IAL R
EP
OR
T
18

GRI INDICATOR GRI DESCRIPTION IOF 2016 ANNUAL FINANCIAL REPORT AND ANNUAL REVIEW
Anti-Competitive Behaviour
G4-SO7 Legal actions for anti-competitive behaviour, anti-trust, and monopoly practices.
Nil actions.
Compliance
G4-SO8 Significant fines and non-monetary sanctions for non-compliance with laws and regulations.
None.
G4-SO9 Percentage of new suppliers that were screened using criteria for impacts on society.
The Manager has management policies, practices and reporting of supply chains, these are detailed in the IOM 2016 Sustainability Report. In 2016 a new Supply Chain Management System was developed, highlighted by a Supplier Code of Conduct covering expectations regarding environment, social and governance issues.
Additionally, Investa co-authored a paper with KPMG Banarra detailing ESG Risks in the Property Supply Chain.
G4-SO10 Significant actual and potential negative impacts on society in the supply chain and actions taken.
Nil.
G4-SO11 Number of grievances about impacts on society, filed, addressed and resolved through formal grievance mechanisms.
Nil.
PRODUCT RESPONSIBILITY
Customer Health and Safety
G4-PR1 Health and safety assessments of products and services.
The Manager’s Safety, Health and Environmental (SHE) Management System (SHEMS) provides company-wide identification and management of risks and opportunities, using the Australian Standard AS/NZS/ISO 14001:2004 and AS/NZS 4804:2001 as a basis. Investa engages NSCA (National Safety Council of Australia) to audit premises in accordance with the SHEMS.
G4-PR2 Incidents of non-compliance with regulations and voluntary codes regarding health and safety.
None.
30 JUN
E 2016 IN
VE
STA
OFFIC
E FU
ND
AN
NU
AL F
INA
NC
IAL R
EP
OR
T
19

GRI INDICATOR GRI DESCRIPTION IOF 2016 ANNUAL FINANCIAL REPORT AND ANNUAL REVIEW
Product and Service Labelling
G4-PR3 Product and service information required by procedures.
In Australia, mandatory Commercial Building Disclosure (CBD) obligations are set out under the Building Energy Efficiency Disclosure Act 2010 (Cth). Building Energy Efficiency Certificates (BEECs) must be in place and disclosed at the point of sale or lease of office accommodation greater than 2,000 square metres. Current BEECs relating to IOF properties are made publicly accessible on the online Building Energy Efficiency Register.
G4-PR4 Incidents of non-compliance with regulations and voluntary codes concerning products and services.
None.
G4-PR5 Customer satisfaction surveys.
The Manager participated in an industry customer survey in 2014, with 93% of respondents satisfied with the Manager as owner. Additionally, 86% of respondents affirmed they would recommend the Manager as a building manager.
The manager did not participate in 2015 due to the corporate activity relating to change of ownership of the manager. It intends to re-start participation in FY17
Marketing Communications
G4-PR6-PR7 Incidents of non-compliance Nil.
Customer Privacy
G4-PR8 Substantiated complaints regarding breaches of customer privacy.
Nil.
Compliance
G4-PR9 Significant fines for non-compliance with laws and regulations.
Nil.
ANNUAL FINANCIAL REPORT GRI INDEX
30 JUN
E 2016 IN
VE
STA
OFFIC
E FU
ND
AN
NU
AL F
INA
NC
IAL R
EP
OR
T
20

FINANCIAL REPORT
567 Collins Street, Melbourne
30 JUN
E 2016 IN
VE
STA
OFFIC
E FU
ND
AN
NU
AL F
INA
NC
IAL R
EP
OR
T
21
30 JUNE 2016INVESTA OFFICE FUND


CONTENTS
Directors’ Report 24
Auditor’s Independence Declaration 34
Consolidated Income Statements 35
Consolidated Statements of Comprehensive Income 36
Consolidated Statements of Financial Position 37
Consolidated Statements of Changes in Equity 38
Consolidated Statements of Cash Flows 40
Notes to the Consolidated Financial Statements 41
Note 1. Summary of significant accounting policies 41
Note 2. Critical accounting estimates and judgements 48
Note 3. Segment information 49
Note 4. Income tax benefit 50
Note 5. Distributions 51
Note 6. Earnings per unit 52
Note 7. Trade and other receivables 53
Note 8. Discontinued operations 54
Note 9. Derivative financial instruments 55
Note 10. Asset classified as held for sale 55
Note 11. Investments accounted for using the equity method 56
Note 12. Investment properties 59
Note 13. Property portfolio information 60
Note 14. Trade and other payables 63
Note 15. Borrowings 63
Note 16. Contributed equity 65
Note 17. Reserves 66
Note 18. Retained earnings 66
Note 19. Commitments 67
Note 20. Capital management 67
Note 21. Financial risk management 70
Note 22. Fair value measurements 77
Note 23. Related parties 81
Note 24. Auditor’s remuneration 84
Note 25. Parent financial information 85
Note 26. Note to the Consolidated Statements of Cash Flows 86
Note 27. Significant matters affecting the Group 87
Note 28. Events occurring after the reporting period 88
Directors’ Declaration 89
Independent Auditor’s Report 90
The Investa Office Fund was formed by the stapling of the units in two Australian registered schemes, Armstrong Jones Office Fund (ARSN 090 242 229) and Prime Credit Property Trust (ARSN 089 849 196). Investa Listed Funds Management Limited (ABN 37 149 175 655; AFS licence number 401414) is the Responsible Entity of both schemes, and is incorporated and domiciled in Australia. The registered office of Investa Listed Funds Management Limited is Level 6, Deutsche Bank Place, 126 Phillip Street, Sydney, New South Wales.
This report is not an offer or invitation to subscribe or purchase, or a recommendation of securities. It does not take into account the investment objectives, financial situation and particular needs of the investor.
Before making an investment in Investa Office Fund, the investor or prospective investor should consider whether such an investment is appropriate to their particular investment needs, objectives and financial circumstances and consult an investment adviser if necessary.
The responsibility for preparation of the financial statements and any financial information contained in this financial report rests solely with the Directors of the Responsible Entity. This financial report was authorised for issue by the Directors on 18 August 2016. The Responsible Entity has the power to amend and reissue this financial report.
30 JUN
E 2016 IN
VE
STA
OFFIC
E FU
ND
AN
NU
AL F
INA
NC
IAL R
EP
OR
T
23

DIRECTORS’ REPORTFOR THE YEAR ENDED 30 JUNE 2016
Review of results and operations
Principal activity
The principal activity of the Trusts is to own investment grade office buildings, generating rental and other property income. These properties are either owned directly or indirectly through the ownership of interests in unlisted entities.
There was no significant change in the nature of either Trust’s activities during the year.
Financial results
The Group delivered a net profit attributable to unitholders for the year ended 30 June 2016 of $493.8 million, up 175.6% from the previous year. This was primarily due to strong valuation improvements in the portfolio for the current year. After adjusting for fair value movements and non-operating items, the Property Council FFO increased by 3.4% to $175.6 million, driven by property level income growth and the income from 567 Collins Street, Melbourne, which completed in July 2015.
Property and investment portfolios
At 30 June 2016 the Group held interest in twenty two investments located in the key central business districts of major Australian cities. The portfolio is valued at $3,625.9 million and has a total net lettable area of 421,895 sqm at the Group’s share.
a) Property portfolio
The key events for the current financial year and up to the date of this report include:
> Completed 116,253 sqm of leasing across the total lettable area in the portfolio.
> Leased over 31,482 sqm in Brisbane including significant leases to the State Government of Queensland for 8,912 sqm for 7 years at 140 Creek Street, Brisbane and the Commonwealth Government for 10 years over 2,623 sqm at 295 Ann Street, Brisbane. The portfolio occupancy in Brisbane increased to 90% as at 30 June 2016 from 78% as at 30 June 2015;
> Completion of the new premium grade tower at 567 Collins Street, Melbourne on 7 July 2015;
> Exchange of contracts for the sale of 383 La Trobe Street, Melbourne on 17 July 2015 for $70.7 million subject to settlement adjustments and transaction costs, at a 31% premium to the prior book value. The contracts entitle Prime to a 15% non-refundable deposit and outline a deferred settlement period of twelve to eighteen months from the date of exchange. Settlement is anticipated to occur in January 2017;
> Continued progress on the development of a 22,000 sqm A grade tower at 151 Clarence Street, Sydney with the demolition commenced in March 2016 and the building expected to be completed in Q3 2018; and
> Successful negotiation of an 11.5 year lease extension with Telstra for 63,400 sqm at 242 Exhibition Street, Melbourne. This will provide a long term income stream and de-risk the Melbourne portfolio.
The Investa Office Fund (IOF or the Group) was formed by the stapling of the units in two trusts, Armstrong Jones Office Fund (the Fund) and Prime Credit Property Trust (Prime) (collectively defined as the Trusts). The Responsible Entity for the Trusts is Investa Listed Funds Management Limited (ILFML), which presents the Group’s Annual Financial Report together with Prime’s Annual Financial Report for the year ended 30 June 2016.
In accordance with Accounting Standard AASB 3 Business Combinations, the stapling arrangement referred to above is regarded as a business combination and the Fund has been identified as the Parent for preparing Consolidated Financial Reports.
The Directors’ report is a combined Directors’ report that covers both the Group and Prime. The financial information for the Group and Prime is taken from the Consolidated Financial Statements and notes.
Directors
The following persons were Directors of Investa Listed Funds Management Limited during the financial year and up to the date of this report:
Richard Longes Independent Non-Executive Chairman (appointed as Director 15 April 2016 and appointed as Chairman 18 April 2016)
John Fast Independent Non-Executive Director (appointed 15 April 2016)
Geoff Kleemann Independent Non-Executive Director (appointed 15 April 2016)
Bob Seidler AM Independent Non-Executive Director (appointed 15 April 2016)
Jonathan Callaghan Executive Director (resigned 28 January 2016 and re-instated 15 April 2016)
Deborah Page AM Independent Non-Executive Chairman (resigned 18 April 2016)
Peter Dodd Independent Non-Executive Director (resigned 18 April 2016)
Peter Rowe Independent Non-Executive Director (resigned 18 April 2016)
Scott MacDonald Non-Executive Director (resigned 31 October 2015)
Campbell Hanan Alternate Director (alternate for Scott MacDonald; ceased 31 October 2015)
30 JUN
E 2016 IN
VE
STA
OFFIC
E FU
ND
AN
NU
AL F
INA
NC
IAL R
EP
OR
T
24

b) Valuations
In November 2015, the Group’s entire investment property portfolio was independently valued, with the exception of 383 La Trobe Street, Melbourne, an asset contracted for sale. Further, 52% of the portfolio by value (30 June 2015: 97%) was independently valued in June 2016 (including investment properties held through equity accounted investments). The valuation increase over book value for the year was 9% (30 June 2015: 4%). The weighted average capitalisation rate adopted as at 30 June 2016 was 6.2% for the portfolio (30 June 2015: 6.9%).
Strong valuation results were achieved across Sydney and Melbourne assets with total valuation uplifts of 11% for the year:
> Active leasing, increased market rents and cap rate compression in Sydney contributed to valuation uplifts at 10–20 Bond Street of $60.0 million (31%), 6 O’Connell Street of $29.5 million (20%) and Piccadilly Complex of $43.0 million (20%);
> Continued investor demand for premium grade assets resulted in cap rate compression at 126 Phillip Street, Sydney, where the valuation increased by $40.9 million (21%); and
> Investor demand for high quality and long WALE assets resulted in cap rate compression in Melbourne, with 567 Collins Street increasing by $31.7 million (12%), 242 Exhibition Street increasing by $12.4 million (5%) and 800 Toorak Road increasing by $11.0 million (10%).
The Group’s asset values in Brisbane increased by 9% for the year across the portfolio, following a period of significant leasing activity and asset repositioning:
> 140 Creek Street increased by $23.1 million (14%) in value following the lease up of 18,297 sqm during the year, improving the WALE of the asset to 6.0 years and allowing for cap rate compression;
> 295 Ann Street increased by $8.9 million (8%) with three new deals completed during the year; and
> 239 George Street increased by $3.9 million (3%).
Contrary to rising valuations in Sydney, Melbourne, and Brisbane, asset values in Perth declined as the slowdown in the resource sector resulted in significant decreases in office rents. The Group’s assets in Perth declined in value by 15% on average over the year.
The Group’s Sydney and Melbourne assets, which total 80% of the portfolio by value, performed well throughout the year. Occupancy has remained high in Sydney (98%) and Melbourne (100%) resulting from strong demand from tenants particularly within the professional and business service sectors. The Sydney market in particular has benefited from significant withdrawals of office space, fuelled by residential conversions and compulsory acquisitions by the NSW Government as part of the Sydney Metro City & Southwest infrastructure projects. High levels of demand and declining vacancies have led to effective rental growth, particularly in assets targeted at affordable users, where absolute rental levels have traditionally been relatively low. This has seen growth in face rents, and declines in incentives for both renewals and new deals.
In spite of the challenging leasing conditions in Brisbane, the Group has seen solid leasing results in the current financial year and hence has materially decreased its income exposure in that city. New leases were signed with SAP, the State Government of Queensland and Turner Townsend at 140 Creek Street, Brisbane, while at 295 Ann Street, Brisbane leases with the Commonwealth Government and Australian Institute of Management resulted in an occupancy of 95% and a weighted average lease expiry (WALE) of 6.3 years.
Perth assets make up only 4% of the Group’s portfolio by value. However, challenging leasing conditions persist in that market and have impacted the performance of the portfolio. Despite being well located and offering high quality and affordable A grade office space, vacancies remain at 66 St Georges Terrace, Perth where 5,394 sqm being 39% is available for lease.
Key metrics for the portfolio as at and for the year ended 30 June 2016 include:
> Occupancy of 96% (30 June 2015: 93%);
> Tenant retention of 77% (30 June 2015: 62%);
> Like-for-like net property income growth of 3.1% (30 June 2015: -1.3%); and
> Weighted average lease expiry of 4.8 years (30 June 2015: 5.2 years).
30 JUN
E 2016 IN
VE
STA
OFFIC
E FU
ND
AN
NU
AL F
INA
NC
IAL R
EP
OR
T
25

DIRECTORS’ REPORT CONTINUEDFOR THE YEAR ENDED 30 JUNE 2016
Financial performance
A summary of the Group and Prime’s results for the year is set out in the tables below:
Investa Office Prime Credit Fund Property Trust
30 June 30 June 30 June 30 June 2016 2015 2016 2015 $m $m $m $m
Net profit attributable to unitholders 493.8 179.2 223.0 143.2
Net profit from continuing operations 493.8 281.8 223.0 143.2
Property Council Funds From Operations 175.6 169.9 na na
Per stapled unit: Cents Cents Cents Cents
Basic and diluted earnings per unit from net profit1 80.4 29.2 na na
Basic and diluted earnings per unit from net profit from continuing operations 80.4 45.9 na na
Property Council Funds From Operations per unit 28.6 27.7 na na
Distributions per unit 19.60 19.25 13.00 11.20
1. The basic and diluted earnings per unit from net profit for the Fund and Prime as at 30 June 2016 were 44.1 cents (30 June 2015: 5.9 cents) and 36.3 cents (30 June 2015: 23.3 cents) respectively.
A distribution of $60.2 million for the half-year ended 30 June 2016 was recognised in the 2016 financial year and is scheduled to be paid on 31 August 2016.
Basic and diluted earnings per stapled unit from net profit, as calculated under applicable accounting standards for the year ended 30 June 2016, was 80.4 cents, compared to 29.2 cents for the previous year. This change is a result of:
> Strong valuation improvements in the portfolio for the current year; and
> A decrease in the prior year’s net profit as a result of a loss from the reclassification of the foreign currency translation reserve to the profit and loss.
Distributions per unit have increased by 1.8% from 19.25 cents to 19.60 cents for the year ended 30 June 2016.
Property Council FFO
Property Council FFO is defined as the Group’s underlying and recurring earnings from its operations, determined by adjusting statutory net profit (under AIFRS) for non-cash and other items such as the amortisation of tenant incentives and rent free periods, fair value gains/losses on investment property, fair value gains/losses on the mark to market of derivatives, the straight-lining of rent, non-FFO deferred tax benefits and expenses, foreign currency translation reserves recognised in net profit, and other unrealised or one-off items. Property Council FFO is also included in the Segment information note of the Consolidated Financial Statements, refer to Note 3.
30 JUN
E 2016 IN
VE
STA
OFFIC
E FU
ND
AN
NU
AL F
INA
NC
IAL R
EP
OR
T
26

Property Council FFO for the year ended 30 June 2016 and 30 June 2015 has been calculated as follows:
Investa Office Fund
30 June 30 June 2016 2015 $m $m
Net profit attributable to unitholders 493.8 179.2
Adjusted for:
Net gain on change in fair value of:
Investments 1 (316.2) (129.5)
Derivatives 2 (56.5) (87.8)
Net foreign exchange loss 2 14.4 77.0
Amortisation of incentives 32.3 26.4
Straight-lining of lease revenue 3.6 1.4
Transfer of foreign currency translation reserve to profit or loss – 104.7
Other 3 4.2 (1.5)
Property Council FFO 175.6 169.9
1. Net gain on change in fair value of investments includes the fair values of investment properties held by the Group and investment properties held through equity accounted investments.
2. Net gain on change in fair value of derivatives is predominately due to increases in the fair values of the Group’s cross currency interest rate swaps which mitigate its exposure to foreign exchange rate movements on its US dollar denominated US Private Placements (USPPs). This gain has been partly offset by the net foreign exchange loss driven by the change in carrying amount of the USPPs, which for accounting are translated to Australian dollars using the foreign exchange rate prevailing at the year end.
3. “Other” includes legal and advisory expenses associated with the DEXUS Proposal; income tax expenses; and other unrealised or one-off items.
Property Council FFO for the year to 30 June 2016 increased by 3.4% to $175.6 million (30 June 2015: $169.9 million) mainly due to increased net property income of $11.0 million resulting from full year contributions from 567 Collins Street, Melbourne, higher rents at 105-151 Miller Street, Sydney and improved occupancy and rent reviews from the other Sydney properties. This increase was partially offset by reduced income following the sale of 628 Bourke Street, Melbourne, the redevelopment of 151 Clarence Street, Sydney and lower interest income on the Group’s interest bearing loan to 567 Collins Street Trust.
30 JUN
E 2016 IN
VE
STA
OFFIC
E FU
ND
AN
NU
AL F
INA
NC
IAL R
EP
OR
T
27

DIRECTORS’ REPORT CONTINUEDFOR THE YEAR ENDED 30 JUNE 2016
Financial position
A summary of the Group and Prime’s net asset position for the year is set out below:
Investa Office Prime Credit Fund Property Trust
30 June 30 June 30 June 30 June 2016 2015 2016 2015
Value of total assets ($m) 3,783.4 3,321.2 1,946.0 1,713.9
Total liabilities ($m) 1,187.1 1,098.3 506.6 417.6
Net assets ($m) 2,596.3 2,222.9 1,439.4 1,296.3
Net tangible assets per unit (dollars) 4.23 3.62 2.34 2.11
The value of the Group and Prime’s total assets is derived using the basis set out in Note 1 of the Consolidated Financial Statements. The net tangible assets per unit is calculated by dividing the total equity attributable to unitholders of the Group or Prime by the number of units on issue.
Total assets increased by $462.2 million (13.9%) to $3,783.4 million (30 June 2015: $3,321.2 million) mainly due to positive valuation to the Group’s investment property portfolio; additions to existing properties; and positive revaluation to the Group’s cross currency interest rate swaps which mitigate exposure to foreign exchange rate movement on its US dollar denominated debt. Total liabilities increased by $88.8 million (8.1%) to $1,187.1 million (30 June 2015: $1,098.3 million) predominantly due to increase in debt to fund the construction of 567 Collins Street, Melbourne and an increase in the carrying value of US denominated debt resulting from the weakening of the Australian dollar.
Capital management
Investa Office Fund
30 June 30 June 2016 2015
Drawn debt ($m) 1,092.7 1,001.2
Drawn debt – look-through ($m) 1 1,013.0 936.0
Undrawn committed debt - look-through ($m) 186.0 195.0
Gearing ratio – look-through 27.7% 28.8%
Weighted average debt expiry – look-through 2 5.0 years 5.2 years
Interest rate hedging – look-through 44.4% 42.7%
Leverage ratio – look-through 31.4% 33.1%
Interest coverage – look-through (times) 4.3x 4.4x
1. Represents the Group’s look-through drawn debt, based on the AUD liability on the USPPs after applying cross currency swap hedging arrangements.2. Current year calculation includes the impact of the Group’s refinance of the bank debt expiring in March 2017 with new bank debt expiring from July 2019
to July 2021.
In February 2016, the Responsible Entity on behalf of the Fund and Prime entered into new debt facility agreements of $350.0 million with a maturity date of March 2017. This allowed the Group and Prime to refinance their bank debt maturing in June 2016 and August 2016.
Subsequent to 30 June 2016, the Responsible Entity on behalf of the Fund and Prime refinanced the $350.0 million bank debt facility maturing in March 2017 with new bank debt facility agreements of $350.0 million maturing from July 2019 to July 2021.
30 JUN
E 2016 IN
VE
STA
OFFIC
E FU
ND
AN
NU
AL F
INA
NC
IAL R
EP
OR
T
28

b) Dynamic portfolio management
The Responsible Entity continues to seek to enhance and maximise the performance of the Group’s investment property portfolio in major Australian CBD markets through the ownership of three classes of assets:
> Core assets – these assets will provide a solid income base to support distributions and operations, providing an element of stability through real estate cycles.
> Value add assets – these assets offer greater opportunity for growth through redevelopment, re-leasing, or operational change and improvement.
> Tactical assets – these properties are typically smaller and are not considered to form part of the Group’s long-term portfolio positioning.
The Group will continue to seek out opportunities to maximise risk adjusted returns by acquiring assets that meet the needs of today’s tenants, by targeting markets with attractive demand/supply dynamics, and by divesting assets where management believe value has been maximised and that are no longer considered to form part of the Group’s long-term portfolio positioning.
c) Focused capital management
The Responsible Entity continues to be focused on optimising investment returns through prudent and disciplined capital management. This will be achieved by:
> Maintaining the diversified sources and appropriate maturities of debt facilities;
> Maintaining a sustainable level of distributions, being at least equal to taxable income;
> Targeting gearing levels from 25% to 35%, while acknowledging that gearing may vary from the target in the short term from time to time; and
> Maintaining the BBB+ Standard and Poor’s (S&P) credit rating.
Business strategies and prospects for future financial years
Information regarding the Responsible Entity’s business strategies for the Group and future financial prospects is outlined below.
Business strategies
The key business strategies for the Group as at 30 June 2016 are set out below.
a) Proactive asset management
A key strategy of the Responsible Entity is to enhance the property portfolio’s returns. This will be achieved by utilising the skills and expertise of the Investa Office management platform (the Management Platform) to proactively manage the assets, including:
> Enhancing tenant communications and services to minimise vacancy and maximise rental returns;
> Actively addressing short-term lease expiries and vacancy risks to improve income returns;
> Upgrading assets where appropriate to create relevant, appropriately priced accommodation for today’s tenants;
> Continuing to focus on property operational efficiencies; and
> Optimising environmental performance of assets through appropriate capital expenditure programs.
30 JUN
E 2016 IN
VE
STA
OFFIC
E FU
ND
AN
NU
AL F
INA
NC
IAL R
EP
OR
T
29

DIRECTORS’ REPORT CONTINUEDFOR THE YEAR ENDED 30 JUNE 2016
Business strategies and prospects for future financial years (continued)
Material business risks
The achievement of the Responsible Entity’s business objectives for the Group is subject to the following.
Market cycle Economic growth and economic environment present risks to tenant vacancies, the property valuation cycle, the availability of funding, interest rates, and foreign exchange rates. The mitigation of these risks is discussed further below.
Vacancy levels The level of vacancy can impact the Group’s rental returns and market value of its office properties. A high vacancy level is likely to result in lower rental returns and lower property values. This risk is mitigated by the Group’s ability to utilise the specialist skills and expertise of the Management Platform, which has a strong focus on tenant service and amenities to embed high levels of tenant retention, together with a focus on managing lease expiries in the near to medium term. The Group has low levels of existing vacancy of 4% and WALE of 4.8 years across the Australian portfolio. Less than 6% of income from the Group’s portfolio expires in the next 12 months.
Property valuation cycle Conditions prevailing in the general economic environment and the property investment markets affect the value of the Group’s property investments. Declines in the Group’s property values would increase the Group’s gearing levels, which may increase borrowing costs and the risk of a breach of financing covenants. This risk is mitigated by the Group’s target gearing range appropriately reflecting the property valuation cycle; maintaining a spread to gearing covenants; and by the Group’s investment in high quality commercial grade office buildings.
Australian commercial property investments continue to attract significant interest from both domestic and international investors seeking attractive income returns and investment in real assets. This investment is strongest in Sydney and Melbourne, with strong occupancy fundamentals enhancing investor confidence; whereas weaker tenant demand combined with high levels of recent supply additions in the Brisbane and Perth markets present a more challenging outlook. With interest rates remaining at record lows across the developed world, commercial property prices have increased as capitalisation rates have tightened. We expect the low interest rate environment to continue to support low office market yields in all the major global markets. Australia will remain high on the list of destinations for global capital as the spread between Australian office yields and bonds remains very healthy by global standards.
Availability of funding The availability of funding can impact the Group’s level of liquidity and ability to grow as a shortage of available capital would impact the ability to refinance maturing debt facilities and limit the ability to invest in new or existing assets. This risk is mitigated by the Group’s diversified sources of financing; staggering debt maturities across multiple years with no large debt maturity in any one year; and by the Group managing debt levels to its target gearing range from 25% to 35%, while acknowledging that gearing may vary from the target in the short term from time to time.
Subsequent to the year end, the Group refinanced its current debt facilities by entering into new debt facility arrangements with long-term maturities. Consequently, the Group will not have any debt facilities maturing in the 12 months after the reporting date.
Interest rates The level of interest rates can affect the amount of interest payable on the Group’s debt facilities as well as impacting investor sentiment towards property assets and hence, market values. Higher interest rates typically increase interest costs and may reduce investment in property assets, while low interest rates reduce interest costs and can encourage increased investment activity. Interest payable risk is mitigated by the use of interest rate derivatives based on hedge ratio limit ranges outlined in Note 21(a) of the Consolidated Financial Statements.
Exchange rate risk The Group mitigates its exposure to exchange rate risk on its USD 325.0 million USPPs borrowing through cross currency swap hedging arrangements. These arrangements minimise the interest rate and exchange rate risk on the USPPs borrowings.
30 JUN
E 2016 IN
VE
STA
OFFIC
E FU
ND
AN
NU
AL F
INA
NC
IAL R
EP
OR
T
30

Significant matters affecting the Group
a) Independent Board Committee (the IBC)
In February 2015, Morgan Stanley Real Estate Investing (Morgan Stanley) commenced a formal sale process of the Management Platform, owned by Investa Office Management Holdings Pty Limited (IOMHPL). IOMHPL is the direct parent of Investa Office Management Pty Limited (IOM), which is the parent entity of the Group’s Responsible Entity, ILFML and of the related management entities that provide asset and property management services to the Group’s investment property portfolio.
The IBC was established in December 2014 in anticipation of the Morgan Stanley sale process. The members of the IBC were the former Independent Directors of ILFML, namely, Deborah Page, Peter Dodd and Peter Rowe. The IBC had advised that it considered various alternatives available to the Group as part of the strategic review.
On 18 December 2015, ILFML entered into a binding Implementation Agreement with DEXUS in relation to DEXUS’s proposed acquisition of 100% of the units in the Group by way of a trust scheme (DEXUS Proposal). At a unitholder meeting held on 15 April 2016, the DEXUS Proposal failed to receive approval by the requisite majority of IOF Unitholders. As a result, the Implementation Agreement with DEXUS was terminated. The IBC has also been dissolved. Under the terms of the Implementation Agreement, a $23.52 million break fee could be payable by the Group to DEXUS in certain circumstances (as set out in the Implementation Agreement), including where a competing transaction to the DEXUS Proposal is completed by 31 December 2016.
The IBC had appointed several advisors to assist with its strategic review. The Group may be required to pay trailing fees under the mandates with these advisors, if certain events relating to the control or management of the Group occur within specified timeframes. These trailing fees, based on the total assets of the Group as at 30 June 2016 can amount up to $2.8 million in aggregate if an internalisation proposal is approved or implemented or up to $16.1 million in aggregate if there is a change of control of the Group. Any entitlement to trailing fees reduces after 31 May 2017 and ceases on 1 December 2017
b) Investa Property Group
In March 2016, ICPF Holdings Limited (ICPFHL) acquired IOMHPL from Morgan Stanley. ICPFHL is stapled to the wholesale unlisted fund, the Investa Commercial Property Fund (ICPF). The stapled ICPF-ICPFHL structure is known as Investa Property Group (IPG). ILFML, the Responsible Entity of the Group has become a subsidiary of ICPFHL.
Future financial prospects
a) Market conditions
The Australian economy is in a relatively strong position, with the transition away from mining investment-led economic growth becoming increasingly entrenched, as a lower Australian dollar and low interest rates continue to stimulate the non-mining economy. Although economic growth has been slightly below trend over the last year, Australia continues to deliver enviable rates of growth compared to other developed economies. However, economic performance continues to vary across different states and markets, with New South Wales and Victoria benefitting the most from the rebalancing of the economy, at the expense of Western Australia and, to a lesser extent, Queensland. Evidence of this can be seen in labour force data, with the rate of national unemployment gradually declining over the last 12 months to 5.7%. However, the bulk of these jobs has been created in the Eastern Seaboard states, particularly in white-collar industries such as business services.
The impact of these labour market trends can be observed in office market data. Sydney, and to a lesser extent Melbourne, have seen above average levels of demand for space, which has tightened the market vacancy rate. Sydney in particular is becoming supply constrained in some market segments, and as a result, office rents are expanding strongly and tenant incentives are winding back, particularly in the case of lease renewals. Melbourne is lagging behind Sydney somewhat; however, market conditions are improving. Brisbane is emerging from a period of above average supply which has increased the vacancy rate. However after a period of weakness, office space absorption has improved over the last 12 months, returning to average levels. This has resulted in a stabilisation of rents and tenant incentives in Brisbane. Perth continues to face significant market headwinds. The unwinding of mining investment has resulted in resources companies and associated service providers cutting back their space requirements. This has been exacerbated by falling commodity prices which have reduced the likelihood that any new mining projects will be approved in the short term. We expect further downward pressure on rental levels before the market stabilises over the next 24 months.
b) Earnings guidance
The Group’s 30 June 2017 forecast earnings guidance (based on Property Council FFO) is 29.2 cents per unit (30 June 2016 actual: 28.6 cents per unit) with a full year distribution of 20.0 cents per unit (30 June 2016 actual: 19.60 cents per unit). This guidance is subject to prevailing market conditions, no material changes to the portfolio and no capital transactions, other than the settlement of 383 La Trobe Street, Melbourne.
30 JUN
E 2016 IN
VE
STA
OFFIC
E FU
ND
AN
NU
AL F
INA
NC
IAL R
EP
OR
T
31

DIRECTORS’ REPORT CONTINUEDFOR THE YEAR ENDED 30 JUNE 2016
Events occurring after the reporting period
Subsequent to 30 June 2016, the Responsible Entity on behalf of the Fund and Prime refinanced the $350.0 million bank debt facility maturing in March 2017 with new bank debt facility agreements of $350.0 million maturing from July 2019 to July 2021.
On 25 July 2016, the Group agreed terms for an 11.5 year lease extension with Telstra at 242 Exhibition Street, Melbourne, a property held by an equity accounted investment that is jointly owned with ICPF. Telstra occupies over 63,000 sqm of the office tower and has extended its lease expiry from May 2020 to October 2031. This lease extension provides income stability and secures the long-term outlook for the asset.
The Directors of the Responsible Entity are not aware of any other matter or circumstance not otherwise dealt with within this report or the financial report that has significantly affected or may significantly affect the operations of the Group or Prime, the results of those operations, or state of the Group’s or Prime’s affairs in future financial periods.
Business strategies and prospects for future financial years (continued)
Significant matters affecting the Group (continued)
c) Rights under the Implementation Deed
The Group holds certain rights under an Implementation Deed between ILFML, IOMHPL and IPGH Pty Limited (IPGH) dated 19 December 2012 and amended on 8 September 2015 (Implementation Deed). These rights include:
> A right to negotiate in good faith in relation to the acquisition of a 50% interest in the Management Platform once the Group is notified that the gross asset value of the commercial office assets of the Group equals or exceeds $3.5 billion (the Due Diligence Commencement Date); and
> A right of first refusal in the event that IOMHPL wishes to sell an interest in the Management Platform to an unrelated third party at any time prior to the date that is 12 months after the Due Diligence Commencement Date.
On 12 August 2016, the Group received a Certificate of Valuation from IOMHPL confirming that the gross asset value of the commercial office assets of the Group was greater than $3.5 billion. As a result, under the terms of the Implementation Deed, the Group has a 12 month period (that commenced on 12 August 2016) in which it may choose to exercise its right by notifying IOMHPL and commence the process to negotiate the purchase of 50% interest in the Management Platform. IOMHPL has stated the price at which IOMHPL is prepared to sell a 50% interest in the Management Platform as follows:
> If completion of the sale takes place before 28 February 2017, the price is $45.0 million plus agreed working capital and other agreed reimbursement adjustments.
> If completion of the sale takes place after 28 February 2017, the price is the higher of:
> $45.0 million plus agreed working capital and other agreed reimbursement adjustments; and
> The fair market price as at the expected completion date of the sale as determined by an independent expert appointed by IOMHPL (acting reasonably) in consultation with ILFML.
The price mentioned above is also subject to agreement on the various transaction documents to give effect to the sale of the interest and governing the joint venture arrangements.
The Directors will review and consider the Certificate of Valuation within the period allowed under the Implementation Deed.
ILFML will keep IOF unitholders informed in accordance with its Australian Securities Exchange continuous disclosure obligation.
30 JUN
E 2016 IN
VE
STA
OFFIC
E FU
ND
AN
NU
AL F
INA
NC
IAL R
EP
OR
T
32

Interests in the Trusts
There was no movement in the units on issue of the Group or Prime during the current year.
ILFML and its associates had the following interest in the Trusts as at 30 June 2016:
Investa Office Prime Credit Fund Property Trust
30 June 30 June 30 June 30 June 2016 2015 2016 2015 Name ’000 ’000 ’000 ’000
Investa Office Management Holdings Pty Limited 1 54,878 1 54,878
1 54,878 1 54,878
Fees paid and payable to and the number of units in the Trusts held by the Responsible Entity and its associates at the end of the financial year are set out in Note 23 of the Consolidated Financial Statements.
Audit and non-audit fees
PricewaterhouseCoopers continues in office in accordance with section 327 of the Corporations Act 2001 (Cth).
The Directors of the Responsible Entity have adopted a policy governing Auditor Independence which specifies that the auditing firm should not provide services that are or could be perceived to be in conflict with the role of auditor. Each non-audit service is considered in the context of this policy. The Responsible Entity may decide to employ the auditor on assignments additional to their statutory audit duties where the auditor’s expertise and experience with the Group and Prime are important.
Details of the amounts paid or payable to the auditor for audit and non-audit services provided are detailed in Note 24 of the Consolidated Financial Statements.
Auditor’s Independence Declaration
A copy of the Auditor’s Independence Declaration as required under section 307C of the Corporations Act 2001 is set out on page 34.
Rounding of amounts
The Trusts are of a kind of entity referred to in ASIC Corporations (Rounding in Financial/Directors’ Report) Instrument 2016/191, issued by the Australian Securities & Investments Commission, relating to the “rounding off” of amounts in the Directors’ report and in the Consolidated Financial Statements. Amounts in the Directors’ report and the Consolidated Financial Statements have been rounded off in accordance with that Instrument to the nearest hundred thousand dollars, or in certain cases, the nearest thousand dollars.
This report is made in accordance with a resolution of the Directors.
RA LongesChairmanSydney
18 August 2016
Environmental regulation
The Directors of the Responsible Entity are satisfied that adequate systems are in place for the management of the Trusts’ environmental responsibility and compliance with various licence requirements and regulations. Further, the Directors are not aware of any material breaches of these requirements and, to the best of their knowledge, all activities have been undertaken in compliance with environmental requirements.
Indemnification and insurance of officers and the auditor
The officers of the Responsible Entity are covered under an insurance policy maintained by ICPF Holdings Limited on behalf of all its subsidiaries, including the Responsible Entity. The Group has not paid any insurance premium for any person who is or has been a director or officer of the Responsible Entity.
The Responsible Entity may indemnify, on a full indemnity basis and to the full extent permitted by the law, each officer against all losses or liabilities incurred by the person as an officer of the Responsible Entity. The Responsible Entity and IOMHPL (a parent company of the Responsible Entity) have provided a Deed of Indemnity, Access and Insurance in favour of the Directors of the Responsible Entity. The Deed indemnifies these persons on a full indemnity basis to the extent permitted by law for all liabilities incurred as a director or officer of the Responsible Entity.
PricewaterhouseCoopers (PwC) as auditor of the Group is not indemnified out of the assets of the Group.
Other information
ATO income tax audit
The Australian Taxation Office has completed its audit of the income tax returns for Prime and has advised that it does not presently intend as its primary course to amend the income of Prime nor the Group’s unitholders in respect of the audit.
30 JUN
E 2016 IN
VE
STA
OFFIC
E FU
ND
AN
NU
AL F
INA
NC
IAL R
EP
OR
T
33

AUDITOR’S INDEPENDENCE DECLARATIONFOR THE YEAR ENDED 30 JUNE 2016
30 JUN
E 2016 IN
VE
STA
OFFIC
E FU
ND
FIN
AN
CIA
L RE
PO
RT
34

Investa Office Prime Credit Fund Property Trust
30 June 30 June 30 June 30 June 2016 2015 2016 2015 Note $m $m $m $m
Revenue from continuing operations
Rental and other property income 207.4 209.9 79.6 77.7
Interest income 9.9 7.6 9.8 7.3
217.3 217.5 89.4 85.0
Net foreign exchange loss (14.3) (78.6) (5.4) (30.2)
Net gain on change in fair value of:
Investment properties 12 233.4 89.4 51.4 24.3
Derivative financial instruments 56.5 87.8 20.1 33.1
Share of net profit of equity accounted investments 11 115.5 67.8 115.5 67.8
Net loss on disposal of assets (0.5) – (0.7) –
Property expenses (50.9) (52.5) (20.7) (22.0)
Responsible Entity’s fees (12.3) (11.1) (7.2) (6.5)
Finance costs (43.2) (41.6) (15.1) (12.1)
Transaction costs 3 (5.5) – (2.7) –
Other expenses (2.2) (3.1) (1.6) (2.4)
Profit before income tax 493.8 275.6 223.0 137.0
Income tax benefit 4 – 6.2 – 6.2
Profit from continuing operations for the year 493.8 281.8 223.0 143.2
Loss from discontinuing operations for the year 8 – (102.6) – –
Net profit attributable to unitholders for the year 493.8 179.2 223.0 143.2
Attributable to unitholders of:
Armstrong Jones Office Fund 270.8 36.0 – –
Prime Credit Property Trust 223.0 143.2 223.0 143.2
493.8 179.2 223.0 143.2
Distributions and earnings per unit
Distributions per unit (cents) 5 19.60 19.25 13.00 11.20
Basic and diluted earnings per unit from net profit from continuing operations:
Per stapled unit (cents) 6 80.4 45.9 na na
Per unit of each trust (cents) 6 44.1 22.6 36.3 23.3
Basic and diluted earnings per unit from net profit
Per stapled unit (cents) 6 80.4 29.2 na na
Per unit of each trust (cents) 6 44.1 5.9 36.3 23.3
The above Consolidated Income Statements should be read in conjunction with the accompanying notes.
CONSOLIDATED INCOME STATEMENTSFOR THE YEAR ENDED 30 JUNE 2016
35
30 JUN
E 2016 IN
VE
STA
OFFIC
E FU
ND
AN
NU
AL F
INA
NC
IAL R
EP
OR
T

CONSOLIDATED STATEMENTS OF COMPREHENSIVE INCOMEFOR THE YEAR ENDED 30 JUNE 2016
Investa Office Prime Credit Fund Property Trust
30 June 30 June 30 June 30 June 2016 2015 2016 2015 Note $m $m $m $m
Net profit for the year 493.8 179.2 223.0 143.2
Other comprehensive income:
Items that may be reclassified to profit or loss
Transfer of foreign currency translation reserve from disposed operations to profit and loss 17 – 104.7 – –
Exchange differences on translation of foreign operations 17 – (1.2) – –
Total comprehensive income for the year 493.8 282.7 223.0 143.2
Total comprehensive income for the year attributable to unitholders of:
Armstrong Jones Office Fund 270.8 139.5 – –
Prime Credit Property Trust 223.0 143.2 223.0 143.2
Total comprehensive income for the year 493.8 282.7 223.0 143.2
Total comprehensive income for the year attributable to unitholders arising from:
Armstrong Jones Office Fund
Continuing operations 270.8 138.6 – –
Discontinued operations – 0.9 – –
270.8 139.5 – –
Prime Credit Property Trust
Continuing operations 223.0 143.2 223.0 143.2
Discontinued operations – – – –
223.0 143.2 223.0 143.2
493.8 282.7 223.0 143.2
The components of other comprehensive income shown above are presented net of related income tax effects.
The above Consolidated Statements of Comprehensive Income should be read in conjunction with the accompanying notes.
30 JUN
E 2016 IN
VE
STA
OFFIC
E FU
ND
AN
NU
AL F
INA
NC
IAL R
EP
OR
T
36

CONSOLIDATED STATEMENTS OF FINANCIAL POSITIONAS AT 30 JUNE 2016
Investa Office Prime Credit Fund Property Trust
30 June 30 June 30 June 30 June 2016 2015 2016 2015 Note $m $m $m $m
Current assets
Cash and cash equivalents 2.1 3.6 1.4 1.0
Trade and other receivables 7 12.6 18.2 7.5 10.5
14.7 21.8 8.9 11.5
Assets classified as held for sale 10 70.5 – 70.5 –
85.2 21.8 79.4 11.5
Non-current assets
Trade and other receivables 7 – 114.2 – 114.2
Derivative financial instruments 9 143.5 86.6 57.2 36.9
Investments accounted for using the equity method 11 801.8 543.7 801.8 543.7
Investment properties 12 2,752.9 2,554.9 1,007.6 1,007.6
3,698.2 3,299.4 1,866.6 1,702.4
Total assets 3,783.4 3,321.2 1,946.0 1,713.9
Current liabilities
Trade and other payables 14 25.7 29.9 10.0 12.4
Distribution payable 5 60.2 59.6 37.5 35.0
Derivative financial instruments 9 4.2 2.5 0.9 –
Borrowings 15 337.0 61.9 198.0 41.9
427.1 153.9 246.4 89.3
Non-current liabilities
Derivative financial instruments 9 7.8 9.1 0.3 1.1
Borrowings 15 752.2 935.3 259.9 327.2
760.0 944.4 260.2 328.3
Total liabilities 1,187.1 1,098.3 506.6 417.6
Net assets 2,596.3 2,222.9 1,439.4 1,296.3
Equity
Contributed equity 16 2,142.3 2,142.3 1,193.8 1,193.8
Retained earnings 18 454.0 80.6 245.6 102.5
Total equity 2,596.3 2,222.9 1,439.4 1,296.3
Attributable to unitholders of:
Armstrong Jones Office Fund:
Contributed equity 16 948.5 948.5 – –
Retained earnings/(accumulated losses) 208.4 (21.9) – –
1,156.9 926.6 – –
Prime Credit Property Trust 1,439.4 1,296.3 1,439.4 1,296.3
Total equity 2,596.3 2,222.9 1,439.4 1,296.3
The above Consolidated Statements of Financial Position should be read in conjunction with the accompanying notes.
37
30 JUN
E 2016 IN
VE
STA
OFFIC
E FU
ND
AN
NU
AL F
INA
NC
IAL R
EP
OR
T

CONSOLIDATED STATEMENTS OF CHANGES IN EQUITYFOR THE YEAR ENDED 30 JUNE 2016
Attributable to unitholders of Investa Office Fund
Contributed Retained Total Equity Reserves earnings equity Note $m $m $m $m
Balance at 1 July 2014 2,142.3 (103.5) 19.6 2,058.4
Net profit for the year – – 179.2 179.2
Other comprehensive income – 103.5 – 103.5
Total comprehensive income for the year – 103.5 179.2 282.7
Transactions with unitholders in their capacity as equity holders:
Distributions paid or payable 5 – – (118.2) (118.2)
– – (118.2) (118.2)
Balance at 30 June 2015 2,142.3 – 80.6 2,222.9
Balance at 1 July 2015 2,142.3 – 80.6 2,222.9
Net profit for the year – – 493.8 493.8
Other comprehensive income – – – –
Total comprehensive income for the year – – 493.8 493.8
Transactions with unitholders in their capacity as equity holders:
Distributions paid or payable 5 – – (120.4) (120.4)
– – (120.4) (120.4)
Balance at 30 June 2016 2,142.3 – 454.0 2,596.3
30 JUN
E 2016 IN
VE
STA
OFFIC
E FU
ND
AN
NU
AL F
INA
NC
IAL R
EP
OR
T
38

Attributable to unitholders of Prime Credit Property Trust
Contributed Retained Total Equity Reserves earnings equity Note $m $m $m $m
Balance at 1 July 2014 1,193.8 – 7.3 1,201.1
Net profit for the year – – 143.2 143.2
Other comprehensive income – – – –
Total comprehensive income for the year – – 143.2 143.2
Transactions with unitholders in their capacity as equity holders:
Distributions paid or payable 5 – – (48.0) (48.0)
– – (48.0) (48.0)
Balance at 30 June 2015 1,193.8 – 102.5 1,296.3
Balance at 1 July 2015 1,193.8 – 102.5 1,296.3
Net profit for the year – – 223.0 223.0
Other comprehensive income – – – –
Total comprehensive income for the year – – 223.0 223.0
Transactions with unitholders in their capacity as equity holders:
Distributions paid or payable 5 – – (79.9) (79.9)
– – (79.9) (79.9)
Balance at 30 June 2016 1,193.8 – 245.6 1,439.4
The above Consolidated Statements of Changes in Equity should be read in conjunction with the accompanying notes.
39
30 JUN
E 2016 IN
VE
STA
OFFIC
E FU
ND
AN
NU
AL F
INA
NC
IAL R
EP
OR
T

Investa Office Prime Credit Fund Property Trust
30 June 30 June 30 June 30 June 2016 2015 2016 2015 Note $m $m $m $m
Cash flows from operating activities
Cash receipts in the course of operations (inclusive of GST) 247.6 243.2 96.3 95.5
Cash payments in the course of operations (inclusive of GST) (90.0) (86.2) (39.4) (38.9)
Settlement of income hedging currency derivatives – 2.1 – –
Distribution received from equity accounted investments 11 29.9 25.4 29.9 25.4
Interest received 0.3 0.5 0.1 0.2
Finance costs paid (42.6) (43.2) (14.9) (12.3)
Income taxes refunded – 8.0 – 0.5
Net cash inflow from operating activities 26 145.2 149.8 72.0 70.4
Cash flows from investing activities
Payments for additions to investment properties (54.7) (85.4) (27.9) (45.8)
Payments for the acquisition of investment properties – (7.4) – –
Proceeds from disposal of investment properties – 126.1 – –
Cost of disposal of assets (0.7) – (0.7) –
Proceeds from sale of equity accounted investments – 20.5 – –
Loans to equity accounted investments (76.1) (71.7) (76.1) (71.7)
Loans from equity accounted investments 27.5 0.4 27.5 –
Loans received from stapled entity – – – 20.8
Net cash outflow from investing activities (104.0) (17.5) (77.2) (96.7)
Cash flows from financing activities
Distributions paid to unitholders (119.8) (115.4) (77.4) (63.3)
Proceeds from borrowings 506.0 391.0 371.0 228.0
Repayment of borrowings (429.0) (416.0) (288.0) (140.0)
Net cash (outflow)/inflow from financing activities (42.8) (140.4) 5.6 24.7
Net decrease in cash and cash equivalents (1.6) (8.1) 0.4 (1.6)
Cash and cash equivalents at the beginning of the year 3.6 12.3 1.0 2.5
Effects of exchange rate changes on cash and cash equivalents 0.1 (0.6) – 0.1
Cash and cash equivalents at the end of the year 2.1 3.6 1.4 1.0
Non-cash investing and financing activities 26
The above Consolidated Statements of Cash Flows should be read in conjunction with the accompanying notes.
CONSOLIDATED STATEMENTS OF CASH FLOWSFOR THE YEAR ENDED 30 JUNE 2016
30 JUN
E 2016 IN
VE
STA
OFFIC
E FU
ND
AN
NU
AL F
INA
NC
IAL R
EP
OR
T
40
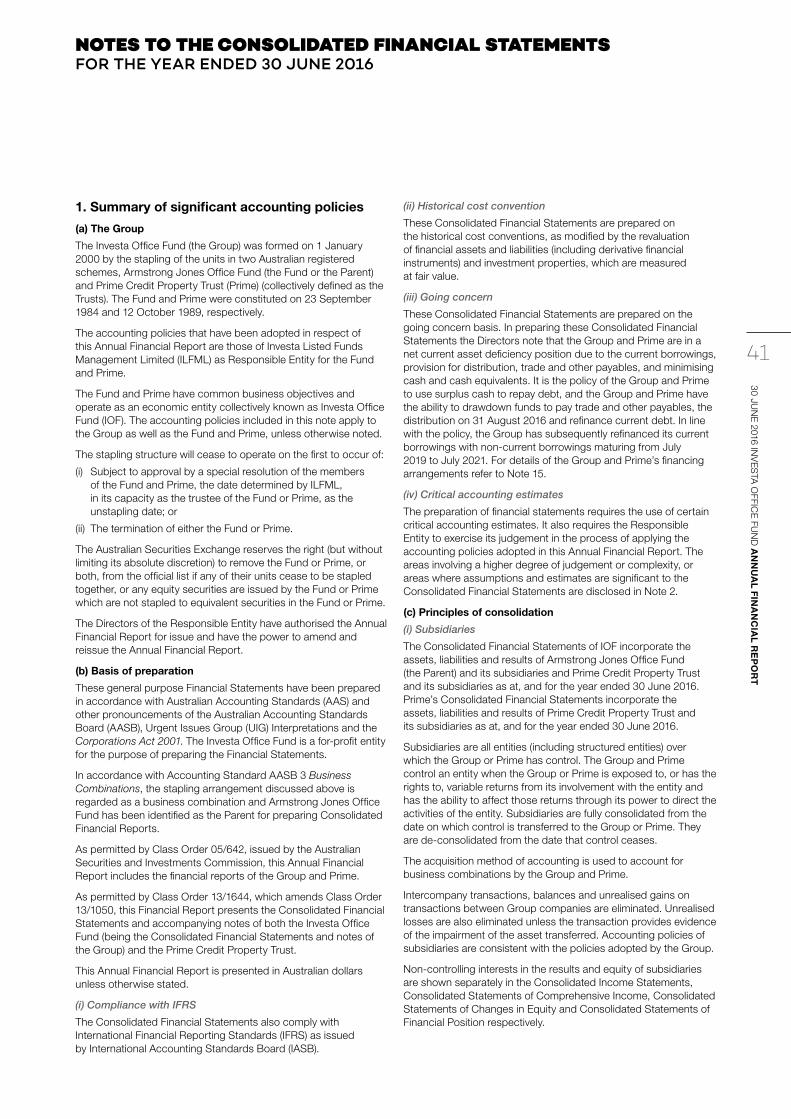
1. Summary of significant accounting policies
(a) The Group
The Investa Office Fund (the Group) was formed on 1 January 2000 by the stapling of the units in two Australian registered schemes, Armstrong Jones Office Fund (the Fund or the Parent) and Prime Credit Property Trust (Prime) (collectively defined as the Trusts). The Fund and Prime were constituted on 23 September 1984 and 12 October 1989, respectively.
The accounting policies that have been adopted in respect of this Annual Financial Report are those of Investa Listed Funds Management Limited (ILFML) as Responsible Entity for the Fund and Prime.
The Fund and Prime have common business objectives and operate as an economic entity collectively known as Investa Office Fund (IOF). The accounting policies included in this note apply to the Group as well as the Fund and Prime, unless otherwise noted.
The stapling structure will cease to operate on the first to occur of:
(i) Subject to approval by a special resolution of the members of the Fund and Prime, the date determined by ILFML, in its capacity as the trustee of the Fund or Prime, as the unstapling date; or
(ii) The termination of either the Fund or Prime.
The Australian Securities Exchange reserves the right (but without limiting its absolute discretion) to remove the Fund or Prime, or both, from the official list if any of their units cease to be stapled together, or any equity securities are issued by the Fund or Prime which are not stapled to equivalent securities in the Fund or Prime.
The Directors of the Responsible Entity have authorised the Annual Financial Report for issue and have the power to amend and reissue the Annual Financial Report.
(b) Basis of preparation
These general purpose Financial Statements have been prepared in accordance with Australian Accounting Standards (AAS) and other pronouncements of the Australian Accounting Standards Board (AASB), Urgent Issues Group (UIG) Interpretations and the Corporations Act 2001. The Investa Office Fund is a for-profit entity for the purpose of preparing the Financial Statements.
In accordance with Accounting Standard AASB 3 Business Combinations, the stapling arrangement discussed above is regarded as a business combination and Armstrong Jones Office Fund has been identified as the Parent for preparing Consolidated Financial Reports.
As permitted by Class Order 05/642, issued by the Australian Securities and Investments Commission, this Annual Financial Report includes the financial reports of the Group and Prime.
As permitted by Class Order 13/1644, which amends Class Order 13/1050, this Financial Report presents the Consolidated Financial Statements and accompanying notes of both the Investa Office Fund (being the Consolidated Financial Statements and notes of the Group) and the Prime Credit Property Trust.
This Annual Financial Report is presented in Australian dollars unless otherwise stated.
(i) Compliance with IFRS
The Consolidated Financial Statements also comply with International Financial Reporting Standards (IFRS) as issued by International Accounting Standards Board (IASB).
(ii) Historical cost convention
These Consolidated Financial Statements are prepared on the historical cost conventions, as modified by the revaluation of financial assets and liabilities (including derivative financial instruments) and investment properties, which are measured at fair value.
(iii) Going concern
These Consolidated Financial Statements are prepared on the going concern basis. In preparing these Consolidated Financial Statements the Directors note that the Group and Prime are in a net current asset deficiency position due to the current borrowings, provision for distribution, trade and other payables, and minimising cash and cash equivalents. It is the policy of the Group and Prime to use surplus cash to repay debt, and the Group and Prime have the ability to drawdown funds to pay trade and other payables, the distribution on 31 August 2016 and refinance current debt. In line with the policy, the Group has subsequently refinanced its current borrowings with non-current borrowings maturing from July 2019 to July 2021. For details of the Group and Prime’s financing arrangements refer to Note 15.
(iv) Critical accounting estimates
The preparation of financial statements requires the use of certain critical accounting estimates. It also requires the Responsible Entity to exercise its judgement in the process of applying the accounting policies adopted in this Annual Financial Report. The areas involving a higher degree of judgement or complexity, or areas where assumptions and estimates are significant to the Consolidated Financial Statements are disclosed in Note 2.
(c) Principles of consolidation
(i) Subsidiaries
The Consolidated Financial Statements of IOF incorporate the assets, liabilities and results of Armstrong Jones Office Fund (the Parent) and its subsidiaries and Prime Credit Property Trust and its subsidiaries as at, and for the year ended 30 June 2016. Prime’s Consolidated Financial Statements incorporate the assets, liabilities and results of Prime Credit Property Trust and its subsidiaries as at, and for the year ended 30 June 2016.
Subsidiaries are all entities (including structured entities) over which the Group or Prime has control. The Group and Prime control an entity when the Group or Prime is exposed to, or has the rights to, variable returns from its involvement with the entity and has the ability to affect those returns through its power to direct the activities of the entity. Subsidiaries are fully consolidated from the date on which control is transferred to the Group or Prime. They are de-consolidated from the date that control ceases.
The acquisition method of accounting is used to account for business combinations by the Group and Prime.
Intercompany transactions, balances and unrealised gains on transactions between Group companies are eliminated. Unrealised losses are also eliminated unless the transaction provides evidence of the impairment of the asset transferred. Accounting policies of subsidiaries are consistent with the policies adopted by the Group.
Non-controlling interests in the results and equity of subsidiaries are shown separately in the Consolidated Income Statements, Consolidated Statements of Comprehensive Income, Consolidated Statements of Changes in Equity and Consolidated Statements of Financial Position respectively.
NOTES TO THE CONSOLIDATED FINANCIAL STATEMENTSFOR THE YEAR ENDED 30 JUNE 2016
30 JUN
E 2016 IN
VE
STA
OFFIC
E FU
ND
AN
NU
AL F
INA
NC
IAL R
EP
OR
T
41

NOTES TO THE CONSOLIDATED FINANCIAL STATEMENTS CONTINUEDFOR THE YEAR ENDED 30 JUNE 2016
(d) Segment reporting
Operating segments are reported in a manner consistent with the internal reporting provided to the chief operating decision maker. The chief operating decision maker, who is responsible for allocating resources and assessing performance of the operating segments, has been identified as the Directors of the Responsible Entity.
(e) Foreign currency translation
(i) Functional and presentation currency
Items included in the Consolidated Financial Statements of each of the Group’s entities are measured using the currency of the primary economic environment in which the entity operates (the functional currency). The Consolidated Financial Statements are presented in Australian dollars, which is the Fund’s functional and presentation currency.
(ii) Transactions and balances
Foreign currency transactions are translated into the functional currency using the exchange rates prevailing at the dates of the transactions. Foreign exchange gains and losses resulting from the settlement of such transactions and from the translation at year end exchange rates of monetary assets and liabilities denominated in foreign currencies are recognised in profit or loss, except when they are deferred in equity as qualifying cash flow hedges and qualifying net investment hedges or are attributable to part of the net investment in a foreign operation.
All other foreign exchange gains and losses are presented in the Consolidated Income Statements on a net basis within other income or other expenses.
Non-monetary items that are measured at fair value in a foreign currency are translated using the exchange rates at the date when the fair value was determined. Translation differences on assets and liabilities carried at fair value are reported as part of the fair value gain or loss. For example, translation differences on non-monetary assets and liabilities such as equities held at fair value through profit or loss are recognised in profit or loss as part of the fair value gain or loss and translation differences on non-monetary assets such as equities classified as available-for-sale financial assets are recognised in other comprehensive income.
(iii) Group entities
The results and financial position of foreign operations (none of which has the currency of a hyperinflationary economy) that have a functional currency different from the presentation currency are translated into the presentation currency as follows:
> Assets and liabilities for each balance sheet presented are translated at the closing rate at the date of that Consolidated Statement of Financial Position;
> Income and expenses for each Consolidated Income Statement and Consolidated Statement of Comprehensive Income are translated at average exchange rates (unless this is not a reasonable approximation of the cumulative effect of the rates prevailing on the transaction dates, in which case income and expenses are translated at the dates of the transactions); and
> All resulting exchange differences are recognised in other comprehensive income.
(c) Principles of consolidation (continued)
(ii) Associates
Associates are all entities over which the Group has significant influence but not control or joint control, generally accompanying a holding of between 20% and 50% of the voting rights. Investments in associates are accounted for using the equity method of accounting, after initially being recognised at cost.
The Group’s share of its associates’ post-acquisition profits or losses is recognised in profit or loss, and its share of post-acquisition other comprehensive income is recognised in other comprehensive income. The cumulative post-acquisition movements are adjusted against the carrying amount of the investment. Dividends or distributions receivable from associates are recognised as a reduction in the carrying amount of the investment.
When the Group’s share of losses in an associate equals or exceeds its interest in the associate, including any other unsecured long-term receivables, the Group does not recognise further losses, unless it has incurred obligations or made payments on behalf of the associate.
Unrealised gains on transactions between the Group and its associates are eliminated to the extent of the Group’s interest in the associates. Unrealised losses are also eliminated unless the transaction provides evidence of an impairment of the asset transferred. Accounting policies of associates have been changed where necessary to ensure consistency with the policies adopted by the Group.
(iii) Joint arrangements
In accordance with AASB 11 Joint Arrangements investments in joint arrangements are classified as either joint operations or joint ventures depending on the contractual rights and obligations each investor has, rather than the legal structure of the joint arrangement. The Responsible Entity has assessed the nature of the Group’s and Prime’s joint arrangements and determined them to have only joint operations.
(iv) Joint operations
The Group recognises its proportionate interests in the assets, liabilities, revenues and expenses of joint operations. These have been incorporated in the financial statements under the appropriate headings.
(v) Joint venture entities
Interests in joint ventures are accounted for using the equity method of accounting, after initially being recognised at cost. The equity method of accounting is described above in Note 1(c)(ii).
1. Summary of significant accounting policies (continued)
30 JUN
E 2016 IN
VE
STA
OFFIC
E FU
ND
AN
NU
AL F
INA
NC
IAL R
EP
OR
T
42

(g) Expenses
(i) Property expenses
Property expenses include rates, leasing fees, taxes and other property outgoings incurred in relation to investment properties where such expenses are recognised as expenses on an accrual basis.
(ii) Finance costs
Finance costs include interest expense and the amortisation of other costs incurred in respect of obtaining finance. Other costs incurred, including loan establishment fees in respect of obtaining finance, are deferred and expensed over the term of the respective agreement.
(iii) Other expenses and transaction costs
All other expenses and transaction costs are recognised in the Consolidated Income Statements on an accruals basis.
(h) Cash and cash equivalents
For the purpose of presentation in the Consolidated Statements of Cash Flows, cash and cash equivalents include cash on hand, deposits held at call with financial institutions, other short-term, highly liquid investments with original maturities of 3 months or less that are readily convertible to known amounts of cash and which are subject to an insignificant risk of changes in value.
(i) Trade and other receivables
Trade receivables are recognised initially at fair value and subsequently measured at amortised cost using the effective interest method, less provision for impairment. Trade receivables are generally due for settlement within 30 days. They are presented as current assets unless collection is not expected for greater than 12 months after the reporting date.
Collectability of trade receivables is reviewed on an ongoing basis. Debts which are known to be uncollectible are written off by reducing the carrying amount directly. An allowance account (provision for impairment of trade receivables) is used when there is objective evidence that the Group will not be able to collect all amounts due according to the original terms of the receivables. Significant financial difficulties of the debtor, probability that the debtor will enter bankruptcy or financial reorganisation, and default or delinquency in payments (greater than 30 days overdue) are considered indicators that the trade receivable is impaired. The amount of the impairment allowance is the difference between the asset’s carrying amount and the present value of estimated future cash flows, discounted at the original effective interest rate. Cash flows relating to short-term receivables are not discounted if the effect of discounting is immaterial.
The amount of the impairment loss is recognised in profit or loss. When a trade receivable for which an impairment allowance had been recognised becomes uncollectible in a subsequent period, it is written off against the allowance account. Subsequent recoveries of amounts previously written off are credited in profit or loss.
On consolidation, exchange differences arising from the translation of any net investment in foreign entities, and of borrowings and other financial instruments designated as hedges of such investments, are recognised in other comprehensive income. When all investments and investment properties held by foreign subsidiaries are sold, the associated exchange differences are reclassified to profit or loss, as part of the gain or loss on sale.
Goodwill and fair value adjustments arising on the acquisition of a foreign operation are treated as assets and liabilities of the foreign operation and translated at the closing rate.
(f) Revenue
Revenue is measured at the fair value of the consideration received or receivable. Amounts disclosed as revenue are net of returns, trade allowances, rebates and amounts collected on behalf of third parties.
The Group recognises revenue when the amount of revenue can be reliably measured, it is probable that future economic benefits will flow to the entity and specific criteria have been met for each of the Group’s activities as described below. The Group bases its estimates on historical results, taking into consideration the type of customer, the type of transaction and the specifics of each arrangement.
Revenue is recognised for the major business activities as follows:
(i) Rental and other property income
Rental income from operating leases is recognised in income on a straight-line basis over the lease term. An asset is recognised to represent the portion of the operating lease revenue in a reporting period relating to fixed increases in operating lease rentals in future periods.
(ii) Disposal of assets
The gain or loss on disposal of assets is recognised when title to the benefits and risks has effectively passed. The gain or loss on disposal of revalued assets is calculated as the difference between the carrying amount of the asset at the time of the disposal and the consideration received.
(iii) Interest income
Interest income is recognised on an accrual basis using the effective interest method. When a receivable is impaired, the Group reduces the carrying amount to its recoverable amount, being the estimated future cash flow discounted at the original effective interest rate of the instrument, and continues unwinding the discount as interest income. Interest income on impaired loans is recognised using the original effective interest rate.
(iv) Distributions
Distributions are recognised as revenue when the right to receive payment is established. This applies even if they are paid out of pre-acquisition profits. However, the investment may need to be tested for impairment as a consequence, refer to Note 1(p).
30 JUN
E 2016 IN
VE
STA
OFFIC
E FU
ND
AN
NU
AL F
INA
NC
IAL R
EP
OR
T
43

NOTES TO THE CONSOLIDATED FINANCIAL STATEMENTS CONTINUEDFOR THE YEAR ENDED 30 JUNE 2016
The excess of the consideration transferred and the amount of any non-controlling interest in the acquiree over the fair value of the net identifiable assets acquired is recorded as goodwill. If those amounts are less than the fair value of the net identifiable assets of the subsidiary acquired and the measurement of all amounts has been reviewed, the difference is recognised directly in profit or loss as a bargain purchase.
Where settlement of any part of cash consideration is deferred, the amounts payable in the future are discounted to their present value as at the date of exchange. The discount rate used is the entity’s incremental borrowing rate, being the rate at which a similar borrowing could be obtained from an independent financier under comparable terms and conditions.
Contingent consideration is classified either as equity or a financial liability. Amounts classified as a financial liability are subsequently remeasured to fair value with changes in fair value recognised in profit or loss.
(l) Investments and other financial instruments
Classification
The Group classifies its financial assets in the following categories: loans and receivables and financial assets at fair value through profit or loss. The classification depends on the purpose for which the investments were acquired. Management determines the classification of its investments at initial recognition.
(i) Loans and receivables
Loans and receivables are non-derivative financial assets with fixed or determinable payments that are not quoted in an active market. They are included in current assets, except for those with maturities greater than 12 months after the reporting period which are classified as non-current assets. Receivables to be settled within 30 days are carried at amounts due.
(ii) Financial assets at fair value through profit or loss
As the Group’s derivatives are not designated as hedges, they are classified as financial assets at fair value through profit or loss, refer to Note 1(m). Assets in this category are classified as current assets if they are expected to be settled within 12 months, otherwise they are classified as non-current.
(iii) Financial assets at fair value through profit or loss (on initial recognition)
The Group classifies certain financial assets as financial assets at fair value through profit or loss on initial recognition as this group of financial assets are managed and its performance is evaluated on a fair value basis in accordance with a documented risk management or investment strategy, and information about the Group is provided to the Trusts’ key management personnel. Assets in this category are classified as current assets if they are expected to be settled within 12 months, otherwise they are classified as non-current.
Recognition and de-recognition
Regular way purchases and sales of financial assets are recognised on trade date – the date on which the Group commits to purchase or sell the asset. Financial assets are de-recognised when the rights to receive cash flows from the financial assets have expired or have been transferred and the Group has transferred substantially all the risks and rewards of ownership.
(j) Assets and liabilities held for sale and discontinued operations
Non-current assets (or disposal groups) are classified as held for sale if their carrying amount will be recovered principally through a sale transaction rather than continuing use and a sale is considered highly probable. They are measured at the lower of their carrying amount and fair value less costs to sell, except for assets such as deferred tax assets and liabilities, financial assets and investment properties that are carried at fair value.
An impairment loss is recognised for any initial impairment or subsequent write-down of the asset (or disposal group) to fair value less costs to sell. A gain is recognised for any subsequent increases in fair value less costs to sell of an asset (or disposal group), but not in excess of any cumulative impairment loss previously recognised. A gain or loss not previously recognised by the date of the sale of the non-current asset (or disposal group) is recognised at the date of de-recognition.
Interest and other expenses attributable to the liabilities of a disposal group classified as held for sale continue to be recognised.
Non-current assets classified as held for sale and the assets of a disposal group classified as held for sale are presented separately from the other assets in the Consolidated Statements of Financial Position. The liabilities of a disposal group classified as held for sale are presented separately from other liabilities in the Consolidated Statements of Financial Position.
A discontinued operation is a component of the entity that has been disposed of or is classified as held for sale and that represents a separate major line of business or geographical area of operations, is part of a single co-ordinated plan to dispose of such a line of business or area of operations, or is a subsidiary acquired exclusively with a view to resale. The results of discontinued operations are presented separately in the onsolidated Income Statements. Comparatives are also adjusted to show the results of a discontinued operation separately in the Consolidated Income Statements.
(k) Acquisition of assets and business combinations
The acquisition method of accounting is used to account for all acquisitions of assets, including business combinations, regardless of whether equity instruments or other assets are acquired. The consideration transferred for the acquisition of a subsidiary comprises the fair value of the assets transferred, the liabilities incurred and the equity interests issued by the Group. The consideration transferred also includes the fair value of any asset or liability resulting from a contingent consideration arrangement and the fair value of any pre-existing equity interest in the subsidiary. Acquisition related costs are expensed as incurred. Identifiable assets acquired and liabilities and contingent liabilities assumed in a business combination are, with limited exceptions, measured initially at their fair values at the acquisition date. On an acquisition-by-acquisition basis, the Group recognises any non-controlling interest in the acquiree either at fair value or at the non-controlling interest’s proportionate share of the acquiree’s net identifiable assets.
1. Summary of significant accounting policies (continued)
30 JUN
E 2016 IN
VE
STA
OFFIC
E FU
ND
AN
NU
AL F
INA
NC
IAL R
EP
OR
T
44

In accordance with AAS B 13 Fair Value Measurement, the fair value of derivative assets and liabilities incorporates credit risk into the valuation. The type of credit risk adjustments include:
(i) Credit Value Adjustment (CVA), applied to asset positions based on credit risk associated with the counterparty; and
(ii) Debit Value Adjustment (DVA), applied to liability positions based on the Group’s or Prime’s own credit risk.
The accounting for subsequent changes depends on whether the derivative is designated as a hedging instrument, and if so, the nature of the item being hedged.
Certain derivative instruments do not qualify for hedge accounting. Changes in the fair value of any derivative instrument that does not qualify for hedge accounting are recognised immediately in profit or loss and are included in other income or other expenses.
(n) Investment properties
Investment properties, principally comprising freehold office buildings, are held for long term rental yields and are not wholly occupied by the Group. Investment properties are measured initially at cost and subsequently carried at fair value.
The basis of valuation of investment properties is fair value being the price that would be received to sell an asset in an orderly transaction between market participants. Fair value takes into account the asset’s highest and best use, being the use of the investment property that is physically possible, legally permissible and financially feasible. It takes into account market participants use for the asset that maximises its value.
Fair value is based on active market prices, adjusted, if necessary, for any difference in the nature, location or condition of the specific asset. The Group also uses alternative valuation methods such as discounted cash flow projections, the capitalisation method and recent prices in less active markets. It is the policy of the Responsible Entity to formally review the carrying value of each property every 6 months to assess whether there may be a material change in the carrying value of the property. Any changes in fair values are recorded in the profit or loss. Refer to Note 22 for further details regarding the valuation methodologies adopted by the Responsible Entity.
On acquisition of an investment property, the Group considers the price outlined in the contract for sale to best reflect its fair value. Therefore, while initially recorded as part of the cost of the investment property, any incidental costs relating to acquisition incurred above-and-beyond the purchase price are immediately transferred to the profit or loss as a change in fair value.
The gain or loss on disposal of revalued assets is calculated as the difference between the carrying amount of the asset at the date of disposal and the net proceeds from disposal and is included in profit or loss in the year of disposal. Refer to Note 1(f).
Land and buildings are an investment and are regarded as a composite asset. Accounting standards do not require investment properties to be depreciated. Accordingly, the building and any component thereof (including plant and equipment) are not depreciated. Expenses capitalised to properties may include the cost of acquisition, additions, refurbishment, redevelopment and fees incurred.
Measurement
At initial recognition, the Group measures a financial asset at its fair value plus, in the case of a financial asset not at fair value through profit or loss, transaction costs that are directly attributable to the acquisition of the financial asset. Transaction costs of financial assets carried at fair value through profit or loss are expensed in profit or loss.
Loans and receivables are subsequently carried at amortised cost using the effective interest method.
Financial assets at fair value through profit or loss are subsequently carried at fair value. Gains or losses arising from changes in the fair value of the financial assets at fair value through profit or loss are presented in profit or loss within other income or other expenses in the period in which they arise. Dividend and distribution income from financial assets at fair value through profit or loss is recognised in profit or loss as part of revenue from continuing operations when the Group’s right to receive payments is established. Interest income from these financial assets is included in the net gains/losses.
Details of how the fair value of financial instruments is determined are disclosed in Note 2 and Note 22.
Impairment
The Group assesses at the end of each reporting period whether there is objective evidence that a financial asset or group of financial assets is impaired. A financial asset or a group of financial assets is impaired and impairment losses are incurred only if there is objective evidence of impairment as a result of one or more events that occurred after the initial recognition of the asset (a ‘loss event’) and that loss event (or events) has an impact on the estimated future cash flows of the financial asset or group of financial assets that can be reliably estimated.
For loans and receivables, the amount of the loss is measured as the difference between the asset’s carrying amount and the present value of estimated future cash flows (excluding future credit losses that have not been incurred) discounted at the financial asset’s original effective interest rate. The carrying amount of the asset is reduced and the amount of the loss is recognised in profit or loss. If a loan has a variable interest rate, the discount rate for measuring any impairment loss is the current effective interest rate determined under the contract. As a practical expedient, the Group may measure impairment on the basis of an instrument’s fair value using an observable market price.
(m) Derivative financial instruments
Derivative financial assets and liabilities are classified as financial assets or liabilities at fair value through profit or loss (held for trading).
The Group uses derivative financial instruments such as foreign currency contracts and interest rate derivatives to hedge its risk associated with foreign currency and interest rate fluctuations. Derivative financial instruments are not held for speculative purposes and are recognised at fair value on the date a derivative contract is entered into and are subsequently re-measured to their fair value at the end of each reporting period.
30 JUN
E 2016 IN
VE
STA
OFFIC
E FU
ND
AN
NU
AL F
INA
NC
IAL R
EP
OR
T
45

NOTES TO THE CONSOLIDATED FINANCIAL STATEMENTS CONTINUEDFOR THE YEAR ENDED 30 JUNE 2016
(q) Trade and other payables
These amounts represent liabilities for amounts owing by the Group at year end which are unpaid. The amounts are unsecured and are usually paid within 30 days of recognition and also include rent in advance. Trade and other payables are presented as current liabilities unless payment is not due within 12 months from the reporting date. They are recognised initially at fair value and subsequently measured at amortised cost using the effective interest rate method.
(r) Borrowings
Borrowings are initially recognised at fair value, net of transaction costs incurred, and subsequently measured at amortised cost. Any difference between the proceeds (net of transaction costs) and the redemption amount is recognised in profit or loss over the period of the borrowings using the effective interest method. Fees paid on the establishment of loan facilities are deferred and expensed over the term of the respective agreement. Other finance costs are expensed. Borrowings are classified as current liabilities unless the Group has an unconditional right to defer settlement of the liability for at least 12 months after the reporting period.
(s) Contributed equity
Units issued are classified as equity. Incremental costs directly attributable to the issue of new units are shown in equity as a deduction, net of tax, from the proceeds. Incremental costs directly attributable to the issue of new units for the acquisition of a business are not included in the cost of the acquisition as part of the purchase consideration.
(t) Distributions
Provision is made for the amount of any distribution calculated and approved on or before the end of the reporting period but not paid at the end of the reporting period.
(u) Earnings per unit
(i) Basic and dilutive earnings per unit
Basic earnings per unit are calculated on net profit attributable to unitholders of the Group, divided by the weighted average number of issued units. As there are no potentially dilutive units on issue, diluted earnings per unit is the same as basic earnings per unit.
(ii) Basic and dilutive earnings per unit from continuing operations
Basic earnings per unit from continuing operations are calculated on the profit from continuing operations attributable to unitholders of the Group, divided by the weighted average number of issued units. As there are no potentially dilutive units on issue, diluted earnings per unit from continuing operations is the same as basic earnings per unit from continuing operations.
(iii) Basic and dilutive earnings per unit from discontinued operations
Basic earnings per unit from discontinued operations are calculated on the profit from discontinued operations attributable to unitholders of the Group, divided by the weighted average number of issued units. As there are no potentially dilutive units on issue, diluted earnings per unit from discontinued operations is the same as basic earnings per unit from discontinued operations.
(n) Investment properties (continued)
(i) Investment properties under construction
Investment properties also include properties under construction for future use as investment properties. These are measured initially at cost and subsequently carried at fair value.
Cash or cash equivalents paid, or the fair value of other consideration given to construct investment properties is considered part of the cost of the property under construction. This includes costs such as finance costs. The cost of an investment property under construction can also include certain types of property related items such as interest income, earned by the Group during the property’s construction.
There are generally no active markets for investment properties under construction resulting in a lack of comparable transactions. As such the Responsible Entity uses a discounted cash flow model in determining the fair value of investment properties under construction.
Where the fair value of an investment property under construction is not reliably determinable, and the Group expects the fair value of the property to be reliably determinable when construction is complete, the Group measures the investment property under construction at cost until either its fair value becomes reliably determinable or construction is completed (whichever is earlier).
(ii) Investment properties under redevelopment
Existing investment properties being redeveloped for continued future use are carried at fair value.
(o) Lease incentives and leasing fees
Incentives such as cash, rent-free periods, or lessee or lessor owned fit outs may be provided to lessees to enter into an operating lease. Leasing fees may also be paid for the negotiation of leases. These incentives and lease fees are capitalised to the investment property and are amortised on a straight-line basis over the term of the lease as a reduction of rental income. The carrying amount of the lease incentives and leasing fees are reflected in the fair value of investment properties.
(p) Impairment of assets
Assets are tested for impairment whenever events or changes in circumstances indicate that the carrying amount may not be recoverable. An impairment loss is recognised for the amount by which the asset’s carrying amount exceeds its recoverable amount. The recoverable amount is the higher of an asset’s fair value less costs to sell and value in use. For the purposes of assessing impairment, assets are grouped by the lowest levels for which there are separately identifiable cash inflows which are largely independent of the cash inflows from other assets or groups of assets (cash generating units). Non-financial assets other than goodwill that suffered impairment are reviewed for possible reversal of the impairment at the end of each reporting period.
1. Summary of significant accounting policies (continued)
30 JUN
E 2016 IN
VE
STA
OFFIC
E FU
ND
AN
NU
AL F
INA
NC
IAL R
EP
OR
T
46

Receivables and payables are stated inclusive of the amount of GST and VAT receivable or payable. The net amount of GST and VAT recoverable from, or payable to, the taxation authority is included with other receivables or payables in the Consolidated Statements of Financial Position.
Cash flows are presented on a gross basis. The GST and VAT components of cash flows arising from investing or financing activities which are recoverable from, or payable to the taxation authority, are presented as operating cash flows.
(x) Rounding of amounts
The Fund and Prime are of a kind of entity referred to in ASIC Corporations (Rounding in Financial/Directors’ Report) Instrument 2016/191, issued by the Australian Securities and Investments Commission, relating to the rounding off of amounts in the Consolidated Financial Statements. Amounts in the Consolidated Financial Statements have been rounded off, in accordance with that Instrument, to the nearest hundred thousand dollars, or in certain cases, the nearest thousand dollars, unless otherwise indicated.
(y) New accounting standards and interpretations
Certain new accounting standards and interpretations have been published that are not mandatory for the reporting period ended 30 June 2016.
(i) AASB 9 Financial Instruments (effective 1 January 2018).
AASB 9 Financial Instruments addresses hedge accounting and the classification, measurement, impairment and de-recognition of financial assets and financial liabilities. When adopted, the standard will simplify the model for classifying and recognising financial instruments and aligns hedge accounting more closely with common risk management practices. Changes in own credit risk in respect of liabilities designated at fair value through profit or loss will be presented in other comprehensive income.
(ii) AASB 15 Revenue from Contracts with Customers and AASB 2015-8 Amendments to Australian Accounting Standards arising from AASB 15 (effective 1 January 2018).
AASB 15 Revenue from Contracts with Customers will replace AASB 118 and is based on the principle that revenue is recognised when control of a good or service transfers to a customer. This new standard requires a five step analysis of transactions to determine whether revenue can be recognised, when revenue can be recognised, and the extent of revenue to be recognised. It applies to all contracts with customers except leases, financial instruments and insurance contracts.
(iii) AASB 16 Leases (effective 1 January 2019).
AASB 16 will replace AASB 117 Leases. It requires recognition of a right-of-use asset along with the associated lease liability where the entity is a lessee. Interest expense will be recognised in profit or loss using the effective interest rate method, and the right-of-use asset will be depreciated. Lessor accounting would largely remain unchanged.
The Responsible Entity is in the process of assessing any implications of the above new accounting standards to the Group’s operations and financial results. The Group does not expect to adopt the new standards before their operative dates.
(v) Income tax
(i) Australian income tax
Under current legislation, the Group is not liable for Australian income tax, provided that the distributable income calculated in accordance with the constitution of the trusts is fully distributed to unitholders each year.
(ii) Foreign income tax
The subsidiaries that hold the Group’s foreign properties may be subject to corporate income tax and withholding tax in countries in which they operate. Under current Australian income tax legislation, unitholders may be entitled to receive a foreign tax credit for this withholding tax.
The income tax expense or revenue for the year is the tax payable on the current year’s taxable income based on the applicable income tax for each jurisdiction, adjusted by changes in deferred tax assets and liabilities attributable to temporary differences and to unused tax losses.
The current income tax charge is calculated on the basis of the tax laws enacted or substantively enacted at the end of the reporting period. Management periodically evaluates positions taken in tax returns with respect to situations in which applicable tax regulation is subject to interpretation. It establishes provisions where appropriate on the basis of amounts expected to be paid to the tax authorities.
Deferred income tax is provided in full, using the liability method, on temporary differences arising between the tax bases of assets and liabilities and their carrying amounts in the Consolidated Financial Statements. The deferred income tax is also not accounted for if it arises from initial recognition of an asset or liability in a transaction other than a business combination that at the time of the transaction affects neither accounting nor taxable profit or loss. Deferred income tax is determined using tax rates (and laws) that have been enacted or substantively enacted by the end of the reporting period and are expected to apply when the related deferred income tax asset is realised or the deferred income tax liability is settled.
Deferred tax assets are recognised for deductible temporary differences and unused tax losses only if it is probable that future taxable amounts will be available to utilise those temporary differences and losses.
Deferred tax assets and liabilities are offset when there is a legally enforceable right to offset current tax assets and liabilities and when the deferred tax balances relate to the same taxation authority. Current tax assets and tax liabilities are offset where the entity has a legally enforceable right to offset and intends either to settle on a net basis, or to realise the asset and settle the liability simultaneously.
Current and deferred tax is recognised in profit or loss, except to the extent that it relates to items recognised in other comprehensive income or directly in equity. In this case, the tax is also recognised in other comprehensive income or directly in equity, respectively.
(w) Goods and Services Tax (GST) and Valued Added Tax (VAT)
Revenues, expenses and assets are recognised net of the amount of associated GST and VAT, unless the GST or VAT incurred is not recoverable from the taxation authority. In this case it is recognised as part of the cost of acquisition of the asset or as part of the expense.
30 JUN
E 2016 IN
VE
STA
OFFIC
E FU
ND
AN
NU
AL F
INA
NC
IAL R
EP
OR
T
47

NOTES TO THE CONSOLIDATED FINANCIAL STATEMENTS CONTINUEDFOR THE YEAR ENDED 30 JUNE 2016
(ii) Estimated value of derivative financial instruments
The fair value of derivative assets and liabilities are based on assumptions of future events and involve significant estimates. The basis of valuation for the Group’s derivatives is set out in Note 1(m). However the fair value of derivatives reported at the reporting date may differ if there is volatility in market rates. The valuation techniques are discussed in detail in Note 22 and have been developed in compliance with requirements of AASB 139 Financial Instruments: Recognition and Measurement and AASB 13 Fair Value Measurement.
(iii) Income taxes
The Group is subject to income taxes in jurisdictions where its foreign assets are domiciled. Judgement is required in determining the Group’s provision for income taxes. There are certain calculations undertaken during the ordinary course of business for which the ultimate determination is uncertain in certain jurisdictions. The Group estimates its tax liabilities based on the Responsible Entity’s understanding of the tax law. Where the final outcome of these matters is different from the amounts that were initially recorded, such differences will impact the current and deferred income tax assets and liabilities in the period in which such determination was made.
(b) Critical judgements in applying the entity’s accounting policies
There were no significant judgements, apart from those involving estimations, that management has made in the process of applying the Responsible Entity’s accounting policies that had a significant effect on the amounts recognised in the Annual Financial Report.
(z) Parent entity financial information
The financial information for the parent entity, disclosed in Note 25 has been prepared on the same basis as the Consolidated Financial Statements, except as set out below.
(i) Financial guarantees
Where the parent entity has provided financial guarantees in relation to loans and payables of subsidiaries for no compensation, the fair values of these guarantees are accounted for as contributions and recognised as part of the cost of the investment.
2. Critical accounting estimates and judgements
The preparation of the Consolidated Financial Statements requires the use of certain critical accounting estimates. It also requires ILFML as the Responsible Entity to exercise its judgement in the process of applying the Group’s accounting policies. The areas involving a higher degree of judgement or complexity, or where assumptions and estimates are significant to the Consolidated Financial Statements are disclosed below. Estimates and judgements are continually evaluated and are based on historical experience and other factors, including expectations of future events that may have a financial impact on the Group and are believed to be reasonable under the circumstances.
(a) Critical accounting estimates and assumptions
The Group is required in certain circumstances to make estimates and assumptions concerning the future. The resulting accounting estimates will, by definition, seldom equal the related actual results. The estimates and assumptions that have a significant risk of causing a material adjustment to the carrying amounts of assets and liabilities within the next financial year are discussed below.
(i) Estimated value of investment properties
Critical judgements are made by the Responsible Entity in respect of the fair values of investment properties (Note 12) and investment properties held through investments in joint venture entities (Note 11). These investment properties are reviewed regularly by reference to external independent property valuations and market conditions, using generally accepted market practices.
The critical assumptions underlying management’s estimates of investment property fair values are those relating to the net passing rent, market rental growth, capitalisation rate, terminal yield and discount rate. If there is any change in these assumptions or regional, national or international economic conditions, the fair value of property investments may differ. Major assumptions used in valuation of property investments are disclosed in Note 22(d).
1. Summary of significant accounting policies (continued)
30 JUN
E 2016 IN
VE
STA
OFFIC
E FU
ND
AN
NU
AL F
INA
NC
IAL R
EP
OR
T
48

3. Segment information
(a) Description of segments
The Group invests in office property and office property under redevelopment and construction, each of which are intended for lease. The Responsible Entity has identified the Group’s operating segments as being the regions in which it operates, based on internal reporting to the chief operating decision maker.
Following the disposal of its last European investment property, Bastion Tower I NV, Belgium, in March 2015, the Group’s property portfolio is now entirely Australian based. As a result, the Group now operates in one segment, being office property in Australia.
Only the Group segment information is provided to the Directors of the Responsible Entity. For this reason segment information has only been disclosed for the Group.
The Group reports net profit attributed to unitholders in accordance with Australian Accounting Standards (AAS). ILFML, as the Responsible Entity of the Group considers the non-AAS measure, Property Council Funds From Operations (Property Council FFO) an important indicator of the underlying performance of the Group. To calculate Property Council FFO, net profit attributable to unitholders is adjusted to exclude non-cash and other items such as the amortisation of tenant incentives, fair value gains/losses on investment property, fair value gains/losses on the mark to market of derivatives, the straight-lining of rent, non-FFO deferred tax benefits and expenses, foreign currency translation reserves recognised in net profit, and other unrealised or one-off items.
(b) Reconciliation of segment result to Property Council FFO
Investa Office Fund
30 June 30 June 2016 2015 $m $m
Australia 200.1 186.9
Europe – 2.2
Segment result 200.1 189.1
Interest income 0.7 10.2
Finance costs (43.1) (41.9)
Responsible Entity’s fees (12.3) (11.1)
Net foreign exchange gain 0.1 0.6
Foreign asset management fees – (0.2)
Other expenses (2.2) (3.2)
143.3 143.5
Amortisation of tenant incentives 32.3 26.4
Property Council FFO 175.6 169.9
49
30 JUN
E 2016 IN
VE
STA
OFFIC
E FU
ND
AN
NU
AL F
INA
NC
IAL R
EP
OR
T

NOTES TO THE CONSOLIDATED FINANCIAL STATEMENTS CONTINUEDFOR THE YEAR ENDED 30 JUNE 2016
3. Segment information (continued)
(c) Reconciliation of Property Council FFO to net profit attributable to unitholders
Investa Office Fund
30 June 30 June 2016 2015 Note $m $m
Property Council FFO 175.6 169.9
Net gain on change in fair value of:
Investment properties 12 233.4 89.4
Equity accounted investments 11 82.8 40.1
Derivatives 1 56.5 87.8
Net foreign exchange loss 1 (14.4) (77.0)
Amortisation of incentives (32.3) (26.4)
Straight-lining of lease revenue (3.6) (1.4)
Other unrealised or one-off items:
Transfer of foreign currency translation reserve to profit and loss 17 – (104.7)
Transaction costs 2 (5.5) –
Other items 1.3 1.5
Net profit attributable to unitholders 493.8 179.2
1. The net gain on change in fair value of derivative is predominantly due to an increase in the fair value of the Group’s cross currency interest rate swaps which mitigate its exposure to foreign exchange rate movements on its US dollar denominated US Private Placements (USPPs). This gain has been partly offset by the net foreign exchange loss driven by the change in carrying amount of the USPPs, which for accounting are translated to Australian dollars using the foreign exchange rate prevailing at the year end.
2. Represents legal and advisory expenses associated with the DEXUS Proposal and other alternatives reviewed by the Independent Board Committee. Refer to Note 27.
4. Income tax benefit
(a) Income tax benefit
Investa Office Prime Credit Fund Property Trust
30 June 30 June 30 June 30 June 2016 2015 2016 2015 $m $m $m $m
Current tax – (6.2) – (6.2)
Deferred tax – – – –
– (6.2) – (6.2)
30 JUN
E 2016 IN
VE
STA
OFFIC
E FU
ND
AN
NU
AL F
INA
NC
IAL R
EP
OR
T
50

4. Income tax benefit (continued)
(b) Numerical reconciliation of income tax benefit to prima facie tax payable
Investa Office Prime Credit Fund Property Trust
30 June 30 June 30 June 30 June 2016 2015 2016 2015 $m $m $m $m
Profit from continuing operations before income tax expense 493.8 275.6 223.0 137.0
Loss from discontinued operations before income tax expense – (102.6) – –
493.8 173.0 223.0 137.0
Tax at the Australian tax rate of 30% (2015: 30%) 148.1 51.9 66.9 41.1
Tax effect of amounts which are not deductible/(taxable) in calculating taxable income:
Australian income (148.3) (52.6) (66.9) (40.3)
Other non-taxable income 0.2 1.3 – (0.2)
Recovery of prior year tax paid/recognised – (6.7) – (6.7)
Difference between Australian and foreign tax rates – (0.1) – (0.1)
Income tax benefit – (6.2) – (6.2)
5. Distributions
Investa Office Prime Credit Fund Property Trust
30 June 30 June 30 June 30 June 2016 2015 2016 2015 Cents Cents Cents Cents
Distributions paid or payable in respect of the following periods at the following rates (in cents per unit):
Half-year ended 31 December 9.80 9.55 6.90 5.50
Half-year ended 30 June 9.80 9.70 6.10 5.70
19.60 19.25 13.00 11.20
The total amounts of these distributions were: $m $m $m $m
Half-year ended 31 December 60.2 58.6 42.4 33.8
Half-year ended 30 June 60.2 59.6 37.5 35.0
Prior period reallocation 1 – – – (20.8)
Total distributions paid or payable 120.4 118.2 79.9 48.0
The distribution for the half year ended 30 June 2015 was recognised in the 2015 financial year and paid on 31 August 2015. The distribution for the half year ended 30 June 2016 was recognised in the 2016 financial year and is scheduled to be paid on 31 August 2016.
1. The prior period reallocation represents a reallocation of distributions required between the Fund and Prime in respect of financial years prior to 2011. This adjustment had no impact on the Group’s total distributions, net assets, or net profit attributable to unitholders.
51
30 JUN
E 2016 IN
VE
STA
OFFIC
E FU
ND
AN
NU
AL F
INA
NC
IAL R
EP
OR
T

NOTES TO THE CONSOLIDATED FINANCIAL STATEMENTS CONTINUEDFOR THE YEAR ENDED 30 JUNE 2016
6. Earnings per unit
(a) Per stapled unit
Investa Office Fund
30 June 30 June 2016 2015
Weighted average number of units outstanding (thousands) 614,047 614,047
Profit from continuing operations attributable to unitholders ($ millions) 493.8 281.8
Basic and diluted earnings per unit from continuing operations (cents) 80.4 45.9
Loss from discontinued operations attributable to unitholders ($ millions) – (102.6)
Basic and diluted earnings per unit from discontinued operations (cents) – (16.7)
Profit attributable to unitholders ($ millions) 493.8 179.2
Basic and diluted earnings per unit (cents) 80.4 29.2
(b) Per unit of each Trust
Armstrong Jones Prime Credit Office Fund Property Trust
30 June 30 June 30 June 30 June 2016 2015 2016 2015
Weighted average number of units outstanding (thousands) 614,047 614,047 614,047 614,047
Profit from continuing operations attributable to unitholders ($ millions) 270.8 138.6 223.0 143.2
Basic and diluted earnings per unit from continuing operations (cents) 44.1 22.6 36.3 23.3
Loss from discontinued operations attributable to unitholders ($ millions) – (102.6) – –
Basic and diluted earnings per unit from discontinued operations (cents) – (16.7) – –
Profit attributable to unitholders ($ millions) 270.8 36.0 223.0 143.2
Basic and diluted earnings per unit (cents) 44.1 5.9 36.3 23.3
30 JUN
E 2016 IN
VE
STA
OFFIC
E FU
ND
AN
NU
AL F
INA
NC
IAL R
EP
OR
T
52

7. Trade and other receivables
(a) Trade and other receivables
Investa Office Prime Credit Fund Property Trust
30 June 30 June 30 June 30 June 2016 2015 2016 2015 $m $m $m $m
Current assets
Rental and other amounts due 1 0.8 1.2 0.1 0.3
Allowance for impairment loss (0.4) (0.2) (0.2) (0.2)
Accrued income, prepayments and other receivables 12.2 17.2 7.6 10.4
12.6 18.2 7.5 10.5
Non-current assets
Loan to equity accounted investments 2 – 114.2 – 114.2
– 114.2 – 114.2
1. Rental and other amounts are receivable within 30 days.2. The prior year amount represents an interest bearing loan to 567 Collins Street Trust, a joint venture entity of the Group. The loan was converted to
an equity investment in 567 Collins Street Trust in 2016 financial year and the Group holds this investment as an investment accounted for using the equity method.
(b) Other receivables
These amounts generally arise from transactions outside the usual operating activities of the Group. Interest may be charged at commercial rates where agreements allow. Collateral is not normally obtained.
(c) Past due but not impaired
At 30 June 2016, trade receivables of the Group of $0.5 million (30 June 2015: $0.4 million) and $nil (30 June 2015: $nil) trade receivables of Prime were past due but not impaired. Those amounts which were past due but not impaired have been collected subsequent to reporting date or are expected to be collected without dispute or legal proceedings that would otherwise affect the recoverability of the amount.
(d) Risk exposure
Due to the short-term nature of these receivables, their carrying amount is assumed to approximate their fair value. The maximum exposure to credit risk at the end of the reporting period is the carrying amount of each class of receivables mentioned above. Refer to Note 21 for more information on the risk management policy of the Group.
53
30 JUN
E 2016 IN
VE
STA
OFFIC
E FU
ND
AN
NU
AL F
INA
NC
IAL R
EP
OR
T
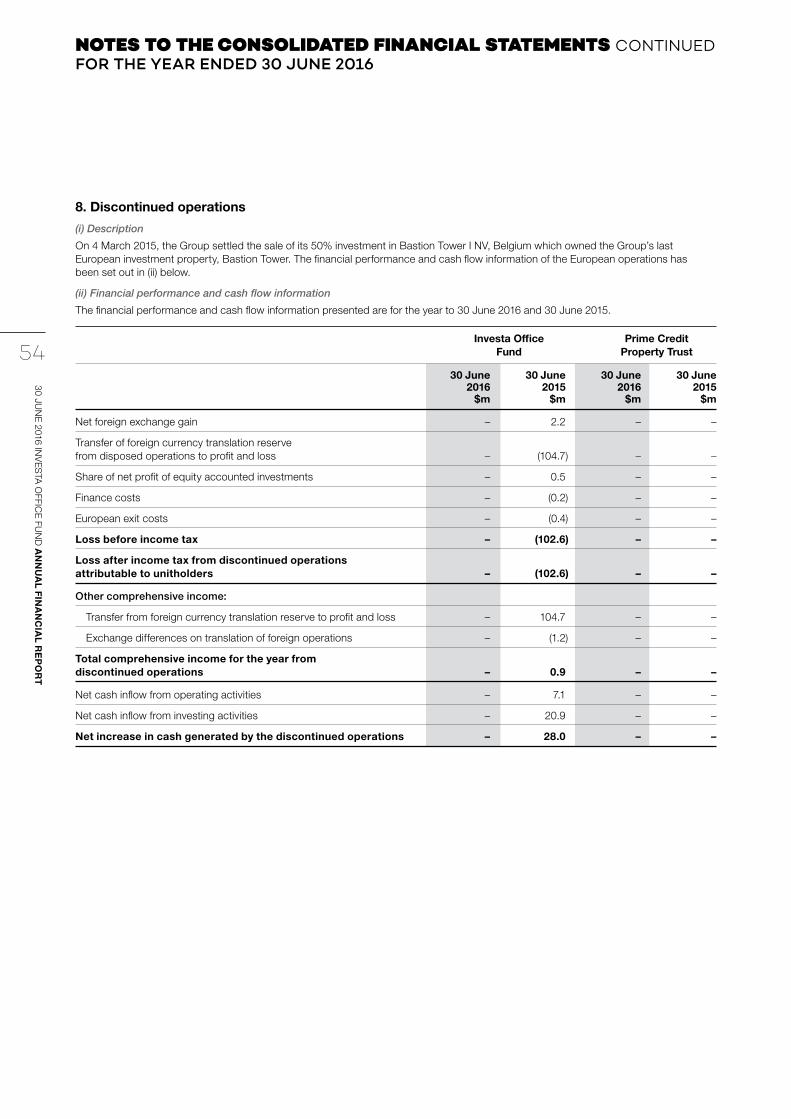
NOTES TO THE CONSOLIDATED FINANCIAL STATEMENTS CONTINUEDFOR THE YEAR ENDED 30 JUNE 2016
8. Discontinued operations
(i) Description
On 4 March 2015, the Group settled the sale of its 50% investment in Bastion Tower I NV, Belgium which owned the Group’s last European investment property, Bastion Tower. The financial performance and cash flow information of the European operations has been set out in (ii) below.
(ii) Financial performance and cash flow information
The financial performance and cash flow information presented are for the year to 30 June 2016 and 30 June 2015.
Investa Office Prime Credit Fund Property Trust
30 June 30 June 30 June 30 June 2016 2015 2016 2015 $m $m $m $m
Net foreign exchange gain – 2.2 – –
Transfer of foreign currency translation reserve from disposed operations to profit and loss – (104.7) – –
Share of net profit of equity accounted investments – 0.5 – –
Finance costs – (0.2) – –
European exit costs – (0.4) – –
Loss before income tax – (102.6) – –
Loss after income tax from discontinued operations attributable to unitholders – (102.6) – –
Other comprehensive income:
Transfer from foreign currency translation reserve to profit and loss – 104.7 – –
Exchange differences on translation of foreign operations – (1.2) – –
Total comprehensive income for the year from discontinued operations – 0.9 – –
Net cash inflow from operating activities – 7.1 – –
Net cash inflow from investing activities – 20.9 – –
Net increase in cash generated by the discontinued operations – 28.0 – –30 JU
NE
2016 INV
ES
TA O
FFICE
FUN
D A
NN
UA
L FIN
AN
CIA
L RE
PO
RT
54

9. Derivative financial instruments
Investa Office Prime Credit Fund Property Trust
30 June 30 June 30 June 30 June 2016 2015 2016 2015 $m $m $m $m
Non-current assets
Cross currency swap contracts 136.4 81.0 55.4 35.6
Interest rate derivative contracts 7.1 5.6 1.8 1.3
143.5 86.6 57.2 36.9
Current liabilities
Interest rate derivative contracts 4.2 2.5 0.9 –
4.2 2.5 0.9 –
Non-current liabilities
Interest rate derivative contracts 7.8 9.1 0.3 1.1
7.8 9.1 0.3 1.1
Risk exposures and fair value measurements
Information about the Group’s exposure to credit risk, foreign exchange and interest rate risk and about the methods and assumptions used in determining fair values is provided in Notes 21 and 22. The maximum exposure to credit risk at the end of the reporting period is the carrying amount of each class of derivative financial assets mentioned above.
10. Asset classified as held for sale
Investa Office Prime Credit Fund Property Trust
30 June 30 June 30 June 30 June 2016 2015 2016 2015 $m $m $m $m
Asset classified as held for sale
Investment in 383 La Trobe Street, Melbourne 1 70.5 – 70.5 –
70.5 – 70.5 –
1. On 17 July 2015, Prime exchanged contracts to sell 383 La Trobe Street, Melbourne for $70.7 million less committed costs. The contracts for sale entitle Prime to a 15% non-refundable deposit and outline a deferred settlement period of twelve to eighteen months from the date of exchange. Settlement is anticipated to occur in January 2017. Accordingly, the investment property has been classified as an asset held for sale.
55
30 JUN
E 2016 IN
VE
STA
OFFIC
E FU
ND
AN
NU
AL F
INA
NC
IAL R
EP
OR
T

NOTES TO THE CONSOLIDATED FINANCIAL STATEMENTS CONTINUEDFOR THE YEAR ENDED 30 JUNE 2016
11. Investments accounted for using the equity method
(a) Details of joint venture entities
Investments in joint venture entities are accounted for in the Consolidated Financial Statements using the equity method of accounting, after initially being recognised at cost.
The Group and Prime have investments in joint venture entities, all of which are incorporated in Australia and have a 30 June reporting date.
Name of Ownership Investa Office Prime Creditjoint venture entity Principal activity interest Fund Property Trust
30 June 30 June 30 June 30 June 30 June 30 June 2016 2015 2016 2015 2016 2015 $m $m $m $m $m $m
Armstrong Jones Office Fund
IOF Finance Pty Limited 1 Financial services 50% 50% – – – –
Prime Credit Property Trust
242 Exhibition Street Trust Real estate investment 50% 50% 257.0 245.1 257.0 245.1
Phillip Street Trust Real estate investment 25% 25% 131.8 108.3 131.8 108.3
Macquarie Street Trust Real estate investment 25% 25% 109.4 90.4 109.4 90.4
567 Collins Street Trust Real estate investment 50% 50% 303.6 99.9 303.6 99.9
IOF Finance Pty Limited 1 Financial services 50% 50% – – – –
Total 801.8 543.7 801.8 543.7
1. This investment is a joint venture of both Armstrong Jones Office Fund and Prime Credit Property Trust and is consolidated in the Group’s Financial Report.
Investments in joint venture entities are held through the ownership of interests in unlisted property trusts and the book value represents the ownership percentage of the net tangible assets of the relevant trusts. The principal net tangible asset of the relevant trusts is the investment property.
The carrying value of the investment in joint venture entities are supported by the underlying property value as above. The book value of the investment will vary from the independent valuation of the underlying property due to the Group’s share of the joint venture entities other assets and liabilities.
Refer to Note 13 for detailed property information of the Group and Prime’s property portfolio, including those held through investments accounted for using the equity method.
(b) Movements in carrying amounts
Investa Office Prime Credit Fund Property Trust
30 June 30 June 30 June 30 June 2016 2015 2016 2015 $m $m $m $m
Balance at the beginning of the year 543.7 476.4 543.7 476.4
Acquisitions and contributions to equity accounted investments 172.5 27.5 172.5 27.5
Share of profits after income tax 115.5 67.8 115.5 67.8
Cash distributions received (29.9) (25.4) (29.9) (25.4)
Capital distributions received – (2.6) – (2.6)
Balance at the end of the year 801.8 543.7 801.8 543.7
30 JUN
E 2016 IN
VE
STA
OFFIC
E FU
ND
AN
NU
AL F
INA
NC
IAL R
EP
OR
T
56

11. Investments accounted for using the equity method (continued)
(c) Summarised financial information of investments accounted for using the equity method
Investa Office Prime Credit Fund Property Trust
30 June 30 June 30 June 30 June 2016 2015 2016 2015 $m $m $m $m
Share of results
Revenue 58.2 40.9 58.2 36.6
Gain on change in fair value of:
Investment properties 82.8 40.1 82.8 41.1
Expenses (25.5) (12.7) (25.5) (9.9)
Profit before income tax 115.5 68.3 115.5 67.8
Income tax expense – – – –
Profit for the year 115.5 68.3 115.5 67.8
Profit for the year disclosed as:
Profit from continuing operations 115.5 67.8 115.5 67.8
Profit from discontinuing operations – 0.5 – –
Total profit for the year 115.5 68.3 115.5 67.8
The following table of summarised financial information is reported directly from the Group’s and Prime’s equity accounted investments. The summarised financial information has not been adjusted for the Group’s or Prime’s ownership interest in the investments, or any differences in accounting policies.
Investa Office Prime Credit Fund Property Trust
30 June 30 June 30 June 30 June 2016 2015 2016 2015 $m $m $m $m
Joint venture entities’ financial information (at 100%)
Cash and cash equivalents 1.6 0.9 1.6 0.9
Current assets 9.3 2.9 9.3 2.9
Non-current assets 2,082.4 1,713.8 2,082.4 1,713.8
Current liabilities (13.9) (2.5) (13.9) (2.5)
Non-current liabilities (1.6) (230.3) (1.6) (230.3)
Net assets 2,076.2 1,483.9 2,076.2 1,483.9
Revenue 130.4 185.5 130.4 185.5
Profit for the year 332.3 172.3 332.3 172.3
Total comprehensive income 332.3 172.3 332.3 172.3
57
30 JUN
E 2016 IN
VE
STA
OFFIC
E FU
ND
AN
NU
AL F
INA
NC
IAL R
EP
OR
T

NOTES TO THE CONSOLIDATED FINANCIAL STATEMENTS CONTINUEDFOR THE YEAR ENDED 30 JUNE 2016
11. Investments accounted for using the equity method (continued)
(c) Summarised financial information of investments accounted for using the equity method (continued)
The tables below outline reconciliations of the above summarised financial information to the Group and Prime’s share of profits after income tax, and the carrying value of the Group and Prime’s equity accounted investments.
Investa Office Prime Credit Fund Property Trust
30 June 30 June 30 June 30 June 2016 2015 2016 2015 $m $m $m $m
Profits for the year (at 100%) 332.3 172.3 332.3 172.3
Less profits attributable to outside ownership interests:
242 Exhibition Street Trust (28.8) (27.8) (28.8) (27.8)
Phillip Street Trust (83.5) (30.3) (83.5) (30.3)
Macquarie Street Trust (68.4) (24.8) (68.4) (24.8)
567 Collins Street Trust (36.1) (21.6) (36.1) (21.6)
Share of profits after income tax 115.5 67.8 115.5 67.8
Investa Office Prime Credit Fund Property Trust
30 June 30 June 30 June 30 June 2016 2015 2016 2015 $m $m $m $m
Net assets (at 100%) 2,076.2 1,483.9 2,076.2 1,483.9
Less net assets attributable to outside ownership interests:
242 Exhibition Street Trust (256.7) (244.8) (256.7) (244.8)
Phillip Street Trust (392.5) (325.0) (392.5) (325.0)
Macquarie Street Trust (326.2) (270.9) (326.2) (270.9)
567 Collins Street Trust (302.2) (99.9) (302.2) (99.9)
Share of net assets 798.6 543.3 798.6 543.3
Add provisions for unpaid distributions (at share) 3.2 0.4 3.2 0.4
Investment balance at the end of the year 801.8 543.7 801.8 543.7
(d) Capital commitments
There are no significant restrictions resulting from borrowing arrangements, regulatory requirements or contractual arrangements between the Group and its joint venture entities, to transfer funds to the entity in the form of cash dividends and/or distributions, or to repay loans or advances made by the entity.
(e) Contingent liabilities of investments accounted for using the equity method
The Group has no share of contingent liabilities in investments accounted for using the equity method.
30 JUN
E 2016 IN
VE
STA
OFFIC
E FU
ND
AN
NU
AL F
INA
NC
IAL R
EP
OR
T
58

12. Investment properties
(a) Investment properties at fair value
Investa Office Prime Credit Fund Property Trust
30 June 30 June 30 June 30 June 2016 2015 2016 2015 $m $m $m $m
Investment properties at fair value 2,752.9 2,554.9 1,007.6 1,007.6
Refer to Note 13 for detailed property information of the Group and Prime’s property portfolio.
(b) Movement in carrying amounts
Investa Office Prime Credit Fund Property Trust
30 June 30 June 30 June 30 June 2016 2015 2016 2015 $m $m $m $m
Carrying amount at beginning of the year 2,554.9 2,395.5 1,007.6 946.7
Additions to existing investment properties 71.2 100.9 33.2 52.9
Transfer to assets classified as held for sale (70.5) – (70.5) –
Amortisation of tenant incentives and leasing fees (32.5) (29.5) (14.8) (15.6)
Straight-lining of lease revenue (3.6) (1.4) 0.7 (0.7)
Net change in fair value 233.4 89.4 51.4 24.3
Carrying amount at the end of the year 2,752.9 2,554.9 1,007.6 1,007.6
(c) Tenant incentives and leasing fees (included in the carrying amounts above)
Investa Office Prime Credit Fund Property Trust
30 June 30 June 30 June 30 June 2016 2015 2016 2015 $m $m $m $m
Cost 145.2 133.8 57.9 53.7
Accumulated amortisation (64.2) (48.3) (37.4) (29.6)
81.0 85.5 20.5 24.1
(d) Valuation basis
The valuation basis for investment properties is outlined in Note 22.
59
30 JUN
E 2016 IN
VE
STA
OFFIC
E FU
ND
AN
NU
AL F
INA
NC
IAL R
EP
OR
T

NOTES TO THE CONSOLIDATED FINANCIAL STATEMENTS CONTINUEDFOR THE YEAR ENDED 30 JUNE 2016
12. Investment properties (continued)
(e) Leasing arrangements
The investment properties are leased to tenants under long-term operating leases with rentals payable monthly. Minimum lease payments receivable on leases of investment properties are as follows:
Investa Office Prime Credit Fund Property Trust
30 June 30 June 30 June 30 June 2016 2015 2016 2015 $m $m $m $m
Within one year 210.7 196.1 72.1 70.7
Later than one year but not greater than five years 565.9 610.0 219.6 221.8
Later than five years 299.9 330.8 123.7 150.7
1,076.5 1,136.9 415.4 443.2
(f) Non-current assets pledged as security & contractual obligations
At 30 June 2016 and 30 June 2015 there were no investment properties pledged as security by the Group.
(g) Contractual obligations
Refer to Note 19 for disclosure of any contractual obligations to purchase, construct or develop investment property or for repairs, maintenance or enhancements contracted but not provided at reporting date.
13. Property portfolio information
The Group and Prime’s investment property portfolios comprise properties held through direct ownership interests and properties held through investments accounted for using the equity method.
Investa Office Prime Credit Fund Property Trust
30 June 30 June 30 June 30 June 2016 2015 2016 2015 $m $m $m $m
Investment properties held through:
Direct ownership interests 2,752.9 2,554.9 1,007.6 1,007.6
Direct ownership interest, classified as held for sale 70.5 – 70.5 –
Investments accounted for using the equity method 802.5 656.9 802.5 656.9
Total portfolio 3,625.9 3,211.8 1,880.6 1,664.5
30 JUN
E 2016 IN
VE
STA
OFFIC
E FU
ND
AN
NU
AL F
INA
NC
IAL R
EP
OR
T
60

Acquisition Cost Independent Independent Independent Book Book date including all valuation valuer valuation value value additions date amount 30 Jun 2016 30 Jun 2015 $m 1 $m $m $m
Armstrong Jones Office Fund
10–20 Bond St Sydney NSW (50%) Jun 89 290.6 Jun 16 JLL 251.0 251.0 192.8
388 George St Sydney NSW (50%) Oct 02 156.3 Nov 15 CBRE 210.0 210.3 209.9
347 Kent St Sydney NSW Jan 99 191.6 Nov 15 CBRE 275.0 275.0 272.7
99 Walker St North Sydney NSW Jul 13 154.6 Jun 16 Knight Frank 220.0 220.0 183.0
Piccadilly Complex Sydney NSW (50%) Mar 14 200.9 Jun 16 Savills 260.5 260.5 210.3
6 O’Connell St Sydney NSW Jun 14 143.6 Jun 16 CBRE 180.0 180.0 147.0
239 George St Brisbane QLD Jul 98 94.4 Nov 15 CBRE 127.0 126.3 120.6
15 Adelaide St Brisbane QLD Jul 98 36.9 Nov 15 CBRE 55.5 55.7 51.0
836 Wellington St Perth WA Sep 07 82.9 Nov 15 CBRE 69.5 69.5 75.0
16–18 Mort St Canberra ACT Mar 01 77.2 Jun 16 Savills 97.0 97.0 85.0
Total Fund portfolio 1,429.0 1,745.5 1,745.3 1,547.3
1. Cost amounts comprise historical acquisition costs and capital expenditure incurred to the year end.
61
30 JUN
E 2016 IN
VE
STA
OFFIC
E FU
ND
AN
NU
AL F
INA
NC
IAL R
EP
OR
T
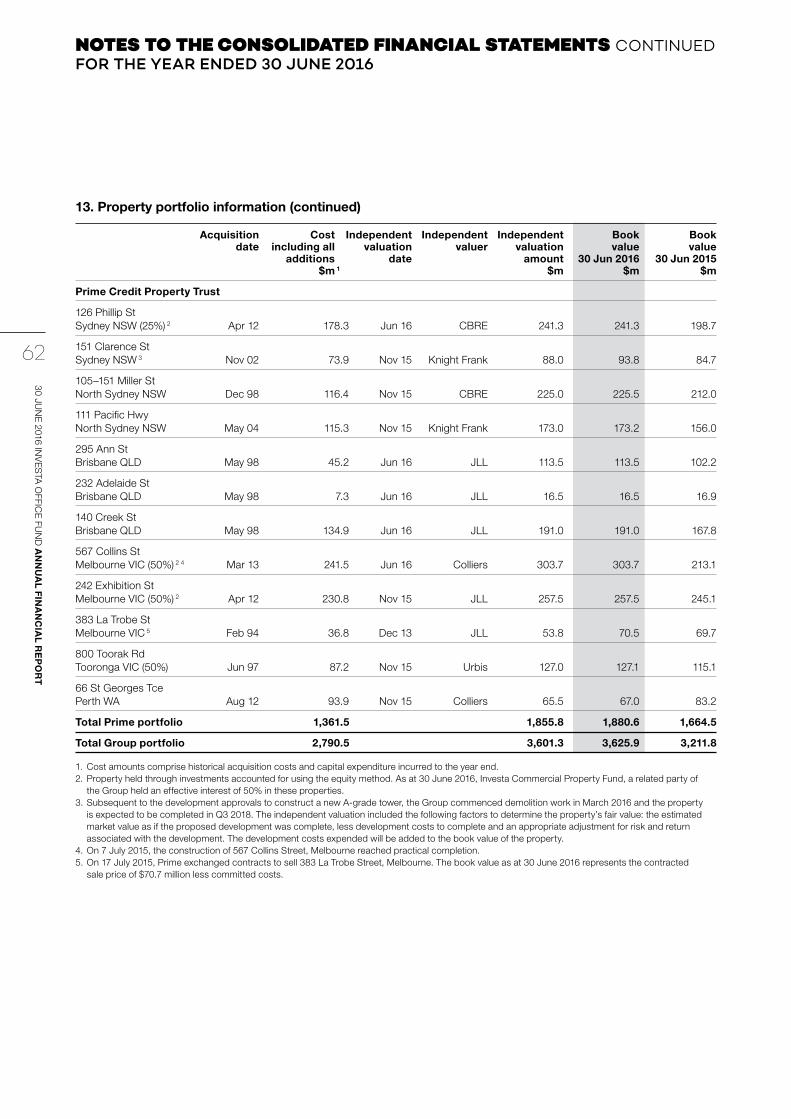
NOTES TO THE CONSOLIDATED FINANCIAL STATEMENTS CONTINUEDFOR THE YEAR ENDED 30 JUNE 2016
13. Property portfolio information (continued)
Acquisition Cost Independent Independent Independent Book Book date including all valuation valuer valuation value value additions date amount 30 Jun 2016 30 Jun 2015 $m 1 $m $m $m
Prime Credit Property Trust
126 Phillip St Sydney NSW (25%) 2 Apr 12 178.3 Jun 16 CBRE 241.3 241.3 198.7
151 Clarence St Sydney NSW 3 Nov 02 73.9 Nov 15 Knight Frank 88.0 93.8 84.7
105–151 Miller St North Sydney NSW Dec 98 116.4 Nov 15 CBRE 225.0 225.5 212.0
111 Pacific Hwy North Sydney NSW May 04 115.3 Nov 15 Knight Frank 173.0 173.2 156.0
295 Ann St Brisbane QLD May 98 45.2 Jun 16 JLL 113.5 113.5 102.2
232 Adelaide St Brisbane QLD May 98 7.3 Jun 16 JLL 16.5 16.5 16.9
140 Creek St Brisbane QLD May 98 134.9 Jun 16 JLL 191.0 191.0 167.8
567 Collins St Melbourne VIC (50%) 2 4 Mar 13 241.5 Jun 16 Colliers 303.7 303.7 213.1
242 Exhibition St Melbourne VIC (50%) 2 Apr 12 230.8 Nov 15 JLL 257.5 257.5 245.1
383 La Trobe St Melbourne VIC 5 Feb 94 36.8 Dec 13 JLL 53.8 70.5 69.7
800 Toorak Rd Tooronga VIC (50%) Jun 97 87.2 Nov 15 Urbis 127.0 127.1 115.1
66 St Georges Tce Perth WA Aug 12 93.9 Nov 15 Colliers 65.5 67.0 83.2
Total Prime portfolio 1,361.5 1,855.8 1,880.6 1,664.5
Total Group portfolio 2,790.5 3,601.3 3,625.9 3,211.8
1. Cost amounts comprise historical acquisition costs and capital expenditure incurred to the year end.2. Property held through investments accounted for using the equity method. As at 30 June 2016, Investa Commercial Property Fund, a related party of
the Group held an effective interest of 50% in these properties.3. Subsequent to the development approvals to construct a new A-grade tower, the Group commenced demolition work in March 2016 and the property
is expected to be completed in Q3 2018. The independent valuation included the following factors to determine the property’s fair value: the estimated market value as if the proposed development was complete, less development costs to complete and an appropriate adjustment for risk and return associated with the development. The development costs expended will be added to the book value of the property.
4. On 7 July 2015, the construction of 567 Collins Street, Melbourne reached practical completion.5. On 17 July 2015, Prime exchanged contracts to sell 383 La Trobe Street, Melbourne. The book value as at 30 June 2016 represents the contracted
sale price of $70.7 million less committed costs.
30 JUN
E 2016 IN
VE
STA
OFFIC
E FU
ND
AN
NU
AL F
INA
NC
IAL R
EP
OR
T
62

14. Trade and other payables
Investa Office Prime Credit Fund Property Trust
30 June 30 June 30 June 30 June 2016 2015 2016 2015 $m $m $m $m
Current
Trade payables 17.7 19.1 6.9 8.6
Other payables 8.0 10.8 3.1 3.8
25.7 29.9 10.0 12.4
15. Borrowings
Investa Office Prime Credit Fund Property Trust
30 June 30 June 30 June 30 June 2016 2015 2016 2015 $m $m $m $m
Current liabilities – unsecured
Bank debt (AUD) 337.0 62.0 198.0 42.0
Capitalised commitments and upfront fees – (0.1) – (0.1)
337.0 61.9 198.0 41.9
Non-current liabilities – unsecured
Bank debt (AUD) 193.0 391.0 93.0 166.0
Medium Term Note (AUD) 125.0 125.0 – –
US Private Placements (USD) 437.7 423.2 168.3 162.8
755.7 939.2 261.3 328.8
Capitalised commitments and upfront fees (3.5) (3.9) (1.4) (1.6)
752.2 935.3 259.9 327.2
Total borrowings 1,089.2 997.2 457.9 369.1
63
30 JUN
E 2016 IN
VE
STA
OFFIC
E FU
ND
AN
NU
AL F
INA
NC
IAL R
EP
OR
T

NOTES TO THE CONSOLIDATED FINANCIAL STATEMENTS CONTINUEDFOR THE YEAR ENDED 30 JUNE 2016
15. Borrowings (continued)
(a) Financing arrangements
At 30 June 2016 the Group had unsecured bank, Medium Term Note (MTN) and USD denominated US Private Placement (USPP) debt facilities, each with specific maturities and limits as detailed below:
Investa Office Fund
30 June 2016 30 June 2015
Limit Drawn Undrawn Limit Drawn Undrawn Maturity $m $m $m $m $m $m date
Bilateral facilities
Bank debt – – – 132.0 62.0 70.0 Jun 16
Bank debt – – – 150.0 145.0 5.0 Aug 16
Bank debt 350.0 337.0 13.0 – – – Mar 17
Bank debt 50.0 50.0 – 50.0 50.0 – Jun 18
Bank debt 66.0 10.0 56.0 66.0 55.0 11.0 Jul 18
Bank debt 84.0 – 84.0 84.0 84.0 – Aug 18
Bank debt 50.0 50.0 – 50.0 50.0 – Jun 19
Bank debt 50.0 50.0 – 50.0 – 50.0 Jul 19
Bank debt 66.0 33.0 33.0 66.0 7.0 59.0 Aug 19
716.0 530.0 186.0 648.0 453.0 195.0
MTN 125.0 125.0 – 125.0 125.0 – Nov 17
USPPs 1
Tranche 1 105.1 105.1 – 101.6 101.6 – Apr 25
Tranche 2 168.3 168.3 – 162.8 162.8 – Aug 25
Tranche 3 86.2 86.2 – 83.3 83.3 – Apr 27
Tranche 4 78.1 78.1 – 75.5 75.5 – Apr 29
Total 1,278.7 1,092.7 186.0 1,196.2 1,001.2 195.0
1. The USPP amounts have been translated at the year end foreign exchange rate.
(b) New bank debt
In February 2016, the Responsible Entity on behalf of the Fund and Prime entered into new debt facility agreements of $350.0 million with a maturity date of March 2017. This allowed the Group and Prime to refinance their bank debt maturing in June 2016 and August 2016.
Subsequent to 30 June 2016, the Responsible Entity on behalf of the Fund and Prime refinanced the $350.0 million bank debt facility maturing in March 2017 with new bank debt facility agreements of $350.0 million maturing from July 2019 to July 2021.
(c) Risk exposure and fair value disclosures
Refer to Note 21 for further details on the Group’s exposure to risk arising from borrowings and the maturity profile of borrowings. Refer to Note 22 for the fair value of borrowings.
30 JUN
E 2016 IN
VE
STA
OFFIC
E FU
ND
AN
NU
AL F
INA
NC
IAL R
EP
OR
T
64

16. Contributed equity
(a) Carrying amounts
Investa Office Prime Credit Fund Property Trust
30 June 30 June 30 June 30 June 2016 2015 2016 2015 $m $m $m $m
Balance at the beginning and end of the year 2,142.3 2,142.3 1,193.8 1,193.8
The balance at the end of the year is attributable to the unitholders of:
Armstrong Jones Office Fund 948.5 948.5 – –
Prime Credit Property Trust 1,193.8 1,193.8 1,193.8 1,193.8
2,142.3 2,142.3 1,193.8 1,193.8
(b) Number of issued units
Investa Office Prime Credit Fund Property Trust
30 June 30 June 30 June 30 June 2016 2015 2016 2015 000’s 000’s 000’s 000’s
Balance at the beginning and end of the year 614,047 614,047 614,047 614,047
(c) Terms of units
All units are fully paid and rank equally with each other for all purposes. Each unit entitles the holder to one vote, in person or by proxy, at a meeting of unitholders.
(d) Capital risk management
Refer to Note 20 for the capital management strategy for the Group.
65
30 JUN
E 2016 IN
VE
STA
OFFIC
E FU
ND
AN
NU
AL F
INA
NC
IAL R
EP
OR
T

NOTES TO THE CONSOLIDATED FINANCIAL STATEMENTS CONTINUEDFOR THE YEAR ENDED 30 JUNE 2016
17. Reserves
Investa Office Prime Credit Fund Property Trust
30 June 30 June 30 June 30 June 2016 2015 2016 2015 $m $m $m $m
Foreign currency translation
Balance at the beginning of year – (103.5) – –
Translation differences arising during the year – (1.2) – –
Transfer to the profit and loss – 104.7 – –
Total reserves at the end of the year – – – –
The balance at the end of the year is attributable to the unitholders of:
Armstrong Jones Office Fund – – – –
Prime Credit Property Trust – – – –
– – – –
The foreign currency translation reserve represents the translation of foreign controlled entities. Exchange differences arising on translation of the foreign controlled entities are recognised in other comprehensive income as described in Note 1(e) and accumulated in a reserve within equity. The cumulative amount is reclassified to profit or loss when the net investment is disposed of or sold. During the year ended 30 June 2015, the final European investment was disposed and the cumulative balance that pertains to the European operations was reclassified to the Consolidated Statements of Comprehensive Income.
18. Retained earnings
Investa Office Prime Credit Fund Property Trust
30 June 30 June 30 June 30 June 2016 2015 2016 2015 $m $m $m $m
Balance at the beginning of the year 80.6 19.6 102.5 7.3
Net profit for the year 493.8 179.2 223.0 143.2
Distributions paid or payable (120.4) (118.2) (79.9) (48.0)
Balance at the end of the year 454.0 80.6 245.6 102.5
The balance at the end of the year attributable to the unitholders of:
Armstrong Jones Office Fund 208.4 (21.9) – –
Prime Credit Property Trust 245.6 102.5 245.6 102.5
454.0 80.6 245.6 102.5
30 JUN
E 2016 IN
VE
STA
OFFIC
E FU
ND
AN
NU
AL F
INA
NC
IAL R
EP
OR
T
66

19. Commitments
(a) Capital commitments
Capital expenditure contracted for at the reporting date but not recognised as liabilities is as follows:
Investa Office Prime Credit Fund Property Trust
30 June 30 June 30 June 30 June 2016 2015 2016 2015 $m $m $m $m
Investment properties 15.1 29.4 8.4 7.0
Investment property under construction:
567 Collins Street, Melbourne 1 – 56.4 – 56.4
151 Clarence Street, Sydney 112.2 – 112.2 –
1. This investment property reached practical completion on 7 July 2015 and is held by an equity accounted investment.
20. Capital management
The Group aims to meet its strategic objectives and operational needs to maximise returns to unitholders through the appropriate use of debt and equity, taking into account the additional financial risks of using debt.
In determining the optimal capital structure, the Group takes into account a number of factors including the capital needs of its portfolio; the relative cost of debt versus equity; the execution and market risk of raising equity or debt; the additional financial risks of debt including increased volatility of earnings due to exposure to interest rate movements; the liquidity risk of maturing debt facilities; the potential for acceleration prior to maturity; and the market in general.
In assessing this risk, the Group takes into account the relative security of its income flows, the predictability of its expenses, its debt profile, the degree of hedging and the overall level of debt as measured by gearing.
The actual capital structure at a point in time is the product of a number of factors, many of which are market driven and to various degrees outside of the control of the Group, particularly the impact of revaluations on gearing levels, the availability of new equity and the liquidity in real estate markets. While the Group periodically reviews the optimal capital structure, the ability to achieve the optimal structure may be impacted by market conditions and the actual position may often differ from the initial position. The Group’s capital position is primarily monitored through its ratio of total debt to total assets (Gearing Ratio), calculated on a look-through basis, in which the Group’s interest in its joint arrangements and joint venture entities are proportionately consolidated based on the Group’s ownership interest. The Group’s strategy is to maintain the Gearing Ratio in the range of 25% to 35%. The actual Gearing Ratio may vary from this range in the short term from time to time.
67
30 JUN
E 2016 IN
VE
STA
OFFIC
E FU
ND
AN
NU
AL F
INA
NC
IAL R
EP
OR
T

NOTES TO THE CONSOLIDATED FINANCIAL STATEMENTS CONTINUEDFOR THE YEAR ENDED 30 JUNE 2016
20. Capital management (continued)
Investa Office Fund
30 June 30 June 2016 2015 $m $m
Total consolidated debt 1,089.2 997.2
Add:
AUD liability – USPP 358.0 358.0
Less:
USPP debt carrying value (437.7) (423.2)
Net look-through debt 1 1,009.5 932.0
Total consolidated assets 3,783.4 3,321.2
Less:
Share of net assets – equity accounted investments included in consolidated assets (801.8) (543.7)
Add:
Share of total assets – equity accounted investments 805.2 658.6
Receivables from and payables to equity accounted investments – (114.2)
Foreign currency hedge asset balance 2 (136.4) (81.0)
Total look-through assets 3,650.4 3,240.9
Gearing Ratio 27.7% 28.8%
1. Represents the Group’s look-through debt, based on the AUD liability on the USPPs after applying cross currency swap hedging arrangements.2. This equates to the fair value of the Group’s cross currency interest rate swap assets at the year end.
In addition to the Gearing Ratio, the Group monitors the ratio of total liabilities to total assets (Leverage Ratio) to ensure compliance with the Group’s debt covenants. The calculation of the Leverage Ratio varies depending on the Group’s different types of debt. The table below outlines the Group’s more onerous debt covenant calculation and result.
30 JUN
E 2016 IN
VE
STA
OFFIC
E FU
ND
AN
NU
AL F
INA
NC
IAL R
EP
OR
T
68

Investa Office Fund
30 June 30 June 2016 2015 $m $m
Total consolidated liabilities 1,187.1 1,098.3
Add:
Share of liabilities – equity accounted investments 3.4 114.9
Less:
Receivables from and payables to equity accounted investments – (114.2)
Total look-through liabilities (Leverage Ratio) 1,190.5 1,099.0
Total consolidated assets 3,783.4 3,321.2
Less:
Share of net assets – equity accounted investments included in consolidated assets (801.8) (543.7)
Add:
Share of total assets – equity accounted investments 805.2 658.6
Receivables from and payables to equity accounted investments – (114.2)
Total look-through assets (Leverage Ratio) 3,786.8 3,321.9
Leverage Ratio 31.4% 33.1%
As part of a stapled entity, Prime’s capital is not separately managed. Any capital changes for the Group may result in consequential changes for Prime.
69
30 JUN
E 2016 IN
VE
STA
OFFIC
E FU
ND
AN
NU
AL F
INA
NC
IAL R
EP
OR
T

NOTES TO THE CONSOLIDATED FINANCIAL STATEMENTS CONTINUEDFOR THE YEAR ENDED 30 JUNE 2016
21. Financial risk management
Introduction
The Group’s principal financial instruments comprise cash, receivables, payables, borrowings, derivative financial instruments, and other financial liabilities.
The Group’s activities expose it to a variety of financial risks:
> Market risk;
> Credit risk; and
> Liquidity risk.
The Group’s overall risk management program focuses on the unpredictability of financial markets and seeks to minimise potential adverse effects on the financial performance of the Group. The Group uses derivative financial instruments such as interest rate swaps, cross currency interest rate swaps, interest rate caps and collars, and foreign exchange contracts to hedge certain risk exposures. Derivatives are exclusively used for hedging purposes and not as trading or other speculative instruments. The Group uses different methods to measure different types of risk to which it is exposed. These methods include sensitivity analysis in the case of interest rate risk and ageing analysis for credit risk.
As part of a stapled entity, Prime’s financial risk is not separately managed and forms part of the Group’s overall risk management program. Management of the financial risks of the Group may result in consequential changes for Prime. While not separately reported to key management personnel, qualitative risk information arising from Prime’s financial instruments has been included in the sections below. This is outlined to indicate the extent of Prime’s risks arising from financial instruments.
(a) Market risk
(i) Interest rate risk
Interest rate risk is the risk that the fair value of future cash flows of a financial instrument will fluctuate because of changes in market interest rates. The primary objective of interest risk management is to manage the potential for financial loss measured in terms of impact on earnings arising from unfavourable movements in interest rates.
The Group’s main interest rate risk arises from borrowings. Borrowings issued at variable rates expose the Group to cash flow interest rate risk. The Group’s preference is to protect itself from large and rapid movements in financial markets, to achieve a less volatile exposure to movements in interest rates through prudent risk management techniques. The Group’s policy is to hedge the Group’s forecast borrowings using interest rate derivatives based on the following hedge ratio limit ranges.
Hedge ratio limit range
1–3 years 30% – 80%
3+ years 0% – 75%
The Group analyses its interest rate exposure on a regular basis. Various scenarios are simulated taking into consideration refinancing, renewal of existing positions and hedging. Based on these scenarios, the Group calculates the impact on profit or loss of a defined interest rate shift. The scenarios are run only for liabilities that represent the major interest-bearing positions. The simulation is done on a regular basis to verify that the maximum loss potential is within limit established by the Responsible Entity.
Based on the various scenarios, the Group manages its cash flow interest rate risk by using:
> Floating-to-fixed interest rate swaps (or swaptions);
> Interest rate caps and collars; and
> Cross currency interest rate swaps.
Interest rate swaps have the economic effect of converting borrowings from floating rates to fixed rates or from fixed to floating. Generally, the Group raises borrowings, some of which are at floating rates and swaps them into fixed rates that are lower than those available if the Group borrowed at fixed rates directly. Under the interest rate swaps, the Group agrees with other parties to exchange, at specified intervals (mainly quarterly), the difference between fixed contract rates and floating-rate interest amounts calculated by reference to the agreed notional principal amounts.
Interest rate caps are derivatives that provide the Group with an upper limit at which the Group will no longer be exposed to increases in floating interest rates. Interest rate collars are derivatives that provide the Group with an upper limit similar to an interest rate cap. Interest rate collars, however, also provide a lower limit which the Group is exposed to if floating interest rates decrease below the lower limit.
Cross currency interest rate swaps minimise both foreign interest rate and exchange rate risk exposure on the Group’s USPPs debt facilities, converting 100% of the foreign denominated principal outstanding and related finance costs to Australian dollar exposures. These cross currency swaps also swap the obligation to pay fixed interest to floating interest.
30 JUN
E 2016 IN
VE
STA
OFFIC
E FU
ND
AN
NU
AL F
INA
NC
IAL R
EP
OR
T
70

Interest rate risk exposure
The Group’s interest rate risk from borrowings is summarised in the table below.
Investa Office Fund Weighted Floating Fixed interest rate average interest Less than 1–5 More than interest rate rate 1 year years 5 years Total (%pa) $m $m $m $m $m
30 June 2016
Borrowings:
Denominated in AUD – floating 2.8% 530.0 – – – 530.0
Denominated in AUD – fixed 1 5.4% – – 125.0 – 125.0
Denominated in USD – fixed 4.4% – – – 437.7 437.7
530.0 – 125.0 437.7 1,092.7
30 June 2015
Borrowings:
Denominated in AUD – floating 3.8% 453.0 – – – 453.0
Denominated in AUD – fixed 1 5.4% – – 125.0 – 125.0
Denominated in USD – fixed 4.4% – – – 423.2 423.2
453.0 – 125.0 423.2 1,001.2
1. Represents the fixed interest rate on the Group’s MTN, swapped to a floating interest rate via fixed to floating interest rate derivative, as disclosed below.
The Group’s weighted average fixed and floating rate derivatives (notional principal denominated in Australian dollars) held at reporting date can be summarised by maturity as follows:
June 2016 1 June 2017 June 2018 June 2019 June 2020 June 2021 $m $m $m $m $m $m
Interest rate swaps (fixed) 449.9 420.4 400.9 533.1 – –
Average fixed rate 3.2% 3.1% 2.5% 1.9% – –
Interest rate swaptions – 24.4 100.0 100.0 100.0 0.8
Interest rate swaps (floating) 2 125.0 125.0 44.5 – – –
1. Amounts represent the notional principal rather than weighted average notional principal as at the reporting date.2. Represents floating interest rate derivatives used to swap the fixed MTN interest rate.
The Group’s weighted average fixed rate derivatives (notional principal denominated in Australian dollars) held at the end of the previous financial year can be summarised by maturity as follows:
June 2015 1 June 2016 June 2017 June 2018 June 2019 June 2020 $m $m $m $m $m $m
Interest rate swaps (fixed) 399.9 367.3 418.4 216.0 – –
Average fixed rate 3.4% 3.4% 3.2% 3.0% – –
Interest rate swaptions – – 24.4 87.8 50.0 50.0
Interest rate swaps (floating) 2 125.0 125.0 125.0 44.5 – –
1. Amounts represent the notional principal rather than weighted average notional principal as at the reporting date.2. Represents floating interest rate derivatives used to swap the fixed MTN interest rate.
71
30 JUN
E 2016 IN
VE
STA
OFFIC
E FU
ND
AN
NU
AL F
INA
NC
IAL R
EP
OR
T

NOTES TO THE CONSOLIDATED FINANCIAL STATEMENTS CONTINUEDFOR THE YEAR ENDED 30 JUNE 2016
21. Financial risk management (continued)
Interest rate risk exposure (continued)
Prime’s interest rate risk from borrowings is summarised in the table below.
Prime Credit Property Trust Weighted Floating Fixed interest rate average interest Less than 1–5 More than interest rate rate 1 year years 5 years Total (%pa) $m $m $m $m $m
30 June 2016
Borrowings:
Denominated in AUD – floating 2.7% 291.0 – – – 291.0
Denominated in USD – fixed 4.0% – – – 168.3 168.3
291.0 – – 168.3 459.3
30 June 2015
Denominated in AUD – floating 3.6% 208.0 – – – 208.0
Denominated in USD – fixed 4.0% – – – 162.8 162.8
208.0 – – 162.8 370.8
Prime’s weighted average fixed and floating rate derivatives (notional principal denominated in Australian dollars) held at reporting date can be summarised by maturity as follows:
June 2016 1 June 2017 June 2018 June 2019 June 2020 June 2021 $m $m $m $m $m $m
Interest rate swaps (fixed) 128.9 123.8 181.6 296.4 – –
Average fixed rate 2.6% 2.6% 1.9% 1.9% – –
1. Amounts represent the notional principal rather than weighted average notional principal as at the reporting date.
Prime’s weighted average fixed and floating rate derivatives (notional principal denominated in Australian dollars) held at the previous reporting date can be summarised by maturity as follows:
June 2015 1 June 2016 June 2017 June 2018 June 2019 June 2020 $m $m $m $m $m $m
Interest rate swaps (fixed) 128.9 128.9 121.8 – – –
Average fixed rate 2.6% 2.6% 2.6% – – –
1. Amounts represent the notional principal rather than weighted average notional principal as at the reporting date.
Interest rate sensitivity analysis
Sensitivity on net interest expense
The impact on interest expense of a 100 basis point increase or decrease in market interest rates at reporting date is shown below. This analysis is based on the interest rate risk exposure in existence at reporting date. Interest expense is sensitive to movements in market interest rates on floating rate debt, not hedged by derivatives. Aside from the profit or loss impact on equity resulting from a 100 basis point increase or decrease in market interest rates, the 100 basis point increase or decrease in market interest rates at the reporting date has no other impact on equity.
Sensitivity on changes in fair value of interest rate derivatives
The impact of changes in the fair value of interest rate derivatives for a 100 basis point increase or decrease in market interest rates at reporting date is shown below. The sensitivity on the fair value arises from the impact that changes in market rates will have on the mark-to-market valuation of the interest rate derivatives. The fair value of interest rate derivatives is calculated as the present value of estimated future cash flows for each derivative, based on the forward market interest rate curve. Gains or losses arising from changes in the fair value are reflected in the Consolidated Income Statements. Aside from the profit or loss impact on equity resulting from a 100 basis point increase or decrease in market interest rates, the 100 basis point increase or decrease in market interest rates at the reporting date has no other impact on equity.
30 JUN
E 2016 IN
VE
STA
OFFIC
E FU
ND
AN
NU
AL F
INA
NC
IAL R
EP
OR
T
72

A 100 basis points sensitivity is used for consistency of reporting interest rate risk between the current and prior financial years. The Group considers this reasonable given the current level of both short-term and long-term interest rates.
Investa Office Fund Sensitivity on change in fair value Sensitivity on net interest expense of interest rate derivatives
30 June 2016 30 June 2015 30 June 2016 30 June 2015 + 100bps – 100bps + 100bps – 100bps + 100bps – 100bps + 100bps – 100bps $m $m $m $m $m $m $m $m
Variable interest rates – AUD (4.4) 4.4 (4.1) 4.1 12.8 (14.0) 37.7 (44.5)
Prime Credit Property Trust Sensitivity on change in fair value Sensitivity on net interest expense of interest rate derivatives
30 June 2016 30 June 2015 30 June 2016 30 June 2015 + 100bps – 100bps + 100bps – 100bps + 100bps – 100bps + 100bps – 100bps $m $m $m $m $m $m $m $m
Variable interest rates – AUD (2.9) 2.9 (2.1) 2.1 5.8 (5.9) 12.8 (14.9)
(ii) Foreign exchange risk
Foreign exchange risk is the risk that the value of a financial commitment, asset or liability will fluctuate due to changes in foreign exchange rates. The Group’s foreign exchange risk arises primarily from offshore borrowings and associated finance costs.
The Group’s exposure to foreign currency risk, denominated in Australian dollars, was as follows:
Investa Office Fund Net foreign currency asset/(liability) United States dollars
30 June 30 June 2016 2015 $m $m
Cash 0.1 0.1
Derivative financial instruments 136.4 81.0
Borrowings (437.7) (423.2)
Net liabilities (301.2) (342.1)
The Group mitigates its exposure to the foreign exchange risk inherent in the carrying value of its offshore borrowings by entering into cross currency interest rate swaps. These convert 100% of the foreign denominated principal outstanding and related finance costs to Australian dollar exposures. As a result sensitivity to foreign exchanges is deemed insignificant.
(b) Credit risk
Credit risk refers to the risk that a counterparty is unable to pay amounts in full when due and defaults on its contractual obligations resulting in a financial loss to the Group. Credit risk for the Group arises from cash and cash equivalents, derivative financial instruments and deposits with banks and financial institutions, as well as credit exposures to customers, including outstanding receivables and committed transactions.
The Responsible Entity seeks to mitigate this risk for the Group through the setting of credit policies that include ensuring that investments, cash and derivative transactions are only undertaken with financial institutions with an appropriate credit rating. Receivables and other committed transactions are with a range of counterparties including corporates, individuals, government entities and semi government entities including wholly owned privatised government entities, retail and other property trade receivables. These counterparties have a range of credit ratings or in the case of individuals no credit rating. These counterparties are subject to active on-going monitoring including ensuring that transactions are only entered into with appropriate creditworthy counterparties, or that security remains with the Group until settlement. Where there is a concern on the credit worthiness, receivables relating to leasing contracts entered into in the normal course of business may be secured by rental deposits and/or other forms of security.
73
30 JUN
E 2016 IN
VE
STA
OFFIC
E FU
ND
AN
NU
AL F
INA
NC
IAL R
EP
OR
T

NOTES TO THE CONSOLIDATED FINANCIAL STATEMENTS CONTINUEDFOR THE YEAR ENDED 30 JUNE 2016
21. Financial risk management (continued)
(b) Credit risk (continued)
The Group’s and Prime’s exposure to credit risk consists of the following:
Investa Office Prime Credit Fund Property Trust
30 June 30 June 30 June 30 June 2016 2015 2016 2015 $m $m $m $m
Cash and cash equivalents 2.1 3.6 1.4 1.0
Receivables 1 12.6 132.4 7.5 124.7
Derivative financial instruments 143.5 86.6 57.2 36.9
Total financial assets 158.2 222.6 66.1 162.6
1. An analysis of credit risk exposure for receivables is included in Note 7.
(c) Liquidity risk
Liquidity risk is the risk that the Group will not be able to meet its financial obligations, or other cash outflows, as they fall due, because of a lack of liquid assets or access to adequate committed credit facilities. Management of liquidity risk is carried out by the Responsible Entity and the Group’s risk management policy sets a target for the level of cash and available undrawn debt facilities to cover future committed expenditure in the next year, loan maturities within the next year and an allowance for unforeseen events such as tenant default.
The Group assesses the liquidity risk as its ability to meet its payment obligations to satisfy its external credit providers. The Group measures the risk by ascertaining its cash requirements regularly through cash flow forecasts. The Group’s main objective is to ensure the continued ability to meet its financial liabilities.
Refinancing risk, also part of liquidity risk, is the risk that the maturity profile of debt makes it difficult to refinance (or rollover) maturing debt, or that it creates an excessive exposure to potentially unfavourable market conditions at any given time. The Group is exposed to refinancing risks arising from the availability of finance as well as the interest rates and credit margins at which financing is available. The Group manages this risk, where appropriate, by refinancing borrowings in advance of the maturity of the borrowing, staggering maturity dates, and securing longer term facilities where appropriate and consistent with the Group’s strategy. The Group also uses interest rate derivatives to hedge known and forecast positions and reviews potential transactions to understand the impact on the Group’s covenants and credit risk profile.
Refer to Note 15 for disclosure of borrowing facilities available to the Group.
The contractual maturities of the Group’s financial liabilities at reporting date are reflected in the following table. It shows the undiscounted contractual cash flows required to discharge the liabilities including interest at market rates. Foreign currencies have been converted at exchange rates at the reporting date.
Investa Office Fund Less than 1–5 Greater than 1 year years 5 years Total $m $m $m $m
30 June 2016
Trade and other payables (25.7) – – (25.7)
Borrowings (337.0) (318.0) (437.7) (1,092.7)
Projected interest cost on borrowings 1 (40.4) (90.5) (98.0) (228.9)
Projected interest cost on derivative liabilities 1 2 (5.7) (5.7) – (11.4)
Distribution payable (60.2) – – (60.2)
Total forecast undiscounted future cash flow (469.0) (414.2) (535.7) (1,418.9)
Projected interest income on derivative assets 2 9.2 28.1 155.2 192.5
Net liquidity exposure (459.8) (386.1) (380.5) (1,226.4)
30 JUN
E 2016 IN
VE
STA
OFFIC
E FU
ND
AN
NU
AL F
INA
NC
IAL R
EP
OR
T
74

Investa Office Fund Less than 1–5 Greater than 1 year years 5 years Total $m $m $m $m
30 June 2015
Trade and other payables (29.9) – – (29.9)
Borrowings (62.0) (516.0) (423.2) (1,001.2)
Projected interest cost on borrowings 1 (43.5) (106.5) (113.4) (263.4)
Projected interest cost on derivative liabilities 1 2 (4.9) (5.4) – (10.3)
Distribution payable (59.6) – – (59.6)
Total forecast undiscounted future cash flow (199.9) (627.9) (536.6) (1,364.4)
Projected interest income on derivative assets 2 9.3 12.6 109.7 131.6
Net liquidity exposure (190.6) (615.3) (426.9) (1,232.8)
1. Projection is based on the likely outcome of the facilities given the interest rates, margins, foreign exchange rates and interest rate forward curves as at the reporting date up until the contractual maturity of the facilities. The projection is based on the undiscounted cash flows.
2. In accordance with AASB 7, the future value of contractual cash flows of non-derivative and derivative liabilities is only included in liquidity risk disclosures. As derivatives are exchanges of cash flows, the positive cash flows from derivative assets have been disclosed separately to provide a more meaningful analysis of the Group’s net liquidity exposure. The methodology used to calculate projected interest income on derivative assets is consistent with the above liquidity risk disclosures.
The contractual maturities of the Prime’s financial liabilities at reporting date, on the same basis, were:
Prime Credit Property Trust Less than 1–5 Greater than 1 year years 5 years Total $m $m $m $m
30 June 2016
Trade and other payables (10.0) – – (10.0)
Borrowings (198.0) (93.0) (168.3) (459.3)
Projected interest cost on borrowings 1 (10.8) (28.4) (27.6) (66.8)
Projected interest cost on derivative liabilities 1 2 (0.9) (0.3) – (1.2)
Distribution payable (37.5) – – (37.5)
Total forecast undiscounted future cash flow (257.2) (121.7) (195.9) (574.8)
Projected interest income on derivative assets 2 3.4 9.2 63.5 76.1
Net liquidity exposure (253.8) 112.5 (132.4) (498.7)
30 June 2015
Trade and other payables (12.4) – – (12.4)
Borrowings (42.0) (166.0) (162.8) (370.8)
Projected interest cost on borrowings 1 (13.9) (38.3) (33.2) (85.4)
Projected interest cost on derivative liabilities 1 2 (0.6) (0.4) – (1.0)
Distribution payable (35.0) – – (35.0)
Total forecast undiscounted future cash flow (103.9) (204.7) (196.0) (504.6)
Projected interest income on derivative assets 2 3.1 3.3 49.1 55.5
Net liquidity exposure (100.8) (201.4) (146.9) (449.1)
1. Projection is based on the likely outcome of the facilities given the interest rates, margins, foreign exchange rates and interest rate forward curves as at the reporting date up until the contractual maturity of the facilities. The projection is based on the undiscounted cash flows.
2. In accordance with AASB 7, the future value of contractual cash flows of non-derivative and derivative liabilities is only included in liquidity risk disclosures. As derivatives are exchanges of cash flows, the positive cash flows from derivative assets have been disclosed separately to provide a more meaningful analysis of Prime’s net liquidity exposure. The methodology used to calculate projected interest income on derivative assets is consistent with the above liquidity risk disclosures.
75
30 JUN
E 2016 IN
VE
STA
OFFIC
E FU
ND
AN
NU
AL F
INA
NC
IAL R
EP
OR
T

NOTES TO THE CONSOLIDATED FINANCIAL STATEMENTS CONTINUEDFOR THE YEAR ENDED 30 JUNE 2016
21. Financial risk management (continued)
(d) Offsetting financial assets and financial liabilities
Financial assets and liabilities are offset and the net amount reported in the Consolidated Statements of Financial Position when there is a legally enforceable right to offset the recognised amounts and there is an intention to settle on a net basis or realise the asset and settle the liability simultaneously.
There are no recognised financial instruments that are offset in the Consolidated Statements of Financial Position.
(i) Netting arrangements – not currently enforceable
Agreements with derivative counterparties are based on International Swaps and Derivatives Association (ISDA) Agreements. Under the terms of these arrangements, where certain credit events occur (such as default), the net position owing/receivable to a single counterparty in the same currency will be taken as owing and all the relevant arrangements terminated. As the Group and Prime does not presently have a legally enforceable right of set-off, these amounts have not been offset in the Consolidated Statements of Financial Position.
The following table presents the recognised financial instruments that are subject to enforceable netting arrangements and other similar agreements but not offset. The column ‘net amount‘ shows the impact on the Group’s and Prime’s Consolidated Statements of Financial Position if all set-off rights were exercised.
Investa Office Fund Amounts subject Gross amounts to netting presented arrangements Net amount $m $m $m
30 June 2016
Derivative financial assets 143.5 (7.1) 136.4
Derivative financial liabilities (12.0) 7.1 (4.9)
131.5 – 131.5
30 June 2015
Derivative financial assets 86.6 (5.7) 80.9
Derivative financial liabilities (11.6) 5.7 (5.9)
75.0 – 75.0
Prime Credit Property Trust Amounts subject Gross amounts to netting presented arrangements Net amount $m $m $m
30 June 2016
Derivative financial assets 57.2 (1.2) 56.0
Derivative financial liabilities (1.2) 1.2 –
56.0 – 56.0
30 June 2015
Derivative financial assets 36.9 (1.1) 35.8
Derivative financial liabilities (1.1) 1.1 –
35.8 – 35.8
30 JUN
E 2016 IN
VE
STA
OFFIC
E FU
ND
AN
NU
AL F
INA
NC
IAL R
EP
OR
T
76

22. Fair value measurements
The Group and Prime measure and recognise the following assets and liabilities at fair value on a recurring basis:
> Derivative financial instruments; and
> Investment properties.
The Group and Prime did not measure any financial assets or financial liabilities at fair value on a non-recurring basis as at 30 June 2016 and 30 June 2015.
(a) Fair value hierarchy
To provide an indication about the reliability of the inputs used in determining fair value, the Group classifies its derivative financial instruments and investment properties into three levels prescribed under the accounting standards:
> Quoted prices (unadjusted) in active markets for identical assets or liabilities (level 1);
> Inputs other than quoted prices included within level 1 that are observable for the asset or liability, either directly (as prices) or indirectly (derived from prices) (level 2); and
> Inputs for the asset or liability that are not based on observable market data (unobservable inputs) (level 3).
The following table presents the Group’s assets and liabilities that were measured and recognised at fair value on a recurring basis.
Investa Office Fund 30 June 2016 30 June 2015
Level 1 Level 2 Level 3 Total Level 1 Level 2 Level 3 Total $m $m $m $m $m $m $m $m
Financial assets
Derivative financial instruments – 143.5 – 143.5 – 86.6 – 86.6
Total financial assets – 143.5 – 143.5 – 86.6 – 86.6
Non-financial assets
Investment properties 1 – – 2,823.4 2,823.4 – – 2,554.9 2.554.9
Total non-financial assets – – 2,823.4 2,823.4 – – 2,554.9 2,554.9
Financial liabilities
Derivative financial instruments – 12.0 – 12.0 – 11.6 – 11.6
Total financial liabilities – 12.0 – 12.0 – 11.6 – 11.6
1. Includes investment properties classified as held for sale.
The following table presents Prime’s assets and liabilities that were measured and recognised at fair value on a recurring basis.
Prime Credit Property Trust 30 June 2016 30 June 2015
Level 1 Level 2 Level 3 Total Level 1 Level 2 Level 3 Total $m $m $m $m $m $m $m $m
Financial assets
Derivative financial instruments – 57.2 – 57.2 – 36.9 – 36.9
Total financial assets – 57.2 – 57.2 – 36.9 – 36.9
Non-financial assets
Investment properties – – 1,078.1 1,078.1 – – 1,007.6 1,007.6
Total non-financial assets – – 1,078.1 1,078.1 – – 1,007.6 1,007.6
Financial liabilities
Derivative financial instruments – 1.2 – 1.2 – 1.1 – 1.1
Total financial liabilities – 1.2 – 1.2 – 1.1 – 1.1
There have been no transfers between levels of the fair value hierarchy for the years ended 30 June 2016 and 30 June 2015.
77
30 JUN
E 2016 IN
VE
STA
OFFIC
E FU
ND
AN
NU
AL F
INA
NC
IAL R
EP
OR
T

NOTES TO THE CONSOLIDATED FINANCIAL STATEMENTS CONTINUEDFOR THE YEAR ENDED 30 JUNE 2016
22. Fair value measurements (continued)
(a) Fair value hierarchy (continued)
The Group and Prime have a number of assets and liabilities which are not measured at fair value, but for which fair values are disclosed in the notes. These had the following fair values:
Investa Office Fund Prime Credit Property Trust
30 June 2016 30 June 2015 30 June 2016 30 June 2015
Carrying Carrying Carrying Carrying amount Fair value amount Fair value amount Fair value amount Fair value $m $m $m $m $m $m $m $m
Non-current liabilities
Borrowings – MTN 125.0 129.5 125.0 131.0 – – – –
Borrowings – USPPs 437.7 500.8 423.2 444.2 168.3 192.5 162.8 171.4
562.7 630.3 548.2 575.2 168.3 192.5 162.8 171.4
The fair values of non-current borrowings outlined in the table above are estimated by discounting the future contractual cash flows at the current market interest rates that are available to the Group for similar financial instruments. For the year ending 30 June 2016, the borrowing rates were determined to be between 4.0% and 5.4% (30 June 2015: 4.0% and 5.4% respectively), depending on the type of borrowing.
Due to their short-term nature, the carrying amounts of current receivables, current payables, distributions payable and other borrowings are assumed to approximate their fair values. At year end the carrying amount of the non-current loan receivable is $nil (30 June 2015: $114.2 million). At 30 June 2015, the fair value of the non-current loan receivable disclosed in Note 7 was based on future contractual cash flows discounted using the lending rate of 6.4%.
(b) Valuation techniques used to derive level 2 and level 3 fair values
For financial instruments not traded in active markets, the Group uses several valuation techniques. These valuation techniques maximise the use of observable market data where it is available and rely as little as possible on entity specific estimates. If all significant inputs required to fair value the instrument are observable, the instrument is included in level 2.
Financial instruments that use valuation techniques with only observable market inputs or unobservable inputs that are not significant to the overall valuation are all included in level 2. These financial instruments include cross currency swap contracts and interest rate derivatives.
If one or more of the significant inputs is not based on observable market data, the instrument is included in level 3.
Specific valuation techniques used to value financial instruments include:
> The use of quoted market prices or dealer quotes for similar instruments;
> Computing the present value of the estimated future cash flows, based on observable yield curves, to determine the fair value of interest rate swaps;
> Using forward exchange rates at the balance sheet date to determine the fair value of cross currency swaps; and
> Other valuation techniques, such as discounted cash flow analysis, used to determine fair value of other financial instruments.
Based on the investment property valuation process outlined below, the Responsible Entity determines a property’s value within a range of reasonable fair value estimates.
The best evidence of fair value is current prices in an active market for similar properties. Where such information is not available the Directors consider information from a variety of sources including:
> Current prices in an active market for properties of a different nature or recent prices of similar properties in less active markets, adjusted to reflect these differences;
> Discounted cash flow projections on reliable estimates of future cash flows; and
> Capitalised income projections based upon a property’s estimated net market income, and a capitalisation rate derived from an analysis of market evidence.
All resulting fair value estimates for investment properties are included in level 3 due to the unobservable nature of inputs.
30 JUN
E 2016 IN
VE
STA
OFFIC
E FU
ND
AN
NU
AL F
INA
NC
IAL R
EP
OR
T
78
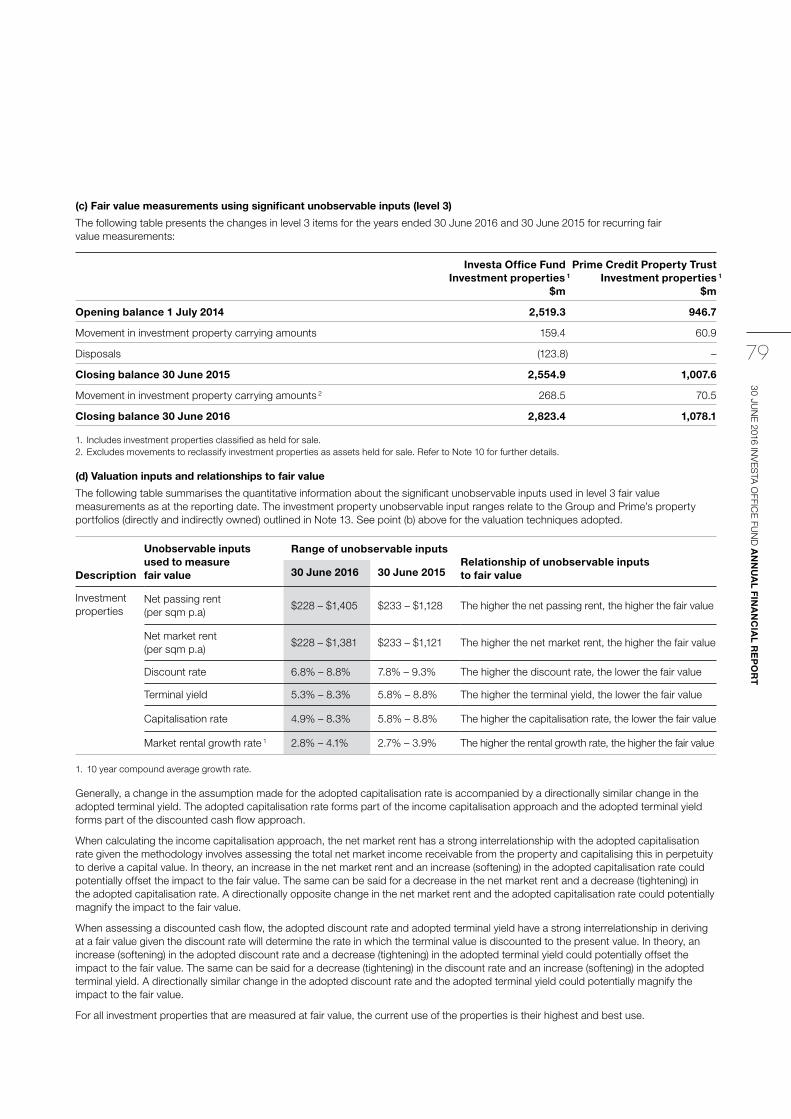
(c) Fair value measurements using significant unobservable inputs (level 3)
The following table presents the changes in level 3 items for the years ended 30 June 2016 and 30 June 2015 for recurring fair value measurements:
Investa Office Fund Prime Credit Property Trust Investment properties 1 Investment properties 1
$m $m
Opening balance 1 July 2014 2,519.3 946.7
Movement in investment property carrying amounts 159.4 60.9
Disposals (123.8) –
Closing balance 30 June 2015 2,554.9 1,007.6
Movement in investment property carrying amounts 2 268.5 70.5
Closing balance 30 June 2016 2,823.4 1,078.1
1. Includes investment properties classified as held for sale.2. Excludes movements to reclassify investment properties as assets held for sale. Refer to Note 10 for further details.
(d) Valuation inputs and relationships to fair value
The following table summarises the quantitative information about the significant unobservable inputs used in level 3 fair value measurements as at the reporting date. The investment property unobservable input ranges relate to the Group and Prime’s property portfolios (directly and indirectly owned) outlined in Note 13. See point (b) above for the valuation techniques adopted.
Description
Unobservable inputs used to measure fair value
Range of unobservable inputs Relationship of unobservable inputs to fair value30 June 2016 30 June 2015
Investment properties
Net passing rent (per sqm p.a)
$228 – $1,405 $233 – $1,128 The higher the net passing rent, the higher the fair value
Net market rent (per sqm p.a)
$228 – $1,381 $233 – $1,121 The higher the net market rent, the higher the fair value
Discount rate 6.8% – 8.8% 7.8% – 9.3% The higher the discount rate, the lower the fair value
Terminal yield 5.3% – 8.3% 5.8% – 8.8% The higher the terminal yield, the lower the fair value
Capitalisation rate 4.9% – 8.3% 5.8% – 8.8% The higher the capitalisation rate, the lower the fair value
Market rental growth rate 1 2.8% – 4.1% 2.7% – 3.9% The higher the rental growth rate, the higher the fair value
1. 10 year compound average growth rate.
Generally, a change in the assumption made for the adopted capitalisation rate is accompanied by a directionally similar change in the adopted terminal yield. The adopted capitalisation rate forms part of the income capitalisation approach and the adopted terminal yield forms part of the discounted cash flow approach.
When calculating the income capitalisation approach, the net market rent has a strong interrelationship with the adopted capitalisation rate given the methodology involves assessing the total net market income receivable from the property and capitalising this in perpetuity to derive a capital value. In theory, an increase in the net market rent and an increase (softening) in the adopted capitalisation rate could potentially offset the impact to the fair value. The same can be said for a decrease in the net market rent and a decrease (tightening) in the adopted capitalisation rate. A directionally opposite change in the net market rent and the adopted capitalisation rate could potentially magnify the impact to the fair value.
When assessing a discounted cash flow, the adopted discount rate and adopted terminal yield have a strong interrelationship in deriving at a fair value given the discount rate will determine the rate in which the terminal value is discounted to the present value. In theory, an increase (softening) in the adopted discount rate and a decrease (tightening) in the adopted terminal yield could potentially offset the impact to the fair value. The same can be said for a decrease (tightening) in the discount rate and an increase (softening) in the adopted terminal yield. A directionally similar change in the adopted discount rate and the adopted terminal yield could potentially magnify the impact to the fair value.
For all investment properties that are measured at fair value, the current use of the properties is their highest and best use.
79
30 JUN
E 2016 IN
VE
STA
OFFIC
E FU
ND
AN
NU
AL F
INA
NC
IAL R
EP
OR
T

NOTES TO THE CONSOLIDATED FINANCIAL STATEMENTS CONTINUEDFOR THE YEAR ENDED 30 JUNE 2016
22. Fair value measurements (continued)
(e) Valuation process
The Responsible Entity valuation policy generally requires all investment properties, whether owned directly or jointly, to be valued by an independent external valuer at least every two years, or more frequently where there has been a significant market movement or where the carrying value is not reflective of the fair value. The Group’s external valuations are performed by independent, professionally qualified valuers who hold a recognised relevant professional qualification and have specialised expertise in valuing investment properties. Where an asset is valued by an independent external valuer, the external valuation is adopted.
Every six months, the Responsible Entity reviews the carrying value to ensure that:
> The Group’s investment property carrying values are best reflective of their fair values;
> The Group is compliant with applicable regulations such as the Corporations Act 2001 and ASIC regulations; and
> The Group is compliant with the Trusts’ Compliance Plan.
The carrying value of an investment property equates to an independent, external valuation. This however may vary due to capital expenditure and the accounting treatment of lease incentives and leasing fees incurred between periods of obtaining an independent, external valuation.
Internal valuations are prepared for all assets with the exception of those assets being independently externally valued within three months of the reporting date. Internal valuations are performed by utilising information from property forecasts to which appropriate capitalisation rates, terminal yields and discount rates based on comparable market evidence and recent external valuation parameters are used to produce capitalisation and discounted cash flow valuations.
Where an asset was independently externally valued within three months of and on the reporting date, a desktop valuation review is performed to assess whether there are any movements in the independent external valuation inputs from the date of the external valuation to the reporting date, that would impact the Responsible Entity’s best estimate of fair value from the most recent independent external valuation.
At the reporting date internal and desktop valuations are reviewed by the Responsible Entity and:
> If the internal valuation is within 5% of the current carrying value, then the carrying value is retained; and
> If the internal valuation differs by more than 5% to the current carrying value, an independent external valuation will be undertaken.
30 JUN
E 2016 IN
VE
STA
OFFIC
E FU
ND
AN
NU
AL F
INA
NC
IAL R
EP
OR
T
80

23. Related parties
(a) Responsible Entity
Investa Listed Funds Management Limited (ILFML) is the Responsible Entity of the Fund and Prime. The Directors of the Responsible Entity are outlined in Note 23(f).
In March 2016 ICPF Holdings Limited (ICPFHL) acquired Investa Office Management Holdings Pty Limited (IOMHPL) from Morgan Stanley Real Estate Investing. IOMHPL is the direct parent of Investa Office Management Pty Limited (IOM), which is the parent entity of ILFML, and of the related management entities that provide asset and property management services to the Group’s investment property portfolio. ICPFHL is stapled to Investa Commercial Property Fund (ICPF), a related party to the Group to form Investa Property Group (IPG).
(b) Responsible Entity and its related parties’ fees
The Responsible Entity fee is based on 0.55% per annum of the Trusts’ market capitalisation, to be paid quarterly. The fee for a quarter cannot change by more or less than 2.5% from the previous quarter’s fee.
During the years ended 30 June 2016 and 30 June 2015, ILFML and its related parties received or will receive the following fees.
Investa Office Prime Credit Fund Property Trust
30 June 30 June 30 June 30 June 2016 2015 2016 2015 000’s 000’s 000’s 000’s
Investa Listed Funds Management Limited:
Responsible Entity’s fees 12,266 11,113 7,152 6,490
Safe custody fees 92 90 47 48
Related parties of the Responsible Entity: 1
Property management fees 3,793 3,947 1,863 2,232
Leasing fees 1,531 2,945 472 1,826
Project management services 1,246 915 842 710
18,928 19,010 10,376 11,306
1. Related parties of ILFML include Investa Asset Management Pty Limited, Investa Asset Management (Qld) Pty Limited and Investa Office Development Pty Limited who earned property management, leasing and project management fees for managing the property interests of the Group during the year. These fees were determined on normal commercial terms and conditions and approved by the Independent Directors.
(c) Other transactions with related parties of the Responsible Entity
567 Collins Street, Melbourne, a premium grade office building was jointly constructed by the Group and ICPF, a related party of the Responsible Entity. Practical completion of this development was achieved on 7 July 2015. The Group had advanced funds to 567 Collins Street Trust, a joint venture entity of the Group, in proportion to its unitholding in the Trust. These funds were used to meet the contracted construction and other related costs. During the year the balance of the advanced funds was converted to an equity investment in 567 Collins Street Trust. During the year ended 30 June 2016 $9,632,774 of interest income (30 June 2015: $7,144,377) was earned by the Group on the advanced balance.
During the year ended 30 June 2016, in proportion to the Group’s ownership interests in this joint venture entity, related parties of ILFML received $1,163,500 (30 June 2015: $1,168,213) in property management, leasing and project management fees for services provided to investment properties held by those joint venture entities.
During the years ended 30 June 2016 and 30 June 2015 the Group received rent and other property income from leasing space to related entities of ILFML. The terms of these lease agreements are based on arms-length conditions and approved by the Independent Directors.
81
30 JUN
E 2016 IN
VE
STA
OFFIC
E FU
ND
AN
NU
AL F
INA
NC
IAL R
EP
OR
T

NOTES TO THE CONSOLIDATED FINANCIAL STATEMENTS CONTINUEDFOR THE YEAR ENDED 30 JUNE 2016
23. Related parties (continued)
(d) Responsible Entity and its related parties’ interest in the Group
ILFML and its related parties had the following interest in the Group and Prime as at the reporting date, and distributions received/receivable for the year then ended:
30 June 2016 Distributions received/receivable
Number of Investa Office Prime Credit units held Fund Property Trust Name 000’s 000’s 000’s
Investa Office Management Holdings Pty Limited 1 5,378 3,787
1 5,378 3,787
30 June 2015 Distributions received/receivable
Number of Investa Office Prime Credit units held Fund Property Trust Name 000’s 000’s 000’s
Investa Office Management Holdings Pty Limited 54,878 8,374 4,885
Post Sale Portfolio Issuer Pty Limited – 2,190 1,261
54,878 10,564 6,146
(e) Cross staple loan
As at 30 June 2016, Prime owed the Fund $nil (30 June 2015: $9,010) via a cross staple loan. For the year ended 30 June 2016 Prime recorded interest income of $nil (30 June 2015: $nil) and an interest expense of $12,006 (30 June 2015: $95,393) on the loan.
(f) Key management personnel
Key management personnel are those persons having authority and responsibility for planning, directing and controlling the activities of the entity, directly or indirectly, including any Director of the Responsible Entity.
The names of the Directors and Alternate Director of the Responsible Entity, and their dates of appointment or resignation if they were not Directors during the whole of the financial year, are:
Richard Longes Independent Non-Executive Chairman (appointed as Director 15 April 2016 and appointed as Chairman 18 April 2016)
John Fast Independent Non-Executive Director (appointed 15 April 2016)
Geoff Kleemann Independent Non-Executive Director (appointed 15 April 2016)
Bob Seidler AM Independent Non-Executive Director (appointed 15 April 2016)
Jonathan Callaghan Executive Director (resigned 28 January 2016 and re-instated 15 April 2016)
Deborah Page AM Independent Non-Executive Chairman (resigned 18 April 2016)
Peter Dodd Independent Non-Executive Director (resigned 18 April 2016)
Peter Rowe Independent Non-Executive Director (resigned 18 April 2016)
Scott MacDonald Non-Executive Director (resigned 31 October 2015)
Campbell Hanan Alternate Director (alternate for Scott MacDonald; ceased 31 October 2015)
The names of key management personnel in addition to the Directors and Alternate Director outlined above include:
Jason Leong Acting Fund Manager (appointed 20 April 2016)
Ming Long Fund Manager (resigned 20 April 2016)
Key management personnel do not receive any remuneration directly from the Group. They receive remuneration from the Responsible Entity or its related parties. Consequently, the Group does not pay any compensation as defined in Accounting Standard AASB 124 Related Parties to its key management personnel.
30 JUN
E 2016 IN
VE
STA
OFFIC
E FU
ND
AN
NU
AL F
INA
NC
IAL R
EP
OR
T
82

Key management personnel, including their related parties, held the following units and distributions received or receivable directly, indirectly or beneficially in each Trust at each year end.
30 June 2016 Distributions received/receivable
Name Prime Balance at Addition/ Acquired Balance at Investa Credit the start of (removal) during the end of Office Property the year of KMP the year the year Fund Trust ’000 ’000 ’000 ’000 $’000 $’000
Deborah Page AM 29 (29) – – 3 2
Peter Dodd 20 (20) – – 2 1
Scott MacDonald 74 (74) – – – –
Ming Long 25 (25) – – 2 2
Campbell Hanan 8 (8) – – – –
30 June 2015 Distributions received/receivable
Name Prime Balance at Addition/ Acquired Balance at Investa Credit the start of (removal) during the end of Office Property the year of KMP the year the year Fund Trust ’000 ’000 ’000 ’000 $’000 $’000
Deborah Page AM 26 – 3 29 6 3
Peter Dodd 20 – – 20 4 2
Scott MacDonald 74 – – 74 14 8
Ming Long 25 – – 25 5 3
Campbell Hanan 8 – – 8 2 1
Toby Phelps 4 (4) – – – –
83
30 JUN
E 2016 IN
VE
STA
OFFIC
E FU
ND
AN
NU
AL F
INA
NC
IAL R
EP
OR
T

NOTES TO THE CONSOLIDATED FINANCIAL STATEMENTS CONTINUEDFOR THE YEAR ENDED 30 JUNE 2016
23. Related parties (continued)
(g) Transactions with equity accounted investments
Receivables and payables from/to equity accounted investments
Investa Office Prime Credit Fund Property Trust
30 June 30 June 30 June 30 June 2016 2015 2016 2015 000’s 000’s 000’s 000’s
Amount receivable from 567 Collins Street Trust – 114,231 – 114,231
Cash distributions received from joint venture entities 29,942 25,353 29,942 25,353
Capital distributions received from joint venture entities – 2,678 – 2,678
Interest income 9,633 7,179 9,633 7,144
Interest expense – 262 – –
Movements in receivables and payables from/(to) equity accounted investments
567 Collins Street Trust
30 June 30 June 2016 2015 000’s 000’s
Balance at beginning of the year 114,231 60,209
Loan advances 76,125 71,700
Loan repayments (27,500) –
Interest received 9,633 7,144
Capital distributions received – 2,678
Conversion of debt investment to equity investment (172,489) (27,500)
Balance at the end of the year – 114,231
24. Auditor’s remuneration
During the year the following fees were paid or payable for services provided by the auditor of the parent entity, its related practices and non-related audit firms:
Investa Office Prime Credit Fund Property Trust
30 June 30 June 30 June 30 June 2016 2015 2016 2015 000’s 000’s 000’s 000’s
PricewaterhouseCoopers
Audit or review of financial reports of the Fund and any other entity in the Group 222 216 111 108
Other advisory and assurance services 210 53 105 41
Total remuneration of PwC 432 269 216 149
30 JUN
E 2016 IN
VE
STA
OFFIC
E FU
ND
AN
NU
AL F
INA
NC
IAL R
EP
OR
T
84

25. Parent financial information
(a) Summary financial information about the parent of each Trust
Armstrong Jones Prime Credit Office Fund Property Trust
30 June 30 June 30 June 30 June 2016 2015 2016 2015 $m $m $m $m
Current assets – 5.4 2.8 1.8
Total assets 2,196.4 1,972.0 1,956.8 1,728.8
Current liabilities (174.2) (57.9) (241.5) (81.8)
Total liabilities (1,039.5) (1,045.4) (517.4) (432.5)
Equity:
Issued units 948.5 948.5 1,193.8 1,193.8
Retained earnings/(accumulated losses) 208.4 (21.9) 245.6 102.5
Total equity 1,156.9 926.6 1,439.4 1,296.3
Net profit attributable to unitholders from:
Continuing operations 270.8 137.4 223.0 143.2
Total comprehensive income 270.8 139.5 223.0 143.2
(b) Capital commitments
Commitments for capital expenditure on investment property contracted by each Trust but not provided at the reporting date were payable as follows:
Armstrong Jones Prime Credit Office Fund Property Trust
30 June 30 June 30 June 30 June 2016 2015 2016 2015 $m $m $m $m
Investment properties 2.7 10.6 0.3 0.8
Investment property under construction
567 Collins Street, Melbourne 1 – – – 56.4
151 Clarence Street, Sydney – – 112.2 –
1. This investment property reached practical completion on 7 July 2015 and is held by an equity accounted investment.
(c) Investments in subsidiaries
During the years ended 30 June 2016 and the 30 June 2015 the principal activity of the subsidiaries continued to consist of investment in commercial property either directly or indirectly through the ownership of units in unlisted property trusts. The subsidiaries of the Fund are incorporated in Australia and Europe, and have a 30 June reporting date. The subsidiaries of Prime are incorporated in Australia and have a 30 June reporting date.
85
30 JUN
E 2016 IN
VE
STA
OFFIC
E FU
ND
AN
NU
AL F
INA
NC
IAL R
EP
OR
T

NOTES TO THE CONSOLIDATED FINANCIAL STATEMENTS CONTINUEDFOR THE YEAR ENDED 30 JUNE 2016
26. Note to the Consolidated Statements of Cash Flows
Reconciliation of profit to net cash flows from operations is as follows:
Armstrong Jones Prime Credit Office Fund Property Trust
30 June 30 June 30 June 30 June 2016 2015 2016 2015 $m $m $m $m
Net profit for the year 493.8 179.2 223.0 143.2
Adjustments for:
Straight-lining of lease revenue 3.6 1.4 (0.7) 0.7
Unrealised foreign exchange gain 14.3 77.7 5.4 30.0
Net loss on disposal of investments – – – –
Net gain on change in fair value of:
Investment properties (233.4) (89.4) (51.4) (24.3)
Derivatives (56.5) (87.8) (20.1) (33.1)
Transfer of foreign currency translation reserve from disposed operations to profit and loss – 104.7 – –
Amortisation of tenant incentives and leasing fees 32.3 29.5 14.8 15.6
Excess of distributions received from equity accounted investments over share of profits (85.6) (42.4) (85.6) (42.4)
Excess of distribution from assets held for sale over share of profits – (0.5) – –
Cost of disposal of assets 0.5 – 0.7 –
Non cash interest income (9.6) (7.1) (9.6) (7.1)
Other non-cash items (15.1) (16.8) (4.5) (6.7)
Net cash provided by operating activities for the year before changes in working capital 144.3 148.5 72.0 75.9
Changes in working capital:
Decrease/(increase) in receivables 5.6 4.5 3.1 (0.5)
Decrease in payables (4.7) (3.2) (3.1) (5.0)
Net cash provided by operating activities from operations 145.2 149.8 72.0 70.4
(a) Non-cash investing and financing activities
Investa Office Prime Credit Fund Property Trust
30 June 30 June 30 June 30 June 2016 2015 2016 2015 $m $m $m $m
Conversion of debt investment to equity investment 172.5 27.5 172.5 27.5
Capital distributions received from equity investment – 2.6 – 2.6
567 Collins Street Trust issued units to Prime during the year ended 30 June 2016 and 30 June 2015. The issue of units was settled through a non-cash transaction, converting $172.5 million (30 June 2015: $27.5 million) of the loan between Prime and 567 Collins Street Trust to equity.
30 JUN
E 2016 IN
VE
STA
OFFIC
E FU
ND
AN
NU
AL F
INA
NC
IAL R
EP
OR
T
86

27. Significant matters affecting the Group
(a) Independent Board Committee (the IBC)
In February 2015, Morgan Stanley Real Estate Investing (Morgan Stanley) commenced a formal sale process of the Management Platform, owned by Investa Office Management Holdings Pty Limited (IOMHPL). IOMHPL is the direct parent of Investa Office Management Pty Limited (IOM), which is the parent entity of the Group’s Responsible Entity, ILFML and of the related management entities that provide asset and property management services to the Group’s investment property portfolio.
The IBC was established in December 2014 in anticipation of the Morgan Stanley sale process. The members of the IBC were the former Independent Directors of ILFML, namely, Deborah Page, Peter Dodd and Peter Rowe. The IBC had advised that it considered various alternatives available to the Group.
On 18 December 2015, ILFML entered into a binding Implementation Agreement with DEXUS in relation to DEXUS’s proposed acquisition of 100% of the units in the Group by way of a trust scheme (DEXUS Proposal). At a unitholder meeting held on 15 April 2016, the DEXUS Proposal failed to receive approval by the requisite majority of IOF Unitholders. As a result, the Implementation Agreement with DEXUS was terminated. The IBC has also been dissolved. Under the terms of the Implementation Agreement, a $23.52 million break fee could be payable by the Group to DEXUS in certain circumstances (as set out in the Implementation Agreement), including where a competing transaction to the DEXUS Proposal is completed by 31 December 2016.
The IBC had appointed several advisors to assist with its strategic review. The Group may be required to pay trailing fees under the mandates with these advisors, if certain events relating to the control or management of the Group occur within specified timeframes. These trailing fees, based on the total assets of the Group as at 30 June 2016 can amount up to $2.8 million in aggregate if an internalisation proposal is approved or implemented or up to $16.1 million in aggregate if there is a change of control of the Group. Any entitlement to trailing fees reduces after 31 May 2017 and ceases on 1 December 2017.
(b) Investa Property Group
In March 2016, ICPF Holdings Limited (ICPFHL) acquired IOMHPL from Morgan Stanley. ICPFHL is stapled to the wholesale unlisted fund, the Investa Commercial Property Fund (ICPF). The stapled ICPF-ICPFHL structure is known as Investa Property Group (IPG). ILFML, the Responsible Entity of the Group has become a subsidiary of ICPFHL.
(c) Rights under the Implementation Deed
The Group holds certain rights under an Implementation Deed between ILFML, IOMHPL and IPGH Pty Limited (IPGH) dated 19 December 2012 and amended on 8 September 2015 (Implementation Deed). These rights include:
> A right to negotiate in good faith in relation to the acquisition of a 50% interest in the Management Platform once the Group is notified that the gross asset value of the commercial office assets of the Group equals or exceeds $3.5 billion (the Due Diligence Commencement Date); and
> A right of first refusal in the event that either IOMHPL wishes to sell an interest in the Management Platform to an unrelated third party at any time prior to the date that is 12 months after the Due Diligence Commencement Date.
On 12 August 2016, the Group received a Certificate of Valuation from IOMHPL confirming that the gross asset value of the commercial office assets of the Group was greater than $3.5 billion. As a result, under the terms of the Implementation Deed, the Group has a 12 month period (that commenced on 12 August 2016) in which it may choose to exercise its right by notifying IOMHPL and commence the process to negotiate the purchase of 50% interest in the Management Platform. IOMHPL has stated the price at which IOMHPL is prepared to sell a 50% interest in the Management Platform as follows:
> If completion of the sale takes place before 28 February 2017, the price is $45.0 million plus agreed working capital and other agreed reimbursement adjustments.
> If completion of the sale takes place after 28 February 2017, the price is the higher of:
> $45.0 million plus agreed working capital and other agreed reimbursement adjustments; and
> The fair market price as at the expected completion date of the sale as determined by an independent expert appointed by IOMHPL (acting reasonably) in consultation with ILFML.
The price mentioned above is also subject to agreement on the various transaction documents to give effect to the sale of the interest and governing the joint venture arrangements.
The Directors will review and consider the Certificate of Valuation within the period allowed under the Implementation Deed.
ILFML will keep IOF unitholders informed in accordance with its Australian Securities Exchange continuous disclosure obligation.
87
30 JUN
E 2016 IN
VE
STA
OFFIC
E FU
ND
AN
NU
AL F
INA
NC
IAL R
EP
OR
T

NOTES TO THE CONSOLIDATED FINANCIAL STATEMENTS CONTINUEDFOR THE YEAR ENDED 30 JUNE 2016
28. Events occurring after the reporting period
Subsequent to 30 June 2016, the Responsible Entity on behalf of the Fund and Prime refinanced the $350.0 million bank debt facility maturing in March 2017 with new bank debt facility agreements of $350.0 million maturing from July 2019 to July 2021.
On 25 July 2016, the Group agreed terms for an 11.5 year lease extension with Telstra at 242 Exhibition Street, Melbourne, a property held by an equity accounted investment that is jointly owned with ICPF. Telstra occupies over 63,000 sqm of the office tower and has extended its lease expiry from May 2020 to October 2031. This lease extension provides income stability and secures the long-term outlook for the asset.
The Directors of the Responsible Entity are not aware of any other matter or circumstance not otherwise dealt with within this financial report that has significantly affected or may significantly affect the operations of the Group or Prime, the results of those operations, or state of the Group’s or Prime’s affairs in future financial periods.
30 JUN
E 2016 IN
VE
STA
OFFIC
E FU
ND
AN
NU
AL F
INA
NC
IAL R
EP
OR
T
88

In the opinion of the Directors of Investa Listed Funds Management Limited, the Responsible Entity of Armstrong Jones Office Fund and Prime Credit Property Trust:
(a) The Consolidated Financial Statements and notes set out on pages 35 to 88 are in accordance with the Corporations Act 2001, including:
(i) Complying with Accounting Standards, the Corporations Regulations 2001 and other mandatory professional reporting requirements; and
(ii) Giving a true and fair view of each of, the Group and Prime Credit Property Trust’s consolidated financial position as at 30 June 2016 and of their performance for the year ended on that date; and
(b) There are reasonable grounds to believe that each of Armstrong Jones Office Fund and Prime Credit Property Trust will be able to pay their debts as and when they become due and payable.
Note 1 confirms that the Consolidated Financial Statements also comply with International Financial Reporting Standards as issued by the International Accounting Standards Board.
This declaration has been made in accordance with a resolution of the Directors of Investa Listed Funds Management Limited as the Responsible Entity of Armstrong Jones Office Fund and Prime Credit Property Trust and after receiving the declarations required to be made by the Chief Executive Officer and Chief Financial Officer to the Directors in accordance with section 295A of the Corporations Act 2001 for the year ending 30 June 2016.
RA LongesChairmanSydney
18 August 2016
DIRECTORS’ DECLARATION
89
30 JUN
E 2016 IN
VE
STA
OFFIC
E FU
ND
AN
NU
AL F
INA
NC
IAL R
EP
OR
T

INDEPENDENT AUDITOR’S REPORTTO THE STAPLED SECURITYHOLDERS OF INVESTA OFFICE FUND AND THE UNITHOLDERS OF PRIME CREDIT PROPERTY TRUST
30 JUN
E 2016 IN
VE
STA
OFFIC
E FU
ND
AN
NU
AL F
INA
NC
IAL R
EP
OR
T
90

91
30 JUN
E 2016 IN
VE
STA
OFFIC
E FU
ND
AN
NU
AL F
INA
NC
IAL R
EP
OR
T

INVESTOR RELATIONS
The IOF website, www.investa.com.au/IOF, contains important information on the Fund including recent annual reports and Australian Securities Exchanges (ASX) announcements historical information about distributions paid unit pricing and units on issue. While visiting the site, unitholders can access Link Market Services’ website, the registry provider for IOF. Link Market Services manages the IOF unit registry and can assist with investment details including holding balances and payment history.Approach to Investor Relations
The Fund’s unitholder base is made up of both institutional and private investors. The management team regularly engages and communicates with all investors through a specific schedule undertaken throughout the year. This includes the results presentations, immediately following the release of the financial statements to the ASX in August and February each year, which provide investors with a detailed overview of the Fund’s performance for the relevant period.
Unitholders
Our private unitholders are a valued part of our unitholder base and are actively encouraged to provide feedback and communicate throughout the year.
Our institutional unitholders constitute a large majority of IOF’s unitholder base and are provided with opportunities to provide feedback and communicate with management via our annual reporting schedule.
Annual General Meeting
The Annual General Meeting provides all unitholders with an opportunity to engage directly with the Directors and senior management, and to question the Board and Chairman on matters relating to the business of the Fund. A detailed presentation on the performance and management of the Fund is lodged with the ASX and delivered by the Fund Manager and Chairman at the meeting.
Annual reporting suite
During the year unitholders are also provided with Fund updates via the annual reporting suite and the half year review. Any material announcements during the year are lodged with the ASX and are available on the ASX website and the IOF website www.investa.com.au/IOF
Roadshows and investor meetings
Undertaken after the Fund’s results presentation each year, management provides an opportunity for investors, analysts and the media to meet one-on-one or in small forums directly with senior management of the Fund throughout Australia, Asia, US and Europe.
www.investa.com.au/IOF
Industry conferences
Throughout the year management promotes the Fund by attending various industry conferences, meeting with existing and potential investors and providing further clarification on the Fund’s operations, strategy and competitive advantage.
ASX listing
Investa Office Fund is listed on the ASX. The ASX code for the Fund is “IOF”. Units in the Fund trade on the ASX in the same manner as shares in a listed company. Unitholders wishing to trade their units will need to use the services of a stockbroker or online broking facility.
Annual taxation statement
The Fund produces the annual tax statement at the end of August each year. This statement advises the taxable income for the financial year ended 30 June. Unitholders may view their financial year 2016 annual taxation statement by visiting www.investa.com.au/IOF and accessing “Investor Login” on the landing page.
Distribution payments
The Fund pays distributions half-yearly in August and February. Distribution payments to unitholders with registered addresses in Australia will only be made by direct credit to their nominated bank account. Unitholders with registered addresses outside of Australia will receive payment by the method they have nominated.
You will continue to receive a distribution statement in the form nominated by you (electronic or paper) for your tax records. Please provide details of your nominated bank account to our share registrar, Link Market Services. If your banking instructions are not received by the record date for each distribution, your distribution payment will be retained by Investa Office Fund until your banking instructions are received, after which the full amount will be paid into your nominated bank account.
Distribution reinvestment plan
The distribution reinvestment plan (DRP) is currently switched off. Should this change, an ASX announcement will be made to the market and participation forms will be sent to unitholders.
On-market buy back
There is no current on-market buy back.
Disposal and acquisition of stapled securities
Investa Office Fund is a stapled security consisting of units in both PCP Trust and AJO Fund. The sale (or acquisition) of units in IOF represents the sale (or acquisition) of separate interests in each of the two entities. For capital gains tax purposes, the acquisition costs and disposal proceeds need to be apportioned to each of the two entities, using a reasonable basis of apportionment.
30 JUN
E 2016 IN
VE
STA
OFFIC
E FU
ND
AN
NU
AL F
INA
NC
IAL R
EP
OR
T
92

Distribution paid for half year ended June 30 2016
31 August 2016
FY16 Annual Taxation Statements available
31 August 2016
Annual General Meeting 20 October 2016
Half year results for six months to 31 December 2016 released to ASX
23 February 2017
Distribution payment for half year ended 31 December 2016
28 February 2017
Annual results for year to 30 June 2017 released to ASX
17 August 2017
Distribution paid for half year ended 30 June 2017
31 August 2017
FY17 Annual Taxation Statements available
31 August 2017
FY17 Annual Report available September 2017
31 December 2015 30 June 2016
PCP Trust 56.6% 55.5%
AJO Fund 43.4% 44.6%
Units on issue
The number of IOF units on issue currently stands at 614,047,458.
Unitholder meetings
The Annual General Meeting of unitholders of IOF is currently scheduled to be held in October 2016. All unitholders will be sent a Notice of Meeting approximately one month in advance to advise of the agenda and venue for the meeting. Details of the location will also be made available on the IOF website. Additional unitholder meetings may occur at other times during the year and unitholders will be advised in writing of the details.
2016/2017 Key dates1
Enquiries
If a unitholder wishes to advise of a change of address, altered or closed bank account to which distributions are directed, or wishes to advise a tax file number, then please contact IOF’s registry provider as follows:
Link Market Services Limited Locked Bag A14 Sydney South NSW 1235 Phone: Freecall (+61) 1300 851 394 Fax: +61 2 9287 0303 Email: [email protected] Website: www.linkmarketservices.com.au
Enquiries about IOF can be directed to the Investor Relations representative as follows:
Investa Property Group Level 6 Deutsche Bank Place 126 Phillip Street Sydney NSW 2000 Phone: Freecall 1300 130 231 (within Australia) or +61 2 8226 9497 (outside Australia) Fax: +61 2 9844 9360 Email: [email protected]
Complaints
Any unitholder wishing to register a complaint should direct it to the Investor Relations representative of ILFML in the first instance.
Investor Relations RepresentativeInvesta Listed Funds Management LimitedLevel 6 Deutsche Bank Place126 Phillip StreetSydney NSW 2000Phone: 1300 130 231 (within Australia)or +61 2 8226 9497 (outside Australia)Fax: +61 2 9844 9300Email: [email protected]
Investa Listed Funds Management Limited is a member of an independent dispute resolution scheme, the FinancialOmbudsman Service (FOS). If a unitholder believes that a complaint remains unresolved or wishes that it is further investigated, the FOS can be contacted as below:
Financial Ombudsman Service
GPO Box 3Melbourne VIC 3001Phone: 1300 780 808Fax: +61 3 9613 6399Email: [email protected]
Investa Listed Funds Management Limited is committed to ensuring the confidentiality and security of personal information.
1. These timings are indicative only and subject to change.
One possible method of apportionment is on the basis of the relative net assets (excluding minority interest) of the individual entities comprising IOF, which are out in the following table as at 31 December 2015 and 30 June 2016.
93
30 JUN
E 2016 IN
VE
STA
OFFIC
E FU
ND
AN
NU
AL F
INA
NC
IAL R
EP
OR
T

THE TOP 20 AND SUBSTANTIAL HOLDINGS
RANK NAME 31 AUG 2016 %
1 HSBC CUSTODY NOMINEES (AUSTRALIA) LIMITED 143,807,558 23.42
2 J P MORGAN NOMINEES AUSTRALIA LIMITED 100,620,211 16.39
3 MERRILL LYNCH (AUSTRALIA) NOMINEES PTY LIMITED 60,377,886 9.83
4 CITICORP NOMINEES PTY LIMITED 53,425,094 8.70
5 NATIONAL NOMINEES LIMITED 51,952,858 8.46
6 POST SALE PORTFOLIO ISSUER PTY LIMITED 31,942,406 5.20
7 POST SALE PORTFOLIO ISSUER PTY LIMITED 22,936,049 3.74
8 BNP PARIBAS NOMS PTY LIMITED 20,212,273 3.29
9 HSBC CUSTODY NOMINEES (AUSTRALIA) LIMITED - A/C 2 6,913,104 1.13
10 CITICORP NOMINEES PTY LIMITED 6,617,469 1.08
11 AMP LIFE LIMITED 5,704,335 0.93
12 BNP PARIBAS NOMINEES PTY LIMITED 5,310,649 0.86
13 IOOF INVESTMENT MANAGEMENT LIMITED 5,279,222 0.86
14 RBC INVESTOR SERVICES AUSTRALIA NOMINEES PTY LIMITED 4,090,631 0.67
15 RBC INVESTOR SERVICES AUSTRALIA NOMINEES PTY LIMITED 3,287,090 0.54
16 HSBC CUSTODY NOMINEES (AUSTRALIA) LIMITED 2,637,863 0.43
17 SANDHURST TRUSTEES LIMITED 1,943,210 0.32
18 CS FOURTH NOMINEES PTY LIMITED 1,691,494 0.28
19 BRISPOT NOMINEES PTY LIMITED 1,672,552 0.27
20 BOND STREET CUSTODIANS LIMITED 1,510,562 0.25
Total 531,932,516 86.63
Balance of register 82,114,942 13.37
Grand total 614,047,458 100.00
Top 20 holdings
30 JUN
E 2016 IN
VE
STA
OFFIC
E FU
ND
AN
NU
AL F
INA
NC
IAL R
EP
OR
T
94

EFFECTIVE DATE NAME NUMBER OF UNITS %
1 March 2016 Morgan Stanley and its subsidiaries 72,432,929 11.80
12 April 2016 Cromwell Property Group 61,404,600 9.99
8 March 2016 The Vanguard Group, Inc 50,058,157 8.15
8 May 2015 State Street Corporation 34,229,024 5.57
RANGE SECURITIES % NO. OF HOLDERS
100,001 and Over 550,490,633 89.65 74
50,001 to 100,000 3,158,435 0.51 48
10,001 to 50,000 22,687,252 3.69 1,323
5,001 to 10,000 18,313,455 2.98 2,592
1,001 to 5,000 17,775,276 2.89 6,406
1 to 1,000 1,622,407 0.26 3,380
Total 614,047,458 100.00 13,823
Unmarketable Parcels 5,835 0.00 335
Holdings distribution
Substantial holdings
The table below gives details of the last notice for each substantial unitholder lodged with the Australian Securities Exchange to 31 August 2016.
95
30 JUN
E 2016 IN
VE
STA
OFFIC
E FU
ND
AN
NU
AL F
INA
NC
IAL R
EP
OR
T

GLOSSARY
TERM MEANING
AASB Australian Accounting Standards Board
AIFRS Australian equivalents to International Financial Reporting Standards
AJO Fund Armstrong Jones Office Fund (ARSN 090 242 229)
ASX ASX Limited (ACN 008 624 691) trading as Australian Securities Exchange, which is the main Australian marketplace for the trading of equities, government bonds and other fixed interest securities.
AUM Assets under management
Board The Board of Directors of the Responsible Entity
Bps or basis points A basis point is a common unit of measure for interest rates and other percentages. One basis point is equal to 1/100th of 1%, or 0.01% (0.0001), and is used to denote the percentage change in a financial instrument.
CBD Central Business District refers to the business and financial area of an Australian state capital city.
CDP Carbon Disclosure Project is an independent not-for-profit organisation that works with investors, businesses and governments to benchmark organisations’ greenhouse gas emissions.
Corporations Act Corporations Act 2001 (Cth)
Directors Directors of the Responsible Entity
DPU Distributions per unit
ESG Environmental, Social, and Governance
FFO Property Council Funds From Operations defined as the Fund’s underlying and recurring earnings from its operations, determined by adjusting statutory net profit (under AIFRS) for non-cash and other items such as the amortisation of tenant incentives and rent free periods, fair value gains/losses on investment property, fair value gains/losses on the mark to market of derivatives, the straight-lining of rent, non-FFO deferred tax benefits and expenses, foreign currency translation reserves recognised in net profit, and any other unrealised or one-off items.
FY Financial Year
GRESB Global Real Estate Sustainability Benchmark, from the GRESB Foundation, an investor-led organisation committed to assessing the sustainability performance of real estate portfolios around the globe.
GRI Global Reporting Initiative are voluntary international reporting guidelines to ensure completeness, transparency, materiality and boundary setting of corporate reporting. A ‘GRI Index’ covers environmental, social and financial report contents.
ILFML Investa Listed Funds Management Limited (ACN 149 175 655)
30 JUN
E 2016 IN
VE
STA
OFFIC
E FU
ND
AN
NU
AL F
INA
NC
IAL R
EP
OR
T
96

TERM MEANING
Independent Directors The Directors of the Responsible Entity who are external directors within the meaning of section 601JA(2) of the Corporations Act. As at the date of this Report, the Independent Directors are Richard Longes, John Fast, Geoff Kleemann and Bob Seidler AM.
Investa, Investa Office or the manager
IOM and its subsidiaries (which include the Responsible Entity), which operates the Management Platform.
Investa Sustainability Institute (ISI) Investa Office established ISI in 2009 to facilitate action research for sustainability in the built environment. ISI engages in collaborative ventures between Investa Office and organisations with shared interests including academia, industry and professional bodies and government.
IOF or the Fund Investa Office Fund (ASX: IOF), which comprises of the AJO Fund and the PCP Trust.
IOM Investa Office Management Pty Limited (ACN 161 345 065)
IPG Investa Property Group
Management Platform The management platform operated by Investa Office is an integrated property platform incorporating property services, funds, portfolio and asset management services and development and sustainability services.
NABERS National Australian Built Environment Ratings System, is a national rating system that measures the environmental performance of Australian buildings, tenancies, homes, shopping centres and hotels.
NLA Net Lettable Area
Non-AAS measure A financial measure not in accordance with Australian Accounting Standards.
NTA Net Tangible Assets
Operating earnings A non-AAS measure used by the Responsible Entity to measure underlying performance of the Group prior to FY13. To calculate operating earnings, net profit attributable to unitholders is adjusted to exclude unrealised gains or losses, certain non-cash items, fair value gains or losses on investments and other amounts that are non-recurring or capital in nature.
PCP Trust Prime Credit Property Trust (ARSN 089 849 196)
Responsible Entity or RE Investa Listed Funds Management Limited (ACN 149 175 655)
S&P Standard & Poor’s
Unit A stapled security in IOF consisting of one unit in AJO Fund stapled to one unit in PCP Trust or a unit in AJO Fund or PCP Trust, as the context requires.
United Nations Principles for Responsible Investment
United Nations Principles for Responsible Investment, proclaimed by the UN Secretary-General in 2005 are put into practice through a voluntary framework for investors to incorporate ESG issues into decision-making and ownership practices.
USPP US Private Placement
97
30 JUN
E 2016 IN
VE
STA
OFFIC
E FU
ND
AN
NU
AL F
INA
NC
IAL R
EP
OR
T

CORPORATE DIRECTORY
Investa Office FundArmstrong Jones Office FundARSN 090 242 229
Prime Credit Property TrustARSN 089 849 196
Responsible EntityInvesta Listed Funds Management Limited (ILFML)ACN 149 175 655 AFSL 401414
Registered OfficeDeutsche Bank PlaceLevel 6, 126 Phillip StreetSydney NSW 2000 Australia
Phone: +61 2 8226 9300Fax: +61 2 9844 9300
Email: [email protected]: www.investa.com.au/IOF
Directors of ILFMLRichard Longes (Chairman)John FastGeoff KleemannBob Seidler AMJonathan Callaghan
IOF Fund ManagerJason Leong (Acting Fund Manager until 22 August 2016)Penny Ransom (Fund Manager from 22 August 2016)
Company SecretaryIvan Gorridge
ASX CodeIOF
Unit RegistryLink Market Services LimitedLevel 12, 680 George StreetSydney NSW 2000
Locked Bag A14Sydney South NSW 1235Phone: +61 1300 851 394 (local call cost)or: +61 1300 851 394 (outside Australia)Fax: +61 2 9287 0303
Email: [email protected]
AuditorsPricewaterhouseCoopersDarling Park Tower 2201 Sussex Street,Sydney NSW 2000
Disclaimer
This Annual Financial Report (Report) was prepared by Investa Listed Funds Management Limited (ACN 149 175 655 and AFSL 401414) (the Responsible Entity) on behalf of the Investa Office Fund (ASX: IOF) (IOF), which comprises the Prime Credit Property Trust (ARSN 089 849 196) and the Armstrong Jones Office Fund (ARSN 090 242 229). Information contained in this Report is current as at 30 June 2016 unless otherwise stated.
This Report is provided for general information purposes only and has been prepared without taking account of any particular reader’s financial situation, objectives or needs. Nothing contained in this Report constitutes investment, legal, tax or other advice. Accordingly, readers should conduct their own due diligence in relation to any information contained in this Report and, before acting on any information in this Report, consider its appropriateness, having regard to their objectives, financial situation and needs, and seek the assistance of their financial or other licensed professional adviser before making any investment decision.
Except as required by law, no representation or warranty, express or implied, is made as to the fairness, accuracy or completeness of the information, opinions and conclusions, or as to the reasonableness of any assumption, contained in this Report. By reading this Report and to the extent permitted by law, the reader releases the Responsible Entity, IOF, each of their related entities and affiliates (together, the Investa Property Group), and the directors, officers, employees, agents, representatives and advisers of any member of the Investa Property Group from any liability (including, without limitation, in respect of direct, indirect or consequential loss or damage arising by negligence) arising in relation to any reader relying on anything contained in or omitted from this Report.
This Report may include forward-looking statements, which are not guarantees or predictions of future performance. Any forward-looking statements contained in this Report involve known and unknown risks and uncertainties which may cause actual results to differ from those contained in this Report. Past performance is not an indication of future performance. As such, any past performance information in this document is illustrative only and should not be relied upon.
Any investment in IOF is subject to investment and other known and unknown risks, some of which are beyond its control. The Responsible Entity does not guarantee the performance of IOF, any particular rate of return, the repayment of capital or any particular tax treatment.
This Report does not constitute an offer, invitation, solicitation or recommendation with respect to the subscription for, purchase or sale of any security, nor does it form the basis of any contract or commitment.
30 JUN
E 2016 IN
VE
STA
OFFIC
E FU
ND
AN
NU
AL F
INA
NC
IAL R
EP
OR
T
98

126 Phillip Street, Sydney

Contact detailsIf you have any questions regarding IOF’s reporting or in relation to your unitholding, please call the Investa information line on +61 1300 851 394.
Further details about the Fund can be accessed and downloaded at www.investa.com.au/IOF
The first choice in Australian Office


![Woolworths Limited [2013] SALC 23](https://static.fdocuments.in/doc/165x107/61f2476a9d684774a016a9bb/woolworths-limited-2013-salc-23.jpg)