Annual financial report at 31 December 2012 · 2014-08-08 · Annex 1: Attestation of the...
182
1 Annual financial report at 31 December 2012
Transcript of Annual financial report at 31 December 2012 · 2014-08-08 · Annex 1: Attestation of the...

1
Annual financial report at 31 December 2012

2

3
Contents
Page
Composition of corporate bodies 3
Board of Directors' Report for 2012 5
Consolidated financial statements at 31/12/2012 29
Consolidated balance sheet 30
Consolidated income statements for the year 32
Comprehensive consolidated income statements for the year 33
Consolidated cash flow statement 34
Statement of changes in consolidated equity 36
Notes to the annual financial report 37
1. General Information 37
2. Scope of consolidation 37
3. Accounting principles 39 3.1 Reference Accounting Principles 39 3.1.1 Accounting principles, amendments and interpretations in force
from 1 January 2012 40 3.1.2 Accounting principles, amendments and interpretations not
yet applicable and not adopted early by the Group 40 3.1.3 New accounting principles and amendments in force
from 1st January 2012 but not relevant for the Group 42 3.2 Consolidation principles 42 3.3 Business sector information 43 3.4 Treatment of foreign currency transactions 43 3.5 Non-current assets (held for sale)
and discontinued operations 44 3.6 Property, plant and equipment 44 3.7 Goodwill 45 3.8 Other intangible assets 45 3.9 Impairment of assets 46 3.10 Investments 47 3.11 Cash and cash equivalents 48 3.12 Current financial assets, receivables and other current assets 48 3.13 Derivative financial instruments 48 3.14 Inventories 49 3.15 Share capital and Treasury stock 49 3.16 Interest-bearing financial payables 50 3.17 Liabilities for employee benefits 50 3.18 Income taxes 51 3.19 Provisions for risks and charges 51 3.20 Current financial liabilities, trade payables and other debts 52 3.21 Revenues 52

4
3.22 Costs 52
4. Financial risk management 52
5. Discontinued operations 54
6. Business sector information 54
7. Acquisition of investments 59
8. Cash and cash equivalents 63
9. Trade receivables 63
10. Inventories 64
11. Derivative financial instruments 64
12. Assets held for sale 68
13. Other current assets 69
14. Property, plant and equipment 69
15. Goodwill 70
16. Other intangible assets 71
17. Other financial assets 72
18. Deferred tax assets and liabilities 74
19. Interest-bearing financial payables and bank payables 75
20. Other current liabilities 76
21. Provisions for risks and charges 76
22. Liabilities for employee benefits 77
23. Share capital 78
24. Reserves 84
25. Minority shareholders' equity 86
26. Other net revenues 86
27. Costs by nature 87
28. Directors' and statutory auditors' remuneration 87
29. Financial income and charges 88
30. Income taxes 88
31. Earnings per share 90
32. Information on financial assets and liabilities 91
33. Information on financial risks 92
34. Notes to the cash flow statement 97
35. Commitments 98
36. Transactions with related parties 98
37. Events occurring after the close of the year 101
Annex 1: Attestation of the consolidated financial statements pursuant to art. 81-ter of Consob regulation no.11971 of 14 May 1999 as amended 102
Report of the board of statutory auditors on the consolidated financial statements 103
Auditing report on the consolidated financial statements 104

5
Board of Directors
Giovanni Cavallini
Fulvio Montipò
Deputy Chairman and Director Executive
Paolo Marinsek Director Executive
Salvatore Bragantini (c) Independent Director
Franco Cattaneo (a), (b), (c)
Independent Director
Sergio Erede Non-executive Director
Giuseppe Ferrero
Non-executive Director
Giancarlo Mocchi (a) Non-executive Director
Marco Reboa (a), (b), (c)
Independent Director
Giovanni Tamburi (b) Non-executive Director
Board of Statutory Auditors
Enrico Cervellera
Chairman
Achille Delmonte Statutory Auditor
Paolo Scarioni
Statutory Auditor
Independent Auditors
PricewaterhouseCoopers S.p.A.
(a) Member of the Audit and Risks Committee (b) Member of the Remuneration Committee
(c) Member of the Related Party Transactions Committee
Chairman

6

7
Board of Directors' Report for 2012
6
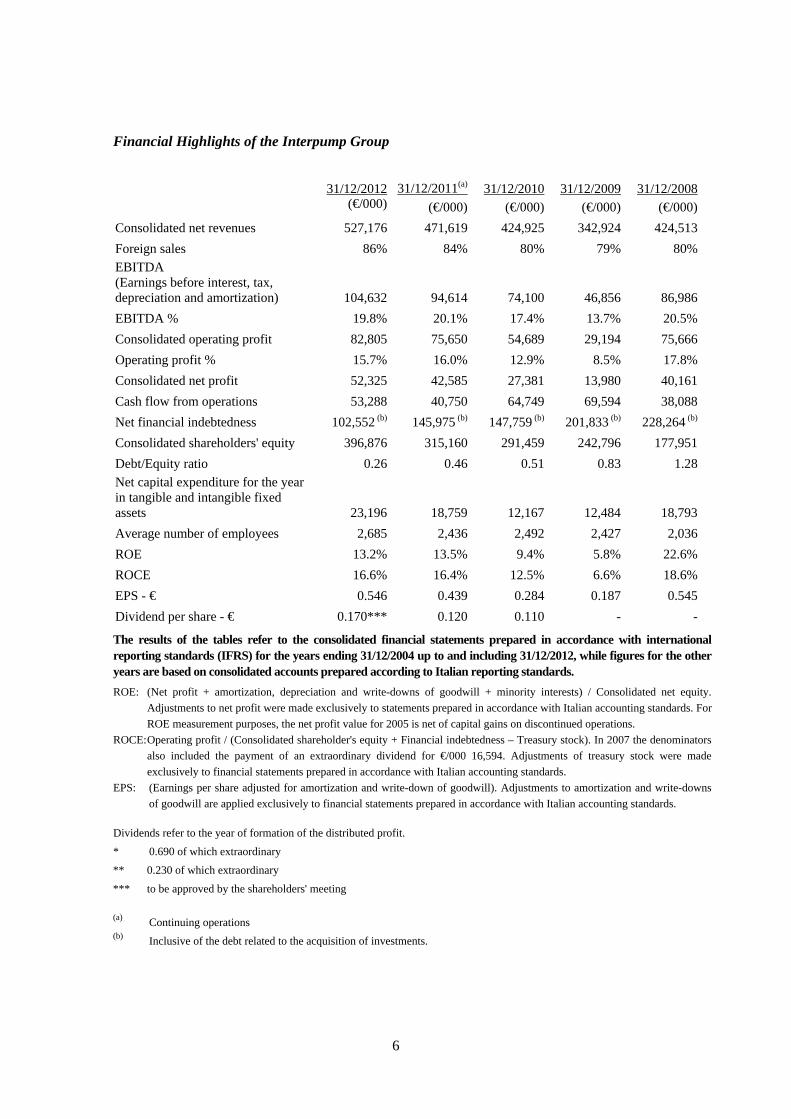
Financial Highlights of the Interpump Group
31/12/2012 31/12/2011(a) 31/12/2010
31/12/2009 31/12/2008 (€/000) (€/000) (€/000) (€/000) (€/000)
Consolidated net revenues 527,176 471,619 424,925 342,924 424,513
Foreign sales 86% 84% 80% 79% 80%EBITDA (Earnings before interest, tax, depreciation and amortization) 104,632 94,614 74,100 46,856 86,986
EBITDA % 19.8% 20.1% 17.4% 13.7% 20.5%
Consolidated operating profit 82,805 75,650 54,689 29,194 75,666
Operating profit % 15.7% 16.0% 12.9% 8.5% 17.8%
Consolidated net profit 52,325 42,585 27,381 13,980 40,161
Cash flow from operations 53,288 40,750 64,749 69,594 38,088
Net financial indebtedness 102,552 (b) 145,975 (b) 147,759 (b) 201,833 (b) 228,264 (b)
Consolidated shareholders' equity 396,876 315,160 291,459 242,796 177,951
Debt/Equity ratio 0.26 0.46 0.51 0.83 1.28Net capital expenditure for the year in tangible and intangible fixed assets 23,196 18,759 12,167 12,484 18,793
Average number of employees 2,685 2,436 2,492 2,427 2,036
ROE 13.2% 13.5% 9.4% 5.8% 22.6%
ROCE 16.6% 16.4% 12.5% 6.6% 18.6%
EPS - € 0.546 0.439 0.284 0.187 0.545
Dividend per share - € 0.170*** 0.120 0.110 - - The results of the tables refer to the consolidated financial statements prepared in accordance with international reporting standards (IFRS) for the years ending 31/12/2004 up to and including 31/12/2012, while figures for the other years are based on consolidated accounts prepared according to Italian reporting standards.
ROE: (Net profit + amortization, depreciation and write-downs of goodwill + minority interests) / Consolidated net equity.
Adjustments to net profit were made exclusively to statements prepared in accordance with Italian accounting standards. For
ROE measurement purposes, the net profit value for 2005 is net of capital gains on discontinued operations.
ROCE: Operating profit / (Consolidated shareholder's equity + Financial indebtedness – Treasury stock). In 2007 the denominators
also included the payment of an extraordinary dividend for €/000 16,594. Adjustments of treasury stock were made
exclusively to financial statements prepared in accordance with Italian accounting standards.
EPS: (Earnings per share adjusted for amortization and write-down of goodwill). Adjustments to amortization and write-downs
of goodwill are applied exclusively to financial statements prepared in accordance with Italian accounting standards.
Dividends refer to the year of formation of the distributed profit.
* 0.690 of which extraordinary
** 0.230 of which extraordinary
*** to be approved by the shareholders' meeting
(a) Continuing operations (b) Inclusive of the debt related to the acquisition of investments.

7
31/12/2007 31/12/2006 31/12/2005 31/12/2004 31/12/2003
(€/000) (€/000) (€/000) (€/000) (€/000)
Consolidated net revenues 432,195 364,876 331,608 531,745 501,721
Foreign sales 79% 76% 74% 76% 79%EBITDA (Earnings before interest, tax, depreciation and amortization) 94,255 79,144 67,985 77,329 75,267
EBITDA % 21.8% 21.7% 20.5% 14.5% 15.0%
Consolidated operating profit 82,231 69,715 57,384 60,488 59,181
Operating profit % 19.0% 19.1% 17.3% 11.4% 11.8%
Consolidated net profit 42,913 41,592 27,074 19,726 14,253
Cash flow from operations 44,698 37,876 31,705 17,493 35,474
Net financial indebtedness 186,173 137,464 127,701 211,633 205,616
Consolidated shareholders' equity 147,131 155,888 156,679 179,855 173,797
Debt/Equity ratio 1.38 0.88 0.82 1.18 1.18Net capital expenditure for the year in tangible and intangible fixed assets 13,831 13,066 8,100 18,008 19,527
Average number of employees 1,882 1,617 1,589 2,360 2,363
ROE 29.2% 26.6% 17.3% 11.0% 15.7%
ROCE 23.5% 23.8% 20.2% 15.4% 17.1%
EPS - € 0.567 0.542 0.363 0.322 0.315
Dividend per share - € 0.430** 0.180 0.840* 0.130 0.120

8
MAIN EVENTS OF THE YEAR 2012 saw the first consolidation of newly acquired companies Galtech S.p.A., Takarada Industria e Comercio Ltda (Brazil), M.T.C. S.r.l., brought into the Group at the start of 2012; the basis of consolidation also includes full twelve-month data for American Mobile Power Inc. (USA), which was acquired in April 2011 and which was therefore consolidated for only nine months in 2011. For greater clarity in the definition of the specific activities, the Group has decided to designate the Industrial Sector as the Water Jetting Sector. 2012 was characterised by an 11.8% rise in sales with respect to continuing operations in 2011 (excluding the Electric Motors Sector, which was divested in September 2011 and without the investment in Hydrocar Roma, divested in July 2012). On a like for like basis the increase was 6.1%. A breakdown by business sector shows the Hydraulic Sector growing by 12.4% (+0.6% on a like for like basis) and a rise of 11.2% for the Water Jetting Sector. The breakdown by geographical area displays differentiated growth figures: North America showed the most consistent growth (+21.0% and +18.7% like for like) followed by the Pacific Area and the Rest of the World, which overall grew by 16.6% (+6.9% like for like) as a consequence of rising GDP in the countries in question. In contrast, Italy saw a 5.9% drop in sales (-13.0% like for like) due to the difficulties afflicting the domestic economy, while the rest of Europe grew by 7.4% (+1.5% like for like). EBITDA reached €104.6 million (19.8% of sales) versus €94.6 million in 2011 (20.1% of sales) thus up by 10.6% and establishing the best result in absolute value of the Interpump Group for the second year running. EBITDA adjusted for non-recurring expenses was €105.6 million (20.0% of sales), with an increase of 11.6%. Net profit totalled €52.3 million, 22.9% higher than the figure of €42.6 million recorded for 2011. In June 2012 a total of 4,712,160 warrants were exercised, with the consequent subscription of 2,896,015 new ordinary shares for total value of €14,477,178.89 of which €1,505,927.8 by way of share capital and €12,971,251.18 by way of a premium. At October 2012 a further 13,528,608 warrants were exercised with the relative subscription of 8,314,457 new ordinary shares for a total value of €42,403,730.70 of which €4,323,517.64 by way of share capital and €38,080,213.06 by way of premium. The new share capital is therefore composed of 108,879,294 ordinary shares with a unit face value of €0.52 for the total amount of €56,617,232.88. The success of the capital increase following exercise of the warrants both confirms the confidence of our shareholders at a time of great uncertainty in terms of macroeconomic developments and has also boosted the Interpump Group's equity strength, with positive effects on the rating, further making it possible to access new financial resources that can be used to speed up the Group's growth and development process. The Group intensified its initiatives for external growth during the period. On 18 January 2012 the Group acquired M.T.C., a company engaged in the production and sale of directional control valves and a range of other hydraulic valves based in the north Italian

9
province of Reggio Emilia. In 2011 M.T.C. recorded sales of €5.7 million (€5.3 million in 2012) and booked EBITDA of €1.4 million or 23.9% of sales (€1.0 million in 2012, equivalent to 19.3% of sales). At 31 December 2011 the company's net cash position was €0.6 million (€0.8 million on 31 December 2012). A total cash price of €3.0 million was disbursed to acquire 60% of MTC's capital stock. The sellers are entitled to dispose of the remaining 40% from the date of approval of the 2014 financial statements until the date of approval of the 2025 financial statements. On 31 January 2012 the Group acquired Galtech, a Reggio Emilia based company operating in the production and sale of gear pumps and motors, directional control valves, hydraulic accessories and components in general. In 2011 the company recorded €15.0 million of sales (€15.0 million also in 2012), while adjusted EBITDA was negative in the amount of €0.3 million (a positive figure of €0.5 million was booked in 2012). At 31 December 2011 the company's financial debt was €1.7 million (€0.8 million at 31 December 2012). The acquisition of 53% of Galtech's share capital was achieved for a total price of €3.3 million, paid half in cash and half with no. 300,831 Interpump Group S.p.A. treasury shares. The sellers are entitled to divest the remaining 47% from the date of approval of the 2014 financial statements until the date of approval of the 2025 financial statements. The operations of Galtech and MTC are highly synergic with respect to the business of the Interpump Group's Hydraulic Sector. In this context, it should be noted that Interpump Hydraulics S.p.A., a 100% owned subsidiary of Interpump Group S.p.A, is world leader in power take-offs for industrial vehicles and through the acquisitions of Galtech and MTC, it has strengthened its market position, broadening its product offering. Takarada, a leading manufacturer and vendor of power take-offs and related hydraulic components for industrial vehicles based in Caxias do Sul (Brazil – the state of Rio Grande do Sul ) was acquired on 15 February 2012. In 2011 the company's sales totalled 17.9 million reais (€8.0 million), versus the figure of 15.8 million reais in 2012 (€6.3 million), with EBITDA of 3.3 million reais (€1.5 million), equivalent to 18.6% of sales in 2011, while EBITDA for 2012 was 2.1 million reais (€0.8 million) or 13.4% of sales. A total of 29.0 million reais (€12,9 million) was paid in cash for 100% of Takarada's capital, inclusive of the company's financial debt. Takarada business is highly synergic with respect to the activities of the Interpump Group's Hydraulic Sector. With the acquisition of Takarada, the Interpump Group lays the basis for strong growth of the Hydraulic Sector in Brazil, a country that is expected to engage in high levels of spending on infrastructure in the next few years, also because it has been selected to host two of the absolute top international sports events (World Soccer Championship and the Olympics). 24 July 2012 saw the acquisition of GITOP S.r.l., the company used by our subsidiary Oleodinamica Panni S.r.l. to handle peak production demands and to manufacture smaller lots of cylinders. In 2012 GITOP recorded sales of €1.2 million and EBITDA of €0.2 million, equivalent to 17.5% of sales. At 30 June 2012 the company had a net cash position of €348 thousand. 100% of GITOP's stock was purchased for the price of €600 thousand. Due to its minimal significance, GITOP was not consolidated in 2012. As from 1 January 2013 GITOP was merged with and embodied in Oleodinamica Panni S.r.l. Also on 24 July 2012 we completed the sale of our interest in Hydrocar Roma S.r.l. for €370 thousand to be collected in three instalments, the first of which for €150 thousand at the time of signing of the notary's deed, while the second and third instalments of €110 thousand each are
10
due within 12 and 24 months of the foregoing contract signing date. The payment is secured by an adequate guarantee. Interpump Hydraulics UK Ltd, a distribution company based in Birmingham, was incorporated on 10 September 2012 with the aim of ensuring the Group's direct presence on the important UK market.

11

12

13
Consolidated income statement for the year
(€/000) 2012 2011
Net sales 527,176 471,619Cost of sales (327,571) (294,378)Gross industrial margin 199,605 177,241% on net sales 37.9% 37.6%
Other operating revenues 8,775 7,559Distribution costs (53,448) (45,802)General and administrative expenses (69,375) (60,320)Other operating costs (2,752) (3,028)EBIT 82,805 75,650% on net sales 15.7% 16.0%
Financial income 4,905 6,365Financial charges (12,756) (15,032)Adjustment of the value of investments carried at equity (147) (367)Profit for the period before taxes 74,807 66,616
Income taxes (22,494) (22,998)Consolidated profit of continuing operations for the period 52,313 43,618% on net sales 9.9% 9.2%
Result of discontinued operations and businesses held for sale 12 (1,033)
Consolidated net profit for the period 52,325 42,585
% on net sales 9.9% 9.0%
Due to: Parent company shareholders 51,418 41,232Subsidiaries' minority shareholders 907 1,353
Consolidated net profit for the period 52,325 42,585
EBITDA of continuing operations 104,632 94,614% on net sales 19.8% 20.1%
Shareholders' equity 396,876 315,160Net financial indebtedness 74,549 126,963Payables for the acquisition of investments 28,003 19,012Capital employed 499,428 461,135
ROCE 16.6% 16.4%ROE 13.2% 13.5%Basic earnings per share 0.546 0.439
EBITDA = EBIT + Depreciation/Amortization + Provisions ROCE = EBIT/ Capital employed ROE = Consolidated profit for the period / Consolidated shareholders' equity
* = Since EBITDA is not identified as accounting measure in the context of the Italian accounting principles nor in the context of the international accounting standards (IAS/IFRS), the quantitative determination of EBITDA may not be unequivocal. EBITDA is a measure utilized by the company to monitor and assess operating performance. EBITDA is considered by the management as a significant parameter for company performance assessment since it is not influenced by the effects of different criteria for determination of taxable income, amount and characteristics of employed capital and related amortization policies. The criterion for the determination of EBITDA applied by the company may differ from that used by other companies/groups and hence the value of this parameter may not be directly comparable with the EBITDA values disclosed by said other companies/groups.

14
NET SALES
Net sales in 2012 totalled €527.2 million, up by 11.8% with respect to sales of continuing operations in 2011 (€471.6 million). Like for like growth was 6.1%. The breakdown of sales by business sector and geographical area is as follows:
(€/000) ItalyRest of Europe
North America Pacific Area
Rest of the World Total
31/12/2012
Hydraulic Sector 52,358 65,195 77,027 12,170 50,986 257,736Water Jetting Sector 19,185 78,284 110,448 42,612 18,911 269,440Total 71,543 143,479 187,475 54,782 69,897 527,176
31/12/2011
Hydraulic Sector 56,363 60,161 62,979 10,592 39,150 229,245Water Jetting Sector 19,692 73,445 92,007 41,901 15,329 242,374Total continuing operations 76,055 133,606 154,986 52,493 54,479 471,619
2012/2011 percentage change
Hydraulic Sector -7.1% +8.4% +22.3% +14.9% +30.2% +12.4%Water Jetting Sector -2.6% +6.6% +20.0% +1.7% +23.4% +11.2%Total -5.9% +7.4% +21.0% +4.4% +28.3% +11.8%
Total changes on a like for like basis -13.0% +1.5% +18.7% -1.3% +14.9% +6.1% The Hydraulic Sector grew by 0.6 % like for like. PROFITABILITY
In 2012 non-recurring expenses were booked for €1 million in respect of costs related to the termination of the office of the Chairman, which will occur at the time of the next shareholders' meeting for approval of the financial statements, and for €1 million relative to the allocation of Group companies restructuring costs. The first item exerted a negative effect on EBITDA and EBIT while the second item only affected EBIT. The cost of sales accounted for 62.1% of turnover (62.4% in 2011). Production costs, which stood at €121.2 million (€102.2 million in 2011, which however did not include the three companies acquired successively and which included only a portion of American Mobile's costs), accounted for 23.0% of sales (21.7% in 2011). Like for like production costs rose by 8.7% (+6.3% net of exchange differences). The purchase costs of raw materials and commercial components, including changes in inventories, totalled €206.4 million (€192.1 million in 2011, which however did not include the three companies acquired successively and which included only a portion of American Mobile's costs). Like for like purchases increased by 2.2% (while when considered like for like and net of exchange differences they were 2.4% lower than purchases for the prior year). The incidence of purchase costs, including the change in inventories, was 39.2% compared to the 40.7% of 2011, reflecting a 1.5 percentage point improvement (1.5 percentage points also on a like for like basis). Like for like distribution costs were 11.5% higher (+7.2% net of exchange differences) than in 2011, with an 0.5 percentage point increase of the incidence on sales.

15
With respect to 2011 general and administrative expenses rose by 8.8% like for like (+6.0% net of exchange differences) while the relative incidence on sales increased by 0.3 percentage points. €1 million of non-recurring costs were booked in 2012, as described earlier. Net of these one-off components general and administrative expenses were up by 7.2%. Total payroll costs were €121.8 million (€106.6 million in 2011). Like for like payroll costs rose by 7.7% due to a 5.9% increase in per capita cost and an increase of 41 in the average headcount. The total number of Group employees in 2012 was 2,685 (2,477 like for like) compared to 2,436 in 2011. The like for like increase in the average headcount can be broken down as follows: -32 in Europe, +41 in the US and +32 in the Rest of the World (China, India, Chile and Australia). EBIT stood at € 82.8 million (15.7% of sales) compared to the € 75.7 million of 2011 (16.0% of sales), reflecting an increase of 9.5%. EBITDA totalled €104.6 million (19.8% of sales) compared to the €94.6 million of 2011, which accounted for 20.1% of sales (+10.6%). The following table shows EBITDA for each business sector:
31/12/2012€/000
% on total
sales*31/12/2011
€/000
% on total sales* Growth/
Contraction
Hydraulic Sector 36,699 14.2% 32,818 14.3% +11.8%Water Jetting Sector 67,945 25.1% 60,664 25.0% +12.0%Other Revenues Sector (12) n.s. 1,132 n.s. n.s.Total 104,632 19.8% 94,614 20.1% +10.6%
* = Total sales also include sales to other group companies, while the sales analysed previously are exclusively those external to the Group (see 6 in the notes). Therefore, for the purposes of comparability the percentage is calculated on total sales rather than the sales shown earlier.
Like for EBITDA of the Hydraulic Sector was €33.9 million (14.7% of sales), reflecting an upturn of 3.3%. The tax rate for the period was 30.1% (34.5% in 2011). The reduced rate was due to lower taxes in the amount of €5.4 million, of which €2.7 million relative to the deductibility of the tax loss resulting from the sale of Unielectric in 2011 booked in 2012 following completion of the relative procedure, and in the amount of €0.4 million for deferred tax assets relative to another possible similar event, and finally for €2.3 million relative to tax rebates for the deductibility of IRAP on employee salaries relative to prior years. Net of this phenomenon the 2012 tax rate would have been 37.3%. The adjusted tax rate of 2011, when deferred tax assets were booked further to legislative changes in Italy concerning the facility to carry forward prior tax losses, was 36.6%. Net profit totalled €52.3 million (€42.6 million in 2011), reflecting growth of 22.9%. The result of discontinued operations in 2012 refers to the data of Hydrocar Roma and the reversal of the provision for contingent liabilities associated with the disposal of Unielectric net of the cost recorded following adjustment of the selling price of the investment. Basic earnings per share were €0.546 (€0.439 in 2011), reflecting an increase of 24.4%.

16
In compliance with CONSOB Communication no. 6064293 of 28 July 2006 we draw your attention to the fact that no atypical and/or unusual transactions were carried out in the period. CASH FLOW
The change in net debt can be analysed as follows: 2012
€/000 2011
€/000
Opening net financial position (126,963) (126,122)
Cash flow from operations 65,572 60,445
Liquidity generated (absorbed) by the management of commercial working capital (14,797) (21,482)
Liquidity generated (absorbed) by other current assets and liabilities 2,513 1,787
Capital expenditure in tangible fixed assets (16,860) (10,642)
Proceeds from sales of tangible fixed assets 3,342 1,584
Increase in other intangible fixed assets (2,321) (2,763)
Received financial income 1,973 2,896
Other (824) (915)
Free cash flow of continuing operations 38,598 30,910
Acquisition of investments, including debt received and net of treasury stock assigned
(20,430) (4,824)
Sale of investments, including transferred financial debt 1,378 1,551
Dividends paid (11,731) (10,768)
Outlays for purchase of treasury stock (15,827) (16,489)
Proceeds from sale of treasury stock to beneficiaries of stock options 2,025 188
Capital increase following exercise of warrants 56,881 31
Proceeds from sale of financial assets 1,634 -
Loans granted to (repayments from) non-consolidated subsidiaries (90) 7
Net liquidity generated (used) by continuing operations 52,438 606
Net liquidity generated (used) by discontinued operations 20 (2,110)
Exchange rate differences (44) 663
Net financial position at end of period (74,549) (126,963)
Net liquidity generated by operations was €65.6 million (€60.4 million in 2011), reflecting an increase of 8.5 %. Free cash flow stood at €38.6 million, up by 24.9% on 2011 when the figure was €30.9 million. €14.8 million of commercial working capital was absorbed in 2012 due to the sustained growth recorded over the period (€21.5 million in 2011). Commercial working capital grew by 9.1% compared to 31/12/2011 on a like for like basis. At 31 December 2012 all financial covenants had been amply complied with. The sale of investments in 2012 refers to the disposal of 5% of Mega Pacific Pty Ltd, the disposal of 70% of Hydrocar Roma S.r.l. and to the collection of the second instalment of the 70% disposal of Unielectric S.p.A., while in 2011 this item refers to the disposal of 20% of Wuxi Weifu China-Italy Gear Company Ltd and collection of the first instalment for the disposal of 70% of Unielectric S.p.A., net of cash transferred.

17
The net cash position breaks down as follows: 31/12/2012 31/12/2011 01/01/2011
€/000 €/000 €/000
Cash and cash equivalents 115,069 109,068 138,721
Payables to banks (10,614) (8,762) (7,751)
Interest-bearing financial payables (current portion) (87,303) (113,700) (125,374)
Interest-bearing financial payables (non-current portion) (91,701) (113,569) (131,718)
Total (74,549) (126,963) (126,122)
The Group also has binding contractual commitments for the purchase of residual interests in subsidiaries for €28.0 million (€19.0 million at 31/12/2011). In target company acquisition processes it is Group strategy to purchase majority packages, signing purchase commitments for the residual stakes the price of which is set in accordance with the results that the company is able to achieve in the subsequent years, thus guaranteeing on the one hand the continuation in the company of the historic management and on the other hand maximizing the goal of increasing profitability. 31/12/2012
€/000 31/12/2011
€/000
Debt for acquisition of residual stakes in Hydroven - 210
Debts for deferred payments of AVI instalments 766 1,006
Payables for the acquisition of 20% of American Mobile 2,410 2,315
Commitments to exercise the options to sell on Galtech and MTC shares 10,239 -
Commitment to exercise options to sell on the shares of Interpump Hydraulics International S.p.A.
14,588 15,481
Total 28,003 19,012
The residual debt of €210 thousand for the purchase of holdings in Hydroven was paid in 2012. On 2 November 2011 the Group acquired the remaining 49% of subsidiary AVI S.r.l. for €1,350 thousand, of which €270 thousand paid at the same time as the acquisition of the holdings with the remainder to be settled in four annual instalments of €270 thousand each. The contract for the acquisition of an 80% stake in American Mobile envisages the purchase of the remaining 20% in April of 2016 on the basis of the results achieved by the company in the two preceding years. We therefore proceeded to estimate the expected debt on the basis of a business plan. Commitments for the purchase of shares of Interpump Hydraulics International S.p.A. refer to the valuation of the put options recognized for minority shareholders of the company, which allow them to sell their holdings to Interpump Hydraulics S.p.A. on the basis of a price that will depend on the results achieved in the two years prior to the sale. We therefore proceeded to measure this commitment on the basis of a business plan. Commitments for the purchase of shares of Galtech S.p.A. and MTC S.r.l. refer to the valuation of put options awarded to minority shareholders of the companies, which allow them to sell their holdings to Interpump Hydraulics S.p.A. on the basis of a price that will depend on the results achieved in the two years prior to the sale. We therefore proceeded to measure this commitment on the basis of a business plan.

18
Debts for the acquisition of investments were discounted to current value taking into account the time factor.
GROUP BALANCE SHEET
Below we give the reclassified balance sheet in relation to cash flows obtained/used:
31/12/2012(€/000)
% 31/12/2011 (€/000)
%
Trade receivables 96,371 95,912
Net inventories 131,692 117,021
Other current assets 15,807 15,302
Accounts payable to suppliers (53,612) (57,962)
Short-term tax payables (6,655) (8,552)
Short-term portion for provisions for risks and charges (4,653) (2,851)
Other short-term liabilities (25,710) (24,476)
Net operating working capital 153,240 30.7 134,394 29.1
Net intangible and tangible fixed assets 134,673 126,339
Goodwill 225,921 213,400
Other financial fixed assets 1,840 3,424
Other non-current assets 20,480 17,564
Liabilities for employee benefits (11,008) (9,698)
Medium/long-term portion for provisions for risks and charges (1,339) (1,720)
Other medium/long-term liabilities (24,379) (22,568)
Total net fixed assets 346,188 69.3 326,741 70.9
Total capital employed 499,428 100 461,135 100
Financed by:
Shareholders' equity for the Group 391,043 309,697
Minority interests 5,833 5,463
Total shareholders' equity 396,876 79.5 315,160 68.3
Cash and cash equivalents (115,069) (109,068)
Payables to banks 10,614 8,762
Short-term interest-bearing financial payables 87,303 113,700
Short-term payable for purchase of investments 2,413 473
Total short term financial payables (cash) (14,739) (3.0) 13,867 3.0
Medium/long-term interest-bearing financial payables 91,701 113,569
Medium/long-term payable for purchase of investments 25,590 18,539
Total medium/long-term financial payables 117,291 23.5 132,108 28.7
Total sources of financing 499,428 100 461,135 100
The Interpump Group's equity structure is balanced, with a leverage ratio of 0.26 (0.46 at 31 December 2011). The leverage ratio is calculated as the ratio between the short and medium/long-term financial payables and shareholders' equity inclusive of minority interests. The leverage ratio recorded recognized at 31 December 2012 was the lowest since the year on which the Group was listed on the Stock Exchange in 1996.

19
Capital employed increased from €461.1 million at 31 December 2011 to €499.4 million at 31 December 2012. The increase is primarily related to the 2012 acquisitions of Takarada, Galtech and MTC. ROCE stood at 16.6% (16.4% in 2011). ROE was 13.2% (13.5% in 2011). ROE was influenced by the capital increase performed further to the exercise of the warrants.
CAPITAL EXPENDITURE
Expenditure on property, plant and machinery stood at €30.3 million, of which €9.4 million through the acquisition of investments (€16.5 million in 2011, of which €0.6 million through the acquisition of investments). Note that the companies belonging to the very-high pressure Pumps Division record machinery manufactured and hired out to customers under tangible fixed assets (€4.4 million at 31/12/2012 and €3.7 million at 31/12/2011). Net of these latter amounts and expenditure related to the acquisition of equity investments, actual capital expenditure stood at €16.4 million in 2012 (€11.9 million at 31/12/2011) and refers to the normal renewal and modernization of plant, machinery and equipment. The difference with respect to the expenditure recorded in the cash flow statement is due to the dynamics of payments. Intangible fixed assets increased by €2.8 million, of which €0.5 million through the acquisition of investments (€3.8 million in 2011, of which €1 million through the acquisition of investments) and refer mainly to expenditure dedicated to developing new products.
RESEARCH AND DEVELOPMENT
The Research and Design Centre (Interpump Engineering S.r.l.), set up to centralize design and development of new products in high pressure pumps, hydraulic pumps and hydraulic components, completed projects for two new families of high pressure pumps and developed four new evolutions in terms of performance or applications of existing pumps, in addition to seven new valves. There are also several projects currently underway for new high and very-high pressure pumps, valves for the Water Jetting Sector and hydraulic pumps in addition research and development was conducted primarily within Interpump Hydraulics for the Hydraulic Sector and in Hammelmann for very high pressure Pumps Division. Group strategy over the next few years is to continue with high levels of expenditure in the area of research and development in order to assure renewed impetus to structured growth. Research costs have been capitalized in accordance with their multi-annual usefulness. The development costs capitalized in 2012 amount to €/000 1,908 (€/000 2,434 in 2011), while costs were charged to the income statement for €/000 8,581 (€/000 6,846 in 2011).
ENVIRONMENT
The Interpump Group is engaged exclusively in mechanical engineering and components assembly activities that are not accompanied by the emission of pollutants into the environment. The production process is performed in full compliance with statutory legislation.
EXPOSURE TO RISKS, UNCERTAINTIES AND FINANCIAL RISK FACTORS
The Group is exposed to the normal risks and uncertainties of any business activity. The markets in which the Group operates are world niche markets of limited size and with few significant competitors. These market characteristics constitute a significant barrier preventing the entry of new competitors due to significant scale effects, which are to be considered against the backdrop of relatively uncertain economic returns for potential newcomers. The Interpump
20
Group enjoys a position of world leadership in the fields of high and very-high pressure pumps and hydraulic components, both positions accentuating the risks and uncertainties of the business venture.
The financial risk factors are described in note 4 of the consolidated financial statements.
CORPORATE GOVERNANCE AND EXERCISE OF WARRANTS
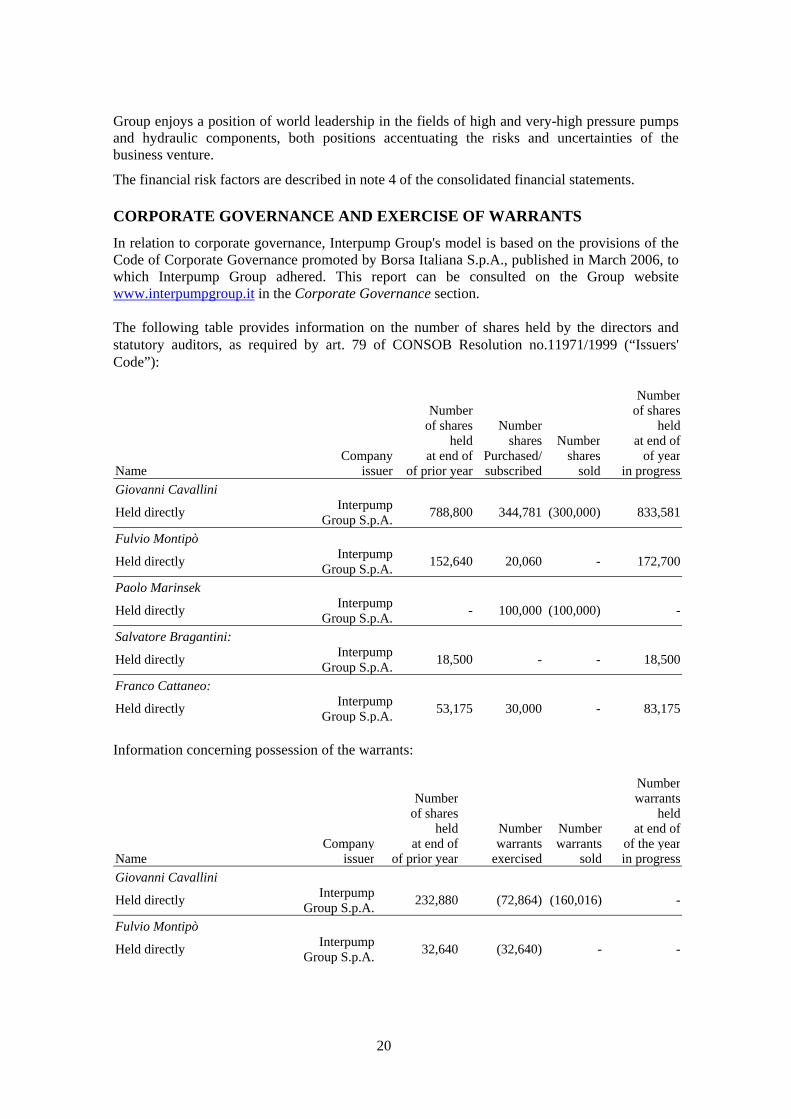
In relation to corporate governance, Interpump Group's model is based on the provisions of the Code of Corporate Governance promoted by Borsa Italiana S.p.A., published in March 2006, to which Interpump Group adhered. This report can be consulted on the Group website www.interpumpgroup.it in the Corporate Governance section. The following table provides information on the number of shares held by the directors and statutory auditors, as required by art. 79 of CONSOB Resolution no.11971/1999 (“Issuers' Code”):
Number Number of shares of shares Number held held shares Number at end of Company at end of Purchased/ shares of year
Name issuer of prior year subscribed sold in progress
Giovanni Cavallini
Held directly Interpump
Group S.p.A.788,800 344,781 (300,000) 833,581
Fulvio Montipò
Held directly Interpump
Group S.p.A.152,640 20,060 - 172,700
Paolo Marinsek
Held directly Interpump
Group S.p.A.- 100,000 (100,000) -
Salvatore Bragantini:
Held directly Interpump
Group S.p.A.18,500 - - 18,500
Franco Cattaneo:
Held directly Interpump
Group S.p.A.53,175 30,000 - 83,175
Information concerning possession of the warrants:
Number Number warrants of shares held held Number Number at end of
Company at end of warrants warrants of the yearName issuer of prior year exercised sold in progress
Giovanni Cavallini
Held directly Interpump
Group S.p.A.232,880 (72,864) (160,016) -
Fulvio Montipò
Held directly Interpump
Group S.p.A.32,640 (32,640) - -

21
On 26 July 2007 several shareholders sold a total of 22.227% of the share capital of Interpump Group S.p.A. to a company designated Gruppo IPG Holding S.r.l. domiciled in Milan, and signed a Shareholders' Agreement concerning the representative portions of the entire share capital of Gruppo IPG Holding S.r.l. The Shareholders' Agreement contains constraints and limitations on the transfer of holdings and the purchase of shares, and agreements for the exercise of voting rights in Gruppo IPG Holding S.r.l. and in Interpump Group S.p.A. The Agreement came into effect on 26 July 2007 and proceeds until 7 November 2015. At 31/12/2012 Gruppo IPG Holding S.r.l. held 26.9883% of the share capital gross of treasury stock. The shareholders of Gruppo IPG Holding S.r.l. are composed of the Montipò family, MAIS S.p.A. (controlled by Ms Isabella Seragnoli), Tamburi Investment Partners, Gruppo Ferrero S.p.A., and Sergio Erede. The Cavallini family, an original signatory of the agreement, divested its interests in Gruppo IPG Holding S.r.l. on 7 November 2012 further to termination of the office of Chairman of Mr Cavallini as from 30 April 2013. Giovanni Cavallini departs from the group after 17 years of service during which he occupied the position of Chief Executive Officer from 1996 until 2005 and that of Chairman from 2005. An excerpt from the Shareholders Agreement and from the Articles of Association of IGP Holding can be consulted on the company website at www.interpumpgroup.it in the Corporate Governance section.
STOCK OPTION PLANS
With the aim of motivating Group management and promoting participation in the goal of value creation for shareholders there are currently three stock option plans in existence, one approved by the Shareholders' Meeting of 16 April 2002 (2002/2005 plan), one approved by the Shareholders' Meeting of 20 April 2006 (2006/2009 plan), and one approved by the Shareholders' Meeting of 21 April 2010 (2010/2012 plan). The 2002/2005 plan is addressed to several directors and group employees and involves the assignment of up to 4,000,000 options to be allocated over the following 4 years using the company's treasury stock at an exercise price equal to the greater of the current market value at the time of allocation or the carrying value. Assignment depends on share prices reaching pre-established stock market quotations and/or the achievement of specific financial parameters and personal targets. At 31 December 2012 the situation of the plan was as follows: Number of rights assigned 3,944,700Number of shares purchased (3,308,850)Number of rights expired (53,000)Number of newly exercisable rights 16,000Total number of options not yet exercised 598,850

22
Options as yet unexercised are shown in the following table:
Price per share for the
exercise of options Exercising period
Number of rights assigned
at start of year
Number of rights
matured in the year
Number of shares acquired
in the year
Number of options
exercisable at year end
Parent Company Directors Fulvio Montipò € 5.6774 01.05.2006-31.12.2013 247,500 - - 247,500
Paolo Marinsek € 5.6774 01.05.2006-31.12.2013 178,000 - - 178,000
Other beneficiaries (employees) € 5.6774 01.05.2006-31.12.2013 177,350 - (4,000) 173,350
Total 602,850 - (4,000) 598,850
The 2006/2009 plan is addressed to several Group directors and employees and involves the assignment of up to 4,000,000 options to be allocated over the following 4 years using the company's treasury stock at an exercise price equal to the greater of the current market value at the time of allocation and the carrying value. Assignment depends on share prices reaching pre-established stock market quotations and/or the achievement of specific financial parameters and personal targets. The options can be exercised after three years from the date of allocation. At 31 December 2012 the situation of the plan was as follows: Number of rights assigned 2,999,296Number of shares purchased (583,700)Total number of options not yet exercised 2,415,596 The beneficiaries of the options were:
Price per share for the
exercise of options Exercising period
Number of rights assigned
at start of year
Number of rights
matured in the year
Number of shares acquired
in the year
Number of options
exercisable at year end
Parent Company Directors
€ 7.2884 01.05.2010-31.05.2015 215,033 - - 215,033
€ 5.4047 01.05.2011-31.05.2016 215,191 - - 215,191
€ 3.7524 01.11.2012-31.05.2017 80,000 - - 80,000
Giovanni Cavallini
€ 3.7524 01.05.2010-31.12.2017 300,000 - (300,000) -
€ 7.2884 01.05.2010-31.05.2015 215,033 - - 215,033
€ 5.4047 01.05.2011-31.05.2016 215,191 - - 215,191
€ 3.7524 01.11.2012-31.05.2017 80,000 - - 80,000 Fulvio Montipò
€ 3.7524 01.05.2010-31.12.2017 300,000 - - 300,000

23
Price per share for the
exercise of options Exercising period
Number of rights assigned
at start of year
Number of rights
matured in the year
Number of shares acquired
in the year
Number of options
exercisable at year end
€ 7.2884 01.05.2010-31.05.2015 148,869 - - 148,869
€ 5.4047 01.05.2011-31.05.2016 148,979 - - 148,979
€ 3.7524 01.11.2012-31.05.2017 70,000 - - 70,000 Paolo Marinsek
€ 3.7524 01.05.2010-31.12.2017 100,000 - (100,000) -
€ 7.2884 01.05.2010-31.05.2015 218,000 - - 218,000
€ 5.4047 01.05.2011-31.05.2016 248,000 - - 248,000
€ 3.7524 01.11.2012-31.05.2017 45,000 - (3,200) 41,800
Other beneficiaries (employees)
€ 3.7524 01.07.2010-31.12.2017 350,000 - (130,500) 219,500
Total 2,949,296 - (533,700) 2,415,596
The Shareholders' Meeting of 21 April 2010 approved the adoption of a new incentive plan designated “Interpump 2010/2012 Incentives Plan”. The plan, which is based on the free assignment of options that grant the beneficiaries the right, on the achievement of specified objectives, to (i) purchase or underwrite the Company’s shares up to the maximum number of 3,000,000 or, (ii) at the discretion of the Board of Directors, receive the payment of a differential equivalent to any increase in the market value of the Company’s ordinary shares. Beneficiaries of the plan can be employees or directors of the Company and/or its subsidiaries, identified among parties with significant roles or functions. The exercise price has been set at €3.75 per share. The options can be exercised between 30 June 2013 and 31 December 2016. The conditions for the exercise of the options are connected to the arrival at specific parameters related to the financial statements and performance of Interpump Group shares. Since the targets of the plan were accomplished the 2,860,000 options assigned have matured, as resolved by the Board of directors' meetings held on 15 March 2011 and 24 April 2012. The options assigned are no. 1,000,000 each for Giovanni Cavallini and Fulvio Montipò, no. 320,000 for Paolo Marinsek and no. 540,000 for the other beneficiaries.
RELATIONS WITH GROUP COMPANIES AND TRANSACTIONS WITH RELATED PARTIES
With regard to transactions entered into with related parties, including intercompany transactions, we point out that they cannot be defined as either atypical or unusual, inasmuch as they form part of the normal course of activities of the Group companies. These transactions are regulated at arm's length conditions, taking into account the characteristics of the assets transferred and services rendered. Information on relations with related parties, including the information required by CONSOB communication of 28 July 2006, is given in Note 36 to the annual financial report. In its meeting held on 10 November 2010 the Board of Directors of Interpump Group S.p.A. approved the Procedure for Transactions with Related Parties in application of the new legislation enacted to implement the relevant European Council Directive and the relative Consob Regulation. For more details we invite you to refer to the report on corporate governance and the ownership structure, which is available on www.interpumpgroup.it in the Corporate Governance section.

24
TREASURY STOCK
Information on treasury stock is given in Note 23 of the annual financial report.
RECONCILIATION WITH THE FINANCIAL STATEMENTS OF THE PARENT COMPANY
Reconciliation of consolidated net equity and net profit ascribable to the Parent company's shareholders with those relative to the individual financial statements of the Parent company is as follows:
Shareholders' equity
Net profit
Shareholders' equity
at 31/12/12 of 2012 at 31/12/2011
Parent Company's financial statements 233,902 16,812 182,185
Difference between the book value of consolidated investments and their valuation according to the equity method 157,950
34,756 128,171
Greater book value of a building owned by the Parent Company 204 (4) 208
Elimination of Parent Company's intra-group income (1,013) (146) (867)
Total consolidation adjustments 157,141 34,606 127,512
Shareholders' equity and result attributable to the Parent Company's shareholders 391,043
51,418 309,697
GROUP COMPANIES
At 31 December 2012 the Interpump Group was composed of a structure headed by Interpump Group S.p.A., which has direct and indirect controlling stakes in the capital of 41 companies (of which one winding up) operating in the two business sectors (denominated the Hydraulic Sector and the Water Jetting Sector). The Parent company, with registered offices in Sant’Ilario d’Enza, produces high and very-high pressure piston pumps for water and high pressure cleaners, which are classified in the Water Jetting Sector. The main data of the consolidated subsidiaries are summarised in the table below, whereas for the Parent Company the data are provided in the financial report attached hereto.

25
Fully consolidated companies
Share capital
(€/000)
Percent stake
Registered office
Main activity
Sales €/millions
31/12/2012
Sales €/millions
31/12/2011
Average number of employees
2012
Average number of employees
2011
Hammelmann Maschinenfabrik GmbH 25 100% Oelde - Germany High pressure systems and pumps (Water Jetting Sector)
86.9
74.5 291
275
Muncie Power Products Inc. 784 100% Muncie - USA Power take-offs and hydraulic pumps (Hydraulic Sector)
72.7
63.7
280
266
NLB Corporation Inc. 12 100% Detroit (USA) High pressure systems and pumps (Water Jetting Sector)
67.4
54.6
217
202
Interpump Hydraulics S.p.A. 2,632 100% Nonantola (MO) Power take-offs and hydraulic pumps (Hydraulic Sector)
46.6
51.6
299
309
General Pump Companies Inc. 1,854 100% Minneapolis – USA Distributor of high pressure pumps (Water Jetting Sector)
37.7
32.8
56
57
HS Penta S.p.A. 4,244 100% Faenza (RA) Production and sale of hydraulic cylinders (Hydraulic Sector)
25.1
22.9
101
145
Oleodinamica Panni S.r.l. 2,000 100% Tezze sul Brenta (VI) Production and sale of hydraulic cylinders (Hydraulic Sector)
20.2
20.4
116
115
Hammelmann Corporation Inc. 39 100% Dayton (USA) Sale of high pressure systems and pumps (Water Jetting Sector)
18.8
14.3 25
24
Contarini Leopoldo S.r.l. 47 100% Lugo (RA) Production and sale of hydraulic cylinders (Hydraulic Sector)
18.6
19.7
96
99
Wuxi Interpump Weifu Hydraulics Company Limited
2,095 65% Wuxi - China Sale of hydraulic pumps and power takeoffs and valves (Hydraulic Sector)
16.4
14.8
105
93
Galtech S.p.A. 2,000 53% Reggio Emilia Production and sale of hydraulic valves and directional controls (Hydraulic Sector)
15.0
-
87
-
Hammelmann Australia Pty Ltd 472 100% Melbourne (Australia) Sale of high pressure systems and pumps (Water Jetting Sector)
14.0
13.3
17
15
Hydrocar Chile S.A. 37 60% Santiago (Chile) Sale of hydraulic pumps and power takeoffs (Hydraulic Sector)
12.0
11.2
63
52
Hydroven S.r.l. 200 100% Tezze sul Brenta (VI) Sale of ancillary products for industrial vehicles, hydraulic pumps and power takeoffs (Hydraulic Sector)
9.5
10.2
38
38
American Mobile Inc. 3,410 80% Fairmont (USA) Production and sale of hydraulic cylinders (Hydraulic Sector)
9.1
5.5
* 57
38**
Cover S.r.l. 41 100% Gazzo Veronese (VR) Production and sale of hydraulic cylinders (Hydraulic Sector)
8.9
10.5
51
50
Modenflex Hydraulics S.r.l. 10 100% Modena Production and sale of hydraulic cylinders (Hydraulic Sector)
6.3
6.2
29
29
Takarada Industria e Comercio Ltda 2,892 100% Caxia do Sul (Brazil) Power take-offs and hydraulic pumps (Hydraulic Sector)
6.3
-
81
-
Interpump Hydraulics India Private Ltd
330 100% Hosur (India) Production and sale of power takeoffs and hydraulic pumps (Hydraulic Sector)
6.2
7.5
77
74

26
Fully consolidated companies
Share capital
(€/000)
Percent stake
Registered office
Main activity
Sales€/millions
31/12/2012
Sales€/millions
31/12/2011
Average number of employees
2012
Average number of employees
2011
Hammelmann Pump System Co. Ltd 871 90% Tianjin (China) Sale of very high pressure systems and pumps (Water Jetting Sector) 5.4
4.1
15
14
A.V.I. S.r.l. 10 100% Varedo (MI) Sale of ancillary products for industrial vehicles, hydraulic pumps and power takeoffs (Hydraulic Sector) 5.3
5.8
14
14
MTC S.r.l. 80 60% Bagnolo in Piano (RE) Production and sale of hydraulic valves and directional controls (Hydraulic Sector) 5.3
-
29
-
General Technology S.r.l. 100 100% Reggio Emilia Accessories for high-pressure pumps and pressure washers (Water Jetting Sector) 5.0
5.2
21
21
Interpump Hydraulics France S.a.r.l. 76 99.77% Peltre-Metz (France) Sale of hydraulic pumps and power takeoffs (Hydraulic Sector) 4.4
5.0
22
21
SIT S.p.A. 105 65% Sant'Ilario d'Enza (RE) Sheet metal drawing, shearing and pressing (Water Jetting Sector) 3.9
3.5
25
25
Unidro S.a.r.l. 8 90% Barby (France) Production and sale of hydraulic cylinders (Hydraulic Sector) 3.4
3.3
10
9
Interpump Engineering S.r.l 76 100% Reggio Emilia Research and development (Other Revenues Sector) 2.9
2.9
14
16
Copa Hydrosystem Odd 3 90% Trojan (Bulgaria) Production and sale of hydraulic cylinders (Hydraulic Sector) 2.2
2.1
46
44
Golf Hydrosystem Odd (4) 3 90% Sofia (Bulgaria) Production and sale of hydraulic cylinders (Hydraulic Sector) 2.1
2.0
30
29
Hammelmann S. L. 738 100% Zaragoza - Spain Sale of very high pressure systems and pumps (Water Jetting Sector) 1.7
1.7 5
5
Interpump Hydraulics International S.p.A.
14,162 81.61% Nonantola (MO) Cylinders Pole Holdings (Hydraulic Sector) -
-
-
-
Interpump Hydraulics do Brasil Partecipacoes Ltda
12,308 100% San Paolo (Brazil) Holding of Takarada Industria e Comercio Ltda (Hydraulic Sector) -
-
-
-
Teknova S.r.l. (winding up) 362 100% Reggio Emilia Inoperative (Other Revenues Sector) - - - -
* = revenues for 9 months in 2011 - acquired on 15/04/2011; ** = average headcount over nine months in 2011.

27
Companies not fully consolidated
Share capital
(€/000)
Percentage stake of capital Registered office
Main activity
General Pump China 111 100% Ningbo - China Resale of components (Water Jetting Sector)
Hammelmann Bombas e Sistemas Ltda 232 100% San Paolo - Brazil Sale of very high pressure systems and pumps (Water Jetting Sector)
HS Penta Africa Pty Ltd 351 52% Johannesburg - South Africa
Production and sale of hydraulic cylinders (Hydraulic Sector)
Syscam Gestión Integrada S.A. 27 60% Conchalì - Chile Sale of hydraulic pumps and power takeoffs (Hydraulic Sector)
Interpump Hydraulics Middle East FZCO
209 100% Dubai Sale of hydraulic cylinders and hydraulic pumps (Hydraulic Sector)
Galtech Canada Inc. 76 100% Terrebonne Quebec (Canada)
Sale of hydraulic valves and directional controls (Hydraulic Sector)
GITOP S.r.l. 30 100% Tezze sul Brenta (VI) Production and sale of hydraulic cylinders (Hydraulic Sector)
Interpump Hydraulics UK Ltd 13 100% Birmingham Sale of hydraulic pumps and power takeoffs (Hydraulic Sector)
28
EVENTS OCCURRING AFTER THE END OF THE YEAR AND BUSINESS OUTLOOK
Considering the short span of time since 31 December 2012, the well-known difficulties being experienced by world markets and also the short period of time historically covered by the order portfolio, we do not yet have sufficient information to make a reliable forecast of performance in the current year. In any case, no other events were recorded such that would require mention in this report.
FURTHER INFORMATION
In relation to the regulatory prescriptions concerning the condition for the listing of subsidiaries incorporated or regulated in compliance with the laws of non-EU countries, we draw your attention to the fact that, with respect to 31 December 2011 American Mobile Inc. was added to the companies of significant influence in relation to the consolidated financial statements further its inclusion in the audit plan, even though it had not individually exceeded the limits established pursuant to art. 151 of the Issuers' Code. Despite this situation American Mobile Inc. was included in the audit plan in order to comply with the cumulative limits defined by said art. 151.
It should be noted that the Parent Company is not subject to activities of management or coordination. The resolution of the Interpump Group S.p.A. Board of Directors of 12 June 2008 acknowledges that "Interpump Group S.p.A." is not subject to the management or coordination of the shareholder "Gruppo IPG Holding S.r.l." because:
the shareholder has no means or facilities for the execution of such activities, having no employees or other personnel capable of providing support for the activities of the board of directors;
the shareholder does not prepare the budgets or business plans of Interpump Group S.p.A.; it does not issue any directives or instructions to its subsidiary, nor does it require to be
informed beforehand or to approve either its most significant transactions or its routine administration;
there are no formal or informal committees or work groups in existence formed of representatives of Gruppo IPG Holding and representatives of the subsidiary.
Interpump Group S.p.A., together with Teknova S.r.l. and Interpump Hydraulics S.p.A. adhered to the national tax consolidation option. In addition, also Interpump Hydraulics International S.p.A., HS Penta S.p.A., Contarini Leopoldo S.r.l., Oleodinamica Panni S.r.l., Cover S.r.l. and Modenflex Hydraulics S.r.l., have adhered to another national tax consolidation. Pursuant to the terms of art. 3 of Consob Resolution no. 18079 of 20 January 2012, Interpump Group S.p.A. chose to adhere to the opt-out regime provided for by art. 70, par. 8, and art. 71, par. 1-bis, of Consob Reg. no. 11971/99 (as amended), thus making use of the faculty of derogation from the obligation to publish the informative documents prescribed at the time of significant operations of merger, break-up, capital increases by means of the conferment of assets in kind, acquisitions and divestments. Milan, 19 March 2013 For the Board of Directors Mr Giovanni Cavallini Chairman of the Board of Directors

29
Consolidated financial statements at 31/12/2012
Interpump Group S.p.A. and subsidiaries

30
Consolidated balance sheet
(€/000) Notes 31/12/2012 31/12/2011
ASSETS
Current assets Cash and cash equivalents 8 115,069 109,068Trade receivables 9, 32 96,371 95,912Inventories 10 131,692 117,021Tax receivables 6,705 4,425Derivative financial instruments 11, 32 306 -Assets held for sale 12 2,121 2,123Other current assets 13, 32 6,675 8,754Total current assets 358,939 337,303
Non-current assets Property, plant and equipment 14 112,527 102,777Goodwill 15 225,921 213,400Other intangible assets 16 22,146 23,562Other financial assets 17, 32 1,840 3,424Tax receivables 2,802 1,017Deferred tax assets 18 16,707 15,057Other non-current assets 971 1,490Total non-current assets 382,914 360,727Total assets 741,853 698,030
31
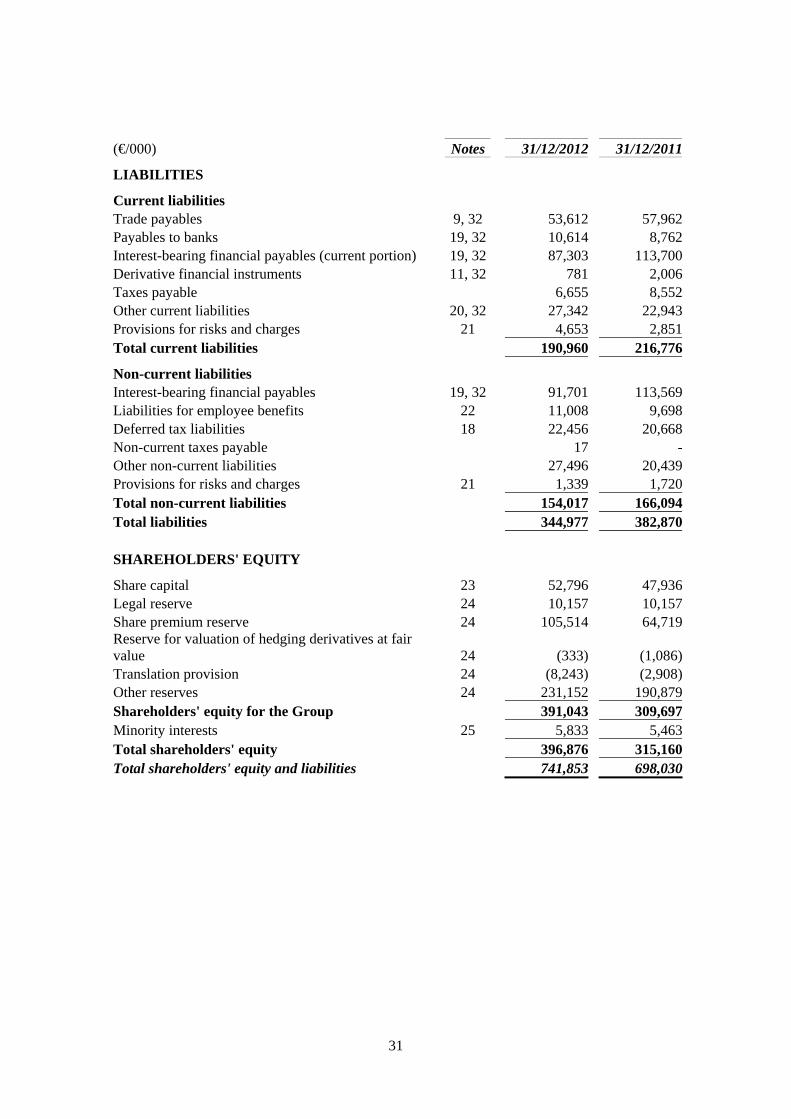
(€/000) Notes 31/12/2012 31/12/2011
LIABILITIES
Current liabilities Trade payables 9, 32 53,612 57,962Payables to banks 19, 32 10,614 8,762Interest-bearing financial payables (current portion) 19, 32 87,303 113,700Derivative financial instruments 11, 32 781 2,006Taxes payable 6,655 8,552Other current liabilities 20, 32 27,342 22,943Provisions for risks and charges 21 4,653 2,851Total current liabilities 190,960 216,776
Non-current liabilities Interest-bearing financial payables 19, 32 91,701 113,569Liabilities for employee benefits 22 11,008 9,698Deferred tax liabilities 18 22,456 20,668Non-current taxes payable 17 -Other non-current liabilities 27,496 20,439Provisions for risks and charges 21 1,339 1,720Total non-current liabilities 154,017 166,094Total liabilities 344,977 382,870 SHAREHOLDERS' EQUITY
Share capital 23 52,796 47,936Legal reserve 24 10,157 10,157Share premium reserve 24 105,514 64,719Reserve for valuation of hedging derivatives at fair value 24 (333) (1,086)Translation provision 24 (8,243) (2,908)Other reserves 24 231,152 190,879Shareholders' equity for the Group 391,043 309,697Minority interests 25 5,833 5,463Total shareholders' equity 396,876 315,160Total shareholders' equity and liabilities 741,853 698,030

32
Consolidated income statements for the year
(€/000) Notes 2012 2011
Net sales 527,176 471,619Cost of sales 27 (327,571) (294,378)
Gross industrial margin 199,605 177,241
Other net revenues 26 8,775 7,559
Distribution costs 27 (53,448) (45,802)General and administrative expenses 27, 28 (69,375) (60,320)Other operating costs 27 (2,752) (3,028)
Ordinary profit before financial charges 82,805 75,650
Financial income 29 4,905 6,365Financial charges 29 (12,756) (15,032)Adjustment of the value of investments held at equity
(147)
(367)
Profit for the period before taxes 74,807 66,616
Income taxes 30 (22,494) (22,998)Consolidated profit of continuing operations for the period
52,313
43,618
Result of discontinued operations 12 (1,033)
Net profit for the period 52,325 42,585
Due to: Parent company shareholders 51,418 41,232
Subsidiaries' minority shareholders 907 1,353
Consolidated profit for the period 52,325 42,585
Continuing operations basic earnings per share 0.546 0.451
Discontinued operations basic earnings per share - (0.012)
Basic earnings per share 31 0.546 0.439
Continuing operations diluted earnings per share 0.539 0.446
Discontinued operations diluted earnings per share - (0.012)
Diluted earnings per share 31 0.539 0.434

33
Comprehensive consolidated income statements for the year
(€/000) 2012 2011
Consolidated profit for the year (A) 52,325 42,585
Recognition of derivative financial instruments to hedge the interest rate risk recorded in accordance with the cash flow hedging method:
- Profit (Loss) on derivative financial instruments for the period - -- Minus: Adjustment for reclassification of profits (losses) to the income statement -
-
- Minus: Adjustment for recognition of fair value of reserves 623 1,283
Total 623 1,283
Recognition of derivative financial instruments to hedge the exchange rate risk recorded in accordance with the cash flow hedging method:
- Profit (Loss) on derivative financial instruments for the period 91 (367)- Minus: Adjustment for reclassification of profits (losses) to the income statement 367
(67)
- Minus: Adjustment for recognition of fair value of reserves - -
Total 458 (434)
Profits (Losses) arising from the conversion to euro of the financial statements of foreign companies (5,277)
5,344
Profits (Losses) of companies carried at equity 27 18
Related taxes (328) (206)
Profits (losses) recorded directly in equity in the year (B) (4,497) 6,005
Comprehensive consolidated profit for the year (A) + (B) 47,828 48,590
Due to: Parent company shareholders 46,836 47,164Subsidiaries' minority shareholders 992 1,426
Consolidated profit for the period 47,828 48,590

34
Consolidated cash flow statement
(€/000) 2012 2011
Cash flow from operating activities
Earnings before taxes and the result of discontinued operations 74,807 66,616
Adjustments for non-cash items:
Capital losses (Capital gains) from the sale of fixed assets (1,958) (1,922)
Capital losses (Capital gains) from the sale of investments (155) -
Amortization and depreciation, loss and reinstatement of the value of assets 20,143 18,063
Costs ascribed to the income statement relative to stock options that do not involve monetary outflows for the Group 872
962
Losses (Profit) on investments 147 367
Net change of risk reserves and allocations to provisions for employee benefits 1,626 598
Outlays for tangible fixed assets destined for hire (4,413) (3,700)
Proceeds from the sale of fixed assets granted for hire 4,703 2,250
Change in medium-/long-term tax receivables (1,881) -
Net financial charges 7,851 8,667
Other (23) 180
101,719 92,081
(Increase) decrease in trade receivables and other current assets 2,608 (14,491)
(Increase) decrease in inventories (9,882) (11,118)
Increase (decrease) in trade payables and other current liabilities (5,010) 5,914
Interest paid (8,052) (8,702)
Currency exchange gains realized (632) (264)
Taxes paid (27,463) (22,670)
Net liquidity generated by operating activities 53,288 40,750
Cash flows from investing activities
Outlay for the acquisition of investments, net of received cash and gross of treasury shares transferred (19,216)
(9,102)
Disposal of investments including transferred cash 1,378 1,551
Capital expenditure in property, plant and equipment (16,860) (10,642)
Proceeds from sales of tangible fixed assets 3,342 1,584
Increase in intangible fixed assets (2,321) (2,763)
Proceeds from the sale of financial assets 1,634 -
Received financial income 1,973 2,896
Other (321) 137
Net liquidity used in investing activities (30,391) (16,339)

35
(€/000) 2012 2011
Cash flow of financing activities
Disbursals (repayments) of loans (49,010) (28,956)
Dividends paid (11,731) (10,768)
Outlays for purchase of treasury stock (15,827) (16,489)
Sale of treasury stock for the acquisition of equity investments. 1,704 4,309
Proceeds from sale of treasury stock to beneficiaries of stock options 2,025 188
Capital increase following exercise of warrants 56,881 31
Loans repaid (granted) by/to non-consolidated subsidiaries (90) 7
Disbursal (repayment) of loans from (to) shareholders - 346
Payment of finance leasing instalments (principal portion) (2,490) (2,379)
Net liquidity obtained through (utilized in) financing activities (18,538) (53,711)
Net increase (decrease) of cash and cash equivalents 4,359 (29,300)
Net increase (decrease) of cash and cash equivalents
Increase (decrease) of cash from discontinued operations 20 (2,110)
Exchange differences from the translation of cash of companies in areas outside the EU (230) 746
Cash and cash equivalents at the beginning of the period 100,306 130,970
Cash and cash equivalents at the end of the period 104,455 100,306
For reconciliation of cash on hand refer to Note 34.

36
Statement of changes in consolidated equity
(€/000) Share
capitalLegal
reserve
Share premium
reserve
Reserve for valuation of
hedging derivatives at
fair valueTranslation
provisionOther
reserves
Group share-
holders' equity
Minority interests Total
Balances as at 1 January 2011 49,193 10,064 74,427 (1,730) (8,196) 160,524 284,282 7,177 291,459 Allocation of 2010 residual profit - 93 - - - (93) - - - Recording in the income statement of the fair value of the stock options assigned and exercisable - - 996 - - - 996 - 996 Purchase of treasury stock (1,845) - (14,644) - - - (16,489) - (16,489) Sale of treasury stock to the beneficiaries of stock options 26 - 162 - - - 188 - 188 Sale of treasury stock for payment of equity investments 559 - 3,750 - - - 4,309 - 4,309 Capital increase following exercise of warrants 3 - 28 - - - 31 - 31 Dividends paid - - - - - (10,412) (10,412) (356) (10,768) Acquisition of additional 49% of AVI - - - - - (372) (372) (899) (1,271) Disposal of investment in Unielectric - - - - - - - (1,885) (1,885) Comprehensive Profit (loss) for 2011 - - - 644 5,288 41,232 47,164 1,426 48,590 Balances at 31 December 2011 47,936 10,157 64,719 (1,086) (2,908) 190,879 309,697 5,463 315,160 Recording in the income statement of the fair value of the stock options assigned and exercisable - - 872 - - - 872 - 872 Purchase of treasury stock (1,406) - (14,421) - - - (15,827) - (15,827) Sale of treasury stock to the beneficiaries of stock options 280 - 1,745 - - - 2,025 - 2,025 Sale of treasury stock for payment of equity investments 157 - 1,547 - - - 1,704 - 1,704 Capital increase following exercise of warrants 5,829 - 51,052 - - - 56,881 - 56,881 Dividends paid - - - - - (11,145) (11,145) (426) (11,571) Disposal of investment in Hydrocar Roma - - - - - - - (196) (196) Comprehensive Profit (loss) for 2012 - - - 753 (5,335) 51,418 46,836 992 47,828 Balances at 31 December 2012 52,796 10,157 105,514 (333) (8,243) 231,152 391,043 5,833 396,876

37
Notes to the annual financial report 1. General information Interpump Group S.p.A. is a company incorporated under Italian law, domiciled in Sant'Ilario d'Enza (RE). The company is listed on the Milan stock exchange.
The Group manufactures and markets high and very high-pressure piston pumps, very high-pressure systems, power takeoffs, hydraulic pumps, hydraulic cylinders and other hydraulic products. The Group has production facilities in northern Italy, the US, Germany, China, India, Bulgaria and Brazil.
The annual report at 31 December 2012, drafted on the basis of the going concern assumption, was approved by the Board of Directors meeting held on this day (19 March 2013).
2. Scope of consolidation The scope of consolidation at 31 December 2012 includes the Parent Company and the following fully consolidated subsidiaries (with the information required on the basis of DEM/6064293 of 28/07/2006): 31/12/2012
Share
capital
Share-holders'
equity
Profit 2012
Percent stake
Company Registered office €/000 €/000 €/000 at 31/12/12
Interpump Hydraulics S.p.A. Nonantola (MO) 2,632 99,182 5,801 100.00%
Muncie Power Prod. Inc. (1) Muncie (USA) 784 42,569 8,065 100.00%
American Mobile Power Inc. (5) Fairmount (USA) 3,410 6,572 1,171 80.00%
Hammelmann Maschinenfabrik GmbH Oelde (Germany) 25 86,654 20,042 100.00%
Hammelmann Corporation Inc (2) Dayton (USA) 39 7,914 2,368 100.00%
Hammelmann S. L. (2) Zaragoza (Spain) 738 1,394 309 100.00%
Hammelmann Pumps Systems Co Ltd (2) Tianjin (China) 871 3,415 802 90.00%
Hammelmann Australia Pty Ltd (2) Melbourne (Australia) 472 6,059 1,344 100.00%
NLB Corporation Detroit (USA) 12 66,495 5,689 100.00%
Interpump Engineering S.r.l Reggio Emilia 76 1,403 233 100.00%
General Pump Inc. Minneapolis (USA) 1,854 12,593 2,662 100.00%
General Technology S.r.l. Reggio Emilia 100 1,844 87 100.00%
SIT S.p.A. S. Ilario d'Enza (RE) 105 1,250 5 65.00%
Interpump Hydraulics France S.a.r.l. (1) Ennery (France) 76 1,691 107 99.77%
Hydroven S.r.l. (1) Tezze sul Brenta (VI) 200 3,185 196 100.00%
AVI S.r.l. (1) Varedo (MI) 10 1,663 165 100.00%
Interpump Hydraulics International S.p.A. (1) Nonantola (MO) 14,162 114,926 2,487 81.61%
HS Penta S.p.A (3) Faenza (RA) 4,244 7,651 195 100.00%
Contarini Leopoldo S.r.l. (3) Lugo (RA) 47 5,950 1,760 100.00%
Oleodinamica Panni S.r.l. (3) Tezze sul Brenta (VI) 2,000 12,529 1,610 100.00%
Cover S.r.l. (3) Gazzo Veronese (VR) 41 6,005 807 100.00%
Hydrocar Chile S.A. (1) Santiago (Chile) 37 6,081 1,322 60.00%
Unidro S.a.r.l. (4) Barby (France) 8 2,111 281 90.00%
Copa Hydrosystem Odd (4) Troyan (Bulgaria) 3 1,818 253 90.00%
Golf Hydrosystem Odd (4) Sofia (Bulgaria) 3 1,435 269 90.00%

38
31/12/2012
Share
capital
Share-holders'
equity
Profit 2011
Percent stake
Company Registered office €/000 €/000 €/000 at 31/12/12
Modenflex Hydraulics S.r.l. (3) Modena 10 2,424 642 100.00%
IKO Hydraulics S.r.l. (wound up in 2012) (3) Forlì 11 - (69) -
Wuxi Interpump Weifu Hydraulics Company Ltd (1) Wuxi - China 2,095 7,260 1,124 65.00%
Interpump Hydraulics India Private Ltd (1) Hosur (India) 306 3,018 (167) 100.00%
Interpump Hydraulics do Brasil Partecipacoes Ltds (1) San Paolo (Brazil) 12,308 10,338 (30) 100.00%
Takarada Industria e Comercio Ltda (6) Caxia do Sul (Brazil) 2,892 2,618 339 100.00%
Galtech S.p.A. (1) Reggio Emilia 2,000 3,553 (41) 53.00%
M.T.C. S.r.l. (1) Bagnolo in Piano (RE) 80 3,332 554 60.00%
Teknova S.r.l. (winding up) Reggio Emilia 362 12 (13) 100.00%
The data given in this table concern financial statements prepared for the purpose of drafting the annual financial report in compliance with international financial reporting standards (IFRS) and they may differ from the statutory accounts prepared in compliance with local financial reporting standards.
(1) = controlled by Interpump Hydraulics S.p.A.
(2) = controlled by Hammelmann Maschinenfabrik GmbH
(3) = controlled by Interpump Hydraulics International S.p.A
(4) = controlled by Contarini Leopoldo S.r.l.
(5) = controlled by Muncie Power Inc.
(6) = controlled by Interpump Hydraulics do Brasil Partecipacoes Ltda
The other companies are controlled directly by Interpump Group S.p.A.
With respect to 2011 the following companies were consolidated in 2012: Interpump Hydraulics do Brasil Partecipacoes Ltda and Takarada Industria e Comercio Ltda, acquired in February 2012, and also Galtech S.p.A. and MTC S.r.l., acquired in January 2012. All these companies were allocated to the “Power takeoffs and hydraulic pumps" cash generating unit. In addition, American Mobile Power Inc., acquired on 15 April 2011 was consolidated in 2012 for twelve months, while it was present for only nine months in 2011.
Discontinued operations of 2012 include the data for six months of Hydrocar Roma, divested in July 2012, while discontinued operations of 2011 refer, in addition to the data for twelve months of Hydrocar Roma, also to the nine-month data of Unielectric, which was divested in September 2011. The minority shareholders of Interpump Hydraulics International S.p.A. are entitled to sell their holdings starting from the approval of the financial statements for the years 2012, 2013 or 2014 depending on the case, at a price established in accordance with the results of the Interpump Hydraulics International Group in the last two financial statements closed before the year in which the option is exercised. In accordance with the prescriptions of IFRS 3, Interpump Hydraulics International S.p.A. was 100% consolidated, recording a debt relative to the estimate of the current value of the exercise price of the options determined on the basis of a business plan. Since the business combination was formed prior to 1 January 2010 it is measured in accordance with the preceding version of IFRS 3, therefore any subsequent changes in the debt relative to the estimate of the current value of the options exercise price will be recorded as an adjustment of the original goodwill.

39
Also the minority shareholders of Galtech and MTC are entitled to dispose of their holdings starting from the approval of the 2014 financial statements up to the 2025 financial statements on the basis of the average results of the company in the last two reporting periods closed before the exercise of the option. Likewise, the minority shareholders of American Mobile Power are obliged to sell – and Muncie is obliged to purchase – their holdings in April 2016 at a price that will be determined on the basis of the company's results as reported in the last two financial statements for the two years prior to this term.
In accordance with the prescriptions of IFRS 3, Galtech S.p.A., MTC S.r.l. and American Mobile Power were 100% consolidated, recording a debt relative to the estimate of the current value of the exercise price of the options determined on the basis of a business plan. Any subsequent changes in the debt relative to the estimate of the current value of the outlay that occur within 12 months from the date of acquisition and that are due to greater or lesser levels of information, will be recorded as an adjustment of goodwill, while after 12 months from the date of acquisition any changes will be recognized in profit and loss. 3. Accounting principles
3.1 Reference accounting principles
The annual financial report at 31 December 2012 was drafted in compliance with international accounting standards (IAS/IFRS) and with the interpretations of the Standing Interpretations Committee (“SIC”) approved by the European Commission as at the date of this Board of Directors' meeting.
The consolidated financial statements are drafted in thousands of euro. The financial statements are drafted according to the cost method with the exception of financial instruments, which are carried at fair value.
Preparation of a report in compliance with IFRS (International Financial Reporting Standards) calls for judgments, estimates, and assumptions that have an effect on assets, liabilities, costs and revenues. The final results may differ from the results obtained using estimates of this type. The captions of the financial statements that call for more subjective appraisal by the directors when preparing estimates and for which a change in the conditions underlying the assumptions utilized could have a significant effect on the financial statements are: goodwill, amortization and depreciation of fixed assets, deferred tax assets and liabilities, the provision for bad debts and the inventories depreciation provision, provisions for risks and charges, defined benefit plans for employees, and liabilities for the acquisition of investments included under other liabilities.
The Group's income statement is prepared by functional areas (also called the "cost of sales" method), this form being considered more representative than presentation by type of expense, this information being specified in the notes to the annual financial report. The chosen form, in fact, complies with the internal reporting and business management methods. For a more comprehensive analysis of the Group's economic results we invite you to refer to the Board of Director's Report submitted together with the Annual financial report at 31/12/2012.
The cash flow statement was prepared with the indirect method.
40
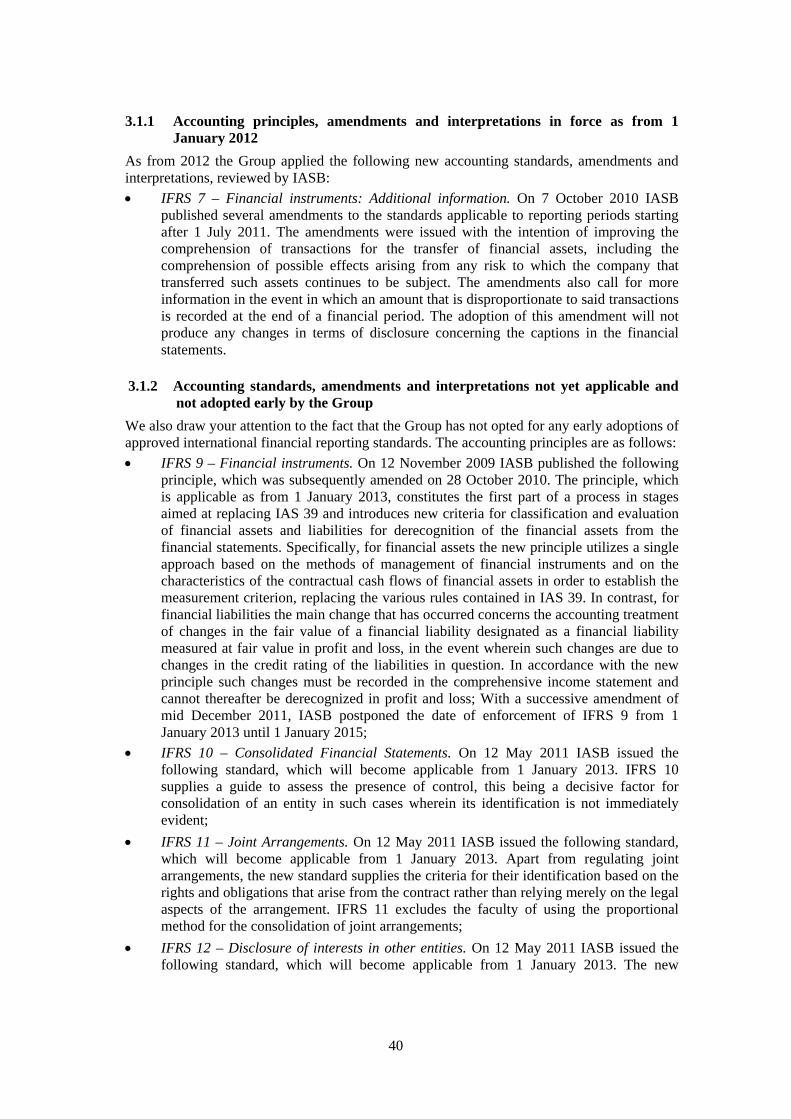
3.1.1 Accounting principles, amendments and interpretations in force as from 1 January 2012
As from 2012 the Group applied the following new accounting standards, amendments and interpretations, reviewed by IASB:
IFRS 7 – Financial instruments: Additional information. On 7 October 2010 IASB published several amendments to the standards applicable to reporting periods starting after 1 July 2011. The amendments were issued with the intention of improving the comprehension of transactions for the transfer of financial assets, including the comprehension of possible effects arising from any risk to which the company that transferred such assets continues to be subject. The amendments also call for more information in the event in which an amount that is disproportionate to said transactions is recorded at the end of a financial period. The adoption of this amendment will not produce any changes in terms of disclosure concerning the captions in the financial statements.
3.1.2 Accounting standards, amendments and interpretations not yet applicable and
not adopted early by the Group
We also draw your attention to the fact that the Group has not opted for any early adoptions of approved international financial reporting standards. The accounting principles are as follows:
IFRS 9 – Financial instruments. On 12 November 2009 IASB published the following principle, which was subsequently amended on 28 October 2010. The principle, which is applicable as from 1 January 2013, constitutes the first part of a process in stages aimed at replacing IAS 39 and introduces new criteria for classification and evaluation of financial assets and liabilities for derecognition of the financial assets from the financial statements. Specifically, for financial assets the new principle utilizes a single approach based on the methods of management of financial instruments and on the characteristics of the contractual cash flows of financial assets in order to establish the measurement criterion, replacing the various rules contained in IAS 39. In contrast, for financial liabilities the main change that has occurred concerns the accounting treatment of changes in the fair value of a financial liability designated as a financial liability measured at fair value in profit and loss, in the event wherein such changes are due to changes in the credit rating of the liabilities in question. In accordance with the new principle such changes must be recorded in the comprehensive income statement and cannot thereafter be derecognized in profit and loss; With a successive amendment of mid December 2011, IASB postponed the date of enforcement of IFRS 9 from 1 January 2013 until 1 January 2015;
IFRS 10 – Consolidated Financial Statements. On 12 May 2011 IASB issued the following standard, which will become applicable from 1 January 2013. IFRS 10 supplies a guide to assess the presence of control, this being a decisive factor for consolidation of an entity in such cases wherein its identification is not immediately evident;
IFRS 11 – Joint Arrangements. On 12 May 2011 IASB issued the following standard, which will become applicable from 1 January 2013. Apart from regulating joint arrangements, the new standard supplies the criteria for their identification based on the rights and obligations that arise from the contract rather than relying merely on the legal aspects of the arrangement. IFRS 11 excludes the faculty of using the proportional method for the consolidation of joint arrangements;
IFRS 12 – Disclosure of interests in other entities. On 12 May 2011 IASB issued the following standard, which will become applicable from 1 January 2013. The new

41
standard specifies a series of information that the company must disclose in relation to interests in other entities, associated companies, special purpose vehicles and other off balance sheet vehicles;
IFRS 13 – Fair value measurement. On 12 May 2011 IASB, in agreement with FASB, issued a fair value measurement guide. The guide, which is the product of five years of preparation, is an important support tool for fair value measurements, an element that helps to harmonize European and US accounting principles and a response from IASB and FASB to markets aimed at alleviating the global financial crisis. The new standard will be applicable as from 1 January 2013:
Amendments to IAS 1 - Presentation of financial statements. On 16 June 2011 IASB published the above amendment, which requires all components presented in the comprehensive income statements (OCI or Other Comprehensive Income) to be grouped depending on whether or not they can be reclassified in the future to profit and loss. The amendment was implemented also by FASB in order to improve the comparability between international financial reporting standards (IFRS) and the US generally accepted accounting principles (US GAAP). The changes will enter into effect as from financial periods starting after 1 July 2012;
Amendments to IAS 19 – Employee benefits. On 16 June IASB published the revised version of IAS 19. The most important changes concern the elimination of the so-called "corridor approach" for recording of actuarial profit and loss (not utilised by Interpump Group), presentation of changes in the assets and liabilities deriving from defined benefit plans, including their re-determination, in the comprehensive income statements, and an increased requirement for disclosure relative to the characteristics and risks bearing on the company associated with defined benefit plans. The amendments were aimed at providing readers of financial statements with a clearer overview of the company's obligations arising from defined benefit plans and the way in which such obligations may affect the company's economic performance, cash flow and net financial position. The changes will take effect as from 1 January 2013;
IAS 32 – Financial Instruments: presentation. On 16 December 2011 IASB clarified the requirements to allow financial assets to be offset with financial liabilities by publishing an amendment to IAS 32 entitled “Offsetting Financial Assets and Financial Liabilities”. The changes are applicable retroactively as from 1 January 2014;
IFRS 7 – Financial instruments: Additional information. On 16 December 2011 IASB and FASB issued shared provisions concerning the disclosures required in the case of offsetting of financial assets and financial liabilities. Said provisions are set down in an amendment to IFRS 7 entitled “Disclosures – Offsetting of financial assets and liabilities”, which will enter into effect as from 1 January 2013. The required disclosures must be supplied retroactively;
IFRS 1 – First adoption of International Financial Reporting Standards (IFRS). On 13 March 2012 IASB published an amendment entitled "Government Loans" which allows companies that are the recipients of government loans below market rates to forego the retroactive modification of the recognition of said loans at the time of initial adoption of IAS/IFRS standards. The amendment will take effect as from 1 January 2013. Early adoption is however permitted;
On 17 May 2012 IASB issued a raft of amendments to IAS/IFRS standards (“Improvements relative to the 2009-2011 cycle”). The changes will take effect as from 1 January 2013. Early adoption is however permitted.
At the date of this report the competent bodies of the European Union had yet to terminate the approval process required for application of the amendments and standards described above.

42
3.1.3 New accounting principles and amendments in force from 1 January 2012 but not relevant for the Group
The following accounting principles, amendments and interpretations, which came into force on 1 January 2012, regulate matters and cases that were not present within the Group at the date of the present interim report, but that may exert accounting effects on future transactions or agreements: IAS 12 – Income taxes. On 20 December 2010 IASB issued an amendment that clarifies
the measurement of deferred taxes on property investments measured at fair value. The amendment introduces the presumption that deferred taxes relative to property investments measured at fair value in accordance with IAS 40 must be determined taking account of the fact that the carrying value of said asset will be recuperated by means of sale. As a consequence of this amendment, SIC-21 – Income Taxes – Recovery of Revalued non-depreciable assets, will no longer be applicable;
IFRS 1 – First adoption of International Financial Reporting Standards (IFRS). This is a minor amendment to the standard that is not significant for the Group.
3.2 Consolidation principles
(i) Subsidiaries Companies are defined as subsidiaries when the parent company has the direct or indirect power to influence their management in such a way as to obtain benefits from the exercise of said activity. The definition of control takes account also of potential voting rights that are currently freely exercisable or convertible. Said potential voting rights are not considered for the purposes of the consolidation process at the time of attribution to minority interests of the economic result and the portion of shareholders' equity pertaining to them. The financial statements of several subsidiaries were not consolidated in consideration of their limited significance; these investments are carried in accordance with the principles illustrated in note 3.10.
The financial statements of subsidiaries are consolidated starting from the date on which the Group acquires control, and deconsolidated from the date on which control is relinquished.
Acquisitions of stakes in subsidiary companies are recorded in accordance with the purchase account method. The acquisition cost corresponds to the current value of the acquired assets, shares issued, or liabilities assumed at the date of acquisition. Ancillary expenses associated with the acquisition are generally recognized in the income statement when they are incurred. The excess of the acquisition cost with respect to the amount of pertinence to the Group of the current value of the net assets acquired is recognized under balance sheet assets as goodwill. Any negative goodwill is recorded in the income statement at the date of acquisition. After the Group has obtained control of an entity the subsequent acquisitions of stakes in said entity which result in a surplus acquisition cost with respect to the amount attributable to the Group are recognized as equity transactions.
For the purposes of consolidation of subsidiaries the method of global integration is adopted, i.e. assuming the entire amount of equity assets and liabilities and all the costs and revenues irrespective of the percentage of control. The accounting value of consolidated equity investments is therefore eliminated against the related interest in their shareholders' equity. The portions of shareholders' equity and profits of minority interests are shown respectively in a specific caption under shareholders' equity and on a separate line of the consolidated income statement. When the losses ascribable to minority shareholders in a consolidated subsidiary exceed the minority interests the excess and all further losses attributable to minority shareholders are ascribed to the Parent Company's shareholders, with the exception

43
of the part for which the minority shareholders have a binding obligation to cover the loss with additional expenditure and are capable of doing so. If the subsidiary subsequently makes a profit, such profits are attributable to the Parent Company's shareholders up to the amount of the losses of the minority shareholders that were previously covered.
(ii) Associated companies Associated companies are companies in which the Group exerts a significant influence without exerting control over their management. The consolidated financial statements include the portion of profits and losses of associated companies in relation to the interest held, evaluated with the net equity method on the date on which the significant influence on the management arose until the date of cessation of said influence. As per the above situation applicable to subsidiary companies, also the acquisition of stakes in associated companies is recognized on the basis of the purchase account method; in this case, any surplus acquisition cost with respect to the portion of pertinence to the Group of the current value of the net assets acquired is incorporated in the value of the investment.
(iii) Investments in other companies Investments in other companies constituting financial assets held for sale are measured at their fair value, if this can be established, and gains and losses deriving from the change in fair value are recognized directly in equity until investments are divested or have suffered a loss of value; at that time, the overall gains or losses previously recognized in equity are ascribed to the income statement for the period. Investments in other companies for which the fair value is not available are recorded at cost after deducting any impairment losses.
(iv) Transactions eliminated in the consolidation process Intercompany balances and the gains and losses arising from intercompany transactions are omitted in the consolidated financial statements. Intercompany gains deriving from transactions with associated companies are omitted in the valuation of the investment with the net equity method. Intercompany losses are only omitted in the absence of evidence that they have been incurred in relation to third parties.
3.3 Business sector information
The business sectors in which the Group operates are determined on the basis of the reports utilised by the Group's senior management to make decisions, and they have been identified as the Water Jetting Sector, which basically includes high and very-high pressure pumps and very high pressure systems, and the Hydraulic Sector, which includes power take-offs, hydraulic cylinders and other hydraulic components. With the aim of providing more comprehensive disclosure, information is provided for the geographical areas in which the Group operates, namely Italy, the Rest of Europe (including non-EU European countries), North America, the Pacific Area (including China and Oceania) and the Rest of the World.
3.4 Treatment of foreign currency transactions
(i) Foreign currency transactions The functional and presentation currency adopted by the Interpump Group is the euro. Foreign exchange transactions are converted into euro on the basis of the exchange rates in force on the date that the related transactions were carried out. Monetary assets and liabilities are translated at the exchange rate in force on the balance sheet reference date. Foreign exchange differences arising from currency translation are booked to the income statement. Non-monetary assets and liabilities valued at historic cost are converted at the exchange rates in force on the date of the related transactions. Monetary assets and liabilities stated at fair

44
value are converted into euro at the exchange rate in force on the date in respect of which the relative fair value was determined.
(ii) Conversion into euro of financial statements in foreign currencies Assets and liabilities of companies residing in countries other than EU countries, including adjustments deriving from the consolidation process relative to goodwill and adjustments to fair value generated by the acquisition of a foreign company outside the EU, are translated at the exchange rates in force on the balance sheet reference date. The revenues and costs of such companies are translated at the average exchange rate in force in the period, which approximates the exchange rates in force on the dates on which the individual transactions were carried out. Foreign exchange differences arising from translation are allocated to a specific equity reserve designated Translation Reserve. At the time of disposal of a foreign economic entity, accumulated exchange differences reported in the Translation Reserve will be recognized in the income statement.
3.5 Non-current assets held for sale and discontinued operations
Assets held for sale and any assets and liabilities pertaining to lines of business destined for sale are valued at the lower of their carrying value at the time these items were classified as held for sale, and their fair value, net of the costs of sale.
Any impairments recorded in application of said principle are recorded in the income statement, both in the event of write-downs for adaptation to the fair value and also in the case of profits and losses deriving from future changes of the fair value.
Business combinations that represent a significant portion of the Group's assets are classified as discontinued operations at the time of their disposal or when they fit the description of assets held for sale, if said requirements existed previously.
3.6 Property, plant and equipment
(i) Own assets Property, plant and equipment are measured at their historic cost and reported net of accumulated depreciation (see next point (iv)) and impairment losses (see heading 3.9). The cost of goods produced internally includes the cost of raw materials, directly related labour costs and a portion of indirect production costs. The cost of assets, whether purchased externally or produced internally, includes the ancillary costs that are directly attributable and necessary for use of the asset and, when they are significant and in the presence of contractual obligations, the current value of the cost estimated for the dismantling and removal of the related assets.
Financial charges relative to loans utilized for the purchase of tangible fixed assets are recorded in the income statement on an accruals basis if they are not specifically allocated to the purchase or construction of the asset, otherwise they are capitalized.
Assets held for sale are valued at the lower of the fair value net of ancillary sales charges and their book value.
(ii) Assets held through financial leasing Assets held through financial leasing agreements, for which the Group has assumed practically all the risks and benefits associated with ownership, are recognized as Group assets. These assets are valued at the lower of the fair value and the discounted value of the leasing instalments at the time of signing of the agreement, net of accumulated depreciation (see following point iv) and the impairment value (see section 3.9). The corresponding

45
liability in relation to the lessor is recorded in the financial statements under financial debts, reduced on the basis of the plan for repayment of the principal amounts. Financial leasing instalments are booked in accordance with the method outlined in section 3.22.
(iii) Subsequent costs The replacement costs of certain parts of assets are capitalized when it is expected that said costs will result in future economic benefits and they can be measured in a reliable manner. All other costs, including maintenance and repair costs, are ascribed to the income statement when they arise.
(iv) Depreciation Depreciation is charged to the income statement systematically on a straight-line basis in relation to the estimated useful life of the assets in accordance with their residual possibility of utilization. Land is not depreciated. The estimated useful life of assets is as follows:
- Property 20-25 years - Plant and machinery 12.5 years - Industrial and commercial equipment 3-6 years - Other assets 3-8 years
The estimated useful life of the assets is reviewed on an annual basis, and any changes in the rates of depreciation are applied where necessary for future depreciation charges.
For assets purchased and/or that became operational during the financial period depreciation is calculated utilizing annual rates reduced by 50%. Historically, this method was represented by the effective utilization of said assets.
3.7 Goodwill
For acquisitions made after 1 January 2004 goodwill represents the surplus amount of the purchase cost with respect to the Group portion of the fair value of current and potential assets and liabilities at the date of purchase.
Goodwill is recorded at cost, net of impairment losses.
Goodwill is allocated to the relative cash generating units and is no longer amortized as from 1 January 2004 (date of transition to IFRS). The carrying value is measured in order to assess the absence of impairment (see section 3.9). Goodwill related to non-consolidated subsidiaries and associates is included in the value of the investment.
Any negative goodwill originating from acquisitions is entered directly in the income statements.
3.8 Other intangible assets
(i) Research and development costs Research costs for the acquisition of new technical know-how are ascribed to the income statement when they arise.
Development costs relating to the creation of new products/accessories or new production processes are capitalized if the Group's companies can prove:
- the technical feasibility and intention of completing the intangible asset in such a way that it is available for use or for sale;
- their ability to use or sell the asset;

46
- the forecast volumes and realization values indicate that the costs incurred for development activities will generate future economic benefits;
- said costs are measurable in a reliable manner; - adequate resources are available to complete the development project.
The capitalized cost includes the cost of raw materials, directly related labour costs and a portion of indirect costs. Other development costs are ascribed to the income statement when they arise. Capitalized development expenses are valued at cost, net of accumulated amortization, (see next point (v)) and impairment (see section 3.9).
(ii) Loan ancillary costs Loan ancillary costs are treated as outlined in section 3.16. Ancillary costs relating to loans still to be disbursed are recorded as current assets and deducted from the loan amounts after payment has been received.
(iii) Other intangible assets Other intangible fixed assets, all having a defined useful life, are measured at cost and recorded net of accumulated amortization (see next point (v)) and impairment (see section 3.9).
Trademarks and patents, which constitute almost the entirety of this caption, are amortized as follows: the Hammelmann trademark and NLB trademarks and patents and the American Mobile trademark are amortized over 15 years, this period being considered representative of the expected useful life, in consideration of their positions as world leaders in their respective markets. On the contrary, the trademarks of the Cylinders Division companies are amortized in 7 years in consideration of the different competitive capacity and in compliance with an independent expert's opinion.
Software licenses are amortized over their period of utilization (3-5 years).
The costs sustained internally for the creation of trademarks or goodwill are recognized in the income statement when they are incurred.
(iv) Subsequent costs Costs incurred subsequently relative to intangible fixed assets are capitalized only if they increase the future economic benefits of the specific capitalized asset, otherwise they are entered in the income statement when they are sustained.
(v) Amortization/depreciation Amortization amounts are recorded in the income statement on a straight-line basis in accordance with the estimated useful life of the capitalized assets to which they refer. The estimated useful life of assets is as follows:
- Patents and trademarks 5-15 years - Development costs 5 years - Granting of software and other licenses 3-5 years
The useful life is reviewed on an annual basis and any changes in the rates are made, where necessary, for future amounts.
3.9 Impairment of assets
The book values of assets, with the exception of inventories (see section 3.14), financial assets regulated by IAS 39, deferred tax assets (see section 3.18), and non-current assets held for sale regulated by IFRS 5, are subject to measurement at the balance sheet reference date in order to identify the existence of possible indicators of impairment. If the valuation process

47
identifies the presence of such indicators the presumed recoverable value of the asset is calculated using the methods indicated in the following point (i).
The presumed recovery value of goodwill and intangible assets that have not yet been used is estimated at intervals of no longer than once a year or more frequently if specific events occur that point to the possible existence of impairment.
If the presumed recovery value of the asset or its cash generating unit is lower than the net book value, the asset to which it refers is consequently adjusted for impairment loss and recognized in the income statement.
Adjustments for impairment losses made in relation to the cash generating units are allocated initially to goodwill, and, for the remainder, to other assets on a proportional basis.
Goodwill is tested for impairment on a yearly basis even if there are no indicators of potential impairment.
(i) Calculation of presumed recovery value The presumed recovery value of securities held to maturity and financial receivables recorded with the criterion of the amortized cost is equivalent to the discounted value of estimated future cash flows; the discount rate is equivalent to the interest rate envisaged at the time of issue of the security or the emergence of the receivable. Short-term receivables are not discounted to present value.
The presumed recovery value of other assets is equal to the higher of their net sale price and their value in use. The value in use is equivalent to the projected future cash flows, discounted to present value at a rate, including tax, that takes account of the market value, of interest rates and specific risks of the asset to which the presumed realization value refers. For assets that do not give rise to independent cash flows the presumed realization value is determined with reference to the cash generating unit to which the asset belongs.
(ii) Reinstatement of impairment losses An impairment relative to securities held to maturity and financial assets recorded with the criterion of the amortized cost is reinstated when the subsequent increase in the presumed recovery value can be objectively related to an event that occurred in a period following the period in which the impairment loss was recorded.
An impairment relative to other assets is reinstated if a change has occurred in the estimate used to determine the presumed recovery value.
Impairment is reinstated to the extent of the corresponding book value that would have been determined, net of depreciation/amortization, if no impairment loss had ever been recognized.
Impairment relative to goodwill can never be reinstated.
3.10 Investments
Investments in associated companies are valued with the equity method as specified by IAS 28.
Investments in other companies are classified among financial instruments available for sale in accordance with the requirements of IAS 39, even if the Group has not manifested any intention of divesting the relative holdings. Investments in other companies, including investments in subsidiaries, which, because of their negligible significance have not been consolidated, are entered at their fair value.

48
Should any impairment of value arise at the balance sheet reference date in comparison to the value determined according to the above method, the investment in question will be written down accordingly.
3.11 Cash and cash equivalents
Cash and cash equivalents include cash on hand, bank and post office deposits and securities having original maturity of less than three months. Current account overdrafts and advances with recourse are deducted from cash only for the purposes of the cash flow statement.
3.12 Current financial assets, receivables and other current assets
Current financial assets, trade receivables and other current assets (excluding derivative financial instruments) are recorded at the time of their initial entry on the basis of the purchase cost inclusive of ancillary costs (fair value for the initial entry).
Subsequently, available for sale financial assets are assessed at their fair value (market value). Gains or losses deriving from the valuation are recognized in equity up to the moment in which the financial asset is sold, at which time the gains or losses are recorded in the income statement. If the market value of the financial assets cannot be reliably determined, they are entered at their purchase cost.
Accounts receivable with due date within normal commercial terms or that accrue interest at market rates are not discounted to present value and are entered at amortized cost net of a bad debt provision booked as a direct deduction from the receivables in question to bring the valuation to the presumed realizable value (see section 3.9). Accounts receivable with due dates beyond normal commercial terms are initially entered at their fair value and subsequently at the amortized cost using the method of the effective interest rate, net of the relative value impairments.
3.13 Derivative financial instruments
It is Group policy to avoid subscribing speculative derivative financial instruments, although, when derivative financial instruments fail to meet the requirements set down for the accounting of hedging derivatives (hedge accounting) in IAS 39 changes to the fair value of such instruments are booked to the income statement as financial charges and/or income.
Derivative financial instruments are brought to book using hedge accounting methods when:
- formal designation and documentation of the hedge relation is present at the start of the hedge;
- the hedge is expected to be highly effective;
- effectiveness can be reliably measured and the hedge is highly effective during the periods of designation.
The fair value of interest rate swaps (IRS) is the amount that the Group estimates it will be obliged to pay or collect to terminate the contract at the date of the balance sheet, taking account of current interest rates and the credit rating of the counterparty. The fair value of derivative financial instruments used to hedge against exchange risks (forward contracts) is equivalent to their market value at the balance sheet date, which corresponds to the market value of the forward contract discounted to present value.

49
The methods used to recognize derivative financial instruments depend on whether or not the conditions and requirements of IAS 39 are fulfilled. Specifically:
(i) Cash flow hedges In the case of a derivative financial instrument for which formal documentation is provided of the hedging relation of the variations in cash flows originating from an asset or liability of a future transaction (underlying hedged variable), considered to be highly probable and that could impact on the income statement, the effective hedge portion deriving from the adaptation of the derivative financial instrument to the fair value is recognized directly in equity. When the underlying hedged item is delivered or settled the relative provision is derecognized from equity and attributed at the book value of the underlying element. The ineffective portion, if present, of the change in value of the hedging instrument is immediately ascribed to the income statement under financial expenses and/or income.
When a financial hedging instrument expires, is sold, terminated, or exercised, or the company changes the relationship with the underlying variable and the forecast transaction has not yet occurred although it is still considered likely, the relative gains or losses deriving from adjustment of the financial instrument to fair value are still retained in equity and are recognized in the income statement when the transaction takes place in accordance with the situation described above. If the forecast transaction related to the underlying risk is no longer expected to occur, the relative gains or losses of the derivative contract, originally recognized in equity, must be taken to the income statement immediately.
(ii) Hedges of monetary assets and liabilities (Fair value hedges) When a derivative financial instrument is used to hedge changes in value of a monetary asset or liability already recorded in the financial statements that can impact on the income statement, the gains and losses relative to the changes in the fair value of the derivative instrument are taken to the income statement immediately. Likewise, the gains and losses relative to the hedged item modify the book value of said item and are recognized in the income statement.
3.14 Inventories
Inventories are valued at the lower of purchase cost and the presumed realization value. The cost is determined with the average weighted cost criterion and it includes all the costs incurred to purchase the materials and transform them at the conditions in force on the date of the balance sheet. The cost of semi-finished goods and finished products includes a portion of indirect costs determined on the basis of normal production capacity. Allowances for inventories are calculated for materials, semi-finished goods and finished products considered to be obsolete or slow moving, taking account of their expected future usefulness and their realization value. The net realization value is estimated taking account of the market price during the course of normal business activities, from which the costs of completion and costs of sale are subsequently deducted.
3.15 Share capital and Treasury stock
In the case of purchase of treasury stock, the price paid, inclusive of any directly attributable ancillary costs, is deducted from share capital for the portion concerning the nominal value of shares and from shareholders' equity for the surplus portion. When said treasury shares are resold or reissued the price collected, net of any directly attributable ancillary charges and the relative tax effect, is recorded as share capital for the portion concerning the nominal value of shares and as shareholders' equity for the surplus.
50
3.16 Interest-bearing financial payables
Interest-bearing financial payables are initially recorded at their fair value net of ancillary charges. After the original entry interest-bearing financial payables are valued with the amortized cost criterion; the difference between the resulting value and the discharge value is entered in the income statement during the term of the loan on the basis of the amortization plan.
3.17 Liabilities for employee benefits
(i) Defined contribution plans The Group participates in defined pension plans with public administration or private plans on a compulsory, contractual, or voluntary basis. The payment of contributions fulfils the Group's obligations towards its employees. The contributions therefore constitute costs of the period in which they are due.
(ii) Defined benefit plans Defined benefits for employees disbursed on termination of their employment with the Group or thereafter, and which include severance indemnity of Italian companies, are calculated separately for each plan, using actuarial techniques to estimate the amount employees have accrued during the year and in previous years. The resulting benefit is discounted to present value and recorded net of the fair value of any relative assets. The discount rate at the balance sheet reference date is calculated as required by IAS 19 with reference to the market yield of high quality corporate bonds. These include only securities released by corporate issuers included in rating class "A", in the assumption that this class identifies a medium rating level corresponding to a low risks level. Considering that IAS 19 makes no explicit reference to a specific product sector, we opted for a composite market curve that could summarize the market conditions existing at the date of valuation of the securities issued by companies operating in various sectors including utilities, telecommunications, finance, banking and industrial. The calculation is performed on an annual basis by an independent actuary using the projected unit credit method.
In the event of increases in the benefits of the plan, the portion of the increase pertaining to the previous period of employment is entered in the income statement on a straight line basis in the period in which the relative rights will be acquired. If the rights are acquired immediately, the increase is immediately recorded in the income statement.
Actuarial gains and losses subsequent to the above date are recognized in the income statement on an accruals basis (the company does not make use of the so-called "corridor method").
Until 31 December 2006 the severance indemnity provision (TFR) of Italian companies was considered to be a defined benefits plan. The rules governing the provision were amended by Law no. 296 of 27 December 2006 (“2007 Finance Act”) and by subsequent Decrees and Regulations enacted in the initial months of 2007. In the light of these changes, and in particular with reference to companies with at least 50 employees, the TFR severance indemnity should now be classified as a defined benefits plan exclusively for the portions accrued prior to 1 January 2007 (and not yet paid out at the date of the financial statements), while after that date TFR should be considered as a defined contributions plan.
(iii) Stock options On the basis of the stock option plan currently in existence certain employees and directors are entitled to purchase the treasury shares of Interpump Group S.p.A. The options are measured at their fair value, which is entered in the income statement and increased by the
51
cost of personnel and directors with a matching entry in the share premium reserve. The fair value is measured at the grant date of the option and recorded in the income statement in the period that runs between said date and the date on which the options become exercisable (vesting period). The fair value of the option is determined using the applicable options measurement method (specifically, the binomial lattice model), taking account of the terms and conditions at which the options were granted.
3.18 Income taxes
Income taxes disclosed in the income statement include current and deferred taxes. Income taxes are generally disclosed in the income statement, except when they refer to types of items that are recorded directly under shareholders' equity. In this case, the income taxes are also recognized directly in equity.
Current taxes are taxes that are expected to be due, calculated by applying to the taxable income the tax rate in force at the balance sheet reference date and the adjustments to taxes of prior years.
Deferred taxes are calculated using the liability method on the timing differences between the amount of assets and liabilities in the consolidated financial statements and the corresponding values recognized for fiscal purposes. Deferred taxes are calculated in accordance with the envisaged method of transfer of timing differences, using the tax rate in force at the reference date of the balance sheet for the following year.
Deferred tax assets are recognized exclusively if it is probable that in future years sufficient taxable income will be generated for the realization of said deferred taxes.
3.19 Provisions for risks and charges
In cases where the Group has a legal or substantial obligation resulting from a past event, and when it is probable that the loss of economic benefits must be sustained in order to fulfil such an obligation, a specific provision for risks and charges is created. If the temporal factor of the envisaged loss of benefits is significant the amount of future cash outflows is discounted to present values at an interest rate including tax that takes account of the market interest rates and the specific risk of the liability in question.
(i) Product warranty provision Liabilities for warranty repairs are allocated to the specific product warranty provision at the time of sale of the products. The provision is determined on the basis of historic data describing the cost of warranty repairs.
(ii) Restructuring provision A restructuring provision is formed exclusively in the event that the Group has approved a formal and detailed restructuring plan and has started to implement it or has published it before the balance sheet reference date. In other cases future costs are not set aside.
(iii) Onerous contracts When the forecast future benefits of a contract are less than the non-eliminable costs relative to it, a specific provision is created equivalent to the difference.

52
3.20 Current financial liabilities, trade payables and other debts
Trade payables and other debts, the relative due date of which is within normal commercial terms, are not discounted to present value and are entered at the amortized cost representative of their discharge value.
Current financial liabilities include the short term portions of financial debts, inclusive of debts for cash advances and other financial liabilities. Financial liabilities are measured at their amortized cost according to the effective interest method.
Financial assets hedged by derivative financial instruments taken out to hedge the interest rate risk are valued at their current value in accordance with the methods specified for hedge accounting.
3.21 Revenues
(i) Revenues from the sale of goods and services Revenues from the sale of goods are entered in the income statement when the risks and benefits connected to the ownership of the goods are substantially transferred to the purchaser. Revenues for services rendered are recognized in the income statement on the basis of the percentage of completion at the balance sheet reference date.
(ii) State grants State grants are recorded as deferred revenue under other liabilities at the time in which there exists a reasonable certainty that they will be disbursed and in which the Group has fulfilled all the necessary conditions to obtain them. Grants received against costs sustained are recorded in the income statement systematically in the same periods in which the relative costs are incurred.
3.22 Costs
(i) Rental and leasing instalments Rental and operating leasing instalments are recorded in the income statement on an accrual basis.
(ii) Financial leasing instalments Financial leasing instalments are entered, in the amount of the capital portion, in reduction of the financial debt, while the interest portion is entered in the income statement.
(iii) Financial income and charges Financial revenues and charges are recorded on an accrual basis in accordance with the interest matured on the net value of the relative financial assets and liabilities, using the effective interest rate. Financial charges and income include currency exchange gains and losses and gains and losses on derivative instruments to be charged to the income statement (see section 3.13).
4. Financial risk management The Group's business is exposed to various financial risks: market risk (including the exchange rate and interest rate risk), credit risk, liquidity risk, price risk and cash flow risk. The risk management programme is based on the unpredictability of financial markets and it aims to minimize any negative impact on the Group's financial performance. Interpump Group utilizes derivative financial instruments to hedge exchange and interest rate risks. The Group does not

53
take out derivative financial instruments of a speculative nature in compliance with the rulings established by the procedure approved by the Board of Directors. Based on this procedure financial risk hedging is managed by a central department in the parent company in cooperation with individual operating units.
(a) Market risks
(i) Exchange rate risk The Group does business internationally and is exposed to the exchange rate risk originating from business conducted in US dollars and Australian dollars. The exchange rate risks are generated in relation to forecasts of future commercial transactions and the recognition of assets and liabilities.
To manage the exchange rate risk generated by forecasts of future commercial transactions stated in a currency other than the company's functional currency (euro), Group companies use plain vanilla forward contracts or purchase options, as advised by the central department. The counterparties of these contracts are premium international banks with high financial strength ratings.
In particular, the Group is open to risk in dollars regarding sales to its US subsidiaries; group policy is to hedge a prudentially determined portion of expected sales for periods of between four and eight months. In addition, the Group has a dollar exposure for other sales; the policy in this case is to hedge the irrevocable customer order or sales invoice, which is concurrent with the receipt of the letter of credit that confirms a definite sale, or the purchase order, when the time interval between the issue of the order and the payment is considered to be significant.
Moreover, the Group has an exposure in Australian dollars regarding sales to a subsidiary. It is Group policy is to hedge short-term sales forecasts.
In relation to financial exposures, in 2011 two intercompany loans were granted, still existing at 31 December 2012, for the total of €2.6 million in currencies other than the currencies utilized by the borrowing companies. The Group has decided not to hedge these loans at the present.
The Group is exposed to an exchange risk in relation to the conversion of the net assets of its US subsidiaries. Considering the strategic importance of these subsidiaries, the assets of which are not expected to be realized in the short term, it was decided that hedge contracts were not necessary in this case.
(ii) Interest rate risk The interest rate risk derives from medium/long-term loans granted at floating rates. It is Group policy to hedge part of the existing loans and, for the unhedged part, to monitor the interest rate curve in order to assess the opportunity of taking out further hedges.
(b) Credit risk The Group does not have any significant credit concentrations. It is Group policy to sell to customers only after their credit rating has been checked and hence within predefined credit limits. Historically the Group has not incurred any major losses for bad debts.
(c) Liquidity risk Prudent management of liquidity risk involves the retention of an appropriate level of cash on hand and sufficient access to lines of credit. Because of the dynamic nature of the company's business, which results also in frequent targeted acquisitions, it is Group policy
54
to ensure it has access to revolving lines of stand-by credit that can be utilized at short notice.
(d) Price and cash flow risk The Group is subject to constant changes in metal prices, especially brass, aluminium, steel, stainless steel and cast iron. Group policy is to hedge this risk where possible by way of medium-term commitments with suppliers, or by means of stocking policies when prices are low, or by entering into agreements with customers to transfer the risk to them.
The Group invests a significant part of its cash on hand in locked up bank deposits, savings accounts and in repurchase agreements of a maximum duration of three months in order to optimize finance management. In repurchase agreements the underlying is composed of the bonds of a primary banking group. Excluding repurchase agreements, the Group does not hold any listed securities which would be subject to stock market fluctuations. Despite the high level of cash investment carried out by the Group the revenues and cash flows of Group operating activities are only marginally influenced by changes in interest generating assets.
Further quantitative information on the financial risks to which the Group is exposed is given in Note 33 "Information on financial risks".
5. Discontinued operations On 24 July we sold our interest in Hydrocar Roma S.r.l. for €370,000, to be collected in three instalments, the first of which for €150,000 at the time of signing of the notary's deed, while the second and third instalments of €110,000 each are due within 12 and 24 months of the data of signing. The payment is secured by an adequate guarantee. On 26 September 2011 the Group divested its 70% stake in Unielectric, a company active in the production of windings and electric motors, for a price of €3.5 million. The price was paid in cash on the execution date in the amount of one third (€1.2 million); the remainder of the price was paid in the amount of €0.9 million in December 2012 following a €0.2 million price adjustment, while €1.2 million will be paid before 15 December 2013. The extended payments were secured by bank guarantees. The transaction led to a capital loss totalling €/000 1,068. The sales, which complied with the requirements of IFRS 5 and the most recent orientations of international accounting principles, have been represented in these notes as discontinued operations.
6. Business sector information Business sector information is provided with reference to the business sectors. We also present the information required by IFRS by geographical area. Information on business sectors reflects the Group internal reporting structure.
In 2012 the Group decided to change the designation of its business sectors: the Industrial Sector therefore became the Water Jetting Sector
The value of components and products transferred between sectors is generally the effective sales price between Group companies and corresponds to the best customer selling prices.
Sector information includes directly attributable costs and costs allocated on the basis of reasonable estimates. The holding costs (remuneration of directors, auditors and functions of the

55
Group's financial management, control and internal auditing, and also consultancy costs and other related costs) were ascribed to the sectors on the basis of sales. The Group is composed of the following business sectors:
Water Jetting Sector (previously called the Industrial Sector). Mainly composed of high and very high-pressure pumps and pumping systems used in a wide range of industrial sectors for the conveyance of fluids. High-pressure piston pumps are the main component of professional high-pressure washers. These pumps are also utilized for a broad range of industrial applications including car wash installations, forced lubrication systems for machine tools, and inverse osmosis systems for water desalination plants. Very high-pressure pumps and systems are used for cleaning surfaces, ships, various types of pipes, and also for removing machining burr, cutting and removing cement, asphalt, and paint coatings from stone, cement and metal surfaces, and for cutting solid materials. Marginally, this sector also includes operations of drawing, shearing and pressing sheet metal and the manufacture and sale of cleaning machinery.
Hydraulics Sector. Includes the production and sale of power take-offs, hydraulic cylinders, pumps, and other hydraulic components. Power take-offs are mechanical devices designed to transmit drive from an industrial vehicle engine or transmission to power a range of ancillary services through hydraulic components. These products, combined with other hydraulic components (directional control valves, controls, etc.) allow the execution of special functions such as lifting tipping bodies, moving truck-mounted cranes, operating mixer truck drums, and so forth. Hydraulic cylinders are components of the hydraulic system of various vehicle types, utilized in a wide range of applications depending on the type. Front-end and underbody cylinders (single acting) are utilized mainly on industrial vehicles in the construction sector, while double acting cylinders are utilized in a range of applications: earthmoving machinery, agricultural machinery, cranes and truck cranes, waste compactors, etc.

56
Interpump Group sector information (amounts shown in €/000) Progressive accounts at 31 December (twelve months) Hydraulic Sector Water Jetting Sector Other Elimination entries Interpump Group 2012 2011 2012 2011 2012 2011 2012 2011 2012 2011
Net sales external to the Group 257,736 229,245 269,440 242,374 - - - - 527,176 471,619 Sales between sectors 15 16 836 620 2,922 2,856 (3,773) (3,492) - - Total net sales 257,751 229,261 270,276 242,994 2,922 2,856 (3,773) (3,492) 527,176 471,619 Cost of sales (172,586) (154,244) (155,865) (141,023) (1,837) (2,041) 2,717 2,930 (327,571) (294,378) Gross industrial margin 85,165 75,017 114,411 101,971 1,085 815 (1,056) (562) 199,605 177,241 % on net sales 33.0% 32.7% 42.3% 42.0% n.s. n.s. 37.9% 37.6%
Other net revenues 5,524 3,937 3,538 2,755 42 1,207 (329) (340) 8,775 7,559 Distribution costs (25,968) (21,766) (27,480) (24,036) - - - - (53,448) (45,802) General and administrative expenses (38,799) (33,166) (30,812) (27,164) (1,149) (892) 1,385 902 (69,375) (60,320) Other operating costs (2,313) (1,848) (439) (1,180) - - - - (2,752) (3,028) Ordinary profit before financial charges 23,609 22,174 59,218 52,346 (22) 1,130 - - 82,805 75,650 % on net sales 9.2% 9.7% 21.9% 21.5% n.s. n.s. 15.7% 16.0%
Financial income 892 911 5,092 5,896 13 16 (1,092) (458) 4,905 6,365 Financial charges (4,913) (4,323) (8,922) (11,156) (13) (11) 1,092 458 (12,756) (15,032) Dividends - - 3,000 3,000 - - (3,000) (3,000) - - Adjustment of the value of investments carried at equity 69 (41) (216) (326) - - - - (147) (367) Profit for the period before taxes 19,657 18,721 58,172 49,760 (22) 1,135 (3,000) (3,000) 74,807 66,616
Income taxes (8,380) (7,335) (14,043) (15,151) (71) (512) - - (22,494) (22,998) Consolidated profit of continuing operations for the period 11,277 11,386 44,129 34,609 (93) 623 (3,000) (3,000) 52,313 43,618
Result of discontinued operations - - - - - - - - 12 (1,033) Consolidated profit for the period 11,277 11,386 44,129 34,609 (93) 623 (3,000) (3,000) 52,325 42,585
Due to: Parent company shareholders 10,454 10,172 44,045 34,565 (93) 623 (3,000) (3,000) 51,418 41,232 Subsidiaries' minority shareholders 823 1,214 84 44 - - - - 907 1,353 Consolidated profit for the period 11,277 11,386 44,129 34,609 (93) 623 (3,000) (3,000) 52,325 42,585
Further information required by IFRS 8 Amortization, depreciation and write-downs 11,896 10,198 8,227 7,863 9 2 - - 20,132 18,063 Other non-monetary costs 2,598 2,358 1,968 2,565 - - - - 4,566 4,923

57
Balance sheet at 31 December (amounts shown in €/000) Hydraulic Sector Water Jetting Sector Other Elimination entries Interpump Group 2012 2011 2012 2011 2012 2011 2012 2012 2012 2011 Assets by sector 323,798 292,889 337,331 319,151 1,758 4,759 (38,224) (29,960) 624,663 586,839Non-current assets held for sale - - 2,121 2,123 - - - - 2,121 2,123Subtotal of assets of the sector (A) 323,798 292,889 339,452 321,274 1,758 4,759 (38,224) (29,960) 626,784 588,962Cash and cash equivalents 115,069 109,068Total assets 741,853 698,030
Subtotal of liabilities of the sector (B) 102,187 94,672 61,686 61,215 1,707 1,900 (38,224) (29,960) 127,356 127,827Payables for payment of investments 28,003 19,012Payables to banks 10,614 8,762Interest-bearing financial payables 179,004 227,269Total liabilities 344,977 382,870
Total assets, net (A-B) 221,611 198,217 277,766 260,059 51 2,859 - 499,428 461,135 Further information required by IFRS 8 Investments carried at equity 1,307 457 205 171 - - - - 1,512 628Non-current assets other than financial assets and deferred tax assets 181,056 161,208 183,156 180,896 155 142 - - 364,367 342,246
58
On a like for like basis the comparison of the Hydraulic Sector is as follows: (amounts shown in €/000) 2012 2011 Net sales external to the Group 230,646 229,245Sales between sectors 15 16Total net sales 230,661 229,261Cost of sales (152,386) (154,244)Gross industrial margin 78,275 75,017% on net sales 33.9% 32.7%
Other net revenues 5,143 3,937Distribution costs (23,577) (21,766)General and administrative expenses (34,990) (33,166)Other operating costs (2,283) (1,848)Ordinary profit before financial charges 22,568 22,174% on net sales 9.8% 9.7%
Financial income 1,096 911Financial charges (4,176) (4,323)Adjustment of the value of investments carried at equity (171) (41)Profit for the period before taxes 19,317 18,721
Income taxes (8,135) (7,335)Consolidated profit for the period 11,182 11,386
Due to: Parent company shareholders 10,359 10,172Subsidiaries' minority shareholders 823 1,214Consolidated profit for the period 11,182 11,386
Cash flows by business sector are as follows (only continuing operations for 2011):
€/000 Hydraulic Sector Water Jetting Sector Other Total 2012 2011 2012 2011 2012 2011 2012 2011
Cash flows from:
Operating activities 18,583 20,210 34,515 20,842 190 (302) 53,288 40,750Investing activities (25,921) (15,292) (4,608) (927) 138 (120) (30,391) (16,339)Financing activities 5,521 (7,763) (24,059) (45,948) - - (18,538) (53,711)Total (1,817) (2,845) 5,848 (26,033) 328 (422) 4,359 (29,300)
2012 investing activities of the Hydraulic Sector include €/000 19,216 relative to the acquisition of equity investments (€/000 9,067 in 2011), and €/000 421 relative to the disposal of equity investments (€/000 441 in 2011). Cash flows of Water Jetting Sector investing activities include outlays for the acquisition of equity investments in the amount of €/000 170 (€/000 35 in 2011) and €/000 957 of receipts for the sale of equity investments (€/000 1,110 in 2011). Financing activities for 2012 include intercompany loans from the Water Jetting Sector to the Hydraulic Sector in the amount of €/000 7,204 to finance new acquisitions (€/000 15,109 in 2011). Moreover, cash flows of the Water Jetting Sector financing activity in 2012 include outlays for the purchase of treasury shares in the amount of €/000 15,827 (€/000 16,489 in 2011) and proceeds from the sale of treasury shares to the beneficiaries of stock options in the amount of €/000 2,025 (€/000 188 in 2011), the value of treasury shares transferred for the acquisition of Galtech in the amount of €/000 1,704 (€/000 4,309 in 2011 for the acquisition of 11% of Interpump Hydraulics International), and receipts deriving from the share capital increase further to the exercise of warrants for €/000 56,881 (€/000 31 in 2011) in addition to

59
dividends paid by the Parent Company, which operates in this sector, in the amount of €/000 11,174 (€/000 10,412 in 2011). Geographical sectors The Group's sector-based operations are divided into five geographical areas, even though management is conducted on a global level.
A breakdown of sales of continuing operations by geographical area is provided below: 2012
(€/000) %2011
(€/000)
% Growth
Italy 71,543 14 76,055 16 -5.9%Rest of Europe 143,479 27 133,606 28 +7.4%North America 187,475 36 154,986 33 +21.0%Pacific Area 54,782 10 52,493 11 +4.4%Rest of the World 69,897 13 54,479 12 +28.3%Total 527,176 100 471,619 100 +11.8%
Data by geographical sector on the basis of the location of non-current assets other than financial assets and deferred tax assets are as follows: 31/12/2012 31/12/2011 (€/000) (€/000)
Italy 214,526 194,401Rest of Europe 76,395 76,219North America 65,518 66,170Pacific Area 3,068 2,781Rest of the World 4,860 2,675Total 364,367 342,246
The geographical areas to which assets are assigned depend on the nationality of the company that holds them. No companies have assets in more than one area.
7. Acquisition of investments As already noted, Interpump Group acquired three equity investments in 2012: Takarada (100%), Galtech (53%) and MTC (60%). The fair value of the assets and liabilities acquired via the foregoing equity investments is deemed to be final since the provisional period allowed by IFRS 3 has now elapsed. The acquisitions had the following effects on the assets and liabilities of the Interpump Group:

60
Takarada
The amounts are expressed in thousands of euro (the exchange rate utilised was 2.2475 reais/euro).
€/000 Amounts acquired
Adjustments to fair value
Carrying values in the acquiring
company
Cash and cash equivalents 280 - 280Trade receivables 995 - 995Inventories 926 - 926Tax receivables 402 402Other current assets 367 - 367Property, plant and equipment 1,392 - 1,392Trademarks 457 - 457Other intangible assets - - -Medium-/long-term tax receivables 13 - 13Deferred tax assets 45 - 45Trade payables (566) - (566)Financial payables to banks - loans (current portion) (380) - (380)Leasing payables (current portion) (21) - (21)Taxes payable (172) - (172)Other current liabilities (293) - (293)Financial payables to banks – loans (medium/long-term portion) (608) - (608)Leasing payables (medium/long-term portion) (15) - (15)Medium/long-term tax payables (48) - (48)Other medium/long-term liabilities (4) - (4)Net assets acquired 2,770 - 2,770Goodwill related to the acquisition 9,621Total acquisition cost 12,391
Total amount paid in cash 12,391Total amount due in medium/long-term -Total acquisition cost 12,391Net indebtedness of the acquired company 744Total change in net financial position 13,135

61
Galtech S.p.A.
€/000 Amounts acquired
Adjustments to fair value
Carrying values in the acquiring
company
Cash and cash equivalents 1 - 1Trade receivables 3,295 - 3,295Inventories 3,522 - 3,522Tax receivables 223 - 223Other current assets 113 - 113Property, plant and equipment 2,327 2,563 4,890Other intangible assets 42 - 42Other financial assets 65 (15) 50Deferred tax assets 804 - 804Other non-current assets 14 - 14Trade payables (3,448) - (3,448)Payables to banks (629) (629)Financial payables to banks - loans (current portion) (393) - (393)Leasing payables (current portion) (75) - (75)Taxes payable (278) - (278)Other current liabilities (639) - (639)Financial payables to banks – loans (medium/long-term portion) (505) - (505)Leasing payables (medium/long-term portion) (186) - (186)Liabilities for employee benefits (severance indemnity provision) (347) - (347)Deferred tax liabilities (244) (805) (1,049)Provision for risks (medium/long-term portion) (68) - (68)Net assets acquired 3,594 1,743 5,337Goodwill related to the acquisition 3,387Total acquisition cost 8,724
Total amount paid in cash 1,643Total amount paid in treasury stock 1,704Total amount due in medium/long-term 5,377Total acquisition cost 8,724Acquired net financial indebtedness 1,787Total change in the net financial position including changes in payables due to the acquisition of investments 10,511
The medium/long-term amount to be paid refers to the value of the put option for the purchase of the remaining 47% calculated on the basis of an estimate developed on the basis of a business plan. The estimated value was discounted to current value at the rate of 5%. The fair value of property, plant and equipment was measured by an independent appraiser. In particular, for the determination of the fair value of plant and machinery we adopted the "replacement cost" estimation procedure. This involved the determination of a reliable "as new value" on the basis of current prices or prices discounted to present value for comparison, including any accessory expenses (costs for transport, installation, testing, hook-ups and similar) and the interest expense accruing on capital variously locked up for the period required for commissioning of the relative asset. The as-new values thus obtained were then subjected to "coefficients for deterioration" (age, condition, technical obsolescence) for determination of the more reliable "current value in use”

62
MTC S.r.l.
€/000 Amounts acquired
Adjustments to fair value
Carrying values in the acquiring
company
Cash and cash equivalents 1,134 - 1,134Trade receivables 1,130 - 1,130Inventories 1,531 - 1,531Tax receivables 264 - 264Other current assets 32 - 32Property, plant and equipment 1,911 1,244 3,155Other intangible assets 7 - 7Other financial assets 2 - 2Deferred tax assets 35 - 35Other current assets 1 - 1Trade payables (873) - (873)Payables to banks (1) - (1)Leasing payables (current portion) (236) - (236)Taxes payable (426) - (426)Other current liabilities (384) - (384)Leasing payables (medium/long-term portion) (499) - (499)Liabilities for employee benefits (severance indemnity provision) (318) - (318)Deferred tax liabilities (292) (391) (683)Net assets acquired 3,018 853 3,871Goodwill related to the acquisition 3,503Total acquisition cost 7,374
Total amount paid by cash 3,000Total amount due in medium/long-term 4,374Total acquisition cost 7,374Net liquidity acquired (398)Total change in the net financial position including changes in payables for the acquisition of investments 6,979
The medium/long-term amount to be paid refers to the value of the put option for the purchase of the remaining 40% calculated on the basis of an estimate developed on the basis of a business plan. The estimated value was discounted to current value at the rate of 5%. The fair value of property, plant and equipment was measured by an independent appraiser. In particular, for the determination of the fair value of plant and machinery we adopted the "replacement cost" estimation procedure. This involved the determination of a reliable "as new value" on the basis of current prices or prices discounted to present value for comparison, including any accessory expenses (costs for transport, installation, testing, hook-ups and similar) and the interest expense accruing on capital variously locked up for the period required for commissioning of the relative asset. The as-new values thus obtained were then subjected to "coefficients for deterioration" (age, condition, technical obsolescence) for determination of the more reliable "current value in use”.

63
8. Cash and cash equivalents 31/12/2012 31/12/2011 (€/000) (€/000)
Cash 76 61Repurchase agreements 292 45,120Bank deposits 114,701 63,887Total 115,069 109,068
Bank deposits include €/000 20,309 in US dollars ($/000 26,803), €/000 2,777 in Renminbi (CNY/000 22,828) and €/000 1,295 in Australian dollars (AUD/000 1,646). At 31 December 2012 bank deposits included locked up deposits maturing in February 2013 for a notional amount of €42 million at a rate of 3.85%. Throughout 2012 the Group proceeded with its policy of optimization of finance management by investing surplus cash in repurchase agreements, locked up bank deposits and savings accounts. Despite a significant reduction of the EURIBOR quotation, which reached its all-time low at the end of 2012, the attentive policy adopted by the Group allowed the achievement of an average rate of return on cash in 2012 of 2.0%, which is substantially in line with the rate recorded in 2011 (2.1%). 9. Trade receivables 31/12/2012 31/12/2011 (€/000) (€/000)
Trade receivables, gross 100,260 99,448Bad debt provision (3,889) (3,536)Trade receivables, net 96,371 95,912
Changes in the bad debt provision were as follows: 2012 2011 (€/000) (€/000)
Opening balances 3,536 3,355Exchange rate difference (16) 7Change to consolidation basis 171 (162)Allocations for the year 1,081 1,387Decreases in the period due to surpluses (148) -Drawdowns in the period (735) (1,051)Closing balance 3,889 3,536
Allocations in the period are booked under other operating costs.
No trade receivables or payables are due beyond 12 months.

64
10. Inventories 31/12/2012 31/12/2011 (€/000) (€/000)
Raw materials and components 26,525 25,074Semi-finished products 47,448 40,129Finished products 57,719 51,818Total inventories 131,692 117,021
Inventories are net of the depreciation provision that changed as indicated below:
2012 2011 (€/000) (€/000) Opening balances 11,309 11,966Exchange rate difference (71) 53Change to consolidation basis 1,001 (978)Allocations for the period 1,719 2,620Drawdowns in the period (2,041) (2,141)Reversal of provisions due to surpluses (25) (211)Closing balance 11,892 11,309
11. Derivative financial instruments Interest rate hedging. The Group adopts a procedure, approved by the Board of Directors, which identifies the derivative financial instruments to be used to hedge against the risk of interest rate fluctuations. These instruments are as follows: Interest Rate Swaps (IRS), Forward Rate Agreements (FRA) and options on interest rates (Caps & Floors).
Current Group policy is to assess the opportunities offered by the market in relation to the possibility to take out interest rate swaps at economically advantageous conditions. This approach is also evident in the hedge taken out in 2009 in the amount of €80,670 thousand, which was expected to show a remaining amount of €46,870 thousand at 31 December 2012 and €69,630 thousand at 31 December 2011. This hedge was taken out to offset the interest rate risk on a loan on the basis of a drawdown plan prepared at the time of the hedge that envisages several repayment instalments with the final payment due on 30/06/2014. This loan however, which was to constitute the underlying of the IRS hedge, has actually been utilised for a lesser amount (€/000 29,470 at 31/12/2012 and €/000 43,230 at 31/12/2011) with respect to the initial intentions resulting, for the surplus portion of the IRS (€/000 17,400 at 31/12/2012 and €/000 26,400 at 31/12/2011), in loss of the conditions required by IAS 39 to qualify as a hedging derivative. The company therefore classified the ineffective part of the IRS as a derivative instrument held for trading. The IRS was taken out on 31 December 2009 at a rate of 2.83%. January 2012 also saw the termination of a second hedge on a loan of €/000 33,333 at an interest rate of 2.70%. Since in September 2011 the hedge had not complied with the limits of effectiveness established by IAS 39 (80-125 percent) at the end of 2011 it was classified as a derivative instrument held for trading.
At 31 December 2012 €45.7 million of cash on hand was held at a fixed rate (€42.0 million at 3.85% maturing in February 2013 and €3.7 million at 3.50% without time limits), while the remaining part was at floating rates, as are financial and bank debts.
65
Exchange risk hedging At 31 December 2012 the Group is subject to: exposure in US dollars for sales made in USD:
- high-pressure pumps;
- various hydraulic components;
- very high pressure systems and pumps;
exposure in Australian dollars in relation to sales of very high pressure systems and pumps made in AUD.
Hedging can be carried out using two types of financial instruments: plain vanilla forwards and sale or purchase options in dollars.
The Group classifies derivatives as shown below:
Purpose of hedge Recognition
Hedges on intercompany sales of high pressure pumps Cash flow hedging
Hedges on sales of high pressure pumps external to the Group Fair value hedging
Hedges on sales of very high pressure systems Cash flow hedging
Hedges on sales of a number of hydraulic components Fair value hedging
Derivatives that do not meet all the requirements of IAS 39 Fair value to P&L
The fair values of exchange rate risk derivative instruments, as defined by IAS 39, were as follows at the close of the year: 31/12/2012
Notional 31/12/2012
Positive fair value
31/12/2012Negative fair value
31/12/2011 Notional
31/12/2011 Positive
fair value
31/12/2011Negative fair value
(€/000) (€/000) (€/000) (€/000) (€/000) (€/000)
IRS hedges on loans 46,870 - 781 102,963 - 1,383
Total 46,870 - 781 102,963 - 1,383
IRS used to hedge interest risks are brought to book according to the cash flow hedging method. The classification of the fair value of hedging derivatives according to the profit and loss method is as follows: 31/12/2012
Notional 31/12/2012
Positive fair value
31/12/2012Negative fair value
31/12/2011 Notional
31/12/2011 Positive
fair value
31/12/2011Negative fair value
(€/000) (€/000) (€/000) (€/000) (€/000) (€/000)
IRS recognized according to the cash flow hedging method 29,470 - 484
43,230
- 798
IRS that do not comply with the requirements of IAS 39 to be defined as hedges 17,400 - 297
59,733
- 585
Total derivative financial instruments to hedge the exchange rate risk 46,870 - 781
102,963
- 1,383
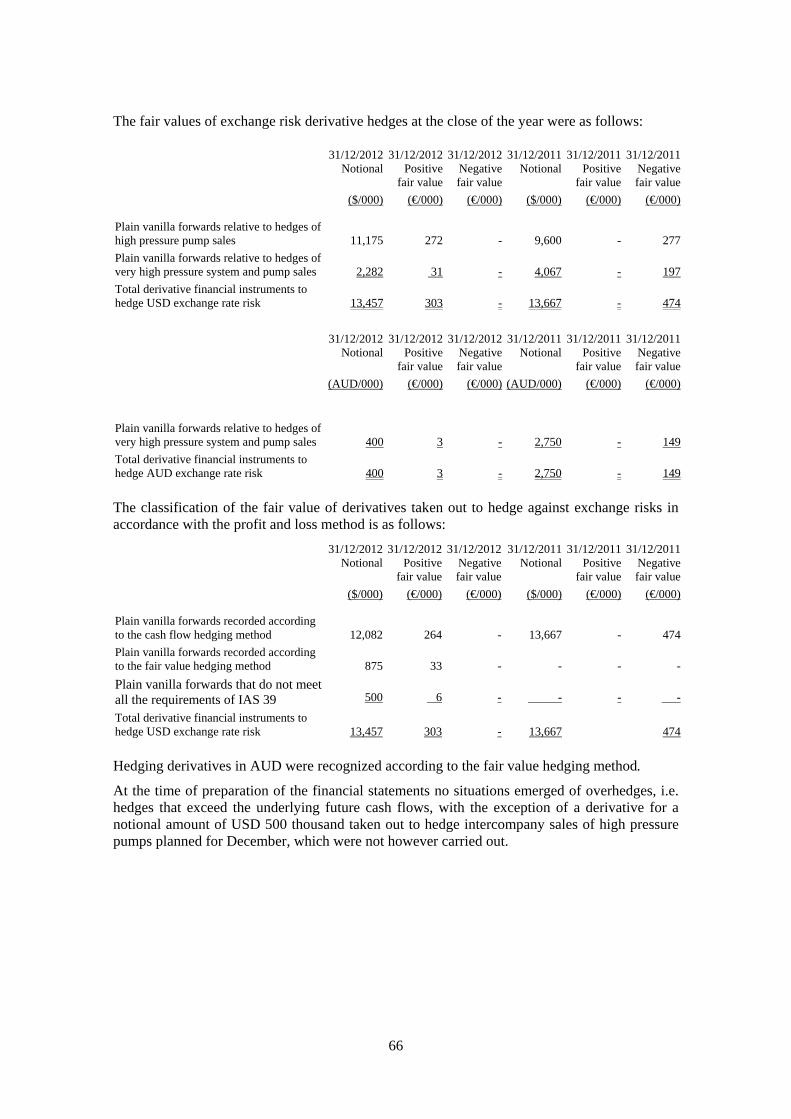
66
The fair values of exchange risk derivative hedges at the close of the year were as follows: 31/12/2012
Notional 31/12/2012
Positive fair value
31/12/2012Negative fair value
31/12/2011 Notional
31/12/2011 Positive
fair value
31/12/2011Negative fair value
($/000) (€/000) (€/000) ($/000) (€/000) (€/000)
Plain vanilla forwards relative to hedges of high pressure pump sales 11,175 272 -
9,600
- 277
Plain vanilla forwards relative to hedges of very high pressure system and pump sales 2,282 31 -
4,067
- 197
Total derivative financial instruments to hedge USD exchange rate risk 13,457 303 -
13,667
- 474
31/12/2012
Notional 31/12/2012
Positive fair value
31/12/2012Negative fair value
31/12/2011 Notional
31/12/2011 Positive
fair value
31/12/2011Negative fair value
(AUD/000) (€/000) (€/000) (AUD/000) (€/000) (€/000)
Plain vanilla forwards relative to hedges of very high pressure system and pump sales 400 3 -
2,750
- 149
Total derivative financial instruments to hedge AUD exchange rate risk 400 3 -
2,750
- 149
The classification of the fair value of derivatives taken out to hedge against exchange risks in accordance with the profit and loss method is as follows:
31/12/2012 Notional
31/12/2012Positive
fair value
31/12/2012Negative fair value
31/12/2011 Notional
31/12/2011 Positive
fair value
31/12/2011Negative fair value
($/000) (€/000) (€/000) ($/000) (€/000) (€/000)
Plain vanilla forwards recorded according to the cash flow hedging method 12,082 264 -
13,667
- 474
Plain vanilla forwards recorded according to the fair value hedging method 875 33 -
-
- -
Plain vanilla forwards that do not meet all the requirements of IAS 39 500 6 -
-
- -
Total derivative financial instruments to hedge USD exchange rate risk 13,457 303 -
13,667
474
Hedging derivatives in AUD were recognized according to the fair value hedging method.
At the time of preparation of the financial statements no situations emerged of overhedges, i.e. hedges that exceed the underlying future cash flows, with the exception of a derivative for a notional amount of USD 500 thousand taken out to hedge intercompany sales of high pressure pumps planned for December, which were not however carried out.

67
Cash flow hedges The net effects recognized in the income statement refer in the amount of €/000 16 to losses recorded on the activity of interest rate risk management and in the amount of €/000 88 to losses arising from the activity of interest rate risk management. Hedging of the interest rate risk concerned loans maturing within 2014. The Interpump Group exchange risk management policy involves hedging of future sales flows and purchase orders. The maximum time frame in which it is predicted that the cash flows will occur is as follows: Purposes of hedging
Hedges on high pressure pump sales 6 months Hedges on sales of very high pressure systems 7 months
It is therefore reasonable to assume that the relative hedge effect suspended in the Provision for valuation of hedging derivatives at fair value will be recorded in the income statement in the next year.
During 2012 the Group removed from equity and transferred to the income statement a negative portion of previously recorded losses in the amount of €/000 239, net of the theoretical tax effect. This amount was booked as a reduction of net sales in the amount of €/000 367 and under deferred and current taxes with positive sign in the amount of €/000 128.
The ineffectiveness deriving from cash flow hedging transactions in 2012 and in 2011 was negligible. Fair value hedges The profits and losses deriving from the valuation of derivative financial instruments in compliance with the rules of fair value hedging and the profits and losses ascribable to the relative hedged elements are shown in the following table: 2012 2011 (€/000) (€/000)
Net profits (losses) on derivative instruments used to hedge against exchange risks
36 18
Change in the fair value of other underlying elements - (8)Profit (loss), net 36 10
Fair values The net effects recognized in the income statement on derivative instruments that do not comply with the parameters of IAS 39 amount to a gain of €/000 3 and are referred mainly to the exchange risk management activity.
The main methods and assumptions made in the estimation of fair values are outlined below.
Derivatives The fair value of plain vanilla forwards is obtained using market prices if the forwards are listed, or discounting the difference between the contractual forward exchange rate and the current spot exchange rate. The interest rate utilized for discounting corresponds to swap broker quotes, tested by applying pricing models and cash flow techniques discounted to current values. In this latter case, the calculation of future cash flows is based on the management's best

68
estimate and the interest rate applied is the market rate for said derivative instruments at the balance sheet date.
Investments in other companies The fair value is essentially represented by the cost, written down if necessary to take account of any value impairments.
Interest-bearing financial payables The fair value is based on the predicted cash flows for the principal amount and interest.
Financial leasing payables The fair value is represented by the discounted value of future cash flows generated by the payment of instalments; the interest rate utilized is the market rate for similar transactions.
Receivables/Payables For receivables and payables due within twelve months the carrying value is assumed as the fair value. The fair value of other receivables and payables is the discounted nominal value if the temporal factor or notional value are significant.
Interest rates utilized to obtain the fair value To establish the fair value the Group utilities the interest rate curve at 31 December plus a suitable spread. The interest rates utilized are as follows:
31/12/2012 31/12/2011 % %
Derivative financial instruments (euro) 0.050/2.320 0.300/2.570Derivative financial instruments (USD) 0.150/2.772 0.200/2.592Derivative financial instruments (AUD) 3.000/4.330 4.350/4.610Interest bearing financial payables (euro) Euribor+0.80/3.00 Euribor+0.40/2.00Interest bearing financial payables (US dollars) - -Financial leasing agreements 2.5/6.8 3.4/6.8Receivables 3.4 3.0Payables 5.0 4.7
Financial instruments measured at fair value refer to financial assets and liabilities listed on active markets (fair value hierarchy level 1).
12. Assets held for sale Assets held for sale at 31 December 2012 refer to an industrial building destined for disposal for which the preliminary procedures for sale are still in progress and which was already classified as held for sale last year. It is deemed that the book value calculated by taking the lower of the cost or fair value was no higher than the realizable value of the above-mentioned building in its current condition.
In 2011 a building classified under "Assets held for sale" was sold for €3.7 million. The price, which was divided into instalments, was collected in the amount of €0.9 million in 2011 with the outstanding amount collected in 2012. The sale produced a capital gain of €/000 1,161.

69
13. Other current assets 31/12/2012 31/12/2011 (€/000) (€/000)
Receivables from the disposal of assets held for sale - 2,795Accrued income and prepayments 2,047 2,103Receivables from the disposal of investments 1,129 1,129Other receivables 1,482 1,292Other current assets 2,017 1,435Total other current assets 6,675 8,754
14. Property, plant and equipment Land and
buildingsPlant and
machinery EquipmentOther assets Total
(€/000) (€/000) (€/000) (€/000) (€/000)
At 31 December 2010 Cost 50,755 126,347 35,815 28,951 241,868Accumulated depreciation (14,899) (75,163) (30,332) (18,353) (138,747)Book value 35,856 51,184 5,483 10,598 103,121
Changes in 2011 Opening book value 35,856 51,184 5,483 10,598 103,121Exchange rate differences 154 143 119 336 752Change to consolidation basis - (1,162) 462 (54) (754)Increases due to purchases 555 7,719 2,640 5,010 15,924Disposals - (942) (99) (1,340) (2,381)Reclassifications 108 (81) 3 - 30Depreciation (1,373) (7,482) (2,439) (2,621) (13,915)Closing book value 35,300 49,379 6,169 11,929 102,777
At 31 December 2011 Cost 51,865 121,870 37,454 31,419 242,608Accumulated depreciation (16,565) (72,491) (31,285) (19,490) (139,831)Book value 35,300 49,379 6,169 11,929 102,777
Changes in 2012 Opening book value 35,300 49,379 6,169 11,929 102,777Exchange rate differences (87) (544) (65) (226) (922)Change to consolidation basis (197) 8,702 441 250 9,196Increases due to purchases 1,762 9,884 2,721 6,488 20,855Disposals - (489) (97) (2,651) (3,237)Reclassifications - (30) 9 (4) (25)Write-downs (241) (3) - (10) (254)Depreciation (1,461) (8,881) (2,563) (2,958) (15,863)Closing book value 35,076 58,018 6,615 12,818 112,527
At 31 December 2012 Cost 52,757 141,411 43,187 33,731 271,086Accumulated depreciation (17,681) (83,393) (36,572) (20,913) (158,559)Book value 35,076 58,018 6,615 12,818 112,527

70
The cost of assets under construction, included in the net book values disclosed in the previous table, is as follows:
Land and buildings
Plant and machinery Equipment
Other assets Total
(€/000) (€/000) (€/000) (€/000) (€/000)
At 1 January 2011 28 170 112 96 406At 31 December 2011 1 974 430 52 1,457At 31 December 2012 970 1,340 604 64 2,978
The following values, included in the net book value of assets disclosed above, are relative to financial leasing agreements:
Land and buildings
Plant and machinery Equipment
Other assets Total
(€/000) (€/000) (€/000) (€/000) (€/000)
At 1 January 2011 2,827 6,371 7 148 9,353At 31 December 2011 2,610 5,147 - 160 7,917At 31 December 2012 2,279 5,053 25 168 7,525
Depreciation of €/000 13,358 was charged to the cost of sales (€/000 11,528 in 2011), €/000 480 to distribution costs (€/000 479 in 2011) and €/000 2,025 for general and administrative expenses (€/000 1,908 in 2011).
At 31 December 2012 the Group had contractual commitments for the purchase of tangible assets in the amount of €/000 6,969 (€/000 2,057 at 31/12/2011).
15. Goodwill Goodwill is allocated to the relative cash generating units (CGU) as shown in the table below.
Company: Balance at
31/12/2011
Increases for theperiod
Decreases for theperiod
Foreign exchange
differences Balance at
31/12/2012
- High pressure pumps division 37,502 - - (96) 37,406
- Very high pressure pumps division 90,659 - - (580) 90,079
Total Water Jetting Sector 128,161 - - (676) 127,485
- Power takeoffs and hydraulic pumps division 38,822 16,511 - (1,932) 53,401
- Cylinders Division 46,417 - (1,382) - 45,035
Total Hydraulic Sector 85,239 16,511 (1,382) (1,932) 98,436
Total 213,400 16,511 (1,382) (2,608) 225,921 The increases of the period are due to the new acquisitions (Takarada, Galtech and MTC) as described in note 7. The decreases are due to a different measurement of the put options of the companies in the Cylinders Division resulting from a revision of the business plan used as a basis for the valuation. The impairment test was conducted using the Discounted Cash Flow method (DCF) net of taxation. Expected cash flows utilized in the calculation of DCF were determined on the basis of 5-year business plans that take account of the various reference scenarios and on the basis of growth forecasts in the various markets. Notably, given the extreme uncertainty regarding the

71
evolution of markets and in consideration of the signs of crisis that are still rife in the current world economic trend (especially in Europe), it was prudentially decided to adopt moderate growth percentages of around 1% for the "High pressure pumps division" and of around 3% - 4% for the other CGUs. For periods after 2017 a perpetual growth rate of 1% was used for the power take-offs and hydraulic pumps division and for the cylinders division CGUs, while perpetual growth of 1.5% was applied to the high pressure and very high pressure pumps division CGUs because of the different market contexts. The forecast cash flows determined in this manner were reduced by a discount factor in order to take into consideration the risk that the future plans could prove to be impracticable. WACC, after tax, was determined for the various CGUs as follows:
CGU WACC
High pressure pumps division 8.01% Very high pressure pumps division 5.68%
Power take-offs and hydraulic pumps division 6.95% Cylinders Division 8.56% Weighted average cost of capital 6.63%
The WACC utilized in 2011 was 5.80%. In addition, a sensitivity analysis was carried out in compliance with the requirements of the joint document issued by Banca d'Italia, Consob, and ISVAP on 3 March 2010. Reducing the expected cash flows of each CGU by 10% would not have resulted in the need to write down goodwill, and nor would increasing the cost of capital utilized to actualize the predicted flows by 50 basis points.
16. Other intangible assets
Productdevelopment
costs
Patentstrademarks
and industrial rights
Other intangible
fixed assets Total (€/000) (€/000) (€/000) (€/000)
At 31 December 2010 13,918 28,316 2,282 44,516Cost (7,797) (10,871) (1,953) (20,621)Accumulated amortization 6,121 17,445 329 23,895Book value
Changes in 2011 Opening book value 6,121 17,445 329 23,895Exchange rate differences 55 263 (4) 314Changes to consolidation basis - 1,021 (31) 990Increases 2,434 201 200 2,835Decreases (35) (6) - (41)Reclassifications - (30) - (30)Write-downs (702) (14) - (716)Amortization (1,185) (2,327) (173) (3,685)Closing book value 6,688 16,553 321 23,562 At 31 December 2011 Cost 16,668 29,752 2,307 48,727Accumulated amortization (9,980) (13,199) (1,986) (25,165)Book value 6,688 16,553 321 23,562

72
Product
development costs
Patentstrademarks
and industrial rights
Other intangible
fixed assets Total (€/000) (€/000) (€/000) (€/000)
Changes in 2012 Opening book value 6,688 16,553 321 23,562Exchange rate differences (26) (191) (7) (224)Changes to consolidation basis 5 462 39 506Increases 1,908 271 162 2,341Decreases - (38) - (38)Reclassifications - - 25 25Write-downs (91) - - (91)Amortization (1,308) (2,404) (223) (3,935)Closing book value 7,176 14,653 317 22,146
At 31 December 2012 Cost 18,514 30,228 2,959 51,701Accumulated amortization (11,338) (15,575) (2,642) (29,555)Book value 7,176 14,653 317 22,146
The cost of assets under construction, included in the net book values disclosed in the previous table, is as follows:
Productdevelopment
costs
Patentstrademarks
and industrial rights
Other intangible
fixed assets Total (€/000) (€/000) (€/000) (€/000)
At 1 January 2011 3,908 - 43 3,951At 31 December 2011 4,235 2 - 4,237At 31 December 2012 4,386 2 - 4,386
Amortization amounts were recorded entirely under general and administrative expenses, while write-downs were recorded under other operating costs.
Product development costs consist exclusively of capitalized internal costs. 17. Other financial assets This item comprises:
31/12/2012 31/12/2011 (€/000) (€/000)
Employee and directors' life insurance policy - 2,406Investments in non-consolidated subsidiaries 1,512 628Investments in other companies 12 161Loans to non-consolidated subsidiaries 310 224Other 6 5Total 1,840 3,424
The reduction of the value of employees' and directors' life insurance policies is due in the amount of €/000 1,634 to the redemption of several policies due to the resignation of several

73
directors of foreign subsidiaries, and for the remaining amount to the classification of this item under other current assets due to the occurrence of the insured event. The following changes were recorded:
2012 2011 (€/000) (€/000)
Opening balance 3,424 3,399Exchange rate differences 14 84Increases for the period 1,129 597Change in the value of investments measured at fair value 1 2Changes to consolidation basis 52 -Decreases for the year (2,034) (658)Reclassifications to other current assets (746) -Closing balance 1,840 3,424
Breakdown of the value of investments in non-consolidated subsidiaries:
Company
31/12/2012
% stake
31/12/2011
% stake
(€/000) (€/000)
Subsidiaries GITOP S.r.l. 643 100% - - Galtech Canada Inc. 285 100% - - Syscam Gestión Integrada S.A. 252 60% 202 60% General Pump China 205 100% 171 100% HS Penta Africa Pty Ltd 114 52% 50 52% Interpump Hydraulics (UK) Ltd 13 100% - - Interpump Hydraulics Middle East FZCO - 100% 205 100% Total subsidiaries 1,512 628
Although they are subsidiaries, GITOP S.r.l., Galtech Canada Inc, Syscam Gestion Integrada S.A., General Pump China, HS Penta Africa Pty Ltd, Interpump Hydraulics (UK) Ltd and Interpump Hydraulics Middle East FZCO were not consolidated due to their modest size.
On 31 January 2012 the Group acquired Galtech, a Reggio Emilia based company operating in the production and sale of gear pumps and motors, directional controls, hydraulic accessories and components in general. Galtech controls Galtech Canada Inc., which acts as its distributor on the North American market. In 2012 Galtech Canada recorded a substantial increase in sales and profitability, although in absolute terms the values are still of limited significance.
On 24 July we acquired GITOP S.r.l., a company utilised by controlling company Oleodinamica Panni S.r.l. to cope with peak production demands and to manufacturer smaller lots of cylinders. 100% of GITOP's stock was purchased for the price of €600 thousand. GITOP was merged with Oleodinamica Panni in January 2013.
Interpump Hydraulics UK Ltd, a distribution company based in Birmingham, was incorporated on 10 September with the aim of ensuring direct presence of the Group on the important UK market.
In 2012 Hammelmann Maschinenfabrik GmbH proceeded to execute two capital increases in Hammelmann Bombas e Sistemas Ltda for a total of €/000 170. Hammelmann Bombas e Sistema Ltda, which was incorporated in order to obtain a local distributor capable of penetrating the Brazilian market in a more effective manner, continues to be affected by costs

74
related to the start-up phase, therefore on the consolidated level the value of the investment was prudentially reduced to zero and a provision for risks and charges was set up in the amount of €/000 234 in accordance with the losses sustained.
Interpump Hydraulics Middle East FZCO with registered office in Dubai was incorporated on 19 December 2011. The company is controlled in the measure of 50% by Interpump Hydraulics S.p.A. and 50% by HS Penta S.p.A. The incorporation of this company forms part of the Group's strategy of growth in areas with the greatest potential and fastest rate of development. Interpump Hydraulics Middle East FZCO was not consolidated in 2012 or in 2011 because it has only started operated recently; in addition, the value of the investment was cancelled and a risks provision was set up for €/000 116 in accordance with the losses incurred during the start-up stage.
18 Deferred tax assets and liabilities Changes during the year in deferred tax assets and liabilities are listed below:
Deferred tax assets Deferred tax liabilities
2012 2011 2012 2011
(€/000) (€/000) (€/000) (€/000)
At 31 December of the previous year 15,057 14,161 20,668 18,856
Exchange rate differences (59) 50 (221) 388
Changes to consolidation basis 848 (336) 1,668 (72)
Allocation to income statement in the period 1,161 1,355 313 1,545
Allocation to income statement of discontinued operations - 76
- (6)
Allocation to reserves for the year (300) (249) 28 (43)
At 31 December 16,707 15,057 22,456 20,668
Deferred tax assets/liabilities directly charged to equity refer to the accounting of the fair value of derivative financial instruments recorded in accordance with the hedge accounting method.
Deferred tax assets and liabilities refer to the following items of the balance sheet:
Deferred tax assets Deferred tax liabilities
31/12/2012 31/12/2011 31/12/2012 31/12/2011
(€/000) (€/000) (€/000) (€/000)
Property, plant and equipment 5,731 5,970 14,515 12,957
Intangible fixed assets 413 477 7,341 6,724
Investments 430 66 11 11
Inventories 4,590 4,212 - -
Receivables 502 482 - -
Derivative financial instruments 150 448 28 -
Liabilities for employee benefits 219 193 323 540
Net equity 36 77 - -
Provisions for risks and charges 1,152 642 -
Past tax losses 1,963 1,395 - -
Other 1,521 1,095 238 436
Total 16,707 15,057 22,456 20,668

75
No deferred tax liabilities were recorded for reserves qualifying for tax relief as their distribution is not envisaged (see note 23).
19. Interest-bearing financial payables and bank payables The main loans are all subject to the following financial covenants, calculated using consolidated figures:
- Net financial indebtedness / Shareholders' equity;
- Net financial indebtedness / EBITDA;
- EBITDA / Financial charges;
At 31/12/2012 all financial covenants had been amply complied with.
31/12/2012 31/12/2011 (€/000) (€/000)
Current Due to banks 10,614 8,762
Bank loans 85,157 111,128Financial leasing agreements 1,802 2,226Other 344 346Total current interest bearing financial payables 87,303 113,700
Non-current Bank loans 88,457 109,423Financial leasing agreements 3,244 4,146Total non-current interest bearing financial payables 91,701 113,569 The terms of maturity of non-current financial payables are as shown below:
31/12/2012 31/12/2011 (€/000) (€/000)
From 1 to 2 years 29,887 62,733From 2 to 5 years 59,170 38,938After 5 years 2,644 11,898Total 91,701 113,569 See note 11 for details of interest rates.
At 31/12/2012 all loans were subject to floating-rate interest. Hedge contracts were taken out on several loans for a total amount of €/000 29,470 (see note 11).

76
The loans include the following amounts in reais relative to the Brazilian subsidiaries:
31/12/2012 31/12/2011 (€/000) (€/000)
Interest-bearing financial payables (current portion) 312 -Interest-bearing financial payables (non-current portion) 655 - The exchange rate at 31/12/2012 was 2.7036 reais / 1 euro.
The Group has the following lines of credit that were unused at year-end:
31/12/2012 31/12/2011 (€/000) (€/000)
Export advances and Italy portfolio 72,647 70,852Current account overdrafts 22,685 20,135Medium/long-term financing 41,500 50,676Total 136,832 141,663 The unused medium/long-term lines of credit at 31/12/2012 refer mainly to the BNL loan taken out on 31 July 2012 in the amount of €30 million.
20. Other current liabilities 31/12/2012 31/12/2011 (€/000) (€/000)
Payables for acquisition of investments 2,413 473Other short-term payables 24,377 22,192Other 552 278Total 27,342 22,943
The residual amount of other short-term payables mainly concerns payables to personnel, directors and statutory auditors, and to social security institutions.
21. Provisions for risks and charges Changes were as follows:
(€/000) Product
warranty provision
Agents' termination
indemnity provision
Provision for returns
on sales
Provision for liabilities and
charges on investments
Restructuring
provision Other Total
Balance at 31/12/2011 2,386 445 128 505 138 969 4,571
Exchange rate difference (17) - (3) - - (9) (29)
Increase of the year 560 17 17 171 1,000 108 1,873
Surplus transferred to the income statement (351) (18) - -
-
- (369)
Changes to consolidation basis
- (18) - -
-
- (18)
Reclassifications - - - - 500 500
Drawdowns in the year (97) (1) - - (138) (300) (536)
Balance at 31/12/2012 2,481 425 142 676 1,500 768 5,992

77
The balance of other provisions at 31/12/2012 refers to various disputes or estimated liabilities in Group companies.
The closing balance is disclosed as shown below in the balance sheet:
31/12/2012 31/12/2011 (€/000) (€/000)
Current 4,653 2,851Non-current 1,339 1,720Total 5,992 4,571
The Parent company and several of its subsidiaries are directly involved in several lawsuits. It is however considered that the settlement of said lawsuits will not generate any significant liabilities for the Group that cannot be covered by the risk provisions that have already been created.
22. Liabilities for employee benefits Liabilities for defined benefit plans The following movements were recorded in liabilities:
2012 2011 (€/000) (€/000)
Liabilities at 1 January 9,698 10,225Amount charged to income statement in the period 1,690 916Reclassifications to other current liabilities (62) (200)Change to consolidation basis 630 (707)Payments made (948) (536)Liabilities at 31 December 11,008 9,698
The following items were recognized in the income statement:
2012 2011 (€/000) (€/000)
Current service cost 238 215Financial charges 212 160Actuarial loss (profit) recorded in the period 1,240 541Past service cost - -Total recognized in the income statement 1,690 916
Items recognized in the income statement were booked as follows:
2012 2011 (€/000) (€/000)
Cost of sales 866 418Distribution costs 248 144General and administrative expenses 364 194Financial charges 212 160Total 1,690 916

78
Liabilities for defined benefit plans (Severance indemnity - TFR) were established with the following actuarial assumptions:
Unit of measurement 2012 2011
Interest rate % 3.29 4.32Expected increase in rate of remuneration* % 3.06 3.33Percentage of employees expected to resign (turnover)** % 2.39 4.11Annual cost-of-living increase % 2.0 2.0Average period of employment Years 12.39 11.30
* = restricted to companies with less than 50 employees. ** = average annual resignation percentage, all causes, in the first ten years following the assessment. 23. Share capital The share capital at 31 December 2012 was composed of 108,879,294 ordinary shares with a unit par value of €0.52 for a total amount of €56,617,232.88. In contrast, share capital recorded in the financial statements amounts to €/000 52,796 because the nominal value of purchased treasury shares, net of divested treasury stock, was deducted from the share capital in compliance with the reference accounting principles. At 31 December 2012 Interpump Group S.p.A. held 7,349,239 treasury shares in the portfolio corresponding to 6.75% of the capital stock, acquired at an average unit cost of € 4.9626. Changes in treasury stock over the past two years have been as follows: Number
Balance at 31/12/2010 3,059,9722011 purchases 3,548,594Sale of shares to finance acquisitions of subsidiaries (1,074,286)Sale of shares for the exercise of stock options (50,000)Balance at 31/12/2011 5,484,2802012 purchases 2,703,490Sale of shares to finance acquisitions of subsidiaries (300,831)Sale of shares for the exercise of stock options (537,700)Balance at 31/12/2012 7,349,239
In June 2012 a total of 4,712,160 warrants were exercised, with the consequent subscription of 2,896,015 new ordinary shares for total value of €14,477,178.98 of which €1,505,927.80 by way of share capital and €12,971,251.18 by way of a premium. At October 2012 a further 13,528,608 warrants were exercised with the relative subscription of 8,314,457 new ordinary shares for a total value of €42,403,730.70 of which €4,323,517.64 by way of share capital and €38,080,213.06 by way of premium.

79
Taking treasury stock into consideration, the following changes were recorded in the number of shares in circulation: 2012 2011 Number of shares Number of shares
Ordinary shares in existence at 1 January 97,668,822 97,662,391Treasury stock (5,484,280) (3,059,972)Shares in circulation at 1 January 92,184,542 94,602,419Purchased treasury stock (2,703,490) (3,548,594)Treasury stock sold 838,531 1,124,286Increase in share capital 11,210,472 6,431Total shares in circulation at 31 December 101,530,055 92,184,542
The aims identified by the Group in its capital management are to create value for all shareholders and support the Group's development both through internal means and via targeted acquisitions. The Group therefore intends to maintain an adequate level of capitalization, which simultaneously makes it possible to generate a satisfactory economic return for shareholders and guarantee economically effective access to external sources of borrowing. The Group constantly monitors the evolution of the debt to equity ratio and cash generation through its industrial operations. In order to attain these goals the Group keeps a close check on the cash flows generated by the business sectors in which it operates, both through the improvement or maintenance of profitability and through careful management of working capital and other expenditure. Capital is construed as both the value provided by Interpump Group shareholders (share capital and share premium reserve, totalling €/000 158,310 at 31 December 2012 and €/000 112,655 at 31 December 2011) and the value generated by the Group in terms of the results of operations (other reserves and legal reserve, including profit for the year, overall equivalent to €/000 241,309 at 31 December 2012 and €/000 201,036 at 31 December 2011, excluding the translation provision and the provision for fair value measurement of hedge derivatives). Purchased treasury stock The amount of treasury stock held by Interpump Group is recorded in an equity provision. In 2012 the Group acquired 2,703,490 treasury shares at an average unit cost of €5.8544 (3,548,594 in 2011). Treasury stock sold In relation to stock option plans a total of 537,700 options were exercised resulting in a receipt of €/000 2,025 (50,000 options exercised for €/000 188 in 2011). In addition, with the acquisition of 53% of the stock of Galtech S.p.A. on 31 January 2012 300,831 treasury shares were divested (1,074,286 in 2011 for the acquisition of an 11% interest in Interpump Hydraulics International). Assigned options After having checked that the relative goals had been accomplished the Board of Directors' meeting of 24 April 2012 determined that the 560,560 options of the 2010/2012 incentive plan had now become exercisable. In particular, 196,000 options assigned to Giovanni Cavallini, 196,000 options assigned to Fulvio Montipò, 62,720 options assigned to Paolo Marinsek and 105,840 options assigned to other beneficiaries all became exercisable. The options can be exercised at the price of €3.75 per share from 30 June 2013 until 31 December 2016.

80
The fair value of the stock options assigned with the new incentives plan had already been established at the time of the prior allocation, which was dependent on the accomplishment of the goals. Stock options The fair value of the 2006/2009 and 2010/2012 stock option plans was recognized in the 2012 and 2011 financial statements in compliance with IFRS 2. Costs of €/000 872 (€/000 996 in 2011) relating to the stock option plans were therefore recognized in the 2012 income statement, with a matching entry in the share premium reserve. Said costs represent the portion for the financial period of the value of the options assigned to employees and directors, established at the allocation date, corresponding to the value of services rendered by the latter in addition to normal remuneration.
The effects in the income statement were booked as follows:
2012 2011 (€/000) (€/000)
Cost of sales - -Distribution costs 47 47General and administrative expenses 825 949Total 872 996
Changes in the share premium reserve were as follows:
2012 2011 €/000 €/000
Share premium reserve at 1 January 64,719 74,427Increase in the period for recording in the income statement of the fair value of stock options assigned
872 996
Increase for the disposal of treasury stock further to payment for acquisitions of subsidiaries
1,547 3,750
Increase for share capital increase 51,052 28Increases for the disposal of treasury stock further to the exercise of stock options
1,745 162
Utilization for coverage of the purchase of treasury stock (14,421) (14,644)Share premium reserve at 31 December 105,514 64,719
The 2002/2005 plan is described analytically in the Board of Directors' Report. The cost of each tranche is determined in a different manner for each vesting period and is recorded in the income statement for each tranche in the period of maturity on the basis of the months that have elapsed from the date of allocation to the reporting date.

81
Changes in options are as follows:
2012 2011 Number of options Number of options
Options assigned at 1 January 602,850 602,850Options assigned during the year - -Options exercised during the year (4,000) -Options reissued (cancelled) during the year - -Total options assigned at 31 December 598,850 602,850Of which: vested at 31 December 598,850 602,850not vested at 31 December - -Total options assigned at 31 December 598,850 602,850
The remaining 598,850 options refer to the fourth tranche (exercise price of € 5.6774) and are exercisable until 31/12/2013.
The Shareholders' Meeting of 20 April 2006 approved another stock option plan (2006/2009) which, like the previous one, is described in detail in the Board of Directors' Report. Options are exercisable as shown in the following table:
No. of options granted
Exercise period
Exercise price (€)
First tranche 796,935 01/05/2010 – 31/05/2015 7.2884Second tranche 827,361 01/05/2010 – 31/05/2015 5.4047Third tranche 271,800 01/11/2012 – 31/05/2017 3.7524Fourth tranche 519,500 01/07/2010 – 31/12/2017 3.7524Total 2,415,596
Changes in options are as follows:
2012 2011 Number of options Number of options
Options assigned at 1 January 2,949,296 2,999,296Options assigned during the year - -Options exercised during the year (533,700) (50,000)Options reissued (cancelled) during the year - -Total options assigned at 31 December 2,415,596 2,949,296Of which: - vested at 31 December 2,415,596 2,674,296- not vested at 31 December - 275,000Total options assigned at 31 December 2,415,596 2,949,296
The Shareholders' Meeting of 21 April 2010 approved the adoption of a new incentive plan designated “Interpump 2010/2012 Incentives Plan”. The plan, which is based on the free assignment of options that grant the beneficiaries the right, on the achievement of specified objectives, to (i) purchase or subscribe the Company’s shares up to the maximum number of
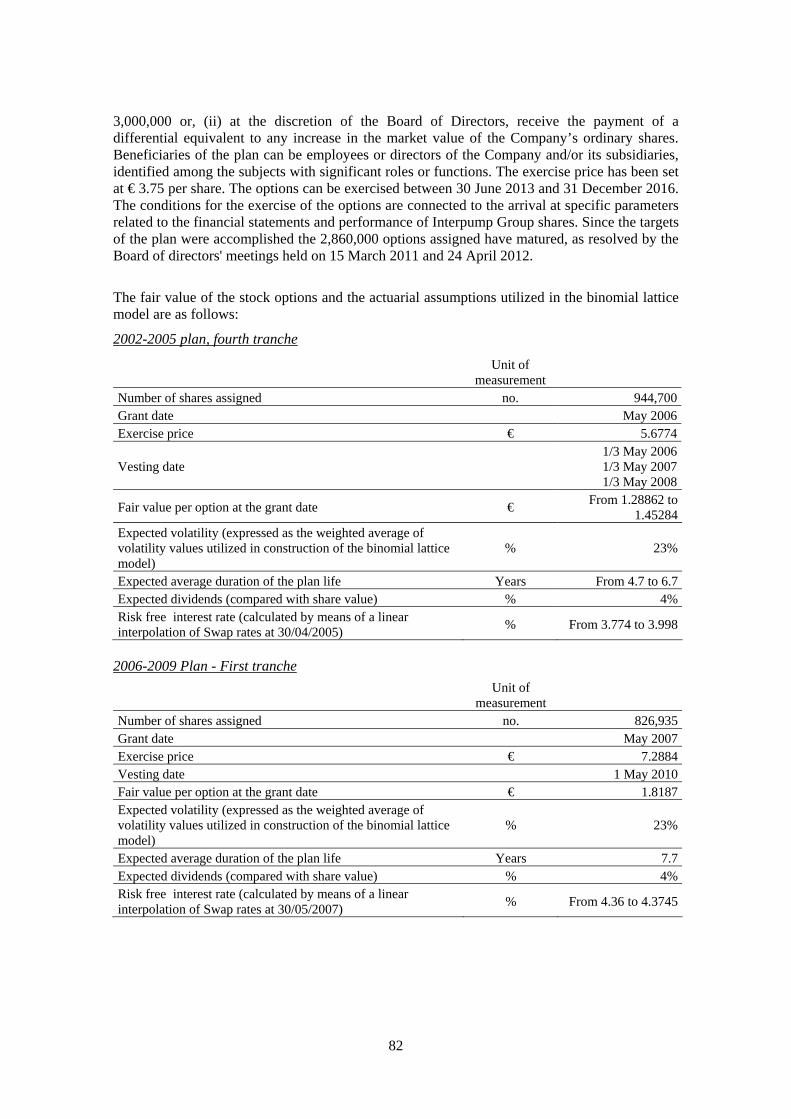
82
3,000,000 or, (ii) at the discretion of the Board of Directors, receive the payment of a differential equivalent to any increase in the market value of the Company’s ordinary shares. Beneficiaries of the plan can be employees or directors of the Company and/or its subsidiaries, identified among the subjects with significant roles or functions. The exercise price has been set at € 3.75 per share. The options can be exercised between 30 June 2013 and 31 December 2016. The conditions for the exercise of the options are connected to the arrival at specific parameters related to the financial statements and performance of Interpump Group shares. Since the targets of the plan were accomplished the 2,860,000 options assigned have matured, as resolved by the Board of directors' meetings held on 15 March 2011 and 24 April 2012.
The fair value of the stock options and the actuarial assumptions utilized in the binomial lattice model are as follows:
2002-2005 plan, fourth tranche
Unit of measurement
Number of shares assigned no. 944,700Grant date May 2006Exercise price € 5.6774
Vesting date 1/3 May 2006
1/3 May 20071/3 May 2008
Fair value per option at the grant date € From 1.28862 to
1.45284Expected volatility (expressed as the weighted average of volatility values utilized in construction of the binomial lattice model)
% 23%
Expected average duration of the plan life Years From 4.7 to 6.7Expected dividends (compared with share value) % 4%Risk free interest rate (calculated by means of a linear interpolation of Swap rates at 30/04/2005)
% From 3.774 to 3.998
2006-2009 Plan - First tranche
Unit of measurement
Number of shares assigned no. 826,935Grant date May 2007Exercise price € 7.2884Vesting date 1 May 2010Fair value per option at the grant date € 1.8187Expected volatility (expressed as the weighted average of volatility values utilized in construction of the binomial lattice model)
% 23%
Expected average duration of the plan life Years 7.7Expected dividends (compared with share value) % 4%Risk free interest rate (calculated by means of a linear interpolation of Swap rates at 30/05/2007)
% From 4.36 to 4.3745

83
2006-2009 Plan - Second tranche
2006-2009 Plan - Third tranche
Unit of measurement
Number of shares assigned no. 275,000Grant date April/July 2009Exercise price € 3.7524Vesting date 1 November 2012Fair value per option at the grant date € 0.57306Expected volatility (expressed as the weighted average of volatility values utilized in construction of the binomial lattice model)
% 30%
Expected average duration of the plan life Years 7.83Expected dividends (compared with share value) % 4%Risk free interest rate (calculated by means of a linear interpolation of Swap rates at 30/06/2009)
% From 3.258 to 3.395
2006-2009 plan, fourth tranche
Unit of measurement
Number of shares assigned no. 827,361Grant date May 2008Exercise price € 5.4047Vesting date 1 May 2011Fair value per option at the grant date € 1.2431Expected volatility (expressed as the weighted average of volatility values utilized in construction of the binomial lattice model)
% 23%
Expected average duration of the plan life Years 7.7Expected dividends (compared with share value) % 4%Risk free interest rate (calculated by means of a linear interpolation of Swap rates at 17/04/2008)
% From 4.445 to 4.496
Unit of measurement
Number of shares assigned no. 1,100,000Grant date March 2010Exercise price 3.7524Vesting date 1 July 2010Fair value per option at the grant date € 0.92286Expected volatility (expressed as the weighted average of volatility values utilized in construction of the binomial lattice model)
% 30%
Expected average duration of the plan life Years 7.75Expected dividends (compared with share value) % 4%Risk free interest rate (calculated by means of a linear interpolation of swap rates at 2010)
% From 2.899 to 3.069

84
2010//2012 Plan
First assignment Unit of measurement
Number of shares assigned no. 2,320,000Grant date 21 April 2010Exercise price 3.7500Vesting date 1 July 2013Fair value per option at the grant date € 0.89555Expected volatility (expressed as the weighted average of volatility values utilized in construction of the binomial lattice model)
% 30%
Expected average duration of the plan life Years 6.666Expected dividends (compared with share value) % 4%Risk free interest rate (calculated by means of a linear interpolation of swap rates at 21 April 2010)
% From 2.63 to 2.83
Second assignment Unit of
measurement Number of shares assigned no. 540,000Grant date 7 July 2010Exercise price 3.7500Vesting date 1 July 2013Fair value per option at the grant date € 1.08964Expected volatility (expressed as the weighted average of volatility values utilized in construction of the binomial lattice model)
% 30%
Expected average duration of the plan life Years 6.5Expected dividends (compared with share value) % 4%Risk free interest rate (calculated by means of a linear interpolation of swap rates at 7 July 2010)
% From 2.29 to 2.49
The expected volatility of the underlying (Interpump Group share) is a measure of the prospect of price fluctuations in a specific period. The indicator that measures volatility in the model utilized to evaluate the options is the mean square annualized deviation of compound returns of the Interpump Group share through time.
24. Reserves Reserve for valuation of hedging derivatives at fair value This includes net accumulated changes in the fair value of derivative financial instruments classified as hedges and recorded using the hedge accounting method.
Translation provision This provision consists of exchange gains generated by the conversion of the financial statements of foreign subsidiaries based outside the EU and from variations in goodwill ascribable to these companies, again as a result of exchange rate fluctuations.

85
Classification of equity according on the possibility of utilization
(amounts in €/000)
Amount Possibility of
utilization
Available portion
Tax payable in the event of distribution
Summary of amounts utilized in previous three
years
to cover losses
for other reasons
Share capital 56,617 B - - - -
Nominal value of treasury stock in the portfolio
(3,821)
Total share capital 52,796
Capital reserves
From Parent Company's financial statements:
Legal reserve 6,860 B - - - -
Share premium reserve 78,481 A,B,C 78,481 - - -
Total from Parent Company's financial statements
85,341
Consolidation entries 36
Total from consolidated financial statements
85,377
Profit reserves:
From Parent Company's financial statements:
Legal reserve 3,298 B - - - -
Share premium reserve 25,464 A,B,C 24,952 1,687 - 23,170
Extraordinary reserve 46,654 A,B,C 46,370 - - -
Reserve for share capital reduction 3,821 - - - - -
First Time Adoption Reserve (34) - - - - -
Reserve for valuation of hedging derivatives at fair value
(250) - - -
-
-
Profit for the period 16,812 A,B,C 15,646 - - -
Total from Parent Company's financial statements
95,765 86.968
Consolidation entries 157,105
Total from consolidated financial statements
252,870
Reserve for treasury stock held 36,471 - - - - 5,989
Treasury stock (36,471)
Non-distributable portion* (4,296)
Remaining distributable portion 161,153
A: to increase capital B: to cover losses C: for shareholder dividends
*= represents the non-distributable portion destined to cover deferred costs that have not yet been amortized.
Utilizations refer to dividends, purchase of treasury stock and reductions of reserves for other causes and do not include transfers between reserves. In particular, with reference to the changes that occur red in the past three years note that the drawdowns of the share premium reserve refer to purchases of treasury stock, while drawdowns from the reserve for treasury stock held refer to the sale of treasury shares at a price below their carrying value.
According to Italian tax regulations, reserves and profit can be freely distributed and are not subject to tax even in the event of distribution if the reserves and net profit exceed the negative components of income ascribed only in the tax return. Otherwise, distributed reserves and profit

86
are subject to tax in the measure in which the residual reserves and profits are lower than the negative components of income that have been ascribed exclusively to the tax return. At 31 December 2012 this condition had been complied with in full, hence no taxes were payable in the event of distribution of the parent company's entire profits for the year and the entirety of available reserves, beyond the taxes already indicated in the prior statement.
Breakdown of components recorded directly in equity
2012 2011 (amounts in €/000) Amount
before taxes TaxesAmount net
of taxesAmount
before taxes
Taxes Amount net
of taxesRecognition of derivative financial instruments used to hedge the interest rate risk recorded in accordance with the cash flow hedging method 623 (172) 451 1,283
(352) 931Recognition of derivative financial instruments used to hedge the exchange risk recorded in accordance with the cash flow hedging method 458 (156) 302 (434)
146 (288)Profits (Losses) arising from the conversion to euro of the financial statements of foreign companies (5,277) (5,277) 5,344
- 5,344Profits (Losses) of companies carried at equity 27 - 27 18
- 18
Total (4,169) (328) (4,497) 6,211 (206) 6,005
25. Minority shareholders' equity This is the portion of consolidated shareholders' equity pertaining to minority shareholders of the consolidated subsidiaries. The following changes were recorded:
(€/000)
Interpump Hydraulics
Group
Interpump Hydraulics
International Group
SitS.p.A.
Hammelmann Pump System
(China)
Portions of intercompany
profits tied up in inventory Total
Balance at 31/12/2011 4,506 512 436 293 (284) 5,463Dividends distributed to minority interests (342) (55) - (29) - (426)
Exchange rate difference 88 - - (3) - 85
Disposal of Hydrocar Roma (196) - - - - (196)
Minority interests profit (loss) for the period 922 80 2 81 (178) 907
Balance at 31/12/2012 4,978 537 438 342 (462) 5,833

87
26. Other net revenues 2012 2011 (€/000) (€/000)
Reimbursement of expenses 4,061 2,558Income from the sale of waste and scrap 2,063 2,073Capital gain from the disposal of assets held for sale - 1,162Capital gains from the sale of property, plant and equipment 204 106Reclassification from assets available for sale 140 1Utilization of surplus provisions and allocations 517 135Insurance refunds 36 132Other 1,754 1,392Total 8,775 7,559
27. Costs by nature 2012 2011 (€/000) (€/000)
Amortization and depreciation of intangible and tangible fixed assets 20,143 18,063Payroll expenses 121,838 106,572Purchases of raw materials, components and changes in inventory 206,403 192,136External manufacturing 15,684 11,732Hire purchase and leasing charges 8,463 7,270Other costs 80,615 67,755Total cost of sales, distribution costs, general and administrative expenses and other operating costs
453,146 403,528
In accordance with the requirements of article 149-duodecies of the Issuers' Code as amended by Consob Resolution no. 15915 of 3 May 2007 published in the Official Journal of the Italian Republic no. 111 of 15 May 2007 (S.O. no. 115), the remuneration amounts for 2012 are listed below for services rendered to the Group by the independent auditors and the entities belonging to the network of said independent auditing company:
assignments for auditing of the parent company €/000 126;
assignments for auditing of subsidiaries €/000 613;
other subsidiaries €/000 14.
The above amounts are included under Other costs within general and administrative expenses.
28. Directors' and statutory auditors' remuneration The emoluments of the Directors and Statutory Auditors of Interpump Group S.p.A. for the execution of their functions, also in the companies included in the scope of consolidation, are as follows:
2012 2011 (€/000) (€/000)
Directors 5,872 5,073Statutory auditors 182 171Total remuneration 6,054 5,244

88
The amounts include the emoluments resolved by the Shareholders' Meeting, the emoluments established by the Board of Directors for directors vested with special offices, including bonuses, remuneration for employment relationships and the remunerative component deriving from stock option plans represented by the fair value of the options calculated at the time of their allocation, for the portion relating to the year, and also any remuneration due by way of severance indemnities. The difference with respect to 2011 is essentially due to this latter type of compensation.
29. Financial income and charges 2012 2011 (€/000) (€/000)
Financial income Interest income 2,130 3,044Other financial income 30 2Foreign exchange gains 1,591 1,668Earnings from valuation of derivative financial instruments 1,154 1,651Total financial income 4,905 6,365
Financial charges Interest payable 8,993 10,500Other financial charges 212 160Foreign exchange losses 2,620 2,444Losses from valuation of derivative financial instruments 931 1,928Total financial charges 12,756 15,032Total financial charges, net 7,851 8,667
30. Income taxes The tax rate for the period was 30.1% (34.5% in 2011). The reduced rate was due to lower taxes in the amount of €5.4 million, of which €2.7 million relative to the deductibility of the tax loss resulting from the sale of Unielectric in 2011 booked in 2012 following completion of the relative procedure, and in the amount of €0.4 million for deferred tax assets relative to another possible similar event, and finally for €2.3 million relative to tax rebates for the deductibility of IRAP on employee salaries relative to prior years. Net of this phenomenon the 2012 tax rate would have been 37.3%. The adjusted tax rate of 2011, when deferred tax assets were booked further to legislative changes in Italy concerning the facility to carry forward prior tax losses, was 36.6%.
Taxes recognized in the income statement can be broken down as follows:
2012 2011 (€/000) (€/000)
Current taxes (27,826) (22,884)Current taxes of prior financial periods 4,484 76Deferred taxes 848 (190)Total taxes (22,494) (22,998)

89
Deferred tax recognized in the income statement can be broken down as follows:
2012 2011 (€/000) (€/000)
Deferred tax assets generated during the period 2,349 2,093Deferred tax liabilities generated during the period (1,889) (2,877)Deferred tax assets transferred to the income statement (1,188) (2,108)Deferred tax liabilities transferred to the income statement 1,576 1,332Unrecognized deferred tax assets - -Deferred taxes not calculated in previous years - 1,370Total deferred taxes 848 (190)
The reconciliation of taxes calculated on the basis of the nominal rates in force in the different countries and the effective tax burden is a follows:
2012 2011
(€/000) (€/000)
IRES/National tax
Profit before taxes from the income statement 74,807 66,616
Theoretical taxes at Italian rate (27.5%) 20,572 18,319
Effect of different rates applicable to foreign subsidiaries (1,310) (1,425)
Tax on dividends from subsidiaries 760 342
Higher (Lower) taxes resulting from the valuation of investments using the equity method 167 64
Higher taxes for non-deductible stock option costs 36 42
Higher (Lower) taxes due to non-recording of deferred tax assets on fiscal losses - (56)
Previously unallocated deferred tax assets on tax losses - (1,370)
Lower taxes due to IRAP deduction relating to payroll expenses and similar in the period (521) -
Lower taxes due to IRAP deduction on interest expenses in the period (63) -Lower taxes of prior years due to the failure to deduct IRAP on payroll and related expenses (Decree no.201 of 6 December 2011, art. 2 par. 1) (2,328) -
Lower taxes of prior years due to the deductibility of the tax loss resulting from the sale of Unielectric (2,699) -
Higher deferred taxes allocated to write-downs of investments carried out in prior years (365) -
Taxes relating to previous years 216 (7)
Higher taxes on financial expenses relative to discounting of debts for the acquisition of equity investments 309 234
Higher (Lower) taxes for non-taxable revenues and non-deductible costs (88) (47)
Total IRES/National tax 14,686 16,096
IRAP/Local income taxes
Profit before taxes from the income statement 74,807 66,616
Theoretical taxes at Italian rate (3.9%) 2,917 2,598
Effect of different rates applicable to foreign subsidiaries 2,599 2,157
Higher taxes for non-deductible payroll costs 1,351 1,414
Higher taxes for non-deductible directors' emoluments 324 277
Higher taxes due to non-deductible financial expenses 513 309
Higher tax resulting from valuation of investments using equity method 25 11
Taxes relating to previous years (15) (69)
Higher (Lower) taxes for non-taxable revenues and non-deductible costs 94 205
Total IRAP/Local income taxes 7,808 6,902
Total income taxes recognized in the income statement 22,494 22,998

90
The Parent Company chose along with Teknova S.r.l. and Interpump Hydraulics S.p.A. to take up the option of national tax consolidation. In addition, also Interpump Hydraulics International S.p.A., HS Penta S.p.A., Contarini Leopoldo S.r.l., Oleodinamica Panni S.r.l., Cover S.r.l. and Modenflex Hydraulics S.r.l., have adhered to another national tax consolidation.
31. Earnings per share Basic earnings per share Earnings per share are calculated on the basis of consolidated profit for the period attributable to Parent Company shareholders, divided by the weighted average number of ordinary shares as follows:
2012 2011
Consolidated profit for the period attributable to parent company shareholders (€/000)
51,418 41,232
Average number of shares in circulation 94,134,090 93,963,275Basic earnings per share (€) 0.546 0.439
Diluted earnings per share Diluted earnings per share are calculated on the basis of diluted consolidated profit of the period attributable to the parent company's shareholders, divided by the weighted average number of ordinary shares in circulation adjusted by the number of potentially dilutive ordinary shares. The calculation is as follows:
2012 2011
Consolidated profit for the period attributable to parent company shareholders (€/000)
51,418 41,232
Average number of shares in circulation 94,134,090 93,963,275Number of potential shares for stock option plans (*) 1,345,560 840,181Number of potential shares for the exercise of warrants (**) - 166,593Average number of shares (diluted) 95,479,650 94,970,049Diluted earnings per share (€) 0.539 0.434
(*) calculated as the number of shares assigned for in-the-money stock option plans multiplied by the ratio between the difference between the average value of the share in the period and the exercise price at the numerator, and the average value of the share in the period at the denominator.
(*) calculated as the number of shares potentially exercisable by the ratio between the difference between the average value of the share in the period and the exercise price at the numerator, and the average value of the share in the period at the denominator.
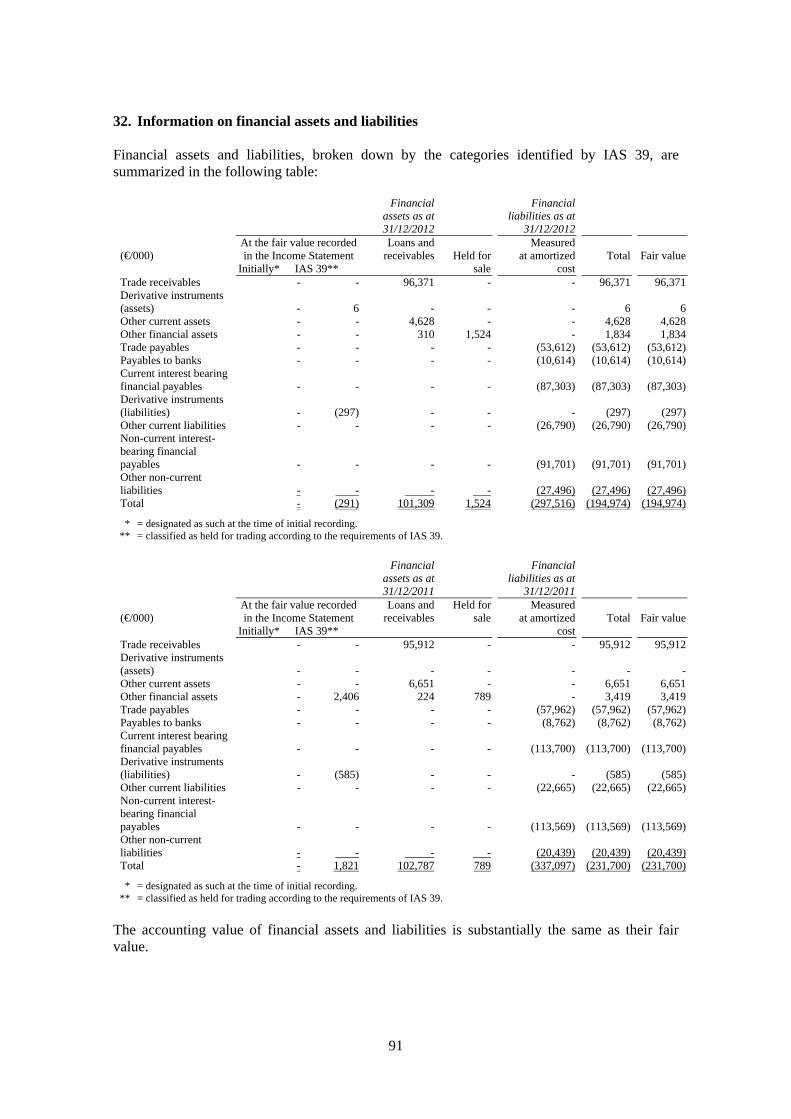
91
32. Information on financial assets and liabilities Financial assets and liabilities, broken down by the categories identified by IAS 39, are summarized in the following table:
Financial assets as at31/12/2012
Financial liabilities as at
31/12/2012
(€/000)
At the fair value recorded in the Income Statement
Initially* IAS 39**
Loans and receivables Held for
sale
Measured at amortized
cost
Total
Fair value
Trade receivables - - 96,371 - - 96,371 96,371Derivative instruments (assets)
- 6 - -
-
6
6
Other current assets - - 4,628 - - 4,628 4,628Other financial assets - - 310 1,524 - 1,834 1,834Trade payables - - - - (53,612) (53,612) (53,612)Payables to banks - - - - (10,614) (10,614) (10,614)Current interest bearing financial payables
- - - -
(87,303)
(87,303)
(87,303)
Derivative instruments (liabilities)
- (297) - -
-
(297)
(297)
Other current liabilities - - - - (26,790) (26,790) (26,790)Non-current interest-bearing financial payables
- - - -
(91,701)
(91,701)
(91,701)Other non-current liabilities
- - - -
(27,496)
(27,496)
(27,496)
Total - (291) 101,309 1,524 (297,516) (194,974) (194,974)
* = designated as such at the time of initial recording. ** = classified as held for trading according to the requirements of IAS 39.
Financial
assets as at31/12/2011
Financial liabilities as at
31/12/2011
(€/000)
At the fair value recorded in the Income Statement
Initially* IAS 39**
Loans and receivables
Held for sale
Measured at amortized
cost
Total
Fair value
Trade receivables - - 95,912 - - 95,912 95,912Derivative instruments (assets)
- - - -
-
-
-
Other current assets - - 6,651 - - 6,651 6,651Other financial assets - 2,406 224 789 - 3,419 3,419Trade payables - - - - (57,962) (57,962) (57,962)Payables to banks - - - - (8,762) (8,762) (8,762)Current interest bearing financial payables
- - - -
(113,700)
(113,700)
(113,700)
Derivative instruments (liabilities)
- (585) - -
-
(585)
(585)
Other current liabilities - - - - (22,665) (22,665) (22,665)Non-current interest-bearing financial payables
- - - -
(113,569)
(113,569)
(113,569)Other non-current liabilities
- - - -
(20,439)
(20,439)
(20,439)
Total - 1,821 102,787 789 (337,097) (231,700) (231,700)
* = designated as such at the time of initial recording. ** = classified as held for trading according to the requirements of IAS 39.
The accounting value of financial assets and liabilities is substantially the same as their fair value.

92
In 2012 the Group income statement showed fair value earnings for €/000 103 (€/000 608 in 2011) and fair value losses for €/000 100 (€/000 763 in 2011) on derivative financial instruments, which, although arising for hedging purposes, failed to meet all the requirements of IAS 39 in order to be considered hedges. These derivative financial instruments are the non-hedging portion of the IRS and a plain vanilla forward contract that arose in 2012 and was extinguished at the end of February 2013. Note 11 gives the methods for calculation utilized to establish the fair value of derivative financial instruments and their maturity dates. No effects were recognized in the 2012 income statement on the underlyings (gains of €/000 3 and losses of €/000 20 in 2011).
Loans and receivables generated revenues and costs. Revenues refer to exchange rate gains for €/000 1,301 (€/000 1,140 in 2011). In contrast, costs refer to bad debts for €/000 1,080 (€/000 1,448 in 2011), included in the face of the income statement adopted under other operating costs, to foreign exchange losses for €/000 2,068 (€/000 1,454 in 2011).
Also financial liabilities valued at the amortized cost generated costs and revenues in the income statement. Revenues refer to exchange rate gains €/000 290 (€/000 374 in 2011), while costs refer to currency exchange losses of €/000 392 (€/000 970 in 2011) and the portion of ancillary charges initially incurred to obtain the loans and then distributed on the basis of the loan duration according to the financial method. In 2012 the value of these expenses booked to the income statement totalled €/000 815 (€/000 493 in 2011).
Financial assets and liabilities that are not designated at fair value recorded in the Income Statement (all those indicated in the previous table with the exception of those appearing in the first two columns) generated, respectively, interest receivable for €/000 144 (€/000 90 in 2011) and interest payable for €/000 8,178 (€/000 10,007 in 2011); in addition, general and administrative expenses include commission amounts and bank charges for €/000 834 (€/000 605 in 2011).
33. Information on financial risks The company is exposed to financial risks associated with its activities: market risk (mainly relative to exchange rates and interest rates), since the Group does
business internationally and is exposed to the exchange rate risk related to business conducted in US dollars and Australian dollars;
credit risk connected with business relations with customers;
liquidity risk, with special reference to the availability of financial resources and access to the lending market and financial instruments in general;
price risk in relation to metal price fluctuations that constitute a significant portion of the raw materials purchase price.
The Group is not exposed to significant risk concentrations.
As described in Note 4 "Financial risks management", the Interpump Group constantly monitors the financial risks to which it is exposed so that the potential negative effects can be evaluated in advance and appropriate actions can be taken to mitigate them.
The following section provides reference qualitative and quantitative indications concerning the uncertainty of such risks for the Interpump Group.
The quantitative data given below are not to be construed as forecasts; specifically, the sensitivity analyses concerning market risks are unable to reflect the complexity and associated relations of markets that may derive from each prospected change.

93
Exchange risk
The Group is exposed to risks deriving from fluctuations in currency exchange rates that can impact on the economic result and shareholders' equity value. Specifically:
wherever Group companies generate revenues in currencies other than the currencies in which the respective costs are denominated, exchange rate fluctuations can impact on the relative companies' operating profit. In 2012 the total amount of cash flows directly exposed to exchange risks corresponded to approximately 9% of Group sales (approximately 9% also in 2011). The main exchange relations to which the Group is exposed concern: - EUR/USD, concerning sales of high-pressure pumps and very high-pressure systems in
dollars in North America through the Group's distribution companies;
- EUR/USD, concerning sales in dollars of various hydraulic components in South America;
- Chilean Peso/USD, concerning sales in dollars of various hydraulic components in South America;
- EUR/AUD, concerning sales in Australian dollars of very high-pressure systems in Australia through one of the Group's distribution companies;
- Renminbi/USD and Renminbi/EUR, in relation to sales in dollars and euros of hydraulic pumps on the North American and Indian markets.
The Interpump Group has adopted a policy of hedging commercial transactions denominated in foreign currency, in the framework of which the most effective derivative instruments for the achievement of the preset goals have been identified and the relative responsibilities, duties and system of delegations have been defined. In relation to the exposure in dollars for sales of high-pressure pumps and very high pressure systems to its US subsidiaries it is Group policy to hedge a prudentially determined portion of predicted sales for periods of four to eight months. This strategy is followed also for sales in AUS dollars although due to the more limited predictive time span at times the decision to hedge may coincide with the reception of the order. In relation to the exposure in dollars for sales of high pressure pumps on the American market to customers outside the Group, it is Group policy to hedge the receivable or foreign currency collected, in the event of advance payment, that arise further to the sales projections agreed with the customer. With regard to sales in dollars made from Europe on the South American market, Group policy involves hedging the irrevocable order of the customer or the sales invoice, this moment coinciding with the reception of the relative letter of credit wherein the sale becomes certain, because the period of time that elapses prior to payment is considered to be significant and the Group intends to reduce its exposure to the exchange fluctuation risk by this method. In 2012 the Group exchange risk hedging policy concerned approximately 57% of the cash-flows described above (61% in 2011).
Whenever Group companies sustain costs denominated in foreign currencies other than the currencies of denomination of the relative revenues fluctuations in the exchange rates can affect the operating profit of the companies in question. In 2012 the total amount of cash flows directly exposed to exchange risks corresponded to approximately 9% of Group turnover (approximately 10% in 2011) and mainly involved the USD/EUR exchange rate. Currently Group policy relative to purchases in foreign currency is to refrain from systematically taking out hedges because it is considered that said costs have not yet reached a level such as to allow the benefits connected with stabilization of the exchange risk to offset the costs associated with the setting up of the relative hedge.
94
However, the Group monitors this phenomenon constantly both in relation to exchange rate trends and also the evolution of the business.
again in relation to commercial activities Group companies can be in a position wherein they hold commercial receivables or payables denominated in currencies other than the account currency of the holding entity. Fluctuations in exchange rates can therefore result in the realization or assessment of positive or negative exchange differences. As highlighted earlier, it is Group policy to hedge exposure deriving from trade receivables and keep constant track of the effectiveness of hedging exposures deriving from trade receivables.
in relation to financial exposure, wherever the monetary outflows/inflows are denominated in a currency other than the account currency utilized by the creditor/debtor company, fluctuation of the exchange rates can impact negatively on the net profits of said companies. In 2010 Interpump Hydraulics S.p.A. granted a €2 million loan to its subsidiary Interpump Hydraulics India, which was still in existence at 31 December 2012. For the present the Group has decided not to hedge this exposure, which generated an exchange loss of €/000 99 in 2012 (exchange gain of €/000 236 in 2011). Also, in 2011 Interpump Hydraulics S.p.A. granted a $/000 813 loan to its subsidiary Wuxi Interpump Weifu Hydraulics. For the present the Group has decided not to hedge this exposure, which generated an exchange loss of €/000 99 in 2012 (exchange gain of €/000 236 in 2011).
several Group subsidiaries are situated in non-EU countries, notably the US, Chile, Australia, China, India and Brazil. Since the Group's functional currency is the euro, the income statements of these companies are converted into euro at the average exchange rate of the period. Changes in exchange rates can impact on the corresponding value of revenues, costs and economic result in euro.
the assets and liabilities of consolidated companies with accounting currency other than the euro can assume different equivalent euro values depending on exchange rates. As provided for by the reference accounting principles, the effects of changes in the exchange rate are recognized directly in equity in the Translation provision caption. The Group monitors the main exposures to the translation exchange rate risk; at the date of the financial statements there were no hedges in existence taken out to cover said exposures.
In 2012 and 2011 the nature and structure of exposure to the exchange risk and the hedging policies adopted by the Group remained substantially unchanged with respect to the previous year. Sensitivity analysis relative to the exchange risk
The potential loss deriving from the change in the fair value of financial assets and liabilities caused by a hypothetical and immediate increase in the value of the euro of 10% with respect to the main foreign currencies would therefore be approximately €/000 769 (€/000 801 in 2011). The sensitivity analysis did not take account of changes in the receivables and payables in relation to which the hedge operations were set up. It is reasonable to assume that the fluctuation in exchange rates could produce an opposite economic effect on the derivative financial instruments of an amount that is identical to the change in the underlying hedged transactions thereby effectively offsetting the fluctuation.

95
Interest rate risk
Group companies utilize external financial resources in the form of debt and allocate cash on hand to bank and post office deposits or repurchase agreements. Changes in the market interest rate influence the cost and yield of various forms of financing and investment, thus impacting on the level of financial charges sustained by the Group. It is Group policy to monitor the slope of the interest rates curve and to hedge part of the loans currently in existence. As more fully described in note 11, at 31/12/2012 loans for which the interest range was hedged totalled €/000 29,470.
At 31 December 2012 €45.7 million of cash on hand was held at a fixed rate (€42.0 million at 3.85% maturing in February 2013 and €3.7 million at 3.50% without time limits), while the remaining part was at floating rates, as are financial and bank debts.
Sensitivity analysis relative to the interest rate risk
The effects on the Group of a hypothetical and immediate upward variation in interest rates of 50 basis points would be higher financial expenses, net of the increase in financial income, totalling €/000 156 (€/000 120 in 2011). It is reasonable to assume that a 50 basis points decrease in interest rates would produce an equivalent effect, although this time in terms of lower financial expenses. The sensitivity analysis did not take account of loans in relation to which hedge operations were set up. It is reasonable to assume that the fluctuation in interest rates could produce an opposite economic effect on the derivative financial instruments of an amount that is identical to the change in the underlying hedged transactions thereby effectively offsetting the fluctuation.
Credit risk
The maximum theoretical exposure to credit risk of the Group at 31 December 2012 and 2011 is represented by the carrying value of financial assets recorded in the financial statements.
However, historically the Group has never suffered any significant bad debts (0.2% of sales in 2012 and 0.3% of sales in 2011). This is because the Group generally allows extended payments only to its long-term customers, whose solubility and economic stability is known. In contrast, new customers, after having passed an initial credit rating analysis, are required to make payments in advance or to open a letter of credit for amounts due.
Individual write-downs are applied in relation to positions, if of significant magnitude, in relation to which an objective condition of bad debt is recorded for the totality or a part of the outstanding amount. The amount of the write-down takes account of an estimate of the recoverable flows and the relative collection date, and the expenses and costs for future debt recovery. Provisions on a collective basis are allocated in relation to receivables that are not subject to individual write-downs, taking account of the historic exposure and statistical data.
At 31 December 2012 Loans and Receivables included under financial assets for the purposes of IFRS 7 totalled €/000 101,309 (€/000 102,787 at 31/12/2011), and they include €/000 3,889 relative to written down receivables (€/000 3,536 at 31/12/2011); on the residual amount payments overdue by less than three months were €/000 15,819 (€/000 17,257 at 31/12/2011), while those overdue beyond three months totalled €/000 5,942 (€/000 4,929 at 31/12/2011). In relation to receivables overdue by less than three months guarantees received total €/000 1,358 (€/000 944 at 31/12/2011), while in relation to receivables overdue by more than three months the guarantees received totalled €/000 140 (€/000 200 in 2011).
The Group is not exposed to any significant concentrations of sales. In fact, in 2012 the top customer in terms of sales accounted for just 2% (2% also in 2011) while the top 10 customers accounted for 9% of total sales (8% in 2011). In terms of sector, the concentration is similar because the top customer in terms of sales accounts for around 2% for the Water Jetting Sector

96
and around 3% for the Hydraulic Sector, while the top 10 customers absorb 13% for the Water Jetting Sector and 15% for the Hydraulic Sector.
Liquidity risk
The liquidity risk can arise if it becomes impossible to obtain, at acceptable economic conditions, the financial resources needed for the Group's business operations.
The two main factors that define the Group's liquidity situation are the resources generated by or used in operating and investing activities, and the characteristics of expiry and renewal of debt or liquidity of financial investments and the relative market conditions.
The Group has adopted a series of policies and processes aimed at optimizing the management of resources in order to reduce the liquidity risk:
retention of an appropriate level of cash on hand;
strengthening of the Group's equity structure thanks to the availability of own equity (share capital increases performed in 2012 and 2011);
diversification of the banks with which the Group operates;
access to adequate lines of credit;
negotiation of covenants on the consolidated level;
monitoring of the prospective conditions of liquidity in relation to the corporate process.
The characteristics of maturity of interest bearing financial debts and bank debts are described in note 19.
Management considers that the currently available funds and lines of credit, in addition to resources that will be generated by operating and financing activities, will allow the Group to meet requirements deriving from investing activities, management of working capital and repayment of debts at their natural due dates, in addition to ensuring the pursuit of a strategy of growth, also by means of targeted acquisitions capable of creating value for shareholders. Cash on hand at 31 December 2012 totalled €115.1 million. Cash on hand plus the significant cash generation from operations that the Group has been able to realize in 2012 are definitely factors that will make it possible to reduce Group exposure to the liquidity risk. In consideration of the high level of cash held in 2012 and 2011 the Group took out repurchase agreements, locked-up bank deposits and savings accounts in order to optimize finance management. The decision to maintain a high level of liquidity was adopted in order to minimize the liquidity risk, which is considered important given the current state of uncertainty of the economy.
Price risk
The Group is exposed to risks deriving from fluctuations in the prices of metals that can impact on economic results and profit margins. Specifically, the incidence of costs for the purchase of metals was 20% of total Group purchase costs of raw materials, semi-finished products and finished products in 2012 (20% also in 2011). The main metals utilized by the Group include brass, aluminium, steel, stainless steel, cast iron, and, to a lesser extent, copper, sheet metal and mild steel. With respect to 31 December 2011 prices of raw materials used by the Group did not increase significantly and even fell in some cases. The Group constantly monitors the trend of the prices of these materials in the attempt to adopt the most effective policies to reduce the potential exposure to this risk.
The Group sectors feature differing levels of propensity towards the risk of fluctuations in the prices of metals, notably:
in the Water Jetting Sector the cost of metals constituted approximately 14% of costs for the purchase of raw materials, semi-finished products and finished products in 2012 (18% in
97
2011). The metals utilized are primarily brass, steel, stainless steel, aluminium and copper. The policy is to leave the cost of storage of materials to vendors; this means that the risk is hedged by means of orders for periods and quantities made at fixed price. At 31 December 2012 existing commitments had been signed to cover 31% of projected consumption of brass and 62% of the projected consumption of aluminium for 2013 (52% coverage of the prospected consumption of brass and 20% coverage of the projected consumption of aluminium for 2012). The percentages of coverage of the predicted consumption of brass and aluminium rise still further to 39% and to 74% if, in addition to the commitments entered into, we consider also the stocks of brass and aluminium held at 31/12/2012.
the cost of metals in the Hydraulic Sector constituted around 26% of purchase costs for raw materials, semi-finished products and finished products in 2012 (21% in 2011). The metals utilized are primarily steel, aluminium, mild steel and cast iron. The prices of these commodities, with the exception of aluminium, are not historically sensitive to significant fluctuations. The Group therefore considers that a strategy aimed at accurate analysis of price trends is sufficient to mitigate the price risk. In relation to aluminium, no hedging transactions are undertaken because of the limited effect of such operations on purchase prices.
Generally the selling prices of the various Group companies are reviewed once a year.
34. Notes to the cash flow statement
Property, plant and equipment
In 2012, the Group purchased property, plant and equipment totalling €/000 20,855 (€/000 15,924 in 2011). This expenditure involved the payment of €/000 21,273, inclusive of the payment of past debts for the same purpose and net of deferred payables and outlays for tangible fixed assets destined for hire (€/000 14,686 in 2011).
Cash and cash equivalents
This item can be broken down as follows:
31/12/2012 31/12/2011 (€/000) (€/000)
Cash and cash equivalents 115,069 109,068Payables to banks (for current account overdrafts and advances subject to collection)
(10,614) (8,762)
Cash and cash equivalents from the cash flow statement 104,455 100,306
Net financial position and cash flow statement
For the amount and detail of the main components of the net financial position and the changes that occurred in 2012 and 2011 we invite you to refer to the "Cash Flow" section of the Board of Directors' Report.
98
35. Commitments At 31/12/2012 the group had commitments to purchase raw materials totalling €/000 7,216 (€/000 7,331 at 31/12/2011).
Furthermore, the Group also has commitments to purchase tangible assets totalling €/000 6,969 (€/000 2,057 at 31/12/2011).
The Group has signed rental and hire purchase agreements primarily regarding buildings, machinery, cars and computers. The total outlay in 2012 was €/000 8,424 (€/000 8,564 in 2011). At 31/12/2012, the following commitments were outstanding:
(€/000)
Due within 1 year 8,650Due from 1 to 2 years 6,231Due from 2 to 5 years 5,962Due beyond 5 years 1,500Total 22,343
36. Transactions with related parties The Group has relations with unconsolidated subsidiaries and other related parties at arm's length conditions considered to be normal in the respective reference markets, taking account of the characteristics of the goods and services rendered. Transactions between Interpump Group S.p.A. and its consolidated subsidiaries, which are related parties of the company, were eliminated in the consolidated financial statements and are not described in this note.
The effects on the Group's consolidated income statements for 2012 and 2011 are shown below:
2012 (€/000)
Consolidated Total
Non-
consolidated subsidiaries
Associates
Other
related parties
Total
related parties
% incidence on caption
in financial statements
Net sales 527,176 4,339 - 48 4,387 0.8% Cost of sales 327,571 683 - 16,245 16,928 5.2% Other revenues 8,775 56 - 3 59 0.7% Distribution costs 53,448 436 - 1,294 1,730 3.2% General and administrative expenses 69,375
-
-
1,012
1,012
1.5% Financial income 4,905 31 - - 31 0.6% Financial charges 12,756 - - 17 17 0.1%

99
2011 (€/000)
Consolidated Total
Non-
consolidated subsidiaries
Associates
Other
related parties
Total
related parties
% incidence on caption
in financial statements
Net sales 471,619 1,494 - 131 1,625 0.3% Cost of sales 294,378 263 33 14,246 14,542 4.9% Other revenues 7,559 9 - 2 11 0.1% Distribution costs 45,802 583 - 1,146 1,729 3.8% General and administrative expenses 60,320
-
-
910
910
1.5% Financial charges 15,032 - - 8 8 0.1%
The effects on the consolidated balance sheet at 31 December 2012 and 2011 are described below:
31 December 2012 (€/000)
Consolidated Total
Non-
consolidated subsidiaries
Associates
Other
related parties
Total
related parties
% incidence on caption
in financial statements
Trade receivables 96,371 2,367 - 7 2,374 2.5% Other non-current financial assets
1,840
1,822
-
-
1,822
99.0%
Trade payables 53,612 356 - 1,499 1,855 3.5% Current interest bearing financial payables
87,303
-
-
344
344
0.4% Short-term provision for risks and charges
4,653
350
-
-
350
7.5%
31 December 2011 (€/000)
Consolidated Total
Non-
consolidated subsidiaries
Associates
Other
related parties
Total
related parties
% incidence on caption
in financial statements
Trade receivables 95,912 1,050 - 20 1,070 1.1% Other non-current financial assets
3,424
852
-
-
852
24.9%
Trade payables 57,962 243 - 3,864 4,107 7.1% Current interest bearing financial payables
122,462
-
-
346
346
0.3% Other current liabilities
22,943
-
-
13
13
0.1%
Short-term provision for risks and charges
2,851
179
-
-
179
6.3% Other non-current liabilities
20,439
217
-
-
217
1.1%

100
Relationships to non-consolidated subsidiaries Relations with non-consolidated subsidiaries are as follows. (€/000) Receivables Revenues
31/12/2012 31/12/2011 2012 2011HS Penta Africa Pty Ltd 823 715 1,606 1,142Galtech Canada Inc. 341 - 1,221 -Interpump Hydraulics Middle East 804 - 835 -General Pump China Inc. 86 39 416 349Hammelmann Bombas e Sistemas Ltda 238 267 162 (68)Syscam Gestione Integrada 1 29 95 80GITOP S.r.l. 21 - 39 -Interpump Hydraulics (UK) Ltd 53 - 21 -
Total subsidiaries 2,367 1,050 4,395 1,503
(€/000) Payables Costs
31/12/2012 31/12/2011 2012 2011General Pump China Inc. 58 59 426 294Hammelmann Bombas e Sistemas Ltda 88 173 393 552GITOP S.r.l. 209 - 300 -
HS Penta Africa Pty Ltd 1 11 - -
Total subsidiaries 356 243 1,119 846
(€/000) Loans Interest income
31/12/2012 31/12/2011 2012 2011Interpump Hydraulics Middle East 105 - 2 -Interpump Hydraulics (UK) Ltd 49 - - -General Pump China Inc. 127 195 - -Hammelmann Bombas e Sistemas Ltda 29 29 - -Total subsidiaries 310 224 2 -
Financial income from unconsolidated subsidiaries in 2012 include also dividends received from Syscam Gestione Integrada for €/000 29. (€/000) Other liabilities
tax receivables Interest payable (nine months)
31/12/2012 31/12/2011 2012 2011Hammelmann SNG - 217 - -Total subsidiaries - 217 - -
In 2012 Hammelmann SNG was merged with Hammelmann Maschinenfabrik GmbH.

101
Relationships with associates Relations with associates are as outlined below (amounts shown in €/000): (€/000) Payables Costs
31/12/2012 31/12/2011 2012 2011Wuxi Weifu China-Italy Company Ltd - - - 33Total associates - - - 33 Wuxi Weifu China-Italy Gear Company Ltd was divested in 2011. Transactions with other related parties Transactions with other related parties regard the leasing of facilities owned by companies controlled by current shareholders and directors of Group companies in the amount of €4,279 thousand (€3,806 thousand in 2011) and legal consultancy services provided by entities connected with directors and statutory auditors of the Group for €306 thousand (€299 thousand in 2011). Rental costs were y €209 thousand higher than in 2011 due to the effect of the consolidation of the companies newly acquired in 2012. Costs for rentals were booked to the cost of sales in the amount of €3,202 thousand (€2,826 thousand in 2011), to distribution costs in the amount of €854 thousand (€773 thousand in 2011) and to general and administrative expenses in the amount of €223 thousand (€207 thousand in 2011) to general and administrative expenses. Consultancy costs were booked in the amount of €60 thousand to distribution costs (€60 thousand also in 2011) and in the amount of €246 thousand to general and administrative expenses (€239 thousand in 2011).
Moreover, further to the stipulation of building rental contracts with other related parties, the Group has commitments for €9,790 thousand (€13,052 thousand at 31 December 2011). 37. Events occurring after the close of the year After 31 December 2012 no atypical or unusual transactions were carried such that would require mention in this report or call for changes to the consolidated financial statements at 31 December 2012.

102
Annex 1 Attestation of the consolidated financial statements pursuant to art. 81-(3) of Consob regulation no. 11971 (which refers to art. 154-(2) para. 5 of the Consolidated Finance Act) of 14 May 1999 as amended 1. The undersigned Paolo Marinsek and Carlo Banci, respectively Executive
Director and Manager responsible for the drafting of company accounting documents of Interpump Group S.p.A., taking account also of the provisions of art. 154-(2), paras. 3 and 4 of decree D.Lgs 24 February 1998 no. 58 state:
– the adequacy in relation to the characteristics of the business and
– the effective application
of the administrative and accounting procedures for the formation of the consolidated financial statements during 2012.
2. In addition, it is confirmed that the consolidated financial statements of
Interpump Group S.p.A. and its subsidiaries for the year ended 31 December 2012, which show consolidated total assets of €741,853 thousand, consolidated net profit of €52,325 thousand and consolidated shareholder's equity of €396,876 thousand:
a) correspond to the results of the company books and accounting entries;
b) were prepared in compliance with the international accounting standards approved by the European Commission further to the enforcement of Ruling (CE) no. 1606/2002 of the European Parliament and the European Council of 19 July 2002, and the provisions issued in implementation of art. 9 of decree D. Lgs. 38/2005 and the contents are suitable for providing a truthful and fair representation of the equity, economic and financial situation of the company and the group of companies included in the scope of consolidation;
c) the Board of Directors' report contains a reliable analysis of performance and results and the situation of the issuer and the companies included in the consolidation together with a description of the main risks and uncertainties to which they are exposed.
Milan, 19 March 2013 Paolo Marinsek Carlo Banci Executive Director Manager responsible for drafting
company accounting documents

103
Report of the Board of Statutory Auditors on the consolidated financial statements for the year ended 31 December 2012
Shareholders of the parent company Interpump Group SpA,
This report refers to the consolidated financial statements of the member companies of the Group headed by Interpump Group SpA.
The report reflects the duties assigned to the Board of Statutory Auditors by decree D.Lgs. no.58 of 24 February 1998, and which in this case refer to the report of this Board in relation to the separate financial statements at 31 December 2012 of the parent company Interpump Group SpA.
On these grounds, the Board of Statutory Auditors: - has verified and monitored, within the scope of our competence, the suitability of the
company's organizational structure and the observance of the principles of correct administration, by means of direct checks and through information gathered from the persons in charge of the administrative function and meetings with representatives of the Independent Auditors appointed to perform legal auditing of the accounts, PriceWaterhouseCoopers SpA, with the purpose of assuring the reciprocal exchange of data and relevant information;
- has received from the Board of Directors within the required terms both the separate financial statements for 2012 accompanied by the board of directors' report and the consolidated financial statements with the relative report;
- has checked the full observance of legal requirements concerning the consolidated financial statements and the accompanying board of directors' report;
- has examined the independent auditors' report of 25 March 2013, which contains no qualified remarks or information requests;
- has acknowledged that the financial statements of the main subsidiaries are subject to legal auditing of the accounts by their respective Boards of Statutory Auditors, by a legal auditor, or by an independent auditing company, depending on the context.
As part of our general supervisory role, we saw no major events requiring disclosure in this report.
To complete this report you are invited to read our comments on the separate financial statements of Interpump Group Spa for the year ending 31 December 2012, containing all information required by the Italian stock exchange regulatory body.
It is our opinion that the consolidated financial statements as a whole are an accurate representation of the Interpump Group SpA Group's equity and financial situation and economic result (€/000 52,325) for the year ended 31 December 2012, in conformity with the regulations governing consolidated financial statements mentioned above.
The Board of Statutory Auditors also declares that the directors' report on Group operations is an accurate and consistent representation of the consolidated accounts.
Milan, 26 March 2013
THE BOARD OF STATUTORY AUDITORS
Enrico Cervellera
Achille Delmonte
Paolo Scarioni

104

105

106

107
Interpump Group S.p.A.
Draft annual financial statements at 31 December 2012

108

109
Contents Page
Board of Directors' Report for 2012 of the Parent Company Interpump Group S.p.A. 111
Financial Statements of Parent Company Interpump Group S.p.A. at 31/12/2012 123
Balance sheet 124
Income statements 126
Comprehensive income statements 127
Cash Flow Statement 128
Statement of changes in equity 130
Notes to the financial statements of Interpump Group S.p.A. 131
1 General Information 131
2 Accounting Principles used: 2.1 Reference accounting principles 131
2.1.1 Accounting principles, amendments and interpretations in force from 1 January 2012 132
2.1.2 Accounting principles, amendments and interpretations not yet applicable and not adopted early by the company 132
2.1.3 New accounting principles and amendments in force from 1 January 2012 but not relevant for the company 134
2.2 Business sector information 134 2.3 Treatment of foreign currency transactions 134 2.4 Non-current assets held for sale
and discontinued operations 135 2.5 Property, plant and equipment 135 2.6 Goodwill 136 2.7 Other intangible assets 136 2.8 Impairment of assets 137 2.9 Investments 138 2.10 Cash and cash equivalents 138 2.11 Current financial assets, receivables and other current assets 138 2.12 Inventories 138 2.13 Share capital and Treasury stock 139 2.14 Interest-bearing financial payables 139 2.15 Liabilities for employee benefits 139 2.16 Income taxes 140 2.17 Provisions for risks and charges 141 2.18 Current financial liabilities, trade payables and other debts 141 2.19 Revenues 141 2.20 Costs 141
110
3 Financial risk management 142 3.1 Financial risk factors 142 3.2 Recognition of derivative financial instruments and
hedged transactions 142
4 Cash and cash equivalents 144
5 Trade receivables 144
6 Inventories 145
7 Derivative financial instruments 145
8 Assets held for sale 149
9 Other current assets 149
10 Property, plant and equipment 149
11 Goodwill 150
12 Other intangible assets 151
13 Investments in subsidiaries 152
14 Other financial assets 152
15 Deferred tax assets and liabilities 152
16 Interest-bearing financial payables and bank payables 153
17 Other current liabilities 154
18 Provisions for risks and charges 155
19 Liabilities for employee benefits 155
20 Share capital 156
21 Reserves 163
22 Information on financial assets and liabilities 164
23 Information on financial risks 165
24 Net sales 169
25 Other net revenues 169
26 Costs by nature 170
27 Financial income and charges 170
28 Income taxes 171
29 Earnings per share 172
30 Notes to the cash flow statement 173
31 Commitments 173
32 Transactions with related parties 173
33 Events occurring after the close of the year 174
Annex 1: Attestation of the annual financial statements pursuant to art. 81-ter of Consob regulation no.11971 of 14 May 1999 as amended 175
Statutory Auditors' Report to the Shareholders' Meeting 176
Independent Report on the annual financial statements of Interpump Group S.p.A. 179

111
2012 Board of Directors' Report for the Parent Company Interpump Group S.p.A.

112

113
As in previous years, the operations of Interpump Group S.p.A. consisted, in addition to ordinary industrial activities, in the strategic and management coordination of the Group, in the drive to optimize the Group's financial flows, and in research activities and the selection of equity investments to acquire with the aim of accelerating the Group's expansion. Since 1996, the year in which the company was first listed on the Stock Exchange, at 31/12/2012 a total of twenty-four acquisitions have been made. In particular, three new acquisitions were carried out in 2012 through subsidiary Interpump Hydraulics S.p.A.
On 18 January 2012 the Group acquired M.T.C., a company engaged in the production and sale of directional control valves and a range of other hydraulic valves based in the north Italian province of Reggio Emilia. A total cash price of €3.0 million was disbursed to acquire 60% of MTC's capital stock.
On 31 January 2012 the Group acquired Galtech, a Reggio Emilia based company operating in the production and sale of gear pumps and motors, directional controls, hydraulic accessories and components in general. 53% of Galtech's share capital was acquired for a total price of €3.3 million paid half in cash and half with 300,831 Interpump Group S.p.A. treasury shares.
The operations of Galtech and MTC are highly synergic with respect to the business of the Group's Hydraulic Sector. In this context, it should be noted that Interpump Hydraulics S.p.A., a 100% owned subsidiary of Interpump Group S.p.A, is world leader in power take-offs for industrial vehicles and it has strengthened its market position and broadened its product offering with the acquisitions of Galtech and MTC.
Takarada, a leading manufacturer and seller of power take-offs and related hydraulic components for industrial vehicles based in Caxias do Sul (Brazil – the state of Rio Grande do Sul ), was acquired on 15 February 2012. A total of 29.0 million reais (€12,9 million) was paid in cash for 100% of Takarada's capital, inclusive of the company's financial debt. Takarada's business is highly synergic with respect to the activities of the Interpump Group's Hydraulic Sector. With the acquisition of Takarada the Interpump Group lays the basis for strong growth of the Hydraulic Sector in Brazil, a country that is expected to engage in high levels of spending on infrastructure in the next few years also because it has been selected to host two of the absolute top international sports events (World Soccer Championship and the Olympics).
For more information on these acquisitions refer to note 7 to the consolidated financial statements.
On 24 July 2012 we acquired GITOP S.r.l., the company used by our subsidiary Oleodinamica Panni S.r.l. to handle peak production demands and to manufacture smaller lots of cylinders. 100% of GITOP's stock was purchased for the price of €600 thousand.
A share capital increase further to exercise of the warrants was completed successfully in 2012 with a total receipt of € 56.9 million thus demonstrating the confidence displayed by our shareholders at a time of significant macroeconomic uncertainty. Apart from strengthening the already sound equity structure of the company, the new financial inflows to Interpump Group will have positive effects on the rating and speed up the process of growth of the company and the Group through internal and external lines.
As fully described in the 2011 annual Board of Directors' Report, on 26 September 2011 the company divested its 70% stake in Unielectric, a company operating in the production of windings and electric motors. The sale, which complied with the requirements of IFRS 5 and the most recent orientations of international accounting principles, has been represented as a Discontinued Operation in the consolidated financial statements and the individual financial statements of Interpump Group S.p.A.

114
1 Profitability
Interpump Group S.p.A. booked net revenues of € 70.0 million (€ 73.5 million in 2011). The analysis by geographic area of the revenues from sales and services is given in the commentary on this item in the notes to the financial statements.
The cost of sales accounted for 65.6% of turnover (66.8% in 2011). Production costs, which totalled 20.8 million euro (21.0 million euro in 2011) accounted for 29.6% of sales (28.6% in 2011). The purchase costs of raw materials and components sourced on the market, including changes in inventories, totalled € 25.1 million (€ 28.1 million in 2011). The incidence of purchase costs, inclusive of the change in inventories, was 2.3 percentage points lower than in 2011. Distribution costs decreased by 13.1% compared to 2011, and their incidence on sales rose by 0.9%. General and administrative expenses were up by 11.6% with respect to 2011, while the relative incidence on sales grew by 2.8 percentage points. G&A expenses for 2012 however were influenced by the provision of the end of office indemnity amount of Mr Cavallini in the amount of €1.0 million. G&A expenses, net of the aforementioned one-off cost, were up by 3.7%; their incidence on sales rose by just 1.5 percentage points. Total payroll costs were €18.3 million (18,1 million in 2011) for an average number of 360 employees (359 employees in 2011). Payroll costs increased by 0.9% mainly due to an increase in the per capita cost, while the average headcount remained substantially unchanged. The reconciliation of the income statement to obtain intermediate results is as follows: 2012
(€/000)% on sales
2011 (€/000)
% on sales
Ordinary profit before financial charges 17,847 15,337 Dividends (10,041) (5,906) Impairment losses on investments 13 12 Operating profit (EBIT) 7,819 11.2% 9,443 12.8%Amortization, depreciation and write-downs 2,777 3,068 Gross operating profit (EBITDA) 10,596 15.1% 12,511 17.0%
EBIT totalled €7.8 million, equivalent to 11.2% of sales, compared to the €9.4 million of 2011 (12.8% of sales) and was therefore lower than in 2011, mainly due to the higher incidence of general expenses due to the one-off amount commented above and to a lower level of sales volumes. EBITDA totalled €10.5 million or 15.1% of sales, compared to the €12.5 million of 2011, which accounted for 17.0% of sales. EBITDA adjusted for non-recurring expenses was €11.6 million or 16.5% of sales.

115
The year to 31 December 2012 closed with a net profit of 16.8 million euro (8.0 million euro in 2011) influenced by the events summarized in the following table: 2012 2011 (€/000) (€/000)
Net profit disclosed in income statement 16,812 7,968Result of discontinued operations (99) 798Income taxes (1,168) 2,882Earnings before tax 15,545 11,648Impairment losses on investments 13 12Earnings before tax adjusted by non-recurring operations (A) 15,558 11,660Dividends from subsidiaries (B) (10,041) (5,906)Earnings before tax adjusted by non-recurring operations and dividends (A+B)
5,517 5,754
Income taxes 1,168 (2,882)Taxes relative to the tax deductibility of the capital loss from the sale of investments
(3,064) -
Taxes for the deductibility of IRAP on employee salaries of prior years (816) -Taxes relating to previous years (78) 26Taxes on dividends 147 219Net Profit (Loss) adjusted for non-recurring operations and dividends 2,874 3,117
In 2012 lower taxes were booked in the amount of €3.9 million, of which €2.7 million relative to the deductibility of the tax loss resulting from the sale of Unielectric in 2011 booked in 2012 following completion of the relative procedure, and in the amount of €0.4 million for deferred tax assets relative to another possible similar event, and finally for €0.8 million relative to tax rebates for the deductibility of IRAP on employee salaries relative to prior years. The result of discontinued operations in 2012 refers to the reversal of the provision for contingent liabilities associated with the disposal of Unielectric in 2011, net of the cost recorded following adjustment of the selling price of the investment.

116
2 Balance sheet
Below we give the reclassified balance sheet on the basis of cash flows obtained/used: 31/12/2012
(€/000)% 31/12/2011
(€/000) %
Trade receivables 10,013 10,788
Net inventories 9,748 10,534
Other current assets 6,356 7,569
Accounts payable to suppliers (10,927) (10,034)
Short-term tax payables (629) (660)
Other short-term liabilities (5,841) (6,462)
Net operating working capital 8,720 3.0 11,735 4.1
Net intangible and tangible fixed assets 19,487 17,366
Goodwill 32,506 32,506
Investments 191,880 191,768
Other financial fixed assets 38,573 34,369
Other non-current assets 3,717 3,228
Liabilities for employee benefits (3,529) (3,269)
Medium/long-term portion for provisions for risks and charges (5) (304)
Other medium/long-term liabilities (906) (1,005)
Total net fixed assets 281,723 97.0 274,659 95.9
Total capital employed 290,443 100.0 286,394 100.0
Financed by:
Total shareholders' equity 233,901 80.5 182,185 63.6
Cash and cash equivalents (70,485) (68,232)
Payables to banks 51 2,360
Short-term interest-bearing financial payables 51,435 79,941
Total short term financial payables (cash) (18,999) (6.5) 14,069 4.9
Total medium/long-term financial payables 75,541 26.0 90,140 31.5
Total sources of financing 290,443 100 286,394 100
The reclassified layout of the balance sheet adopted makes it possible to assess the capital soundness of the company, highlighting its capacity to maintain a condition of financial equilibrium in the medium/long-term. The company's equity structure was further strengthened in 2012 thanks to the success of the share capital increase following exercising of the warrants, allowing the company to gain access to new financial resources capable of speeding up the process of growth of the company and the Group.
117
3 Capital expenditure
Capital expenditure in tangible fixed assets stood at 3.6 million euro (2.1 million euro in 2011) and is related to the normal renewal and modernization of plant and equipment. The difference with respect to the expenditure recorded in the cash flow statement is due to the dynamics of payments. Increases in intangible fixed assets amounted to 1.3 million euro (1.5 million euro in 2011), mostly concerning product development costs of Interpump Engineering.
4 Loans
Net financial indebtedness at 31 December 2012 was 56.5 million euro (104.2 million euro at 31/12/2011). Changes during the year are listed in the table below.
2012 2011 (€/000) (€/000)
Opening net financial position (104,209) (79,551)
Cash flow from operations 5,258 1,005Liquidity generated (absorbed) by commercial working capital 1,432 (1,363)Liquidity generated (absorbed) by other current assets and liabilities 1,142 1,020Net expenditure in tangible and intangible fixed assets (1,806) (2,661)Received financial income 1,314 2,932Other (160) (393)Free cash flow 7,180 540Proceeds from the disposal of investments 957 1,128Purchase of treasury stock (15,827) (16,489)Proceeds from sales of treasury stock for stock options 2,025 188Dividends received 10,096 5,906Dividends paid (11,145) (10,412)Share capital increase 56,881 31Reimbursement (Disbursement) of loans from (to) subsidiaries (2,500) (5,550)Cash flow generated (used) 47,667 (24,658)Net financial position at year end (56,542) (104,209) The net cash position breaks down as follows: 31/12/2012 31/12/2011 1/1/2011 (€/000) (€/000) (€/000)
Cash and cash equivalents 70,485 68,232 89,282Payables to banks (51) (2,360) (602)Interest-bearing financial payables (current portion) (51,435) (79,941) (75,453)Interest-bearing financial payables (non-current portion) (75,541) (90,140) (92,778)Total (56,542) (104,209) (79,551)
At 31 December 2012 all the loan covenants had been amply complied with.

118
5 Relations with subsidiaries
The company also operates through subsidiaries with which it entertains commercial and financial relationships. These relations are detailed in the table below (amounts expressed in €/000):
Receivables Revenues 31/12/2012 31/12/2011 2012 2011Subsidiaries: General Pump Inc. 1,325 2,000 16,172 14,620NLB Corporation Inc. 129 - 912 409General Technology S.r.l. 285 261 690 698General Pump China Inc. 86 39 415 328Interpump Hydraulics India Ltd 242 79 238 78Interpump Engineering S.r.l 44 25 125 174Interpump Hydraulics S.p.A. 484 264 47 79Hydroven S.r.l. 5 1 39 7AVI S.r.l. 3 10 25 15Hammelmann S. L. 6 - 5 -SIT S.p.A. - - 4 4Contarini Leopoldo S.r.l. - - 3 3Cover S.r.l. - - 3 3Oleodinamica Panni S.r.l. 2 2 3 3HS Penta S.p.A. 9 17 3 3Modenflex Hydraulics S.r.l. - - 2 2MTC S.r.l. - - 2 -Galtech S.p.A. - - 1 -Hammelmann Maschinenfabrik GmbH 117 212 - -Teknova S.r.l. (winding up) 14 7 - -Golf Hydrosystem Odd 2 - - -Interpump Hydraulics (UK) Ltd 1 - - -Unielectric S.p.A. (*) - - - 2Hydrocar Roma S.r.l. - 1 - 4Interpump Hydraulics International S.p.A. - 127 - -Total 2,754 3,045 18,689 16,432
(*) the investment was sold on 26 September 2011, so as from that date it is no longer part of the Interpump Group.
At 31/12/2012 the entire receivable due from Hammelmann Machinenfabrik GmbH concerns finance income on loans, while the receivables due from General Technology S.r.l., Interpump Hydraulics S.p.A., HS Penta S.p.A. and Teknova S.r.l., in addition to components of trade receivables, include also the part of uncollected financial income amounting, respectively, to €/000 9, €/000 413, €/000 9 and €/000 5. The receivables from Teknova S.r.l. refers, in the amount of €/000 9, to the inclusion in the Italian tax consolidation regime. All other receivables refer to relations of a commercial nature governed at arm's length conditions.

119
Payables Costs
31/12/2012 31/12/2011 2012 2011Subsidiaries: General Technology S.r.l. 185 450 4,766 5,068Interpump Engineering S.r.l 729 881 771 453SIT S.p.A. 74 53 234 274Hammelmann Maschinenfabrik GmbH 24 37 218 175General Pump China Inc. 21 - 51 -General Pump Inc. 3 3 8 32Hydroven S.r.l. - - - 1Contarini Leopoldo S.r.l. - - 1 1Unielectric S.p.A. (*) - - - 1,461Interpump Hydraulics S.p.A. 1,116 508 - -HS Penta S.p.A. - 21 - -Total subsidiaries 2,152 1,953 6,049 7,465
(*) the investment was sold on 26 September 2011, so as from that date it is no longer part of the Interpump Group.
The accounts payable to Interpump Hydraulics S.p.A. refer to the inclusion in the Italian tax consolidation regime. All other payables refer to relations of a commercial nature governed at arm's length conditions.
Financial relations are as outlined below (amounts shown in €/000):
Loans granted Interest income 31/12/2012 31/12/2011 2012 2011Subsidiaries: Hammelmann Maschinenfabrik GmbH 6,000 9,000 271 396Interpump Hydraulics International S.p.A. - 2,000 25 247Interpump Hydraulics S.p.A. 30,513 21,309 1,042 176General Technology S.r.l. 1,050 1,050 21 26HS Penta S.p.A. 800 800 20 25Teknova S.r.l. (winding up) 210 210 5 5Total 38,573 34,369 1,384 875 Loans were disbursed at the following conditions:
- General Technology Euribor +0.75;
- Hammelmann Maschinenfabrik Euribor +1.75;
- HS Penta S.p.A. Euribor +1.75;
- Interpump Hydraulics S.p.A. Euribor +1.75;
- Teknova S.r.l. Euribor +1
6 Transactions with related parties
These transactions are described in note 32 of the financial statements.

120
7 Exposure to risks and uncertainties and Financial risk factors
The company is exposed to the normal risks and uncertainties of any business activity. The markets in which the company operates are world niche markets of moderate size and with few competitors. These market characteristics constitute a significant barrier preventing the ingress of new competitors due to significant scale effects against the backdrop of relatively uncertain economic returns for potential new entrants. The company retains world leadership positions that mitigate the risks and uncertainties of the business activity.
These financial risk factors are described in note 3 of the financial statements.
8 Environment
The company is engaged exclusively in mechanical engineering and components assembly activities that are not accompanied by the emission of pollutants into the environment. The production process is performed in full compliance with statutory legislation.
9 Further information
In 2012 the Research and Design Centre (Interpump Engineering S.r.l.), set up to centralize design and development of new products, completed two new high pressure pump families and developed four new evolutions in terms of performance or applications of existing pumps, in addition to numerous accessories. A number of projects are currently underway to design new high and very high pressure pumps.
It is company policy to continue to invest heavily in research and development in future years in order to add further impetus to organic growth. Subsidiary Interpump Engineering S.r.l. charged € 2,033 thousand in payment for the aforesaid operations, € 1,294 thousand of which was capitalized in intangible fixed assets in accordance with their multi-annual usefulness (€ 1,949 thousand in 2011, of which € 1,512 thousand capitalized).
As at 31 December 2012 the company held 7,349,329 treasury shares corresponding, on that date, to 6.75% of the capital, purchased at an average unit cost of € 4.9626.
With regard to stock option plans and the shares of the company and of subsidiaries held by directors, auditors, and general managers you are invited to consult the 2012 Board of Directors' Report, which is attached to the consolidated financial statements.
In 2010 the company renewed its adherence to the national tax consolidation which, in addition to Interpump Group S.p.A., also includes Teknova S.r.l. and Interpump Hydraulics S.p.A.
We draw your attention to the fact that the company is not subject to activities of management and coordination, and that Gruppo IPG Holding S.r.l., with registered office in Milan, is the company that drafts the consolidated financial statements that include the data of Interpump Group S.p.A. and its subsidiaries. The consolidated financial statements are available from the Milan business register.
Pursuant to the terms of art. 3 of Consob Resolution no. 18079 of 20 January 2012, Interpump Group S.p.A. chose to adhere to the opt-out regime provided for by art. 70, par. 8, and art. 71, par. 1-bis, of Consob Reg. no. 11971/99 (as amended), thus making use of the faculty of derogation from the obligation to publish the informative documents prescribed at the time of significant operations of merger, break-up, capital increases by means of the conferment of assets in kind, acquisitions and divestments.

121
10 Events occurring after the end of the year and the business outlook
Considering the short time since 31 December 2012, and in the light of the short period of time historically covered by the order portfolio, we do not yet have enough information to make a reliable forecast of expected trends in the current year. No other events occurred such as to deserve mention in this report, and the company's business proceeded smoothly.
11 Proposal to the Shareholders' Meeting
In relation to the profit for the year of € 16,812,363, we propose:
- allocating € 1,165,889 to the Legal reserve;
- assigning a dividend of € 0.17 to each of the outstanding shares including the right as per art. 2357-ter par. 2 of the Italian Civil Code, withdrawing the portion not covered by the profit for the period from the extraordinary reserve;
Milan, 19 March 2013
For the Board of Directors
Giovanni Cavallini
Chairman

122

123
Financial Statements at 31 December 2012 of the Parent Company Interpump Group S.p.A.
INTERPUMP GROUP S.p.A.
Registered office: S. Ilario d'Enza (RE) Via E. Fermi, 25
Share Capital: € 56,617,232.88 Reggio Emilia Court - Company Register no. 117217
Tax code 11666900151 VAT number 01682900350

124
Balance sheet Euro Notes 31/12/2012 31/12/2011 ASSETS
Current assets Cash and cash equivalents 4 70,485,382 68,231,937Trade receivables 5, 22 10,013,342 10,788,069Inventories 6 9,748,010 10,533,931Tax receivables 2,225,419 1,013,785Derivative financial instruments 7, 22 272,118 -Assets held for sale 8 2,121,484 2,121,484Other current assets 9, 22 1,736,553 4,433,107Total current assets 96,602,308 97,122,313
Non-current assets Property, plant and equipment 10 15,133,896 13,397,870Goodwill 11 32,505,900 32,505,900Other intangible assets 12 4,353,153 3,967,840Investments in subsidiaries 13 191,879,790 191,768,276Other financial assets 14, 22 38,573,440 34,368,961Tax receivables 1,391,084 450,624Deferred tax assets 15 1,861,059 1,658,451Other non-current assets 464,381 1,119,060Total non-current assets 286,162,703 279,236,982Total assets 382,765,011 376,359,295

125
Euro Notes 31/12/2012 31/12/2011 LIABILITIES
Current liabilities Trade payables 5, 22 10,927,202 10,034,121Payables to banks 22 50,708 2,359,796Interest-bearing financial payables (current portion) 16, 22 51,435,266 79,941,231Derivative financial instruments 7 781,359 1,659,351Taxes payable 628,568 660,489Other current liabilities 17, 22 5,059,646 4,802,477Total current liabilities 68,882,749 99,457,465
Non-current liabilities Interest-bearing financial payables 16, 22 75,540,736 90,139,961Liabilities for employee benefits 19 3,528,789 3,268,929Deferred tax liabilities 15 905,779 1,004,575Provisions for risks and charges 18 5,254 303,515Total non-current liabilities 79,980,558 94,716,980Total liabilities 148,863,307 194,174,445 SHAREHOLDERS' EQUITY Share capital 20 52,795,629 47,935,962Legal reserve 21 10,157,558 10,156,890Share premium reserve 21 104,677,337 63,887,046Reserve for valuation of hedging derivatives at fair value
21 (250,121) (649,457)
Other reserves 21 66,521,301 60,854,409Total shareholders' equity 233,901,704 182,184,850Total shareholders' equity and liabilities 382,765,011 376,359,295

126
Income statements Euro Notes 2012 2011
Net sales 24 70,038,135 73,513,979Cost of sales 26 (45,923,468) (49,133,228)
Gross industrial margin 24,114,667 24,380,751
Other net revenues 25 1,392,849 1,435,455
Distribution costs 26 (3,863,560) (3,415,560)General and administrative expenses 26 (13,673,782) (12,257,006)Impairment losses on assets 12, 13 (99,053) (662,926)
Other operating costs 26 (65,000) (49,000)Dividends 10,041,131 5,905,710
Ordinary profit before financial charges 17,847,252 15,337,424
Financial income 27 4,236,269 5,323,094Financial charges 27 (6,538,063) (9,012,508)
Profit for the period before taxes 15,545,458 11,648,010
Income taxes 28 1,168,342 (2,882,316)Profit for the period after taxes and before capital loss on discontinued operations 16,713,800 8,765,694
Result of discontinued operations 98,563 (797,749)
Net profit for the period 16,812,363 7,967,945
Continuing operations basic earnings per share 0.178 0.093Discontinued operations basic earnings per share 0.001 (0.008)
Basic earnings per share 29 0.179 0.085
Continuing operations diluted earnings per share 0.175 0.092Discontinued operations diluted earnings per share 0.001 (0.008)
Diluted earnings per share 29 0.176 0.084

127
Comprehensive income statements
(€/000) 2012 2011
Net profit (A) 16,812 7,968
Accounting of derivative financial instruments used to hedge the interest rate risk recorded in accordance with the cash flow hedging method:
- Profit (Loss) on derivative financial instruments for the period - -- Minus: Adjustment for reclassification of profits (losses) to the income statement -
-
- Minus: Adjustment for recognition of fair value to reserves in the previous period 356
969
Total 356 969
Accounting of derivative financial instruments used to hedge the exchange rate risk recorded in accordance with the cash flow hedging method:
- Profit (Loss) on derivative financial instruments for the period 84 (123)- Minus: Adjustment for reclassification of profits (losses) to the income statement 123
(126)
- Minus: Adjustment for fair value recognition to reserves in the previous period -
-
Total 207 (249)
Related taxes (163) (188)
Profits (losses) recorded directly in equity (B) 400 532
Comprehensive net profit (A) + (B) 17,212 8,500

128
Cash flow statement (€/000) 2012 2011
Cash flow from operating activities
Earnings before taxes and capital losses on discontinued operations 15,545 11,648
Adjustments for non-cash items:
Capital gains from the sale of fixed assets (13) (4)
Amortization and depreciation of tangible and intangible fixed assets 2,777 3,066
Costs ascribed to the income statement relative to stock options that do not involve monetary outflows for the Group 742 845
Impairment losses (reinstatements) of assets 13 12
Net change of risk funds and allocations to provisions for employee benefits 249 (118)
Change in medium-/long-term tax receivables (941) -
Dividends ascribed in the income statement (10,041) (5,906)
Net financial charges 2,302 3,689
10,633 13,232
(Increase) decrease in trade receivables and other current assets (747) (1,071)
(Increase) decrease in inventories 786 1,054
Increase (decrease) in trade payables and other current liabilities 2,535 (326)
Taxes paid (806) (5,486)
Interest paid (4,413) (6,832)
Currency exchange gains realized (156) 91
Net liquidity generated by operating activities 7,832 662
Cash flows from investing activities
Proceeds from the sale of Unielectric net of ancillary expenses paid 957 1,128
Outlays for purchase of treasury stock (15,827) (16,489)
Proceeds from sales of treasury stock for stock options 2,025 188
Disposal of treasury stock to support the company acquisition operation 1,704 4,309
Capital expenditure in property, plant and equipment (3,331) (1,882)
Proceeds from sales of tangible fixed assets 2,863 710
Increase in intangible fixed assets (1,338) (1,489)
Received financial income 1,314 2,932
Other (4) (77)
Net liquidity generated (used) by investing activities (11,637) (10,670)

129
(€/000) 2012 2011
Cash flow of financing activities
Dividends received 10,096 5,906
Dividends paid (11,145) (10,412)
(Disbursal) Repayment of intercompany loans (4,204) (9,859)
Capital increase, net of ancillary expenses paid and including rights sold 56,881 31
Disbursal (repayment of) loans (43,261) 1,534
Net liquidity obtained through (utilized in) financing activities 8,367 (12,800)
Net increase (decrease) of cash and cash equivalents 4,562 (22,808)
Cash and cash equivalents at the beginning of the period 65,872 88,680
Cash and cash equivalents at the end of the period 70,434 65,872
For reconciliation of cash on hand refer to Note 30.

130
Statement of changes in equity
Share
capitalLegal
reserve
Share premium
reserve
Reserve for valuation of
hedging derivatives
at fair valueOther
reserves
Total share-
holders' equity
Balances at 1 January 2011 49,193 10,064 73,622 (1,182) 63,392 195,089Allocation of 2010 profit - 93 - - (93) -Distribution of the dividend - - - - (10,412) (10,412)Recording in the income statement of the fair value of stock options assigned to and exercisable by Interpump Group S.p.A. employees. - - 845 - - 845Fair value measurement of the stock options assigned to and exercisable by employees of subsidiaries - 124 - - 124Capital increase following exercise of warrants 3 - 28 - - 31Purchase of treasury stock (1,845) - (14,644) - - (16,489)Sale of treasury stock to the beneficiaries of stock options 26 - 162 - - 188Sale of treasury stock for the acquisition of equity investments. 559 - 3,750 - - 4,309Comprehensive net profit for the year - - - 532 7,968 8,500
Balances at 31 December 2011 47,936 10,157 63,887 (650) 60,855 182,185Allocation of 2011 profit - 1 - - (1) -Distribution of the dividend - - - - (11,145) (11,145)Recording in the income statement of the fair value of stock options assigned to and exercisable by Interpump Group S.p.A. employees. - - 742 - - 742Fair value measurement of the stock options assigned to and exercisable by employees of subsidiaries - - 125 - - 125Capital increase following exercise of warrants 5,829 - 51,052 - - 56,881Purchase of treasury stock (1,406) - (14,421) - - (15,827)Sale of treasury stock to the beneficiaries of stock options 280 - 1,745 - - 2,025Sale of treasury stock for the acquisition of equity investments. 157 - 1,547 - - 1,704Comprehensive net profit for the year - - - 400 16,812 17,212
Balances at 31 December 2012 52,796 10,158 104,677 (250) 66,521 233,902

131
Notes to the financial statements of Interpump Group S.p.A. 1. General information Interpump Group S.p.A. is a company incorporated under Italian law with registered offices in Sant'Ilario d'Enza (RE), listed on the Milan Stock Exchange. The company manufactures and markets high and very high-pressure piston pumps and has controlling interests in 41 companies. Interpump Group S.p.A. has production facilities in Sant'Ilario d'Enza (RE). For more specific information on the company's operations please refer to the Board of Directors' Report provided with the consolidated financial statements. The financial statements for the year ended 31 December 2012 were approved by the Board of Directors on this day (19 March 2013).
2. Accounting principles used 2.1 Reference Accounting Principles The consolidated financial statements at 31 December 2012 were drafted in compliance with international accounting standards (IAS/IFRS) and with the interpretations of the Standing Interpretations Committee (“SIC”) approved by the European Commission as at the date of this Board of Directors' meeting. The figures of Balance sheet and Income statement are shown in euro, while the other schedules and notes are shown in thousands of euro. The financial statements are drafted according to the cost method, with the exception of financial instruments, which are carried at fair value. Preparation of a report in compliance with IFRS (International Financial Reporting Standards) calls for judgments, estimates, and assumptions that have an effect on assets, liabilities, costs and revenues. The final results may differ from the results obtained using estimates of this type. The captions of the financial statements that call for more subjective appraisal by the directors when preparing estimates and for which a change in the conditions underlying the assumptions utilized could have a significant effect on the financial statements are: goodwill, amortization and depreciation of fixed assets, deferred tax assets and liabilities, the provision for bad debts and the inventories depreciation provision, provisions for risks and charges and defined benefit plans for employees. The company's income statements are prepared by functional areas (or cost of sales), this form being considered more representative than presentation by type of sales, this information being specified in the notes to the financial statements. The chosen form, in fact, complies with the internal reporting and business management methods. For a complete analysis of the economic results of the company, refer to the Board of Directors' Report submitted with the 2012 Consolidated Financial Statements. The cash flow statement was prepared with the indirect method.

132
2.1.1 Accounting principles, amendments and interpretations in force from 1 January 2012
As from 2012 the company applied the following new accounting standards, amendments and interpretations, reviewed by IASB: IFRS 7 – Financial instruments: Additional information. On 7 October 2010
IASB published several amendments to the standards applicable to accounting periods starting after 1 July 2011. The amendments were issued with the intention of improving the understanding of transactions for the transfer of financial assets, including the comprehension of possible effects arising from any risk to which the company that transferred such assets continues to be subject. The amendments also call for more information in the event in which an amount that is disproportional to said transactions is recorded at the end of a financial period. The adoption of this amendment will not produce any changes in terms of disclosure concerning the captions in the financial statements.
2.1.2 Accounting principles, amendments and interpretations not yet applicable and not
adopted early by the company
We also draw your attention to the fact that the company has not performed any early adoptions of approved international financial reporting standards. The accounting principles are as follows:
IFRS 9 – Financial instruments. On 12 November 2009 IASB published the following principle, which was subsequently amended on 28 October 2010. The principle, which is applicable as from 1 January 2013, constitutes the first part of a process in stages aimed at replacing IAS 39 and introduces new criteria for classification and evaluation of financial assets and liabilities for derecognition of the financial assets from the financial statements. Specifically, for financial assets the new principle utilises a single approach based on the methods of management of financial instruments and on the characteristics of the contractual cash flows of financial assets in order to establish the measurement criterion, replacing the various rules contained in IAS 39. In contrast, for financial liabilities the main change that has occurred concerns the accounting treatment for changes in the fair value of a financial liability designated as a financial liability measured at fair value in profit and loss, in the event wherein such changes are due to changes in the credit rating of the liabilities in question. In accordance with the new principle such changes must be recorded in the comprehensive income statement and cannot thereafter be derecognized in profit and loss; With a successive amendment of mid December 2011 IASB postponed the date of enforcement of IFRS 9 from 1 January 2013 until 1 January 2015;
IFRS 10 – Consolidated Financial Statements. On 12 May 2011 IASB issued the following standard, which will become applicable from 1 January 2013. IFRS 10 supplies a guide to assess the presence of control, this being a decisive factor for consolidation of an entity in such cases wherein its identification is not immediate;
IFRS 11 – Joint Arrangements. On 12 May 2011 IASB issued the following standard, which will become applicable from 1 January 2013. Apart from regulating joint arrangements, the new standard supplies the criteria for their identification based on the rights and obligations that arise from the contract rather than relying merely on the legal aspects of the arrangement. IFRS 11

133
excludes the faculty of using the proportional method for the consolidation of joint arrangements;
IFRS 12 – Disclosure of interests in other entities. On 12 May 2011 IASB issued the following standard, which will become applicable from 1 January 2013. The new standard specifies a series of information that the company must disclose in relation to interests in other entities, associated companies, special purpose vehicles and other off balance sheet vehicles;
IFRS 13 – Fair value measurement. On 12 May 2011 IASB, in agreement with FASB, issued a fair value measurement guide. The guide, which is the product of five years of preparation, is an important support tool for fair value measurements, an element that helps to harmonize European and US accounting principles, and a response from IASB and FASB to markets aimed at alleviating the global financial crisis. The new standard will be applicable as from 1 January 2013:
Amendments to IAS 1 - Presentation of financial statements. On 16 June 2011 IASB published the above amendment, which requires all components presented in the comprehensive income statements (OCI or Other Comprehensive Income) to be grouped depending on whether or not they can be reclassified in the future to profit and loss. The amendment was implemented also by FASB in order to improve the comparability between international financial reporting standards (IFRS) and the US generally accepted accounting principles (US GAAP). The changes will enter into effect as from reporting periods starting after 1 July 2012;
Amendments to IAS 19 – Employee benefits. On 16 June IASB published the revised version of IAS 19. The most important changes concern the elimination of the so-called "corridor approach" for recording of actuarial profit and loss (not utilized by Interpump Group), presentation of changes in the assets and liabilities deriving from defined benefit plans, including their re-determination, in the comprehensive income statements, and an increased requirement for information relative to the characteristics and risks bearing on the company associated with defined benefit plans. The amendments were aimed at providing readers of financial statements with a clearer overview of the company's obligations arising from defined benefit plans, and the way in which such obligations may affect the company's economic performance, cash flow and net financial position. The changes will take effect as from 1 January 2013;
IAS 32 – Financial Instruments: presentation. On 16 December 2011 IASB clarified the requirements to allow financial instrument assets to be offset with financial instrument liabilities by publishing an amendment to IAS 32 entitled “Offsetting Financial Assets and Financial Liabilities”. The changes are applicable retroactively as from 1 January 2014;
IFRS 7 – Financial instruments: Additional information. On 16 December 2011 IASB and FASB issued shared provisions concerning the disclosures required in the case of offsetting of financial assets and financial liabilities. Said provisions are set down in an amendment to IFRS 7 entitled “Disclosures – Offsetting of financial assets and liabilities” which will enter into effect as from 1 January 2013. The required disclosures must be supplied retroactively;
IFRS 1 – First adoption of International Financial Reporting Standards (IFRS). On 13 March 2012 IASB published an amendment entitled "Government Loans" which allows companies that are the recipients of government loans below market rates to dispense with the retroactive modification of the recognition of said loans

134
at the time of initial adoption of IAS/IFRS standards. The amendment will take effect as from 1 January 2013. Early adoption is however permitted;
On 17 May 2012 IASB issued a raft of amendments to IAS/IFRS standards (“Improvements relative to the 2009-2011 cycle”). The changes will take effect as from 1 January 2013. Early adoption is however permitted.
At the date of this report the competent bodies of the European Union had yet to terminate the approval process required for application of the amendments and standards described above.
2.1.3 New accounting principles and amendments in force from 1 January 2012 but not
relevant for the company
The following accounting principles, amendments and interpretations, which came into force on 1 January 2012, regulate matters and cases that were not present within the Group at the date of the present report, but that may exert accounting effects on future transactions or agreements: IAS 12 – Income taxes. On 20 December 2010 IASB issued an amendment that
clarifies the measurement of deferred taxes on property investments measured at fair value. The amendment introduces the presumption that deferred taxes relative to property investments measured at fair value in accordance with IAS 40 must be determined taking account of the fact that the carrying value of said asset will be recuperated by means of sale. As a consequence of this amendment, SIC-21 – Income Taxes – Recovery of Revalued non-depreciable assets, will no longer be applicable;
IFRS 1 – First adoption of International Financial Reporting Standards (IFRS). This is a minor amendment to the standard that is not significant for the company.
2.2 Business sector information The business sectors in which the Group operates are determined on the basis of the reporting utilized by Group top management to make decisions, and they have been identified as the Water Jetting Sector, which basically includes high and very-high pressure pumps and very high pressure systems, and the Hydraulic Sector, which includes power take-offs, hydraulic cylinders and other hydraulic components. Interpump Group S.p.A. operates entirely in the Water Jetting Sector so it was not considered necessary to present the relative sector information. With the aim of providing more comprehensive disclosure, information is provided for the geographical areas in which the company operates, namely Italy, the Rest of Europe (including non-EU European countries) and the Rest of the World.
2.3 Treatment of foreign currency transactions (i) Foreign currency transactions
The functional and presentation currency adopted by Interpump Group S.p.A. is the euro. Foreign exchange transactions are converted into euro on the basis of the exchange rates in force on the date that the related transactions were carried out. Monetary assets and liabilities are translated at the exchange rate in force on the balance sheet reference date. Foreign exchange differences arising from currency translation are booked to the income statement. Non-monetary assets and liabilities valued at historic cost are translated at the exchange rates in force on the date of the related transactions. Monetary assets and liabilities stated at fair value

135
are converted into euro at the exchange rate in force on the date in respect of which the relative fair value was determined.
2.4. Non-current assets held for sale and discontinued operations Assets held for sale and any assets and liabilities pertaining to lines of business or consolidated investments held for sale, are valued at the lower of their book value at the time of classification of said captions as "held for sale", and their fair value, net of the costs of sale. Any impairments recorded in application of said principle are recorded in the income statement, both in the event of write-downs for adaptation to the fair value and also in the case of profits and losses deriving from future changes of the fair value. Investments that fit the definition of discontinued operations are classified as discontinued operations at the time of their disposal or when they fit the description of assets held for sale, if said requirements existed previously.
2.5 Property, plant and equipment (i) Own assets Property, plant and equipment are valued at the historic cost and are disclosed net of accumulated depreciation (see next point iii) and impairment losses (see section 2.8). The cost of goods produced internally includes the cost of raw materials, directly related labour costs, and a portion of indirect production costs. The cost of assets, whether purchased externally or produced internally, includes the ancillary costs that are directly attributable and necessary for use of the asset and, when they are significant and in the presence of contractual obligations, the current value of the cost estimated for the dismantling and removal of the related assets.
Financial charges relative to loans utilized for the purchase of tangible fixed assets are recorded in the income statement on an accruals basis if they are not specifically allocated to the purchase or construction of the asset, otherwise they are capitalized.
Assets held for sale are valued at the lower of the fair value net of ancillary charges to the sale and their book value at the time of classification of said captions as held for sale. (ii) Subsequent costs The replacement costs of certain parts of assets are capitalized when it is expected that said costs will result in future economic benefits and they can be measured in a reliable manner. All other costs, including maintenance and repair costs, are ascribed to the income statement when they arise. (iii) Depreciation Depreciation is charged to the income statement on a straight-line basis in relation to the estimated useful life of the assets in accordance with their residual possibility of utilization. Land is not depreciated. The estimated useful life of assets is as follows: - Buildings 25 years - Plant and machinery 12.5 years - Industrial and commercial equipment 4 years - Other assets 4-8 years

136
The estimated useful life of the assets is reviewed on an annual basis, and any changes in the rates of depreciation are applied where necessary for future depreciation charges.
For assets purchased and/or that became operational during the financial period, depreciation is calculated utilizing annual rates reduced by 50%. Historically, this method of calculation has been representative of the effective utilization of the assets in question.
2.6 Goodwill Goodwill represents the portions of the merger deficit paid under this name and originating in the merger operations of previous years and allocated to this item on the basis of an independent survey.
Goodwill is recorded at cost, net of impairment losses. Goodwill is allocated to a single cash generating unit and is no longer amortized as from 1 January 2004. The book value is measured in order to assess the absence of impairment (see section 2.8).
2.7 Other intangible assets (i) Research and development costs Research costs for the acquisition of new technical know-how are ascribed to the income statement when they arise.
Development costs relating to the creation of new products/accessories or new production processes are capitalized if the Group's companies can prove: - the technical feasibility and intention of completing the intangible asset in such a way that it
is available for use or for sale; - their ability to use or sell the asset; - the forecast volumes and realization values indicate that the costs incurred for development
activities will generate future economic benefits; - said costs are measurable in a reliable manner; - and the resources exist to complete the development project.
The activity of new products development is handled by the subsidiary Interpump Engineering S.r.l. The capitalized cost is determined by the invoices received for this type of activity. Capitalized development costs are valued at cost, net of accumulated amortization, (see next point v) and impairment (see section 2.8). Other development costs are ascribed to the income statement when they arise. (ii) Loan ancillary costs Loan ancillary costs are deducted from the nominal amount of the loan and handled as outlined in section 2.14 (iii) Other intangible assets Other intangible assets, all having a defined useful life, are valued at cost and recorded net of accumulated amortization (see next point v) and impairment (see section 2.8).
Software licenses are amortized over their period of utilization (5 years).
The costs sustained internally for the creation of trademarks or for goodwill are recognized in the income statement when they are incurred.

137
(iv) Subsequent costs Costs incurred subsequently relative to intangible fixed assets are capitalized only if they increase the future economic benefits of the specific capitalized asset, otherwise they are entered in the income statement when they are sustained. (v) Amortization/depreciation Amortization amounts are recorded in the income statement on a straight-line basis in accordance with the estimated useful life of the capitalized assets to which they refer. The estimated useful life of assets is as follows: Patents and trademarks 3 years Development costs 5 years Granting of software licenses 5 years The useful life is reviewed on an annual basis and any changes in the rates are made, where necessary, for future amounts.
2.8 Impairment of assets The book values of assets, with the exception of inventories (see section 2.12), financial assets regulated by IAS 39, deferred tax assets (see section 2.16), and non-current assets held for sale regulated by IFRS 5, are subject to measurement at the balance sheet reference date in order to identify the existence of possible indicators of impairment. If the valuation process identifies the presence of such indicators, the presumed recoverable value of the asset is calculated using the methods indicated in the following point (i).
The presumed recovery value of goodwill and intangible assets that have not yet been used is estimated at intervals of no longer than once a year or more frequently if specific events occur that point to the possible existence of impairment. If the presumed recovery value of the asset or its cash generating unit is lower than the net book value, the asset to which it refers is consequently adjusted for impairment loss with entry into the income statement.
Goodwill is systematically measured (impairment test)at least once a year or more as prescribed by IAS 36. (i) Calculation of presumed recovery value The presumed recovery value of securities held to maturity and financial receivables recorded with the criterion of the amortized cost is equivalent to the discounted value of estimated future cash flows; the discounted rate is equivalent to the interest rate envisaged at the time of issue of the security or the emergence of the receivable. Short-term receivables are not discounted to current value.
The presumed recovery value of other assets is equal to the higher of their net sale price and their utilization value. The utilization value is equivalent to the forecast future cash flows, discounted to a rate, gross of taxes, that takes account of the market value of interest rates and specific risks of the asset to which the presumed realization value refers. For assets that do not give rise to independent cash flows the presumed realization value is determined with reference to the cash generating unit to which the asset belongs. (ii) Reinstatement of impairment losses An impairment relative to securities held to maturity and financial assets recorded with the criterion of the amortized cost, is reinstated when the subsequent increase in the presumed

138
recovery value can be objectively related to an event that occurred in a period following the period in which the impairment loss was recorded.
An impairment relative to other assets is reinstated if a change has occurred in the estimate used to determine the presumed recovery value.
Impairment is reinstated to the extent of the corresponding book value that would have been determined, net of depreciation/amortization, if no impairment loss had ever been recognized.
Impairment relative to goodwill can never be reinstated.
2.9 Investments Investments in subsidiaries and associated companies are valued at cost.
Should any impairment of value arise at the balance sheet reference date in comparison to the value determined according to the above method, the investment in question will be written down.
2.10 Cash and cash equivalents Cash and cash equivalents include cash on hand, bank and post office deposits, and securities having original maturity date of less than three months. Current account overdrafts and advances with recourse are deducted from cash only for the purposes of the cash-flow statement.
2.11 Current financial assets, receivables and other current assets Current financial assets, trade receivables and other current assets (excluding derivative financial instruments) are recorded, at the time of their initial entry, on the basis of the purchase cost inclusive of ancillary costs (fair value for the initial entry).
Subsequently, financial assets available for sale are assessed at their fair value. Gains or losses deriving from the valuation are recognized in equity up to the moment in which the financial asset is sold, when the gains or losses are recorded in the income statement. If the market value of the financial assets cannot be reliably determined, they are entered at their purchase cost.
Accounts receivable, with due date within normal commercial terms or that accrue interest at market rates, are not discounted to current value and are entered at amortized cost net of a bad debt provision booked as a direct deduction from the receivables in question to bring the valuation to the presumed realizable value (see section 2.8). Accounts receivable with due dates beyond normal commercial terms are initially entered at their fair value and subsequently at the amortized cost using the method of the effective interest rate, net of the relative value impairments.
2.12 Inventories Inventories are valued at the lower of purchase cost and the presumed realization value. The cost is determined with the criterion of the average weighted cost and it includes all the costs incurred to purchase the materials and transform them at the conditions in force on the date of the balance sheet. The cost of semi-finished goods and finished products includes a portion of indirect costs determined on the basis of normal production capacity. Write down provisions are

139
calculated for materials, semi-finished goods and finished products considered to be obsolete or slow moving, taking account of their expected future usefulness and their realization value. The net realization value is estimated taking account of the market price during the course of normal business activities, from which the costs of completion and costs of sale are subsequently deducted.
2.13 Share capital and Treasury stock In the case of purchase of treasury stock, the price paid, inclusive of any directly attributable ancillary costs, is deducted from share capital for the portion concerning the nominal value of shares and from shareholders' equity for the surplus portion. When said treasury shares are resold or reissued, the price collected, net of any directly attributable ancillary charges and the relative tax effect, is recorded as share capital for the portion concerning the nominal value of shares and as shareholders' equity for the surplus.
2.14 Interest-bearing financial payables Interest-bearing financial payables are initially recorded at their fair value, net of ancillary charges. After the original entry, interest-bearing financial payables are valued with the amortized cost criterion; the difference between the resulting value and the discharge value is entered in the income statement during the term of the loan on the basis of the amortization plan.
2.15 Liabilities for employee benefits (i) Defined contribution plans The company participates in defined pension plans with public administration or private plans on a compulsory, contractual or voluntary basis. The payment of contributions fulfils the company's obligations towards its employees. The contributions therefore constitute costs of the period in which they are due. (ii) Defined benefit plans Defined benefit plans for employees - disbursed at the time of termination of the period of employment with the company or thereafter - that include severance indemnity, are calculated separately for each plan, estimating the amount of the future benefit that the employees have accrued during the year and in previous years by means of actuarial techniques. The resulting benefit is discounted to present value and recorded net of the fair value of any relative assets. The discount rate at the balance sheet reference date is calculated as required by IAS 19 with reference to the market yield of high quality corporate bonds. These include only securities released by corporate issuers included in rating class "A", in the assumption that this class identifies a medium rating level corresponding to a low risks level. Considering that IAS 19 makes no explicit reference to a specific product sector, we opted for a composite market curve that could summarize the market conditions existing at the date of valuation of the securities issued by companies operating in various sectors including utilities, telecommunications, finance, banking and industrial. The calculation is performed on an annual basis by an independent actuary using the projected unit credit method.
In the event increases in the benefits of the plan, the portion of the increase pertaining to the previous period of employment is entered in the income statement on a straight line basis in the

140
period in which the relative rights will be acquired. If the rights are acquired immediately, the increase is immediately recorded in the income statement.
Actuarial gains and losses are recognized in the income statement on an accruals basis (the company does not make use of the so-called "corridor method").
Until 31 December 2006 the severance indemnity provision (TFR) of Italian companies was considered to be a defined benefits plan. The rules governing the provision were amended by Law no. 296 of 27 December 2006 (“2007 Finance Act”) and by subsequent Decrees and Regulations enacted in the initial months of 2007. In the light of these changes, and in particular with reference to companies with at least 50 employees, as is the case of Interpump Group S.p.A., the TFR severance indemnity provision should now be classified as a defined benefits plan exclusively for the portions accrued prior to 1 January 2007 (and not yet paid out at the date of the financial statements), while after that date TFR should be considered as a defined contributions plan. (iii) Stock options On the basis of the stock option plan currently in existence, certain employees and directors are entitled to purchase the treasury shares of Interpump Group S.p.A. The options are measured at their fair value, which is entered in the income statement and increased by the cost of personnel and directors with a matching entry in the share premium reserve. The fair value is measured at the grant date of the option and recorded in the income statement in the period that runs between said date and the date on which the options become exercisable (vesting period). The fair value of the option is determined using the applicable options measurement method (specifically, the binomial lattice model), taking account the terms and conditions at which the options were granted.
The remuneration component deriving from stock option plans with Interpump Group S.p.A. shares as the underlying, in accordance with the matters envisaged by interpretation IFRIC 11, is recognized as a capital grant disbursed to subsidiaries wherein the beneficiaries of the stock option plans are employees and consequently recorded as an increase of the relative value of the shareholdings, with a matching entry recorded directly in equity.
2.16 Income taxes Income taxes disclosed in the income statement include current and deferred taxes. Income taxes are generally disclosed in the income statement, except when they refer to types of items that are recorded directly under shareholders' equity. In this case, the income taxes are also recognized directly in equity.
Current taxes are taxes that are expected to be due, calculated by applying to the taxable income the tax rate in force at the balance sheet reference date and the adjustments to taxes of prior years.
Deferred taxes are calculated using the liability method on the temporary differences between the amount of assets and liabilities in the financial statements and the corresponding values recognized for fiscal purposes. Deferred taxes are calculated in accordance with the envisaged method of transfer of timing differences, using the tax rate in force at the reference date of years in which the timing differences arose.
Deferred tax assets are recognized exclusively in the event that it is probable that in future years sufficient taxable incomes will be generated for the realization of said deferred taxes.

141
2.17 Provisions for risks and charges In cases wherein the company has a legal or substantial obligation resulting from a past event, and when it is probable that the loss of economic benefits must be sustained in order to fulfil such an obligation, a specific provision for risks and charges is created. If the temporal factor of the envisaged loss of benefits is significant, the amount of the future cash outflows is discounted to present values at a rate, gross of taxes, that takes account of the market interest rates and the specific risk of the liability in question.
2.18 Current financial liabilities, trade payables and other debts Trade payables and other debts, the relative due date of which is within normal commercial terms, are not discounted to present value and are entered at the amortized cost representative of their discharge value.
Current financial liabilities include the short term portions of financial debts, inclusive of debts for cash advances and other financial liabilities. Financial liabilities are measured at their amortized cost according to the effective interest method. Financial assets hedged by derivative financial instruments taken out to hedge the interest rate risk are valued at their current value in accordance with the methods specified for hedge accounting.
2.19 Revenues (i) Revenues from the sale of goods and services Revenues from the sale of goods are entered in the income statement when the risks and benefits connected to the ownership of the goods are substantially transferred to the purchaser. Revenues for services rendered are recorded in the income statement on the basis of the percentage of completion at the balance sheet reference date. (ii) Dividends Dividends are recognized in the income statement on the date they became payable, and are classified under ordinary earnings before interest and tax because they are considered to represent the ordinary holding activities performed by the company.
2.20 Costs (i) Rental and operating leasing instalments Rental and operating leasing instalments are recorded in the income statement on an accrual basis. (ii) Financial income and charges Financial income and charges are recorded on an accrual basis in accordance with the interest matured on the net value of the relative financial assets and liabilities, using the effective interest rate. Financial income and charges include foreign exchange gains and losses and gains and losses on derivative instruments booked to the income statement (see section 3.2).

142
3. Financial risk management 3.1 Financial risk factors The business of the company is exposed to various financial risks: market risk (including the exchange rate risk and interest rate risk), credit risk and liquidity risk. The financial risks management programme is based on the unpredictability of financial markets and it is aimed at minimizing any negative impact on the company's financial performance. Interpump Group S.p.A. utilizes derivative financial instruments to hedge against exchange and interest rate risks. The company does not hold derivative financial instruments of a speculative nature, in compliance with the rulings established by the procedure approved by the Board of Directors.
(a) Market risks (i) Exchange rate risk
The company does business internationally and is exposed to the exchange rate risk related to business conducted in US dollars. Exchange rate risks are generated in relation to forecasts of future commercial and financial transactions outside the EU. To manage the exchange rate risk that is generated in relation to forecasts of future commercial transactions and from the recognition of assets and liabilities in a different currency from the company's functional currency (euro); the company utilizes plain vanilla forwards or options. The company bills its US subsidiaries and also a major US customer in dollars and has therefore hedged forecast future cash-flows; the policy is to hedge a prudentially determined portion of predicted sales for a variable period of between four and eight months.
(ii) Interest rate risk Interest rate risk derives from medium/long-term loans granted at floating rates. Company policy is to hedge part of the existing loans and, for the unhedged part, to monitor the interest rate curve in order to assess the opportunity of taking out further hedges.
(b) Credit risk
The company does not have any significant concentrations of receivables. It is company policy to make sales to customers following a careful assessment of their credit rating and therefore within preset credit limits. Historically, the company has not had to support any significant losses on receivables.
(c) Liquidity risk Prudent management of liquidity risk involves the retention of an appropriate level of cash on hand and sufficient access to lines of credit. Because of the dynamic nature of the company's business, which results also in frequent targeted acquisitions, it is company policy to ensure access to revolving stand-by lines of credit that can be utilized at short notice.
(d) Price and cash flow risk The company is subject to constant changes in metal prices, especially brass, aluminium, copper and steel. It is company policy to hedge this risk where possible by way of medium-term commitments with suppliers or stockpiling policies when prices are at the low point of their cycle.

143
The company invests a significant part of its cash on hand in locked up bank deposits, savings accounts and in repurchase agreements of a maximum duration of three months, in order to optimize finance management. In repurchase agreements the underlying is composed of the bonds of a primary banking group. Excluding repurchase agreements, the company does not hold any listed securities which would be subject to stock market fluctuations. Despite the high level of cash investment carried out by the company, the revenues and cash flows of the company's operating activities are only marginally influenced by changes in interest generating assets.
Further quantitative information on the financial risks to which the company is exposed is given on Note 23 "Information on financial risks". 3.2 Recognition of derivative financial instruments and hedged transactions As already pointed out, the company avoids subscribing speculative derivative financial instruments, although, when derivative financial instruments fail to meet the requirements set down for the accounting of hedging derivatives (hedge accounting) in IAS 39, changes to the fair value of such instruments are booked to the income statement as financial charges and/or income. Derivative financial instruments are brought to account using hedge accounting methods when: - formal designation and documentation of the hedge relation is present at the start of the
hedge; - the hedge is expected to be highly effective; - effectiveness can be reliably measured and the hedge is highly effective during the periods
of designation.
The fair value of interest rate swaps (IRS) is the amount that the company estimates it will be obliged to pay or collect to terminate the contract at the date of the balance sheet, taking account of current interest rates and the credit rating of the counterparty. The fair value of derivative financial instruments used to hedge against exchange risks (forward contracts) is equivalent to their market value at the balance sheet date, which corresponds to the market value of the forward contract discounted to present value.
The methods used to recognize derivative financial instruments depend on whether or not the conditions and requirements of IAS 39 have been fulfilled. Specifically: (i) Cash flow hedges In the case of a derivative financial instrument for which formal documentation is provided of the hedging relation of the variations in cash flows originating from an asset or liability of a future transaction (underlying hedged variable), considered to be highly probable and that could impact on the income statement, the effective hedge portion deriving from the adaptation of the derivative financial instrument to the fair value is recognized directly in equity. When the underlying hedged item is delivered or settled, the relative provision is derecognized from equity and attributed at the recording value of the underlying element. The ineffective portion, if present, of the change in value of the hedging instrument is immediately ascribed to the income statement under financial expenses and/or income.
When a hedging financial instrument expires, is sold, terminated, or exercised, or the company changes the relationship with the underlying variable, and the forecast transaction has not yet occurred although it is still considered likely, the relative gains or losses deriving from adjustment of the financial instrument to fair value are still retained in equity and are recognized in the income statement when the transaction takes place in accordance with the situation described above. If the forecast transaction related to the underlying risk is no longer expected

144
to occur, the relative gains or losses of the derivative contract, originally deferred in equity, must be taken to the income statement immediately. (ii) Hedges of monetary assets and liabilities (Fair value hedges) When a derivative financial instrument is used to hedge changes in value of a monetary asset or liability already recorded in the financial statements that can impact on the income statement, the gains and losses relative to the changes in the fair value of the derivative instrument are taken to the income statement immediately. Likewise, the gains and losses relative to the hedged item modify the book value of said item and are recognized in the income statement.
4. Cash and cash equivalents 31/12/2012 31/12/2011 (€/000) (€/000)
Cash 6 6Bank deposits 70,479 23,226Repurchase agreements - 45,000Total 70,485 68,232
Bank accounts include €/000 2,290 originally held in US dollars ($/000 3,021). At 31 December 2013 bank deposits included locked up deposits maturing in February 2012 for a notional amount of €42 million at a rate of 3.85%. The rate of interest on ordinary bank deposits during the year was approximately 0.45% (0.90% in 2011), while the rate on other instruments (locked-in bank deposits, savings accounts and repurchase agreements) utilised as a form of investment for cash exceeding normal requirements was on average approximately 3.43% (2.60% in 2011). 5. Trade receivables 31/12/2012 31/12/2011 (€/000) (€/000)
Trade receivables, gross 10,374 11,125Bad debt provision (361) (337)Trade receivables, net 10,013 10,788
Changes in the bad debt provision were as follows: 2012 2011 (€/000) (€/000)
Opening balances 337 322Allocations for the year 65 49Utilizations in the period due to losses (41) (34)Closing balance 361 337
Allocations in the period are booked under other operating costs. Receivables in US dollars amount to €/000 1,448 (corresponding to $/000 1,910), €/000 1,272 of which hedged against currency exchange rate fluctuations.

145
No trade receivables or payables are due beyond 12 months. 6. Inventories 31/12/2012 31/12/2011 (€/000) (€/000)
Raw materials and components 3,237 3,973Semi-finished products 4,686 5,151Finished products 1,825 1,410Total inventories 9,748 10,534
Inventories are net of an allowance for inventories totalling €/000 769 (€/000 800 at 31/12/2011) allocated to cover materials considered to be obsolete or slow moving stock. Changes in the inventories allowance were as follows: 2012 2011 (€/000) (€/000)
Opening balances 800 450Allocations for the year - 395Utilizations in the period due to losses (31) (45)Closing balance 769 800
7. Derivative financial instruments Interest rate hedging The company adopts a procedure, approved by the Board of Directors, which identifies the derivative financial instruments to be used to hedge against the risk of interest rate fluctuations These instruments are as follows: Interest Rate Swaps (IRS), Forward Rate Agreements (FRA) and options on interest rates (Caps & Floors). Company policy is currently to assess the opportunities offered by the market in relation to the possibility to take out Interest Rate Swaps at economically advantageous conditions. This approach is also evident in the hedge taken out in 2009 in the amount of €80,670 thousand, which was expected to show a remaining amount of €46,870 thousand at 31 December 2012 and €69,630 thousand at 31 December 2011. This hedge was taken out to offset the interest rate risk on a loan on the basis of a drawdown plan prepared at the time of the hedge that envisages several repayment instalments with the final payment due on 30/06/2014. This loan however, which was to constitute the underlying of the IRS hedge, has actually been utilised for a lesser amount (€/000 29,470 at 31/12/2012 and €/000 43,230 at 31/12/2011) with respect to the initial intentions resulting, for the surplus portion of the IRS (€/000 17,400 at 31/12/2012 and €/000 26,400 at 31/12/2011), in loss of the conditions required by IAS 39 to qualify as a hedging derivative. The company therefore classified the ineffective part of the IRS as a derivative instrument held for trading. The IRS was taken out on 31 December 2009 at a rate of 2.83%. January 2012 also saw the termination of a second hedge on a loan of €/000 33,333 at an interest rate of 2.70%. Since in the hedge had not complied with the limits of effectiveness established by IAS 39 (80-125 percent) in September 2011, at the end of 2011 it was classified as a derivative instrument held for trading. At 31 December 2012, cash in the amount of € 42,0 million was held at a fixed interest rate (maturity in February 2013) while the remainder was held at floating rate, as were finance and bank debts.

146
Exchange risk hedging The company is subject to exposure of the US dollar for sales in the US of high pressure pumps to subsidiary General Pump; of a mechanical component to subsidiary NLB; of high pressure pumps also to customers outside the Group. The hedges, which were solely related to the sale of high pressure pumps, because the sales of mechanical components are still for insignificant amounts, were created using a single financial instrument: the plain vanilla forward. The company classifies the derivatives hedging sales of high pressure pumps to General Pump as cash flow hedging, while the derivatives hedging sales of high pressure pumps to customers outside the Group are classified as fair value hedging. The fair values of interest rate risk derivative hedges at the close of the year were as follows:
31/12/2012 Notional
31/12/2012Positive
fair value
31/12/2012Negative fair value
31/12/2011
Notional
31/12/2011 Positive
fair value
31/12/2011Negative fair value
(€/000) (€/000) (€/000) (€/000) (€/000) (€/000)
IRS hedges on loans 46,870 - 781 102,963 - 1,383
Total 46,870 - 781 102,963 - 1,383
The fair values of exchange rate risk derivative hedges at the close of the year were as follows:
31/12/2012 Notional
31/12/2012Positive
fair value
31/12/2012Negative fair value
31/12/2011
Notional
31/12/2011 Positive
fair value
31/12/2011Negative fair value
($/000) (€/000) (€/000) ($/000) (€/000) (€/000)
Plain vanilla forwards relative to the hedging of high-pressure pump sales 11,175 272 - 9,600 - 276
Total derivative financial instruments to hedge USD exchange rate risk 11,175 272 - 9,600 - 276
The IRS used to hedge interest risks are booked according to the cash flow hedging method. The classification of the fair value of hedging derivatives according to the profit and loss method is as follows:
31/12/2012 Notional
31/12/2012Positive
fair value
31/12/2012Negative fair value
31/12/2011
Notional
31/12/2011 Positive
fair value
31/12/2011Negative fair value
(€/000) (€/000) (€/000) (€/000) (€/000) (€/000)
IRS recognized according to the cash flow hedging method 29,470 - 484
43,230
- 798
IRS that do not comply with the requirements of IAS 39 to be defined as hedges 17,400 - 297
59,733
- 585
Total derivative financial instruments to hedge the exchange rate risk 46,870 - 781
102,963
- 1,383

147
Plain vanilla forwards used to hedge interest risks are brought to book according to the cash flow hedging method and the fair value hedging method. The fair value breakdown of hedging derivatives according to the profit and loss method is as follows:
31/12/2012 Notional
31/12/2012Positive
fair value
31/12/2012Negative fair value
31/12/2011
Notional
31/12/2011 Positive
fair value
31/12/2011Negative fair value
($/000) (€/000) (€/000) ($/000) (€/000) (€/000)
Plain vanilla forwards recorded according to the fair value hedging method 875 33 -
-
- -
Plain vanilla forwards recorded according to the cash flow hedging method 9,800 233 -
9,600
- 276
Plain vanilla forwards that do not comply with the requirements of IAS 39 to be defined as hedges 500 6 -
-
- -
Total derivative financial instruments to hedge USD exchange rate risk 11,175 272 -
9,600
- 276
At the time of preparation of the financial statements no situations emerged of overhedges, i.e. that exceed the underlying future cash flows, with the exception of a derivative for a notional amount of USD 500 thousand taken out to hedge sales planned for December which were not however carried out. Cash flow hedges The net effects recognized in the income statement refer, in the amount of €/000 16 to losses recorded on the activity of interest rate risk management and in the amount of €/000 12 to losses arising from the activity of interest rate risk management.
Hedging of the exchange risk concerned loans maturing within 2014. The company exchange risk management policy involves the hedging of future commercial cash flows. The maximum time span in which it is predicted that the cash flows will originate is 6 months. It is therefore reasonable to assume that the relative hedge effect suspended in the Provision for valuation of hedging derivatives at fair value will be recorded in the income statement in the next year.
In 2012 the company transferred from equity and ascribed to the income statement a negative portion of profits previously booked for €/000 84 (€/000 86 in 2011) net of the theoretical tax effect. This amount was recognized in reduction of net sales for €/000 123 and under current taxes for €/000 39.
The ineffectiveness deriving from cash flow hedging transactions in 2012 and in 2011 was negligible.

148
Fair value hedges The profits and losses deriving from the valuation of derivative financial instruments in compliance with the rules of fair value hedging and the profits and losses ascribable to the relative hedged elements are shown in the following table: 2012 2011 (€/000) (€/000)
Net profit (loss) on derivative instruments utilized to hedge against exchange risks
43 -
Change in the fair value of the other underlying elements (3) -Profit (loss), net 40 -
Fair values The net effects recognized in the income statement on derivative instruments that do not comply with the parameters of IAS 39 amount to a gain of €/000 270 and are referred mainly to the interest rates risk management activity.
The main methods and assumptions made in the estimation of fair values are outlined below.
Derivatives The fair value of plain vanilla forwards is obtained using market prices, if the forwards are listed, or discounting the difference between the contractual forward exchange rate and the current spot exchange rate. The interest rate utilized for discounting corresponds to swap brokers quotes, tested by applying pricing models and cash flow techniques discounted to current values. In this latter case, the calculation of future cash flows is based on the management's best estimate, whilst the interest rate applied is the market rate for said derivative instruments at the balance sheet date.
Interest-bearing financial payables The fair value is based on the predicted cash flows for the principal amount and interest.
Receivables/Payables For receivables and payables due within twelve months the carrying value is assumed as the fair value. The fair value of other receivables and payables is the discounted nominal value if the temporal factor or notional value are significant.
Interest rates utilized to obtain the fair value To establish the fair value, the company utilizes the interest rate curve plus a suitable spread. The interest rates utilized are as follows: 31/12/2012 31/12/2011 % %Derivative financial instruments (euro) 0,050/2,320 0,300/2,570Derivative financial instruments (USD) 0,150/2,772 0,200/2,592Interest bearing financial payables (euro) Euribor+0.80/300 Euribor+0.45/1.75Financial leasing agreements N/a N/aReceivables and payables 3.4 3.0
Financial instruments measured at value refer to financial assets and liabilities listed on active markets (fair value hierarchy level 1).

149
8. Assets held for sale This category includes an industrial building that is no longer used, for which a property agent has been appointed to secure a sale in a period that is commensurate with current property market conditions. In 2011 a building classified under "Assets held for sale" was sold for €3.7 million. The price, which was divided into instalments, was collected in the amount of €0.9 million in 2011 with the outstanding amount was collected in 2012. 9. Other current assets This item comprises: 31/12/2012 31/12/2011 (€/000) (€/000)
Receivables from the disposal of investments 1,129 1,129Receivables from the disposal of assets held for sale - 2,795Accrued income and prepayments 305 342Other receivables 303 167Total 1,737 4,433
10. Property, plant and equipment Land and
buildingsPlant and
machinery EquipmentOther assets Total
(€/000) (€/000) (€/000) (€/000) (€/000)
At 1 January 2011 Cost 7,541 22,680 10,511 2,225 42,957Accumulated depreciation (2,772) (16,050) (9,159) (1,960) (29,941)Book value 4,769 6,630 1,352 265 13,016
Changes in 2011 Opening book value 4,769 6,630 1,352 265 13,016Increases 9 1,174 826 64 2,073Disposals (1) (1) (3) - (5)Depreciation (116) (865) (593) (112) (1,686)Closing book value 4,661 6,938 1,582 217 13,398
At 31 December 2011 Cost 7,552 23,724 11,334 2,286 44,896Accumulated depreciation (2,891) (16,786) (9,752) (2,069) (31,498)Book value 4,661 6,938 1,582 217 13,398
Changes in 2012 Opening book value 4,661 6,938 1,582 217 13,398Increases 23 2,266 886 385 3,560Disposals - - - - -Depreciation (116) (962) (613) (133) (1,824)Closing book value 4,568 8,242 1,855 469 15,134

150
Land and
buildingsPlant and
machinery EquipmentOther assets Total
(€/000) (€/000) (€/000) (€/000) (€/000)
At 31 December 2012 Cost 7,575 25,918 12,193 2,561 48,247Accumulated depreciation (3,007) (17,676) (10,338) (2,092) (33,113)Book value 4,568 8,242 1,855 469 15,134
The cost of assets under construction, included in the net book values disclosed in the previous table, is as follows: Land and
buildingsPlant and
machinery Equipment Other assets Total
(€/000) (€/000) (€/000) (€/000) (€/000)
At 1 January 2011 - 119 105 - 224At 31 December 2011 - 231 427 - 658At 31 December 2012 - 885 593 - 1,478
There are no finance leasing contracts in existence. Depreciation of €/000 1,732 was charged to the cost of sales (€/000 1,605 in 2011) and €/000 92 for general and administrative expenses (€/000 81 in 2011). At 31 December 2012 the company had contractual commitments for the purchase of tangible assets equal to €/000 2,799 ( €/000 1,507 at 31/12/2011). 11. Goodwill Goodwill consists of the merger surplus, as described in section 2.6. The impairment test was conducted using the Discounted Cash Flow method (DCF) net of taxation. Expected cash flows utilized in the DCF calculation were determined on the basis of a 5-year business plan that takes account of the various reference scenarios and on the basis of growth forecasts in the various markets. For periods after 2017 a prospect of perpetual growth of 1.5% was utilized. The forecast cash flows determined in this manner were reduced by a discount factor in order to take into consideration the risk that the future plans could prove to be impracticable. WACC, after tax, was measured at 8.01%. At 31/12/2011 the WACC was 6.23%. In addition, a sensitivity analysis was carried out in compliance with the requirements of the joint document issued by Banca d'Italia, Consob, and ISVAP on 3 March 2010. Reducing the expected cash flows of the CGU by 10% would not have resulted in any form of impairment, likewise, also increasing the cost of capital utilized to actualize the forecast flows by 0.5% would not have produced any impairment. For a complete and more detailed analysis of goodwill refer to Note 15 in the Consolidated Financial Statements at 31/12/2012.
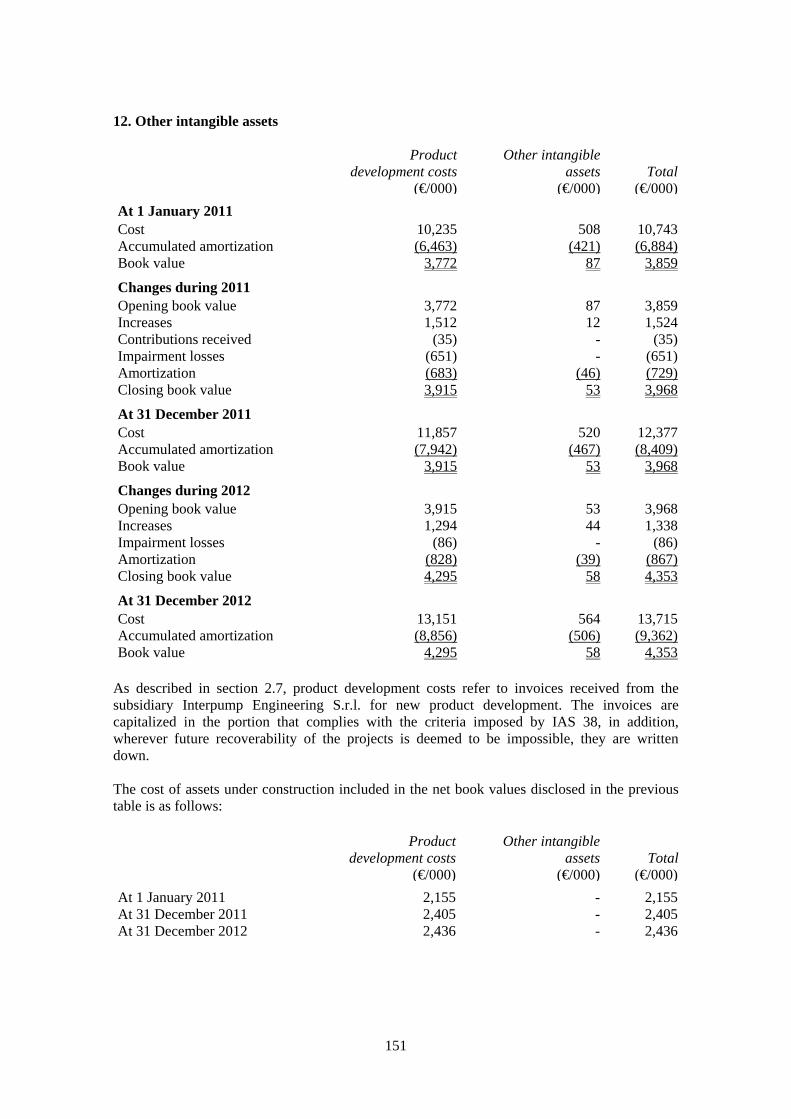
151
12. Other intangible assets Product
development costsOther intangible
assets Total (€/000) (€/000) (€/000)
At 1 January 2011 Cost 10,235 508 10,743Accumulated amortization (6,463) (421) (6,884)Book value 3,772 87 3,859
Changes during 2011 Opening book value 3,772 87 3,859Increases 1,512 12 1,524Contributions received (35) - (35)Impairment losses (651) - (651)Amortization (683) (46) (729)Closing book value 3,915 53 3,968
At 31 December 2011 Cost 11,857 520 12,377Accumulated amortization (7,942) (467) (8,409)Book value 3,915 53 3,968
Changes during 2012 Opening book value 3,915 53 3,968Increases 1,294 44 1,338Impairment losses (86) - (86)Amortization (828) (39) (867)Closing book value 4,295 58 4,353
At 31 December 2012 Cost 13,151 564 13,715Accumulated amortization (8,856) (506) (9,362)Book value 4,295 58 4,353
As described in section 2.7, product development costs refer to invoices received from the subsidiary Interpump Engineering S.r.l. for new product development. The invoices are capitalized in the portion that complies with the criteria imposed by IAS 38, in addition, wherever future recoverability of the projects is deemed to be impossible, they are written down. The cost of assets under construction included in the net book values disclosed in the previous table is as follows: Product
development costsOther intangible
assets Total (€/000) (€/000) (€/000)
At 1 January 2011 2,155 - 2,155At 31 December 2011 2,405 - 2,405At 31 December 2012 2,436 - 2,436

152
Amortization of €/000 867 (€/000 7297 in 2011) was booked entirely to general and administrative costs. 13. Investments in subsidiaries (€/000)
Balance at 31
December 2011
Increases due to assignment
of stock options Decreases
Impairment losses
Balance at 31
December 2012
Subsidiaries: NLB Corporation Inc. 62,048 - - - 62,048General Pump Companies Inc. 8,903 - - - 8,903Interpump Hydraulics S.p.A. 91,312 - - - 91,312Hammelmann GmbH 26,032 - - - 26,032Interpump Engineering S.r.l 138 - - - 138General Technology S.r.l. 2,095 - - - 2,095Teknova S.r.l. (winding up) 25 - - (13) 12SIT S.p.A. 814 - - - 814Hammelmann Bombas e Sistemas Ltda 13 - - - 13Fair value of subsidiaries' employees stock options 387 125 -
- 512
Total subsidiaries 191,767 125 - (13) 191,879
All the equity investments held by Interpump Group S.p.A., with the exception of the investment in Sit S.p.A., are considered, starting from the date of acquisition, as financial assets since they correspond to financial instruments available for sale. As required by IFRIC 11, which came into force on 1 January 2010, share-based payment agreements (stock option plans) were recorded, the subject of which is equity instruments of the parent company in favour of the employees of its subsidiaries. The fair value of the stock options assigned to and exercisable by employees of subsidiaries of €/000 125 was added to the value of the investment, with the increase in the share premium reserve as a matching entry. The impairment of Teknova S.r.l. (winding up) is due to adaptation to the book value of shareholders' equity, following losses for the year. 14. Other financial assets The only item included under other financial assets relates to loans to subsidiaries, a breakdown of which is given in Note 5 of the "2012 Board of Directors' Report of the Parent Company Interpump Group S.p.A.".

153
15. Deferred tax assets and liabilities Changes in deferred tax assets and liabilities are listed below: 2012 2011 2012 2011 Deferred
taxassets
Deferredtax
assets
Deferred tax
liabilities
Deferred tax
liabilities (€/000) (€/000) (€/000) (€/000)
At 1 January 1,658 2,109 1,005 1,051Charged to income statement in the period 340 (223) (125) (6)Recording in reserves for the year (137) (228) 26 (40)At 31 December 1,861 1,658 906 1,005
Deferred tax assets and liabilities can be booked to the following items of the balance sheet: 31/12/2012 31/12/2011 31/12/2012 31/12/2011
Deferred tax assets
Deferred tax assets
Deferred tax
liabilities
Deferred tax
liabilities (€/000) (€/000) (€/000) (€/000)Property, plant and equipment 280 350 721 730Intangible fixed assets 222 250 - -Inventories 241 251 - -Receivables 22 21 - -Investments 365 - 12 12Liabilities for employee benefits - - 129 221Shareholders' equity
- capital increase ancillary expenses - derivative financial instruments
35117
70252
-
26 --
Other 579 464 18 42Total 1,861 1,658 906 1,005
Deferred tax assets/liabilities recognized directly in equity refer to the recognition of the fair value of derivative financial instruments recorded in accordance with the hedge accounting method and booking of capital increase ancillary expenses. No deferred tax liabilities were recorded for reserves qualifying for tax relief as their distribution is not envisaged (see note 21). 16. Interest-bearing financial payables and bank payables
The main loans are all subject to the following financial covenants, calculated using consolidated figures:
- Net financial indebtedness / Shareholders' equity;
- Net financial indebtedness / EBITDA;
- EBITDA / Financial charges;
At 31/12/2012 all financial covenants had been amply complied with.

154
Non-current financial payables have the following due dates: 31/12/2012 31/12/2011 (€/000) (€/000)
From 1 to 2 years 17,716 45,927From 2 to 5 years 55,684 33,081After 5 years 2,141 11,132Total 75,541 90,140
The average interest rate on loans for 2012, considering also the effects of the hedges taken out as indicated in note 7, was approximately 2.7% (3.4% in 2011). At 31/12/2012 all loans were at floating-rates. The company has the following lines of credit which were unused at year-end: 31/12/2012 31/12/2011 (€/000) (€/000)
Current account overdrafts and export advances 37,345 35,416Medium/long-term financing 34,000 45,472Total 71,345 80,888
The unused medium/long-term lines of credit at 31/12/2012 refer mainly to the BNL loan taken out on 31 July 2012 in the amount of €30 million. 17. Other current liabilities This item comprises: 31/12/2012 31/12/2011 (€/000) (€/000)
Payables to personnel 1,690 1,432Payables to social security institutions 1,266 1,265Customer advances 313 406Customer credit balances 99 301Customers for credit notes to issue 236 12Payables for the remuneration of directors/auditors 1,442 1,321Other 14 65Total 5,060 4,802

155
18. Provisions for risks and charges Changes were as follows:
(€/000) Balance at
31/12/2011Allocations of
the yearDrawdowns
of the year Balance at
31/12/2012
Provision for potential liabilities connected to the disposal of investments 300 - (300) -Other 4 1 - 5Total 304 1 (300) 5 The closing balance is disclosed as shown below in the balance sheet: 31/12/2012 31/12/2011 (€/000) (€/000)
Current - -Non-current 5 304Total 5 304
19. Liabilities for employee benefits Liabilities for defined benefit plans The following movements were recorded in liabilities:
2012 2011 (€/000) (€/000)
Liabilities at 1 January 3,269 3,237Amount charged to income statement in the period 450 219Reclassifications to other current liabilities (56) (64)Payments made (134) (123)Liabilities at 31 December 3,529 3,269
The following items were recognized in the income statement: 2012 2011 (€/000) (€/000)
Current service cost - -Financial charges 68 55Actuarial loss (profit) recorded in the period 382 164Past service cost - -Total recognized in the income statement 450 219

156
Items recognized in the income statement were booked as follows: 2012 2011 (€/000) (€/000)
Cost of sales 277 119Distribution costs 62 26General and administrative expenses 43 19Financial charges 68 55Total 450 219
Refer to the "Board of Directors' Report" in chapter “1. Profitability” for a breakdown of payroll costs. The average number of employees broken down by category is as follows: 2012 2011
Executives 8 8Middle management 7 8White collar 64 62Blue collar 281 281Total 360 359
Liabilities for defined benefit plans (Severance indemnity - TFR) were established with the following actuarial assumptions: Unit of
measurement 2012 2011Interest rate % 3.29 4.32Expected increase in rate of remuneration % n.a. n.a.Percentage of employees expected to resign before retirement age (turnover)*
% 2.42 4.03
Annual cost-of-living increase % 2.0 2.0Average period of employment Years 14.73 13.00
* = average annual resignation percentage, all causes, in the first ten years following the assessment. 20. Share capital The share capital at 31 December 2012 was composed of 108,879,294 ordinary shares with a unit par value of €0.52 for a total amount of €56,617,232.88. In contrast, share capital recorded in the financial statements amounts to €/000 52,796 because the nominal value of purchased treasury shares, net of divested treasury stock, was deducted from the share capital in compliance with the reference accounting principles. At 31 December 2012 Interpump S.p.A. held 7,349,239 treasury shares in the portfolio corresponding to 6.75% of the capital stock, acquired at an average unit cost of € 4.9626.

157
Changes in treasury stock over the past two years have been as follows: Number
Balance at 31/12/2010 3,059,9722011 purchases 3,548,594Sale of shares to finance subsidiaries' purchases (1,074,286)Sale of shares for the exercise of stock options (50,000)Balance at 31/12/2011 5,484,2802012 purchases 2,703,490Sale of shares to finance subsidiaries' purchases (300,831)Sale of shares for the exercise of stock options (537,700)Balance at 31/12/2012 7,349,239
At June 2012 a total of 4,712,160 warrants were exercised, with the consequent subscription of 2,896,015 new ordinary shares for total value of €14,477,178.89 of which €1,505,927.8 by way of share capital and €12,971,251.18 by way of a premium. At October 2012 a further 13,528,608 warrants were exercised with the relative subscription of 8,314,457 new ordinary shares for a total value of €42,403,730.70 of which €4,323,517.64 by way of share capital and €38,080,213.06 by way of premium. Taking treasury stock into consideration, the following changes were recorded in the number of shares in circulation: 2012 2011 Number of shares Number of shares
Ordinary shares in existence at 1 January 97,668,822 97,662,391Treasury stock (5,484,280) (3,059,972)Shares in circulation at 1 January 92,184,542 94,602,419Purchased treasury stock (2,703,490) (3,548,594)Treasury stock sold 838,531 1,124,286Increase in share capital 11,210,472 6,431Total shares in circulation at 31 December 101,530,055 92,184,542
The aims identified by the Group in the management of capital are the creation of value for all shareholders and supporting development of the Group, both internal and through targeted acquisitions. The Group therefore intends to maintain an adequate level of capitalization, which simultaneously makes it possible to generate a satisfactory economic return for shareholders and to guarantee the economically effective access to external sources of borrowing. The Group constantly monitors the evolution of the debt to equity ratio and the generation of cash through its industrial operations. In order to attain the aforementioned goals, the Group constantly monitors the cash flows generated by the business sectors in which it operates, both through improvement or maintenance of profitability, and careful management of working capital and of other expenditure. Capital is construed as both the value provided by Interpump Group shareholders (share capital and share premium reserve, totalling €/000 157,473 at 31 December 2012 and €/000 111,823 at 31 December 2011), and the value generated by the company in terms of the results of operations (other reserves and legal reserve, including profit for the year, overall equivalent to €/000 76,679 at 31 December 2012 and €/000 71,011 at 31 December 2011, excluding the translation provision and the provision for fair value measurement of hedge derivatives).

158
Purchased treasury stock The amount of treasury stock held by Interpump Group is recorded in an equity provision. In 2012 the company acquired 2,703,490 treasury shares at an average unit cost of €5.8544 (3,548,594 in 2011). Treasury stock sold In the framework of the exercise of stock options a total of 537,700 options were exercised resulting in a receipt of €/000 2,025 (50,000 options were exercised for €/000 188 in 2011). In addition, with the acquisition of 53% of the stock of Galtech S.p.A. on 31 January 2012 300,831 treasury shares were divested (1,074,286 in 2011 for the acquisition of an 11% interest in Interpump Hydraulics International). Assigned options After having checked that the relative goals had been accomplished, The Board of Directors' meeting of 24 April 2012 determined that the 560,560 options of the 2010/2012 incentive plan had now become exercisable. In particular, 196,000 options assigned to Giovanni Cavallini, 196,000 options assigned to Fulvio Montipò, 62,720 options assigned to Paolo Marinsek and 105,840 options assigned to other beneficiaries all became exercisable. The options can be exercised at the price of €3.75 per share as from 30 June 2013 until 31 December 2016. The fair value of the stock options assigned with the new incentives plan had already been established at the time of the prior allocation, which was dependent on the accomplishment of the goals. Stock options The fair value of the 2006/2009 and 2010/2012 stock option plans was recognized in the 2012 and 2011 financial statements in compliance with IFRS 2. Costs of €/000 742 (€/000 845 in 2011) relating to the stock option plans were therefore recognized in the 2012 income statement, with a matching entry in the share premium reserve. Said costs represent the portion for the financial period of the value of the options assigned to employees and directors, established at the allocation date, corresponding to the value of the services rendered by the latter in addition to normal remuneration.
The effects in the income statement were booked as follows:
2012 2011 (€/000) (€/000)
Cost of sales - -Distribution costs 29 29General and administrative expenses 713 816Total 742 845

159
Changes in the share premium reserve were as follows:
2012 2011 €/000 €/000
Share premium reserve at 1 January 63,887 73,622Increase of the period due to recording in the income statement of the fair value of stock options assigned
742 845
Increase of the period due to recording in equity of the fair value of stock options assigned to subsidiaries' employees
125 124
Increases for the transfer of treasury stock following the payment for acquisitions of subsidiaries
1,547 3,750
Increase for share capital increase 51,052 28Increases for the transfer of treasury stock following the exercise of stock options
1,745 162
Utilization for coverage of the purchase of treasury stock (14,421) (14,644)Share premium reserve at 31 December 104,677 63,887
The 2002/2005 plan is described analytically in the Board of Directors' Report on the 2012 Consolidated Financial Statements. The cost of each tranche is determined in a different manner for each vesting period and is recorded in the income statement for each tranche in the period of maturity on the basis of the months that have elapsed from the date of allocation to the reporting date. Changes in options are as follows:
2012 2011 Number of options Number of options
Options assigned at 1 January 602,850 602,850Options assigned during the year - -Options exercised during the year (4,000) -Options reissued (cancelled) during the year - -Total options assigned at 31 December 598,850 602,850Of which: vested at 31 December 598,850 602,850not vested at 31 December - -Total options assigned at 31 December 598,850 602,850
The remaining 598,850 options refer to the fourth tranche (exercise price of € 5.6774) and are exercisable until 31/12/2013.
The Shareholders' Meeting of 20 April 2006 approved another stock option plan (2006/2009) which, like the previous one, is described in detail in the Board of Directors' Report. Options are exercisable as shown in the following table:
No. of options granted
Exercise period Exercise price (€)
First tranche 796,935 01/05/2010 – 31/05/2015 7.2884Second tranche 827,361 01/05/2010 – 31/05/2015 5.4047Third tranche 271,800 01/11/2012 – 31/05/2017 3.7524Fourth tranche 519,500 01/07/2010 – 31/12/2017 3.7524Total 2,415,596

160
Changes in options are as follows:
2012 2011 Number of options Number of options
Options assigned at 1 January 2,949,296 2,999,296Options assigned during the year - -Options exercised during the year (533,700) (50,000)Options reissued (cancelled) during the year - -Total options assigned at 31 December 2,415,596 2,949,296Of which: - vested at 31 December 2,415,596 2,674,296- not vested at 31 December - 275,000Total options assigned at 31 December 2,415,596 2,949,296
The Shareholders' Meeting of 21 April 2010 approved the adoption of a new incentive plan designated “Interpump 2010/2012 Incentives Plan”. The plan, which is based on the free assignment of options that grant the beneficiaries the right, on the achievement of specified objectives, to (i) purchase or subscribe the Company’s shares up to the maximum number of 3,000,000 or, (ii) at the discretion of the Board of Directors, receive the payment of a differential equivalent to any increase in the market value of the Company’s ordinary shares. Beneficiaries of the plan can be employees or directors of the Company and/or its subsidiaries, identified among the subjects with significant roles or functions. The exercise price has been set at € 3.75 per share. The options can be exercised between 30 June 2013 and 31 December 2016. The conditions for the exercise of the options are linked to the achievement of specific parameters in the financial statements and of performance of Interpump Group shares. Since the targets of the plan were accomplished the 2,860,000 options assigned have matured, as resolved by the Board of directors' meetings held on 15 March 2011 and 24 April 2012. The fair value of the stock options and the actuarial assumptions utilized in the binomial lattice model are as follows:
2002-2005 plan, fourth tranche
Unit of measurement
Number of shares assigned no. 944,700Grant date May 2006Exercise price € 5.6774
Vesting date 1/3 May 2006
1/3 May 20071/3 May 2008
Fair value per option at the grant date € From 1.28862 to
1.45284Expected volatility (expressed as the weighted average of volatility values utilized in construction of the binomial lattice model)
% 23%
Expected average duration of the plan life Years From 4.7 to 6.7Expected dividends (compared with share value) % 4%Risk free interest rate (calculated by means of a linear interpolation of Swap rates at 30/04/2005)
% From 3.774 to 3.998

161
2006-2009 Plan - First tranche
Unit of measurement
Number of shares assigned no. 826,935Grant date May 2007Exercise price € 7.2884Vesting date 1 May 2010Fair value per option at the grant date € 1.8187Expected volatility (expressed as the weighted average of volatility values utilized in construction of the binomial lattice model)
% 23%
Expected average duration of the plan life Years 7.7Expected dividends (compared with share value) % 4%Risk free interest rate (calculated by means of a linear interpolation of Swap rates at 30/05/2007)
% From 4.36 to 4.3745
2006-2009 Plan - Second tranche
2006-2009 Plan - Third tranche
Unit of measurement
Number of shares assigned no. 275,000Grant date April/July 2009Exercise price € 3.7524Vesting date 1 November 2012Fair value per option at the grant date € 0.57306Expected volatility (expressed as the weighted average of volatility values utilized in construction of the binomial lattice model)
% 30%
Expected average duration of the plan life Years 7.83Expected dividends (compared with share value) % 4%Risk free interest rate (calculated by means of a linear interpolation of Swap rates at 30/06/2009)
% From 3.258 to 3.395
Unit of measurement
Number of shares assigned no. 827,361Grant date May 2008Exercise price € 5.4047Vesting date 1 May 2011Fair value per option at the grant date € 1.2431Expected volatility (expressed as the weighted average of volatility values utilized in construction of the binomial lattice model)
% 23%
Expected average duration of the plan life Years 7.7Expected dividends (compared with share value) % 4%Risk free interest rate (calculated by means of a linear interpolation of Swap rates at 17/04/2008)
% From 4.445 to 4.496
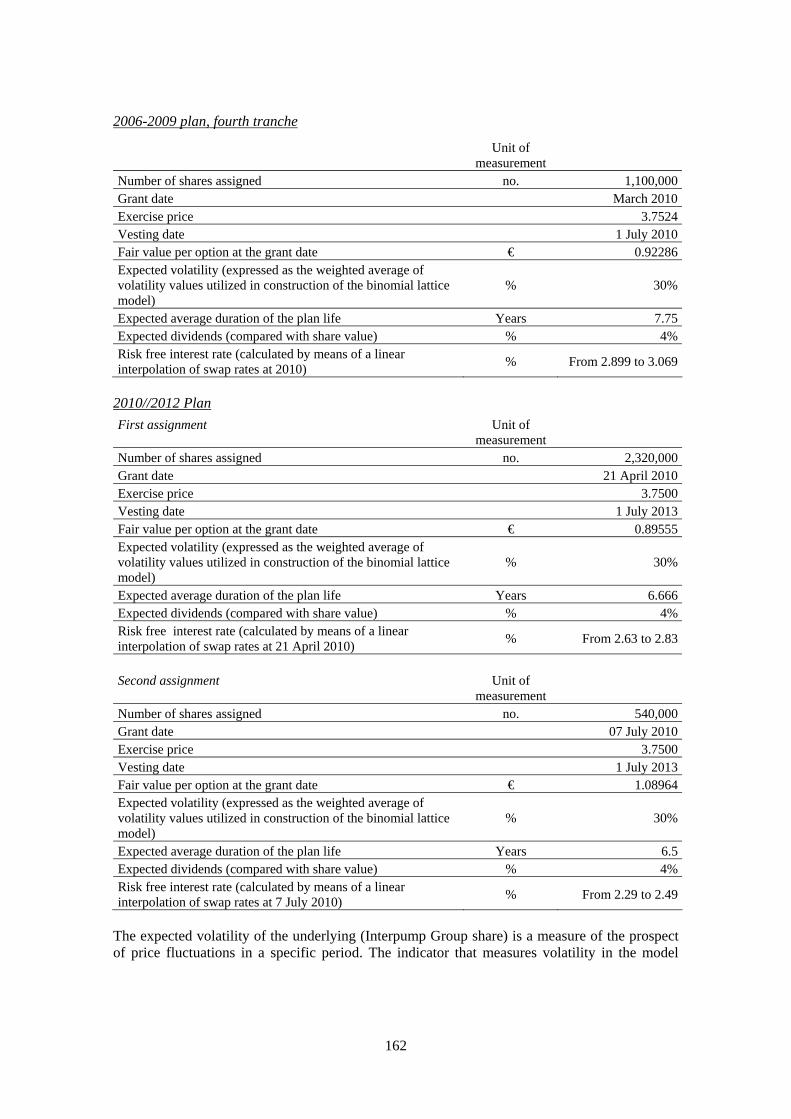
162
2006-2009 plan, fourth tranche
2010//2012 Plan
First assignment Unit of measurement
Number of shares assigned no. 2,320,000Grant date 21 April 2010Exercise price 3.7500Vesting date 1 July 2013Fair value per option at the grant date € 0.89555Expected volatility (expressed as the weighted average of volatility values utilized in construction of the binomial lattice model)
% 30%
Expected average duration of the plan life Years 6.666Expected dividends (compared with share value) % 4%Risk free interest rate (calculated by means of a linear interpolation of swap rates at 21 April 2010)
% From 2.63 to 2.83
Second assignment Unit of
measurement Number of shares assigned no. 540,000Grant date 07 July 2010Exercise price 3.7500Vesting date 1 July 2013Fair value per option at the grant date € 1.08964Expected volatility (expressed as the weighted average of volatility values utilized in construction of the binomial lattice model)
% 30%
Expected average duration of the plan life Years 6.5Expected dividends (compared with share value) % 4%Risk free interest rate (calculated by means of a linear interpolation of swap rates at 7 July 2010)
% From 2.29 to 2.49
The expected volatility of the underlying (Interpump Group share) is a measure of the prospect of price fluctuations in a specific period. The indicator that measures volatility in the model
Unit of measurement
Number of shares assigned no. 1,100,000Grant date March 2010Exercise price 3.7524Vesting date 1 July 2010Fair value per option at the grant date € 0.92286Expected volatility (expressed as the weighted average of volatility values utilized in construction of the binomial lattice model)
% 30%
Expected average duration of the plan life Years 7.75Expected dividends (compared with share value) % 4%Risk free interest rate (calculated by means of a linear interpolation of swap rates at 2010)
% From 2.899 to 3.069

163
utilized to evaluate the options is the mean square annualized deviation of compound returns of the Interpump Group share through time.
21. Reserves Reserve for valuation of hedging derivatives at fair value This includes net accumulated changes in the fair value of derivative financial instruments classified as hedges and recorded using the hedge accounting method.
Classification of net equity depending on the possibility of utilization (amounts in €/000)
Amount Possibility of
utilization
Available portion Tax payable in the
event of distribution
Summary of amounts utilized in previous three
years
to cover losses
for other reasons
Share capital
Subscribed and fully paid-up share capital
56,617 B - - - -
Nominal value of treasury stock in the portfolio
(3,821) - - -
-
-
Total share capital 52,796
Capital reserves
Legal reserve 6,860 B - - - -
Share premium reserve 78,481 A,B,C 78,481 - - -
Total capital reserves 85,341
Profit reserves:
Legal reserve 3,298 B - - - -
Share premium reserve 25,464 A,B,C 24,952 1,687 - 23,170
Extraordinary reserve 46,654 A,B,C 46,370 - - -
Reserve for share capital reduction 3,821 - - - - -
First Time Adoption Reserve (34) - - - - -
Reserve for valuation of hedging derivatives at fair value
(250) - - -
-
-
Profit for the period 16,812 A,B,C 15,646 - - -
Total profit reserves 95,765 86,968
Reserve for treasury stock held 36,471 - - - - 5,989
Treasury stock (36,471) - - - - -
Non-distributable portion* (4,296)
Remaining distributable portion 161,153
A: to increase capital B: to cover losses C: for shareholder dividends
*= represents the non-distributable portion destined to cover deferred costs that have not yet been amortized.
We draw your attention to the fact that €/000 12,987 of the share premium reserve qualifies for tax relief in that it was fiscally formed from the revaluation reserve, Law 342/2000 and Law 266/2005.
Drawdowns refer to dividends, purchase of treasury stock and reductions of reserves for other causes and do not include transfers between reserves. In particular, with reference to the changes that occur red in the past three years note that the drawdowns of the share premium reserve refer to purchases of treasury stock, while drawdowns from the reserve for treasury stock held refer to the sale of treasury shares at a price below their carrying value.

164
According to national tax regulations, reserves and profit can be freely distributed and are not subject to tax even in the event of distribution if the reserves and net profit exceed the negative components of income ascribed only in the tax return. Otherwise, distributed reserves and profit are subject to tax in the measure in which the residual reserves and profits are lower than the negative components of income that have been ascribed exclusively to the tax return. At 31 December 2012, this condition has been complied with in full, hence no taxes were payable in the event of distribution of the parent company's entire profits for the year and the entirety of available reserves, beyond the taxes already indicated in the prior statement. Breakdown of components recorded directly in equity
2012 2011
(€/000) Pre-tax
amount Taxes
Amount net
of taxes
Pre-tax
amount
Taxes
Amount net
of taxes
Recognition of derivative
financial instruments used to
hedge the interest rate risk
recorded in accordance with the
cash flow hedging method 356 (98) 258 969
(266) 703
Recognition of derivative
financial instruments used to
hedge the exchange rate risk
recorded in accordance with the
cash flow hedging method 207 (65) 142 (249)
78 (171)
Total 563 (163) 400 720 (188) 532
22. Information on financial assets and liabilities Financial assets and liabilities, broken down by the categories identified by IAS 39, are summarized in the following tables: Financial assets
as at31/12/2012
Financial liabilities as at
31/12/2012
(€/000)
At the fair value recorded in the Income Statement
Initially* IAS 39**
Loans and receivables
Valued at amortized cost
Total
Fair value
Trade receivables - - 10,013 - 10,013 10,013Derivative instruments (assets)
- 6 - - 6 6
Other current assets - - 1,432 - 1,432 1,432Other financial assets - 38,573 - 38,573 38,573Trade payables - - - (10,927) (10,927) (10,927)Current interest bearing financial payables
- - - (51,435)
(51,435)
(51,435)
Derivative instruments (liabilities)
(297) - - -
(297)
(297)
Other current liabilities - - - (5,060) (5,060) (5,060)Non-current interest-bearing financial payables
- - - (75,541)
(75,541)
(75,541)
Total (297) 6 50,018 (142,963) (93,236) (93,236) * = designated as such at the time of initial recording. ** = classified as held for trading according to the requirements of IAS 39.

165
Financial assets
as at31/12/2011
Financial liabilities as at
31/12/2011
(€/000)
At the fair value recorded in the Income Statement
Initially* IAS 39**
Loans and receivables
Valued at amortized cost
Total
Fair value
Trade receivables - - 10,788 - 10,788 10,788Derivative instruments (assets)
- - - - - -
Other current assets - - 4,091 - 4,091 4,091Other financial assets - - 34,369 - 34,369 34,369Trade payables - - - (10,034) (10,034) (10,034)Current interest bearing financial payables
- - - (79,941)
(79,941)
(79,941)
Derivative instruments (liabilities)
(489) (96) - -
(585)
(585)
Other current liabilities - - - (4,802) (4,802) (4,802)Non-current interest-bearing financial payables
- - - (90,140)
(90,140)
(90,140)
Total (489) (96) 49,248 (184,917) (136,254) (136,254) * = designated as such at the time of initial recording. ** = classified as held for trading according to the requirements of IAS 39.
The carrying value of financial assets and liabilities is substantially the same as their fair value.
The company has recorded fair value profits in the income statement in the amount of €/000 295 (€/000 919 in 2011) and fair value losses for €/000 25 (€/000 757 in 2011) on derivative financial instruments, which, although they arose for hedging purposes, failed to meet all the requirements of IAS 39 in order to qualify as hedges. Note 7 gives the methods for calculation utilized to establish the fair value of derivative financial instruments. A loss of €/000 11 was recorded on the underlying transactions in 2011; no effects were recorded in 2012.
Loans and receivables generated revenues and costs. Revenues refer to exchange rate gains for €/000 347 (€/000 222 in 2011). In contrast, the costs refer to exchange losses in the amount of €/000 301 (€/000 263 in 2011), to bad debts for €/000 65 (€/000 49 in 2011) classified under other operating costs.
Financial liabilities measured at the amortized cost generated costs relative to the portion of ancillary expenses initially incurred to obtain the loans and subsequently distributed throughout the duration of the loan in accordance with the financial method. In 2012 the value of these expenses booked to the income statement was €/000 815 (€/000 458 in 2011).
Financial assets and liabilities that are not designated at fair value recorded in the Income Statement (in the case of Interpump Group S.p.A. all those indicated in the above tables) generated interest receivable for €/000 1,383 (€/000 873 in 2011) and interest expense for €/000 4,711 (€/000 6,709 in 2011); in addition, general and administrative expenses include bank commissions and charges for €/000 93 (€/000 97 in 2011).
23. Information on financial risks The company is exposed to financial risks associated with its activities: market risks (mainly relative to currency exchange rates and interest rates) since the
company does business internationally and is exposed to the exchange risk deriving from exposure to the US dollar;
credit risk connected with business relations with customers;

166
liquidity risk, with special reference to the availability of financial resources and access to the lending market and financial instruments in general;
price risk in relation to metal price fluctuations that constitute a significant portion of the raw materials purchase price.
The company is not exposed to significant concentrations of risks
As described in Note 3 "Management of financial risks" the company constantly monitors the financial risks to which it is exposed in such a way as to make an advance assessment of potential negative effects and take appropriate actions to mitigate them.
The following section contains reference qualitative and quantitative indications regarding the uncertainty of these risks for Interpump Group S.p.A.
The quantitative data given below are not to be construed as forecasts; specifically, the sensitivity analyses concerning market risks are unable to reflect the complexity and correlated relations of markets that may derive from each prospected change.
Exchange risk
The company is exposed to risks arising from fluctuations in currency exchange rates, which may affect economic results. Specifically:
for revenues denominated in currencies other than the currencies in which the respective costs are denominated, exchange rate fluctuations can impact on the company's operating profit. In 2012 the total amount of cash flow exposed directly to exchange risks was approximately 25% of company sales (approximately 22% in 2011). The exchange rates to which the company is exposed are EUR/USD, in relation to sales in dollars of high-pressure pumps in North America through General Pump Inc., which is sited in this important market, and, stating from 2012, directly to an important US customer. Starting from 2011 the company began billing in USD also to its other US subsidiary, NLB Inc., even though the relative amounts remain fairly modest. The Interpump Group has adopted a policy of hedging commercial transactions denominated in foreign currency, in the framework of which the most effective derivative instruments for the achievement of the preset goals have been identified and the relative responsibilities, duties and system of delegations have been defined. In relation to the exposure in dollars for sales on the American market to subsidiary General Pump Inc., it is company policy to hedge a prudentially determined portion of predicted sales for periods of four to eight months. In relation to exposures in dollars for sales on the American market to subsidiary NLB Inc., the company has decided for the present not to hedge them because it considers that they have not yet reached a level such as to allow the benefits associated with the stabilization of the exchange rates to cover the costs connected with setting up the relative hedges. In relation to the exposure in dollars for sales on the American market to customers outside the Group, it is company policy to hedge the receivable or foreign currency collected in the event of advance payment, that arise further to the sales projections agreed with the customer. In 2012 the company's exchange risk hedging policy involved 95% of the previously illustrated cash flows (89% in 2011).
again in relation to commercial activities, the company may be in a position wherein it holds commercial receivables denominated in currencies other than the account currency. Fluctuations in exchange rates can therefore result in the realization or emergence of positive or negative exchange differences. It is company policy, as previously specified, to hedge exposure deriving from trade receivables.
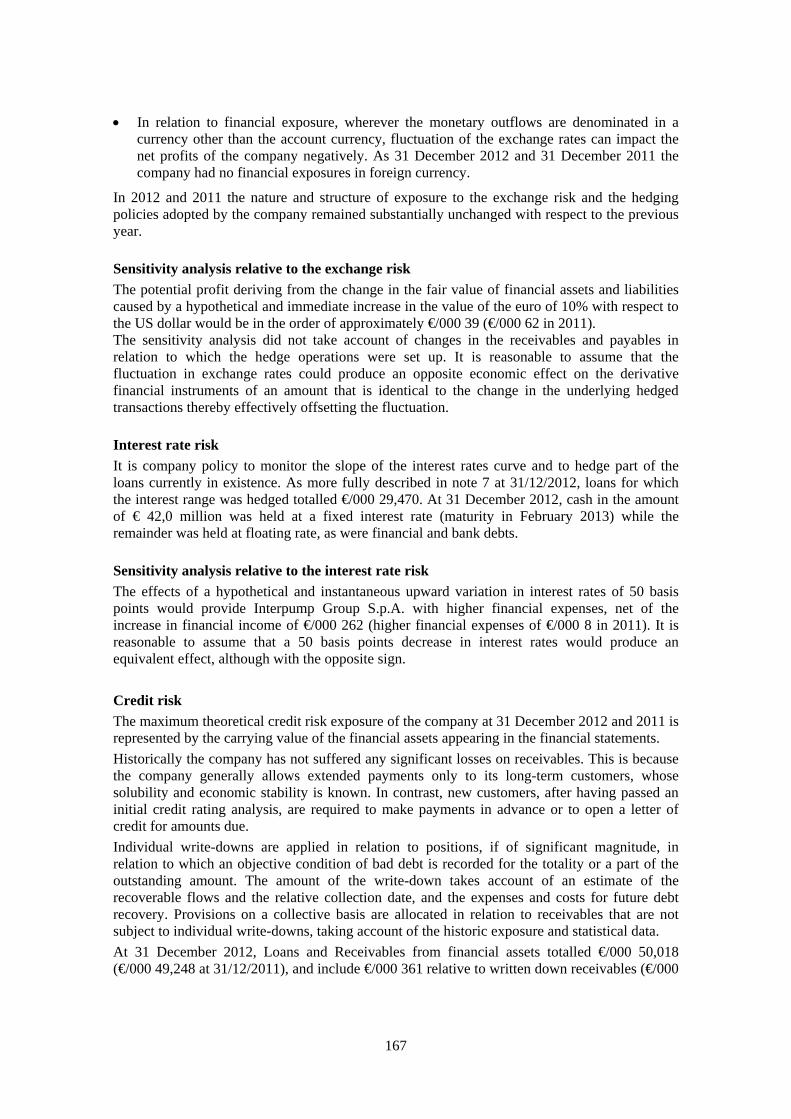
167
In relation to financial exposure, wherever the monetary outflows are denominated in a currency other than the account currency, fluctuation of the exchange rates can impact the net profits of the company negatively. As 31 December 2012 and 31 December 2011 the company had no financial exposures in foreign currency.
In 2012 and 2011 the nature and structure of exposure to the exchange risk and the hedging policies adopted by the company remained substantially unchanged with respect to the previous year.
Sensitivity analysis relative to the exchange risk
The potential profit deriving from the change in the fair value of financial assets and liabilities caused by a hypothetical and immediate increase in the value of the euro of 10% with respect to the US dollar would be in the order of approximately €/000 39 (€/000 62 in 2011). The sensitivity analysis did not take account of changes in the receivables and payables in relation to which the hedge operations were set up. It is reasonable to assume that the fluctuation in exchange rates could produce an opposite economic effect on the derivative financial instruments of an amount that is identical to the change in the underlying hedged transactions thereby effectively offsetting the fluctuation.
Interest rate risk
It is company policy to monitor the slope of the interest rates curve and to hedge part of the loans currently in existence. As more fully described in note 7 at 31/12/2012, loans for which the interest range was hedged totalled €/000 29,470. At 31 December 2012, cash in the amount of € 42,0 million was held at a fixed interest rate (maturity in February 2013) while the remainder was held at floating rate, as were financial and bank debts.
Sensitivity analysis relative to the interest rate risk
The effects of a hypothetical and instantaneous upward variation in interest rates of 50 basis points would provide Interpump Group S.p.A. with higher financial expenses, net of the increase in financial income of €/000 262 (higher financial expenses of €/000 8 in 2011). It is reasonable to assume that a 50 basis points decrease in interest rates would produce an equivalent effect, although with the opposite sign.
Credit risk
The maximum theoretical credit risk exposure of the company at 31 December 2012 and 2011 is represented by the carrying value of the financial assets appearing in the financial statements.
Historically the company has not suffered any significant losses on receivables. This is because the company generally allows extended payments only to its long-term customers, whose solubility and economic stability is known. In contrast, new customers, after having passed an initial credit rating analysis, are required to make payments in advance or to open a letter of credit for amounts due.
Individual write-downs are applied in relation to positions, if of significant magnitude, in relation to which an objective condition of bad debt is recorded for the totality or a part of the outstanding amount. The amount of the write-down takes account of an estimate of the recoverable flows and the relative collection date, and the expenses and costs for future debt recovery. Provisions on a collective basis are allocated in relation to receivables that are not subject to individual write-downs, taking account of the historic exposure and statistical data.
At 31 December 2012, Loans and Receivables from financial assets totalled €/000 50,018 (€/000 49,248 at 31/12/2011), and include €/000 361 relative to written down receivables (€/000
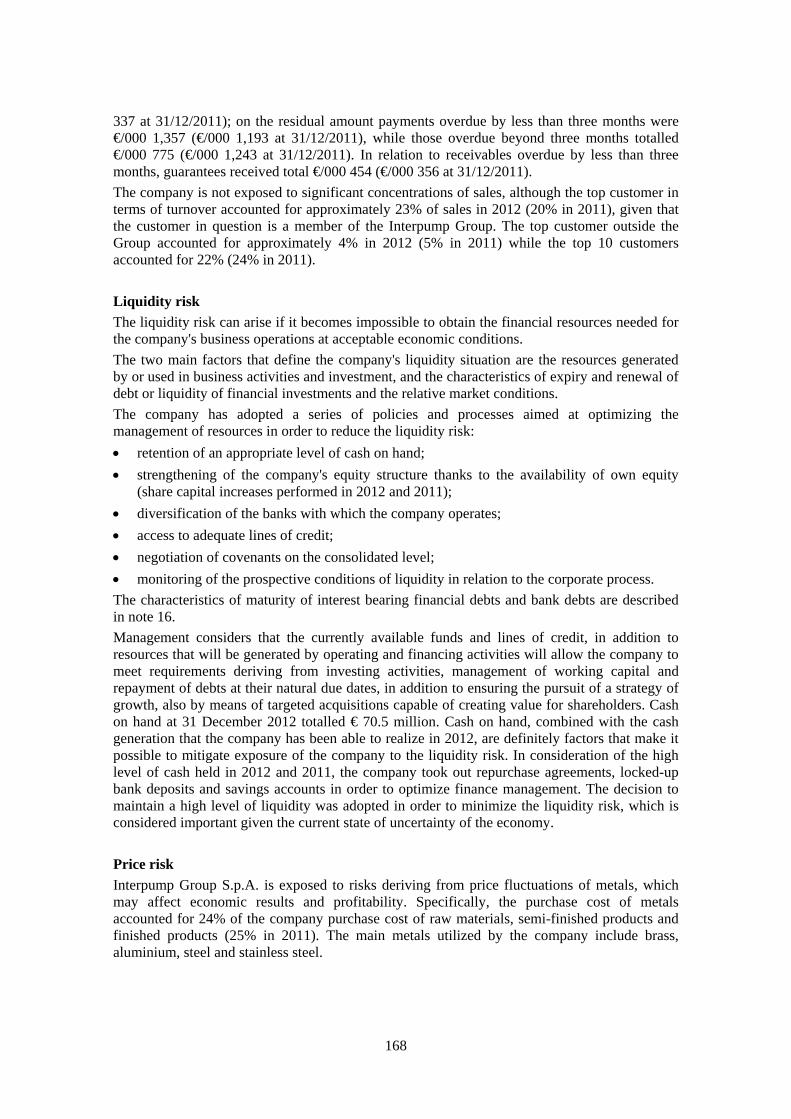
168
337 at 31/12/2011); on the residual amount payments overdue by less than three months were €/000 1,357 (€/000 1,193 at 31/12/2011), while those overdue beyond three months totalled €/000 775 (€/000 1,243 at 31/12/2011). In relation to receivables overdue by less than three months, guarantees received total €/000 454 (€/000 356 at 31/12/2011).
The company is not exposed to significant concentrations of sales, although the top customer in terms of turnover accounted for approximately 23% of sales in 2012 (20% in 2011), given that the customer in question is a member of the Interpump Group. The top customer outside the Group accounted for approximately 4% in 2012 (5% in 2011) while the top 10 customers accounted for 22% (24% in 2011).
Liquidity risk
The liquidity risk can arise if it becomes impossible to obtain the financial resources needed for the company's business operations at acceptable economic conditions.
The two main factors that define the company's liquidity situation are the resources generated by or used in business activities and investment, and the characteristics of expiry and renewal of debt or liquidity of financial investments and the relative market conditions.
The company has adopted a series of policies and processes aimed at optimizing the management of resources in order to reduce the liquidity risk:
retention of an appropriate level of cash on hand;
strengthening of the company's equity structure thanks to the availability of own equity (share capital increases performed in 2012 and 2011);
diversification of the banks with which the company operates;
access to adequate lines of credit;
negotiation of covenants on the consolidated level;
monitoring of the prospective conditions of liquidity in relation to the corporate process.
The characteristics of maturity of interest bearing financial debts and bank debts are described in note 16.
Management considers that the currently available funds and lines of credit, in addition to resources that will be generated by operating and financing activities will allow the company to meet requirements deriving from investing activities, management of working capital and repayment of debts at their natural due dates, in addition to ensuring the pursuit of a strategy of growth, also by means of targeted acquisitions capable of creating value for shareholders. Cash on hand at 31 December 2012 totalled € 70.5 million. Cash on hand, combined with the cash generation that the company has been able to realize in 2012, are definitely factors that make it possible to mitigate exposure of the company to the liquidity risk. In consideration of the high level of cash held in 2012 and 2011, the company took out repurchase agreements, locked-up bank deposits and savings accounts in order to optimize finance management. The decision to maintain a high level of liquidity was adopted in order to minimize the liquidity risk, which is considered important given the current state of uncertainty of the economy.
Price risk
Interpump Group S.p.A. is exposed to risks deriving from price fluctuations of metals, which may affect economic results and profitability. Specifically, the purchase cost of metals accounted for 24% of the company purchase cost of raw materials, semi-finished products and finished products (25% in 2011). The main metals utilized by the company include brass, aluminium, steel and stainless steel.

169
It is our policy to transfer the cost of stocking materials to suppliers; in this scenario the risk is hedged by means of orders for specific periods and quantities agreed at fixed prices; at 31 December 2012 there existed signed commitments covering 36% of expected brass consumption and 63% of expected aluminium consumption for 2013 (61% coverage of forecast brass consumption and 21% coverage of forecast aluminium consumption at 31/12/2011), 27% of steel consumption (13% at 31/12/2011) and 20% of stainless steel consumption predicted for next year (22% at 31/12/2011). In addition, at 31 December 2012 stock on hand covered 7% of prospected brass consumption (4% at 31/12/2011), 11% of aluminium consumption (11% at 31/12/2011), 13% of steel consumption (33% at 31/12/2011) and 5% of stainless steel consumption (16% at 31/12/2011).
The company generally reviews selling prices on a once-yearly basis. 24. Net sales The following table shows a breakdown of sales by geographical area: 2012 2011 (€/000) (€/000)
Italy 14,829 15,818Rest of Europe 18,861 20,201Rest of the World 36,348 37,495Total 70,038 73,514
Details of net sales by invoicing currency are provided below: 2012 2011 (€/000) (€/000)
Euro 52,689 57,082USD 17,349 16,432Total 70,038 73,514
Sales in USD refer primarily to invoices issued to the US subsidiary General Pump Inc. Sales to the other US subsidiary, NLB Inc., which started in 2011, doubled in terms of value in 2012 although in absolute terms the value is still modest. Starting from 2012 the company started billing in USD also to an American customer outside the Group. 25. Other net revenues 2012 2011 (€/000) (€/000)
Sale of scrap 209 498Capital gains on the sale of tangible assets 13 4Reimbursement of expenses 426 343Other 745 590Total 1,393 1,435

170
26. Costs by nature 2012 2011 (€/000) (€/000)
Amortization, depreciation and write-downs of tangible and intangible fixed asset (notes 10 and 12)
2,777 3,066
Payroll expenses 18,265 18,095Raw materials and components 25,169 28,109External manufacturing 2,832 3,783Hire purchase and leasing charges 267 260Other costs 13,342 12,193Total cost of sales, distribution costs, general and administrative expenses, other operating costs and impairment losses on tangible and intangible fixed assets.
62,652 65,506 The emoluments of the Directors and Statutory Auditors of Interpump Group S.p.A. in 2012 were, respectively, €/000 5,441 and €/000 158 and they include remuneration resolved by the Shareholders' Meeting, the remuneration established by the Board of Directors for directors vested with special offices, including bonuses, remuneration for employment relationships and the remunerative component deriving from stock option plans represented by the fair value of the options calculated at the time of their allocation, for the portion relating to the year, and also the amount due to the Chairman for end of office indemnity. 27. Financial income and charges 2012 2011 (€/000) (€/000)
Financial income Interest income 2,953 3,401Foreign exchange gains 347 373Earnings from valuation of derivative financial instruments 936 1,549Total 4,236 5,323
Financial charges Interest payable 5,526 7,167Other financial charges 68 55Foreign exchange losses 461 274Losses from valuation of derivative financial instruments 483 1,517Total 6,538 9,013

171
28. Income taxes The reconciliation of taxes calculated on the basis of the nominal rates in force and the effective tax burden is a follows: 2012 2011 (€/000) (€/000)
IRES
Profit before taxes from the income statement 15,545 11,648
Theoretical taxes at nominal rate (27.5%) 4,275 3,203
Lower taxes for non-taxable dividends (2,490) (1,405)
Higher taxes due to non-deductible write-downs of investments 4 3
Lower taxes due to IRAP deduction relating to payroll expenses and similar (182) -
Lower taxes due to IRAP deduction on interest expenses (28) -Lower taxes of prior years due to the failure to deduct IRAP on payroll and related expenses (of Decree no.201/2011 art. 2 para. 1(4)) (816) -
Lower taxes of prior years due to the deductibility of the tax loss resulting from the sale of Unielectric (2,699) -
Higher deferred taxes allocated to write-downs of investments carried out in prior years (365) -
Taxes for prior financial periods 82 (27)
Other 43 45
Total IRES (2,176) 1,819
IRAP/Local income taxes
Profit before taxes from the income statement 15,545 11,648
Theoretical taxes at nominal rate (3.9%) 606 454
Lower taxes for non-taxable dividends (393) (231)
Higher taxes due to non-deductible write-downs of investments 1 -
Higher taxes for non-deductible payroll costs 443 472
Higher taxes for non-deductible directors' emoluments 200 162
Higher taxes due to non-deductible financial expenses 92 144
Taxes for prior financial periods (4) 1
Other 63 61
Total IRAP/Local income taxes 1,008 1,063
Total income taxes recognized in the income statement (1,168) 2,882
We draw your attention to the fact that the company chose, together with Teknova S.r.l. and Interpump Hydraulics S.p.A., to take up the option of national tax consolidation Taxes recognized in the income statement can be broken down as follows:
2012 2011 (€/000) (€/000)
Current taxes (2,448) (2,691)Current taxes of prior financial periods 3,151 26Deferred taxes 465 (217)Total taxes 1,168 (2,882)

172
In 2012 lower taxes were booked in the amount of €3.9 million, of which €2.7 million relative to the deductibility of the tax loss resulting from the sale of Unielectric in 2011 booked in 2012 following completion of the relative procedure, and in the amount of €0.4 million for deferred tax assets relative to another possible similar event, and finally for €0.8 million relative to tax rebates for the deductibility of IRAP on employee salaries relative to prior years. Deferred tax recognized in the income statement can be broken down as follows:
2012 2011 (€/000) (€/000)
Deferred tax assets generated during the period 946 706Deferred tax liabilities generated during the period - (23)Deferred tax assets transferred to the income statement (606) (929)Deferred tax liabilities transferred to the income statement 125 29Total deferred taxes 465 (217)
29. Earnings per share Basic earnings per share Earnings per share are calculated on the basis of profit for the period divided by the weighted average number of ordinary shares during the year as follows
2012 2011
Profit for the period attributable to shareholders (€/000) 16,812 7,968Average number of shares in circulation 94,134,090 93,963,275Basic earnings per share for the period 0.179 0.085
Diluted earnings per share Diluted earnings per share are calculated on the basis of diluted profit of the period attributable to the parent company's shareholders, divided by the weighted average number of ordinary shares in circulation adjusted by the number of potentially dilutive ordinary shares. The calculation is as follows:
2012 2011
Profit for the period attributable to shareholders (€/000) 16,812 7,968Average number of shares in circulation 94,134,090 93,963,275Number of potential shares for stock option plans (*) 1,345,560 840,181Number of potential shares for the exercise of warrants (**) - 166,593Average number of shares (diluted) 95,479,650 94,970,049Earnings per diluted share at 31 December (€) 0.176 0.084
(*) calculated as the number of shares assigned for in-the-money stock option plans multiplied by the ratio between the difference between the average value of the share in the period and the exercise price at the numerator, and the average value of the share in the period at the denominator.
(**) calculated as the number of shares potentially exercisable by the ratio between the difference between the average value of the share in the period and the exercise price at the numerator, and the average value of the share in the period at the denominator.

173
30. Notes to the cash flow statement Property, plant and equipment In 2012 the company purchased property, plant and equipment totalling €/000 3,560 (€/000 2,073 in 2011). This expenditure involved the payment of €/000 3,331, inclusive of the payment of past debts for the same purpose and net of payables deferred to the following year (€/000 1,882 in 2011). Cash and cash equivalents This item can be broken down as follows:
31/12/2012 31/12/2011 1/1/2011 (€/000) (€/000) (€/000)
Cash and cash equivalents 70,485 68,232 89,282Payables to banks (for current account overdrafts, advances subject to collection and accrued interest) (51)
(2,360) (602)
Cash and cash equivalents from the cash flow statement 70,434 65,872 88,680 Net financial position and cash flow statement For the amount and details of the main components of the net financial position and the changes that occurred in 2012 and 2011 we invite you to refer to the "Loans" section of the Board of Directors' Report. 31. Commitments The company has commitments to purchase tangible fixed assets totalling €/000 2,799 (€/000 1,507 at 31/12/2011). Interpump Group S.p.A. signed rental and hire purchase agreements mainly for warehouses, offices, and cars. The total outlay in 2012 was €/000 393 (€/000 363 in 2011). At 31/12/2012, the following commitments were outstanding:
€/000
Due within 1 year 393Due from 1 to 2 years 325Due from 2 to 5 years 413Due beyond 5 years -Total 1,131
In addition, in relation to the sale of an investment in 2011, the price of which was spread over several instalments, the last of which due in 2013, the company received adequate bank guarantees amounting to €/000 1,167 at 31/12/2012. 32. Transactions with related parties Transactions involving top management Transactions with related parties concerned consultancy provided by entities related to directors of the Parent company and subsidiaries in the amount of €/000 217 (€/000 171 in 2011) and other costs for €/000 3 (€/000 4 in 2011). The financial statements at 31 December 2012 show residual payables due to such entities for €/000 59 (€/000 33 at 31/12/2011). With regard to transactions with Group companies we invite you to refer to chapter 5 of the Board of Directors' Report.

174
The transactions mentioned above were carried out at arm's length conditions. 33. Events occurring after the close of the year After 31 December 2012 there were no further events such that require mention here.

175
Annex 1
Attestation of the annual financial statements pursuant to art. 81-(3) of Consob regulation no. 11971 of 14 May 1999 as amended 1. The undersigned Paolo Marinsek and Carlo Banci, respectively Executive Director and
Manager responsible for the drafting of company accounting documents of Interpump Group S.p.A., taking account also of the provisions of art. 154-(2), paras. 3 and 4 of decree D.Lgs 24 February 1998 no. 58 state:
- adequacy in relation to the characteristics of the business and
- the effective application,
of the administrative and accounting procedures for the formation of the annual financial statements during 2012.
2. In addition, it is confirmed that the annual financial statements of Interpump Group S.p.A for the year ended 31 December 2012, showing total assets of €382,765 thousand, net profit of €16,812 thousand and shareholders' equity of €233,902 thousand:
a) correspond to the results of the company books and accounting entries;
b) were prepared in compliance with the international accounting standards approved by the European Commission further to the enforcement of Ruling (CE) no. 1606/2002 of the European Parliament and the European Council of 19 July 2002, and the provisions issued in implementation of art. 9 of decree D. Lgs. 38/2005 and the contents are suitable for providing a truthful and fair representation of the equity, economic and financial situation of the company;
c) the Board of Directors' report contains a reliable analysis of performance and results and the situation of the issuer together with a description of the main risks and uncertainties to which it is exposed.
Milan, 19 March 2013 Paolo Marinsek Carlo Banci Executive Director Manager responsible for drafting
company accounting documents

176
Report of the Board of Statutory Auditors to the Shareholders' Meeting of Interpump Group S.p.A. on the financial statements at 31 December 2012, in compliance with art. 2429 of the Italian Civil Code and art. 153 of decree D.Lgs. 58/1998.
Shareholders,
The Board of Statutory Auditors herewith reports to you on its operations as required by Art. 2429 of the Italian Civil Code and Art. 153 of decree D. Lgs. 58/1998, taking account also of the principles of conduct prescribed by the "Consigli Nazionali dei Dottori Commercialisti e degli Esperti Contabili" (National Councils of Certified Public Accountants) and CONSOB Communication of 6 April 2001, as amended.
1. The Board of Directors regularly informed the Board of Statutory Auditors as required under Art. 150 of decree D.Lgs. 58/1998.
The operations of the greatest significance in economic and financial terms performed by the company in 2012 were as follows:
a) 18 January 2012: acquisition of a 60% interest in MTC Srl for €/ML 3.0.
b) 31 January 2012: acquisition of a 53% interest in Galtech SpA for €/ML 3.3, half of which settled in cash and half with no. 300,831 shares issued by Interpump Group SpA.
c) 15 February 2012: acquisition of 100% of Takarada SA (Brazil) for Reais 29.0 million (€/ML 12.9).
d) Exercise of warrants:
June 2012 no. 4,712,160 warrants, with the subscription of no. 2,896,015 new shares for the equivalent of € 14,477,178.98;
October 2012 no. 13,528,608 warrants, with the subscription of no. 8,314,457 new shares for the equivalent of € 42,403,730.70;
the global market value of the subscribed shares (€ 56,880,909.68) was booked to share capital in the amount of € 5,829,445.44 and to the share premium reserve for € 51,051,464.24. The new share capital is therefore composed of 108,879,294 ordinary shares with a unit face value of €0.52 for the total amount of €56,617,232.88.
2.1 We found no trace of any atypical and/or unusual transactions conducted with third parties, related parties or intra-group operations carried out in 2012 by the Company.
2.2 With regard to the transactions performed in the framework of the Group and with related parties, the Directors provided specifications and precise information in the Board of Directors' Report and in the Notes to the separate financial statements for 2012, specifying the following matters in particular:
a) the company entertained relations at arm's length conditions with other Group companies and with top management, as described in section 5 of the Board of Directors' Report and in note no. 32 of the Notes to the separate financial statements;
b) the company currently has active stock option plans designed to incentivize and build loyalty among company management (including Directors G. Cavallini, F. Montipò and P. Marinsek), as described in detail in note no. 20 of the Notes to the separate financial statements.
The Company has issued a specific report to provide the remuneration disclosures required by statutory legislation.

177
2.3 With regard to intercompany transactions, the Directors' report describes the characteristics of commercial and financial relations entertained with subsidiaries and associates; we consider that the relative amounts are congruous and that the operations carried out were in line with the interests of the company.
2.4 Giovanni Cavallini will stand down from the office of Chairman and depart from the Group as from 30 April 2013.
3. Independent auditing company PriceWaterhouseCoopers S.p.A. issued its report on 25 March 2013 in compliance with the requirements of articles 14 and 16 of decree D.Lgs. 39/2010, wherein it attests that the annual financial statements provide a clear and fair view of the financial position, results and cash flows of the company.
The Independent Auditors also judged the information given in the corporate governance report to be in compliance with the financial statements, as required by the amendments introduced by decree D. Lgs 173/2008.
4. We have received no complaints pursuant to art. 2408 of the Italian Civil Code.
5. The Company has not awarded any additional assignments to PriceWaterhouseCoopers SpA.
6. No assignments were awarded to parties associated with the independent auditors.
7. We have expressed our opinions in relation to the incentive plans (including the stock option plans), the remuneration amounts as per art. 2389 no. 3 of the Italian Civil Code and their consistency with the general remunerations policy; also, pursuant to the requirements of art. 3.C.5 of the Code of Corporate Governance, we have also checked the correct application of the criteria and procedures for assessment utilized by the Board of Directors to assess the independence of its members.
8. The Board of Statutory Auditors met 8 times during the year and attended 8 meetings of the Board of Directors; we also participated in 5 meetings of the Internal Control and Risks Committee and in the Shareholders' Meetings. We hereby confirm that the Remuneration Committee met twice during the year.
9. We have verified and monitored, within the scope of our competence, the observance of the principles of correct administration, by means of direct checks and through information gathered from the persons in charge of the various company functions and meetings with representatives of the Independent Auditing Company, arranged with the purpose of assuring the reciprocal exchange of data and relevant information. No anomalies or matters to be submitted to your attention have emerged in this context.
10. We have also verified and supervised, within the scope of our competence, the suitability of the company's organizational structure, in which context we have no matters to submit to your attention.
11. We evaluated the adequacy of the Company's internal control system and administrative and accounts system, and the reliability of this latter in relation to the true and faithful representation of all aspects of company operations, by means of: (i) examination of reports of the manager responsible for drafting company accounting documents on the Administrative and Accountancy Structure and Corporate Governance System on Company Information; (ii) information gathered from the managers of the various

178
company functions; (iii) relations with the supervisory bodies of subsidiaries pursuant to the terms of subsections 1 and 2 of Art. 151 of D.Lgs. 58/1998; (iv) participation in the works of the Control and Risks Committee (in compliance with the Code of Corporate Governance). From the activities performed no anomalies emerged that could be construed as indicators of inadequacy of the corporate governance system.
12. On the basis of the provisions contained in art. 19 of decree D. Lgs. 27 January 2010 no. 39, the Board of Statutory Auditors - identified by said provisions as the Committee for Internal Control and Accounts Auditing - also supervised over: the financial disclosure process; legal auditing of the annual accounts and the consolidated accounts; independence of the independent legal auditing company, in particular with regard
to the provision of services other than auditing to Interpump Group SpA and the Group companies.
We found no trace of elements requiring mention in this report.
13. The Company has issued its subsidiaries with the instructions necessary to comply with the disclosure obligations prescribed in Art. 114, subsection 2, of decree D.Lgs. 58/1998. Said instructions are adequate in compliance with statutory requirements.
14. We have verified through direct checks and by analyzing information obtained from the Independent Auditing Company, the full observance of legal requirements concerning the formation of the separate financial statements and the attached Board of Directors' Report.
15. With reference to Corporate Governance and the methods of tangible implementation of the rules of governance set down by the Code of Corporate Governance issued by Borsa Italiana, the Company's methods of adherence are described in detail in the relative report with which we are in full agreement.
16. As part of our general supervisory role, no major events emerged requiring notification to supervisory bodies or disclosure in this report.
17. Having taken account of the results of the separate financial statements for the year ending 31 December 2012, which show net profit for the year of €16,812,363, in consideration of the matters illustrated above and taking account of the report issued by the independent auditors, we express our agreement with the proposal made by the Board of Directors, both with regard to the approval of the separate financial statements and also with regard to the proposal for distribution of profit for the year.
Finally, we agree with the proposal to take part of the dividend from available provisions, in consideration of the group's consolidated profit and the economic and financial outlook of the group.
* * * * *
Milan, 26 March 2013
THE BOARD OF STATUTORY AUDITORS
Enrico Cervellera
Achille Delmonte
Paolo Scarioni

179

180


![2016 second quarter - Esprinetinvestor.esprinet.com/contenuti/download/[15.09.2016]H1...2016/09/15 · 1 Press release in accordance with Consob Regulation n. 11971/99 Esprinet to](https://static.fdocuments.in/doc/165x107/5f746168ccf002319d234c9a/2016-second-quarter-15092016h1-20160915-1-press-release-in-accordance.jpg)


